结论前进一步,后退两步
旧款 ThinkPad P16 比竞争对手更大、更重。然而,最新款的联想 ThinkPad P16 Gen 3 似乎矫枉过正了:它的移动性更强,但在性能方面却做出了牺牲,比如 GPU 的 105 W TGP 和 180 W 充电器。对于这个以性能为主要目标的产品线来说,这并不是我们所期望的。
ThinkPad P16 G3 的整体性能还是很高的,它的许多优秀品质使其成为一款出色的工作主力。尤其值得一提的是它的可扩展性,因为这款笔记本最多可以安装 192 GB 内存和 3 个 2280 SSD。对于使用 CAD 或本地 AI 的用户来说,这是一款非常出色的笔记本电脑。
Pros
Cons
联想将其移动工作站称为 ThinkPad P 系列,P 代表动力或性能。我们的评测设备--联想 ThinkPad P16 Gen 3,比该系列的任何其他型号都更能代表这一点。它优先考虑的是性能,而不是移动性等其他方面。它是该系列中最重、最厚,但也是功能最强大的 ThinkPad 笔记本电脑,拥有最多的配置选项和升级潜力。如果你购买的是 P16 Gen 3,那么你需要的就是这种强大的性能--而且你有很多钱。无论是 CAD 还是本地 AI,甚至是充当便携式服务器,ThinkPad P16 都能胜任。
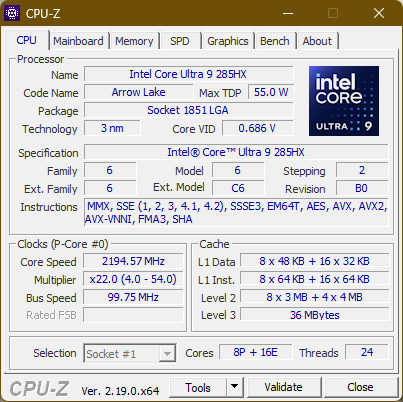
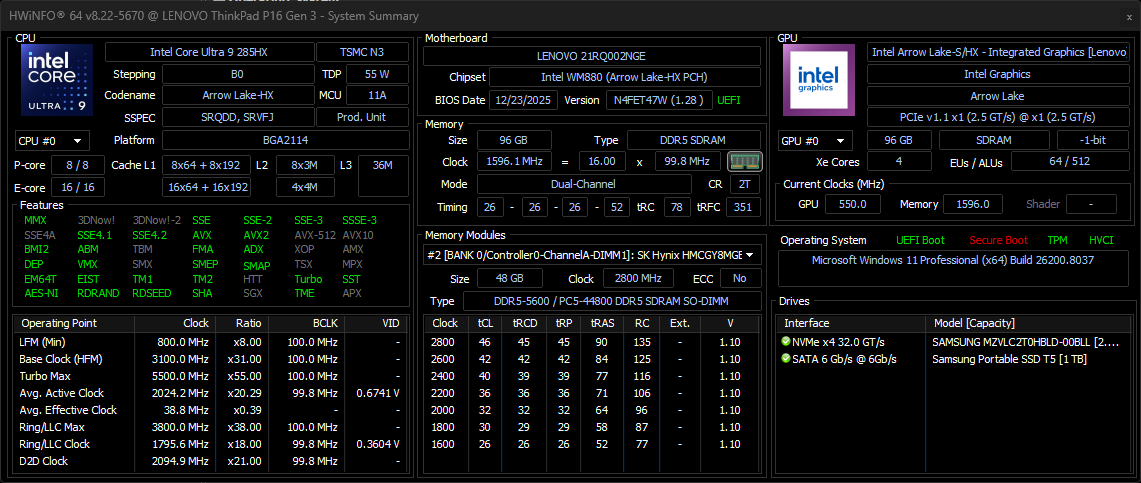
规格Core Ultra 9 和 RTX Pro 3000 Blackwell
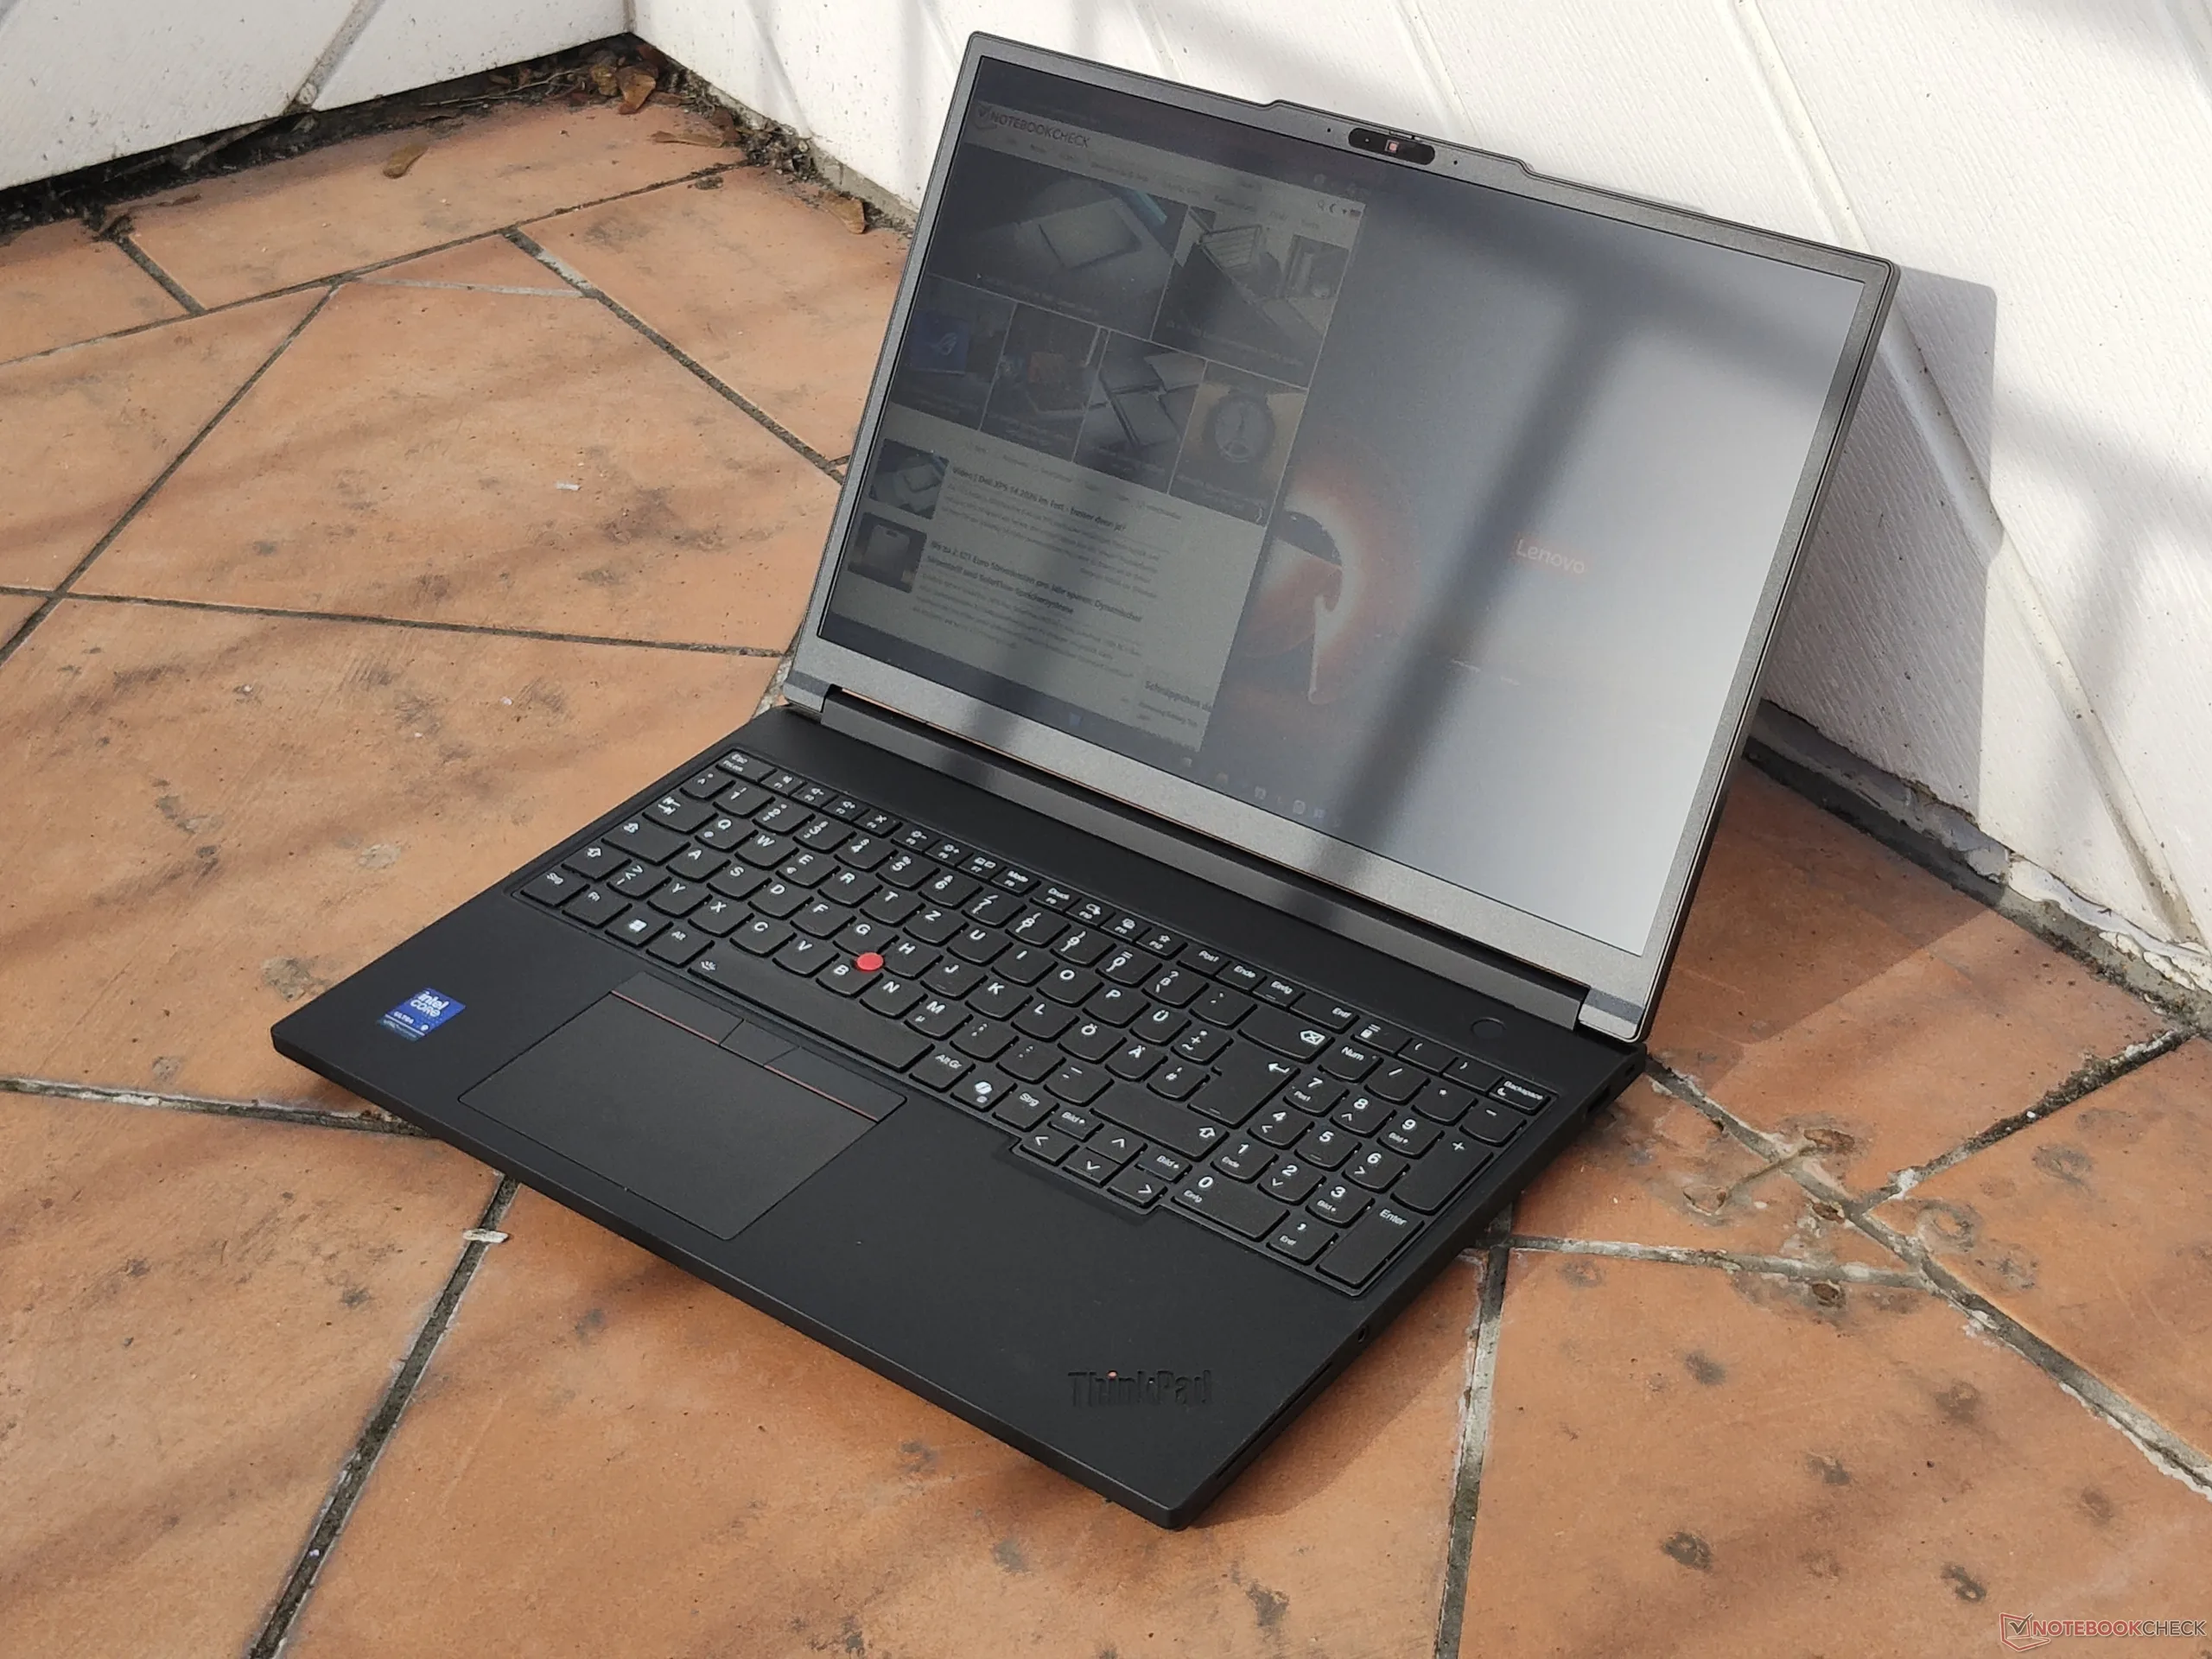
外壳ThinkPad P16 的全新开始
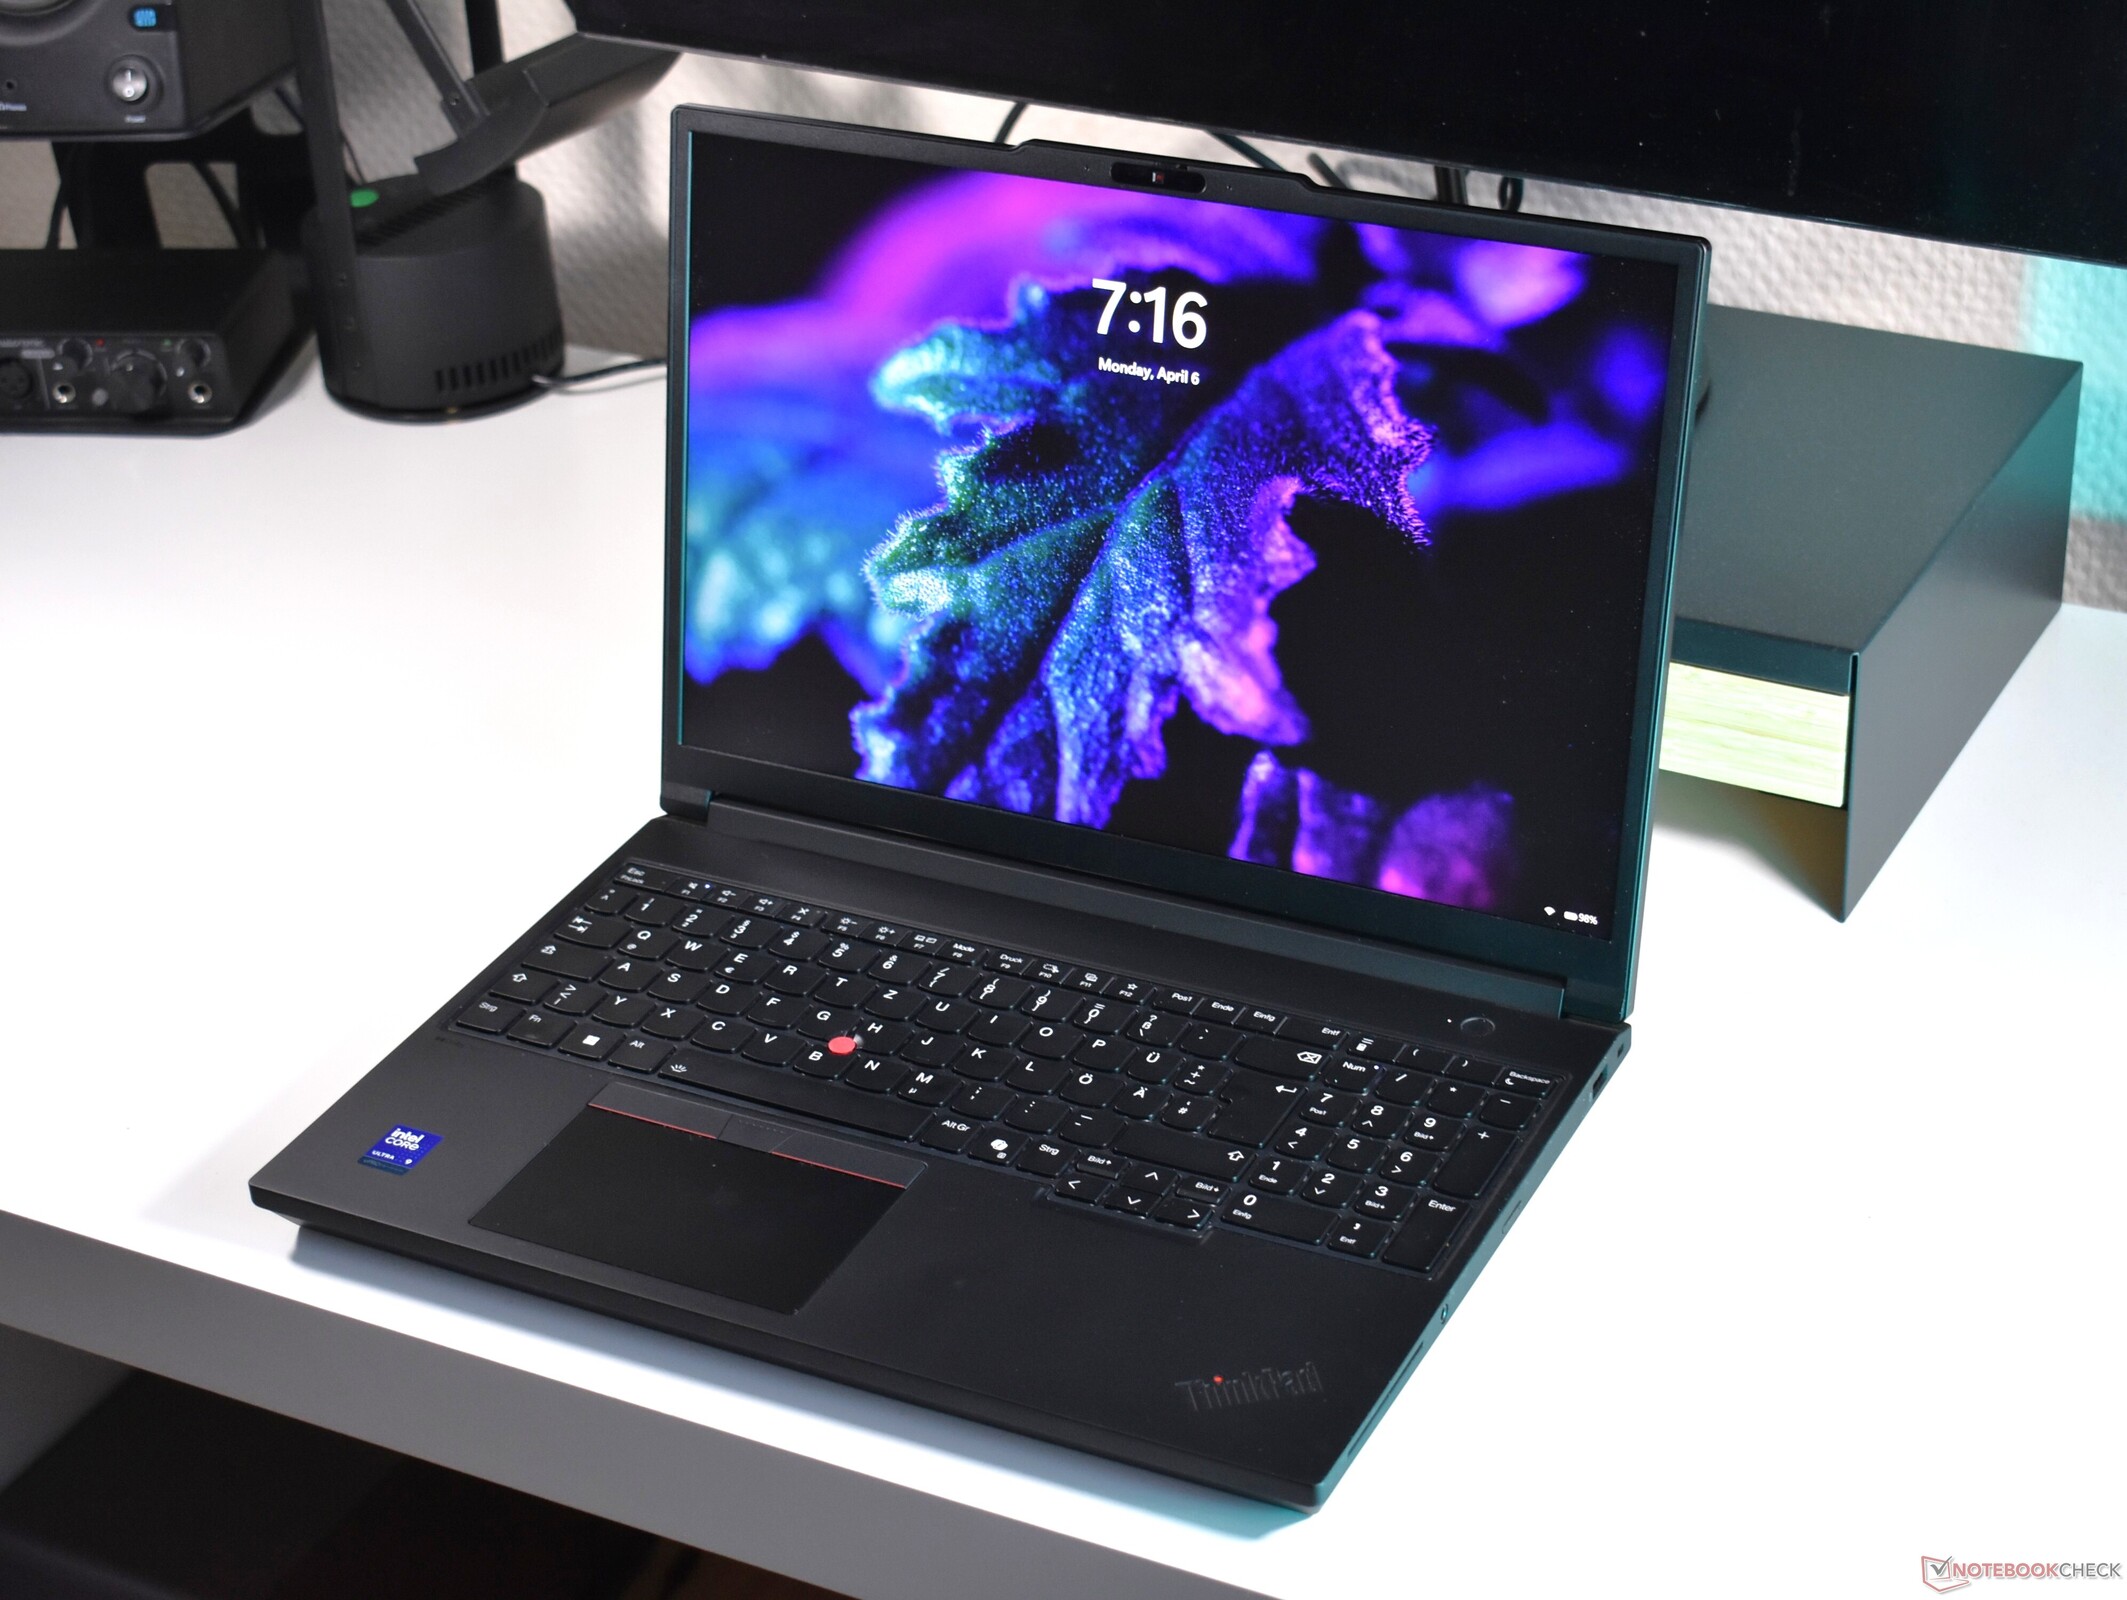
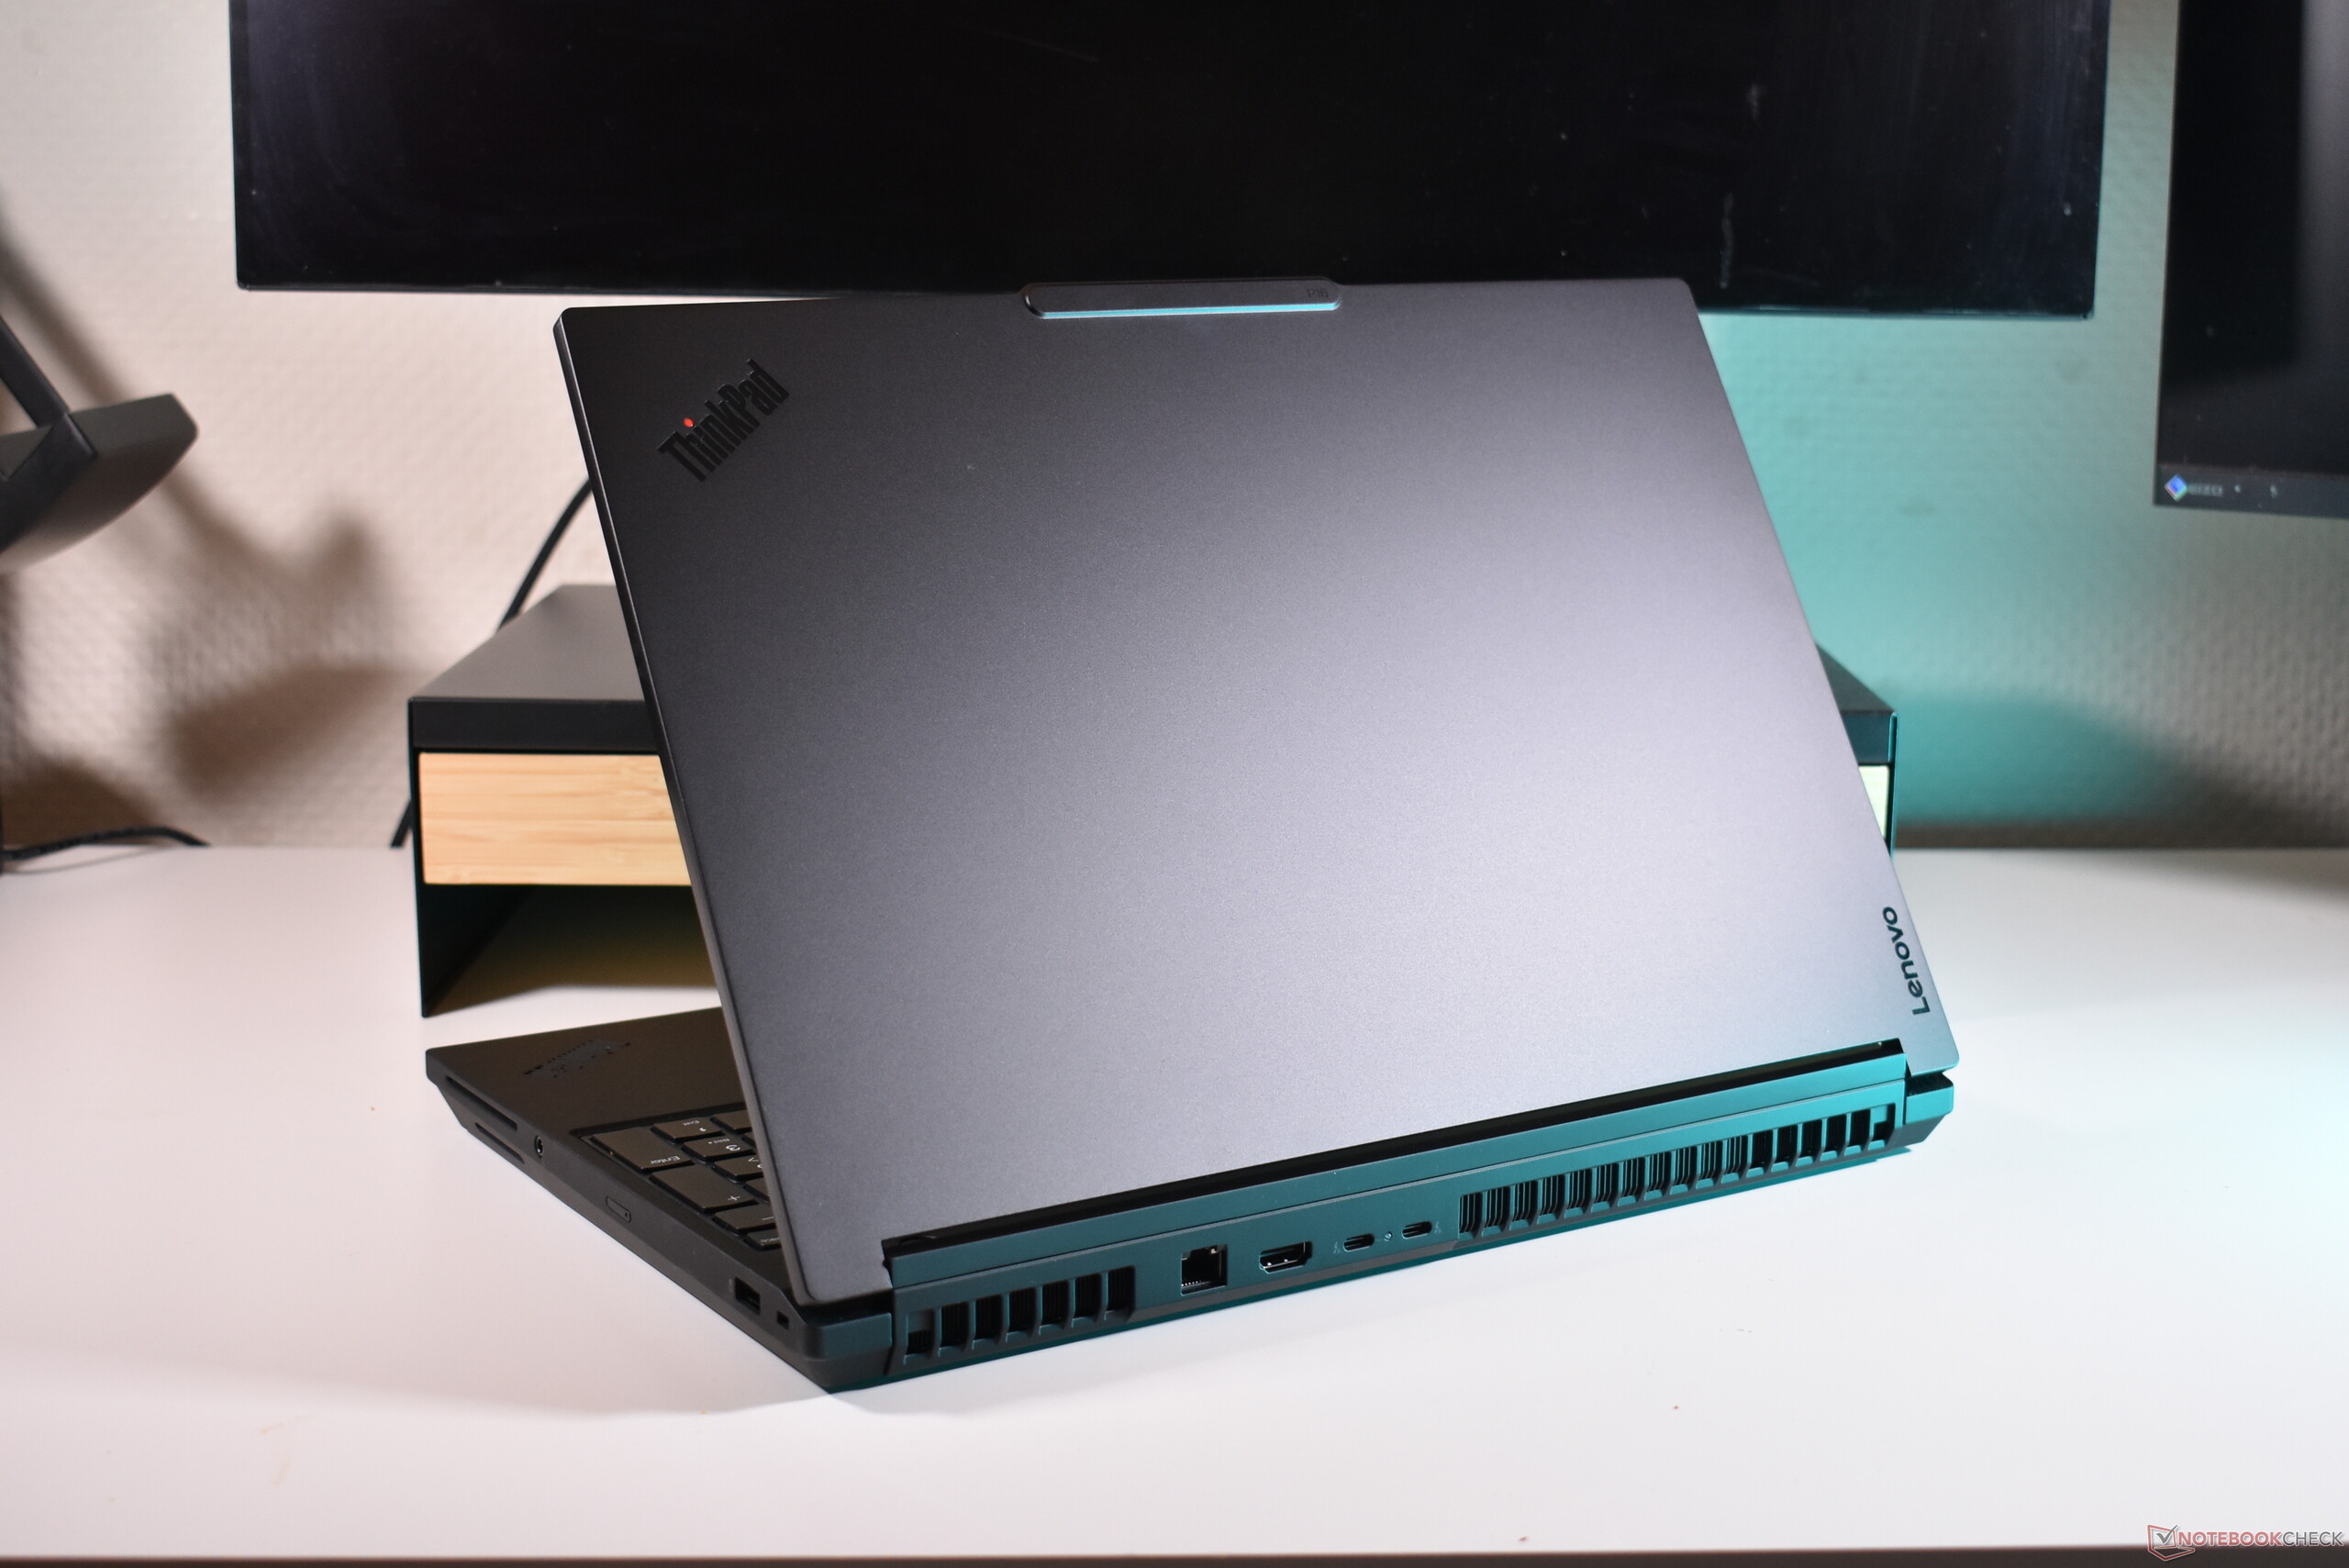
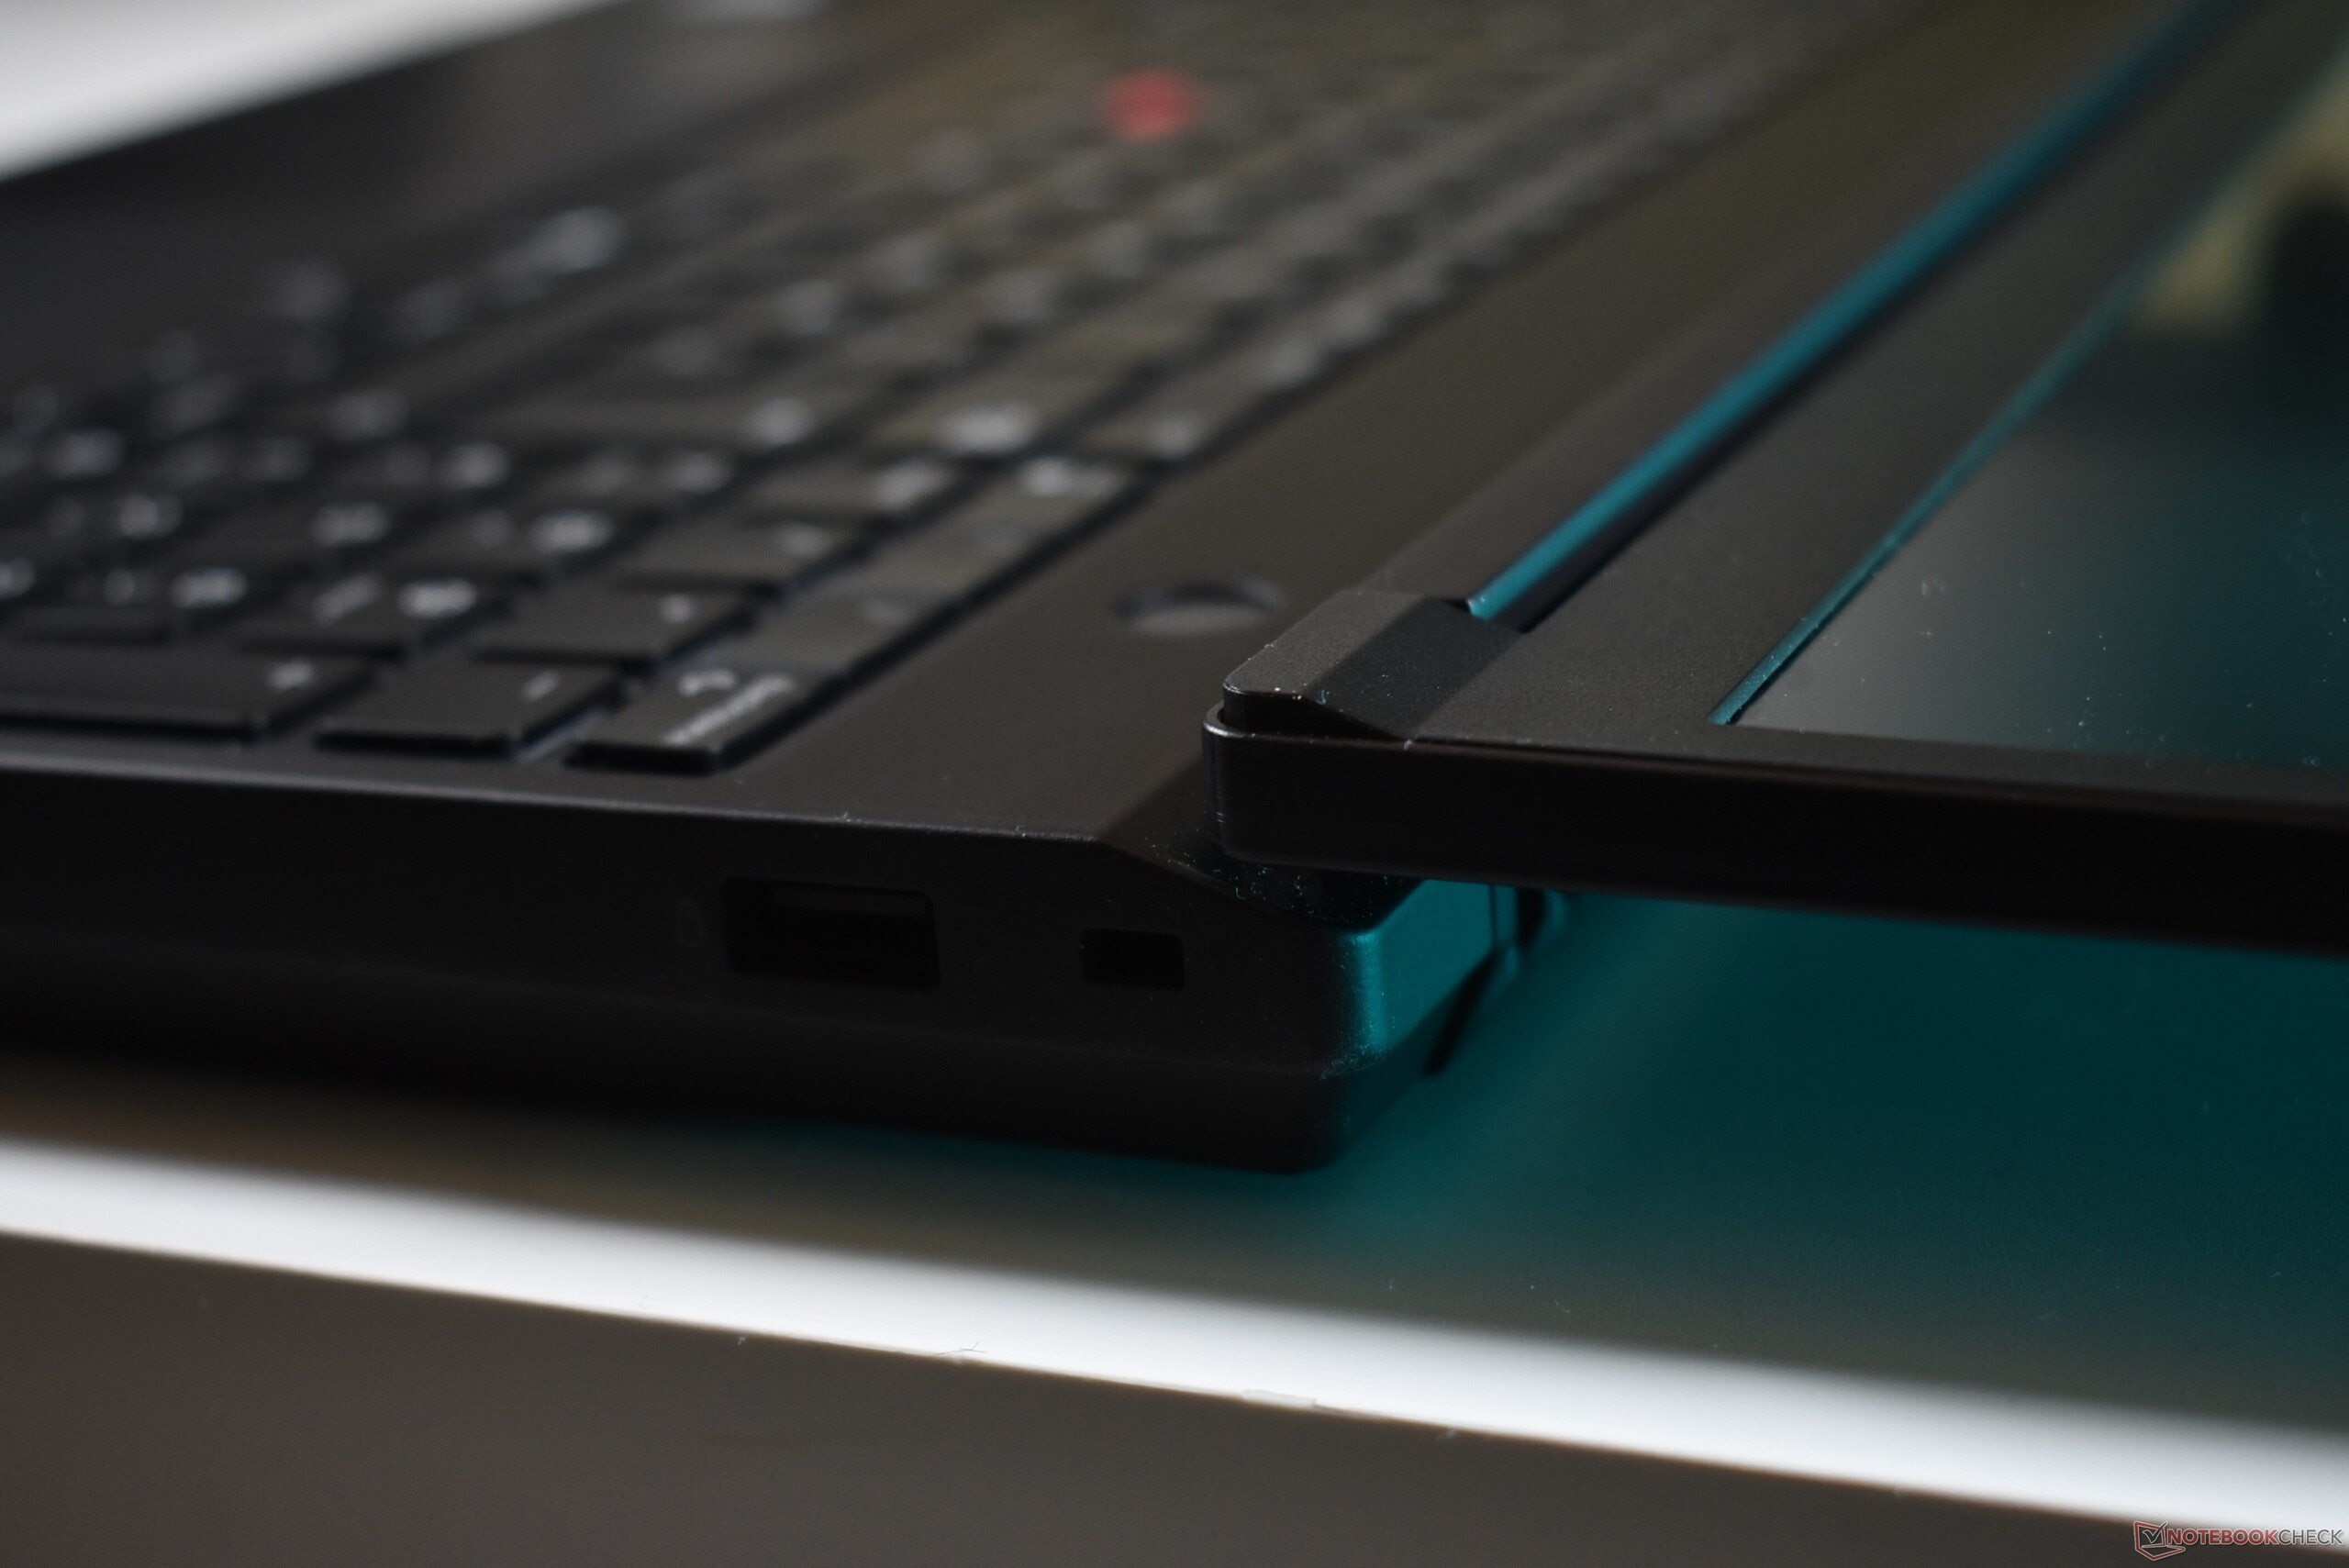
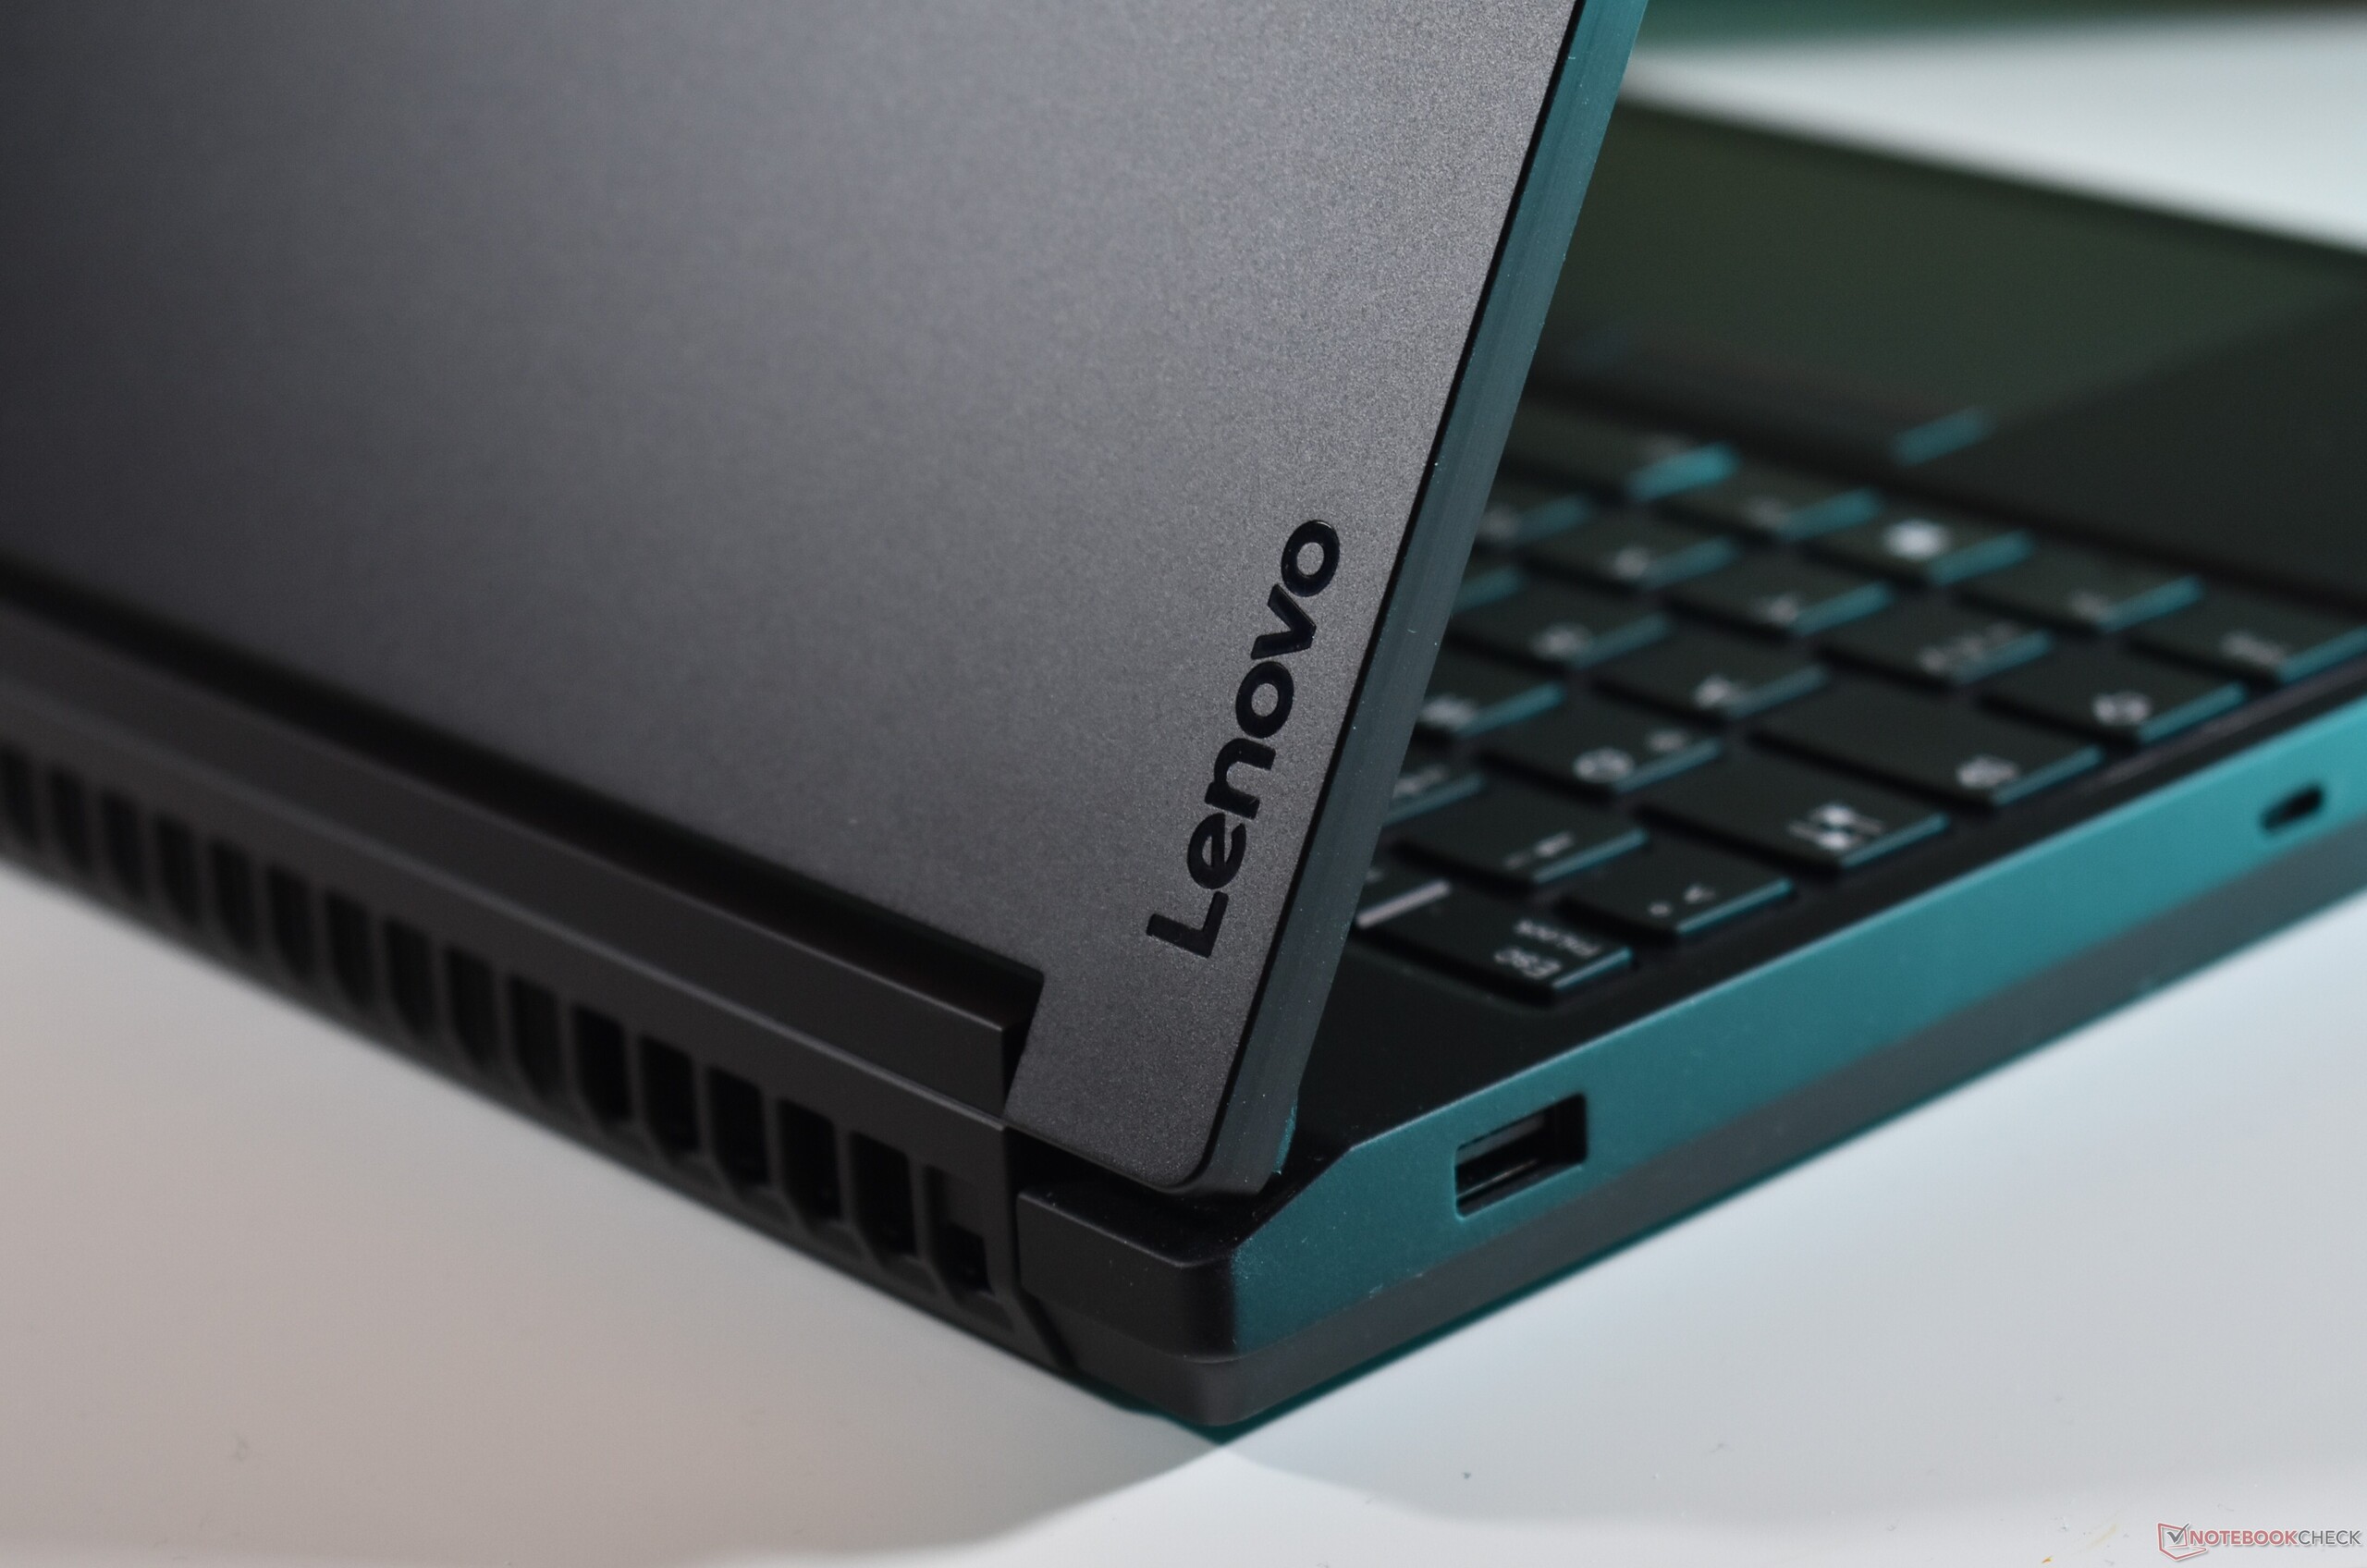
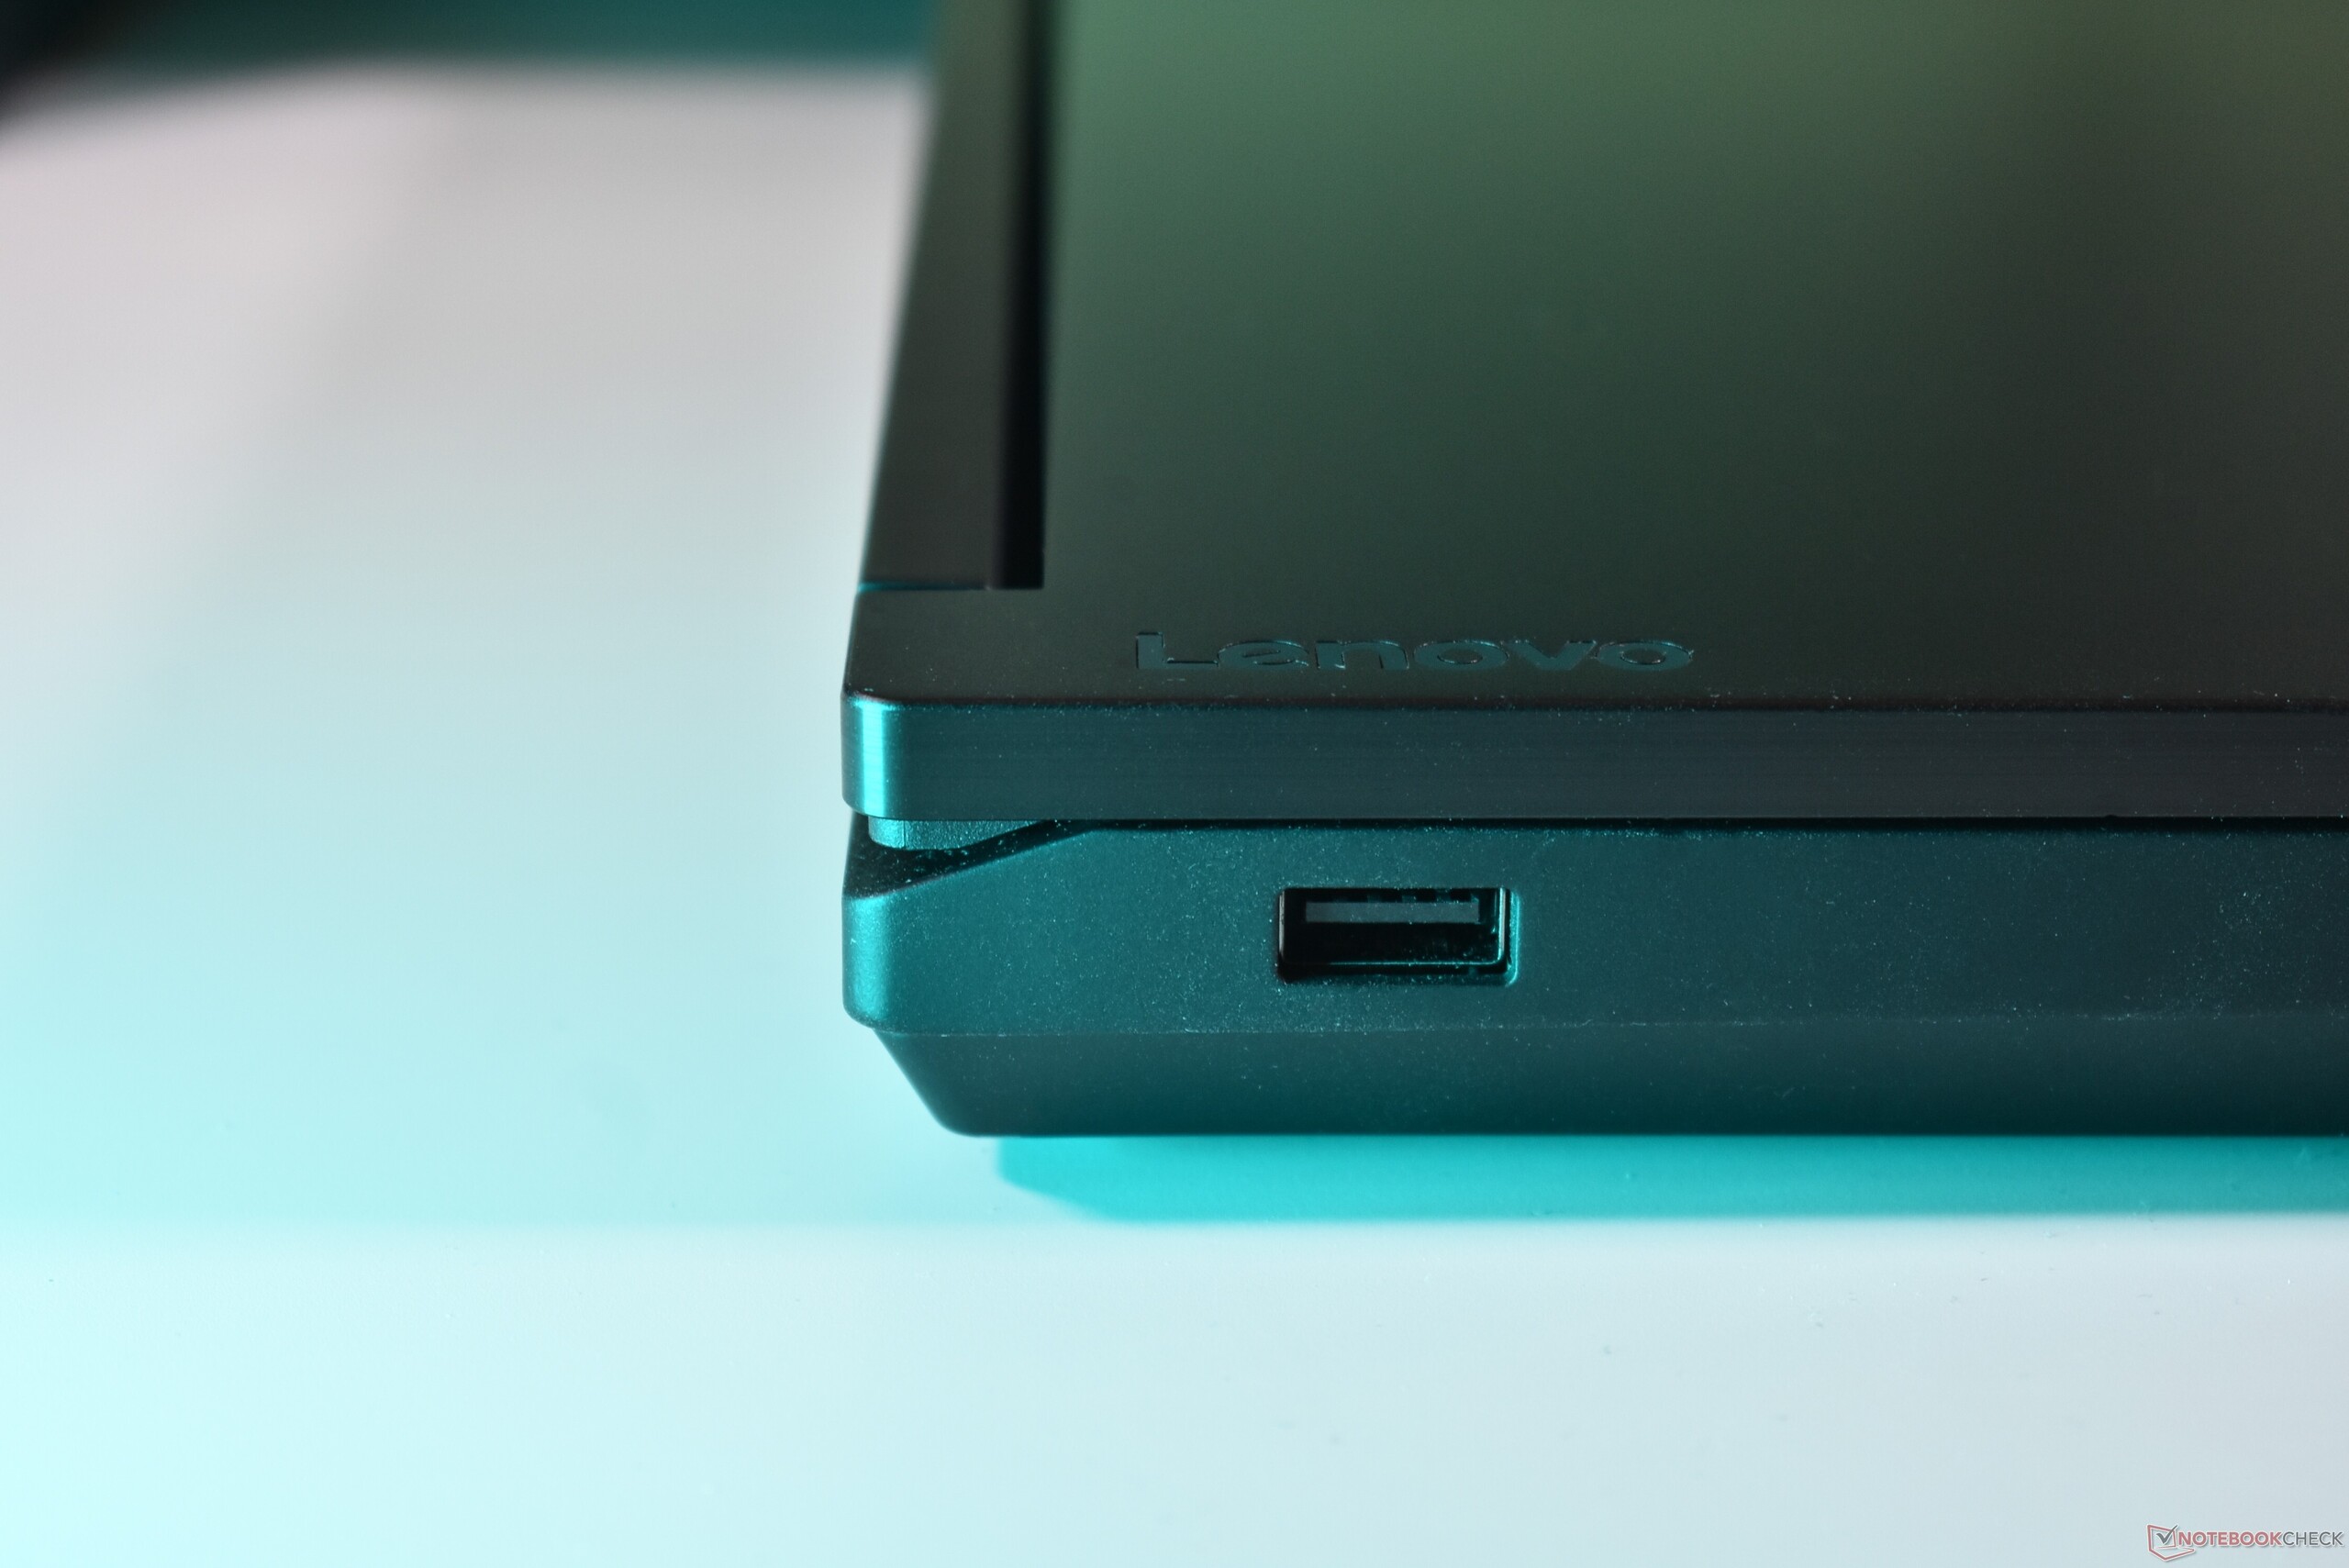
使用原装 ThinkPad P16 第一代和 ThinkPad P16 Gen 2,联想为其工作站开辟了一个大胆的新方向:灰色取代了黑色,圆润取代了方正。所有这些在新款联想 ThinkPad P16 Gen 3 上都已过时。但它并没有完全摒弃旧款 P16 的设计:联想保留了铝制顶盖,不过现在是阳极氧化黑色。金属机身的下半部分使用了典型的黑色 ThinkPad 涂层,光滑而略带橡胶感。今年的新设计是采用了更宽的单片铰链,这也是联想放置 Wi-Fi 天线的地方。屏幕几乎不会晃动,可以 180 度打开。可以单手打开。
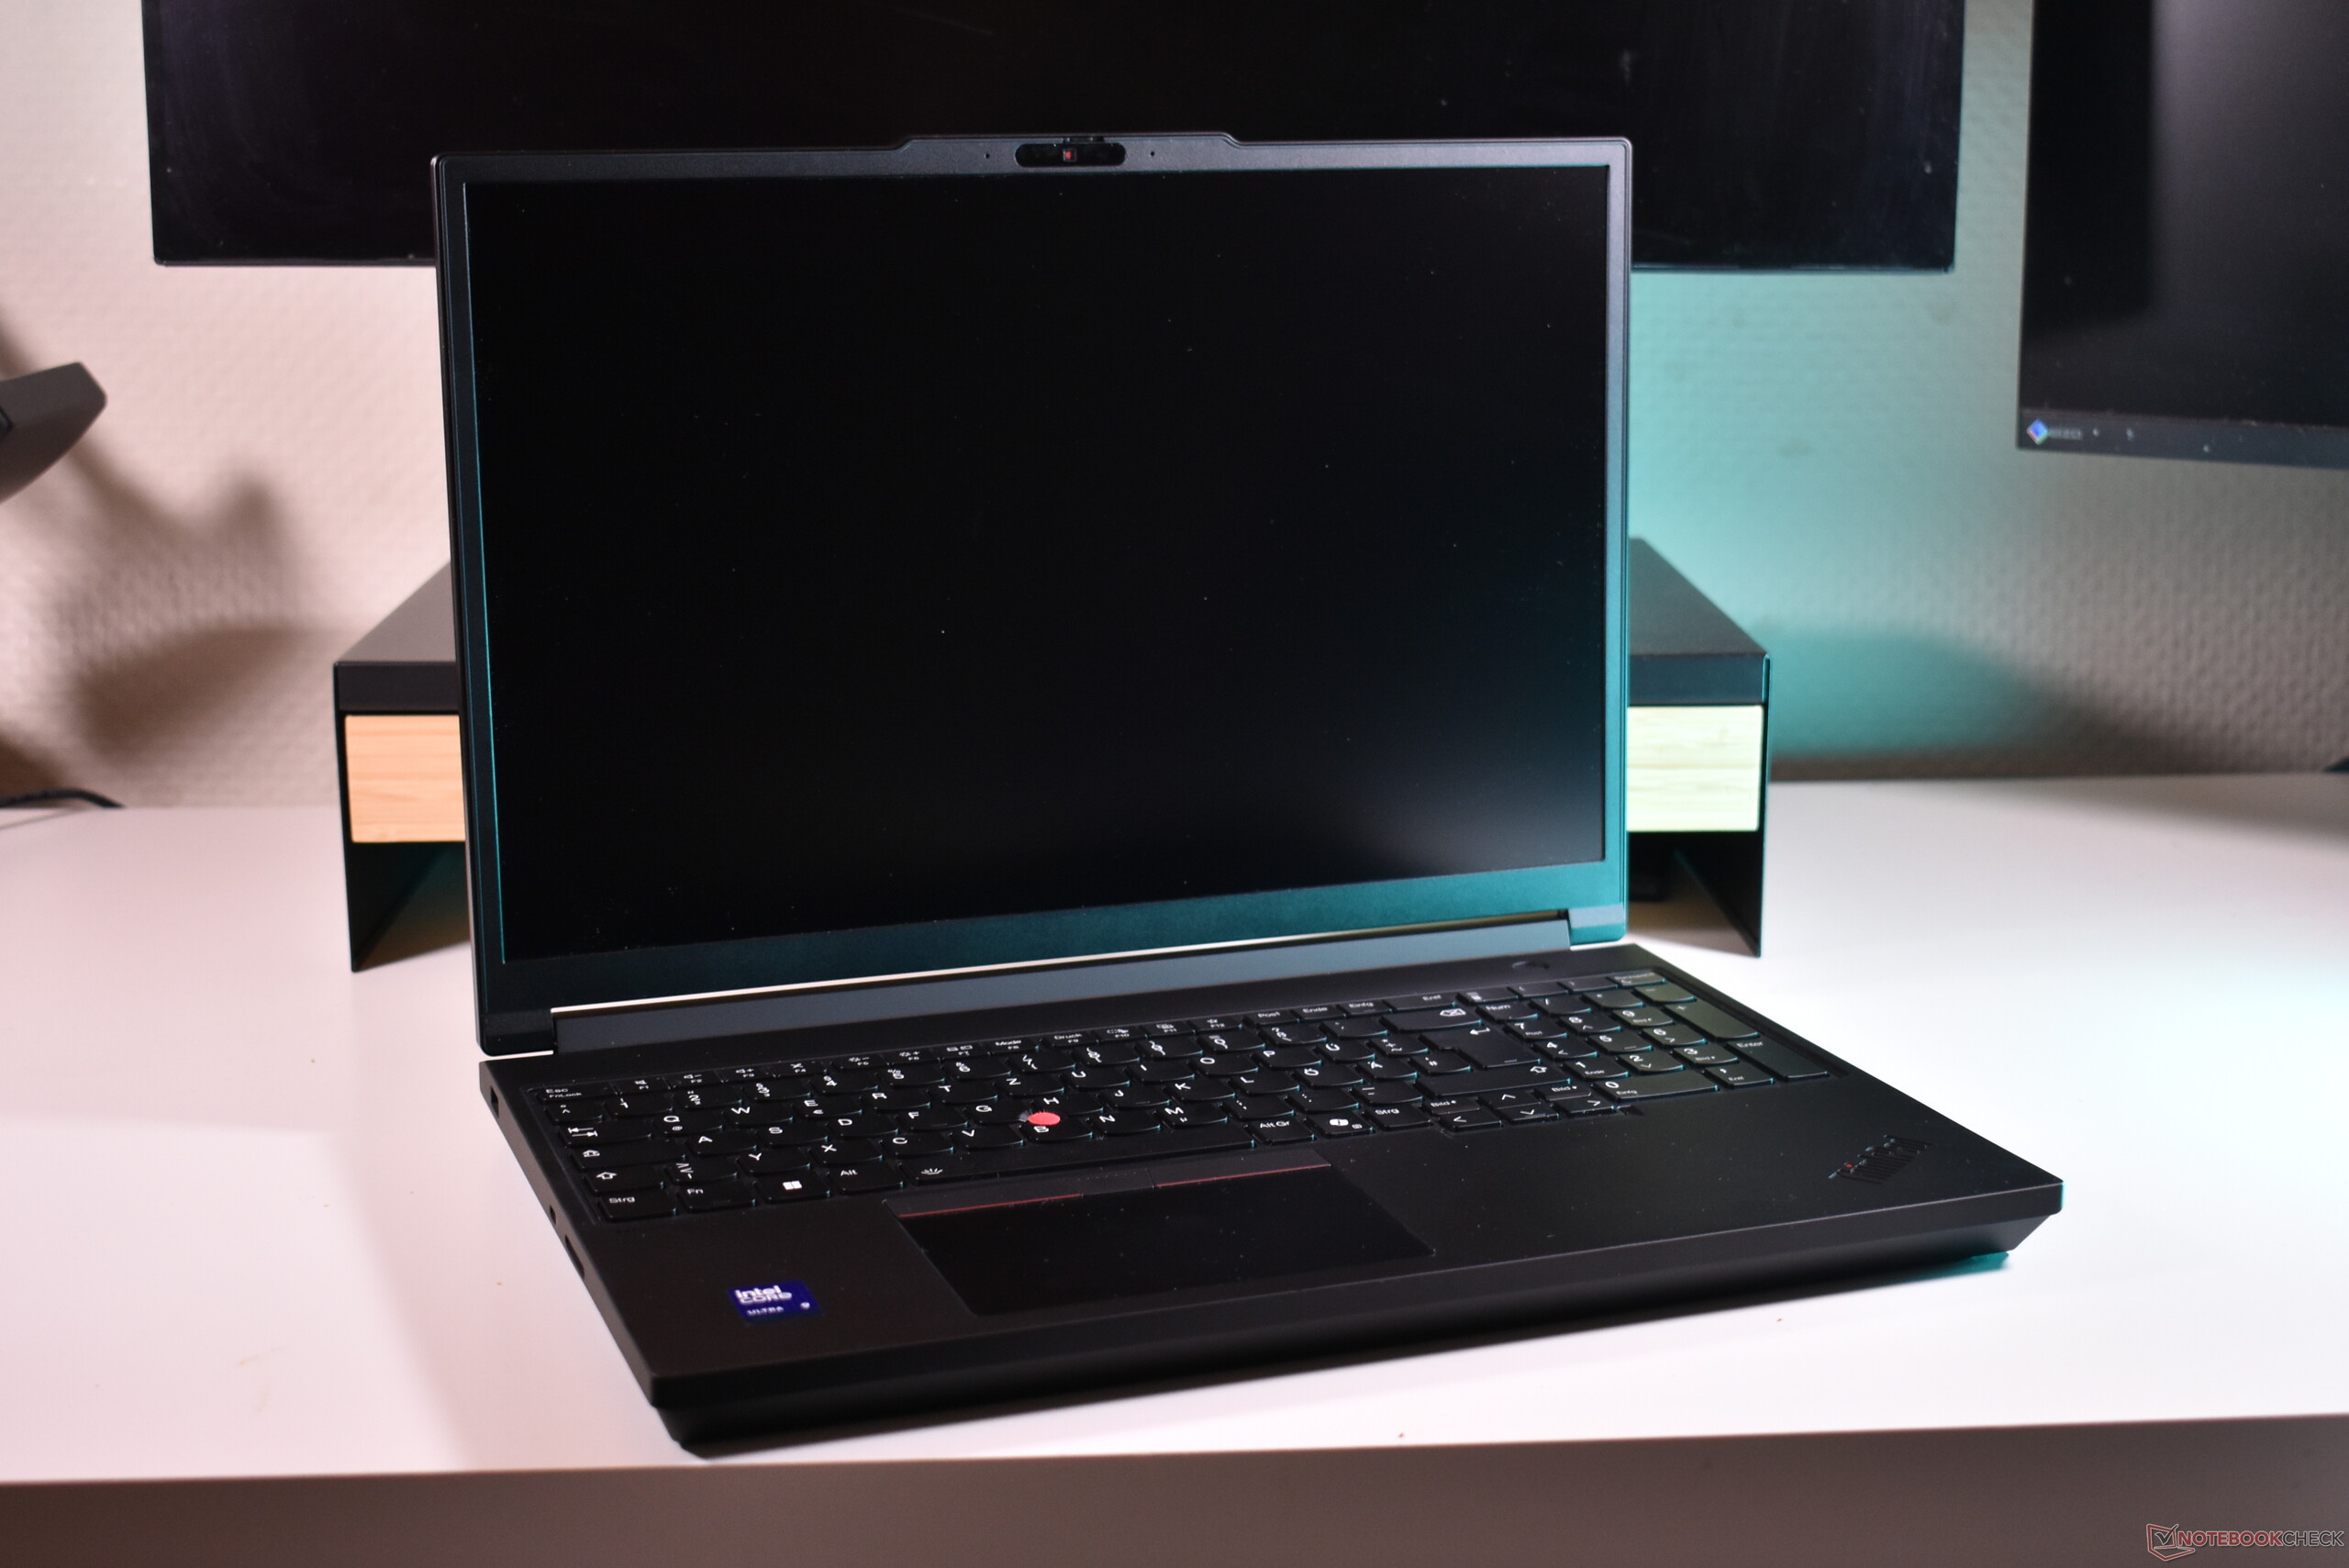
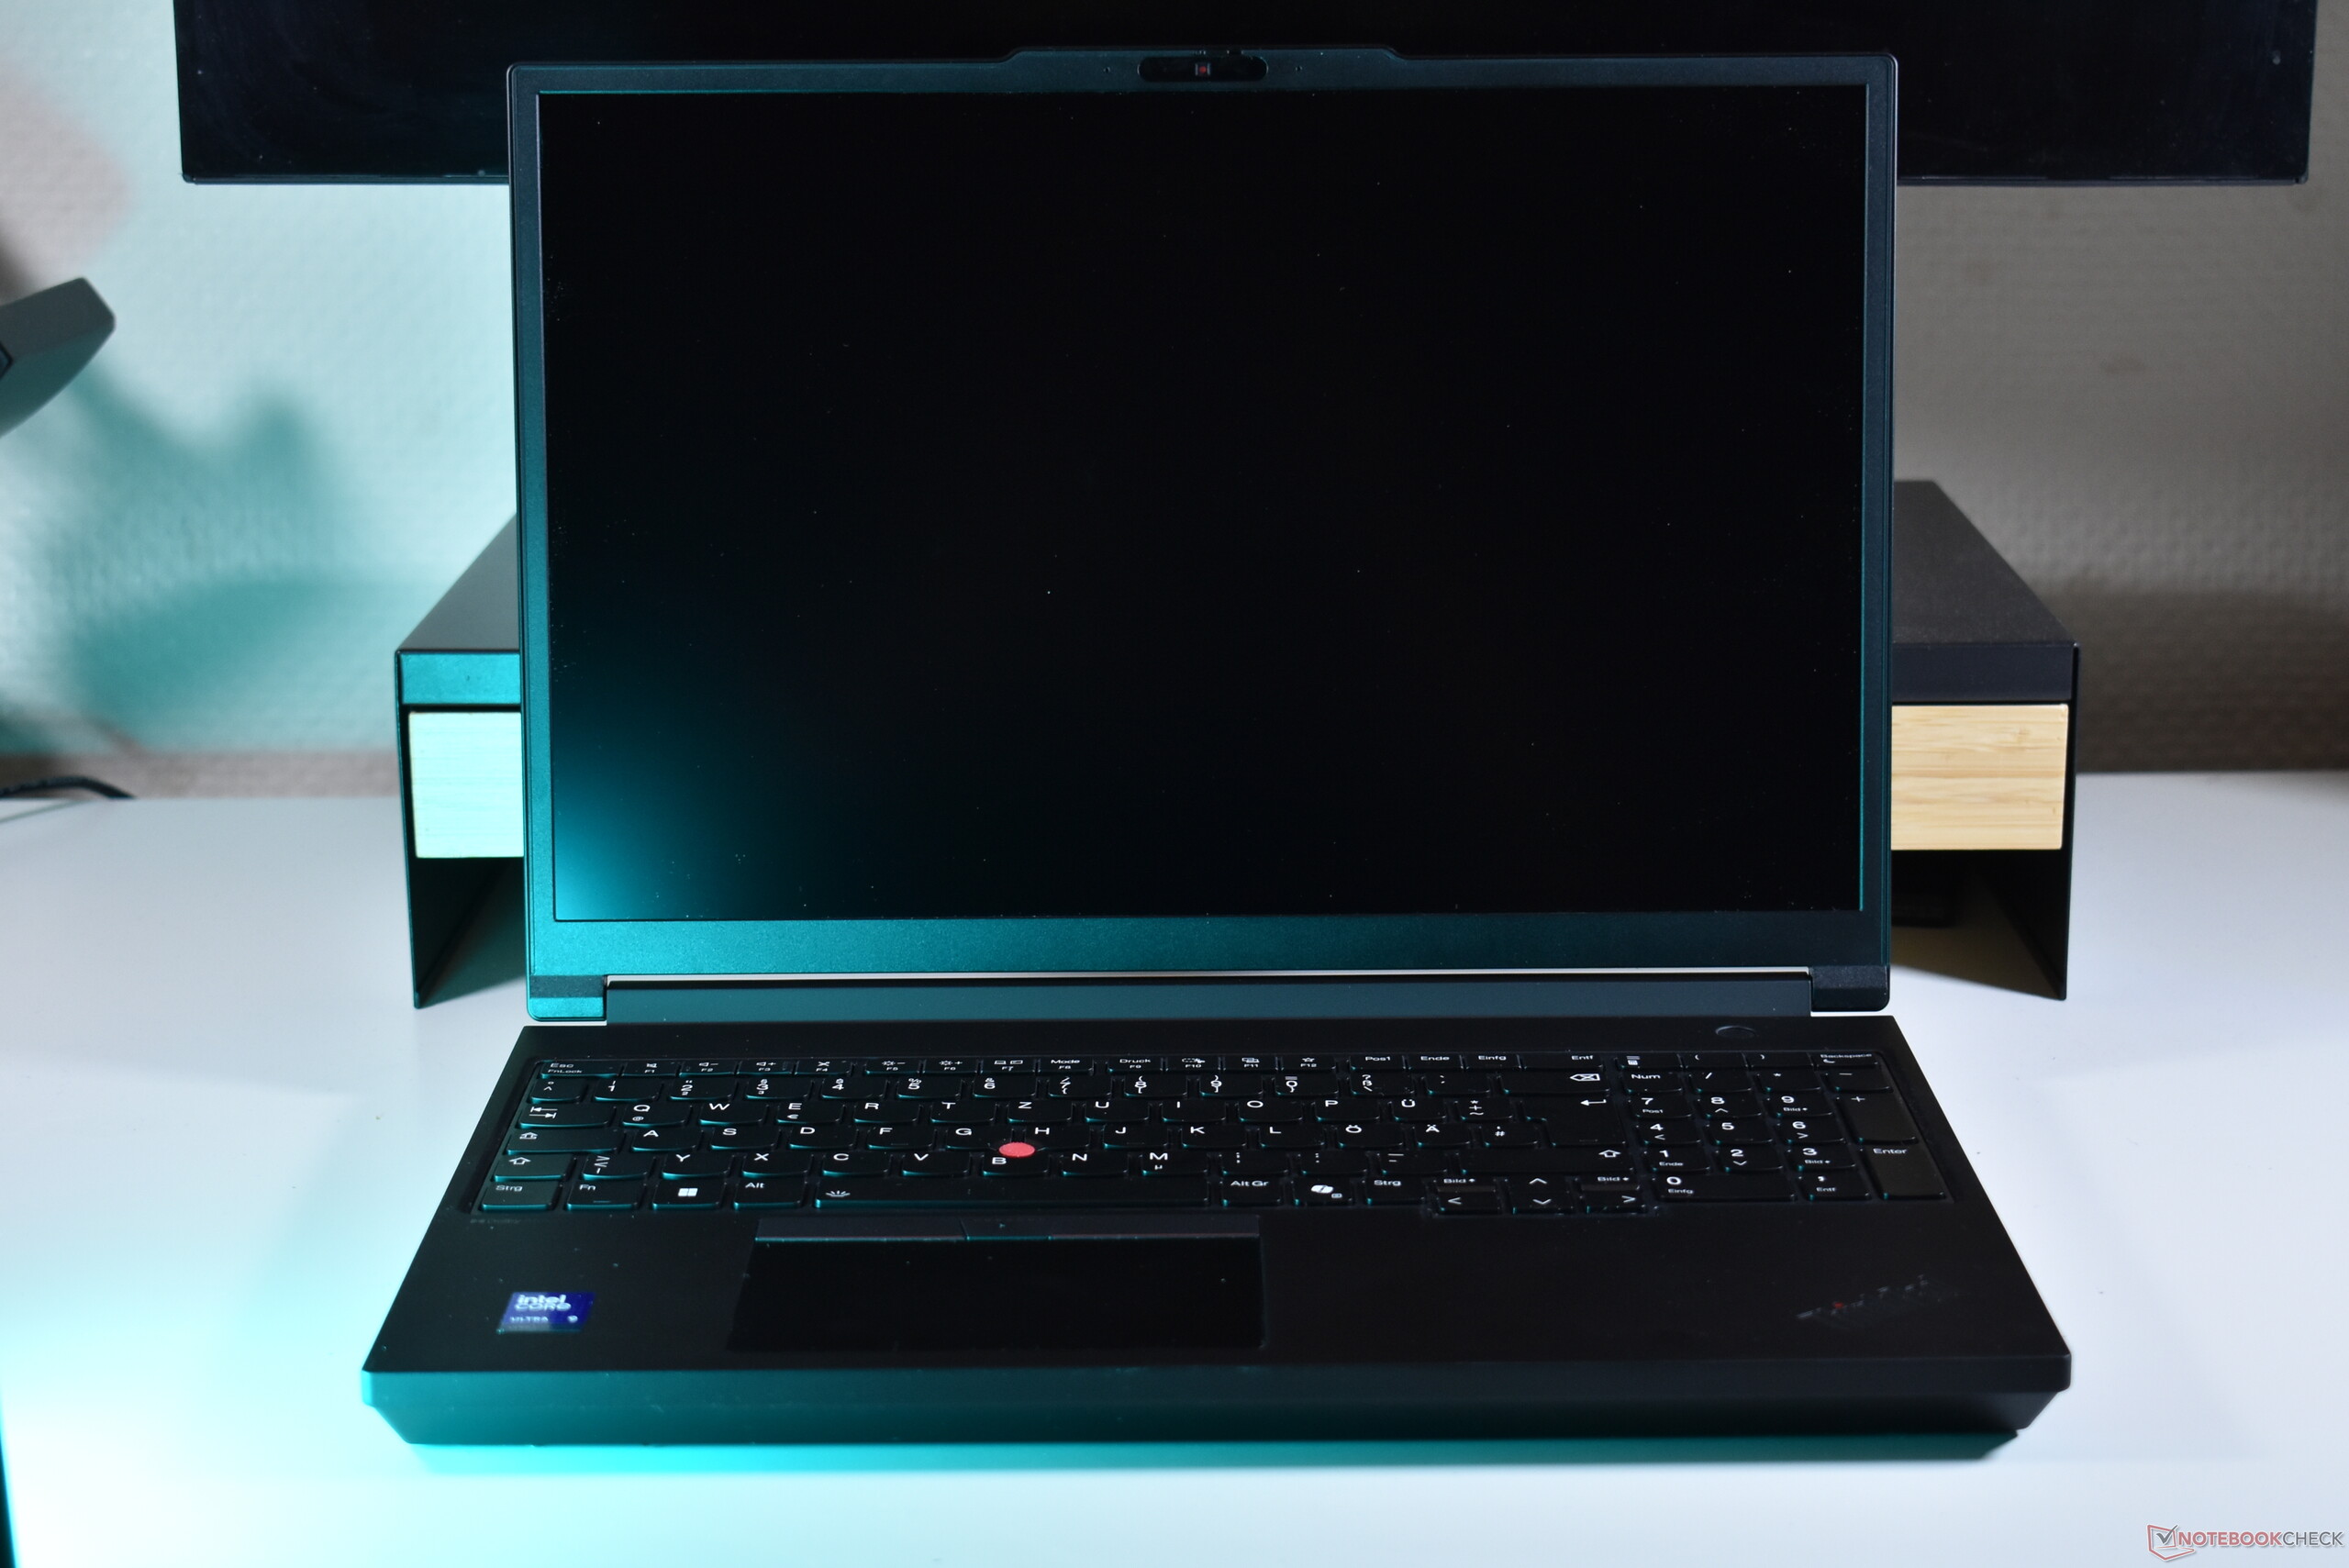

与旧版本相比,新款 P16 明显更加轻巧紧凑。虽然它仍然又大又重,但在全尺寸 16 英寸工作站笔记本电脑中,它不再是最大最重的。显然,优化移动性是联想的优先考虑事项之一。
连接性
主要新闻是背面的 Thunderbolt 5 端口。此外,第三个 USB-C 现在支持 Thunderbolt 4。此外,联想还恢复了 RJ45 以太网,支持 2.5 GBit 的速度。ThinkPad P16 现在可通过 USB-C 接口充电。


SD 读卡器
| SD Card Reader | |
| average JPG Copy Test (av. of 3 runs) | |
| Lenovo ThinkPad T16g Gen 3 RTX 5080 (ADATA SD8.0 Express 512 GB) | |
| Lenovo ThinkPad T16g Gen 3 RTX 5080 (Angelbird AV Pro V60) | |
| Average of class Workstation (49.6 - 681, n=14, last 2 years) | |
| HP ZBook Fury 16 G11 (Toshiba Exceria Pro SDXC 64 GB UHS-II) | |
| Lenovo ThinkPad P1 Gen 8 (Toshiba Exceria Pro SDXC 64 GB UHS-II) | |
| Lenovo ThinkPad P16 Gen 3 (AV Pro V60) | |
| Dell Pro Max 16 Plus (Toshiba Exceria Pro SDXC 64 GB UHS-II) | |
| Lenovo ThinkPad P16 G2 21FA000FGE | |
| maximum AS SSD Seq Read Test (1GB) | |
| Lenovo ThinkPad T16g Gen 3 RTX 5080 (ADATA SD8.0 Express 512 GB) | |
| Lenovo ThinkPad T16g Gen 3 RTX 5080 (Angelbird AV Pro V60) | |
| Average of class Workstation (87.6 - 1455, n=14, last 2 years) | |
| Lenovo ThinkPad P16 Gen 3 (AV Pro V60) | |
| HP ZBook Fury 16 G11 (Toshiba Exceria Pro SDXC 64 GB UHS-II) | |
| Dell Pro Max 16 Plus (Toshiba Exceria Pro SDXC 64 GB UHS-II) | |
| Lenovo ThinkPad P1 Gen 8 (Toshiba Exceria Pro SDXC 64 GB UHS-II) | |
| Lenovo ThinkPad P16 G2 21FA000FGE | |
交流


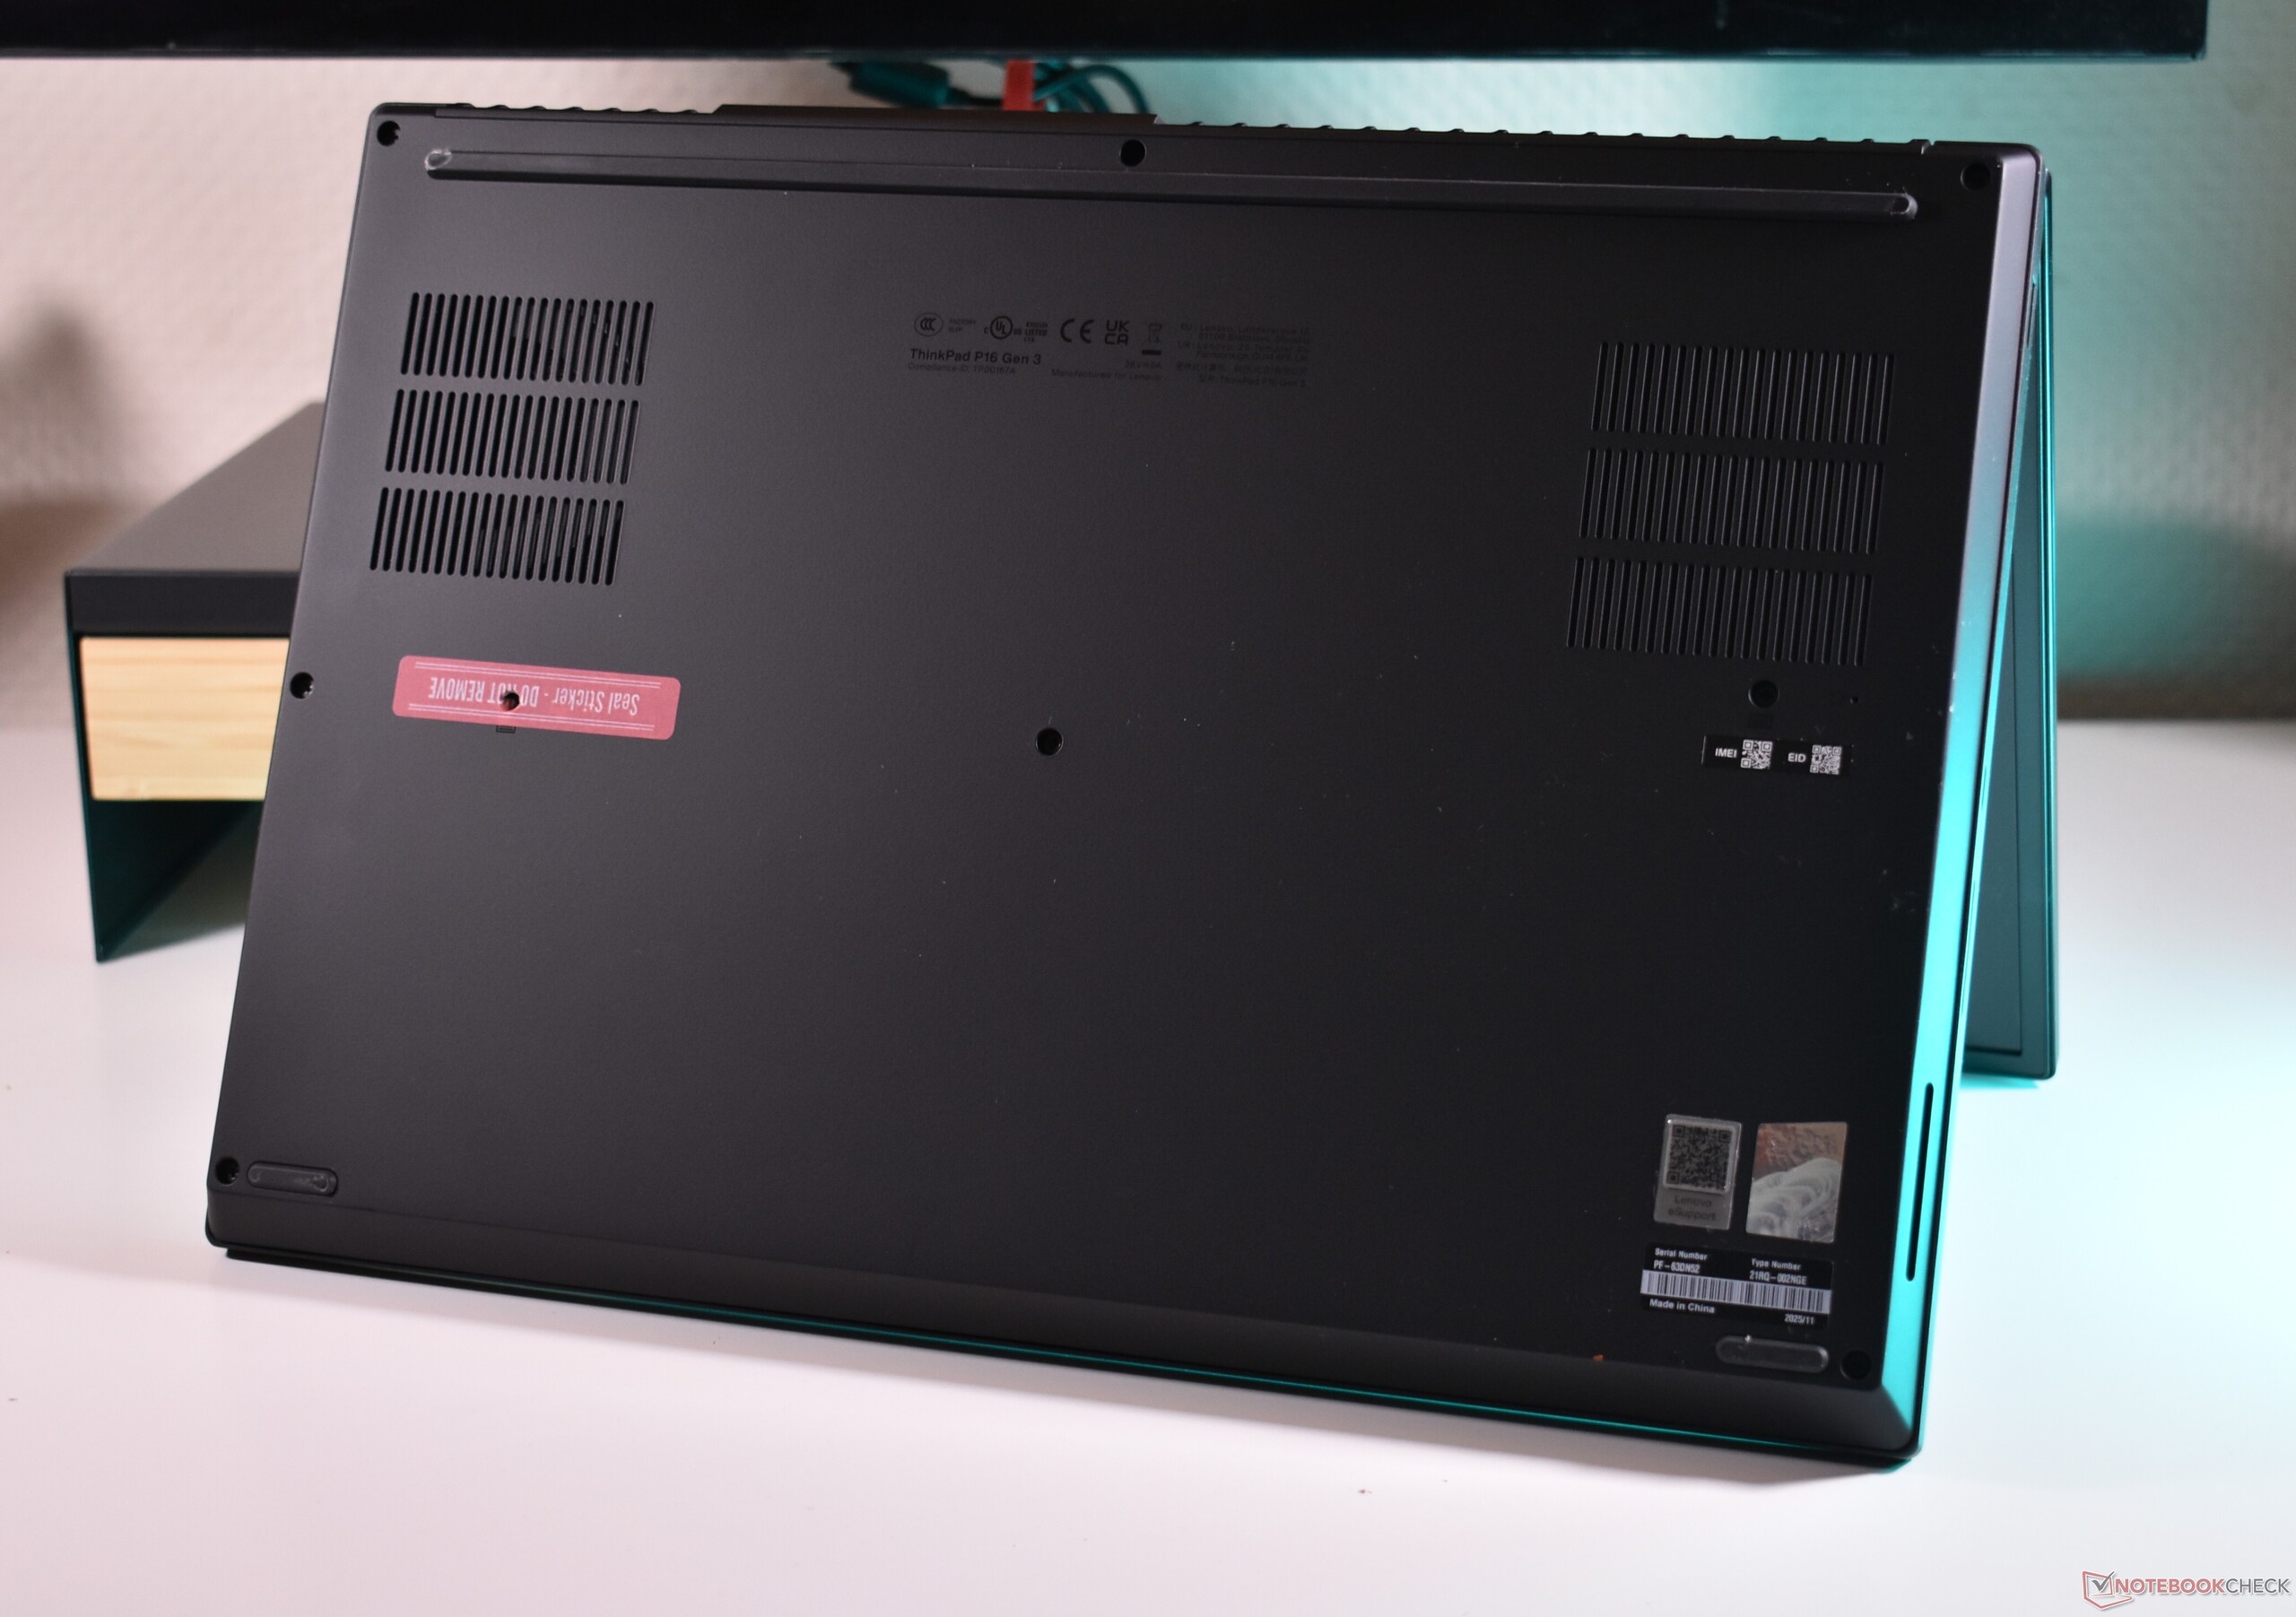
维护


输入设备
键盘
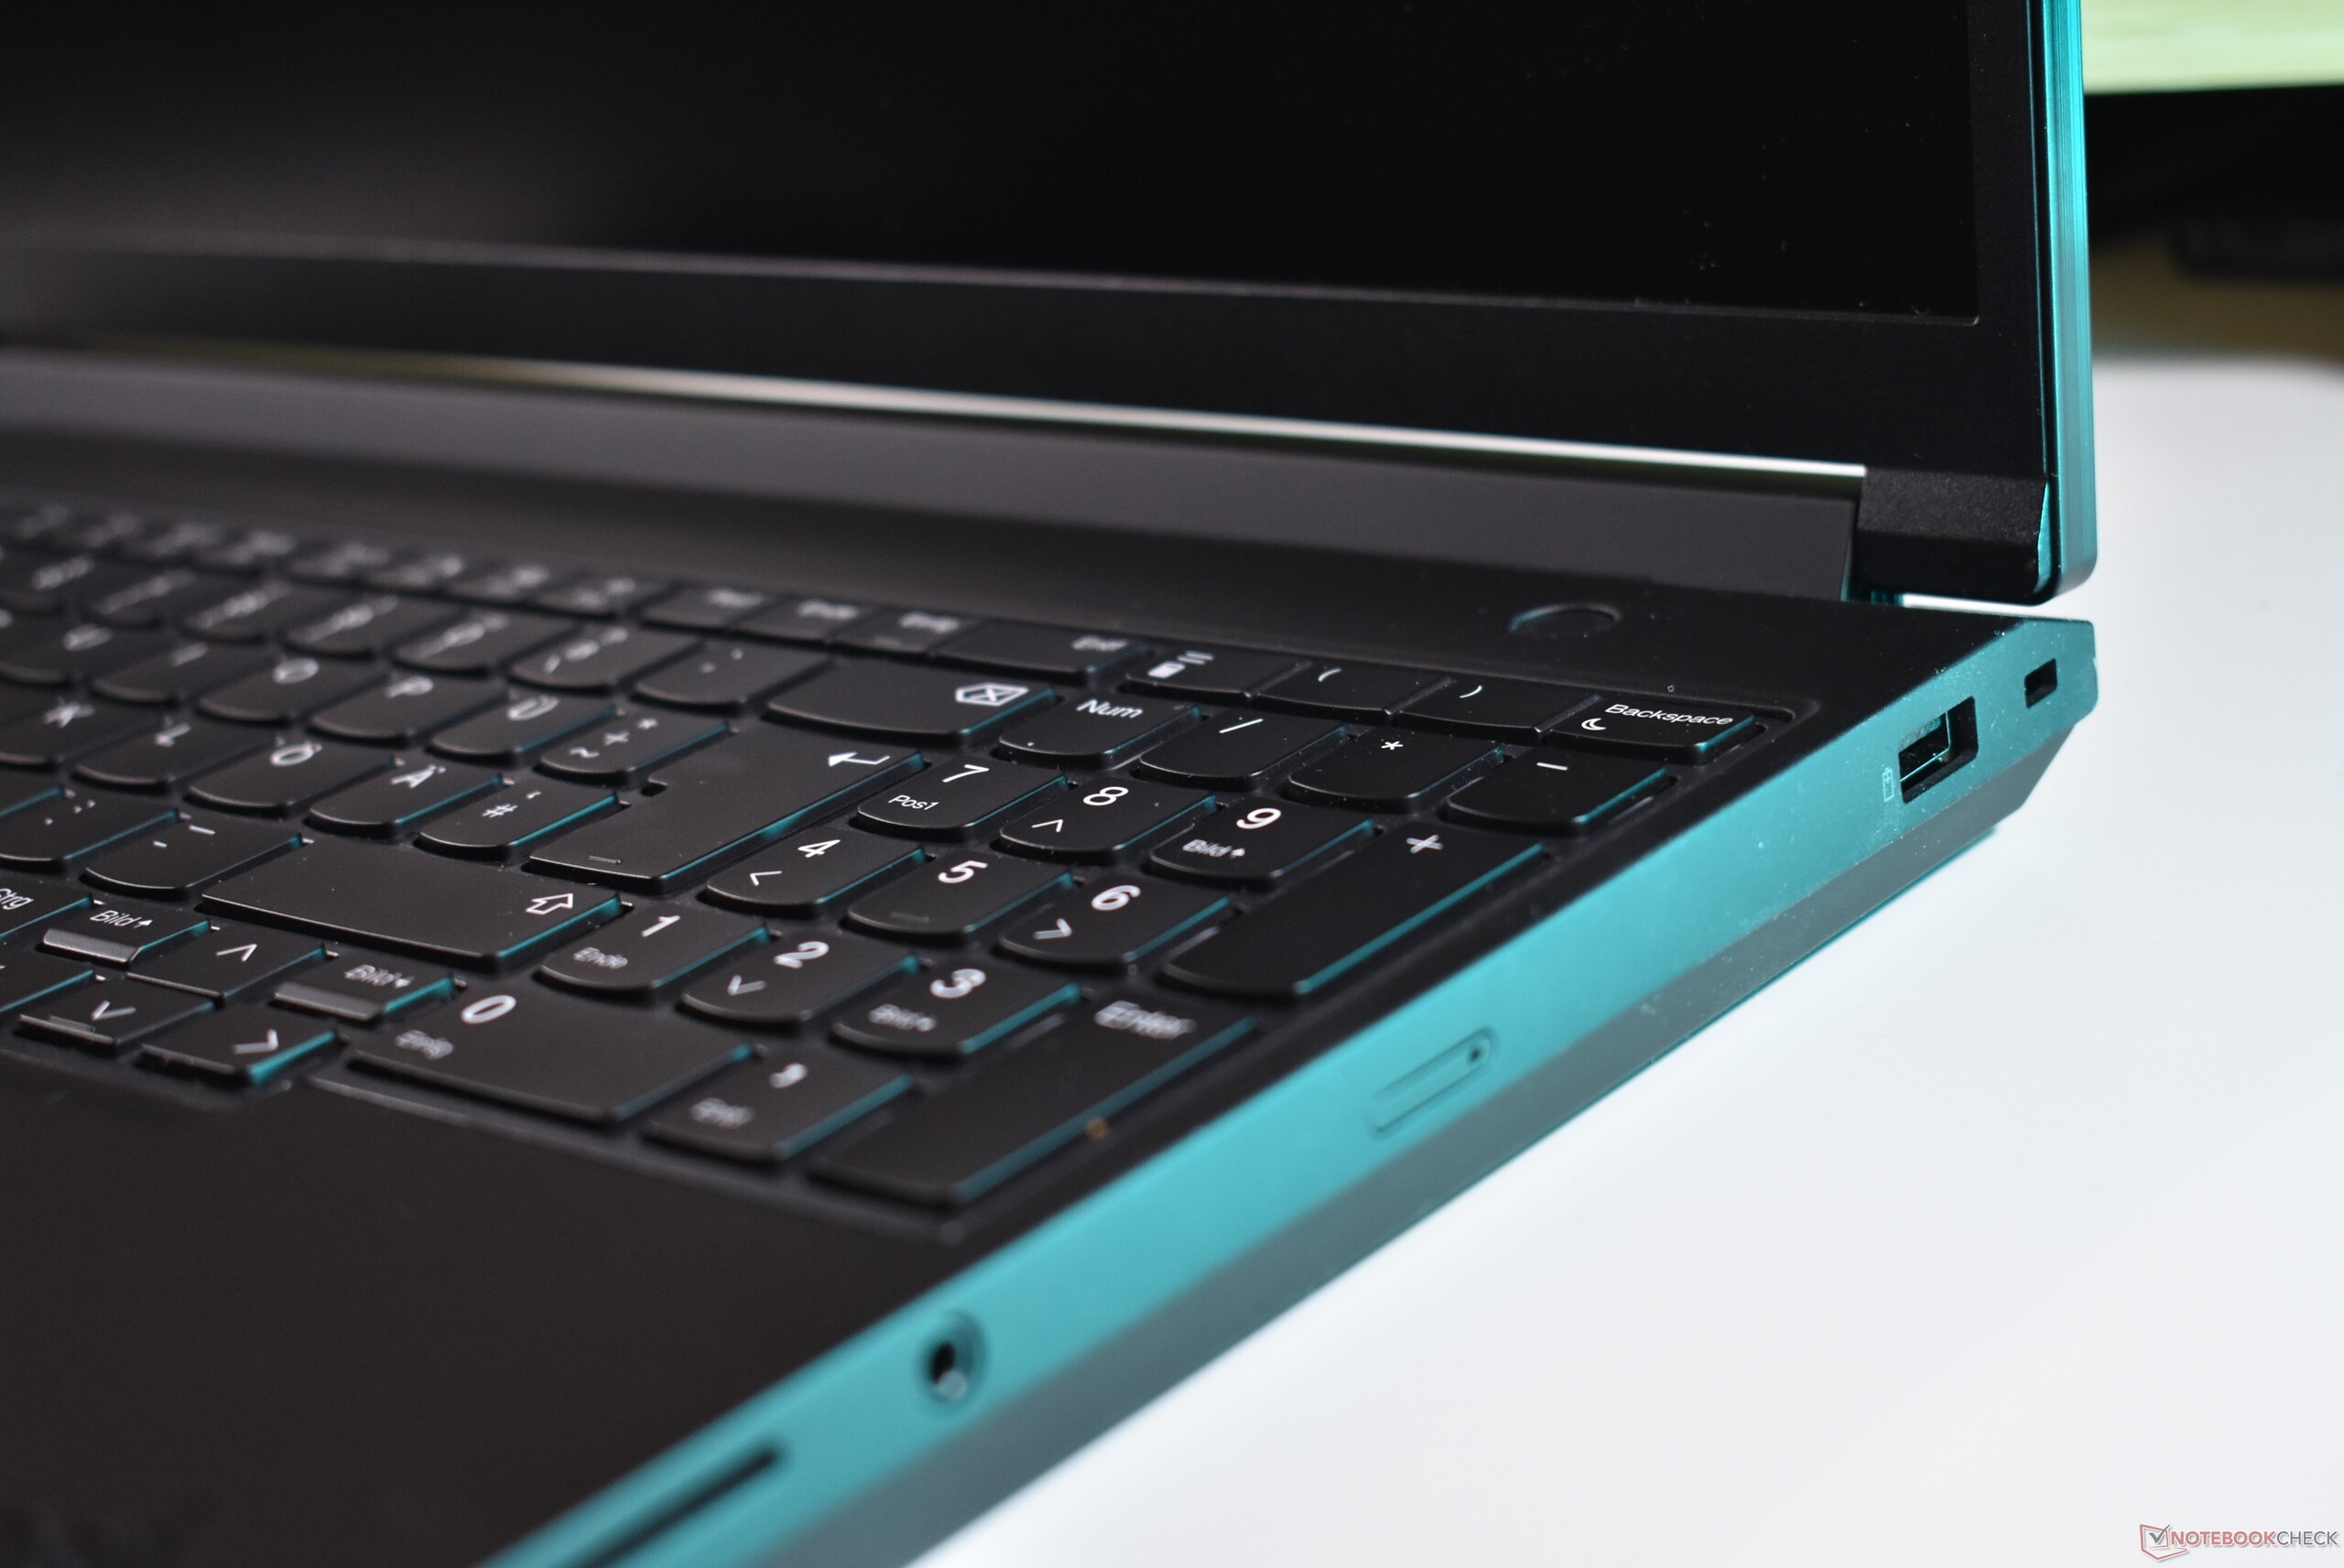
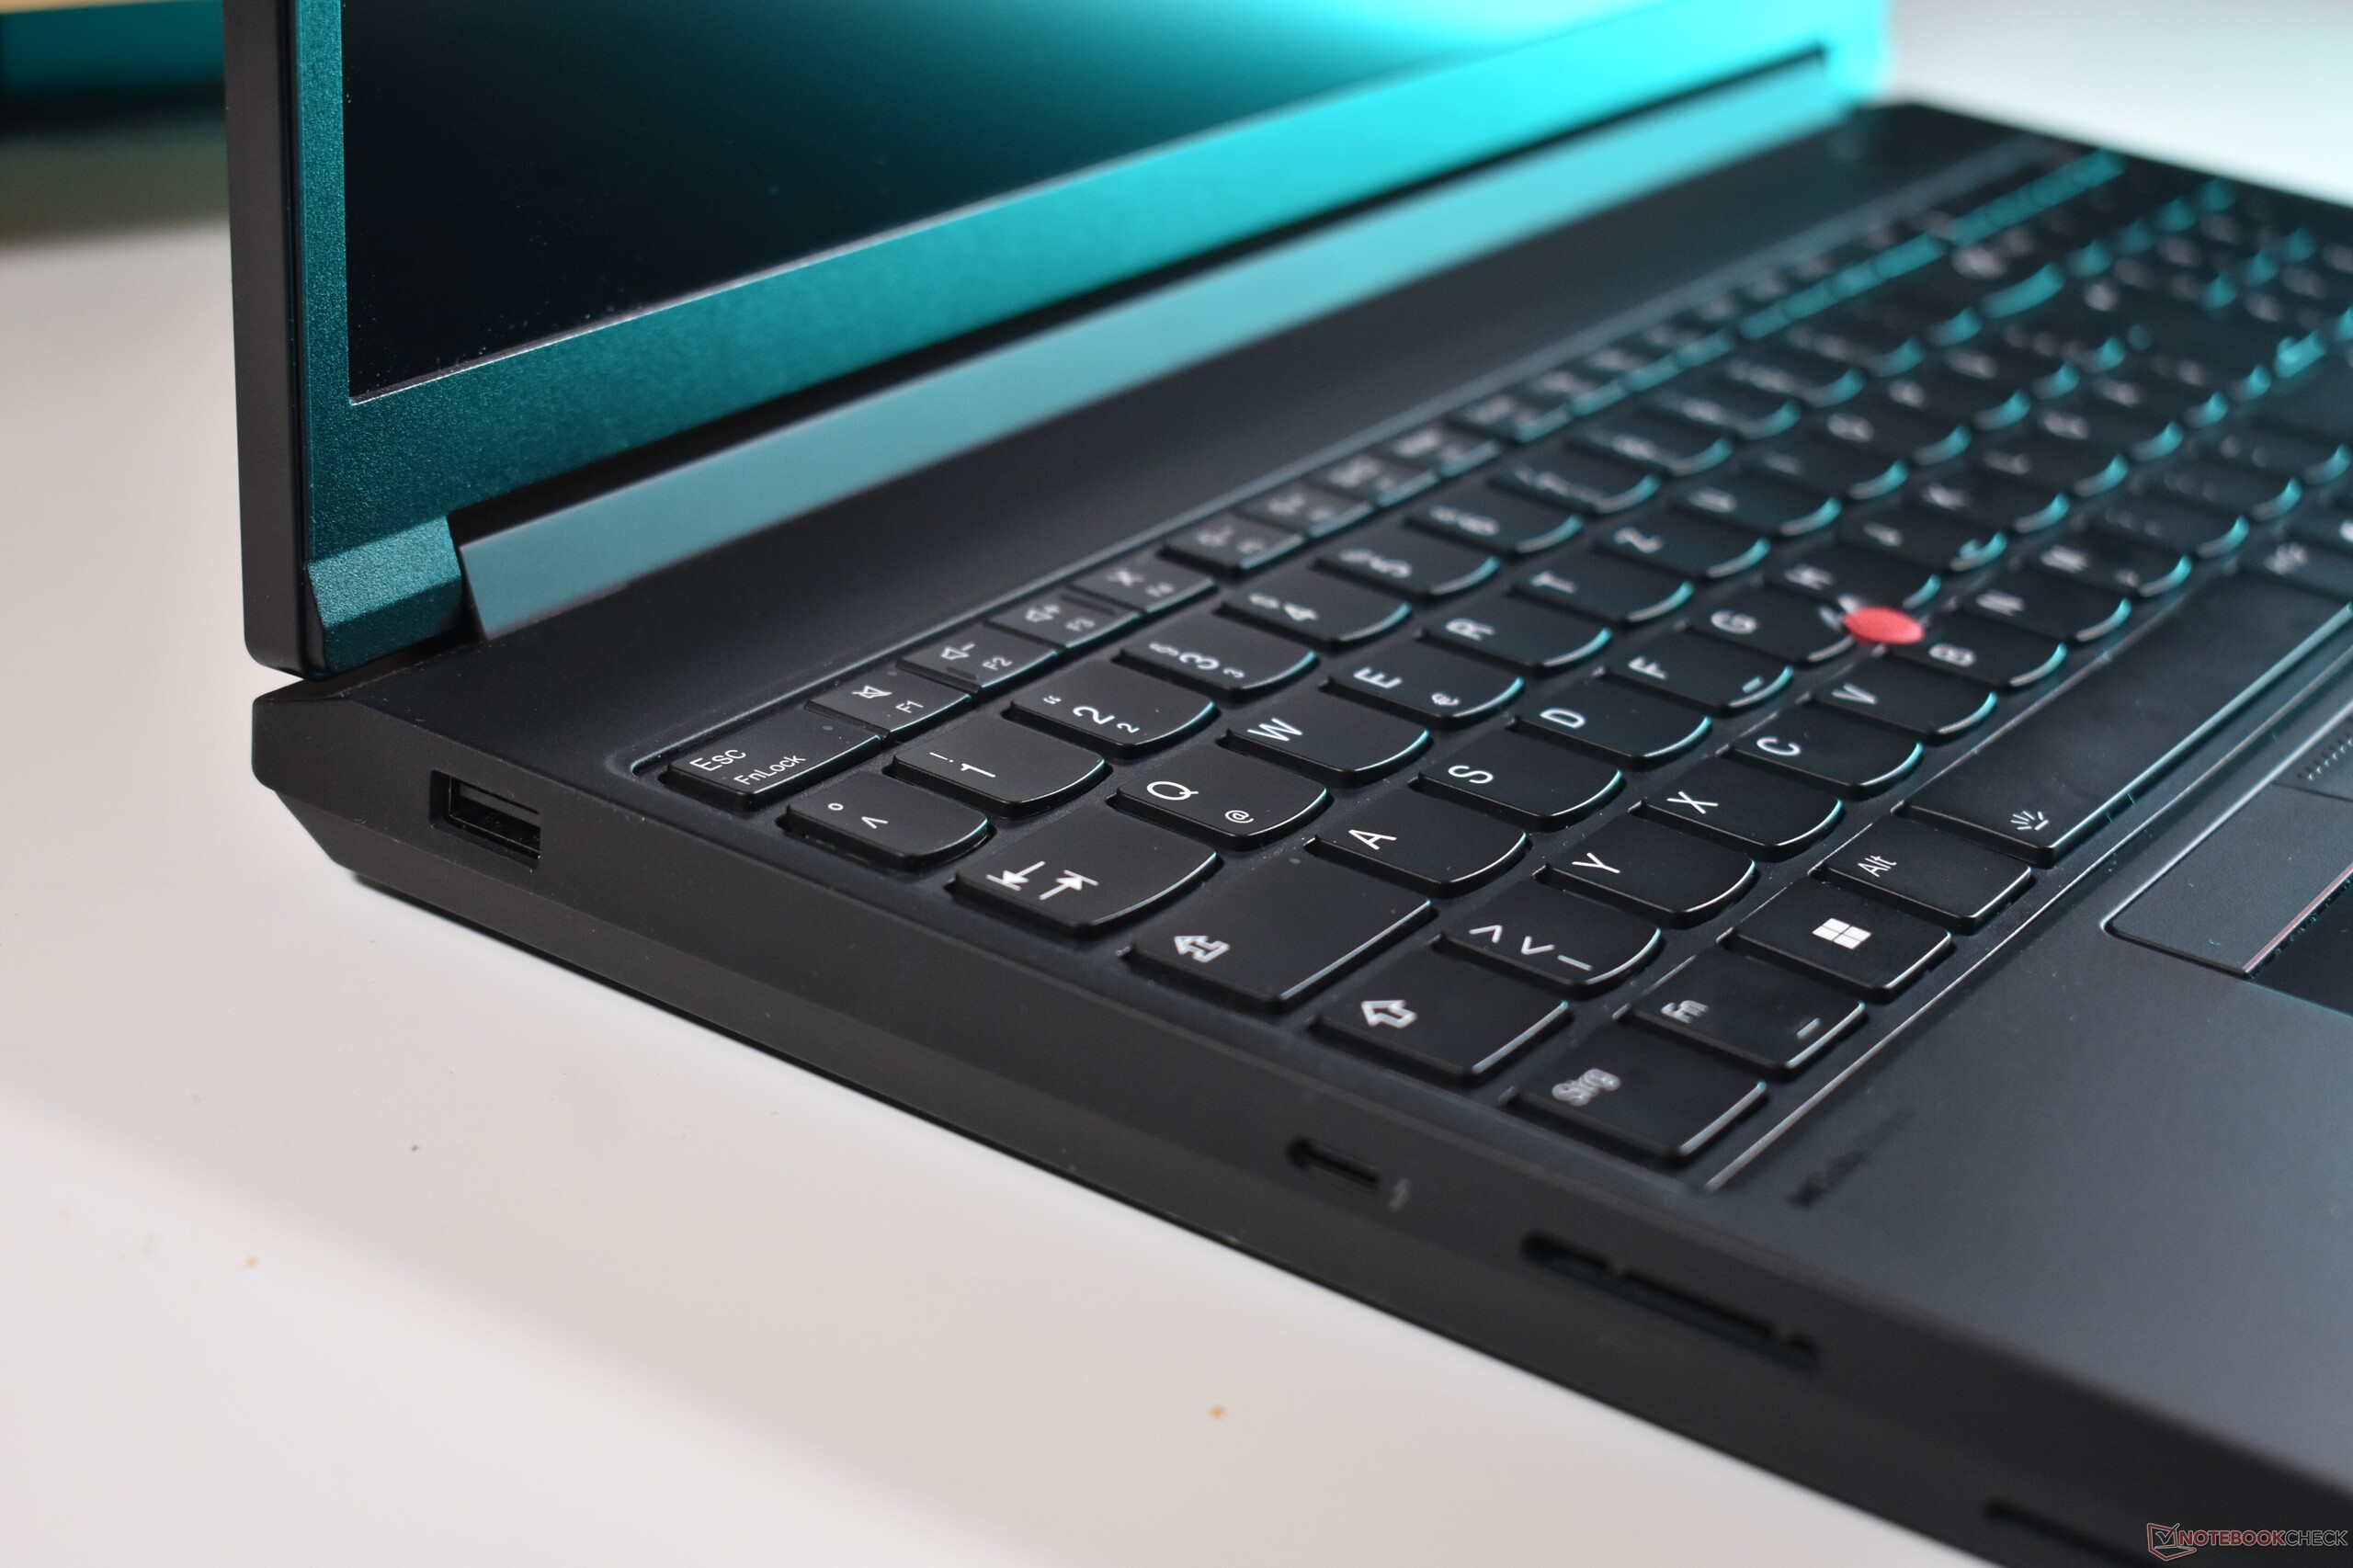
虽然笔记本电脑的其他部分发生了变化,但两段式 wite-LED 背光键盘依然如故。圆润、微凹的按键触感柔软而清晰,键程为 1.5 毫米。键盘布局宽敞,专用数字键盘非常适合数字运算。总之,使用键盘是一种享受,它是目前 ThinkPad 产品系列中最好的键盘之一。

触摸板
除了颜色从银色变为黑色之外,触摸板与之前的 ThinkPad P16 G2.机械潜水板触摸板的胶膜表面尺寸为 11.5 x 6.5 厘米,具有良好的阻尼咔嗒声,虽然手感不如玻璃,但表面光滑,非常好用。拥有三个专用按键的 ThinkPad TrackPoint 同样出色,甚至更胜一筹。


显示屏
购买联想 ThinkPad P16 Gen 3 的用户可以选择三种不同的屏幕:
- WUXGA (1,920 x 1,200), IPS, 500 cd/m², 100 % sRGB, 雾面, 60 Hz
- 3.2K (3,200 x 2,000), Tandem OLED, 600 cd/m² (SDR) / 1500 cd/m² peak (HDR),100%DCI P3,半亮光, 40 - 120 Hz VRR, Dolby Vision
- 4K-WQUXGA(3,840 x 2,400),IPS,800 cd/m²,100 % DCI P3,亚光,杜比视界,60 赫兹
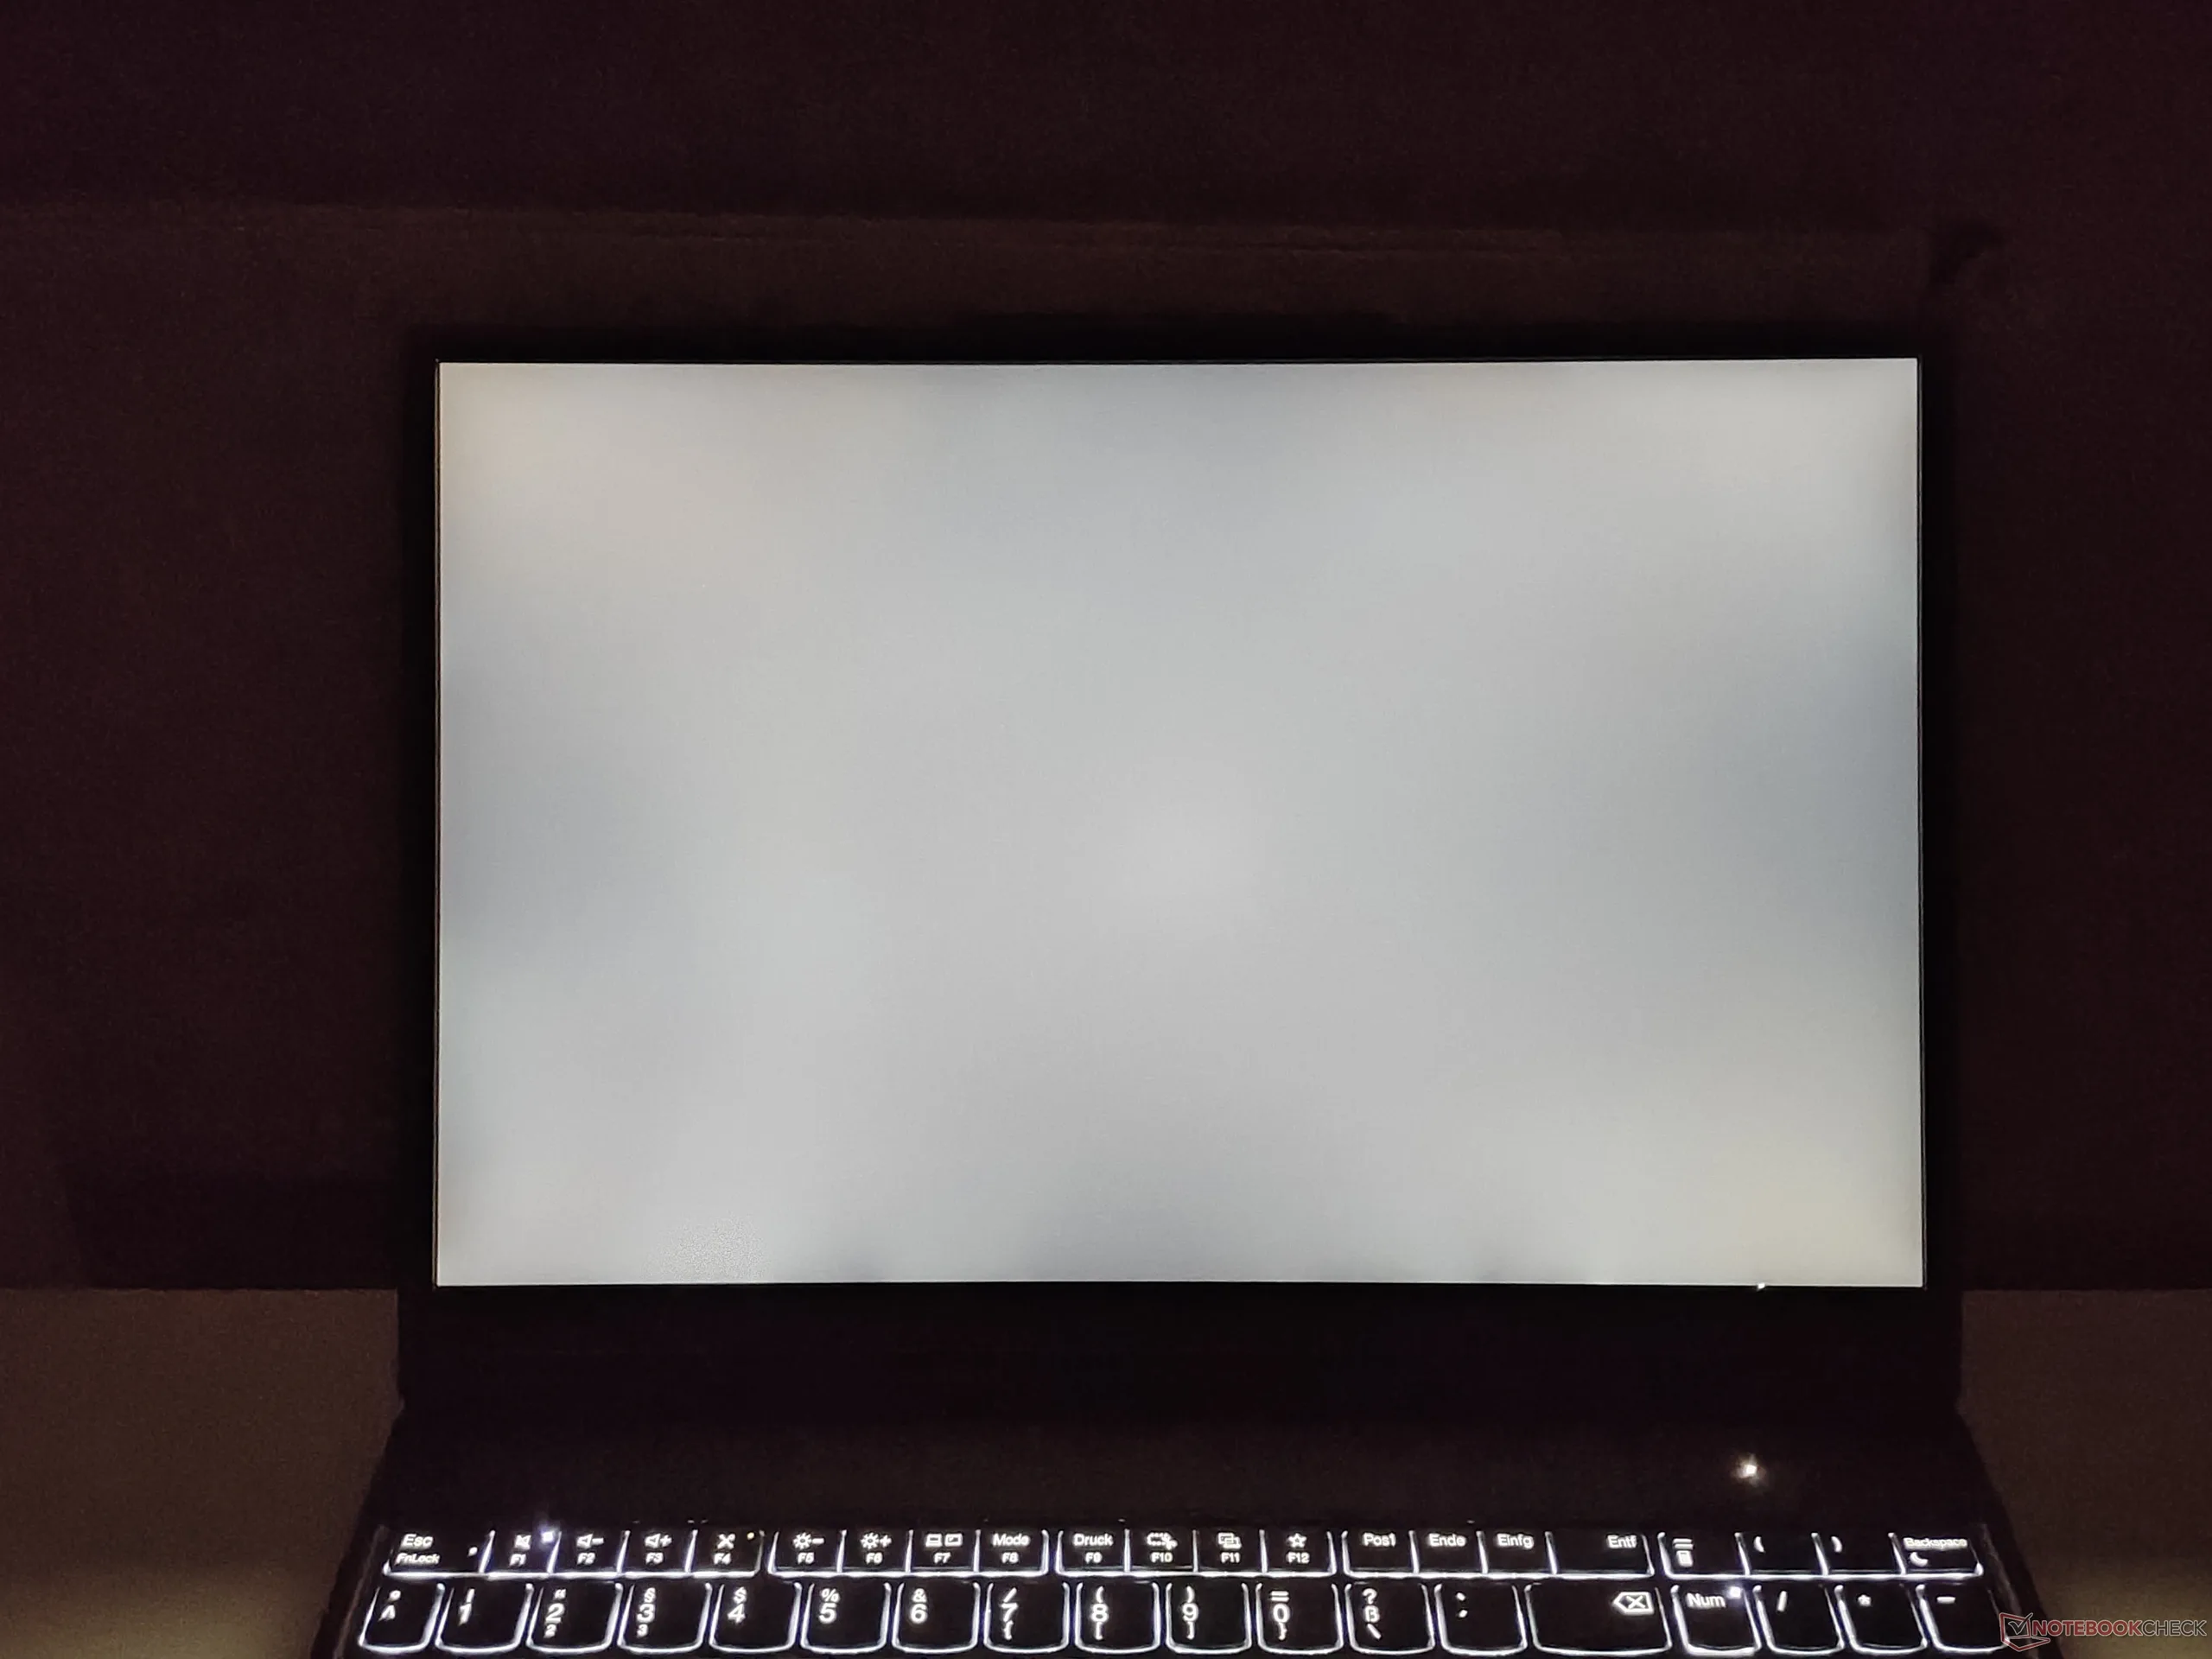
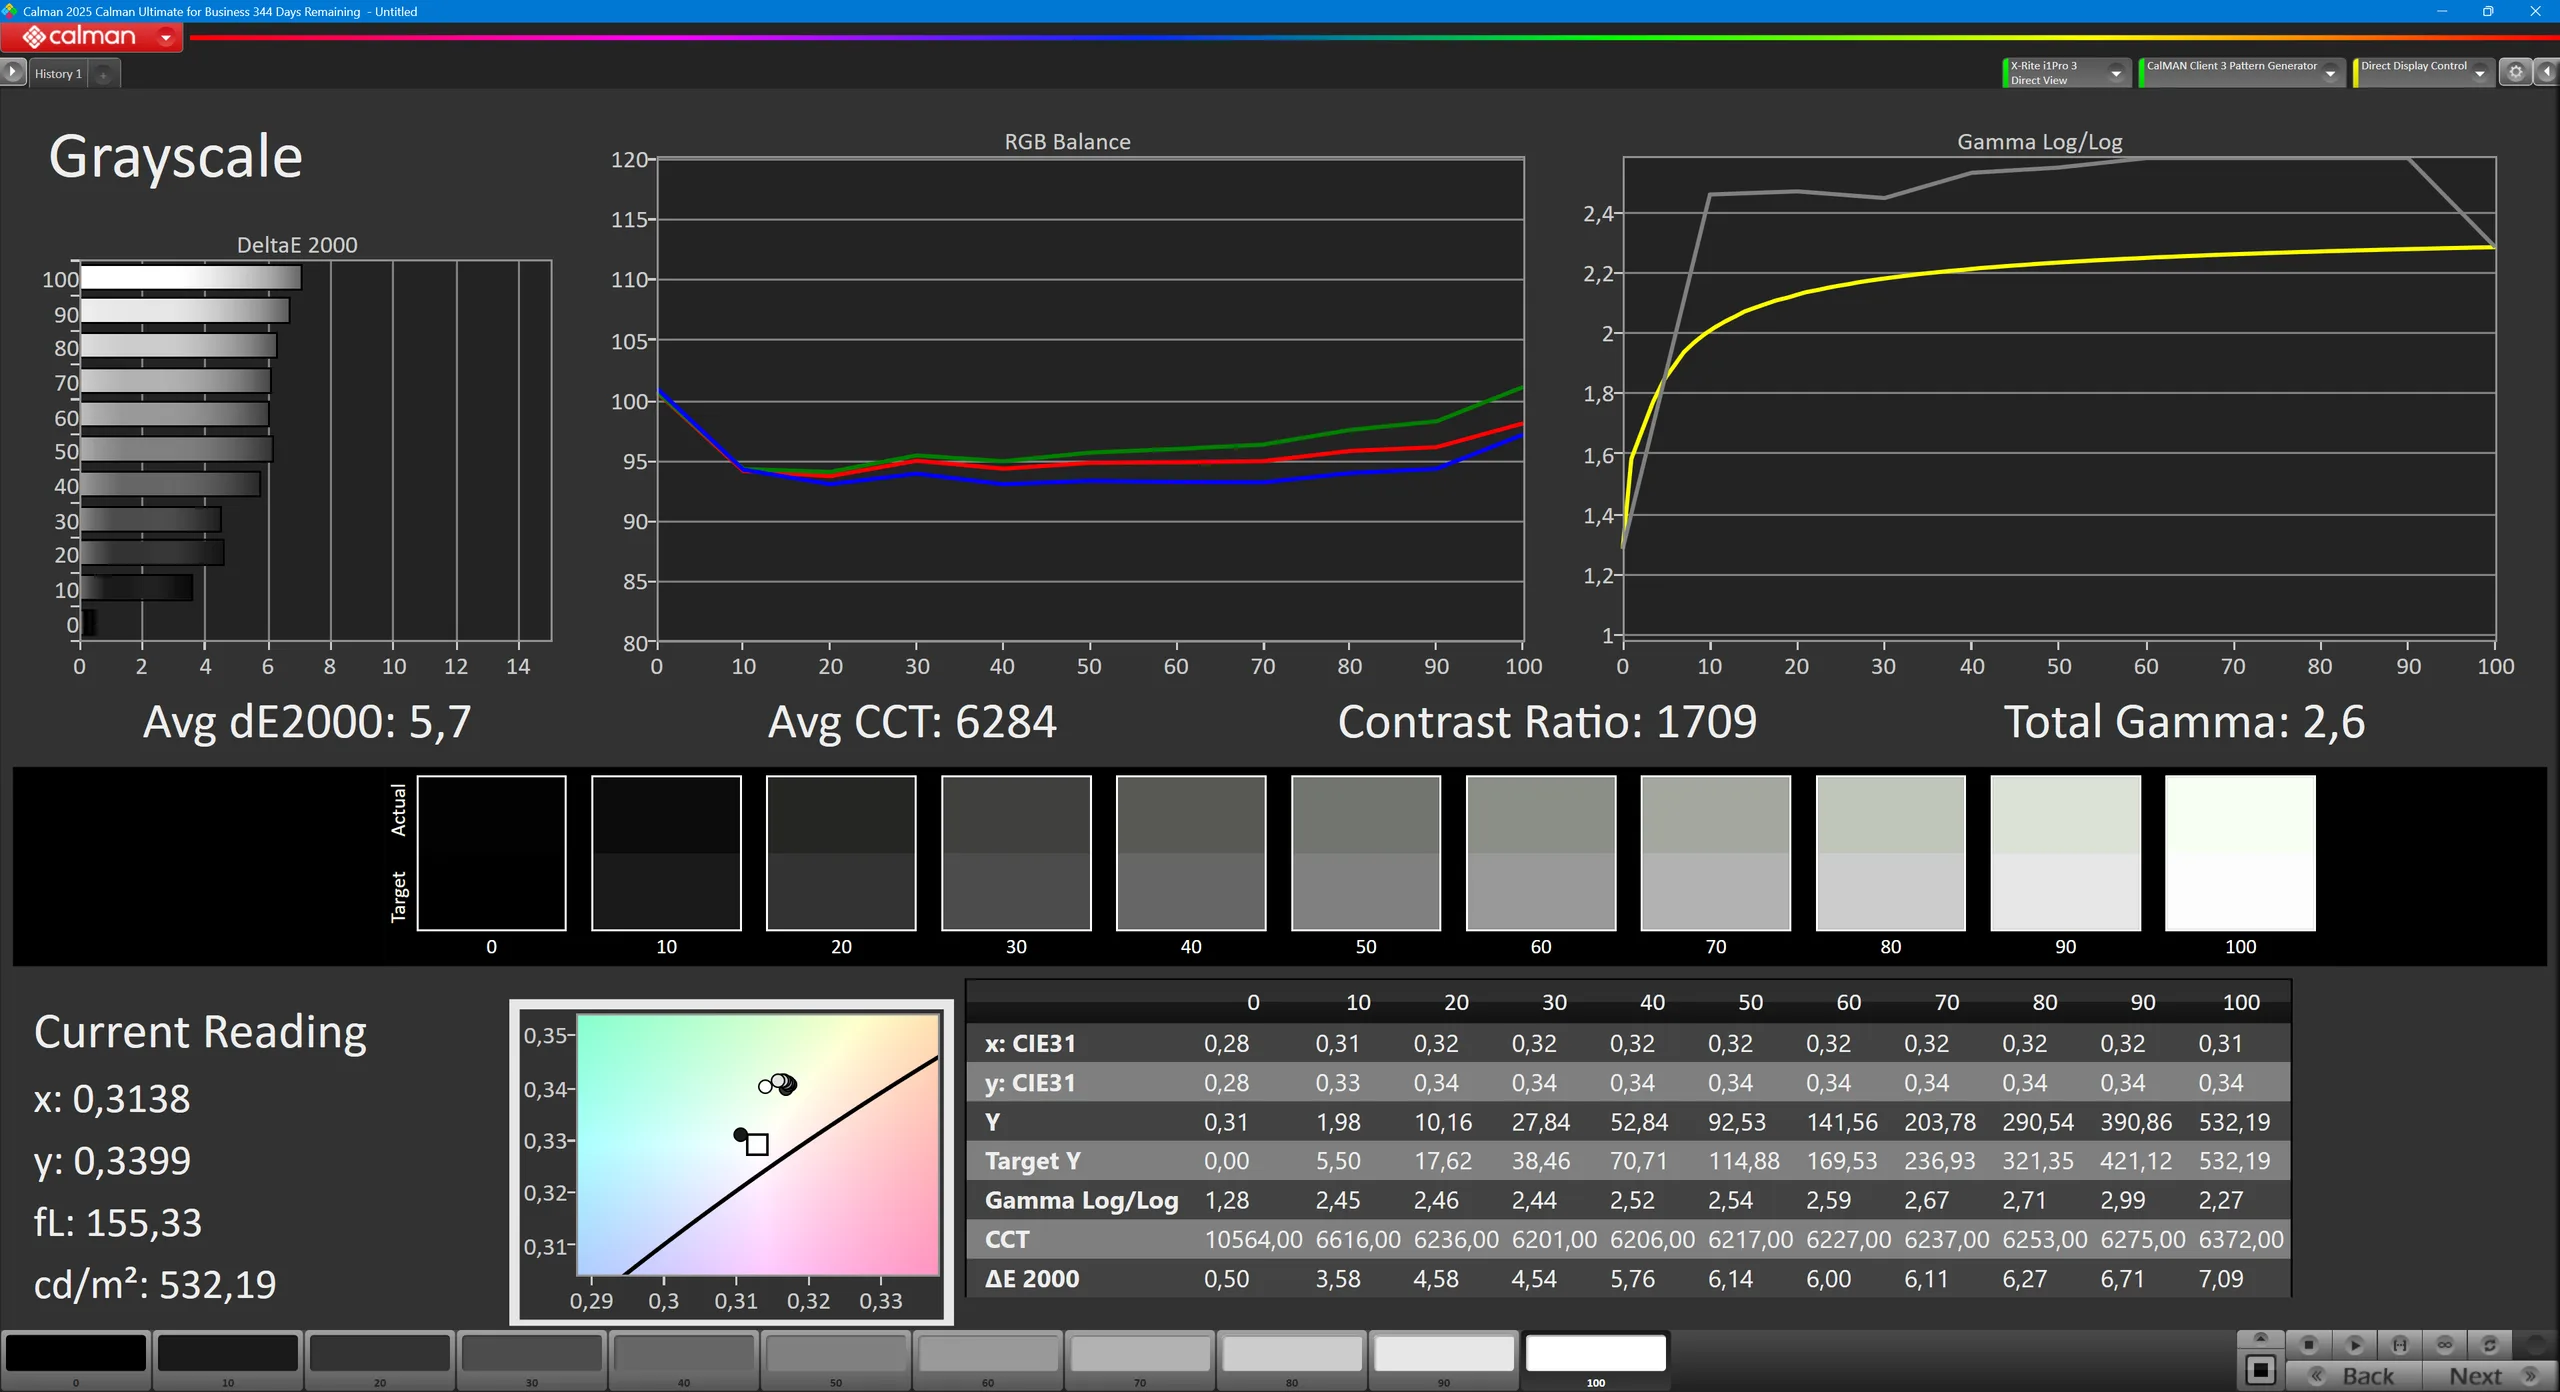
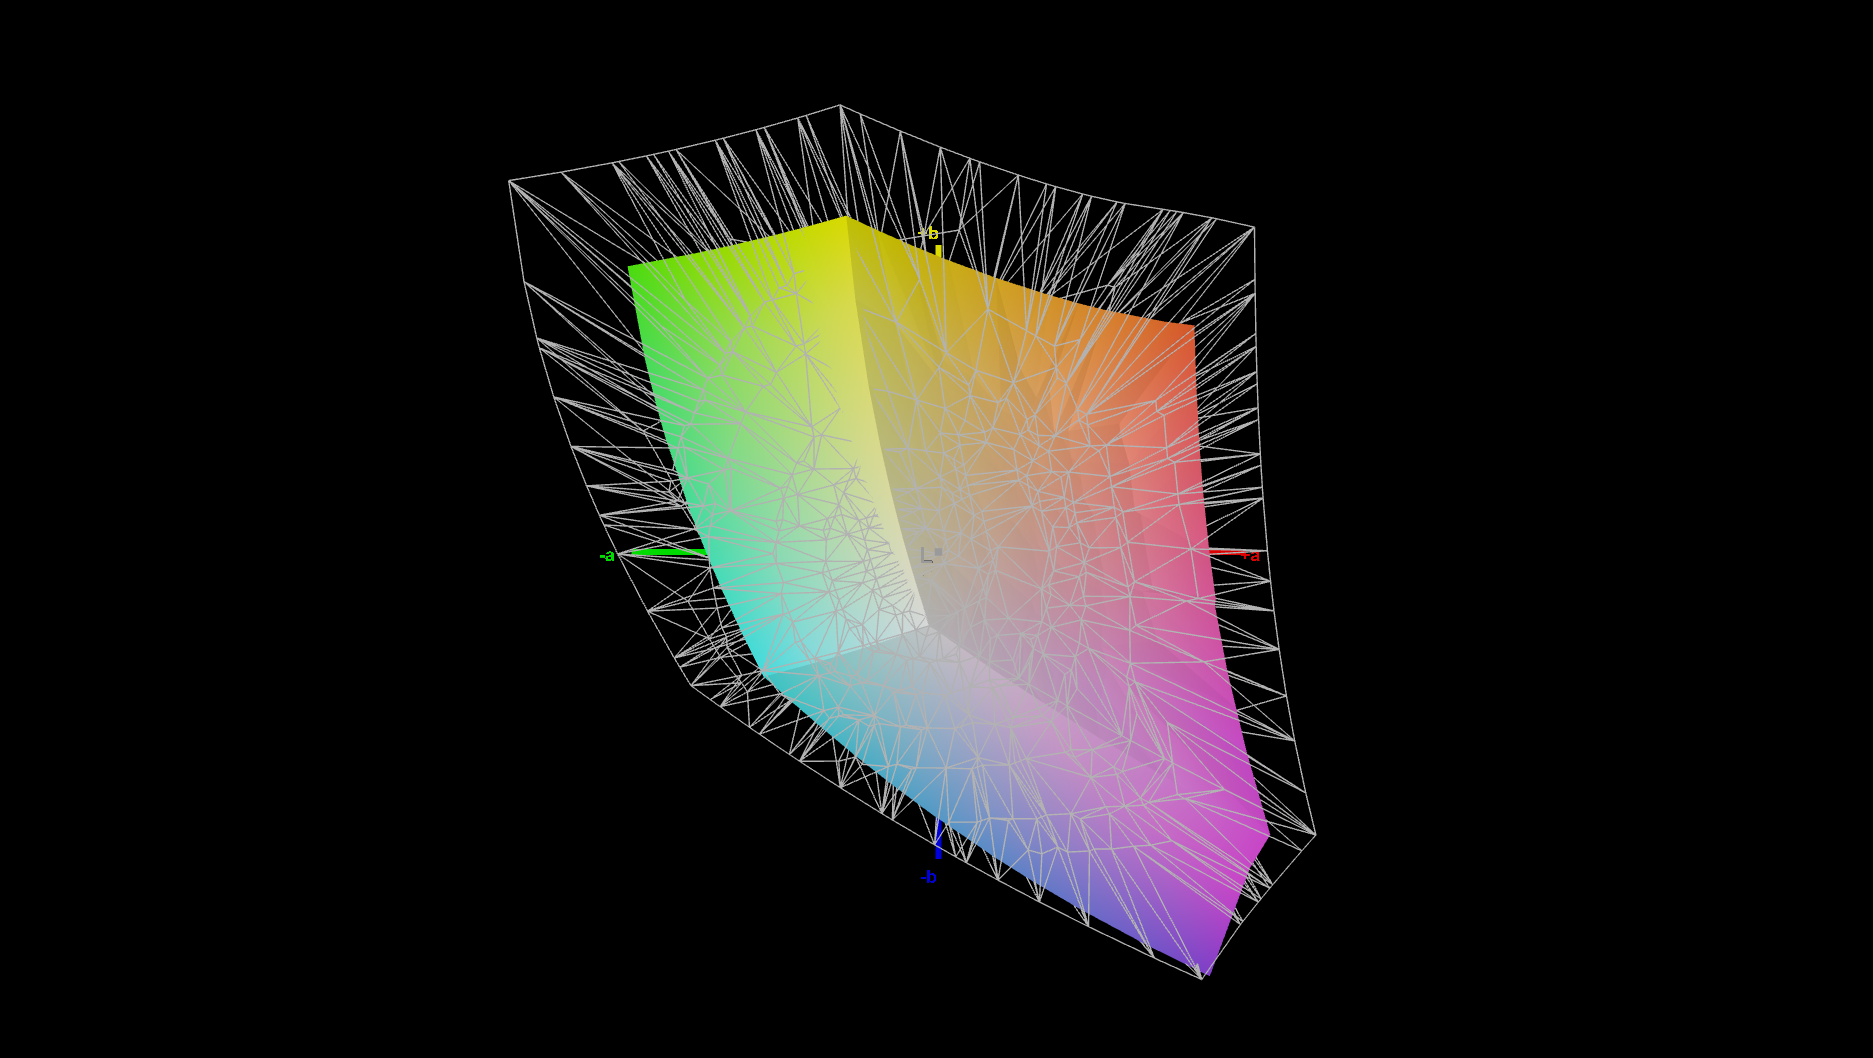
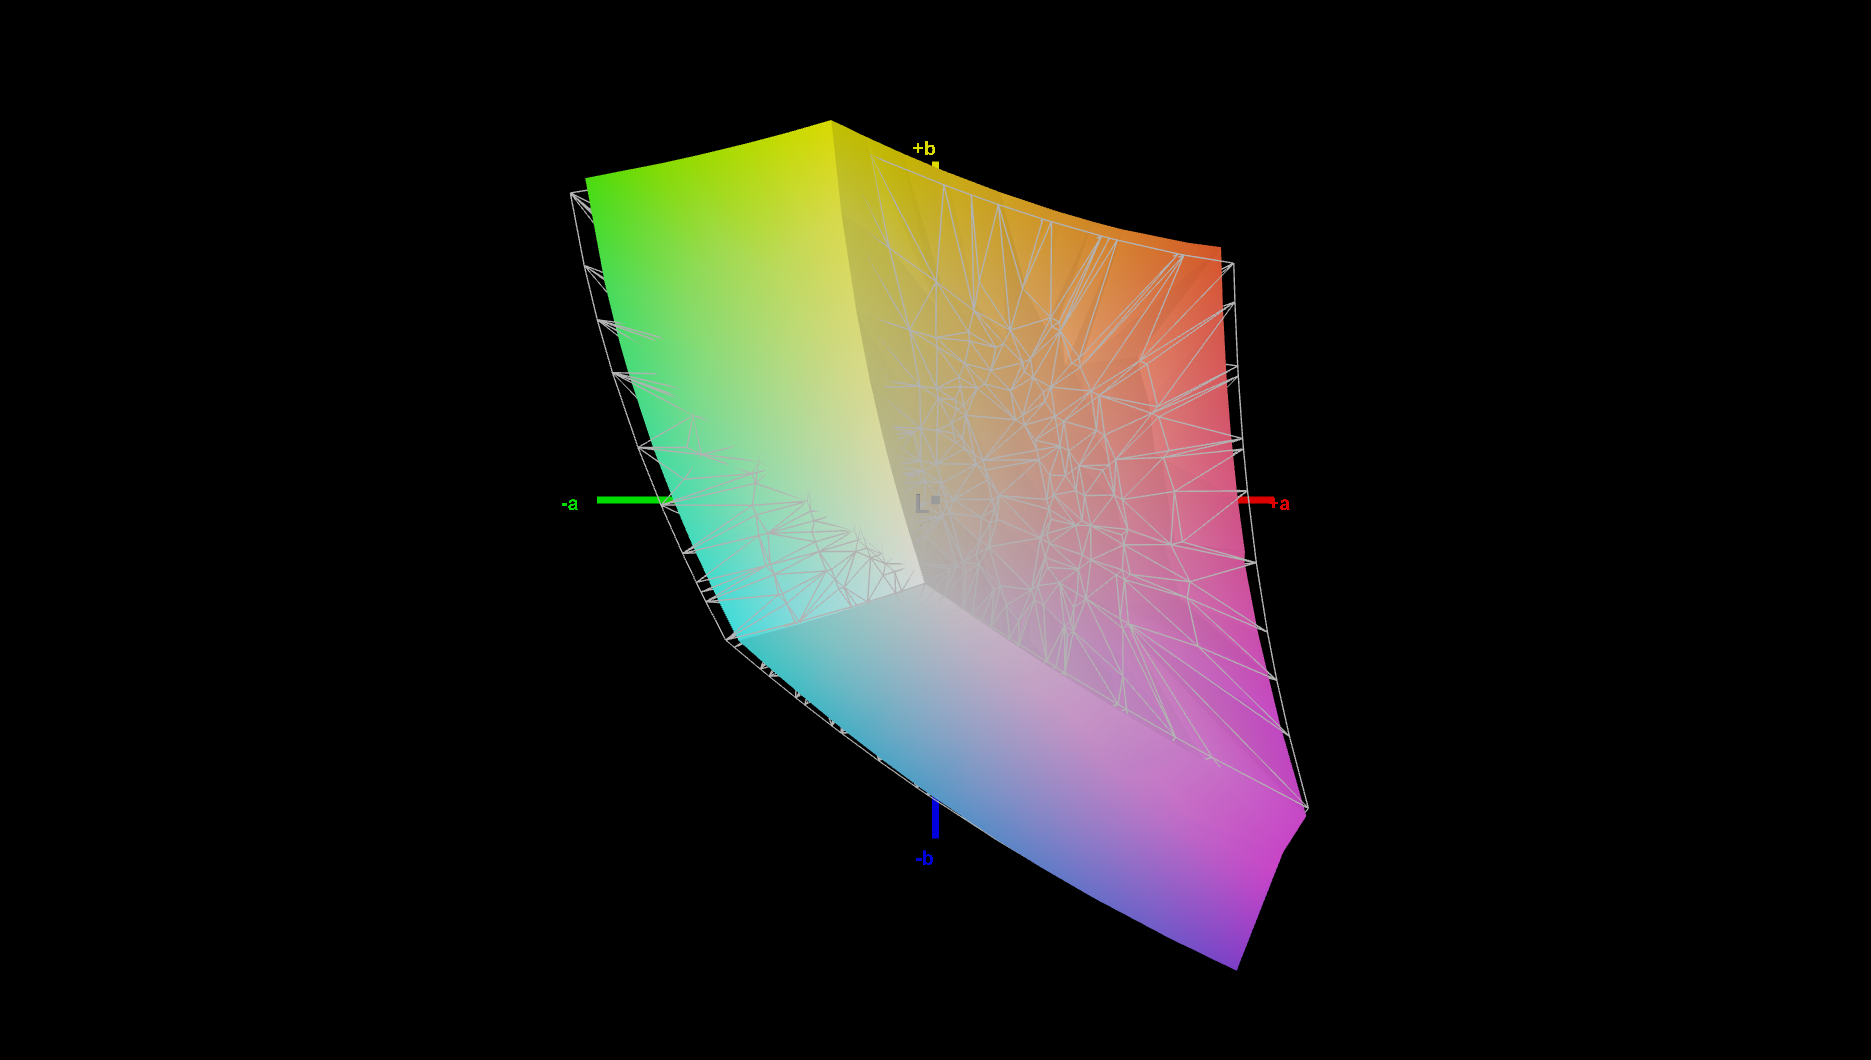
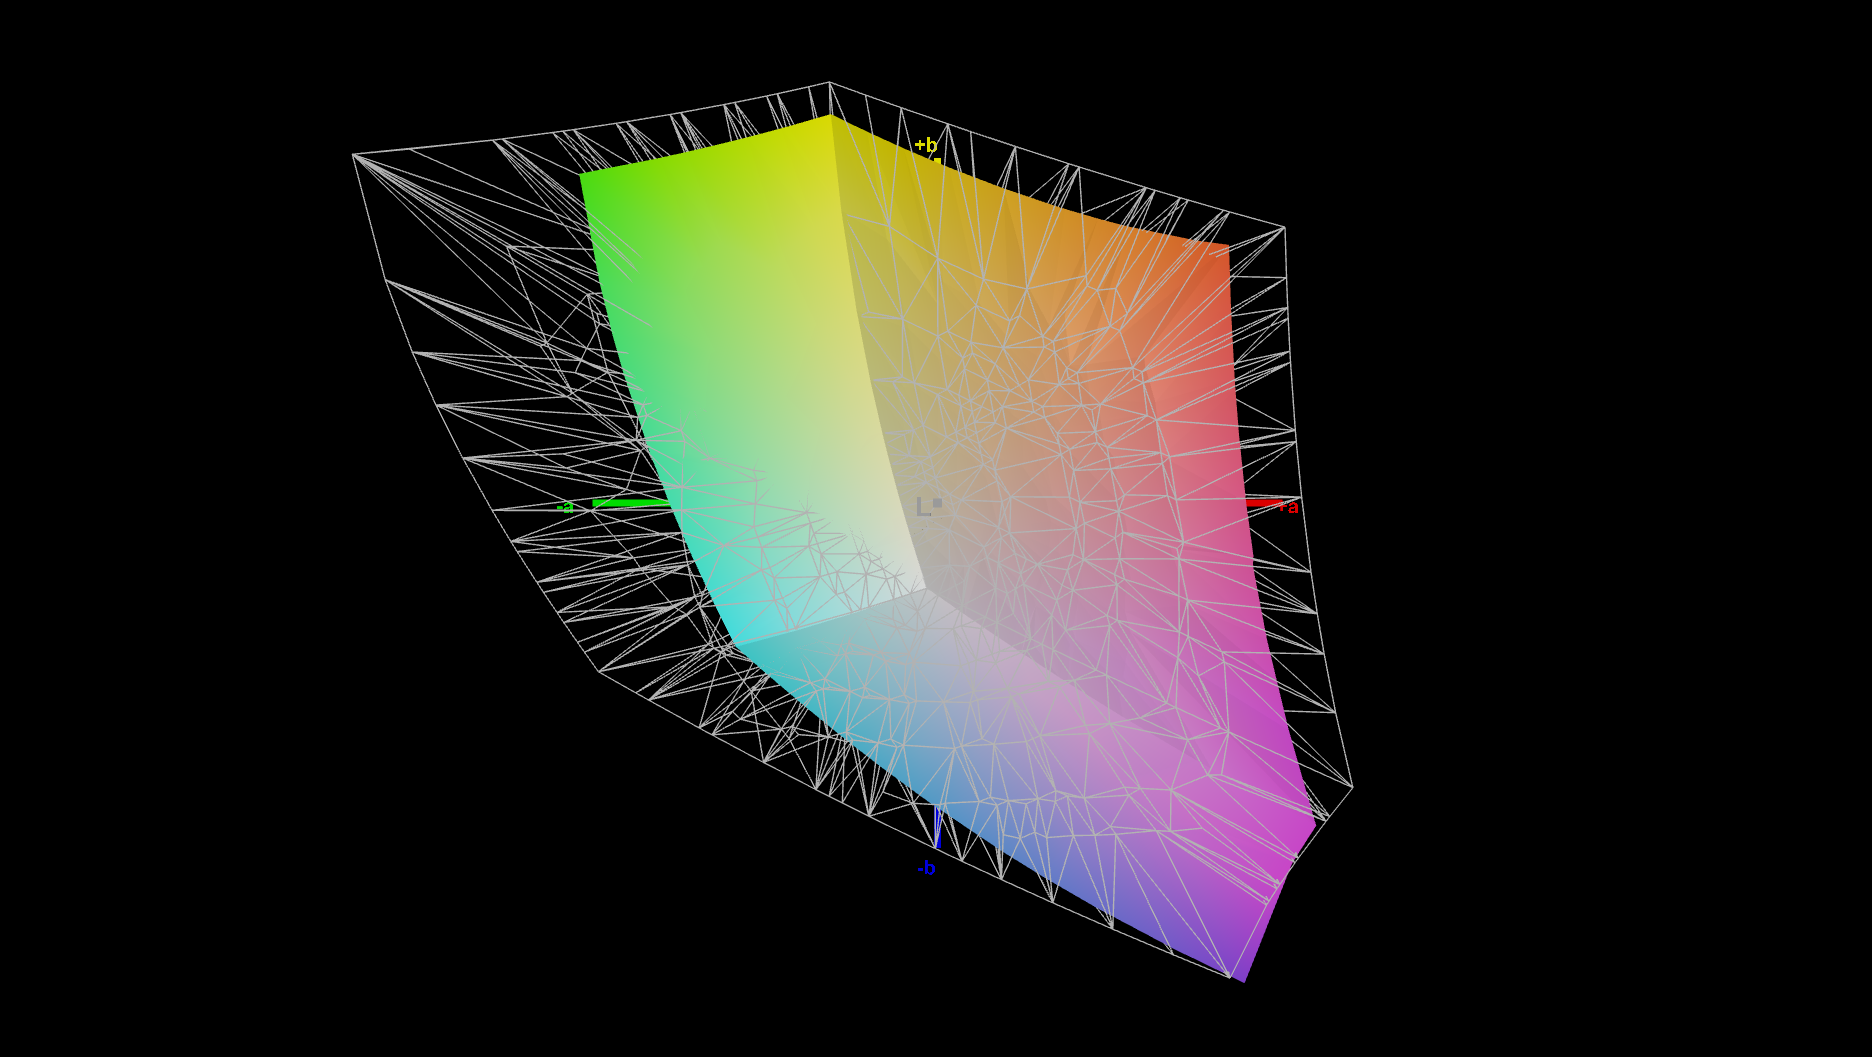
我们评测样本的基本屏幕选项适合办公室工作和其他不需要广色域的任务。但由于 60 Hz 的刷新率较慢,对于多媒体使用来说,它并不是最好的选择。至少没有 PWM。我们确实希望分辨率能更高一些,因为对于如此昂贵的 16 英寸工作站来说,WUXGA 分辨率并不算高。
| |||||||||||||||||||||||||
Brightness Distribution: 88 %
Center on Battery: 532 cd/m²
Contrast: 1716:1 (Black: 0.31 cd/m²)
ΔE ColorChecker Calman: 4.4 | ∀{0.5-29.43 Ø4.71}
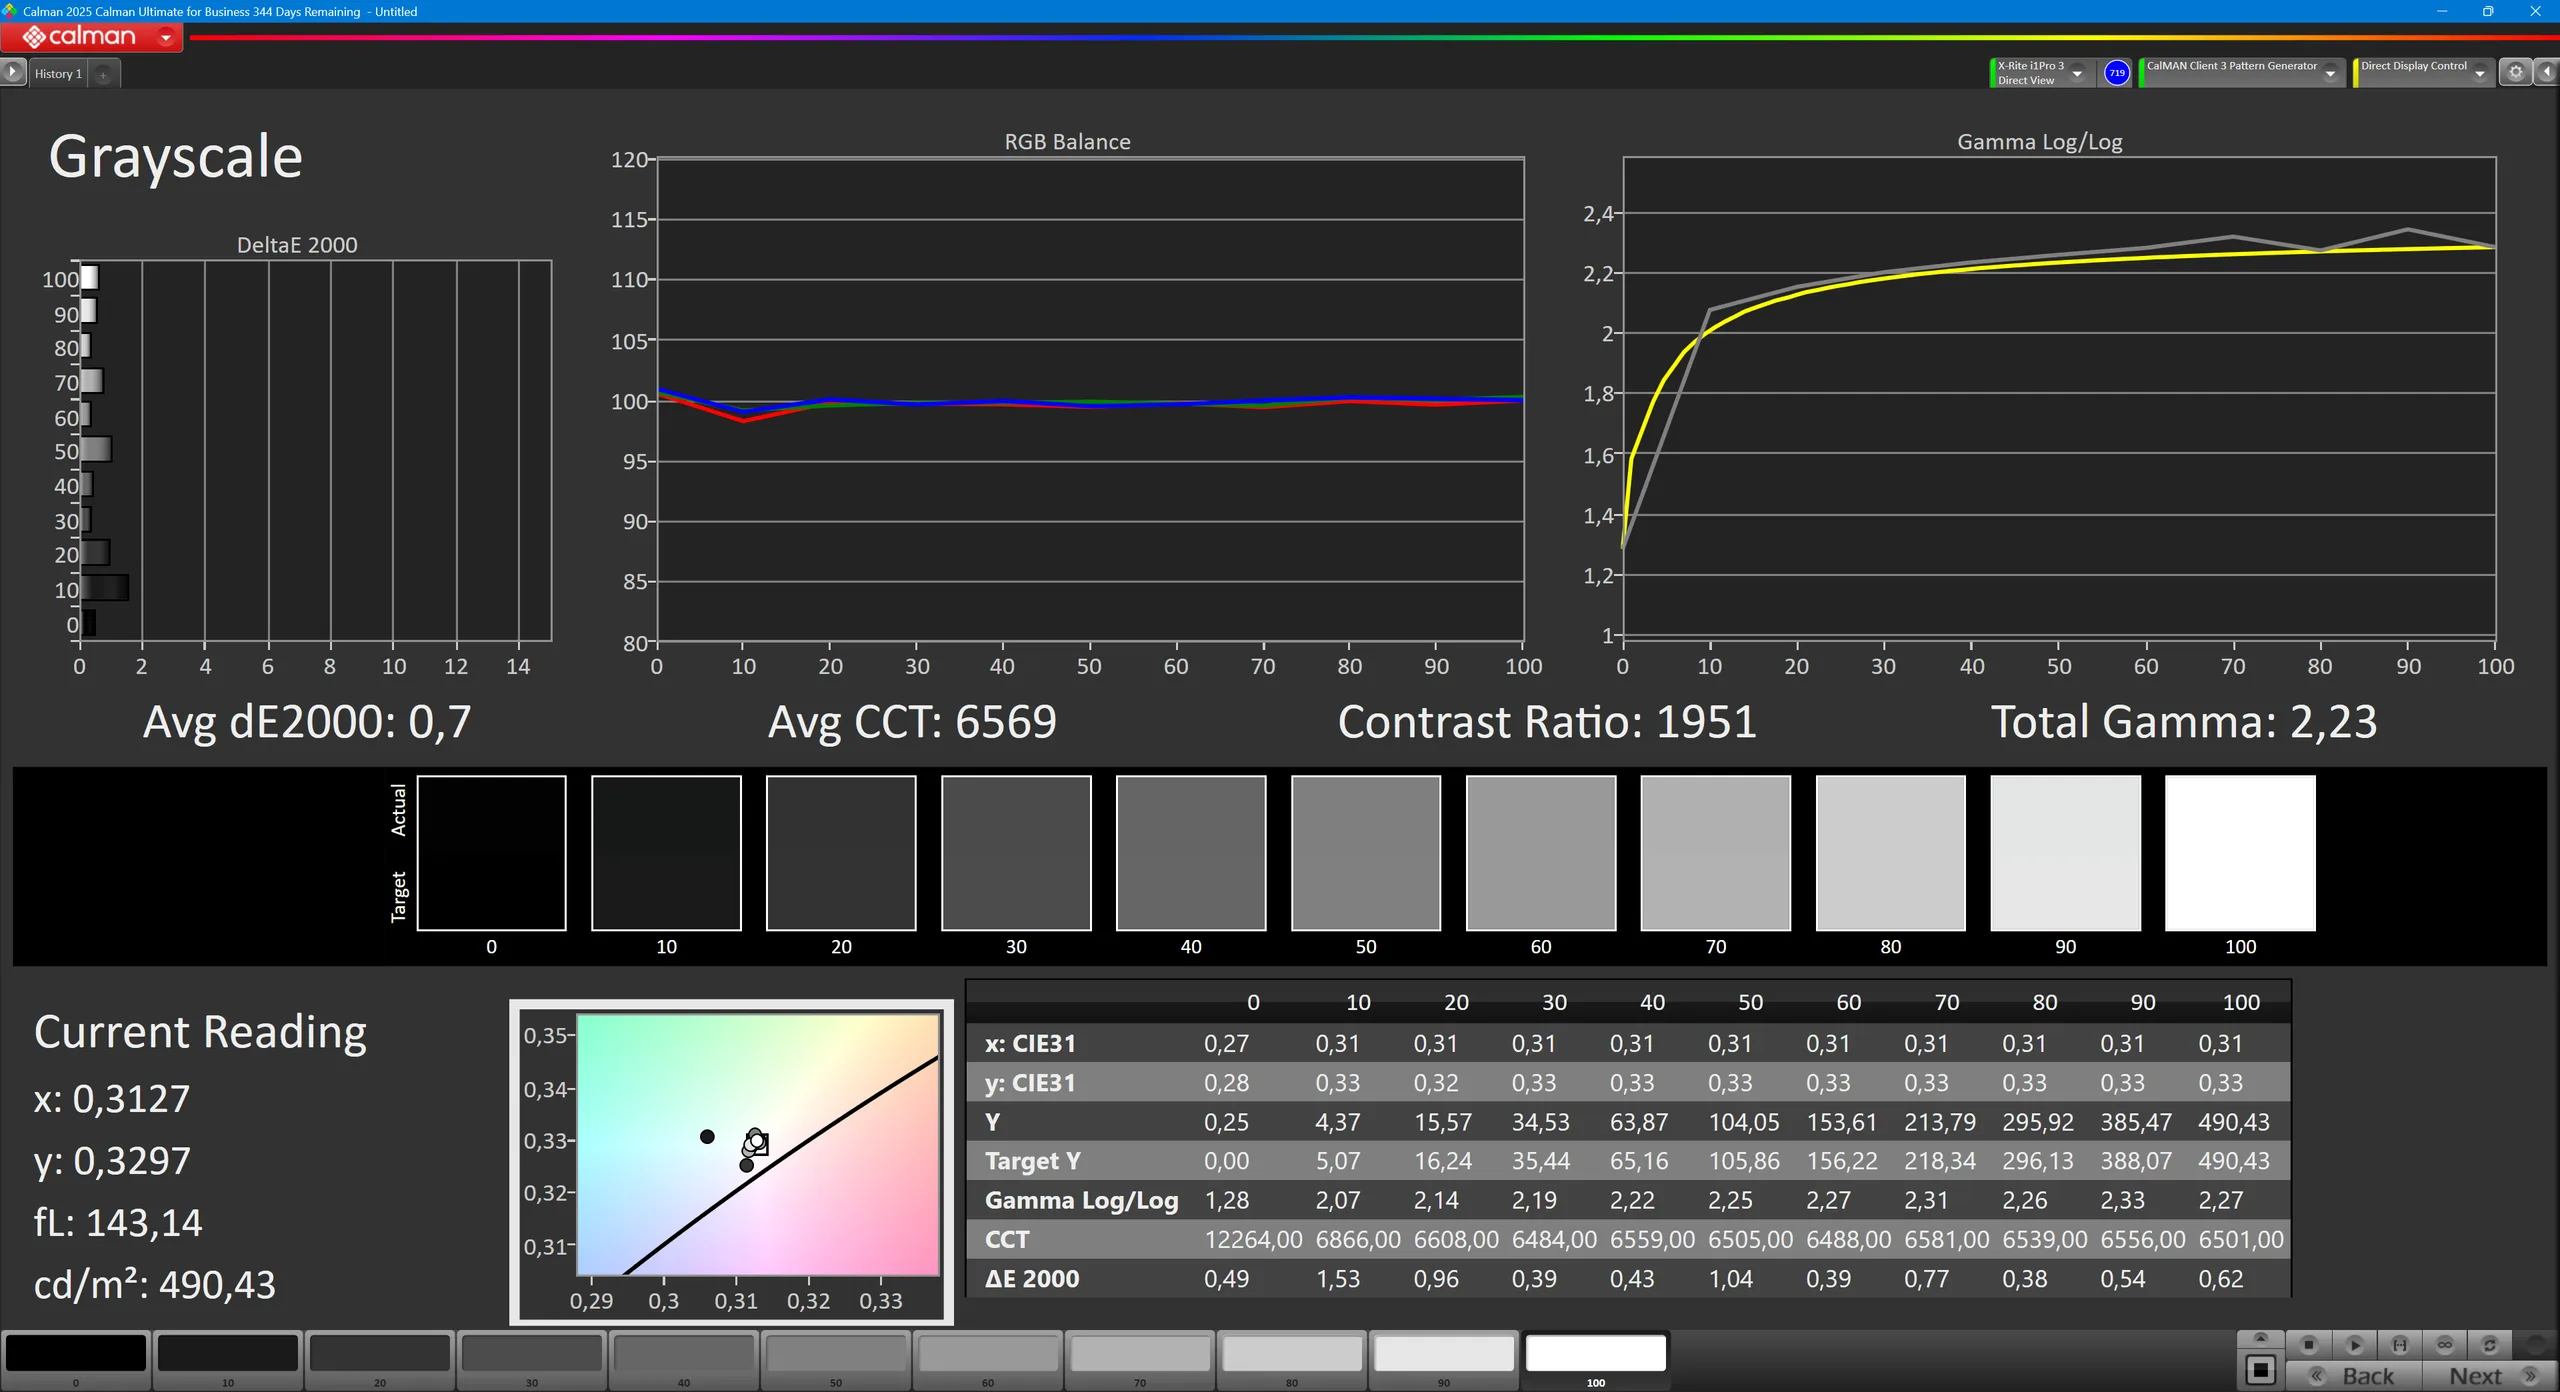
calibrated: 1.1
ΔE Greyscale Calman: 5.7 | ∀{0.09-98 Ø4.96}
66.6% AdobeRGB 1998 (Argyll 3D)
95.2% sRGB (Argyll 3D)
64.9% Display P3 (Argyll 3D)
Gamma: 2.6
CCT: 6284 K
| Lenovo ThinkPad P16 Gen 3 N160JCA-GT1, IPS LED, 1920x1200, 16", 60 Hz | Lenovo ThinkPad P16 G2 21FA000FGE MNG007DA1-9, IPS LED, 2560x1600, 16", 165 Hz | Dell Pro Max 16 Plus Samsung 160HC01, OLED, 3840x2400, 16", 120 Hz | HP ZBook Fury 16 G11 AUO87A8, IPS, 3840x2400, 16", 120 Hz | Lenovo ThinkPad T16g Gen 3 RTX 5080 ATNA60KA02-0, OLED, 3200x2000, 16", 120 Hz | Lenovo ThinkPad P1 Gen 8 Samsung ATNA60KA02-0, Tandem OLED, 3200x2000, 16", 120 Hz | |
|---|---|---|---|---|---|---|
| Display | 8% | 29% | 29% | 30% | 34% | |
| Display P3 Coverage (%) | 64.9 | 71 9% | 97.3 50% | 98.4 52% | 98.8 52% | 98.8 52% |
| sRGB Coverage (%) | 95.2 | 99.2 4% | 100 5% | 99.9 5% | 100 5% | 100 5% |
| AdobeRGB 1998 Coverage (%) | 66.6 | 73.2 10% | 88.8 33% | 86 29% | 88.9 33% | 97.5 46% |
| Response Times | 52% | 97% | 59% | 97% | 97% | |
| Response Time Grey 50% / Grey 80% * (ms) | 29.8 ? | 12.8 ? 57% | 0.63 ? 98% | 11.4 ? 62% | 1.51 ? 95% | 0.57 ? 98% |
| Response Time Black / White * (ms) | 18.7 ? | 10.1 ? 46% | 0.89 ? 95% | 8.4 ? 55% | 0.44 ? 98% | 0.73 ? 96% |
| PWM Frequency (Hz) | 479.9 ? | 1200 ? | 1199 | |||
| PWM Amplitude * (%) | 28 | 22 | 18 | |||
| Screen | -5% | 29% | -1% | 43% | 37% | |
| Brightness middle (cd/m²) | 532 | 510 -4% | 530.9 0% | 457.6 -14% | 585 10% | 561.8 6% |
| Brightness (cd/m²) | 497 | 517 4% | 540 9% | 466 -6% | 590 19% | 566 14% |
| Brightness Distribution (%) | 88 | 89 1% | 95 8% | 83 -6% | 98 11% | 99 13% |
| Black Level * (cd/m²) | 0.31 | 0.37 -19% | 0.43 -39% | |||
| Contrast (:1) | 1716 | 1378 -20% | 1064 -38% | |||
| Colorchecker dE 2000 * | 4.4 | 2.6 41% | 2.42 45% | 2.78 37% | 0.9 80% | 1.29 71% |
| Colorchecker dE 2000 max. * | 6.9 | 5.2 25% | 5.76 17% | 5.53 20% | 2.7 61% | 2.96 57% |
| Colorchecker dE 2000 calibrated * | 1.1 | 2.3 -109% | 0.7 36% | 1.37 -25% | 0.81 26% | |
| Greyscale dE 2000 * | 5.7 | 3.6 37% | 0.8 86% | 2 65% | 1.4 75% | 1.4 75% |
| Gamma | 2.6 85% | 2.26 97% | 2.23 99% | 2.28 96% | 2.18 101% | 2.23 99% |
| CCT | 6284 103% | 5969 109% | 6488 100% | 6806 96% | 6442 101% | 6319 103% |
| Total Average (Program / Settings) | 18% /
6% | 52% /
40% | 29% /
14% | 57% /
49% | 56% /
47% |
* ... smaller is better


Display Response Times
| ↔ Response Time Black to White | ||
|---|---|---|
| 18.7 ms ... rise ↗ and fall ↘ combined | ↗ 10.4 ms rise |  |
| ↘ 8.3 ms fall | ||
| The screen shows good response rates in our tests, but may be too slow for competitive gamers. In comparison, all tested devices range from 0.1 (minimum) to 240 (maximum) ms. » 42 % of all devices are better. This means that the measured response time is similar to the average of all tested devices (19.8 ms). | ||
| ↔ Response Time 50% Grey to 80% Grey | ||
| 29.8 ms ... rise ↗ and fall ↘ combined | ↗ 13.7 ms rise |  |
| ↘ 16.1 ms fall | ||
| The screen shows relatively slow response rates in our tests and may be too slow for gamers. In comparison, all tested devices range from 0.165 (minimum) to 636 (maximum) ms. » 40 % of all devices are better. This means that the measured response time is similar to the average of all tested devices (31 ms). | ||
Screen Flickering / PWM (Pulse-Width Modulation)
| Screen flickering / PWM not detected |  | ||
In comparison: 52 % of all tested devices do not use PWM to dim the display. If PWM was detected, an average of 7747 (minimum: 5 - maximum: 343500) Hz was measured. | |||


性能
测试条件
- 最佳电池寿命:PL1 45 W / PL2 160 W
- 平衡型PL1 100 瓦 / PL2 160 瓦
- 最佳性能:PL1 110 瓦 / PL2 160 瓦
所有基准测试均在 "最佳性能 "模式下进行。
处理器
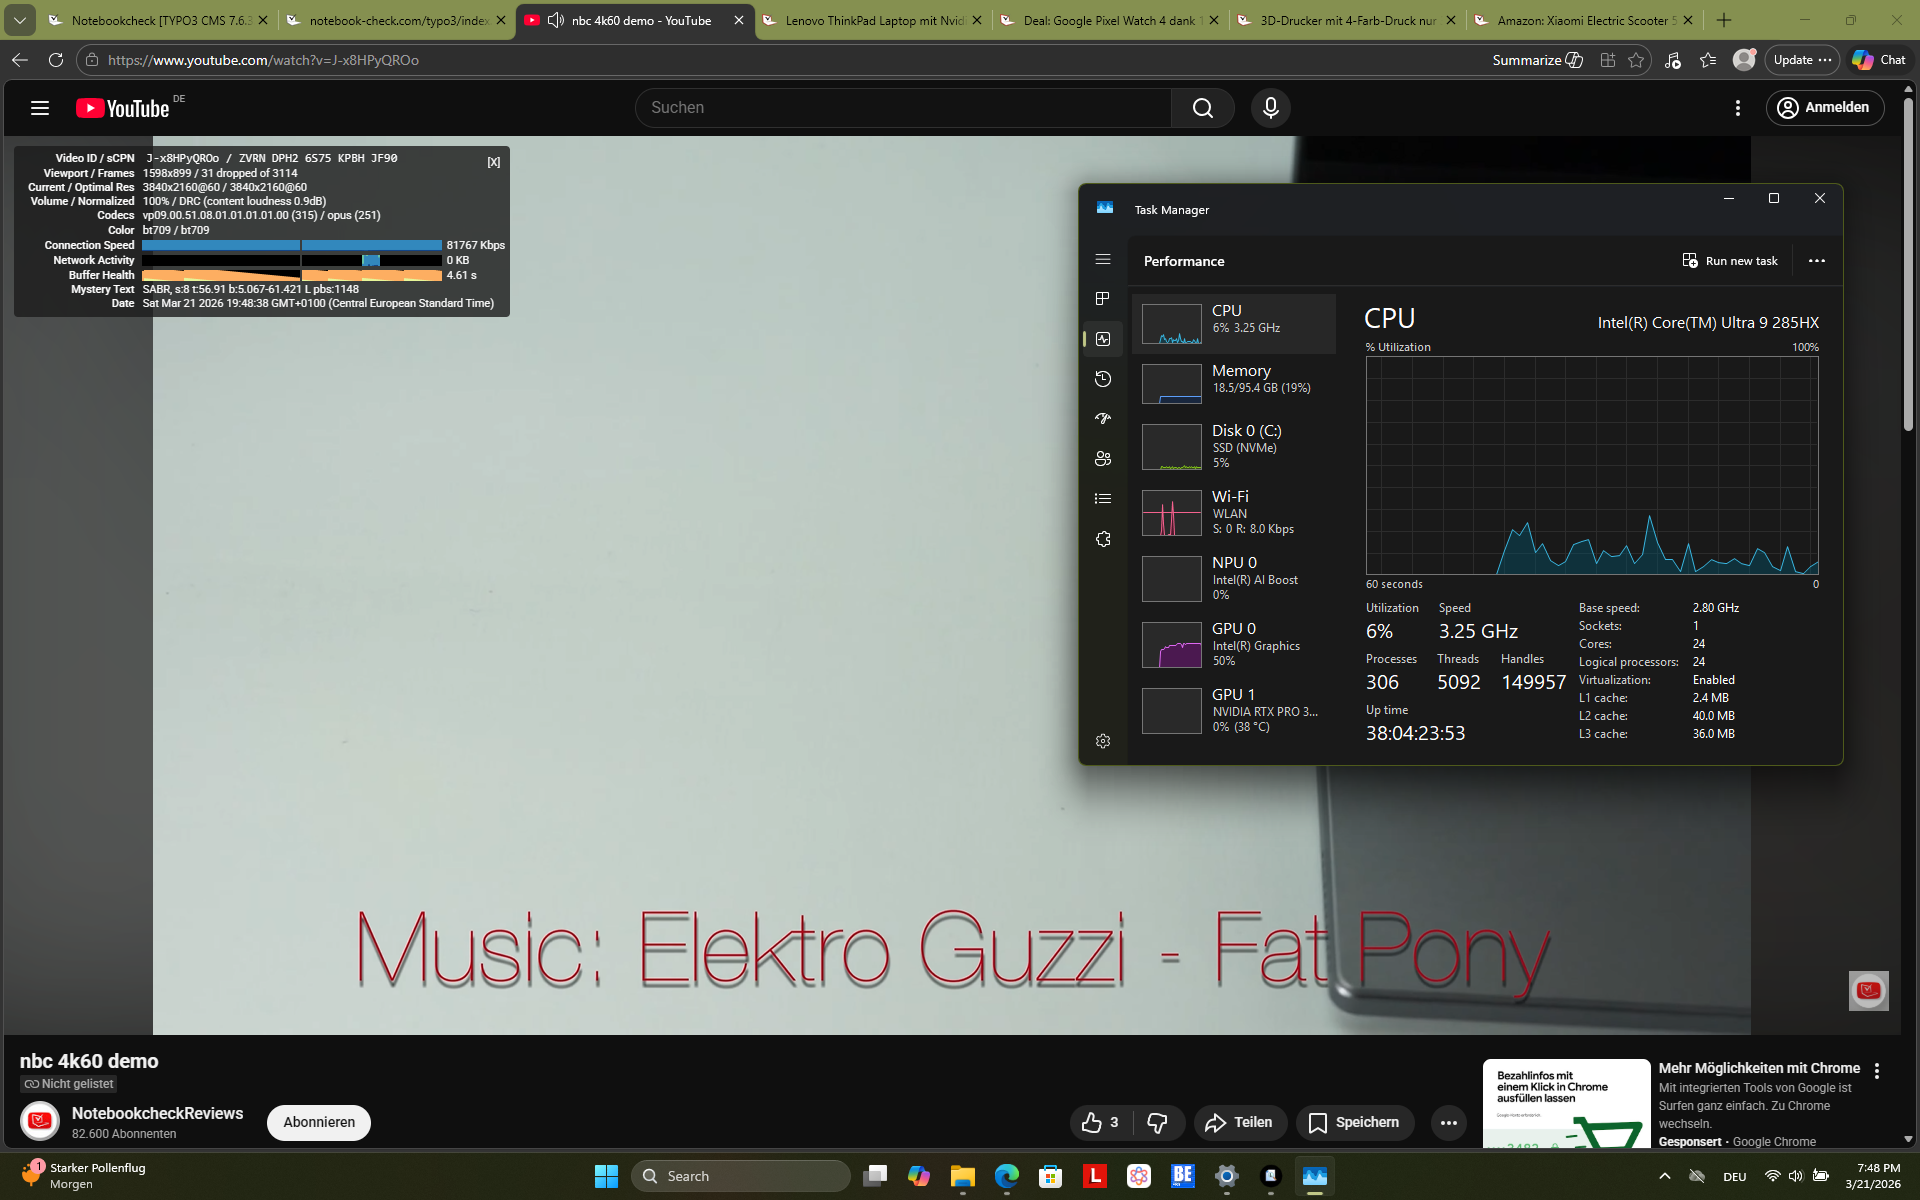
英特尔 英特尔酷睿至尊285HX是一款功能强大的 "箭湖 "处理器,基于英特尔最新的台式机 CPU 系列。该处理器共有 24 个内核,其中 8 个内核的主频可达 5.5 GHz,是笔记本电脑中速度最快的英特尔 CPU 之一。更多与其他处理器的比较,请参阅 我们的 CPU 列表.
平均而言,ThinkPad P16 Gen 3 比 ThinkPad P16 Gen 2 快 43%。 ThinkPad P16 Gen 2处理器性能提高了 43%。尽管在性能上取得了如此大的进步,但 CPU 的性能仍略低于该芯片的平均水平。
当笔记本电脑使用电池供电时,性能降低了 26%,在 Cinebench R23 多核测试中仅为 27728 分。
Cinebench R15 多回路运行
Cinebench R23: Multi Core | Single Core
Cinebench R20: CPU (Multi Core) | CPU (Single Core)
Cinebench R15: CPU Multi 64Bit | CPU Single 64Bit
Blender: v2.79 BMW27 CPU
7-Zip 18.03: 7z b 4 | 7z b 4 -mmt1
Geekbench 6.7: Multi-Core | Single-Core
Geekbench 5.5: Multi-Core | Single-Core
HWBOT x265 Benchmark v2.2: 4k Preset
LibreOffice : 20 Documents To PDF
R Benchmark 2.5: Overall mean
| CPU Performance rating | |
| Average Intel Core Ultra 9 285HX | |
| Lenovo ThinkPad T16g Gen 3 RTX 5080 | |
| Dell Pro Max 16 Plus | |
| Lenovo ThinkPad P16 Gen 3 | |
| HP ZBook Fury 16 G11 | |
| Average of class Workstation | |
| Lenovo ThinkPad P1 Gen 8 | |
| Lenovo ThinkPad P16 G2 21FA000FGE -2! | |
| Cinebench R23 / Multi Core | |
| Lenovo ThinkPad T16g Gen 3 RTX 5080 | |
| Average Intel Core Ultra 9 285HX (34955 - 40117, n=6) | |
| Dell Pro Max 16 Plus | |
| Lenovo ThinkPad P16 Gen 3 | |
| HP ZBook Fury 16 G11 | |
| Average of class Workstation (14621 - 38520, n=23, last 2 years) | |
| Lenovo ThinkPad P1 Gen 8 | |
| Lenovo ThinkPad P16 G2 21FA000FGE | |
| Cinebench R23 / Single Core | |
| Lenovo ThinkPad P16 Gen 3 | |
| Lenovo ThinkPad T16g Gen 3 RTX 5080 | |
| Average Intel Core Ultra 9 285HX (2057 - 2303, n=6) | |
| HP ZBook Fury 16 G11 | |
| Dell Pro Max 16 Plus | |
| Average of class Workstation (1712 - 2228, n=23, last 2 years) | |
| Lenovo ThinkPad P1 Gen 8 | |
| Lenovo ThinkPad P16 G2 21FA000FGE | |
| Cinebench R20 / CPU (Multi Core) | |
| Lenovo ThinkPad T16g Gen 3 RTX 5080 | |
| Average Intel Core Ultra 9 285HX (13152 - 15751, n=6) | |
| Dell Pro Max 16 Plus | |
| Lenovo ThinkPad P16 Gen 3 | |
| HP ZBook Fury 16 G11 | |
| Average of class Workstation (5760 - 15043, n=23, last 2 years) | |
| Lenovo ThinkPad P1 Gen 8 | |
| Lenovo ThinkPad P16 G2 21FA000FGE | |
| Cinebench R20 / CPU (Single Core) | |
| Lenovo ThinkPad P16 Gen 3 | |
| Lenovo ThinkPad T16g Gen 3 RTX 5080 | |
| Average Intel Core Ultra 9 285HX (799 - 884, n=6) | |
| HP ZBook Fury 16 G11 | |
| Dell Pro Max 16 Plus | |
| Average of class Workstation (671 - 857, n=23, last 2 years) | |
| Lenovo ThinkPad P1 Gen 8 | |
| Lenovo ThinkPad P16 G2 21FA000FGE | |
| Cinebench R15 / CPU Multi 64Bit | |
| Lenovo ThinkPad T16g Gen 3 RTX 5080 | |
| Average Intel Core Ultra 9 285HX (5427 - 6232, n=6) | |
| Lenovo ThinkPad P16 Gen 3 | |
| Dell Pro Max 16 Plus | |
| HP ZBook Fury 16 G11 | |
| Average of class Workstation (2489 - 5810, n=23, last 2 years) | |
| Lenovo ThinkPad P1 Gen 8 | |
| Lenovo ThinkPad P16 G2 21FA000FGE | |
| Cinebench R15 / CPU Single 64Bit | |
| Lenovo ThinkPad T16g Gen 3 RTX 5080 | |
| Average Intel Core Ultra 9 285HX (307 - 340, n=6) | |
| Lenovo ThinkPad P16 Gen 3 | |
| Dell Pro Max 16 Plus | |
| Lenovo ThinkPad P1 Gen 8 | |
| HP ZBook Fury 16 G11 | |
| Average of class Workstation (191.4 - 328, n=23, last 2 years) | |
| Lenovo ThinkPad P16 G2 21FA000FGE | |
| Blender / v2.79 BMW27 CPU | |
| Lenovo ThinkPad P1 Gen 8 | |
| Lenovo ThinkPad P16 G2 21FA000FGE | |
| Average of class Workstation (91 - 222, n=23, last 2 years) | |
| HP ZBook Fury 16 G11 | |
| Lenovo ThinkPad P16 Gen 3 | |
| Dell Pro Max 16 Plus | |
| Lenovo ThinkPad T16g Gen 3 RTX 5080 | |
| Average Intel Core Ultra 9 285HX (83 - 103, n=6) | |
| 7-Zip 18.03 / 7z b 4 | |
| Average Intel Core Ultra 9 285HX (99260 - 128778, n=6) | |
| Dell Pro Max 16 Plus | |
| Lenovo ThinkPad T16g Gen 3 RTX 5080 | |
| HP ZBook Fury 16 G11 | |
| Lenovo ThinkPad P16 Gen 3 | |
| Average of class Workstation (60489 - 116969, n=23, last 2 years) | |
| Lenovo ThinkPad P16 G2 21FA000FGE | |
| Lenovo ThinkPad P1 Gen 8 | |
| 7-Zip 18.03 / 7z b 4 -mmt1 | |
| HP ZBook Fury 16 G11 | |
| Lenovo ThinkPad T16g Gen 3 RTX 5080 | |
| Average Intel Core Ultra 9 285HX (6422 - 6822, n=6) | |
| Dell Pro Max 16 Plus | |
| Lenovo ThinkPad P16 Gen 3 | |
| Lenovo ThinkPad P16 G2 21FA000FGE | |
| Average of class Workstation (5126 - 6960, n=23, last 2 years) | |
| Lenovo ThinkPad P1 Gen 8 | |
| Geekbench 6.7 / Multi-Core | |
| Dell Pro Max 16 Plus | |
| Average Intel Core Ultra 9 285HX (18212 - 22104, n=6) | |
| Lenovo ThinkPad T16g Gen 3 RTX 5080 | |
| Lenovo ThinkPad P16 Gen 3 | |
| Lenovo ThinkPad P1 Gen 8 | |
| Average of class Workstation (12721 - 20887, n=23, last 2 years) | |
| HP ZBook Fury 16 G11 | |
| Geekbench 6.7 / Single-Core | |
| Lenovo ThinkPad T16g Gen 3 RTX 5080 | |
| Average Intel Core Ultra 9 285HX (2907 - 3088, n=6) | |
| Lenovo ThinkPad P16 Gen 3 | |
| HP ZBook Fury 16 G11 | |
| Dell Pro Max 16 Plus | |
| Average of class Workstation (2389 - 3065, n=23, last 2 years) | |
| Lenovo ThinkPad P1 Gen 8 | |
| Geekbench 5.5 / Multi-Core | |
| Dell Pro Max 16 Plus | |
| Average Intel Core Ultra 9 285HX (18992 - 27010, n=6) | |
| Lenovo ThinkPad T16g Gen 3 RTX 5080 | |
| Lenovo ThinkPad P16 Gen 3 | |
| HP ZBook Fury 16 G11 | |
| Average of class Workstation (11542 - 25554, n=23, last 2 years) | |
| Lenovo ThinkPad P1 Gen 8 | |
| Lenovo ThinkPad P16 G2 21FA000FGE | |
| Geekbench 5.5 / Single-Core | |
| Lenovo ThinkPad T16g Gen 3 RTX 5080 | |
| Average Intel Core Ultra 9 285HX (2121 - 2232, n=6) | |
| Lenovo ThinkPad P16 Gen 3 | |
| Dell Pro Max 16 Plus | |
| Average of class Workstation (1783 - 2183, n=23, last 2 years) | |
| HP ZBook Fury 16 G11 | |
| Lenovo ThinkPad P1 Gen 8 | |
| Lenovo ThinkPad P16 G2 21FA000FGE | |
| HWBOT x265 Benchmark v2.2 / 4k Preset | |
| Average Intel Core Ultra 9 285HX (35.3 - 44.3, n=6) | |
| Lenovo ThinkPad T16g Gen 3 RTX 5080 | |
| Dell Pro Max 16 Plus | |
| Lenovo ThinkPad P16 Gen 3 | |
| Average of class Workstation (17.8 - 40.5, n=23, last 2 years) | |
| HP ZBook Fury 16 G11 | |
| Lenovo ThinkPad P1 Gen 8 | |
| Lenovo ThinkPad P16 G2 21FA000FGE | |
| LibreOffice / 20 Documents To PDF | |
| Lenovo ThinkPad P16 G2 21FA000FGE | |
| HP ZBook Fury 16 G11 | |
| Average of class Workstation (37.1 - 74.7, n=23, last 2 years) | |
| Lenovo ThinkPad T16g Gen 3 RTX 5080 | |
| Average Intel Core Ultra 9 285HX (38 - 49.1, n=6) | |
| Dell Pro Max 16 Plus | |
| Lenovo ThinkPad P16 Gen 3 | |
| Lenovo ThinkPad P1 Gen 8 | |
| R Benchmark 2.5 / Overall mean | |
| Lenovo ThinkPad P16 G2 21FA000FGE | |
| Lenovo ThinkPad P1 Gen 8 | |
| Average of class Workstation (0.3825 - 0.603, n=23, last 2 years) | |
| Dell Pro Max 16 Plus | |
| Average Intel Core Ultra 9 285HX (0.4012 - 0.4444, n=6) | |
| Lenovo ThinkPad P16 Gen 3 | |
| Lenovo ThinkPad T16g Gen 3 RTX 5080 | |
| HP ZBook Fury 16 G11 | |
* ... smaller is better
AIDA64: FP32 Ray-Trace | FPU Julia | CPU SHA3 | CPU Queen | FPU SinJulia | FPU Mandel | CPU AES | CPU ZLib | FP64 Ray-Trace | CPU PhotoWorxx
| Performance rating | |
| Average Intel Core Ultra 9 285HX | |
| Lenovo ThinkPad T16g Gen 3 RTX 5080 | |
| Dell Pro Max 16 Plus | |
| Lenovo ThinkPad P16 Gen 3 | |
| Average of class Workstation | |
| HP ZBook Fury 16 G11 | |
| Lenovo ThinkPad P1 Gen 8 | |
| Lenovo ThinkPad P16 G2 21FA000FGE | |
| AIDA64 / FP32 Ray-Trace | |
| Lenovo ThinkPad T16g Gen 3 RTX 5080 (v6.92.6600) | |
| Average Intel Core Ultra 9 285HX (29076 - 42341, n=6) | |
| Dell Pro Max 16 Plus (v6.92.6600) | |
| Lenovo ThinkPad P16 Gen 3 (v6.92.6600) | |
| Average of class Workstation (16730 - 61611, n=23, last 2 years) | |
| Lenovo ThinkPad P1 Gen 8 (v6.92.6600) | |
| HP ZBook Fury 16 G11 (v6.92.6600) | |
| Lenovo ThinkPad P16 G2 21FA000FGE (v6.75.6100) | |
| AIDA64 / FPU Julia | |
| Average Intel Core Ultra 9 285HX (161276 - 210885, n=6) | |
| Lenovo ThinkPad T16g Gen 3 RTX 5080 (v6.92.6600) | |
| Lenovo ThinkPad P16 Gen 3 (v6.92.6600) | |
| Dell Pro Max 16 Plus (v6.92.6600) | |
| Average of class Workstation (89597 - 186971, n=23, last 2 years) | |
| Lenovo ThinkPad P1 Gen 8 (v6.92.6600) | |
| HP ZBook Fury 16 G11 (v6.92.6600) | |
| Lenovo ThinkPad P16 G2 21FA000FGE (v6.75.6100) | |
| AIDA64 / CPU SHA3 | |
| Lenovo ThinkPad T16g Gen 3 RTX 5080 (v6.92.6600) | |
| Average Intel Core Ultra 9 285HX (7757 - 9815, n=6) | |
| Lenovo ThinkPad P16 Gen 3 (v6.92.6600) | |
| Dell Pro Max 16 Plus (v6.92.6600) | |
| Average of class Workstation (4178 - 8975, n=23, last 2 years) | |
| Lenovo ThinkPad P1 Gen 8 (v6.92.6600) | |
| HP ZBook Fury 16 G11 (v6.92.6600) | |
| Lenovo ThinkPad P16 G2 21FA000FGE (v6.75.6100) | |
| AIDA64 / CPU Queen | |
| Lenovo ThinkPad T16g Gen 3 RTX 5080 (v6.92.6600) | |
| HP ZBook Fury 16 G11 (v6.92.6600) | |
| Lenovo ThinkPad P16 Gen 3 (v6.92.6600) | |
| Average Intel Core Ultra 9 285HX (134345 - 141681, n=6) | |
| Dell Pro Max 16 Plus (v6.92.6600) | |
| Lenovo ThinkPad P16 G2 21FA000FGE (v6.75.6100) | |
| Average of class Workstation (60778 - 144411, n=23, last 2 years) | |
| Lenovo ThinkPad P1 Gen 8 (v6.92.6600) | |
| AIDA64 / FPU SinJulia | |
| Average of class Workstation (8165 - 29343, n=23, last 2 years) | |
| Lenovo ThinkPad T16g Gen 3 RTX 5080 (v6.92.6600) | |
| HP ZBook Fury 16 G11 (v6.92.6600) | |
| Average Intel Core Ultra 9 285HX (12559 - 14431, n=6) | |
| Dell Pro Max 16 Plus (v6.92.6600) | |
| Lenovo ThinkPad P16 Gen 3 (v6.92.6600) | |
| Lenovo ThinkPad P16 G2 21FA000FGE (v6.75.6100) | |
| Lenovo ThinkPad P1 Gen 8 (v6.92.6600) | |
| AIDA64 / FPU Mandel | |
| Lenovo ThinkPad T16g Gen 3 RTX 5080 (v6.92.6600) | |
| Average Intel Core Ultra 9 285HX (84053 - 108922, n=6) | |
| Lenovo ThinkPad P16 Gen 3 (v6.92.6600) | |
| Dell Pro Max 16 Plus (v6.92.6600) | |
| Average of class Workstation (44497 - 98153, n=23, last 2 years) | |
| Lenovo ThinkPad P1 Gen 8 (v6.92.6600) | |
| HP ZBook Fury 16 G11 (v6.92.6600) | |
| Lenovo ThinkPad P16 G2 21FA000FGE (v6.75.6100) | |
| AIDA64 / CPU AES | |
| Lenovo ThinkPad T16g Gen 3 RTX 5080 (v6.92.6600) | |
| Average Intel Core Ultra 9 285HX (119553 - 134195, n=6) | |
| Lenovo ThinkPad P16 Gen 3 (v6.92.6600) | |
| Dell Pro Max 16 Plus (v6.92.6600) | |
| Average of class Workstation (73133 - 187841, n=23, last 2 years) | |
| HP ZBook Fury 16 G11 (v6.92.6600) | |
| Lenovo ThinkPad P16 G2 21FA000FGE (v6.75.6100) | |
| Lenovo ThinkPad P1 Gen 8 (v6.92.6600) | |
| AIDA64 / CPU ZLib | |
| Lenovo ThinkPad T16g Gen 3 RTX 5080 (v6.92.6600) | |
| Average Intel Core Ultra 9 285HX (1886 - 2267, n=6) | |
| Lenovo ThinkPad P16 Gen 3 (v6.92.6600) | |
| Dell Pro Max 16 Plus (v6.92.6600) | |
| Average of class Workstation (929 - 2148, n=23, last 2 years) | |
| HP ZBook Fury 16 G11 (v6.92.6600) | |
| Lenovo ThinkPad P1 Gen 8 (v6.92.6600) | |
| Lenovo ThinkPad P16 G2 21FA000FGE (v6.75.6100) | |
| AIDA64 / FP64 Ray-Trace | |
| Lenovo ThinkPad T16g Gen 3 RTX 5080 (v6.92.6600) | |
| Average Intel Core Ultra 9 285HX (15059 - 22312, n=6) | |
| Dell Pro Max 16 Plus (v6.92.6600) | |
| Average of class Workstation (8545 - 32891, n=23, last 2 years) | |
| Lenovo ThinkPad P16 Gen 3 (v6.92.6600) | |
| Lenovo ThinkPad P1 Gen 8 (v6.92.6600) | |
| HP ZBook Fury 16 G11 (v6.92.6600) | |
| Lenovo ThinkPad P16 G2 21FA000FGE (v6.75.6100) | |
| AIDA64 / CPU PhotoWorxx | |
| Dell Pro Max 16 Plus (v6.92.6600) | |
| Lenovo ThinkPad P1 Gen 8 (v6.92.6600) | |
| Average of class Workstation (37151 - 93684, n=23, last 2 years) | |
| Average Intel Core Ultra 9 285HX (39232 - 62611, n=6) | |
| Lenovo ThinkPad T16g Gen 3 RTX 5080 (v6.92.6600) | |
| Lenovo ThinkPad P16 Gen 3 (v6.92.6600) | |
| HP ZBook Fury 16 G11 (v6.92.6600) | |
| Lenovo ThinkPad P16 G2 21FA000FGE (v6.75.6100) | |
系统性能
PCMark 10: Score | Essentials | Productivity | Digital Content Creation
CrossMark: Overall | Productivity | Creativity | Responsiveness
WebXPRT 3: Overall
WebXPRT 4: Overall
Mozilla Kraken 1.1: Total
| Performance rating | |
| Lenovo ThinkPad T16g Gen 3 RTX 5080 | |
| Lenovo ThinkPad P16 Gen 3 | |
| Average Intel Core Ultra 9 285HX, NVIDIA RTX PRO 3000 Blackwell Generation Laptop | |
| Dell Pro Max 16 Plus -4! | |
| Lenovo ThinkPad P1 Gen 8 | |
| HP ZBook Fury 16 G11 | |
| Average of class Workstation | |
| Lenovo ThinkPad P16 G2 21FA000FGE -1! | |
| PCMark 10 / Score | |
| Lenovo ThinkPad T16g Gen 3 RTX 5080 | |
| Lenovo ThinkPad P16 Gen 3 | |
| Average Intel Core Ultra 9 285HX, NVIDIA RTX PRO 3000 Blackwell Generation Laptop (n=1) | |
| Lenovo ThinkPad P1 Gen 8 | |
| Average of class Workstation (6563 - 10409, n=19, last 2 years) | |
| HP ZBook Fury 16 G11 | |
| Lenovo ThinkPad P16 G2 21FA000FGE | |
| PCMark 10 / Essentials | |
| Lenovo ThinkPad P16 G2 21FA000FGE | |
| Lenovo ThinkPad P1 Gen 8 | |
| Average of class Workstation (9622 - 11157, n=19, last 2 years) | |
| Lenovo ThinkPad P16 Gen 3 | |
| Average Intel Core Ultra 9 285HX, NVIDIA RTX PRO 3000 Blackwell Generation Laptop (n=1) | |
| Lenovo ThinkPad T16g Gen 3 RTX 5080 | |
| HP ZBook Fury 16 G11 | |
| PCMark 10 / Productivity | |
| Lenovo ThinkPad T16g Gen 3 RTX 5080 | |
| Lenovo ThinkPad P16 Gen 3 | |
| Average Intel Core Ultra 9 285HX, NVIDIA RTX PRO 3000 Blackwell Generation Laptop (n=1) | |
| Lenovo ThinkPad P1 Gen 8 | |
| Average of class Workstation (8789 - 20616, n=19, last 2 years) | |
| HP ZBook Fury 16 G11 | |
| Lenovo ThinkPad P16 G2 21FA000FGE | |
| PCMark 10 / Digital Content Creation | |
| Lenovo ThinkPad T16g Gen 3 RTX 5080 | |
| Lenovo ThinkPad P16 Gen 3 | |
| Average Intel Core Ultra 9 285HX, NVIDIA RTX PRO 3000 Blackwell Generation Laptop (n=1) | |
| HP ZBook Fury 16 G11 | |
| Average of class Workstation (8108 - 15631, n=19, last 2 years) | |
| Lenovo ThinkPad P1 Gen 8 | |
| Lenovo ThinkPad P16 G2 21FA000FGE | |
| CrossMark / Overall | |
| Lenovo ThinkPad T16g Gen 3 RTX 5080 | |
| Dell Pro Max 16 Plus | |
| Lenovo ThinkPad P16 Gen 3 | |
| Average Intel Core Ultra 9 285HX, NVIDIA RTX PRO 3000 Blackwell Generation Laptop (n=1) | |
| HP ZBook Fury 16 G11 | |
| Lenovo ThinkPad P1 Gen 8 | |
| Average of class Workstation (1307 - 2267, n=22, last 2 years) | |
| Lenovo ThinkPad P16 G2 21FA000FGE | |
| CrossMark / Productivity | |
| Lenovo ThinkPad T16g Gen 3 RTX 5080 | |
| Lenovo ThinkPad P16 Gen 3 | |
| Average Intel Core Ultra 9 285HX, NVIDIA RTX PRO 3000 Blackwell Generation Laptop (n=1) | |
| Dell Pro Max 16 Plus | |
| HP ZBook Fury 16 G11 | |
| Lenovo ThinkPad P1 Gen 8 | |
| Average of class Workstation (1130 - 2122, n=22, last 2 years) | |
| Lenovo ThinkPad P16 G2 21FA000FGE | |
| CrossMark / Creativity | |
| Dell Pro Max 16 Plus | |
| Lenovo ThinkPad T16g Gen 3 RTX 5080 | |
| Lenovo ThinkPad P16 Gen 3 | |
| Average Intel Core Ultra 9 285HX, NVIDIA RTX PRO 3000 Blackwell Generation Laptop (n=1) | |
| HP ZBook Fury 16 G11 | |
| Average of class Workstation (1657 - 2725, n=22, last 2 years) | |
| Lenovo ThinkPad P1 Gen 8 | |
| Lenovo ThinkPad P16 G2 21FA000FGE | |
| CrossMark / Responsiveness | |
| Lenovo ThinkPad T16g Gen 3 RTX 5080 | |
| Lenovo ThinkPad P16 Gen 3 | |
| Average Intel Core Ultra 9 285HX, NVIDIA RTX PRO 3000 Blackwell Generation Laptop (n=1) | |
| Dell Pro Max 16 Plus | |
| HP ZBook Fury 16 G11 | |
| Lenovo ThinkPad P1 Gen 8 | |
| Average of class Workstation (993 - 2096, n=22, last 2 years) | |
| Lenovo ThinkPad P16 G2 21FA000FGE | |
| WebXPRT 3 / Overall | |
| Lenovo ThinkPad T16g Gen 3 RTX 5080 | |
| Lenovo ThinkPad P16 Gen 3 | |
| Average Intel Core Ultra 9 285HX, NVIDIA RTX PRO 3000 Blackwell Generation Laptop (n=1) | |
| Lenovo ThinkPad P1 Gen 8 | |
| Dell Pro Max 16 Plus | |
| Lenovo ThinkPad P16 G2 21FA000FGE | |
| HP ZBook Fury 16 G11 | |
| Average of class Workstation (260 - 360, n=23, last 2 years) | |
| WebXPRT 4 / Overall | |
| Lenovo ThinkPad P16 Gen 3 | |
| Average Intel Core Ultra 9 285HX, NVIDIA RTX PRO 3000 Blackwell Generation Laptop (n=1) | |
| Lenovo ThinkPad T16g Gen 3 RTX 5080 | |
| Dell Pro Max 16 Plus | |
| HP ZBook Fury 16 G11 | |
| Lenovo ThinkPad P1 Gen 8 | |
| Average of class Workstation (189.2 - 326, n=23, last 2 years) | |
| Mozilla Kraken 1.1 / Total | |
| Lenovo ThinkPad P16 G2 21FA000FGE | |
| Lenovo ThinkPad P1 Gen 8 | |
| Average of class Workstation (411 - 538, n=23, last 2 years) | |
| HP ZBook Fury 16 G11 | |
| Dell Pro Max 16 Plus | |
| Lenovo ThinkPad T16g Gen 3 RTX 5080 | |
| Lenovo ThinkPad P16 Gen 3 | |
| Average Intel Core Ultra 9 285HX, NVIDIA RTX PRO 3000 Blackwell Generation Laptop (n=1) | |
* ... smaller is better
| PCMark 10 Score | 10149 points | |
Help | ||
| AIDA64 / Memory Copy | |
| Lenovo ThinkPad P1 Gen 8 | |
| Dell Pro Max 16 Plus | |
| Average of class Workstation (56003 - 164795, n=23, last 2 years) | |
| Average Intel Core Ultra 9 285HX (63431 - 93933, n=6) | |
| Lenovo ThinkPad T16g Gen 3 RTX 5080 | |
| Lenovo ThinkPad P16 Gen 3 | |
| HP ZBook Fury 16 G11 | |
| Lenovo ThinkPad P16 G2 21FA000FGE | |
| AIDA64 / Memory Read | |
| Dell Pro Max 16 Plus | |
| Average Intel Core Ultra 9 285HX (67084 - 97565, n=6) | |
| Average of class Workstation (55795 - 121563, n=23, last 2 years) | |
| Lenovo ThinkPad P1 Gen 8 | |
| Lenovo ThinkPad P16 Gen 3 | |
| Lenovo ThinkPad T16g Gen 3 RTX 5080 | |
| HP ZBook Fury 16 G11 | |
| Lenovo ThinkPad P16 G2 21FA000FGE | |
| AIDA64 / Memory Write | |
| Dell Pro Max 16 Plus | |
| Average of class Workstation (55663 - 214520, n=23, last 2 years) | |
| Average Intel Core Ultra 9 285HX (64112 - 89691, n=6) | |
| Lenovo ThinkPad P16 Gen 3 | |
| Lenovo ThinkPad T16g Gen 3 RTX 5080 | |
| Lenovo ThinkPad P1 Gen 8 | |
| Lenovo ThinkPad P16 G2 21FA000FGE | |
| HP ZBook Fury 16 G11 | |
| AIDA64 / Memory Latency | |
| Lenovo ThinkPad P16 Gen 3 | |
| Lenovo ThinkPad T16g Gen 3 RTX 5080 | |
| Lenovo ThinkPad P1 Gen 8 | |
| Average Intel Core Ultra 9 285HX (104.8 - 151.7, n=6) | |
| Average of class Workstation (84.5 - 165.2, n=23, last 2 years) | |
| Dell Pro Max 16 Plus | |
| Lenovo ThinkPad P16 G2 21FA000FGE | |
| HP ZBook Fury 16 G11 | |
* ... smaller is better
DPC 延迟
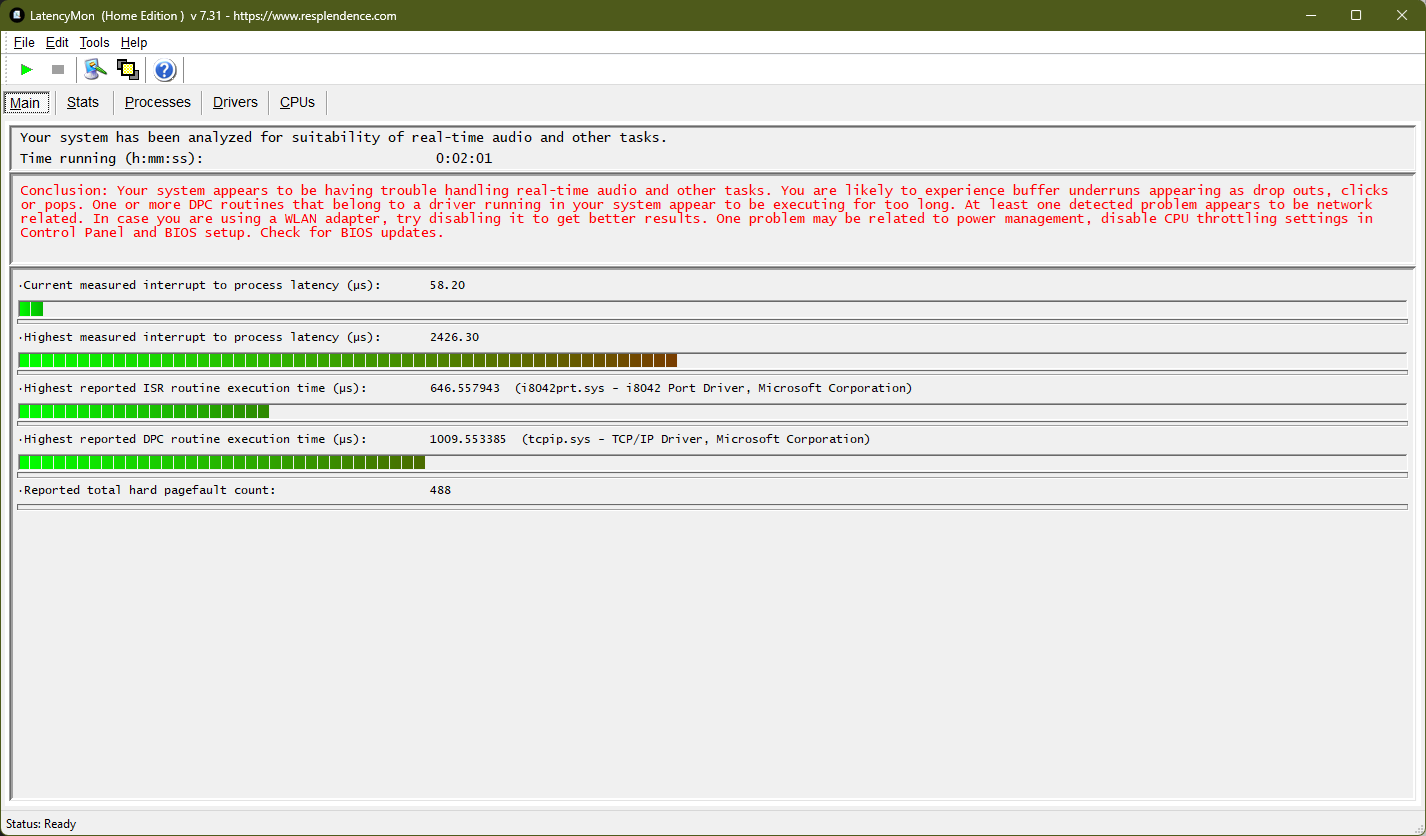
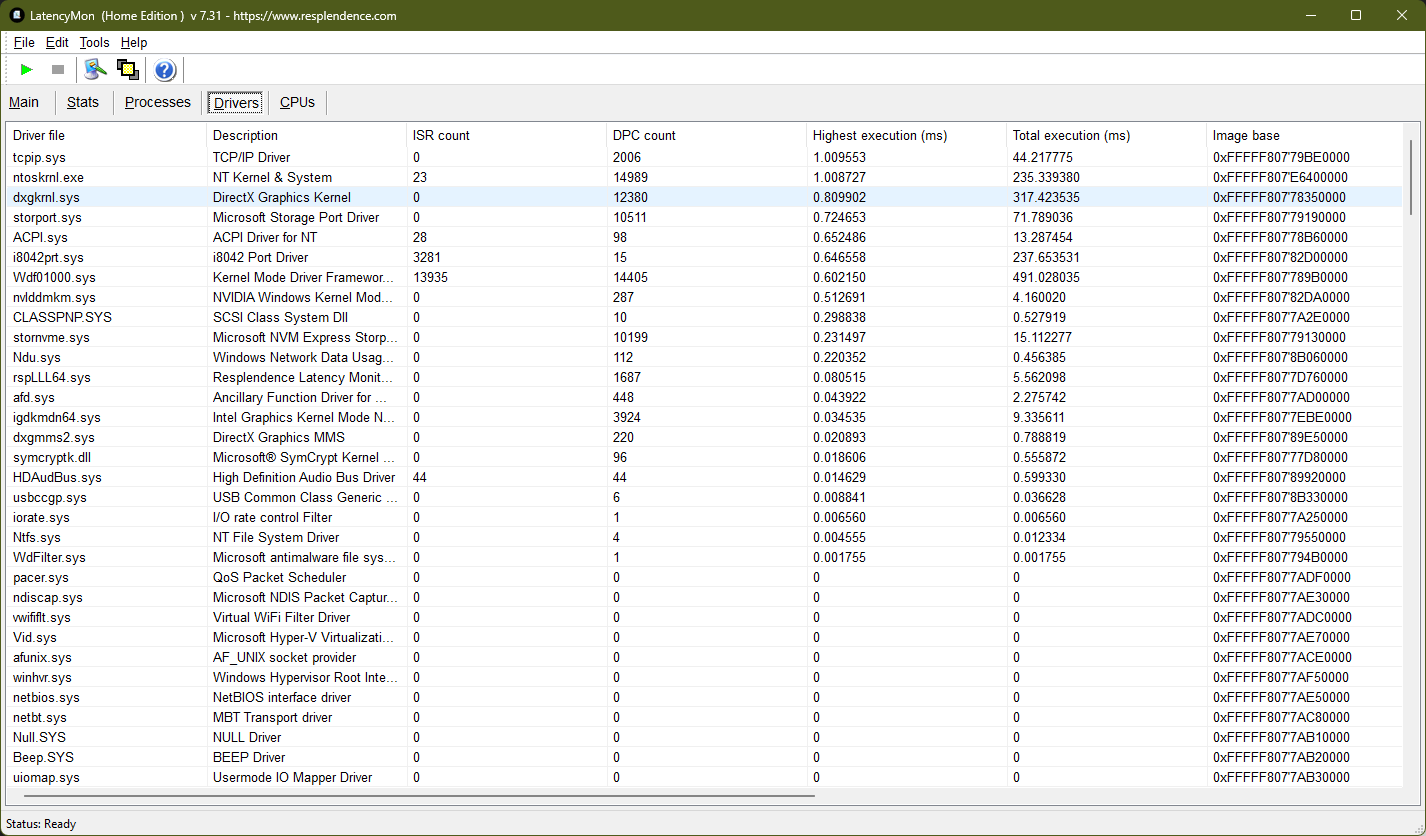
| DPC Latencies / LatencyMon - interrupt to process latency (max), Web, Youtube, Prime95 | |
| HP ZBook Fury 16 G11 | |
| Lenovo ThinkPad P1 Gen 8 | |
| Dell Pro Max 16 Plus | |
| Lenovo ThinkPad P16 Gen 3 | |
| Lenovo ThinkPad T16g Gen 3 RTX 5080 | |
| Lenovo ThinkPad P16 G2 21FA000FGE | |
* ... smaller is better
存储设备
联想使用的是三星生产的快速 PCIe 5.0 固态硬盘 PM9E1,容量为 2 TB。这款 M.2 2280 固态硬盘在我们的基准测试中表现出色,超过了大多数其他工作站。不过,在负载情况下,性能确实会受到一些影响。
ThinkPad 键盘下方有两个额外的 NVMe 4.0 M.2 2280 托架,可以扩展大量存储空间。

* ... smaller is better
磁盘节流DiskSpd 读取循环,队列深度 8
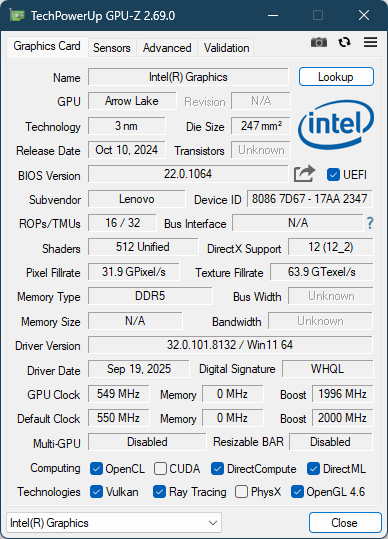
图形处理器性能
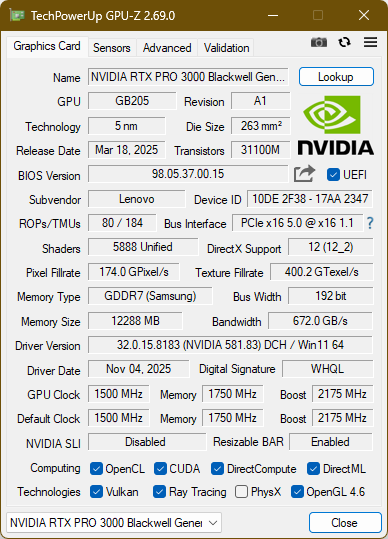
联想使用 Nvidia RTX Pro 3000 Blackwell是 Nvidia 的专业 ISV 认证 GPU。该显卡可与 NvidiaGeForce RTX 5070 Ti 相媲美。在 ThinkPad P16 Gen 3 中,联想将其功耗限制在 105 W,与戴尔 Pro Max 16 Plus 的 175 W TGP RTX 5000 Pro 相差甚远。 戴尔 Pro Max 16 Plus.因此,性能受到影响,在专业(SPECviewperf)和消费者(3DMark)测试中都落后于竞争对手约 24%。
总体而言,当 P16 Gen 3 使用电池供电时,GPU 性能有所下降,3DMark 11 GPU 测试仅为 37978 分,下降了 23%。
| 3DMark 06 Standard Score | 63693 points | |
| 3DMark Vantage P Result | 116321 points | |
| 3DMark 11 Performance | 39176 points | |
| 3DMark Cloud Gate Standard Score | 65135 points | |
| 3DMark Fire Strike Score | 31208 points | |
| 3DMark Time Spy Score | 14579 points | |
Help | ||
* ... smaller is better
游戏性能
| Cyberpunk 2077 - 1920x1080 Ultra Preset (FSR off) | |
| Dell Pro Max 16 Plus | |
| Lenovo ThinkPad T16g Gen 3 RTX 5080 | |
| Lenovo ThinkPad P16 Gen 3 | |
| HP ZBook Fury 16 G11 | |
| Average of class Workstation (21.5 - 152.4, n=23, last 2 years) | |
| Lenovo ThinkPad P1 Gen 8 | |
| Baldur's Gate 3 - 1920x1080 Ultra Preset AA:T | |
| Dell Pro Max 16 Plus | |
| Lenovo ThinkPad T16g Gen 3 RTX 5080 | |
| Lenovo ThinkPad P16 Gen 3 | |
| HP ZBook Fury 16 G11 | |
| Lenovo ThinkPad P1 Gen 8 | |
| Average of class Workstation (23.7 - 205, n=24, last 2 years) | |
| Final Fantasy XV Benchmark - 1920x1080 High Quality | |
| Dell Pro Max 16 Plus | |
| Lenovo ThinkPad T16g Gen 3 RTX 5080 | |
| Lenovo ThinkPad P16 Gen 3 | |
| HP ZBook Fury 16 G11 | |
| Lenovo ThinkPad P1 Gen 8 | |
| Average of class Workstation (26.4 - 197.6, n=23, last 2 years) | |
| Lenovo ThinkPad P16 G2 21FA000FGE | |
赛博朋克 2077》超 FPS 图表
| low | med. | high | ultra | QHD | 4K DLSS | 4K FSR | 4K | |
|---|---|---|---|---|---|---|---|---|
| GTA V (2015) | 183.5 | 182.6 | 176.4 | 131.7 | 116.7 | |||
| Dota 2 Reborn (2015) | 204 | 181.7 | 167.3 | 157 | 128.7 | |||
| Final Fantasy XV Benchmark (2018) | 204 | 164 | 132 | 111 | 63.8 | |||
| X-Plane 11.11 (2018) | 136.1 | 118.7 | 92.1 | 73.5 | ||||
| Strange Brigade (2018) | 524 | 380 | 321 | 290 | 204 | 108.7 | ||
| Baldur's Gate 3 (2023) | 172.4 | 147.8 | 128.9 | 126.8 | 91.9 | 75.8 | 75.4 | 49.4 |
| Cyberpunk 2077 (2023) | 138.7 | 137 | 112.7 | 102.5 | 70.7 | 37.7 | 30.8 | |
| Kingdom Come Deliverance 2 (2025) | 166.7 | 131.2 | 106.4 | 80.2 | 56.3 | 44.8 | 30 | |
| Civilization 7 (2025) | 287 | 183.6 | 163.2 | 116.9 | 88.7 | 62.4 | ||
| Assassin's Creed Shadows (2025) | 79 | 74 | 62 | 47 | 39 | 37 | 26 | |
| The Elder Scrolls IV Oblivion Remastered (2025) | 87.8 | 81.6 | 76.4 | 35.3 | 23.6 | 21.6 | 24.3 | 13.3 |
| Doom: The Dark Ages (2025) | 98.2 | 80.3 | 73.4 | 69.7 | 46.9 | 35.1 | 24.9 | |
| F1 25 (2025) | 189.1 | 176.5 | 165.8 | 33.8 | 20.1 | 17.7 | 9.25 | |
| Borderlands 4 (2025) | 71.5 | 59 | 46.6 | 32.5 | 22 | 64.6 | 11.5 | |
| The Outer Worlds 2 (2025) | 101.1 | 97.1 | 83.4 | 50.3 | 32.6 | 27.2 | 17 | |
| ARC Raiders (2025) | 167.6 | 137 | 121.7 | 84.4 | 57.5 | 55.7 | 31.3 | |
| Anno 117: Pax Romana (2025) | 129 | 103.8 | 78 | 41.5 | 29 | 26 | 15.9 |
排放量
系统噪音
在办公室使用时,ThinkPad 笔记本电脑的双风扇基本上是安静的,但在负载情况下声音会变得相当大,即使在不同的房间也能听到超过 50 分贝(a)的声音。
我们无法检测到 ThinkPad P16 Gen 3 的线圈啸叫。
Noise level
| Idle |
| 23.6 / 27.2 / 27.2 dB(A) |
| Load |
| 42.7 / 53.9 dB(A) |
 | ||
30 dB silent 40 dB(A) audible 50 dB(A) loud |
||
min: | ||
| Lenovo ThinkPad P16 Gen 3 Ultra 9 285HX, RTX PRO 3000 Blackwell Generation Laptop | Lenovo ThinkPad P16 G2 21FA000FGE i7-13700HX, RTX 2000 Ada Generation Laptop | Dell Pro Max 16 Plus Ultra 9 285HX, RTX PRO 5000 Blackwell Generation Laptop | HP ZBook Fury 16 G11 i9-14900HX, RTX 3500 Ada Generation Laptop | Lenovo ThinkPad T16g Gen 3 RTX 5080 Ultra 9 275HX, GeForce RTX 5080 Laptop | Lenovo ThinkPad P1 Gen 8 Ultra 7 255H, RTX PRO 2000 Blackwell Generation Laptop | |
|---|---|---|---|---|---|---|
| Noise | 1% | -6% | 5% | -1% | 14% | |
| off / environment * (dB) | 23.6 | 23.5 -0% | 23.2 2% | 23.2 2% | 24.7 -5% | 23.1 2% |
| Idle Minimum * (dB) | 23.6 | 23.5 -0% | 26.7 -13% | 23.2 2% | 24.7 -5% | 23.1 2% |
| Idle Average * (dB) | 27.2 | 29.2 -7% | 30.5 -12% | 23.2 15% | 28.9 -6% | 23.1 15% |
| Idle Maximum * (dB) | 27.2 | 29.5 -8% | 34 -25% | 29.5 -8% | 28.9 -6% | 23.1 15% |
| Load Average * (dB) | 42.7 | 32.7 23% | 39.8 7% | 43 -1% | 30.4 29% | 27.3 36% |
| Cyberpunk 2077 ultra * (dB) | 53.9 | 54.3 -1% | 48.2 11% | 57.7 -7% | ||
| Load Maximum * (dB) | 53.9 | 56.6 -5% | 54.3 -1% | 48.2 11% | 57.7 -7% | 47.9 11% |
| Witcher 3 ultra * (dB) | 50.6 |
* ... smaller is better
温度
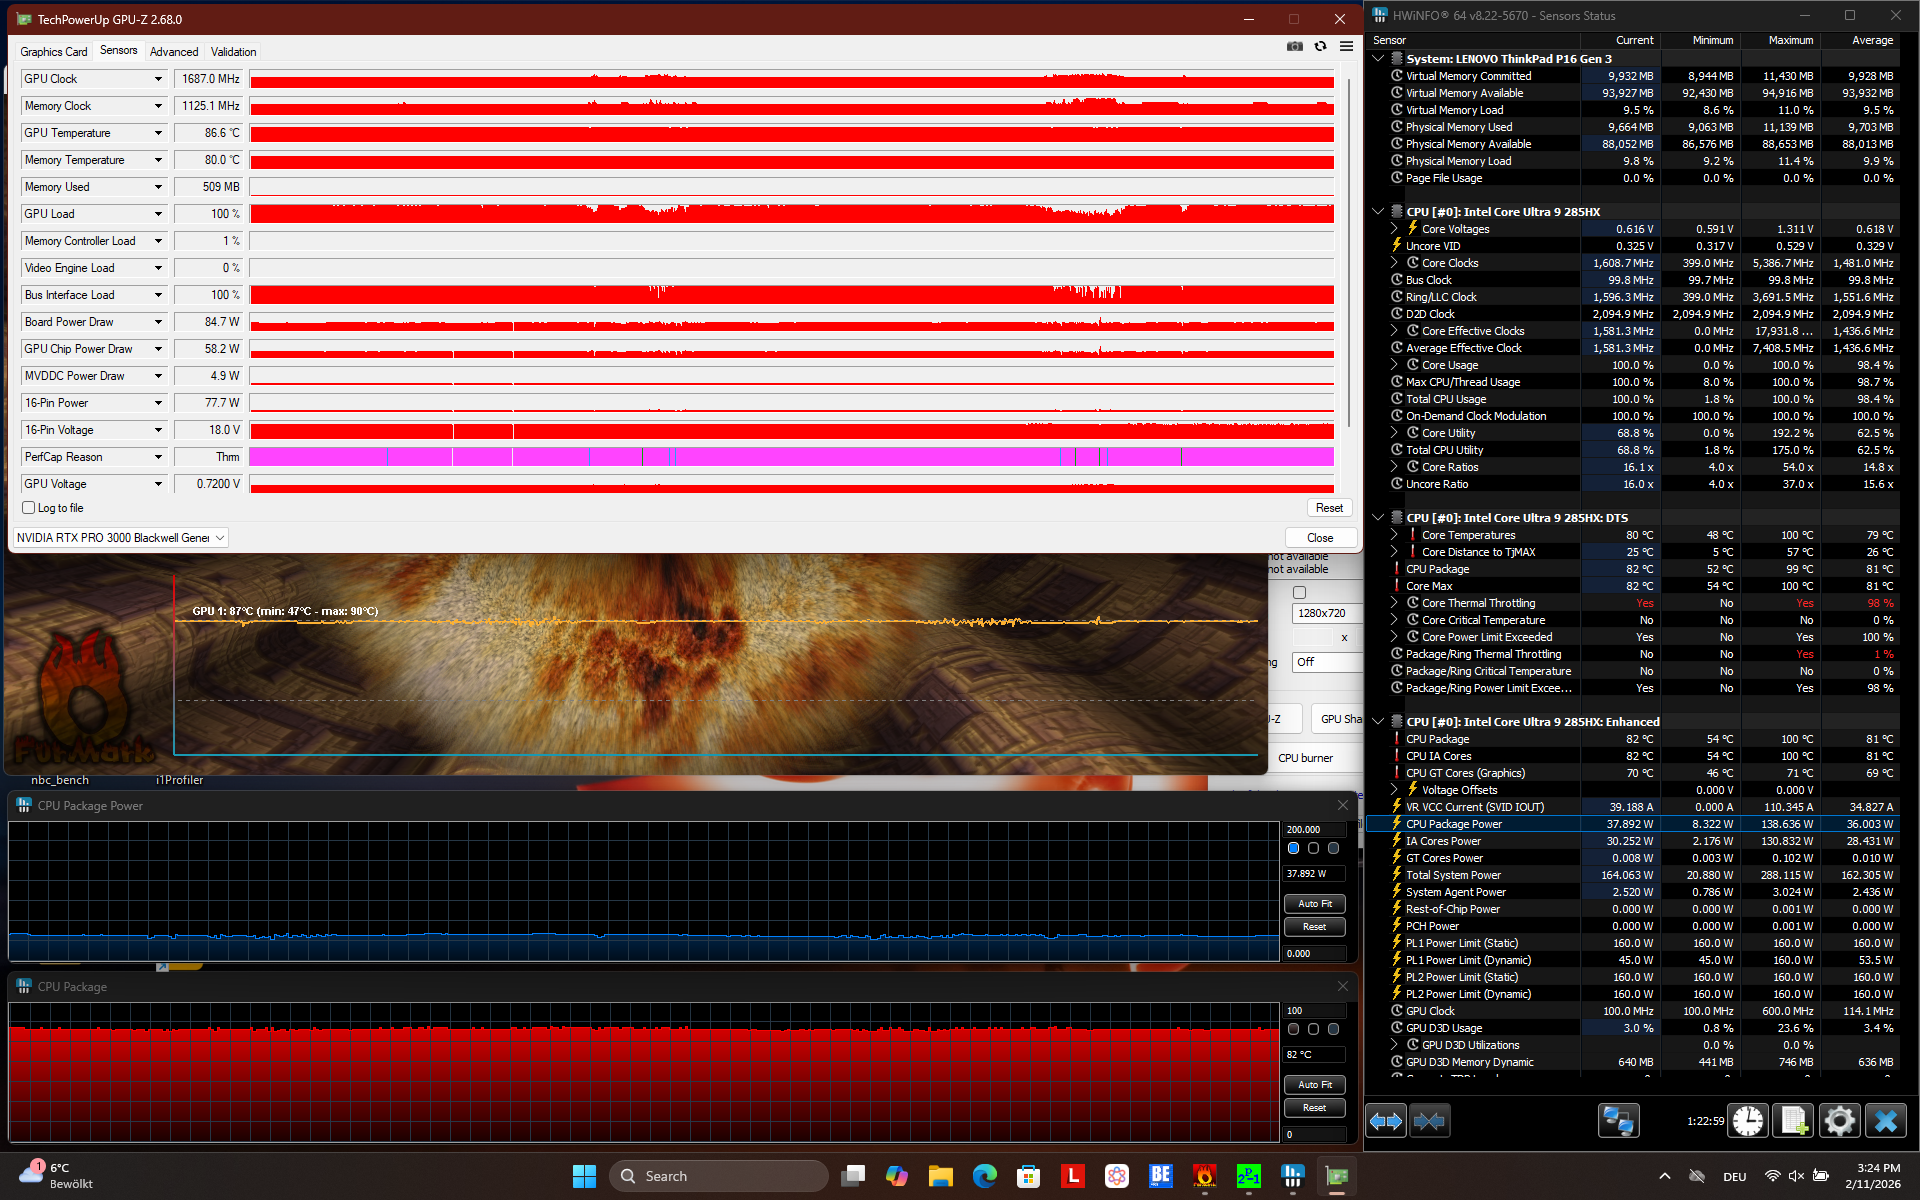
由于 ThinkPad P16 Gen 3 比上一代产品更加小巧,因此运行时温度稍高也就不足为奇了。整体最高温度为 50.8 摄氏度或 123 华氏度,掌托的触感也变得有些温热。
在综合负载下,图形处理器和中央处理器都无法保持最大功耗。CPU 的最大功耗为 37 瓦,GPU 为 85 瓦。
(-) The maximum temperature on the upper side is 50.8 °C / 123 F, compared to the average of 38.2 °C / 101 F, ranging from 22.2 to 69.8 °C for the class Workstation.
(-) The bottom heats up to a maximum of 48 °C / 118 F, compared to the average of 41.1 °C / 106 F
(+) In idle usage, the average temperature for the upper side is 26.9 °C / 80 F, compared to the device average of 32 °C / 90 F.
(±) 3: The average temperature for the upper side is 35 °C / 95 F, compared to the average of 32 °C / 90 F for the class Workstation.
(+) The palmrests and touchpad are reaching skin temperature as a maximum (32.4 °C / 90.3 F) and are therefore not hot.
(-) The average temperature of the palmrest area of similar devices was 27.8 °C / 82 F (-4.6 °C / -8.3 F).
| Lenovo ThinkPad P16 Gen 3 Ultra 9 285HX, RTX PRO 3000 Blackwell Generation Laptop | Lenovo ThinkPad P16 G2 21FA000FGE i7-13700HX, RTX 2000 Ada Generation Laptop | Dell Pro Max 16 Plus Ultra 9 285HX, RTX PRO 5000 Blackwell Generation Laptop | HP ZBook Fury 16 G11 i9-14900HX, RTX 3500 Ada Generation Laptop | Lenovo ThinkPad T16g Gen 3 RTX 5080 Ultra 9 275HX, GeForce RTX 5080 Laptop | Lenovo ThinkPad P1 Gen 8 Ultra 7 255H, RTX PRO 2000 Blackwell Generation Laptop | |
|---|---|---|---|---|---|---|
| Heat | 10% | -1% | -10% | 6% | 6% | |
| Maximum Upper Side * (°C) | 50.8 | 47.2 7% | 40.4 20% | 42.2 17% | 43.9 14% | 45 11% |
| Maximum Bottom * (°C) | 48 | 39.5 18% | 45.6 5% | 48 -0% | 45.4 5% | 33 31% |
| Idle Upper Side * (°C) | 30.1 | 28.1 7% | 32.8 -9% | 37 -23% | 27.7 8% | 30.6 -2% |
| Idle Bottom * (°C) | 27.5 | 25.3 8% | 33 -20% | 36.8 -34% | 28.6 -4% | 31.6 -15% |
* ... smaller is better
发言人
P16 G3 的扬声器位于机身侧面,尽管体积微小,但表现出色,声音响亮,甚至还能发出相同的低音,适合聆听音乐。
Lenovo ThinkPad P16 Gen 3 audio analysis
(+) | speakers can play relatively loud (83.5 dB)
Bass 100 - 315 Hz
(±) | reduced bass - on average 9.9% lower than median
(±) | linearity of bass is average (13% delta to prev. frequency)
Mids 400 - 2000 Hz
(+) | balanced mids - only 4% away from median
(+) | mids are linear (4% delta to prev. frequency)
Highs 2 - 16 kHz
(+) | balanced highs - only 2.2% away from median
(+) | highs are linear (4.8% delta to prev. frequency)
Overall 100 - 16.000 Hz
(+) | overall sound is linear (10% difference to median)
Compared to same class
» 6% of all tested devices in this class were better, 3% similar, 91% worse
» The best had a delta of 7%, average was 17%, worst was 35%
Compared to all devices tested
» 4% of all tested devices were better, 1% similar, 94% worse
» The best had a delta of 4%, average was 23%, worst was 134%
Lenovo ThinkPad P1 Gen 8 audio analysis
(+) | speakers can play relatively loud (87.5 dB)
Bass 100 - 315 Hz
(±) | reduced bass - on average 9.8% lower than median
(±) | linearity of bass is average (11.2% delta to prev. frequency)
Mids 400 - 2000 Hz
(+) | balanced mids - only 2.9% away from median
(+) | mids are linear (2.8% delta to prev. frequency)
Highs 2 - 16 kHz
(+) | balanced highs - only 3% away from median
(+) | highs are linear (4.7% delta to prev. frequency)
Overall 100 - 16.000 Hz
(+) | overall sound is linear (8.3% difference to median)
Compared to same class
» 1% of all tested devices in this class were better, 1% similar, 97% worse
» The best had a delta of 7%, average was 17%, worst was 35%
Compared to all devices tested
» 2% of all tested devices were better, 1% similar, 97% worse
» The best had a delta of 4%, average was 23%, worst was 134%
能源管理
耗电量
与之前的 ThinkPad P16 相比,功耗更低。负载情况下的功耗超过 180 W,表明即使连接充电器,设备也可能耗尽电池。
| Off / Standby | |
| Idle | |
| Load |
|
Key:
min: | |
| Lenovo ThinkPad P16 Gen 3 Ultra 9 285HX, RTX PRO 3000 Blackwell Generation Laptop, Samsung PM9E1 MZVLC2T0HBLD, IPS LED, 1920x1200, 16" | Lenovo ThinkPad P16 G2 21FA000FGE i7-13700HX, RTX 2000 Ada Generation Laptop, SK hynix PC801 HFS001TEJ9X162N, IPS LED, 2560x1600, 16" | Dell Pro Max 16 Plus Ultra 9 285HX, RTX PRO 5000 Blackwell Generation Laptop, SK hynix PCB01 HFS001TFM9X186N, OLED, 3840x2400, 16" | HP ZBook Fury 16 G11 i9-14900HX, RTX 3500 Ada Generation Laptop, SK hynix PC801 HFS001TEJ9X101N, IPS, 3840x2400, 16" | Lenovo ThinkPad T16g Gen 3 RTX 5080 Ultra 9 275HX, GeForce RTX 5080 Laptop, Samsung PM9E1 MZVLC2T0HBLD, OLED, 3200x2000, 16" | Lenovo ThinkPad P1 Gen 8 Ultra 7 255H, RTX PRO 2000 Blackwell Generation Laptop, Samsung PM9E1 1 TB MZVLC1T0HFLU, Tandem OLED, 3200x2000, 16" | Average NVIDIA RTX PRO 3000 Blackwell Generation Laptop | Average of class Workstation | |
|---|---|---|---|---|---|---|---|---|
| Power Consumption | -7% | -135% | -15% | -12% | -10% | 0% | -3% | |
| Idle Minimum * (Watt) | 7.8 | 9.3 -19% | 35.1 -350% | 8.6 -10% | 9.9 -27% | 15.4 -97% | 7.8 ? -0% | 9.11 ? -17% |
| Idle Average * (Watt) | 12.6 | 14.1 -12% | 39.2 -211% | 14.8 -17% | 17.1 -36% | 16.5 -31% | 12.6 ? -0% | 13.8 ? -10% |
| Idle Maximum * (Watt) | 16.5 | 15.5 6% | 56 -239% | 15.7 5% | 17.7 -7% | 23.1 -40% | 16.5 ? -0% | 17.9 ? -8% |
| Load Average * (Watt) | 118.7 | 133.6 -13% | 130.2 -10% | 129.4 -9% | 125.6 -6% | 86.6 27% | 118.7 ? -0% | 96 ? 19% |
| Cyberpunk 2077 ultra external monitor * (Watt) | 161.3 | 213 -32% | 192.6 -19% | 166.8 -3% | 121.8 24% | |||
| Cyberpunk 2077 ultra * (Watt) | 159.6 | 229 -43% | 199.4 -25% | 160.5 -1% | 123.1 23% | |||
| Load Maximum * (Watt) | 181.4 | 179.6 1% | 285.2 -57% | 236.1 -30% | 182.8 -1% | 143.6 21% | 181.4 ? -0% | 180.3 ? 1% |
| Witcher 3 ultra * (Watt) | 144.9 |
* ... smaller is better
功耗 赛博朋克/压力测试
外部显示器功耗
电池寿命
ThinkPad P16 Gen 3 配备 99 Wh 大容量电池和节能 WUXGA 屏幕,在我们的电池测试中表现出色: 11.在 Wi-Fi 上网测试(150 cd/m²)中的 6 小时表现优于所有其他参与比较的工作站。
| Lenovo ThinkPad P16 Gen 3 Ultra 9 285HX, RTX PRO 3000 Blackwell Generation Laptop, 99 Wh | Lenovo ThinkPad P16 G2 21FA000FGE i7-13700HX, RTX 2000 Ada Generation Laptop, 94 Wh | Dell Pro Max 16 Plus Ultra 9 285HX, RTX PRO 5000 Blackwell Generation Laptop, 96 Wh | HP ZBook Fury 16 G11 i9-14900HX, RTX 3500 Ada Generation Laptop, 95 Wh | Lenovo ThinkPad T16g Gen 3 RTX 5080 Ultra 9 275HX, GeForce RTX 5080 Laptop, 99.9 Wh | Lenovo ThinkPad P1 Gen 8 Ultra 7 255H, RTX PRO 2000 Blackwell Generation Laptop, 90 Wh | Average of class Workstation | |
|---|---|---|---|---|---|---|---|
| Battery runtime | -26% | -69% | -42% | -19% | -53% | -23% | |
| WiFi v1.3 (h) | 11.6 | 8.6 -26% | 3.6 -69% | 6.7 -42% | 9.4 -19% | 5.5 -53% | 8.55 ? -26% |
| Load (h) | 1.8 | 1.441 ? -20% |
笔记本检查评级
ThinkPad P16 Gen 3 是一款功能强大、可高度扩展的移动工作站,具有出色的制造质量、输入设备、端口选项和明亮的雾面屏幕,以及良好的电池续航能力。奇怪的是,性能是最大的缺点,因为它还可以做得更好。
Lenovo ThinkPad P16 Gen 3
- 04/22/2026 v8
Benjamin Herzig
 Total Sustainability Score:
 潜在竞争对手比较
Image | Model / Review | Price | Weight | Height | Display |
|---|---|---|---|---|---|
1. 89%  | Lenovo ThinkPad P16 Gen 3 Intel Core Ultra 9 285HX ⎘ NVIDIA RTX PRO 3000 Blackwell Generation Laptop ⎘ 96 GB Memory, 2048 GB SSD | Amazon: List Price: 4000 Euro | 2.7 kg | 30 mm | 16.00" 1920x1200 142 PPI IPS LED |
2. 90.2% v7 (old)  | Lenovo ThinkPad P16 G2 21FA000FGE Intel Core i7-13700HX ⎘ NVIDIA RTX 2000 Ada Generation Laptop ⎘ 32 GB Memory, 1024 GB SSD | Amazon: List Price: 2750 Euro | 3 kg | 30.23 mm | 16.00" 2560x1600 189 PPI IPS LED |
3. 88.4%  | Dell Pro Max 16 Plus Intel Core Ultra 9 285HX ⎘ NVIDIA RTX PRO 5000 Blackwell Generation Laptop ⎘ 128 GB Memory, SSD | Amazon: List Price: 5000 USD | 2.8 kg | 30.9 mm | 16.00" 3840x2400 283 PPI OLED |
4. 85.9%  | HP ZBook Fury 16 G11 Intel Core i9-14900HX ⎘ NVIDIA RTX 3500 Ada Generation Laptop ⎘ 64 GB Memory, 1024 GB SSD | Amazon: List Price: 3300 USD | 2.6 kg | 28.5 mm | 16.00" 3840x2400 283 PPI IPS |
5. 87.3%  | Lenovo ThinkPad T16g Gen 3 RTX 5080 Intel Core Ultra 9 275HX ⎘ NVIDIA GeForce RTX 5080 Laptop ⎘ 64 GB Memory, 2048 GB SSD | Amazon: 1. $3,599.99 Lenovo ThinkPad P16 Gen 3 La... 2. $2,200.00 Lenovo ThinkPad P16s Gen 3 2... 3. $1,399.99 Lenovo ThinkPad E16 Gen 3 Bu... List Price: 4800€ | 2.6 kg | 29.8 mm | 16.00" 3200x2000 236 PPI OLED |
6. 91.6%  | Lenovo ThinkPad P1 Gen 8 Intel Core Ultra 7 255H ⎘ NVIDIA RTX PRO 2000 Blackwell Generation Laptop ⎘ 32 GB Memory, 1024 GB SSD | Amazon: List Price: 2000 USD | 1.9 kg | 20.6 mm | 16.00" 3200x2000 236 PPI Tandem OLED |
Transparency
The selection of devices to be reviewed is made by our editorial team. The test sample was provided to the author as a loan by the manufacturer or retailer for the purpose of this review. The lender had no influence on this review, nor did the manufacturer receive a copy of this review before publication. There was no obligation to publish this review. As an independent media company, Notebookcheck is not subjected to the authority of manufacturers, retailers or publishers.
This is how Notebookcheck is testing
Every year, Notebookcheck independently reviews hundreds of laptops and smartphones using standardized procedures to ensure that all results are comparable. We have continuously developed our test methods for around 20 years and set industry standards in the process. In our test labs, high-quality measuring equipment is utilized by experienced technicians and editors. These tests involve a multi-stage validation process. Our complex rating system is based on hundreds of well-founded measurements and benchmarks, which maintains objectivity. Further information on our test methods can be found here.

