Notebookcheck Logo

测试中的Eldon Ring。笔记本和台式机基准测试

一款伟大游戏的PC移植版存在问题。 尽管《艾尔登环》在主机上可能很成功,但这个巨大的开放世界角色扮演游戏在PC上似乎一直被忽视,直到最近。尽管存在缺陷,我们还是在不同的分辨率和质量水平上进行了基准测试。
Gaming Laptop / Notebook Desktop Gamecheck
艾尔登戒指

技术

毫无疑问,《Elden Ring》是有史以来最好的角色扮演游戏之一,尽管它有一些小缺陷。然而,From Software在PC版发布时并没有给自己带来任何好处--这也是该开发商的典型做法。与其他灵魂游戏类似,第一批补丁(本文基于3月中旬的1.0.3版本)仍有几个问题,首先是在使用鼠标和键盘时只显示控制台按钮,这可能导致很多混乱的情况。

总的来说,控制(尤其是菜单,在可用性方面更好一些)是为使用游戏手柄而设计的,但这并不意味着你不能用鼠标和键盘来玩《Elden Ring》(例如,作者用它成功完成了《黑暗之魂3》)。

艾尔登戒指
艾尔登戒指
艾尔登戒指
艾尔登戒指

除了不太周全的控制方式,不幸的是,《Elden Ring》目前还有许多其他技术问题和缺陷。例如,PC玩家不仅面临着每秒60帧的固定FPS限制(目前只能通过MOD禁用),而且--无论使用的硬件和选择的设置如何--有时会出现或多或少的强烈抖动,这对游戏的玩法会产生非常不利的影响。

此外,偶尔会出现崩溃和图形错误(如隐藏的马)。埃尔登环的开始和结束在某些地方也需要很长的时间。此外,图片模式或分辨率的变化往往不能正确应用,所以你必须来回切换几次。

艾尔登戒指
艾尔登戒指
艾尔登戒指
艾尔登戒指

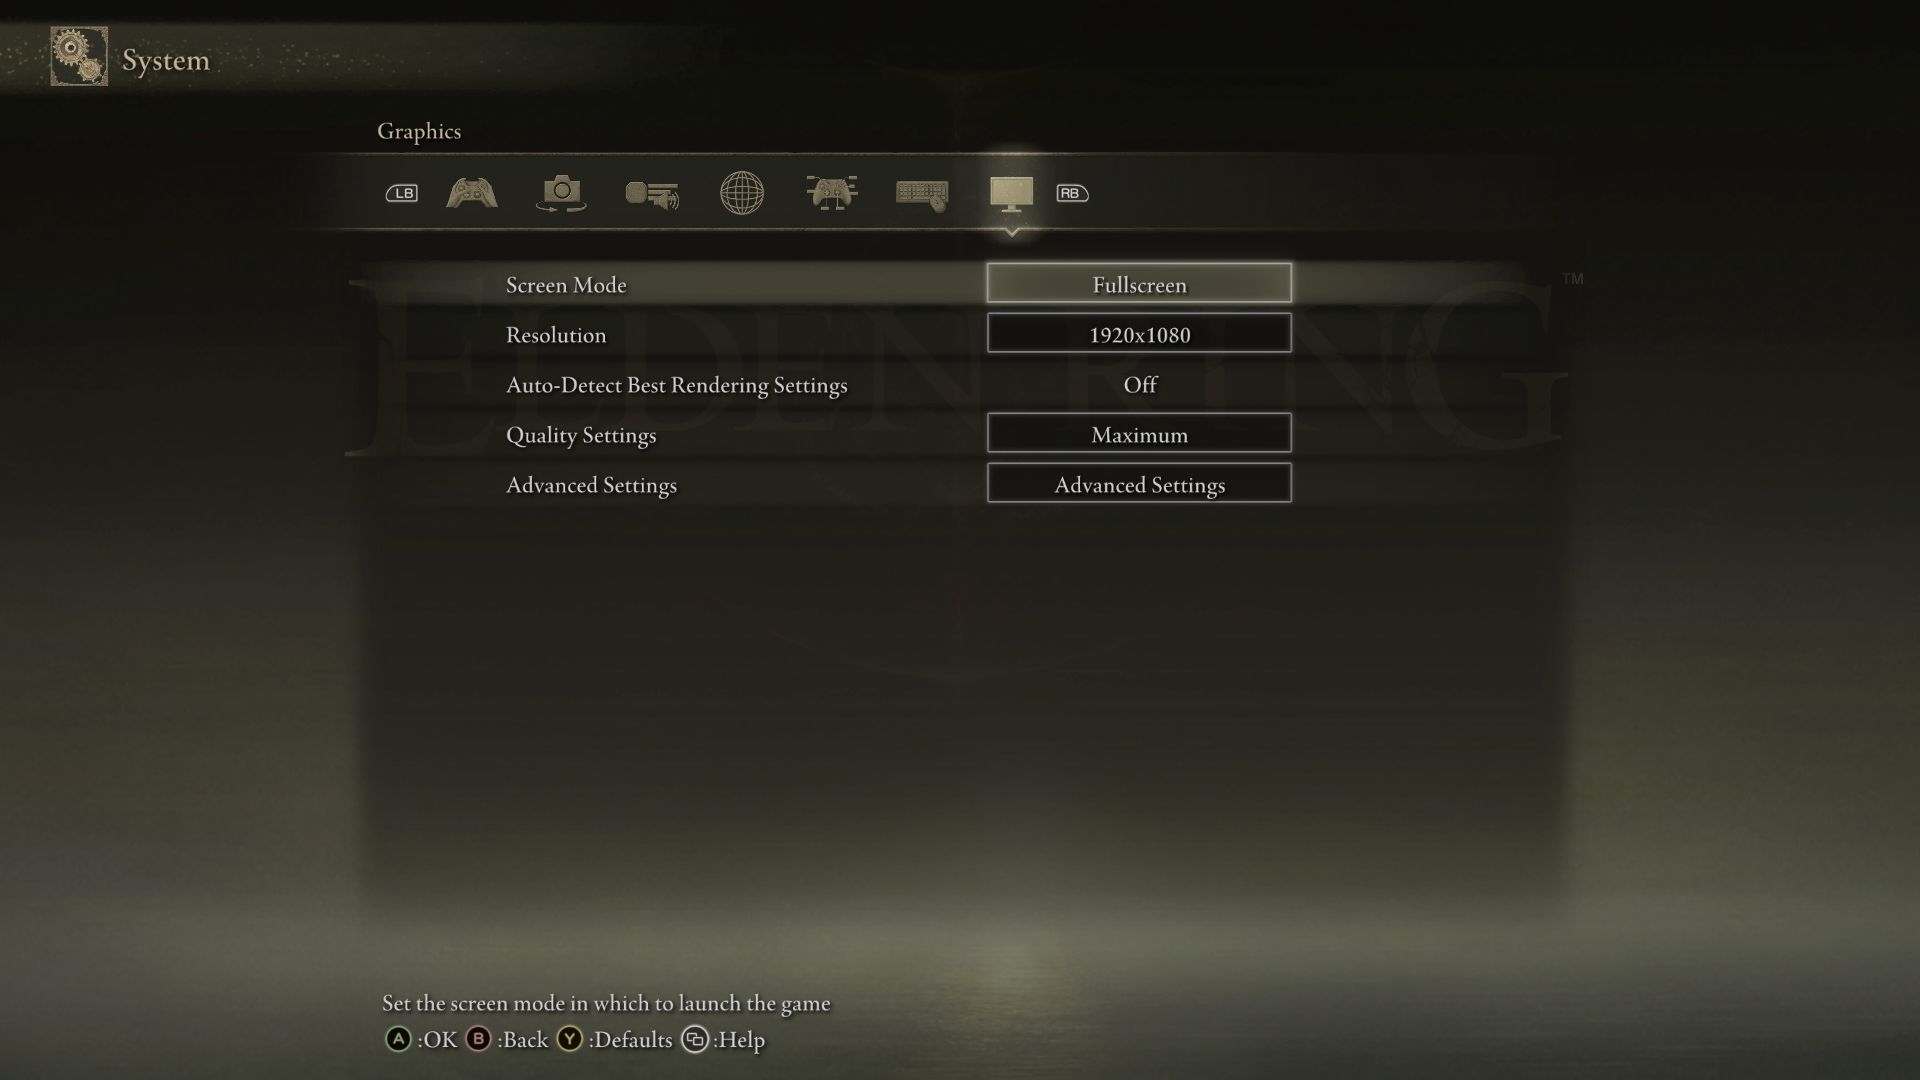
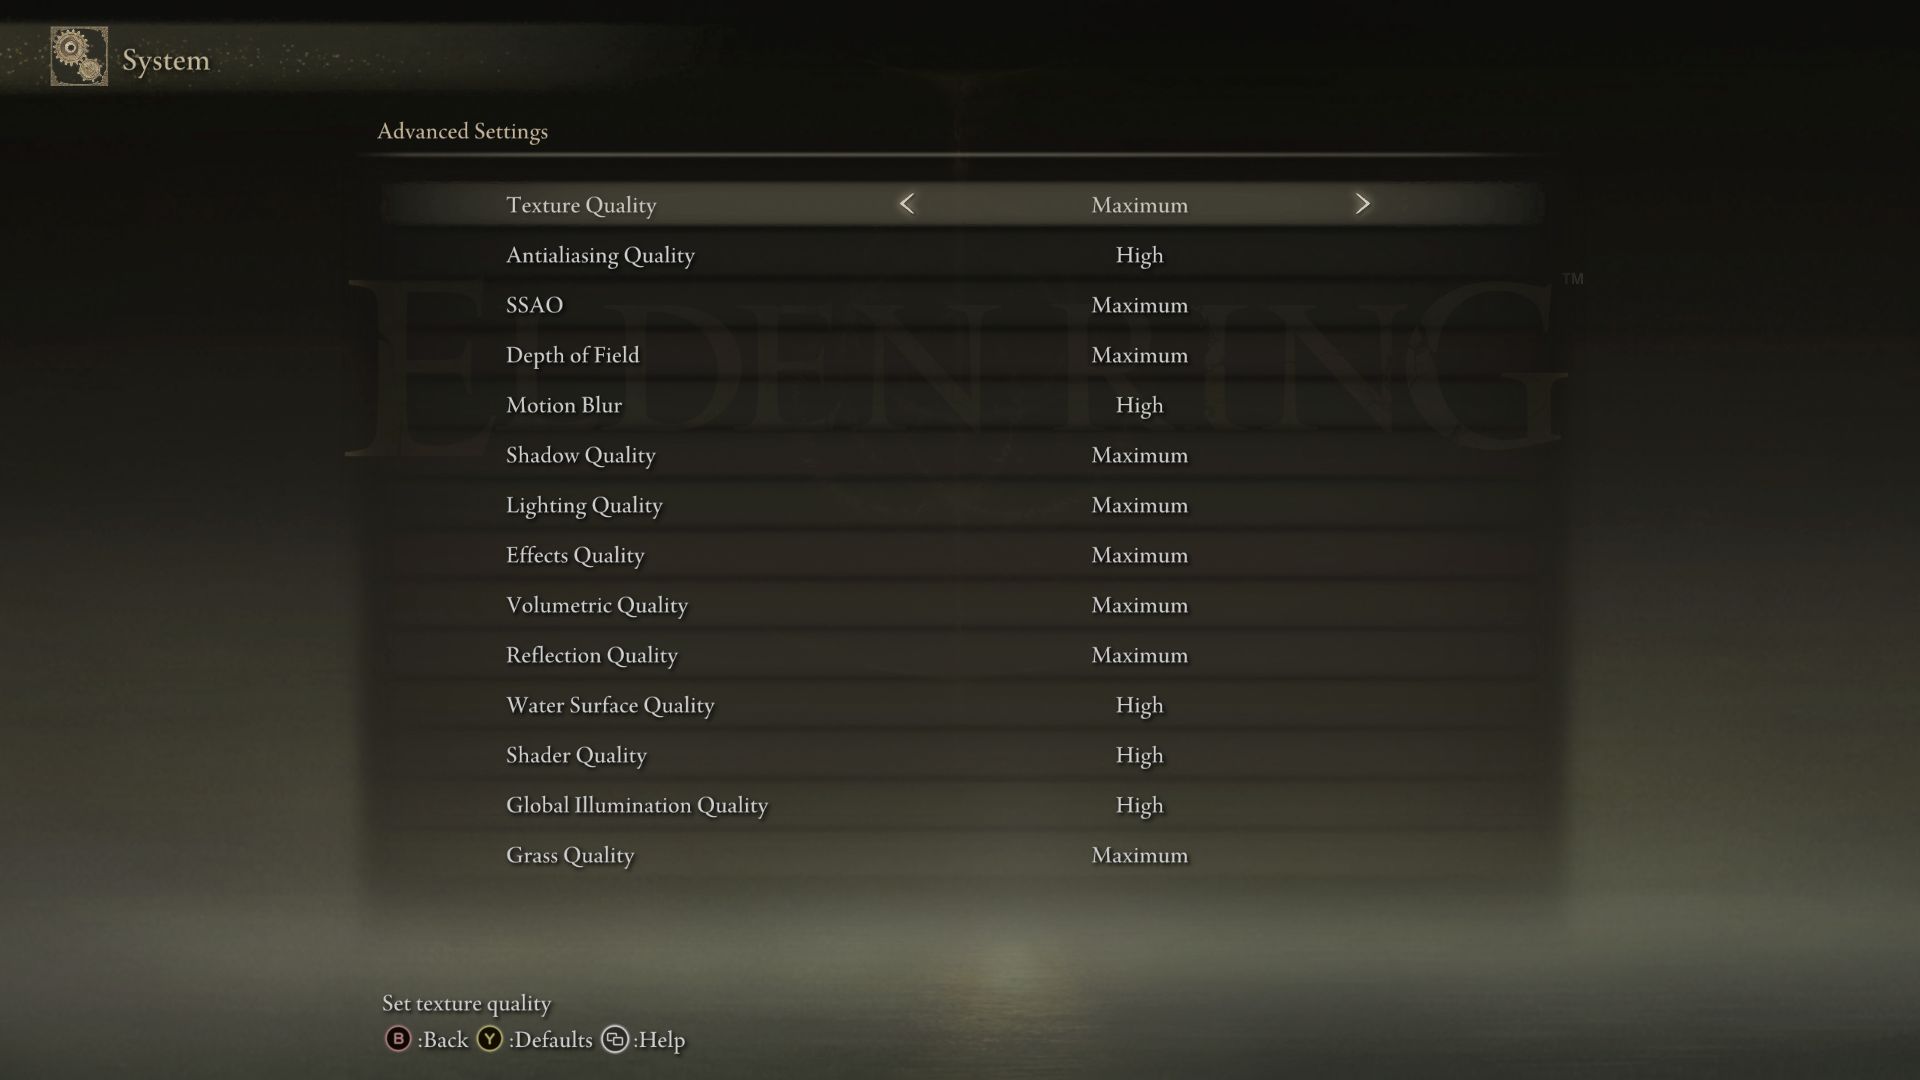
支持图形菜单:该标题在设置量方面的数字还算不错。虽然缺少V-Sync这样的经典设置,但高级选项仍然包含10多个质量控制,其中一些对视觉效果有很大影响。虽然最低设置看起来非常适中,但游戏从中等细节看起来还不错。

还有几个预设可用,方便地不需要重新启动。在最高水平上,图形质量被证明是坚实的,尽管与《黑暗之魂3》相比你几乎看不到任何改进。一些类型的代表作品在技术上要更进一步或更现代一些。一些买家会对纹理质量等方面感到失望。

艾尔登戒指
艾尔登戒指
艾尔登戒指
艾尔登戒指

然而,From Software在一定程度上用宏大和非常有个性的艺术风格弥补了技术上的局限性--老式的灵魂部分打招呼--。敌人的设计和世界的气氛几乎是无可匹敌的--它简直是非常出色。不仅仅是由于高植被密度、一天中变化的时间、郁郁葱葱的景色、不同的天气状况(雨、风等)以及可破坏的关卡元素,还有巨大的氛围。

如果你想第一次尝试类似灵魂或其他From Software的游戏,我们认为最好从《Elden Ring》开始。虽然你仍然要通过互联网搜索来学习很多东西,但它比它的精神前辈更适合初学者,而且有更好的移动处理(关键词:跳跃)。

艾尔登戒指
艾尔登戒指

基准

由于《Elden Ring》没有集成的基准,所以我们又采用了游戏中的序列来测量速度。正如你在下面的视频中所看到的,我们使用快速旅行来到达 "Elleh教堂",你在开始游戏后不久就会到达那里,骑在马背上大约20秒就可以到达开始的地牢。

结果

对于基准,我们主要使用我们的合作伙伴XMG (Schenker Technologies)的租赁设备。MSI被使用。

FHD (1,920 x 1,080)

如果排除奇怪的抽搐和经常出现的最低FPS差,《Elden Ring》的系统要求相对适中。虽然iGPU如 英特尔Iris Xe很快就达到了它们的极限,中端型号如GeForce GTX 1650(Ti)也能在全高清状态下以超过40 FPS的平均水平运行高至最大设置。

Elden Ring
    1920x1080 Low Preset     1920x1080 Medium Preset     1920x1080 High Preset     1920x1080 Maximum Preset
NVIDIA GeForce RTX 3090, i9-9900K
MSI GeForce RTX 3090 Suprim X
59.1 (32.2min, 35.1P0.1, 41.9P1) fps ∼42%
58.7 (31.5min, 31.9P0.1, 40.6P1) fps ∼42%
58.7 (31.4min, 32.2P0.1, 40.7P1) fps ∼47%
NVIDIA GeForce RTX 3080, i9-9900K
MSI GeForce RTX 3080 Gaming X Trio
59.2 (33.1min, 38.1P0.1, 43.5P1) fps ∼42%
58.6 (32.5min, 33.3P0.1, 39.1P1) fps ∼42%
58.6 (32min, 34.1P0.1, 39.9P1) fps ∼47%
NVIDIA GeForce RTX 3070, i9-9900K
MSI GeForce RTX 3070 Ventus 3X
59.3 (33.3min, 37.2P0.1, 44.9P1) fps ∼42%
58.8 (28.9min, 31.9P0.1, 39.3P1) fps ∼43%
58.6 (32.4min, 33.3P0.1, 38.4P1) fps ∼47%
NVIDIA GeForce RTX 3070 Laptop GPU, i7-11800H
XMG Neo 17 @140 W TGP
59.7 (35.3min, 38.7P0.1, 48.5P1) fps ∼42%
59.4 (35.7min, 36.8P0.1, 43.7P1) fps ∼43%
59.3 (34.4min, 36.2P0.1, 42.2P1) fps ∼48%
NVIDIA GeForce RTX 3080 Laptop GPU, i7-11800H
XMG Neo 15 @165 W TGP
59.5 (35min, 37.7P0.1, 45.4P1) fps ∼42%
59.2 (34min, 34.5P0.1, 43.5P1) fps ∼43%
59.1 (34.2min, 35.8P0.1, 42.8P1) fps ∼48%
NVIDIA GeForce RTX 3060 Laptop GPU, i7-11800H
XMG Core 15 @130 W TGP
59.5 (29.1min, 34P0.1, 47P1) fps ∼42%
59.3 (35.6min, 38.2P0.1, 43.3P1) fps ∼43%
59.1 (24min, 35.4P0.1, 43P1) fps ∼48%
AMD Radeon RX 6800S, R9 6900HS
Asus ROG Zephyrus G14 GA402RK
58 (29.1min, 29.8P0.1, 33.5P1) fps ∼41%
58 (28min, 28.3P0.1, 33.8P1) fps ∼42%
57.8 (25.5min, 27.2P0.1, 33.2P1) fps ∼47%
AMD Radeon RX 6800M, R9 5900HX
Asus ROG Strix G15
57.6 (27.2min, 27.3P0.1, 31.5P1) fps ∼41%
57.5 (24.2min, 25.7P0.1, 32P1) fps ∼42%
57.4 (24.3min, 24.5P0.1, 30.9P1) fps ∼46%
NVIDIA GeForce GTX 1660 Ti Mobile, i7-9750H
MSI GP65 Leopard 9SD
58 (27.3min, 30.4P0.1, 37P1) fps ∼41%
57.3 (29.9min, 31.1P0.1, 36P1) fps ∼41%
56.9 (26.7min, 28.4P0.1, 33.6P1) fps ∼46%
NVIDIA GeForce RTX 3050 Ti Laptop GPU, i7-11800H
XMG Focus 17 @75 W TGP
59.4 (31.3min, 32.2P0.1, 46.1P1) fps ∼42%
58.7 (25.9min, 26.5P0.1, 40.6P1) fps ∼42%
55.9 (23.4min, 26.2P0.1, 37.2P1) fps ∼45%
NVIDIA GeForce GTX 1650 Ti Mobile, i7-10750H
MSI GP75
59.1 (33.8min, 34.3P0.1, 43.5P1) fps ∼43%
58.8 (23.8min, 34.7P0.1, 43P1) fps ∼41%
55.5 (25.3min, 28.8P0.1, 37.6P1) fps ∼40%
46.9 (20min, 22.8P0.1, 31.4P1) fps ∼38%
NVIDIA GeForce GTX 1650 Mobile, i7-10750H
MSI GL75
58.3 (26min, 30P0.1, 38.5P1) fps ∼43%
55.6 (19.9min, 32.5P0.1, 37P1) fps ∼39%
50.5 (23.6min, 23.7P0.1, 33.8P1) fps ∼37%
43.1 (21.6min, 22.3P0.1, 30.1P1) fps ∼35%
AMD Radeon 680M, R9 6900HS
Asus ROG Zephyrus G14
52.7 (22.3min, 23.9P0.1, 32.1P1) fps ∼39%
41.5 (18.1min, 19.8P0.1, 27.8P1) fps ∼29%
37.2 (18.8min, 19.9P0.1, 24.7P1) fps ∼27%
31.5 (15.7min, 15.9P0.1, 20.9P1) fps ∼25%
Intel Iris Xe Graphics G7 96EUs, i7-1165G7
Honor MagicBook 14
23.7 (7.77min, 8.73P0.1, 14.1P1) fps ∼17%
19.2 (6.6min, 7.25P0.1, 11.4P1) fps ∼14%
18.8 (5.47min, 6.04P0.1, 10.5P1) fps ∼14%
15.6 (5.17min, 5.18P0.1, 9.84P1) fps ∼13%

QHD (2,560 x 1,440)

那些想在QHD显示屏上进行游戏的人需要一个来自中高档的代表。 2.560 x 1,440像素和最大的预设是可以玩的,从一个 GeForce GTX 1660 TiRTX 3050 Ti.

Elden Ring
    2560x1440 Maximum Preset
NVIDIA GeForce RTX 3070 Laptop GPU, i7-11800H
XMG Neo 17 @140 W TGP
59.3 (33.1min, 35.3P0.1, 42.6P1) fps ∼43%
NVIDIA GeForce RTX 3080 Laptop GPU, i7-11800H
XMG Neo 15 @165 W TGP
59 (32.6min, 34.9P0.1, 41.8P1) fps ∼42%
NVIDIA GeForce RTX 3090, i9-9900K
MSI GeForce RTX 3090 Suprim X
58.7 (31.3min, 33P0.1, 38.8P1) fps ∼42%
NVIDIA GeForce RTX 3080, i9-9900K
MSI GeForce RTX 3080 Gaming X Trio
58.6 (30min, 32.2P0.1, 39.3P1) fps ∼42%
NVIDIA GeForce RTX 3060 Laptop GPU, i7-11800H
XMG Core 15 @130 W TGP
58.6 (29.9min, 32.8P0.1, 40P1) fps ∼42%
NVIDIA GeForce RTX 3070, i9-9900K
MSI GeForce RTX 3070 Ventus 3X
58.5 (28.4min, 29.4P0.1, 38.5P1) fps ∼42%
AMD Radeon RX 6800S, R9 6900HS
Asus ROG Zephyrus G14 GA402RK
57.8 (25.3min, 29.3P0.1, 35.9P1) fps ∼42%
AMD Radeon RX 6800M, R9 5900HX
Asus ROG Strix G15
57 (20.8min, 22.2P0.1, 28.8P1) fps ∼41%
NVIDIA GeForce GTX 1660 Ti Mobile, i7-9750H
MSI GP65 Leopard 9SD
47.9 (11.3min, 26.7P0.1, 32.1P1) fps ∼34%
NVIDIA GeForce RTX 3050 Ti Laptop GPU, i7-11800H
XMG Focus 17 @75 W TGP
43.9 (17.6min, 22.1P0.1, 31.1P1) fps ∼32%
NVIDIA GeForce GTX 1650 Ti Mobile, i7-10750H
MSI GP75
35.5 (21.6min, 21.9P0.1, 27.3P1) fps ∼26%
NVIDIA GeForce GTX 1650 Mobile, i7-10750H
MSI GL75
31.4 (15.8min, 17.5P0.1, 22.3P1) fps ∼23%

UHD (3,840 x 2,160)

在UHD范围内,只有在使用最高预设时,你才会对高端GPU感到满意。根据我们的基准,一个超过40 FPS的平均值是可以用 Radeon RX 6800M.

Elden Ring
    3840x2160 Maximum Preset
NVIDIA GeForce RTX 3090, i9-9900K
MSI GeForce RTX 3090 Suprim X
58.4 (32.1min, 32.9P0.1, 36.9P1) fps ∼46%
NVIDIA GeForce RTX 3080, i9-9900K
MSI GeForce RTX 3080 Gaming X Trio
58.3 (31.3min, 32.2P0.1, 37.4P1) fps ∼46%
NVIDIA GeForce RTX 3070, i9-9900K
MSI GeForce RTX 3070 Ventus 3X
57.1 (29.1min, 29.2P0.1, 36.9P1) fps ∼45%
NVIDIA GeForce RTX 3080 Laptop GPU, i7-11800H
XMG Neo 15 @165 W TGP
50.7 (20.4min, 28.5P0.1, 37P1) fps ∼40%
NVIDIA GeForce RTX 3070 Laptop GPU, i7-11800H
XMG Neo 17 @140 W TGP
48.1 (18.2min, 20.7P0.1, 34.5P1) fps ∼38%
AMD Radeon RX 6800M, R9 5900HX
Asus ROG Strix G15
45.7 (22.2min, 23P0.1, 28.6P1) fps ∼36%
NVIDIA GeForce RTX 3060 Laptop GPU, i7-11800H
XMG Core 15 @130 W TGP
39.8 (20.4min, 20.7P0.1, 28P1) fps ∼31%
AMD Radeon RX 6800S, R9 6900HS
Asus ROG Zephyrus G14 GA402RK
38.7 (20.3min, 21.7P0.1, 28.5P1) fps ∼30%
NVIDIA GeForce GTX 1660 Ti Mobile, i7-9750H
MSI GP65 Leopard 9SD
27.6 (17.1min, 17.2P0.1, 20.1P1) fps ∼22%
NVIDIA GeForce RTX 3050 Ti Laptop GPU, i7-11800H
XMG Focus 17 @75 W TGP
25.6 (12.3min, 13.6P0.1, 16.3P1) fps ∼20%
NVIDIA GeForce GTX 1650 Ti Mobile, i7-10750H
MSI GP75
19.9 (15.4min, 15.6P0.1, 17.1P1) fps ∼16%
NVIDIA GeForce GTX 1650 Mobile, i7-10750H
MSI GL75
17.3 (7.92min, 8.21P0.1, 9.75P1) fps ∼14%

注意事项

由于游戏测试非常耗时,而且经常受到安装或激活限制的限制,我们只能为您提供文章发表时的部分基准测试。更多的显卡将在未来几天和几周内加入。

Overview

Show Restrictions
PosModel< PrevNext >Elden Ring
 Elden Ring (2022)
low
1920x1080
Low Preset
med.
1920x1080
Medium Preset
high
1920x1080
High Preset
ultra
1920x1080
Maximum Preset
QHD
2560x1440
Maximum Preset
4K
3840x2160
Maximum Preset
NVIDIA GeForce RTX 3090 Ti
60n2
60n2
60n2
60n2
60n2
60n2
NVIDIA GeForce RTX 4090 Laptop GPU
60
60
60
60
60
60
NVIDIA GeForce RTX 3090
59.8
59.5n2
59.3n2
59.3n2
59.3n2
59.15n2
NVIDIA GeForce RTX 4080 Laptop GPU
59.9
59.8
59.8
59.6
59.3
NVIDIA GeForce RTX 3080 12 GB
60
60
60
60
60
60
NVIDIA GeForce RTX 3080
59.2
58.6
58.6
58.6
58.3
AMD Radeon RX 6800
60
60
60
60
60
59.6
NVIDIA Titan RTX
59.9
59.9
59.7
59.9
59.9
59.6
NVIDIA GeForce RTX 3080 Ti Laptop GPU
59.8
59
57.9
NVIDIA GeForce RTX 4070 Laptop GPU
59.6
59.5
59.5
59.5
45
NVIDIA GeForce RTX 3070
59.3
58.8
58.6
58.5
57.1
AMD Radeon RX 6700 XT
60
60
60
60
60
50.5
NVIDIA GeForce RTX 3080 Laptop GPU
59.5
59.2
59.1
59
50.7
NVIDIA GeForce RTX 3060 Ti
59.9
59.4
59.9
59.9
59.9
49.5
Intel Arc A770
60
60
60
60
60
50
NVIDIA GeForce RTX 3070 Ti Laptop GPU
59.8
59.85n2
53n2
59.7
NVIDIA GeForce RTX 4060 Laptop GPU
59.5
NVIDIA GeForce RTX 2080 Super (Desktop)
60
48.8
AMD Radeon RX 6800M
57.6
57.5
57.4
57
45.7
PosModel< PrevNext >Elden Ring
low med. high ultra QHD 4K
AMD Radeon RX 6600 XT
60
60
60
59.4
59.9
38.6
NVIDIA GeForce RTX 3070 Laptop GPU
59.7
59.4
59.3
59.3
48.1
AMD Radeon RX 6800S
58
58
57.8
57.8
38.7
NVIDIA GeForce RTX 3060
60
60
60
59.9
56.8
35.2
NVIDIA Titan X Pascal
59.9
59.9
59.9
59.9n2
59.9
47.5
NVIDIA GeForce RTX 2070 Super (Desktop)
59.9
59.9
59.9
59.9
59.7
42.1
AMD Radeon RX 5700 XT (Desktop)
60
60
60
59.8
58.3
37.8
NVIDIA GeForce RTX 3060 Laptop GPU
59.5
59.65n2
59.55n2
58.6
39.8
AMD Radeon RX 7600S
59.7
59.6
59.5
58.2
34.8
NVIDIA GeForce RTX 2060 Super (Desktop)
59.9
59.9
59.7
59.9
59.8
56.9
AMD Radeon RX 6600
60
60
60
59.9
58.2
34
AMD Radeon RX 5700 (Desktop)
60
60
60
60
59.3
36.1
AMD Radeon RX 6600M
60
60
60
AMD Radeon RX 6700S
59.9
59.9
59.9
56.6
NVIDIA GeForce RTX 3050
60
60
60
60
51.6
31.1
AMD Radeon RX 5600 XT (Desktop)
59.5
59.9
59.8
59.8
52.1
33.1
NVIDIA GeForce GTX 1660 Ti (Desktop)
59.9
59.9
59.9
58.4
47.5
28.2
NVIDIA GeForce GTX 1660 Super (Desktop)
59.9
59.9
59.8
57.1
47
27.7
AMD Radeon RX 6500 XT
59.4
59.5
59.4
58
44
20.6
AMD Radeon RX 5500 XT (Desktop)
59.8
59.6
56.5
46.8
34.7
22
PosModel< PrevNext >Elden Ring
low med. high ultra QHD 4K
Intel Arc A730M
59.9
59.7
56.9
46.2
NVIDIA GeForce GTX 1660 Ti Mobile
58
57.3
56.9
47.9
27.6
NVIDIA GeForce RTX 3050 Ti Laptop GPU
59.4n3
58.7n3
55.9n3
43.9
25.6
NVIDIA GeForce GTX 1660 (Desktop)
59.9
59.8
59.5
54.9
41.8
24.3
NVIDIA GeForce GTX 1650 Super (Desktop)
58.9
52.2
45
37.2
27.6
14.4
NVIDIA GeForce RTX 3050 4GB Laptop GPU
48.7n2
46.95n2
45.3n2
NVIDIA GeForce GTX 1060 Mobile
58
56.9
54.2
48.4
NVIDIA GeForce GTX 1650 Ti Mobile
59.1
58.8
55.5
46.9
35.5
19.9
AMD Radeon RX 5500M
37
35.8
35.2
35.2
NVIDIA GeForce RTX 2050 Mobile
50.1
43.1
39
34.9
NVIDIA GeForce GTX 1650 Mobile
58.3
55.6
50.5
43.1
31.4
17.3
NVIDIA T1200 Laptop GPU
52.9
47
39.5
36.8
NVIDIA T600 Laptop GPU
52.4
45
39
29.9
NVIDIA GeForce GTX 1050 Ti Mobile
35.7
31.4
25.9
AMD Radeon 680M
52.7
41.5
37.2
31.5
NVIDIA GeForce MX450
31.5n2
25.25n2
23.85n2
20.95n2
13.5
NVIDIA GeForce GTX 1050 Mobile
42.65n2
36.3n2
31.5n2
26.15n2
AMD Radeon 660M
39.6
29.9
26.9
AMD Radeon RX 560X (Laptop)
39
35
29.9
25
Intel Iris Xe Graphics G7 96EUs
34.6n2
30.35n2
26.2n2
21.75n2
PosModel< PrevNext >Elden Ring
low med. high ultra QHD 4K
NVIDIA GeForce MX350
22.6
21.2
14.8
AMD Radeon RX 550 (Laptop)
14.5
11.5
9.32
NVIDIA GeForce MX250
21.4
11.2
NVIDIA GeForce MX150
23.2
Intel Iris Xe Graphics G7 80EUs
24.05n2
17.1n2
14.35n2
13.3
AMD Radeon 540X
15.9
12.2
Intel UHD Graphics 64EUs (Alder Lake 12th Gen)
35.5
29.1
24.7
20.3
Intel Iris Plus Graphics G7 (Ice Lake 64 EU)
15.5
12.7
AMD Radeon RX Vega 10
19.05n2
16.05n2
15.2
13.3
Intel UHD Graphics Xe G4 48EUs
18.5
14.8
13.6
11.2
Intel UHD Graphics Xe 32EUs (Tiger Lake-H)
18.3
14.9
Intel UHD Graphics 770
20.6
19
16
AMD Radeon RX Vega 8 (Ryzen 4000/5000)
32n2
30.2n3
24.6n3
21n3
16.65n2
9.11n2
AMD Radeon RX Vega 7
22.5n2
18.95n2
16.5
13.9
AMD Radeon RX Vega 8 (Ryzen 2000/3000)
13
12
AMD Radeon RX Vega 6 (Ryzen 4000/5000)
16.7
Intel UHD Graphics G1 (Ice Lake 32 EU)
8.51
Intel UHD Graphics Xe 16EUs (Tiger Lake-H)
10.3
Intel UHD Graphics 620
6.29
Intel UHD Graphics (Jasper Lake 16 EU)
5.18
(-) * Smaller values are better. / n123 Number of benchmarks for this median value / * Approximate position


Legend
5Stutters – This game is very likely to stutter and have poor frame rates. Based on all known benchmarks using the specified graphical settings, average frame rates are expected to fall below 25fps
May Stutter – This graphics card has not been explicitly tested on this game. Based on interpolated information from surrounding graphics cards of similar performance levels, stutters and poor frame rates are expected.
30Fluent – Based on all known benchmarks using the specified graphical settings, this game should run at or above 25fps
40Fluent – Based on all known benchmarks using the specified graphical settings, this game should run at or above 35fps
60Fluent – Based on all known benchmarks using the specified graphical settings, this game should run at or above 58fps
May Run Fluently – This graphics card has not been explicitly tested on this game. Based on interpolated information from surrounding graphics cards of similar performance levels, fluent frame rates are expected.
?Uncertain – This graphics card experienced unexpected performance issues during testing for this game. A slower card may be able to achieve better and more consistent frame rates than this particular GPU running the same benchmark scene.
Uncertain – This graphics card has not been explicitly tested on this game and no reliable interpolation can be made based on the performances of surrounding cards of the same class or family.
The value in the fields displays the average frame rate of all values in the database. Move your cursor over the value to see individual results.

Test systems

XMG Neo 15 (RTX 3080) - 点击照片,打开配置器 (bestware.com)
XMG Neo 17 (RTX 3070) - 点击照片,打开配置器 (bestware.com)
XMG Core 15 (RTX 3060) - 点击照片打开配置器 (bestware.com)
XMG Focus 17 (RTX 3050 Ti) - 点击照片打开配置器 (bestware.com)

设备
显卡 处理器 内存 操作系统
XMG Neo 15 NvidiaGeForce RTX 3080 @165 W TGP (16 GB GDDR6) Intel Core i7-11800H 2 x 16 GB DDR4 Windows 11
XMG Neo 17 NvidiaGeForce RTX 3070 @140 W TGP (8 GB GDDR6) Intel Core i7-11800H 2 x 16 GB DDR4 Windows 11
XMG Core 15 NvidiaGeForce RTX 3060 @130 W TGP (6 GB GDDR6) Intel Core i7-11800H 2 x 16 GB DDR4 Windows 11
XMG Focus 17 NvidiaGeForce RTX 3050 Ti @75 W TGP (4 GB GDDR6) Intel Core i7-11800H 2 x 16 GB DDR4 Windows 11
微星GP65 NvidiaGeForce GTX 1660 Ti (6 GB GDDR6) Intel Core i7-9750H 2 x 8 GB DDR4 Windows 11
微星GP75 NvidiaGeForce GTX 1650 Ti (4 GB GDDR6) Intel Core i7-10750H 2 x 8 GB DDR4 Windows 11
微星GL75 NvidiaGeForce GTX 1650 (4 GB GDDR6) Intel Core i7-10750H 2 x 8 GB DDR4 Windows 11
华硕ROG Strix G15 AMD Radeon RX 6800M(12 GB GDDR6) AMD Ryzen 9 5900HX 2 x 8 GB DDR4 Windows 11
MSI Prestige 14 Evo Intel Iris Xe (96 CUs) Intel Core i7-1195G7 2 x 8 GB DDR4 Windows 11
Honor MagicBook 14 Intel Iris Xe (96 CUs) Intel Core i7-1165G7 1 x 16 GB DDR4 Windows 11
Acer Swift 3 SF314-42 AMD Radeon Vega 7 AMD Ryzen 7 4700U 2 x 4 GB DDR4 Windows 11
台式电脑 I MSIGeForce RTX 3090 (24 GB GDDR6X)
MSIGeForce RTX 3080 (10 GB GDDR6X)
MSIGeForce RTX 3070 (8 GB GDDR6)
Intel Core i9-9900K 4 x 8 GB DDR4 Windows 11
桌面-PC II NvidiaGeForce RTX 3090 FE (24 GB GDDR6X)
NvidiaGeForce RTX 3060 (12 GB GDDR6X)
Nvidia Titan RTX (24 GB GDDR6)
NvidiaGeForce RTX 2070 Super (8 GB GDDR6) Nvidia
GeForce RTX 2060 Super (8 GB GDDR6)
KFA2GeForce GTX 1660 Super (6 GB GDDR6)
PNYGeForce GTX 1660 (6 GB GDDR5)
KFA2GeForce GTX 1650 Super (4 GB GDDR6)
KFA2GeForce GTX 1650 (4 GB GDDR5)AMD GDDR5)
AMD Radeon RX 6700 XT(12 GB DDR6)
AMD Radeon RX 6600 XT(8 GB GDDR6)
AMD Radeon RX 6600(8 GB GDDR6)
AMD Radeon RX 5700 XT(8 GB GDDR6)
AMDRadeon RX 5700 (8 GB GDDR6)
AMD Radeon RX 5600 XT (6 GB GDDR6)
AMD Radeon RX 5500 XT (8 GB GDDR6)
AMD Ryzen 9 5900X 2 x 32 GB DDR4 Windows 10 64 Bit
桌面电脑III NvidiaGeForce RTX 2080 Super FE Intel Core i9-11900K 2 x 8 GB DDR4 Windows 11
4K显示器 Nvidia驱动 AMD驱动
华硕PB287Q,飞利浦Brilliance 329P9H, 宏碁Predator XB321HK ForceWare 511.79 Adrenalin 22.2.3
Please share our article, every link counts!
> Notebookcheck中文版(NBC中国) > 评测 > 测试中的Eldon Ring。笔记本和台式机基准测试
Florian Glaser, 2022-03-22 (Update: 2022-03-22)