Notebookcheck Logo

星球大战绝地求生》评测:笔记本电脑和台式机基准测试

这场比赛的条件适中,其他方面都很好。 发行商EA在过去几年中并不轻松--正如《FIFA》中的 "Pay to Win "或《绝地求生》的糟糕表现与高硬件要求所显示的那样。为了进行流畅的光剑战斗,你需要哪种显卡?
Gaming Laptop / Notebook Desktop Gamecheck
绝地求生者

我们目前在游戏基准中使用这些笔记本电脑。点击照片可以直接进入相应的制造商的网站。所有进一步的测试系统(塔式电脑、迷你电脑......)都在文章末尾列出。

技术

在听说该游戏在发布时收到了许多负面评论--这些评论特别涉及到游戏的性能--我们决定等到第一个补丁发布后再来衡量我们的基准。尽管《绝地求生》的运行仍然不尽如人意,但到目前为止,最大的问题似乎已经解决了(截至05/02/23)。

虽然游戏的系统要求异常高,而且无论你在什么硬件上玩,它的运行有时都有点颠簸,但你仍然可以在更强大的GPU上享受相对良好的游戏体验。

绝地求生者
绝地求生者
绝地求生者
绝地求生者
绝地求生者
绝地求生者

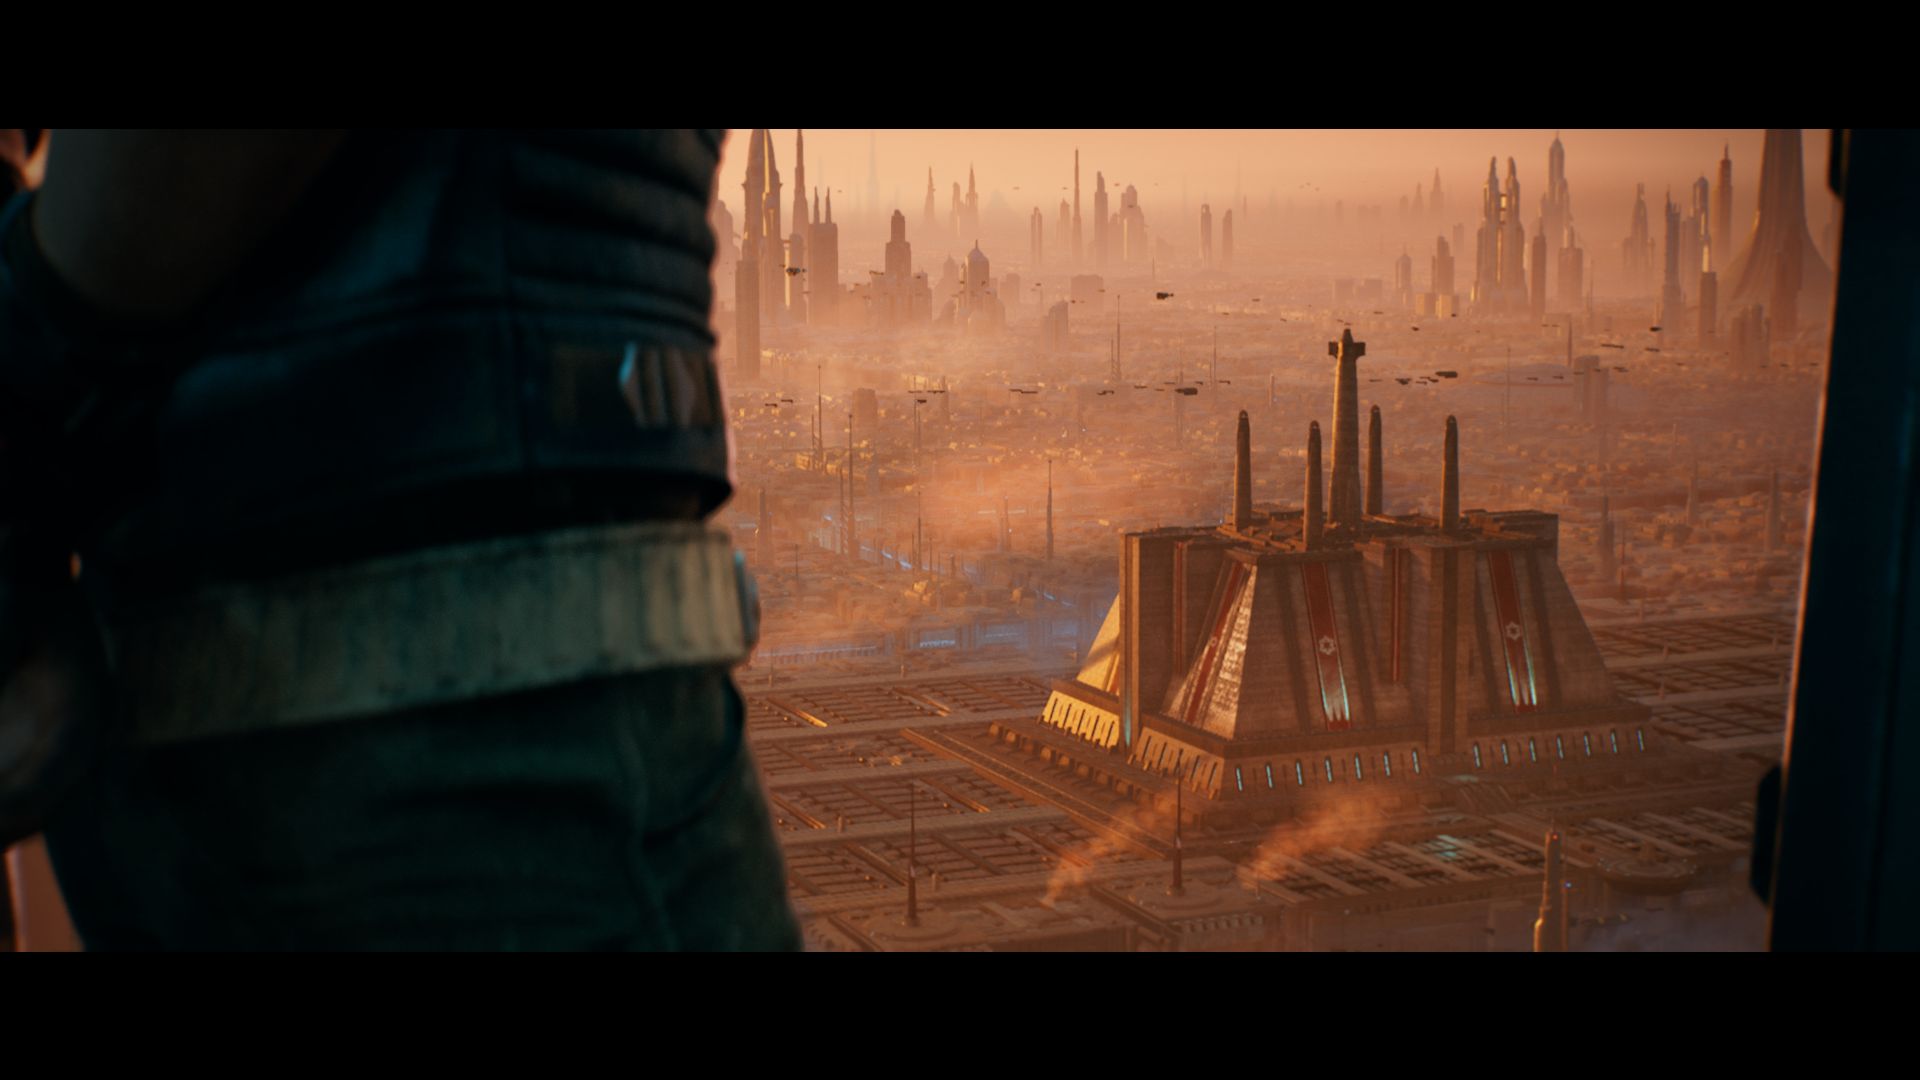
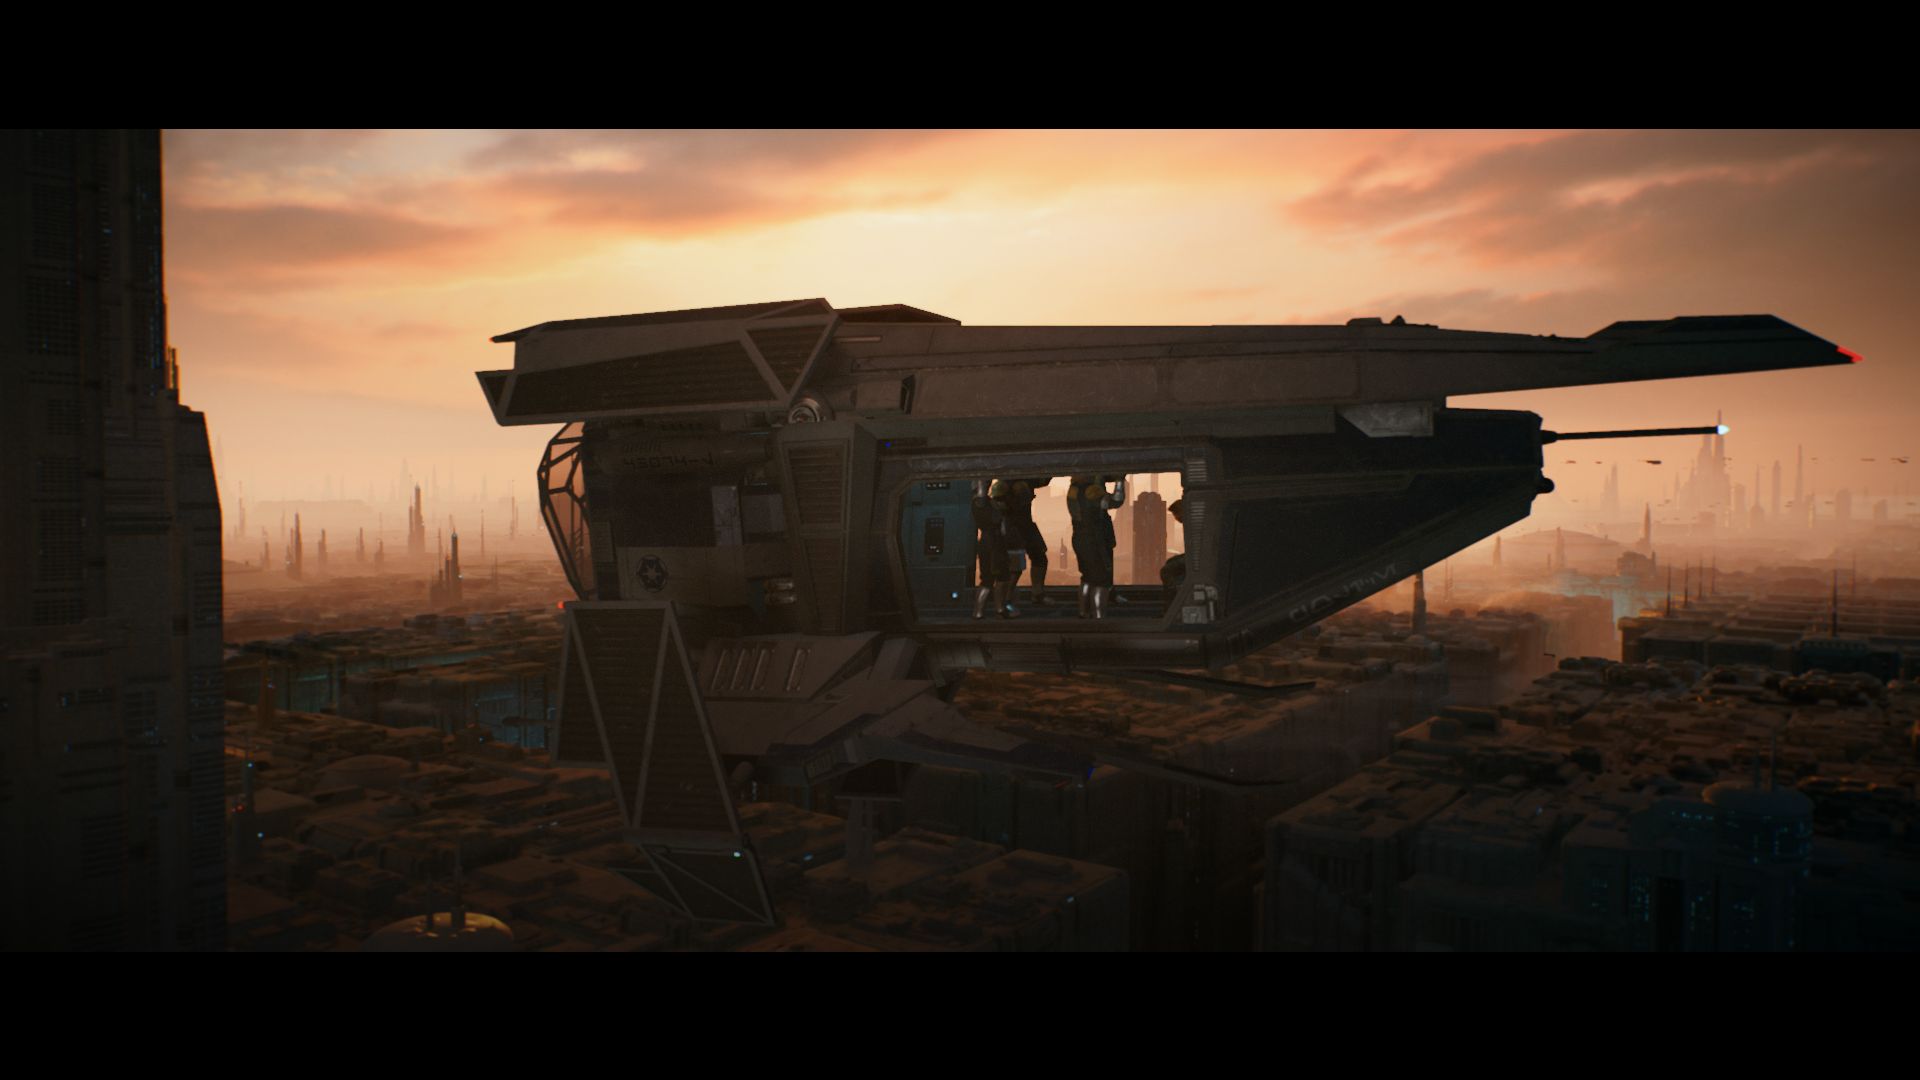
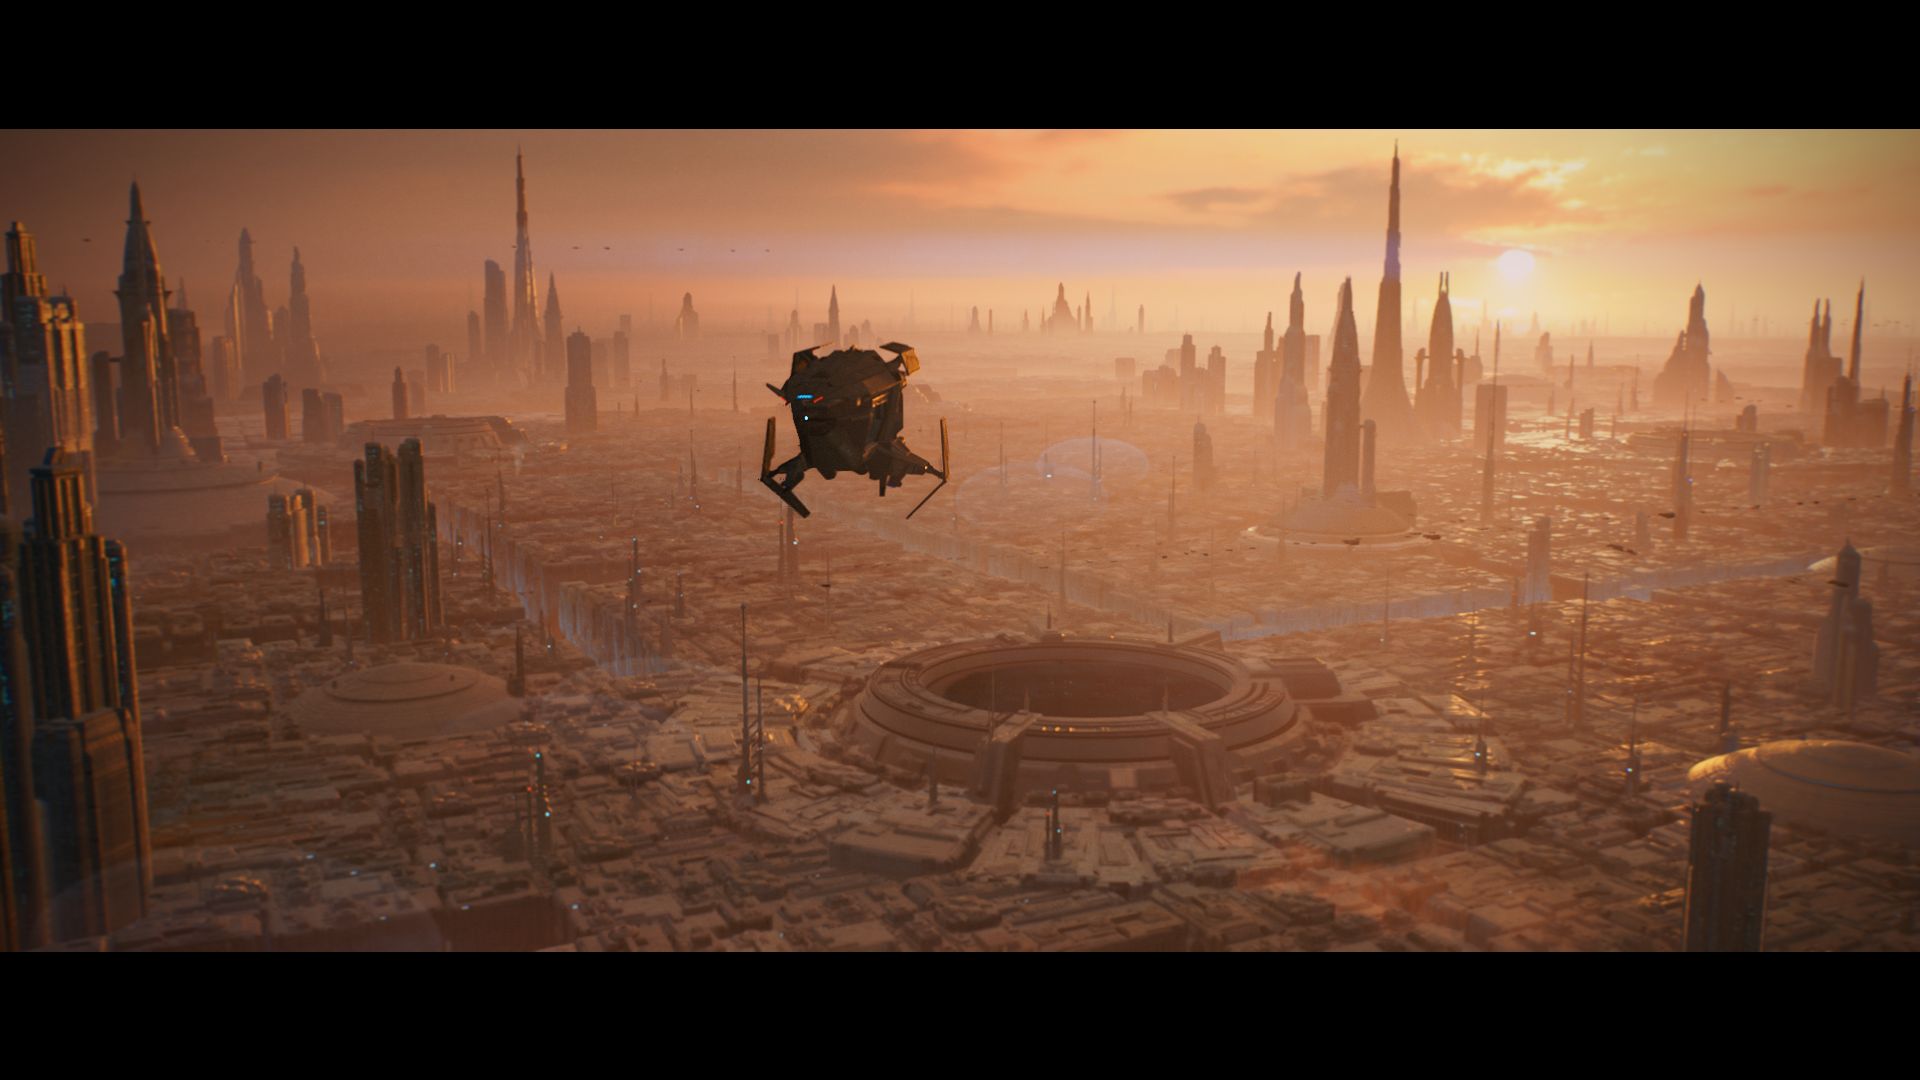
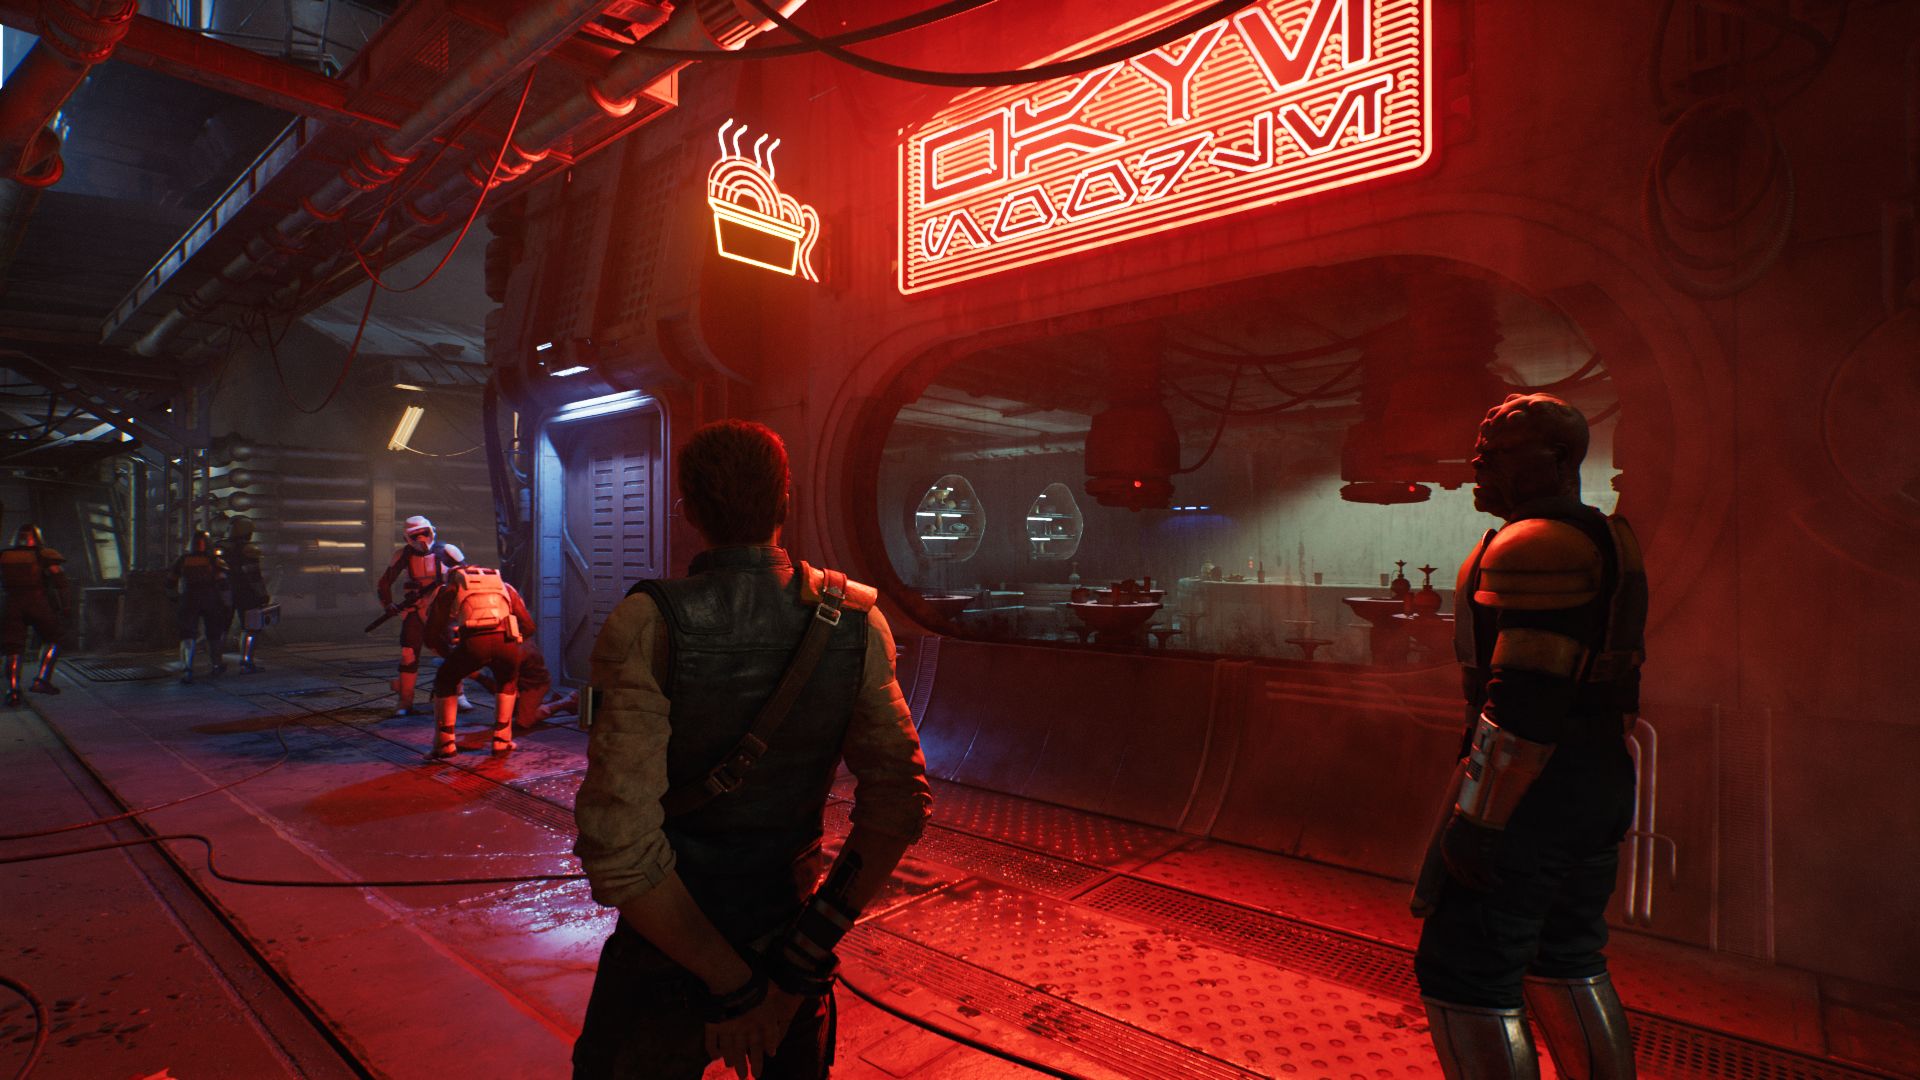
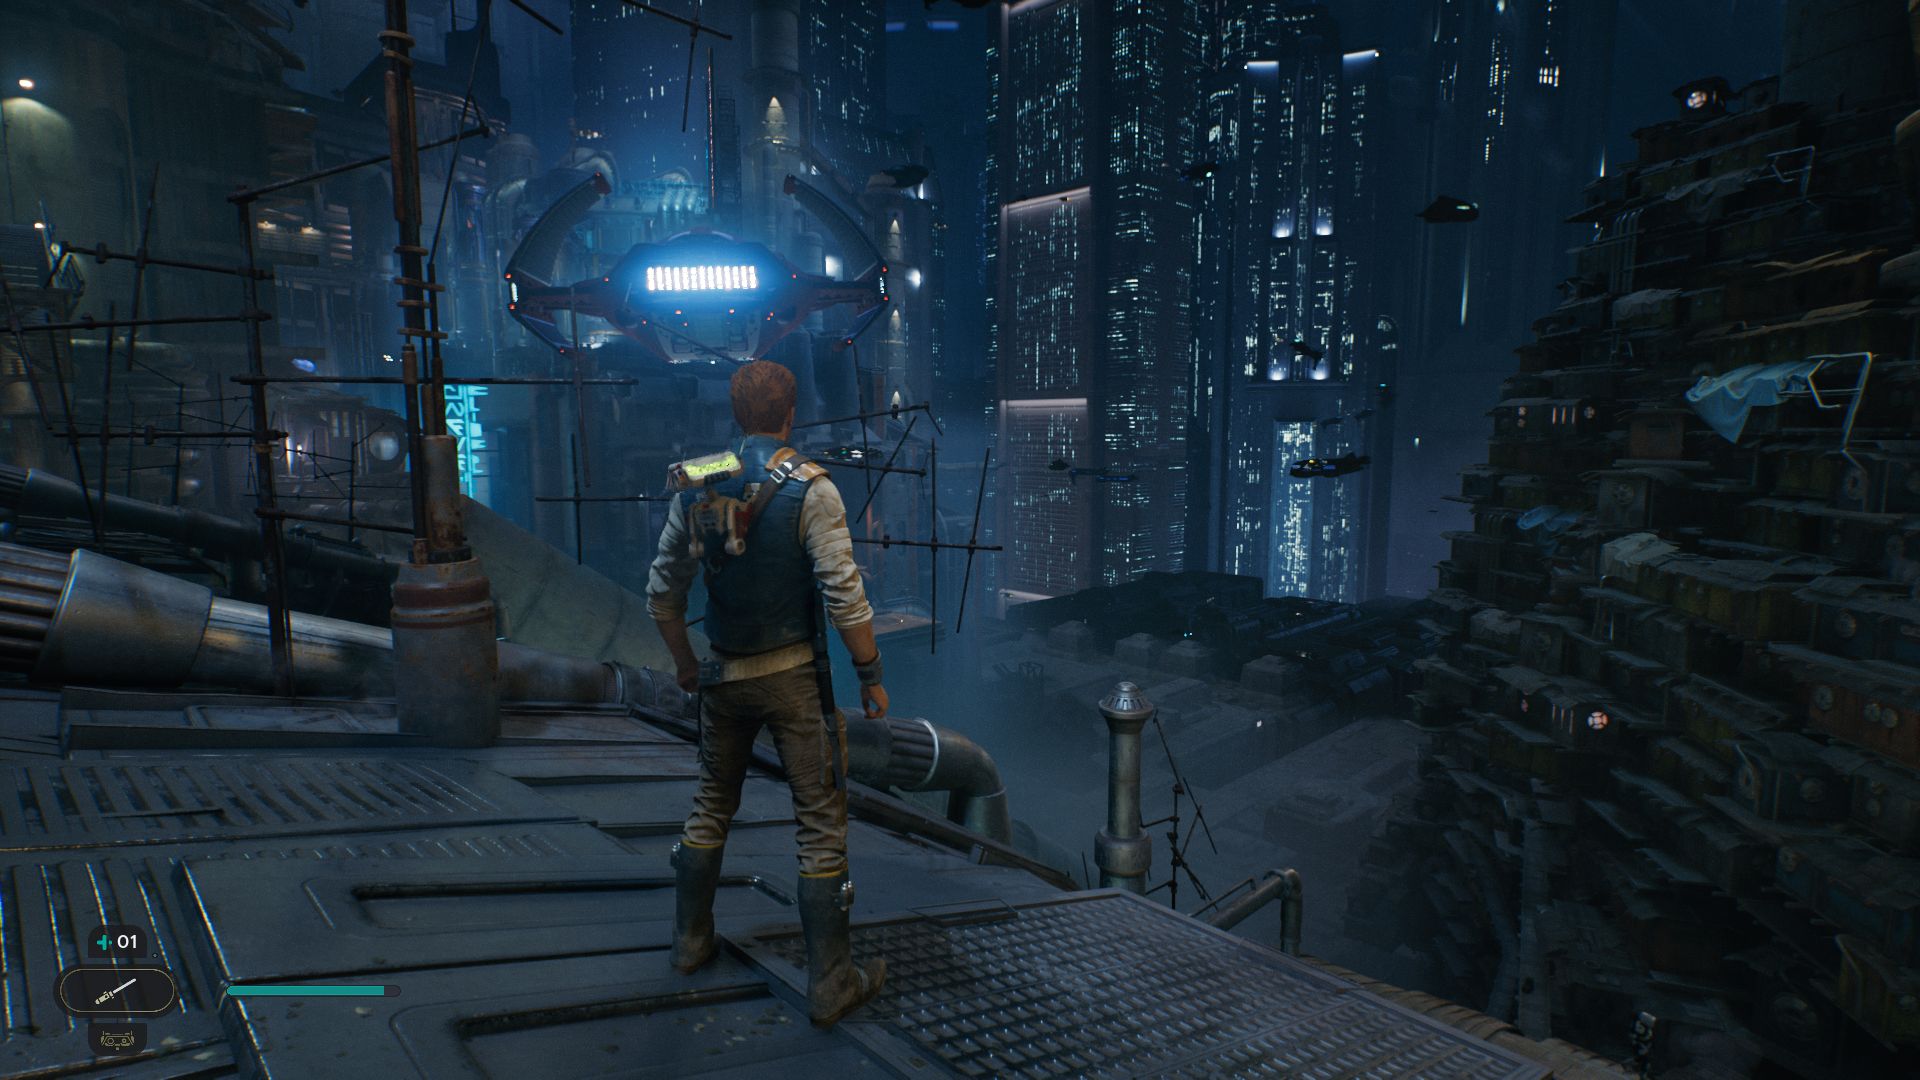
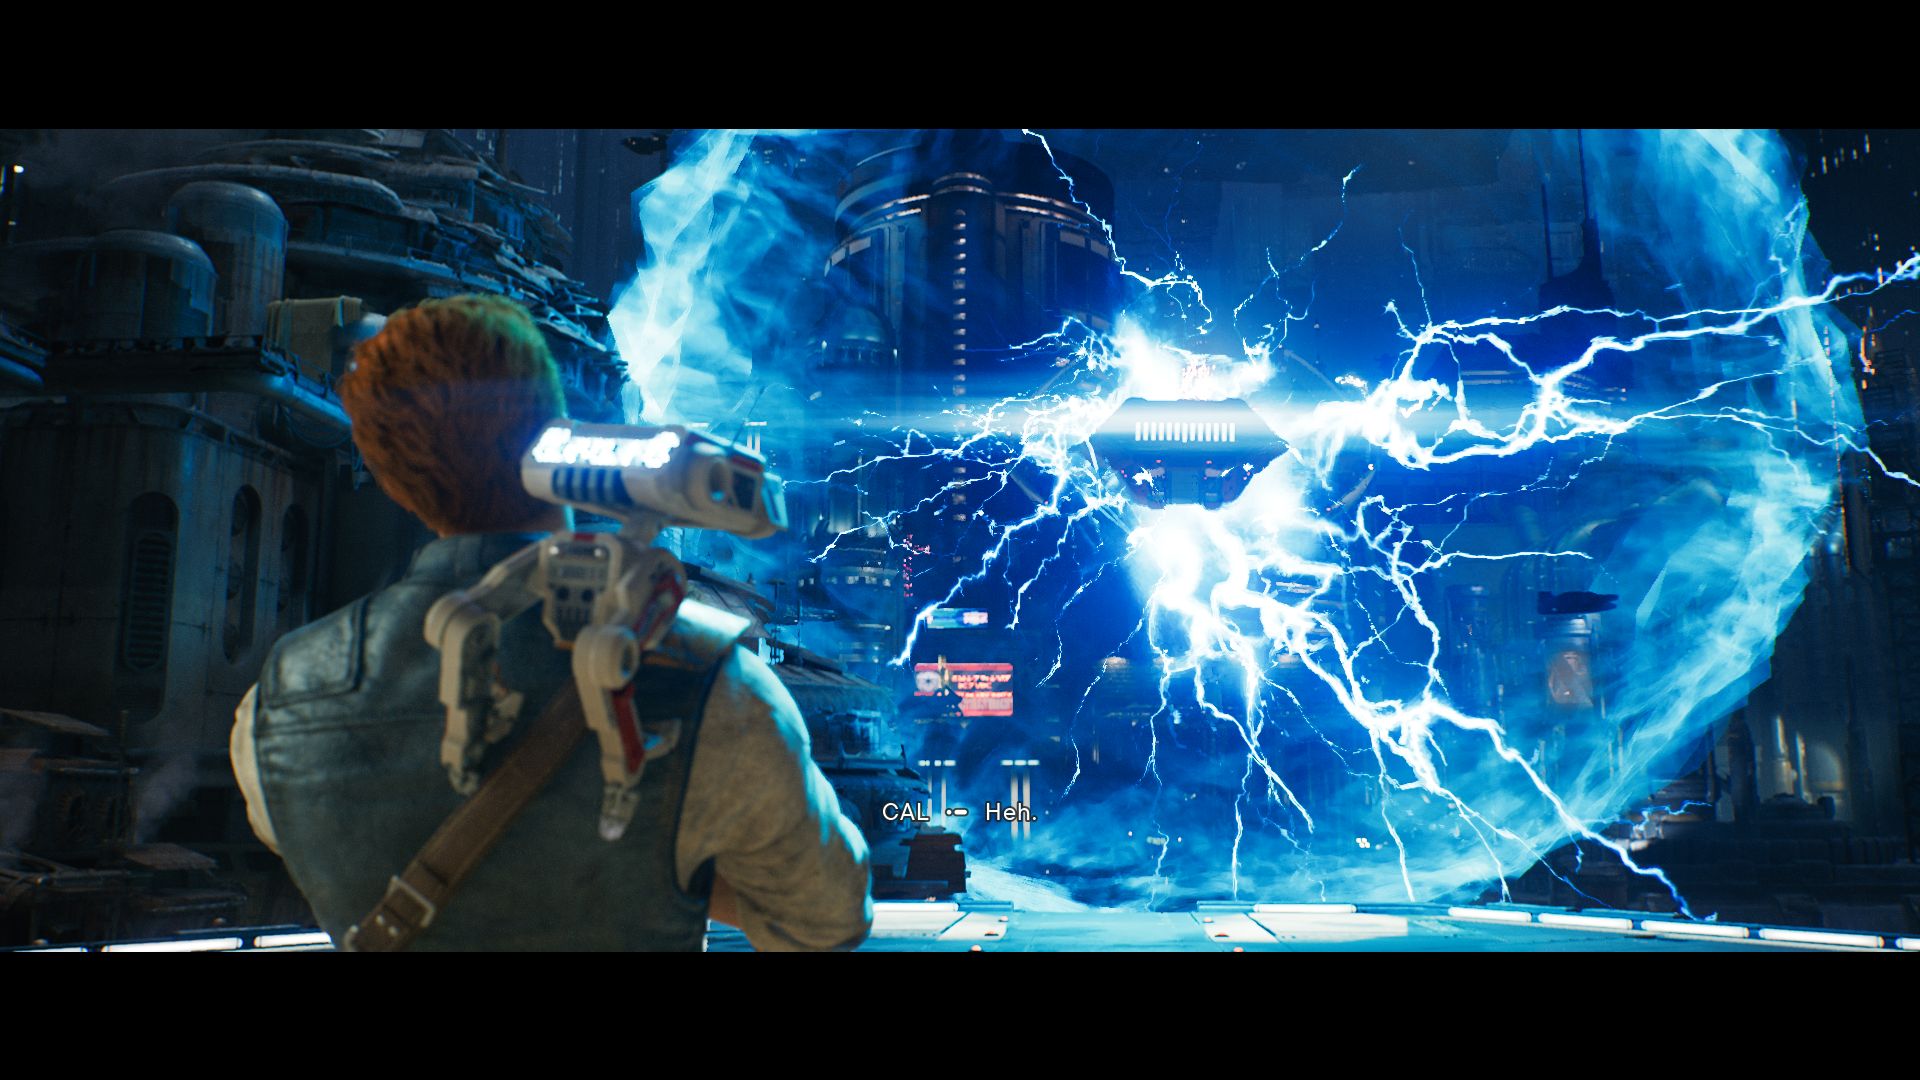
在视觉上,除了图形上的错误外,这款游戏真的不能被批评。里面的关卡经过精心设计,在大气的背景音乐和成功的战斗机制中散发着大量的星战气息。人物、纹理和效果也令人印象深刻--使游戏具有整体的良好品质。它的电影制作和游戏结构也可以说是如此。

绝地求生者
绝地求生者
绝地求生者
绝地求生者
绝地求生者
绝地求生者

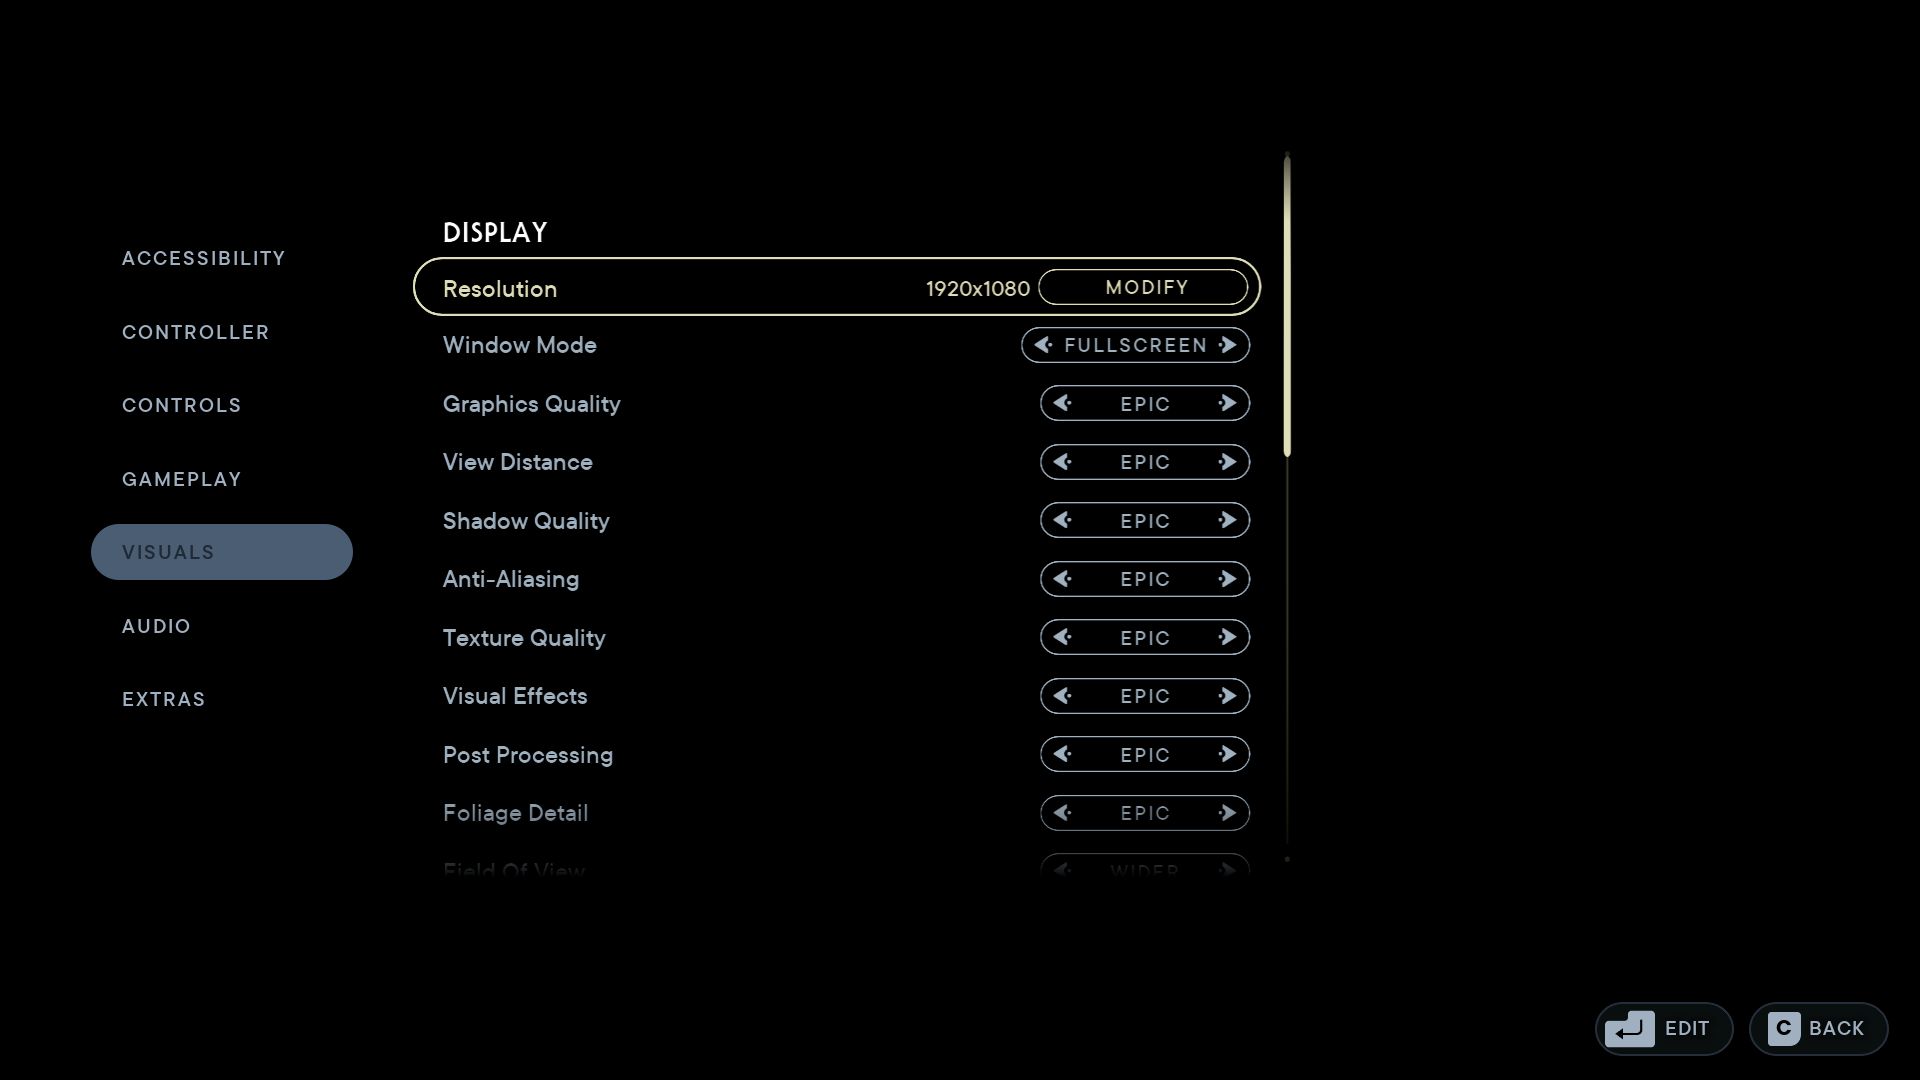
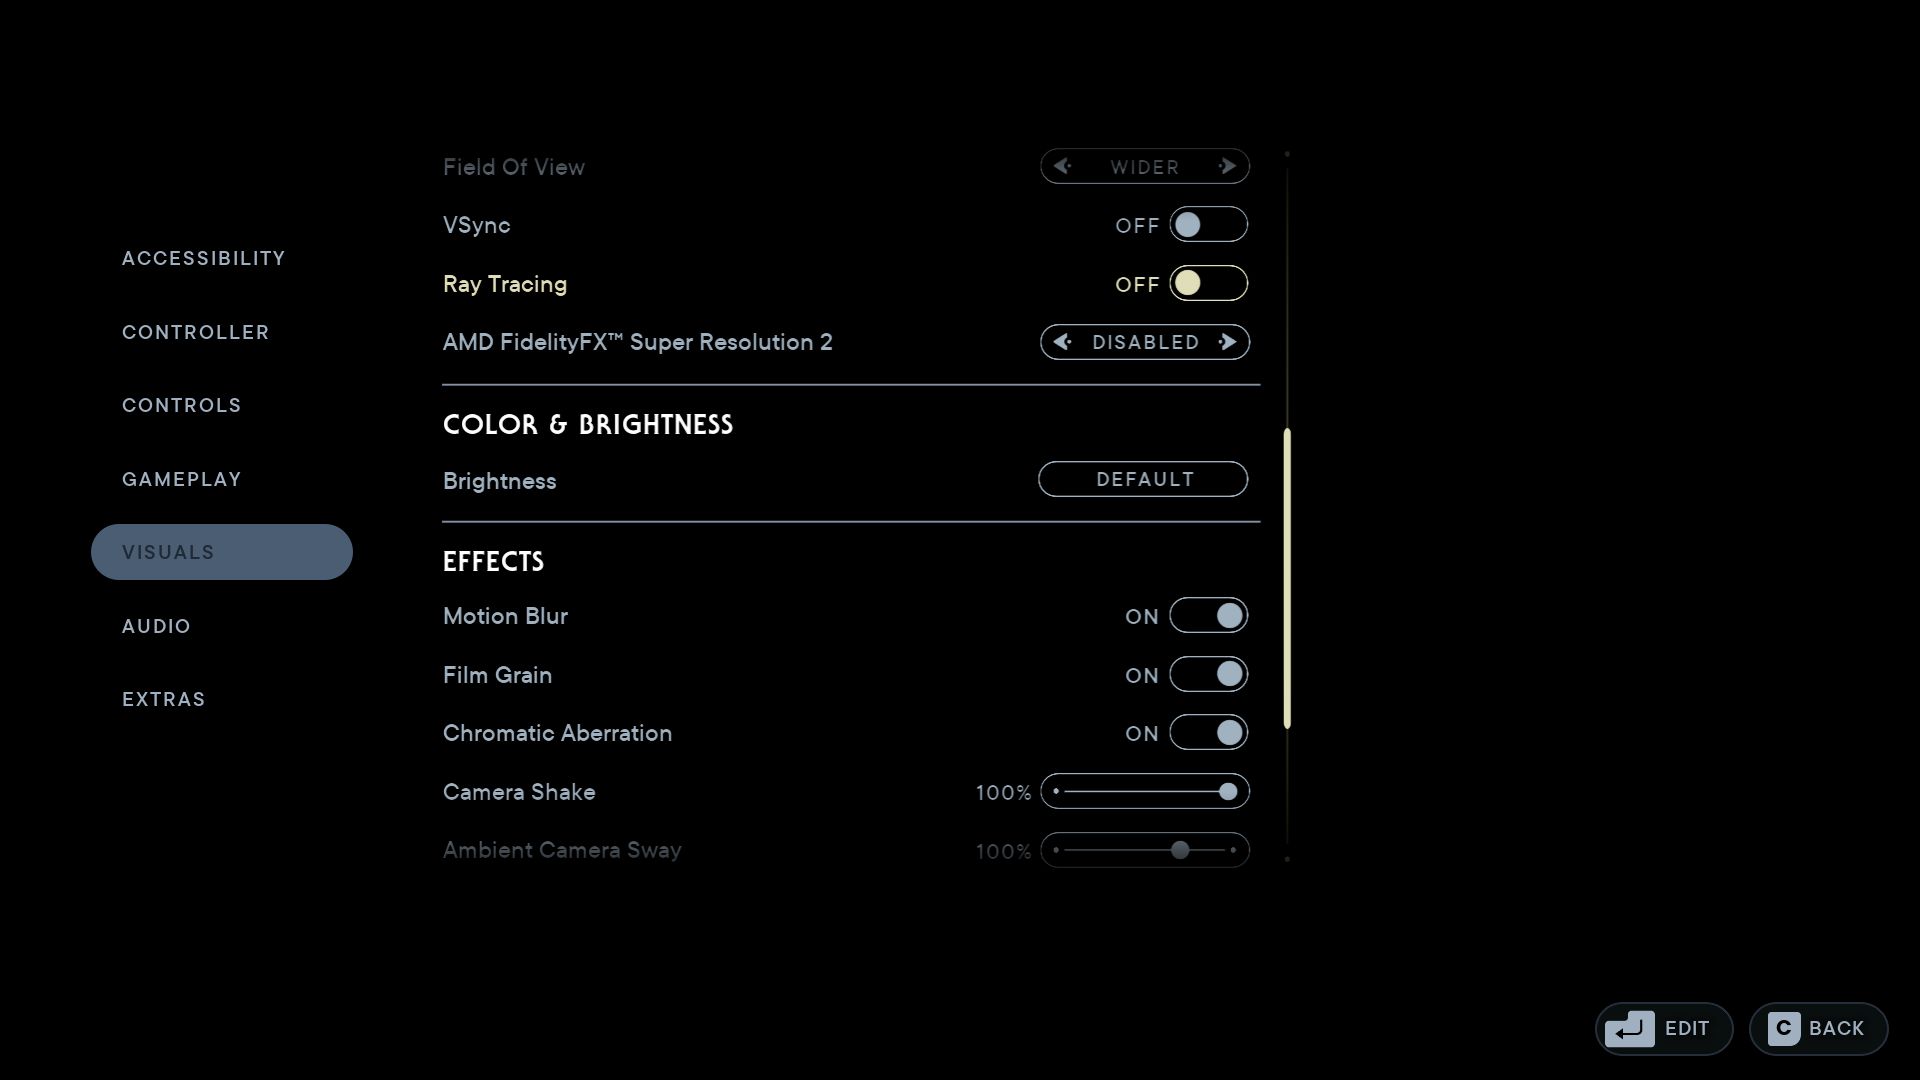
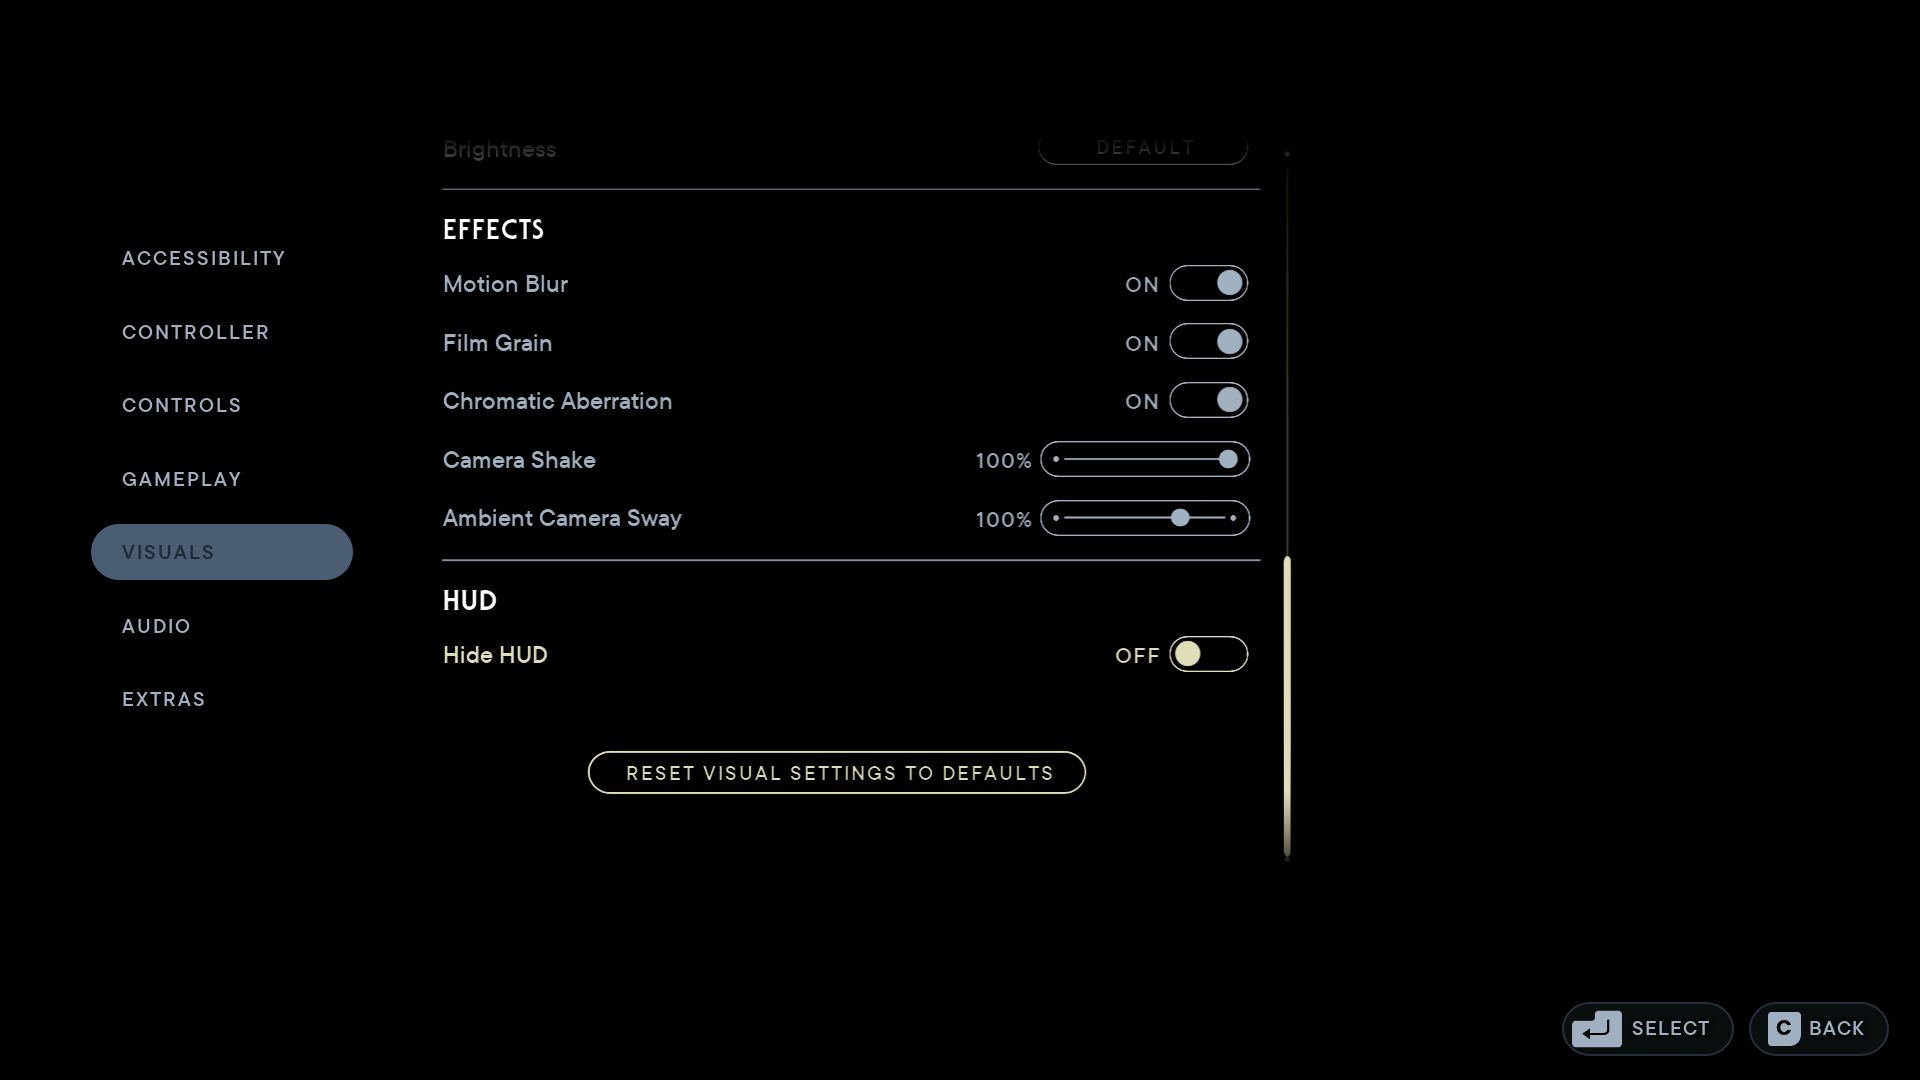
EA(或开发商Respawn)可以改进的一件事是图形菜单。一方面,游戏是为使用游戏手柄而设计的,所以使用鼠标/键盘被证明是有点棘手的。另一方面,任何一个单独的选项旁边甚至都没有解释(至少更改后无需重启游戏即可应用)。虽然你可能会在上部改变分辨率,并有选择地选择一个预设--在中间部分,有V-Sync、光线追踪和FSR 2的各种按钮(DLSS目前不可用)。底部的颜色、效果和HUD选项应该不会对游戏的性能产生明显的影响。

绝地求生者
绝地求生者
绝地求生者
绝地求生者
绝地求生者
绝地求生者

可悲的是,每次启动游戏时都要对游戏文件进行优化,这在今天已经成为一种常态。即便如此,这个过程也在不断加快,例如,与《最后的我们》相比 最后的我们》(The Last of Us- 相比,它在这方面几乎创造了新的负面记录。另一方面,这款游戏需要相当长的时间来下载,其大小为130GB。

绝地求生者
绝地求生者
绝地求生者

基准

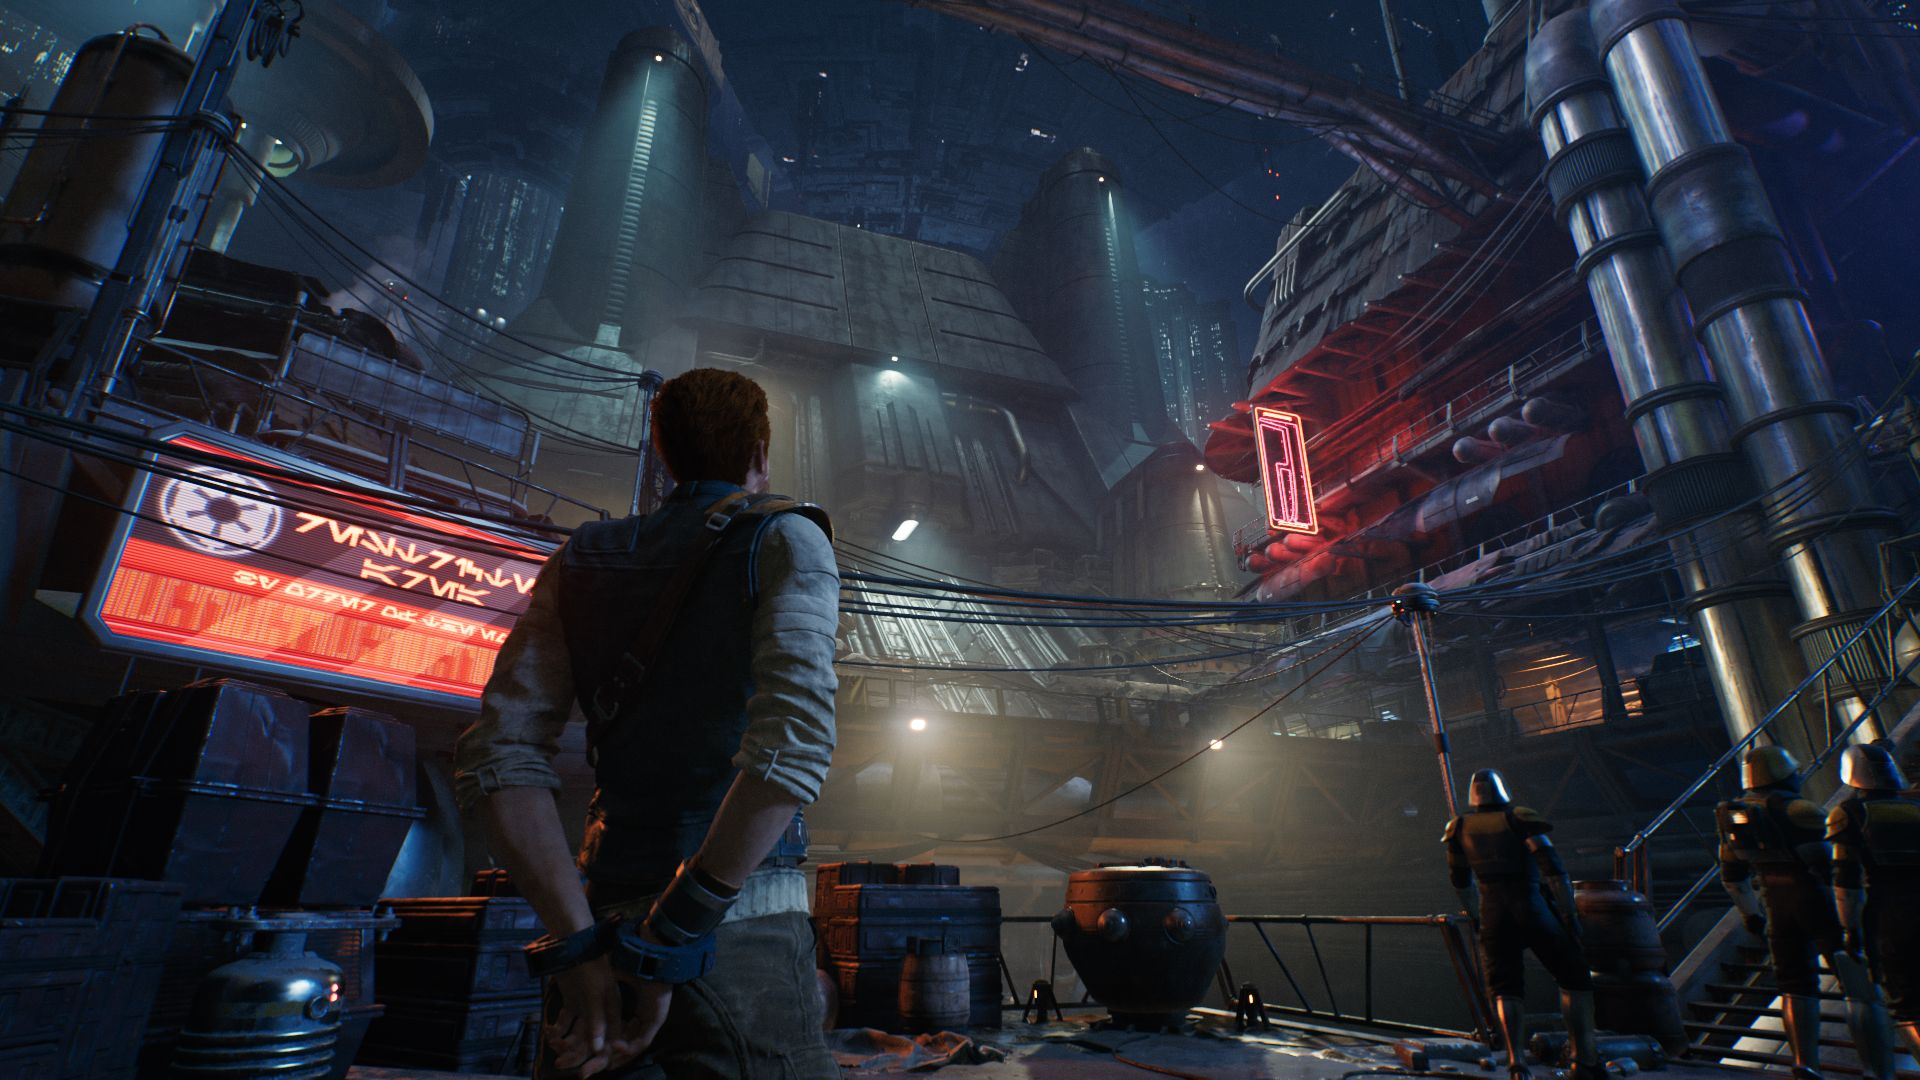
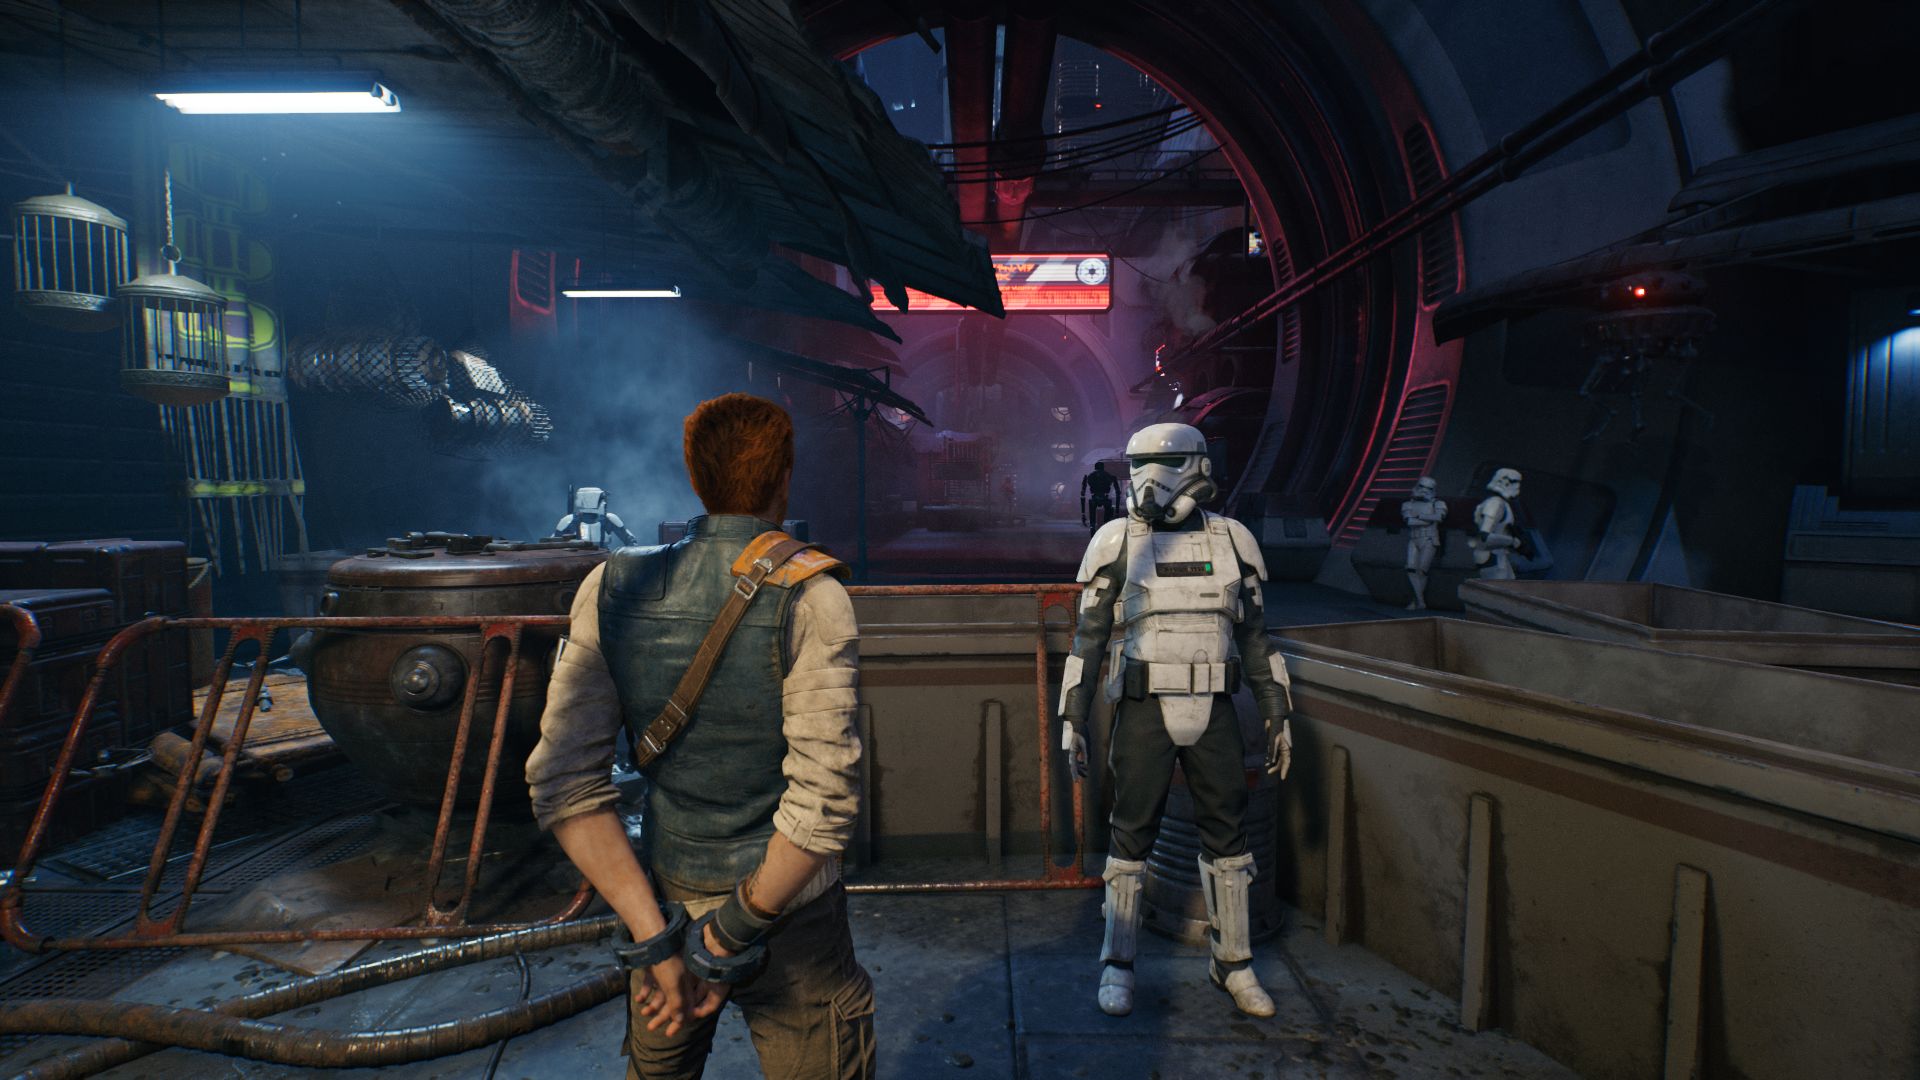
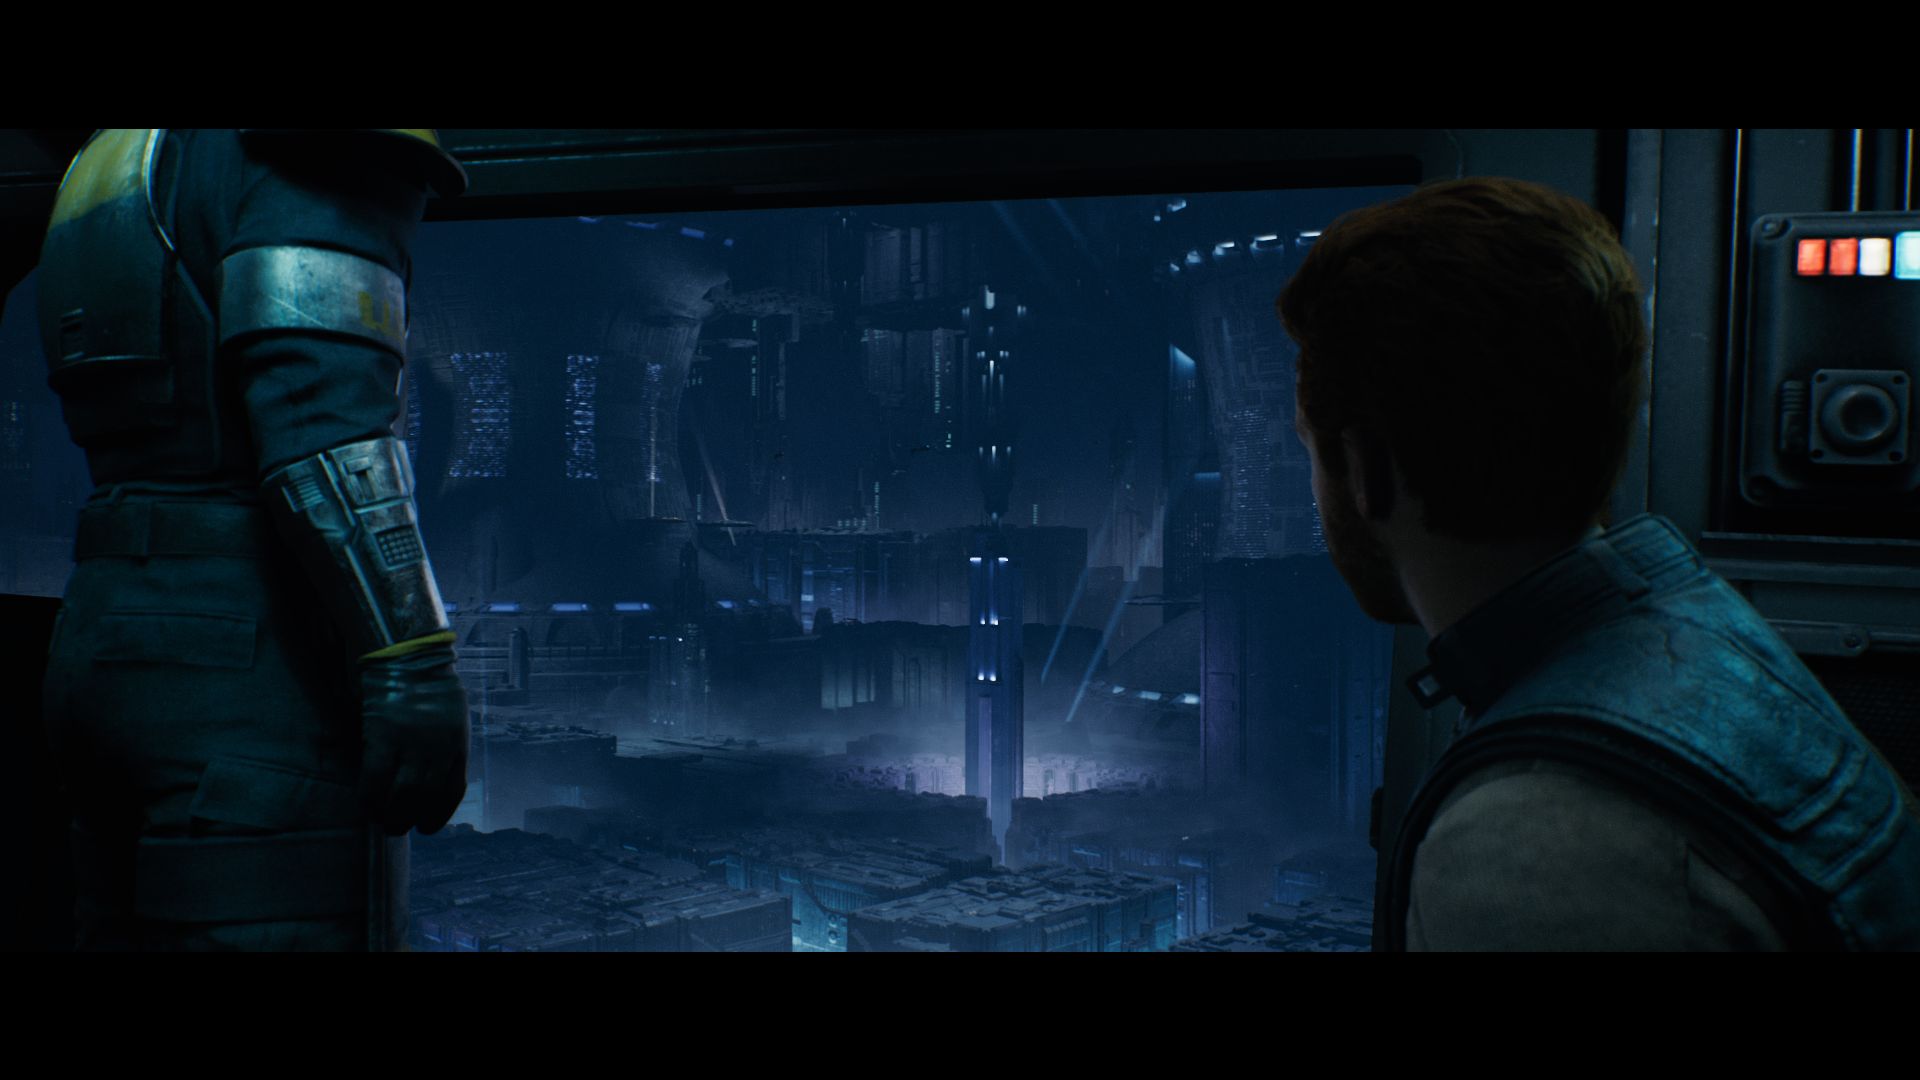
我们用游戏的开头来测量速度,在那里,戴着手铐的主角被引向科罗斯坎特的当地坏人。使用工具CapFrameX,我们记录了30秒的设定路线。你可以在下面的视频中看一下这个序列。

结果


FHD (1,920 x 1,080)

即使使用更强大的iGPU,如Radeon 680M的情况下,游戏在任何超过低设置和分辨率的情况下都很吃力。你真的不应该指望使用预设的低分辨率能超过1,920 x 1,080像素。然而,目前的中端GPU能够比较好地管理全高清。例如,一个RTX 4050使用高预设的TGP能够以超过60帧的速度运行游戏,使用预设的Epic能够达到约50帧。

Star Wars Jedi Survivor
    1920x1080 Low Preset     1920x1080 Medium Preset     1920x1080 High Preset     1920x1080 Epic Preset
AMD Radeon RX 7900 XTX, i9-12900K
Desktop-PC
128.9 (22.9min, 61.9P0.1, 86.5P1) fps ∼75%
127.4 (22.4min, 51.1P0.1, 86.5P1) fps ∼76%
123.8 (26.2min, 43.5P0.1, 87.2P1) fps ∼69%
NVIDIA GeForce RTX 4080, i9-12900K
Desktop-PC
119 (33.3min, 48.6P0.1, 85.9P1) fps ∼69%
116.6 (19.7min, 50.4P0.1, 81.8P1) fps ∼70%
116 (24.9min, 42.6P0.1, 84.6P1) fps ∼64%
NVIDIA GeForce RTX 4090 Laptop GPU, i9-13900HX
XMG Neo 17 E23
113.9 (19.7min, 49P0.1, 76.1P1) fps ∼66%
108.6 (15.8min, 29.8P0.1, 67.4P1) fps ∼65%
108.4 (15.1min, 36.5P0.1, 71.1P1) fps ∼60%
NVIDIA GeForce RTX 4080 Laptop GPU, i9-13900HX
Schenker Key 17 Pro E23
108.7 (27.9min, 41.5P0.1, 78.7P1) fps ∼63%
105.7 (18.5min, 41.7P0.1, 77.1P1) fps ∼63%
102.2 (20.3min, 41.7P0.1, 73.4P1) fps ∼57%
NVIDIA GeForce RTX 4060 Laptop GPU, i9-13900HX
XMG Pro 15 E23
94.1 (26.5min, 41.6P0.1, 66.8P1) fps ∼55%
77.6 (12min, 25.9P0.1, 53.8P1) fps ∼47%
63 (19.4min, 26.6P0.1, 45.4P1) fps ∼35%
NVIDIA GeForce RTX 4050 Laptop GPU, i9-13900HX
XMG Focus 15 E23
85.8 (22.3min, 42.7P0.1, 62.8P1) fps ∼50%
65.9 (20.5min, 27.9P0.1, 44.5P1) fps ∼40%
52 (17.7min, 24.4P0.1, 37.2P1) fps ∼29%
AMD Radeon RX 6800S, R9 6900HS
Asus ROG Zephyrus G14
68.6 (18.4min, 28.2P0.1, 49P1) fps ∼73%
66 (16.7min, 28.7P0.1, 44.2P1) fps ∼38%
61.2 (14min, 23.8P0.1, 38.3P1) fps ∼37%
51.2 (12min, 17.8P0.1, 38.4P1) fps ∼28%
AMD Radeon 680M, R9 6900HS
Asus ROG Zephyrus G14
40.2 (18.4min, 19.4P0.1, 28.7P1) fps ∼43%
27.3 (14.2min, 14.5P0.1, 17.1P1) fps ∼16%
19.7 (10.1min, 11P0.1, 13.4P1) fps ∼12%
15.4 (8.22min, 8.38P0.1, 11P1) fps ∼9%

QHD (2,560 x 1,440)

任何想在2560×1440像素和最大设置下玩《绝地求生》的人,肯定至少需要一台GeForce RTX 4060或类似设备(同样是高TGP)。

Star Wars Jedi Survivor
    2560x1440 Epic Preset
AMD Radeon RX 7900 XTX, i9-12900K
Desktop-PC
112.4 (23.6min, 45.1P0.1, 79.7P1) fps ∼75%
NVIDIA GeForce RTX 4080, i9-12900K
Desktop-PC
101.9 (15.3min, 44P0.1, 74.3P1) fps ∼68%
NVIDIA GeForce RTX 4090 Laptop GPU, i9-13900HX
XMG Neo 17 E23
83 (18.6min, 40.3P0.1, 58.4P1) fps ∼55%
NVIDIA GeForce RTX 4080 Laptop GPU, i9-13900HX
Schenker Key 17 Pro E23
72.5 (20.5min, 35.8P0.1, 54.9P1) fps ∼48%
NVIDIA GeForce RTX 4060 Laptop GPU, i9-13900HX
XMG Pro 15 E23
39.7 (19.2min, 20.9P0.1, 30.5P1) fps ∼26%
NVIDIA GeForce RTX 4050 Laptop GPU, i9-13900HX
XMG Focus 15 E23
32.5 (12.3min, 17.6P0.1, 24.4P1) fps ∼22%

UHD (3,840 x 2,160)

游戏在4K时绝对会成为一个资源占用者。你至少需要一台带有RTX 4080RTX 4090才能在3,840 x 2,160像素下使用预设的Epic运行游戏,同时仍然保持体面的帧率--这里还假设你有高TGP设置的选项。

Star Wars Jedi Survivor
    3840x2160 Epic Preset
AMD Radeon RX 7900 XTX, i9-12900K
Desktop-PC
56.6 (16.7min, 25.9P0.1, 45P1) fps ∼41%
NVIDIA GeForce RTX 4080, i9-12900K
Desktop-PC
54.3 (21.1min, 29.4P0.1, 41.3P1) fps ∼39%
NVIDIA GeForce RTX 4090 Laptop GPU, i9-13900HX
XMG Neo 17 E23
42.3 (7.45min, 12.9P0.1, 26.8P1) fps ∼31%
NVIDIA GeForce RTX 4080 Laptop GPU, i9-13900HX
Schenker Key 17 Pro E23
35.3 (16.4min, 23.2P0.1, 26.9P1) fps ∼26%
NVIDIA GeForce RTX 4060 Laptop GPU, i9-13900HX
XMG Pro 15 E23
19.2 (12.4min, 13.1P0.1, 15P1) fps ∼14%
NVIDIA GeForce RTX 4050 Laptop GPU, i9-13900HX
XMG Focus 15 E23
15.8 (10.6min, 10.9P0.1, 13.2P1) fps ∼11%

光线追踪

激活光线追踪的性能损失既不低,也不特别陡峭。只要你将分辨率限制在1,920 x 1,080像素,RTX 4050或RTX 4060就能很好地运行该游戏。对于更好的分辨率,我们会建议使用FSR。

Star Wars Jedi Survivor
    1920x1080 Epic Preset + Ray Tracing
NVIDIA GeForce RTX 4080, i9-12900K
Desktop-PC
86.3 (22min, 30.3P0.1, 58.1P1) fps ∼70%
NVIDIA GeForce RTX 4090 Laptop GPU, i9-13900HX
XMG Neo 17 E23
80.5 (6.02min, 10.5P0.1, 33.2P1) fps ∼65%
AMD Radeon RX 7900 XTX, i9-12900K
Desktop-PC
79.3 (8.89min, 22.2P0.1, 52.8P1) fps ∼64%
NVIDIA GeForce RTX 4080 Laptop GPU, i9-13900HX
Schenker Key 17 Pro E23
76.9 (11.4min, 20.1P0.1, 50.9P1) fps ∼62%
NVIDIA GeForce RTX 4060 Laptop GPU, i9-13900HX
XMG Pro 15 E23
48.9 (11.8min, 14.6P0.1, 35.6P1) fps ∼39%
NVIDIA GeForce RTX 4050 Laptop GPU, i9-13900HX
XMG Focus 15 E23
41.3 (11min, 18.7P0.1, 29.6P1) fps ∼33%
AMD Radeon RX 6800S, R9 6900HS
Asus ROG Zephyrus G14
37.2 (9.11min, 9.76P0.1, 26.3P1) fps ∼30%

注意事项

由于游戏测试需要大量时间,而且经常受到安装或激活限制,因此在发布时我们只能提供部分基准测试。我们将在未来几天和几周内增加更多的显卡。

Overview

Show Restrictions
PosModel< PrevNext >Star Wars Jedi Survivor
 Star Wars Jedi Survivor (2023)
low
1920x1080
Low Preset
med.
1920x1080
Medium Preset
high
1920x1080
High Preset
ultra
1920x1080
Epic Preset
QHD
2560x1440
Epic Preset
4K
3840x2160
Epic Preset
NVIDIA GeForce RTX 4090
190n3
186.1n3
186n3
158.5n3
150.3n3
82.3n3
AMD Radeon RX 7900 XTX
186.2
155.65n2
151.45n2
146.3n2
117.75n2
59.05n2
NVIDIA GeForce RTX 4080 Super
188.65n2
184.05n2
173.95n2
169.7n2
117.35n2
57.95n2
NVIDIA GeForce RTX 4080
119
116.6
116
101.9
54.3
NVIDIA GeForce RTX 4070 Ti
145.5
139.9
138.2
128.4
87.4
42.9
AMD Radeon RX 7900 GRE
131.35n2
125n2
116.95n2
112.9n2
84.5n2
41.15n2
AMD Radeon RX 6950 XT
156
147.5
139.4
132.3
86.2
41.8
NVIDIA GeForce RTX 4090 Laptop GPU
131.2
120.75n2
107.3n4
108.4n5
84.4n5
42.3n5
NVIDIA GeForce RTX 3090
158.1
137.1
133.4
125.8
82.8
41.7
AMD Radeon RX 7800 XT
147.9
135.8
126.6
117.5
76
37.1
NVIDIA GeForce RTX 4080 Laptop GPU
108.7
105.7
102.2
72.5
35.3
NVIDIA GeForce RTX 4070
127.7
130.2
121.2
106.7
69.6
34.3
AMD Radeon RX 6800
128.9
113.7
104.1
97
62.1
29.9
AMD Radeon RX 7700 XT
129.9
115.6
107.5
101
62.3
30.3
NVIDIA Titan RTX
124.1
108.8
100.6
95.3
60
30.6
NVIDIA GeForce RTX 3070 Ti
123.7
109.1
96.4
100.5
61.1
30.3
NVIDIA GeForce RTX 4060 Ti 16G
113.6
98.3
91.7
85.3
53.5
25
NVIDIA GeForce RTX 4060 Ti 8G
114.2n3
98.6n3
91.3n3
84.7n3
54.2n3
25.4n3
NVIDIA GeForce RTX 3080 Ti Laptop GPU
84.1
79.4
75.8
49.5
24.8
PosModel< PrevNext >Star Wars Jedi Survivor
low med. high ultra QHD 4K
NVIDIA GeForce RTX 4070 Laptop GPU
84n5
78.3n6
75.6n7
72.05n8
45.85n8
24.2n3
AMD Radeon RX 6750 XT
107.8
94.7
87.5
82
51.7
24.8
AMD Radeon RX 6700 XT
99.6
88
82
76.3
48
22.6
NVIDIA GeForce RTX 3080 Laptop GPU
83.5
73
68.1
67.35n2
45.1
23.2
NVIDIA GeForce RTX 3060 Ti
100.7
82
87.4
78
49
23.8
Intel Arc A770
81.1
73.1
68.4
65.1
44
22.3
NVIDIA GeForce RTX 4060
85.1
74
69.3
65.4
40.8
19.3
AMD Radeon RX 7600
87.6
78.8
73.6
68.4
43
20.3
NVIDIA GeForce RTX 3070 Ti Laptop GPU
79.5
74.3
71.8
46
22.8
NVIDIA GeForce RTX 4060 Laptop GPU
76.1n4
69.1n5
65.4n8
60.85n10
38.25n10
18.8n2
AMD Radeon RX 6650 XT
82.4
73.8
69
63.9
39.1
18.7
NVIDIA GeForce RTX 3070 Laptop GPU
81.1
72.3
67.4
56.8n2
36.65n2
17.95n2
AMD Radeon RX 6800S
68.6
66
61.2
51.2
AMD Radeon RX 7600M XT
79.6
70.1
66
61.3
37.8
16.8
Intel Arc A750
75.9
67.2
63.3
58.9
39
19.5
Apple M3 Max 40-Core GPU
51
NVIDIA Titan X Pascal
67.7
60.3
56.2
52.7
34
17.3
NVIDIA GeForce RTX 2070 Super (Desktop)
87.1
74.4
69.7
65.6
41.6
20.2
AMD Radeon RX 5700 XT (Desktop)
76
65.7
60.8
57.3
36.5
18.7
AMD Radeon RX 7600S
61.2
57.5
53.8
33.7
15.5
PosModel< PrevNext >Star Wars Jedi Survivor
low med. high ultra QHD 4K
Intel Arc A580
66.3
59.6
55.9
52.8
32.7
16.5
NVIDIA GeForce RTX 2060 Super (Desktop)
72
62.2
57.1
54.2
33.7
16.8
AMD Radeon RX 6600
66.1
58
54.5
50.8
30.9
14.3
Apple M3 Pro 18-Core GPU
30
26
17
AMD Radeon RX 5700 (Desktop)
66.4
57.7
53.3
50.7
32.4
16.1
AMD Radeon RX 6600M
66.3n2
57.55n2
54.35n2
50.6n2
30.4n2
14.55n2
AMD Radeon RX 5600 XT (Desktop)
69.5
62.2
59.3
55.4
34.1
15.5
NVIDIA GeForce GTX 1660 Super (Desktop)
51.9
43.7
41.4
38.8
23.6
10.5
AMD Radeon RX 6500 XT
39.1
30.4
28.9
23.7
AMD Radeon RX 5500 XT (Desktop)
42.5
36.2
33.5
31.6
20.2
10.2
NVIDIA GeForce RTX 4050 Laptop GPU
63n3
58n5
56n7
50.7n7
31.75n4
15.8
Intel Arc A730M
47.35n2
42.55n2
39n2
36.45n2
11.6
NVIDIA GeForce GTX 1660 Ti Mobile
48.2
41.5
39.2
37
NVIDIA GeForce RTX 3050 Ti Laptop GPU
36.9
31
28.9
25.8
15.4
NVIDIA GeForce GTX 1660 (Desktop)
48.4
41
38.6
36.1
22.2
10.2
NVIDIA GeForce GTX 1650 Super (Desktop)
43.6
34.7
32.9
28.8
15.4
5.15
NVIDIA GeForce RTX 3050 4GB Laptop GPU
30.1n2
25.65n2
24.45n2
23.7n2
NVIDIA GeForce GTX 1060 Mobile
26.6
23.2
22.1
20.4
NVIDIA GeForce GTX 1650 Ti Mobile
31.8
26.2
24.2
23.7
Intel Arc A370M
23
19.7
19.2
17.7
PosModel< PrevNext >Star Wars Jedi Survivor
low med. high ultra QHD 4K
AMD Radeon RX 5500M
35.1
32.2
30.2
29.4
NVIDIA GeForce RTX 2050 Mobile
21.8
20.1
19.1
NVIDIA GeForce GTX 1650 Mobile
28.8
23.6
22.4
21.1
Intel Arc A380
26.1
22.8
21.6
20.4
AMD Radeon 780M
22.7
20
18.3
16.6
AMD Radeon 680M
40.2
27.3
19.7
15.4
NVIDIA GeForce GTX 1050 Mobile
15.6
13.8
13
12.3
AMD Radeon 660M
11.5
10.2
AMD Radeon RX 560X (Laptop)
15.7
13.5
12.2
NVIDIA GeForce MX350
9.32
AMD Radeon RX 550 (Laptop)
6.45
NVIDIA GeForce MX250
7.39
AMD Radeon RX Vega 10
7.29
AMD Radeon RX Vega 8 (Ryzen 4000/5000)
9.36
AMD Radeon RX Vega 6 (Ryzen 4000/5000)
7
AMD Radeon RX Vega 5
5.71
(-) * Smaller values are better. / n123 Number of benchmarks for this median value / * Approximate position


Legend
5Stutters – This game is very likely to stutter and have poor frame rates. Based on all known benchmarks using the specified graphical settings, average frame rates are expected to fall below 25fps
May Stutter – This graphics card has not been explicitly tested on this game. Based on interpolated information from surrounding graphics cards of similar performance levels, stutters and poor frame rates are expected.
30Fluent – Based on all known benchmarks using the specified graphical settings, this game should run at or above 25fps
40Fluent – Based on all known benchmarks using the specified graphical settings, this game should run at or above 35fps
60Fluent – Based on all known benchmarks using the specified graphical settings, this game should run at or above 58fps
May Run Fluently – This graphics card has not been explicitly tested on this game. Based on interpolated information from surrounding graphics cards of similar performance levels, fluent frame rates are expected.
?Uncertain – This graphics card experienced unexpected performance issues during testing for this game. A slower card may be able to achieve better and more consistent frame rates than this particular GPU running the same benchmark scene.
Uncertain – This graphics card has not been explicitly tested on this game and no reliable interpolation can be made based on the performances of surrounding cards of the same class or family.
The value in the fields displays the average frame rate of all values in the database. Move your cursor over the value to see individual results.

All test systems

设备 显卡 处理器 内存
笔记本电脑
XMG Neo 17 E23 NvidiaGeForce RTX 4090 @175 W TGP (16 GB GDDR6X) Intel Core i9-13900HX 2 x 16 GB DDR5
Schenker Key 17 Pro E23 NvidiaGeForce RTX 4080 @175 W TGP (12 GB GDDR6X) Intel Core i9-13900HX 2 x 16 GB DDR5
XMG Pro 15 E23 NvidiaGeForce RTX 4060 @140 W TGP (8 GB GDDR6) Intel Core i9-13900HX 2 x 16 GB DDR5
XMG Focus 15 E23 NvidiaGeForce RTX 4050 @140 W TGP (6 GB GDDR6) Intel Core i9-13900HX 2 x 16 GB DDR5
华硕ROG Zephyrus G14 AMD Radeon RX 6800S (8 GB GDDR6) & AMD Radeon 680M AMD Ryzen 9 6900HS 2 x 16 GB DDR5
塔式电脑
定制 I NvidiaGeForce RTX 4080 (16 GB GDDR6X)
AMD Radeon RX 7900 XTX (24 GB GDDR6)
Intel Core i9-12900K 2 x 16 GB DDR4
Custom II PalitGeForce RTX 4090 GameRock OC (24 GB GDDR6X)
Nvidia GeForce RTX 3090 FE (24 GB GDDR6X)
Nvidia GeForce RTX 3060 Ti (8 GB GDDR6X)
NvidiaTitan RTX (24 GB GDDR6)
lNvidia GeForce RTX2070 Super (8 GB GDDR6)
Nvidia GeForce RTX 2060 Super (8 GB GDDR6)
KFA2 GeForce GTX 1660 Super (6 GB GDDR6)
PNY GeForce GTX 1660 (6 GB GDDR5)
KFA2 GeForce GTX 1650 Super (4 GB GDDR6)
AMD RadeonRX 6950 XT (16 GB DDR6)
AMD Radeon RX 6800 (16 GB DDR6)
AMD Radeon RX 6700 XT (12 GB DDR6)
AMD Radeon RX 6650 XT (8 GB GDDR6)
AMD Radeon RX 6600 (8 GB GDDR6)
AMDRadeon RX 5700 XT (8 GB GDDR6)
AMD Radeon RX 5700 (8 GB GDDR6)
AMD Radeon RX 5600 XT (6 GB GDDR6)
AMD Radeon RX 5500 XT (8 GB GDDR6)
AMD Ryzen 9 7950X 2 x 16 GB DDR5
迷你电脑
Minisforum NUCXi7 NvidiaGeForce RTX 3070 @125 W TGP(8 GB GDDR6) Intel Core i7-11800H 2 x 8 GB DDR4
Minisforum HX99G AMD Radeon RX 6600M @100 W TGP(8 GB GDDR6) AMD Ryzen 9 6900HX 2 x 16 GB DDR5
Morefine S500+ AMD Radeon RX Vega 8 AMD Ryzen 9 5900HX 2 x 16 GB DDR4
Zotac ZBOX CI665 Nano Intel Iris Xe Graphics G7 (96 CUs) Intel Core i7-1165G7 2 x 8 GB DDR4
4K显示器 操作系统 Nvidia驱动 AMD驱动
Philips Brilliance 329P9H, Gigabyte M32U Windows 11 ForceWare 531.79 Adrenalin 23.4.3
Please share our article, every link counts!
> Notebookcheck中文版(NBC中国) > 评测 > 星球大战绝地求生》评测:笔记本电脑和台式机基准测试
Florian Glaser, 2023-05- 6 (Update: 2023-05- 6)