Notebookcheck Logo

最后的我们》第一部分回顾:笔记本电脑和台式机基准测试

过山车般的情绪。 PC粉丝为《最后的我们》的发行等待了近10年。其结果是一个真正的过山车--从情感和技术的角度来看。我们对这款PC游戏进行了基准测试。
Gaming Laptop / Notebook Desktop Gamecheck
最后的我们》(The Last of Us

技术方面

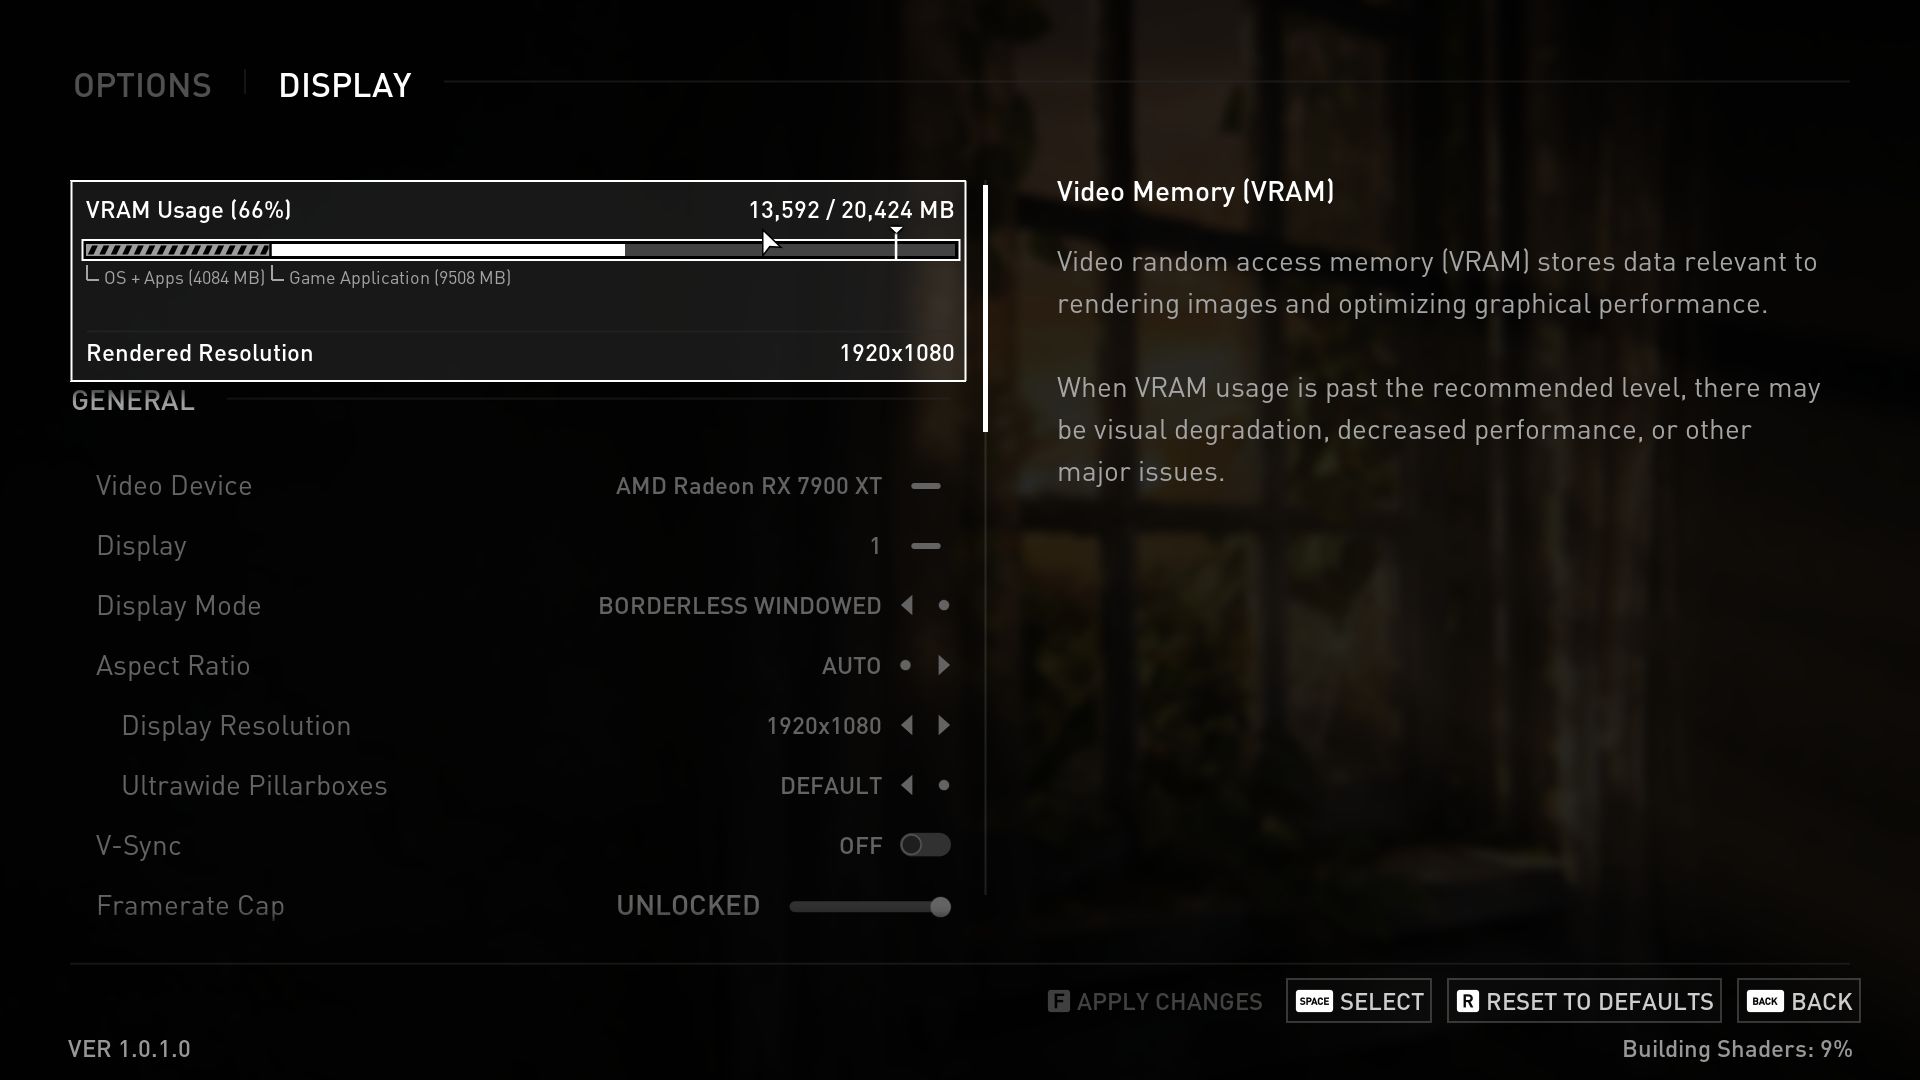
一个具有荒谬的VRAM消耗的等待模拟器:这就是目前对PC版《最后的我们》的总结。难怪这款动作冒险游戏在Steam上遭到了负面评论的轰炸。混乱从最初的几秒钟开始:着色器的安装至少需要半个小时--即使在顶级PC上。这是一个新的记录--而且不是一个好的方式。但相比之下,漫长的加载时间感觉无害。

昂贵的VRAM消耗原来和安装着色器所需的时间一样是个麻烦事。特别是6GB或更少的显卡很快就会遇到很多麻烦。这导致我们的测试设备与一个GeForce RTX 3060在试图以1,920 x 1,080像素的超预设运行游戏时持续崩溃。Nvidia多年来给他们的显卡提供了太少的VRAM,这并没有什么帮助--尽管不得不说,《最后的我们》在这方面的程序设计普遍很糟糕。

最后的我们》(The Last of Us

乍一看,这个表现不佳的游戏令人惊讶,因为索尼以前的PC改编作品(如 蜘蛛人迈尔斯-莫拉莱斯,消失的日子&战争之神)都给人留下了相当好的印象。这里的问题似乎是IronGalaxy ,负责PC移植的开发商,他们在过去并不总是提供干净的工作(关键词:Batman Arkham Knight )。但是不管谁对这个技术问题负责,我们的观点是《最后的我们》不应该以这种形式在PC上发布。我们只希望未来的更新能够处理所有这些问题。

归根结底,这款游戏绝对有潜力可以享受--只要你有一块强大的显卡,有大量的VRAM。重制版的图形总体上看起来相当现代和最新的。纹理以及更高层次的效果(烟、火、反射......)和人物都很好。该游戏在其细节水平和伟大的氛围方面得到了一些真正的分数。我们喜欢它的电影制作和视频序列与游戏之间的大部分动态过渡。另一个积极的方面是游戏中引人入胜的故事性。

最后的我们》(The Last of Us

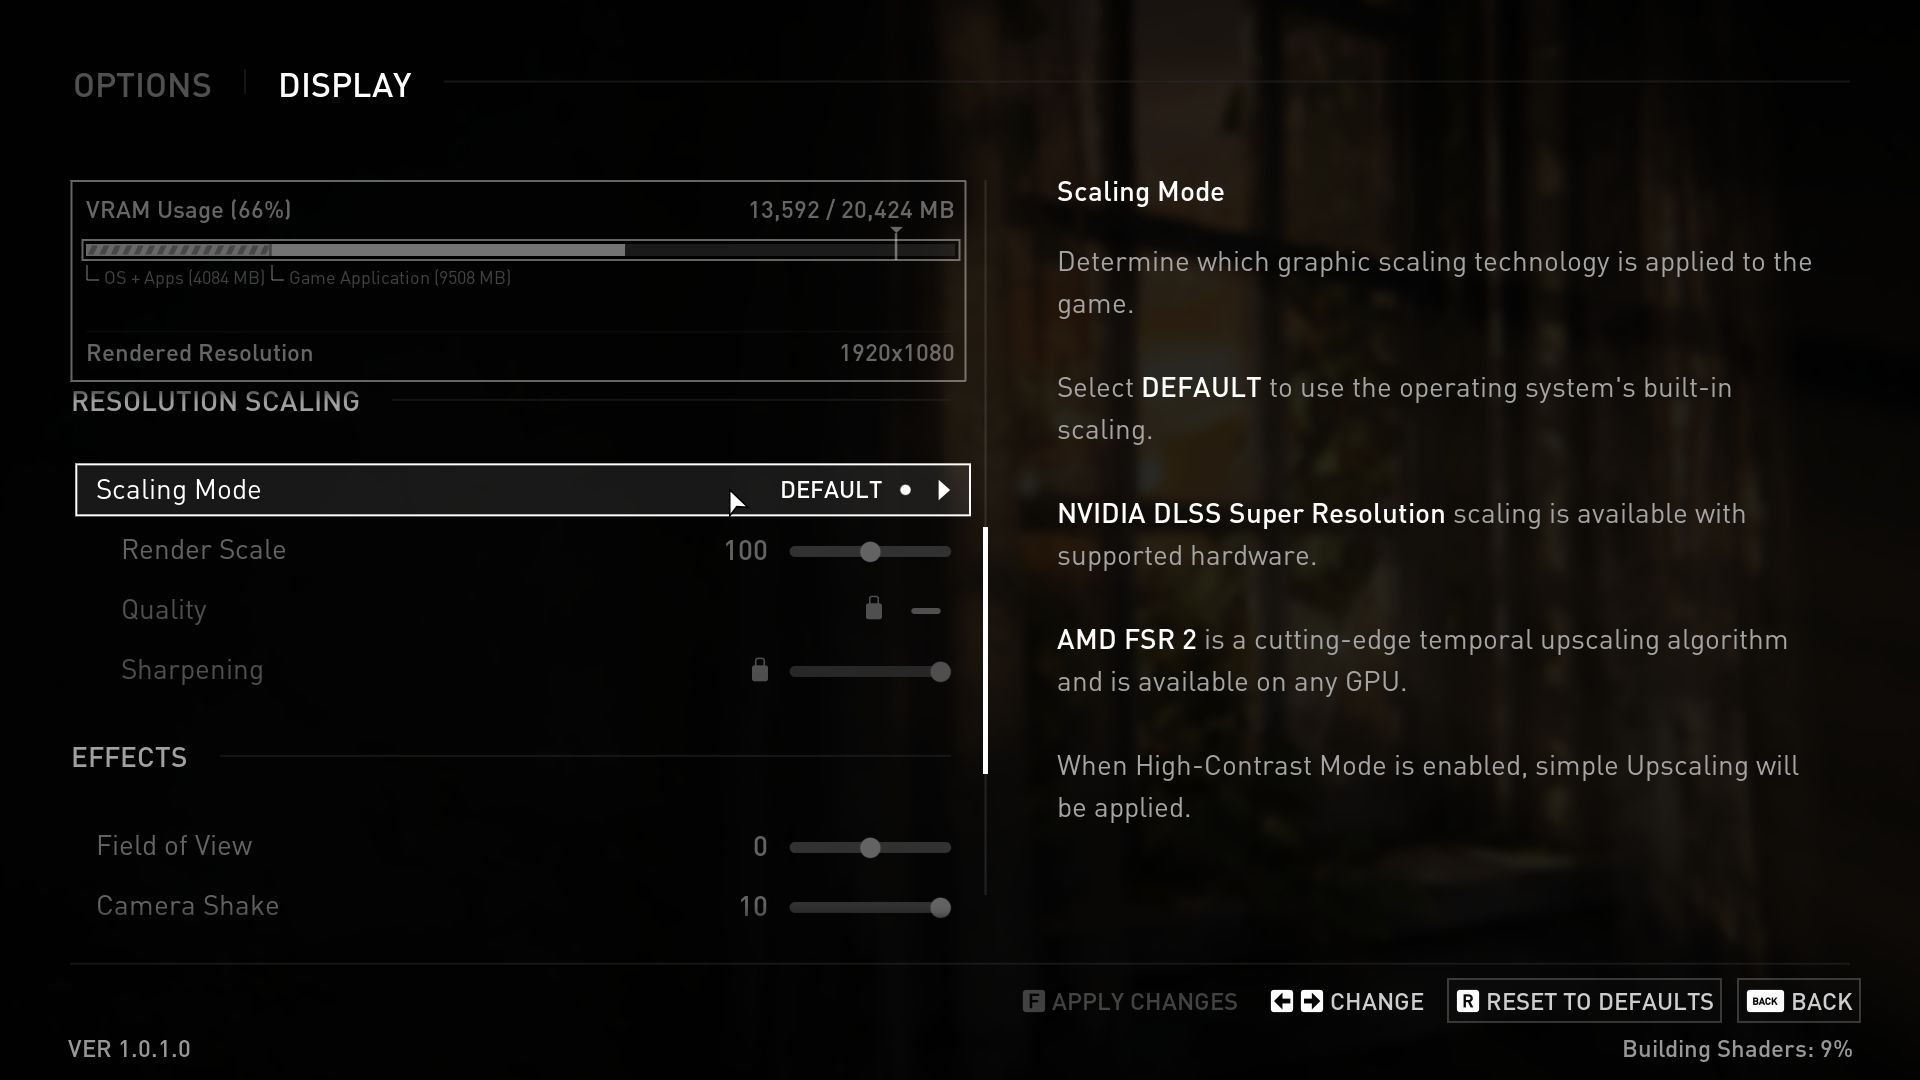
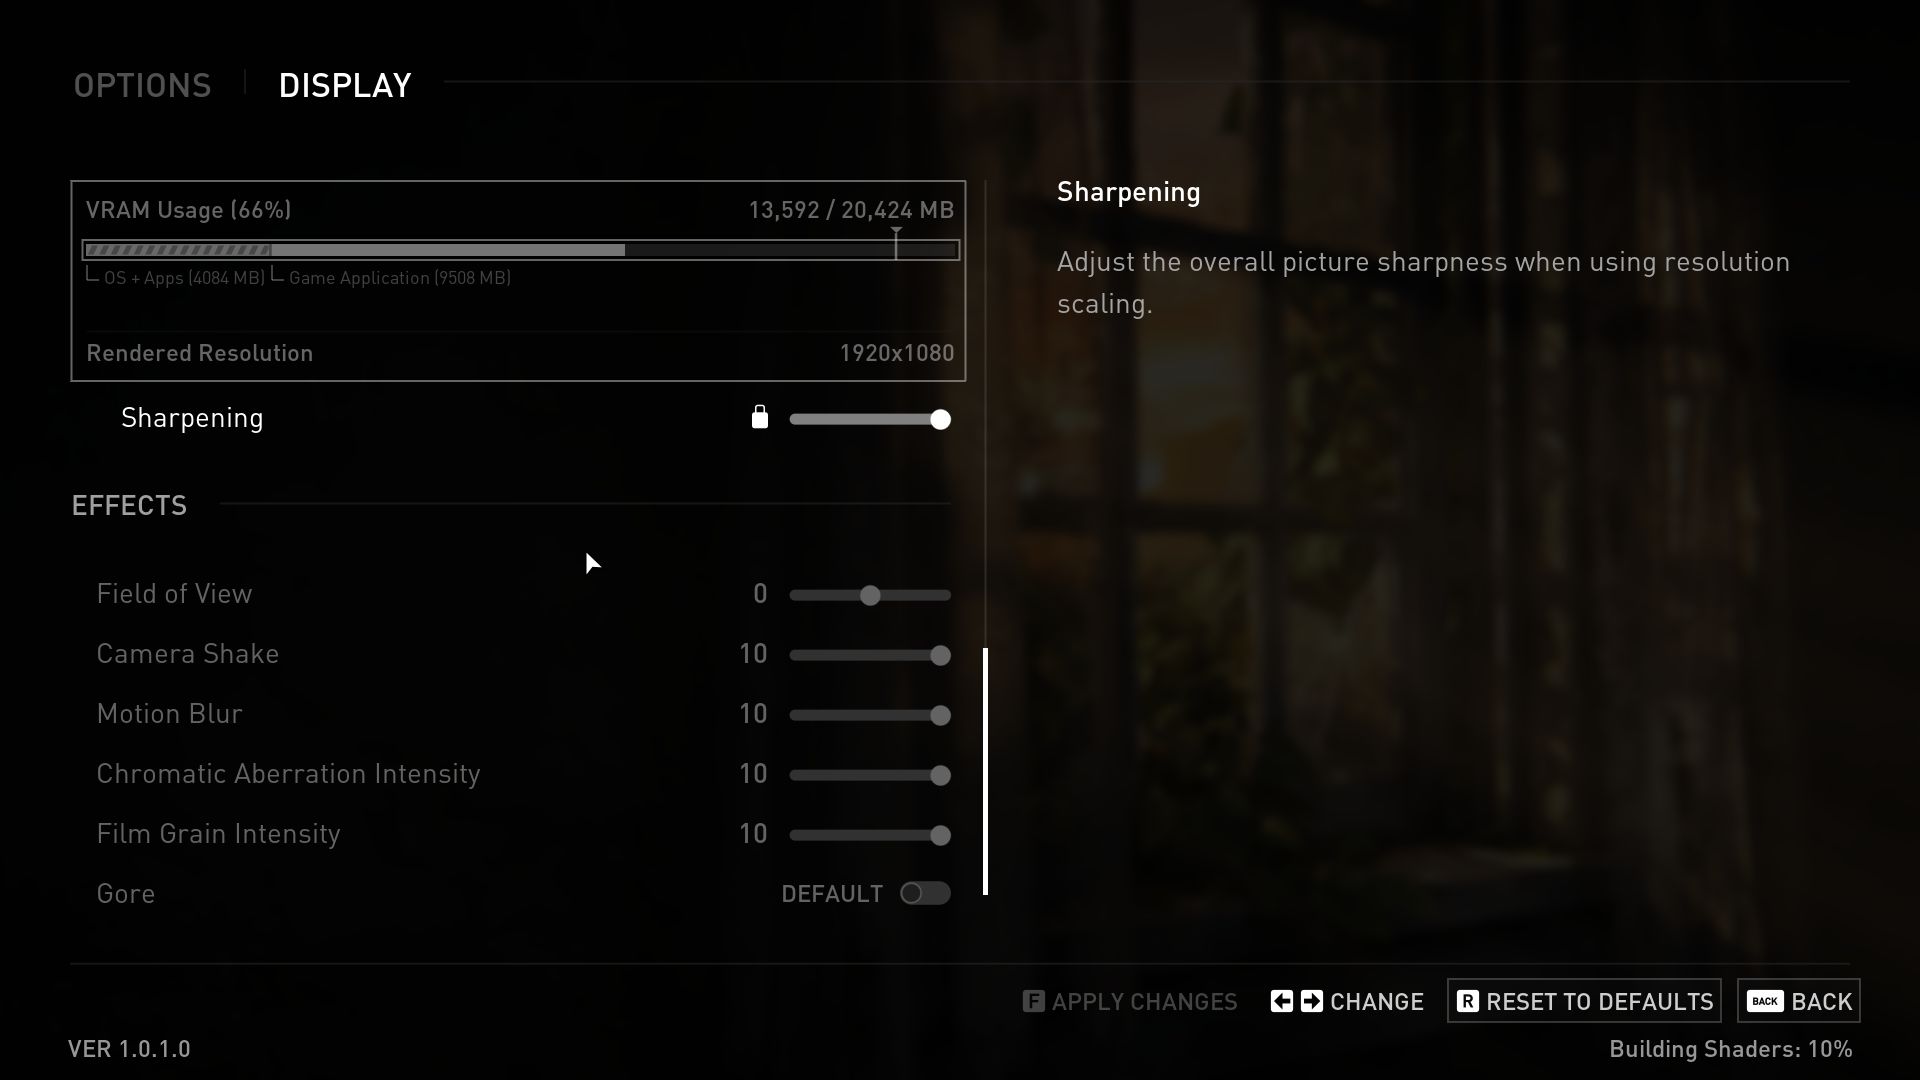
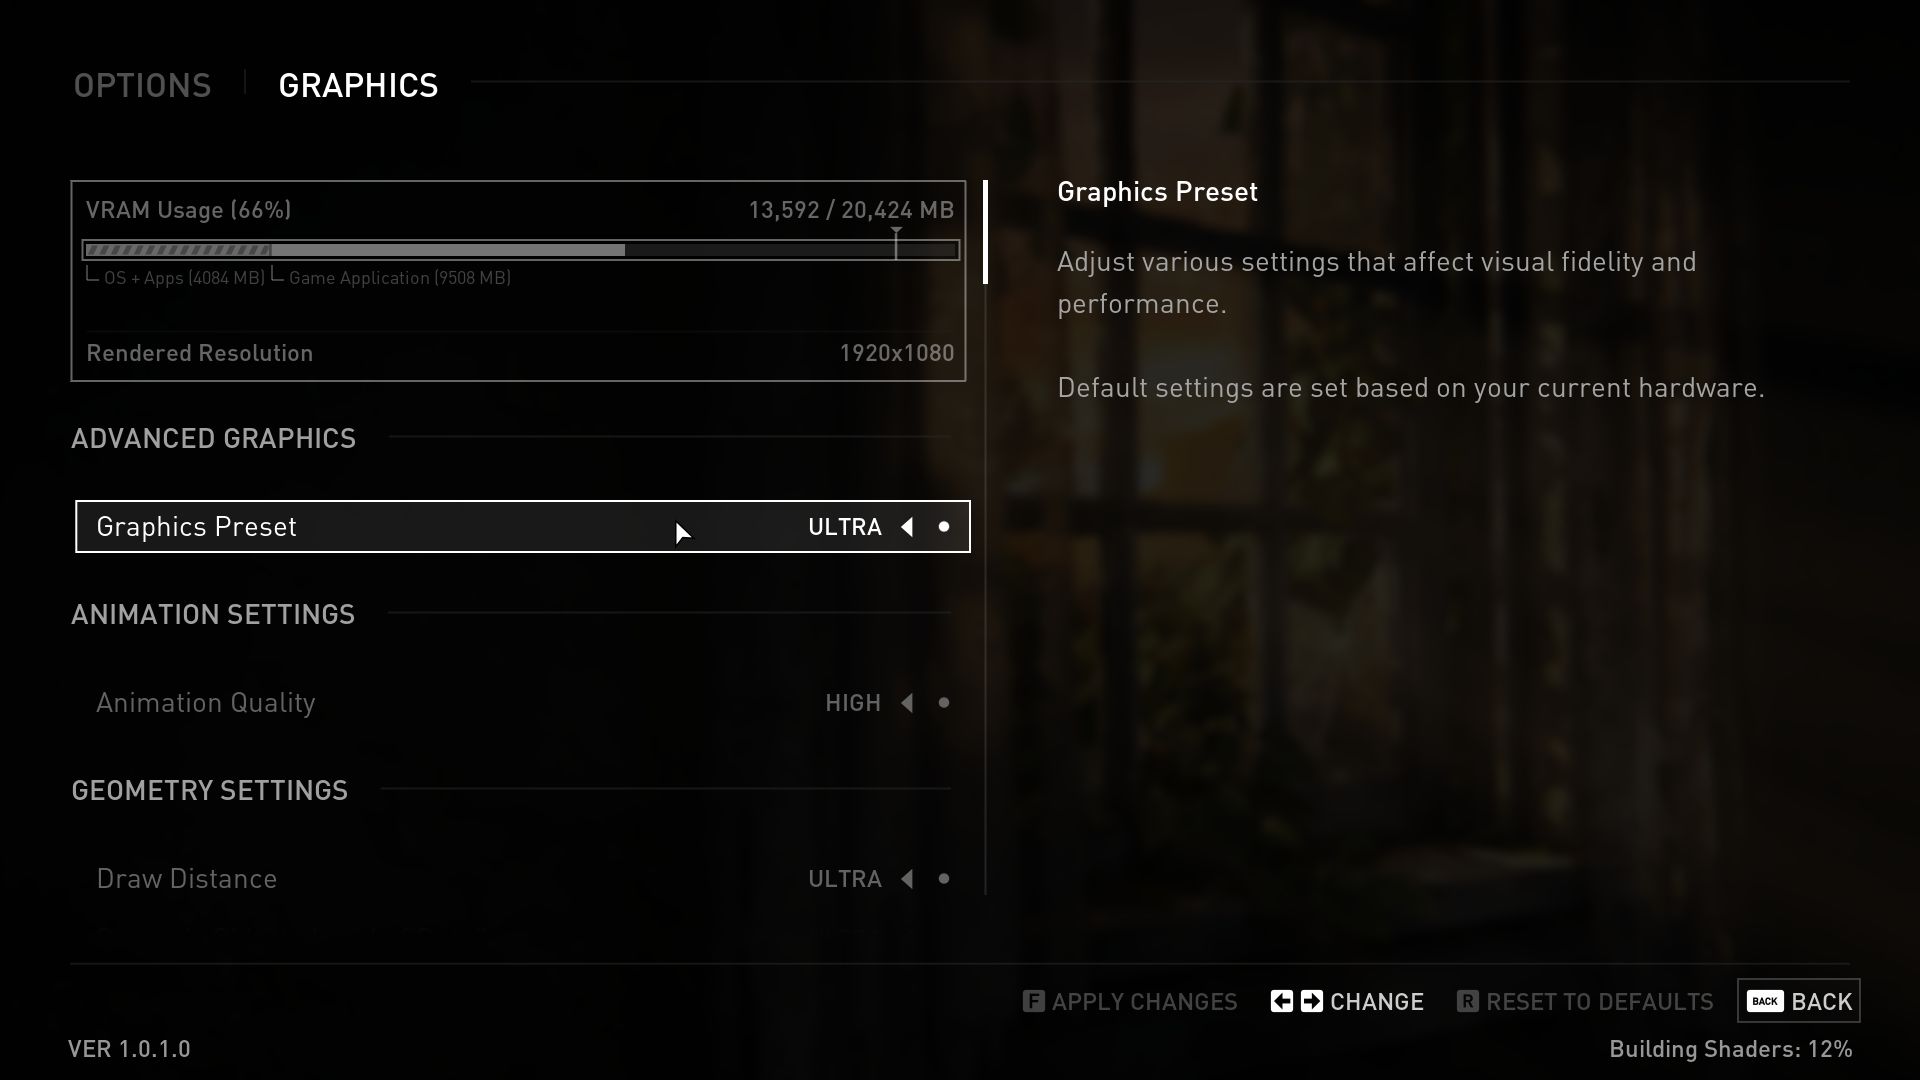
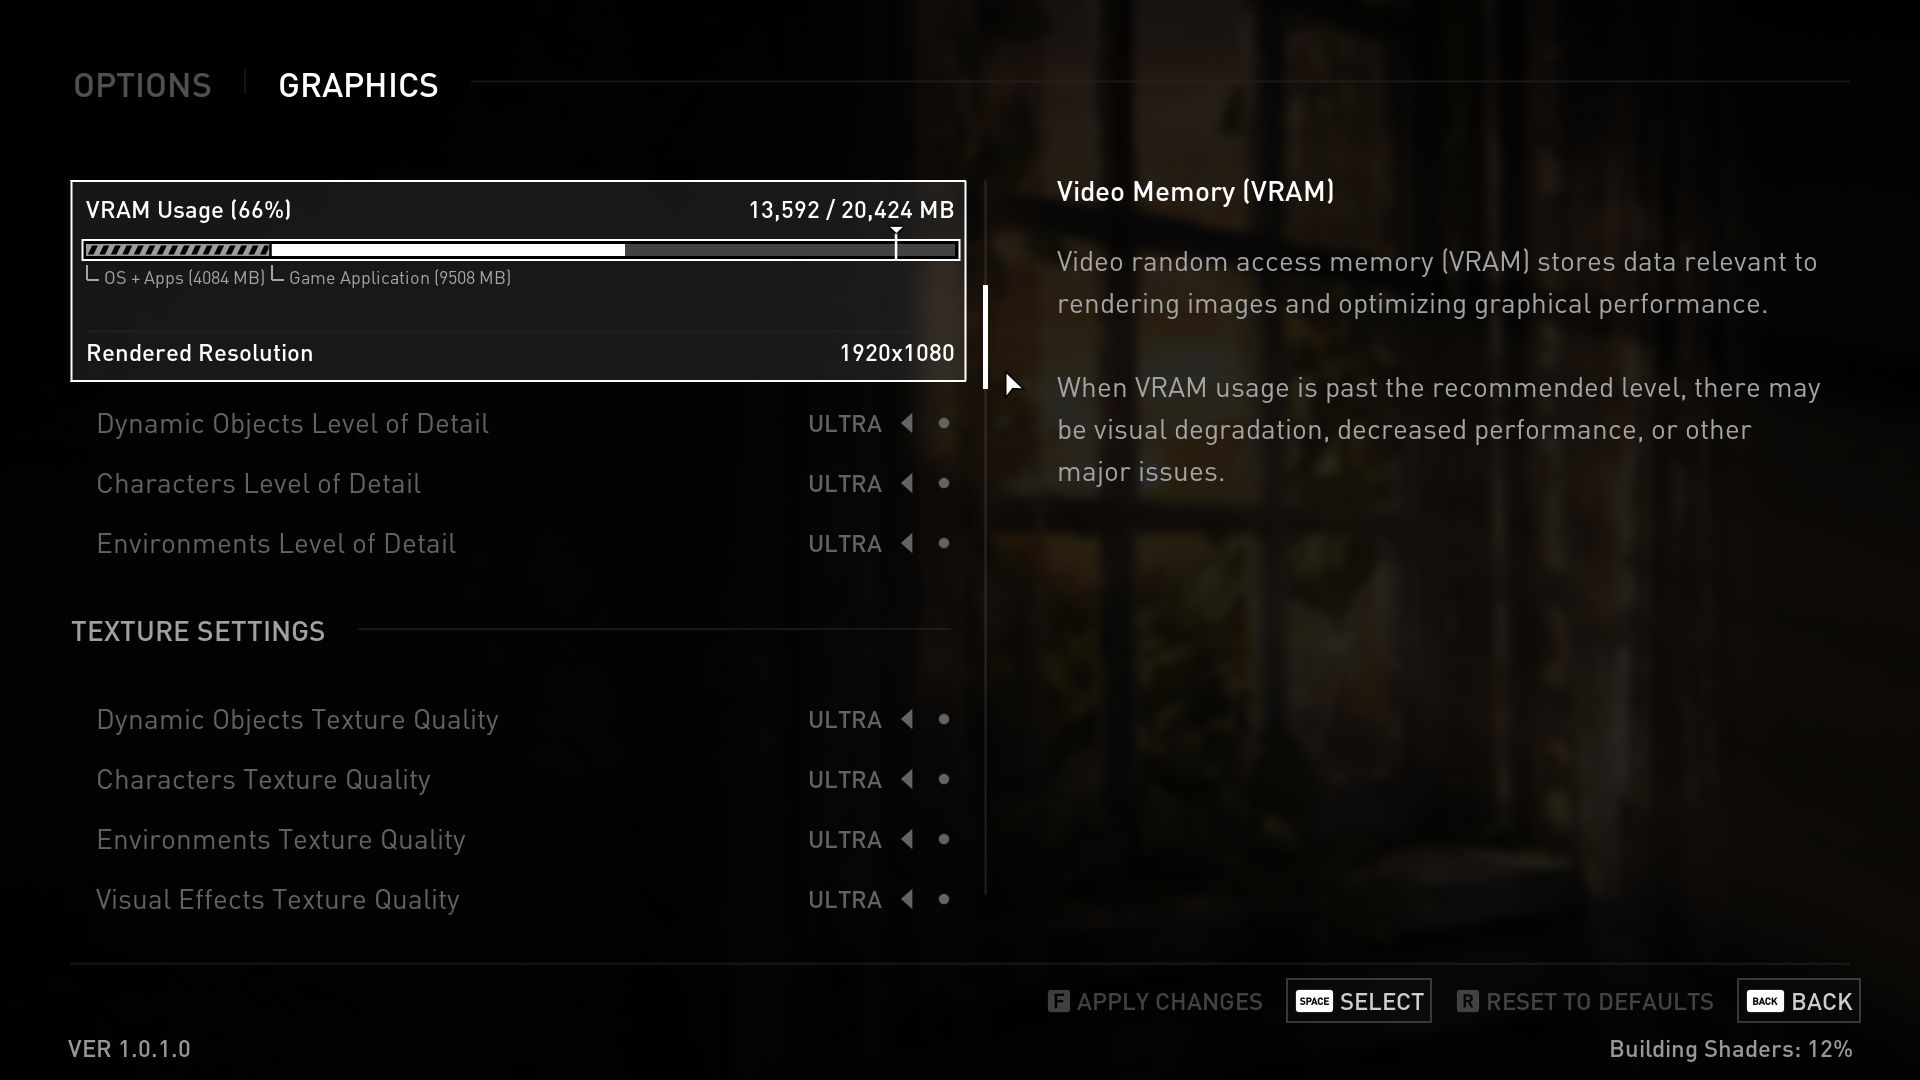
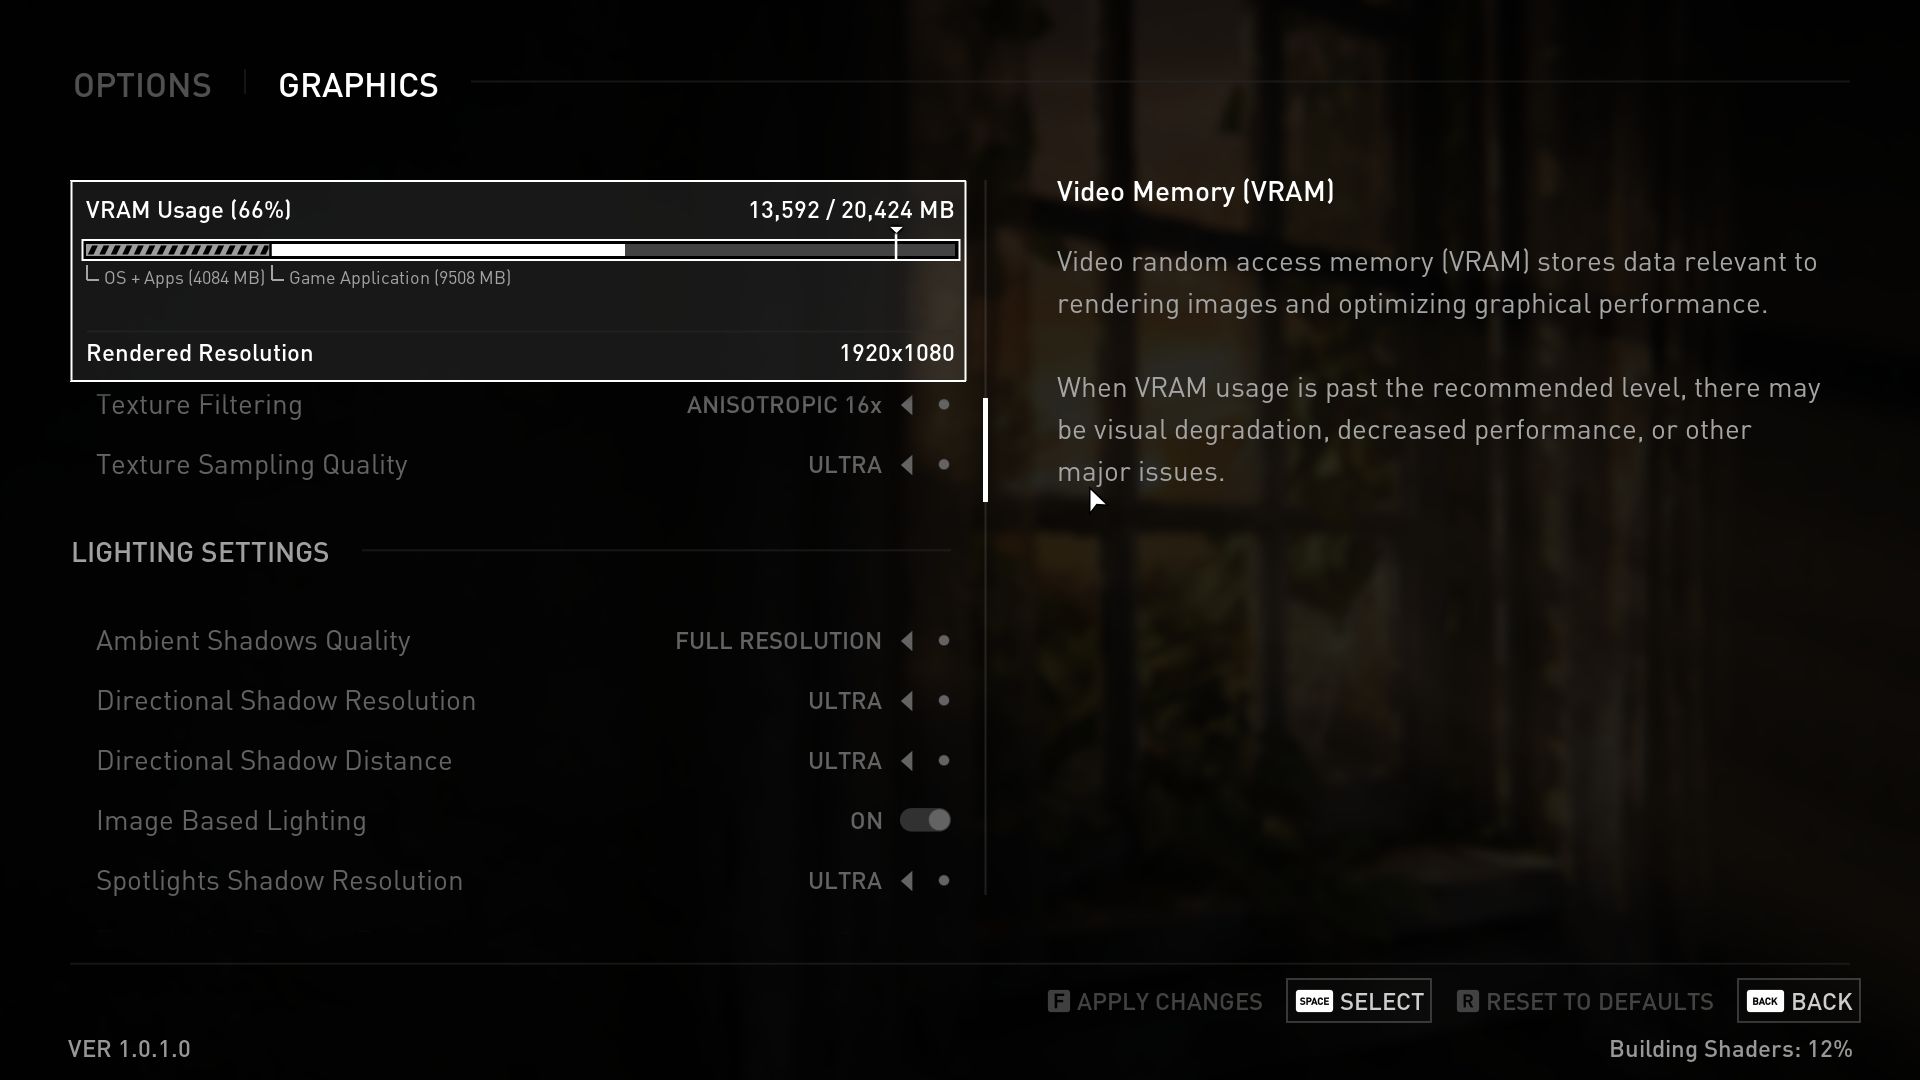
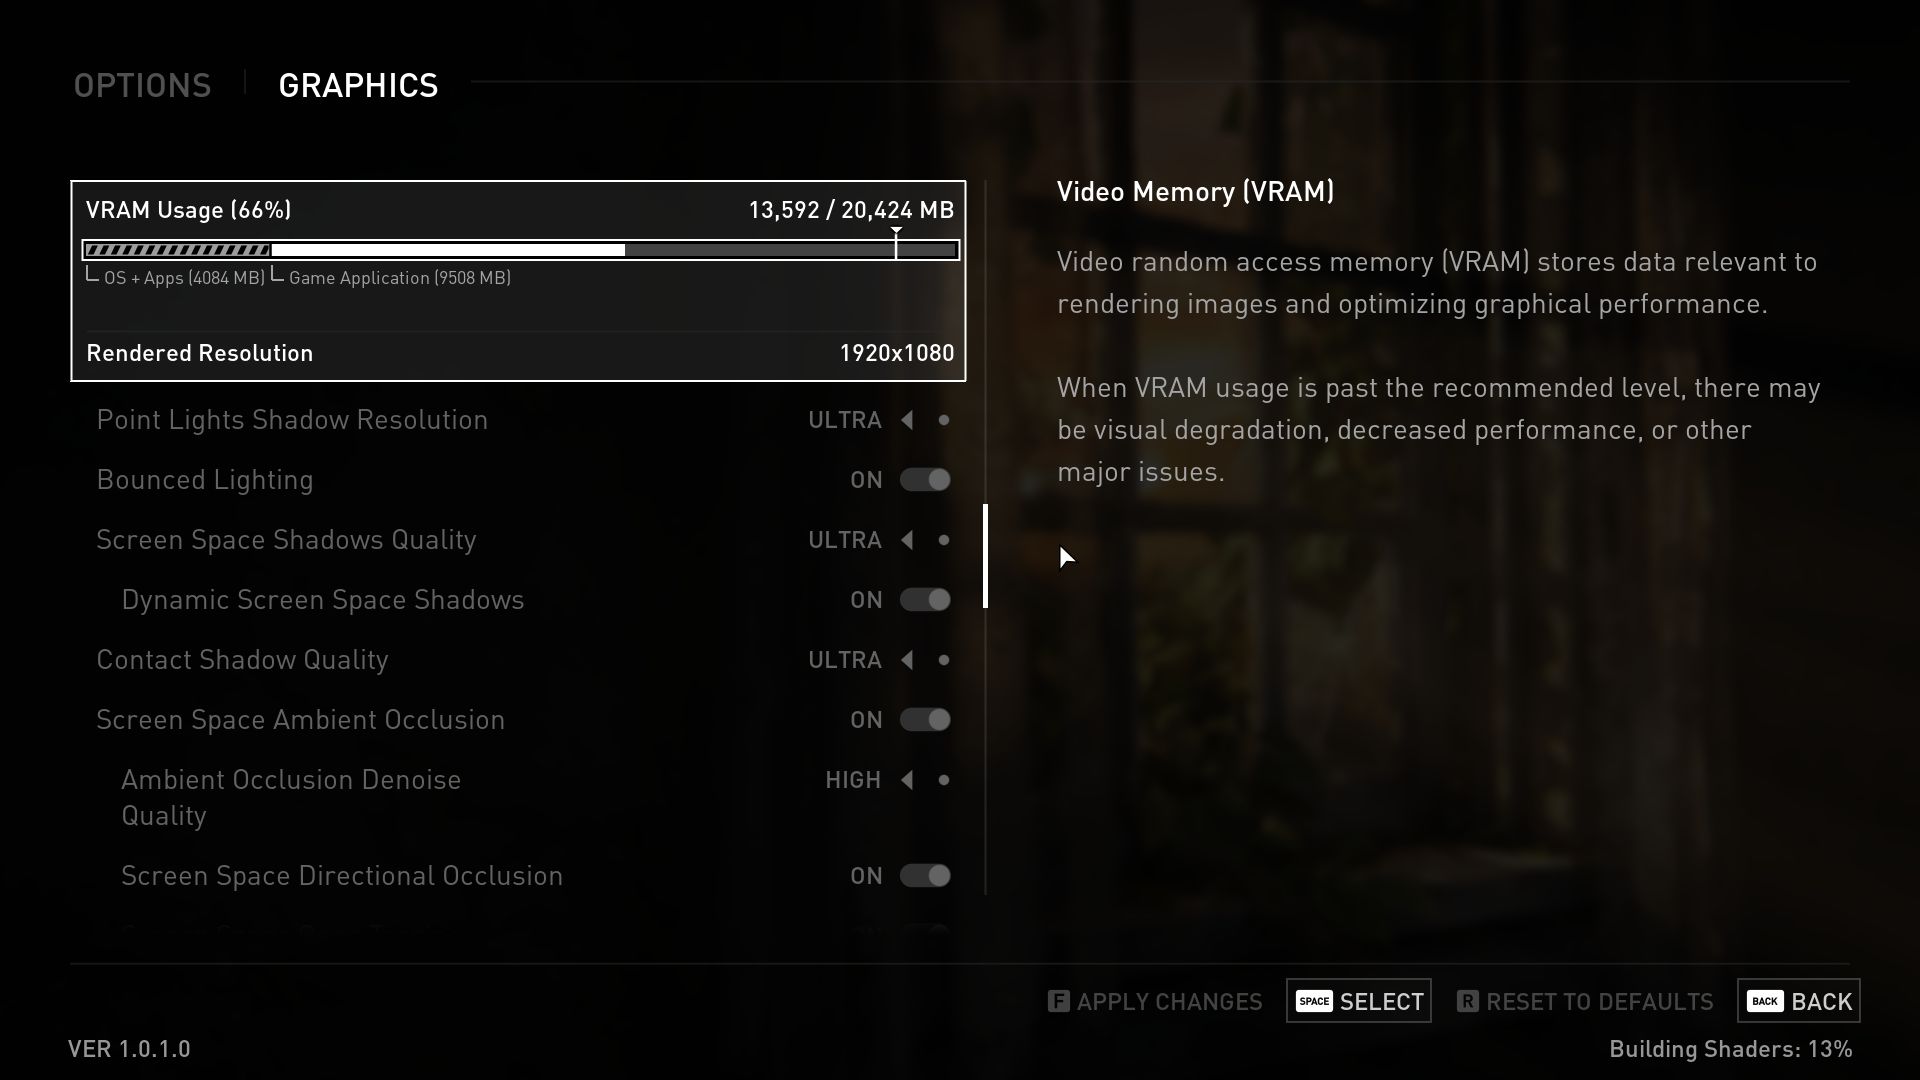
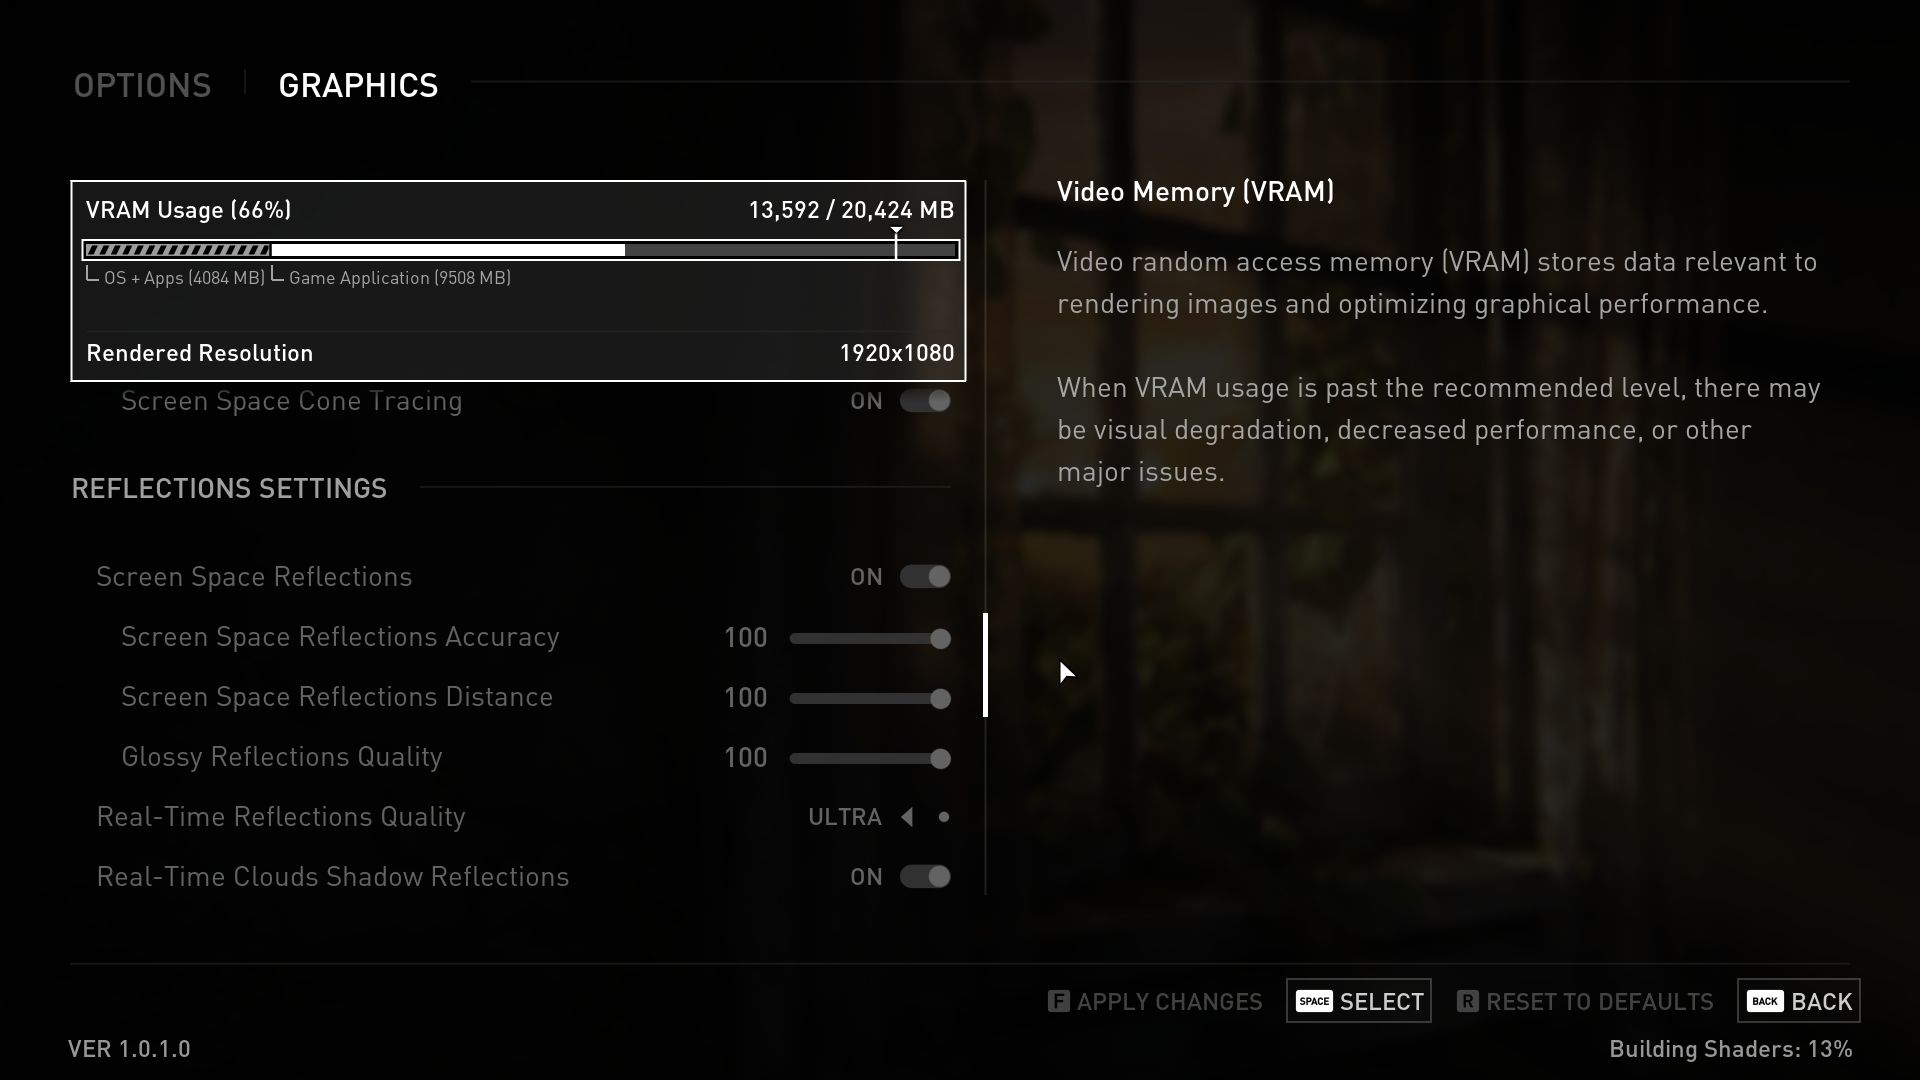
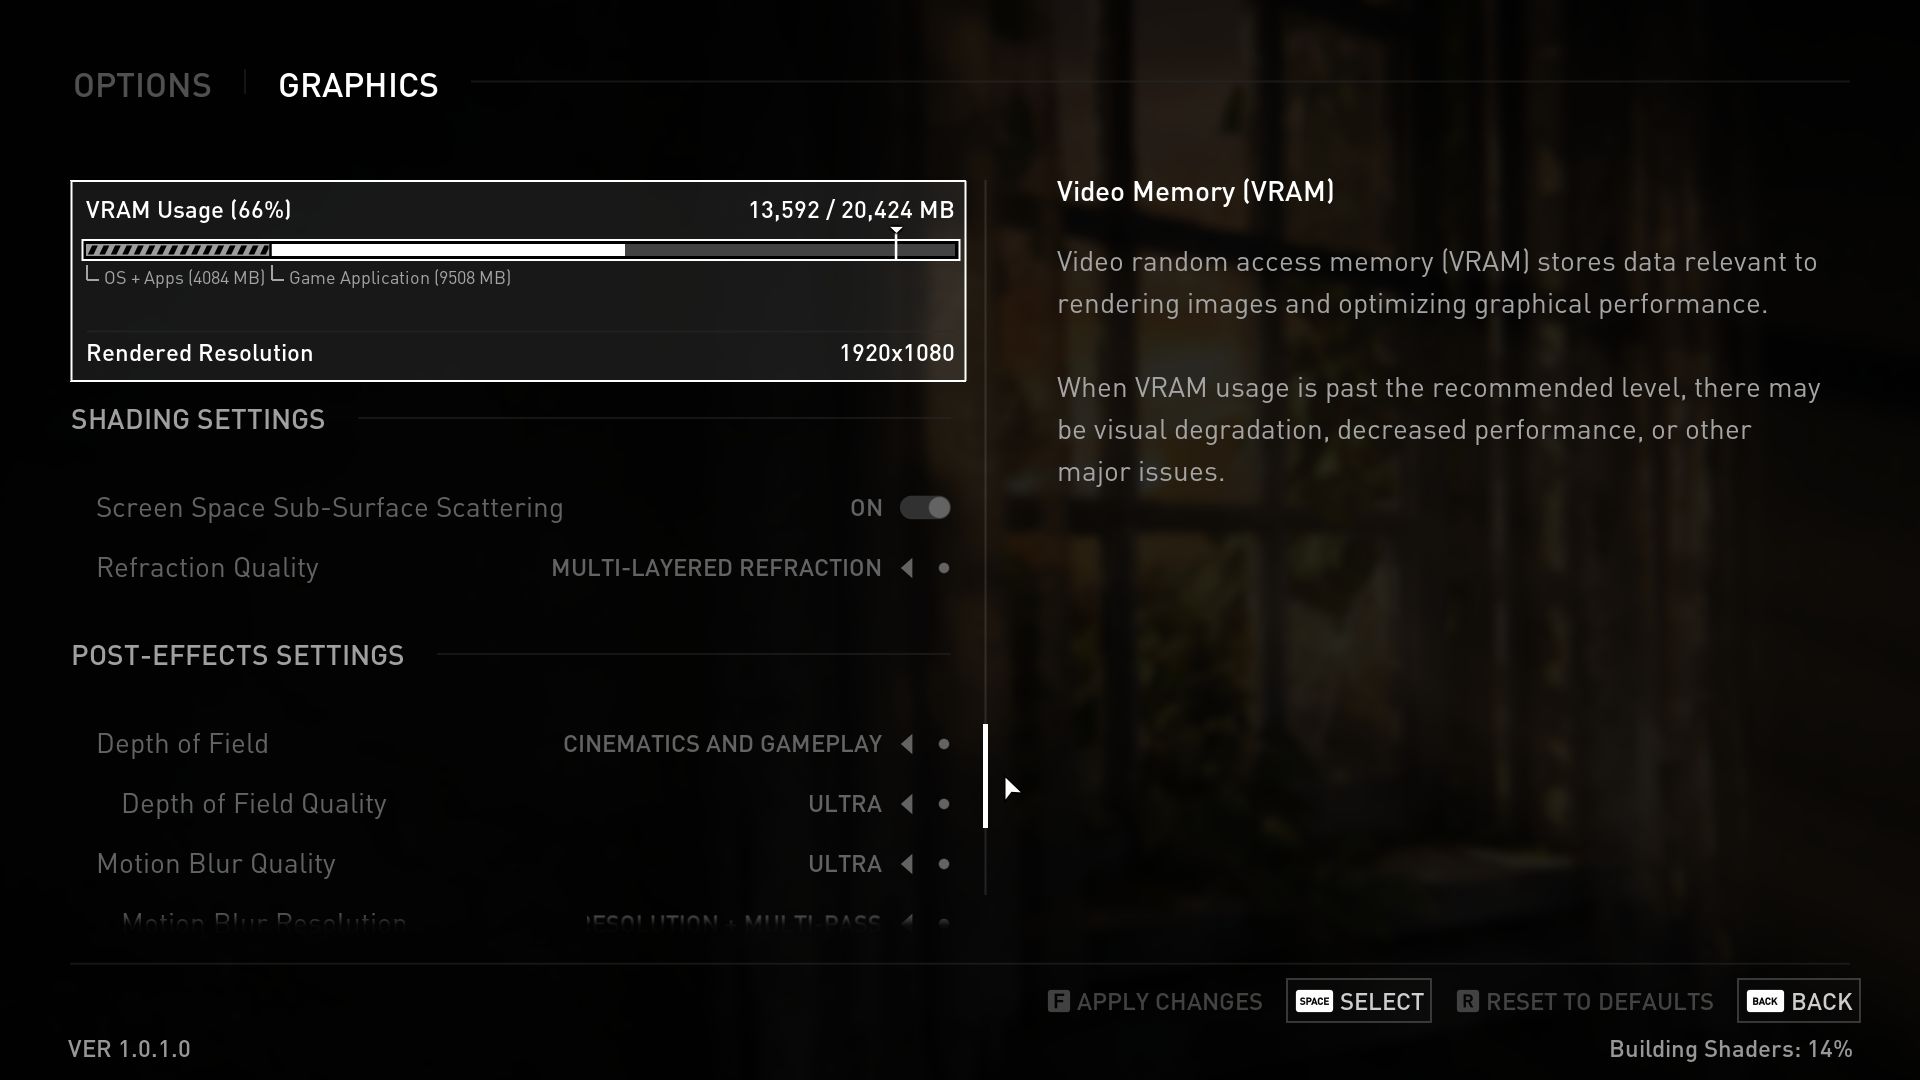
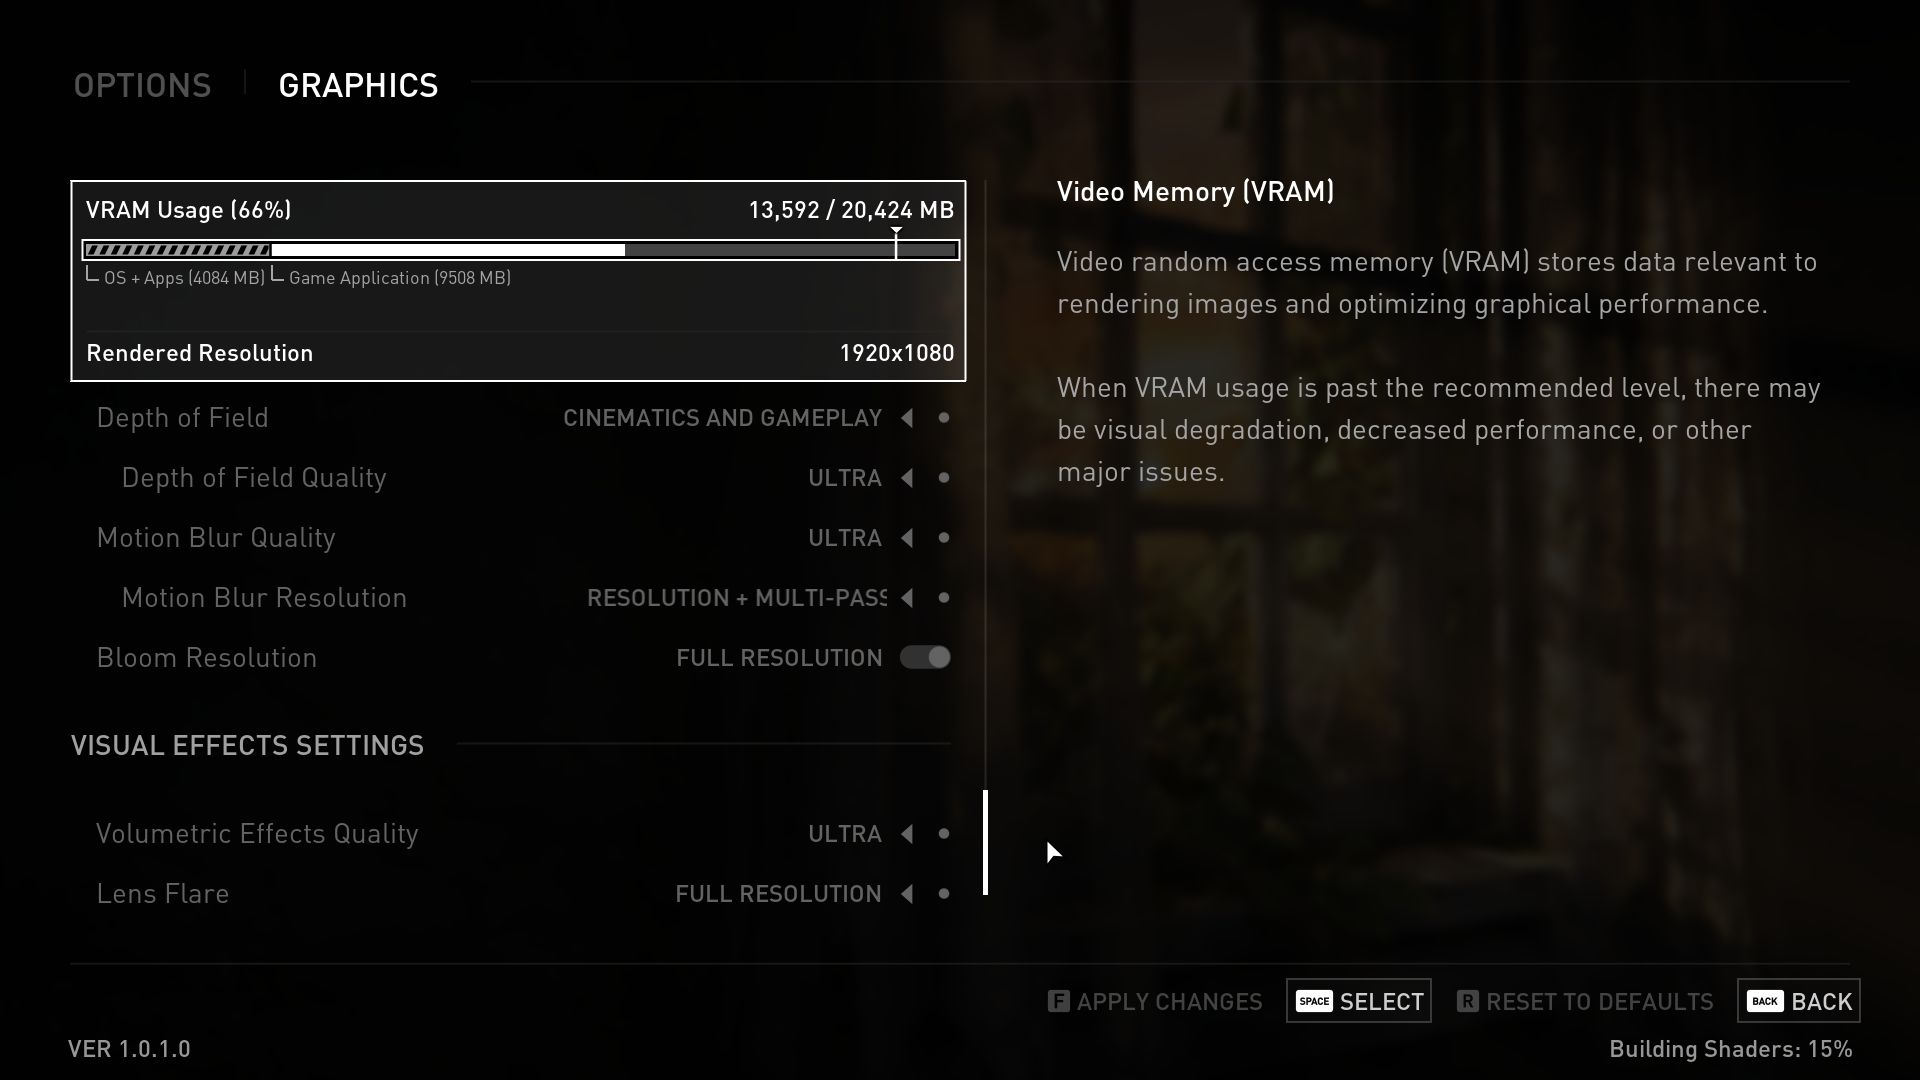
制片人在图形菜单上肯定做得很过分。最后的我们》提供了如此多的选项(见截图),以至于你不得不长时间滚动,并很快失去了什么是什么的线索。值得庆幸的是,有一些实用的预设,可以让你少走一些弯路,一键提高游戏的质量。更改是即时进行的,因此不必重新启动游戏。正如现代游戏所期望的那样,它支持各种升级选项,如FSR和Nvidia独有的DLSS(然而,缺少光线追踪)。

与控制台版本相比,只有当你选择这样做时,FPS率才会受到限制。另一个积极因素是详细描述了CPU、GPU和VRAM的影响,有时甚至包括方便的对比图片。我们唯一错过的是一个 "经典 "全屏模式。在中等分辨率下对CPU的要求很高,这可能要归咎于游戏在降低设置后几乎没有任何表现,这导致了明显的图形恶化。

最后的我们》(The Last of Us


基准

我们使用了游戏中的视频片段以及 "真实 "游戏的组合来进行基准测量。你可以在下面的视频中看到我们使用的确切段落,它发生在游戏的开始附近,有很多路人和效果。我们使用CapframeX工具记录了大约1分钟的帧率。

结果


FHD (1,920 x 1,080)

当谈到使用iGPU时,你几乎可以忘记《最后的我们》。即使是Radeon680M,在使用最小设置的全高清情况下也未能达到30 FPS大关(1,280 x 720像素只是可玩)。你至少需要一台中端设备才能在1,920 x 1,080像素下玩这个游戏。ARadeon RX 6600M在使用中度和高度预设的情况下能够达到近60 FPS。

The Last of Us
    1920x1080 Low Preset     1920x1080 Medium Preset     1920x1080 High Preset     1920x1080 Ultra Preset
NVIDIA GeForce RTX 4080, i9-12900K
Desktop-PC
156.3 (47.2min, 71.8P0.1, 93.1P1) fps ∼59%
147.8 (50.4min, 68.9P0.1, 86.7P1) fps ∼61%
144 (52.2min, 66P0.1, 85.9P1) fps ∼63%
138.6 (50.3min, 61.1P0.1, 75.8P1) fps ∼65%
AMD Radeon RX 7900 XTX, i9-12900K
Desktop-PC
155.2 (42.3min, 72.6P0.1, 90.2P1) fps ∼58%
145.5 (56.8min, 78.5P0.1, 90P1) fps ∼60%
142.2 (64.3min, 77.9P0.1, 95P1) fps ∼62%
128.3 (5.05min, 74.9P0.1, 87.1P1) fps ∼60%
AMD Radeon RX 7900 XT, i9-12900K
Desktop-PC
152.9 (8.83min, 78.7P0.1, 94.1P1) fps ∼57%
141 (48.2min, 76.3P0.1, 93.7P1) fps ∼58%
135.8 (24.1min, 77.6P0.1, 95.6P1) fps ∼59%
118.8 (63.6min, 72.5P0.1, 83.6P1) fps ∼56%
NVIDIA GeForce RTX 3080, i9-12900K
Desktop-PC
148.6 (31.6min, 70P0.1, 93.2P1) fps ∼56%
128.8 (54.7min, 69.9P0.1, 87.9P1) fps ∼53%
120.2 (57min, 68.6P0.1, 88P1) fps ∼52%
106.3 (52min, 58.2P0.1, 75.1P1) fps ∼50%
NVIDIA GeForce RTX 3080 Ti Laptop GPU, i9-12900HX
MSI Titan GT77 12UHS
107.8 (36.6min, 46.6P0.1, 62.8P1) fps ∼40%
95.4 (37.7min, 49.2P0.1, 61.4P1) fps ∼39%
88.4 (30.4min, 44.6P0.1, 58.8P1) fps ∼39%
81.2 (22.3min, 43.2P0.1, 57P1) fps ∼38%
NVIDIA GeForce RTX 3070, i9-12900K
Desktop-PC
126.7 (57.3min, 70.1P0.1, 91.6P1) fps ∼47%
107.2 (58min, 67.5P0.1, 84.7P1) fps ∼44%
97.5 (52.9min, 71.2P0.1, 81.7P1) fps ∼43%
79.1 (8.14min, 20.6P0.1, 60.2P1) fps ∼37%
AMD Radeon RX 6800M, R9 5900HX
Asus ROG Strix G15
68.8 (25.7min, 33P0.1, 42.4P1) fps ∼26%
64.5 (25.3min, 36.8P0.1, 40.5P1) fps ∼26%
62.4 (25.2min, 34.1P0.1, 39.9P1) fps ∼27%
56.9 (3.53min, 25.5P0.1, 38.6P1) fps ∼27%
NVIDIA GeForce RTX 3060 Laptop GPU, i7-12700H
Lenovo Legion 5 Pro
90.8 (30.8min, 48.2P0.1, 68P1) fps ∼34%
65.5 (37.9min, 40.3P0.1, 50.7P1) fps ∼27%
54.8 (1.514min, 3.89P0.1, 37.4P1) fps ∼24%
AMD Radeon RX 6600M, R7 5800H
Lenovo Legion 5
69.6 (23.9min, 31.3P0.1, 46.4P1) fps ∼26%
58.8 (27min, 30.7P0.1, 44.1P1) fps ∼24%
53.9 (27min, 29.7P0.1, 45.4P1) fps ∼24%
37.6 (3.44min, 4.56P0.1, 29.5P1) fps ∼18%
AMD Radeon 680M, R9 6900HS
Asus ROG Zephyrus G14
26.4 (17.7min, 18.6P0.1, 21.7P1) fps ∼10%
19.5 (14.5min, 16P0.1, 16.9P1) fps ∼8%
16.6 (13.2min, 14P0.1, 14.4P1) fps ∼7%
13.1 (3.17min, 3.18P0.1, 11.4P1) fps ∼6%

QHD (2,560 x 1,440)

2,560 x 1,440像素和超预设的组合已经让硬件特别是VRAM出了一身汗。一个 GeForce RTX 3070,是第一个成功达到40 FPS以上的。

The Last of Us
    2560x1440 Ultra Preset
NVIDIA GeForce RTX 4080, i9-12900K
Desktop-PC
106.8 (21.7min, 61.3P0.1, 77.6P1) fps ∼69%
AMD Radeon RX 7900 XTX, i9-12900K
Desktop-PC
95.1 (44.1min, 67P0.1, 71.9P1) fps ∼62%
AMD Radeon RX 7900 XT, i9-12900K
Desktop-PC
83.9 (55.6min, 60P0.1, 62.8P1) fps ∼54%
NVIDIA GeForce RTX 3080, i9-12900K
Desktop-PC
71.2 (38.4min, 49.4P0.1, 56P1) fps ∼46%
NVIDIA GeForce RTX 3080 Ti Laptop GPU, i9-12900HX
MSI Titan GT77 12UHS
56.8 (21.8min, 42.9P0.1, 46.6P1) fps ∼37%
NVIDIA GeForce RTX 3070, i9-12900K
Desktop-PC
48.8 (14.5min, 18.5P0.1, 33.1P1) fps ∼32%
AMD Radeon RX 6800M, R9 5900HX
Asus ROG Strix G15
36.2 (19.3min, 20.9P0.1, 28.6P1) fps ∼23%
AMD Radeon RX 6600M, R7 5800H
Lenovo Legion 5
24.4 (2.69min, 4.13P0.1, 17.9P1) fps ∼16%

UHD (3,840 x 2,160)

如果你在3840 x 2160像素和最大设置下玩游戏,即使是顶级的芯片,如GeForce RTX 3080 Ti真的很吃力。在这里,利用DLSS是有意义的,例如,如下表所示。

The Last of Us
    3840x2160 Ultra Preset + Quality DLSS     3840x2160 Ultra Preset
NVIDIA GeForce RTX 4080, i9-12900K
Desktop-PC
89.3 (48.1min, 53.4P0.1, 66.3P1) fps ∼70%
56.1 (36.1min, 40.2P0.1, 44.8P1) fps ∼72%
AMD Radeon RX 7900 XTX, i9-12900K
Desktop-PC
51.6 (39.9min, 40.7P0.1, 42.5P1) fps ∼66%
AMD Radeon RX 7900 XT, i9-12900K
Desktop-PC
43.9 (34.6min, 35.2P0.1, 36.7P1) fps ∼56%
NVIDIA GeForce RTX 3080, i9-12900K
Desktop-PC
59.6 (30.6min, 35.4P0.1, 46.4P1) fps ∼47%
34.9 (7.6min, 12P0.1, 20.2P1) fps ∼45%
NVIDIA GeForce RTX 3080 Ti Laptop GPU, i9-12900HX
MSI Titan GT77 12UHS
45.8 (32.5min, 34.2P0.1, 36.1P1) fps ∼36%
29.4 (17.7min, 21.7P0.1, 23.1P1) fps ∼38%
NVIDIA GeForce RTX 3070, i9-12900K
Desktop-PC
37.9 (12.2min, 13.9P0.1, 25.2P1) fps ∼30%
21.6 (3.55min, 3.78P0.1, 6.25P1) fps ∼28%
AMD Radeon RX 6800M, R9 5900HX
Asus ROG Strix G15
15.2 (0.913min, 1.047P0.1, 6.47P1) fps ∼20%
AMD Radeon RX 6600M, R7 5800H
Lenovo Legion 5
9.88 (1.564min, 1.783P0.1, 3.86P1) fps ∼13%

注意事项

由于游戏测试非常耗时,而且经常受到安装或激活限制的制约,因此在发表本文时,我们只能为您提供部分基准测试结果。我们将在未来几天和几周内增加更多的显卡。

Overview

Show Restrictions
PosModel< PrevNext >The Last of Us
 The Last of Us (2023)
low
1920x1080
Low Preset
med.
1920x1080
Medium Preset
high
1920x1080
High Preset
ultra
1920x1080
Ultra Preset
QHD
2560x1440
Ultra Preset
4K
3840x2160
Ultra Preset

3840x2160
Ultra Preset + Quality DLSS
NVIDIA GeForce RTX 4090
206.65n4
193.2n4
186.15n4
178.8n4
144.25n4
82.4n4
123.4n4
AMD Radeon RX 7900 XTX
167.45n2
158.55n2
154.15n2
144.1n2
111.15n2
60.95n2
NVIDIA GeForce RTX 4080 Super
228.5n2
204n2
190.45n2
172.4n2
120.95n2
61.25n2
99.8n2
NVIDIA GeForce RTX 4080
156.3
147.8
144
138.6
106.8
56.1
89.3
AMD Radeon RX 7900 XT
152.9
141
135.8
118.8
83.9
43.9
NVIDIA GeForce RTX 4070 Ti
176.8
154.7
141.8
127.6
87.9
44.2
72.6
AMD Radeon RX 7900 GRE
144.55n2
129.55n2
124.65n2
114.7n2
86.8n2
43.9n2
AMD Radeon RX 6950 XT
156
143
132.3
111.2
76.8
39.6
NVIDIA GeForce RTX 4090 Laptop GPU
113.7
110.8
106.05n2
98.5n2
81.8n3
43.8n3
54.3
NVIDIA GeForce RTX 3090
156.3
137.3
129.1
113.3
80.3
41.5
65
AMD Radeon RX 7800 XT
165.1
148.8
135.8
124.5
86.1
42.7
NVIDIA GeForce RTX 4080 Laptop GPU
126.8
117.9
107.6
76.3
33.6
NVIDIA GeForce RTX 3080
148.6
128.8
120.2
106.3
71.2
34.9
59.6
NVIDIA GeForce RTX 4070
164.7
138.7
122.7
108.8
72.5
35.2
58
AMD Radeon RX 6800
135
113.6
102.6
84.3
58.9
29.4
AMD Radeon RX 7700 XT
154.6
132.5
122
105
68
29.6
NVIDIA Titan RTX
126.3
108.4
101
83.5
58.3
28.7
46.2
NVIDIA GeForce RTX 3070 Ti
148.8
121.9
108.3
90.1
57
25
41.9
NVIDIA GeForce RTX 4060 Ti 16G
143.4
117.1
103.6
87.4
56.3
26.8
43.3
PosModel< PrevNext >The Last of Us
low med. high ultra QHD 4K
NVIDIA GeForce RTX 4060 Ti 8G
143.8n3
116.1n3
101.4n3
76.6n3
49.5n3
21.1n3
38.4n3
NVIDIA GeForce RTX 3080 Ti Laptop GPU
107.8
95.4
88.4
81.2
56.8
29.4
45.8
NVIDIA GeForce RTX 4070 Laptop GPU
98.6n3
85.9n3
77.7n3
69.7n4
42.8n4
30.6
NVIDIA GeForce RTX 3070
126.7
107.2
97.5
79.1
48.8
21.6
37.9
AMD Radeon RX 6750 XT
133.6
113
101.9
85.7
56.1
24.2
AMD Radeon RX 6700 XT
91.7
92.9
83.7
73
46.8
21.2
NVIDIA GeForce RTX 3080 Laptop GPU
99.4
82.8
75.6
64.8
43.4
20.9
33.7
NVIDIA GeForce RTX 3060 Ti
119.1
96.2
87
66.1
40.2
13.9
5.45
Intel Arc A770
69.5
58.5
52.9
45.4
34.3
18.9
NVIDIA GeForce RTX 4060
117.3
95.4
81.3
68.2
39.9
18.6
30.8
AMD Radeon RX 7600
114.2
93.6
75.8
64.3
36.5
15.2
NVIDIA GeForce RTX 4060 Laptop GPU
74.6
62.5
63.3n2
49.15n2
32.7
AMD Radeon RX 6800M
68.8
64.5
62.4
56.9
36.2
15.2
AMD Radeon RX 6650 XT
103.3
80.8
71.3
52.8
32.6
14.5
NVIDIA GeForce RTX 3070 Laptop GPU
96.6
82.2
71.6
55.3n2
31.75n2
16.5
31
AMD Radeon RX 7600M XT
89.9
73
60.2
41.6
25.4
8.81
Intel Arc A750
49.5
36.4
46
38.7
28.4
12.7
NVIDIA Titan X Pascal
72.5
60.5
55.8
48.6
30.8
15
NVIDIA GeForce RTX 2070 Super (Desktop)
100.2
81
72.7
50
34
15.8
6.09
AMD Radeon RX 5700 XT (Desktop)
97.1
78
70.2
57
35
16.5
PosModel< PrevNext >The Last of Us
low med. high ultra QHD 4K
NVIDIA GeForce RTX 3060 Laptop GPU
90.8
65.5
54.8
AMD Radeon RX 7600S
81.4
67.6
60.2
51.5
Intel Arc A580
63.9
51.9
47.6
39.3
28.4
14.5
NVIDIA GeForce RTX 2060 Super (Desktop)
86.8
70.1
61.6
45.2
29.1
12.7
AMD Radeon RX 6600
94
75.2
64.2
51.1
26.9
10.8
AMD Radeon RX 5700 (Desktop)
84.8
69.1
61.2
50.3
32.4
14.8
AMD Radeon RX 6600M
83.5n3
68.5n3
56.6n3
43.9n3
26.1n3
11.1n3
AMD Radeon RX 5600 XT (Desktop)
76.5
61.3
52.6
42
27.5
6.47
NVIDIA GeForce GTX 1660 Super (Desktop)
66.8
52.3
43.2
32.8
19.9
3.72
AMD Radeon RX 6500 XT
54.1
37.1
28.7
24.4
AMD Radeon RX 5500 XT (Desktop)
57.2
45.6
36.5n2
19.6
9.05
NVIDIA GeForce RTX 4050 Laptop GPU
87.6n2
68.4n4
56.5n4
42.8n3
27.65n2
6.65
Intel Arc A730M
34.3
32.2
31.3
28.7
NVIDIA GeForce GTX 1660 Ti Mobile
59.6
48.4
42.2
31.6
NVIDIA GeForce RTX 3050 Ti Laptop GPU
44.9
32.9
25.6
NVIDIA GeForce GTX 1660 (Desktop)
59.7
47.1
38.9
31.6
18.9
NVIDIA GeForce GTX 1650 Super (Desktop)
53.1
40.8
35.7
26.7
15.9
NVIDIA GeForce RTX 3050 4GB Laptop GPU
47.3
39
33.8
NVIDIA GeForce GTX 1060 Mobile
32.3
25.6
21.9
17.3
NVIDIA GeForce GTX 1650 Ti Mobile
39.4
30.8
24.5
PosModel< PrevNext >The Last of Us
low med. high ultra QHD 4K
NVIDIA GeForce RTX 2050 Mobile
31.2
23.8
18.3
13.3
NVIDIA GeForce GTX 1650 Mobile
34.5
25.9
19.3
Intel Arc A380
30.6
24.4
21.5
17.7
AMD Radeon 780M
24.8
18.6
15.2
12.9
AMD Radeon 680M
26.4
19.5
16.6
13.1
NVIDIA GeForce GTX 1050 Mobile
18.2
14.5
12.1
AMD Radeon 660M
17.7
13.2
11.1
AMD Radeon RX 560X (Laptop)
20.3
15.8
13.3
10.3
NVIDIA GeForce MX350
7.86
AMD Radeon RX 550 (Laptop)
3.22
AMD Radeon 540X
8.77
AMD Radeon RX Vega 10
10.7
8.63
Intel UHD Graphics Xe 32EUs (Tiger Lake-H)
7.41
Intel UHD Graphics 770
7.1
AMD Radeon RX Vega 8 (Ryzen 4000/5000)
12
AMD Radeon RX Vega 8 (Ryzen 2000/3000)
7.69
AMD Radeon RX Vega 6 (Ryzen 4000/5000)
10
Intel UHD Graphics Xe 16EUs (Tiger Lake-H)
3.32
(-) * Smaller values are better. / n123 Number of benchmarks for this median value / * Approximate position


Legend
5Stutters – This game is very likely to stutter and have poor frame rates. Based on all known benchmarks using the specified graphical settings, average frame rates are expected to fall below 25fps
May Stutter – This graphics card has not been explicitly tested on this game. Based on interpolated information from surrounding graphics cards of similar performance levels, stutters and poor frame rates are expected.
30Fluent – Based on all known benchmarks using the specified graphical settings, this game should run at or above 25fps
40Fluent – Based on all known benchmarks using the specified graphical settings, this game should run at or above 35fps
60Fluent – Based on all known benchmarks using the specified graphical settings, this game should run at or above 58fps
May Run Fluently – This graphics card has not been explicitly tested on this game. Based on interpolated information from surrounding graphics cards of similar performance levels, fluent frame rates are expected.
?Uncertain – This graphics card experienced unexpected performance issues during testing for this game. A slower card may be able to achieve better and more consistent frame rates than this particular GPU running the same benchmark scene.
Uncertain – This graphics card has not been explicitly tested on this game and no reliable interpolation can be made based on the performances of surrounding cards of the same class or family.
The value in the fields displays the average frame rate of all values in the database. Move your cursor over the value to see individual results.

测试系统

微星Titan GT77 (RTX 3080 Ti)
联想Legion 5 Pro (RTX 3060)
华硕ROG Strix G15 (RX 6800M)
联想Legion 5 (RX 6600M)

我们目前使用这些笔记本电脑作为我们的游戏基准。点击照片将带你到各自制造商的页面。所有其他测试系统(塔式电脑、迷你电脑......)都可以在以下列表中找到。

设备 显卡 处理器 内存
笔记本电脑
微星Titan GT77 12UHS NvidiaGeForce RTX 3080 Ti @175 W TGP (16 GB GDDR6) Intel Core i9-12900 2 x 16 GB DDR5
联想Legion 5 Pro NvidiaGeForce RTX 3060 @140 W TGP (6 GB GDDR6) Intel Core i7-12700H 2 x 8 GB DDR5
华硕ROG Strix G15 AMD Radeon RX 6800M(12 GB GDDR6) AMD Ryzen 9 5900HX 2 x 8 GB DDR4
联想Legion 5 AMD Radeon RX 6600M(8 GB GDDR6) AMD Ryzen 7 5800H 2 x 8 GB DDR4
华硕ROG Zephyrus G14 AMD Radeon 680M AMD Ryzen 9 6900HS 2 x 16 GB DDR5
塔式电脑
定制 I AMD Radeon RX 7900 XTX (24 GB GDDR6)
AMD Radeon RX 7900 XT (20 GB GDDR6)
MSIGeForce RTX 3080 (10 GB GDDR6X)
MSIGeForce RTX 3070 (8 GB GDDR6)
Intel Core i9-12900K 2 x 16 GB DDR4
Custom II PalitGeForce RTX 4090 GameRock OC (24 GB GDDR6X)
Nvidia GeForce RTX 3090 FE (24 GB GDDR6X)
Nvidia GeForce RTX 3060 Ti (8 GB GDDR6X)
NvidiaTitan RTX (24 GB GDDR6)
lNvidia GeForce RTX2070 Super (8 GB GDDR6)
Nvidia GeForce RTX 2060 Super (8 GB GDDR6)
KFA2 GeForce GTX 1660 Super (6 GB GDDR6)
PNY GeForce GTX 1660 (6 GB GDDR5)
KFA2 GeForce GTX 1650 Super (4 GB GDDR6)
AMD RadeonRX 6950 XT (16 GB DDR6)
AMD Radeon RX 6800 (16 GB DDR6)
AMD Radeon RX 6700 XT (12 GB DDR6)
AMD Radeon RX 6650 XT (8 GB GDDR6)
AMD Radeon RX 6600 (8 GB GDDR6)
AMDRadeon RX 5700 XT (8 GB GDDR6)
AMD Radeon RX 5700 (8 GB GDDR6)
AMD Radeon RX 5600 XT (6 GB GDDR6)
AMD Radeon RX 5500 XT (8 GB GDDR6)
AMD Ryzen 9 7950X 2 x 16 GB DDR5
Custom III NvidiaGeForce RTX 2080 Super FE Intel Core i9-11900K 2 x 8 GB DDR4
迷你电脑
Zotac ZBOX CI665 Nano Intel Iris Xe Graphics G7 (96 CUs) Intel Core i7-1165G7 2 x 8 GB DDR4
Morefine S500+ AMD Radeon RX Vega 8 AMD Ryzen 9 5900HX 2 x 16 GB DDR4
Minisforum NUCXi7 NvidiaGeForce RTX 3070 @125 W TGP(8 GB GDDR6) Intel Core i7-11800H 2 x 8 GB DDR4
Minisforum HX99G AMD Radeon RX 6600M @100 W TGP(8 GB GDDR6) AMD Ryzen 9 6900HX 2 x 16 GB DDR5
4K显示器 操作系统 Nvidia驱动 AMD驱动
Philips Brilliance 329P9H, Gigabyte M32U Windows 11 ForceWare Adrenalin
Please share our article, every link counts!
> Notebookcheck中文版(NBC中国) > 评测 > 最后的我们》第一部分回顾:笔记本电脑和台式机基准测试
Florian Glaser, 2023-04- 3 (Update: 2023-04- 3)