Notebookcheck Logo

Ratchet & Clank Rift Apart:笔记本电脑和台式机基准测试

非常科幻壮观。 虽然 AMD 显卡目前仍无法使用光线追踪技术,但 PC 版的《棘轮与叮当》(Ratchet & Clank:Rift Apart》是过去几年中较好的游戏机移植版之一。我们运行了大量基准测试,包括 DLSS 和 Frame Generation。
Gaming Laptop / Notebook Desktop Gamecheck
棘轮与铮铮裂痕》拆解

本次评测使用的笔记本

XMG Neo 17 E23(RTX 4090)
Schenker Key 17 Pro E23(RTX 4080)
XMG Pro 15 E23(RTX 4070 和 RTX 4060)
XMG Focus 15 E23(RTX 4050)
华硕 ROG Strix Scar 17(RTX 3080 Ti)
宏碁掠夺者 Helios 300(RTX 3070 Ti)
华硕 ROG Zephyrus G14(RX 6800S 和 680M)
 

技术方面

在经历了 最后的我们及其对 VRAM 的极高要求之后,我们对索尼娱乐的下一款 PC 改编游戏持怀疑态度。不过,我们可以松一口气了:尽管对系统的要求并不低,但《Rift Apart》并没有成为绝对的硬件杀手。负责此次 PC 版制作的荷兰工作室 Nixxes Software 带来了丰富的经验,无论是通过上一款 Deus Ex-, 古墓丽影- 或 蜘蛛侠-部件

棘轮与铮铮裂痕》拆解
棘轮与铮铮裂痕》拆解
棘轮与铮铮裂痕》拆解
棘轮与铮铮裂痕》拆解
棘轮与铮铮裂痕》拆解
棘轮与铮铮裂痕》拆解

与 PS5 原版一样,《Rift Apart》在 PC 上也拥有非常出色的视觉效果,是目前该平台上最精美、最高品质的游戏之一。无论是纹理、角色、特效还是细节的整体丰富度:技术都达到了很高的水平,当然,多彩的漫画外观则取决于玩家的品味。

棘轮与铮铮裂痕》拆解
棘轮与铮铮裂痕》拆解
棘轮与铮铮裂痕》拆解
棘轮与铮铮裂痕》拆解
棘轮与铮铮裂痕》拆解
棘轮与铮铮裂痕》拆解

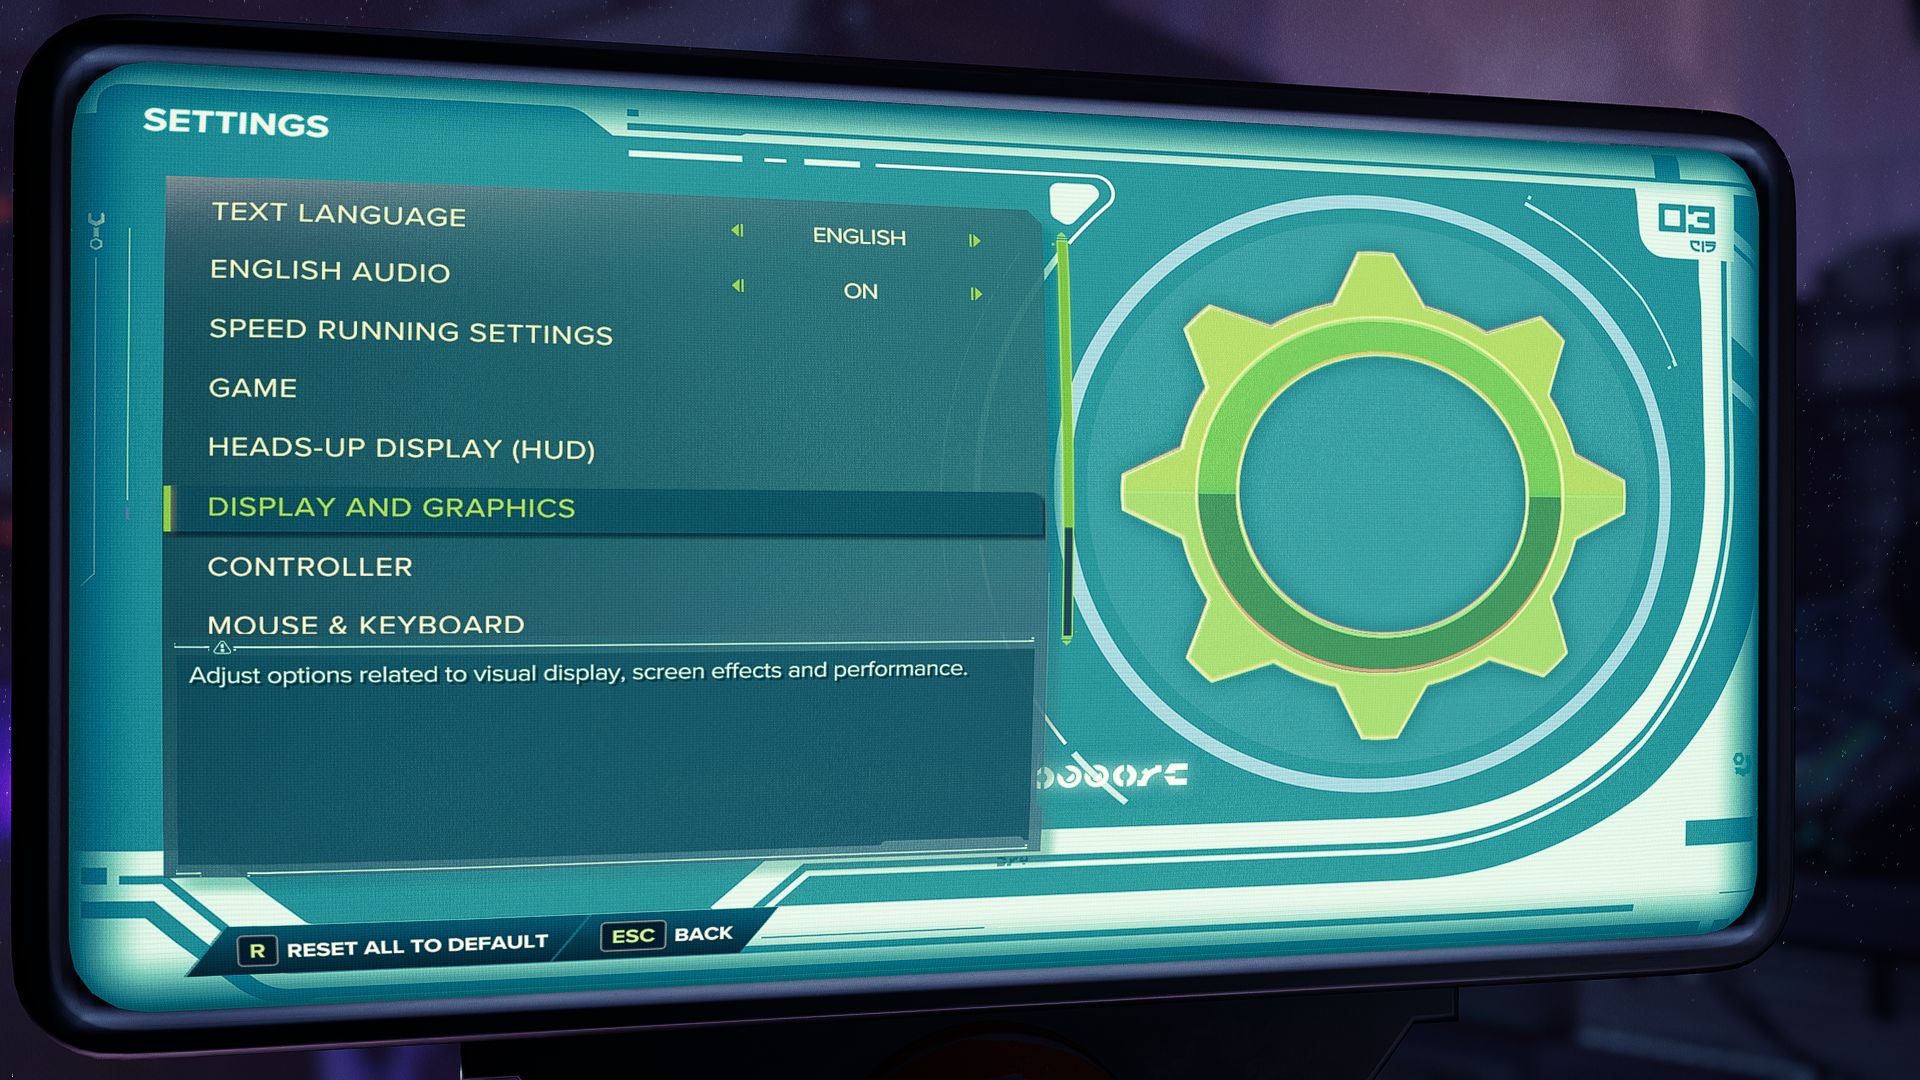
此外,该游戏的图形菜单也值得称赞,无论是在游戏外还是在游戏内都能方便地访问。这些选项分为两个标签。显示菜单包括分辨率、图像模式、边缘平滑(可选 SMAA、TAA 和 DLAA)和 VSync,而图形菜单则有 20 多个独立设置,其中部分可通过预设自动控制。

棘轮与铮铮裂痕》拆解
棘轮与铮铮裂痕》拆解
棘轮与铮铮裂痕》拆解
棘轮与铮铮裂痕》拆解
棘轮与铮铮裂痕》拆解
棘轮与铮铮裂痕》拆解
棘轮与铮铮裂痕》拆解
 

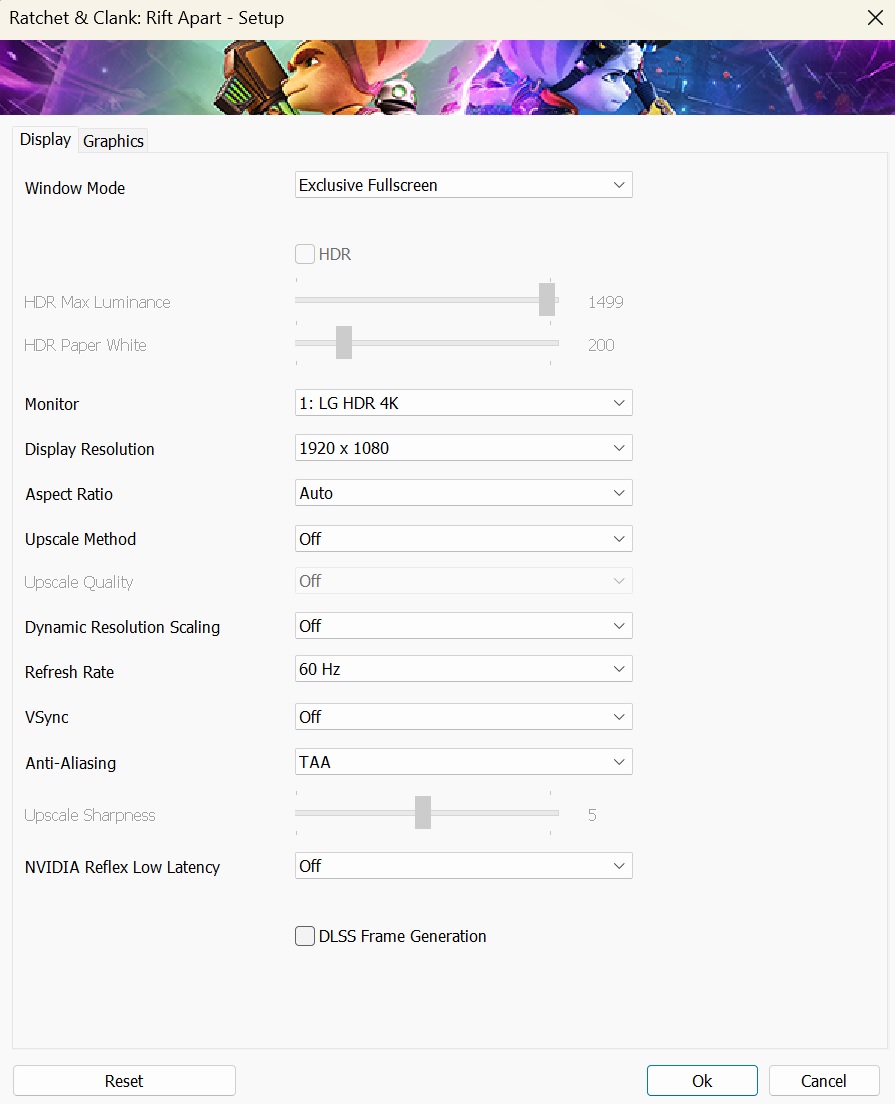
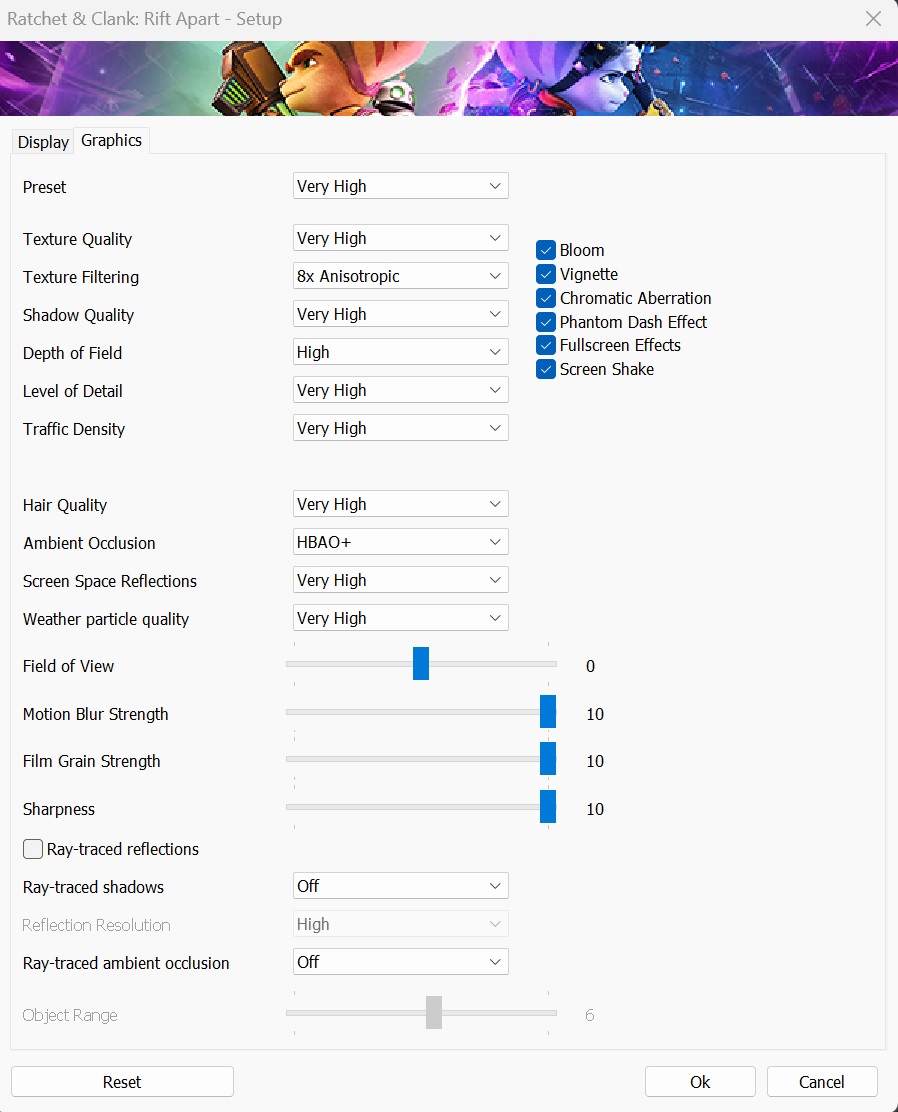
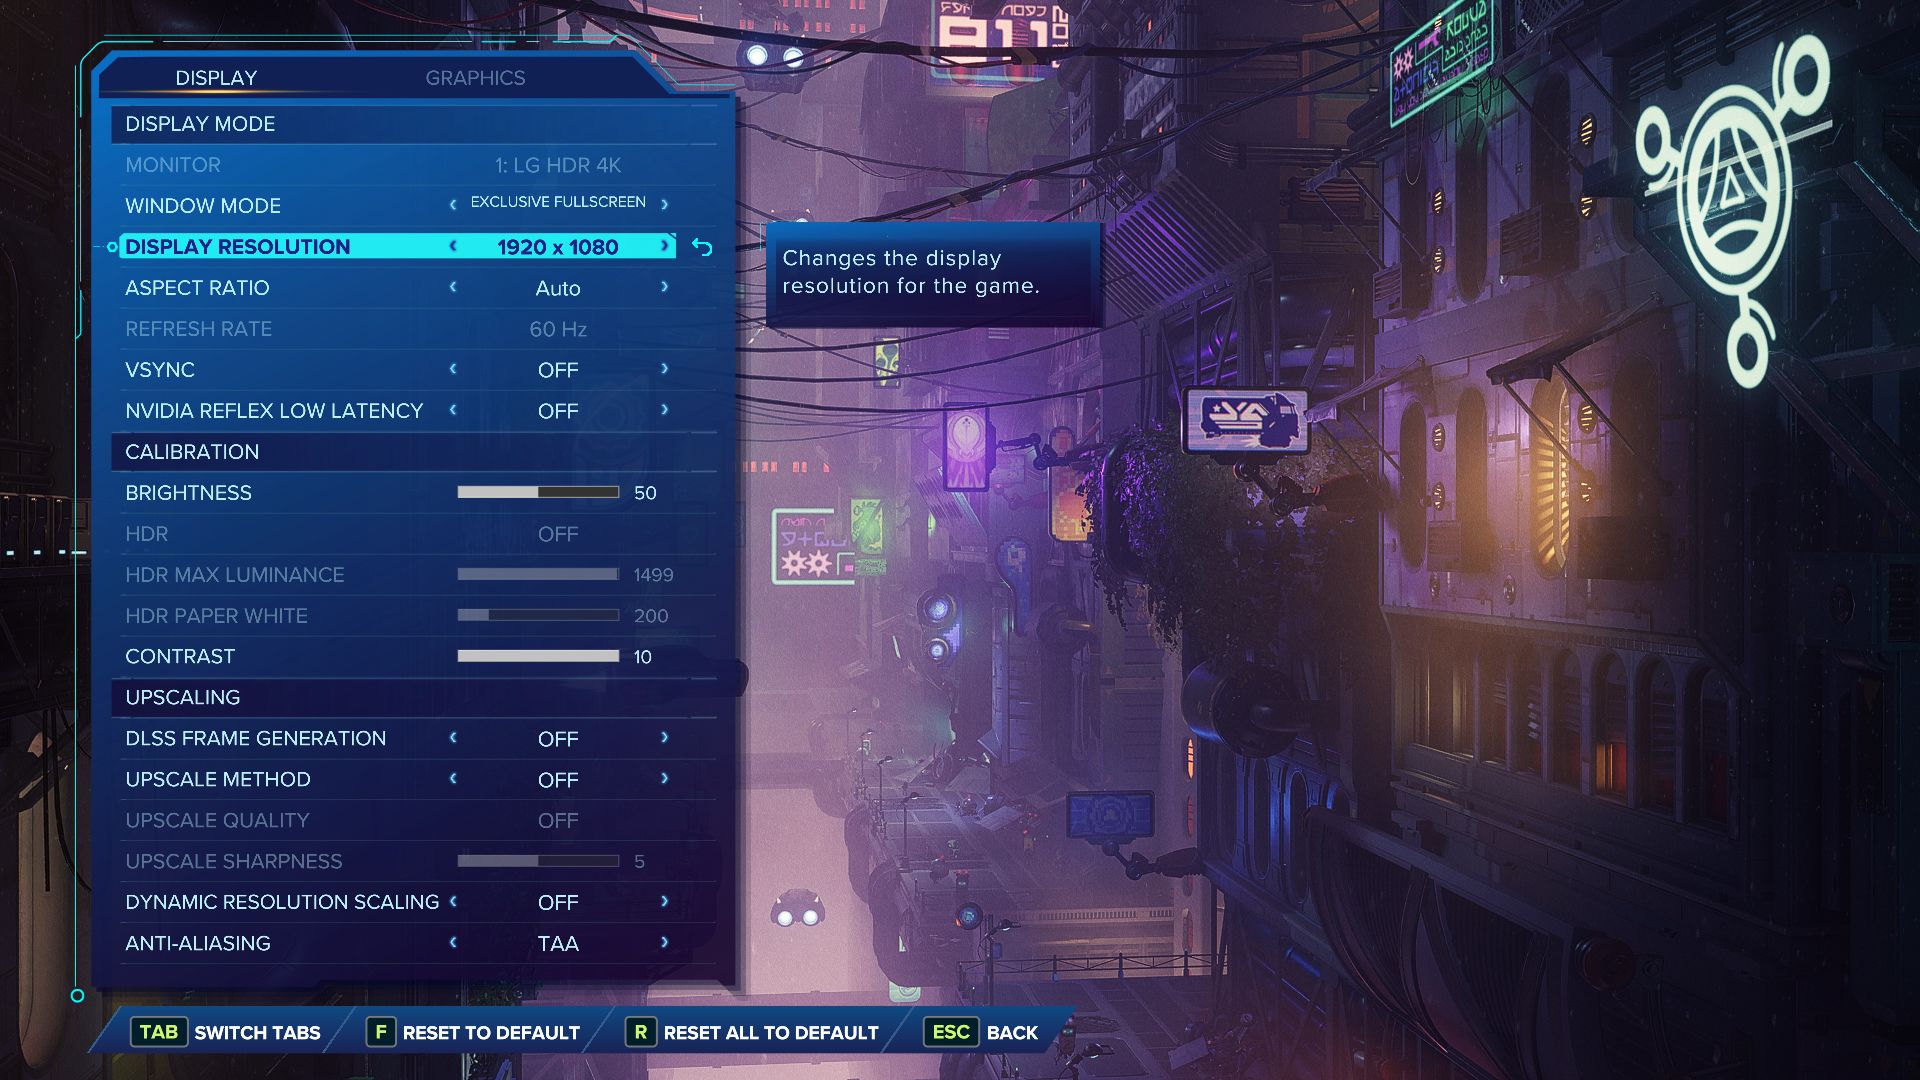
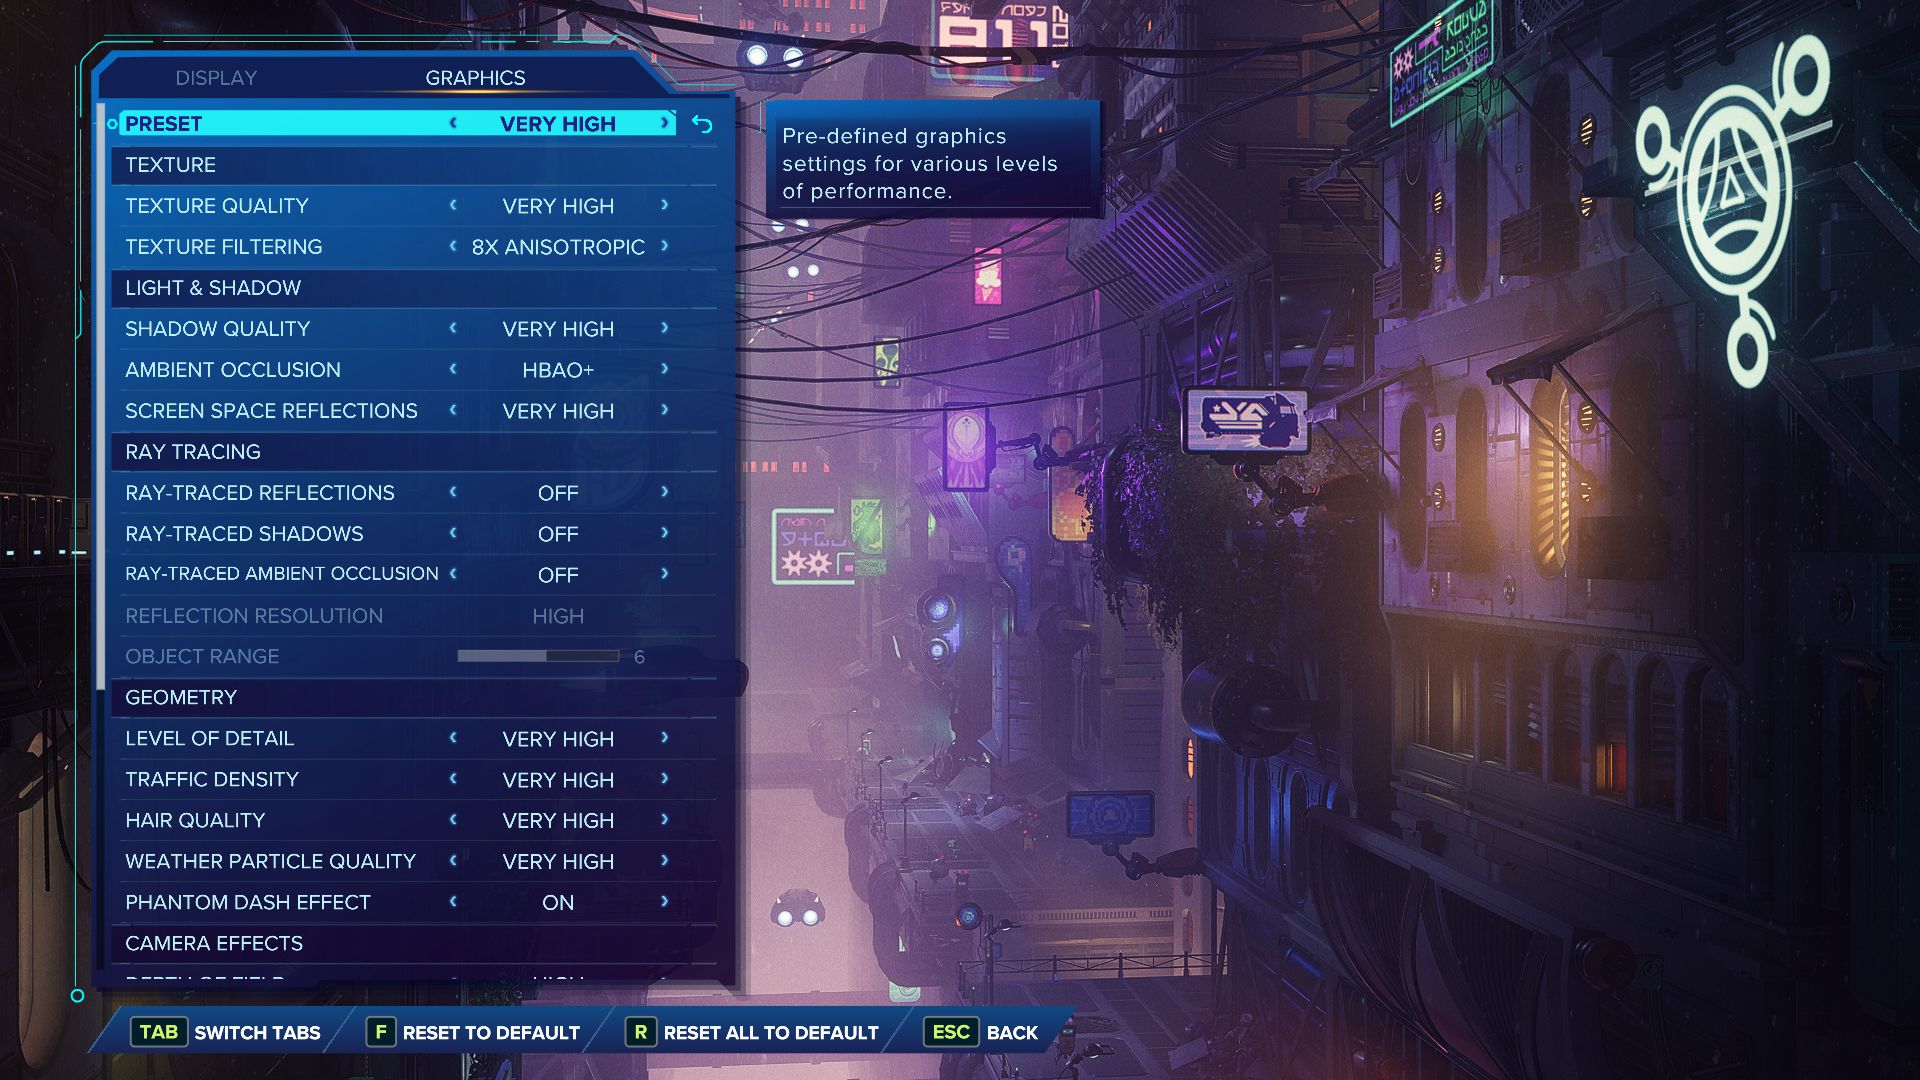
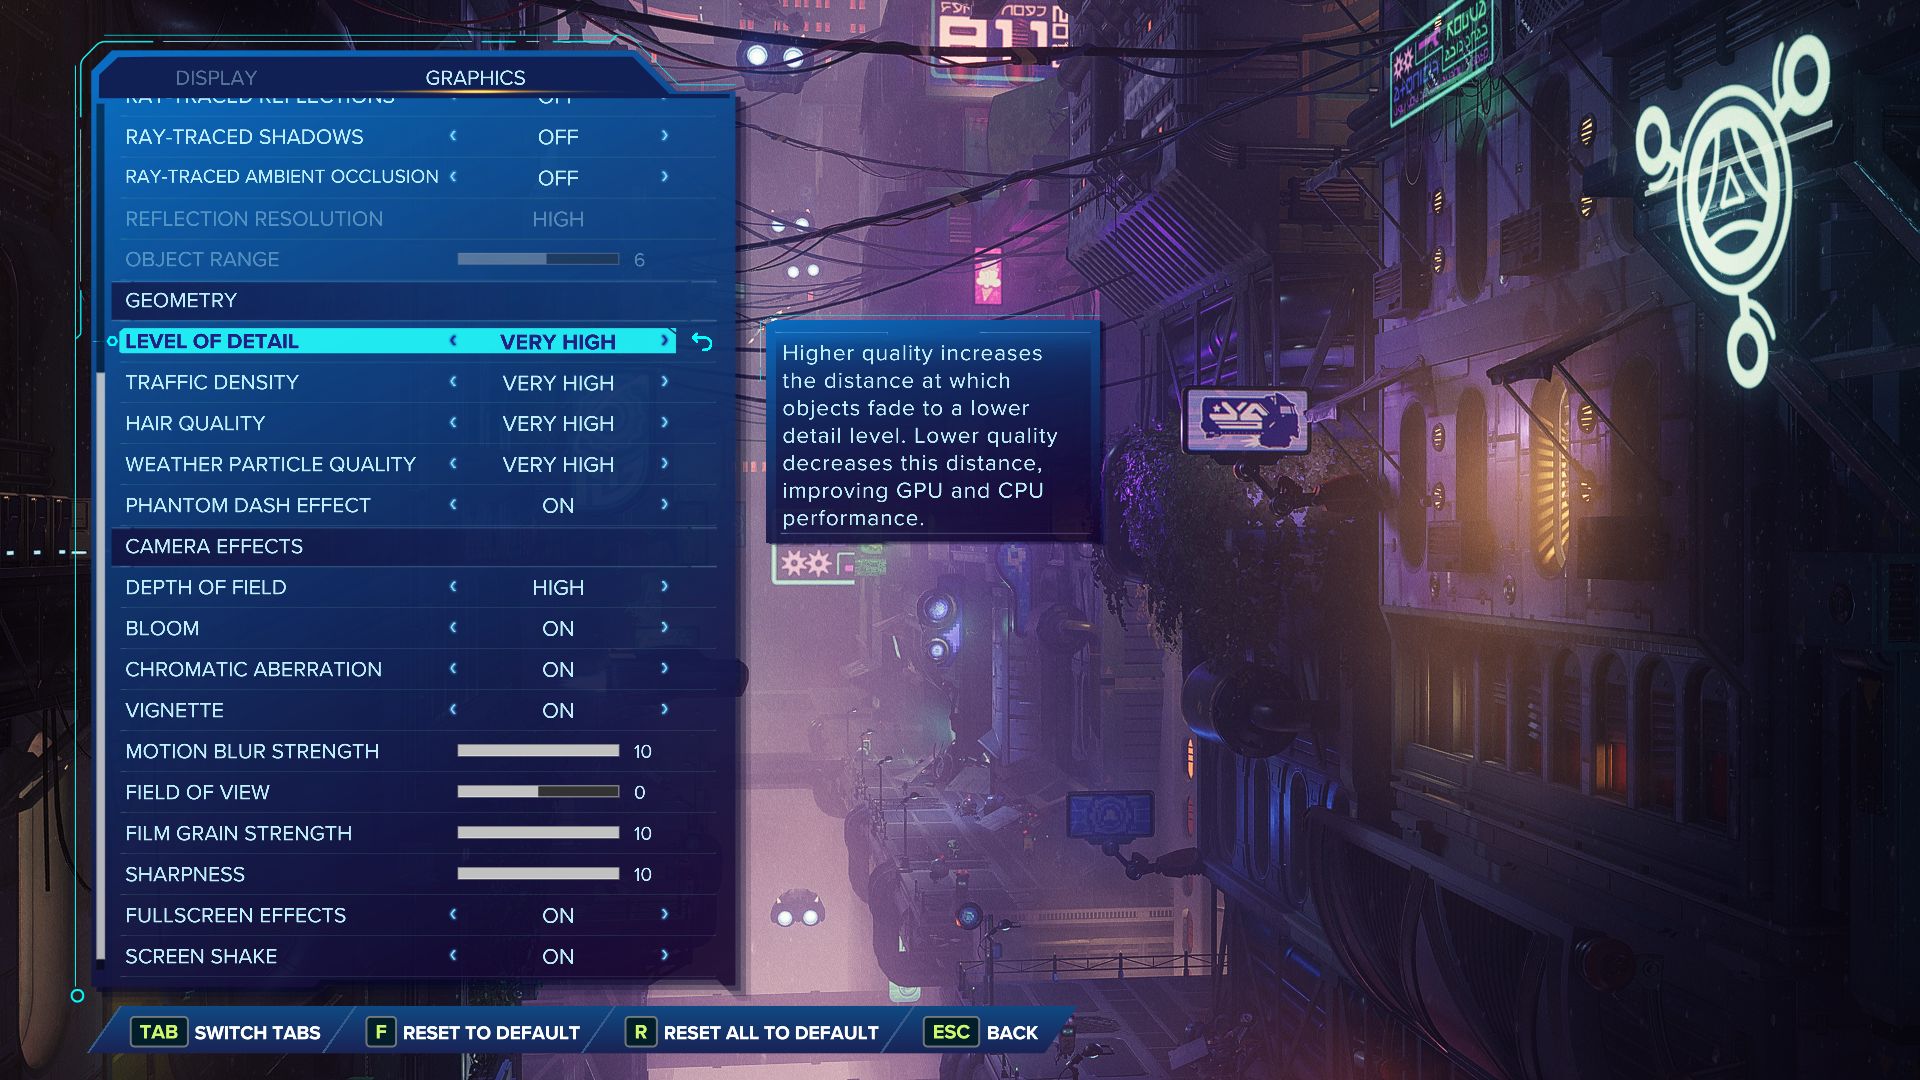
总的来说,Rift Apart 提供了许多现代功能,如升频(Nvidia DLSS、AMD FSR、Intel XeSS)和光线追踪(反射、阴影、环境闭塞),但遗憾的是,正如开头提到的,后者还不能在 AMD GPU 上激活。另一方面,RTX 4000 代 Nvidia 芯片的用户可以为 Frame Generation 的出现感到高兴。从现有的说明来看,没有不同设置的对比图片是可以原谅的。上图:更改图形选项无需重启游戏。除了一次崩溃之外,《Rift Apart》在我们的基准测试中运行稳定。

基准

我们使用游戏的开头进行速度测量,因为最初的平台骑行(见视频)显示了许多数字,而且序列完全相同,非常适合进行基准测试。我们使用 CapFrameX 工具记录了 25 秒序列的帧速率。虽然该游戏 "仅 "以第三人称视角运行,但由于序列(移动、打斗等)速度较快,我们建议至少达到 40 FPS。

成果


全高清(1,920 x 1,080)

只要将像素限制在 1,920 x 1,080 像素,对系统的要求就很适中。尽管即使是最强的 iGPU 之一的 Radeon 680M也只能支持全高清下的低细节,每秒帧数略低于 30;而目前的中端型号,如 Geforce RTX 4050等目前的中端型号也能流畅运行高至最高设置。

Ratchet & Clank Rift Apart
    1920x1080 Low Preset     1920x1080 Medium Preset AA:T     1920x1080 High Preset AA:T     1920x1080 Very High Preset AA:T
NVIDIA GeForce RTX 4080, i9-12900K
Desktop-PC
186.6 (93.4min, 133.2P0.1, 150.4P1) fps ∼100%
163.5 (76.2min, 102.9P0.1, 115.4P1) fps ∼100%
135.6 (65.8min, 78.5P0.1, 96.8P1) fps ∼100%
AMD Radeon RX 7900 XTX, i9-12900K
Desktop-PC
175.5 (120.1min, 134.6P0.1, 150.4P1) fps ∼94%
151.5 (99.3min, 104.1P0.1, 113.7P1) fps ∼93%
126.1 (57.7min, 83.9P0.1, 92.6P1) fps ∼93%
NVIDIA GeForce RTX 4090 Laptop GPU, i9-13900HX
XMG Neo 17 E23
161.8 (82.8min, 111.7P0.1, 130P1) fps ∼87%
136.6 (51.2min, 61.8P0.1, 89.9P1) fps ∼84%
115.4 (47.7min, 53.7P0.1, 75.6P1) fps ∼85%
NVIDIA GeForce RTX 4080 Laptop GPU, i9-13900HX
Schenker Key 17 Pro E23
151.8 (49.4min, 113.2P0.1, 124P1) fps ∼81%
124 (33.1min, 60.2P0.1, 81.1P1) fps ∼76%
107.3 (35.2min, 50.4P0.1, 63.7P1) fps ∼79%
NVIDIA GeForce RTX 3080 Ti Laptop GPU, i9-12900H
Asus ROG Strix Scar 17 G733ZX
115.2 (70.1min, 79.7P0.1, 95.7P1) fps ∼62%
93.7 (20.6min, 34.8P0.1, 60.5P1) fps ∼57%
80.3 (11.7min, 22P0.1, 43.5P1) fps ∼59%
NVIDIA GeForce RTX 4070 Laptop GPU, i9-13900HX
XMG Pro 15 E23
79.5 (61.2min, 62.6P0.1, 65.4P1) fps ∼43%
64.7 (35min, 38.8P0.1, 44P1) fps ∼40%
58.1 (26min, 27P0.1, 36.2P1) fps ∼43%
NVIDIA GeForce RTX 3070 Ti Laptop GPU, i7-12700H
Acer Predator Helios 300 PH315-55
73.9 (51.7min, 57.4P0.1, 61.5P1) fps ∼40%
59.5 (32.2min, 37.2P0.1, 39.4P1) fps ∼36%
55 (17.2min, 29.6P0.1, 35.5P1) fps ∼41%
NVIDIA GeForce RTX 4060 Laptop GPU, i9-13900HX
XMG Pro 15 E23
73.4 (57min, 57.8P0.1, 61.4P1) fps ∼39%
60.6 (37.7min, 39P0.1, 40.2P1) fps ∼37%
54 (30.3min, 32.6P0.1, 35.5P1) fps ∼40%
NVIDIA GeForce RTX 4050 Laptop GPU, i9-13900HX
XMG Focus 15 E23
67.1 (50.9min, 51.5P0.1, 55.9P1) fps ∼36%
49.4 (29min, 29.4P0.1, 30.8P1) fps ∼30%
41.6 (16.8min, 20P0.1, 25.3P1) fps ∼31%
AMD Radeon RX 6800S, R9 6900HS
Asus ROG Zephyrus G14
71.5 (50.3min, 51.6P0.1, 55.7P1) fps ∼100%
62.9 (21.6min, 45.9P0.1, 48.6P1) fps ∼34%
44.7 (28.6min, 28.7P0.1, 29.1P1) fps ∼27%
37.8 (24.4min, 24.8P0.1, 25.1P1) fps ∼28%
AMD Radeon 680M, R9 6900HS
Asus ROG Zephyrus G14
29.9 (21.1min, 22.6P0.1, 23.4P1) fps ∼42%
25.5 (19.3min, 19.4P0.1, 20.1P1) fps ∼14%
21.1 (13.5min, 13.6P0.1, 15.7P1) fps ∼13%
18 (10.1min, 10.8P0.1, 12.6P1) fps ∼13%

QHD (2,560 x 1,440)

对于 QHD 显示屏,应倾向于使用高端 GPU。例如,2560 x 1440 像素和极高预设值使用GeForce RTX 3070 Ti非常流畅。

Ratchet & Clank Rift Apart
    2560x1440 Very High Preset AA:T
NVIDIA GeForce RTX 4080, i9-12900K
Desktop-PC
127.6 (63.3min, 72.9P0.1, 87P1) fps ∼100%
AMD Radeon RX 7900 XTX, i9-12900K
Desktop-PC
114.3 (79.5min, 82P0.1, 86.8P1) fps ∼90%
NVIDIA GeForce RTX 4090 Laptop GPU, i9-13900HX
XMG Neo 17 E23
107.1 (27.6min, 56P0.1, 67.7P1) fps ∼84%
NVIDIA GeForce RTX 4080 Laptop GPU, i9-13900HX
Schenker Key 17 Pro E23
91.1 (44.6min, 48.7P0.1, 56.5P1) fps ∼71%
NVIDIA GeForce RTX 3080 Ti Laptop GPU, i9-12900H
Asus ROG Strix Scar 17 G733ZX
65 (17.4min, 24.9P0.1, 41P1) fps ∼51%
NVIDIA GeForce RTX 4070 Laptop GPU, i9-13900HX
XMG Pro 15 E23
49.1 (19.5min, 21.8P0.1, 32.1P1) fps ∼38%
NVIDIA GeForce RTX 4060 Laptop GPU, i9-13900HX
XMG Pro 15 E23
46.1 (18.9min, 30.1P0.1, 31.1P1) fps ∼36%
NVIDIA GeForce RTX 3070 Ti Laptop GPU, i7-12700H
Acer Predator Helios 300 PH315-55
45.8 (19.2min, 19.9P0.1, 29.5P1) fps ∼36%
NVIDIA GeForce RTX 4050 Laptop GPU, i9-13900HX
XMG Focus 15 E23
31.4 (18.7min, 19.2P0.1, 20.2P1) fps ∼25%

超高清(3,840 x 2,160)

与往常一样,4K 系列的表现非常出色。3,840 x 2,160 像素和最高预设值的混合物需要大量的 VRAM 和 GeForce RTX 3080 Ti或更高。

Ratchet & Clank Rift Apart
    3840x2160 Very High Preset AA:T
NVIDIA GeForce RTX 4080, i9-12900K
Desktop-PC
85 (57min, 58.4P0.1, 61.2P1) fps ∼100%
AMD Radeon RX 7900 XTX, i9-12900K
Desktop-PC
80.2 (61min, 61.9P0.1, 63.3P1) fps ∼94%
NVIDIA GeForce RTX 4090 Laptop GPU, i9-13900HX
XMG Neo 17 E23
67.6 (37.5min, 42.1P0.1, 45.8P1) fps ∼80%
NVIDIA GeForce RTX 4080 Laptop GPU, i9-13900HX
Schenker Key 17 Pro E23
57.9 (27.1min, 28.9P0.1, 38.8P1) fps ∼68%
NVIDIA GeForce RTX 3080 Ti Laptop GPU, i9-12900H
Asus ROG Strix Scar 17 G733ZX
41.6 (16.6min, 22.3P0.1, 27.5P1) fps ∼49%
NVIDIA GeForce RTX 4070 Laptop GPU, i9-13900HX
XMG Pro 15 E23
33.2 (18.4min, 18.4P0.1, 21.6P1) fps ∼39%
NVIDIA GeForce RTX 3070 Ti Laptop GPU, i7-12700H
Acer Predator Helios 300 PH315-55
30.6 (18.9min, 20P0.1, 21.5P1) fps ∼36%
NVIDIA GeForce RTX 4060 Laptop GPU, i9-13900HX
XMG Pro 15 E23
28.8 (8.21min, 13.2P0.1, 19.7P1) fps ∼34%
NVIDIA GeForce RTX 4050 Laptop GPU, i9-13900HX
XMG Focus 15 E23
15.6 (11.8min, 11.8P0.1, 11.9P1) fps ∼18%

光线追踪

不同显卡的光线追踪性能差异很大。以 1,920 x 1,080 像素和最大设置为例 RTX 4060.当启用 DLSS(我们选择了质量设置)和帧生成功能时,3840 x 2160 像素的光线追踪性能就会让人感到好奇。而 台式机 RTX 4080笔记本 RTX 4090在不使用 DLSS 和 FG 的情况下,与全高清相比,性能(几乎)完全相同,但在 GPU 性能较弱的情况下,部分性能会极度下降(见 RTX 4050 至 RTX 4070).可能是这里的 VRAM 压力特别大,所以低于 16 GB 的一切都会导致问题。

Ratchet & Clank Rift Apart
    1920x1080 Very High Preset + Very High Raytracing AA:T     3840x2160 Very High Preset + Very High Raytracing + DLSS Quality + FG
NVIDIA GeForce RTX 4080, i9-12900K
Desktop-PC
105.5 (60min, 67.6P0.1, 75P1) fps ∼100%
104.8 (52.4min, 60.6P0.1, 71.8P1) fps ∼100%
NVIDIA GeForce RTX 4090 Laptop GPU, i9-13900HX
XMG Neo 17 E23
90.9 (1.445min, 39.1P0.1, 56.8P1) fps ∼86%
84.4 (32min, 35.8P0.1, 47.5P1) fps ∼81%
NVIDIA GeForce RTX 4080 Laptop GPU, i9-13900HX
Schenker Key 17 Pro E23
75.8 (0.625min, 39.3P0.1, 46.7P1) fps ∼72%
36.6 (12.4min, 14.6P0.1, 24.5P1) fps ∼35%
NVIDIA GeForce RTX 3080 Ti Laptop GPU, i9-12900H
Asus ROG Strix Scar 17 G733ZX
59.4 (2.1min, 18.7P0.1, 33.4P1) fps ∼56%
NVIDIA GeForce RTX 4070 Laptop GPU, i9-13900HX
XMG Pro 15 E23
44.8 (1.446min, 13.6P0.1, 20.5P1) fps ∼42%
13.3 (4.87min, 4.92P0.1, 5.61P1) fps ∼13%
NVIDIA GeForce RTX 4060 Laptop GPU, i9-13900HX
XMG Pro 15 E23
44.5 (1.318min, 20.1P0.1, 23.2P1) fps ∼42%
12 (4.07min, 4.33P0.1, 5.25P1) fps ∼11%
NVIDIA GeForce RTX 3070 Ti Laptop GPU, i7-12700H
Acer Predator Helios 300 PH315-55
38.3 (1.283min, 3.92P0.1, 17.7P1) fps ∼36%
NVIDIA GeForce RTX 4050 Laptop GPU, i9-13900HX
XMG Focus 15 E23
25.6 (0.554min, 2P0.1, 14.5P1) fps ∼24%
6.03 (2.59min, 2.6P0.1, 2.83P1) fps ∼6%

备注

由于游戏测试非常耗时,而且经常受到安装或激活限制,因此我们只能为您提供部分基准,以便发表文章。稍后将安装更多显卡。

Overview

Show Restrictions
PosModel< PrevNext >Ratchet & Clank Rift Apart
 Ratchet & Clank Rift Apart (2023)
low
1920x1080
Low Preset
med.
1920x1080
Medium Preset
TAA
high
1920x1080
High Preset
TAA
ultra
1920x1080
Very High Preset
TAA
QHD
2560x1440
Very High Preset
TAA
4K
3840x2160
Very High Preset
TAA
NVIDIA GeForce RTX 4090
236n2
224n2
194.85n2
168.45n2
157.15n2
112.45n2
AMD Radeon RX 7900 XTX
230
190.75n2
161.15n2
137.35n2
121.35n2
83.4n2
NVIDIA GeForce RTX 4080 Super
230.5n2
228.5n2
193.6n2
170.35n2
143.75n2
92.1n2
NVIDIA GeForce RTX 4080
186.6
163.5
135.6
127.6
85
AMD Radeon RX 7900 GRE
161.05n2
143.4n2
121.25n2
106.15n2
88n2
58.9n2
AMD Radeon RX 6950 XT
167.4
146.3
123.3
109.3
93.2
64.2
NVIDIA GeForce RTX 4090 Laptop GPU
163.4
158.7n2
136n2
113.25n2
102.9n2
67.6
NVIDIA GeForce RTX 3090
205n3
176.7n2
141.05n2
122.55n2
102.45n2
64.8n2
AMD Radeon RX 7800 XT
168.6
144.6
119.8
105.4
85.7
54.6
AMD Radeon RX 7900M
86.2
83.6
54.8
NVIDIA GeForce RTX 4080 Laptop GPU
151.8
124
107.3
91.1
57.9
NVIDIA GeForce RTX 3080 12 GB
172.6
135.6
117.1
94.7
60.1
AMD Radeon RX 6800
133.5
117.9
97.2
85.5
71.5
46.9
AMD Radeon RX 7700 XT
151.3
121.9
102.1
90
72
42.5
NVIDIA Titan RTX
152.2
131.9
106.4
93.2
75.3
47.1
NVIDIA GeForce RTX 3070 Ti
132.6
115
93.7
83.7
69.1
45.7
NVIDIA GeForce RTX 4060 Ti 16G
141.6
124.4
101.4
90.1
70.6
42
NVIDIA GeForce RTX 4060 Ti 8G
101.5
91.1
73.3
68.3
63.7
56.6
NVIDIA GeForce RTX 3080 Ti Laptop GPU
115.2
93.7
80.3
65
41.6
PosModel< PrevNext >Ratchet & Clank Rift Apart
low med. high ultra QHD 4K
NVIDIA GeForce RTX 4070 Laptop GPU
90.4
75.65n4
61.25n4
56.7n4
48.8n3
33.2
NVIDIA GeForce RTX 3070
110.7
87.2
78.8
64.5
41.7
AMD Radeon RX 6750 XT
129.3
111
94.4
82.6
66.4
34.6
AMD Radeon RX 6700 XT
124.8
107.8
91.1
81.1
62.9
37.3
NVIDIA GeForce RTX 3080 Laptop GPU
113.8
100.6
81.6
72.3
65.9
62.3
NVIDIA GeForce RTX 3060 Ti
119.4
103.2
82.7
73.4
60.8
37.3
Intel Arc A770
113
98
79.2
68.5
56.4
36.2
AMD Radeon RX 7600
84.5
71.2
50.2
40.9
33.4
20.2
NVIDIA GeForce RTX 3070 Ti Laptop GPU
73.9
59.5
55
45.8
30.6
NVIDIA GeForce RTX 4060 Laptop GPU
85.4n3
74.7n4
60.6n4
54.3n4
46.1n3
28.8
AMD Radeon RX 6650 XT
78.5
65.8
47.8
41.2
31.6
19.2
NVIDIA GeForce RTX 3070 Laptop GPU
87.6
75.7
66.8
63.5
61.7
51.3
AMD Radeon RX 6800S
71.5
62.9
44.7
37.8
AMD Radeon RX 7600M XT
26.5
21
12.8
11.5
9.4
6.7
Intel Arc A750
85.4
74.3
59.9
53.7
43.5
30.5
NVIDIA Titan X Pascal
98.6
85.2
64.9
55.3
44.8
27.8
NVIDIA GeForce RTX 2070 Super (Desktop)
86
74.8
60.2
54
43.7
29.7
AMD Radeon RX 5700 XT (Desktop)
81.8
67.5
53.8
46.6
38.6
23.8
AMD Radeon RX 7600M
46.2
35.5
30.7
24.6
15.4
AMD Radeon RX 7600S
50.7
41.3
31.7
24.9
16.2
PosModel< PrevNext >Ratchet & Clank Rift Apart
low med. high ultra QHD 4K
Intel Arc A580
86.5
74.4
59.7
52.9
43.4
27.2
NVIDIA GeForce RTX 2060 Super (Desktop)
78.4
68.6
55.7
49.2
39.9
25.6
AMD Radeon RX 6600
72.9
59.6
44.5
37.6
29.2
15.5
AMD Radeon RX 5700 (Desktop)
71.9
60.4
48.9
42.1
34.5
21.7
AMD Radeon RX 6600M
62.8
59
47
39.4
34.9
30
AMD Radeon RX 5600 XT (Desktop)
61.7
51.9
41.9
28.4
24.9
19
NVIDIA GeForce GTX 1660 Super (Desktop)
63.4
52.4
44.7
33.4
26.6
14.3
AMD Radeon RX 6500 XT
23.7
20.5
15.3
10.6
AMD Radeon RX 5500 XT (Desktop)
44.5
38
28.6
24.7
19.6
12.1
NVIDIA GeForce RTX 4050 Laptop GPU
80.7
67.7n3
48.5n3
41.6n3
32.5n2
15.6
Intel Arc A730M
54.3n2
47.8n2
38.4n2
36.35n2
NVIDIA GeForce GTX 1660 Ti Mobile
58
49.6
40.3
36.3
NVIDIA GeForce GTX 1660 (Desktop)
59.6
49.3
36.4
31.9
21.6
13.5
NVIDIA GeForce GTX 1650 Super (Desktop)
45
38.4
29.5
22.8
12.2
6.74
NVIDIA GeForce RTX 3050 4GB Laptop GPU
60.7
42.6
35.1
28.5
NVIDIA GeForce GTX 1650 Ti Mobile
29.9
24.7
18
15.7
AMD Radeon RX 5500M
25.6
23
16.5
NVIDIA GeForce RTX 2050 Mobile
18.8
17.9
16.7
NVIDIA GeForce GTX 1650 Mobile
27.6
20.8
15.1
12.9
Intel Arc A380
41.8
30.9
24.6
21.1
PosModel< PrevNext >Ratchet & Clank Rift Apart
low med. high ultra QHD 4K
Intel Arc A310
30.3
24.6
19.1
16.1
Intel Arc 8-Cores iGPU
28.4
29
25.9
21.1
AMD Radeon 780M
23.9
23.6n2
18.15n2
20.2
AMD Radeon 680M
29.9
25.5
21.1
18
NVIDIA GeForce GTX 1050 Mobile
24.8
21.1
15.6
12.7
AMD Radeon 760M
20.5
AMD Radeon RX 560X (Laptop)
16.5
13.4
9.83
AMD Radeon RX Vega 10
11.4
10.1
Intel UHD Graphics Xe 32EUs (Tiger Lake-H)
8.75
Intel UHD Graphics 770
8.4
NVIDIA GeForce MX130
3.76
AMD Radeon RX Vega 6 (Ryzen 4000/5000)
9.46
Intel UHD Graphics 630
3.81
(-) * Smaller values are better. / n123 Number of benchmarks for this median value / * Approximate position


Legend
5Stutters – This game is very likely to stutter and have poor frame rates. Based on all known benchmarks using the specified graphical settings, average frame rates are expected to fall below 25fps
May Stutter – This graphics card has not been explicitly tested on this game. Based on interpolated information from surrounding graphics cards of similar performance levels, stutters and poor frame rates are expected.
30Fluent – Based on all known benchmarks using the specified graphical settings, this game should run at or above 25fps
40Fluent – Based on all known benchmarks using the specified graphical settings, this game should run at or above 35fps
60Fluent – Based on all known benchmarks using the specified graphical settings, this game should run at or above 58fps
May Run Fluently – This graphics card has not been explicitly tested on this game. Based on interpolated information from surrounding graphics cards of similar performance levels, fluent frame rates are expected.
?Uncertain – This graphics card experienced unexpected performance issues during testing for this game. A slower card may be able to achieve better and more consistent frame rates than this particular GPU running the same benchmark scene.
Uncertain – This graphics card has not been explicitly tested on this game and no reliable interpolation can be made based on the performances of surrounding cards of the same class or family.
The value in the fields displays the average frame rate of all values in the database. Move your cursor over the value to see individual results.

All test systems

设备 图形卡 处理器 内存
笔记本电脑
XMG Neo 17 E23 NvidiaGeForce RTX 4090 @175 W TGP (16 GB GDDR6X) Intel Core i9-13900HX 2 x 16 GB DDR5
Schenker Key 17 Pro E23 NvidiaGeForce RTX 4080 @175 W TGP (12 GB GDDR6X) Intel Core i9-13900HX 2 x 16 GB DDR5
XMG Pro 15 E23 NvidiaGeForce RTX 4070 @140 W TGP (8 GB GDDR6) Intel Core i9-13900HX 2 x 16 GB DDR5
XMG Pro 15 E23 NvidiaGeForce RTX 4060 @140 W TGP (8 GB GDDR6) Intel Core i9-13900HX 2 x 16 GB DDR5
XMG Focus 15 E23 NvidiaGeForce RTX 4050 @140 W TGP (6 GB GDDR6) Intel Core i9-13900HX 2 x 16 GB DDR5
华硕 ROG Strix Scar 17 NvidiaGeForce RTX 3080 Ti @150 W TGP (16 GB GDDR6) Intel Core i9-12900H 2 x 16 GB DDR5
Acer Predator Helios 300 NvidiaGeForce RTX 3070 Ti @150 W TGP (8 GB GDDR6) Intel Core i7-12700H 2 x 8 GB DDR5
华硕 ROG Zephyrus G14 AMD Radeon RX 6800S (8 GB GDDR6) & AMD Radeon 680M AMD Ryzen 9 6900HS 2 x 16 GB DDR5
立式 PC
定制 I NvidiaGeForce RTX 4080 (16 GB GDDR6X)
AMD Radeon RX 7900 XTX (24 GB GDDR6)
Intel Core i9-12900K 2 x 16 GB DDR4
Custom II PalitGeForce RTX 4090 GameRock OC (24 GB GDDR6X)
Nvidia GeForce RTX 3090 FE (24 GB GDDR6X)
Nvidia GeForce RTX 3060 Ti (8GB GDDR6X)
NvidiaTitan RTX (24GB GDDR6)
lNvidia GeForce RTX2070Super (8 GB GDDR6)
Nvidia GeForce RTX 2060 Super (8GB GDDR6)
KFA2 GeForce GTX 1660 Super (6GB GDDR6)
PNY GeForce GTX 1660 (6 GB GDDR5)
KFA2 GeForce GTX 1650 Super (4 GB GDDR6)
AMDRadeonRX6950 XT (16 GB DDR6)
AMD Radeon RX 6800 (16 GB DDR6)
AMD Radeon RX 6700 XT (12 GB DDR6)
AMD Radeon RX 6650 XT (8GB GDDR6)
AMD Radeon RX 6600 (8GB GDDR6
)AMDRadeonRX 5700 XT (8 GB GDDR6)
AMD Radeon RX5700 (8GB GDDR6)
AMD Radeon RX 5600 XT (6GB GDDR6)
AMD Radeon RX 5500 XT (8GB GDDR6)
AMD Ryzen 9 7950X 2 x 16 GB DDR5
迷你 PC
Minisforum NUCXi7 NvidiaGeForce RTX 3070 @125 W TGP (8 GB GDDR6) Intel Core i7-11800H 2 x 8 GB DDR4
Minisforum HX99G AMD Radeon RX 6600M @100 W TGP (8 GB GDDR6) AMD Ryzen 9 6900HX 2 x 16 GB DDR5
Morefine S500+ AMD Radeon RX Vega 8 AMD Ryzen 9 5900HX 2 x 16 GB DDR4
4K 显示器 操作系统 Nvidia 驱动程序 AMD 驱动程序
飞利浦 Brilliance 329P9H、技嘉 M32U Windows 11 ForceWare 536.67 Adrenalin 23.7.2
Please share our article, every link counts!
> Notebookcheck中文版(NBC中国) > 评测 > Ratchet & Clank Rift Apart:笔记本电脑和台式机基准测试
Florian Glaser, 2023-08- 8 (Update: 2023-08- 8)