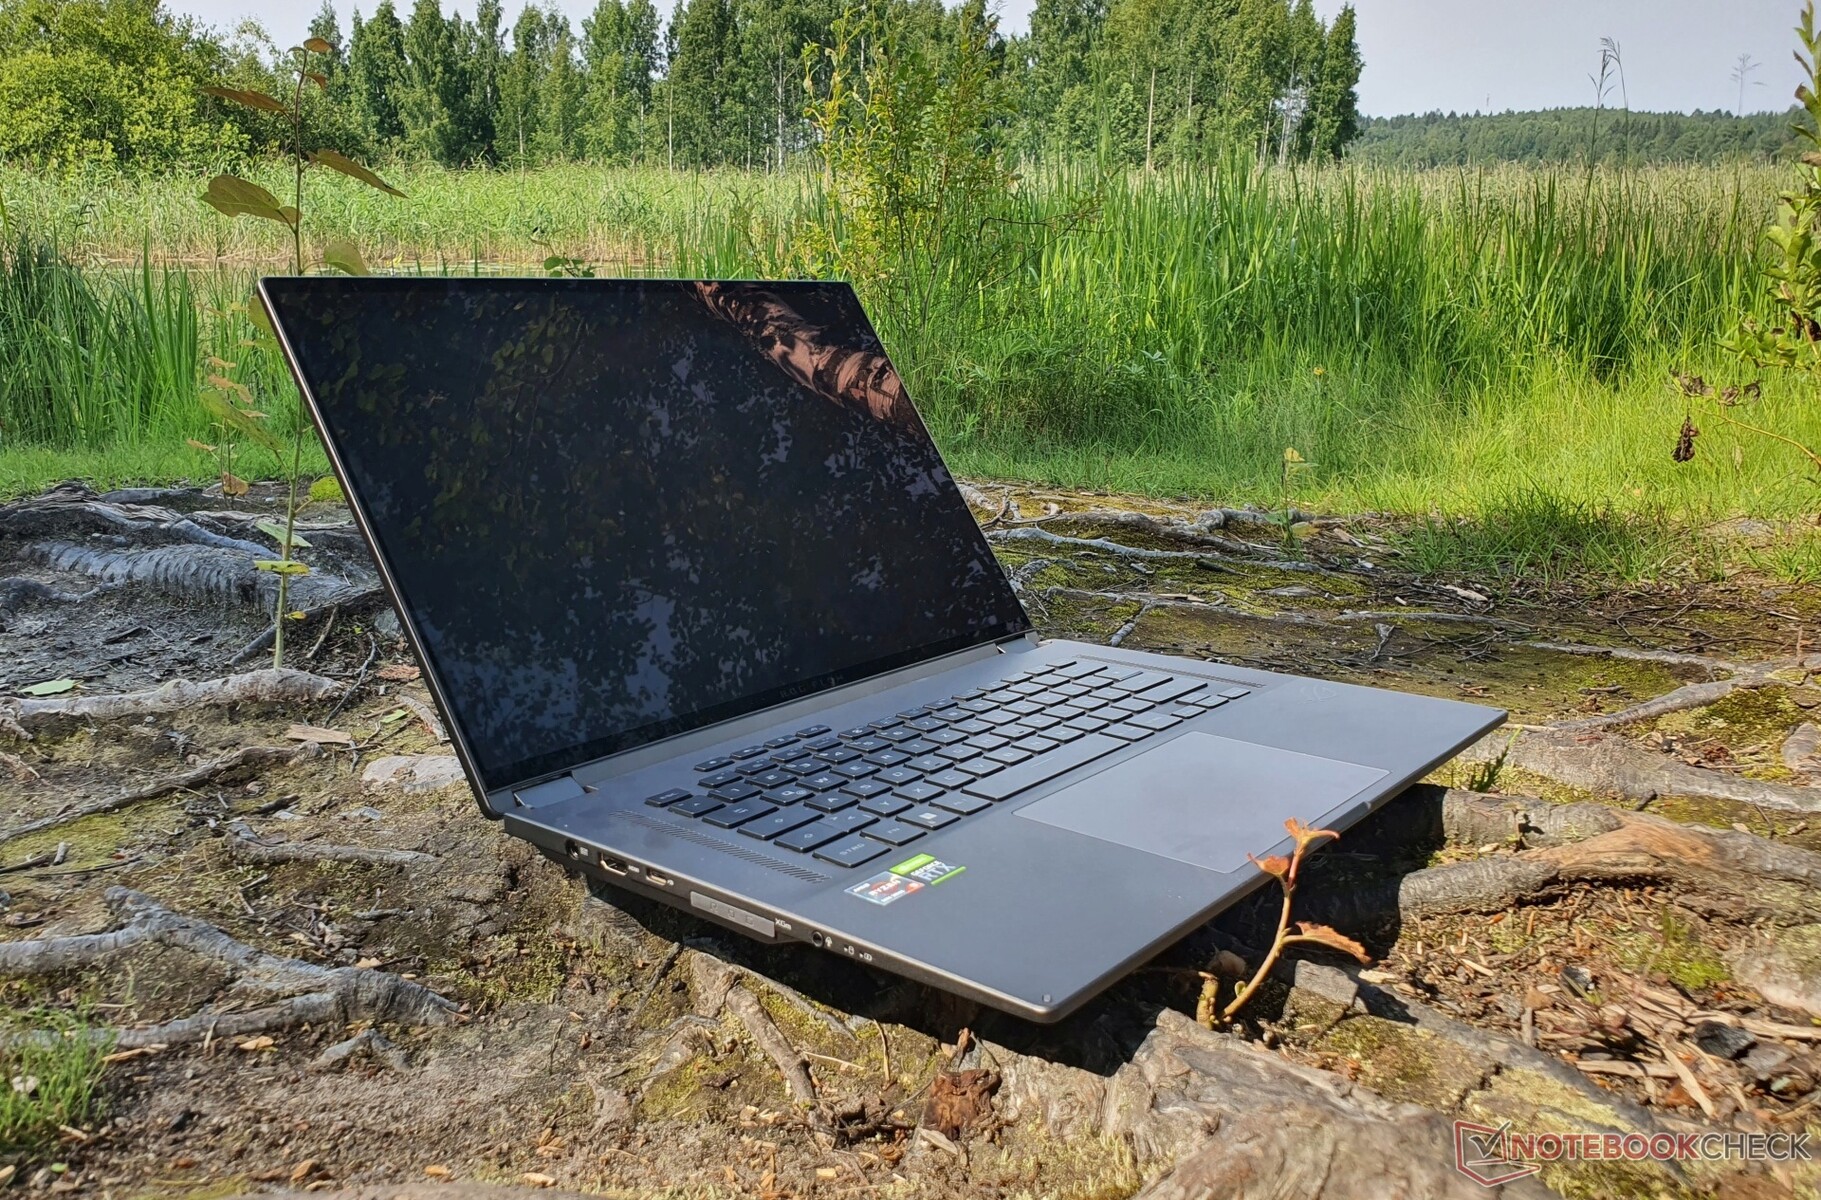
华硕ROG Flow X16笔记本电脑评测。带有迷你LED的二合一游戏机
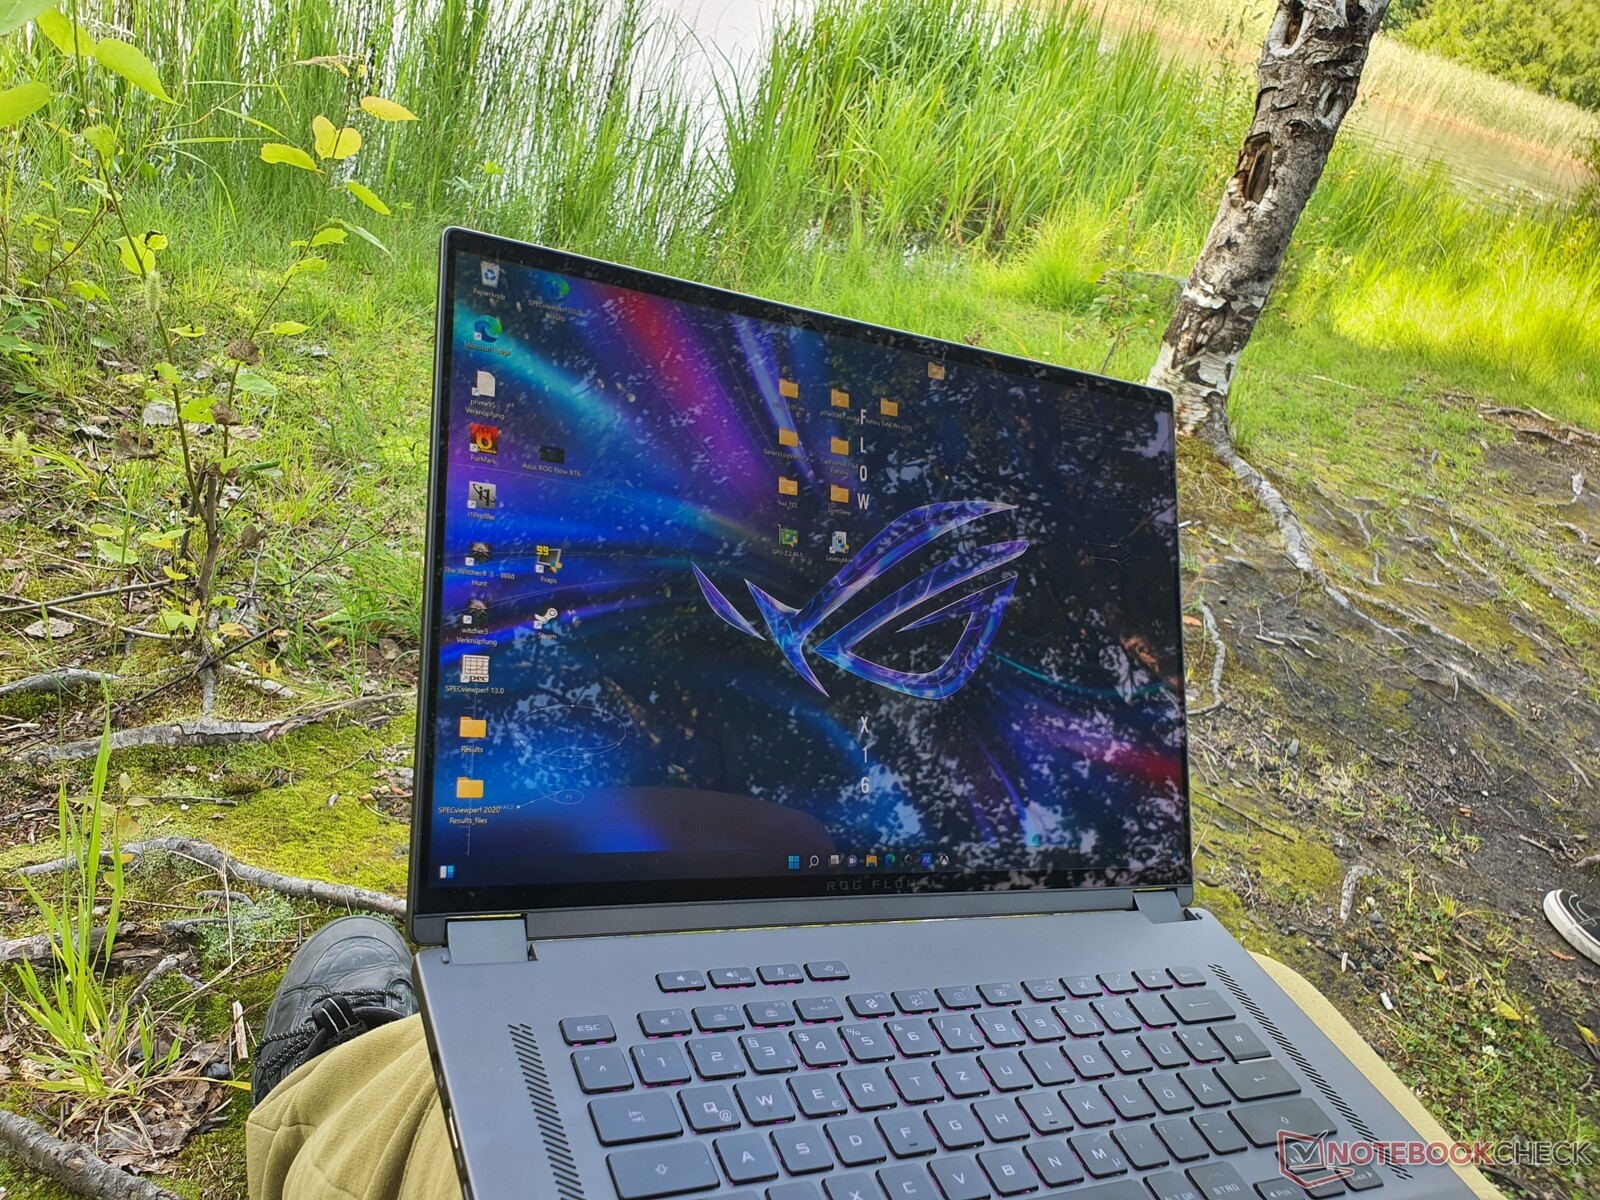
1,100 nit-strong迷你LED显示屏在华硕ROG Flow X16中首次亮相,它的独特性也来自于其可转换设计。RTX 3070 Ti 与125瓦的TGP使其成为真正的游戏笔记本,具有许多人热切期待的高端多媒体功能。
我们已经能够彻底检查一个预生产的样品设备的细节。由于这个审查模型是生产模型的代表(根据华硕的说法),我们擅自给它一个评级。预计在最终的生产版本之前,该设备会有微小的变化,这些变化将相应地反映在本评论的更新中。我们还在审查ROG XG Mobile 图形底座(可单独购买),其GeForce RTX 3080 Laptop GPU 在Flow X16上(去年也对ROG Flow X13进行了类似的测试),并将很快作为本评论的更新提供结果。
华硕ROG Flow X16与其流行的、几乎同样独特的兄弟姐妹一起构成了华硕的二合一游戏笔记本电脑系列,即ROG Flow X13以及去年推出的 ROG Flow Z13 (2合1平板电脑)。16:10格式的16英寸QHD显示屏通过迷你LED提供了类似于OLED的黑色水平,还宣传了DCI-P3色彩空间覆盖率,用于专业图像编辑。可以想象,支持笔输入的触摸屏对创意工作很有用,而且 AMD的Ryzen 6900HS也承诺会有很大的潜力。虽然所有这些规格在纸面上读起来很美妙,但我们的审查揭示了这种原始力量在多大程度上可以在紧凑的华硕敞篷车中得到充分利用,以及任何缺点可能是什么。
我们的华硕Rog Flow X16样品模型配有NvidiaGeForce RTX 3070 Ti,32GB内存和1TB SSD,似乎还没有广泛上市。根据你的位置,相同的(即相同的硬件与特定地区的键盘布局)或略有不同的配置可能以不同的价格提供,通常开始于2500.00美元左右。详情见本评论末尾的 "价格和可用性"。
独特的、紧凑的16英寸游戏机的直接竞争对手少之又少。尽管如此,华硕Rog Flow X16主要是为创意任务、多媒体和游戏而设计的,因此我们将其与以下笔记本进行了比较。Gigabyte Aero 16,MSI Stealth GS66,LenovoLegion 5 Pro, LenovoThinkPad X1 Extreme,MacBook Pro 16 (2021), Microsoft的Surface Laptop Studio, Dell的紧凑型XPS 17 和华硕的内部Zephyrus M16 。
后者在许多方面与ROG X16 Flow相似,我们在评测中的不同点上指出了这一点。与较小的ROG Flow X13 ,以及与传统的、厚实的游戏巨无霸如华硕的ROG Strix Scar 15 。配备英特尔酷睿i7-12700H、中端Arc显卡和3K OLED触摸屏的惠普Spectre 16可折叠机将于8月底左右上市,对于不主要对游戏感兴趣的目标群体来说也可能会感兴趣。据报道,联想的Legion Slim 7i也将使用迷你LED。
潜在的竞争对手比较
Rating | Date | Model | Weight | Height | Size | Resolution | Price |
|---|---|---|---|---|---|---|---|
| 89.5 % v7 (old) | 08 / 2022 | Asus ROG Flow X16 GV601RW-M5082W R9 6900HS, GeForce RTX 3070 Ti Laptop GPU | 2.1 kg | 19.4 mm | 16.10" | 2560x1600 | |
| 85.6 % v7 (old) | 06 / 2021 | Asus ROG Zephyrus M16 GU603H i9-11900H, GeForce RTX 3070 Laptop GPU | 2 kg | 20 mm | 16.00" | 2560x1600 | |
| 86.3 % v7 (old) | 06 / 2022 | Asus ROG Strix Scar 15 G533ZW-LN106WS i9-12900H, GeForce RTX 3070 Ti Laptop GPU | 2.3 kg | 27.2 mm | 15.60" | 2560x1440 | |
| 84.7 % v7 (old) | 03 / 2022 | Gigabyte Aero 16 YE5 i9-12900HK, GeForce RTX 3080 Ti Laptop GPU | 2.3 kg | 22.4 mm | 16.00" | 3840x2400 | |
| 88 % v7 (old) | 03 / 2022 | Lenovo Legion 5 Pro 16 G7 i7 RTX 3070Ti i7-12700H, GeForce RTX 3070 Ti Laptop GPU | 2.6 kg | 26.6 mm | 16.00" | 2560x1600 | |
| 84.5 % v7 (old) | 02 / 2022 | MSI Stealth GS66 12UGS i7-12700H, GeForce RTX 3070 Ti Laptop GPU | 2.2 kg | 19.8 mm | 15.60" | 2560x1440 | |
| 93.2 % v7 (old) | 11 / 2021 | Apple MacBook Pro 16 2021 M1 Pro M1 Pro, M1 Pro 16-Core GPU | 2.2 kg | 16.8 mm | 16.20" | 3456x2234 | |
| 88.3 % v7 (old) | 12 / 2021 | Lenovo ThinkPad X1 Extreme G4-20Y50040GE i9-11950H, GeForce RTX 3080 Laptop GPU | 1.9 kg | 18.2 mm | 16.00" | 3840x2400 | |
| 88.8 % v7 (old) | 06 / 2022 | Dell XPS 17 9720 RTX 3060 i7-12700H, GeForce RTX 3060 Laptop GPU | 2.5 kg | 19.5 mm | 17.00" | 3840x2400 | |
| 89 % v7 (old) | 03 / 2022 | Microsoft Surface Laptop Studio i7 RTX 3050 Ti i7-11370H, GeForce RTX 3050 Ti Laptop GPU | 1.8 kg | 19 mm | 14.40" | 2400x1600 | |
| 84.7 % v7 (old) | 02 / 2021 | Asus ROG Flow X13 GV301QH R9 5980HS, GeForce GTX 1650 Max-Q | 1.4 kg | 15.8 mm | 13.40" | 3840x2400 |
案例 - 华硕的稳定的游戏笔记本电脑
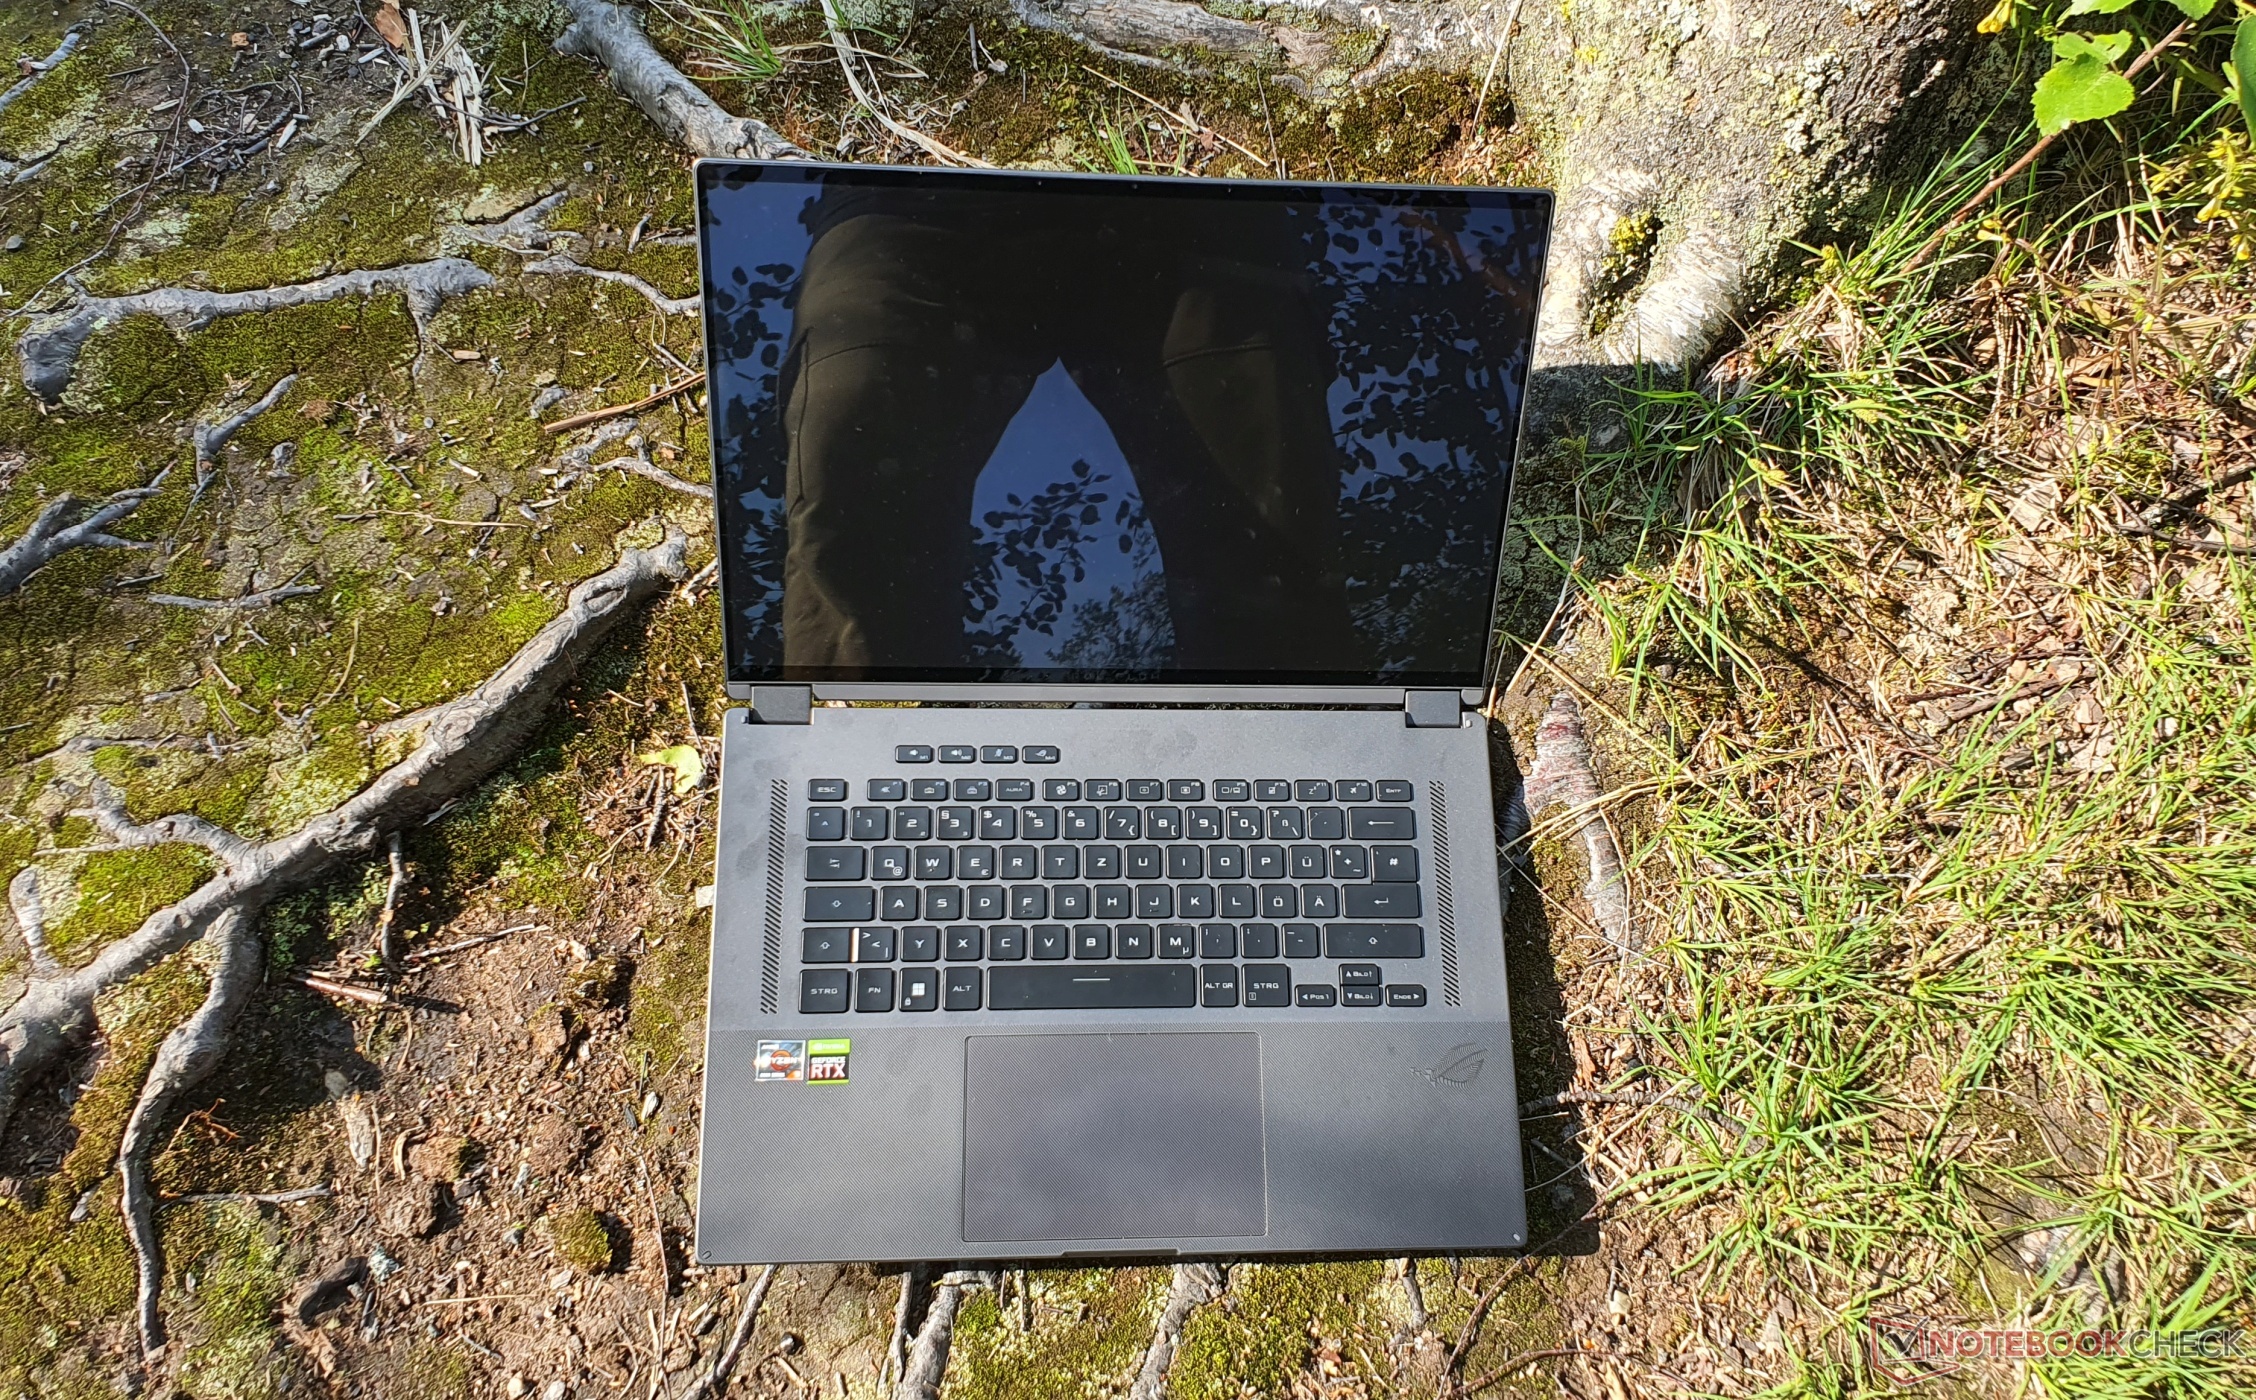
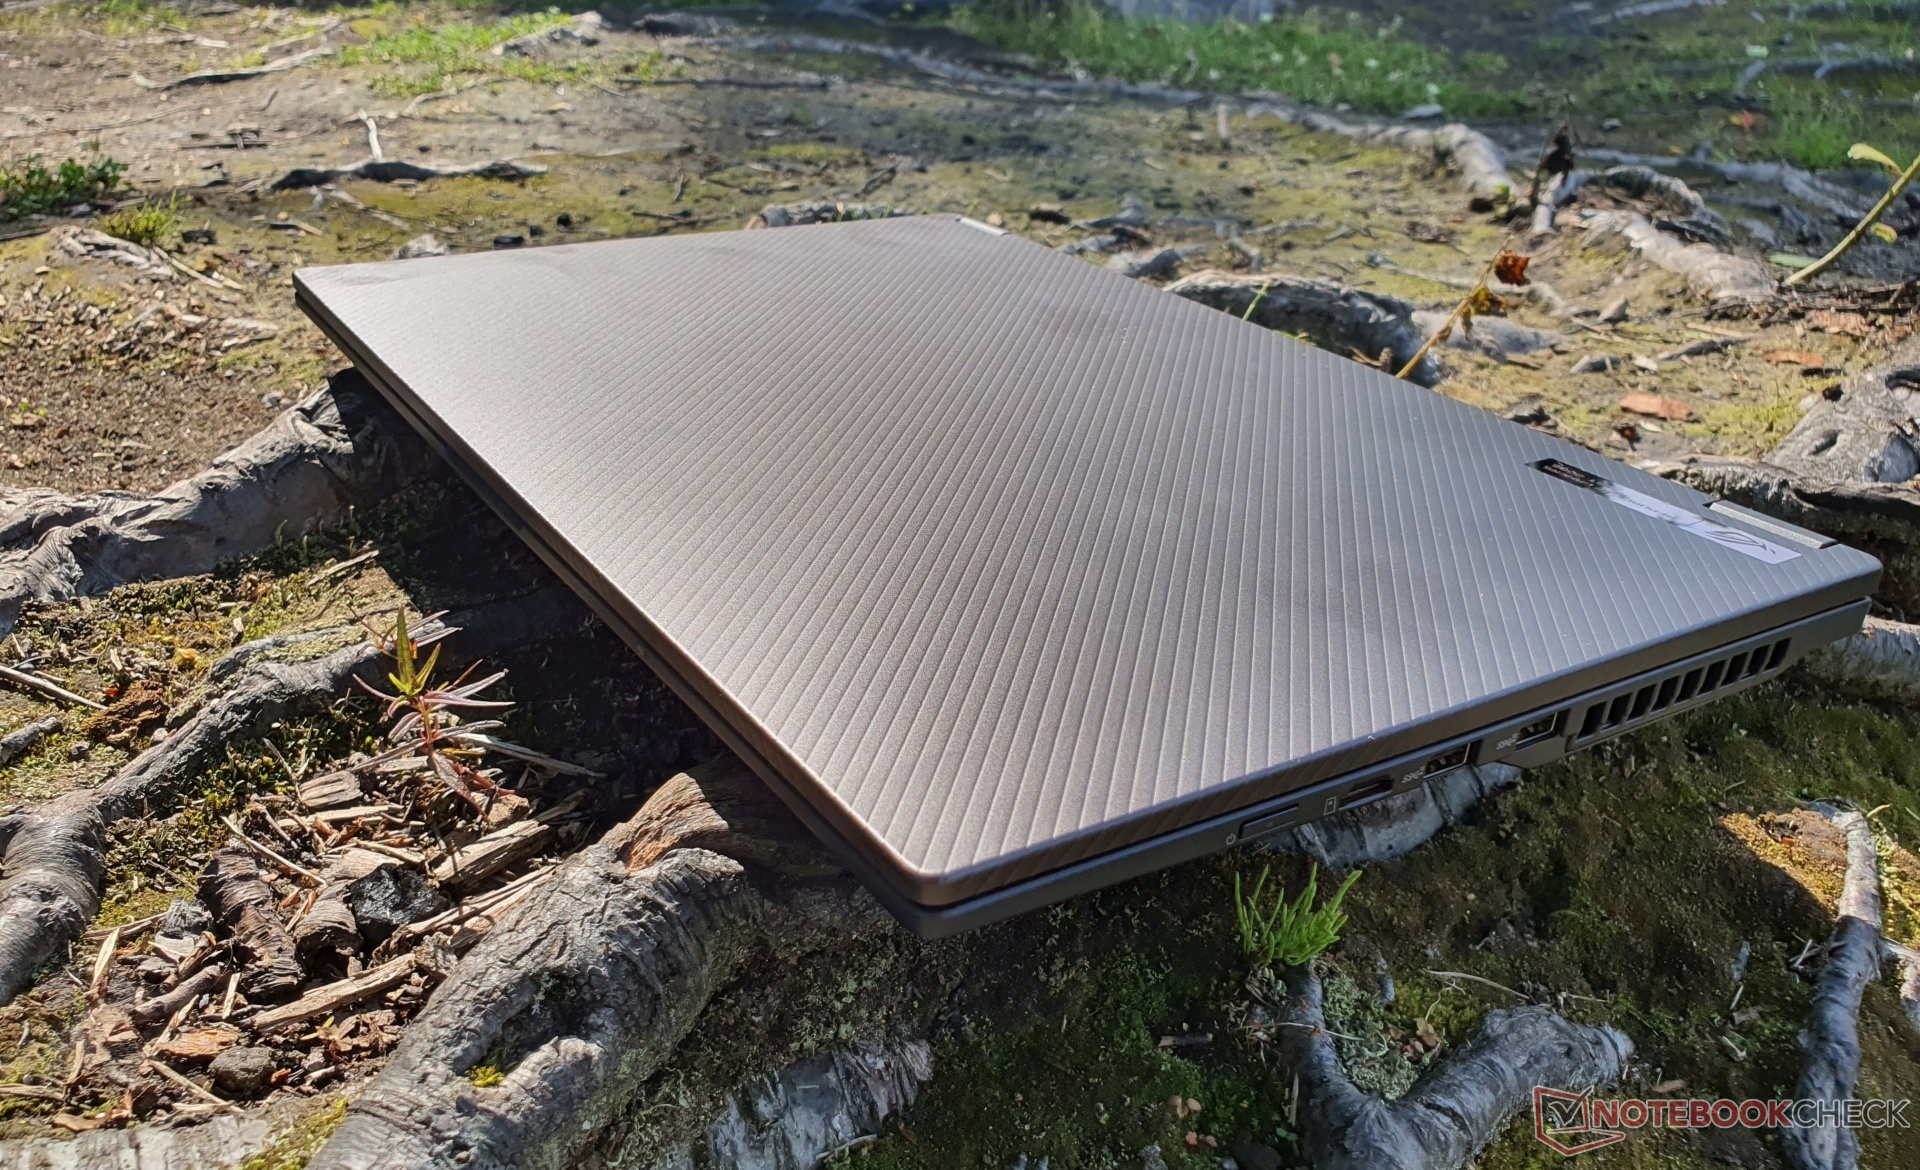
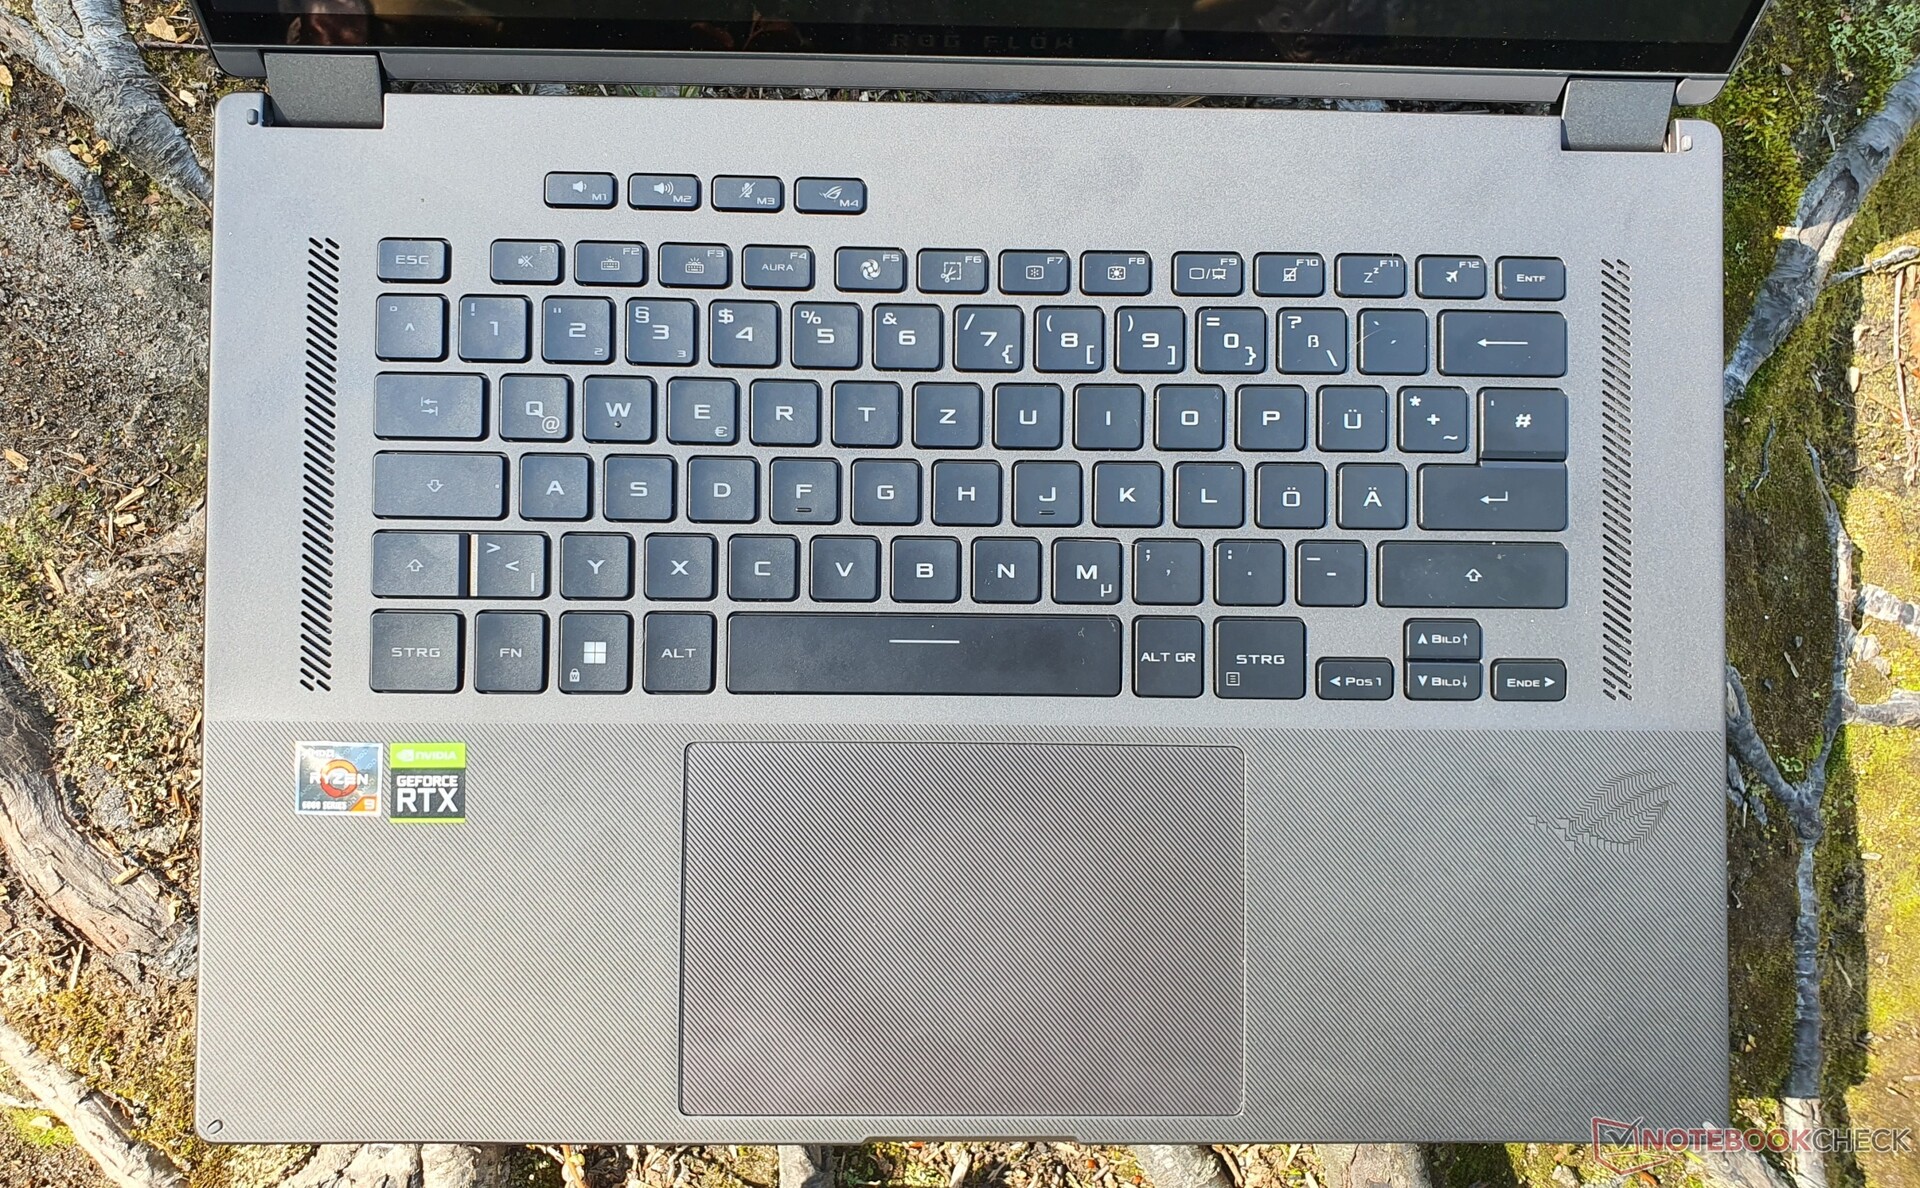
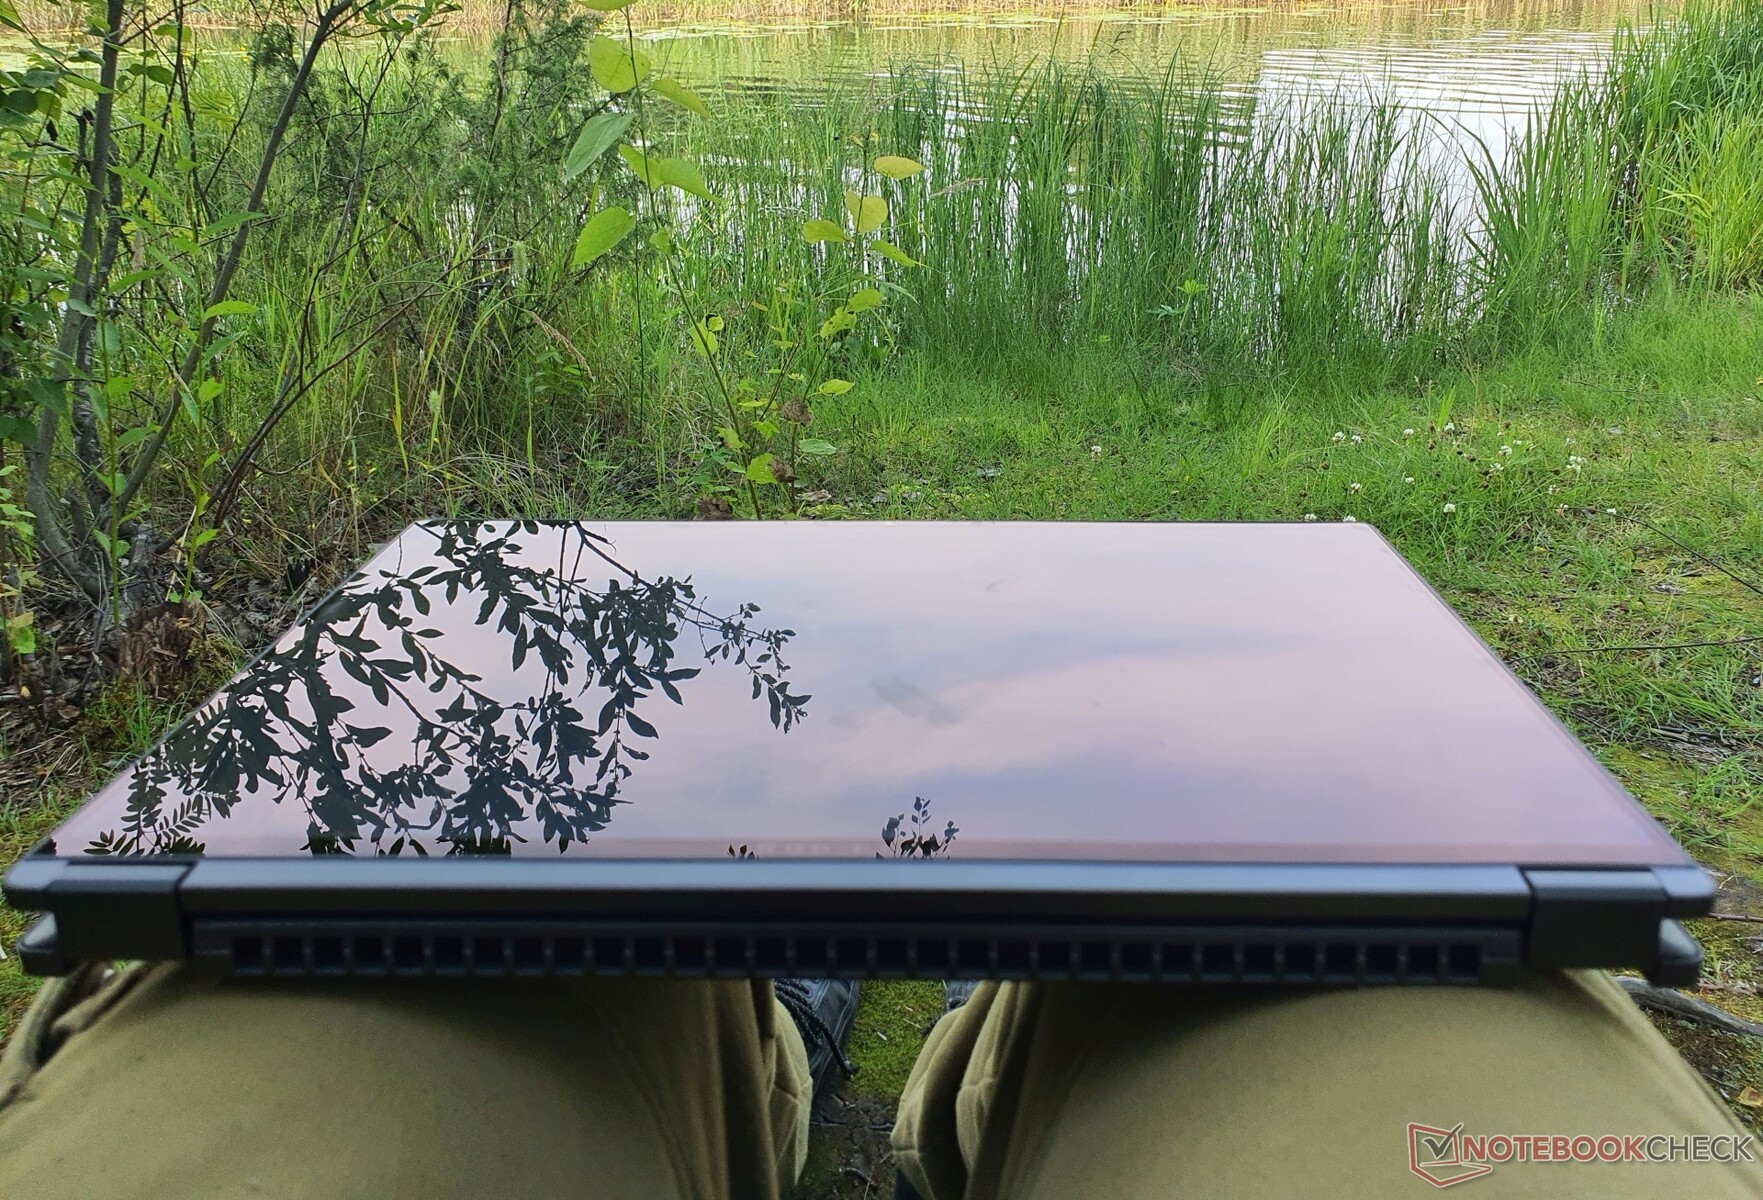
原则上说,ROG Flow X16是一个混合了较小的流动X13和 Zephyrus M16:前者的铁灰色塑料盖子上独特的凹槽被复制了,还有一般的形状和轮廓,只是尺寸更大。基本单元,包括底板,类似于Zephyrus M16。
华硕使用了大量的镁元素,所以设备整体感觉非常优质。然而,盖子和底板是由软塑料制成的,特别容易被划伤。这在一定程度上降低了我们最初的积极印象。
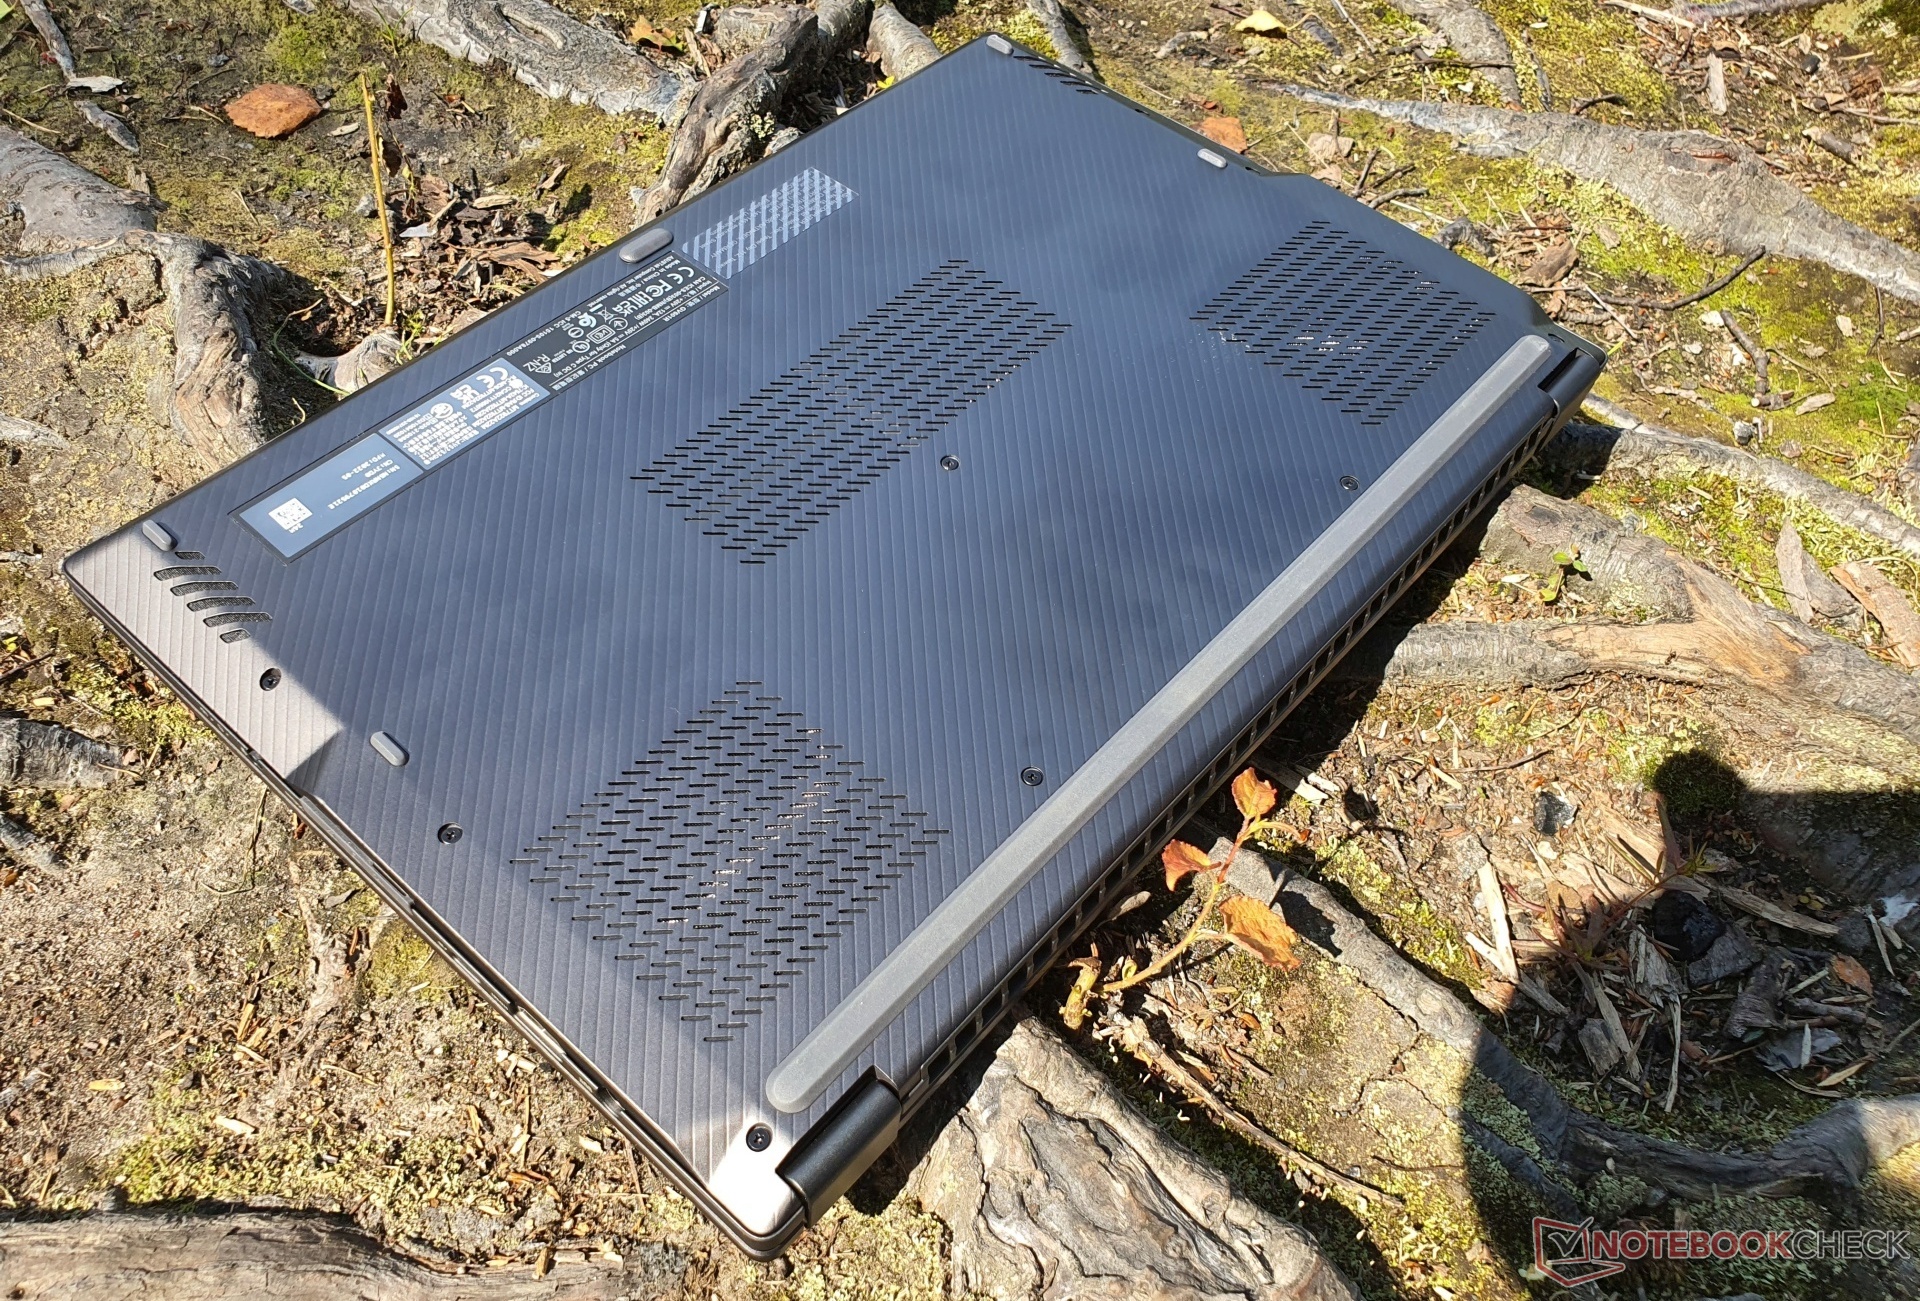
对显示屏背面进行有针对性的施压并不会导致图像失真,底板由13颗螺丝固定。然而,当从设备上拆下时,底板变成了一块灵活的塑料。
工艺水平很高,底板不能被扭曲,显示屏也没有留下什么扭曲的空间。从触觉上看,略微粗糙的表面感觉非常好。盖子上的图案也以一种完全的光学形式复制在掌托上,包括触摸板。指纹立即可见,但预计最终版本的Flow X16不会采用波纹图案,而是采用特殊涂层来防止指纹。
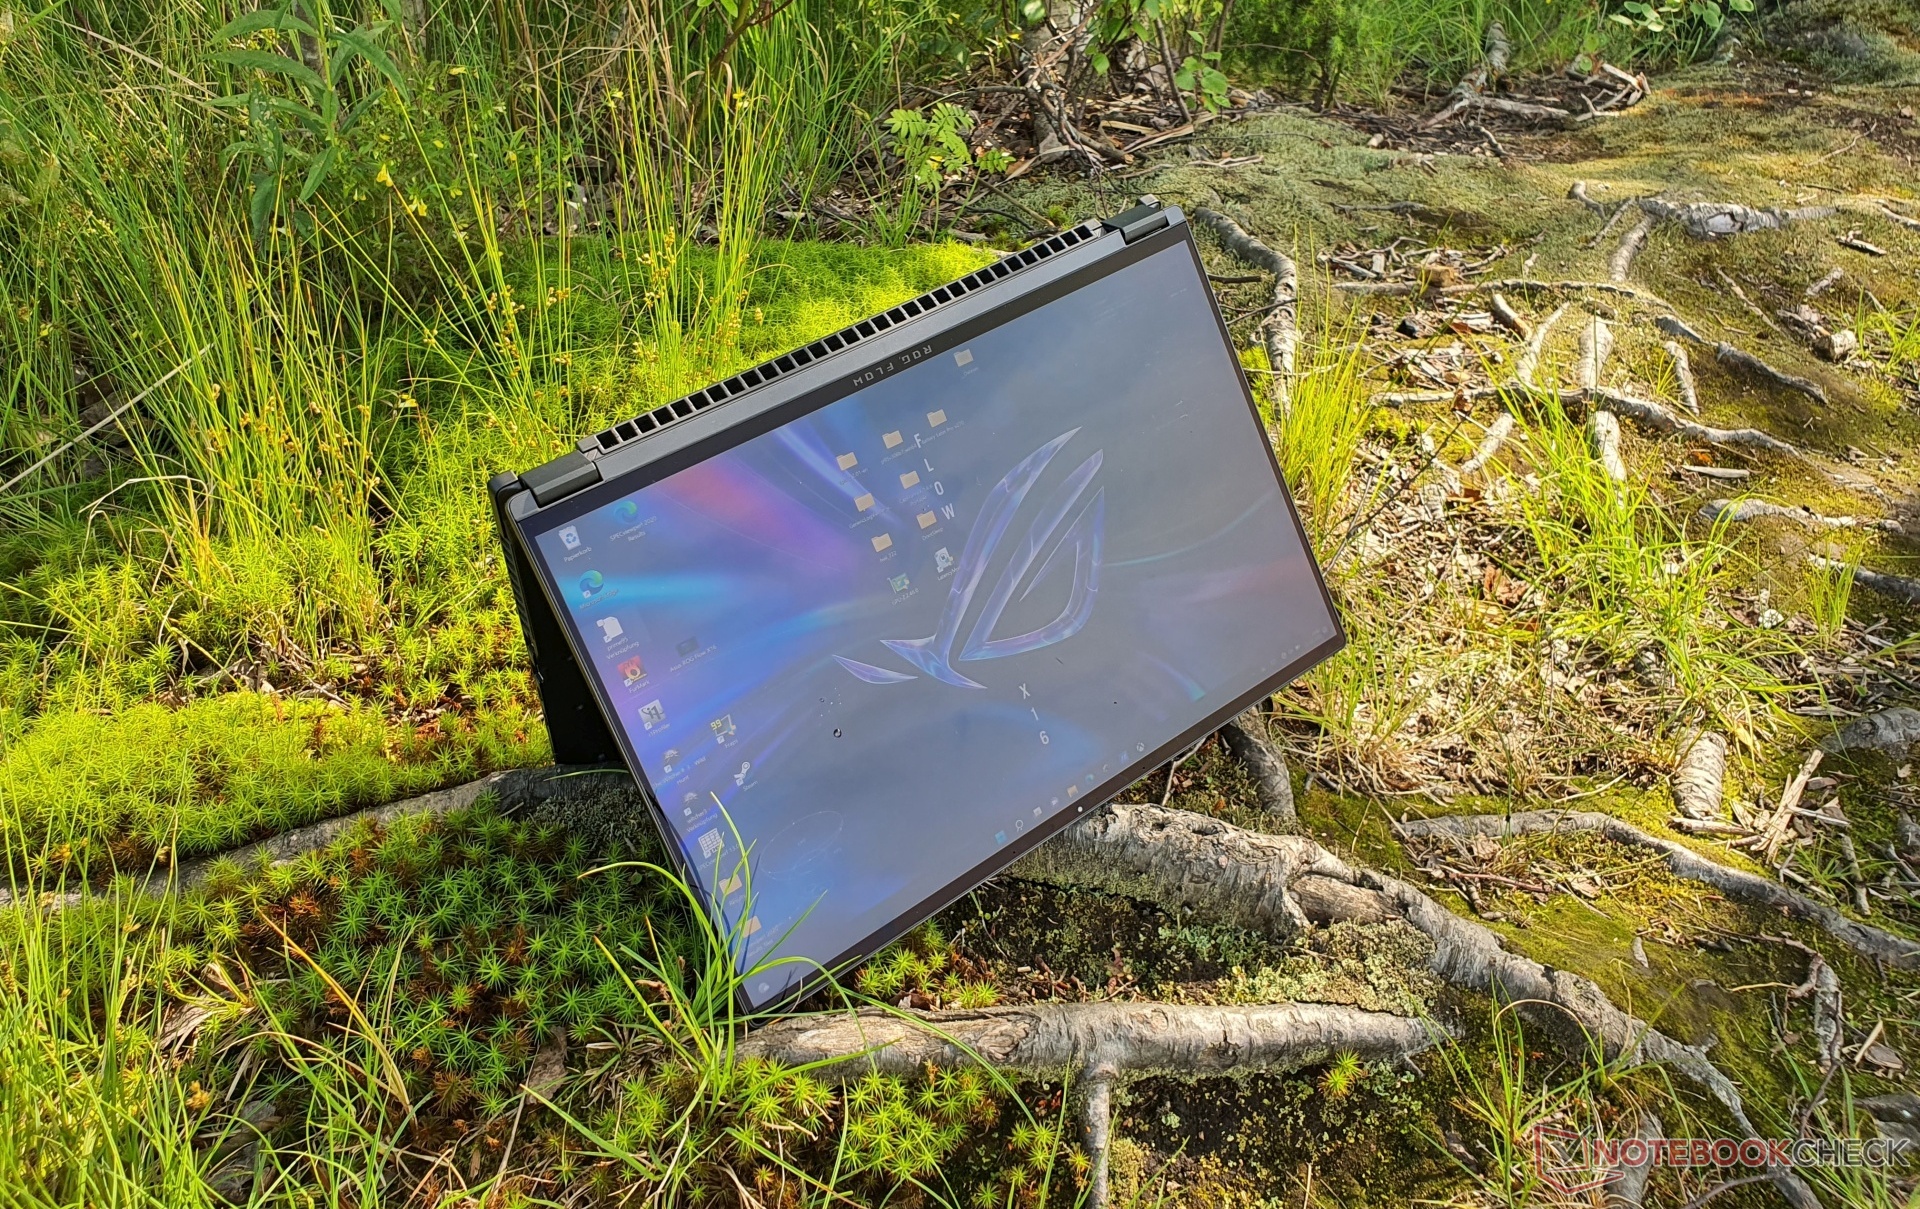
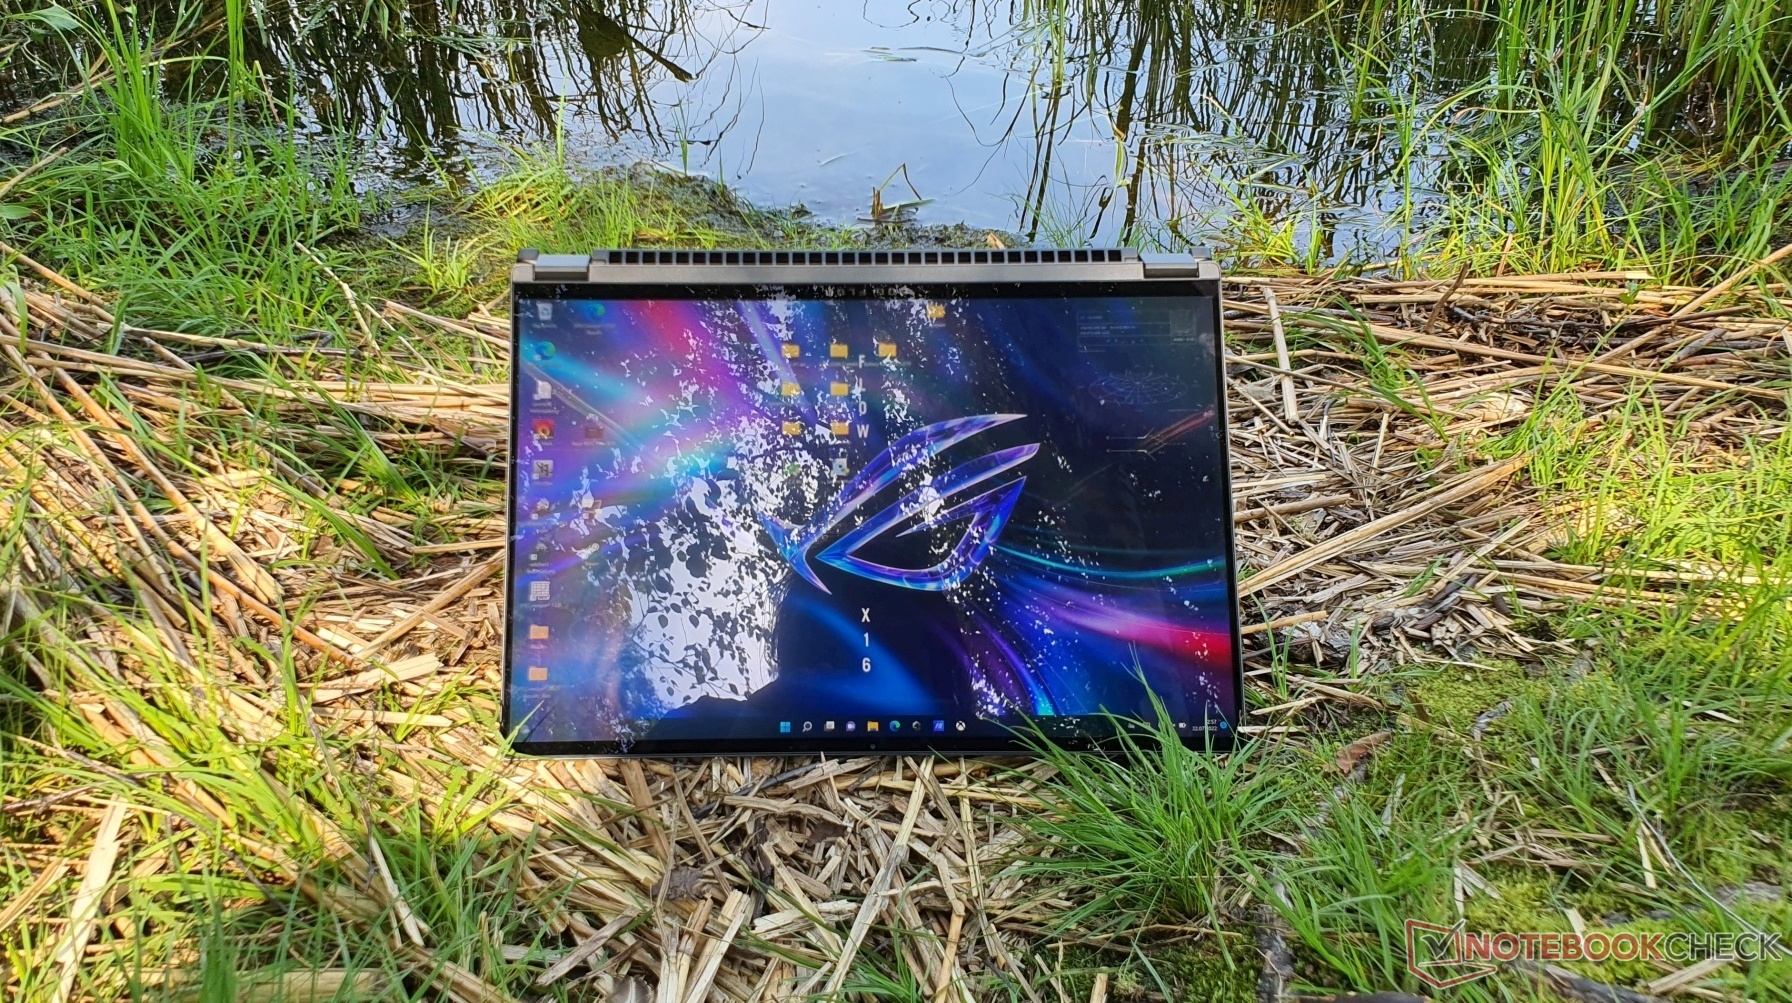
这款敞篷车的两个铰链允许显示屏360°旋转,并将其牢牢固定在位置上。敞篷车的显示屏有点晃动的事实总是不能完全避免。总的来说,在平稳性和稳定性之间实现了良好的平衡。ROG Flow X16也可以用一只手打开。在平板电脑和帐篷模式下,小垫片可以保护基本单元。

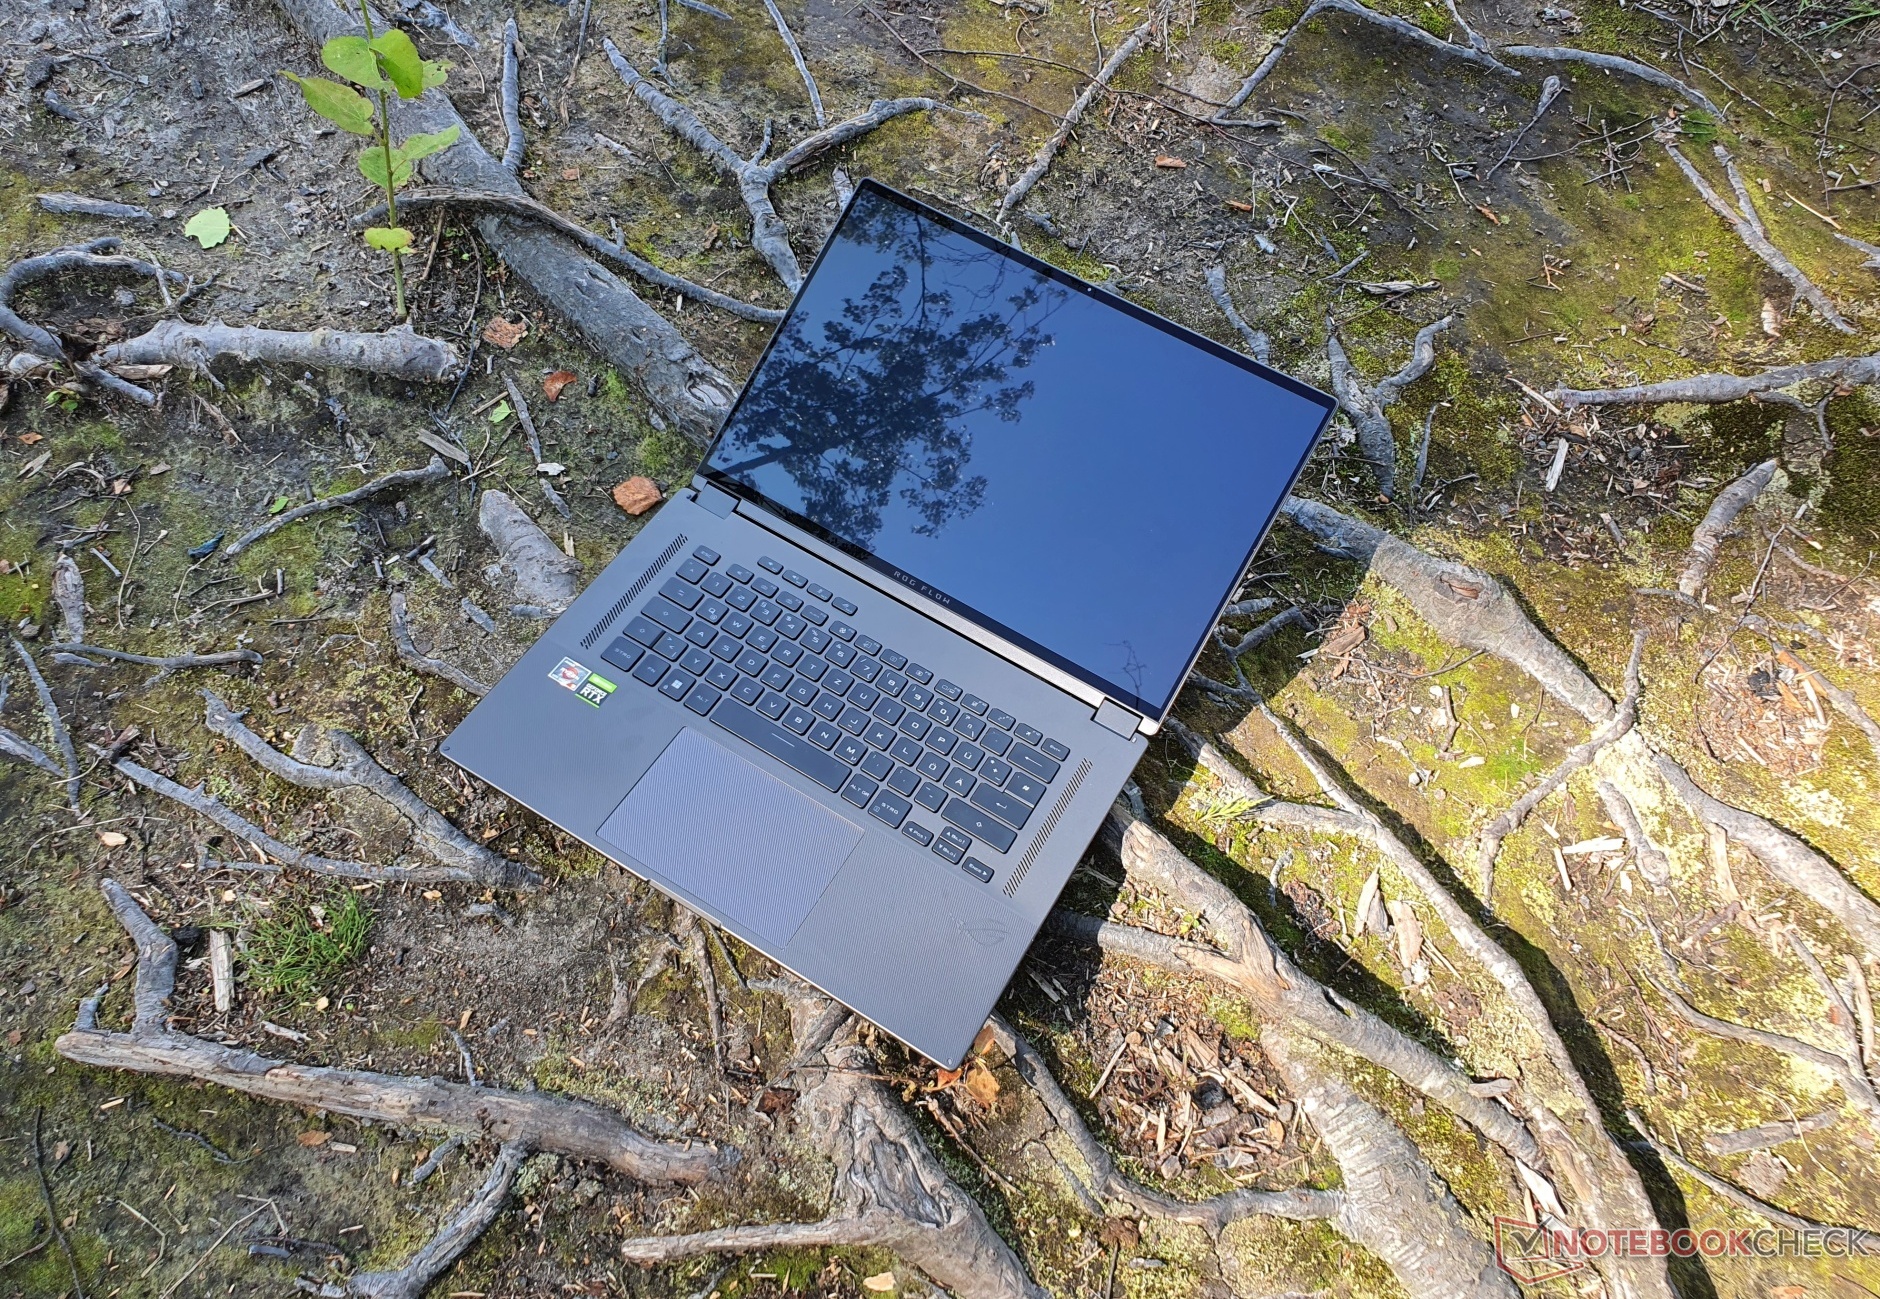

通过ROG Flow X16,华硕成功地创造了一台在16英寸笔记本中尺寸最小的笔记本,甚至超过了我们比较领域中的一些15英寸笔记本,尽管Gigabyte Aero 16和 MSI Stealth GS66已经是非常紧凑的型号。14.4英寸的 Surface Laptop Studio显然更加紧凑,但也不是一个真正的游戏玩家。
只有ThinkPad X1 Extreme在配备强大GPU的设备中,只有ThinkPad X1 Extreme在重量上更胜一筹,但其80W的TGP需要一个不太复杂的冷却解决方案。华硕的Zephyrus M16由于采用了类似的外壳,所以大致上与之相当。
设备 - 华硕的Flow系列提供特殊的eGPU
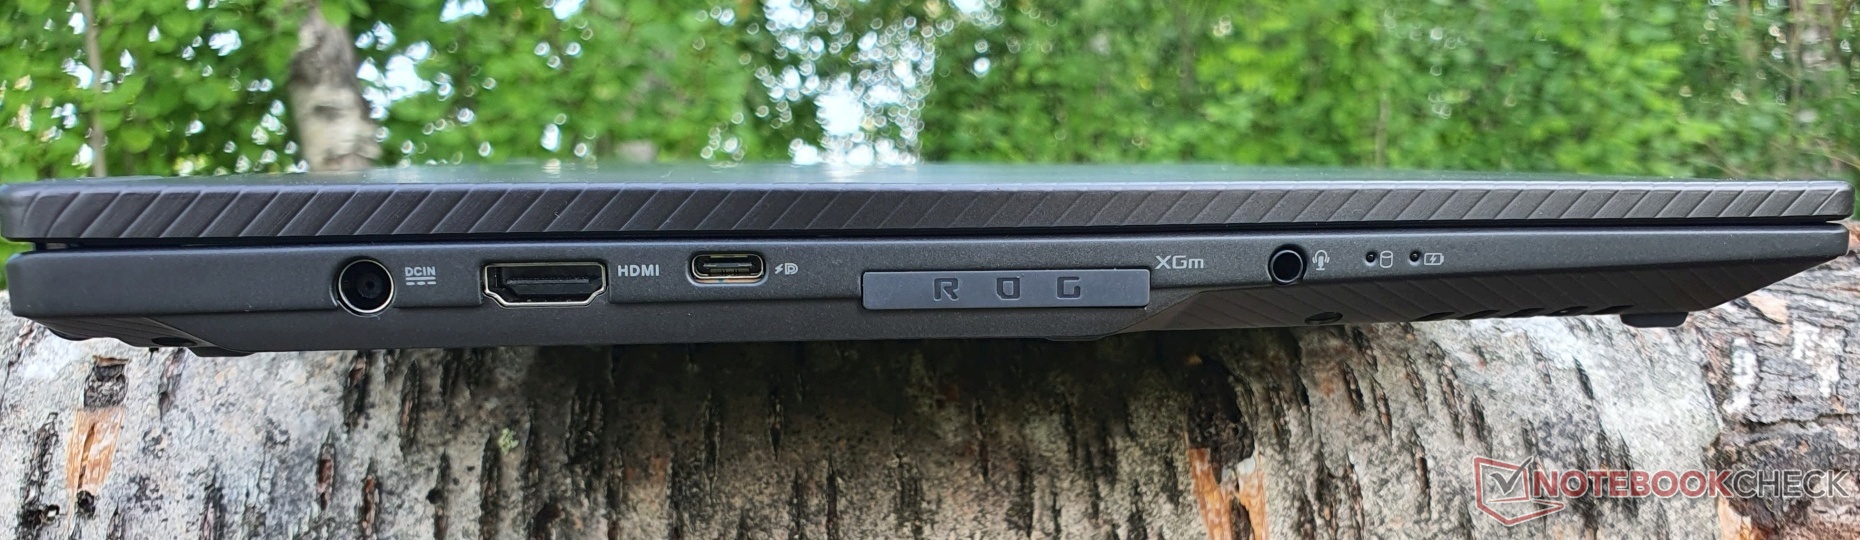
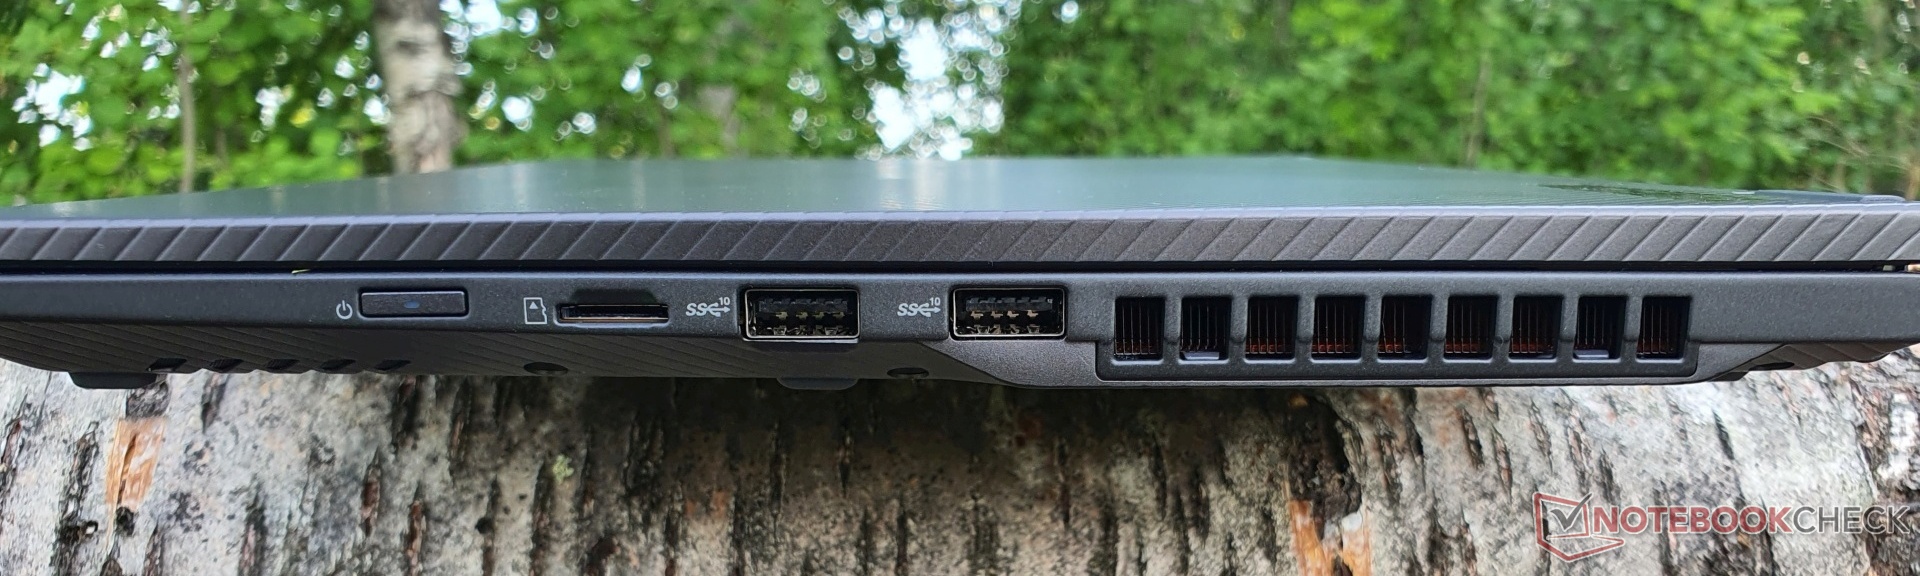
华硕ROG Flow X16提供四个USB 3.2 Gen2端口,其中两个是A型,而另外两个是C型,都支持DisplayPort和高达100瓦的Power Delivery。xGM端口中的USB-C端口的DisplayPort连接到专用的Nvidia GPU,而另一个USB-C端口连接到Radeon GPU,HDMI 2.0b端口也是如此,支持G-Sync。今年晚些时候,华硕可能会提供一个USB 4.0的软件升级。
SD读卡器只在微型版本中提供,而LAN端口则没有。ROG Flow系列具有xGM端口,用于可选的图形底座(eGPU),可容纳一个GeForce RTX 3080(笔记本GPU)。这是迄今为止底座的唯一选择,比传统的eGPU更紧凑,并连接到两倍的带宽(64 GBit/s @PCIe 3.0 8倍,而32 GBit/s @Thunderbolt 3/4)。
当然,在我们这个集成了移动RTX 3070 Ti的模型中,性能的提高可能是微不足道的,而且目前还不清楚该底座是否会在未来得到更新。尽管如此,我们将测量任何差异并很快报告。此外,在 ROG XG Mobile(我们之前已经评测过)提供了额外的端口,如GBit LAN和一个全尺寸的DisplayPort。
此外,还有一个3.5毫米音频插孔,以及240瓦电源的电源插座。端口之间的间距是足够的,但在我们的预发布版本中,右侧的电源按钮松散地坐落在机箱内。指纹识别器也被省略了。
SD卡阅读器
UHS-II microSD读卡器在复制测试中取得了非常好的结果,在我们的参考microSD卡(AV PRO microSD 128 GB V60)的连续读取中取得了158 MB/s和约183 MB/s。特别是在复制方面,ROG Flow X16远远领先于竞争对手。只有戴尔的XPS 17实现了更高的复制率(~205 MB/s)。
| SD Card Reader | |
| average JPG Copy Test (av. of 3 runs) | |
| Dell XPS 17 9720 RTX 3060 (Toshiba Exceria Pro SDXC 64 GB UHS-II) | |
| Asus ROG Flow X16 GV601RW-M5082W (AV Pro SD microSD 128 GB V60) | |
| Average of class Gaming (20.9 - 210, n=54, last 2 years) | |
| Apple MacBook Pro 16 2021 M1 Pro (Angelbird AV Pro V60) | |
| Asus ROG Zephyrus M16 GU603H (AV PRO microSD 128 GB V60) | |
| maximum AS SSD Seq Read Test (1GB) | |
| Dell XPS 17 9720 RTX 3060 (Toshiba Exceria Pro SDXC 64 GB UHS-II) | |
| Asus ROG Zephyrus M16 GU603H (AV PRO microSD 128 GB V60) | |
| Asus ROG Flow X16 GV601RW-M5082W (AV Pro SD microSD 128 GB V60) | |
| Average of class Gaming (25.5 - 261, n=51, last 2 years) | |
沟通
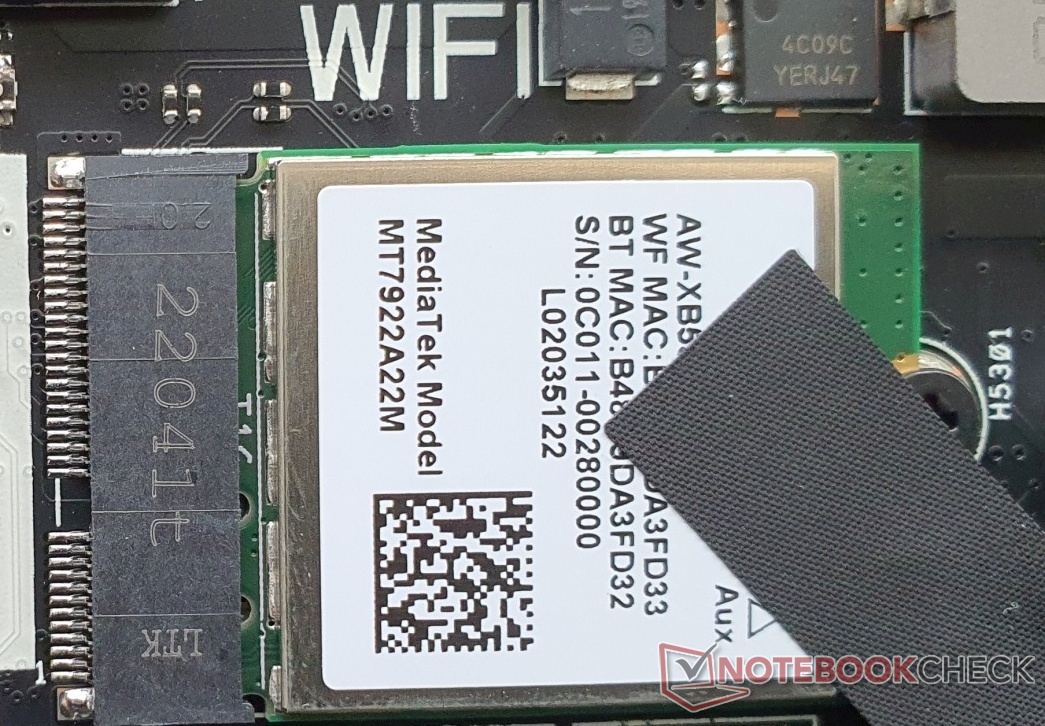
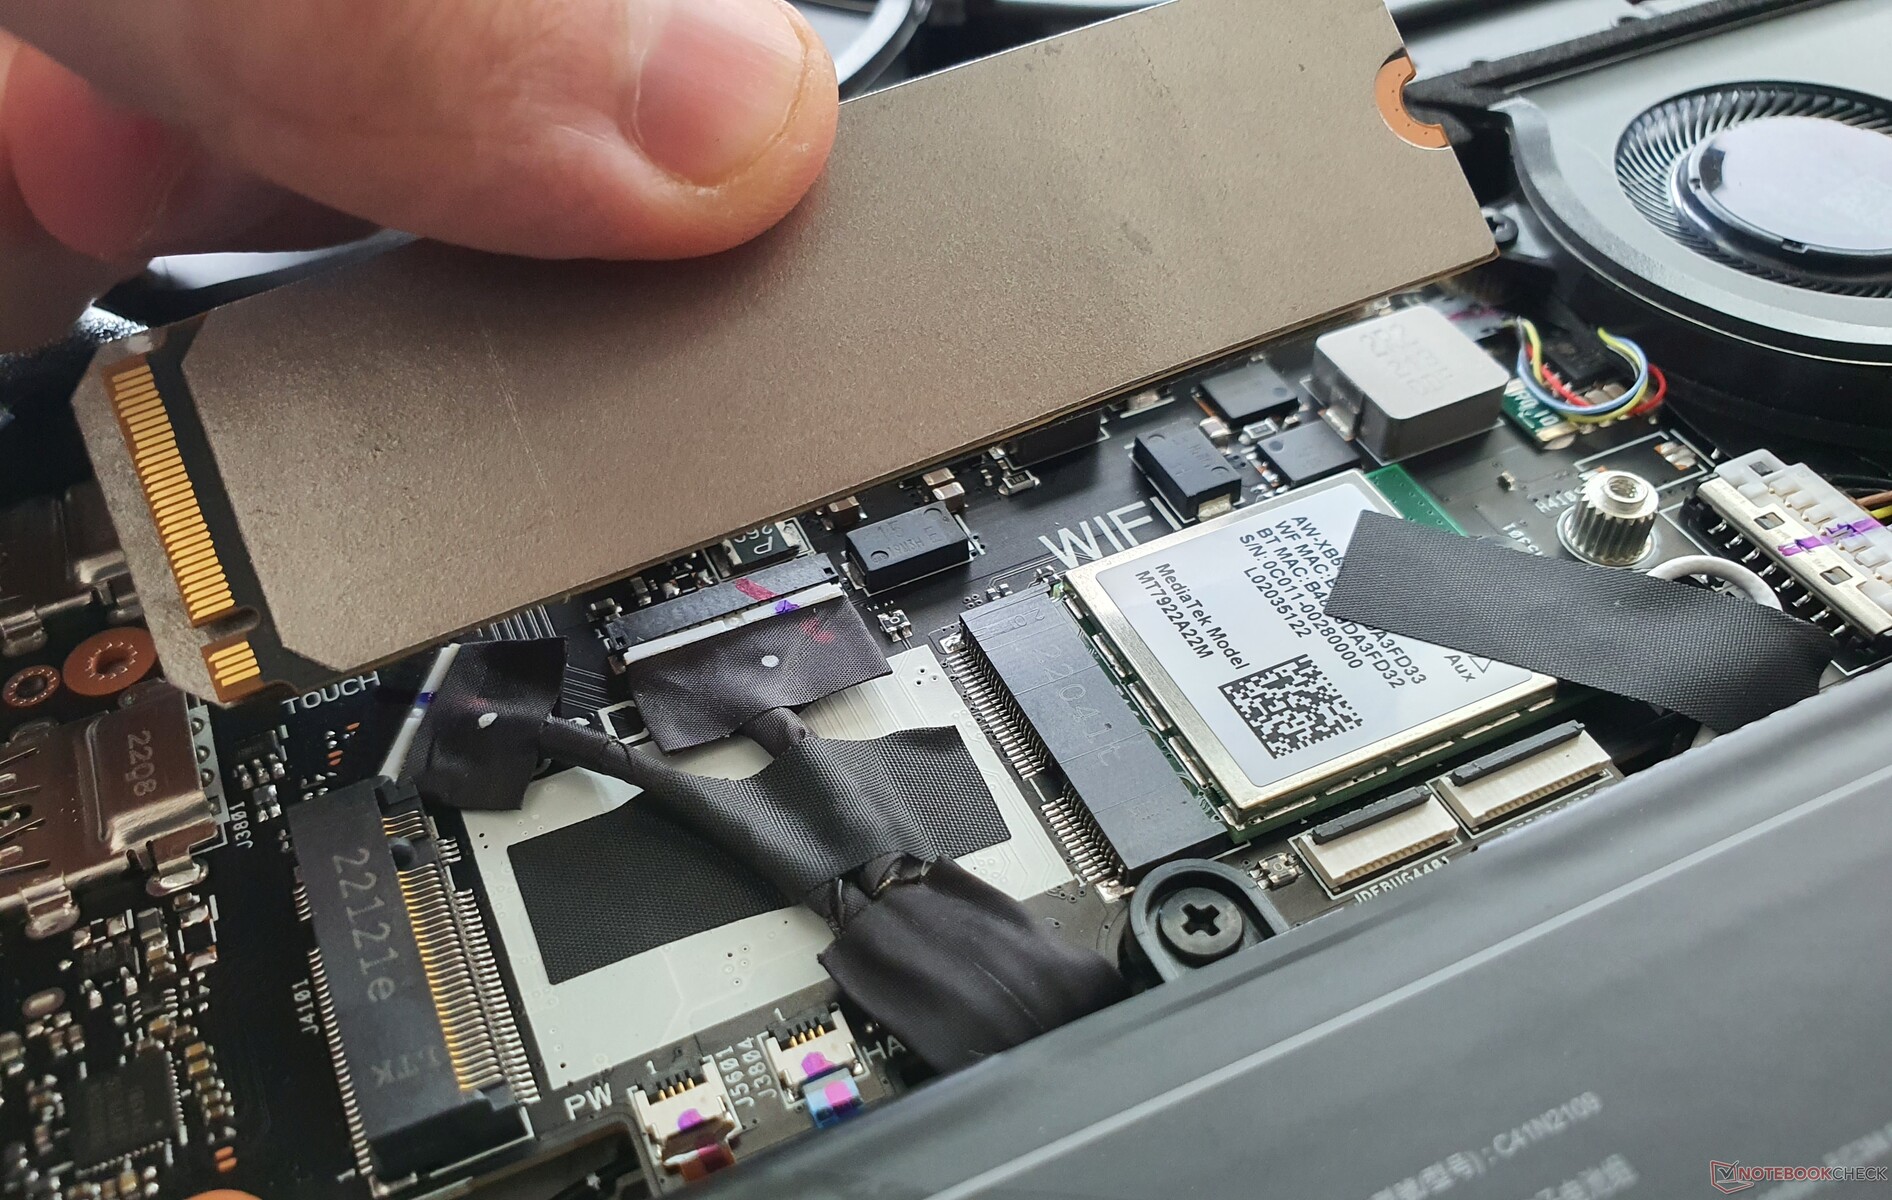
安装的WiFi 6E模块来自联发科,在两个方向上都能提供体面的速度。因此,MT7922的功能是MT7921的两倍。 Zephyrus M16和 MacBook Pro 16.
网络摄像头

一个720p的变体(1280x720)被用作网络摄像头,但它提供了比平常更好的清晰度和更少的失真。没有机械快门,但有用于Windows Hello的红外线。


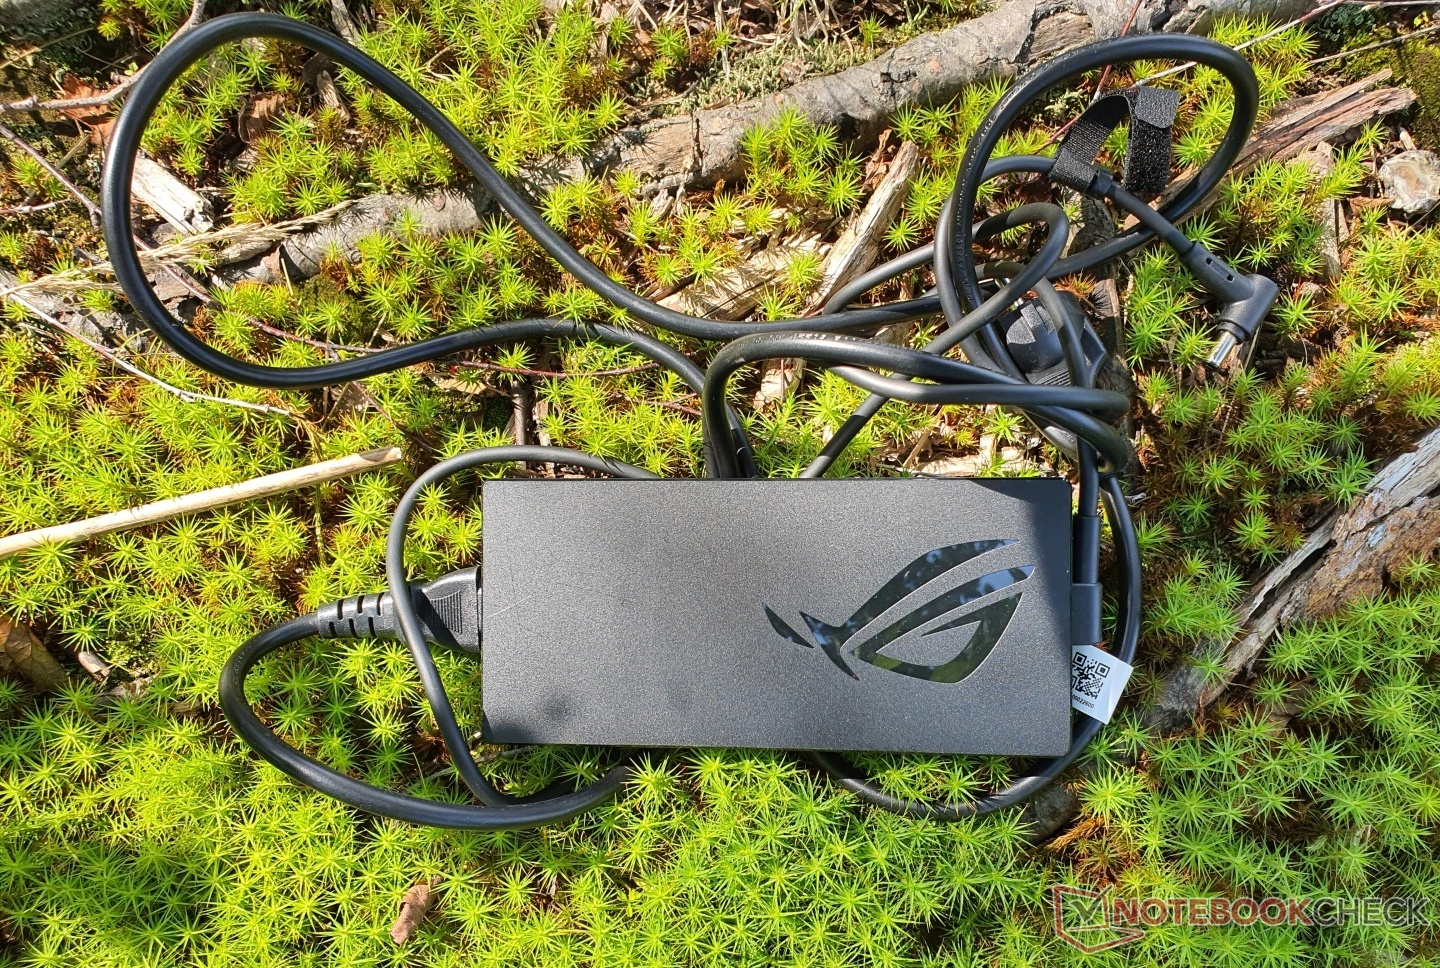
辅料
在我们的评测包中,华硕提供了一个240瓦的电源适配器,以及华硕SA201H触控笔用于触摸屏输入(包括在交货范围内)。我们还收到一个ROG BP4071笔记本电脑背包。我们单独订购了外部图形底座和ROG 100瓦的USB-C电源。
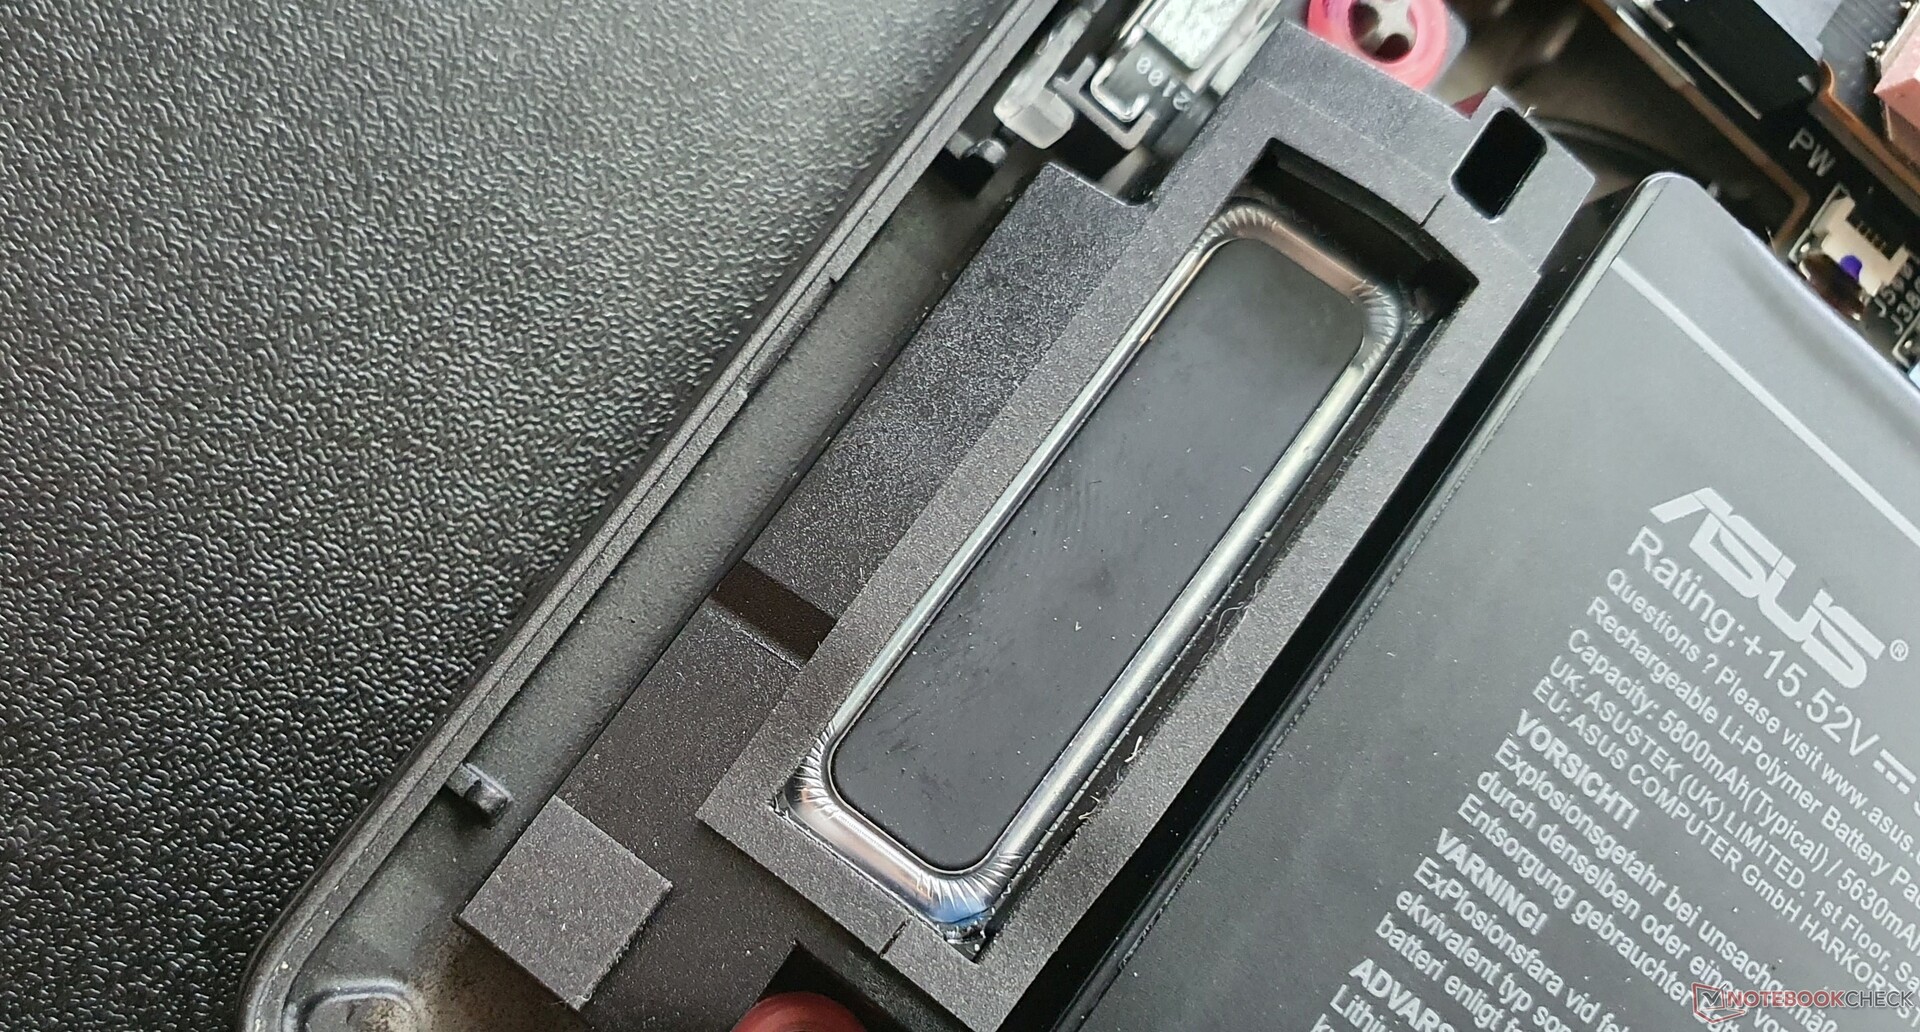
维护
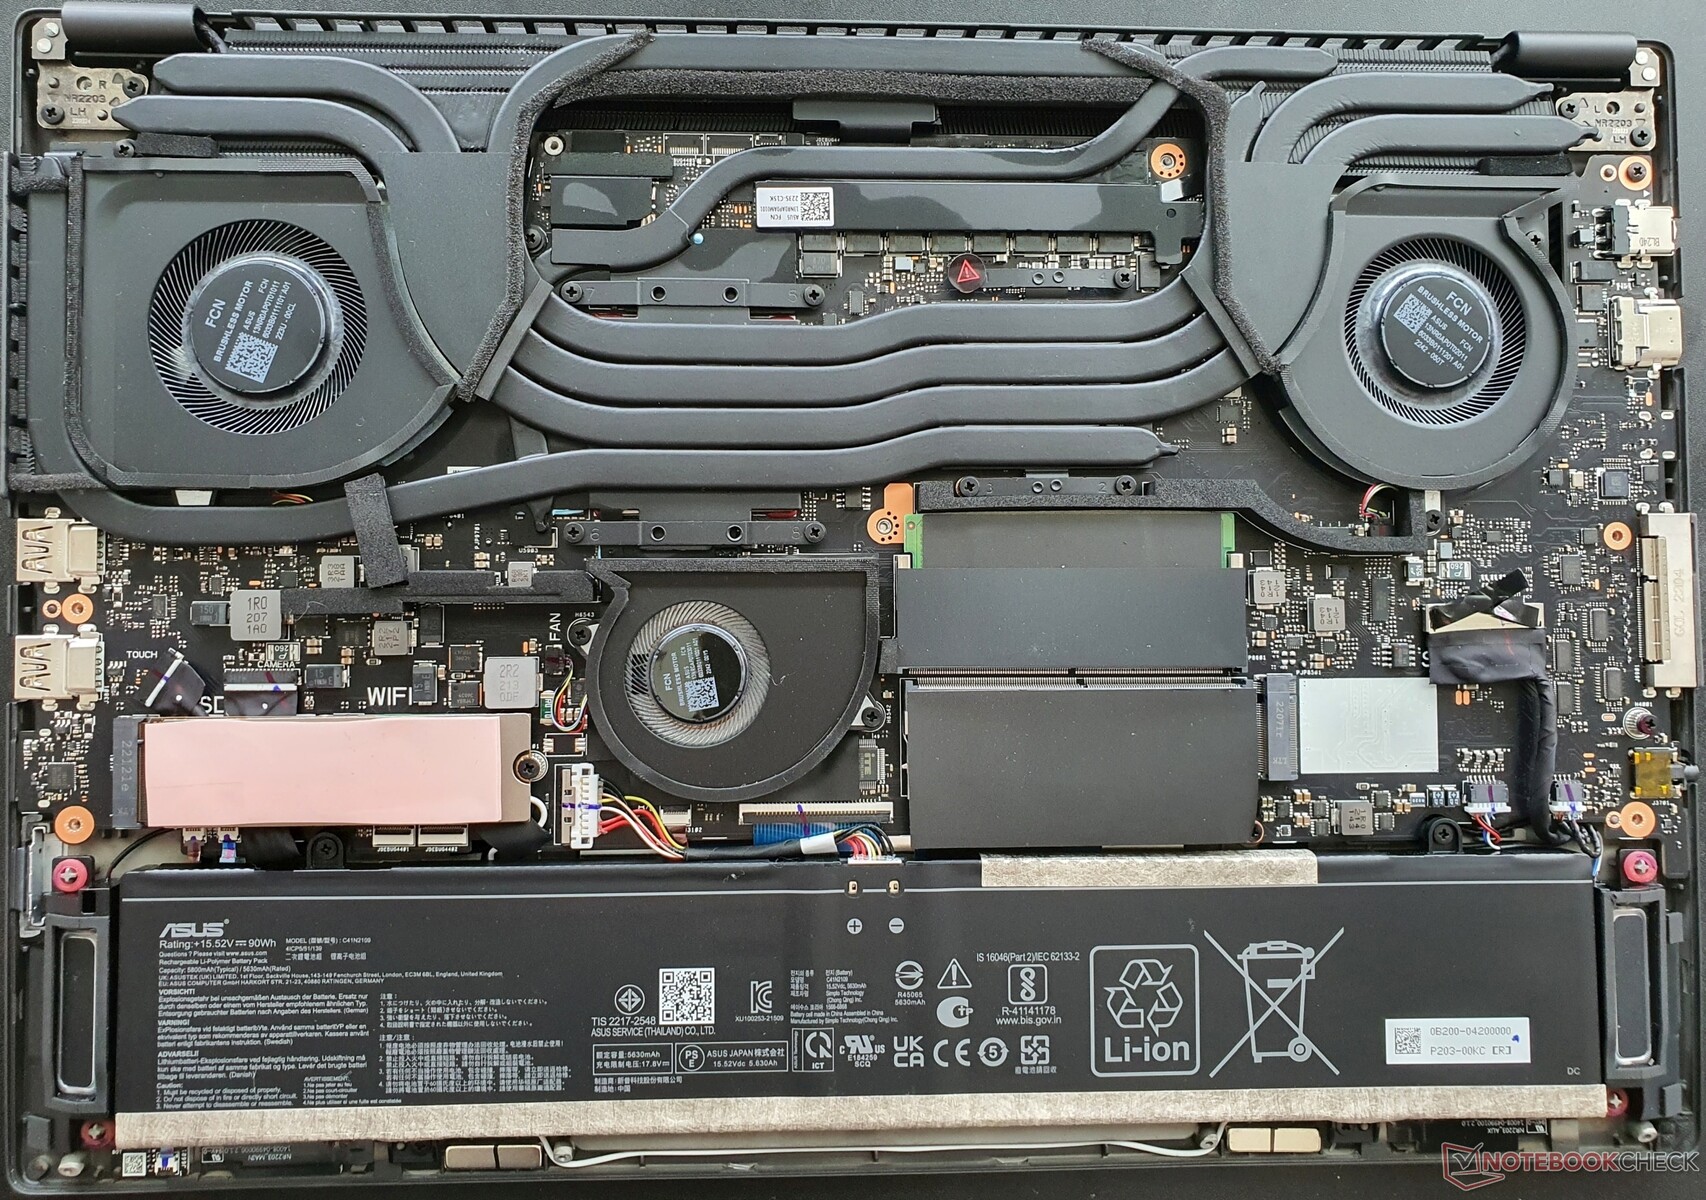
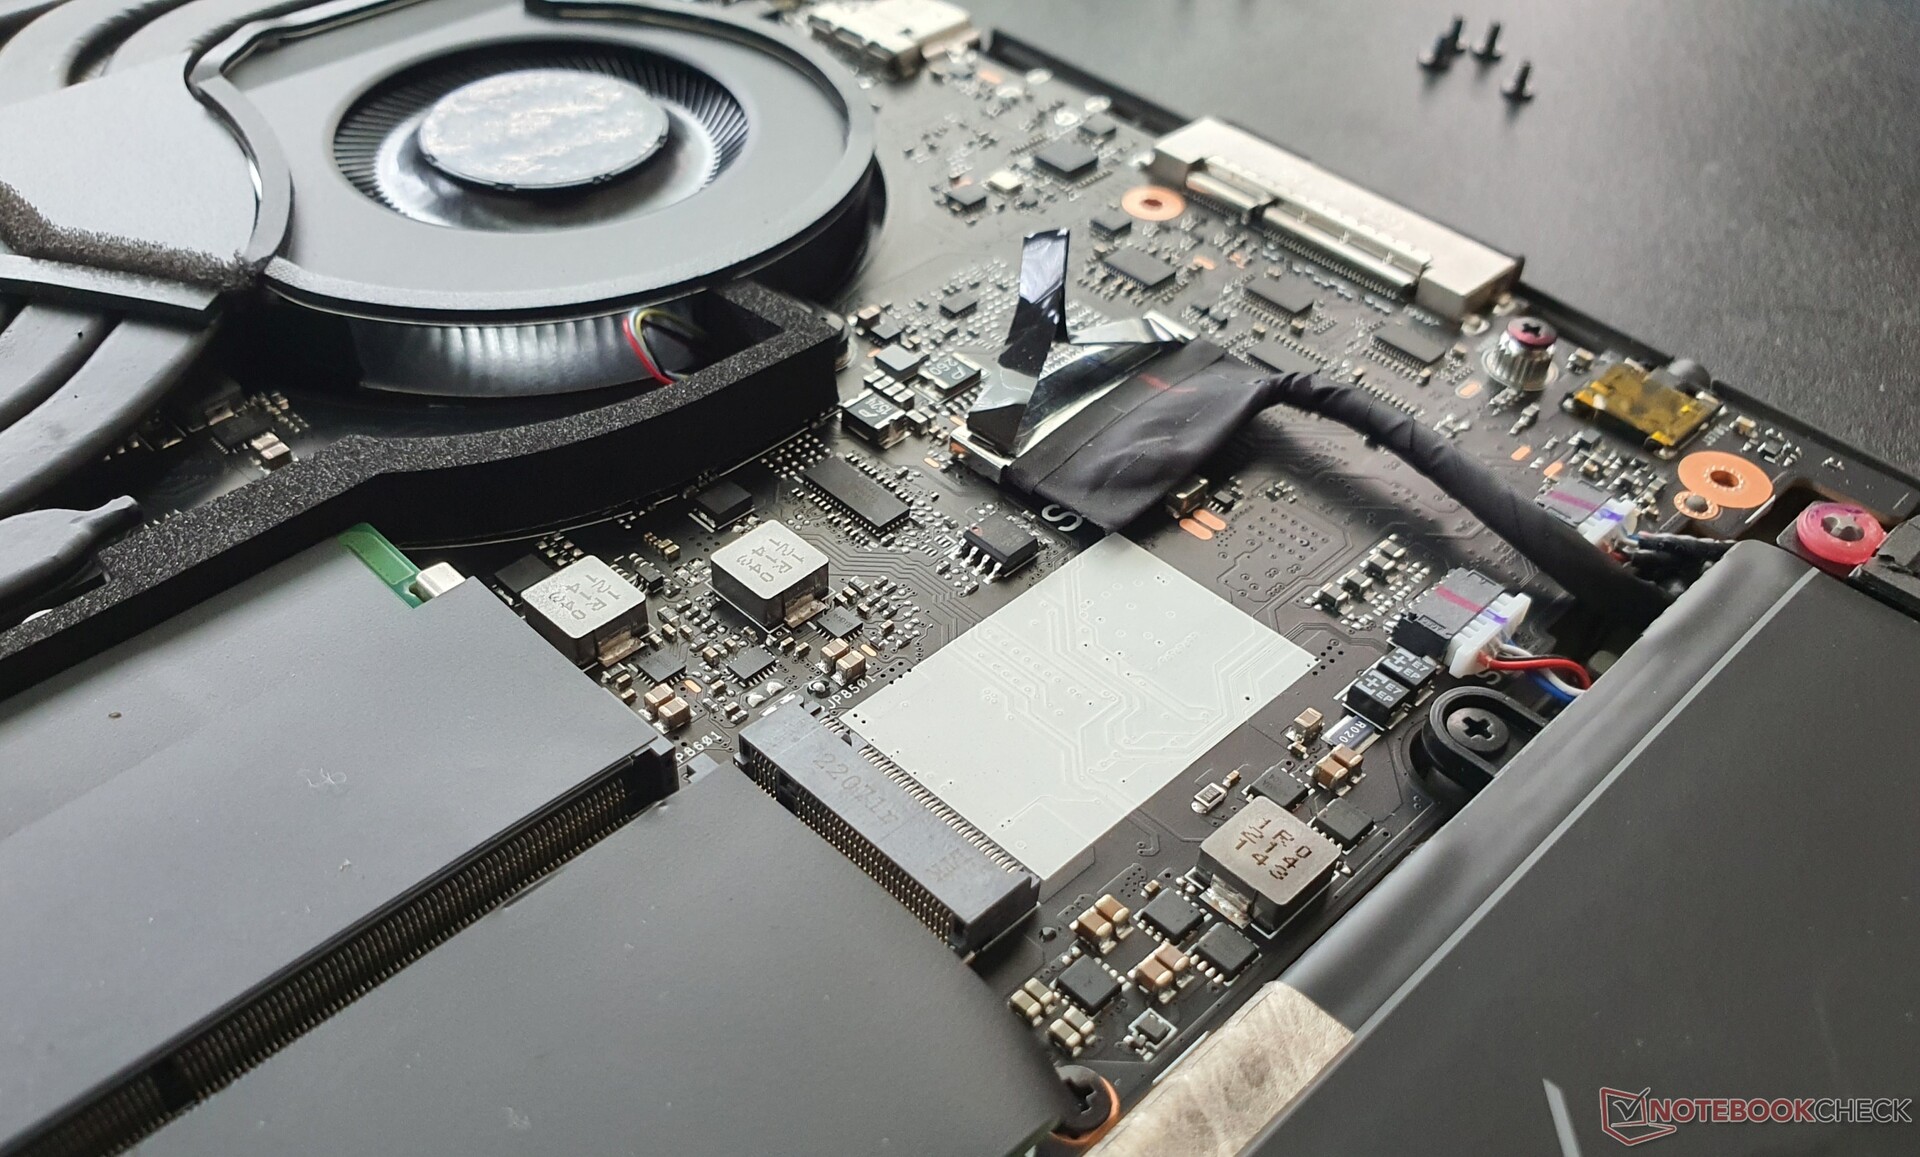
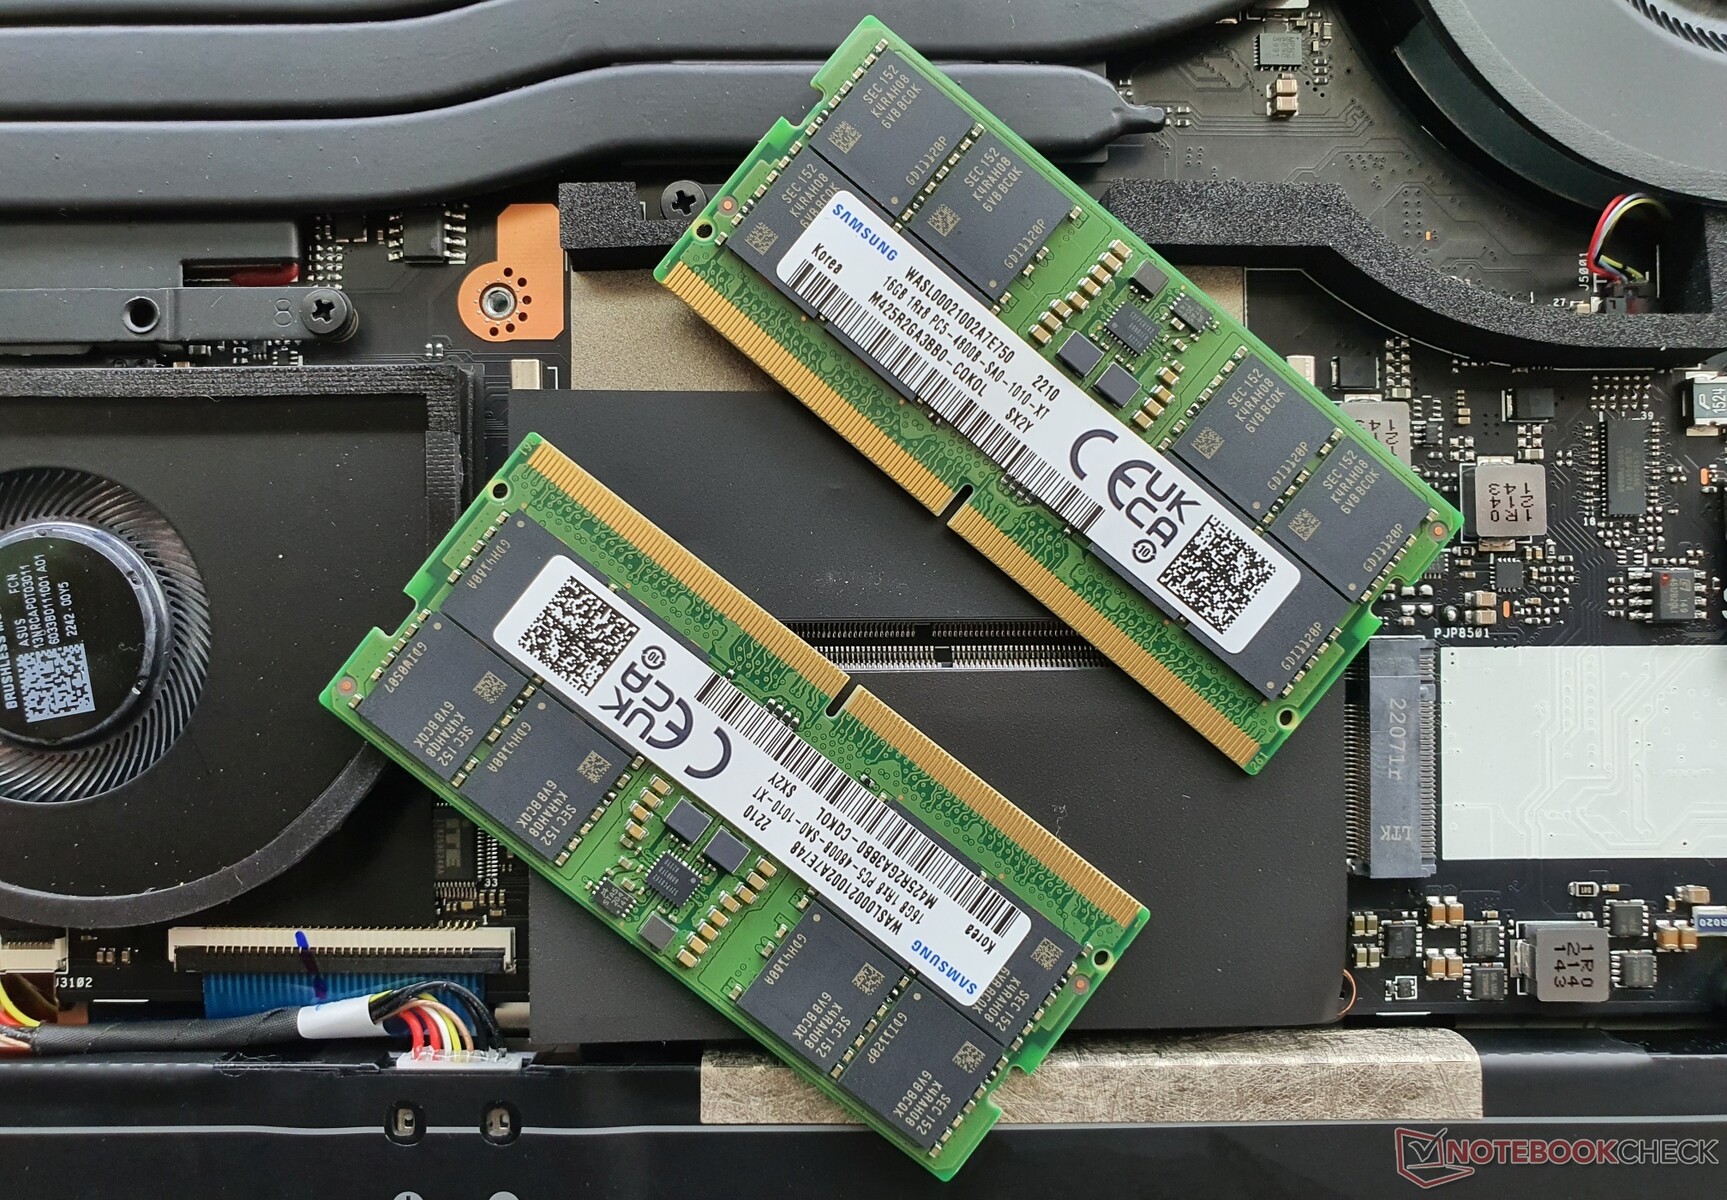
必须松开13个菲利普斯螺钉,才能拆除塑料底板。此外,一些夹子必须用铲子或镐头来松开。三个风扇(1个CPU、1个GPU和1个系统风扇)在里面等着我们,它们可以被清洁。电池是用螺丝固定的,因此可以更换。
此外,内存(两个插槽)可以升级,在M.2-2280插槽(PCIe 4.0)中可以使用更大的SSD。一个M.2-2242插槽可供另一个固态硬盘使用。
担保
在德国,华硕为ROG Flow X16提供24个月的保修,并提供取货和退货服务。这可能因地而异,所以在购买前一定要向你的供应商查询。
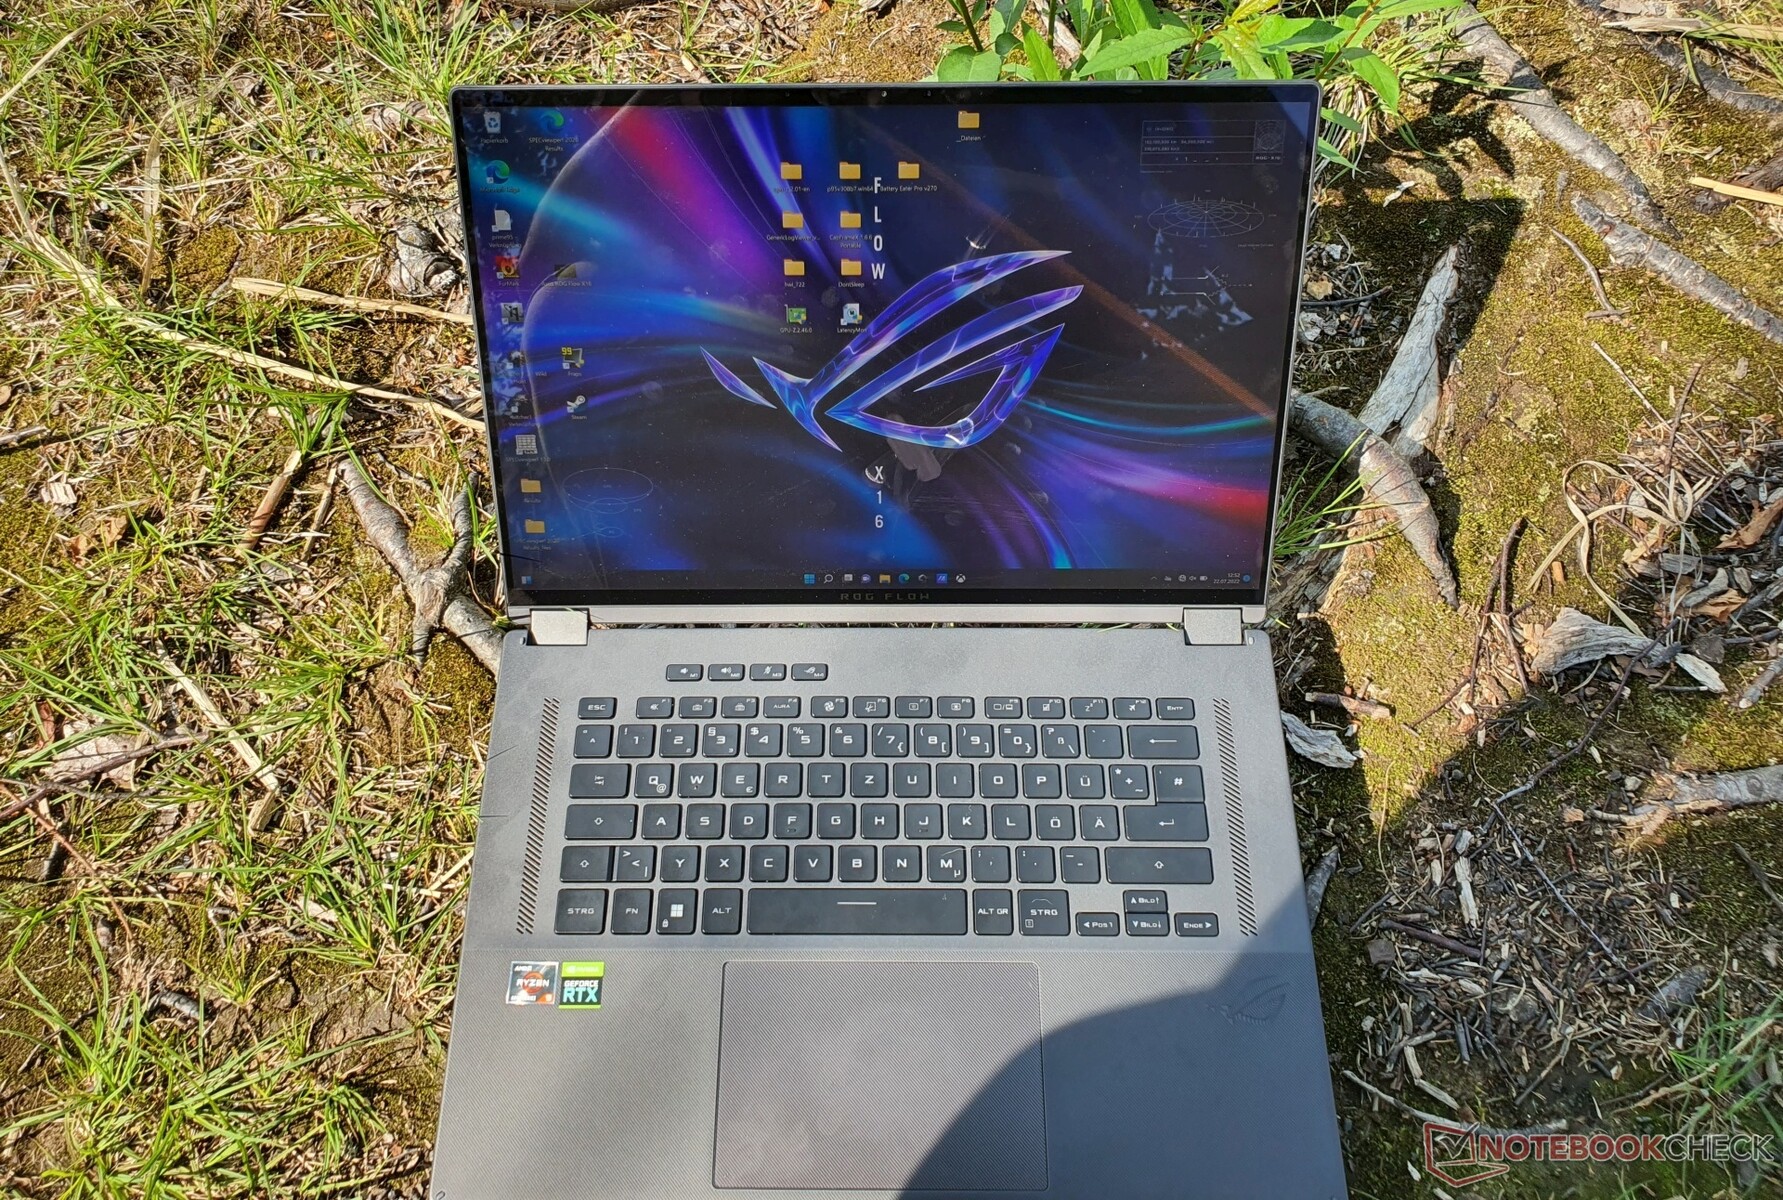
输入设备 - 带有1.7毫米行程的RGB背光键盘
键盘
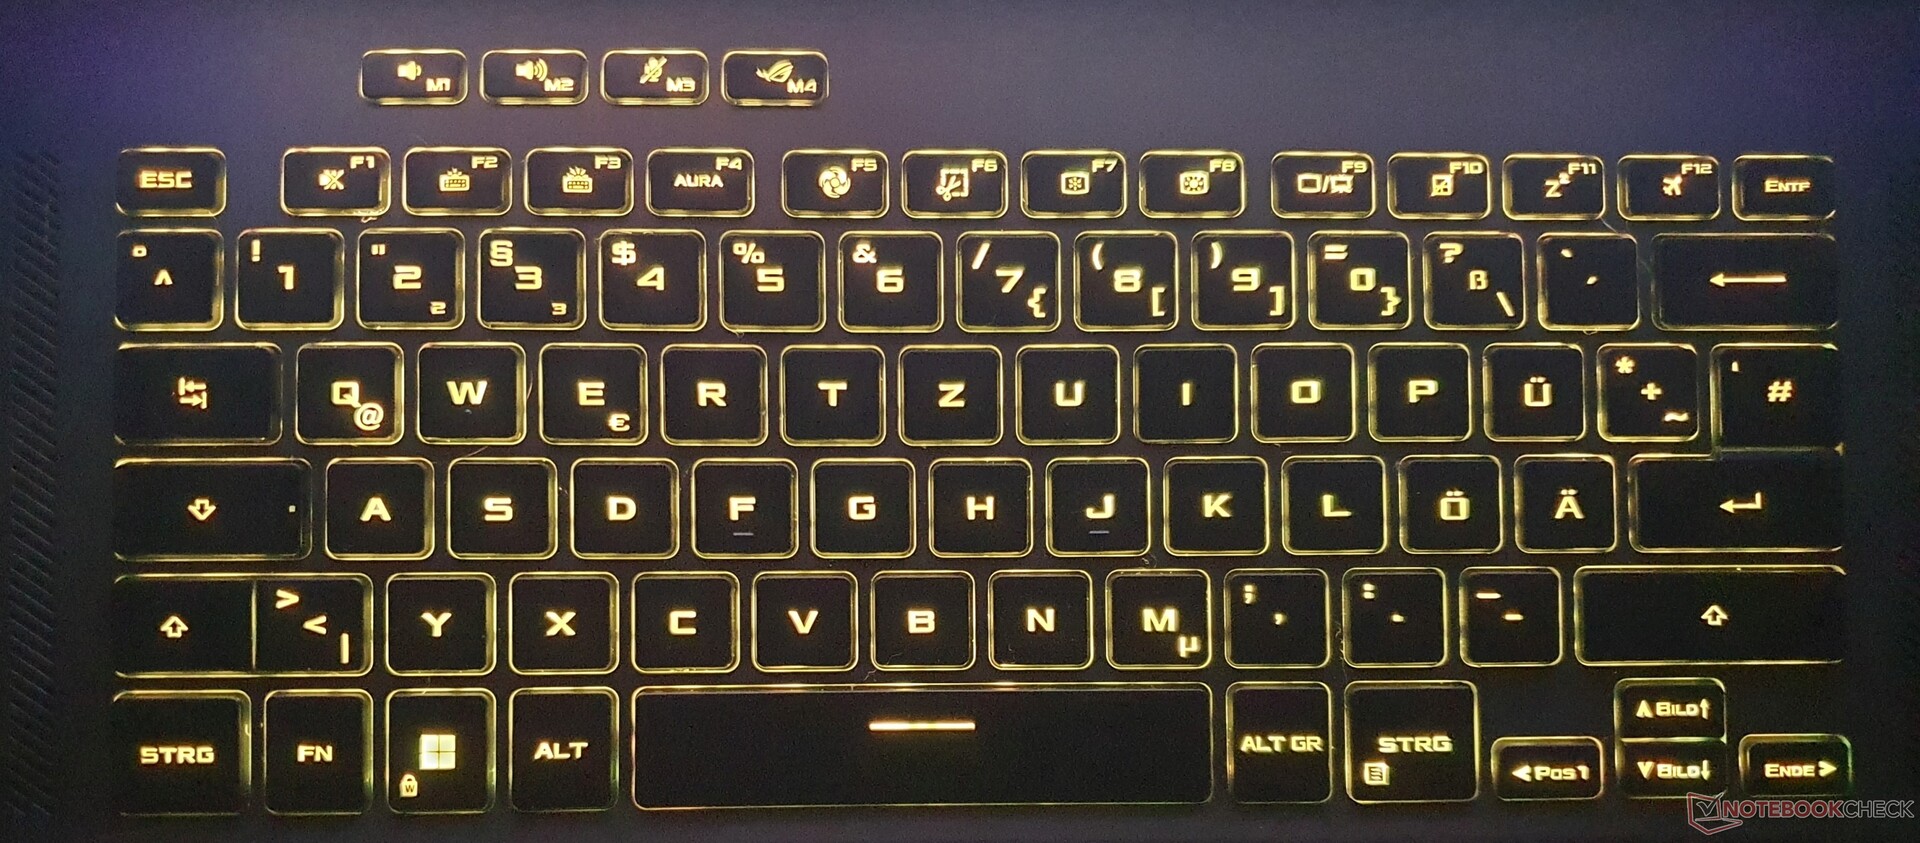
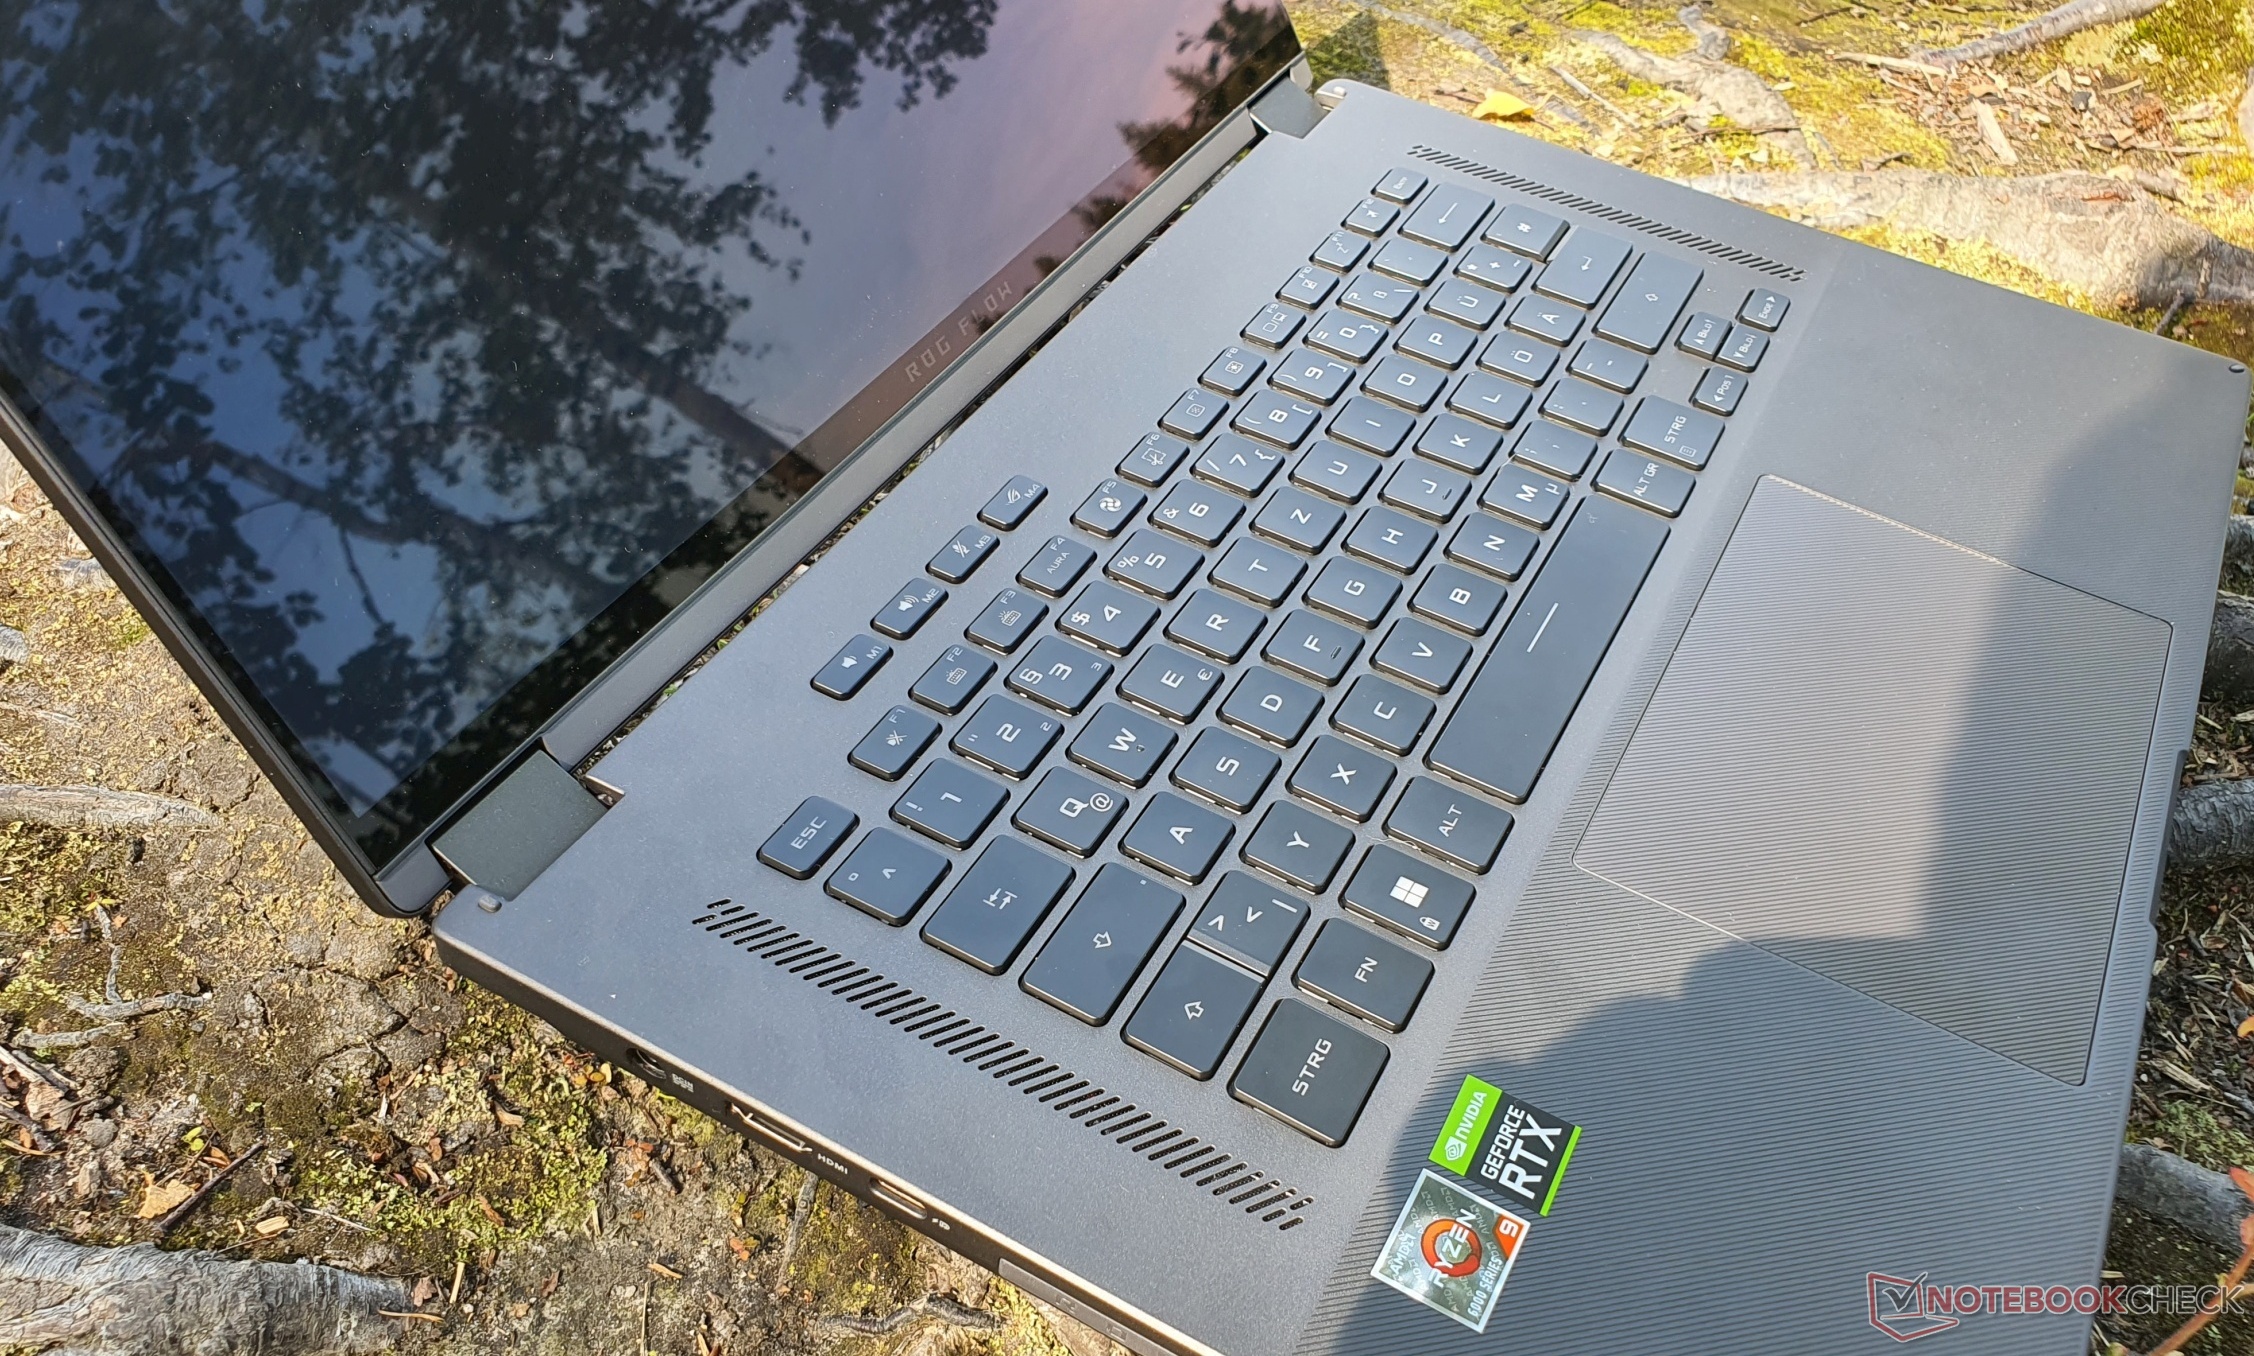
华硕在ROG Flow X16中安装了一个6排chiclet键盘,其键位略小,为15 x 15 mm。字母甚至更大,并采用了特殊的排版。典型的游戏笔记本电脑。
1.7毫米的行程很宽裕,压力点明显,笔画清晰,但对某些人来说,按键的阻力可能有点太低,主观上感觉稍微有点松动。与一些商务笔记本不同的是,这些按键没有凹陷,但在短时间的熟悉之后,没有什么能阻碍快速打字。基本上,所安装的键盘与在 Zephyrus M16.支持N键翻转,允许同时正确注册多个按键。
RGB照明可以在三个强度级别中调整。然而,按键不能单独编程(即每键RGB)。布局很好,没有惊喜。方向键是一半大小,回车键被分割开来,通常的双倍分配已经被分配。
触摸板和触摸屏
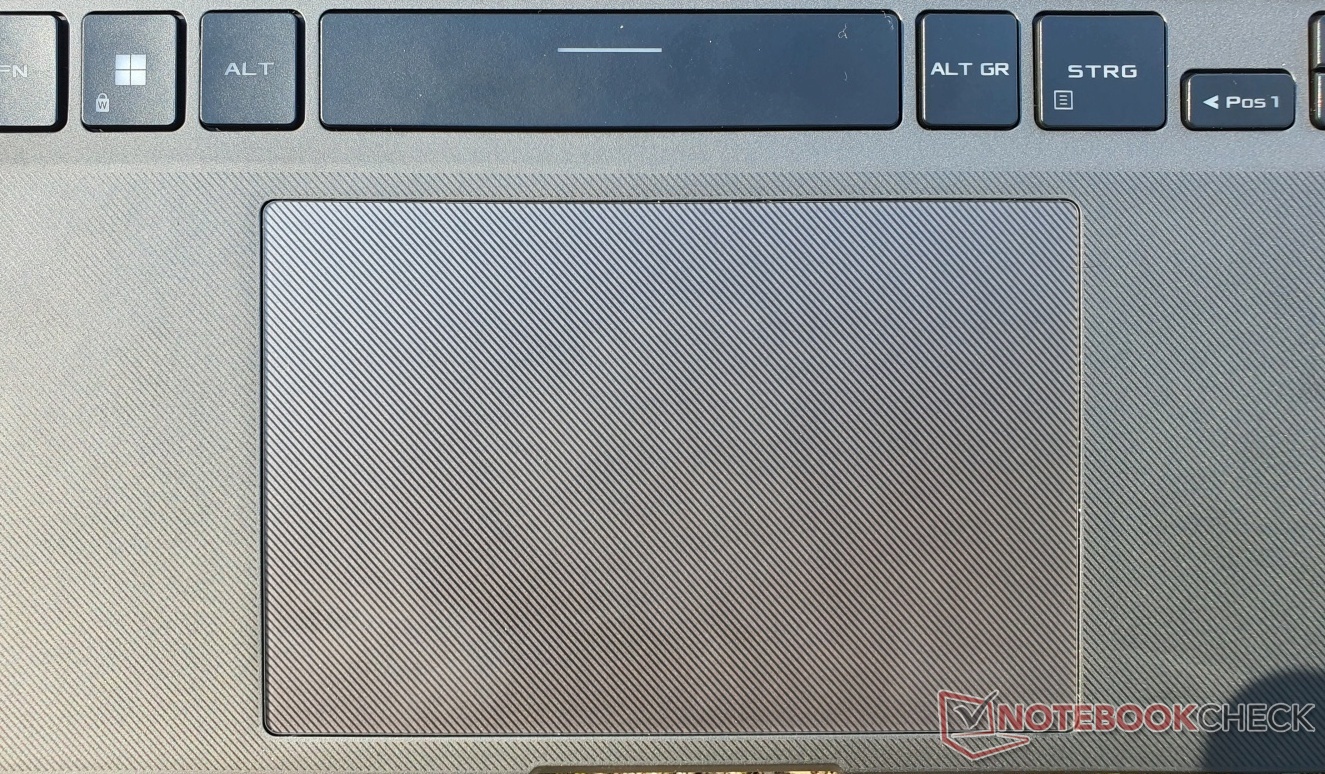
大型玻璃触摸板的尺寸为13 x 8.5厘米,具有出色的滑行性能。响应和精确度都达到了很高的水平。多点触摸手势和滚动功能没有问题。
集成键点击安静,行程短,反馈令人满意。然而,触摸板在很短的时间内就失效了,无法重新激活。我们怀疑这是由于驱动问题造成的,只适用于我们的预生产模型。
ROG X16 Flow的所有型号都配有触摸屏。响应和准确性都很好--在165赫兹的刷新率下,滚动特别有趣。附带的手写笔(华硕SA201H)有4,096个压力级别,由AAAA电池供电。它在触摸屏上快速而精确地滑行,笔尖提供了足够的反馈,底部的两个集成按钮也是如此。
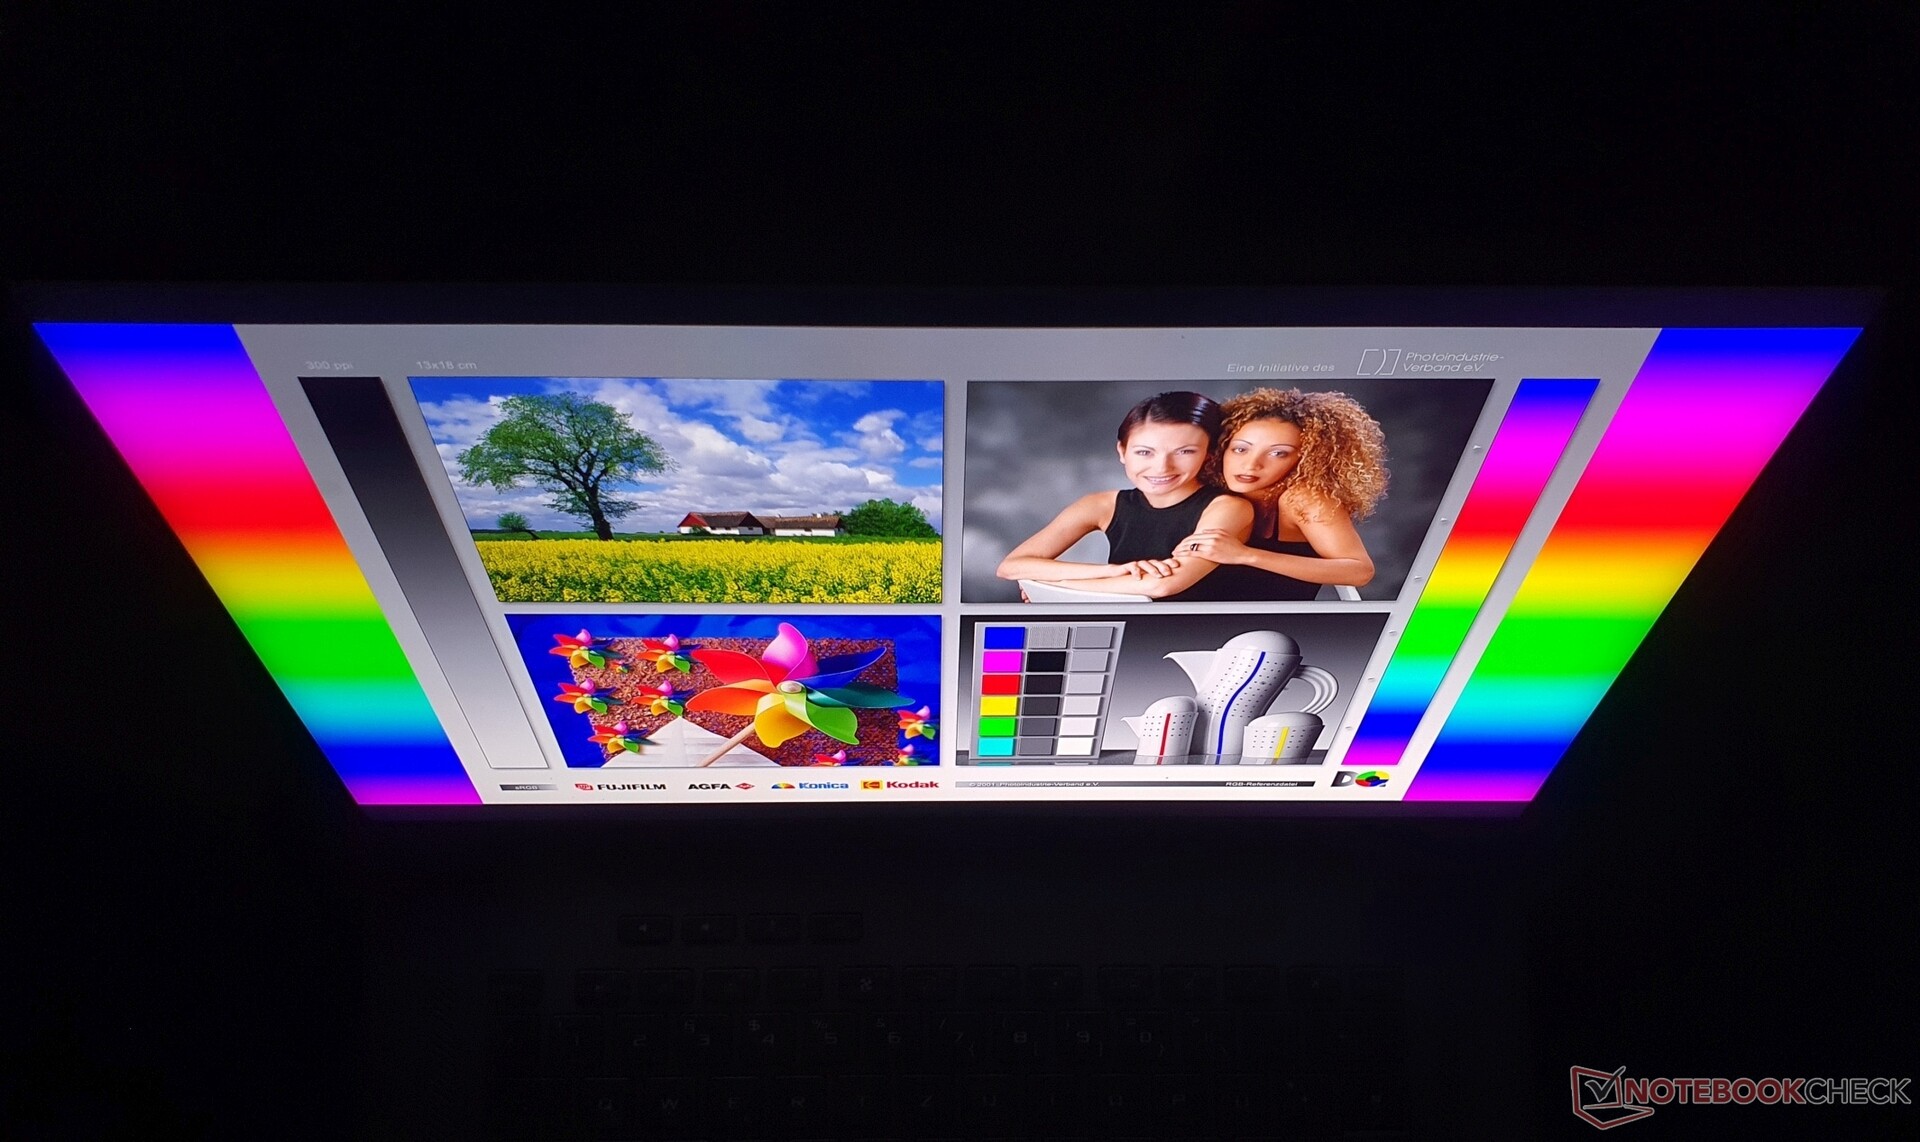
最佳游戏显示器?带有HDR 1000的迷你LED

ROG Flow X16可以订购带或不带迷你LED背光的产品。一些功能保持不变:16:10格式的2560x1600分辨率、165赫兹的刷新率和支持手写笔的光面触摸屏。
我们的变体中安装的迷你LED首次在游戏笔记本中支持DisplayHDR 1000,与华硕自己的Zephyrus Duo 16 。然而,后者还提供了一个哑光的非触摸变体。
启用DisplayHDR 1000后,内容看起来更加吸引人,相比之下,以前的笔记本电脑只支持HDR 400,图像增强效果明显降低。到目前为止,唯一具有DisplayHDR 1000的其他笔记本电脑是MSI Creator 17 (2020)和Apple'sMacBook Pro 16 (2021)。联想的Legion Slim 7i带有迷你LED显示屏,也应该在今年晚些时候上市。
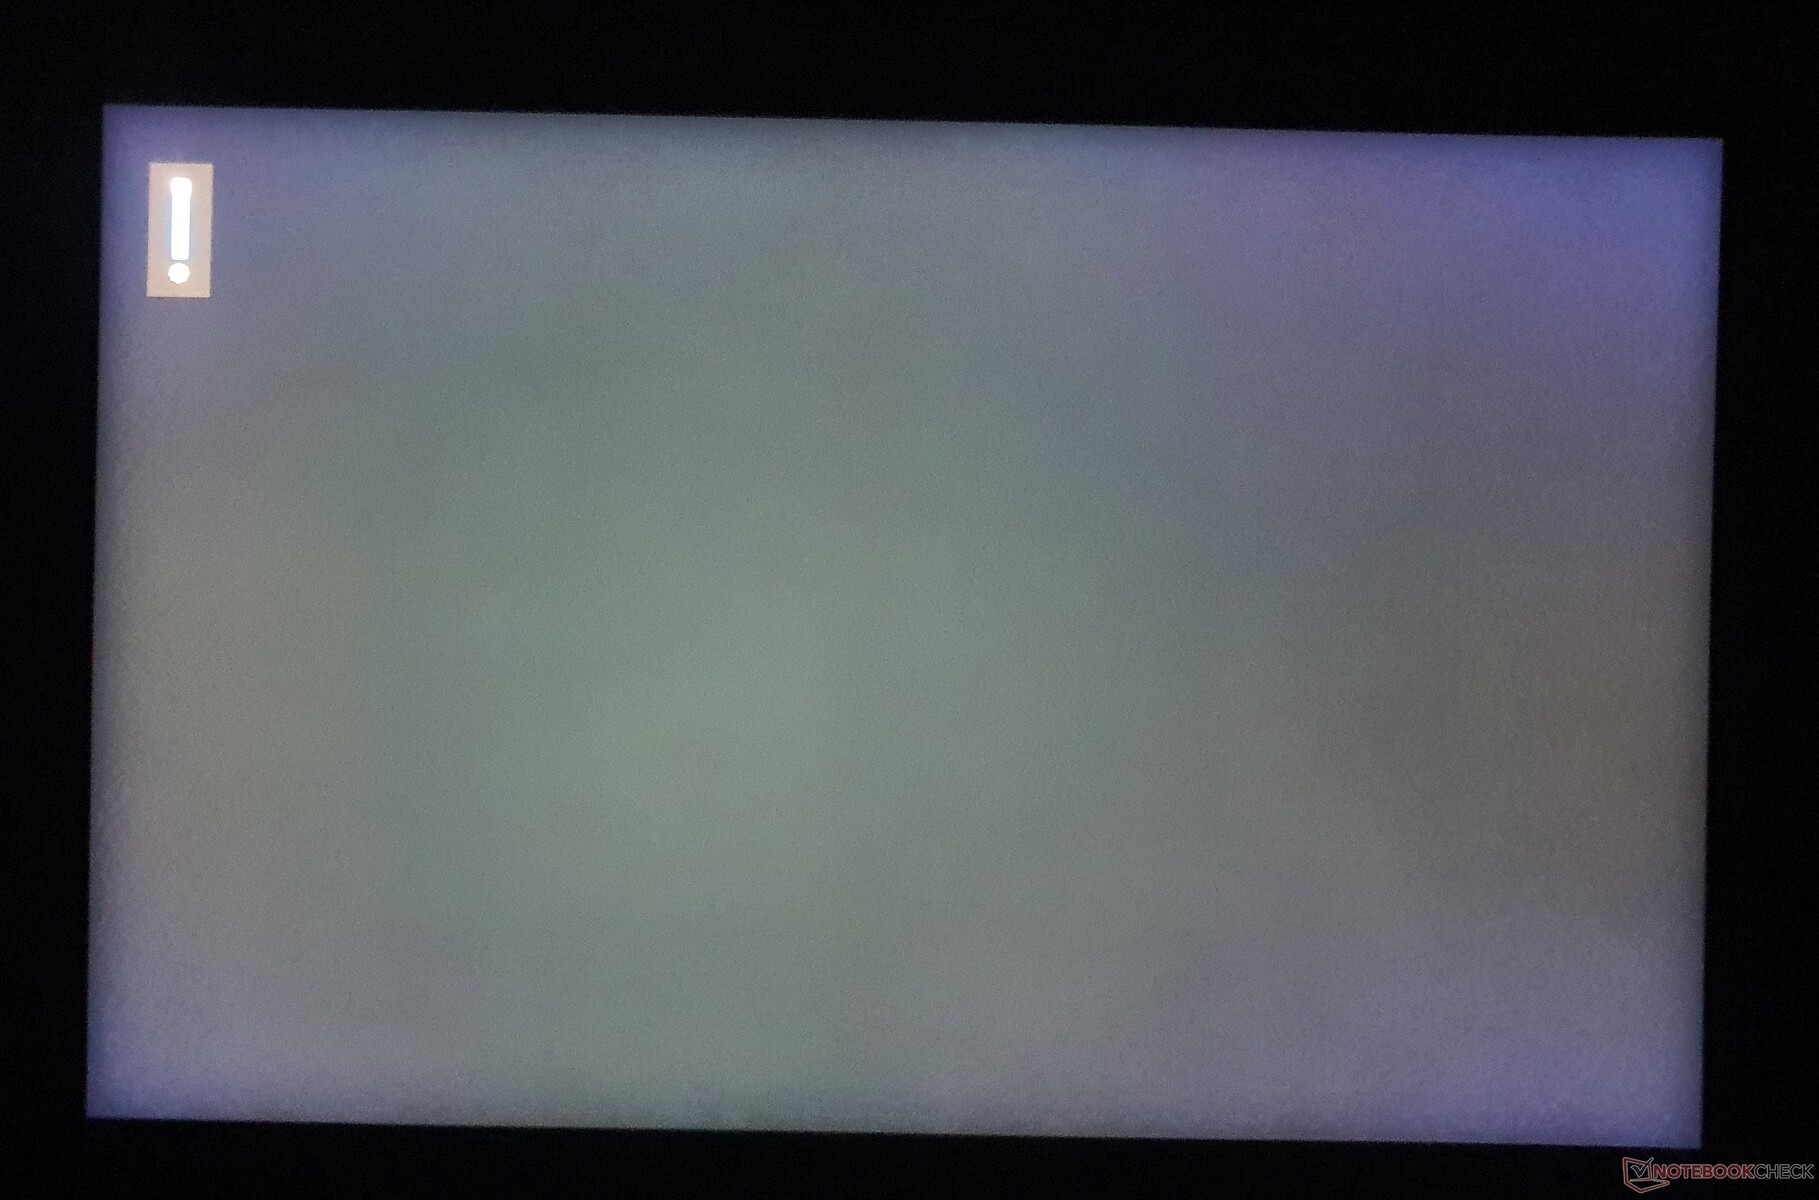
主观的画面感很好。颜色显示得非常好,启用HDR时~1100尼特的峰值亮度(在正常的桌面模式下也能工作)非常出色,0.11尼特的黑色水平几乎和OLED一样丰富,而4,527:1的对比度也非常好,这是迷你LED的典型特征。我们的测量是在SDR模式下进行的。在HDR模式下,对比度通常要高得多,特别是由于我们显示器的512个激活的局部调光区。一旦显示黑色,个别像素区域就会完全关闭,或者在HDR内容下区域会发出非常明亮的光芒。没有光晕,这也解释了95%的非常坚实的照明同质性。平均HDR亮度通常比峰值亮度低20%左右(未测量)。
再加上165赫兹的帧率和11毫秒的良好响应时间(灰到灰和黑到白),该显示器在HDR游戏中是无与伦比的。支持自适应同步。只有那些主要玩快节奏射击游戏的人可能会寻找具有更高帧率和更低响应时间的替代品,如微星Stealth GS66,并且可能更喜欢较低的全高清分辨率,因为在快节奏的射击游戏中,最大的FPS和速度有绝对的优先权。但由于ROG X16 Flow也是为创作者设计的,它不仅是游戏中HDR内容的理想选择,也是编辑中的理想选择。
总的来说,只有Apple'的MacBook Pro 16 ,其自身的迷你LED显示屏的显示质量接近于此。OLED面板,如Gigabyte Aero 16 ,对于DisplayHDR 1000来说不够亮。另一方面,迷你LED在我们的评测设备中表现出 "绽放"(即明亮的LED的光线照射到周围较暗的内容,类似于背光出血,因为局部调光区域比像素大),但这比MacBook或采用M1芯片的iPad Pro 12.9 中的情况要轻一些。到目前为止,PWM是我们一直在迷你LED显示器中观察到的,但7,400兆赫的极高频率应该不会造成任何问题,即使对于敏感的用户来说。
| |||||||||||||||||||||||||
Brightness Distribution: 94 %
Center on Battery: 502 cd/m²
Contrast: 4527:1 (Black: 0.11 cd/m²)
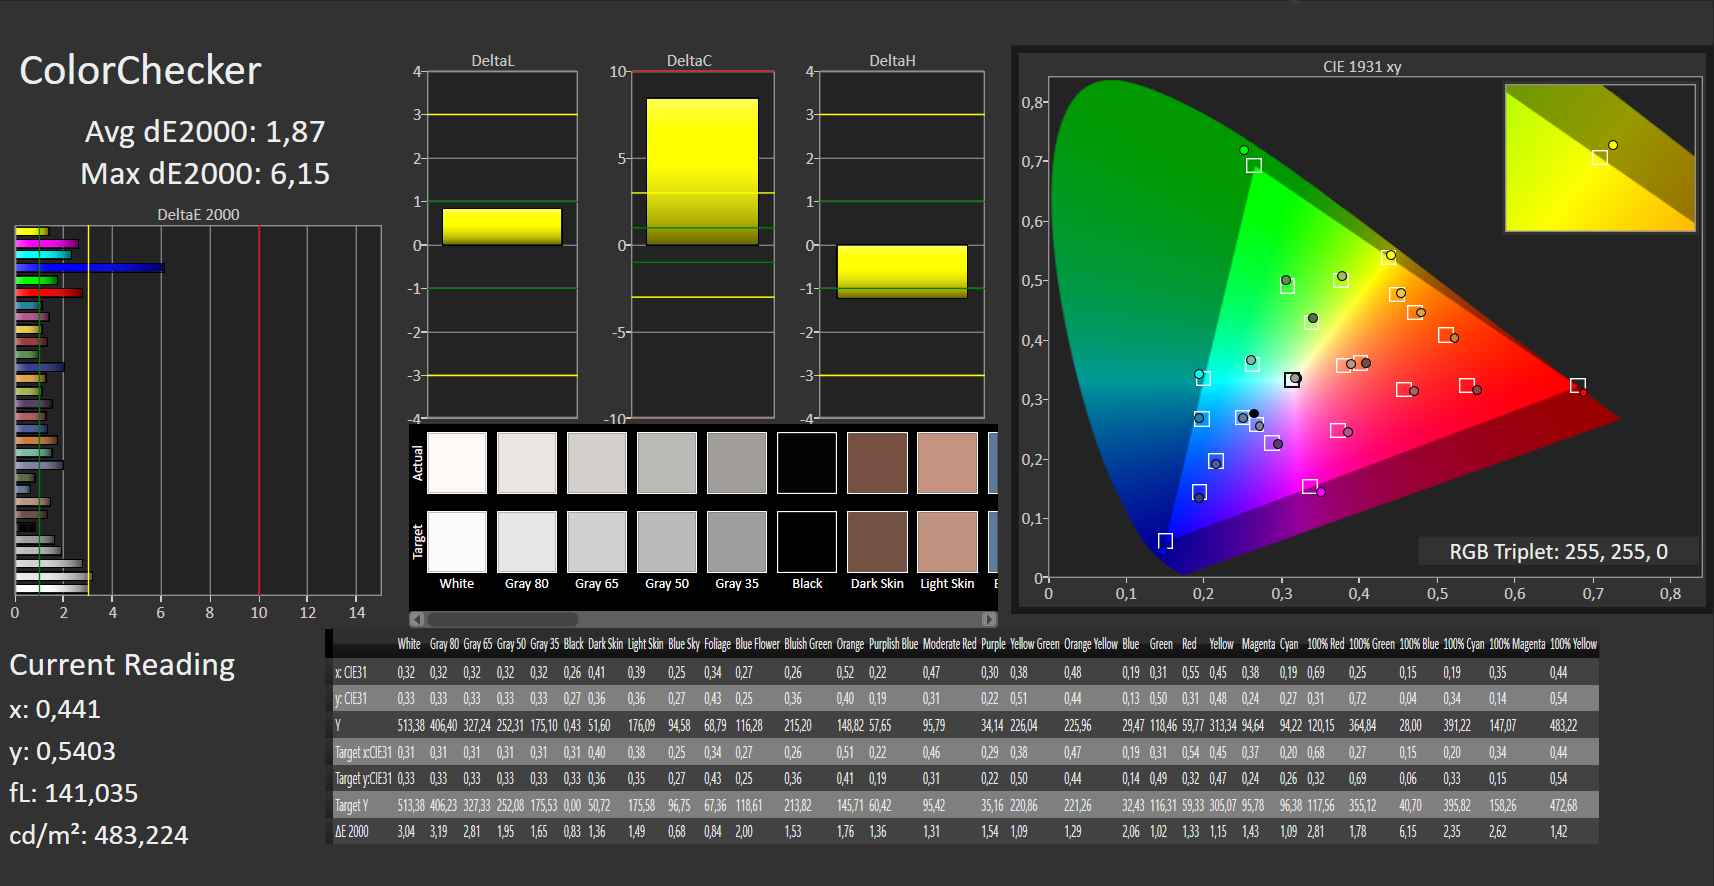
ΔE ColorChecker Calman: 1.87 | ∀{0.5-29.43 Ø4.72}
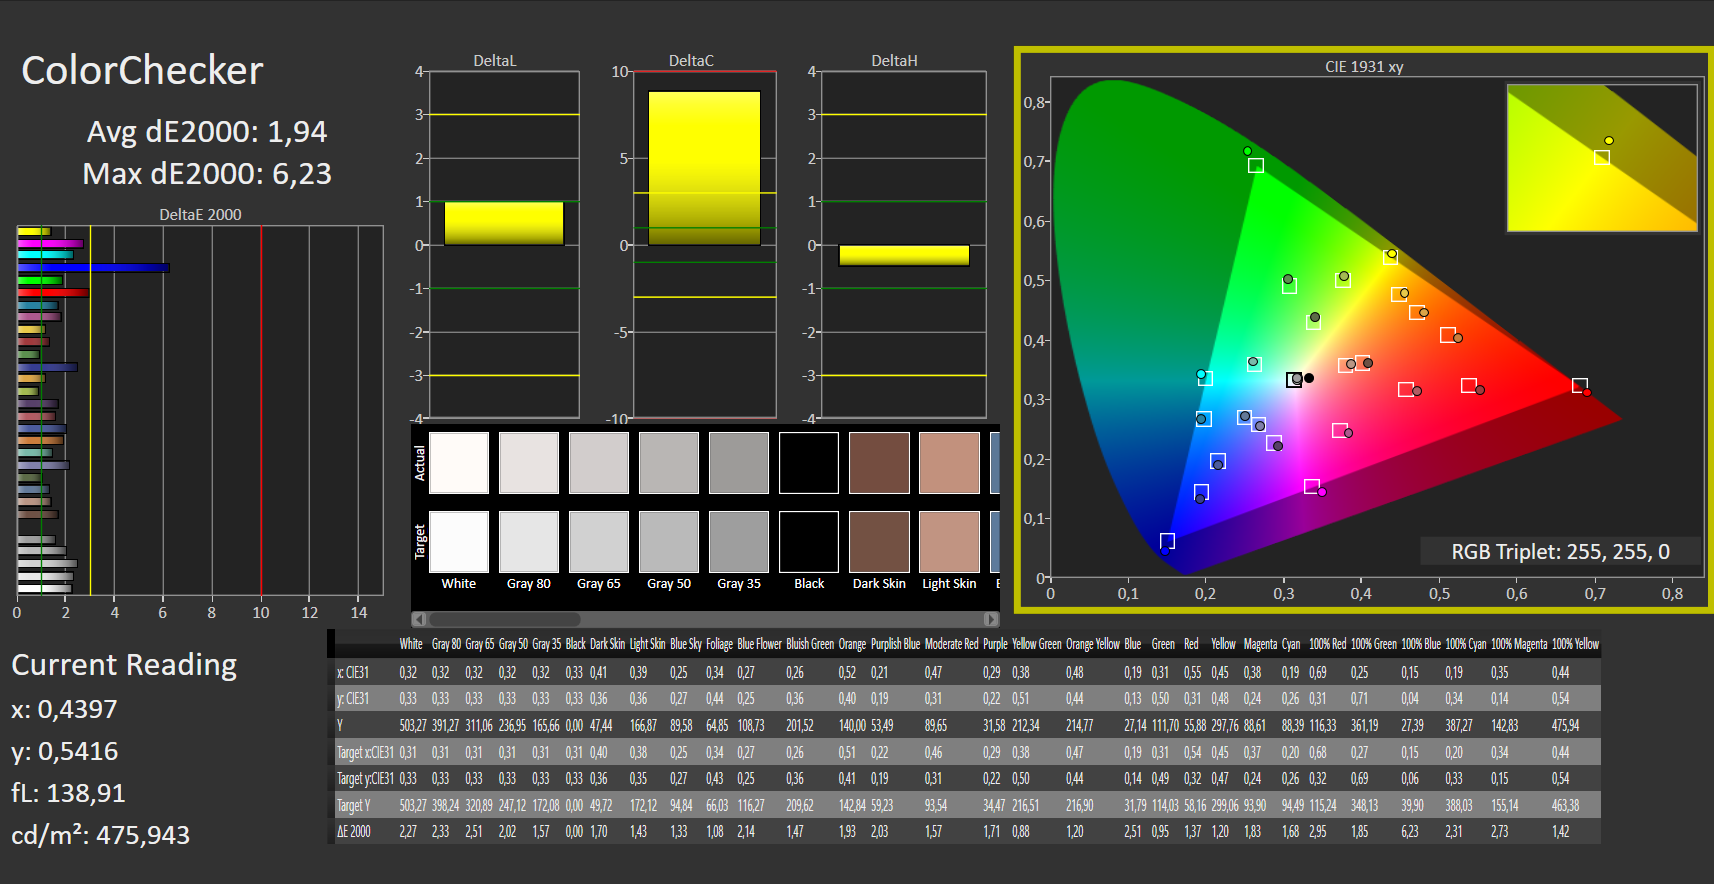
calibrated: 1.94
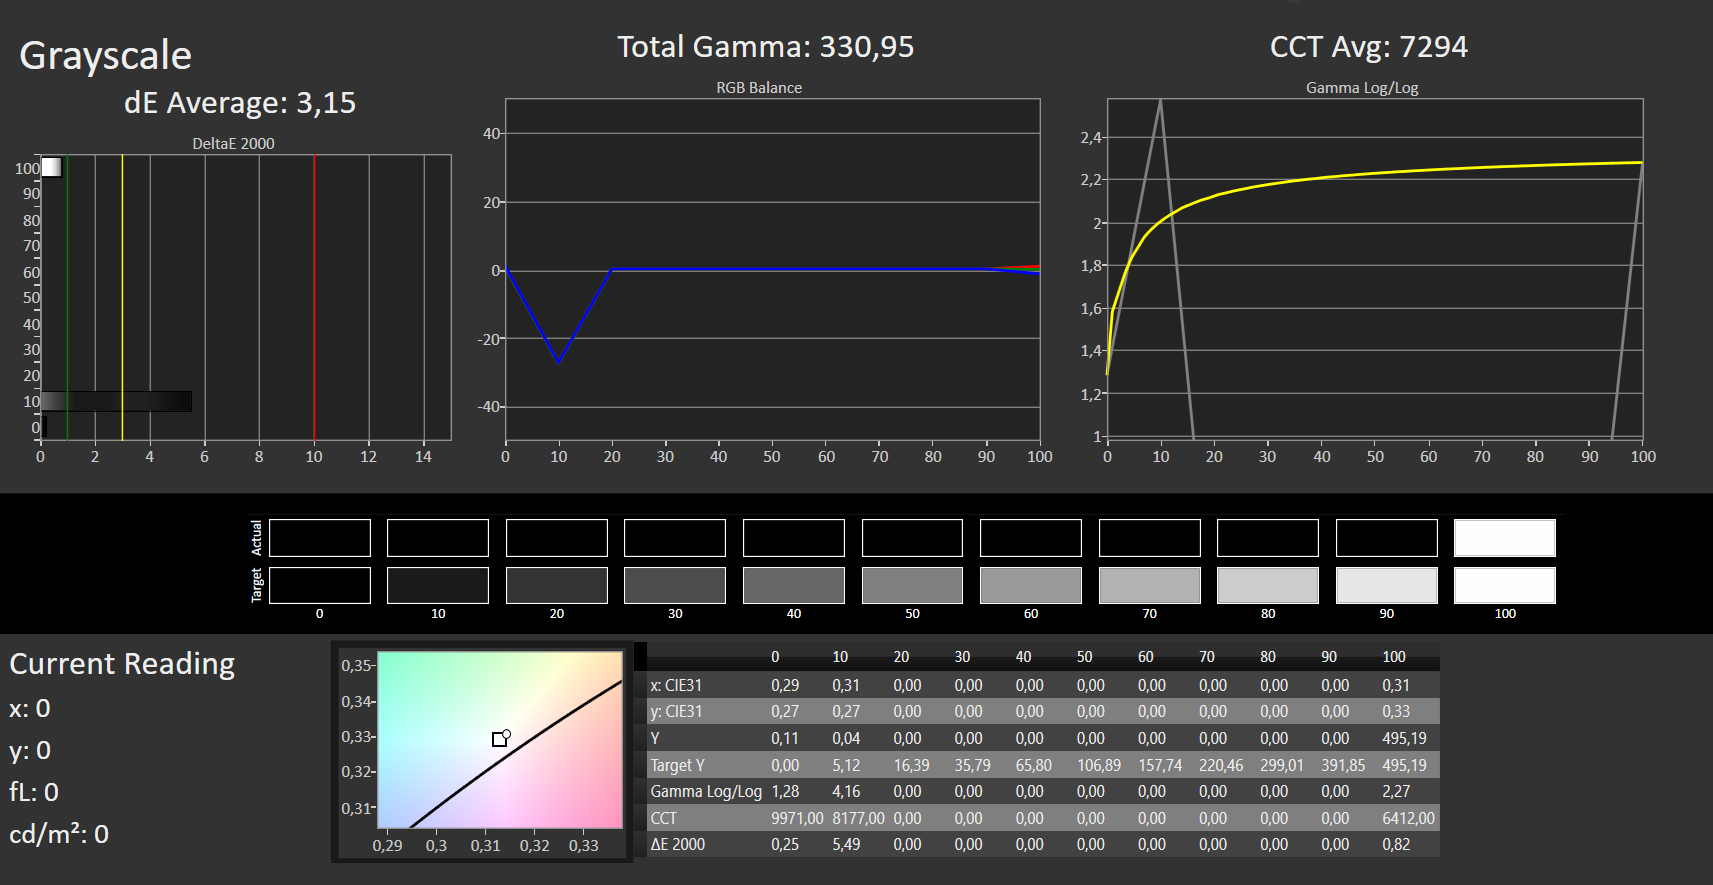
ΔE Greyscale Calman: 3.15 | ∀{0.09-98 Ø4.97}
90.21% AdobeRGB 1998 (Argyll 3D)
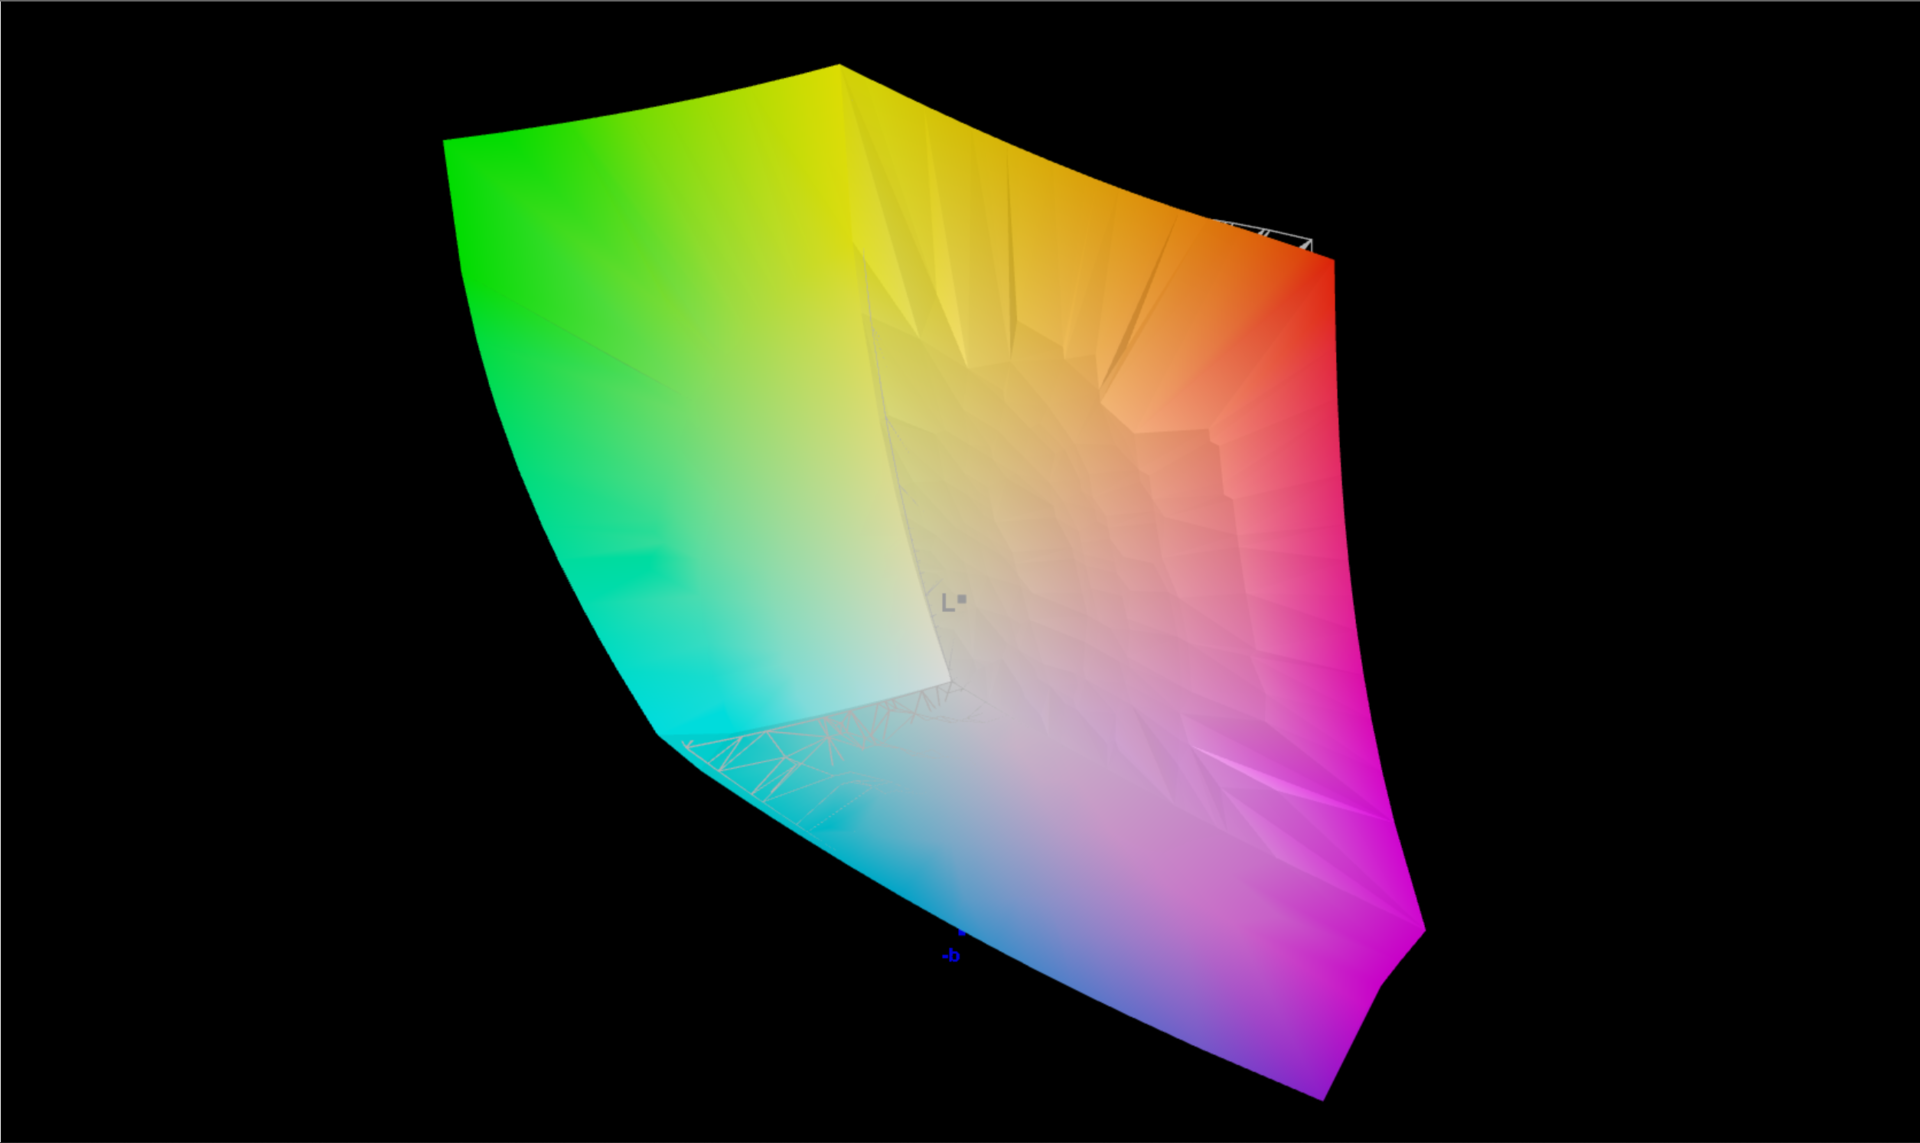
99.99% sRGB (Argyll 3D)
99.82% Display P3 (Argyll 3D)
Gamma: 330.95
CCT: 7294 K
| Asus ROG Flow X16 GV601RW-M5082W AUO B160QAN02.S, Mini LED, 2560x1600, 16.1" | Asus ROG Zephyrus M16 GU603H AU Optronics AUOC199, IPS, 2560x1600, 16" | Gigabyte Aero 16 YE5 Samsung SDC416B, AMOLED, 3840x2400, 16" | MSI Stealth GS66 12UGS Sharp LQ156T1JW04 (SHP153C), IPS-Level, 2560x1440, 15.6" | Lenovo Legion 5 Pro 16 G7 i7 RTX 3070Ti NE160QDM-NY1, IPS, 2560x1600, 16" | Apple MacBook Pro 16 2021 M1 Pro Liquid Retina XDR, Mini-LED, 3456x2234, 16.2" | Lenovo ThinkPad X1 Extreme G4-20Y5CTO1WW (3050 Ti) LP160UQ1-SPB1, IPS LED, 3840x2400, 16" | Dell XPS 17 9720 RTX 3060 Sharp LQ170R1, IPS, 3840x2400, 17" | Microsoft Surface Laptop Studio i7 RTX 3050 Ti LQ144P1JX01, IPS, 2400x1600, 14.4" | |
|---|---|---|---|---|---|---|---|---|---|
| Display | -3% | -18% | -1% | -3% | -4% | -11% | |||
| Display P3 Coverage (%) | 99.82 | 96.4 -3% | 68.7 -31% | 99.1 -1% | 84.3 -16% | 92.9 -7% | 80.6 -19% | ||
| sRGB Coverage (%) | 99.99 | 99.7 0% | 97.6 -2% | 100 0% | 98.3 -2% | 100 0% | 99.9 0% | ||
| AdobeRGB 1998 Coverage (%) | 90.21 | 85.6 -5% | 70.9 -21% | 88 -2% | 97.8 8% | 85.3 -5% | 78.5 -13% | ||
| Response Times | 51% | 80% | 35% | -15% | -511% | -364% | -293% | -275% | |
| Response Time Grey 50% / Grey 80% * (ms) | 11 ? | 4.8 ? 56% | 2.4 ? 78% | 6 ? 45% | 17.6 ? -60% | 42.8 ? -289% | 60 ? -445% | 51.2 ? -365% | 58.4 ? -431% |
| Response Time Black / White * (ms) | 11 ? | 6 ? 45% | 2 ? 82% | 8.4 ? 24% | 7.6 ? 31% | 91.6 ? -733% | 42 ? -282% | 35.2 ? -220% | 24 ? -118% |
| PWM Frequency (Hz) | 7400 ? | 60 ? | 14880 | 5000 ? | |||||
| Screen | -61% | 104% | -57% | -32% | 82% | -32% | -90% | -5% | |
| Brightness middle (cd/m²) | 498 | 448 -10% | 368 -26% | 272 -45% | 502 1% | 514 3% | 639 28% | 512.7 3% | 497 0% |
| Brightness (cd/m²) | 502 | 446 -11% | 368 -27% | 253 -50% | 491 -2% | 497 -1% | 612 22% | 463 -8% | 491 -2% |
| Brightness Distribution (%) | 94 | 86 -9% | 93 -1% | 87 -7% | 91 -3% | 95 1% | 84 -11% | 85 -10% | 92 -2% |
| Black Level * (cd/m²) | 0.11 | 0.48 -336% | 0.01 91% | 0.25 -127% | 0.37 -236% | 0.02 82% | 0.47 -327% | 0.32 -191% | 0.29 -164% |
| Contrast (:1) | 4527 | 933 -79% | 36800 713% | 1088 -76% | 1357 -70% | 25700 468% | 1360 -70% | 1602 -65% | 1714 -62% |
| Colorchecker dE 2000 * | 1.87 | 2.76 -48% | 2.33 -25% | 3.73 -99% | 2.7 -44% | 1.4 25% | 2.2 -18% | 5.98 -220% | 1.2 36% |
| Colorchecker dE 2000 max. * | 6.15 | 7.09 -15% | 4.34 29% | 9.43 -53% | 4.5 27% | 2.8 54% | 5.3 14% | 12.09 -97% | 2.8 54% |
| Colorchecker dE 2000 calibrated * | 1.94 | 2.86 -47% | 0.98 49% | 1.4 28% | 1.4 28% | 0.8 59% | |||
| Greyscale dE 2000 * | 3.15 | 3.1 2% | 0.8 75% | 6.5 -106% | 2.7 14% | 2.3 27% | 1.7 46% | 7.2 -129% | 1.9 40% |
| Gamma | 330.95 1% | 2.153 102% | 2.119 104% | 2.172 101% | 2.44 90% | 2.27 97% | 2.31 95% | 2.54 87% | 2.14 103% |
| CCT | 7294 89% | 6826 95% | 6569 99% | 6485 100% | 6326 103% | 6792 96% | 6390 102% | 6914 94% | 6821 95% |
| Color Space (Percent of AdobeRGB 1998) (%) | 87 | ||||||||
| Color Space (Percent of sRGB) (%) | 100 | ||||||||
| Total Average (Program / Settings) | -5% /
-41% | 92% /
99% | -8% /
-32% | -22% /
-26% | -143% /
-28% | -133% /
-73% | -129% /
-101% | -97% /
-44% |
* ... smaller is better
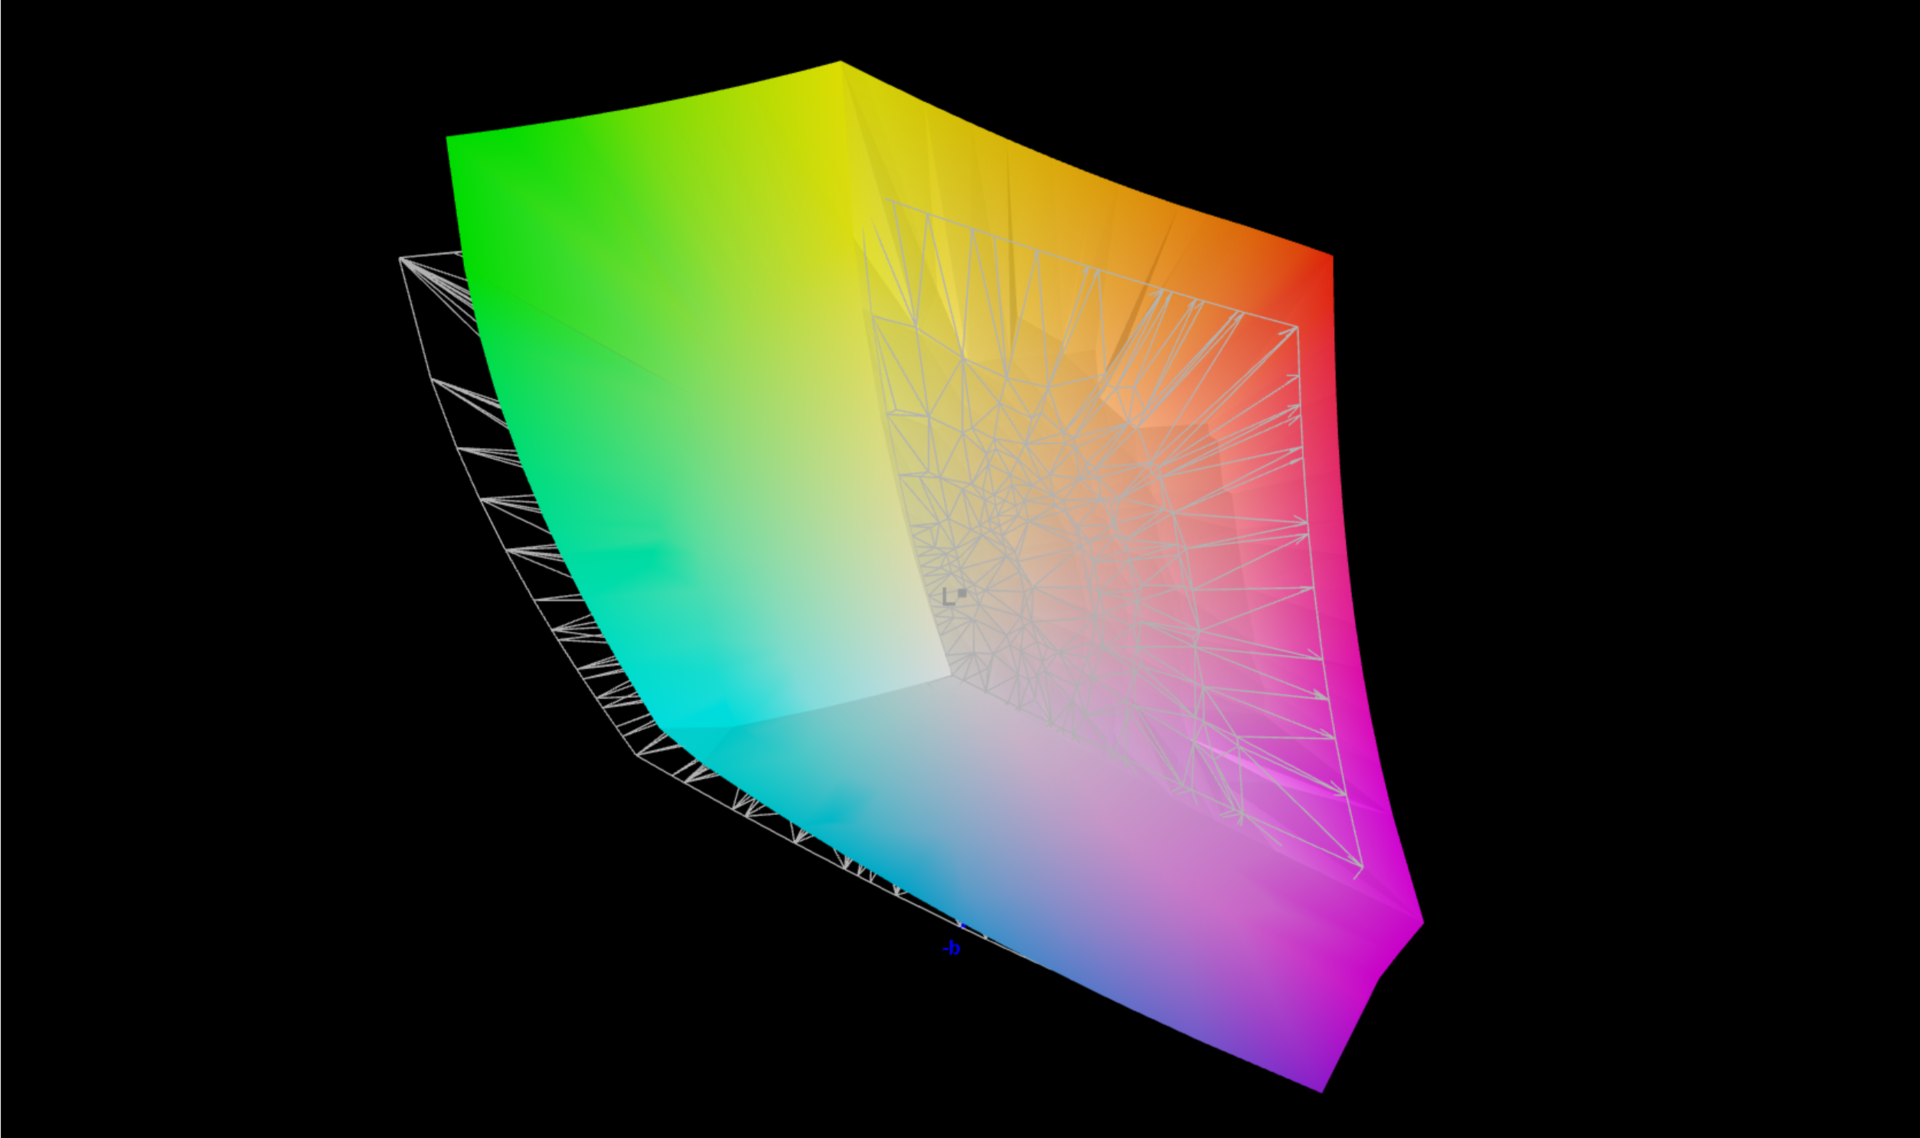
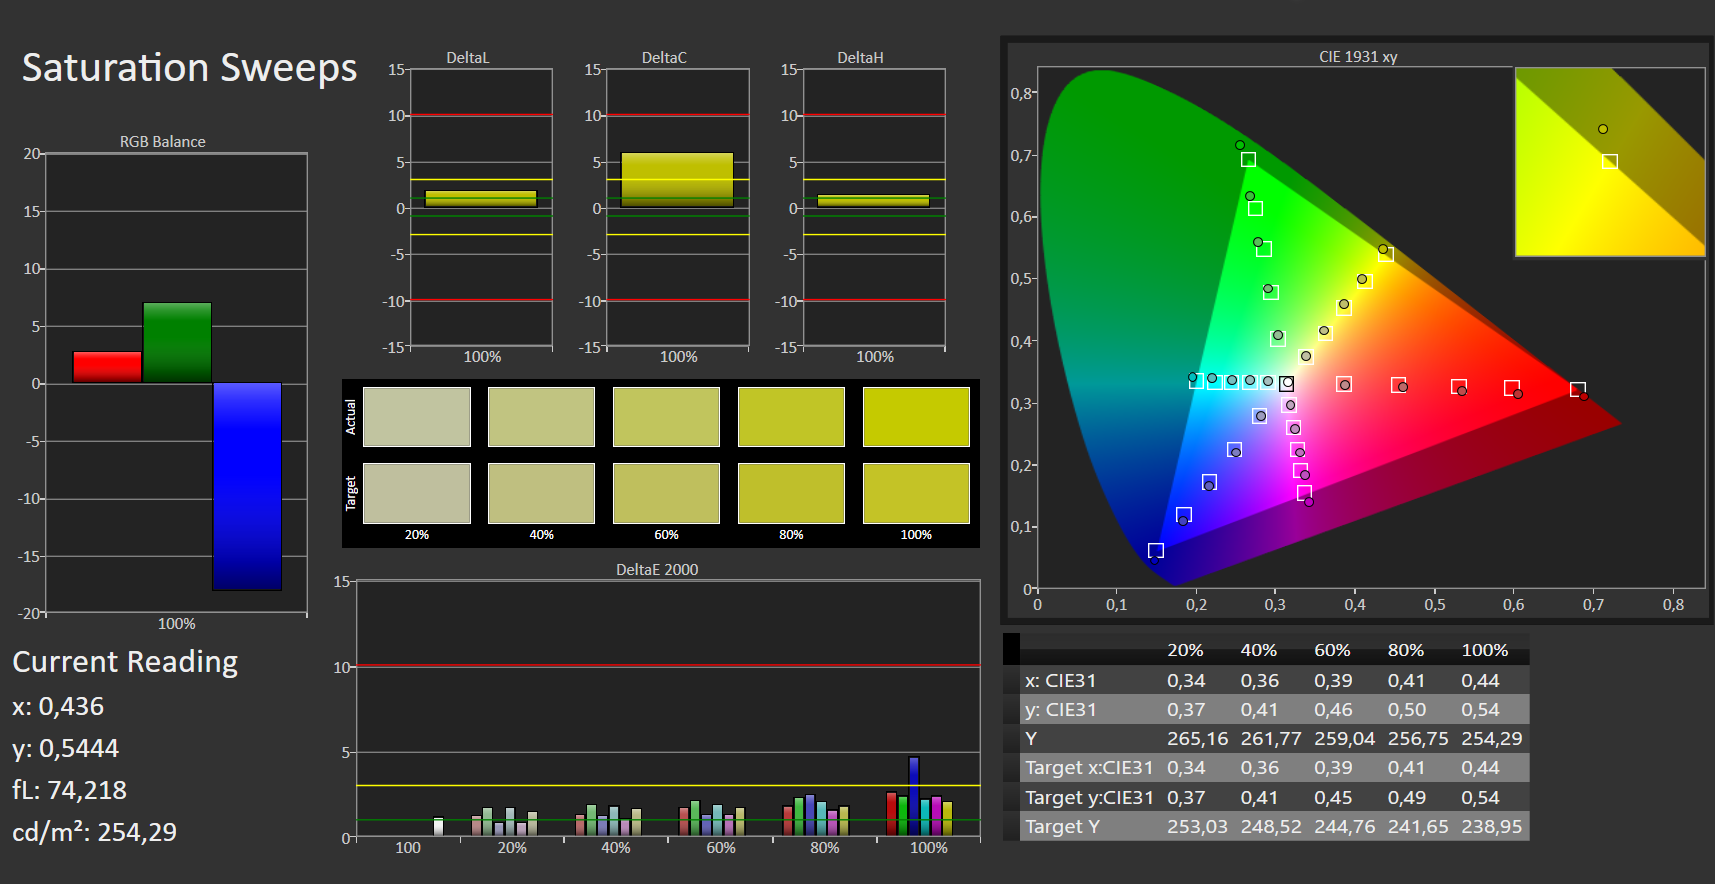
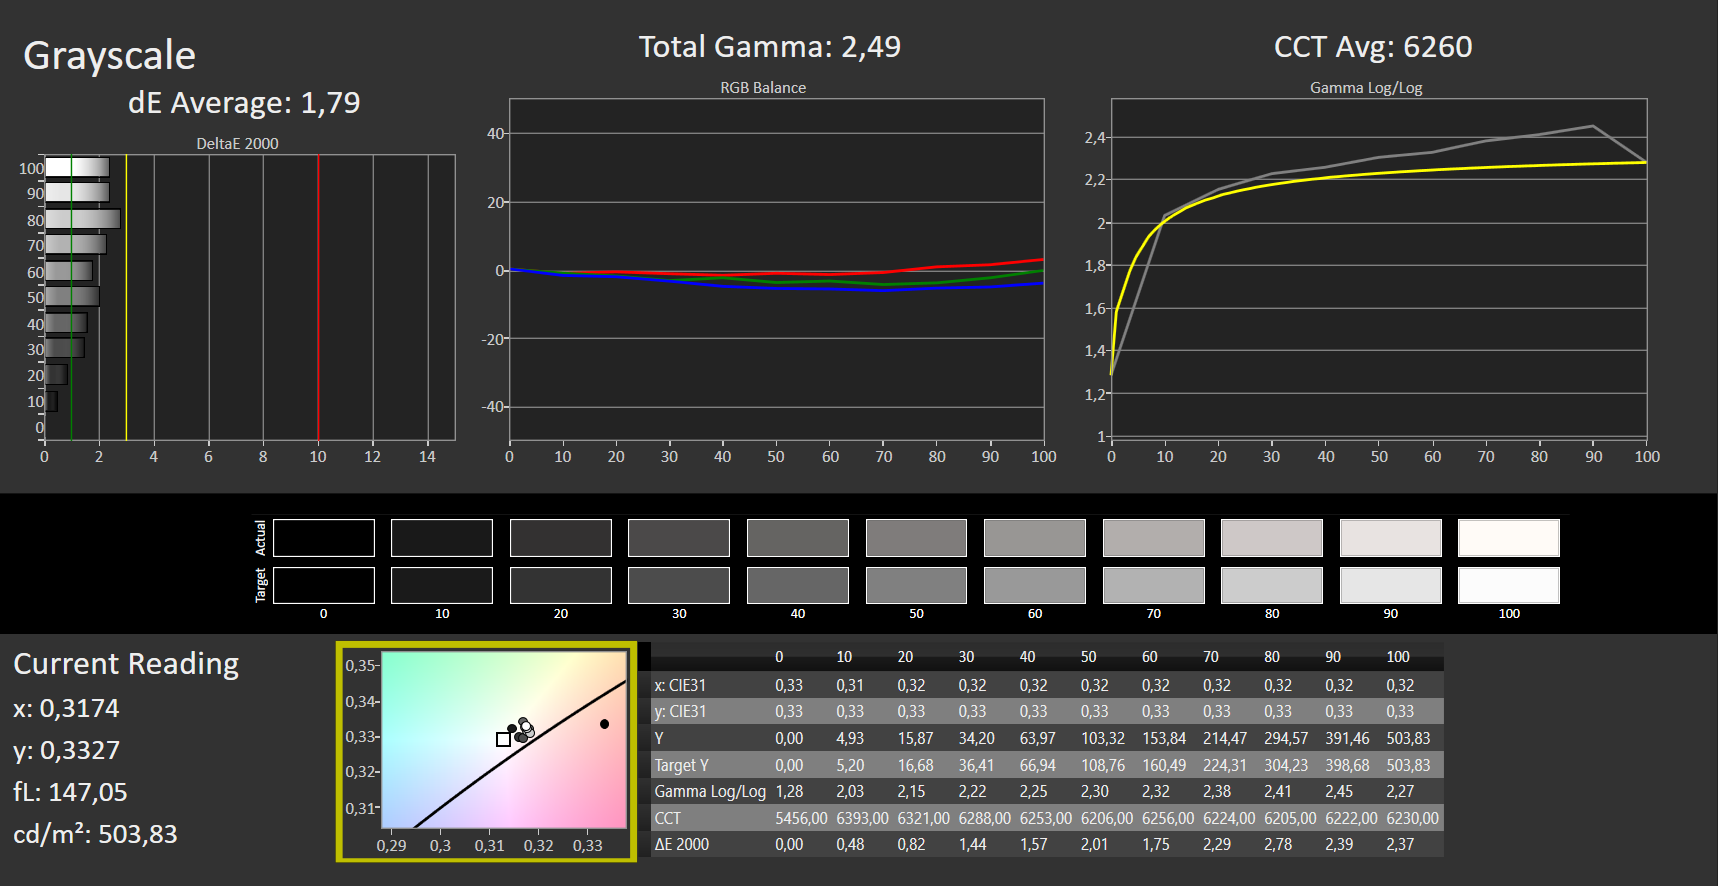
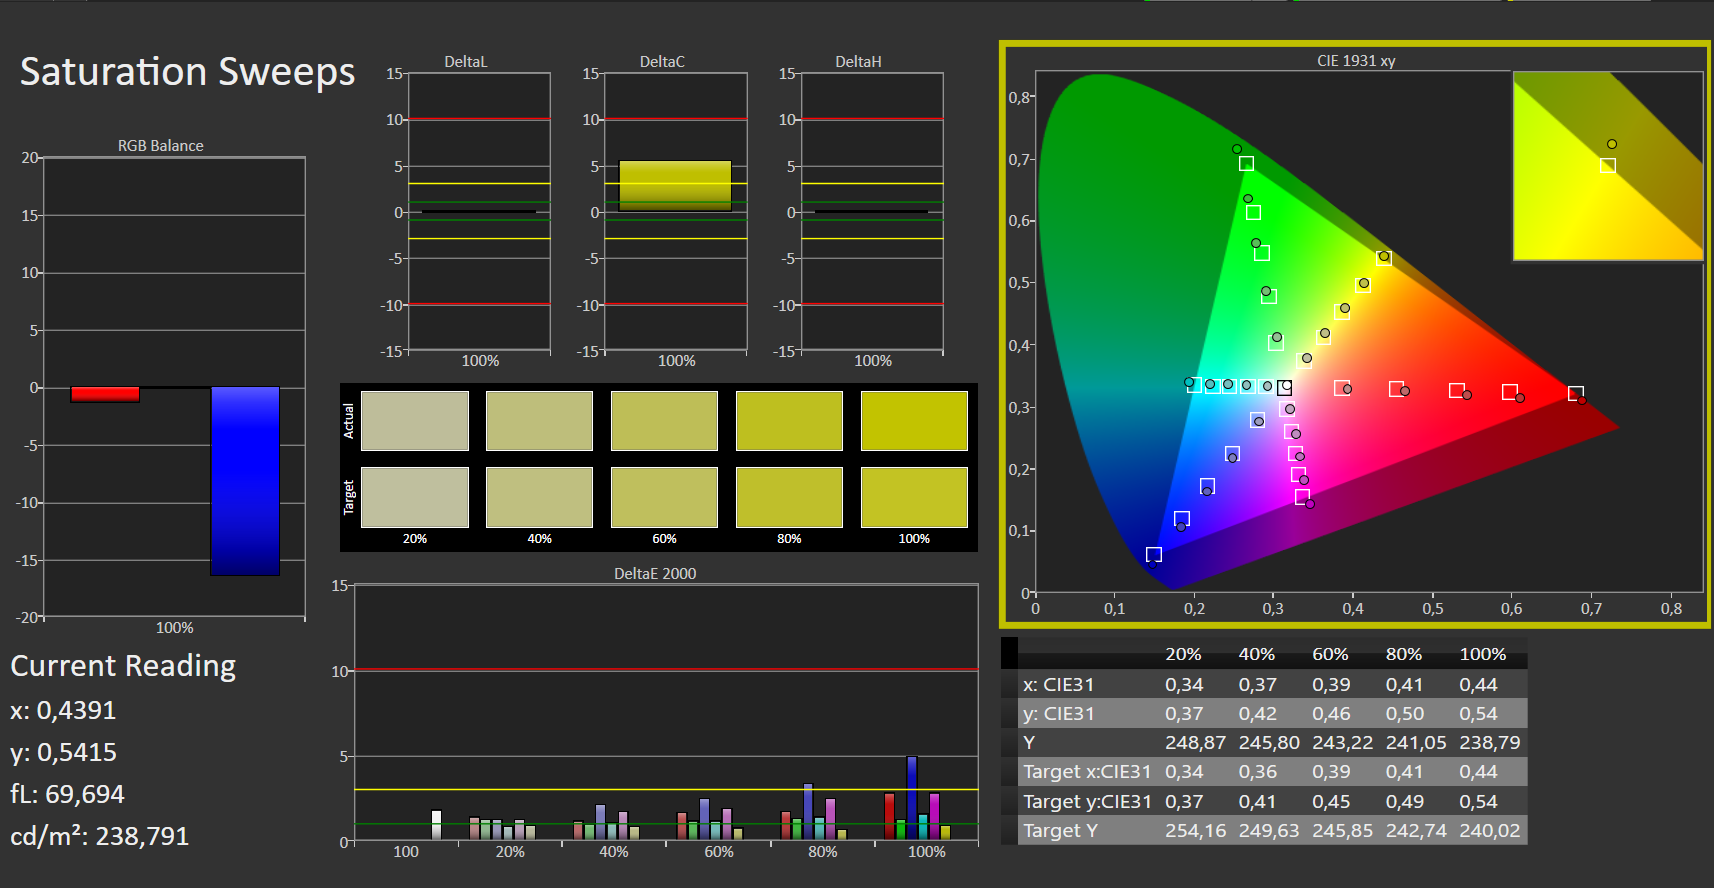
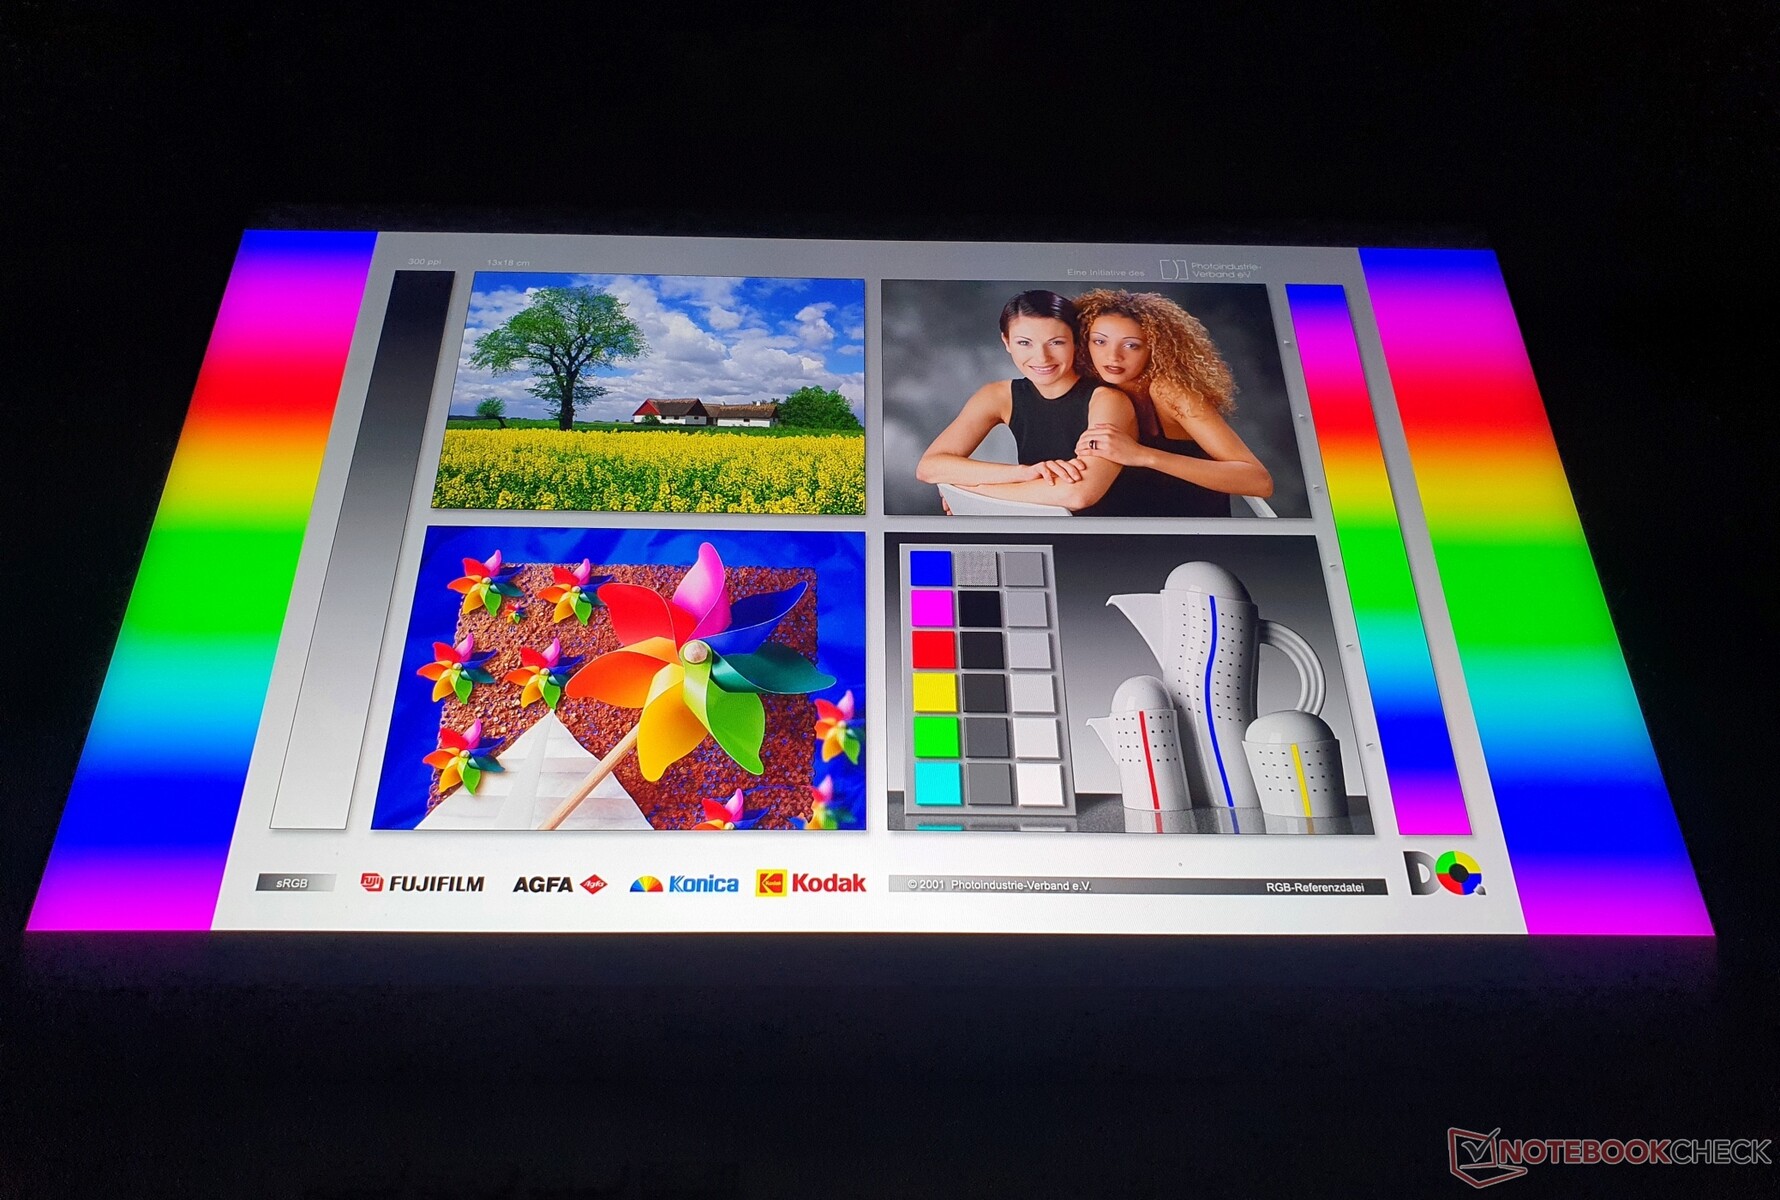
在我们的测试领域,ROG Flow X16是唯一能覆盖90%以上的Adobe RGB色彩空间(90.2%)的笔记本。因此,没有什么能阻挡苛刻的图像和视频编辑。
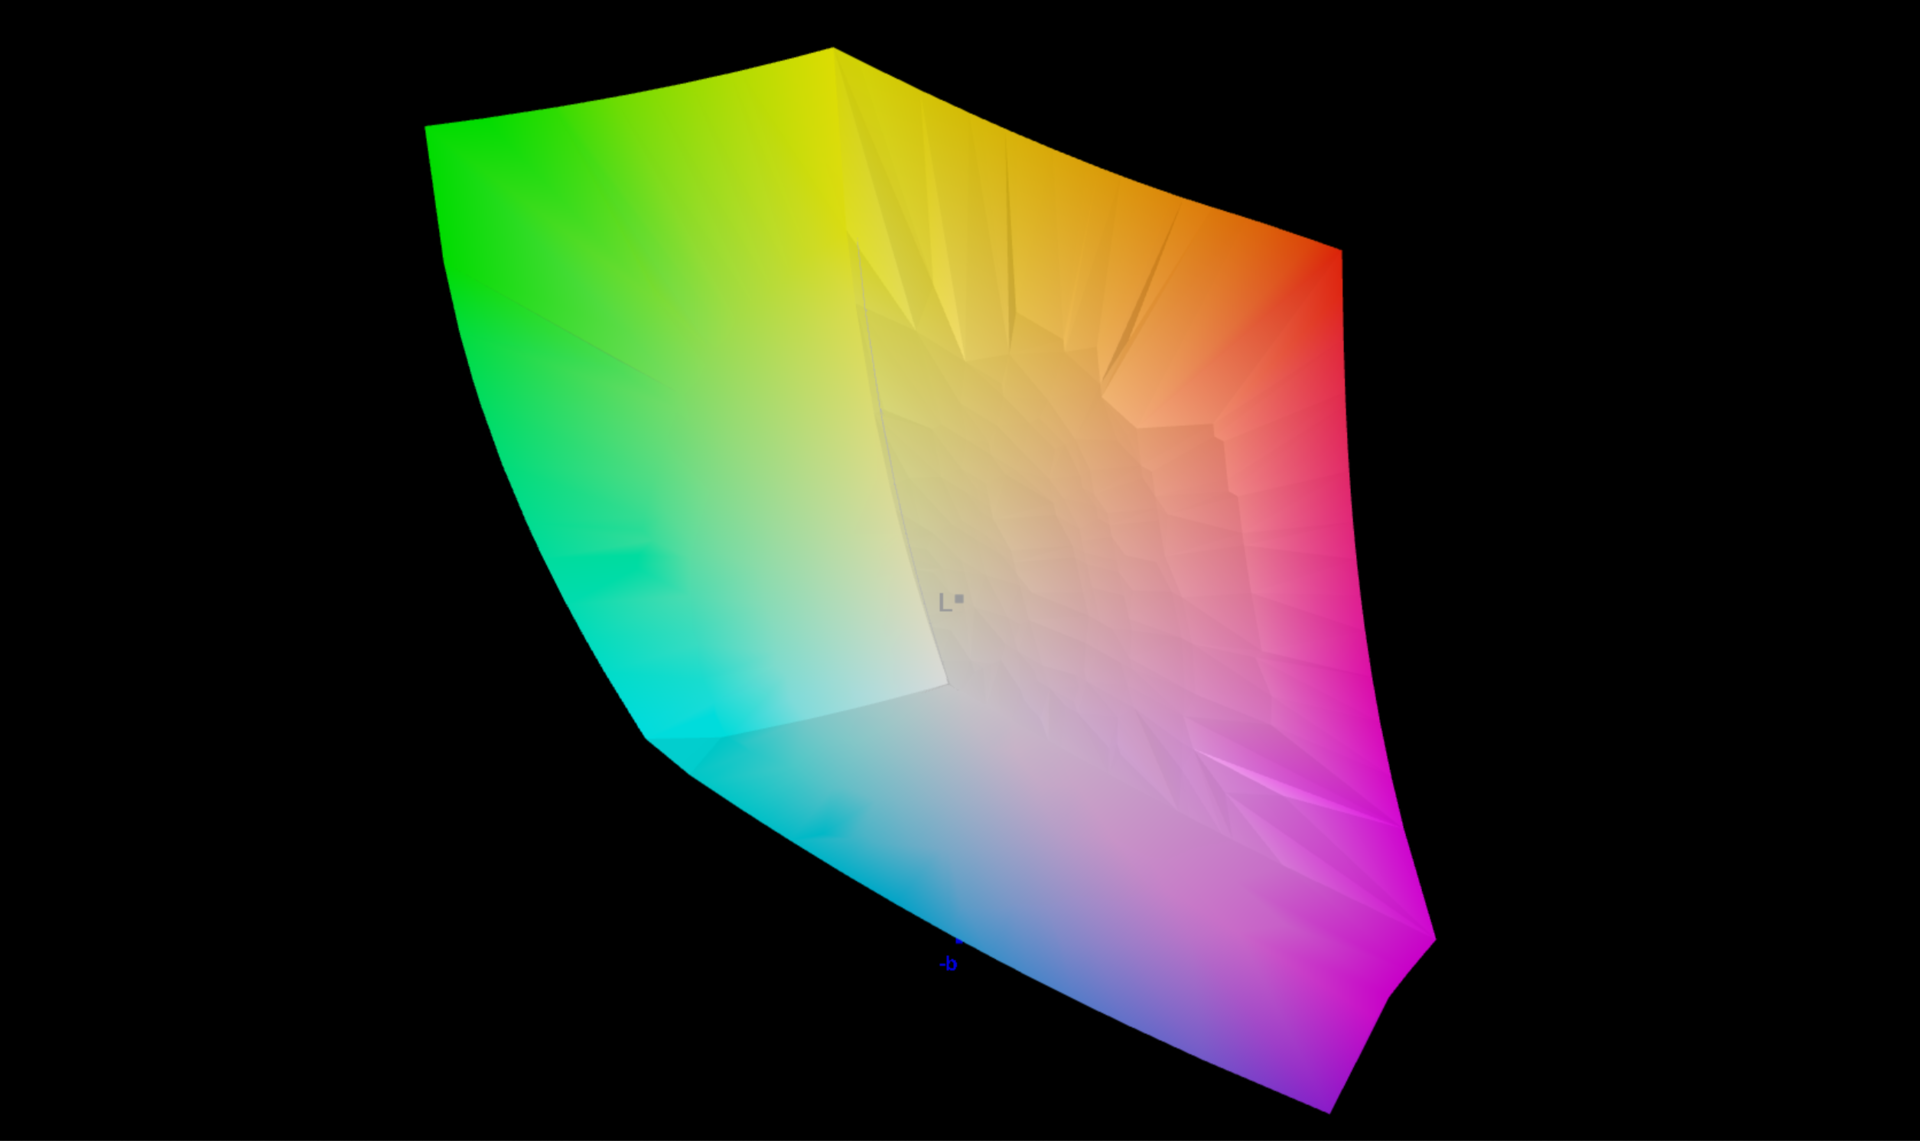
经过工厂校准的迷你LED显示器(Pantone认证)的DeltaE-2000值在颜色和灰度方面都低于3的阈值。然而,蓝色偏离了6.15的数值,我们无法通过校准来改善。红色、绿色和蓝色的平衡可以说是完美的。所以绝对没有偏色。
像往常一样,校准后的颜色配置文件可在照明图形旁边下载。
Display Response Times
| ↔ Response Time Black to White | ||
|---|---|---|
| 11 ms ... rise ↗ and fall ↘ combined | ↗ 1 ms rise |  |
| ↘ 10 ms fall | ||
| The screen shows good response rates in our tests, but may be too slow for competitive gamers. In comparison, all tested devices range from 0.1 (minimum) to 240 (maximum) ms. » 29 % of all devices are better. This means that the measured response time is better than the average of all tested devices (19.8 ms). | ||
| ↔ Response Time 50% Grey to 80% Grey | ||
| 11 ms ... rise ↗ and fall ↘ combined | ↗ 1 ms rise |   |
| ↘ 10 ms fall | ||
| The screen shows good response rates in our tests, but may be too slow for competitive gamers. In comparison, all tested devices range from 0.165 (minimum) to 636 (maximum) ms. » 24 % of all devices are better. This means that the measured response time is better than the average of all tested devices (31 ms). | ||
Screen Flickering / PWM (Pulse-Width Modulation)
| Screen flickering / PWM detected | 7400 Hz | ≤ 100 % brightness setting |    |
The display backlight flickers at 7400 Hz (worst case, e.g., utilizing PWM) Flickering detected at a brightness setting of 100 % and below. There should be no flickering or PWM above this brightness setting. The frequency of 7400 Hz is quite high, so most users sensitive to PWM should not notice any flickering. In comparison: 52 % of all tested devices do not use PWM to dim the display. If PWM was detected, an average of 7781 (minimum: 5 - maximum: 343500) Hz was measured. | |||
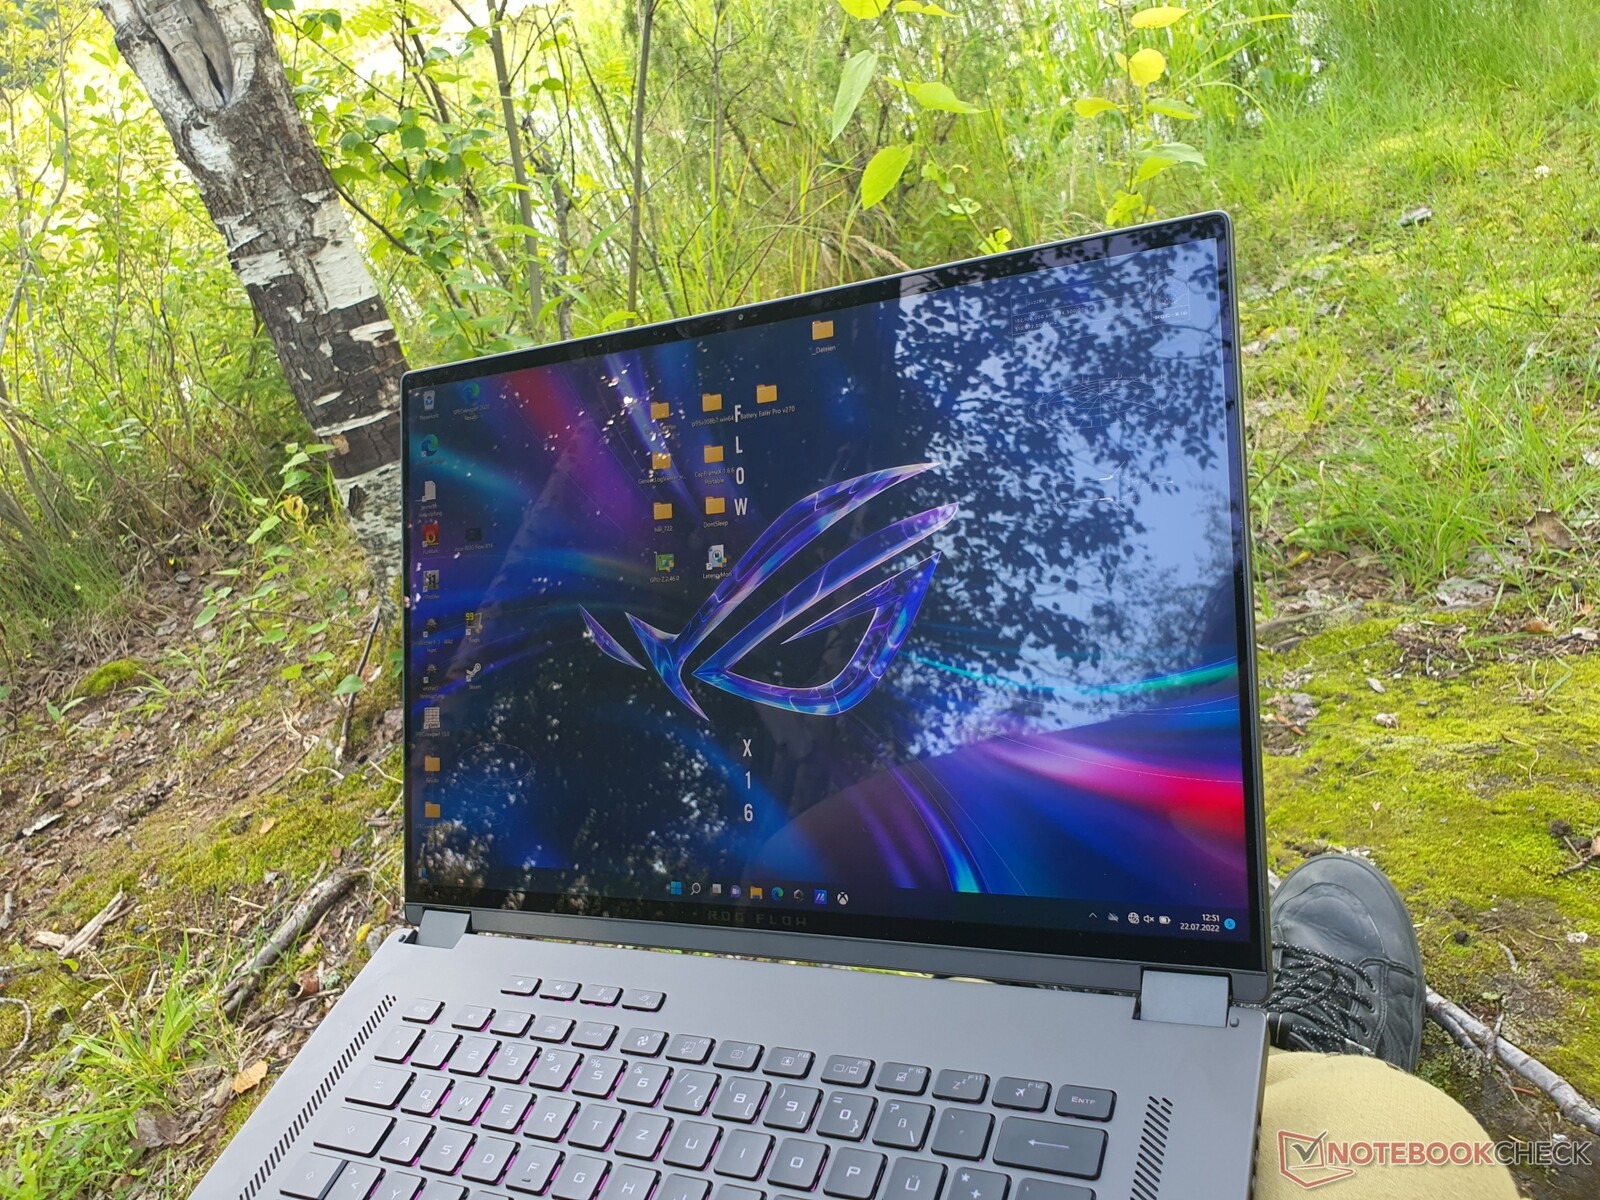
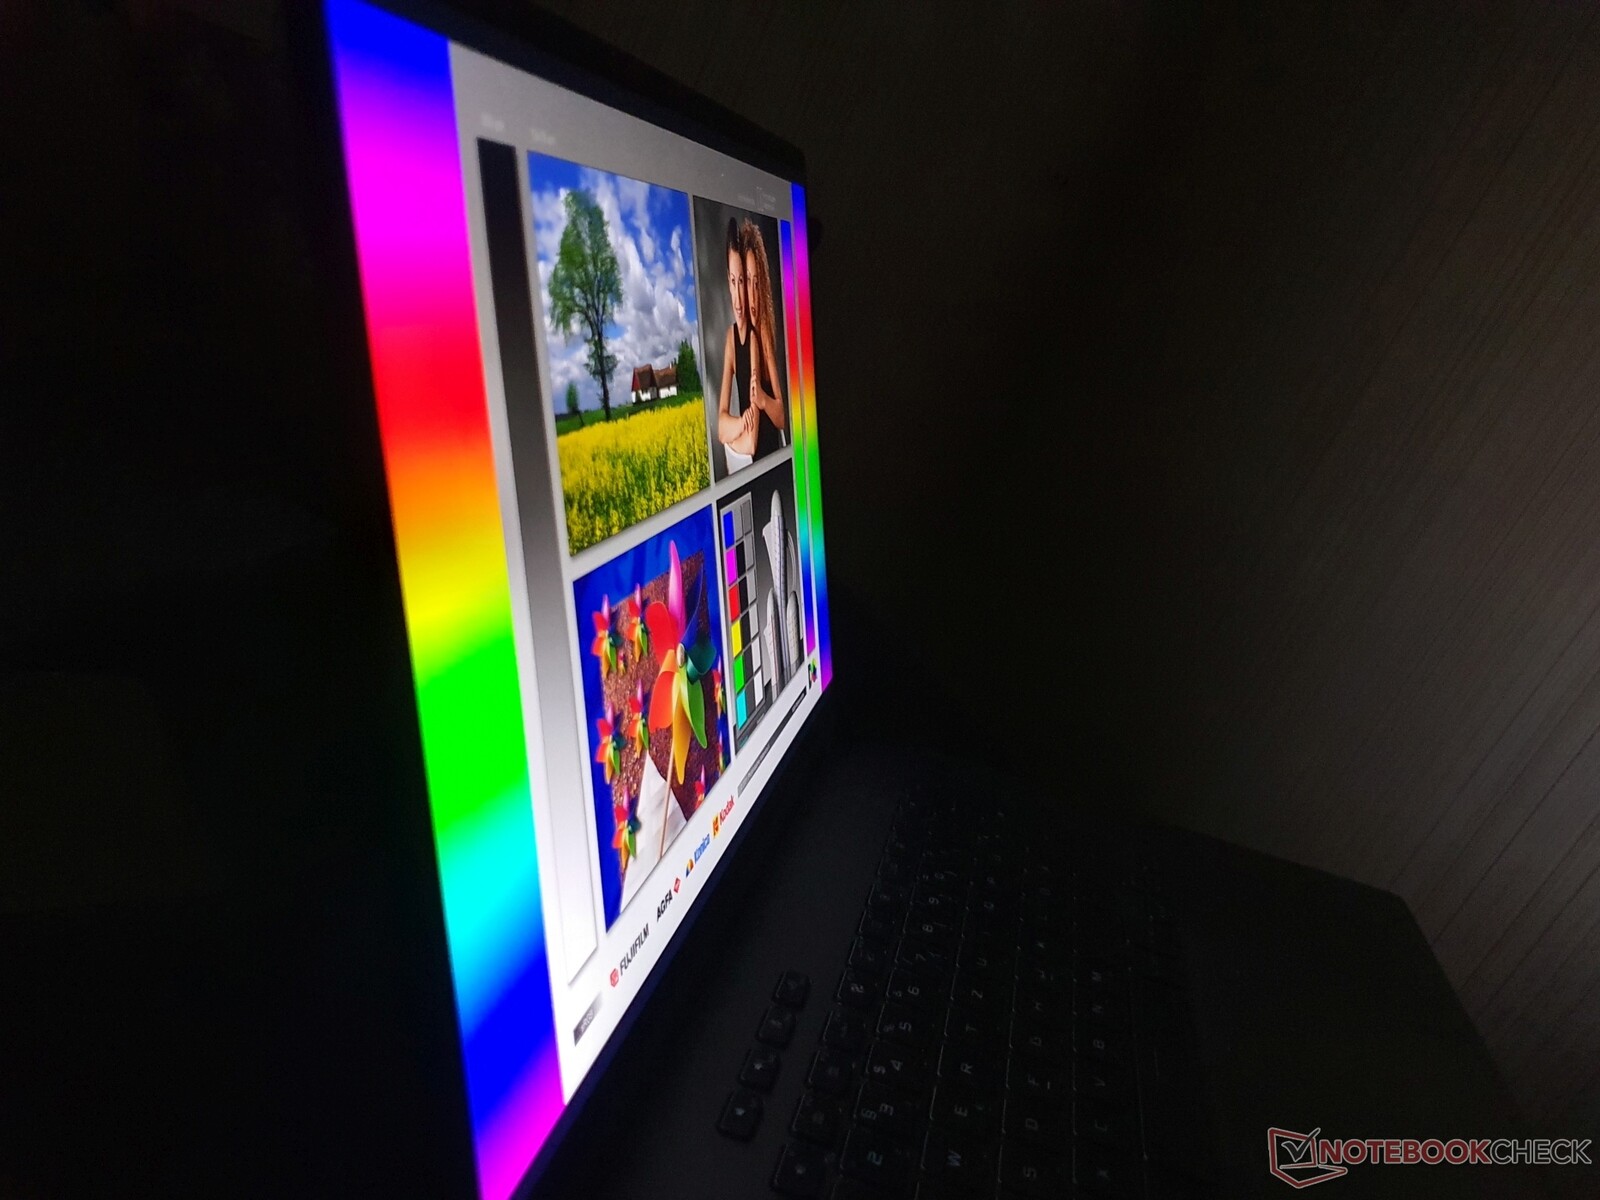
显示屏的反射非常强烈,因此即使是500尼特的亮度也有必要在(部分)阴凉处使用。在电池模式下,最大亮度为1100尼特的HDR的使用仍然被停用,以达到省电的目的。
OLED显示屏在视角稳定性方面仍有轻微优势,但正如IPS的典型情况一样,华硕ROG Flow X16的屏幕处于高水准。
性能 - RTX 3070 Ti与125瓦的紧凑型游戏笔记本电脑
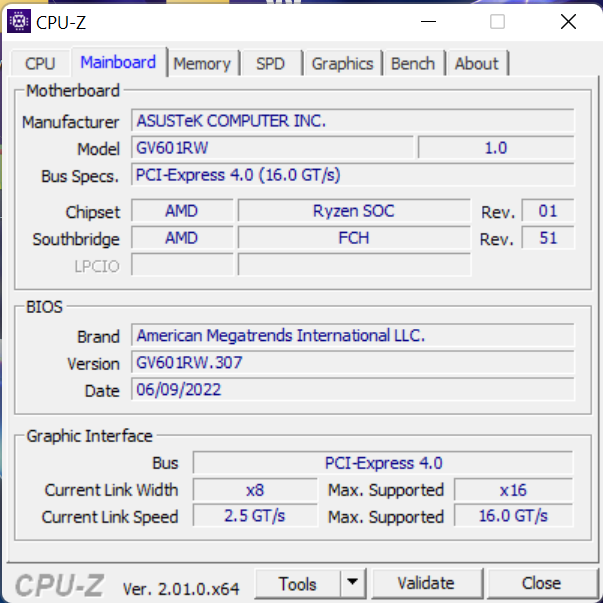
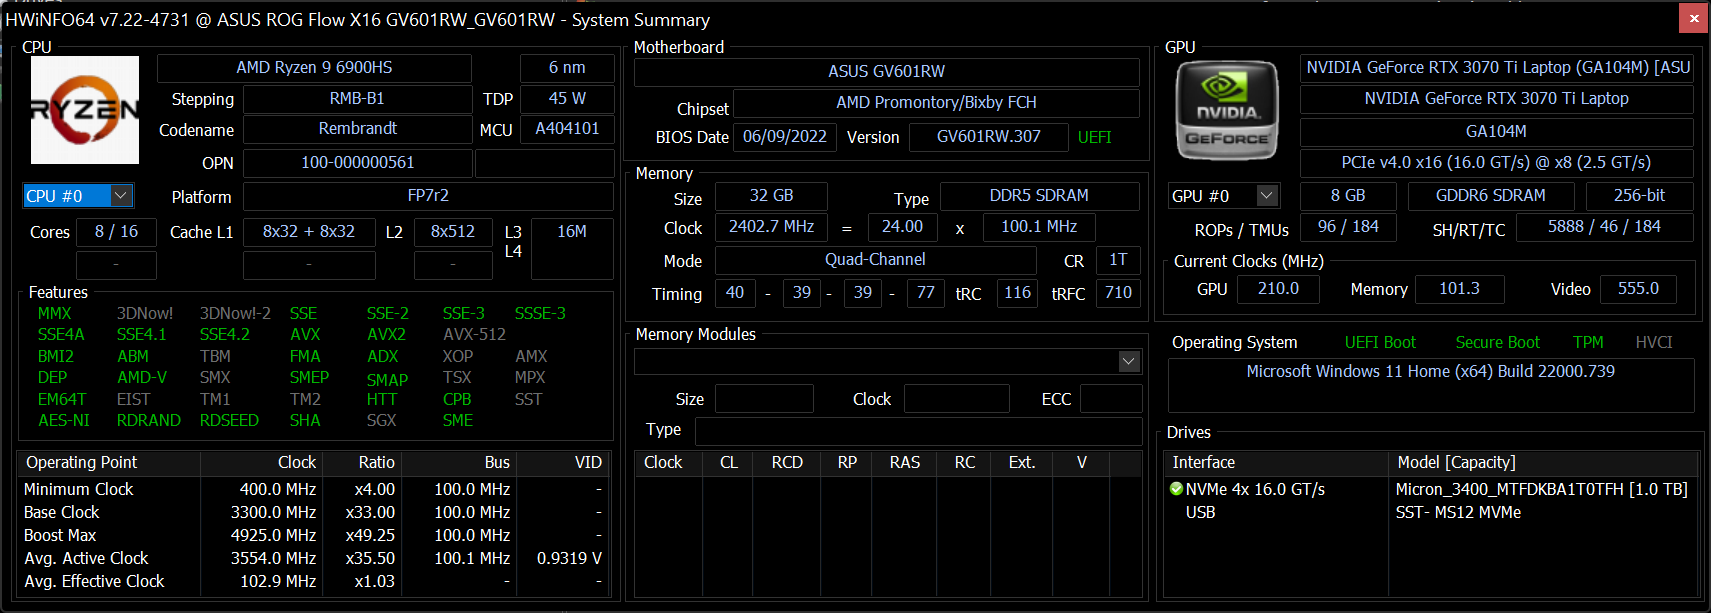
我们的配置是配备了一个 AMD Ryzen 9 6900HS八核处理器和一个 NvidiaGeForce RTX 3070 Ti具有125瓦的TGP(包括动态提升)。还集成了一个MUX开关。
更便宜的型号配备了一个RTX 3060或 RTX 3050 Ti。后者总是配备一个 Ryzen 7 6800HS(时钟低200MHz)。
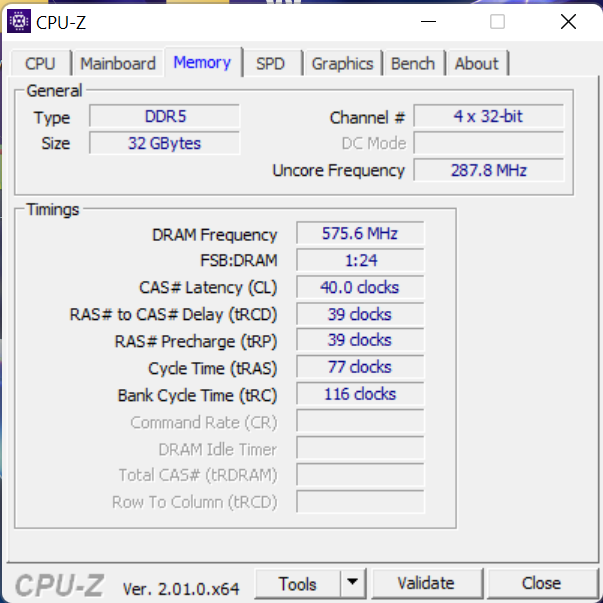
ROG Flow X16配备了8至32GB的DDR5-4800内存。我们的评测单元有32GB的内存(双通道模式下的2个16GB模块),可容纳1TB的固态硬盘,这是提供的最小容量。最多可以订购2TB,最多可以操作两个PCIe 4.0固态硬盘。

测试条件
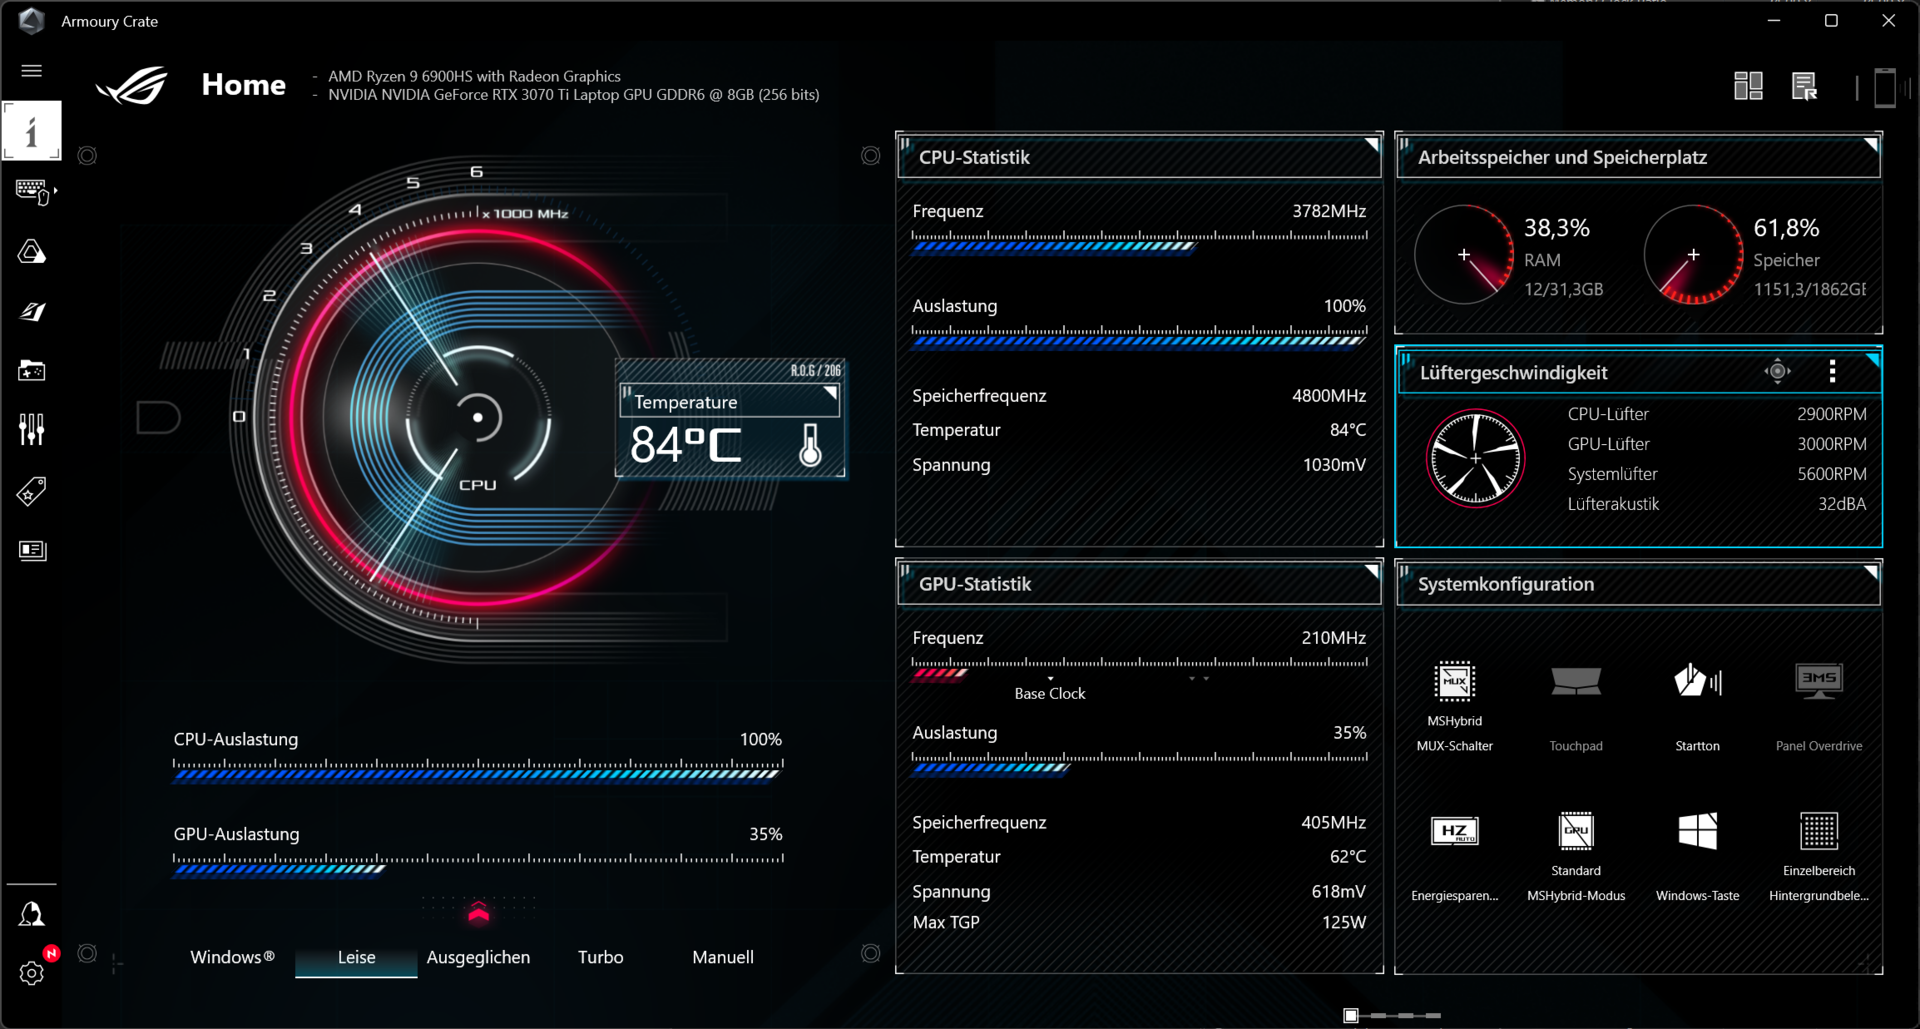
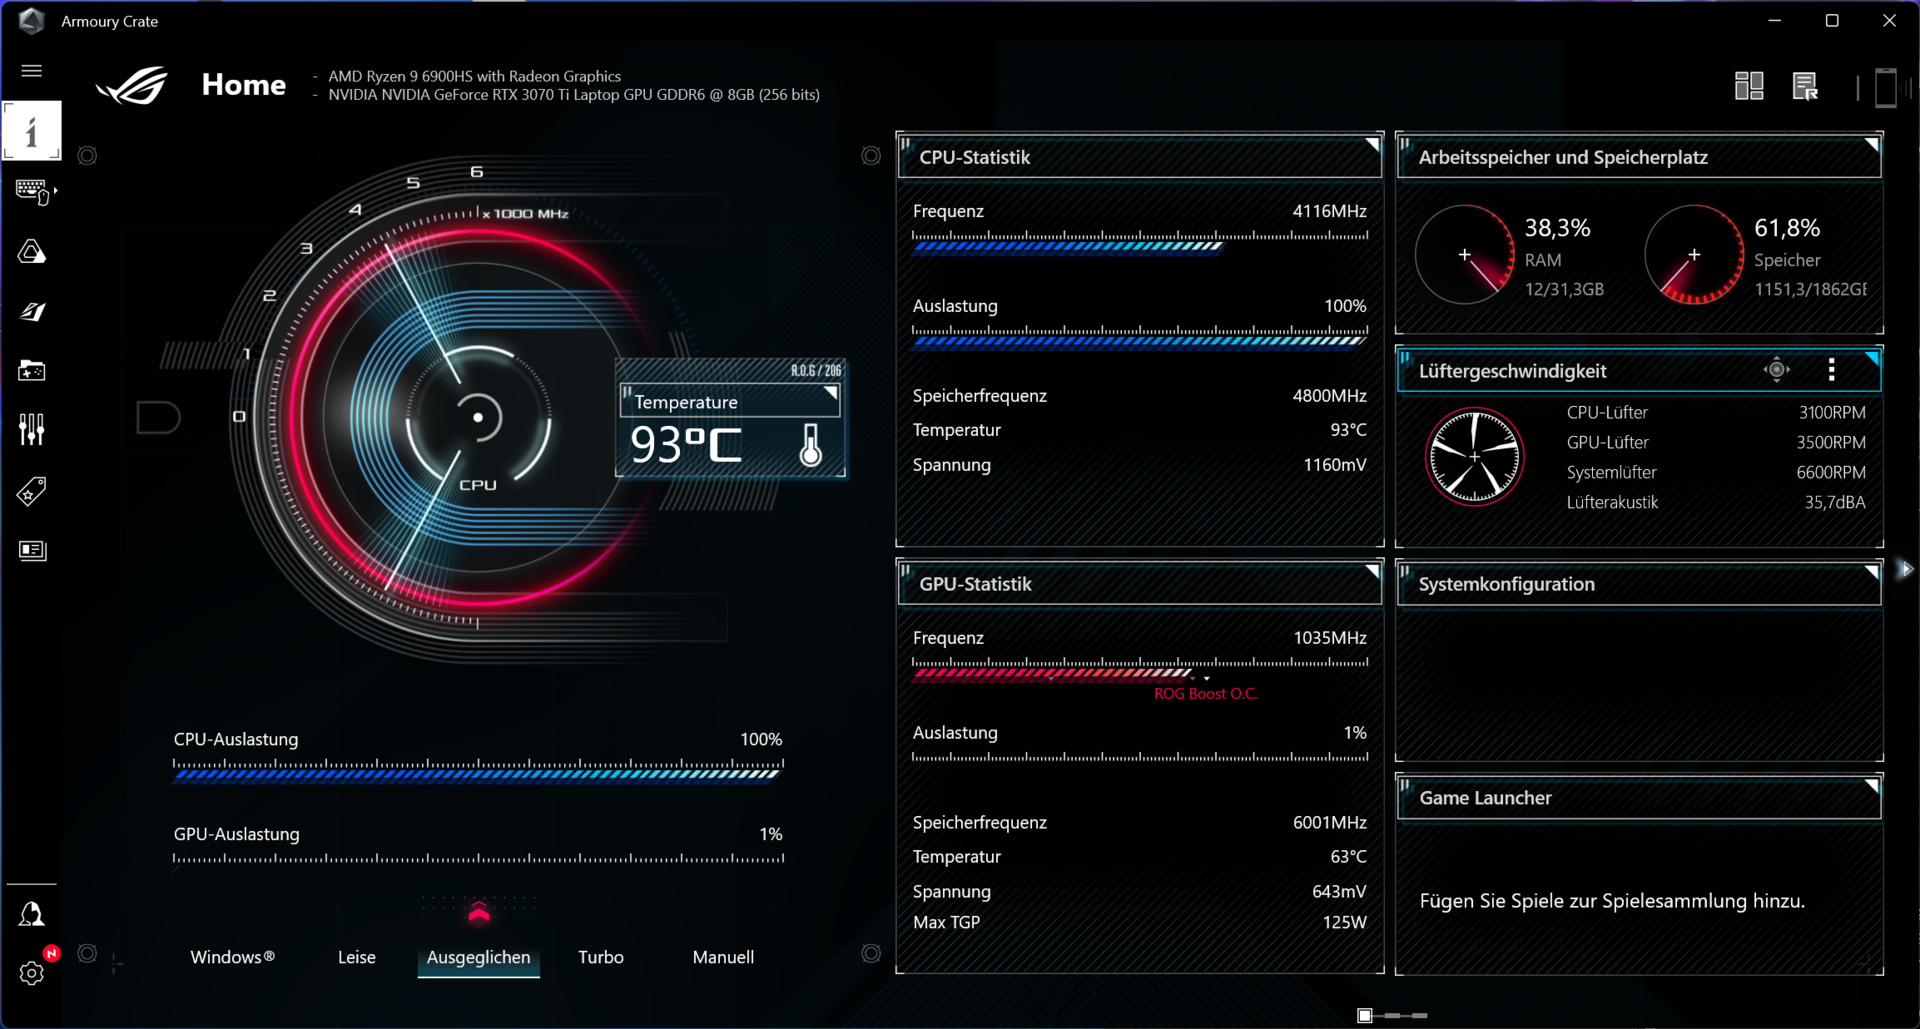
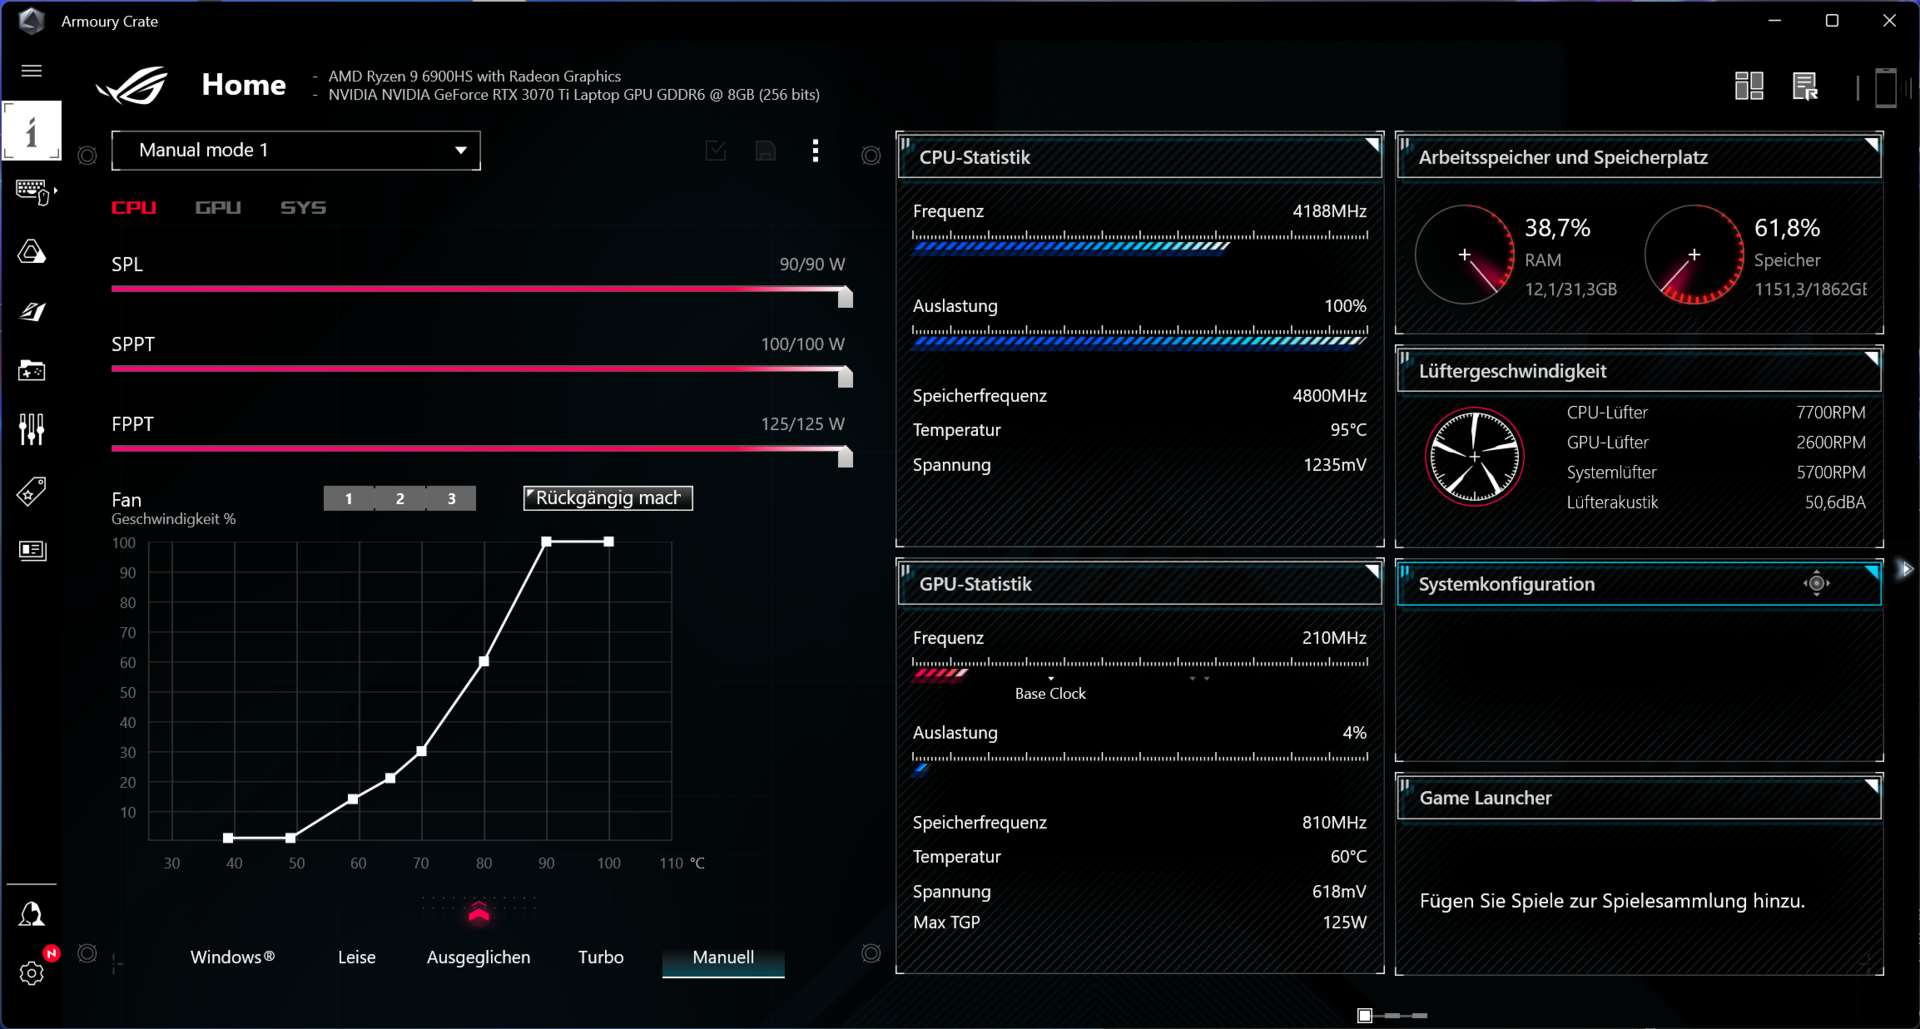
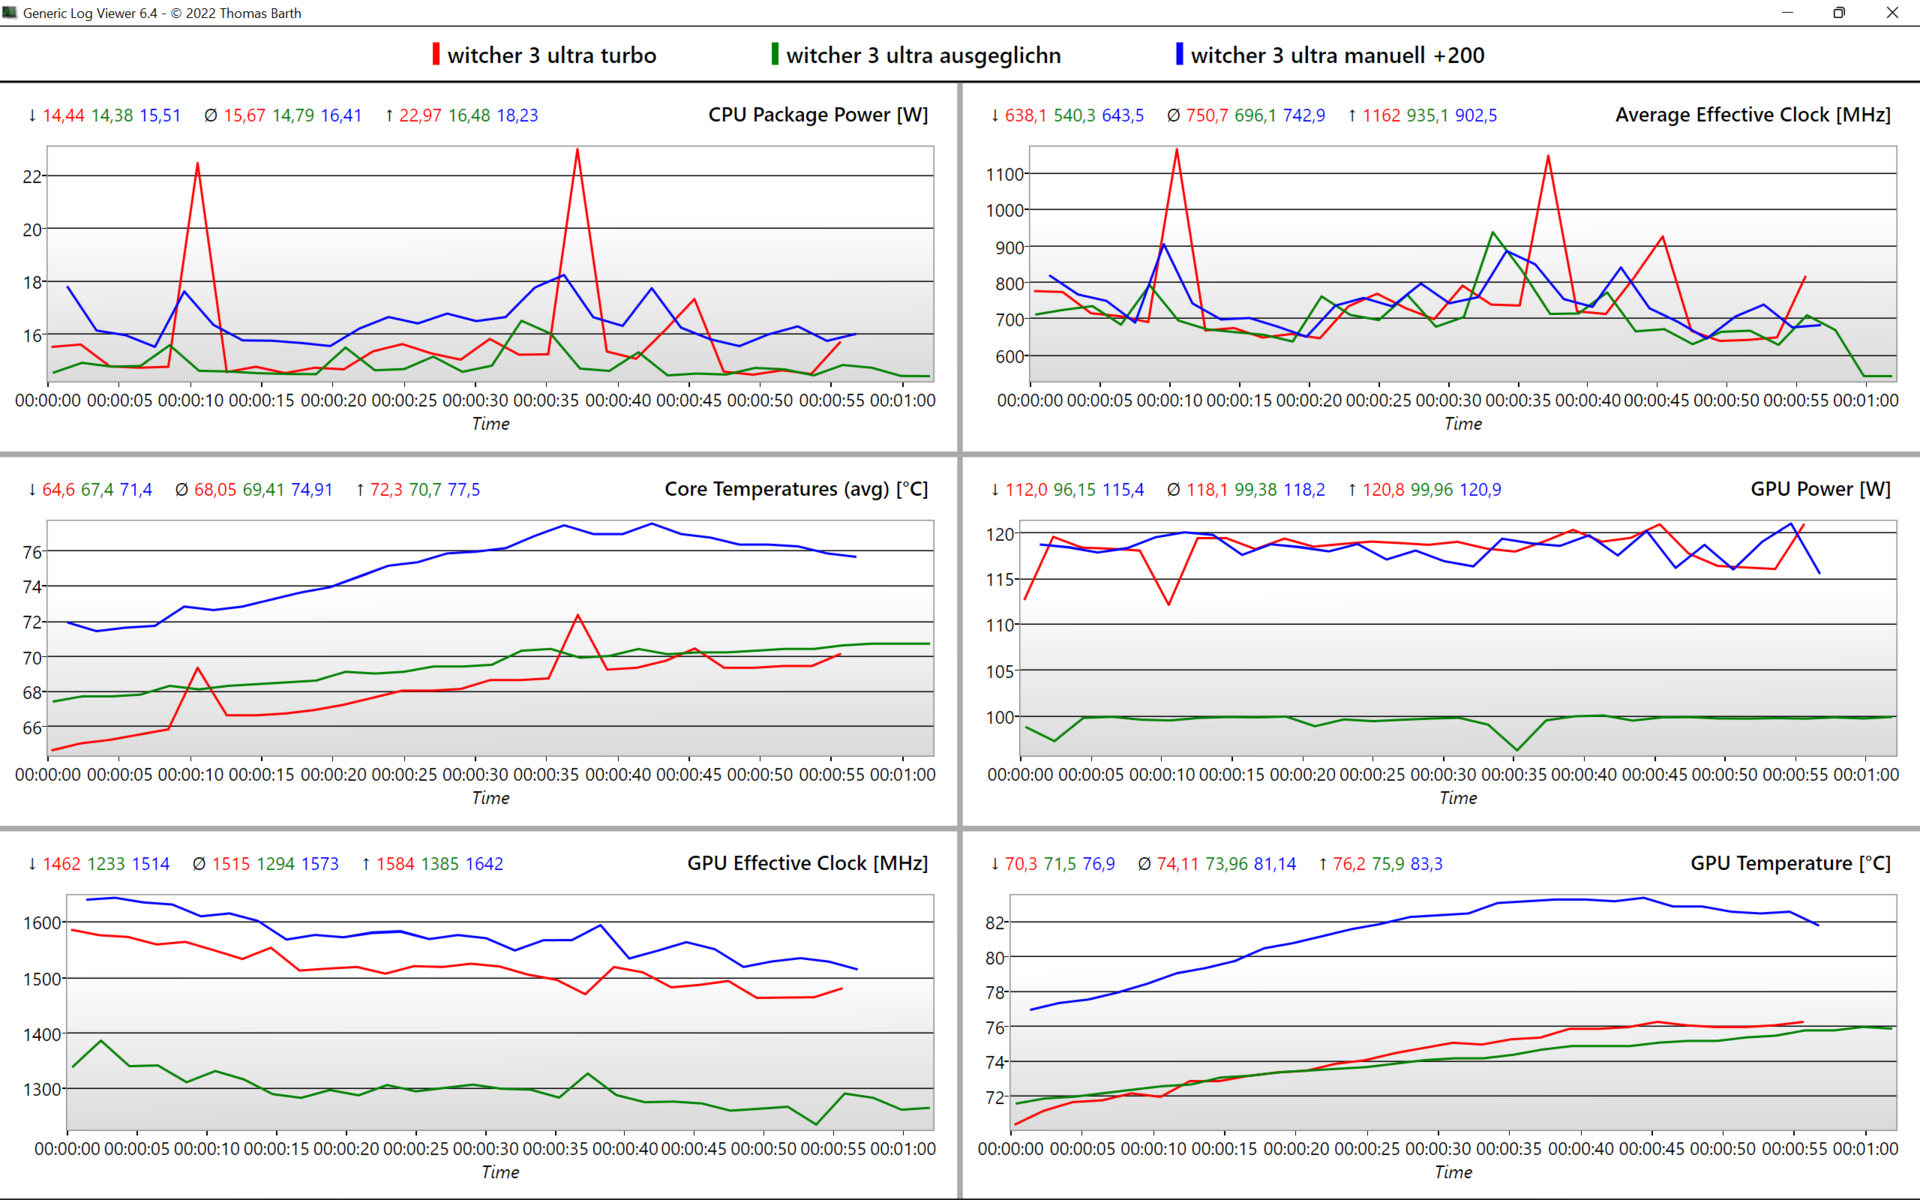
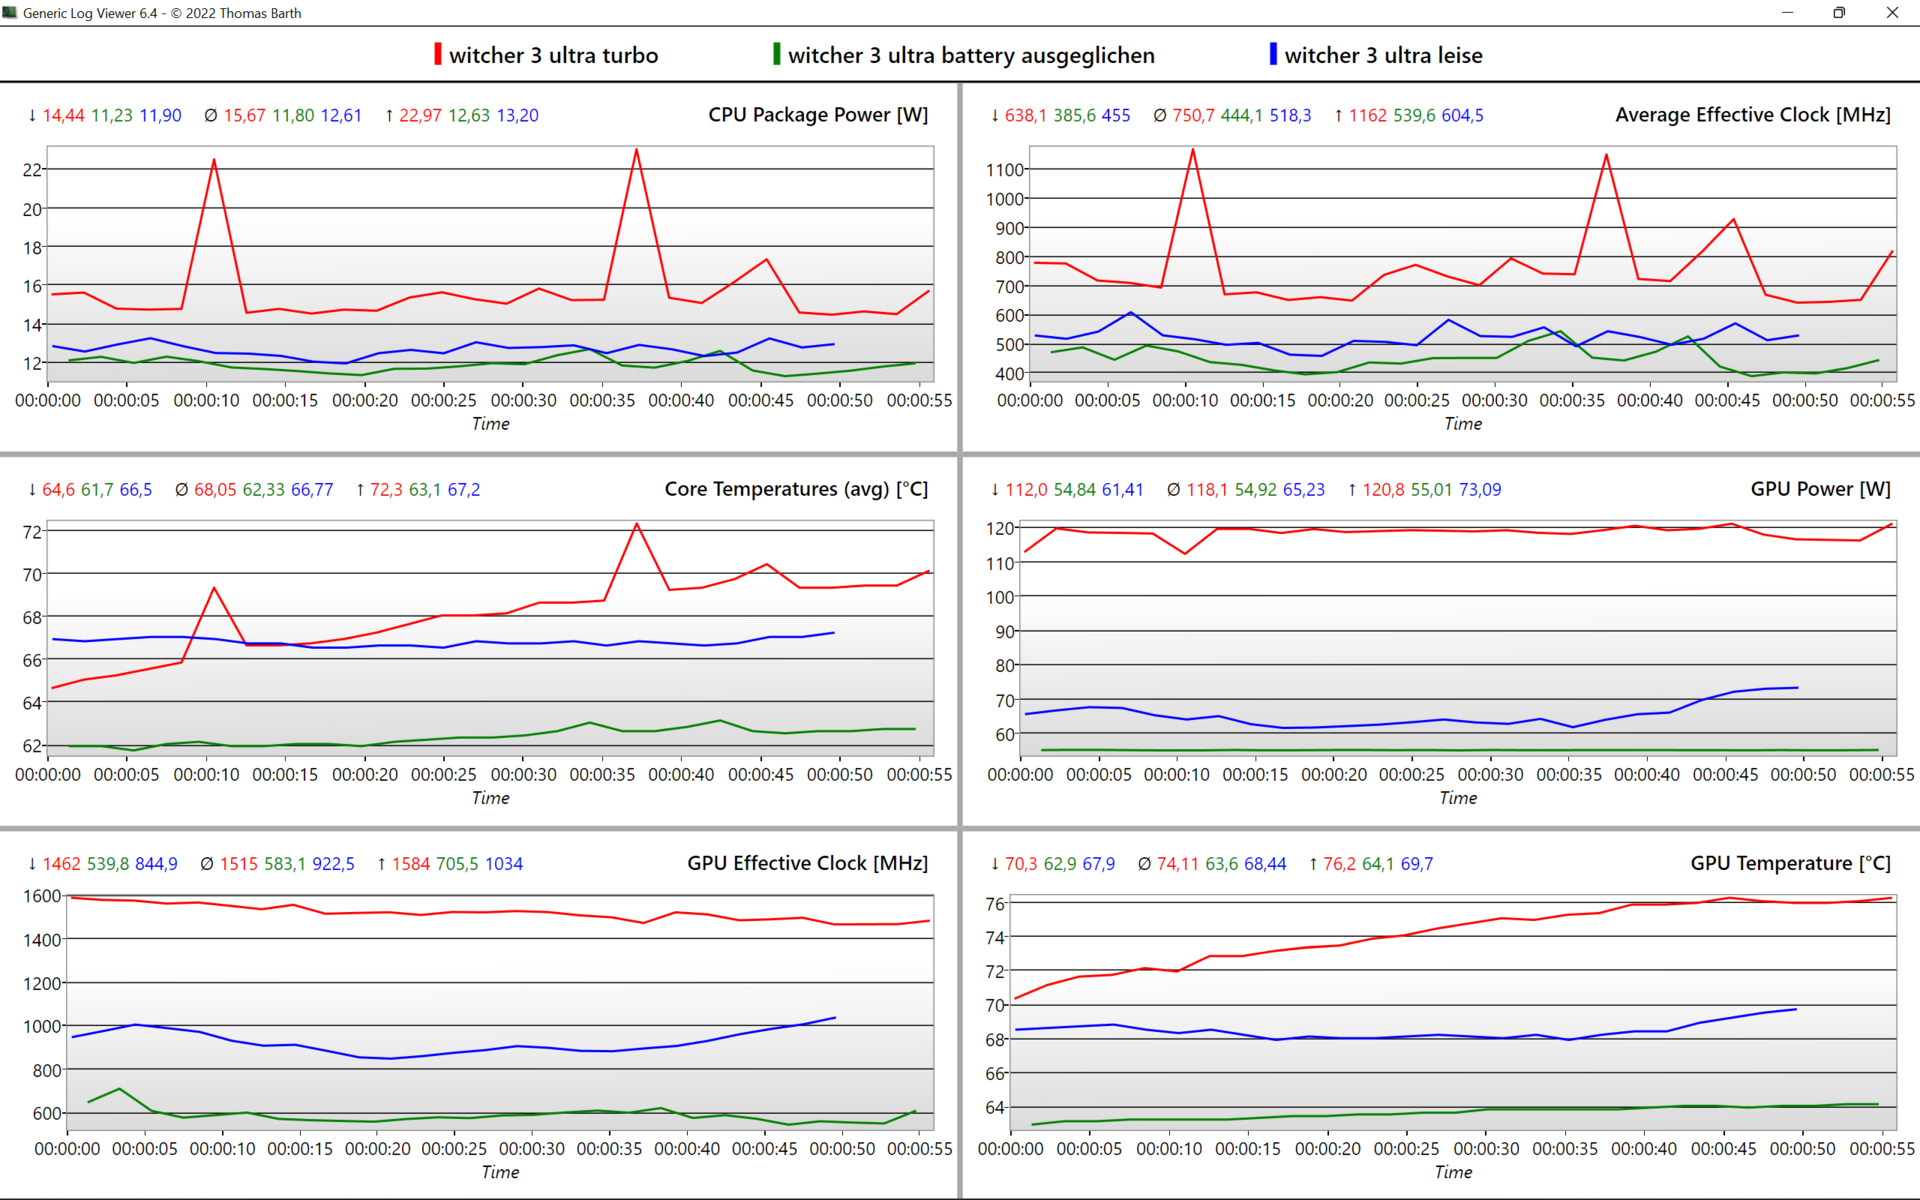
华硕的Armoury Crate软件提供四种不同的性能模式。静音、平衡( 自5.2.12版起为 "性能")、涡轮 和手动,其中手动 允许你设置自己的风扇曲线和调整TDP设置,以及超频dGPU。
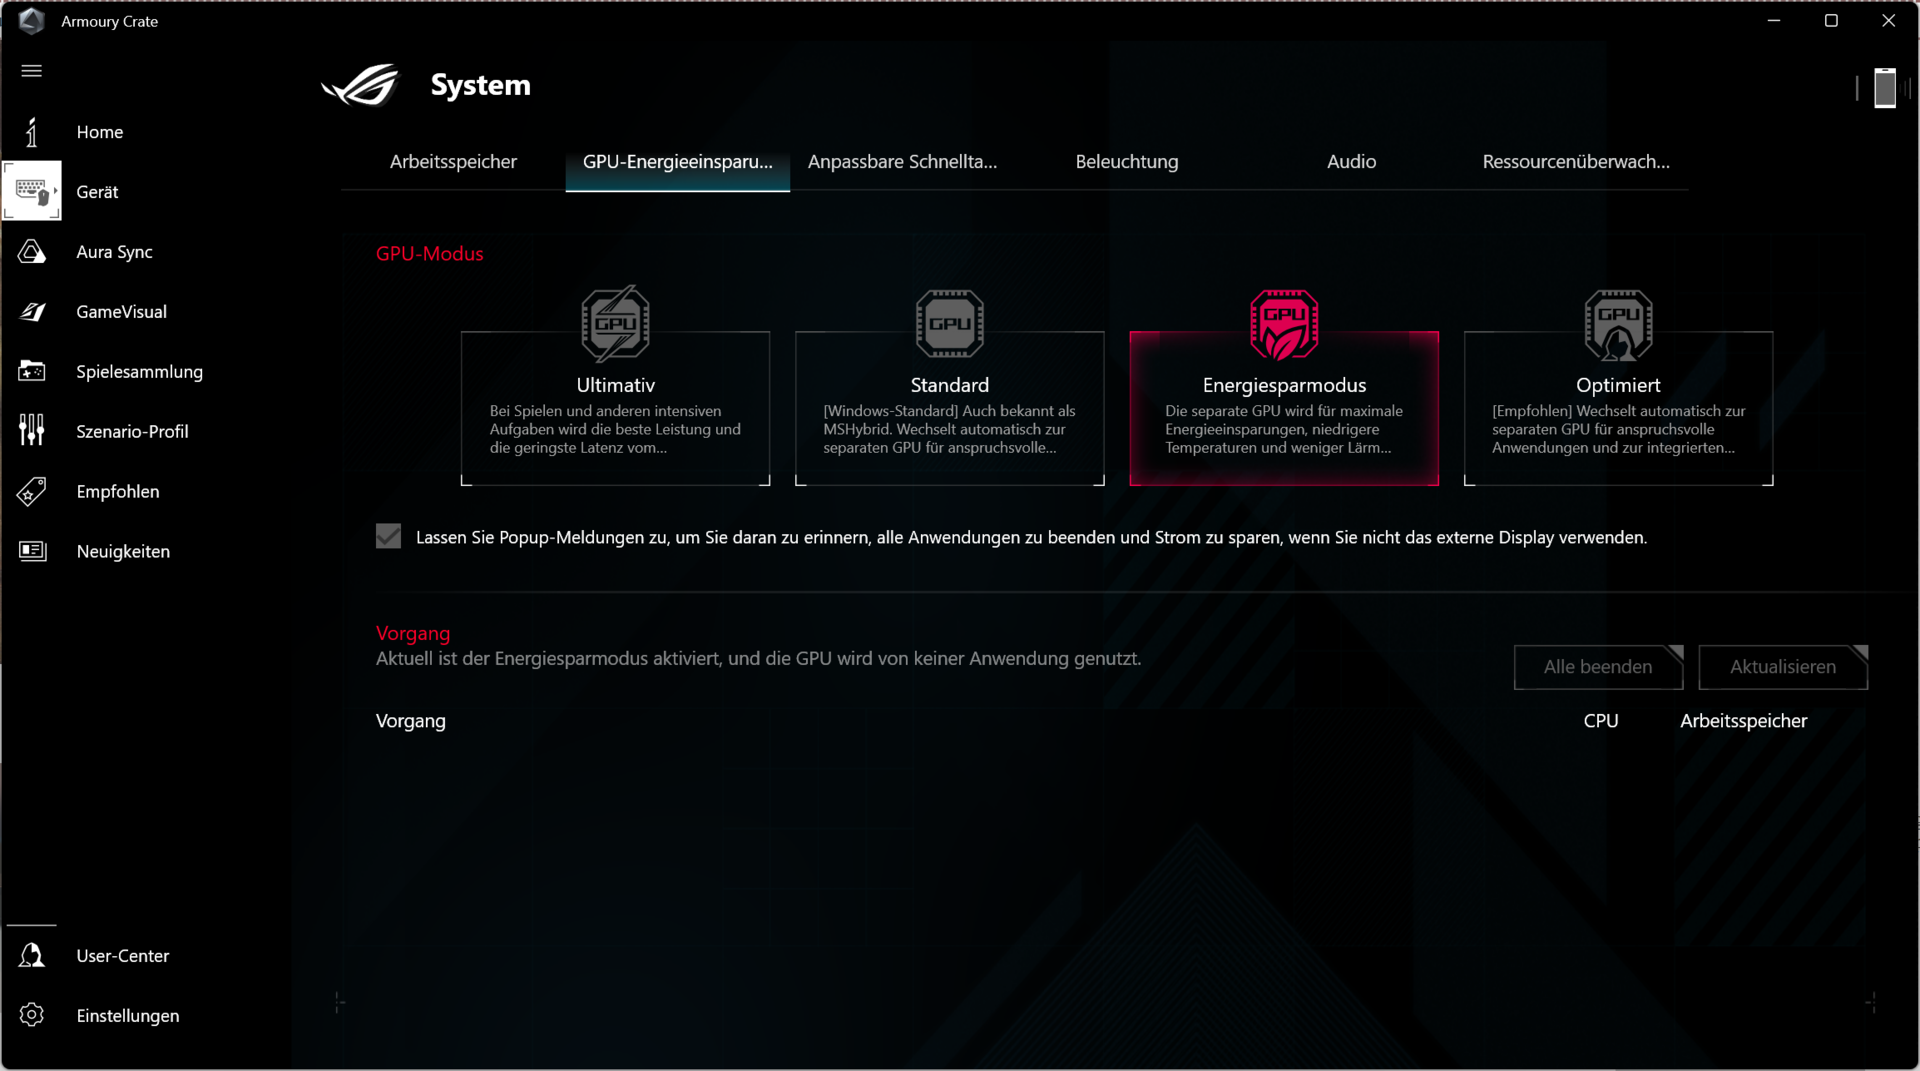
还有四种GPU模式。终极、标准、节能和优化。"Ultimate "启用了MUX开关,它可以保持RTX 3070 Ti作为活动的GPU,并将其直接连接到内部显示器,而不是通过Radeon iGPU迂回。激活它需要重新启动(没有高级优化)。在标准 模式下,你可以根据需要在集成和专用图形单元之间进行切换(Optimus/"MSHybrid"),而在节能 模式下,Nvidia GPU被停用(也是在主电源操作中),使用iGPU。优化模式与标准模式相对应,不同的是,在电池模式下,Nvidia GPU完全停用。
不同模式对TDP/TGP、时钟频率、温度和风扇行为的影响将在相应的 "处理器"、"显卡 "和 "排放 "部分讨论。我们在Turbo 模式和GPU的标准 模式下进行了性能相关的基准测试。其他模式的测试将在整个评论中讨论。WLAN模式下的电池运行时间是在平衡 模式和启用GPU节能模式下确定的。
在Amoury Crate的性能值和电池运行时间方面还有很多可以改进的地方,直到发布。我们的评测设备运行在5.1.8版本(更新:为了使Armoury Crate保持可用,必须安装5.2.12版本的更新),BIOS版本307和GeForce 驱动512.78。

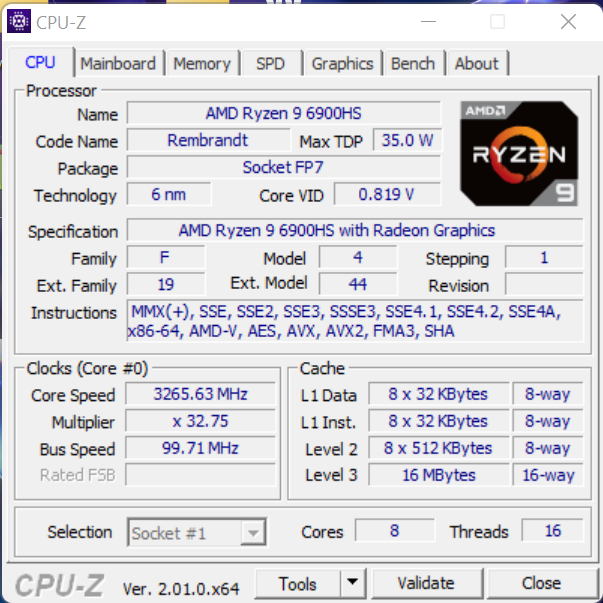
处理器
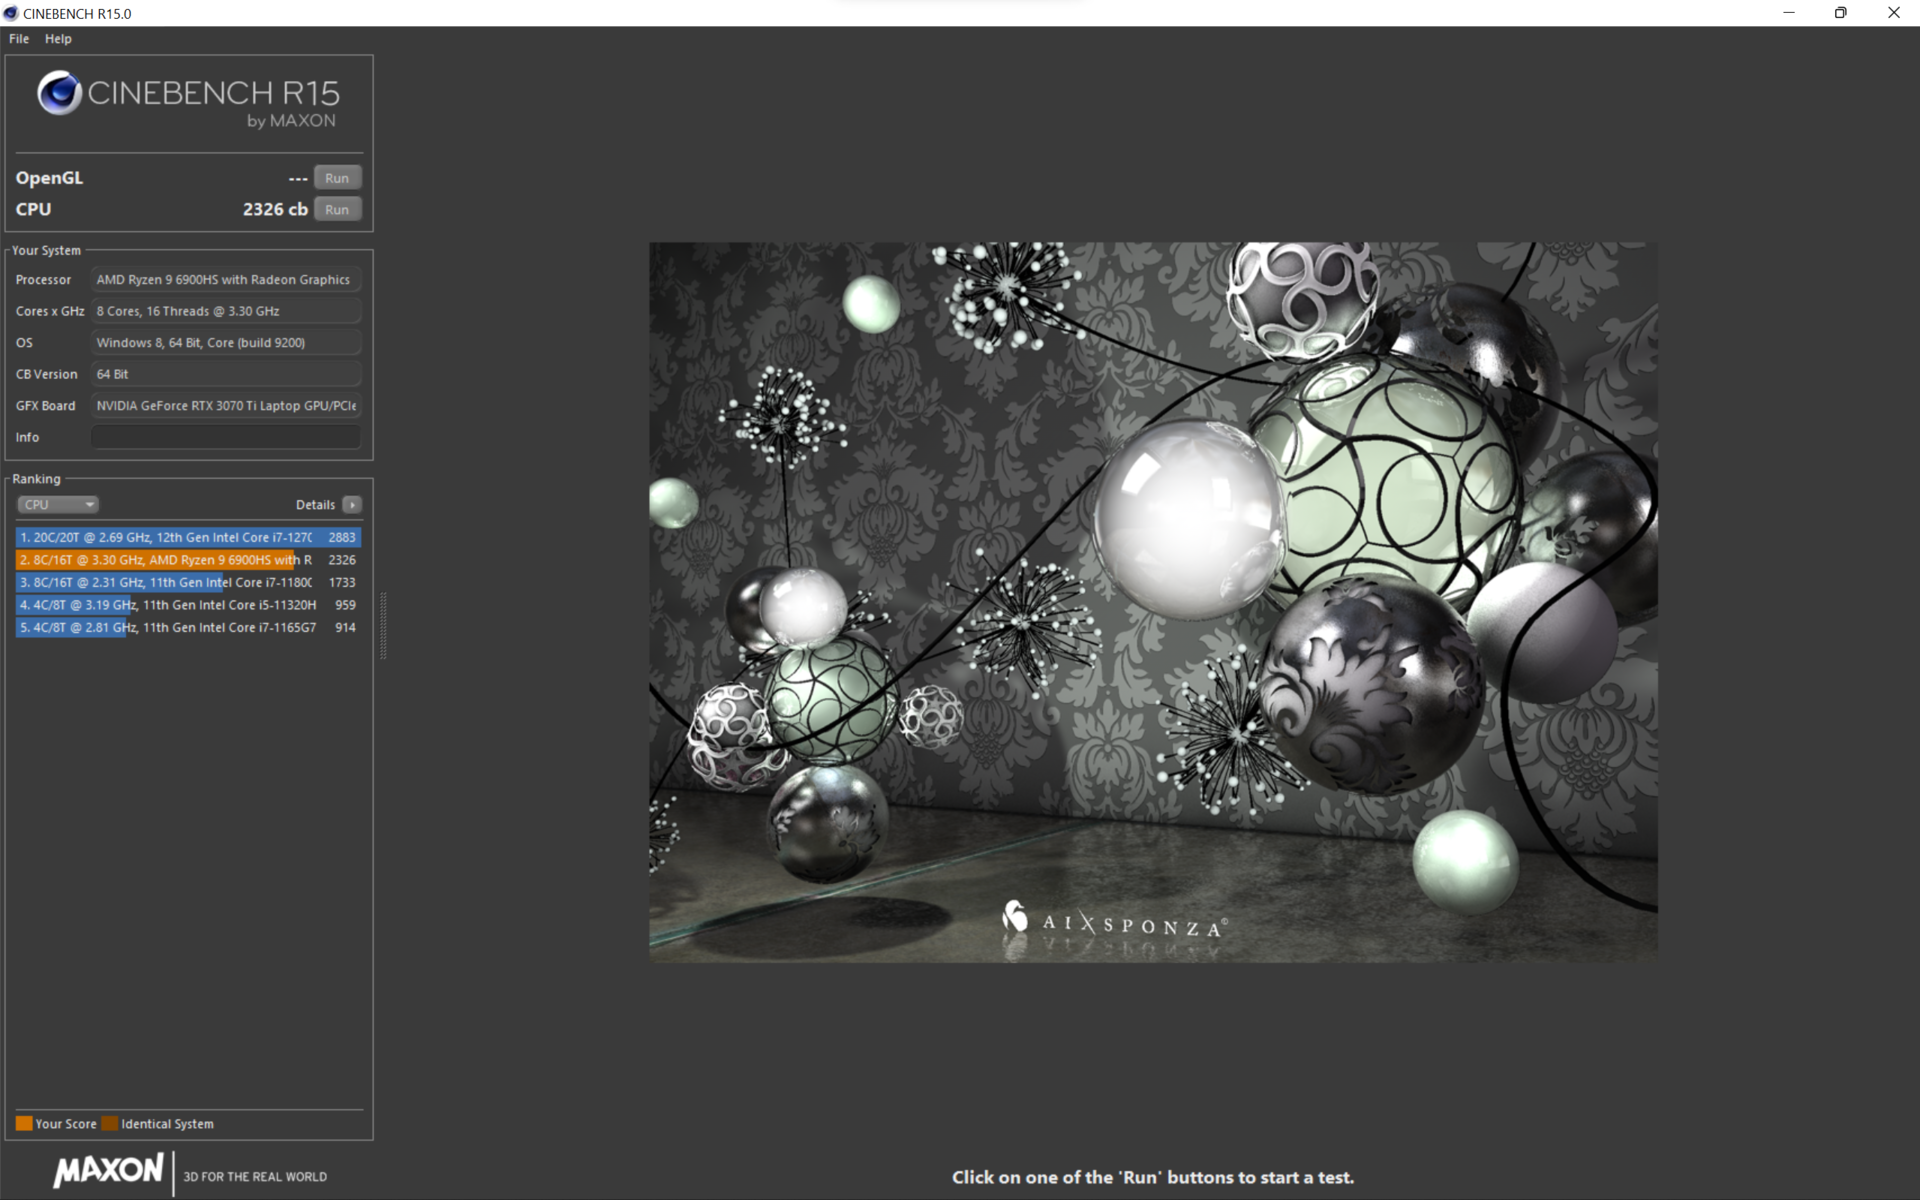
AMD 6900HS是一个八核CPU,有8倍的3.3GHz基本时钟,以及1个核心的4.9GHz的Turbo和8个核心的4.36GHz的测量。其中,4.26 GHz永久保持在Turbo模式下,而CPU持续消耗74瓦,加热到91℃。
因此,35瓦的CPU得到了很好的利用。在4.36GHz时的初始消耗约为90瓦。因此没有达到设定为100瓦的短期功率限制 "SPPT"(英特尔称为 "PL2"),也没有达到90瓦的长期功率限制 "SPL"(PL1)。AMD仍然有FPPT(快速封装功率跟踪),这里设置了125瓦。
在平衡
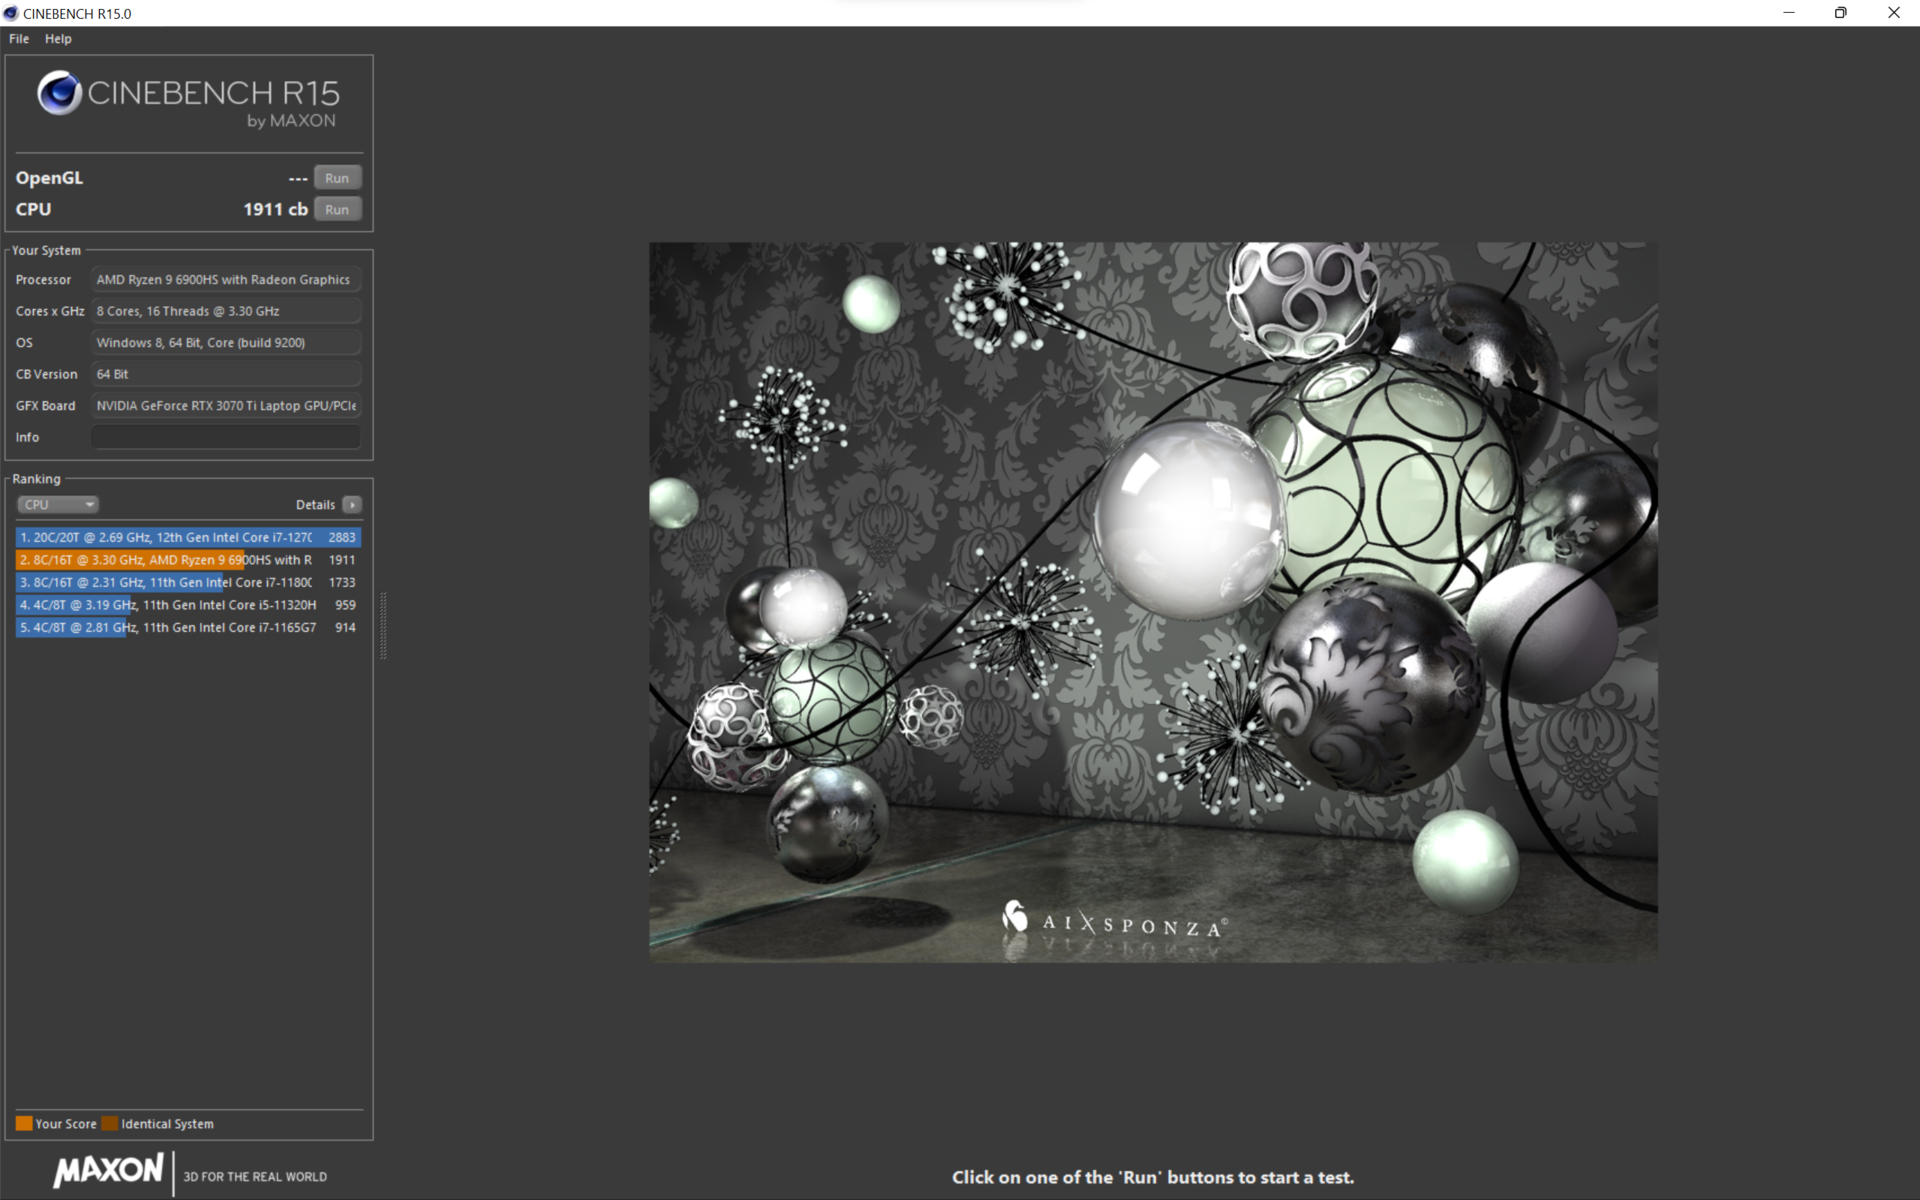
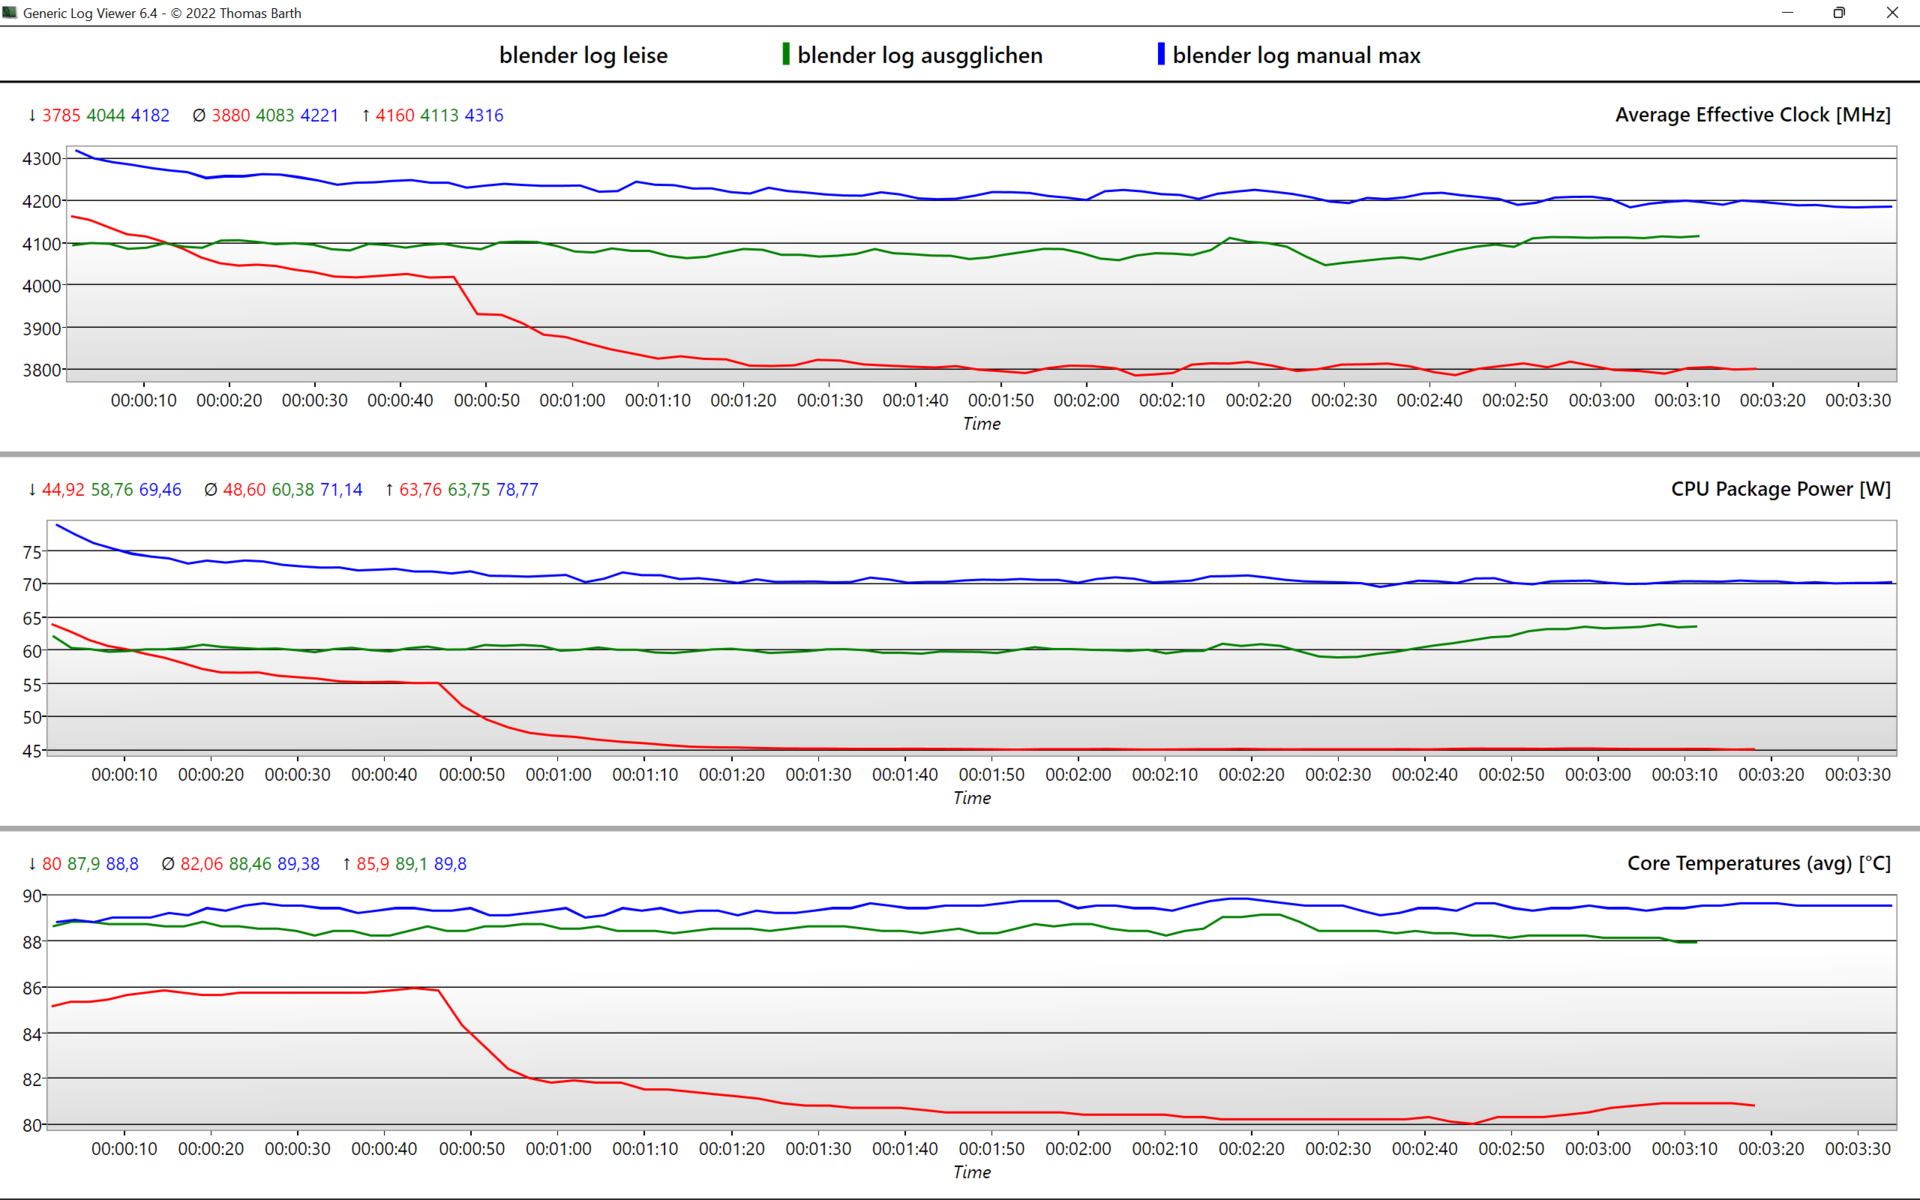
模式下,CPU时钟略微下降到4.1GHz,性能只下降了3%,但明显改善了风扇噪音。 35.7 db(A)而不是45.1 db(A)。功率限制降低了10瓦,为65瓦,CPU的温度保持在2℃左右。在静音
模式下,时钟在50秒后下降到8x 3.8 GHz,功耗从最初的65瓦下降到45瓦。然后,风扇在32 db(A)时变得非常悦耳,CPU温度明显降低到80℃。长期性能大约降低15%。在电池模式下,完全没有提升,所有的功率限制都被限制在35瓦,这导致性能降低约20%。英特尔的同类产品在电池模式下,特别是在35瓦的限制下(50%及以上),性能的下降往往要明显得多。负载下的风扇甚至更安静。
在CBR15中,Ryzen 9因此能够击败Alder Lake的对手,例如更大的戴尔XPS 17 。薄型的Stealth GS66和Aero 16 ,速度快了20%,因为Alder Lake从高耗电中获益匪浅。较厚的游戏笔记本,如Scar 15 或Legion 5 Pro ,速度更快。
在总体评级中,我们的测试设备属于中场。Apple M1 Pro在Geekbench 5.4中快36%。


| 电源模式 | CPU时钟(GHz) | CPU温度(℃) | CPU功耗(W) | 响度(db(A) @Blender |
|---|---|---|---|---|
| 手动(最大) | 4,2 | 89 | 70 | 50,6 |
| Turbo | 4,26 | 91 | 75 | 45,1 |
| 平衡/性能 | 4,1 | 89 | 60 | 36 |
| 静音 | 3,8 | 80 | 45 | 32 |
| 电池 | 3.5 | 72 | 35 | 26,7 - 30,7 |
Cinebench R15 Multi Sustained Load
Cinebench R23: Multi Core | Single Core
Cinebench R20: CPU (Multi Core) | CPU (Single Core)
Cinebench R15: CPU Multi 64Bit | CPU Single 64Bit
Blender: v2.79 BMW27 CPU | v3.3 Classroom CPU | v3.3 Classroom CUDA
7-Zip 18.03: 7z b 4 | 7z b 4 -mmt1
Geekbench 5.5: Multi-Core | Single-Core | OpenCL Score
HWBOT x265 Benchmark v2.2: 4k Preset
LibreOffice : 20 Documents To PDF
R Benchmark 2.5: Overall mean
V-Ray 5 Benchmark: CPU | GPU CUDA | GPU RTX
V-Ray Benchmark Next 4.10: CPU | GPU
Mozilla Kraken 1.1: Total
WebXPRT 3: Overall
WebXPRT 4: Overall
Octane V2: Total Score
Jetstream 2: 2.0 Total
Sunspider: 1.0 Total Score
Speedometer 2.0: Result 2.0
| CPU Performance rating | |
| Average of class Gaming -1! | |
| Asus ROG Strix Scar 15 G533ZW-LN106WS -11! | |
| Lenovo Legion 5 Pro 16 G7 i7 RTX 3070Ti -7! | |
| MSI Stealth GS66 12UGS -10! | |
| Gigabyte Aero 16 YE5 -3! | |
| Dell XPS 17 9720 RTX 3060 -10! | |
| Asus ROG Zephyrus M16 GU603H -12! | |
| Asus ROG Flow X16 GV601RW-M5082W | |
| Lenovo ThinkPad X1 Extreme G4-20Y50040GE -9! | |
| Apple MacBook Pro 16 2021 M1 Pro -11! | |
| Asus ROG Flow X13 GV301QH -5! | |
| Average AMD Ryzen 9 6900HS | |
| Microsoft Surface Laptop Studio i7 RTX 3050 Ti -7! | |
| Blender / v3.3 Classroom CPU | |
| Average AMD Ryzen 9 6900HS (378 - 469, n=3) | |
| Asus ROG Flow X16 GV601RW-M5082W | |
| Average of class Gaming (122 - 565, n=106, last 2 years) | |
| Blender / v3.3 Classroom CUDA | |
| Average AMD Ryzen 9 6900HS (42 - 116, n=2) | |
| Asus ROG Flow X16 GV601RW-M5082W | |
| Average of class Gaming (15 - 228, n=110, last 2 years) | |
| 7-Zip 18.03 / 7z b 4 -mmt1 | |
| Average of class Gaming (4199 - 7436, n=109, last 2 years) | |
| Gigabyte Aero 16 YE5 | |
| Asus ROG Strix Scar 15 G533ZW-LN106WS | |
| Lenovo Legion 5 Pro 16 G7 i7 RTX 3070Ti | |
| MSI Stealth GS66 12UGS | |
| Average AMD Ryzen 9 6900HS (5538 - 5958, n=5) | |
| Asus ROG Flow X16 GV601RW-M5082W | |
| Dell XPS 17 9720 RTX 3060 | |
| Asus ROG Flow X13 GV301QH | |
| Asus ROG Zephyrus M16 GU603H | |
| Microsoft Surface Laptop Studio i7 RTX 3050 Ti | |
| HWBOT x265 Benchmark v2.2 / 4k Preset | |
| Average of class Gaming (11.5 - 44.3, n=109, last 2 years) | |
| Lenovo Legion 5 Pro 16 G7 i7 RTX 3070Ti | |
| Asus ROG Strix Scar 15 G533ZW-LN106WS | |
| MSI Stealth GS66 12UGS | |
| Gigabyte Aero 16 YE5 | |
| Asus ROG Flow X16 GV601RW-M5082W | |
| Average AMD Ryzen 9 6900HS (14.2 - 17.9, n=5) | |
| Dell XPS 17 9720 RTX 3060 | |
| Asus ROG Flow X13 GV301QH | |
| Asus ROG Zephyrus M16 GU603H | |
| Lenovo ThinkPad X1 Extreme G4-20Y50040GE | |
| Microsoft Surface Laptop Studio i7 RTX 3050 Ti | |
| V-Ray 5 Benchmark / CPU | |
| Average of class Gaming (5864 - 30302, n=35, last 2 years) | |
| Dell XPS 17 9720 RTX 3060 | |
| Gigabyte Aero 16 YE5 | |
| Asus ROG Flow X16 GV601RW-M5082W | |
| Lenovo ThinkPad X1 Extreme G4-20Y50040GE | |
| Average AMD Ryzen 9 6900HS (8067 - 9648, n=3) | |
| Apple MacBook Pro 16 2021 M1 Pro | |
| Asus ROG Flow X13 GV301QH | |
| V-Ray 5 Benchmark / GPU CUDA | |
| Average of class Gaming (887 - 3288, n=36, last 2 years) | |
| Gigabyte Aero 16 YE5 | |
| Asus ROG Flow X16 GV601RW-M5082W | |
| Lenovo ThinkPad X1 Extreme G4-20Y50040GE | |
| Average AMD Ryzen 9 6900HS (210 - 1224, n=3) | |
| Apple MacBook Pro 16 2021 M1 Pro | |
| Asus ROG Flow X13 GV301QH | |
| V-Ray 5 Benchmark / GPU RTX | |
| Average of class Gaming (1146 - 4363, n=36, last 2 years) | |
| Asus ROG Flow X13 GV301QH | |
| Lenovo ThinkPad X1 Extreme G4-20Y50040GE | |
| Gigabyte Aero 16 YE5 | |
| Asus ROG Flow X16 GV601RW-M5082W | |
| Average AMD Ryzen 9 6900HS (538 - 1510, n=2) | |
| V-Ray Benchmark Next 4.10 / CPU | |
| Average of class Gaming (10048 - 45327, n=102, last 2 years) | |
| Lenovo Legion 5 Pro 16 G7 i7 RTX 3070Ti | |
| Asus ROG Strix Scar 15 G533ZW-LN106WS | |
| MSI Stealth GS66 12UGS | |
| Gigabyte Aero 16 YE5 | |
| Asus ROG Zephyrus M16 GU603H | |
| Average AMD Ryzen 9 6900HS (13527 - 15533, n=4) | |
| Asus ROG Flow X16 GV601RW-M5082W | |
| Asus ROG Flow X13 GV301QH | |
| Microsoft Surface Laptop Studio i7 RTX 3050 Ti | |
| V-Ray Benchmark Next 4.10 / GPU | |
| Average of class Gaming (427 - 1627, n=104, last 2 years) | |
| Lenovo Legion 5 Pro 16 G7 i7 RTX 3070Ti | |
| Gigabyte Aero 16 YE5 | |
| MSI Stealth GS66 12UGS | |
| Asus ROG Flow X16 GV601RW-M5082W | |
| Asus ROG Zephyrus M16 GU603H | |
| Asus ROG Strix Scar 15 G533ZW-LN106WS | |
| Microsoft Surface Laptop Studio i7 RTX 3050 Ti | |
| Average AMD Ryzen 9 6900HS (75 - 427, n=4) | |
| Asus ROG Flow X13 GV301QH | |
| WebXPRT 4 / Overall | |
| Average of class Gaming (176.4 - 354, n=100, last 2 years) | |
| Asus ROG Flow X16 GV601RW-M5082W | |
| Average AMD Ryzen 9 6900HS (184.4 - 225, n=3) | |
| Octane V2 / Total Score | |
| Average of class Gaming (89353 - 139447, n=29, last 2 years) | |
| Gigabyte Aero 16 YE5 | |
| Lenovo Legion 5 Pro 16 G7 i7 RTX 3070Ti | |
| Lenovo ThinkPad X1 Extreme G4-20Y50040GE | |
| Asus ROG Flow X16 GV601RW-M5082W | |
| Average AMD Ryzen 9 6900HS (n=1) | |
| Asus ROG Flow X13 GV301QH | |
| Apple MacBook Pro 16 2021 M1 Pro | |
| Microsoft Surface Laptop Studio i7 RTX 3050 Ti | |
| Jetstream 2 / 2.0 Total | |
| Average of class Gaming (291 - 516, n=30, last 2 years) | |
| Gigabyte Aero 16 YE5 | |
| Lenovo Legion 5 Pro 16 G7 i7 RTX 3070Ti | |
| Dell XPS 17 9720 RTX 3060 | |
| Asus ROG Flow X16 GV601RW-M5082W | |
| Average AMD Ryzen 9 6900HS (223 - 236, n=2) | |
| Lenovo ThinkPad X1 Extreme G4-20Y50040GE | |
| Apple MacBook Pro 16 2021 M1 Pro | |
| Microsoft Surface Laptop Studio i7 RTX 3050 Ti | |
| Asus ROG Flow X13 GV301QH | |
| Sunspider / 1.0 Total Score | |
| Average AMD Ryzen 9 6900HS (94 - 119.2, n=2) | |
| Gigabyte Aero 16 YE5 | |
| Asus ROG Flow X16 GV601RW-M5082W | |
| Apple MacBook Pro 16 2021 M1 Pro | |
| Speedometer 2.0 / Result 2.0 | |
| Average of class Gaming (29 - 686, n=28, last 2 years) | |
| Apple MacBook Pro 16 2021 M1 Pro | |
| Gigabyte Aero 16 YE5 | |
| Lenovo Legion 5 Pro 16 G7 i7 RTX 3070Ti | |
| Average AMD Ryzen 9 6900HS (n=1) | |
| Asus ROG Flow X16 GV601RW-M5082W | |
| Lenovo ThinkPad X1 Extreme G4-20Y50040GE | |
| Microsoft Surface Laptop Studio i7 RTX 3050 Ti | |
* ... smaller is better
AIDA64: FP32 Ray-Trace | FPU Julia | CPU SHA3 | CPU Queen | FPU SinJulia | FPU Mandel | CPU AES | CPU ZLib | FP64 Ray-Trace | CPU PhotoWorxx
| AIDA64 / FP32 Ray-Trace | |
| Average of class Gaming (10227 - 85542, n=108, last 2 years) | |
| Asus ROG Flow X16 GV601RW-M5082W | |
| Average AMD Ryzen 9 6900HS (14212 - 16072, n=5) | |
| Lenovo ThinkPad X1 Extreme G4-20Y50040GE | |
| Asus ROG Strix Scar 15 G533ZW-LN106WS | |
| Lenovo Legion 5 Pro 16 G7 i7 RTX 3070Ti | |
| MSI Stealth GS66 12UGS | |
| Gigabyte Aero 16 YE5 | |
| Dell XPS 17 9720 RTX 3060 | |
| Microsoft Surface Laptop Studio i7 RTX 3050 Ti | |
| AIDA64 / FP64 Ray-Trace | |
| Average of class Gaming (5509 - 45446, n=108, last 2 years) | |
| Asus ROG Flow X16 GV601RW-M5082W | |
| Lenovo ThinkPad X1 Extreme G4-20Y50040GE | |
| Average AMD Ryzen 9 6900HS (7530 - 8981, n=5) | |
| Lenovo Legion 5 Pro 16 G7 i7 RTX 3070Ti | |
| Asus ROG Strix Scar 15 G533ZW-LN106WS | |
| MSI Stealth GS66 12UGS | |
| Gigabyte Aero 16 YE5 | |
| Dell XPS 17 9720 RTX 3060 | |
| Microsoft Surface Laptop Studio i7 RTX 3050 Ti | |
| AIDA64 / CPU PhotoWorxx | |
| Average of class Gaming (12271 - 89891, n=108, last 2 years) | |
| Dell XPS 17 9720 RTX 3060 | |
| MSI Stealth GS66 12UGS | |
| Asus ROG Strix Scar 15 G533ZW-LN106WS | |
| Gigabyte Aero 16 YE5 | |
| Microsoft Surface Laptop Studio i7 RTX 3050 Ti | |
| Lenovo Legion 5 Pro 16 G7 i7 RTX 3070Ti | |
| Asus ROG Flow X16 GV601RW-M5082W | |
| Average AMD Ryzen 9 6900HS (25757 - 30291, n=5) | |
| Lenovo ThinkPad X1 Extreme G4-20Y50040GE | |
系统性能
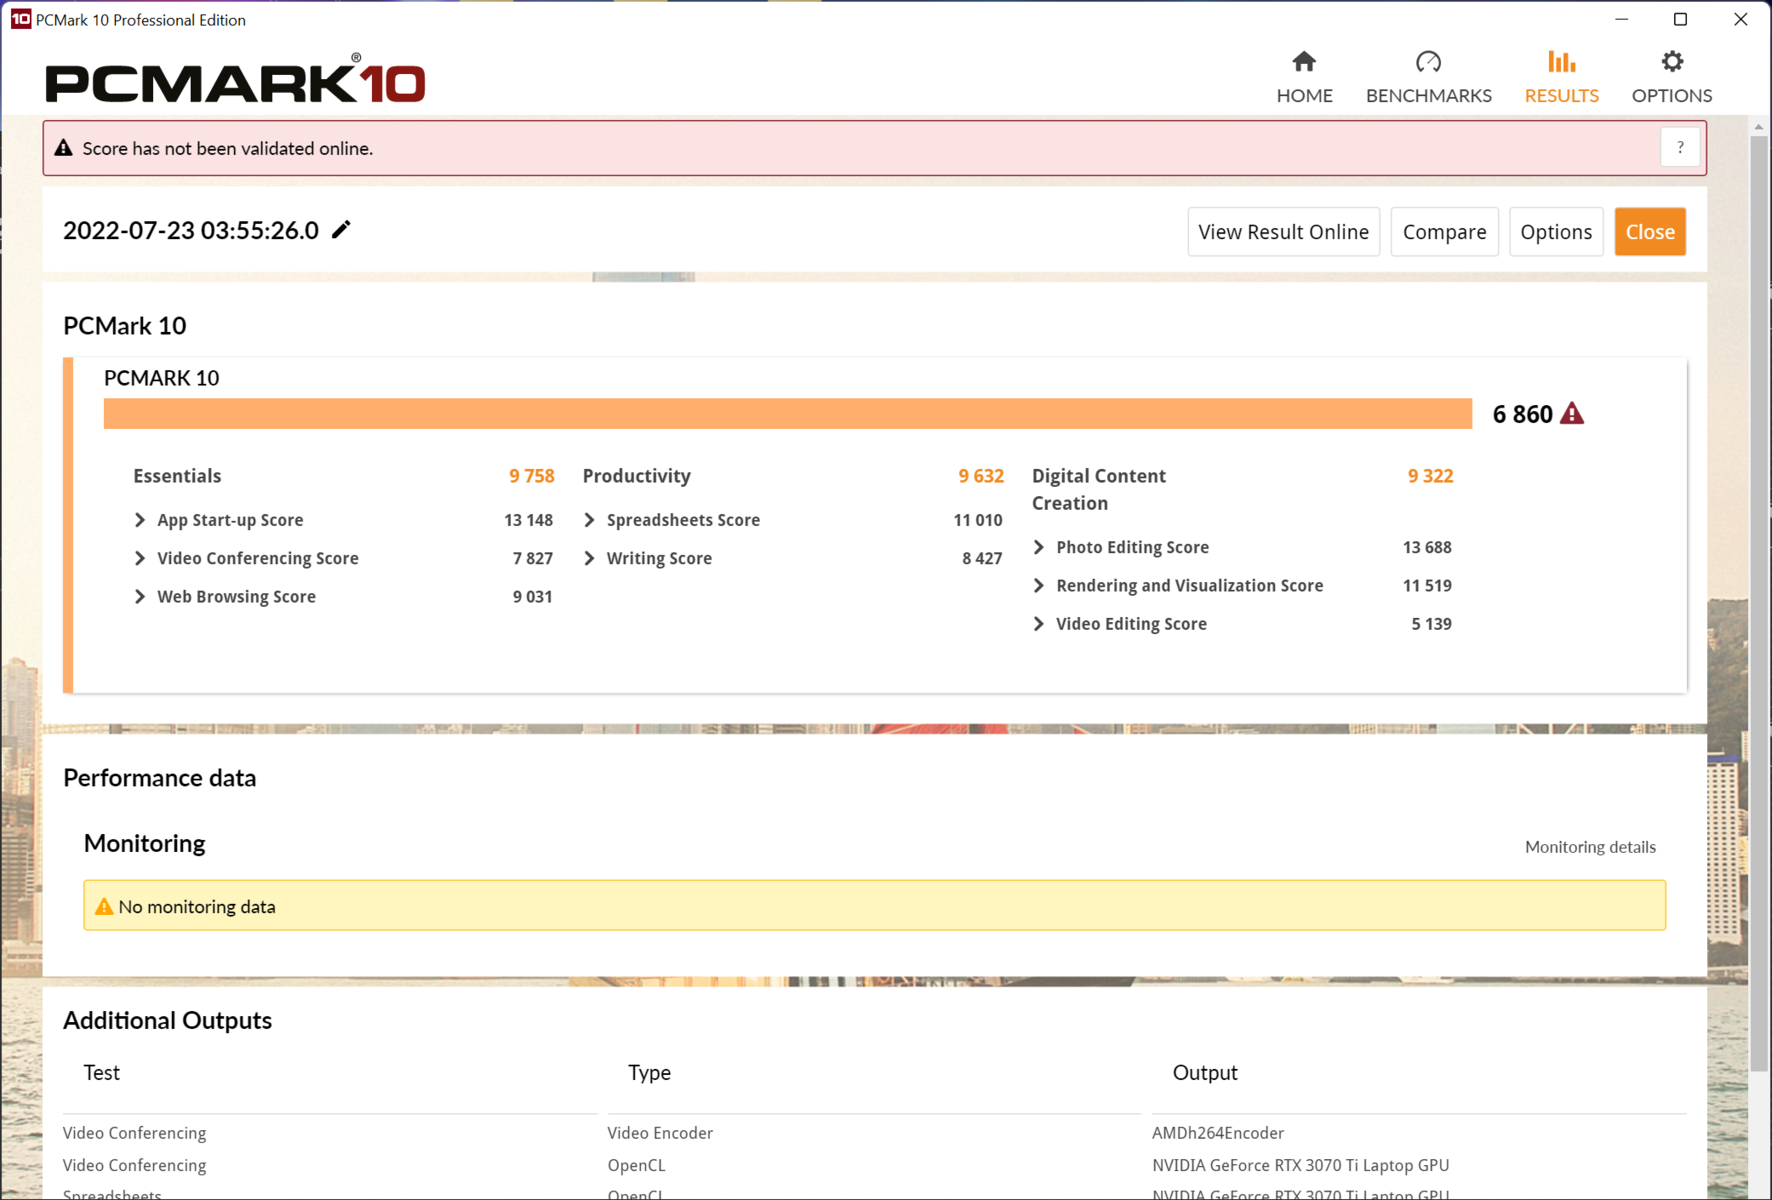
PCMark 10:ROG Flow X16在这里处于中场。主观的系统性能非常好,完全没有滞后性。在MS Windows下,任何输入都不可能更快。在播放4K YouTube视频时,用多个标签进行密集浏览对AMD笔记本电脑来说不是问题。甚至有足够的马力进行流媒体游戏。
CrossMark: Overall | Productivity | Creativity | Responsiveness
| PCMark 10 / Score | |
| Average of class Gaming (5828 - 11574, n=96, last 2 years) | |
| Asus ROG Strix Scar 15 G533ZW-LN106WS | |
| Gigabyte Aero 16 YE5 | |
| MSI Stealth GS66 12UGS | |
| Lenovo Legion 5 Pro 16 G7 i7 RTX 3070Ti | |
| Dell XPS 17 9720 RTX 3060 | |
| Asus ROG Zephyrus M16 GU603H | |
| Lenovo ThinkPad X1 Extreme G4-20Y50040GE | |
| Asus ROG Flow X16 GV601RW-M5082W | |
| Average AMD Ryzen 9 6900HS, NVIDIA GeForce RTX 3070 Ti Laptop GPU (n=1) | |
| Asus ROG Flow X13 GV301QH | |
| Microsoft Surface Laptop Studio i7 RTX 3050 Ti | |
| PCMark 10 / Essentials | |
| Gigabyte Aero 16 YE5 | |
| MSI Stealth GS66 12UGS | |
| Dell XPS 17 9720 RTX 3060 | |
| Asus ROG Strix Scar 15 G533ZW-LN106WS | |
| Average of class Gaming (8810 - 12600, n=100, last 2 years) | |
| Asus ROG Zephyrus M16 GU603H | |
| Lenovo ThinkPad X1 Extreme G4-20Y50040GE | |
| Lenovo Legion 5 Pro 16 G7 i7 RTX 3070Ti | |
| Asus ROG Flow X13 GV301QH | |
| Asus ROG Flow X16 GV601RW-M5082W | |
| Average AMD Ryzen 9 6900HS, NVIDIA GeForce RTX 3070 Ti Laptop GPU (n=1) | |
| Microsoft Surface Laptop Studio i7 RTX 3050 Ti | |
| PCMark 10 / Productivity | |
| Average of class Gaming (6845 - 21327, n=98, last 2 years) | |
| Asus ROG Strix Scar 15 G533ZW-LN106WS | |
| Gigabyte Aero 16 YE5 | |
| Lenovo Legion 5 Pro 16 G7 i7 RTX 3070Ti | |
| Asus ROG Flow X16 GV601RW-M5082W | |
| Average AMD Ryzen 9 6900HS, NVIDIA GeForce RTX 3070 Ti Laptop GPU (n=1) | |
| MSI Stealth GS66 12UGS | |
| Dell XPS 17 9720 RTX 3060 | |
| Asus ROG Zephyrus M16 GU603H | |
| Lenovo ThinkPad X1 Extreme G4-20Y50040GE | |
| Asus ROG Flow X13 GV301QH | |
| Microsoft Surface Laptop Studio i7 RTX 3050 Ti | |
| PCMark 10 / Digital Content Creation | |
| Average of class Gaming (7602 - 19657, n=98, last 2 years) | |
| Asus ROG Strix Scar 15 G533ZW-LN106WS | |
| Lenovo Legion 5 Pro 16 G7 i7 RTX 3070Ti | |
| Gigabyte Aero 16 YE5 | |
| MSI Stealth GS66 12UGS | |
| Dell XPS 17 9720 RTX 3060 | |
| Asus ROG Zephyrus M16 GU603H | |
| Lenovo ThinkPad X1 Extreme G4-20Y50040GE | |
| Asus ROG Flow X16 GV601RW-M5082W | |
| Average AMD Ryzen 9 6900HS, NVIDIA GeForce RTX 3070 Ti Laptop GPU (n=1) | |
| Asus ROG Flow X13 GV301QH | |
| Microsoft Surface Laptop Studio i7 RTX 3050 Ti | |
| CrossMark / Overall | |
| Gigabyte Aero 16 YE5 | |
| Asus ROG Strix Scar 15 G533ZW-LN106WS | |
| Average of class Gaming (1366 - 2409, n=97, last 2 years) | |
| Lenovo Legion 5 Pro 16 G7 i7 RTX 3070Ti | |
| Dell XPS 17 9720 RTX 3060 | |
| Asus ROG Flow X16 GV601RW-M5082W | |
| Average AMD Ryzen 9 6900HS, NVIDIA GeForce RTX 3070 Ti Laptop GPU (n=1) | |
| Lenovo ThinkPad X1 Extreme G4-20Y50040GE | |
| Apple MacBook Pro 16 2021 M1 Pro | |
| Microsoft Surface Laptop Studio i7 RTX 3050 Ti | |
| CrossMark / Productivity | |
| Gigabyte Aero 16 YE5 | |
| Asus ROG Strix Scar 15 G533ZW-LN106WS | |
| Lenovo Legion 5 Pro 16 G7 i7 RTX 3070Ti | |
| Average of class Gaming (1386 - 2254, n=97, last 2 years) | |
| Dell XPS 17 9720 RTX 3060 | |
| Lenovo ThinkPad X1 Extreme G4-20Y50040GE | |
| Asus ROG Flow X16 GV601RW-M5082W | |
| Average AMD Ryzen 9 6900HS, NVIDIA GeForce RTX 3070 Ti Laptop GPU (n=1) | |
| Microsoft Surface Laptop Studio i7 RTX 3050 Ti | |
| Apple MacBook Pro 16 2021 M1 Pro | |
| CrossMark / Creativity | |
| Average of class Gaming (1343 - 2729, n=97, last 2 years) | |
| Gigabyte Aero 16 YE5 | |
| Asus ROG Strix Scar 15 G533ZW-LN106WS | |
| Dell XPS 17 9720 RTX 3060 | |
| Apple MacBook Pro 16 2021 M1 Pro | |
| Lenovo Legion 5 Pro 16 G7 i7 RTX 3070Ti | |
| Asus ROG Flow X16 GV601RW-M5082W | |
| Average AMD Ryzen 9 6900HS, NVIDIA GeForce RTX 3070 Ti Laptop GPU (n=1) | |
| Lenovo ThinkPad X1 Extreme G4-20Y50040GE | |
| Microsoft Surface Laptop Studio i7 RTX 3050 Ti | |
| CrossMark / Responsiveness | |
| Gigabyte Aero 16 YE5 | |
| Asus ROG Strix Scar 15 G533ZW-LN106WS | |
| Lenovo Legion 5 Pro 16 G7 i7 RTX 3070Ti | |
| Average of class Gaming (1226 - 2334, n=97, last 2 years) | |
| Dell XPS 17 9720 RTX 3060 | |
| Lenovo ThinkPad X1 Extreme G4-20Y50040GE | |
| Asus ROG Flow X16 GV601RW-M5082W | |
| Average AMD Ryzen 9 6900HS, NVIDIA GeForce RTX 3070 Ti Laptop GPU (n=1) | |
| Microsoft Surface Laptop Studio i7 RTX 3050 Ti | |
| Apple MacBook Pro 16 2021 M1 Pro | |
| PCMark 10 Score | 6860 points | |
Help | ||
| AIDA64 / Memory Latency | |
| Average of class Gaming (75.3 - 259, n=108, last 2 years) | |
| Microsoft Surface Laptop Studio i7 RTX 3050 Ti | |
| Asus ROG Strix Scar 15 G533ZW-LN106WS | |
| Lenovo Legion 5 Pro 16 G7 i7 RTX 3070Ti | |
| MSI Stealth GS66 12UGS | |
| Asus ROG Flow X16 GV601RW-M5082W | |
| Dell XPS 17 9720 RTX 3060 | |
| Average AMD Ryzen 9 6900HS (79.2 - 110.9, n=5) | |
| Gigabyte Aero 16 YE5 | |
| Lenovo ThinkPad X1 Extreme G4-20Y50040GE | |
* ... smaller is better
DPC延时
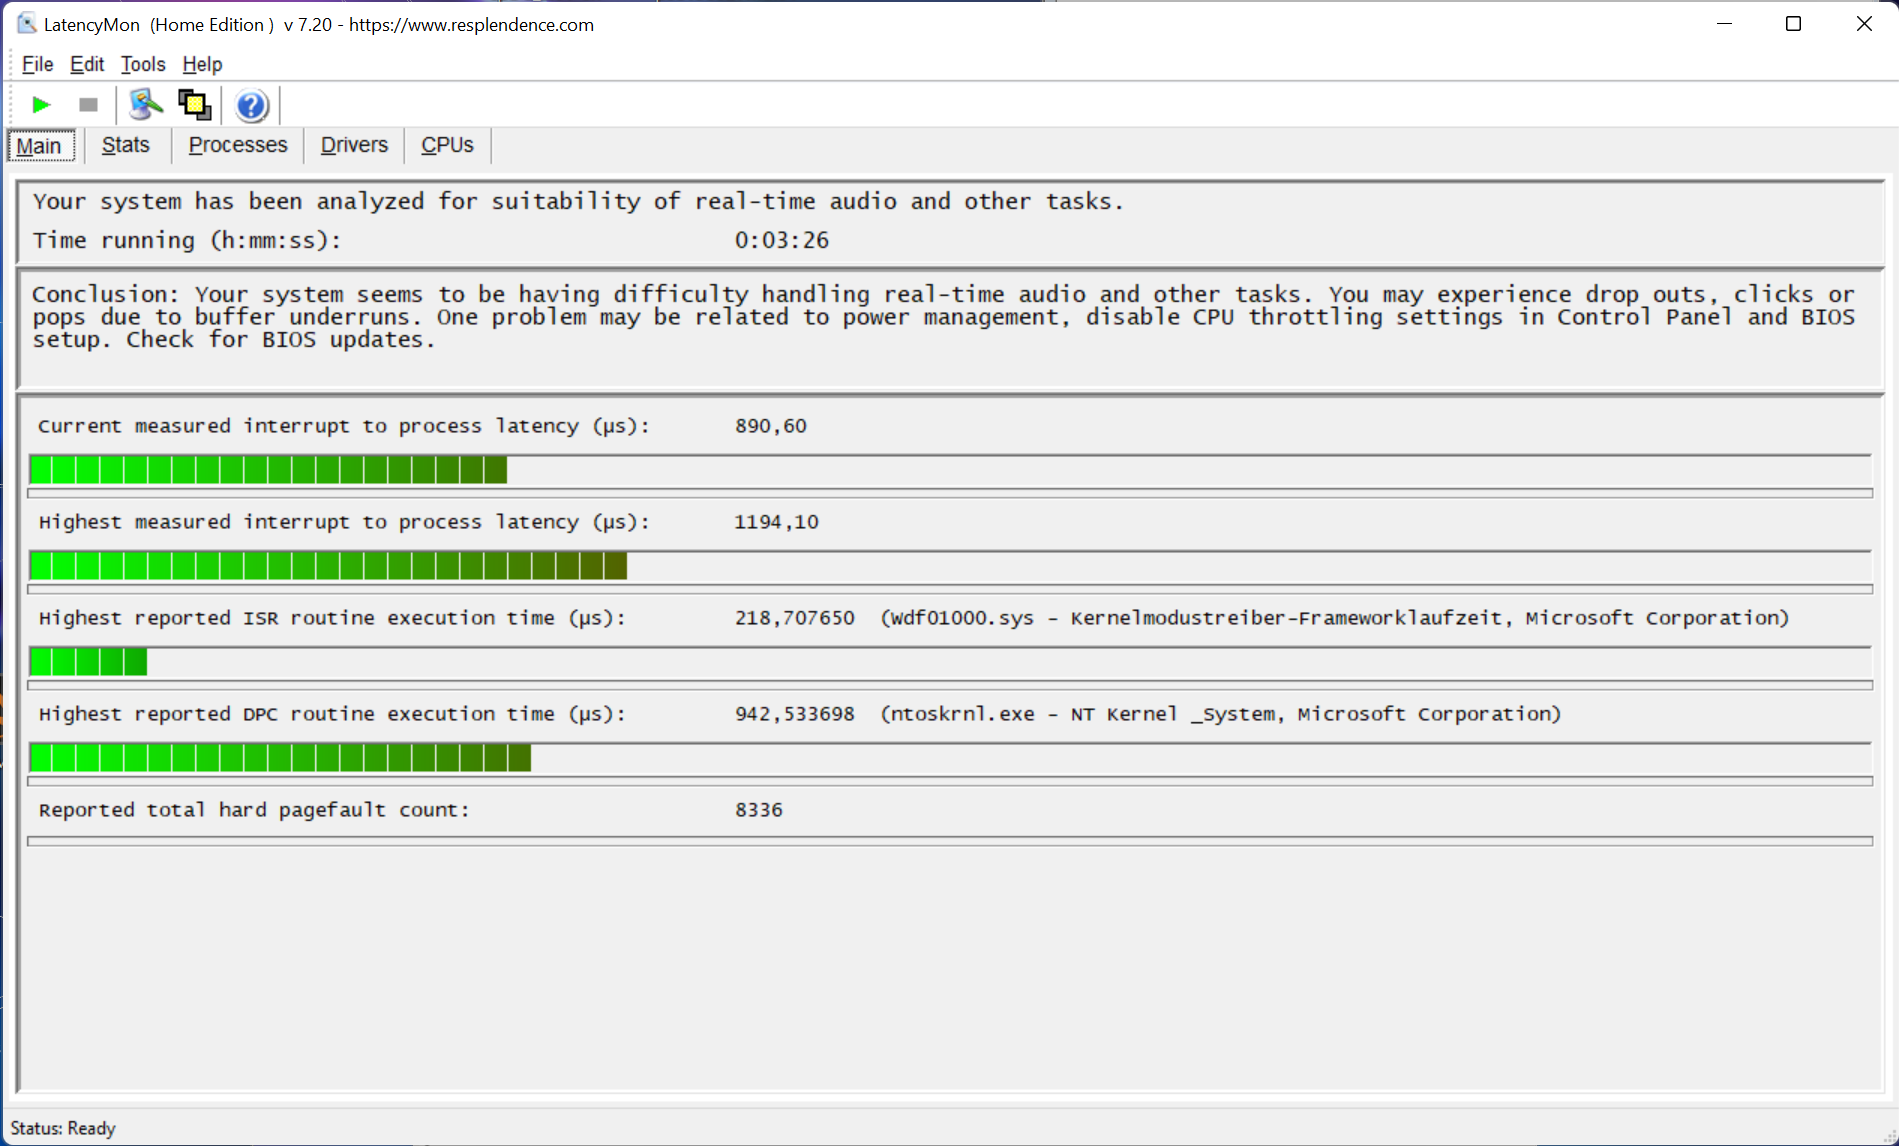
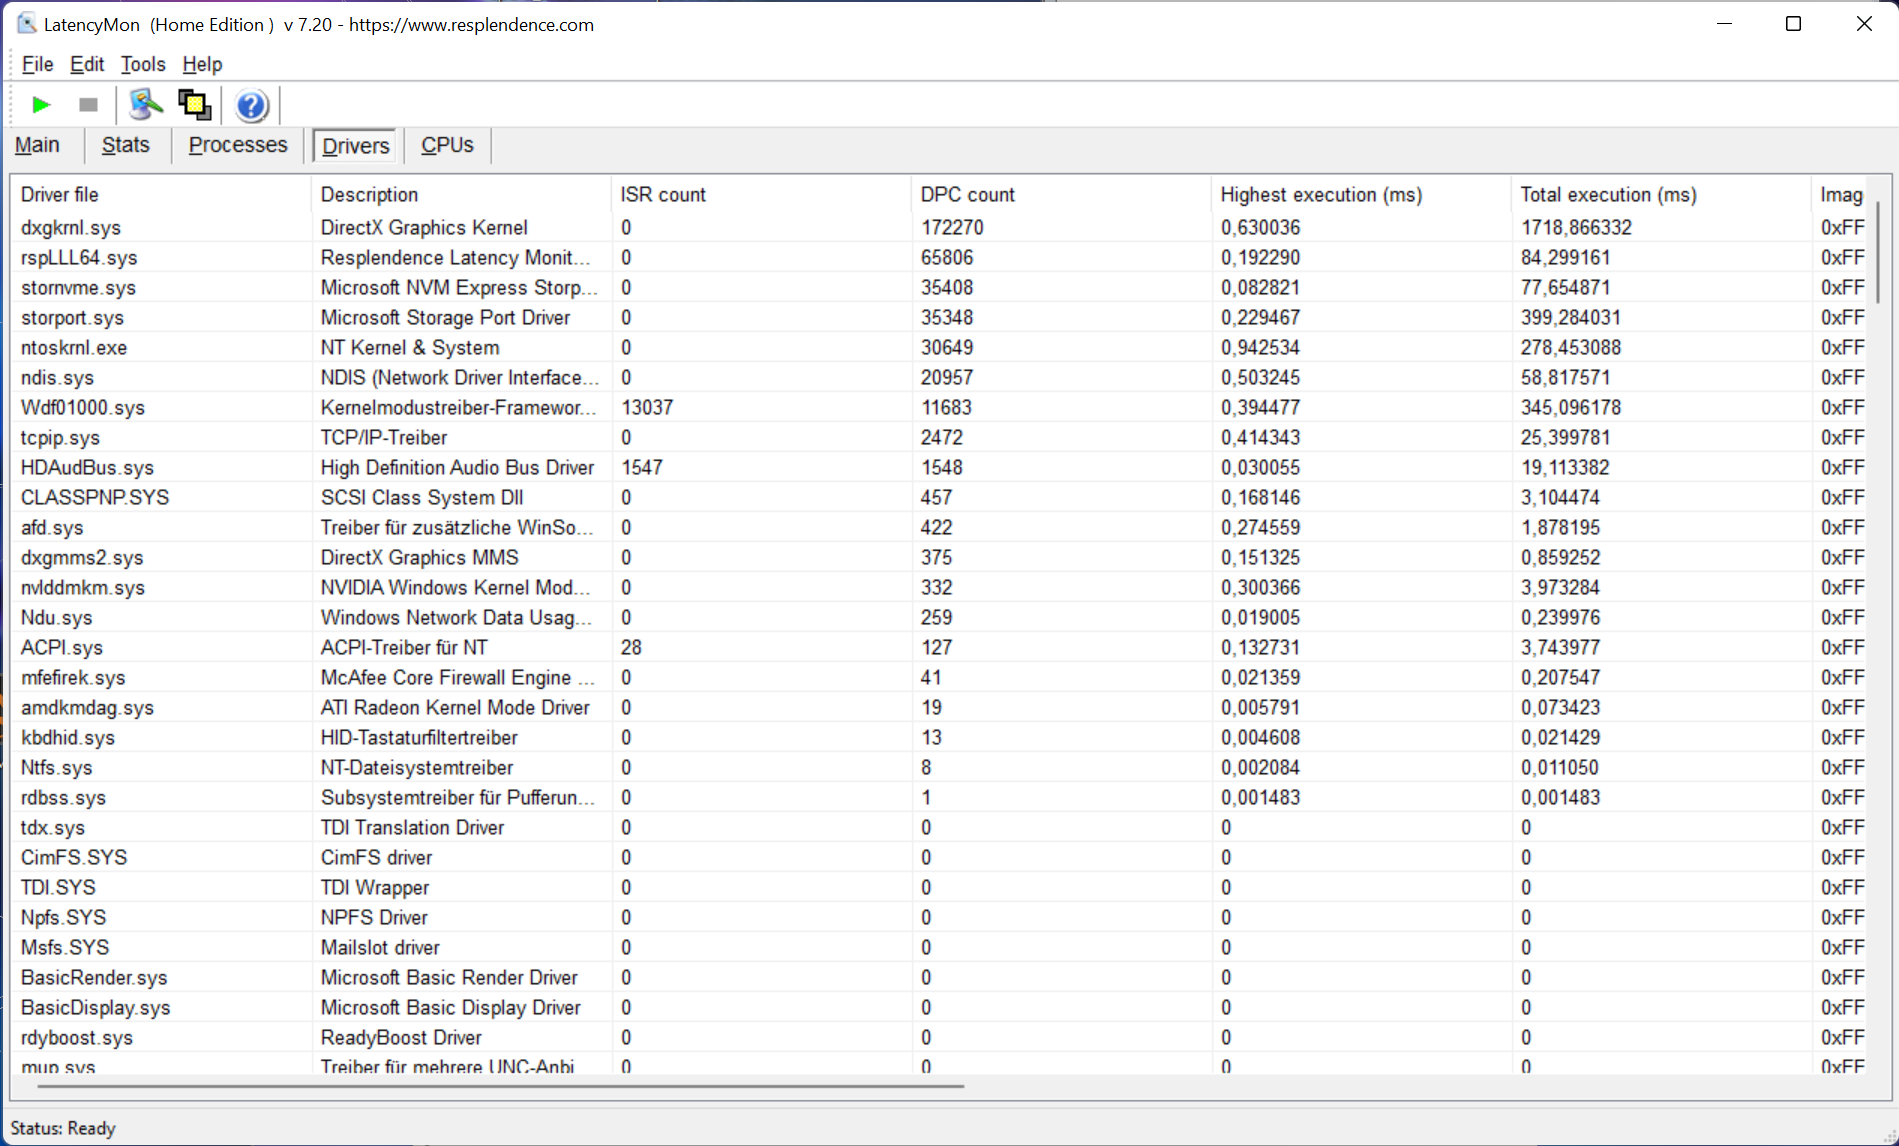
ROG Flow X16,即我们的评测型号,似乎在实时管理音频和视频编辑方面有问题。DirectX图形内核在这里负有主要责任。未来的BIOS更新可能会改善这一点。
4K YouTube播放导致CPU负载为4%,Radeon iGPU的负载为20%。没有跳过的帧被登记。
| DPC Latencies / LatencyMon - interrupt to process latency (max), Web, Youtube, Prime95 | |
| Asus ROG Flow X13 GV301QH | |
| MSI Stealth GS66 12UGS | |
| Lenovo ThinkPad X1 Extreme G4-20Y50040GE | |
| Asus ROG Flow X16 GV601RW-M5082W | |
| Asus ROG Zephyrus M16 GU603H | |
| Asus ROG Strix Scar 15 G533ZW-LN106WS | |
| Microsoft Surface Laptop Studio i7 RTX 3050 Ti | |
| Lenovo Legion 5 Pro 16 G7 i7 RTX 3070Ti | |
| Gigabyte Aero 16 YE5 | |
| Dell XPS 17 9720 RTX 3060 | |
* ... smaller is better
存储设备
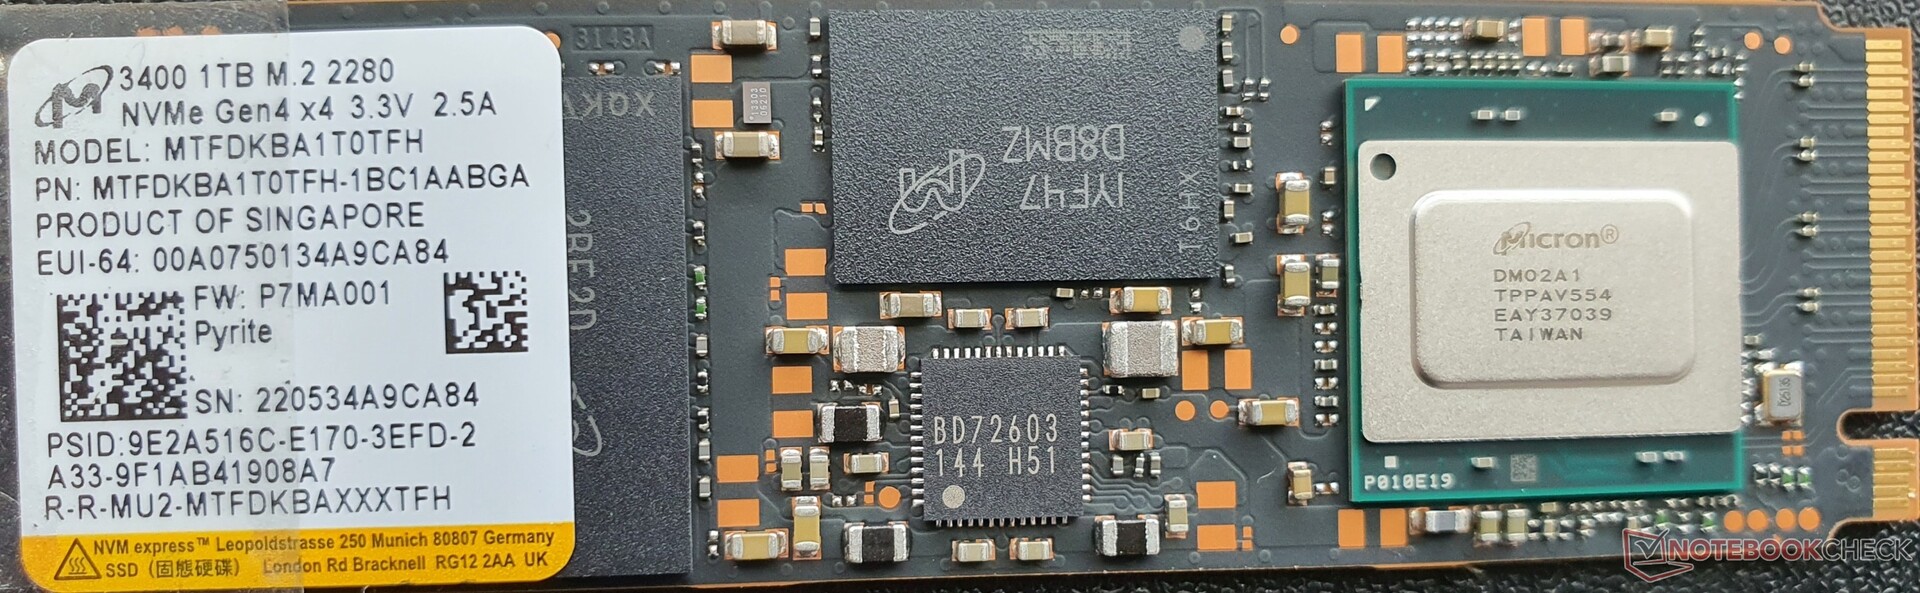
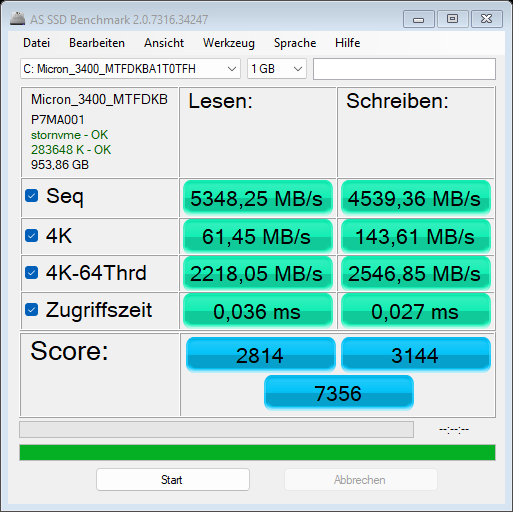
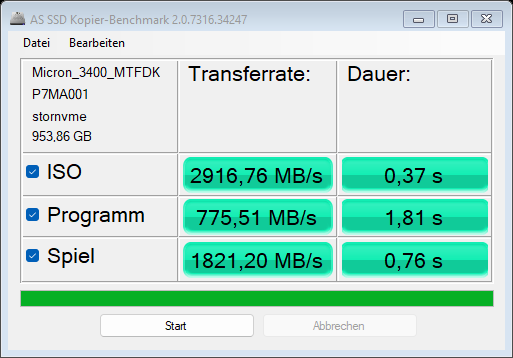
1兆字节的Micron 3400通过PCIe 4.0连接,能够以高速运行。我们的读取性能耐力测试没有显示任何下降。然而,4K的数值稍稍落后于竞争对手。
| Asus ROG Flow X16 GV601RW-M5082W GeForce RTX 3070 Ti Laptop GPU, R9 6900HS, Micron 3400 1TB MTFDKBA1T0TFH | Asus ROG Zephyrus M16 GU603H GeForce RTX 3070 Laptop GPU, i9-11900H, Samsung PM9A1 MZVL22T0HBLB | Asus ROG Strix Scar 15 G533ZW-LN106WS GeForce RTX 3070 Ti Laptop GPU, i9-12900H, Samsung PM9A1 MZVL22T0HBLB | Gigabyte Aero 16 YE5 GeForce RTX 3080 Ti Laptop GPU, i9-12900HK, Phison ESR01TBMFCT | Lenovo Legion 5 Pro 16 G7 i7 RTX 3070Ti GeForce RTX 3070 Ti Laptop GPU, i7-12700H, Samsung PM9A1 MZVL21T0HCLR | Lenovo ThinkPad X1 Extreme G4-20Y50040GE GeForce RTX 3080 Laptop GPU, i9-11950H, Kioxia XG7 KXG7AZNV1T02 | Dell XPS 17 9720 RTX 3060 GeForce RTX 3060 Laptop GPU, i7-12700H, Samsung PM9A1 MZVL21T0HCLR | Microsoft Surface Laptop Studio i7 RTX 3050 Ti GeForce RTX 3050 Ti Laptop GPU, i7-11370H, SK Hynix PC711 1TB HFS001TDE9X084N | |
|---|---|---|---|---|---|---|---|---|
| AS SSD | 9% | 15% | 26% | 24% | -4% | -14% | -21% | |
| Seq Read (MB/s) | 5348.25 | 5615 5% | 5563.48 4% | 5588 4% | 5036 -6% | 5386 1% | 5241.84 -2% | 2768 -48% |
| Seq Write (MB/s) | 4539.36 | 4297 -5% | 4045.87 -11% | 3267 -28% | 3784 -17% | 4218 -7% | 2208.41 -51% | 1683 -63% |
| 4K Read (MB/s) | 61.45 | 55.3 -10% | 81.3 32% | 109.4 78% | 88.1 43% | 65.9 7% | 79.6 30% | 63.7 4% |
| 4K Write (MB/s) | 143.61 | 170.5 19% | 248.96 73% | 321.6 124% | 240.4 67% | 223.2 55% | 221.57 54% | 191.1 33% |
| 4K-64 Read (MB/s) | 2218.05 | 2591 17% | 2740.24 24% | 2966 34% | 2788 26% | 2757 24% | 1264.16 -43% | 917 -59% |
| 4K-64 Write (MB/s) | 2546.85 | 3190 25% | 3345.62 31% | 3342 31% | 3424 34% | 1736 -32% | 3070.83 21% | 1983 -22% |
| Access Time Read * (ms) | 0.036 | 0.04 -11% | 0.022 39% | 0.056 -56% | 0.02 44% | 0.049 -36% | 0.031 14% | 0.024 33% |
| Access Time Write * (ms) | 0.027 | 0.025 7% | 0.017 37% | 0.012 56% | 0.018 33% | 0.02 26% | 0.056 -107% | 0.019 30% |
| Score Read (Points) | 2814 | 3208 14% | 3378 20% | 3634 29% | 3380 20% | 3361 19% | 1868 -34% | 1257 -55% |
| Score Write (Points) | 3144 | 3790 21% | 3999 27% | 3991 27% | 4043 29% | 2381 -24% | 3513 12% | 2343 -25% |
| Score Total (Points) | 7356 | 8563 16% | 9031 23% | 9380 28% | 9094 24% | 7397 1% | 6203 -16% | 4206 -43% |
| Copy ISO MB/s (MB/s) | 2916.76 | 2358.18 -19% | 2352 -19% | 3221 10% | 2598 -11% | 2874.04 -1% | 1991 -32% | |
| Copy Program MB/s (MB/s) | 775.51 | 466.47 -40% | 1031 33% | 939 21% | 434.7 -44% | 447.82 -42% | 606 -22% | |
| Copy Game MB/s (MB/s) | 1821.2 | 1211.65 -33% | 2188 20% | 1995 10% | 1230 -32% | 1327.42 -27% | 1435 -21% |
* ... smaller is better
* ... smaller is better
Sustained Performance Read: DiskSpd Read Loop, Queue Depth 8
图形卡
Nvidia的GeForce RTX 3070 Ti被用作专用的图形单元,它可以访问8GB的GDDR6 VRAM。由于最强大的变体(125瓦的TGP,包括动态提升),性能达到了很高的水平,这不一定是你对一个紧凑而轻巧的16英寸敞篷车所期望的。
即使是微星Stealth GS66由于其较低的105瓦的TGP,作为一个纯粹的游戏笔记本也不得不认输,而 Gigabyte Aero 16搭配其 RTX 3080 Ti的Gigabyte Aero 16则落后10%左右,因为它尽管有类似的构造,却只能冷却90瓦。只有更厚的游戏笔记本,如 Legion 5 Pro和 ROG Strix Scar 15能够以150瓦(125瓦+25瓦动态提升)的更高TGP运行RTX 3070 Ti,因此在3DMark基准测试中比ROG Flow X16高出10%至15%。
使用Radeon 680M iGPU,Flow X16的电池游戏时间几乎是启用RTX 3070 Ti时的两倍(2:06小时对0:56小时)。dGPU的性能仍然是iGPU的两倍,而且至少有50%的原始dGPU性能仍然可用。相比较而言,XMG Neo 15在电池模式下将其图形性能限制了90%。使用100瓦的USB-C电源,只有一半的dGPU性能可用。
虽然RTX 3070 Ti不是专业的工作站GPU,但相应的性能,如SpecViewPerf测试,令人印象深刻,CUDA基准测试也处于高水平。尽管如此,ROG Flow X16并不是作为工作站笔记本电脑设计的,为此缺少专门的驱动程序。
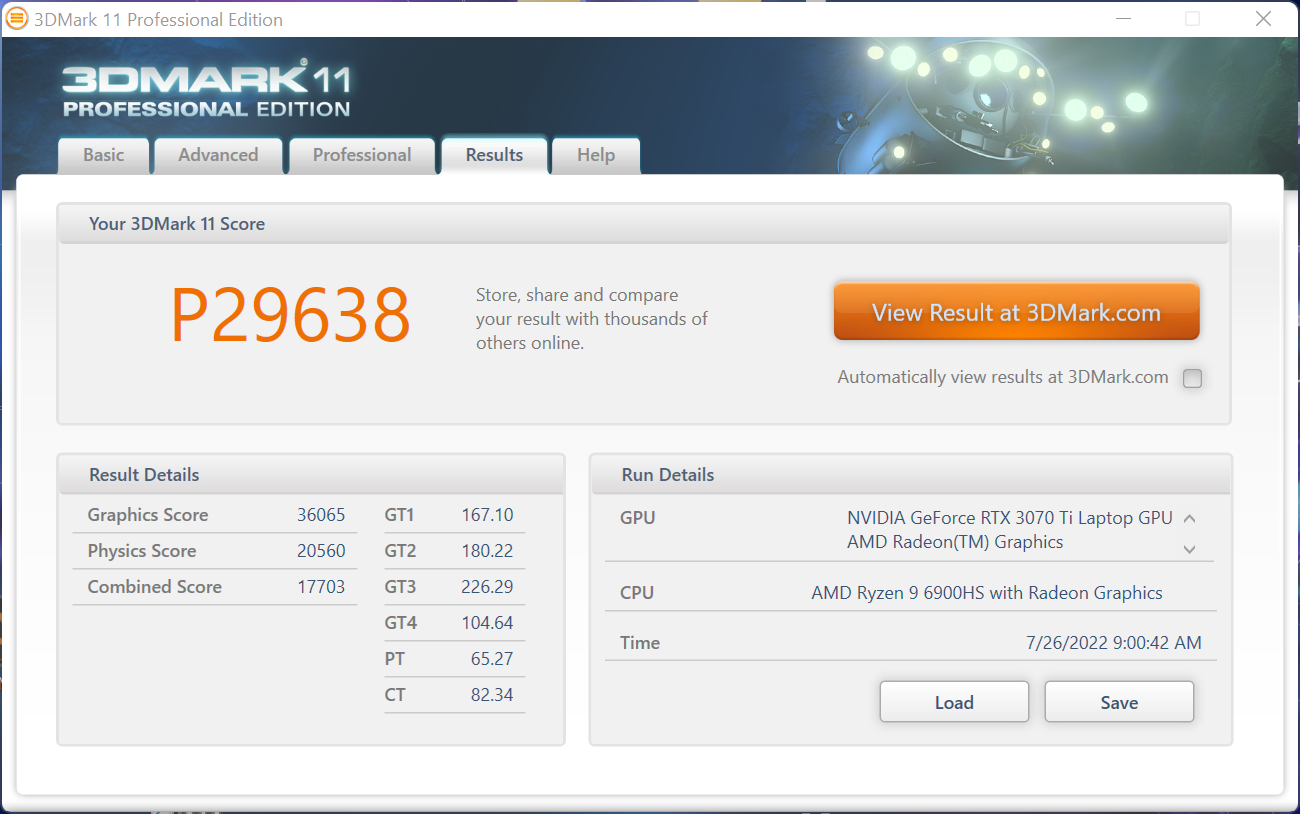
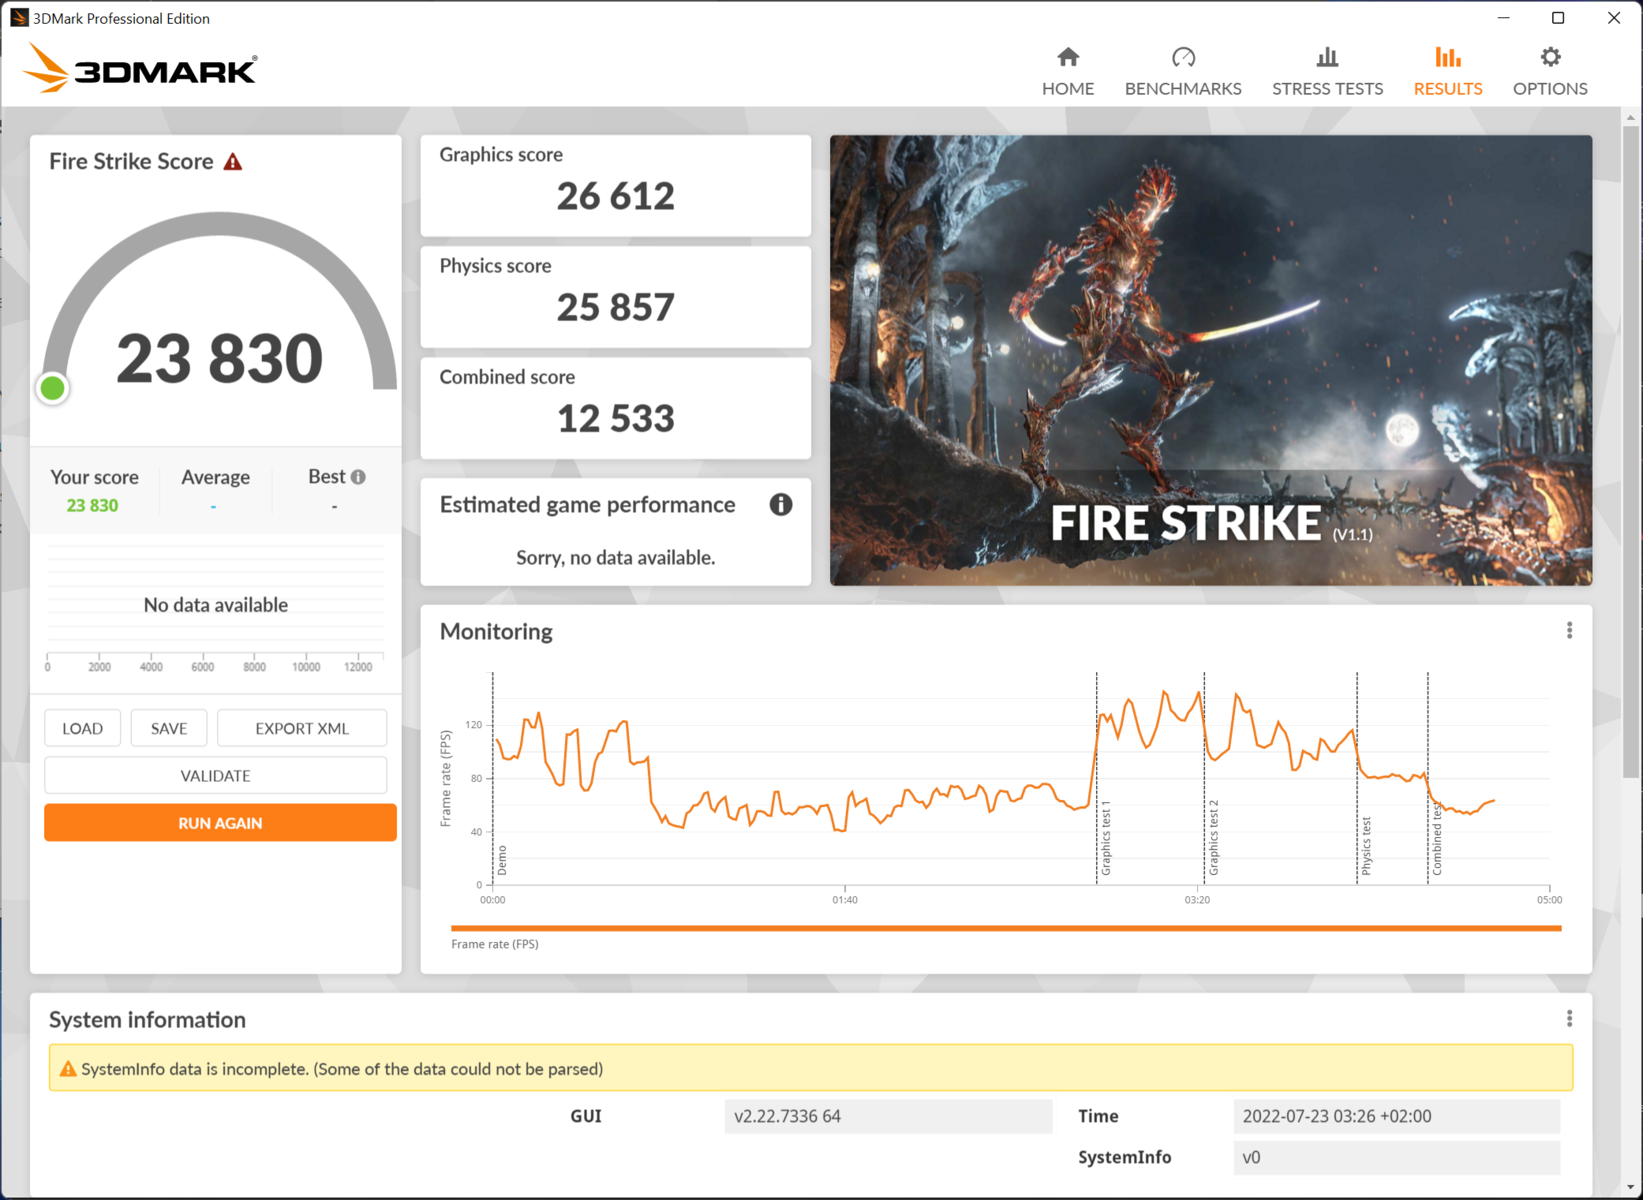


| 3DMark 11 Performance | 29638 points | |
| 3DMark Cloud Gate Standard Score | 51280 points | |
| 3DMark Fire Strike Score | 23830 points | |
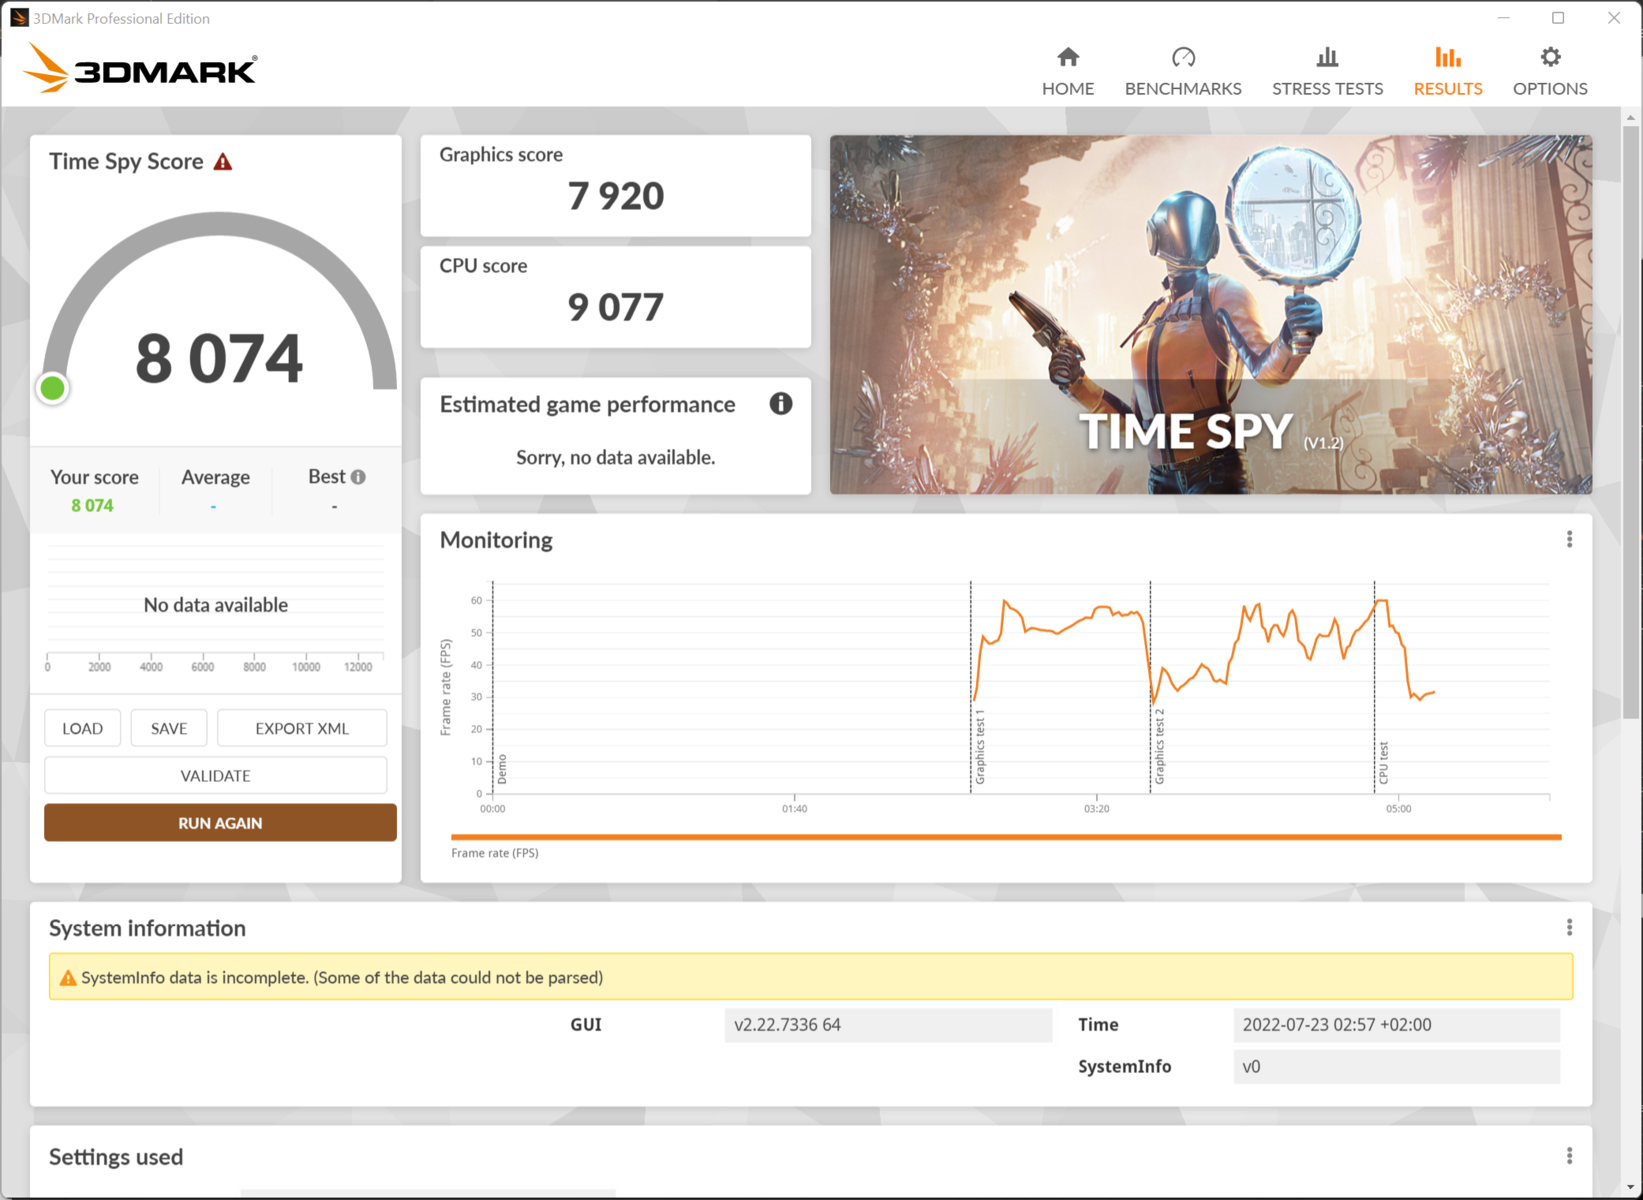
| 3DMark Time Spy Score | 10352 points | |
Help | ||
| Blender - v3.3 Classroom CUDA | |
| Asus ROG Flow X16 GV601RW-M5082W | |
| MSI Raider GE77 HX 12UHS | |
* ... smaller is better
游戏性能
竞争设备在高分辨率下的运行速度平均只有5%到10%,GeForce RTX 3070 Ti(ROG Strix Scar 15, Legion 5 Pro, Acer Predator Triton 500 SE),而在 Witcher 3,当我们通过华硕的Armoury Crate超频GPU或激活MUX开关时,与Legion 5 Pro的差距甚至会缩小。
一个 RTX 3080 Ti具备105W的TGP,例如在 MSI Steath GS77的速度只有~10%。在更薄的 Aero 16它的运行速度甚至比我们的ROG Flow X16还要慢,因为Aero 16只能冷却~90瓦。
使用大约150W的TGP (XMG Pro 17, Razer Blade 17, Medion Erazer Beast X30),它的RTX 3080 Ti的速度要快15%到20%。在我们的数据库中,移动GPU的最佳结果比我们的评测设备高30%左右,这是由少数纯游戏笔记本实现的,这些笔记本由于有更多的空间用于更强的冷却系统,因此拥有165至175瓦的TGP (MSI Raider GE77 HX, Alienware x17 R2总的来说,对于一个紧凑的16英寸敞篷车来说,这是一个非常好的结果,可以轻松运行QHD分辨率的较新游戏。在电池电量下,高细节的全高清游戏仍然是可能的。
启用MUX开关后,游戏性能提高了6%至7%,而在 "手动模式 "下超频也实现了类似的提高。然而,两者的结合并没有进一步提高性能。不同模式的所有效果都可以在下表中看到。没有超频的MUX开关提供了最好的结果,这也使系统更加安静,只有45.4分贝(A)。在静音 模式下,你会损失30%的GPU性能,以换取35.5分贝(A)的安静。
| 电源模式 | Witcher 3 Ultra (FPS) | GPU Clock (MHz) | GPU Temperature (°C) | GPU Power Draw (W) | Loudness in db(A) |
|---|---|---|---|---|---|
| MUX +200MHz | 104,4 | 1.550 | 75 | 116 | 51,2 |
| MUX @Turbo | 104,9 | 1.500 | 71 | 116 | 45,4 |
| 手动+200MHz | 102,3 | 1.550 | 75 | 116 | 51,2 |
| Turbo | 97,8 | 1.500 | 71 | 116 | 45,4 |
| 平衡/性能 | 89,3 | 1.270 | 72 | 100 | 42,4 |
| 静音 | 59,9 | 1.000 | 69 | 65 | 35,5 |
| 电池@静音 | 48,4 | 600 | 64 | 55 | 32 |
| Radeon 680M iGPU | 25,6 | 2.200 | 65 | 35 | 25,8 |
| Shadow of the Tomb Raider | |
| 1920x1080 Highest Preset AA:T | |
| Average NVIDIA GeForce RTX 3070 Ti Laptop GPU (119 - 129, n=2) | |
| Asus ROG Flow X16 GV601RW-M5082W | |
| Average of class Gaming (96 - 116, n=2, last 2 years) | |
| Apple MacBook Pro 16 2021 M1 Max | |
| Apple MacBook Pro 16 2021 M1 Pro | |
| 2560x1440 Highest Preset AA:T | |
| Asus ROG Flow X16 GV601RW-M5082W | |
| Average NVIDIA GeForce RTX 3070 Ti Laptop GPU (n=1) | |
| Ghostwire Tokyo | |
| 1920x1080 Highest Settings | |
| Average NVIDIA GeForce RTX 3070 Ti Laptop GPU (115.4 - 145.1, n=4) | |
| Asus ROG Flow X16 GV601RW-M5082W | |
| 2560x1440 Highest Settings | |
| Average NVIDIA GeForce RTX 3070 Ti Laptop GPU (83.9 - 93.1, n=2) | |
| Asus ROG Flow X16 GV601RW-M5082W | |
| 1920x1080 Highest Settings + Maximum Ray Tracing | |
| Asus ROG Flow X16 GV601RW-M5082W | |
| Average NVIDIA GeForce RTX 3070 Ti Laptop GPU (48.9 - 59.9, n=3) | |
| Tiny Tina's Wonderlands | |
| 1920x1080 High Preset (DX12) | |
| Average of class Gaming (72.1 - 203, n=5, last 2 years) | |
| Average NVIDIA GeForce RTX 3070 Ti Laptop GPU (115 - 118.3, n=3) | |
| Asus ROG Flow X16 GV601RW-M5082W | |
| 1920x1080 Badass Preset (DX12) | |
| Average of class Gaming (55 - 159.4, n=5, last 2 years) | |
| Average NVIDIA GeForce RTX 3070 Ti Laptop GPU (89.8 - 93.7, n=4) | |
| Asus ROG Flow X16 GV601RW-M5082W | |
| 2560x1440 Badass Preset (DX12) | |
| Average of class Gaming (58.9 - 111.2, n=3, last 2 years) | |
| Average NVIDIA GeForce RTX 3070 Ti Laptop GPU (59.3 - 63.9, n=3) | |
| Asus ROG Flow X16 GV601RW-M5082W | |
| Borderlands 3 | |
| 1920x1080 High Overall Quality (DX11) | |
| Asus ROG Flow X16 GV601RW-M5082W | |
| Average NVIDIA GeForce RTX 3070 Ti Laptop GPU (n=1) | |
| Apple MacBook Pro 16 2021 M1 Max | |
| Apple MacBook Pro 16 2021 M1 Pro | |
| 1920x1080 Badass Overall Quality (DX11) | |
| Asus ROG Flow X16 GV601RW-M5082W | |
| Average NVIDIA GeForce RTX 3070 Ti Laptop GPU (n=1) | |
| Apple MacBook Pro 16 2021 M1 Max | |
| Apple MacBook Pro 16 2021 M1 Pro | |
| 2560x1440 Badass Overall Quality (DX11) | |
| Asus ROG Flow X16 GV601RW-M5082W | |
| Average NVIDIA GeForce RTX 3070 Ti Laptop GPU (n=1) | |
| Metro Exodus | |
| 1920x1080 Ultra Quality AF:16x | |
| Average NVIDIA GeForce RTX 3070 Ti Laptop GPU (71 - 77.2, n=2) | |
| Asus ROG Flow X16 GV601RW-M5082W | |
| 1920x1080 Ultra Quality DXR AF:16x | |
| Average NVIDIA GeForce RTX 3070 Ti Laptop GPU (61.3 - 65.1, n=2) | |
| Asus ROG Flow X16 GV601RW-M5082W | |
| 2560x1440 Ultra Quality AF:16x | |
| Asus ROG Flow X16 GV601RW-M5082W | |
| Average NVIDIA GeForce RTX 3070 Ti Laptop GPU (n=1) | |
| Hunt Showdown | |
| 1920x1080 High Preset | |
| Asus ROG Flow X16 GV601RW-M5082W | |
| Average NVIDIA GeForce RTX 3070 Ti Laptop GPU (116 - 125.9, n=2) | |
| MSI Stealth GS66 12UGS | |
| 2560x1440 High Preset | |
| Asus ROG Flow X16 GV601RW-M5082W | |
| Average NVIDIA GeForce RTX 3070 Ti Laptop GPU (75.1 - 82.5, n=2) | |
| MSI Stealth GS66 12UGS | |
我们一小时的Witcher 3 测试显示,帧率稳定,没有任何下滑。
Witcher 3 FPS Chart
| low | med. | high | ultra | QHD | |
|---|---|---|---|---|---|
| GTA V (2015) | 179.3 | 156.3 | 94.6 | 83.7 | |
| The Witcher 3 (2015) | 264 | 189 | 97.8 | ||
| Dota 2 Reborn (2015) | 135.4 | 128.9 | 116 | 112.1 | |
| Final Fantasy XV Benchmark (2018) | 170.6 | 123.5 | 94.9 | 75.5 | |
| X-Plane 11.11 (2018) | 97.4 | 87.9 | 70.8 | ||
| Far Cry 5 (2018) | 113 | 109 | 88 | ||
| Strange Brigade (2018) | 304 | 214 | 184 | 167.2 | |
| Shadow of the Tomb Raider (2018) | 124 | 119 | 83 | ||
| Metro Exodus (2019) | 149.2 | 114.3 | 88.3 | 71 | 52.7 |
| Borderlands 3 (2019) | 104.2 | 92.4 | 80.9 | 58.7 | |
| Hunt Showdown (2020) | 125.9 | 82.5 | |||
| Assassin´s Creed Valhalla (2020) | 88 | 79 | 61 | ||
| God of War (2022) | 83.6 | 59.8 | 44.7 | ||
| Dying Light 2 (2022) | 119.6 | 80.7 | 71.1 | 48.7 | |
| Cyberpunk 2077 1.6 (2022) | 108.8 | 89.2 | 75.6 | 43.1 | |
| Ghostwire Tokyo (2022) | 131 | 130.2 | 83.9 | ||
| Tiny Tina's Wonderlands (2022) | 115.2 | 90.7 | 59.3 |
排放--得益于华硕的三风扇方案,游戏玩家很安静
系统噪音
当闲置时,我们面对的是一台沉默的笔记本电脑。风扇保持静止。只有在多核负载下,它们才会不时地跳动起来,但即使如此,它们也是有节制的,比如在用多个标签浏览时。
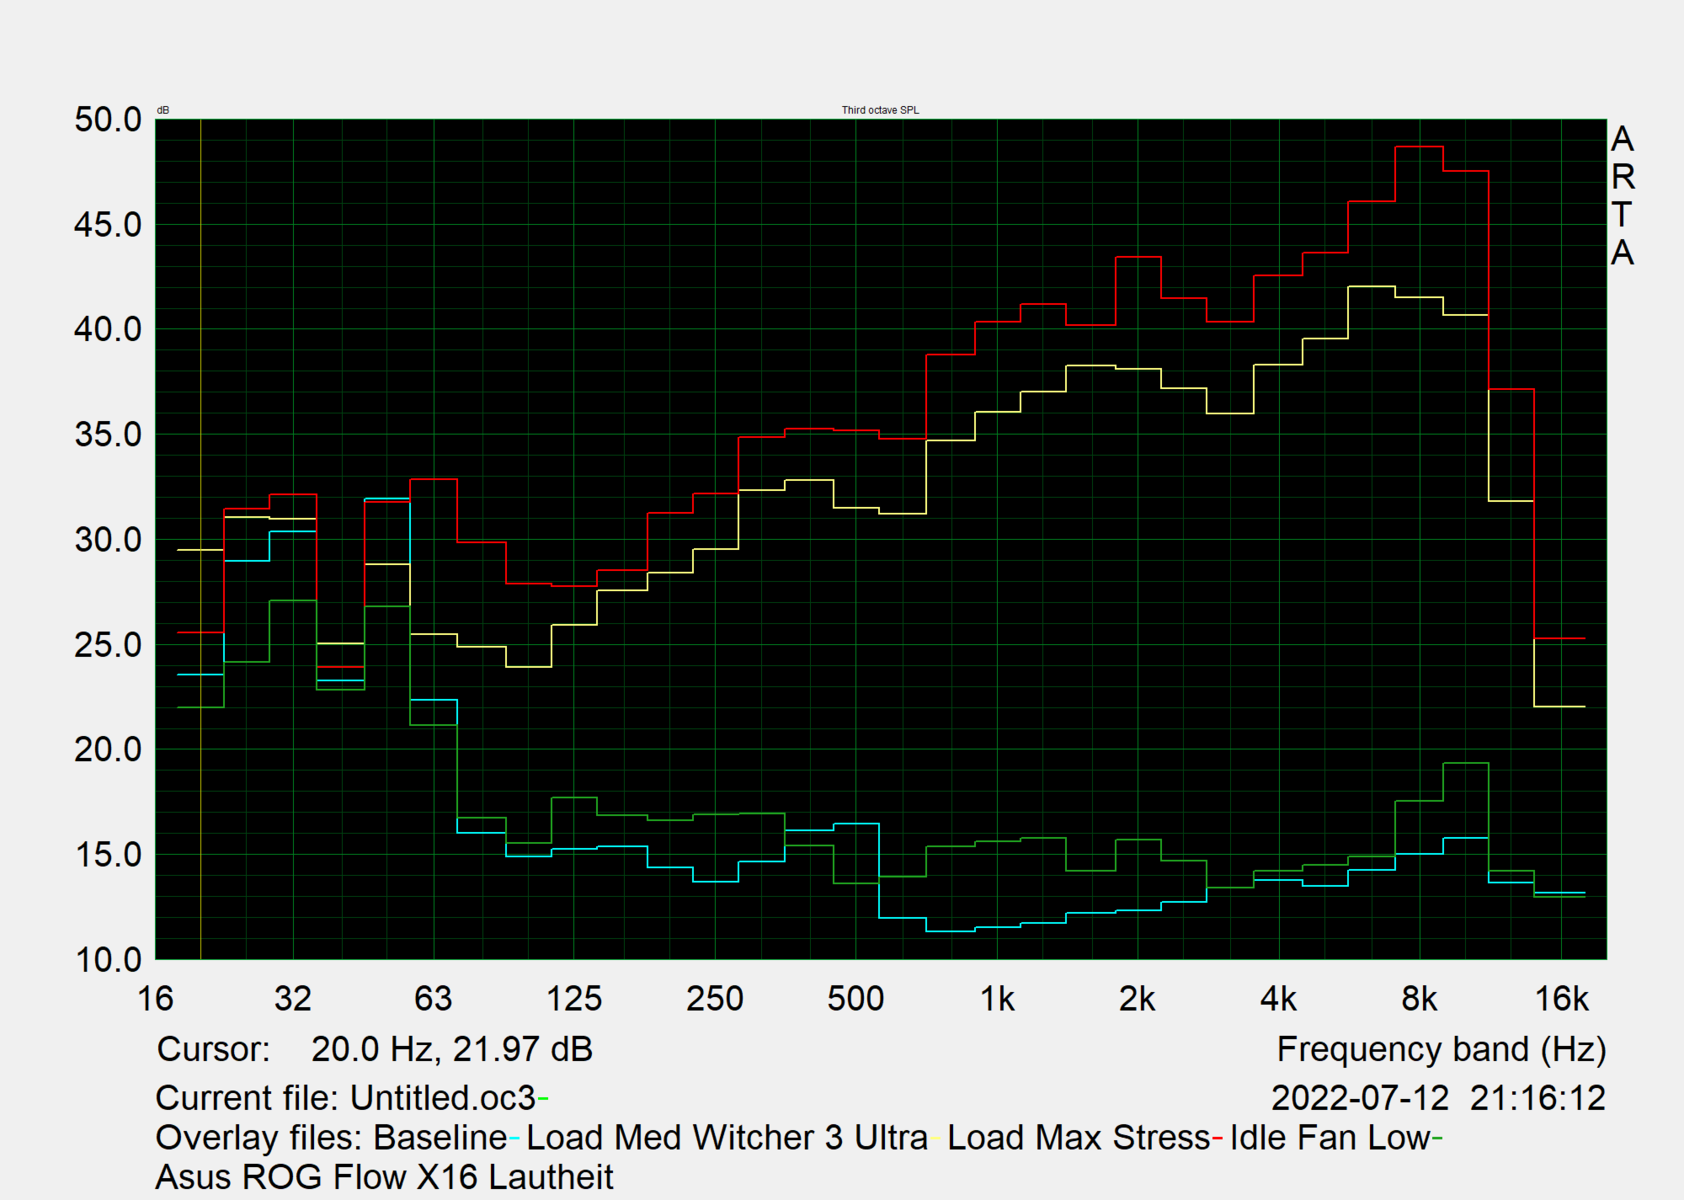
在性能 模式的永久负载下,风扇的噪音,根据不同的情况,徘徊在36分贝(A)(@Blender CPU基准)或42.4分贝(A)的游戏。在Turbo 模式下,笔记本电脑在两种情况下平均发出45分贝(A),但在高综合负荷下可以增加到50分贝(A)以下。在压力测试(Prime95 + FurMark)中,这甚至变成了55分贝(A)。至少风扇在高频率下不会发出任何噪音。也没有检测到线圈的啸叫。
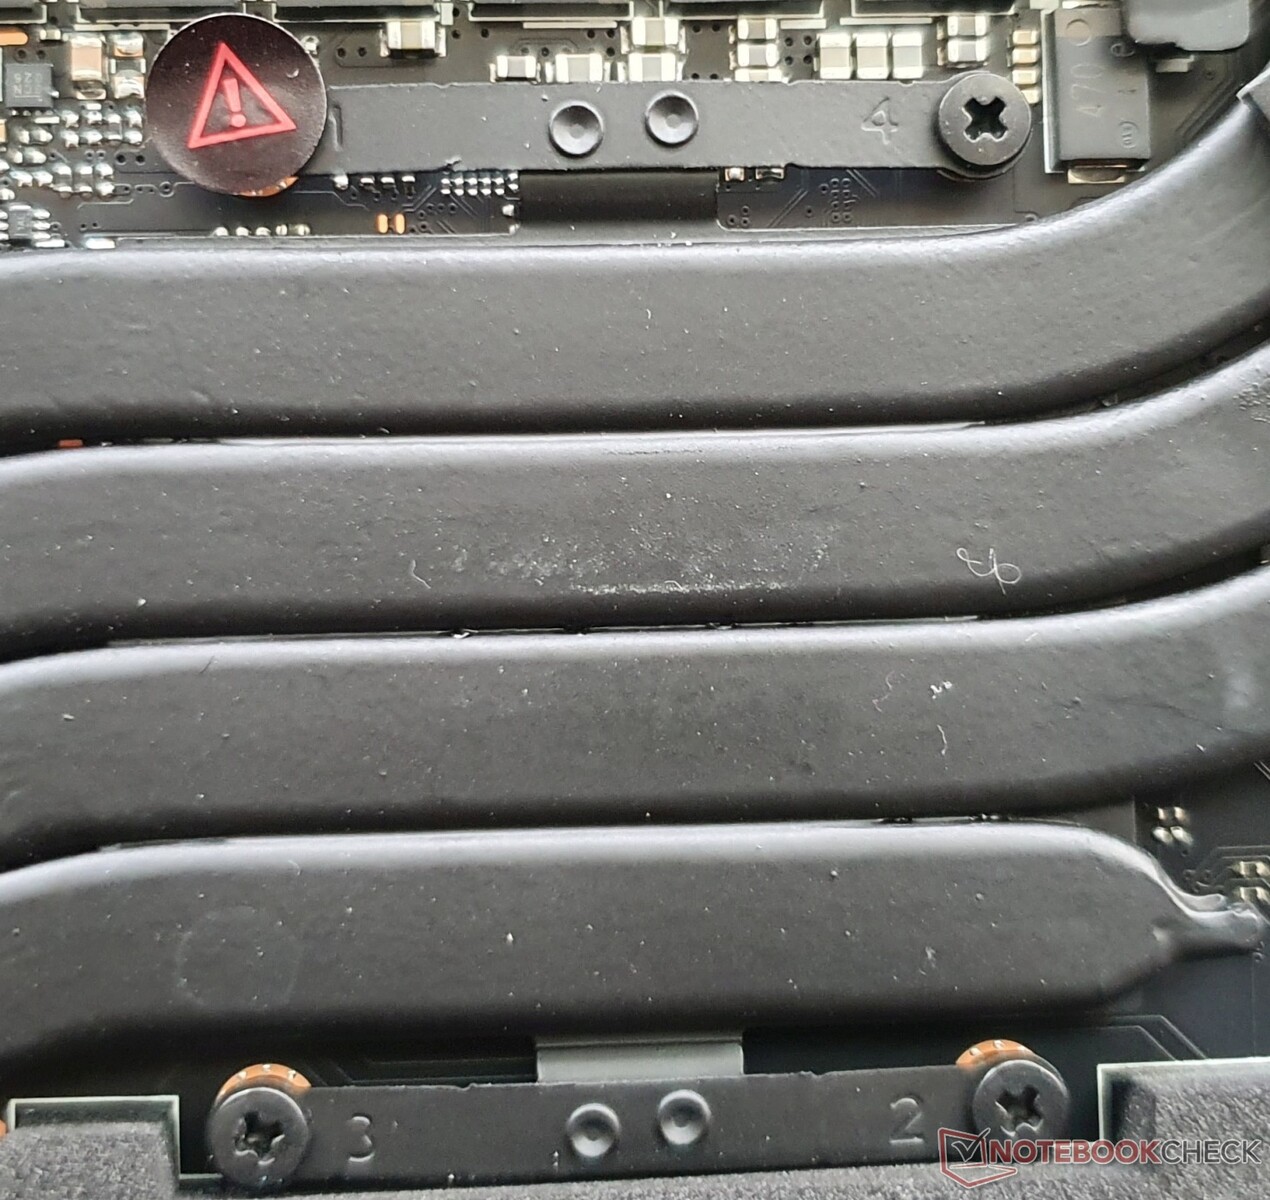
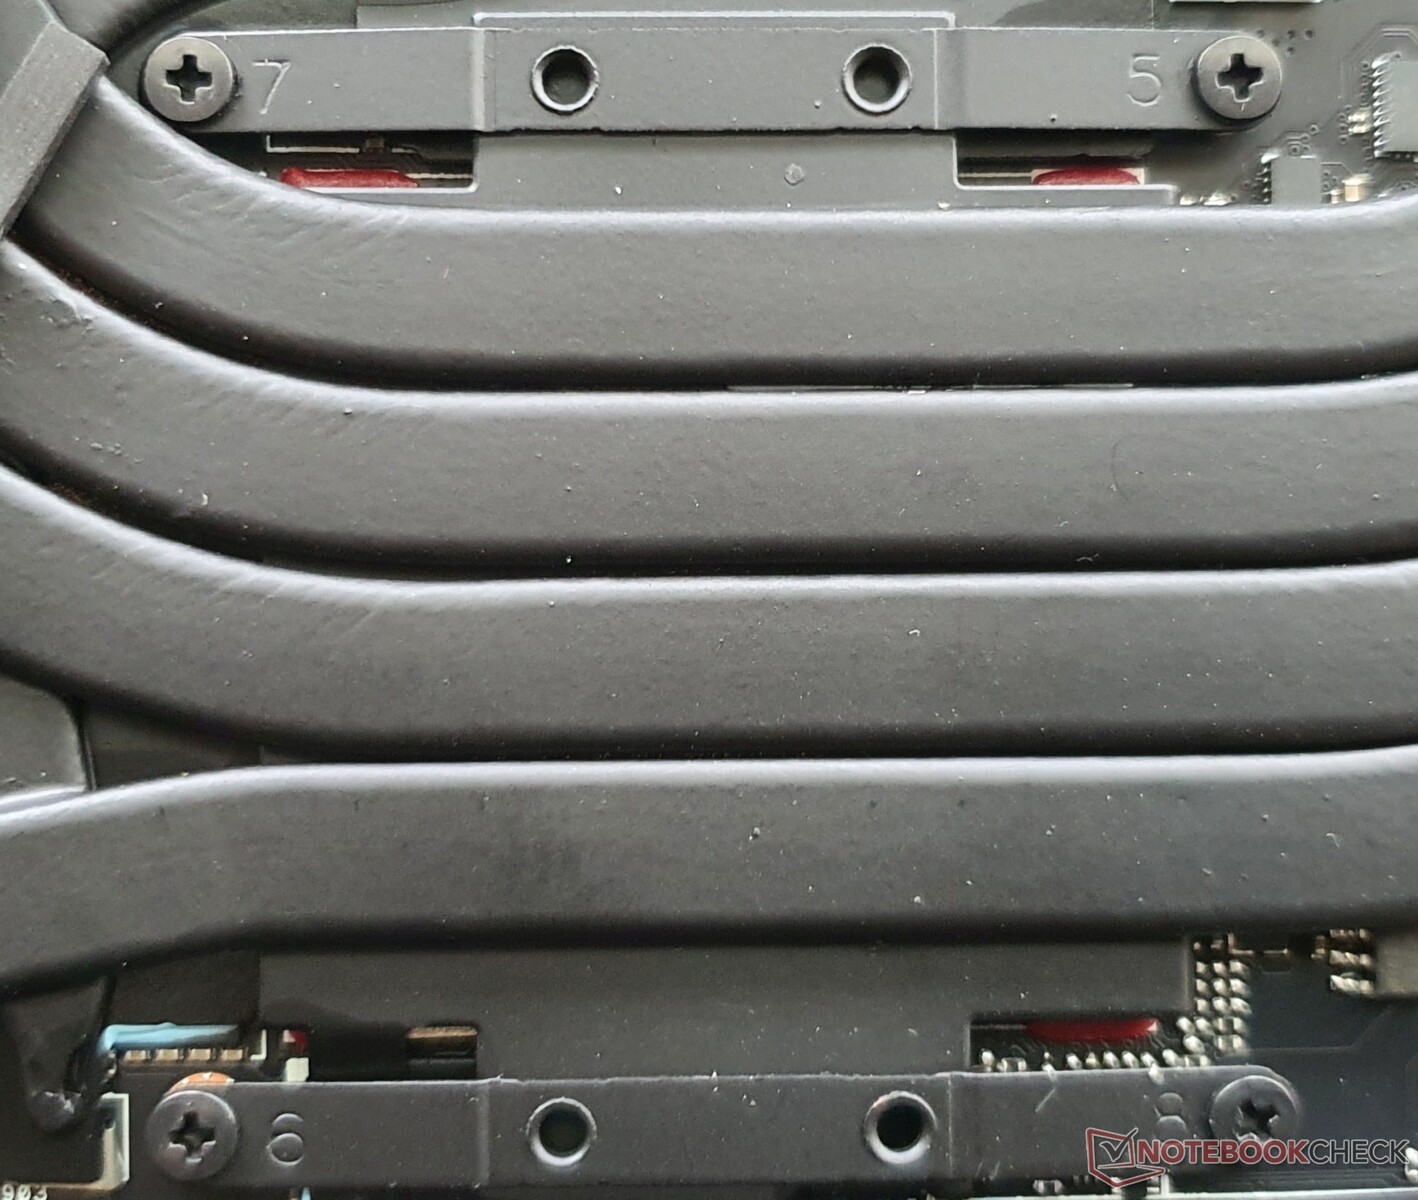
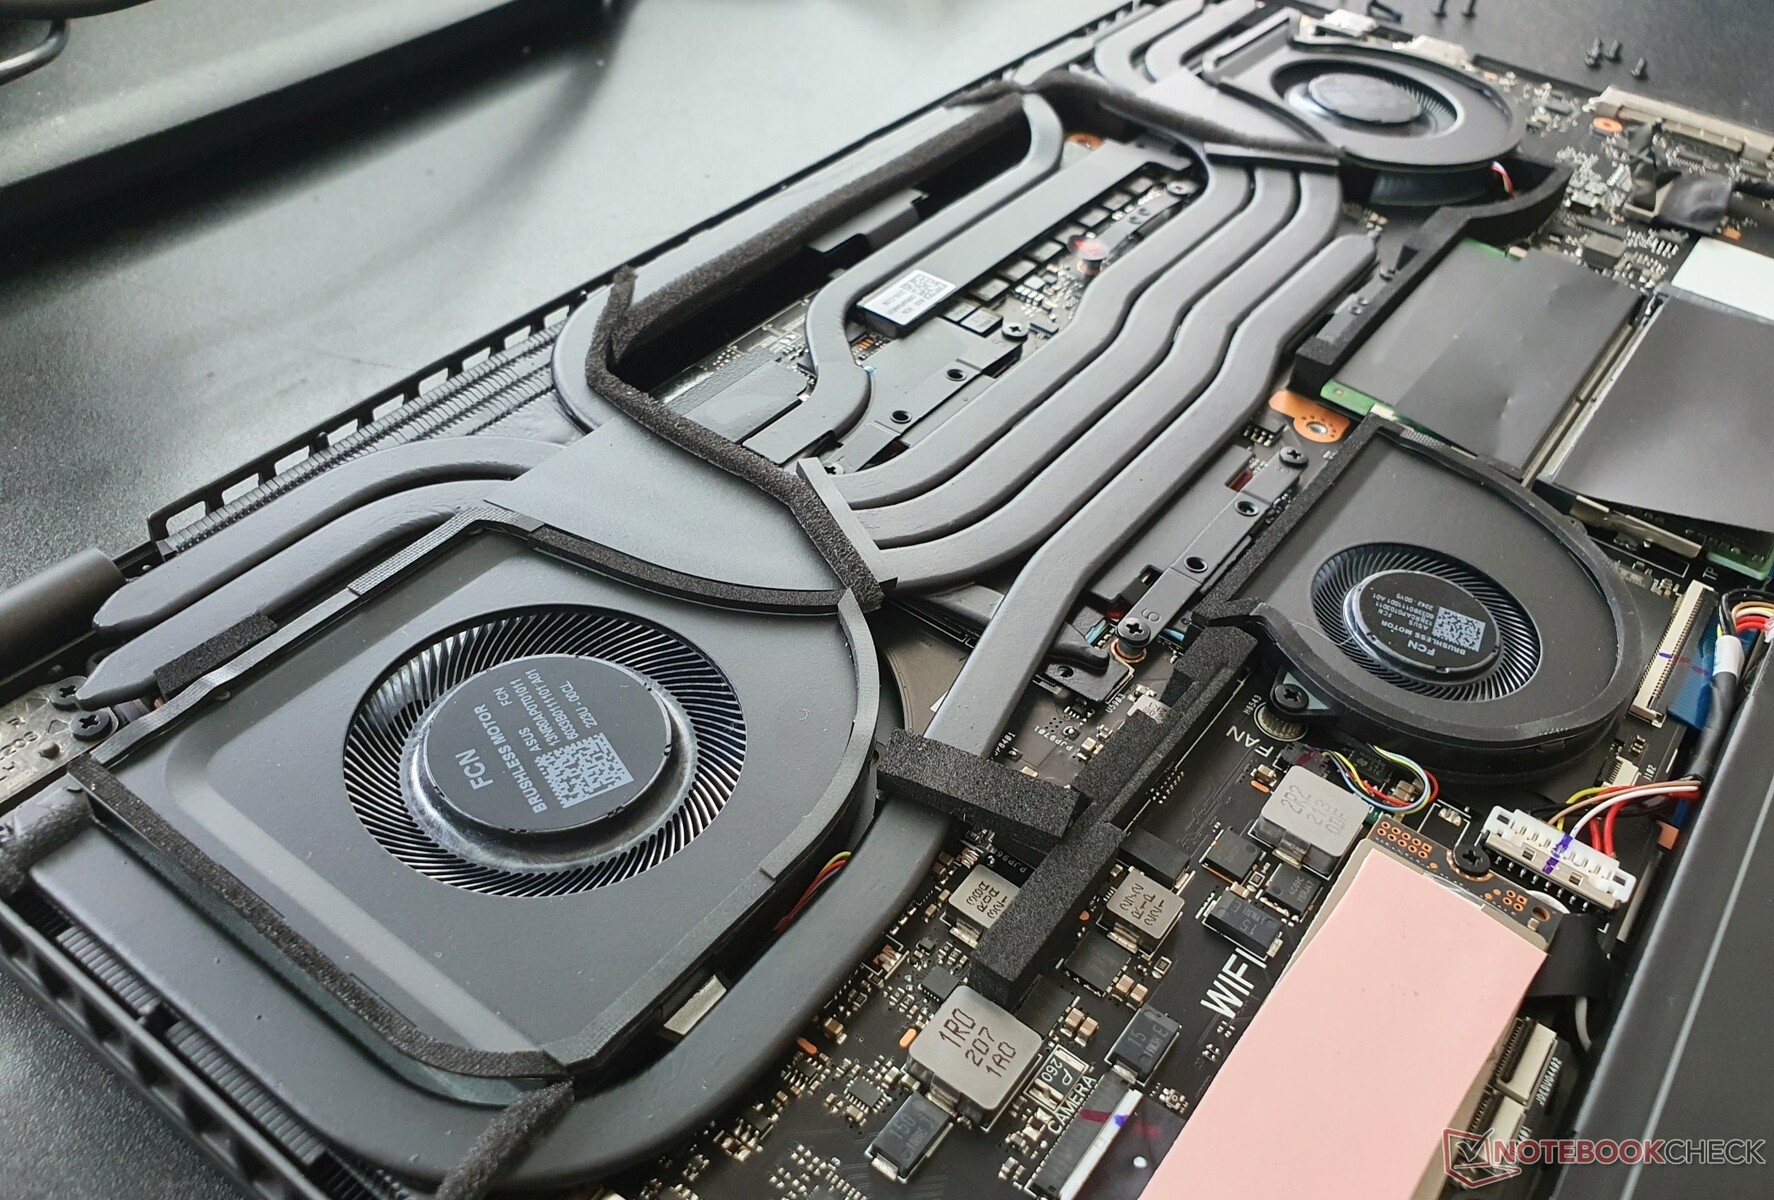
相对较好的数值是由于几个因素的结合:五根热管,三个风扇,液态金属导热膏,设备背面的边缘到边缘的风扇出口和内部的泡沫元素,集中和引导气流。这样一个系统能够冷却140瓦(CPU为15-40瓦,GPU为100-125瓦),这对一个紧凑的16英寸可折叠机来说是非常好的。
在我们的比较领域中,纯游戏笔记本电脑也没有任何风扇,在空转时保持静止,在负载时产生类似的体积。到目前为止,最安静的代表是 MacBook Pro 16,这要归功于其高效的Apple M1 ARM处理器。
Noise level
| Idle |
| 25.5 / 25.5 / 27.4 dB(A) |
| Load |
| 49.9 / 55 dB(A) |
 | ||
30 dB silent 40 dB(A) audible 50 dB(A) loud |
||
min: | ||
| Asus ROG Flow X16 GV601RW-M5082W GeForce RTX 3070 Ti Laptop GPU, R9 6900HS, Micron 3400 1TB MTFDKBA1T0TFH | Asus ROG Zephyrus M16 GU603H GeForce RTX 3070 Laptop GPU, i9-11900H, Samsung PM9A1 MZVL22T0HBLB | Asus ROG Strix Scar 15 G533ZW-LN106WS GeForce RTX 3070 Ti Laptop GPU, i9-12900H, Samsung PM9A1 MZVL22T0HBLB | Gigabyte Aero 16 YE5 GeForce RTX 3080 Ti Laptop GPU, i9-12900HK, Phison ESR01TBMFCT | Lenovo Legion 5 Pro 16 G7 i7 RTX 3070Ti GeForce RTX 3070 Ti Laptop GPU, i7-12700H, Samsung PM9A1 MZVL21T0HCLR | MSI Stealth GS66 12UGS GeForce RTX 3070 Ti Laptop GPU, i7-12700H, WDC PC SN810 1TB | Apple MacBook Pro 16 2021 M1 Pro M1 Pro 16-Core GPU, M1 Pro, Apple SSD AP1024R | Lenovo ThinkPad X1 Extreme G4-20Y50040GE GeForce RTX 3080 Laptop GPU, i9-11950H, Kioxia XG7 KXG7AZNV1T02 | Dell XPS 17 9720 RTX 3060 GeForce RTX 3060 Laptop GPU, i7-12700H, Samsung PM9A1 MZVL21T0HCLR | |
|---|---|---|---|---|---|---|---|---|---|
| Noise | -12% | -27% | -8% | -3% | -9% | 17% | 4% | 9% | |
| off / environment * (dB) | 25.5 | 25 2% | 26.86 -5% | 25 2% | 24.6 4% | 24 6% | 24.7 3% | 24.7 3% | 23.8 7% |
| Idle Minimum * (dB) | 25.5 | 25 2% | 39.07 -53% | 30 -18% | 28.4 -11% | 31 -22% | 24.7 3% | 24.7 3% | 24.1 5% |
| Idle Average * (dB) | 25.5 | 31 -22% | 39.07 -53% | 32 -25% | 28.4 -11% | 32 -25% | 24.7 3% | 24.7 3% | 24.1 5% |
| Idle Maximum * (dB) | 27.4 | 42 -53% | 39.07 -43% | 33 -20% | 28.4 -4% | 35 -28% | 24.7 10% | 28.1 -3% | 24.1 12% |
| Load Average * (dB) | 49.9 | 48 4% | 53.34 -7% | 45 10% | 49.4 1% | 48 4% | 26.1 48% | 42.5 15% | 43.2 13% |
| Load Maximum * (dB) | 55 | 56 -2% | 56.6 -3% | 52 5% | 54.7 1% | 48 13% | 37.4 32% | 52.1 5% | 48 13% |
| Witcher 3 ultra * (dB) | 52 | 56.6 | 50 | 49.4 | 43 | 46.4 | 48 |
* ... smaller is better
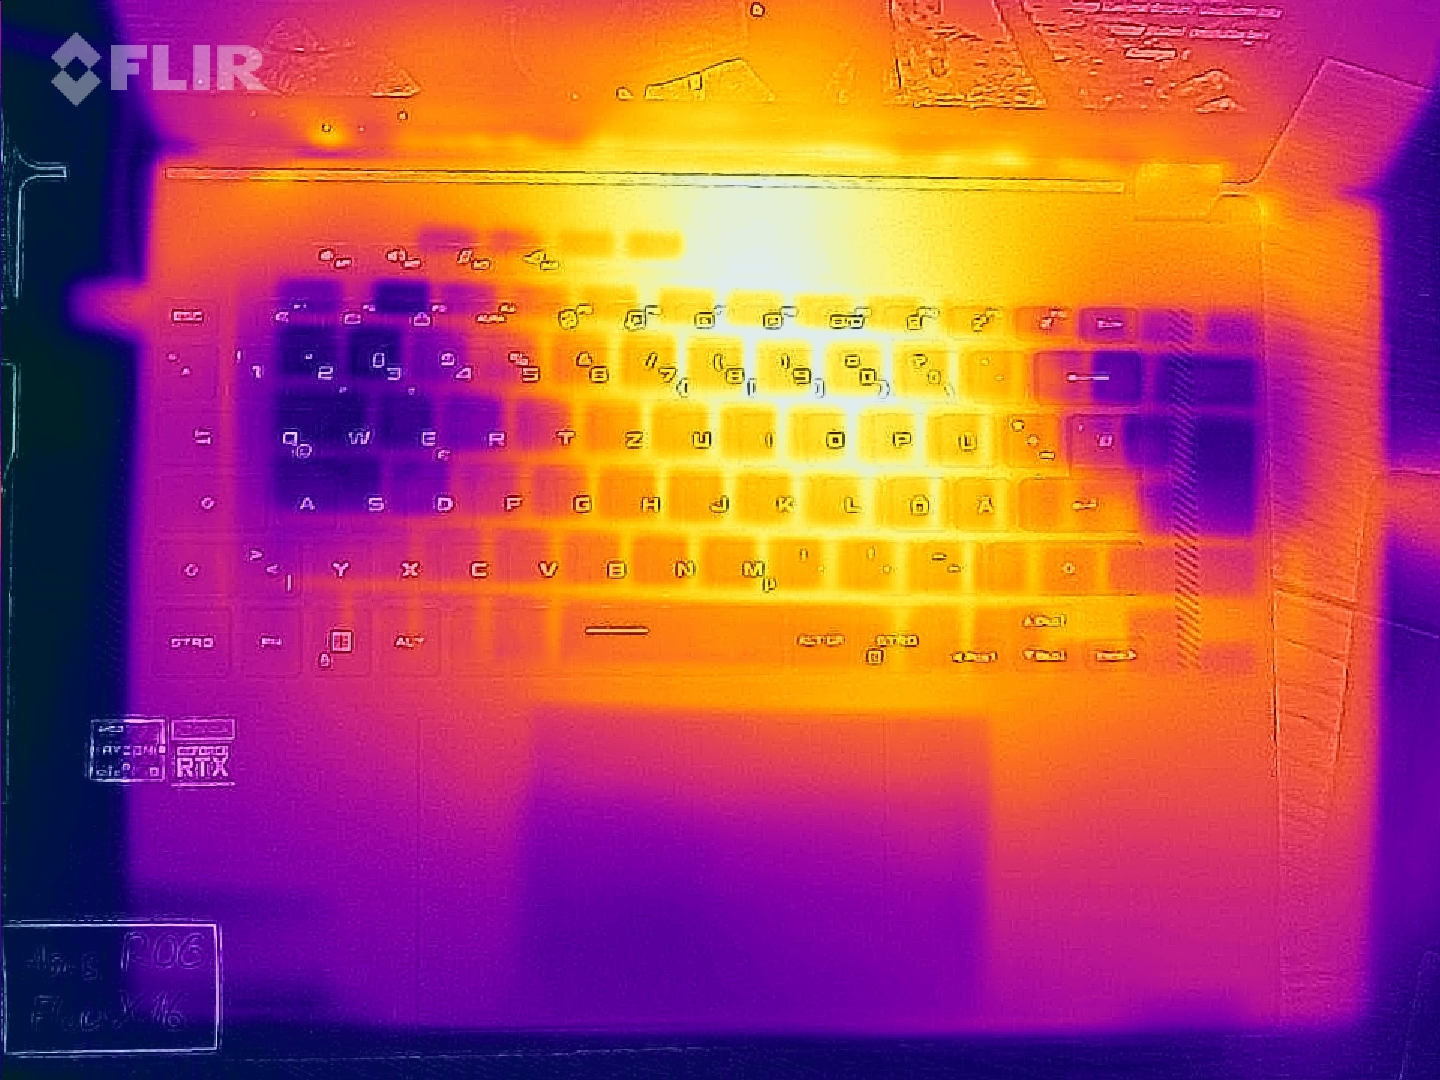
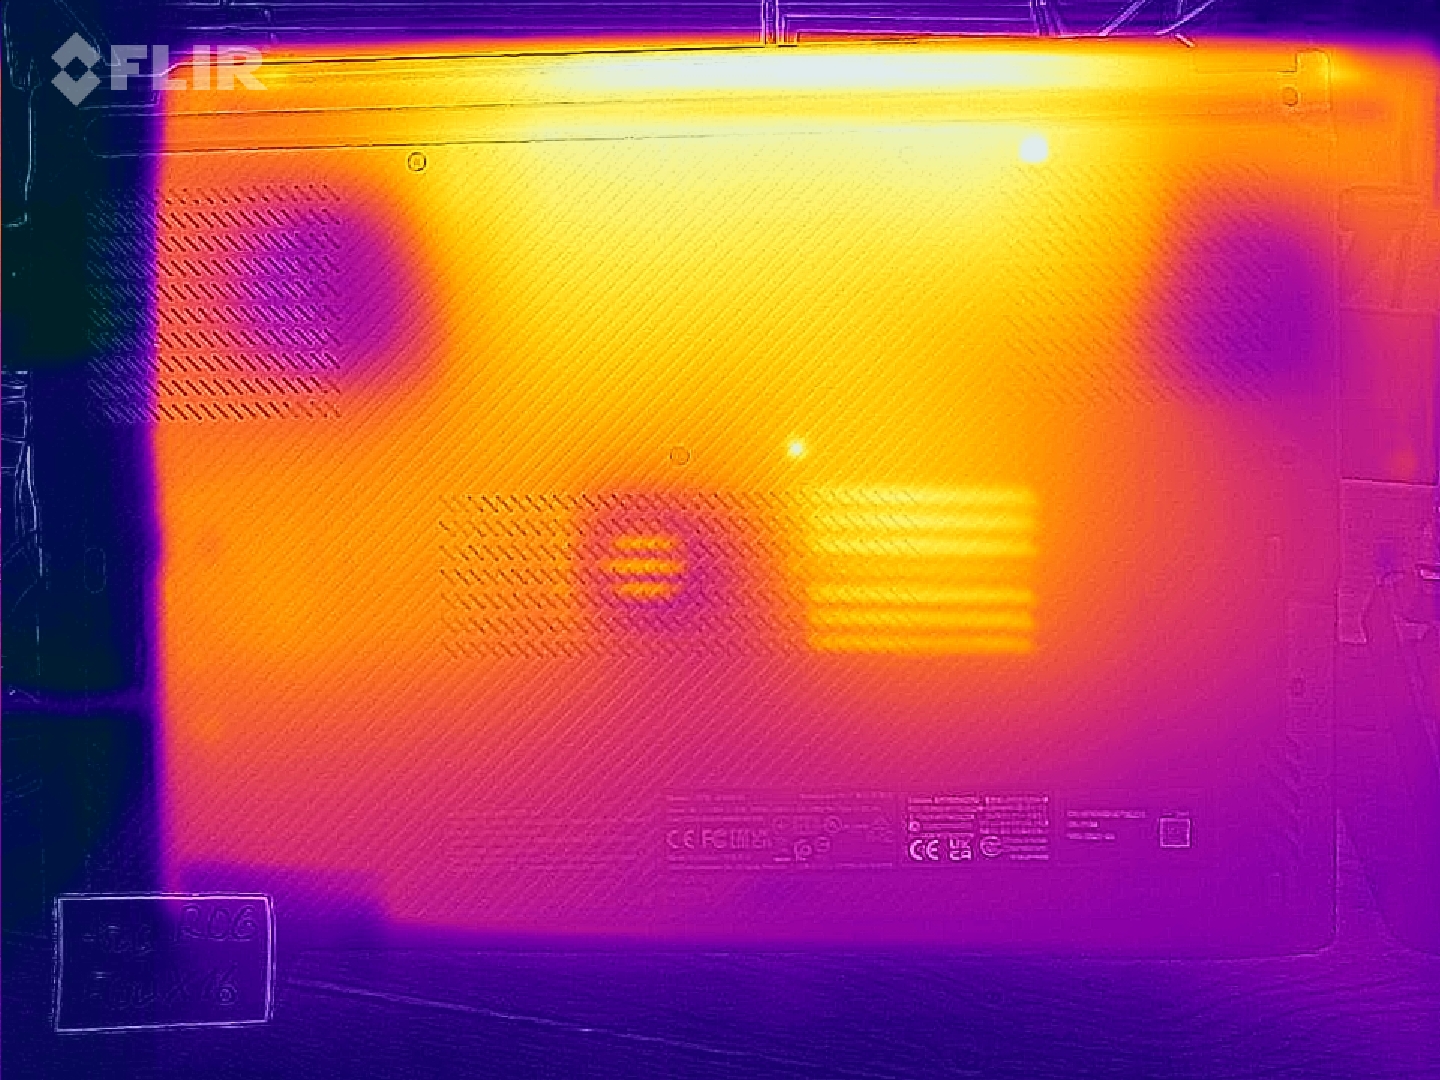
温度
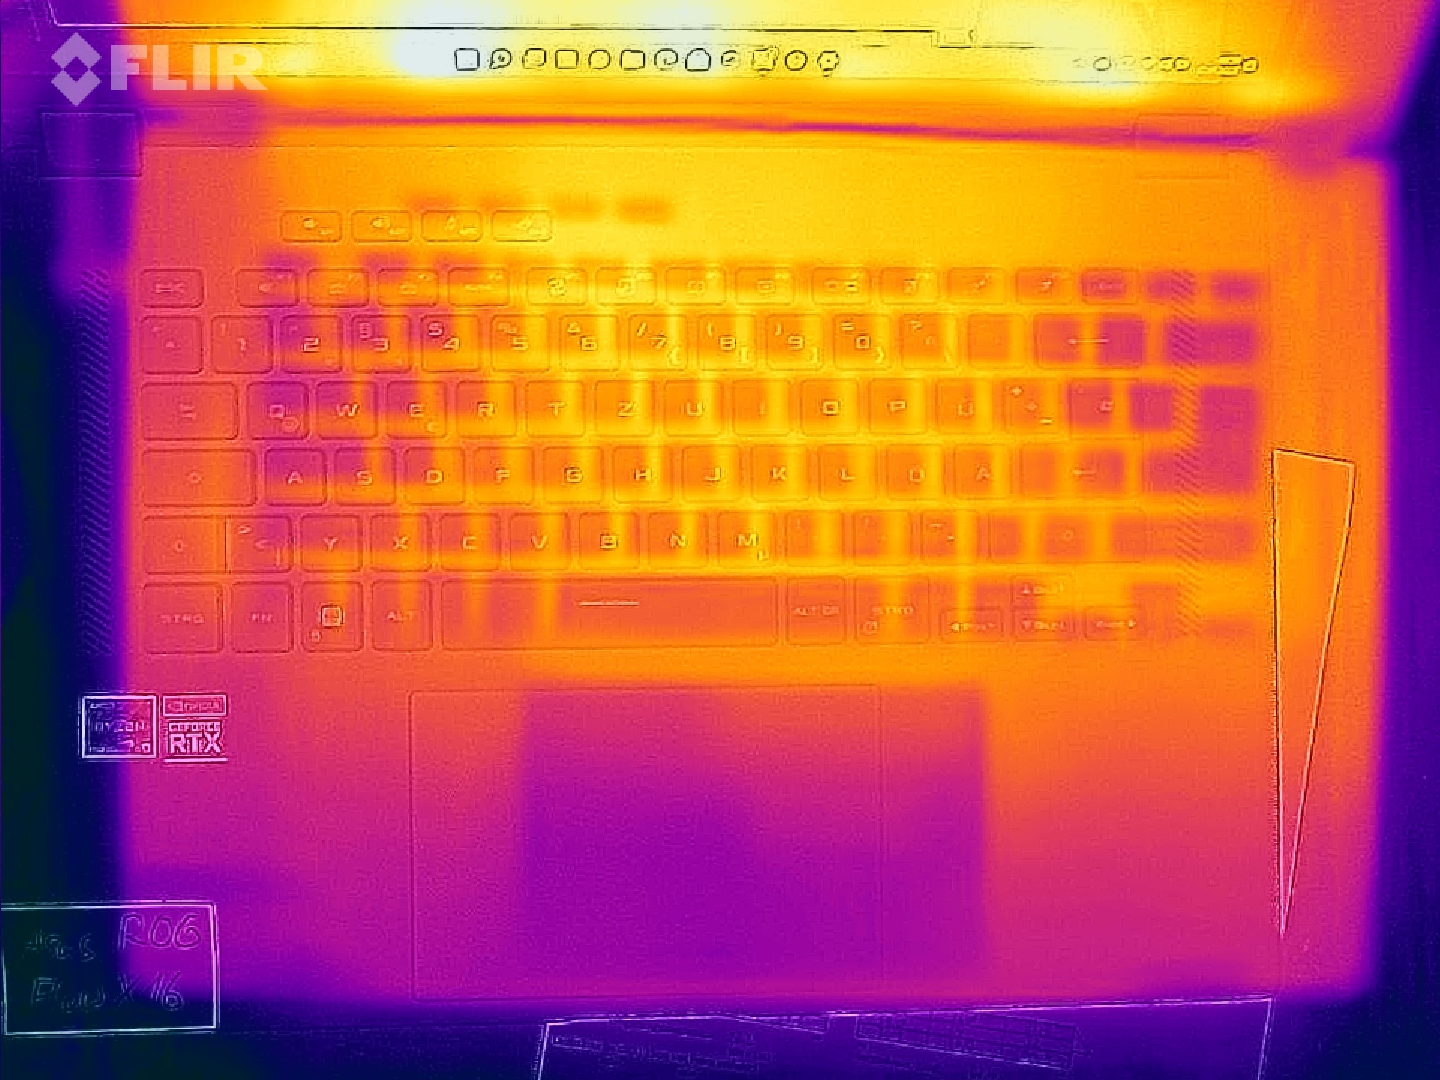
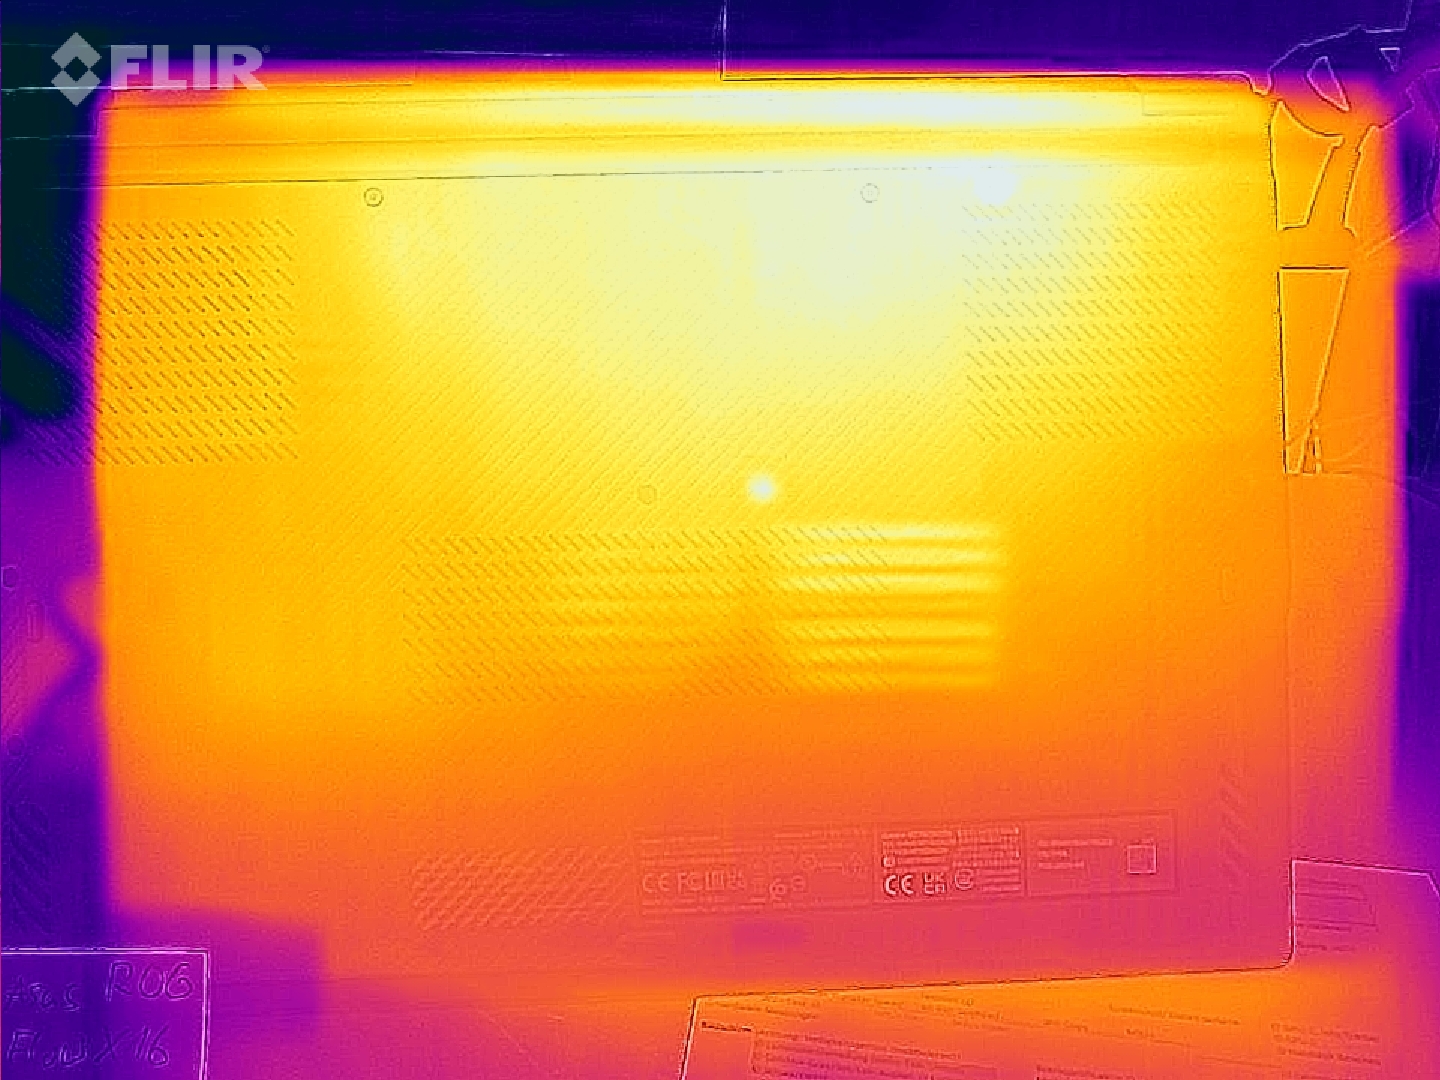
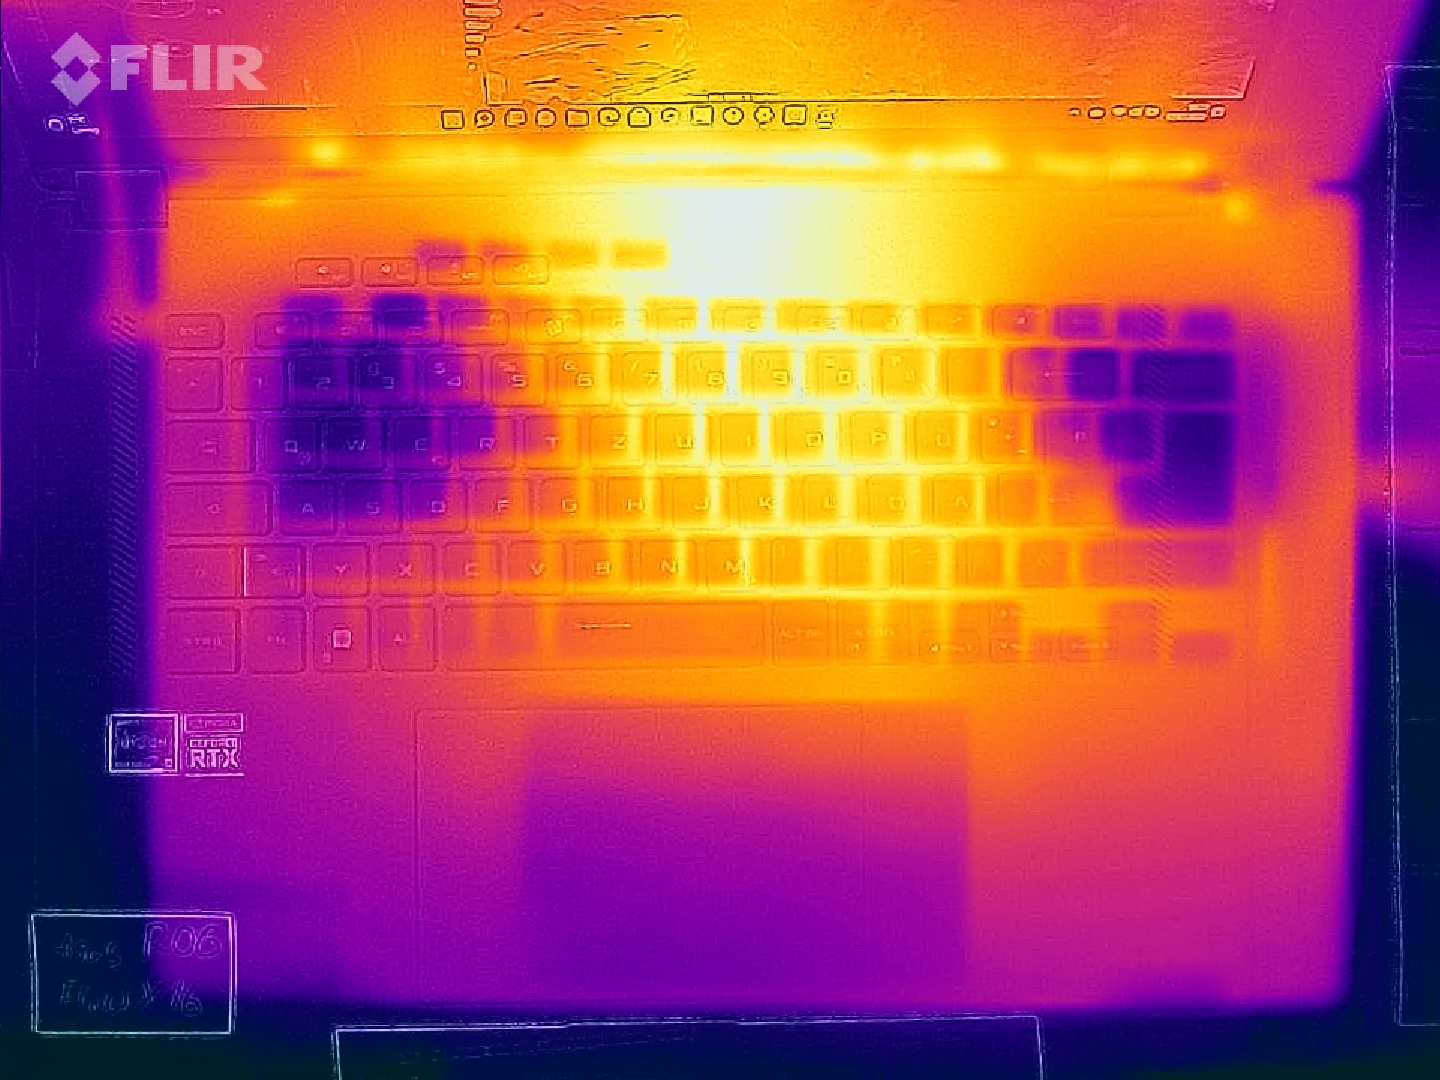
在键盘上方的中心位置,表面温度会变得相当高。我们在最大负荷时测得55℃,在游戏时测得52.8℃。当敞篷车在后面支撑起来,使底部的风扇有更好的空气供应时,这些热点仍然明显较冷。具有强大硬件的类似薄型笔记本在负载情况下也有类似的发热 (Stealth GS66, Aero 16和 ThinkPad X1 Extreme).
在长时间以最大亮度显示HDR内容时,显示屏也会变热(由于功耗高),但不会达到令人困扰的程度。
(-) The maximum temperature on the upper side is 55.1 °C / 131 F, compared to the average of 40.4 °C / 105 F, ranging from 21.2 to 68.8 °C for the class Gaming.
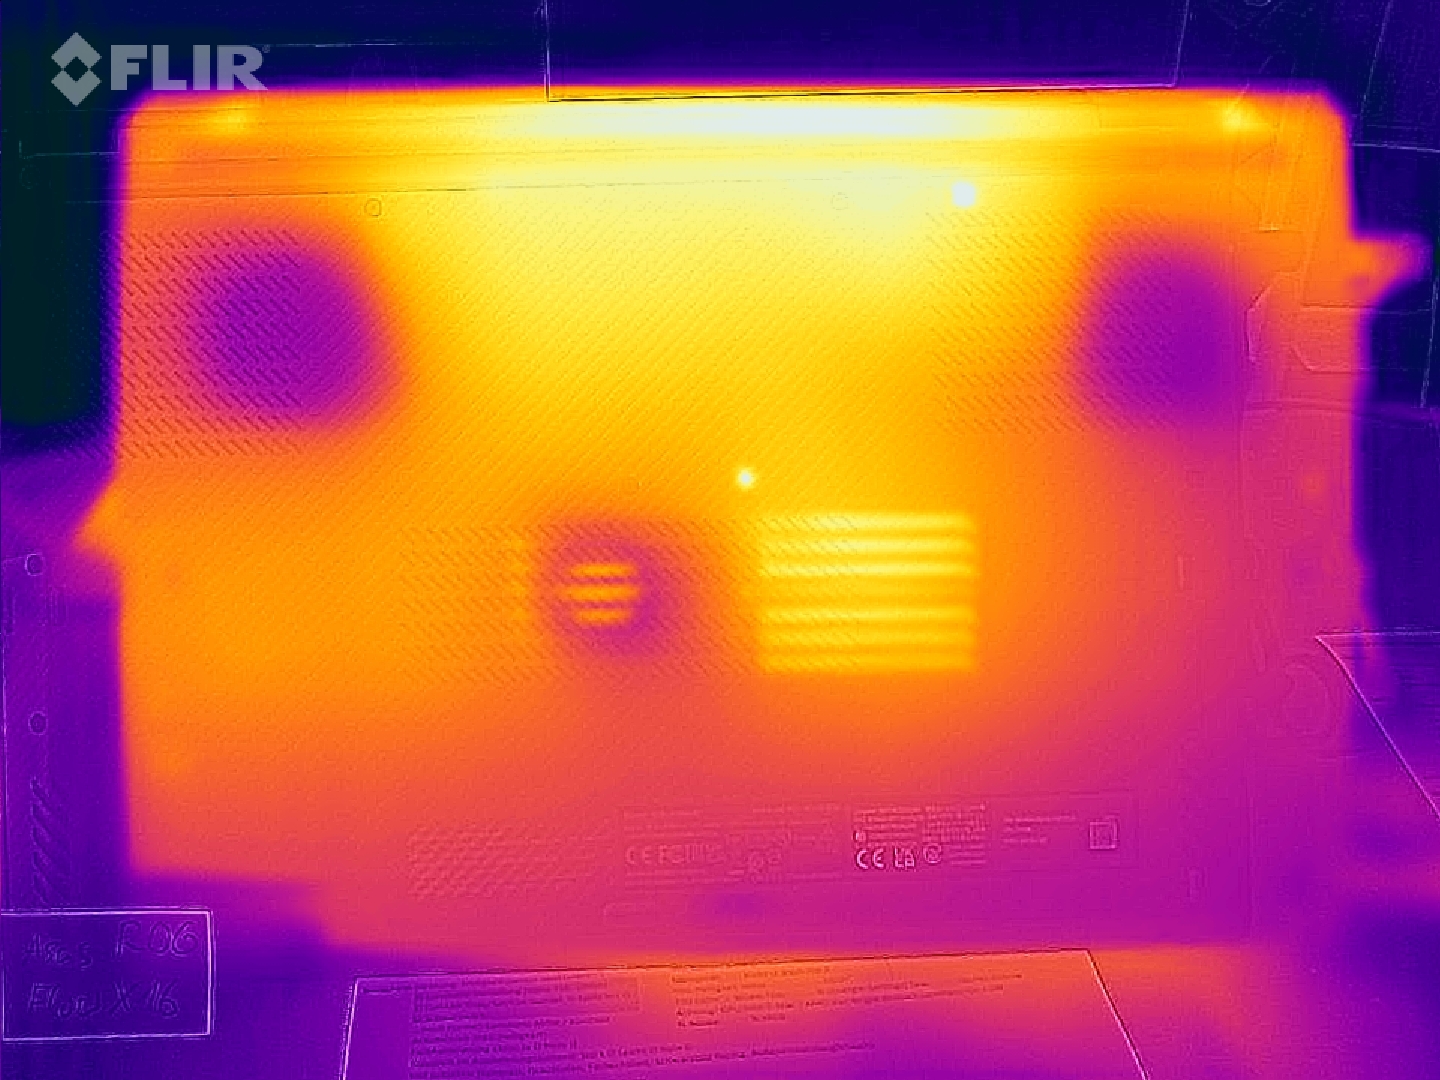
(-) The bottom heats up to a maximum of 50.3 °C / 123 F, compared to the average of 43.2 °C / 110 F
(±) In idle usage, the average temperature for the upper side is 32.8 °C / 91 F, compared to the device average of 33.9 °C / 93 F.
(-) Playing The Witcher 3, the average temperature for the upper side is 40.5 °C / 105 F, compared to the device average of 33.9 °C / 93 F.
(-) The palmrests and touchpad can get very hot to the touch with a maximum of 40.8 °C / 105.4 F.
(-) The average temperature of the palmrest area of similar devices was 28.8 °C / 83.8 F (-12 °C / -21.6 F).
| Asus ROG Flow X16 GV601RW-M5082W AMD Ryzen 9 6900HS, NVIDIA GeForce RTX 3070 Ti Laptop GPU | Asus ROG Strix Scar 15 G533ZW-LN106WS Intel Core i9-12900H, NVIDIA GeForce RTX 3070 Ti Laptop GPU | Gigabyte Aero 16 YE5 Intel Core i9-12900HK, NVIDIA GeForce RTX 3080 Ti Laptop GPU | Lenovo Legion 5 Pro 16 G7 i7 RTX 3070Ti Intel Core i7-12700H, NVIDIA GeForce RTX 3070 Ti Laptop GPU | MSI Stealth GS66 12UGS Intel Core i7-12700H, NVIDIA GeForce RTX 3070 Ti Laptop GPU | Apple MacBook Pro 16 2021 M1 Pro Apple M1 Pro, Apple M1 Pro 16-Core GPU | Lenovo ThinkPad X1 Extreme G4-20Y50040GE Intel Core i9-11950H, NVIDIA GeForce RTX 3080 Laptop GPU | Dell XPS 17 9720 RTX 3060 Intel Core i7-12700H, NVIDIA GeForce RTX 3060 Laptop GPU | Microsoft Surface Laptop Studio i7 RTX 3050 Ti Intel Core i7-11370H, NVIDIA GeForce RTX 3050 Ti Laptop GPU | |
|---|---|---|---|---|---|---|---|---|---|
| Heat | 3% | 5% | 7% | 9% | 29% | 10% | 7% | 29% | |
| Maximum Upper Side * (°C) | 55.1 | 42.6 23% | 49 11% | 45.3 18% | 54 2% | 41 26% | 51.4 7% | 51.8 6% | 42.3 23% |
| Maximum Bottom * (°C) | 50.3 | 50.2 -0% | 55 -9% | 61.2 -22% | 59 -17% | 39 22% | 55.9 -11% | 44.2 12% | 38.2 24% |
| Idle Upper Side * (°C) | 35.5 | 36.2 -2% | 33 7% | 28.6 19% | 26 27% | 24 32% | 27.2 23% | 34.8 2% | 23.4 34% |
| Idle Bottom * (°C) | 36.1 | 40.2 -11% | 33 9% | 31.4 13% | 27 25% | 24 34% | 28.8 20% | 33.2 8% | 23.5 35% |
* ... smaller is better
压力测试
在纯粹的CPU压力下,睿驰96900HS的时钟仍然是3.9GHz,温度保持在90℃左右。在综合压力下(Prime95 + FurMark),时钟保持在3 GHz,比基本时钟低300 MHz。GPU在800 MHz和1.4 GHz之间交替运行,而 RTX 3070 Ti在Witcher 3 压力测试中的时钟频率为1.5 GHz。它的温度在每种情况下都远低于90℃。
| CPU时钟(GHz) | GPU时钟(MHz) | CPU温度(℃) | GPU温度(℃) | CPU耗电(W) | GPU耗电(W) | 综合耗电(W) | |
| 系统空闲 | 0.07 | 0.2 | 43 | 39 | 7,5 | 13 | 20,5 |
| Prime95压力 | 3,9 | - | 87 | - | 75 | - | 75 |
| Prime95 + FurMark 应力 | 3 | 800 - 1.400 | 87 | 81 | 40 | 100 | 140 |
| FurMark 压力 | 0,2 | 1.150 | 75 | 83 | 20 | 120 | 140 |
| Witcher 3 应力 | 0,75 | 1.500 | 70 | 74 | 15 | 125 | 140 |
发言人
华硕基本上使用了与Zephyrus M16相同的声音系统。Zephyrus M16和 ROG Strix G15这意味着有四个低音单元,但缺少两个额外的高音单元。扬声器产生的最大声压为80.7db(A),这对笔记本电脑来说是很好的,但对于有大风扇的游戏来说是不够的。
低音只是在很小的程度上有所欠缺,中音非常平衡,而高音则有一点过头。从主观上讲,没有多少笔记本电脑能给出更好的音质;根据我们的数据库,所有评测设备中只有6%能做得更好。
Asus ROG Flow X16 GV601RW-M5082W audio analysis
(±) | speaker loudness is average but good (80.7 dB)
Bass 100 - 315 Hz
(±) | reduced bass - on average 12.7% lower than median
(±) | linearity of bass is average (13.8% delta to prev. frequency)
Mids 400 - 2000 Hz
(+) | balanced mids - only 1.3% away from median
(+) | mids are linear (4.7% delta to prev. frequency)
Highs 2 - 16 kHz
(±) | higher highs - on average 6.4% higher than median
(+) | highs are linear (6.8% delta to prev. frequency)
Overall 100 - 16.000 Hz
(+) | overall sound is linear (12.9% difference to median)
Compared to same class
» 17% of all tested devices in this class were better, 4% similar, 79% worse
» The best had a delta of 6%, average was 18%, worst was 132%
Compared to all devices tested
» 12% of all tested devices were better, 3% similar, 85% worse
» The best had a delta of 4%, average was 24%, worst was 134%
Apple MacBook Pro 16 2021 M1 Pro audio analysis
(+) | speakers can play relatively loud (84.7 dB)
Bass 100 - 315 Hz
(+) | good bass - only 3.8% away from median
(+) | bass is linear (5.2% delta to prev. frequency)
Mids 400 - 2000 Hz
(+) | balanced mids - only 1.3% away from median
(+) | mids are linear (2.1% delta to prev. frequency)
Highs 2 - 16 kHz
(+) | balanced highs - only 1.9% away from median
(+) | highs are linear (2.7% delta to prev. frequency)
Overall 100 - 16.000 Hz
(+) | overall sound is linear (4.6% difference to median)
Compared to same class
» 0% of all tested devices in this class were better, 0% similar, 100% worse
» The best had a delta of 5%, average was 17%, worst was 45%
Compared to all devices tested
» 0% of all tested devices were better, 0% similar, 100% worse
» The best had a delta of 4%, average was 24%, worst was 134%
能源管理 - 异常升高的闲置值
消耗功率

闲置时,在静音+ GPU节能模式下需要12.2瓦。在静音+ GPU平衡 模式下,系统需要整整25.5瓦,而在涡轮 模式下则需要不到30瓦。这些都是不寻常的高值,即使对于游戏笔记本来说也是如此,这可能部分是由于迷你LED显示屏的原因。
Scar 15,Legion 5 Pro 和MSI Stealth GS66 在闲置时都需要明显较少的电力。另一方面,OLED笔记本电脑与ROG Flow X16的空闲值一样高。
由于在 Witcher 3 ,CPU和GPU共需要约140瓦,这就为系统的其他部分留下了43瓦的空间。最大压力测试最初要求240瓦的电源适配器提供253瓦的功率。然而,该值在几秒钟后急剧下降,并在一分钟后定格在可接受的217瓦特。
| Off / Standby | |
| Idle | |
| Load |
|
Key:
min: | |
| Asus ROG Flow X16 GV601RW-M5082W R9 6900HS, GeForce RTX 3070 Ti Laptop GPU, Micron 3400 1TB MTFDKBA1T0TFH, Mini LED, 2560x1600, 16.1" | Asus ROG Zephyrus M16 GU603H i9-11900H, GeForce RTX 3070 Laptop GPU, Samsung PM9A1 MZVL22T0HBLB, IPS, 2560x1600, 16" | Asus ROG Strix Scar 15 G533ZW-LN106WS i9-12900H, GeForce RTX 3070 Ti Laptop GPU, Samsung PM9A1 MZVL22T0HBLB, IPS-level, 2560x1440, 15.6" | Gigabyte Aero 16 YE5 i9-12900HK, GeForce RTX 3080 Ti Laptop GPU, Phison ESR01TBMFCT, AMOLED, 3840x2400, 16" | Lenovo Legion 5 Pro 16 G7 i7 RTX 3070Ti i7-12700H, GeForce RTX 3070 Ti Laptop GPU, Samsung PM9A1 MZVL21T0HCLR, IPS, 2560x1600, 16" | MSI Stealth GS66 12UGS i7-12700H, GeForce RTX 3070 Ti Laptop GPU, WDC PC SN810 1TB, IPS-Level, 2560x1440, 15.6" | Apple MacBook Pro 16 2021 M1 Pro M1 Pro, M1 Pro 16-Core GPU, Apple SSD AP1024R, Mini-LED, 3456x2234, 16.2" | Lenovo ThinkPad X1 Extreme G4-20Y50040GE i9-11950H, GeForce RTX 3080 Laptop GPU, Kioxia XG7 KXG7AZNV1T02, IPS, 3840x2400, 16" | Dell XPS 17 9720 RTX 3060 i7-12700H, GeForce RTX 3060 Laptop GPU, Samsung PM9A1 MZVL21T0HCLR, IPS, 3840x2400, 17" | Average NVIDIA GeForce RTX 3070 Ti Laptop GPU | Average of class Gaming | |
|---|---|---|---|---|---|---|---|---|---|---|---|
| Power Consumption | 18% | 24% | -19% | 17% | 23% | 56% | 27% | 37% | 10% | 15% | |
| Idle Minimum * (Watt) | 12.2 | 11 10% | 7.56 38% | 26 -113% | 8.6 30% | 11 10% | 5 59% | 12.3 -1% | 5.9 52% | 14.2 ? -16% | 13.2 ? -8% |
| Idle Average * (Watt) | 25.5 | 20 22% | 13.5 47% | 30 -18% | 17.6 31% | 16 37% | 15.1 41% | 22.8 11% | 15.8 38% | 19.9 ? 22% | 18.9 ? 26% |
| Idle Maximum * (Watt) | 29.8 | 30 -1% | 16.87 43% | 37 -24% | 18.5 38% | 23 23% | 15.5 48% | 13.9 53% | 26.7 10% | 26.2 ? 12% | 24.5 ? 18% |
| Load Average * (Watt) | 183 | 111 39% | 128.9 30% | 127 31% | 110 40% | 110 40% | 54 70% | 95.4 48% | 117.4 36% | 125.8 ? 31% | 108.5 ? 41% |
| Witcher 3 ultra * (Watt) | 183.6 | 156 15% | 196.2 -7% | 176 4% | 227 -24% | 151 18% | 154 16% | 114.8 37% | |||
| Load Maximum * (Watt) | 253 | 197 22% | 274.86 -9% | 236 7% | 294.6 -16% | 230 9% | 90 64% | 170.7 33% | 136.6 46% | 248 ? 2% | 254 ? -0% |
* ... smaller is better
Power consumption Witcher 3 / Stress test
Power consumption with an external monitor
电池寿命
我们测量了关闭HDR、在Armoury Crate的平衡 模式和GPU节能 模式(禁用dGPU)下的WLAN电池运行时间。在电池模式下,帧率被自动设置为60赫兹(这一功能可以被禁用),而在测试期间亮度为173尼特。之后,我们运行了一个标准化的脚本,在不同的时间间隔调用网页,必要时沿着网页滚动,点击链接,看图片和动画以及人们在网站上做的任何事情。
结果是平庸的:与一个没有迷你LED显示屏的相同型号进行比较将是有趣的。我们的结果是刚刚超过5:39小时(在165赫兹下少了1小时)。在500尼特的全SDR亮度下,我们又损失了近2个小时(3:45小时),而用电池供电的游戏在大约50分钟后就结束了。
大致相同的Zephyrus M16具有相同的电池尺寸和一个更饥饿的英特尔处理器,可以管理超过7个半小时。然而,在竞争者中,有很多游戏笔记本在WLAN测试中不能持续6个小时,这对该类笔记本来说并不罕见。固件和BIOS更新可能会改善Flow X16的电池寿命。90Wh的电池完全充电需要一个半小时。
Apple's MacBook Pro 16以近17小时的电池寿命脱颖而出,当你考虑到它还采用了迷你LED显示屏时,这就更令人印象深刻了。
| Asus ROG Flow X16 GV601RW-M5082W R9 6900HS, GeForce RTX 3070 Ti Laptop GPU, 90 Wh | Asus ROG Zephyrus M16 GU603H i9-11900H, GeForce RTX 3070 Laptop GPU, 90 Wh | Asus ROG Strix Scar 15 G533ZW-LN106WS i9-12900H, GeForce RTX 3070 Ti Laptop GPU, 90 Wh | Gigabyte Aero 16 YE5 i9-12900HK, GeForce RTX 3080 Ti Laptop GPU, 99 Wh | Lenovo Legion 5 Pro 16 G7 i7 RTX 3070Ti i7-12700H, GeForce RTX 3070 Ti Laptop GPU, 80 Wh | MSI Stealth GS66 12UGS i7-12700H, GeForce RTX 3070 Ti Laptop GPU, 99.9 Wh | Apple MacBook Pro 16 2021 M1 Pro M1 Pro, M1 Pro 16-Core GPU, 99.6 Wh | Lenovo ThinkPad X1 Extreme G4-20Y50040GE i9-11950H, GeForce RTX 3080 Laptop GPU, 90 Wh | Dell XPS 17 9720 RTX 3060 i7-12700H, GeForce RTX 3060 Laptop GPU, 97 Wh | Asus ROG Flow X13 GV301QH R9 5980HS, GeForce GTX 1650 Max-Q, 62 Wh | Average of class Gaming | |
|---|---|---|---|---|---|---|---|---|---|---|---|
| Battery runtime | 57% | 27% | 45% | -19% | 37% | 196% | 21% | 32% | 51% | 44% | |
| WiFi v1.3 (h) | 5.7 | 7.7 35% | 8.4 47% | 6.4 12% | 5.4 -5% | 5.4 -5% | 16.9 196% | 6.8 19% | 8.7 53% | 5.8 2% | 7.04 ? 24% |
| Witcher 3 ultra (h) | 0.9 | 1.2 33% | |||||||||
| Load (h) | 0.9 | 1.6 78% | 0.9 0% | 1.6 78% | 0.6 -33% | 1.6 78% | 1.1 22% | 1 11% | 1.8 100% | 1.47 ? 63% | |
| Reader / Idle (h) | 13.3 | 8.9 | 7.8 | 10.4 | 8.71 ? | ||||||
| H.264 (h) | 8.5 | 7.5 | 6.3 | 17.5 | 6.9 | 6.9 | 8.26 ? |
Pros
Cons
结论--华硕ROG Flow X16:成功的游戏敞篷车
华硕在ROG Flow X16的形式上成功地创造了一个成熟的游戏笔记本电脑和多媒体可转换的混合体。尽管设计紧凑,但由于采用了特殊的冷却设计,温度和噪音水平仍在限制范围内。这也允许使用一个GeForce RTX 3070 Ti125W的TGP,而许多高级别的多媒体笔记本电脑,如 戴尔XPS 17或 Gigabyte Aero 16,不得不用80至105瓦的功率来做。
因此,Flow X16的性能很好,这得益于现有的MUX开关的帮助。AMD的节俭型 Ryzen 9 6900HS也提供了足够的功率,即使在电池模式下也能保持高度的可及性,与许多英特尔的同类产品不同。
游戏和创意任务的另一个基本因素是显示屏,华硕在这方面不可能做得更好,因为迷你LED屏幕是同类产品中最好的,在亮度方面优于同样高对比度的OLED显示屏,即使这不能完全利用电池电量。尽管如此,DisplayHDR 1000使相应的内容(例如在游戏时)看起来非常漂亮,也改善了桌面模式下的对比度和黑值(512个局部调光区被激活)。在交付状态下,经过良好校准的QHD面板对DCI-P3色彩空间的覆盖率接近100%,这对专业图像编辑来说是一个保证,而轻微的绽放效果只是略微令人不安。
360°铰链对于在帐篷模式下用控制器玩游戏或在旅途中的情况也是有利的,只要你不打算每次超过几个小时。此外,还有良好的扬声器以及升级到64GB DDR5内存和安装第二个固态硬盘的可能性。做工是高水平的,输入设备也很好,尽管有些人希望具有1.7毫米宽大行程的安静键盘更清晰,而其他人则希望RGB灯光可以单独编程。
ROG Flow X16以其高性能、深思熟虑的冷却系统和明亮的迷你LED显示屏而成为独特的二合一游戏机--不仅在游戏中,而且在所有多媒体任务中。电池寿命是我们的主要批评点。
USB 4缺失,但华硕的xGM端口为未来更强大的电子GPU带来了希望。我们还希望有一个LAN端口,以及一个指纹识别器、一个全尺寸的SD读卡器和一个1080p网络摄像头。你还必须忍受空转时的高耗电量,这可以通过华硕的节能配置文件来减少。电池运行时间不是很好,但对于该类设备来说是正常的,可以通过未来的更新加以改善。
归根结底,只有两个方面阻碍了我们的决定。略低于3,000美元的价格(或2,000美元的基本配置,没有Mini LED和RTX 3050 Ti)和你真正需要的问题。一个拥有最大TGP、最佳响应时间和最高FPS的经典游戏玩家?那么你最好选择 微星突袭者GE77 HX.这款强大的 Legion 5 Pro,也相当便宜,约为1,900美元,但没有那么紧凑,而且它比ROG Flow X16在更高的排放中挣扎。
也就是说,Flow X16的GPU性能是其他任何具有这种紧凑尺寸的笔记本所不具备的,更不用说其二合一功能。对于那些可以不使用Windows并因此可以不使用大多数游戏的人来说,MacBook Pro 16是一个不错的选择。 MacBook Pro 16配有M1系统芯片的MacBook Pro 16具有许多优势,如很长的电池运行时间、大部分的静音操作和非常好的迷你LED显示屏。
价格和可用性
我们的评测样品(GV601RW-M5082W)配有Ryzen 9 6900HS、32GB内存、1TB SSD、RTX 3070 Ti和迷你LED显示屏,是为德语市场准备的预发布型号,在那里还没有上市。
其他不同配置的型号已经在一些国家上市。例如,一个几乎相同的配置(用16GB内存而不是32GB)在美国,售价为2,699.99美元。.一个完全相同的配置可通过亚马逊在英国。但目前被列为缺货。印度列出了两个型号不同的配置,不同的价格。澳大利亚则提供了一个相同的配置,价格为4,099.00澳元.在撰写本文时(2022年8月4日),价格和供应情况可能会发生变化。
上述的例子并不详尽。建议用户直接通过华硕的Republic of Gamers网站查询(如适用)。只需在产品 ->笔记本电脑下找到寻找ROG Flow X 16,然后点击哪里购买。
Asus ROG Flow X16 GV601RW-M5082W
- 08/03/2022 v7 (old)
Marvin Gollor
Price comparison

