华硕ROG Strix Scar 15 G533ZW笔记本电脑评论。1440p 240 Hz的游戏动力,配备桤木湖酷睿i9和150 W RTX 3070 Ti
华硕ROG Strix系列是每年年初备受期待的游戏笔记本阵容之一,值得关注。这款 ROG Strix Scar 15 (2022)在2022年CES期间宣布,升级为英特尔Alder Lake-H和图形选项,直到 NvidiaGeForce RTX 3080 Ti 笔记本电脑GPU.华硕继续将G533的命名发扬光大到2022年,但在品牌上做了一些改变。
虽然华硕完全转向AMD Ryzen 5000系列的产品,但与 ROG Strix Scar 152021年,该公司现在已经将产品线分为不同的英特尔Alder Lake和AMD Ryzen 6000产品。
在15.6英寸格式中,我们有一些产品,如我们目前的测试装置,ROG Strix Scar 15 G533ZW。在AMD方面,华硕放弃了 "Scar "品牌(以及签名设计和Keystone),Strix G15 G513系列由CPU选项提供,最高可达 Ryzen 9 6900HX和高达150 WRTX 3080笔记本电脑GPU.
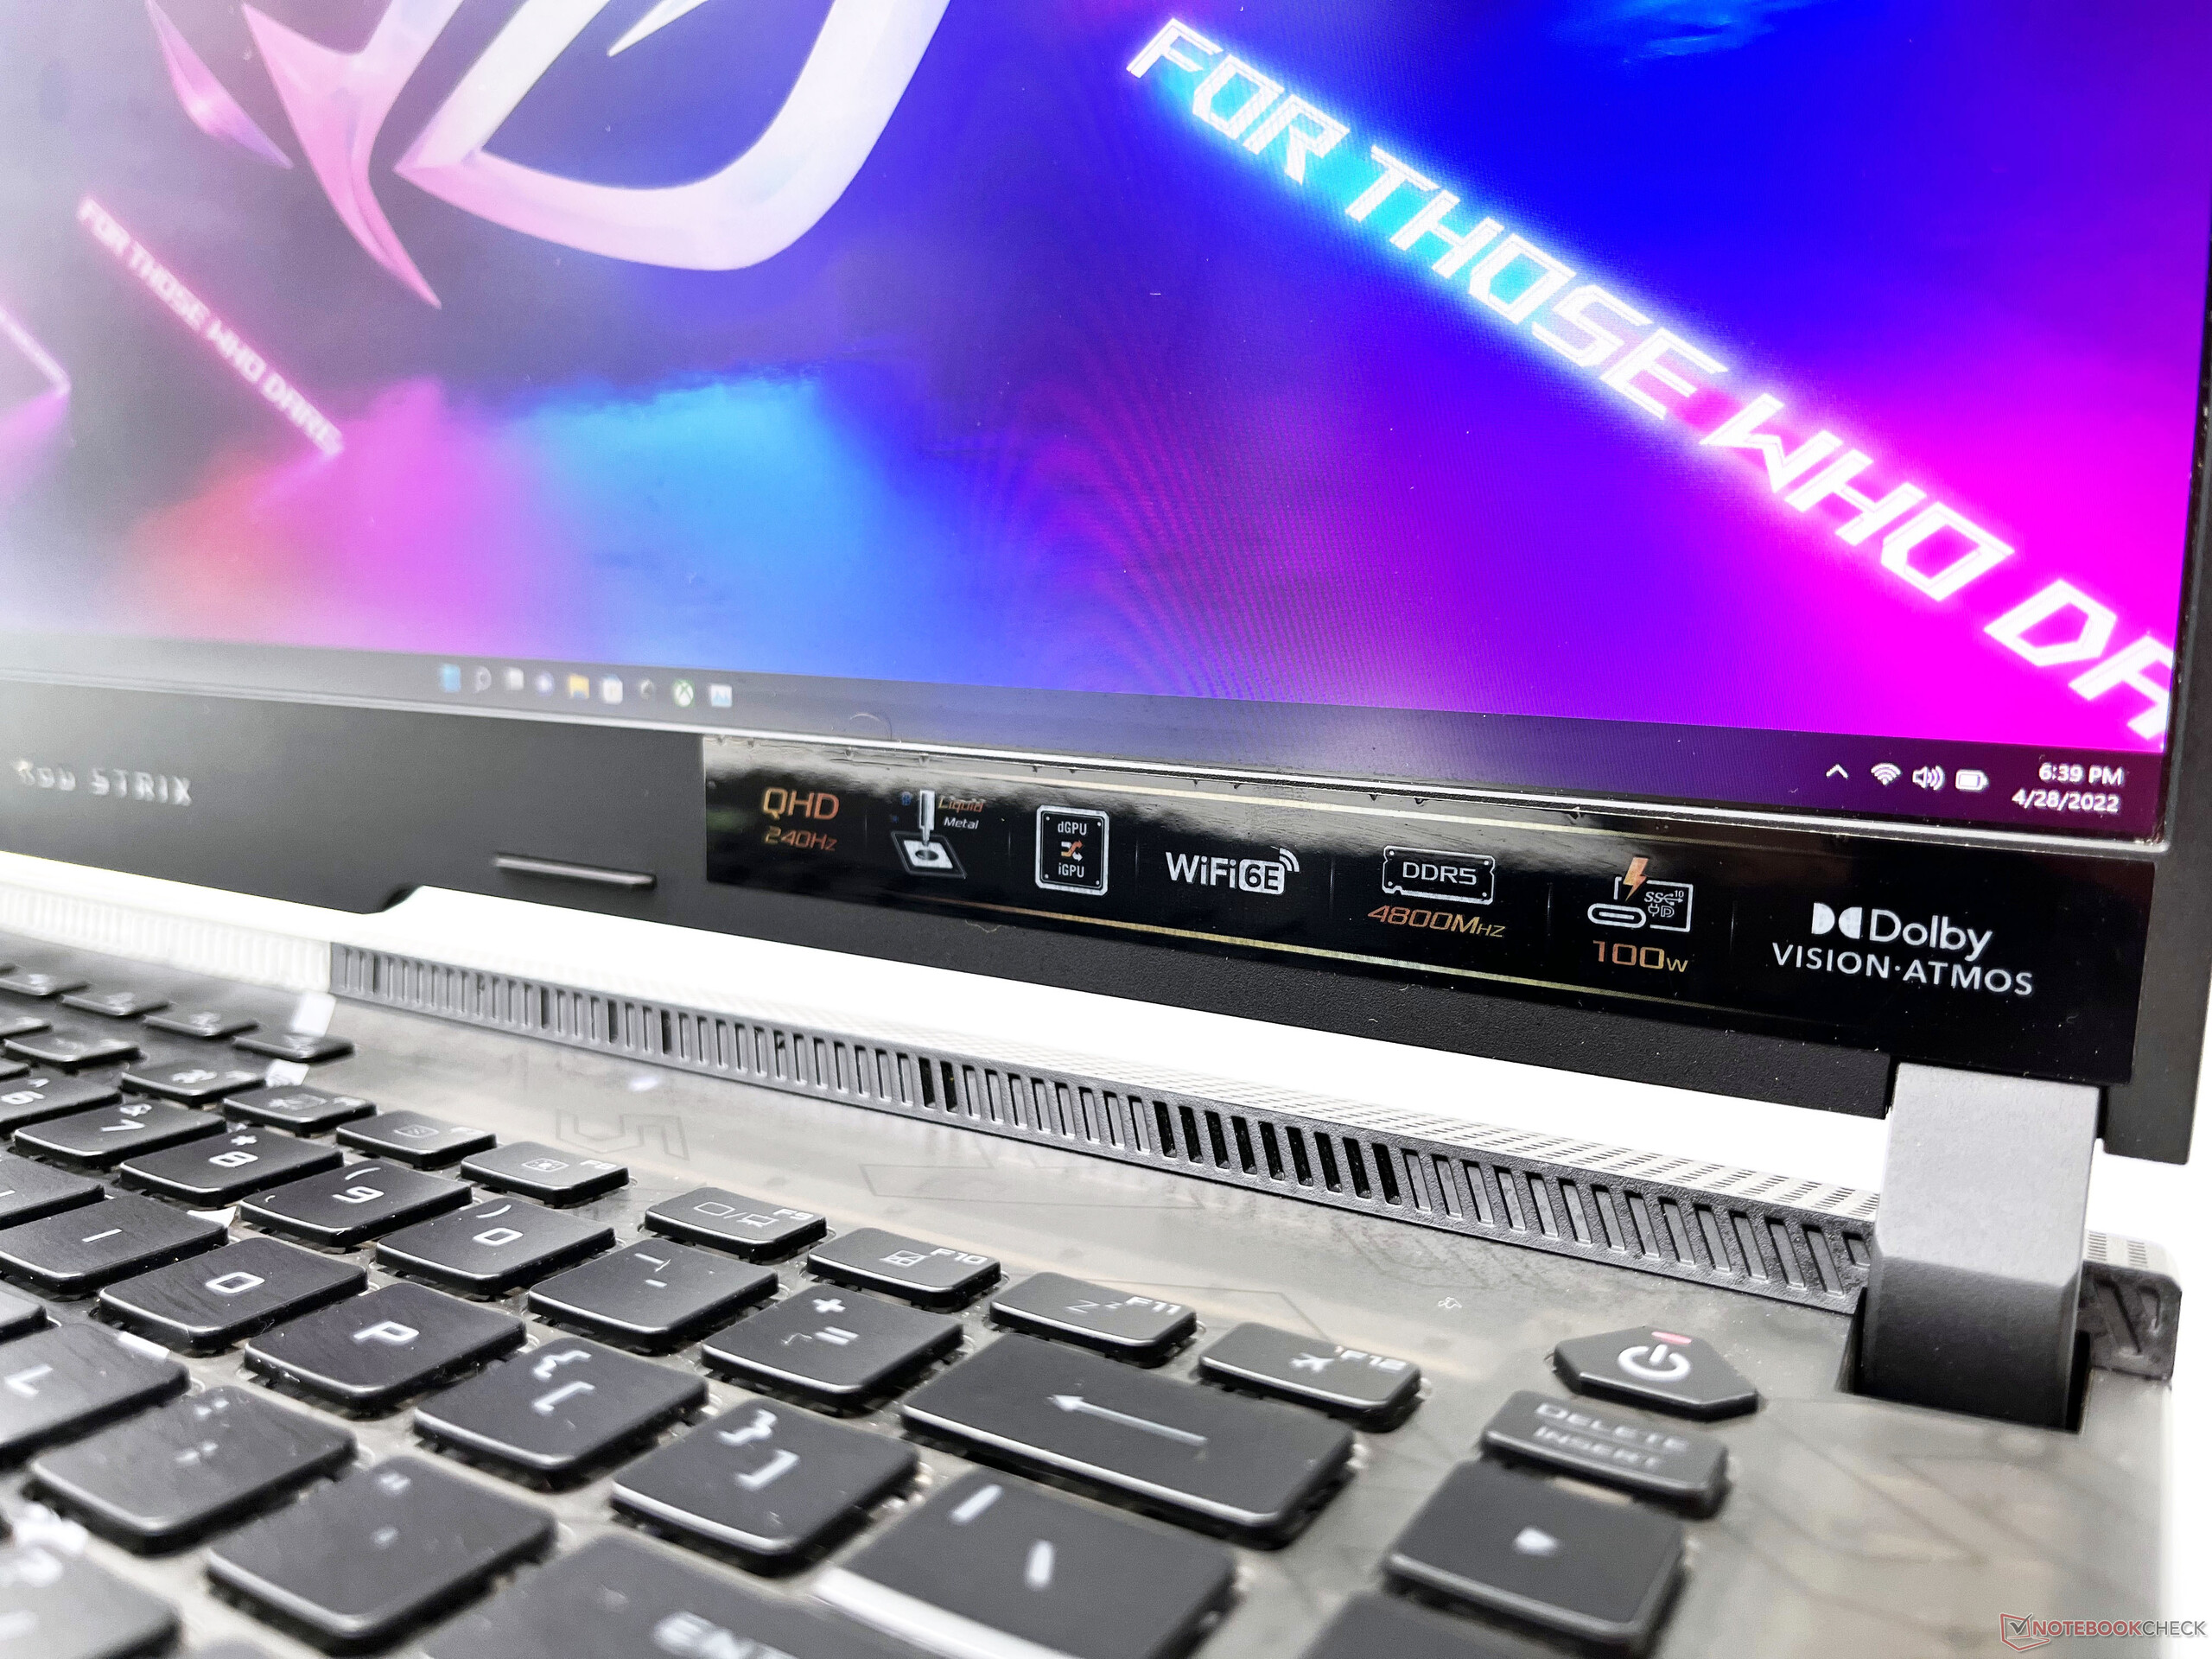
ROG Strix Scar 15 G533ZW (2022)为该阵容引入了一些诱人的新功能。所有2022年的ROG笔记本电脑现在都配备了MUX开关,可以在Armory Crate内启用。我们还可以看到高达WQHD 240 Hz面板的显示选项,DDR5-4800内存,PCIe Gen 4固态硬盘,更快的USB端口,2.5G网络和Wi-Fi 6E。
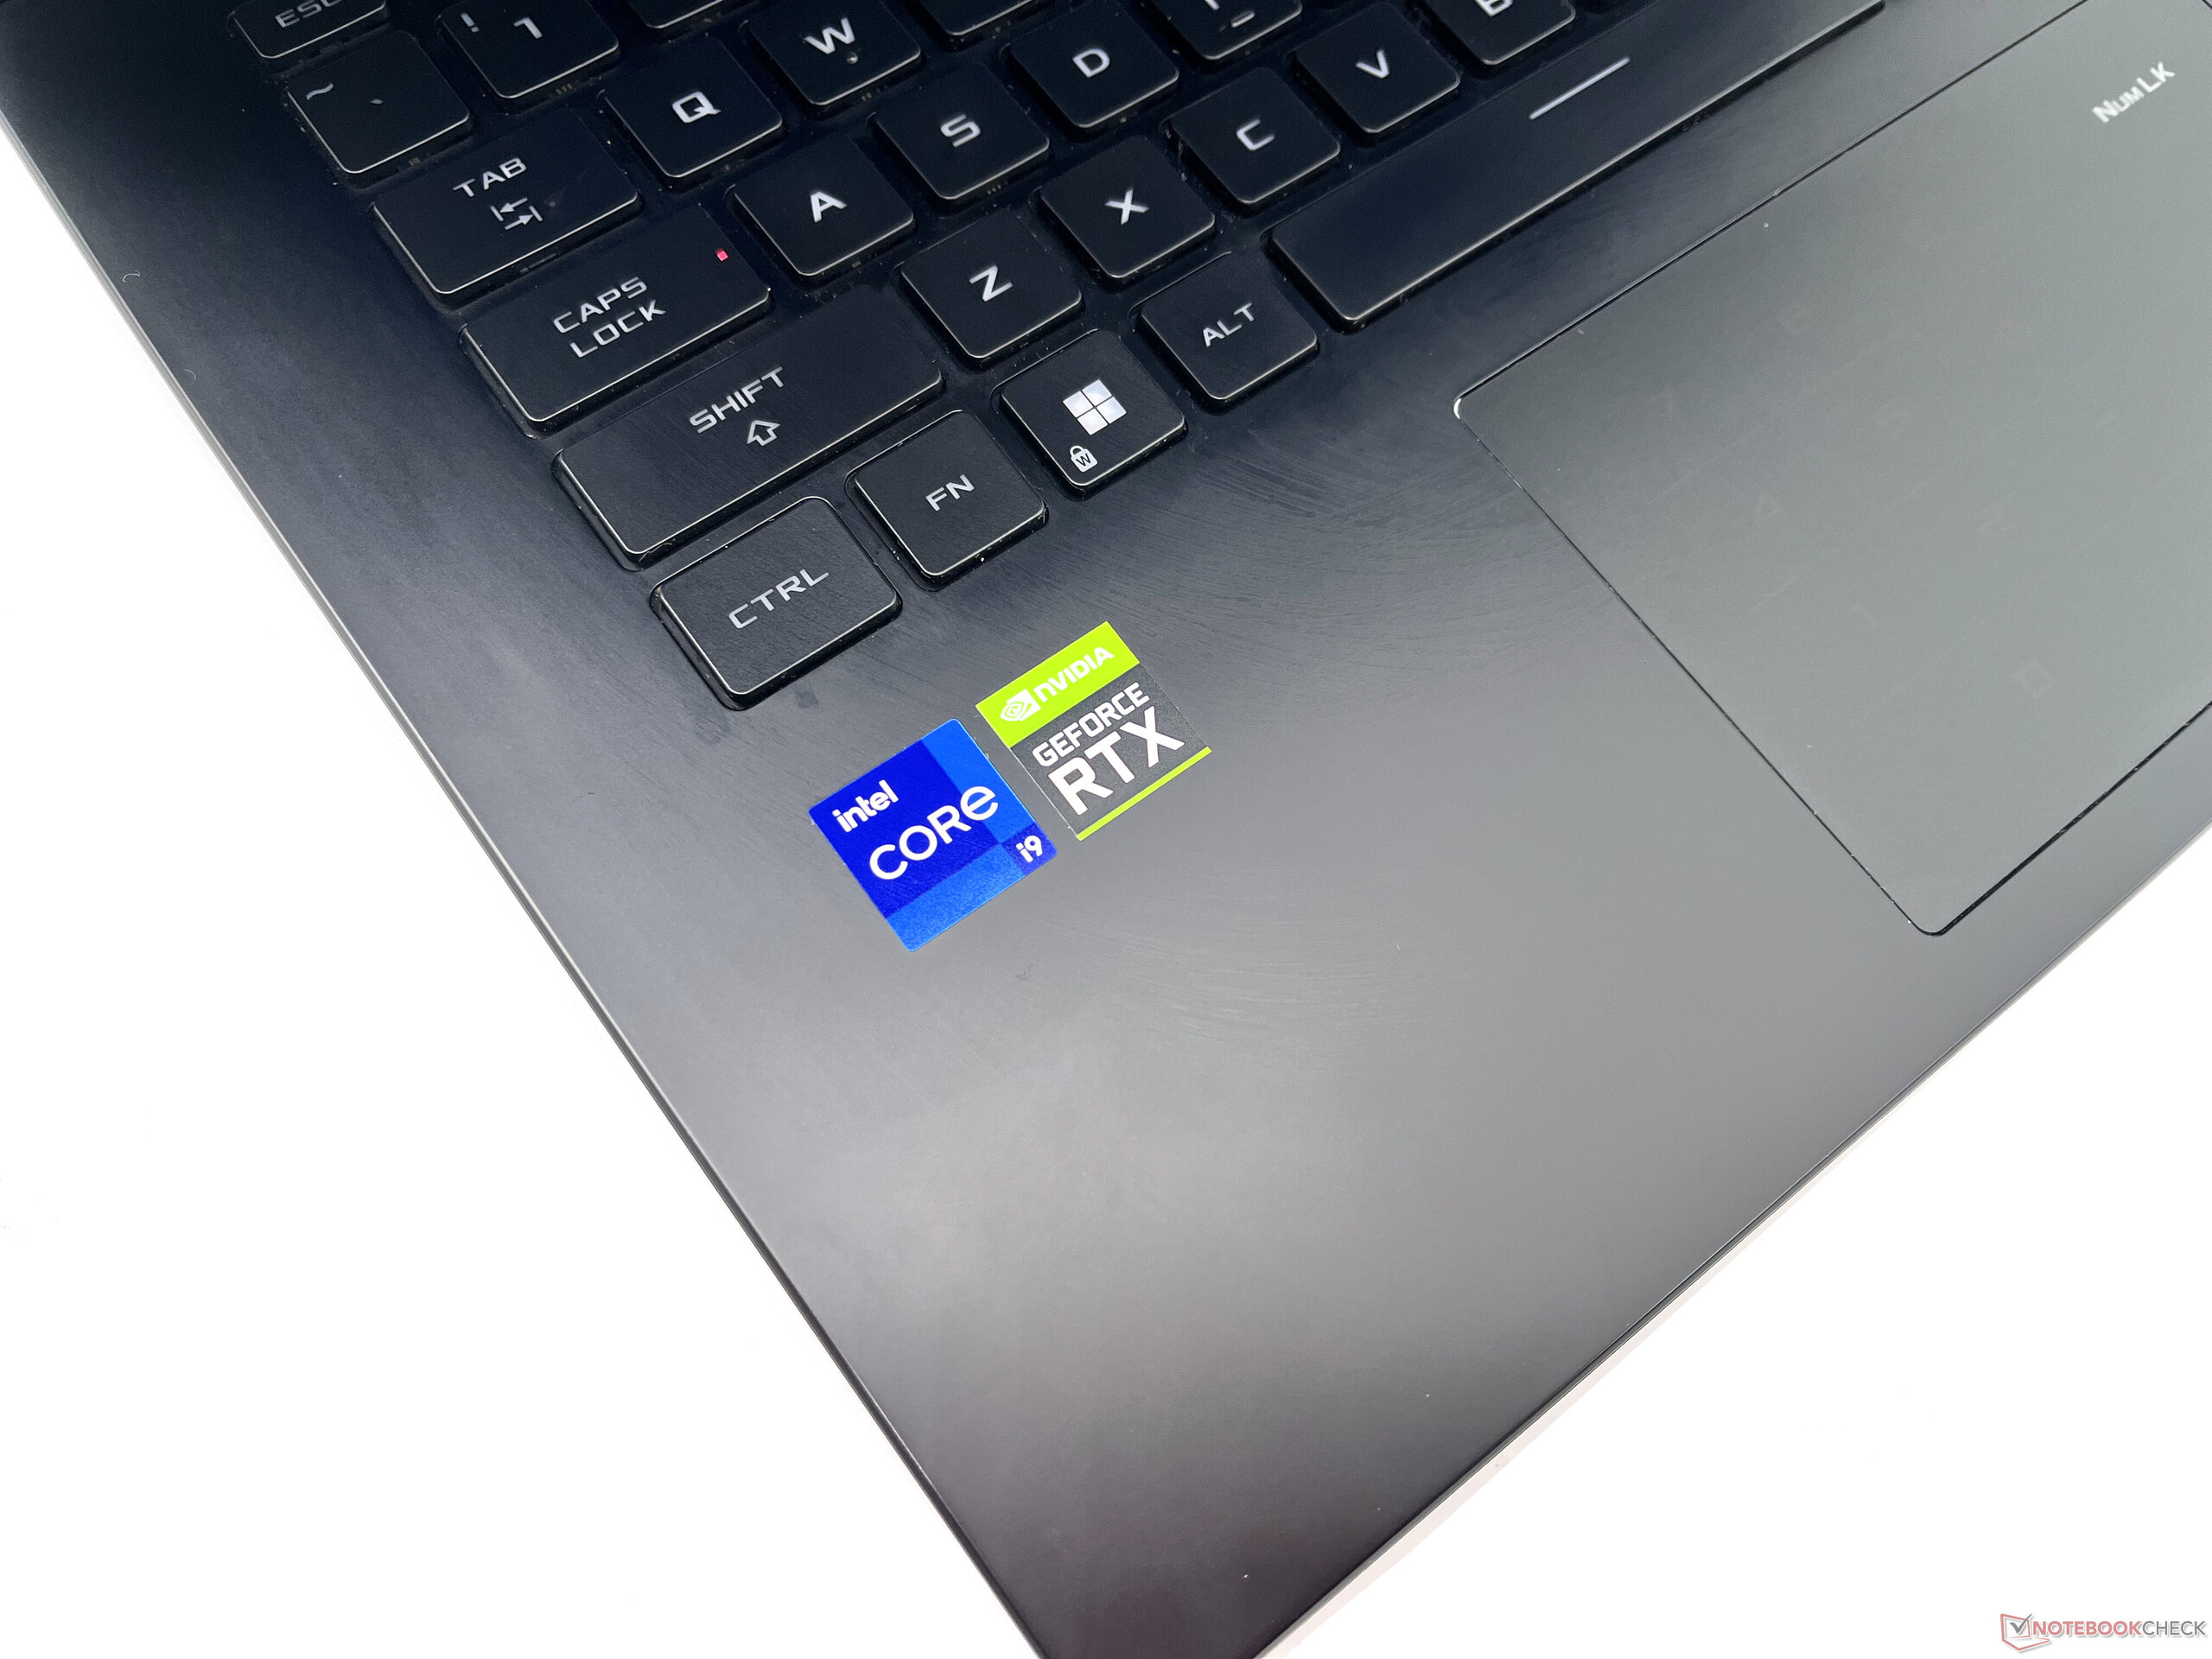
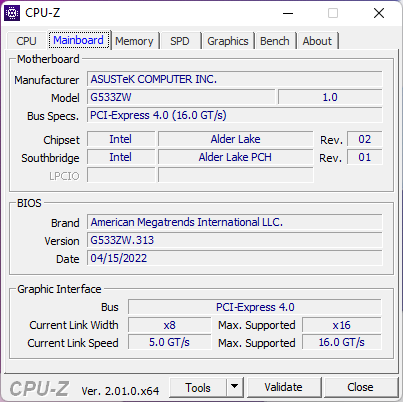
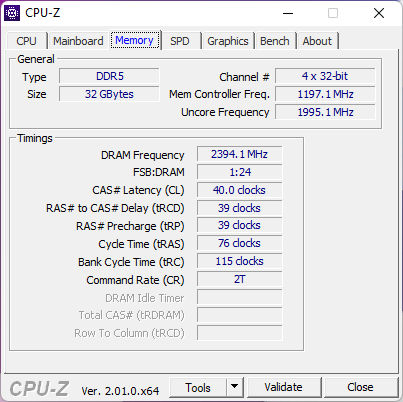
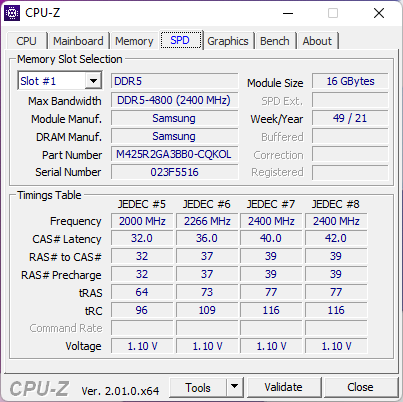
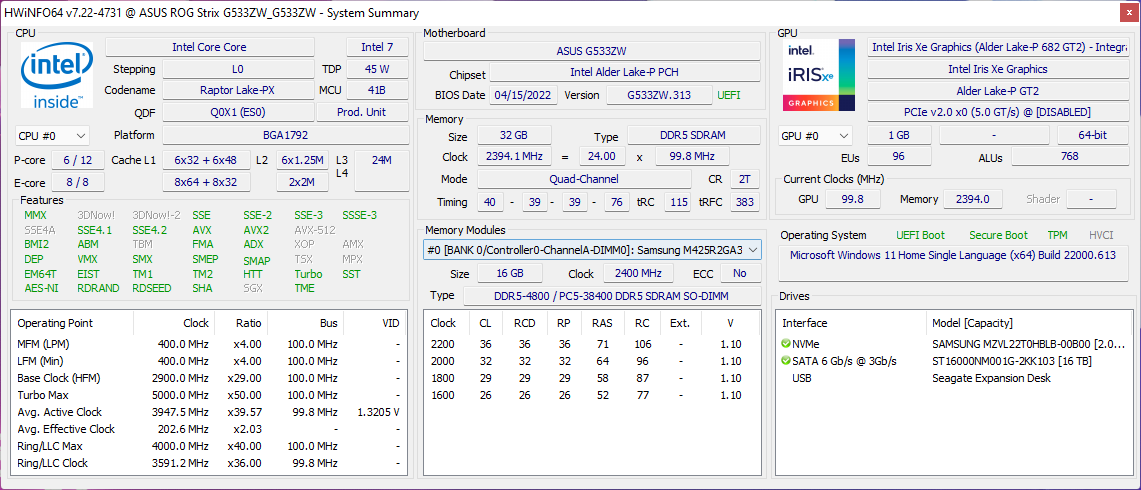
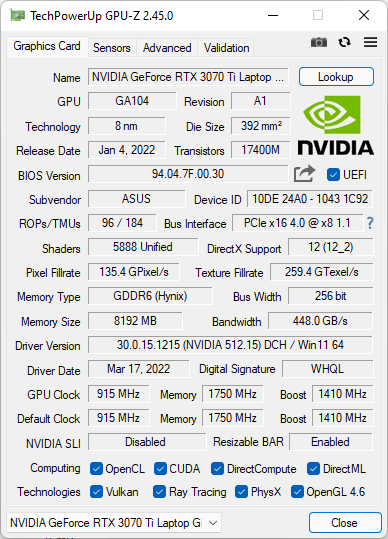
我们测试的ROG Strix Scar 15 G533ZW设备是由酷睿i9-12900H和一个150 WRTX 3070 Ti笔记本GPU.板上有32GB DDR5-4800内存,以及2TB Gen 4 NVMe SSD。这个配置会让你付出2,64,990英镑(3,419美元)的代价。
在这次审查中,我们采取了ROG Strix Scar 15 G533ZW的旋转,看看新的升级是否值得你考虑。
潜在的竞争对手比较
Rating | Date | Model | Weight | Height | Size | Resolution | Price |
|---|---|---|---|---|---|---|---|
| 86.3 % v7 (old) | 06 / 2022 | Asus ROG Strix Scar 15 G533ZW-LN106WS i9-12900H, GeForce RTX 3070 Ti Laptop GPU | 2.3 kg | 27.2 mm | 15.60" | 2560x1440 | |
| 80.7 % v7 (old) | 04 / 2022 | MSI Pulse GL66 12UEK i9-12900H, GeForce RTX 3060 Laptop GPU | 2.3 kg | 25 mm | 15.60" | 1920x1080 | |
| 84.7 % v7 (old) | 03 / 2022 | Gigabyte Aero 16 YE5 i9-12900HK, GeForce RTX 3080 Ti Laptop GPU | 2.3 kg | 22.4 mm | 16.00" | 3840x2400 | |
| 86.9 % v7 (old) | 03 / 2022 | MSI Vector GP66 12UGS i9-12900H, GeForce RTX 3070 Ti Laptop GPU | 2.3 kg | 23.4 mm | 15.60" | 1920x1080 | |
| 87.4 % v7 (old) | 06 / 2022 | MSI Raider GE66 12UHS i9-12900HK, GeForce RTX 3080 Ti Laptop GPU | 2.4 kg | 23.4 mm | 15.60" | 3840x2160 | |
| 85.5 % v7 (old) | 05 / 2022 | HP Omen 16-b1090ng i7-12700H, GeForce RTX 3070 Ti Laptop GPU | 2.3 kg | 23 mm | 16.10" | 2560x1440 | |
| 88 % v7 (old) | 03 / 2022 | Lenovo Legion 5 Pro 16 G7 i7 RTX 3070Ti i7-12700H, GeForce RTX 3070 Ti Laptop GPU | 2.6 kg | 26.6 mm | 16.00" | 2560x1600 | |
| 89.4 % v7 (old) | 05 / 2022 | Razer Blade 14 Ryzen 9 6900HX R9 6900HX, GeForce RTX 3070 Ti Laptop GPU | 1.8 kg | 16.8 mm | 14.00" | 2560x1440 | |
| 86.7 % v7 (old) | 03 / 2022 | Asus ROG Zephyrus G14 GA402RK R9 6900HS, Radeon RX 6800S | 1.7 kg | 19.5 mm | 14.00" | 2560x1600 | |
| 89.1 % v7 (old) | 03 / 2022 | Razer Blade 15 2022 i7-12800H, GeForce RTX 3080 Ti Laptop GPU | 2.1 kg | 16.99 mm | 15.60" | 2560x1440 |
案件。与去年相比没有变化
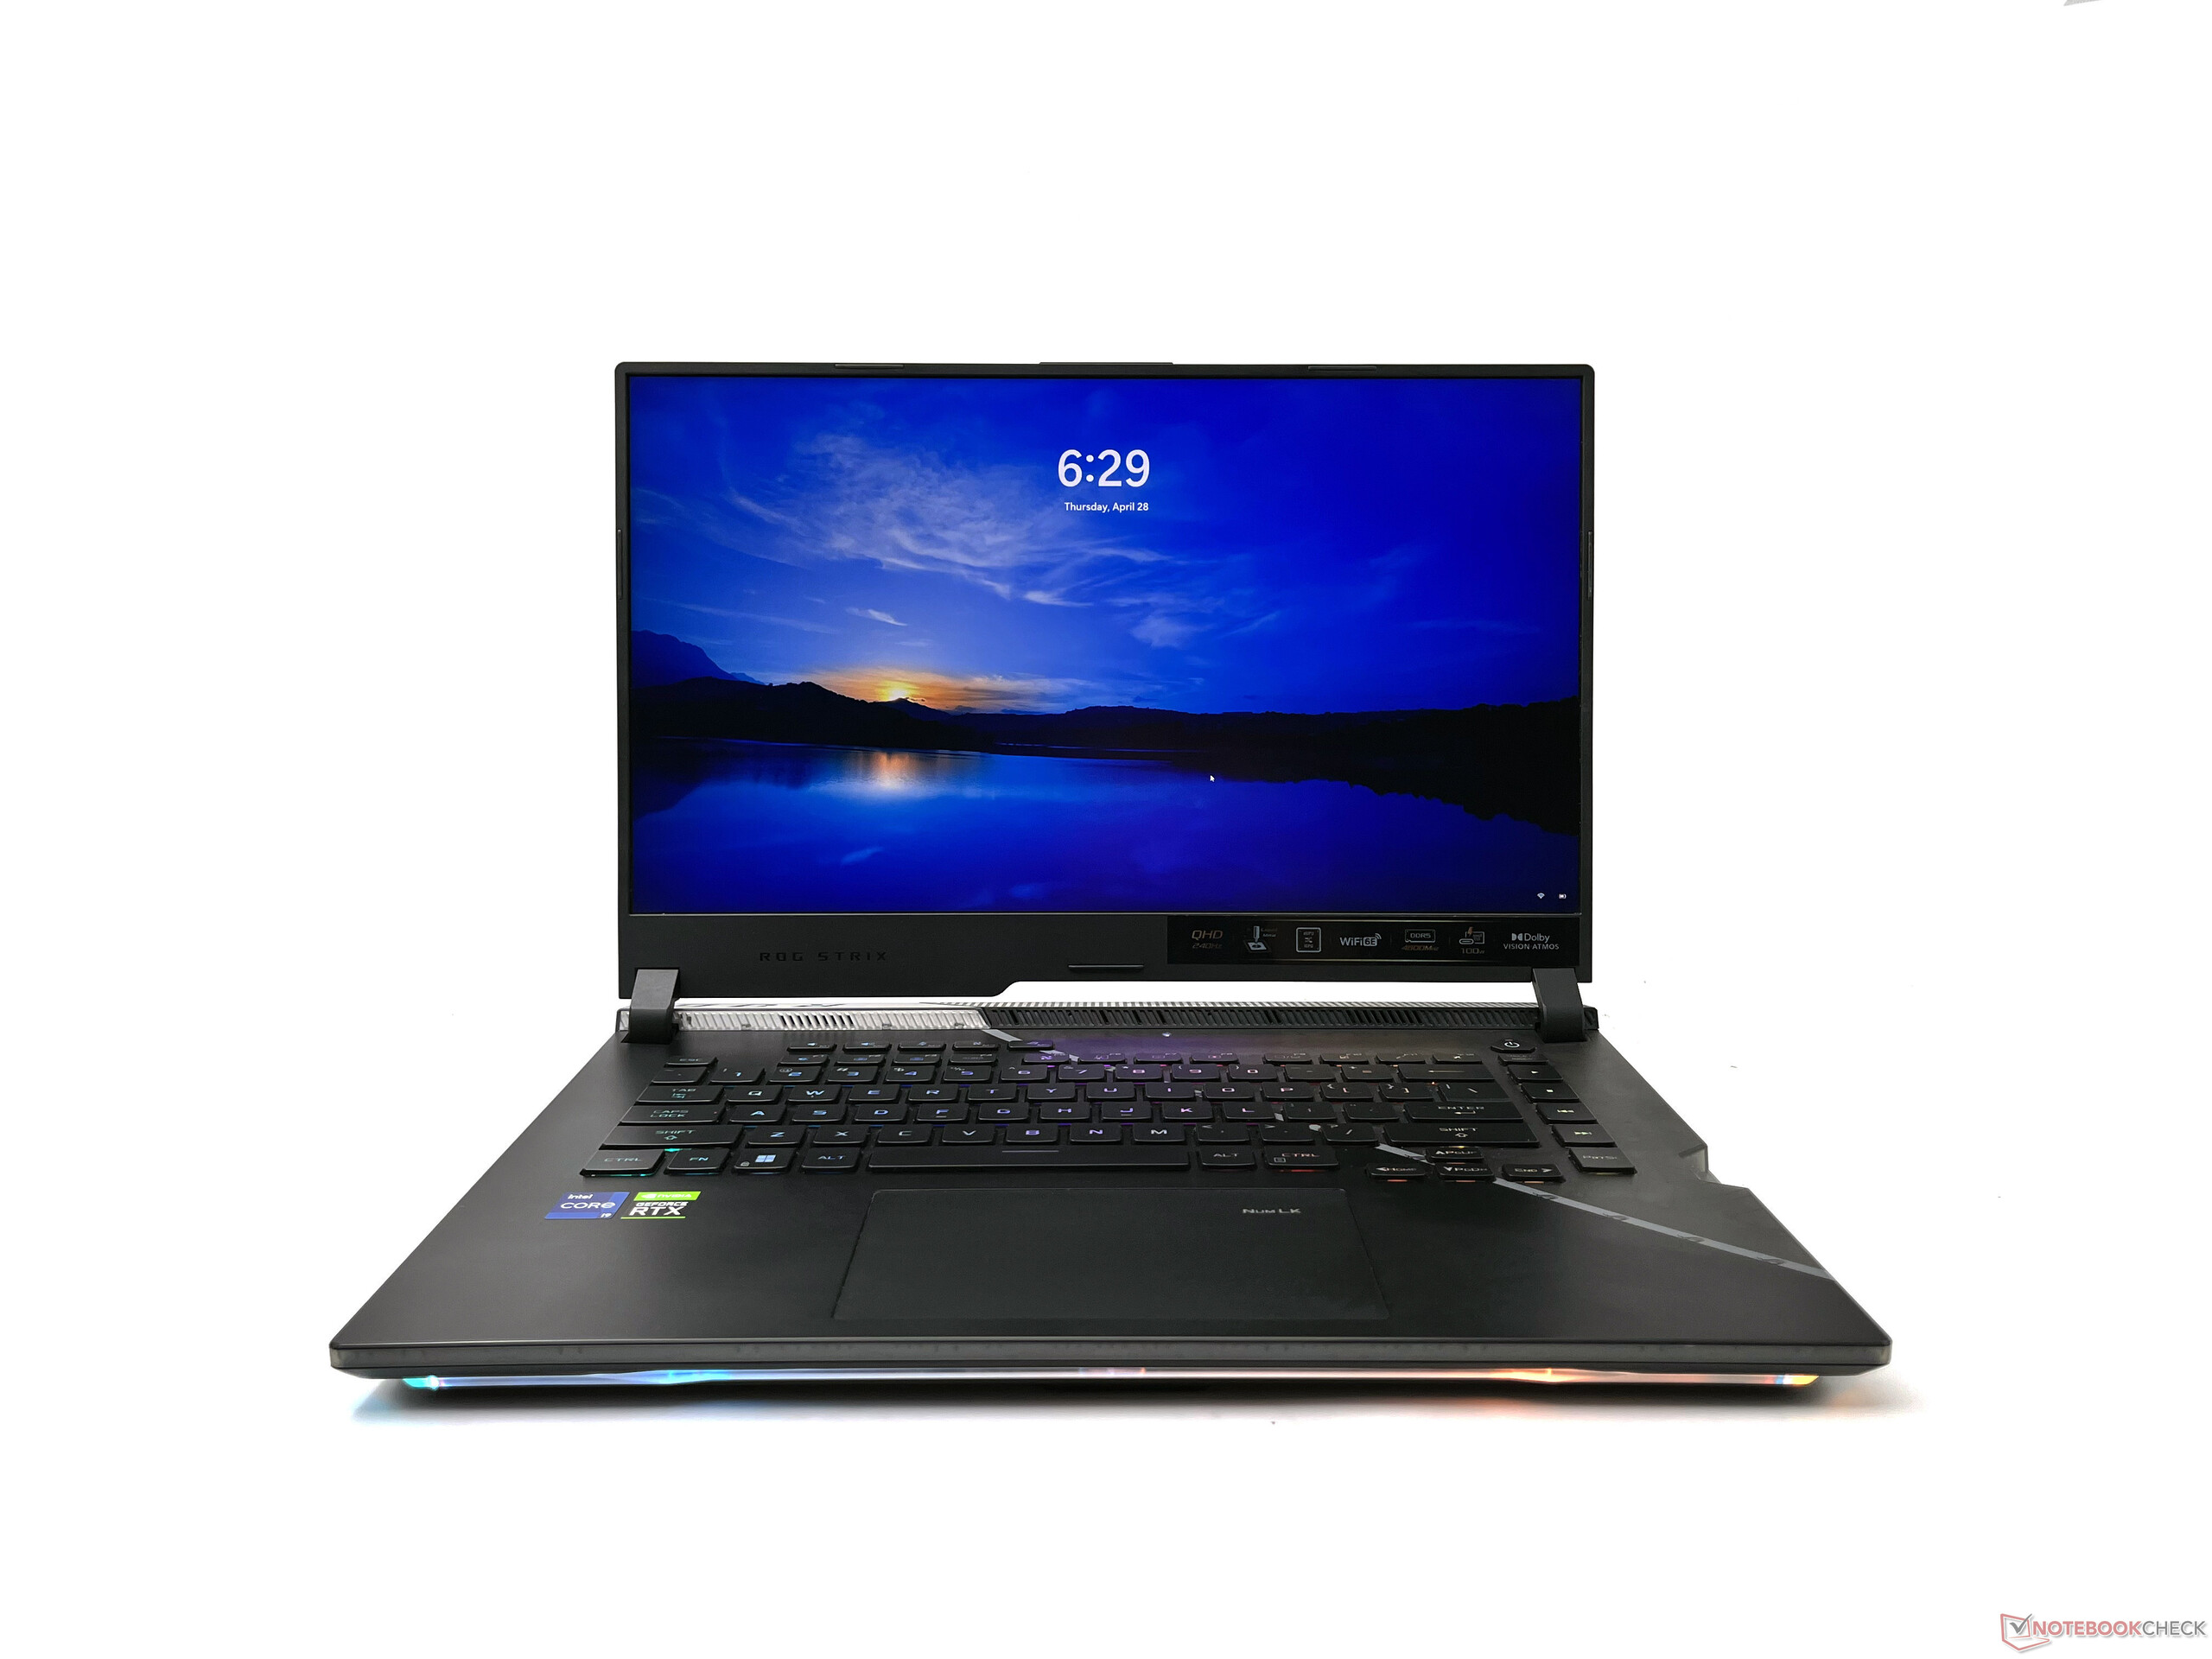
ROG Strix Scar 15 G533ZW在设计、尺寸和重量方面与去年的机型几乎没有区别。主体主要由塑料制成--它并不感觉廉价或俗气,但它可以迅速聚集相当多的指纹和污点。
如果用力按压的话,键盘板会有一些明显的弯曲,但没有什么特别的问题。键盘甲板的右边缘是半透明的,具有标志性的Scar风格,可以偷看内部结构。
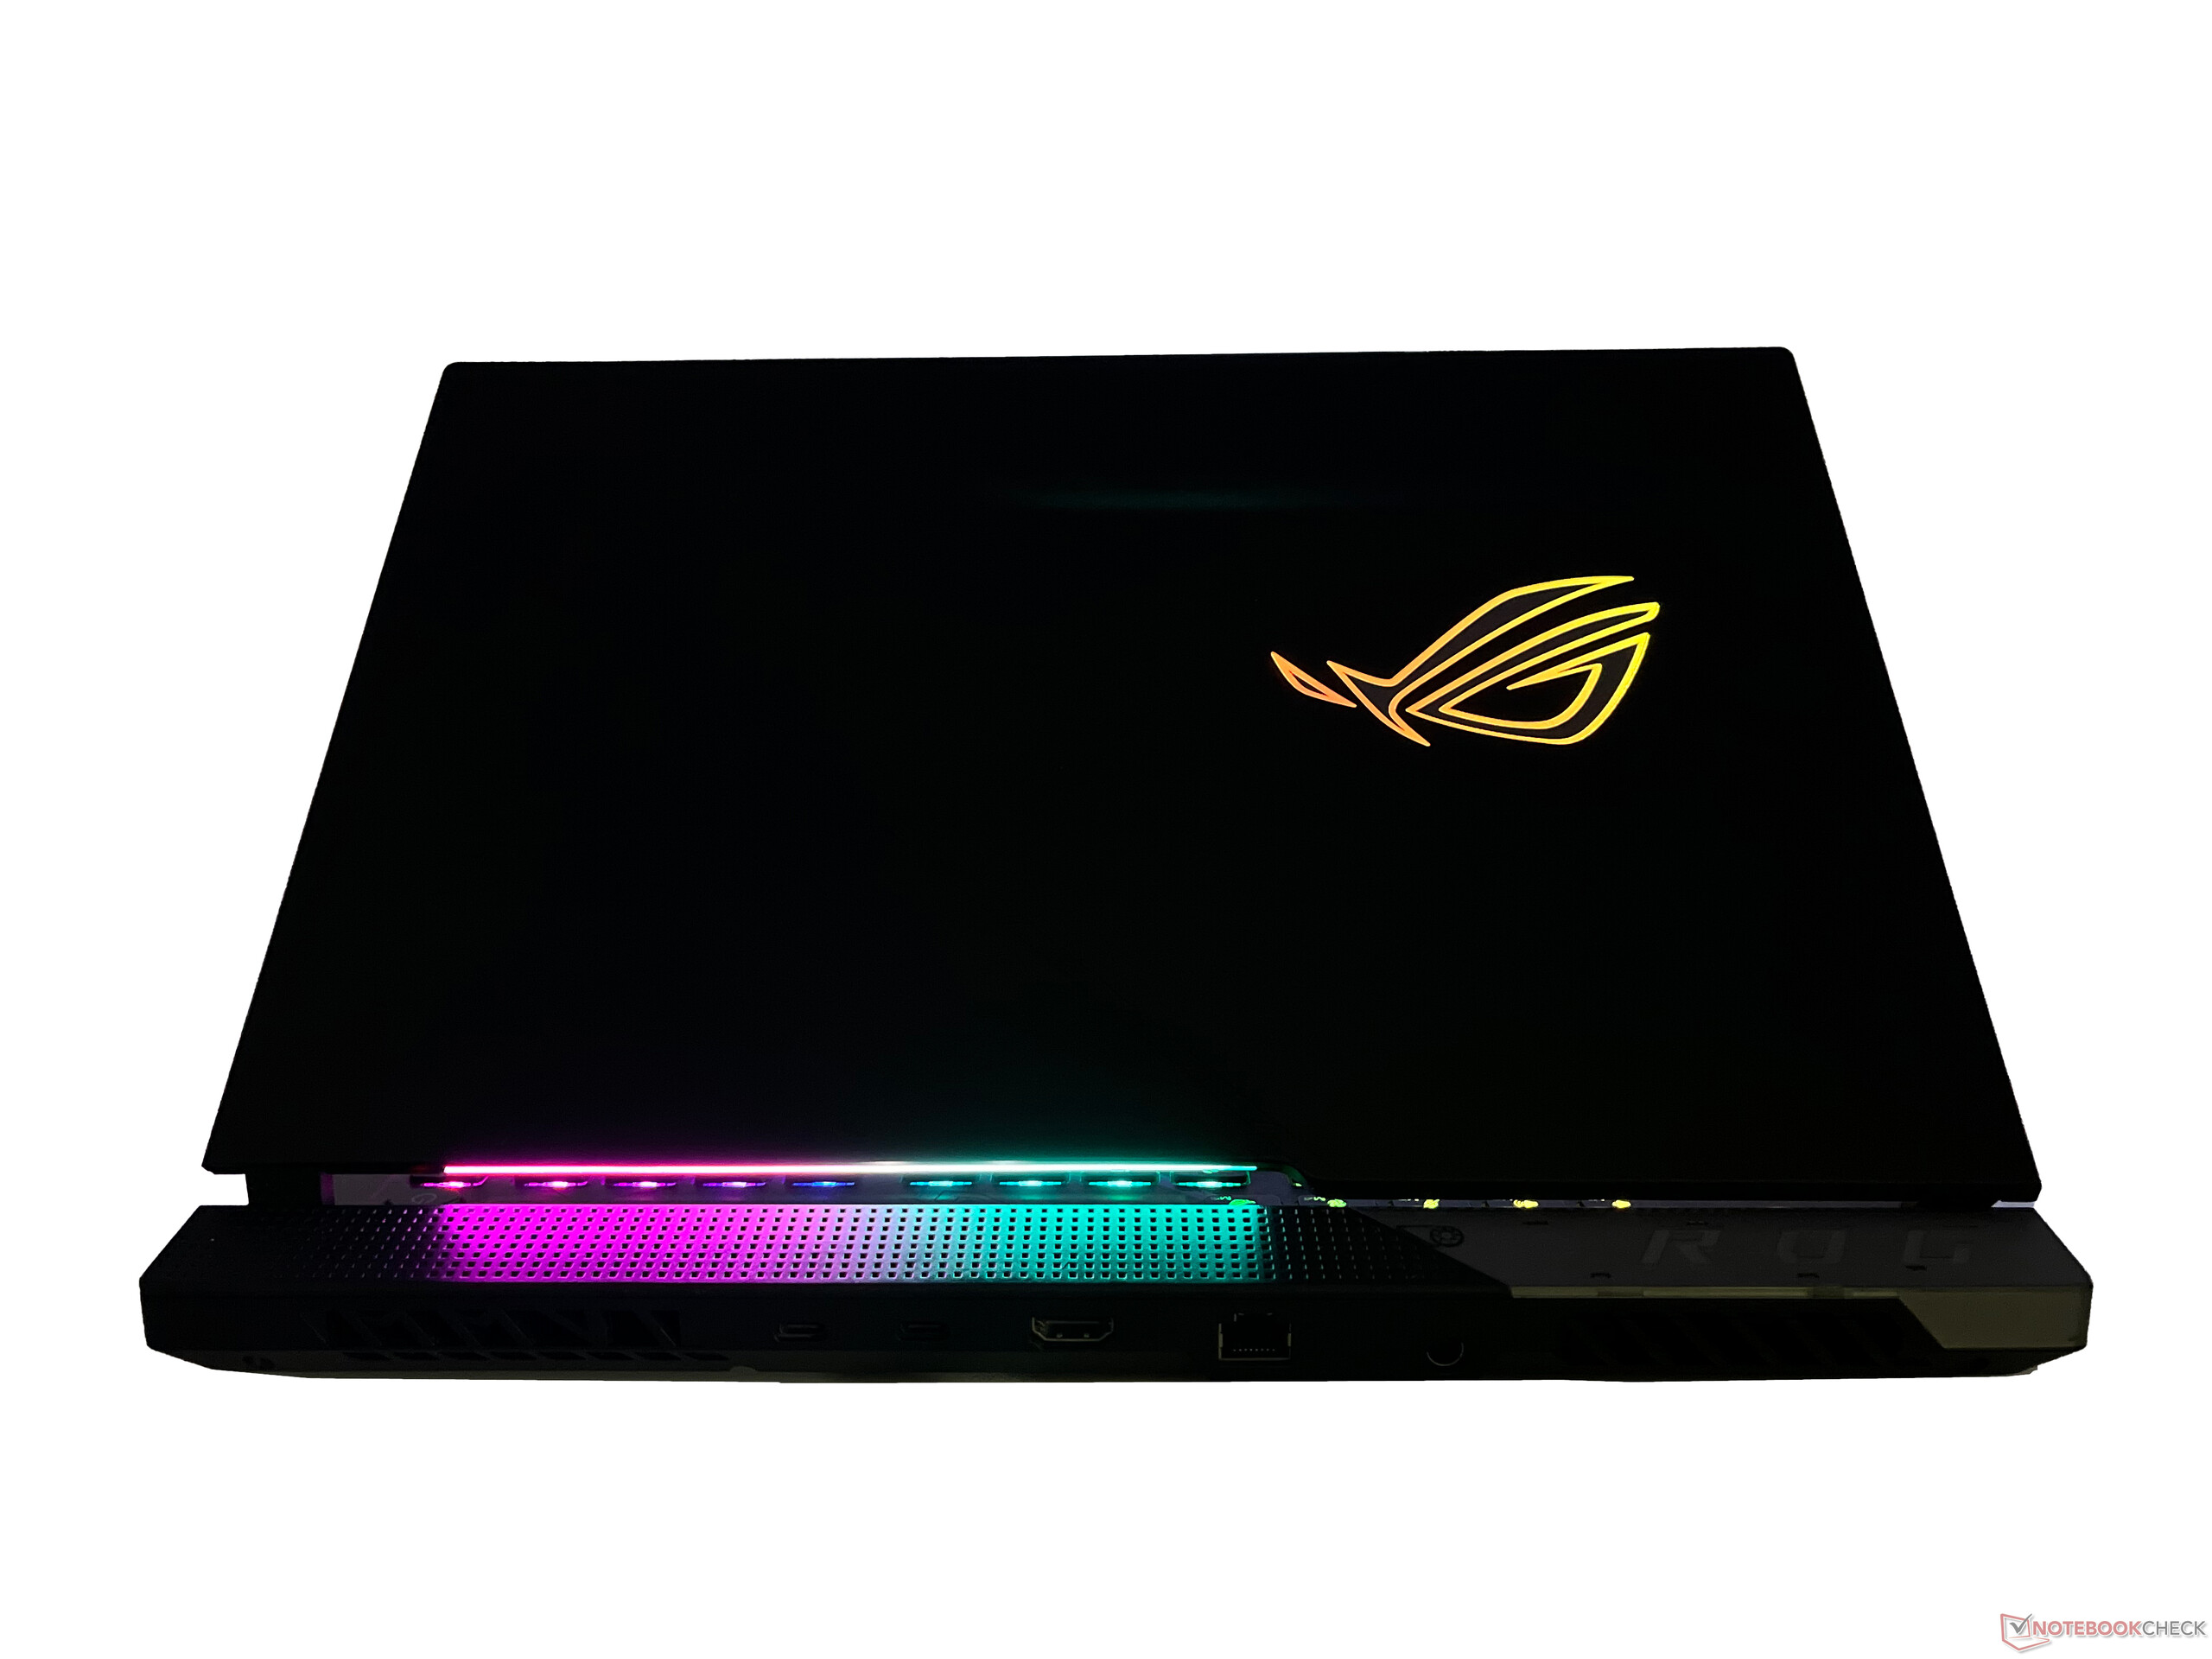
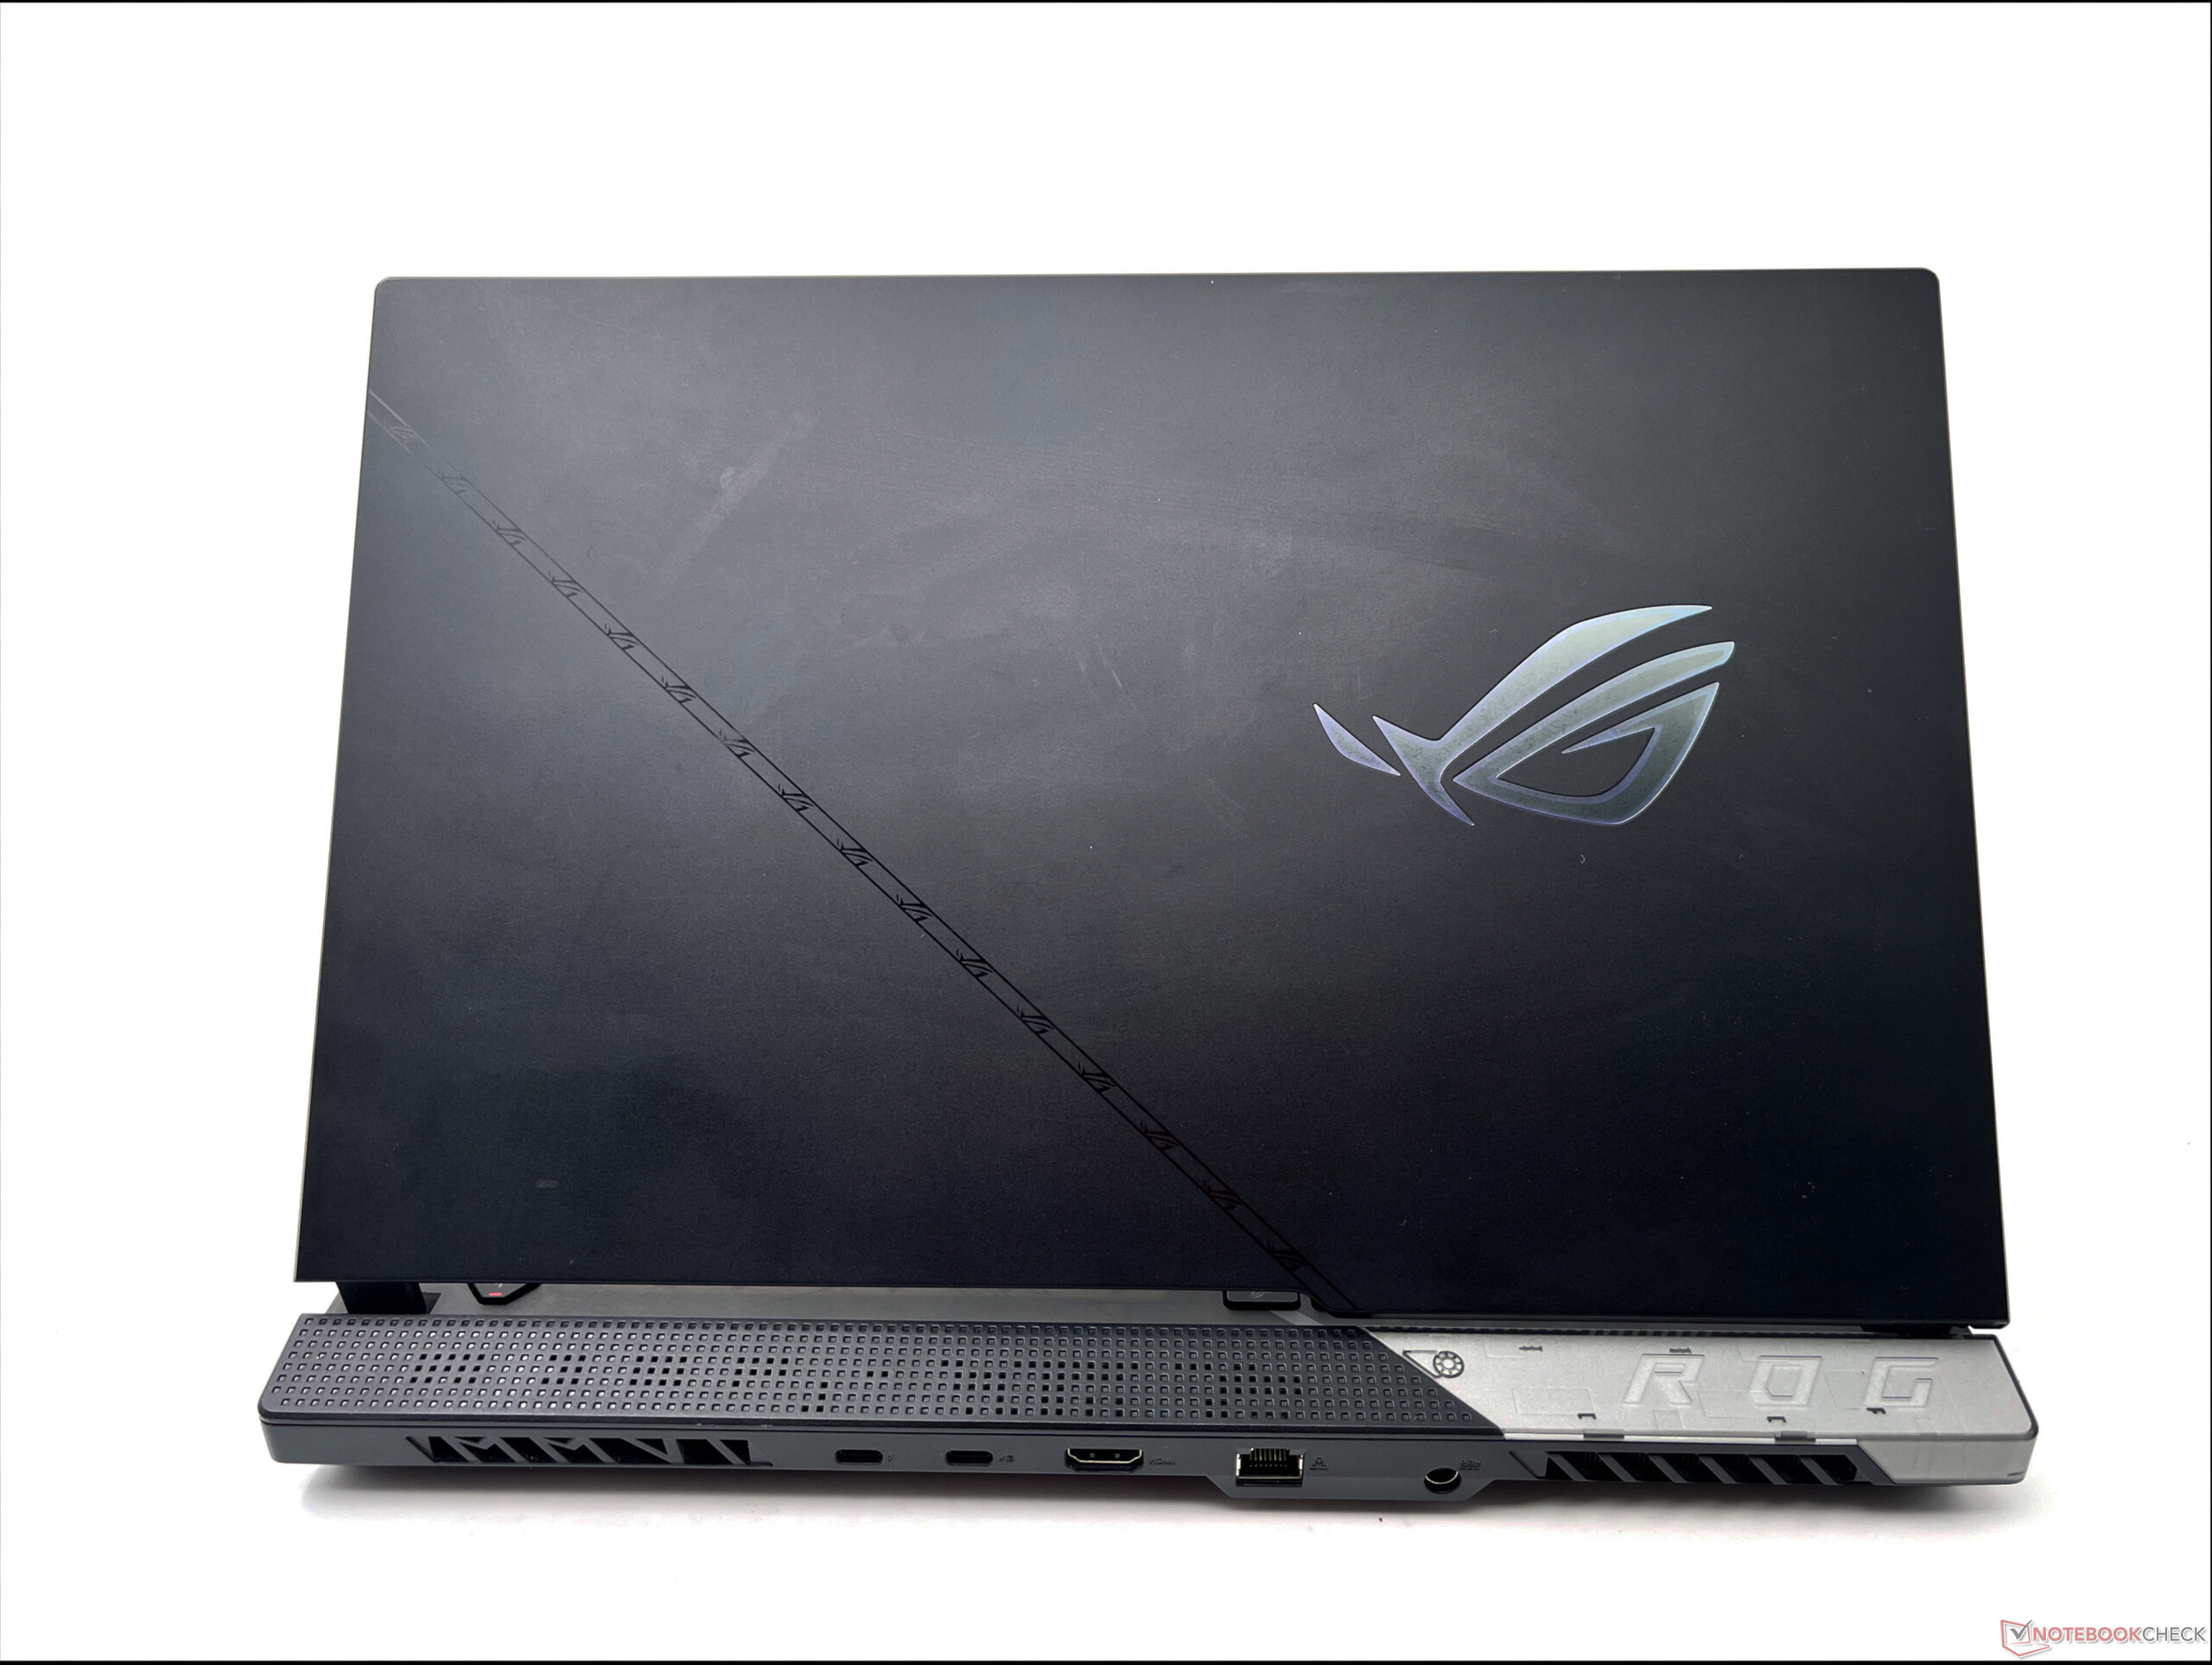
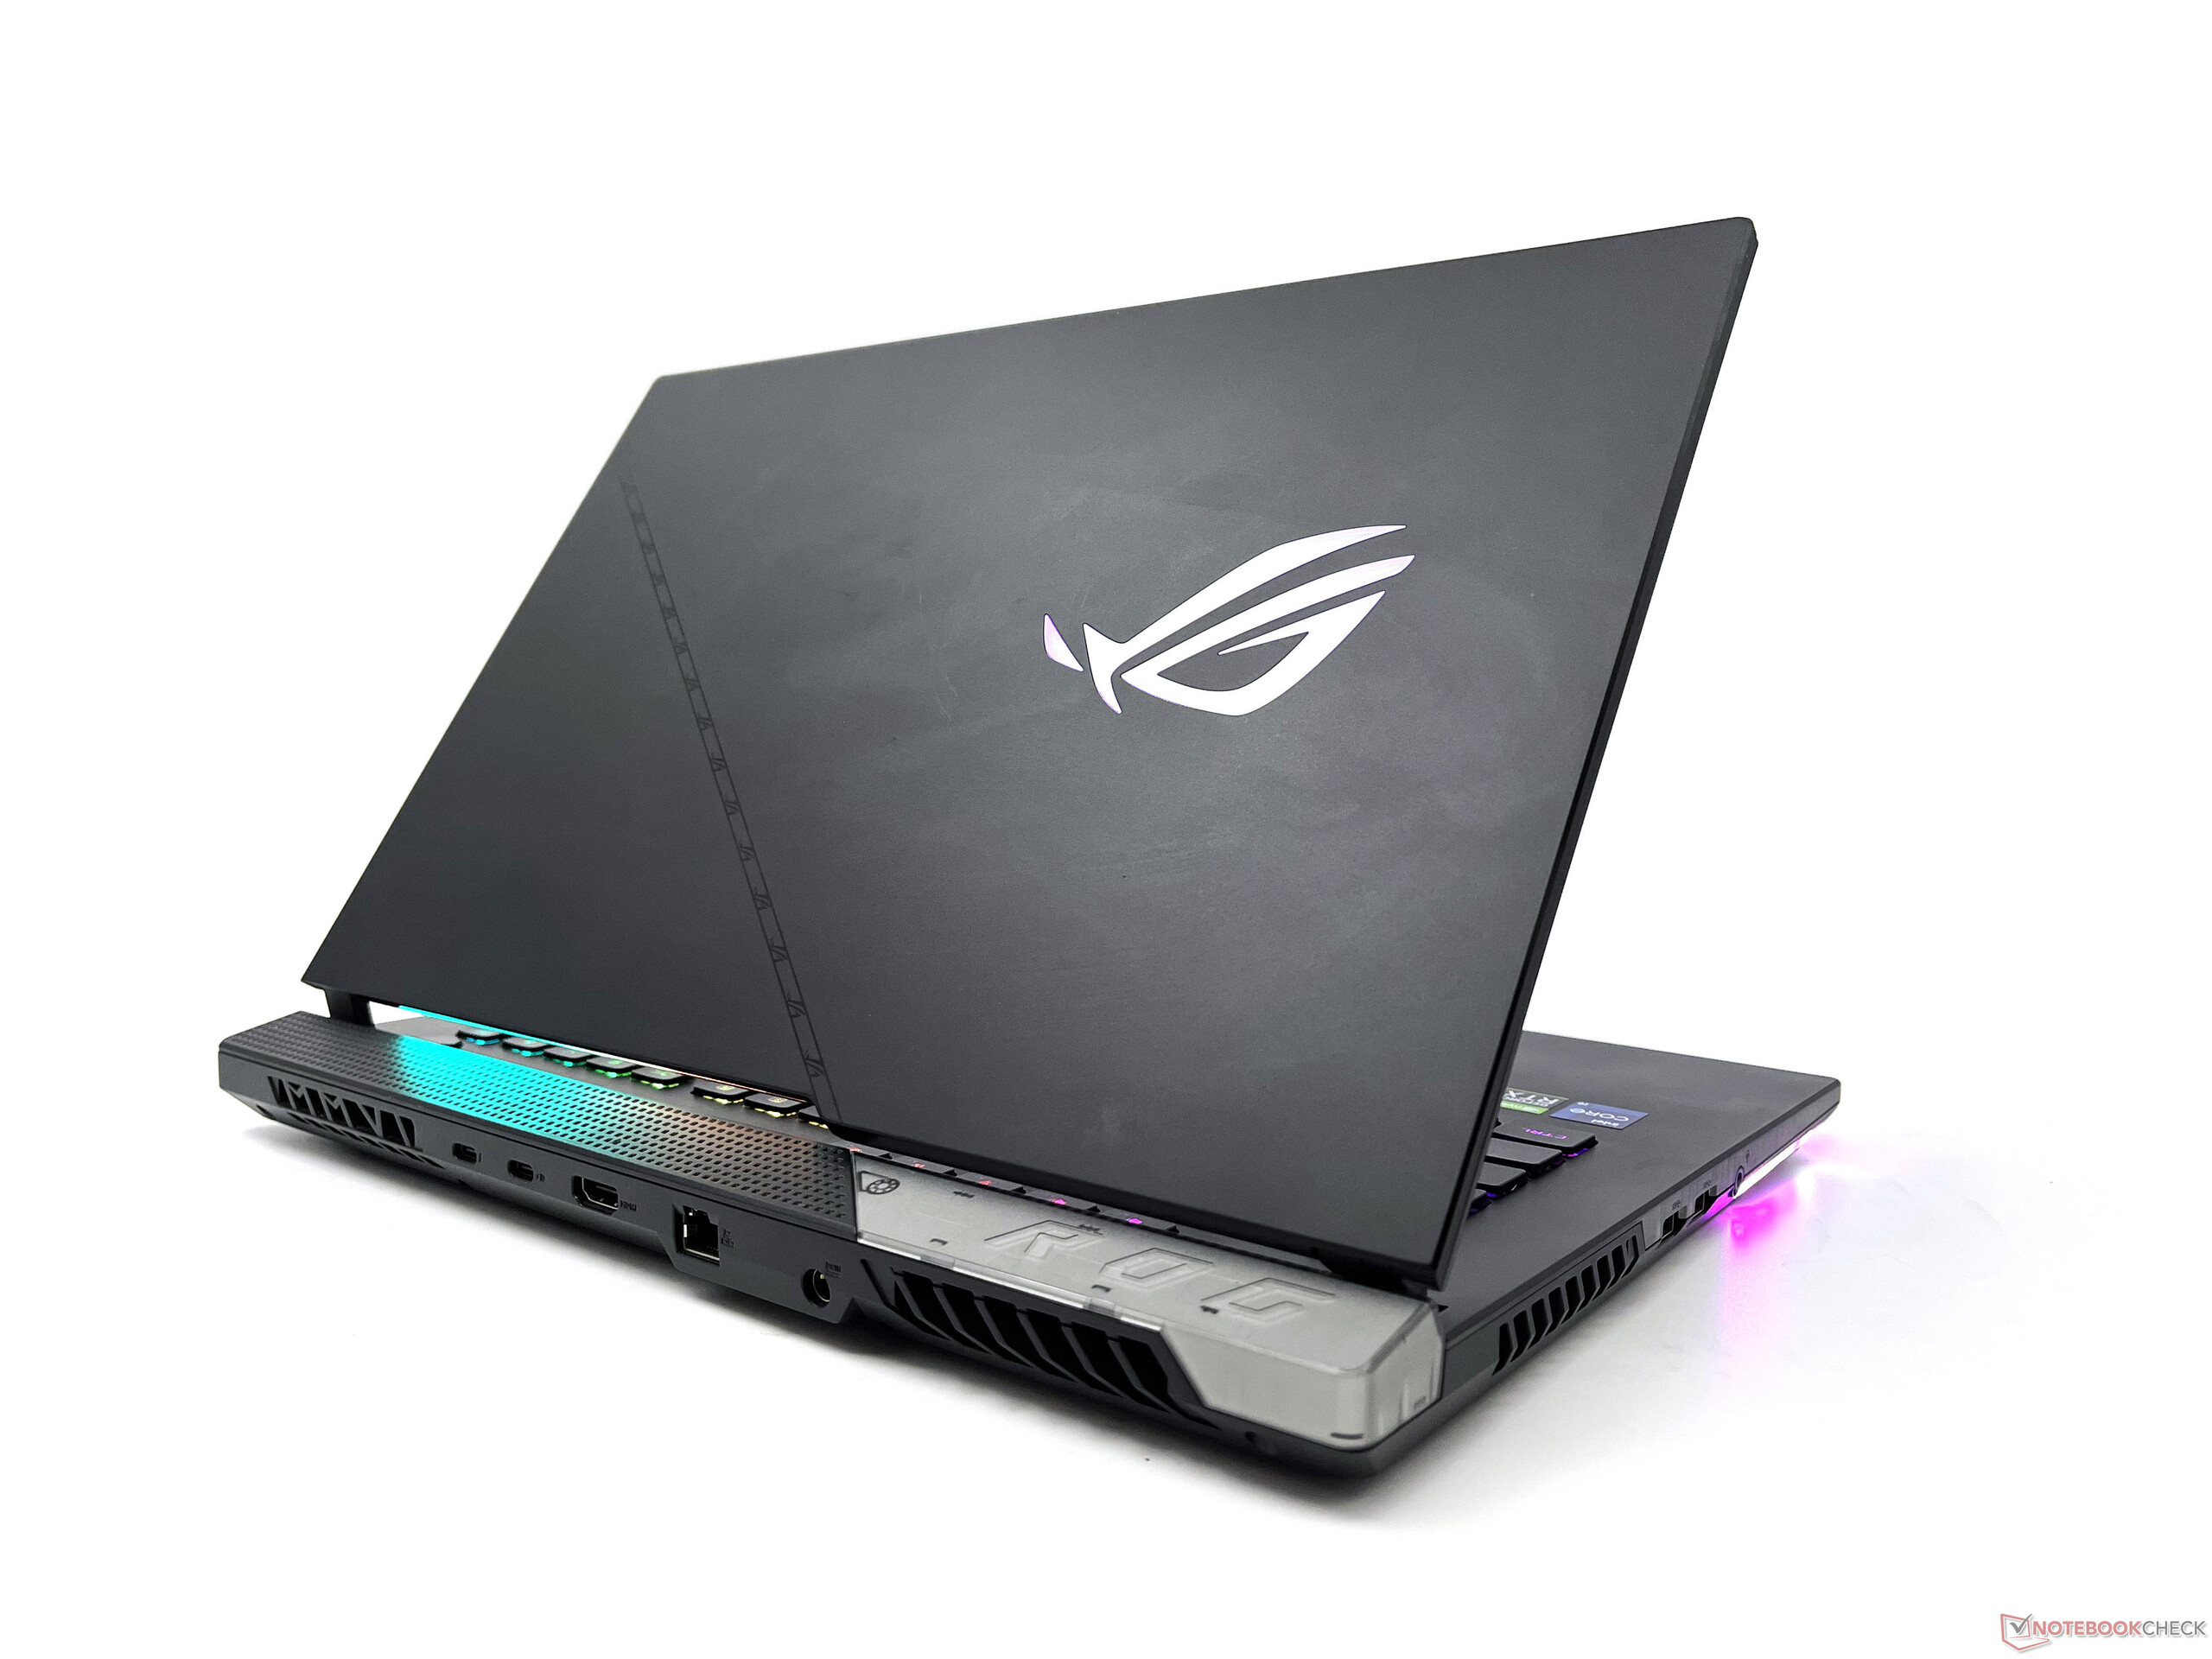
盖子是由铝制成的,可以用一个手指打开,但它的弯曲度有点大,不符合我们的喜好。盖子的背面有ROG的标志,其轮廓得到一些RGB的喜爱。显示屏的底部也有LED灯,可以增加一些亮点。盖子只能打开到大约130°,当在腿上使用该设备时,这可能会有点麻烦。
底部是橡胶的,可以牢牢抓住。还有一些可定制的ROG盔甲帽--盒子里有几个,但如果你喜欢,你可以3D打印定制的。
总的来说,华硕ROG Strix Scar 15 G533ZW的建造质量在大多数情况下是坚固的,除了键盘和盖子的一些弯曲。
连接性。板载Thunderbolt 4和Wi-Fi 6E
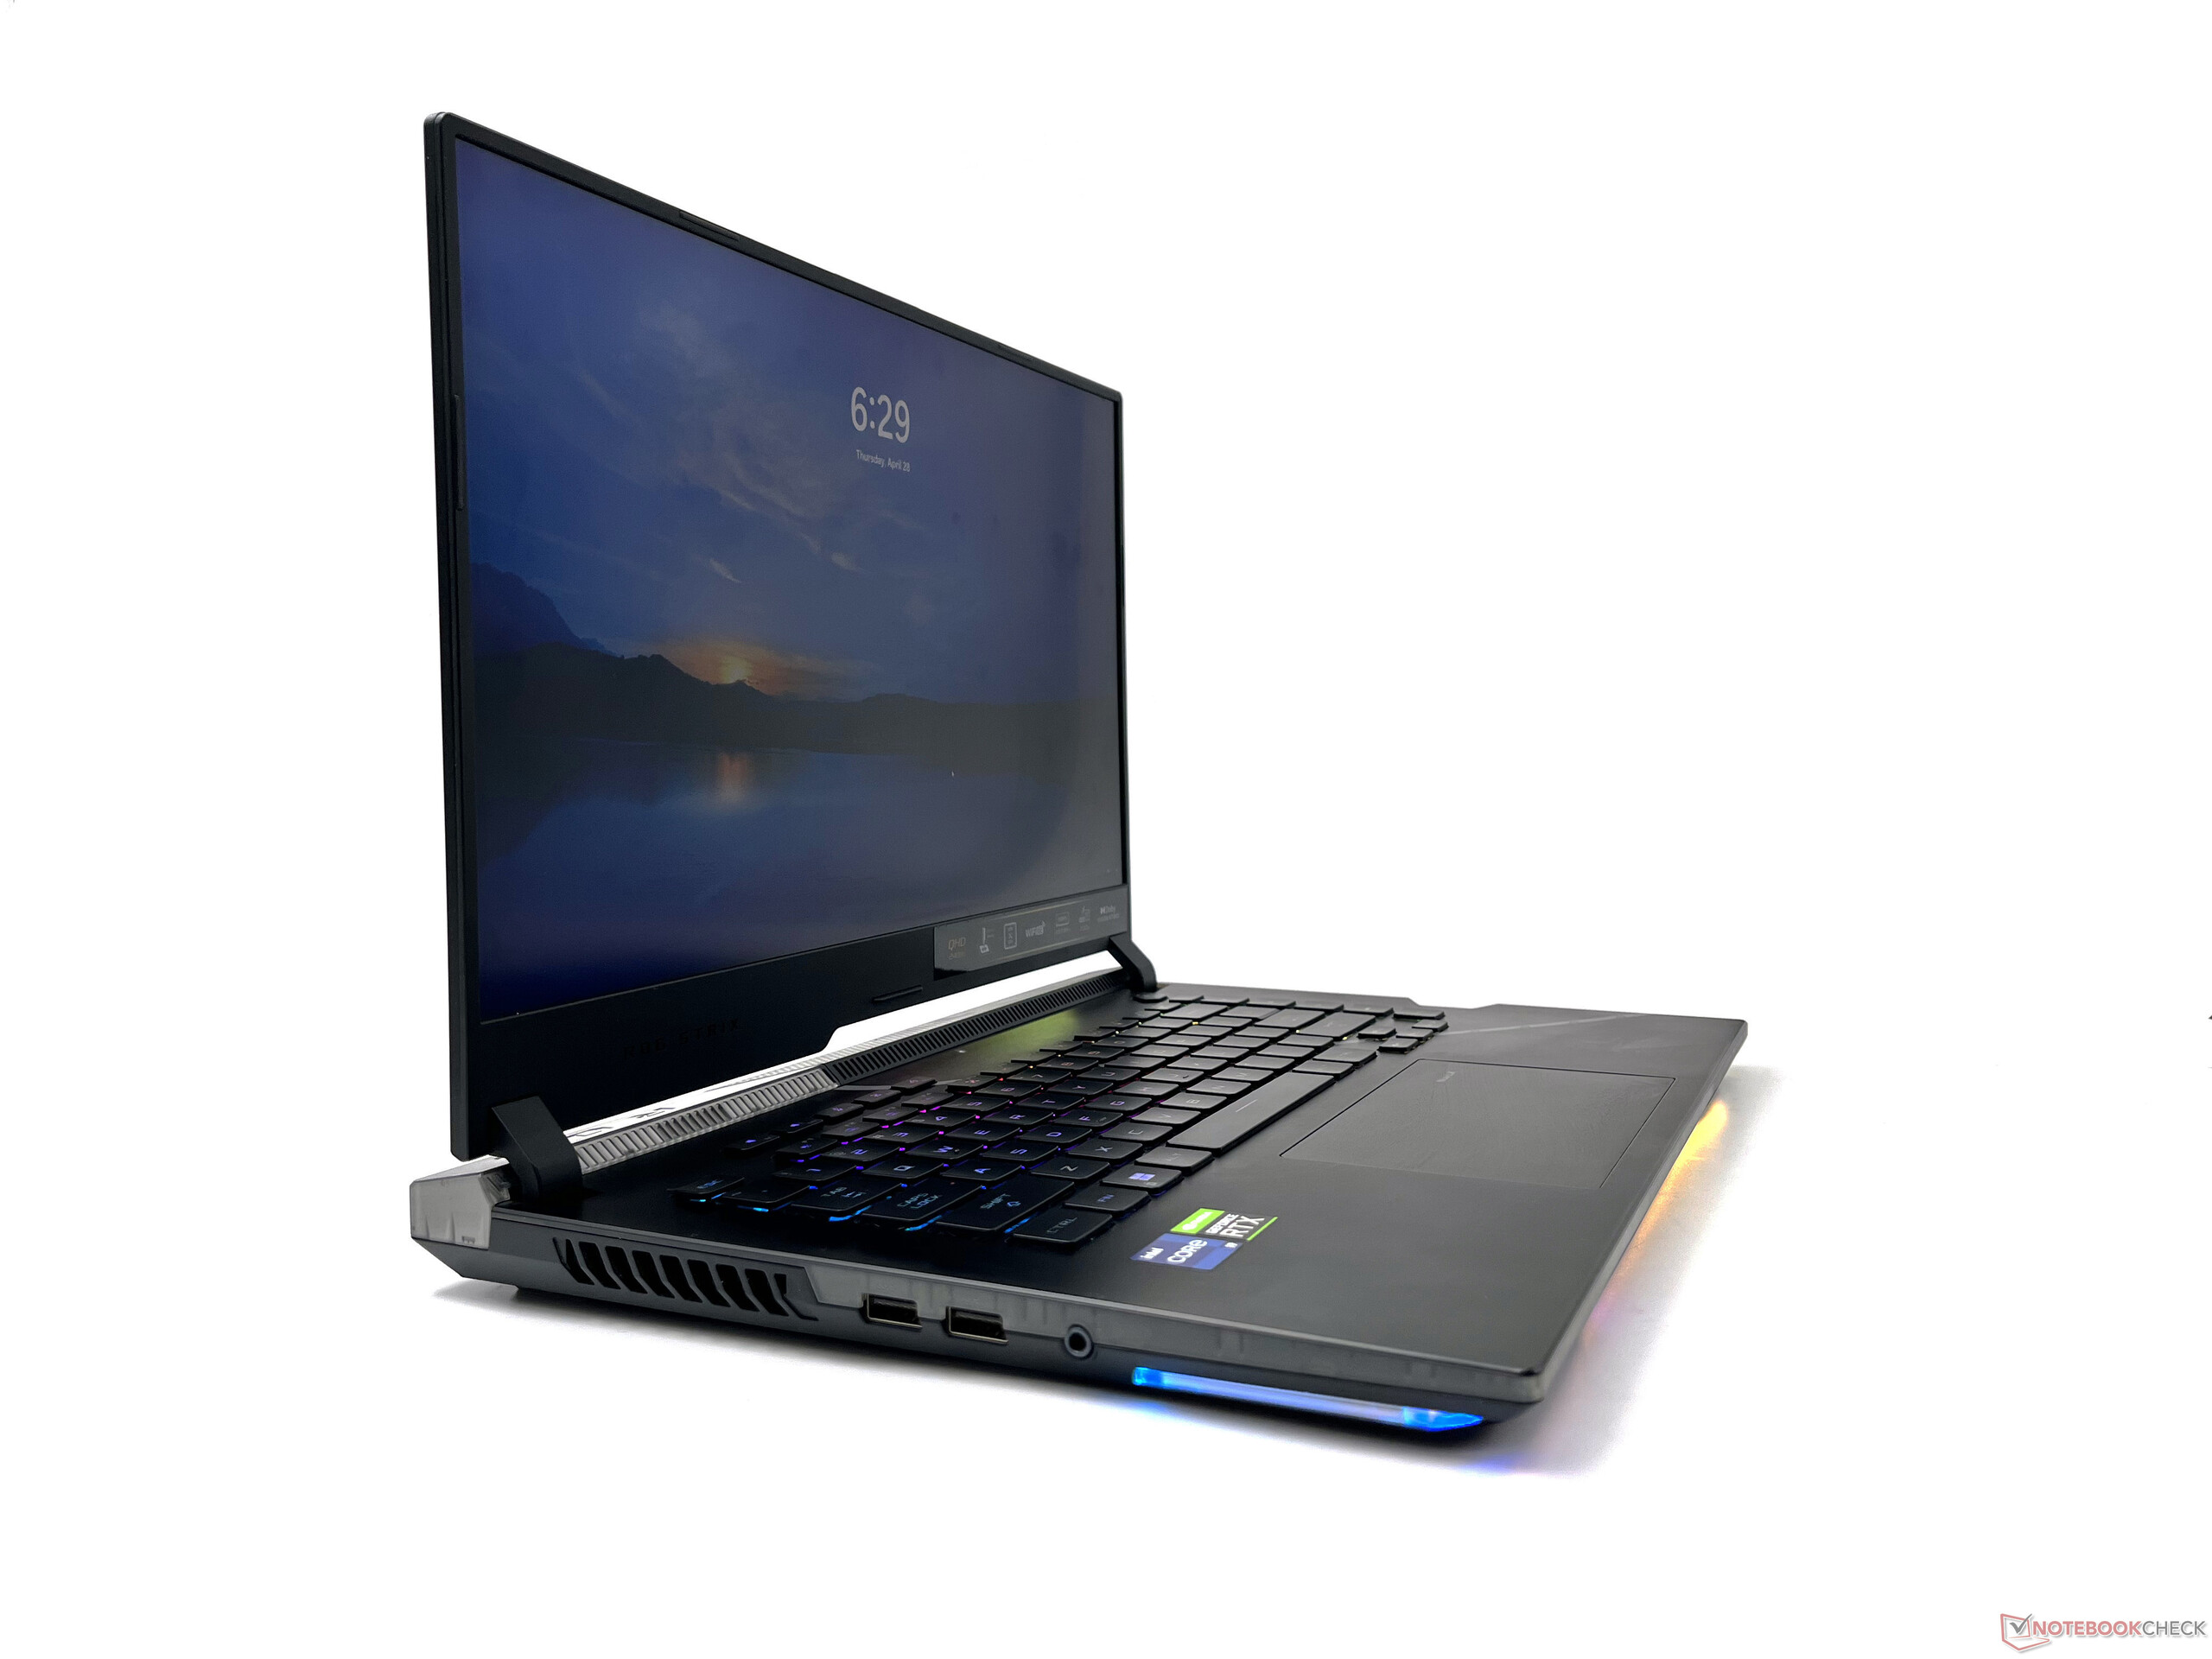
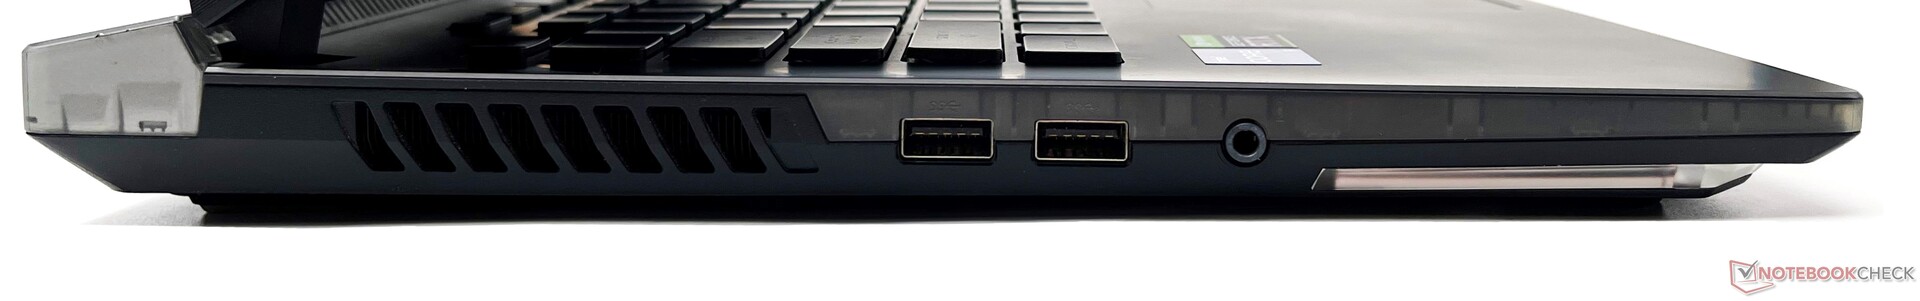
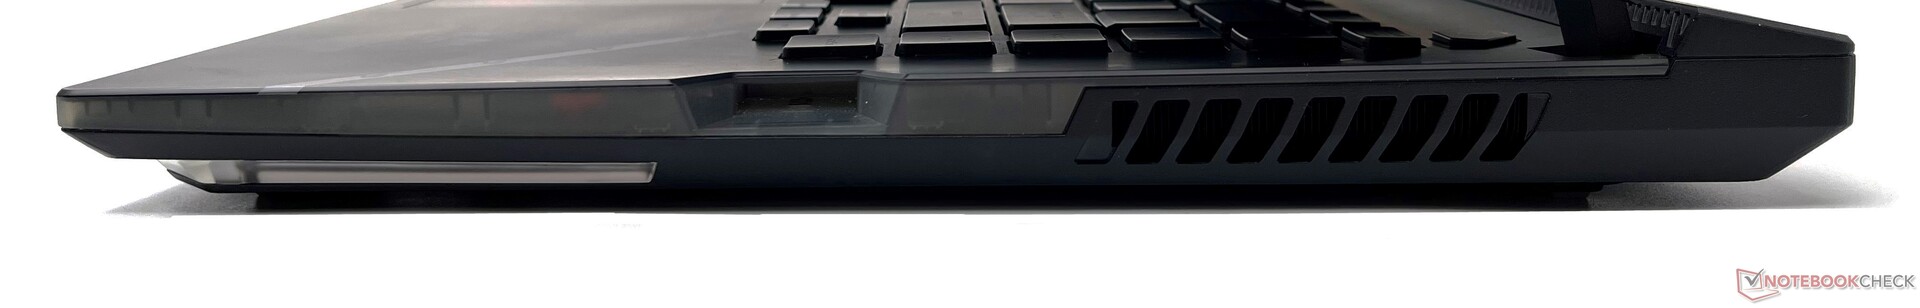
在I/O方面,ROG Strix Scar 15 G533涵盖了基本的内容。在左边,有两个USB 3.2 Gen 1 Type-A和一个组合音频插孔,而右边只有一个插槽,用于放置 ROG Keystone 2.Keystone 2是一个NFC钥匙,与Armory Crate应用程序一起使用,可以应用各种性能和RGB配置文件,还可以解锁一个隐藏的影子驱动器。
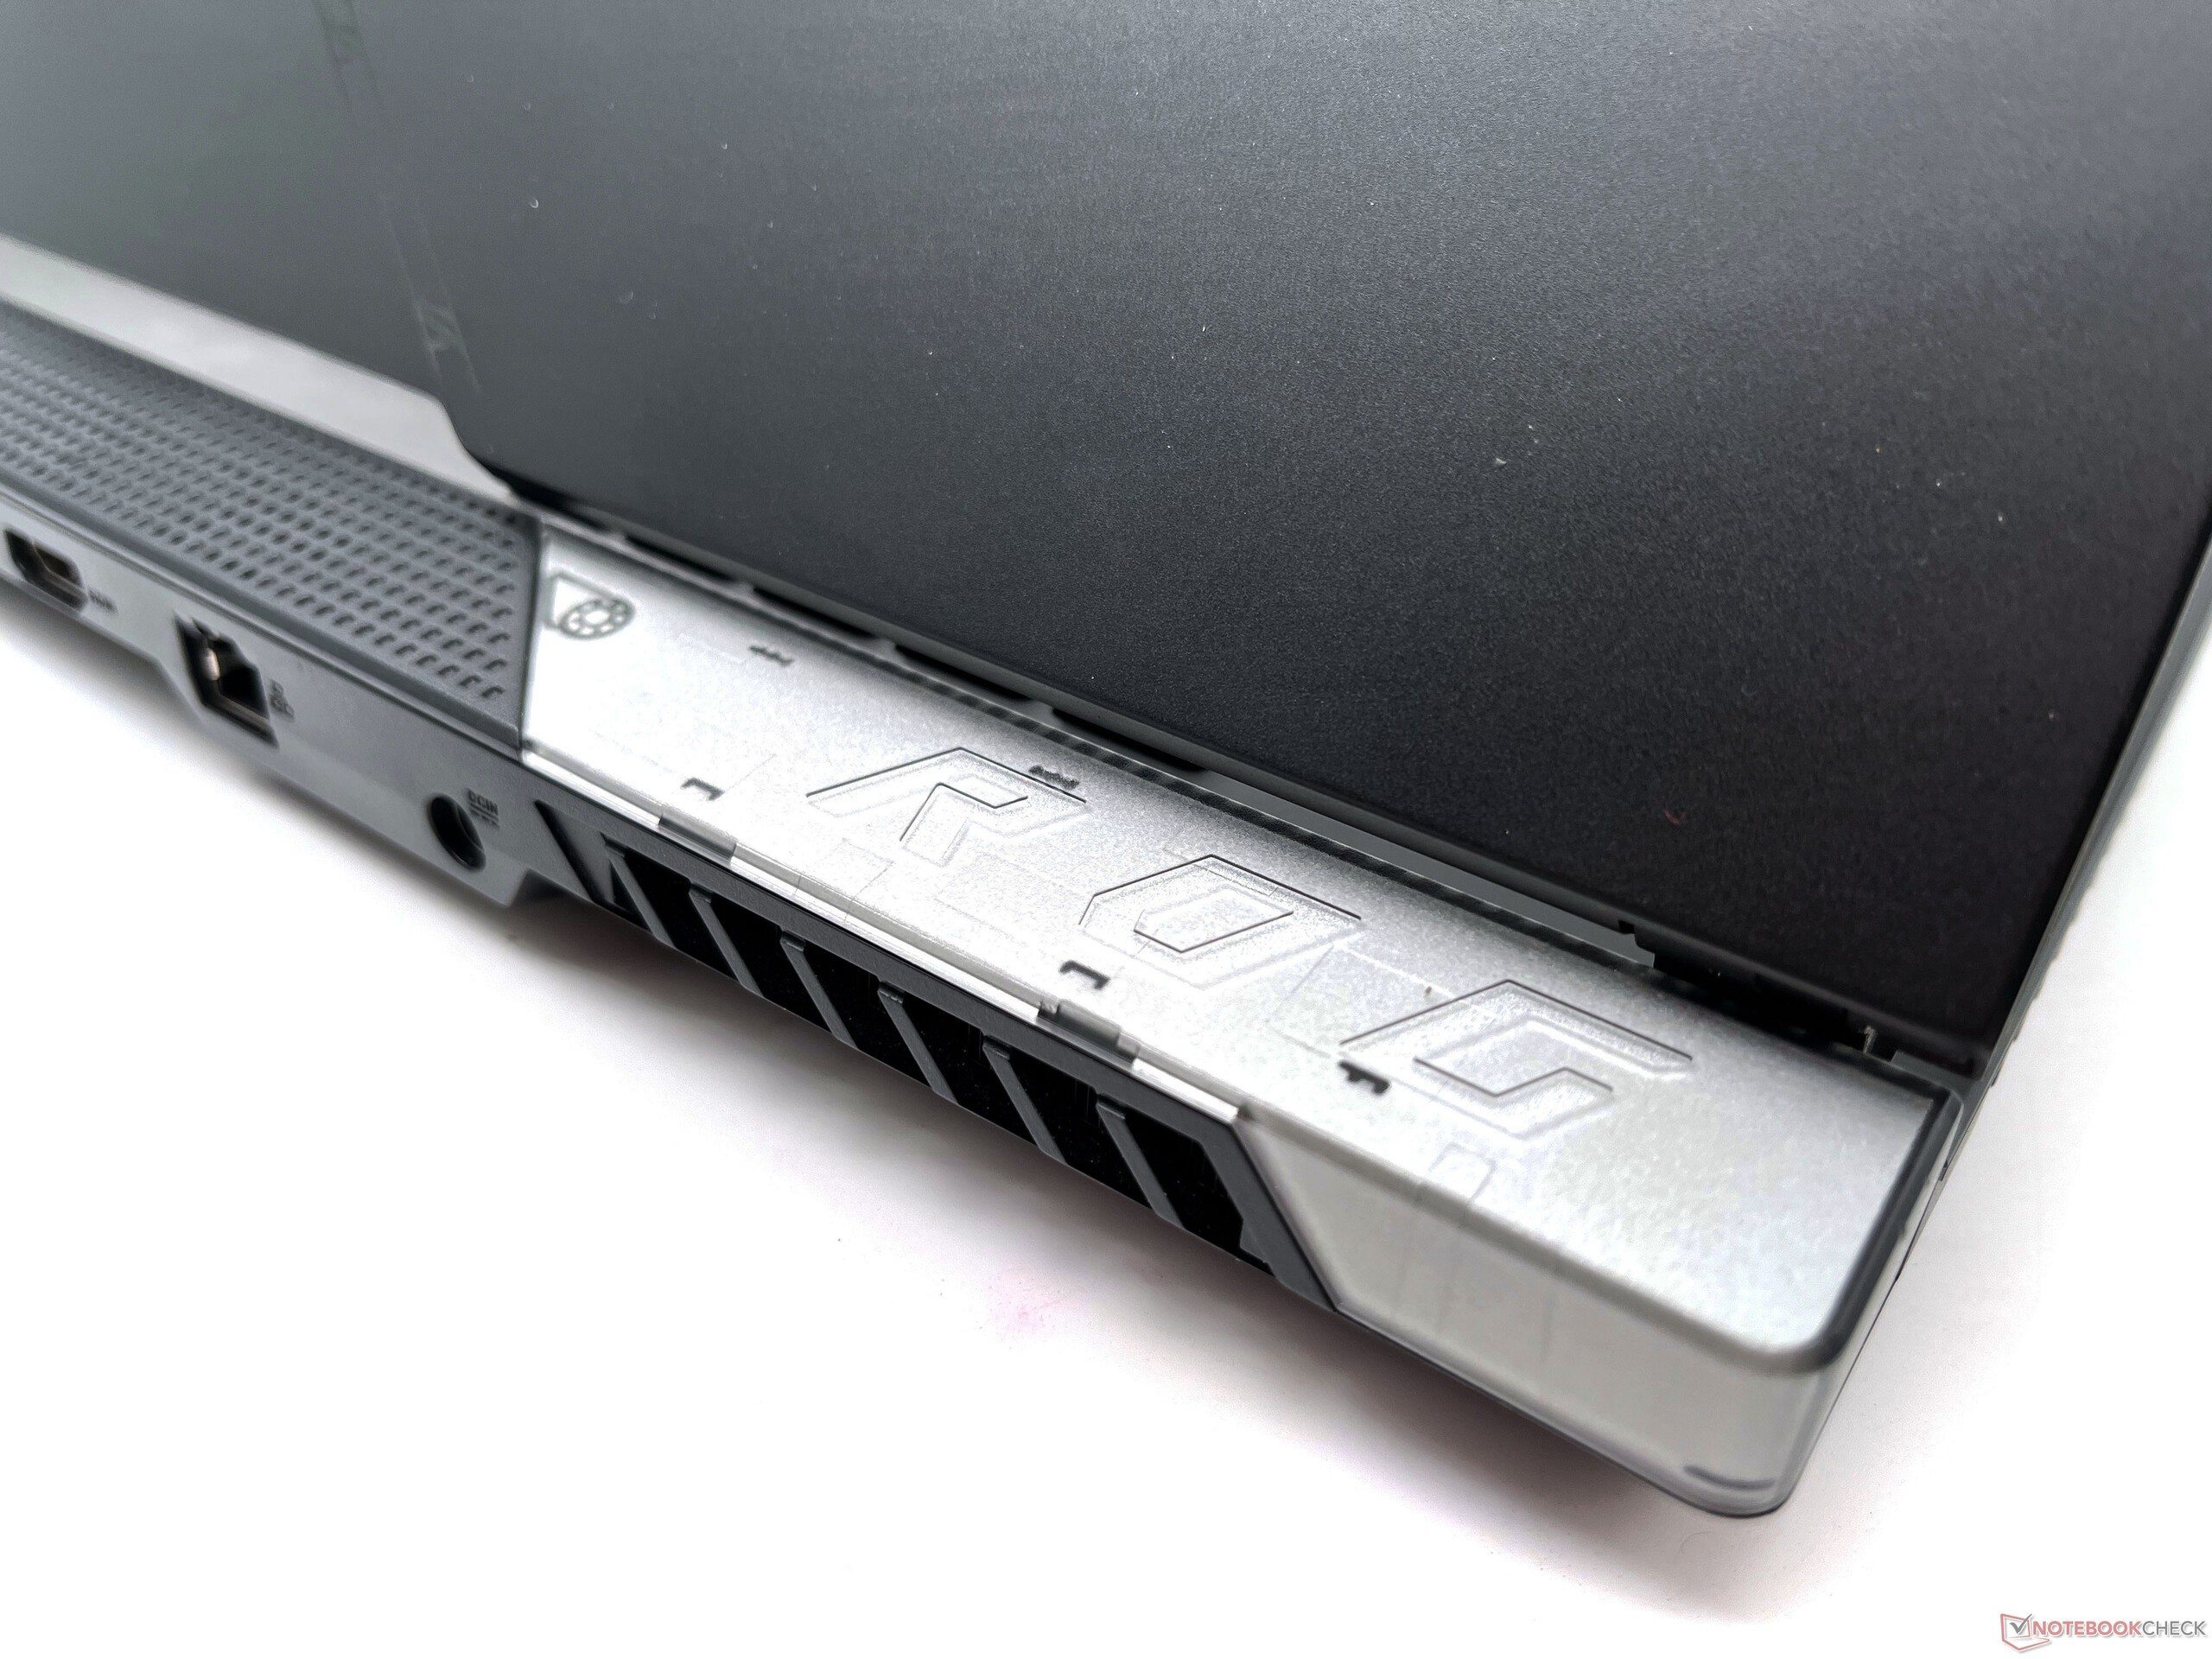
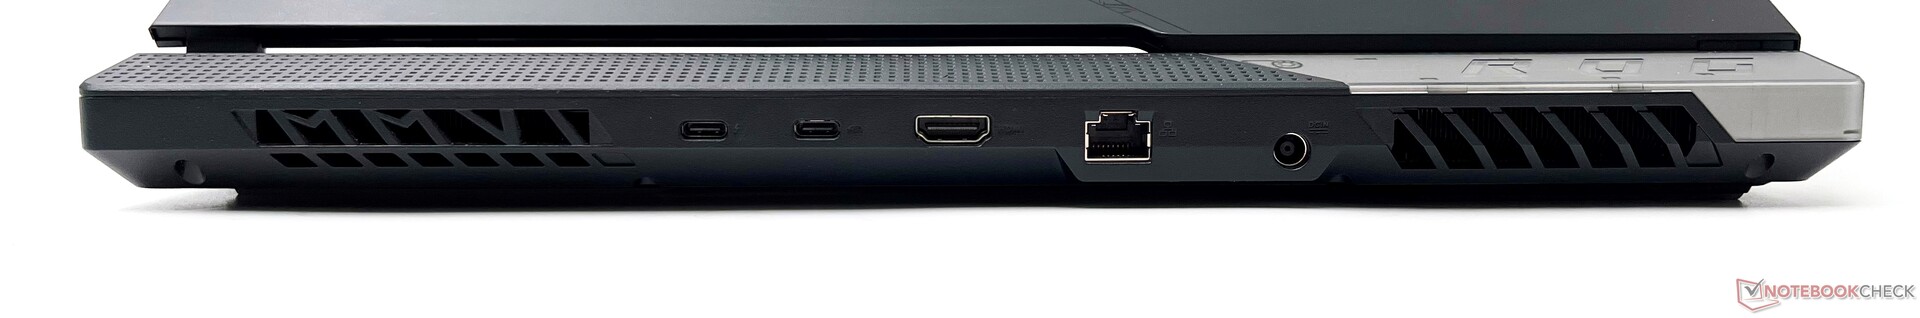
大部分的端口都位于后部。这些端口包括一个雷电4端口,一个支持DisplayPort输出和Power Delivery的USB 3.2 Gen2 Type-C,HDMI 2.1输出,一个2.5G以太网端口,以及直流电源输入。
端口的位置很方便,不会妨碍外部鼠标的移动。不幸的是,Scar 15没有提供SD卡插槽或Kensington锁插槽。
沟通
ROG Strix Scar 15通过英特尔Wi-Fi 6E AX211卡提供Wi-Fi 6E连接。我们已经看到,之前有几款笔记本电脑采用了AX211芯片组。但ROG Strix Scar 15可能是在印度推出的第一个支持新无线标准的笔记本电脑。
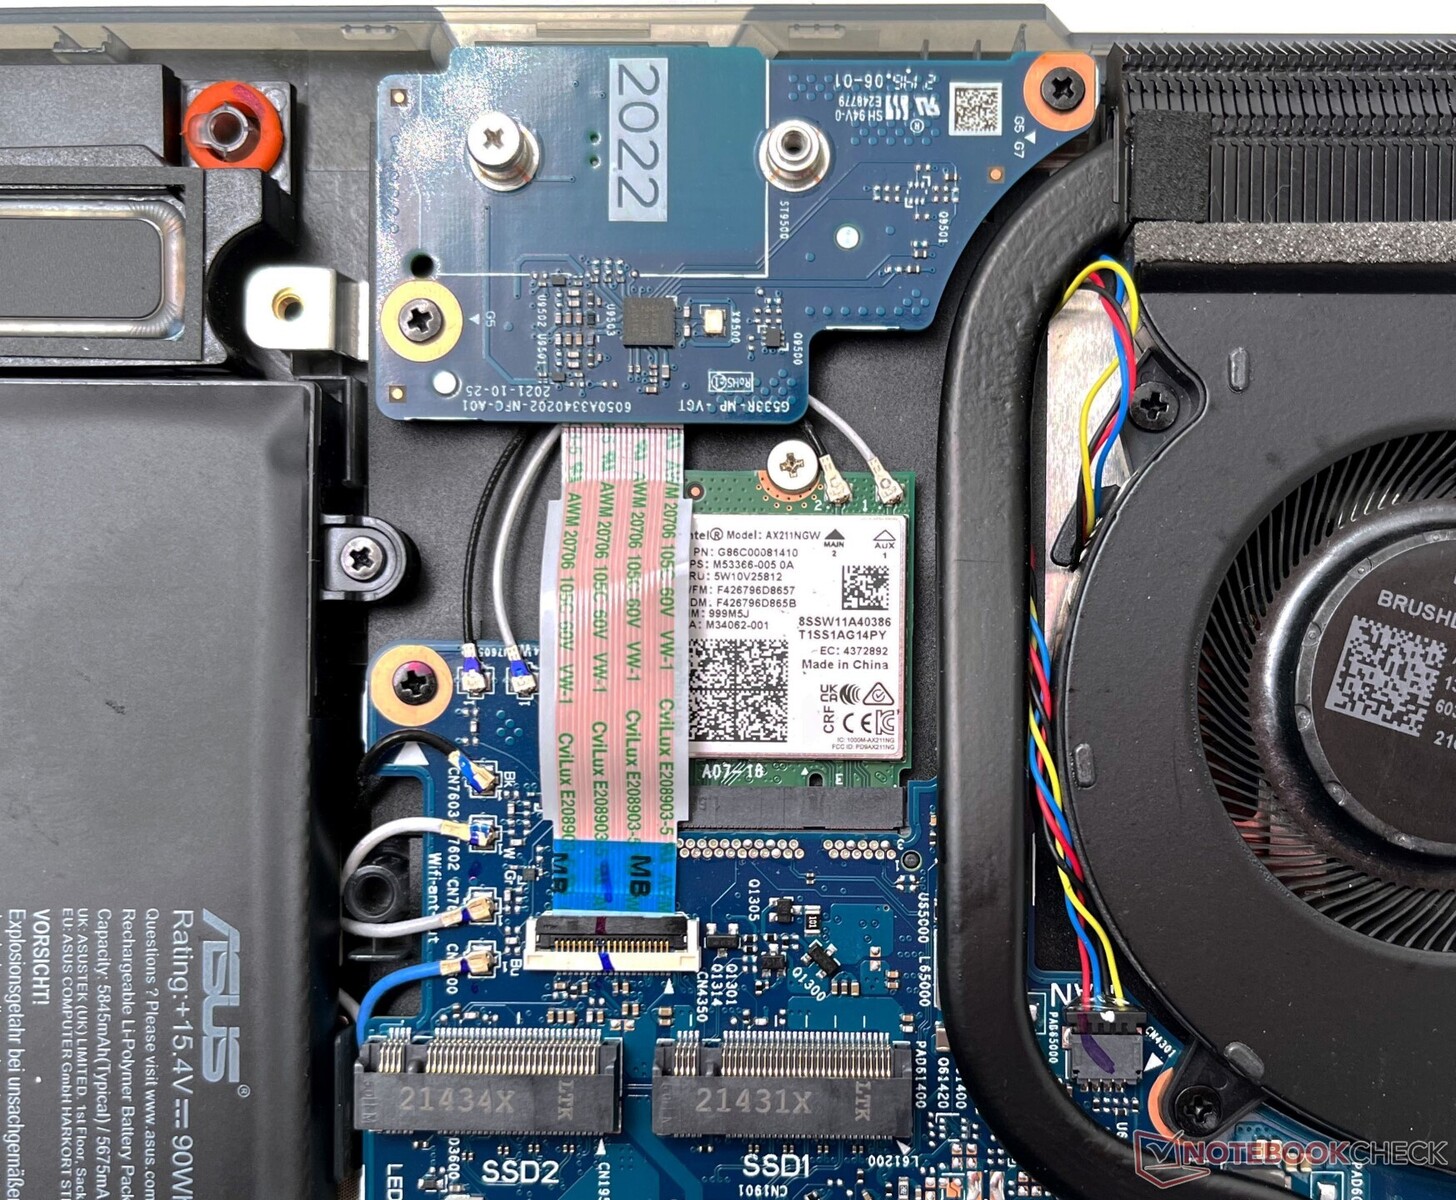
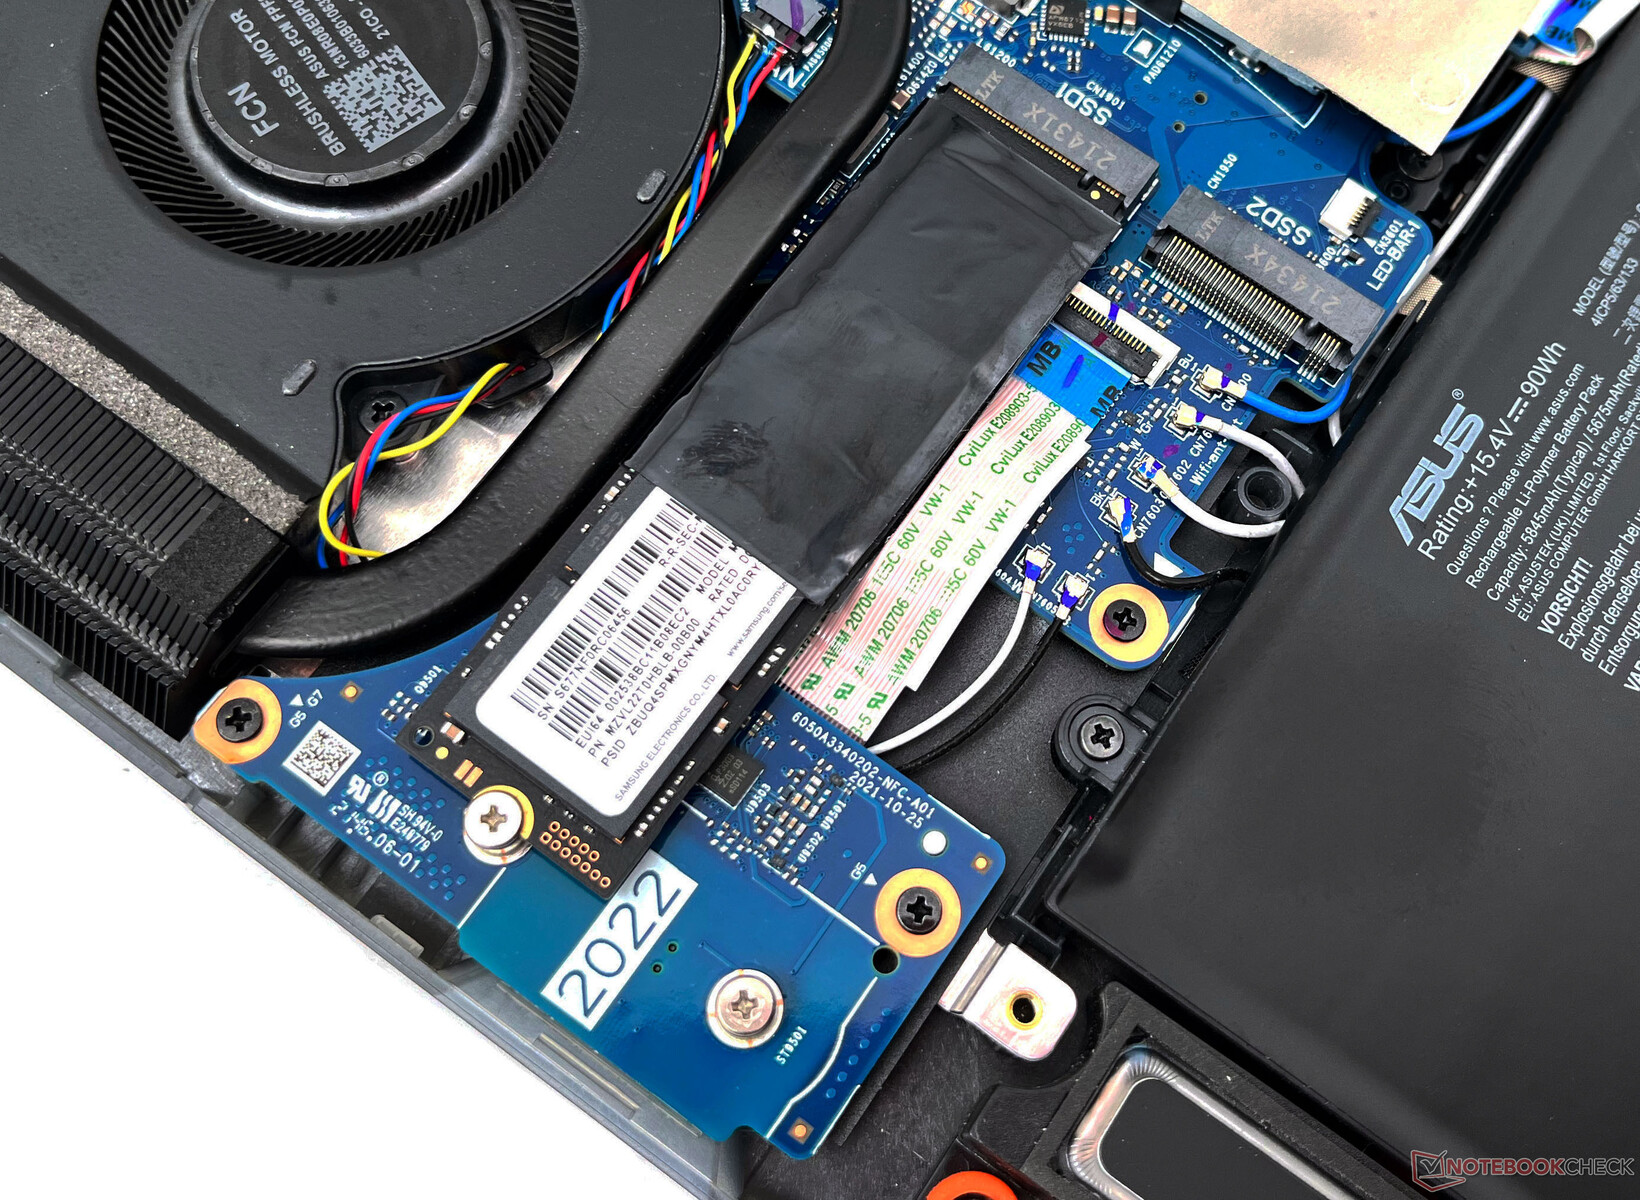
如果需要,Scar 15的Wi-Fi卡可以被换掉,但我们对它的位置并不十分喜欢。WLAN卡实际上被藏在主要的M.2固态硬盘下面,需要拆下硬盘,以便升级或更换。你还应该小心来自Keystone PCB的数据线,它直接在卡的上方运行。
因此,我们用参考的华硕ROG Rapture GT-AXE11000路由器测试了Wi-Fi 5 GHz和Wi-Fi 6E的性能,在距离设备1米的清晰视线范围内。我们的测试设备在接收测试中显示6E的平均接收速度高达6%,在传输测试中显示与5GHz类似的平均吞吐量。 6E频段还允许更高的最大接收值,接近2 Gbit/s。
我们确实观察到,在刚启动到Windows时,需要一些时间才能使6GHz选项可用来连接。在测试中没有观察到吞吐量的重大下降。
网络摄像头
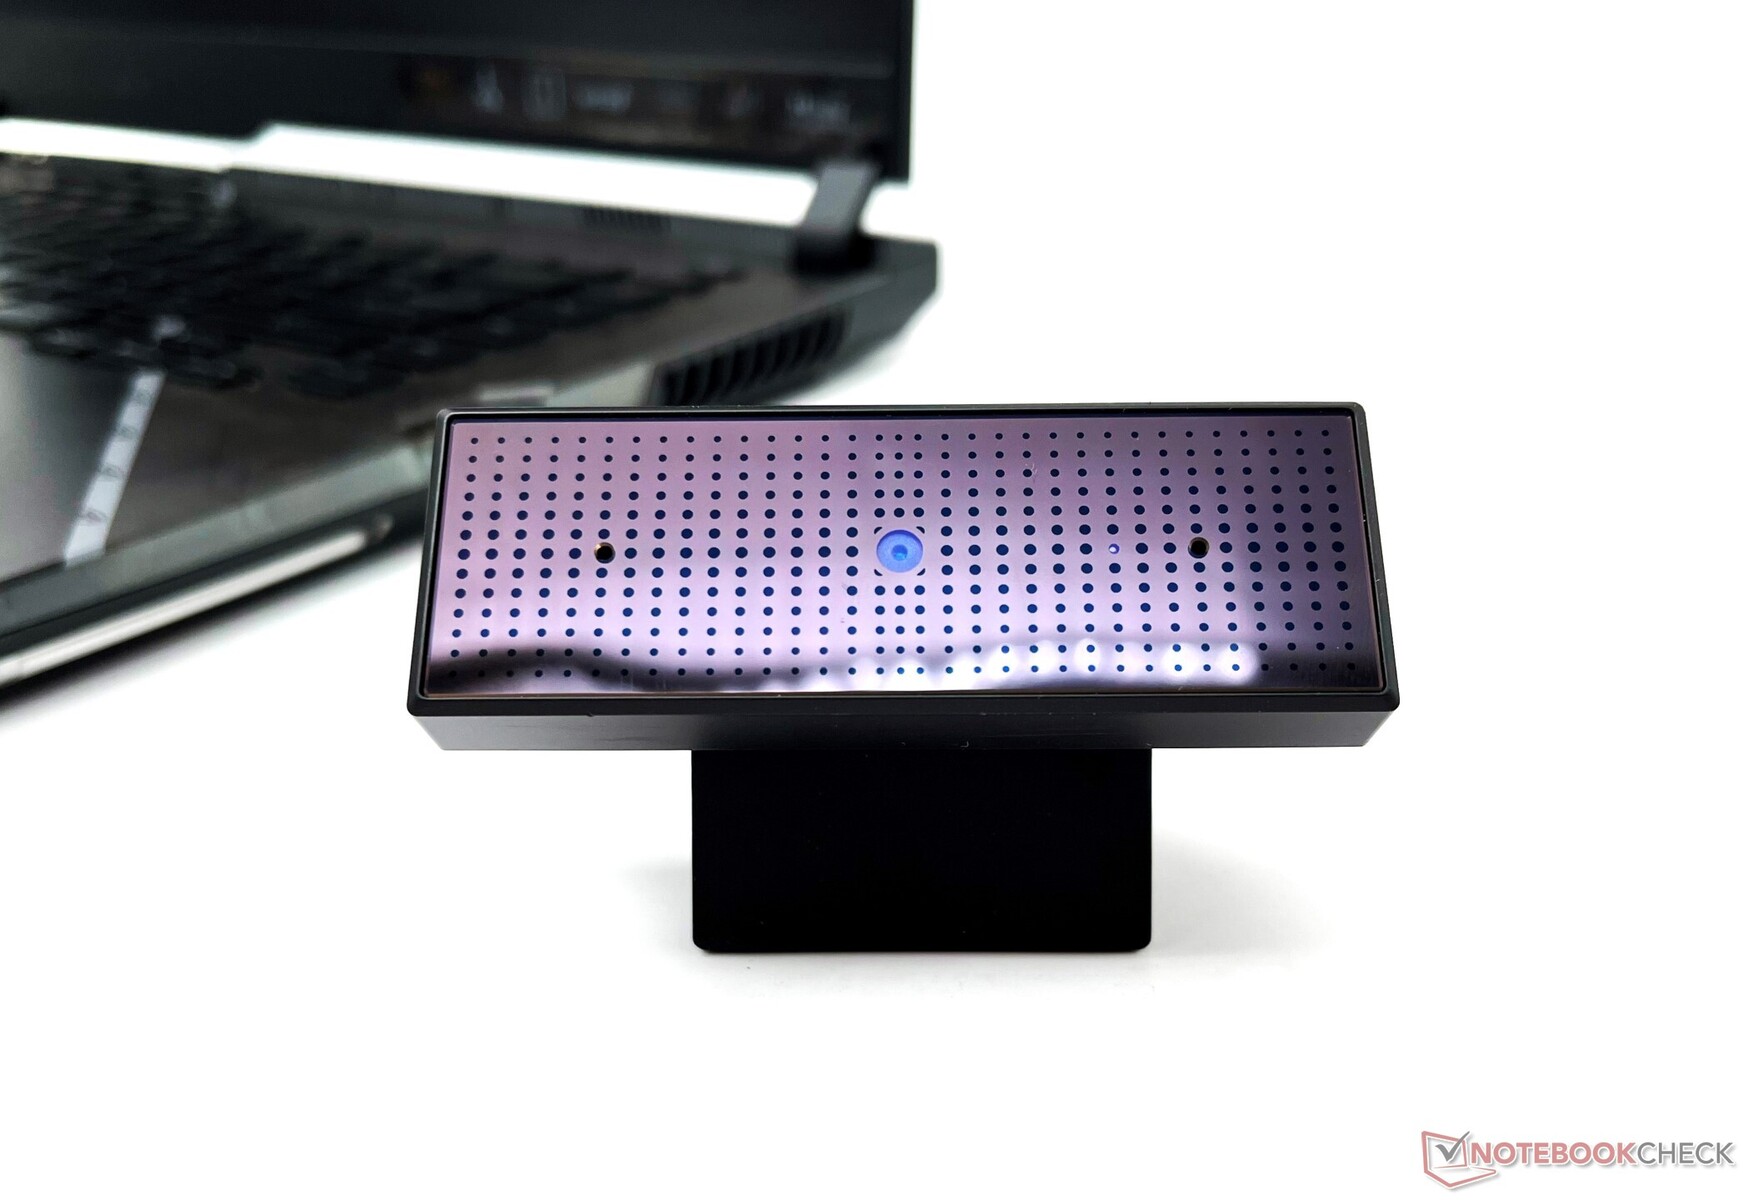
ROG Strix Scar 15没有配备网络摄像头。然而,我们的评测单位配备了一个外部的ROG Eye 1080p 60 fps网络摄像头,内置波束成形双麦克风。该网络摄像头可以在桌面上使用,也可以安装在Scar 15的顶部边框上。
在大多数情况下,ROG Eye的图像质量是相当可用的。在光线充足的房间里,通过我们的ColorChecker Passport,ROG Eye摄像头显示的平均Delta E色彩精度为15.12,在白色和黑色斑块中看到最低的Delta E值。
测试图显示了体面的细节,但图像中缺乏锐利度和清晰度。如果单独购买,ROG Eye网络摄像头将使你花费约5,800英镑(约75美元或更低)。


安全问题
由于ROG Strix Scar 15针对的是游戏人群,华硕在安全功能上有所节制,如指纹识别器或红外摄像头。不过,有一个TPM 2.0模块存在。
辅料
盒子里有电源适配器和通常的文书工作。你还会得到ROG Keystone 2钥匙和两个可替换的ROG装甲帽。我们的设备在发货时配备了ROG Eye外部网络摄像头,但一些零售单位可能不提供,这取决于SKU和地区。
维护
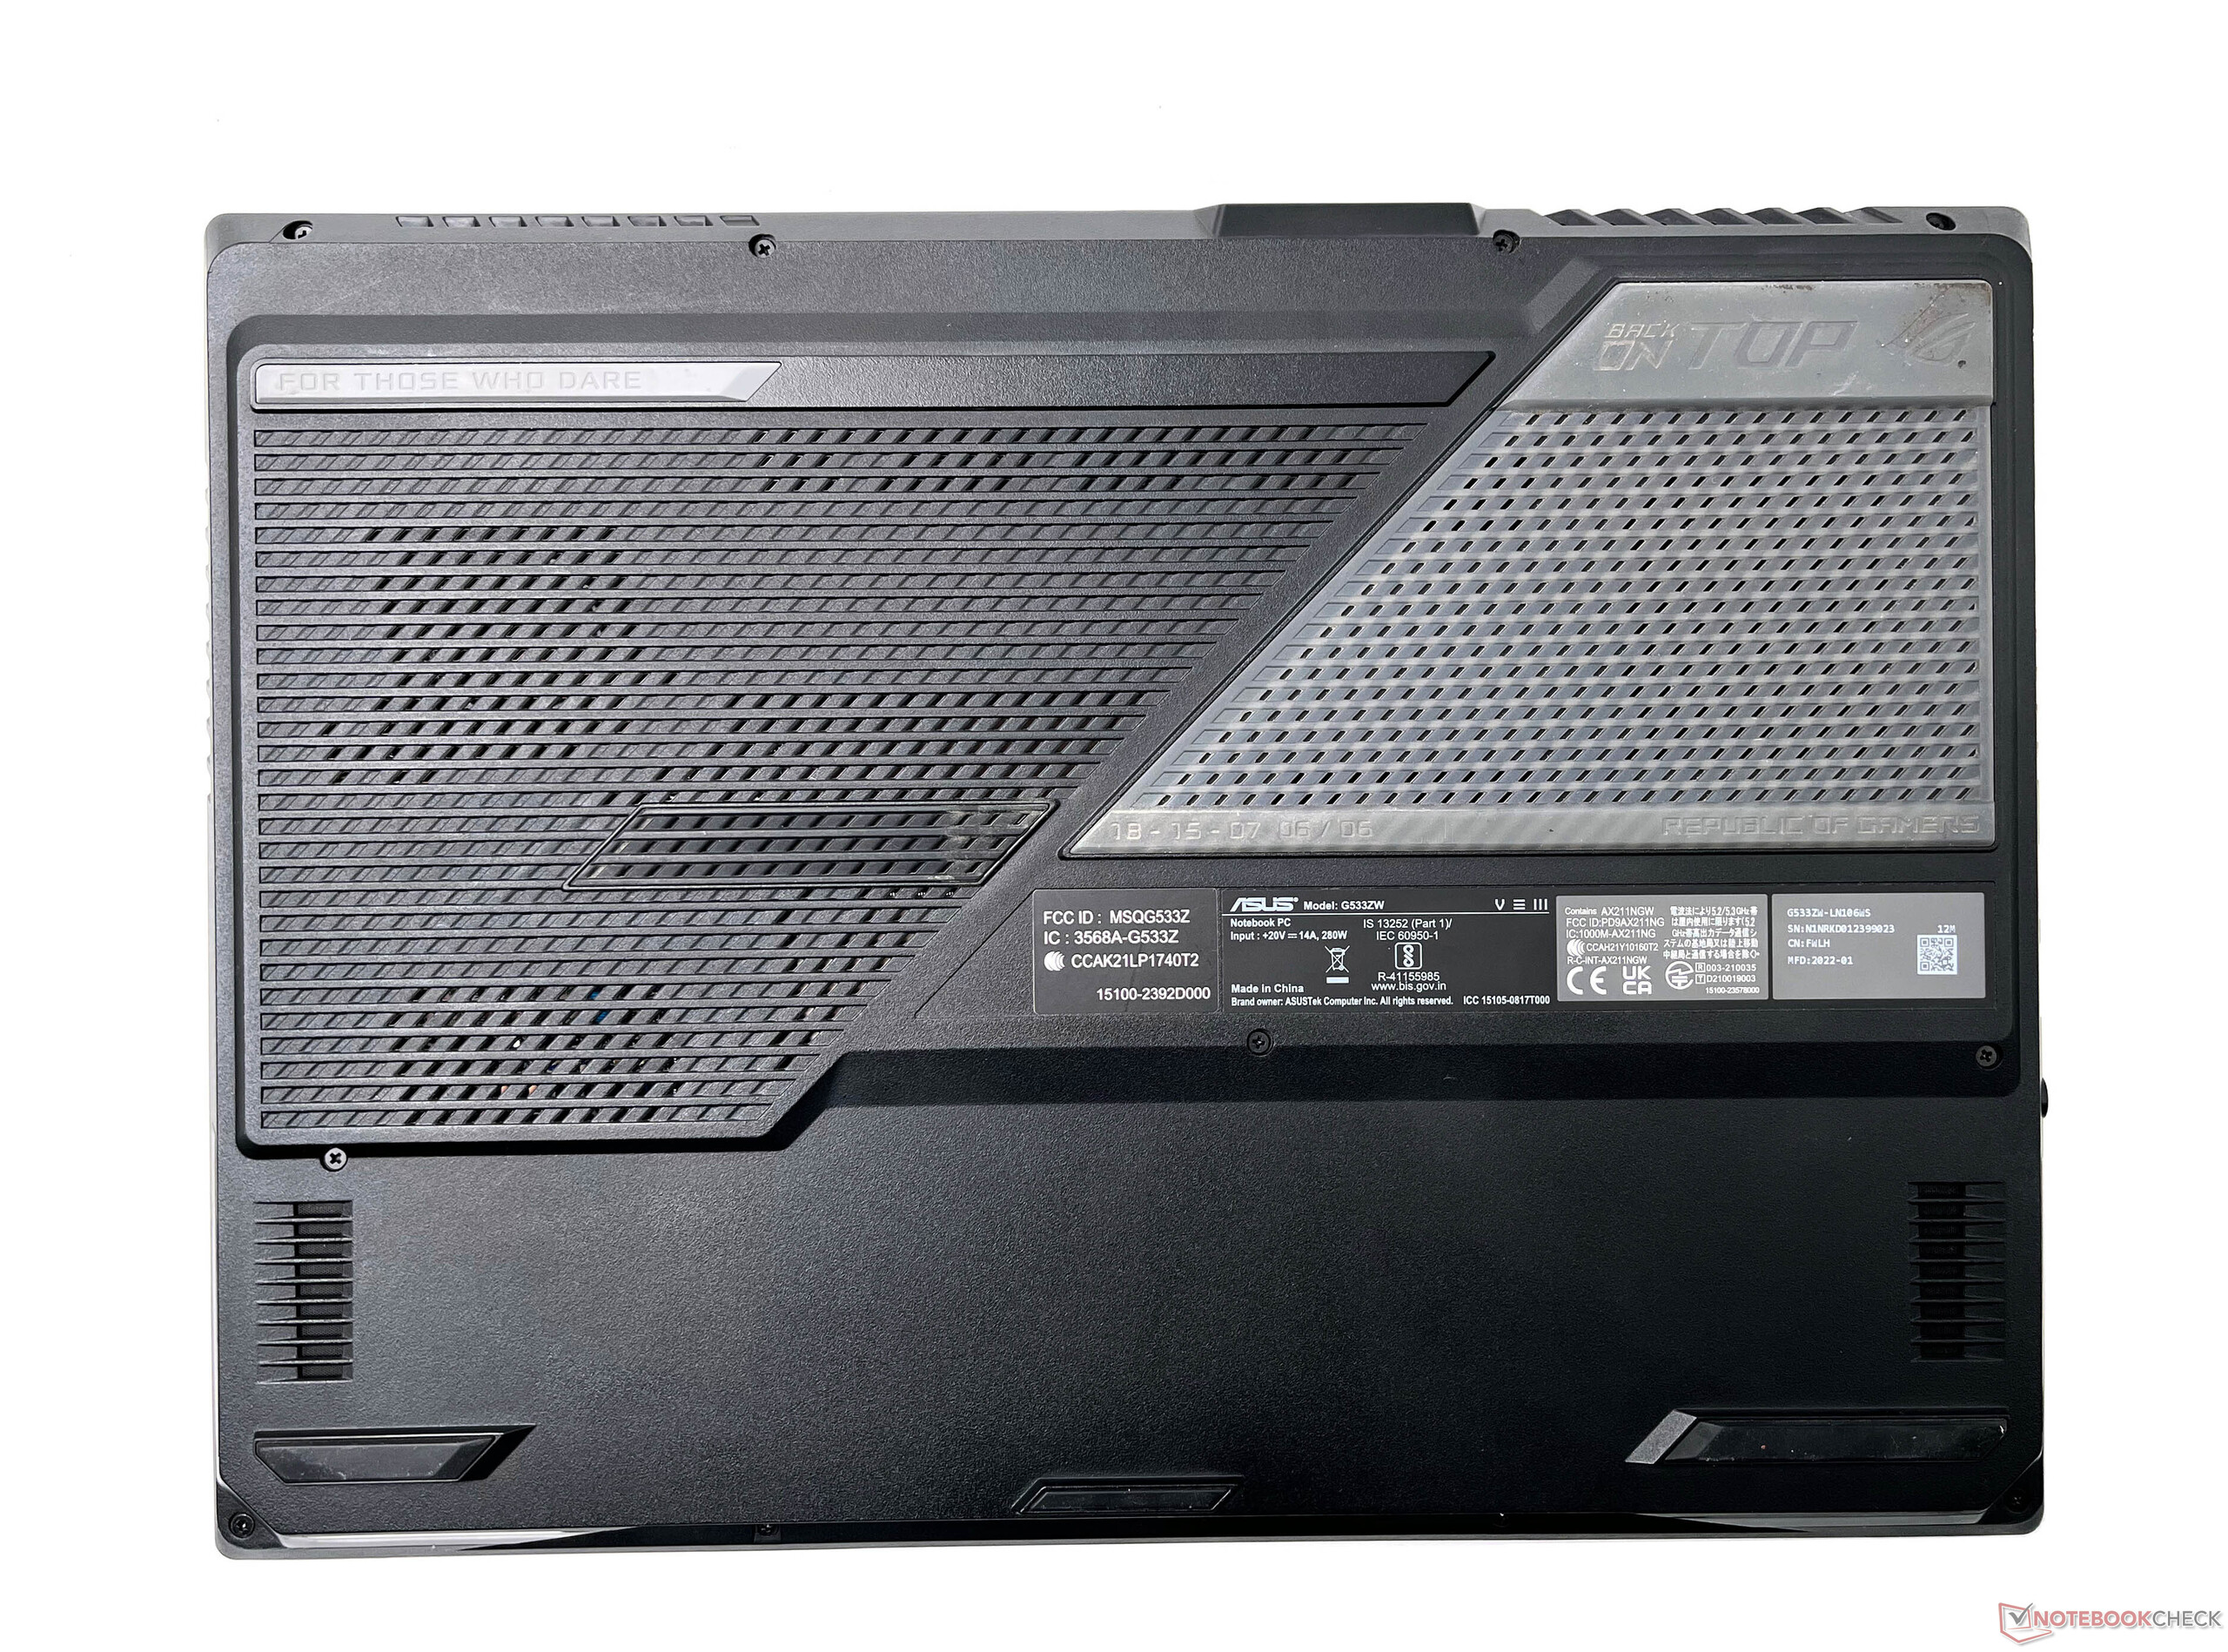
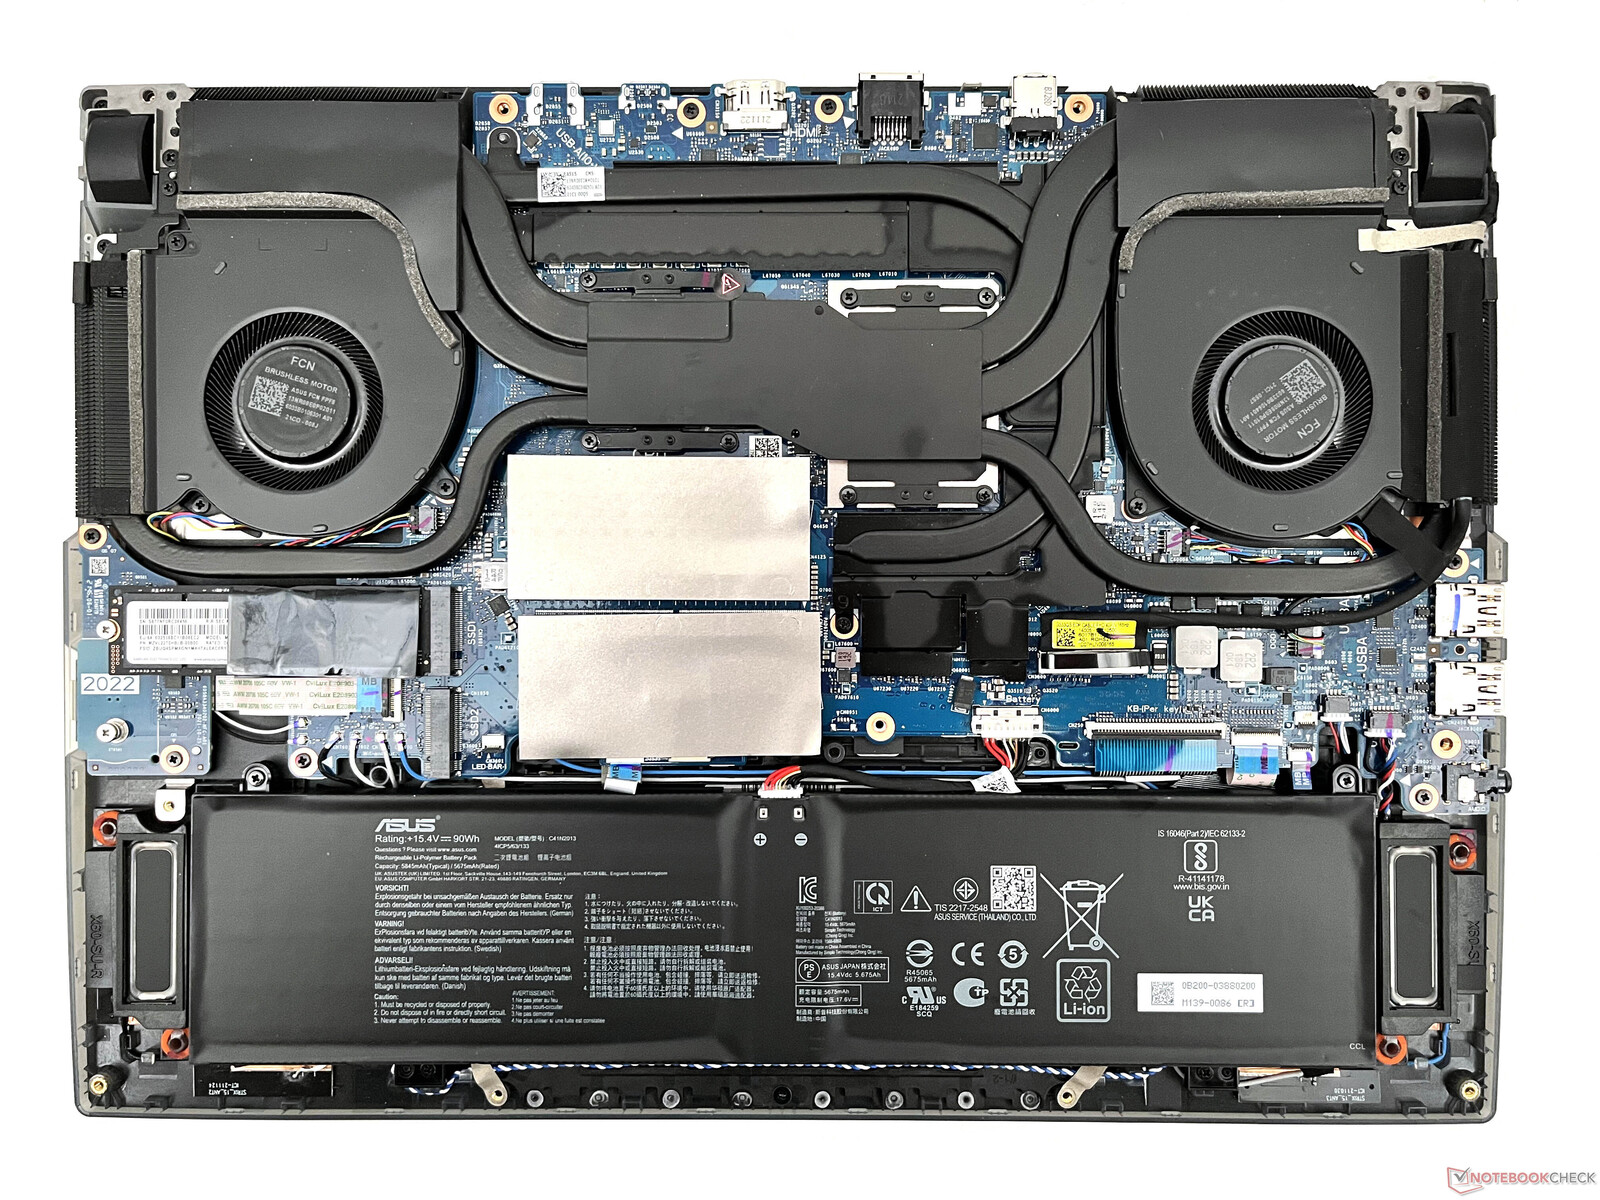
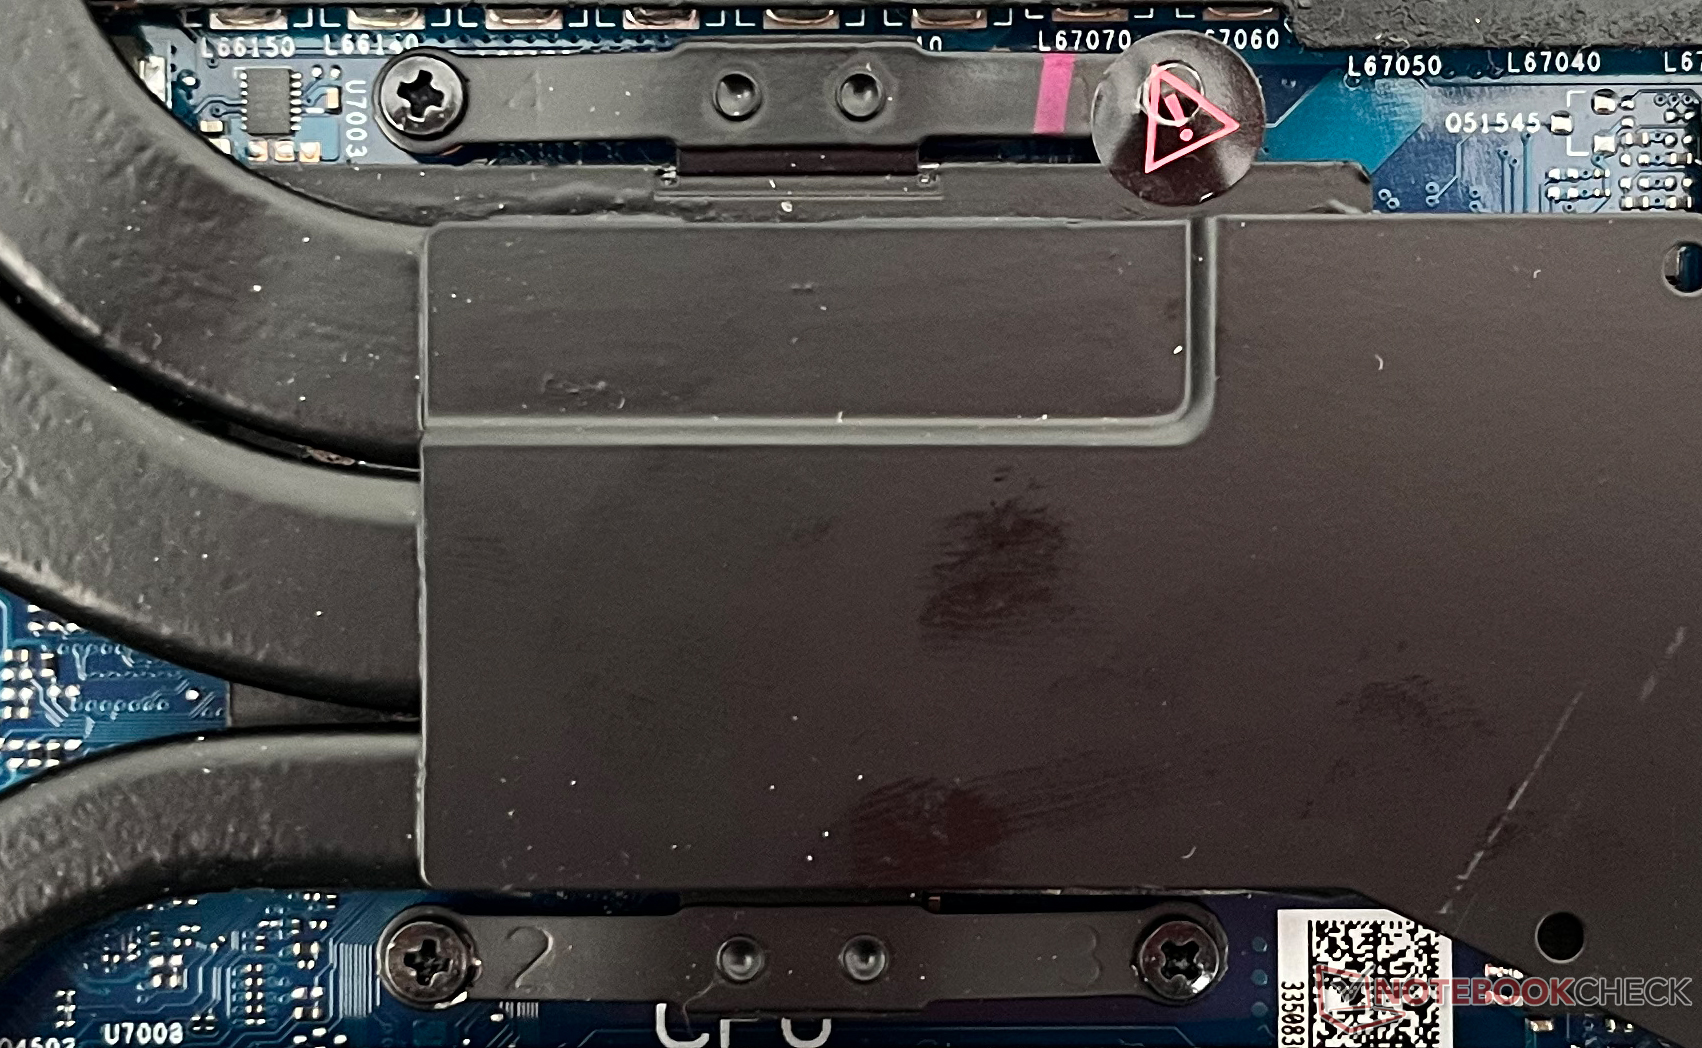
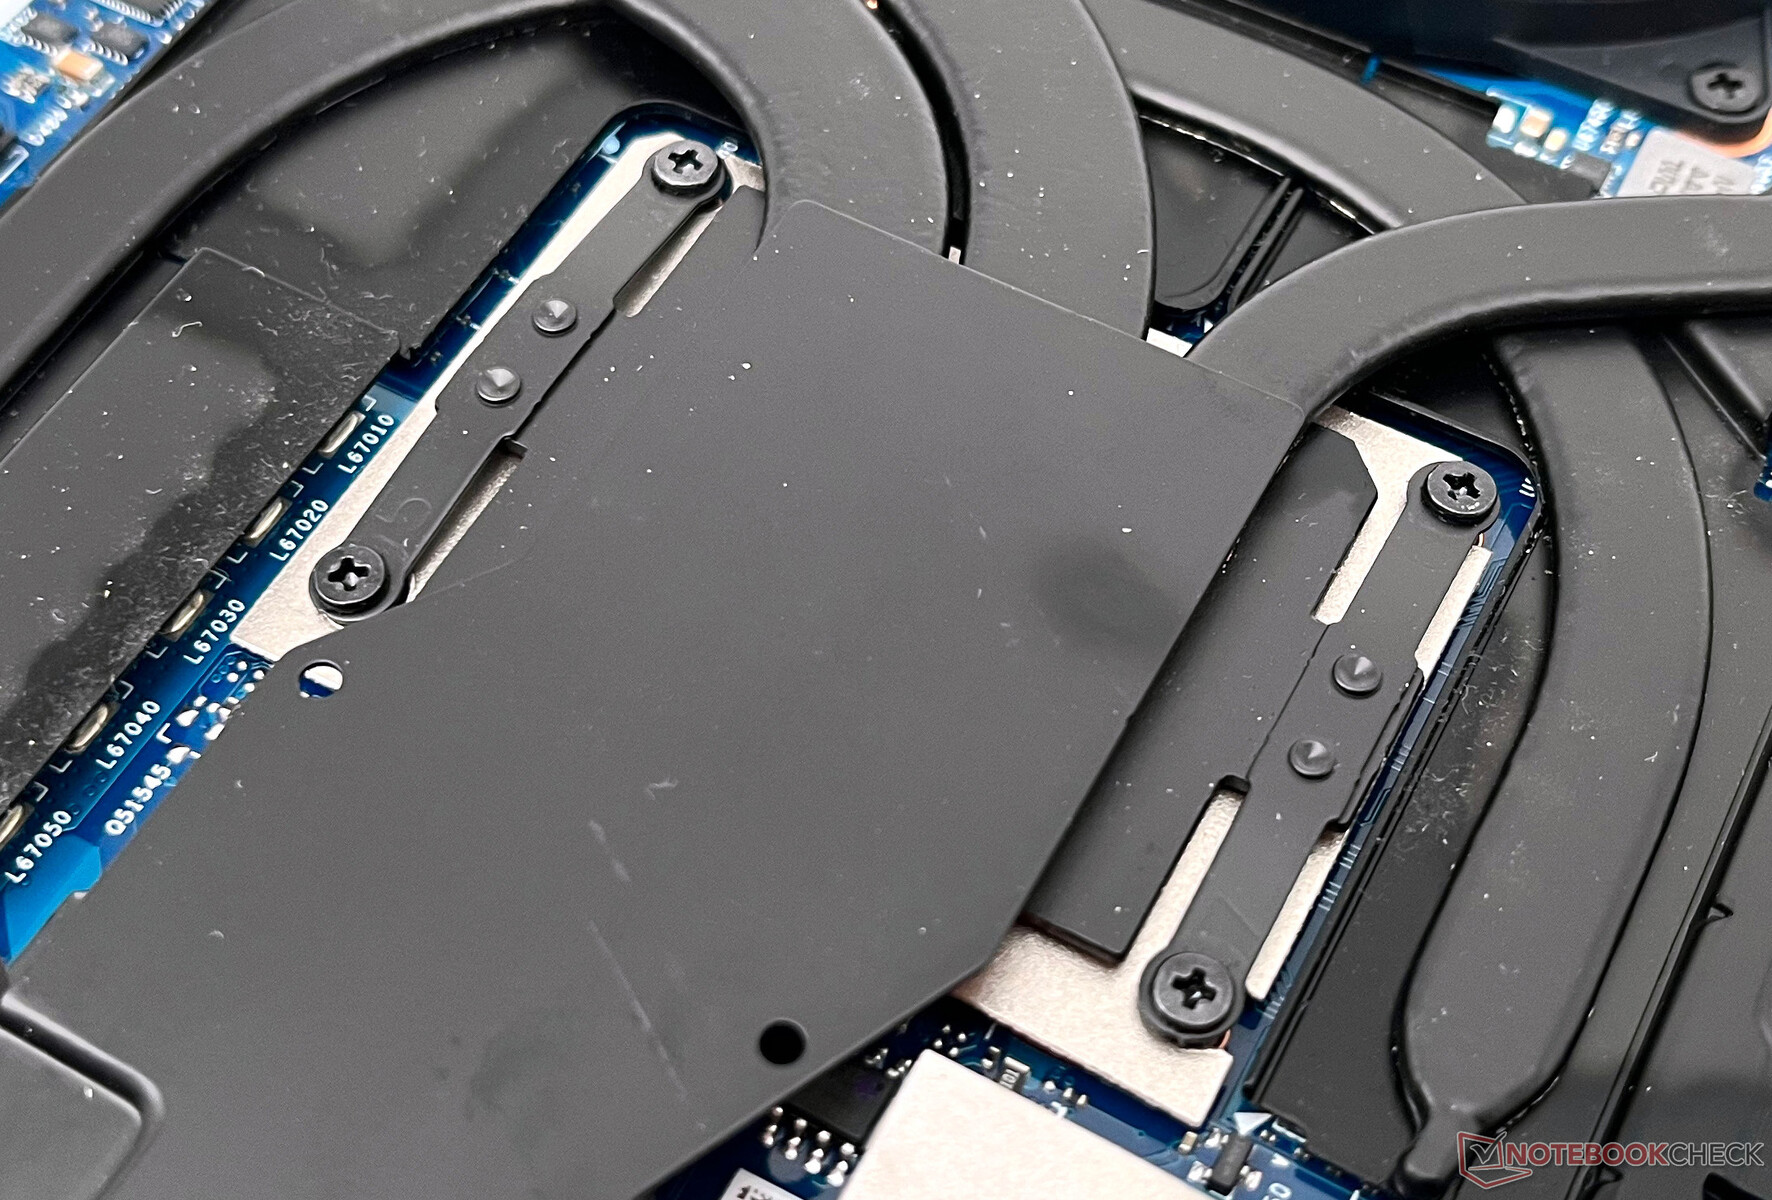
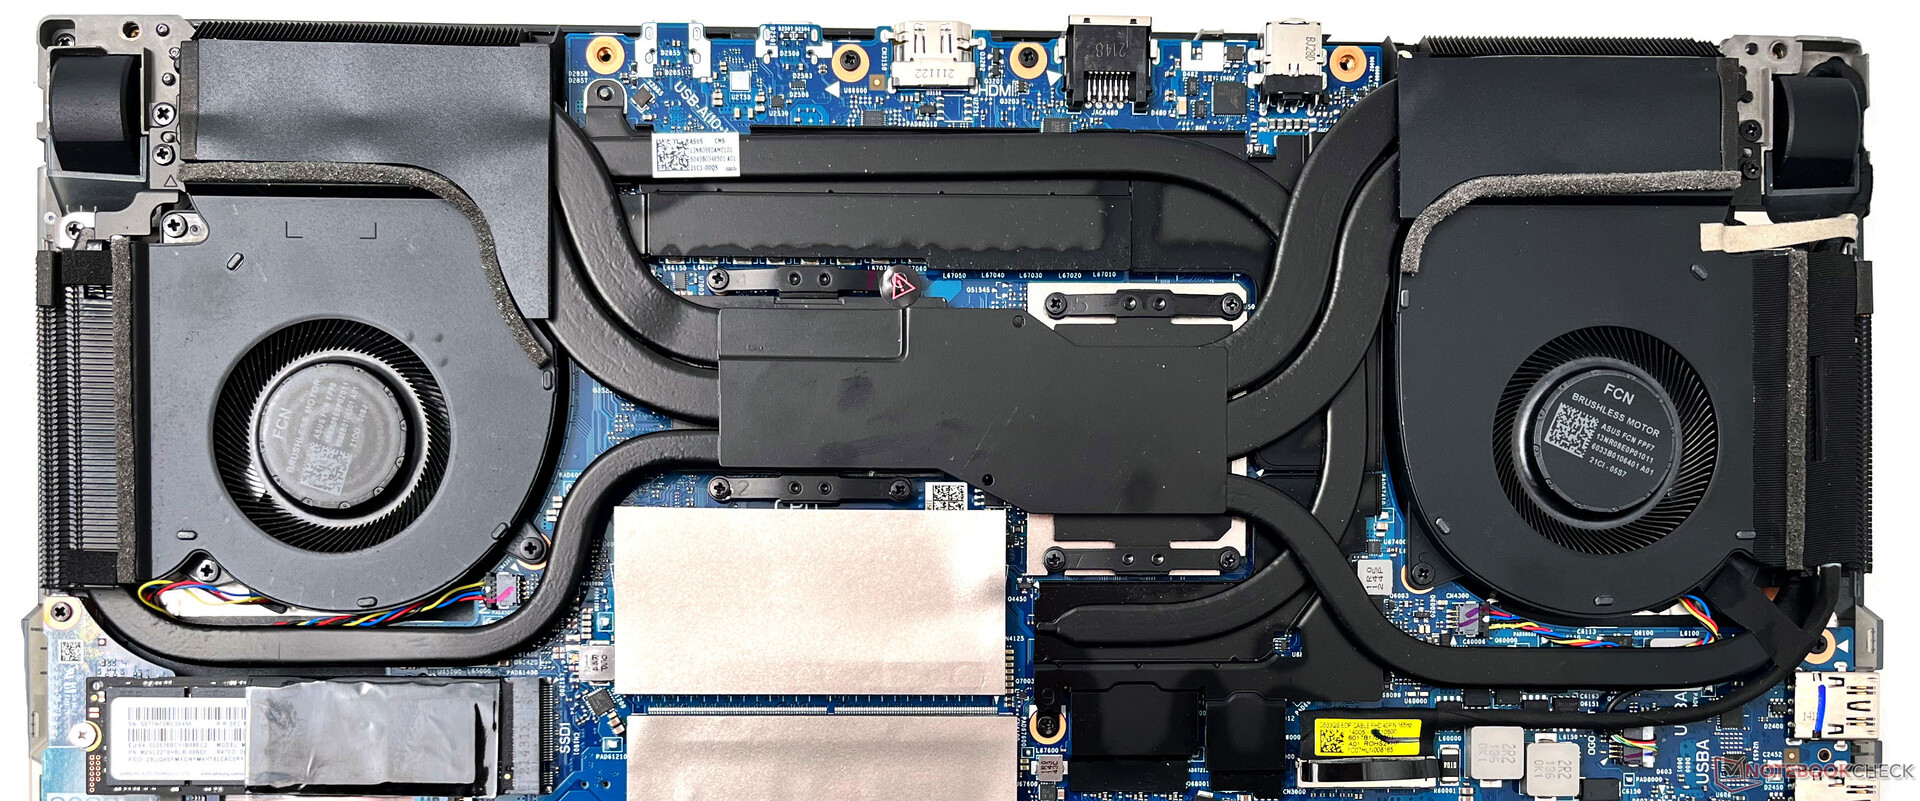
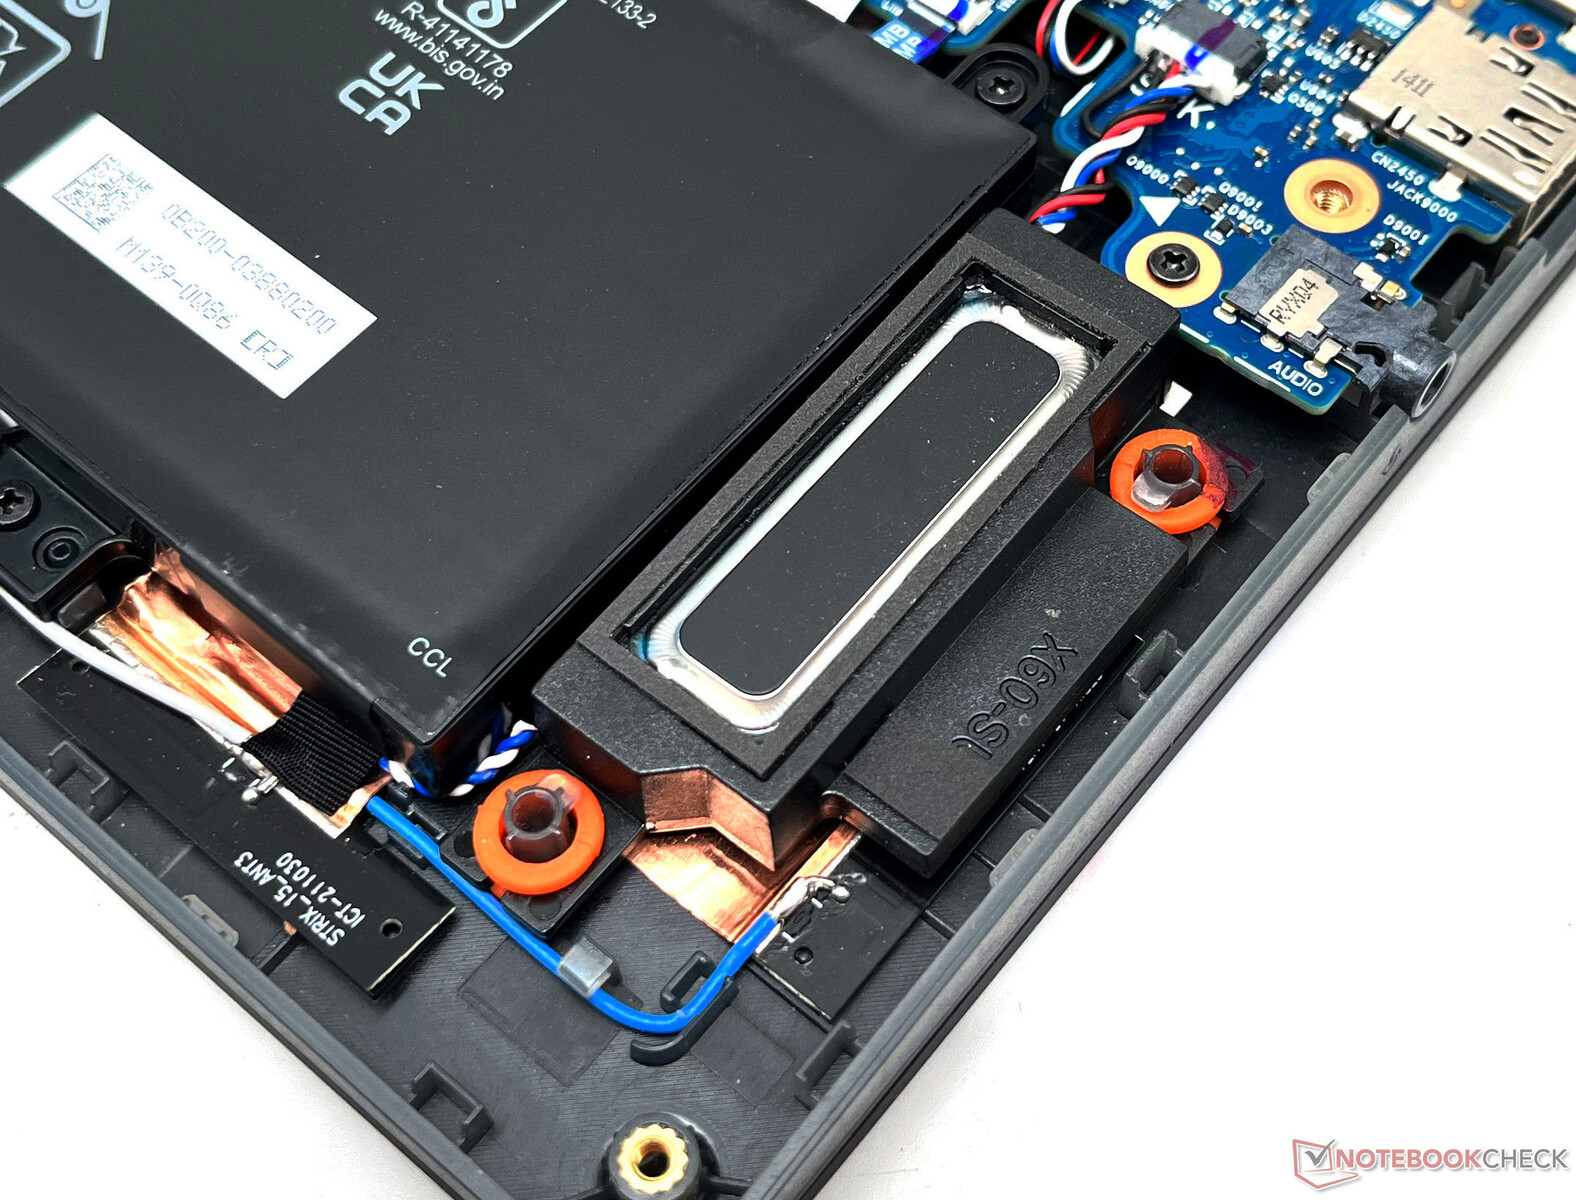
卸下10颗PH0螺丝后,底板可以很容易地被撬开。然而,这里需要小心,因为有脆弱的带状电缆从底板到主板。这些电缆控制底板前缘的RGB灯条。
在我们看来,将机箱的RGB灯条放在这个位置并不是一个好主意,因为如果你在拆卸底板时不小心,细细的电缆就会折断,从而使接触内部部件变得复杂。LED应该是主机箱本身的一部分,最好像MSI GE76 Raider ,例如。
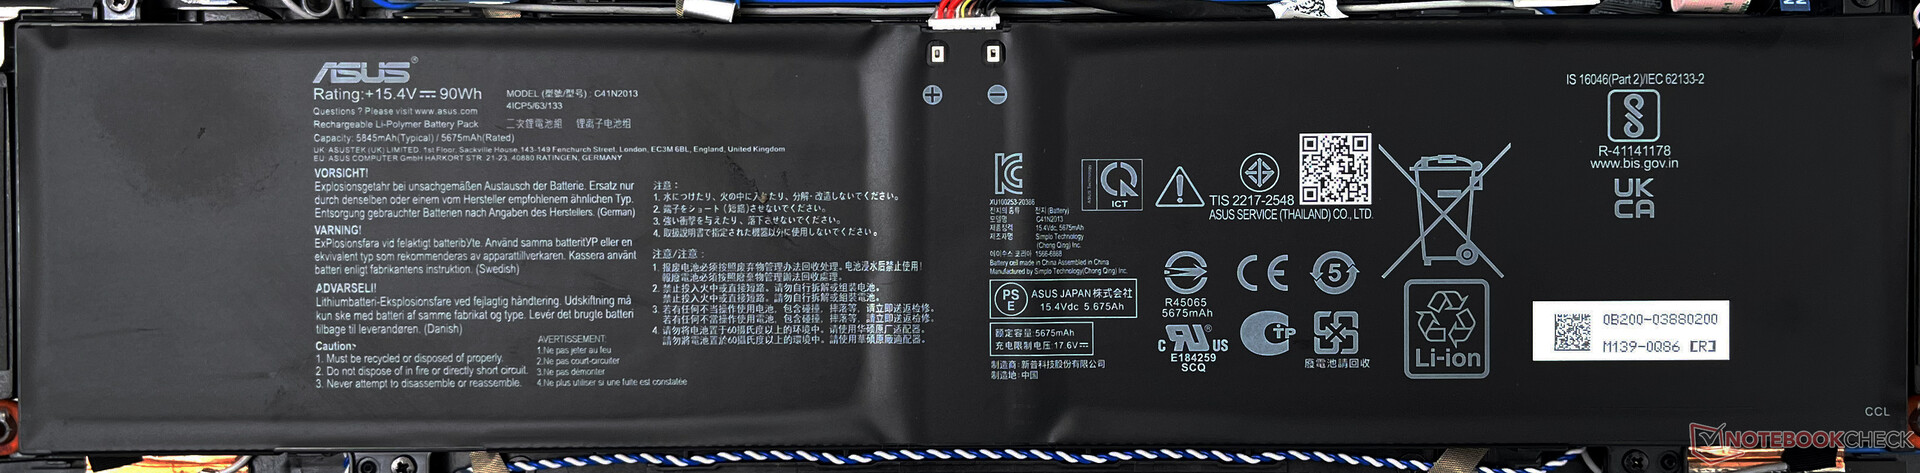
内部结构没有任何特别的惊喜。你得到了可交换的SO-DIMMs,M.2 SSDs,和WLAN卡,一个大的90瓦时电池,和一个双风扇八热管冷却系统。
担保
华硕在印度为ROG Strix Scar 15提供了一年的标准保修。额外的Premium Care可以通过MyAsus应用程序或从华硕商店购买额外的保修延期。
印度买家目前可以利用"返校 "优惠延长两年和三年的保修期,并在购买后15天内为包括ROG系列在内的各种华硕笔记本组合提供意外损坏保护。
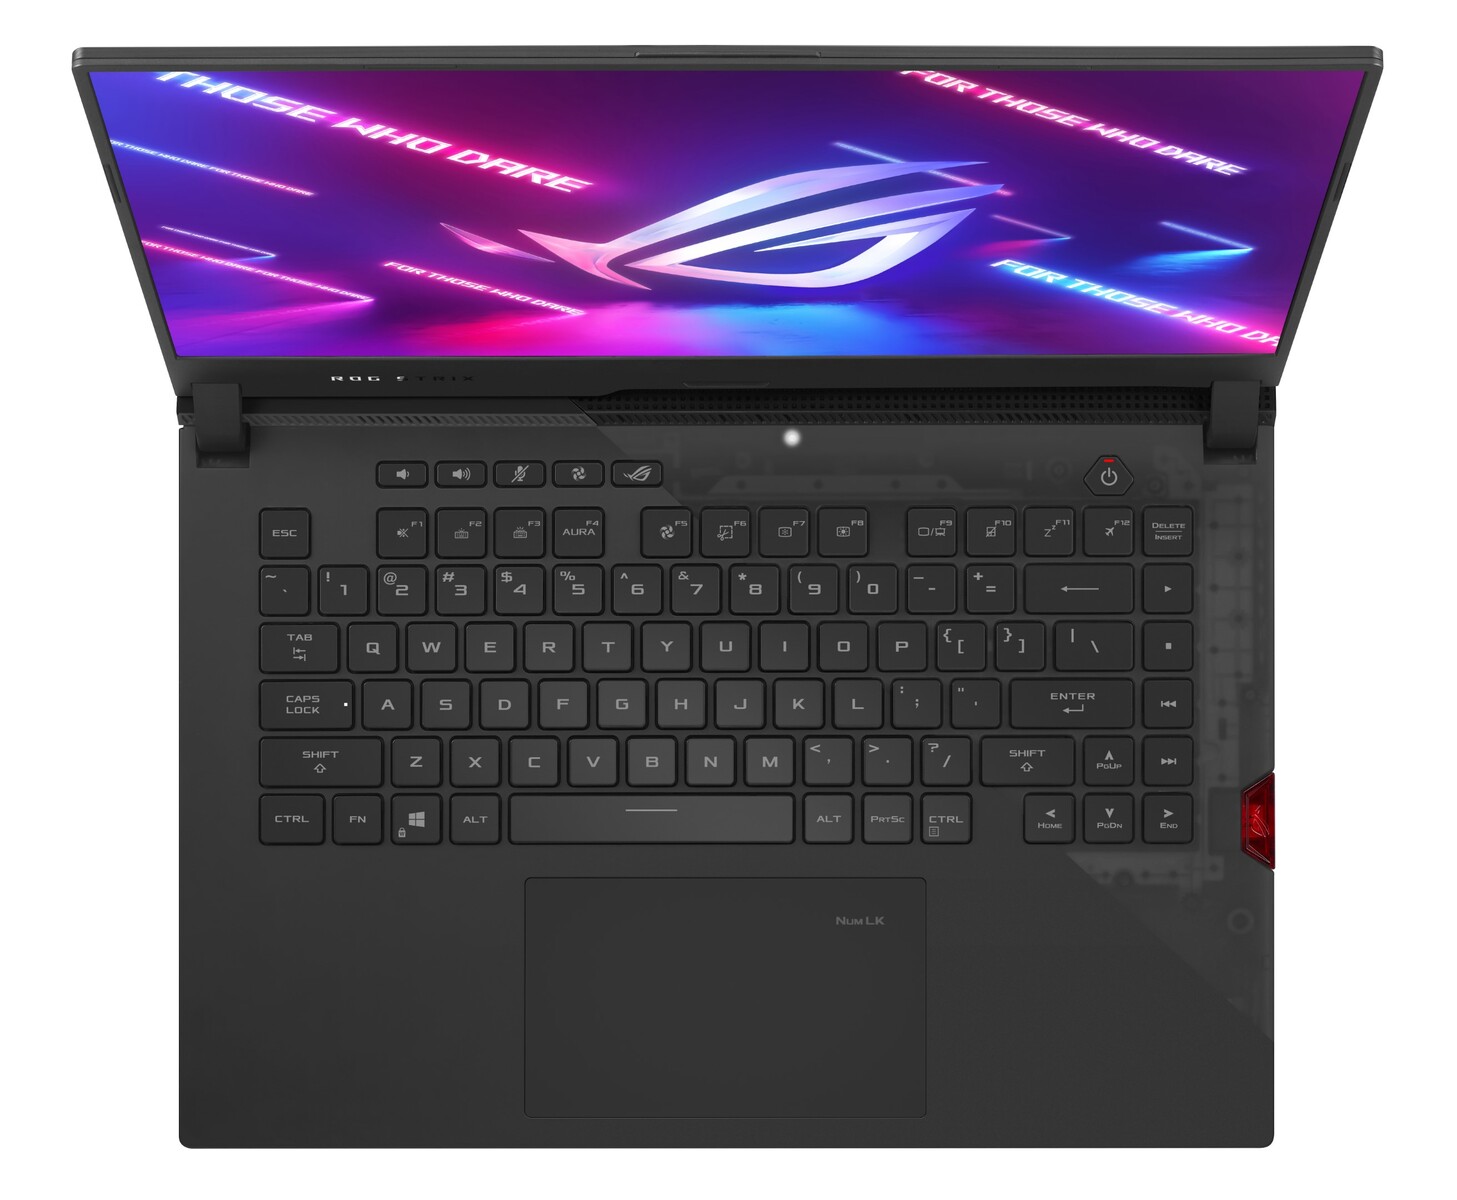
输入设备。返回到薄膜开关
键盘
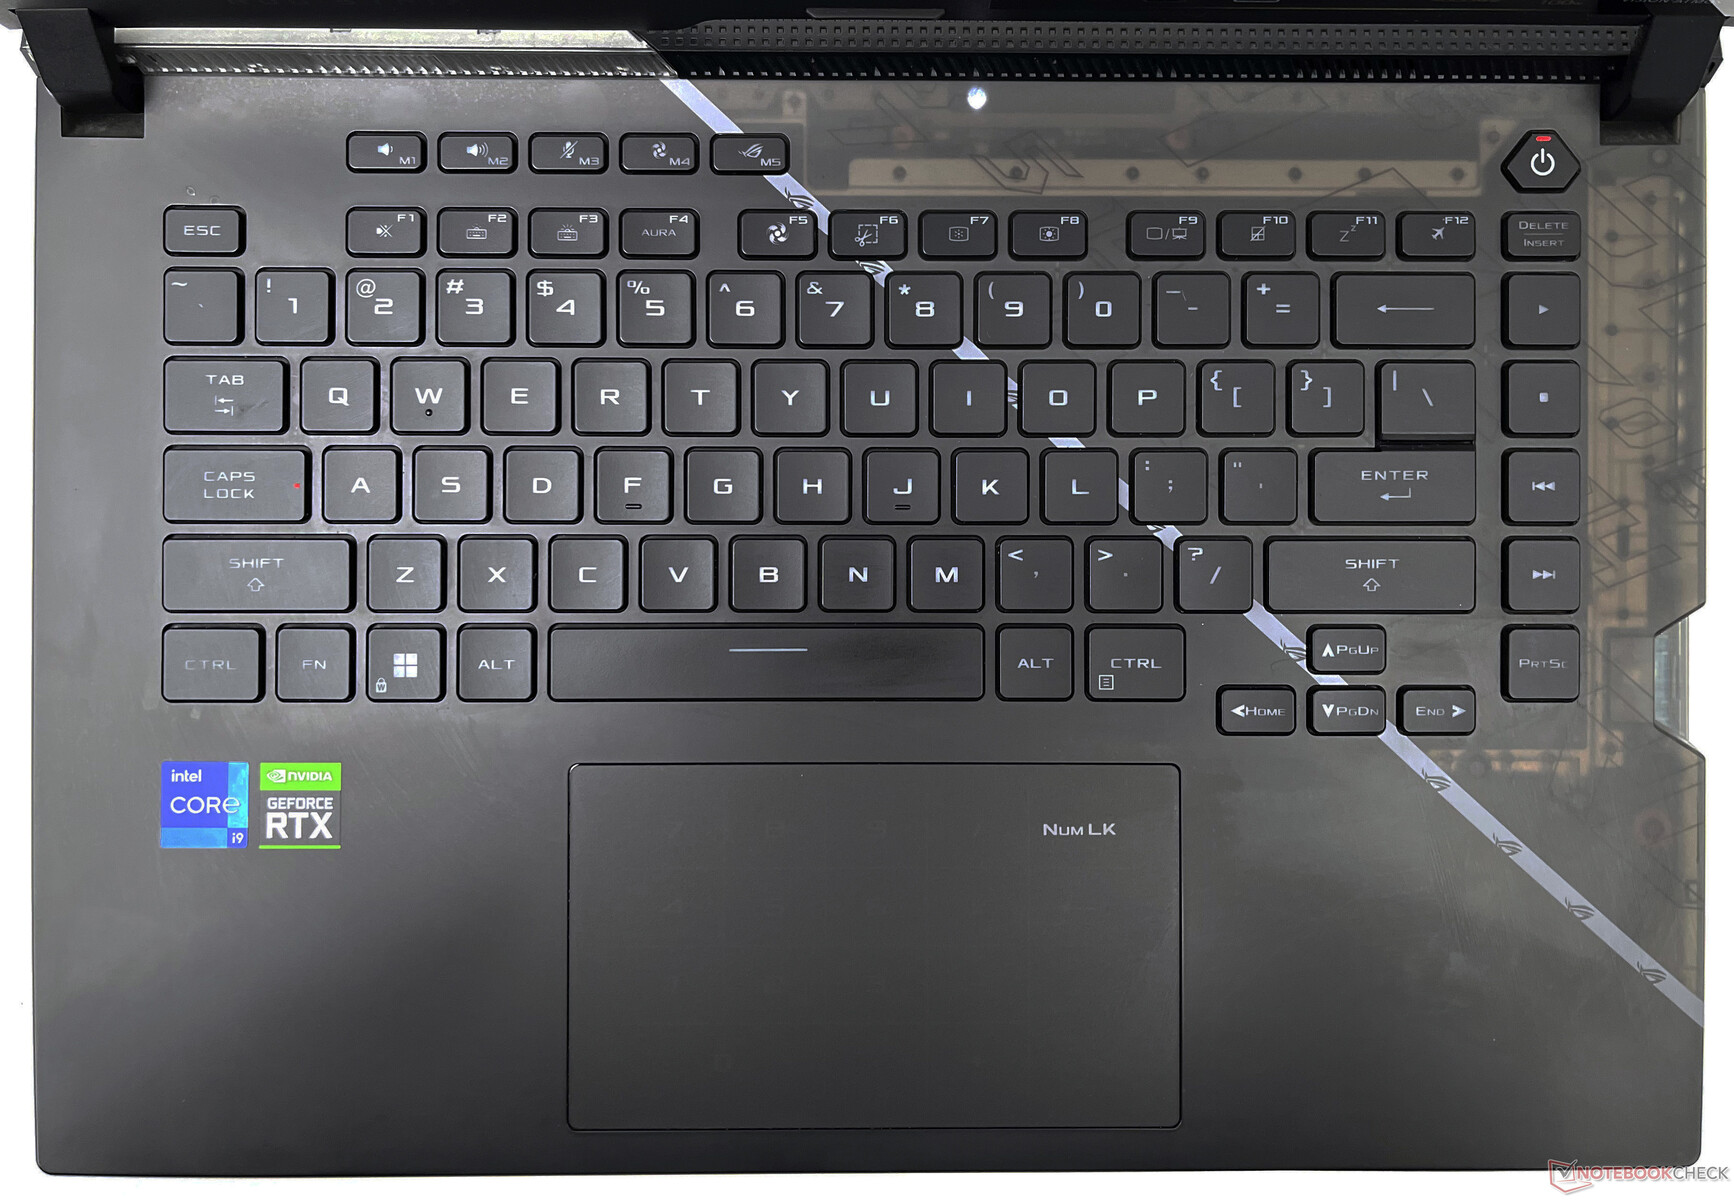
哑光键盘甲板是一个污垢和油脂的磁铁,尽管华硕声称是相反的。的2021年ROG Strix Scar 15的键盘采用了光电机械开关,但华硕在今年的Scar 15中又恢复了经典的薄膜圆顶开关。为了补偿,华硕采用了它所谓的ROG Overstroke,它可以在笔画的较早部分登记按键。键盘有足够的间距,一般来说,打字是相当舒适的,有很好的触感。
最上面一行是音量、麦克风静音、风扇速度和Armory Crate应用程序的快速快捷键。这些键也可以通过Armory Crate映射到自定义快捷键和宏。箭头键比我们希望的要小,但可以完成工作。华硕表示,在WASD键周围有小的通风口,将空气吸入机箱,防止键盘升温。
RGB亮度足以通过Aura Sync享受各种照明效果。所有的键都可以单独点亮,但华硕出于某种原因喜欢把F1-F12的字样放在黑暗中。
触摸板
13厘米×7.5厘米的触摸板很宽敞,并提供流畅的滑行。然而,点击声很浅,而且对我们的口味来说有点响。游戏者最好使用一个合适的鼠标。
触摸板上有一个用于数字键盘的软触摸开关,它只在白色下发光。
显示。杜比视界,对比度差,但响应时间有所改善
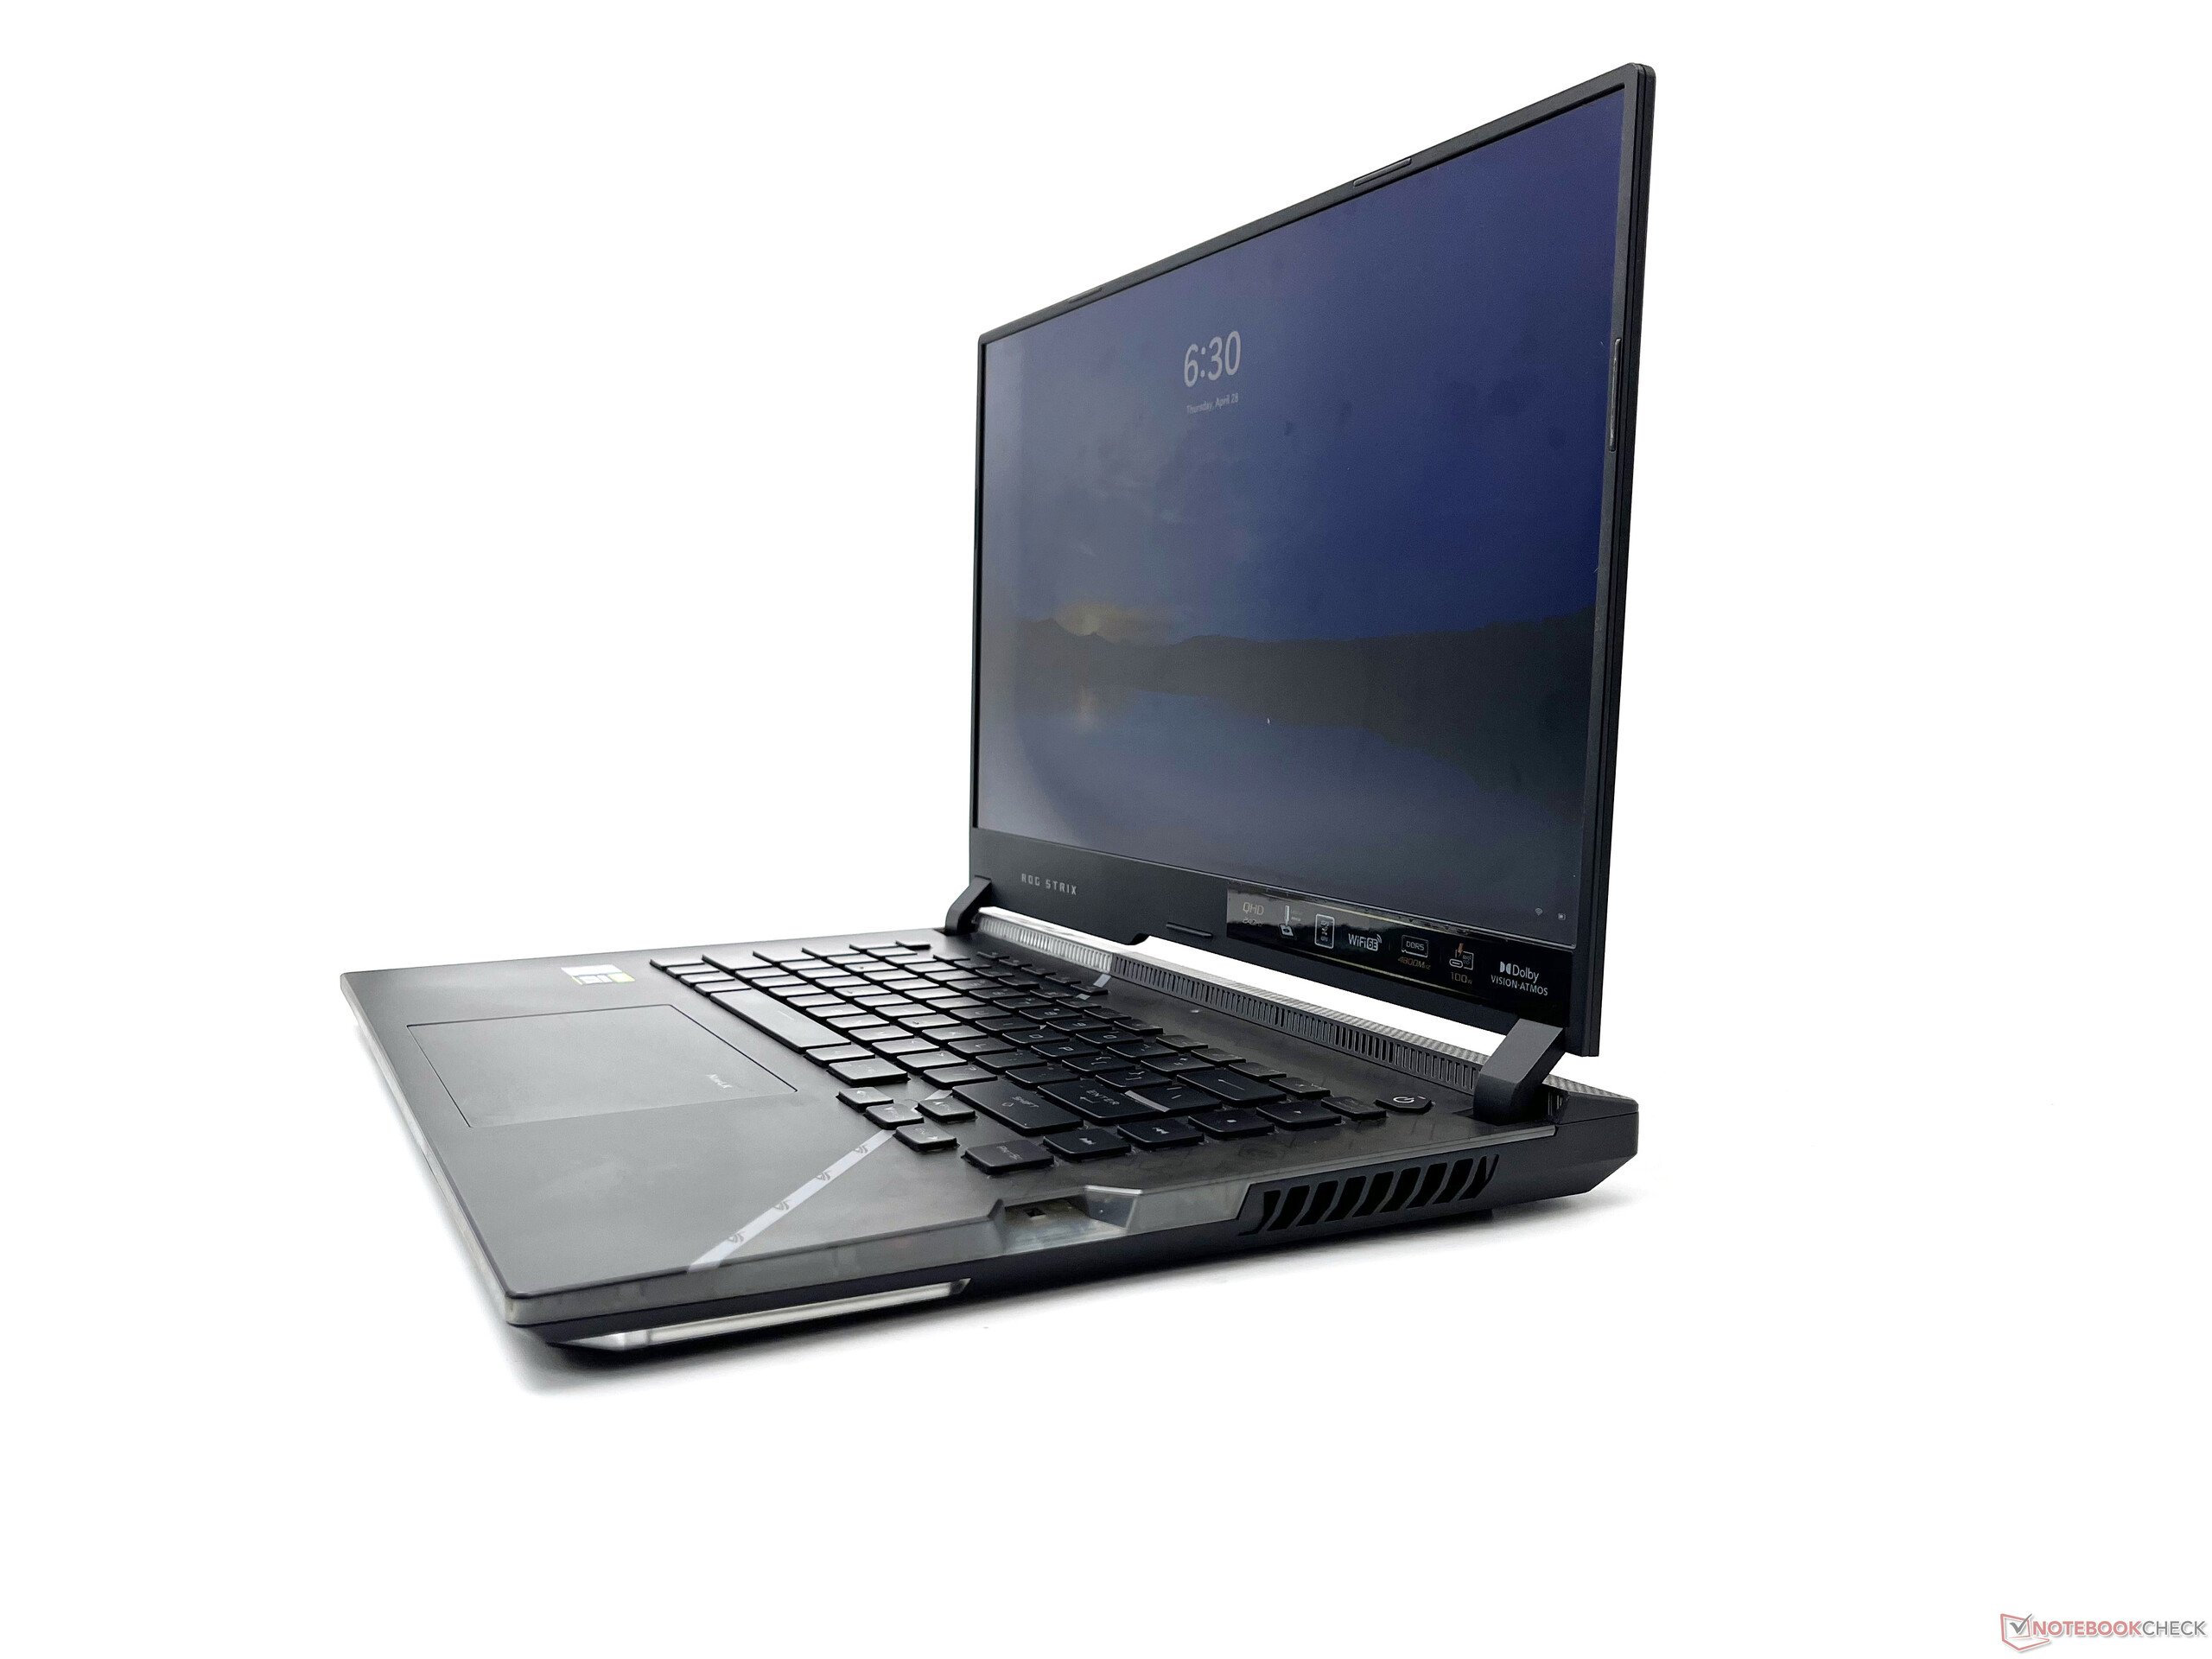
华硕在新的Scar 15中基本上使用了与去年相同的QHD IPS BOE面板,但在型号上略有修改,所有15英寸和17英寸SKU的刷新率为240 Hz。
Scar 15的显示屏支持Dolby Vision HDR和自适应同步。在接下来的测量中,我们使用了杜比视界设置中的默认 "明亮 "配置文件。
由于磨砂涂层的原因,子像素的排列显得有些模糊。我们观察到在长时间曝光的情况下有明显的背光渗漏。
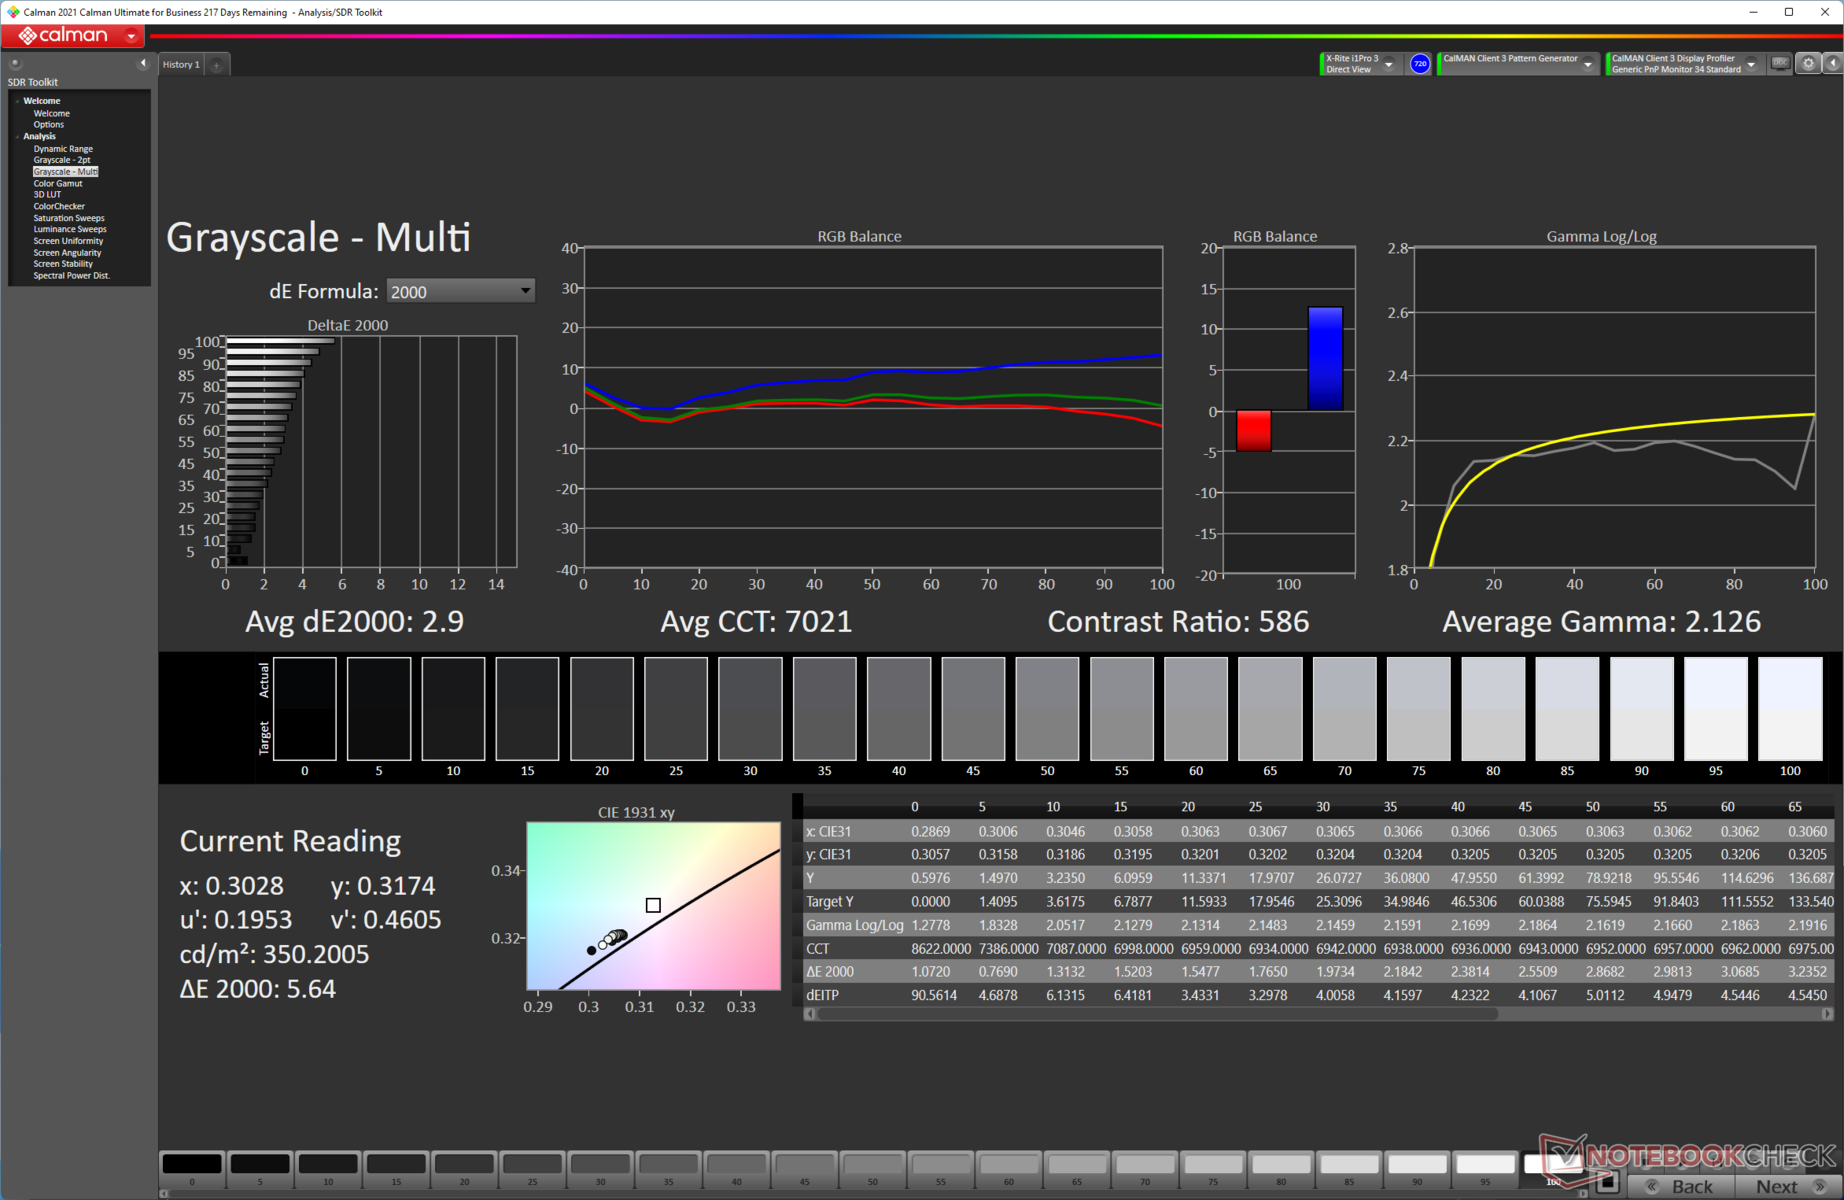
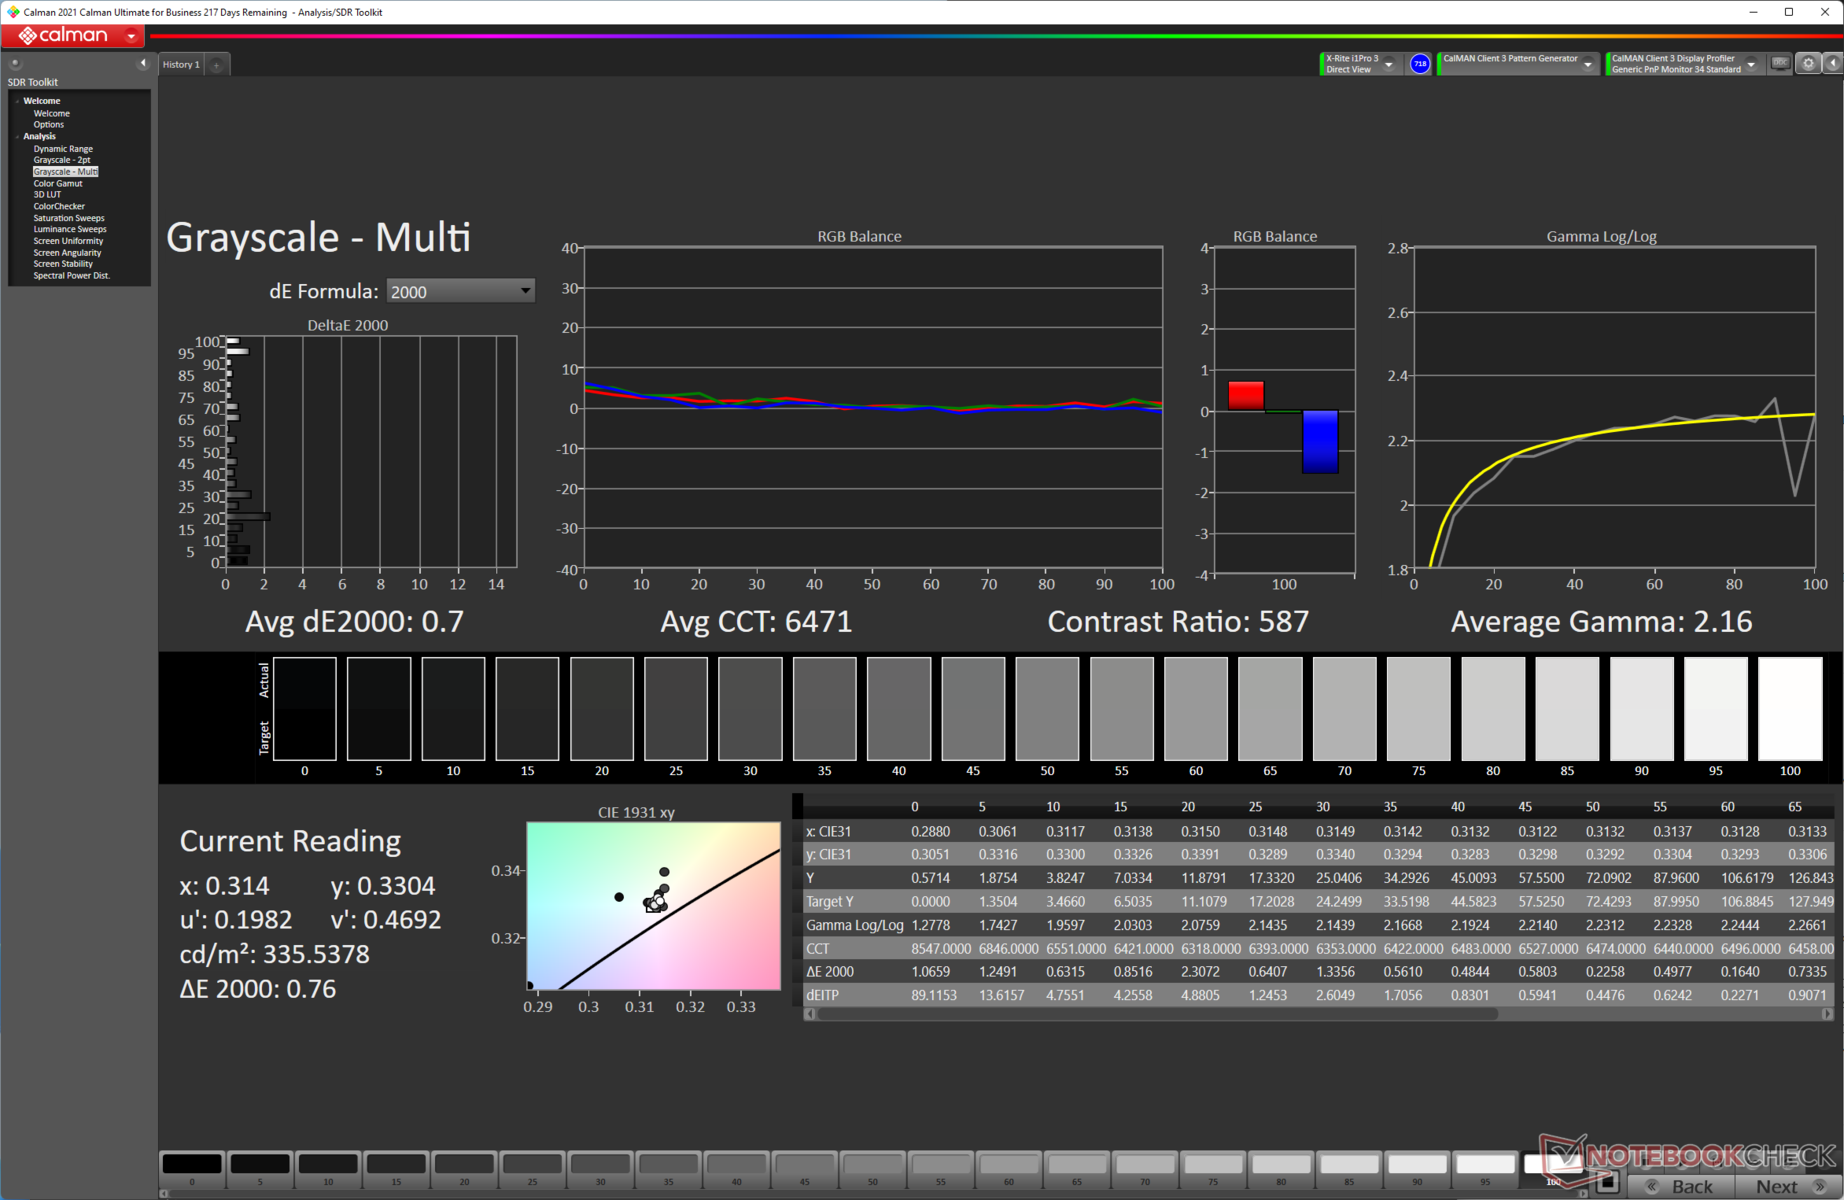
亮度分布为91%,还算不错。然而,该面板的对比度很差,只有586:1。对于一个IPS面板来说,整体的主观观看体验还是相当不错的。


| |||||||||||||||||||||||||
Brightness Distribution: 91 %
Center on Battery: 346 cd/m²
Contrast: 586:1 (Black: 0.59 cd/m²)
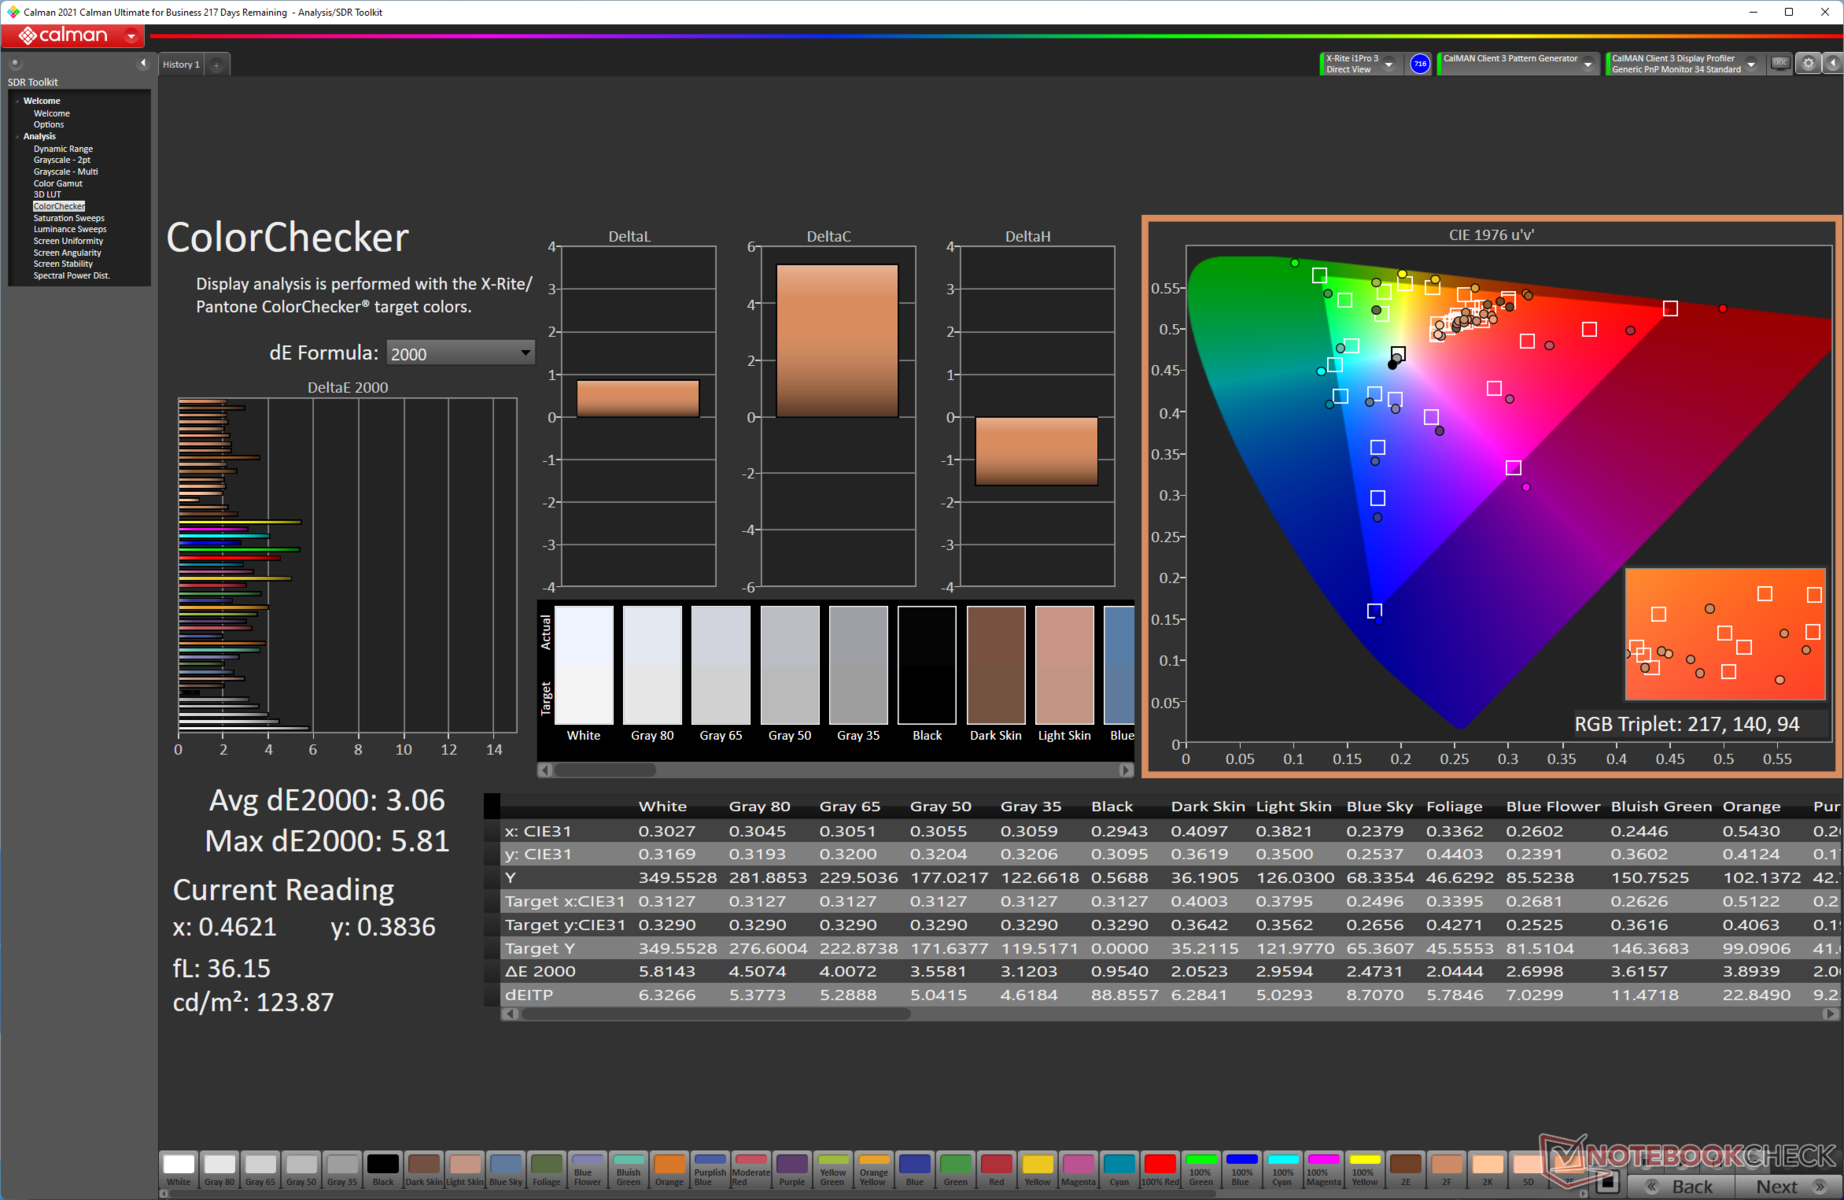
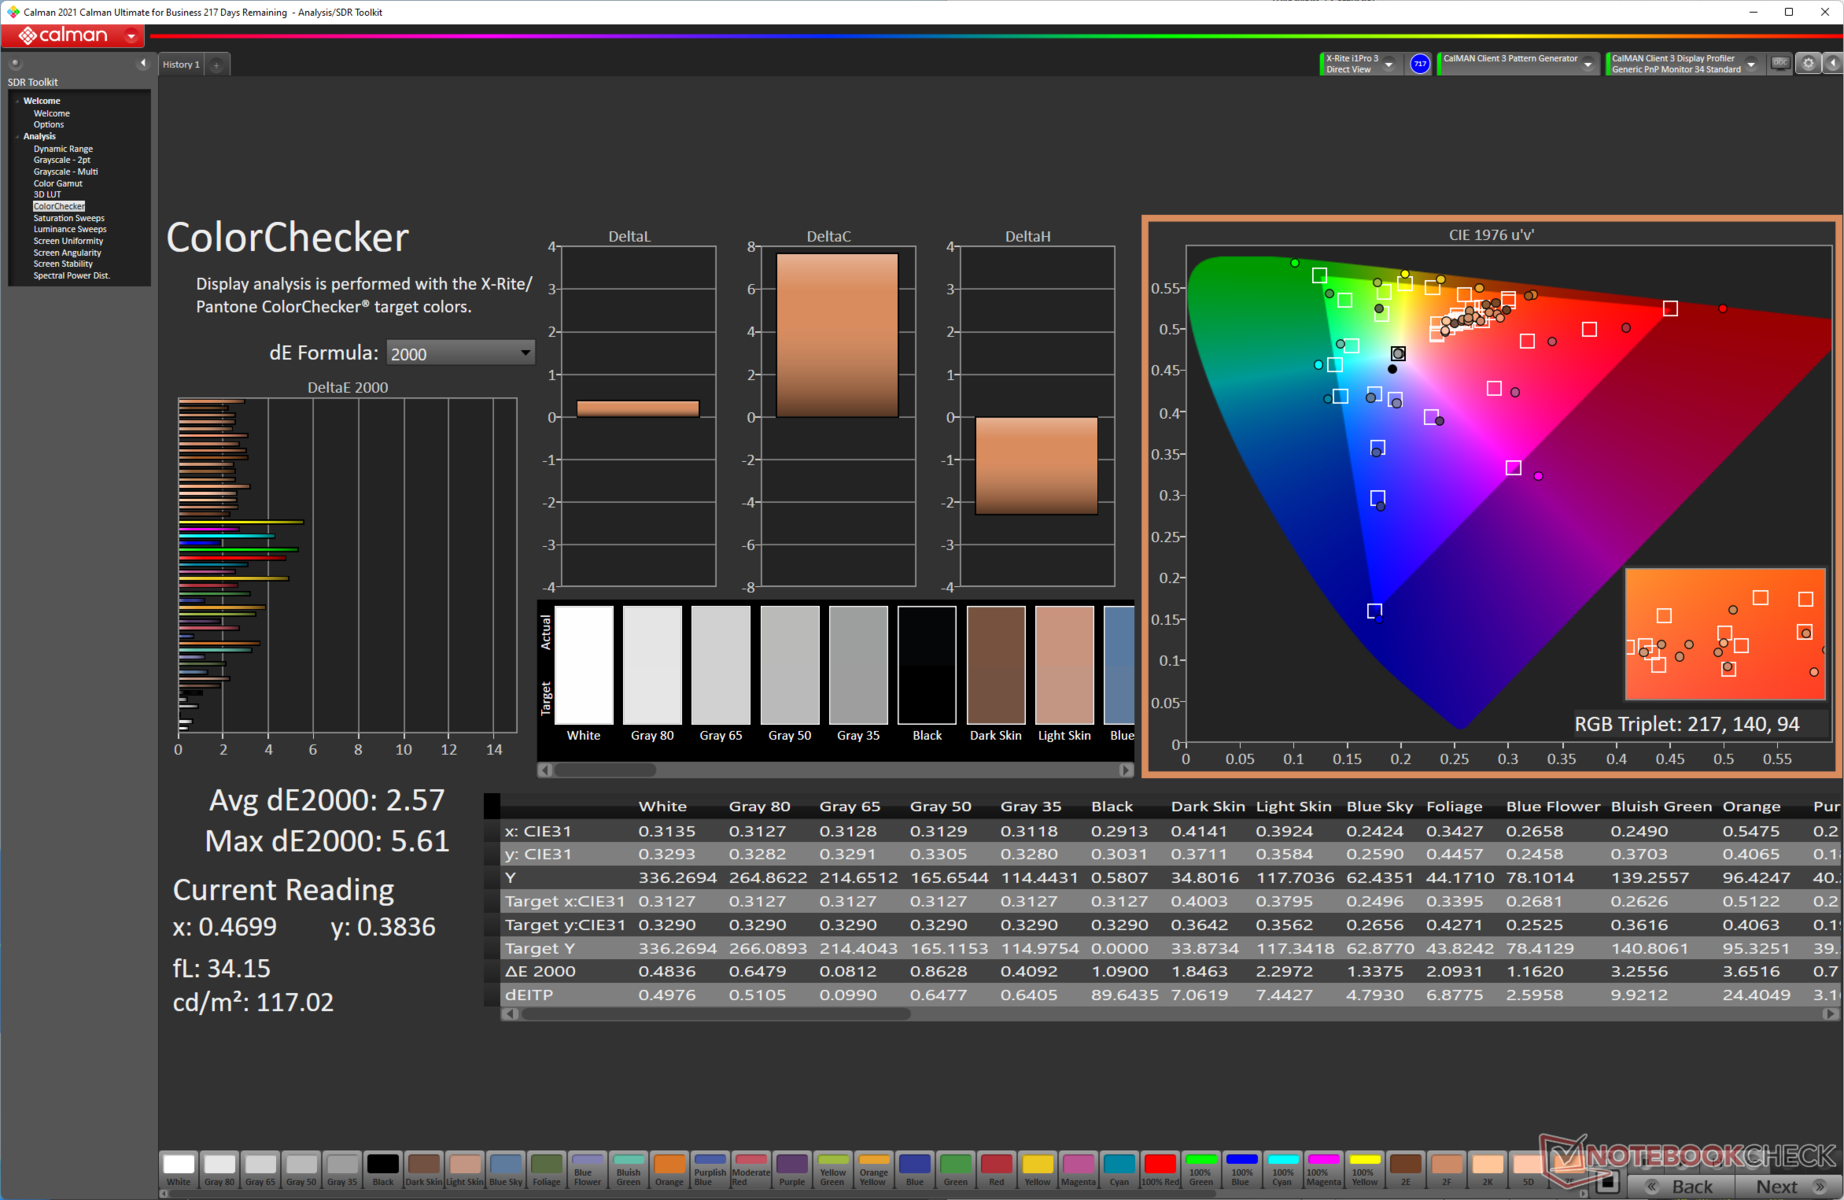
ΔE ColorChecker Calman: 3.06 | ∀{0.5-29.43 Ø4.73}
calibrated: 2.57
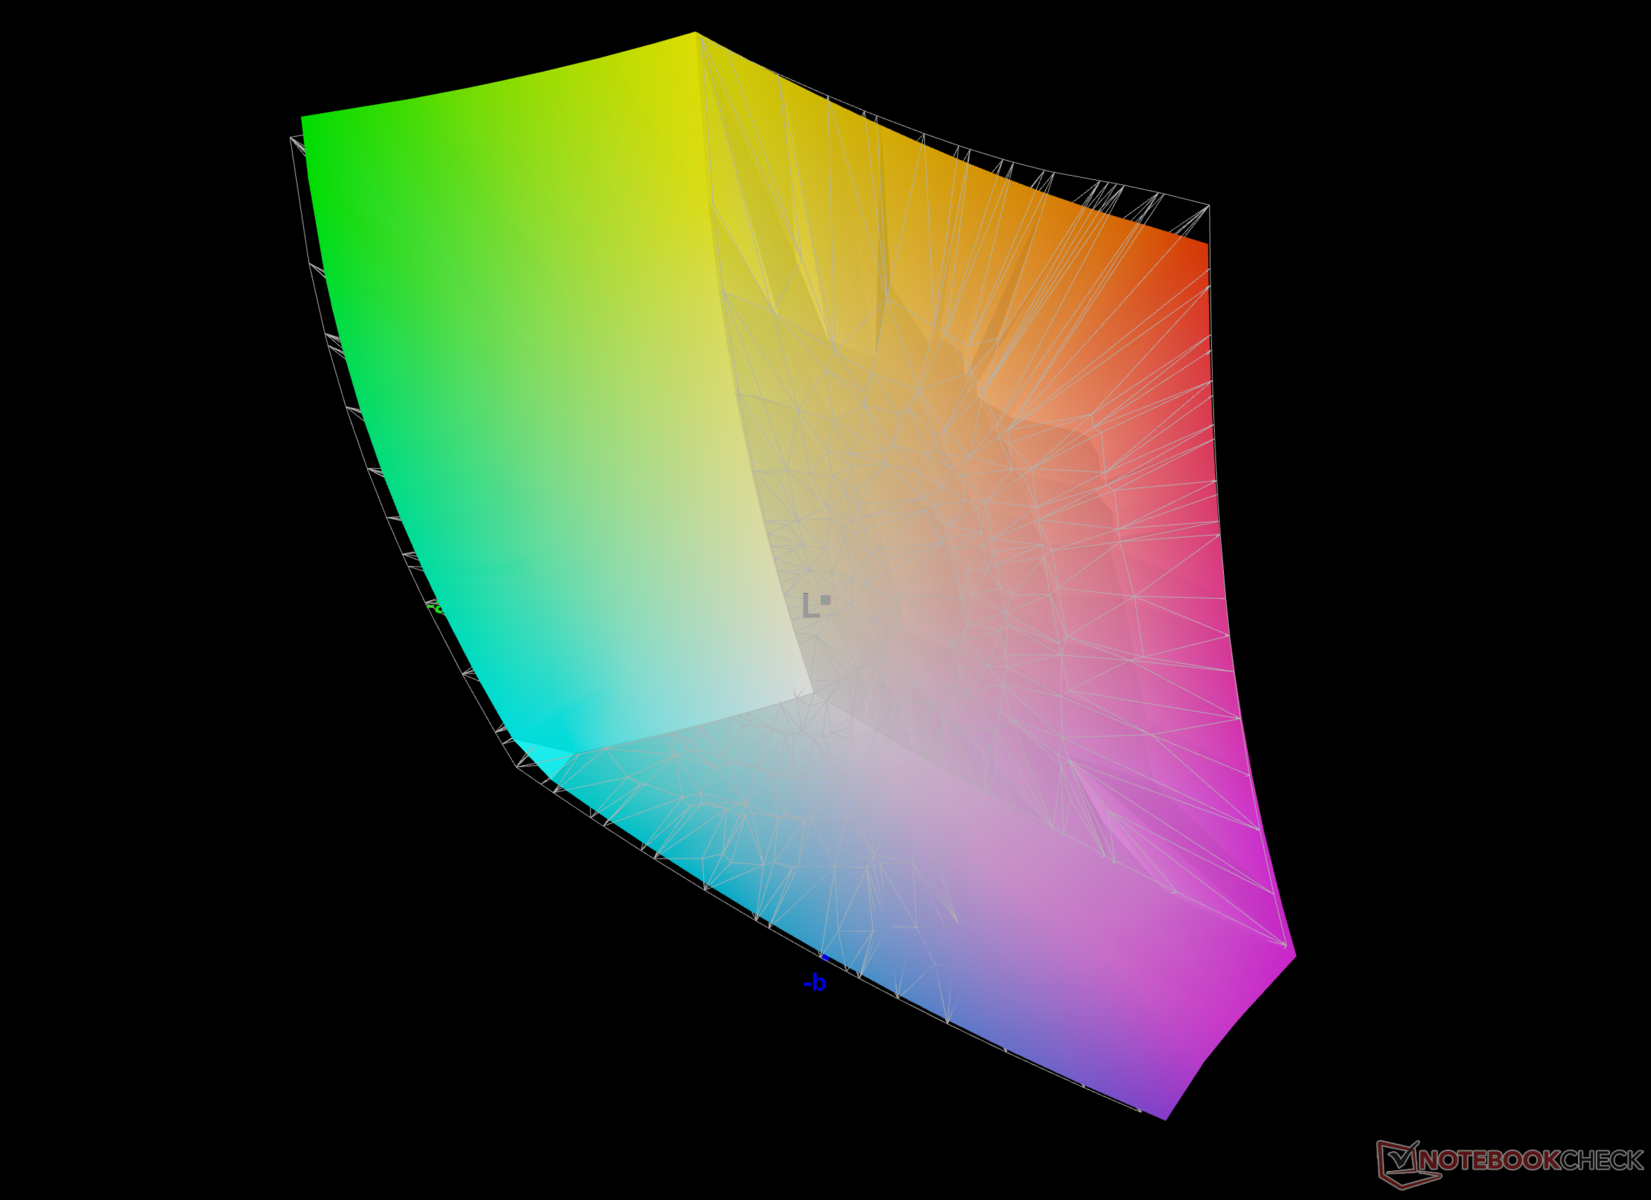
84.5% AdobeRGB 1998 (Argyll 3D)
99.9% sRGB (Argyll 3D)
96.2% Display P3 (Argyll 3D)
Gamma: 2.12
CCT: 7021 K
| Asus ROG Strix Scar 15 G533ZW BOE CQ NE156QHM-NZ2, IPS-level, 2560x1440, 15.6" | MSI Pulse GL66 12UEK AU Optronics B156HAN08.4 (AUOAF90), IPS, 1920x1080, 15.6" | MSI Vector GP66 12UGS BOE NE156FHM-NZ3, IPS, 1920x1080, 15.6" | MSI Raider GE66 12UHS AUO51EB, IPS, 3840x2160, 15.6" | HP Omen 16-b1090ng BOE09E5, IPS, 2560x1440, 16.1" | Lenovo Legion 5 Pro 16 G7 i7 RTX 3070Ti NE160QDM-NY1, IPS, 2560x1600, 16" | Razer Blade 15 2022 Sharp LQ156T1JW03, IPS, 2560x1440, 15.6" | |
|---|---|---|---|---|---|---|---|
| Display | -51% | -14% | -2% | -14% | -16% | 2% | |
| Display P3 Coverage (%) | 96.2 | 39 -59% | 70.1 -27% | 80.4 -16% | 71 -26% | 68.7 -29% | 99.1 3% |
| sRGB Coverage (%) | 99.9 | 58.4 -42% | 99.5 0% | 98.4 -2% | 97.9 -2% | 97.6 -2% | 99.9 0% |
| AdobeRGB 1998 Coverage (%) | 84.5 | 40.3 -52% | 72.1 -15% | 94.7 12% | 73.3 -13% | 70.9 -16% | 86.8 3% |
| Response Times | -334% | -1% | -105% | -55% | -63% | -69% | |
| Response Time Grey 50% / Grey 80% * (ms) | 7.86 ? 4.21 ? | 38.8 ? -394% | 5.8 ? 26% | 18.8 ? -139% | 14.5 ? -84% | 17.6 ? -124% | 14.4 ? -83% |
| Response Time Black / White * (ms) | 7.5 ? | 28 ? -273% | 9.6 ? -28% | 12.8 ? -71% | 9.4 ? -25% | 7.6 ? -1% | 11.6 ? -55% |
| PWM Frequency (Hz) | |||||||
| Screen | 28% | 24% | 21% | 12% | 43% | 17% | |
| Brightness middle (cd/m²) | 346 | 248 -28% | 353.1 2% | 351 1% | 335 -3% | 502 45% | 286 -17% |
| Brightness (cd/m²) | 329 | 245 -26% | 325 -1% | 347 5% | 319 -3% | 491 49% | 271 -18% |
| Brightness Distribution (%) | 91 | 86 -5% | 85 -7% | 90 -1% | 90 -1% | 91 0% | 89 -2% |
| Black Level * (cd/m²) | 0.59 | 0.13 78% | 0.38 36% | 0.35 41% | 0.28 53% | 0.37 37% | 0.25 58% |
| Contrast (:1) | 586 | 1908 226% | 929 59% | 1003 71% | 1196 104% | 1357 132% | 1144 95% |
| Colorchecker dE 2000 * | 3.06 | 3.14 -3% | 2.24 27% | 2.54 17% | 4.38 -43% | 2.7 12% | 2.74 10% |
| Colorchecker dE 2000 max. * | 5.81 | 5.82 -0% | 5 14% | 8.36 -44% | 9.48 -63% | 4.5 23% | 5.21 10% |
| Colorchecker dE 2000 calibrated * | 2.57 | 3.14 -22% | 1.02 60% | 0.67 74% | 1.33 48% | 1.4 46% | 2.52 2% |
| Gamma | 2.12 104% | 2.49 88% | 2.24 98% | 2.089 105% | 2.103 105% | 2.44 90% | 2.2 100% |
| CCT | 7021 93% | 6468 100% | 6864 95% | 7036 92% | 6244 104% | 6326 103% | 6408 101% |
| Greyscale dE 2000 * | 1.2 | 4 | 4.1 | 7 | 2.7 | 1.1 | |
| Total Average (Program / Settings) | -119% /
-46% | 3% /
11% | -29% /
-4% | -19% /
-4% | -12% /
13% | -17% /
0% |
* ... smaller is better
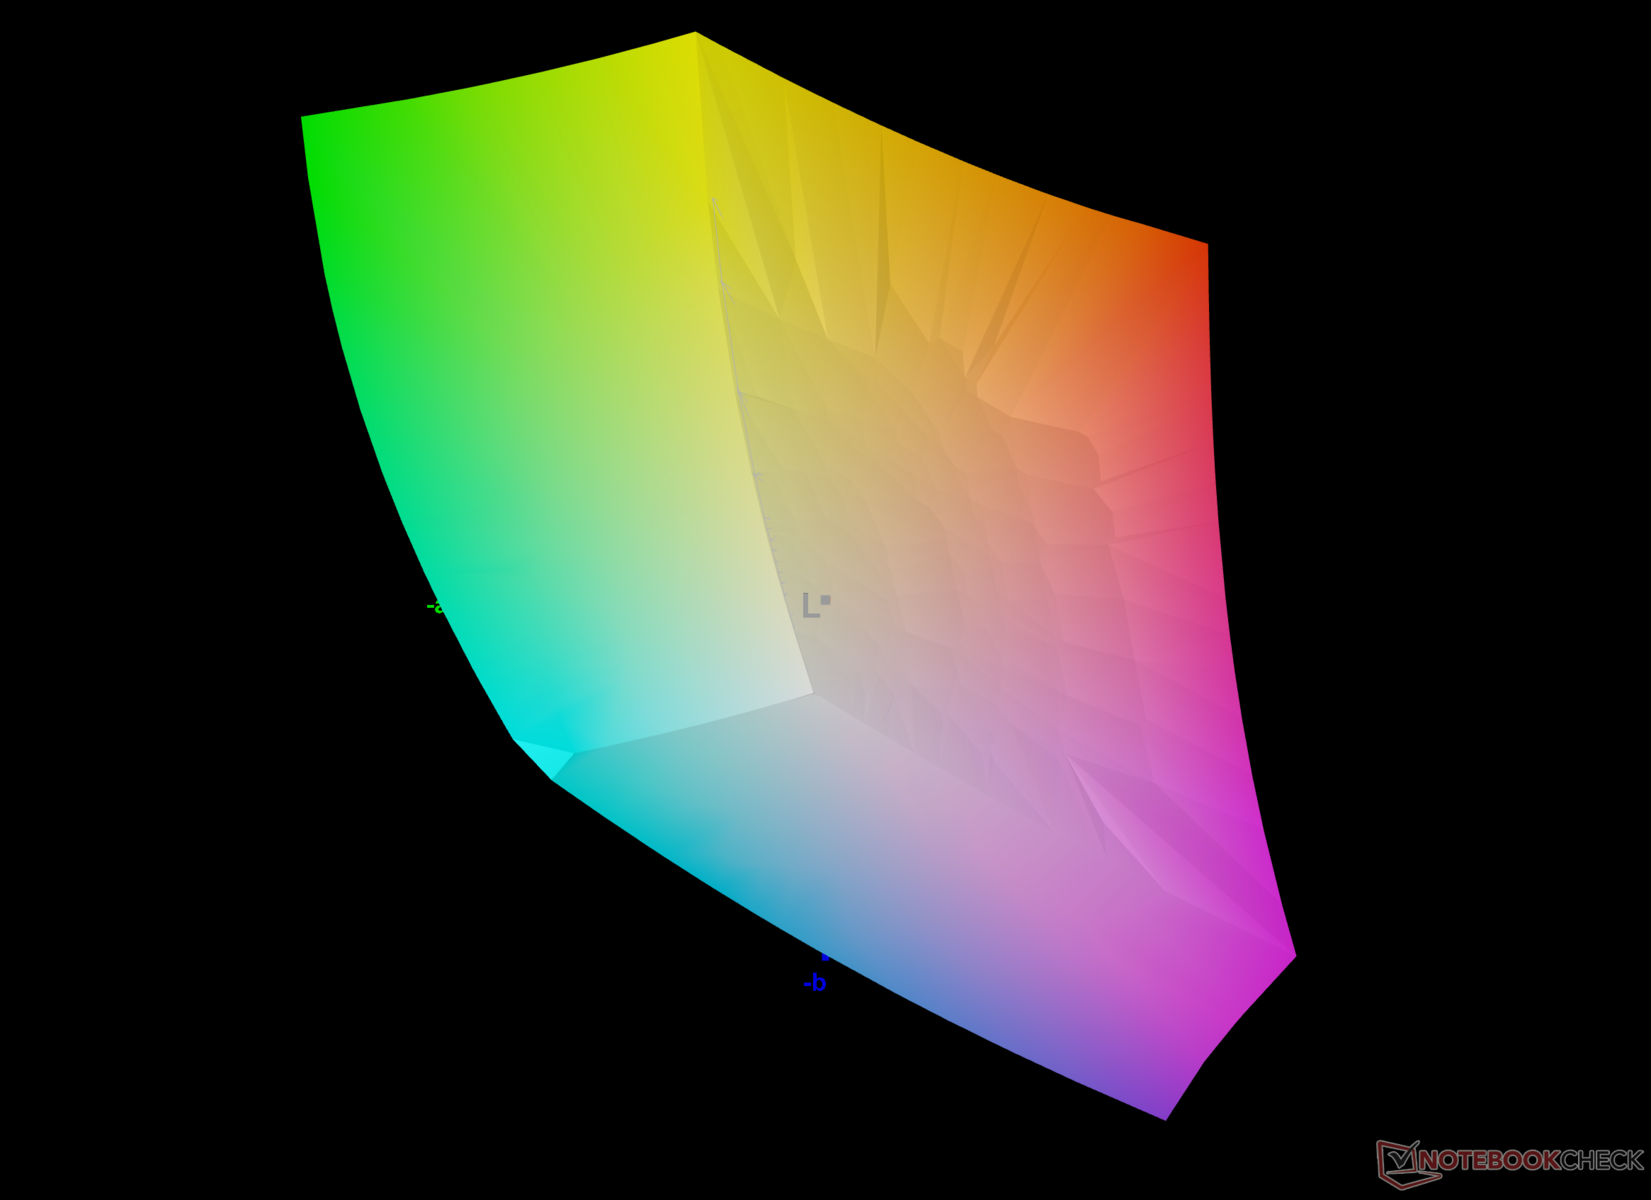
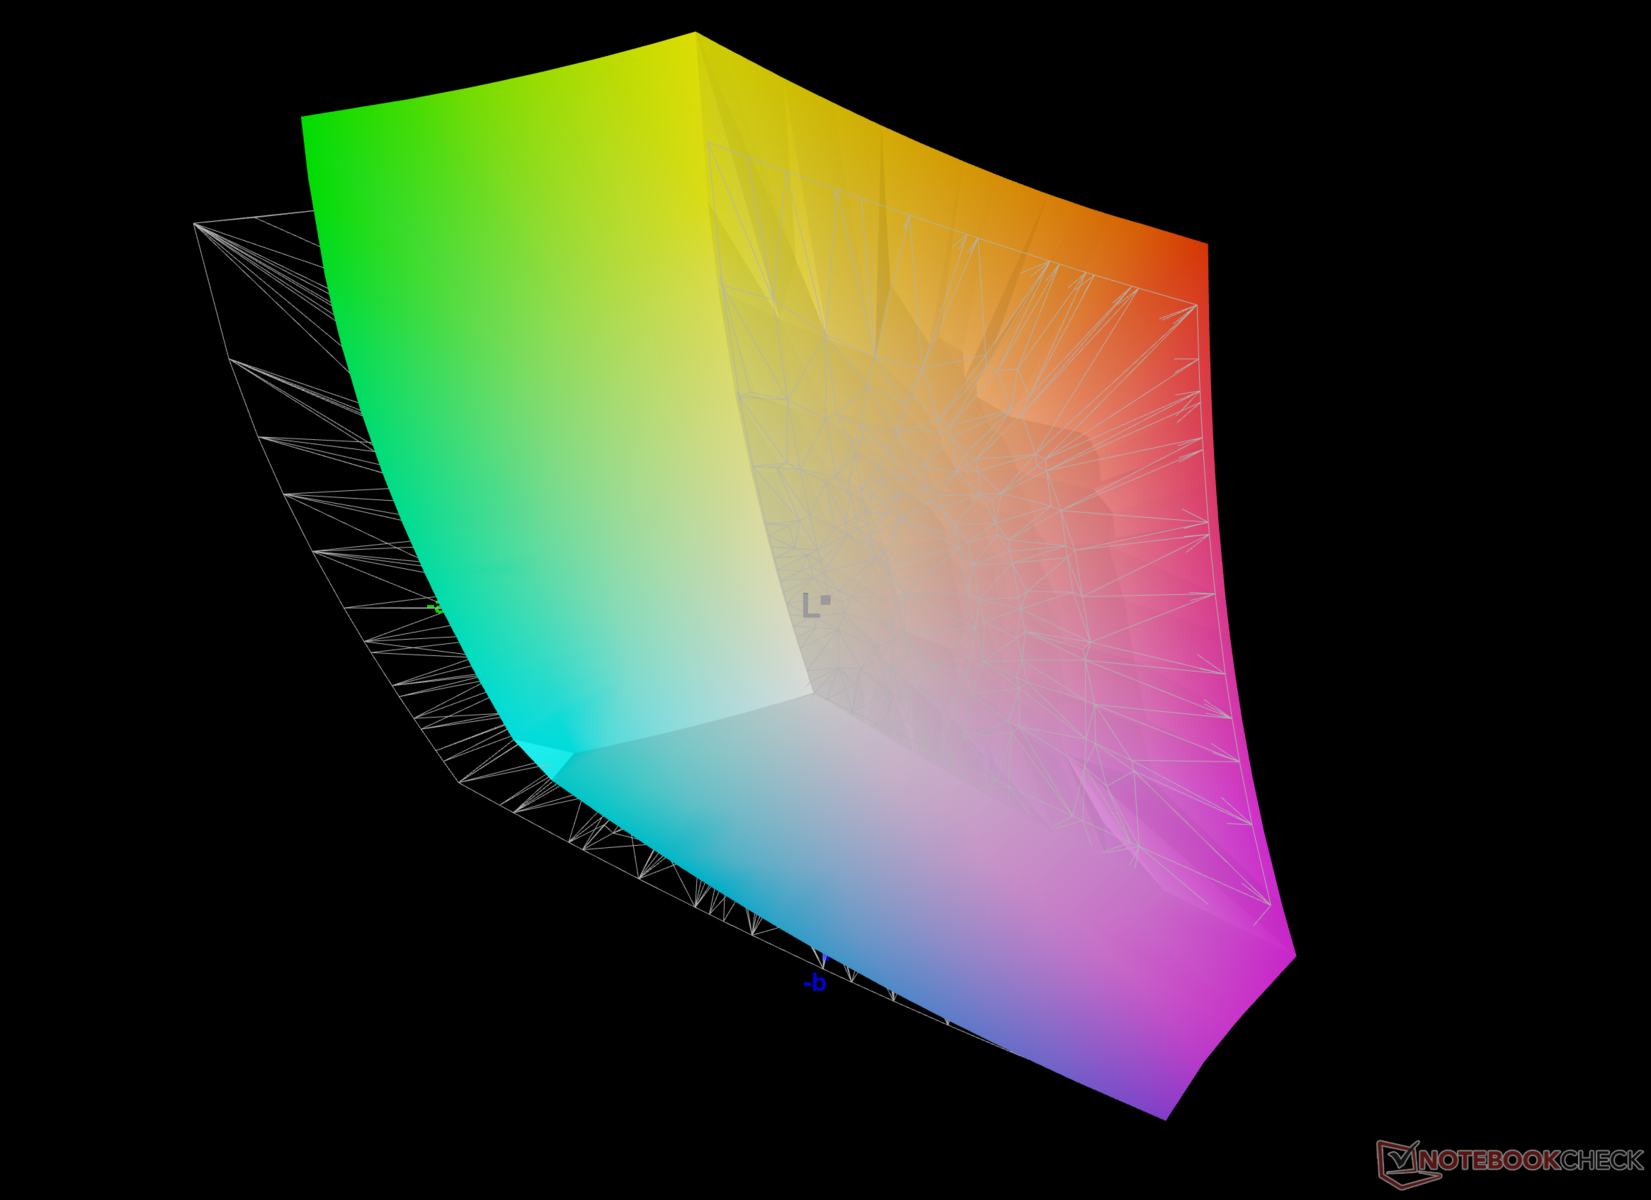
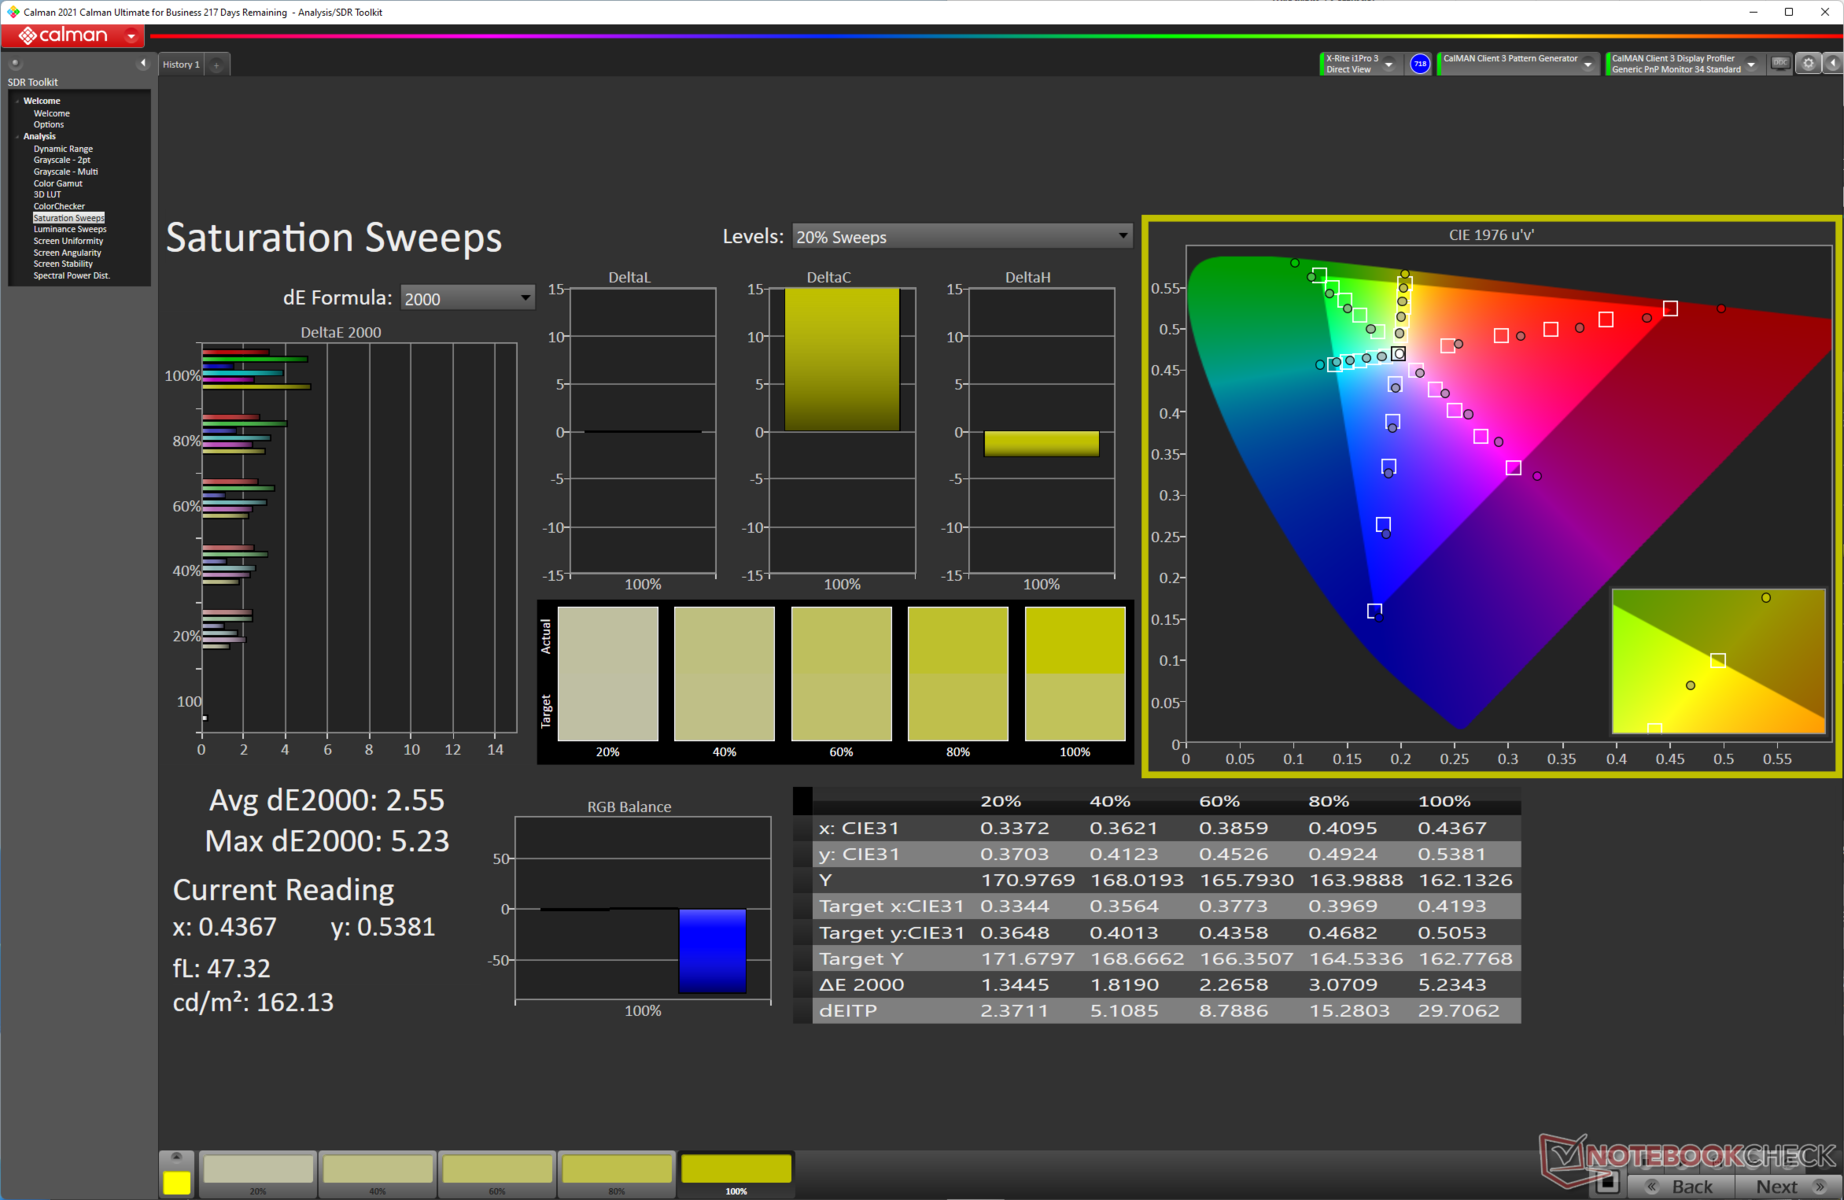
在色域覆盖方面,ROG Strix Scar 15的显示屏在游戏笔记本中表现非常好。该面板涵盖了完整的sRGB光谱和几乎所有的DCI-P3。AdobeRGB覆盖率也很好,接近85%,这使得Scar 15的显示屏非常适用于专业照片和视频编辑工作流程。
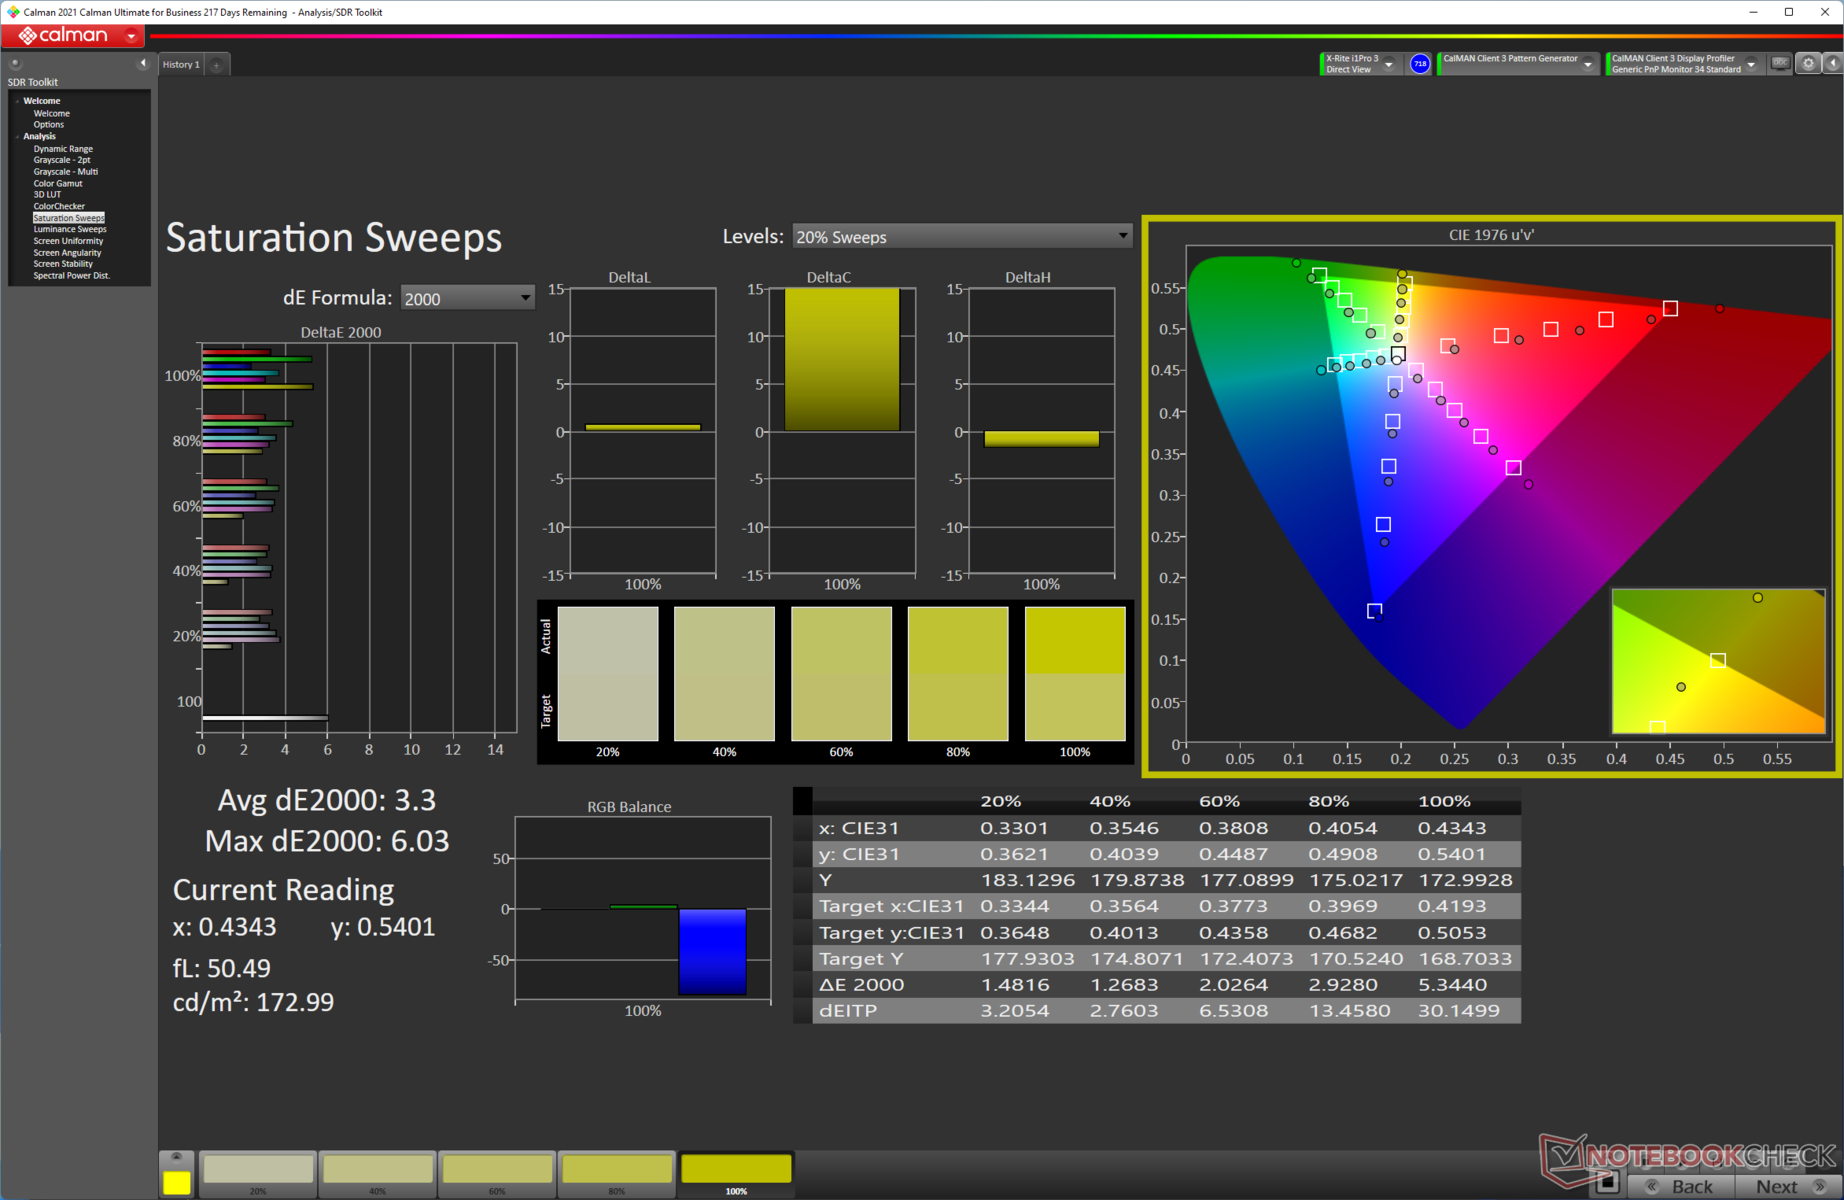
开箱即用的色彩校准已经相当不错,灰度的平均Delta E为2.9,ColorChecker为3.06,我们的校准程序有助于进一步将灰度的平均Delta E降至0.7,ColorChecker的Delta E降至2.57。在彩色光谱的红色和蓝色部分出现了较高的偏差。
我们经过校准的ICC文件可以从上面的链接下载。
京东方CQ NE156QHM-NZ2面板似乎比去年的变种提供了更多的响应时间,这应该会让游戏玩家满意。我们测量了7.5毫秒的100%黑色到100%白色的综合响应时间和4.21毫秒的50%灰色到80%灰色的综合响应时间。
华硕默认启用超速模式,这体现在50%灰度到80%灰度数据中看到的 "喇叭 "信号。面板超速可以在Armory Crate应用程序中禁用。这将灰色到灰色的响应时间增加到7.86毫秒。
我们没有观察到任何PWM或屏幕在所有亮度水平上的闪烁,所以长期使用该显示器应该不会造成任何眼睛疲劳。
欲了解更多信息,请参考我们的文章"为什么脉冲宽度调制(PWM)是如此令人头疼",还可以查看我们的 PWM排名表以了解所有评测设备的PWM频率比较。
Display Response Times
| ↔ Response Time Black to White | ||
|---|---|---|
| 7.5 ms ... rise ↗ and fall ↘ combined | ↗ 3.89 ms rise | 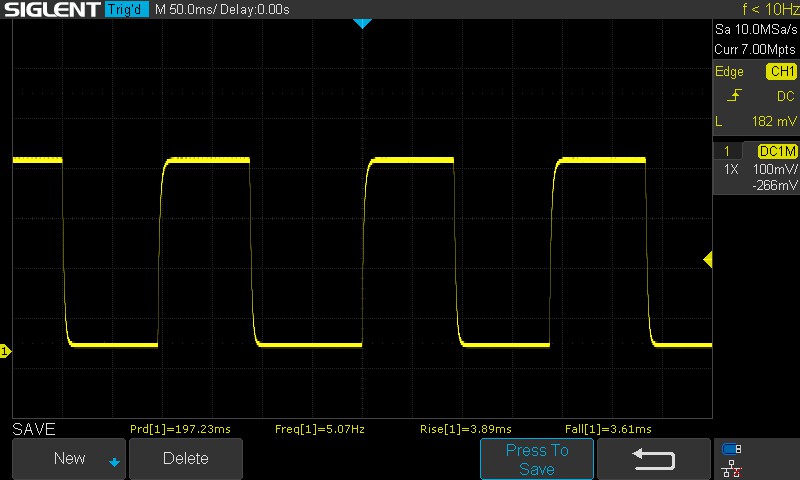 |
| ↘ 3.61 ms fall | ||
| The screen shows very fast response rates in our tests and should be very well suited for fast-paced gaming. In comparison, all tested devices range from 0.1 (minimum) to 240 (maximum) ms. » 22 % of all devices are better. This means that the measured response time is better than the average of all tested devices (19.9 ms). | ||
| ↔ Response Time 50% Grey to 80% Grey | ||
| 4.21 ms ... rise ↗ and fall ↘ combined | ↗ 1.98 ms rise | 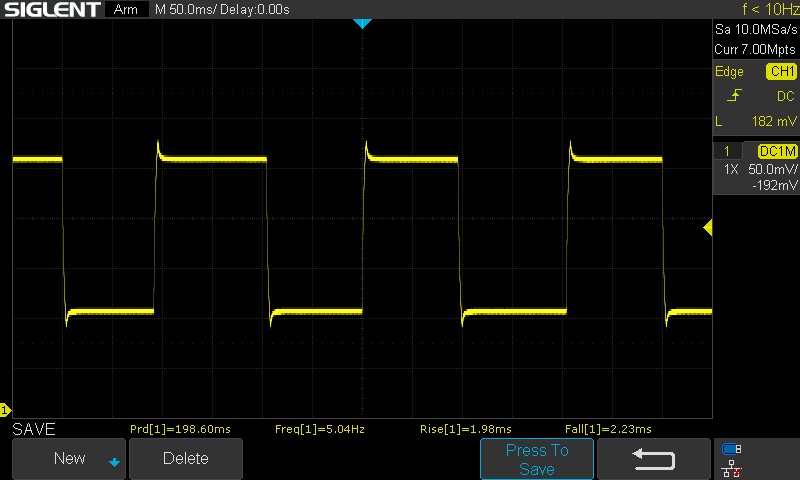 |
| ↘ 2.23 ms fall | ||
| The screen shows very fast response rates in our tests and should be very well suited for fast-paced gaming. In comparison, all tested devices range from 0.165 (minimum) to 636 (maximum) ms. » 16 % of all devices are better. This means that the measured response time is better than the average of all tested devices (31.1 ms). | ||
| ↔ Response Time 50% Grey to 80% Grey | ||
| 7.86 ms ... rise ↗ and fall ↘ combined | ↗ 4.02 ms rise | 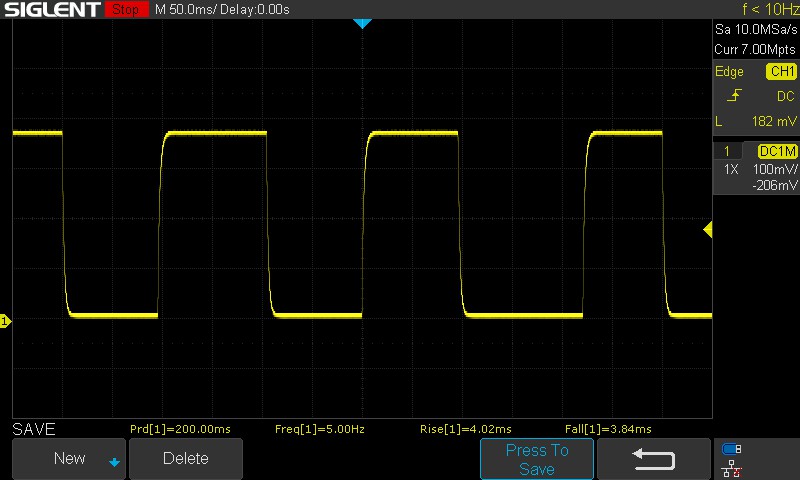 |
| ↘ 3.84 ms fall | ||
| The screen shows very fast response rates in our tests and should be very well suited for fast-paced gaming. In comparison, all tested devices range from 0.165 (minimum) to 636 (maximum) ms. » 21 % of all devices are better. This means that the measured response time is better than the average of all tested devices (31.1 ms). | ||
Screen Flickering / PWM (Pulse-Width Modulation)
| Screen flickering / PWM not detected | 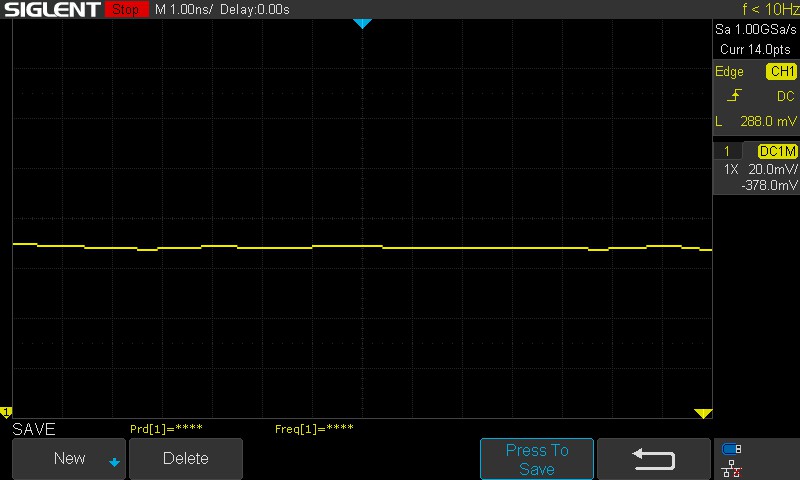 | ||
In comparison: 52 % of all tested devices do not use PWM to dim the display. If PWM was detected, an average of 7784 (minimum: 5 - maximum: 343500) Hz was measured. | |||
只要没有刺眼的阳光落在显示屏上,户外观看就很好。可视角度很广,但我们观察到从极端角度观看时,亮度和色彩信息的损失。


性能。酷睿i9-12900H以135瓦的功率获得翅膀
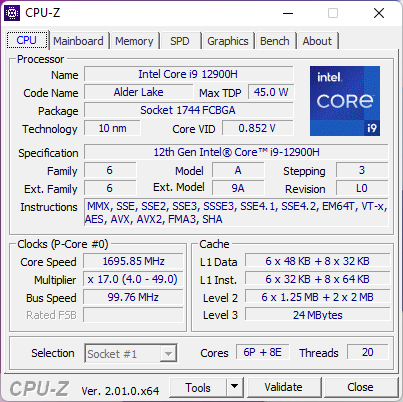
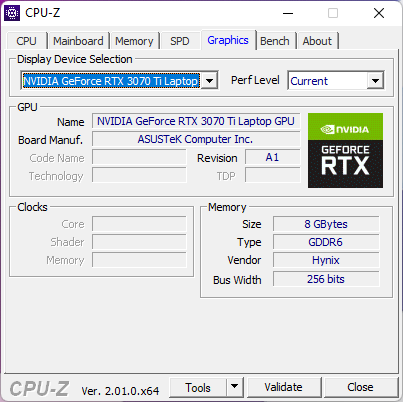
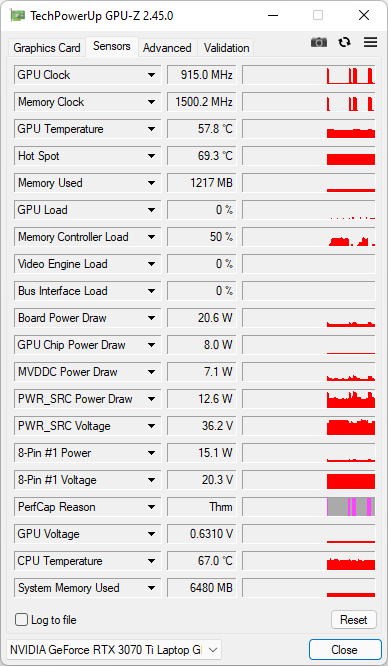
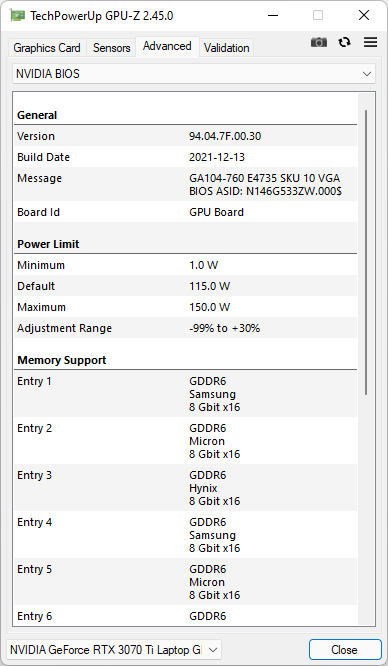
华硕为我们测试的ROG Strix Scar 15设备配备了一个 英特尔酷睿i9-12900HCPU和一个150WNvidiaGeForce RTX 3070 Ti Laptop GPU.
显然,带有液态金属热界面材料(TIM)的酷睿i9-12900H是所有2022年Scar 15 SKU上事实上的处理器选项,至少在印度是如此。然而,GPU选项的范围是140W的RTX 3060到150瓦的RTX 3080 Ti.
测试条件
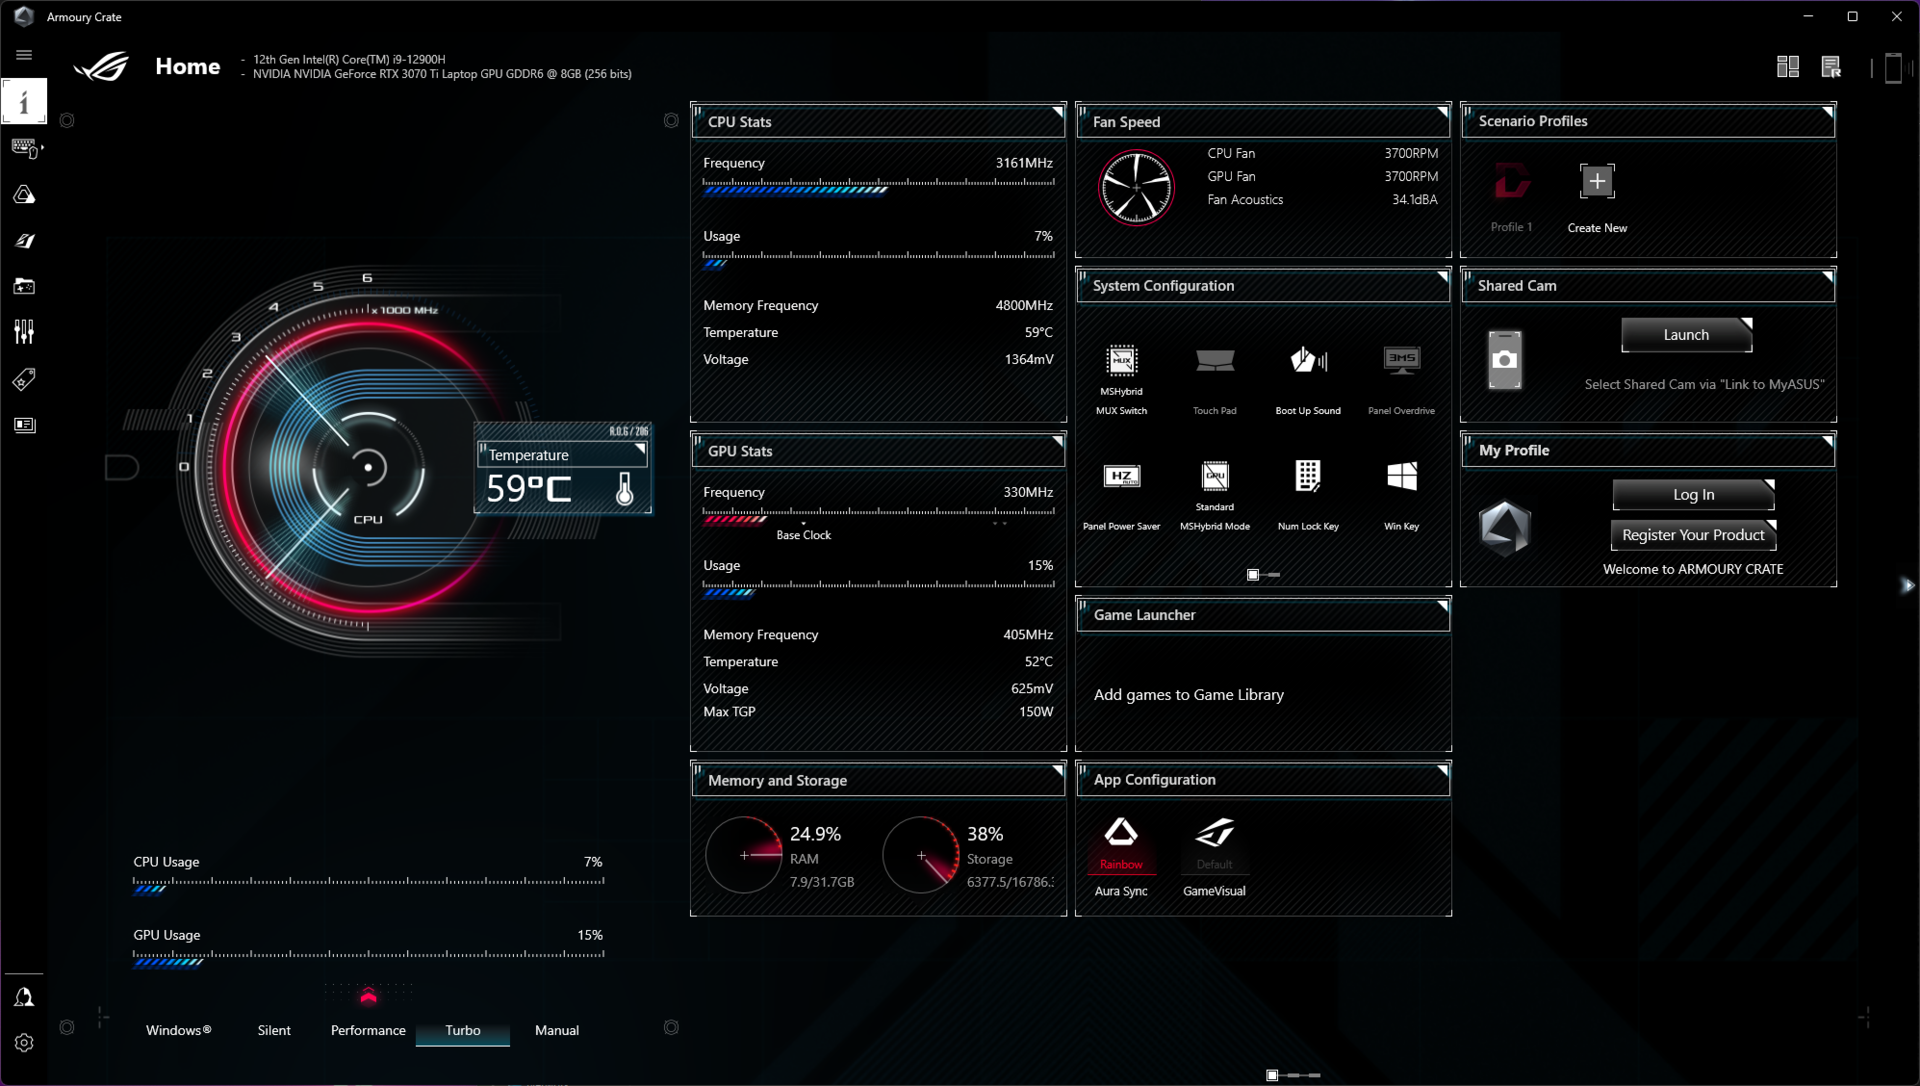
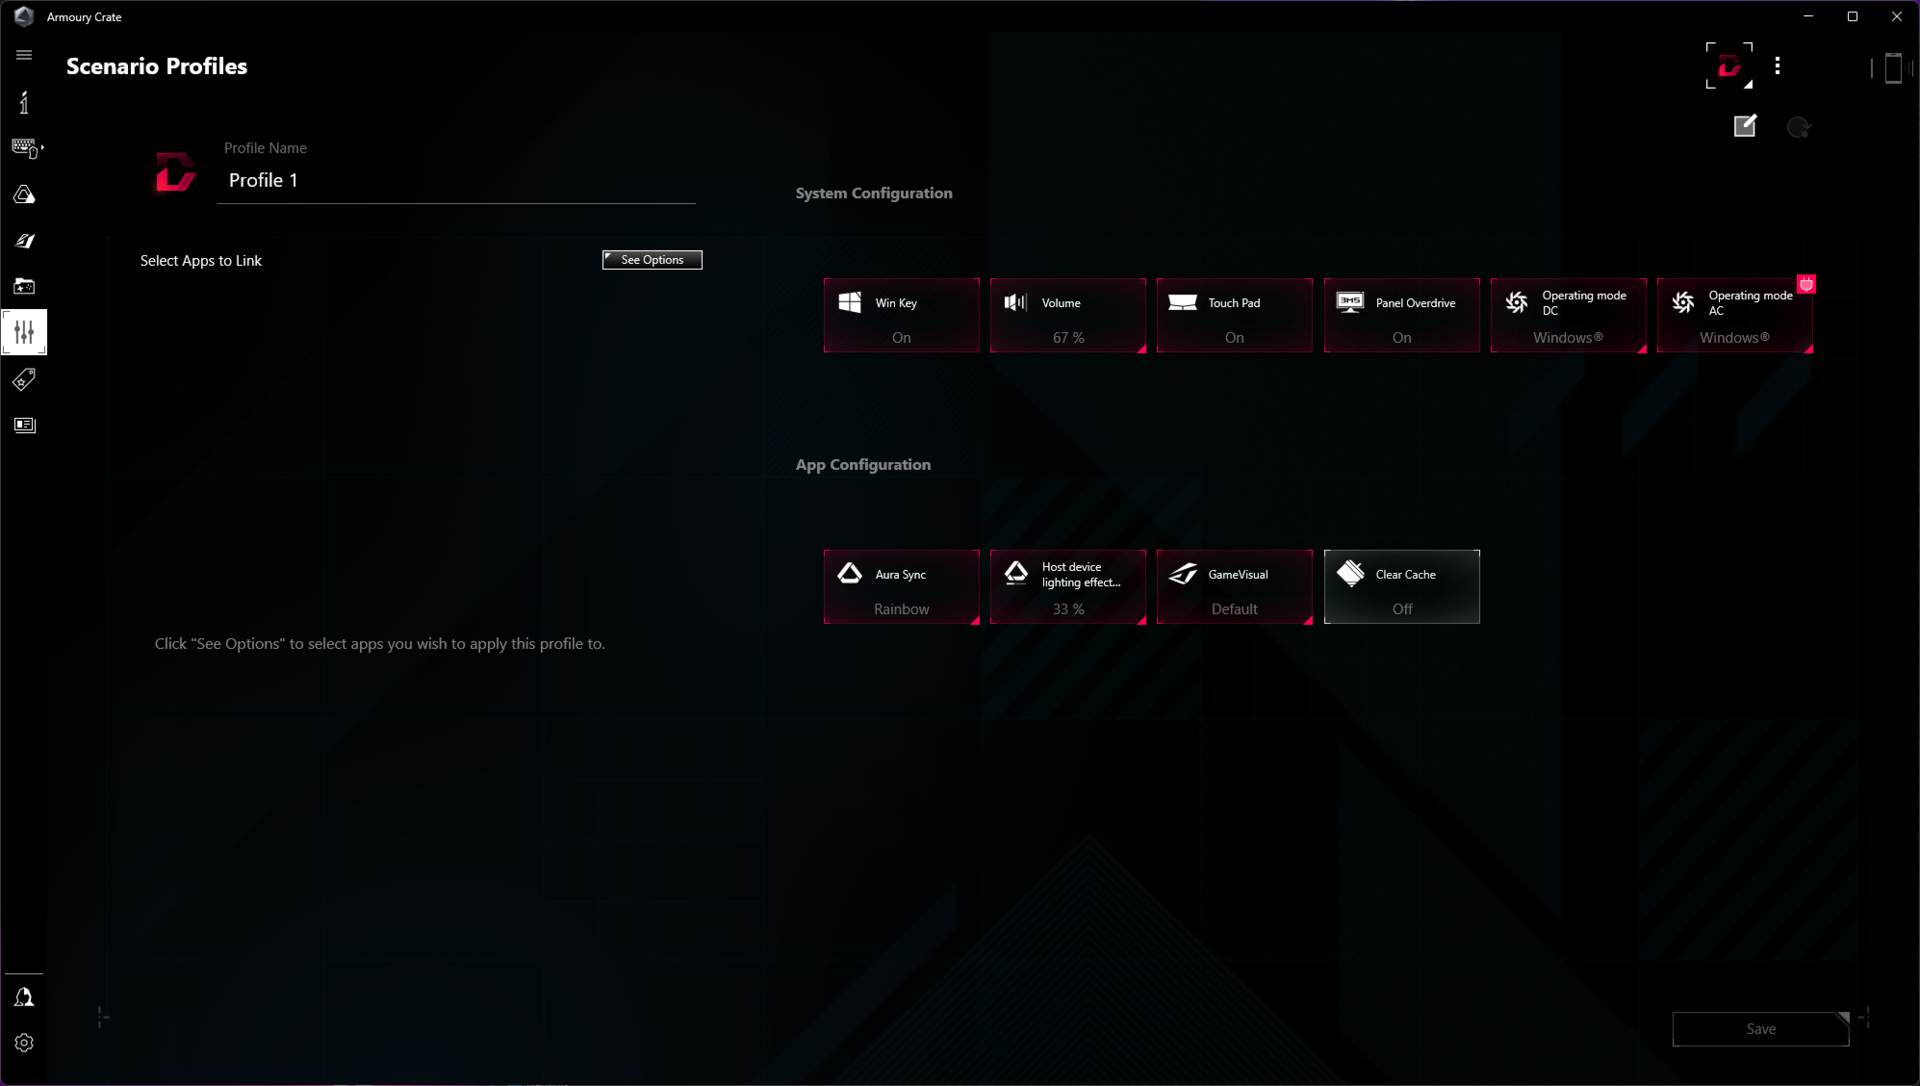
Armory Crate应用程序允许选择三种主要性能模式之一--静音、性能和涡轮。你还可以在手动模式下手动调整时钟和风扇设置,或者简单地让Windows电源配置文件接管Windows模式。
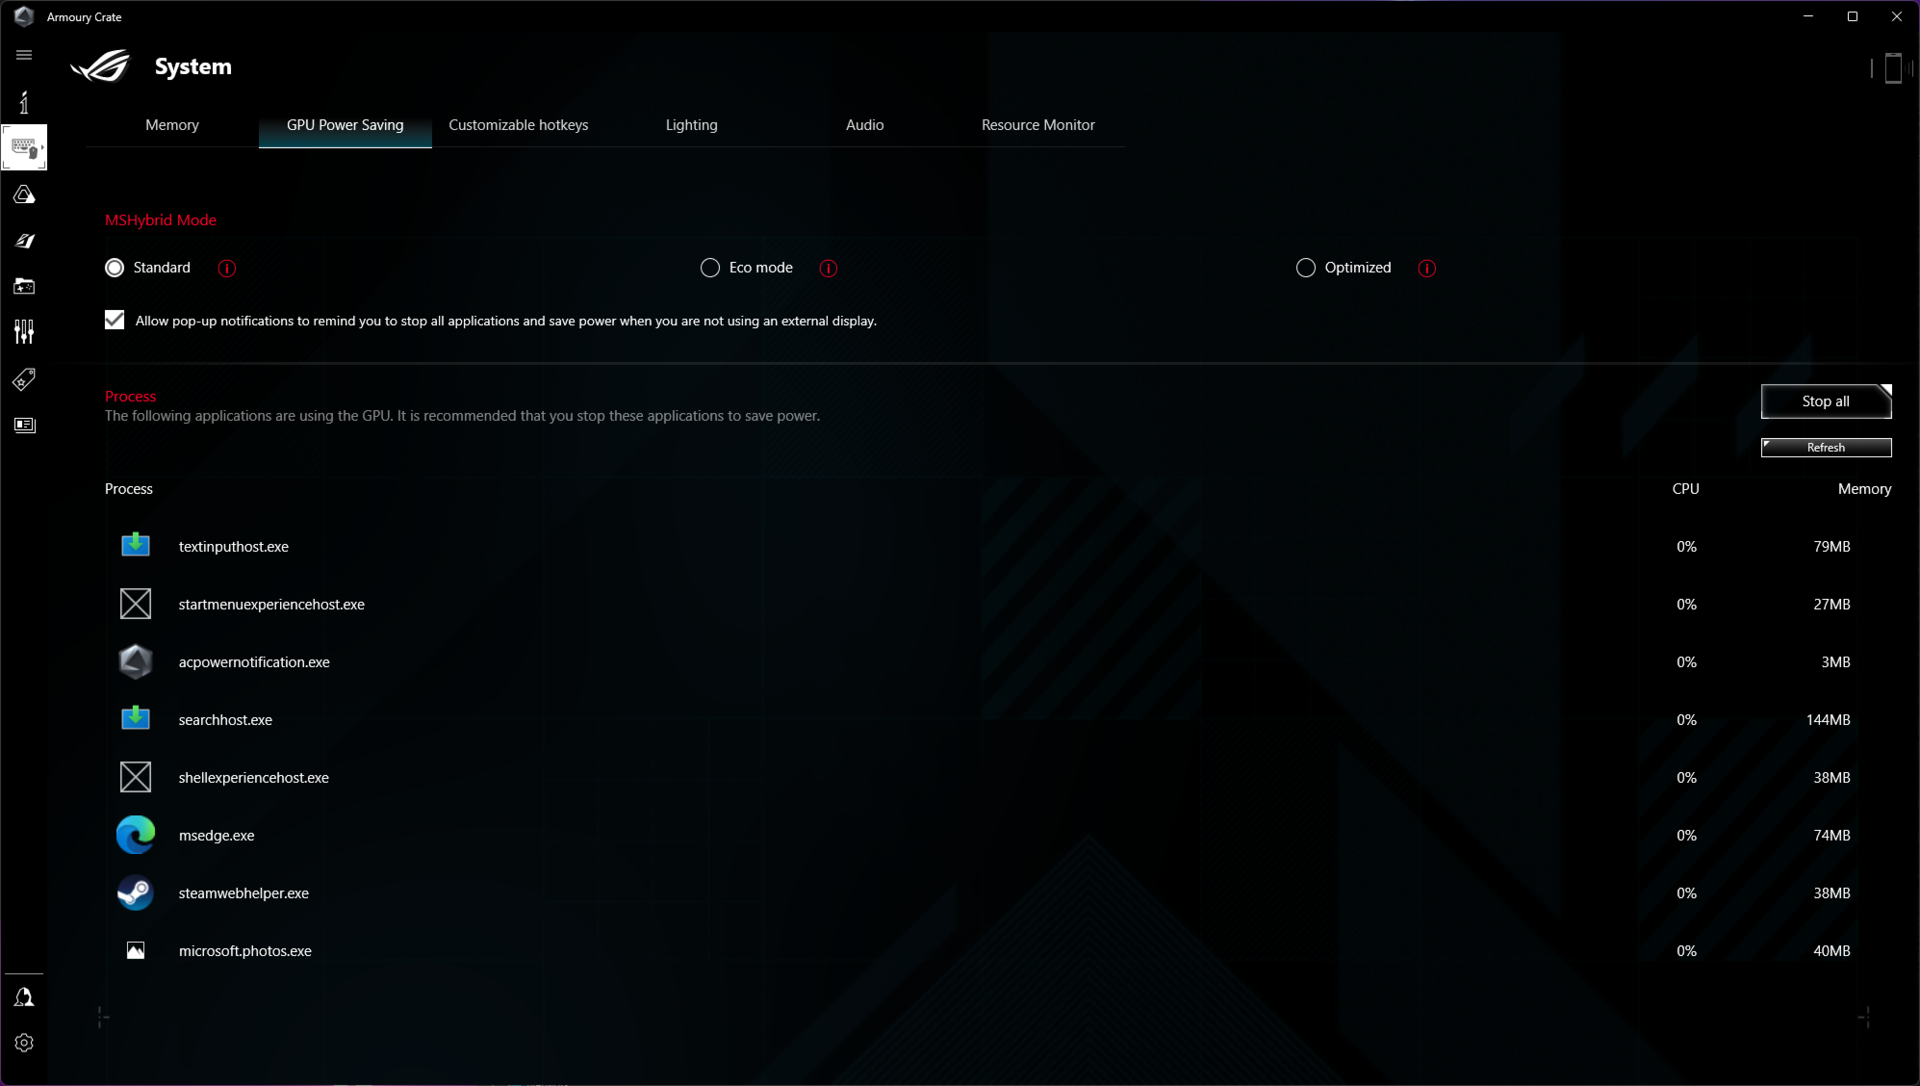
对于GPU,华硕允许在默认的MSHybrid模式和MUX模式之间进行选择。MUX开关允许绕过iGPU将dGPU信号直接路由到内部显示器。这可以提供轻微的性能优势,我们将在GPU性能部分看到这一点。然而,为了便于比较,我们使用标准的MSHybrid模式,因为这是默认配置。
下表说明了PL1和PL2值在每个选择的电源配置文件中的变化。我们建议在高负荷工作和游戏中使用涡轮增压模式,如果风扇的噪音水平不是问题的话。
| 性能模式 | PL1 / Tau | PL2 / Tau |
|---|---|---|
| 静音 | 45 W / 56 s | 70 W / 2.44 ms |
| 性能 | 80 W / 56 s | 90 W / 2.44 ms |
| Turbo | 135 W / 56 s | 135 W / 2.44 ms |
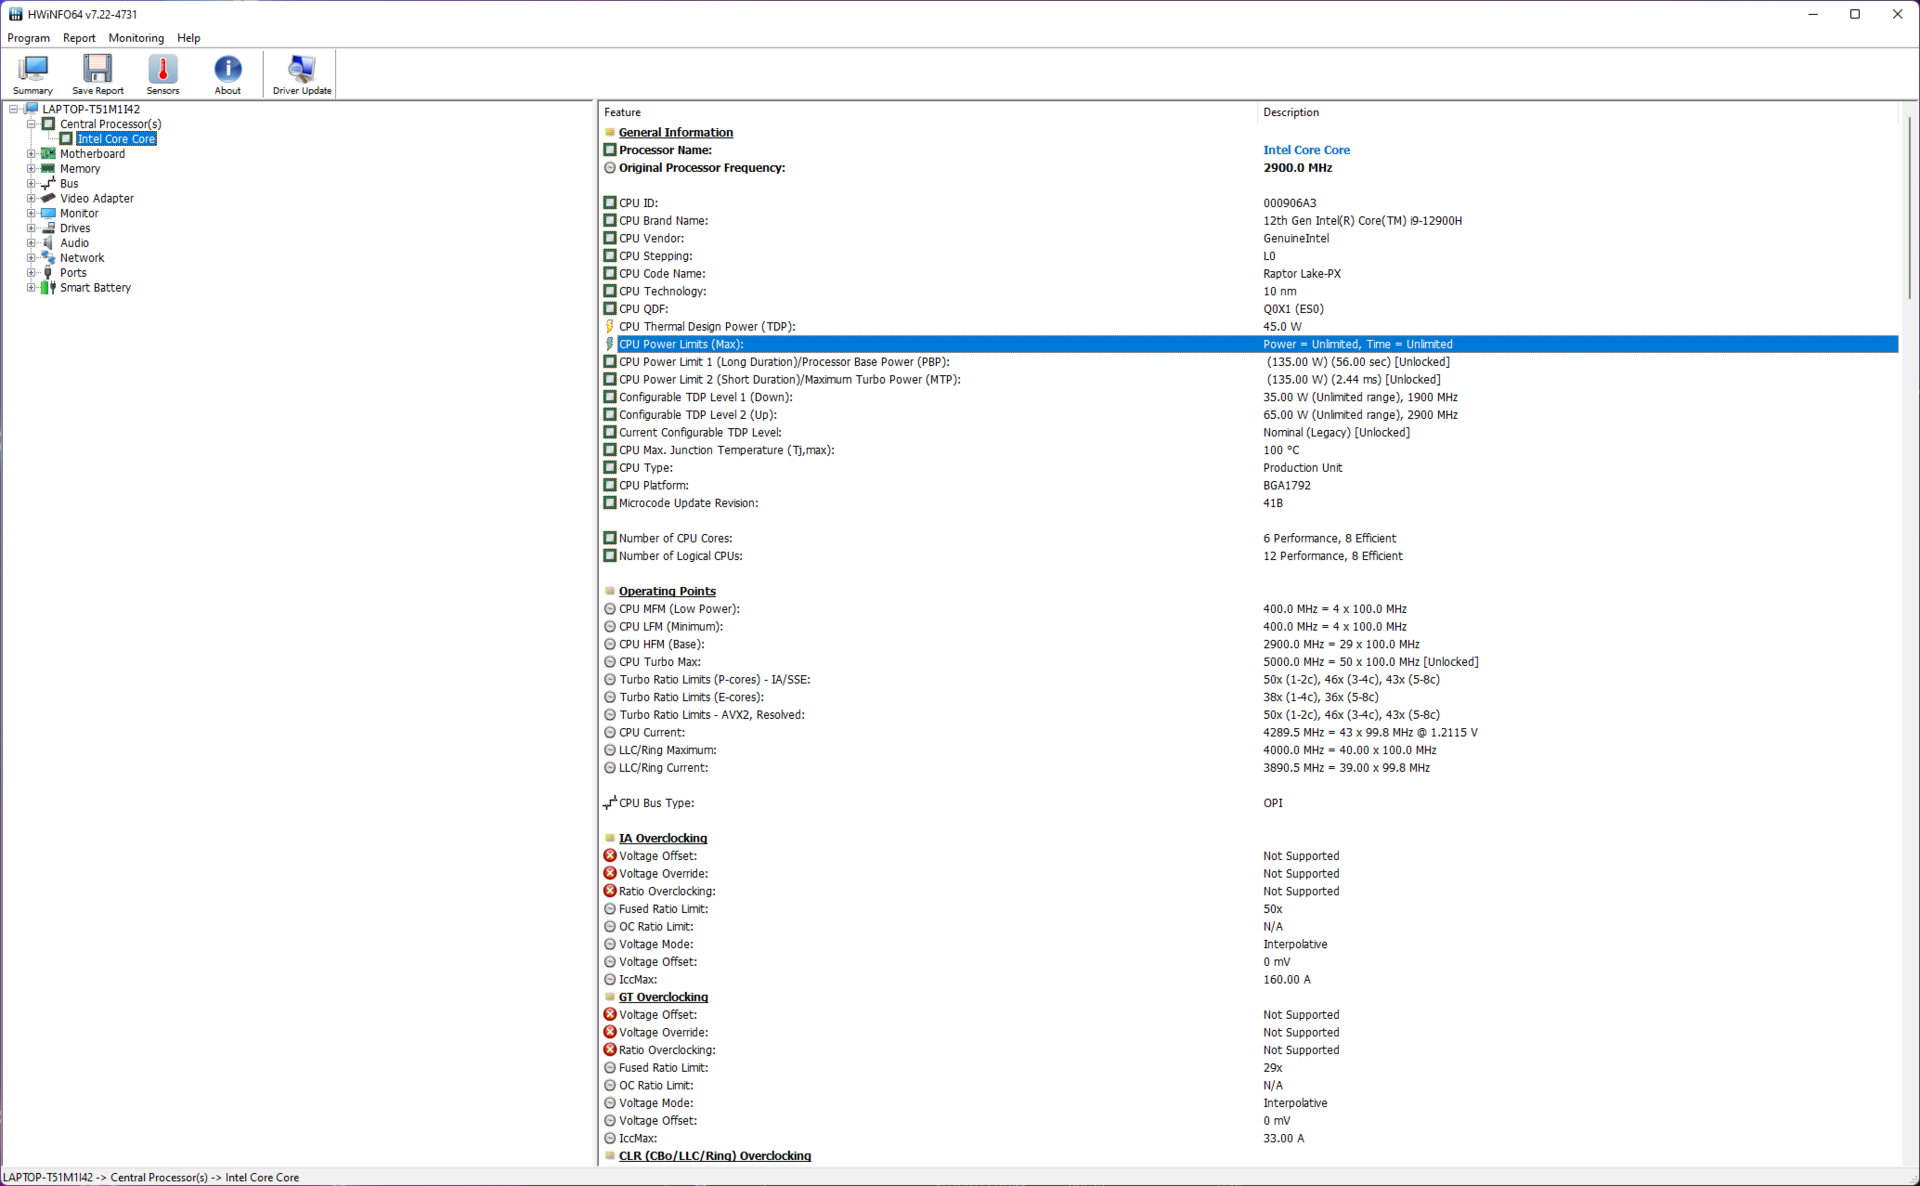
在我们的测试中,我们选择了涡轮模式,因为它允许酷睿i9-12900H以无锁的135W PL1/PL2充分施展其肌肉。在适用的情况下,我们提供了各种性能模式之间的比较数据。
处理器
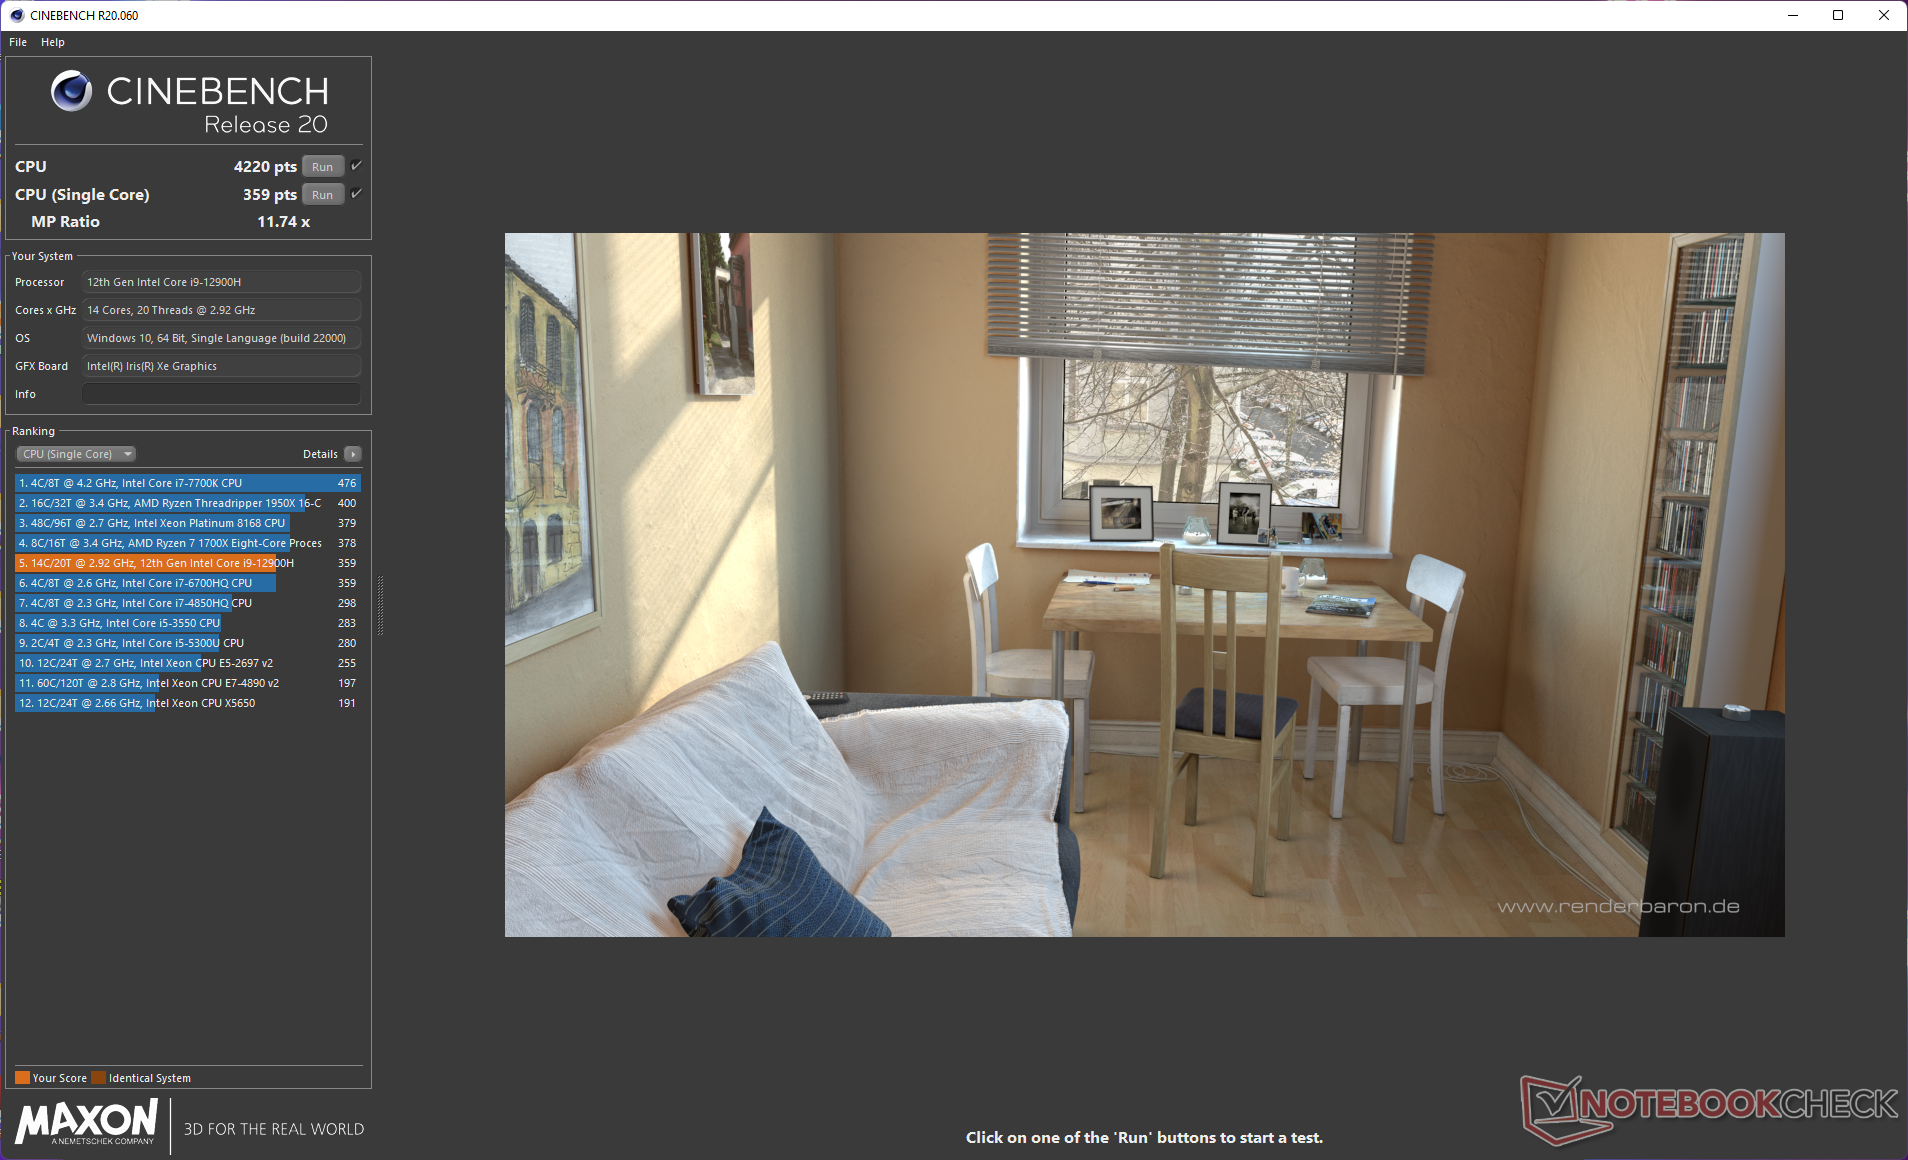
酷睿i9-12900H是第12代桤木湖部件,有14个核心(6P+8E)和20个线程。华硕实施了强大的冷却系统,确保酷睿i9-12900H能够提供持续的性能,在Cinebench R15多核循环测试中没有太多节流。
有趣的是,我们观察到 酷睿i7-12700H在 联想Legion 5i Pro 16 G7提供了略高的多核性能的全面性。然而,酷睿i9-12900H在单核负载方面确实有优势。
Cinebench R15 Multi Loop
酷睿i9-12900H似乎也有轻微的优势。 酷睿i9-12900HK在MSI Raider GE66 12UHS中,Core i9-12900H似乎也比Core i9-12900HK略胜一筹,但与MSI Raider GE66 12UHS中未锁定乘数的Alder Lake芯片打成平手。 Gigabyte Aero 16 YE5在单核Cinebench测试中与Alder Lake芯片持平。
在电池方面,ROG Strix Scar 15切换到静音电源计划。这导致Cinebench R20的多核性能大幅下降40%,单核数据下降50%。
Cinebench R23: Multi Core | Single Core
Cinebench R20: CPU (Multi Core) | CPU (Single Core)
Cinebench R15: CPU Multi 64Bit | CPU Single 64Bit
Blender: v2.79 BMW27 CPU
7-Zip 18.03: 7z b 4 | 7z b 4 -mmt1
Geekbench 5.5: Multi-Core | Single-Core
HWBOT x265 Benchmark v2.2: 4k Preset
LibreOffice : 20 Documents To PDF
R Benchmark 2.5: Overall mean
| CPU Performance rating | |
| Average of class Gaming | |
| Asus ROG Strix Scar 15 G533ZW-LN106WS | |
| Gigabyte Aero 16 YE5 | |
| Lenovo Legion 5 Pro 16 G7 i7 RTX 3070Ti | |
| MSI Pulse GL66 12UEK | |
| MSI Raider GE66 12UHS | |
| MSI Vector GP66 12UGS | |
| HP Omen 16-b1090ng | |
| Average Intel Core i9-12900H | |
| Razer Blade 15 2022 | |
| Razer Blade 14 Ryzen 9 6900HX | |
| Asus ROG Zephyrus G14 GA402RK | |
| Cinebench R23 / Multi Core | |
| Average of class Gaming (10488 - 40970, n=110, last 2 years) | |
| Lenovo Legion 5 Pro 16 G7 i7 RTX 3070Ti | |
| Asus ROG Strix Scar 15 G533ZW-LN106WS | |
| Gigabyte Aero 16 YE5 | |
| MSI Pulse GL66 12UEK | |
| MSI Vector GP66 12UGS | |
| MSI Raider GE66 12UHS | |
| HP Omen 16-b1090ng | |
| Average Intel Core i9-12900H (7359 - 19648, n=28) | |
| Razer Blade 15 2022 | |
| Razer Blade 14 Ryzen 9 6900HX | |
| Asus ROG Zephyrus G14 GA402RK | |
| Cinebench R23 / Single Core | |
| Average of class Gaming (1166 - 2356, n=110, last 2 years) | |
| Gigabyte Aero 16 YE5 | |
| Asus ROG Strix Scar 15 G533ZW-LN106WS | |
| MSI Pulse GL66 12UEK | |
| MSI Vector GP66 12UGS | |
| MSI Raider GE66 12UHS | |
| Average Intel Core i9-12900H (1634 - 1930, n=28) | |
| Lenovo Legion 5 Pro 16 G7 i7 RTX 3070Ti | |
| HP Omen 16-b1090ng | |
| Razer Blade 15 2022 | |
| Asus ROG Zephyrus G14 GA402RK | |
| Razer Blade 14 Ryzen 9 6900HX | |
| Cinebench R20 / CPU (Multi Core) | |
| Average of class Gaming (4029 - 16108, n=109, last 2 years) | |
| Lenovo Legion 5 Pro 16 G7 i7 RTX 3070Ti | |
| Asus ROG Strix Scar 15 G533ZW-LN106WS | |
| Gigabyte Aero 16 YE5 | |
| MSI Pulse GL66 12UEK | |
| MSI Vector GP66 12UGS | |
| MSI Raider GE66 12UHS | |
| HP Omen 16-b1090ng | |
| Razer Blade 15 2022 | |
| Average Intel Core i9-12900H (2681 - 7471, n=28) | |
| Razer Blade 14 Ryzen 9 6900HX | |
| Asus ROG Zephyrus G14 GA402RK | |
| Cinebench R20 / CPU (Single Core) | |
| Average of class Gaming (442 - 895, n=109, last 2 years) | |
| MSI Pulse GL66 12UEK | |
| MSI Vector GP66 12UGS | |
| Asus ROG Strix Scar 15 G533ZW-LN106WS | |
| MSI Raider GE66 12UHS | |
| Average Intel Core i9-12900H (624 - 738, n=28) | |
| Lenovo Legion 5 Pro 16 G7 i7 RTX 3070Ti | |
| HP Omen 16-b1090ng | |
| Razer Blade 15 2022 | |
| Gigabyte Aero 16 YE5 | |
| Asus ROG Zephyrus G14 GA402RK | |
| Razer Blade 14 Ryzen 9 6900HX | |
| Cinebench R15 / CPU Multi 64Bit | |
| Average of class Gaming (1578 - 6271, n=109, last 2 years) | |
| Asus ROG Strix Scar 15 G533ZW-LN106WS | |
| Lenovo Legion 5 Pro 16 G7 i7 RTX 3070Ti | |
| HP Omen 16-b1090ng | |
| Gigabyte Aero 16 YE5 | |
| MSI Pulse GL66 12UEK | |
| MSI Raider GE66 12UHS | |
| Average Intel Core i9-12900H (1395 - 3077, n=28) | |
| MSI Vector GP66 12UGS | |
| Razer Blade 14 Ryzen 9 6900HX | |
| Razer Blade 15 2022 | |
| Asus ROG Zephyrus G14 GA402RK | |
| Cinebench R15 / CPU Single 64Bit | |
| Average of class Gaming (188.8 - 343, n=109, last 2 years) | |
| Gigabyte Aero 16 YE5 | |
| MSI Pulse GL66 12UEK | |
| Asus ROG Strix Scar 15 G533ZW-LN106WS | |
| MSI Vector GP66 12UGS | |
| MSI Raider GE66 12UHS | |
| Lenovo Legion 5 Pro 16 G7 i7 RTX 3070Ti | |
| Average Intel Core i9-12900H (235 - 277, n=29) | |
| HP Omen 16-b1090ng | |
| Razer Blade 15 2022 | |
| Asus ROG Zephyrus G14 GA402RK | |
| Razer Blade 14 Ryzen 9 6900HX | |
| Blender / v2.79 BMW27 CPU | |
| Asus ROG Zephyrus G14 GA402RK | |
| Average Intel Core i9-12900H (160 - 451, n=28) | |
| Razer Blade 15 2022 | |
| Razer Blade 14 Ryzen 9 6900HX | |
| Gigabyte Aero 16 YE5 | |
| MSI Vector GP66 12UGS | |
| MSI Raider GE66 12UHS | |
| MSI Pulse GL66 12UEK | |
| HP Omen 16-b1090ng | |
| Asus ROG Strix Scar 15 G533ZW-LN106WS | |
| Lenovo Legion 5 Pro 16 G7 i7 RTX 3070Ti | |
| Average of class Gaming (80 - 330, n=107, last 2 years) | |
| 7-Zip 18.03 / 7z b 4 | |
| Average of class Gaming (33491 - 148086, n=108, last 2 years) | |
| HP Omen 16-b1090ng | |
| Lenovo Legion 5 Pro 16 G7 i7 RTX 3070Ti | |
| MSI Raider GE66 12UHS | |
| Gigabyte Aero 16 YE5 | |
| Asus ROG Strix Scar 15 G533ZW-LN106WS | |
| MSI Vector GP66 12UGS | |
| MSI Pulse GL66 12UEK | |
| Razer Blade 14 Ryzen 9 6900HX | |
| Razer Blade 15 2022 | |
| Average Intel Core i9-12900H (34684 - 76677, n=28) | |
| Asus ROG Zephyrus G14 GA402RK | |
| 7-Zip 18.03 / 7z b 4 -mmt1 | |
| Average of class Gaming (4199 - 7436, n=108, last 2 years) | |
| Gigabyte Aero 16 YE5 | |
| MSI Vector GP66 12UGS | |
| MSI Pulse GL66 12UEK | |
| MSI Raider GE66 12UHS | |
| Asus ROG Strix Scar 15 G533ZW-LN106WS | |
| HP Omen 16-b1090ng | |
| Asus ROG Zephyrus G14 GA402RK | |
| Average Intel Core i9-12900H (5302 - 6289, n=28) | |
| Razer Blade 14 Ryzen 9 6900HX | |
| Lenovo Legion 5 Pro 16 G7 i7 RTX 3070Ti | |
| Razer Blade 15 2022 | |
| Geekbench 5.5 / Multi-Core | |
| Average of class Gaming (6460 - 27010, n=108, last 2 years) | |
| Asus ROG Strix Scar 15 G533ZW-LN106WS | |
| Gigabyte Aero 16 YE5 | |
| MSI Raider GE66 12UHS | |
| HP Omen 16-b1090ng | |
| Lenovo Legion 5 Pro 16 G7 i7 RTX 3070Ti | |
| Razer Blade 15 2022 | |
| MSI Vector GP66 12UGS | |
| Average Intel Core i9-12900H (8519 - 14376, n=31) | |
| MSI Pulse GL66 12UEK | |
| Asus ROG Zephyrus G14 GA402RK | |
| Razer Blade 14 Ryzen 9 6900HX | |
| Geekbench 5.5 / Single-Core | |
| Average of class Gaming (986 - 2474, n=108, last 2 years) | |
| MSI Vector GP66 12UGS | |
| Gigabyte Aero 16 YE5 | |
| MSI Raider GE66 12UHS | |
| Asus ROG Strix Scar 15 G533ZW-LN106WS | |
| MSI Pulse GL66 12UEK | |
| HP Omen 16-b1090ng | |
| Average Intel Core i9-12900H (1631 - 1897, n=31) | |
| Razer Blade 15 2022 | |
| Lenovo Legion 5 Pro 16 G7 i7 RTX 3070Ti | |
| Asus ROG Zephyrus G14 GA402RK | |
| Razer Blade 14 Ryzen 9 6900HX | |
| HWBOT x265 Benchmark v2.2 / 4k Preset | |
| Average of class Gaming (11.5 - 44.3, n=108, last 2 years) | |
| Lenovo Legion 5 Pro 16 G7 i7 RTX 3070Ti | |
| Asus ROG Strix Scar 15 G533ZW-LN106WS | |
| HP Omen 16-b1090ng | |
| MSI Vector GP66 12UGS | |
| MSI Pulse GL66 12UEK | |
| MSI Raider GE66 12UHS | |
| Gigabyte Aero 16 YE5 | |
| Razer Blade 14 Ryzen 9 6900HX | |
| Razer Blade 15 2022 | |
| Average Intel Core i9-12900H (8.05 - 22.5, n=28) | |
| Asus ROG Zephyrus G14 GA402RK | |
| LibreOffice / 20 Documents To PDF | |
| Razer Blade 15 2022 | |
| Razer Blade 14 Ryzen 9 6900HX | |
| Average of class Gaming (19 - 88.8, n=108, last 2 years) | |
| Asus ROG Zephyrus G14 GA402RK | |
| Average Intel Core i9-12900H (36.8 - 59.8, n=28) | |
| Lenovo Legion 5 Pro 16 G7 i7 RTX 3070Ti | |
| MSI Pulse GL66 12UEK | |
| HP Omen 16-b1090ng | |
| MSI Vector GP66 12UGS | |
| Asus ROG Strix Scar 15 G533ZW-LN106WS | |
| Gigabyte Aero 16 YE5 | |
| MSI Raider GE66 12UHS | |
| R Benchmark 2.5 / Overall mean | |
| Razer Blade 14 Ryzen 9 6900HX | |
| Asus ROG Zephyrus G14 GA402RK | |
| Razer Blade 15 2022 | |
| Average Intel Core i9-12900H (0.4218 - 0.506, n=28) | |
| Lenovo Legion 5 Pro 16 G7 i7 RTX 3070Ti | |
| HP Omen 16-b1090ng | |
| MSI Raider GE66 12UHS | |
| Asus ROG Strix Scar 15 G533ZW-LN106WS | |
| Average of class Gaming (0.3439 - 0.759, n=109, last 2 years) | |
| MSI Pulse GL66 12UEK | |
| MSI Vector GP66 12UGS | |
| Gigabyte Aero 16 YE5 | |
* ... smaller is better
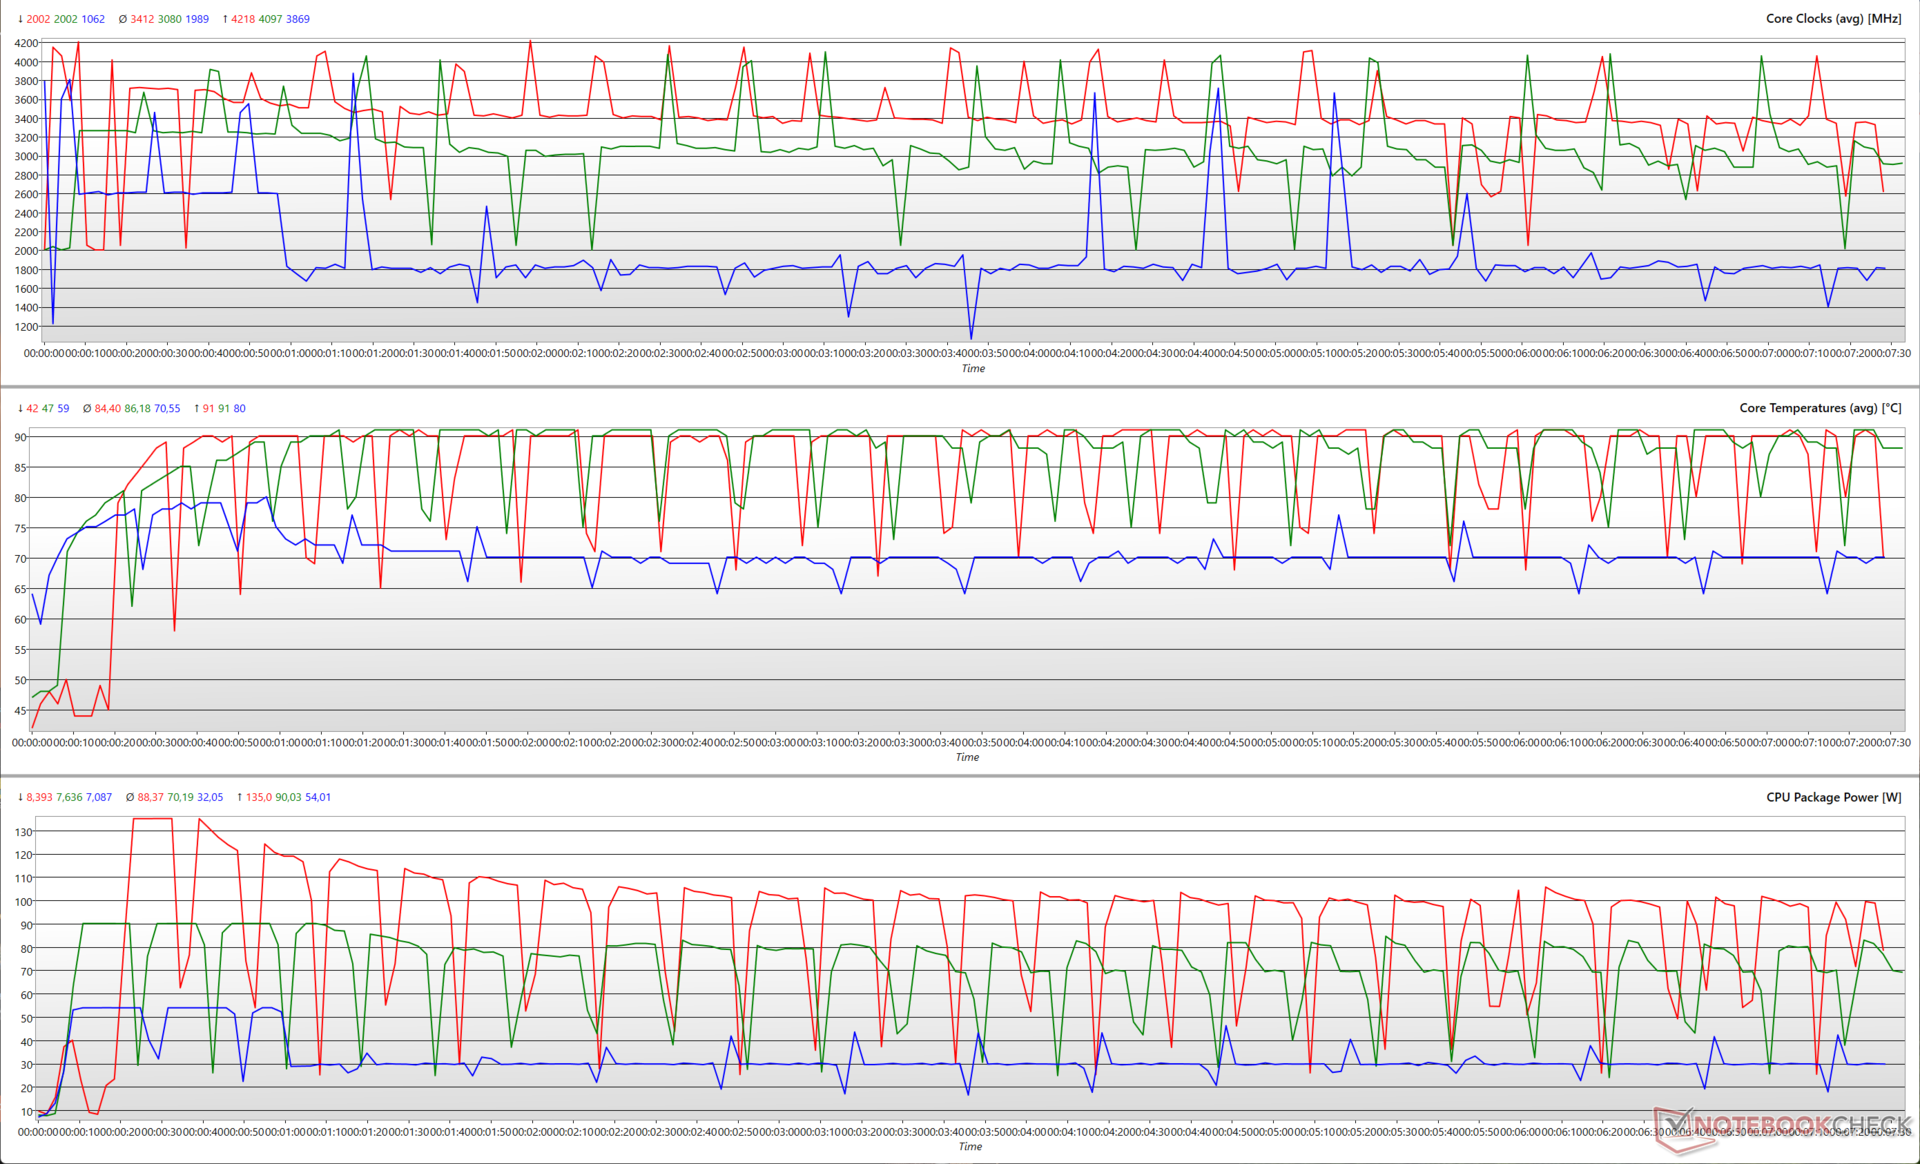
下图说明了在Cinebench R15多核循环中,不同的CPU参数在每种性能模式下的变化。Turbo允许Core i9-12900H使用135 W,但这不会持续超过10秒。在循环的大部分时间里,CPU最终定格在~100W。在这个过程中,平均核心温度达到90℃,而时钟达到4.1GHz到4.2GHz之间。
在性能模式下,最初需要90瓦的封装功率,但从第六次循环开始,这个功率就稳定在80瓦。核心温度在这里也达到了90℃,但处理器只能在几个间隔内触及4GHz以上。
静音模式开始时接近60瓦,但在接近30瓦的时候就稳定下来。正如预期的那样,这导致较低的CPU时钟通常在2GHz附近,偶尔会飙升到3.5GHz。该模式下的温度相当低,为70℃。
AIDA64: FP32 Ray-Trace | FPU Julia | CPU SHA3 | CPU Queen | FPU SinJulia | FPU Mandel | CPU AES | CPU ZLib | FP64 Ray-Trace | CPU PhotoWorxx
| Performance rating | |
| Average of class Gaming | |
| Razer Blade 14 Ryzen 9 6900HX | |
| Asus ROG Zephyrus G14 GA402RK | |
| Asus ROG Strix Scar 15 G533ZW-LN106WS | |
| Lenovo Legion 5 Pro 16 G7 i7 RTX 3070Ti | |
| Average Intel Core i9-12900H | |
| MSI Raider GE66 12UHS | |
| Gigabyte Aero 16 YE5 | |
| MSI Pulse GL66 12UEK | |
| MSI Vector GP66 12UGS | |
| HP Omen 16-b1090ng | |
| Razer Blade 15 2022 | |
| AIDA64 / FP32 Ray-Trace | |
| Average of class Gaming (10227 - 85542, n=107, last 2 years) | |
| Razer Blade 14 Ryzen 9 6900HX | |
| Asus ROG Zephyrus G14 GA402RK | |
| Average Intel Core i9-12900H (4074 - 18289, n=29) | |
| Asus ROG Strix Scar 15 G533ZW-LN106WS | |
| Lenovo Legion 5 Pro 16 G7 i7 RTX 3070Ti | |
| MSI Pulse GL66 12UEK | |
| MSI Raider GE66 12UHS | |
| MSI Vector GP66 12UGS | |
| Gigabyte Aero 16 YE5 | |
| Razer Blade 15 2022 | |
| HP Omen 16-b1090ng | |
| AIDA64 / FPU SinJulia | |
| Average of class Gaming (4424 - 33636, n=107, last 2 years) | |
| Razer Blade 14 Ryzen 9 6900HX | |
| Asus ROG Zephyrus G14 GA402RK | |
| Asus ROG Strix Scar 15 G533ZW-LN106WS | |
| Lenovo Legion 5 Pro 16 G7 i7 RTX 3070Ti | |
| MSI Pulse GL66 12UEK | |
| MSI Vector GP66 12UGS | |
| Gigabyte Aero 16 YE5 | |
| MSI Raider GE66 12UHS | |
| HP Omen 16-b1090ng | |
| Razer Blade 15 2022 | |
| Average Intel Core i9-12900H (5709 - 10410, n=29) | |
| AIDA64 / FPU Mandel | |
| Average of class Gaming (25115 - 128721, n=107, last 2 years) | |
| Razer Blade 14 Ryzen 9 6900HX | |
| Asus ROG Zephyrus G14 GA402RK | |
| Average Intel Core i9-12900H (11257 - 45581, n=29) | |
| Lenovo Legion 5 Pro 16 G7 i7 RTX 3070Ti | |
| Asus ROG Strix Scar 15 G533ZW-LN106WS | |
| MSI Pulse GL66 12UEK | |
| MSI Raider GE66 12UHS | |
| MSI Vector GP66 12UGS | |
| Gigabyte Aero 16 YE5 | |
| Razer Blade 15 2022 | |
| HP Omen 16-b1090ng | |
| AIDA64 / CPU ZLib | |
| Average of class Gaming (574 - 2531, n=107, last 2 years) | |
| Asus ROG Strix Scar 15 G533ZW-LN106WS | |
| Lenovo Legion 5 Pro 16 G7 i7 RTX 3070Ti | |
| MSI Pulse GL66 12UEK | |
| MSI Vector GP66 12UGS | |
| MSI Raider GE66 12UHS | |
| Gigabyte Aero 16 YE5 | |
| HP Omen 16-b1090ng | |
| Razer Blade 15 2022 | |
| Average Intel Core i9-12900H (449 - 1193, n=29) | |
| Razer Blade 14 Ryzen 9 6900HX | |
| Asus ROG Zephyrus G14 GA402RK | |
| AIDA64 / FP64 Ray-Trace | |
| Average of class Gaming (5509 - 45446, n=107, last 2 years) | |
| Razer Blade 14 Ryzen 9 6900HX | |
| Asus ROG Zephyrus G14 GA402RK | |
| Average Intel Core i9-12900H (2235 - 10511, n=29) | |
| Lenovo Legion 5 Pro 16 G7 i7 RTX 3070Ti | |
| Asus ROG Strix Scar 15 G533ZW-LN106WS | |
| MSI Pulse GL66 12UEK | |
| MSI Raider GE66 12UHS | |
| MSI Vector GP66 12UGS | |
| Gigabyte Aero 16 YE5 | |
| HP Omen 16-b1090ng | |
| Razer Blade 15 2022 | |
| AIDA64 / CPU PhotoWorxx | |
| Average of class Gaming (12271 - 89891, n=107, last 2 years) | |
| Razer Blade 15 2022 | |
| HP Omen 16-b1090ng | |
| MSI Raider GE66 12UHS | |
| Asus ROG Strix Scar 15 G533ZW-LN106WS | |
| Gigabyte Aero 16 YE5 | |
| Average Intel Core i9-12900H (20960 - 48269, n=30) | |
| Lenovo Legion 5 Pro 16 G7 i7 RTX 3070Ti | |
| Asus ROG Zephyrus G14 GA402RK | |
| Razer Blade 14 Ryzen 9 6900HX | |
| MSI Vector GP66 12UGS | |
| MSI Pulse GL66 12UEK | |
查看我们专门的 英特尔酷睿i9-12900H页面,了解更多的基准和性能比较。
系统性能
系统性能在预期范围内,与类似配置的设备相当。我们没有注意到在一般的生产力或网络浏览任务中出现任何障碍。
CrossMark: Overall | Productivity | Creativity | Responsiveness
| PCMark 10 / Score | |
| Average of class Gaming (5828 - 11574, n=94, last 2 years) | |
| MSI Raider GE66 12UHS | |
| MSI Vector GP66 12UGS | |
| Asus ROG Strix Scar 15 G533ZW-LN106WS | |
| Gigabyte Aero 16 YE5 | |
| Asus ROG Zephyrus G14 GA402RK | |
| Average Intel Core i9-12900H, NVIDIA GeForce RTX 3070 Ti Laptop GPU (7087 - 8072, n=6) | |
| Razer Blade 15 2022 | |
| Lenovo Legion 5 Pro 16 G7 i7 RTX 3070Ti | |
| Razer Blade 14 Ryzen 9 6900HX | |
| HP Omen 16-b1090ng | |
| MSI Pulse GL66 12UEK | |
| PCMark 10 / Essentials | |
| MSI Raider GE66 12UHS | |
| Gigabyte Aero 16 YE5 | |
| MSI Vector GP66 12UGS | |
| Razer Blade 14 Ryzen 9 6900HX | |
| Asus ROG Zephyrus G14 GA402RK | |
| Average Intel Core i9-12900H, NVIDIA GeForce RTX 3070 Ti Laptop GPU (10266 - 11663, n=6) | |
| Razer Blade 15 2022 | |
| Asus ROG Strix Scar 15 G533ZW-LN106WS | |
| Average of class Gaming (8810 - 12600, n=98, last 2 years) | |
| MSI Pulse GL66 12UEK | |
| HP Omen 16-b1090ng | |
| Lenovo Legion 5 Pro 16 G7 i7 RTX 3070Ti | |
| PCMark 10 / Productivity | |
| Average of class Gaming (6845 - 18766, n=96, last 2 years) | |
| Asus ROG Strix Scar 15 G533ZW-LN106WS | |
| MSI Raider GE66 12UHS | |
| Average Intel Core i9-12900H, NVIDIA GeForce RTX 3070 Ti Laptop GPU (9402 - 10742, n=6) | |
| MSI Vector GP66 12UGS | |
| Gigabyte Aero 16 YE5 | |
| Lenovo Legion 5 Pro 16 G7 i7 RTX 3070Ti | |
| Asus ROG Zephyrus G14 GA402RK | |
| MSI Pulse GL66 12UEK | |
| Razer Blade 15 2022 | |
| HP Omen 16-b1090ng | |
| Razer Blade 14 Ryzen 9 6900HX | |
| PCMark 10 / Digital Content Creation | |
| Average of class Gaming (7602 - 19657, n=96, last 2 years) | |
| MSI Raider GE66 12UHS | |
| MSI Vector GP66 12UGS | |
| Razer Blade 15 2022 | |
| Asus ROG Strix Scar 15 G533ZW-LN106WS | |
| Lenovo Legion 5 Pro 16 G7 i7 RTX 3070Ti | |
| Gigabyte Aero 16 YE5 | |
| Asus ROG Zephyrus G14 GA402RK | |
| Average Intel Core i9-12900H, NVIDIA GeForce RTX 3070 Ti Laptop GPU (10009 - 12541, n=6) | |
| HP Omen 16-b1090ng | |
| Razer Blade 14 Ryzen 9 6900HX | |
| MSI Pulse GL66 12UEK | |
| CrossMark / Overall | |
| Gigabyte Aero 16 YE5 | |
| MSI Pulse GL66 12UEK | |
| Asus ROG Strix Scar 15 G533ZW-LN106WS | |
| Average of class Gaming (1366 - 2409, n=96, last 2 years) | |
| Lenovo Legion 5 Pro 16 G7 i7 RTX 3070Ti | |
| Average Intel Core i9-12900H, NVIDIA GeForce RTX 3070 Ti Laptop GPU (1664 - 2044, n=6) | |
| CrossMark / Productivity | |
| MSI Pulse GL66 12UEK | |
| Gigabyte Aero 16 YE5 | |
| Asus ROG Strix Scar 15 G533ZW-LN106WS | |
| Lenovo Legion 5 Pro 16 G7 i7 RTX 3070Ti | |
| Average of class Gaming (1386 - 2254, n=96, last 2 years) | |
| Average Intel Core i9-12900H, NVIDIA GeForce RTX 3070 Ti Laptop GPU (1591 - 1968, n=6) | |
| CrossMark / Creativity | |
| Average of class Gaming (1343 - 2729, n=96, last 2 years) | |
| Gigabyte Aero 16 YE5 | |
| Asus ROG Strix Scar 15 G533ZW-LN106WS | |
| MSI Pulse GL66 12UEK | |
| Lenovo Legion 5 Pro 16 G7 i7 RTX 3070Ti | |
| Average Intel Core i9-12900H, NVIDIA GeForce RTX 3070 Ti Laptop GPU (1797 - 2148, n=6) | |
| CrossMark / Responsiveness | |
| MSI Pulse GL66 12UEK | |
| Gigabyte Aero 16 YE5 | |
| Asus ROG Strix Scar 15 G533ZW-LN106WS | |
| Lenovo Legion 5 Pro 16 G7 i7 RTX 3070Ti | |
| Average Intel Core i9-12900H, NVIDIA GeForce RTX 3070 Ti Laptop GPU (1514 - 2069, n=6) | |
| Average of class Gaming (1226 - 2334, n=96, last 2 years) | |
| PCMark 8 Home Score Accelerated v2 | 6245 points | |
| PCMark 8 Work Score Accelerated v2 | 6416 points | |
| PCMark 10 Score | 7904 points | |
Help | ||
| AIDA64 / Memory Copy | |
| Average of class Gaming (21750 - 129946, n=107, last 2 years) | |
| HP Omen 16-b1090ng | |
| MSI Raider GE66 12UHS | |
| Razer Blade 15 2022 | |
| Gigabyte Aero 16 YE5 | |
| Asus ROG Strix Scar 15 G533ZW-LN106WS | |
| Average Intel Core i9-12900H (34438 - 74264, n=29) | |
| Lenovo Legion 5 Pro 16 G7 i7 RTX 3070Ti | |
| Asus ROG Zephyrus G14 GA402RK | |
| Razer Blade 14 Ryzen 9 6900HX | |
| MSI Pulse GL66 12UEK | |
| MSI Vector GP66 12UGS | |
| AIDA64 / Memory Read | |
| Average of class Gaming (22956 - 118858, n=107, last 2 years) | |
| MSI Raider GE66 12UHS | |
| HP Omen 16-b1090ng | |
| Razer Blade 15 2022 | |
| Gigabyte Aero 16 YE5 | |
| Asus ROG Strix Scar 15 G533ZW-LN106WS | |
| Average Intel Core i9-12900H (36365 - 74642, n=29) | |
| Lenovo Legion 5 Pro 16 G7 i7 RTX 3070Ti | |
| Asus ROG Zephyrus G14 GA402RK | |
| Razer Blade 14 Ryzen 9 6900HX | |
| MSI Vector GP66 12UGS | |
| MSI Pulse GL66 12UEK | |
| AIDA64 / Memory Write | |
| Average of class Gaming (22297 - 135096, n=107, last 2 years) | |
| Razer Blade 15 2022 | |
| MSI Raider GE66 12UHS | |
| Asus ROG Strix Scar 15 G533ZW-LN106WS | |
| HP Omen 16-b1090ng | |
| Gigabyte Aero 16 YE5 | |
| Average Intel Core i9-12900H (32276 - 67858, n=29) | |
| Lenovo Legion 5 Pro 16 G7 i7 RTX 3070Ti | |
| Asus ROG Zephyrus G14 GA402RK | |
| Razer Blade 14 Ryzen 9 6900HX | |
| MSI Pulse GL66 12UEK | |
| MSI Vector GP66 12UGS | |
| AIDA64 / Memory Latency | |
| Average of class Gaming (75.3 - 259, n=107, last 2 years) | |
| Asus ROG Strix Scar 15 G533ZW-LN106WS | |
| Lenovo Legion 5 Pro 16 G7 i7 RTX 3070Ti | |
| MSI Raider GE66 12UHS | |
| MSI Pulse GL66 12UEK | |
| MSI Vector GP66 12UGS | |
| HP Omen 16-b1090ng | |
| Gigabyte Aero 16 YE5 | |
| Average Intel Core i9-12900H (74.7 - 118.1, n=28) | |
| Razer Blade 14 Ryzen 9 6900HX | |
| Asus ROG Zephyrus G14 GA402RK | |
| Razer Blade 15 2022 | |
* ... smaller is better
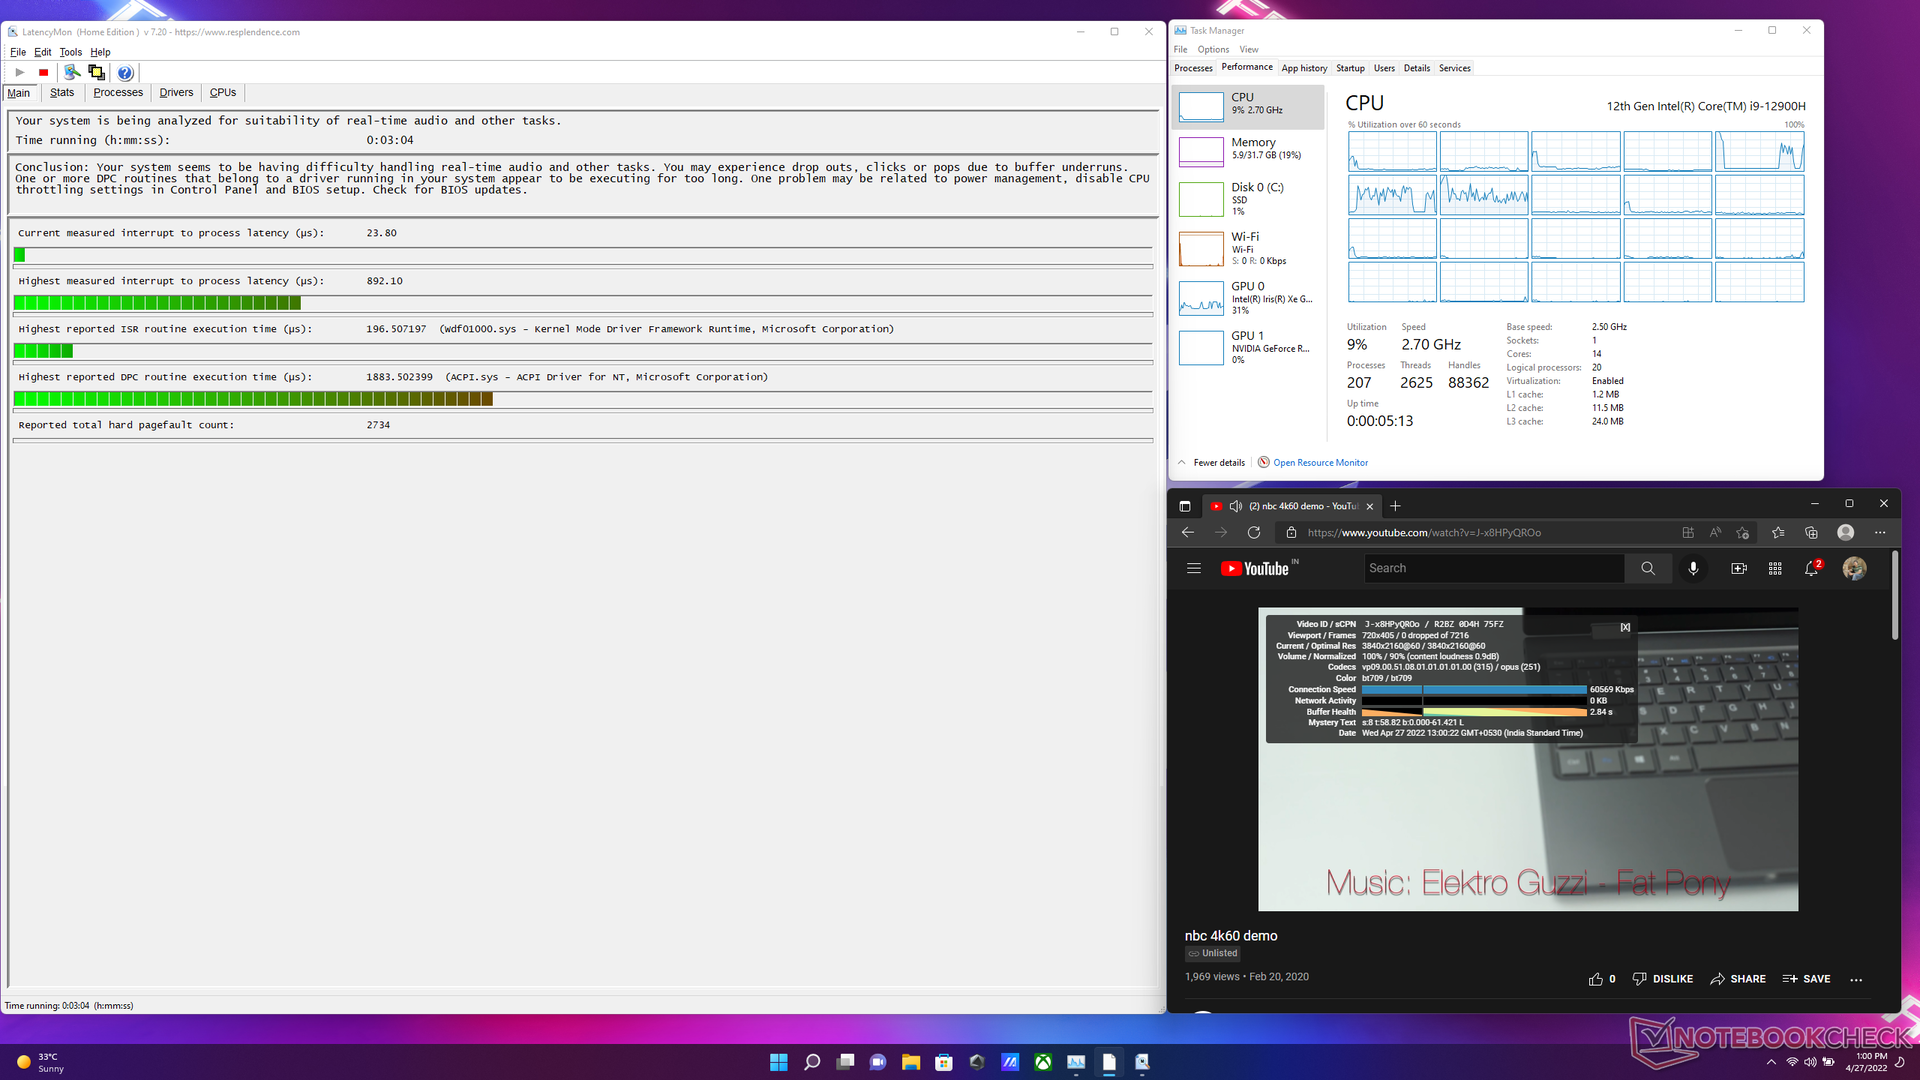
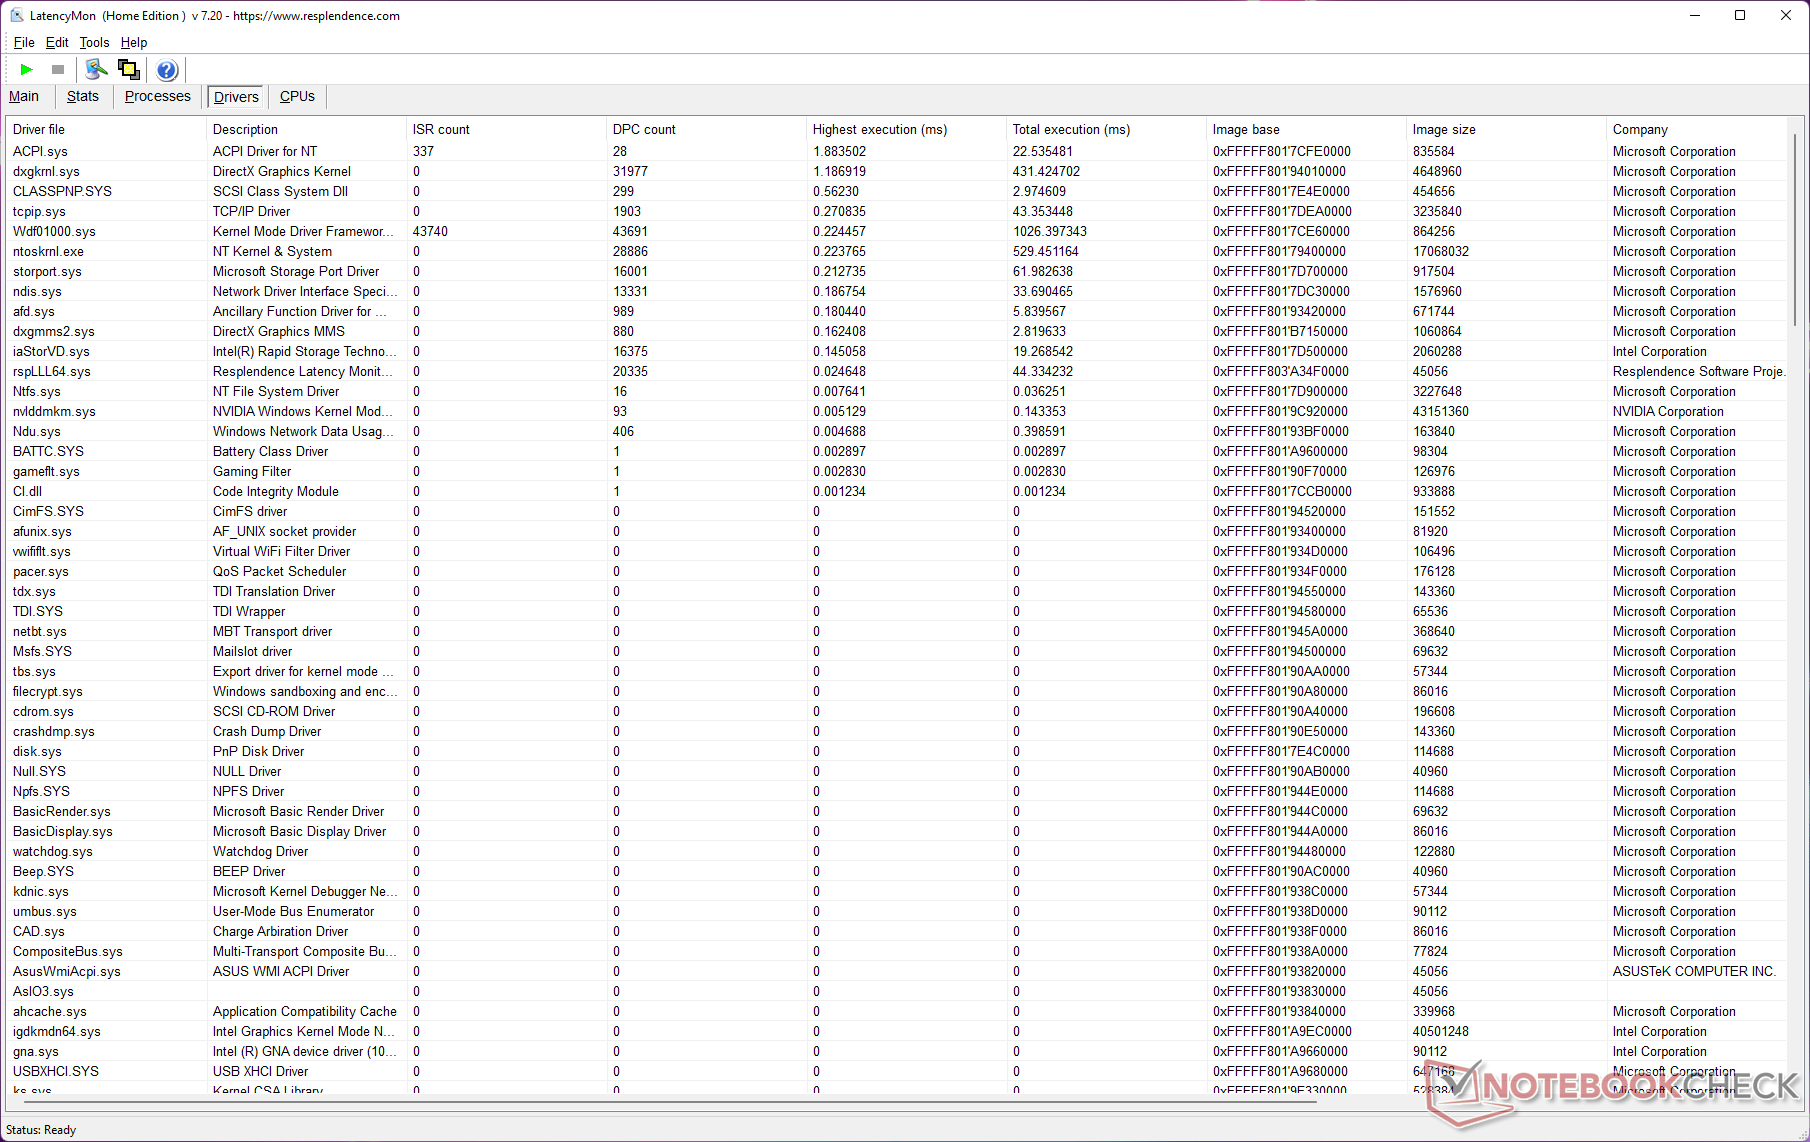
DPC延时
Scar 15的实测DPC延迟低于其大多数竞争对手。也就是说,当涉及到实时音频和视频工作流程时,你仍然可能遇到潜在的障碍。Windows电源管理组件ACPI.sys似乎是观察到的高DPC延时的原因。
| DPC Latencies / LatencyMon - interrupt to process latency (max), Web, Youtube, Prime95 | |
| MSI Raider GE66 12UHS | |
| Asus ROG Zephyrus G14 GA402RK | |
| MSI Vector GP66 12UGS | |
| Razer Blade 15 2022 | |
| Razer Blade 14 Ryzen 9 6900HX | |
| MSI Pulse GL66 12UEK | |
| Asus ROG Strix Scar 15 G533ZW-LN106WS | |
| Lenovo Legion 5 Pro 16 G7 i7 RTX 3070Ti | |
| HP Omen 16-b1090ng | |
| Gigabyte Aero 16 YE5 | |
* ... smaller is better
我们专门的 DPC 延迟排行页面提供了更多经过审查的设备之间的延迟比较。
存储设备
我们的ROG Strix Scar 15设备配备了2TB的三星PM9A1 NVMe SSD。其基准性能与其他配备PM9A1的笔记本电脑相当。
然而,在DiskSpd持续读取队列深度为8的第六次循环后,该驱动器明显节流,因为驱动器上或底板上没有提供散热解决方案。
没有安装2.5英寸SATA驱动器的空间。尽管如此,华硕提供了一个二级M.2插槽,用于添加另一个NVMe存储扩展。

| Asus ROG Strix Scar 15 G533ZW Samsung PM9A1 MZVL22T0HBLB | MSI Pulse GL66 12UEK Micron 2450 512GB MTFDKBA512TFK | Gigabyte Aero 16 YE5 Phison ESR01TBMFCT | MSI Vector GP66 12UGS | MSI Raider GE66 12UHS Samsung PM9A1 MZVL22T0HBLB | HP Omen 16-b1090ng WDC PC SN810 1TB | Lenovo Legion 5 Pro 16 G7 i7 RTX 3070Ti Samsung PM9A1 MZVL21T0HCLR | Razer Blade 14 Ryzen 9 6900HX Samsung PM9A1 MZVL21T0HCLR | Asus ROG Zephyrus G14 GA402RK Micron 2450 1TB MTFDKBK1T0TFK | Razer Blade 15 2022 SSSTC CA6-8D1024 | Average Samsung PM9A1 MZVL22T0HBLB | Average of class Gaming | |
|---|---|---|---|---|---|---|---|---|---|---|---|---|
| Drive Performance rating | ||||||||||||
| Percent (pt) | 87.9 | 60.8 -31% | 89.7 2% | 63 -28% | 85.5 -3% | 67.6 -23% | 90.1 3% | 85.3 -3% | 64.4 -27% | 79.1 -10% | 76.5 -13% | 71.6 -19% |
| DiskSpd | -21% | 9% | -20% | 1% | -16% | 11% | 4% | -27% | -3% | -6% | -11% | |
| seq read (MB/s) | 2397 | 2038 -15% | 3819 59% | 2119 -12% | 3813 59% | 3928 64% | 4486 87% | 4352 82% | 2262 -6% | 4119 72% | 3903 ? 63% | 3492 ? 46% |
| seq write (MB/s) | 4488 | 3275 -27% | 4457 -1% | 3405 -24% | 3838 -14% | 4033 -10% | 4368 -3% | 4240 -6% | 3454 -23% | 4167 -7% | 4101 ? -9% | 3932 ? -12% |
| seq q8 t1 read (MB/s) | 7006 | 3613 -48% | 7028 0% | 3563 -49% | 5358 -24% | 6867 -2% | 6637 -5% | 6670 -5% | 3563 -49% | 6921 -1% | 7079 ? 1% | 7318 ? 4% |
| seq q8 t1 write (MB/s) | 5263 | 3351 -36% | 5004 -5% | 3448 -34% | 4951 -6% | 5412 3% | 4940 -6% | 4995 -5% | 3455 -34% | 4740 -10% | 5439 ? 3% | 5787 ? 10% |
| 4k q1 t1 read (MB/s) | 86.8 | 71.5 -18% | 88.7 2% | 69.5 -20% | 88.3 2% | 77.1 -11% | 97.4 12% | 79.8 -8% | 62.4 -28% | 79.6 -8% | 77.3 ? -11% | 69.8 ? -20% |
| 4k q1 t1 write (MB/s) | 294 | 421 43% | 373 27% | 408 39% | 273 -7% | 205 -30% | 274 -7% | 196.8 -33% | 249 -15% | 256 -13% | 212 ? -28% | 201 ? -32% |
| 4k q32 t16 read (MB/s) | 3975 | 1550 -61% | 3555 -11% | 1844 -54% | 4068 2% | 1528 -62% | 4158 5% | 4174 5% | 1841 -54% | 3184 -20% | 2860 ? -28% | 2321 ? -42% |
| 4k q32 t16 write (MB/s) | 3509 | 3249 -7% | 3612 3% | 3354 -4% | 3478 -1% | 585 -83% | 3544 1% | 3559 1% | 3364 -4% | 2141 -39% | 2177 ? -38% | 1924 ? -45% |
| AS SSD | -116% | -6% | -242% | -6% | -29% | -0% | -37% | -116% | -33% | -28% | -44% | |
| Score Total (Points) | 9031 | 4693 -48% | 9380 4% | 6130 -32% | 8959 -1% | 5985 -34% | 9094 1% | 9147 1% | 7568 -16% | 7659 -15% | 7177 ? -21% | 6824 ? -24% |
| Score Read (Points) | 3378 | 1878 -44% | 3634 8% | 2008 -41% | 3341 -1% | 1994 -41% | 3380 0% | 3439 2% | 2722 -19% | 3431 2% | 2615 ? -23% | 2251 ? -33% |
| Score Write (Points) | 3999 | 1837 -54% | 3991 0% | 3087 -23% | 3977 -1% | 3093 -23% | 4043 1% | 4026 1% | 3451 -14% | 2563 -36% | 3292 ? -18% | 3491 ? -13% |
| Seq Read (MB/s) | 5563.48 | 3127 -44% | 5588 0% | 3080 -45% | 5098.97 -8% | 5396.69 -3% | 5036 -9% | 5482.07 -1% | 3209 -42% | 5750 3% | 5454 ? -2% | 5507 ? -1% |
| Seq Write (MB/s) | 4045.87 | 2977 -26% | 3267 -19% | 2997 -26% | 3667.77 -9% | 2667.04 -34% | 3784 -6% | 4007.19 -1% | 3131 -23% | 4073 1% | 3968 ? -2% | 3923 ? -3% |
| 4K Read (MB/s) | 81.3 | 95.9 18% | 109.4 35% | 70 -14% | 84.06 3% | 73.81 -9% | 88.1 8% | 73.78 -9% | 77.7 -4% | 67.2 -17% | 72 ? -11% | 70.2 ? -14% |
| 4K Write (MB/s) | 248.96 | 363.5 46% | 321.6 29% | 352 41% | 244.47 -2% | 247.26 -1% | 240.4 -3% | 174.19 -30% | 218.3 -12% | 221.3 -11% | 195.9 ? -21% | 215 ? -14% |
| 4K-64 Read (MB/s) | 2740.24 | 1469 -46% | 2966 8% | 1630 -41% | 2747.2 0% | 1380.56 -50% | 2788 2% | 2816.7 3% | 2323 -15% | 2789 2% | 1998 ? -27% | 1630 ? -41% |
| 4K-64 Write (MB/s) | 3345.62 | 1175 -65% | 3342 0% | 2435 -27% | 3365.94 1% | 2579.14 -23% | 3424 2% | 3450.87 3% | 2920 -13% | 1934 -42% | 2700 ? -19% | 2885 ? -14% |
| Access Time Read * (ms) | 0.022 | 0.051 -132% | 0.056 -155% | 0.033 -50% | 0.032 -45% | 0.045 -105% | 0.02 9% | 0.035 -59% | 0.065 -195% | 0.023 -5% | 0.03461 ? -57% | 0.06446 ? -193% |
| Access Time Write * (ms) | 0.017 | 0.167 -882% | 0.012 29% | 0.425 -2400% | 0.018 -6% | 0.016 6% | 0.018 -6% | 0.07 -312% | 0.174 -924% | 0.058 -241% | 0.03473 ? -104% | 0.03895 ? -129% |
| Total Average (Program / Settings) | -56% /
-74% | 2% /
1% | -97% /
-142% | -3% /
-3% | -23% /
-24% | 5% /
4% | -12% /
-19% | -57% /
-76% | -15% /
-20% | -16% /
-18% | -25% /
-29% |
* ... smaller is better
Disk Throttling: DiskSpd Read Loop, Queue Depth 8
请参考我们的 SSD和HDD基准测试页面了解更多存储设备的比较。
GPU性能
我们的ROG Strix Scar 15装置具有一个 NvidiaGeForce RTX 3070 Ti Laptop GPU总图形功率(TGP)为150 W(125 W + 25 W动态提升)。
3DMark的整体性能与 Radeon RX 6800S中的 华硕ROG Zephyrus G14.在3DMarkFire Strike 图形和3DMarkTime Spy 图形中,与RTX 3080 Ti笔记本GPU相比,性能分别下降了5%和12%。RTX 3080 Ti 笔记本GPU相比,微星Raider GE66 12UHS中的RTX 3080 Ti笔记本GPU的性能分别下降了5%和12%。
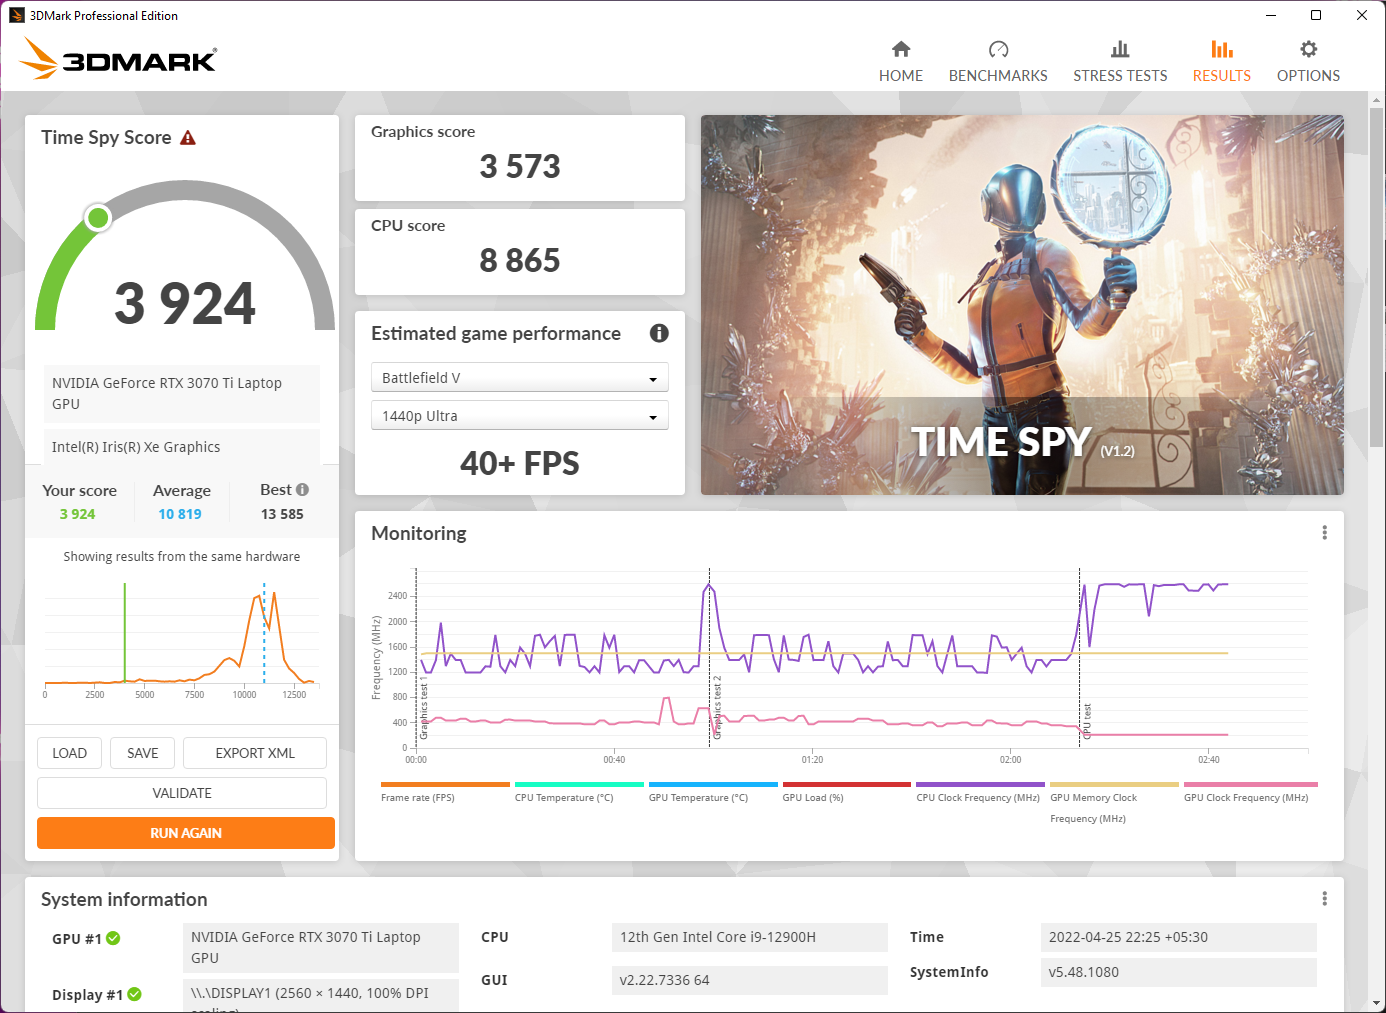
GPU性能在电池电量上受到了巨大的打击。我们观察到Time Spy 图形得分减少了68%。笔记本自动切换到静音性能模式,断开电源适配器后,显示器刷新率从240赫兹降至60赫兹。根据3DMark,电池上的低分仍然与在1440p Ultra条件下Battlefield V
等标题中相当于40多帧的性能相关。如前所述,华硕允许通过Armory Crate使用一个MUX开关来绕过iGPU。华硕声称这样做有9%的性能优势,但你的里程将取决于游戏或图形负载。
下表显示了标准MSHybrid和MUX模式在3DMarkTime Spy 和Fire Strike 图形测试中的比较。尽管我们确实看到了轻微的优势,但这一差异在误差范围内,不会被认为是显著的。
不过,专用的MUX开关仍然是一个很好的功能,在现实世界的游戏中可以派上用场,特别是在1080p下推动更多的帧。
| 3DMark测试 | 标准MSHybrid | MUX交换机 |
|---|---|---|
| Fire Strike 分数 | 24123 | 25390 (+1.1%) |
| Fire Strike 图形 | 29292 | 29811 (+1.77%) |
| Fire Strike 物理 | 30624 | 30101 (-1.70%) |
| Time Spy 分数 | 11481 | 11724 (+2.11%) |
| Time Spy 图形 | 11197 | 11374 (+1.58%) |
| Time Spy cpu | 13413 | 14204 (+5.9%) |
| 3DMark 11 Performance | 34211 points | |
| 3DMark Ice Storm Standard Score | 118774 points | |
| 3DMark Cloud Gate Standard Score | 58464 points | |
| 3DMark Fire Strike Score | 24123 points | |
| 3DMark Fire Strike Extreme Score | 13949 points | |
| 3DMark Time Spy Score | 11481 points | |
Help | ||
游戏性能
在测试的游戏中,性能符合预期。RTX 3070 Ti笔记本电脑的GPU很有能力在外部显示器上进行4K游戏,如果不是在Ultra状态下,至少也是高设置。QHD游戏是完全可能的,所有的细节都被提升到最大。与RTX 3080 Ti笔记本GPU相比,光线追踪确实受到了冲击,但在支持的游戏中,使用DLSS应该可以实现可玩的帧数。
| The Witcher 3 | |
| 1920x1080 Ultra Graphics & Postprocessing (HBAO+) | |
| Average of class Gaming (95 - 240, n=8, last 2 years) | |
| MSI Vector GP66 12UGS | |
| Asus ROG Strix Scar 15 G533ZW-LN106WS | |
| MSI Raider GE66 12UHS | |
| Razer Blade 15 2022 | |
| Lenovo Legion 5 Pro 16 G7 i7 RTX 3070Ti | |
| Average NVIDIA GeForce RTX 3070 Ti Laptop GPU (76.8 - 124.1, n=39) | |
| HP Omen 16-b1090ng | |
| Razer Blade 14 Ryzen 9 6900HX | |
| Asus ROG Zephyrus G14 GA402RK | |
| Gigabyte Aero 16 YE5 | |
| MSI Pulse GL66 12UEK | |
| 3840x2160 High Graphics & Postprocessing (Nvidia HairWorks Off) | |
| Average of class Gaming (114 - 169.8, n=3, last 2 years) | |
| Asus ROG Strix Scar 15 G533ZW-LN106WS | |
| MSI Raider GE66 12UHS | |
| Average NVIDIA GeForce RTX 3070 Ti Laptop GPU (73.2 - 78, n=2) | |
| Gigabyte Aero 16 YE5 | |
| 3840x2160 Ultra Graphics & Postprocessing (HBAO+) | |
| Average of class Gaming (48.4 - 112.4, n=2, last 2 years) | |
| Asus ROG Strix Scar 15 G533ZW-LN106WS | |
| Average NVIDIA GeForce RTX 3070 Ti Laptop GPU (48.4 - 52.3, n=2) | |
| Gigabyte Aero 16 YE5 | |
| F1 2021 | |
| 1920x1080 Ultra High Preset + Raytracing AA:T AF:16x | |
| MSI Raider GE66 12UHS | |
| Asus ROG Strix Scar 15 G533ZW-LN106WS | |
| Lenovo Legion 5 Pro 16 G7 i7 RTX 3070Ti | |
| Asus ROG Zephyrus G14 GA402RK | |
| Average NVIDIA GeForce RTX 3070 Ti Laptop GPU (67.3 - 134.2, n=13) | |
| Gigabyte Aero 16 YE5 | |
| 2560x1440 Ultra High Preset + Raytracing AA:T AF:16x | |
| Lenovo Legion 5 Pro 16 G7 i7 RTX 3070Ti | |
| Asus ROG Strix Scar 15 G533ZW-LN106WS | |
| Gigabyte Aero 16 YE5 | |
| Average NVIDIA GeForce RTX 3070 Ti Laptop GPU (47.5 - 99.2, n=11) | |
| Asus ROG Zephyrus G14 GA402RK | |
| 3840x2160 Ultra High Preset + Raytracing AA:T AF:16x | |
| Asus ROG Strix Scar 15 G533ZW-LN106WS | |
| Average NVIDIA GeForce RTX 3070 Ti Laptop GPU (47 - 56.8, n=3) | |
| Gigabyte Aero 16 YE5 | |
| Asus ROG Zephyrus G14 GA402RK | |
| Assassin´s Creed Valhalla | |
| 1920x1080 Ultra High Preset | |
| Asus ROG Zephyrus G14 GA402RK | |
| MSI Raider GE66 12UHS | |
| Asus ROG Strix Scar 15 G533ZW-LN106WS | |
| Average NVIDIA GeForce RTX 3070 Ti Laptop GPU (73 - 80, n=4) | |
| 2560x1440 Ultra High Preset | |
| MSI Raider GE66 12UHS | |
| Asus ROG Zephyrus G14 GA402RK | |
| Asus ROG Strix Scar 15 G533ZW-LN106WS | |
| Average NVIDIA GeForce RTX 3070 Ti Laptop GPU (56 - 62, n=3) | |
| 3840x2160 Ultra High Preset | |
| MSI Raider GE66 12UHS | |
| Asus ROG Strix Scar 15 G533ZW-LN106WS | |
| Average NVIDIA GeForce RTX 3070 Ti Laptop GPU (35 - 37, n=2) | |
| Asus ROG Zephyrus G14 GA402RK | |
Witcher 3 FPS图表
帧率在在Witcher 3在1080p Ultra的压力测试中,帧率徘徊在103至113帧之间,在大多数情况下似乎相对稳定。
| low | med. | high | ultra | QHD | 4K | |
|---|---|---|---|---|---|---|
| GTA V (2015) | 182.7 | 184.5 | 172.2 | 123.9 | 101.9 | 98 |
| The Witcher 3 (2015) | 441 | 251 | 209 | 111 | 78 | |
| Dota 2 Reborn (2015) | 187 | 173.3 | 164.8 | 158.4 | 130.2 | |
| Final Fantasy XV Benchmark (2018) | 202 | 129.7 | 95.7 | 72.2 | 43.9 | |
| Far Cry 5 (2018) | 160 | 143 | 138 | 130 | 107 | 61 |
| Strange Brigade (2018) | 519 | 274 | 235 | 196.2 | 148.5 | 87.9 |
| Assassin´s Creed Valhalla (2020) | 160 | 111 | 94 | 80 | 62 | 37 |
| F1 2021 (2021) | 405 | 317 | 238 | 134.2 | 98.4 | 56.8 |
| Cyberpunk 2077 1.6 (2022) | 140.3 | 114.6 | 89.5 | 76 | 46 | 24.6 |
看一下 NvidiaGeForce RTX 3070 Ti Laptop GPU和 游戏基准测试页面,了解更多信息和性能比较。
排放。150 W RTX 3070 Ti以高风扇噪音为代价
系统噪音
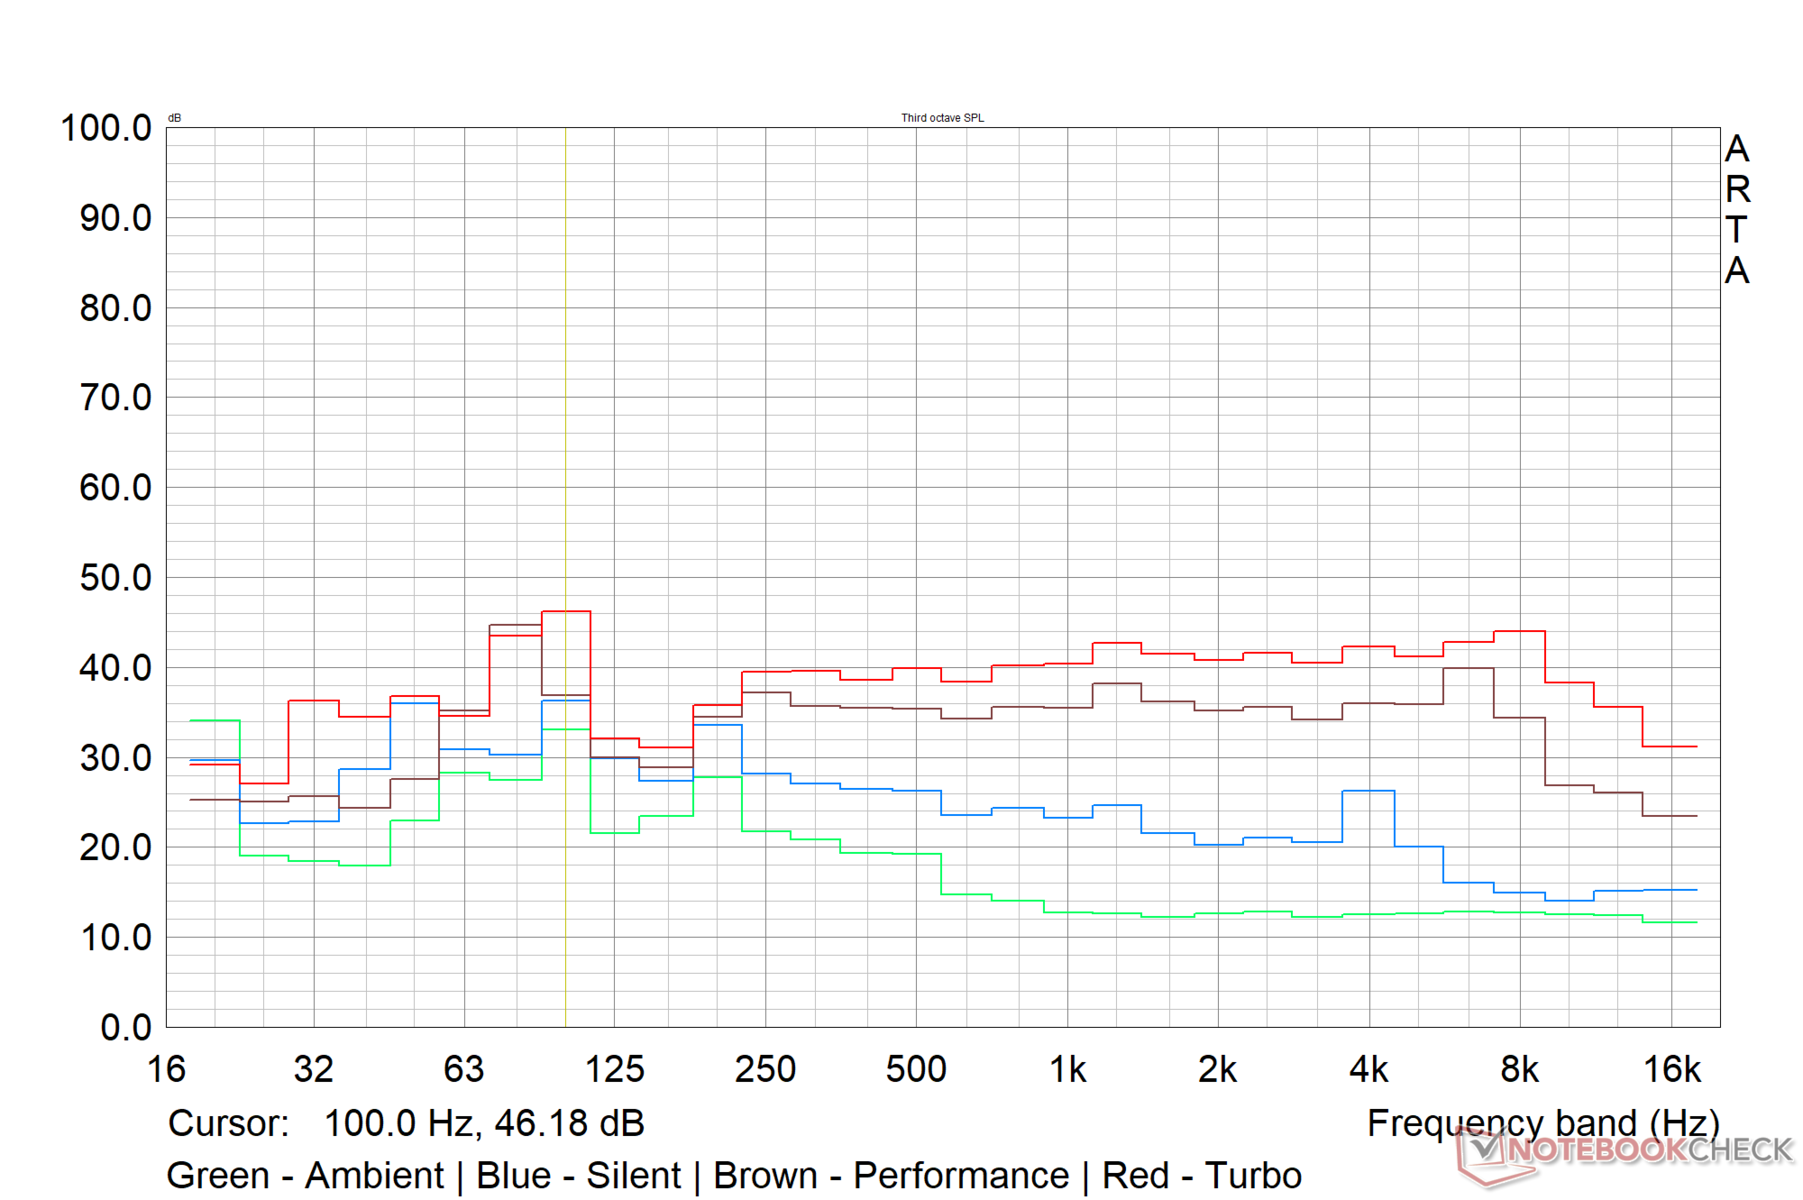
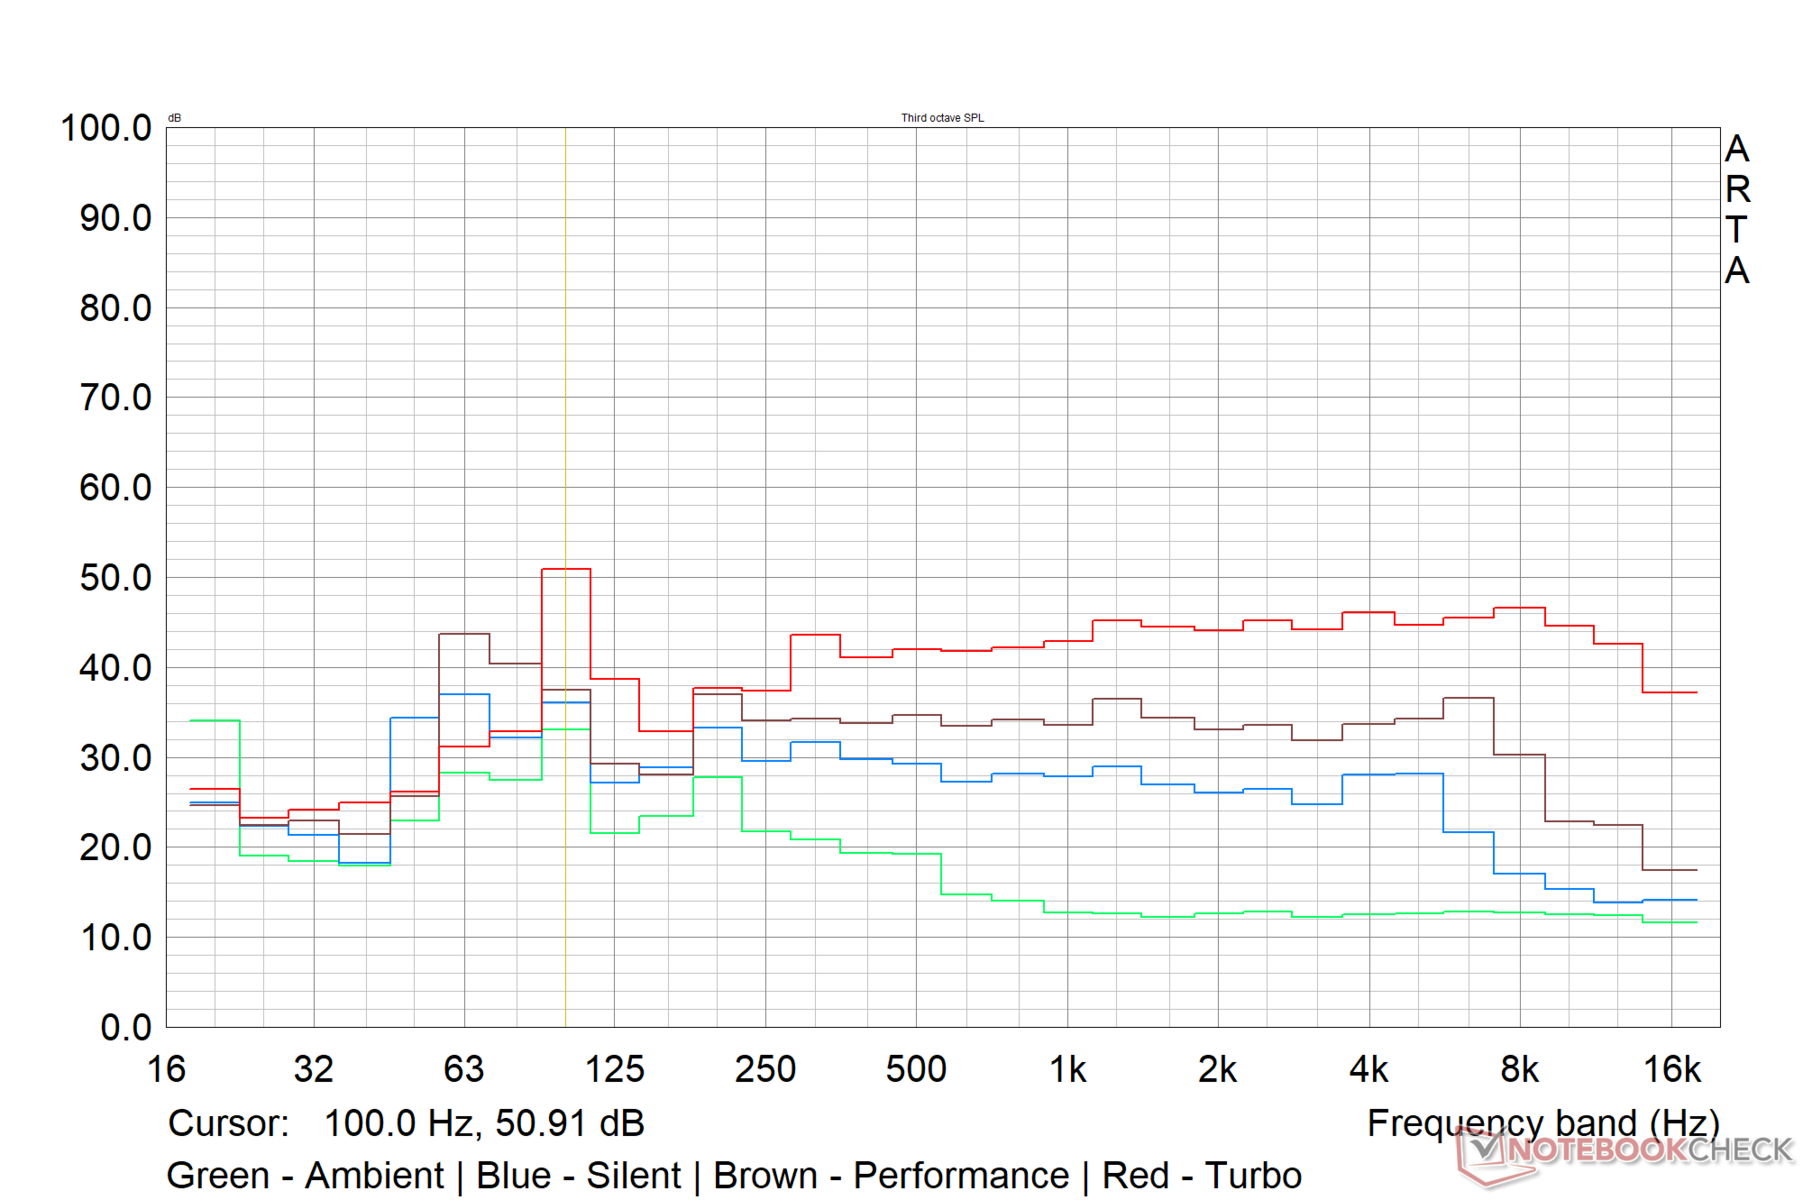
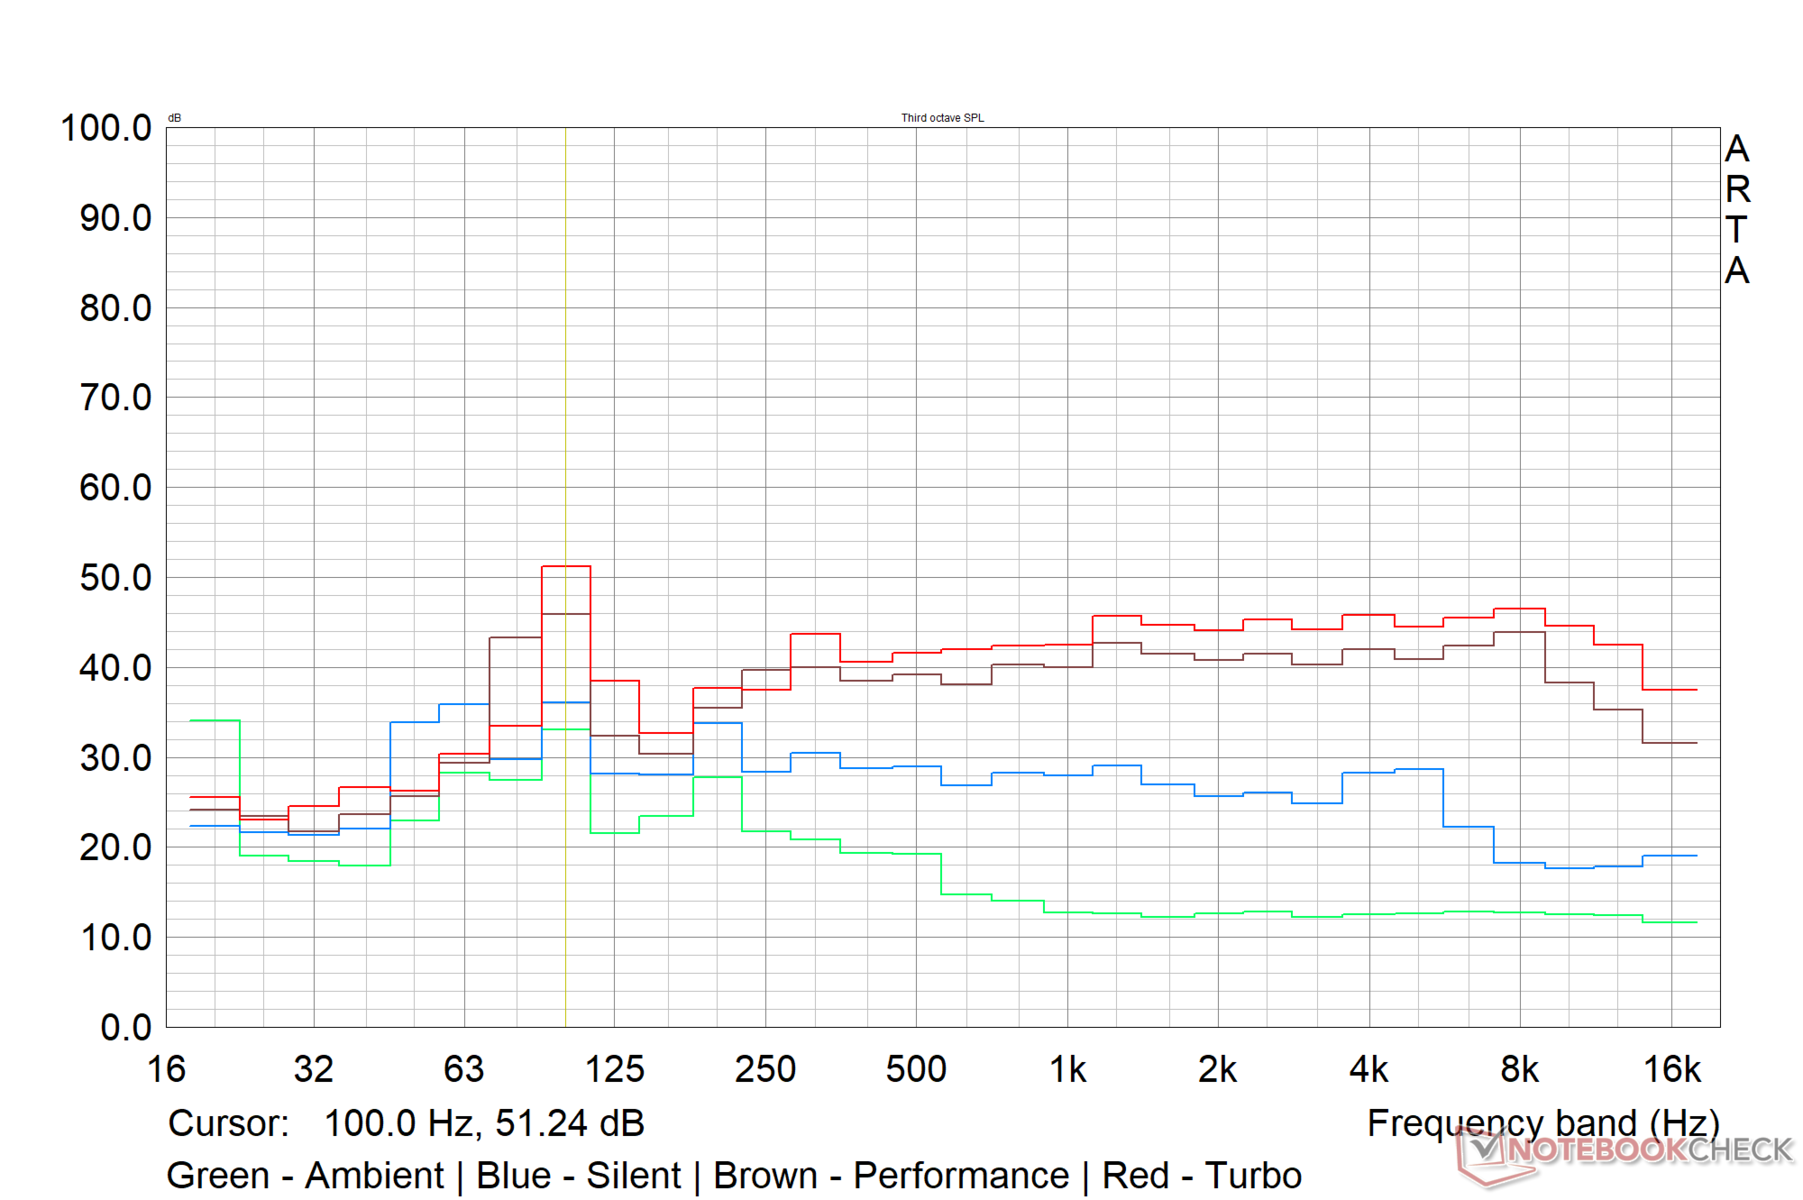
ROG Strix Scar 15的双风扇能够在负载下保持笔记本电脑的良好性能。然而,这是以较高的噪音水平为代价的,特别是在涡轮性能模式下。
为了测量风扇噪音,我们使用了Earthworks M23R全向参考麦克风,连接到Focusrite Scarlett 2i2第三代USB音频接口,并校准为94 dB(A)的声压级。在录音过程中,该装置被放置在离笔记本电脑15厘米的固定距离上。
华硕声称,在Turbo和Performance模式下的最大工作噪音为48 dB(A),但我们在最大负载和TheWitcher 3
Ultra压力情况下记录的风扇噪音水平高达56.6 dB(A)。在Turbo模式下,空闲噪音水平也偏高,但在静音和性能模式下,空闲噪音水平约为29分贝(A)。在静音模式下,我们记录了39.01 dB(A)的最大风扇噪音水平。
Noise level
| Idle |
| 39.07 / 39.07 / 39.07 dB(A) |
| Load |
| 53.34 / 56.6 dB(A) |
 | ||
30 dB silent 40 dB(A) audible 50 dB(A) loud |
||
min: | ||
| Asus ROG Strix Scar 15 G533ZW Intel Core i9-12900H, NVIDIA GeForce RTX 3070 Ti Laptop GPU | MSI Raider GE66 12UHS Intel Core i9-12900HK, NVIDIA GeForce RTX 3080 Ti Laptop GPU | Lenovo Legion 5 Pro 16 G7 i7 RTX 3070Ti Intel Core i7-12700H, NVIDIA GeForce RTX 3070 Ti Laptop GPU | Asus ROG Zephyrus G14 GA402RK AMD Ryzen 9 6900HS, AMD Radeon RX 6800S | Razer Blade 15 2022 Intel Core i7-12800H, NVIDIA GeForce RTX 3080 Ti Laptop GPU | |
|---|---|---|---|---|---|
| Noise | 16% | 16% | 23% | 20% | |
| off / environment * (dB) | 26.86 | 26 3% | 24.6 8% | 24 11% | 25.4 5% |
| Idle Minimum * (dB) | 39.07 | 27 31% | 28.4 27% | 24 39% | 26.2 33% |
| Idle Average * (dB) | 39.07 | 30 23% | 28.4 27% | 26 33% | 26.2 33% |
| Idle Maximum * (dB) | 39.07 | 39 -0% | 28.4 27% | 31 21% | 28.4 27% |
| Load Average * (dB) | 53.34 | 45 16% | 49.4 7% | 45 16% | 44.7 16% |
| Witcher 3 ultra * (dB) | 56.6 | 45 20% | 49.4 13% | 43 24% | 44.7 21% |
| Load Maximum * (dB) | 56.6 | 47 17% | 54.7 3% | 45 20% | 51.9 8% |
* ... smaller is better
温度
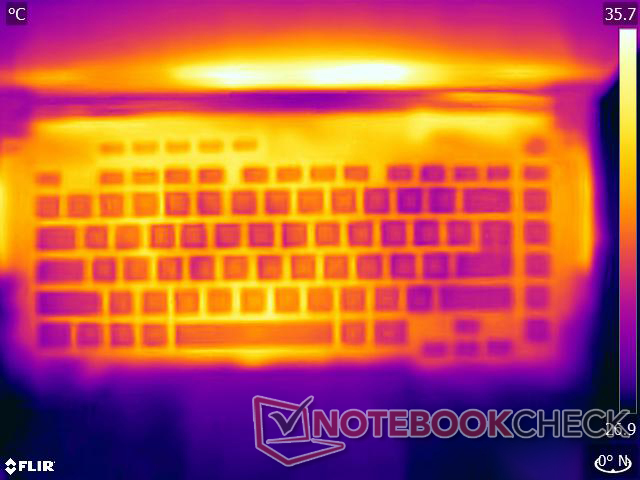
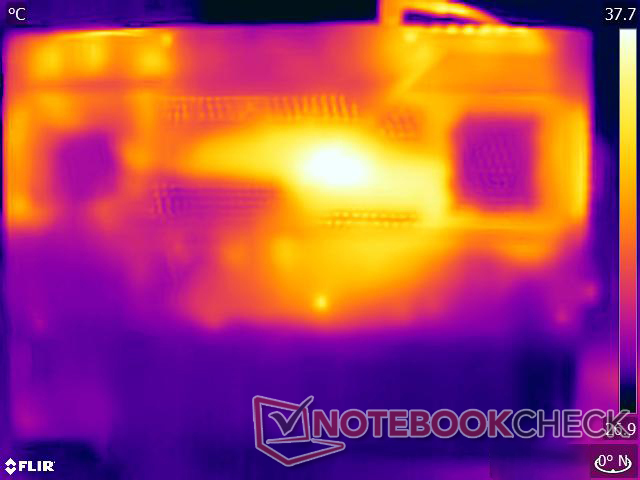
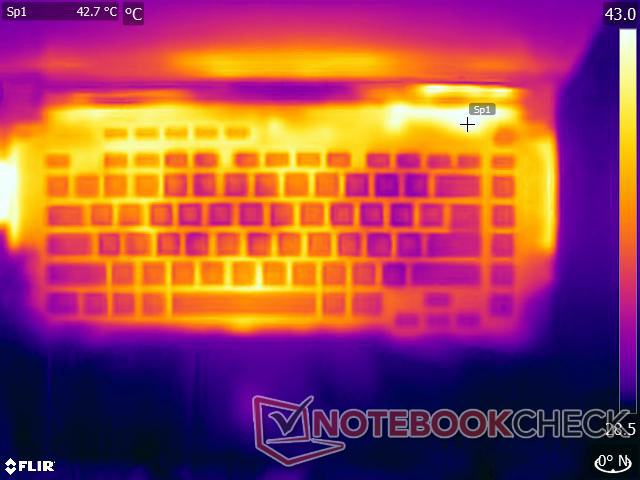
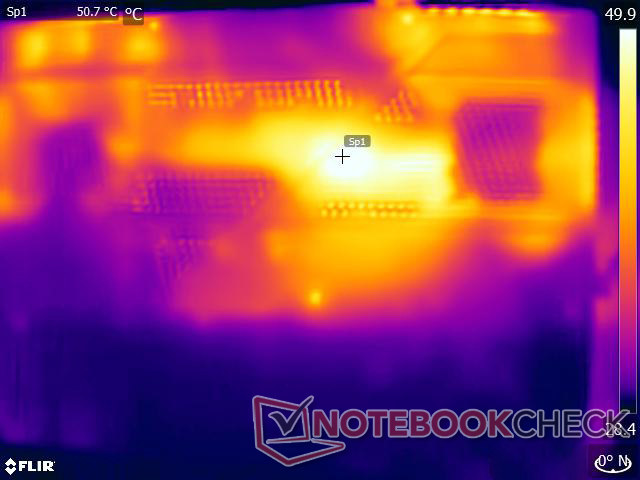
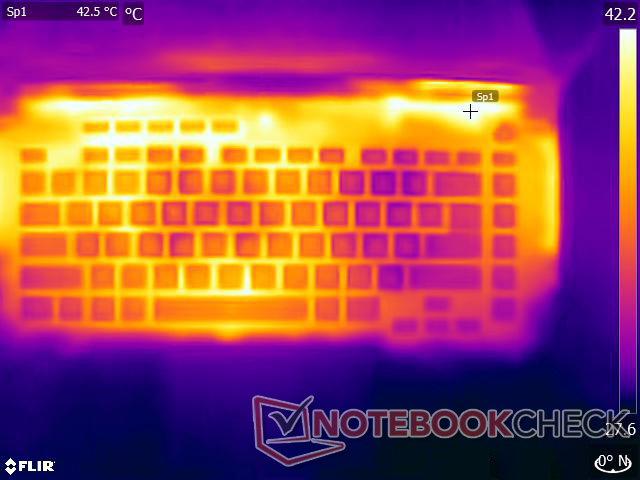
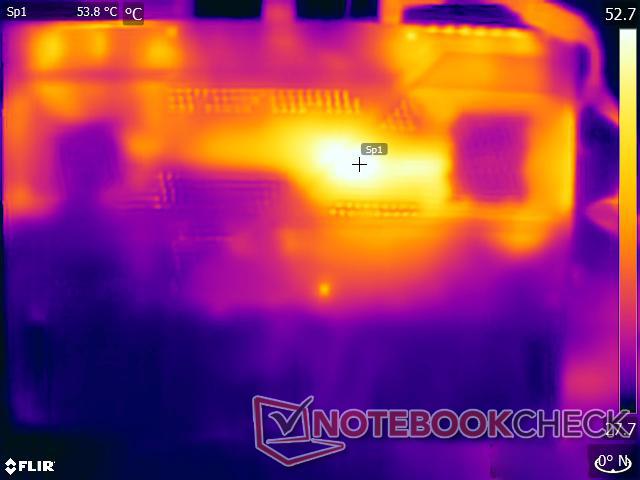
即使有双风扇和八根热管的设置,表面温度在负载下也会变得很高,这通常是游戏笔记本电脑的常态。在Prime95和FurMark的组合负载下,我们记录到顶部的最高温度为42.6℃,底部的最高温度为50.2℃。使用TheWitcher 3,顶部和底部的热点分别为48.4℃和54.4℃。
尽管机箱其他地方的表面温度较高,但华硕在保持掌托区域相对凉爽方面做得不错。如果你想在膝上使用该设备,我们建议切换到静音模式,不要给设备带来太多压力。
(±) The maximum temperature on the upper side is 42.6 °C / 109 F, compared to the average of 40.4 °C / 105 F, ranging from 21.2 to 68.8 °C for the class Gaming.
(-) The bottom heats up to a maximum of 50.2 °C / 122 F, compared to the average of 43.2 °C / 110 F
(±) In idle usage, the average temperature for the upper side is 33.4 °C / 92 F, compared to the device average of 33.9 °C / 93 F.
(-) Playing The Witcher 3, the average temperature for the upper side is 41.3 °C / 106 F, compared to the device average of 33.9 °C / 93 F.
(+) The palmrests and touchpad are reaching skin temperature as a maximum (33.4 °C / 92.1 F) and are therefore not hot.
(-) The average temperature of the palmrest area of similar devices was 28.8 °C / 83.8 F (-4.6 °C / -8.3 F).
| Asus ROG Strix Scar 15 G533ZW Intel Core i9-12900H, NVIDIA GeForce RTX 3070 Ti Laptop GPU | MSI Raider GE66 12UHS Intel Core i9-12900HK, NVIDIA GeForce RTX 3080 Ti Laptop GPU | Lenovo Legion 5 Pro 16 G7 i7 RTX 3070Ti Intel Core i7-12700H, NVIDIA GeForce RTX 3070 Ti Laptop GPU | Asus ROG Zephyrus G14 GA402RK AMD Ryzen 9 6900HS, AMD Radeon RX 6800S | Razer Blade 15 2022 Intel Core i7-12800H, NVIDIA GeForce RTX 3080 Ti Laptop GPU | |
|---|---|---|---|---|---|
| Heat | -7% | 4% | -1% | -3% | |
| Maximum Upper Side * (°C) | 42.6 | 54 -27% | 45.3 -6% | 55 -29% | 50 -17% |
| Maximum Bottom * (°C) | 50.2 | 65 -29% | 61.2 -22% | 55 -10% | 47 6% |
| Idle Upper Side * (°C) | 36.2 | 30 17% | 28.6 21% | 30 17% | 37.4 -3% |
| Idle Bottom * (°C) | 40.2 | 35 13% | 31.4 22% | 32 20% | 38.4 4% |
* ... smaller is better
压力测试
在Turbo profile中强调Scar 15,可以了解到TDP、温度和时钟的变化,以及可用功率在CPU和GPU之间的分配情况。
仅仅通过Prime95,我们观察到Core i9-12900H能够在短时间内消耗130W,然后下降到120W,最终稳定在100至110W之间;在上面的Cinebench R15循环测试中,我们在Turbo模式下看到类似的TDP利用率。因此,CPU温度可以维持在90°C附近,时钟稳定在近3.5GHz。
将FurMark加入到混合测试中,使RTX 3070 Ti开始发挥作用。CPU的TDP现在降到了60W的水平,为GPU留下了更多的散热和功率空间,使后者能够提升到略高于1500MHz的水平,尽管只是短暂的时间。
Witcher 3呈现了一个更真实的画面,即CPU和GPU的指标在游戏过程中如何变化。在这里,我们也看到了动态提升的作用,RTX 3070 Ti现在能够在140 W和150 W TGP之间保持相当好的状态,提升时钟为1800 MHz。酷睿i9-12900H的时钟频率为3GHz,TDP要求低得多,只有25W左右。
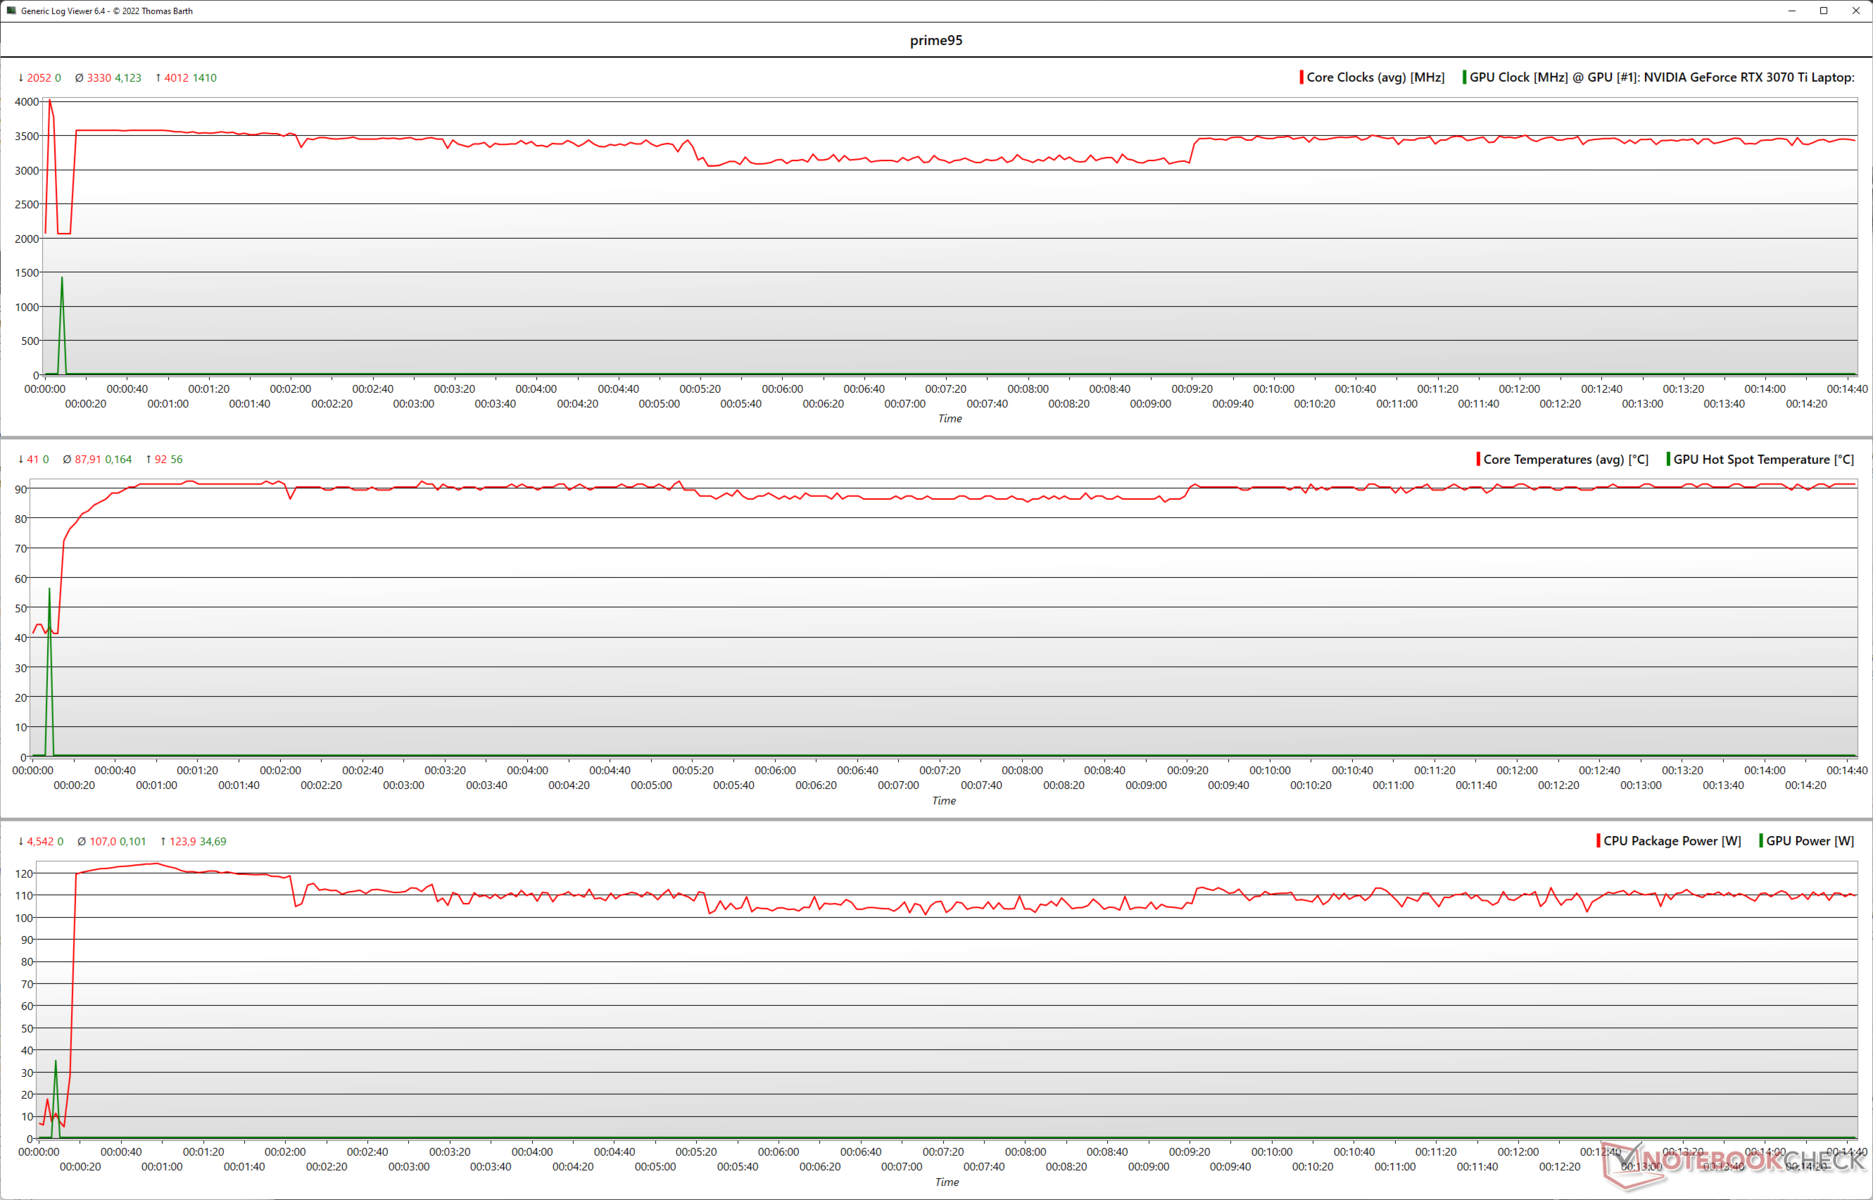
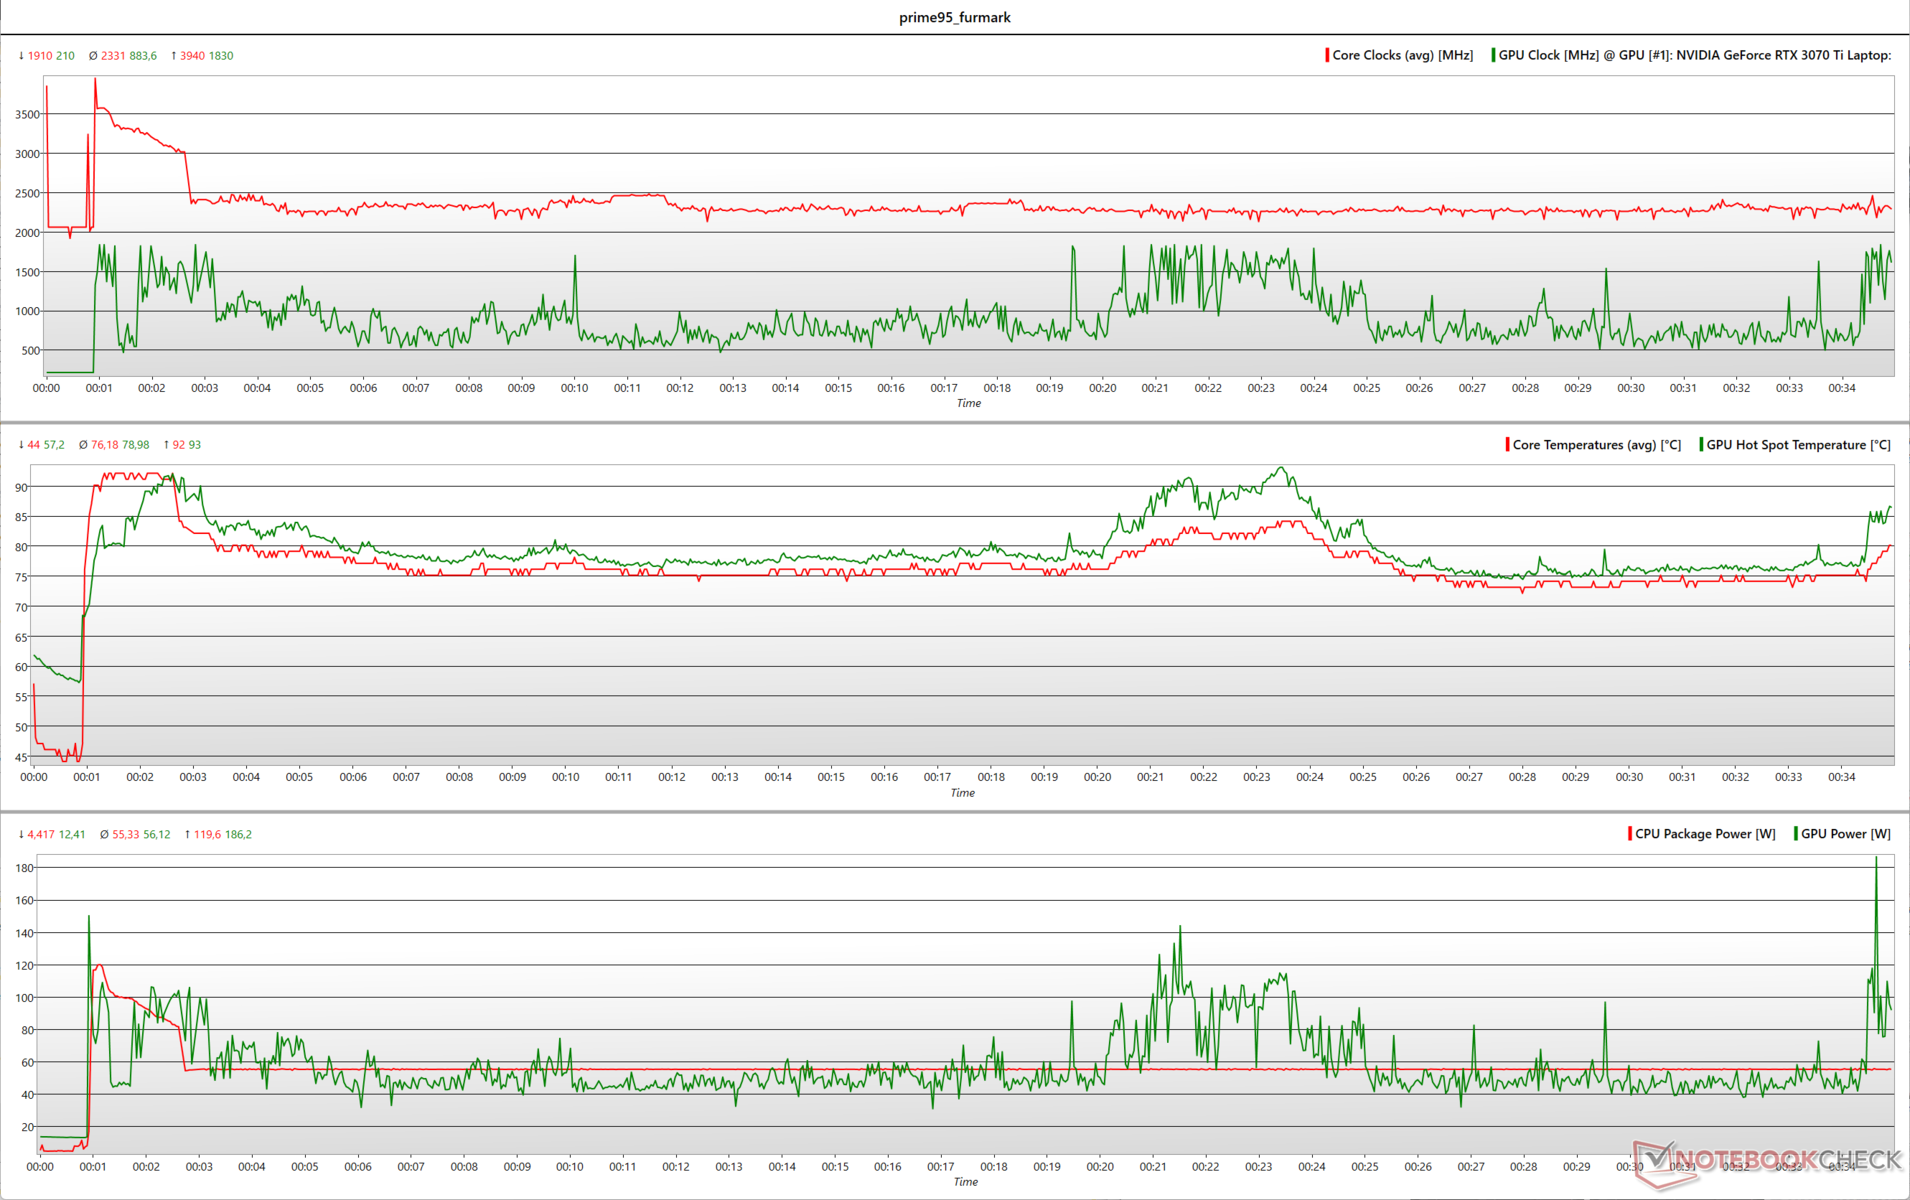
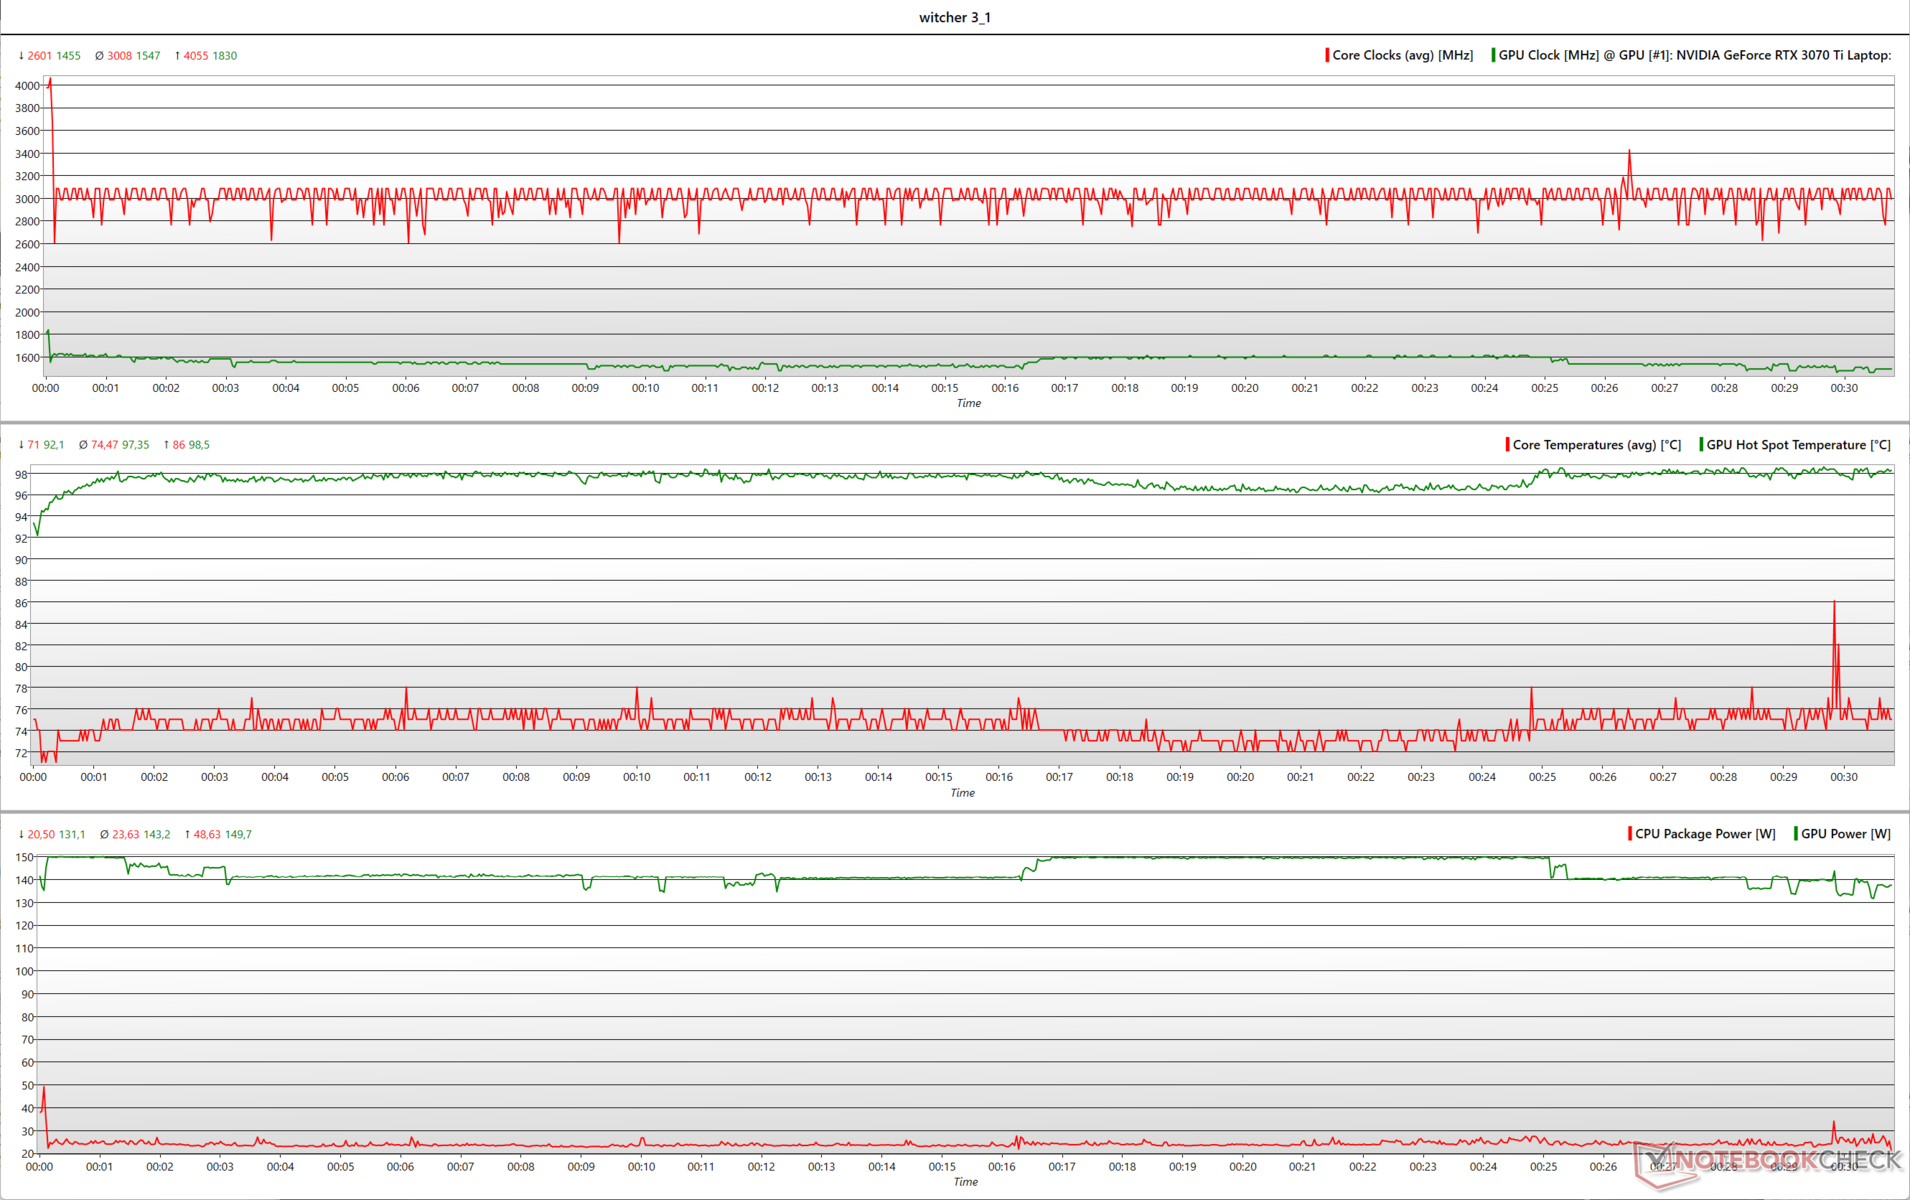
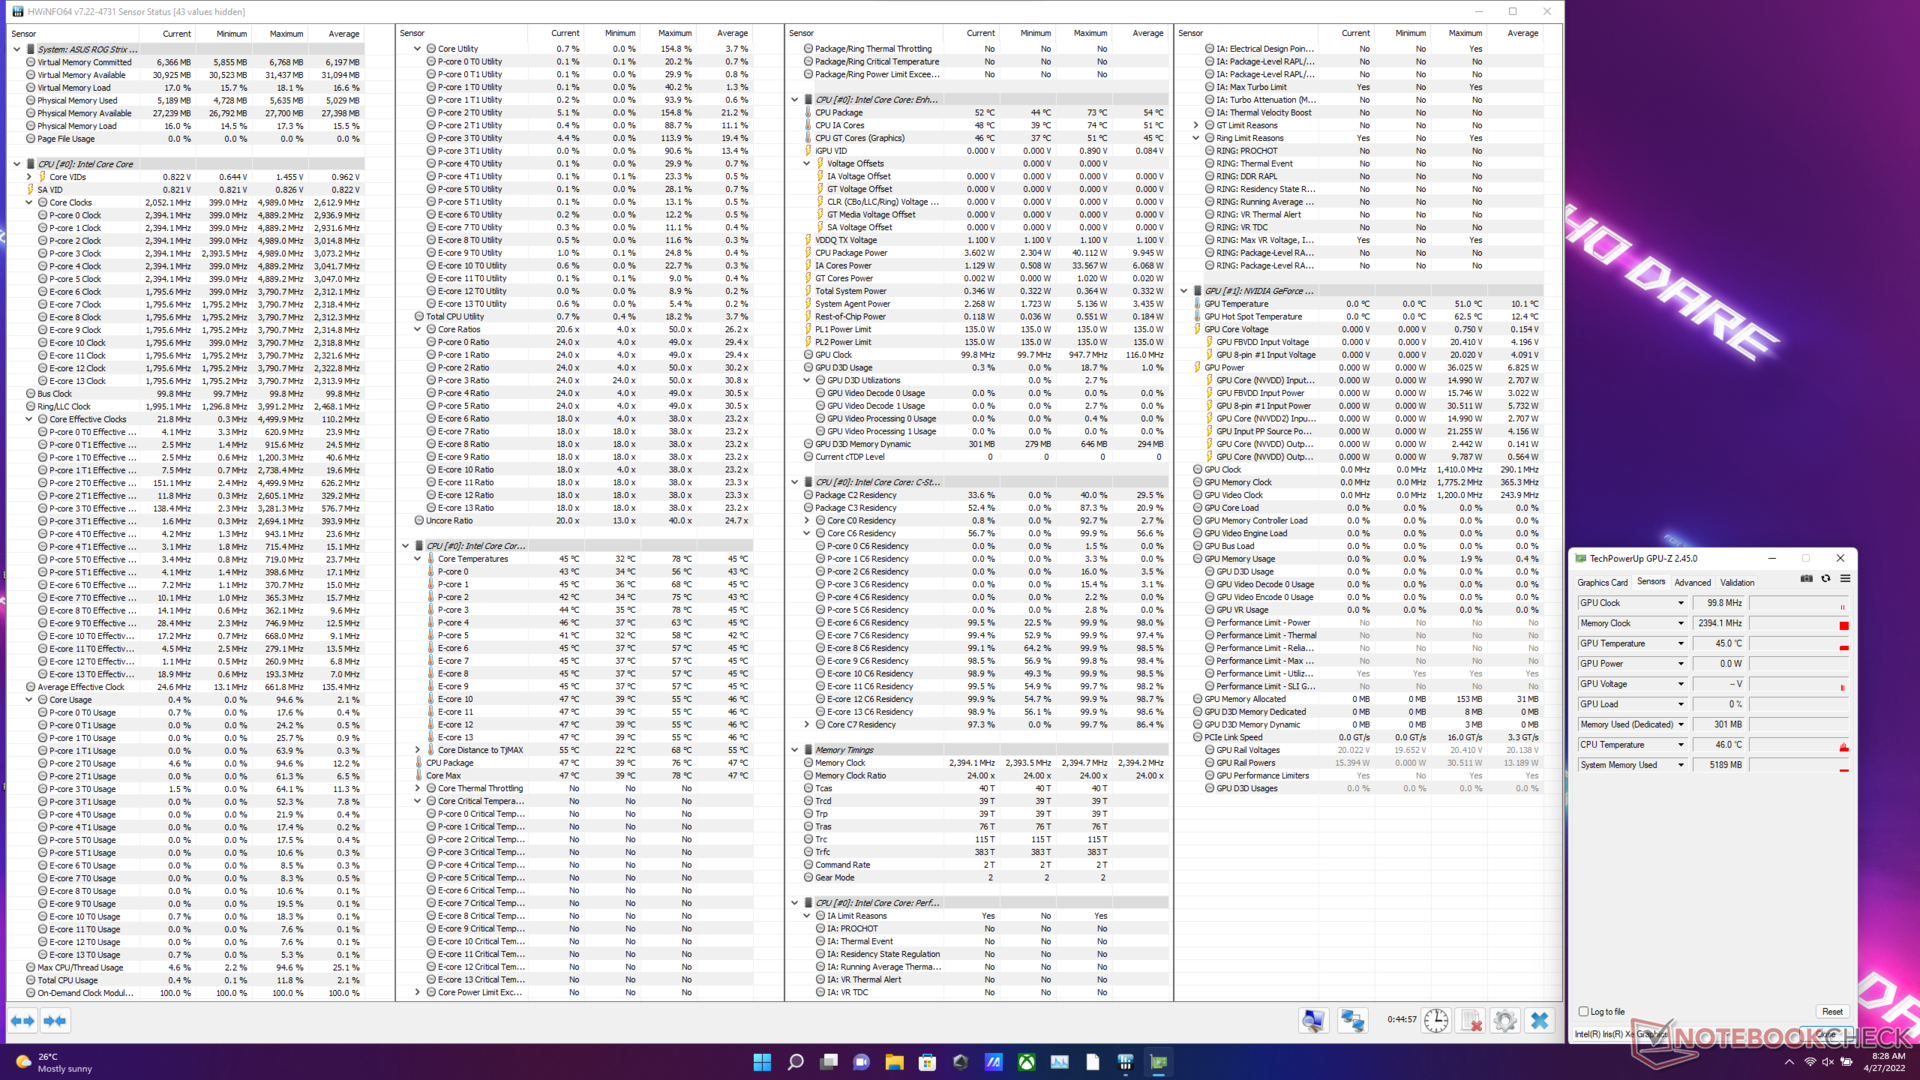
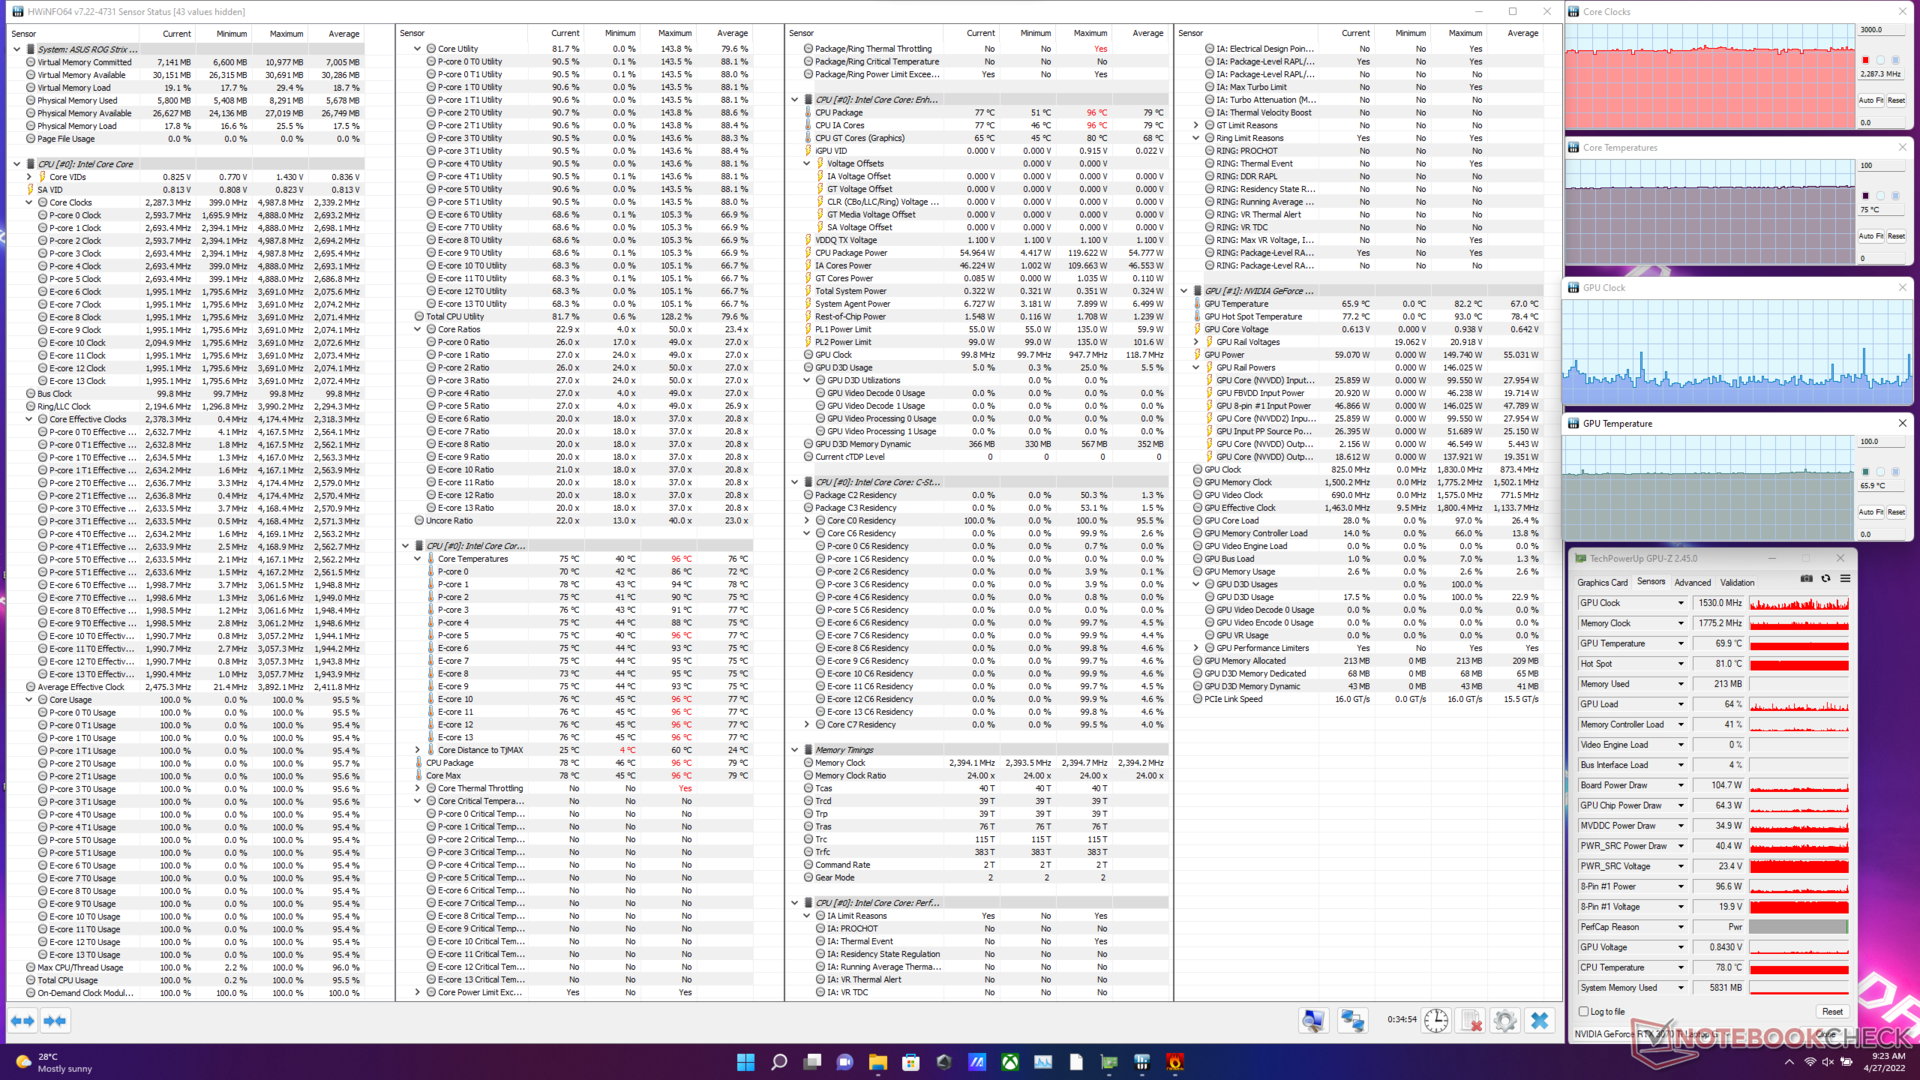
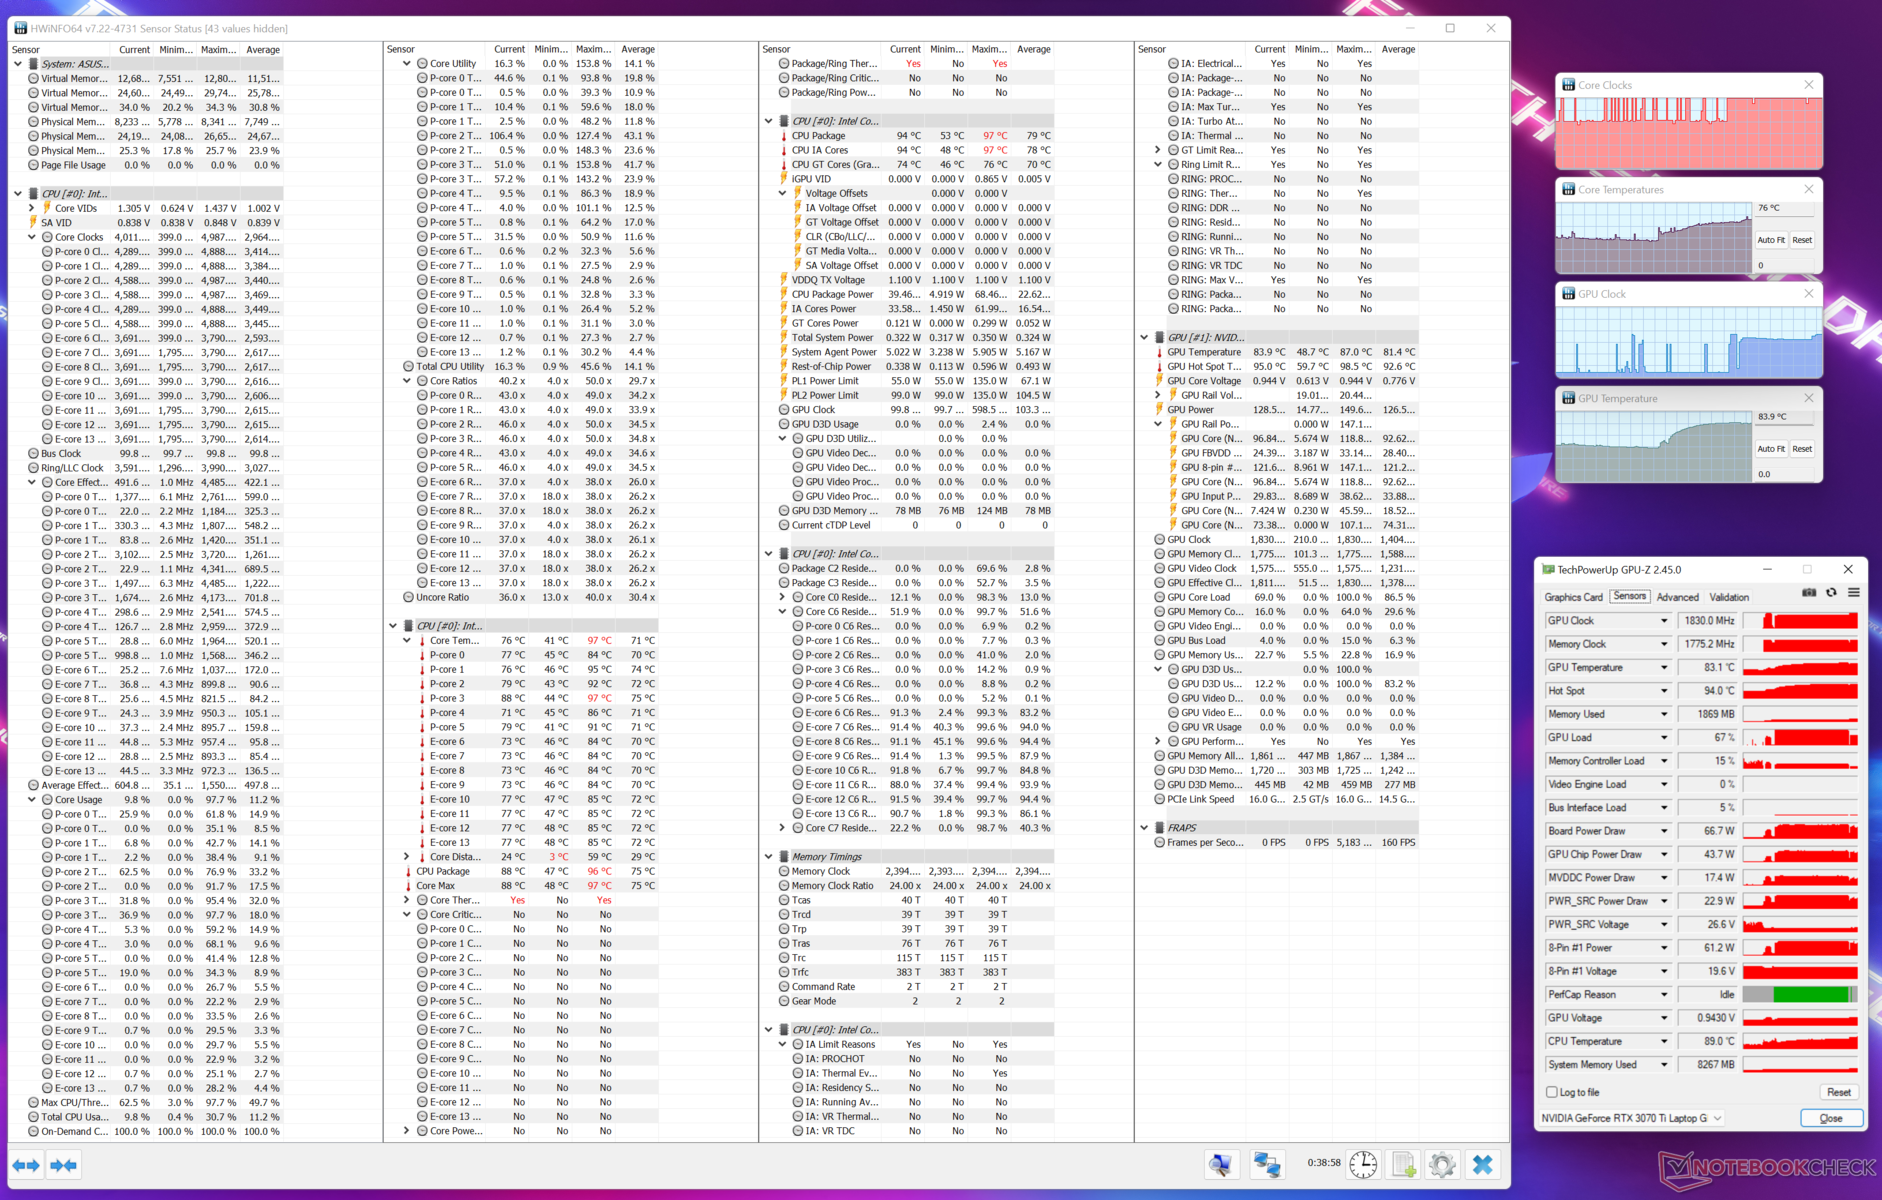
| 压力测试 | CPU时钟(GHz) | GPU时钟(MHz) | CPU平均温度(℃) | GPU平均温度(℃) |
| 系统空闲 | 2.05 | 99.8 | 45 | 45 |
| Prime95 | 3.49 | 99.8 | 87.9 | 44.8 |
| Prime95 + FurMark | 2.28 | 1,530 | 76 | 67 |
| TheWitcher 3 | 4.0 | 1,830 | 71 | 81.4 |
发言人
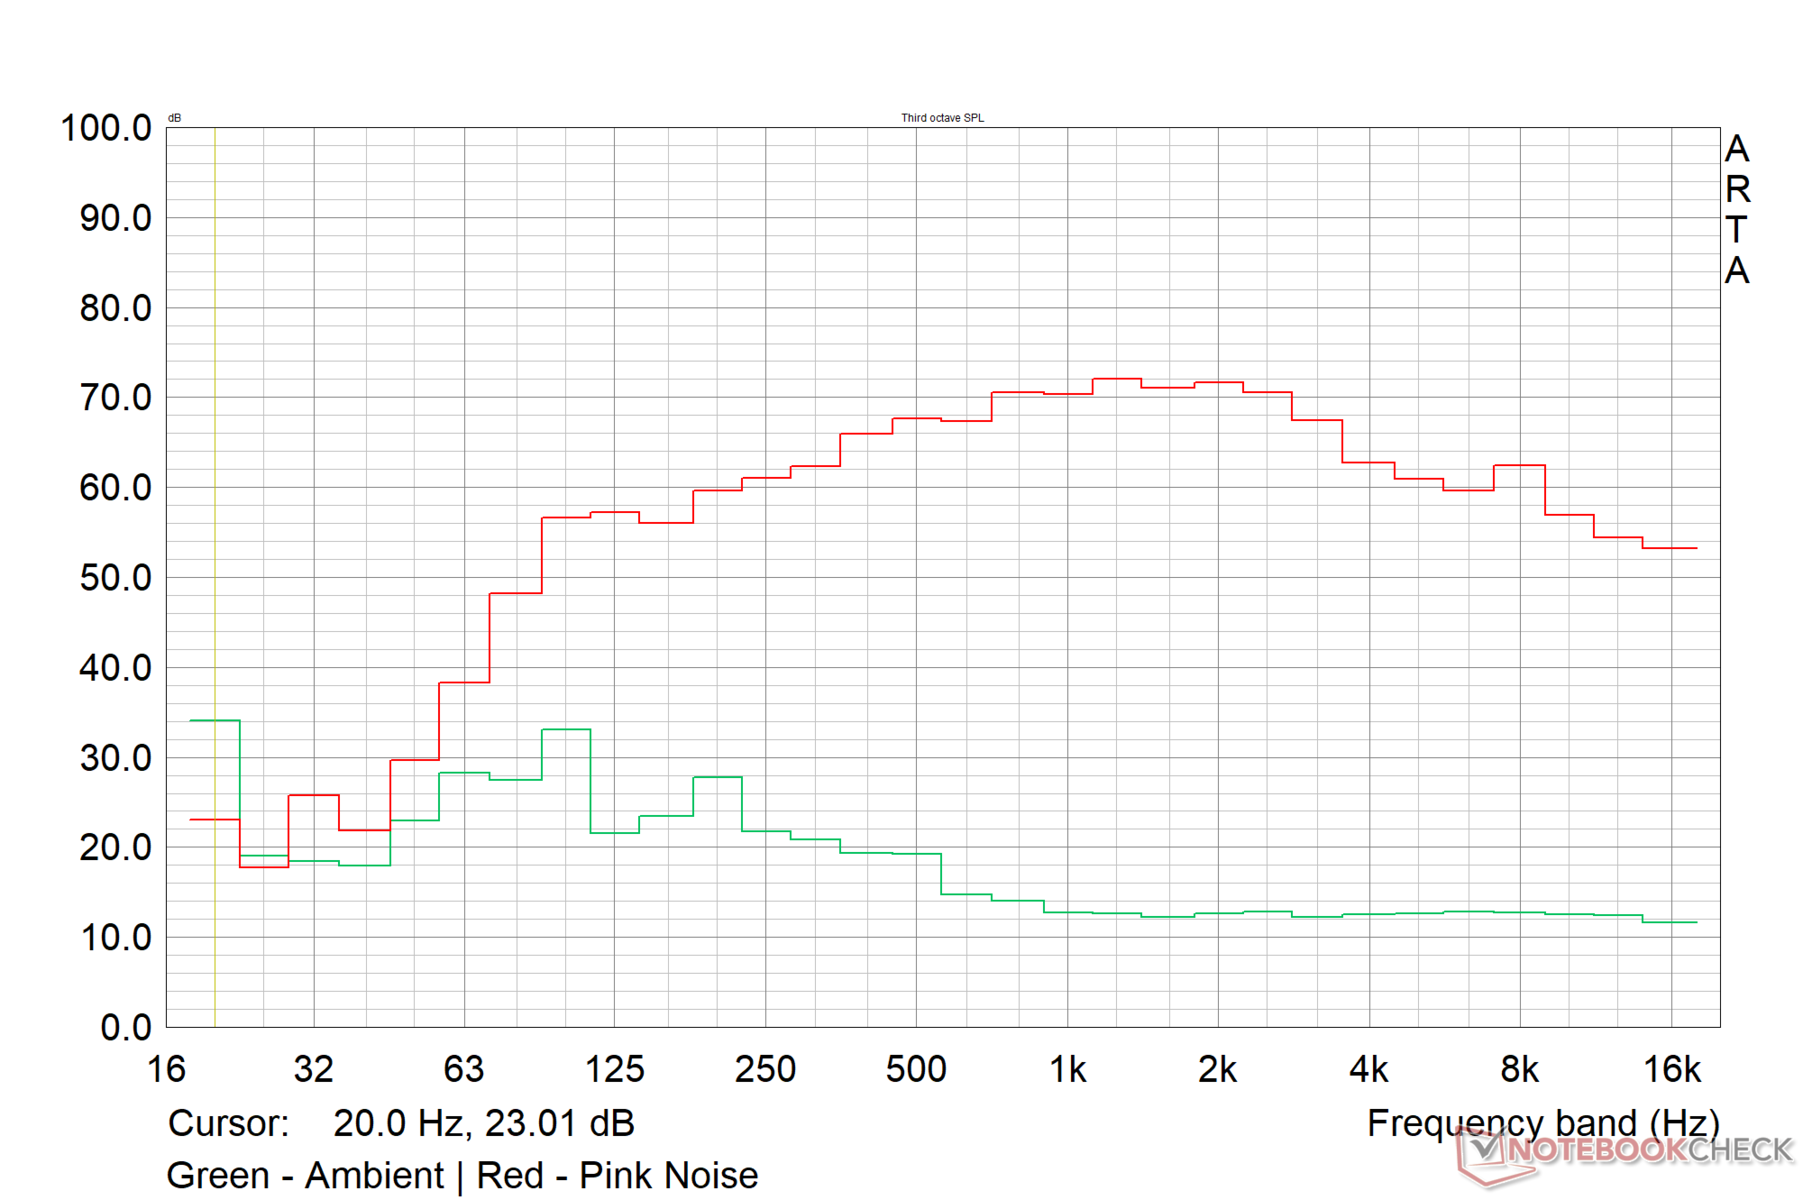
华硕在其材料中实际上没有提到Scar 15的扬声器功率,只是表示该笔记本使用了带有Dolby Atmos和智能放大器的四扬声器系统。最有可能的是,该扬声器系统与2021年的版本没有变化,2021年的版本在前面有2个4瓦的向下发射的扬声器,在显示屏下面的铰链区域附近有2个2瓦的高音扬声器。扬声器在一个中等大小的封闭房间里的响度约为80.5分贝,这是很体面的。
鉴于机箱的限制,被动辐射的低音单元和高音单元的分离导致了一个体面的低音响应。中音是线性的,高音是平衡的。从主观上讲,ROG Strix Scar 15的音频质量对大多数用途来说是相当适用的。在较高的音量下没有可察觉的失真。
扬声器通过了杜比全景声认证,官方的杜比访问应用程序预装了完全启用的杜比全景声耳机和杜比全景声内置扬声器的许可证。该应用程序允许在各种可用的声音配置文件之间进行更改,并创建多达三个自定义EQ预设。
Asus ROG Strix Scar 15 G533ZW-LN106WS audio analysis
(±) | speaker loudness is average but good (80.5 dB)
Bass 100 - 315 Hz
(+) | good bass - only 3.7% away from median
(+) | bass is linear (5.5% delta to prev. frequency)
Mids 400 - 2000 Hz
(±) | higher mids - on average 7.1% higher than median
(+) | mids are linear (3.1% delta to prev. frequency)
Highs 2 - 16 kHz
(+) | balanced highs - only 3.3% away from median
(+) | highs are linear (5.9% delta to prev. frequency)
Overall 100 - 16.000 Hz
(+) | overall sound is linear (12.2% difference to median)
Compared to same class
» 13% of all tested devices in this class were better, 4% similar, 83% worse
» The best had a delta of 6%, average was 18%, worst was 132%
Compared to all devices tested
» 10% of all tested devices were better, 2% similar, 88% worse
» The best had a delta of 4%, average was 24%, worst was 134%
Apple MacBook Pro 16 2021 M1 Pro audio analysis
(+) | speakers can play relatively loud (84.7 dB)
Bass 100 - 315 Hz
(+) | good bass - only 3.8% away from median
(+) | bass is linear (5.2% delta to prev. frequency)
Mids 400 - 2000 Hz
(+) | balanced mids - only 1.3% away from median
(+) | mids are linear (2.1% delta to prev. frequency)
Highs 2 - 16 kHz
(+) | balanced highs - only 1.9% away from median
(+) | highs are linear (2.7% delta to prev. frequency)
Overall 100 - 16.000 Hz
(+) | overall sound is linear (4.6% difference to median)
Compared to same class
» 0% of all tested devices in this class were better, 0% similar, 100% worse
» The best had a delta of 5%, average was 17%, worst was 45%
Compared to all devices tested
» 0% of all tested devices were better, 0% similar, 100% worse
» The best had a delta of 4%, average was 24%, worst was 134%
能源管理。酷睿i9-12900H和RTX 3070 Ti组合可以得到苛刻的要求
消耗功率
华硕为今年的Scar 15提供了一个280W的电源适配器,我们看到这款笔记本在最大负荷下几乎能够最大限度地消耗电量。考虑到强大的内脏,负载下的总体能耗似乎是偏高的。待机时的耗电量可能会更少。
这台 Razer Blade 14配有 Ryzen 9 6900HX的Razer Blade 14在整体上似乎少了20%的经济性,主要是由于空闲时的高耗电量。
| Off / Standby | |
| Idle | |
| Load |
|
Key:
min: | |
| Asus ROG Strix Scar 15 G533ZW i9-12900H, GeForce RTX 3070 Ti Laptop GPU, Samsung PM9A1 MZVL22T0HBLB, IPS-level, 2560x1440, 15.6" | MSI Raider GE66 12UHS i9-12900HK, GeForce RTX 3080 Ti Laptop GPU, Samsung PM9A1 MZVL22T0HBLB, IPS, 3840x2160, 15.6" | Lenovo Legion 5 Pro 16 G7 i7 RTX 3070Ti i7-12700H, GeForce RTX 3070 Ti Laptop GPU, Samsung PM9A1 MZVL21T0HCLR, IPS, 2560x1600, 16" | Razer Blade 14 Ryzen 9 6900HX R9 6900HX, GeForce RTX 3070 Ti Laptop GPU, Samsung PM9A1 MZVL21T0HCLR, IPS, 2560x1440, 14" | Razer Blade 15 2022 i7-12800H, GeForce RTX 3080 Ti Laptop GPU, SSSTC CA6-8D1024, IPS, 2560x1440, 15.6" | Average NVIDIA GeForce RTX 3070 Ti Laptop GPU | Average of class Gaming | |
|---|---|---|---|---|---|---|---|
| Power Consumption | -31% | -10% | -20% | -99% | -36% | -27% | |
| Idle Minimum * (Watt) | 7.56 | 16 -112% | 8.6 -14% | 10.2 -35% | 33.2 -339% | 14.2 ? -88% | 13.2 ? -75% |
| Idle Average * (Watt) | 13.5 | 19 -41% | 17.6 -30% | 26 -93% | 36.4 -170% | 19.9 ? -47% | 18.9 ? -40% |
| Idle Maximum * (Watt) | 16.87 | 26 -54% | 18.5 -10% | 26.7 -58% | 37.6 -123% | 26.2 ? -55% | 24.3 ? -44% |
| Load Average * (Watt) | 128.9 | 110 15% | 110 15% | 89.3 31% | 116.7 9% | 125.8 ? 2% | 108.3 ? 16% |
| Witcher 3 ultra * (Watt) | 196.2 | 202 -3% | 227 -16% | 158.7 19% | 172 12% | ||
| Load Maximum * (Watt) | 274.86 | 242 12% | 294.6 -7% | 227.5 17% | 228.6 17% | 248 ? 10% | 254 ? 8% |
* ... smaller is better
Power Consumption - The Witcher 3 / Stress test
Power Consumption - External Monitor
电池寿命
ROG Strix Scar 15采用了90Whr 4S1P电池。鉴于其强大的内部结构,运行时间是体面的。华硕声称视频播放的备份时间长达10.5小时--我们用H.264 1080p视频循环播放了8.5小时。
在降低亮度的情况下,用我们的标准脚本进行网页浏览的时间持续了近8.5小时。有趣的是,比较中的两款搭载AMD Ryzen 9的笔记本--华硕ROG Zephyrus,都在10.5小时以上。 华硕ROG Zephyrus G14和Razer Blade 14--在这项测试中都能承担约70分钟的运行时间,尽管它们的电池小得多。
用电池玩游戏的结果是,即使在降低亮度的情况下,也只有70分钟的备份。
| Asus ROG Strix Scar 15 G533ZW i9-12900H, GeForce RTX 3070 Ti Laptop GPU, 90 Wh | MSI Raider GE66 12UHS i9-12900HK, GeForce RTX 3080 Ti Laptop GPU, 99 Wh | Lenovo Legion 5 Pro 16 G7 i7 RTX 3070Ti i7-12700H, GeForce RTX 3070 Ti Laptop GPU, 80 Wh | Asus ROG Zephyrus G14 GA402RK R9 6900HS, Radeon RX 6800S, 76 Wh | Razer Blade 14 Ryzen 9 6900HX R9 6900HX, GeForce RTX 3070 Ti Laptop GPU, 62 Wh | Razer Blade 15 2022 i7-12800H, GeForce RTX 3080 Ti Laptop GPU, 80 Wh | Average of class Gaming | |
|---|---|---|---|---|---|---|---|
| Battery runtime | 14% | -32% | 7% | 46% | -42% | 15% | |
| H.264 (h) | 8.5 | 7.1 -16% | 6.3 -26% | 8.26 ? -3% | |||
| WiFi v1.3 (h) | 8.4 | 5.7 -32% | 5.4 -36% | 9.5 13% | 9.5 13% | 4.9 -42% | 7.04 ? -16% |
| Witcher 3 ultra (h) | 1.2 | ||||||
| Load (h) | 0.9 | 1.7 89% | 0.6 -33% | 0.9 0% | 1.6 78% | 1.47 ? 63% | |
| Reader / Idle (h) | 18.1 | 12.2 | 8.71 ? |
Pros
Cons
结论:彪悍的QHD游戏机,在大多数方面都能实现。
华硕继续通过新的升级来完善ROG Strix Scar阵容。 华硕ROG Strix Scar 15 G533(2022)几乎提供了你对这个价格的游戏笔记本电脑所期望的一切。构建质量很好,连接选项很体面,而且也有足够的内部升级空间。某些地区的某些SKU可能不配备外部ROG Eye网络摄像头,所以要记住这一点。
华硕恢复了键盘的薄膜开关--尽管不像我们在去年的模型上看到的光机械开关那样 "咔嚓",但它们仍然能带来体面的打字和游戏体验。缺乏任何形式的生物识别技术是一个不利因素。
显示特性对于一般使用和游戏来说似乎很好,具有QHD分辨率,支持杜比视界,体面的色彩校准,240赫兹刷新,以及快速响应时间。然而,测量的黑色水平似乎不够。
华硕ROG Strix Scar 15 G533拥有畅通无阻的连接性、性能和大量的定制可能性,如果你正在寻找一台有能力的QHD游戏笔记本电脑,只要你能忍受更高的热量和噪音排放,那么它绝对值得你的首要考虑。"
华硕允许酷睿i9-12900H和RTX 3070 Ti充分弯曲,没有什么问题。在移动中仍然可以用较低的性能配置获得足够的性能,但90瓦时的电池最好可以持续更长的时间。
不过,ROG Strix Scar 15并不是没有竞争。微星Vector GP66 12UGS ,作为一个有能力的竞争者,其1080p 360 Hz的显示屏可能会抓住竞技游戏者的注意力。联想Legion 5i Pro 16 ,其酷睿i7-12700H的超强CPU性能,甚至超过了一些笔记本电脑中的酷睿i9-12900HK,设法唤起人们的惊喜。
Scar 15的酷睿i9-12900H的性能也比两个搭载Ryzen 9的竞争者--华硕ROG Zephyrus G14 和Razer Blade 14--高出一头,尽管这些Ryzen 6000笔记本在功耗和电池寿命方面有优势。
在印度市场上,ROG Strix Scar 15的售价为2,64,990英镑(3,419美元),价格较高,但你得到的设备几乎满足了所有的要求,而且可以让你在QHD Ultra下玩许多当前和即将到来的游戏而不出汗。
价格和可用性
华硕ROG Strix Scar 15 G533在印度亚马逊上销售。以及在 美国亚马逊售价3,269美元。你也可以在BestBuy上买到更便宜的Scar 15 G533,配备Core i9-12900H, RTX 3060, 和FHD显示屏,价格为1,736.99美元。.
Asus ROG Strix Scar 15 G533ZW-LN106WS
- 05/31/2022 v7 (old)
Vaidyanathan Subramaniam
Price comparison

