惠普ZBook Power 15 G8笔记本电脑评测。经济型工作站中的大量高端产品
作为一个经济实惠的工作站,惠普ZBook Power 15 G8为这一代的CPU和GPU带来了更新,最大配置提供了英特尔 Tiger Lake 酷睿i9-11950H和 Nvidia RTX A2000.虽然除了4K显示器,vPRO CPU也可以使用,但不幸的是,至强处理器以及随之而来的ECC内存今年将无法使用。但该设备仍然提供了高端工作站的许多特性。
大约1600欧元(约1630美元),我们的配置配备了英特尔的 酷睿i7-11800H, Nvidia的T600作为专业的GPU,以及一个FHD显示器。作为入门级工作站领域的直接竞争对手,我们有 联想ThinkPad P15v G2和 戴尔的Precision 3551.我们的测试将显示,ZBook Power 15 G8凭借其相当强大的组件是否也带来了良好的性价比。
潜在的竞争对手比较
Rating | Date | Model | Weight | Height | Size | Resolution | Price |
|---|---|---|---|---|---|---|---|
| 87.7 % v7 (old) | 07 / 2022 | HP ZBook Power 15 G8 313S5EA i7-11800H, T600 Laptop GPU | 2 kg | 22.8 mm | 15.60" | 1920x1080 | |
| 90.3 % v7 (old) | 10 / 2021 | HP ZBook Fury 15 G8 i9-11950H, RTX A5000 Laptop GPU | 2.5 kg | 25.9 mm | 15.60" | 3840x2160 | |
| 87.8 % v7 (old) | 08 / 2021 | HP ZBook Studio 15 G8 i9-11950H, GeForce RTX 3070 Laptop GPU | 1.9 kg | 18 mm | 15.60" | 3840x2160 | |
| 83.8 % v7 (old) | HP ZBook Firefly 15 G8 2C9R7EA i7-1165G7, T500 Laptop GPU | 1.8 kg | 19.2 mm | 15.60" | 1920x1080 | ||
| 86.2 % v7 (old) | 06 / 2022 | Lenovo ThinkPad P15v G2 21A9000XGE i7-11800H, T1200 Laptop GPU | 2.3 kg | 22.7 mm | 15.60" | 1920x1080 | |
| 81.2 % v7 (old) | 12 / 2020 | Dell Precision 3000 3551 i9-10885H, Quadro P620 | 2.2 kg | 24.92 mm | 15.60" | 1920x1080 |
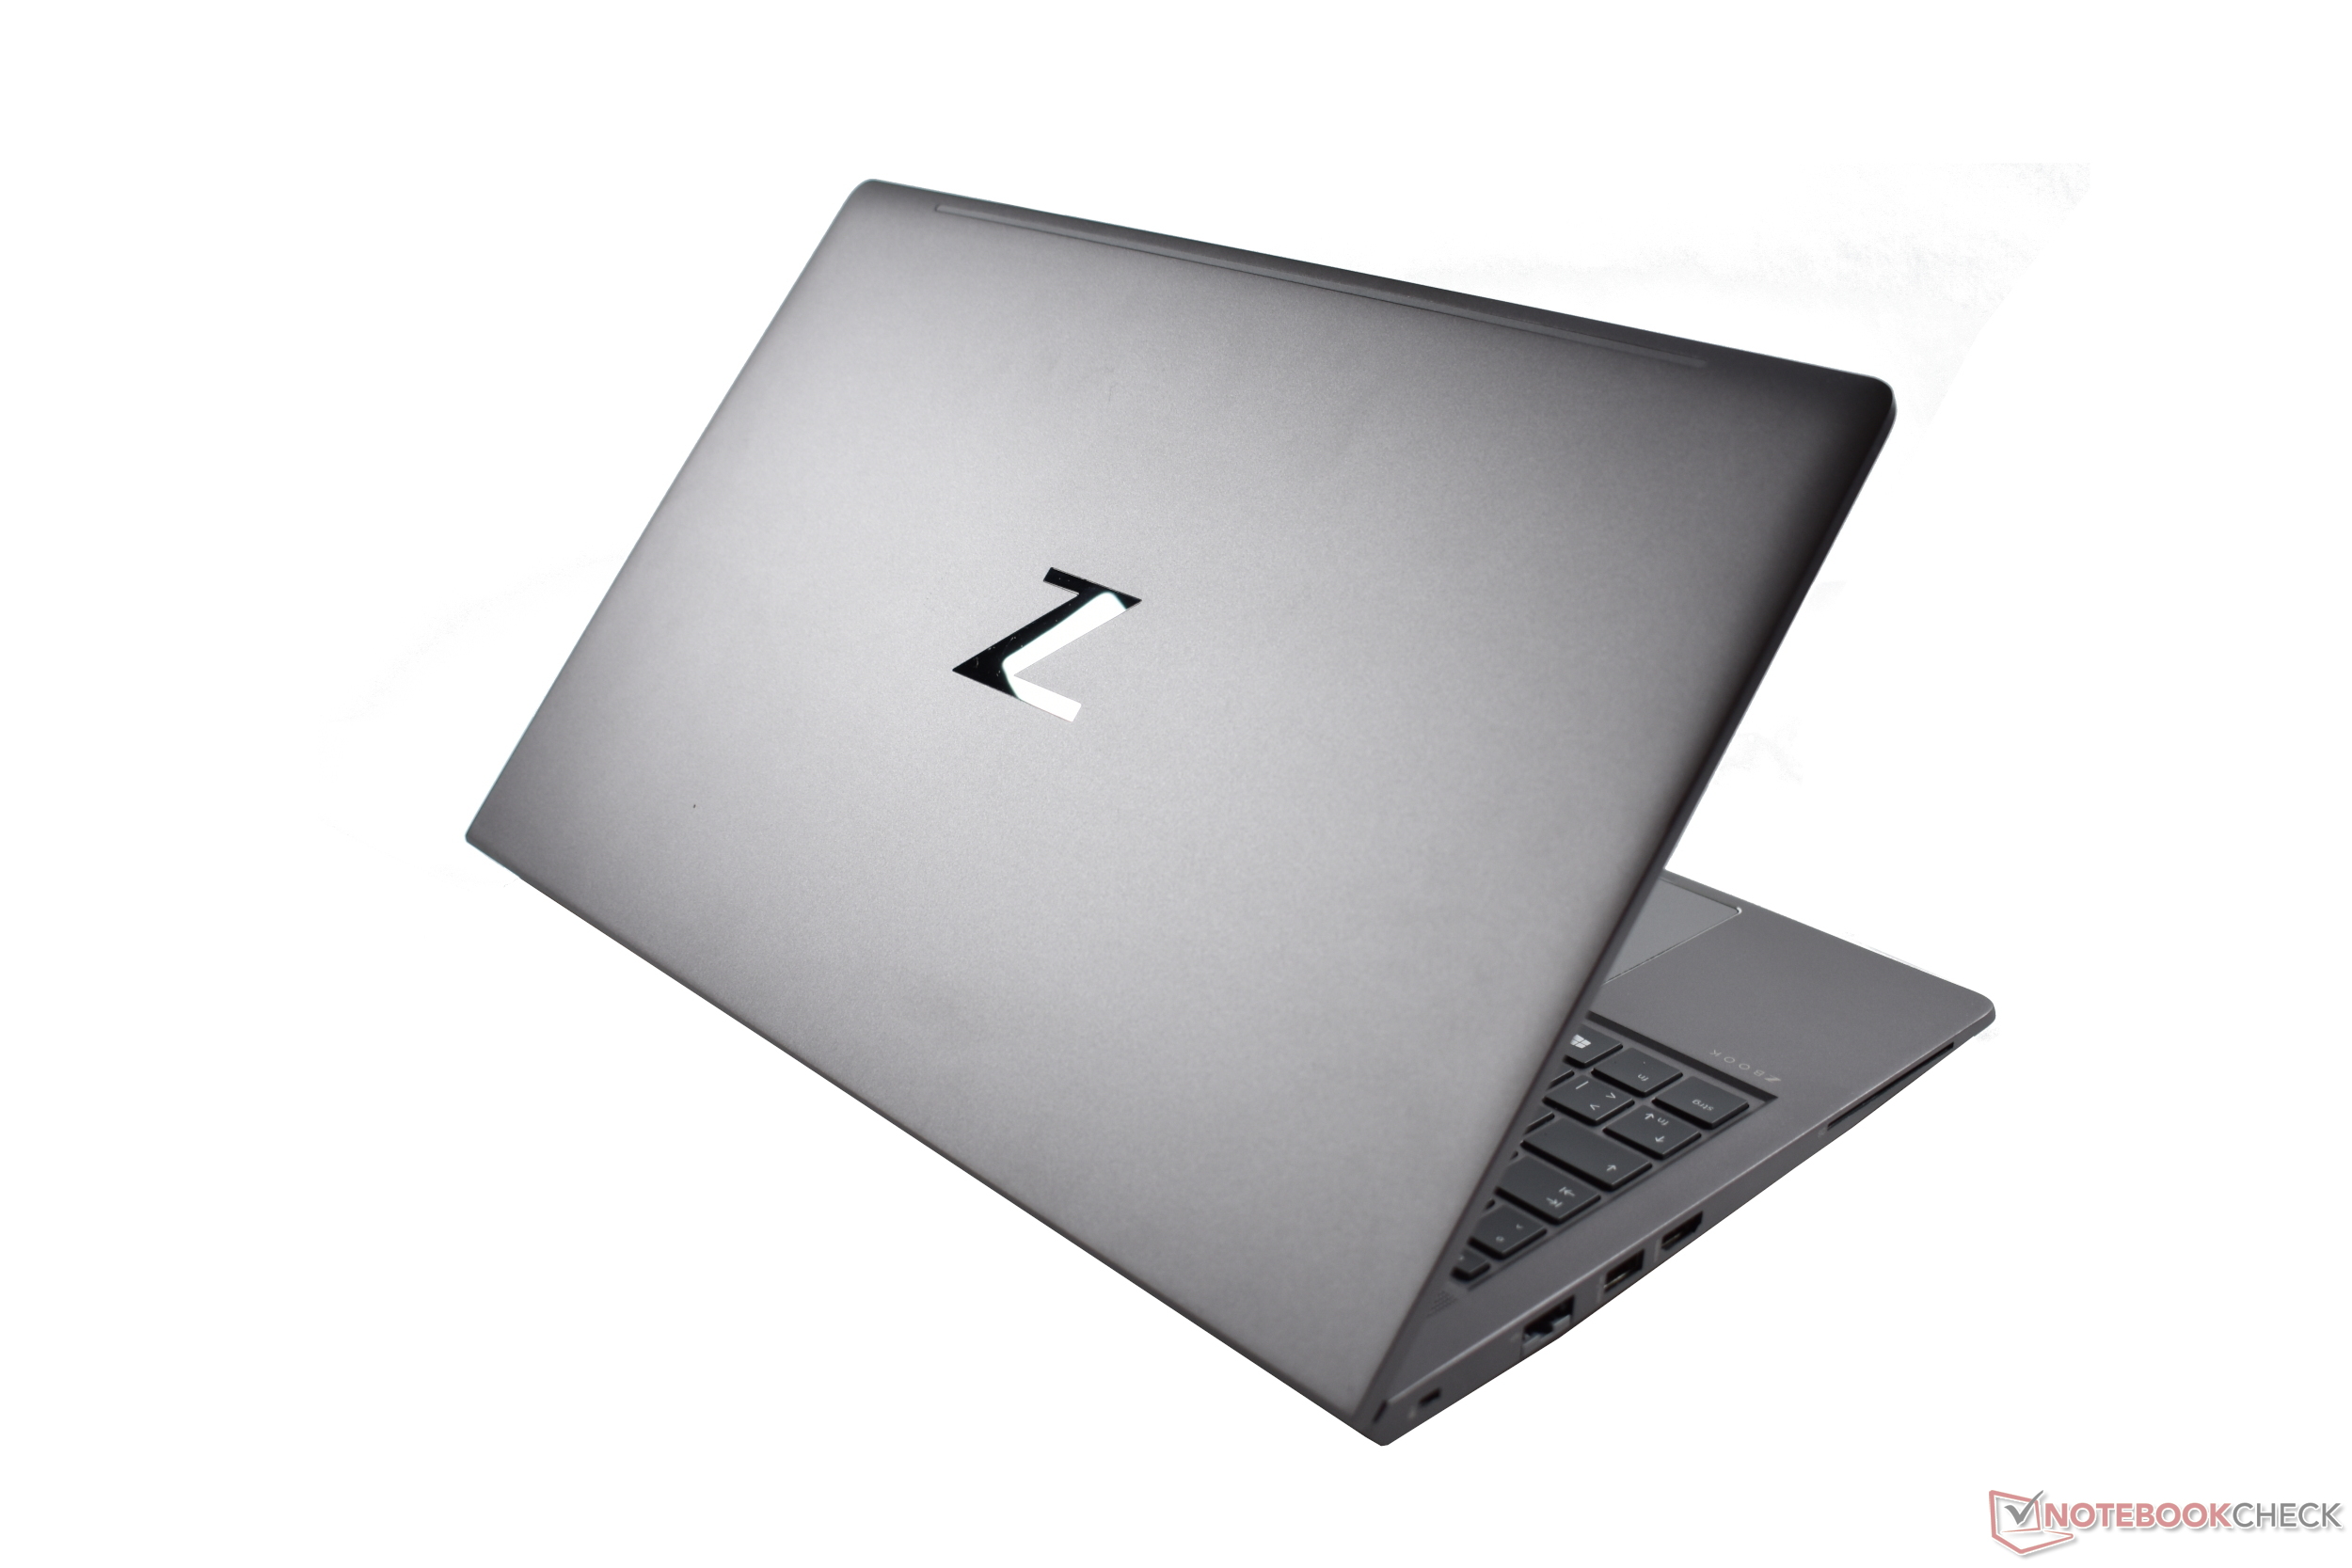
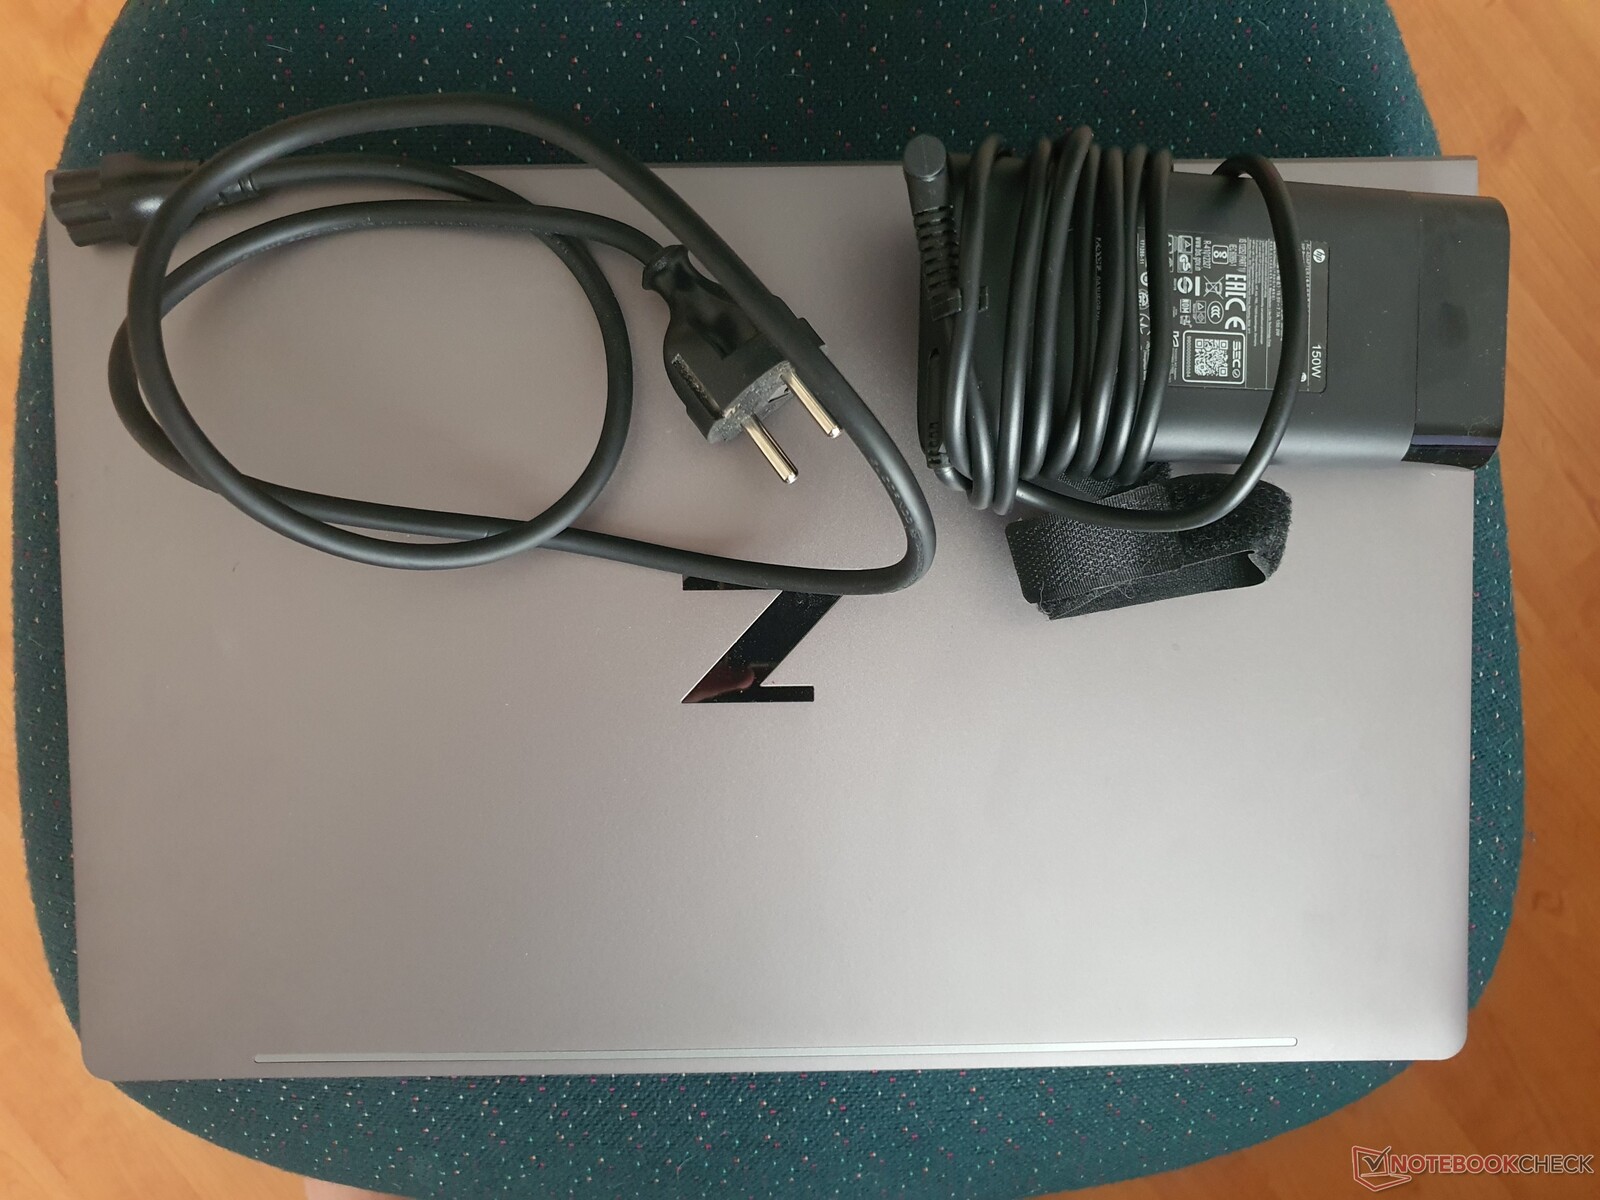
外壳。ZBook Power由坚固的铝制成
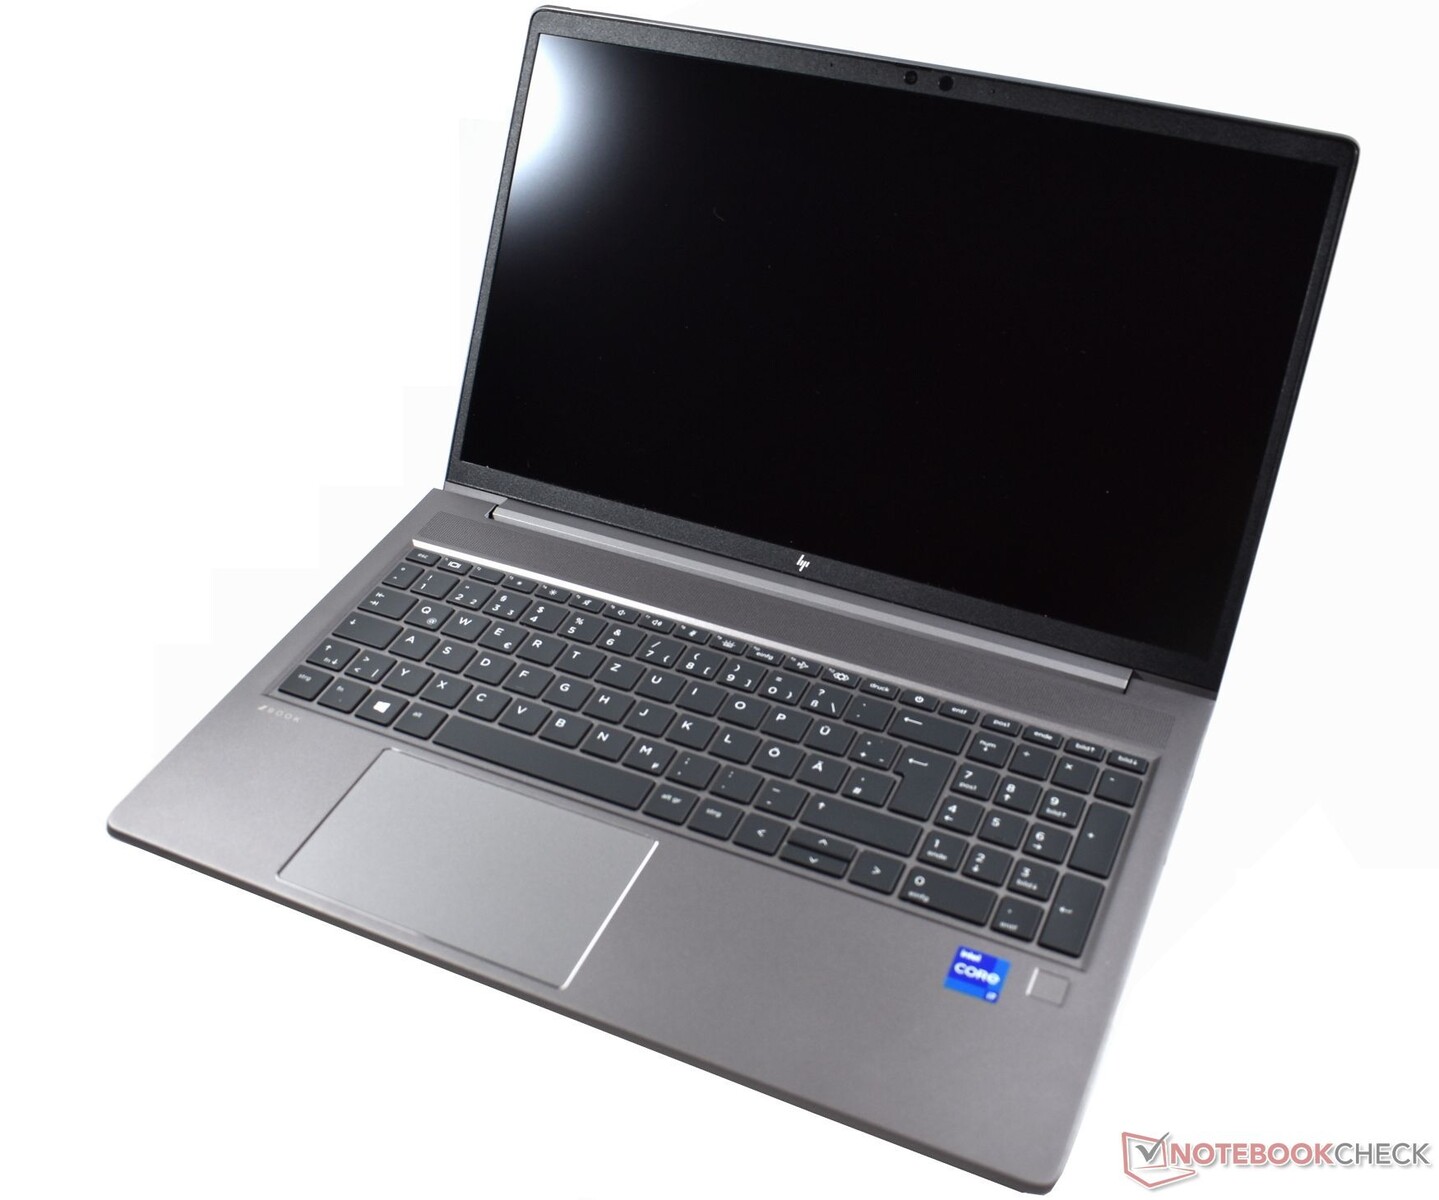
深灰色的铝制外壳赋予ZBook Power 15优雅的外观和相当显著的坚固性,这也被其MIL STD-810H认证所证实。包括磨砂表面在内的触觉效果也没有什么可挑剔的。
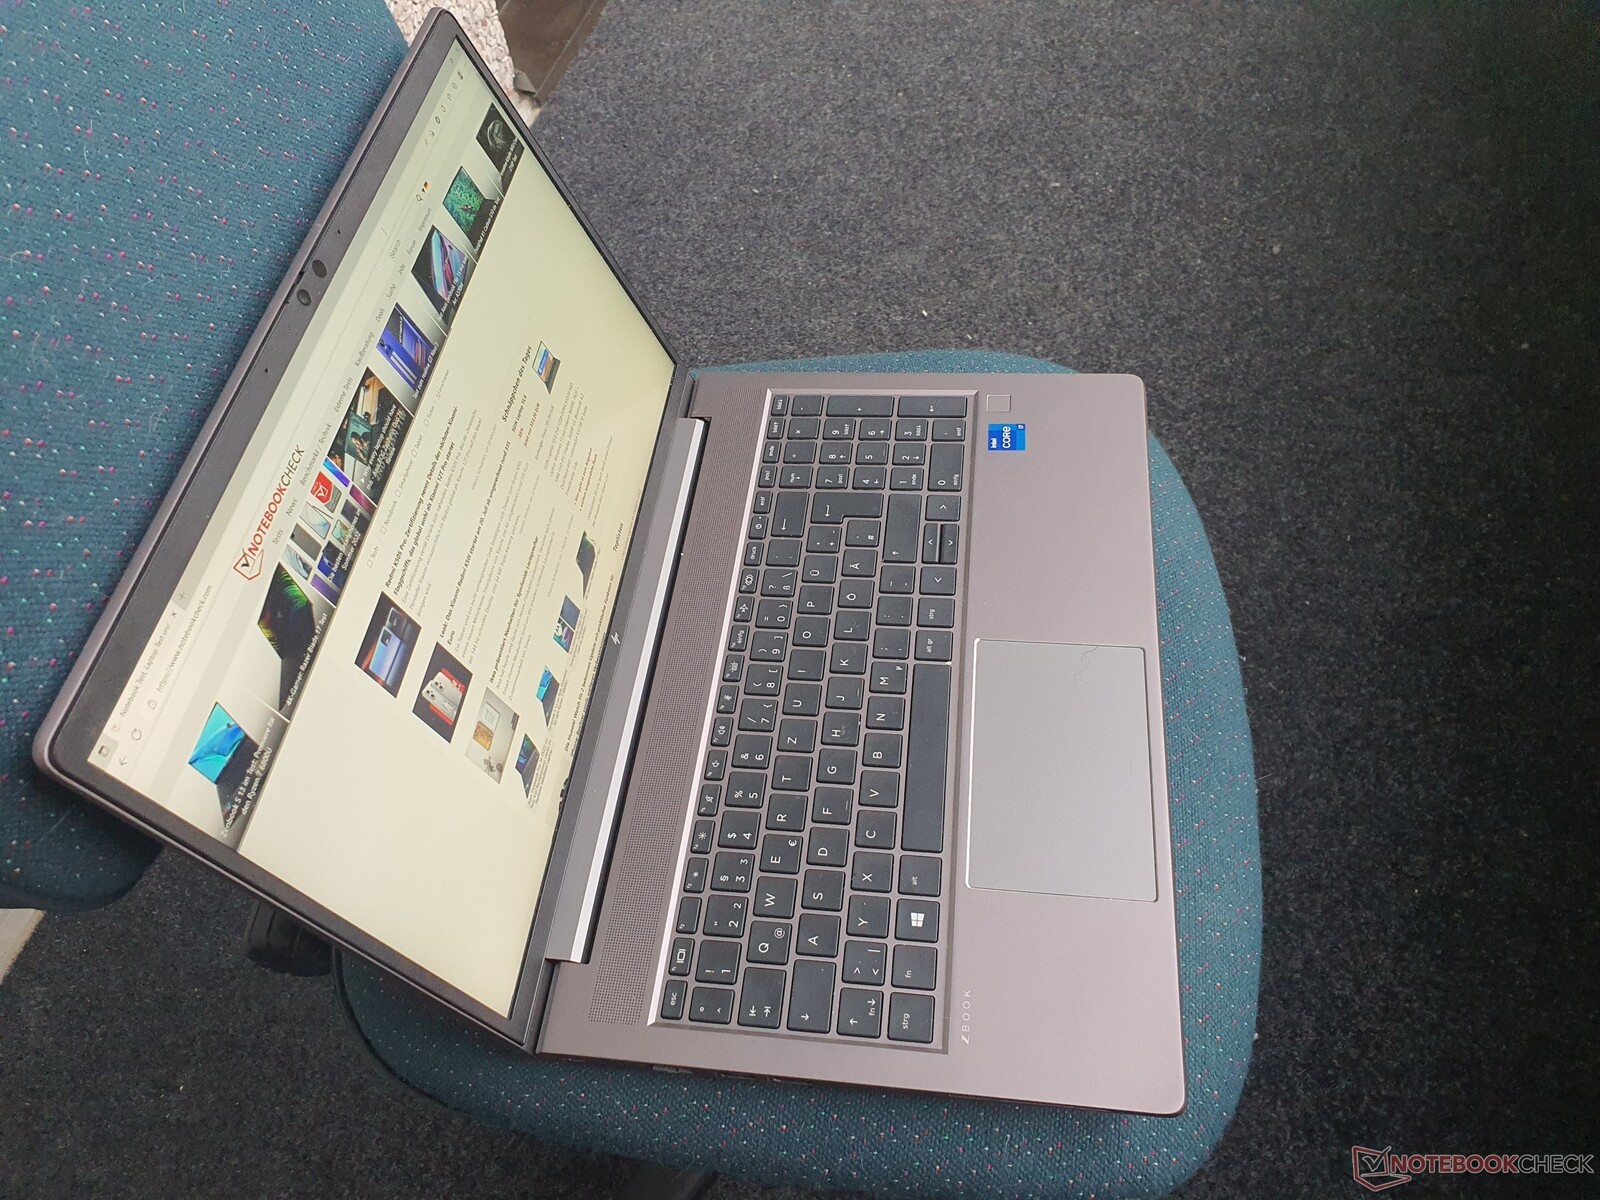
该设备显示出干净的做工,指纹也不是一个问题。盖子可以用一只手打开,大铰链一直延伸到对面,非常结实。
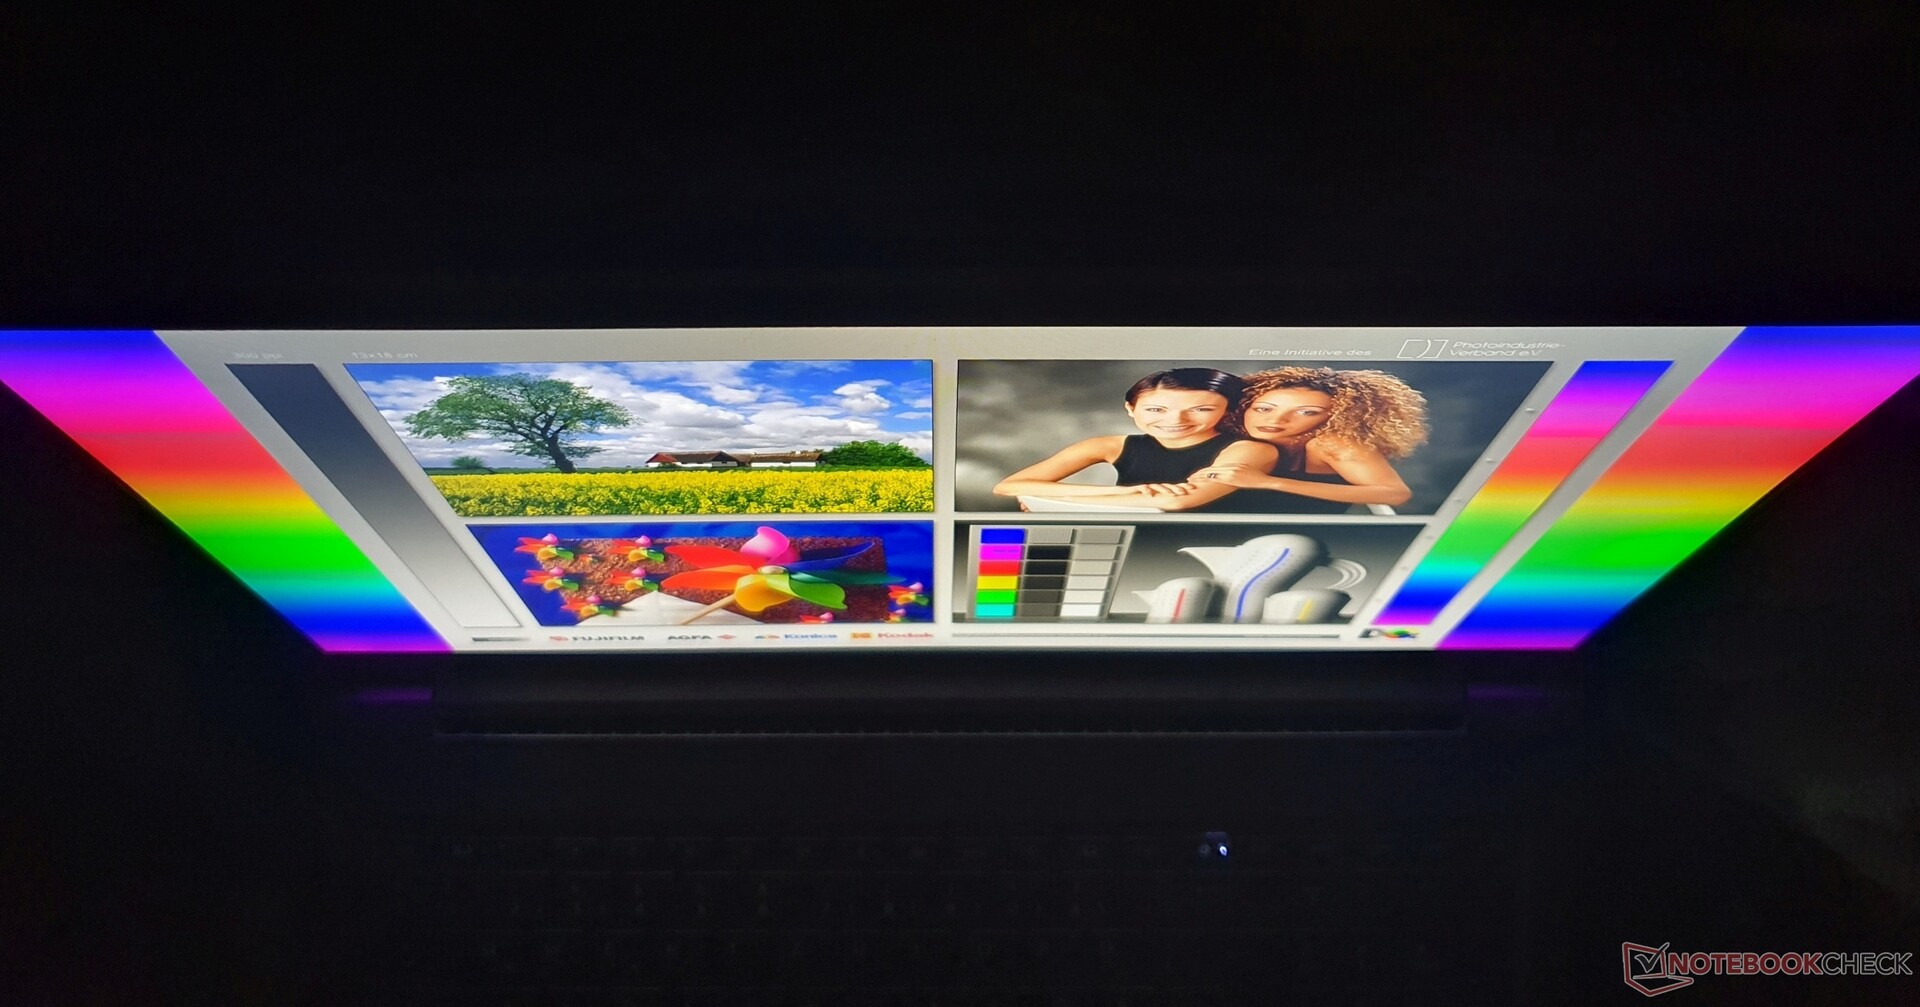
另一方面,盖子的背面可以很容易地用一些单点压力压下去,尽管这不会导致任何图像失真。积极的一点是,带有细长边框的盖子只能被最小限度地扭转,最大的打开角度是~180度。
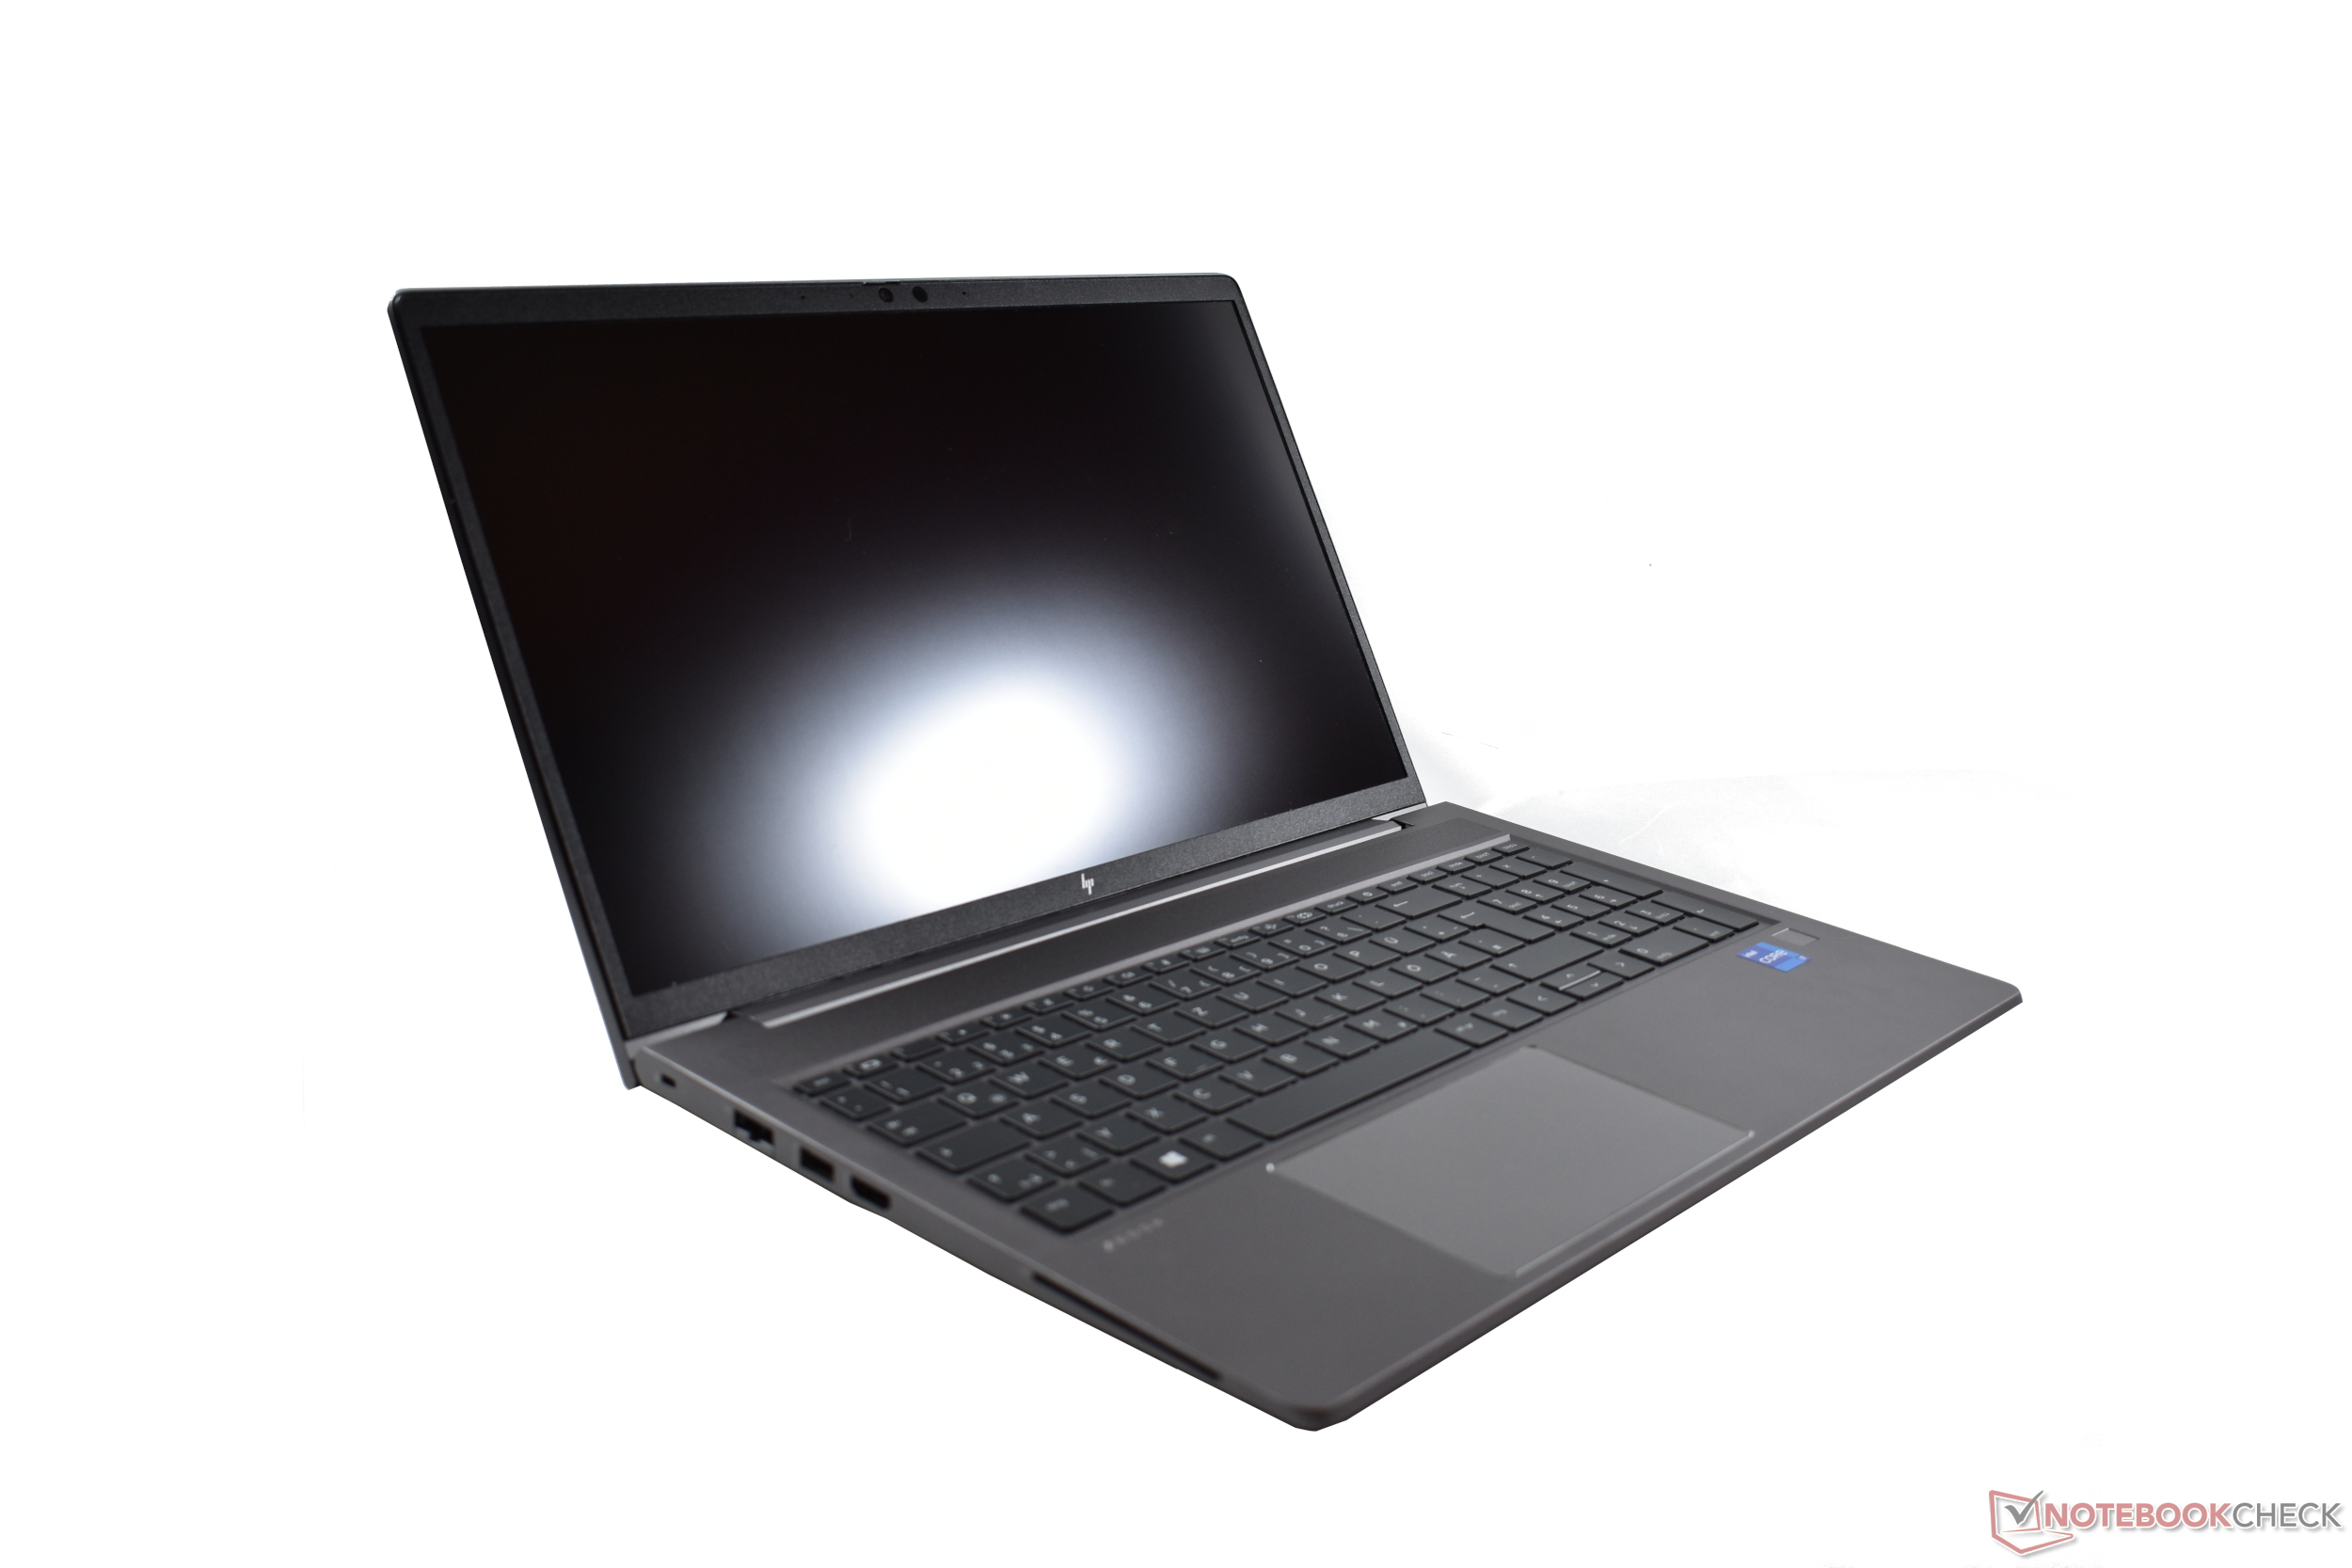
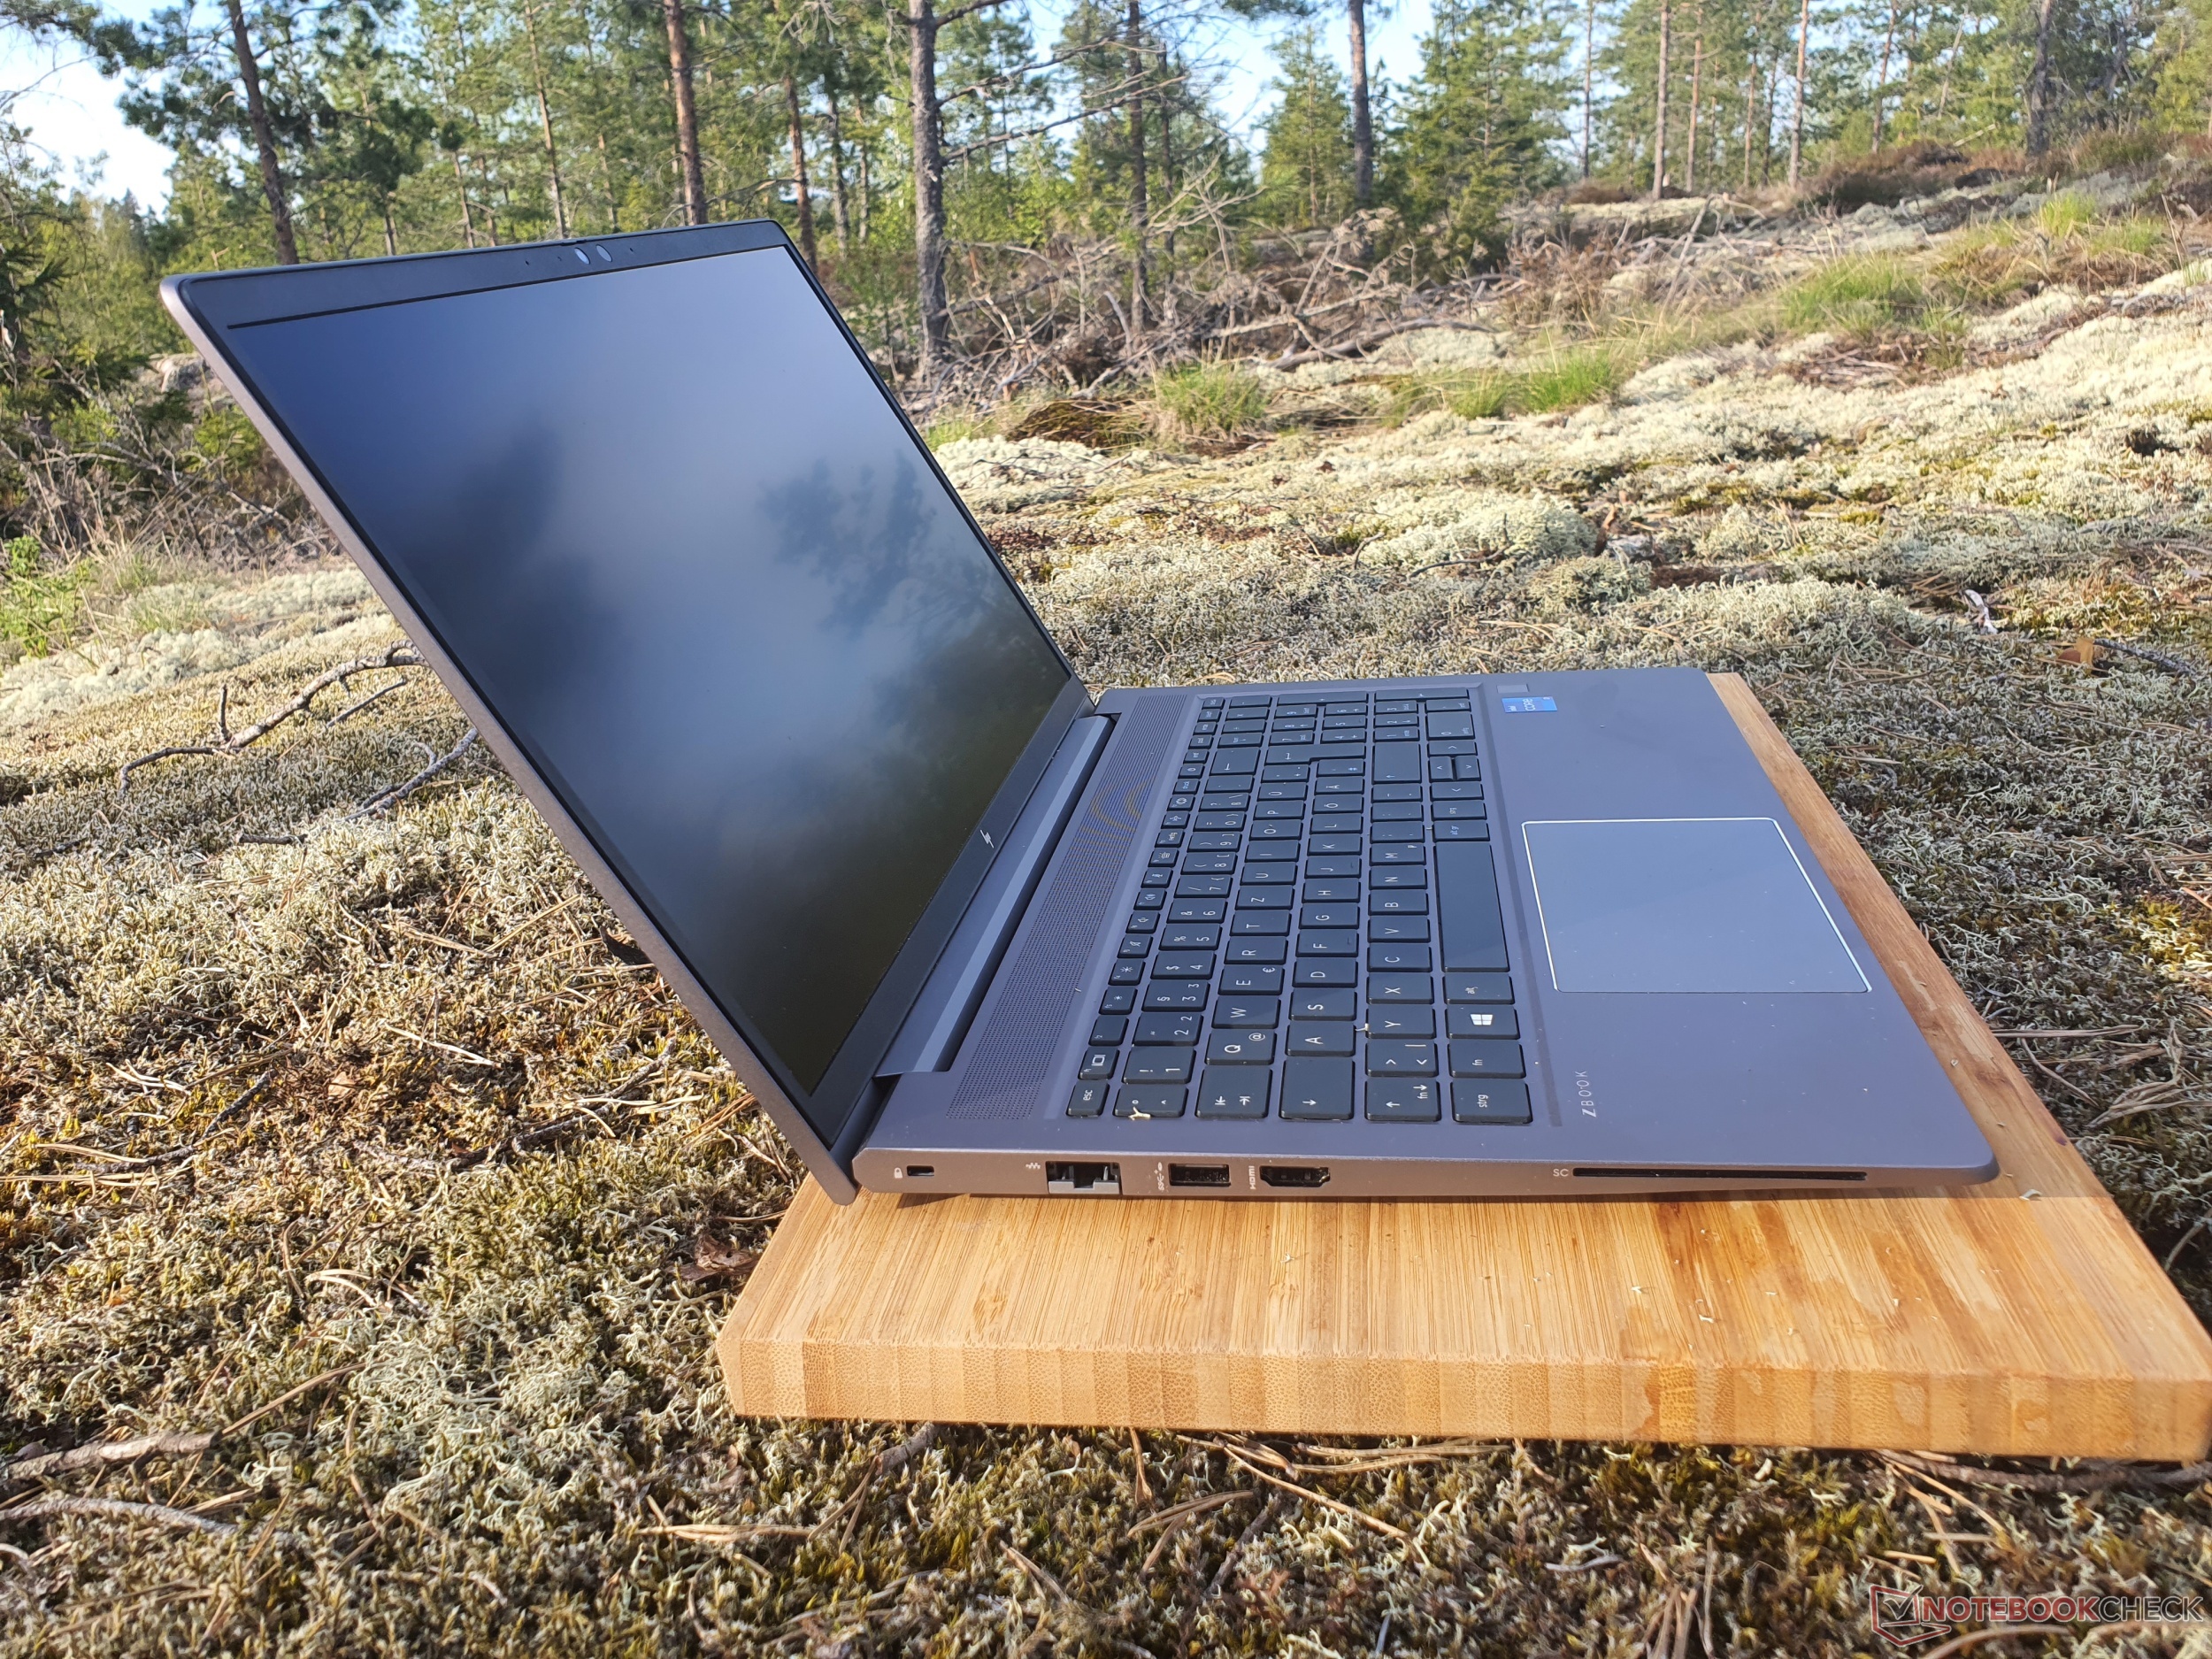
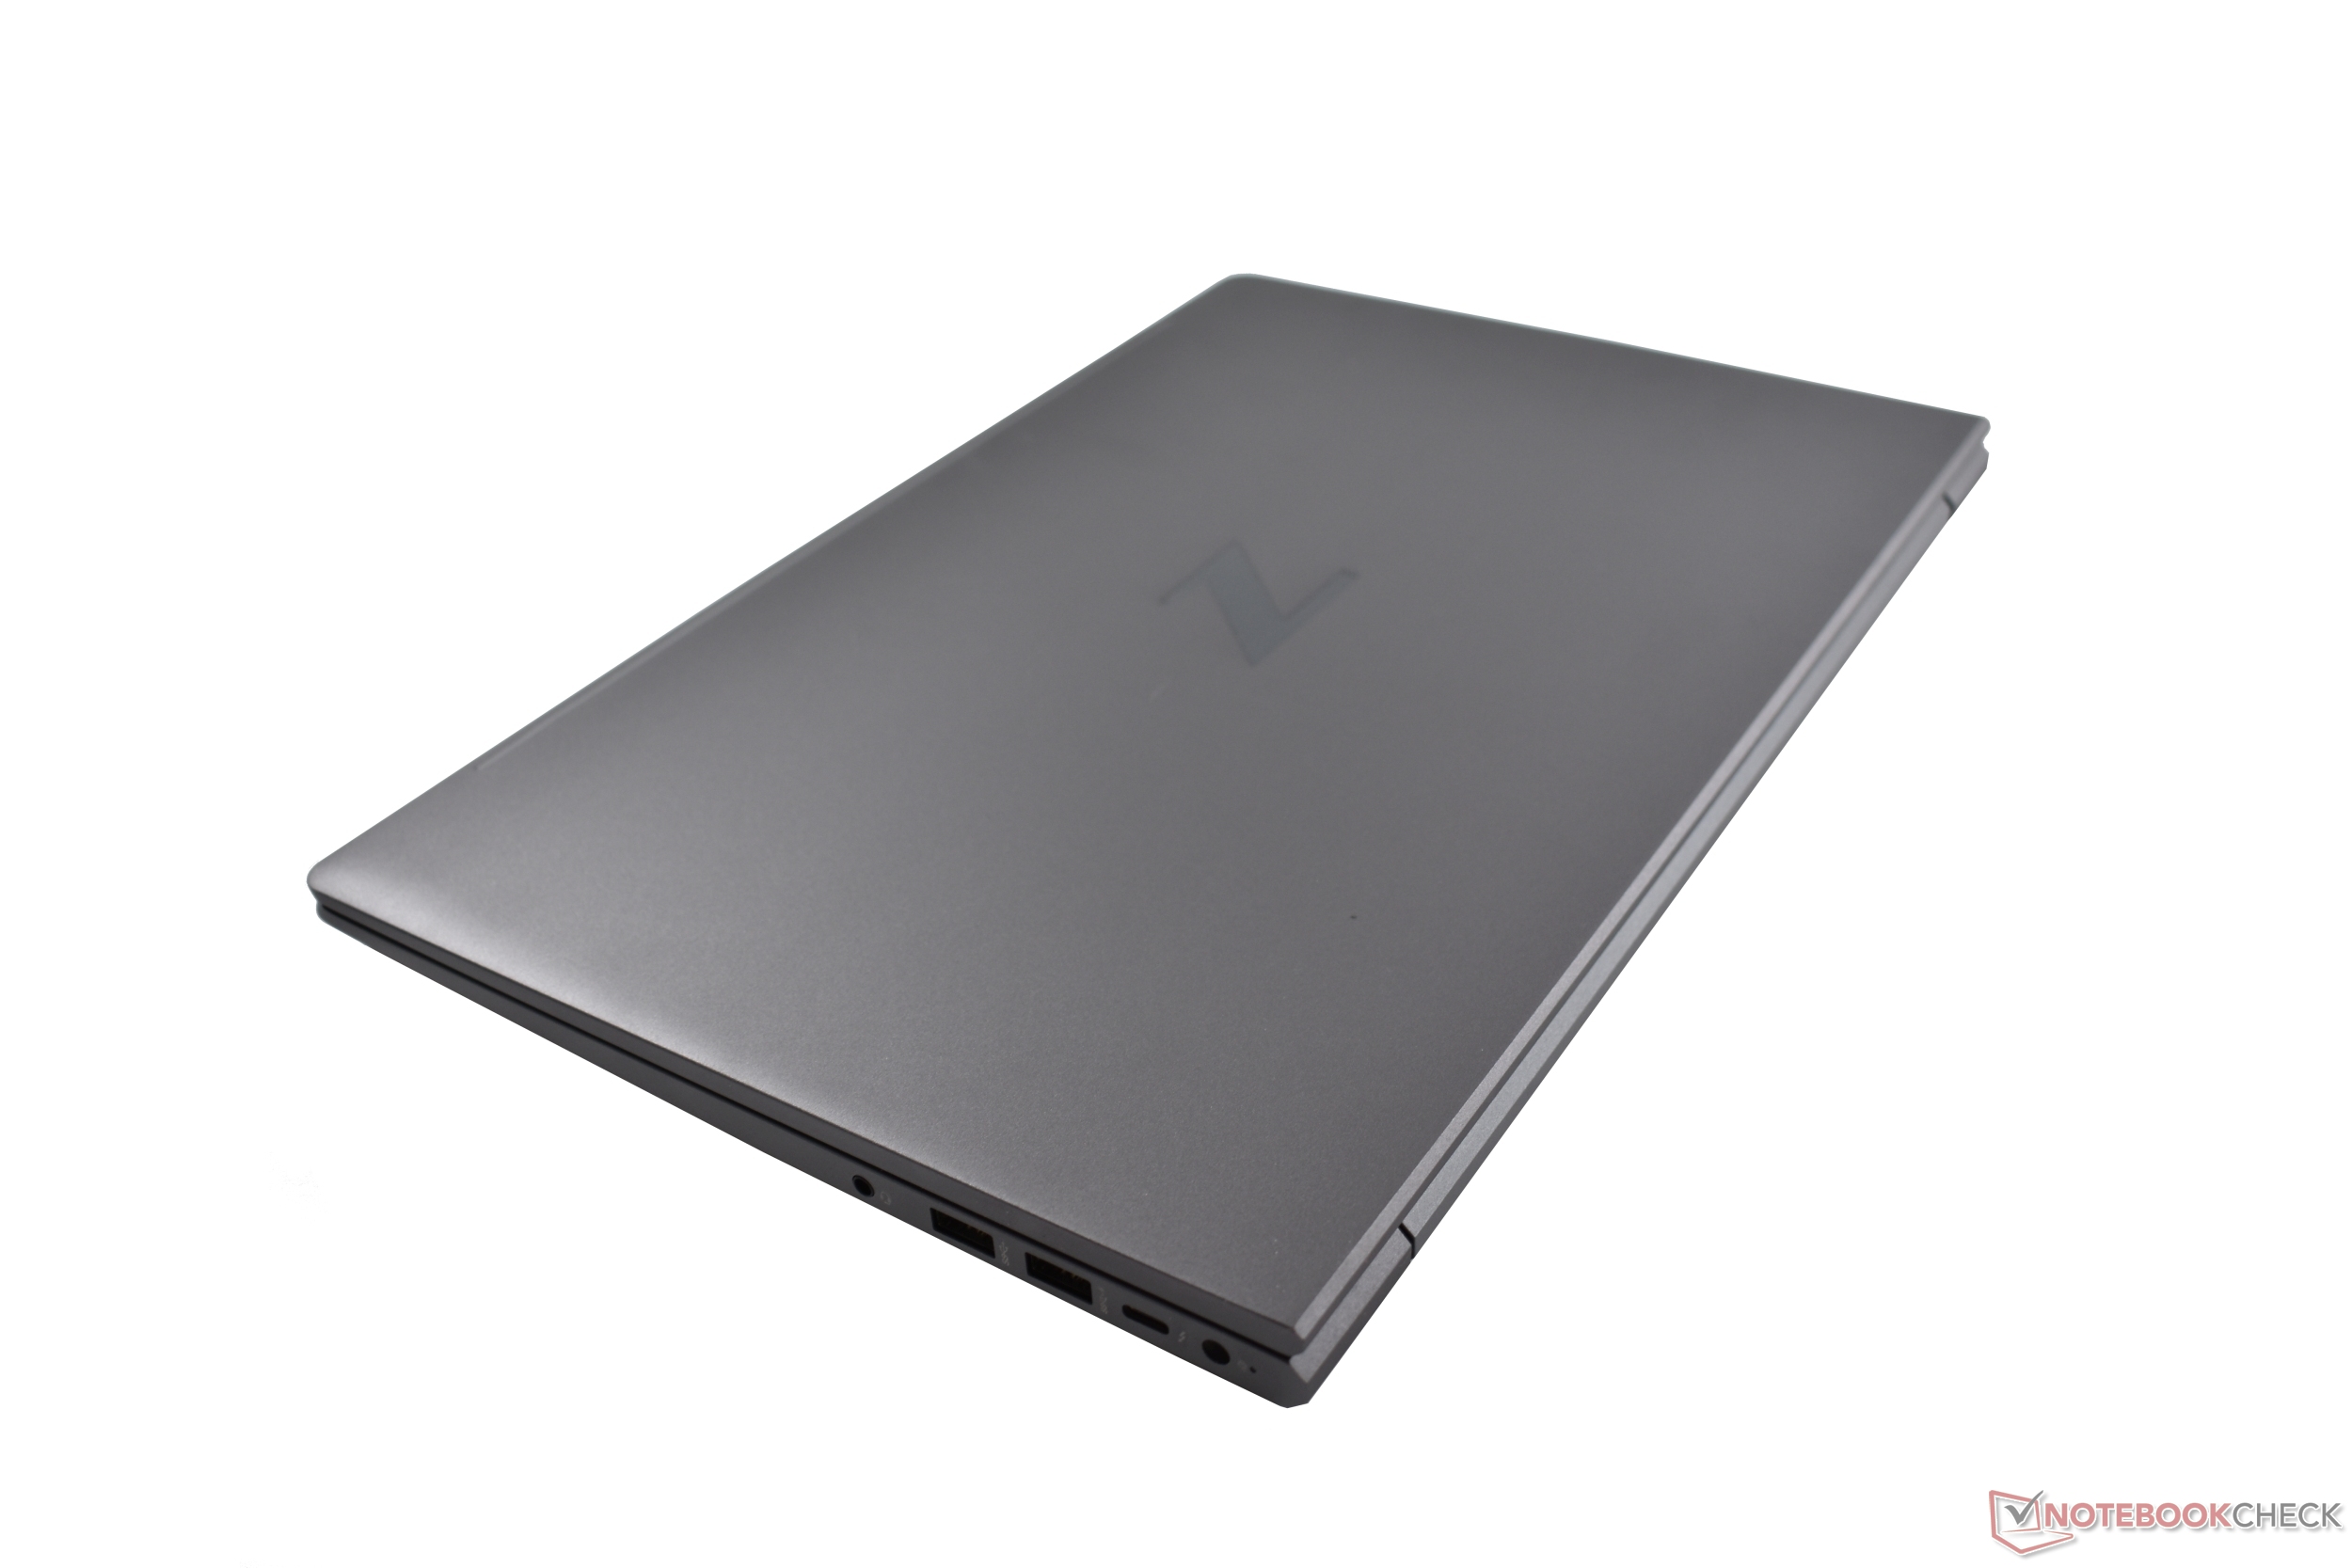
总体而言,该工作站更轻,只有1.97公斤(约4.34磅),也比竞争对手更紧凑。然而,作为一个高级工作站,惠普的 ZBook Studio 15又更薄,只有18毫米(约0.7英寸),惠普的轻型紧凑型工作站也是如此。萤火虫15,其重量也只有1.75公斤(约3.96磅)。
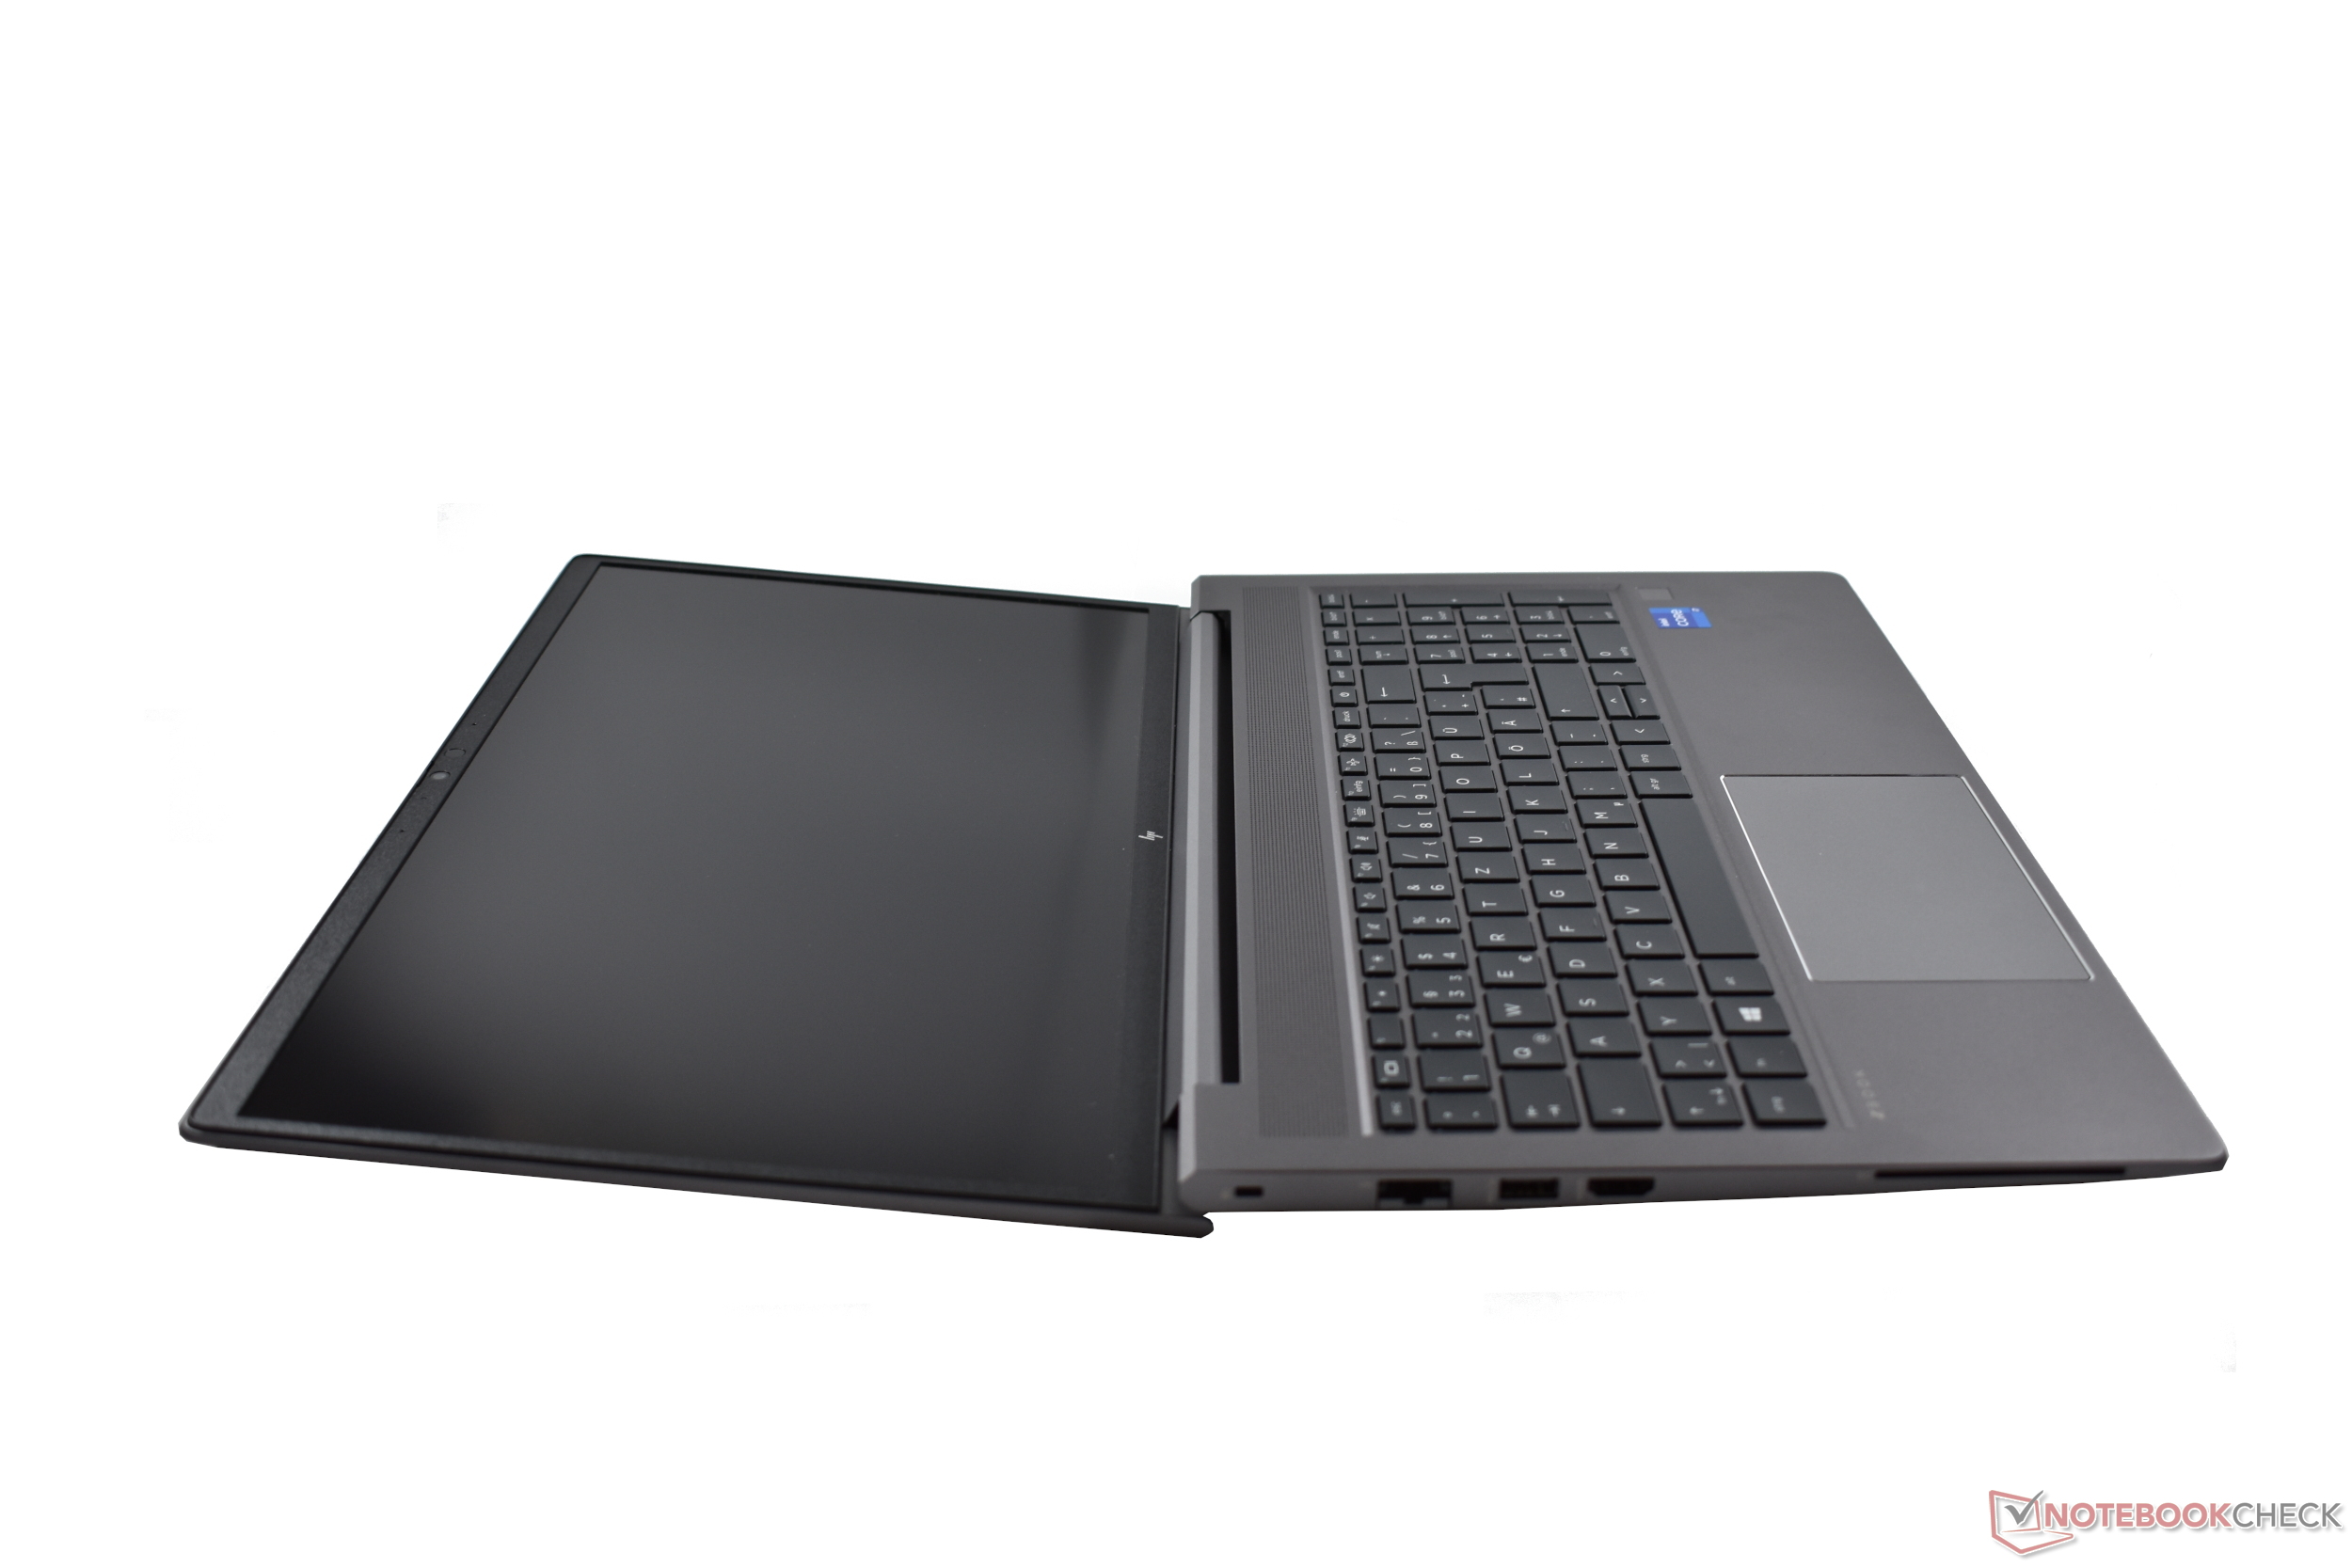
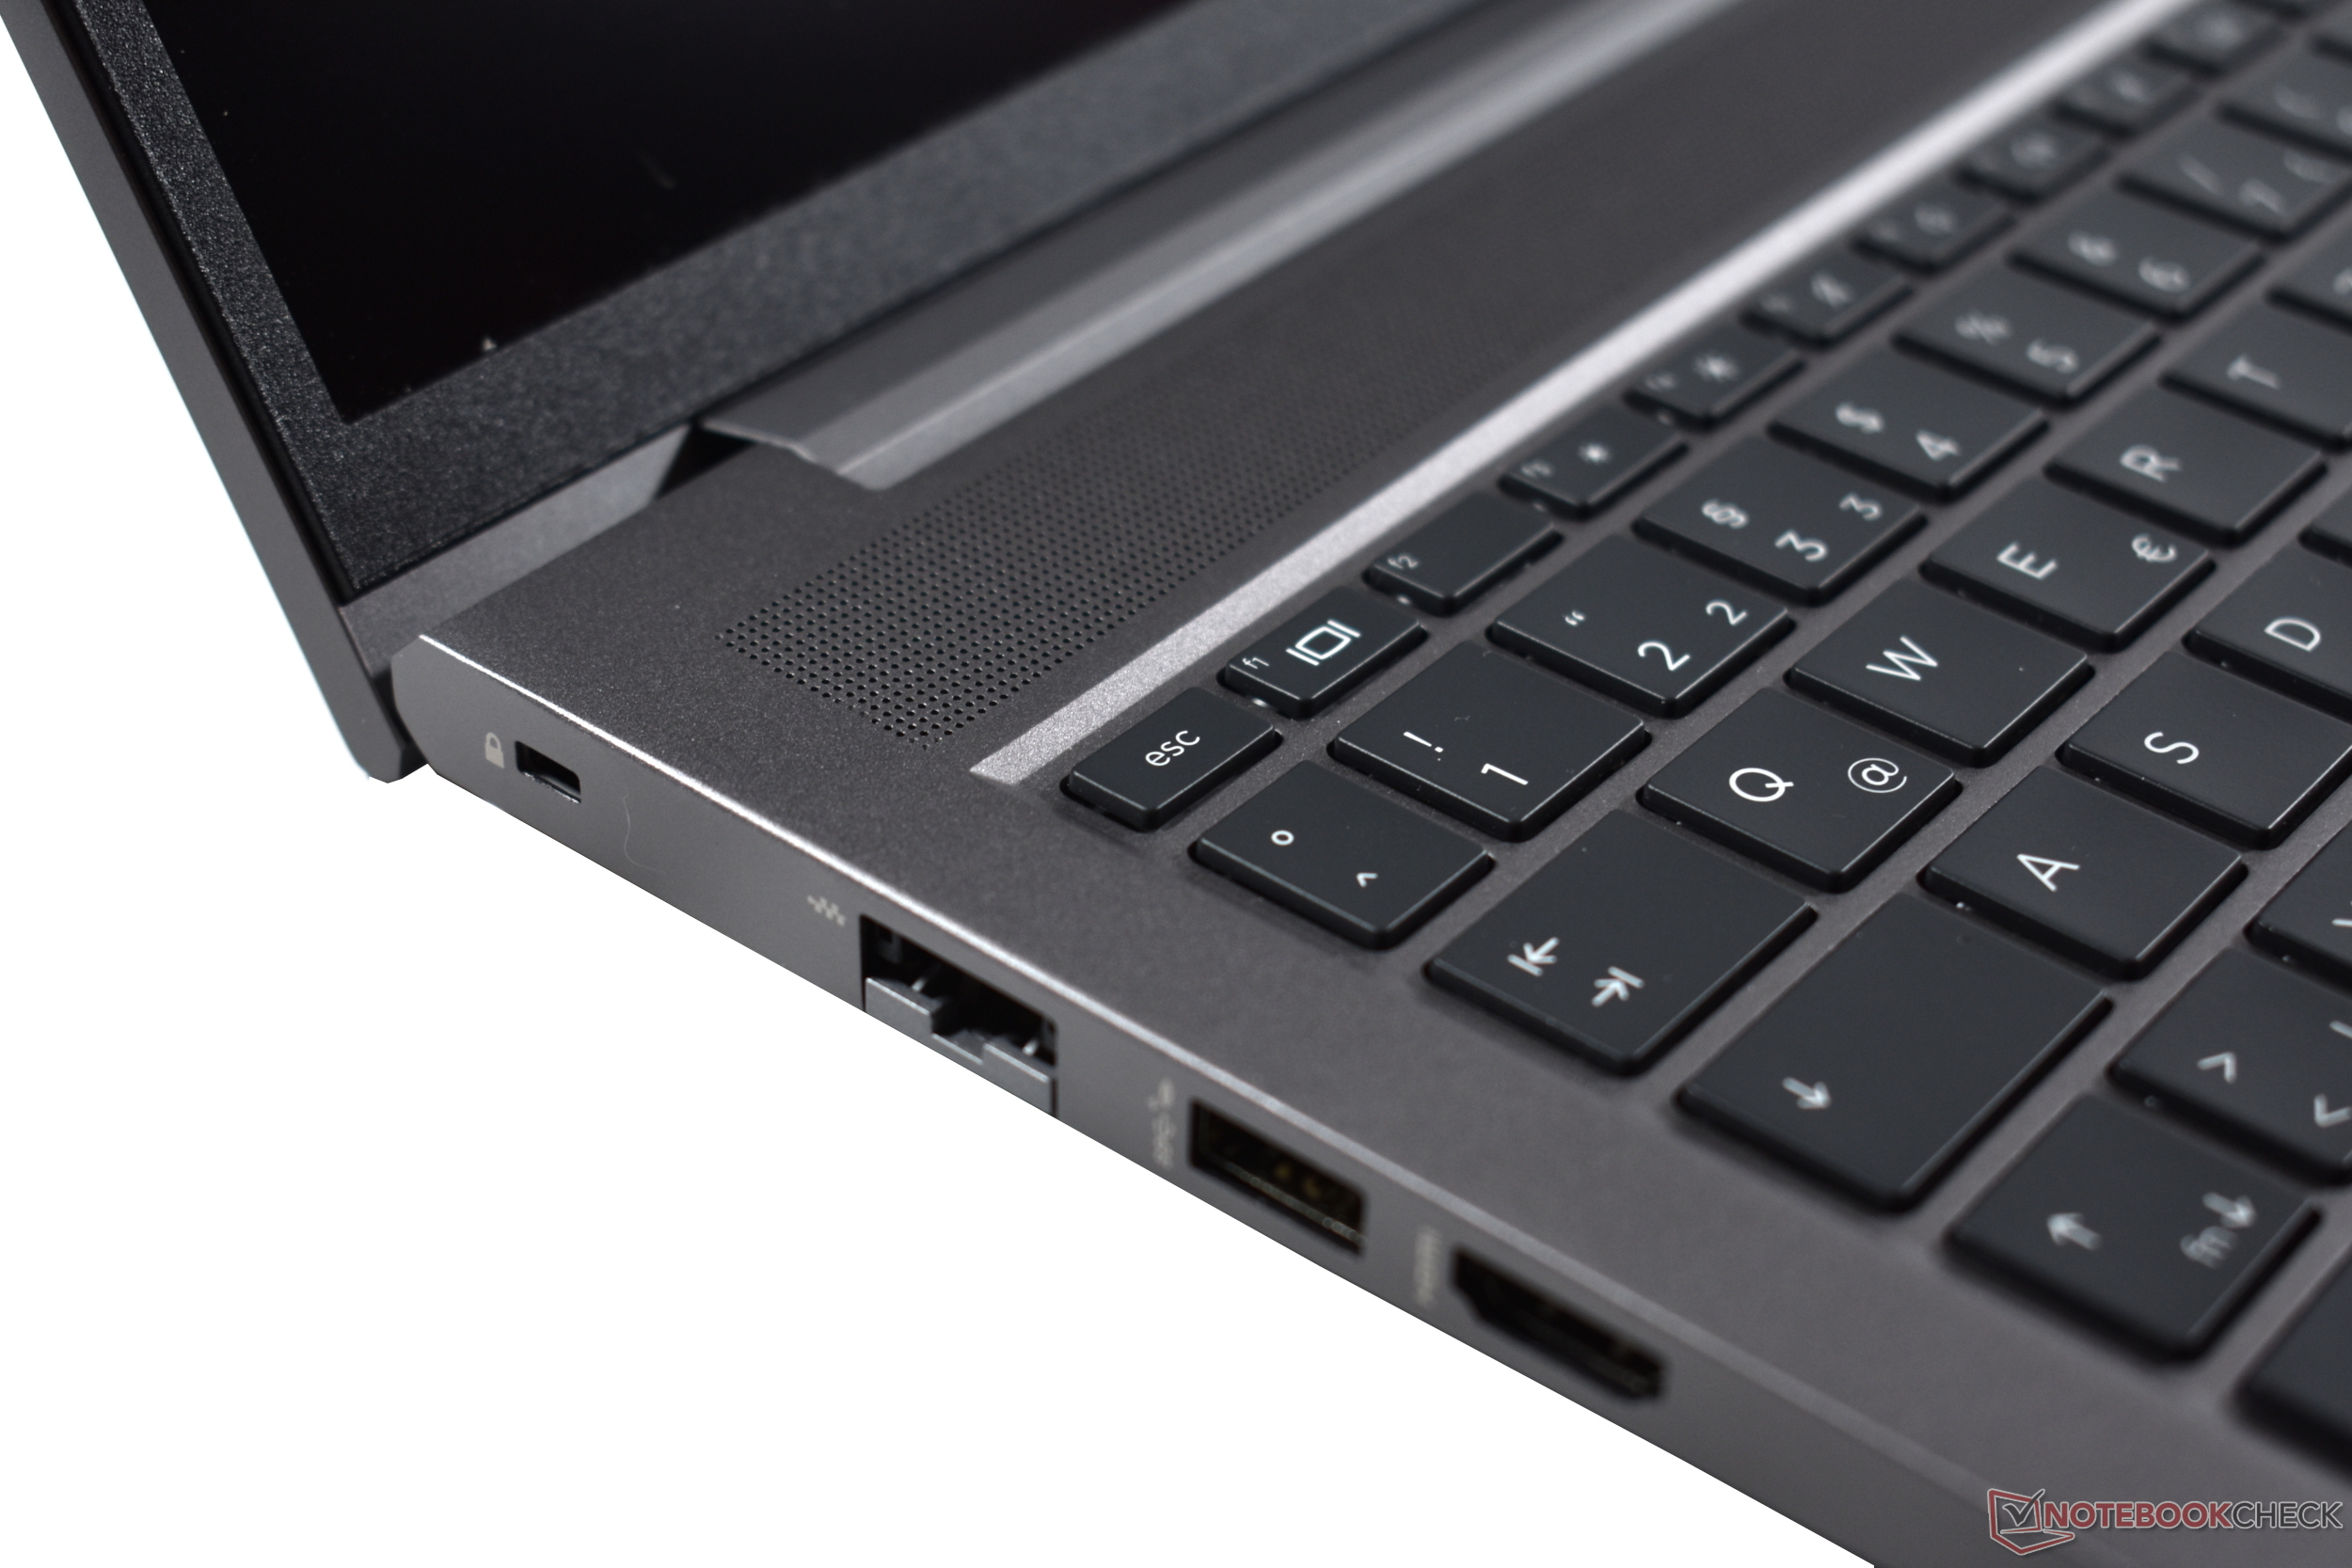
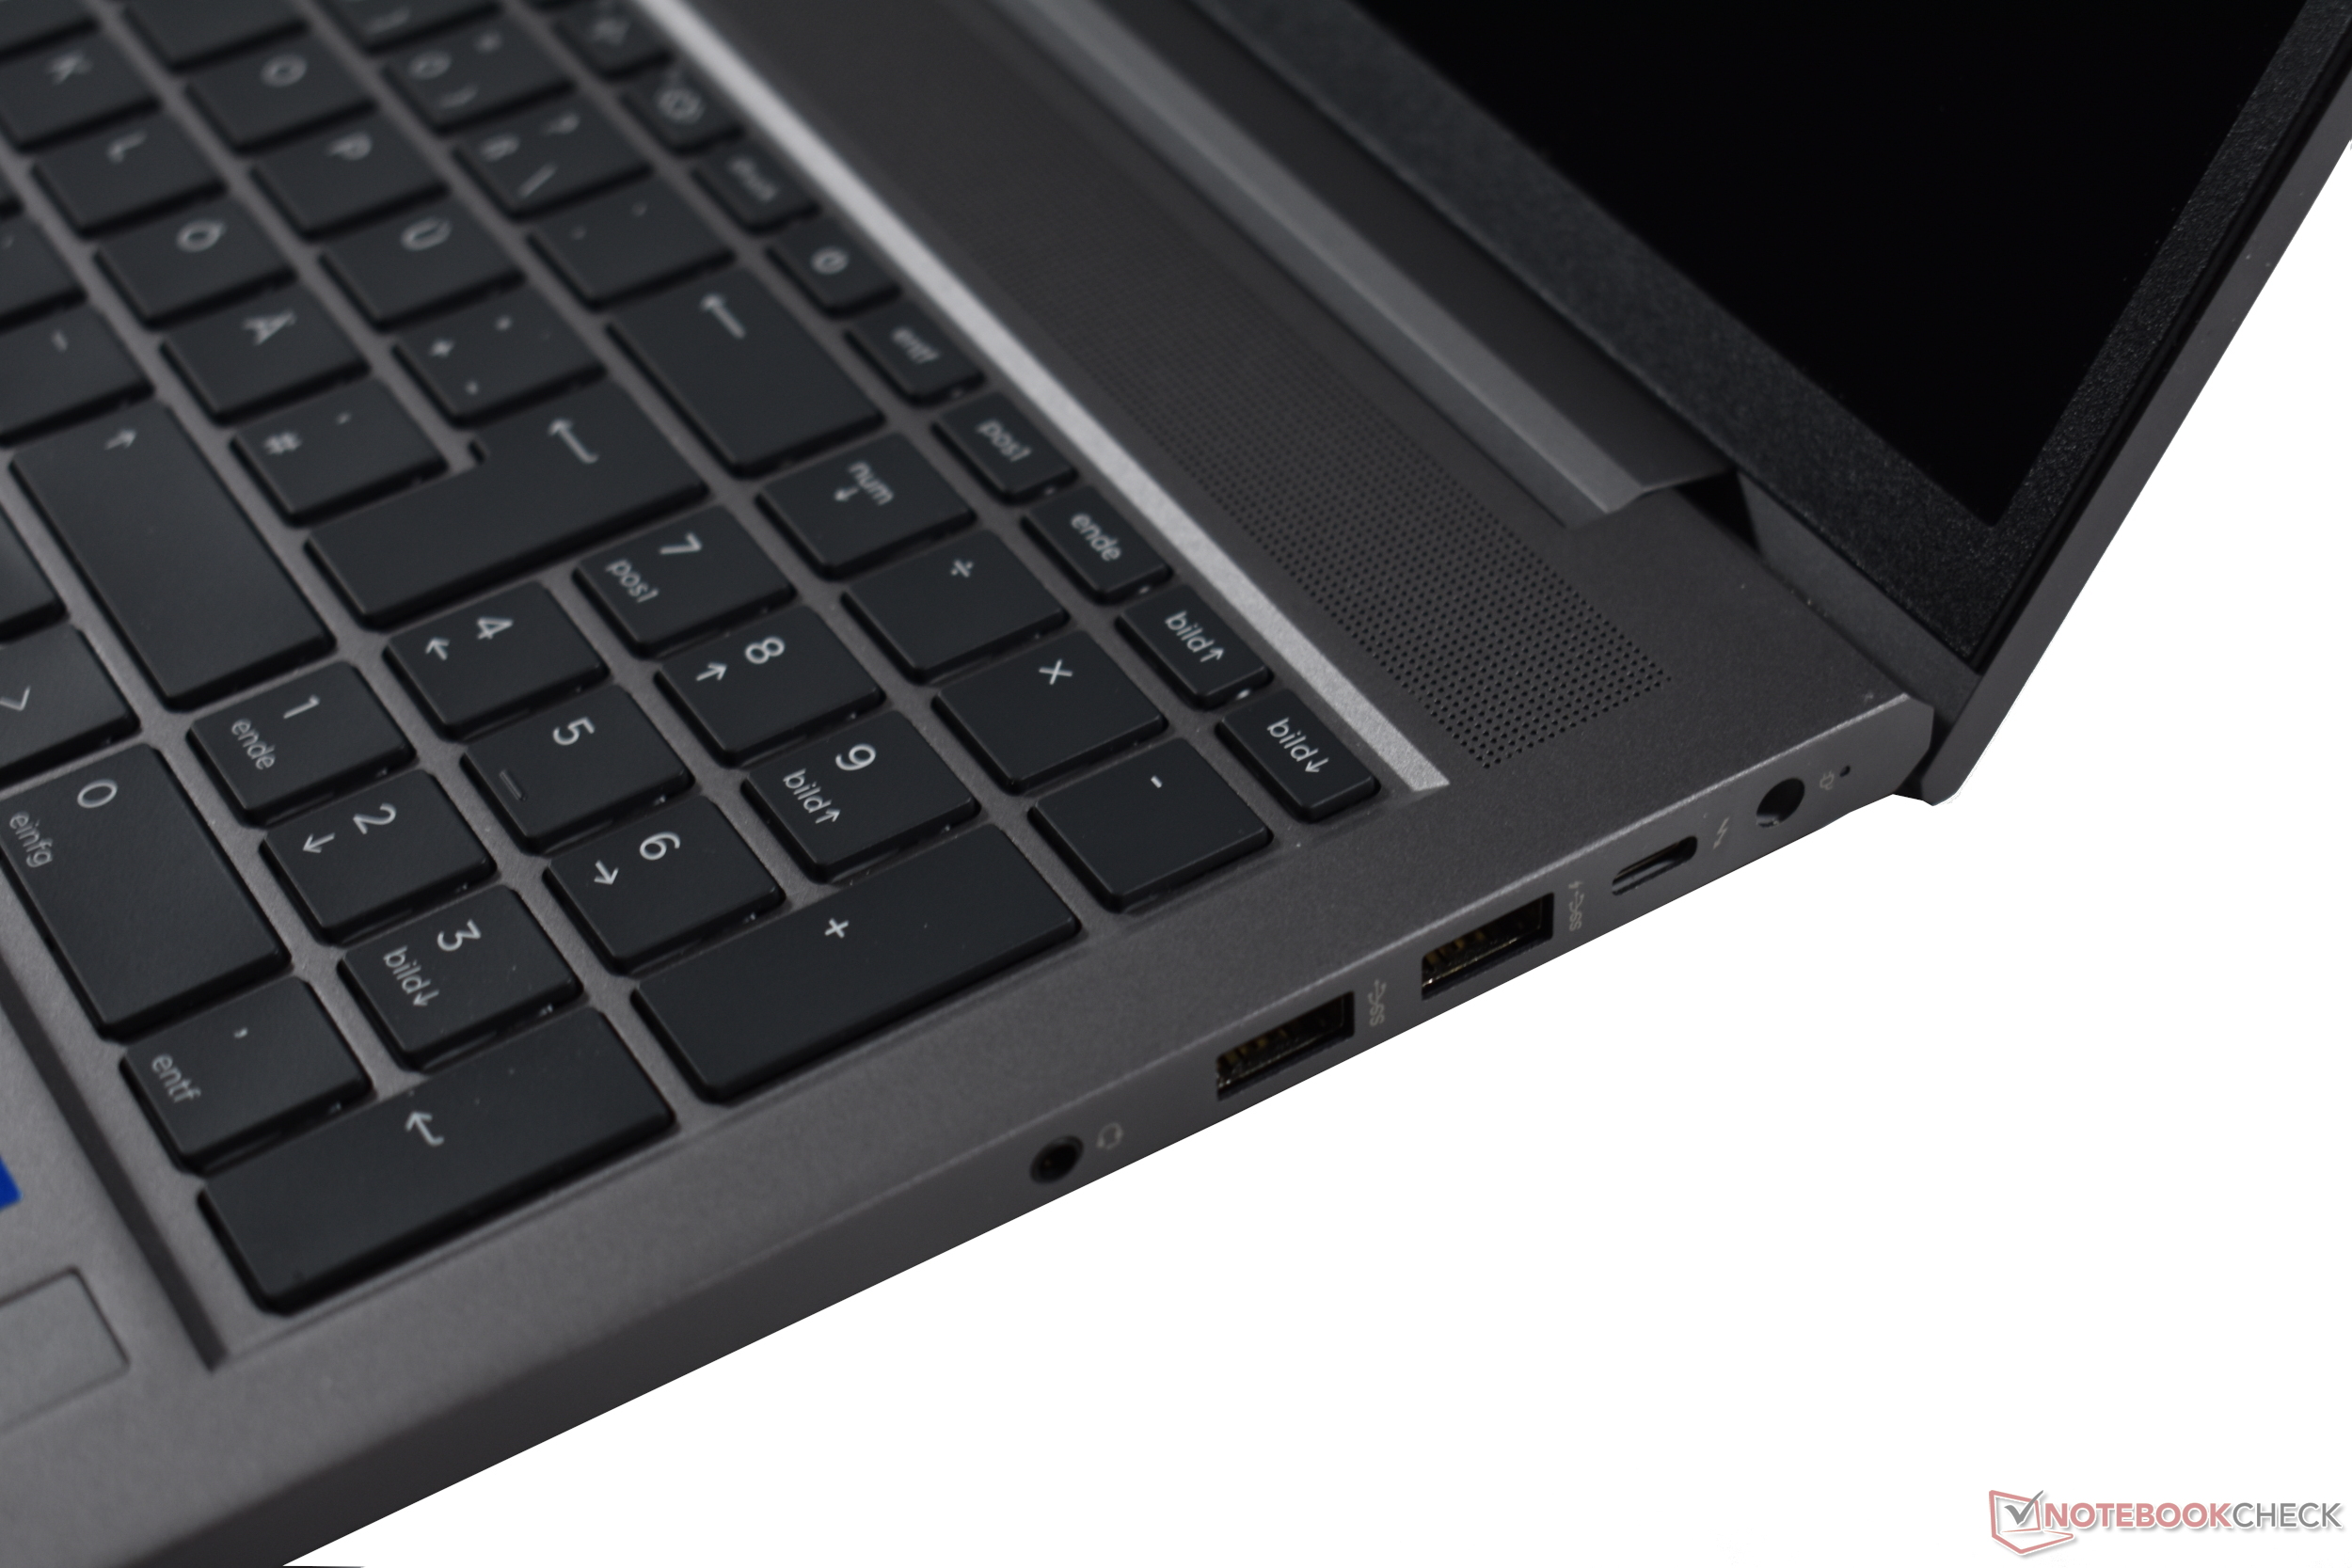
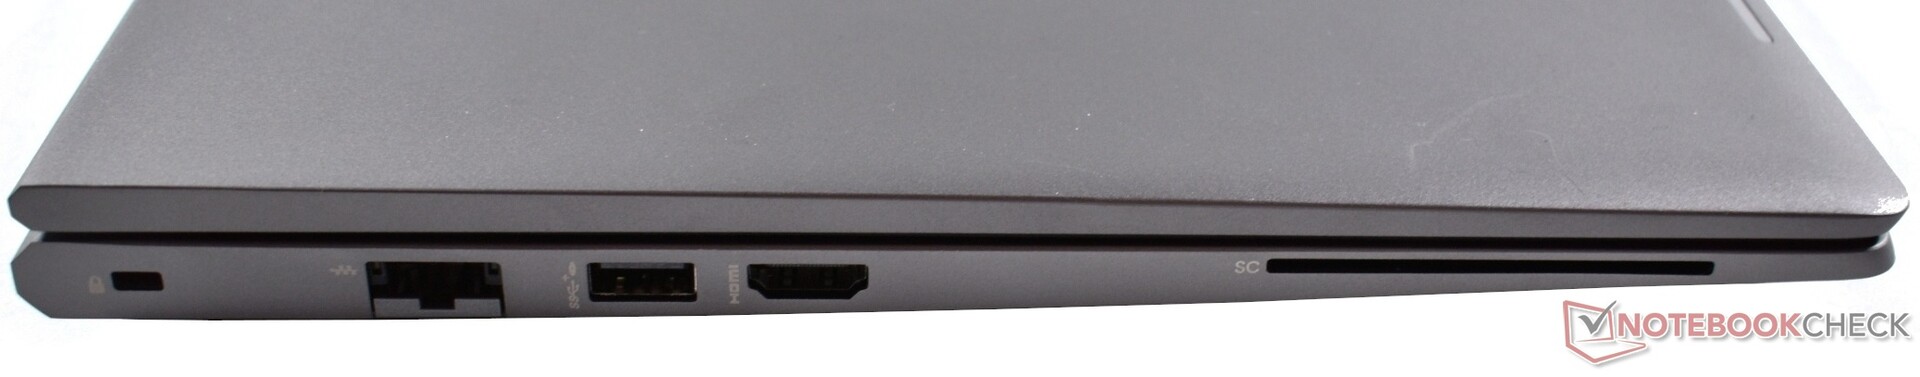
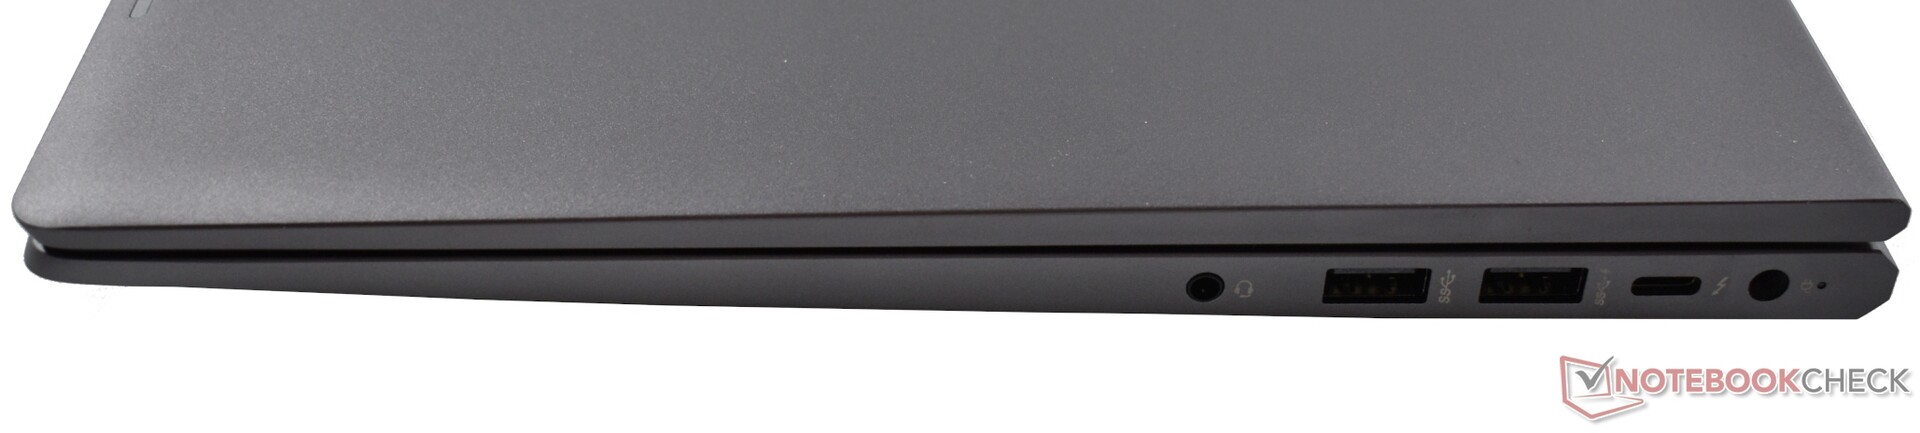
设备。带有USB-C PD和快速WiFi 6的HP ZBook
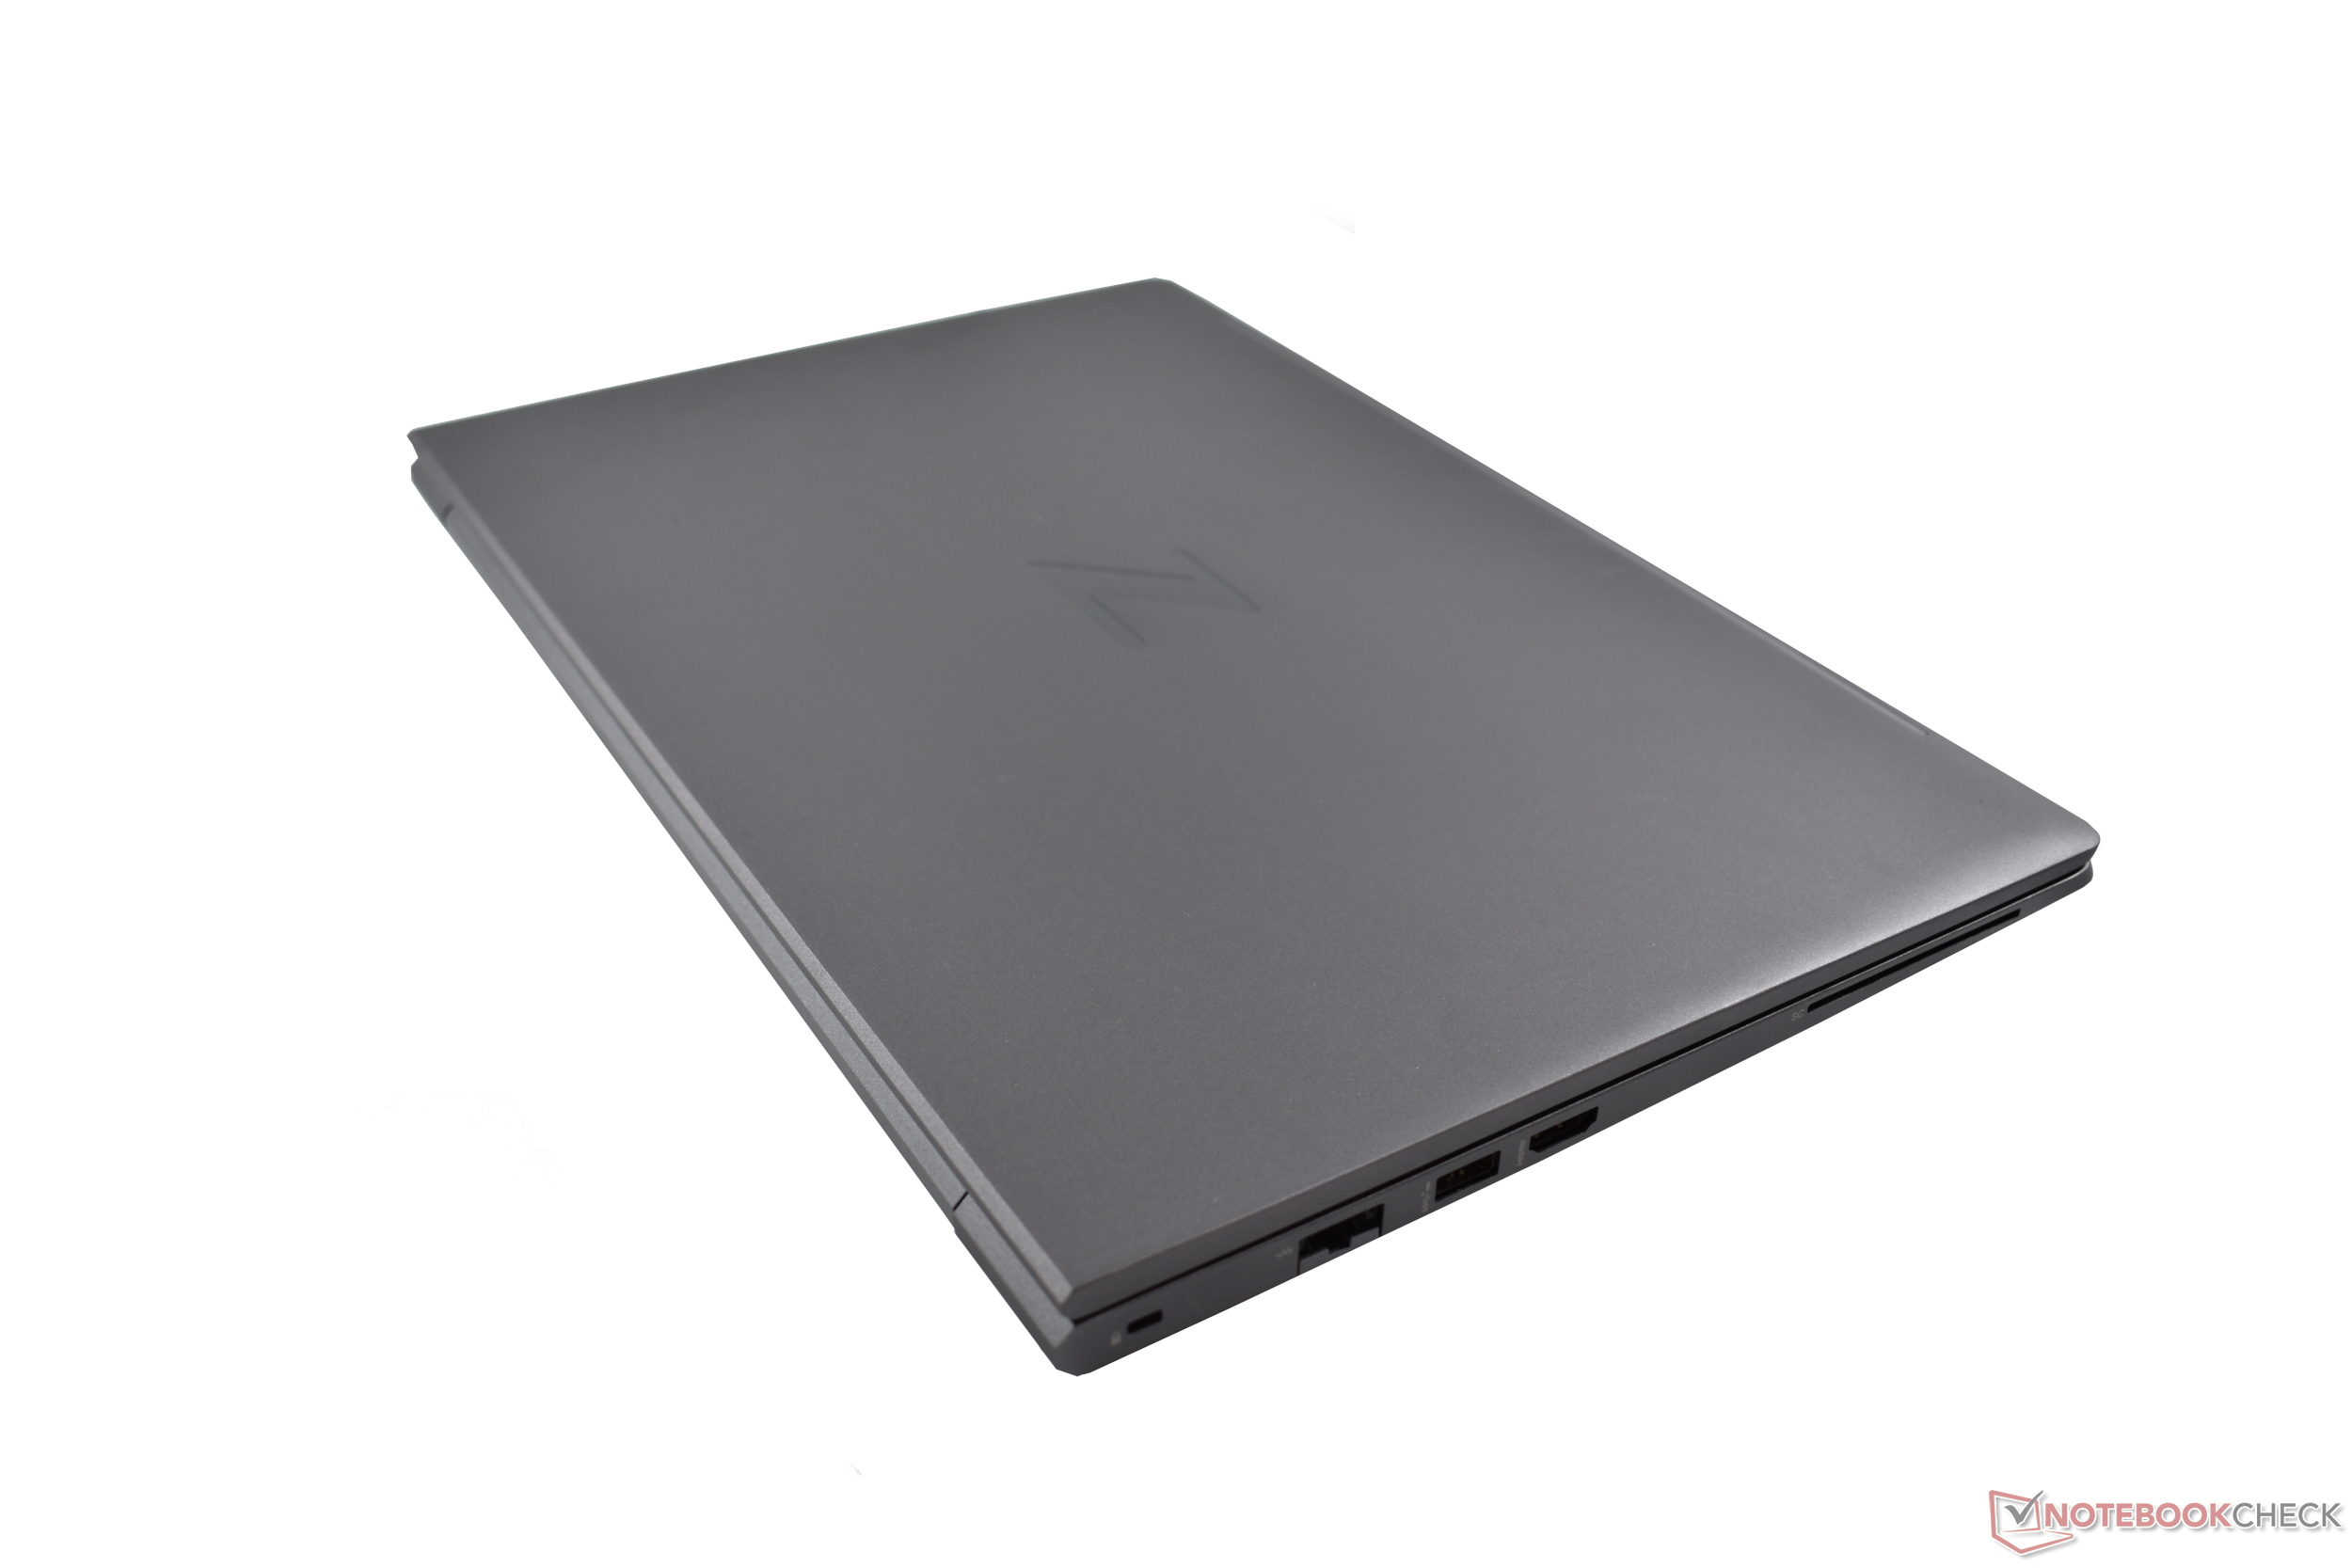
即使作为一个入门级的工作站,ZBook 15 G8也提供了许多重要的连接。有Gbit局域网(即使不是2.5Gbps),总共有三个USB-A 3.1 Gen1(5Gbps)端口,而只有一个Thunderbolt 4连接,而且它还普遍提供DisplayPort 1.4和Power Delivery。我们也很欣赏看到2.0版本的HDMI。
智能卡读卡器是可选的,但总是有一个Kensington锁(纳米)。与专有的充电端口一起,整个包装被一个组合音频端口所包围。然而,我们错过了一个SD卡插槽。
沟通
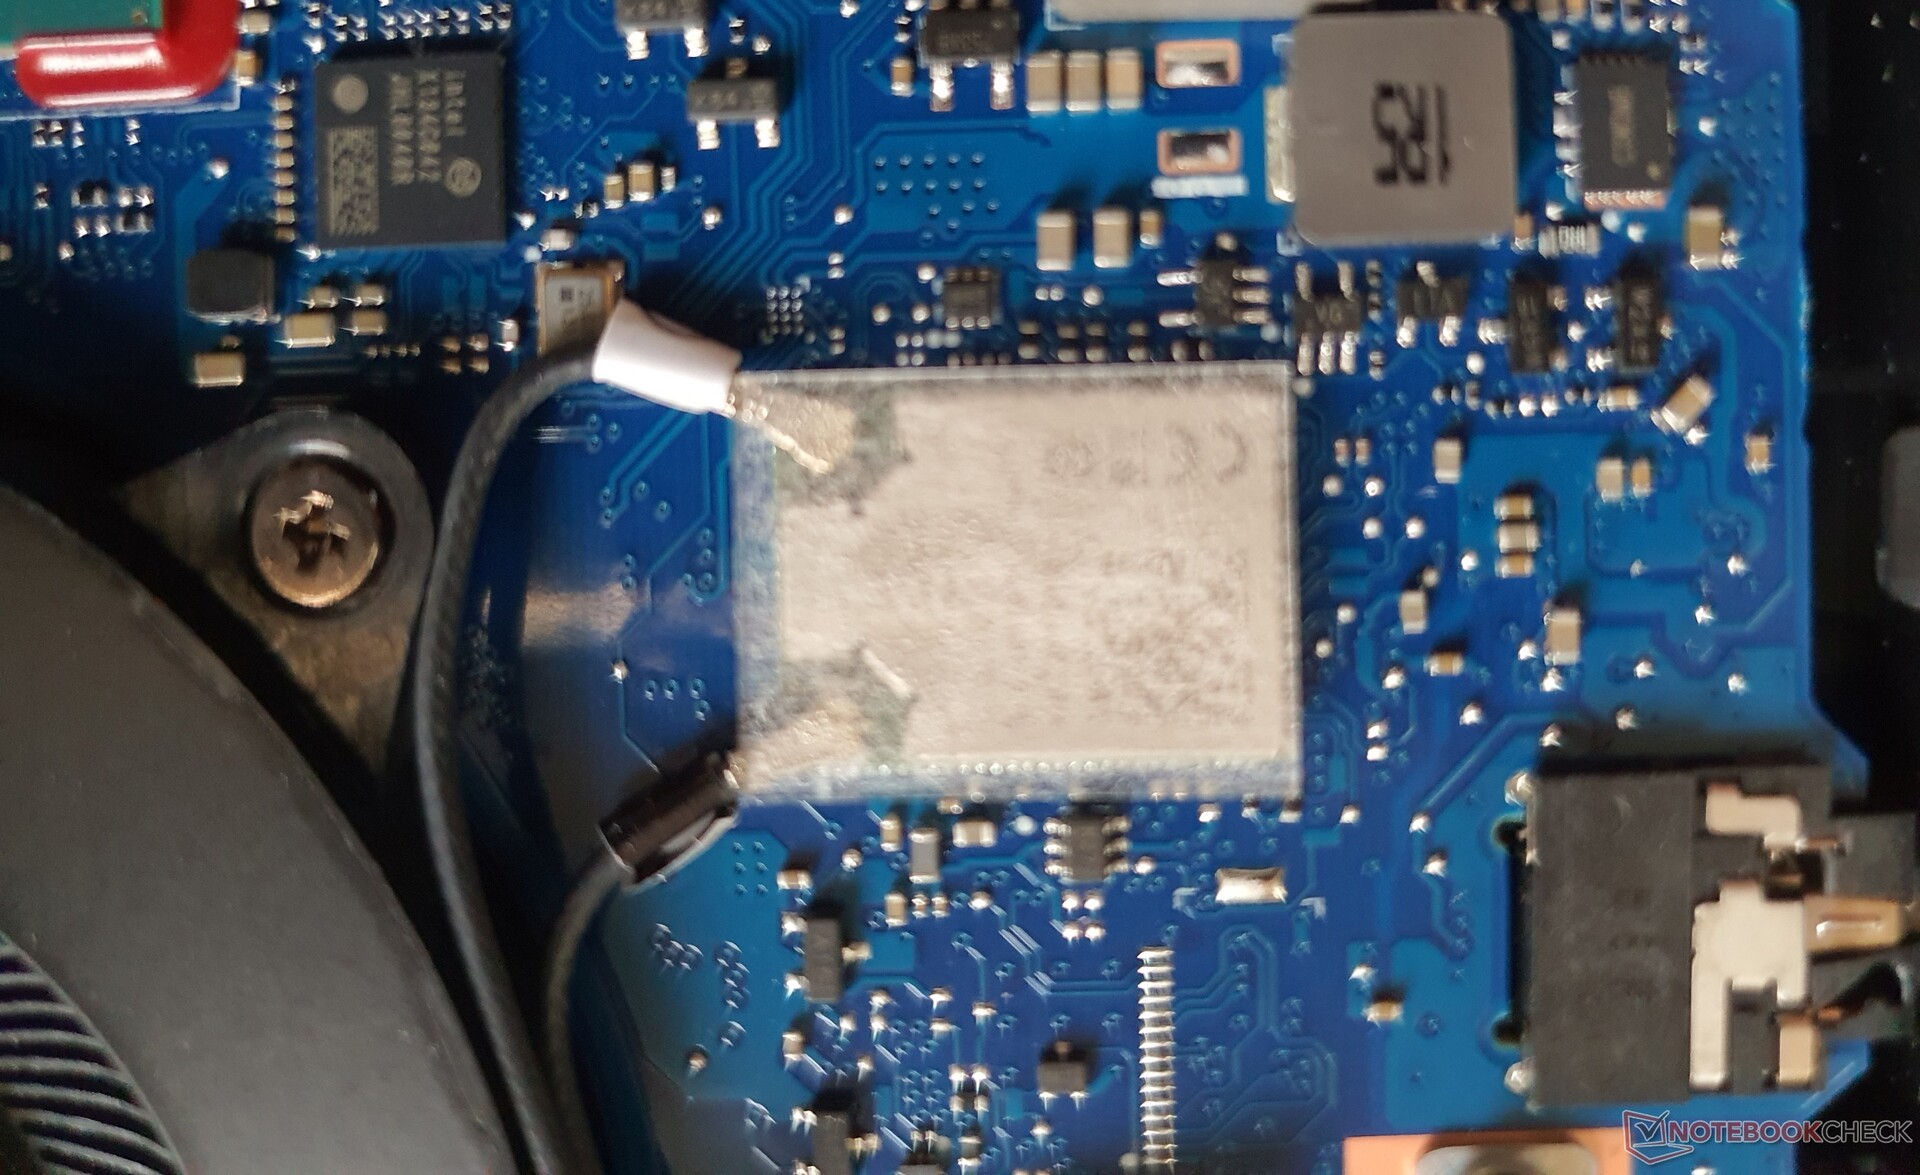
除了Gbit局域网外,英特尔的Wi-Fi 6 AX201 + 蓝牙5.2也以焊接的形式提供。发送时~1.5Gbps,接收时~1.33Gbps,与竞争对手的高Wi-Fi速度相对应。虽然没有WWAN插槽,但NFC可以选择使用。
| Networking | |
| iperf3 transmit AX12 | |
| HP ZBook Power 15 G8 313S5EA | |
| Lenovo ThinkPad P15v G2 21A9000XGE | |
| HP ZBook Studio 15 G8 | |
| HP ZBook Firefly 15 G8 2C9R7EA | |
| HP ZBook Fury 15 G8 | |
| Dell Precision 3000 3551 | |
| Average Intel Wi-Fi 6 AX201 (49.8 - 1775, n=324) | |
| iperf3 receive AX12 | |
| Dell Precision 3000 3551 | |
| HP ZBook Firefly 15 G8 2C9R7EA | |
| Lenovo ThinkPad P15v G2 21A9000XGE | |
| HP ZBook Studio 15 G8 | |
| HP ZBook Power 15 G8 313S5EA | |
| Average Intel Wi-Fi 6 AX201 (136 - 1743, n=324) | |
| HP ZBook Fury 15 G8 | |
网络摄像头

这个720p的网络摄像头提供了一个SureShutter(盖),双阵列麦克风,以及用于Windows Hello的可选红外线。然而,图像质量是有噪音的。


安全问题
在安全方面,惠普并没有采取半点措施。在硬件选项方面,有一个智能卡读卡器和一个用于Windows Hello的红外摄像头。此外,还有一个安全锁的机制,一个指纹识别器,TPM 2.0和一个相机快门。
在软件方面,更多的安全性由惠普系统安全保障(HP System Safeguard)提供,以防止固件攻击或突然的固件错误,惠普客户端安全管理器,惠普Sure Click & Sure Sense防止网络钓鱼和恶意软件,以及一个 "自愈 "BIOS。
辅料
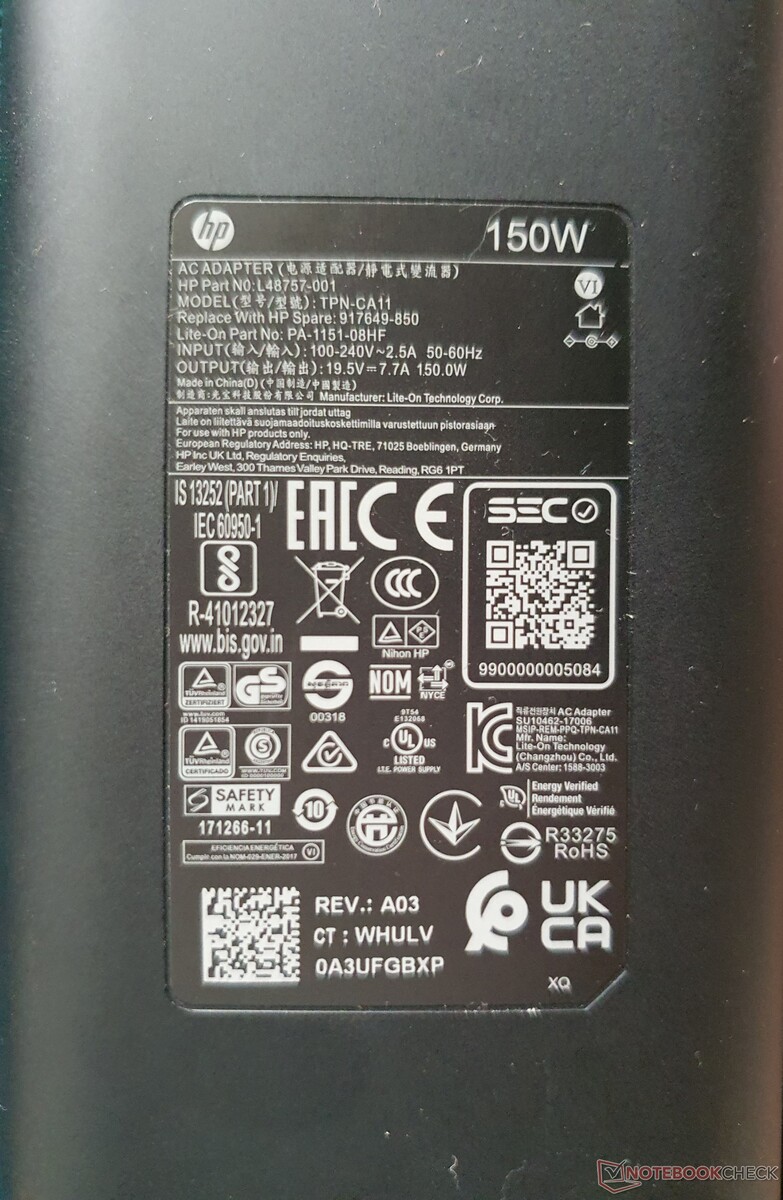
包括一个150瓦的电源(没有dGPU的配置为120瓦)。包装不含塑料(即只有10%),大部分是纸板(45%回收)和纸质纤维素。可选择的是,惠普提供各种USB-C/Thunderbolt底座,但只有HP TB Dock G2与组合线(约200欧元,约204美元)包括Power Delivery。
维护
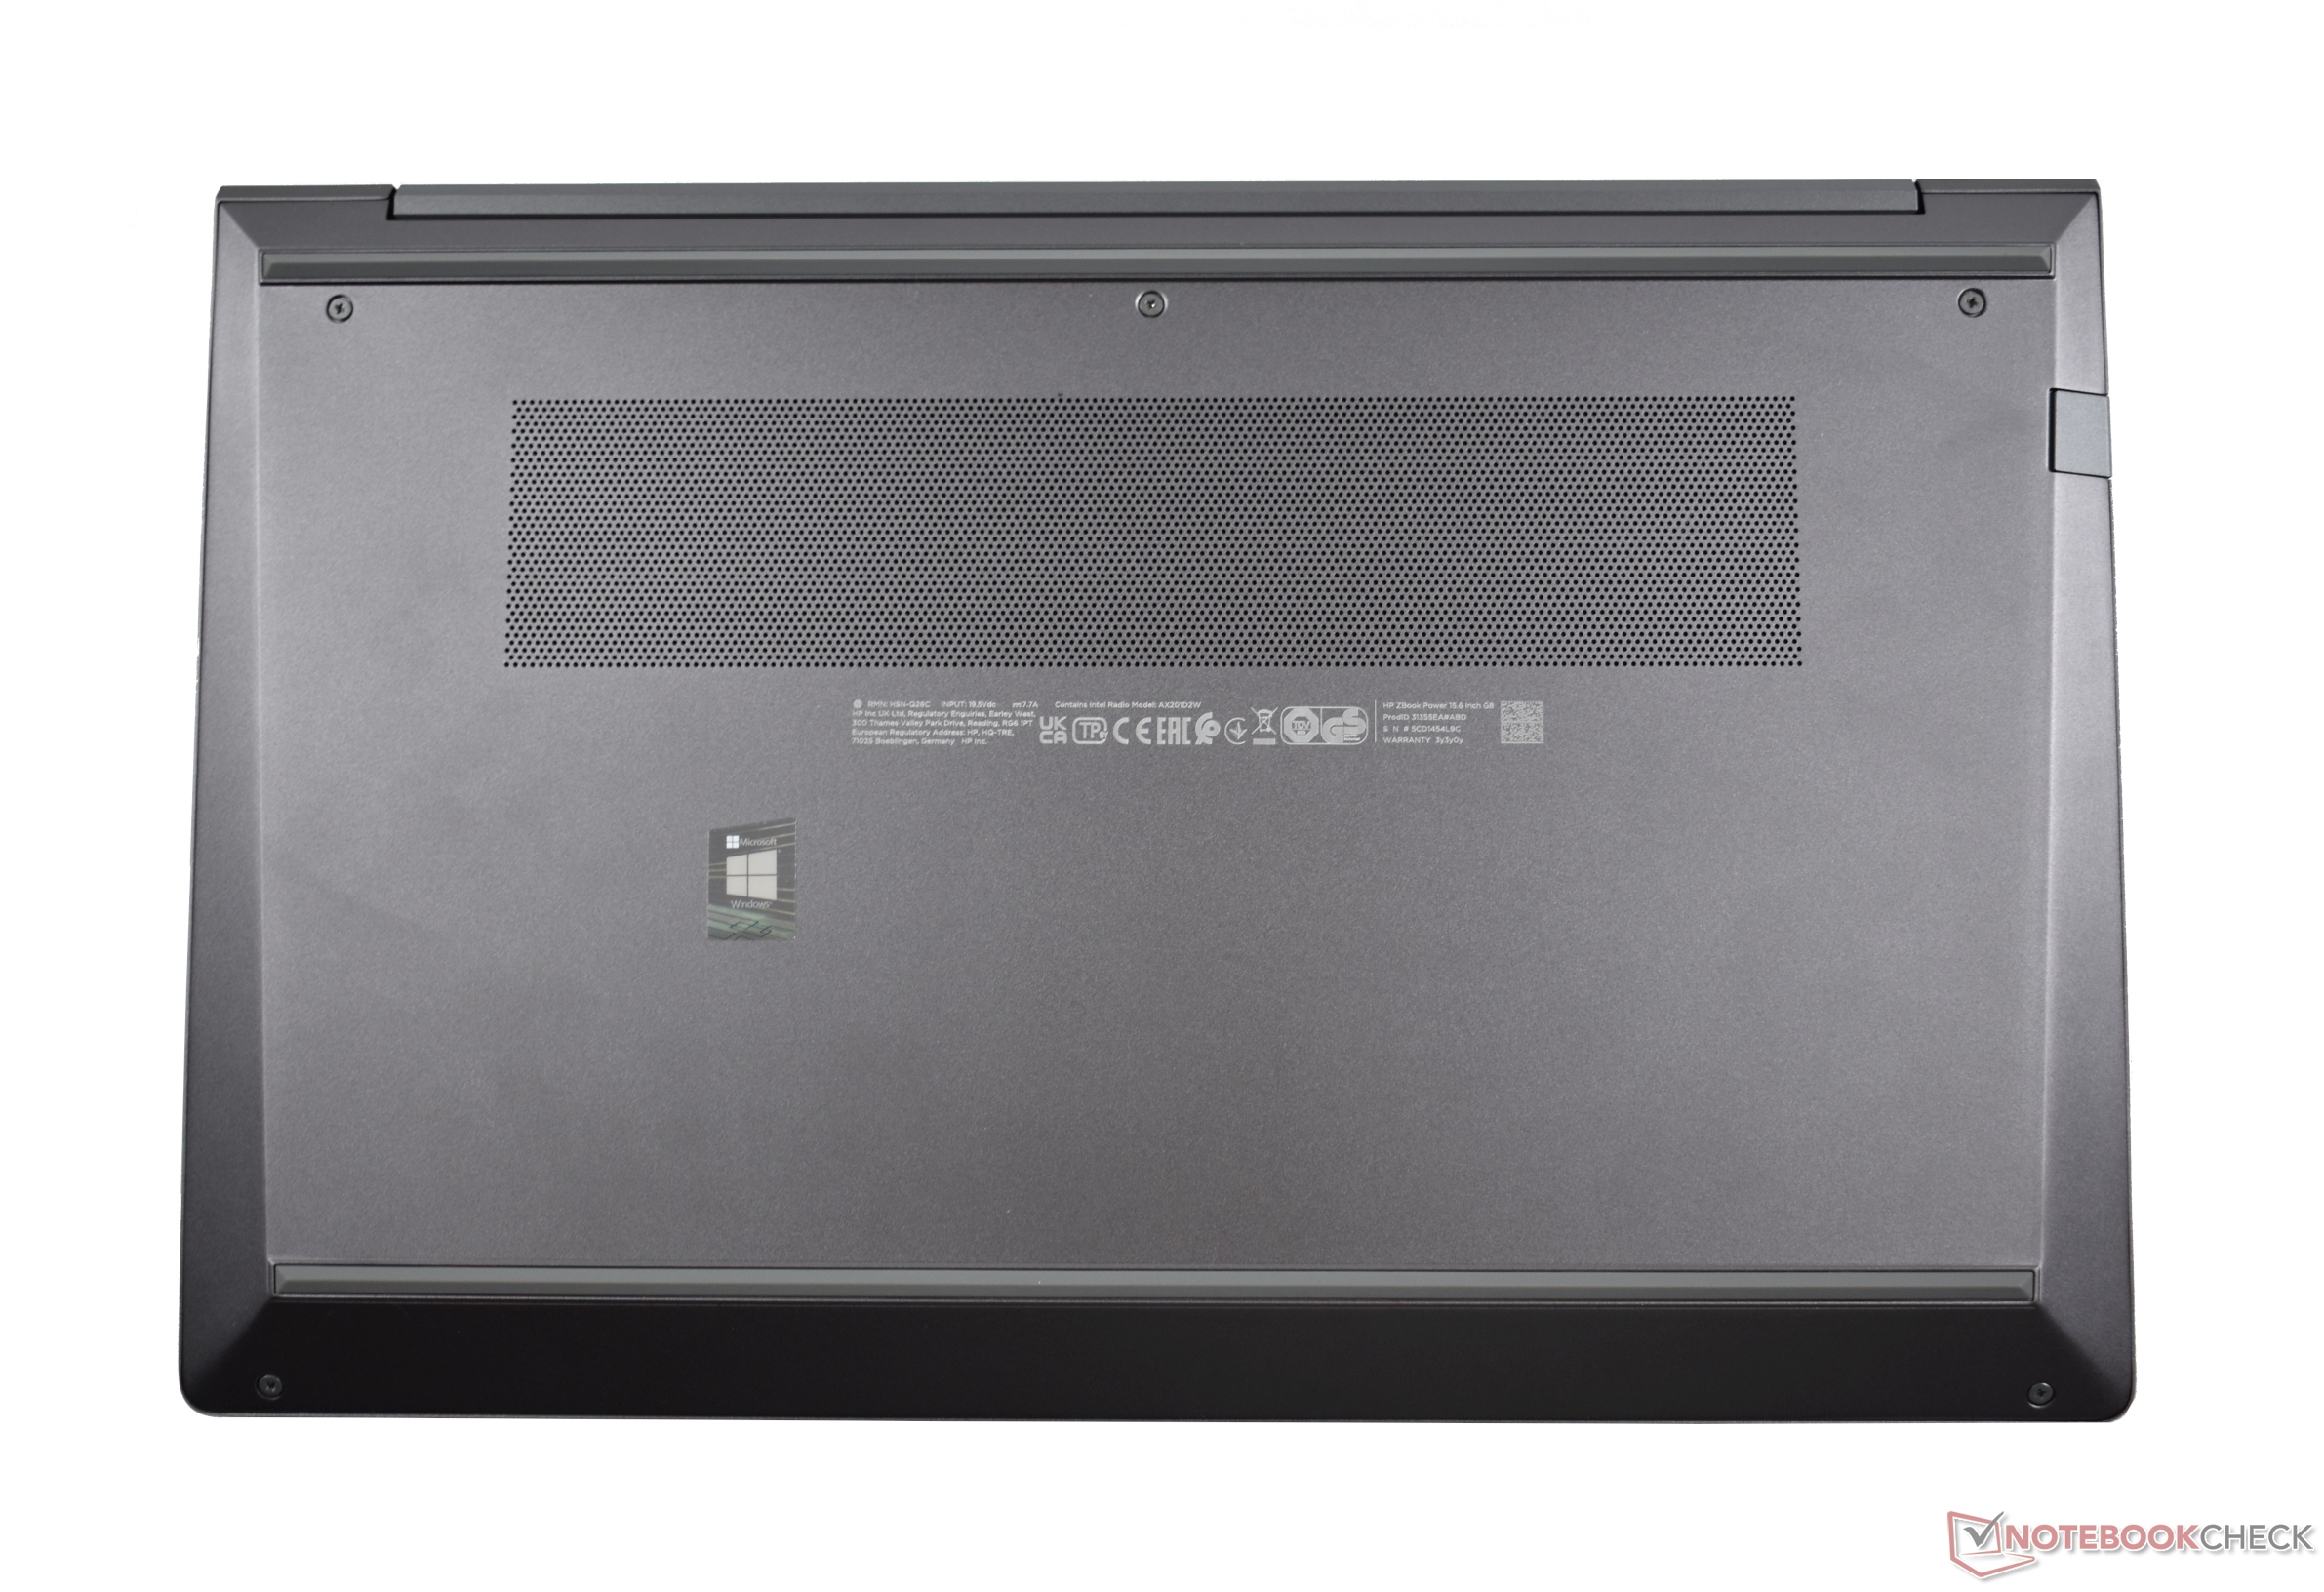
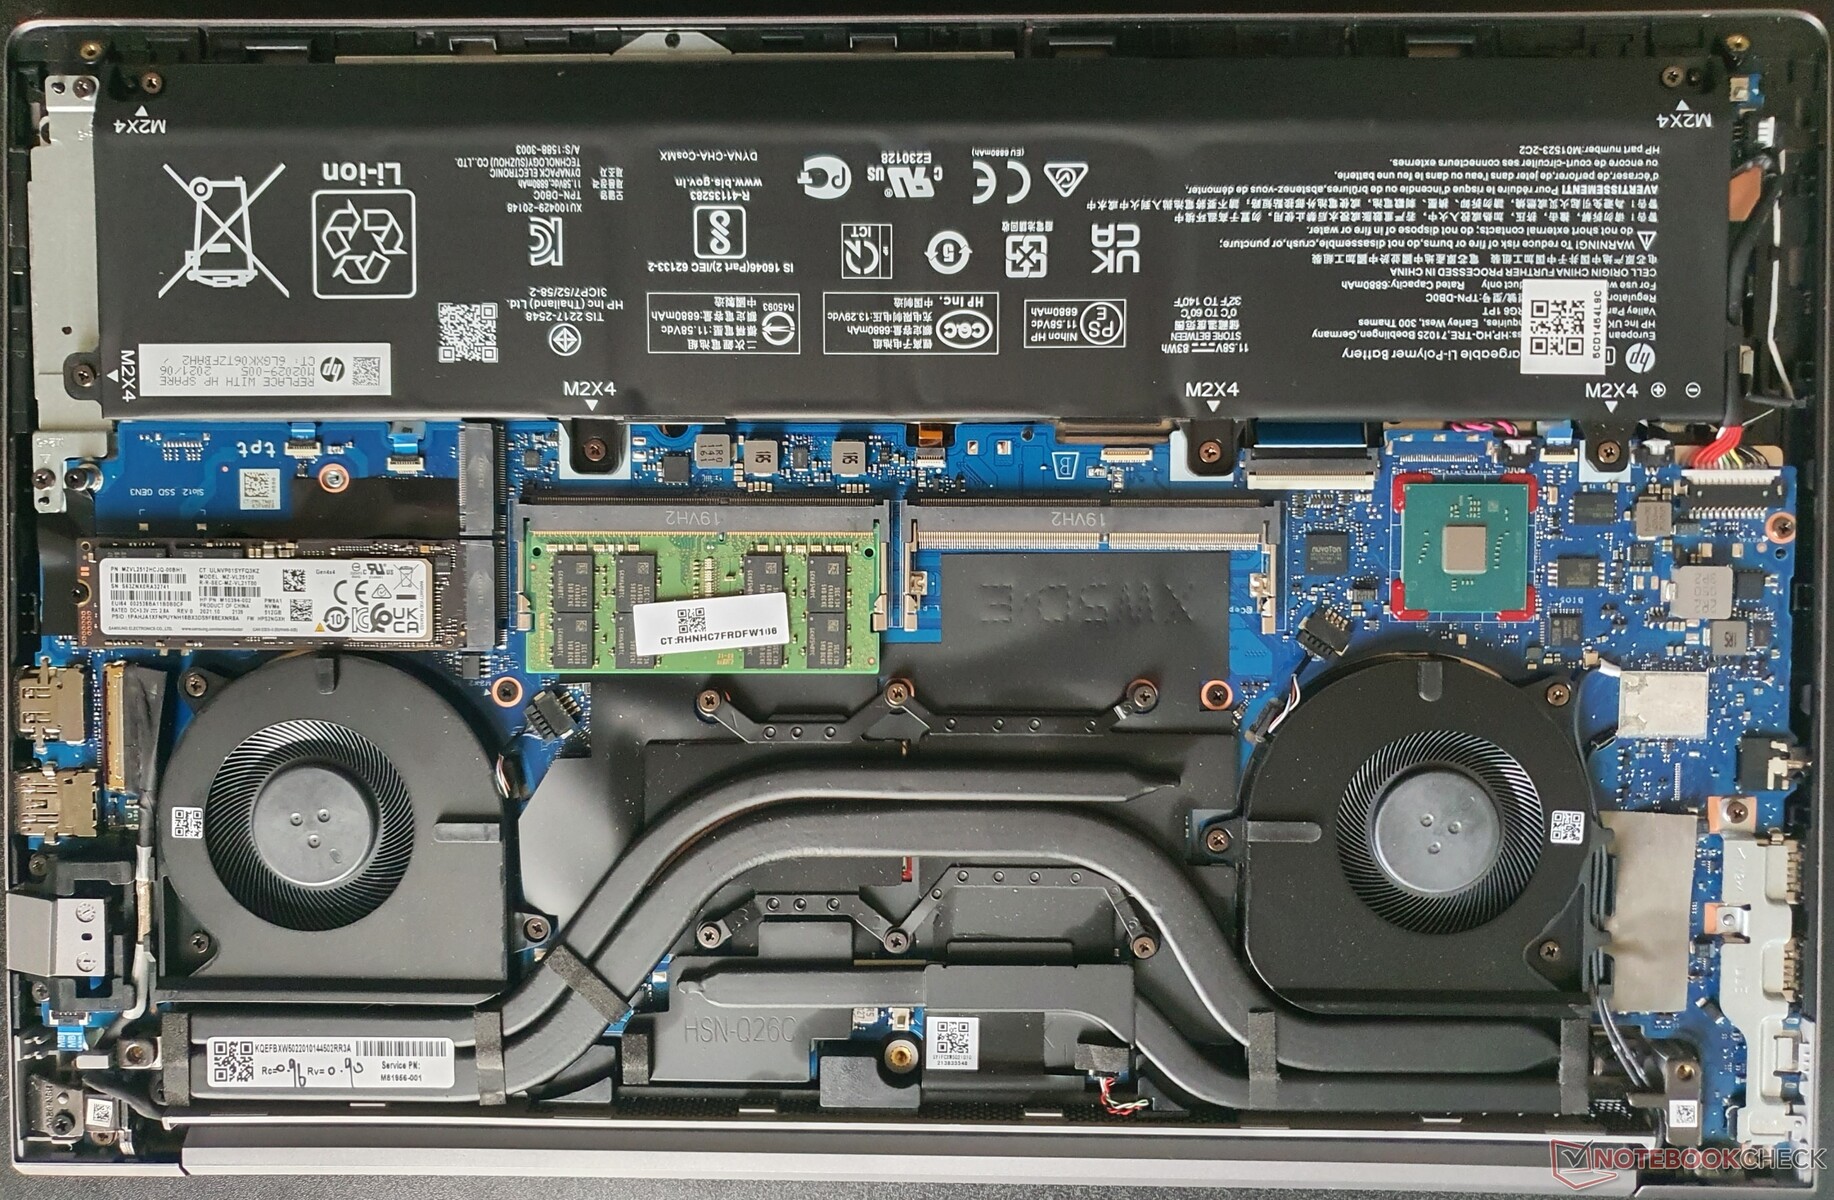
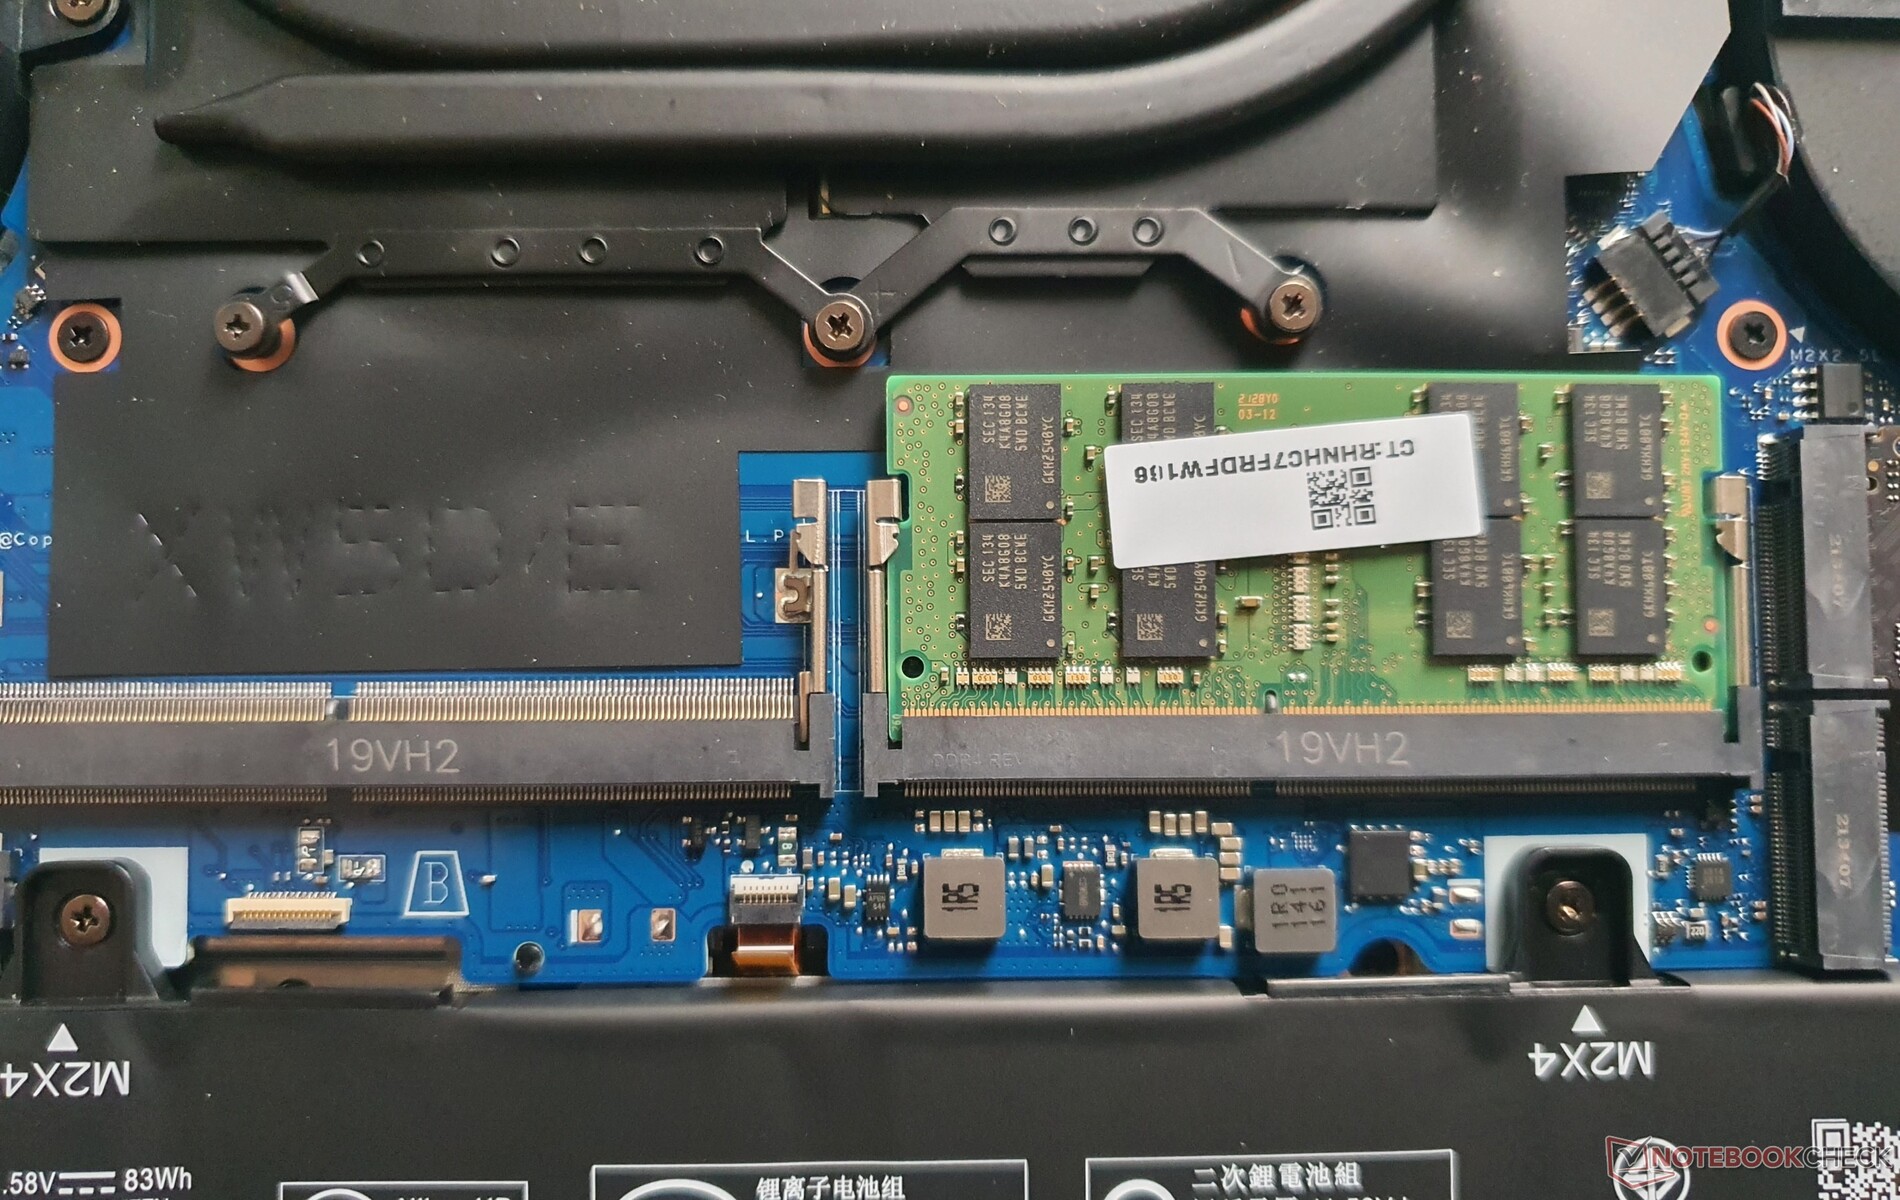
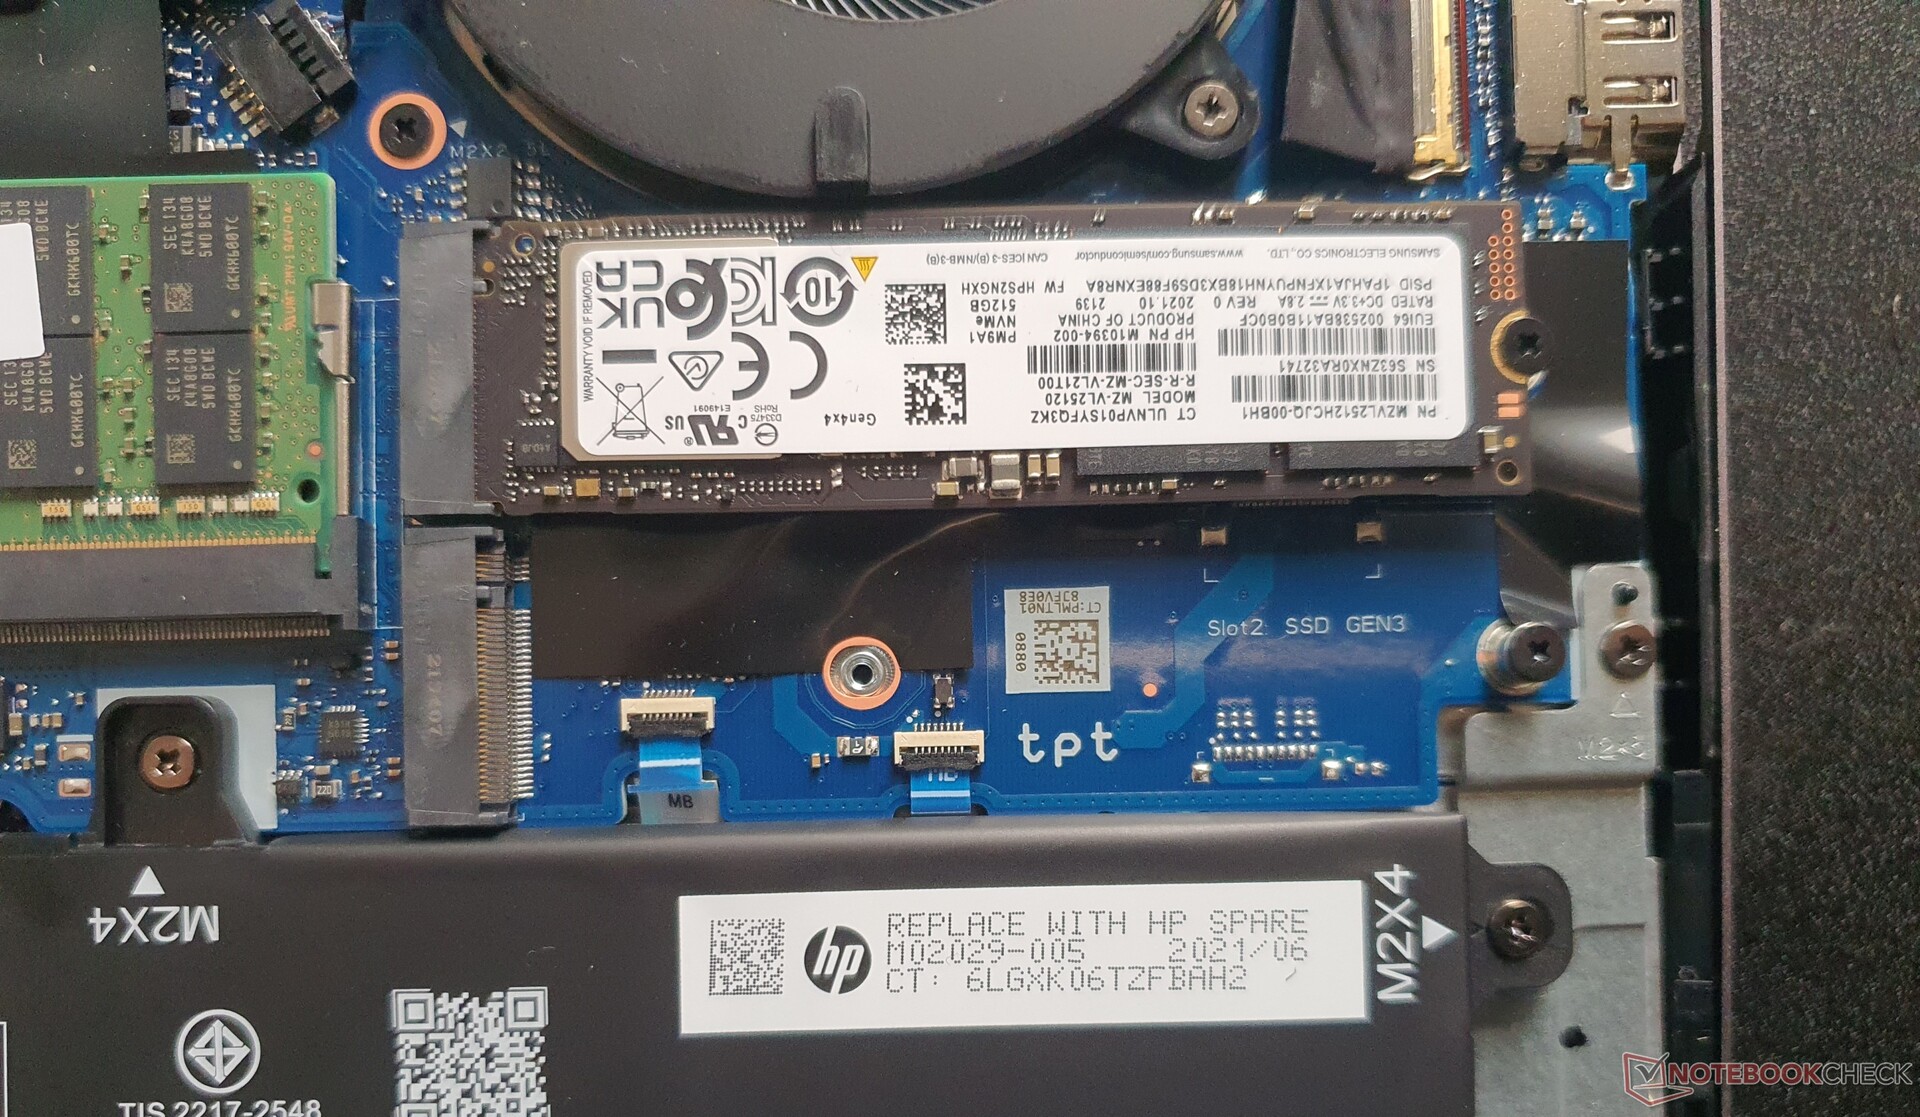
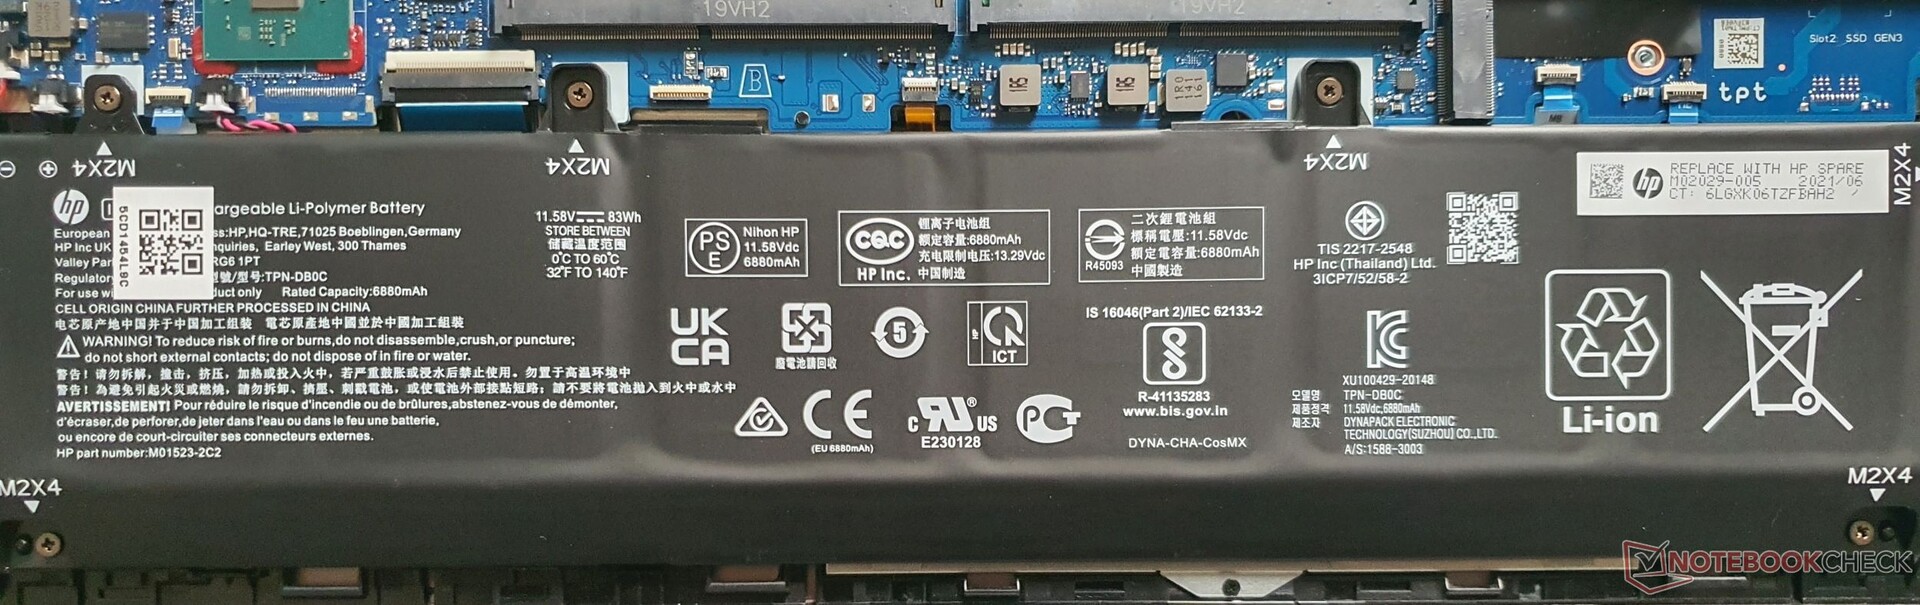
只需卸下五颗飞利浦螺丝,机箱底部就可以用一个塑料撬具轻松卸下。通过这种方式,你可以接触到2个SO DIMMs和2个M.2-2280插槽,同时电池也是可以更换的,螺旋式的冷却系统也可以得到维护。WLAN模块是焊接的,键盘也是固定的。没有WWAN。
担保
在德语区,惠普提供3年的标准保修期,可以延长到5年。它包括提货和退货服务,而现场服务费用另计。这与惠普对高端商务笔记本的政策相一致。
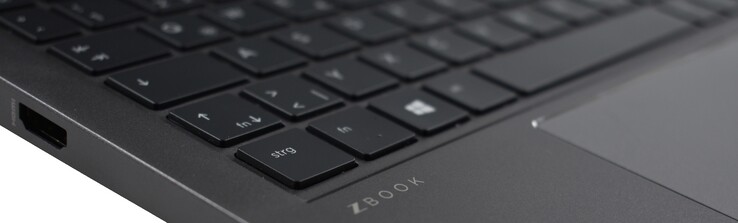
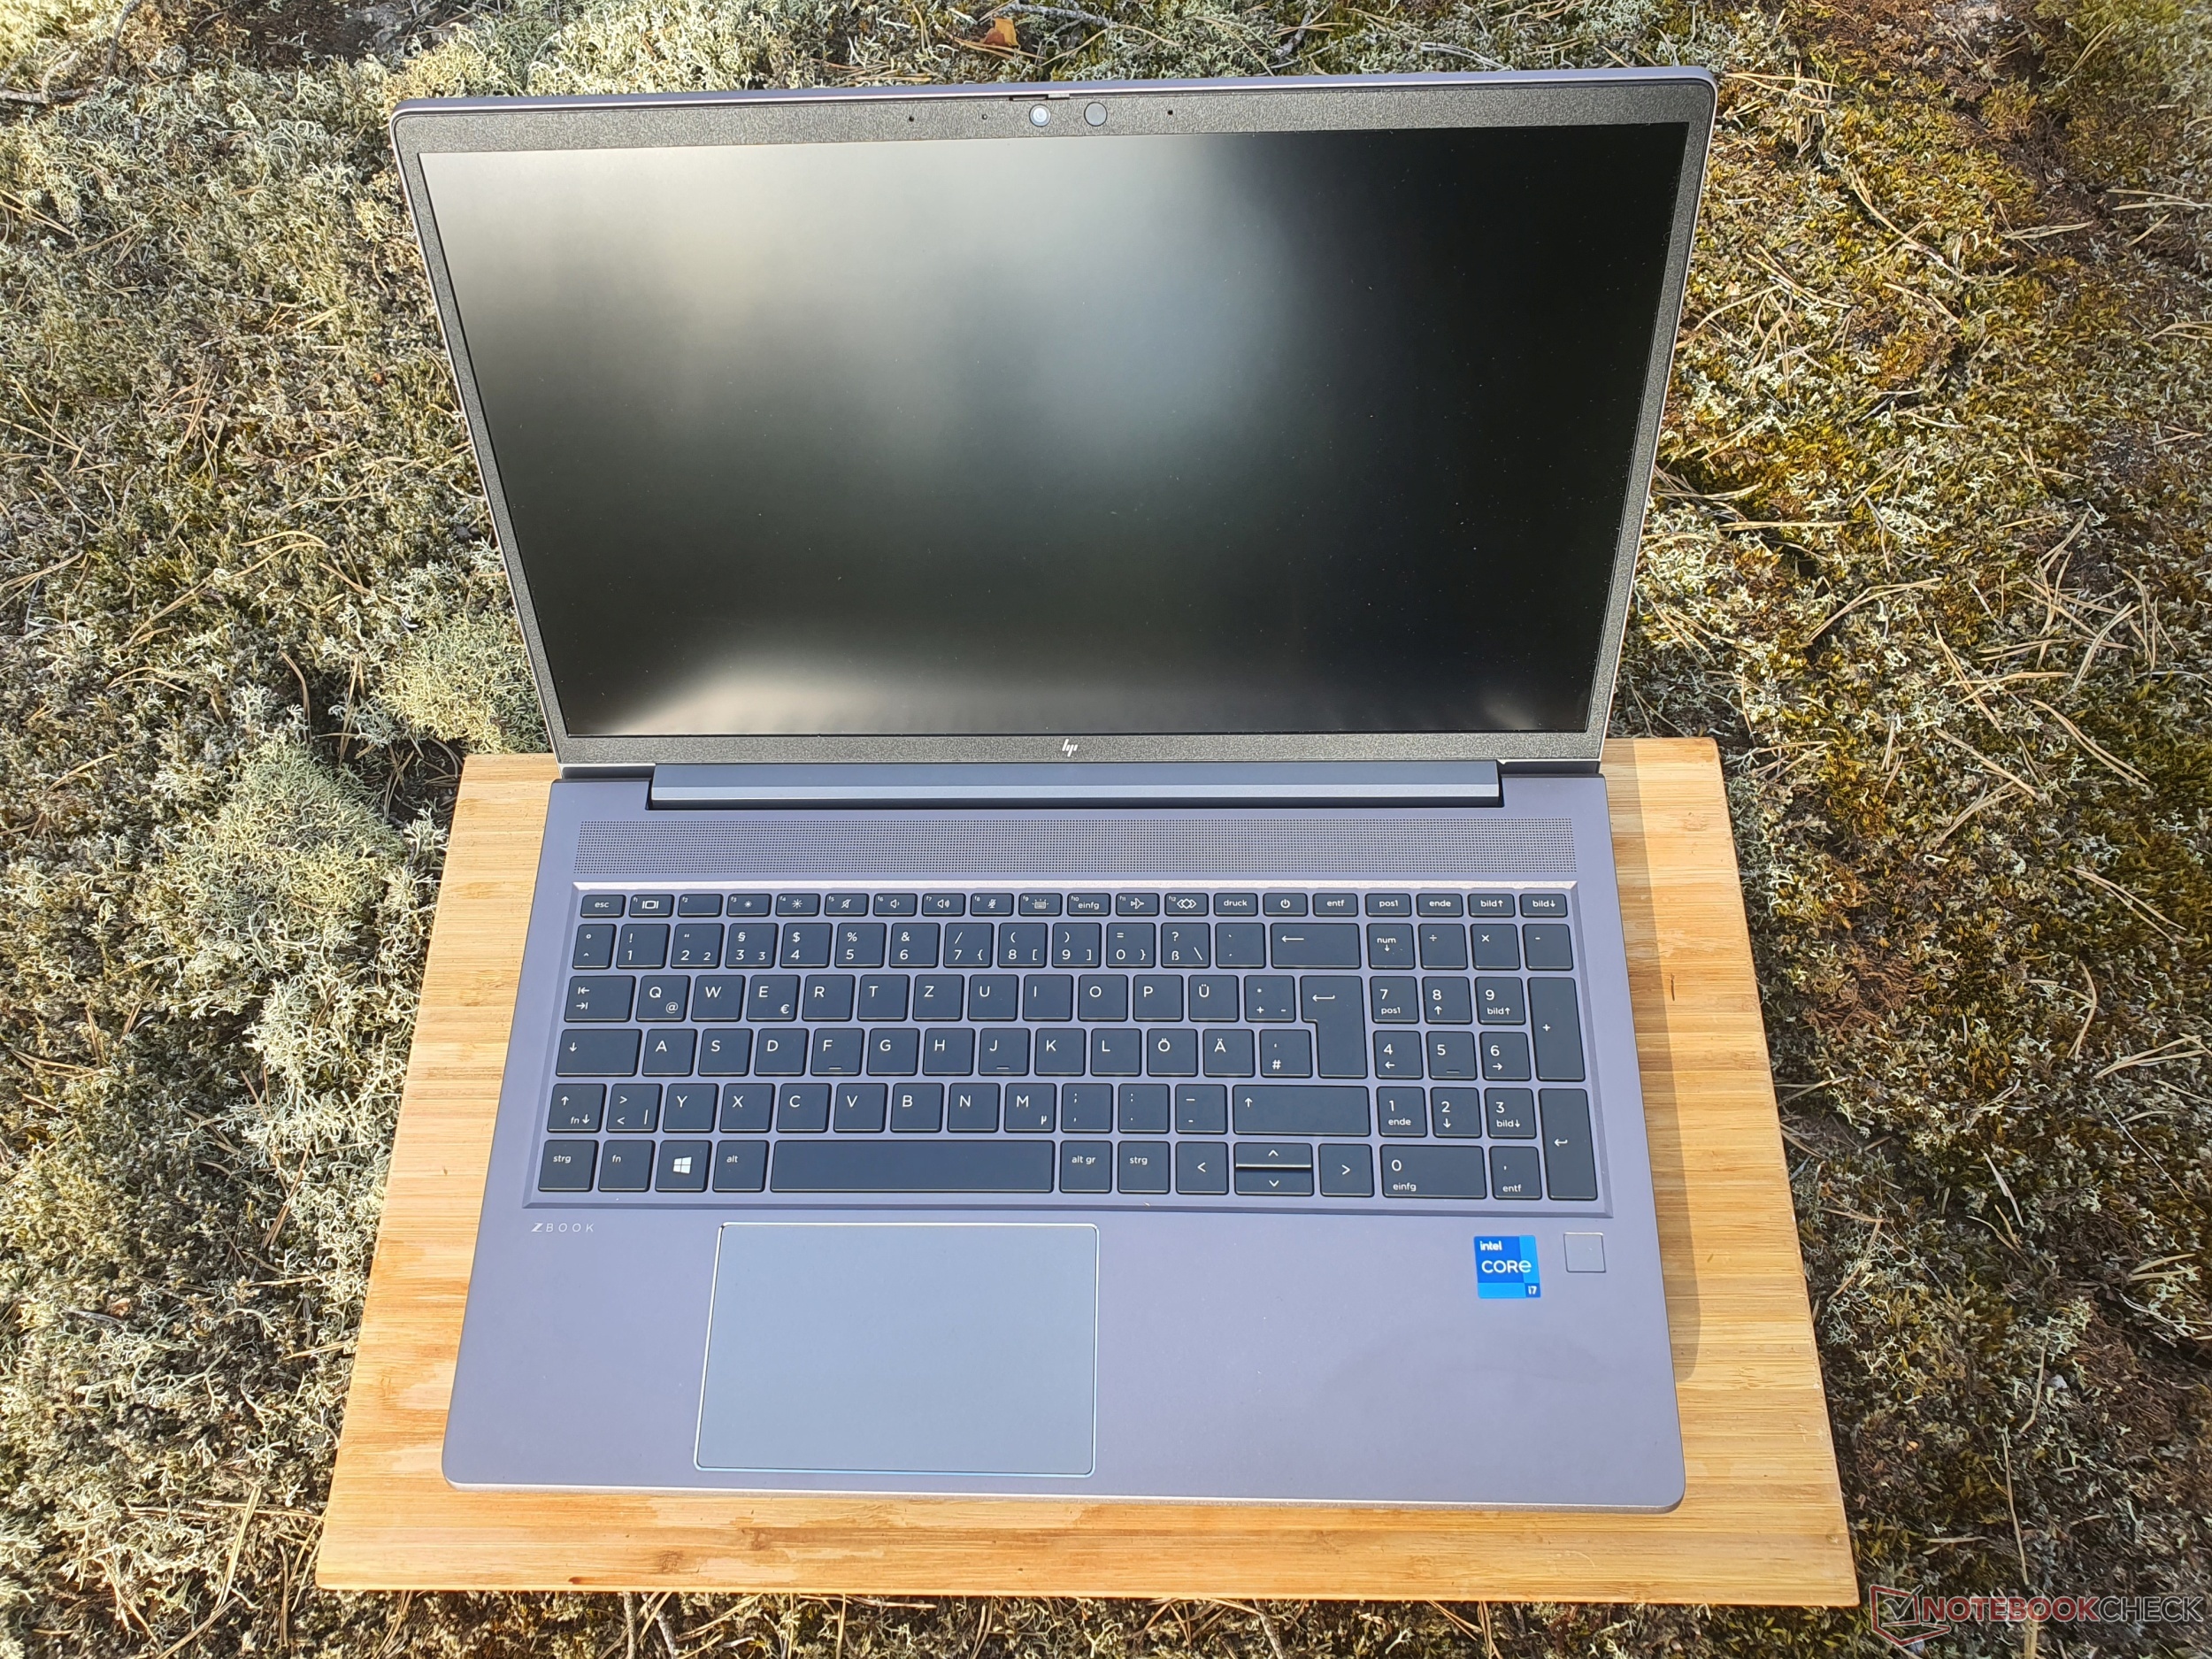
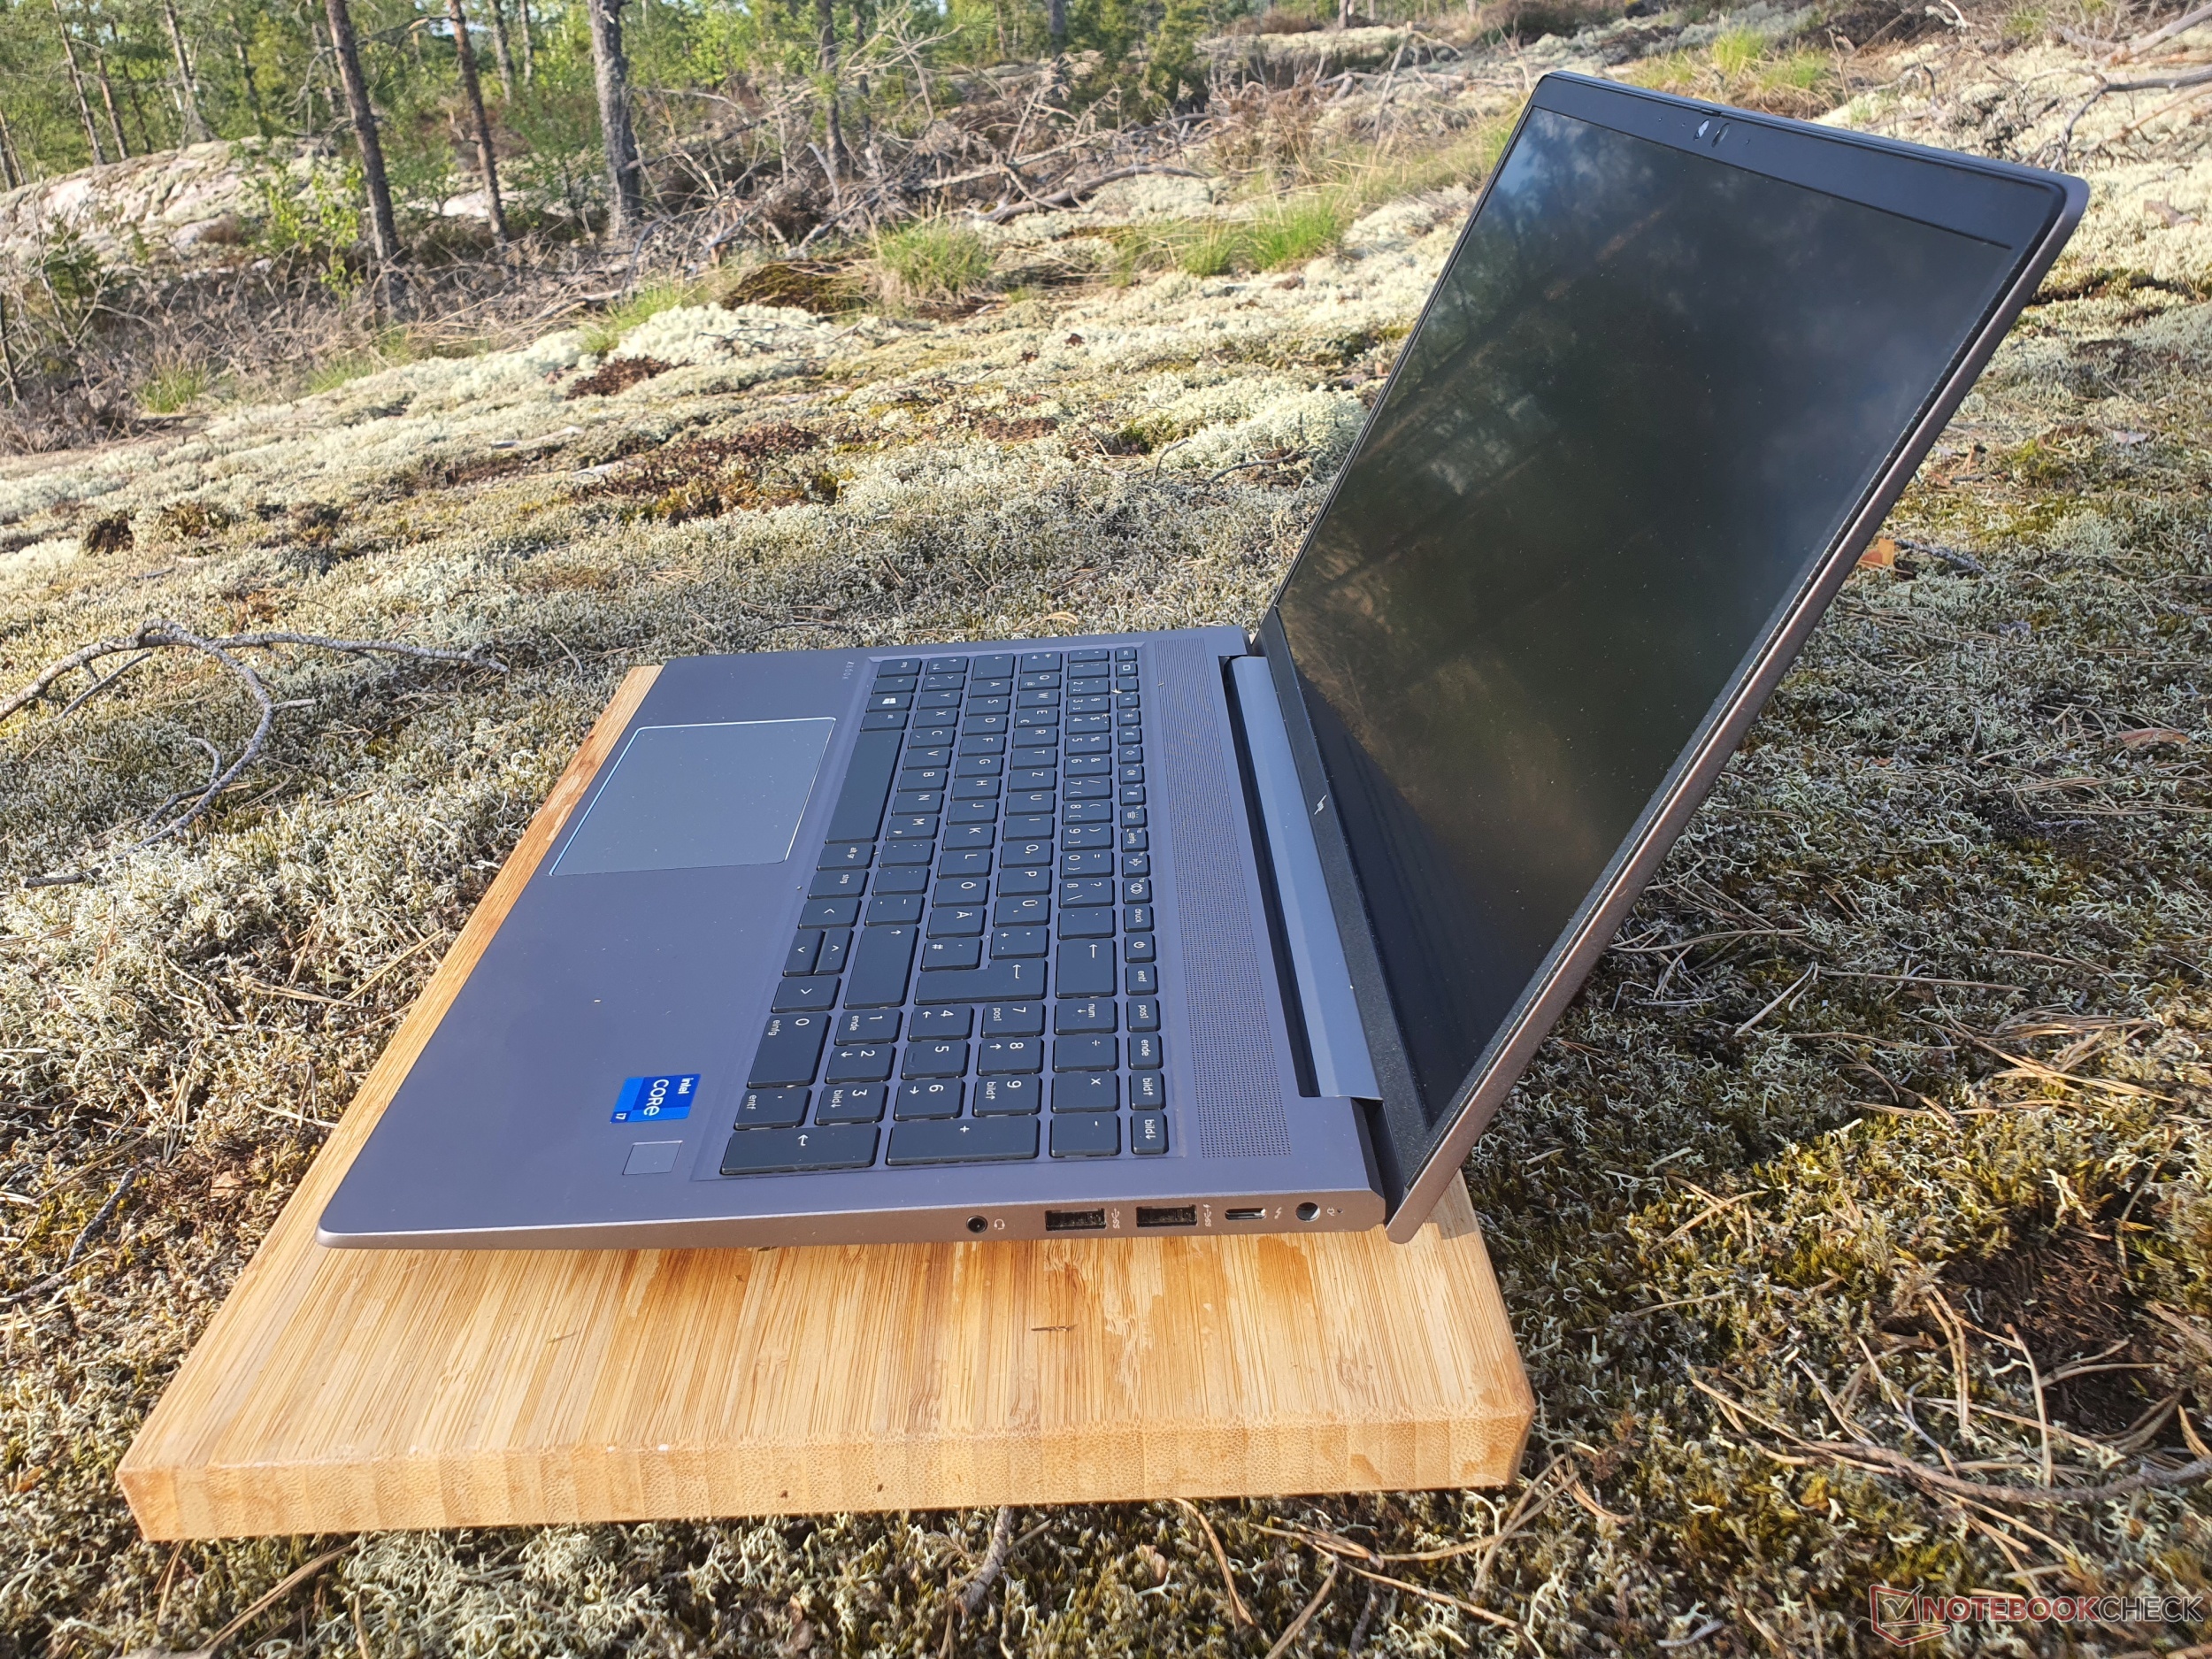
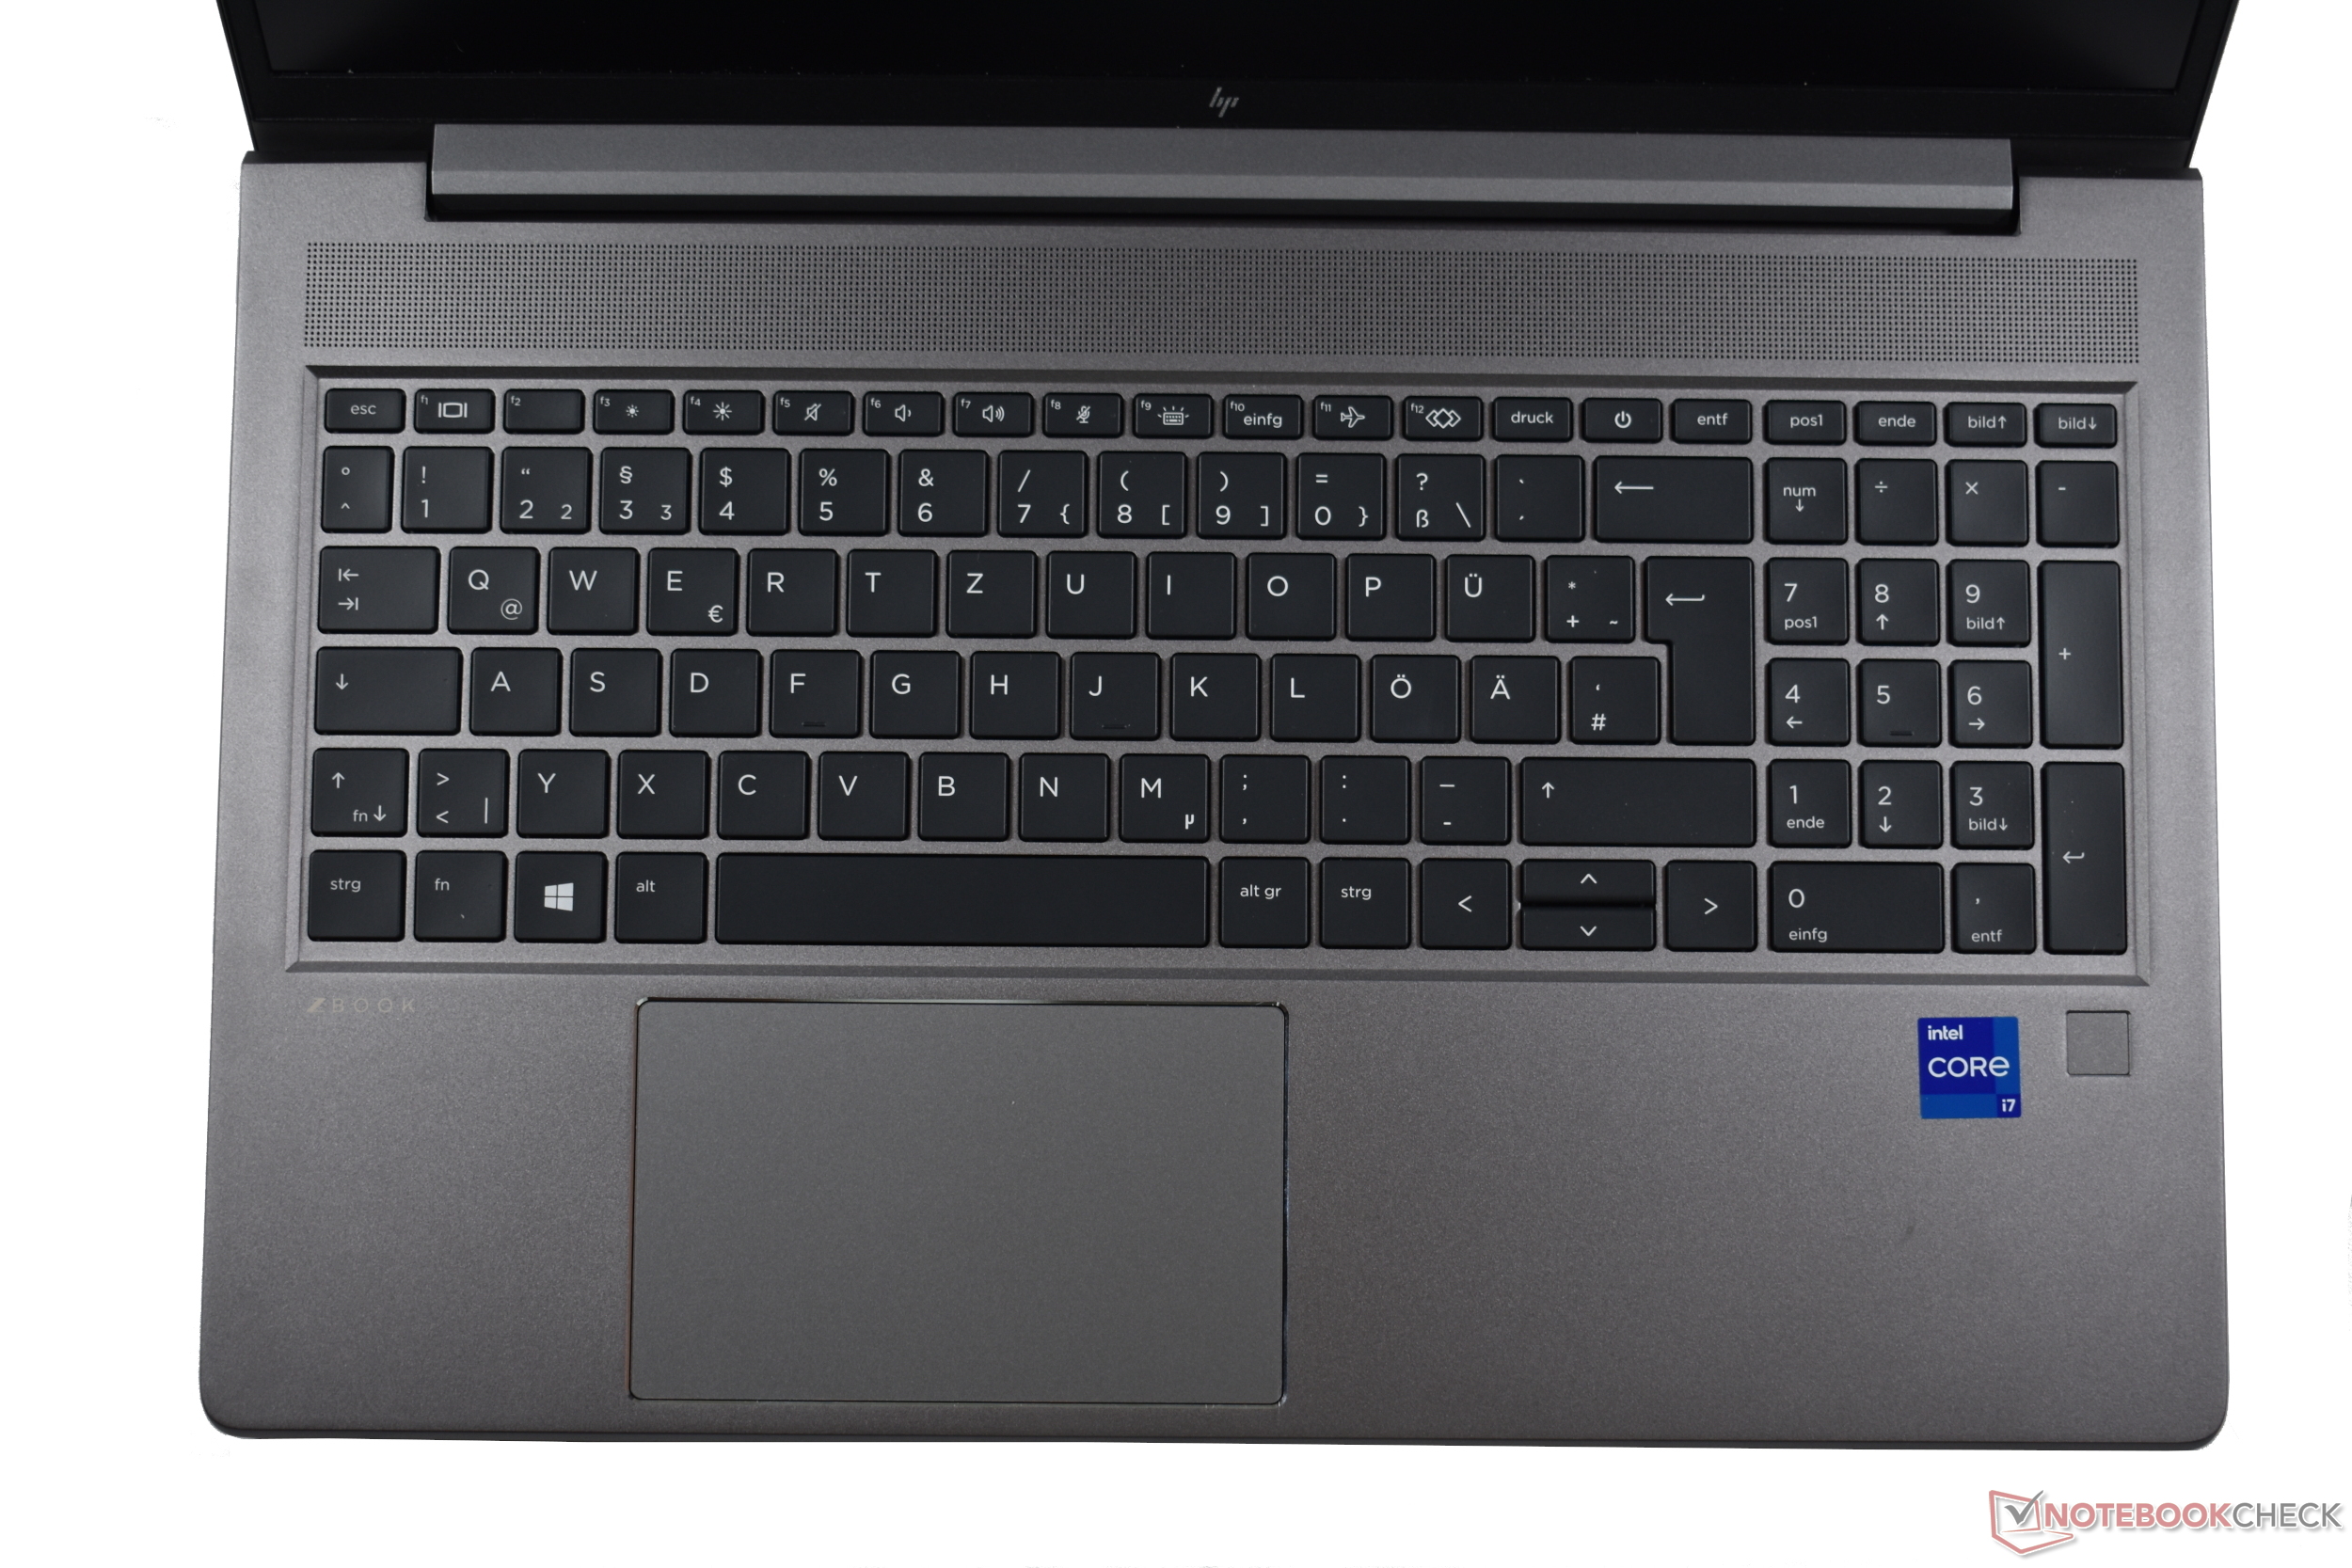
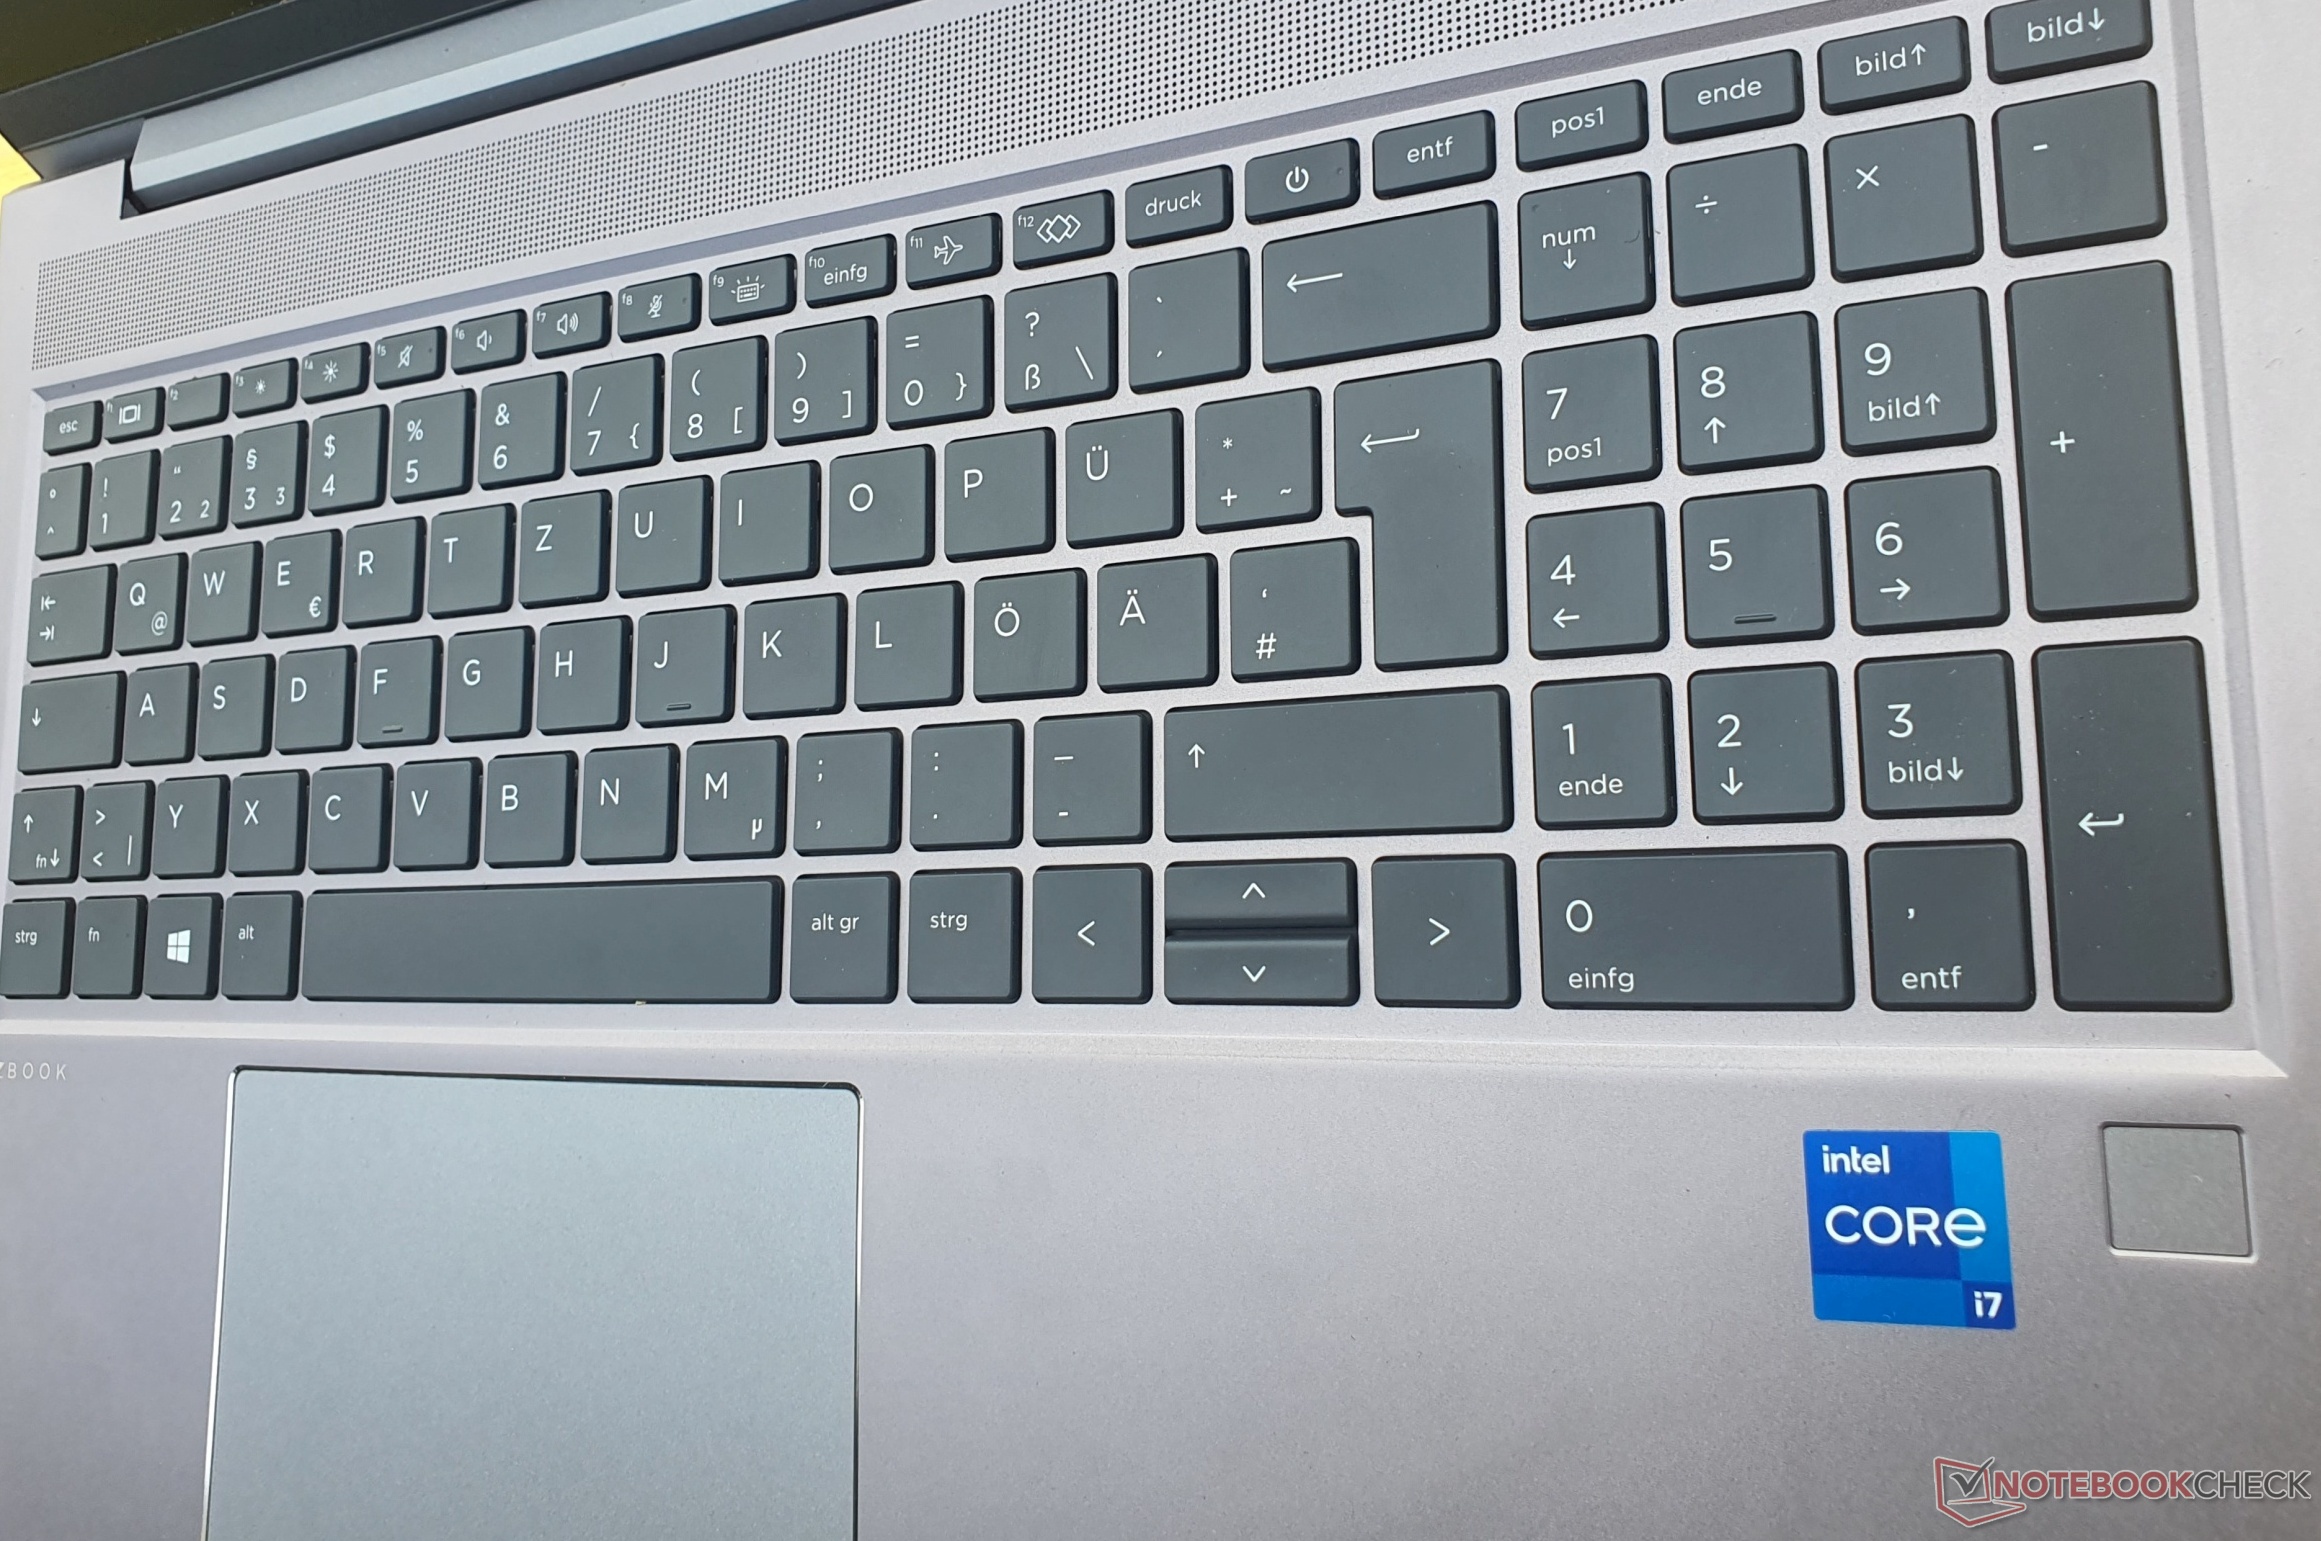
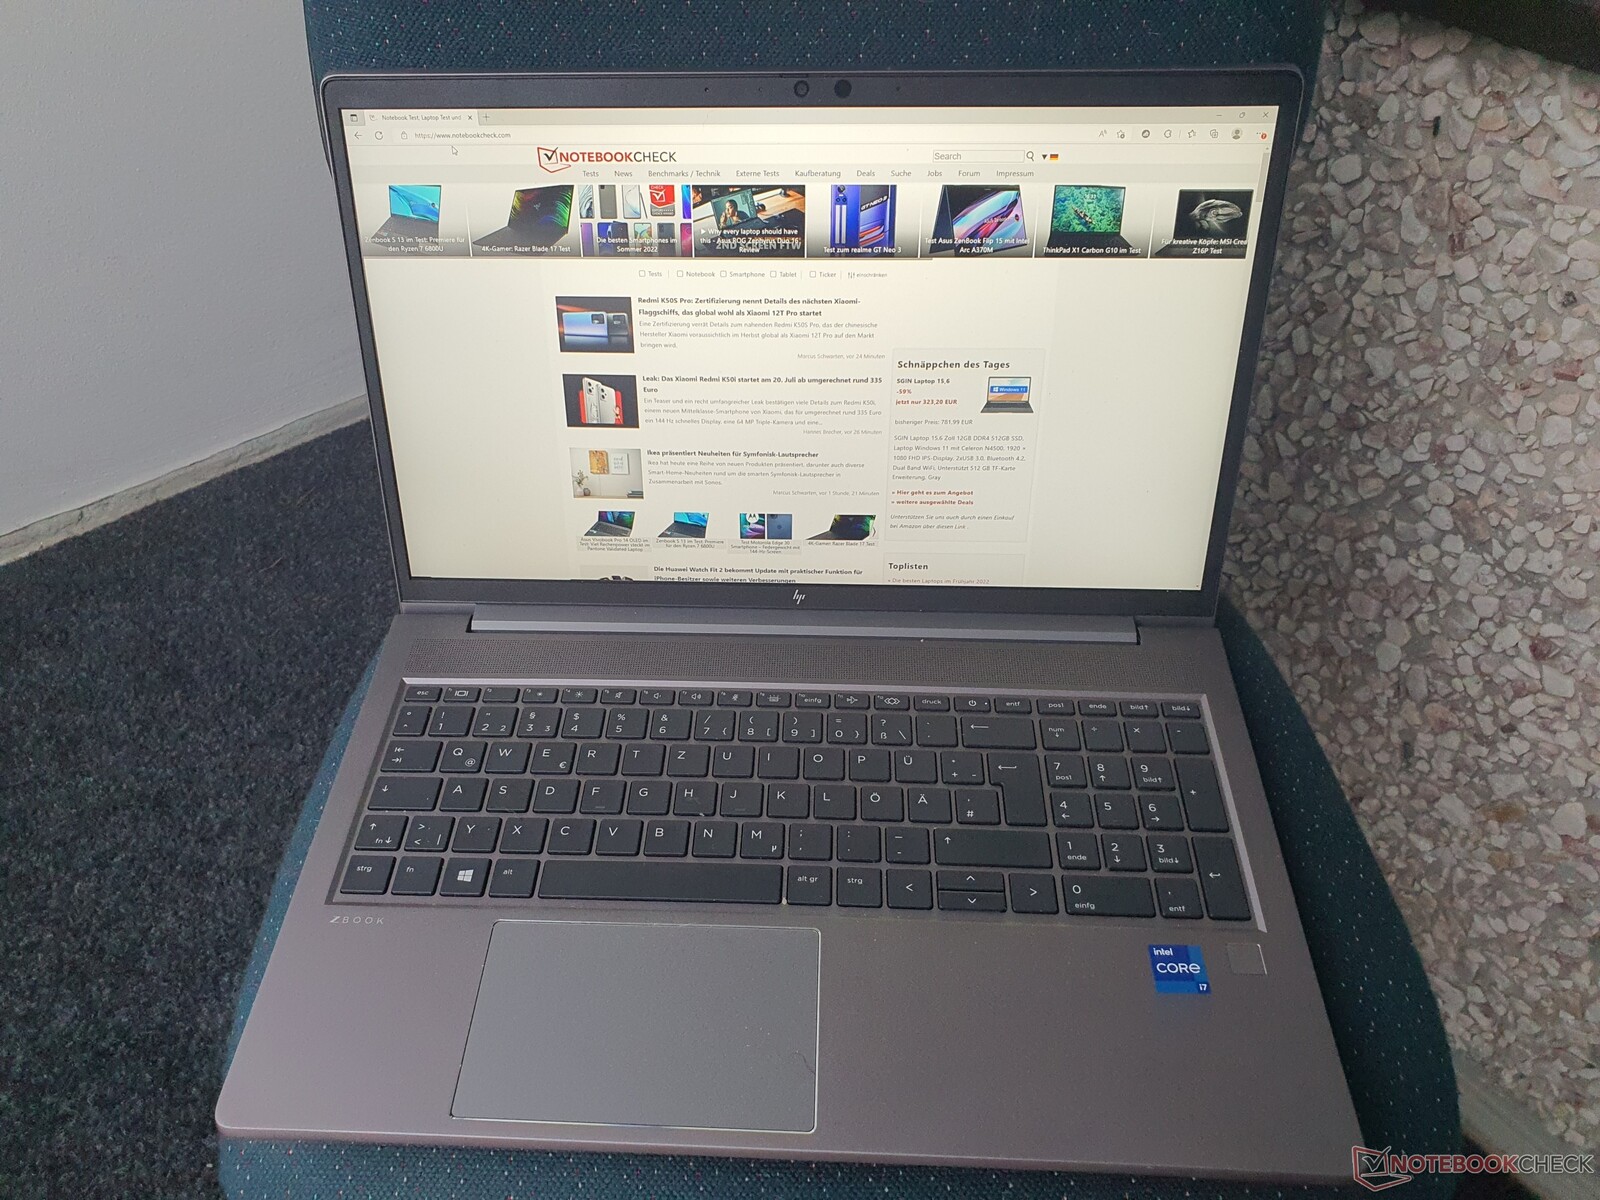
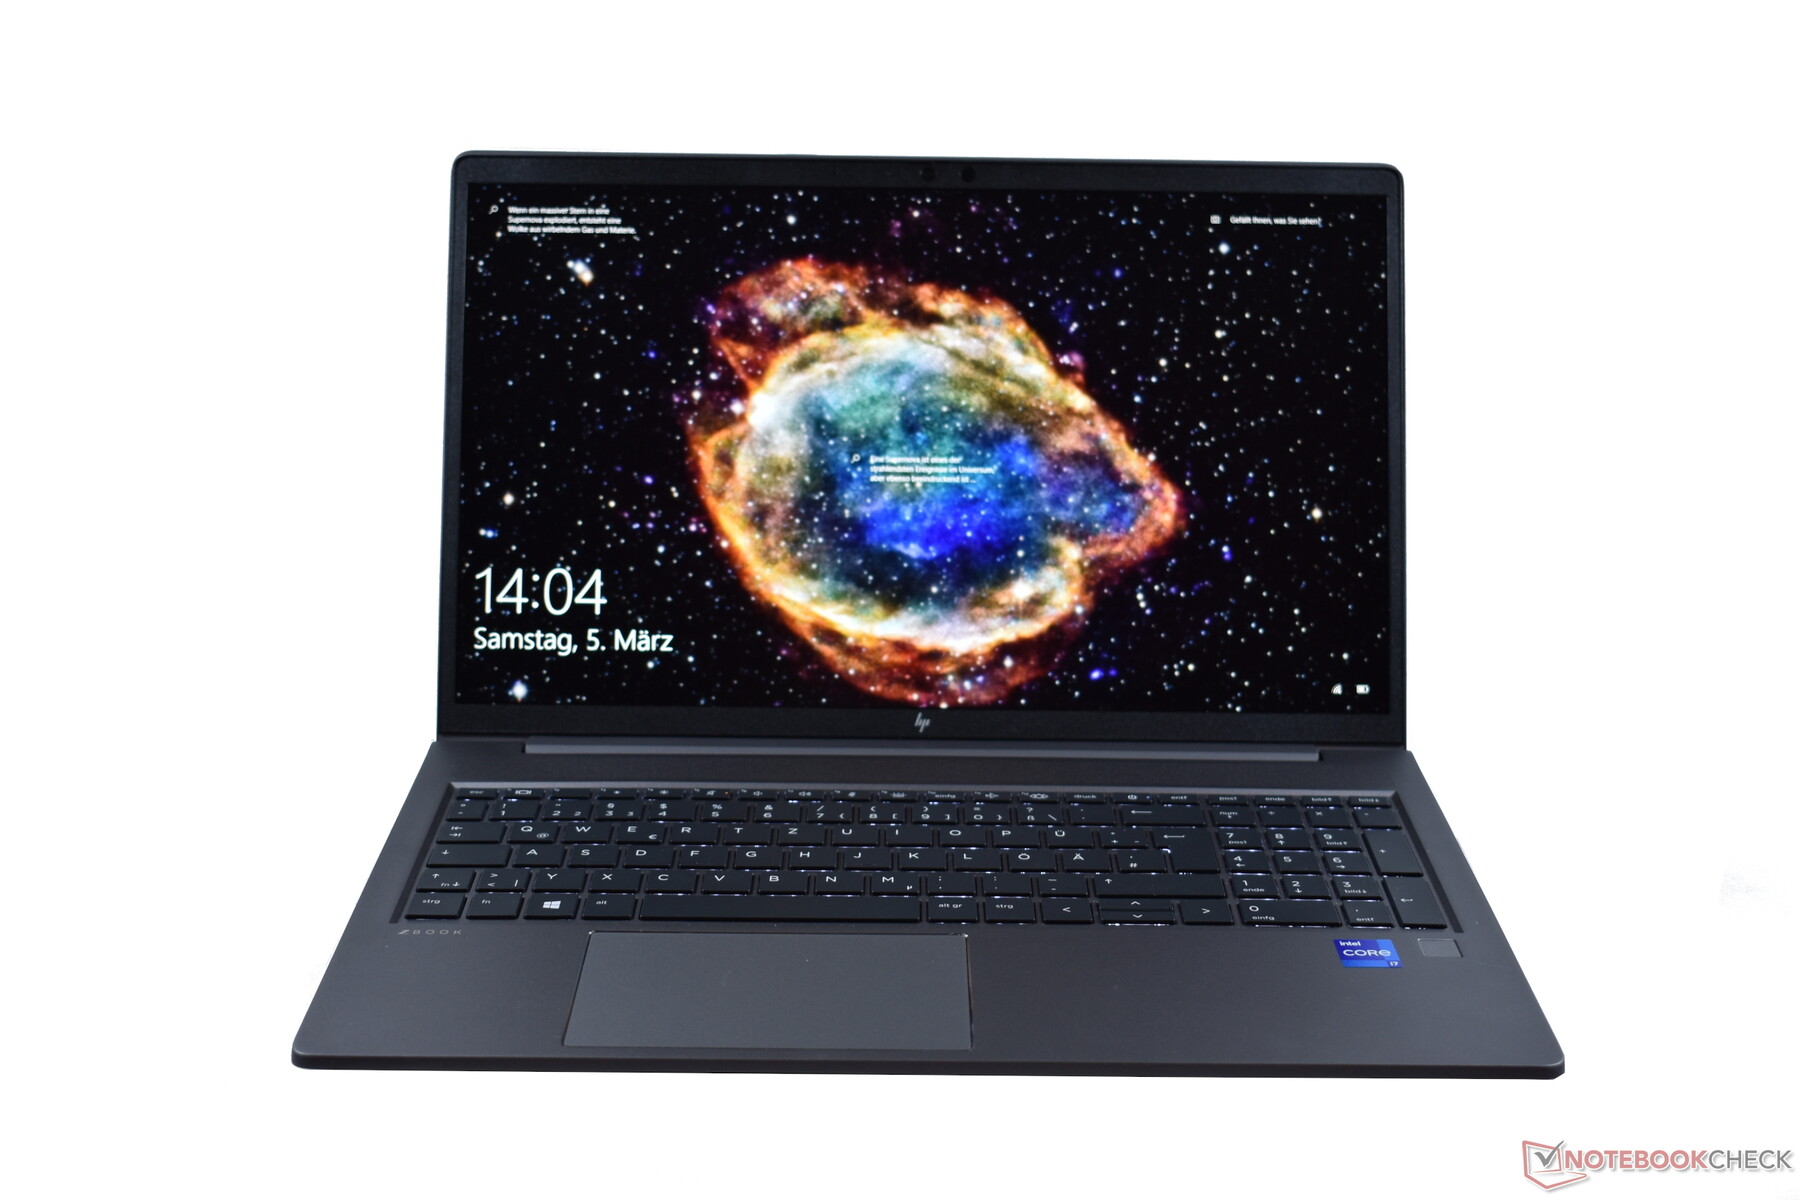
输入设备。ZBook Power以清晰的键盘给人留下深刻印象
键盘
虽然键盘的按键(15×15毫米,约0.6×0.6英寸)和距离略小,但字迹却较大。它与ZBook Firefly的键盘非常相似。 ZBook Firefly 和ZBook Fury因此,打字体验同样清晰,压力点也清晰可辨。1.5毫米(约0.06英寸)的行程增加了有吸引力的整体印象。
键盘是防溅的,它的操作仍然是吸引人的安静。它只能通过在一个地方施加一些压力来非常轻微地压下去。它不一定比ThinkPad P15v差。 ThinkPad P15v.
布局非常成功,但按键较小的包括回车键、左移键、垂直方向键、数字块和顶排。电源键也集成在顶排,但不小心按下它不会导致笔记本电脑进入睡眠状态。有一个两段式照明,其持续时间可以在BIOS中配置。
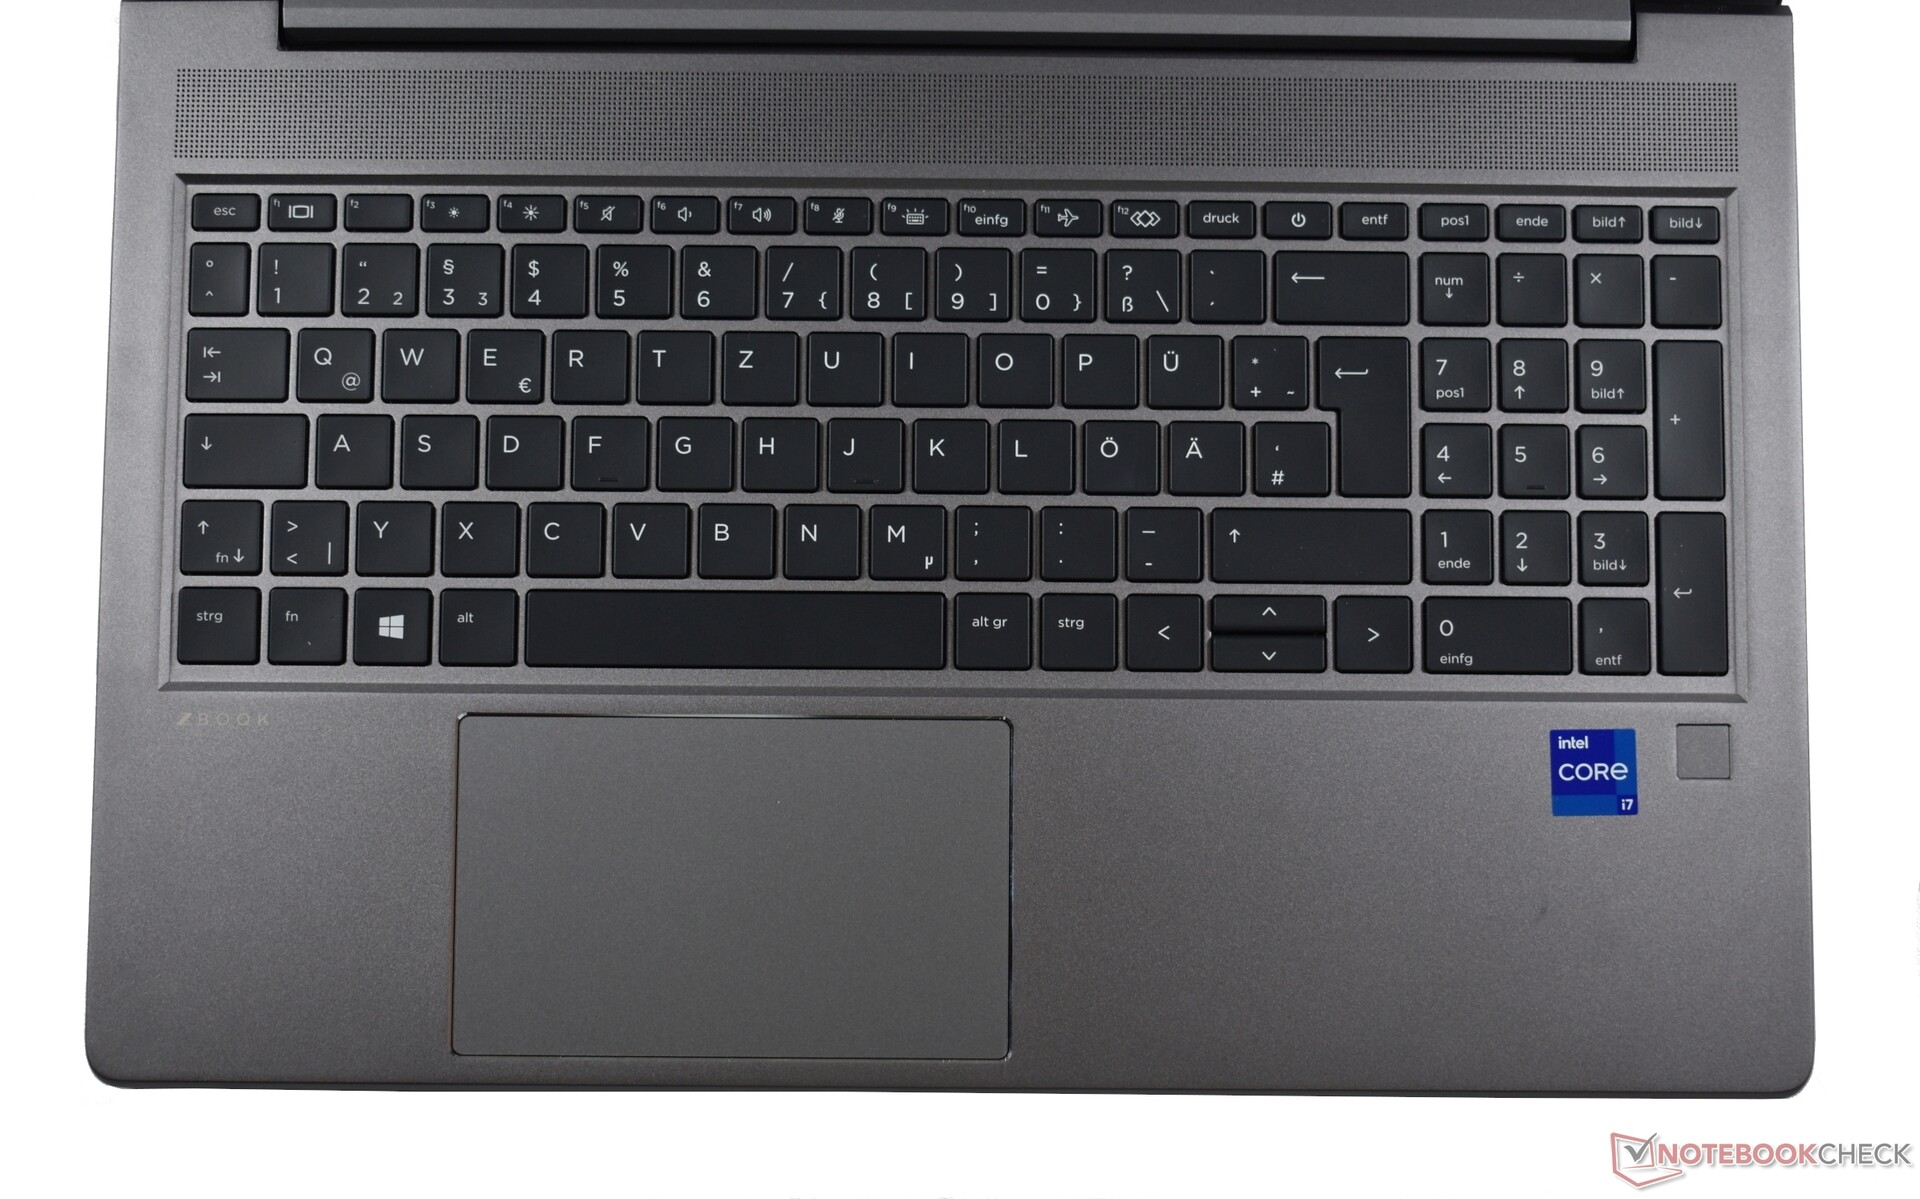
触摸板
11.5×7厘米(约4.5×2.75英寸),反应非常灵敏和精确。光滑的玻璃表面提供了非常好的滑动特性,所有的手势都能完美地实现。集成的按键行程适中,产生强大而响亮的反馈。
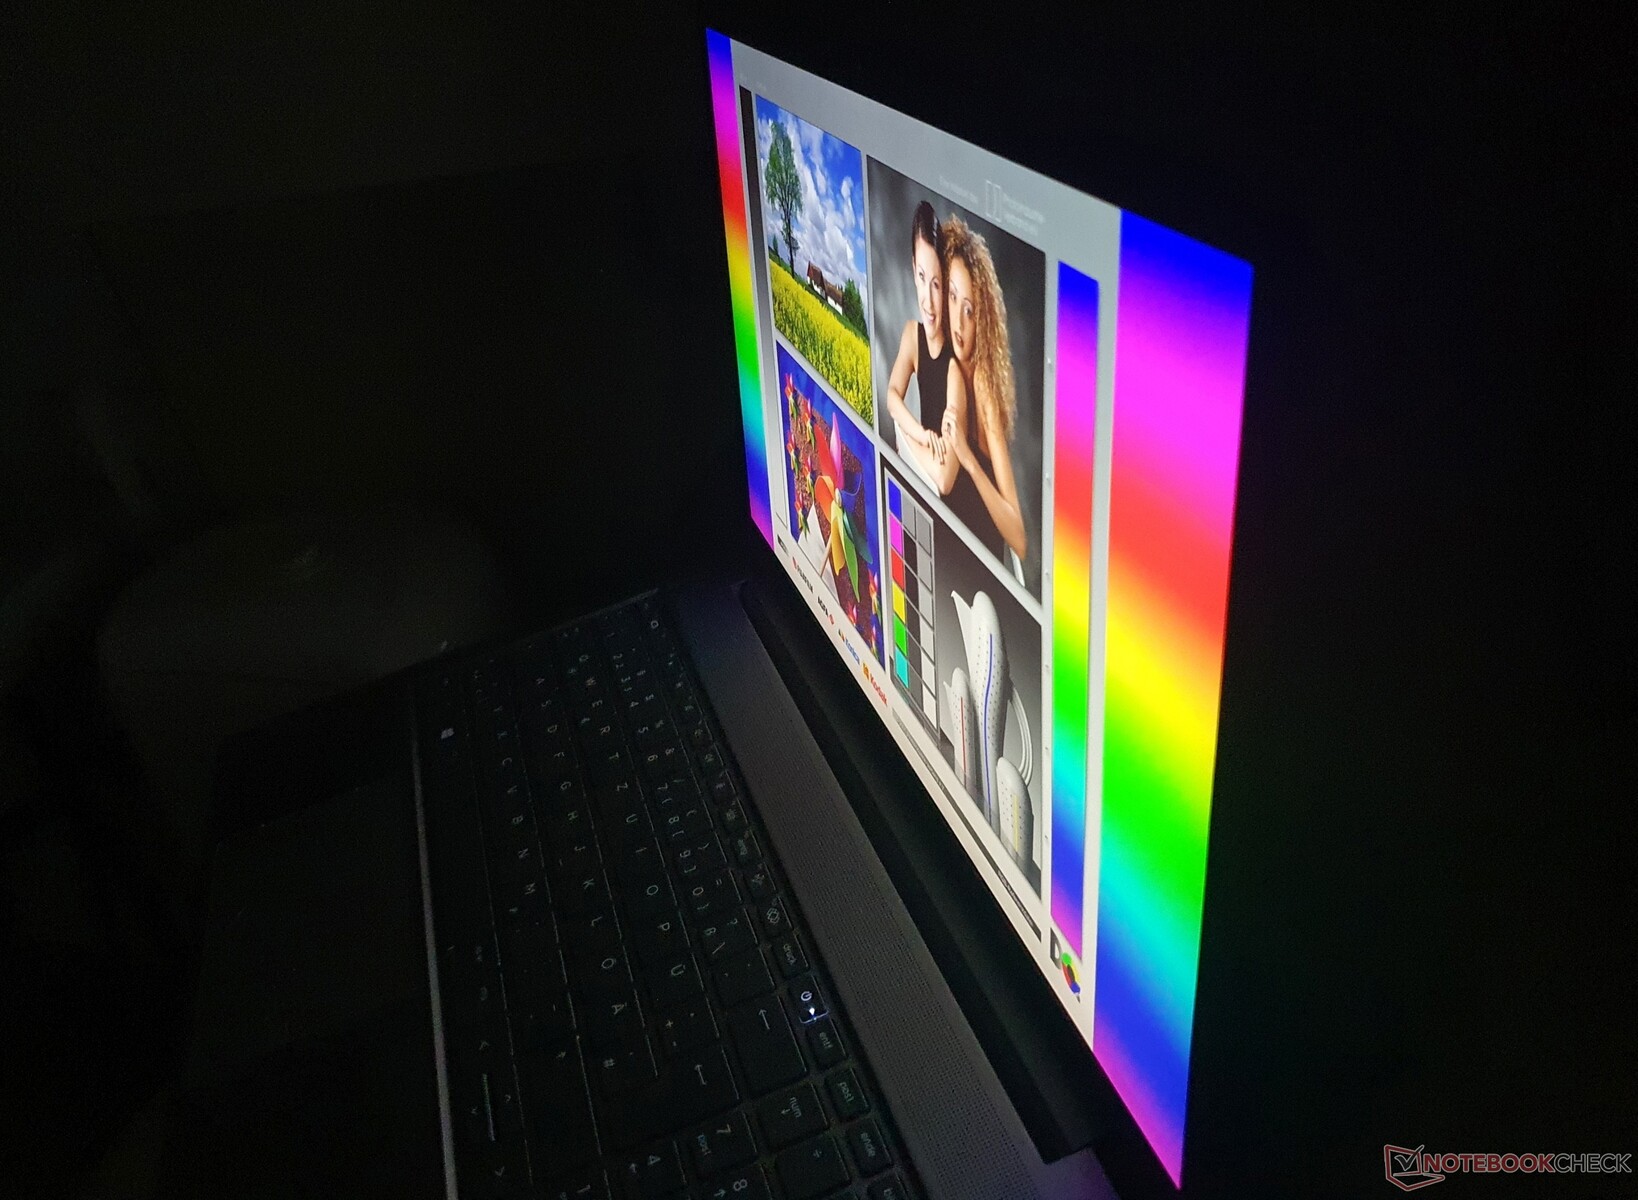
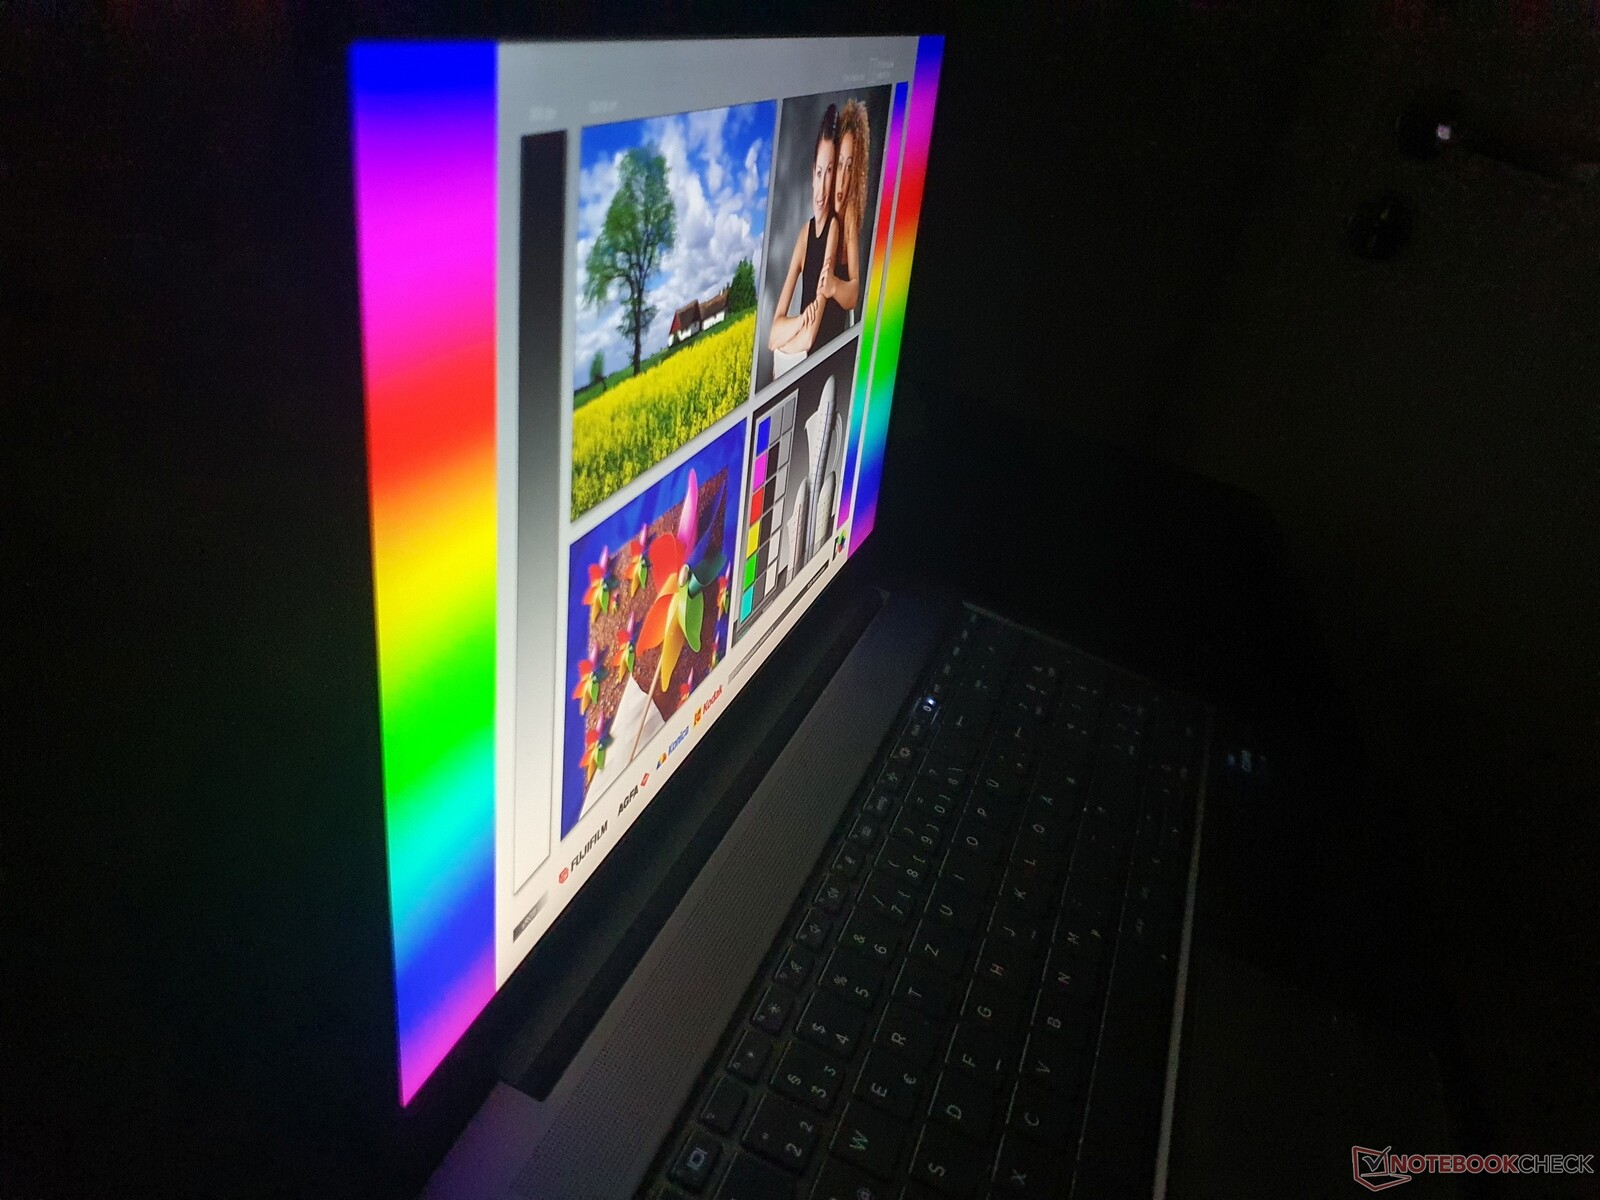
ZBook Power中明亮且高对比度的FHD显示屏
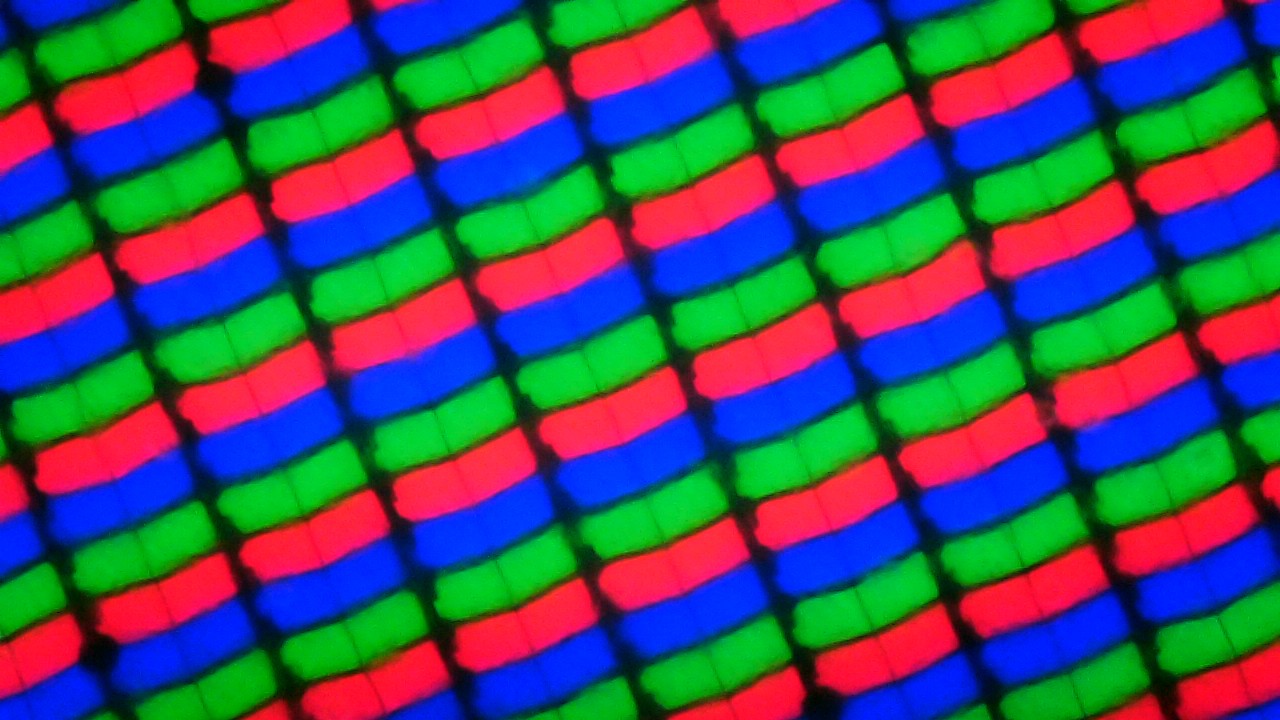

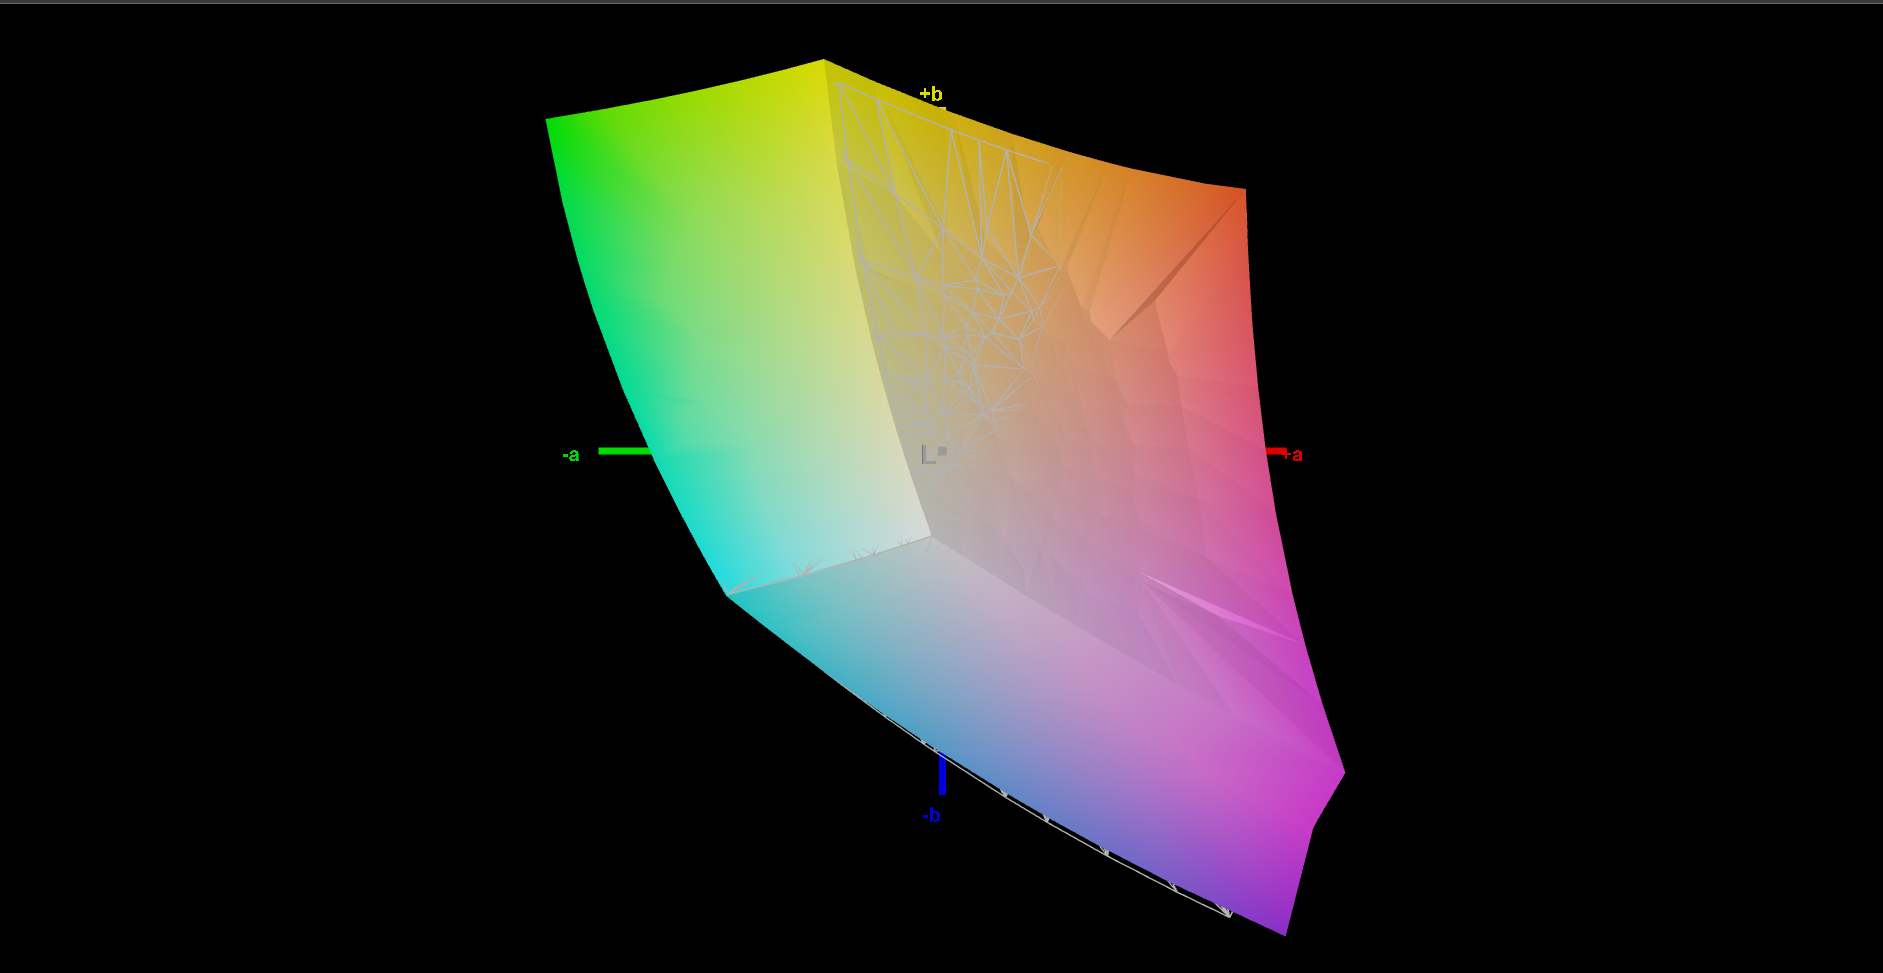
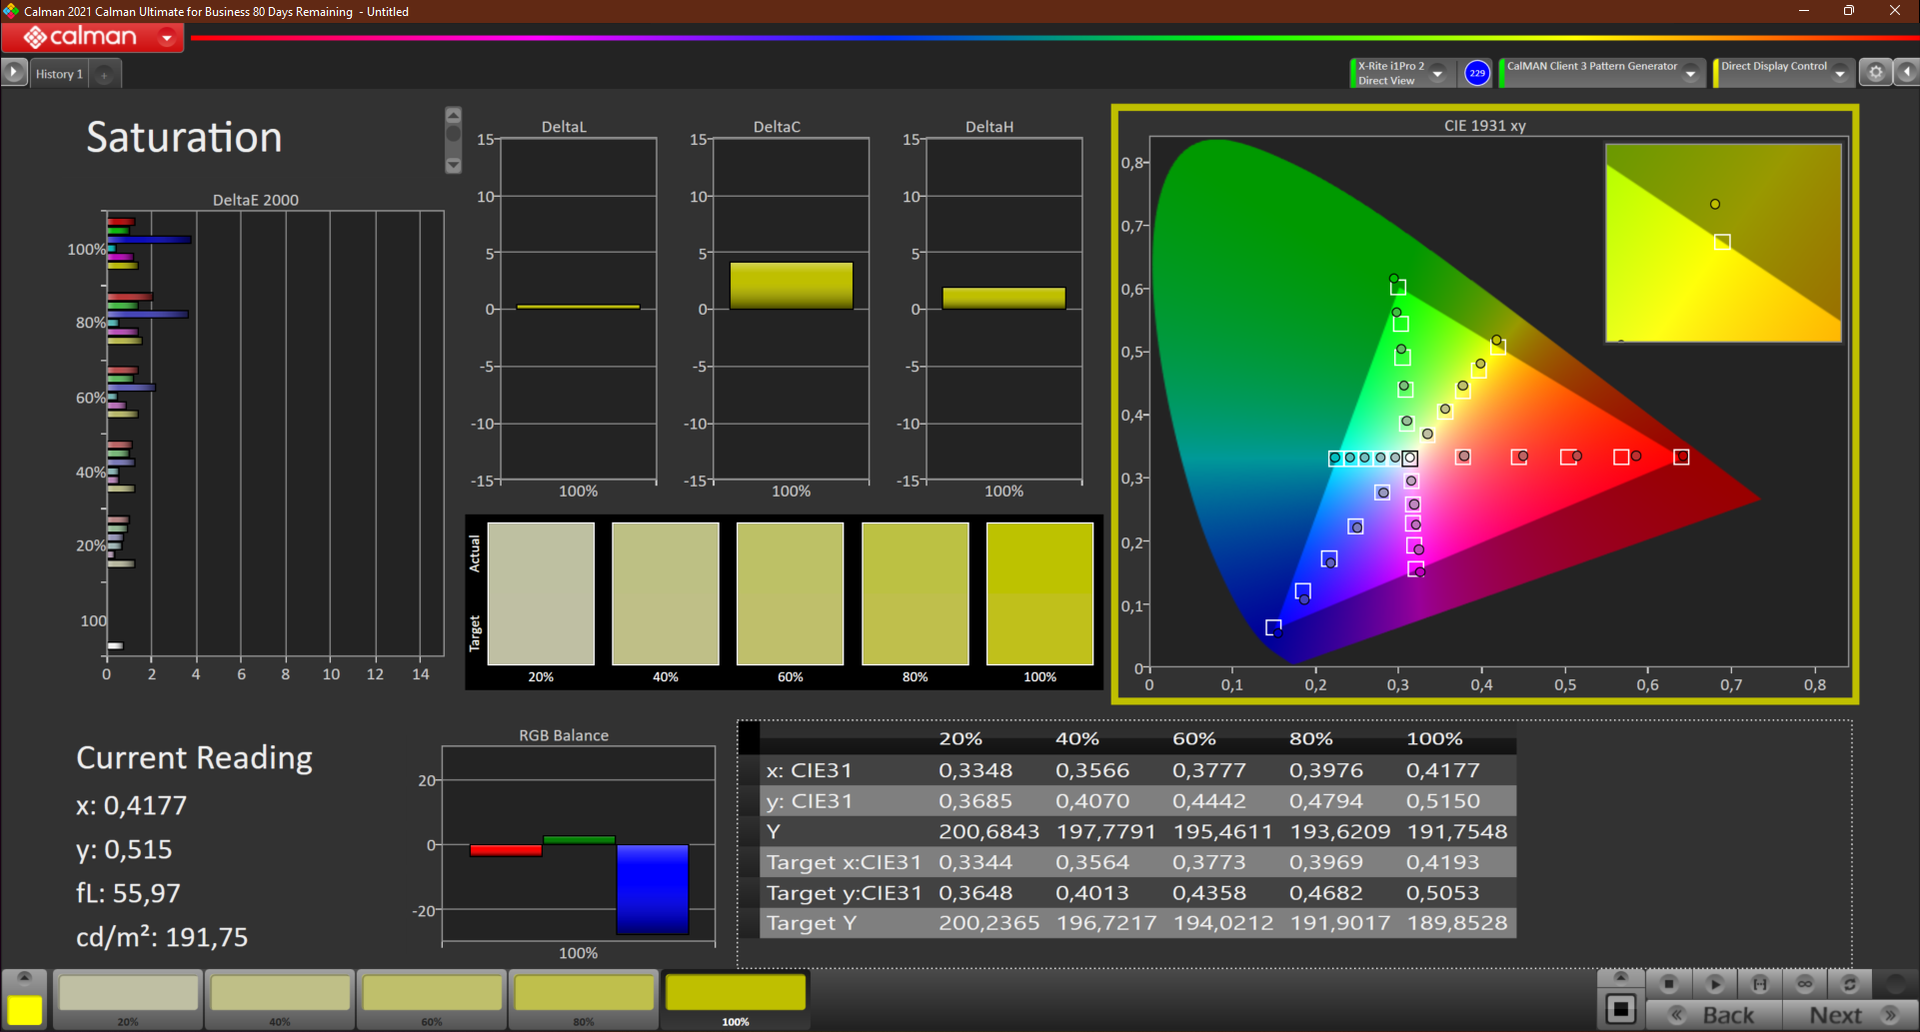
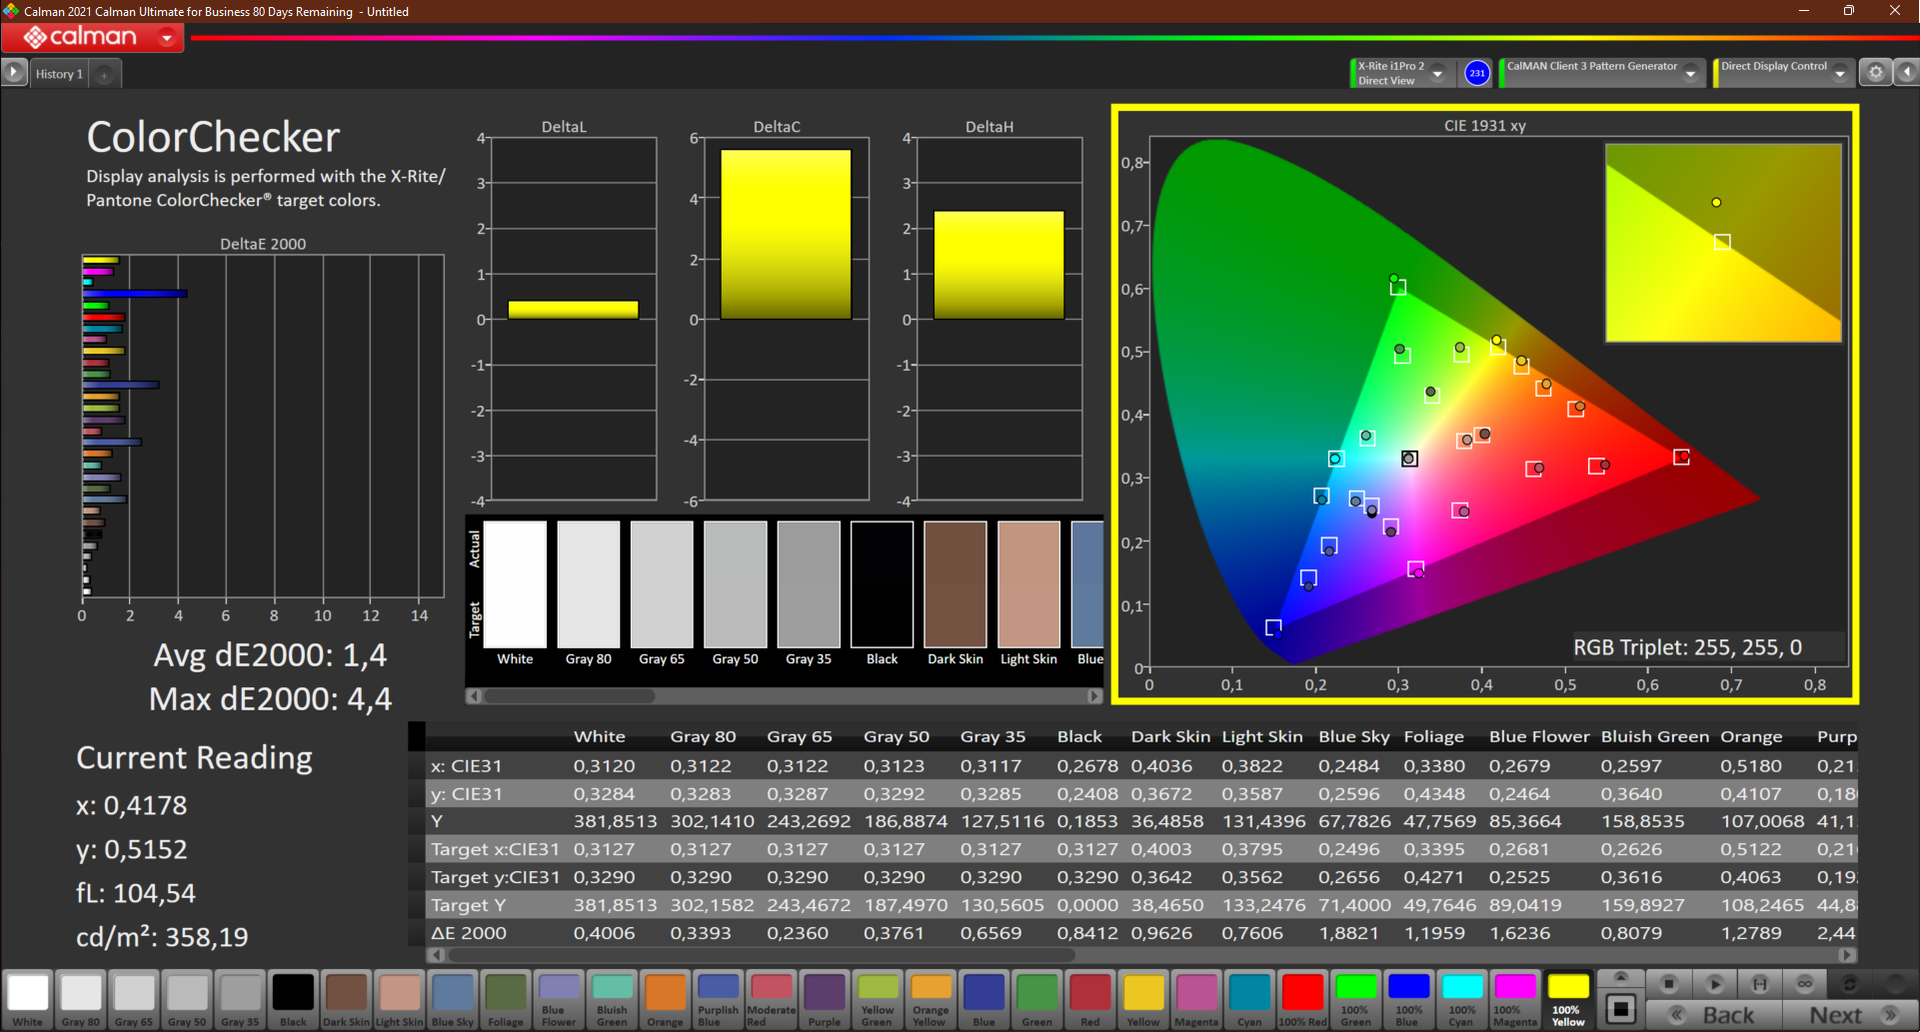
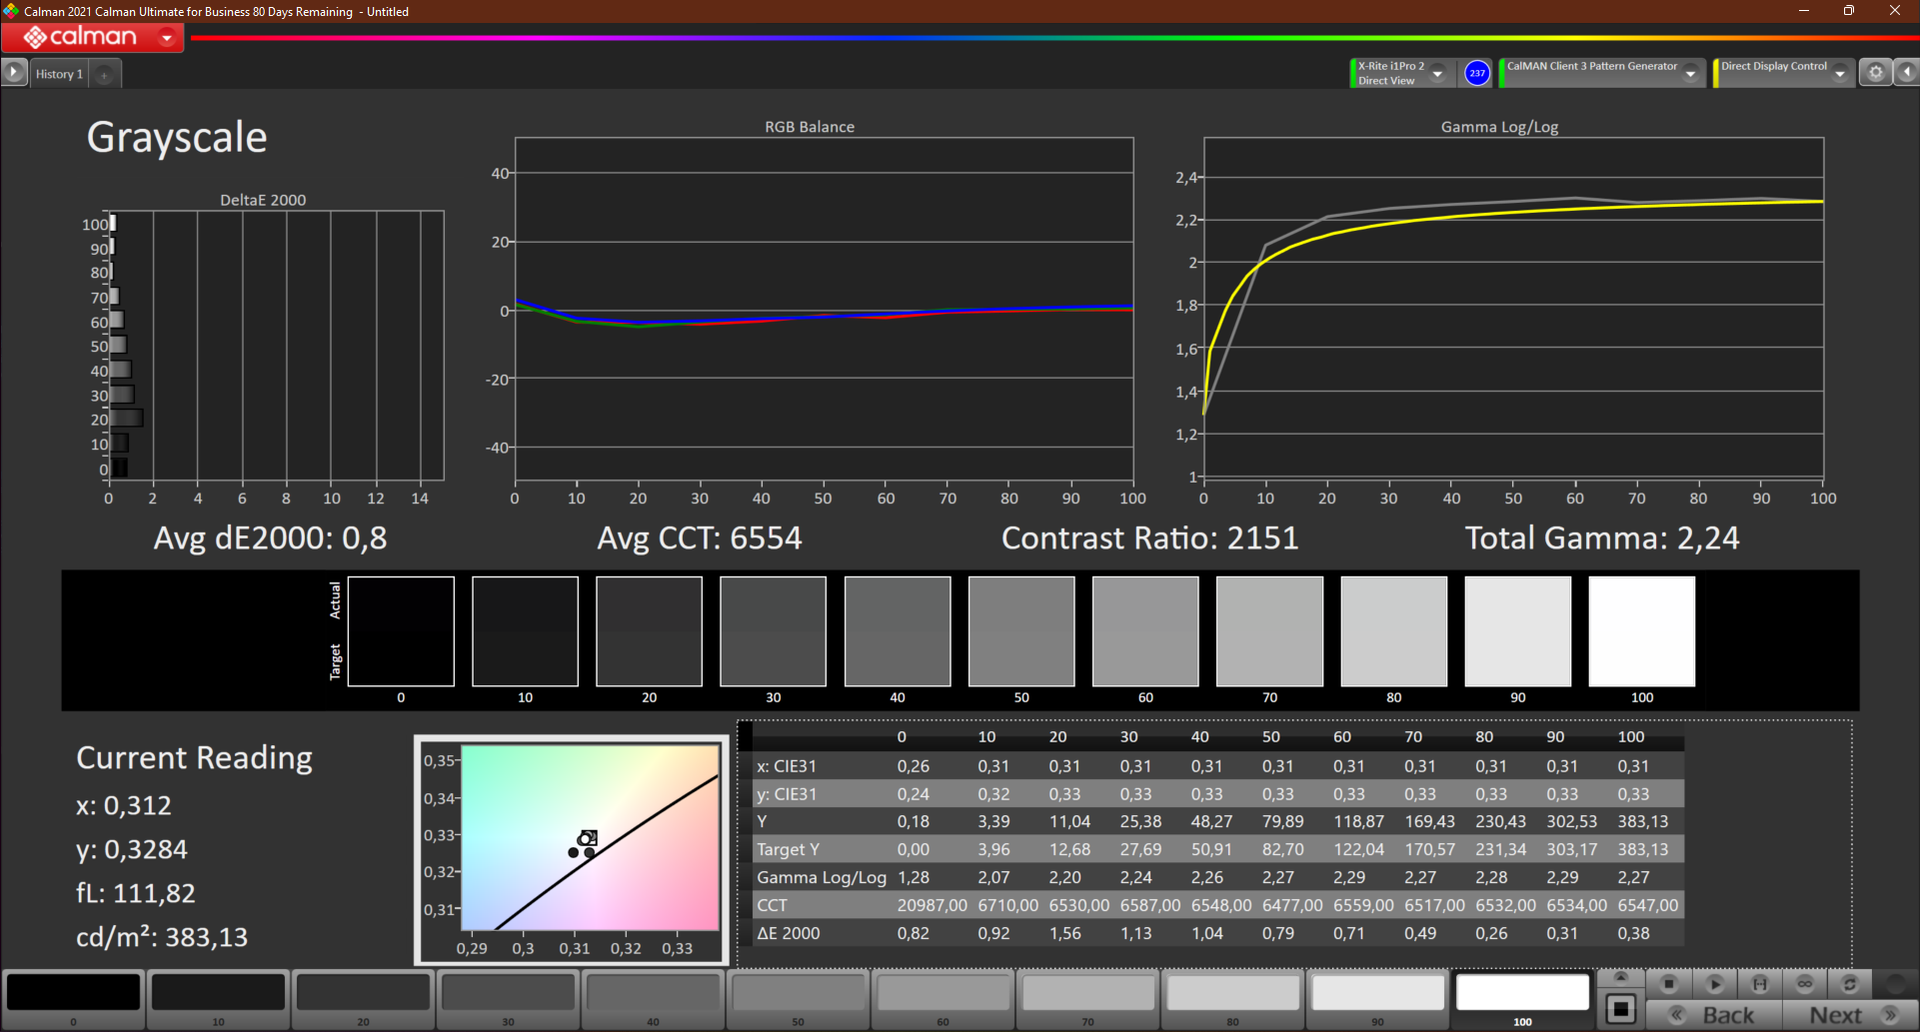
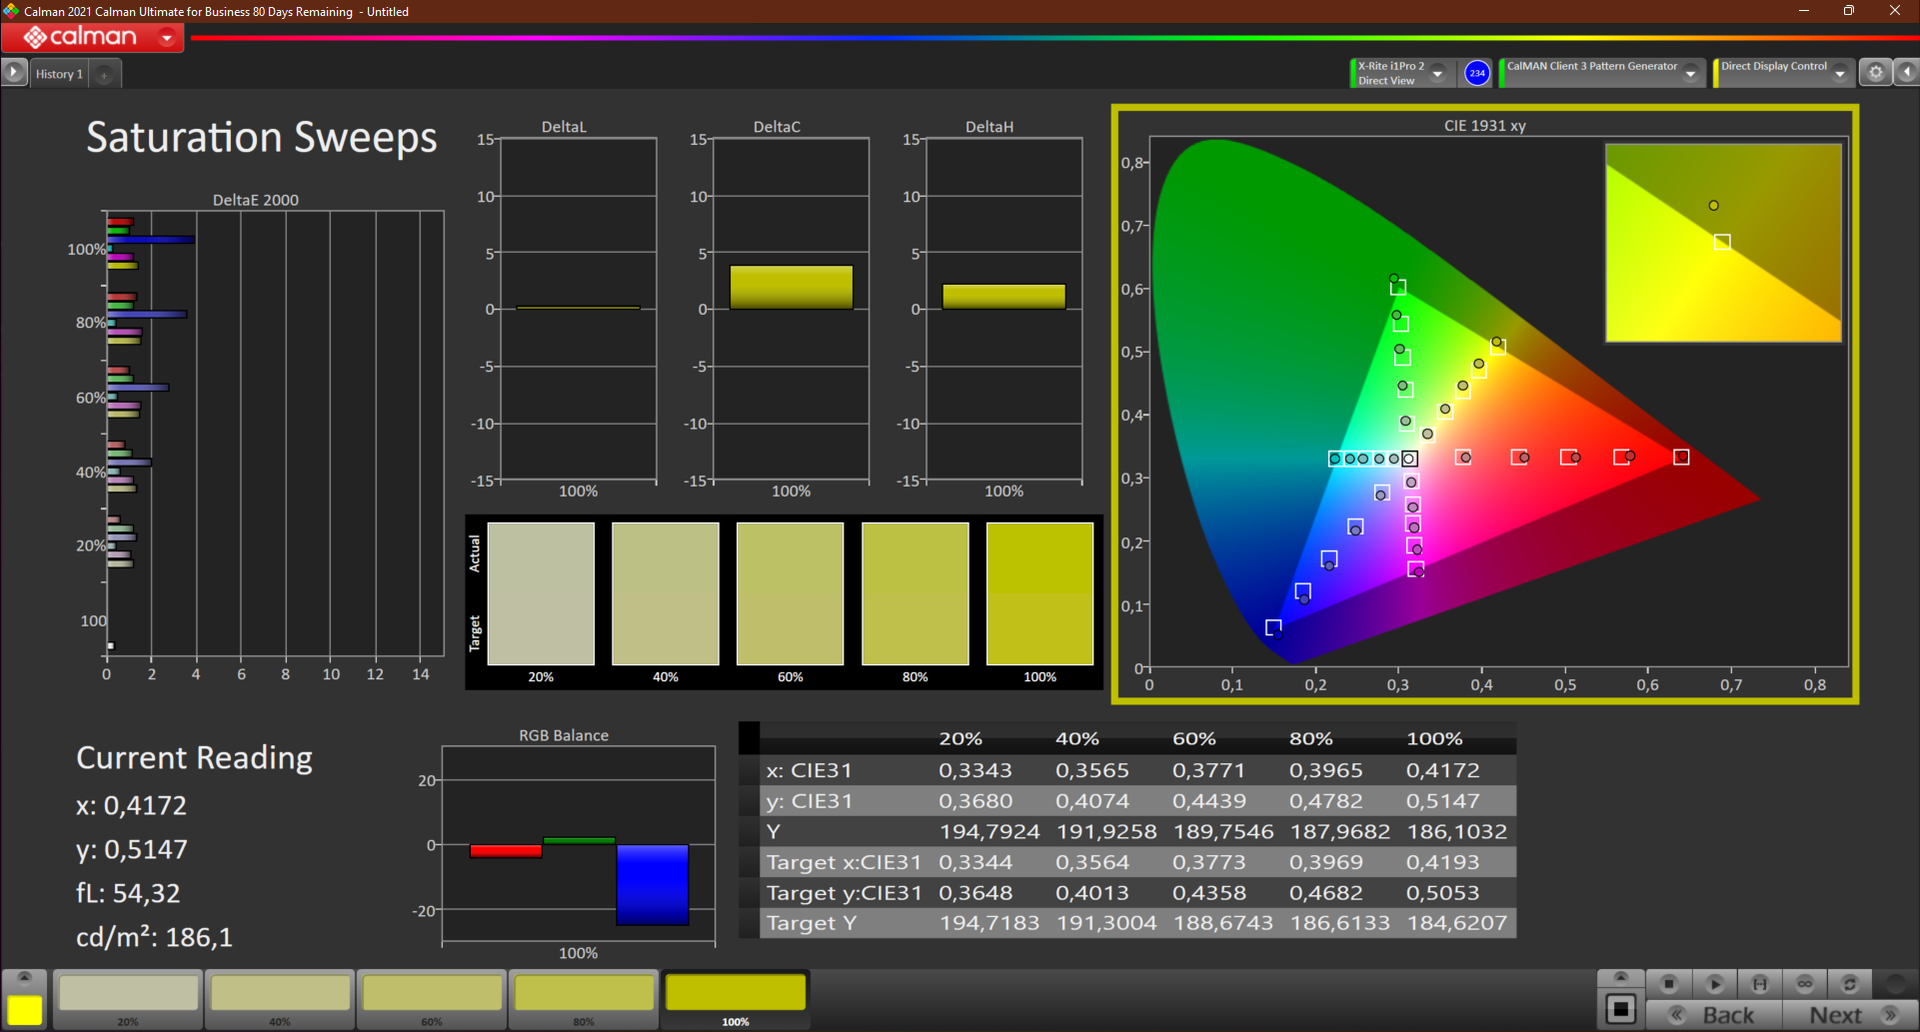
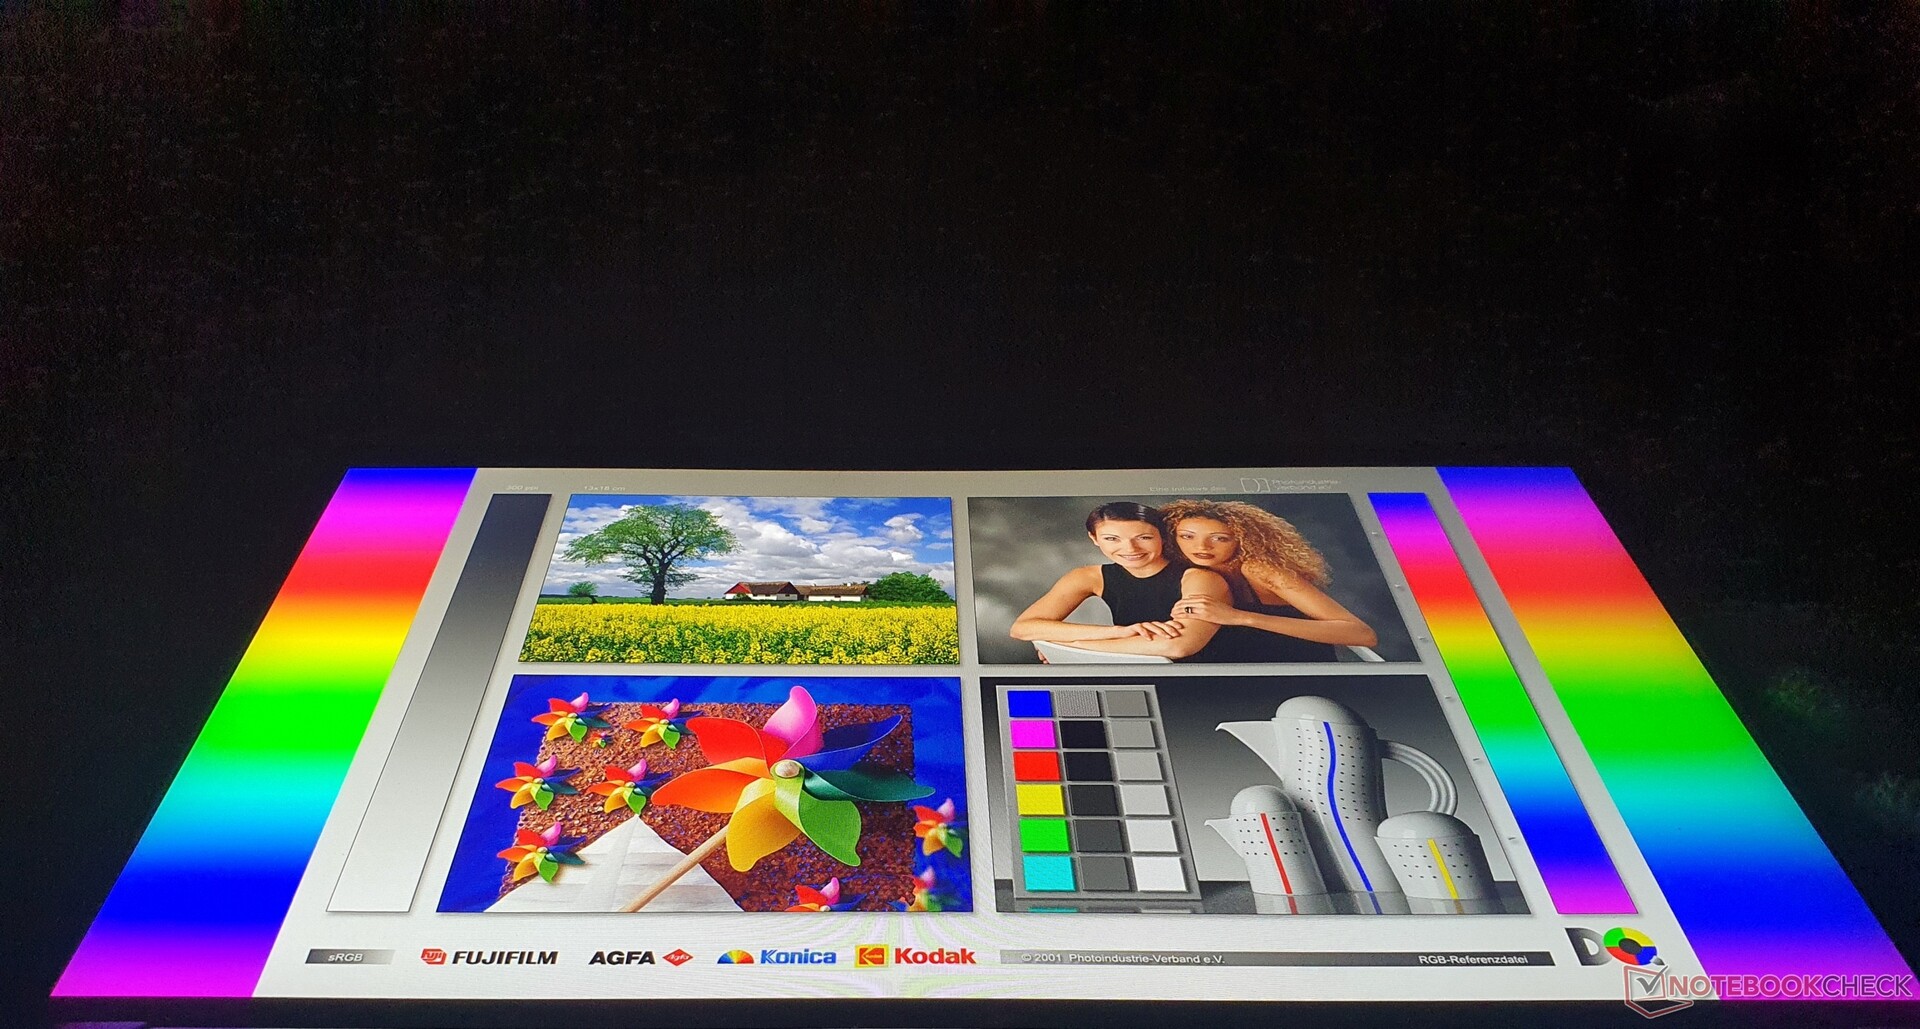
我们的配置包括与前代产品相同的哑光、15.6英寸、明亮(400尼特)、低功耗的FHD IPS面板(AUOA08B),采用16:9格式。它也被用于几个惠普精英和ProBooks,以及在 HP Envy x360 15.
4K选项(3840 x 2160像素)应该会明显减少电池寿命,根据数据表,它只提供sRGB色彩空间的完整覆盖,就像ZBook Firefly G7的4K面板一样--所以你会徒劳地寻找Dreamcolor。入门级面板使用FHD IPS,只有250尼特的亮度,可选触摸。
在平均385尼特的情况下,该面板的亮度明显高于 笔记本P15v和 Precision 3551.DeltaE值(<2)也更准确。对比度是很好的1574:1,加上0.25尼特的黑值,产生了一个饱和的黑色。响应时间慢是一个缺点。没有PWM闪烁。
| |||||||||||||||||||||||||
Brightness Distribution: 78 %
Center on Battery: 393 cd/m²
Contrast: 1572:1 (Black: 0.25 cd/m²)
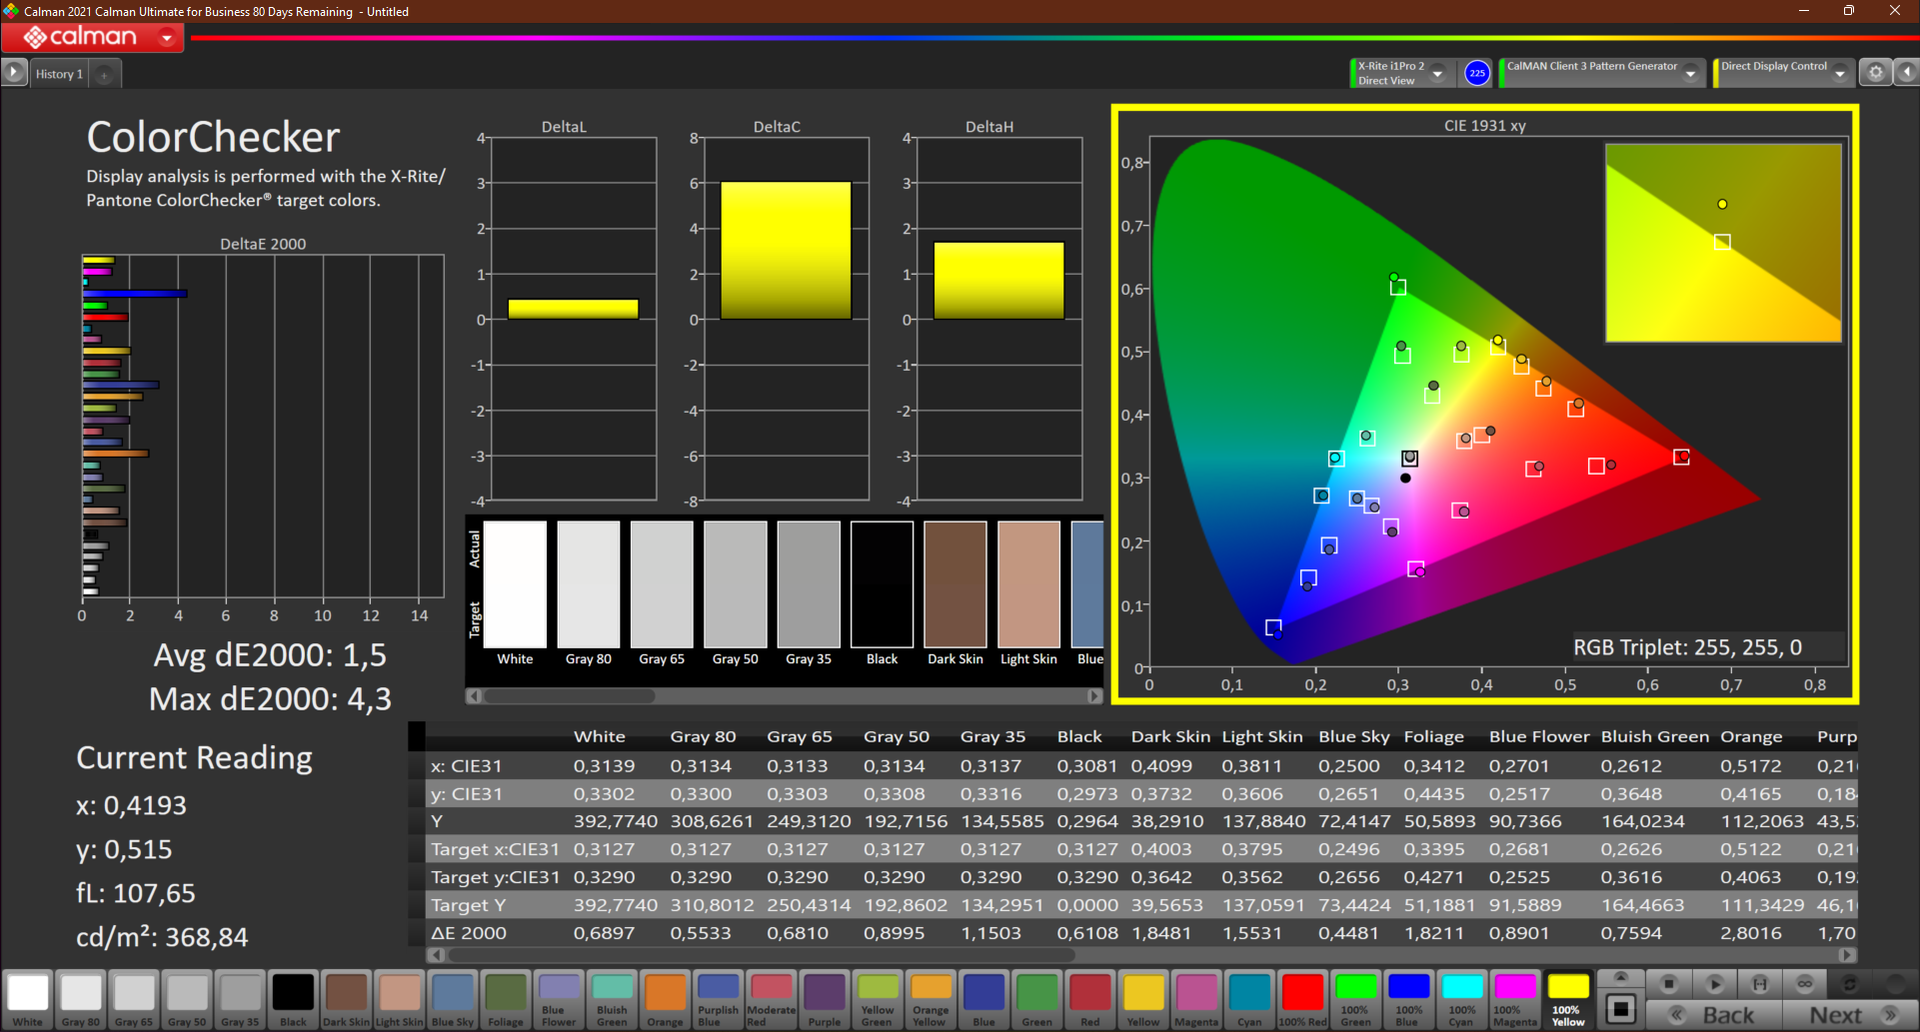
ΔE ColorChecker Calman: 1.5 | ∀{0.5-29.43 Ø4.71}
calibrated: 1.4
ΔE Greyscale Calman: 1.3 | ∀{0.09-98 Ø4.96}
71.3% AdobeRGB 1998 (Argyll 3D)
99% sRGB (Argyll 3D)
70.5% Display P3 (Argyll 3D)
Gamma: 2.26
CCT: 6435 K
| HP ZBook Power 15 G8 313S5EA AUOA08B, IPS LED, 1920x1080, 15.6" | HP ZBook Fury 15 G8 BOE0969, IPS, 3840x2160, 15.6" | HP ZBook Studio 15 G8 SDC4145, OLED, 3840x2160, 15.6" | HP ZBook Firefly 15 G8 2C9R7EA LGD069B, IPS, 1920x1080, 15.6" | Lenovo ThinkPad P15v G2 21A9000XGE N156HCA-EAC, IPS LED, 1920x1080, 15.6" | Dell Precision 3000 3551 LG Philips 156WFD, IPS, 1920x1080, 15.6" | |
|---|---|---|---|---|---|---|
| Display | 20% | 26% | -2% | -36% | -45% | |
| Display P3 Coverage (%) | 70.5 | 95.9 36% | 99.9 42% | 68.6 -3% | 43.7 -38% | 37.5 -47% |
| sRGB Coverage (%) | 99 | 100 1% | 100 1% | 98.5 -1% | 65.1 -34% | 56.5 -43% |
| AdobeRGB 1998 Coverage (%) | 71.3 | 87.3 22% | 95.3 34% | 70 -2% | 45.3 -36% | 38.74 -46% |
| Response Times | 74% | 95% | 12% | 24% | 41% | |
| Response Time Grey 50% / Grey 80% * (ms) | 61 | 14.8 ? 76% | 2.4 ? 96% | 56 ? 8% | 48 ? 21% | 29.6 ? 51% |
| Response Time Black / White * (ms) | 38 ? | 11 ? 71% | 2.4 ? 94% | 32 ? 16% | 28 ? 26% | 26.4 ? 31% |
| PWM Frequency (Hz) | 240.4 ? | |||||
| Screen | -81% | -75% | -90% | -144% | -111% | |
| Brightness middle (cd/m²) | 393 | 626 59% | 379.6 -3% | 397 1% | 305 -22% | 235.5 -40% |
| Brightness (cd/m²) | 385 | 589 53% | 380 -1% | 402 4% | 281 -27% | 228 -41% |
| Brightness Distribution (%) | 78 | 87 12% | 95 22% | 84 8% | 88 13% | 89 14% |
| Black Level * (cd/m²) | 0.25 | 0.58 -132% | 0.13 48% | 0.32 -28% | 0.25 -0% | |
| Contrast (:1) | 1572 | 1079 -31% | 3054 94% | 953 -39% | 942 -40% | |
| Colorchecker dE 2000 * | 1.5 | 5.41 -261% | 5.15 -243% | 5.9 -293% | 5.9 -293% | 5.44 -263% |
| Colorchecker dE 2000 max. * | 4.3 | 9.05 -110% | 7.79 -81% | 9.4 -119% | 20.1 -367% | 13.58 -216% |
| Colorchecker dE 2000 calibrated * | 1.4 | 0.6 57% | 3.1 -121% | 1.1 21% | 4.5 -221% | 5.2 -271% |
| Greyscale dE 2000 * | 1.3 | 6.2 -377% | 2.6 -100% | 8.8 -577% | 5.3 -308% | 3.1 -138% |
| Gamma | 2.26 97% | 2.66 83% | 1.99 111% | 2.47 89% | 2.1 105% | 2.42 91% |
| CCT | 6435 101% | 6101 107% | 6166 105% | 6416 101% | 6307 103% | 7070 92% |
| Color Space (Percent of AdobeRGB 1998) (%) | 63.7 | 35.5 | ||||
| Color Space (Percent of sRGB) (%) | 98.5 | 56.1 | ||||
| Total Average (Program / Settings) | 4% /
-37% | 15% /
-22% | -27% /
-57% | -52% /
-97% | -38% /
-75% |
* ... smaller is better
sRGB色彩空间的覆盖率达到99%,但只有~71%的DCI-P3和AdobeRGB被再现。有了这个,你就可以用笔记本进行半专业水平的图像和视频处理。ThinkPad P15v G2在这里的表现也明显较差(sRGB < 57%)。
在DeltaE为4.3时,最大的偏差是在蓝色方面,即使在校准之后。然而,RGB平衡总体上是好的。校准后,对比度甚至增加到2151:1,而亮度只减少了10尼特。像往常一样,我们的ICC色彩配置文件可以在上面的亮度分布图旁边供你免费下载。

Display Response Times
| ↔ Response Time Black to White | ||
|---|---|---|
| 38 ms ... rise ↗ and fall ↘ combined | ↗ 19 ms rise | 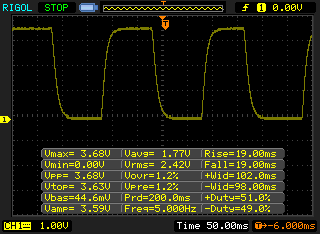 |
| ↘ 19 ms fall | ||
| The screen shows slow response rates in our tests and will be unsatisfactory for gamers. In comparison, all tested devices range from 0.1 (minimum) to 240 (maximum) ms. » 96 % of all devices are better. This means that the measured response time is worse than the average of all tested devices (19.8 ms). | ||
| ↔ Response Time 50% Grey to 80% Grey | ||
| 61 ms ... rise ↗ and fall ↘ combined | ↗ ms rise | 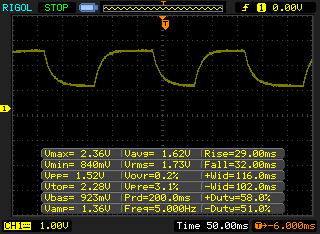 |
| ↘ ms fall | ||
| The screen shows slow response rates in our tests and will be unsatisfactory for gamers. In comparison, all tested devices range from 0.165 (minimum) to 636 (maximum) ms. » 96 % of all devices are better. This means that the measured response time is worse than the average of all tested devices (31 ms). | ||
Screen Flickering / PWM (Pulse-Width Modulation)
| Screen flickering / PWM not detected |  | ||
In comparison: 52 % of all tested devices do not use PWM to dim the display. If PWM was detected, an average of 7757 (minimum: 5 - maximum: 343500) Hz was measured. | |||
哑光显示表面加上385尼特的高亮度使ZBook Power 15适合户外操作。但是,你仍然应该避免阳光直射。
作为典型的IPS显示器,视角稳定性处于非常高的水平,绝不会产生任何问题,例如,如果你想和几个人一起观看视频。
高性能受限于惠普自己的人工智能?
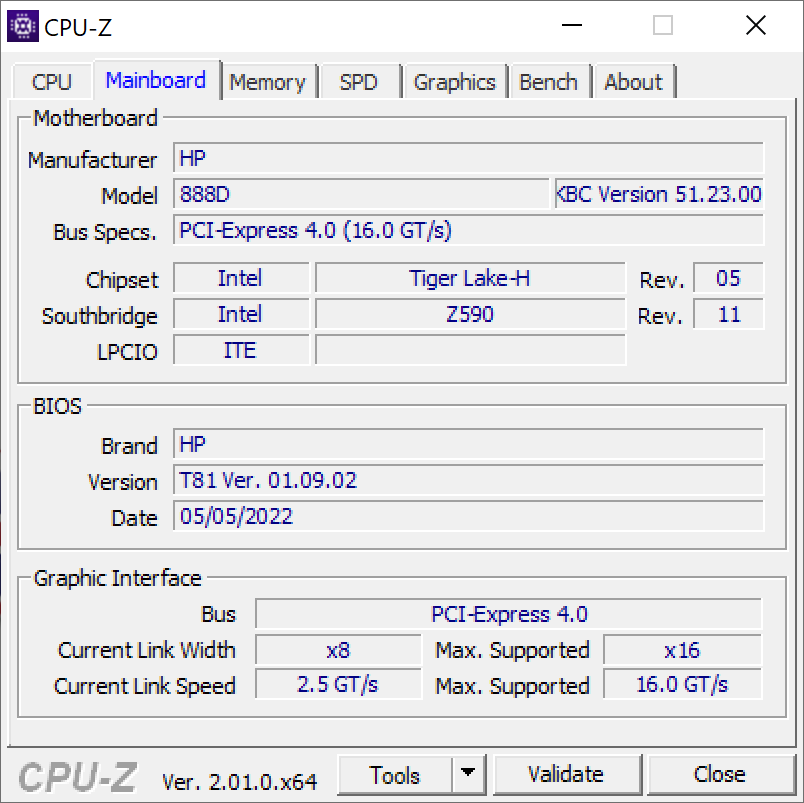
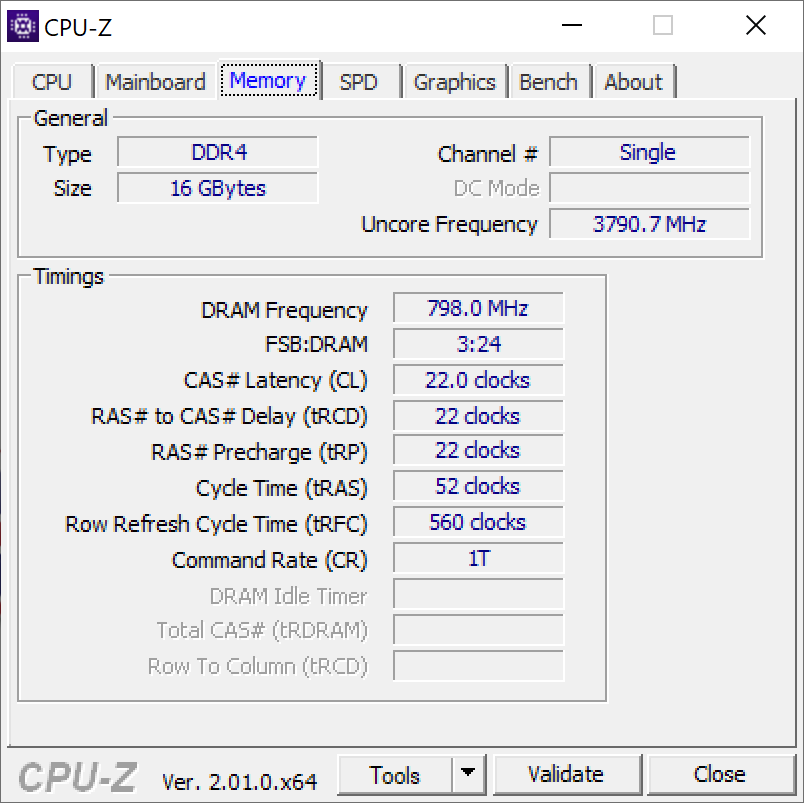
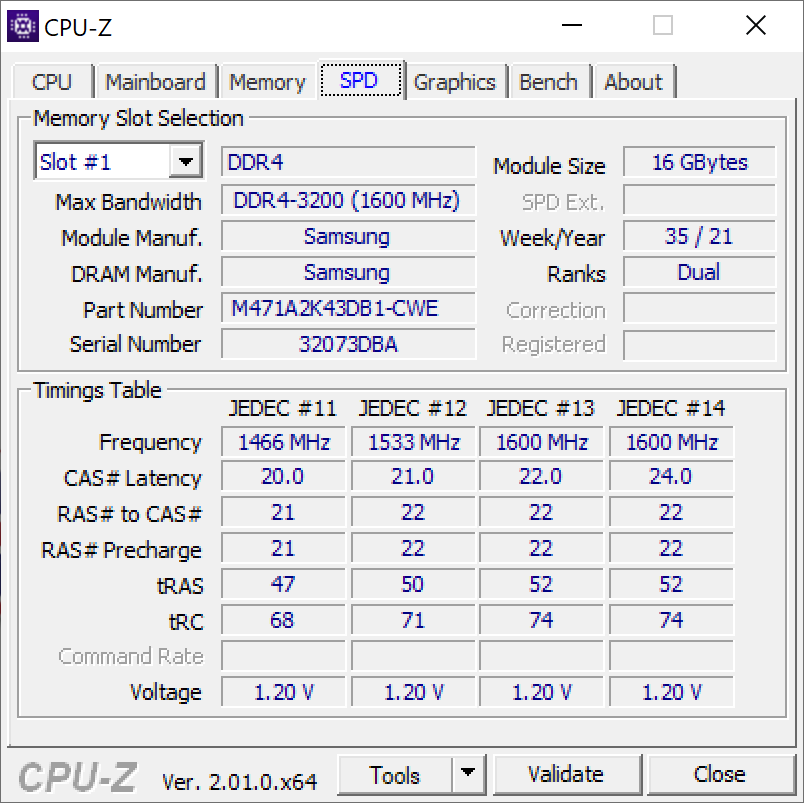
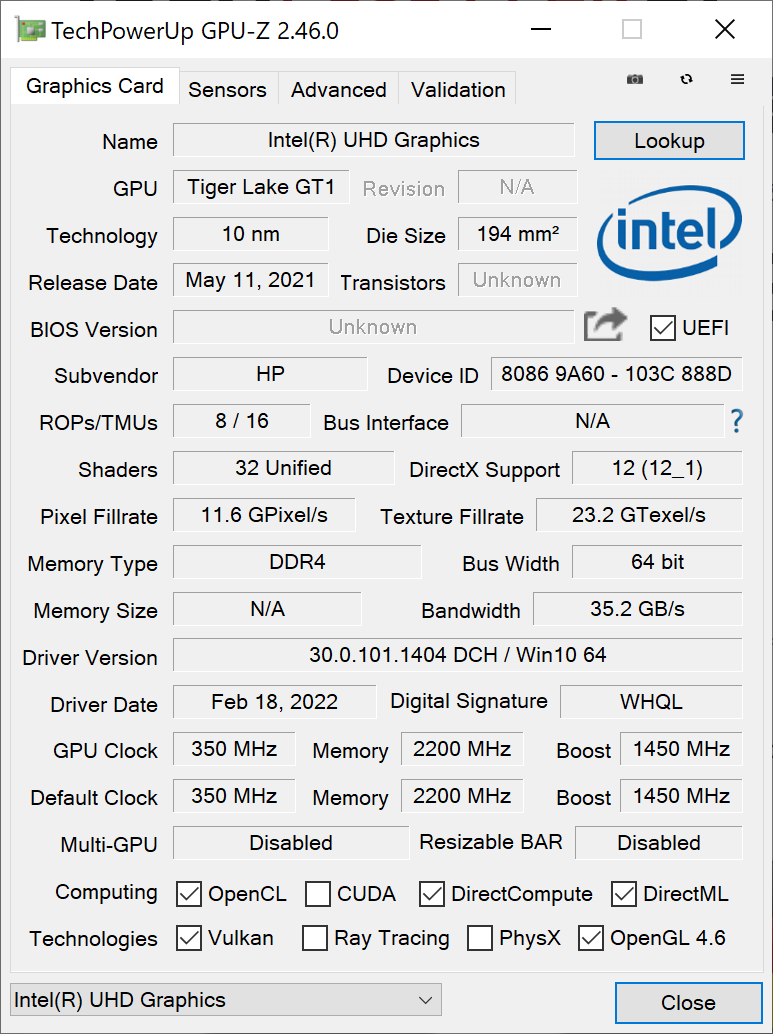
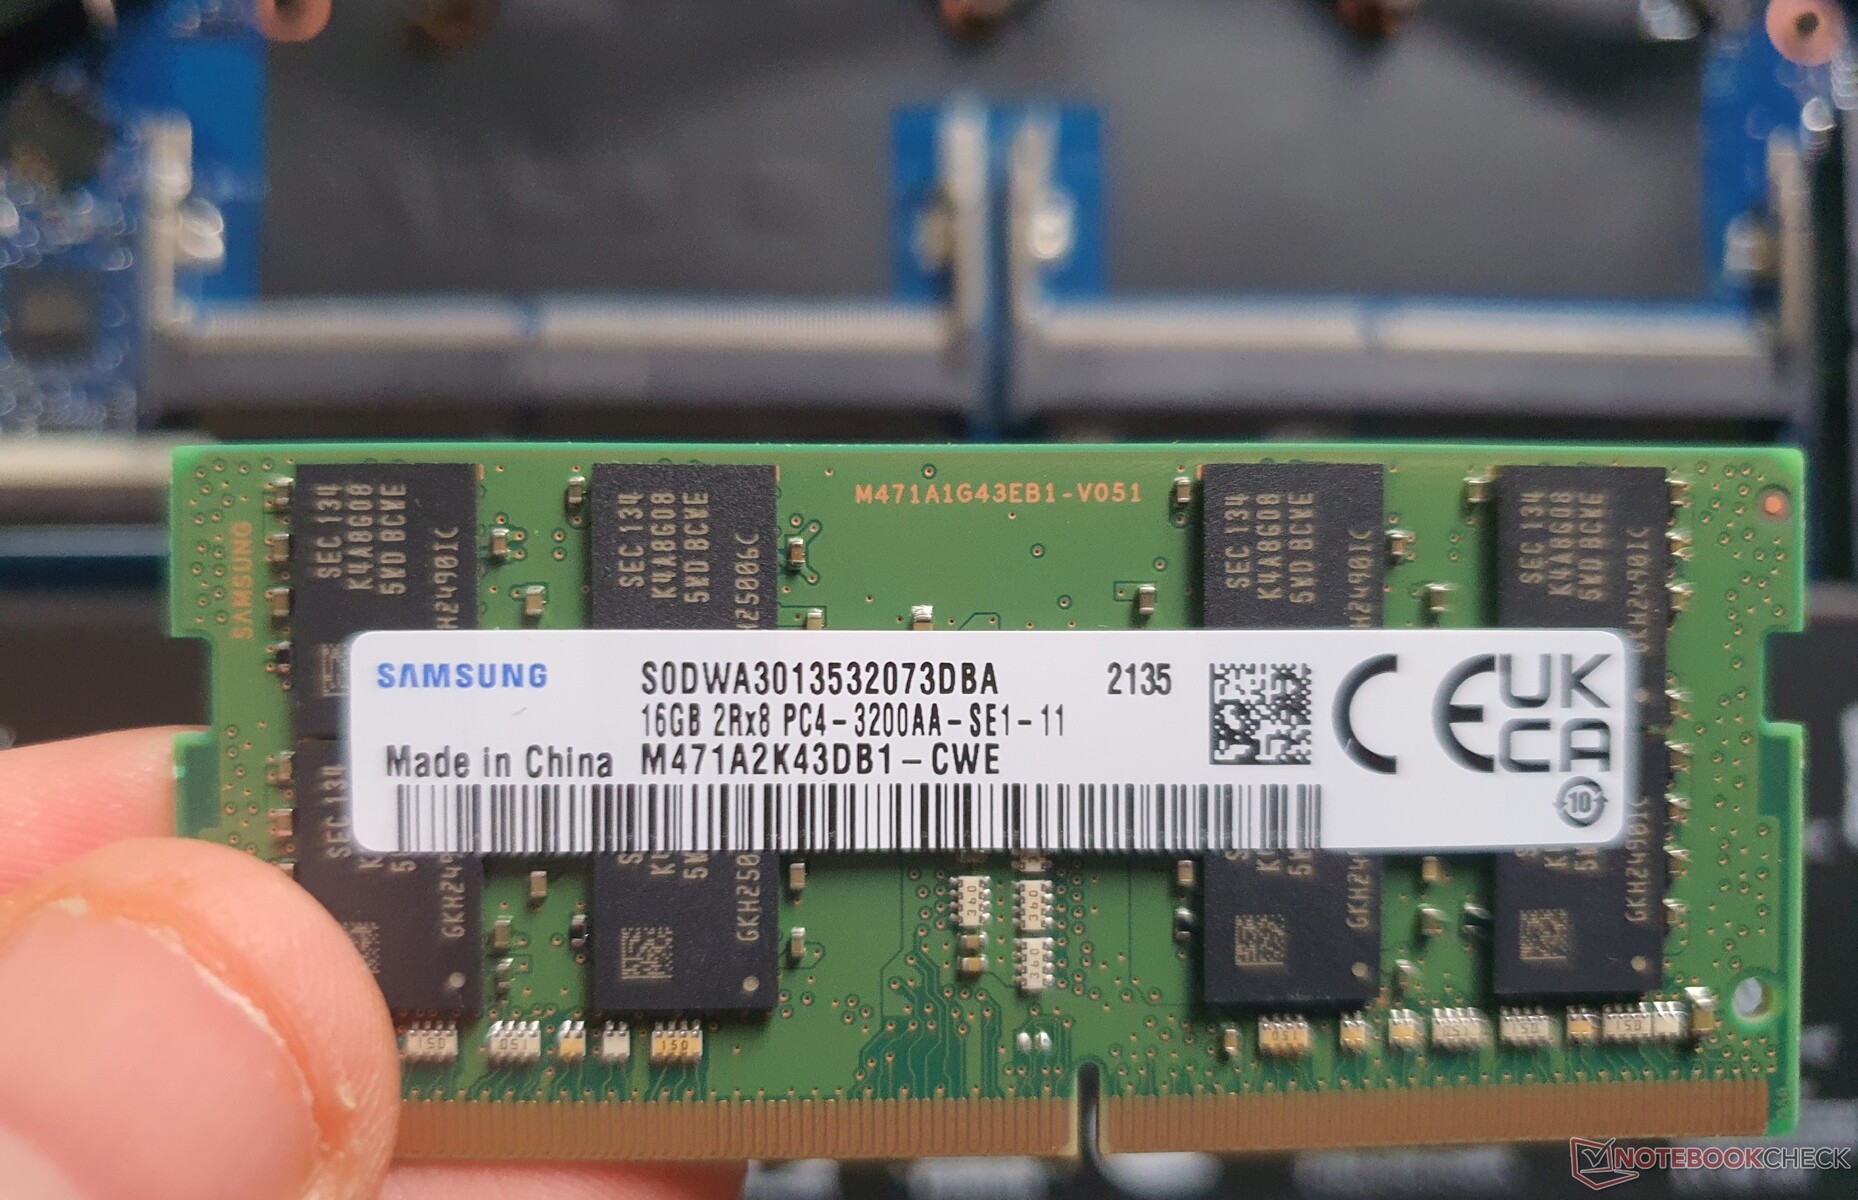
我们的测试装置提供了一个英特尔 酷睿i7-11800H(Tiger Lake, 不含vPRO) 和Nvidia T600dGPU,同时还集成了 英特尔UHD Xe (32 EUs).这由一个16-GB内存模块(DDR4-3200 @DDR4-2933)和一个512-GB PCIe4x4 SSD完成。Xeon CPU和ECC RAM在今年没有上市。
最大的配置包括英特尔的酷睿i9-11950H(vPRO), Nvidia的 RTX A2000,两个32GB的内存模块,以及两个2TB的M.2-2280固态硬盘。还有更实惠的型号,配备英特尔酷睿i5(六核),有无Nvidia GPU均可使用。

测试条件
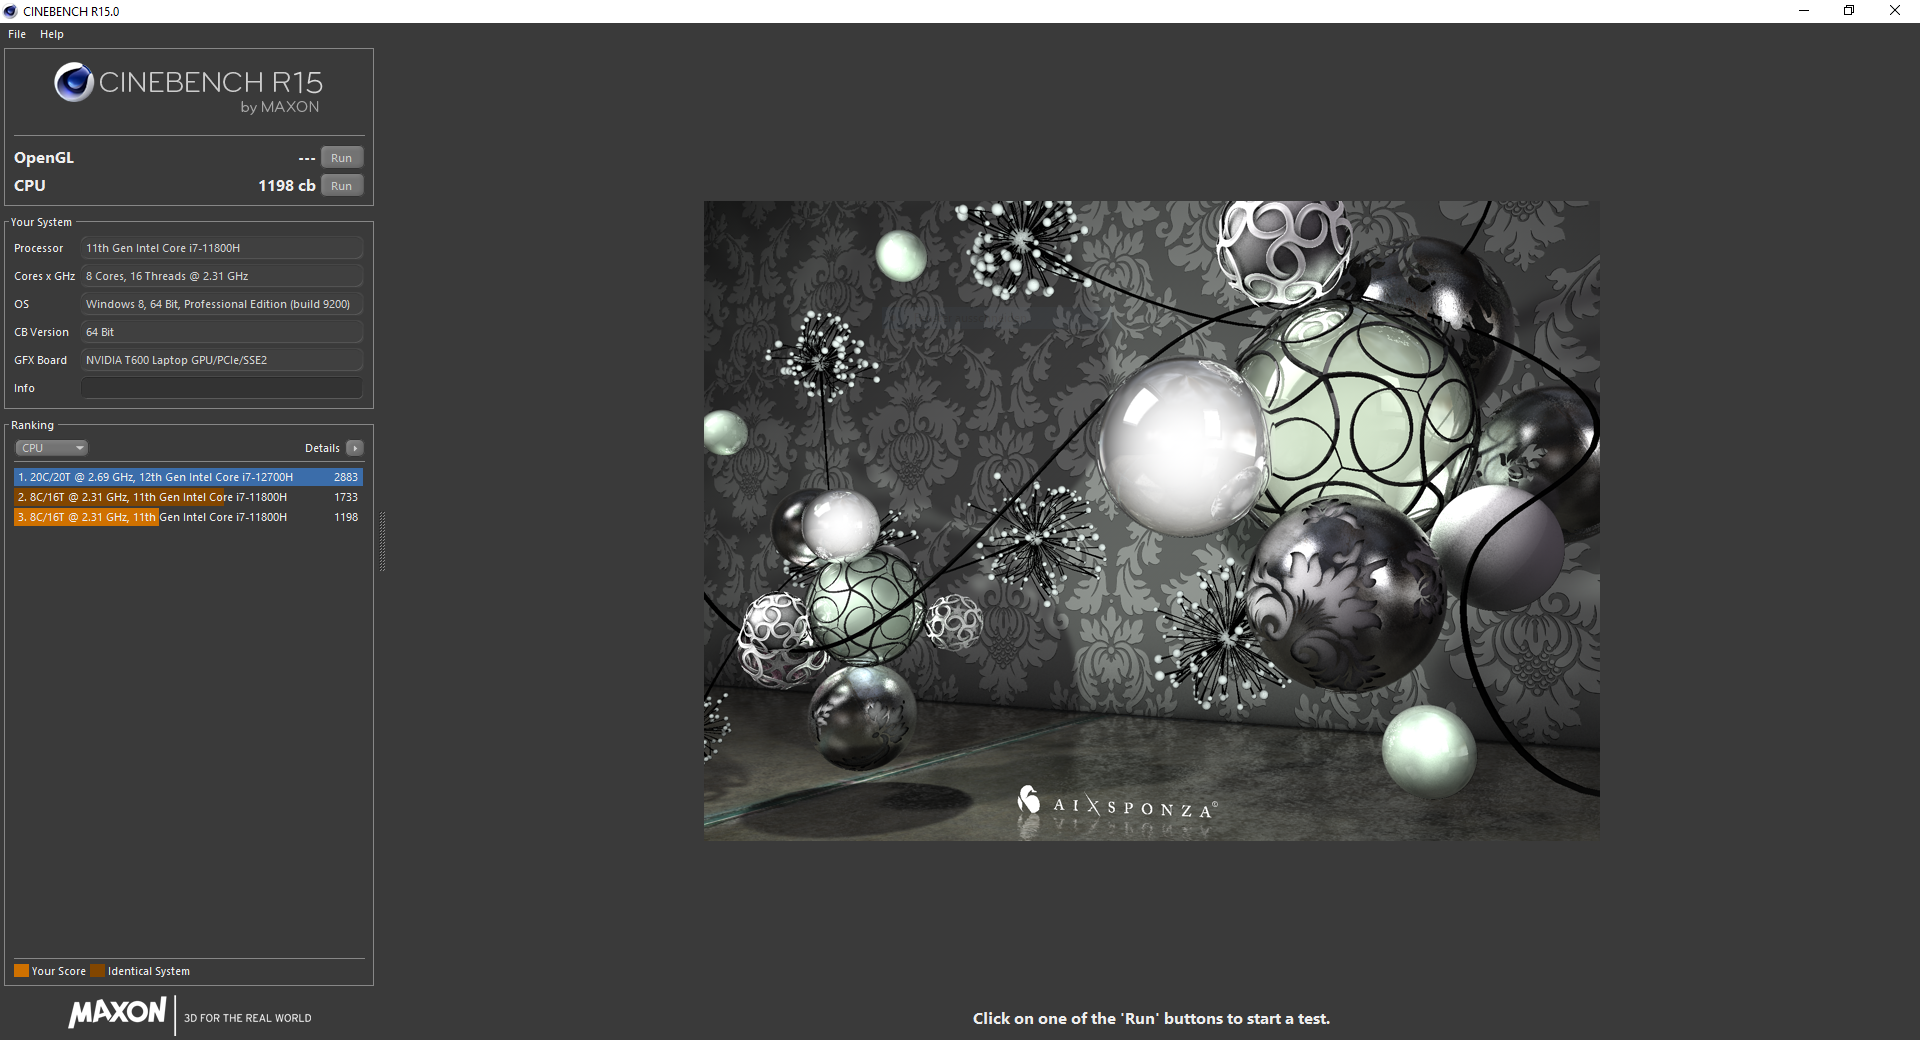
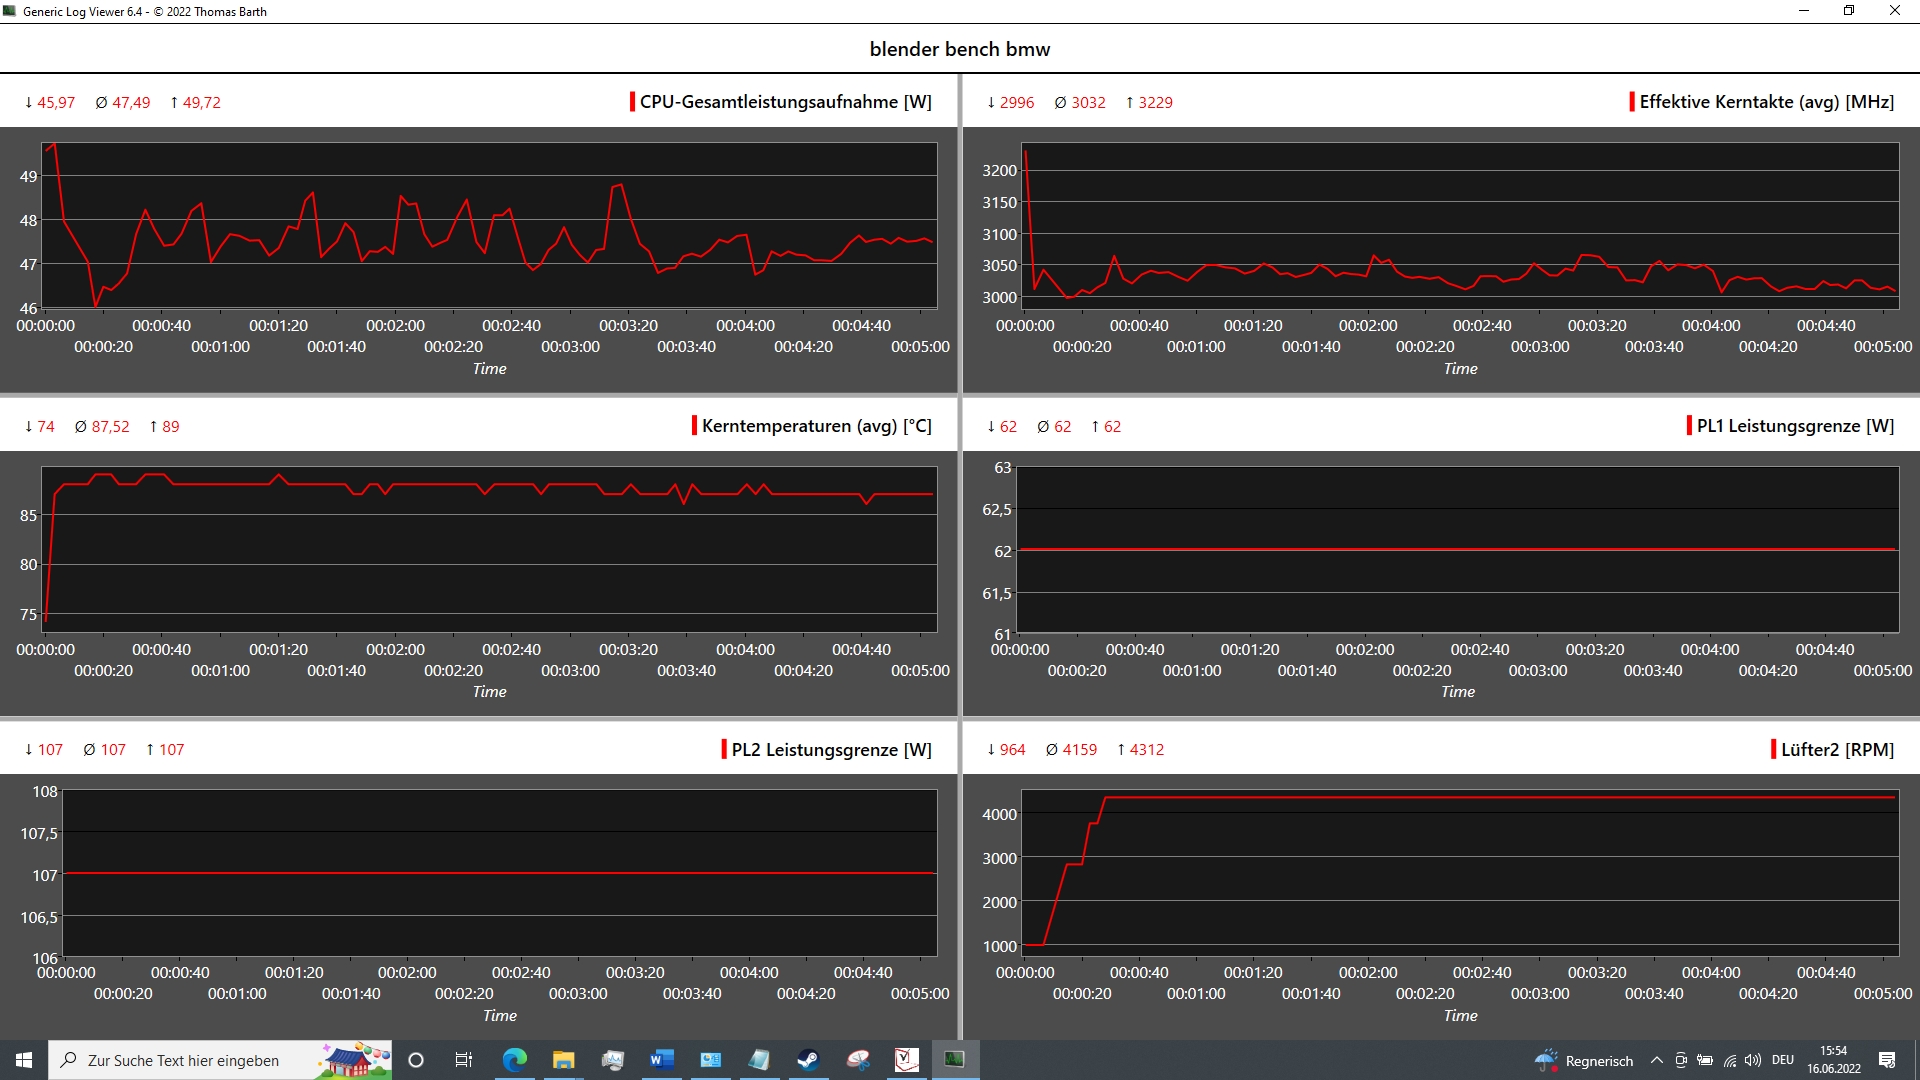
惠普通过使用名为 "Z算法 "的人工智能来控制ZBook 15 G8的性能和风扇行为,该算法使用英特尔的动态调谐技术进行操作。然而,这似乎还不太成熟,因为性能并不恒定。有一次,我们的Cinebench R15测试循环在25次运行中实现了恒定的1,550分,而另一个循环的结果只有~1,100分,第三个是~1,300分。
从V1.01版到V1.09版的BIOS更新并没有改善情况,而是导致了相反的结果。最初在CBR15中取得的2075分(常数:1826分)在任何时候都无法重现,但现在风扇的攻击性明显降低。根据不同的结果,恒定的消耗量一次是40瓦,另一次是47瓦,或者最大的恒定消耗量是55瓦。
处理器
在所述的人工智能行为下,英特尔的实际性能 酷睿i7-11800H与冷却能力相结合,很难确定。
虽然所有的CPU测试都是在旧的BIOS v1.01下进行的,当时AI还比较仁慈,ZBook Power 15在大多数时候都在测试领域处于领先地位。在更新BIOS后,性能勉强超过了 ThinkPad P15v G2平均而言。
似乎也没有短期的Turbo(PL2)了。此外,风扇很晚才开始转动(就在第一次运行完成之前),而且运行时比原来更安静,这是否是由于新的BIOS或电源工作不正常的原因。在电池运行中,性能又降低了约25%。
Cinebench R15 Multi Constant Load Test
Cinebench R23: Multi Core | Single Core
Cinebench R20: CPU (Multi Core) | CPU (Single Core)
Cinebench R15: CPU Multi 64Bit | CPU Single 64Bit
Blender: v2.79 BMW27 CPU
7-Zip 18.03: 7z b 4 | 7z b 4 -mmt1
Geekbench 5.5: Multi-Core | Single-Core
HWBOT x265 Benchmark v2.2: 4k Preset
LibreOffice : 20 Documents To PDF
R Benchmark 2.5: Overall mean
Octane V2: Total Score
Jetstream 2: 2.0 Total
| CPU Performance rating | |
| Average of class Workstation | |
| HP ZBook Studio 15 G8 -1! | |
| HP ZBook Power 15 G8 313S5EA | |
| HP ZBook Fury 15 G8 -3! | |
| Average Intel Core i7-11800H | |
| Lenovo ThinkPad P15v G2 21A9000XGE -3! | |
| Dell Precision 3000 3551 -4! | |
| HP ZBook Firefly 15 G8 2C9R7EA -4! | |
| Cinebench R23 / Multi Core | |
| Average of class Workstation (14621 - 38520, n=23, last 2 years) | |
| HP ZBook Power 15 G8 313S5EA | |
| HP ZBook Fury 15 G8 | |
| HP ZBook Studio 15 G8 | |
| Average Intel Core i7-11800H (6508 - 14088, n=48) | |
| Lenovo ThinkPad P15v G2 21A9000XGE | |
| Cinebench R23 / Single Core | |
| Average of class Workstation (1712 - 2228, n=23, last 2 years) | |
| HP ZBook Fury 15 G8 | |
| HP ZBook Studio 15 G8 | |
| HP ZBook Power 15 G8 313S5EA | |
| Average Intel Core i7-11800H (1386 - 1522, n=45) | |
| Cinebench R20 / CPU (Multi Core) | |
| Average of class Workstation (5760 - 15043, n=23, last 2 years) | |
| HP ZBook Fury 15 G8 | |
| HP ZBook Studio 15 G8 | |
| Average Intel Core i7-11800H (2498 - 5408, n=50) | |
| HP ZBook Power 15 G8 313S5EA | |
| Lenovo ThinkPad P15v G2 21A9000XGE | |
| Dell Precision 3000 3551 | |
| HP ZBook Firefly 15 G8 2C9R7EA | |
| Cinebench R20 / CPU (Single Core) | |
| Average of class Workstation (671 - 857, n=23, last 2 years) | |
| HP ZBook Fury 15 G8 | |
| HP ZBook Studio 15 G8 | |
| HP ZBook Firefly 15 G8 2C9R7EA | |
| HP ZBook Power 15 G8 313S5EA | |
| Average Intel Core i7-11800H (520 - 586, n=47) | |
| Lenovo ThinkPad P15v G2 21A9000XGE | |
| Dell Precision 3000 3551 | |
| Cinebench R15 / CPU Multi 64Bit | |
| Average of class Workstation (2489 - 5810, n=23, last 2 years) | |
| HP ZBook Power 15 G8 313S5EA | |
| HP ZBook Power 15 G8 313S5EA | |
| Average Intel Core i7-11800H (1342 - 2173, n=50) | |
| HP ZBook Studio 15 G8 | |
| HP ZBook Fury 15 G8 | |
| Lenovo ThinkPad P15v G2 21A9000XGE | |
| Dell Precision 3000 3551 | |
| HP ZBook Firefly 15 G8 2C9R7EA | |
| Cinebench R15 / CPU Single 64Bit | |
| Average of class Workstation (191.4 - 328, n=23, last 2 years) | |
| HP ZBook Fury 15 G8 | |
| HP ZBook Studio 15 G8 | |
| HP ZBook Power 15 G8 313S5EA | |
| HP ZBook Firefly 15 G8 2C9R7EA | |
| Average Intel Core i7-11800H (201 - 231, n=46) | |
| Lenovo ThinkPad P15v G2 21A9000XGE | |
| Dell Precision 3000 3551 | |
| Blender / v2.79 BMW27 CPU | |
| HP ZBook Firefly 15 G8 2C9R7EA | |
| Dell Precision 3000 3551 | |
| Lenovo ThinkPad P15v G2 21A9000XGE | |
| Average Intel Core i7-11800H (217 - 454, n=46) | |
| HP ZBook Fury 15 G8 | |
| HP ZBook Power 15 G8 313S5EA | |
| HP ZBook Studio 15 G8 | |
| Average of class Workstation (91 - 222, n=23, last 2 years) | |
| 7-Zip 18.03 / 7z b 4 | |
| Average of class Workstation (60489 - 116969, n=23, last 2 years) | |
| HP ZBook Fury 15 G8 | |
| HP ZBook Studio 15 G8 | |
| HP ZBook Power 15 G8 313S5EA | |
| Average Intel Core i7-11800H (33718 - 56758, n=46) | |
| Lenovo ThinkPad P15v G2 21A9000XGE | |
| Dell Precision 3000 3551 | |
| HP ZBook Firefly 15 G8 2C9R7EA | |
| 7-Zip 18.03 / 7z b 4 -mmt1 | |
| Average of class Workstation (5126 - 6960, n=23, last 2 years) | |
| HP ZBook Studio 15 G8 | |
| HP ZBook Fury 15 G8 | |
| HP ZBook Power 15 G8 313S5EA | |
| Average Intel Core i7-11800H (5138 - 5732, n=46) | |
| HP ZBook Firefly 15 G8 2C9R7EA | |
| Dell Precision 3000 3551 | |
| Lenovo ThinkPad P15v G2 21A9000XGE | |
| Geekbench 5.5 / Multi-Core | |
| Average of class Workstation (11542 - 25554, n=23, last 2 years) | |
| Average Intel Core i7-11800H (4655 - 9851, n=40) | |
| HP ZBook Power 15 G8 313S5EA | |
| HP ZBook Studio 15 G8 | |
| Dell Precision 3000 3551 | |
| Lenovo ThinkPad P15v G2 21A9000XGE | |
| HP ZBook Firefly 15 G8 2C9R7EA | |
| Geekbench 5.5 / Single-Core | |
| Average of class Workstation (1783 - 2183, n=23, last 2 years) | |
| HP ZBook Studio 15 G8 | |
| Average Intel Core i7-11800H (1429 - 1625, n=40) | |
| HP ZBook Firefly 15 G8 2C9R7EA | |
| HP ZBook Power 15 G8 313S5EA | |
| Lenovo ThinkPad P15v G2 21A9000XGE | |
| Dell Precision 3000 3551 | |
| HWBOT x265 Benchmark v2.2 / 4k Preset | |
| Average of class Workstation (17.8 - 40.5, n=23, last 2 years) | |
| HP ZBook Studio 15 G8 | |
| HP ZBook Fury 15 G8 | |
| HP ZBook Power 15 G8 313S5EA | |
| Average Intel Core i7-11800H (7.38 - 17.4, n=46) | |
| Lenovo ThinkPad P15v G2 21A9000XGE | |
| Dell Precision 3000 3551 | |
| HP ZBook Firefly 15 G8 2C9R7EA | |
| LibreOffice / 20 Documents To PDF | |
| Lenovo ThinkPad P15v G2 21A9000XGE | |
| HP ZBook Fury 15 G8 | |
| HP ZBook Studio 15 G8 | |
| Average of class Workstation (37.1 - 74.7, n=23, last 2 years) | |
| Average Intel Core i7-11800H (38.6 - 59.9, n=45) | |
| Dell Precision 3000 3551 | |
| HP ZBook Power 15 G8 313S5EA | |
| HP ZBook Firefly 15 G8 2C9R7EA | |
| R Benchmark 2.5 / Overall mean | |
| HP ZBook Power 15 G8 313S5EA | |
| Lenovo ThinkPad P15v G2 21A9000XGE | |
| Dell Precision 3000 3551 | |
| Average Intel Core i7-11800H (0.548 - 0.615, n=46) | |
| HP ZBook Firefly 15 G8 2C9R7EA | |
| HP ZBook Studio 15 G8 | |
| HP ZBook Fury 15 G8 | |
| Average of class Workstation (0.3825 - 0.603, n=23, last 2 years) | |
| Octane V2 / Total Score | |
| Average of class Workstation (112382 - 129420, n=3, last 2 years) | |
| Average Intel Core i7-11800H (63248 - 70549, n=10) | |
| HP ZBook Power 15 G8 313S5EA | |
| Jetstream 2 / 2.0 Total | |
| Average of class Workstation (327 - 466, n=4, last 2 years) | |
| HP ZBook Power 15 G8 313S5EA | |
| HP ZBook Fury 15 G8 | |
| HP ZBook Studio 15 G8 | |
| Average Intel Core i7-11800H (159.8 - 214, n=16) | |
* ... smaller is better
AIDA64: FP32 Ray-Trace | FPU Julia | CPU SHA3 | CPU Queen | FPU SinJulia | FPU Mandel | CPU AES | CPU ZLib | FP64 Ray-Trace | CPU PhotoWorxx
| Performance rating | |
| Average of class Workstation | |
| HP ZBook Fury 15 G8 | |
| HP ZBook Studio 15 G8 | |
| HP ZBook Power 15 G8 313S5EA | |
| Average Intel Core i7-11800H | |
| Lenovo ThinkPad P15v G2 21A9000XGE | |
| HP ZBook Firefly 15 G8 2C9R7EA | |
| AIDA64 / FP32 Ray-Trace | |
| Average of class Workstation (16730 - 61611, n=23, last 2 years) | |
| HP ZBook Power 15 G8 313S5EA | |
| HP ZBook Fury 15 G8 | |
| HP ZBook Studio 15 G8 | |
| Average Intel Core i7-11800H (8772 - 15961, n=20) | |
| Lenovo ThinkPad P15v G2 21A9000XGE | |
| HP ZBook Firefly 15 G8 2C9R7EA | |
| AIDA64 / FPU Julia | |
| Average of class Workstation (89597 - 186971, n=23, last 2 years) | |
| HP ZBook Fury 15 G8 | |
| HP ZBook Studio 15 G8 | |
| HP ZBook Power 15 G8 313S5EA | |
| Average Intel Core i7-11800H (39404 - 65636, n=20) | |
| Lenovo ThinkPad P15v G2 21A9000XGE | |
| HP ZBook Firefly 15 G8 2C9R7EA | |
| AIDA64 / CPU SHA3 | |
| Average of class Workstation (4178 - 8975, n=23, last 2 years) | |
| HP ZBook Power 15 G8 313S5EA | |
| HP ZBook Fury 15 G8 | |
| HP ZBook Studio 15 G8 | |
| Average Intel Core i7-11800H (2599 - 4439, n=20) | |
| Lenovo ThinkPad P15v G2 21A9000XGE | |
| HP ZBook Firefly 15 G8 2C9R7EA | |
| AIDA64 / CPU Queen | |
| Average of class Workstation (60778 - 144411, n=23, last 2 years) | |
| HP ZBook Studio 15 G8 | |
| HP ZBook Fury 15 G8 | |
| HP ZBook Power 15 G8 313S5EA | |
| Average Intel Core i7-11800H (85233 - 91941, n=20) | |
| Lenovo ThinkPad P15v G2 21A9000XGE | |
| HP ZBook Firefly 15 G8 2C9R7EA | |
| AIDA64 / FPU SinJulia | |
| Average of class Workstation (8165 - 29343, n=23, last 2 years) | |
| HP ZBook Fury 15 G8 | |
| HP ZBook Studio 15 G8 | |
| HP ZBook Power 15 G8 313S5EA | |
| Average Intel Core i7-11800H (6420 - 9792, n=20) | |
| Lenovo ThinkPad P15v G2 21A9000XGE | |
| HP ZBook Firefly 15 G8 2C9R7EA | |
| AIDA64 / FPU Mandel | |
| Average of class Workstation (44497 - 98153, n=23, last 2 years) | |
| HP ZBook Fury 15 G8 | |
| HP ZBook Power 15 G8 313S5EA | |
| HP ZBook Studio 15 G8 | |
| Average Intel Core i7-11800H (23365 - 39464, n=20) | |
| Lenovo ThinkPad P15v G2 21A9000XGE | |
| HP ZBook Firefly 15 G8 2C9R7EA | |
| AIDA64 / CPU AES | |
| Average Intel Core i7-11800H (74617 - 149388, n=20) | |
| Average of class Workstation (73133 - 187841, n=23, last 2 years) | |
| HP ZBook Power 15 G8 313S5EA | |
| HP ZBook Studio 15 G8 | |
| HP ZBook Fury 15 G8 | |
| Lenovo ThinkPad P15v G2 21A9000XGE | |
| HP ZBook Firefly 15 G8 2C9R7EA | |
| AIDA64 / CPU ZLib | |
| Average of class Workstation (929 - 2148, n=23, last 2 years) | |
| HP ZBook Power 15 G8 313S5EA | |
| HP ZBook Studio 15 G8 | |
| HP ZBook Fury 15 G8 | |
| Lenovo ThinkPad P15v G2 21A9000XGE | |
| HP ZBook Firefly 15 G8 2C9R7EA | |
| Average Intel Core i7-11800H (461 - 830, n=43) | |
| AIDA64 / FP64 Ray-Trace | |
| Average of class Workstation (8545 - 32891, n=23, last 2 years) | |
| HP ZBook Power 15 G8 313S5EA | |
| HP ZBook Fury 15 G8 | |
| HP ZBook Studio 15 G8 | |
| Average Intel Core i7-11800H (4545 - 8717, n=21) | |
| Lenovo ThinkPad P15v G2 21A9000XGE | |
| HP ZBook Firefly 15 G8 2C9R7EA | |
| AIDA64 / CPU PhotoWorxx | |
| Average of class Workstation (37151 - 93684, n=23, last 2 years) | |
| HP ZBook Fury 15 G8 | |
| HP ZBook Studio 15 G8 | |
| Average Intel Core i7-11800H (11898 - 26757, n=21) | |
| HP ZBook Firefly 15 G8 2C9R7EA | |
| HP ZBook Power 15 G8 313S5EA | |
| Lenovo ThinkPad P15v G2 21A9000XGE | |
工作站性能
使用新的BIOS(v1.09)评估了工作站相关应用程序的性能。在这里,它的表现比 ThinkPad P15v G2配备的Nvidia T1200,而 惠普萤火虫配有的惠普萤火虫则以约45%的比例超过了配备英伟达T500被超越了约45%。另一方面, ZBook Fury配有RTX A5000在大多数时候提供两倍的性能。
而RTX A2000这是你可以为ZBook Power 15选择的最大值,运行速度应该快50%左右。
| V-Ray 5 Benchmark | |
| CPU | |
| HP ZBook Fury 15 G8 | |
| Lenovo ThinkPad P15v G2 21A9000XGE | |
| GPU CUDA | |
| Lenovo ThinkPad P15v G2 21A9000XGE | |
| HP ZBook Power 15 G8 313S5EA | |
| V-Ray Benchmark Next 4.10 | |
| CPU | |
| HP ZBook Power 15 G8 313S5EA | |
| Lenovo ThinkPad P15v G2 21A9000XGE | |
| Dell Precision 3000 3551 | |
| HP ZBook Firefly 15 G8 2C9R7EA | |
| GPU | |
| HP ZBook Power 15 G8 313S5EA | |
| Lenovo ThinkPad P15v G2 21A9000XGE | |
| Dell Precision 3000 3551 | |
| HP ZBook Firefly 15 G8 2C9R7EA | |
| Geekbench 5.5 - OpenCL Score | |
| Lenovo ThinkPad P15v G2 21A9000XGE | |
| HP ZBook Power 15 G8 313S5EA | |
| HP ZBook Firefly 15 G8 2C9R7EA | |
| Dell Precision 3000 3551 | |
系统性能
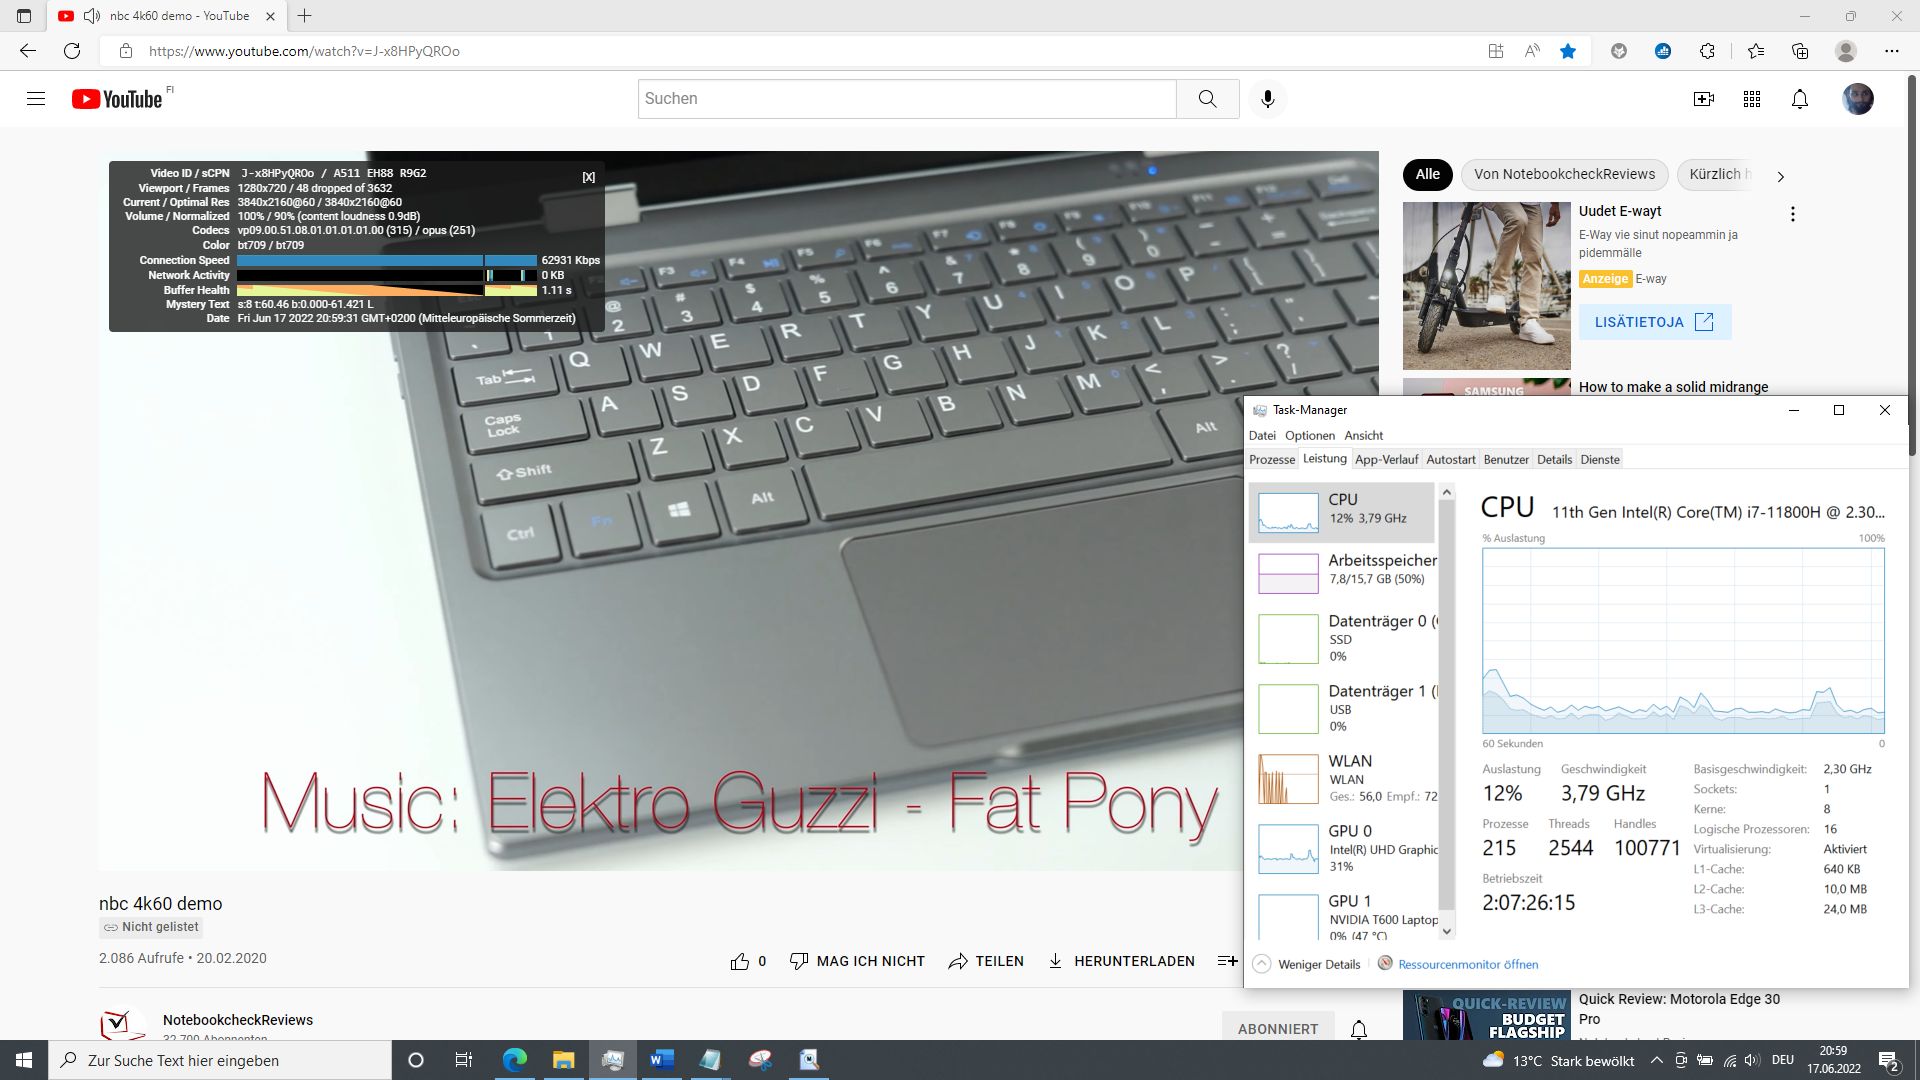
尽管是单通道内存,但系统运行绝对没有任何延迟,即使在使用多个浏览器标签时,4K YouTube视频也在后台运行。
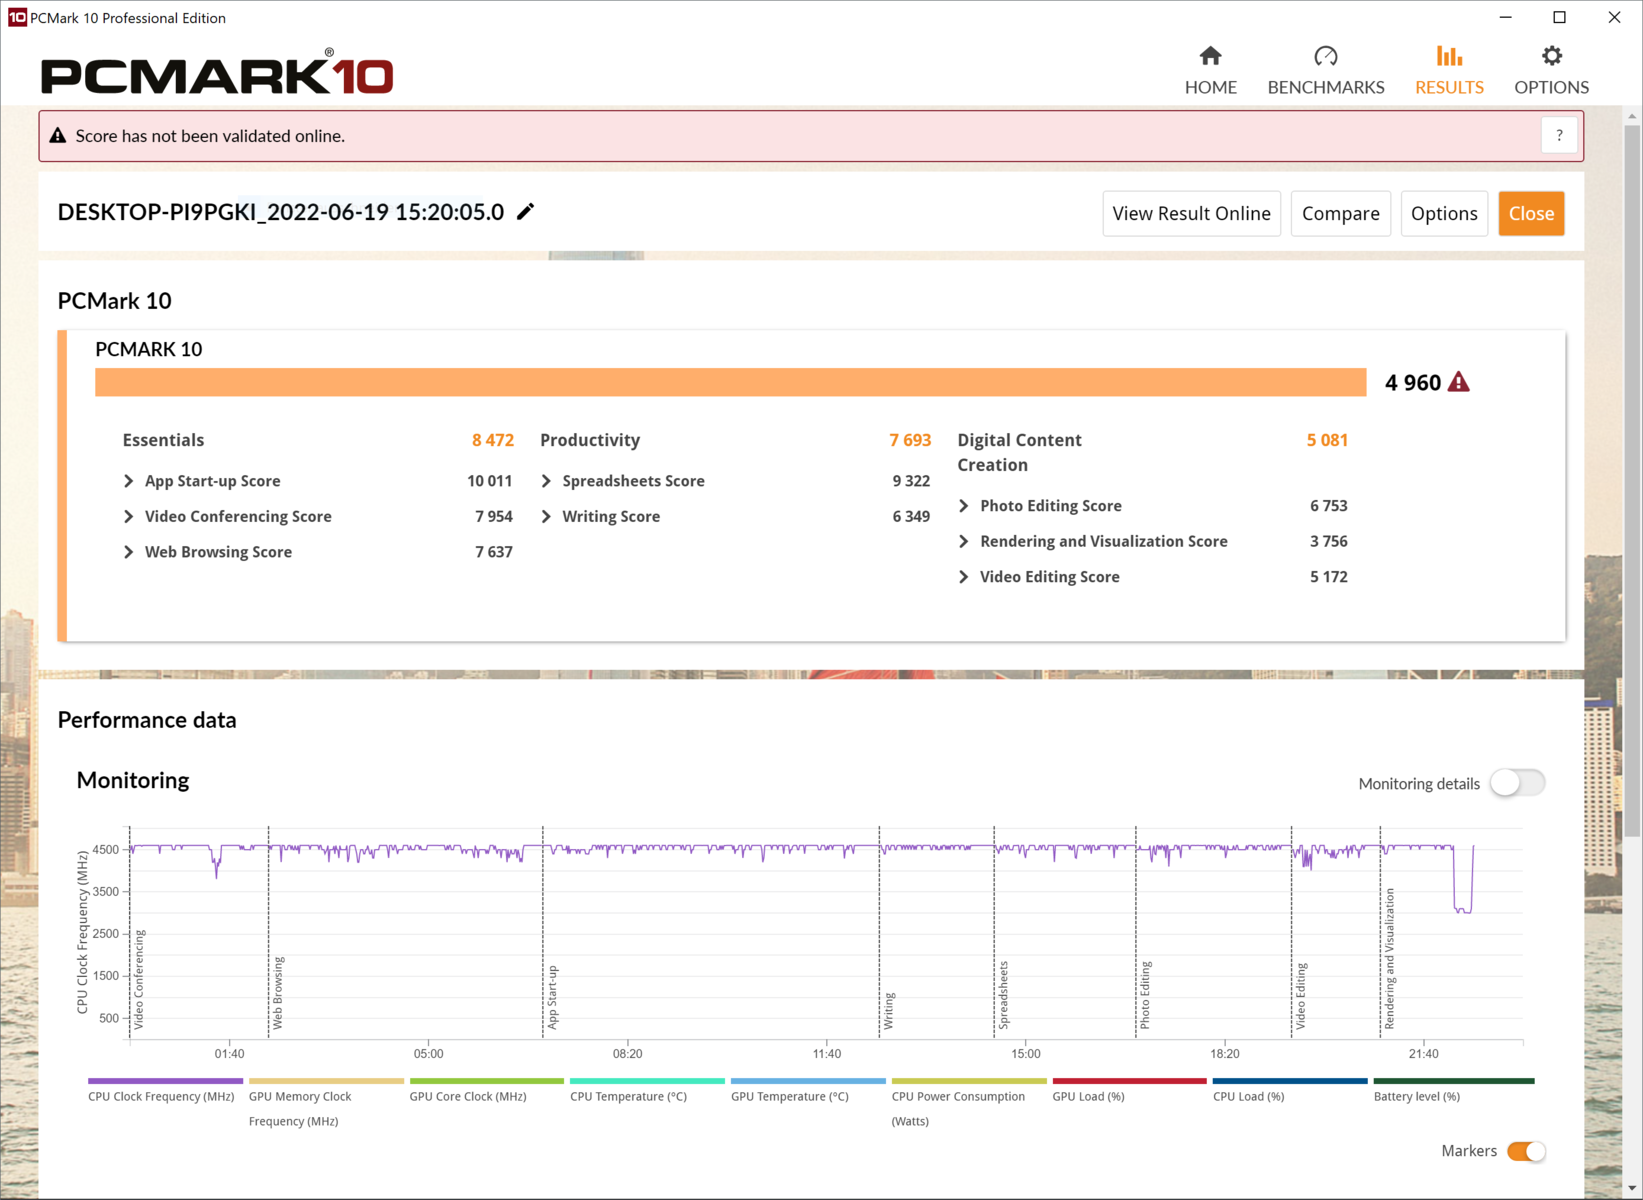
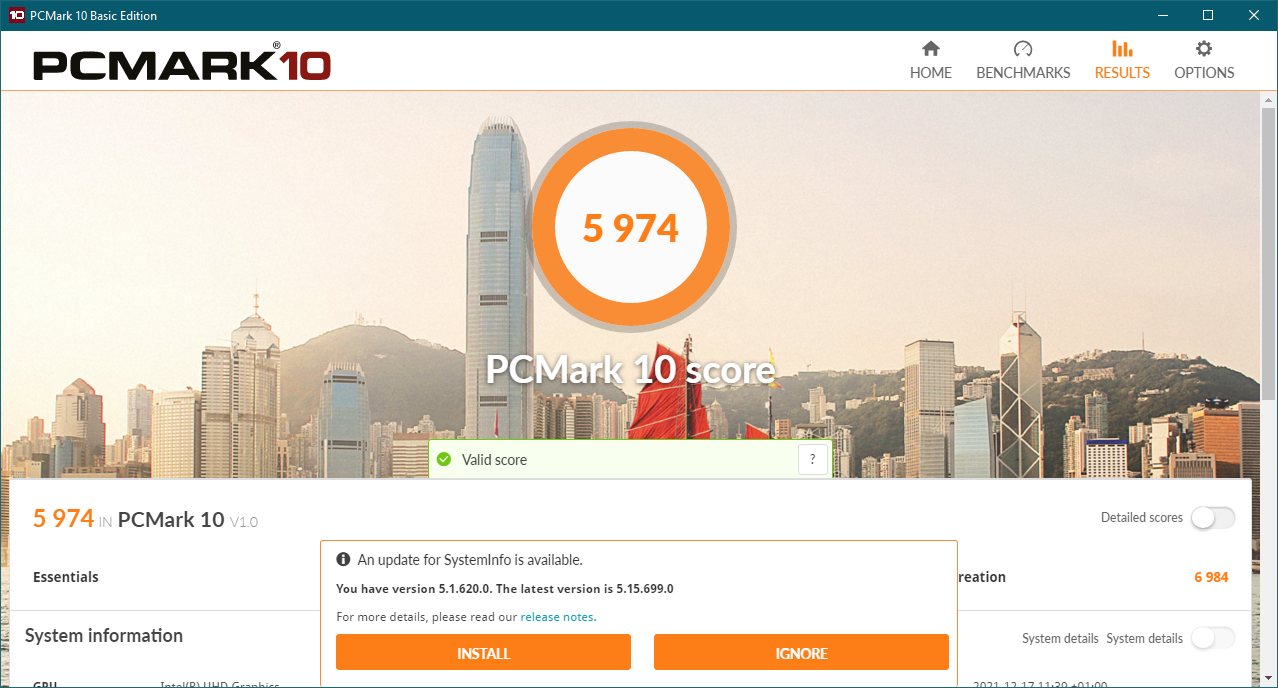
使用新的BIOS,大约损失了15%的性能,因此我们的测试装置在PCMark 10基准测试中排在最后。特别是内容创作得分下降了约28%。
CrossMark: Overall | Productivity | Creativity | Responsiveness
| PCMark 10 / Score | |
| Average of class Workstation (6563 - 10409, n=19, last 2 years) | |
| HP ZBook Fury 15 G8 | |
| HP ZBook Studio 15 G8 | |
| Lenovo ThinkPad P15v G2 21A9000XGE | |
| HP ZBook Firefly 15 G8 2C9R7EA | |
| Dell Precision 3000 3551 | |
| HP ZBook Power 15 G8 313S5EA | |
| Average Intel Core i7-11800H, NVIDIA T600 Laptop GPU (n=1) | |
| PCMark 10 / Essentials | |
| Average of class Workstation (9622 - 11157, n=19, last 2 years) | |
| Dell Precision 3000 3551 | |
| HP ZBook Fury 15 G8 | |
| HP ZBook Studio 15 G8 | |
| Lenovo ThinkPad P15v G2 21A9000XGE | |
| HP ZBook Firefly 15 G8 2C9R7EA | |
| HP ZBook Power 15 G8 313S5EA | |
| Average Intel Core i7-11800H, NVIDIA T600 Laptop GPU (n=1) | |
| PCMark 10 / Productivity | |
| Average of class Workstation (8789 - 20616, n=19, last 2 years) | |
| HP ZBook Firefly 15 G8 2C9R7EA | |
| HP ZBook Fury 15 G8 | |
| HP ZBook Studio 15 G8 | |
| Lenovo ThinkPad P15v G2 21A9000XGE | |
| Dell Precision 3000 3551 | |
| HP ZBook Power 15 G8 313S5EA | |
| Average Intel Core i7-11800H, NVIDIA T600 Laptop GPU (n=1) | |
| PCMark 10 / Digital Content Creation | |
| Average of class Workstation (8108 - 15631, n=19, last 2 years) | |
| HP ZBook Fury 15 G8 | |
| HP ZBook Studio 15 G8 | |
| Lenovo ThinkPad P15v G2 21A9000XGE | |
| HP ZBook Firefly 15 G8 2C9R7EA | |
| HP ZBook Power 15 G8 313S5EA | |
| Average Intel Core i7-11800H, NVIDIA T600 Laptop GPU (n=1) | |
| Dell Precision 3000 3551 | |
| CrossMark / Overall | |
| Average of class Workstation (1307 - 2267, n=22, last 2 years) | |
| HP ZBook Power 15 G8 313S5EA | |
| Average Intel Core i7-11800H, NVIDIA T600 Laptop GPU (n=1) | |
| Lenovo ThinkPad P15v G2 21A9000XGE | |
| CrossMark / Productivity | |
| Average of class Workstation (1130 - 2122, n=22, last 2 years) | |
| HP ZBook Power 15 G8 313S5EA | |
| Average Intel Core i7-11800H, NVIDIA T600 Laptop GPU (n=1) | |
| Lenovo ThinkPad P15v G2 21A9000XGE | |
| CrossMark / Creativity | |
| Average of class Workstation (1657 - 2725, n=22, last 2 years) | |
| HP ZBook Power 15 G8 313S5EA | |
| Average Intel Core i7-11800H, NVIDIA T600 Laptop GPU (n=1) | |
| Lenovo ThinkPad P15v G2 21A9000XGE | |
| CrossMark / Responsiveness | |
| Average of class Workstation (993 - 2096, n=22, last 2 years) | |
| HP ZBook Power 15 G8 313S5EA | |
| Average Intel Core i7-11800H, NVIDIA T600 Laptop GPU (n=1) | |
| Lenovo ThinkPad P15v G2 21A9000XGE | |
| PCMark 10 Score | 4960 points | |
Help | ||
| AIDA64 / Memory Copy | |
| Average of class Workstation (56003 - 164795, n=23, last 2 years) | |
| HP ZBook Fury 15 G8 | |
| HP ZBook Studio 15 G8 | |
| Average Intel Core i7-11800H (24508 - 48144, n=21) | |
| HP ZBook Power 15 G8 313S5EA | |
| HP ZBook Firefly 15 G8 2C9R7EA | |
| Lenovo ThinkPad P15v G2 21A9000XGE | |
| AIDA64 / Memory Read | |
| Average of class Workstation (55795 - 121563, n=23, last 2 years) | |
| HP ZBook Studio 15 G8 | |
| HP ZBook Fury 15 G8 | |
| Average Intel Core i7-11800H (25882 - 50365, n=20) | |
| HP ZBook Power 15 G8 313S5EA | |
| Lenovo ThinkPad P15v G2 21A9000XGE | |
| HP ZBook Firefly 15 G8 2C9R7EA | |
| AIDA64 / Memory Write | |
| Average of class Workstation (55663 - 214520, n=23, last 2 years) | |
| HP ZBook Studio 15 G8 | |
| HP ZBook Fury 15 G8 | |
| Average Intel Core i7-11800H (22240 - 46214, n=20) | |
| HP ZBook Firefly 15 G8 2C9R7EA | |
| HP ZBook Power 15 G8 313S5EA | |
| Lenovo ThinkPad P15v G2 21A9000XGE | |
| AIDA64 / Memory Latency | |
| Average of class Workstation (84.5 - 165.2, n=23, last 2 years) | |
| Lenovo ThinkPad P15v G2 21A9000XGE | |
| HP ZBook Fury 15 G8 | |
| HP ZBook Studio 15 G8 | |
| HP ZBook Power 15 G8 313S5EA | |
| HP ZBook Firefly 15 G8 2C9R7EA | |
| Average Intel Core i7-11800H (71.9 - 104.1, n=44) | |
* ... smaller is better
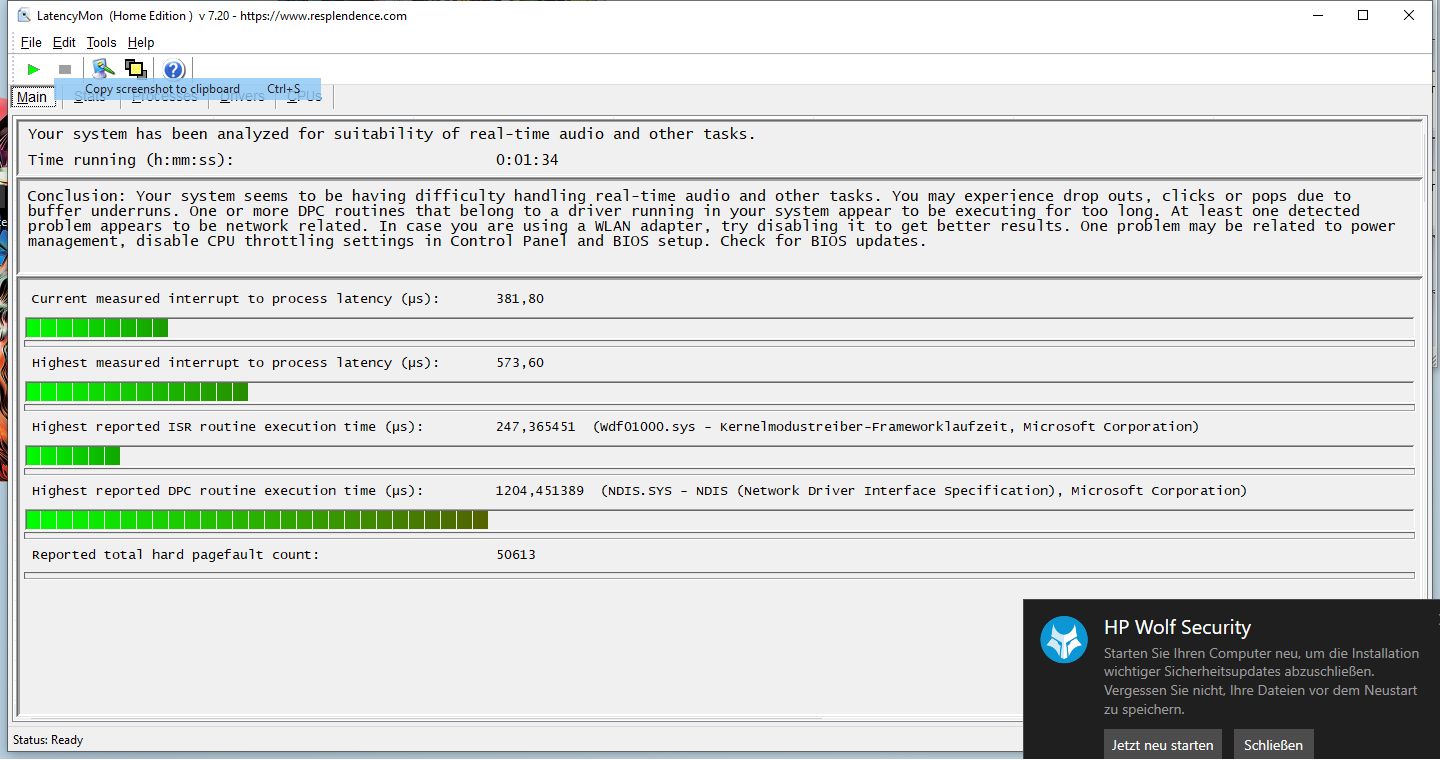
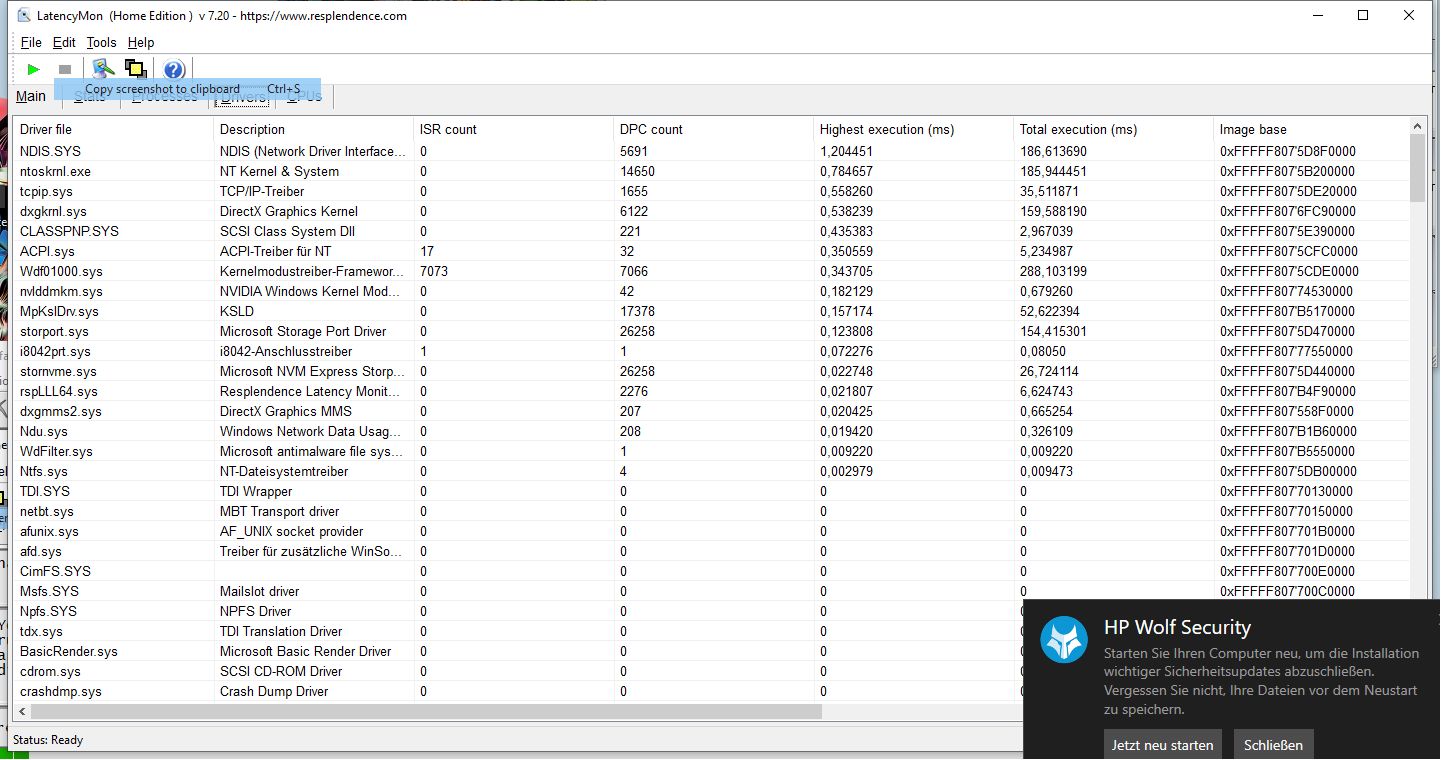
DPC延迟
只有537.6微秒,ZBook Power 15的DPC延迟看起来非常好。然而,分析仍然表明,网络驱动程序会造成一些延迟,因此,实时的视频和音频处理只有在不使用英特尔的AX201 Wi-Fi的情况下才能进行。
重现一段4K YouTube视频导致iGPU的负载为30%,CPU的负载为12%,但我们仍然注意到有一些丢帧。
| DPC Latencies / LatencyMon - interrupt to process latency (max), Web, Youtube, Prime95 (sort by value) | |
| HP ZBook Power 15 G8 313S5EA | |
| HP ZBook Fury 15 G8 | |
| HP ZBook Firefly 15 G8 2C9R7EA | |
| HP ZBook Studio 15 G8 | |
| Dell Precision 3000 3551 | |
| Lenovo ThinkPad P15v G2 21A9000XGE | |
* ... smaller is better
存储解决方案
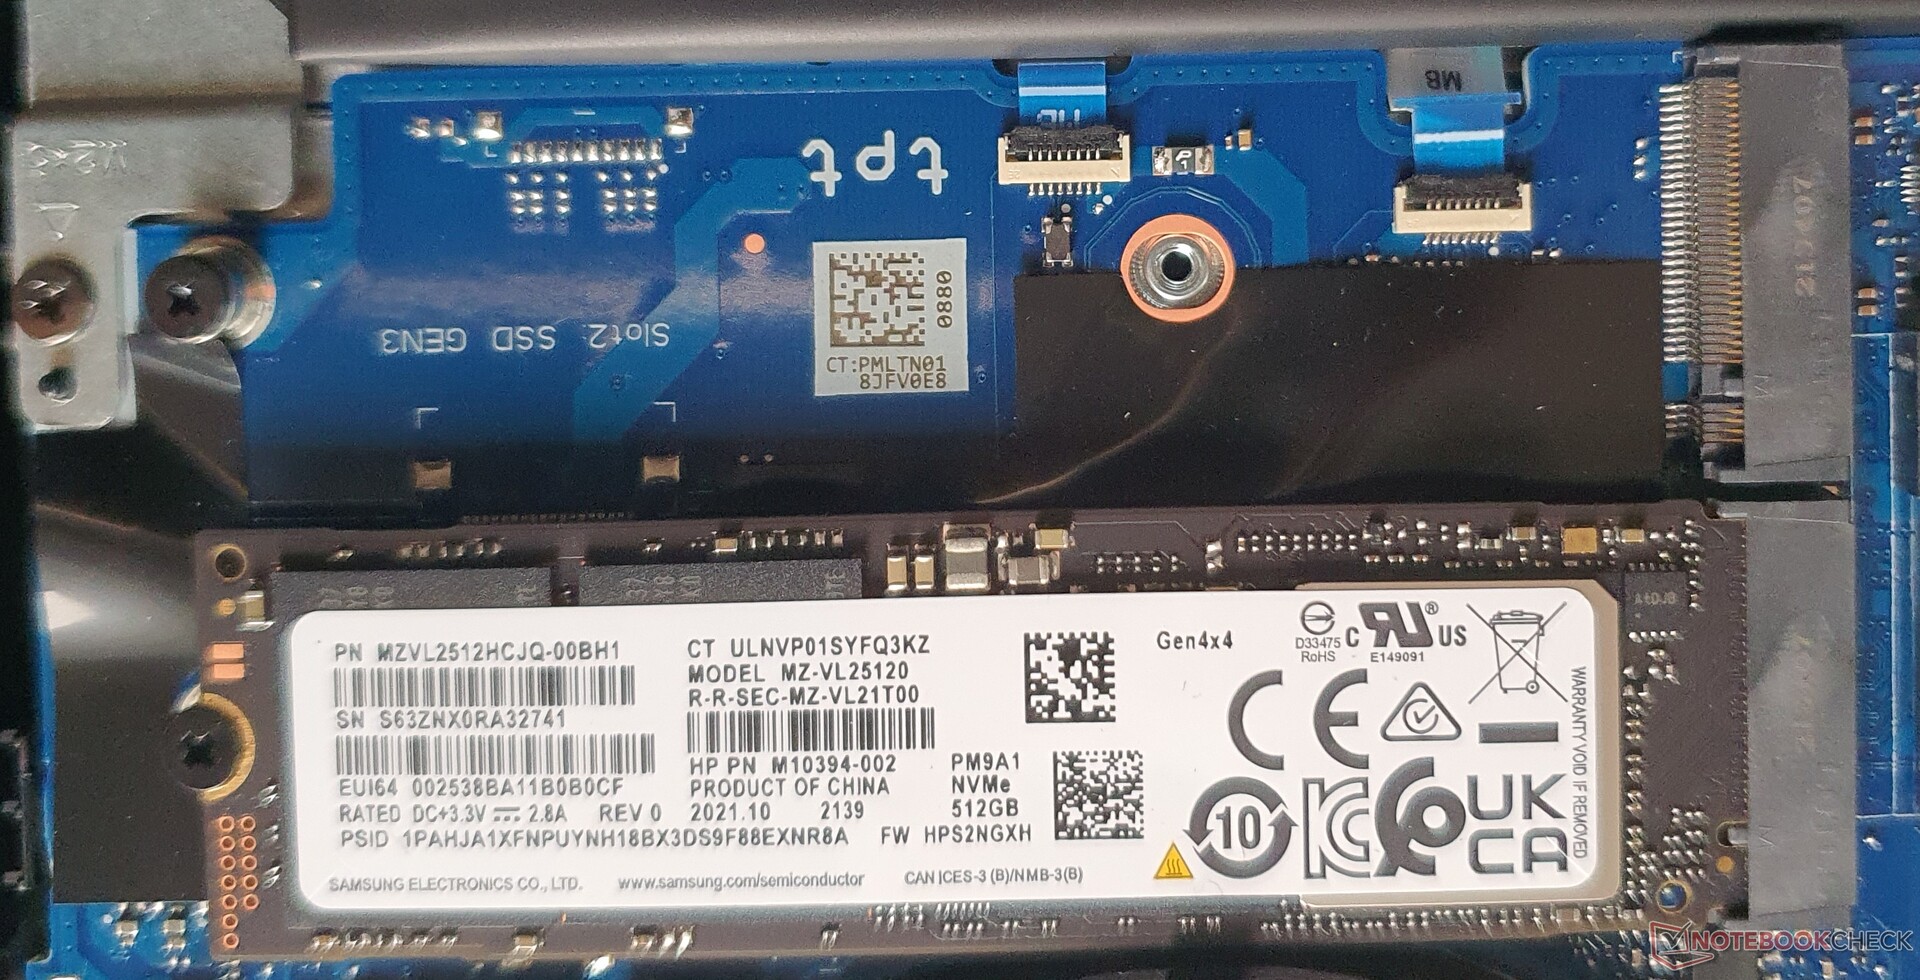
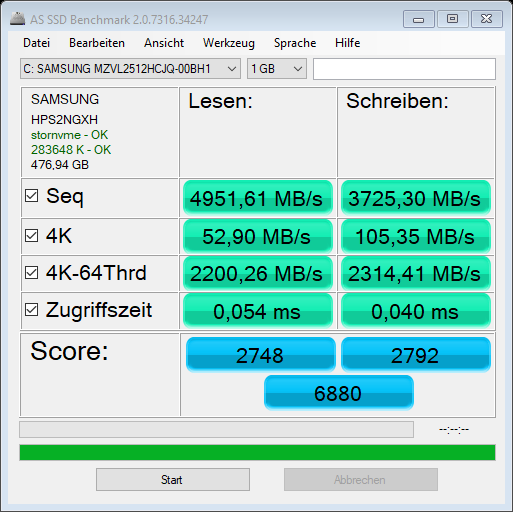
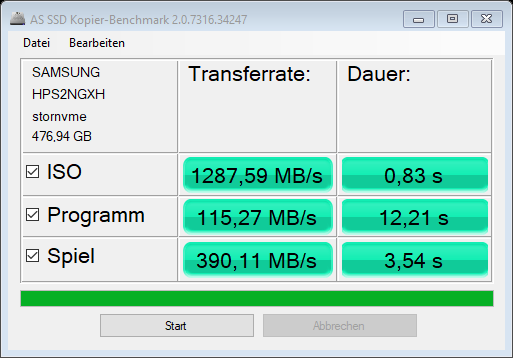
三星PM9A1提供512GB的空间,其中约418GB在交付状态下仍可供用户使用。由于采用了PCIe Gen4x4,包括4K值和访问时间在内的速度最初看起来非常好。第二个插槽(PCIe Gen3x4)也是可用的,两者都经过认证,最高可达2TB。
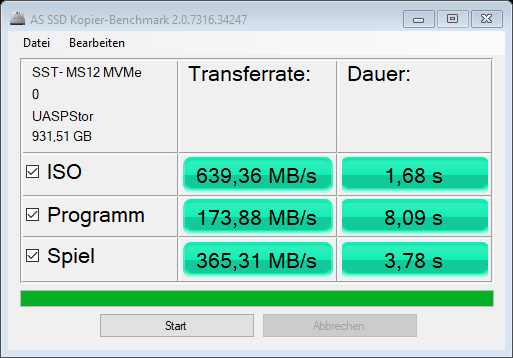
然而,当复制一个较大的程序时,例如,AS SSD显示出非常弱的传输率,只有115 MB/s,而不是1074 MB/s的ZBook Studio 15 G8.即使是价格低廉的 戴尔Precision 3511 管理的复制率也要高得多。我们的外部10-Gbps固态硬盘也可以更快地复制程序。
| HP ZBook Power 15 G8 313S5EA T600 Laptop GPU, i7-11800H, Samsung PM9A1 MZVL2512HCJQ | HP ZBook Fury 15 G8 RTX A5000 Laptop GPU, i9-11950H, Samsung PM981a MZVLB1T0HBLR | HP ZBook Studio 15 G8 GeForce RTX 3070 Laptop GPU, i9-11950H, Samsung PM981a MZVLB2T0HALB | HP ZBook Firefly 15 G8 2C9R7EA T500 Laptop GPU, i7-1165G7, Toshiba XG6 KXG60ZNV1T02 | Lenovo ThinkPad P15v G2 21A9000XGE T1200 Laptop GPU, i7-11800H, Toshiba XG6 KXG6AZNV512G | Dell Precision 3000 3551 Quadro P620, i9-10885H, Toshiba Kioxia XG6 KXG60PNV512G | |
|---|---|---|---|---|---|---|
| AS SSD | -35% | 64% | -26% | -9% | 24% | |
| Seq Read (MB/s) | 4951 | 2937 -41% | 2953 -40% | 2599 -48% | 2684 -46% | 1833 -63% |
| Seq Write (MB/s) | 3725 | 1688 -55% | 1691 -55% | 1305 -65% | 1352 -64% | 1283 -66% |
| 4K Read (MB/s) | 52.9 | 44.27 -16% | 43.98 -17% | 49.65 -6% | 43.68 -17% | 44.56 -16% |
| 4K Write (MB/s) | 105.35 | 105.8 0% | 105.4 0% | 128.1 22% | 105.56 0% | 112.4 7% |
| 4K-64 Read (MB/s) | 2200.26 | 873 -60% | 1065 -52% | 1157 -47% | 976.92 -56% | 1106 -50% |
| 4K-64 Write (MB/s) | 2314.41 | 1996 -14% | 1957 -15% | 1475 -36% | 1452.09 -37% | 1262 -45% |
| Access Time Read * (ms) | 0.054 | 0.048 11% | 0.04 26% | 0.057 -6% | 0.124 -130% | 0.084 -56% |
| Access Time Write * (ms) | 0.04 | 0.107 -168% | 0.105 -163% | 0.03 25% | 0.038 5% | 0.105 -163% |
| Score Read (Points) | 2748 | 1211 -56% | 1404 -49% | 1467 -47% | 1289 -53% | 1334 -51% |
| Score Write (Points) | 2792 | 2271 -19% | 2232 -20% | 1734 -38% | 1693 -39% | 1503 -46% |
| Score Total (Points) | 6880 | 4046 -41% | 4297 -38% | 3894 -43% | 3582 -48% | 3498 -49% |
| Copy ISO MB/s (MB/s) | 1287.6 | 901 -30% | 2474 92% | 1760.5 37% | 2940 128% | |
| Copy Program MB/s (MB/s) | 115.3 | 118.7 3% | 1074 831% | 355 208% | 733 536% | |
| Copy Game MB/s (MB/s) | 390.1 | 372 -5% | 1929 394% | 849 118% | 1442 270% |
* ... smaller is better
| Drive Performance rating - Percent | |
| Average of class Workstation | |
| Average Samsung PM9A1 MZVL2512HCJQ | |
| HP ZBook Power 15 G8 313S5EA | |
| HP ZBook Firefly 15 G8 2C9R7EA | |
| HP ZBook Studio 15 G8 | |
| HP ZBook Fury 15 G8 | |
| Lenovo ThinkPad P15v G2 21A9000XGE | |
| Dell Precision 3000 3551 | |
* ... smaller is better
Constant Performance Reading: DiskSpd Read Loop, Queue Depth 8
图形卡

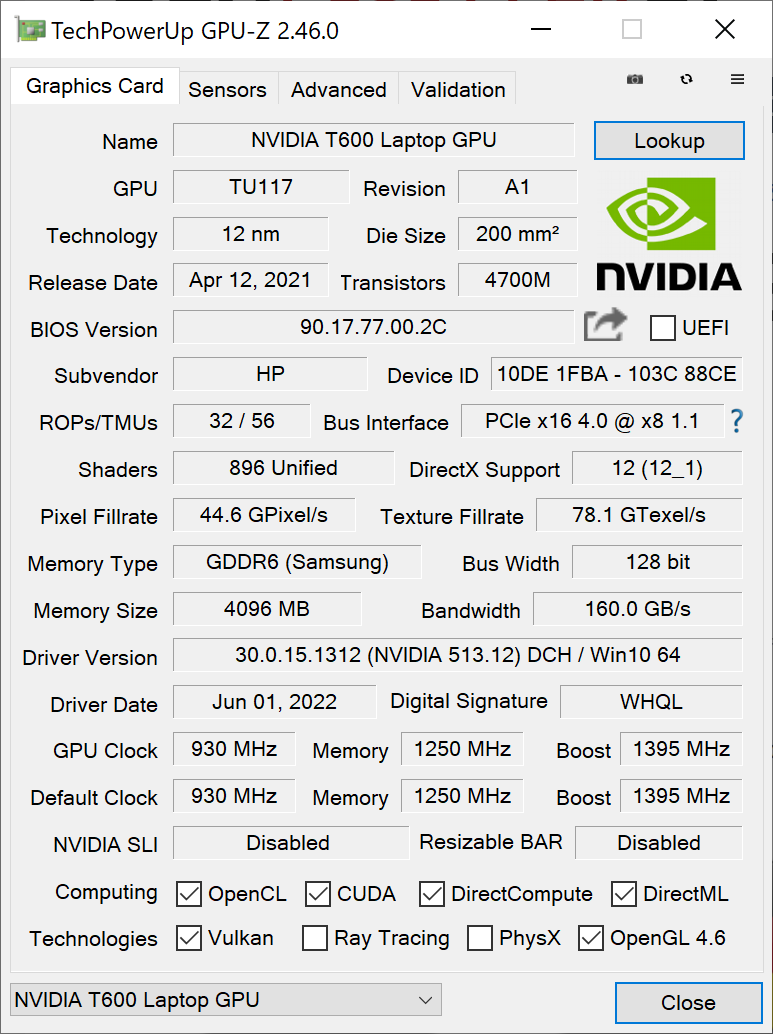
该Nvidia T600这里使用的是专业版本的 GeForce GTX 1650(non-Ti),有4GB的GDDR6 VRAM和25瓦的TGP,升频至1395 MHz。
在许多基准测试中,它仍然落后于 Nvidia T1200的ThinkPad P15v G2的Nvidia T1200,并领先30-50%的 Nvidia T500 中的ZBook Firefly 15 G8.
在电池运行中,你将失去大约20%的图形功率,这仍然允许你在移动操作中进行GPU任务。

| 3DMark Performance rating - Percent | |
| Average of class Workstation | |
| HP ZBook Fury 15 G8 -4! | |
| HP ZBook Studio 15 G8 -4! | |
| HP ZBook Power 15 G8 313S5EA | |
| Average NVIDIA T600 Laptop GPU | |
| Lenovo ThinkPad P15v G2 21A9000XGE -3! | |
| Dell Precision 3000 3551 -3! | |
| HP ZBook Firefly 15 G8 2C9R7EA -4! | |
| 3DMark 06 - 1280x1024 Standard Score AA:0x AF:0x | |
| Average of class Workstation (53112 - 63693, n=3, last 2 years) | |
| HP ZBook Power 15 G8 313S5EA | |
| Average NVIDIA T600 Laptop GPU (n=1) | |
| Lenovo ThinkPad P15v G2 21A9000XGE | |
| Dell Precision 3000 3551 | |
| 3DMark Vantage | |
| 1280x1024 P Result | |
| Average of class Workstation (71988 - 116321, n=3, last 2 years) | |
| HP ZBook Power 15 G8 313S5EA | |
| Average NVIDIA T600 Laptop GPU (n=1) | |
| 1280x1024 P GPU no PhysX | |
| Average of class Workstation (66766 - 117151, n=2, last 2 years) | |
| HP ZBook Power 15 G8 313S5EA | |
| Average NVIDIA T600 Laptop GPU (n=1) | |
| 1280x1024 P CPU no PhysX | |
| Average of class Workstation (94058 - 113900, n=2, last 2 years) | |
| HP ZBook Power 15 G8 313S5EA | |
| Average NVIDIA T600 Laptop GPU (n=1) | |
| 3DMark 11 - 1280x720 Performance GPU | |
| Average of class Workstation (12535 - 69594, n=23, last 2 years) | |
| HP ZBook Fury 15 G8 | |
| HP ZBook Studio 15 G8 | |
| Lenovo ThinkPad P15v G2 21A9000XGE | |
| HP ZBook Power 15 G8 313S5EA | |
| Average NVIDIA T600 Laptop GPU (n=1) | |
| HP ZBook Firefly 15 G8 2C9R7EA | |
| Dell Precision 3000 3551 | |
| 3DMark | |
| 1280x720 Cloud Gate Standard Graphics | |
| Average of class Workstation (58392 - 152418, n=14, last 2 years) | |
| Lenovo ThinkPad P15v G2 21A9000XGE | |
| HP ZBook Power 15 G8 313S5EA | |
| Average NVIDIA T600 Laptop GPU (n=1) | |
| HP ZBook Fury 15 G8 | |
| HP ZBook Studio 15 G8 | |
| Dell Precision 3000 3551 | |
| HP ZBook Firefly 15 G8 2C9R7EA | |
| 1920x1080 Fire Strike Graphics | |
| Average of class Workstation (8293 - 52560, n=23, last 2 years) | |
| HP ZBook Fury 15 G8 | |
| HP ZBook Studio 15 G8 | |
| Lenovo ThinkPad P15v G2 21A9000XGE | |
| HP ZBook Power 15 G8 313S5EA | |
| Average NVIDIA T600 Laptop GPU (n=1) | |
| HP ZBook Firefly 15 G8 2C9R7EA | |
| Dell Precision 3000 3551 | |
| 2560x1440 Time Spy Graphics | |
| Average of class Workstation (2725 - 24806, n=23, last 2 years) | |
| HP ZBook Fury 15 G8 | |
| HP ZBook Studio 15 G8 | |
| Lenovo ThinkPad P15v G2 21A9000XGE | |
| HP ZBook Power 15 G8 313S5EA | |
| Average NVIDIA T600 Laptop GPU (n=1) | |
| HP ZBook Firefly 15 G8 2C9R7EA | |
| Dell Precision 3000 3551 | |
| 3DMark 06 Standard Score | 43438 points | |
| 3DMark Vantage P Result | 39112 points | |
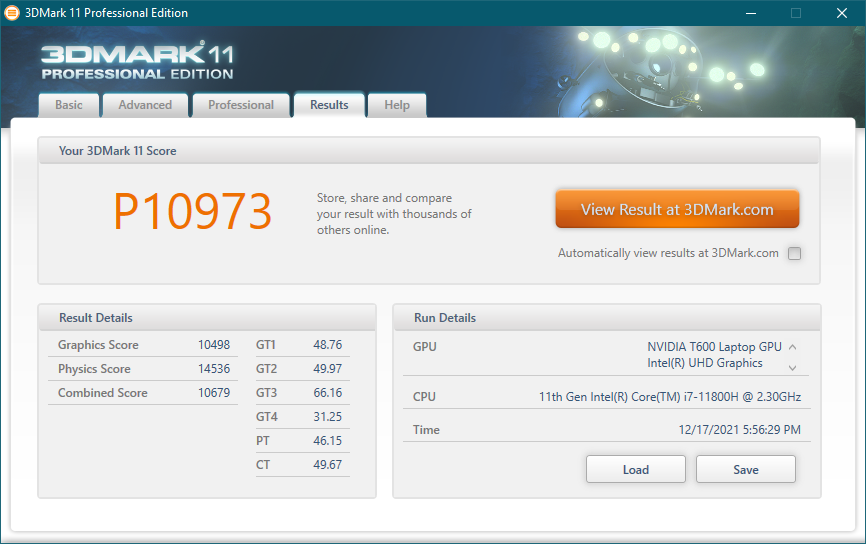
| 3DMark 11 Performance | 10973 points | |
| 3DMark Ice Storm Standard Score | 76482 points | |
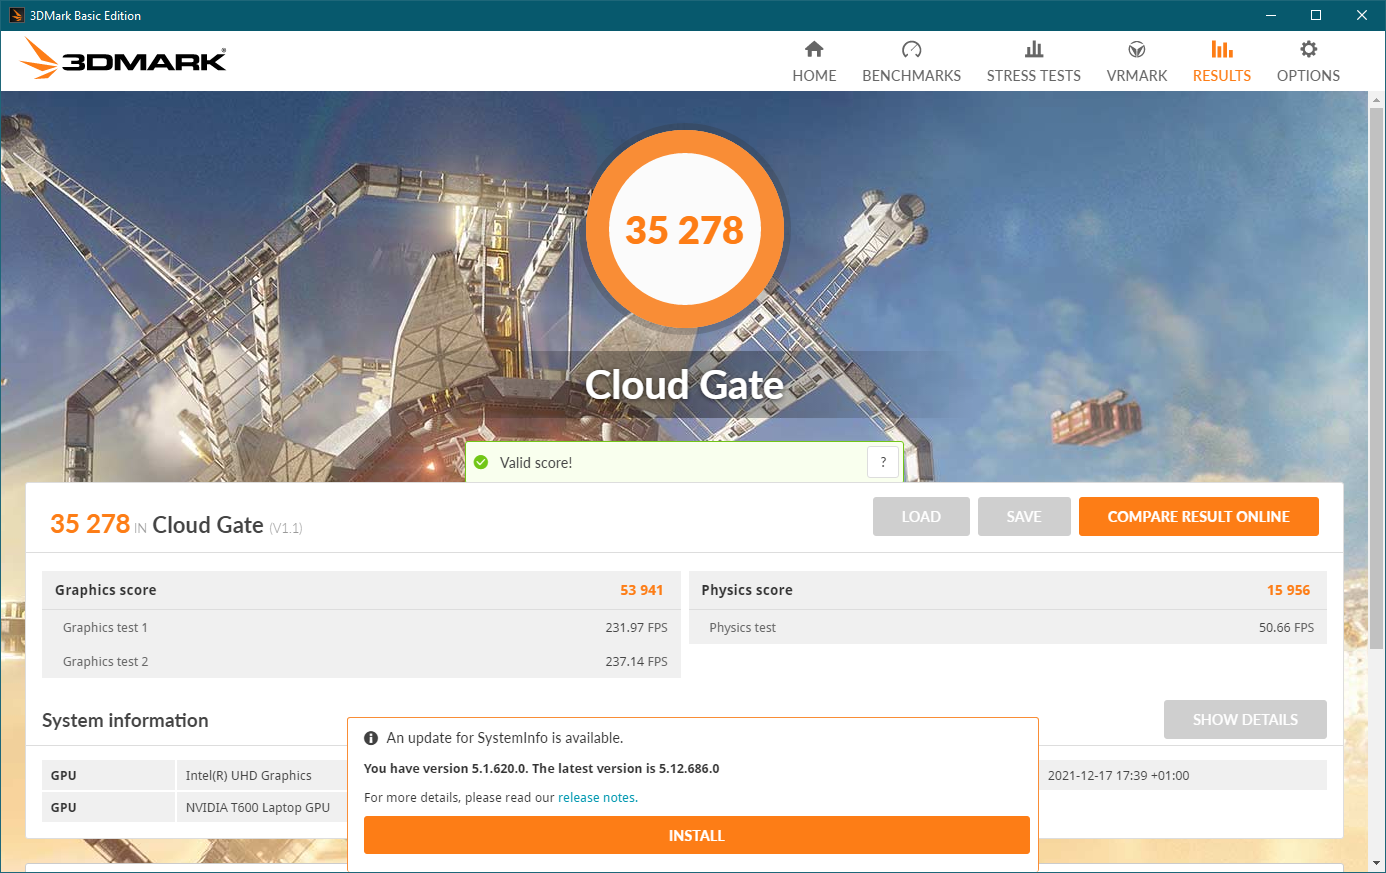
| 3DMark Cloud Gate Standard Score | 35278 points | |
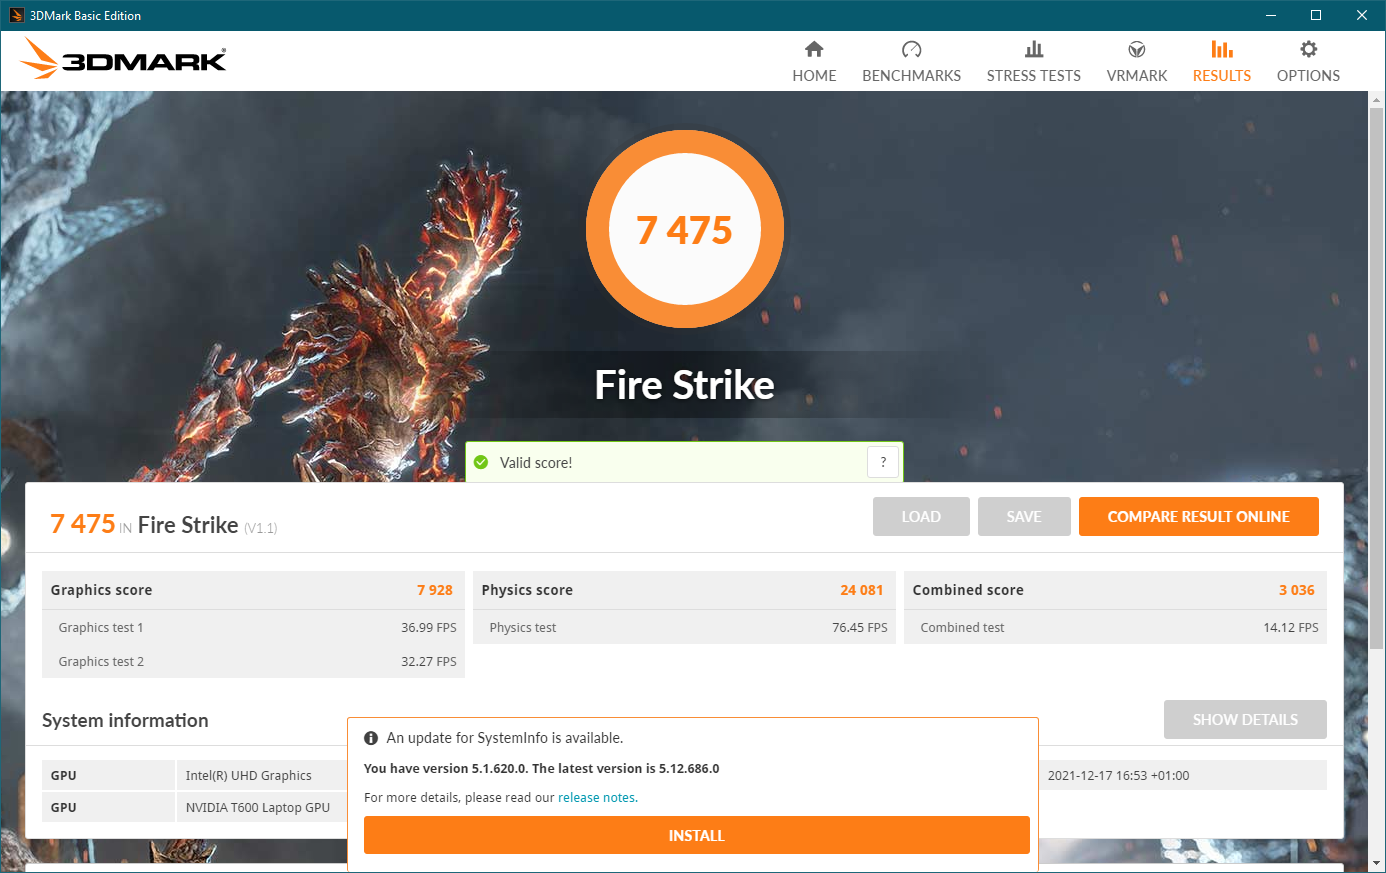
| 3DMark Fire Strike Score | 7475 points | |
| 3DMark Time Spy Score | 3075 points | |
Help | ||
游戏性能
在游戏时, 芯片 能够保持其全部提升的时钟速度。在不到60℃(140°F)的温度下,它不会变得特别热。在现代游戏中,其性能足以满足全高清分辨率下的中等细节。然而,ZBook并不是为游戏而设计的。在这种情况下,系统的总功耗为60瓦,其中25瓦用于GPU。
虽然 笔记本P15v虽然ThinkPad P15v只为其dGPU多提供了10瓦,但它在游戏期间总共消耗了100瓦,而 Nvidia T1200每秒只多提供15%的帧数。这款ZBook Firefly 15 与Nvidia T500平均慢了40%,但在游戏过程中仍然消耗相同的60瓦。在长达一小时的TheWitcher 3测试中,我们没有注意到任何性能下降。
The Witcher 3 FPS Chart
| The Witcher 3 | |
| 1366x768 Medium Graphics & Postprocessing | |
| HP ZBook Studio 15 G8 | |
| HP ZBook Fury 15 G8 | |
| HP ZBook Power 15 G8 313S5EA | |
| Average NVIDIA T600 Laptop GPU (n=1) | |
| Dell Precision 3000 3551 | |
| 1920x1080 High Graphics & Postprocessing (Nvidia HairWorks Off) | |
| Average of class Workstation (n=1last 2 years) | |
| HP ZBook Studio 15 G8 | |
| HP ZBook Fury 15 G8 | |
| Lenovo ThinkPad P15v G2 21A9000XGE | |
| HP ZBook Power 15 G8 313S5EA | |
| Average NVIDIA T600 Laptop GPU (n=1) | |
| Dell Precision 3000 3551 | |
| 1920x1080 Ultra Graphics & Postprocessing (HBAO+) | |
| Average of class Workstation (n=1last 2 years) | |
| HP ZBook Fury 15 G8 | |
| HP ZBook Studio 15 G8 | |
| Lenovo ThinkPad P15v G2 21A9000XGE | |
| HP ZBook Power 15 G8 313S5EA | |
| Average NVIDIA T600 Laptop GPU (n=1) | |
| HP ZBook Firefly 15 G8 2C9R7EA | |
| Dell Precision 3000 3551 | |
| Dota 2 Reborn | |
| 1366x768 med (1/3) | |
| Average of class Workstation (91.2 - 209, n=23, last 2 years) | |
| HP ZBook Fury 15 G8 | |
| HP ZBook Studio 15 G8 | |
| Dell Precision 3000 3551 | |
| HP ZBook Power 15 G8 313S5EA | |
| Average NVIDIA T600 Laptop GPU (n=1) | |
| HP ZBook Firefly 15 G8 2C9R7EA | |
| Lenovo ThinkPad P15v G2 21A9000XGE | |
| 1920x1080 high (2/3) | |
| Average of class Workstation (52.1 - 199.8, n=23, last 2 years) | |
| HP ZBook Fury 15 G8 | |
| HP ZBook Studio 15 G8 | |
| HP ZBook Power 15 G8 313S5EA | |
| Average NVIDIA T600 Laptop GPU (n=1) | |
| Lenovo ThinkPad P15v G2 21A9000XGE | |
| HP ZBook Firefly 15 G8 2C9R7EA | |
| Dell Precision 3000 3551 | |
| 1920x1080 ultra (3/3) best looking | |
| Average of class Workstation (50.7 - 178.4, n=23, last 2 years) | |
| HP ZBook Fury 15 G8 | |
| HP ZBook Studio 15 G8 | |
| HP ZBook Power 15 G8 313S5EA | |
| Average NVIDIA T600 Laptop GPU (n=1) | |
| Lenovo ThinkPad P15v G2 21A9000XGE | |
| HP ZBook Firefly 15 G8 2C9R7EA | |
| Dell Precision 3000 3551 | |
| X-Plane 11.11 | |
| 1280x720 low (fps_test=1) | |
| Average of class Workstation (53.3 - 201, n=24, last 2 years) | |
| HP ZBook Studio 15 G8 | |
| HP ZBook Fury 15 G8 | |
| HP ZBook Power 15 G8 313S5EA | |
| Average NVIDIA T600 Laptop GPU (n=1) | |
| Dell Precision 3000 3551 | |
| Lenovo ThinkPad P15v G2 21A9000XGE | |
| HP ZBook Firefly 15 G8 2C9R7EA | |
| 1920x1080 med (fps_test=2) | |
| HP ZBook Studio 15 G8 | |
| Average of class Workstation (35.9 - 178.2, n=23, last 2 years) | |
| HP ZBook Power 15 G8 313S5EA | |
| Average NVIDIA T600 Laptop GPU (n=1) | |
| HP ZBook Fury 15 G8 | |
| Lenovo ThinkPad P15v G2 21A9000XGE | |
| Dell Precision 3000 3551 | |
| HP ZBook Firefly 15 G8 2C9R7EA | |
| 1920x1080 high (fps_test=3) | |
| HP ZBook Studio 15 G8 | |
| Average of class Workstation (30.5 - 139.7, n=23, last 2 years) | |
| HP ZBook Power 15 G8 313S5EA | |
| Average NVIDIA T600 Laptop GPU (n=1) | |
| HP ZBook Fury 15 G8 | |
| Lenovo ThinkPad P15v G2 21A9000XGE | |
| Dell Precision 3000 3551 | |
| HP ZBook Firefly 15 G8 2C9R7EA | |
| GTA V | |
| 1366x768 Normal/Off AF:4x | |
| Average of class Workstation (140.9 - 185.8, n=17, last 2 years) | |
| HP ZBook Fury 15 G8 | |
| Lenovo ThinkPad P15v G2 21A9000XGE | |
| HP ZBook Power 15 G8 313S5EA | |
| Average NVIDIA T600 Laptop GPU (n=1) | |
| 1920x1080 High/On (Advanced Graphics Off) AA:2xMSAA + FX AF:8x | |
| Average of class Workstation (44.4 - 179.4, n=21, last 2 years) | |
| HP ZBook Fury 15 G8 | |
| Lenovo ThinkPad P15v G2 21A9000XGE | |
| HP ZBook Power 15 G8 313S5EA | |
| Average NVIDIA T600 Laptop GPU (n=1) | |
| 1920x1080 Highest AA:4xMSAA + FX AF:16x | |
| Average of class Workstation (18.1 - 156.1, n=23, last 2 years) | |
| HP ZBook Fury 15 G8 | |
| Lenovo ThinkPad P15v G2 21A9000XGE | |
| HP ZBook Power 15 G8 313S5EA | |
| Average NVIDIA T600 Laptop GPU (n=1) | |
| Shadow of the Tomb Raider | |
| 1280x720 Lowest Preset | |
| HP ZBook Fury 15 G8 | |
| HP ZBook Power 15 G8 313S5EA | |
| Average NVIDIA T600 Laptop GPU (n=1) | |
| Lenovo ThinkPad P15v G2 21A9000XGE | |
| 1920x1080 Medium Preset | |
| HP ZBook Fury 15 G8 | |
| Lenovo ThinkPad P15v G2 21A9000XGE | |
| HP ZBook Power 15 G8 313S5EA | |
| Average NVIDIA T600 Laptop GPU (n=1) | |
| 1920x1080 High Preset AA:SM | |
| HP ZBook Fury 15 G8 | |
| Lenovo ThinkPad P15v G2 21A9000XGE | |
| HP ZBook Power 15 G8 313S5EA | |
| Average NVIDIA T600 Laptop GPU (n=1) | |
| Far Cry 5 | |
| 1920x1080 Medium Preset AA:T | |
| Average of class Workstation (42 - 148, n=9, last 2 years) | |
| HP ZBook Studio 15 G8 | |
| HP ZBook Fury 15 G8 | |
| Lenovo ThinkPad P15v G2 21A9000XGE | |
| HP ZBook Power 15 G8 313S5EA | |
| Average NVIDIA T600 Laptop GPU (n=1) | |
| HP ZBook Firefly 15 G8 2C9R7EA | |
| 1920x1080 High Preset AA:T | |
| Average of class Workstation (39 - 138, n=9, last 2 years) | |
| HP ZBook Studio 15 G8 | |
| HP ZBook Fury 15 G8 | |
| Lenovo ThinkPad P15v G2 21A9000XGE | |
| HP ZBook Power 15 G8 313S5EA | |
| Average NVIDIA T600 Laptop GPU (n=1) | |
| HP ZBook Firefly 15 G8 2C9R7EA | |
| 1920x1080 Ultra Preset AA:T | |
| Average of class Workstation (37 - 128, n=9, last 2 years) | |
| HP ZBook Studio 15 G8 | |
| HP ZBook Fury 15 G8 | |
| Lenovo ThinkPad P15v G2 21A9000XGE | |
| HP ZBook Power 15 G8 313S5EA | |
| Average NVIDIA T600 Laptop GPU (n=1) | |
| HP ZBook Firefly 15 G8 2C9R7EA | |
| Elden Ring | |
| 1920x1080 Medium Preset | |
| Lenovo ThinkPad P15v G2 21A9000XGE | |
| HP ZBook Power 15 G8 313S5EA | |
| Average NVIDIA T600 Laptop GPU (n=1) | |
| 1920x1080 High Preset | |
| Lenovo ThinkPad P15v G2 21A9000XGE | |
| HP ZBook Power 15 G8 313S5EA | |
| Average NVIDIA T600 Laptop GPU (n=1) | |
| 1920x1080 Maximum Preset | |
| Lenovo ThinkPad P15v G2 21A9000XGE | |
| HP ZBook Power 15 G8 313S5EA | |
| Average NVIDIA T600 Laptop GPU (n=1) | |
| Resident Evil Village | |
| 1920x1080 Balanced Preset | |
| Lenovo ThinkPad P15v G2 21A9000XGE | |
| HP ZBook Power 15 G8 313S5EA | |
| Average NVIDIA T600 Laptop GPU (n=1) | |
| 1920x1080 Prioritize Graphics Preset | |
| Lenovo ThinkPad P15v G2 21A9000XGE | |
| HP ZBook Power 15 G8 313S5EA | |
| Average NVIDIA T600 Laptop GPU (n=1) | |
| 1920x1080 Max Preset | |
| Lenovo ThinkPad P15v G2 21A9000XGE | |
| HP ZBook Power 15 G8 313S5EA | |
| Average NVIDIA T600 Laptop GPU (n=1) | |
| Vampire Bloodhunt | |
| 1920x1080 Medium Preset | |
| Lenovo ThinkPad P15v G2 21A9000XGE | |
| HP ZBook Power 15 G8 313S5EA | |
| Average NVIDIA T600 Laptop GPU (n=1) | |
| 1920x1080 High Preset | |
| Lenovo ThinkPad P15v G2 21A9000XGE | |
| HP ZBook Power 15 G8 313S5EA | |
| Average NVIDIA T600 Laptop GPU (n=1) | |
| 1920x1080 Ultra Preset | |
| Lenovo ThinkPad P15v G2 21A9000XGE | |
| HP ZBook Power 15 G8 313S5EA | |
| Average NVIDIA T600 Laptop GPU (n=1) | |
| GRID Legends | |
| 1920x1080 Medium Preset | |
| Lenovo ThinkPad P15v G2 21A9000XGE | |
| HP ZBook Power 15 G8 313S5EA | |
| Average NVIDIA T600 Laptop GPU (n=1) | |
| 1920x1080 High Preset | |
| Lenovo ThinkPad P15v G2 21A9000XGE | |
| HP ZBook Power 15 G8 313S5EA | |
| Average NVIDIA T600 Laptop GPU (n=1) | |
| 1920x1080 Ultra Preset | |
| Lenovo ThinkPad P15v G2 21A9000XGE | |
| HP ZBook Power 15 G8 313S5EA | |
| Average NVIDIA T600 Laptop GPU (n=1) | |
| Mafia Definitive Edition | |
| 1280x720 Low Preset | |
| Lenovo ThinkPad P15v G2 21A9000XGE | |
| HP ZBook Power 15 G8 313S5EA | |
| Average NVIDIA T600 Laptop GPU (n=1) | |
| 1920x1080 Medium Preset | |
| Lenovo ThinkPad P15v G2 21A9000XGE | |
| HP ZBook Power 15 G8 313S5EA | |
| Average NVIDIA T600 Laptop GPU (n=1) | |
| 1920x1080 High Preset | |
| Lenovo ThinkPad P15v G2 21A9000XGE | |
| HP ZBook Power 15 G8 313S5EA | |
| Average NVIDIA T600 Laptop GPU (n=1) | |
| Elex 2 | |
| 1920x1080 Medium / On AA:FX AF:16x | |
| Lenovo ThinkPad P15v G2 21A9000XGE | |
| HP ZBook Power 15 G8 313S5EA | |
| Average NVIDIA T600 Laptop GPU (n=1) | |
| 1920x1080 High / On AA:FX AF:16x | |
| Lenovo ThinkPad P15v G2 21A9000XGE | |
| HP ZBook Power 15 G8 313S5EA | |
| Average NVIDIA T600 Laptop GPU (n=1) | |
| 1920x1080 Ultra / On AA:SM AF:16x | |
| Lenovo ThinkPad P15v G2 21A9000XGE | |
| HP ZBook Power 15 G8 313S5EA | |
| Average NVIDIA T600 Laptop GPU (n=1) | |
| Farming Simulator 22 | |
| 1920x1080 Medium Preset | |
| Lenovo ThinkPad P15v G2 21A9000XGE | |
| HP ZBook Power 15 G8 313S5EA | |
| Average NVIDIA T600 Laptop GPU (n=1) | |
| 1920x1080 High Preset | |
| Lenovo ThinkPad P15v G2 21A9000XGE | |
| HP ZBook Power 15 G8 313S5EA | |
| Average NVIDIA T600 Laptop GPU (n=1) | |
| 1920x1080 Very High Preset | |
| Lenovo ThinkPad P15v G2 21A9000XGE | |
| HP ZBook Power 15 G8 313S5EA | |
| Average NVIDIA T600 Laptop GPU (n=1) | |
| Ghostwire Tokyo | |
| 1920x1080 Medium Settings | |
| Lenovo ThinkPad P15v G2 21A9000XGE | |
| HP ZBook Power 15 G8 313S5EA | |
| Average NVIDIA T600 Laptop GPU (n=1) | |
| 1920x1080 High Settings | |
| Lenovo ThinkPad P15v G2 21A9000XGE | |
| HP ZBook Power 15 G8 313S5EA | |
| Average NVIDIA T600 Laptop GPU (n=1) | |
| 1920x1080 Highest Settings | |
| HP ZBook Power 15 G8 313S5EA | |
| Average NVIDIA T600 Laptop GPU (n=1) | |
| Lenovo ThinkPad P15v G2 21A9000XGE | |
| Riders Republic | |
| 1920x1080 Medium Preset | |
| HP ZBook Power 15 G8 313S5EA | |
| Average NVIDIA T600 Laptop GPU (n=1) | |
| Lenovo ThinkPad P15v G2 21A9000XGE | |
| 1920x1080 High Preset | |
| Lenovo ThinkPad P15v G2 21A9000XGE | |
| HP ZBook Power 15 G8 313S5EA | |
| Average NVIDIA T600 Laptop GPU (n=1) | |
| 1920x1080 Ultra Preset | |
| Lenovo ThinkPad P15v G2 21A9000XGE | |
| HP ZBook Power 15 G8 313S5EA | |
| Average NVIDIA T600 Laptop GPU (n=1) | |
| Dying Light 2 | |
| 1920x1080 Low Quality | |
| Lenovo ThinkPad P15v G2 21A9000XGE | |
| HP ZBook Power 15 G8 313S5EA | |
| Average NVIDIA T600 Laptop GPU (n=1) | |
| 1920x1080 Medium Quality | |
| Lenovo ThinkPad P15v G2 21A9000XGE | |
| HP ZBook Power 15 G8 313S5EA | |
| Average NVIDIA T600 Laptop GPU (n=1) | |
| 1920x1080 High Quality | |
| Lenovo ThinkPad P15v G2 21A9000XGE | |
| HP ZBook Power 15 G8 313S5EA | |
| Average NVIDIA T600 Laptop GPU (n=1) | |
| Tiny Tina's Wonderlands | |
| 1920x1080 Medium Preset (DX12) | |
| Average of class Workstation (115.1 - 233, n=5, last 2 years) | |
| HP ZBook Power 15 G8 313S5EA | |
| Average NVIDIA T600 Laptop GPU (n=1) | |
| 1920x1080 High Preset (DX12) | |
| Average of class Workstation (80 - 171.4, n=5, last 2 years) | |
| HP ZBook Power 15 G8 313S5EA | |
| Average NVIDIA T600 Laptop GPU (n=1) | |
| 1920x1080 Badass Preset (DX12) | |
| Average of class Workstation (64.4 - 137.1, n=5, last 2 years) | |
| HP ZBook Power 15 G8 313S5EA | |
| Average NVIDIA T600 Laptop GPU (n=1) | |
| Deathloop | |
| 1920x1080 Medium Preset | |
| HP ZBook Power 15 G8 313S5EA | |
| Average NVIDIA T600 Laptop GPU (n=1) | |
| 1920x1080 High Preset | |
| HP ZBook Power 15 G8 313S5EA | |
| Average NVIDIA T600 Laptop GPU (n=1) | |
| 1920x1080 Ultra Preset | |
| HP ZBook Power 15 G8 313S5EA | |
| Average NVIDIA T600 Laptop GPU (n=1) | |
| Immortals Fenyx Rising | |
| 1920x1080 Medium Preset | |
| HP ZBook Fury 15 G8 | |
| HP ZBook Power 15 G8 313S5EA | |
| Average NVIDIA T600 Laptop GPU (n=1) | |
| 1920x1080 High Preset | |
| HP ZBook Fury 15 G8 | |
| HP ZBook Power 15 G8 313S5EA | |
| Average NVIDIA T600 Laptop GPU (n=1) | |
| 1920x1080 Very High Preset | |
| HP ZBook Fury 15 G8 | |
| HP ZBook Power 15 G8 313S5EA | |
| Average NVIDIA T600 Laptop GPU (n=1) | |
| low | med. | high | ultra | |
|---|---|---|---|---|
| GTA V (2015) | 142.6 | 137.6 | 82.3 | 44.1 |
| The Witcher 3 (2015) | 158.6 | 92.7 | 52.2 | 27.6 |
| Dota 2 Reborn (2015) | 149.4 | 127.6 | 115.8 | 107.1 |
| Final Fantasy XV Benchmark (2018) | 86 | 43.9 | 31 | |
| X-Plane 11.11 (2018) | 107.9 | 92.4 | 77 | |
| Far Cry 5 (2018) | 105 | 53 | 49 | 45 |
| Strange Brigade (2018) | 190.4 | 76.2 | 60.7 | 52.7 |
| Shadow of the Tomb Raider (2018) | 98 | 53 | 42 | 36 |
| Mafia Definitive Edition (2020) | 83.6 | 40.4 | 34.9 | |
| Immortals Fenyx Rising (2020) | 72 | 45 | 36 | 31 |
| Resident Evil Village (2021) | 113.6 | 58.6 | 52.1 | 44 |
| Deathloop (2021) | 68.9 | 34.4 | 28.4 | 25.2 |
| Riders Republic (2021) | 91 | 52 | 39 | 30 |
| Farming Simulator 22 (2021) | 175.4 | 87.5 | 63.5 | 53.9 |
| Dying Light 2 (2022) | 31.7 | 23 | 18.3 | |
| GRID Legends (2022) | 104.1 | 71 | 57.7 | 41.9 |
| Elden Ring (2022) | 52.4 | 45 | 39 | 29.9 |
| Elex 2 (2022) | 38.5 | 35.7 | 30.5 | 26.9 |
| Ghostwire Tokyo (2022) | 45.7 | 44.3 | 43.9 | 41.8 |
| Tiny Tina's Wonderlands (2022) | 57.5 | 32.8 | 48.3 | 27.2 |
| Vampire Bloodhunt (2022) | 119 | 64.5 | 61.8 | 60.1 |
排放。炫酷的ZBook工作站有时会安静地运行
噪声排放
测试仪只有使用旧版BIOS的测量结果,旧版BIOS仍然允许显著提高风扇速度,并导致负载情况下的噪音水平高达51db(A)。然而,在v1.09版BIOS中,惠普的AI只允许最大的风扇速度为4300 upm左右,不过在敏感的商业环境中,这可能是一个优势。
凭借其两个风扇和三根热管,其散热能力应该比ThinkPad P15v G2的散热能力更强,后者的75瓦的热量由其单风扇成功冷却。然而,在限制性的AI下,惠普ZBook的风扇在综合负载(CPU+GPU)下最多只能冷却65至80瓦的热量。风扇通风口在显示器和机箱之间的底部,从机箱底部吸取空气,这使得在膝盖上使用它不太理想。
在定期上网冲浪时,风扇保持安静,但如果你习惯于在网上快速工作,它们就会不断打开,而且相当嘈杂。至少没有线圈的啸叫。在组件功能相似的情况下,联想的ThinkPad P15v G2 在所有情况下都比较低调,而惠普自己的 ZBook Fury 也运行得比较安静。另一方面,戴尔的Precision 3551 的风扇真的喜欢吹得很厉害。
Noise level
| Idle |
| 25.54 / 25.54 / 25.54 dB(A) |
| Load |
| 48.85 / 50.98 dB(A) |
 | ||
30 dB silent 40 dB(A) audible 50 dB(A) loud |
||
min: | ||
| HP ZBook Power 15 G8 313S5EA T600 Laptop GPU, i7-11800H, Samsung PM9A1 MZVL2512HCJQ | HP ZBook Fury 15 G8 RTX A5000 Laptop GPU, i9-11950H, Samsung PM981a MZVLB1T0HBLR | HP ZBook Studio 15 G8 GeForce RTX 3070 Laptop GPU, i9-11950H, Samsung PM981a MZVLB2T0HALB | HP ZBook Firefly 15 G8 2C9R7EA T500 Laptop GPU, i7-1165G7, Toshiba XG6 KXG60ZNV1T02 | Lenovo ThinkPad P15v G2 21A9000XGE T1200 Laptop GPU, i7-11800H, Toshiba XG6 KXG6AZNV512G | Dell Precision 3000 3551 Quadro P620, i9-10885H, Toshiba Kioxia XG6 KXG60PNV512G | |
|---|---|---|---|---|---|---|
| Noise | 9% | 3% | 14% | 9% | -1% | |
| off / environment * (dB) | 25.54 | 24.1 6% | 23.5 8% | 24.1 6% | 25.21 1% | 25.8 -1% |
| Idle Minimum * (dB) | 25.54 | 24.1 6% | 25.3 1% | 24.1 6% | 25.21 1% | 26.2 -3% |
| Idle Average * (dB) | 25.54 | 24.1 6% | 25.3 1% | 24.1 6% | 25.21 1% | 26.2 -3% |
| Idle Maximum * (dB) | 25.54 | 24.8 3% | 25.3 1% | 27.1 -6% | 25.21 1% | 26.2 -3% |
| Load Average * (dB) | 48.85 | 37.8 23% | 41.2 16% | 32.8 33% | 39.09 20% | 51.2 -5% |
| Witcher 3 ultra * (dB) | 46.58 | 44.2 5% | 49.4 -6% | 36.1 22% | 36.6 21% | 42.7 8% |
| Load Maximum * (dB) | 50.98 | 44.2 13% | 49.4 3% | 36.1 29% | 43.53 15% | 50.7 1% |
* ... smaller is better
温度
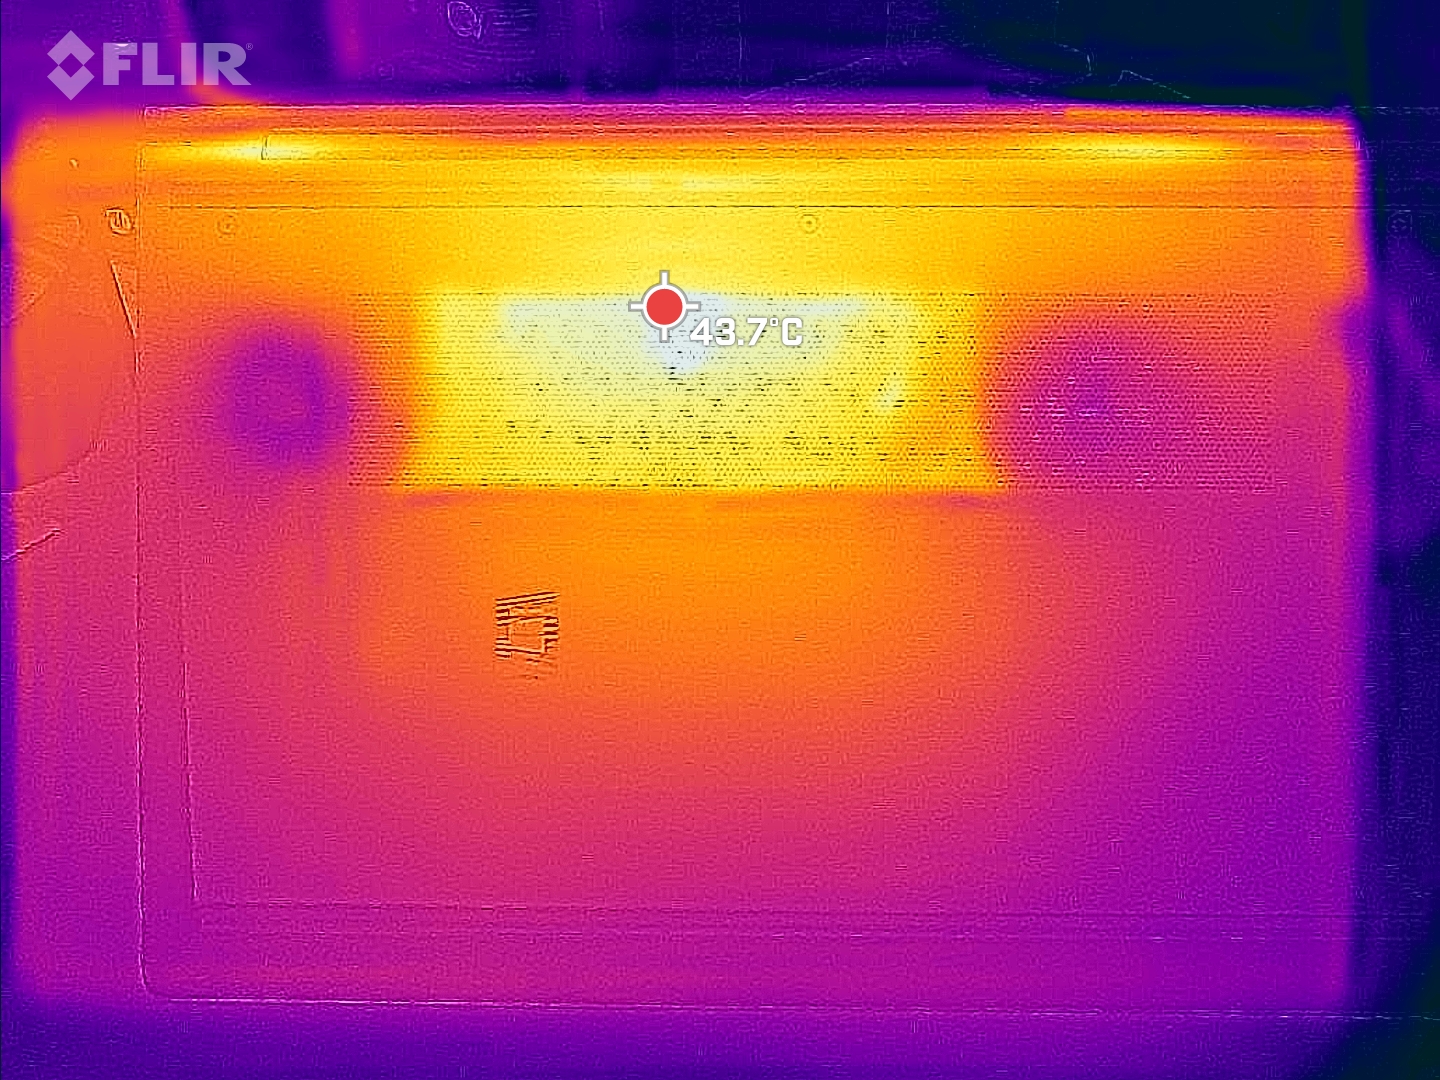
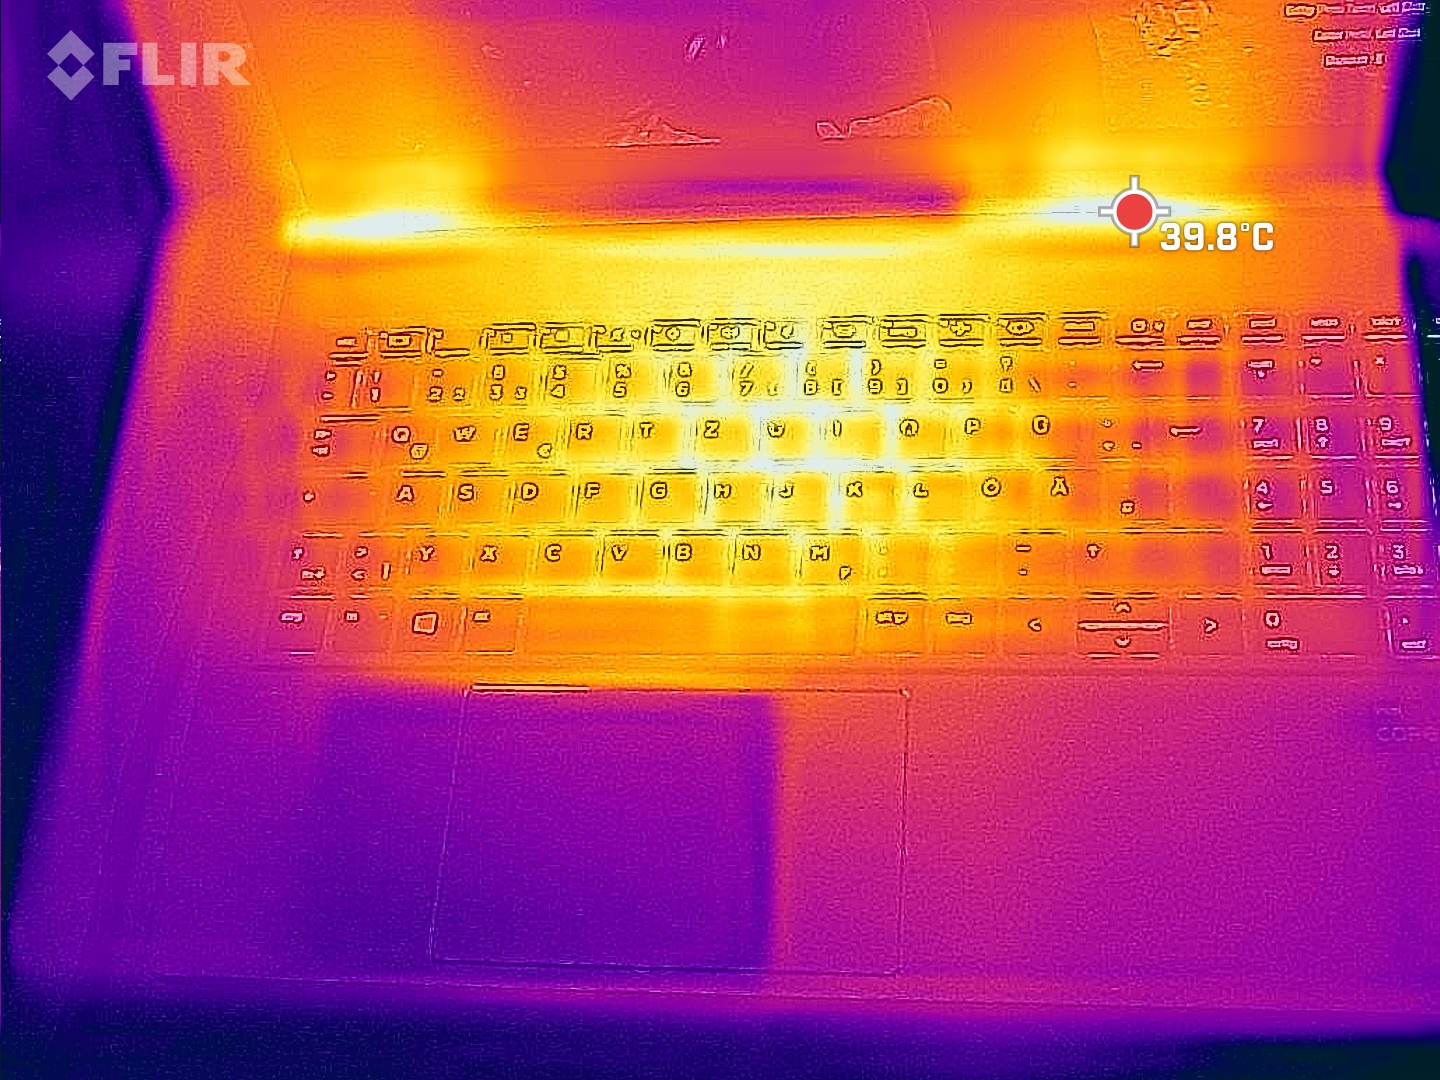
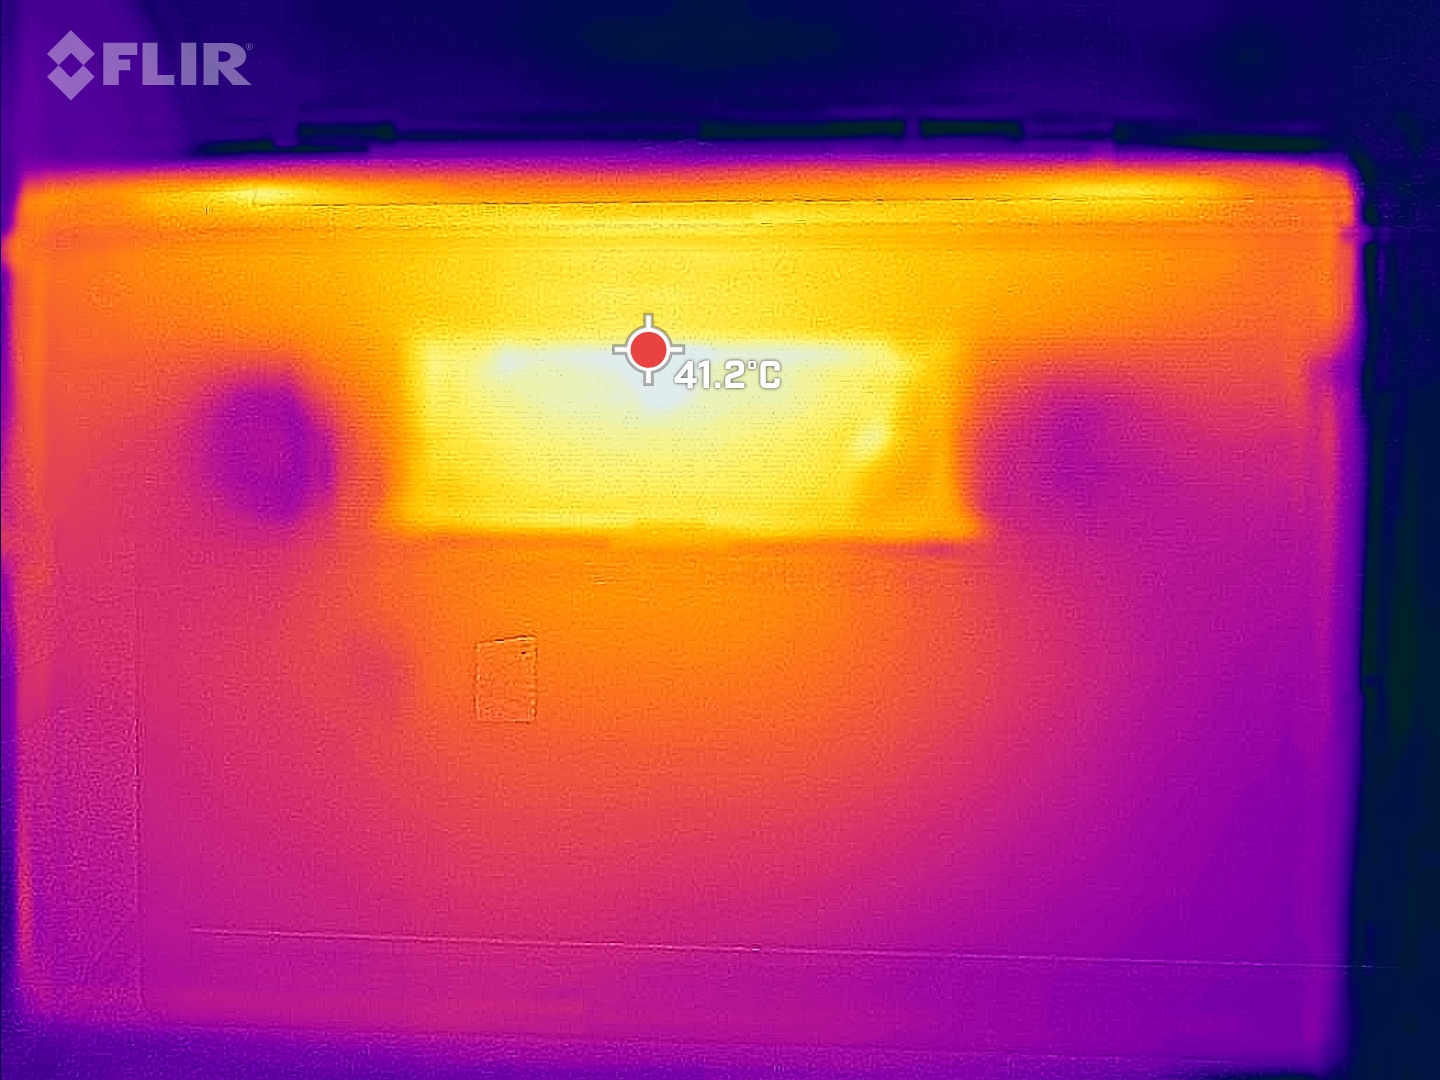
唯一的暖点是在键盘上方的中心位置以及机箱底部的相应位置,而且只是在压力测试中。然而,由于风扇的速度没有那么快,即使在游戏或渲染时,这些暖点也是明显的,甚至在键盘的中央。但它们从未变得令人讨厌的热。
(±) The maximum temperature on the upper side is 41.4 °C / 107 F, compared to the average of 38.2 °C / 101 F, ranging from 22.2 to 69.8 °C for the class Workstation.
(±) The bottom heats up to a maximum of 41.5 °C / 107 F, compared to the average of 41.1 °C / 106 F
(+) In idle usage, the average temperature for the upper side is 22.9 °C / 73 F, compared to the device average of 32 °C / 90 F.
(+) Playing The Witcher 3, the average temperature for the upper side is 30.4 °C / 87 F, compared to the device average of 32 °C / 90 F.
(+) The palmrests and touchpad are cooler than skin temperature with a maximum of 28.4 °C / 83.1 F and are therefore cool to the touch.
(±) The average temperature of the palmrest area of similar devices was 27.8 °C / 82 F (-0.6 °C / -1.1 F).
| HP ZBook Power 15 G8 313S5EA Intel Core i7-11800H, NVIDIA T600 Laptop GPU | HP ZBook Fury 15 G8 Intel Core i9-11950H, NVIDIA RTX A5000 Laptop GPU | HP ZBook Studio 15 G8 Intel Core i9-11950H, NVIDIA GeForce RTX 3070 Laptop GPU | HP ZBook Firefly 15 G8 2C9R7EA Intel Core i7-1165G7, NVIDIA T500 Laptop GPU | Lenovo ThinkPad P15v G2 21A9000XGE Intel Core i7-11800H, NVIDIA T1200 Laptop GPU | Dell Precision 3000 3551 Intel Core i9-10885H, NVIDIA Quadro P620 | |
|---|---|---|---|---|---|---|
| Heat | -18% | -20% | -3% | -21% | -20% | |
| Maximum Upper Side * (°C) | 41.4 | 45.6 -10% | 49 -18% | 41.2 -0% | 53.8 -30% | 47 -14% |
| Maximum Bottom * (°C) | 41.5 | 57.6 -39% | 54.2 -31% | 47.2 -14% | 52.1 -26% | 54.6 -32% |
| Idle Upper Side * (°C) | 23.8 | 26 -9% | 26.2 -10% | 23.7 -0% | 27.6 -16% | 27.8 -17% |
| Idle Bottom * (°C) | 25 | 28.8 -15% | 30.2 -21% | 23.9 4% | 27.7 -11% | 29.2 -17% |
* ... smaller is better
压力测试
CPU只有在压力测试中才能从BIOS的更新中受益。在综合压力下(Prime95 + FurMark),CPU仍然以其基本的时钟速度(2.3 GHz)运行,而之前只能以1.7 GHz运行。另一方面,在1080MHz时,GPU的时钟速度下降了150MHz。在纯粹的CPU压力下,2.65 GHz的速度维持在50瓦的功耗和92 °C(198 °F)的温度。
在纯图形负载下,GPU的运行速度约为1100 MHz,这大大低于其1395 MHz的提升速度。然而,温度仍然只有56°C(133°F),我们怀疑是人工智能的另一个不一致之处。
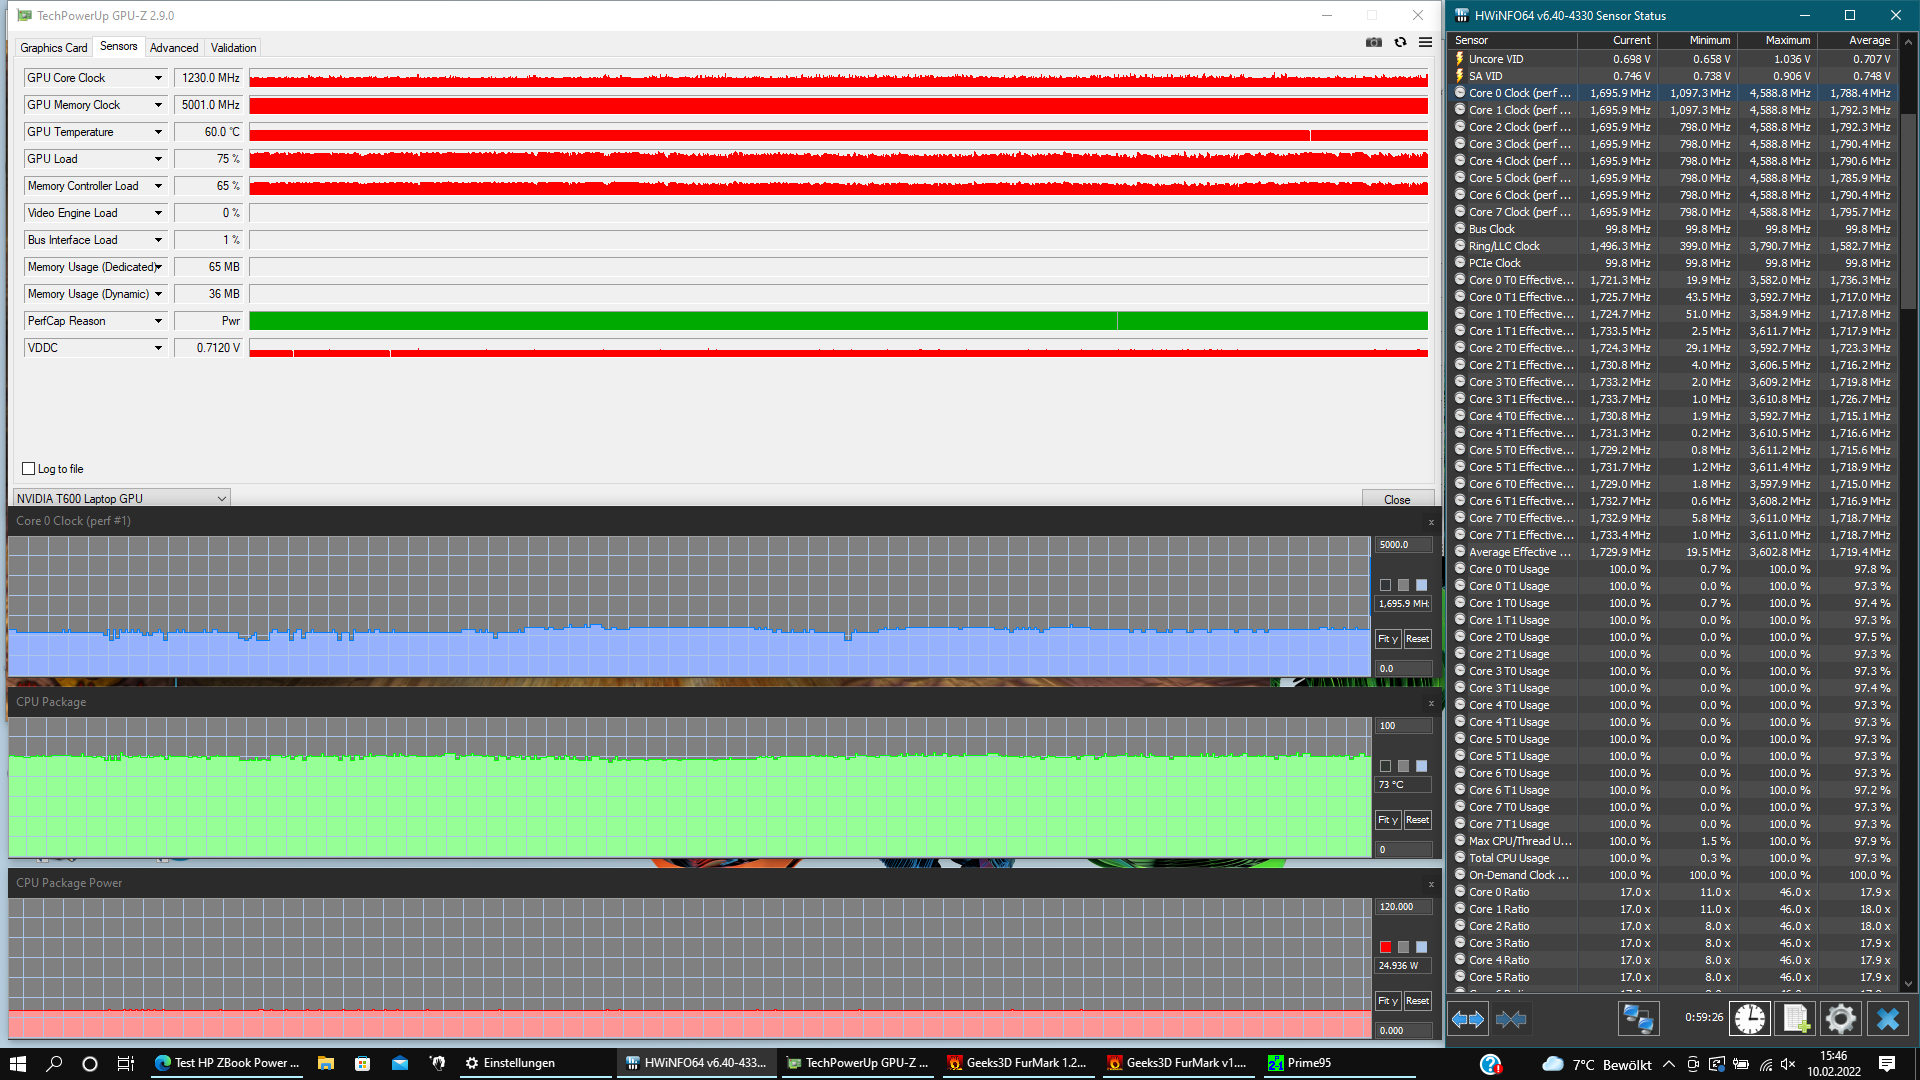

| CPU时钟(GHz) | GPU时钟(MHz) | CPU平均温度(℃) | GPU平均温度(℃) | |
| 系统空闲 | 1.3 | 350 | 35 | 35 |
| Prime95压力 | 2.65 | 350 | 91.8 | -- |
| Prime95 + FurMark Stress | 2.27 | 1081 | 93.4 | 56 |
| FurMark 应力 | 1.3 | 1100 | 52 | 70 |
发言人
向上的2瓦立体声扬声器发出的声音相当平衡,但它们缺乏低音,也不会特别响亮。惠普Fury 15内置的音响系统明显更有吸引力。
虽然它可能足以应付办公任务,但为了享受多媒体,我们建议使用3.5毫米连接或蓝牙的外部音频外围设备。
HP ZBook Power 15 G8 313S5EA audio analysis
(±) | speaker loudness is average but good (72.3 dB)
Bass 100 - 315 Hz
(-) | nearly no bass - on average 23.3% lower than median
(±) | linearity of bass is average (11.8% delta to prev. frequency)
Mids 400 - 2000 Hz
(+) | balanced mids - only 2.5% away from median
(+) | mids are linear (5.1% delta to prev. frequency)
Highs 2 - 16 kHz
(+) | balanced highs - only 4.1% away from median
(+) | highs are linear (3.1% delta to prev. frequency)
Overall 100 - 16.000 Hz
(±) | linearity of overall sound is average (21.4% difference to median)
Compared to same class
» 77% of all tested devices in this class were better, 6% similar, 18% worse
» The best had a delta of 7%, average was 17%, worst was 35%
Compared to all devices tested
» 60% of all tested devices were better, 7% similar, 33% worse
» The best had a delta of 4%, average was 23%, worst was 134%
Lenovo ThinkPad P15v G2 21A9000XGE audio analysis
(-) | not very loud speakers (70.7 dB)
Bass 100 - 315 Hz
(±) | reduced bass - on average 13.4% lower than median
(±) | linearity of bass is average (13.6% delta to prev. frequency)
Mids 400 - 2000 Hz
(+) | balanced mids - only 4.7% away from median
(+) | mids are linear (6.2% delta to prev. frequency)
Highs 2 - 16 kHz
(+) | balanced highs - only 3.2% away from median
(+) | highs are linear (5.7% delta to prev. frequency)
Overall 100 - 16.000 Hz
(±) | linearity of overall sound is average (21.2% difference to median)
Compared to same class
» 76% of all tested devices in this class were better, 6% similar, 18% worse
» The best had a delta of 7%, average was 17%, worst was 35%
Compared to all devices tested
» 59% of all tested devices were better, 7% similar, 34% worse
» The best had a delta of 4%, average was 23%, worst was 134%
电源管理。ZBook Power与超极本一样高效
消耗功率
ZBook Power 15的平均功率为6.32瓦,其空闲值与配备15瓦CPU的系统一样好。笔记本电脑ZBook Fury和 ZBook Power消耗的功率几乎是其三倍。在待机期间,ZBook Power只消耗0.95瓦,因此,当它被折叠起来时,你几乎四天都不用充电。 150瓦的电源也能毫无问题地处理110瓦的负载峰值,并在大约1.5小时内将ZBook充电至80%。
| Off / Standby | |
| Idle | |
| Load |
|
Key:
min: | |
| HP ZBook Power 15 G8 313S5EA i7-11800H, T600 Laptop GPU, Samsung PM9A1 MZVL2512HCJQ, IPS LED, 1920x1080, 15.6" | HP ZBook Fury 15 G8 i9-11950H, RTX A5000 Laptop GPU, Samsung PM981a MZVLB1T0HBLR, IPS, 3840x2160, 15.6" | HP ZBook Studio 15 G8 i9-11950H, GeForce RTX 3070 Laptop GPU, Samsung PM981a MZVLB2T0HALB, OLED, 3840x2160, 15.6" | HP ZBook Firefly 15 G8 2C9R7EA i7-1165G7, T500 Laptop GPU, Toshiba XG6 KXG60ZNV1T02, IPS, 1920x1080, 15.6" | Lenovo ThinkPad P15v G2 21A9000XGE i7-11800H, T1200 Laptop GPU, Toshiba XG6 KXG6AZNV512G, IPS LED, 1920x1080, 15.6" | Dell Precision 3000 3551 i9-10885H, Quadro P620, Toshiba Kioxia XG6 KXG60PNV512G, IPS, 1920x1080, 15.6" | Average NVIDIA T600 Laptop GPU | Average of class Workstation | |
|---|---|---|---|---|---|---|---|---|
| Power Consumption | -130% | -155% | 14% | -33% | -23% | 0% | -94% | |
| Idle Minimum * (Watt) | 4.17 | 8.3 -99% | 11 -164% | 3.3 21% | 5.96 -43% | 5.7 -37% | 4.17 ? -0% | 9.11 ? -118% |
| Idle Average * (Watt) | 6.32 | 19.9 -215% | 18.8 -197% | 5.6 11% | 8.37 -32% | 8.7 -38% | 6.32 ? -0% | 13.8 ? -118% |
| Idle Maximum * (Watt) | 7.1 | 21.8 -207% | 31.7 -346% | 8.7 -23% | 9.05 -27% | 9 -27% | 7.1 ? -0% | 17.9 ? -152% |
| Load Average * (Watt) | 80.41 | 110.9 -38% | 105.2 -31% | 64.4 20% | 91.82 -14% | 100.2 -25% | 80.4 ? -0% | 96 ? -19% |
| Witcher 3 ultra * (Watt) | 62.3 | 165 -165% | 148 -138% | 53 15% | 102 -64% | 56 10% | ||
| Load Maximum * (Watt) | 110.18 | 171.8 -56% | 171.8 -56% | 69 37% | 126.38 -15% | 133.2 -21% | 110.2 ? -0% | 180.3 ? -64% |
* ... smaller is better
Power Consumption The Witcher 3 / Stress Test
Power Consumption With External Monitor
电池寿命
在150尼特的条件下进行网上冲浪时,ZBook的续航时间达到了惊人的12:19小时。ThinkPad P15v仍然明显落后,只有约7.5小时,而 戴尔的Precision 3551能够突破13小时的大关。在负载下超过2小时,ZBook的持续时间相当长,这也是由于其节流的部分原因。
| HP ZBook Power 15 G8 313S5EA i7-11800H, T600 Laptop GPU, 83 Wh | HP ZBook Fury 15 G8 i9-11950H, RTX A5000 Laptop GPU, 94 Wh | HP ZBook Studio 15 G8 i9-11950H, GeForce RTX 3070 Laptop GPU, 83 Wh | HP ZBook Firefly 15 G8 2C9R7EA i7-1165G7, T500 Laptop GPU, 56 Wh | Lenovo ThinkPad P15v G2 21A9000XGE i7-11800H, T1200 Laptop GPU, 68 Wh | Dell Precision 3000 3551 i9-10885H, Quadro P620, 97 Wh | Average of class Workstation | |
|---|---|---|---|---|---|---|---|
| Battery runtime | -50% | -26% | 15% | -26% | 11% | 4% | |
| Reader / Idle (h) | 14.9 | 12.9 -13% | 17.2 15% | 26.1 ? 75% | |||
| H.264 (h) | 10.1 | 15.3 51% | 8 -21% | 10.1 ? 0% | |||
| WiFi v1.3 (h) | 12.3 | 6.2 -50% | 6.2 -50% | 10.5 -15% | 7.5 -39% | 13.6 11% | 8.55 ? -30% |
| Load (h) | 2.1 | 1.8 -14% | 2.3 10% | 0.9 -57% | 1.441 ? -31% |
Pros
Cons
结论。经济实惠的ZBook Power 15适合专业创作者使用
ZBook Power 15 G8(Core i7, Nvidia T600, 8 GB / 256 GB)的价格约为1300欧元(约1324美元),具有一些明显的性价比优势,同时仍然保持了高端工作站的许多特点。ZBook的优势包括输入设备、电池寿命、安全功能、可升级性,以及良好的工作站性能。
虽然我们测试的FHD显示屏并不完全适合产品设计和Adobe,但它仍然提供良好的亮度和对比度值。这种配置的目标群体主要包括Autodesk SolidWorks、产品开发、建筑、施工、工程、2D设计和虚拟现实创作领域的学生和专业人士。
缺点包括性能发展不稳定,但我们无法确认这是否是由于惠普自己的人工智能造成的。此外,在这个经济实惠的工作站中,你必须在没有至强处理器与ECC内存的情况下生活。它还缺少WWAN和SD读卡器,只提供一个雷电4端口。最后,声音再现和网络摄像头也相当糟糕。
"惠普ZBook Power 15 G8对于学生、工程师和没有高端需求的(半)专业人员来说是一个坚实的工作站。不幸的是,可选的4K面板根本没有将目标群体扩大到创意任务,而创意任务需要高色彩精度。否则,所有其他的核心方面都处于高水平"。
该ThinkPad P15v G2提供了类似的性能和输入设备,也有不错的价格。然而,它运行起来明显更安静,并提供一个SD卡读卡器和可能是色彩更准确的4K显示屏选项。另一方面,ThinkPad不支持通过USB-C充电,而且电池寿命明显较低。此外,它更重、更笨重。 戴尔的Precision 3551也是一个耐力冠军,除了在原始性能方面,它并不比ZBook Power差多少,只要你给它配备合适的显示器。然而,它的继任者应该提供更高的性能。
价格和可用性
HP ZBook Power 15 G8 313S5EA
- 07/07/2022 v7 (old)
Marvin Gollor
Price comparison

