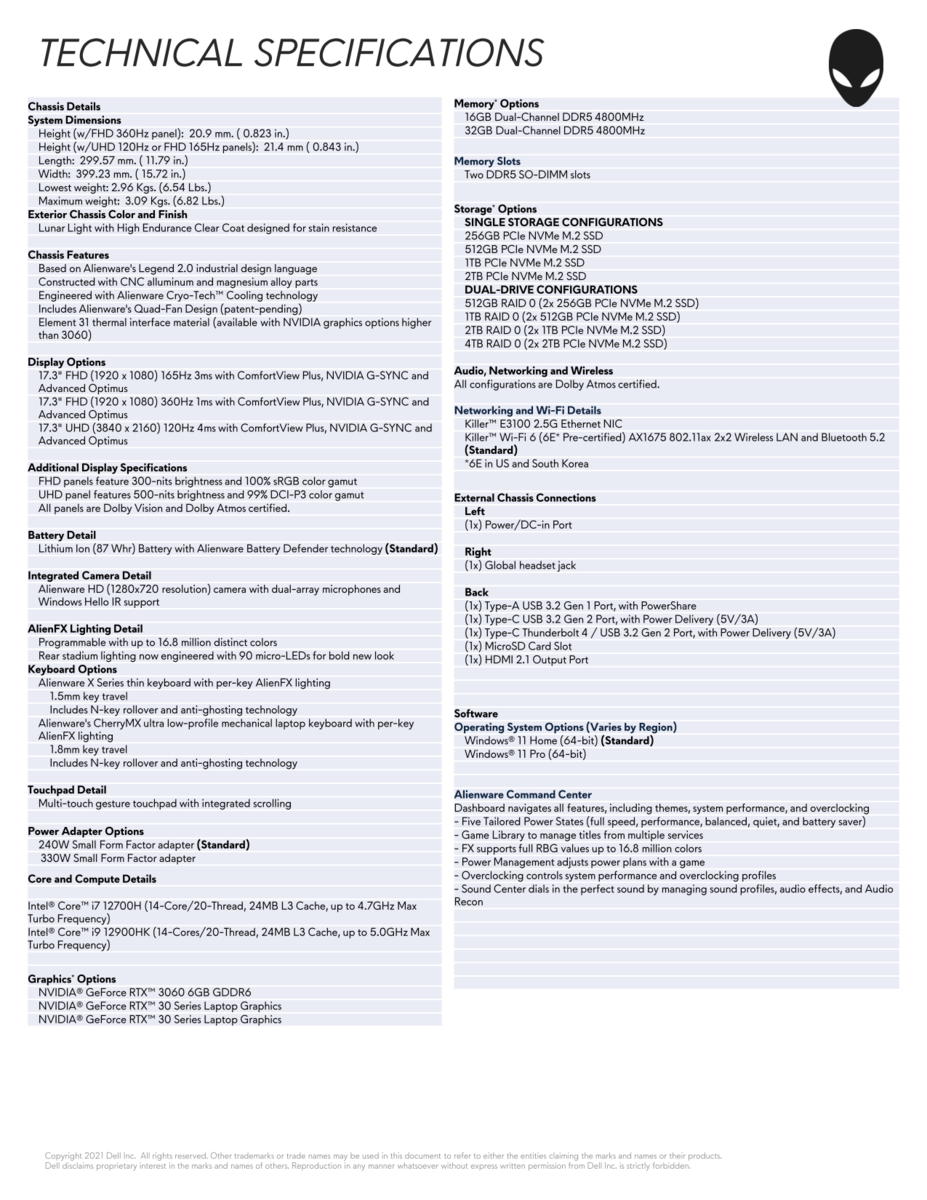
Alienware x17 R2笔记本电脑回顾。峰值175WGeForce RTX 3080 Ti性能
戴尔去年年底推出了Alienware x17系列,采用了全新的机箱设计,以区别于现有的Alienware m17系列。今年,制造商刷新了产品线,推出了Alienware x17 R2,配备了12代英特尔Alder Lake-P CPU和GeForce RTX 3070/3080 Ti显卡,分别取代去年的11代Tiger Lake-H和RTX 3070/3080选项。其他更新也是如此,包括更快的内存(DDR4-3466到DDR5-4800),更新的显示选项,以及对MUX和高级优化的支持。
除了上面提到的内部更新外,Alienware x17 R2使用的机箱与Alienware x17 R1相同。我们建议检查出 我们对x17 R1的评论因为我们对机箱、Cherry机械键盘和端口的现有评论也适用于x17 R2。
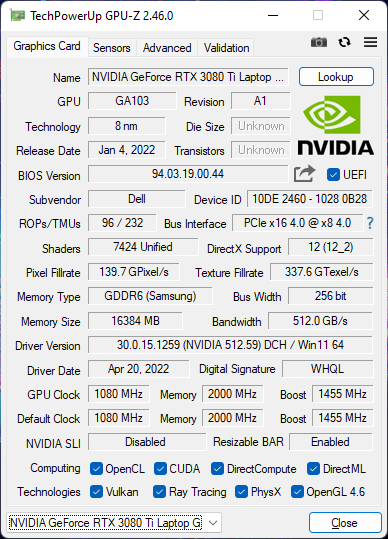
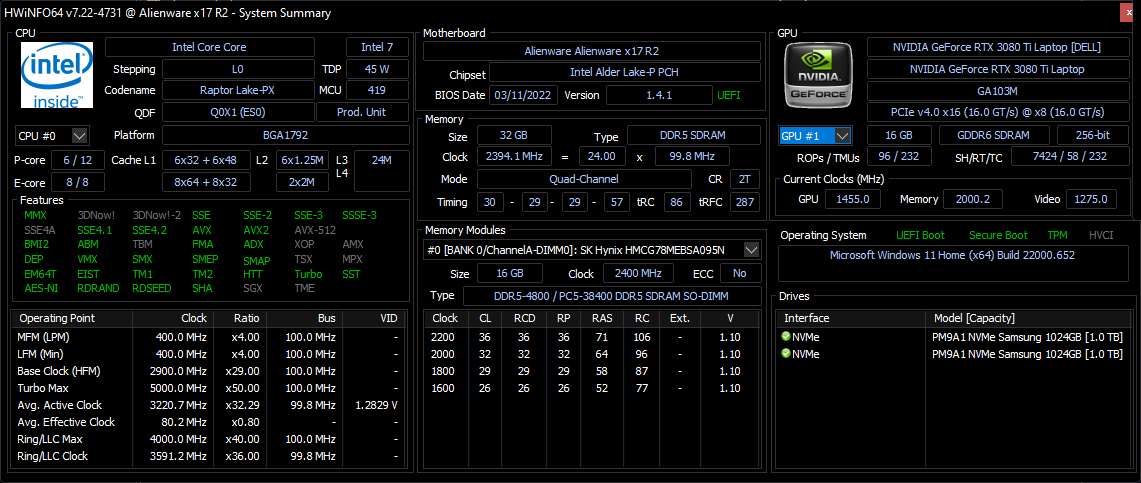
关于所有可配置的选项,请看下面的官方技术规格。我们的具体测试单元是一个更高端的SKU,配备酷睿i9-12900HK,360赫兹1080p显示屏,以及175 WGeForce RTX 3080 Ti显卡,价格略低于4000美元。这一领域的竞争者包括其他超薄的17.3英寸游戏笔记本电脑,如 微星GS77, Razer Blade 17,以及 华硕Zephyrus S17.
更多Alienware评论。
潜在的竞争对手比较
Rating | Date | Model | Weight | Height | Size | Resolution | Price |
|---|---|---|---|---|---|---|---|
| 89.2 % v7 (old) | 05 / 2022 | Alienware x17 R2 P48E i9-12900HK, GeForce RTX 3080 Ti Laptop GPU | 3.1 kg | 20.9 mm | 17.30" | 1920x1080 | |
| 89 % v7 (old) | 09 / 2021 | Alienware x17 RTX 3080 P48E i7-11800H, GeForce RTX 3080 Laptop GPU | 3.2 kg | 21.4 mm | 17.30" | 3840x2160 | |
| 90.1 % v7 (old) | 08 / 2021 | Asus ROG Zephyrus S17 GX703HSD i9-11900H, GeForce RTX 3080 Laptop GPU | 2.8 kg | 19.9 mm | 17.30" | 2560x1440 | |
| 87.2 % v7 (old) | 04 / 2022 | MSI Stealth GS77 12UHS-083US i7-12700H, GeForce RTX 3080 Ti Laptop GPU | 2.9 kg | 20.8 mm | 17.30" | 2560x1440 | |
| 87.4 % v7 (old) | MSI GT76 Titan DT 10SGS i9-10900K, GeForce RTX 2080 Super Mobile | 4.2 kg | 42 mm | 17.30" | 3840x2160 | ||
| 83.2 % v7 (old) | 10 / 2021 | Gigabyte A7 X1 R9 5900HX, GeForce RTX 3070 Laptop GPU | 2.5 kg | 34 mm | 17.30" | 1920x1080 |
案例
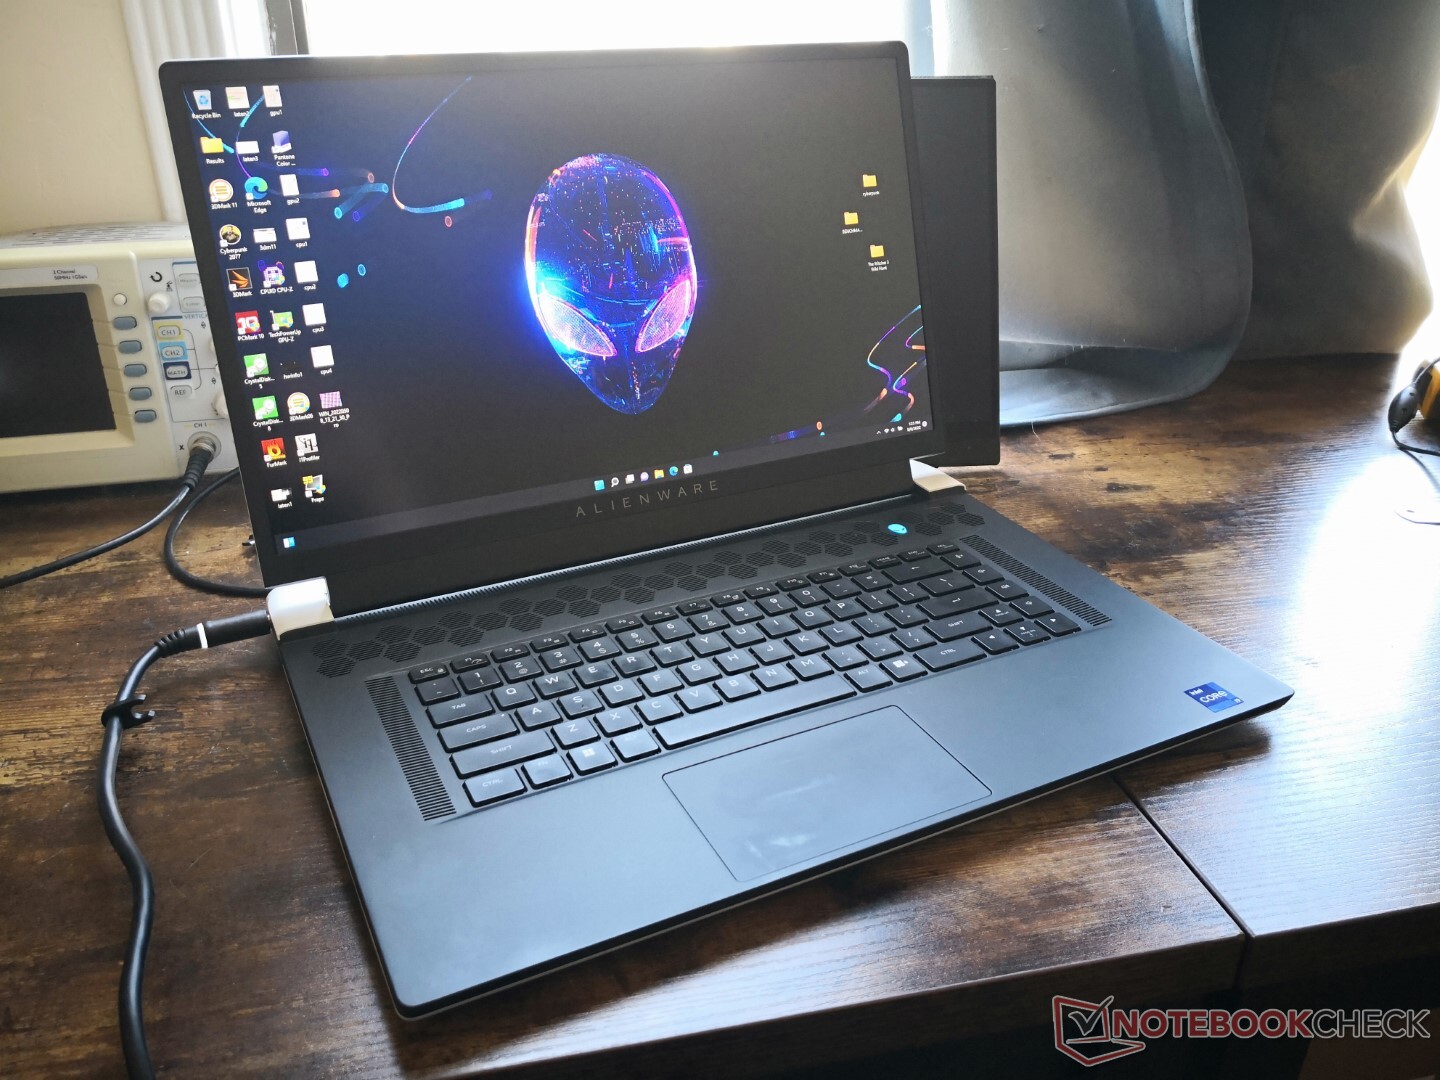
虽然它被宣传为超薄游戏笔记本电脑,但与华硕Zephyrus S17、微星GS77或雷蛇Blade 17等替代品相比,Alienware x17 R2机箱仍然明显更重更大。作为回报,Alienware系统能够携带更强大的175瓦GPU,而其他大多数超薄游戏笔记本的功率都限制在140瓦或以下。
SD卡阅读器
| SD Card Reader | |
| average JPG Copy Test (av. of 3 runs) | |
| MSI GT76 Titan DT 10SGS (Toshiba Exceria Pro M501 UHS-II) | |
| Asus ROG Zephyrus S17 GX703HSD | |
| Alienware x17 R2 P48E (AV Pro V60) | |
| Alienware x17 RTX 3080 P48E (AV Pro V60) | |
| MSI Stealth GS77 12UHS-083US (AV Pro V60) | |
| maximum AS SSD Seq Read Test (1GB) | |
| Asus ROG Zephyrus S17 GX703HSD | |
| Alienware x17 RTX 3080 P48E (AV Pro V60) | |
| Alienware x17 R2 P48E (AV Pro V60) | |
| MSI GT76 Titan DT 10SGS (Toshiba Exceria Pro M501 UHS-II) | |
| MSI Stealth GS77 12UHS-083US (AV Pro V60) | |
沟通
| Networking | |
| iperf3 transmit AX12 | |
| MSI GT76 Titan DT 10SGS | |
| Alienware x17 RTX 3080 P48E | |
| Alienware x17 R2 P48E | |
| Gigabyte A7 X1 | |
| MSI Stealth GS77 12UHS-083US | |
| Asus ROG Zephyrus S17 GX703HSD | |
| iperf3 receive AX12 | |
| Gigabyte A7 X1 | |
| Alienware x17 R2 P48E | |
| MSI GT76 Titan DT 10SGS | |
| MSI Stealth GS77 12UHS-083US | |
| Alienware x17 RTX 3080 P48E | |
| Asus ROG Zephyrus S17 GX703HSD | |
网络摄像头
与最新的Razer Blade 17的1080p相比,网络摄像头仍然是720p,没有物理隐私快门。支持Windows Hello。

")
")
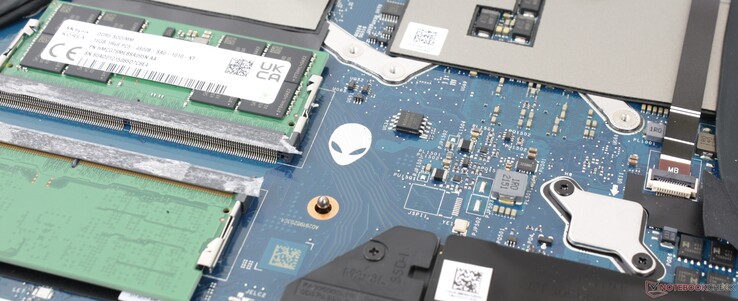
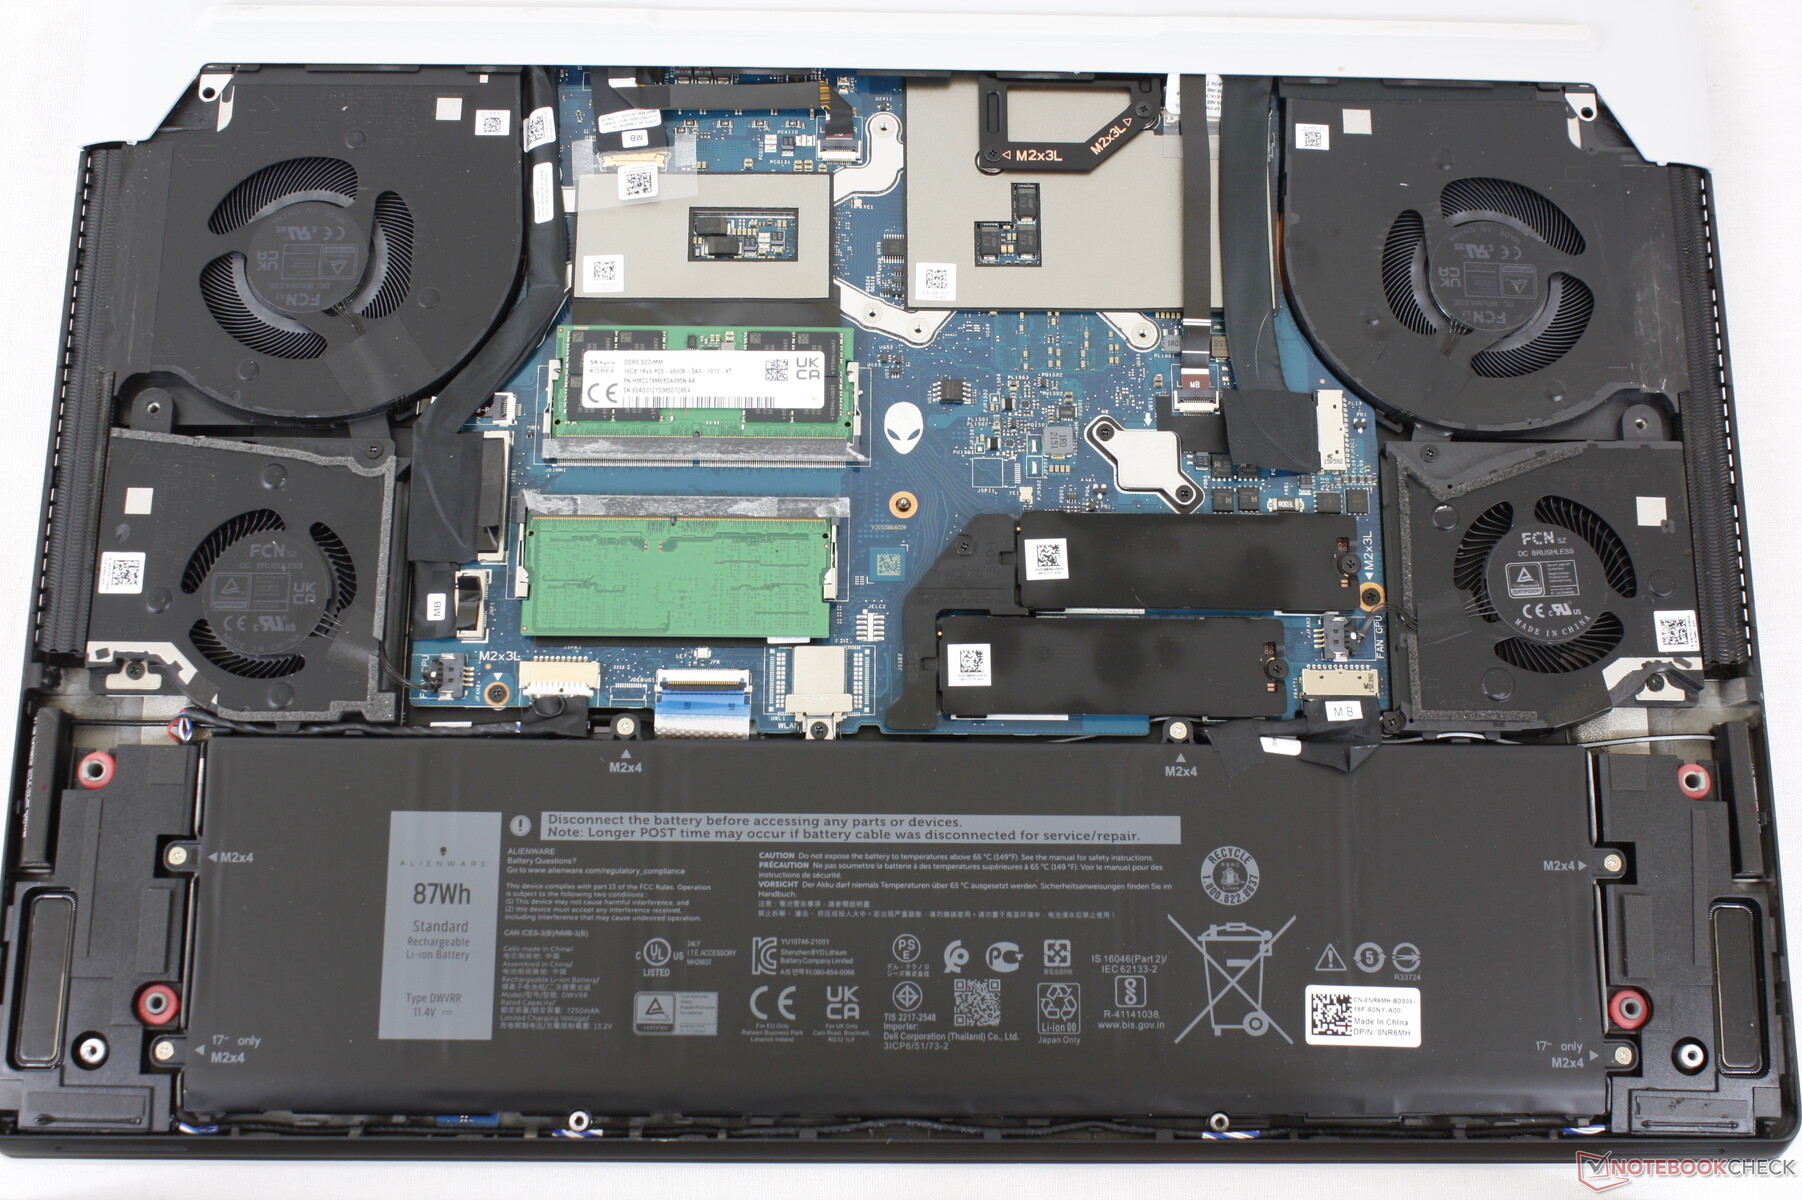
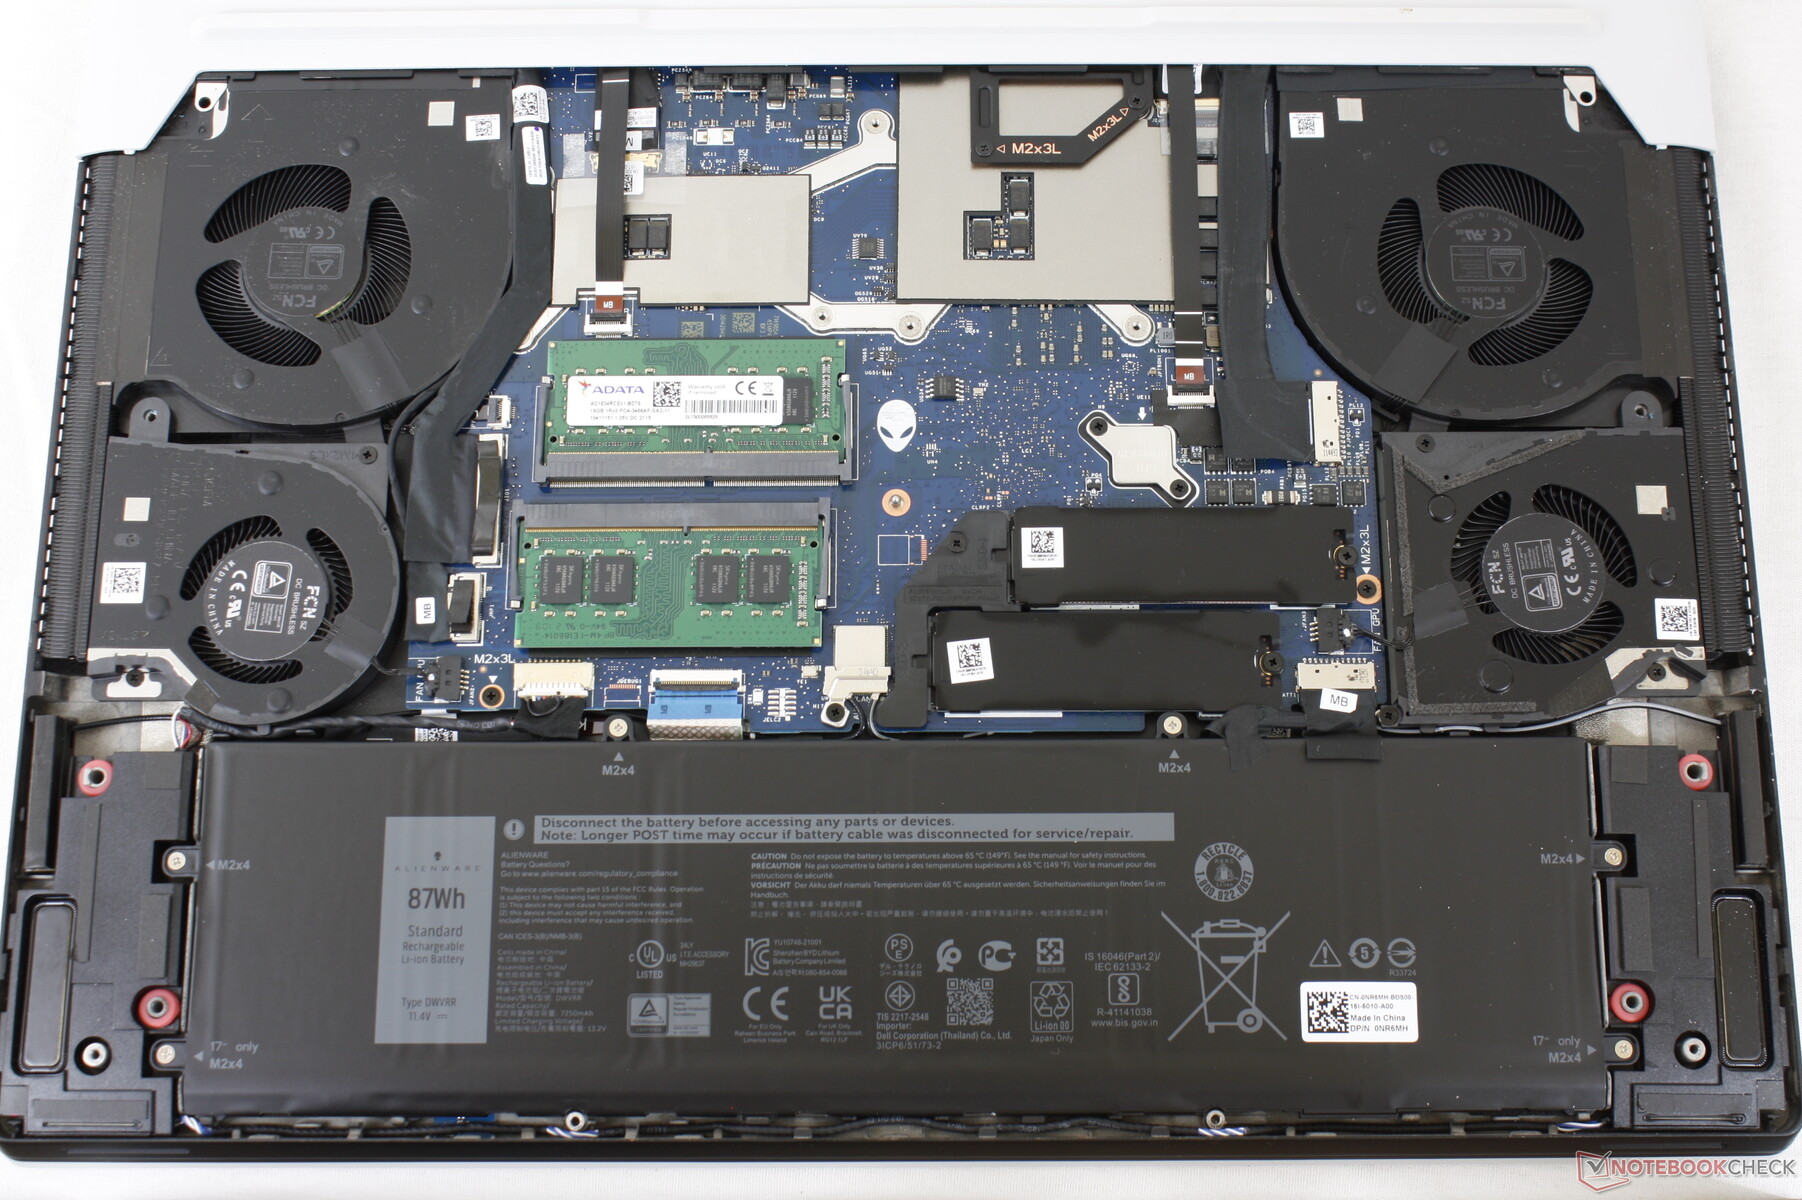
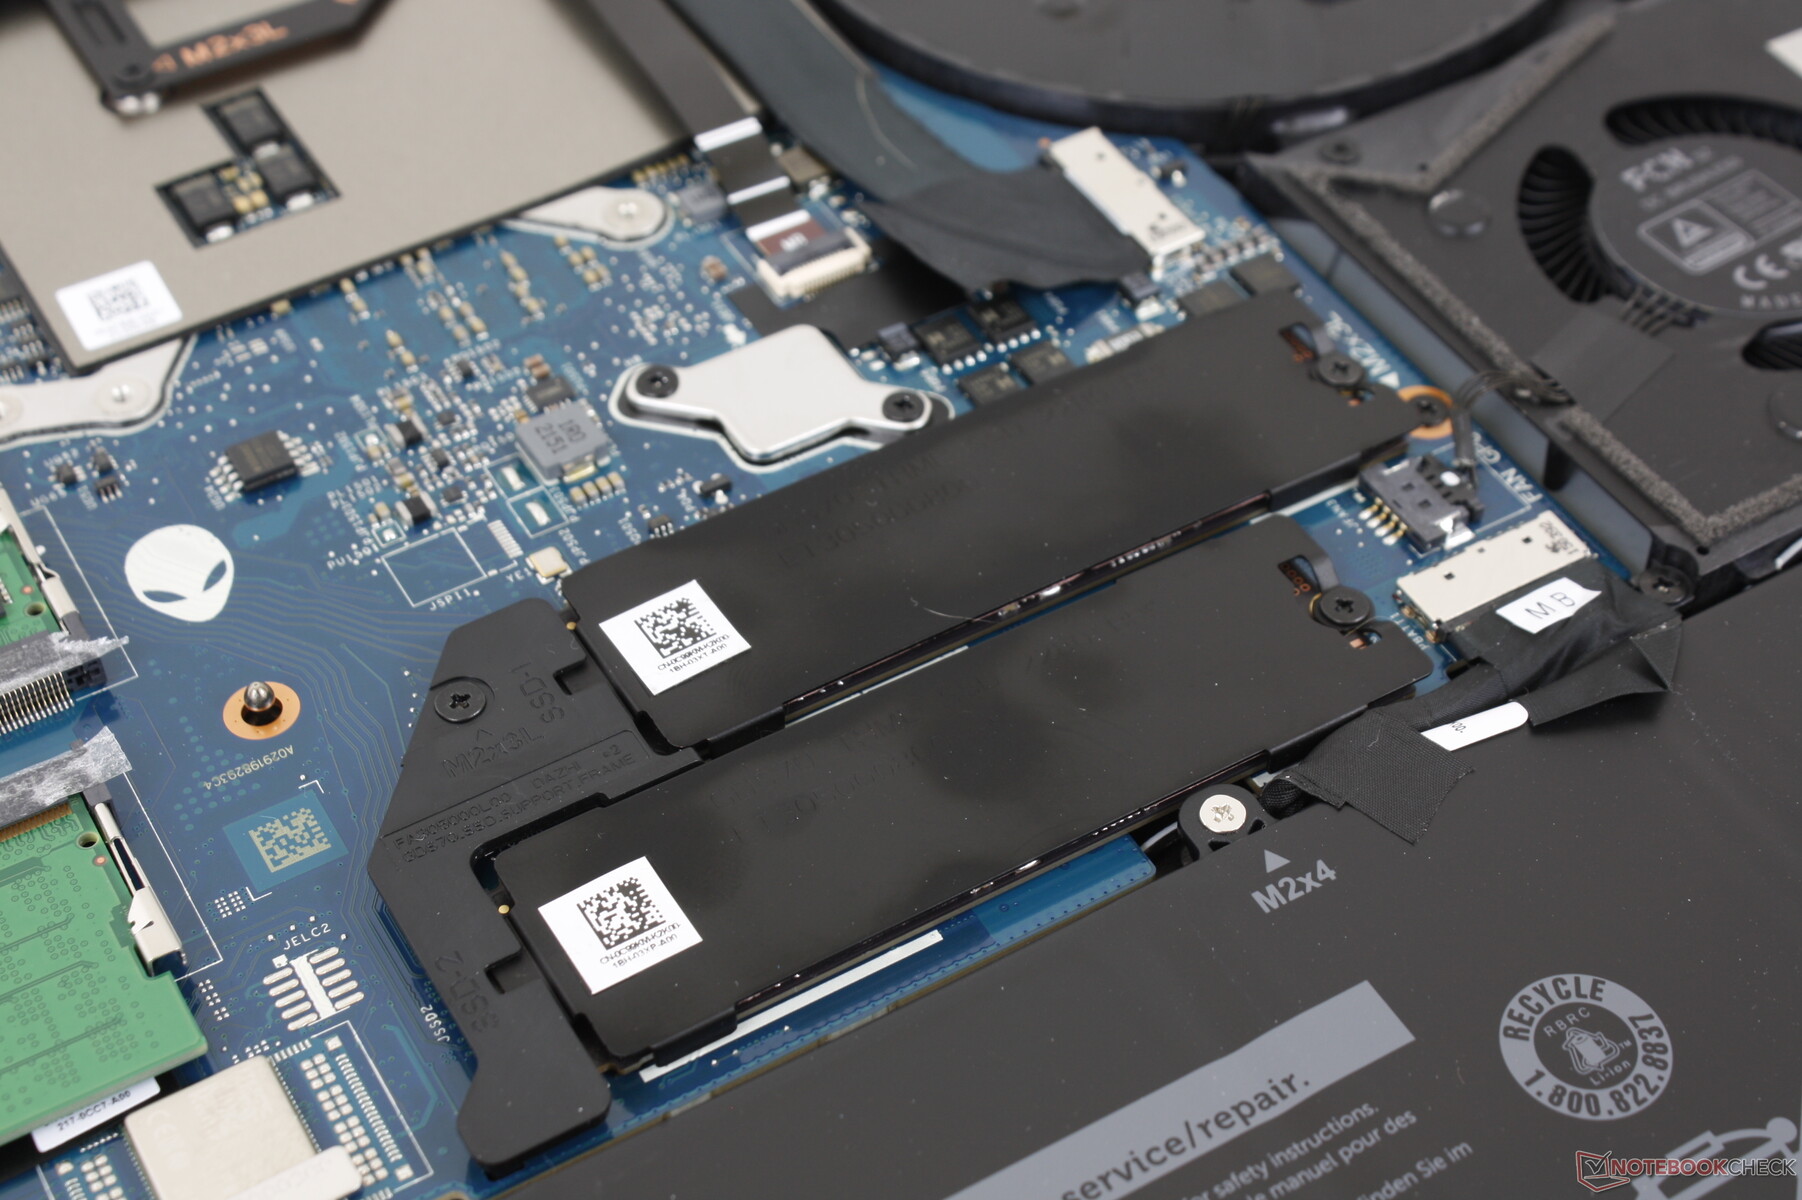
维护
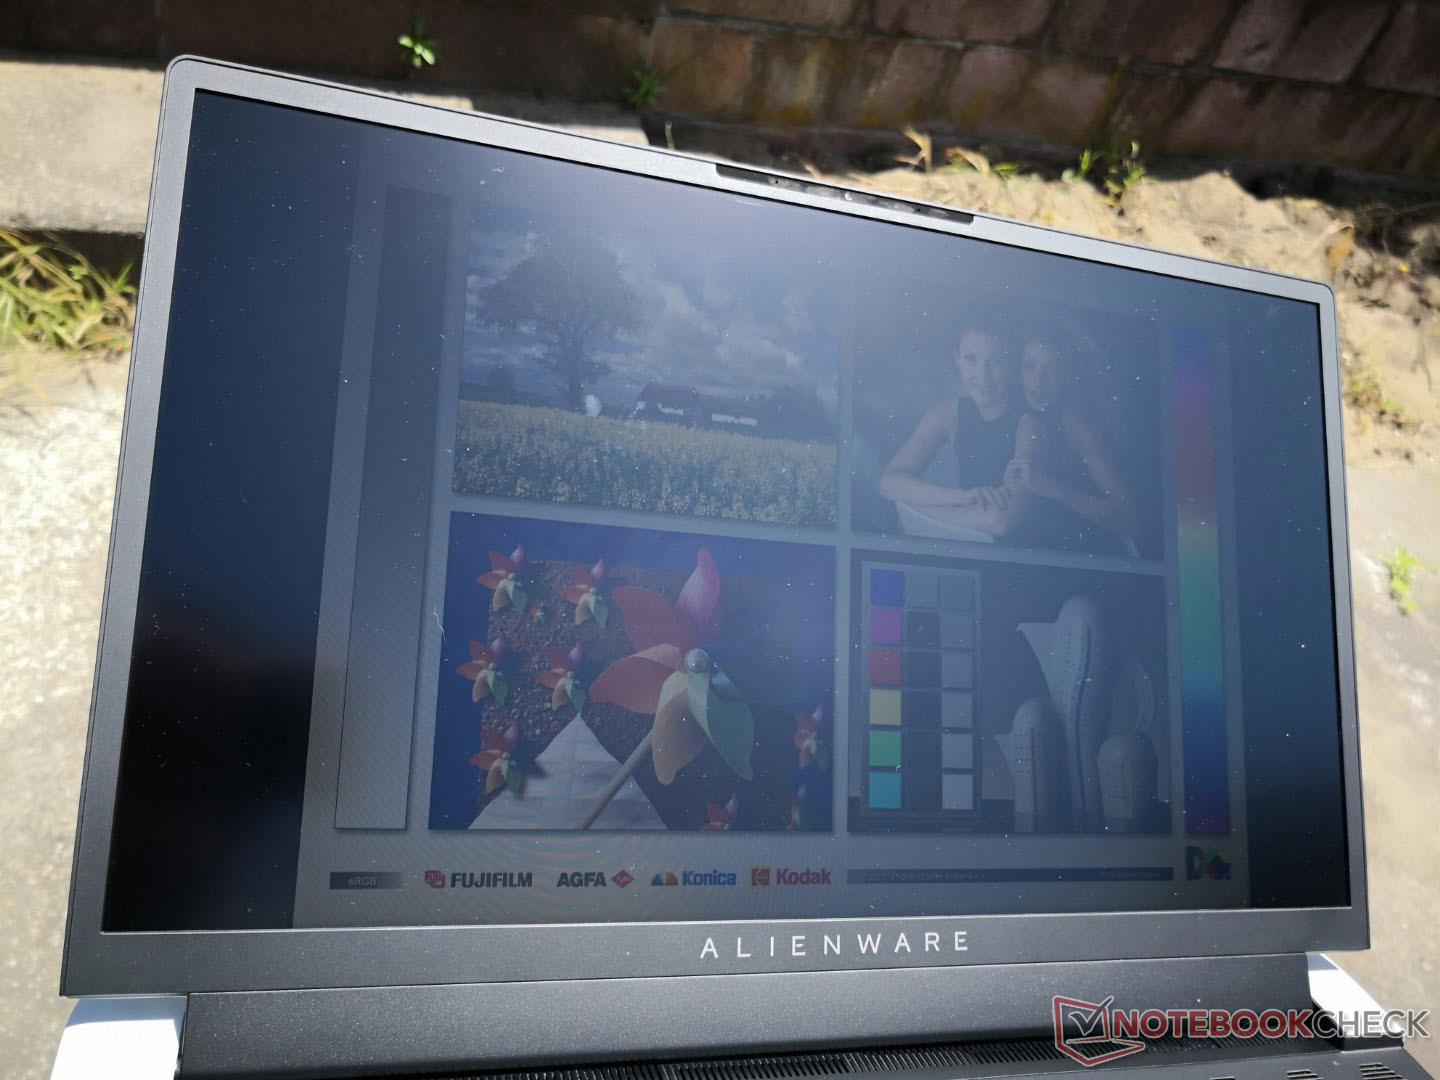
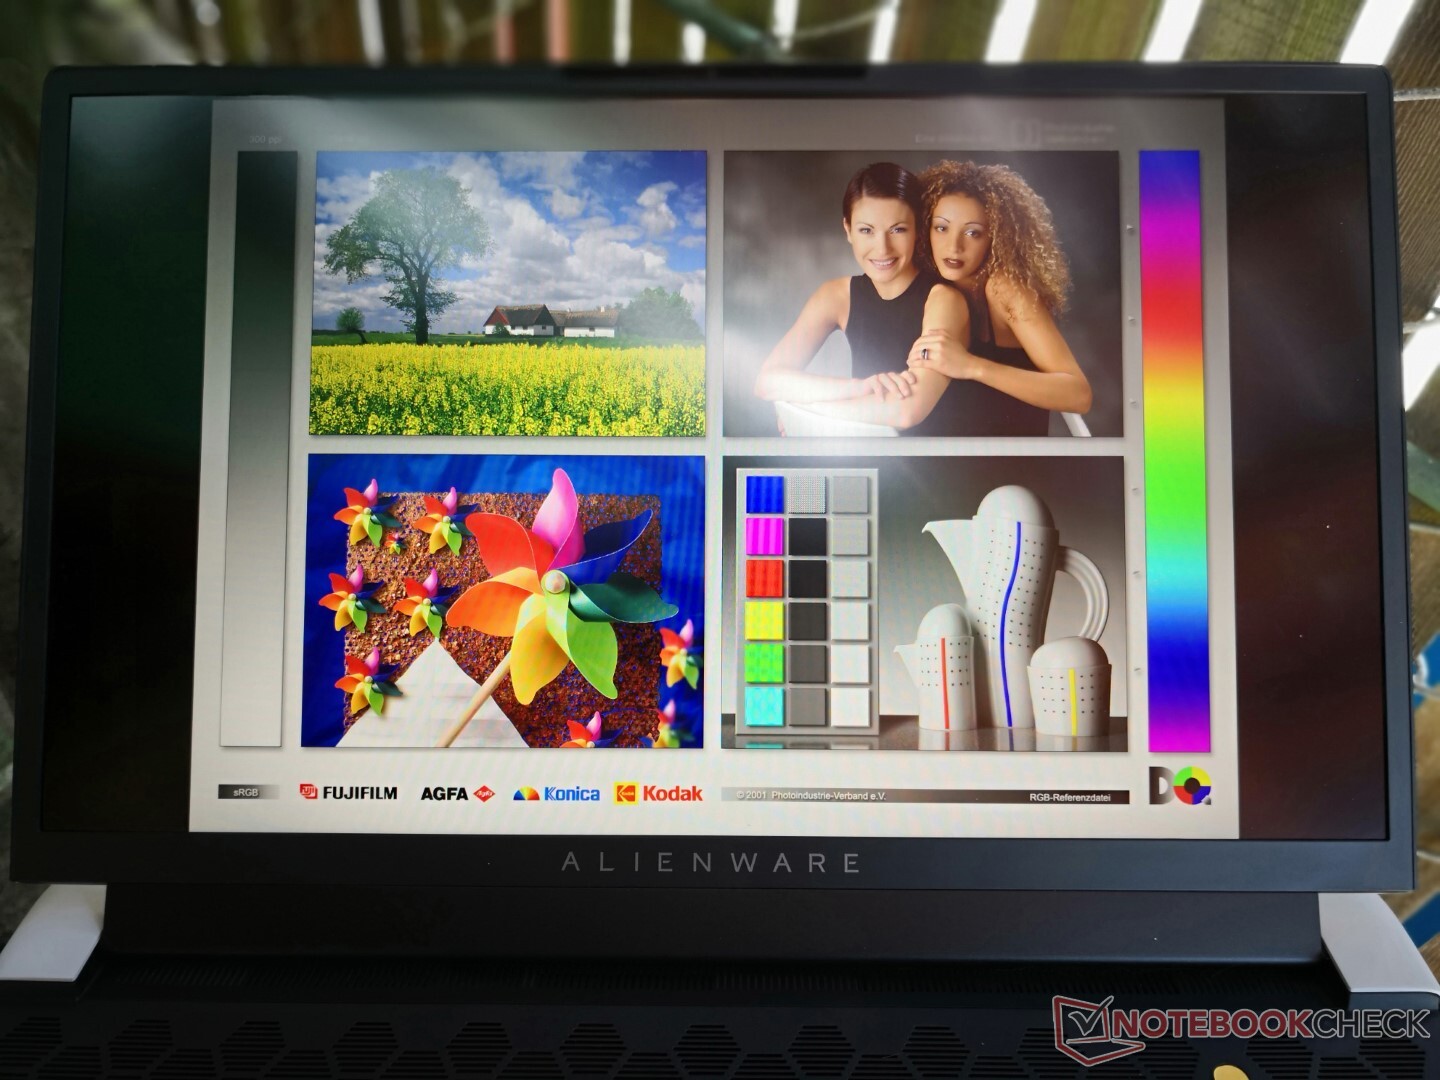
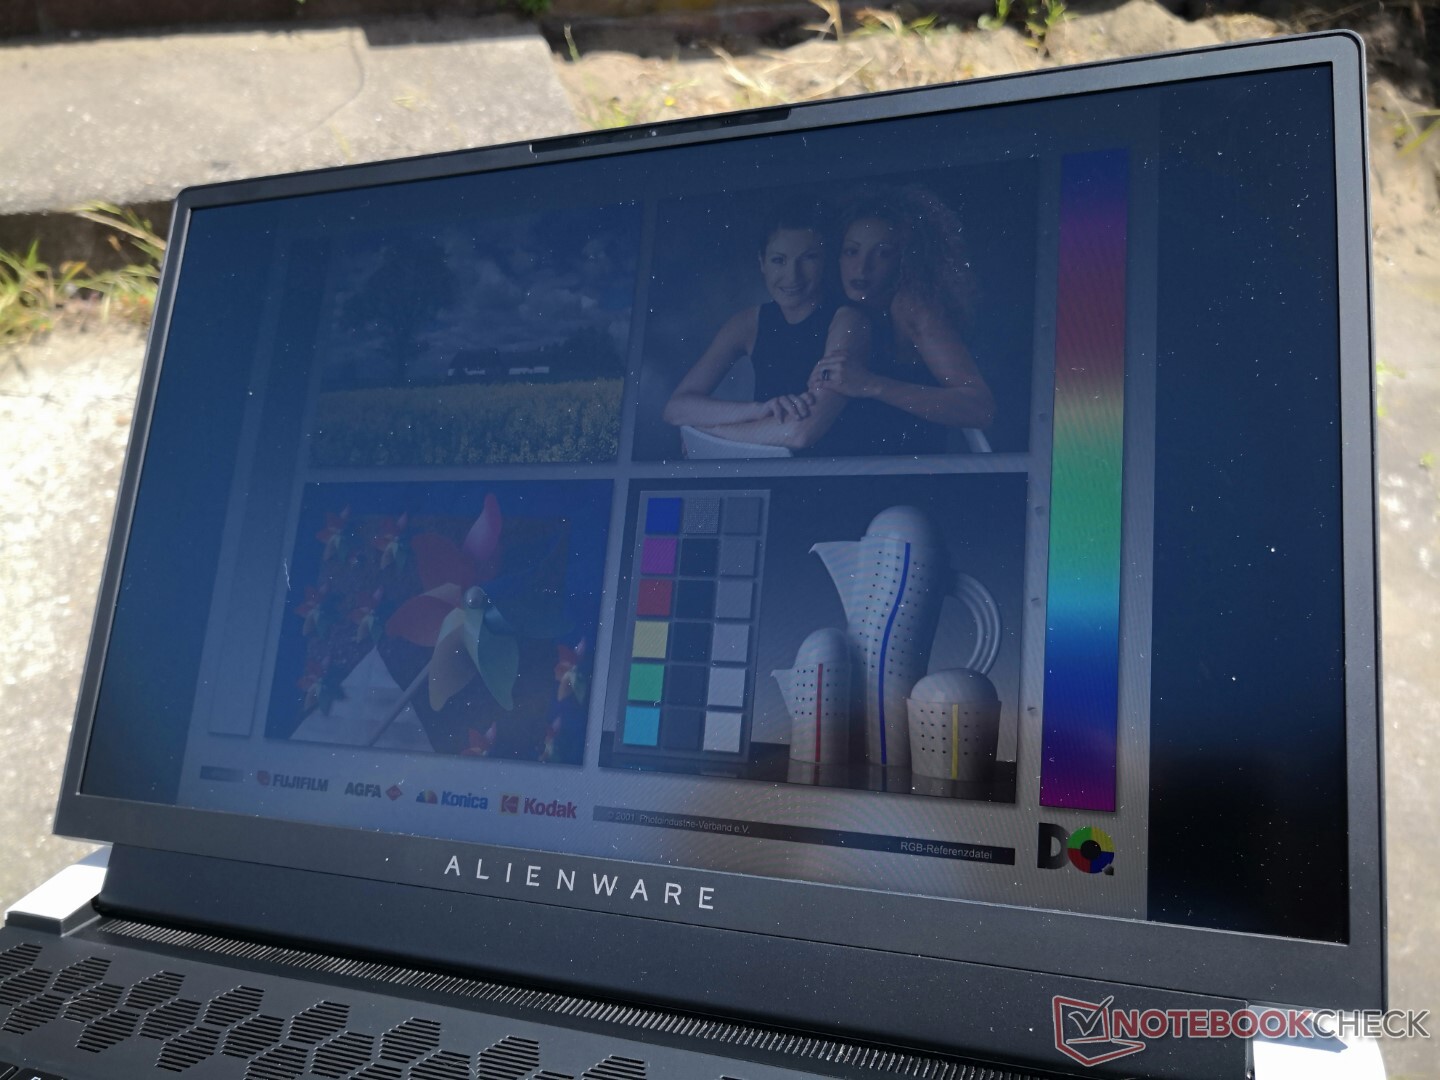
显示
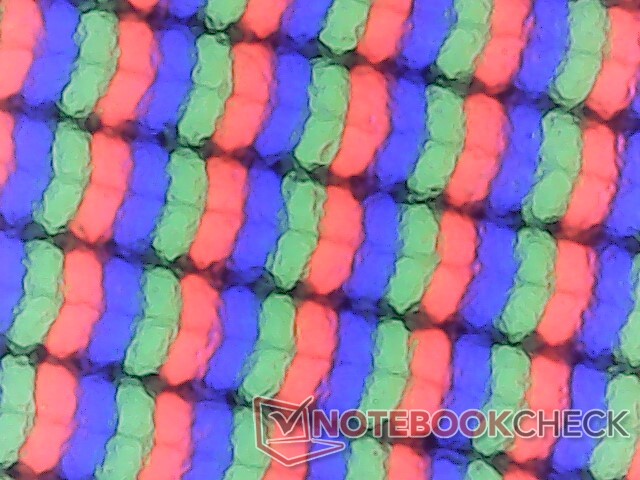
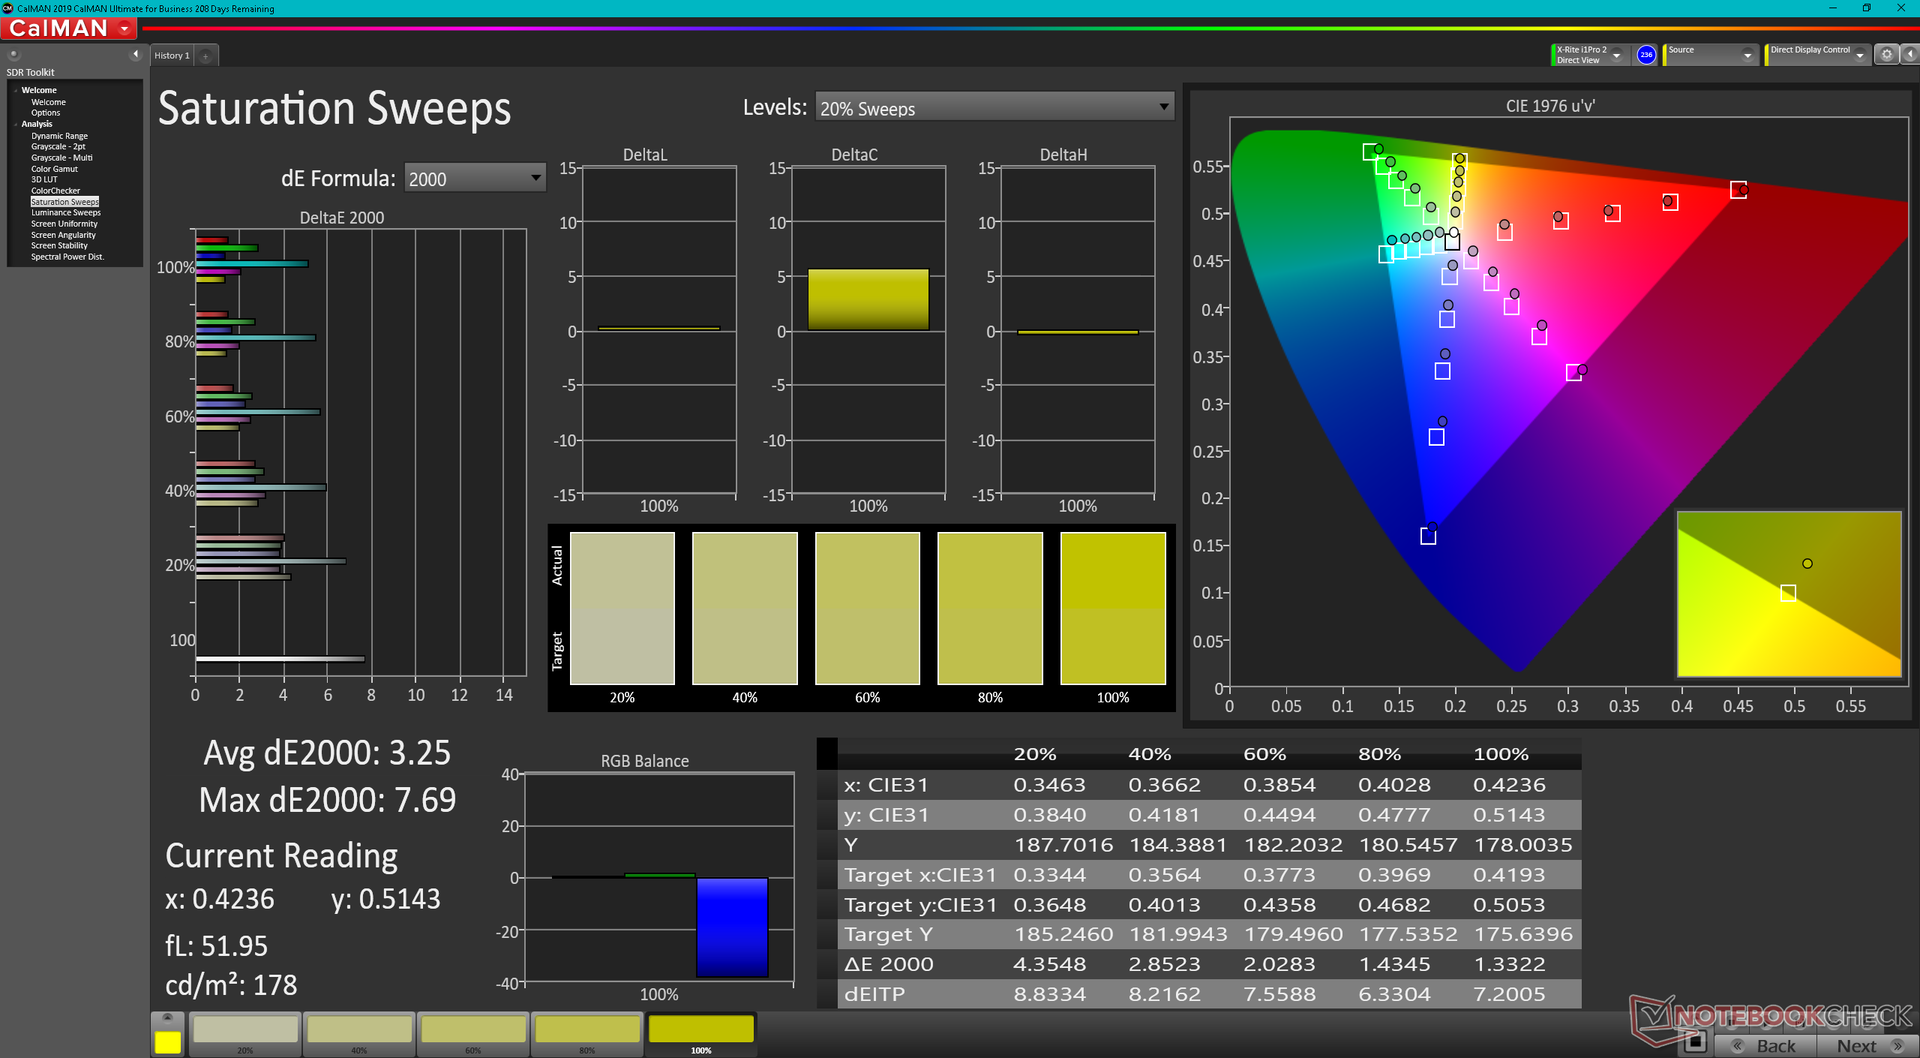
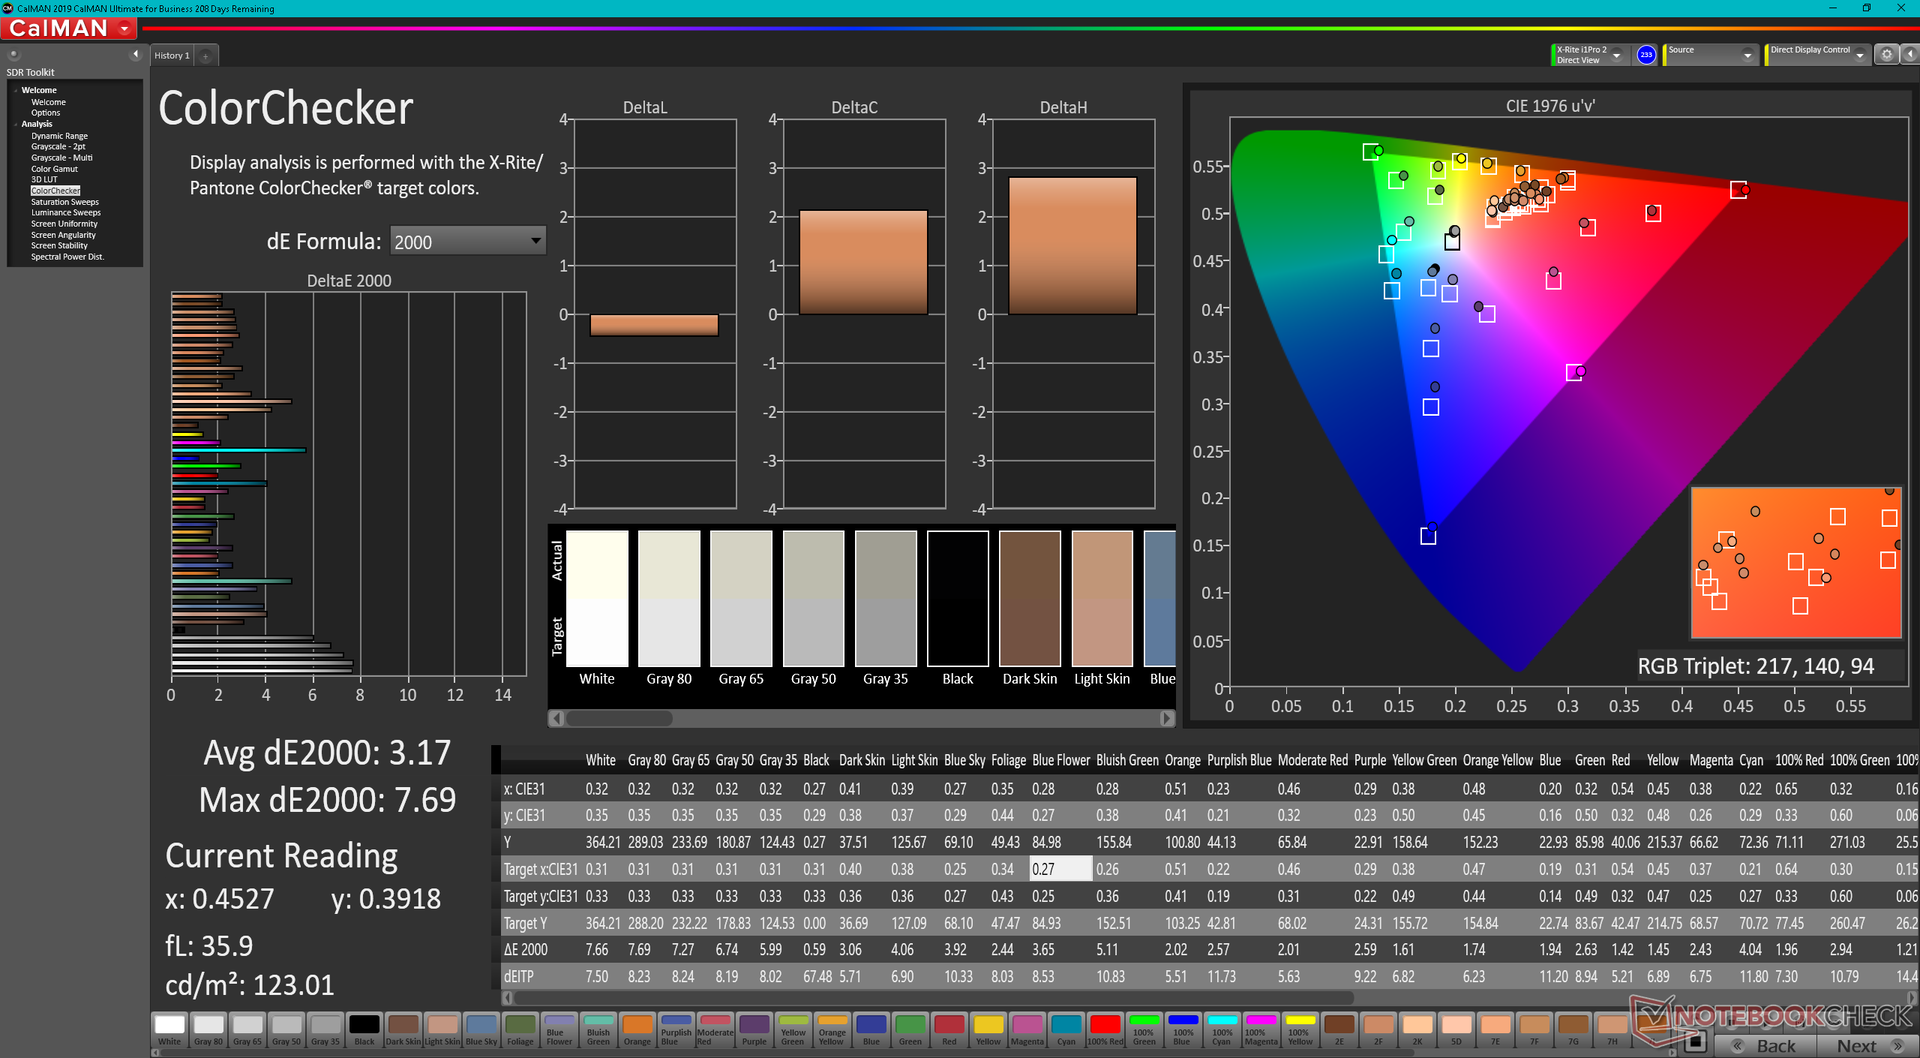
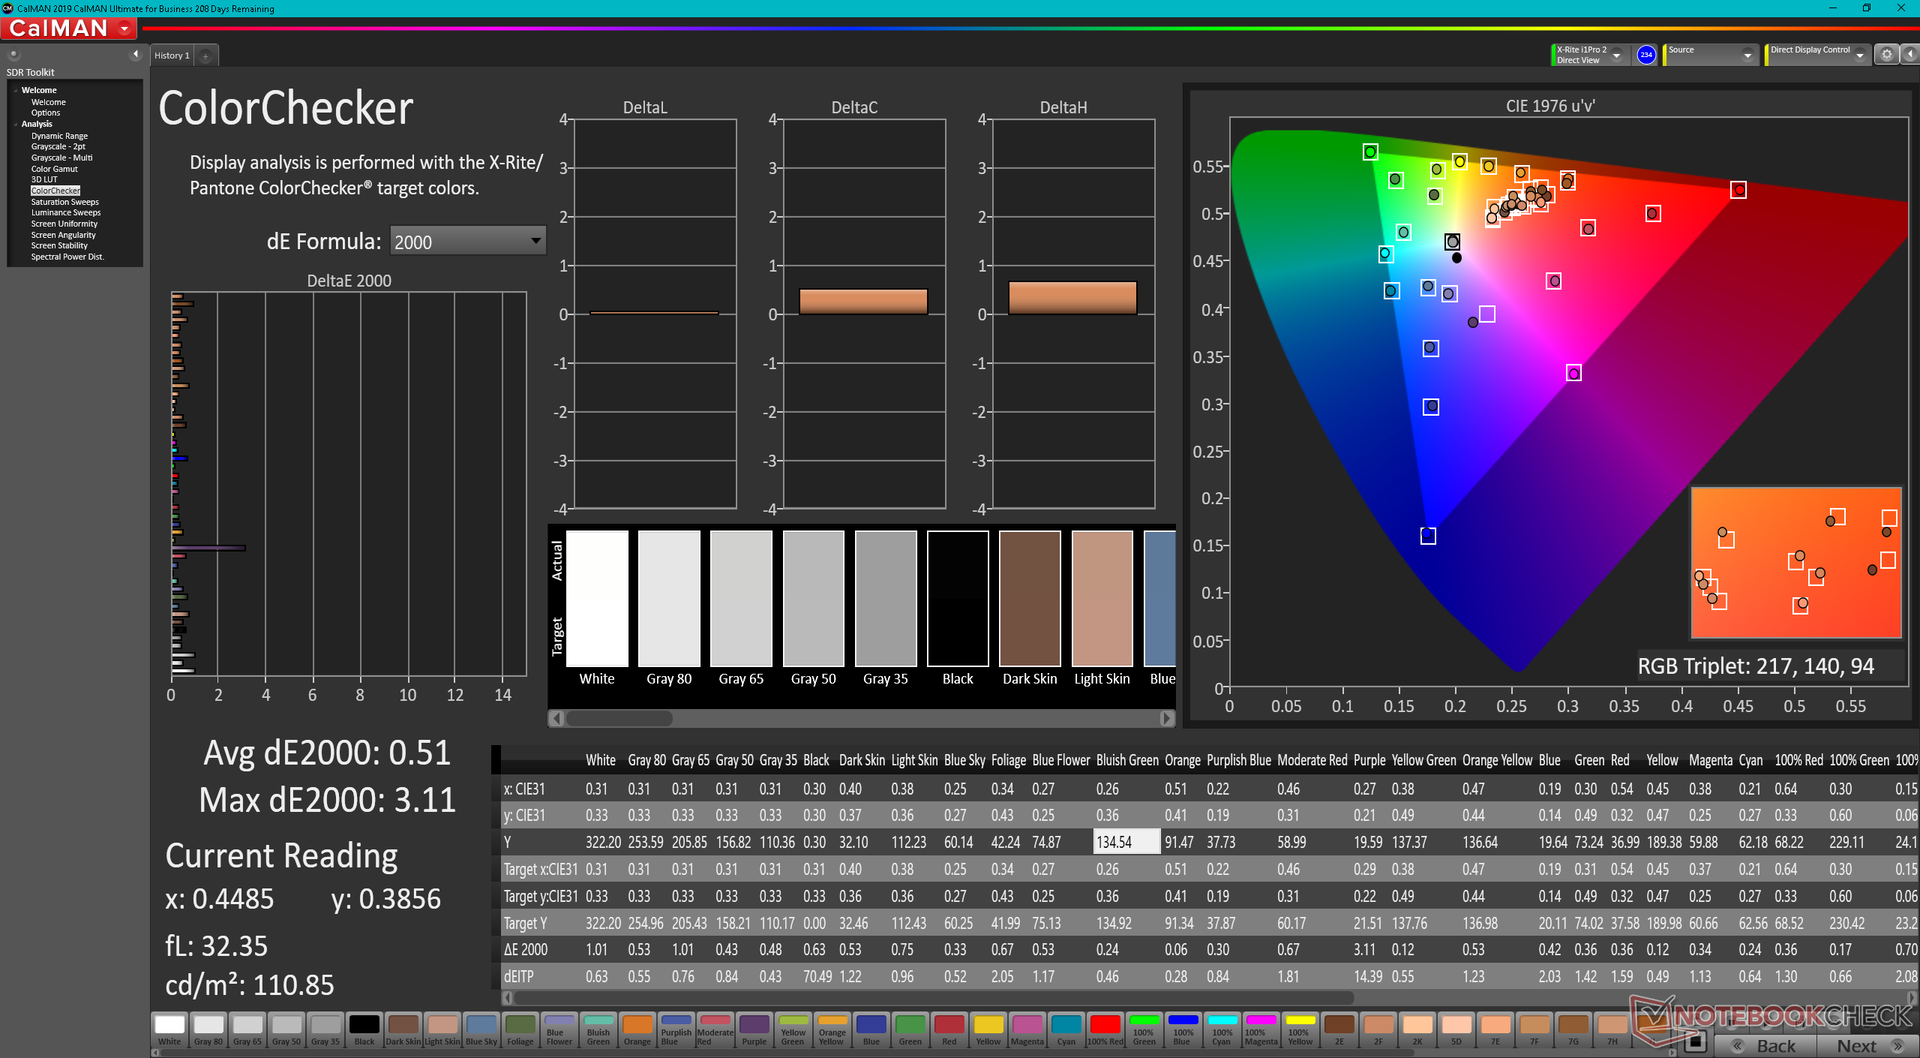
我们的AU Optronics B173HAN IPS面板几乎满足了所有的典型要求,包括快速的360赫兹刷新率,快速的黑白和灰度响应时间,以及完整的sRGB覆盖,适合游戏和大多数图形编辑。其他拥有17.3英寸1080p 360 Hz显示屏选项的笔记本电脑制造商可能会使用与我们的Alienware相同的AU Optronics面板。更高端的4K 120赫兹选项也是可用的,都支持G-Sync。
目前还没有OLED选项,而OLED可以提供比通常的IPS解决方案更广泛的DCI-P3色彩覆盖和更深的黑色水平。
有趣的是,我们的FHD面板没有原来x17 R1上的4K UHD面板那么亮。我们能够测量到这里的最大亮度为365尼特,而4K x17 R1的亮度为439尼特。
| |||||||||||||||||||||||||
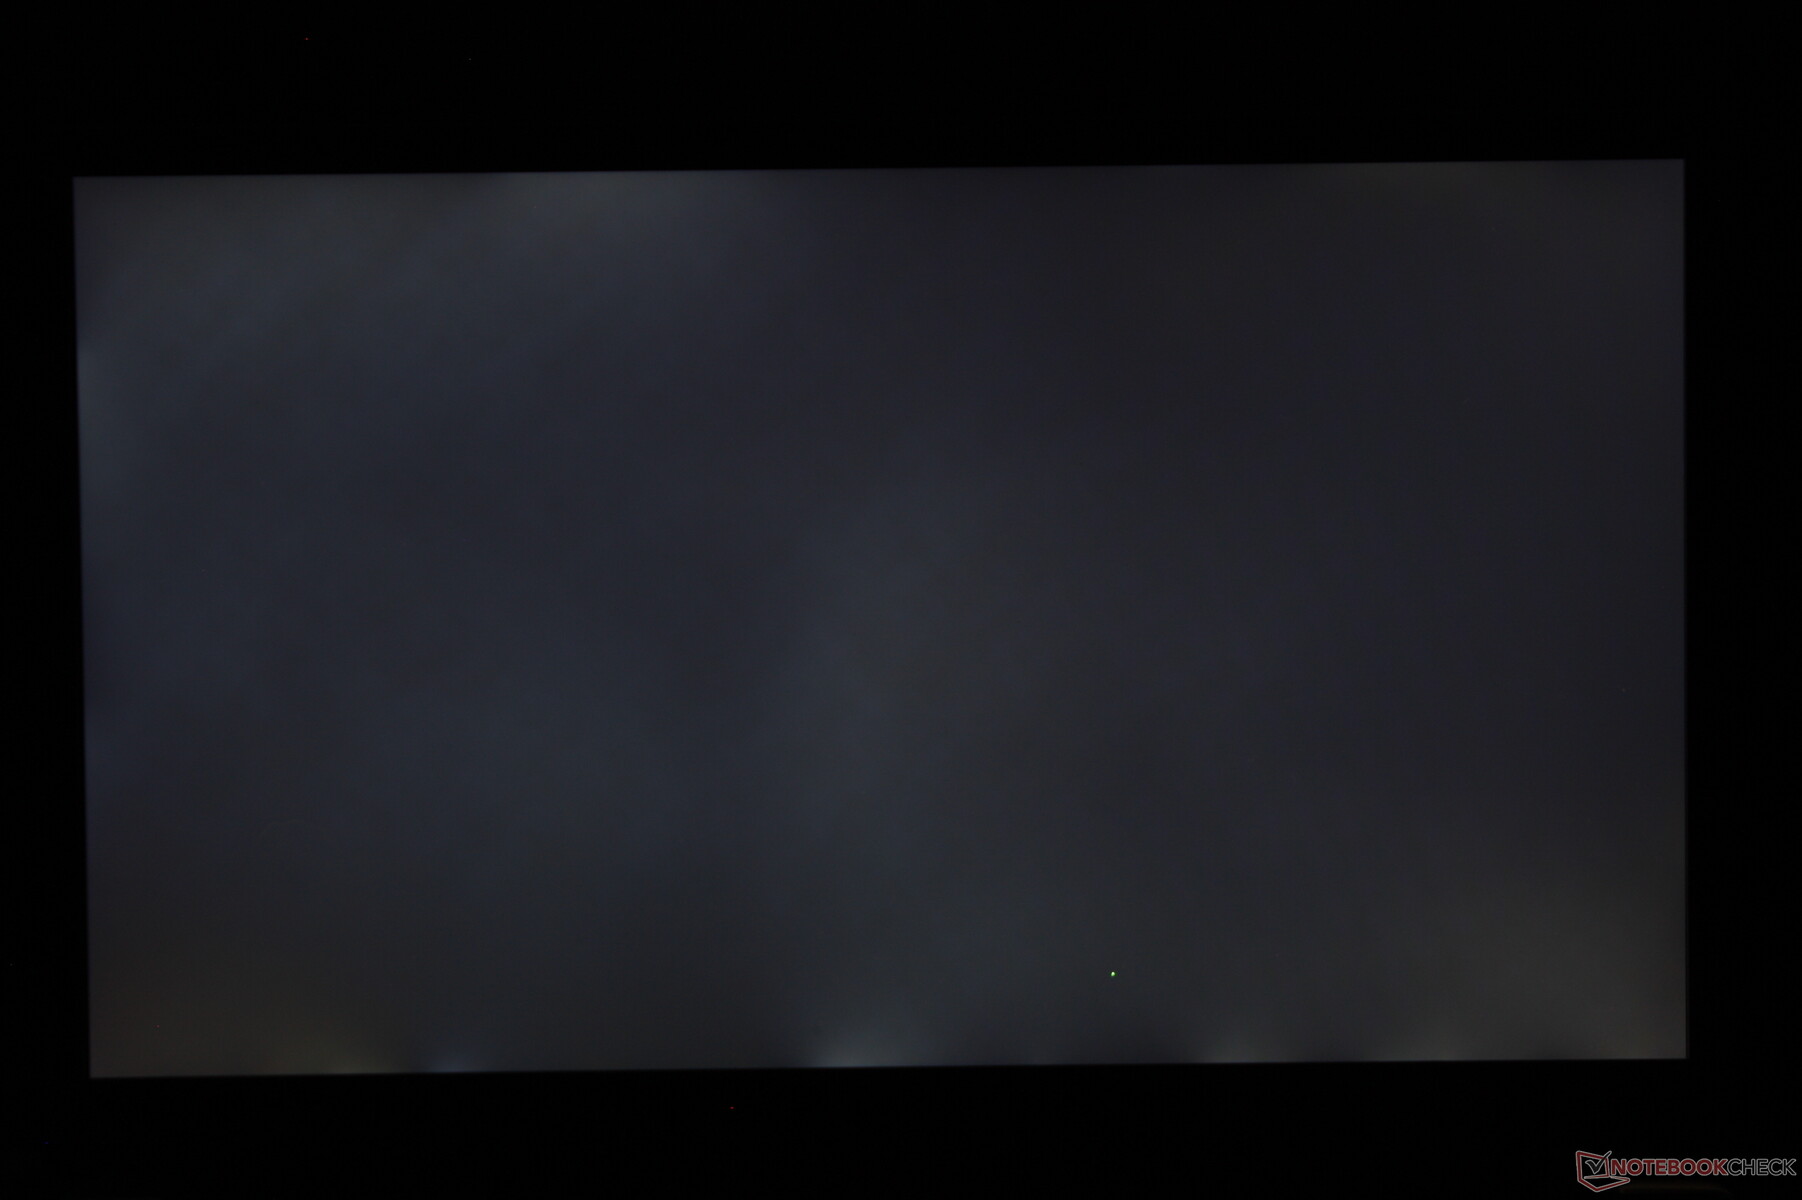
Brightness Distribution: 85 %
Center on Battery: 365.4 cd/m²
Contrast: 1260:1 (Black: 0.29 cd/m²)
ΔE ColorChecker Calman: 3.17 | ∀{0.5-29.43 Ø4.71}
calibrated: 0.51
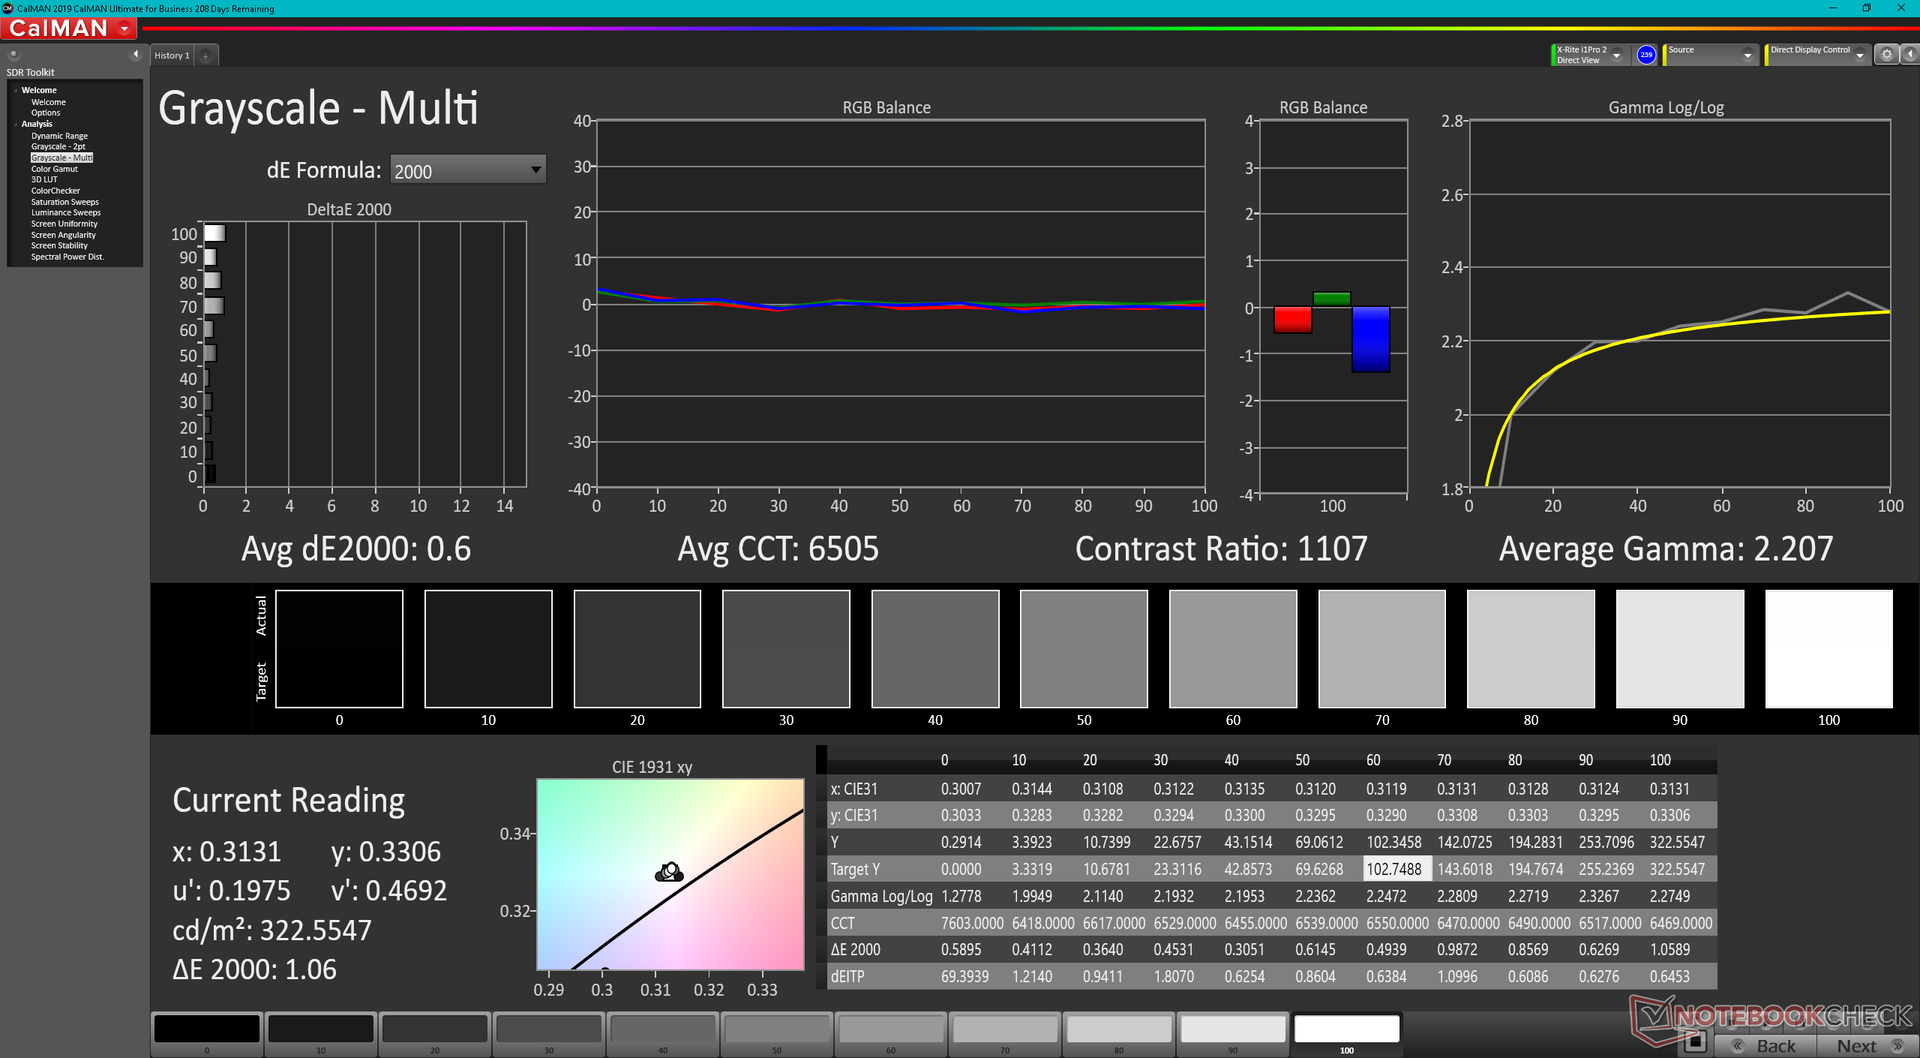
ΔE Greyscale Calman: 5.3 | ∀{0.09-98 Ø4.96}
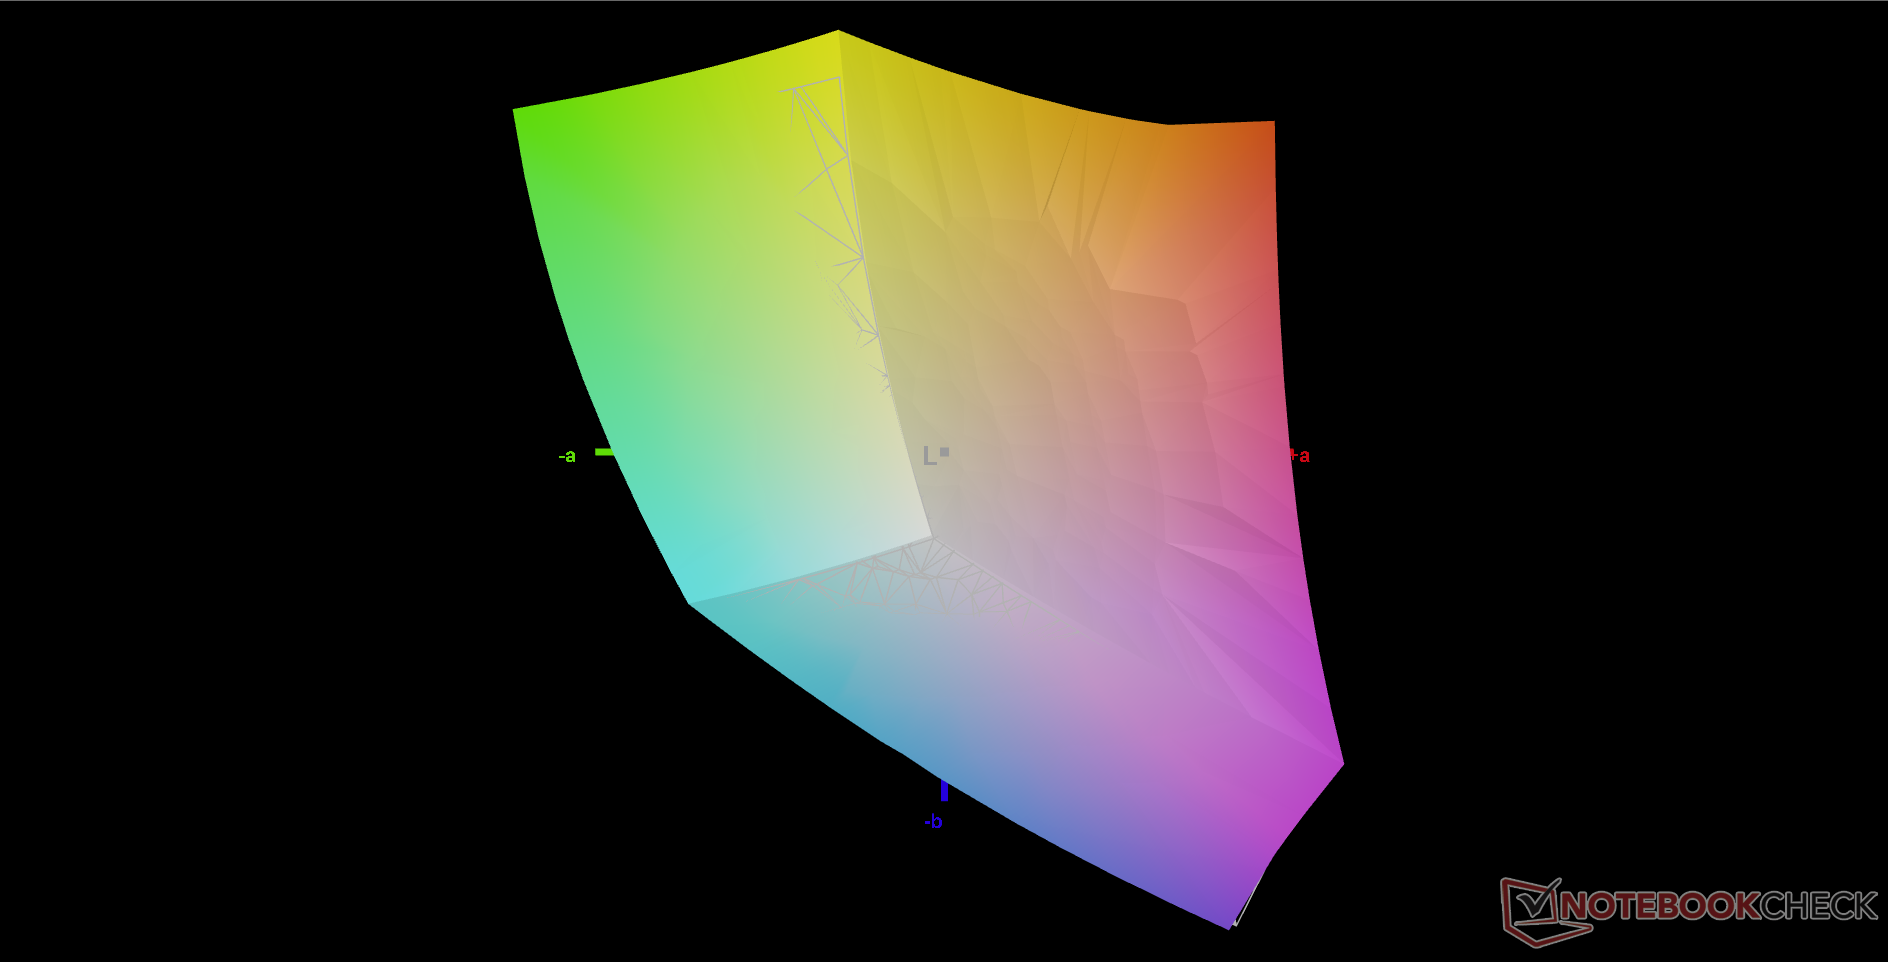
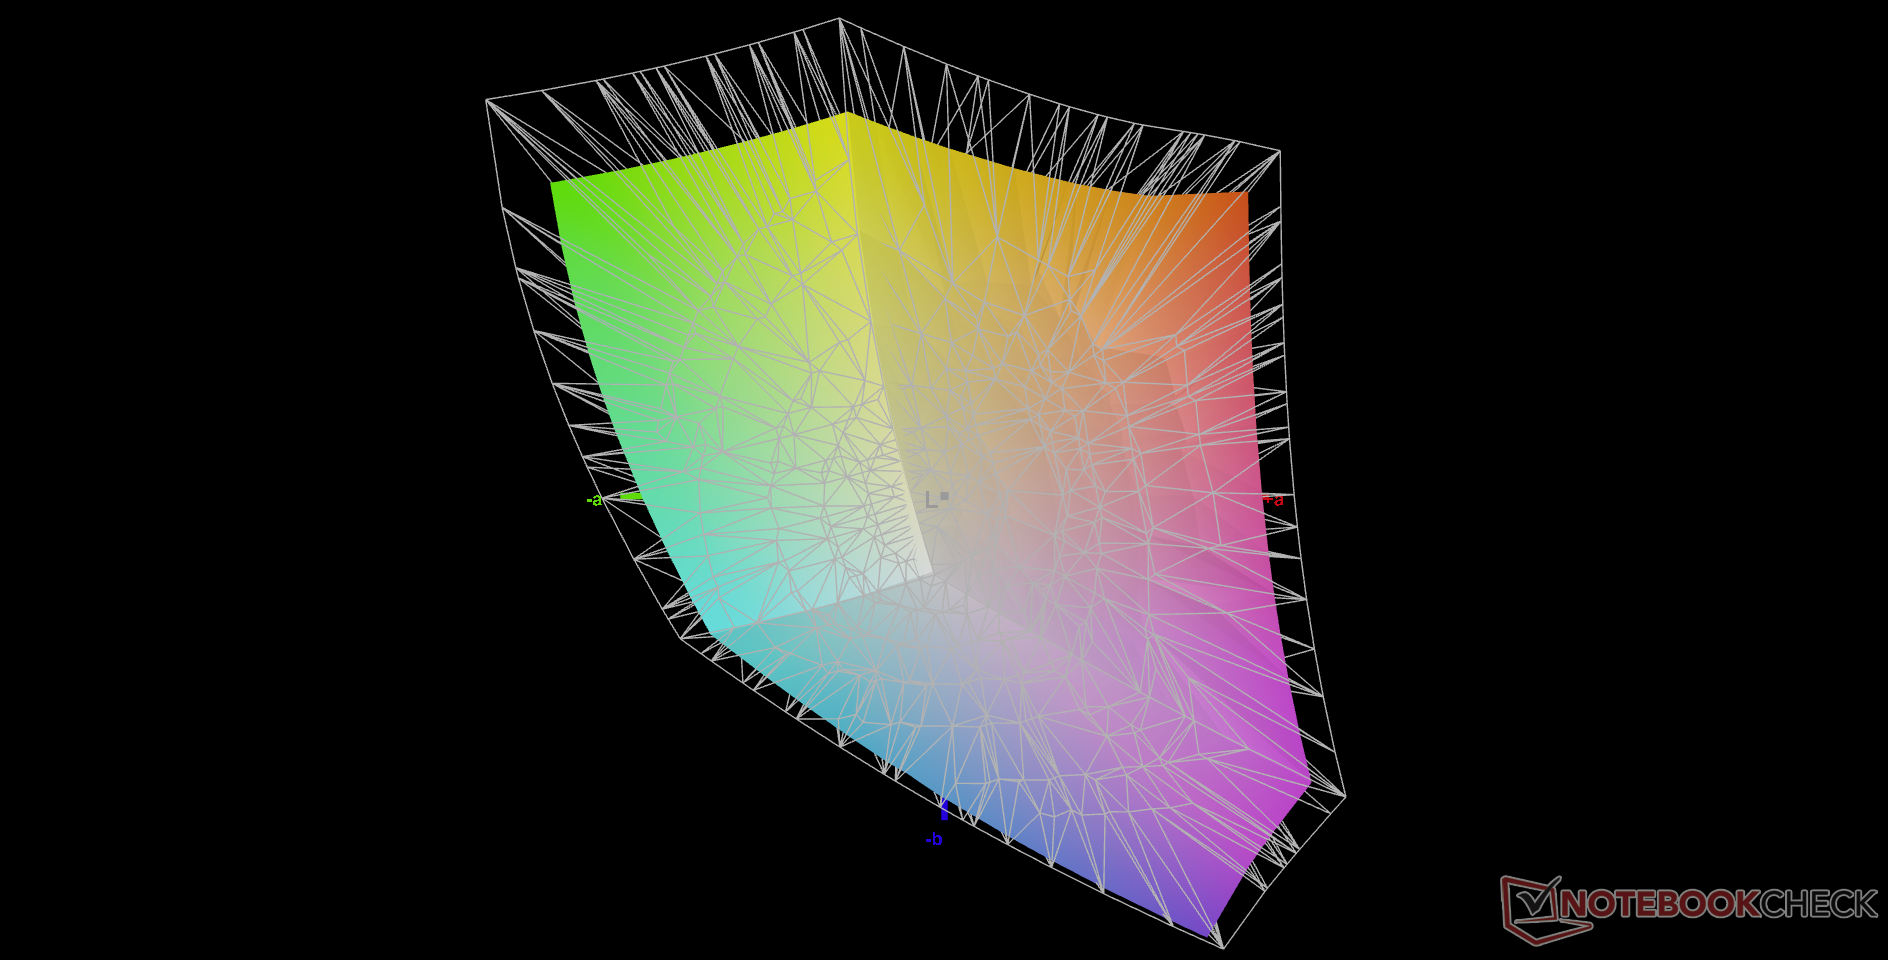
79.6% AdobeRGB 1998 (Argyll 3D)
99.8% sRGB (Argyll 3D)
79.2% Display P3 (Argyll 3D)
Gamma: 2.18
CCT: 5879 K
| Alienware x17 R2 P48E AU Optronics B173HAN, IPS, 1920x1080, 17.3" | Alienware x17 RTX 3080 P48E AU Optronics B173ZAN, IPS, 3840x2160, 17.3" | Asus ROG Zephyrus S17 GX703HSD BOE099D (BOE CQ NE173QHM-NY3), IPS, 2560x1440, 17.3" | MSI Stealth GS77 12UHS-083US BOE NE173QHM-NZ1, IPS, 2560x1440, 17.3" | MSI GT76 Titan DT 10SGS AU Optronics B173ZAN03.3, IPS, 3840x2160, 17.3" | Gigabyte A7 X1 AU Optronics AUO8E8D, IPS, 1920x1080, 17.3" | |
|---|---|---|---|---|---|---|
| Display | 12% | 8% | 10% | 8% | -17% | |
| Display P3 Coverage (%) | 79.2 | 88.3 11% | 94.2 19% | 96.2 21% | 82.5 4% | 61.5 -22% |
| sRGB Coverage (%) | 99.8 | 100 0% | 98.7 -1% | 99.7 0% | 98 -2% | 90.9 -9% |
| AdobeRGB 1998 Coverage (%) | 79.6 | 100 26% | 84.4 6% | 85.8 8% | 96.6 21% | 63.2 -21% |
| Response Times | -15% | 37% | -41% | -57% | -23% | |
| Response Time Grey 50% / Grey 80% * (ms) | 12.4 ? | 14.4 ? -16% | 4.8 61% | 17.6 ? -42% | 23.2 ? -87% | 16 ? -29% |
| Response Time Black / White * (ms) | 9.2 ? | 10.4 ? -13% | 8 13% | 12.8 ? -39% | 11.6 ? -26% | 10.8 ? -17% |
| PWM Frequency (Hz) | ||||||
| Screen | -6% | -29% | -12% | -55% | -39% | |
| Brightness middle (cd/m²) | 365.4 | 438.7 20% | 322 -12% | 334.8 -8% | 419.5 15% | 325 -11% |
| Brightness (cd/m²) | 344 | 435 26% | 288 -16% | 305 -11% | 413 20% | 318 -8% |
| Brightness Distribution (%) | 85 | 91 7% | 72 -15% | 79 -7% | 93 9% | 95 12% |
| Black Level * (cd/m²) | 0.29 | 0.48 -66% | 0.3 -3% | 0.34 -17% | 0.4 -38% | 0.29 -0% |
| Contrast (:1) | 1260 | 914 -27% | 1073 -15% | 985 -22% | 1049 -17% | 1121 -11% |
| Colorchecker dE 2000 * | 3.17 | 4.34 -37% | 3.05 4% | 4.1 -29% | 3.4 -7% | 4.33 -37% |
| Colorchecker dE 2000 max. * | 7.69 | 7.3 5% | 5.23 32% | 7.28 5% | 7.4 4% | 8.6 -12% |
| Colorchecker dE 2000 calibrated * | 0.51 | 0.72 -41% | 1.92 -276% | 3.28 -543% | 1.95 -282% | |
| Greyscale dE 2000 * | 5.3 | 2.4 55% | 3.11 41% | 5.6 -6% | 2 62% | 5.5 -4% |
| Gamma | 2.18 101% | 2.09 105% | 2.13 103% | 2.16 102% | 2.14 103% | 2.142 103% |
| CCT | 5879 111% | 6413 101% | 6553 99% | 6314 103% | 6858 95% | 7893 82% |
| Color Space (Percent of AdobeRGB 1998) (%) | 84 | 84.6 | ||||
| Color Space (Percent of sRGB) (%) | 99 | 97.9 | ||||
| Total Average (Program / Settings) | -3% /
-4% | 5% /
-12% | -14% /
-11% | -35% /
-42% | -26% /
-32% |
* ... smaller is better
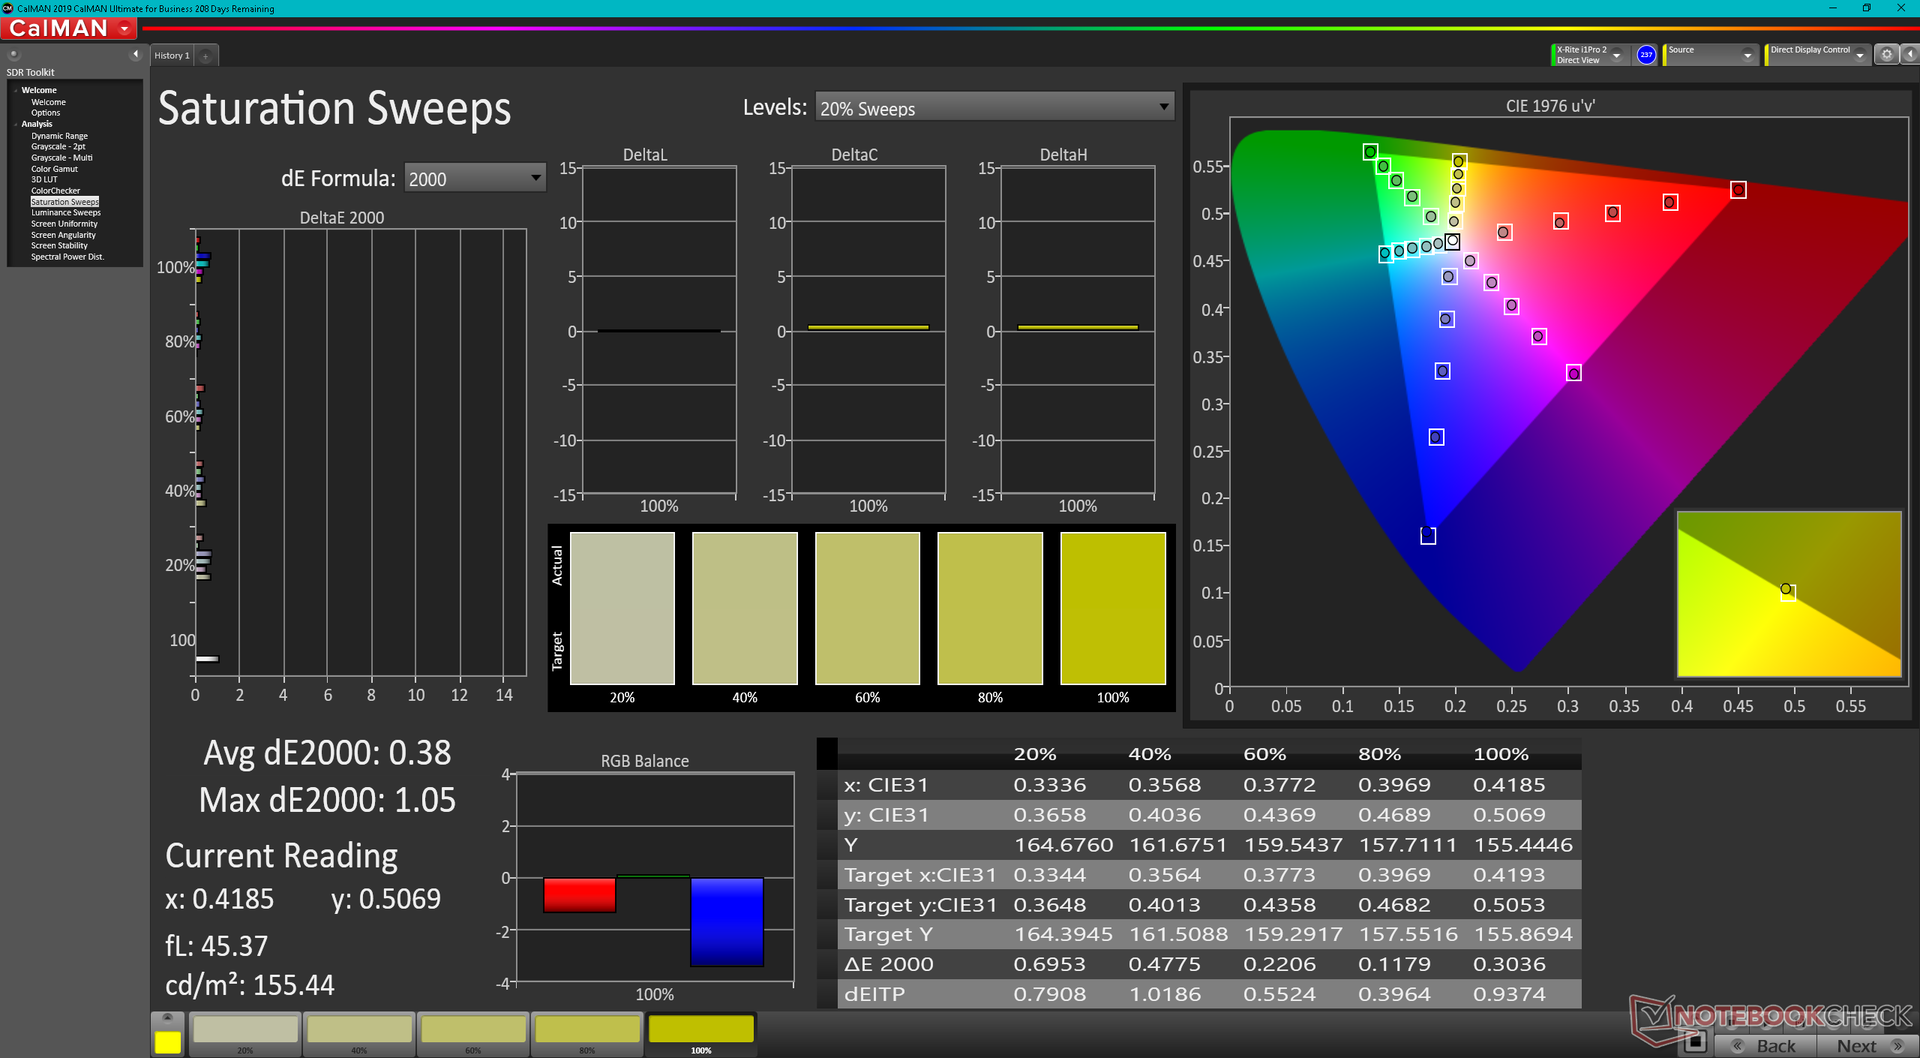
这款显示器在开箱后没有得到很好的校准,尤其是色温过于偏暖。然而,一旦对sRGB进行正确的校准,我们就能够实现平均灰度和色彩deltaE值分别低至0.6和0.51。

Display Response Times
| ↔ Response Time Black to White | ||
|---|---|---|
| 9.2 ms ... rise ↗ and fall ↘ combined | ↗ 5.2 ms rise | 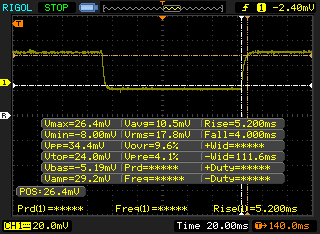 |
| ↘ 4 ms fall | ||
| The screen shows fast response rates in our tests and should be suited for gaming. In comparison, all tested devices range from 0.1 (minimum) to 240 (maximum) ms. » 26 % of all devices are better. This means that the measured response time is better than the average of all tested devices (19.8 ms). | ||
| ↔ Response Time 50% Grey to 80% Grey | ||
| 12.4 ms ... rise ↗ and fall ↘ combined | ↗ 6.4 ms rise | 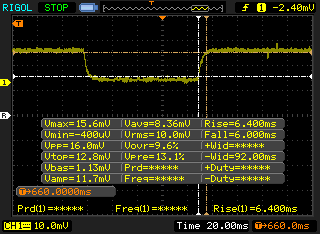 |
| ↘ 6 ms fall | ||
| The screen shows good response rates in our tests, but may be too slow for competitive gamers. In comparison, all tested devices range from 0.165 (minimum) to 636 (maximum) ms. » 26 % of all devices are better. This means that the measured response time is better than the average of all tested devices (31 ms). | ||
Screen Flickering / PWM (Pulse-Width Modulation)
| Screen flickering / PWM not detected | 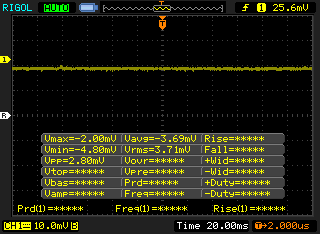 | ||
In comparison: 52 % of all tested devices do not use PWM to dim the display. If PWM was detected, an average of 7754 (minimum: 5 - maximum: 343500) Hz was measured. | |||

业绩
测试条件
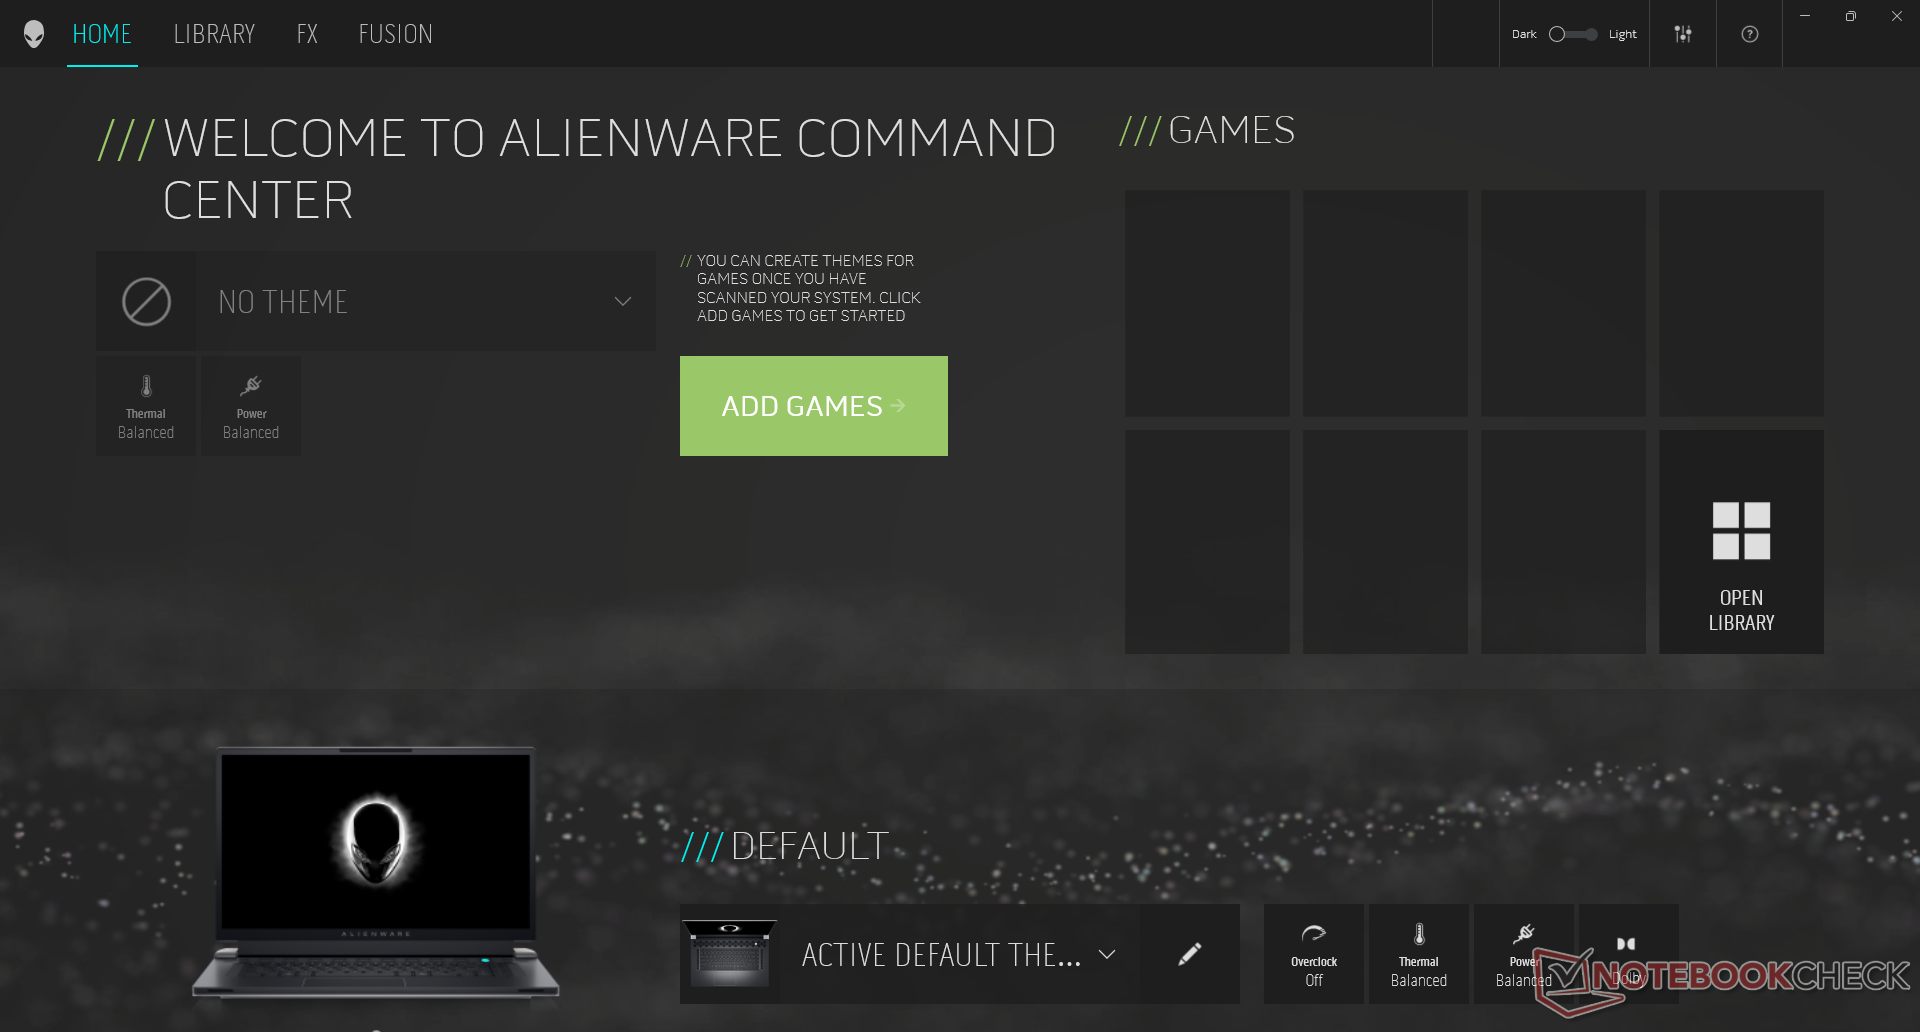
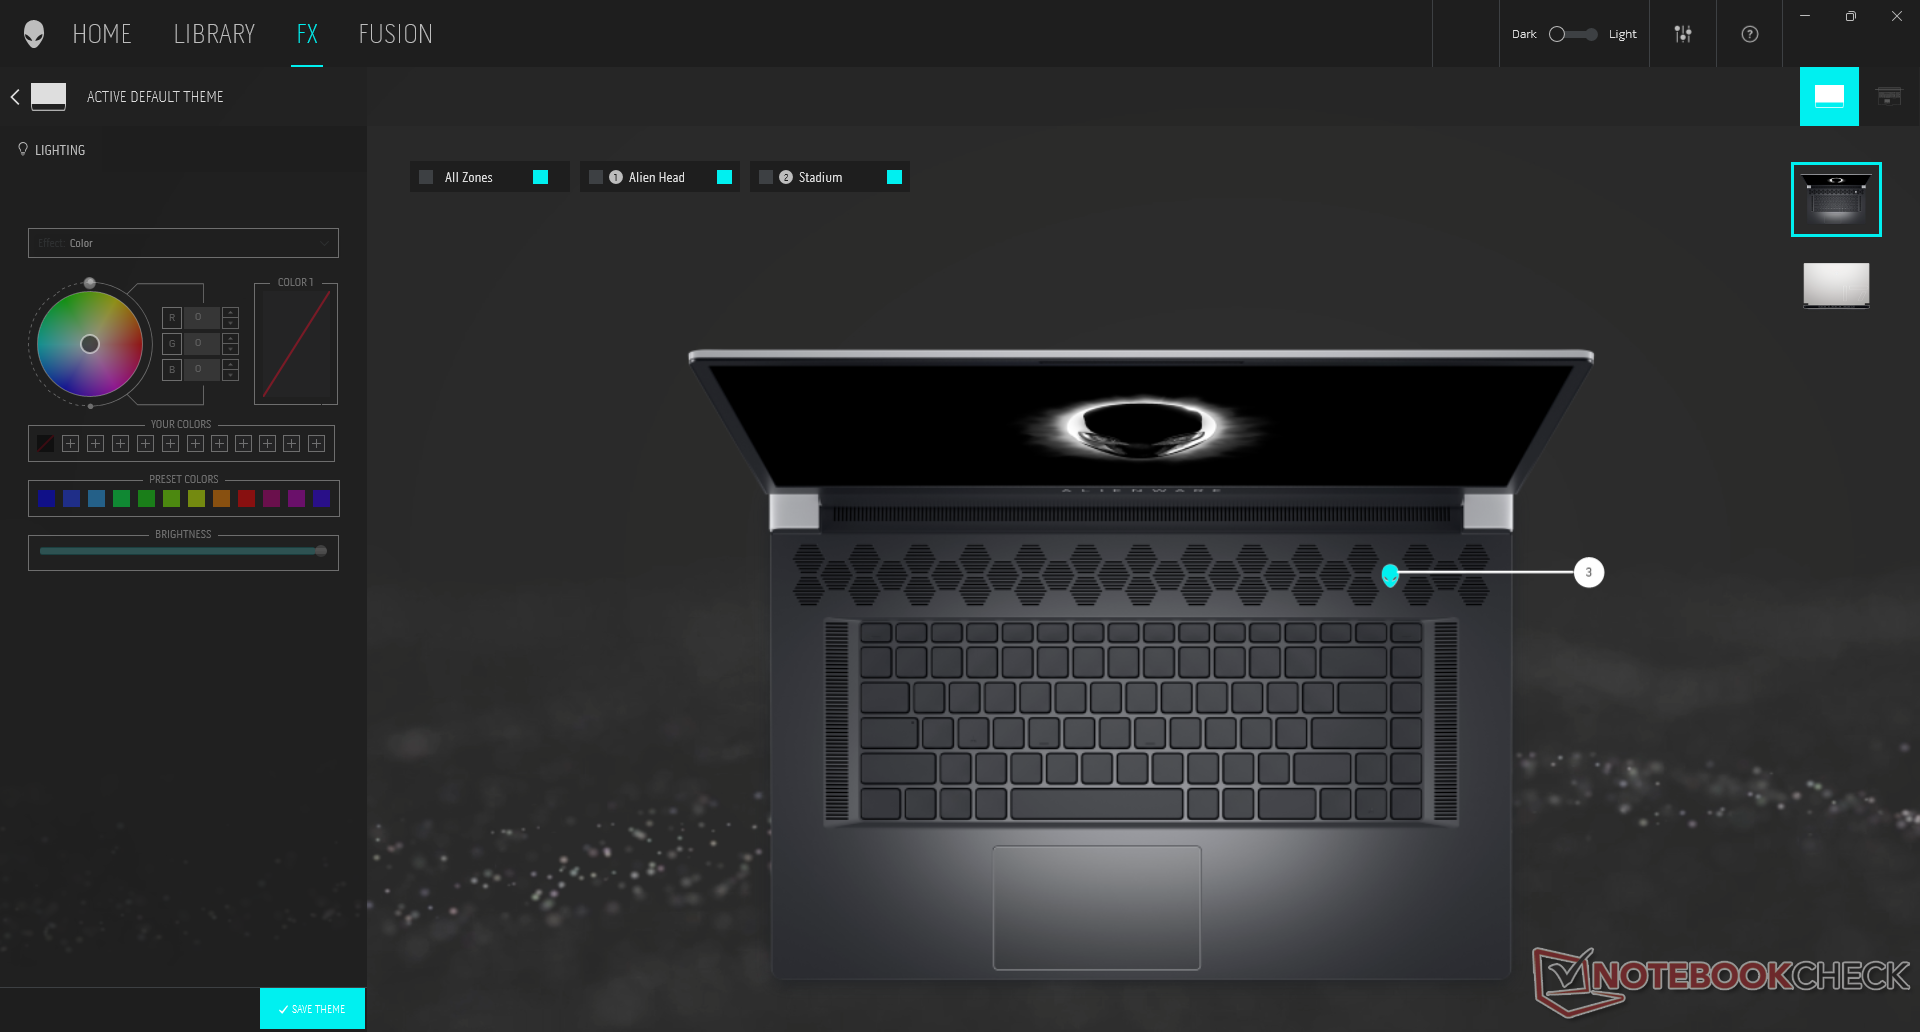
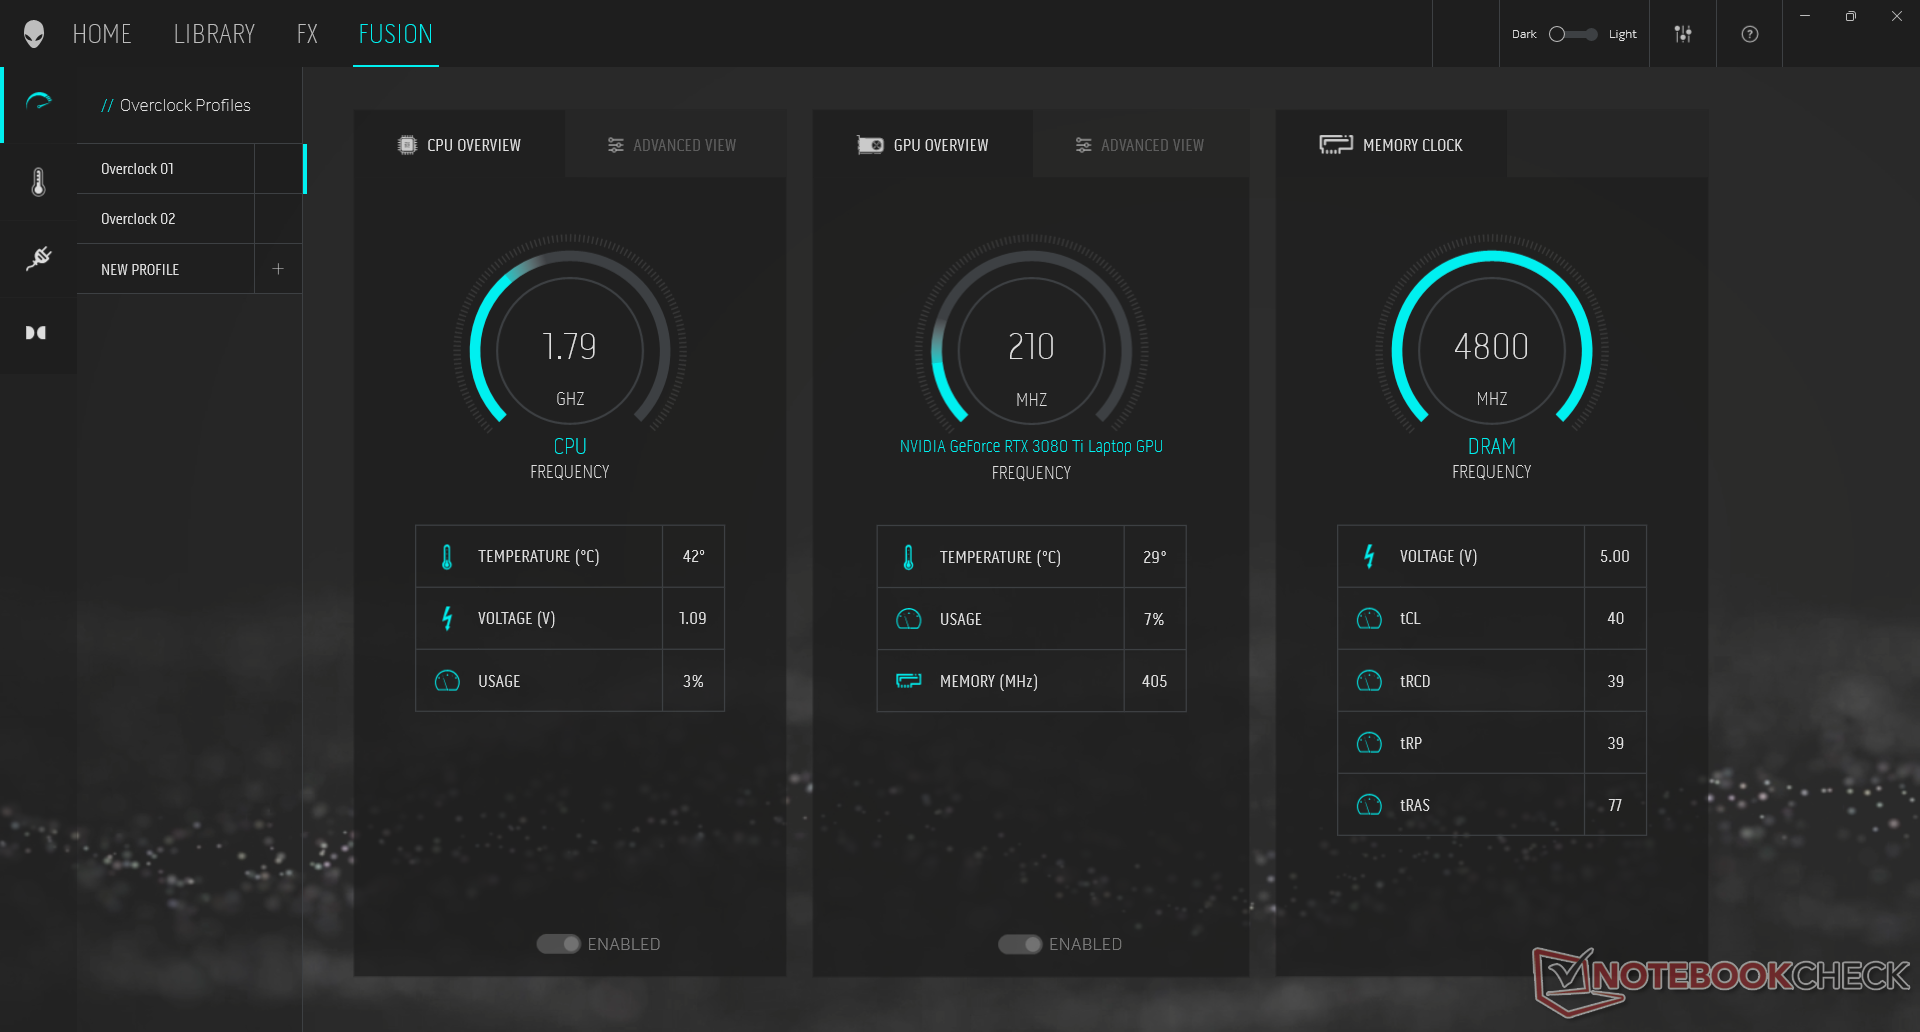
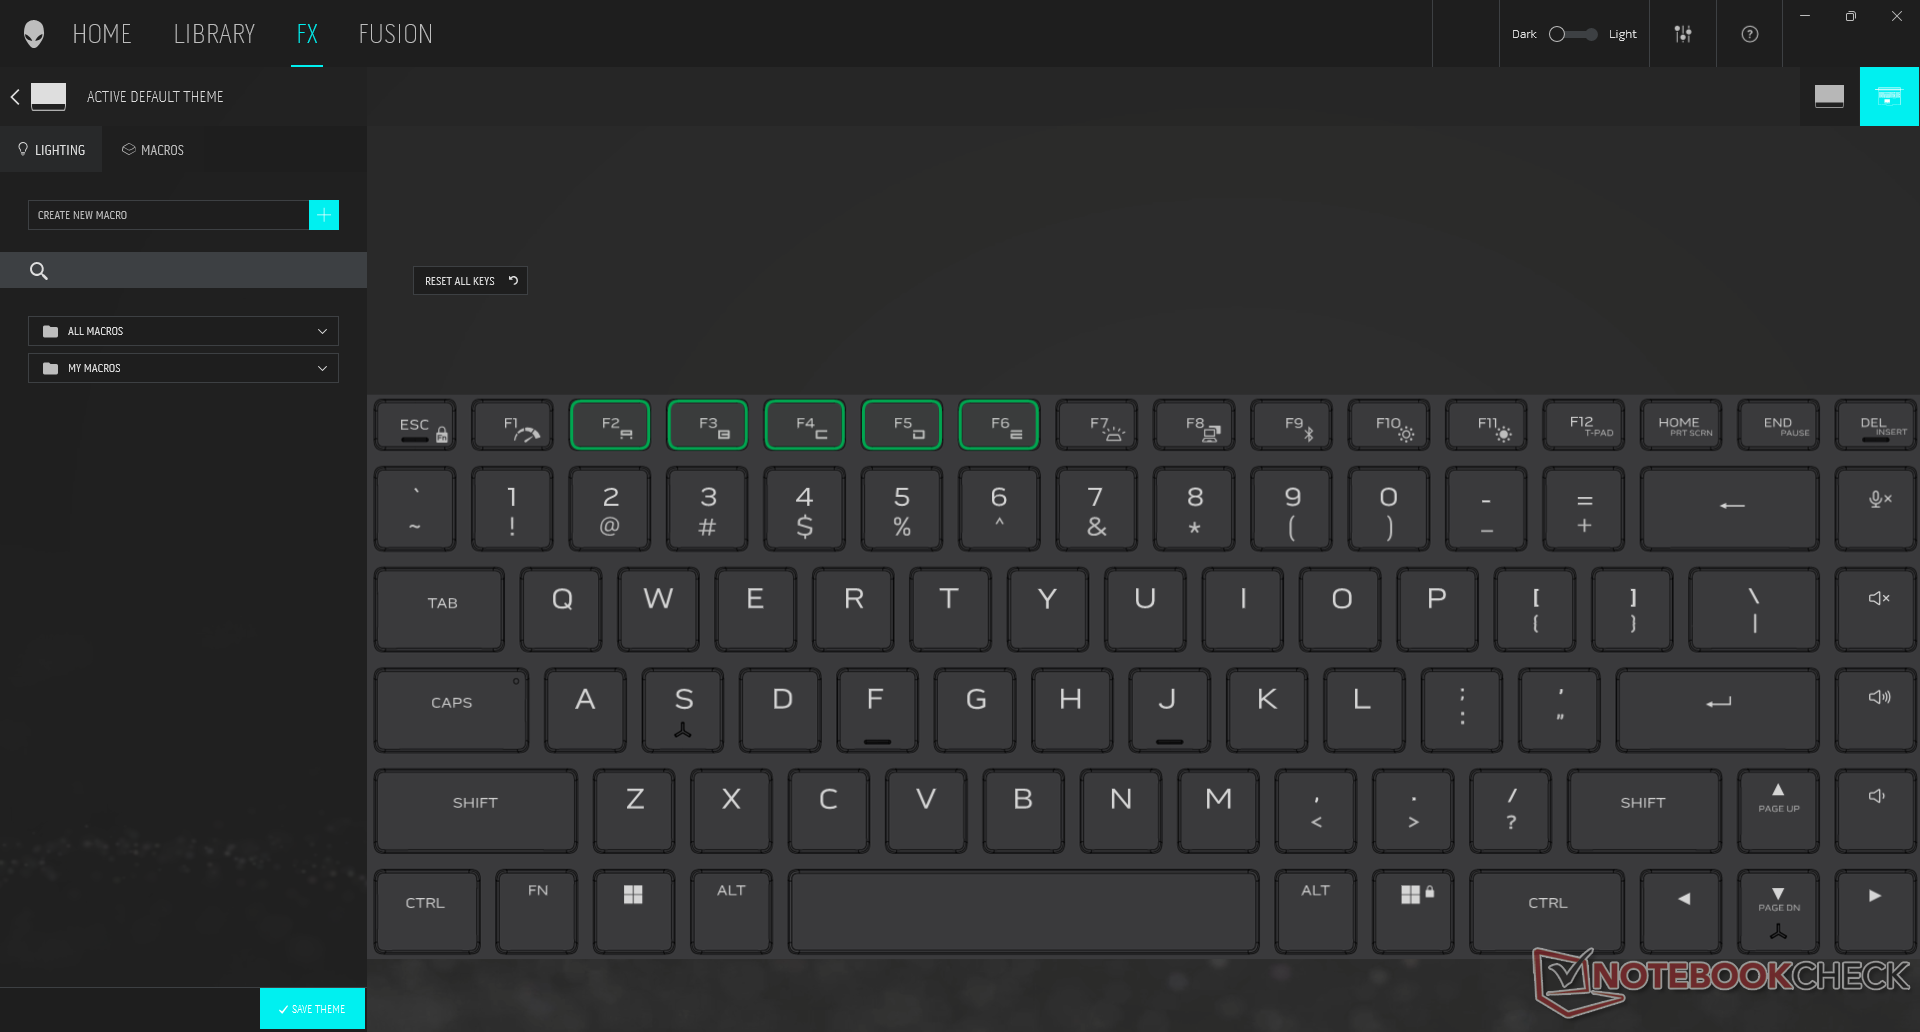
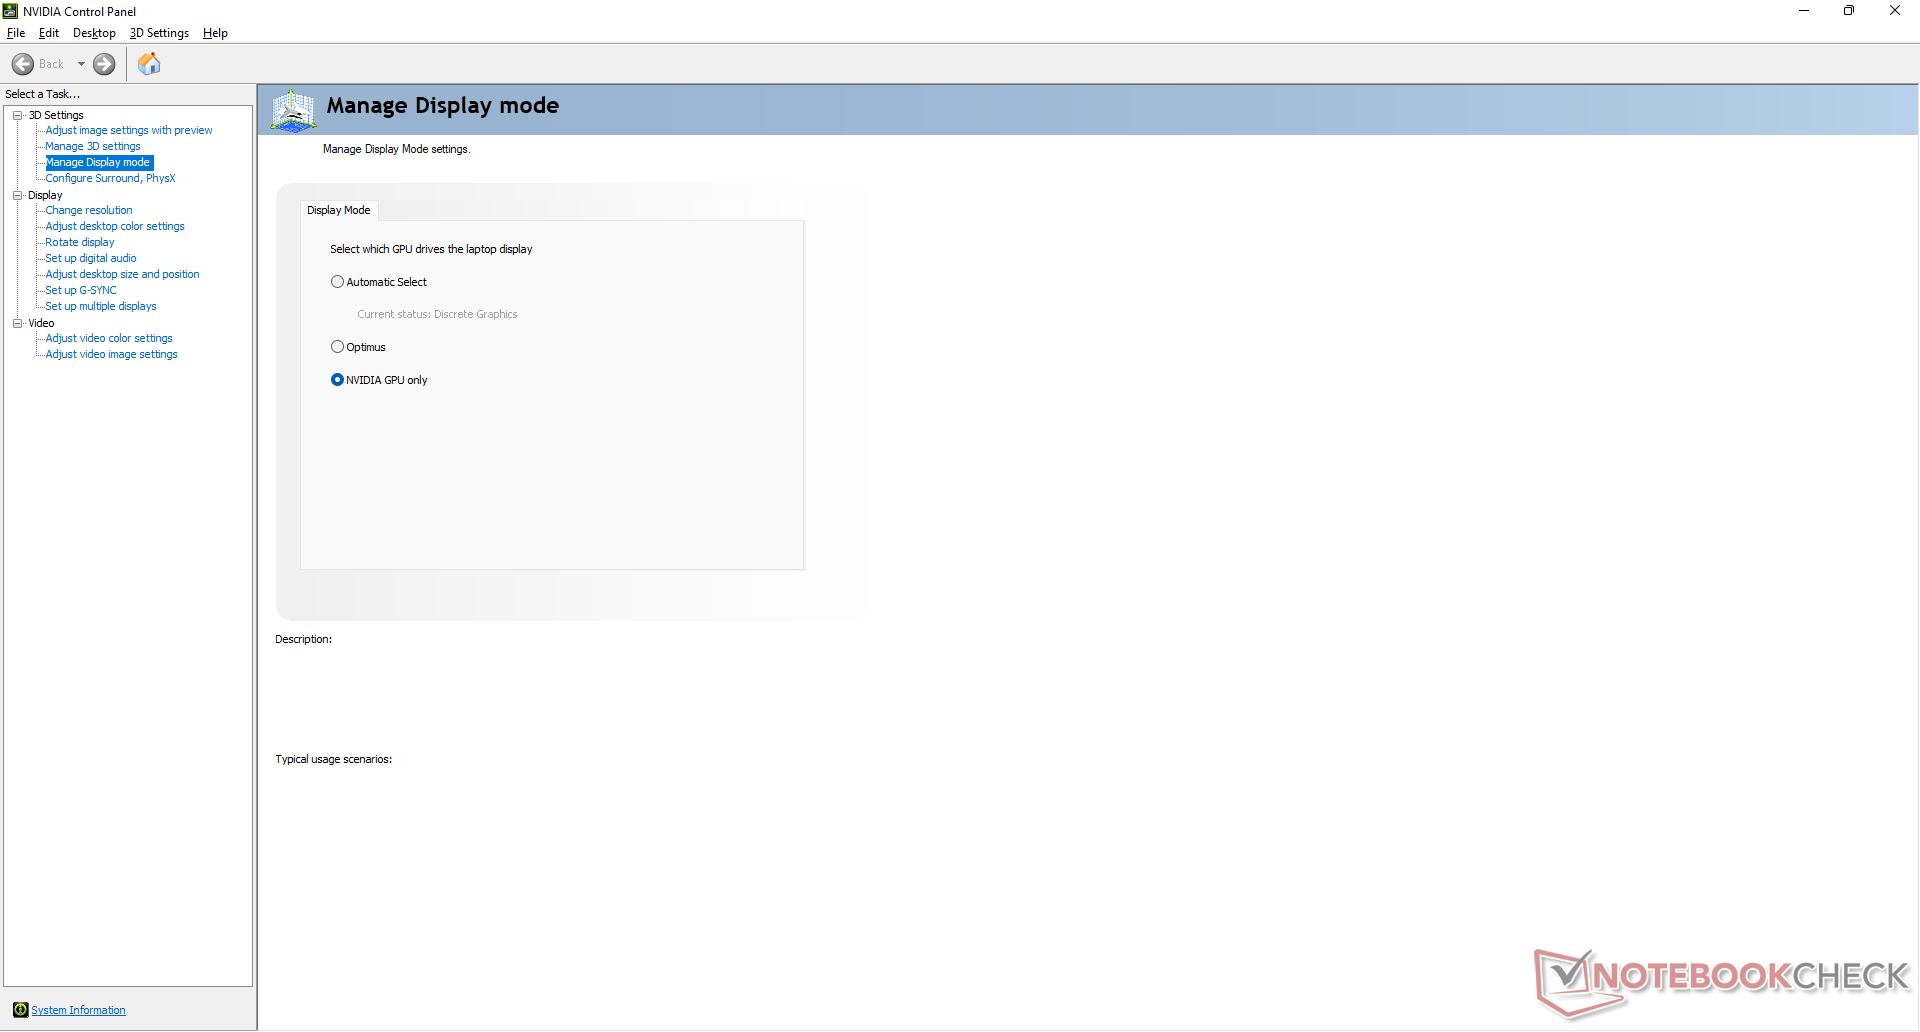
在运行以下任何性能基准测试之前,我们将我们的设备设置为高性能模式并激活独立GPU,以获得尽可能高的分数。高性能模式可以通过Fn+F1轻松切换,而MUX开关可以通过Nvidia控制面板访问。我们强烈建议用户熟悉Alienware命令中心软件,因为这里有电源配置文件、RGB设置、实时监控和其他功能。
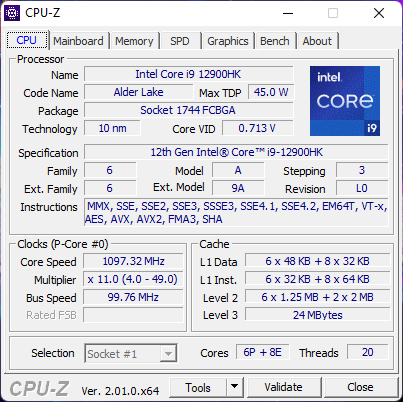
处理器
原始CPU性能比我们数据库中具有相同功能的普通笔记本电脑快约10%至15%。 酷睿i9-12900HK.这是个不错的提升,超过了 酷睿i7-12800H或上一代的 酷睿i7-11800H在多线程工作负载中各提升了30%。AMD最新的Zen 3+ CPU,即 Ryzen 9 6900HX,在原始CineBench基准测试中也一直较慢,但在某些AIDA64基准测试中,它将超过Core i9-12900HK。
Cinebench R15 Multi Loop
Cinebench R23: Multi Core | Single Core
Cinebench R15: CPU Multi 64Bit | CPU Single 64Bit
Blender: v2.79 BMW27 CPU
7-Zip 18.03: 7z b 4 | 7z b 4 -mmt1
Geekbench 5.5: Multi-Core | Single-Core
HWBOT x265 Benchmark v2.2: 4k Preset
LibreOffice : 20 Documents To PDF
R Benchmark 2.5: Overall mean
| Cinebench R20 / CPU (Multi Core) | |
| AMD Radeon RX 6800 XT | |
| Corsair One i300 | |
| Alienware x17 R2 P48E | |
| Average Intel Core i9-12900HK (1828 - 7366, n=14) | |
| Razer Blade 14 Ryzen 9 6900HX | |
| Alienware x17 RTX 3080 P48E | |
| Razer Blade 17 (i7-12800H, RTX 3070 Ti) | |
| Gigabyte A7 X1 | |
| Razer Blade Pro 17 2021 (QHD Touch) | |
| Lenovo Legion Y740-17IRHg-81UJ001VGE | |
| Cinebench R20 / CPU (Single Core) | |
| Corsair One i300 | |
| Alienware x17 R2 P48E | |
| Razer Blade 17 (i7-12800H, RTX 3070 Ti) | |
| Average Intel Core i9-12900HK (316 - 739, n=14) | |
| AMD Radeon RX 6800 XT | |
| Razer Blade 14 Ryzen 9 6900HX | |
| Alienware x17 RTX 3080 P48E | |
| Gigabyte A7 X1 | |
| Razer Blade Pro 17 2021 (QHD Touch) | |
| Lenovo Legion Y740-17IRHg-81UJ001VGE | |
| Cinebench R23 / Multi Core | |
| Corsair One i300 | |
| AMD Radeon RX 6800 XT | |
| Alienware x17 R2 P48E | |
| Average Intel Core i9-12900HK (4796 - 19282, n=14) | |
| Razer Blade 17 (i7-12800H, RTX 3070 Ti) | |
| Razer Blade 14 Ryzen 9 6900HX | |
| Alienware x17 RTX 3080 P48E | |
| Gigabyte A7 X1 | |
| Razer Blade Pro 17 2021 (QHD Touch) | |
| Cinebench R23 / Single Core | |
| Corsair One i300 | |
| Alienware x17 R2 P48E | |
| Razer Blade 17 (i7-12800H, RTX 3070 Ti) | |
| Average Intel Core i9-12900HK (819 - 1940, n=15) | |
| AMD Radeon RX 6800 XT | |
| Razer Blade 14 Ryzen 9 6900HX | |
| Alienware x17 RTX 3080 P48E | |
| Gigabyte A7 X1 | |
| Razer Blade Pro 17 2021 (QHD Touch) | |
| Cinebench R15 / CPU Multi 64Bit | |
| AMD Radeon RX 6800 XT | |
| Corsair One i300 | |
| Alienware x17 R2 P48E | |
| Razer Blade 17 (i7-12800H, RTX 3070 Ti) | |
| Average Intel Core i9-12900HK (965 - 2944, n=14) | |
| Razer Blade 14 Ryzen 9 6900HX | |
| Alienware x17 RTX 3080 P48E | |
| Gigabyte A7 X1 | |
| Razer Blade Pro 17 2021 (QHD Touch) | |
| Lenovo Legion Y740-17IRHg-81UJ001VGE | |
| Cinebench R15 / CPU Single 64Bit | |
| Corsair One i300 | |
| Alienware x17 R2 P48E | |
| Razer Blade 17 (i7-12800H, RTX 3070 Ti) | |
| AMD Radeon RX 6800 XT | |
| Razer Blade 14 Ryzen 9 6900HX | |
| Gigabyte A7 X1 | |
| Average Intel Core i9-12900HK (119 - 279, n=14) | |
| Alienware x17 RTX 3080 P48E | |
| Razer Blade Pro 17 2021 (QHD Touch) | |
| Lenovo Legion Y740-17IRHg-81UJ001VGE | |
| Blender / v2.79 BMW27 CPU | |
| Lenovo Legion Y740-17IRHg-81UJ001VGE | |
| Razer Blade Pro 17 2021 (QHD Touch) | |
| Gigabyte A7 X1 | |
| Average Intel Core i9-12900HK (172.5 - 483, n=13) | |
| Razer Blade 14 Ryzen 9 6900HX | |
| Razer Blade 17 (i7-12800H, RTX 3070 Ti) | |
| Alienware x17 RTX 3080 P48E | |
| Alienware x17 R2 P48E | |
| Corsair One i300 | |
| AMD Radeon RX 6800 XT | |
| 7-Zip 18.03 / 7z b 4 | |
| AMD Radeon RX 6800 XT | |
| Corsair One i300 | |
| Alienware x17 R2 P48E | |
| Razer Blade 17 (i7-12800H, RTX 3070 Ti) | |
| Razer Blade 14 Ryzen 9 6900HX | |
| Average Intel Core i9-12900HK (25736 - 75564, n=14) | |
| Gigabyte A7 X1 | |
| Alienware x17 RTX 3080 P48E | |
| Razer Blade Pro 17 2021 (QHD Touch) | |
| Lenovo Legion Y740-17IRHg-81UJ001VGE | |
| 7-Zip 18.03 / 7z b 4 -mmt1 | |
| AMD Radeon RX 6800 XT | |
| Corsair One i300 | |
| Razer Blade 14 Ryzen 9 6900HX | |
| Alienware x17 R2 P48E | |
| Razer Blade 17 (i7-12800H, RTX 3070 Ti) | |
| Gigabyte A7 X1 | |
| Average Intel Core i9-12900HK (2898 - 6186, n=14) | |
| Alienware x17 RTX 3080 P48E | |
| Razer Blade Pro 17 2021 (QHD Touch) | |
| Lenovo Legion Y740-17IRHg-81UJ001VGE | |
| Geekbench 5.5 / Multi-Core | |
| Corsair One i300 | |
| AMD Radeon RX 6800 XT | |
| Alienware x17 R2 P48E | |
| Razer Blade 17 (i7-12800H, RTX 3070 Ti) | |
| Average Intel Core i9-12900HK (5869 - 14294, n=13) | |
| Razer Blade 14 Ryzen 9 6900HX | |
| Razer Blade Pro 17 2021 (QHD Touch) | |
| Gigabyte A7 X1 | |
| Lenovo Legion Y740-17IRHg-81UJ001VGE | |
| Geekbench 5.5 / Single-Core | |
| Corsair One i300 | |
| Alienware x17 R2 P48E | |
| Razer Blade 17 (i7-12800H, RTX 3070 Ti) | |
| Average Intel Core i9-12900HK (843 - 1918, n=13) | |
| AMD Radeon RX 6800 XT | |
| Razer Blade 14 Ryzen 9 6900HX | |
| Gigabyte A7 X1 | |
| Razer Blade Pro 17 2021 (QHD Touch) | |
| Lenovo Legion Y740-17IRHg-81UJ001VGE | |
| HWBOT x265 Benchmark v2.2 / 4k Preset | |
| AMD Radeon RX 6800 XT | |
| Corsair One i300 | |
| Alienware x17 R2 P48E | |
| Razer Blade 14 Ryzen 9 6900HX | |
| Alienware x17 RTX 3080 P48E | |
| Average Intel Core i9-12900HK (5.33 - 21.6, n=14) | |
| Razer Blade 17 (i7-12800H, RTX 3070 Ti) | |
| Gigabyte A7 X1 | |
| Razer Blade Pro 17 2021 (QHD Touch) | |
| Lenovo Legion Y740-17IRHg-81UJ001VGE | |
| LibreOffice / 20 Documents To PDF | |
| Gigabyte A7 X1 | |
| AMD Radeon RX 6800 XT | |
| Razer Blade 14 Ryzen 9 6900HX | |
| Average Intel Core i9-12900HK (34.8 - 89.1, n=14) | |
| Alienware x17 RTX 3080 P48E | |
| Razer Blade Pro 17 2021 (QHD Touch) | |
| Razer Blade 17 (i7-12800H, RTX 3070 Ti) | |
| Alienware x17 R2 P48E | |
| Corsair One i300 | |
| R Benchmark 2.5 / Overall mean | |
| Lenovo Legion Y740-17IRHg-81UJ001VGE | |
| Razer Blade Pro 17 2021 (QHD Touch) | |
| Alienware x17 RTX 3080 P48E | |
| Average Intel Core i9-12900HK (0.4155 - 0.994, n=14) | |
| Gigabyte A7 X1 | |
| Razer Blade 14 Ryzen 9 6900HX | |
| AMD Radeon RX 6800 XT | |
| Razer Blade 17 (i7-12800H, RTX 3070 Ti) | |
| Alienware x17 R2 P48E | |
| Corsair One i300 | |
* ... smaller is better
AIDA64: FP32 Ray-Trace | FPU Julia | CPU SHA3 | CPU Queen | FPU SinJulia | FPU Mandel | CPU AES | CPU ZLib | FP64 Ray-Trace | CPU PhotoWorxx
| Performance rating | |
| Razer Blade 14 Ryzen 9 6900HX | |
| Gigabyte A7 X1 | |
| Alienware x17 R2 P48E | |
| MSI Stealth GS77 12UHS-083US | |
| Average Intel Core i9-12900HK | |
| AIDA64 / FP32 Ray-Trace | |
| Razer Blade 14 Ryzen 9 6900HX | |
| Gigabyte A7 X1 | |
| Alienware x17 R2 P48E | |
| Average Intel Core i9-12900HK (2677 - 13948, n=15) | |
| MSI Stealth GS77 12UHS-083US | |
| AIDA64 / FPU Julia | |
| Razer Blade 14 Ryzen 9 6900HX | |
| Gigabyte A7 X1 | |
| Average Intel Core i9-12900HK (12762 - 70764, n=15) | |
| Alienware x17 R2 P48E | |
| MSI Stealth GS77 12UHS-083US | |
| AIDA64 / CPU SHA3 | |
| Alienware x17 R2 P48E | |
| Razer Blade 14 Ryzen 9 6900HX | |
| Gigabyte A7 X1 | |
| MSI Stealth GS77 12UHS-083US | |
| Average Intel Core i9-12900HK (841 - 3504, n=15) | |
| AIDA64 / CPU Queen | |
| Alienware x17 R2 P48E | |
| Razer Blade 14 Ryzen 9 6900HX | |
| Gigabyte A7 X1 | |
| MSI Stealth GS77 12UHS-083US | |
| Average Intel Core i9-12900HK (60202 - 107161, n=15) | |
| AIDA64 / FPU SinJulia | |
| Razer Blade 14 Ryzen 9 6900HX | |
| Gigabyte A7 X1 | |
| Alienware x17 R2 P48E | |
| MSI Stealth GS77 12UHS-083US | |
| Average Intel Core i9-12900HK (3225 - 10402, n=15) | |
| AIDA64 / FPU Mandel | |
| Razer Blade 14 Ryzen 9 6900HX | |
| Gigabyte A7 X1 | |
| Alienware x17 R2 P48E | |
| Average Intel Core i9-12900HK (7417 - 34233, n=15) | |
| MSI Stealth GS77 12UHS-083US | |
| AIDA64 / CPU AES | |
| Razer Blade 14 Ryzen 9 6900HX | |
| Gigabyte A7 X1 | |
| Alienware x17 R2 P48E | |
| MSI Stealth GS77 12UHS-083US | |
| Average Intel Core i9-12900HK (32382 - 112498, n=15) | |
| AIDA64 / CPU ZLib | |
| Alienware x17 R2 P48E | |
| MSI Stealth GS77 12UHS-083US | |
| Average Intel Core i9-12900HK (314 - 1209, n=15) | |
| Razer Blade 14 Ryzen 9 6900HX | |
| Gigabyte A7 X1 | |
| AIDA64 / FP64 Ray-Trace | |
| Razer Blade 14 Ryzen 9 6900HX | |
| Gigabyte A7 X1 | |
| Alienware x17 R2 P48E | |
| Average Intel Core i9-12900HK (1501 - 7616, n=15) | |
| MSI Stealth GS77 12UHS-083US | |
| AIDA64 / CPU PhotoWorxx | |
| MSI Stealth GS77 12UHS-083US | |
| Average Intel Core i9-12900HK (24446 - 42462, n=15) | |
| Alienware x17 R2 P48E | |
| Razer Blade 14 Ryzen 9 6900HX | |
| Gigabyte A7 X1 | |
系统性能
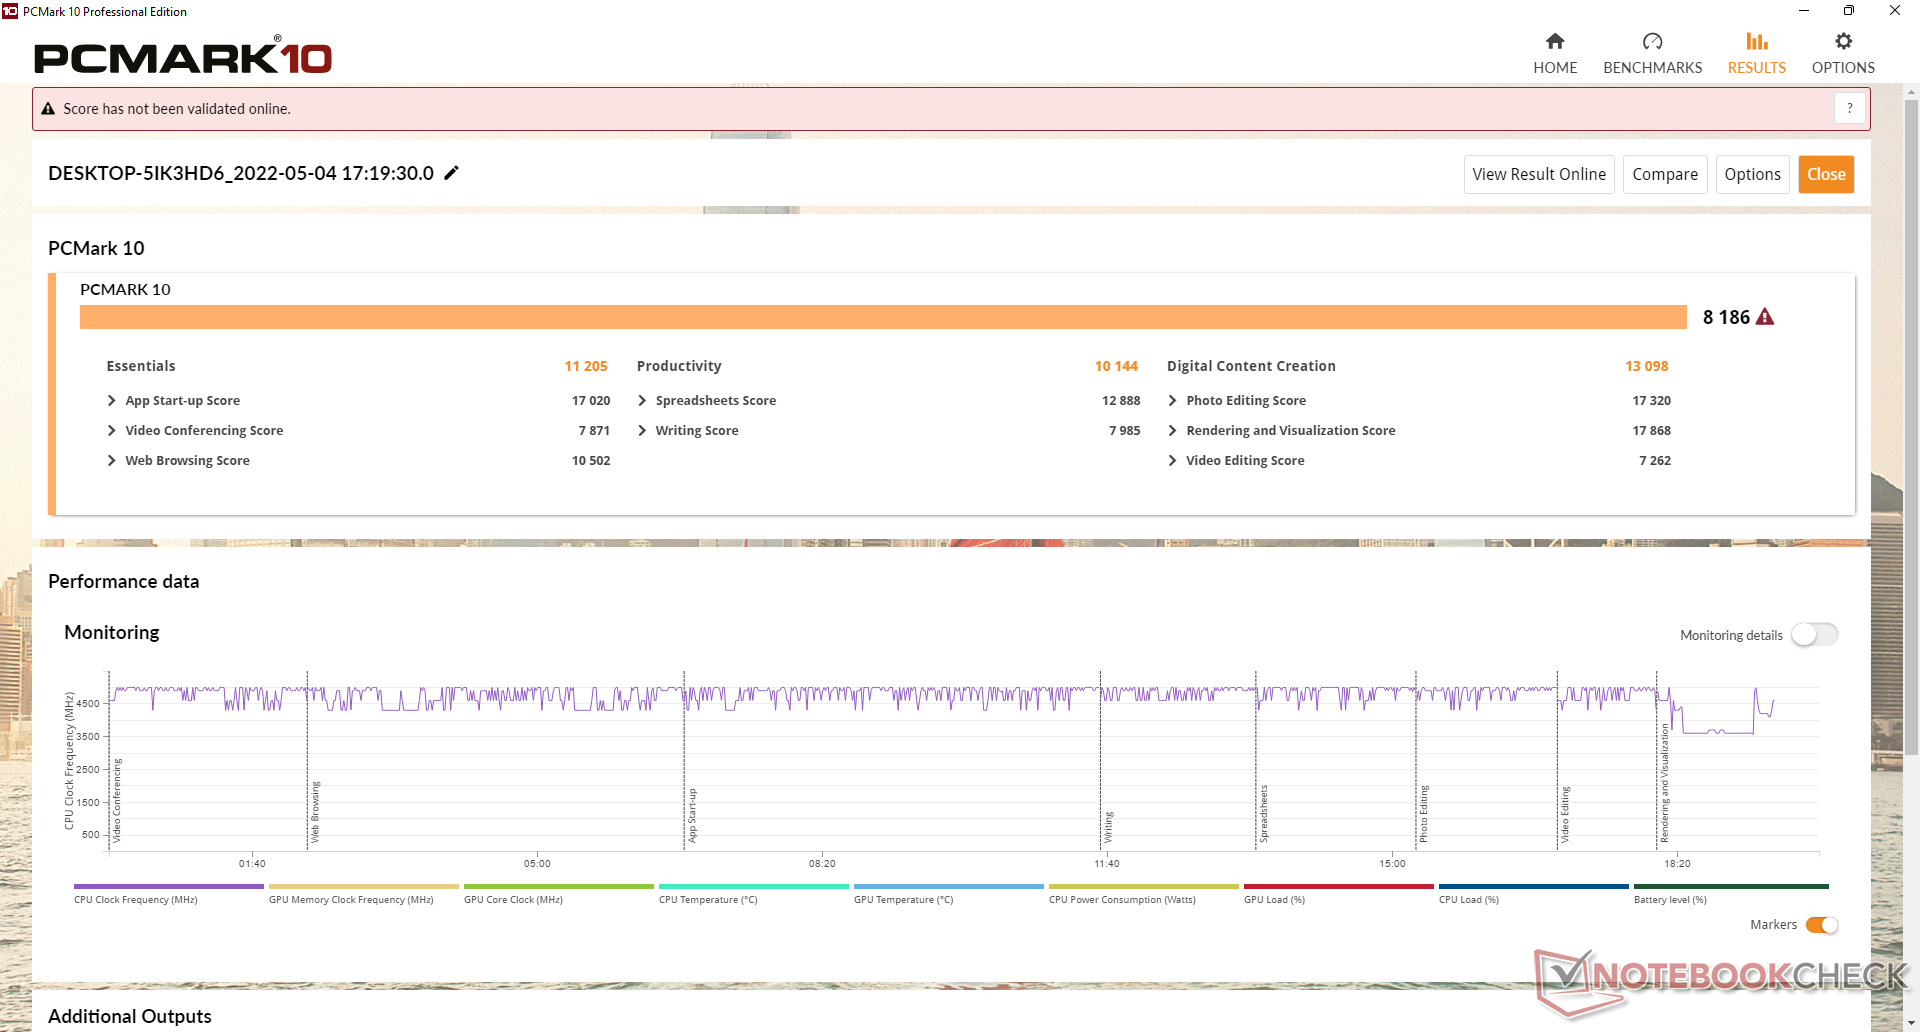
PCMark的结果一直比我们在去年的x17 R1上记录的结果要高,差距相对较小。
值得注意的是,即使在待机或睡眠模式下,该笔记本也会消耗大量的电力。在睡眠模式下,我们能够记录到近12W的消耗量,而其他大多数笔记本电脑的消耗量则<2W。此外,我们的测试设备中的风扇有时会活跃起来,即使在睡眠模式下,设备有时也难以正常唤醒。
CrossMark: Overall | Productivity | Creativity | Responsiveness
| PCMark 10 / Score | |
| Alienware x17 R2 P48E | |
| Average Intel Core i9-12900HK, NVIDIA GeForce RTX 3080 Ti Laptop GPU (7149 - 8186, n=5) | |
| Alienware x17 RTX 3080 P48E | |
| MSI Stealth GS77 12UHS-083US | |
| MSI GT76 Titan DT 10SGS | |
| Asus ROG Zephyrus S17 GX703HSD | |
| Gigabyte A7 X1 | |
| PCMark 10 / Essentials | |
| Alienware x17 R2 P48E | |
| Average Intel Core i9-12900HK, NVIDIA GeForce RTX 3080 Ti Laptop GPU (9870 - 11205, n=5) | |
| Asus ROG Zephyrus S17 GX703HSD | |
| MSI GT76 Titan DT 10SGS | |
| MSI Stealth GS77 12UHS-083US | |
| Alienware x17 RTX 3080 P48E | |
| Gigabyte A7 X1 | |
| PCMark 10 / Productivity | |
| Alienware x17 R2 P48E | |
| Average Intel Core i9-12900HK, NVIDIA GeForce RTX 3080 Ti Laptop GPU (9173 - 10422, n=5) | |
| Alienware x17 RTX 3080 P48E | |
| MSI Stealth GS77 12UHS-083US | |
| Gigabyte A7 X1 | |
| Asus ROG Zephyrus S17 GX703HSD | |
| MSI GT76 Titan DT 10SGS | |
| PCMark 10 / Digital Content Creation | |
| Alienware x17 R2 P48E | |
| Average Intel Core i9-12900HK, NVIDIA GeForce RTX 3080 Ti Laptop GPU (10951 - 13098, n=5) | |
| MSI GT76 Titan DT 10SGS | |
| Alienware x17 RTX 3080 P48E | |
| MSI Stealth GS77 12UHS-083US | |
| Asus ROG Zephyrus S17 GX703HSD | |
| Gigabyte A7 X1 | |
| CrossMark / Overall | |
| Alienware x17 R2 P48E | |
| Average Intel Core i9-12900HK, NVIDIA GeForce RTX 3080 Ti Laptop GPU (970 - 2138, n=5) | |
| CrossMark / Productivity | |
| Alienware x17 R2 P48E | |
| Average Intel Core i9-12900HK, NVIDIA GeForce RTX 3080 Ti Laptop GPU (921 - 2038, n=5) | |
| CrossMark / Creativity | |
| Alienware x17 R2 P48E | |
| Average Intel Core i9-12900HK, NVIDIA GeForce RTX 3080 Ti Laptop GPU (1007 - 2210, n=5) | |
| CrossMark / Responsiveness | |
| Average Intel Core i9-12900HK, NVIDIA GeForce RTX 3080 Ti Laptop GPU (1012 - 2234, n=5) | |
| Alienware x17 R2 P48E | |
| PCMark 10 Score | 8186 points | |
Help | ||
| AIDA64 / Memory Copy | |
| MSI Stealth GS77 12UHS-083US | |
| Average Intel Core i9-12900HK (42967 - 62959, n=15) | |
| Alienware x17 R2 P48E | |
| Gigabyte A7 X1 | |
| AIDA64 / Memory Read | |
| MSI Stealth GS77 12UHS-083US | |
| Average Intel Core i9-12900HK (44419 - 66989, n=15) | |
| Alienware x17 R2 P48E | |
| Gigabyte A7 X1 | |
| AIDA64 / Memory Write | |
| MSI Stealth GS77 12UHS-083US | |
| Average Intel Core i9-12900HK (42144 - 65268, n=15) | |
| Alienware x17 R2 P48E | |
| Gigabyte A7 X1 | |
| AIDA64 / Memory Latency | |
| Alienware x17 R2 P48E | |
| MSI Stealth GS77 12UHS-083US | |
| Gigabyte A7 X1 | |
| Average Intel Core i9-12900HK (79.9 - 109, n=15) | |
| Asus ROG Zephyrus S17 GX703HSD | |
| Alienware x17 RTX 3080 P48E | |
* ... smaller is better
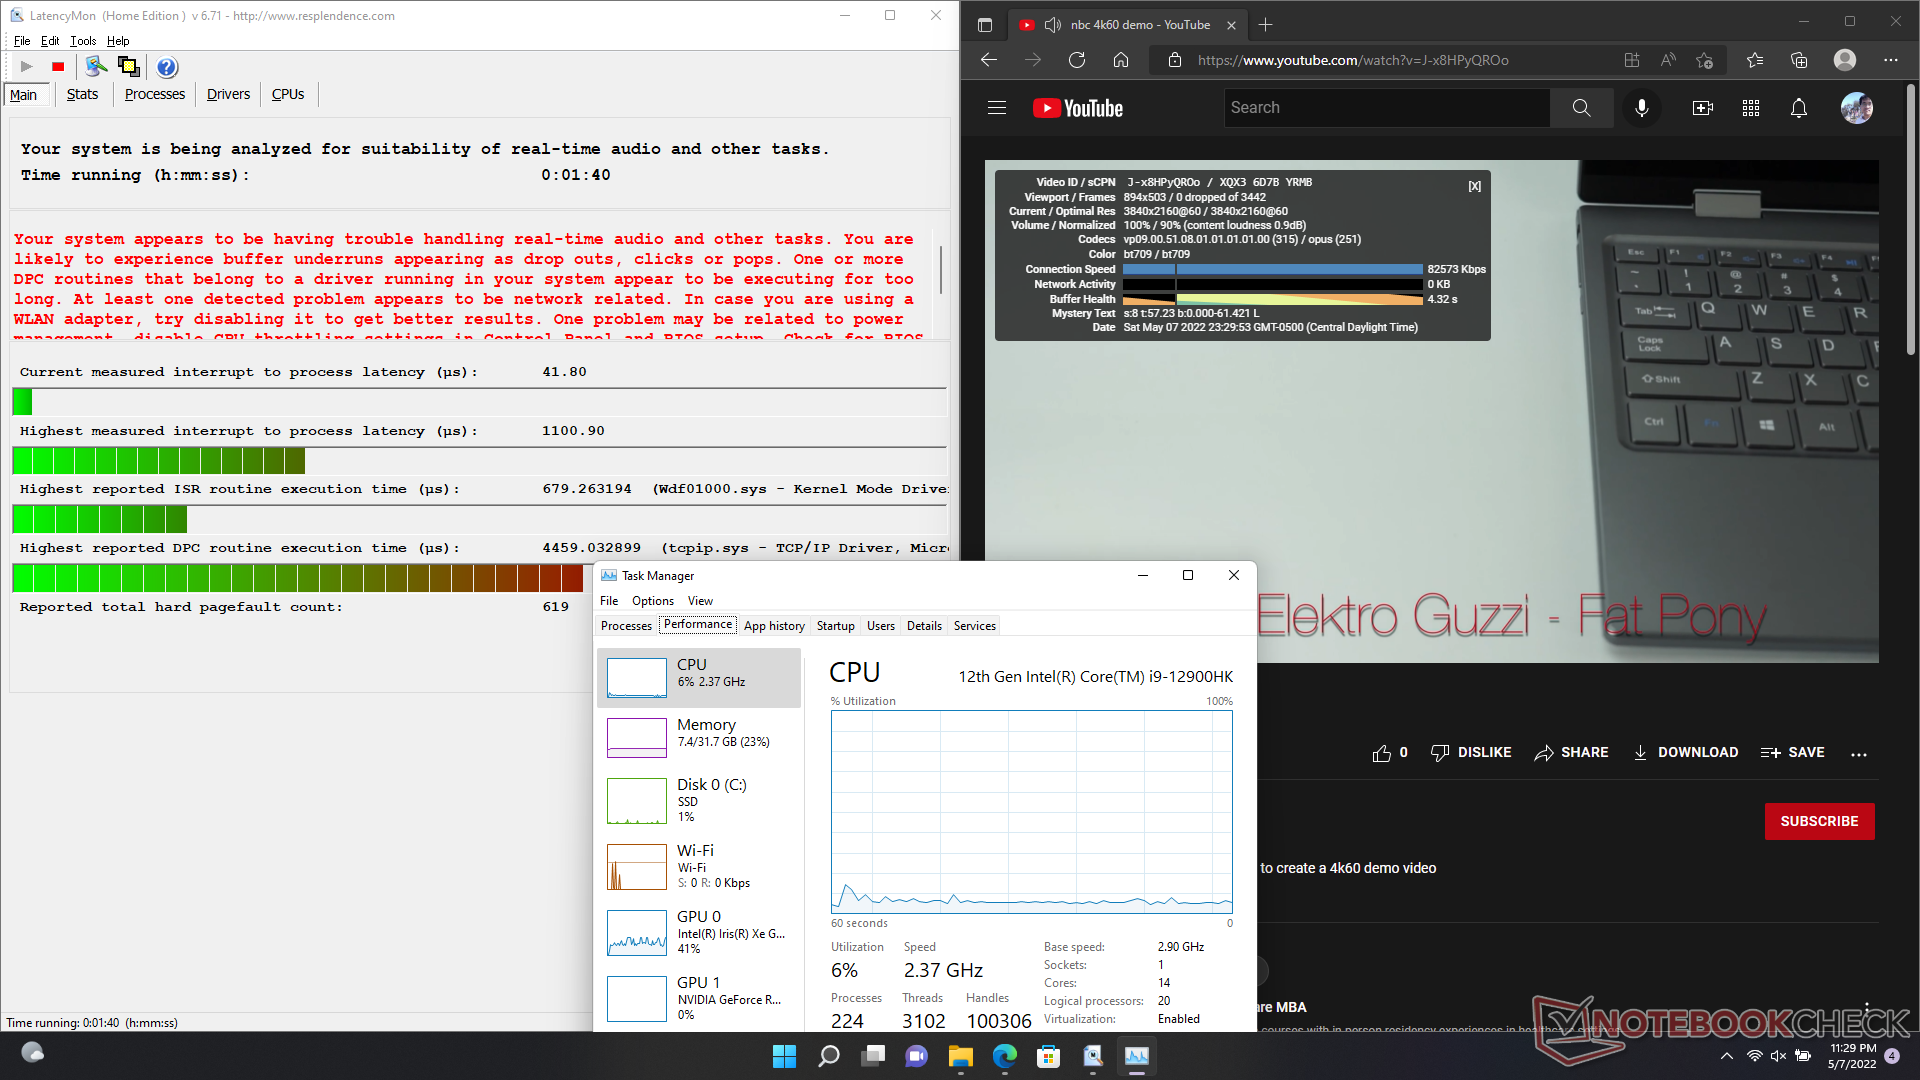
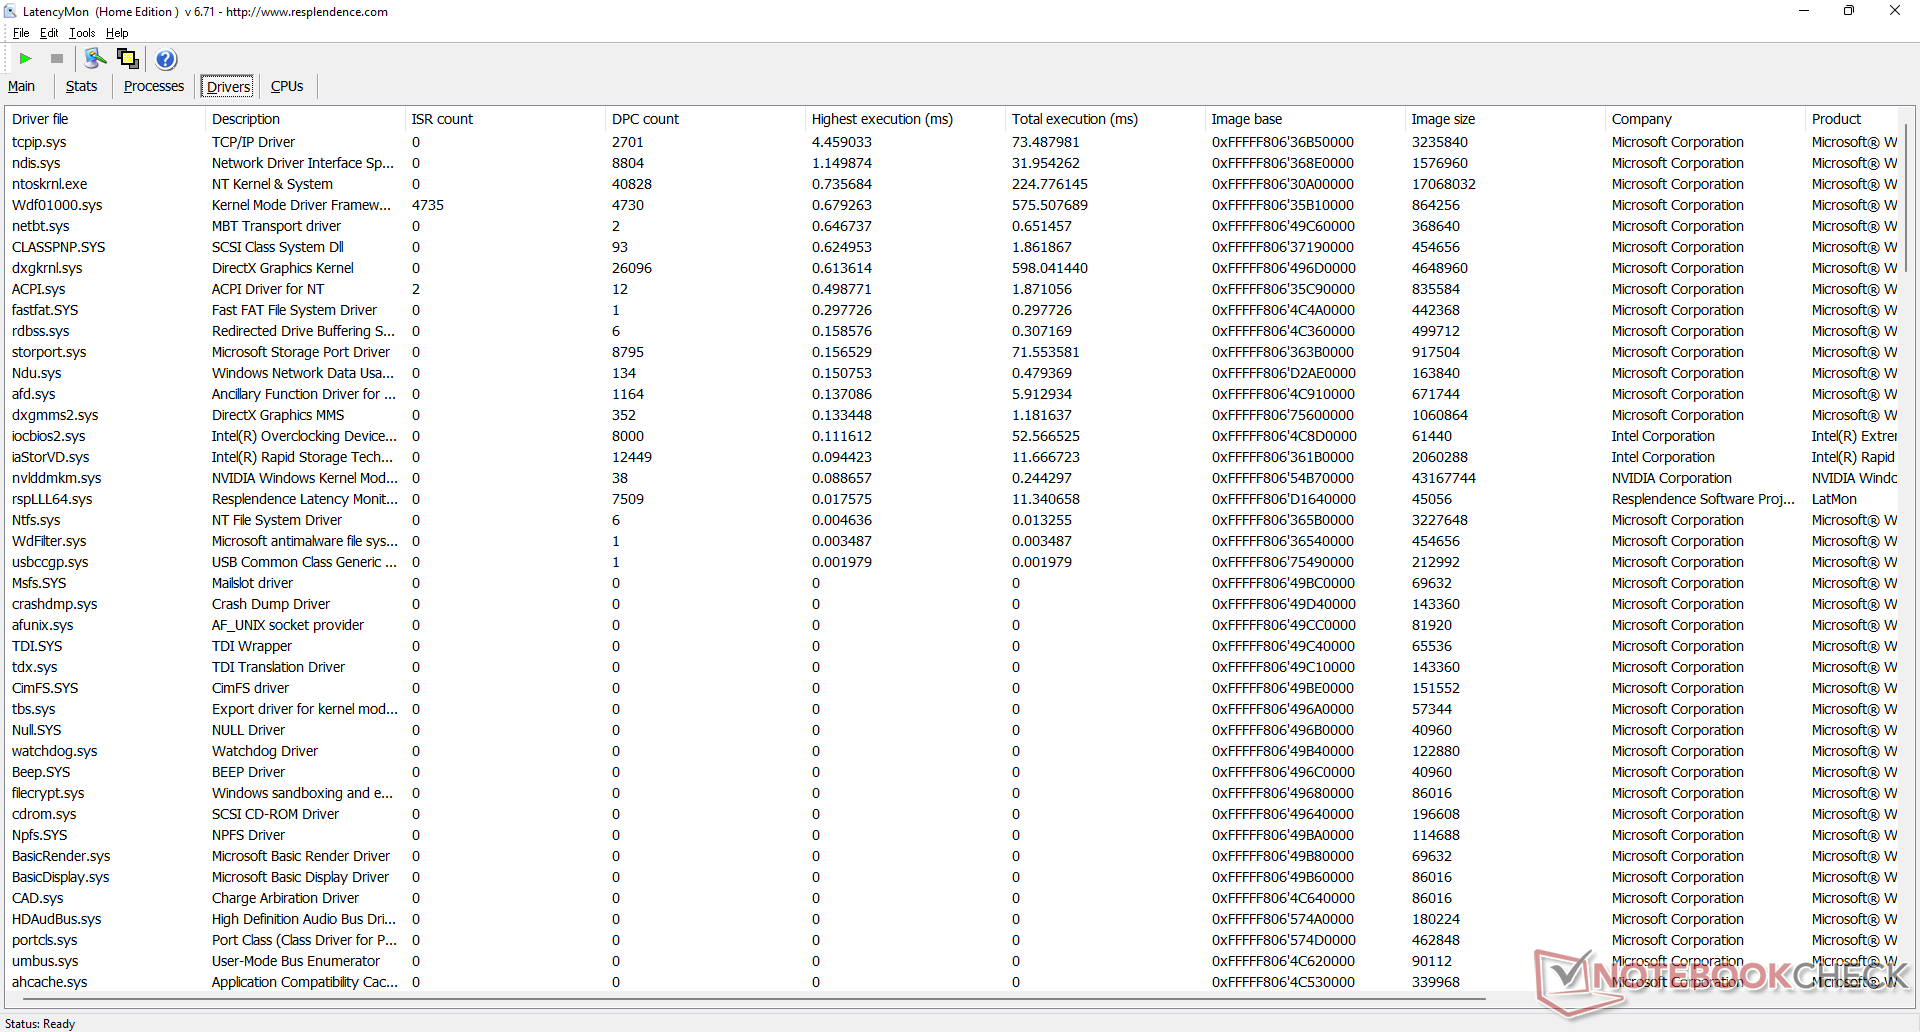
DPC延时
LatencyMon显示了在打开主页的多个浏览器标签时的DPC问题。在60FPS下的4K视频播放很流畅,没有任何丢帧。
| DPC Latencies / LatencyMon - interrupt to process latency (max), Web, Youtube, Prime95 | |
| MSI GT76 Titan DT 10SGS | |
| Alienware x17 RTX 3080 P48E | |
| MSI Stealth GS77 12UHS-083US | |
| Asus ROG Zephyrus S17 GX703HSD | |
| Alienware x17 R2 P48E | |
| Gigabyte A7 X1 | |
* ... smaller is better
存储设备
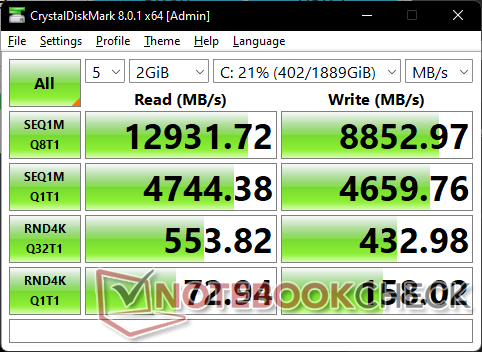
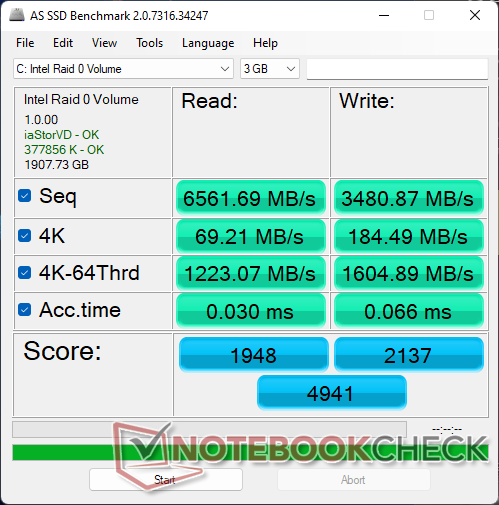

| Drive Performance rating - Percent | |
| Asus ROG Zephyrus S17 GX703HSD | |
| MSI Stealth GS77 12UHS-083US | |
| Alienware x17 R2 P48E | |
| Average 2x Samsung PM9A1 1TB (RAID 0) | |
| Alienware x17 RTX 3080 P48E | |
| MSI GT76 Titan DT 10SGS | |
| Gigabyte A7 X1 | |
* ... smaller is better
Disk Throttling: DiskSpd Read Loop, Queue Depth 8
GPU性能
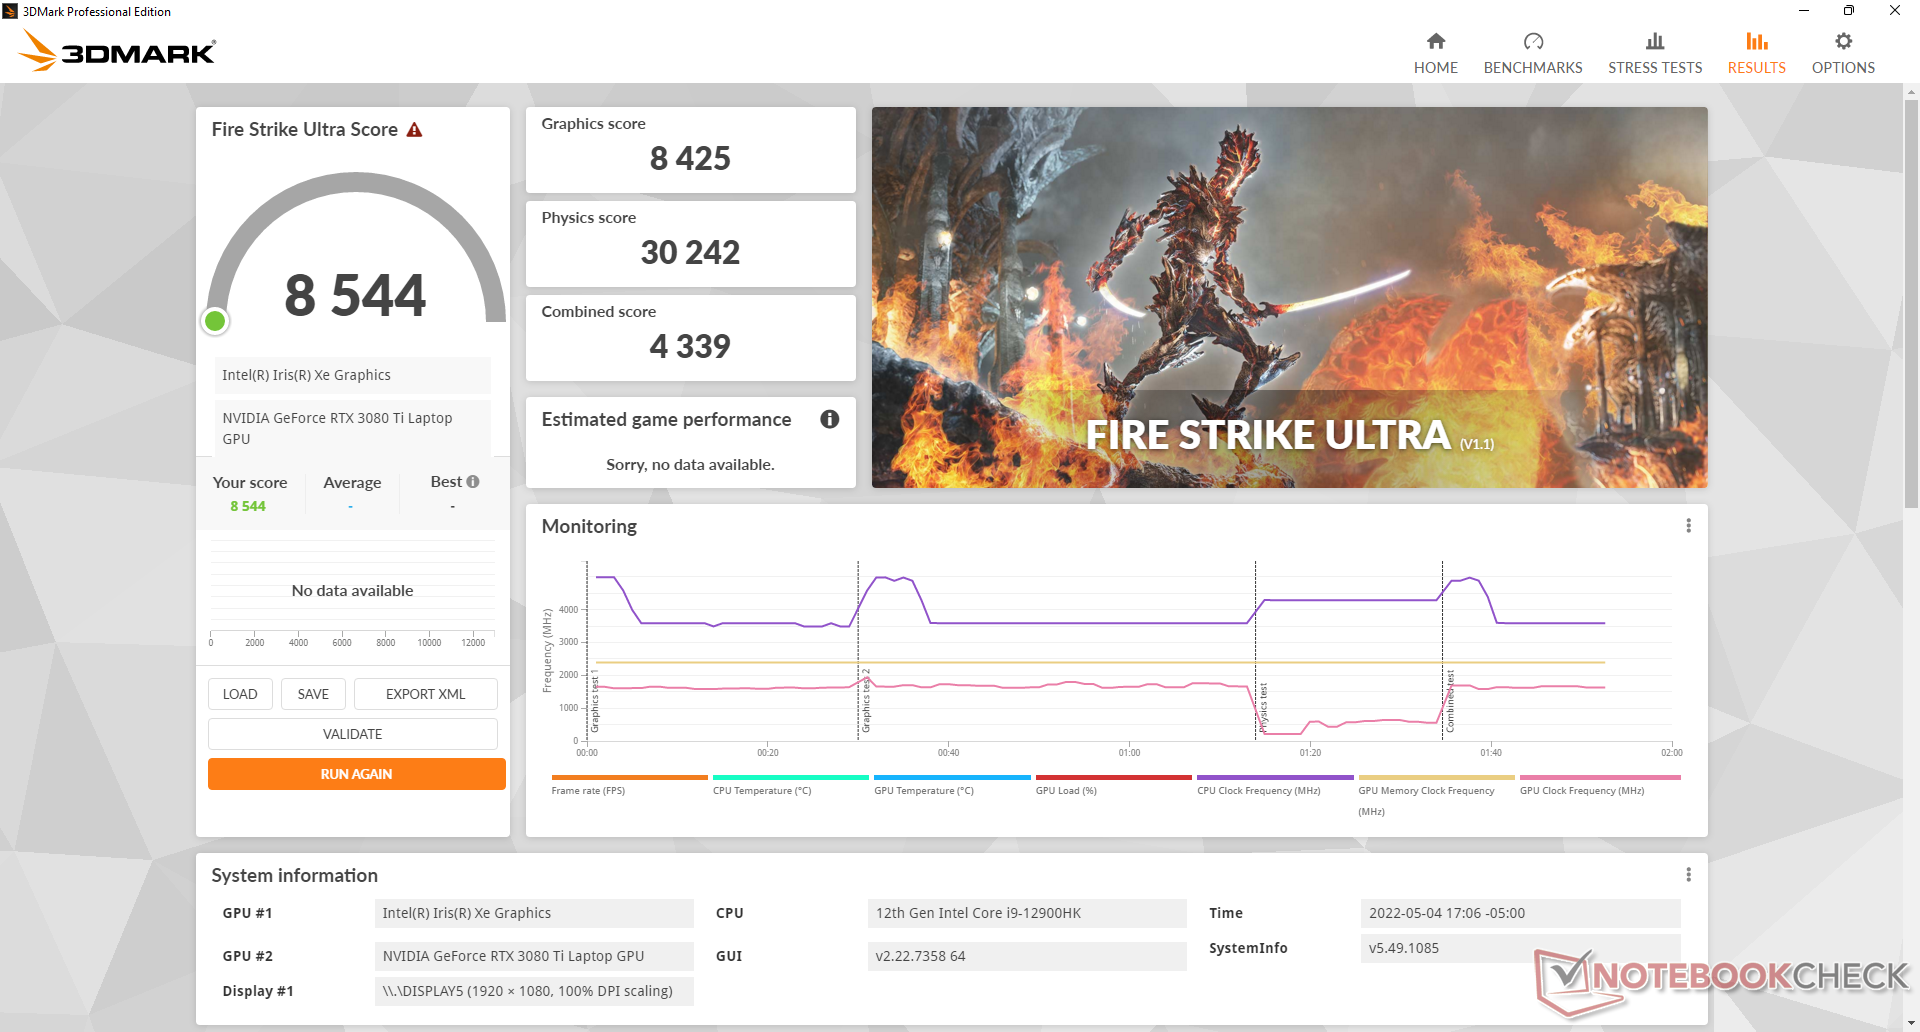
由于其非常高的TGP目标为175W,图形性能是所有游戏笔记本电脑中最快的之一。这款 2022年的Razer Blade 15例如,它配备了相同的 GeForce RTX 3080 TiGPU,尽管其TGP目标值较低,为110W,性能慢了25%至30%。在比较Alienware的GPU和微星GS77的相同GPU时,可以观察到类似的不足之处。 微星GS77的相同GPU进行比较时,也可以看到类似的缺陷。当与快于平均水平的CPU相结合时,用户可以期望帧率略高于大多数其他配备GeForce RTX 3080图形的游戏笔记本电脑。
我们的Alienware x17 R2中的移动RTX 3080 Ti最类似于 桌面GeForce RTX 3070.A 桌面RTX 3080 Ti仍然可以提供比我们的Alienware移动版快近50%的性能。
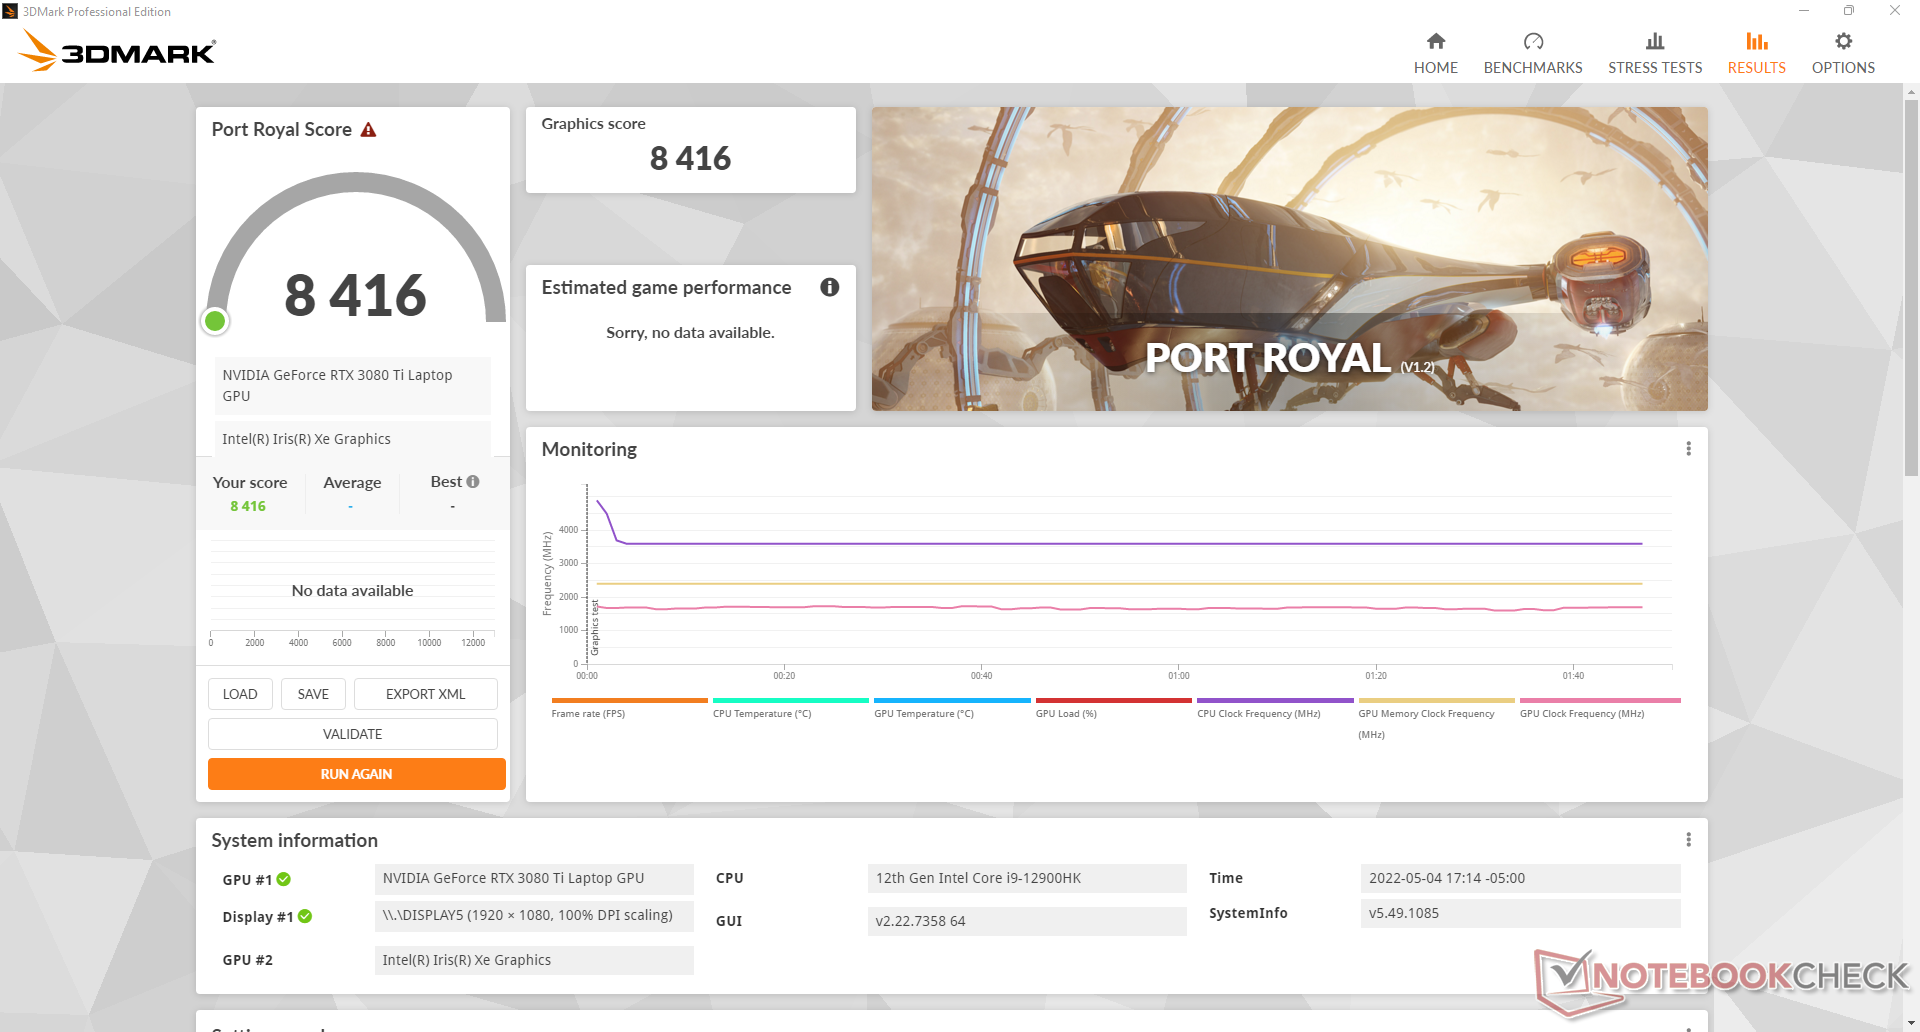
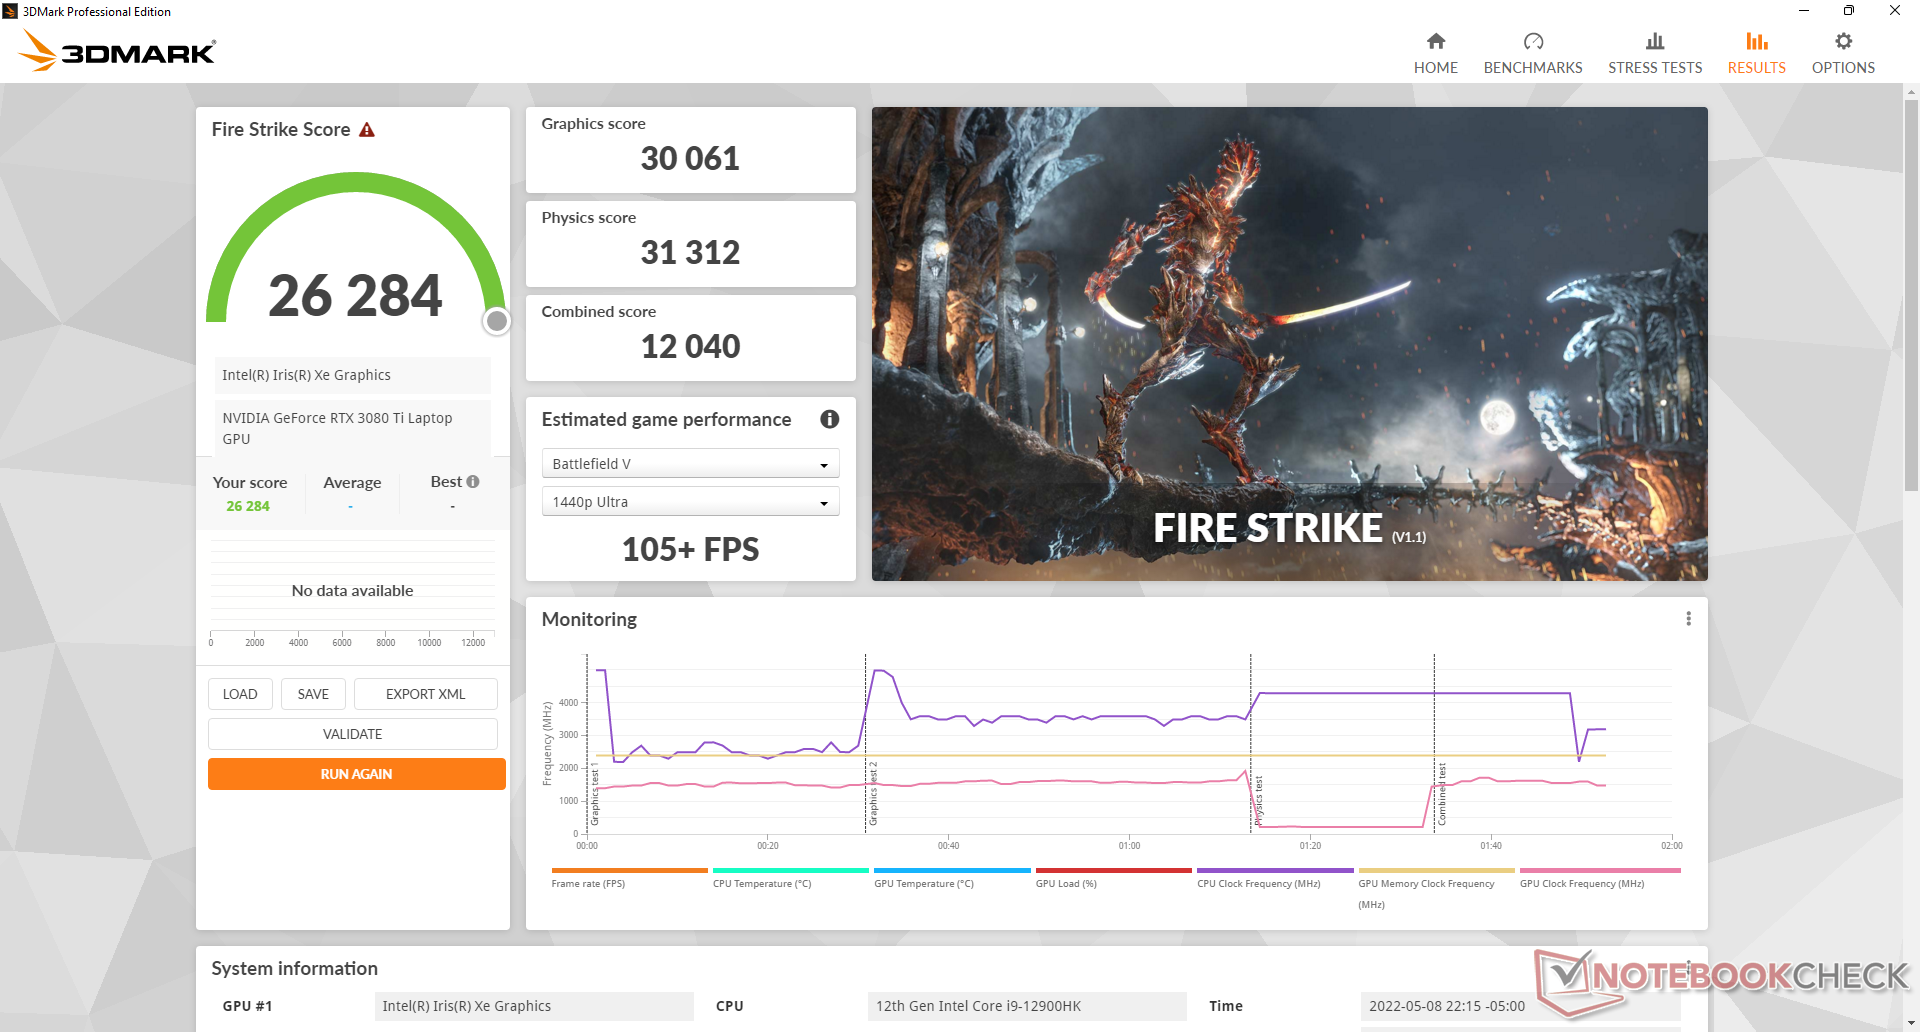
请记住,如果在平衡模式而不是最大风扇模式下运行,图形性能会更慢。 Fire Strike 在平衡电源配置文件上,图形得分将降低约8%至9%。
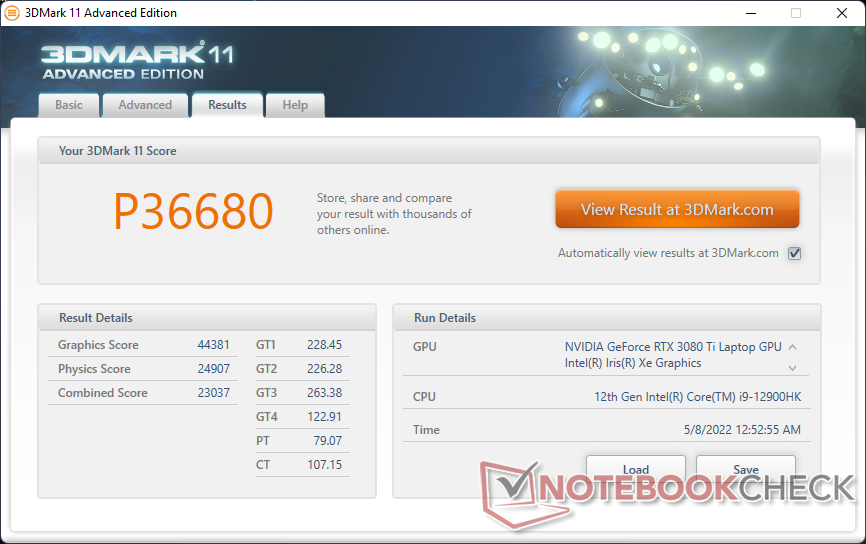
| 3DMark 11 - 1280x720 Performance GPU | |
| Corsair One i300 | |
| Alienware x17 R2 P48E | |
| MSI GeForce RTX 3070 Ventus 3X | |
| Average NVIDIA GeForce RTX 3080 Ti Laptop GPU (13920 - 45841, n=45) | |
| Razer Blade 17 (i7-12800H, RTX 3070 Ti) | |
| MSI Stealth GS77 12UHS-083US | |
| Schenker XMG Apex 17 M21 | |
| Alienware m17 R3 P45E | |
| Asus TUF Gaming F17 FX707Z-HX011W | |
| MSI GF75 Thin 10SDR | |
| 3DMark 11 Performance | 36680 points | |
| 3DMark Cloud Gate Standard Score | 63911 points | |
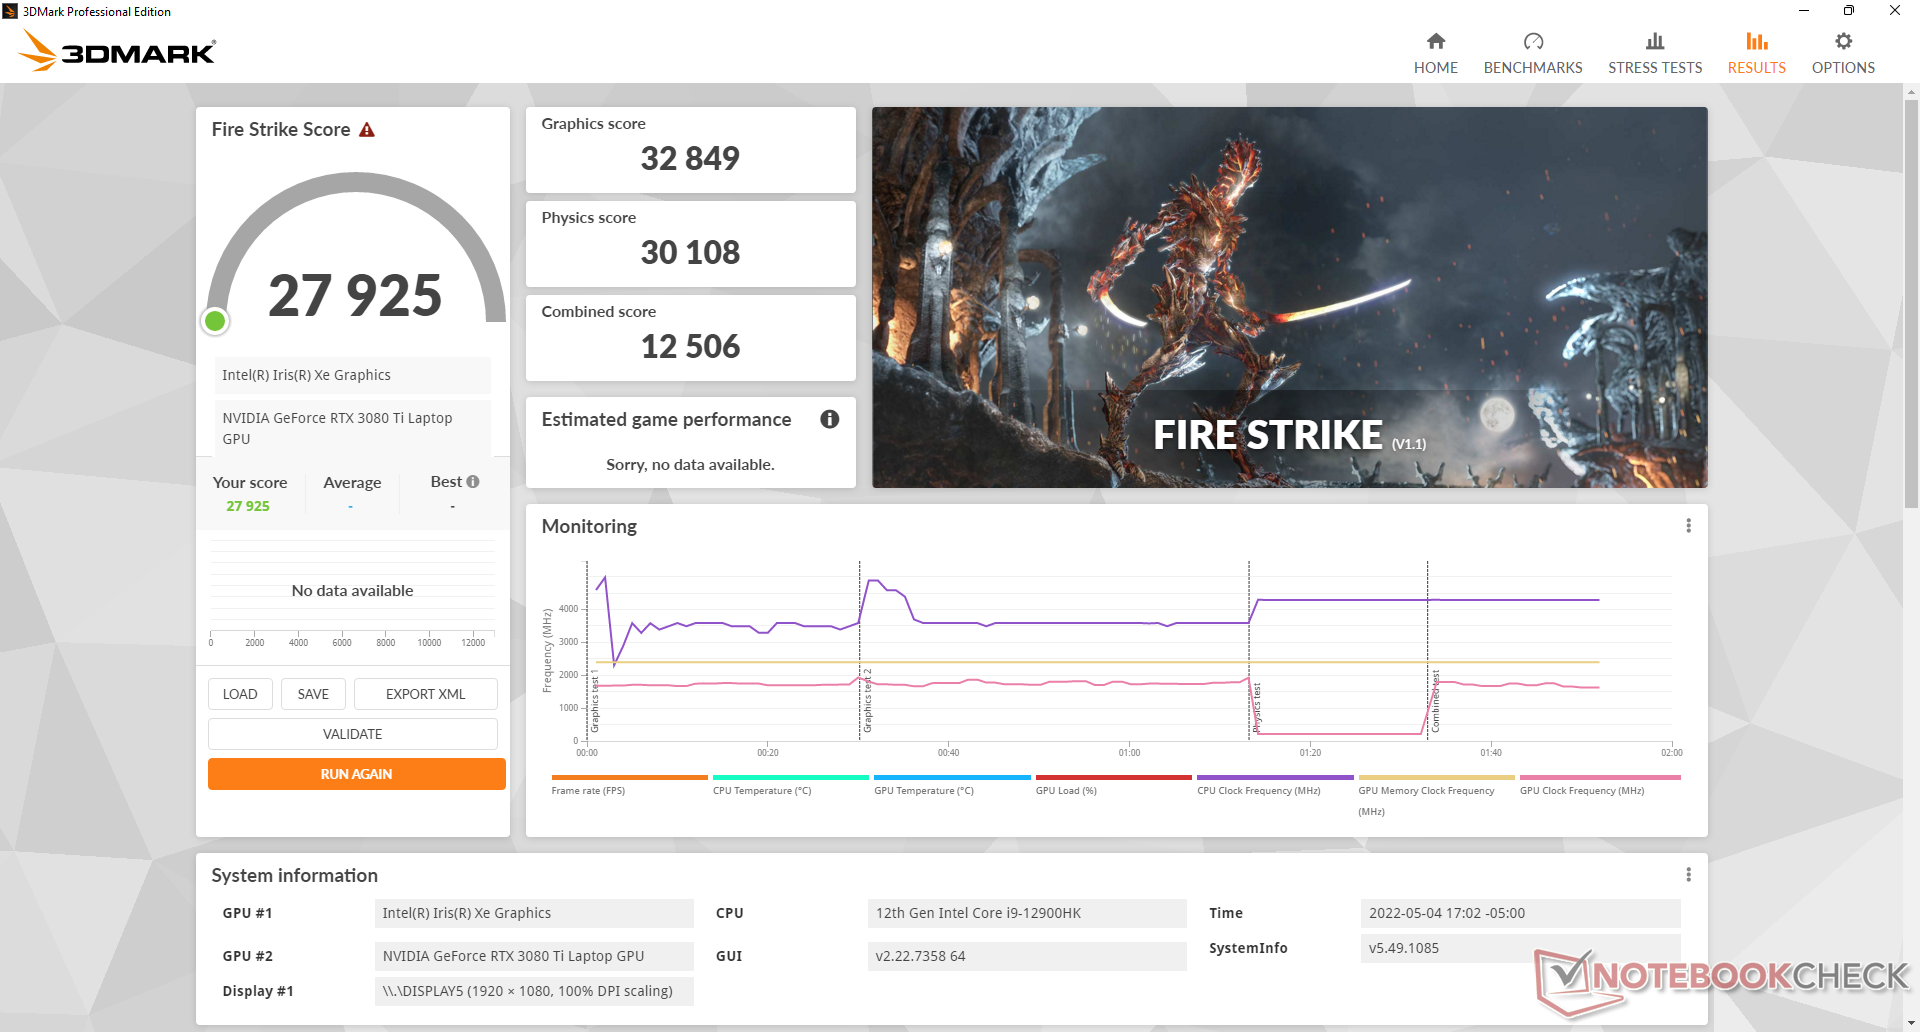
| 3DMark Fire Strike Score | 27925 points | |
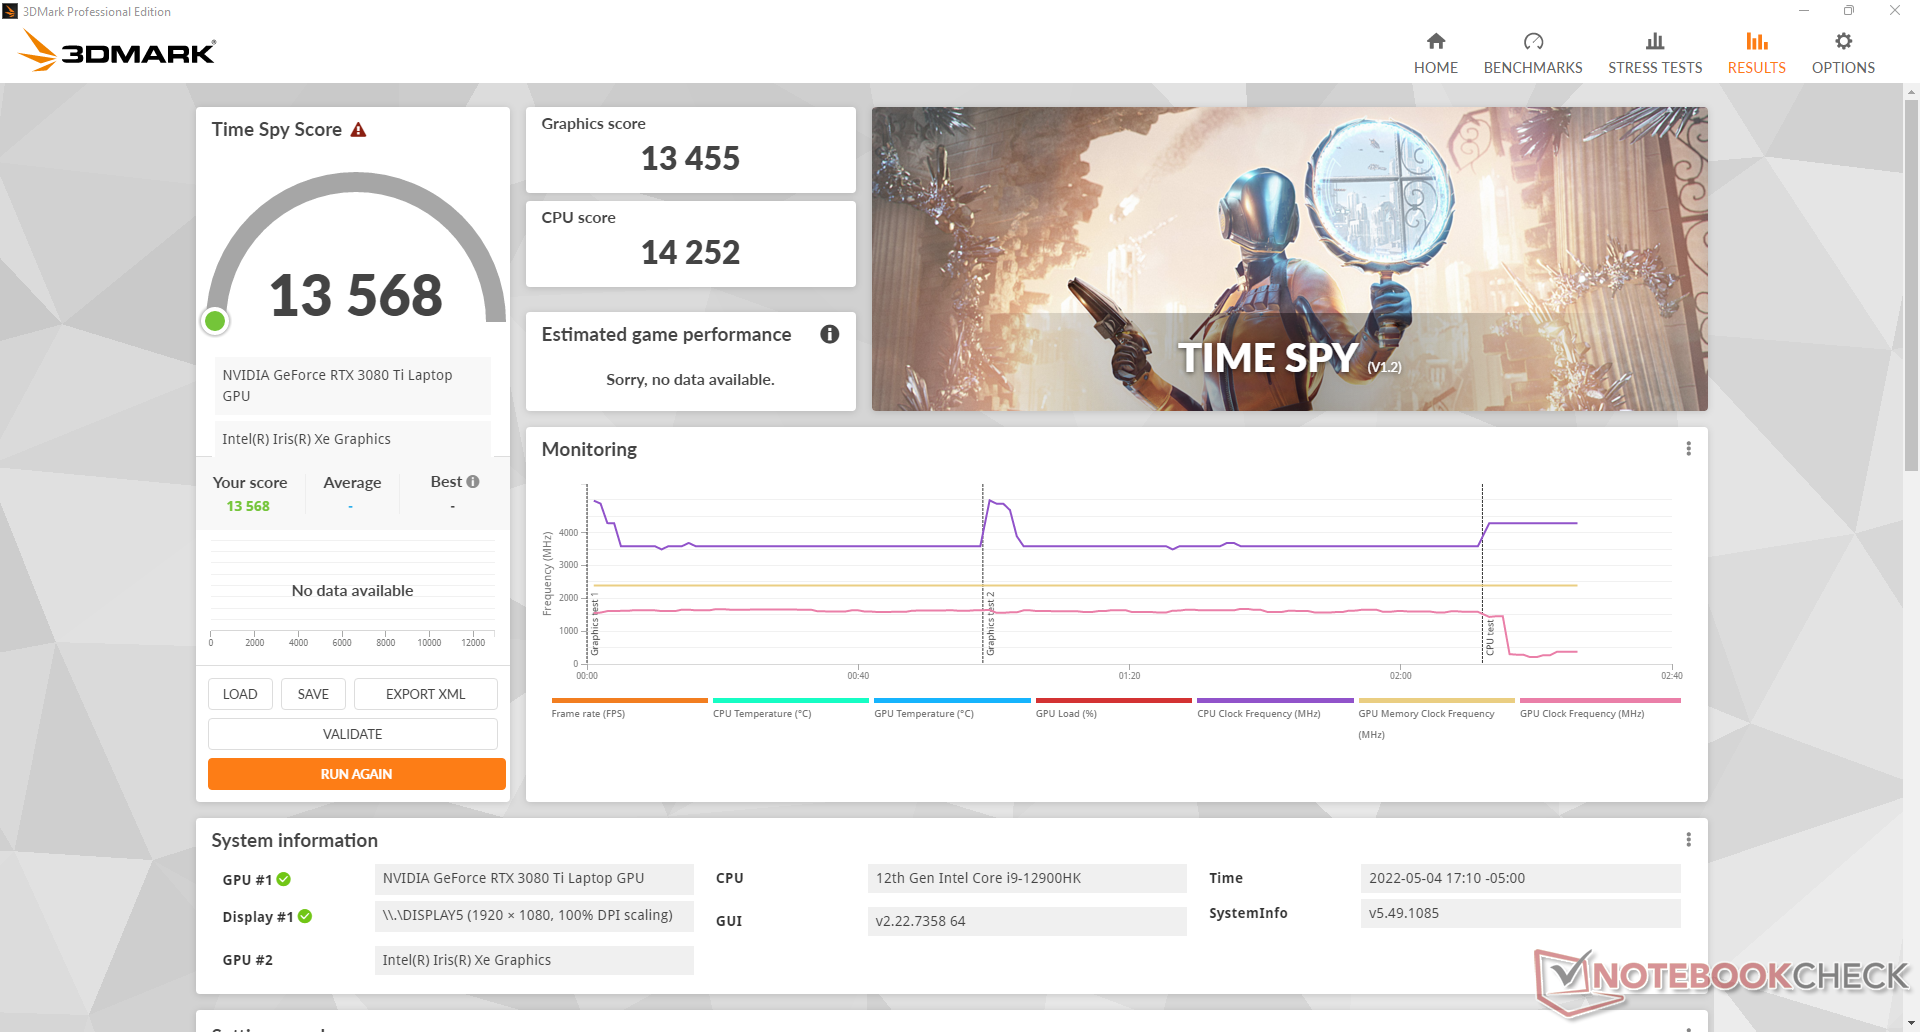
| 3DMark Time Spy Score | 13568 points | |
Help | ||
| Final Fantasy XV Benchmark | |
| 1280x720 Lite Quality | |
| Corsair One i300 | |
| Alienware x17 R2 P48E | |
| MSI GeForce RTX 3070 Ventus 3X | |
| MSI Stealth GS77 12UHS-083US | |
| Alienware m17 R3 P45E | |
| Average NVIDIA GeForce RTX 3080 Ti Laptop GPU (148.3 - 223, n=24) | |
| Asus TUF Gaming F17 FX707Z-HX011W | |
| Razer Blade 17 (i7-12800H, RTX 3070 Ti) | |
| 1920x1080 Standard Quality | |
| Corsair One i300 | |
| Alienware x17 R2 P48E | |
| MSI GeForce RTX 3070 Ventus 3X | |
| Average NVIDIA GeForce RTX 3080 Ti Laptop GPU (110 - 189.3, n=27) | |
| Razer Blade 17 (i7-12800H, RTX 3070 Ti) | |
| Alienware m17 R3 P45E | |
| Schenker XMG Apex 17 M21 | |
| MSI Stealth GS77 12UHS-083US | |
| Asus TUF Gaming F17 FX707Z-HX011W | |
| 1920x1080 High Quality | |
| Corsair One i300 | |
| Alienware x17 R2 P48E | |
| MSI GeForce RTX 3070 Ventus 3X | |
| Average NVIDIA GeForce RTX 3080 Ti Laptop GPU (30.7 - 140.6, n=42) | |
| Razer Blade 17 (i7-12800H, RTX 3070 Ti) | |
| Alienware m17 R3 P45E | |
| MSI Stealth GS77 12UHS-083US | |
| Schenker XMG Apex 17 M21 | |
| Asus TUF Gaming F17 FX707Z-HX011W | |
| X-Plane 11.11 | |
| 1280x720 low (fps_test=1) | |
| Corsair One i300 | |
| Alienware x17 R2 P48E | |
| MSI Stealth GS77 12UHS-083US | |
| Average NVIDIA GeForce RTX 3080 Ti Laptop GPU (38.9 - 187.7, n=43) | |
| MSI GeForce RTX 3070 Ventus 3X | |
| Razer Blade 17 (i7-12800H, RTX 3070 Ti) | |
| Alienware m17 R3 P45E | |
| Asus TUF Gaming F17 FX707Z-HX011W | |
| MSI GF75 Thin 10SDR | |
| Schenker XMG Apex 17 M21 | |
| 1920x1080 med (fps_test=2) | |
| Corsair One i300 | |
| Alienware x17 R2 P48E | |
| MSI Stealth GS77 12UHS-083US | |
| Average NVIDIA GeForce RTX 3080 Ti Laptop GPU (35.2 - 164.7, n=43) | |
| MSI GeForce RTX 3070 Ventus 3X | |
| Razer Blade 17 (i7-12800H, RTX 3070 Ti) | |
| Asus TUF Gaming F17 FX707Z-HX011W | |
| Alienware m17 R3 P45E | |
| MSI GF75 Thin 10SDR | |
| Schenker XMG Apex 17 M21 | |
| 1920x1080 high (fps_test=3) | |
| Corsair One i300 | |
| Alienware x17 R2 P48E | |
| MSI Stealth GS77 12UHS-083US | |
| Average NVIDIA GeForce RTX 3080 Ti Laptop GPU (32.6 - 127, n=45) | |
| Razer Blade 17 (i7-12800H, RTX 3070 Ti) | |
| MSI GeForce RTX 3070 Ventus 3X | |
| Asus TUF Gaming F17 FX707Z-HX011W | |
| Alienware m17 R3 P45E | |
| MSI GF75 Thin 10SDR | |
| Schenker XMG Apex 17 M21 | |
Witcher 3 FPS Chart
| low | med. | high | ultra | |
|---|---|---|---|---|
| GTA V (2015) | 187 | 185.1 | 180.8 | 126.3 |
| The Witcher 3 (2015) | 500.9 | 388.5 | 267.7 | 128 |
| Dota 2 Reborn (2015) | 186.1 | 172.3 | 166.6 | 158.9 |
| Final Fantasy XV Benchmark (2018) | 215 | 167.8 | 127.8 | |
| X-Plane 11.11 (2018) | 161 | 143.9 | 112.9 | |
| Strange Brigade (2018) | 474 | 300 | 243 | 213 |
| Cyberpunk 2077 1.6 (2022) | 167.7 | 142 | 116.2 | 115.7 |
排放
系统噪音
风扇噪音取决于Alienware指挥中心的设置。在平衡模式或更高的模式下,Alienware的风扇往往会频繁跳动,因此在浏览网页、发送电子邮件或流媒体时,建议使用安静模式。我们的设备在运行这些要求不高的负载时,很少会超过32dB(A),但不会让人感到困扰。
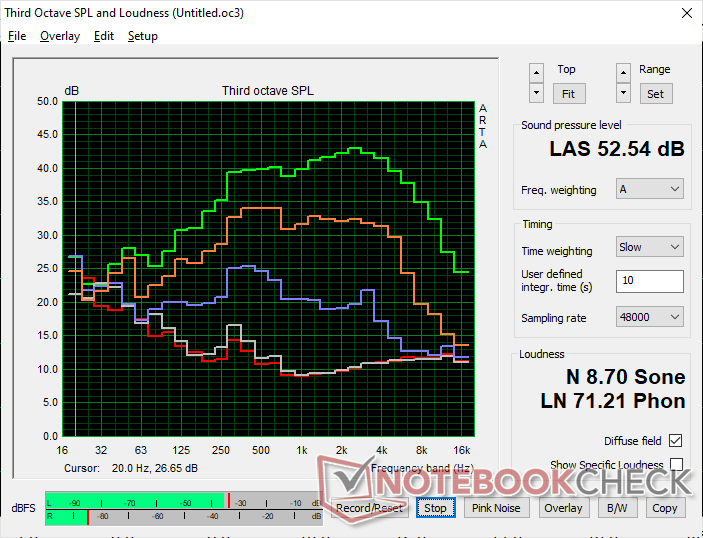
在平衡模式下玩游戏时,风扇噪音将稳定在43.3 dB(A)左右,而在最大风扇模式下则为52.5 dB(A)。用户可能希望在平衡模式下进行游戏,以获得明显安静的风扇噪音,尽管在性能上会有上述的不足。
Noise level
| Idle |
| 23.1 / 23.1 / 23.1 dB(A) |
| Load |
| 31.9 / 52.5 dB(A) |
 | ||
30 dB silent 40 dB(A) audible 50 dB(A) loud |
||
min: | ||
| Alienware x17 R2 P48E GeForce RTX 3080 Ti Laptop GPU, i9-12900HK, 2x Samsung PM9A1 1TB (RAID 0) | Alienware x17 RTX 3080 P48E GeForce RTX 3080 Laptop GPU, i7-11800H, 2x WDC PC SN730 SDBPNTY-1T00 (RAID 0) | Asus ROG Zephyrus S17 GX703HSD GeForce RTX 3080 Laptop GPU, i9-11900H, Samsung PM9A1 MZVL22T0HBLB | MSI Stealth GS77 12UHS-083US GeForce RTX 3080 Ti Laptop GPU, i7-12700H, Micron 3400 1TB MTFDKBA1T0TFH | MSI GT76 Titan DT 10SGS GeForce RTX 2080 Super Mobile, i9-10900K, 2x WDC PC SN730 SDBPNTY-1T00 (RAID 0) | Gigabyte A7 X1 GeForce RTX 3070 Laptop GPU, R9 5900HX, ESR512GTLCG-EAC-4 | |
|---|---|---|---|---|---|---|
| Noise | -7% | -2% | -8% | -18% | -28% | |
| off / environment * (dB) | 22.7 | 24.9 -10% | 23 -1% | 24.5 -8% | 26.4 -16% | 24 -6% |
| Idle Minimum * (dB) | 23.1 | 24.9 -8% | 23 -0% | 24.5 -6% | 27.5 -19% | 25 -8% |
| Idle Average * (dB) | 23.1 | 24.9 -8% | 23 -0% | 24.5 -6% | 27.5 -19% | 29 -26% |
| Idle Maximum * (dB) | 23.1 | 29.6 -28% | 23 -0% | 30.8 -33% | 29.8 -29% | 35 -52% |
| Load Average * (dB) | 31.9 | 31.1 3% | 41 -29% | 34.6 -8% | 30.9 3% | 58 -82% |
| Witcher 3 ultra * (dB) | 52.5 | 49.7 5% | 45 14% | 46.2 12% | 60.7 -16% | 57 -9% |
| Load Maximum * (dB) | 52.5 | 54.8 -4% | 52 1% | 56.8 -8% | 66.6 -27% | 59 -12% |
* ... smaller is better
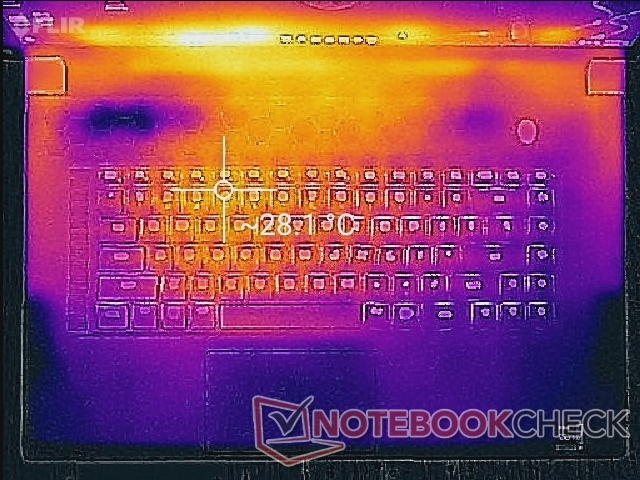
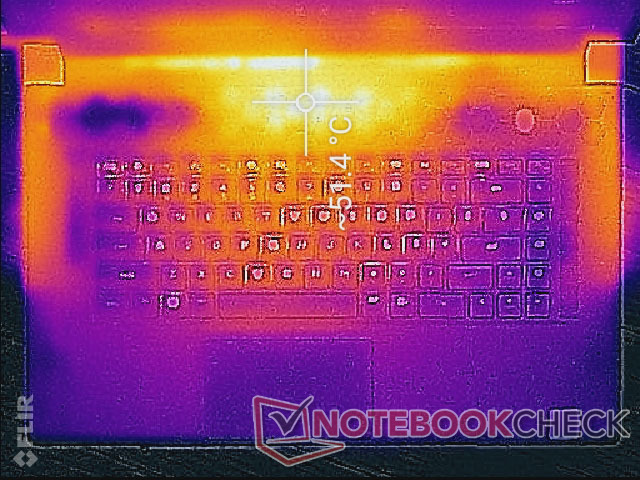
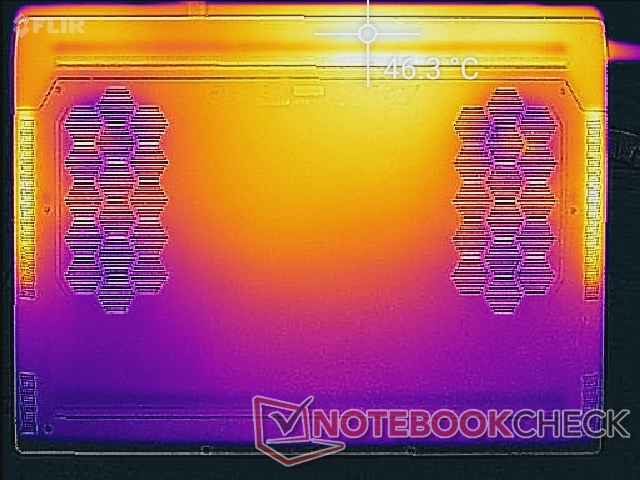
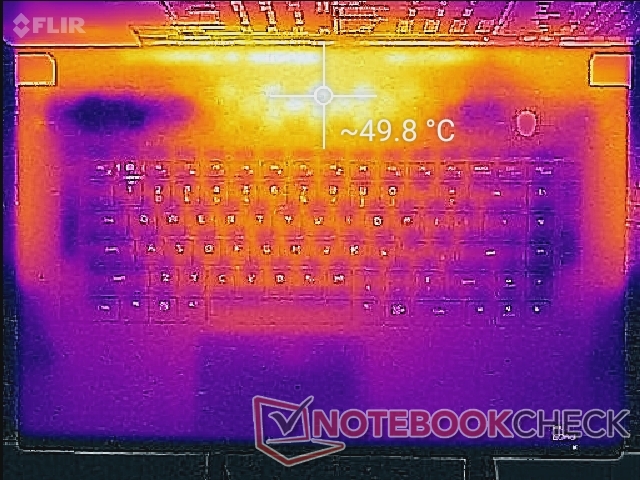
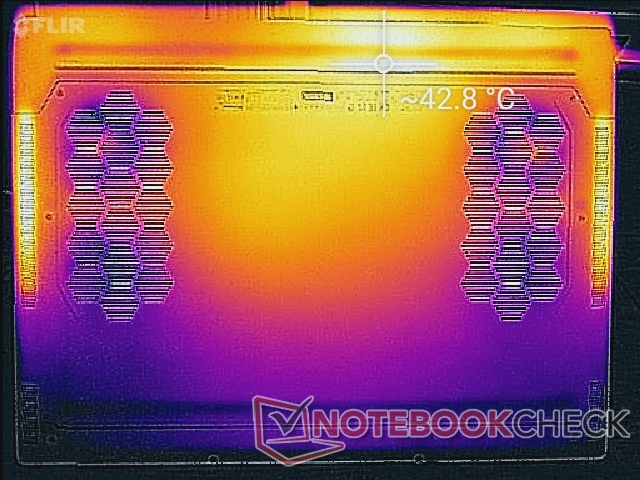
温度
考虑到戴尔以如此薄的设计为目标的极端性能水平,表面温度通常比我们预期的要低。在运行高负载时,热点可以达到45摄氏度或50摄氏度以上,但这些区域是在机箱的后部,远离键盘按键和掌托的地方。系统很热,但在游戏时不会让人感到不舒服。
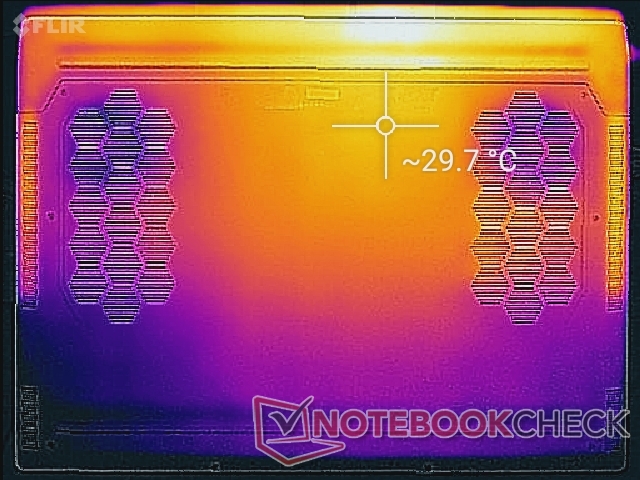
请记住,在系统的几乎所有侧面都有很多通风格栅。由于CPU的温度在加载时达到了很高的水平,因此尽可能不要堵塞任何开口。
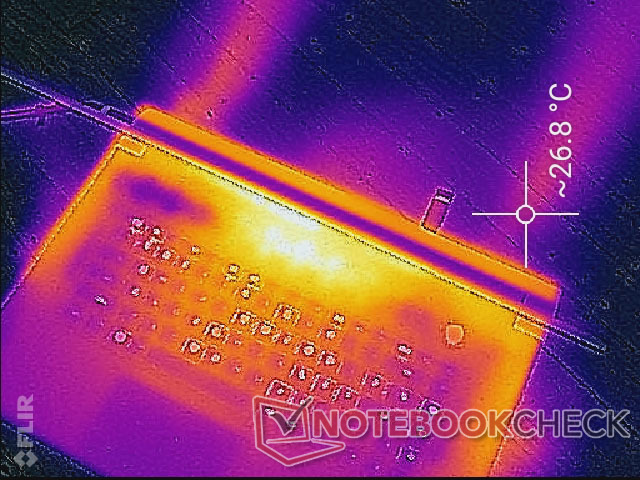
(-) The maximum temperature on the upper side is 49.6 °C / 121 F, compared to the average of 40.4 °C / 105 F, ranging from 21.2 to 68.8 °C for the class Gaming.
(±) The bottom heats up to a maximum of 42.4 °C / 108 F, compared to the average of 43.2 °C / 110 F
(+) In idle usage, the average temperature for the upper side is 26.1 °C / 79 F, compared to the device average of 33.9 °C / 93 F.
(±) Playing The Witcher 3, the average temperature for the upper side is 34.7 °C / 94 F, compared to the device average of 33.9 °C / 93 F.
(+) The palmrests and touchpad are cooler than skin temperature with a maximum of 29.2 °C / 84.6 F and are therefore cool to the touch.
(±) The average temperature of the palmrest area of similar devices was 28.8 °C / 83.8 F (-0.4 °C / -0.8 F).
| Alienware x17 R2 P48E Intel Core i9-12900HK, NVIDIA GeForce RTX 3080 Ti Laptop GPU | Alienware x17 RTX 3080 P48E Intel Core i7-11800H, NVIDIA GeForce RTX 3080 Laptop GPU | Asus ROG Zephyrus S17 GX703HSD Intel Core i9-11900H, NVIDIA GeForce RTX 3080 Laptop GPU | MSI Stealth GS77 12UHS-083US Intel Core i7-12700H, NVIDIA GeForce RTX 3080 Ti Laptop GPU | MSI GT76 Titan DT 10SGS Intel Core i9-10900K, NVIDIA GeForce RTX 2080 Super Mobile | Gigabyte A7 X1 AMD Ryzen 9 5900HX, NVIDIA GeForce RTX 3070 Laptop GPU | |
|---|---|---|---|---|---|---|
| Heat | -14% | -18% | -16% | 7% | 2% | |
| Maximum Upper Side * (°C) | 49.6 | 58.4 -18% | 59 -19% | 50.6 -2% | 36.4 27% | 44 11% |
| Maximum Bottom * (°C) | 42.4 | 49 -16% | 53 -25% | 59.6 -41% | 43 -1% | 49 -16% |
| Idle Upper Side * (°C) | 29.2 | 33.6 -15% | 35 -20% | 30 -3% | 28 4% | 27 8% |
| Idle Bottom * (°C) | 32 | 34.6 -8% | 35 -9% | 37.4 -17% | 33.4 -4% | 30 6% |
* ... smaller is better
压力测试
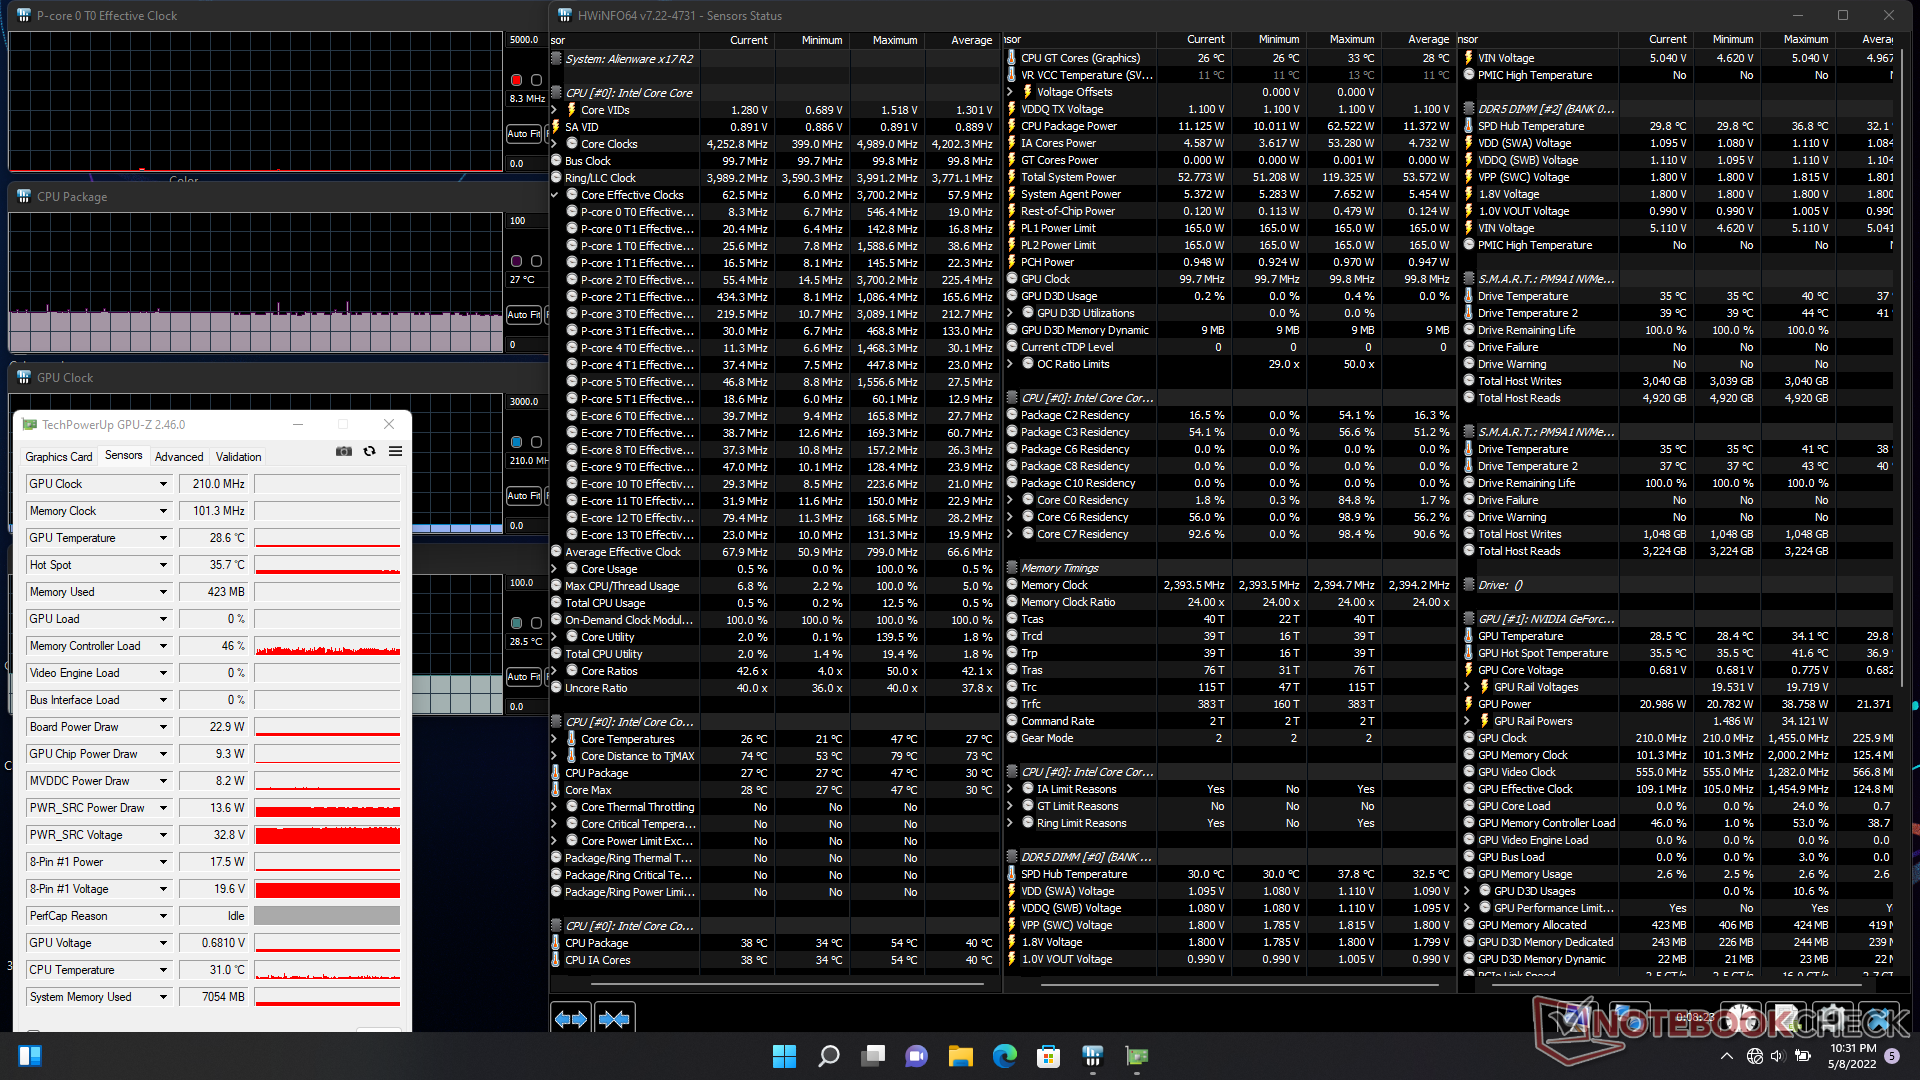
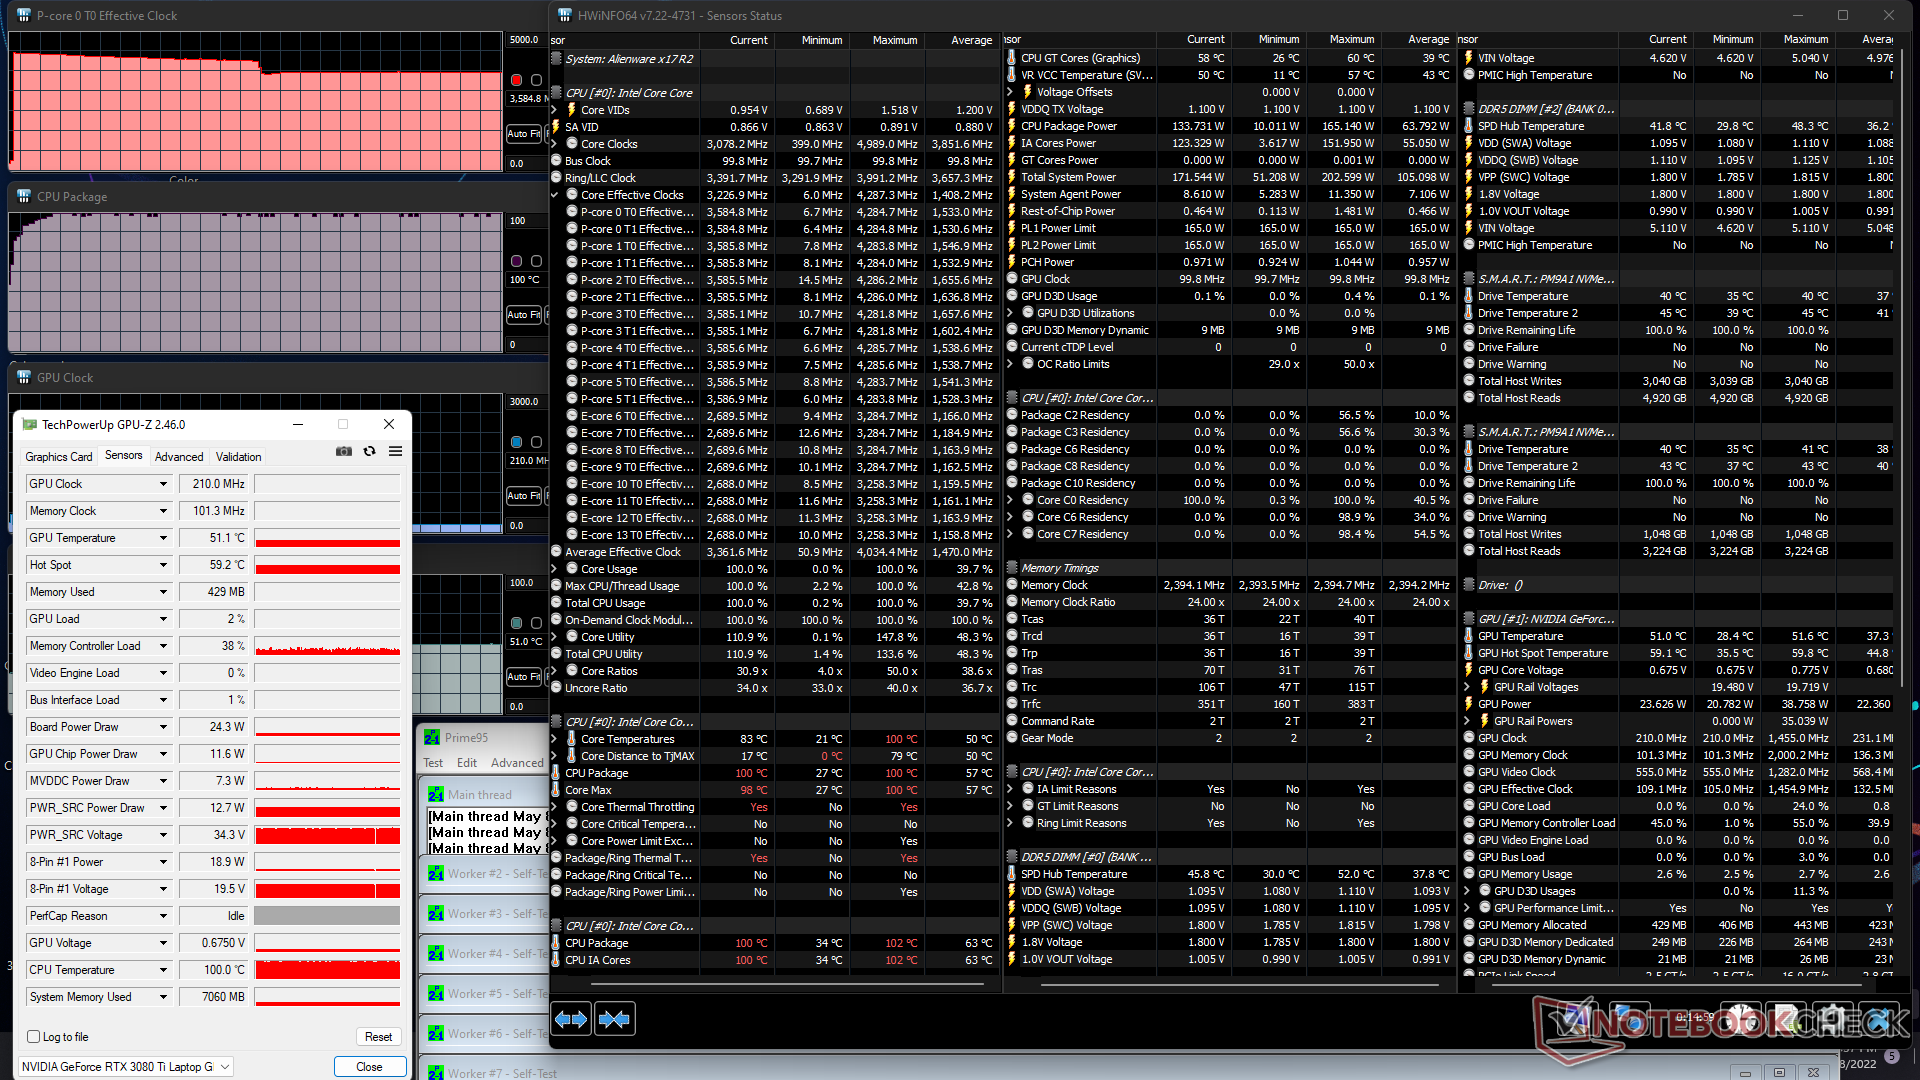
当运行Prime95时,CPU的时钟频率将提升到4.3 GHz,仅几秒钟就达到了100 C的核心温度,时钟频率最终将稳定在3.6 GHz,同时保持核心温度略低于100 C。很明显,在Alienware冷却解决方案的限制下,CPU正在尽可能快地运行。相比之下,微星GS77的Core i7-12700H在类似条件下会稳定在较慢的2.7至3GHz范围。
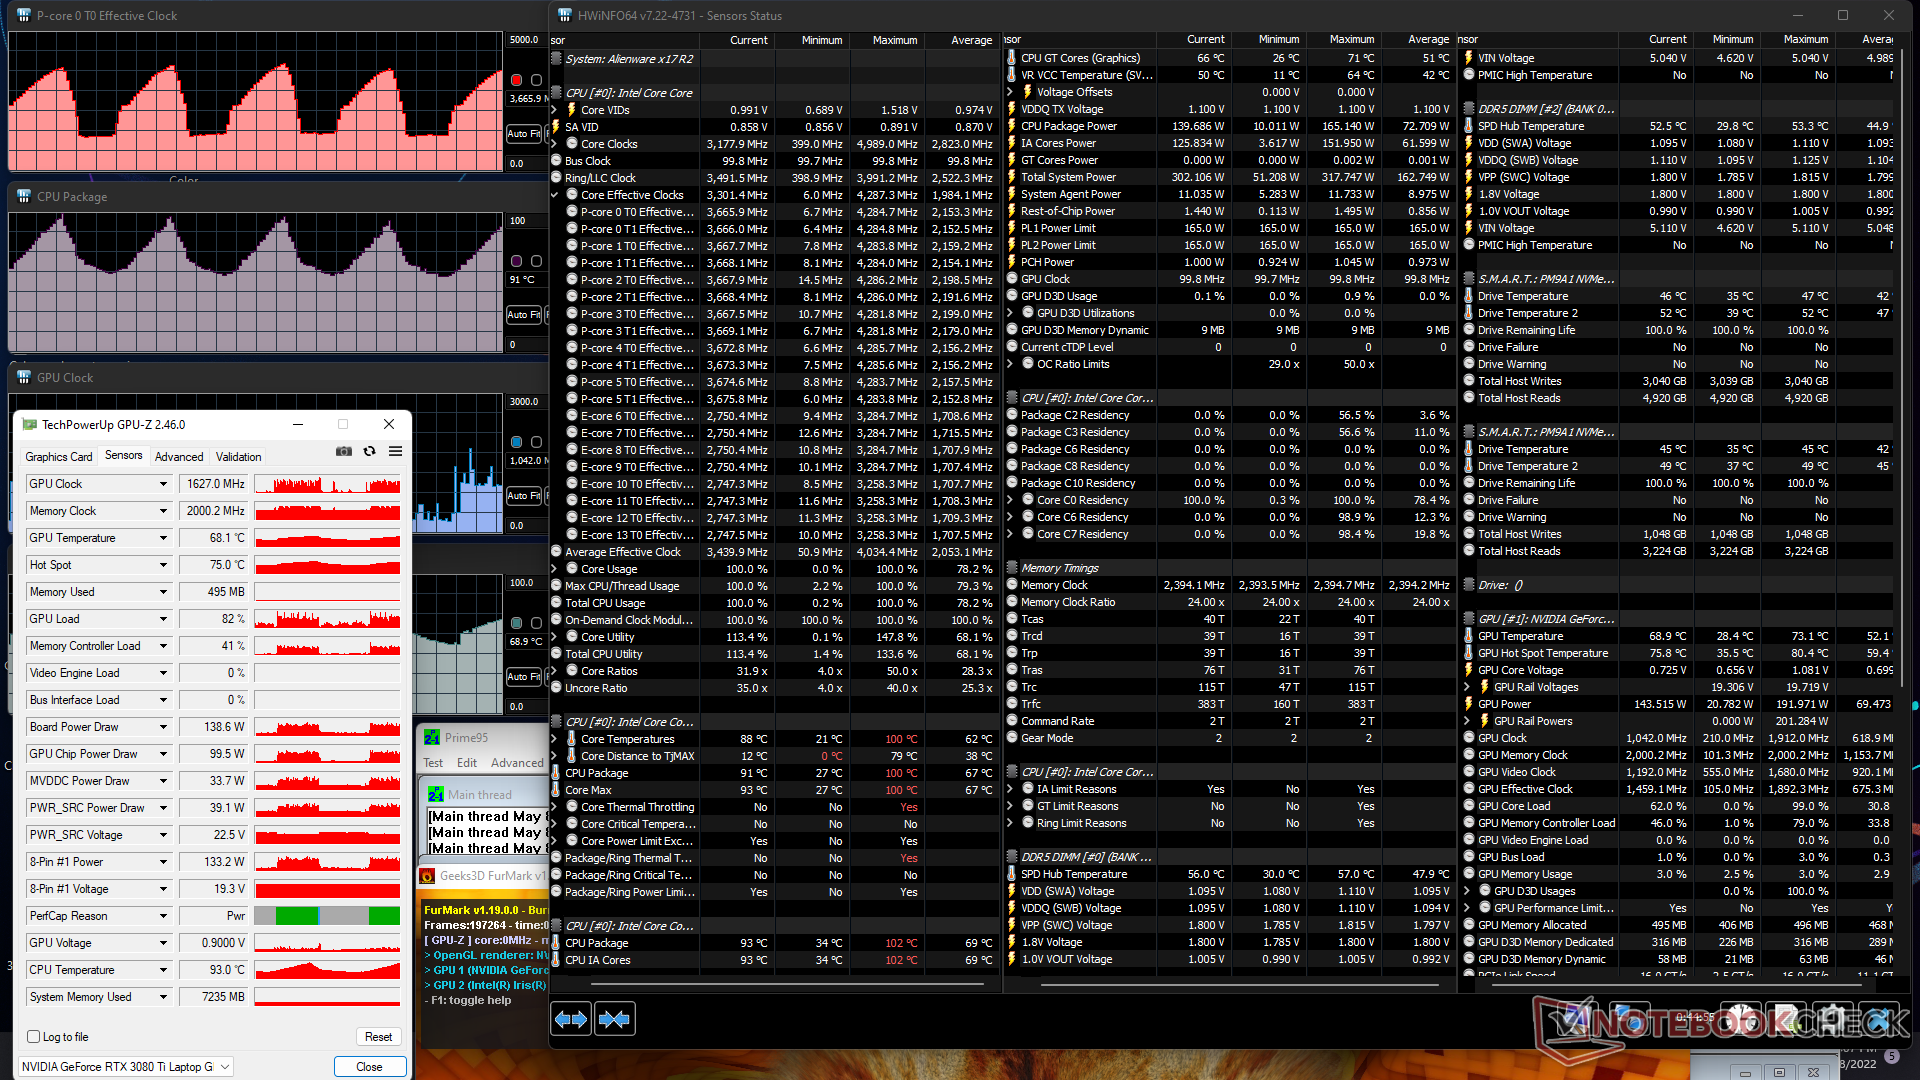
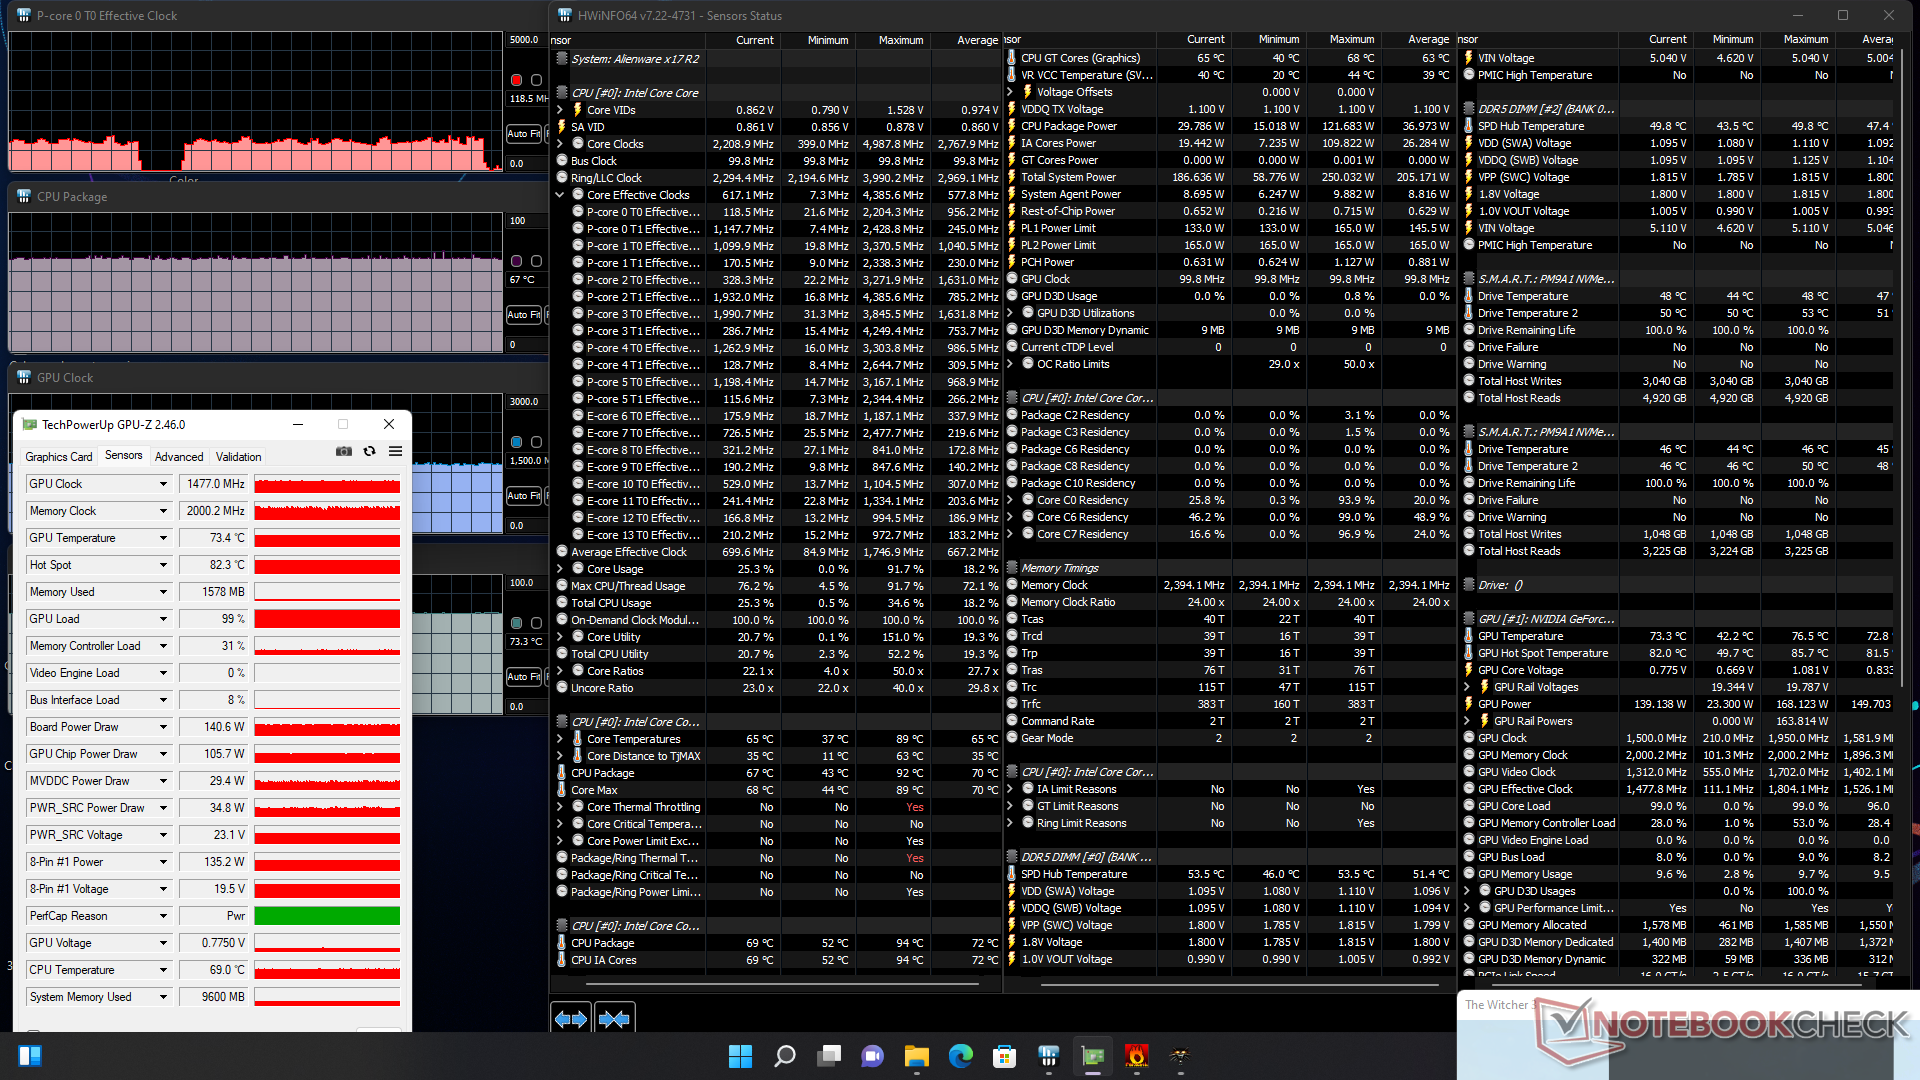
在最大风扇模式下运行时,GPU时钟速率、内存时钟和电路板功耗将分别稳定在1695 MHz、2000 MHz和167 W。 Witcher 3在最大风扇模式下运行时,GPU时钟速率、内存时钟和板卡功耗将分别稳定在1695 MHz、2000 MHz和167 W。如果在平衡模式下,GPU时钟和电路板功耗将分别下降到1477 MHz和141 W。因此,如果用户想充分发挥x17 R2的性能潜力,必须忍受最大风扇噪音模式。在微星GS77上运行同样的测试,将导致GPU时钟速率和内存时钟分别为1432 MHz和1750 MHz,速度较慢。
用电池供电运行将大大限制性能。在电池上进行的Fire Strike 测试将返回物理和图形分数,分别为27369和12095分,而在主电源上则为30108和32849分。
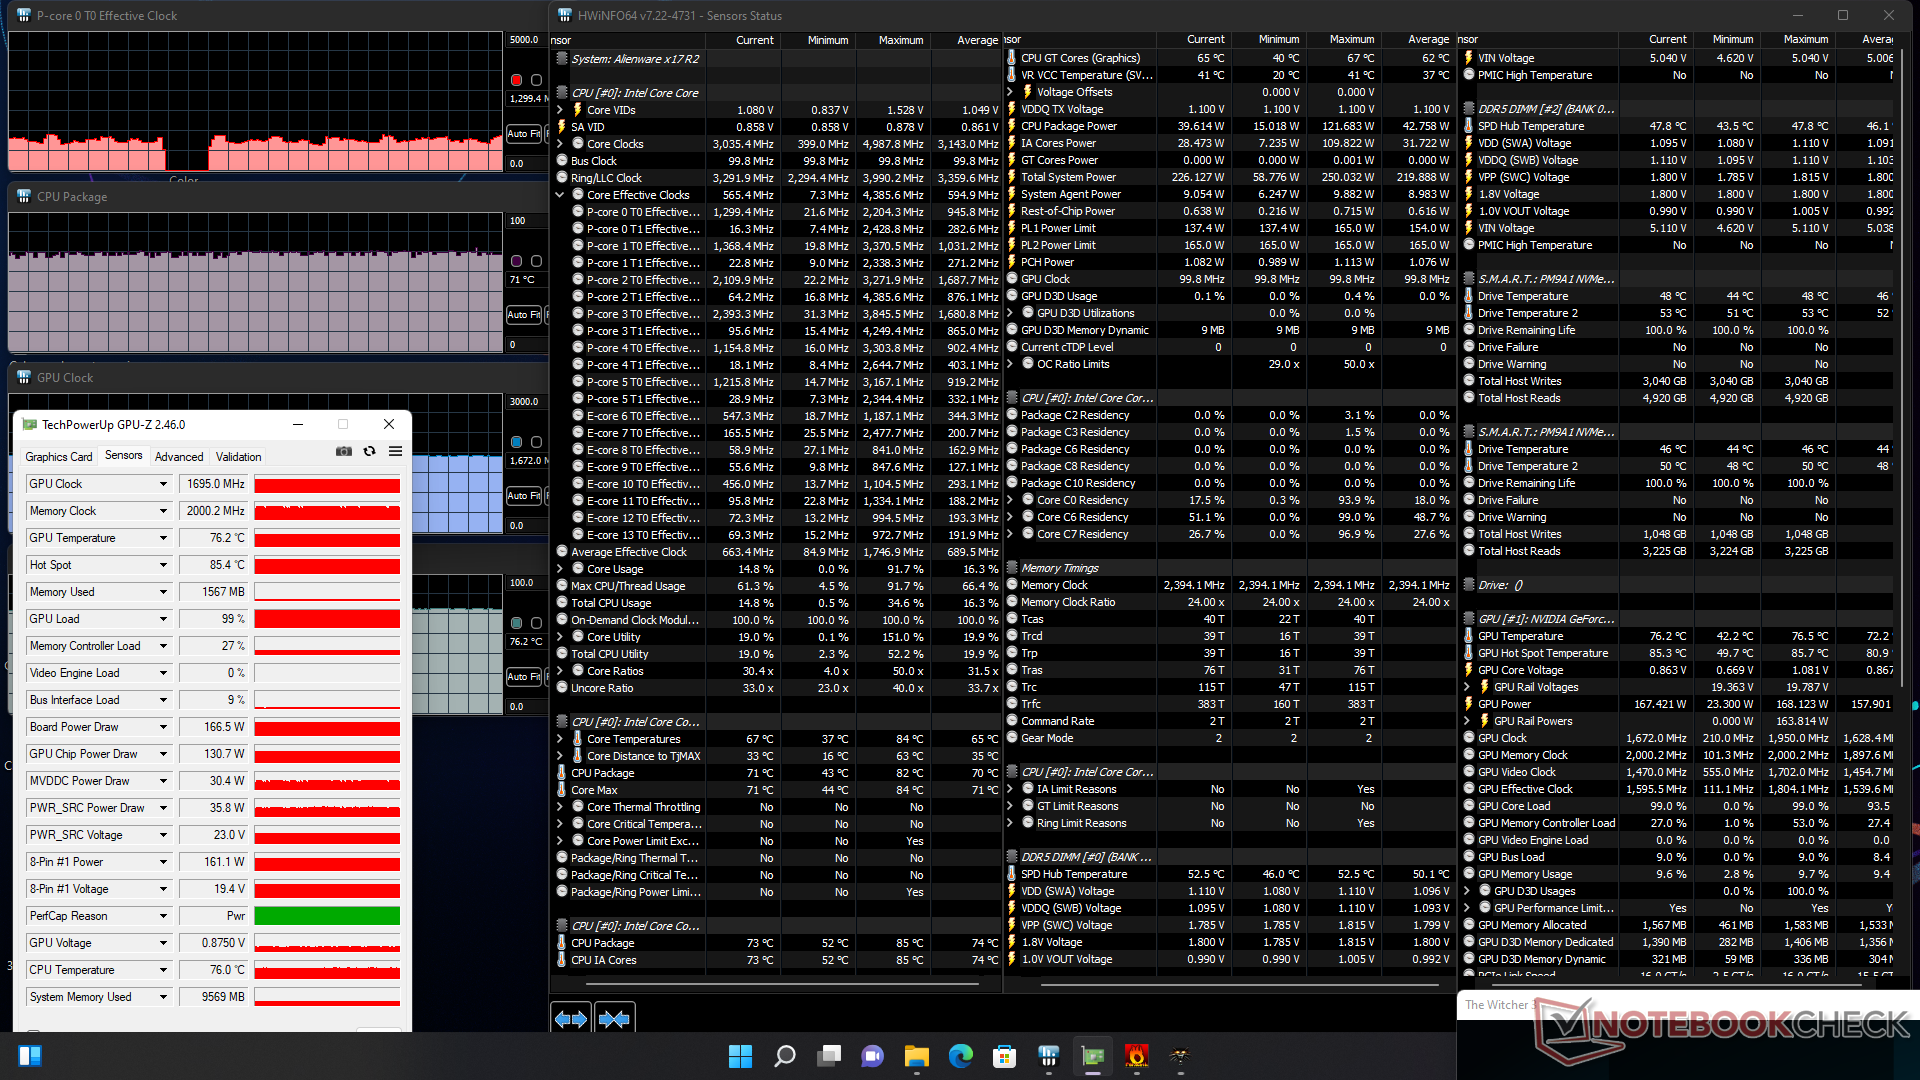
| CPU时钟(GHz) | GPU时钟(MHz) | CPU平均温度(℃) | GPU平均温度(℃) | |
| 系统空闲(最大风扇模式) | -- | -- | 27 | 29 |
| Prime95压力(最大风扇模式) | 3.6 | -- | -- | 100 |
| Prime95 + FurMark 压力(最大风扇模式) | 1.4 - 3.7 | 337 - 1770 | 53 - 100 | 49 - 71 |
| Witcher 3 压力(平衡模式) | ~0.6 | 1477 | 67 | 73 |
| Witcher 3 应力(最大风扇模式) | ~1.3 | 1695 | 71 | 76 |
发言人
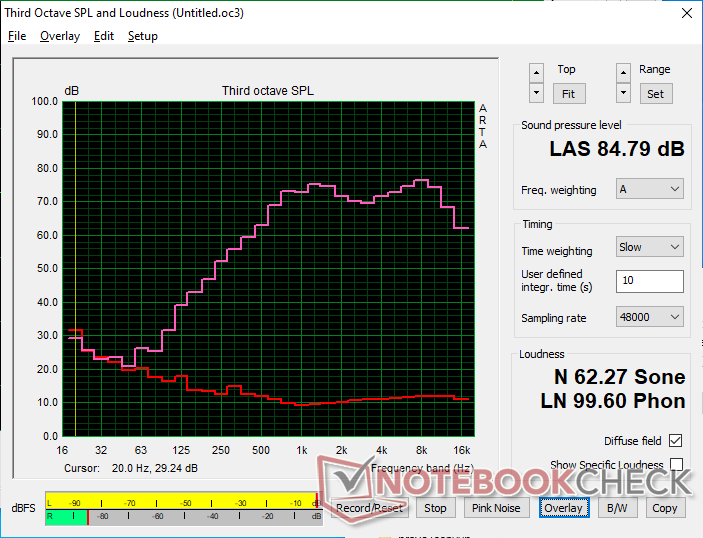
Alienware x17 R2 P48E audio analysis
(+) | speakers can play relatively loud (84.3 dB)
Bass 100 - 315 Hz
(±) | reduced bass - on average 9.7% lower than median
(+) | bass is linear (5.5% delta to prev. frequency)
Mids 400 - 2000 Hz
(+) | balanced mids - only 1.6% away from median
(+) | mids are linear (3% delta to prev. frequency)
Highs 2 - 16 kHz
(±) | higher highs - on average 5% higher than median
(±) | linearity of highs is average (7.6% delta to prev. frequency)
Overall 100 - 16.000 Hz
(+) | overall sound is linear (9.3% difference to median)
Compared to same class
» 3% of all tested devices in this class were better, 2% similar, 95% worse
» The best had a delta of 6%, average was 18%, worst was 132%
Compared to all devices tested
» 3% of all tested devices were better, 1% similar, 96% worse
» The best had a delta of 4%, average was 23%, worst was 134%
Apple MacBook Pro 16 2021 M1 Pro audio analysis
(+) | speakers can play relatively loud (84.7 dB)
Bass 100 - 315 Hz
(+) | good bass - only 3.8% away from median
(+) | bass is linear (5.2% delta to prev. frequency)
Mids 400 - 2000 Hz
(+) | balanced mids - only 1.3% away from median
(+) | mids are linear (2.1% delta to prev. frequency)
Highs 2 - 16 kHz
(+) | balanced highs - only 1.9% away from median
(+) | highs are linear (2.7% delta to prev. frequency)
Overall 100 - 16.000 Hz
(+) | overall sound is linear (4.6% difference to median)
Compared to same class
» 0% of all tested devices in this class were better, 0% similar, 100% worse
» The best had a delta of 5%, average was 17%, worst was 45%
Compared to all devices tested
» 0% of all tested devices were better, 0% similar, 100% worse
» The best had a delta of 4%, average was 23%, worst was 134%
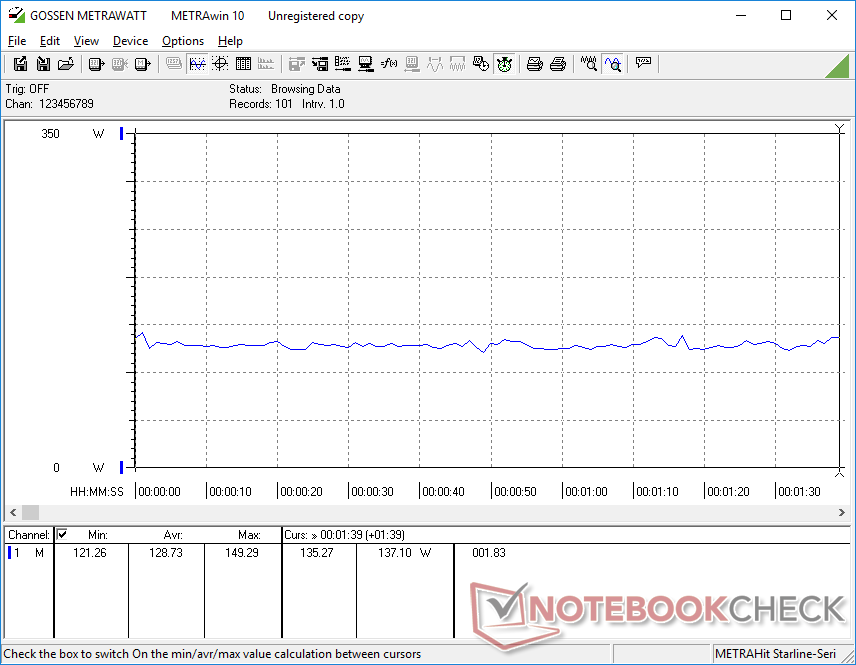
能源管理
消耗功率
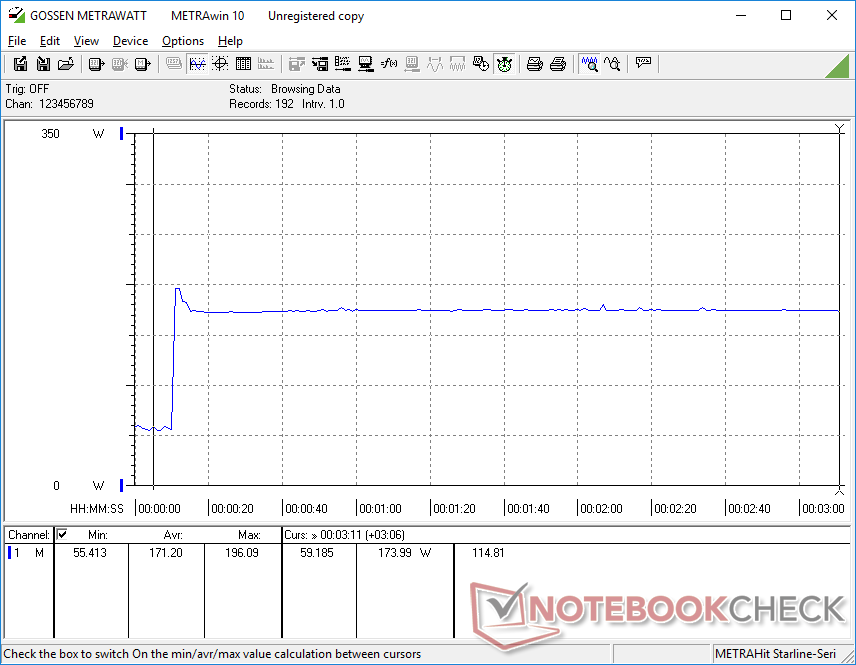
Alienware笔记本电脑总是比其他竞争者更耗电,x17 R2也不例外。当设置为高性能模式时,仅在桌面上空转就需要高达60W的功率,这比大多数U系列动力的超极本在负载下的功率还要高。非常高的消耗很可能是造成下一节中记录的电池寿命不佳的原因。
运行时 Witcher 3 消耗的电力比微星GS77多54%,尽管两者都配备了12代Core-H CPU和相同的GeForce RTX 3080 Ti GPU。作为回报,Alienware系统能够提供高达15%的CPU性能和25%的图形性能,分别比竞争者微星快。
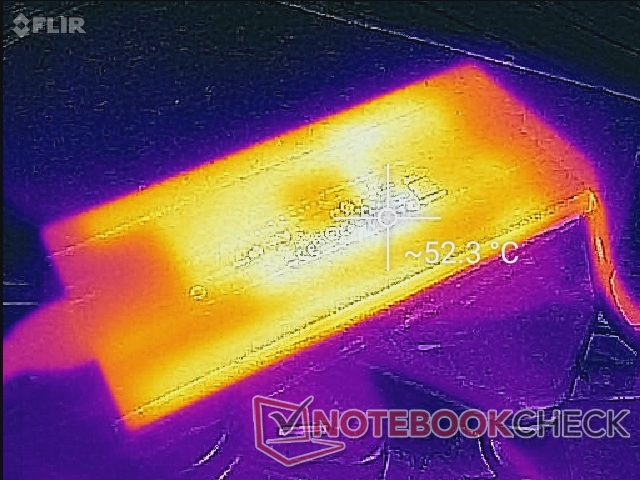
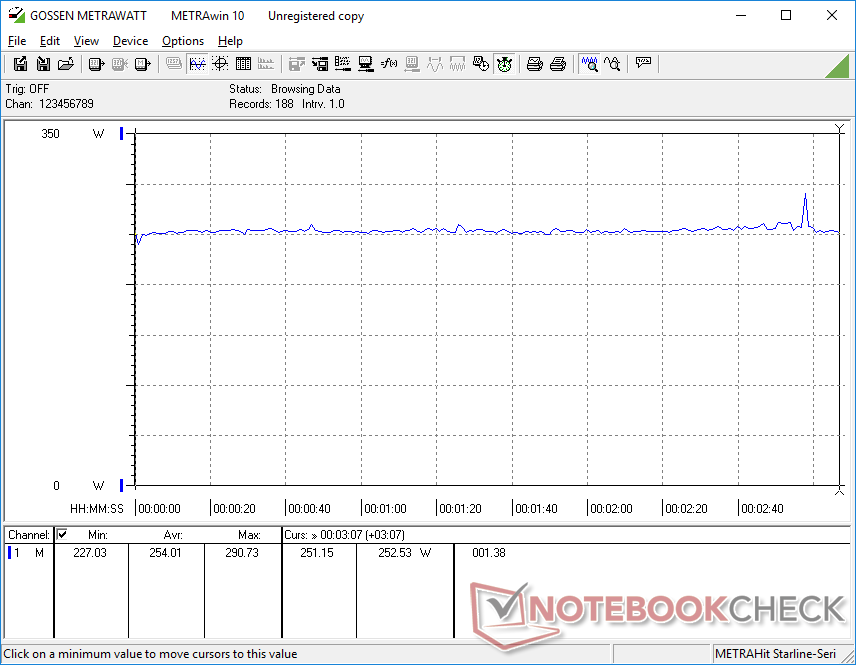
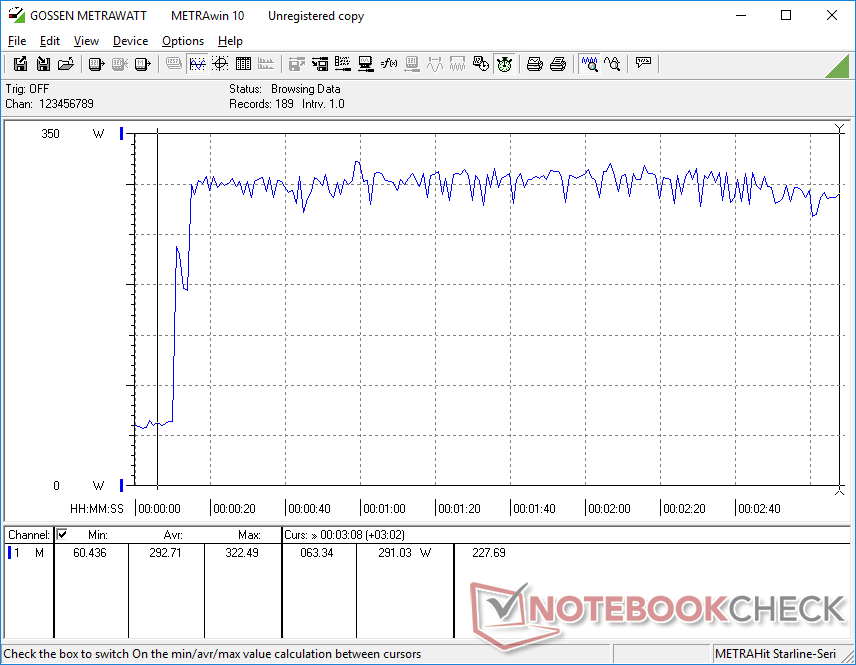
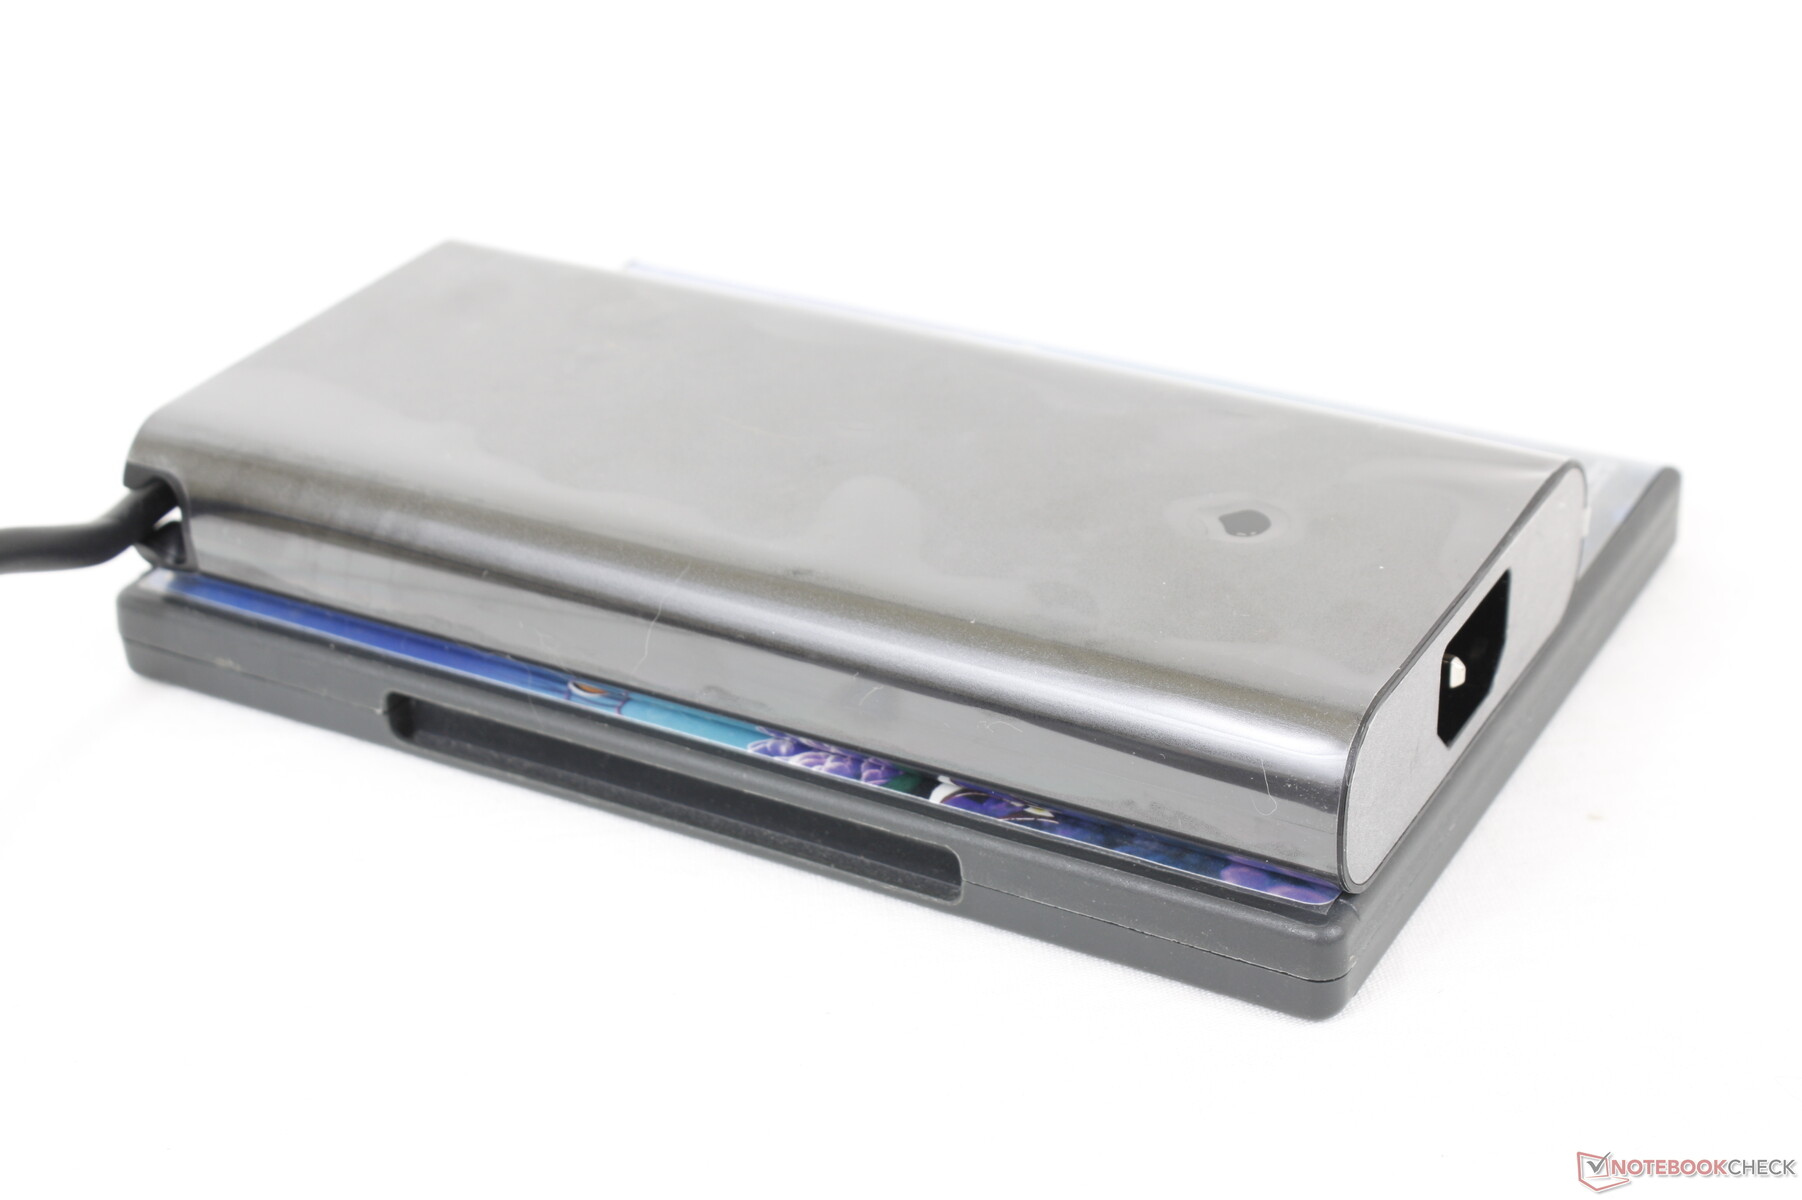
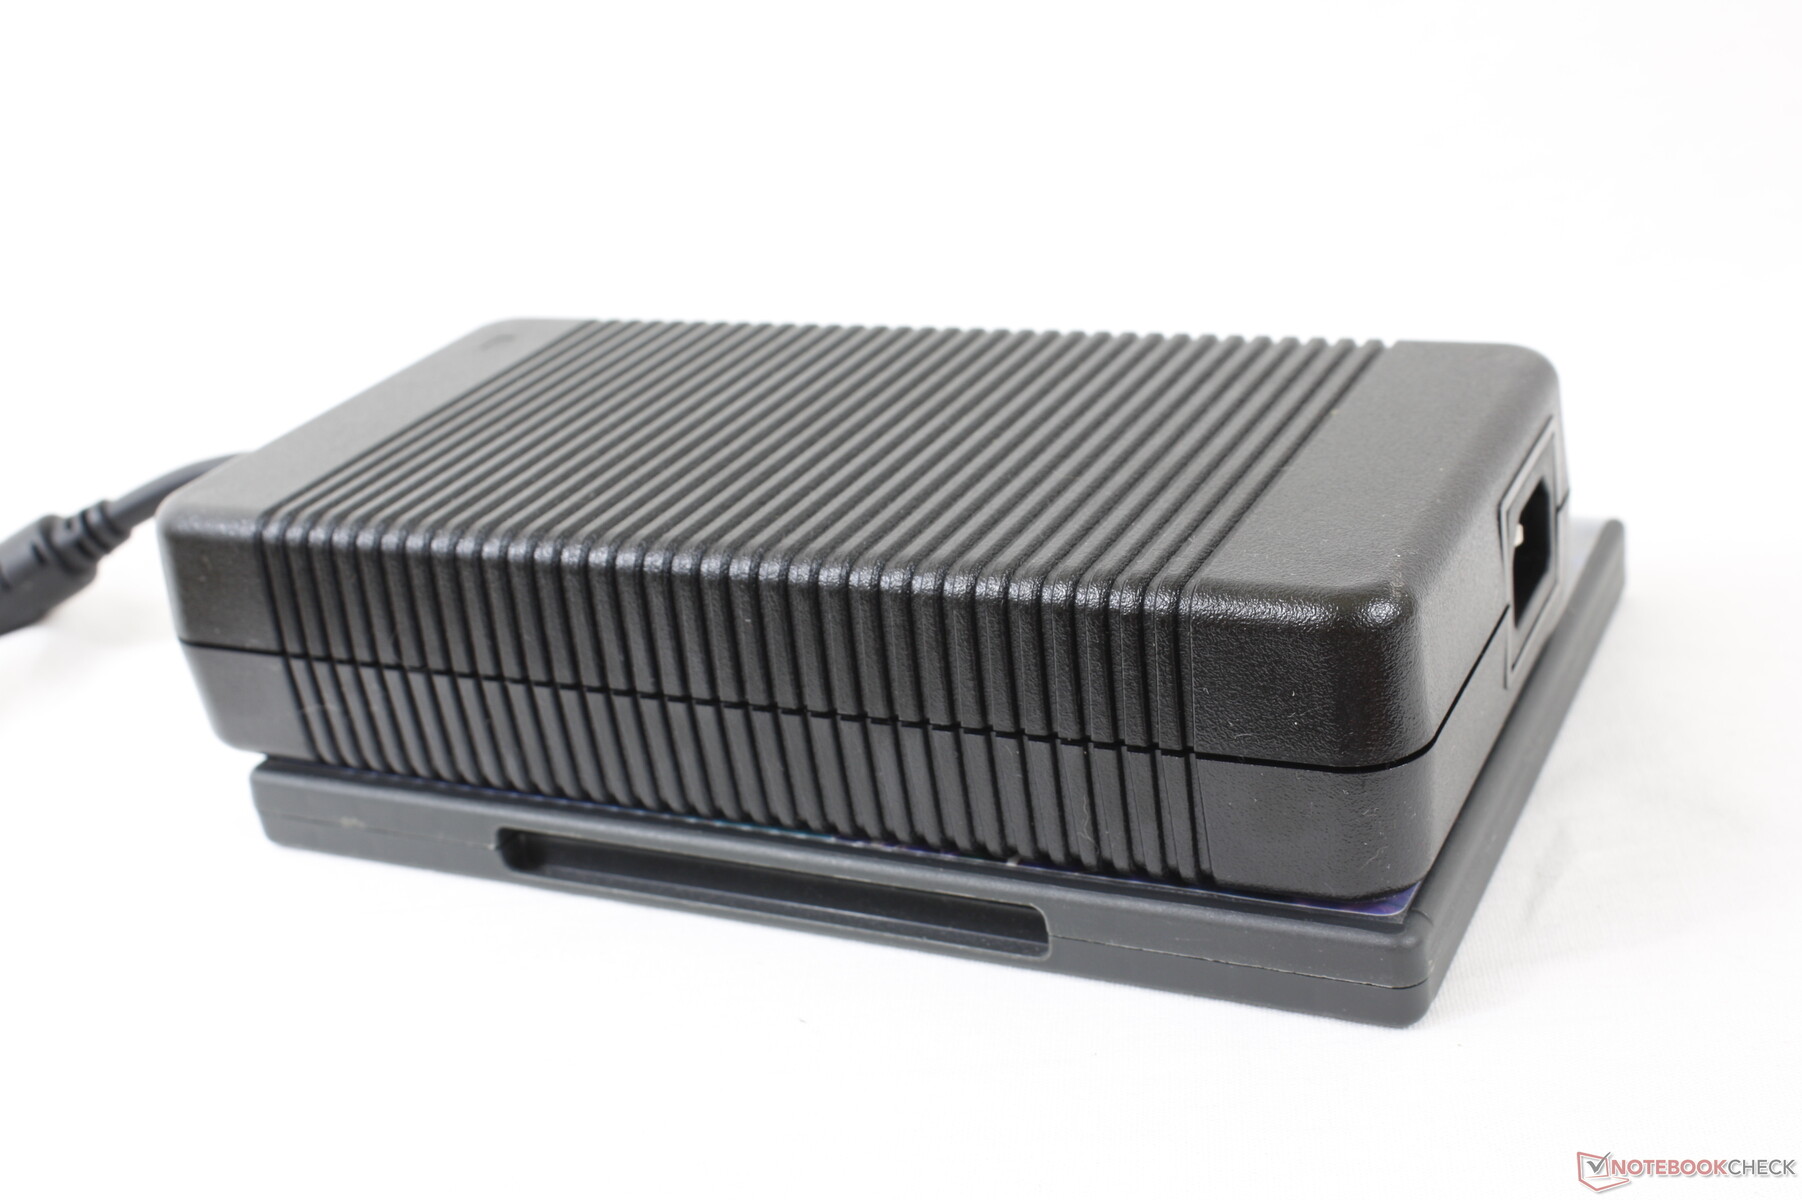
当CPU和GPU都处于100%的利用率时,我们能够从330瓦的交流适配器上记录到323瓦的最大消耗。与去年的x17 R1相比,这次的交流适配器更小(约18.3 x 8.7 x 2.5厘米,约20 x 9.9 x 4.3厘米)。请注意,大多数其他游戏笔记本都配备了较小的交流适配器,功率远低于280瓦。较小的Alienware x17 R2配置可能配备更小的交流适配器。
| Off / Standby | |
| Idle | |
| Load |
|
Key:
min: | |
| Alienware x17 R2 P48E i9-12900HK, GeForce RTX 3080 Ti Laptop GPU, 2x Samsung PM9A1 1TB (RAID 0), IPS, 1920x1080, 17.3" | Alienware x17 RTX 3080 P48E i7-11800H, GeForce RTX 3080 Laptop GPU, 2x WDC PC SN730 SDBPNTY-1T00 (RAID 0), IPS, 3840x2160, 17.3" | Asus ROG Zephyrus S17 GX703HSD i9-11900H, GeForce RTX 3080 Laptop GPU, Samsung PM9A1 MZVL22T0HBLB, IPS, 2560x1440, 17.3" | MSI Stealth GS77 12UHS-083US i7-12700H, GeForce RTX 3080 Ti Laptop GPU, Micron 3400 1TB MTFDKBA1T0TFH, IPS, 2560x1440, 17.3" | MSI GT76 Titan DT 10SGS i9-10900K, GeForce RTX 2080 Super Mobile, 2x WDC PC SN730 SDBPNTY-1T00 (RAID 0), IPS, 3840x2160, 17.3" | Gigabyte A7 X1 R9 5900HX, GeForce RTX 3070 Laptop GPU, ESR512GTLCG-EAC-4, IPS, 1920x1080, 17.3" | |
|---|---|---|---|---|---|---|
| Power Consumption | 22% | 22% | 30% | -15% | 38% | |
| Idle Minimum * (Watt) | 24.1 | 10.2 58% | 21.7 10% | 20 17% | 25.9 -7% | 12 50% |
| Idle Average * (Watt) | 28.5 | 21.2 26% | 27 5% | 21.4 25% | 38 -33% | 14 51% |
| Idle Maximum * (Watt) | 60 | 48.4 19% | 33 45% | 27 55% | 53.2 11% | 19 68% |
| Load Average * (Watt) | 128.7 | 118.7 8% | 108 16% | 100.5 22% | 123.8 4% | 118 8% |
| Witcher 3 ultra * (Watt) | 254 | 249 2% | 195 23% | 165 35% | 312.5 -23% | 205 19% |
| Load Maximum * (Watt) | 323 | 262 19% | 210 35% | 247.1 23% | 459.8 -42% | 229 29% |
* ... smaller is better
Power Consumption Witcher 3 / Stresstest
Power Consumption external Monitor
电池寿命
电池运行时间是我们在任何游戏笔记本电脑上看到的最差的一些。即使在桌面上以最低亮度设置、最低功率配置文件和Optimus图形激活闲置,也只能持续短短4小时。与华硕ROG Zephyrus S17的超过7小时相比,预期只有2小时的真实世界WLAN浏览。
从空电到满电大约需要100分钟。用户也可以用第三方的USB-C适配器进行充电。
| Alienware x17 R2 P48E i9-12900HK, GeForce RTX 3080 Ti Laptop GPU, 87 Wh | Alienware x17 RTX 3080 P48E i7-11800H, GeForce RTX 3080 Laptop GPU, 87 Wh | Asus ROG Zephyrus S17 GX703HSD i9-11900H, GeForce RTX 3080 Laptop GPU, 90 Wh | MSI Stealth GS77 12UHS-083US i7-12700H, GeForce RTX 3080 Ti Laptop GPU, 99 Wh | MSI GT76 Titan DT 10SGS i9-10900K, GeForce RTX 2080 Super Mobile, 90 Wh | Gigabyte A7 X1 R9 5900HX, GeForce RTX 3070 Laptop GPU, 48.96 Wh | |
|---|---|---|---|---|---|---|
| Battery runtime | 91% | 257% | 154% | 20% | 93% | |
| Reader / Idle (h) | 3.9 | 7 79% | 10.8 177% | |||
| WiFi v1.3 (h) | 2 | 5.9 195% | 7.5 275% | 6.2 210% | 2.4 20% | 4.7 135% |
| Load (h) | 0.8 | 0.8 0% | 2.7 238% | 1.4 75% | 1.2 50% | |
| H.264 (h) | 7.2 | |||||
| Witcher 3 ultra (h) | 1 |
Pros
Cons
结论 - 更高的TGP意味着更高的性能
当Nvidia宣布为笔记本电脑推出GeForce RTX 3080 Ti时,我们失望地发现一些型号的目标是非常低的TGP等级,只有大约100W。虽然这种方法可以实现超薄设计,但它也牺牲了性能,因为GPU将有效地被降频。Alienware x17 R2认识到了这种权衡,而是将目标放在了175瓦的明显较高的TGP上,与使用约100瓦的GeForce RTX 3080 Ti的笔记本电脑相比,性能提升了约30%,如 Razer Blade 15或 Gigabyte Aero YE5.通过CPU也可以找到类似的结果。Alienware的这一单一方面可能是它与其他超薄游戏笔记本电脑之间的最大区别因素。
当然,这种 "不惜一切代价提高性能 "的方法也有缺点。尤其是耗电,即使在最低性能设置下,电池寿命也会因此受到影响。该系统也明显比其他超薄游戏笔记本更重更大,尽管该机箱仍被认为是超薄的。端口定位也需要一些时间来适应。
如果你想最大限度地提高性能而不满足于巨大的游戏笔记本电脑,如 MSI GT系列, 华硕ROG Chimera系列,或 笔记本,或者Alienware Area-51m系列,那么Alienware x17 R2及其令人惊讶的令人满意的机械键盘就值得考虑。
价格和可用性
Alienware x17 R2现在正在亚马逊上发货https://www.amazon.com/s?k=alienware+x17+r2&crid=2IQANC3HQRLQQ&sprefix=alienware+x17+r2%2Caps%2C140&ref=nb_sb_noss_1&tag=nbcnewsnet-20有多个SKU,但都不是我们的确切配置。另外,用户可以直接从戴尔购买。.
Alienware x17 R2 P48E
- 05/11/2022 v7 (old)
Allen Ngo
Price comparison

