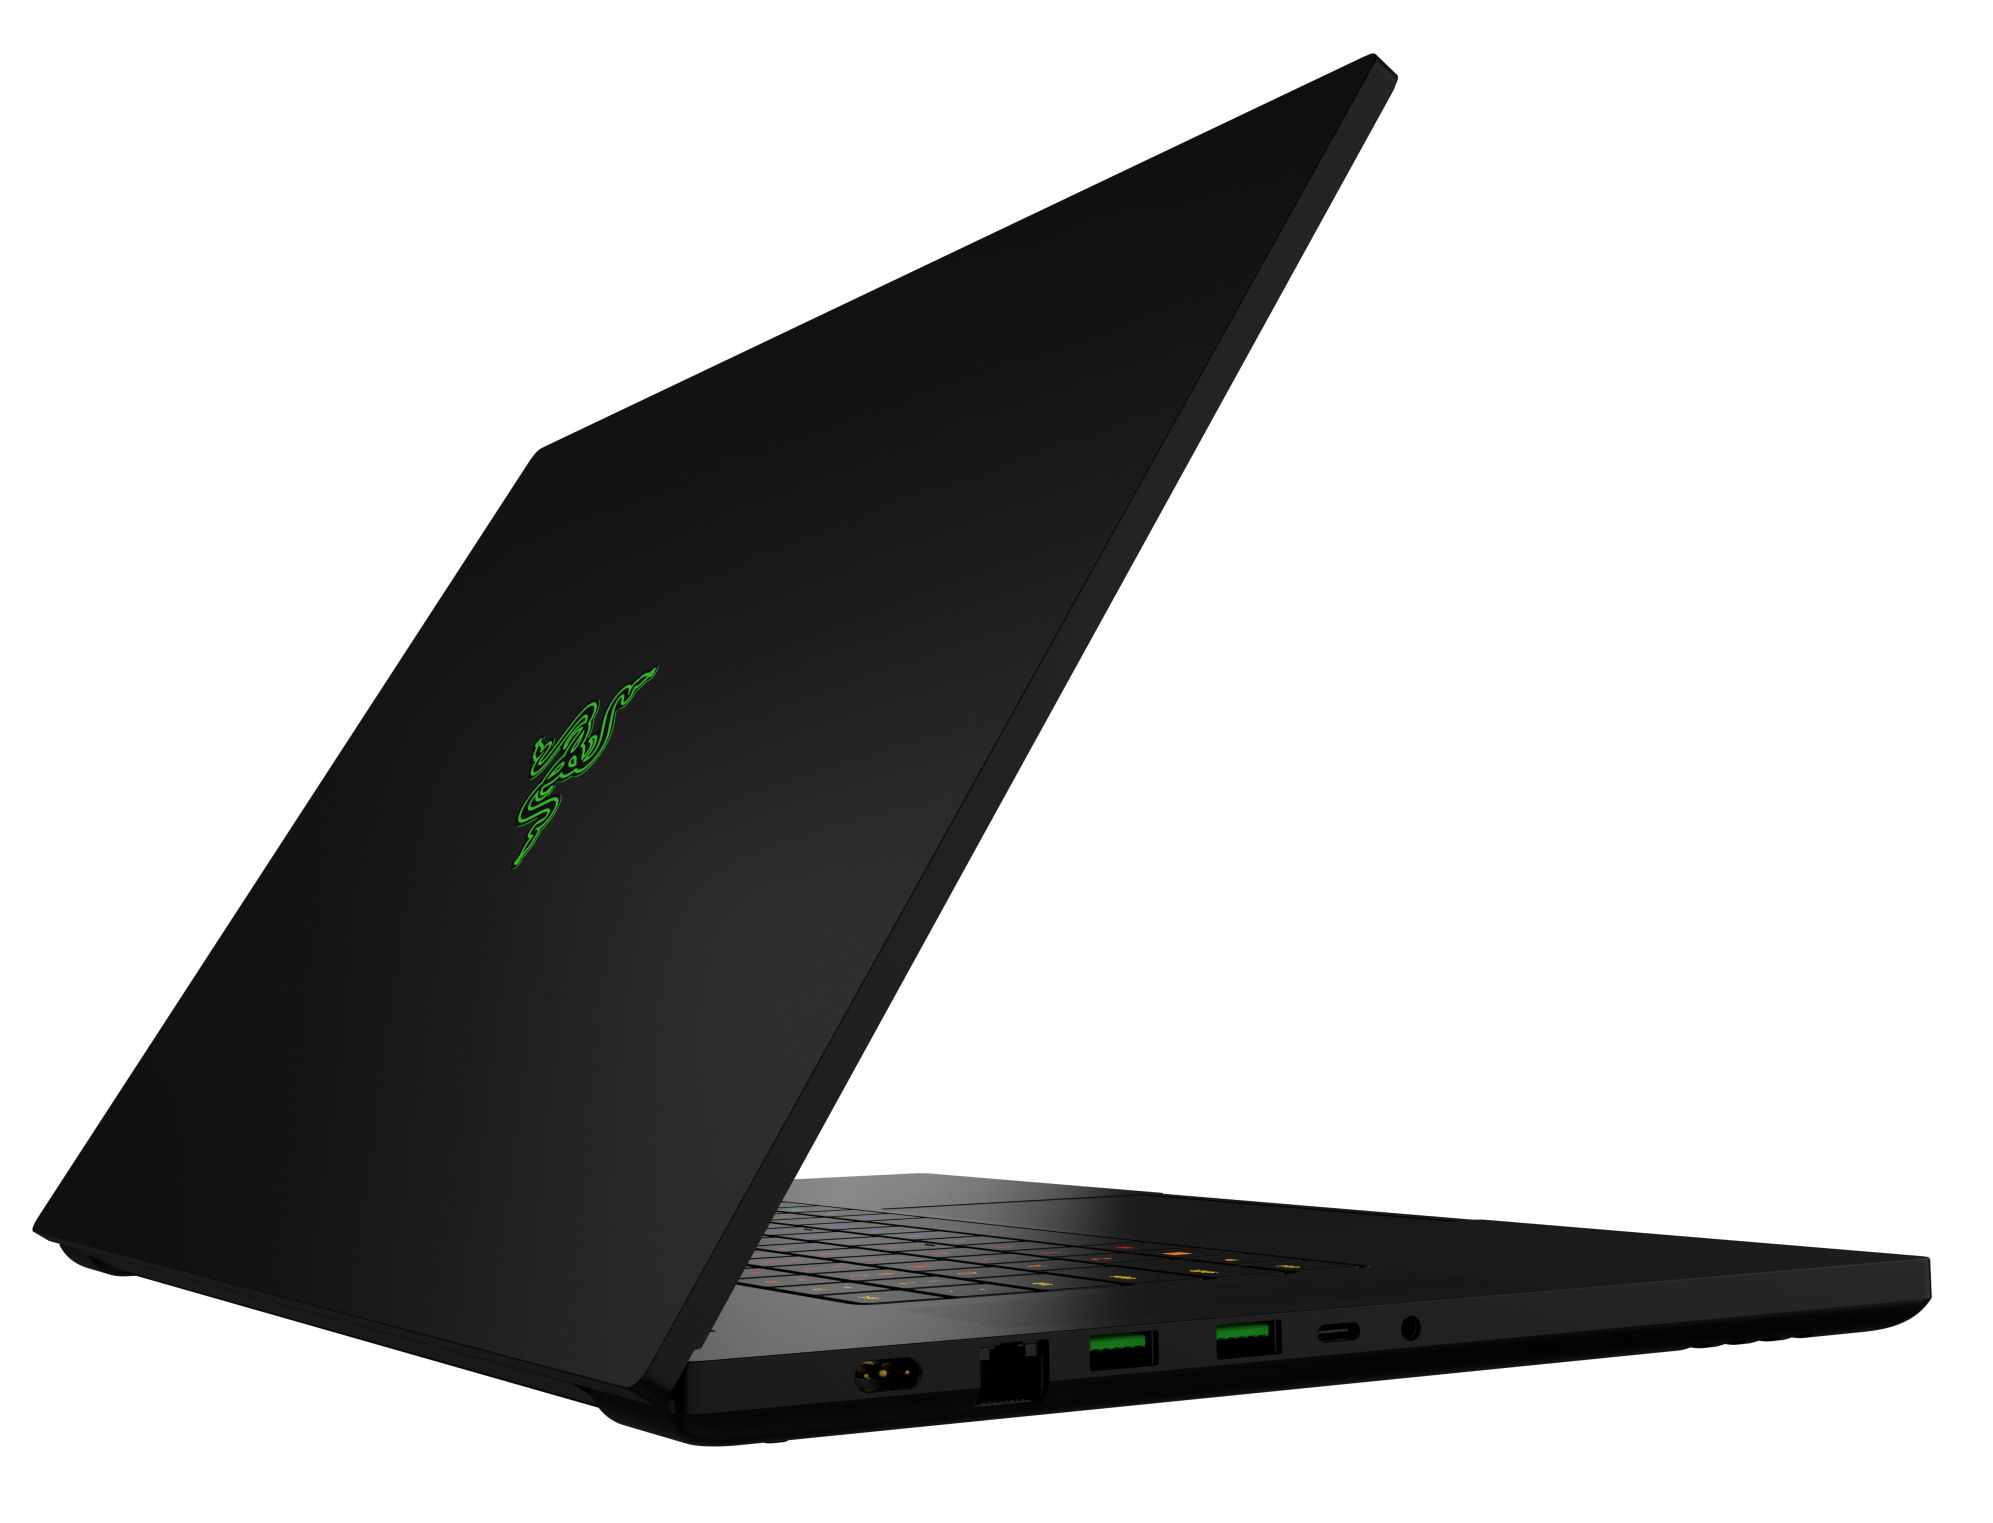
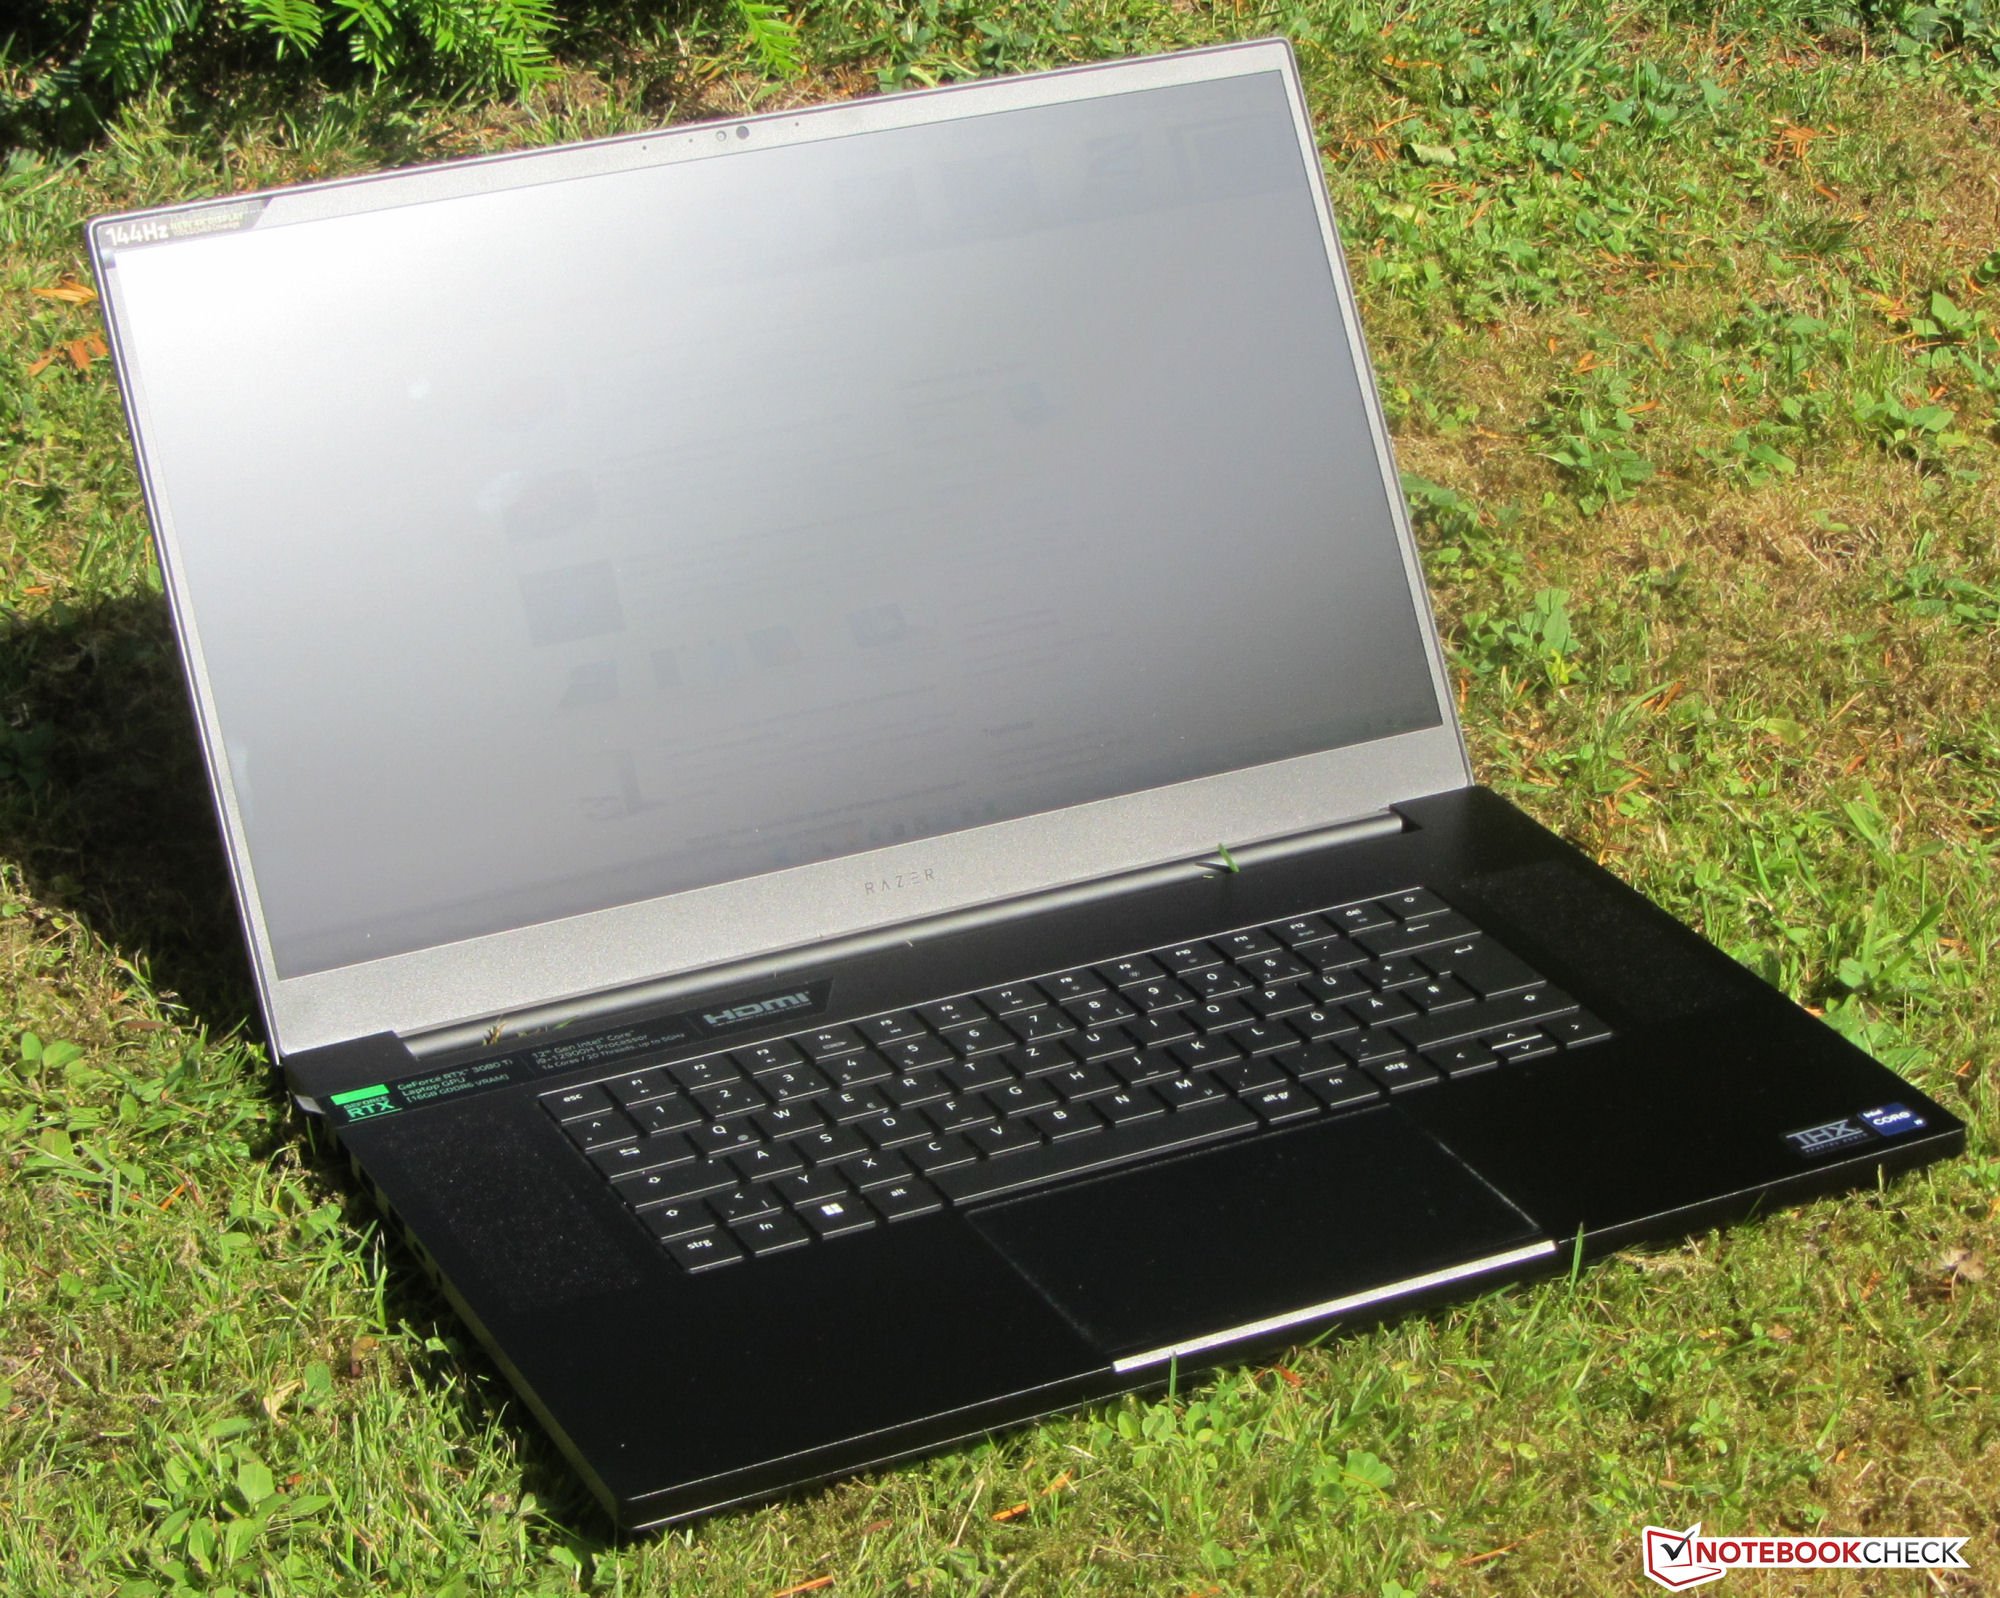
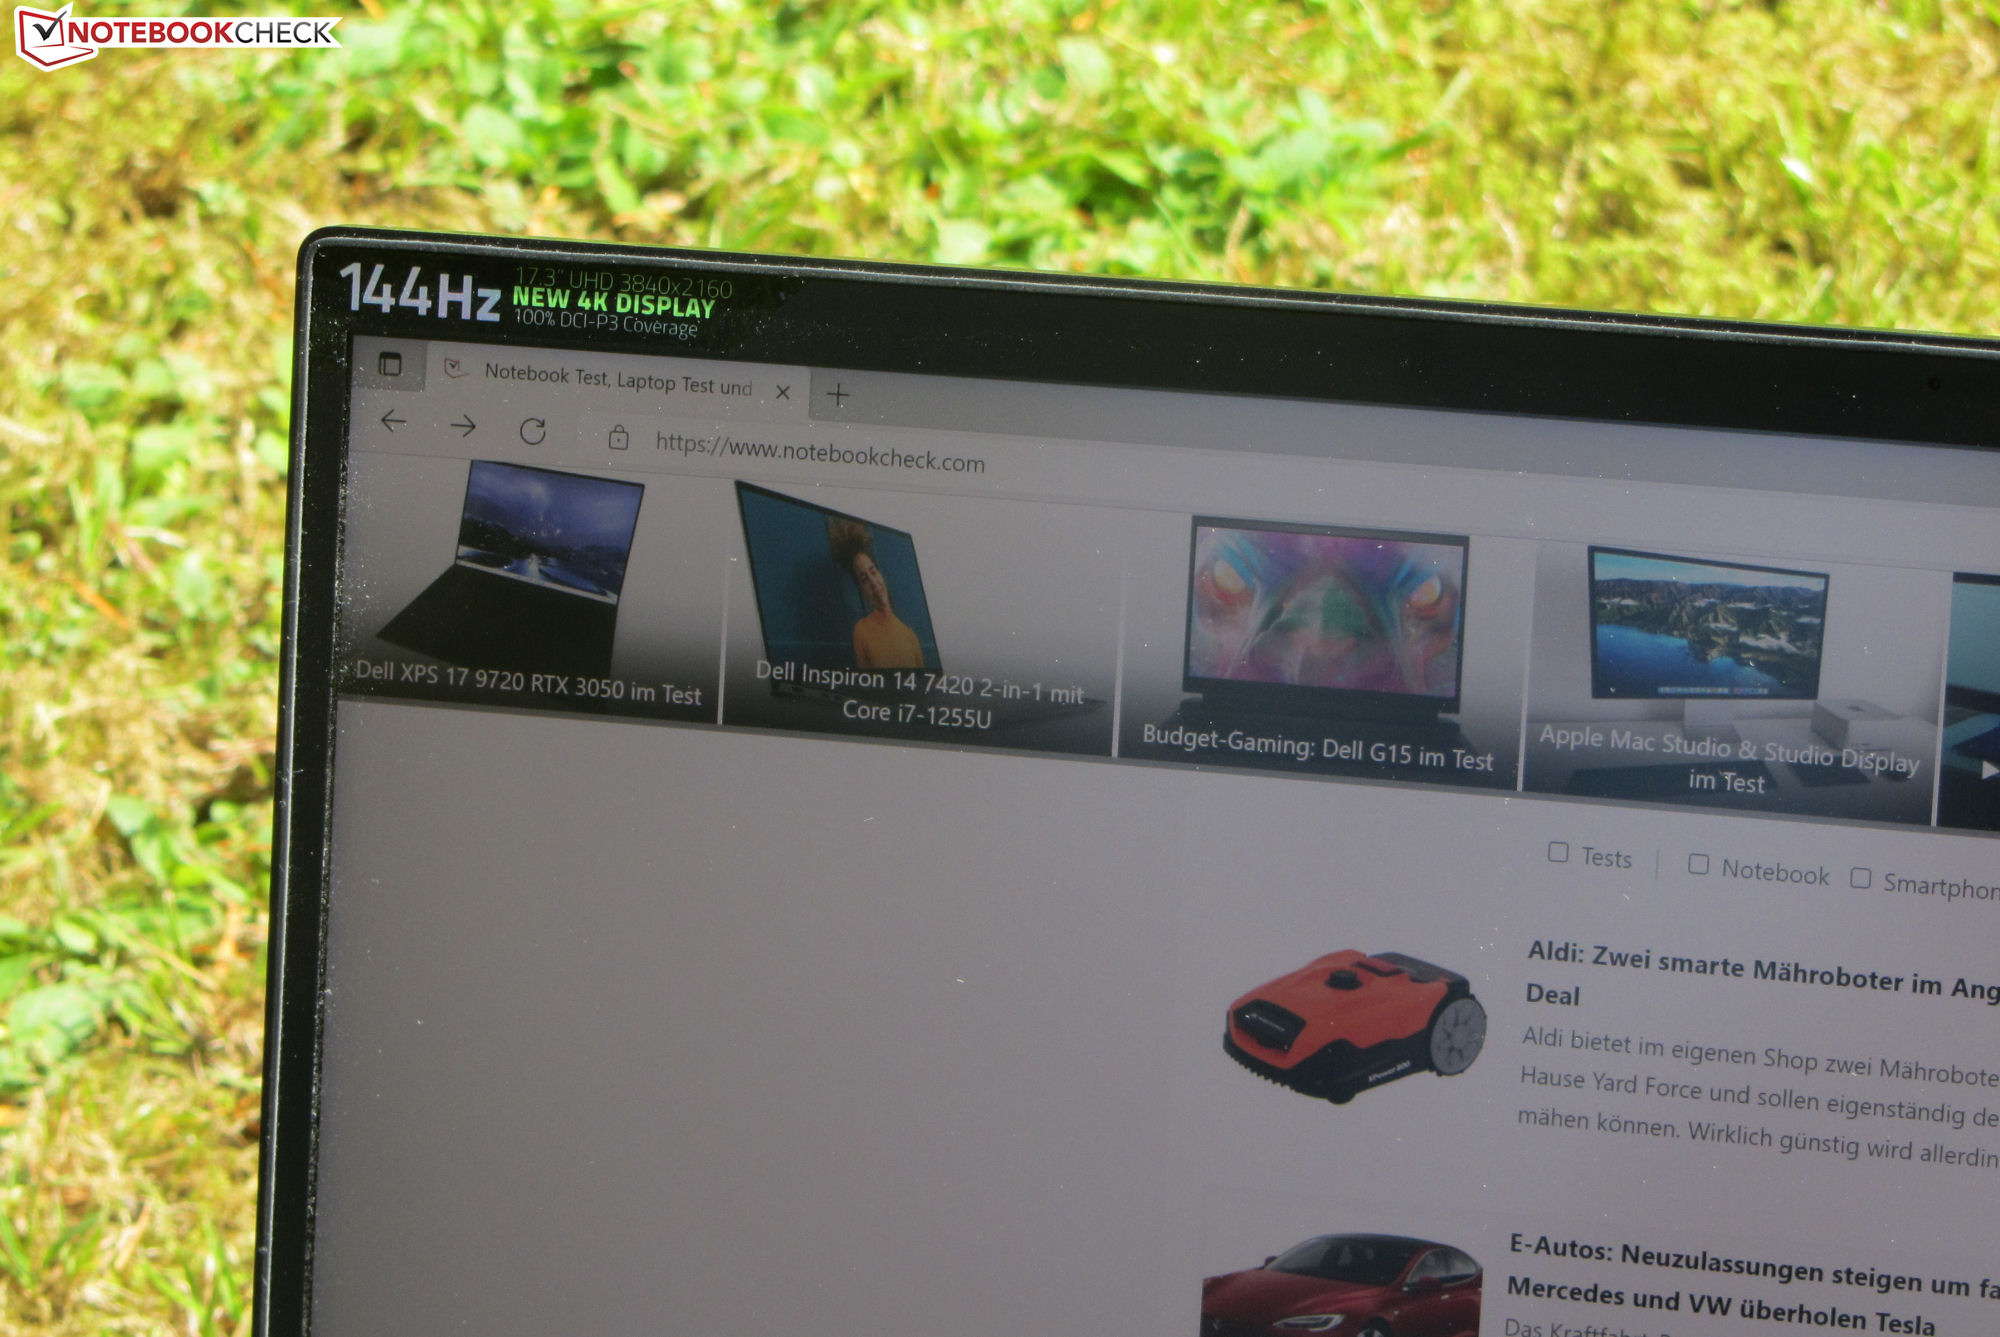
Razer Blade 17(2022年初)回顾。优雅的4K游戏笔记本,屏幕明亮
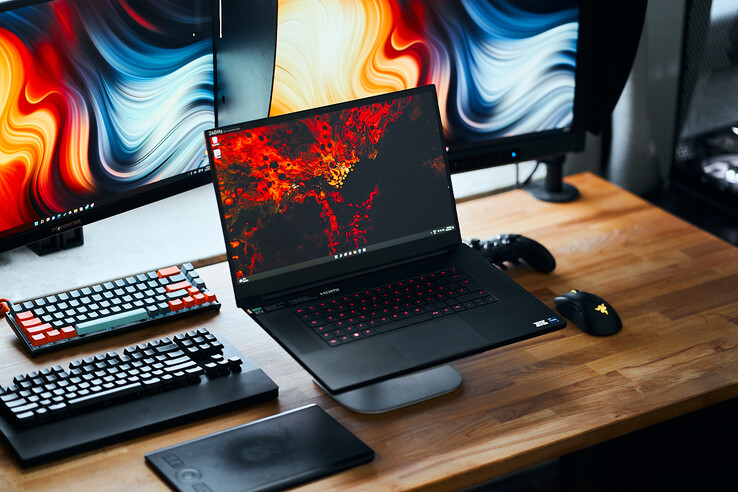
Razer Blade 17针对的是游戏玩家和创意专业人士--特别是在我们测试的高端配置中,配备了Core i9-12900H CPU,GeForce RTX 3080 Ti Laptop GPU,以及17.3英寸4k显示屏,色彩准确。价位在4700欧元左右(约4900美元)。除了RTX 3080 Ti之外,其 美国的兄弟姐妹我们已经测试过,它有一个Core i7-12800H CPU和一个QHD-面板(240赫兹)。竞争对手包括极其强大的笔记本电脑,如 Alienware x17 R2 P48E,以及Medion Erazer Beast X30,以及微星隐形GS77 12UHS.
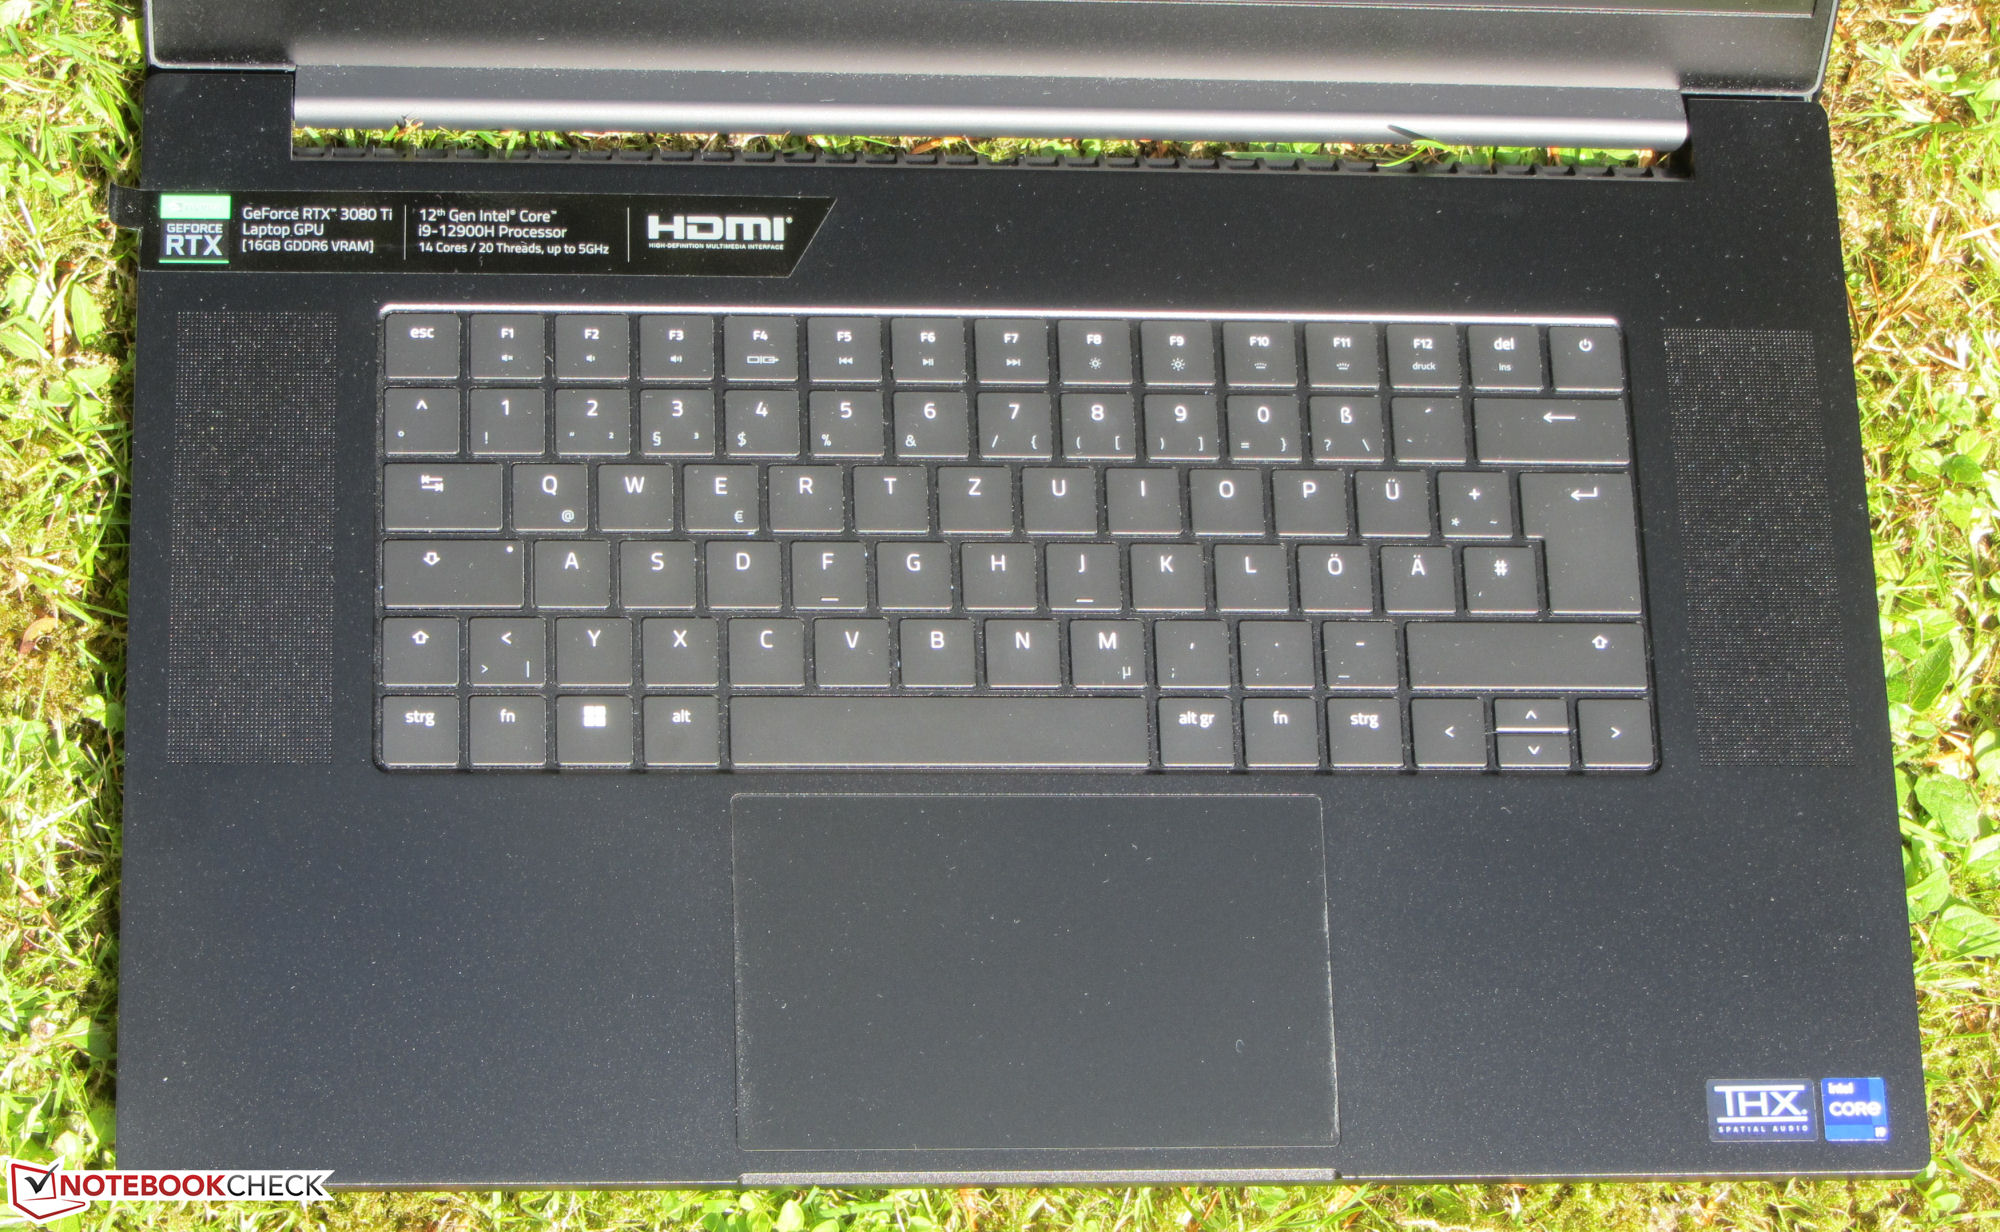
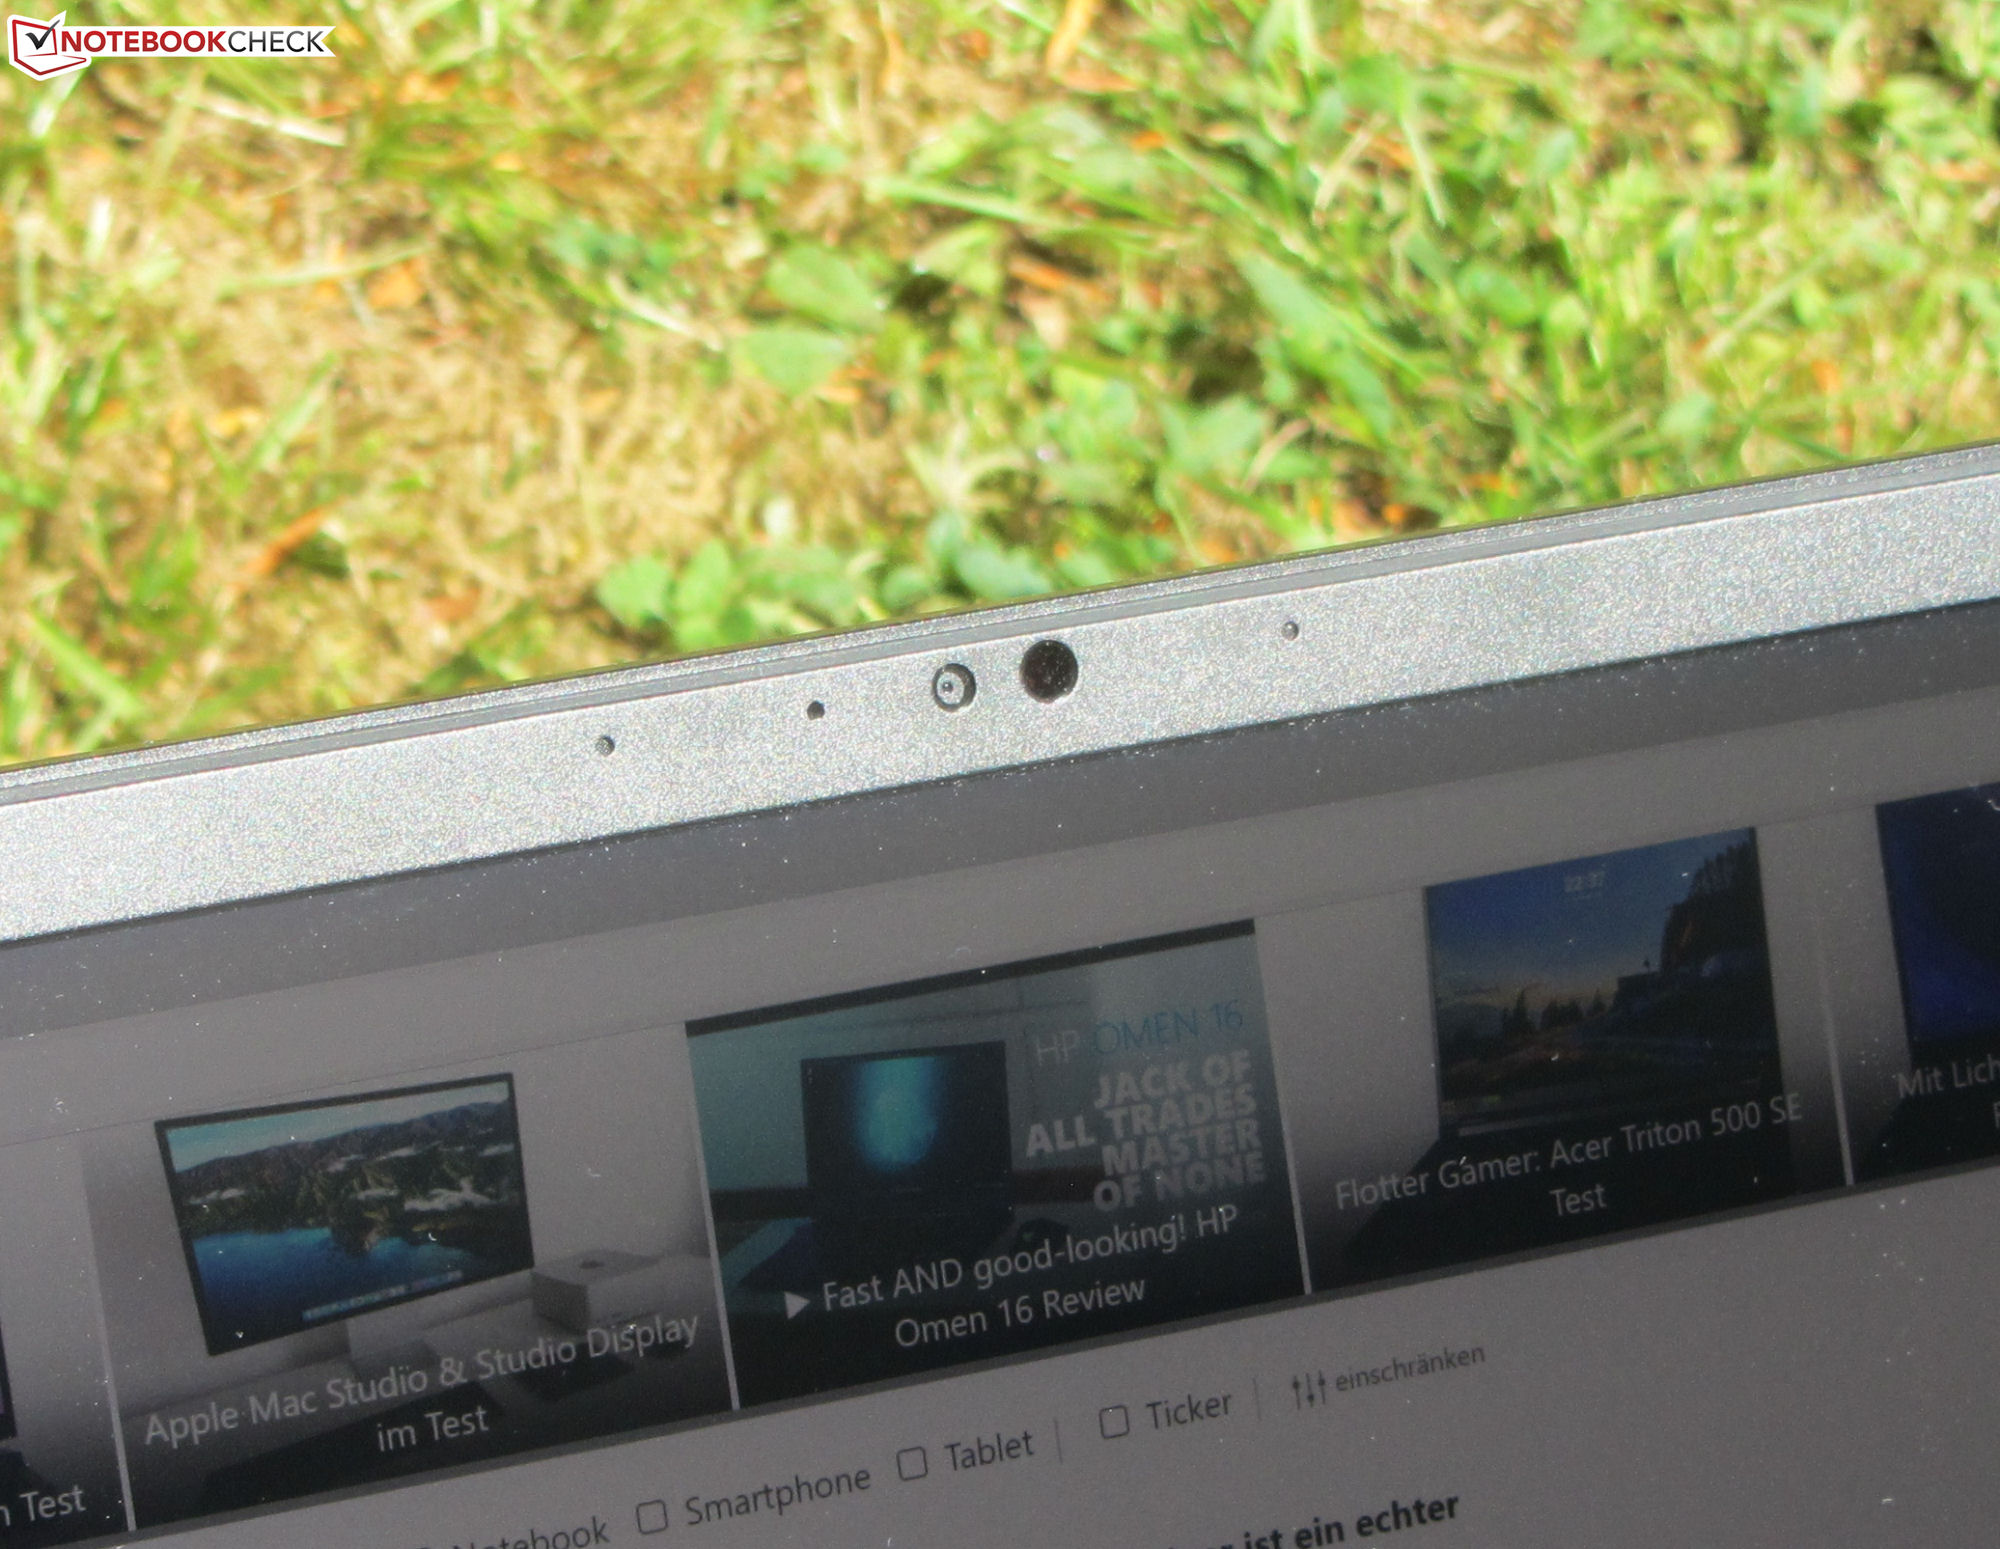
你可以在我们对相同结构的Blade 17 2022(Core i7, QHD)的评论中找到关于机箱、连接设备、输入设备和扬声器的信息。 对相同结构的Blade 17 2022 (Core i7, QHD)的评论中找到相关信息。.
潜在的竞争对手比较
Rating | Date | Model | Weight | Height | Size | Resolution | Price |
|---|---|---|---|---|---|---|---|
| 89.9 % v7 (old) | 07 / 2022 | Razer Blade 17 Early 2022 i9-12900H, GeForce RTX 3080 Ti Laptop GPU | 2.8 kg | 19.9 mm | 17.30" | 3840x2160 | |
| 89.2 % v7 (old) | 05 / 2022 | Alienware x17 R2 P48E i9-12900HK, GeForce RTX 3080 Ti Laptop GPU | 3.1 kg | 20.9 mm | 17.30" | 1920x1080 | |
| 86.7 % v7 (old) | 05 / 2022 | Medion Erazer Beast X30 i9-12900HK, GeForce RTX 3080 Ti Laptop GPU | 2.2 kg | 23 mm | 17.30" | 2560x1440 | |
| 87.2 % v7 (old) | 04 / 2022 | MSI Stealth GS77 12UHS-083US i7-12700H, GeForce RTX 3080 Ti Laptop GPU | 2.9 kg | 20.8 mm | 17.30" | 2560x1440 |
| SD Card Reader | |
| average JPG Copy Test (av. of 3 runs) | |
| Alienware x17 R2 P48E (AV Pro V60) | |
| Razer Blade 17 Early 2022 (AV PRO microSD 128 GB V60) | |
| Razer Blade 17 RTX 3080 Ti (AV Pro V60) | |
| Average of class Gaming (20.9 - 210, n=54, last 2 years) | |
| MSI Stealth GS77 12UHS-083US (AV Pro V60) | |
| Medion Erazer Beast X30 (AV PRO microSD 128 GB V60) | |
| maximum AS SSD Seq Read Test (1GB) | |
| Alienware x17 R2 P48E (AV Pro V60) | |
| Razer Blade 17 RTX 3080 Ti (AV Pro V60) | |
| Average of class Gaming (25.5 - 261, n=51, last 2 years) | |
| Medion Erazer Beast X30 (AV PRO microSD 128 GB V60) | |
| MSI Stealth GS77 12UHS-083US (AV Pro V60) | |
| Networking - iperf3 receive AXE11000 | |
| Medion Erazer Beast X30 | |
| Razer Blade 17 Early 2022 | |
| Average of class Gaming (680 - 1745, n=88, last 2 years) | |
| Average Killer Wi-Fi 6E AX1690i 160MHz (917 - 1727, n=9) | |


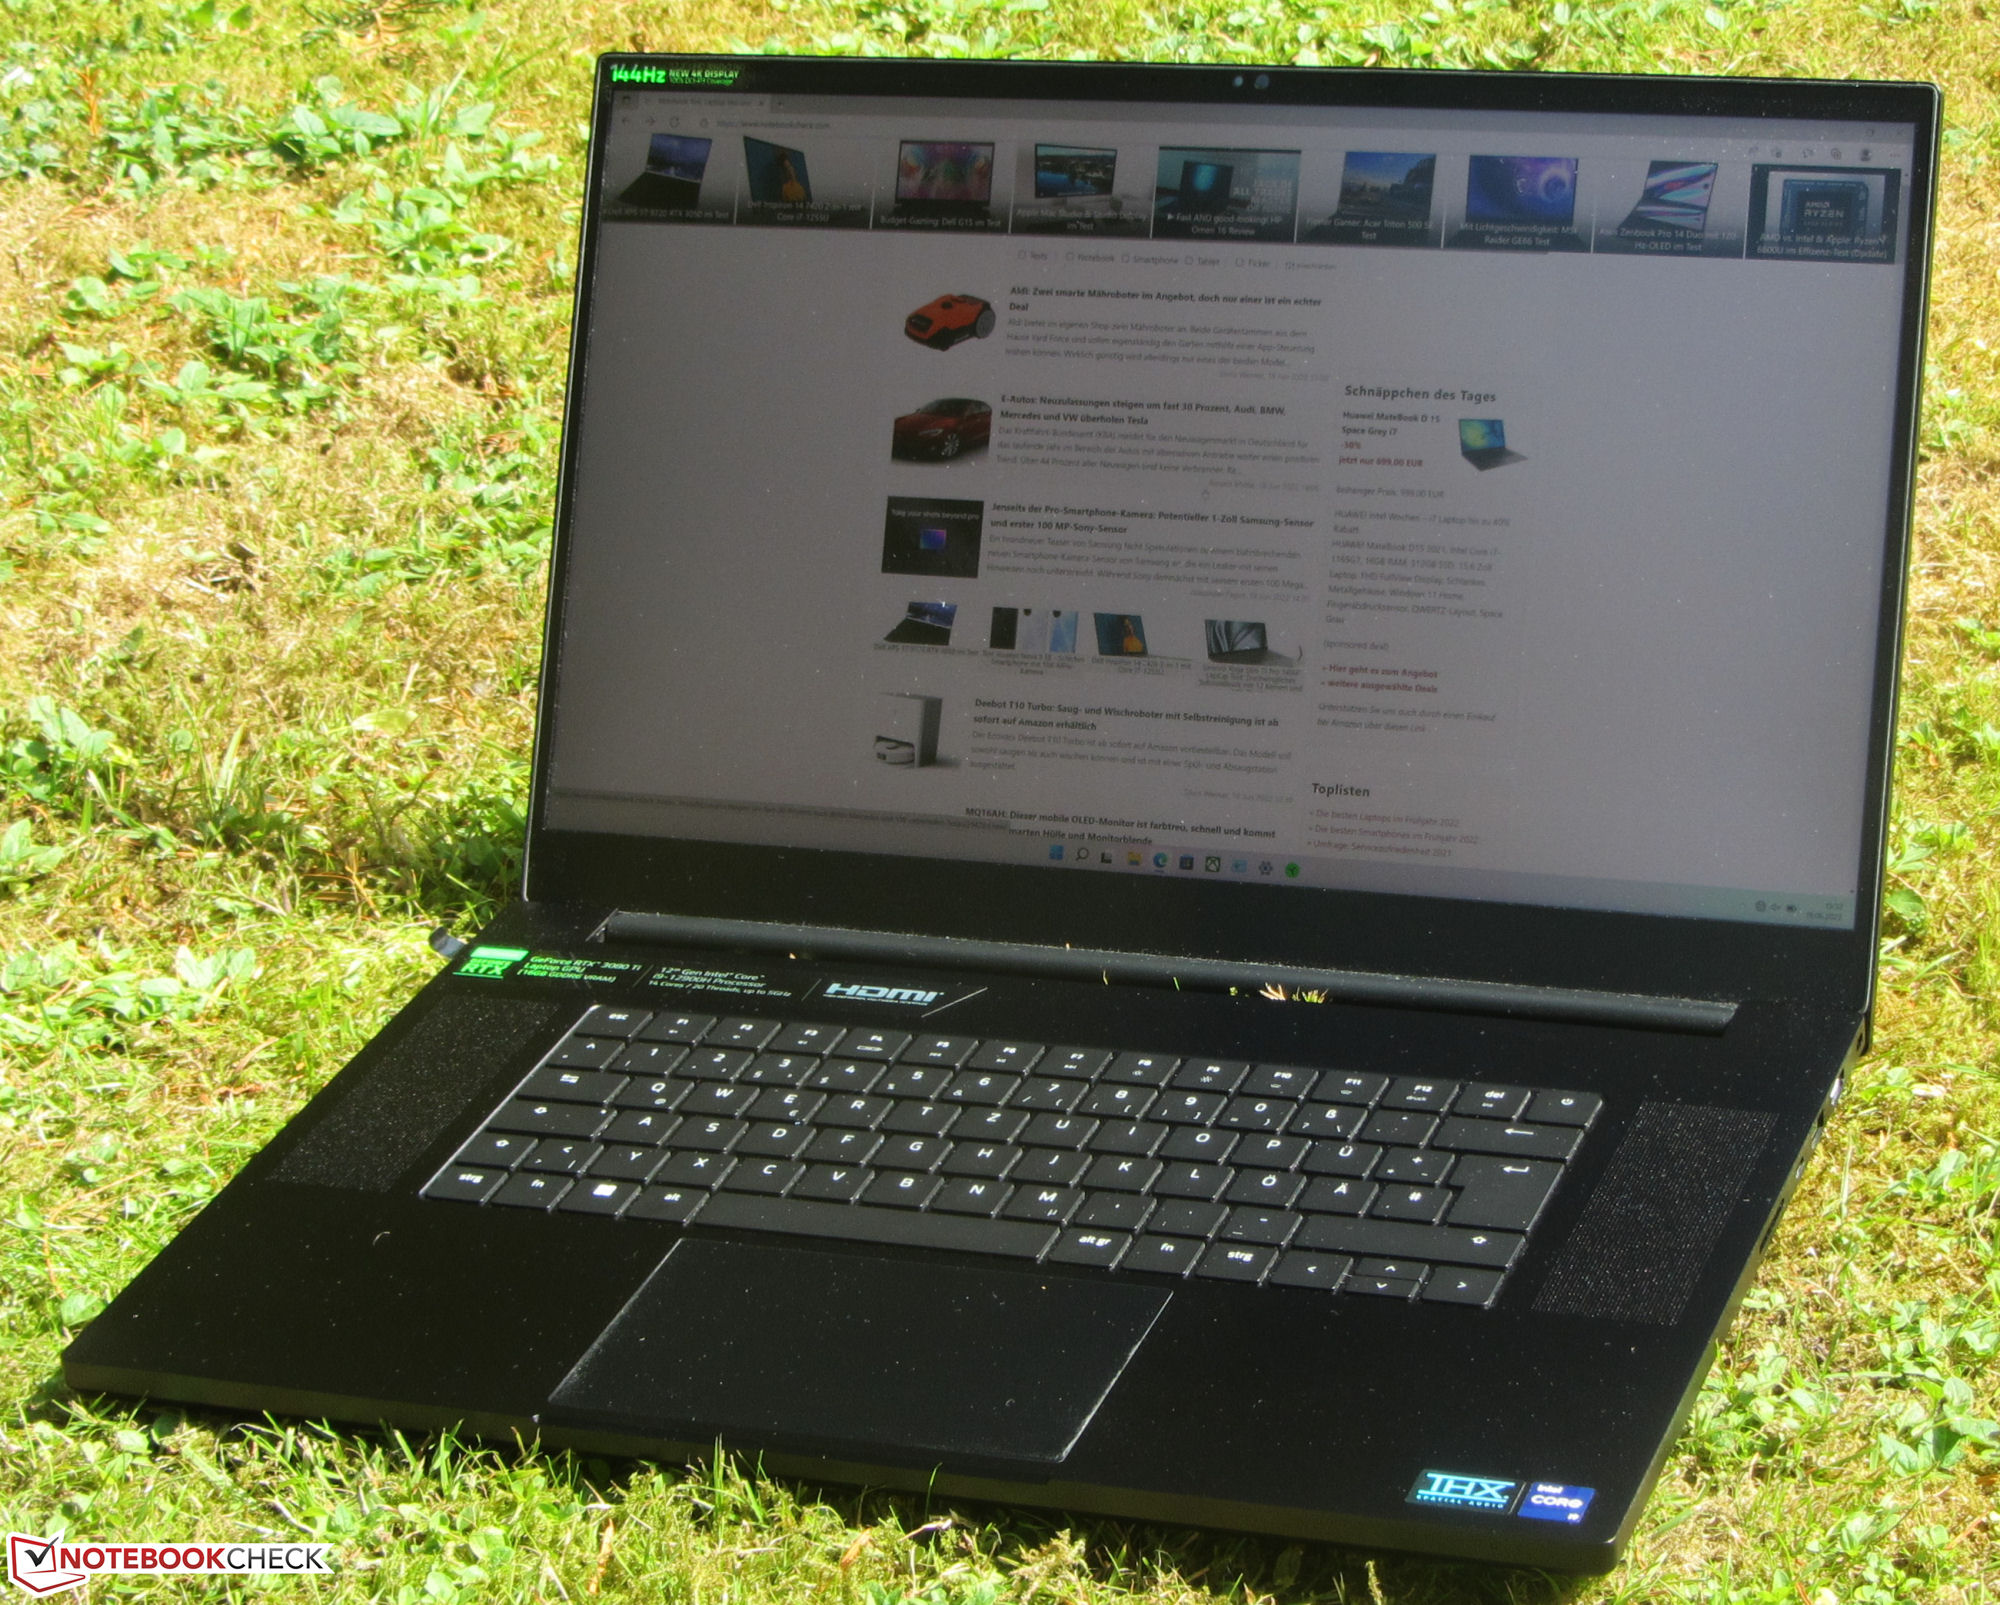
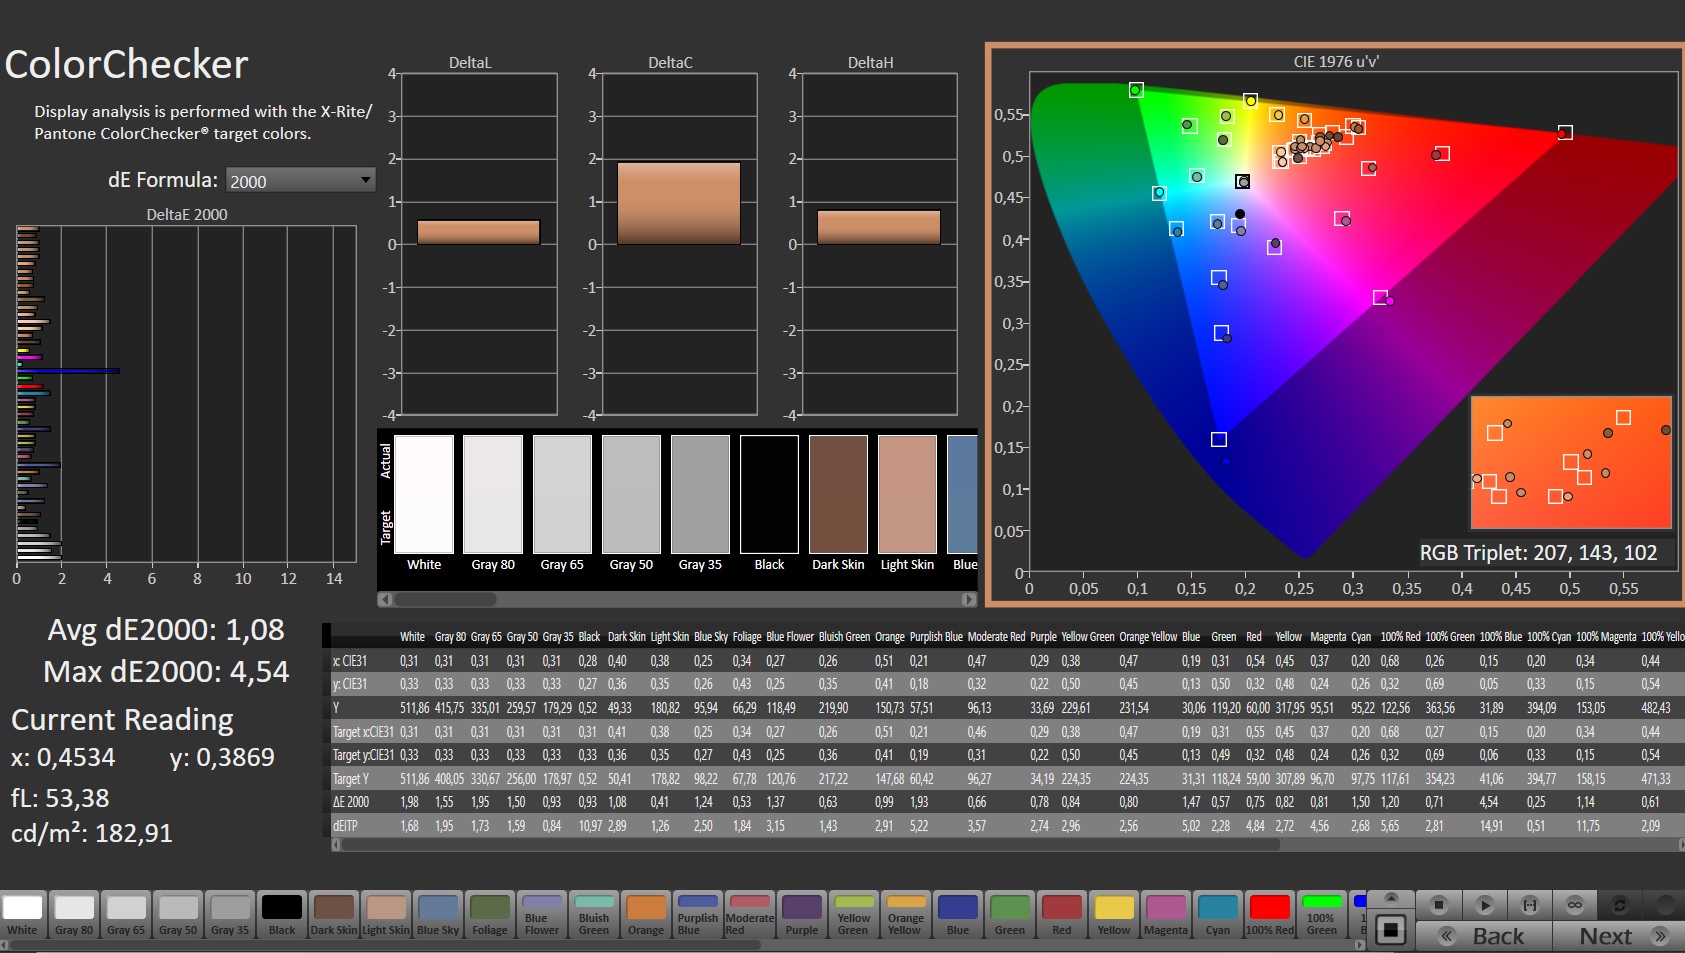
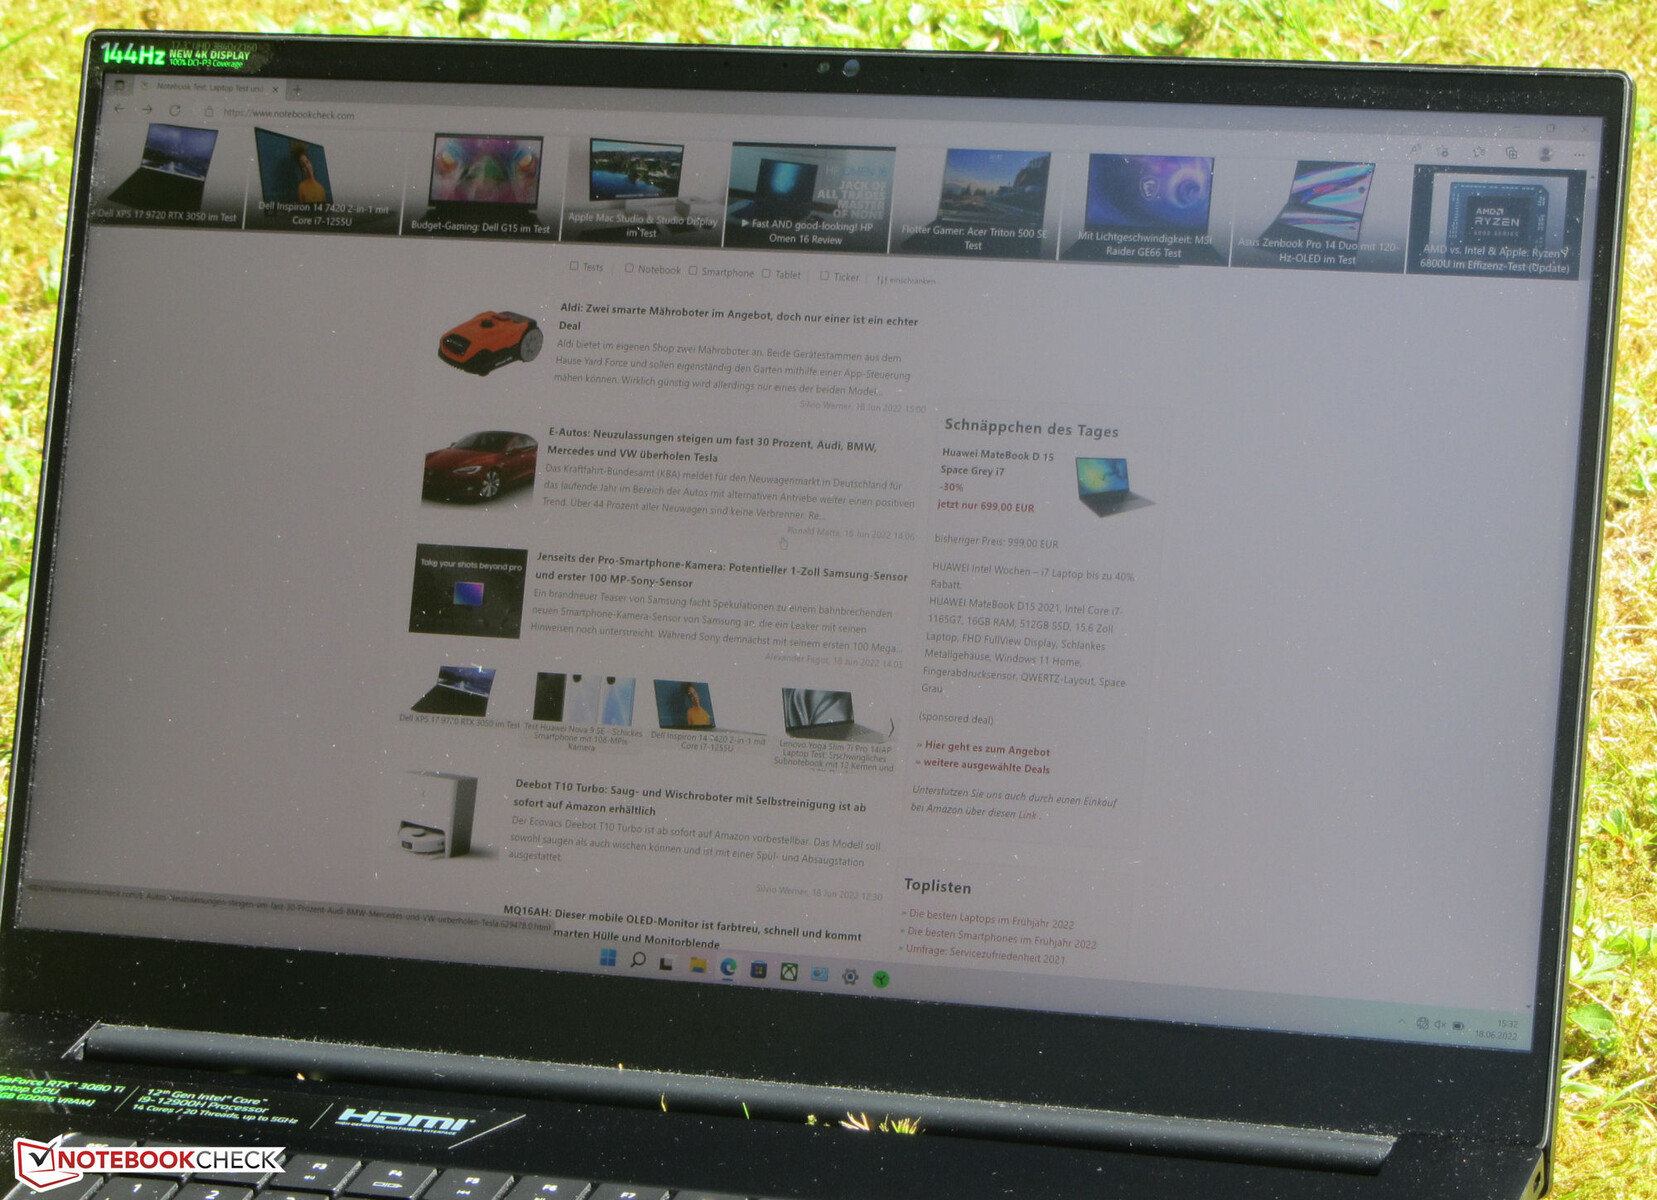
显示屏 - 明亮且色彩准确
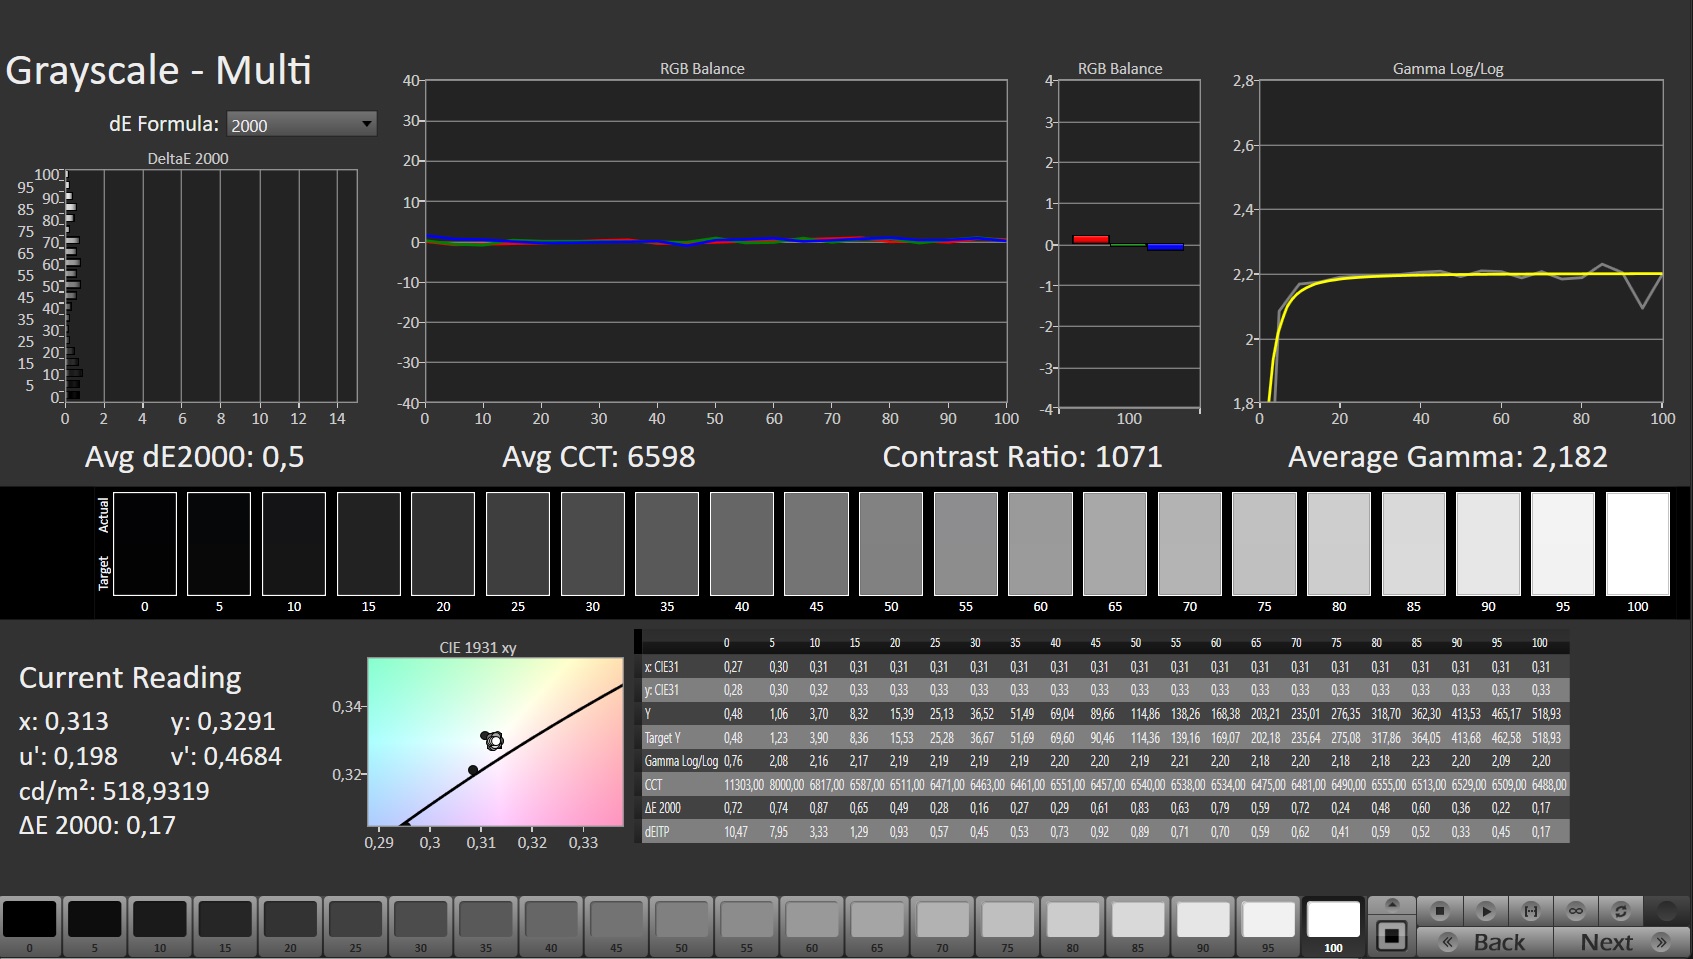
在我们的测试装置中,Razer使用了令人印象深刻的17.3英寸显示屏,具有4K分辨率(3840 x 2160像素)和144赫兹刷新率,提供了更高的亮度(486.3 cd/m²)和比竞争对手的显示屏更短的响应时间。这也适用于与美国兄弟机型的QHD面板的比较。 美国的兄弟姐妹机型我们已经测试过了。1,143:1的对比度也处于较高水平,而且我们在测量过程中没有观察到任何PWM闪烁。
| |||||||||||||||||||||||||
Brightness Distribution: 84 %
Center on Battery: 503 cd/m²
Contrast: 1143:1 (Black: 0.44 cd/m²)
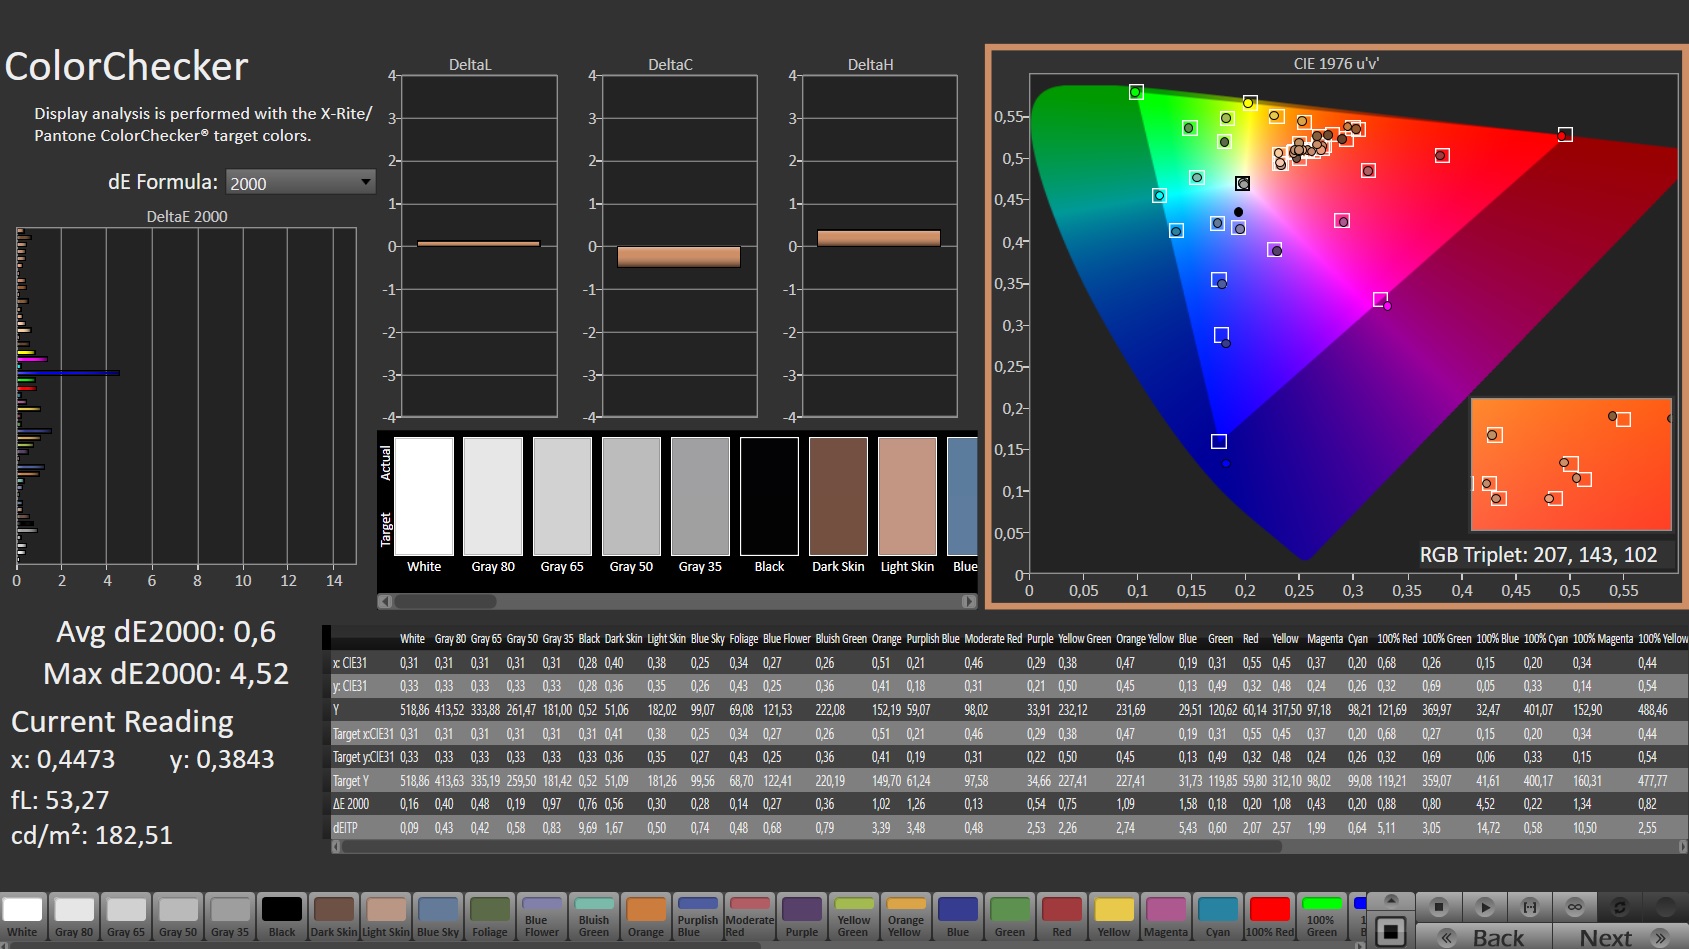
ΔE ColorChecker Calman: 1.08 | ∀{0.5-29.43 Ø4.71}
calibrated: 0.6
ΔE Greyscale Calman: 1.3 | ∀{0.09-98 Ø4.96}
87.3% AdobeRGB 1998 (Argyll 3D)
100% sRGB (Argyll 3D)
99.4% Display P3 (Argyll 3D)
Gamma: 2.151
CCT: 6541 K
| Razer Blade 17 Early 2022 AU Optronics B173ZAN06.9, IPS, 3840x2160, 17.3" | Alienware x17 R2 P48E AU Optronics B173HAN, IPS, 1920x1080, 17.3" | Medion Erazer Beast X30 BOE CQ NE173QHM-NZ3, IPS, 2560x1440, 17.3" | MSI Stealth GS77 12UHS-083US BOE NE173QHM-NZ1, IPS, 2560x1440, 17.3" | Razer Blade 17 RTX 3080 Ti BOE NE173QHM-NZ1, IPS, 2560x1440, 17.3" | |
|---|---|---|---|---|---|
| Display | -10% | -18% | -2% | -1% | |
| Display P3 Coverage (%) | 99.4 | 79.2 -20% | 67.7 -32% | 96.2 -3% | 98.7 -1% |
| sRGB Coverage (%) | 100 | 99.8 0% | 97.6 -2% | 99.7 0% | 99.9 0% |
| AdobeRGB 1998 Coverage (%) | 87.3 | 79.6 -9% | 69.2 -21% | 85.8 -2% | 86.2 -1% |
| Response Times | -65% | -73% | -132% | -120% | |
| Response Time Grey 50% / Grey 80% * (ms) | 7.5 ? | 12.4 ? -65% | 14.7 ? -96% | 17.6 ? -135% | 17.6 ? -135% |
| Response Time Black / White * (ms) | 5.6 ? | 9.2 ? -64% | 8.4 ? -50% | 12.8 ? -129% | 11.4 ? -104% |
| PWM Frequency (Hz) | |||||
| Screen | -63% | -58% | -92% | -37% | |
| Brightness middle (cd/m²) | 503 | 365.4 -27% | 377 -25% | 334.8 -33% | 335.9 -33% |
| Brightness (cd/m²) | 486 | 344 -29% | 352 -28% | 305 -37% | 294 -40% |
| Brightness Distribution (%) | 84 | 85 1% | 86 2% | 79 -6% | 75 -11% |
| Black Level * (cd/m²) | 0.44 | 0.29 34% | 0.32 27% | 0.34 23% | 0.38 14% |
| Contrast (:1) | 1143 | 1260 10% | 1178 3% | 985 -14% | 884 -23% |
| Colorchecker dE 2000 * | 1.08 | 3.17 -194% | 2.91 -169% | 4.1 -280% | 2.82 -161% |
| Colorchecker dE 2000 max. * | 4.54 | 7.69 -69% | 6.78 -49% | 7.28 -60% | 5.04 -11% |
| Colorchecker dE 2000 calibrated * | 0.6 | 0.51 15% | 1.3 -117% | ||
| Greyscale dE 2000 * | 1.3 | 5.3 -308% | 3.4 -162% | 5.6 -331% | 1.7 -31% |
| Gamma | 2.151 102% | 2.18 101% | 2.109 104% | 2.16 102% | 2.14 103% |
| CCT | 6541 99% | 5879 111% | 7273 89% | 6314 103% | 6382 102% |
| Total Average (Program / Settings) | -46% /
-52% | -50% /
-51% | -75% /
-77% | -53% /
-41% |
* ... smaller is better
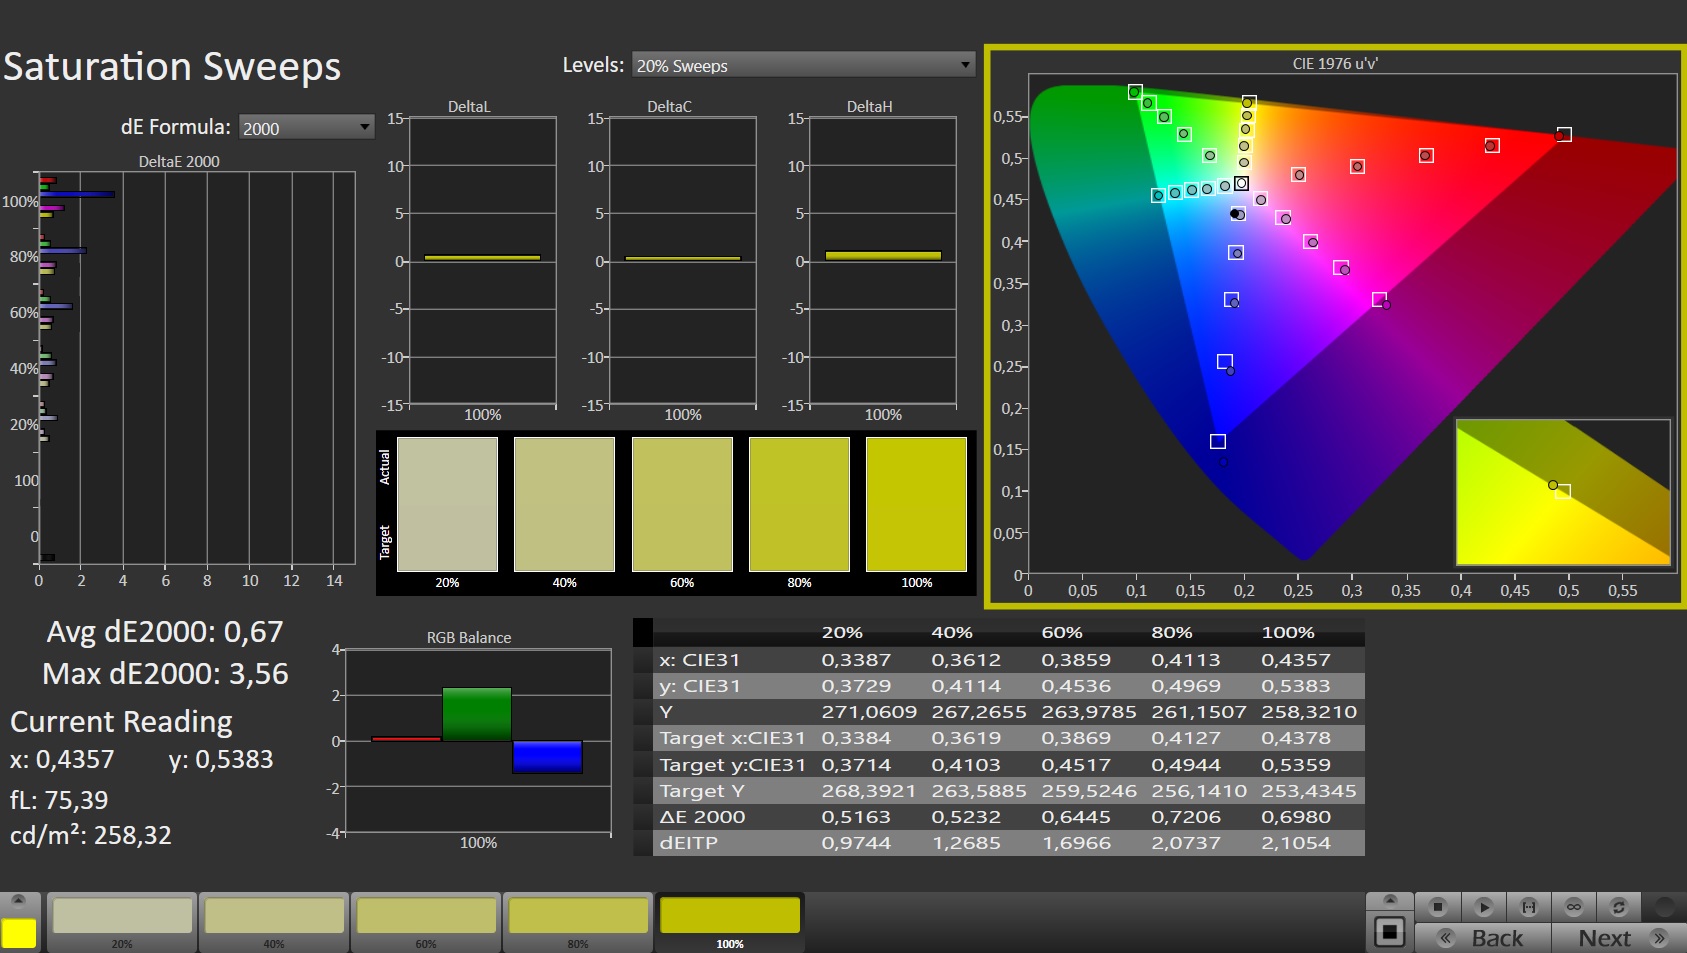
在色彩再现和色彩空间覆盖方面,4K面板和兄弟型号的QHD面板是相似的,两个型号在交付状态下已经提供了几乎相同水平的良好数值。平均色彩偏差保持在DeltaE<3的目标范围内。校准带来了进一步的改善,我们的配置文件链接在上面的显示器信息窗口,供您免费下载。然而,即使在校准之后,4K面板在蓝色调方面显示出一些轻微的弱点。两台显示器都能完全覆盖sRGB和DCI-P3色彩空间,而AdobeRGB色彩空间至少也能分别覆盖到86%和87%。
Display Response Times
| ↔ Response Time Black to White | ||
|---|---|---|
| 5.6 ms ... rise ↗ and fall ↘ combined | ↗ 1.6 ms rise |  |
| ↘ 4 ms fall | ||
| The screen shows very fast response rates in our tests and should be very well suited for fast-paced gaming. In comparison, all tested devices range from 0.1 (minimum) to 240 (maximum) ms. » 18 % of all devices are better. This means that the measured response time is better than the average of all tested devices (19.8 ms). | ||
| ↔ Response Time 50% Grey to 80% Grey | ||
| 7.5 ms ... rise ↗ and fall ↘ combined | ↗ 2.1 ms rise | 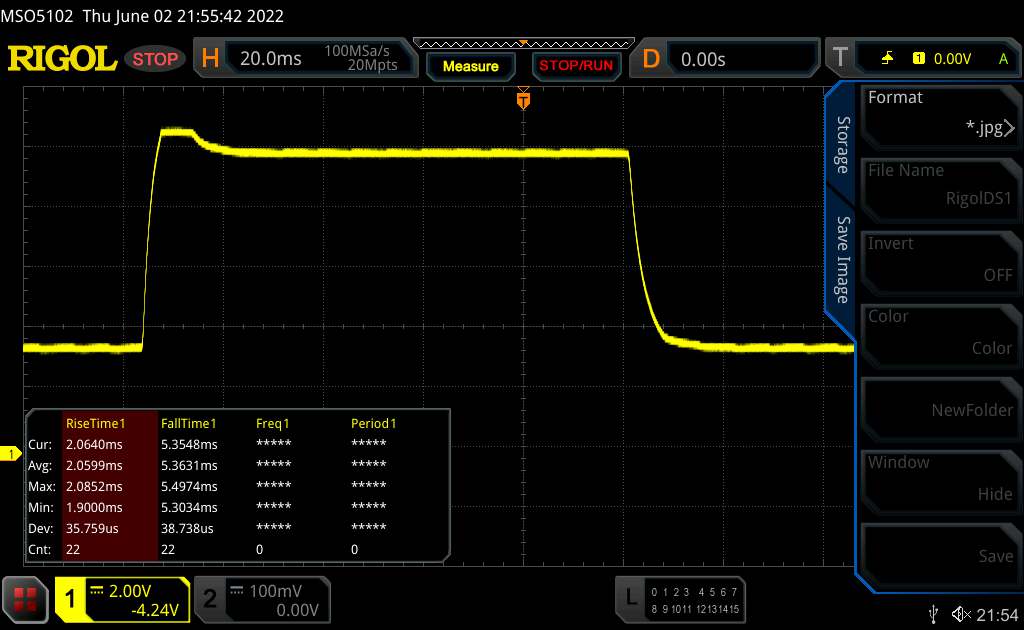 |
| ↘ 5.4 ms fall | ||
| The screen shows very fast response rates in our tests and should be very well suited for fast-paced gaming. In comparison, all tested devices range from 0.165 (minimum) to 636 (maximum) ms. » 20 % of all devices are better. This means that the measured response time is better than the average of all tested devices (31 ms). | ||
Screen Flickering / PWM (Pulse-Width Modulation)
| Screen flickering / PWM not detected | 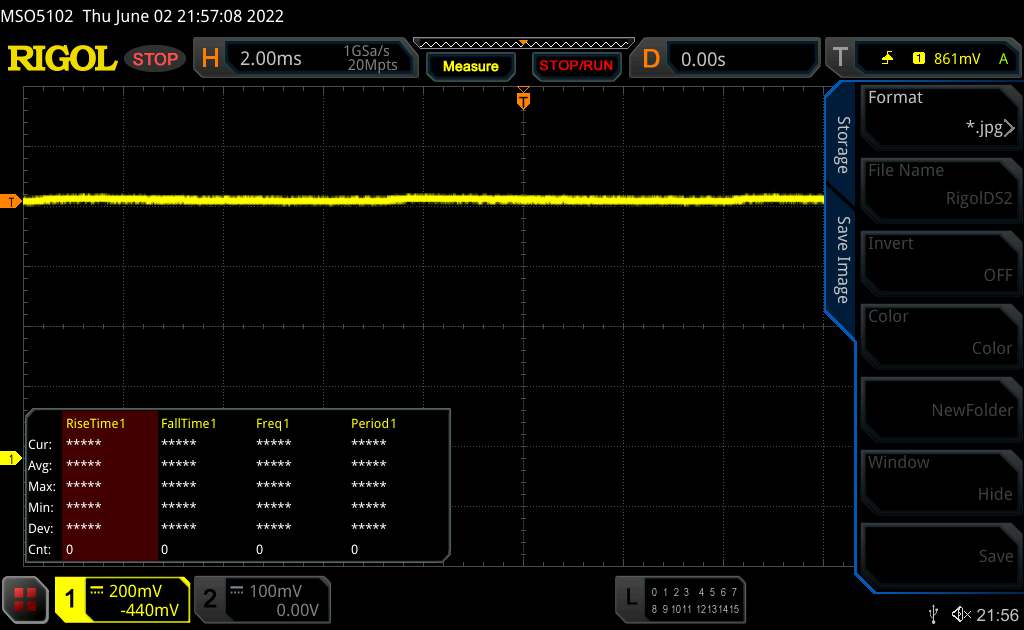 | ||
In comparison: 52 % of all tested devices do not use PWM to dim the display. If PWM was detected, an average of 7754 (minimum: 5 - maximum: 343500) Hz was measured. | |||
IPS面板提供稳定的可视角度,可以从任何角度阅读。由于显示亮度相当高,你也可以在户外轻松阅读其内容。

性能--Razer笔记本电脑使用Alder Lake和Ampere
通过Blade 17,Razer提供了一个17.3英寸的游戏笔记本电脑,能够将目前所有的游戏流畅地显示出来。
测试条件
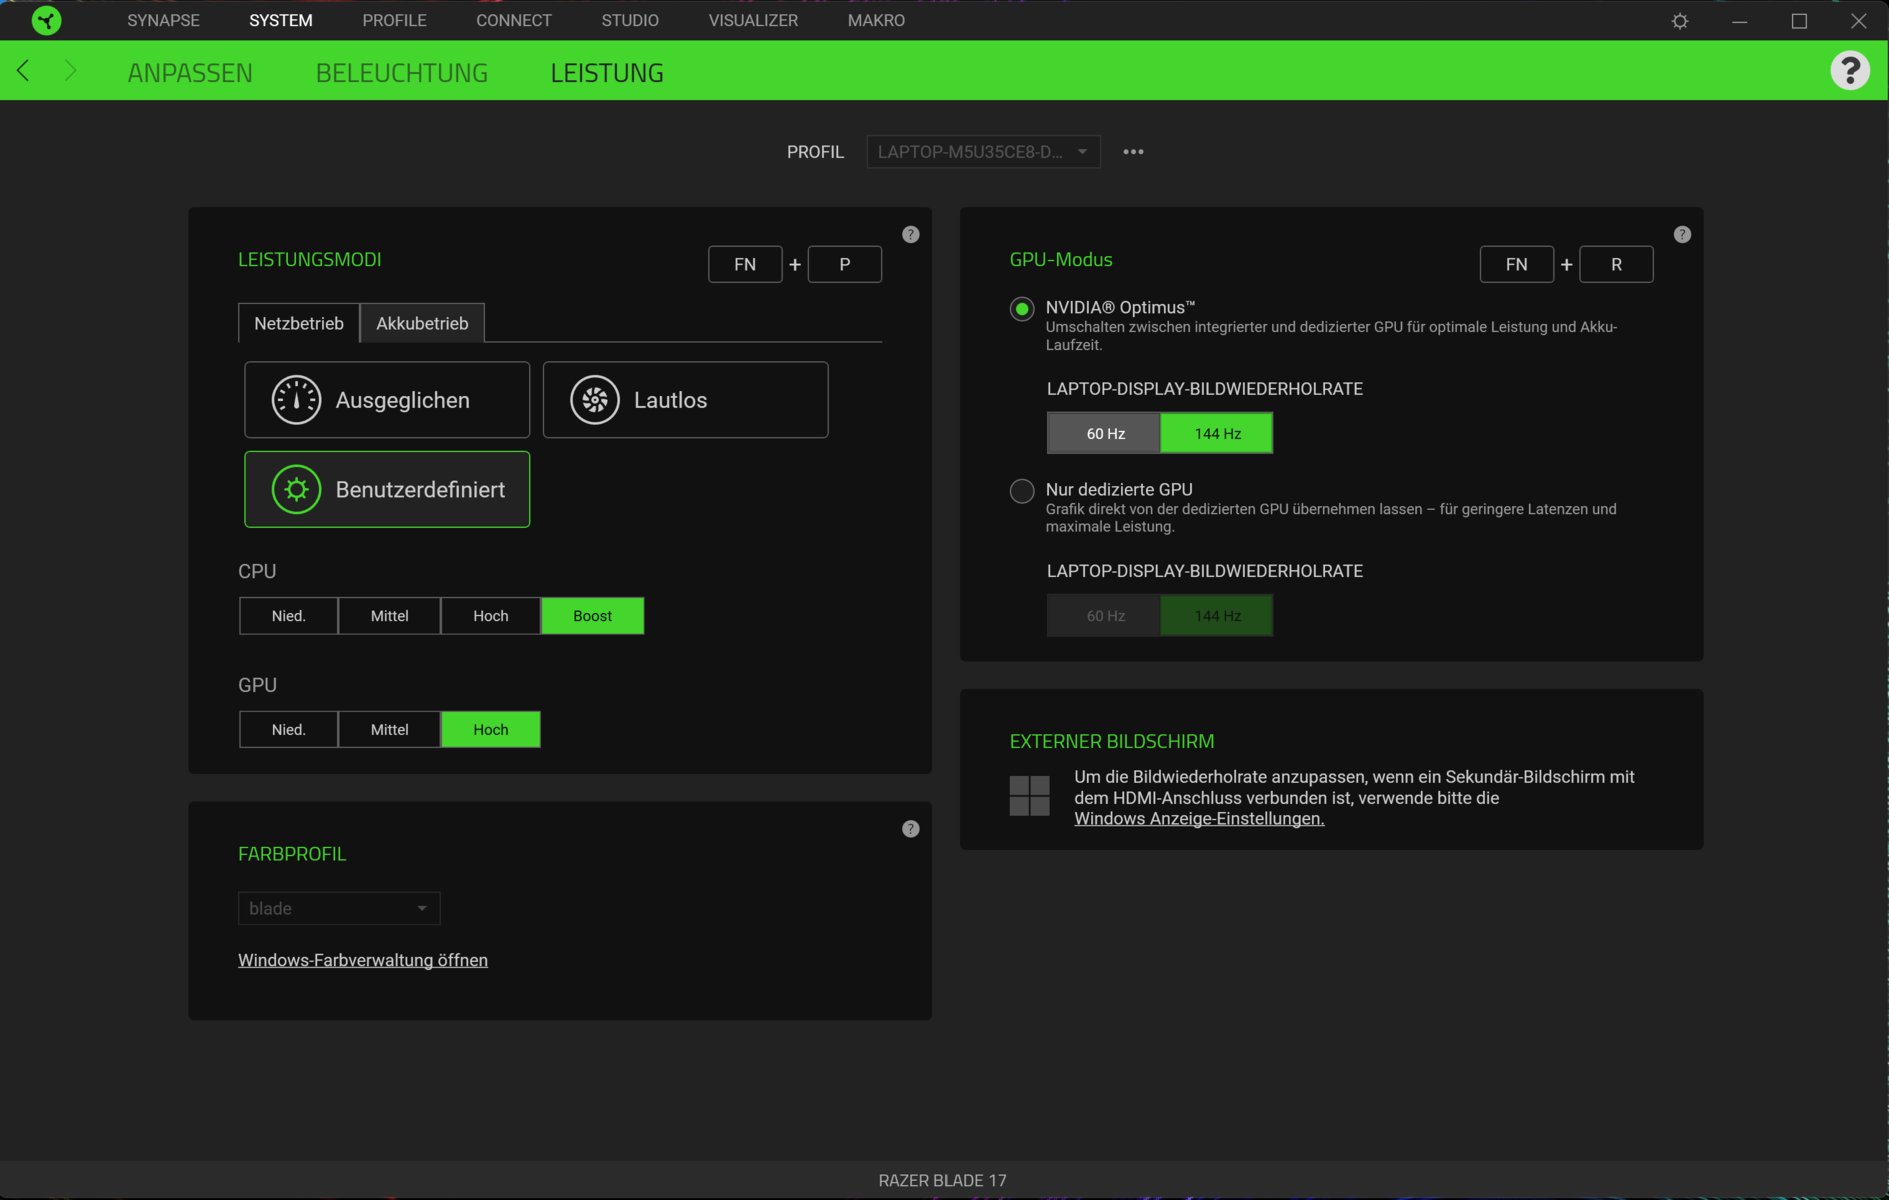
你可以通过使用 "Fn "+"P "组合键在三个可用的性能配置文件("平衡"、"静音 "和 "用户定义")之间切换。用户定义 "配置文件允许你通过Razer Synapse软件为CPU("低"、"中"、"高 "和 "提升")和GPU("低"、"中 "和 "高")设置子预设。在电池操作中,唯一可用的配置文件是 "平衡"。
在我们的测试中,我们使用了 "用户定义 "配置文件与 "中"(CPU)和 "高"(GPU)子预置,这是交付状态下的默认设置。此外,我们使用 "沉默 "配置文件,在最高性能(CPU:"Boost",GPU:"High")和dGPU模式下运行了几个基准测试。你可以在下面的图表中找到结果。
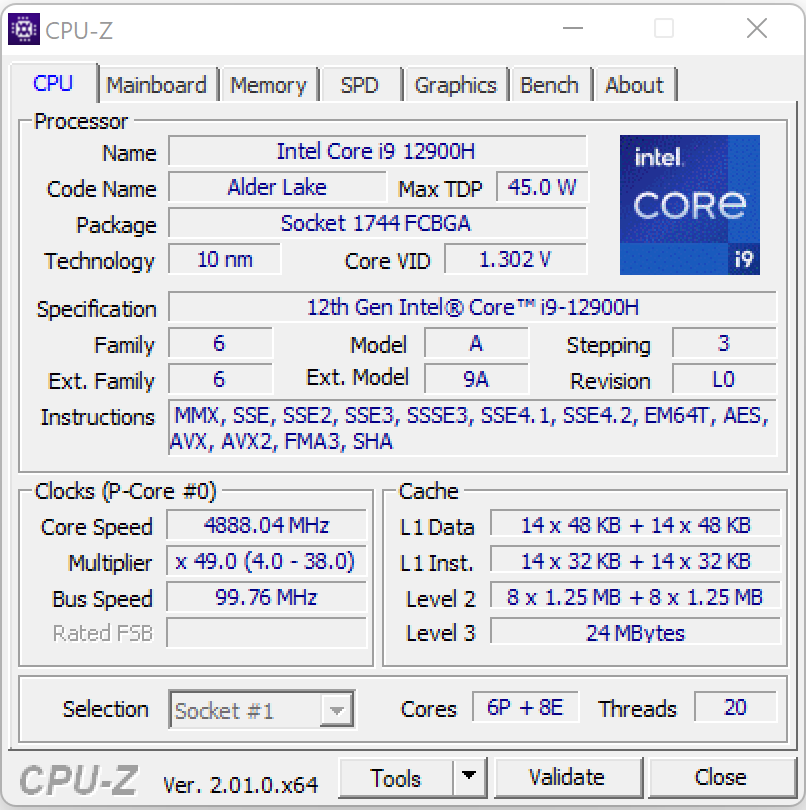
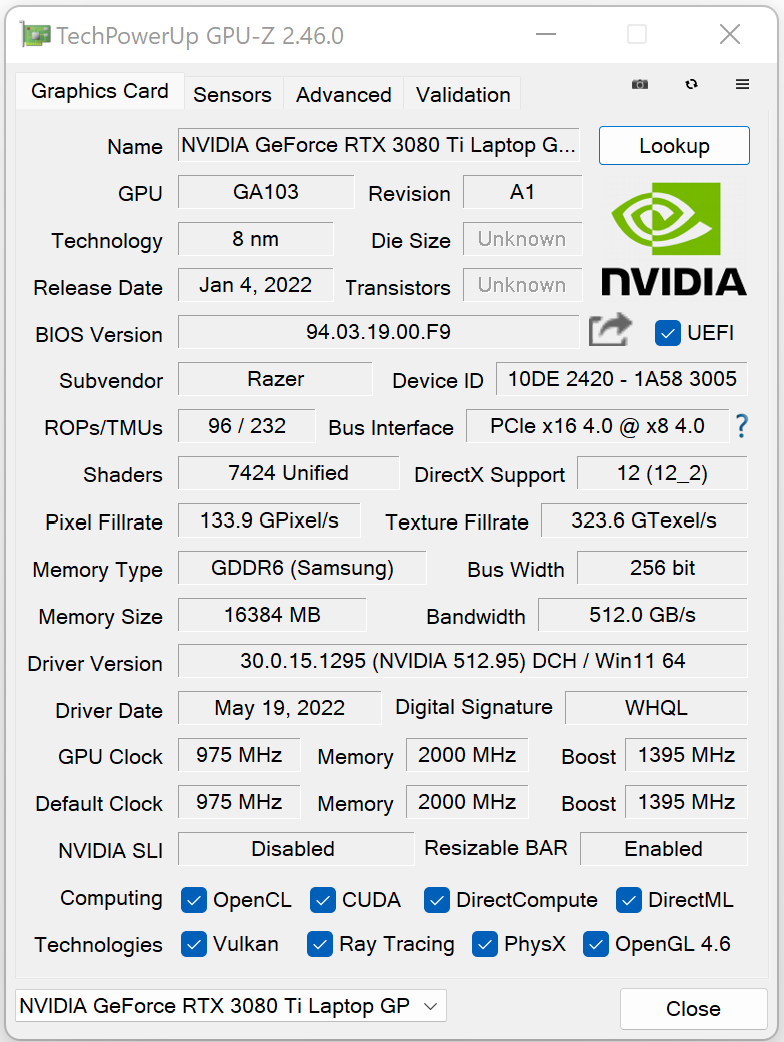
处理器
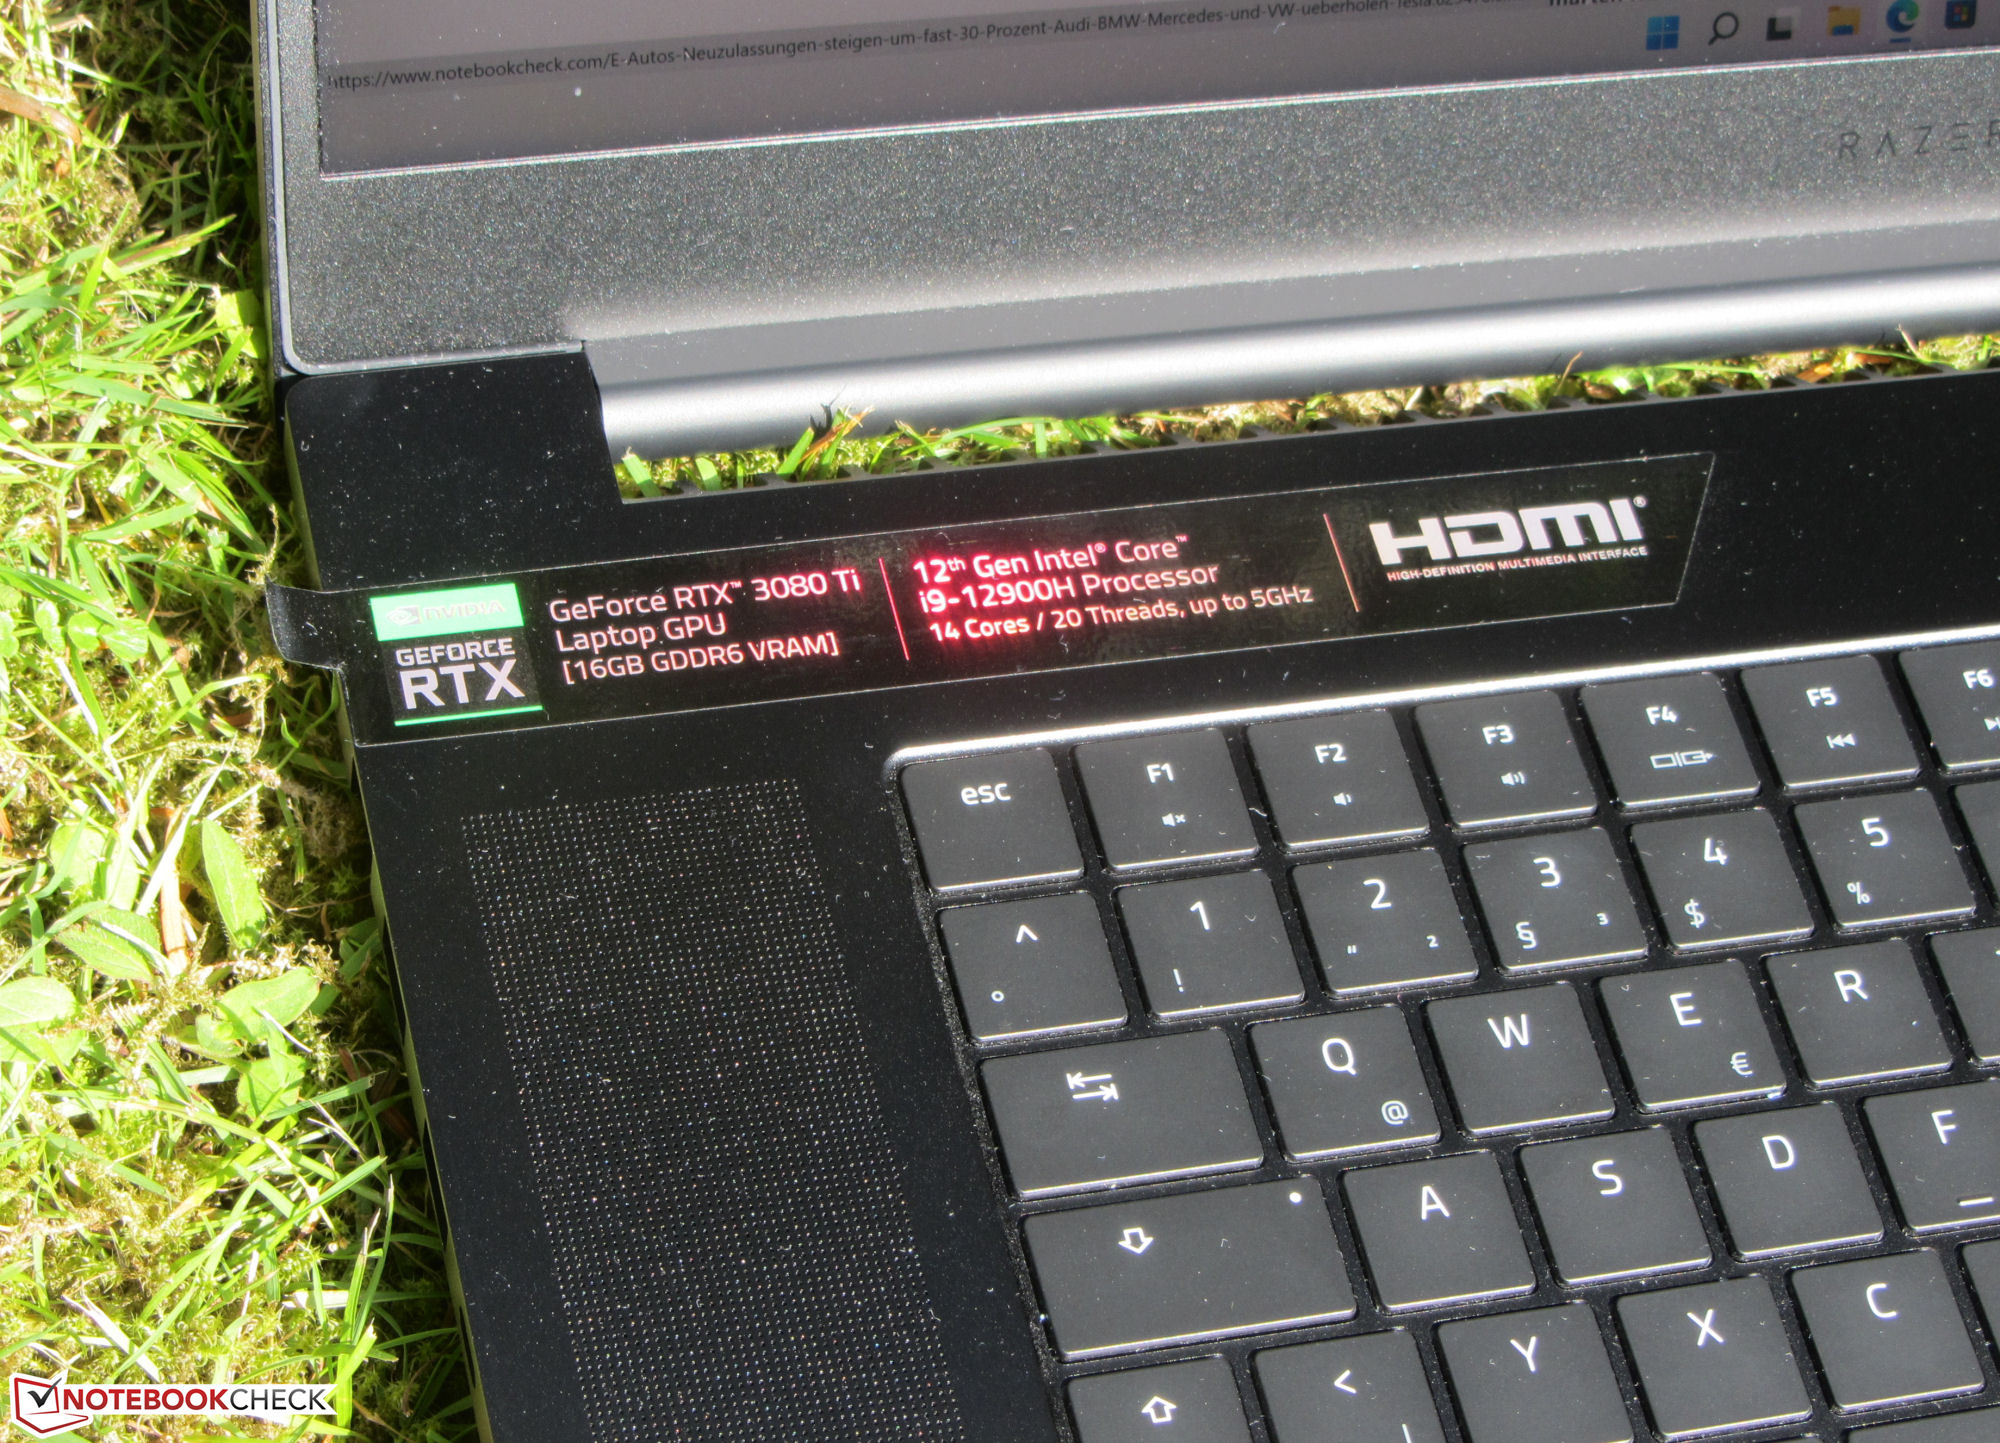
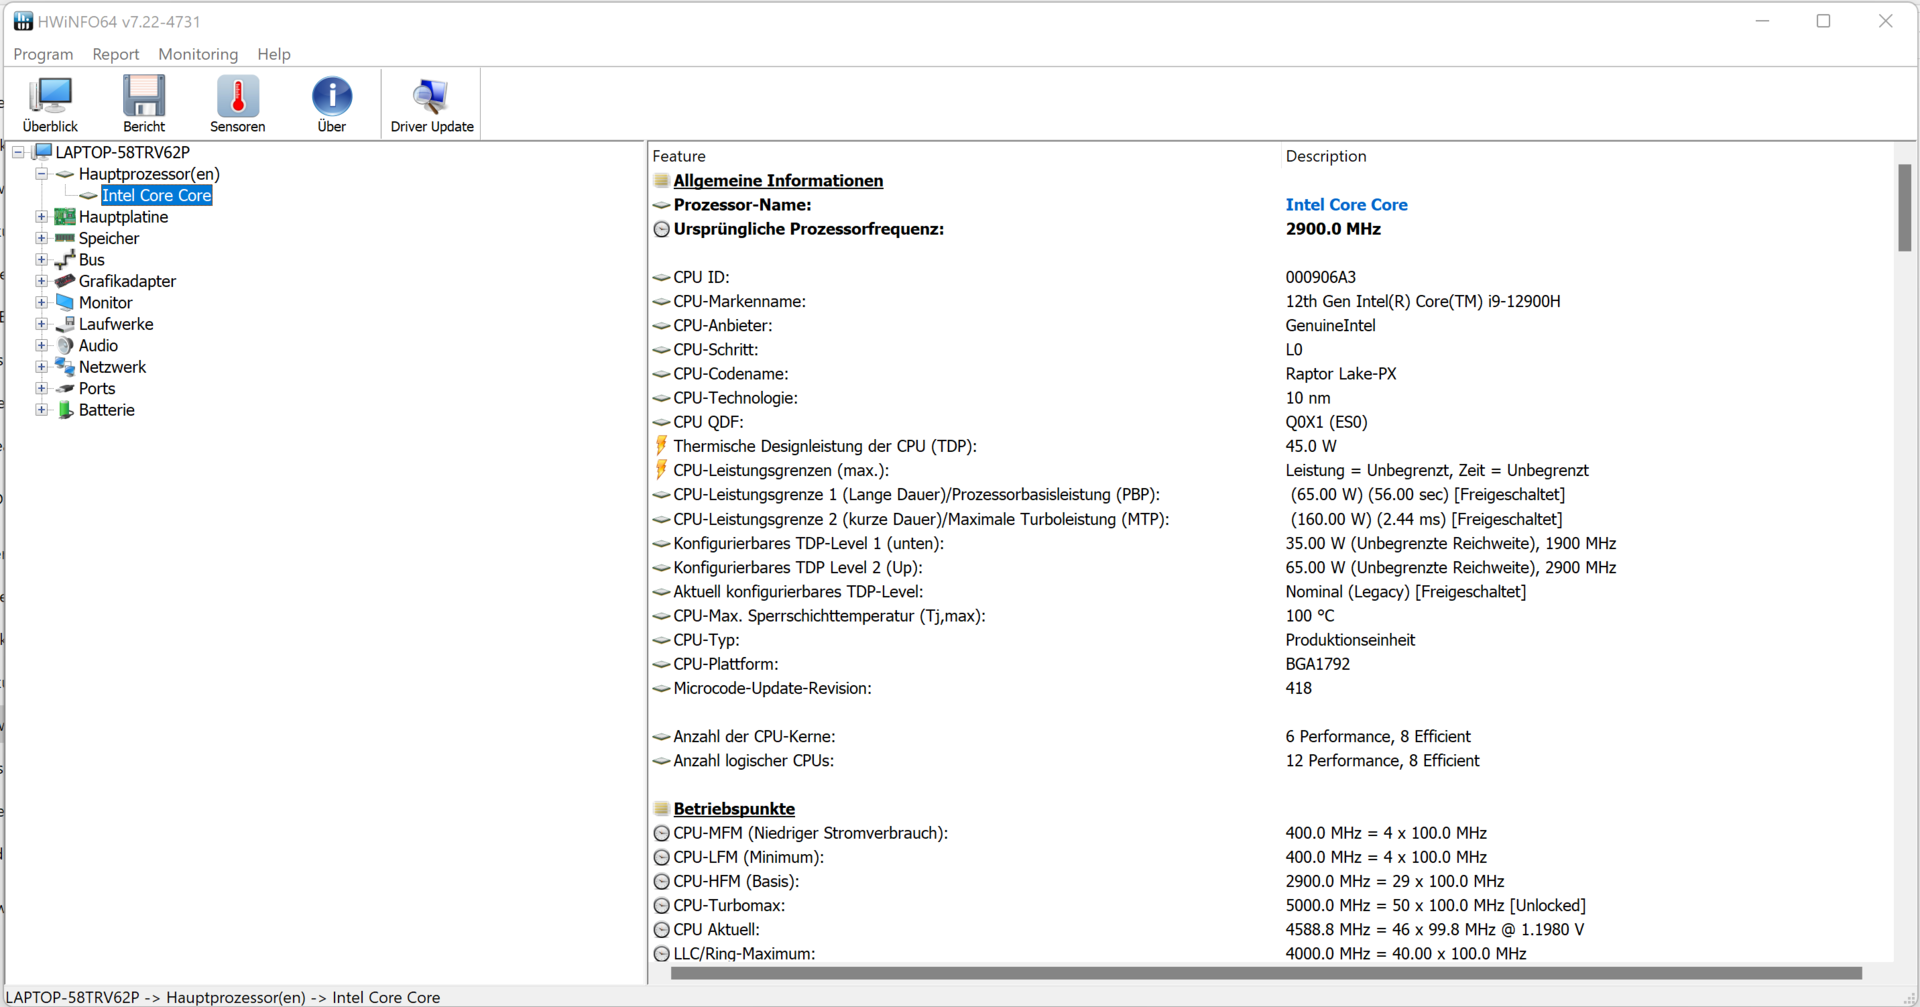
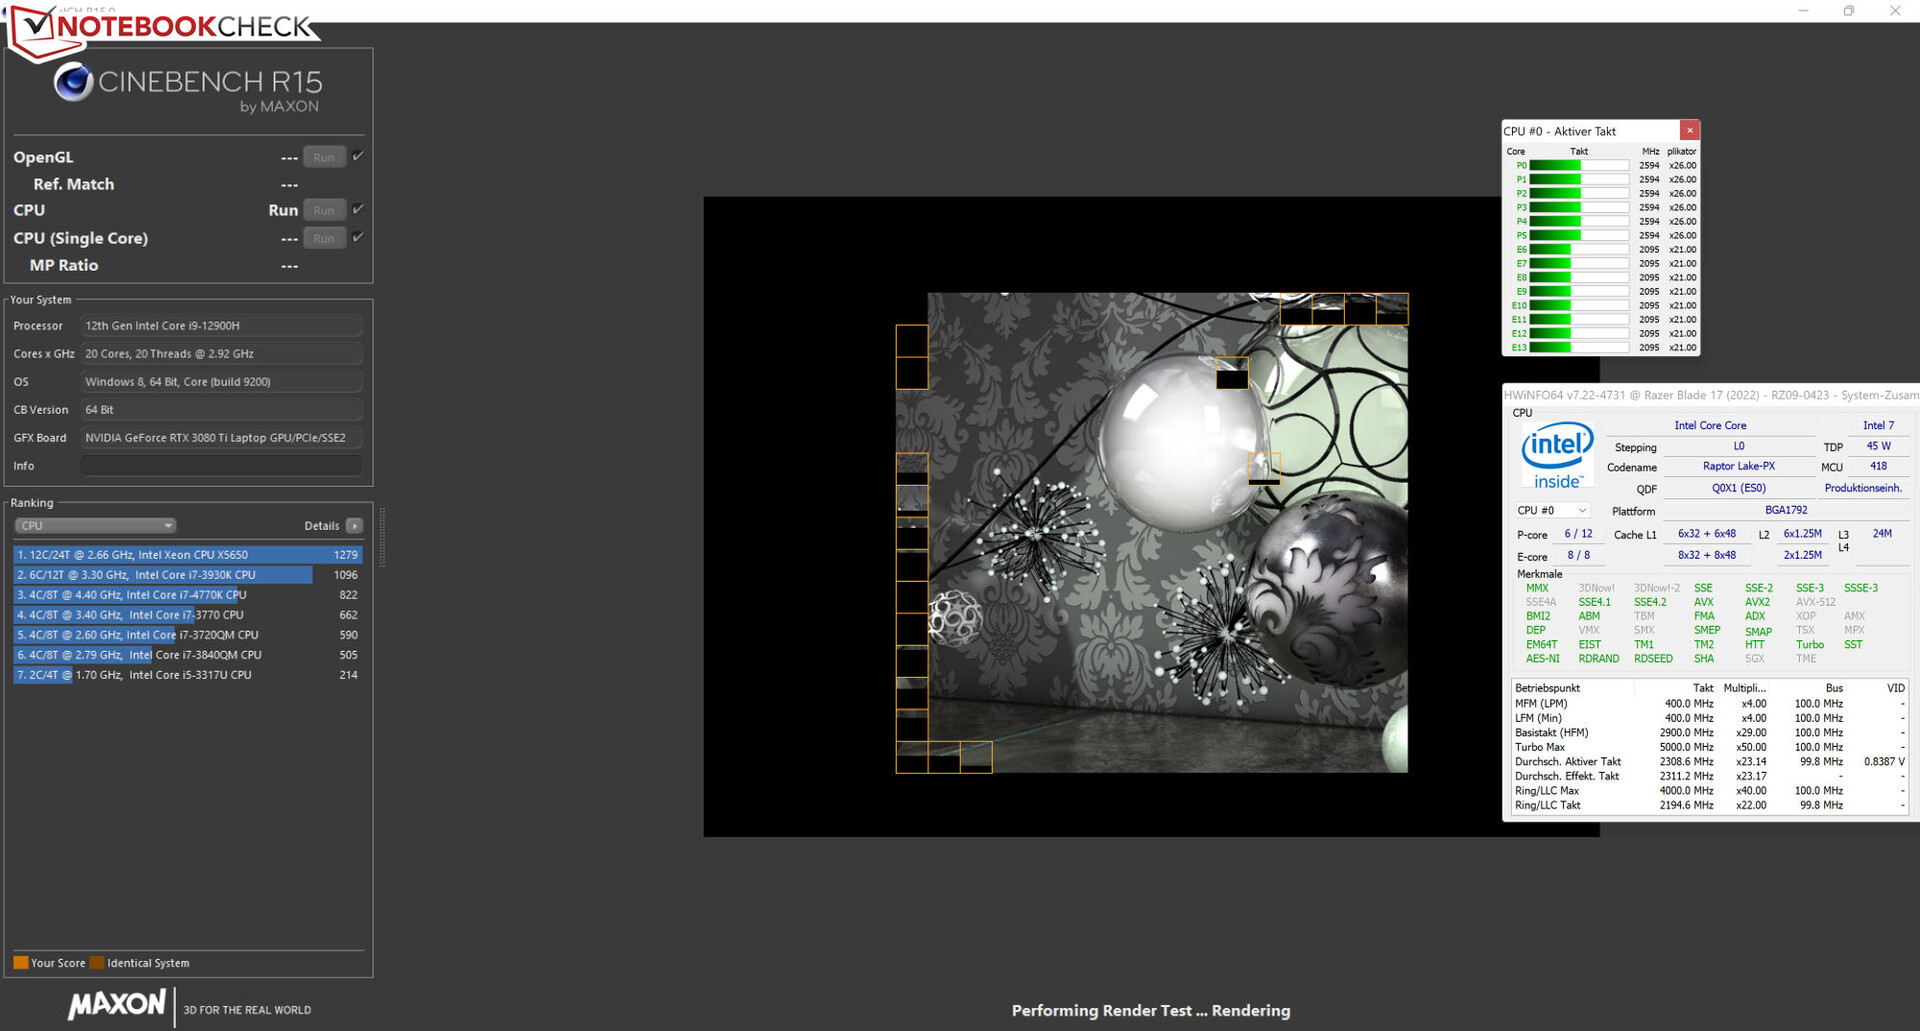
芯片酷睿i9-12900H处理器(Alder Lake)包括六个性能核心(超线程,2.5至5 GHz)和八个效率核心(无超线程,1.8至3.8 GHz)。总的来说,这导致了20个逻辑上的CPU核心。
在CB15多线程测试中,"中等 "CPU子预设确保速度(P核:2.6至2.7GHz,E核:2.1GHz)略高于基本时钟速度。单线程测试以高时钟速度完成(P核:4至4.6GHz,E核:2.1至3.7GHz)。在电池运行中,这些数值明显较低。
使用相同的CPU预设,与Core i9相比,Core i9在峰值上只提供了轻微的性能优势。 酷睿i7-12800H处理器相比,酷睿i9在峰值上仅有轻微的性能优势。这并不奇怪,因为两个CPU提供相同数量的内核,而且酷睿i9提供略高的最大速度(5 GHz对4.8 GHz)。
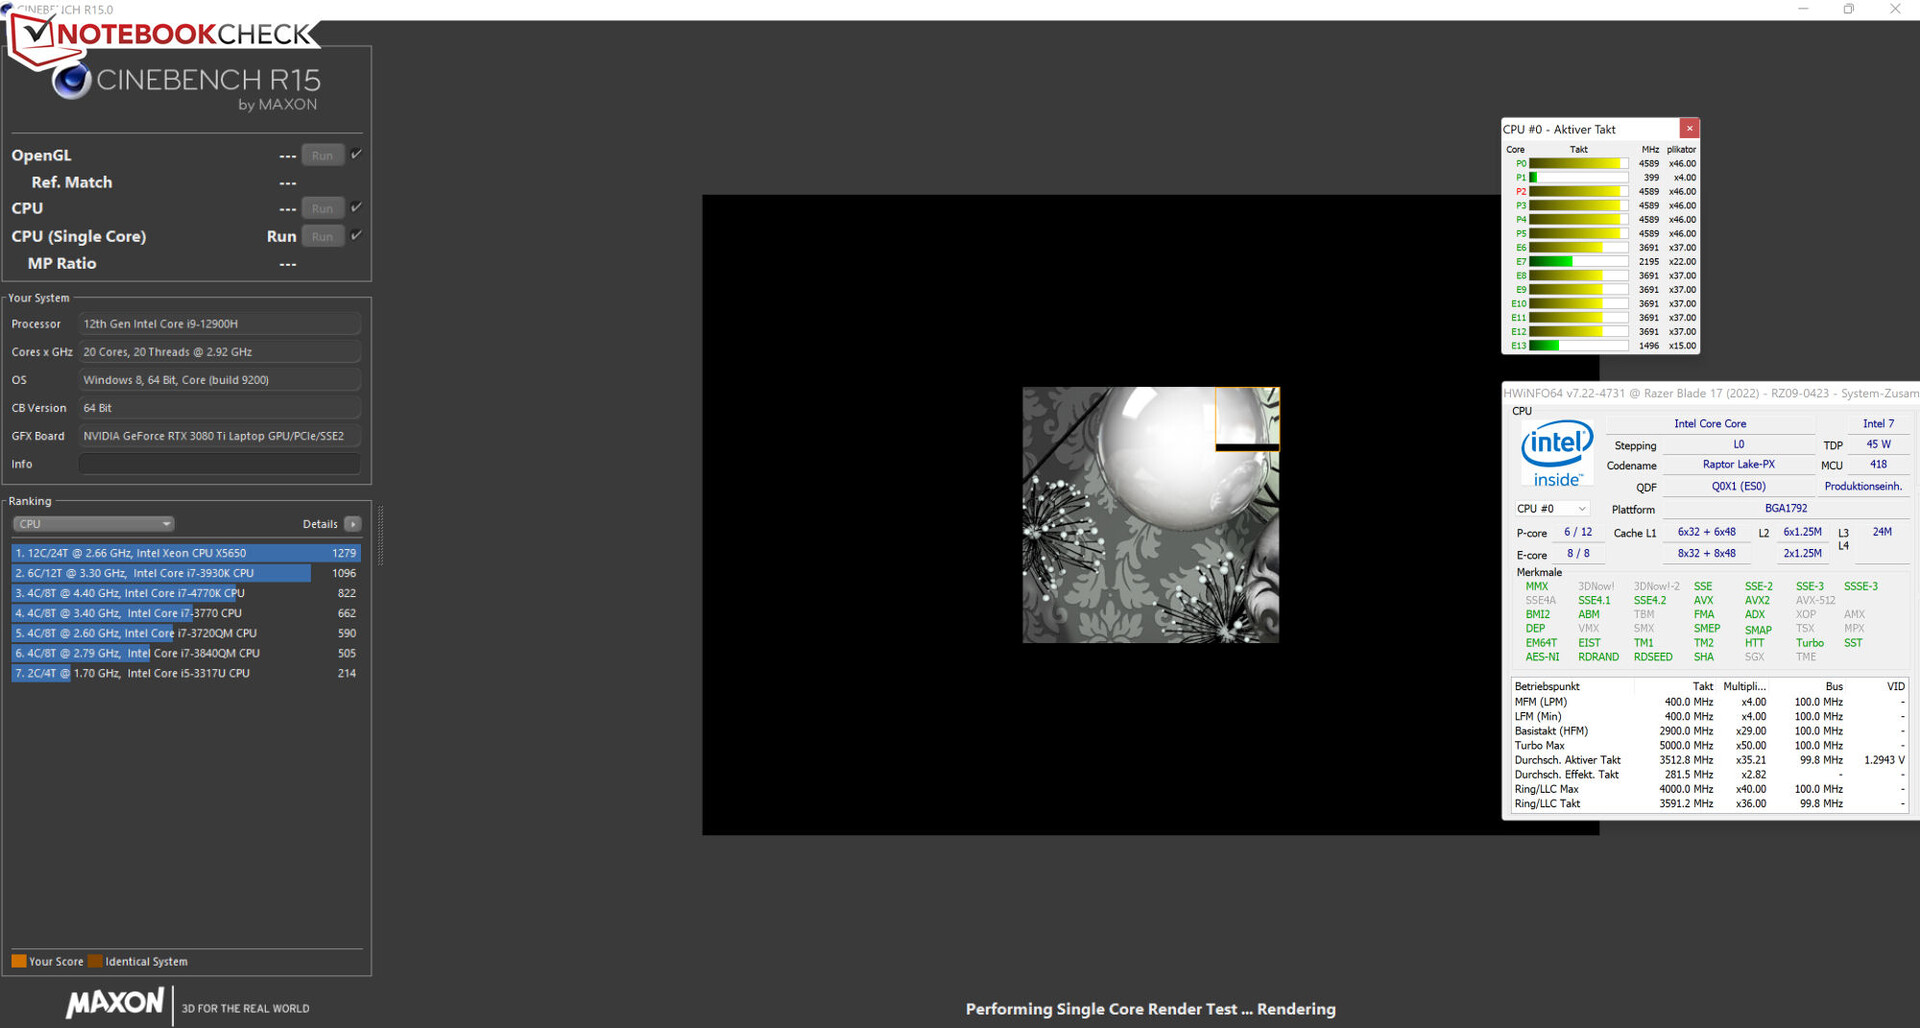
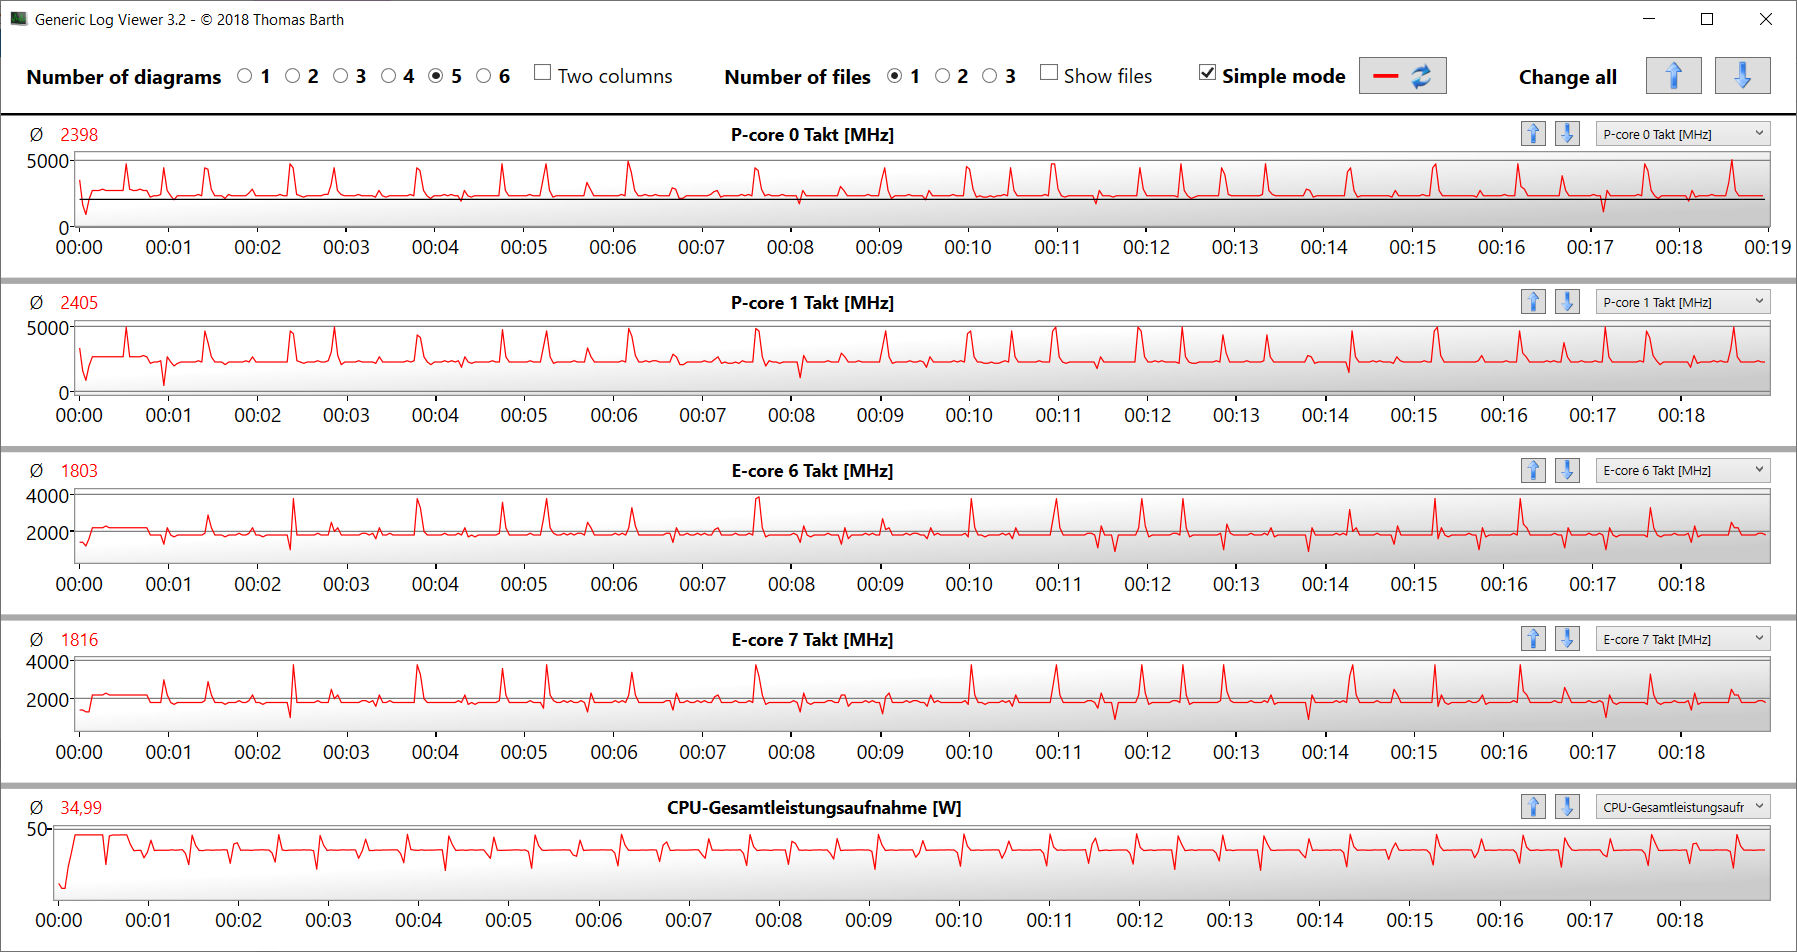
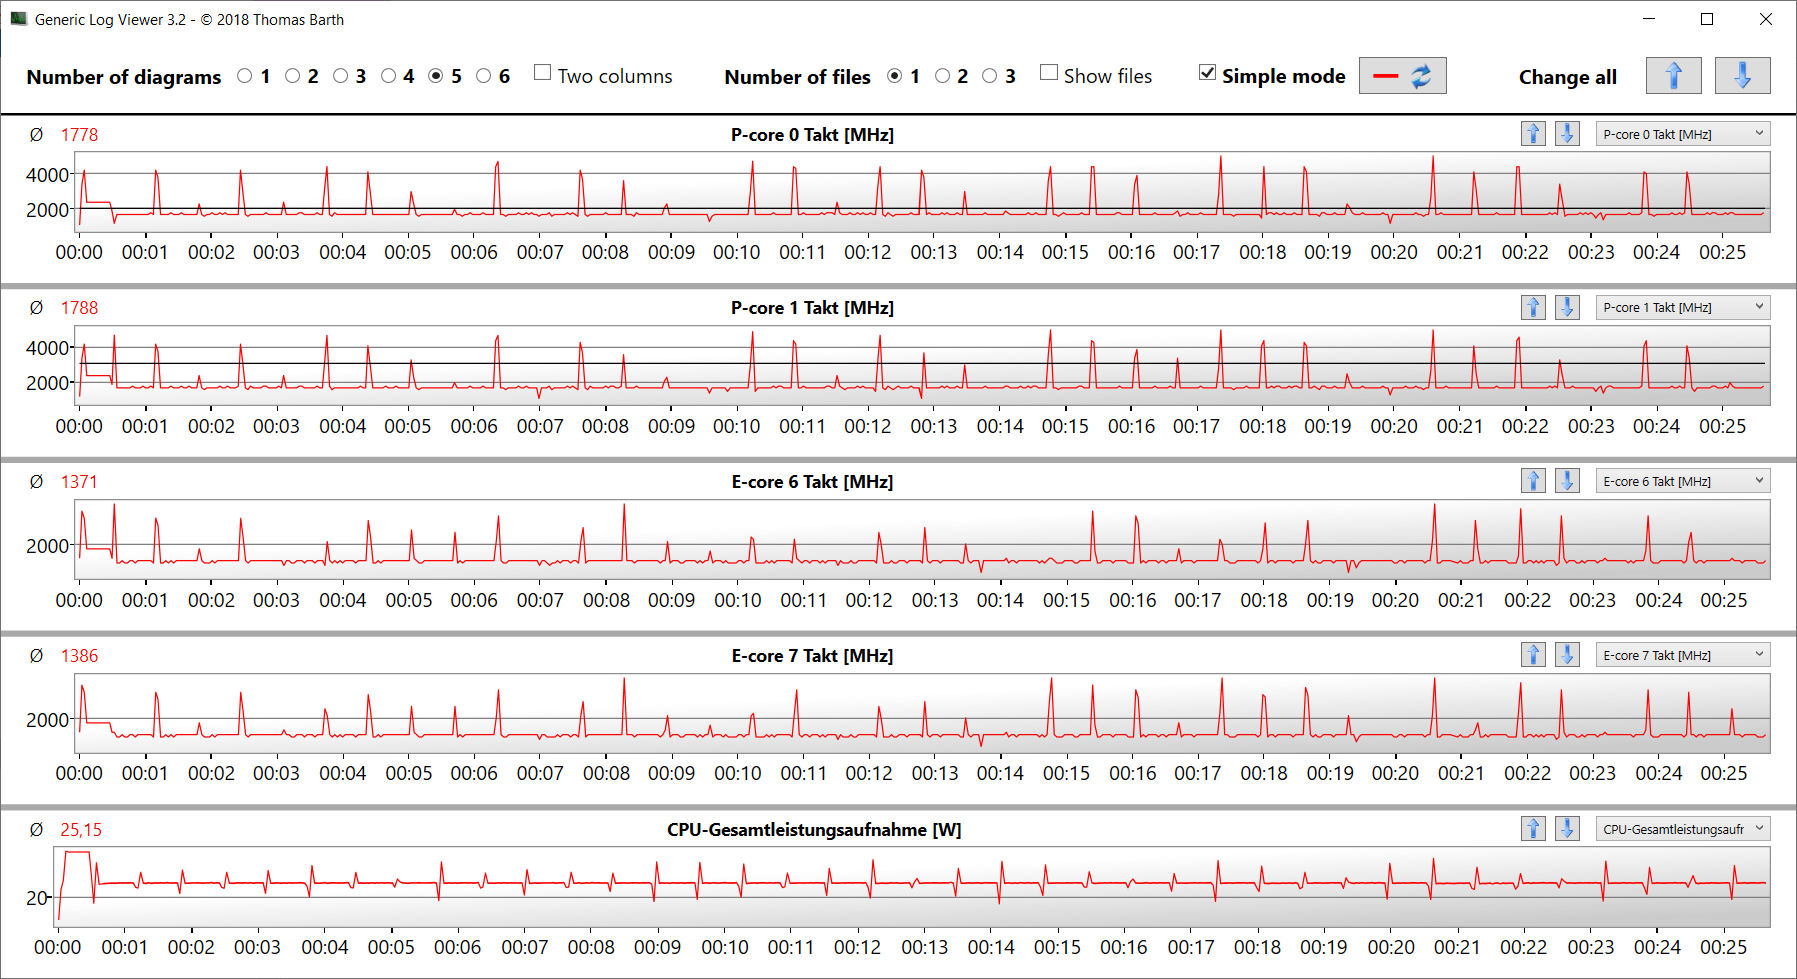
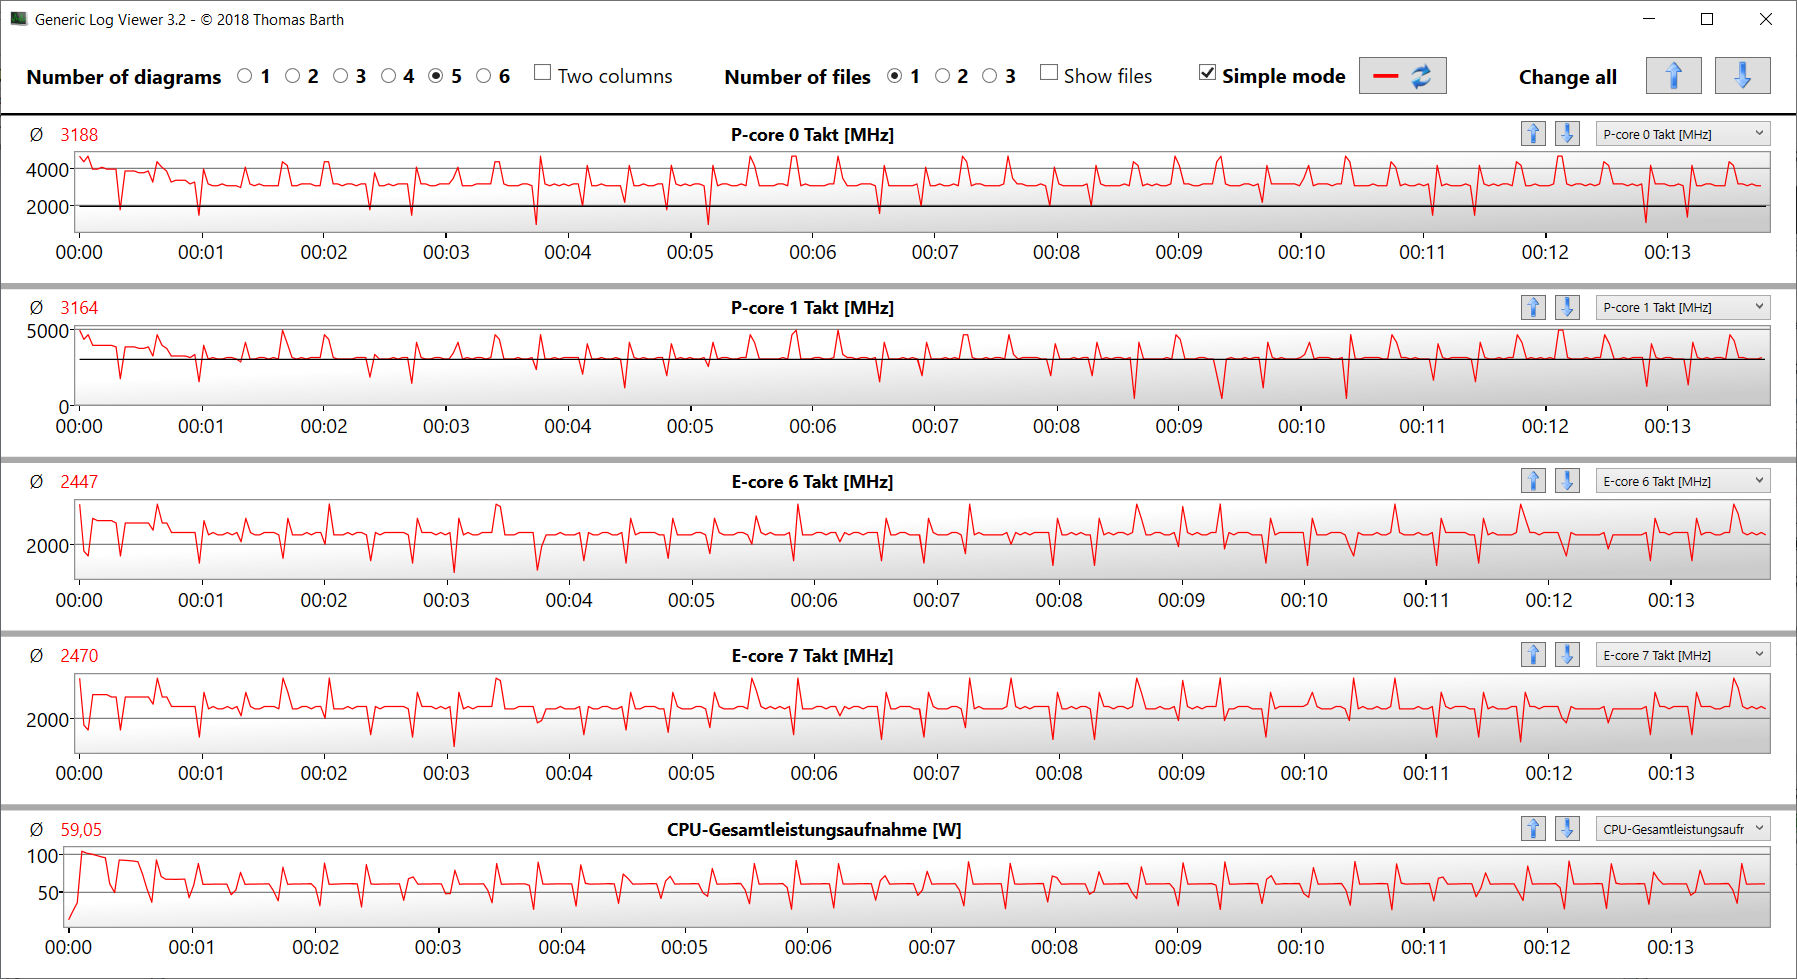
在多线程运行中,Turbo的使用强度很大程度上取决于所选择的CPU子预设。在所有情况下,CPU都能以均匀的时钟速度持续运行,这一点从CB15循环测试中可以看出。值得注意的是,无论选择何种预设,CPU的时钟速度从第一次运行到第二次/第三次运行都会略有下降。与i7 CPU相比,i9 CPU只会在一些短暂的负载高峰期给用户带来值得注意的优势。在较长的负载下,两个处理器之间的性能差距正在缩小,它们最终会非常接近对方。
Cinebench R15 Multi Constant Load Test
| CPU Performance rating - Percent | |
| Average of class Gaming | |
| Alienware x17 R2 P48E | |
| MSI Stealth GS77 12UHS-083US | |
| Razer Blade 17 Early 2022 | |
| Medion Erazer Beast X30 | |
| Average Intel Core i9-12900H | |
| Razer Blade 17 RTX 3080 Ti | |
| Razer Blade 17 Early 2022 | |
| Razer Blade 17 Early 2022 | |
| Cinebench R23 | |
| Multi Core | |
| Average of class Gaming (10488 - 42661, n=107, last 2 years) | |
| Medion Erazer Beast X30 | |
| Alienware x17 R2 P48E | |
| MSI Stealth GS77 12UHS-083US | |
| Razer Blade 17 Early 2022 (Max.) | |
| Razer Blade 17 RTX 3080 Ti | |
| Average Intel Core i9-12900H (7359 - 19648, n=28) | |
| Razer Blade 17 Early 2022 | |
| Razer Blade 17 Early 2022 (Lautlos) | |
| Single Core | |
| Average of class Gaming (1166 - 2415, n=107, last 2 years) | |
| Razer Blade 17 Early 2022 | |
| Alienware x17 R2 P48E | |
| Razer Blade 17 Early 2022 (Max.) | |
| Razer Blade 17 RTX 3080 Ti | |
| Average Intel Core i9-12900H (1634 - 1930, n=28) | |
| MSI Stealth GS77 12UHS-083US | |
| Razer Blade 17 Early 2022 (Lautlos) | |
| Medion Erazer Beast X30 | |
| Cinebench R20 | |
| CPU (Multi Core) | |
| Average of class Gaming (4029 - 16433, n=106, last 2 years) | |
| Medion Erazer Beast X30 | |
| Alienware x17 R2 P48E | |
| MSI Stealth GS77 12UHS-083US | |
| Razer Blade 17 Early 2022 (Max.) | |
| Razer Blade 17 RTX 3080 Ti | |
| Average Intel Core i9-12900H (2681 - 7471, n=28) | |
| Razer Blade 17 Early 2022 | |
| Razer Blade 17 Early 2022 (Lautlos) | |
| CPU (Single Core) | |
| Average of class Gaming (442 - 913, n=106, last 2 years) | |
| Alienware x17 R2 P48E | |
| Razer Blade 17 Early 2022 (Max.) | |
| Razer Blade 17 RTX 3080 Ti | |
| Average Intel Core i9-12900H (624 - 738, n=28) | |
| Razer Blade 17 Early 2022 | |
| MSI Stealth GS77 12UHS-083US | |
| Razer Blade 17 Early 2022 (Lautlos) | |
| Medion Erazer Beast X30 | |
| Cinebench R15 | |
| CPU Multi 64Bit | |
| Average of class Gaming (1578 - 6330, n=105, last 2 years) | |
| Alienware x17 R2 P48E | |
| Medion Erazer Beast X30 | |
| Razer Blade 17 Early 2022 (Max.) | |
| MSI Stealth GS77 12UHS-083US | |
| Average Intel Core i9-12900H (1395 - 3077, n=28) | |
| Razer Blade 17 RTX 3080 Ti | |
| Razer Blade 17 Early 2022 | |
| Razer Blade 17 Early 2022 (Lautlos) | |
| CPU Single 64Bit | |
| Average of class Gaming (188.8 - 350, n=106, last 2 years) | |
| Alienware x17 R2 P48E | |
| Razer Blade 17 Early 2022 (Max.) | |
| Razer Blade 17 RTX 3080 Ti | |
| Average Intel Core i9-12900H (235 - 277, n=29) | |
| MSI Stealth GS77 12UHS-083US | |
| Razer Blade 17 Early 2022 | |
| Razer Blade 17 Early 2022 (Lautlos) | |
| Medion Erazer Beast X30 | |
| Blender - v2.79 BMW27 CPU | |
| Razer Blade 17 Early 2022 (Lautlos) | |
| Razer Blade 17 Early 2022 | |
| Average Intel Core i9-12900H (160 - 451, n=28) | |
| Razer Blade 17 RTX 3080 Ti | |
| Razer Blade 17 Early 2022 (Max.) | |
| MSI Stealth GS77 12UHS-083US | |
| Medion Erazer Beast X30 | |
| Alienware x17 R2 P48E | |
| Average of class Gaming (79 - 330, n=104, last 2 years) | |
| 7-Zip 18.03 | |
| 7z b 4 | |
| Average of class Gaming (33491 - 148086, n=105, last 2 years) | |
| Medion Erazer Beast X30 | |
| Alienware x17 R2 P48E | |
| MSI Stealth GS77 12UHS-083US | |
| Razer Blade 17 Early 2022 (Max.) | |
| Razer Blade 17 RTX 3080 Ti | |
| Average Intel Core i9-12900H (34684 - 76677, n=28) | |
| Razer Blade 17 Early 2022 | |
| Razer Blade 17 Early 2022 (Lautlos) | |
| 7z b 4 -mmt1 | |
| Average of class Gaming (4199 - 7436, n=105, last 2 years) | |
| Razer Blade 17 Early 2022 | |
| Average Intel Core i9-12900H (5302 - 6289, n=28) | |
| Razer Blade 17 RTX 3080 Ti | |
| Alienware x17 R2 P48E | |
| Razer Blade 17 Early 2022 (Max.) | |
| MSI Stealth GS77 12UHS-083US | |
| Razer Blade 17 Early 2022 (Lautlos) | |
| Medion Erazer Beast X30 | |
| Geekbench 5.5 | |
| Multi-Core | |
| Average of class Gaming (6460 - 28263, n=105, last 2 years) | |
| Alienware x17 R2 P48E | |
| Razer Blade 17 Early 2022 (Max.) | |
| MSI Stealth GS77 12UHS-083US | |
| Razer Blade 17 RTX 3080 Ti | |
| Medion Erazer Beast X30 | |
| Average Intel Core i9-12900H (8519 - 14376, n=31) | |
| Razer Blade 17 Early 2022 | |
| Razer Blade 17 Early 2022 (Lautlos) | |
| Single-Core | |
| Average of class Gaming (986 - 2474, n=105, last 2 years) | |
| Alienware x17 R2 P48E | |
| Average Intel Core i9-12900H (1631 - 1897, n=31) | |
| Razer Blade 17 Early 2022 | |
| Razer Blade 17 Early 2022 (Max.) | |
| Razer Blade 17 Early 2022 (Lautlos) | |
| Razer Blade 17 RTX 3080 Ti | |
| MSI Stealth GS77 12UHS-083US | |
| Medion Erazer Beast X30 | |
| HWBOT x265 Benchmark v2.2 - 4k Preset | |
| Average of class Gaming (11.5 - 44.4, n=105, last 2 years) | |
| Alienware x17 R2 P48E | |
| Medion Erazer Beast X30 | |
| MSI Stealth GS77 12UHS-083US | |
| Razer Blade 17 Early 2022 (Max.) | |
| Average Intel Core i9-12900H (8.05 - 22.5, n=28) | |
| Razer Blade 17 RTX 3080 Ti | |
| Razer Blade 17 Early 2022 | |
| Razer Blade 17 Early 2022 (Lautlos) | |
| LibreOffice - 20 Documents To PDF | |
| Average of class Gaming (33.2 - 88.8, n=105, last 2 years) | |
| Medion Erazer Beast X30 | |
| Razer Blade 17 Early 2022 (Lautlos) | |
| Razer Blade 17 RTX 3080 Ti | |
| Razer Blade 17 Early 2022 (Max.) | |
| MSI Stealth GS77 12UHS-083US | |
| Average Intel Core i9-12900H (36.8 - 59.8, n=28) | |
| Alienware x17 R2 P48E | |
| Razer Blade 17 Early 2022 | |
| R Benchmark 2.5 - Overall mean | |
| Medion Erazer Beast X30 | |
| Razer Blade 17 Early 2022 (Lautlos) | |
| MSI Stealth GS77 12UHS-083US | |
| Razer Blade 17 RTX 3080 Ti | |
| Average Intel Core i9-12900H (0.4218 - 0.506, n=28) | |
| Razer Blade 17 Early 2022 (Max.) | |
| Razer Blade 17 Early 2022 | |
| Alienware x17 R2 P48E | |
| Average of class Gaming (0.3439 - 0.759, n=106, last 2 years) | |
* ... smaller is better
AIDA64: FP32 Ray-Trace | FPU Julia | CPU SHA3 | CPU Queen | FPU SinJulia | FPU Mandel | CPU AES | CPU ZLib | FP64 Ray-Trace | CPU PhotoWorxx
| Performance rating | |
| Average of class Gaming | |
| Alienware x17 R2 P48E | |
| Medion Erazer Beast X30 | |
| Average Intel Core i9-12900H | |
| MSI Stealth GS77 12UHS-083US | |
| Razer Blade 17 Early 2022 | |
| Razer Blade 17 RTX 3080 Ti | |
| Razer Blade 17 Early 2022 | |
| Razer Blade 17 Early 2022 | |
| AIDA64 / FP32 Ray-Trace | |
| Average of class Gaming (10227 - 85542, n=105, last 2 years) | |
| Average Intel Core i9-12900H (4074 - 18289, n=29) | |
| Alienware x17 R2 P48E (v6.50.5800) | |
| Medion Erazer Beast X30 (v6.50.5800) | |
| MSI Stealth GS77 12UHS-083US (v6.50.5800) | |
| Razer Blade 17 Early 2022 (v6.50.5800, Max.) | |
| Razer Blade 17 RTX 3080 Ti (v6.50.5800) | |
| Razer Blade 17 Early 2022 (v6.50.5800) | |
| Razer Blade 17 Early 2022 (v6.50.5800, Lautlos) | |
| AIDA64 / FPU Julia | |
| Average of class Gaming (51376 - 238426, n=105, last 2 years) | |
| Average Intel Core i9-12900H (22307 - 93236, n=29) | |
| Alienware x17 R2 P48E (v6.50.5800) | |
| Medion Erazer Beast X30 (v6.50.5800) | |
| MSI Stealth GS77 12UHS-083US (v6.50.5800) | |
| Razer Blade 17 Early 2022 (v6.50.5800, Max.) | |
| Razer Blade 17 RTX 3080 Ti (v6.50.5800) | |
| Razer Blade 17 Early 2022 (v6.50.5800) | |
| Razer Blade 17 Early 2022 (v6.50.5800, Lautlos) | |
| AIDA64 / CPU SHA3 | |
| Average of class Gaming (2180 - 10115, n=105, last 2 years) | |
| Alienware x17 R2 P48E (v6.50.5800) | |
| Medion Erazer Beast X30 (v6.50.5800) | |
| MSI Stealth GS77 12UHS-083US (v6.50.5800) | |
| Average Intel Core i9-12900H (1378 - 4215, n=29) | |
| Razer Blade 17 Early 2022 (v6.50.5800, Max.) | |
| Razer Blade 17 RTX 3080 Ti (v6.50.5800) | |
| Razer Blade 17 Early 2022 (v6.50.5800) | |
| Razer Blade 17 Early 2022 (v6.50.5800, Lautlos) | |
| AIDA64 / CPU Queen | |
| Average of class Gaming (49785 - 173351, n=90, last 2 years) | |
| Alienware x17 R2 P48E (v6.50.5800) | |
| Razer Blade 17 Early 2022 (v6.50.5800, Max.) | |
| Medion Erazer Beast X30 (v6.50.5800) | |
| Razer Blade 17 RTX 3080 Ti (v6.50.5800) | |
| Average Intel Core i9-12900H (78172 - 111241, n=28) | |
| MSI Stealth GS77 12UHS-083US (v6.50.5800) | |
| Razer Blade 17 Early 2022 (v6.50.5800) | |
| Razer Blade 17 Early 2022 (v6.50.5800, Lautlos) | |
| AIDA64 / FPU SinJulia | |
| Average of class Gaming (4424 - 33636, n=105, last 2 years) | |
| Alienware x17 R2 P48E (v6.50.5800) | |
| Medion Erazer Beast X30 (v6.50.5800) | |
| MSI Stealth GS77 12UHS-083US (v6.50.5800) | |
| Razer Blade 17 Early 2022 (v6.50.5800, Max.) | |
| Razer Blade 17 RTX 3080 Ti (v6.50.5800) | |
| Average Intel Core i9-12900H (5709 - 10410, n=29) | |
| Razer Blade 17 Early 2022 (v6.50.5800) | |
| Razer Blade 17 Early 2022 (v6.50.5800, Lautlos) | |
| AIDA64 / FPU Mandel | |
| Average of class Gaming (25115 - 128721, n=105, last 2 years) | |
| Average Intel Core i9-12900H (11257 - 45581, n=29) | |
| Alienware x17 R2 P48E (v6.50.5800) | |
| Medion Erazer Beast X30 (v6.50.5800) | |
| MSI Stealth GS77 12UHS-083US (v6.50.5800) | |
| Razer Blade 17 Early 2022 (v6.50.5800, Max.) | |
| Razer Blade 17 RTX 3080 Ti (v6.50.5800) | |
| Razer Blade 17 Early 2022 (v6.50.5800) | |
| Razer Blade 17 Early 2022 (v6.50.5800, Lautlos) | |
| AIDA64 / CPU AES | |
| Average of class Gaming (39258 - 247074, n=105, last 2 years) | |
| Alienware x17 R2 P48E (v6.50.5800) | |
| MSI Stealth GS77 12UHS-083US (v6.50.5800) | |
| Average Intel Core i9-12900H (31935 - 151546, n=29) | |
| Medion Erazer Beast X30 (v6.50.5800) | |
| Razer Blade 17 Early 2022 (v6.50.5800, Max.) | |
| Razer Blade 17 RTX 3080 Ti (v6.50.5800) | |
| Razer Blade 17 Early 2022 (v6.50.5800) | |
| Razer Blade 17 Early 2022 (v6.50.5800, Lautlos) | |
| AIDA64 / CPU ZLib | |
| Average of class Gaming (574 - 2531, n=105, last 2 years) | |
| Alienware x17 R2 P48E (v6.50.5800) | |
| Medion Erazer Beast X30 (v6.50.5800) | |
| MSI Stealth GS77 12UHS-083US (v6.50.5800) | |
| Razer Blade 17 Early 2022 (v6.50.5800, Max.) | |
| Average Intel Core i9-12900H (449 - 1193, n=29) | |
| Razer Blade 17 RTX 3080 Ti (v6.50.5800) | |
| Razer Blade 17 Early 2022 (v6.50.5800) | |
| Razer Blade 17 Early 2022 (v6.50.5800, Lautlos) | |
| AIDA64 / FP64 Ray-Trace | |
| Average of class Gaming (5509 - 45446, n=105, last 2 years) | |
| Average Intel Core i9-12900H (2235 - 10511, n=29) | |
| Alienware x17 R2 P48E (v6.50.5800) | |
| Medion Erazer Beast X30 (v6.50.5800) | |
| MSI Stealth GS77 12UHS-083US (v6.50.5800) | |
| Razer Blade 17 Early 2022 (v6.50.5800, Max.) | |
| Razer Blade 17 RTX 3080 Ti (v6.50.5800) | |
| Razer Blade 17 Early 2022 (v6.50.5800) | |
| Razer Blade 17 Early 2022 (v6.50.5800, Lautlos) | |
| AIDA64 / CPU PhotoWorxx | |
| Average of class Gaming (12271 - 89891, n=105, last 2 years) | |
| Razer Blade 17 RTX 3080 Ti (v6.50.5800) | |
| Razer Blade 17 Early 2022 (v6.50.5800, Max.) | |
| Medion Erazer Beast X30 (v6.50.5800) | |
| MSI Stealth GS77 12UHS-083US (v6.50.5800) | |
| Razer Blade 17 Early 2022 (v6.50.5800) | |
| Average Intel Core i9-12900H (20960 - 48269, n=30) | |
| Razer Blade 17 Early 2022 (v6.50.5800, Lautlos) | |
| Alienware x17 R2 P48E (v6.50.5800) | |
系统性能
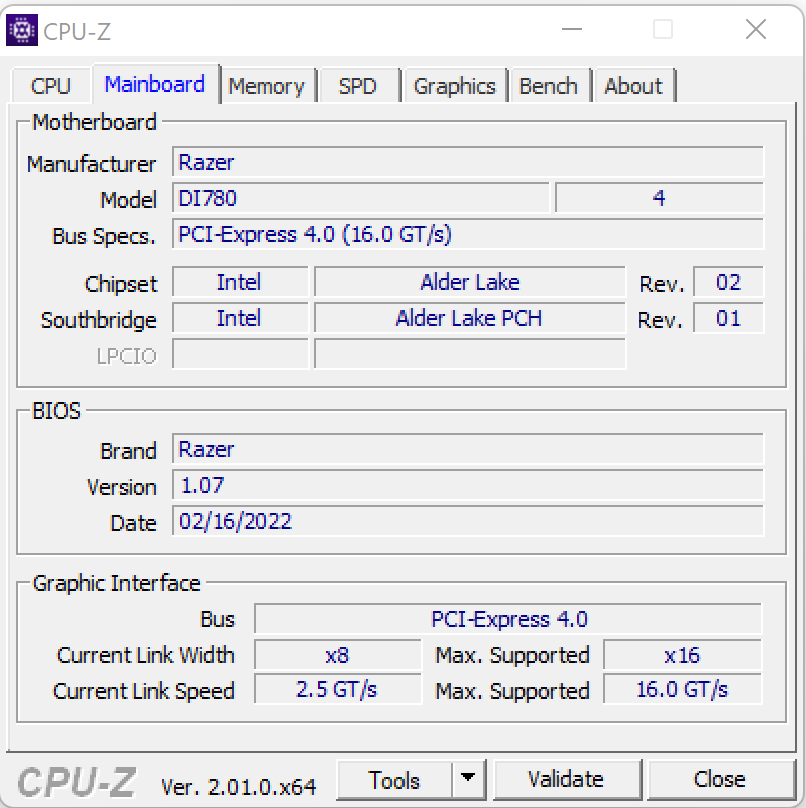
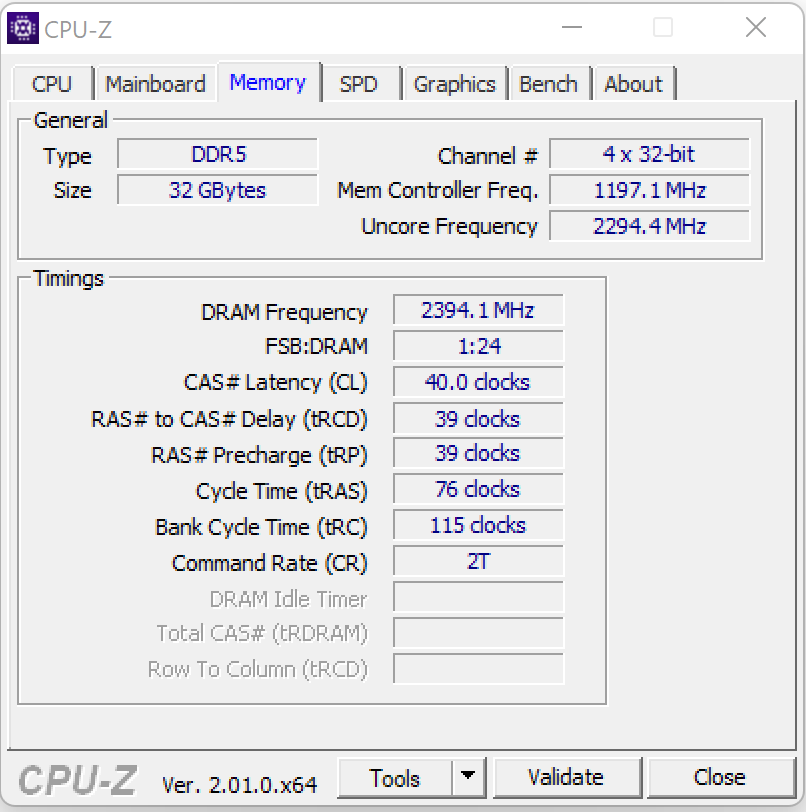
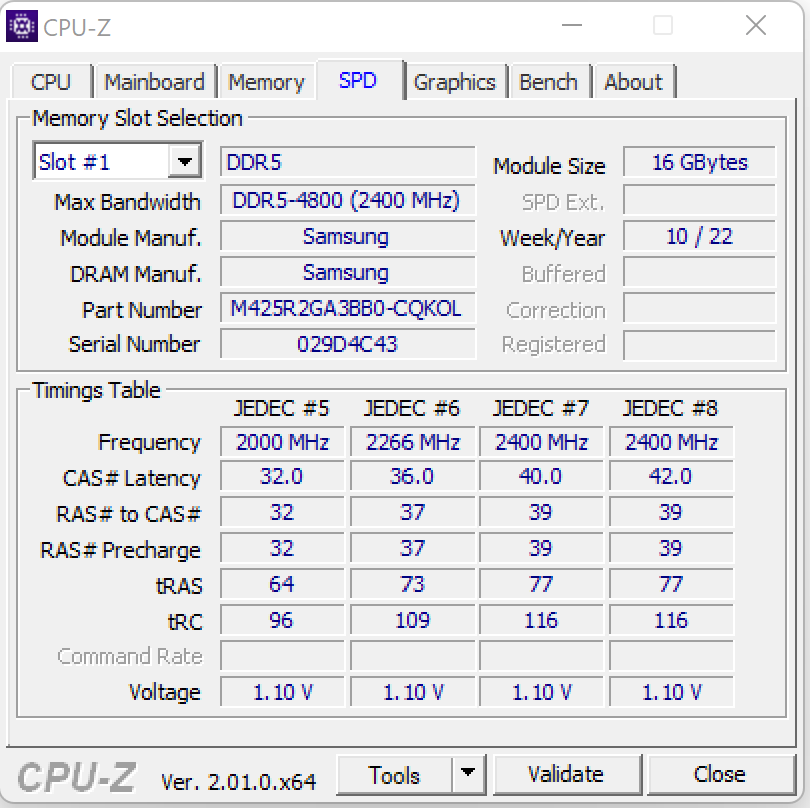
平稳运行的系统的硬件为游戏、视频切割和渲染提供了更充分的计算性能。工作内存的传输率在DDR5-4800存储的正常水平上。它们伴随着良好的PC Mark结果。
CrossMark: Overall | Productivity | Creativity | Responsiveness
| PCMark 10 / Score | |
| Average of class Gaming (5828 - 12414, n=93, last 2 years) | |
| Alienware x17 R2 P48E | |
| Razer Blade 17 RTX 3080 Ti | |
| Average Intel Core i9-12900H, NVIDIA GeForce RTX 3080 Ti Laptop GPU (7139 - 8083, n=6) | |
| MSI Stealth GS77 12UHS-083US | |
| Medion Erazer Beast X30 | |
| Razer Blade 17 Early 2022 | |
| PCMark 10 / Essentials | |
| Alienware x17 R2 P48E | |
| Razer Blade 17 RTX 3080 Ti | |
| Average Intel Core i9-12900H, NVIDIA GeForce RTX 3080 Ti Laptop GPU (10254 - 11178, n=6) | |
| Average of class Gaming (8810 - 11935, n=97, last 2 years) | |
| MSI Stealth GS77 12UHS-083US | |
| Razer Blade 17 Early 2022 | |
| Medion Erazer Beast X30 | |
| PCMark 10 / Productivity | |
| Average of class Gaming (6845 - 25323, n=95, last 2 years) | |
| Alienware x17 R2 P48E | |
| Average Intel Core i9-12900H, NVIDIA GeForce RTX 3080 Ti Laptop GPU (9102 - 11186, n=6) | |
| MSI Stealth GS77 12UHS-083US | |
| Razer Blade 17 RTX 3080 Ti | |
| Medion Erazer Beast X30 | |
| Razer Blade 17 Early 2022 | |
| PCMark 10 / Digital Content Creation | |
| Average of class Gaming (7602 - 19954, n=95, last 2 years) | |
| Alienware x17 R2 P48E | |
| Razer Blade 17 RTX 3080 Ti | |
| Average Intel Core i9-12900H, NVIDIA GeForce RTX 3080 Ti Laptop GPU (9847 - 12627, n=6) | |
| MSI Stealth GS77 12UHS-083US | |
| Medion Erazer Beast X30 | |
| Razer Blade 17 Early 2022 | |
| CrossMark / Overall | |
| Average of class Gaming (1366 - 2409, n=94, last 2 years) | |
| Alienware x17 R2 P48E | |
| Average Intel Core i9-12900H, NVIDIA GeForce RTX 3080 Ti Laptop GPU (1696 - 1965, n=3) | |
| Razer Blade 17 Early 2022 | |
| Medion Erazer Beast X30 | |
| CrossMark / Productivity | |
| Average of class Gaming (1386 - 2254, n=94, last 2 years) | |
| Alienware x17 R2 P48E | |
| Average Intel Core i9-12900H, NVIDIA GeForce RTX 3080 Ti Laptop GPU (1622 - 1870, n=3) | |
| Razer Blade 17 Early 2022 | |
| Medion Erazer Beast X30 | |
| CrossMark / Creativity | |
| Average of class Gaming (1343 - 2786, n=94, last 2 years) | |
| Alienware x17 R2 P48E | |
| Medion Erazer Beast X30 | |
| Average Intel Core i9-12900H, NVIDIA GeForce RTX 3080 Ti Laptop GPU (1855 - 2135, n=3) | |
| Razer Blade 17 Early 2022 | |
| CrossMark / Responsiveness | |
| Average of class Gaming (1226 - 2334, n=94, last 2 years) | |
| Alienware x17 R2 P48E | |
| Razer Blade 17 Early 2022 | |
| Average Intel Core i9-12900H, NVIDIA GeForce RTX 3080 Ti Laptop GPU (1483 - 1777, n=3) | |
| Medion Erazer Beast X30 | |
| PCMark 8 Home Score Accelerated v2 | 4671 points | |
| PCMark 8 Creative Score Accelerated v2 | 6358 points | |
| PCMark 8 Work Score Accelerated v2 | 5464 points | |
| PCMark 10 Score | 7139 points | |
Help | ||
| AIDA64 / Memory Copy | |
| Average of class Gaming (21750 - 129946, n=105, last 2 years) | |
| Razer Blade 17 RTX 3080 Ti (v6.50.5800) | |
| MSI Stealth GS77 12UHS-083US (v6.50.5800) | |
| Medion Erazer Beast X30 (v6.50.5800) | |
| Razer Blade 17 Early 2022 (v6.50.5800, Max.) | |
| Razer Blade 17 Early 2022 (v6.50.5800, Lautlos) | |
| Razer Blade 17 Early 2022 (v6.50.5800) | |
| Average Intel Core i9-12900H (34438 - 74264, n=29) | |
| Alienware x17 R2 P48E (v6.50.5800) | |
| AIDA64 / Memory Read | |
| Average of class Gaming (22956 - 118858, n=105, last 2 years) | |
| Razer Blade 17 RTX 3080 Ti (v6.50.5800) | |
| Medion Erazer Beast X30 (v6.50.5800) | |
| Razer Blade 17 Early 2022 (v6.50.5800, Max.) | |
| MSI Stealth GS77 12UHS-083US (v6.50.5800) | |
| Razer Blade 17 Early 2022 (v6.50.5800, Lautlos) | |
| Razer Blade 17 Early 2022 (v6.50.5800) | |
| Average Intel Core i9-12900H (36365 - 74642, n=29) | |
| Alienware x17 R2 P48E (v6.50.5800) | |
| AIDA64 / Memory Write | |
| Average of class Gaming (22297 - 135096, n=105, last 2 years) | |
| Razer Blade 17 RTX 3080 Ti (v6.50.5800) | |
| MSI Stealth GS77 12UHS-083US (v6.50.5800) | |
| Razer Blade 17 Early 2022 (v6.50.5800, Max.) | |
| Medion Erazer Beast X30 (v6.50.5800) | |
| Razer Blade 17 Early 2022 (v6.50.5800, Lautlos) | |
| Average Intel Core i9-12900H (32276 - 67858, n=29) | |
| Razer Blade 17 Early 2022 (v6.50.5800) | |
| Alienware x17 R2 P48E (v6.50.5800) | |
| AIDA64 / Memory Latency | |
| Average of class Gaming (75.3 - 259, n=105, last 2 years) | |
| Alienware x17 R2 P48E (v6.50.5800) | |
| MSI Stealth GS77 12UHS-083US (v6.50.5800) | |
| Average Intel Core i9-12900H (74.7 - 118.1, n=28) | |
| Razer Blade 17 RTX 3080 Ti (v6.50.5800) | |
| Medion Erazer Beast X30 (v6.50.5800) | |
| Razer Blade 17 Early 2022 (v6.50.5800, Max.) | |
| Razer Blade 17 Early 2022 (v6.50.5800, Lautlos) | |
* ... smaller is better
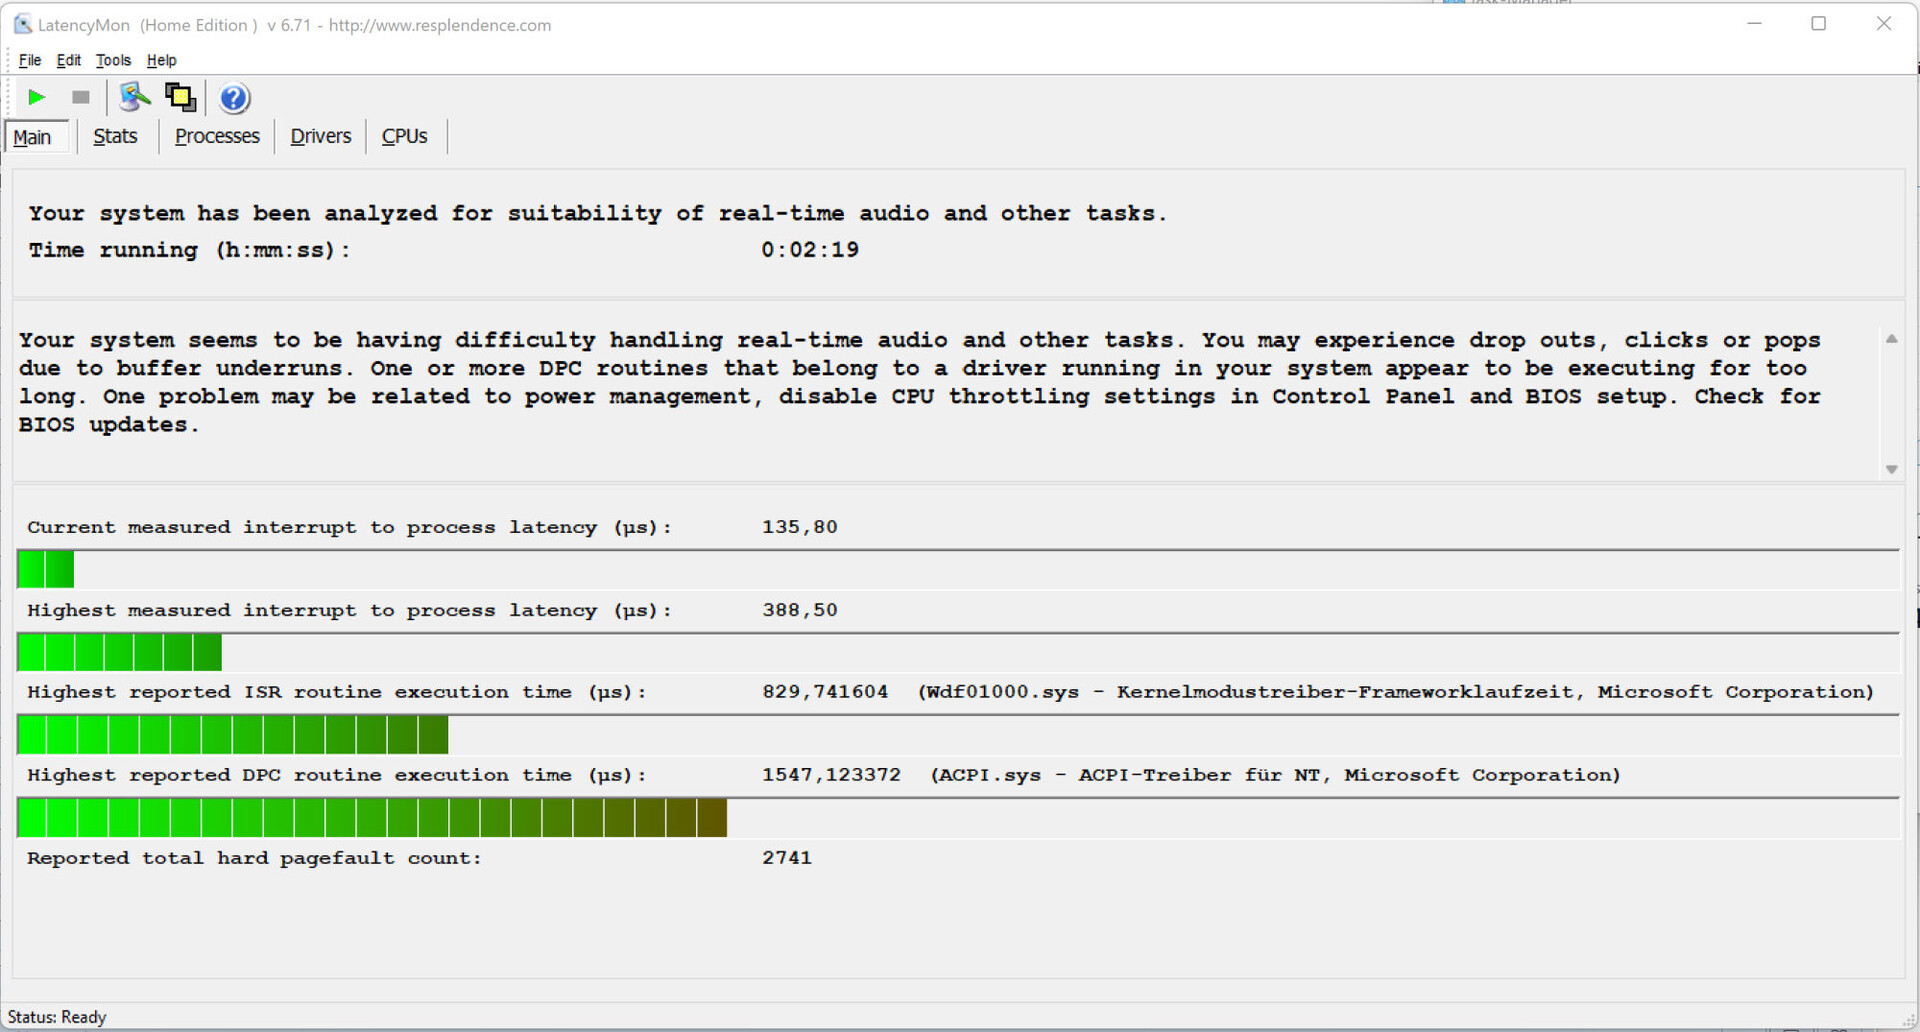
DPC延迟
标准化的延迟监测测试(网络冲浪、4k视频再现、Prime95高负载)显示了DPC延迟的一些明显行为。该系统似乎并不适合实时视频和音频处理。未来的软件更新可能会带来改进,甚至使事情变得更糟。
| DPC Latencies / LatencyMon - interrupt to process latency (max), Web, Youtube, Prime95 | |
| MSI Stealth GS77 12UHS-083US | |
| Alienware x17 R2 P48E | |
| Razer Blade 17 RTX 3080 Ti | |
| Medion Erazer Beast X30 | |
| Razer Blade 17 Early 2022 | |
* ... smaller is better
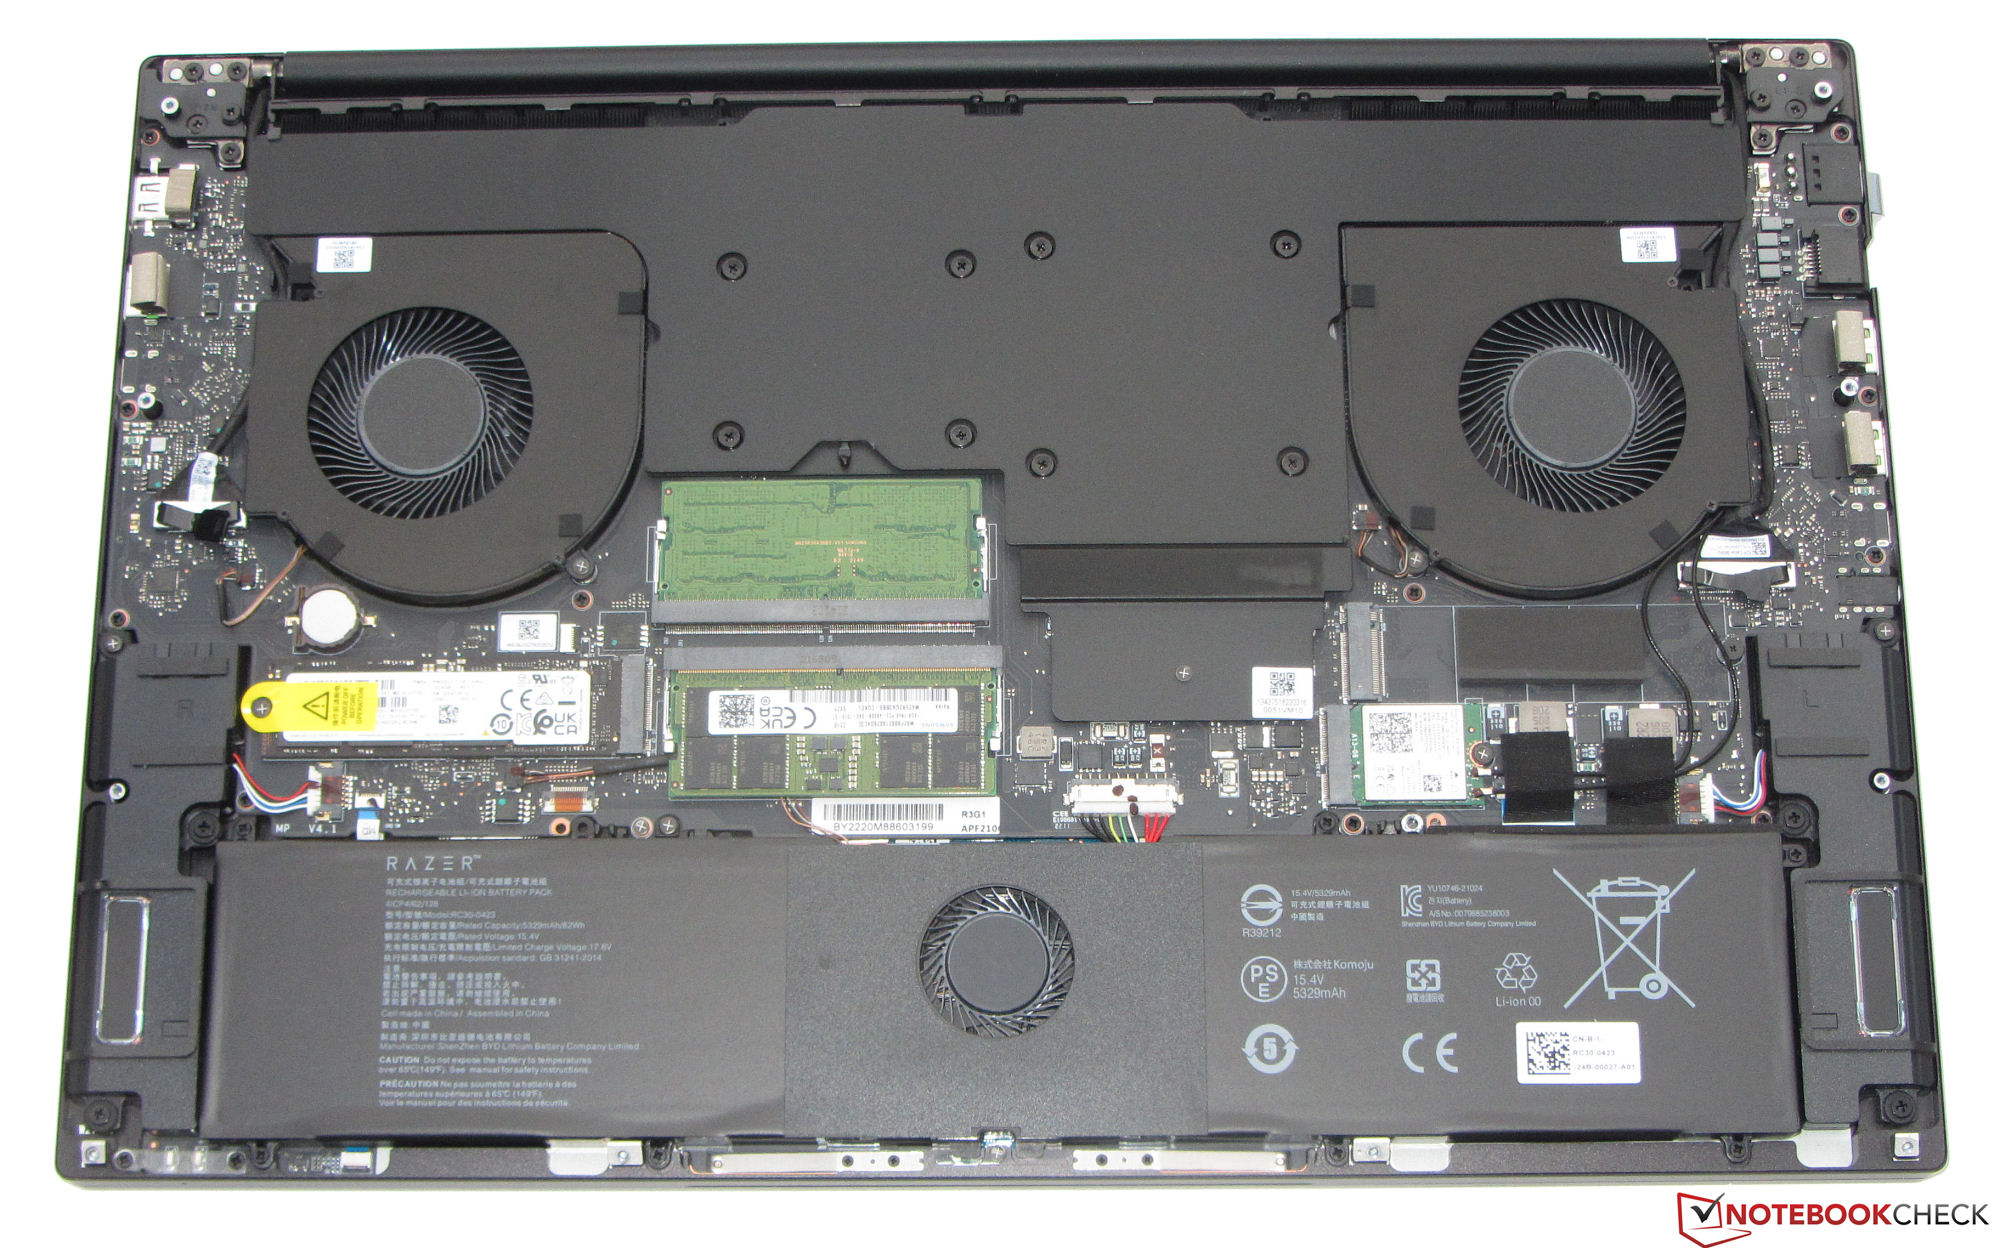
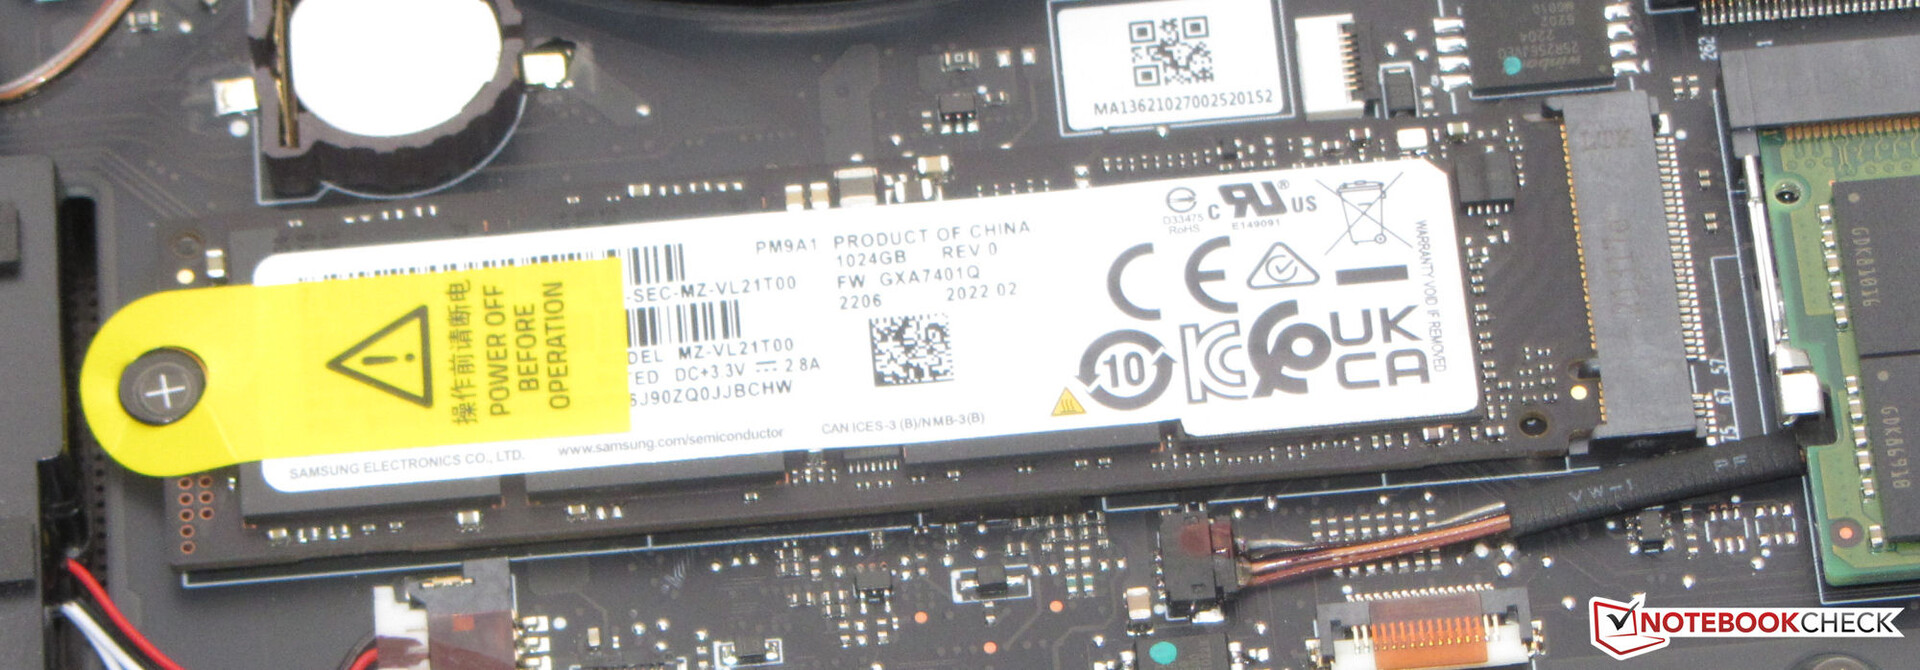
存储解决方案
Razer为Blade配备了来自三星的1TB SSD(PCIe 4,M.2-2280),提供了非常好的传输速率。 此外,该笔记本电脑还提供了第二个SSD(PCIe 4,M.2-2280)的空间。

* ... smaller is better
Constant Performance Reading: DiskSpd Read Loop, Queue Depth 8
图形卡
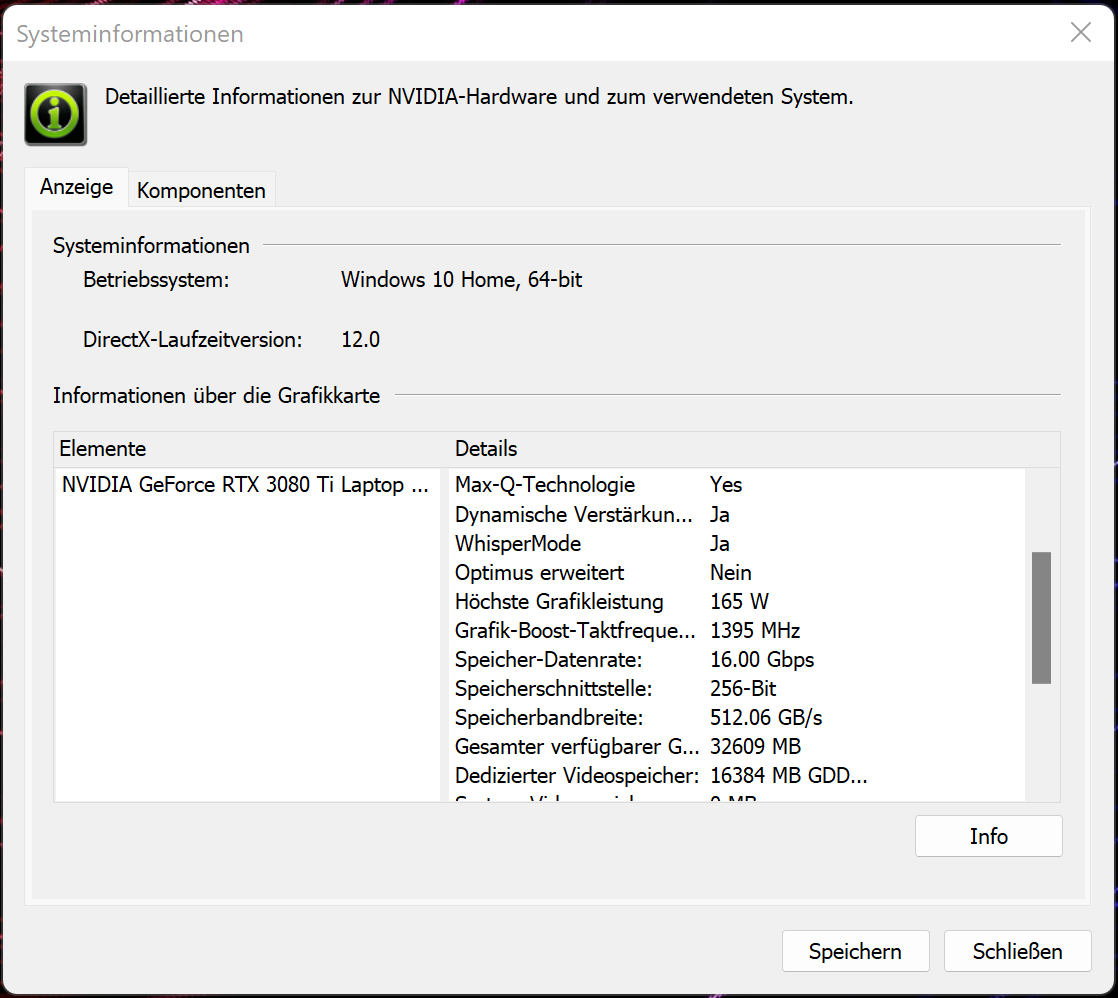
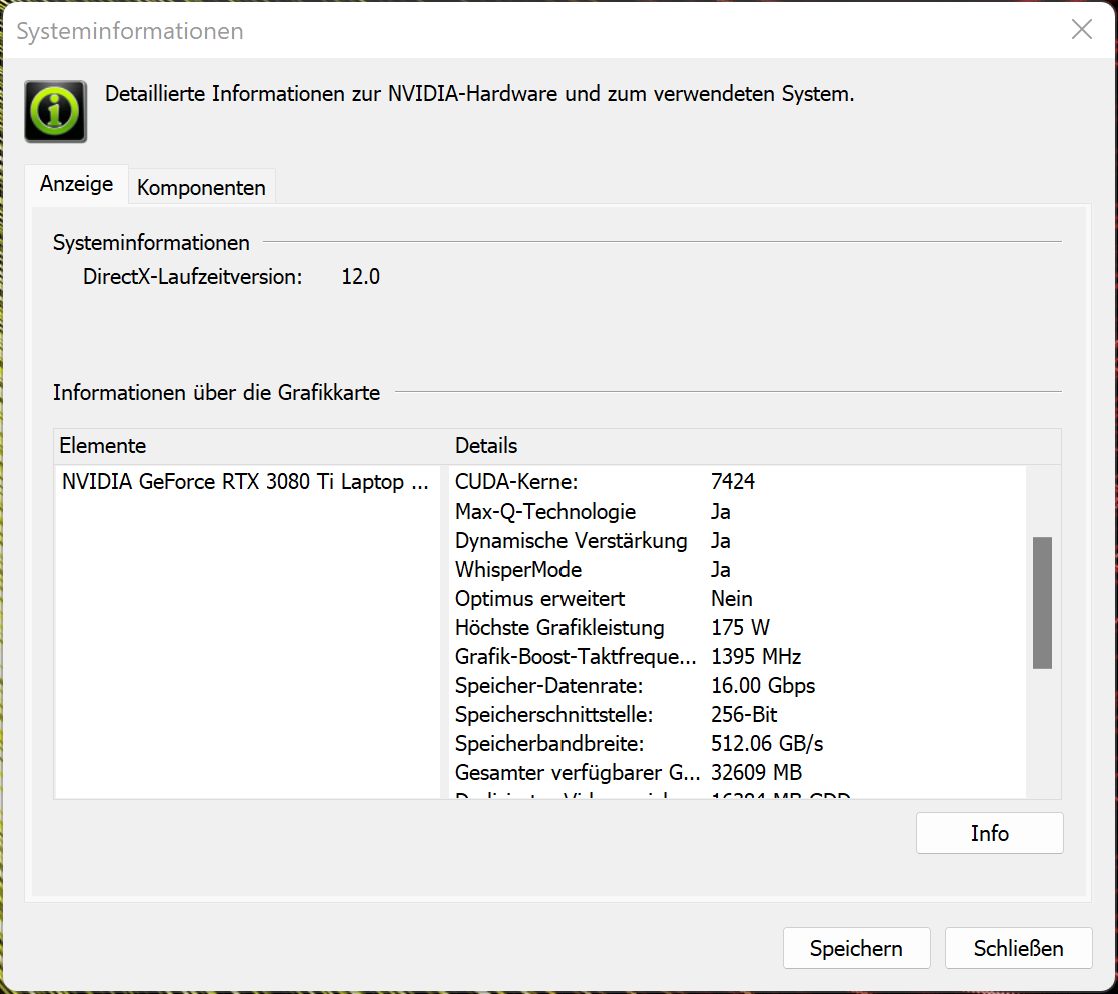
2022年6月的一项BIOS更新增加了内置的TGP GeForce RTX 3080 Ti LaptopGPU(VRAM:16,384 MB GDDR6)从165瓦增加到175瓦--对基准测试结果没有显示任何影响。然而,在所有情况下,结果的范围仍然高于我们之前确定的RTX 3080 Ti的平均水平。TGP没有被完全使用,这一点从我们的TheWitcher 3 测试中可以看出。图形性能可以在不更新BIOS的情况下提高,因为笔记本电脑提供了通过GeForce GPU直接输出图像的选项。
| 3DMark Performance rating - Percent | |
| Average of class Gaming -2! | |
| Alienware x17 R2 P48E -25! | |
| Razer Blade 17 RTX 3080 Ti -25! | |
| Razer Blade 17 Early 2022 -2! | |
| Razer Blade 17 Early 2022 -25! | |
| Razer Blade 17 Early 2022 -25! | |
| Medion Erazer Beast X30 -25! | |
| Average NVIDIA GeForce RTX 3080 Ti Laptop GPU | |
| Asus ROG Zephyrus Duo 16 GX650RX -2! | |
| Razer Blade 17 Early 2022 -25! | |
| MSI Stealth GS77 12UHS-083US -25! | |
| Gigabyte Aero 16 YE5 -1! | |
| 3DMark 11 - 1280x720 Performance GPU | |
| Average of class Gaming (21841 - 80022, n=104, last 2 years) | |
| Alienware x17 R2 P48E | |
| Razer Blade 17 Early 2022 (Max.) | |
| Razer Blade 17 Early 2022 | |
| Razer Blade 17 RTX 3080 Ti | |
| Medion Erazer Beast X30 | |
| Razer Blade 17 Early 2022 (dGPU, 175W) | |
| Asus ROG Zephyrus Duo 16 GX650RX | |
| Average NVIDIA GeForce RTX 3080 Ti Laptop GPU (13920 - 45841, n=45) | |
| Razer Blade 17 Early 2022 (Lautlos) | |
| MSI Stealth GS77 12UHS-083US | |
| Gigabyte Aero 16 YE5 | |
| 3DMark 11 Performance | 30538 points | |
| 3DMark Cloud Gate Standard Score | 42346 points | |
| 3DMark Fire Strike Score | 24291 points | |
| 3DMark Time Spy Score | 11457 points | |
| 3DMark Steel Nomad Score | 3076 points | |
Help | ||
游戏性能
该硬件允许在高至最高设置下进行4k游戏。通常情况下,帧率范围高于RTX 3080 Ti的平均水平。通过GeForce GPU的直接图像输出,有时会导致数值的大幅增加。在类似的性能设置下,兄弟姐妹的模型产生的数值处于相同的水平。即使在较长的时间内,帧率也保持在一个恒定的水平,这在我们的TheWitcher 3 测试中得到了证明(FHD,最大设置,60分钟运行时间)。
| The Witcher 3 - 1920x1080 Ultra Graphics & Postprocessing (HBAO+) | |
| Average of class Gaming (104.7 - 240, n=7, last 2 years) | |
| Alienware x17 R2 P48E | |
| Razer Blade 17 RTX 3080 Ti | |
| Razer Blade 17 Early 2022 (dGPU, 175W) | |
| Razer Blade 17 Early 2022 (Max.) | |
| Razer Blade 17 Early 2022 | |
| Medion Erazer Beast X30 | |
| Razer Blade 17 Early 2022 (Lautlos) | |
| Average NVIDIA GeForce RTX 3080 Ti Laptop GPU (30 - 130.6, n=43) | |
| MSI Stealth GS77 12UHS-083US | |
| Dota 2 Reborn | |
| 1920x1080 ultra (3/3) best looking | |
| Alienware x17 R2 P48E | |
| Razer Blade 17 RTX 3080 Ti | |
| MSI Stealth GS77 12UHS-083US | |
| Average of class Gaming (84.8 - 248, n=107, last 2 years) | |
| Razer Blade 17 Early 2022 (Max.) | |
| Razer Blade 17 Early 2022 (dGPU, 175W) | |
| Medion Erazer Beast X30 | |
| Average NVIDIA GeForce RTX 3080 Ti Laptop GPU (29.9 - 170.5, n=45) | |
| Razer Blade 17 Early 2022 | |
| Razer Blade 17 Early 2022 (Lautlos) | |
| 3840x2160 ultra (3/3) best looking | |
| Average of class Gaming (114.9 - 199.2, n=32, last 2 years) | |
| Razer Blade 17 Early 2022 (dGPU, 175W) | |
| Razer Blade 17 Early 2022 (Max.) | |
| Average NVIDIA GeForce RTX 3080 Ti Laptop GPU (70.8 - 155.6, n=19) | |
| Razer Blade 17 Early 2022 | |
| Razer Blade 17 Early 2022 (Lautlos) | |
| X-Plane 11.11 | |
| 3840x2160 high (fps_test=3) | |
| Razer Blade 17 Early 2022 (dGPU, 175W) | |
| Average of class Gaming (60 - 124.1, n=32, last 2 years) | |
| Razer Blade 17 Early 2022 (Max.) | |
| Average NVIDIA GeForce RTX 3080 Ti Laptop GPU (32.9 - 109.5, n=20) | |
| Razer Blade 17 Early 2022 | |
| Razer Blade 17 Early 2022 (Lautlos) | |
| 1920x1080 high (fps_test=3) | |
| Alienware x17 R2 P48E | |
| Razer Blade 17 Early 2022 (dGPU, 175W) | |
| Razer Blade 17 RTX 3080 Ti | |
| Razer Blade 17 Early 2022 (Max.) | |
| MSI Stealth GS77 12UHS-083US | |
| Average NVIDIA GeForce RTX 3080 Ti Laptop GPU (32.6 - 127, n=45) | |
| Medion Erazer Beast X30 | |
| Average of class Gaming (55.5 - 143.5, n=109, last 2 years) | |
| Razer Blade 17 Early 2022 | |
| Razer Blade 17 Early 2022 (Lautlos) | |
| Final Fantasy XV Benchmark | |
| 3840x2160 High Quality | |
| Average of class Gaming (49.1 - 111.8, n=33, last 2 years) | |
| Razer Blade 17 Early 2022 (1.3, dGPU, 175W) | |
| Razer Blade 17 Early 2022 (1.3, Max.) | |
| Razer Blade 17 Early 2022 (1.3) | |
| Average NVIDIA GeForce RTX 3080 Ti Laptop GPU (35.1 - 61.2, n=18) | |
| Razer Blade 17 Early 2022 (1.3, Lautlos) | |
| 1920x1080 High Quality | |
| Average of class Gaming (41 - 215, n=95, last 2 years) | |
| Alienware x17 R2 P48E (1.3) | |
| Razer Blade 17 Early 2022 (1.3, dGPU, 175W) | |
| Razer Blade 17 RTX 3080 Ti (1.3) | |
| Razer Blade 17 Early 2022 (1.3, Max.) | |
| Average NVIDIA GeForce RTX 3080 Ti Laptop GPU (30.7 - 140.6, n=42) | |
| Razer Blade 17 Early 2022 (1.3) | |
| MSI Stealth GS77 12UHS-083US (1.3) | |
| Medion Erazer Beast X30 (1.3) | |
| Razer Blade 17 Early 2022 (1.3, Lautlos) | |
| GTA V | |
| 1920x1080 Highest AA:4xMSAA + FX AF:16x | |
| Average of class Gaming (48.3 - 186.9, n=94, last 2 years) | |
| Alienware x17 R2 P48E | |
| Razer Blade 17 Early 2022 (Max.) | |
| Razer Blade 17 Early 2022 (dGPU, 175W) | |
| Razer Blade 17 RTX 3080 Ti | |
| MSI Stealth GS77 12UHS-083US | |
| Average NVIDIA GeForce RTX 3080 Ti Laptop GPU (30 - 139.2, n=42) | |
| Medion Erazer Beast X30 | |
| Razer Blade 17 Early 2022 | |
| Razer Blade 17 Early 2022 (Lautlos) | |
| 3840x2160 Highest AA:4xMSAA + FX AF:16x | |
| Average of class Gaming (53.9 - 123.2, n=25, last 2 years) | |
| Razer Blade 17 Early 2022 (Max.) | |
| Razer Blade 17 Early 2022 | |
| Razer Blade 17 Early 2022 (dGPU, 175W) | |
| Average NVIDIA GeForce RTX 3080 Ti Laptop GPU (37.7 - 67.2, n=14) | |
| Razer Blade 17 Early 2022 (Lautlos) | |
| Strange Brigade | |
| 3840x2160 ultra AA:ultra AF:16 | |
| Average of class Gaming (83 - 187.2, n=34, last 2 years) | |
| Razer Blade 17 Early 2022 (1.47.22.14 D3D12, dGPU, 175W) | |
| Razer Blade 17 Early 2022 (1.47.22.14 D3D12) | |
| Average NVIDIA GeForce RTX 3080 Ti Laptop GPU (61.7 - 100.7, n=15) | |
| Razer Blade 17 Early 2022 (1.47.22.14 D3D12, Lautlos) | |
| 1920x1080 ultra AA:ultra AF:16 | |
| Average of class Gaming (76.3 - 458, n=87, last 2 years) | |
| Razer Blade 17 RTX 3080 Ti (1.47.22.14 D3D12) | |
| Razer Blade 17 Early 2022 (1.47.22.14 D3D12, dGPU, 175W) | |
| Alienware x17 R2 P48E (1.47.22.14 D3D12) | |
| Razer Blade 17 Early 2022 (1.47.22.14 D3D12) | |
| Medion Erazer Beast X30 (1.47.22.14 D3D12) | |
| Average NVIDIA GeForce RTX 3080 Ti Laptop GPU (42.3 - 224, n=41) | |
| Razer Blade 17 Early 2022 (1.47.22.14 D3D12, Lautlos) | |
| MSI Stealth GS77 12UHS-083US (1.47.22.14 D3D12) | |
| F1 2021 | |
| 3840x2160 Ultra High Preset + Raytracing AA:T AF:16x | |
| Razer Blade 17 Early 2022 (874931, dGPU, 175W) | |
| Razer Blade 17 Early 2022 (874931, Max.) | |
| Razer Blade 17 Early 2022 (874931) | |
| Average NVIDIA GeForce RTX 3080 Ti Laptop GPU (41.1 - 70.2, n=18) | |
| Razer Blade 17 Early 2022 (874931, Lautlos) | |
| 1920x1080 Ultra High Preset + Raytracing AA:T AF:16x | |
| Razer Blade 17 Early 2022 (874931, dGPU, 175W) | |
| Razer Blade 17 Early 2022 (874931, Max.) | |
| Razer Blade 17 Early 2022 (874931) | |
| Medion Erazer Beast X30 (874931) | |
| Average NVIDIA GeForce RTX 3080 Ti Laptop GPU (30.2 - 160.6, n=30) | |
| Razer Blade 17 Early 2022 (874931, Lautlos) | |
| Far Cry 5 | |
| 3840x2160 Ultra Preset AA:T | |
| Average of class Gaming (n=1last 2 years) | |
| Razer Blade 17 Early 2022 | |
| Razer Blade 17 Early 2022 (dGPU, 175W) | |
| Average NVIDIA GeForce RTX 3080 Ti Laptop GPU (45 - 76, n=9) | |
| 1920x1080 Ultra Preset AA:T | |
| Average NVIDIA GeForce RTX 3080 Ti Laptop GPU (111 - 162, n=24) | |
| Medion Erazer Beast X30 | |
| MSI Stealth GS77 12UHS-083US | |
| Razer Blade 17 RTX 3080 Ti | |
| Razer Blade 17 Early 2022 (dGPU, 175W) | |
| Razer Blade 17 Early 2022 | |
| Average of class Gaming (70 - 151, n=6, last 2 years) | |
The Witcher 3 FPS Chart
| low | med. | high | ultra | QHD | 4K | |
|---|---|---|---|---|---|---|
| GTA V (2015) | 179.4 | 175.2 | 166 | 106 | 102.7 | 118 |
| The Witcher 3 (2015) | 328 | 289 | 218 | 119.6 | 89.6 | |
| Dota 2 Reborn (2015) | 176.1 | 149.2 | 140 | 131.9 | 117.3 | |
| Final Fantasy XV Benchmark (2018) | 155.9 | 139.3 | 112.2 | 90.8 | 55.2 | |
| X-Plane 11.11 (2018) | 127.9 | 115.5 | 95.6 | 82.1 | ||
| Far Cry 5 (2018) | 148 | 127 | 122 | 116 | 110 | 70 |
| Strange Brigade (2018) | 382 | 272 | 229 | 204 | 152.7 | 91.1 |
| F1 2021 (2021) | 295 | 255 | 219 | 132.8 | 104.3 | 62.5 |
| Baldur's Gate 3 (2023) | 117.7 | 84.4 | 46 | |||
| Cyberpunk 2077 (2023) | 91.43 | 57.12 | 25.46 |
排放--刀片17不会过度升温
噪声排放
在日常操作中(办公室、互联网),笔记本电脑并没有产生过多的噪音。偶尔,风扇甚至完全关闭,一片寂静。在负载情况下,它可以变得很响亮,最大噪音水平高达51 dB(A)(压力测试,Witcher 3 测试)。
静音 "性能配置可用于日常操作。虽然笔记本电脑不能静音运行,但它仍然产生较少的噪音和热量。减少的计算性能也足够用于游戏。
Noise level
| Idle |
| 26 / 27 / 32 dB(A) |
| Load |
| 50 / 51 dB(A) |
 | ||
30 dB silent 40 dB(A) audible 50 dB(A) loud |
||
min: | ||
| Razer Blade 17 Early 2022 GeForce RTX 3080 Ti Laptop GPU, i9-12900H, Samsung PM9A1 MZVL21T0HCLR | Alienware x17 R2 P48E GeForce RTX 3080 Ti Laptop GPU, i9-12900HK, 2x Samsung PM9A1 1TB (RAID 0) | Medion Erazer Beast X30 GeForce RTX 3080 Ti Laptop GPU, i9-12900HK, Samsung PM9A1 MZVL21T0HCLR | MSI Stealth GS77 12UHS-083US GeForce RTX 3080 Ti Laptop GPU, i7-12700H, Micron 3400 1TB MTFDKBA1T0TFH | Razer Blade 17 RTX 3080 Ti GeForce RTX 3080 Ti Laptop GPU, i7-12800H, Samsung PM9A1 MZVL21T0HCLR | |
|---|---|---|---|---|---|
| Noise | 14% | -2% | 8% | 11% | |
| off / environment * (dB) | 26 | 22.7 13% | 26 -0% | 24.5 6% | 23.3 10% |
| Idle Minimum * (dB) | 26 | 23.1 11% | 27 -4% | 24.5 6% | 23.3 10% |
| Idle Average * (dB) | 27 | 23.1 14% | 29 -7% | 24.5 9% | 23.3 14% |
| Idle Maximum * (dB) | 32 | 23.1 28% | 34 -6% | 30.8 4% | 26.3 18% |
| Load Average * (dB) | 50 | 31.9 36% | 48 4% | 34.6 31% | 38.2 24% |
| Witcher 3 ultra * (dB) | 51 | 52.5 -3% | 51 -0% | 46.2 9% | 50.9 -0% |
| Load Maximum * (dB) | 51 | 52.5 -3% | 53 -4% | 56.8 -11% | 49.1 4% |
* ... smaller is better
温度
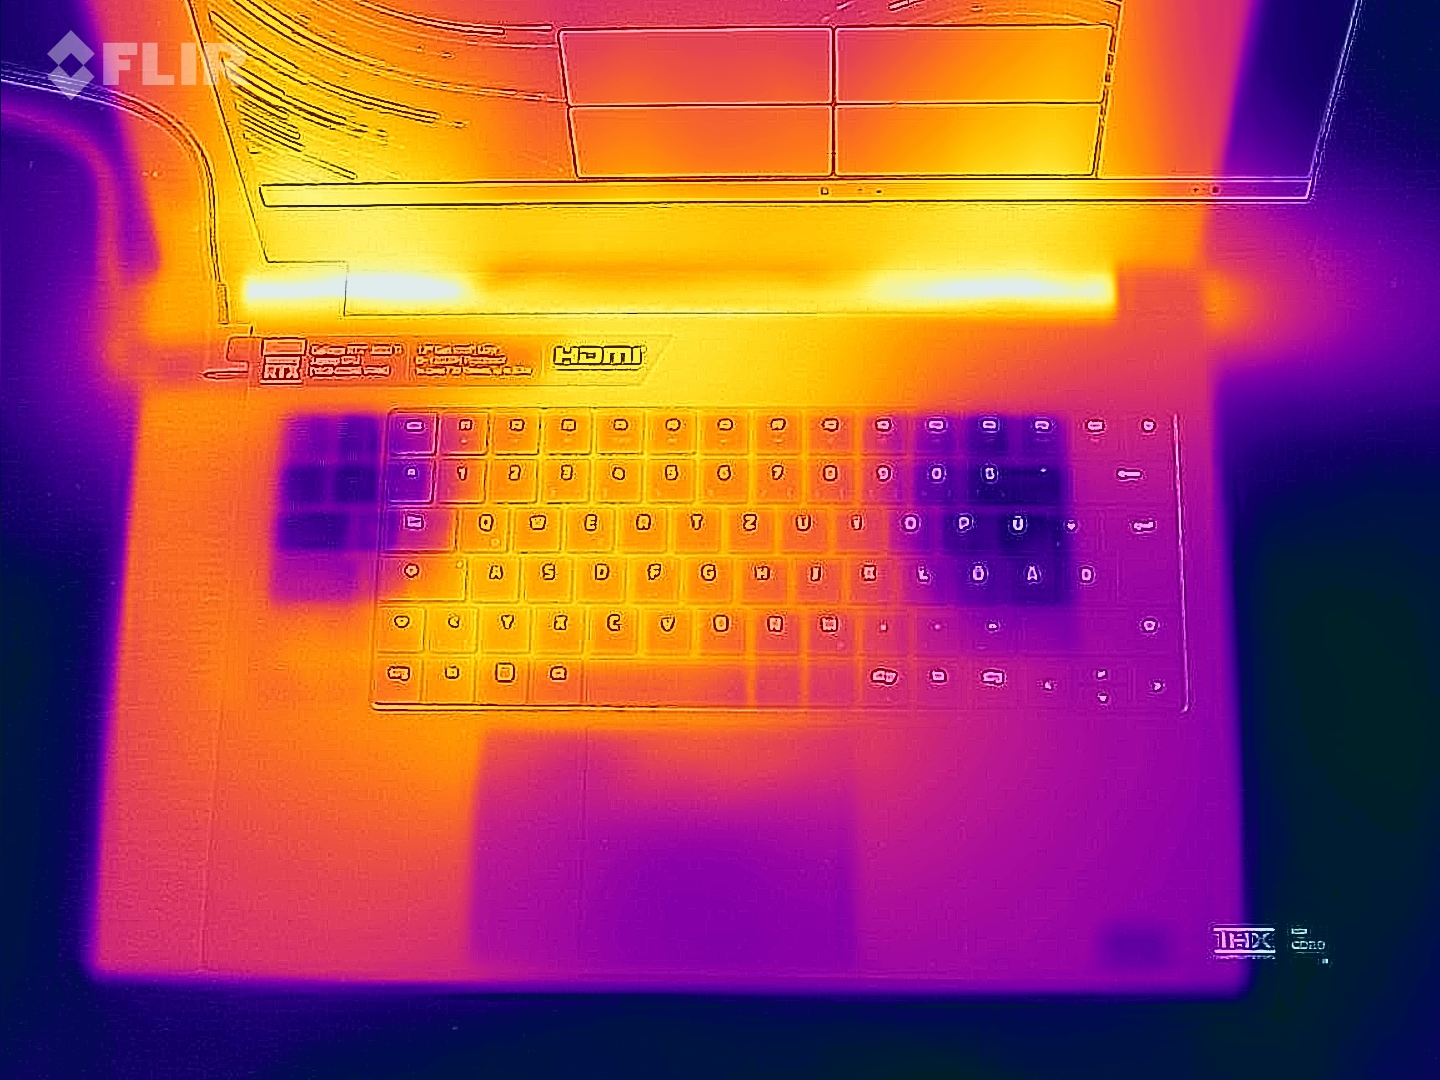
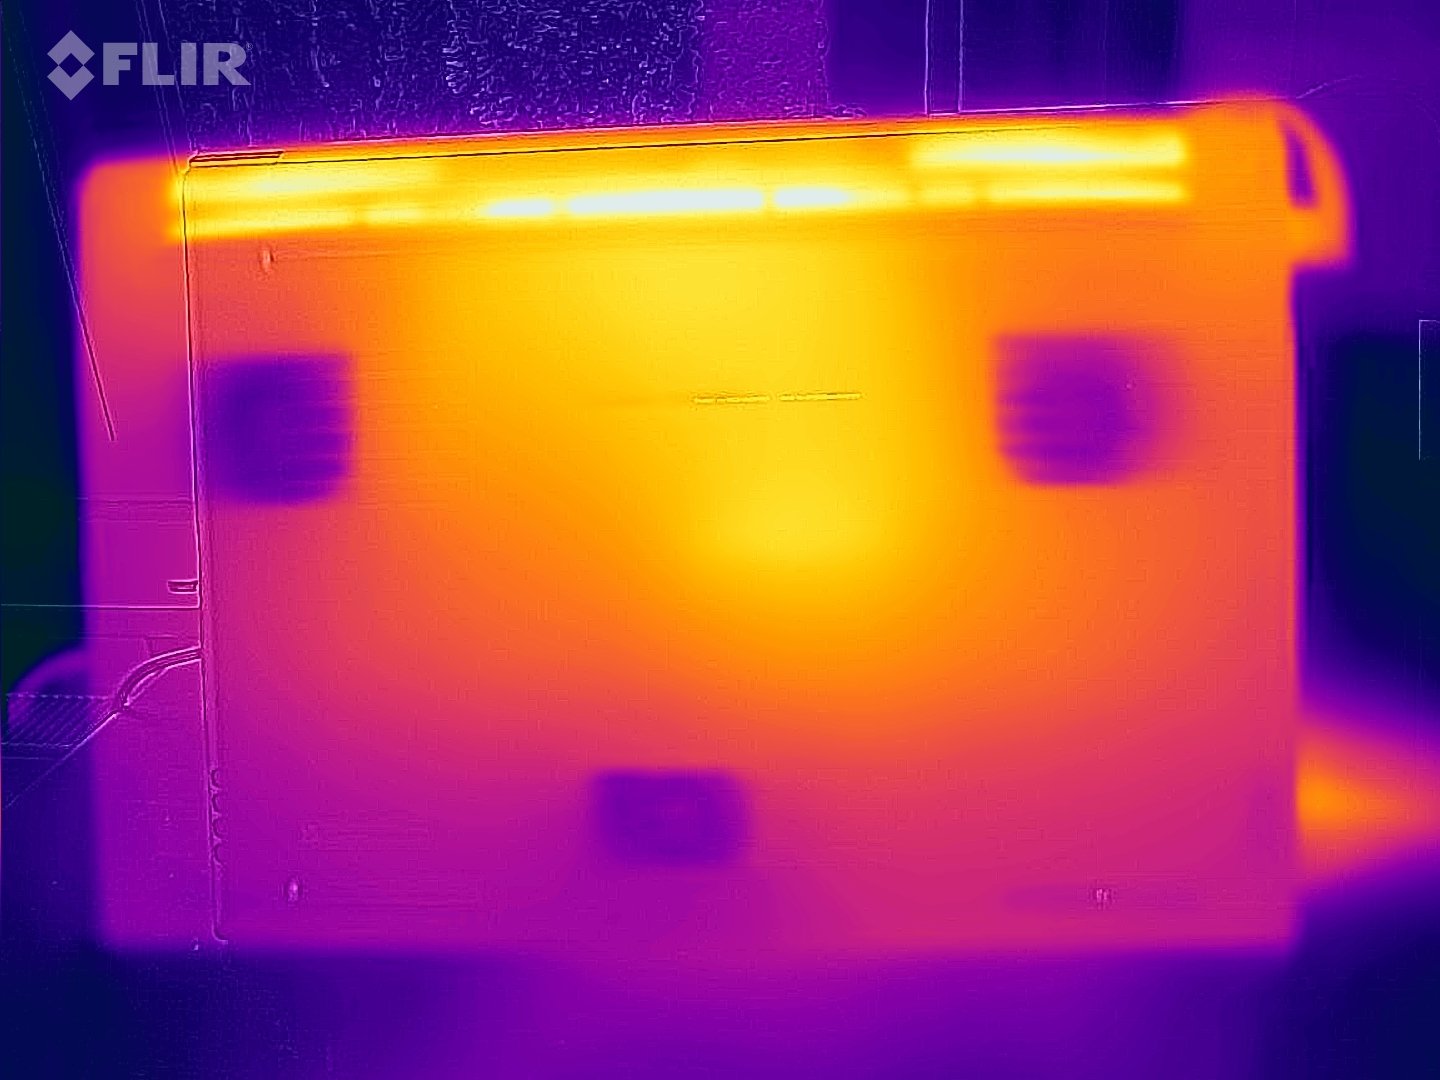
在日常操作中(办公室、互联网),机箱温度保持在绿色范围内。虽然笔记本电脑在负载下明显升温(压力测试,Witcher 3 测试),但热量发展仍然保持在可接受的范围内。 然而,CPU温度有时会达到红色范围。
(-) The maximum temperature on the upper side is 50 °C / 122 F, compared to the average of 40.4 °C / 105 F, ranging from 21.2 to 68.8 °C for the class Gaming.
(-) The bottom heats up to a maximum of 56 °C / 133 F, compared to the average of 43.2 °C / 110 F
(±) In idle usage, the average temperature for the upper side is 33 °C / 91 F, compared to the device average of 33.9 °C / 93 F.
(-) Playing The Witcher 3, the average temperature for the upper side is 42.7 °C / 109 F, compared to the device average of 33.9 °C / 93 F.
(-) The palmrests and touchpad can get very hot to the touch with a maximum of 42 °C / 107.6 F.
(-) The average temperature of the palmrest area of similar devices was 28.8 °C / 83.8 F (-13.2 °C / -23.8 F).
| Razer Blade 17 Early 2022 Intel Core i9-12900H, NVIDIA GeForce RTX 3080 Ti Laptop GPU | Alienware x17 R2 P48E Intel Core i9-12900HK, NVIDIA GeForce RTX 3080 Ti Laptop GPU | Medion Erazer Beast X30 Intel Core i9-12900HK, NVIDIA GeForce RTX 3080 Ti Laptop GPU | MSI Stealth GS77 12UHS-083US Intel Core i7-12700H, NVIDIA GeForce RTX 3080 Ti Laptop GPU | Razer Blade 17 RTX 3080 Ti Intel Core i7-12800H, NVIDIA GeForce RTX 3080 Ti Laptop GPU | |
|---|---|---|---|---|---|
| Heat | 15% | -1% | 3% | 5% | |
| Maximum Upper Side * (°C) | 50 | 49.6 1% | 55 -10% | 50.6 -1% | 46 8% |
| Maximum Bottom * (°C) | 56 | 42.4 24% | 62 -11% | 59.6 -6% | 46.8 16% |
| Idle Upper Side * (°C) | 36 | 29.2 19% | 32 11% | 30 17% | 36.2 -1% |
| Idle Bottom * (°C) | 38 | 32 16% | 36 5% | 37.4 2% | 38.6 -2% |
* ... smaller is better
压力测试
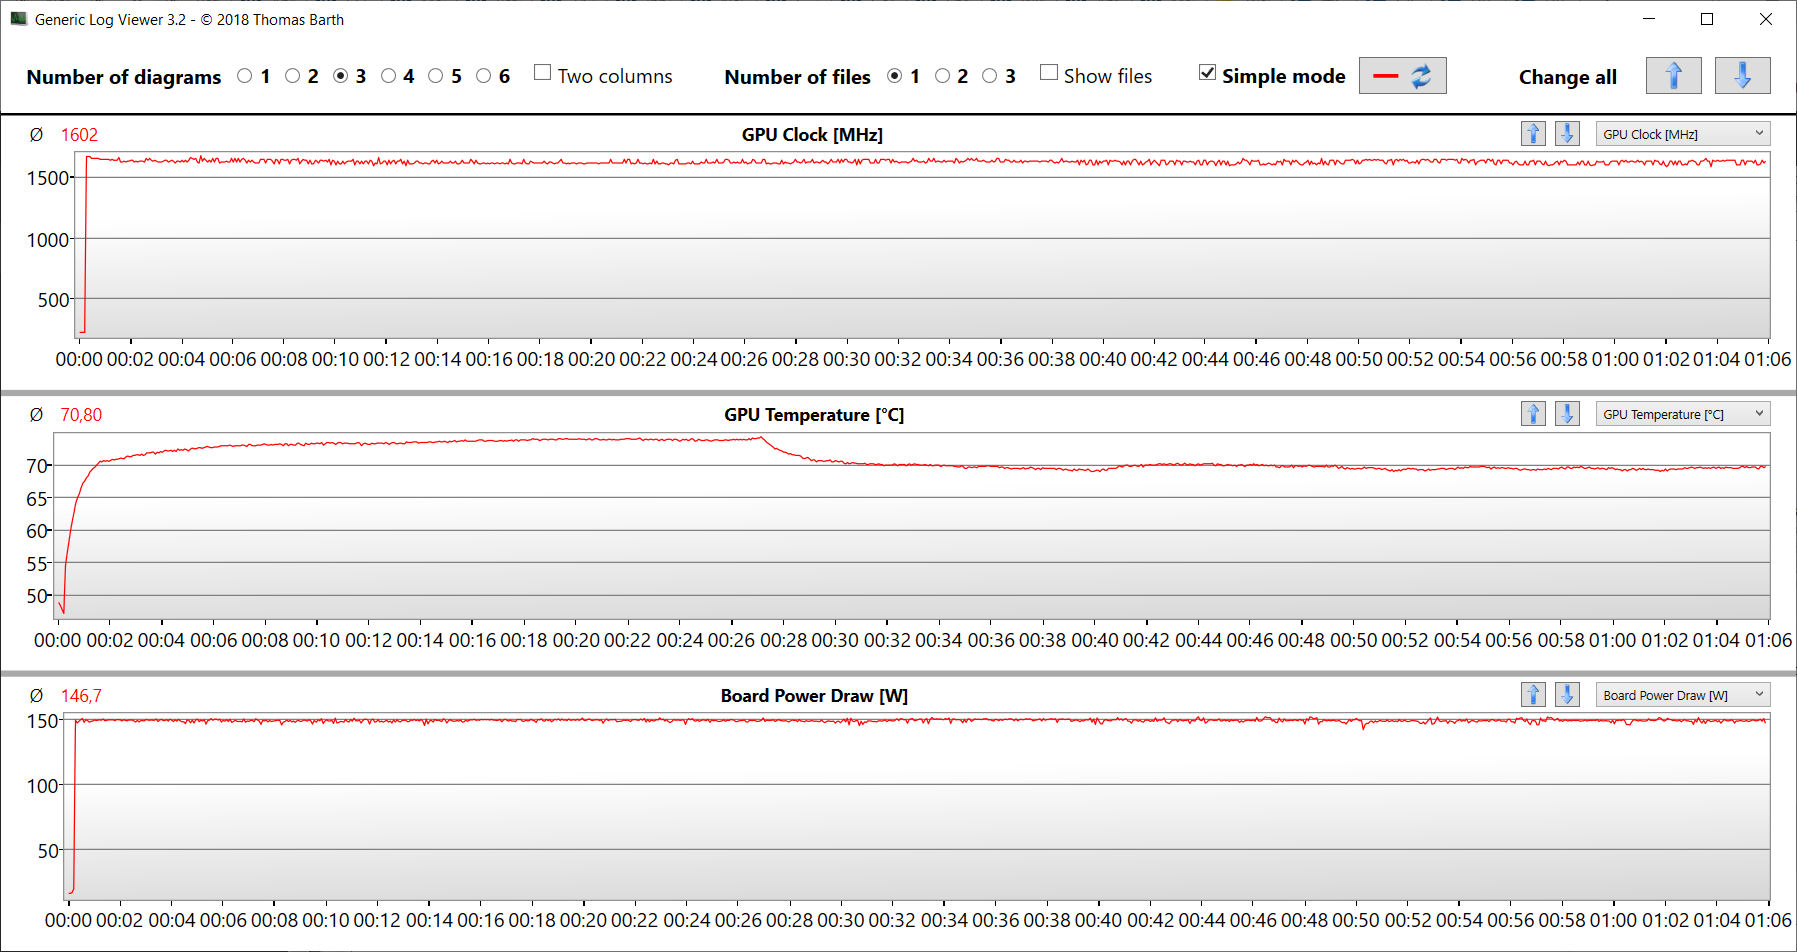
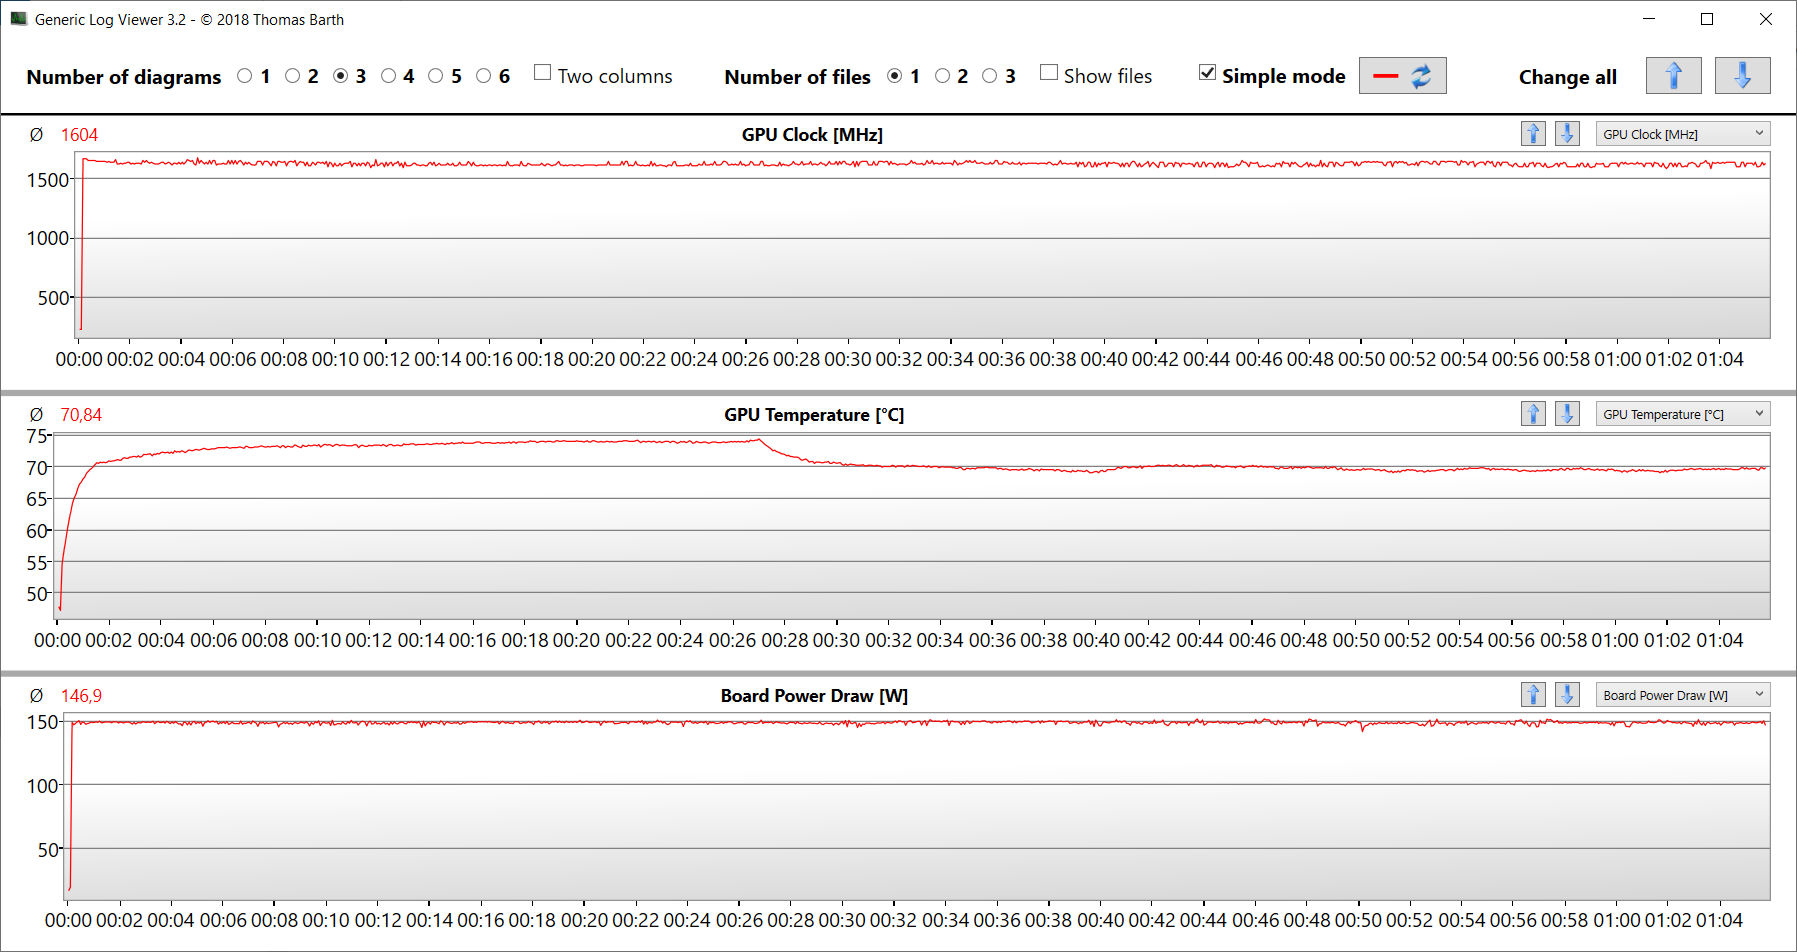
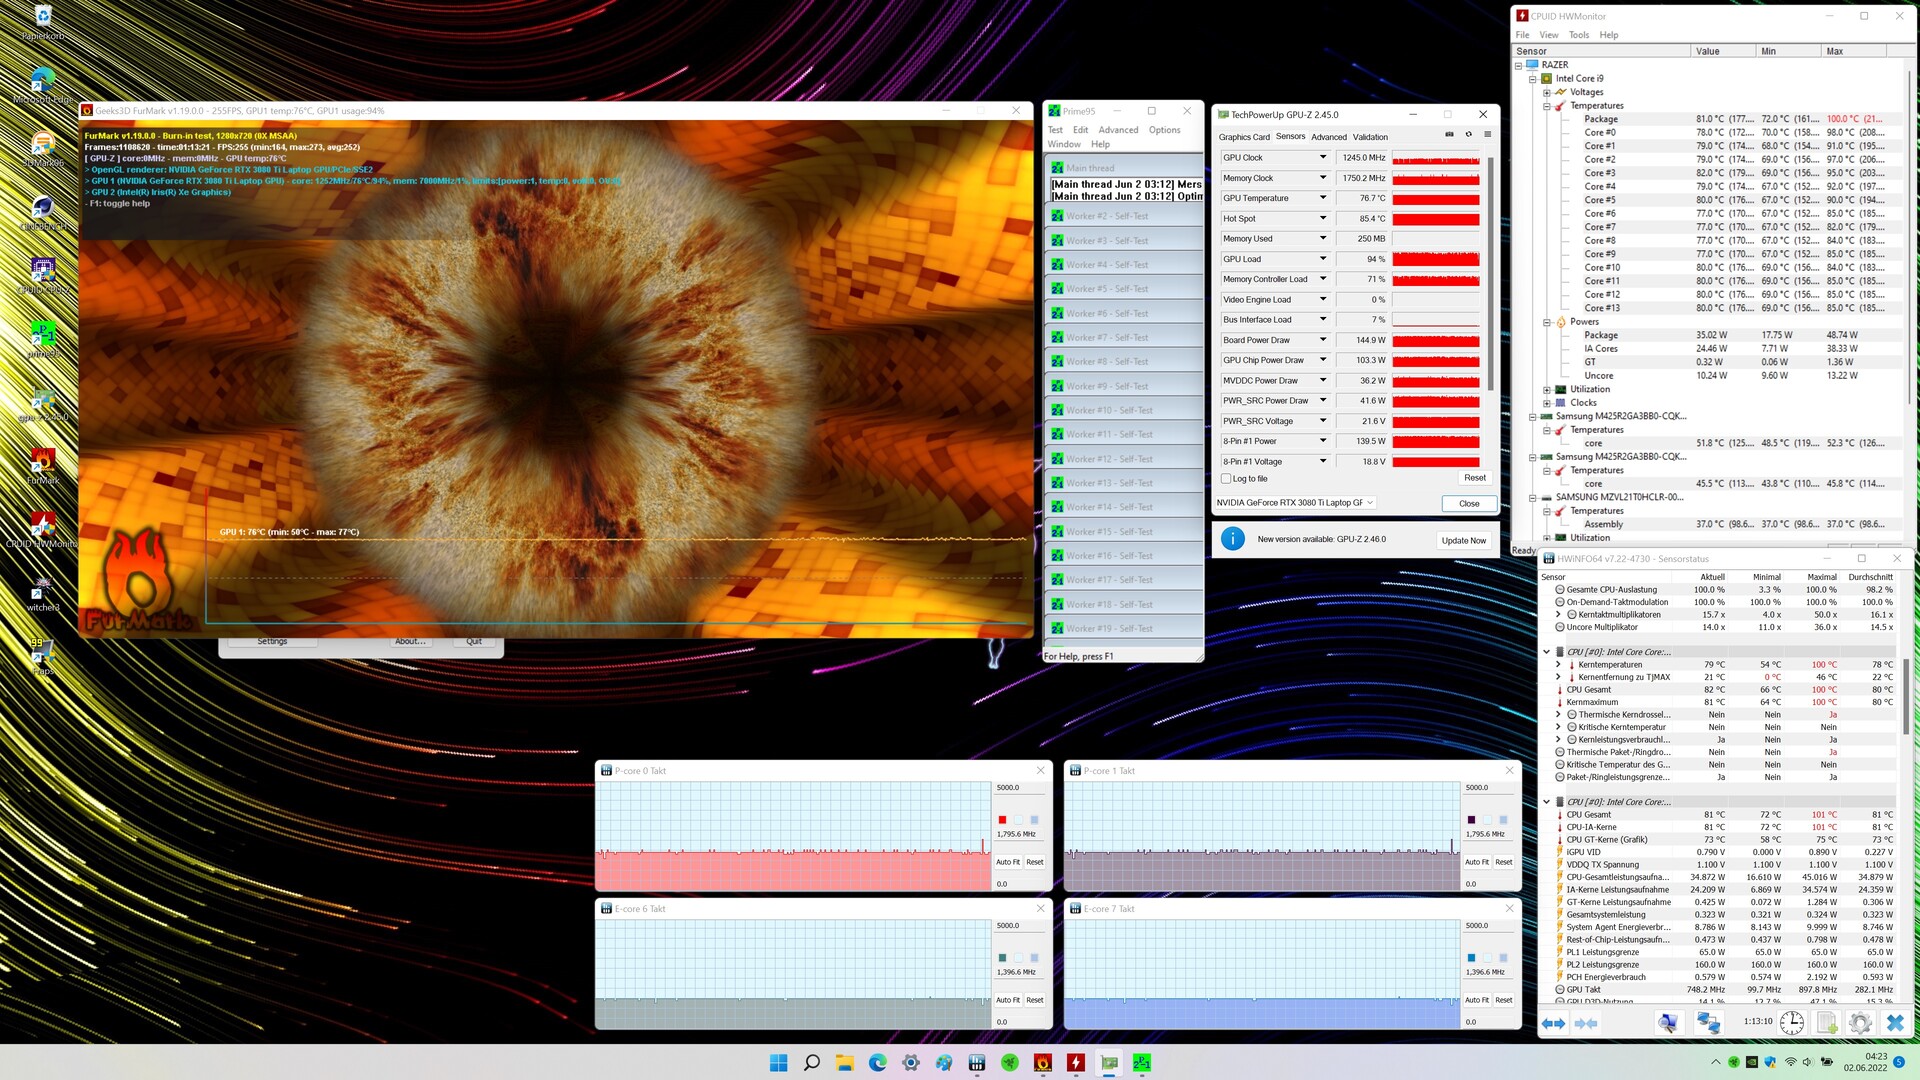
在压力测试的开始阶段(Prime95和Furmark至少运行了一个小时),CPU就已经在低时钟速度下运行了(P核:2.1至2.2GHz;E核:1.6至1.7GHz)。继续下去,P核心的数值下降到1.8GHz,E核心的数值下降到1.4GHz。GPU的时钟速度从大约1500MHz下降到1250MHz左右。压力测试代表了一种极端情况,我们用它来评估系统在满负荷时是否保持稳定。
发言人
Razer Blade 17 Early 2022 audio analysis
(+) | speakers can play relatively loud (83 dB)
Bass 100 - 315 Hz
(±) | reduced bass - on average 7.4% lower than median
(±) | linearity of bass is average (9.7% delta to prev. frequency)
Mids 400 - 2000 Hz
(+) | balanced mids - only 3% away from median
(+) | mids are linear (3.7% delta to prev. frequency)
Highs 2 - 16 kHz
(+) | balanced highs - only 2.5% away from median
(+) | highs are linear (6.1% delta to prev. frequency)
Overall 100 - 16.000 Hz
(+) | overall sound is linear (9.2% difference to median)
Compared to same class
» 3% of all tested devices in this class were better, 1% similar, 96% worse
» The best had a delta of 6%, average was 18%, worst was 132%
Compared to all devices tested
» 3% of all tested devices were better, 1% similar, 96% worse
» The best had a delta of 4%, average was 23%, worst was 134%
MSI Stealth GS77 12UHS-083US audio analysis
(+) | speakers can play relatively loud (84.8 dB)
Bass 100 - 315 Hz
(±) | reduced bass - on average 9.4% lower than median
(±) | linearity of bass is average (9.8% delta to prev. frequency)
Mids 400 - 2000 Hz
(±) | higher mids - on average 7% higher than median
(+) | mids are linear (4.9% delta to prev. frequency)
Highs 2 - 16 kHz
(±) | higher highs - on average 5.8% higher than median
(±) | linearity of highs is average (7.9% delta to prev. frequency)
Overall 100 - 16.000 Hz
(±) | linearity of overall sound is average (15.9% difference to median)
Compared to same class
» 38% of all tested devices in this class were better, 7% similar, 56% worse
» The best had a delta of 6%, average was 18%, worst was 132%
Compared to all devices tested
» 25% of all tested devices were better, 5% similar, 70% worse
» The best had a delta of 4%, average was 23%, worst was 134%
电源管理--Razer笔记本电脑提供了微薄的电池寿命
消耗功率
在空闲运行期间,功耗变成了相对较高的34瓦,而一些竞争对手在这里的效率更高。在高负荷下,刀片的消耗量与竞争对手的水平相似,有时甚至更低。该 Alienware x17 R2 P48E代表了顶部的一个异类。虽然它的耗电量明显较高,但通常也会产生最好的基准测试结果。附带的280瓦电源是足够大的。
注:QHD兄弟姐妹型号 ,在测试时预设了 "Boost "CPU和启动了dGPU模式。这解释了它在空闲操作和低负载下的高消耗。
| Off / Standby | |
| Idle | |
| Load |
|
Key:
min: | |
| Razer Blade 17 Early 2022 i9-12900H, GeForce RTX 3080 Ti Laptop GPU, Samsung PM9A1 MZVL21T0HCLR, IPS, 3840x2160, 17.3" | Alienware x17 R2 P48E i9-12900HK, GeForce RTX 3080 Ti Laptop GPU, 2x Samsung PM9A1 1TB (RAID 0), IPS, 1920x1080, 17.3" | Medion Erazer Beast X30 i9-12900HK, GeForce RTX 3080 Ti Laptop GPU, Samsung PM9A1 MZVL21T0HCLR, IPS, 2560x1440, 17.3" | MSI Stealth GS77 12UHS-083US i7-12700H, GeForce RTX 3080 Ti Laptop GPU, Micron 3400 1TB MTFDKBA1T0TFH, IPS, 2560x1440, 17.3" | Razer Blade 17 RTX 3080 Ti i7-12800H, GeForce RTX 3080 Ti Laptop GPU, Samsung PM9A1 MZVL21T0HCLR, IPS, 2560x1440, 17.3" | Average NVIDIA GeForce RTX 3080 Ti Laptop GPU | Average of class Gaming | |
|---|---|---|---|---|---|---|---|
| Power Consumption | -32% | 13% | 9% | -41% | -2% | 14% | |
| Idle Minimum * (Watt) | 17 | 24.1 -42% | 12 29% | 20 -18% | 29.8 -75% | 17.2 ? -1% | 13 ? 24% |
| Idle Average * (Watt) | 23 | 28.5 -24% | 16 30% | 21.4 7% | 37.1 -61% | 23.3 ? -1% | 19 ? 17% |
| Idle Maximum * (Watt) | 34 | 60 -76% | 22 35% | 27 21% | 60.8 -79% | 30.8 ? 9% | 24.6 ? 28% |
| Load Average * (Watt) | 120 | 128.7 -7% | 118 2% | 100.5 16% | 135.3 -13% | 121.2 ? -1% | 110.7 ? 8% |
| Witcher 3 ultra * (Watt) | 229 | 254 -11% | 223 3% | 165 28% | 243 -6% | ||
| Load Maximum * (Watt) | 243 | 323 -33% | 290 -19% | 247.1 -2% | 273.1 -12% | 276 ? -14% | 259 ? -7% |
* ... smaller is better
Power Consumption The Witcher 3 / Stress Test
Power Consumption With External Monitor
电池寿命
在WLAN测试(通过脚本加载网站)和视频测试(持续循环播放短片Big Buck Bunny(H.264编码,FHD))中,17.3英寸笔记本电脑的运行时间分别达到了3:49 h和4:50 h。由于QHD刀片的显示分辨率较低 QHD刀片由于QHD Blade的显示分辨率较低,使用同样的82瓦时电池可以达到更长的电池寿命,这并不令人惊讶。
| Razer Blade 17 Early 2022 i9-12900H, GeForce RTX 3080 Ti Laptop GPU, 82 Wh | Alienware x17 R2 P48E i9-12900HK, GeForce RTX 3080 Ti Laptop GPU, 87 Wh | Medion Erazer Beast X30 i9-12900HK, GeForce RTX 3080 Ti Laptop GPU, 91.2 Wh | MSI Stealth GS77 12UHS-083US i7-12700H, GeForce RTX 3080 Ti Laptop GPU, 99 Wh | Razer Blade 17 RTX 3080 Ti i7-12800H, GeForce RTX 3080 Ti Laptop GPU, 82 Wh | Average of class Gaming | |
|---|---|---|---|---|---|---|
| Battery runtime | -48% | 33% | 32% | 8% | 41% | |
| Reader / Idle (h) | 7.1 | 3.9 -45% | 7.7 8% | 10.8 52% | 8 13% | 8.27 ? 16% |
| H.264 (h) | 4.8 | 6.4 33% | 8.32 ? 73% | |||
| WiFi v1.3 (h) | 3.8 | 2 -47% | 5.7 50% | 6.2 63% | 5.5 45% | 7.11 ? 87% |
| Load (h) | 1.7 | 0.8 -53% | 2.4 41% | 1.4 -18% | 1.1 -35% | 1.502 ? -12% |
Pros
Cons
结论 - 在一个紧凑的箱子里有很多的性能
我们对Blade 17的测试配置针对的是游戏玩家和创意专业人士。酷睿i9-12900H处理器、GeForce RTX 3080 Ti Laptop GPU(BIOS更新后为175瓦TGP,16GB的VRAM)和32GB的工作内存,使笔记本电脑具备了视频处理、渲染和4K游戏的最高水平。此外,一个快速的PCIe-4固态硬盘(1TB)确保了较短的加载和存储时间。
通过Blade 17(2022年初),Razer为创意专业人士提供了一个成功而强大的工作设备。但这也有其代价。
CPU和GPU能够以高时钟速度持续运行。和这个设备级别一样,噪音和热量的发展处于较高的水平。对于一台强大的4K笔记本电脑来说,4到5小时的实际电池寿命还是可以的。亮点是明亮和反应灵敏的17.3英寸显示屏(4K,IPS,144Hz),色彩还原准确(DCI-P3:100%)。
刀片的价格约为4650欧元(约合人民币4847元),比QHD型号多出约400欧元(约合人民币417元)。 QHD型号.这值得吗?与兄弟机型的酷睿i7相比,酷睿i9几乎没有提供任何额外的功率,特别是在持续负载下。而且该兄弟姐妹提供更好的电池寿命。我们之前测试的QHD机型的另一点是对高级优化的支持。4k刀片不提供这个。
与QHD面板相比,4K显示屏的亮度明显更高,响应时间更短。如果除了更高的分辨率外,这些标准不是决定性因素,你可以安全地选择QHD刀片。在色彩再现和色彩空间覆盖方面,QHD和4K面板的表现同样出色。
作为Blade 17的替代产品,你也可以得到 Medion Erazer Beast X30.它具有几乎相同的尺寸,但带来的重量较轻。在图形性能方面,它仍然略微落后于Razer笔记本电脑。
价格和可用性
Razer Blade 17 Early 2022
- 07/05/2022 v7 (old)
Sascha Mölck
Price comparison

