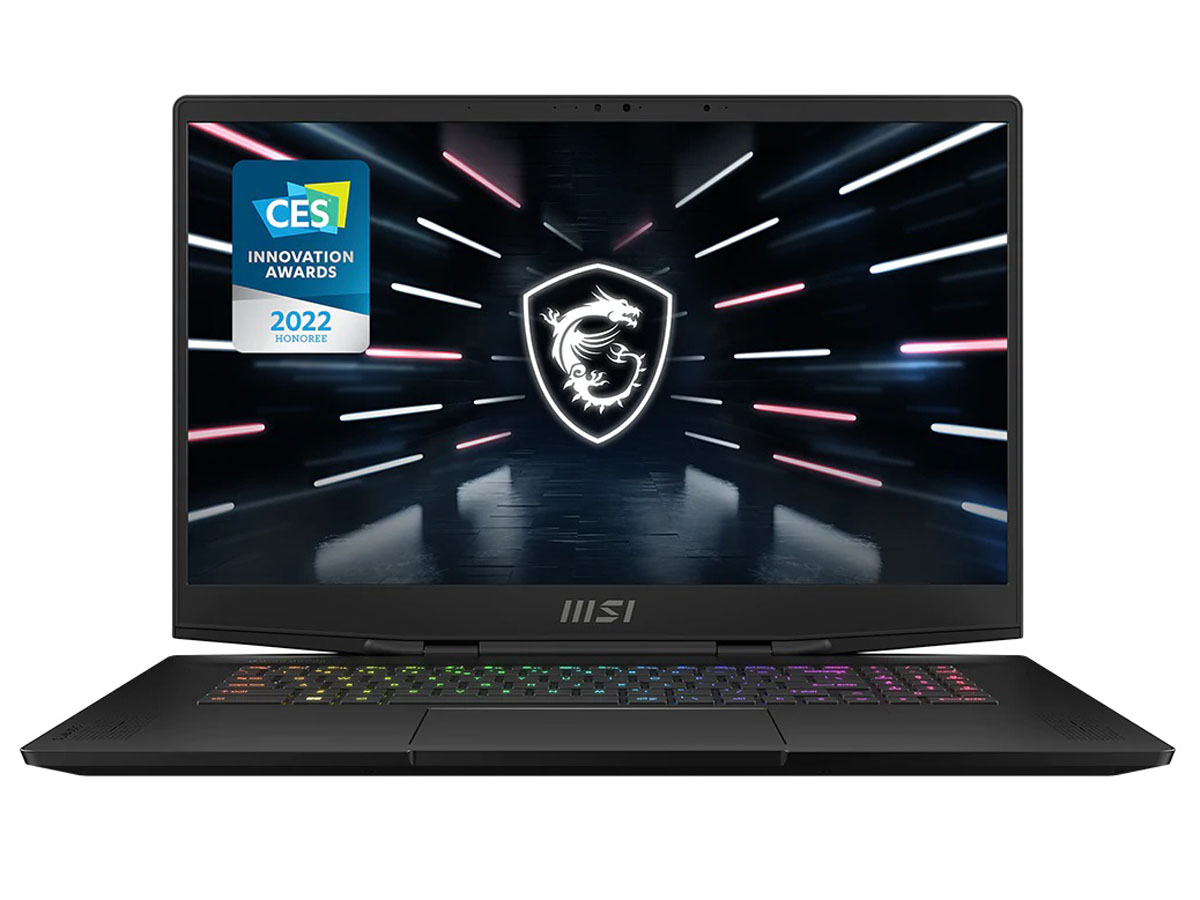
MSI Stealth GS77笔记本电脑评测。一个好的Razer Blade 17替代品?
当微星去年推出搭载第11代英特尔的GS76时,该型号将采用与之前完全不同的机箱设计 芯片.2022年,搭载第12代英特尔的GS77已经到来,取代了GS76,并采用了另一种新鲜的机箱重新设计。我们很惊讶这么快就看到微星GS系列的新外观,尤其是大多数其他笔记本电脑在最终接受改头换面之前至少会连续几年使用相同的机箱骨架。
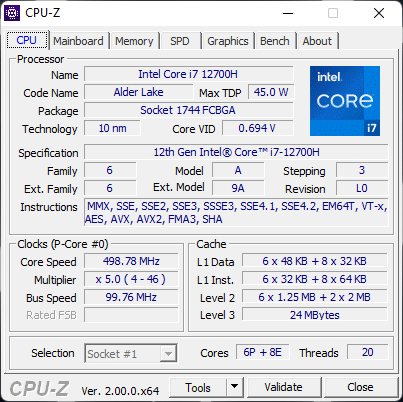
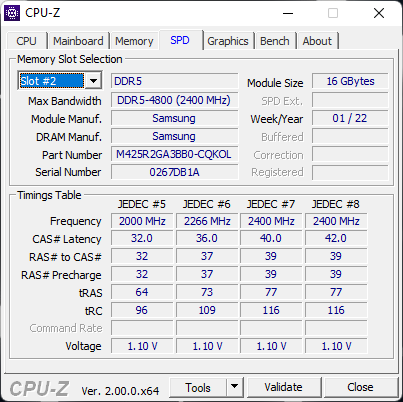
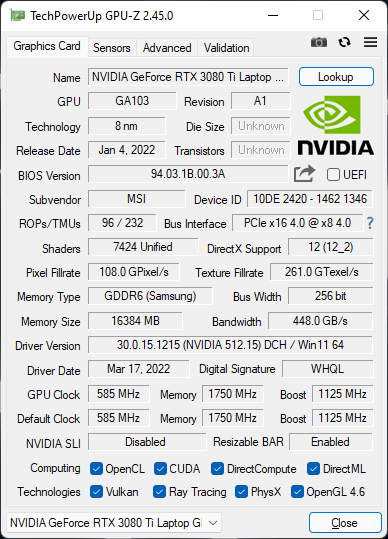
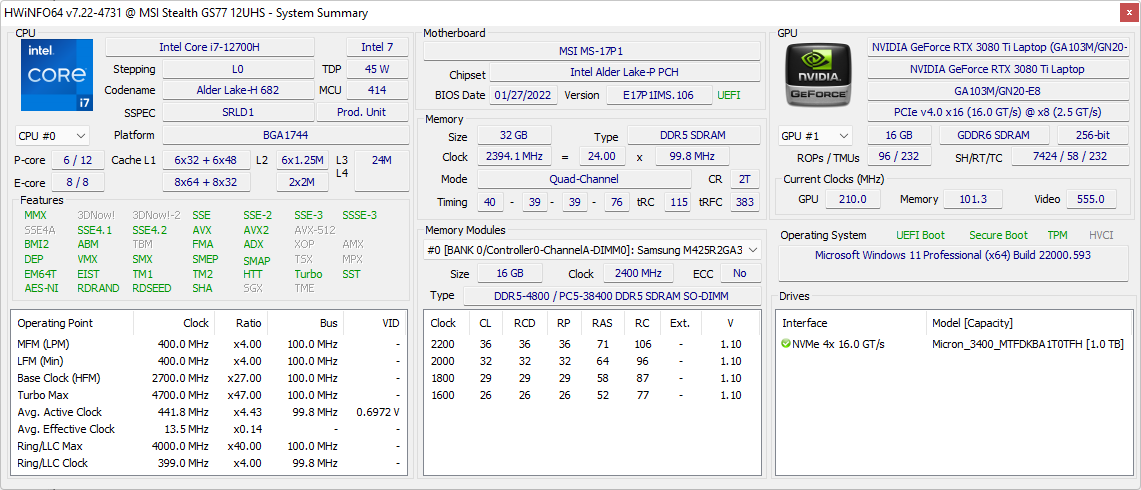
我们在审查中的配置是由Xotic PC提供的,配备12代酷睿i7-12700H CPU,105 W TGPGeForce RTX 3080 Ti GPU,32 GB DDR5-4800内存,240 Hz 1440p IPS显示屏,以及1 TB PCIe4 x4 NVMe SSD,零售价约3700美元。其他SKU可使用Core i9-12900H、RTX 3070 Ti、RTX 3080、360 Hz FHD或120 Hz UHD面板代替。
竞争机型包括其他超薄的 Razer Blade 17, 戴尔Alienware x17,华硕ROG Zephyrus S17, 和 技嘉Aorus 17系列。
更多的微星评论。
潜在的竞争对手比较
Rating | Date | Model | Weight | Height | Size | Resolution | Price |
|---|---|---|---|---|---|---|---|
| 87.2 % v7 (old) | 04 / 2022 | MSI Stealth GS77 12UHS-083US i7-12700H, GeForce RTX 3080 Ti Laptop GPU | 2.9 kg | 20.8 mm | 17.30" | 2560x1440 | |
| 86.2 % v7 (old) | 09 / 2021 | MSI GS76 Stealth 11UH i9-11900H, GeForce RTX 3080 Laptop GPU | 2.4 kg | 20 mm | 17.30" | 3840x2160 | |
| 91.2 % v7 (old) | 03 / 2022 | Razer Blade 17 RTX 3080 Ti i7-12800H, GeForce RTX 3080 Ti Laptop GPU | 2.7 kg | 19.9 mm | 17.30" | 2560x1440 | |
| 87.5 % v7 (old) | 01 / 2022 | MSI GE76 Raider i9-12900HK, GeForce RTX 3080 Ti Laptop GPU | 3 kg | 26 mm | 17.30" | 1920x1080 | |
| 89 % v7 (old) | 09 / 2021 | Alienware x17 RTX 3080 P48E i7-11800H, GeForce RTX 3080 Laptop GPU | 3.2 kg | 21.4 mm | 17.30" | 3840x2160 | |
| 90.1 % v7 (old) | 08 / 2021 | Asus ROG Zephyrus S17 GX703HSD i9-11900H, GeForce RTX 3080 Laptop GPU | 2.8 kg | 19.9 mm | 17.30" | 2560x1440 |
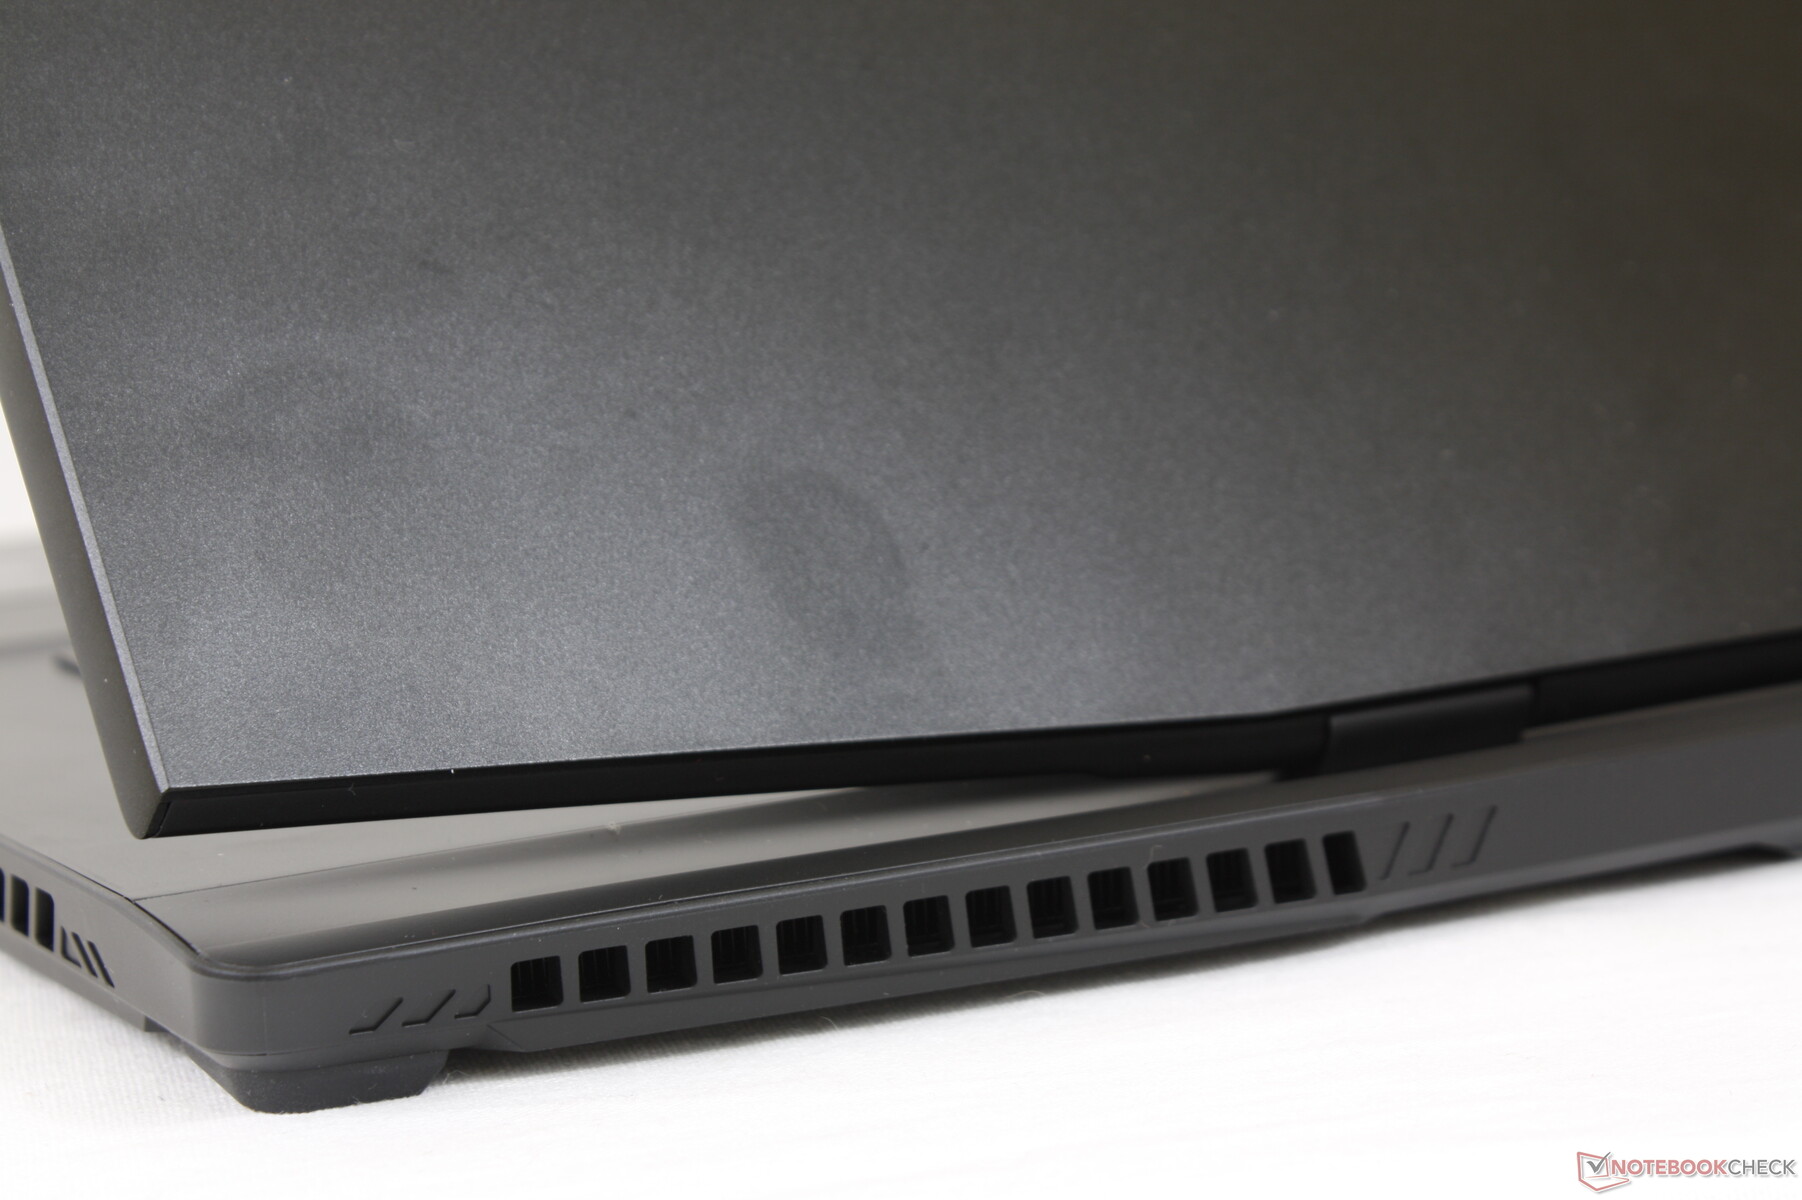
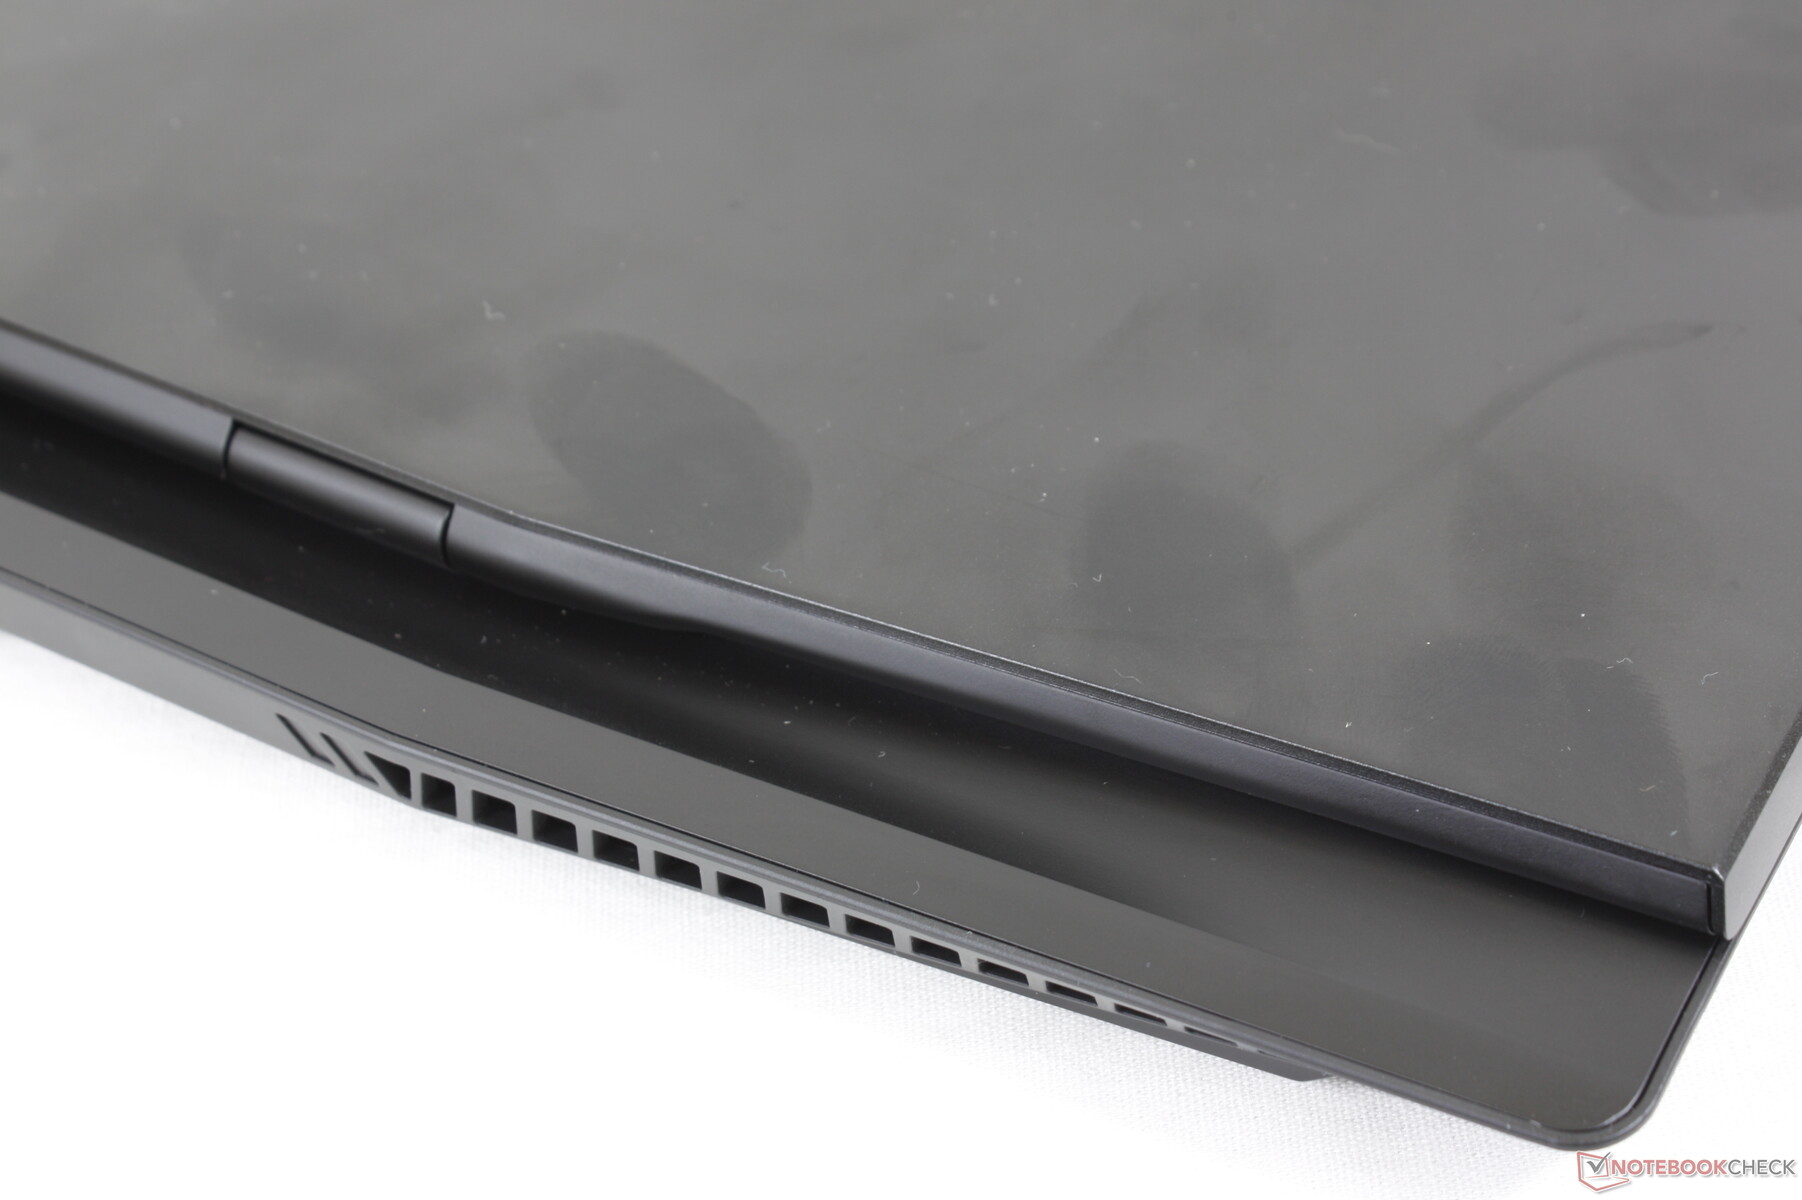
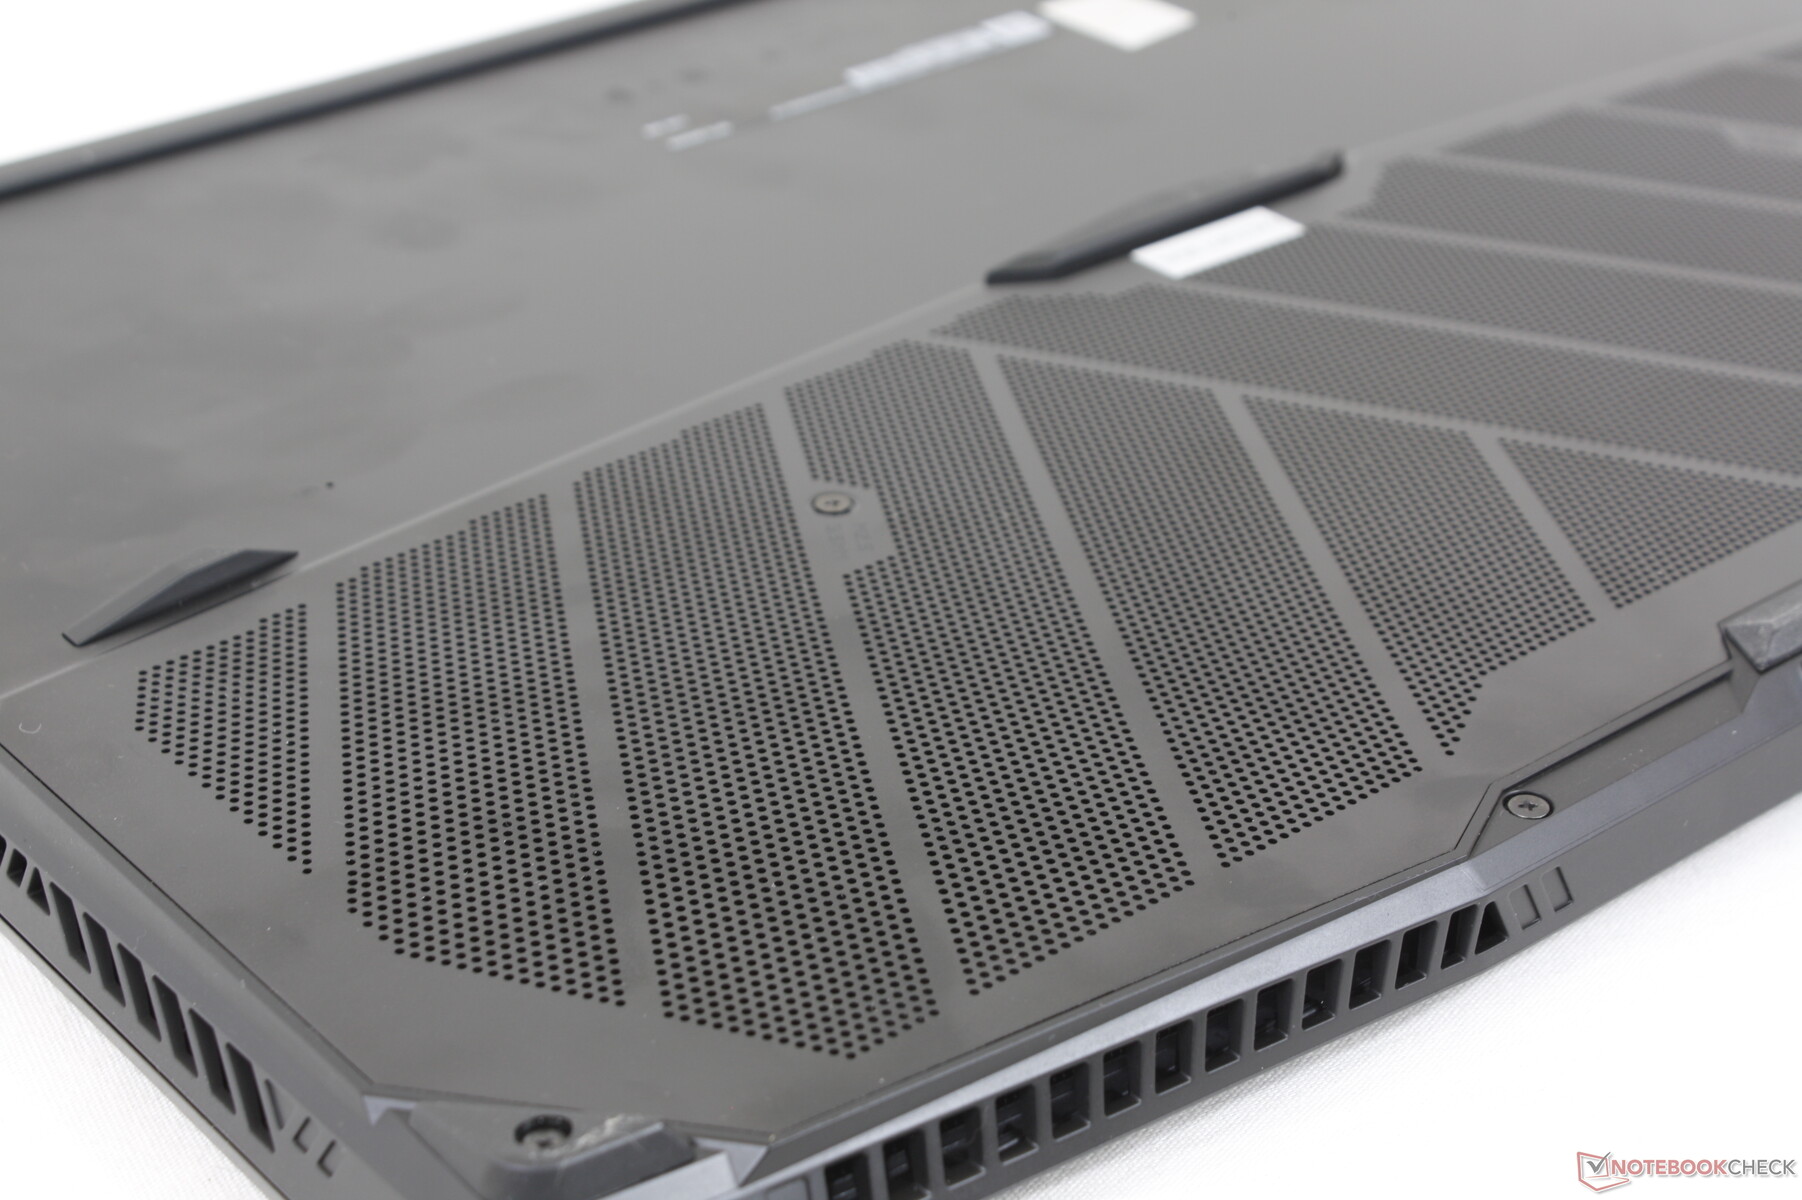
案例 - 更大、更重、更强硬
我们对GS76最大的抱怨之一是,它为了更薄、更轻的外形而牺牲了太多的性能。重新设计的GS77已经解决了这个问题,它引入了一个突出的喷气式发动机后部,就像Alienware x17或微星的GT系列。我们很高兴地看到,机箱的刚性也得到了改善,因为底座和盖子都比以前更不容易受到任何扭曲或凹陷的影响。
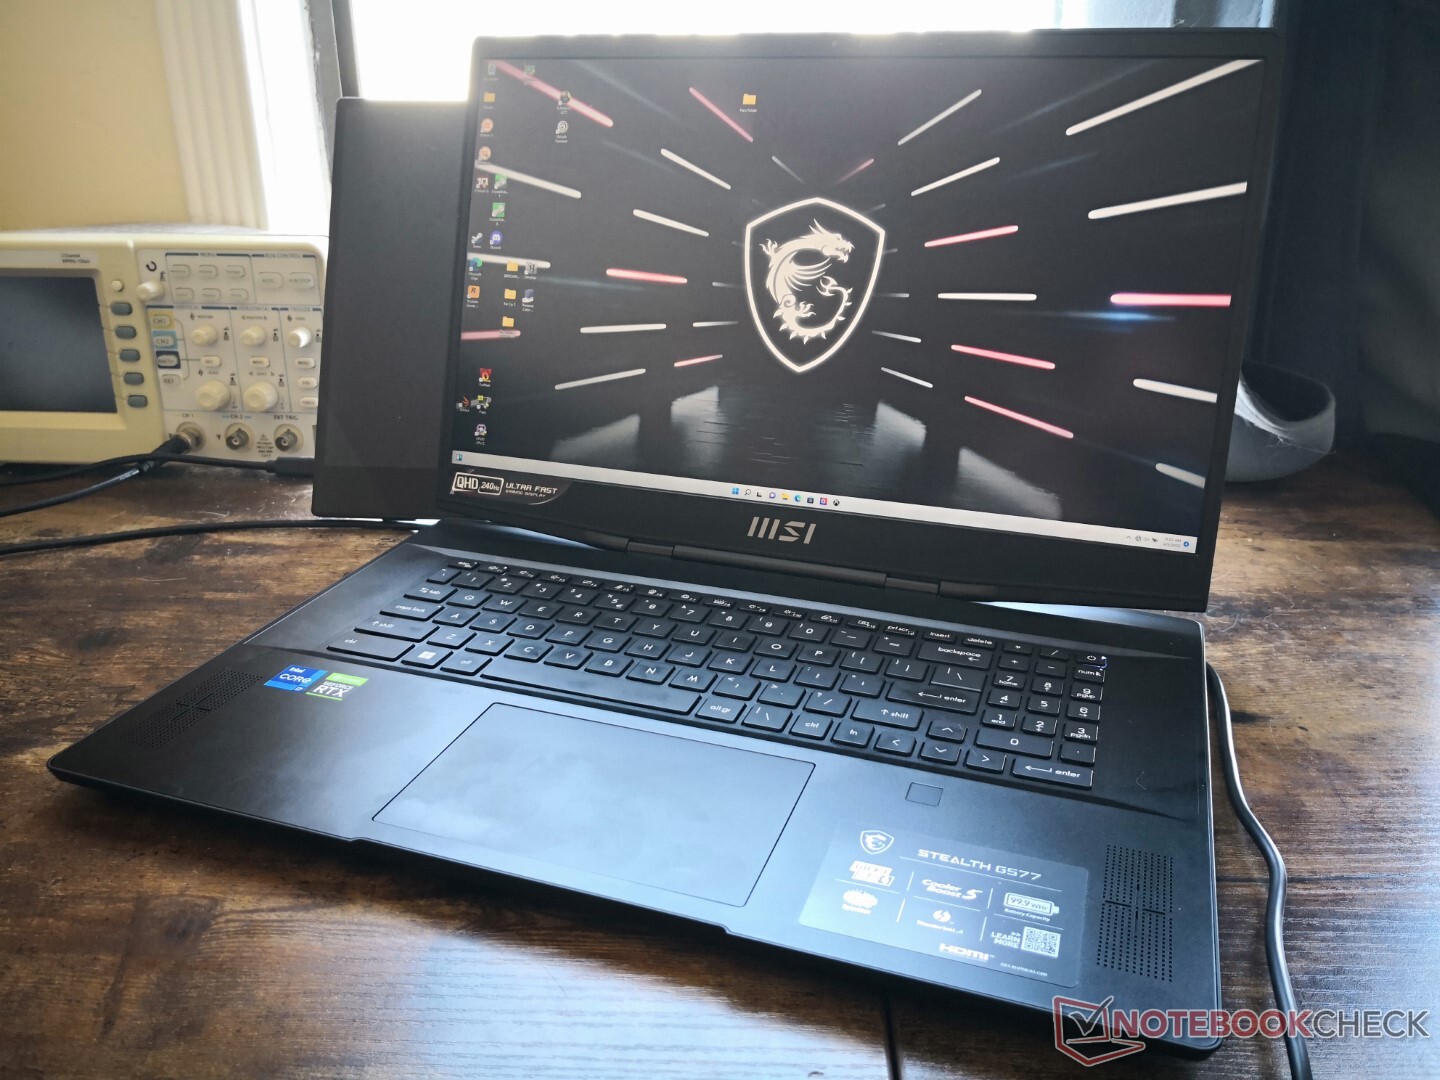
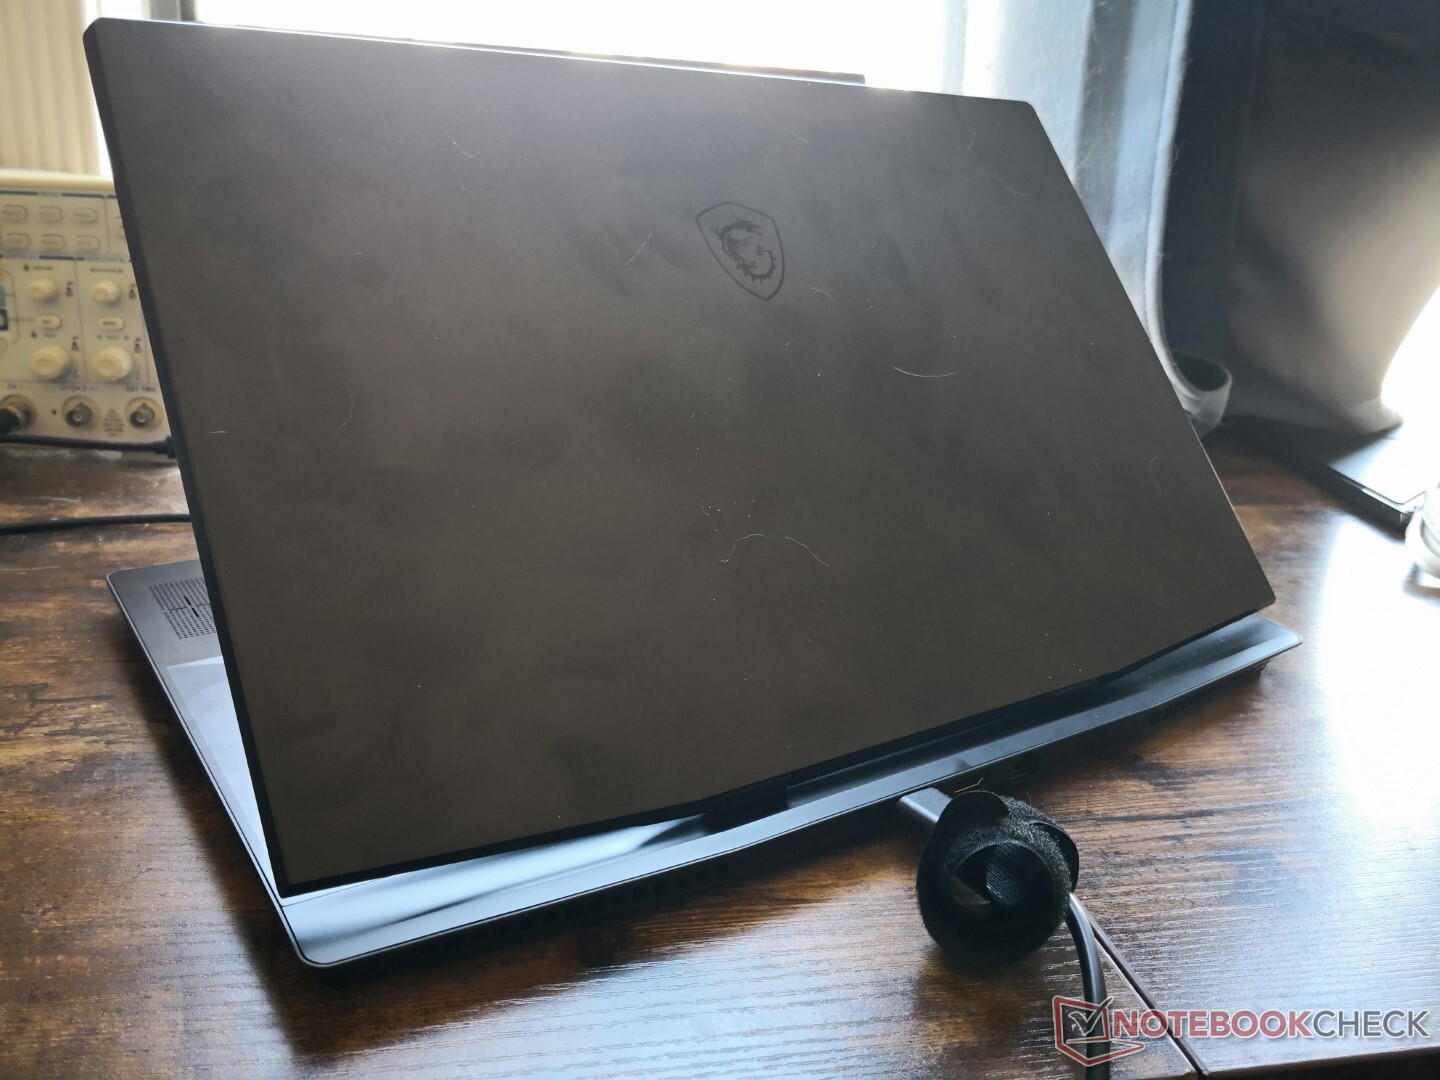
在一个有趣的转折中,GS77明显比老款GS76大和重,分别为14%和21%。尺寸和重量的增加主要归因于前面提到的GS77更大的后部和整体更厚的骨架。因此,该机型在尺寸和重量上都位于刀锋17和Alienware x17之间。相比之下,老款的GS75明显轻了600多克。
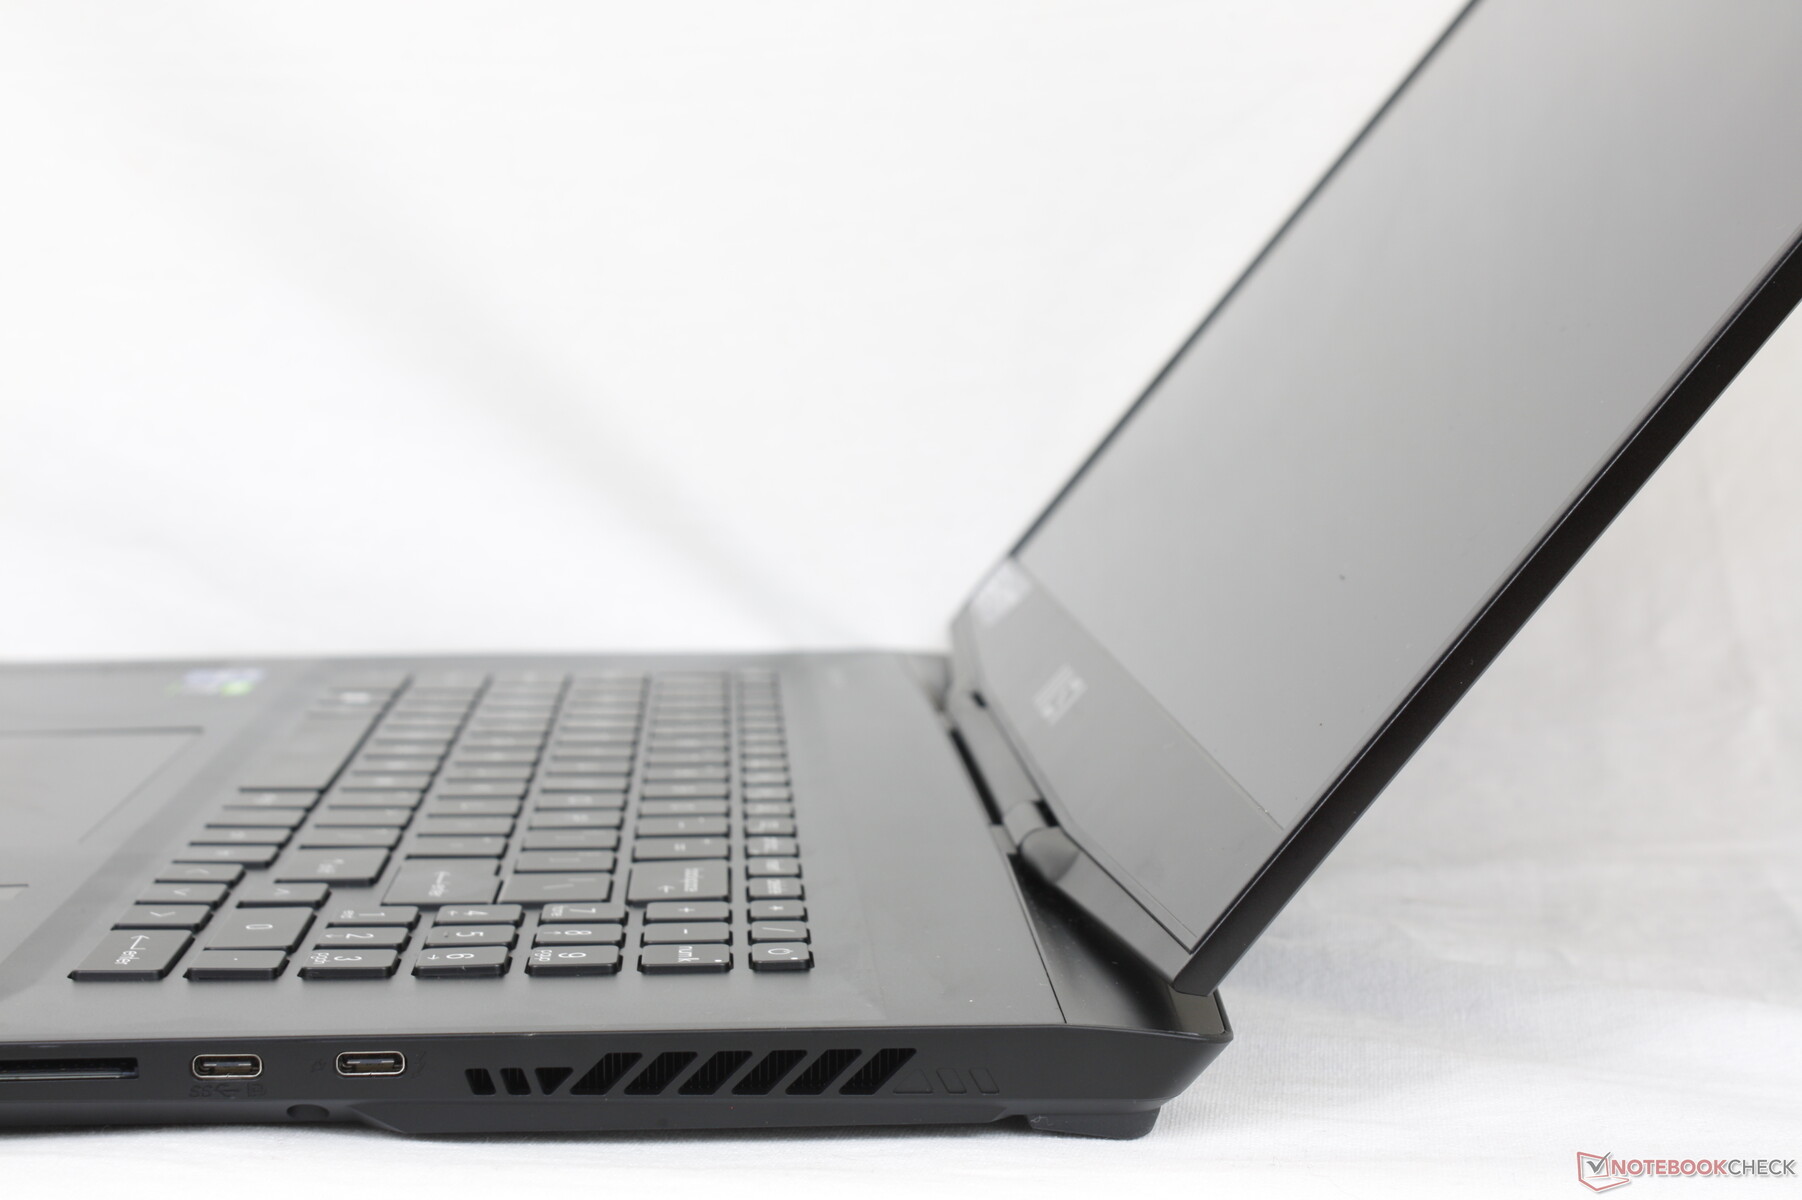
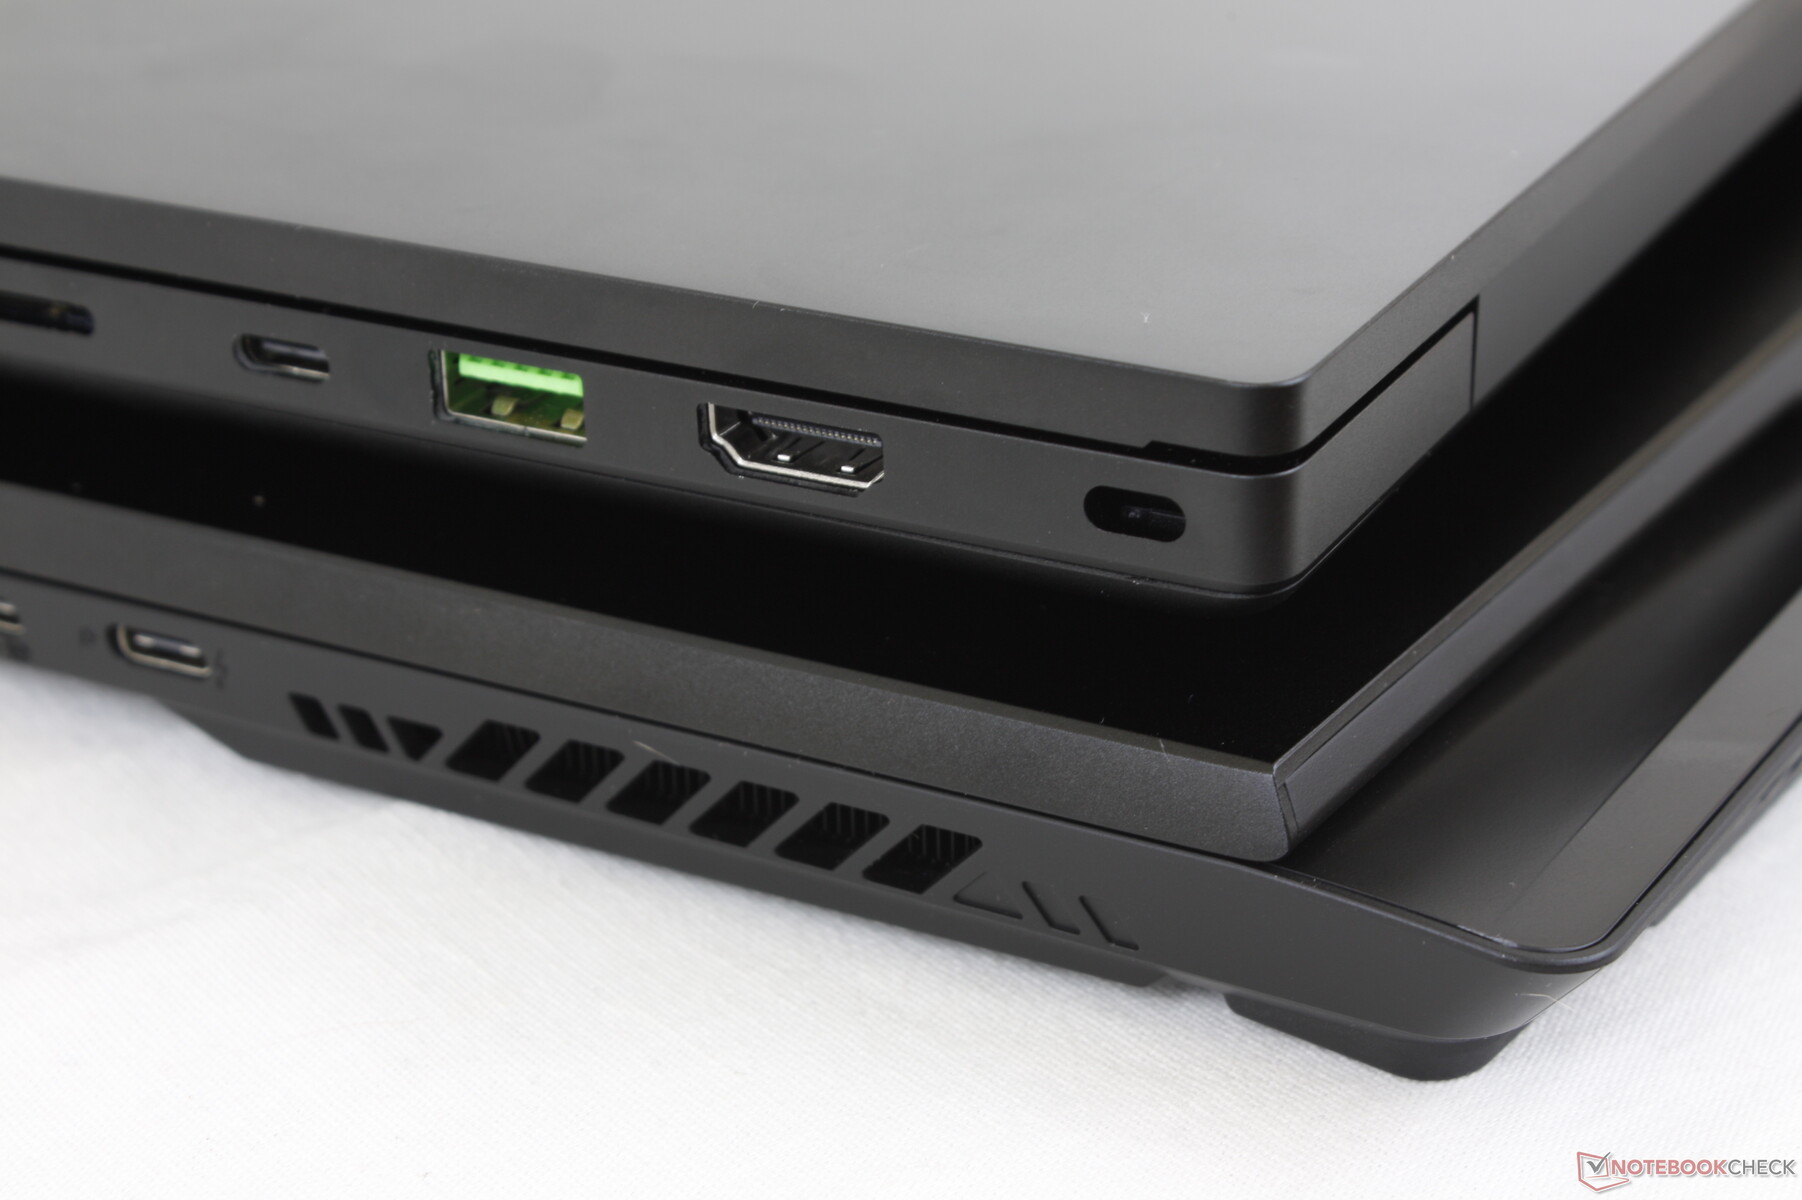
连接性 - 和以前一样
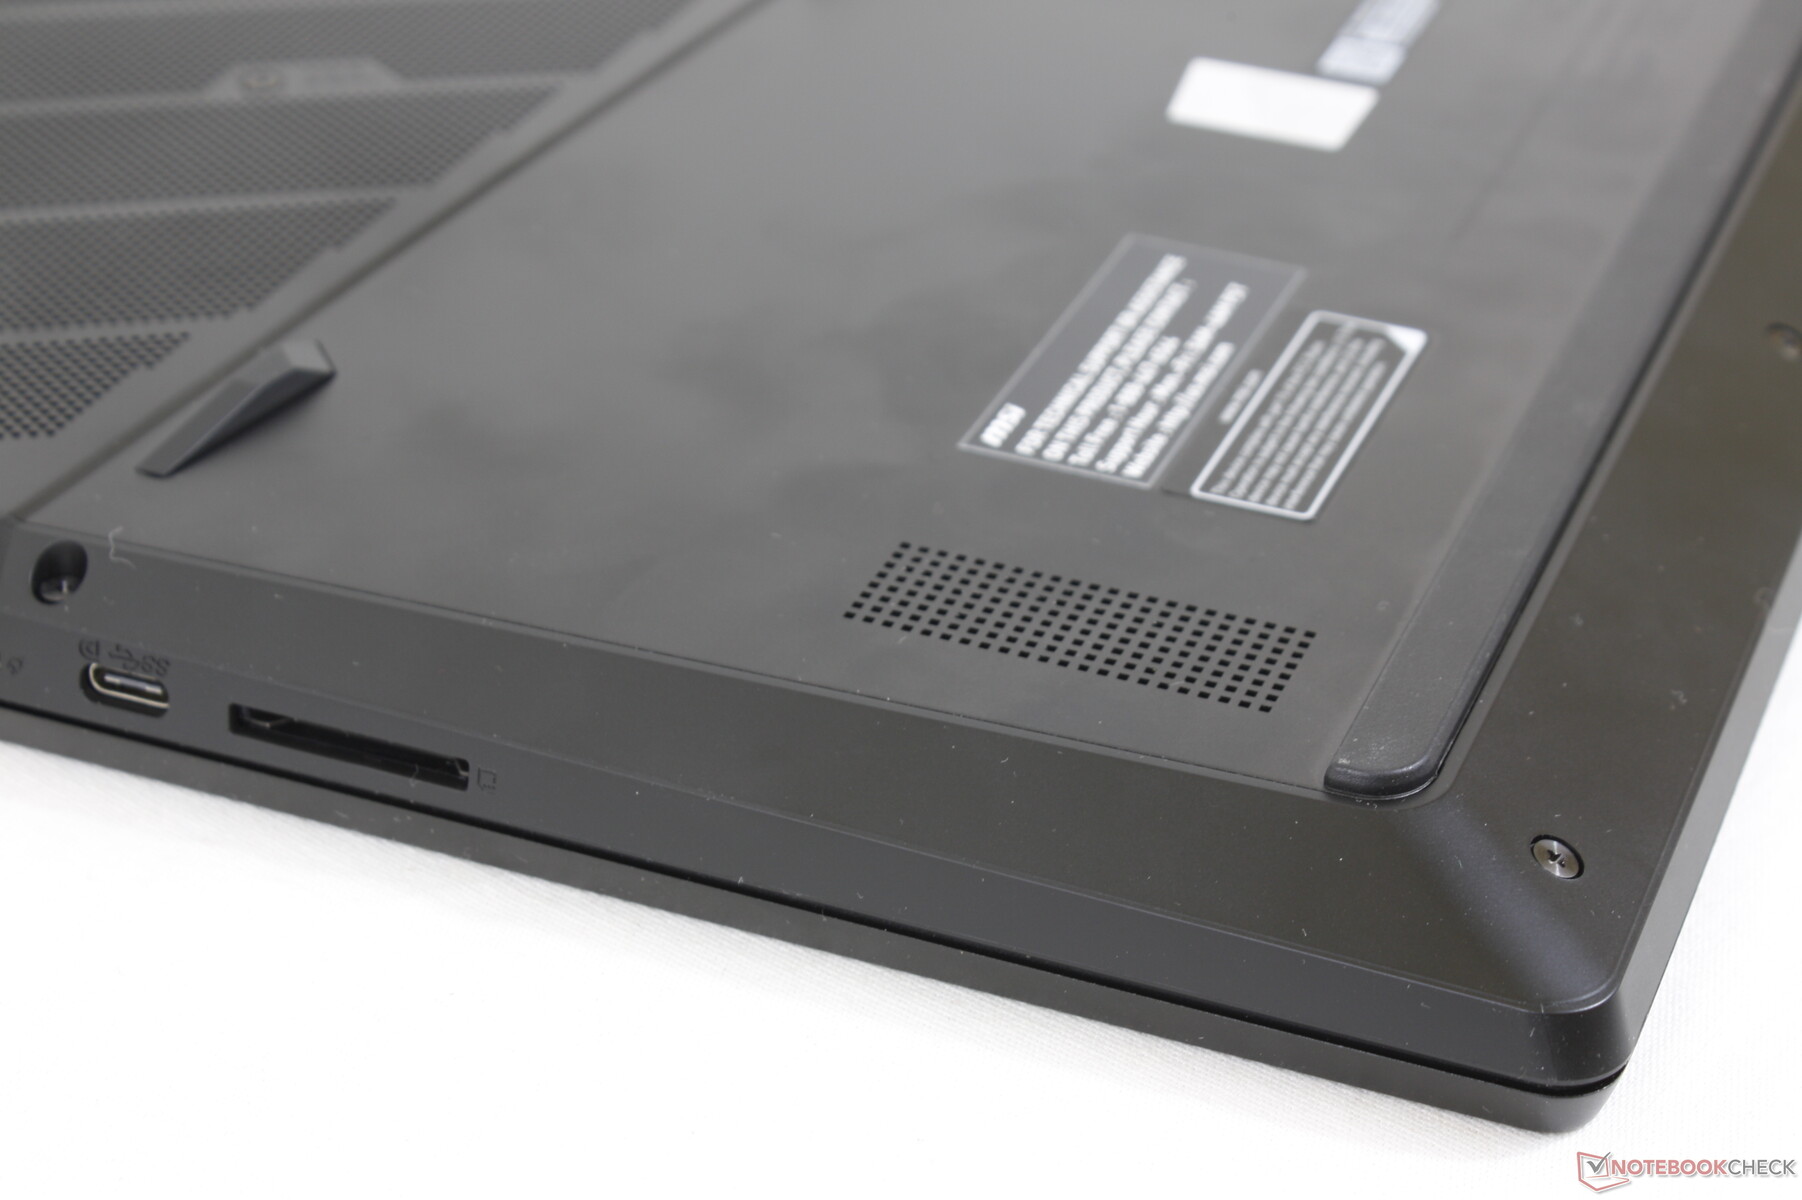
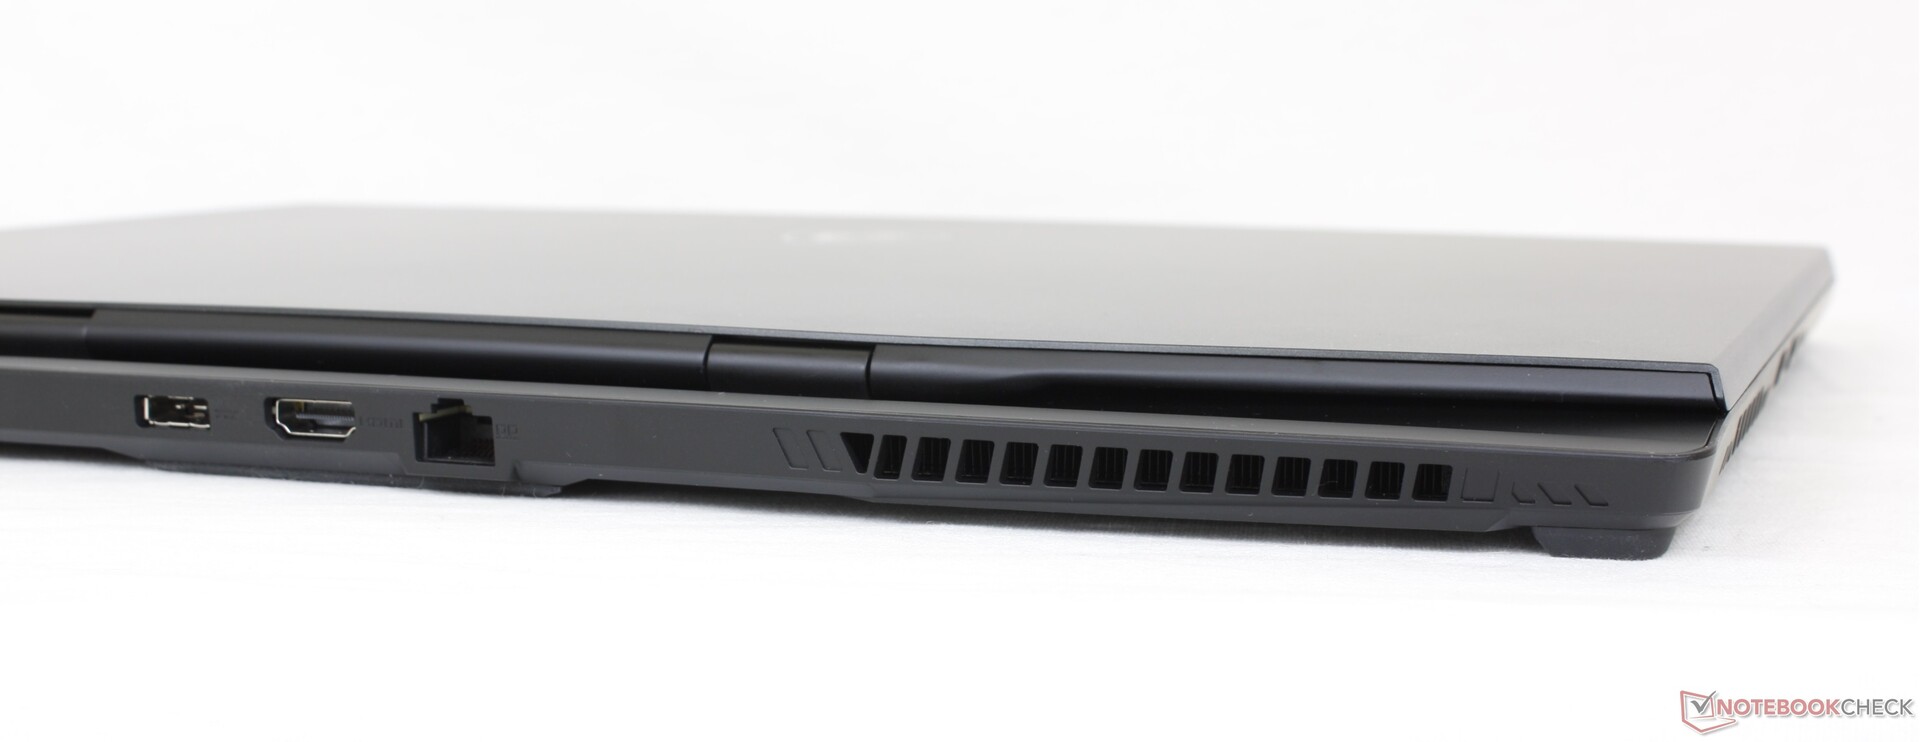
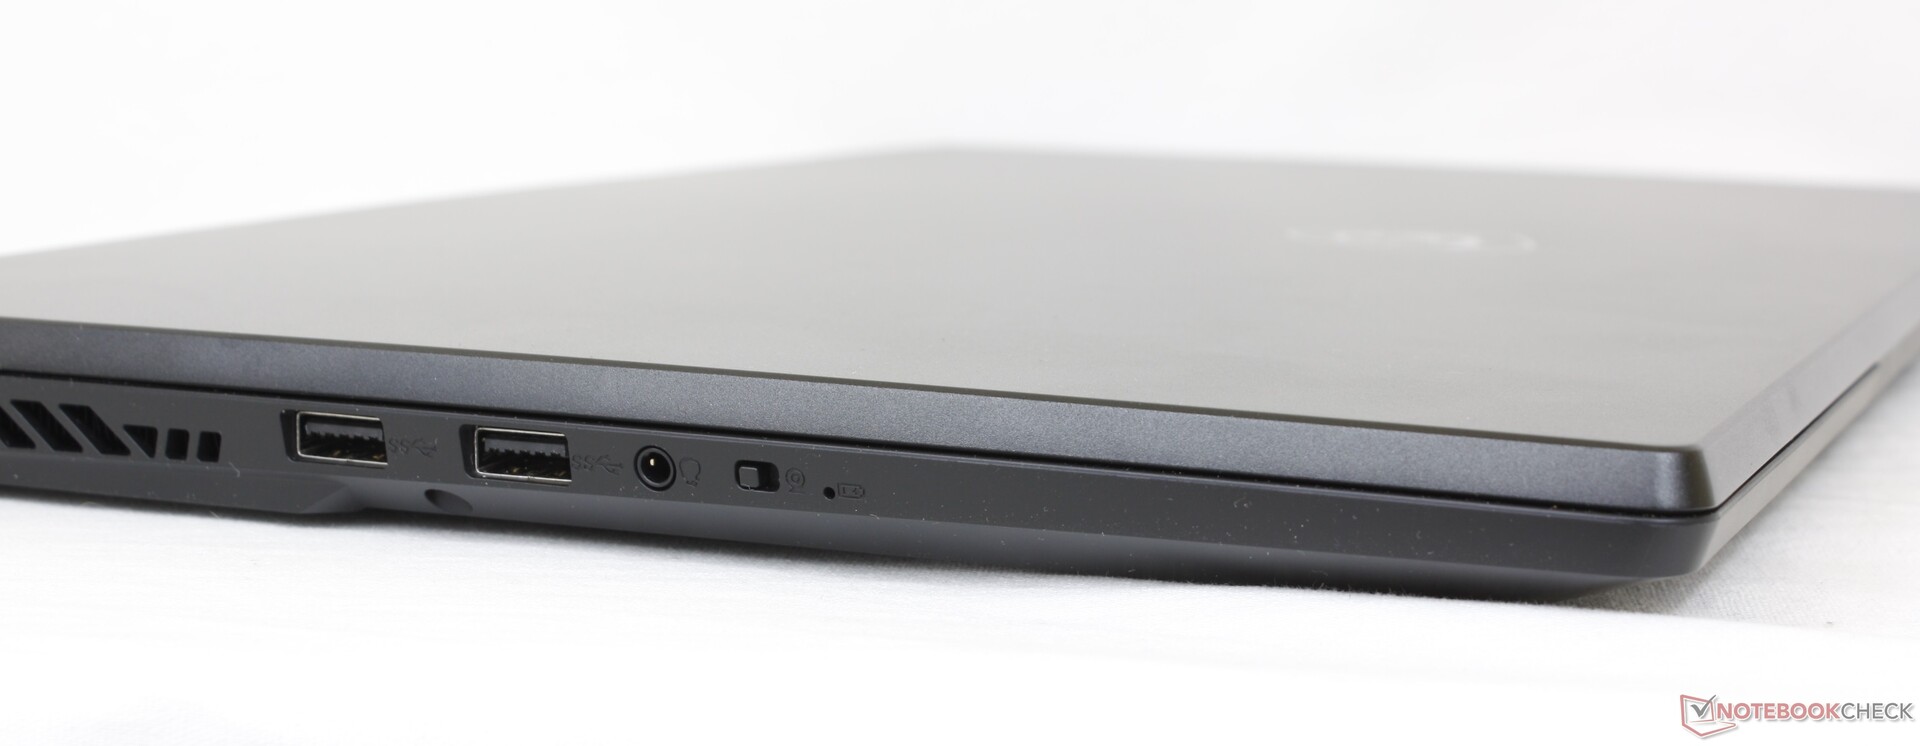
端口选项与GS76相同,只是重新安排了。GS76的后部没有端口,而GS77的端口分布更加均匀:左边3个,右边3个,后面3个。
用户应该注意到,沿着右边的两个USB-C端口中只有一个支持Thunderbolt,就像GS76一样。此外,交流适配器的端口已经改变,所以旧的交流适配器不兼容。
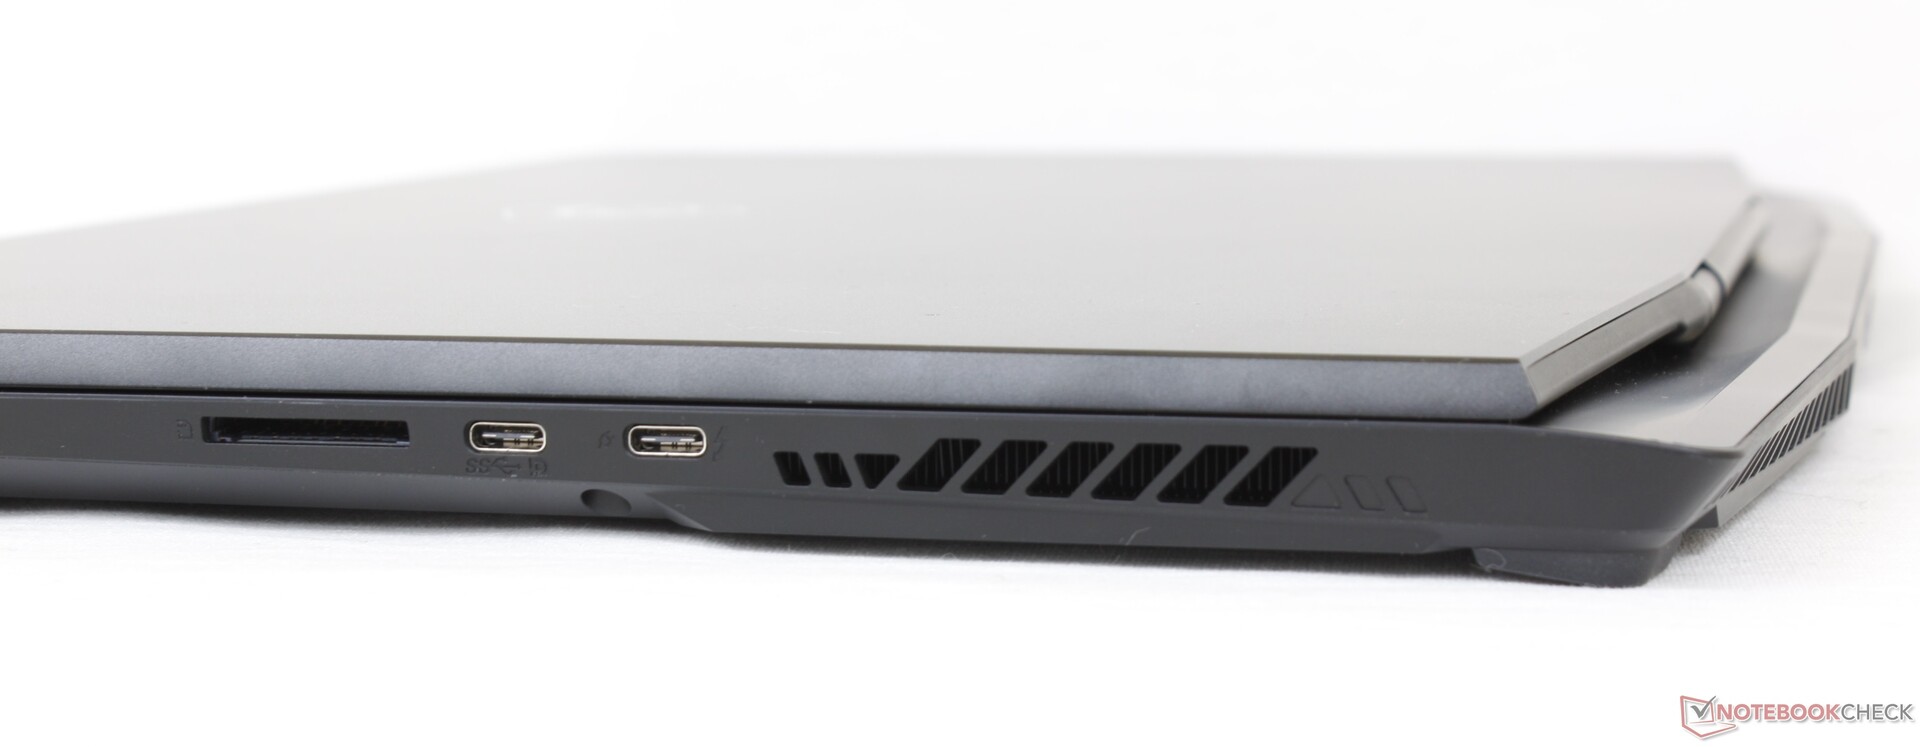
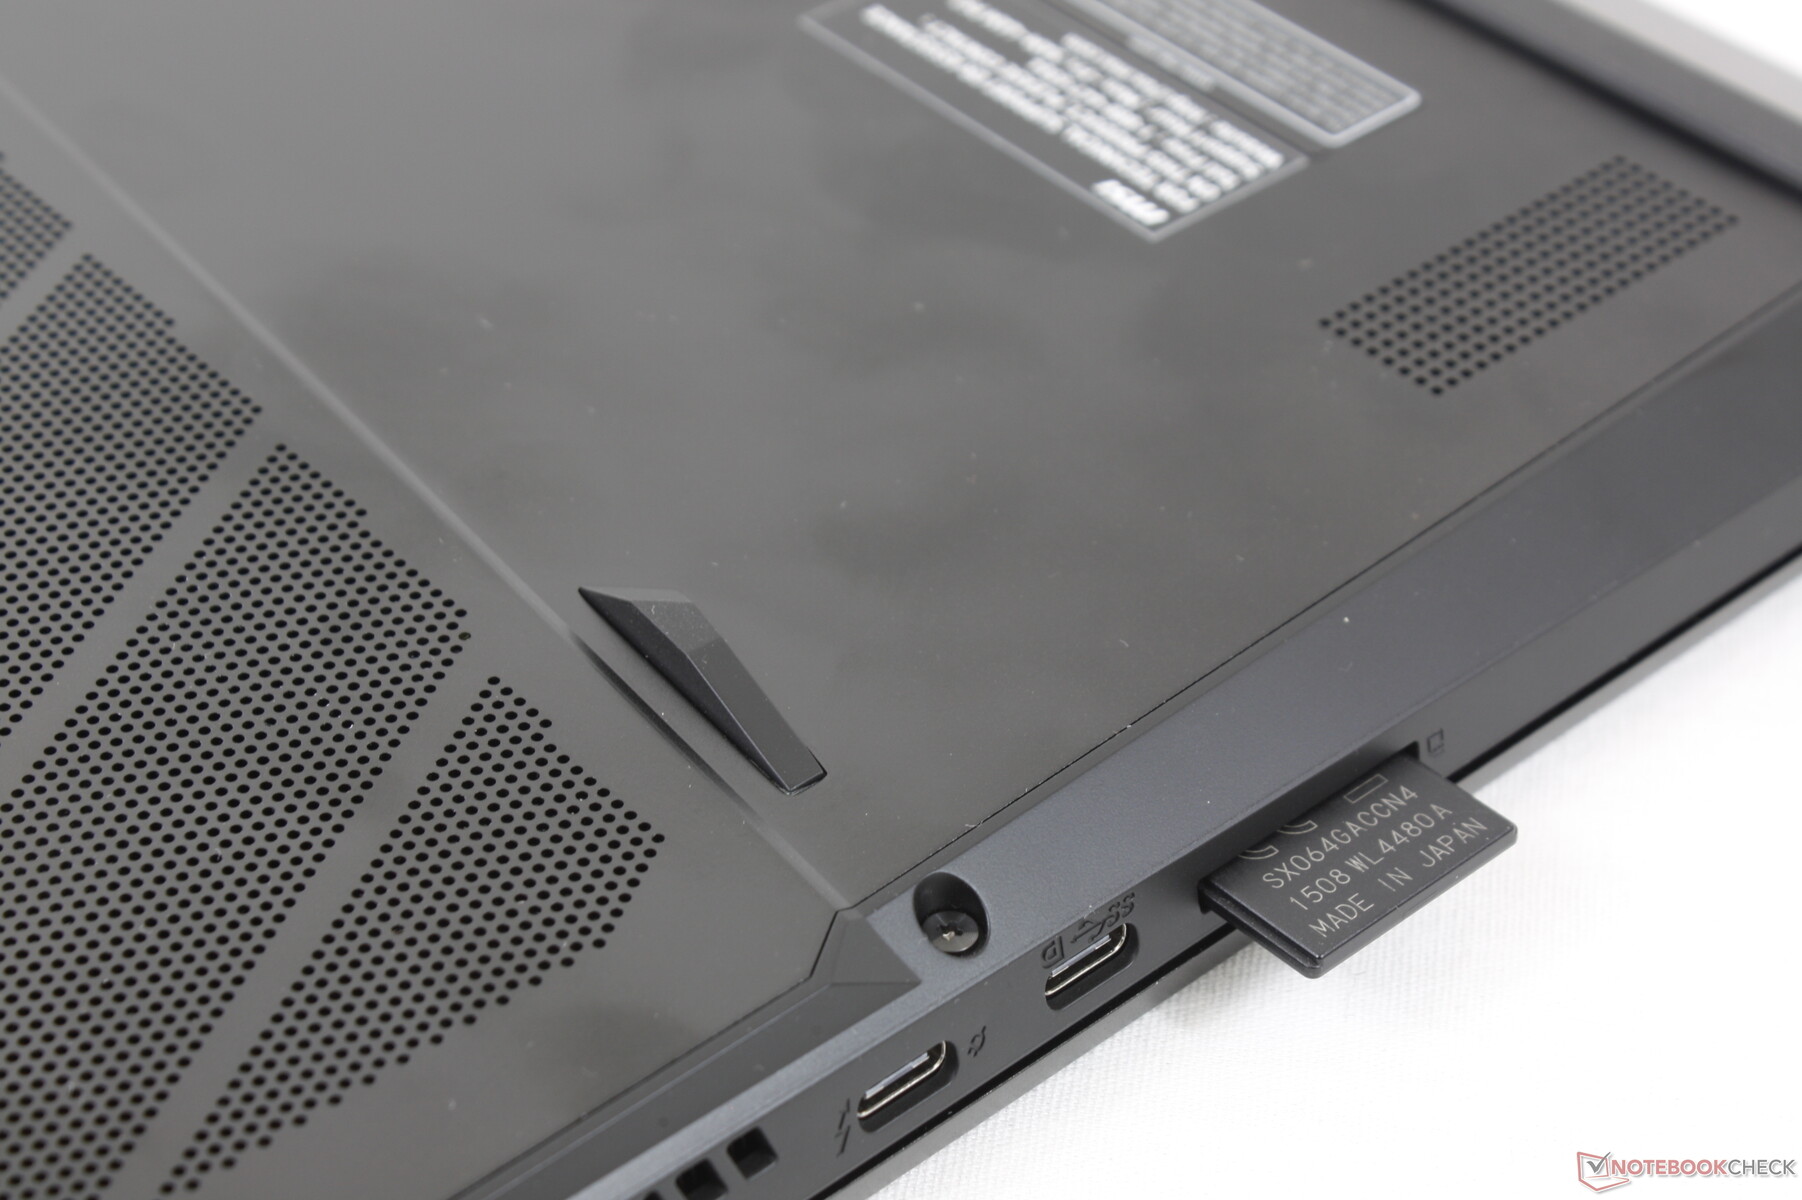
SD卡阅读器
微星公司将其集成的SD读卡器的速度比上一代GS76降低了一半以上。在我们的GS77上将1GB的图片从UHS-II测试卡移动到桌面需要大约14秒,而在GS76上只需要5到6秒。经常依赖SD读卡器的用户可能会对这种降级感到失望。
| SD Card Reader | |
| average JPG Copy Test (av. of 3 runs) | |
| MSI GS76 Stealth 11UH (AV PRO microSD 128 GB V60) | |
| Asus ROG Zephyrus S17 GX703HSD | |
| Alienware x17 RTX 3080 P48E (AV Pro V60) | |
| Razer Blade 17 RTX 3080 Ti (AV Pro V60) | |
| MSI Stealth GS77 12UHS-083US (AV Pro V60) | |
| maximum AS SSD Seq Read Test (1GB) | |
| Asus ROG Zephyrus S17 GX703HSD | |
| Alienware x17 RTX 3080 P48E (AV Pro V60) | |
| MSI GS76 Stealth 11UH (AV PRO microSD 128 GB V60) | |
| Razer Blade 17 RTX 3080 Ti (AV Pro V60) | |
| MSI Stealth GS77 12UHS-083US (AV Pro V60) | |
沟通
网络摄像头
网络摄像头已经从GS76的720p升级到了GS77的1080p,总体来说画面更清晰。红外线支持Windows Hello,电子快门可沿左侧边缘进入。


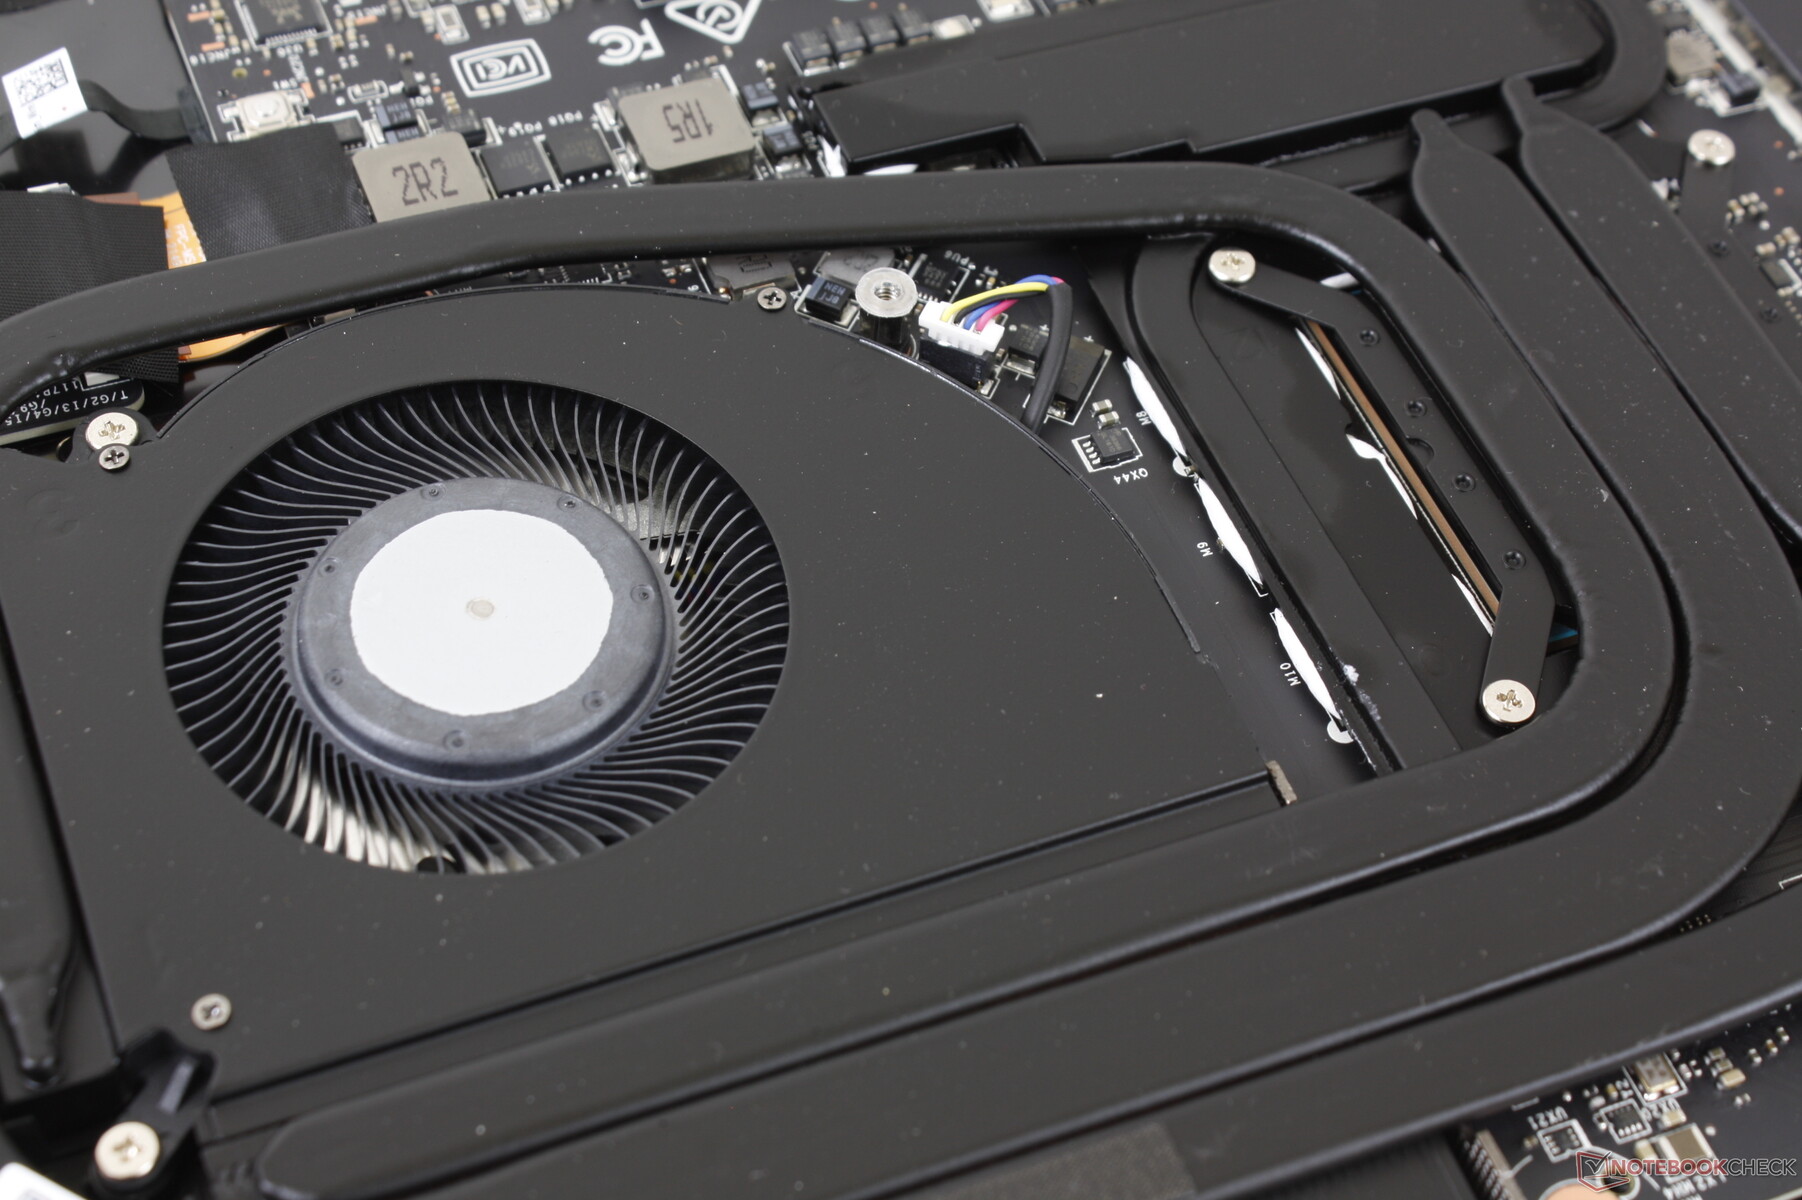
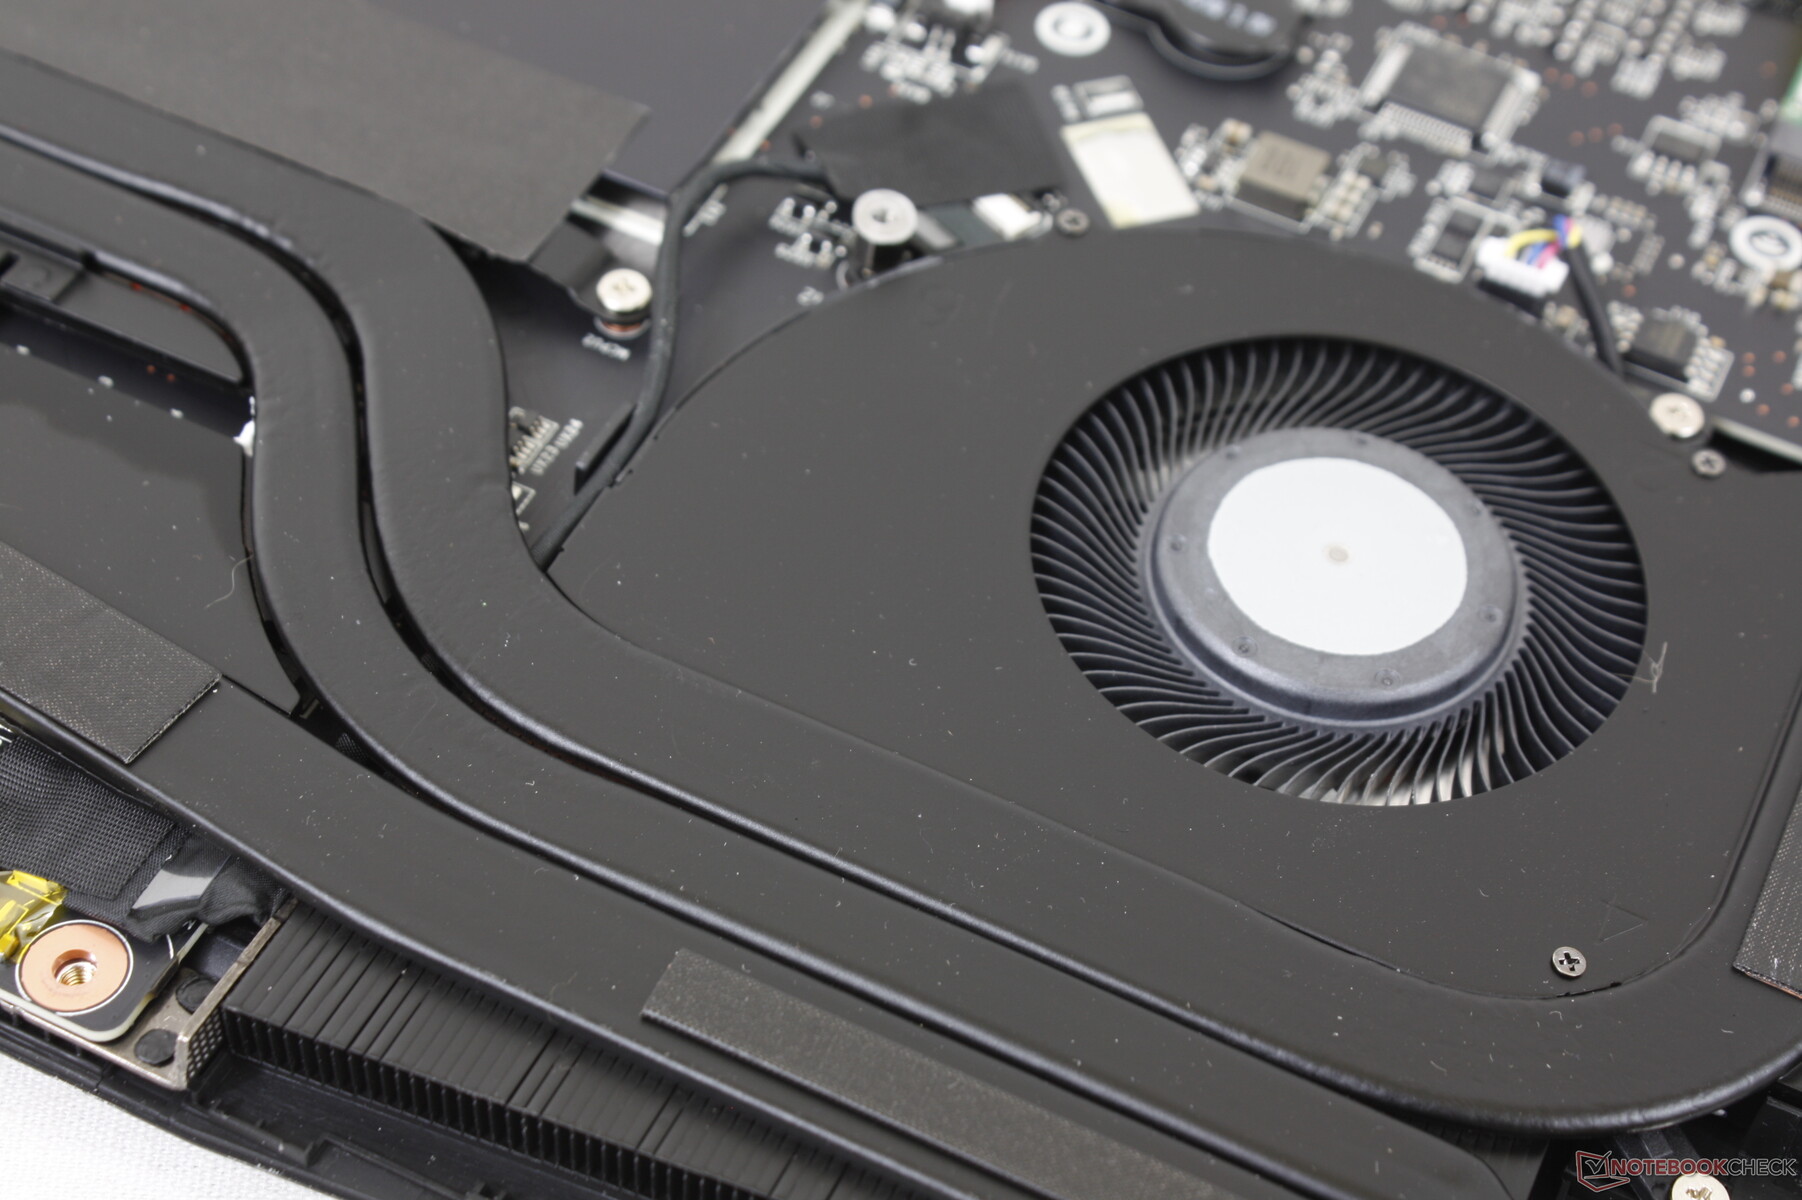
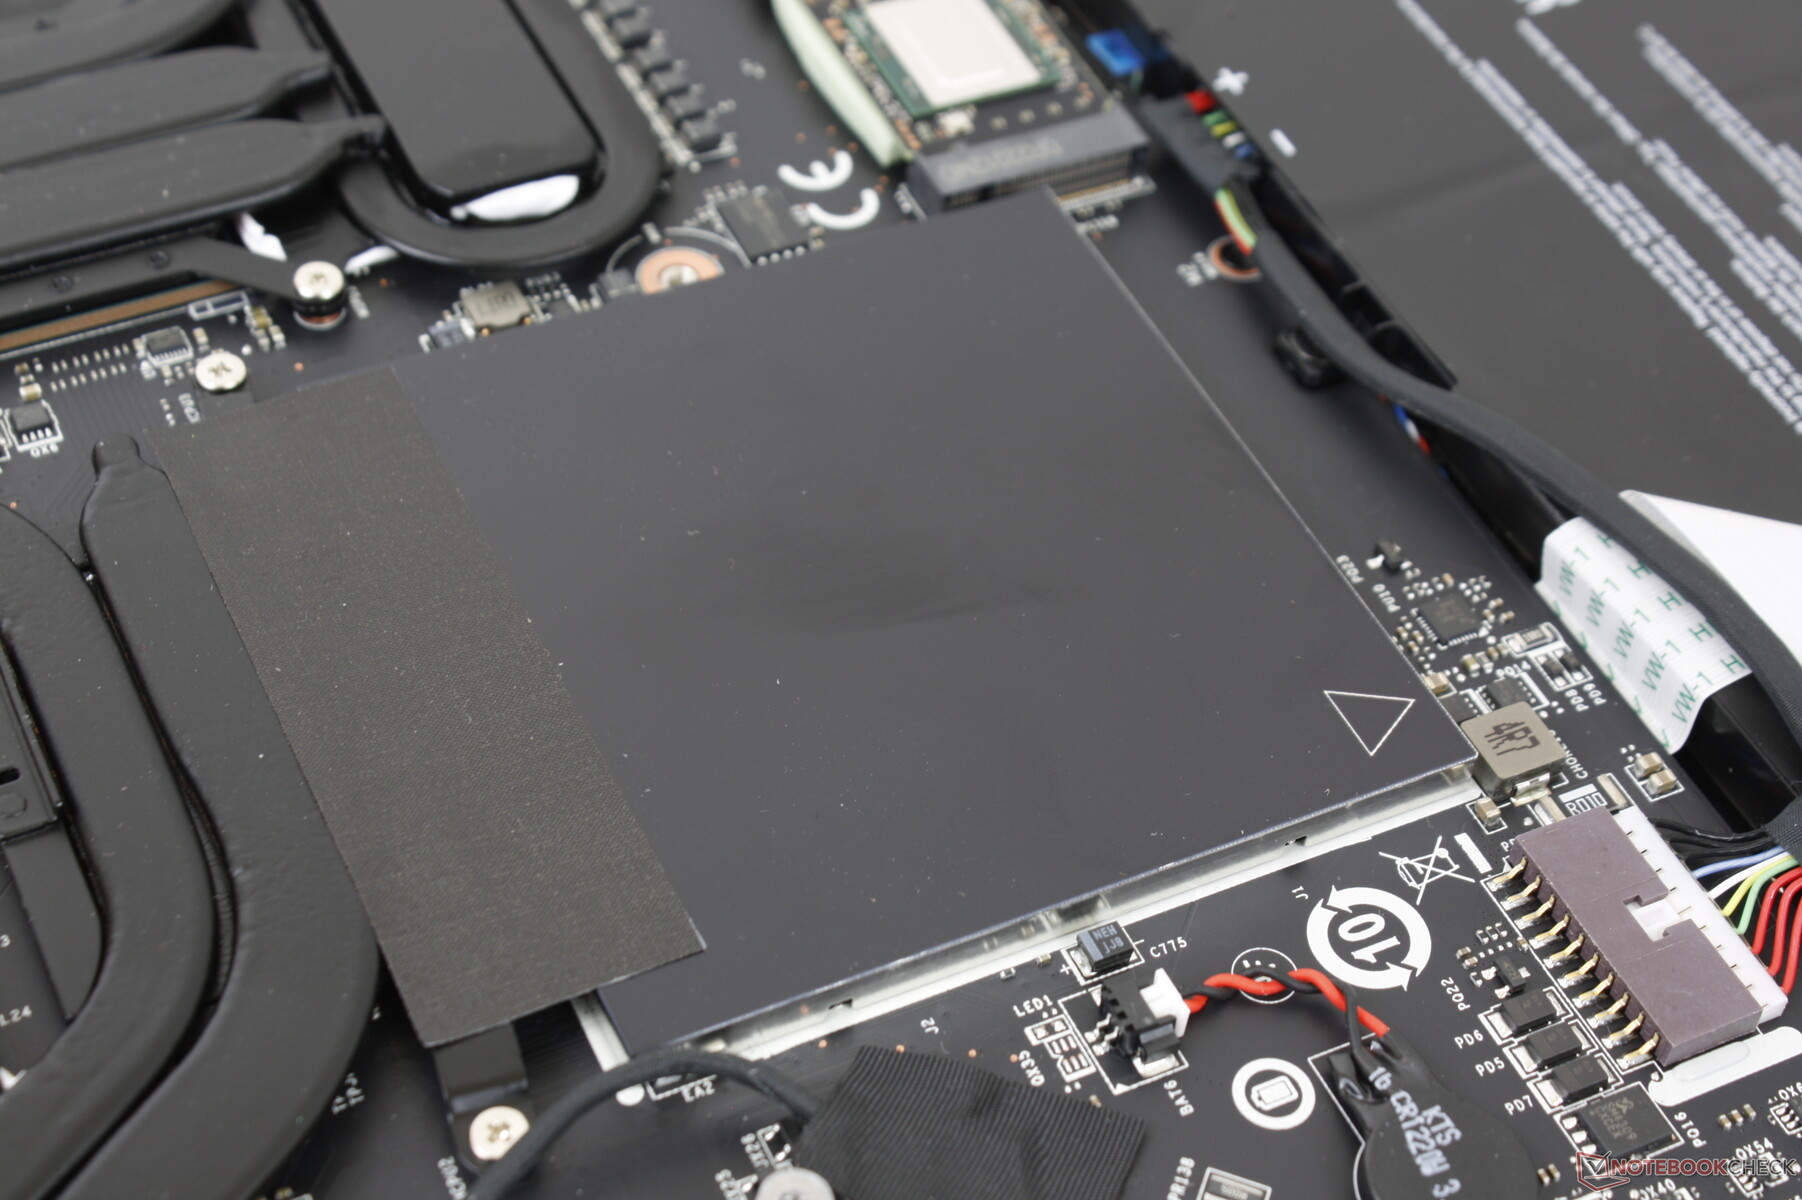
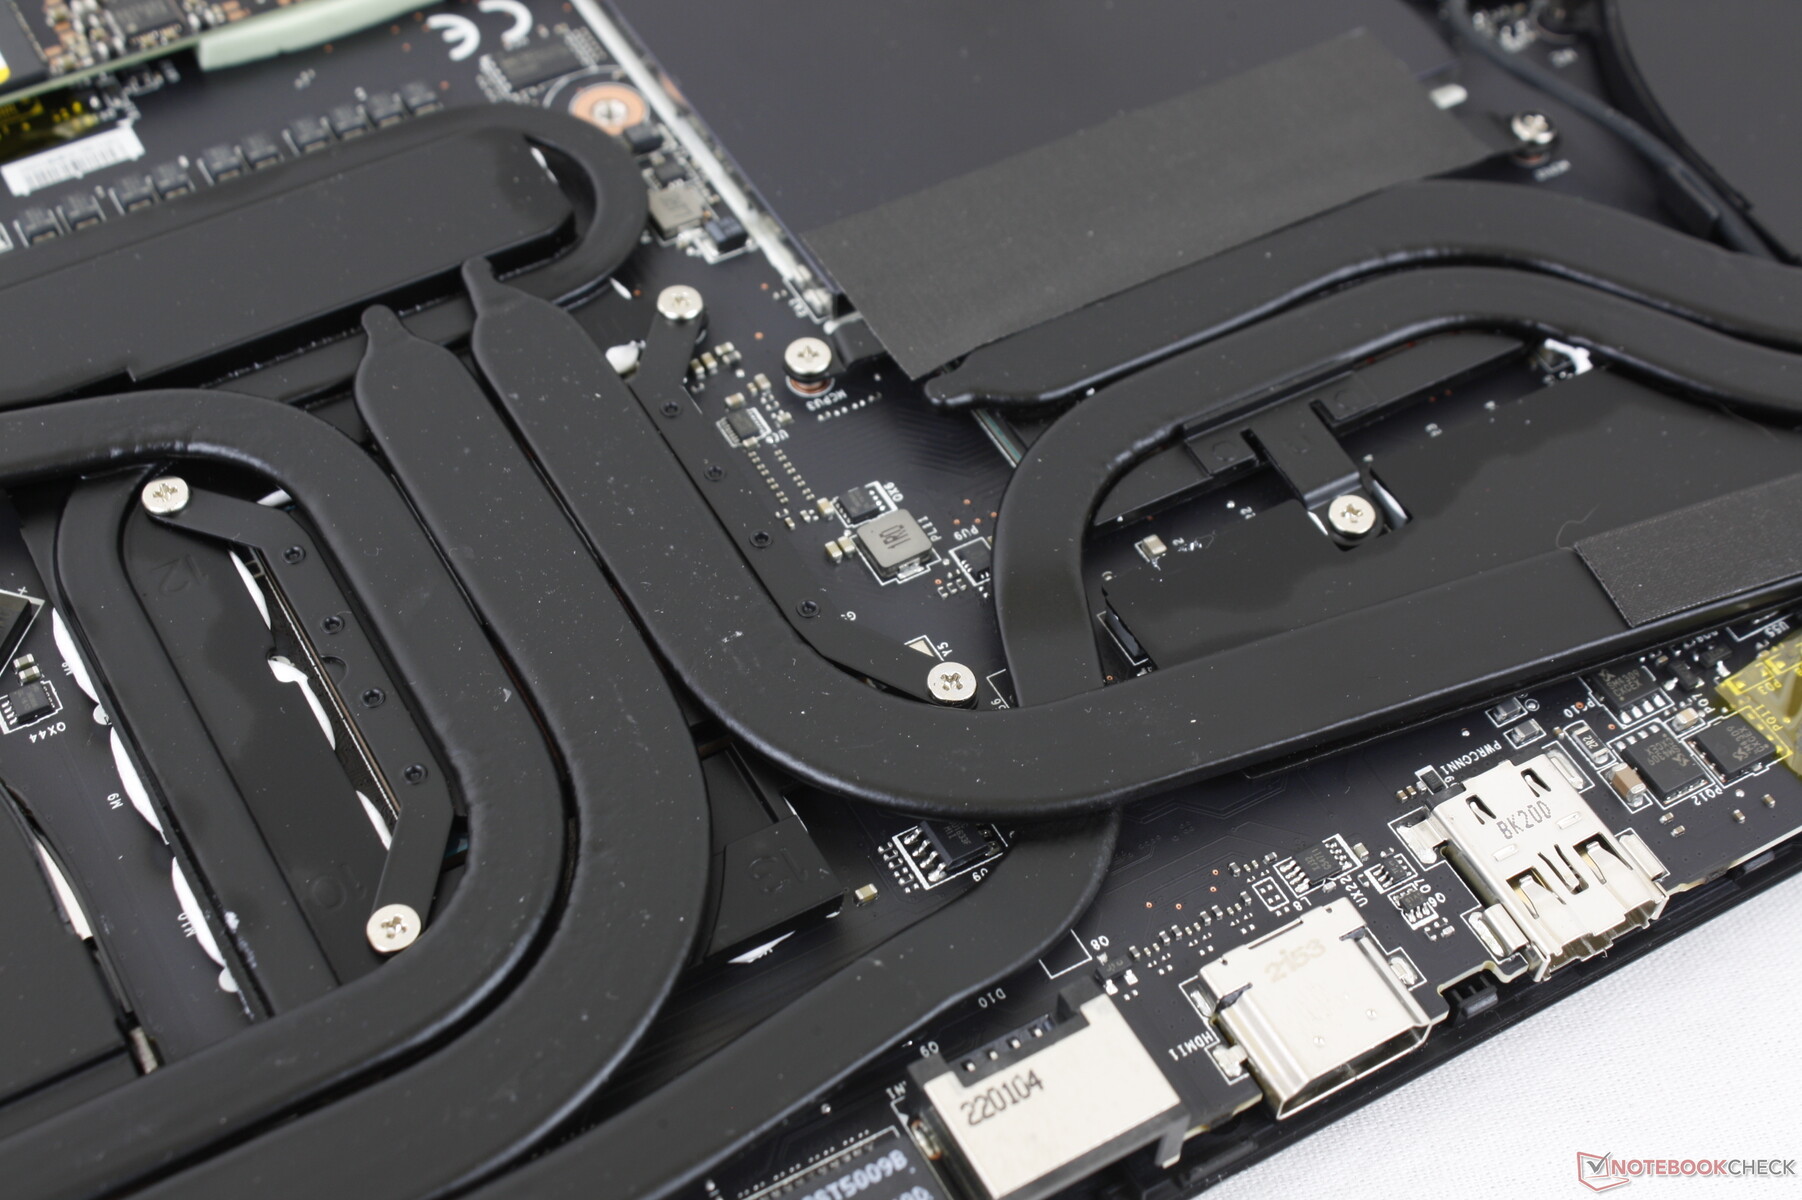
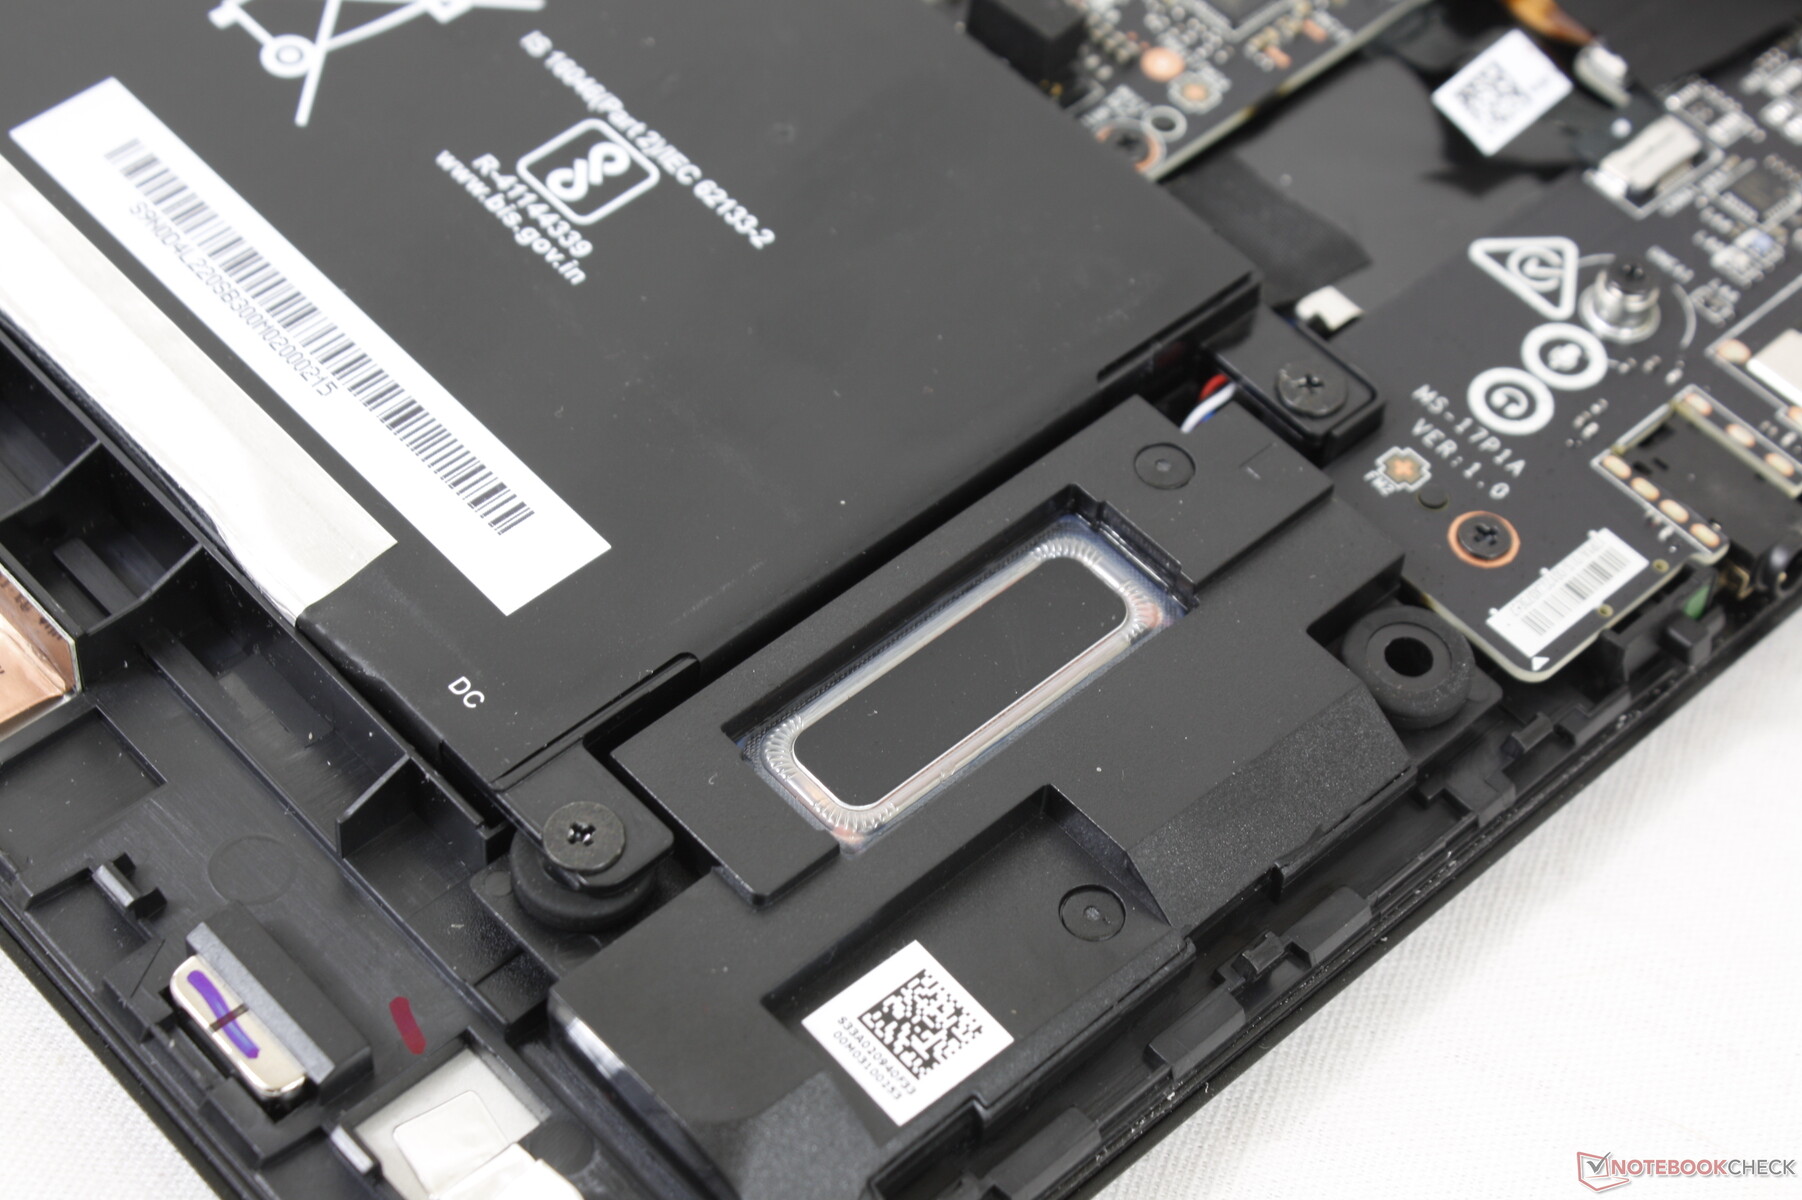
维护
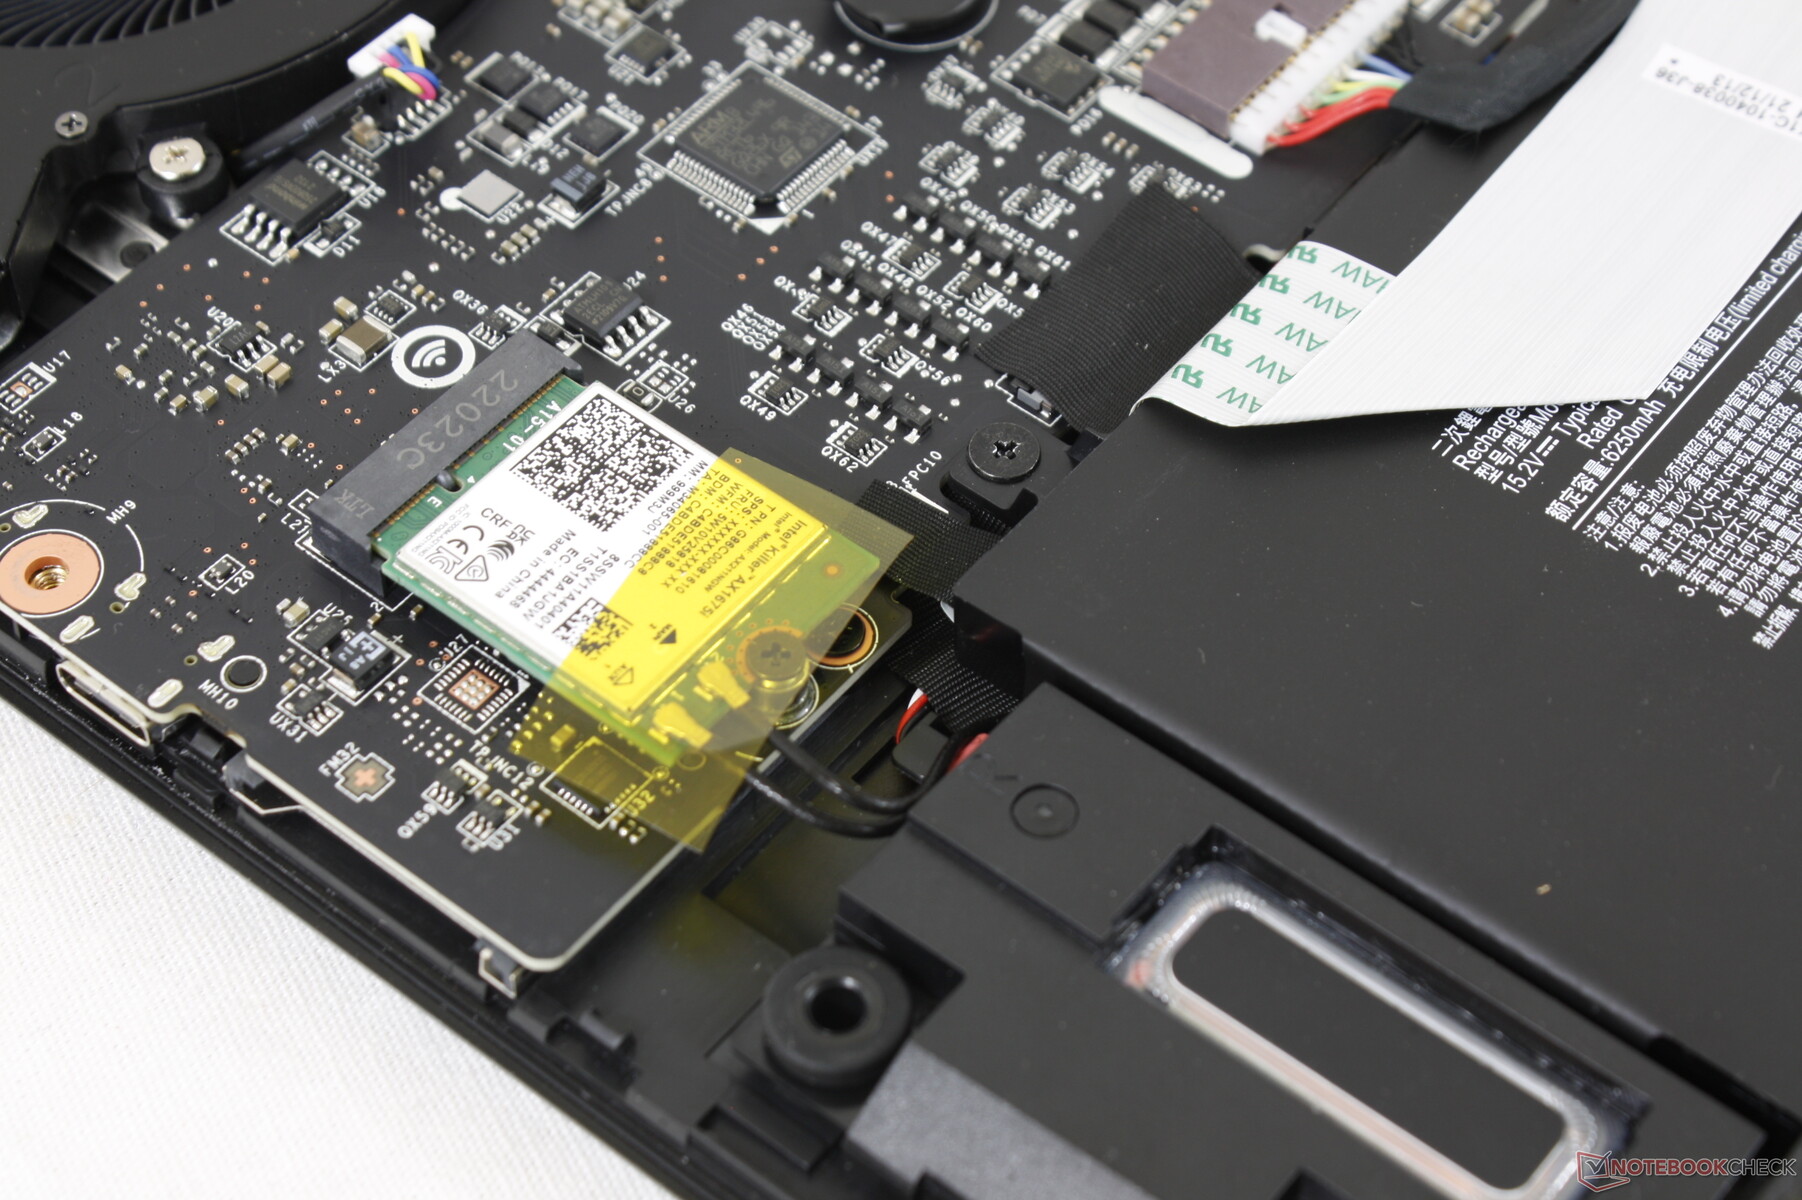
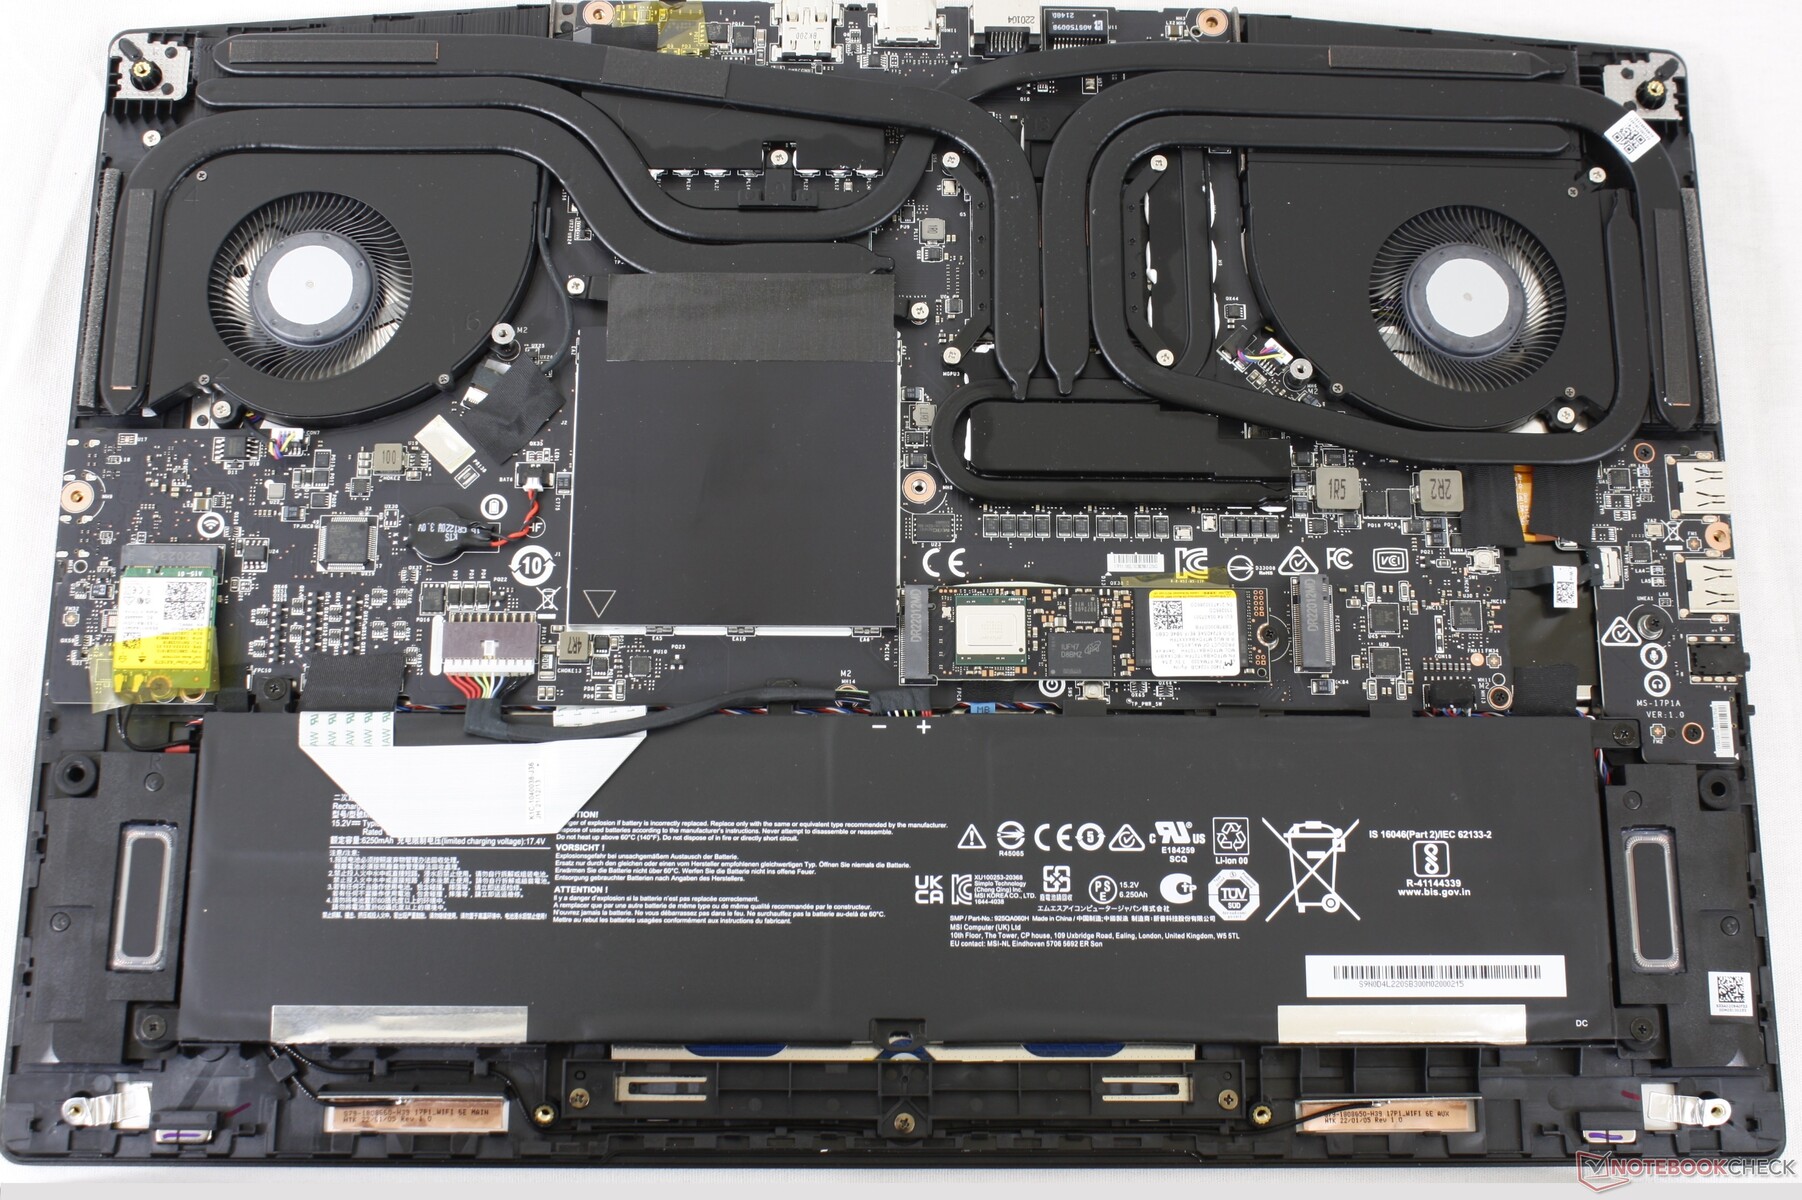
在卸下下面的11颗飞利浦螺钉后,底板相当容易脱落。请记住,必须打破工厂的密封贴纸,这与大多数其他竞争厂商的游戏笔记本不同。
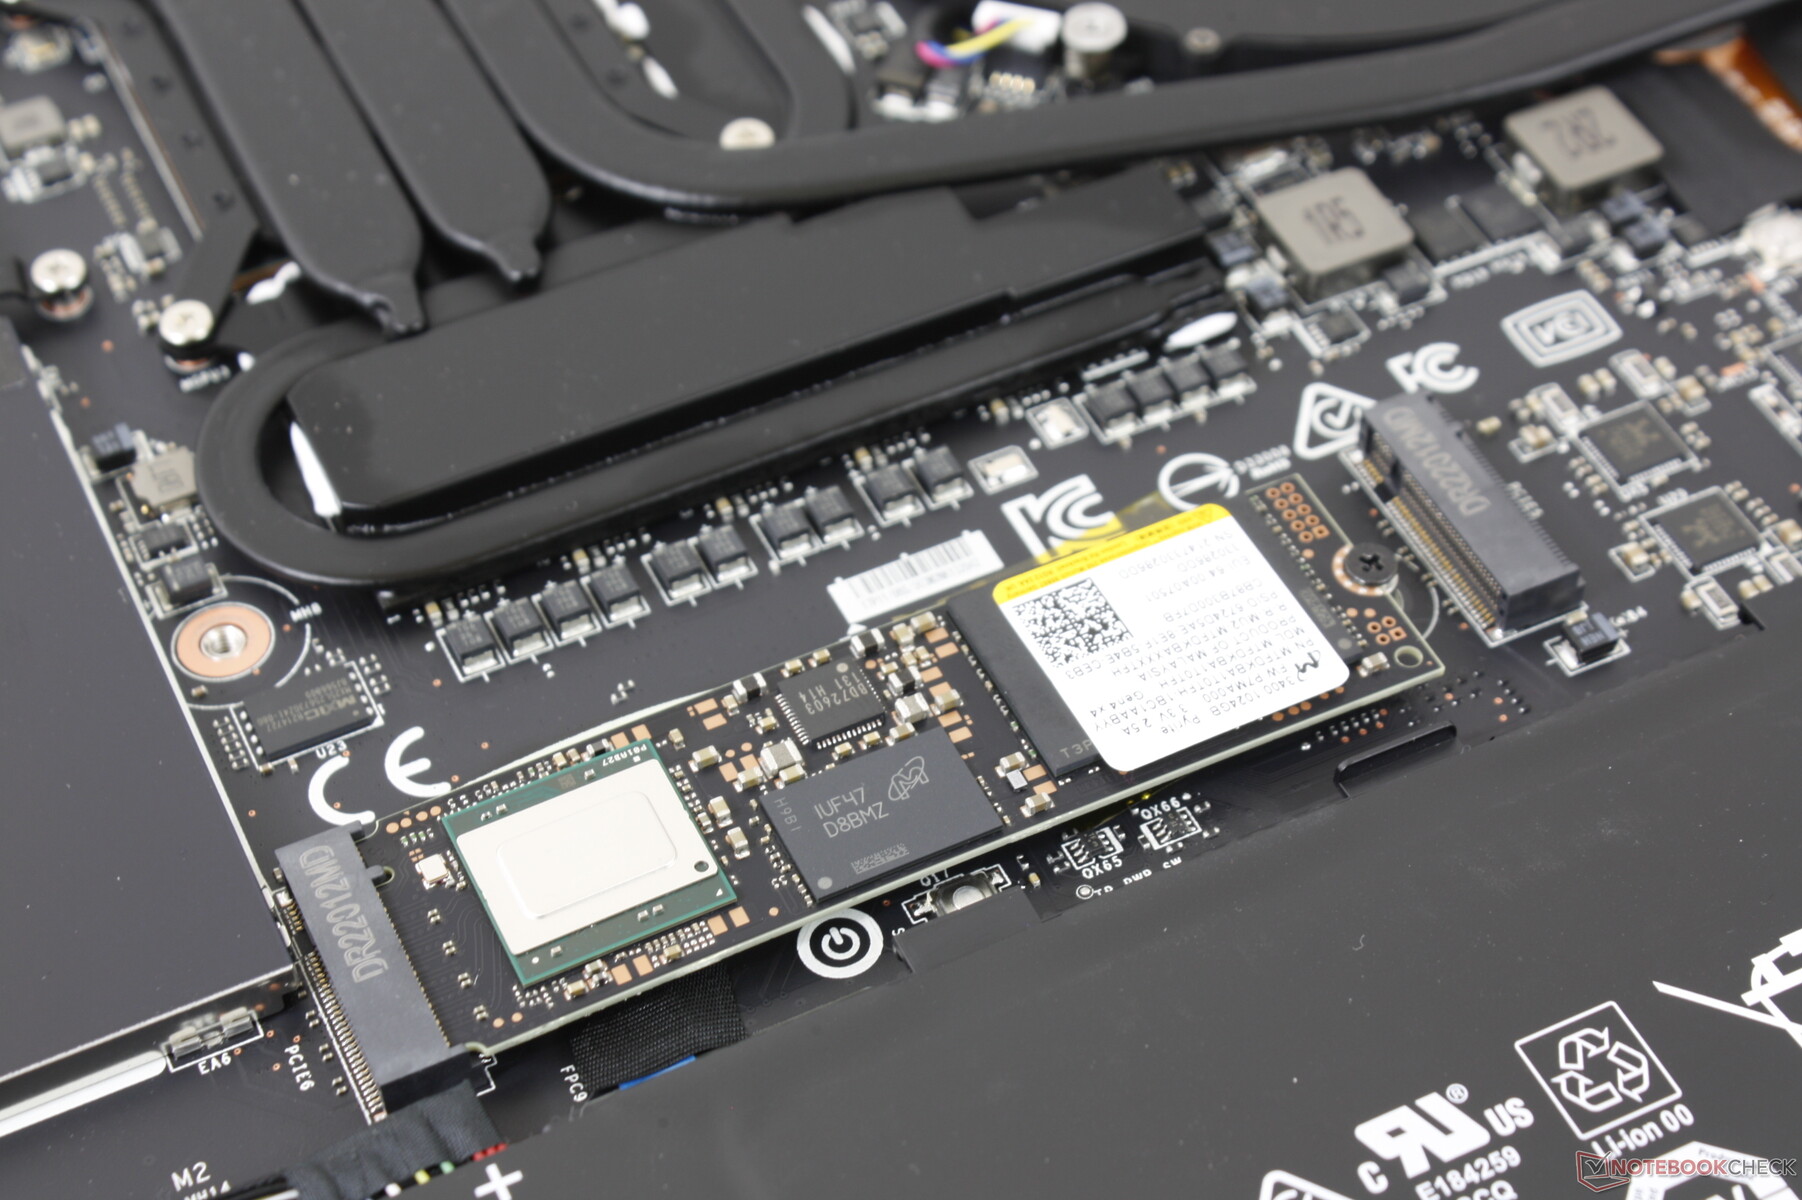
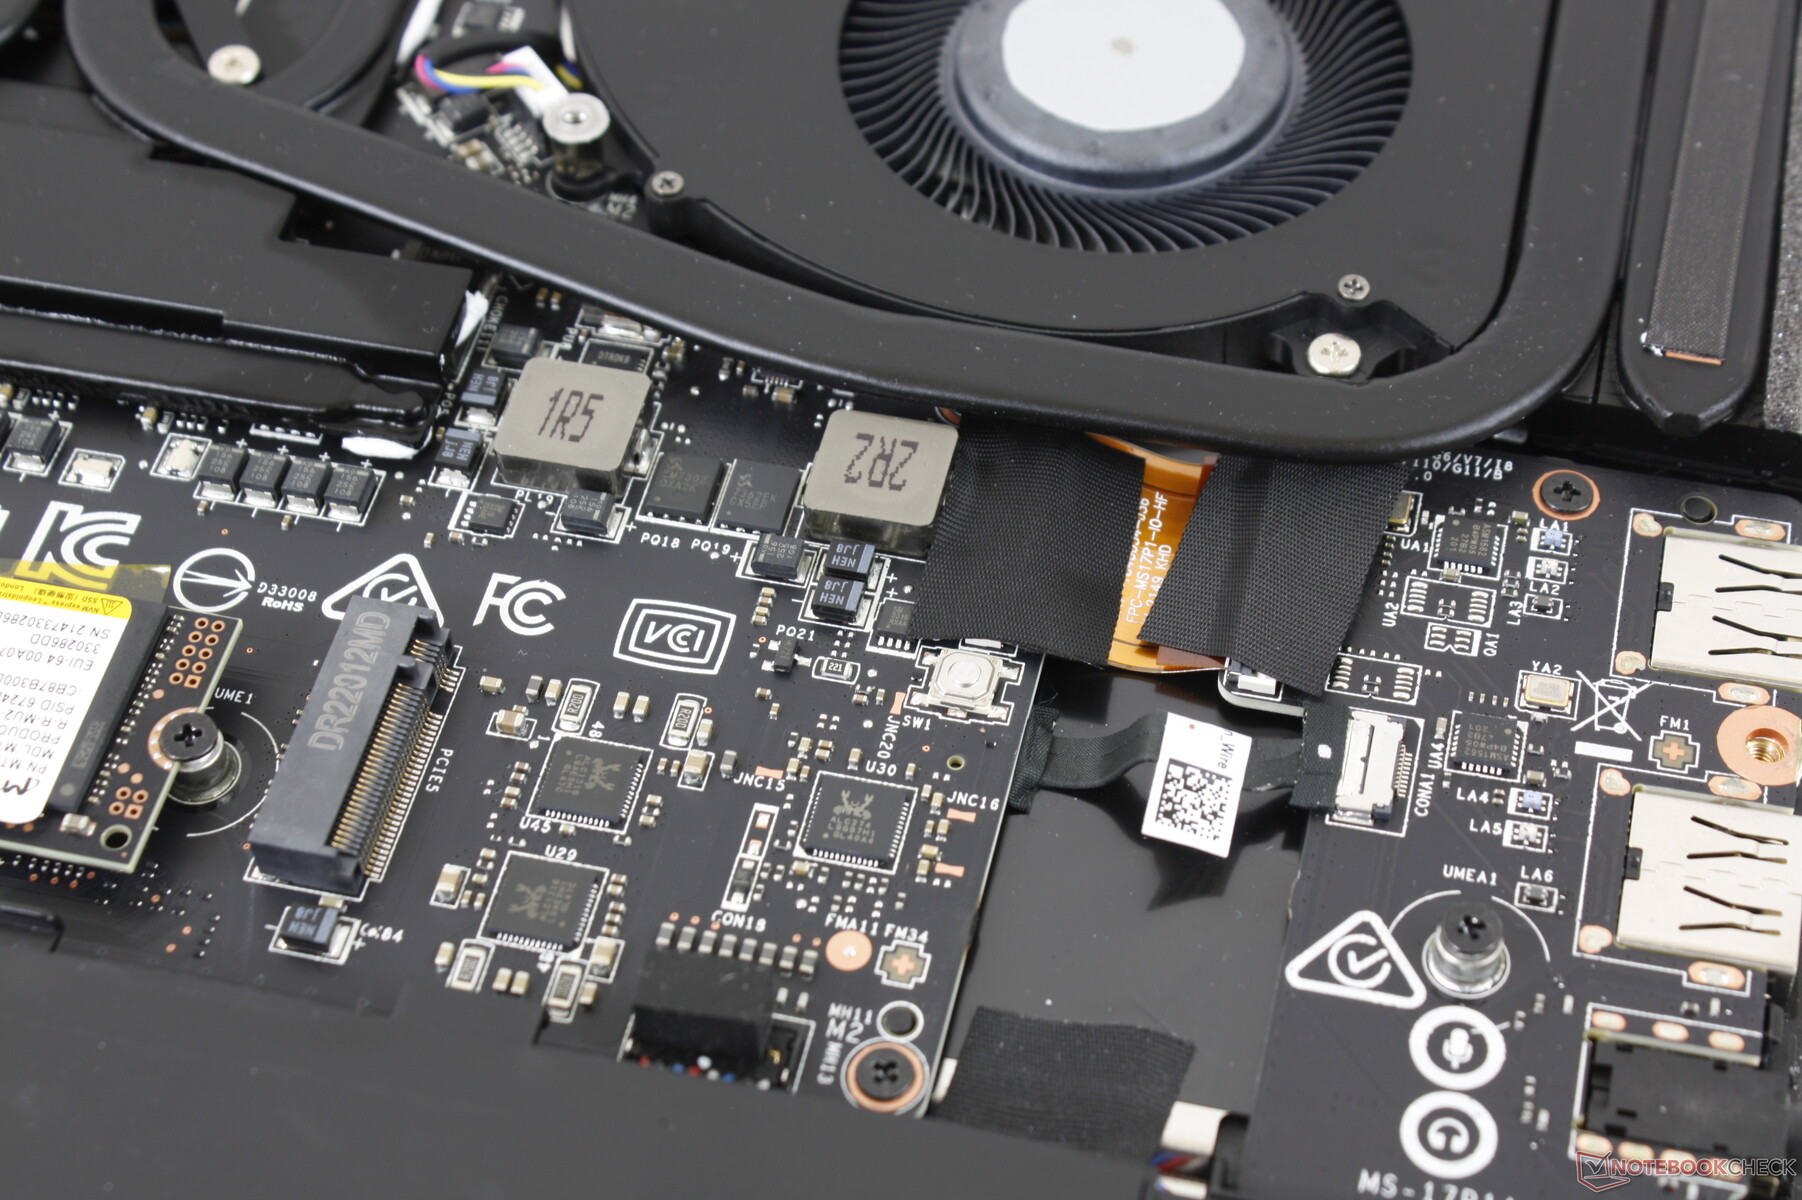
一旦进入内部,用户将有机会接触到2个SODIMM插槽,2个PCIe4 x4 2280 SSD插槽,以及可拆卸的WLAN模块。两个SODIMM插槽有自己的铝盖保护。
配件和保修
零售盒中除了文件和AC适配器外,还包括一个天鹅绒屏幕擦拭布。如果从Xotic PC购买,则有一年的制造商保修期,并有延期选项。
输入设备--侧向步进
键盘
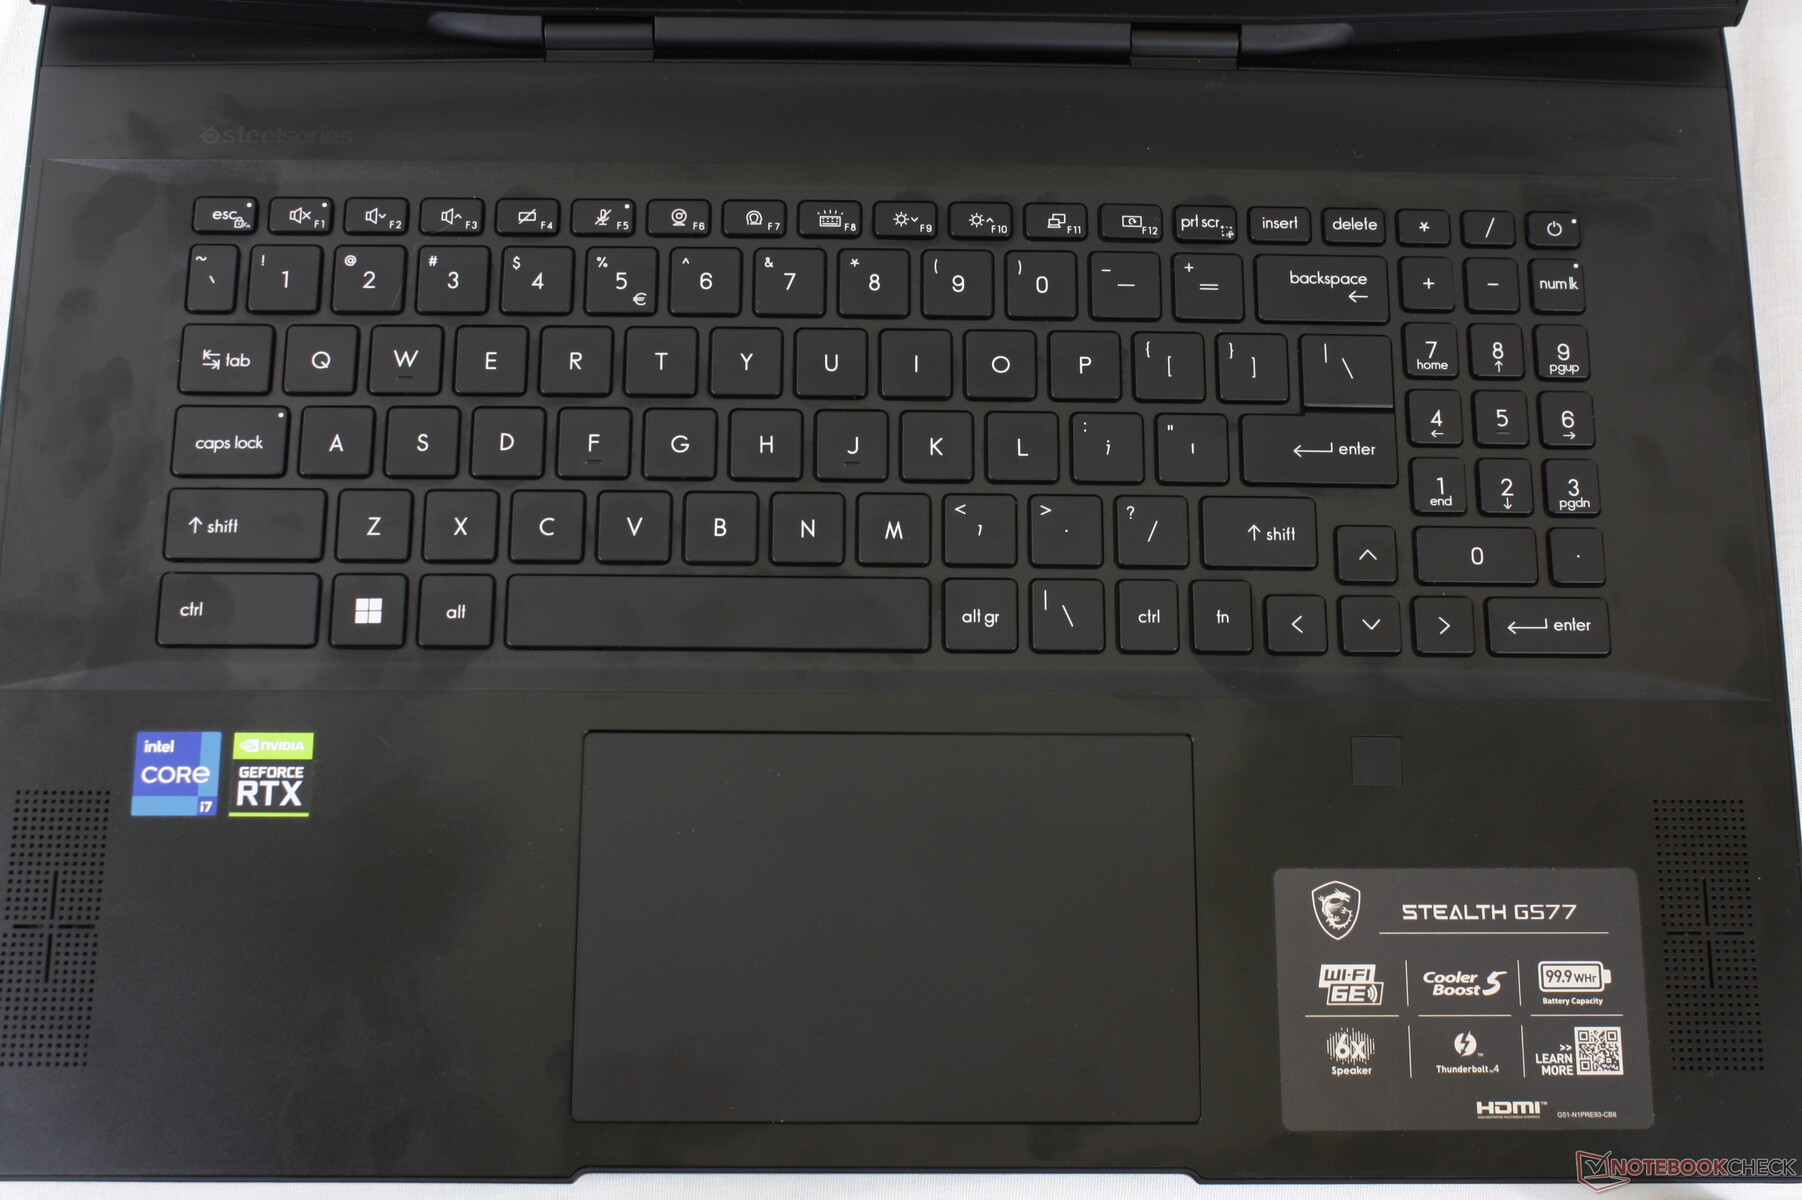
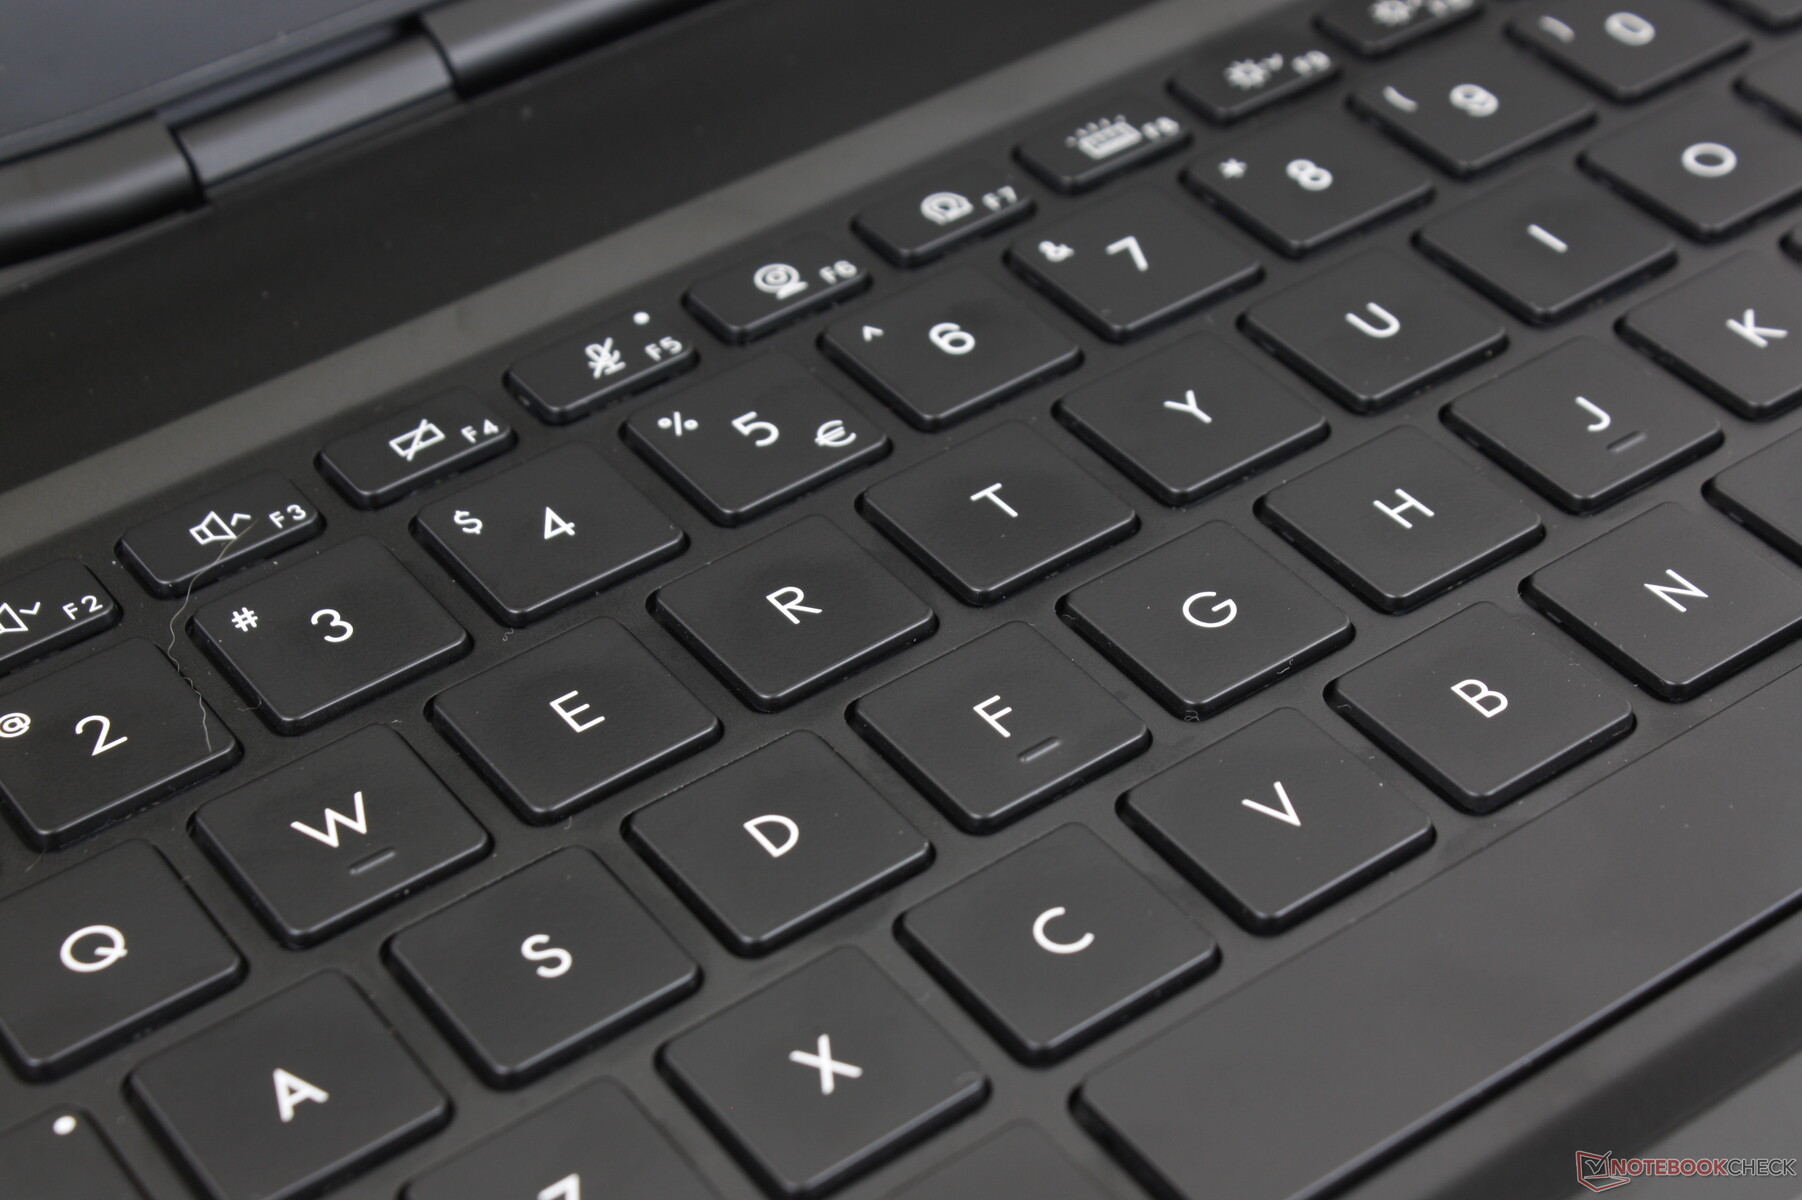
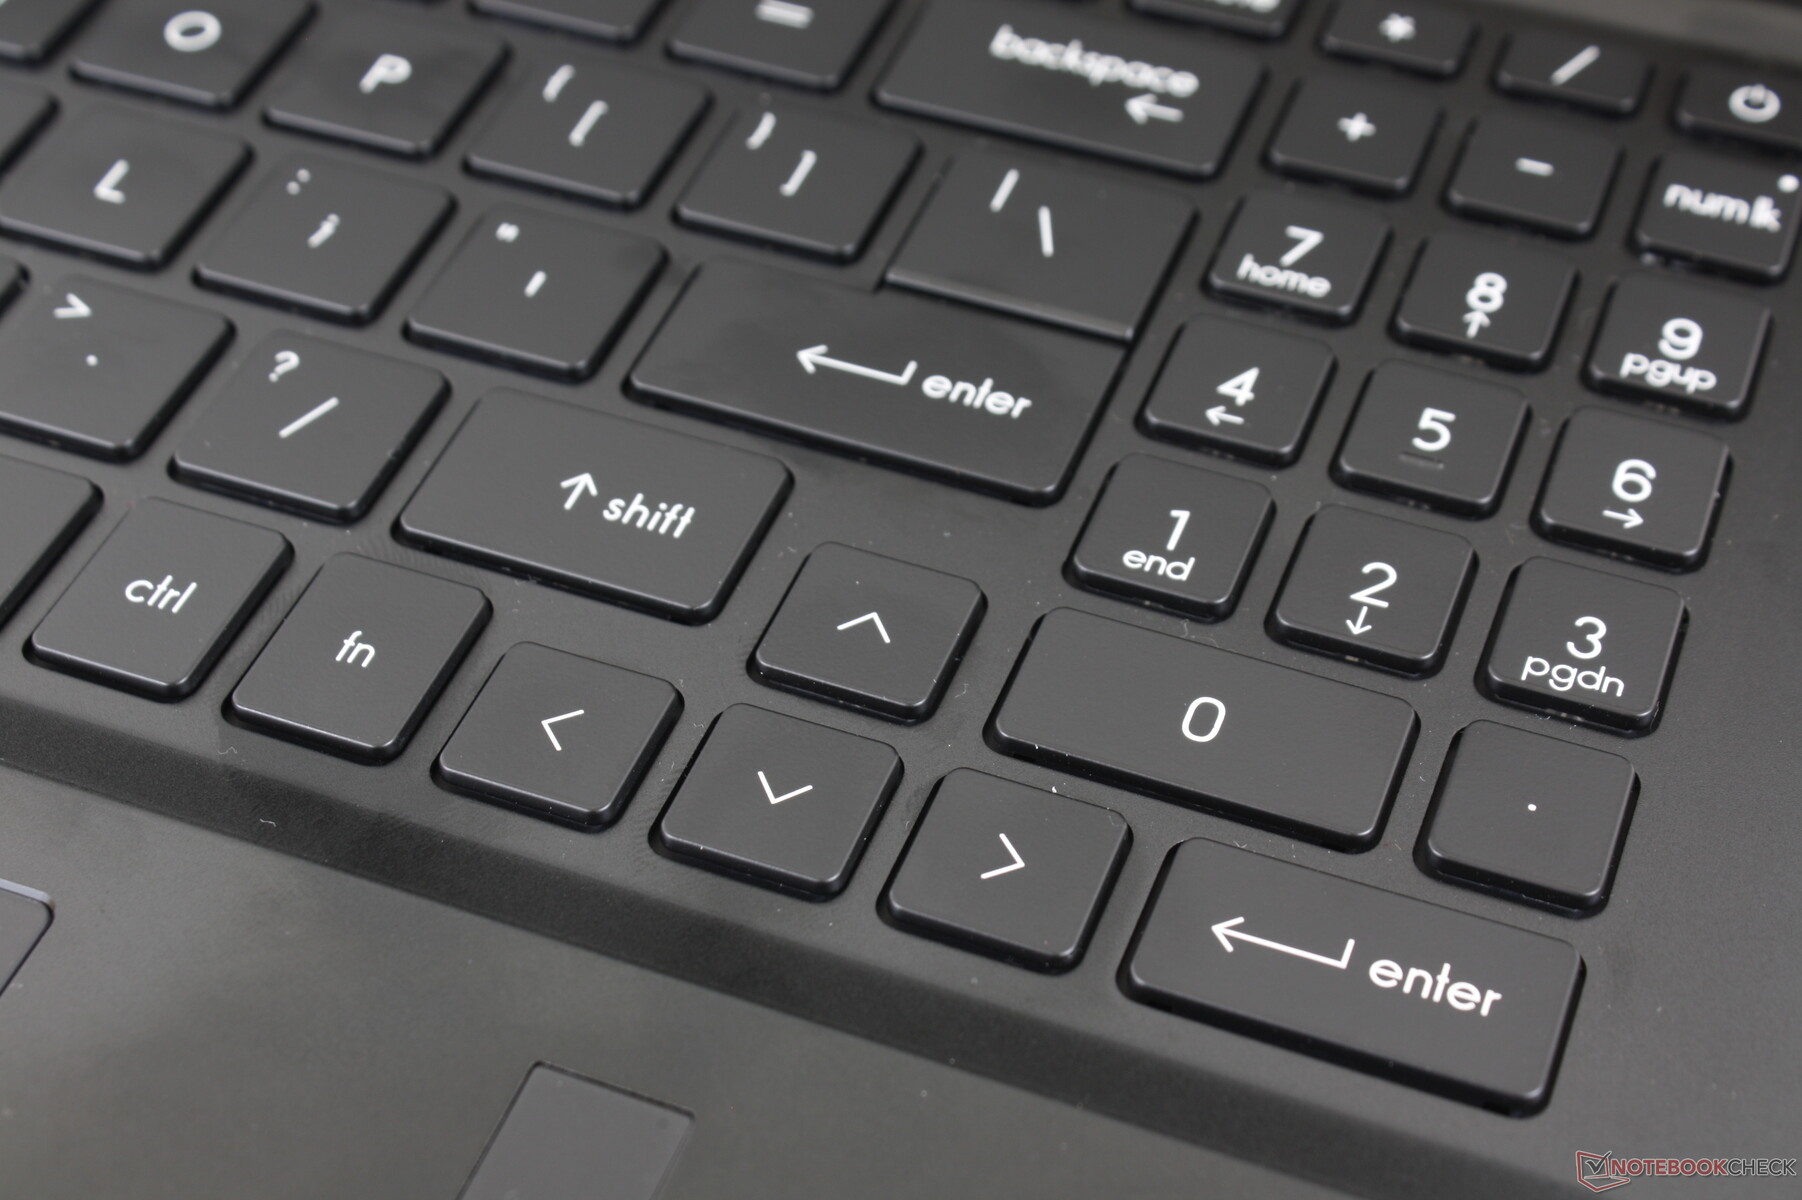
键盘按键比Blade 17上的按键略微柔软和安静一些。因此,这并不一定更好或更坏,因为一些用户可能更喜欢更安静的打字体验,即使这意味着有稍微松软的反馈。GS77甚至还集成了一个专用的小键盘,而Blade则没有。
键的大小是GS77键盘的一个主要缺点。特别是,小键盘、方向键和最上面一排功能键都比主要的QWERTY键小得多,因此它们的反馈明显更灵活、更弱。至少Blade 17上的功能键与主QWERTY键的尺寸相同,以获得更好的统一性。
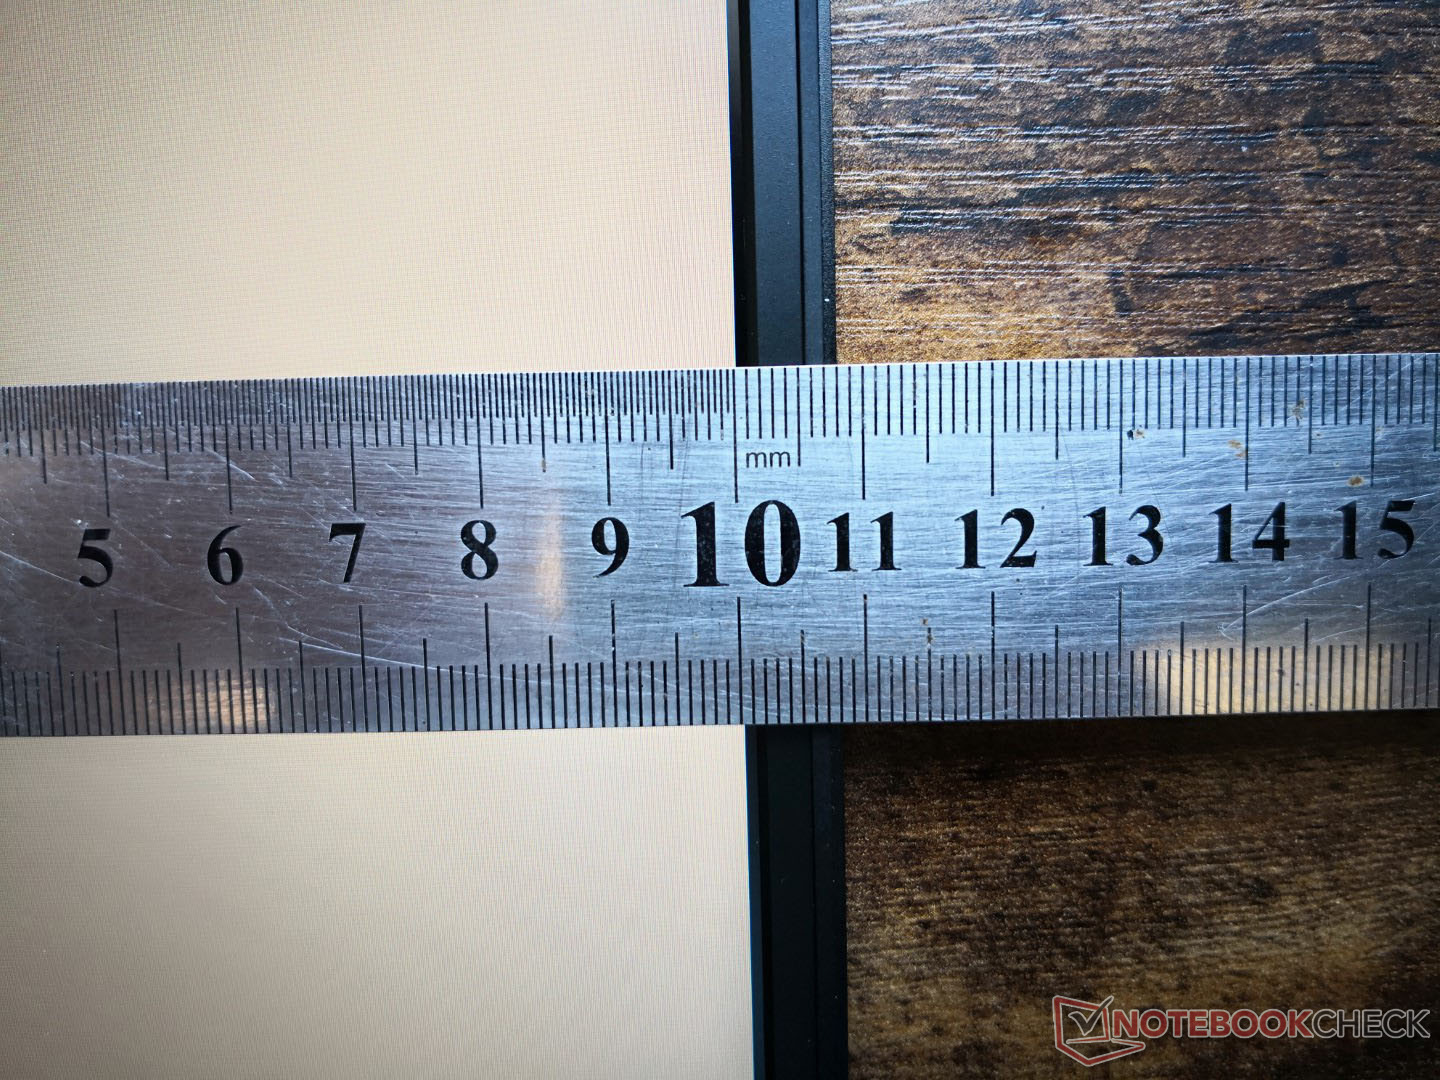
触摸板
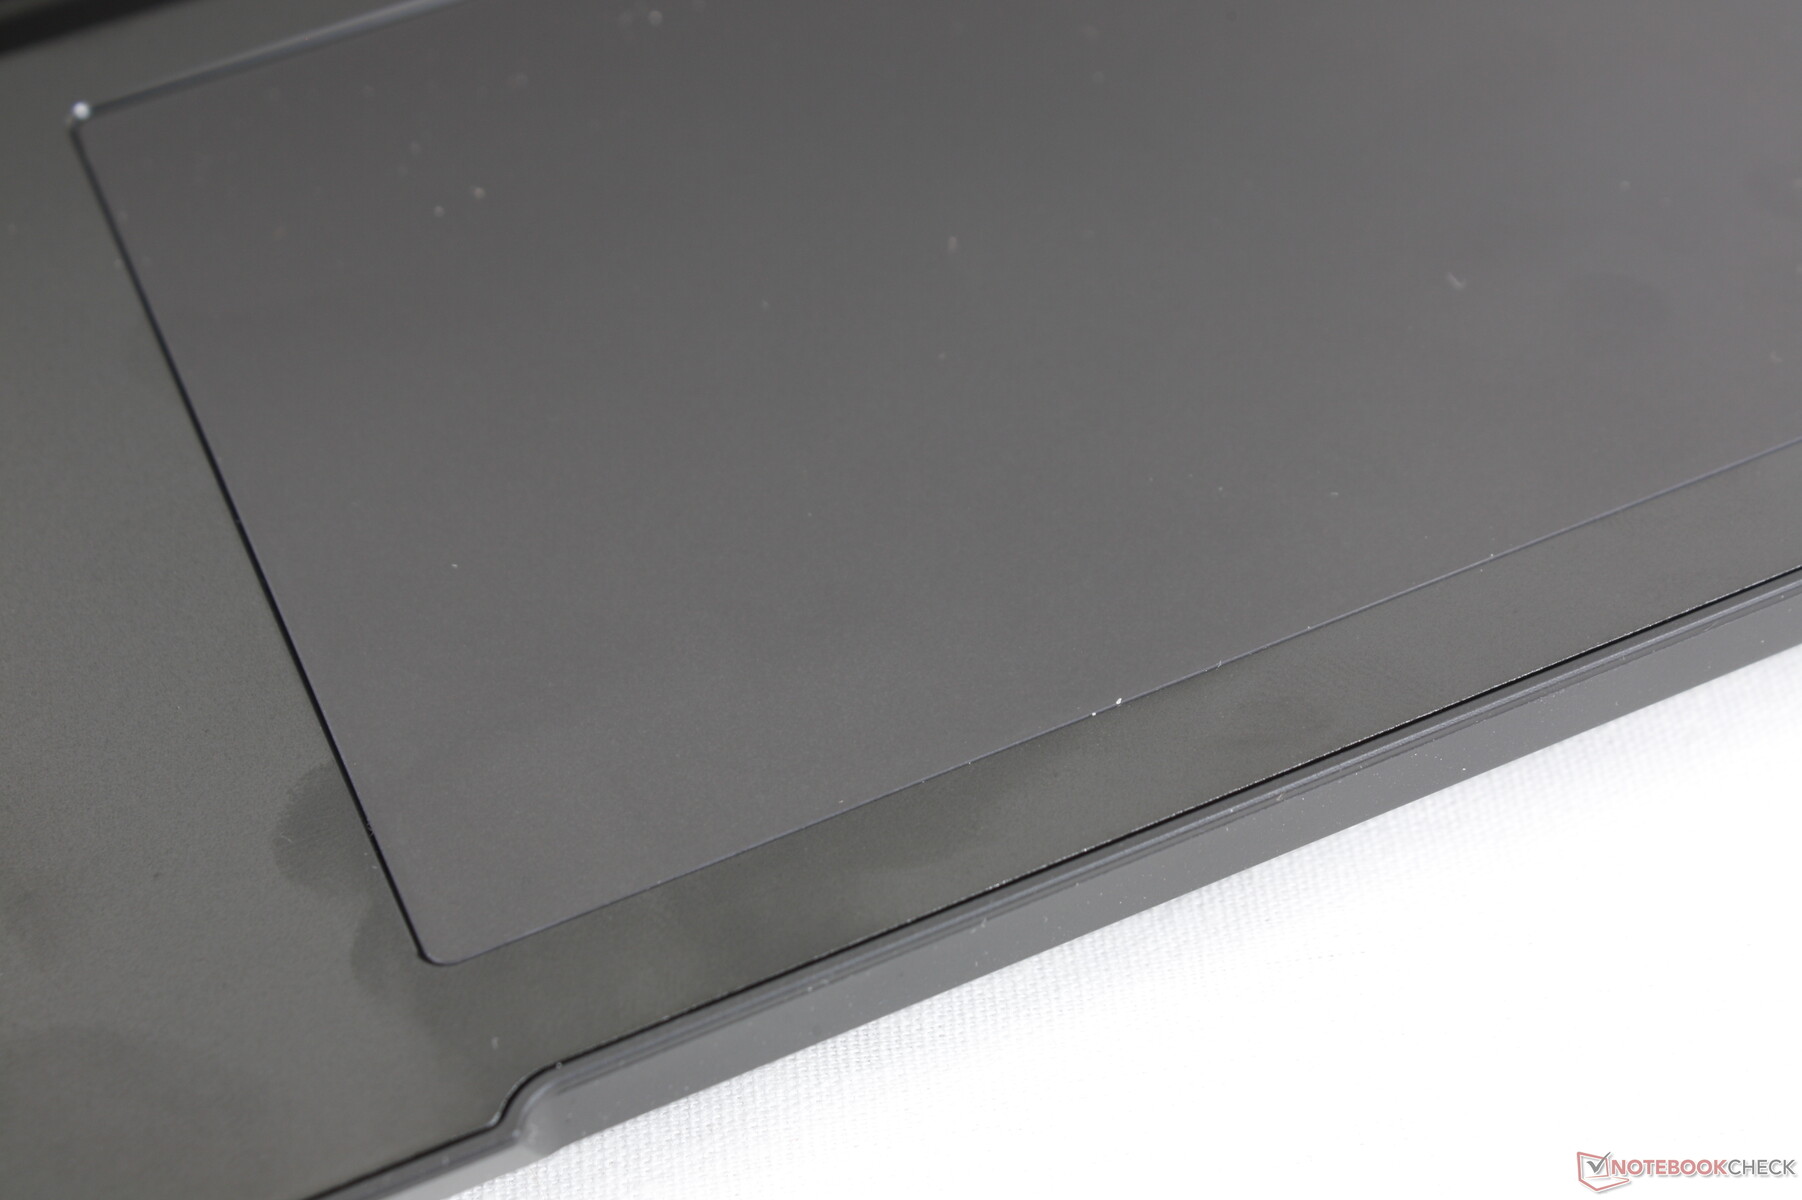
点击板比Blade 17上的稍大一些(13.2 x 8.2厘米,13 x 8厘米)。即使在慢速滑行时,牵引力也非常平稳,与Blade 17的点击板感觉非常相似。相反,它们之间最大的区别是各自的反馈,因为在GS77点击板上的点击比在Razer上的点击更坚硬,声音也更大。
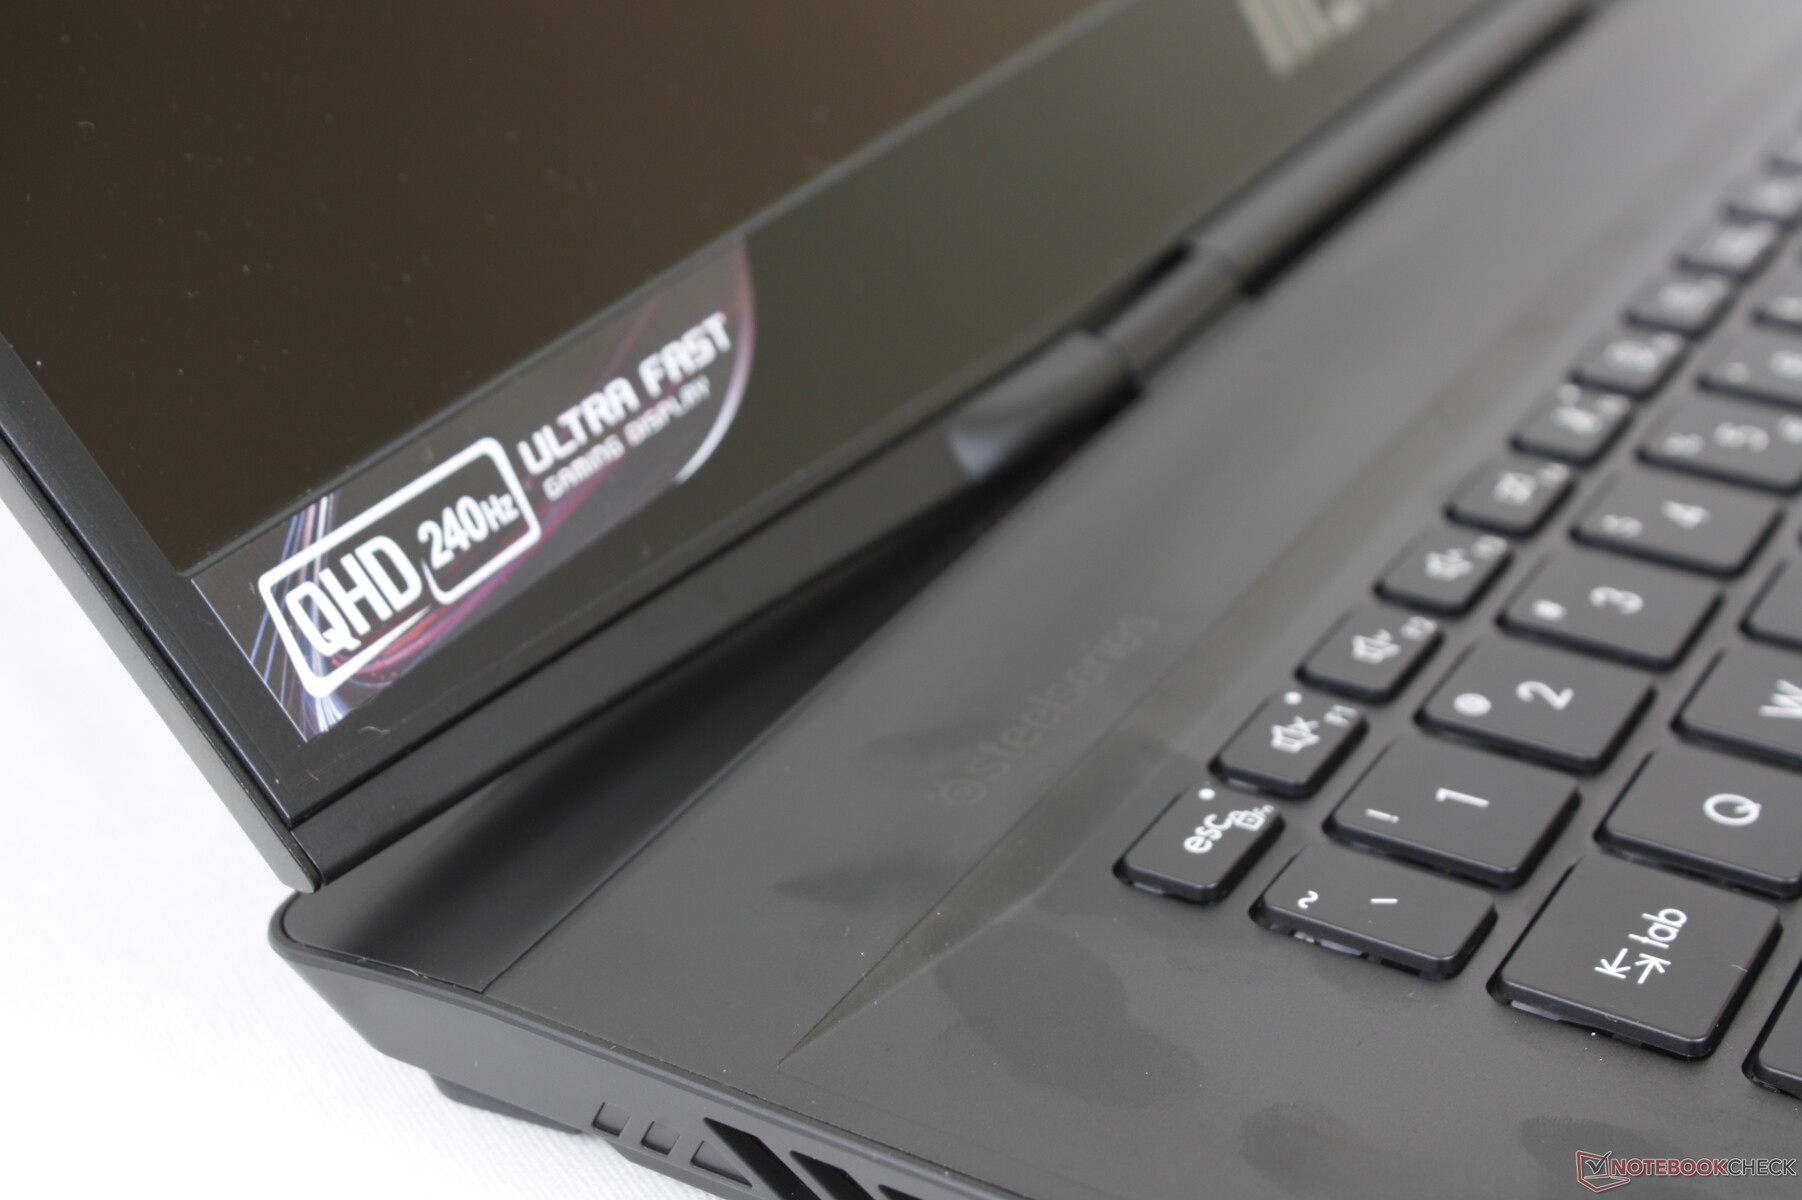
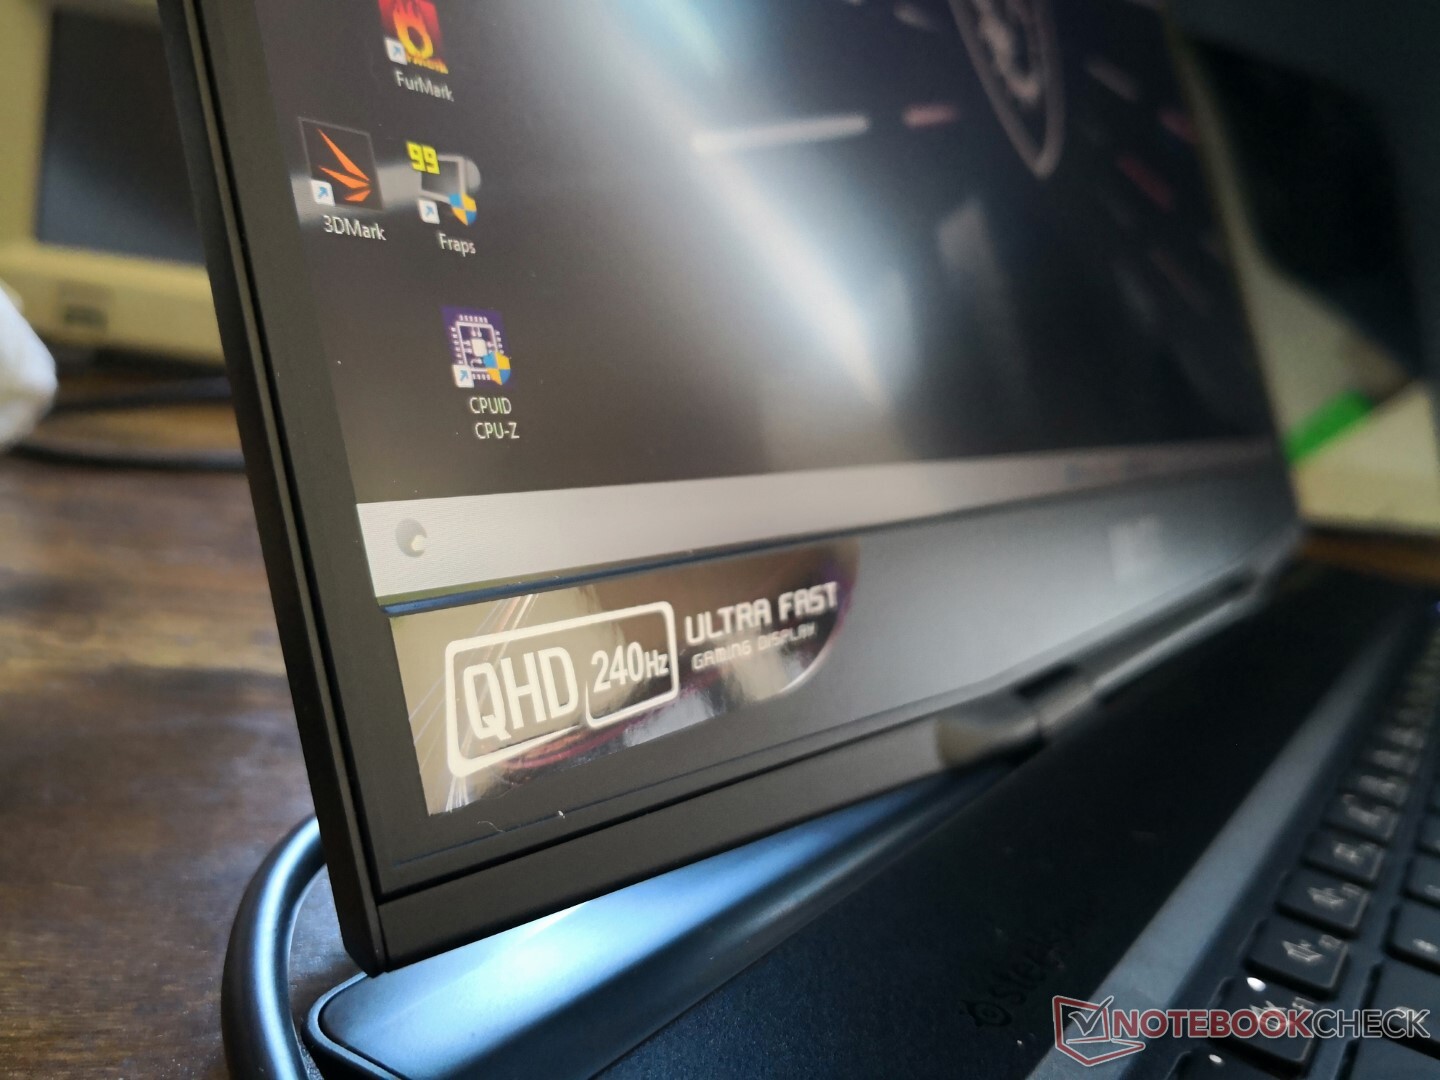
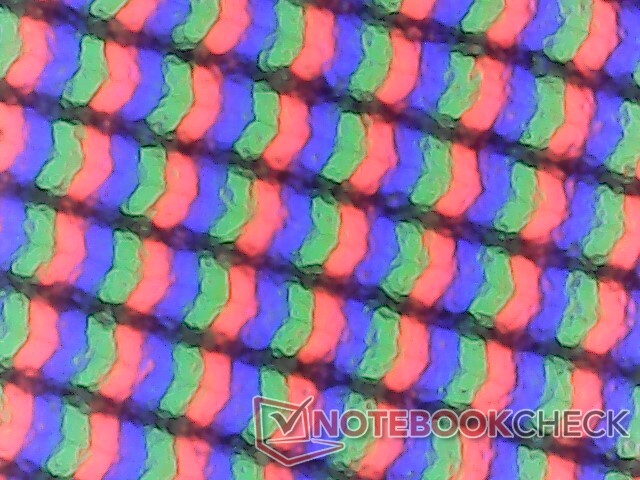
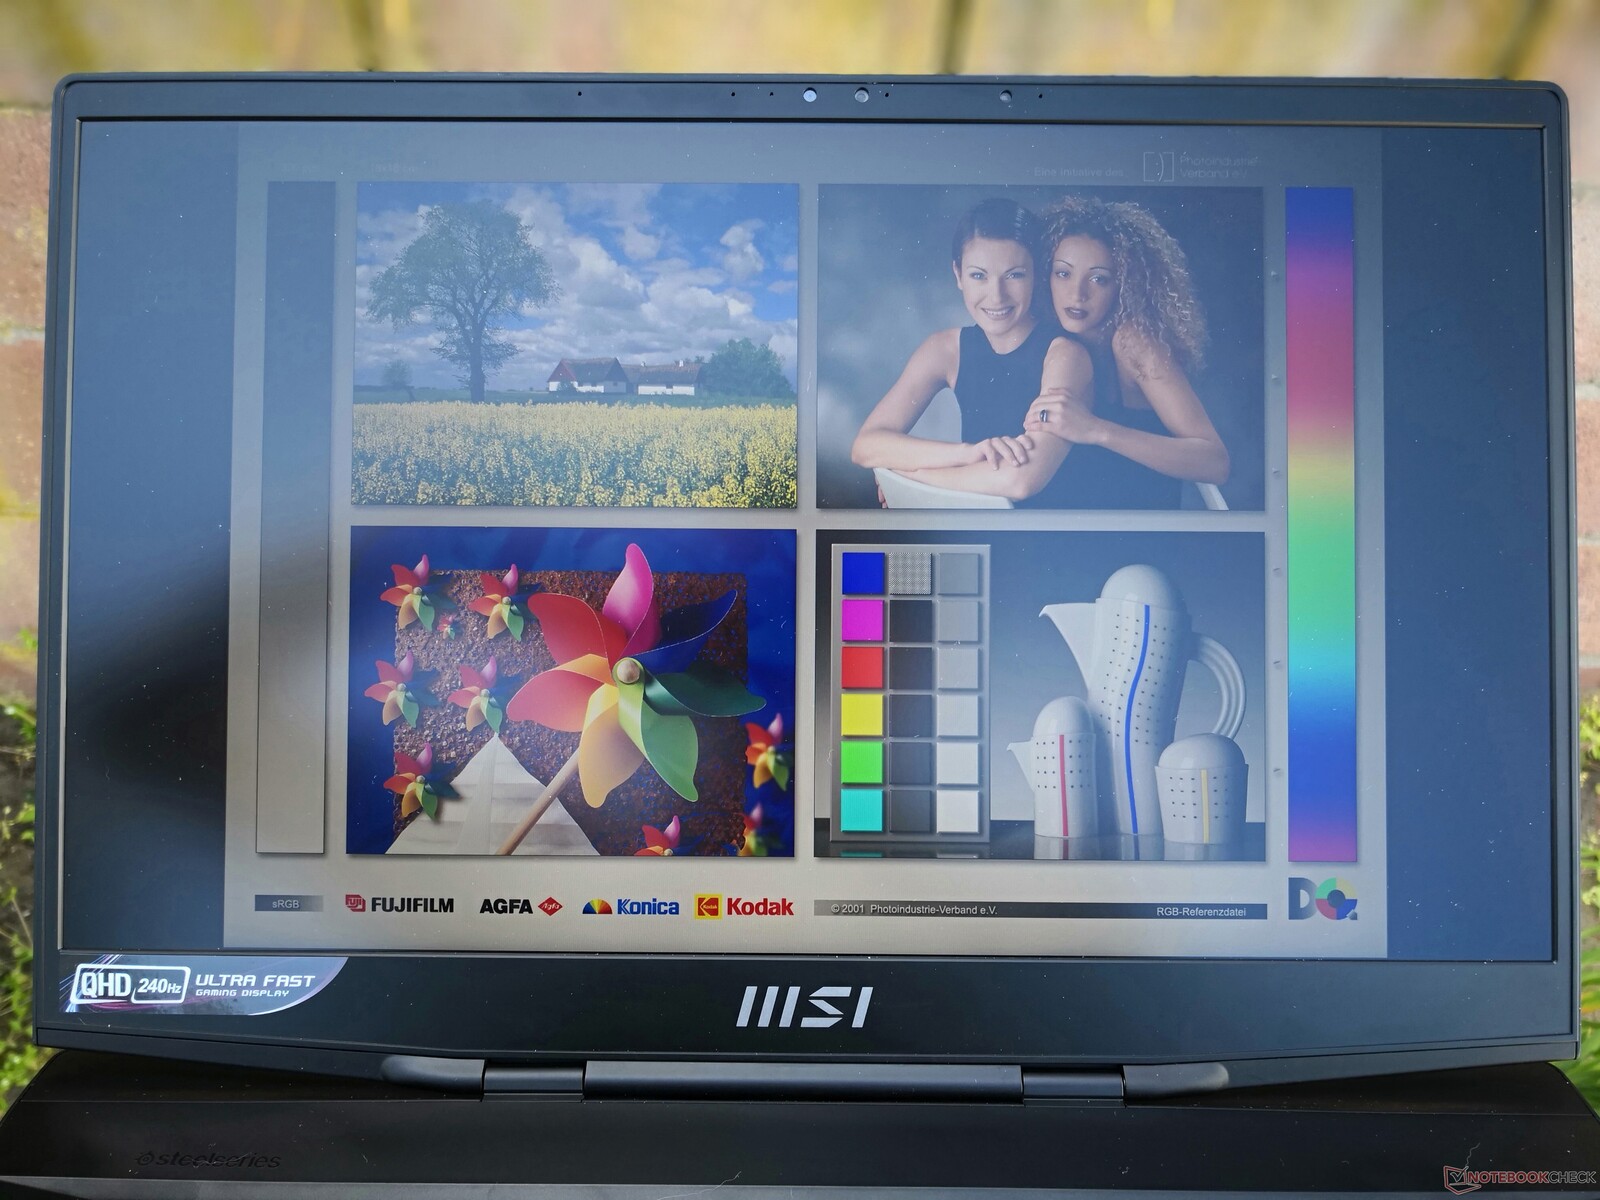
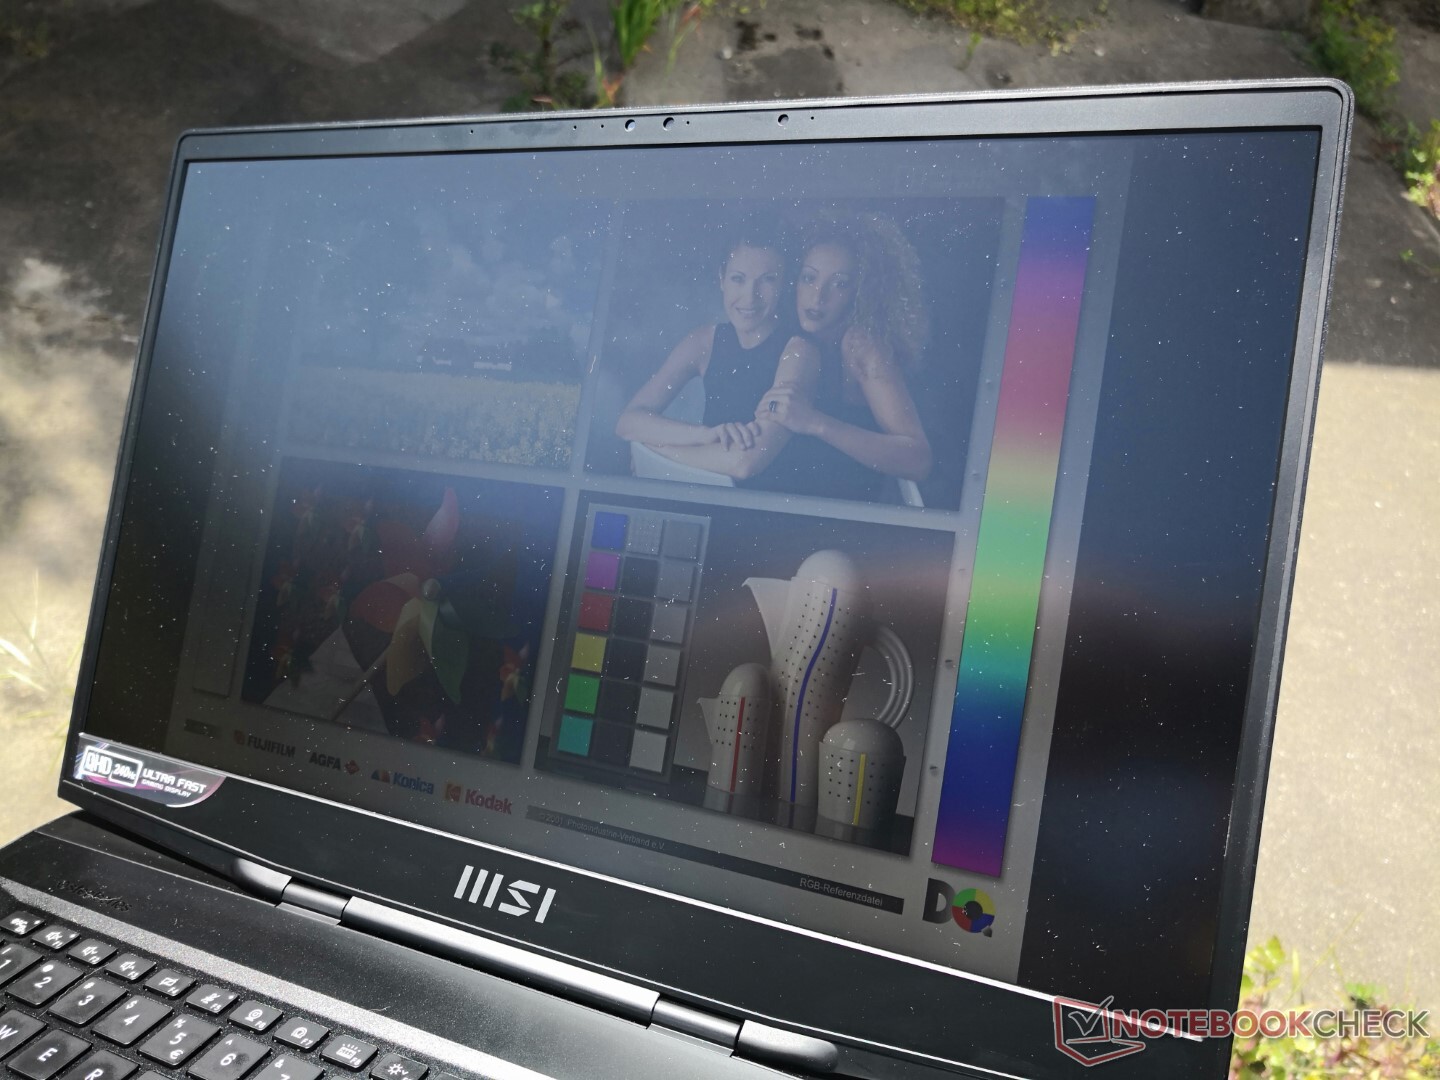
显示器 - 高刷新率为标准
GS77使用的高品质京东方NE173QHM-NZ1 1440p IPS面板与雷蛇在其Blade 17上使用的完全相同。因此,像原生240赫兹刷新率、快速响应时间、体面的~1000:1对比度和完整的DCI-P3覆盖率等核心属性在这两款竞争性的17.3英寸笔记本电脑之间是相同的。
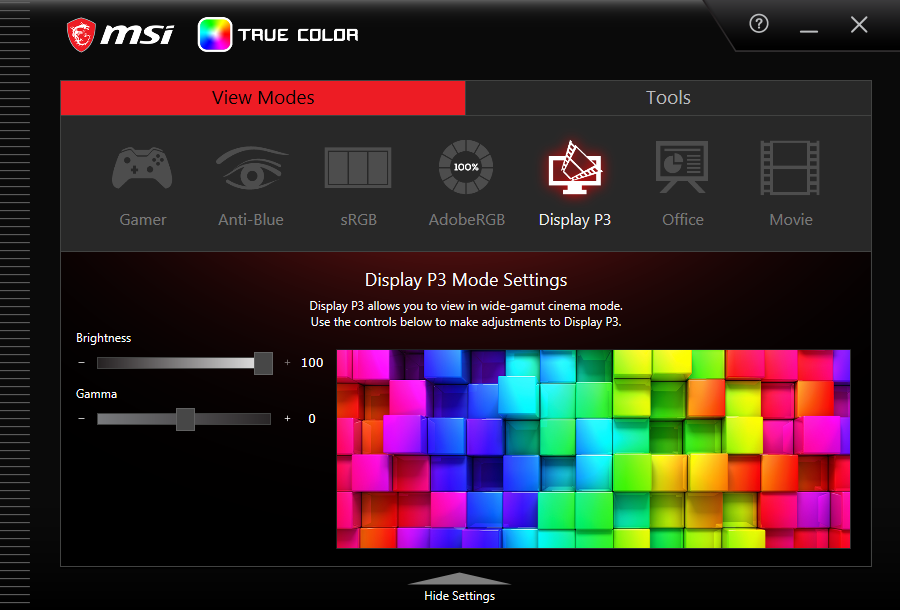
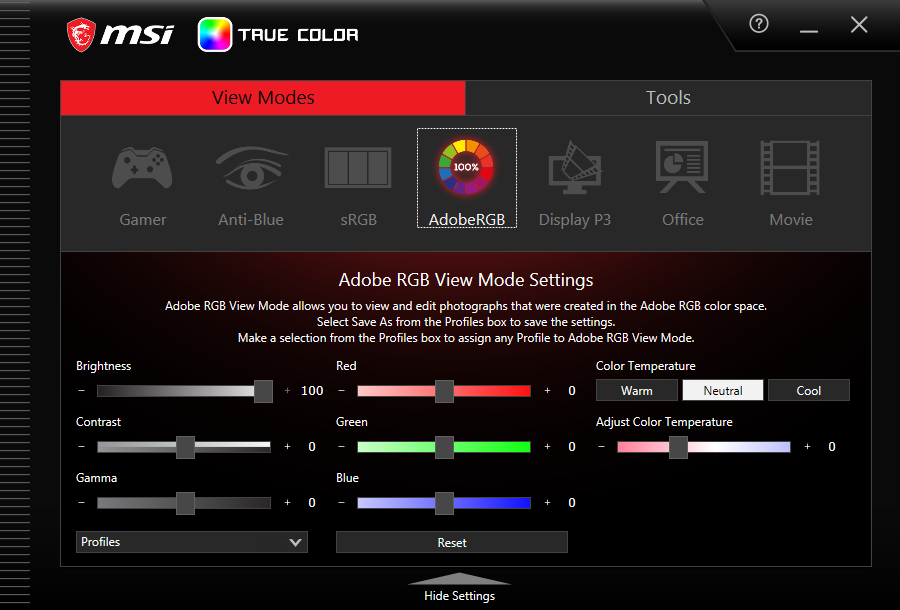
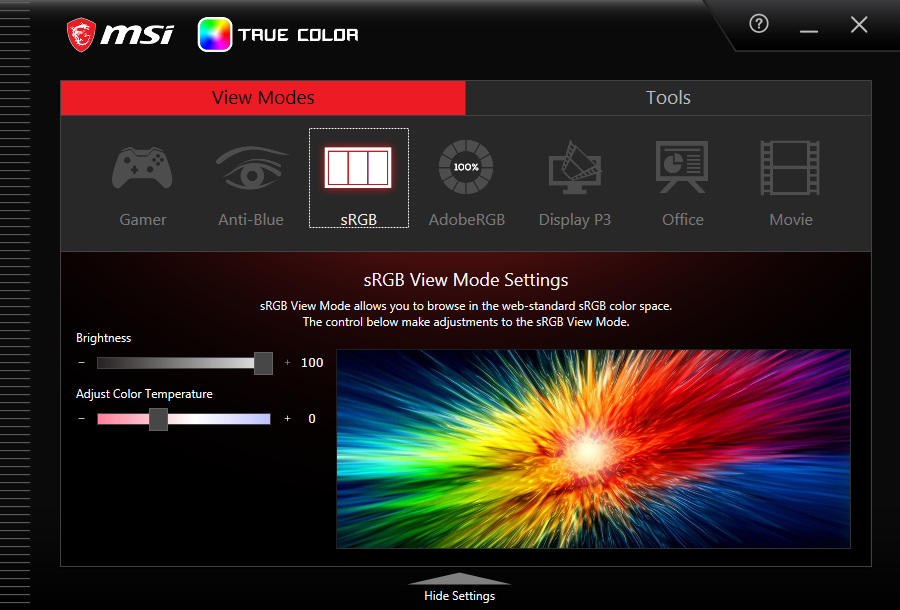
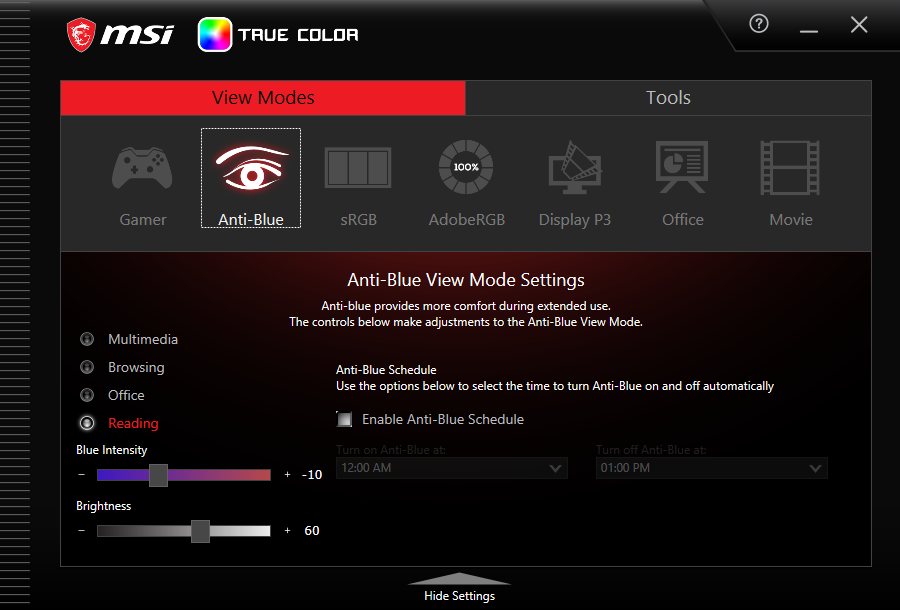
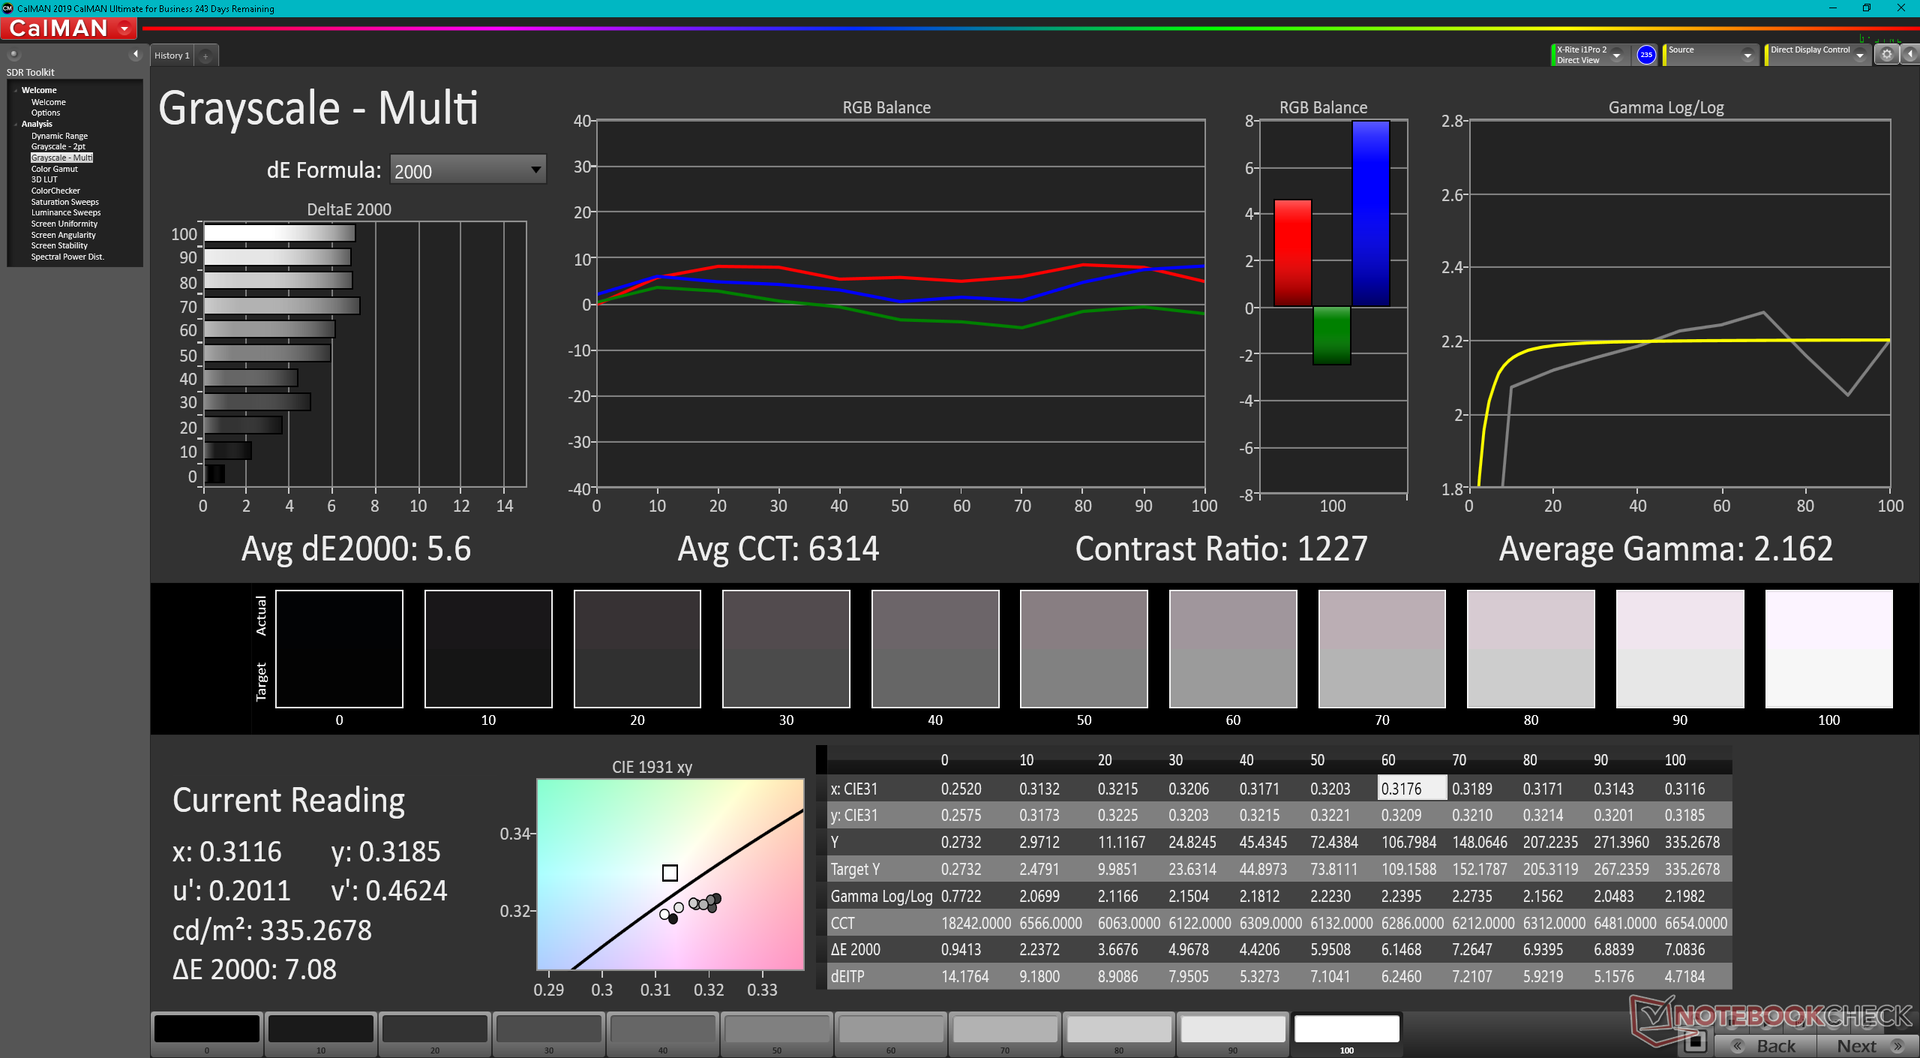
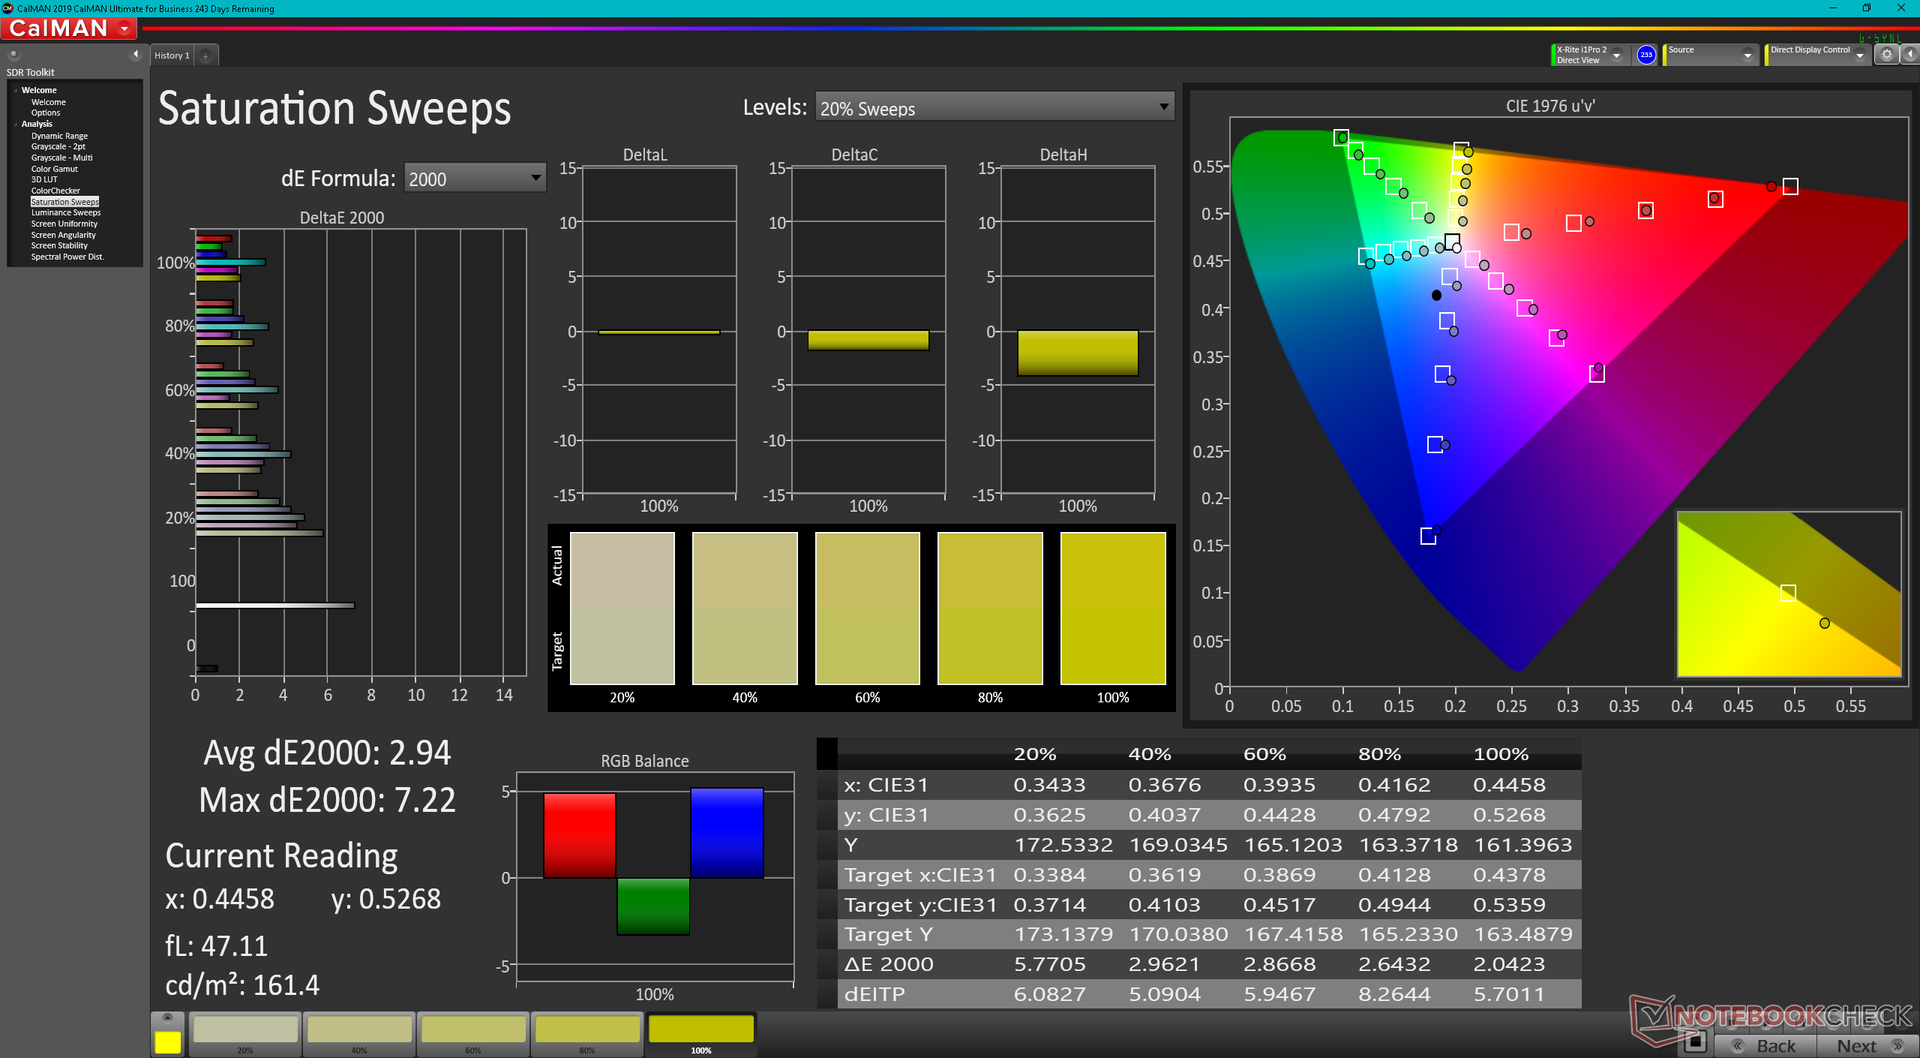
然而,GS77显示屏和Blade 17显示屏之间有两个主要区别。首先,GS77显示器不支持G-Sync或自适应同步,这是因为该机型不支持高级优化或MUX。其次,GS77的面板没有经过工厂校准,因此,即使将配置文件设置为DCI-P3,颜色也有明显偏差。
| |||||||||||||||||||||||||
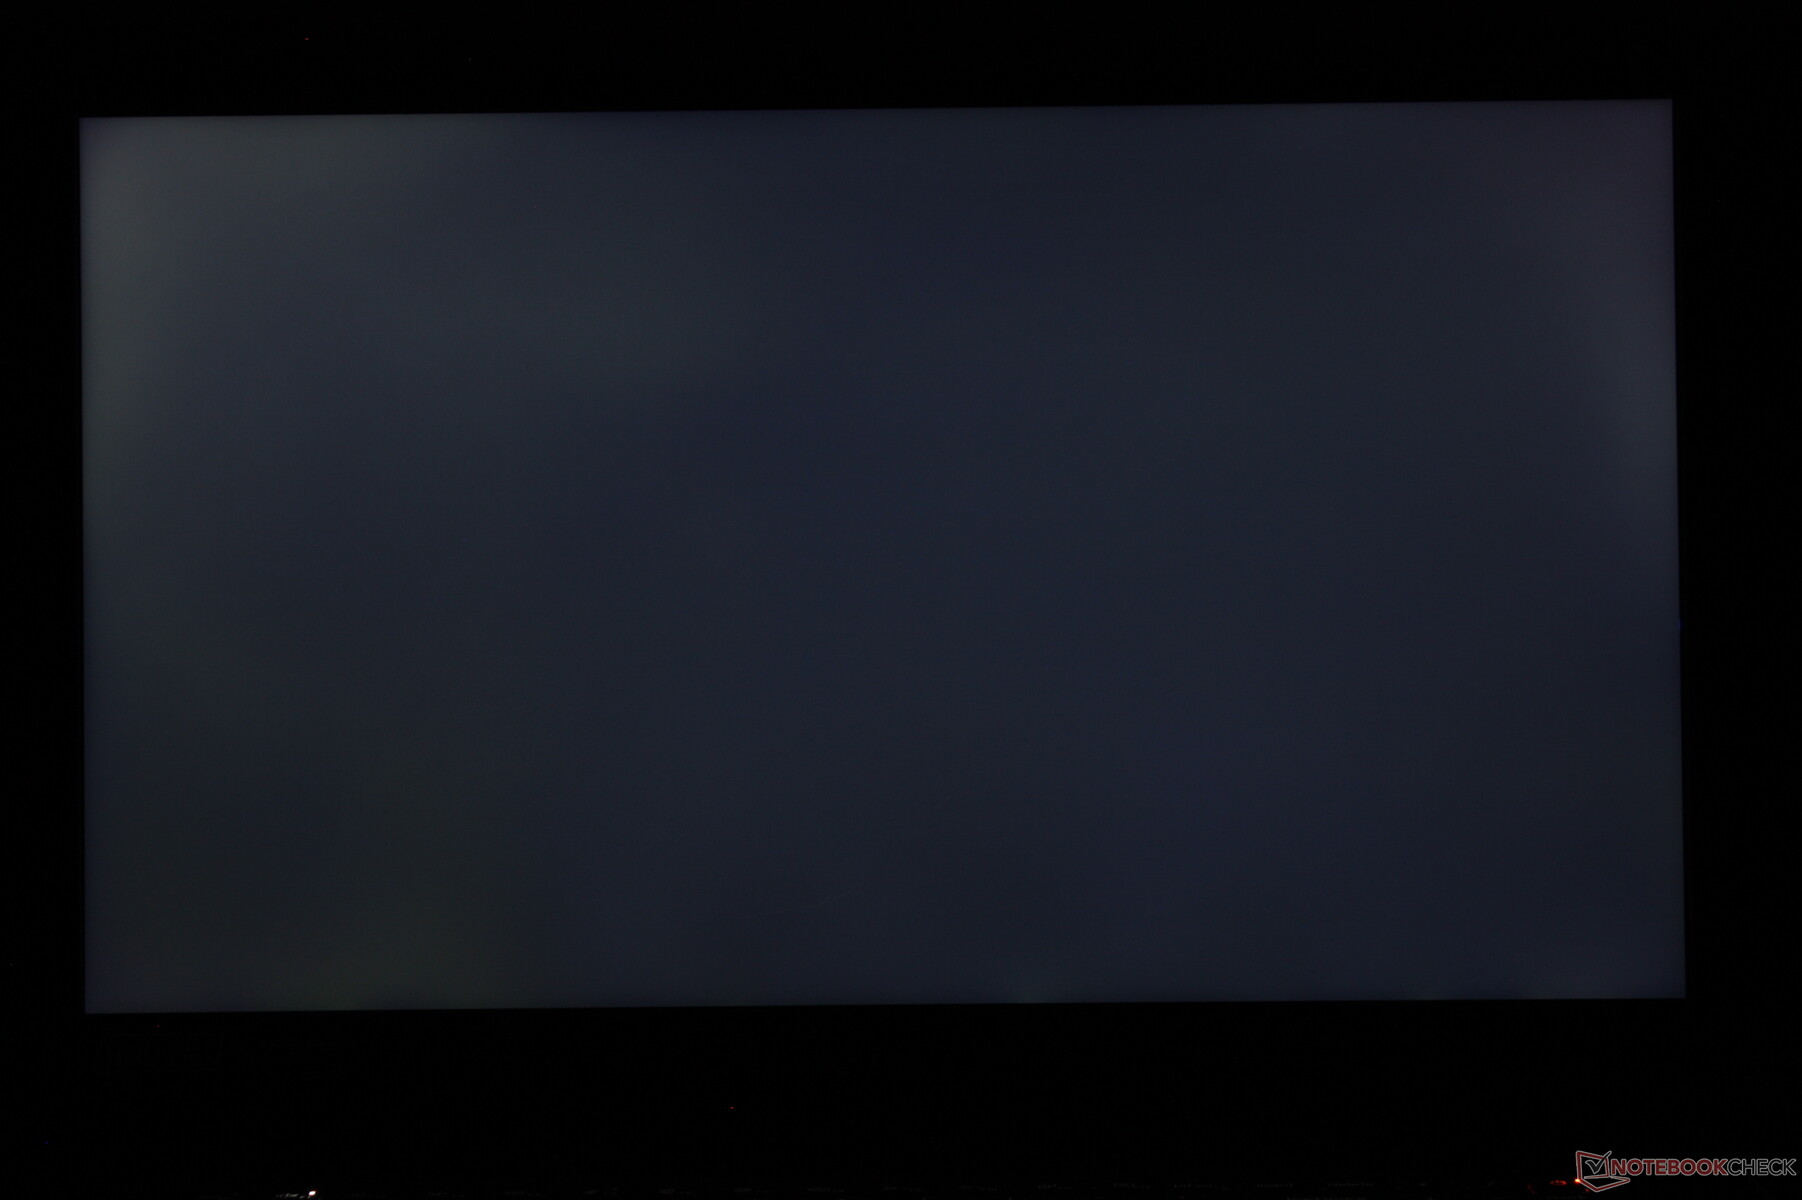
Brightness Distribution: 79 %
Center on Battery: 334.8 cd/m²
Contrast: 985:1 (Black: 0.34 cd/m²)
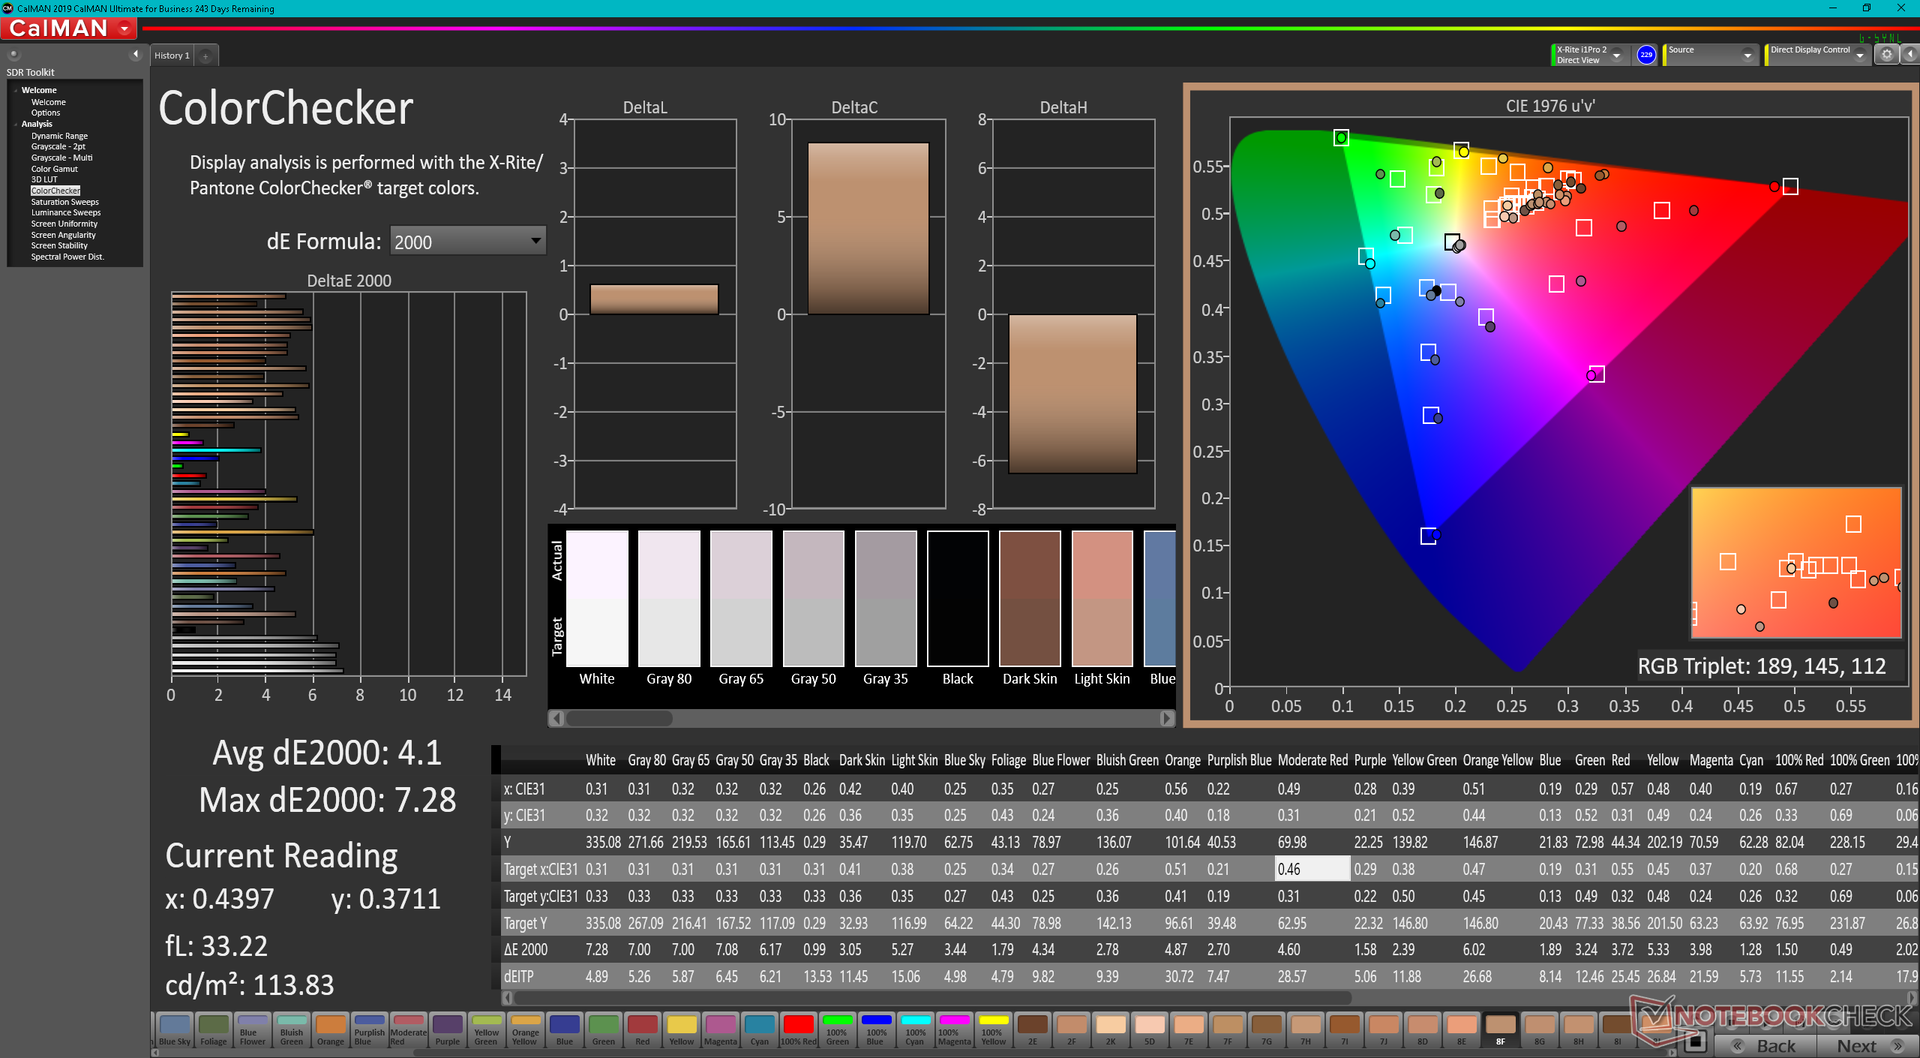
ΔE ColorChecker Calman: 4.1 | ∀{0.5-29.43 Ø4.71}
ΔE Greyscale Calman: 5.6 | ∀{0.09-98 Ø4.96}
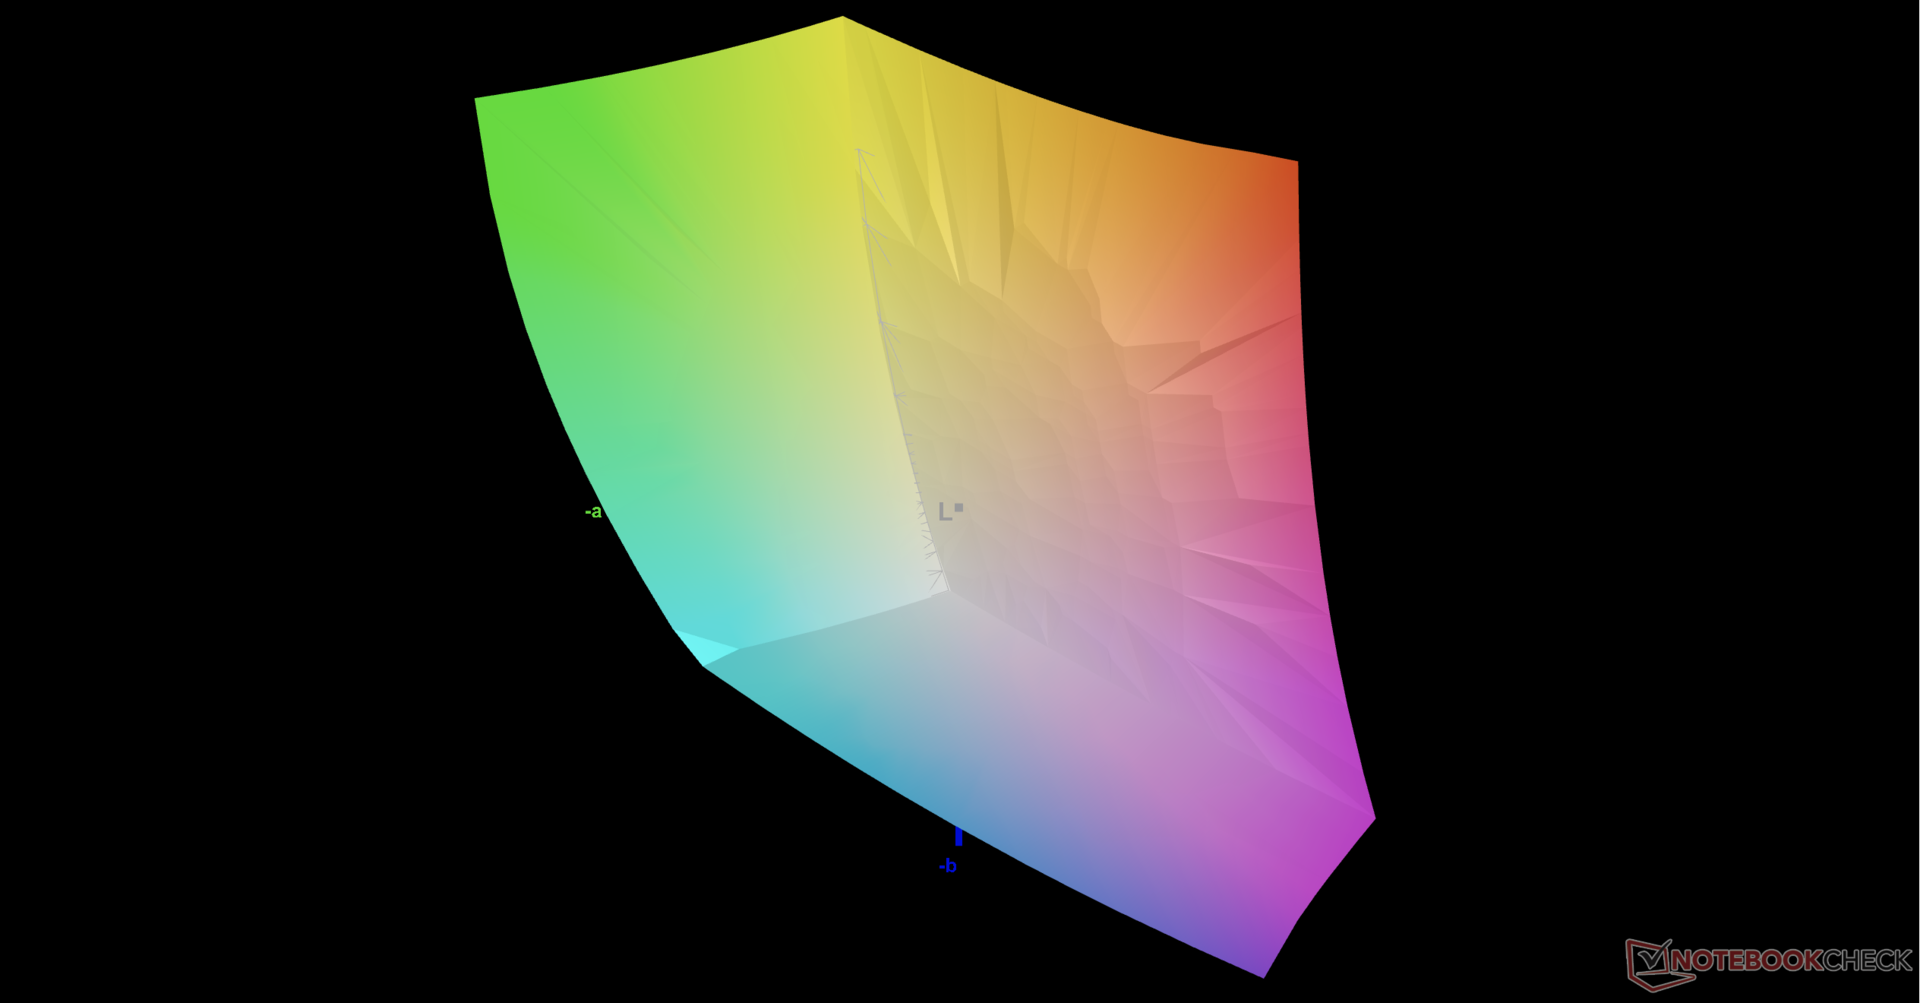
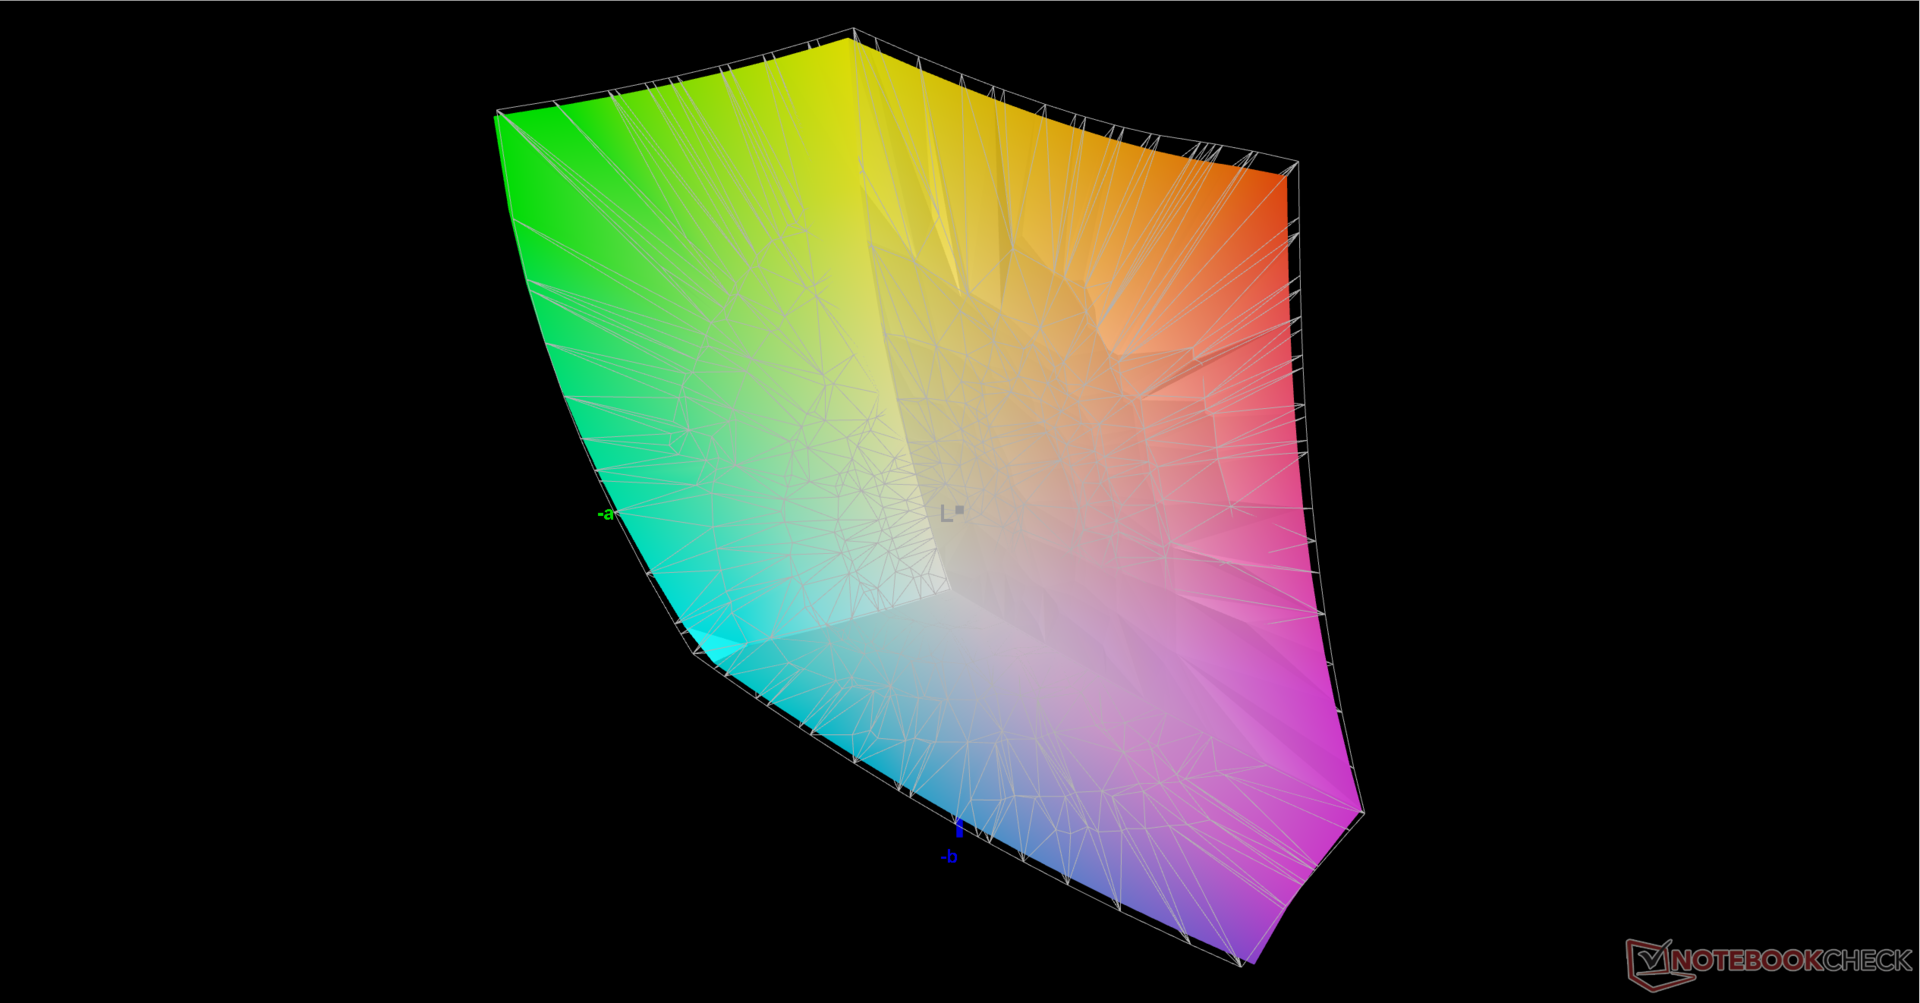
85.8% AdobeRGB 1998 (Argyll 3D)
99.7% sRGB (Argyll 3D)
96.2% Display P3 (Argyll 3D)
Gamma: 2.16
CCT: 6314 K
| MSI Stealth GS77 12UHS-083US BOE NE173QHM-NZ1, IPS, 2560x1440, 17.3" | MSI GS76 Stealth 11UH AUO B173ZAN06.1 (AUODE95), IPS, 3840x2160, 17.3" | Razer Blade 17 RTX 3080 Ti BOE NE173QHM-NZ1, IPS, 2560x1440, 17.3" | MSI GE76 Raider AU Optronics B173HAN05.4 (AUOE295), IPS-Level, 1920x1080, 17.3" | Alienware x17 RTX 3080 P48E AU Optronics B173ZAN, IPS, 3840x2160, 17.3" | Asus ROG Zephyrus S17 GX703HSD BOE099D (BOE CQ NE173QHM-NY3), IPS, 2560x1440, 17.3" | |
|---|---|---|---|---|---|---|
| Display | -21% | 1% | -21% | 3% | -2% | |
| Display P3 Coverage (%) | 96.2 | 63 -35% | 98.7 3% | 63.1 -34% | 88.3 -8% | 94.2 -2% |
| sRGB Coverage (%) | 99.7 | 94.8 -5% | 99.9 0% | 94 -6% | 100 0% | 98.7 -1% |
| AdobeRGB 1998 Coverage (%) | 85.8 | 65 -24% | 86.2 0% | 65.2 -24% | 100 17% | 84.4 -2% |
| Response Times | 50% | 6% | 47% | 19% | 55% | |
| Response Time Grey 50% / Grey 80% * (ms) | 17.6 ? | 8.8 ? 50% | 17.6 ? -0% | 5.6 ? 68% | 14.4 ? 18% | 4.8 73% |
| Response Time Black / White * (ms) | 12.8 ? | 6.4 ? 50% | 11.4 ? 11% | 9.6 ? 25% | 10.4 ? 19% | 8 37% |
| PWM Frequency (Hz) | ||||||
| Screen | 26% | 13% | 30% | 12% | 13% | |
| Brightness middle (cd/m²) | 334.8 | 474 42% | 335.9 0% | 290 -13% | 438.7 31% | 322 -4% |
| Brightness (cd/m²) | 305 | 454 49% | 294 -4% | 290 -5% | 435 43% | 288 -6% |
| Brightness Distribution (%) | 79 | 88 11% | 75 -5% | 96 22% | 91 15% | 72 -9% |
| Black Level * (cd/m²) | 0.34 | 0.46 -35% | 0.38 -12% | 0.23 32% | 0.48 -41% | 0.3 12% |
| Contrast (:1) | 985 | 1030 5% | 884 -10% | 1261 28% | 914 -7% | 1073 9% |
| Colorchecker dE 2000 * | 4.1 | 1.5 63% | 2.82 31% | 1.59 61% | 4.34 -6% | 3.05 26% |
| Colorchecker dE 2000 max. * | 7.28 | 5.59 23% | 5.04 31% | 3.17 56% | 7.3 -0% | 5.23 28% |
| Greyscale dE 2000 * | 5.6 | 2.8 50% | 1.7 70% | 2.5 55% | 2.4 57% | 3.11 44% |
| Gamma | 2.16 102% | 2.158 102% | 2.14 103% | 2.253 98% | 2.09 105% | 2.13 103% |
| CCT | 6314 103% | 6597 99% | 6382 102% | 6640 98% | 6413 101% | 6553 99% |
| Colorchecker dE 2000 calibrated * | 0.86 | 0.87 | 0.72 | 1.92 | ||
| Color Space (Percent of AdobeRGB 1998) (%) | 84 | |||||
| Color Space (Percent of sRGB) (%) | 99 | |||||
| Total Average (Program / Settings) | 18% /
19% | 7% /
9% | 19% /
20% | 11% /
11% | 22% /
16% |
* ... smaller is better
如上所述,微星并没有在出厂时对每块面板进行校准,这一点在我们的X-Rite色度计上显示出来。开箱后的色温太暖,因此GS77的平均DeltaE值相对较高。值得庆幸的是,用户可以通过预装的微星真彩软件手动调整色温和RGB值,不会有太大的麻烦。
Display Response Times
| ↔ Response Time Black to White | ||
|---|---|---|
| 12.8 ms ... rise ↗ and fall ↘ combined | ↗ 7.6 ms rise | 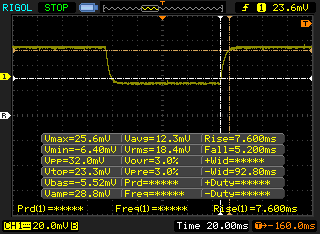 |
| ↘ 5.2 ms fall | ||
| The screen shows good response rates in our tests, but may be too slow for competitive gamers. In comparison, all tested devices range from 0.1 (minimum) to 240 (maximum) ms. » 33 % of all devices are better. This means that the measured response time is better than the average of all tested devices (19.8 ms). | ||
| ↔ Response Time 50% Grey to 80% Grey | ||
| 17.6 ms ... rise ↗ and fall ↘ combined | ↗ 10 ms rise | 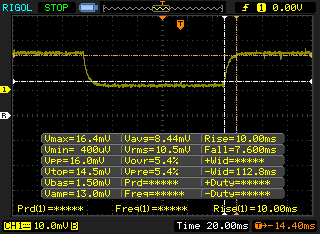 |
| ↘ 7.6 ms fall | ||
| The screen shows good response rates in our tests, but may be too slow for competitive gamers. In comparison, all tested devices range from 0.165 (minimum) to 636 (maximum) ms. » 32 % of all devices are better. This means that the measured response time is better than the average of all tested devices (31 ms). | ||
Screen Flickering / PWM (Pulse-Width Modulation)
| Screen flickering / PWM not detected | 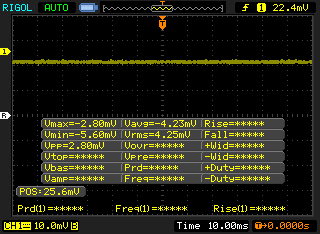 | ||
In comparison: 52 % of all tested devices do not use PWM to dim the display. If PWM was detected, an average of 7754 (minimum: 5 - maximum: 343500) Hz was measured. | |||

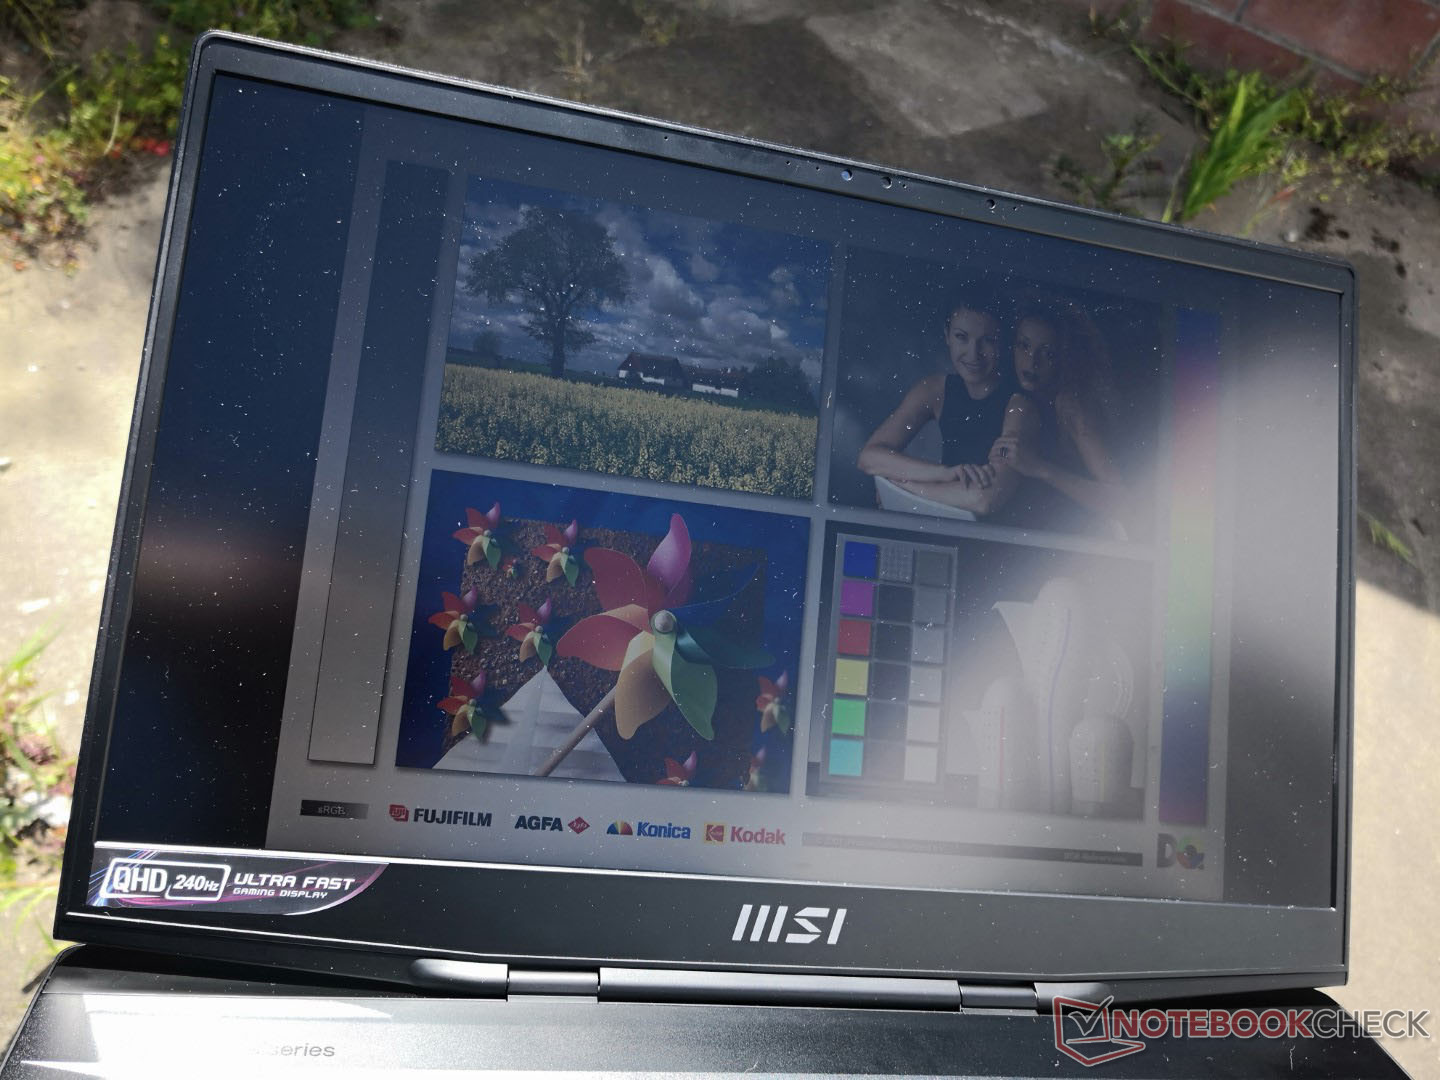
我们的1440p显示屏比我们在4K GS76上记录的要暗淡近30%,与Blade 17的水平更相似。室外能见度随后不如去年的模型好。
性能--第12代英特尔,带105W TGP显卡
测试条件
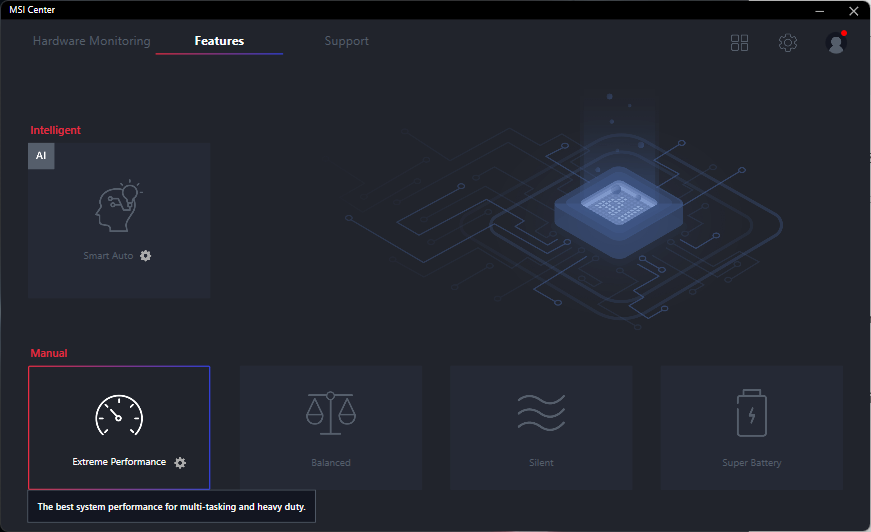
在运行下面的任何基准测试之前,我们通过预装的微星控制中心软件将我们的设备设置为极限性能模式。我们建议用户熟悉这个软件,因为关键的系统功能是在这里切换的。
处理器 - 逐年大幅增长
CPU性能非常好,其结果与我们数据库中配备相同Core i7-12700H CPU的普通笔记本相比,在一到两个百分点之内。多线程性能甚至一直比Blade 17中的Core i7-12800H 快6%到8%。虽然这个优势相对较小,但它确实解释了GS77在低分辨率下游戏时帧率略高于Blade 17的原因。
GS77配备了价格较高的 酷睿i9-12900H选项,但根据我们对市场上少数酷睿i9-12900H笔记本电脑的经验,其性能提升应该只比我们的酷睿i7-12700H高几个百分点。
与英特尔第11代Tiger Lake-H系列相比,性能的同比升级更为显著。当与去年的酷睿i9-11900H的 GS76相比,我们的酷睿i7-12700H在单线程和多线程操作方面分别快了约15%和25%至30%。
Cinebench R15 Multi Loop
Cinebench R23: Multi Core | Single Core
Cinebench R15: CPU Multi 64Bit | CPU Single 64Bit
Blender: v2.79 BMW27 CPU
7-Zip 18.03: 7z b 4 | 7z b 4 -mmt1
Geekbench 5.5: Multi-Core | Single-Core
HWBOT x265 Benchmark v2.2: 4k Preset
LibreOffice : 20 Documents To PDF
R Benchmark 2.5: Overall mean
| Cinebench R20 / CPU (Multi Core) | |
| Corsair One i300 | |
| MSI GE76 Raider | |
| MSI Vector GP66 12UGS | |
| MSI Stealth GS77 12UHS-083US | |
| Razer Blade 17 RTX 3080 Ti | |
| Average Intel Core i7-12700H (1576 - 7407, n=64) | |
| Asus ROG Strix G17 G713QE-RB74 | |
| MSI GS76 Stealth 11UH | |
| Gigabyte A7 X1 | |
| Asus TUF Gaming F17 FX707Z-HX011W | |
| Schenker XMG Pro 17 (Late 2021, RTX 3080) | |
| MSI GE76 Raider 10UH | |
| MSI GS75 10SF-609US | |
| Cinebench R20 / CPU (Single Core) | |
| Corsair One i300 | |
| MSI GE76 Raider | |
| MSI Vector GP66 12UGS | |
| Razer Blade 17 RTX 3080 Ti | |
| Asus TUF Gaming F17 FX707Z-HX011W | |
| MSI Stealth GS77 12UHS-083US | |
| Average Intel Core i7-12700H (300 - 704, n=64) | |
| MSI GS76 Stealth 11UH | |
| Schenker XMG Pro 17 (Late 2021, RTX 3080) | |
| Gigabyte A7 X1 | |
| Asus ROG Strix G17 G713QE-RB74 | |
| MSI GS75 10SF-609US | |
| MSI GE76 Raider 10UH | |
| Cinebench R15 / CPU Multi 64Bit | |
| Corsair One i300 | |
| MSI GE76 Raider | |
| Asus TUF Gaming F17 FX707Z-HX011W | |
| MSI Stealth GS77 12UHS-083US | |
| Average Intel Core i7-12700H (1379 - 2916, n=70) | |
| MSI Vector GP66 12UGS | |
| Razer Blade 17 RTX 3080 Ti | |
| MSI GS76 Stealth 11UH | |
| Gigabyte A7 X1 | |
| Asus ROG Strix G17 G713QE-RB74 | |
| Schenker XMG Pro 17 (Late 2021, RTX 3080) | |
| MSI GE76 Raider 10UH | |
| MSI GS75 10SF-609US | |
| Cinebench R15 / CPU Single 64Bit | |
| Corsair One i300 | |
| MSI GE76 Raider | |
| MSI Vector GP66 12UGS | |
| Razer Blade 17 RTX 3080 Ti | |
| MSI Stealth GS77 12UHS-083US | |
| Asus TUF Gaming F17 FX707Z-HX011W | |
| Average Intel Core i7-12700H (113 - 263, n=65) | |
| Gigabyte A7 X1 | |
| MSI GS76 Stealth 11UH | |
| Asus ROG Strix G17 G713QE-RB74 | |
| Schenker XMG Pro 17 (Late 2021, RTX 3080) | |
| MSI GS75 10SF-609US | |
| MSI GE76 Raider 10UH | |
| Blender / v2.79 BMW27 CPU | |
| MSI GS75 10SF-609US | |
| MSI GE76 Raider 10UH | |
| Schenker XMG Pro 17 (Late 2021, RTX 3080) | |
| MSI GS76 Stealth 11UH | |
| Asus TUF Gaming F17 FX707Z-HX011W | |
| Gigabyte A7 X1 | |
| Asus ROG Strix G17 G713QE-RB74 | |
| Average Intel Core i7-12700H (168 - 732, n=63) | |
| Razer Blade 17 RTX 3080 Ti | |
| MSI Vector GP66 12UGS | |
| MSI Stealth GS77 12UHS-083US | |
| MSI GE76 Raider | |
| Corsair One i300 | |
| 7-Zip 18.03 / 7z b 4 | |
| Corsair One i300 | |
| MSI GE76 Raider | |
| MSI Stealth GS77 12UHS-083US | |
| MSI Vector GP66 12UGS | |
| Razer Blade 17 RTX 3080 Ti | |
| Average Intel Core i7-12700H (22844 - 73067, n=63) | |
| Gigabyte A7 X1 | |
| Asus TUF Gaming F17 FX707Z-HX011W | |
| Asus ROG Strix G17 G713QE-RB74 | |
| MSI GS76 Stealth 11UH | |
| Schenker XMG Pro 17 (Late 2021, RTX 3080) | |
| MSI GS75 10SF-609US | |
| MSI GE76 Raider 10UH | |
| 7-Zip 18.03 / 7z b 4 -mmt1 | |
| Corsair One i300 | |
| MSI GE76 Raider | |
| MSI Vector GP66 12UGS | |
| Razer Blade 17 RTX 3080 Ti | |
| Gigabyte A7 X1 | |
| Average Intel Core i7-12700H (2743 - 5972, n=63) | |
| MSI GS76 Stealth 11UH | |
| Asus TUF Gaming F17 FX707Z-HX011W | |
| Schenker XMG Pro 17 (Late 2021, RTX 3080) | |
| MSI Stealth GS77 12UHS-083US | |
| Asus ROG Strix G17 G713QE-RB74 | |
| MSI GS75 10SF-609US | |
| MSI GE76 Raider 10UH | |
| Geekbench 5.5 / Multi-Core | |
| Corsair One i300 | |
| MSI GE76 Raider | |
| MSI Stealth GS77 12UHS-083US | |
| Razer Blade 17 RTX 3080 Ti | |
| Asus TUF Gaming F17 FX707Z-HX011W | |
| MSI Vector GP66 12UGS | |
| Average Intel Core i7-12700H (5144 - 13745, n=64) | |
| MSI GS76 Stealth 11UH | |
| Schenker XMG Pro 17 (Late 2021, RTX 3080) | |
| MSI GS75 10SF-609US | |
| MSI GE76 Raider 10UH | |
| Gigabyte A7 X1 | |
| Geekbench 5.5 / Single-Core | |
| Corsair One i300 | |
| MSI GE76 Raider | |
| MSI Vector GP66 12UGS | |
| Asus TUF Gaming F17 FX707Z-HX011W | |
| Razer Blade 17 RTX 3080 Ti | |
| MSI Stealth GS77 12UHS-083US | |
| Average Intel Core i7-12700H (803 - 1851, n=64) | |
| MSI GS76 Stealth 11UH | |
| Schenker XMG Pro 17 (Late 2021, RTX 3080) | |
| Gigabyte A7 X1 | |
| MSI GS75 10SF-609US | |
| MSI GE76 Raider 10UH | |
| HWBOT x265 Benchmark v2.2 / 4k Preset | |
| Corsair One i300 | |
| MSI GE76 Raider | |
| MSI Vector GP66 12UGS | |
| MSI Stealth GS77 12UHS-083US | |
| Razer Blade 17 RTX 3080 Ti | |
| Average Intel Core i7-12700H (4.67 - 21.8, n=64) | |
| MSI GS76 Stealth 11UH | |
| Schenker XMG Pro 17 (Late 2021, RTX 3080) | |
| Asus ROG Strix G17 G713QE-RB74 | |
| Gigabyte A7 X1 | |
| Asus TUF Gaming F17 FX707Z-HX011W | |
| MSI GE76 Raider 10UH | |
| MSI GS75 10SF-609US | |
| LibreOffice / 20 Documents To PDF | |
| Asus TUF Gaming F17 FX707Z-HX011W | |
| Gigabyte A7 X1 | |
| Asus ROG Strix G17 G713QE-RB74 | |
| MSI GS75 10SF-609US | |
| MSI GS76 Stealth 11UH | |
| MSI GE76 Raider 10UH | |
| Schenker XMG Pro 17 (Late 2021, RTX 3080) | |
| Razer Blade 17 RTX 3080 Ti | |
| Average Intel Core i7-12700H (34.2 - 95.3, n=63) | |
| MSI Stealth GS77 12UHS-083US | |
| MSI Vector GP66 12UGS | |
| MSI GE76 Raider | |
| Corsair One i300 | |
| R Benchmark 2.5 / Overall mean | |
| MSI GS75 10SF-609US | |
| MSI GE76 Raider 10UH | |
| Schenker XMG Pro 17 (Late 2021, RTX 3080) | |
| MSI GS76 Stealth 11UH | |
| Asus ROG Strix G17 G713QE-RB74 | |
| Gigabyte A7 X1 | |
| Average Intel Core i7-12700H (0.4441 - 1.052, n=63) | |
| Asus TUF Gaming F17 FX707Z-HX011W | |
| MSI Stealth GS77 12UHS-083US | |
| Razer Blade 17 RTX 3080 Ti | |
| MSI GE76 Raider | |
| MSI Vector GP66 12UGS | |
| Corsair One i300 | |
Cinebench R23: Multi Core | Single Core
Cinebench R15: CPU Multi 64Bit | CPU Single 64Bit
Blender: v2.79 BMW27 CPU
7-Zip 18.03: 7z b 4 | 7z b 4 -mmt1
Geekbench 5.5: Multi-Core | Single-Core
HWBOT x265 Benchmark v2.2: 4k Preset
LibreOffice : 20 Documents To PDF
R Benchmark 2.5: Overall mean
* ... smaller is better
AIDA64: FP32 Ray-Trace | FPU Julia | CPU SHA3 | CPU Queen | FPU SinJulia | FPU Mandel | CPU AES | CPU ZLib | FP64 Ray-Trace | CPU PhotoWorxx
| Performance rating | |
| MSI GE76 Raider | |
| Average Intel Core i7-12700H | |
| MSI Stealth GS77 12UHS-083US | |
| Razer Blade 17 RTX 3080 Ti | |
| AIDA64 / FP32 Ray-Trace | |
| Average Intel Core i7-12700H (2585 - 17957, n=64) | |
| MSI GE76 Raider | |
| MSI Stealth GS77 12UHS-083US | |
| Razer Blade 17 RTX 3080 Ti | |
| AIDA64 / FPU Julia | |
| Average Intel Core i7-12700H (12439 - 90760, n=64) | |
| MSI GE76 Raider | |
| MSI Stealth GS77 12UHS-083US | |
| Razer Blade 17 RTX 3080 Ti | |
| AIDA64 / CPU SHA3 | |
| MSI GE76 Raider | |
| MSI Stealth GS77 12UHS-083US | |
| Average Intel Core i7-12700H (833 - 4242, n=64) | |
| Razer Blade 17 RTX 3080 Ti | |
| AIDA64 / CPU Queen | |
| MSI GE76 Raider | |
| Razer Blade 17 RTX 3080 Ti | |
| MSI Stealth GS77 12UHS-083US | |
| Average Intel Core i7-12700H (57923 - 103202, n=63) | |
| AIDA64 / FPU SinJulia | |
| MSI GE76 Raider | |
| MSI Stealth GS77 12UHS-083US | |
| Razer Blade 17 RTX 3080 Ti | |
| Average Intel Core i7-12700H (3249 - 9939, n=64) | |
| AIDA64 / FPU Mandel | |
| Average Intel Core i7-12700H (7135 - 44760, n=64) | |
| MSI GE76 Raider | |
| MSI Stealth GS77 12UHS-083US | |
| Razer Blade 17 RTX 3080 Ti | |
| AIDA64 / CPU AES | |
| MSI GE76 Raider | |
| MSI Stealth GS77 12UHS-083US | |
| Average Intel Core i7-12700H (31839 - 144360, n=64) | |
| Razer Blade 17 RTX 3080 Ti | |
| AIDA64 / CPU ZLib | |
| MSI GE76 Raider | |
| MSI Stealth GS77 12UHS-083US | |
| Average Intel Core i7-12700H (305 - 1171, n=64) | |
| Razer Blade 17 RTX 3080 Ti | |
| AIDA64 / FP64 Ray-Trace | |
| Average Intel Core i7-12700H (1437 - 9692, n=64) | |
| MSI GE76 Raider | |
| MSI Stealth GS77 12UHS-083US | |
| Razer Blade 17 RTX 3080 Ti | |
| AIDA64 / CPU PhotoWorxx | |
| Razer Blade 17 RTX 3080 Ti | |
| MSI GE76 Raider | |
| MSI Stealth GS77 12UHS-083US | |
| Average Intel Core i7-12700H (12863 - 52207, n=64) | |
系统性能
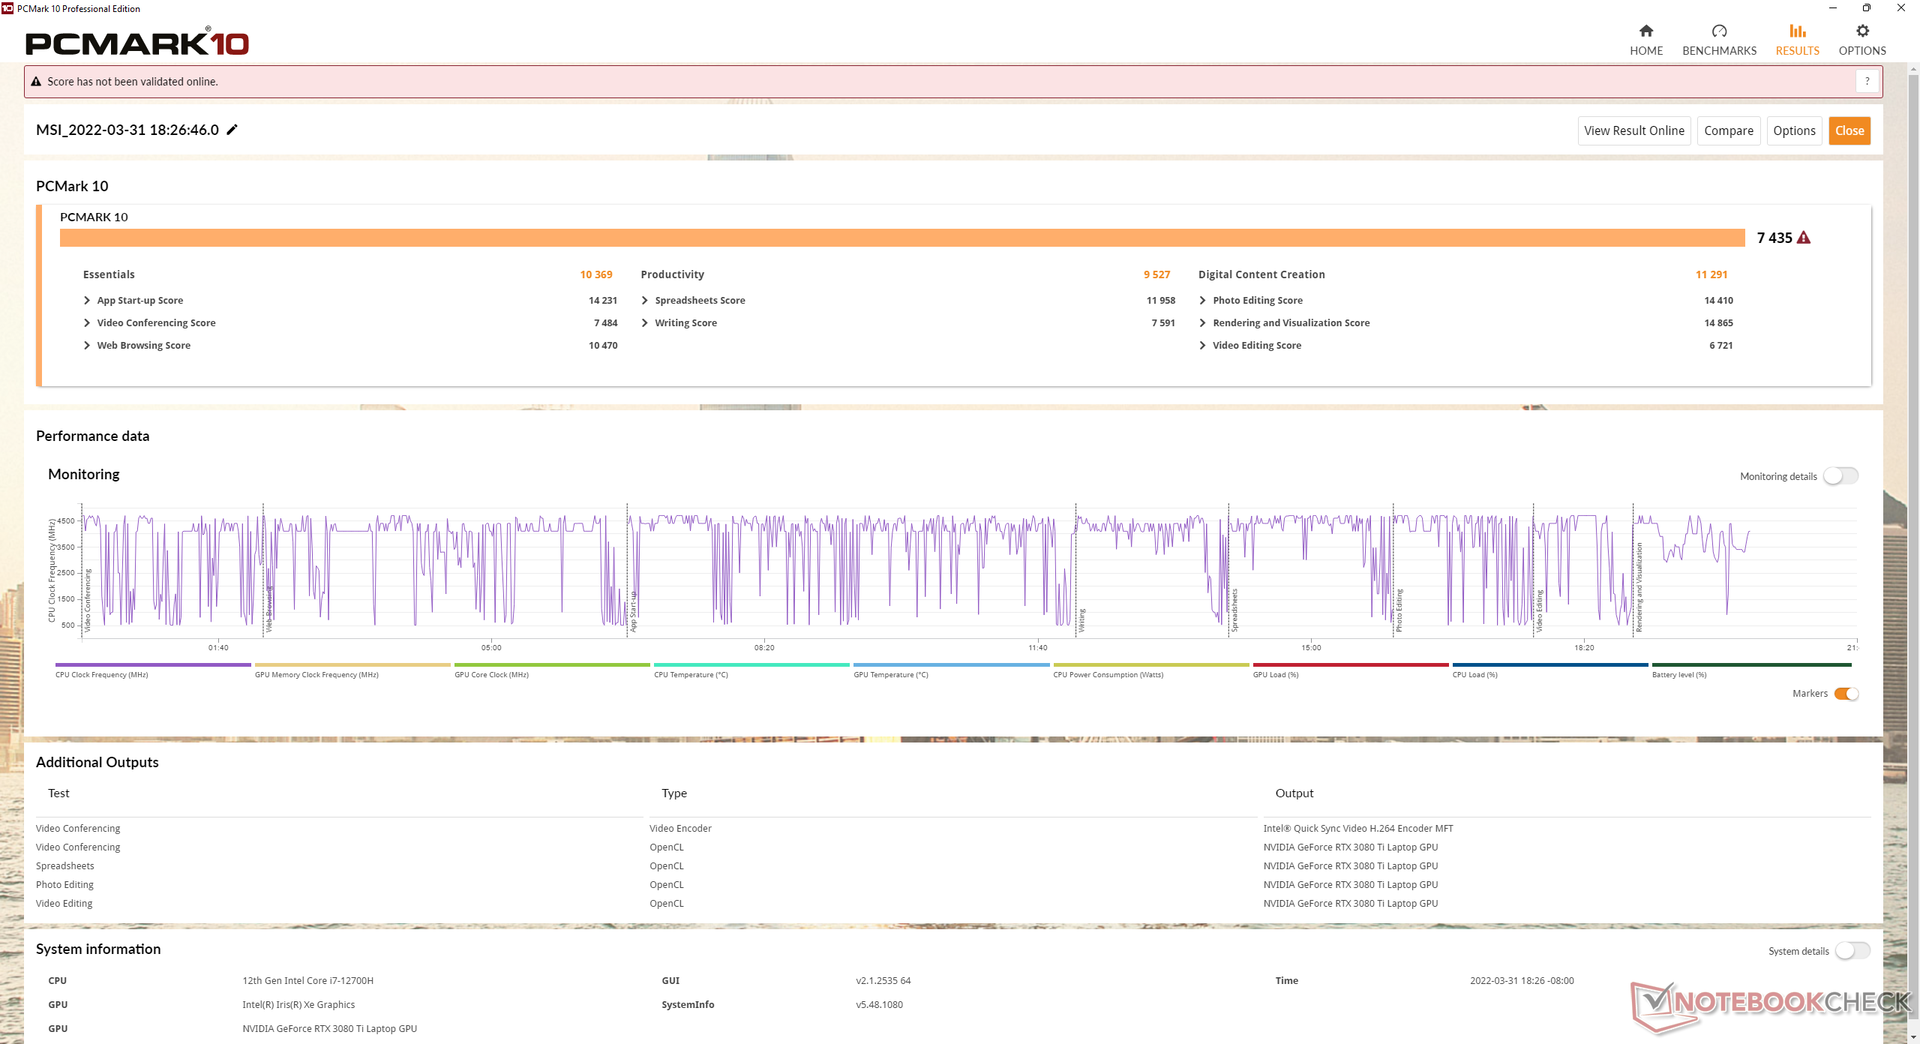
PCMark结果一直领先于去年的GS76,但略微落后于最新的Blade 17。
在我们的评测设备上,我们遇到了几个与睡眠模式和刷新率有关的问题值得一提。当让系统进入睡眠状态时,功耗有时会异常地高,而且表面温度很高。同时,某些游戏包括 Witcher 3幽灵5》和《奇异旅团》,当显示器的原始刷新率被设置为240赫兹而不是60赫兹时,会变成黑色。这些问题都没有出现在我们的Blade 17设备上,尽管这两台笔记本电脑使用的是京东方相同的240赫兹面板。
| PCMark 10 / Score | |
| MSI GE76 Raider | |
| Razer Blade 17 RTX 3080 Ti | |
| Alienware x17 RTX 3080 P48E | |
| MSI Stealth GS77 12UHS-083US | |
| Average Intel Core i7-12700H, NVIDIA GeForce RTX 3080 Ti Laptop GPU (6868 - 7638, n=7) | |
| Asus ROG Zephyrus S17 GX703HSD | |
| MSI GS76 Stealth 11UH | |
| PCMark 10 / Essentials | |
| Razer Blade 17 RTX 3080 Ti | |
| MSI GE76 Raider | |
| Asus ROG Zephyrus S17 GX703HSD | |
| Average Intel Core i7-12700H, NVIDIA GeForce RTX 3080 Ti Laptop GPU (9987 - 11318, n=7) | |
| MSI Stealth GS77 12UHS-083US | |
| Alienware x17 RTX 3080 P48E | |
| MSI GS76 Stealth 11UH | |
| PCMark 10 / Productivity | |
| MSI GE76 Raider | |
| Alienware x17 RTX 3080 P48E | |
| MSI Stealth GS77 12UHS-083US | |
| Average Intel Core i7-12700H, NVIDIA GeForce RTX 3080 Ti Laptop GPU (8944 - 10726, n=7) | |
| Razer Blade 17 RTX 3080 Ti | |
| Asus ROG Zephyrus S17 GX703HSD | |
| MSI GS76 Stealth 11UH | |
| PCMark 10 / Digital Content Creation | |
| MSI GE76 Raider | |
| Razer Blade 17 RTX 3080 Ti | |
| Alienware x17 RTX 3080 P48E | |
| MSI Stealth GS77 12UHS-083US | |
| Average Intel Core i7-12700H, NVIDIA GeForce RTX 3080 Ti Laptop GPU (8956 - 12249, n=7) | |
| Asus ROG Zephyrus S17 GX703HSD | |
| MSI GS76 Stealth 11UH | |
| PCMark 10 Score | 7435 points | |
Help | ||
| AIDA64 / Memory Copy | |
| MSI GE76 Raider | |
| Razer Blade 17 RTX 3080 Ti | |
| MSI Stealth GS77 12UHS-083US | |
| Average Intel Core i7-12700H (25615 - 80511, n=64) | |
| AIDA64 / Memory Read | |
| Razer Blade 17 RTX 3080 Ti | |
| MSI GE76 Raider | |
| MSI Stealth GS77 12UHS-083US | |
| Average Intel Core i7-12700H (25586 - 79442, n=64) | |
| AIDA64 / Memory Write | |
| Razer Blade 17 RTX 3080 Ti | |
| MSI Stealth GS77 12UHS-083US | |
| MSI GE76 Raider | |
| Average Intel Core i7-12700H (23679 - 88660, n=64) | |
| AIDA64 / Memory Latency | |
| MSI Stealth GS77 12UHS-083US | |
| MSI GE76 Raider | |
| Average Intel Core i7-12700H (76.2 - 133.9, n=62) | |
| Asus ROG Zephyrus S17 GX703HSD | |
| Alienware x17 RTX 3080 P48E | |
| Razer Blade 17 RTX 3080 Ti | |
* ... smaller is better
DPC延时
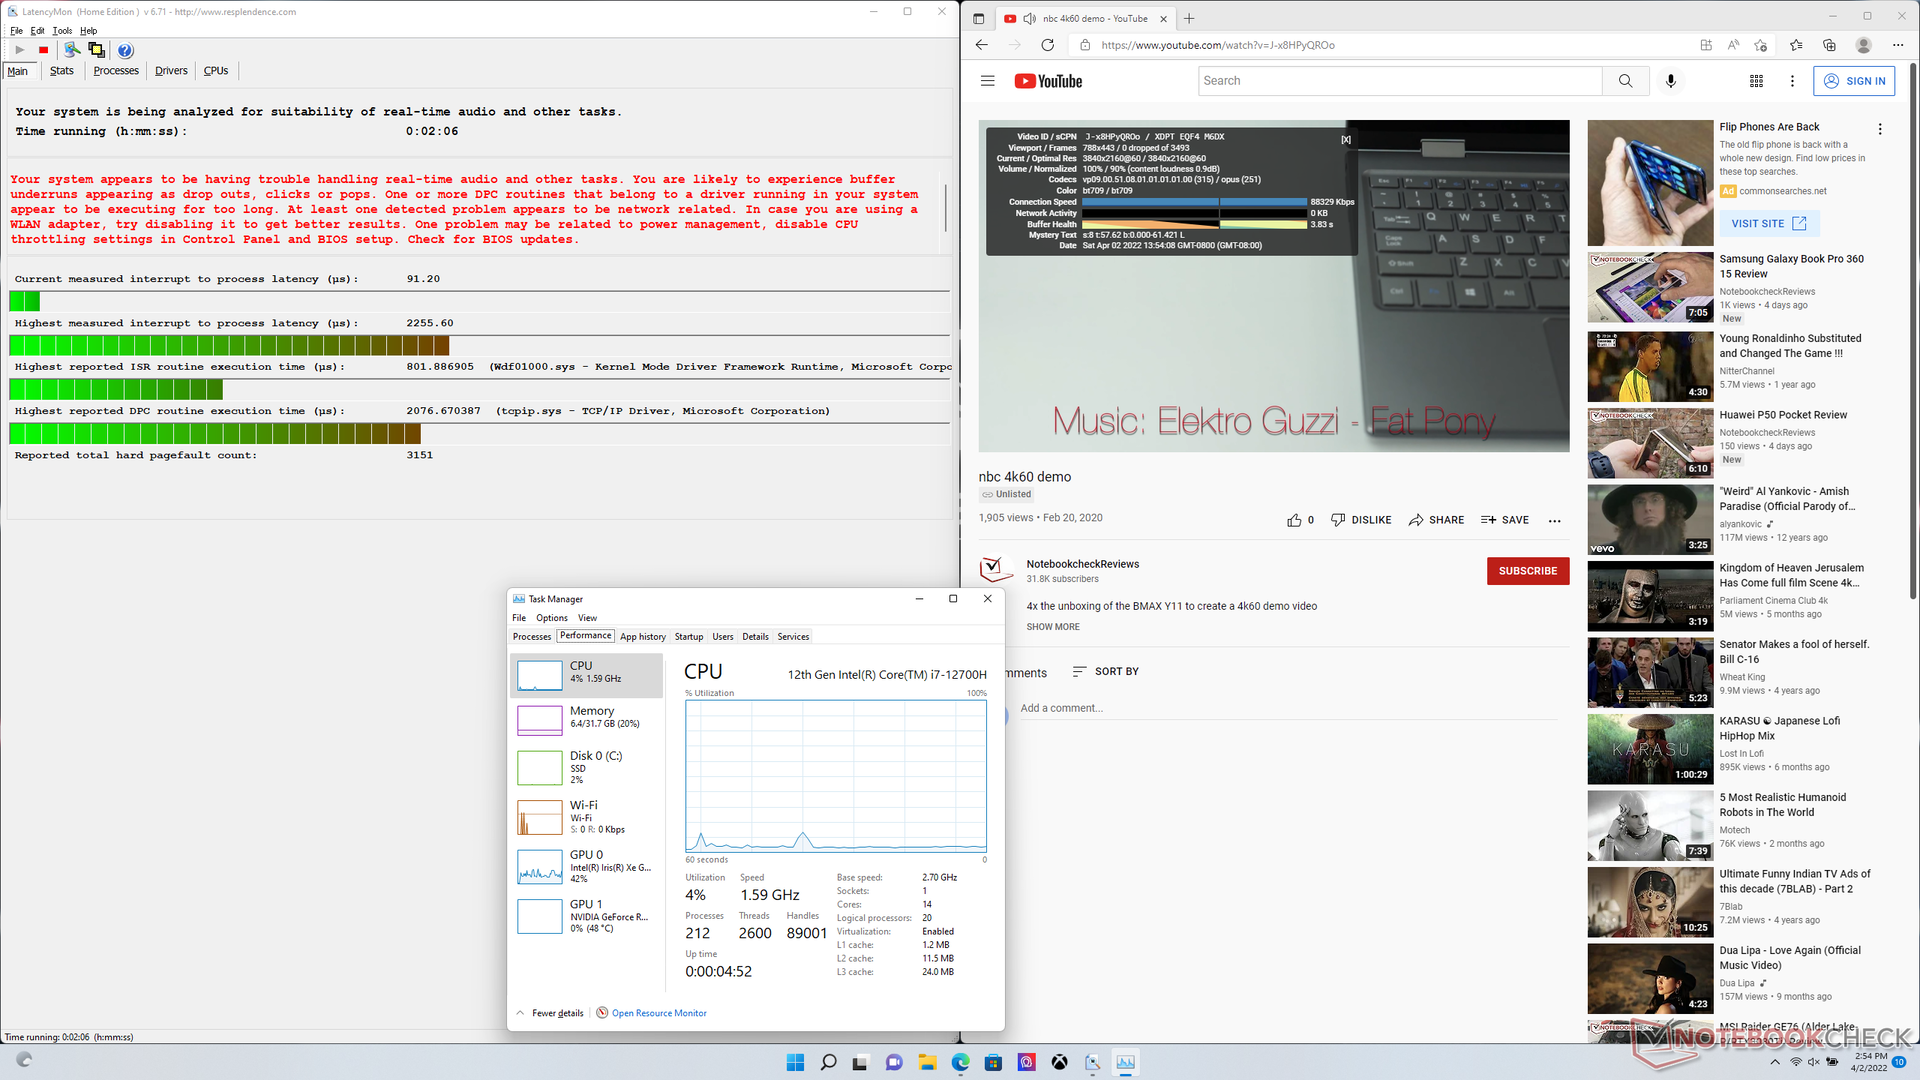
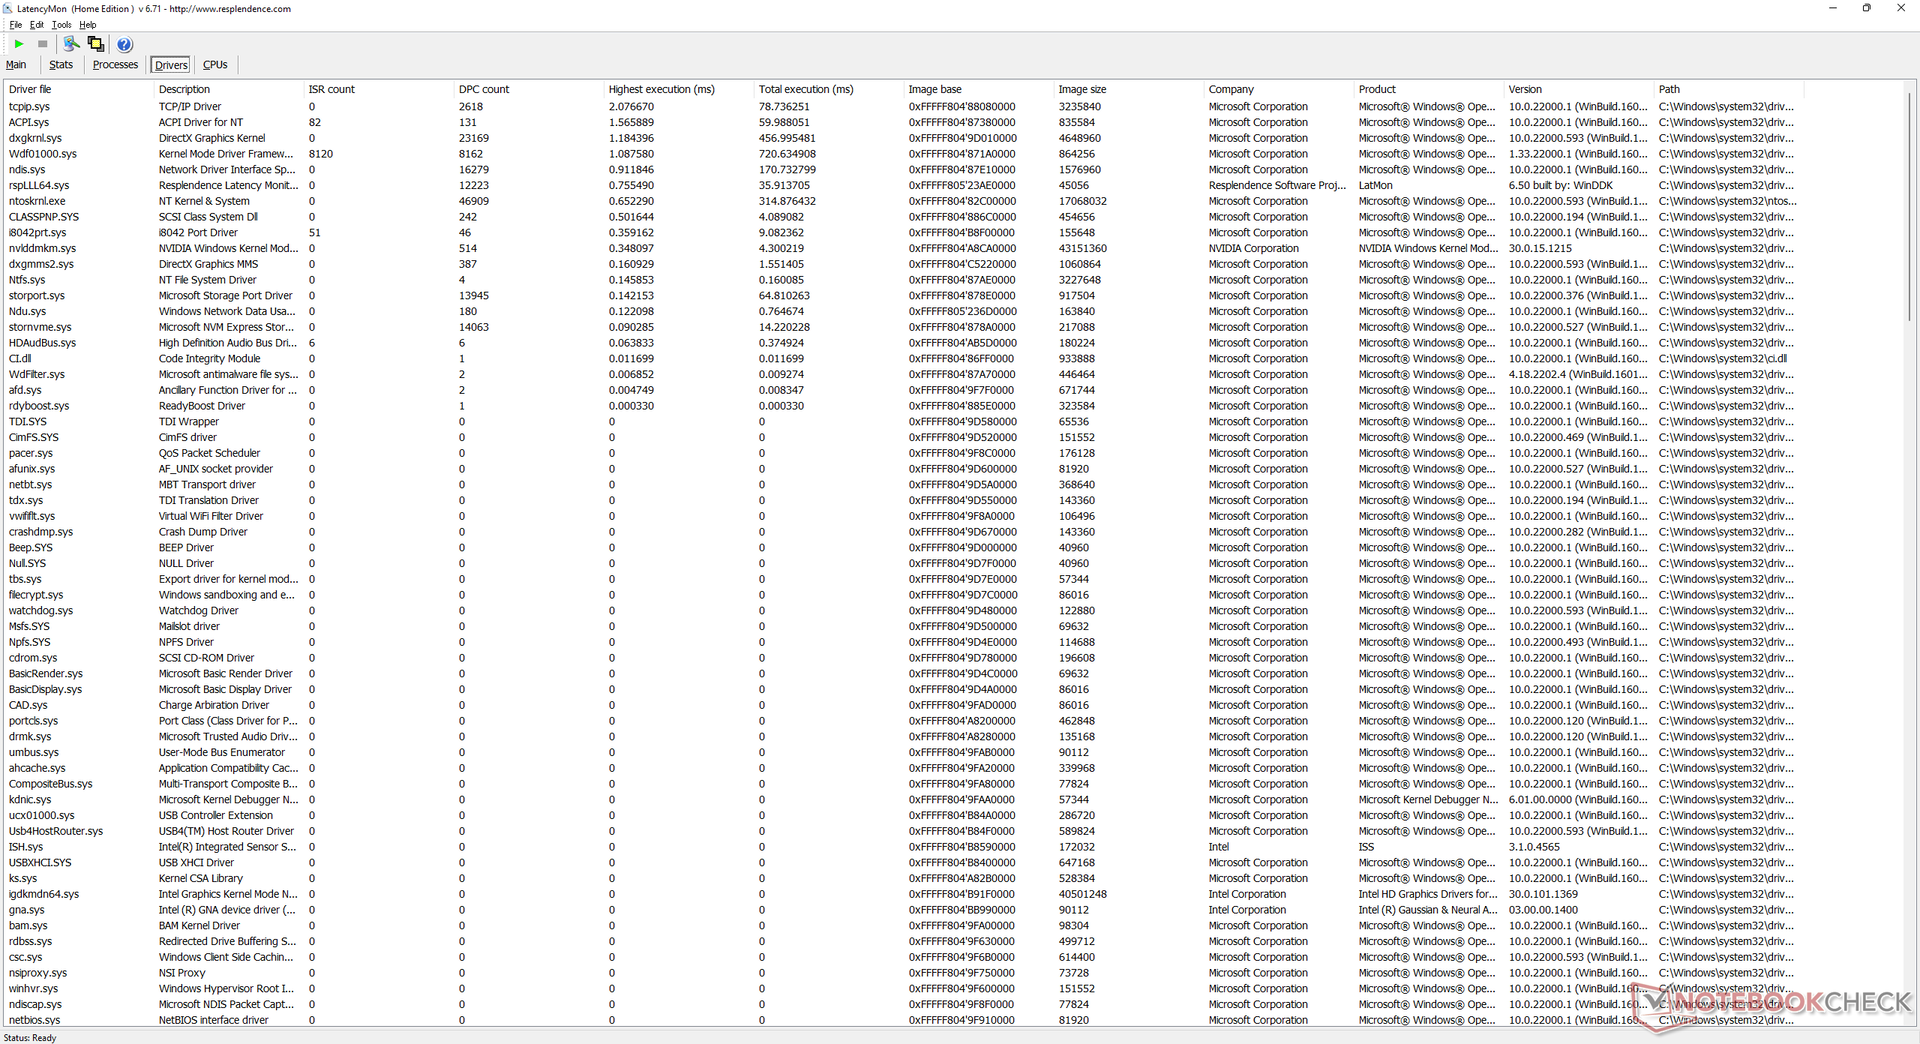
LatencyMon显示在我们的主页上打开多个浏览器标签时存在DPC问题。在我们对iGPU的测试中,以60FPS播放4K视频是完全顺畅的,没有掉帧。
| DPC Latencies / LatencyMon - interrupt to process latency (max), Web, Youtube, Prime95 | |
| Alienware x17 RTX 3080 P48E | |
| MSI Stealth GS77 12UHS-083US | |
| MSI GE76 Raider | |
| Asus ROG Zephyrus S17 GX703HSD | |
| Razer Blade 17 RTX 3080 Ti | |
| MSI GS76 Stealth 11UH | |
* ... smaller is better
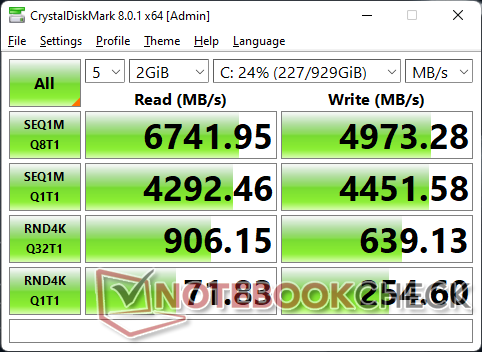
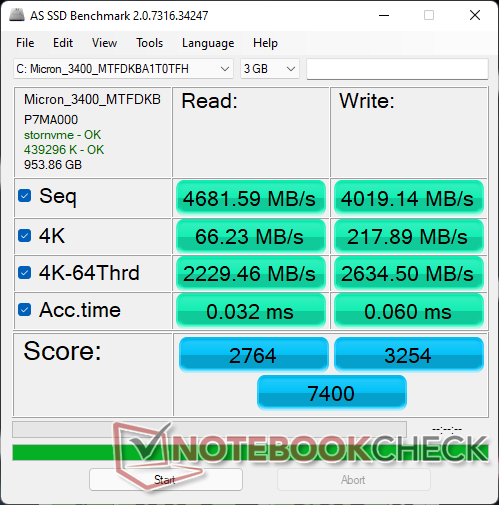
存储设备 - 多达2个PCIe4 x4 NVMe固态硬盘
我们的测试装置配备了美光3400 PCIe4 x4 NVMe SSD。虽然它是一个高端驱动器,但性能似乎一直比大多数旗舰游戏笔记本电脑上的三星PM9A1慢。不过,在接受我们的DiskSpd循环测试时,性能的可持续性还是很好的。

| Drive Performance rating - Percent | |
| Asus ROG Zephyrus S17 GX703HSD | |
| MSI GE76 Raider | |
| Razer Blade 17 RTX 3080 Ti | |
| MSI GS76 Stealth 11UH | |
| MSI Stealth GS77 12UHS-083US | |
| Alienware x17 RTX 3080 P48E | |
* ... smaller is better
Disk Throttling: DiskSpd Read Loop, Queue Depth 8
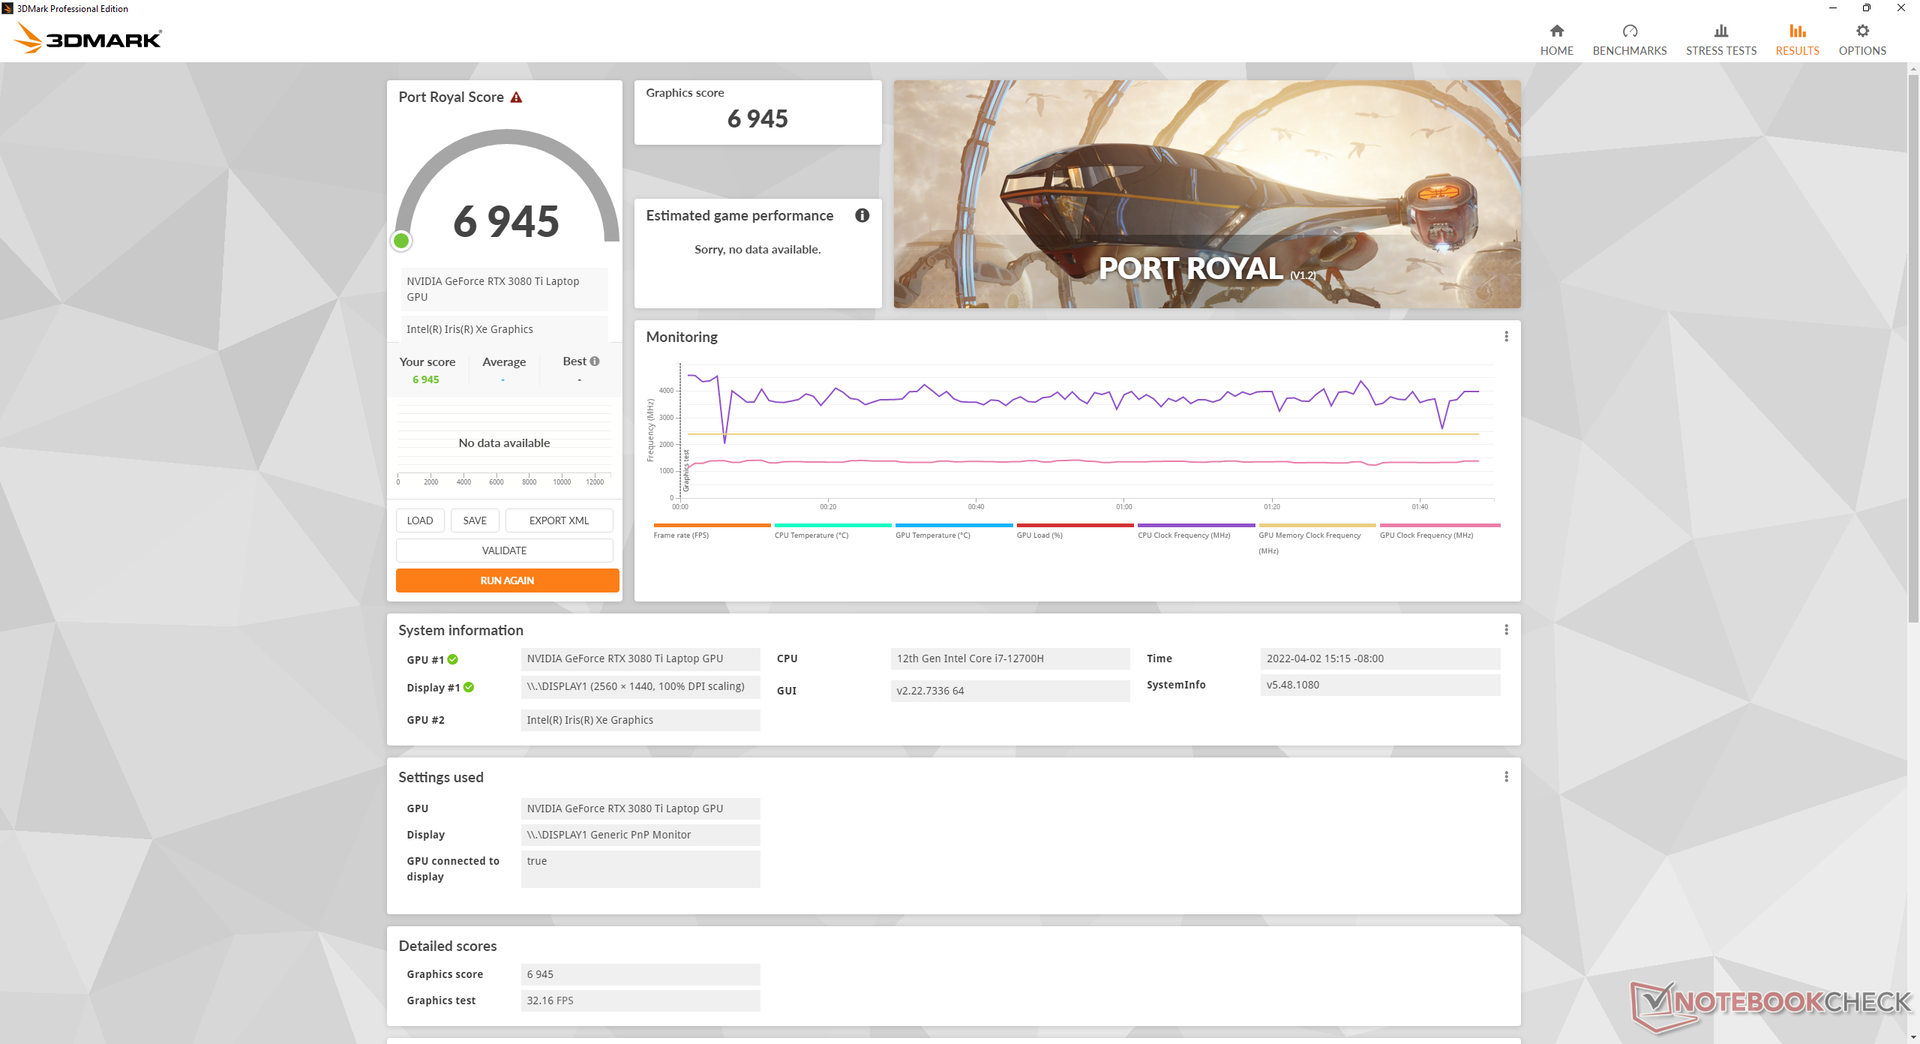
GPU性能--比RTX 3080略微快一些
ǞǞǞ GeForce RTX 3080 TiGS77的性能比RTX 3080 Ti的性能提高了12%至15%。 RTX 3080相比,去年的GS76中的RTX 3080提供了12%到15%的性能提升。然而,与刀锋17中的165瓦RTX 3080 Ti相比,我们的105瓦RTX 3080 Ti慢了大约13%到18%。在更高的分辨率下进行游戏时,这种性能差异最为明显,我们的GS77会一直落后于Razer的替代品。否则,105W RTX 3080 Ti和165W RTX 3080 Ti之间的性能差异在1080p或更低的分辨率下会小得多,因为那里的游戏可能是由CPU控制的。
在平衡电源配置文件上运行GS77,而不是极限性能,将使GPU性能降低约12%。
这 桌面GeForce RTX 3080 Ti仍然比我们的移动版本快得多,约65%至80%。
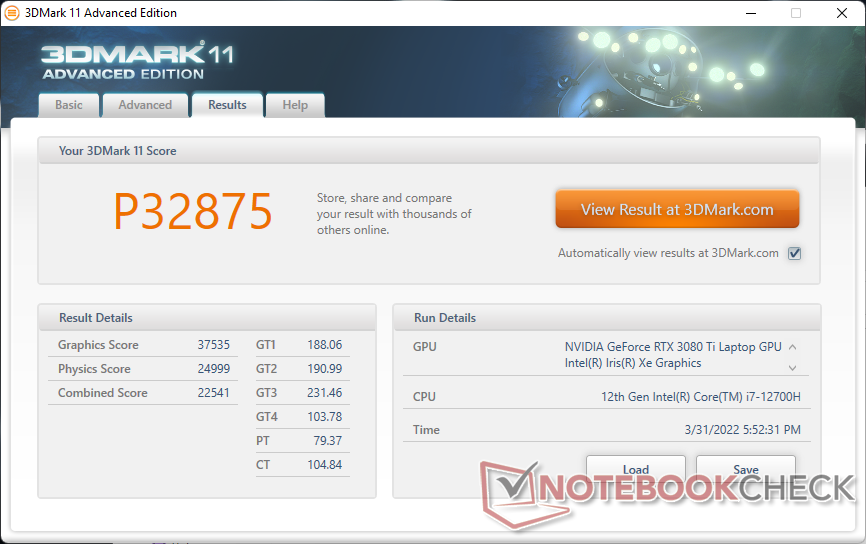

| 3DMark 11 - 1280x720 Performance GPU | |
| NVIDIA GeForce RTX 3080 Ti Founders Edition | |
| Razer Blade 17 RTX 3080 Ti | |
| Average NVIDIA GeForce RTX 3080 Ti Laptop GPU (13920 - 45841, n=45) | |
| MSI Stealth GS77 12UHS-083US | |
| Razer Blade 17 RTX 3070 | |
| Alienware m17 R3 P45E | |
| MSI GS76 Stealth 11UH | |
| Asus TUF Gaming F17 FX706HM | |
| MSI GS75 10SF-609US | |
| Eluktronics RP-17 | |
| Asus ROG Strix G17 G713QE-RB74 | |
| Asus TUF A17 FA706IU-AS76 | |
| 3DMark 11 Performance | 32875 points | |
| 3DMark Cloud Gate Standard Score | 55980 points | |
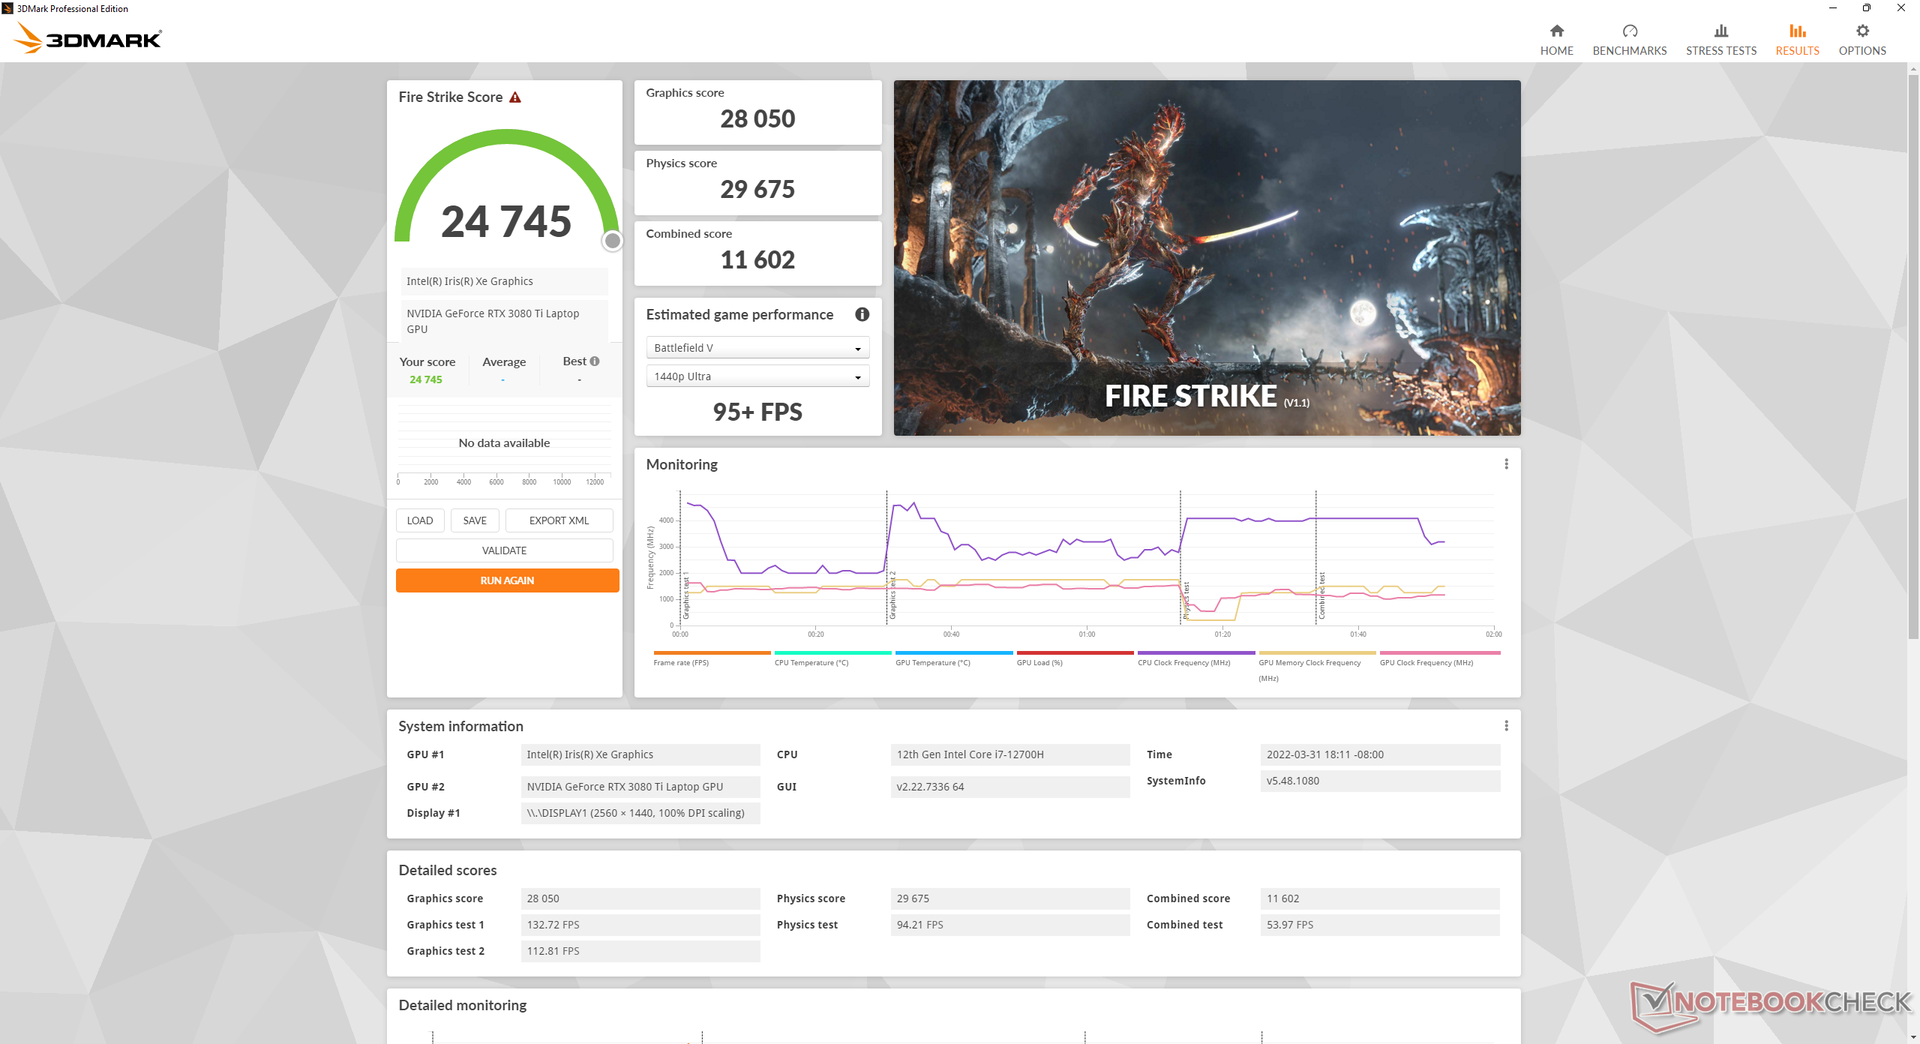
| 3DMark Fire Strike Score | 24745 points | |
| 3DMark Time Spy Score | 10987 points | |
Help | ||
Witcher 3 FPS Chart
| low | med. | high | ultra | QHD | |
|---|---|---|---|---|---|
| GTA V (2015) | 186 | 185 | 175 | 113 | 94.2 |
| The Witcher 3 (2015) | 447.2 | 298.8 | 206.8 | 109.1 | |
| Dota 2 Reborn (2015) | 182 | 169 | 161 | 154 | |
| Final Fantasy XV Benchmark (2018) | 196 | 130 | 101 | 79.5 | |
| X-Plane 11.11 (2018) | 146 | 126 | 103 | ||
| Far Cry 5 (2018) | 190 | 145 | 136 | 129 | 101 |
| Strange Brigade (2018) | 447 | 239 | 196 | 177 | 126 |
| Cyberpunk 2077 1.6 (2022) | 133.2 | 113.6 | 92.9 | 92.8 | 49.7 |
排放
系统噪音 - 不再有三风扇
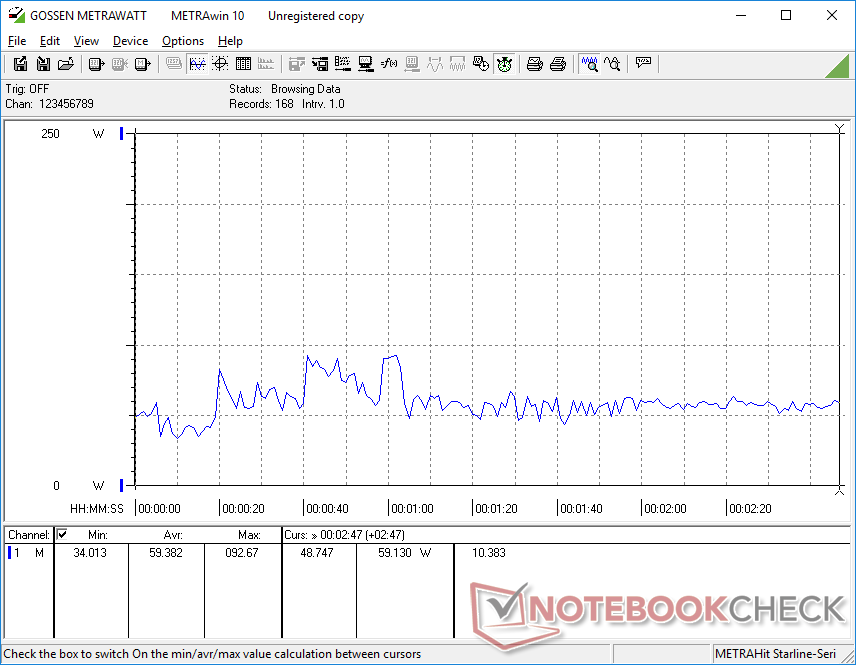
当设置为电池保护器或静音模式时,内部风扇在保持安静方面做得很好。在浏览或播放视频时,在24.5分贝(A)的静音背景下,风扇噪音可能偶尔会突然达到31分贝(A),但不会让人分心。
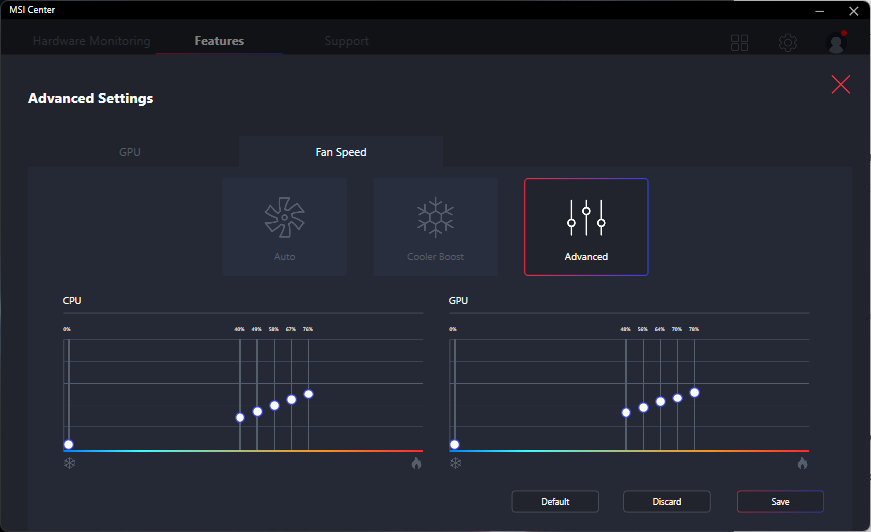
在极致性能模式下运行时的风扇噪音 Witcher 3极限性能模式下的风扇噪音明显比Blade 17安静(46 dB(A) vs. 51 dB(A))。然而,如果启用Cooler Boost模式,GS77就会成为噪音较大的笔记本电脑,达到57 dB(A)。值得庆幸的是,要想充分发挥笔记本电脑的性能,并不需要使用Cooler Boost模式。
在平衡模式而不是极限性能模式下运行同样的游戏,会使风扇噪音略微降低到44.1 dB(A),尽管如前所述,图形性能下降了12%。关注风扇噪音的用户可能想考虑在这些较低的功率配置下进行游戏。
Noise level
| Idle |
| 24.5 / 24.5 / 30.8 dB(A) |
| Load |
| 34.6 / 56.8 dB(A) |
 | ||
30 dB silent 40 dB(A) audible 50 dB(A) loud |
||
min: | ||
| MSI Stealth GS77 12UHS-083US GeForce RTX 3080 Ti Laptop GPU, i7-12700H, Micron 3400 1TB MTFDKBA1T0TFH | MSI GS76 Stealth 11UH GeForce RTX 3080 Laptop GPU, i9-11900H, Samsung PM9A1 MZVL22T0HBLB | Razer Blade 17 RTX 3080 Ti GeForce RTX 3080 Ti Laptop GPU, i7-12800H, Samsung PM9A1 MZVL21T0HCLR | MSI GE76 Raider GeForce RTX 3080 Ti Laptop GPU, i9-12900HK, Samsung PM9A1 MZVL22T0HBLB | Alienware x17 RTX 3080 P48E GeForce RTX 3080 Laptop GPU, i7-11800H, 2x WDC PC SN730 SDBPNTY-1T00 (RAID 0) | Asus ROG Zephyrus S17 GX703HSD GeForce RTX 3080 Laptop GPU, i9-11900H, Samsung PM9A1 MZVL22T0HBLB | |
|---|---|---|---|---|---|---|
| Noise | -8% | 3% | -15% | 1% | 5% | |
| off / environment * (dB) | 24.5 | 24 2% | 23.3 5% | 26 -6% | 24.9 -2% | 23 6% |
| Idle Minimum * (dB) | 24.5 | 24 2% | 23.3 5% | 26 -6% | 24.9 -2% | 23 6% |
| Idle Average * (dB) | 24.5 | 25 -2% | 23.3 5% | 27 -10% | 24.9 -2% | 23 6% |
| Idle Maximum * (dB) | 30.8 | 42 -36% | 26.3 15% | 40 -30% | 29.6 4% | 23 25% |
| Load Average * (dB) | 34.6 | 46 -33% | 38.2 -10% | 50 -45% | 31.1 10% | 41 -18% |
| Witcher 3 ultra * (dB) | 46.2 | 48 -4% | 50.9 -10% | 53 -15% | 49.7 -8% | 45 3% |
| Load Maximum * (dB) | 56.8 | 48 15% | 49.1 14% | 53 7% | 54.8 4% | 52 8% |
* ... smaller is better
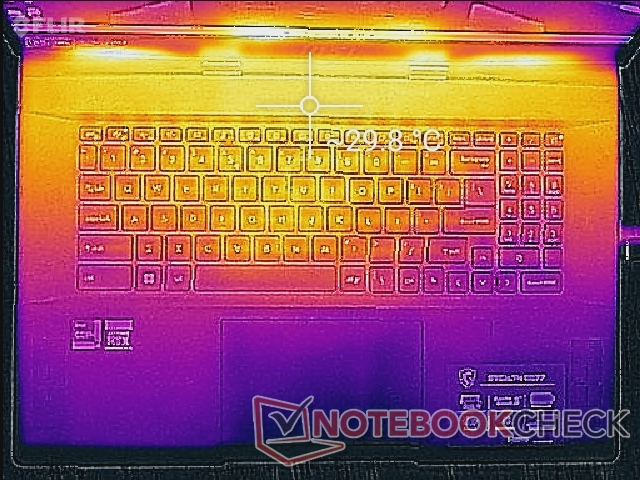
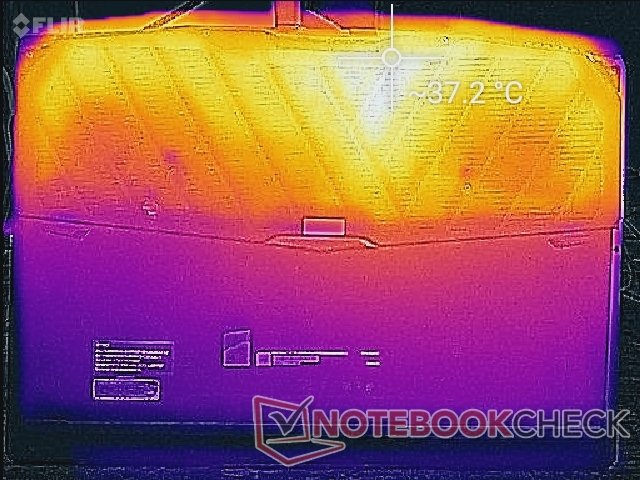
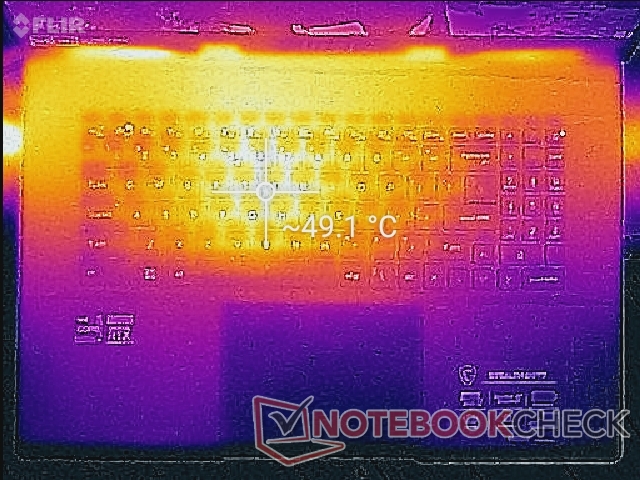
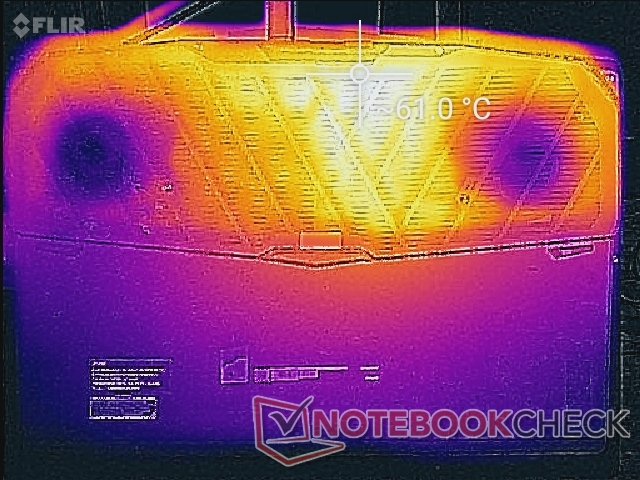
温度
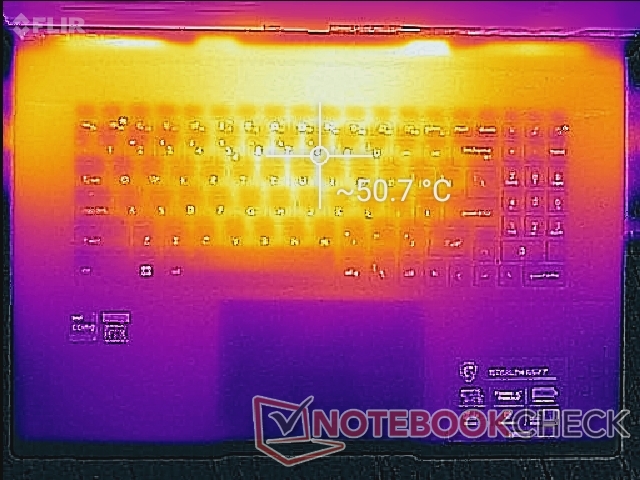
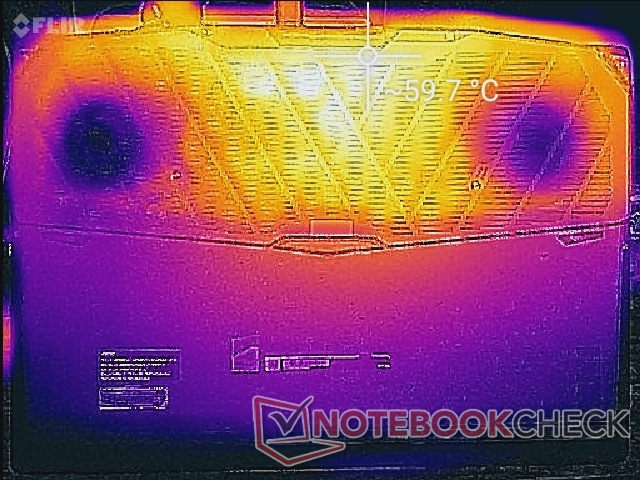
游戏时的表面热点与我们在GS76上记录的差不多,在键盘中心附近约为49℃,底部为61℃。然而,较新机型的温度分布更好,因为现在掌托的温度要低得多,低于30摄氏度,而GS76的温度为35摄氏度或更高。
刀锋17的WASD键比GS77的更凉,因为Razer型号从其WASD键吸入冷空气。在比较GS77和Blade 17的温度图时可以看出这一点。
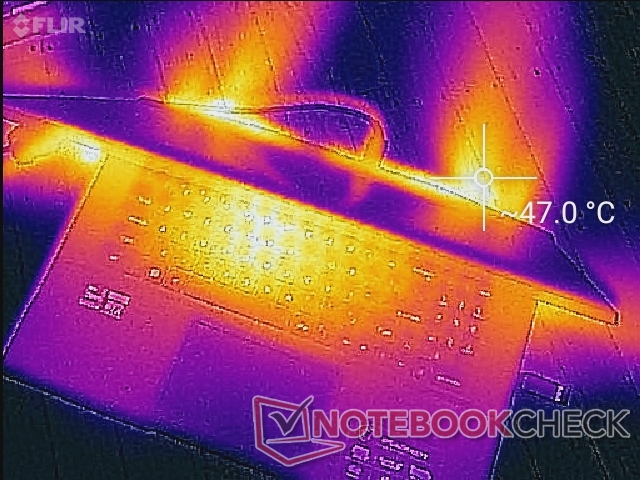
(-) The maximum temperature on the upper side is 50.6 °C / 123 F, compared to the average of 40.4 °C / 105 F, ranging from 21.2 to 68.8 °C for the class Gaming.
(-) The bottom heats up to a maximum of 59.6 °C / 139 F, compared to the average of 43.2 °C / 110 F
(+) In idle usage, the average temperature for the upper side is 26.9 °C / 80 F, compared to the device average of 33.9 °C / 93 F.
(±) Playing The Witcher 3, the average temperature for the upper side is 36.2 °C / 97 F, compared to the device average of 33.9 °C / 93 F.
(+) The palmrests and touchpad are cooler than skin temperature with a maximum of 30 °C / 86 F and are therefore cool to the touch.
(±) The average temperature of the palmrest area of similar devices was 28.8 °C / 83.8 F (-1.2 °C / -2.2 F).
| MSI Stealth GS77 12UHS-083US Intel Core i7-12700H, NVIDIA GeForce RTX 3080 Ti Laptop GPU | MSI GS76 Stealth 11UH Intel Core i9-11900H, NVIDIA GeForce RTX 3080 Laptop GPU | Razer Blade 17 RTX 3080 Ti Intel Core i7-12800H, NVIDIA GeForce RTX 3080 Ti Laptop GPU | MSI GE76 Raider Intel Core i9-12900HK, NVIDIA GeForce RTX 3080 Ti Laptop GPU | Alienware x17 RTX 3080 P48E Intel Core i7-11800H, NVIDIA GeForce RTX 3080 Laptop GPU | Asus ROG Zephyrus S17 GX703HSD Intel Core i9-11900H, NVIDIA GeForce RTX 3080 Laptop GPU | |
|---|---|---|---|---|---|---|
| Heat | 9% | 2% | 7% | -1% | -4% | |
| Maximum Upper Side * (°C) | 50.6 | 49 3% | 46 9% | 43 15% | 58.4 -15% | 59 -17% |
| Maximum Bottom * (°C) | 59.6 | 57 4% | 46.8 21% | 47 21% | 49 18% | 53 11% |
| Idle Upper Side * (°C) | 30 | 28 7% | 36.2 -21% | 33 -10% | 33.6 -12% | 35 -17% |
| Idle Bottom * (°C) | 37.4 | 30 20% | 38.6 -3% | 37 1% | 34.6 7% | 35 6% |
* ... smaller is better
压力测试
当运行Prime95对CPU施加压力时,时钟频率和核心温度将在最初几秒钟内提升到4 GHz和95 C,然后稳定在2.7至3 GHz范围内,以防止处理器变得更热。相比之下,Blade 17中的Core i7-12800H在类似的Prime95条件下,将分别以2.4至2.6 GHz和71 C的速度运行得更慢和更冷。因此,微星将其CPU推向更高的温度,以最大化处理器的性能。在测试开始时,GS77的CPU封装功率将高达122.7W,然后稳定在71W左右,这又高于我们在Razer上记录的61W。
运行时,GPU时钟、内存时钟和温度将分别稳定在1432 MHz、1750 MHz和75 C。 Witcher 3.在Blade 17上运行同样的测试将导致GPU时钟、内存时钟和温度分别为1597 MHz、2000 MHz和77 C。Razer的GPU性能更快,这主要是由于它的TGP目标比我们的MSI高得多(165 W对105 W)。事实上,在运行游戏时,GPU-Z会记录到104.5W的GPU板功耗。
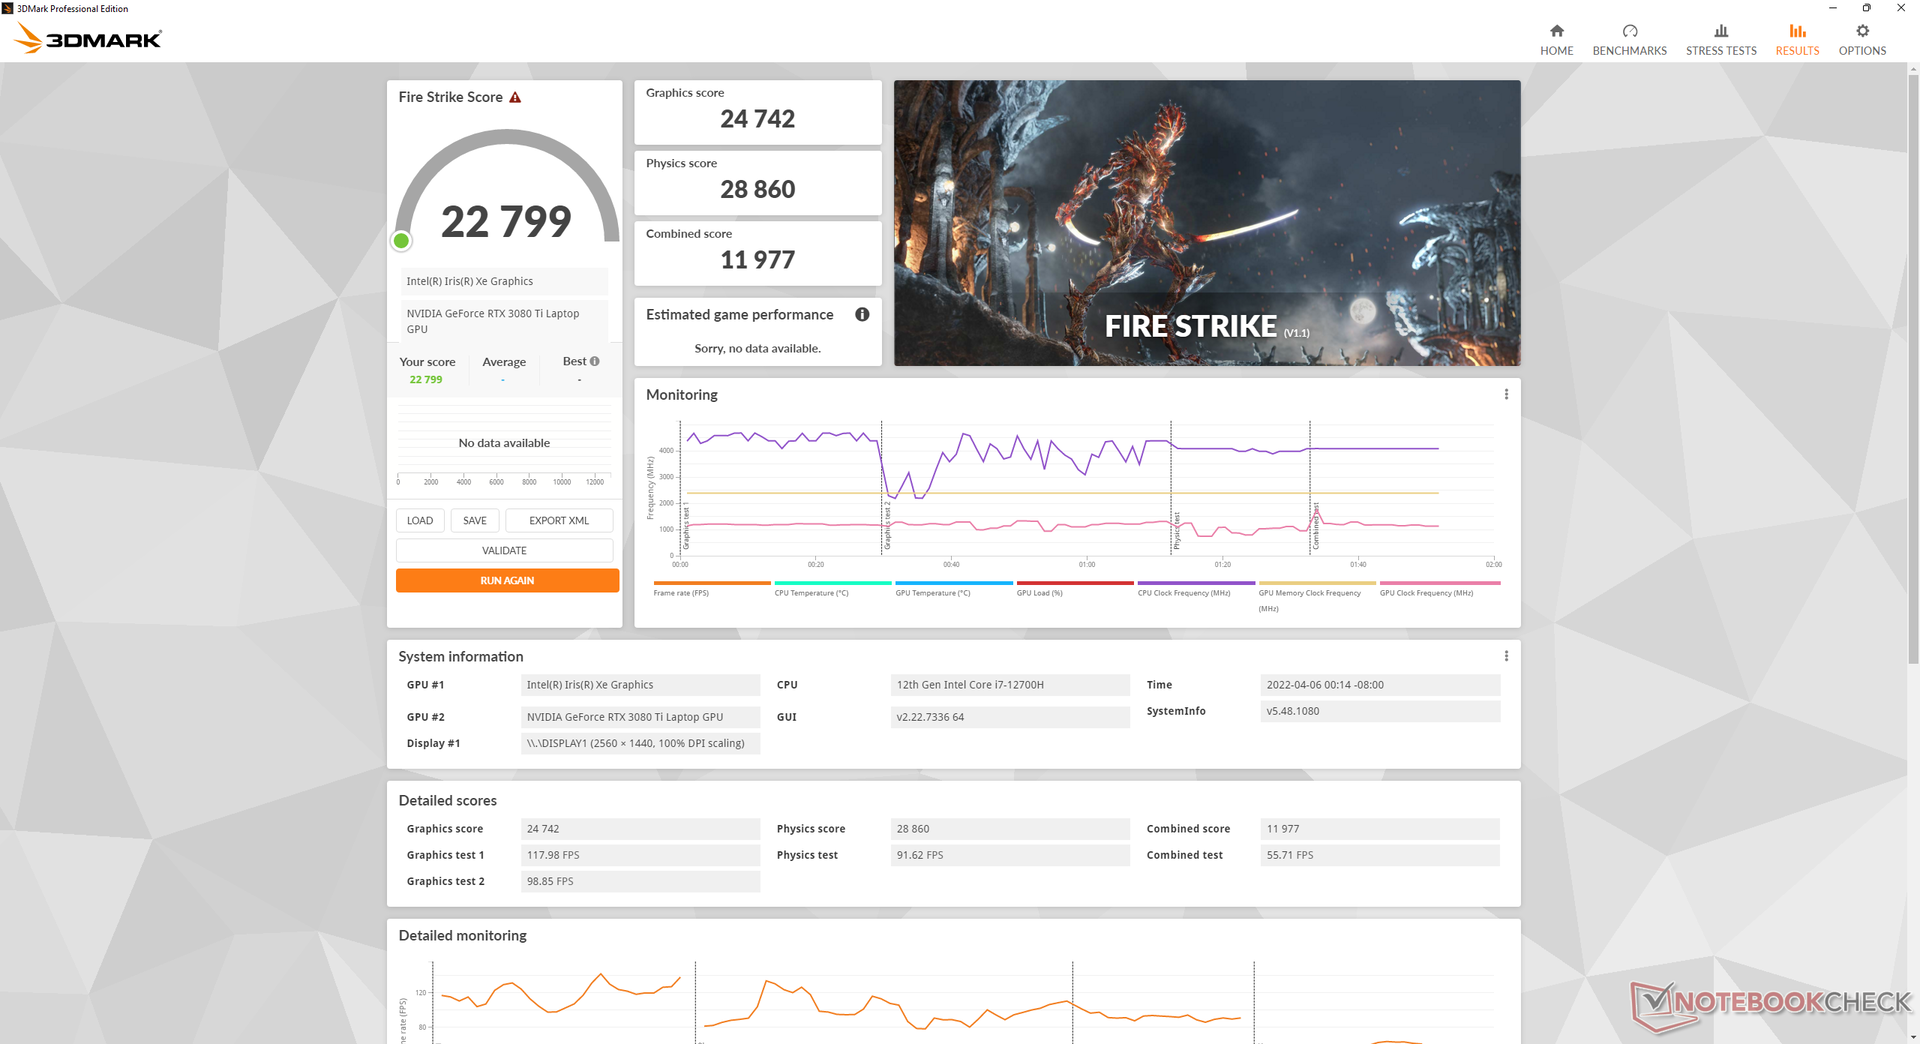
使用电池电源运行限制了性能。在电池上进行的Fire Strike 测试将分别返回物理和图形分数29675和28050分,而在主电源上则为14170和6220分。
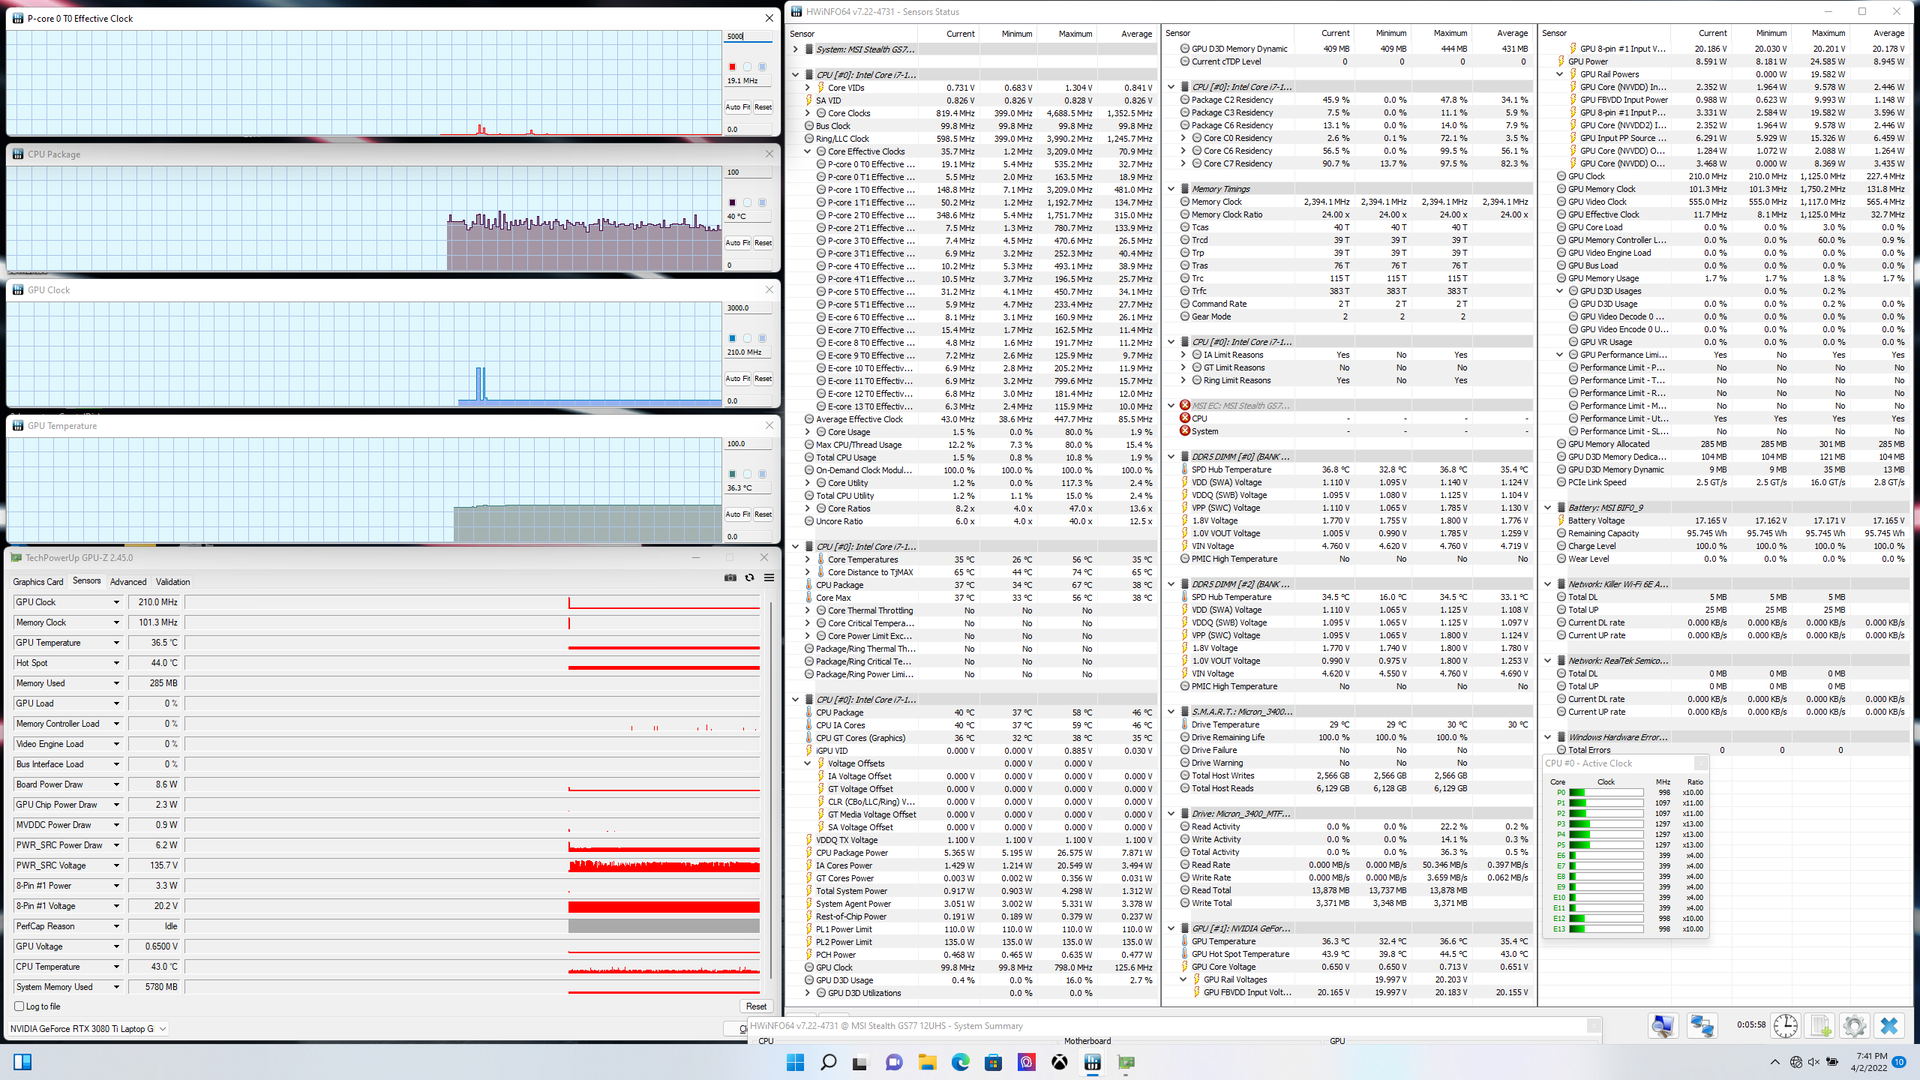
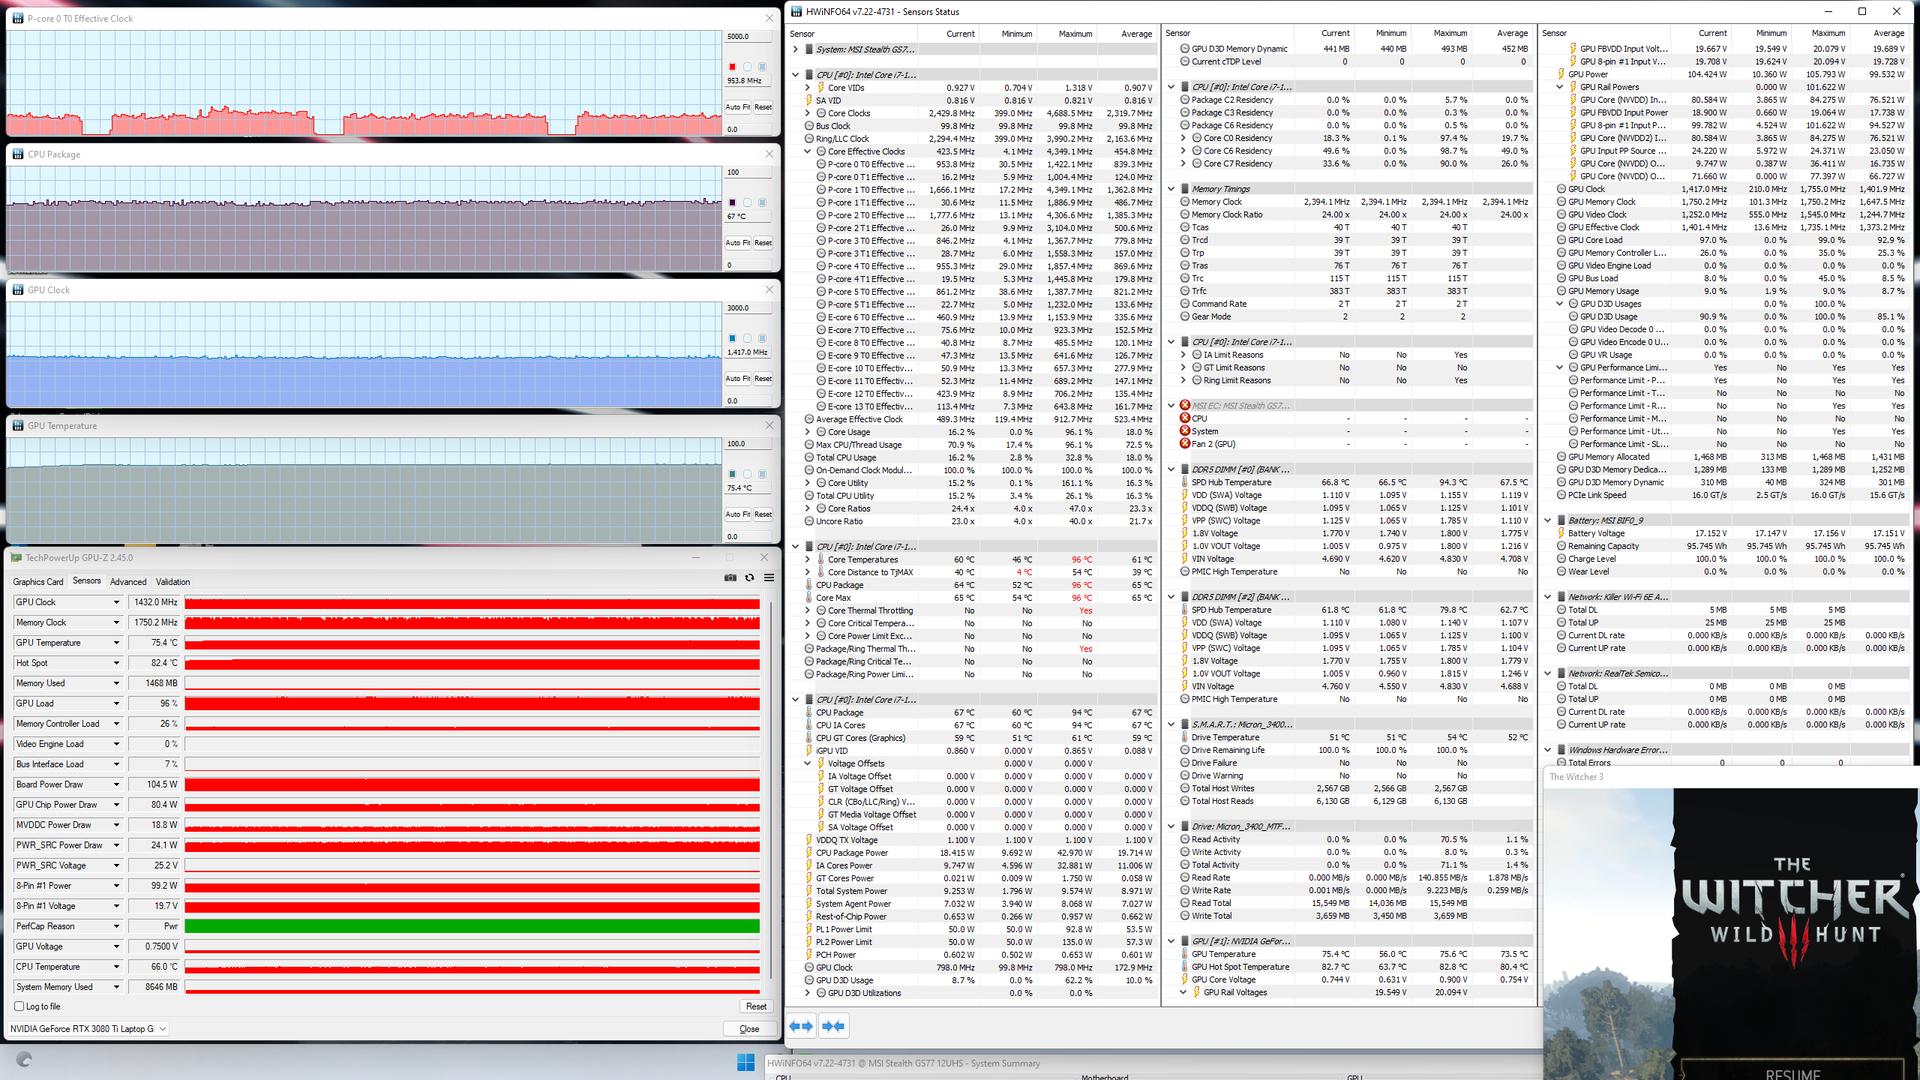
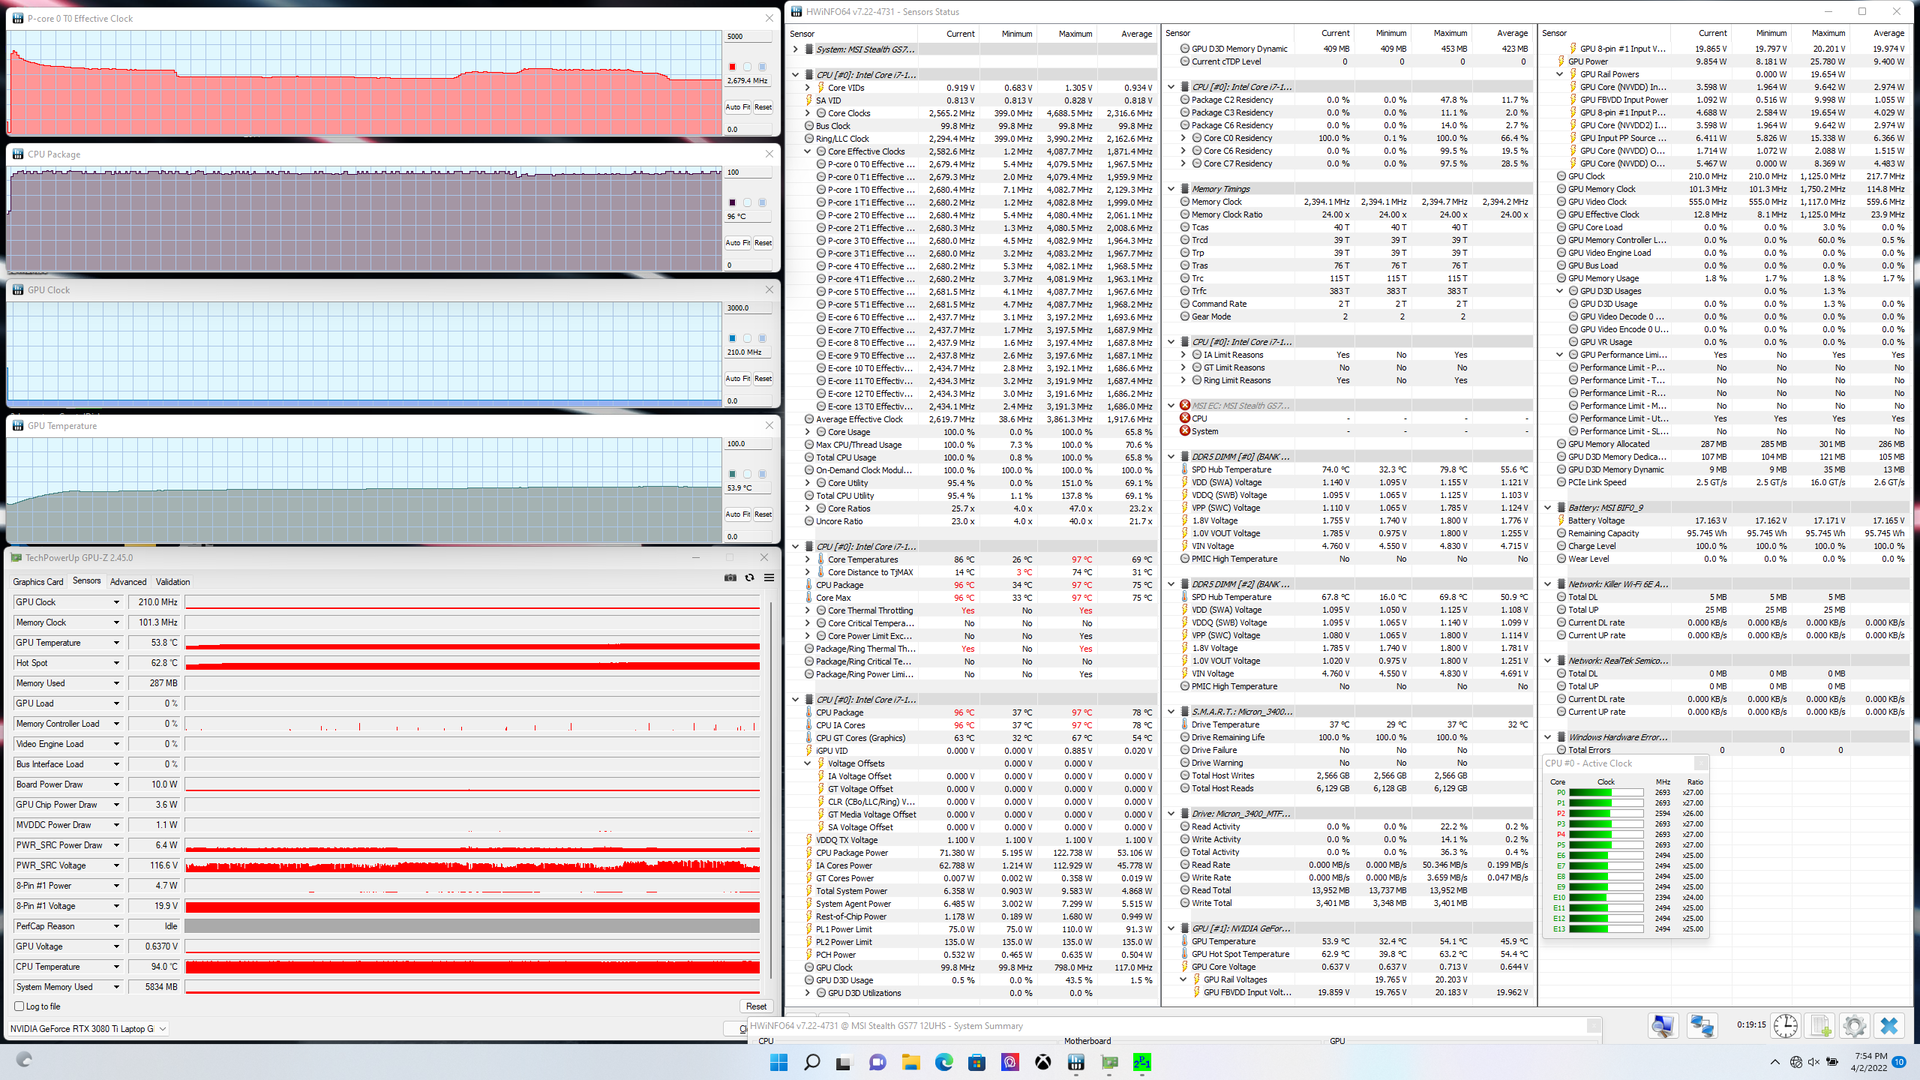
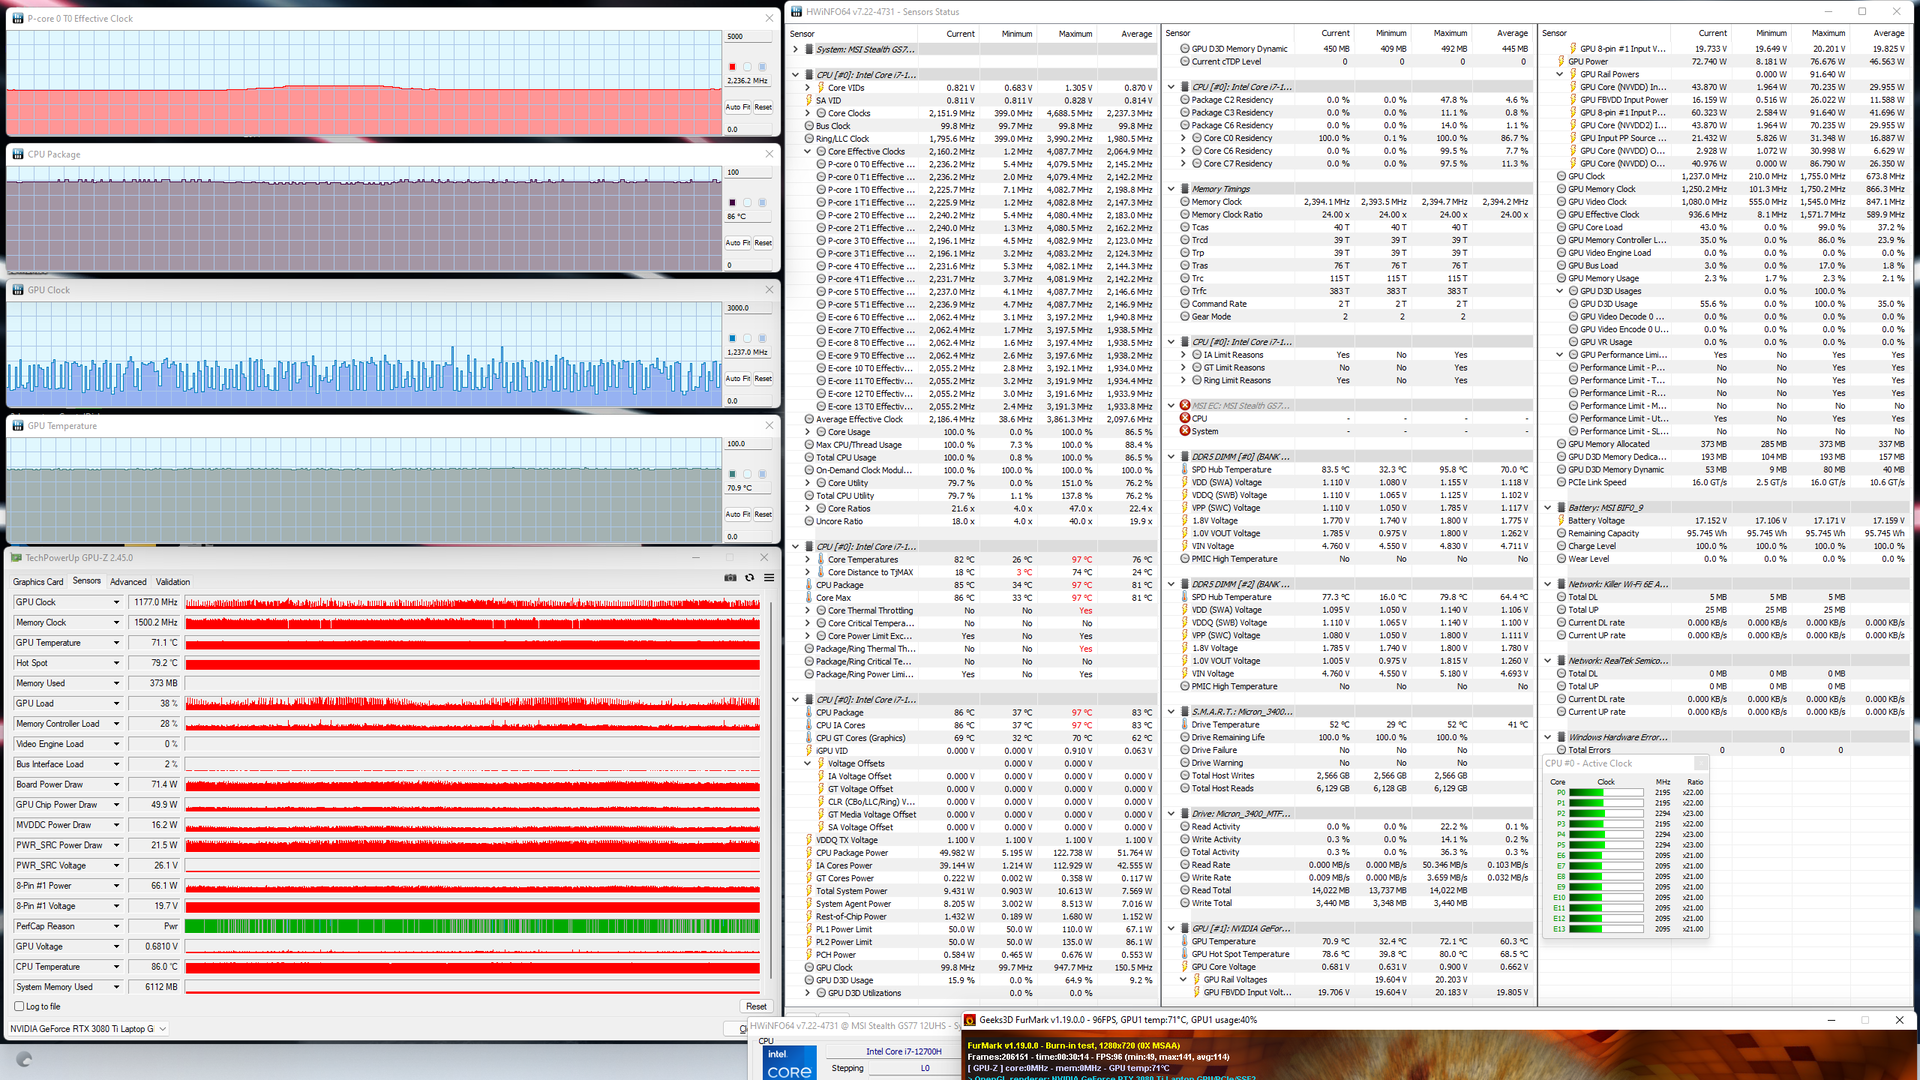
| CPU时钟(GHz) | GPU时钟(MHz) | CPU平均温度(℃) | GPU平均温度(℃) | |
| 系统空闲 | -- | -- | 40 | 37 |
| Prime95压力 | 2.7 - 3.0 | - | 96 | 54 |
| Prime95 + FurMark 压力 | 2.2 | 430 - 1237 | 86 | 71 |
| Witcher 3 应力 | ~1.0 | 1432 | 67 | 75 |
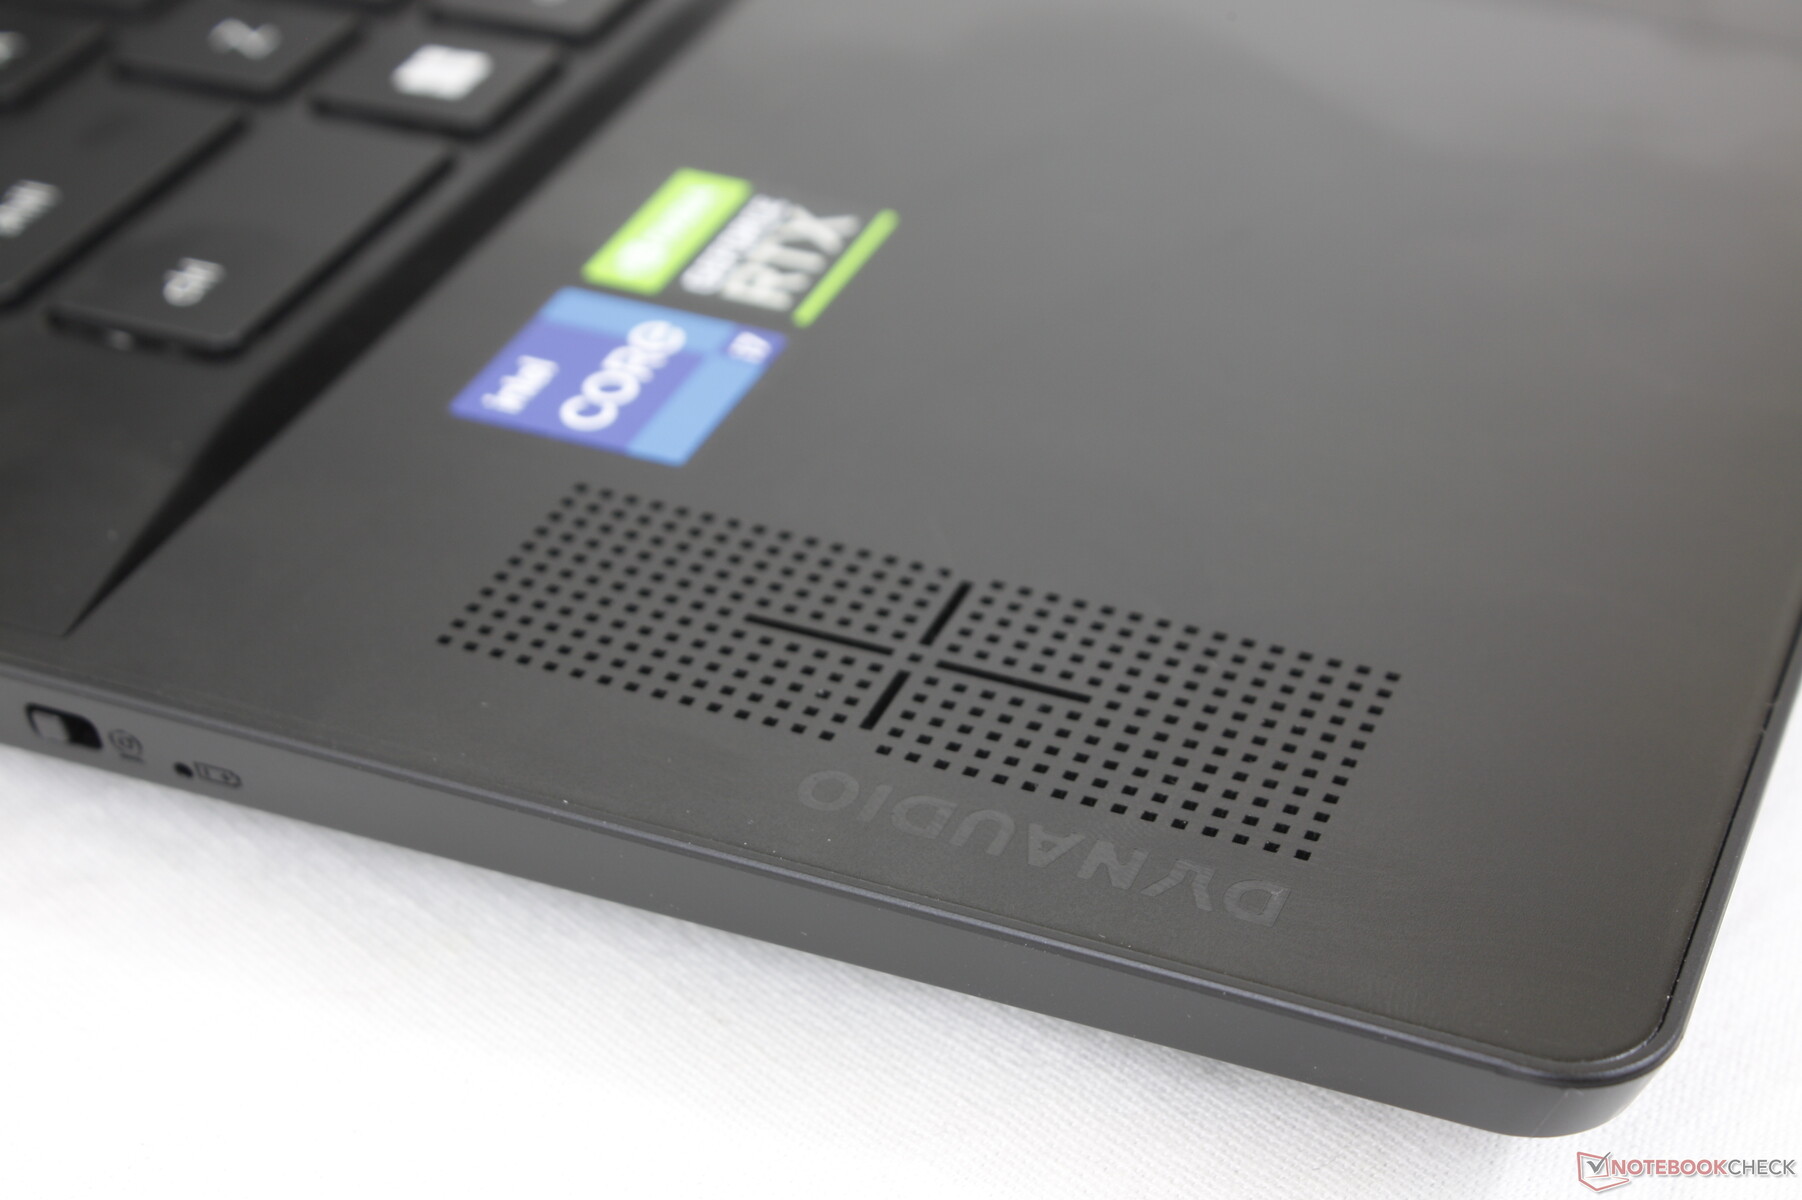
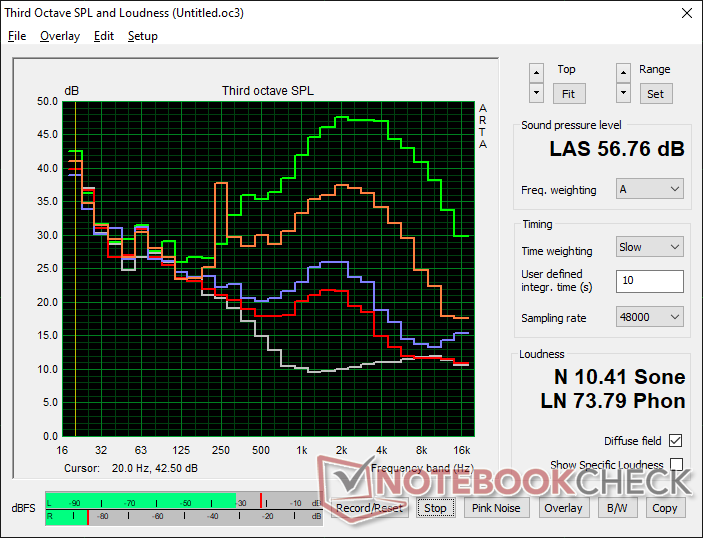
发言人
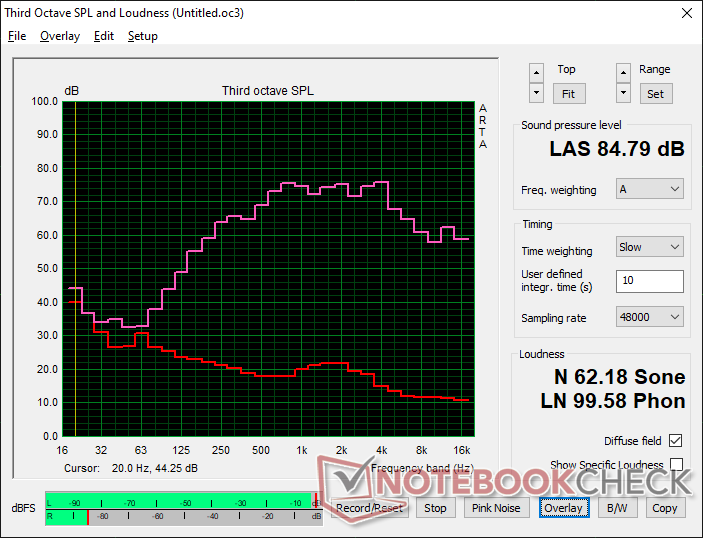
MSI Stealth GS77 12UHS-083US audio analysis
(+) | speakers can play relatively loud (84.8 dB)
Bass 100 - 315 Hz
(±) | reduced bass - on average 9.4% lower than median
(±) | linearity of bass is average (9.8% delta to prev. frequency)
Mids 400 - 2000 Hz
(±) | higher mids - on average 7% higher than median
(+) | mids are linear (4.9% delta to prev. frequency)
Highs 2 - 16 kHz
(±) | higher highs - on average 5.8% higher than median
(±) | linearity of highs is average (7.9% delta to prev. frequency)
Overall 100 - 16.000 Hz
(±) | linearity of overall sound is average (15.9% difference to median)
Compared to same class
» 38% of all tested devices in this class were better, 7% similar, 56% worse
» The best had a delta of 6%, average was 18%, worst was 132%
Compared to all devices tested
» 25% of all tested devices were better, 5% similar, 70% worse
» The best had a delta of 4%, average was 23%, worst was 134%
Apple MacBook Pro 16 2021 M1 Pro audio analysis
(+) | speakers can play relatively loud (84.7 dB)
Bass 100 - 315 Hz
(+) | good bass - only 3.8% away from median
(+) | bass is linear (5.2% delta to prev. frequency)
Mids 400 - 2000 Hz
(+) | balanced mids - only 1.3% away from median
(+) | mids are linear (2.1% delta to prev. frequency)
Highs 2 - 16 kHz
(+) | balanced highs - only 1.9% away from median
(+) | highs are linear (2.7% delta to prev. frequency)
Overall 100 - 16.000 Hz
(+) | overall sound is linear (4.6% difference to median)
Compared to same class
» 0% of all tested devices in this class were better, 0% similar, 100% worse
» The best had a delta of 5%, average was 17%, worst was 45%
Compared to all devices tested
» 0% of all tested devices were better, 0% similar, 100% worse
» The best had a delta of 4%, average was 23%, worst was 134%
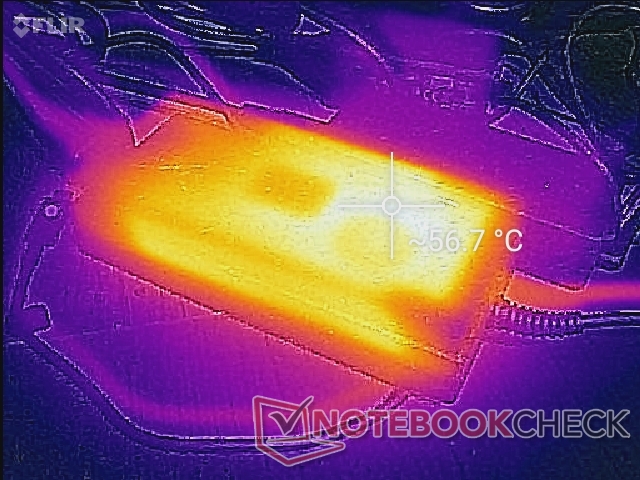
能源管理
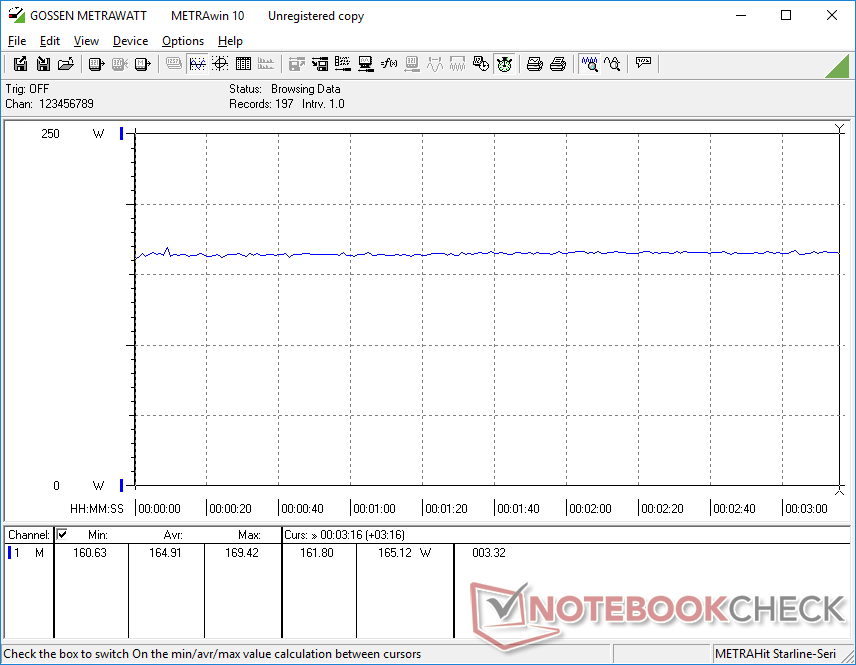
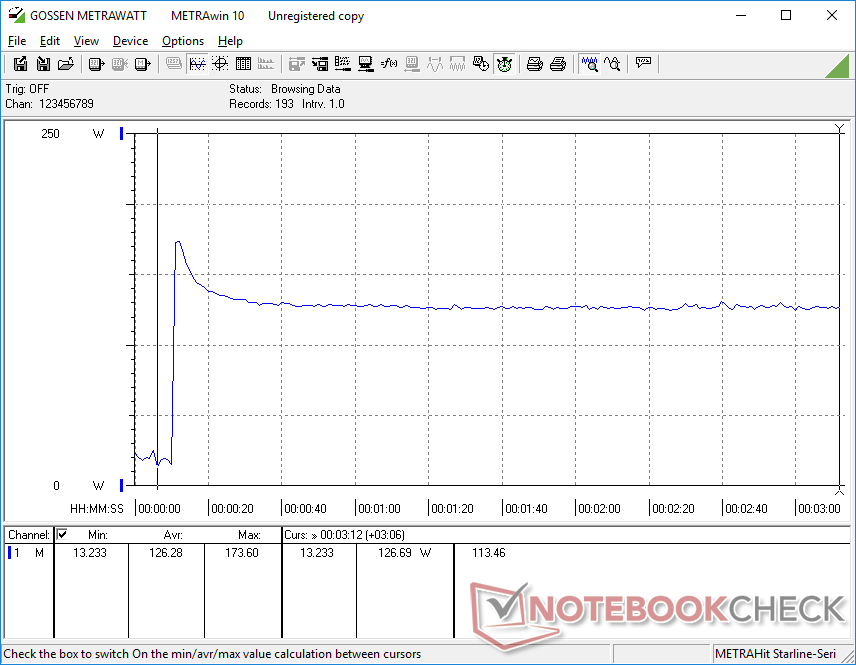
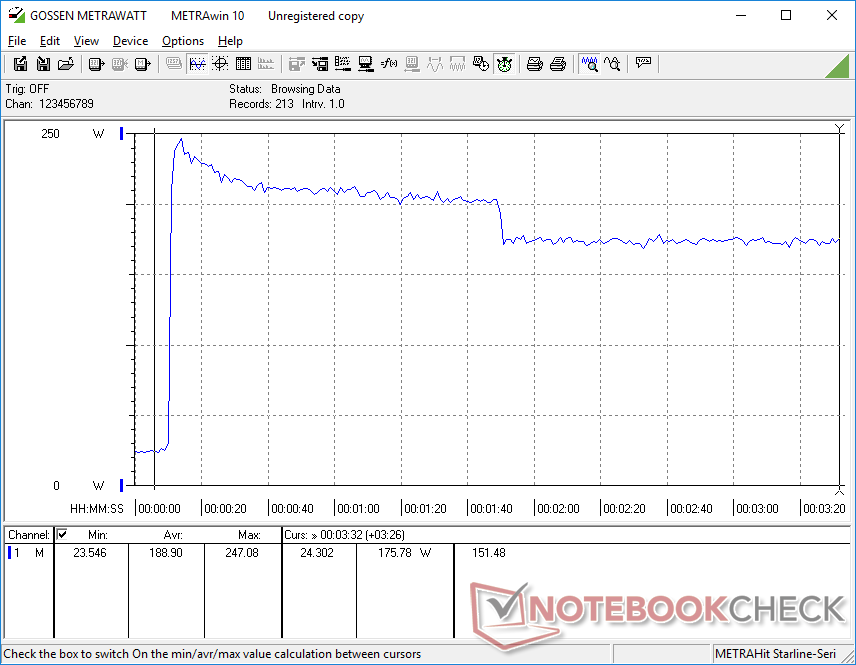
功耗--更耗电一些
尽管性能有所提升,但GS77的要求并不比去年的GS76高。运行 Witcher 3例如,与RTX 3080相比,上述12%至15%的图形性能提升只需要多用5%的电力。这种小的功耗差异可以归因于GS77的CPU和GPU的目标是与GS76的处理器相对类似的TDP和TGP水平。相比之下,2021年和2022年的Blade 17型号之间的TGP目标从100瓦大幅增加到165瓦,导致Blade 17与GS77相比功耗水平明显提高,如下表所示。
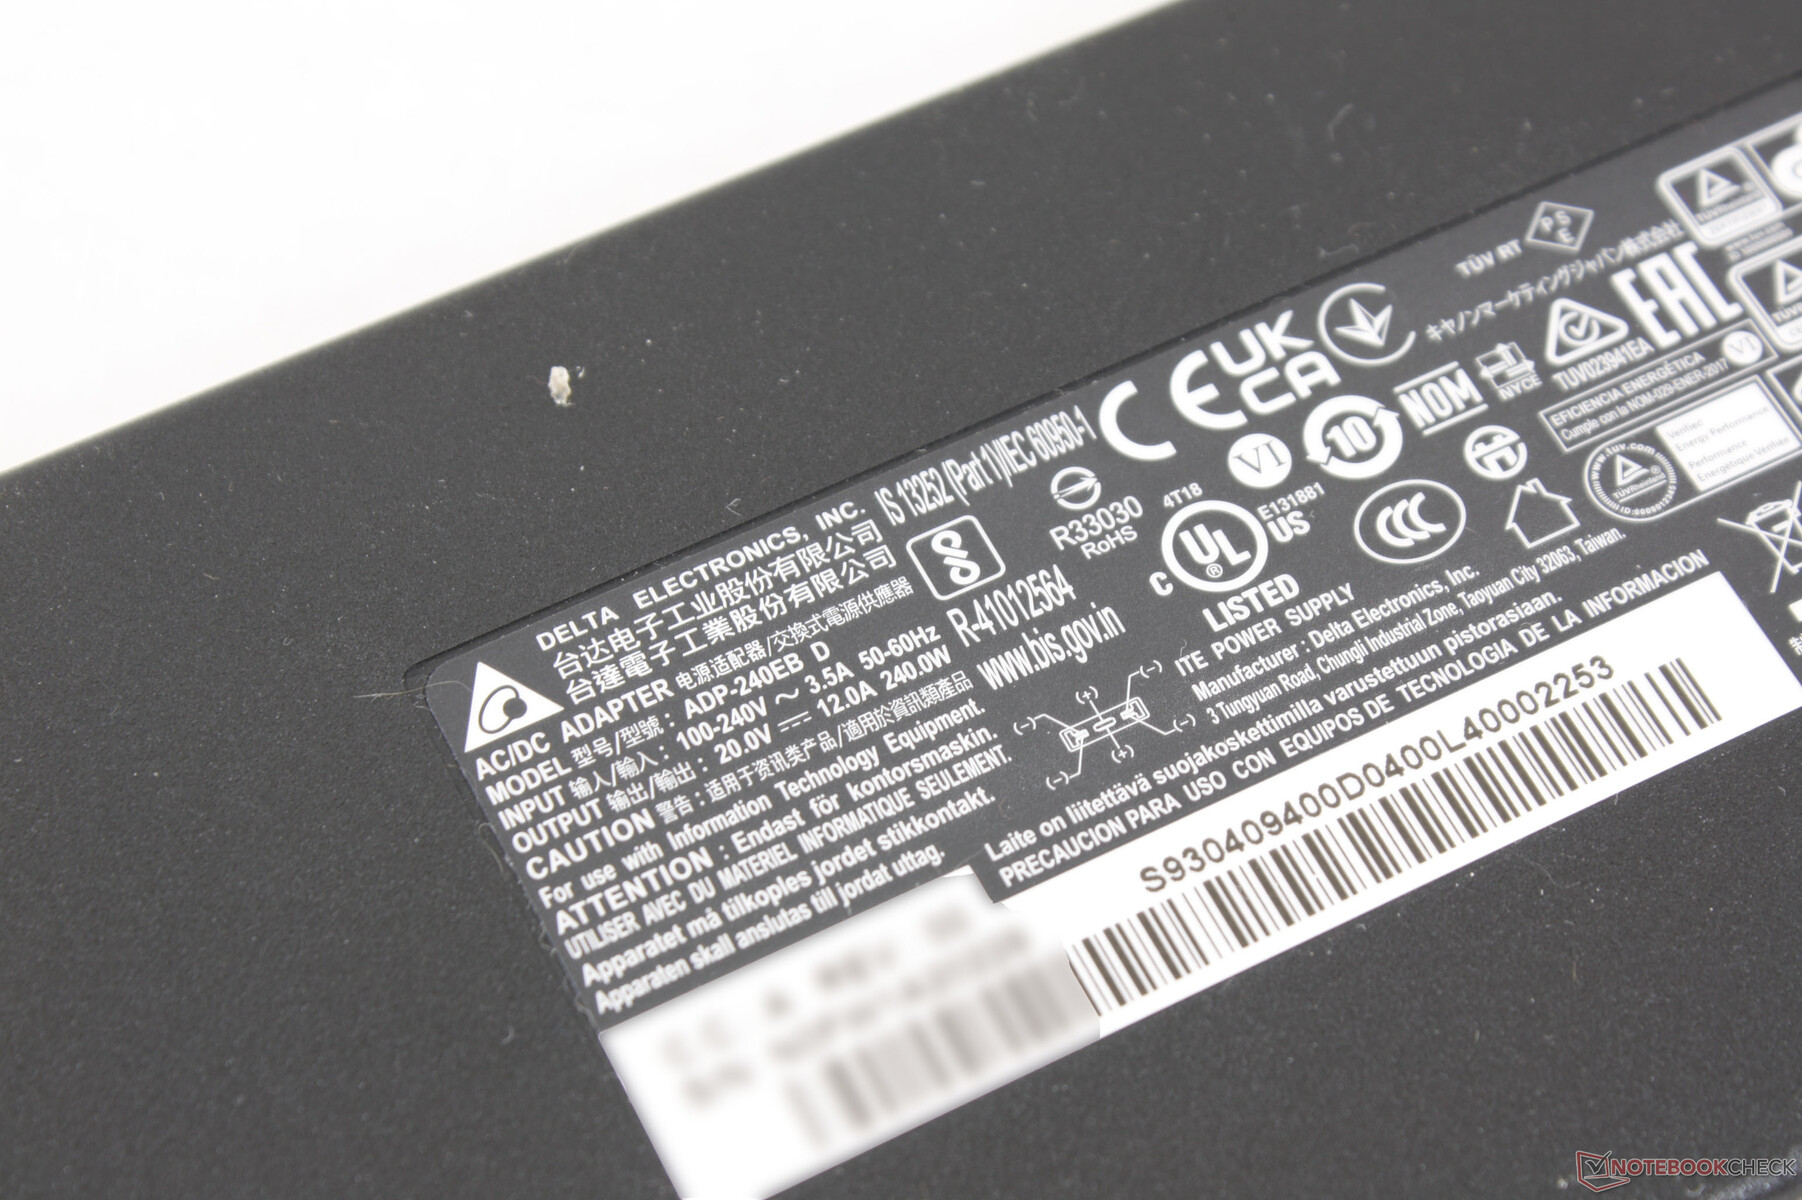
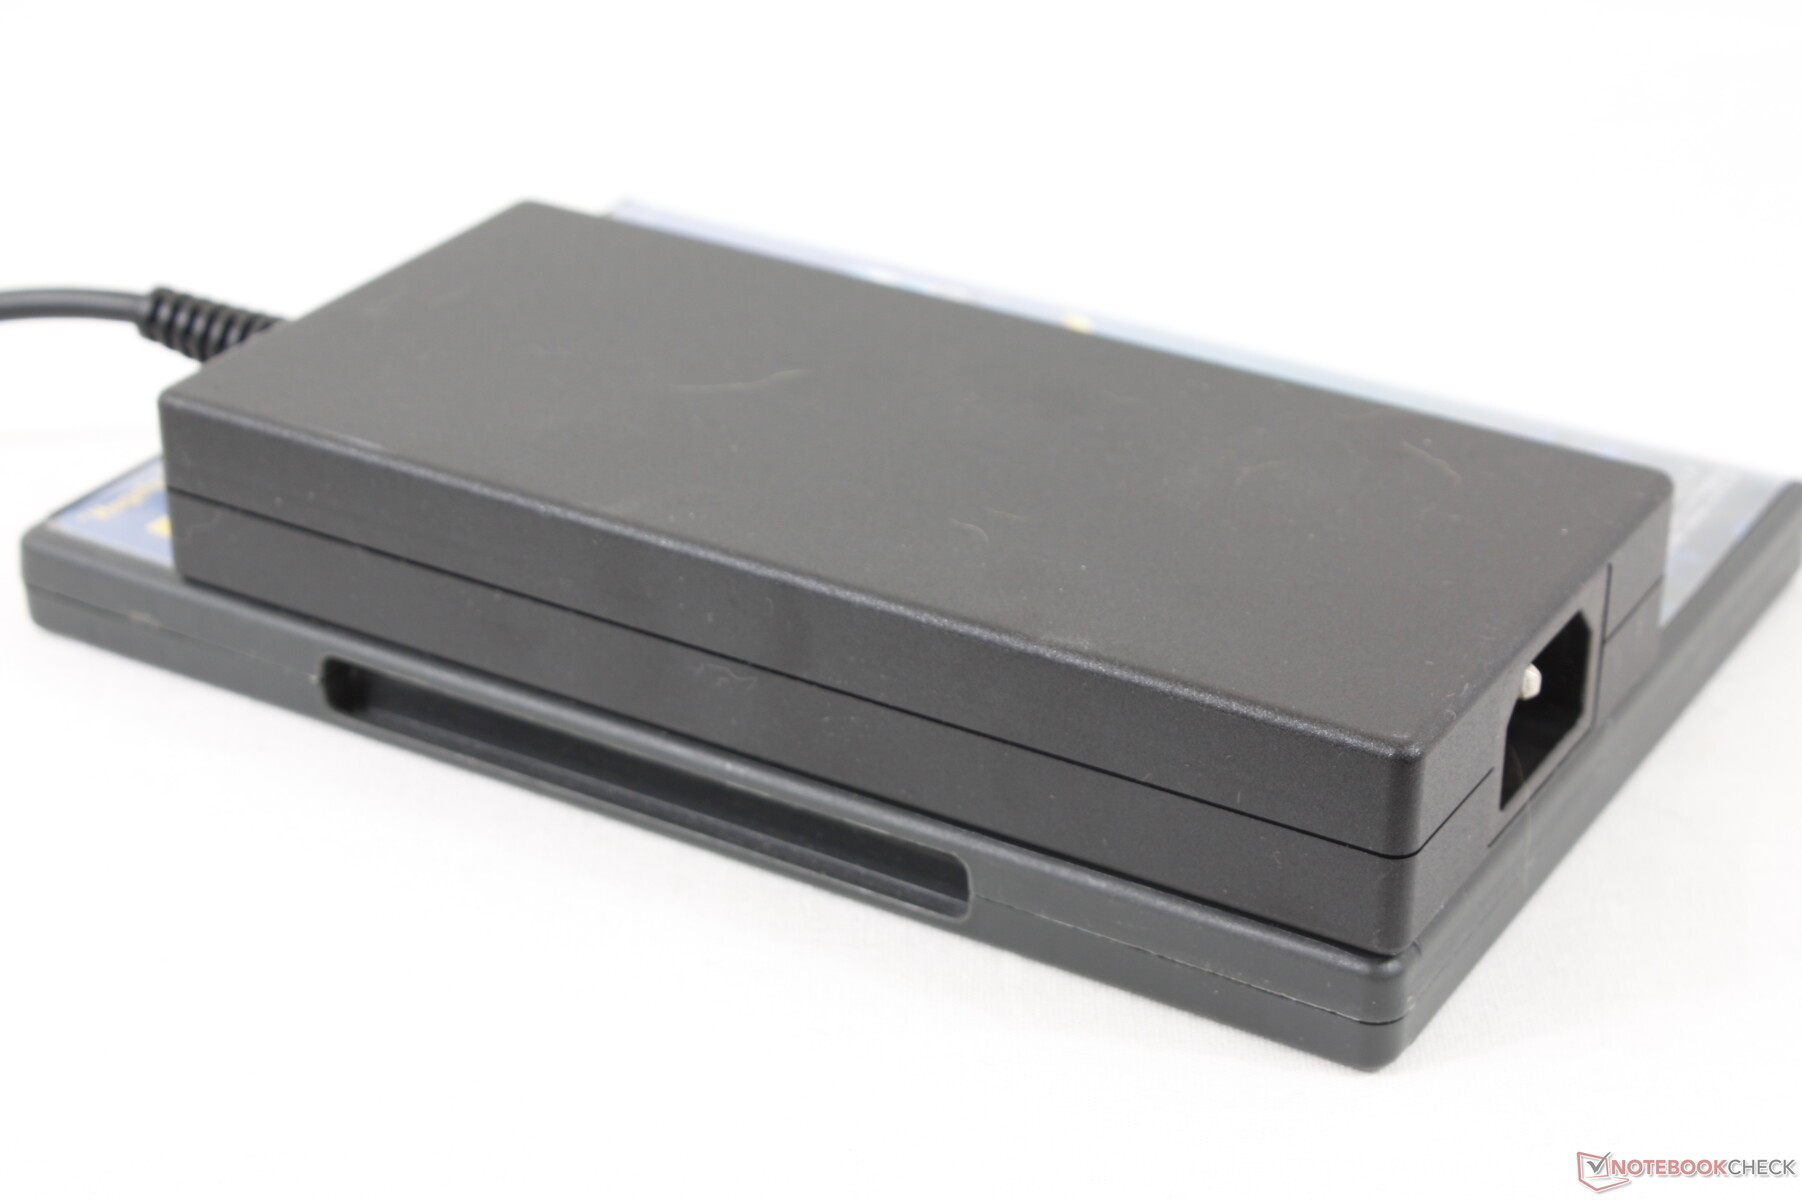
240瓦的交流适配器是标准配置,而Blade 17配备的是更高容量的280瓦适配器。人们可能会认为雷蛇的适配器更大,但微星的240瓦适配器实际上稍大一些(约16.4 x 7.5 x 2.5厘米,约16.4 x 7 x 2.5厘米)。
| Off / Standby | |
| Idle | |
| Load |
|
Key:
min: | |
| MSI Stealth GS77 12UHS-083US i7-12700H, GeForce RTX 3080 Ti Laptop GPU, Micron 3400 1TB MTFDKBA1T0TFH, IPS, 2560x1440, 17.3" | MSI GS76 Stealth 11UH i9-11900H, GeForce RTX 3080 Laptop GPU, Samsung PM9A1 MZVL22T0HBLB, IPS, 3840x2160, 17.3" | Razer Blade 17 RTX 3080 Ti i7-12800H, GeForce RTX 3080 Ti Laptop GPU, Samsung PM9A1 MZVL21T0HCLR, IPS, 2560x1440, 17.3" | MSI GE76 Raider i9-12900HK, GeForce RTX 3080 Ti Laptop GPU, Samsung PM9A1 MZVL22T0HBLB, IPS-Level, 1920x1080, 17.3" | Alienware x17 RTX 3080 P48E i7-11800H, GeForce RTX 3080 Laptop GPU, 2x WDC PC SN730 SDBPNTY-1T00 (RAID 0), IPS, 3840x2160, 17.3" | Asus ROG Zephyrus S17 GX703HSD i9-11900H, GeForce RTX 3080 Laptop GPU, Samsung PM9A1 MZVL22T0HBLB, IPS, 2560x1440, 17.3" | |
|---|---|---|---|---|---|---|
| Power Consumption | 7% | -57% | -4% | -17% | -11% | |
| Idle Minimum * (Watt) | 20 | 14 30% | 29.8 -49% | 12 40% | 10.2 49% | 21.7 -9% |
| Idle Average * (Watt) | 21.4 | 19 11% | 37.1 -73% | 17 21% | 21.2 1% | 27 -26% |
| Idle Maximum * (Watt) | 27 | 31 -15% | 60.8 -125% | 28 -4% | 48.4 -79% | 33 -22% |
| Load Average * (Watt) | 100.5 | 97 3% | 135.3 -35% | 118 -17% | 118.7 -18% | 108 -7% |
| Witcher 3 ultra * (Watt) | 165 | 156 5% | 243 -47% | 252 -53% | 249 -51% | 195 -18% |
| Load Maximum * (Watt) | 247.1 | 231 7% | 273.1 -11% | 272 -10% | 262 -6% | 210 15% |
* ... smaller is better
Power Consumption Witcher 3 / Stresstest
Power Consumption external Monitor
电池寿命--99瓦特的救援
运行时间与我们在去年的GS76上记录的时间几乎相同,比我们在新的Blade 17上记录的时间略长。最新的GS机型因其99瓦的大电池而引人注目,而大多数其他游戏笔记本的电池容量为90瓦或更少。
从空电到满电需要近2.5个小时,我们比大多数其他笔记本电脑多了1个小时。该系统还可以通过其单一的雷电4端口通过USB-C进行充电。
| MSI Stealth GS77 12UHS-083US i7-12700H, GeForce RTX 3080 Ti Laptop GPU, 99 Wh | MSI GS76 Stealth 11UH i9-11900H, GeForce RTX 3080 Laptop GPU, 99.9 Wh | Razer Blade 17 RTX 3080 Ti i7-12800H, GeForce RTX 3080 Ti Laptop GPU, 82 Wh | MSI GE76 Raider i9-12900HK, GeForce RTX 3080 Ti Laptop GPU, 99.99 Wh | Alienware x17 RTX 3080 P48E i7-11800H, GeForce RTX 3080 Laptop GPU, 87 Wh | Asus ROG Zephyrus S17 GX703HSD i9-11900H, GeForce RTX 3080 Laptop GPU, 90 Wh | |
|---|---|---|---|---|---|---|
| Battery runtime | -4% | -19% | -18% | -28% | 57% | |
| Reader / Idle (h) | 10.8 | 9.9 -8% | 8 -26% | 7 -35% | ||
| WiFi v1.3 (h) | 6.2 | 6.4 3% | 5.5 -11% | 5.1 -18% | 5.9 -5% | 7.5 21% |
| Load (h) | 1.4 | 1.3 -7% | 1.1 -21% | 0.8 -43% | 2.7 93% | |
| H.264 (h) | 7.2 | |||||
| Witcher 3 ultra (h) | 1 |
Pros
Cons
结论 - 比GS76好...多数情况下

GS77比GS76前进了几步,又后退了几步。改进之处很多,包括更强硬的骨架、更高分辨率的网络摄像头、更大的点击板、更容易维修、相对类似的电池运行时间、更新的显示选项,以及在与以前差不多的TDP和TGP水平上更高的性能。即使与其他采用酷睿i7或酷睿i9处理器的笔记本电脑相比,CPU性能也比预期的要好。较新的机型感觉比即将淘汰的机型更有质感,给人的印象也更高。
另一方面,GS77在一些关键方面有所退步。特别是机箱尺寸和重量明显比GS76大和重,这意味着GS77不像它的前辈那样适合旅行。240赫兹的QHD面板也不像GS76的4K面板那样明亮,而SD读卡器现在慢了两倍多。这次铰链的最大角度也更窄,移动自由度更低。
总的来说,尽管有一些不幸的挫折,但较新的型号对GS系列来说是一个普遍的进步。然而,105瓦的TGP GPU有些令人担忧,因为它可能表明未来的SKU也将被锁定在~100瓦的GPU上,而蒸汽室冷却的Blade 17可以利用更高功率的165瓦版本。微星错过了为GS77增加额外的理想功能的机会,包括MUX开关、工厂校准的显示器或内部G-Sync支持,所有这些都可以在更小的 Razer Blade 17.
MSI Stealth GS77 12UHS-083US
- 04/07/2022 v7 (old)
Allen Ngo
Price comparison

