宏碁掠夺者Triton 500 SE回顾。配备RTX 3080 Ti和Alder Lake的超薄游戏笔记本
宏碁将掠夺者Triton 500 SE宣传为 "超薄游戏笔记本电脑"。如果从相对尺寸来看,当然也有笔记本明显更厚。但是,宏碁Predator Triton 500 SE的尺寸约为20毫米(约0.8英寸),从绝对尺寸来看,并不是非常薄。但是,你是否希望看到更薄的尺寸是另一个问题,因为宏碁仍然必须以某种方式冷却16英寸16:10格式的所有电源组件,这种格式正变得越来越流行。除了45瓦的 英特尔酷睿i7-12700H处理器外,我们的测试设备还配备了一个 NvidiaGeForce 3080 Ti.
这种组合保证了游戏的最高质量。但我们的详细审查将找出它是否也导致了一个好的笔记本电脑。
潜在的竞争对手比较
Rating | Date | Model | Weight | Height | Size | Resolution | Price |
|---|---|---|---|---|---|---|---|
| 87.2 % v7 (old) | 06 / 2022 | Acer Predator Triton 500 SE PT516-52s-70KX i7-12700H, GeForce RTX 3080 Ti Laptop GPU | 2.3 kg | 19.9 mm | 16.00" | 2560x1600 | |
| 91.2 % v7 (old) | 03 / 2022 | Razer Blade 17 RTX 3080 Ti i7-12800H, GeForce RTX 3080 Ti Laptop GPU | 2.7 kg | 19.9 mm | 17.30" | 2560x1440 | |
| 88 % v7 (old) | 03 / 2022 | Lenovo Legion 5 Pro 16 G7 i7 RTX 3070Ti i7-12700H, GeForce RTX 3070 Ti Laptop GPU | 2.6 kg | 26.6 mm | 16.00" | 2560x1600 | |
| 87.5 % v7 (old) | 01 / 2022 | MSI GE76 Raider i9-12900HK, GeForce RTX 3080 Ti Laptop GPU | 3 kg | 26 mm | 17.30" | 1920x1080 |
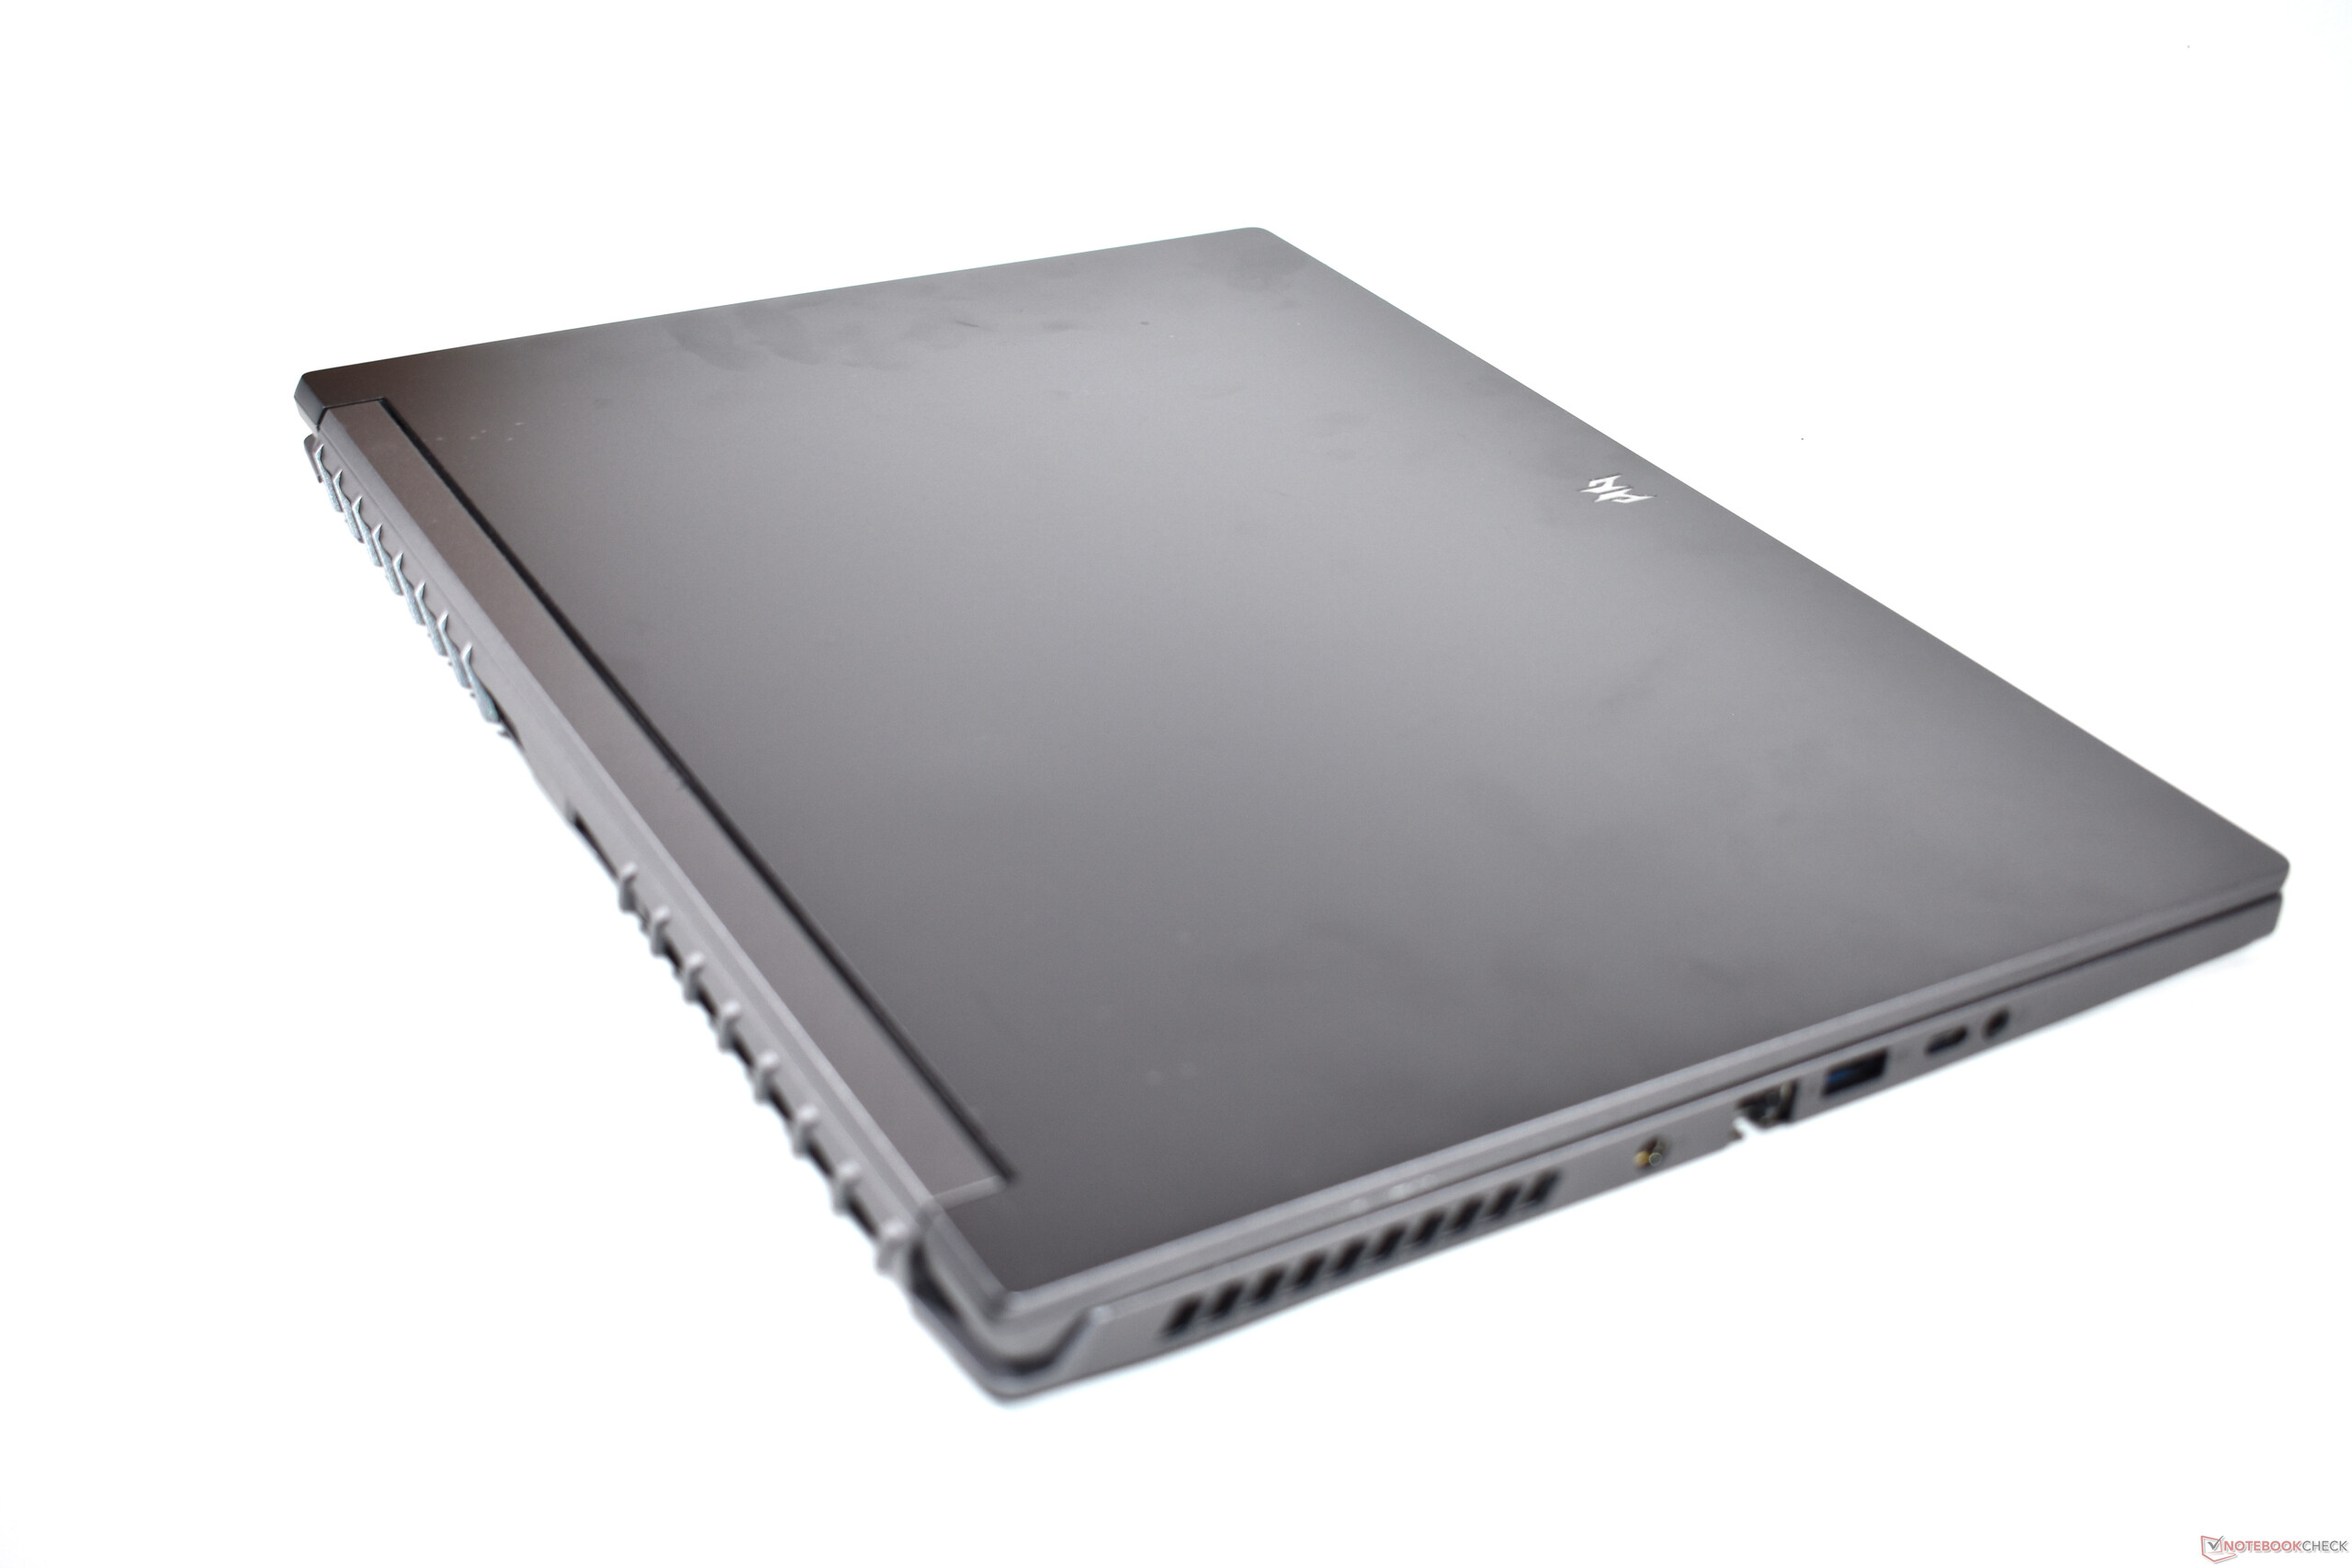
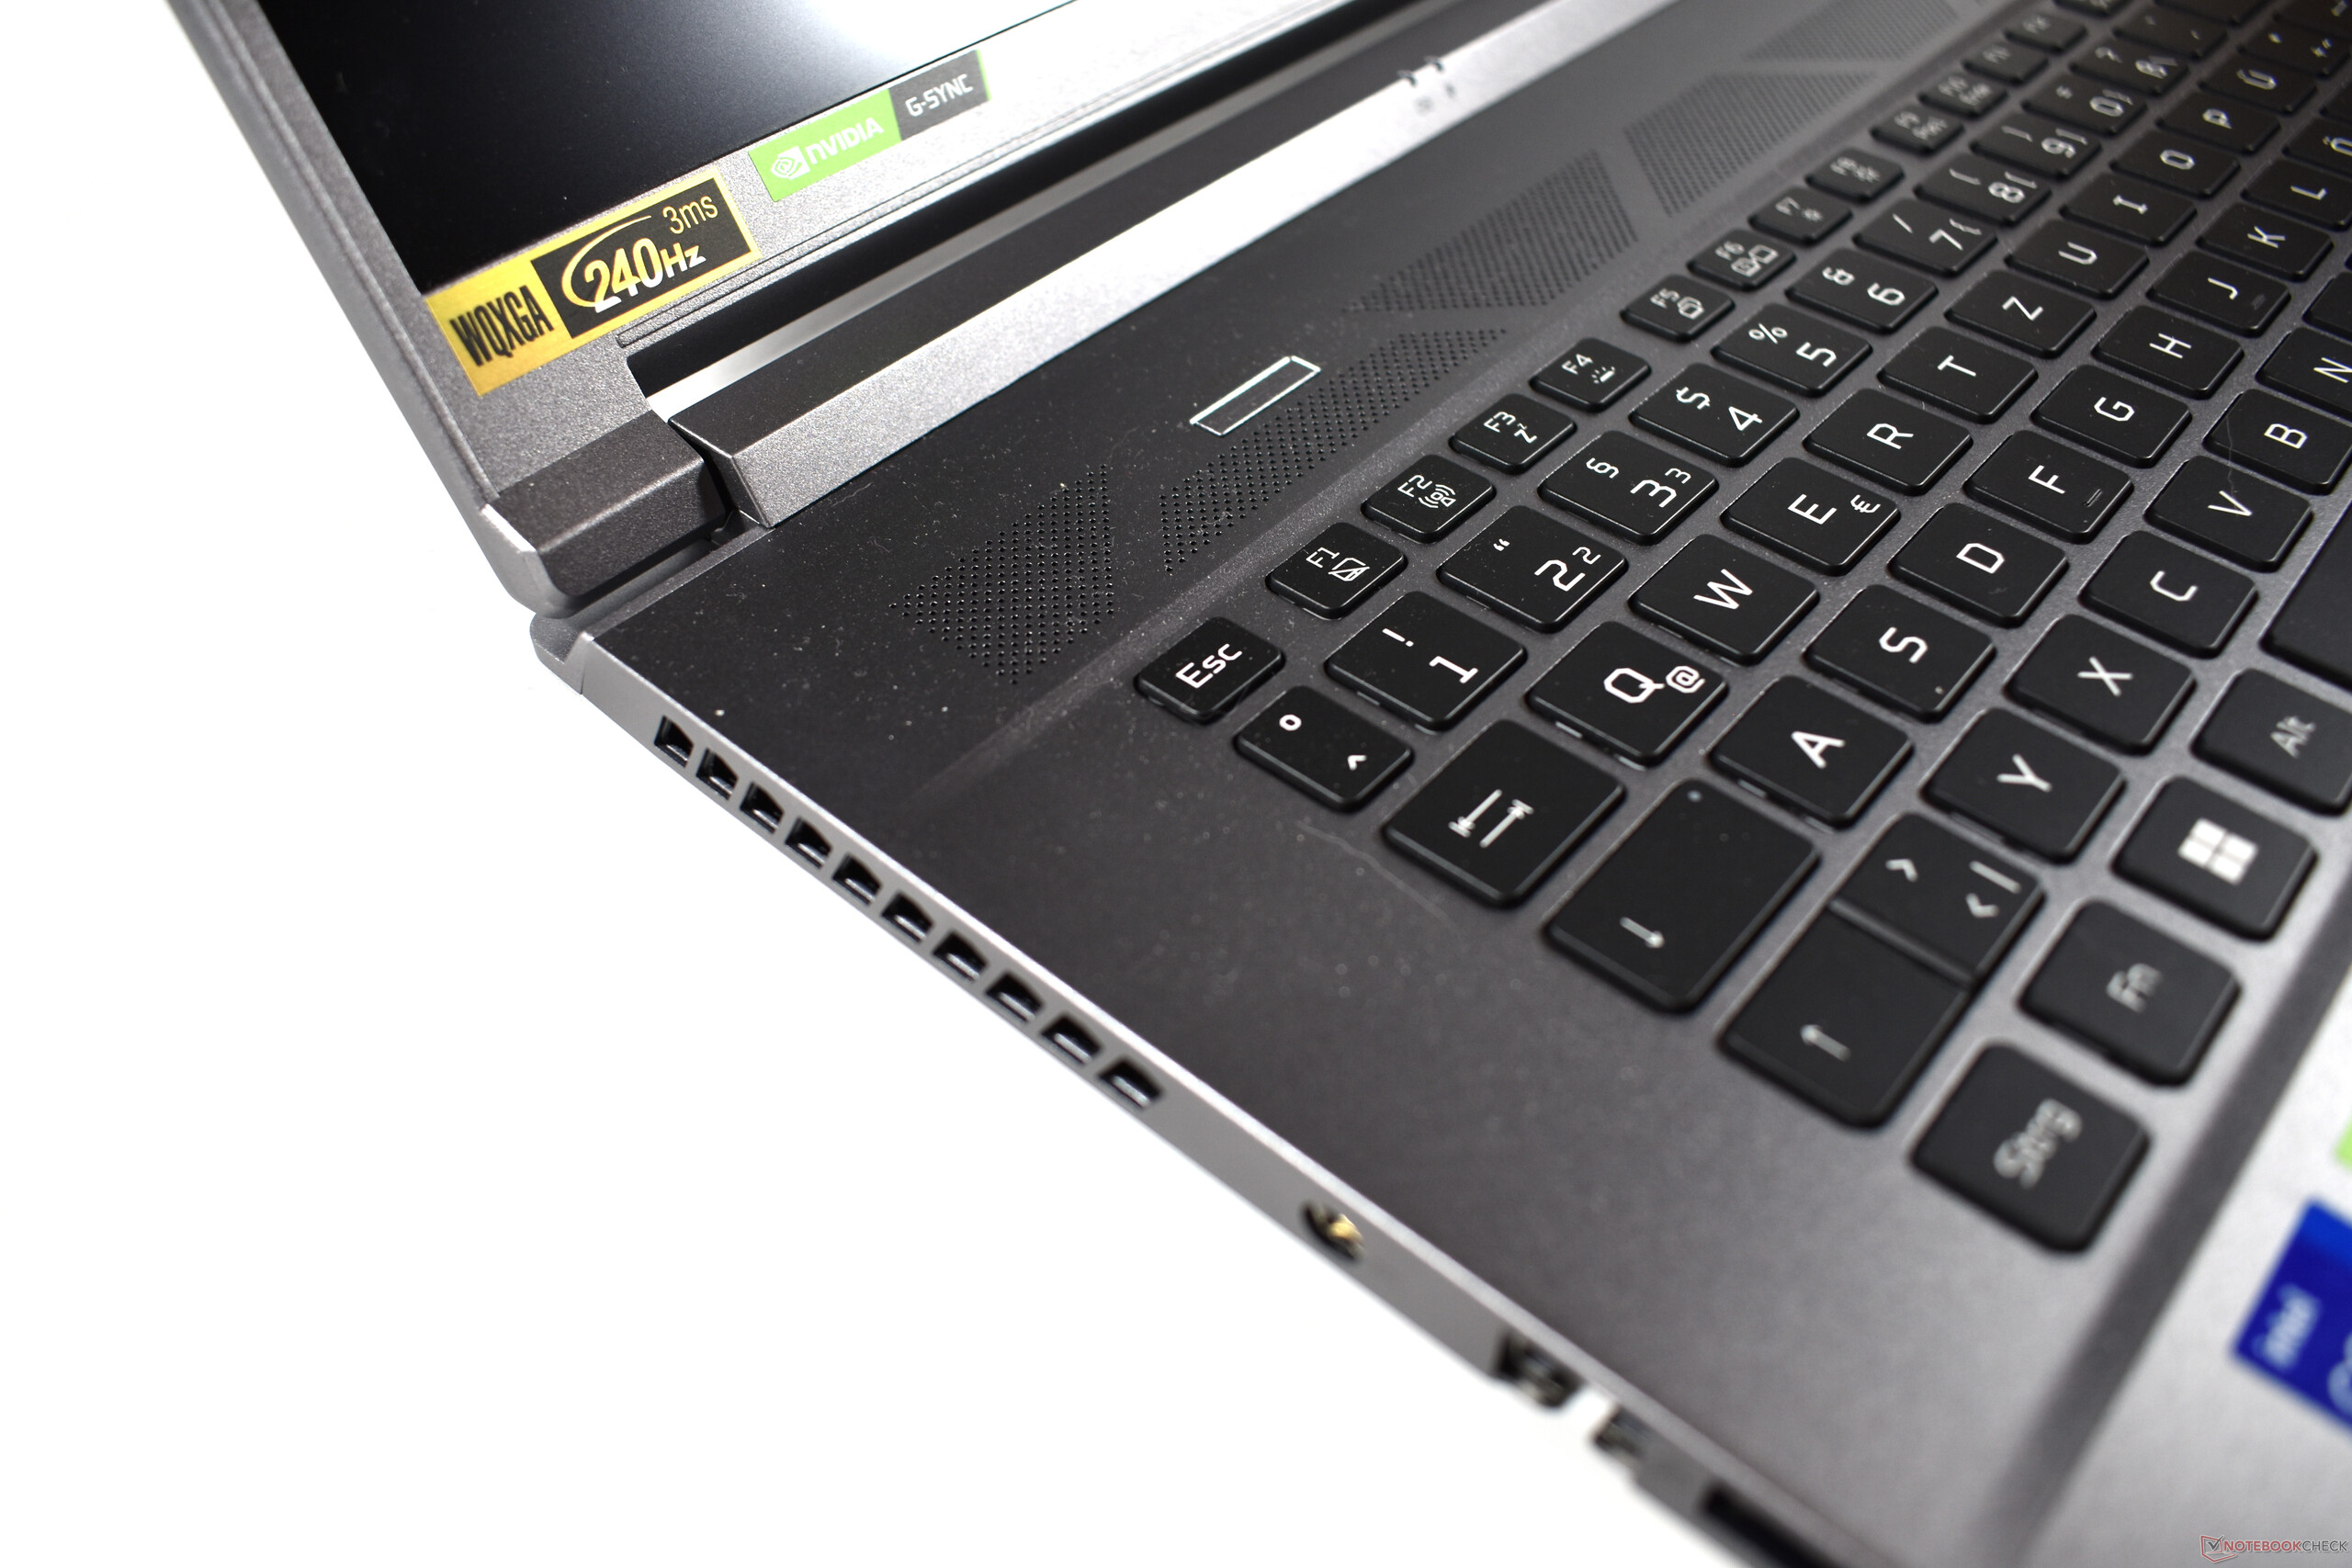
外壳。宏碁笔记本电脑采用铝制外壳设计,有大量的灰色
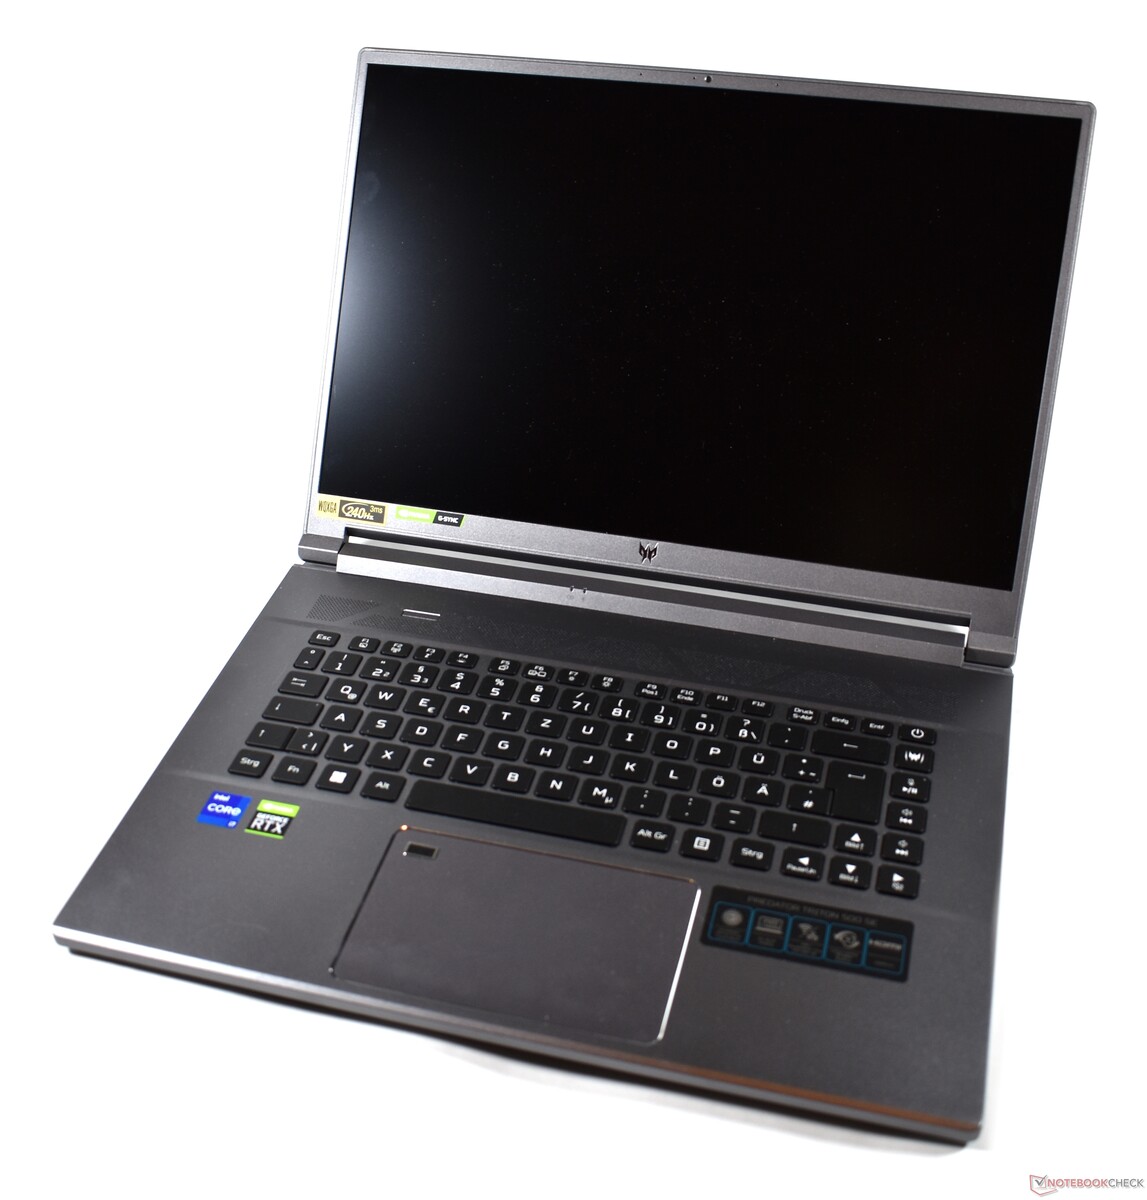
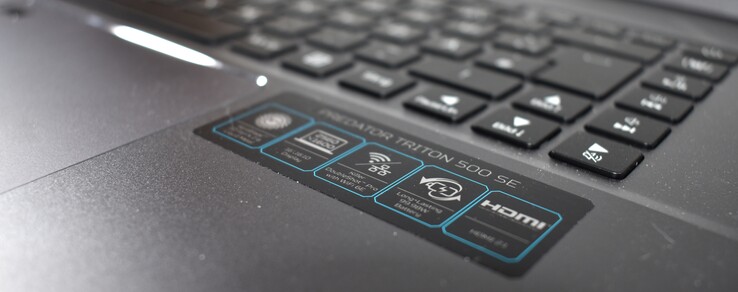
宏碁掠夺者Triton 500 SE的设计对于游戏笔记本来说相当低调,深灰色外壳的外观并没有透露出太多目的。唯一指向游戏的东西是显示屏盖和边框上的捕食者标志,而默认为蓝色的键盘照明也可能吸引一些人的注意。在游戏专用的设计细节方面,还有键盘上方左侧的Turbo键和背面独特的风扇通风口,这些都是强大性能的明显标志。一个能提供一些人体工程学舒适度的设计特征是掌托的圆形前缘。
外壳几乎完全由铝制成。只有显示屏框架是由塑料制成的。这种材料的选择有助于提高机箱的坚固性。底座几乎不能被翘起,也不能被压入。唯一可以做到这一点的地方是键盘和触摸板之间的位置,然后只有当你使用很大的力量时才可以。所以你不必担心键盘的稳定性。不太坚固的是显示屏盖子,因为只用很少的力就已经可以使显示屏翘起来了。 但至少显示屏盖子的背面也有很好的触觉质量,就像机箱底部。
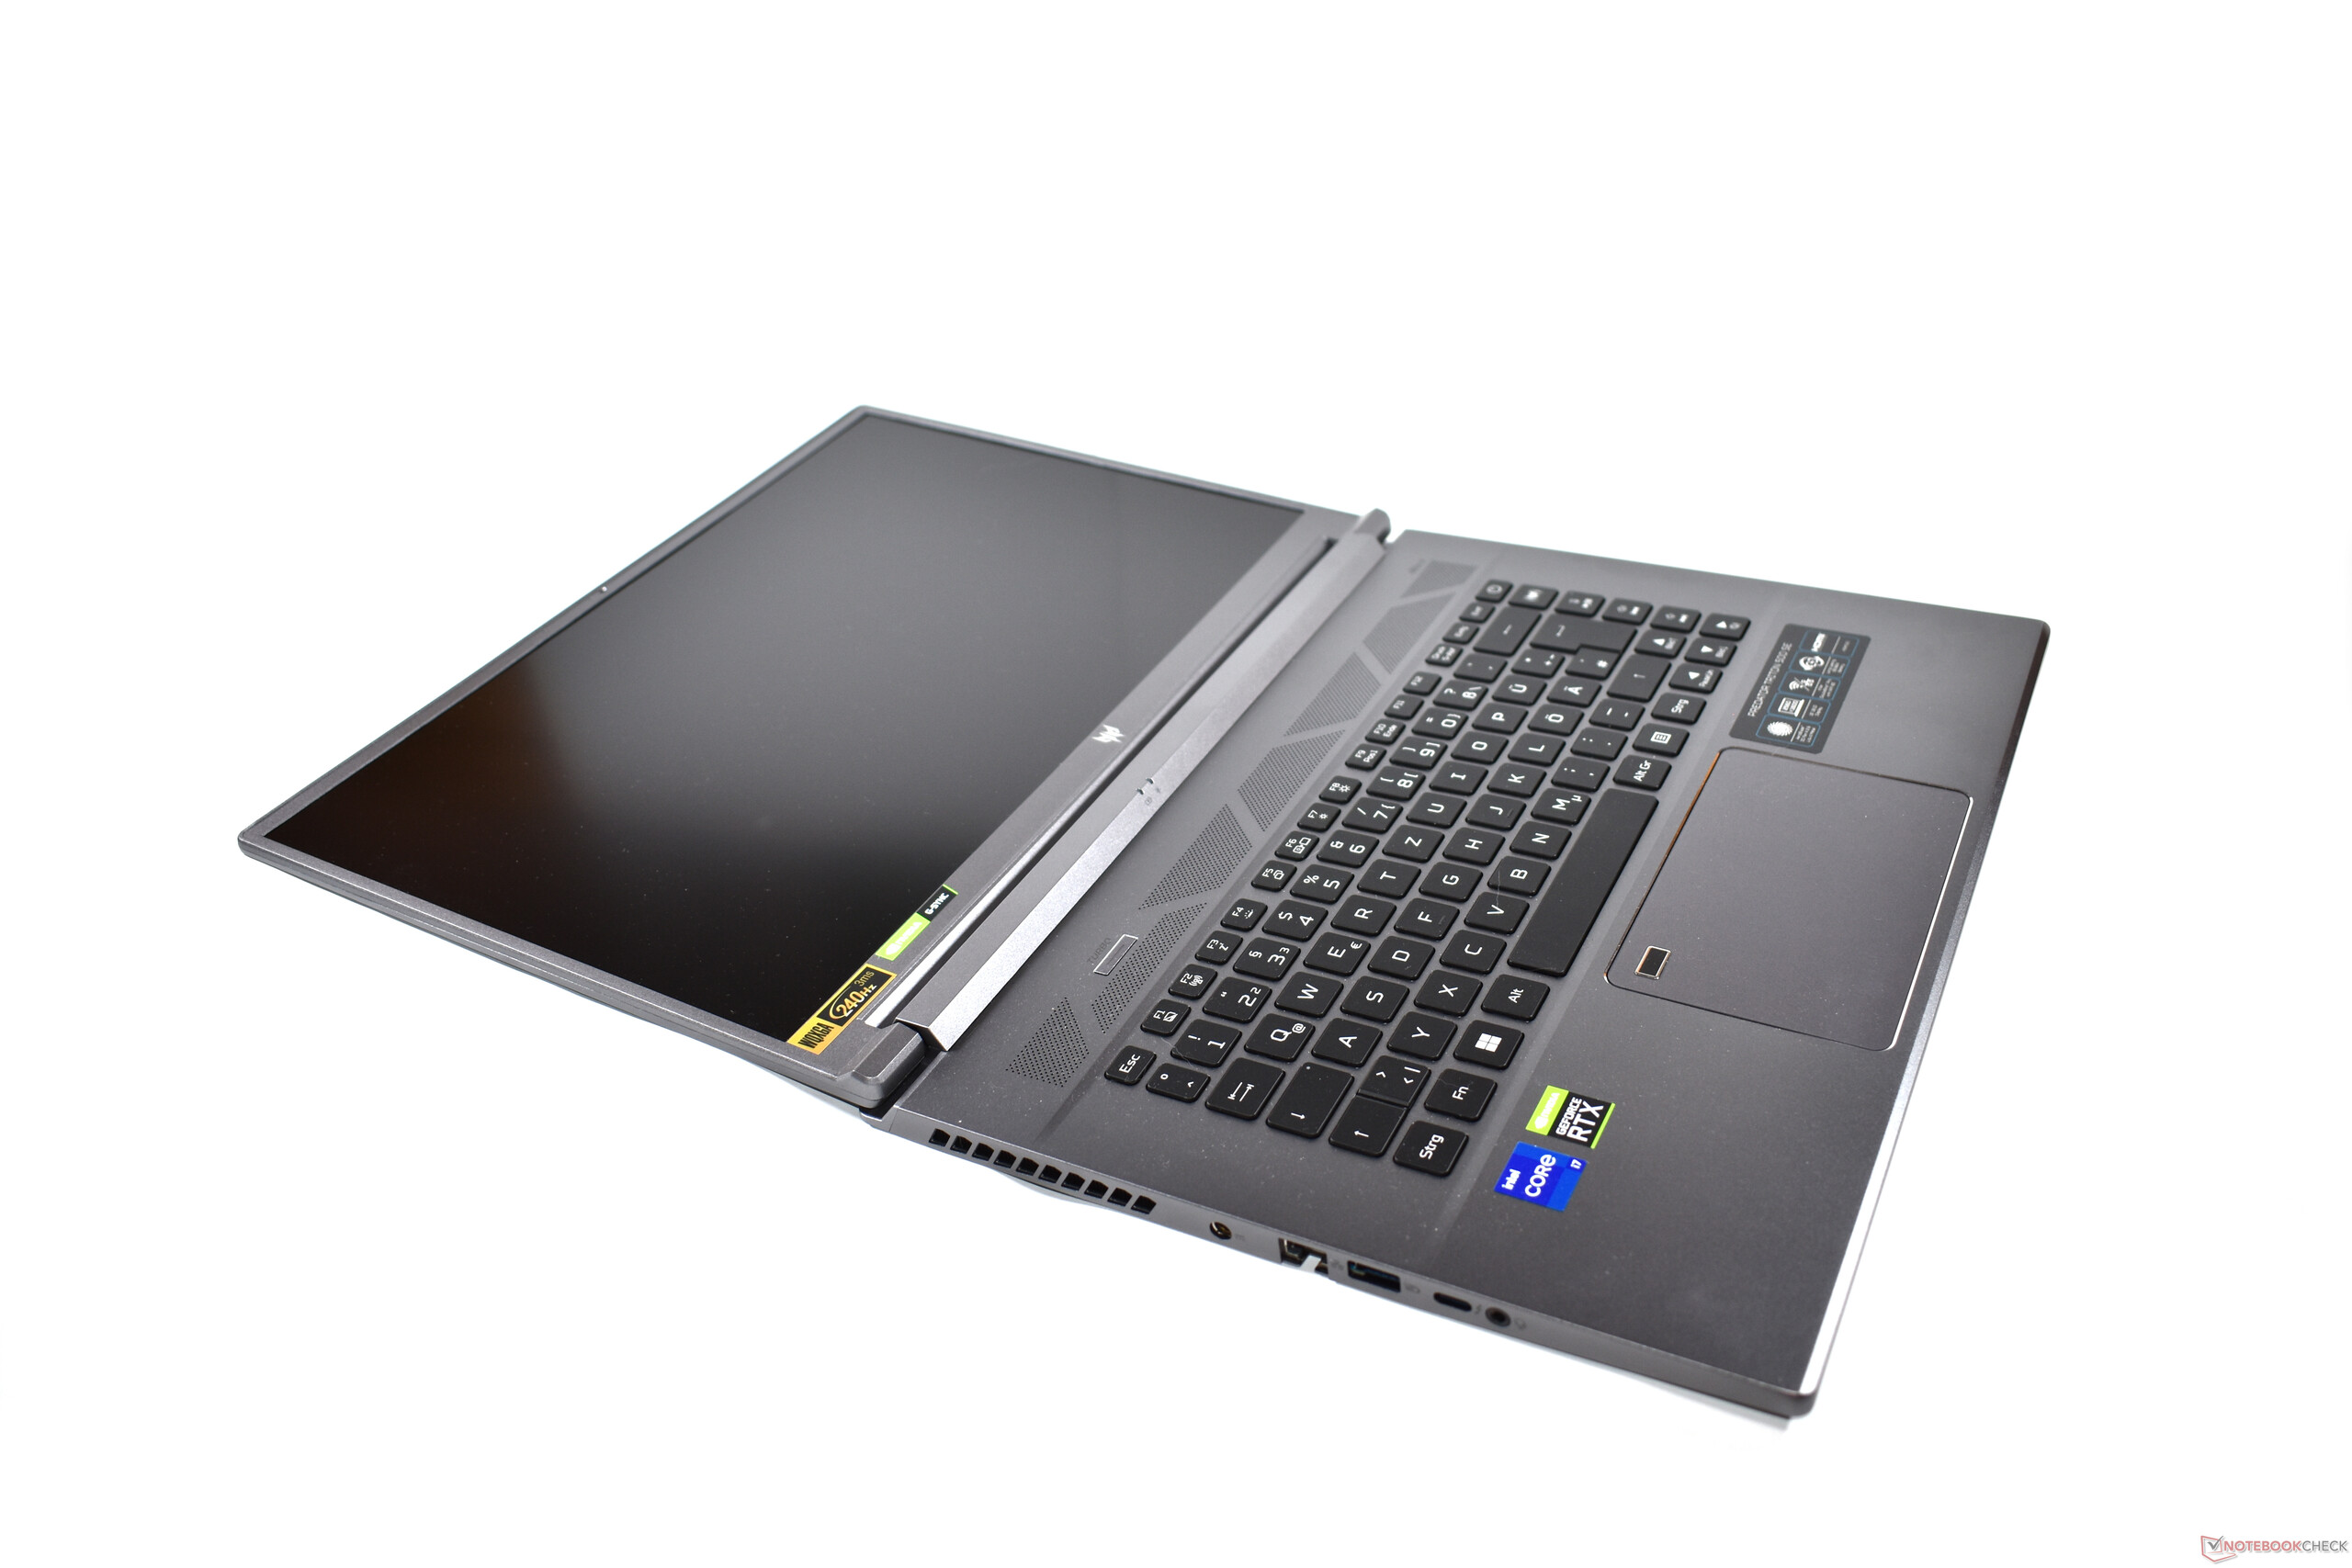
显示屏可以打开到几乎180度的开启角度,这一点非常好。宏碁笔记本电脑可以用一只手打开的事实是另一个积极点。固定在底座上的两个铰链调整得很好,只允许显示器在移动后有一些轻微的晃动。
对于一台游戏笔记本电脑来说,宏碁掠夺者Triton 500SE事实上是很苗条的,只有 雷蛇刀片17可以在这方面进行竞争,因为它同样纤细。然而,那也是明显更宽,其17.3英寸的显示屏为16:9格式。虽然 MSI GE76 Raider也明显更大,但联想Legion 5 Pro 16有一个类似的足迹,但这也是更厚。
就重量而言,宏碁掠夺者Triton 500 SE是明显的赢家。它只有2.3公斤(约5磅),显然是我们比较中的游戏笔记本中的轻量级。
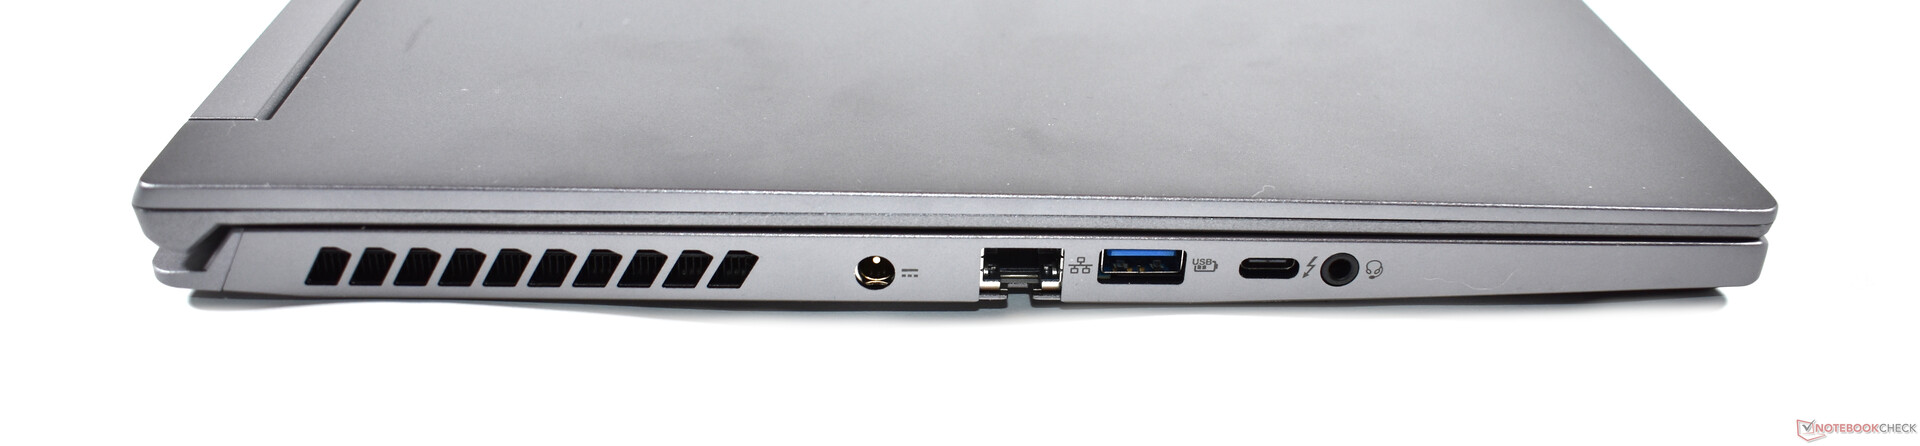
设备。Predator Triton 500 SE以2.5Gbit以太网给人留下深刻印象
连接设备令人印象深刻。现在你可能需要的东西几乎都有。除了HDMI和两个USB-A端口外,宏碁掠夺者Triton 500 SE还提供RJ45以太网和一个全尺寸的SD读卡器。另一个积极的观点是,这些连接分布在两边的事实。另一方面,专有充电端口在中间的位置不是很理想,我们更希望这个连接的位置能在后面更远的地方。
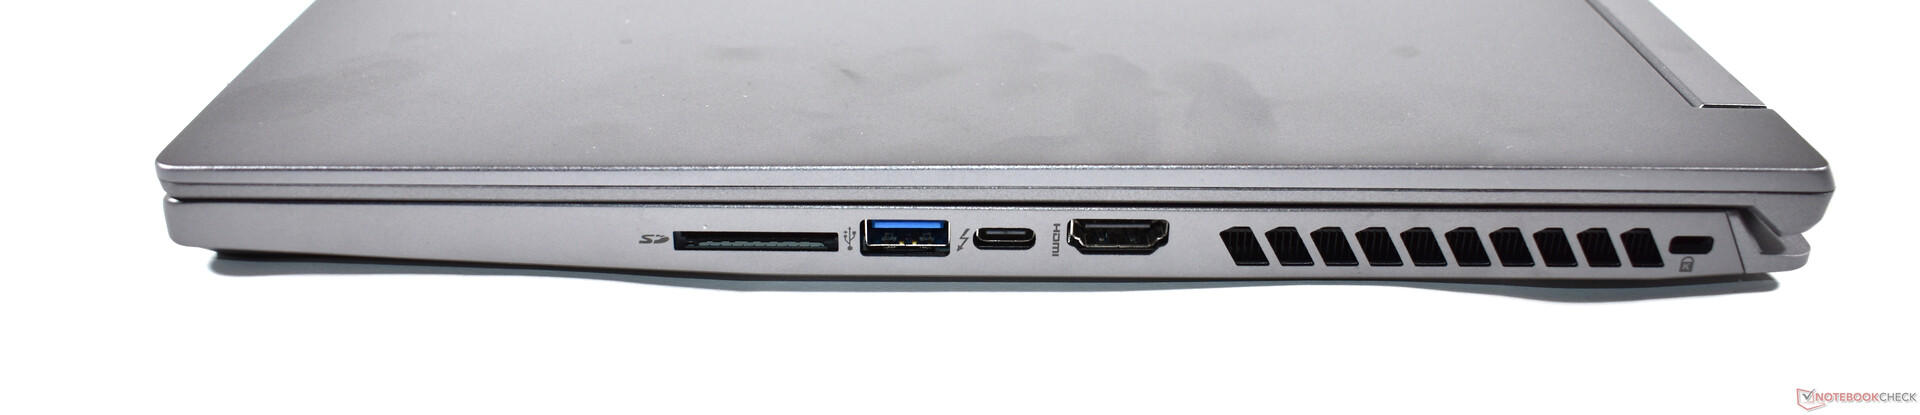
SD卡阅读器
由于SD卡不能完全插入右侧的读卡器,它不适合作为永久存储扩展使用。通过对AV Pro V60存储卡的测量,SD读卡器在基准测试中的表现一般。
| SD Card Reader | |
| average JPG Copy Test (av. of 3 runs) | |
| Razer Blade 17 RTX 3080 Ti (AV Pro V60) | |
| Average of class Gaming (20.9 - 210, n=54, last 2 years) | |
| MSI GE76 Raider (AV PRO microSD 128 GB V60) | |
| Acer Predator Triton 500 SE PT516-52s-70KX (AV PRO microSD 128 GB V60) | |
| maximum AS SSD Seq Read Test (1GB) | |
| Razer Blade 17 RTX 3080 Ti (AV Pro V60) | |
| Average of class Gaming (25.5 - 261, n=51, last 2 years) | |
| Acer Predator Triton 500 SE PT516-52s-70KX (AV PRO microSD 128 GB V60) | |
沟通
除了RJ45连接,即2.5千兆以太网端口外,宏碁掠夺者Triton 500 SE还提供最新一代的Wi-Fi模块。杀手AX1675是一个带有Wi-Fi 6E的2x2卡。
在我们仅限于Wi-Fi 6的基准测试中,该卡可提供高达1664 Mbit/s的速度。接收时绝对稳定的性能非常突出。另一方面,在发送数据时,性能会有变化。
| Networking | |
| iperf3 transmit AXE11000 | |
| Acer Predator Triton 500 SE PT516-52s-70KX | |
| Average of class Gaming (560 - 1862, n=88, last 2 years) | |
| iperf3 receive AXE11000 | |
| Acer Predator Triton 500 SE PT516-52s-70KX | |
| Average of class Gaming (680 - 1745, n=88, last 2 years) | |
| iperf3 receive AX12 | |
| Lenovo Legion 5 Pro 16 G7 i7 RTX 3070Ti | |
| Razer Blade 17 RTX 3080 Ti | |
| MSI GE76 Raider | |
| iperf3 transmit AX12 | |
| Lenovo Legion 5 Pro 16 G7 i7 RTX 3070Ti | |
| MSI GE76 Raider | |
| Razer Blade 17 RTX 3080 Ti | |
网络摄像头
屏幕上方的显示框包含一个分辨率为200万像素的网络摄像头。虽然它的图像比那些典型的720p网络摄像头要好,但与智能手机中的自拍摄像头的质量相比仍有很大差距。


辅料
除了带有专用连接器的230瓦电源外,没有其他附带的配件。
维护
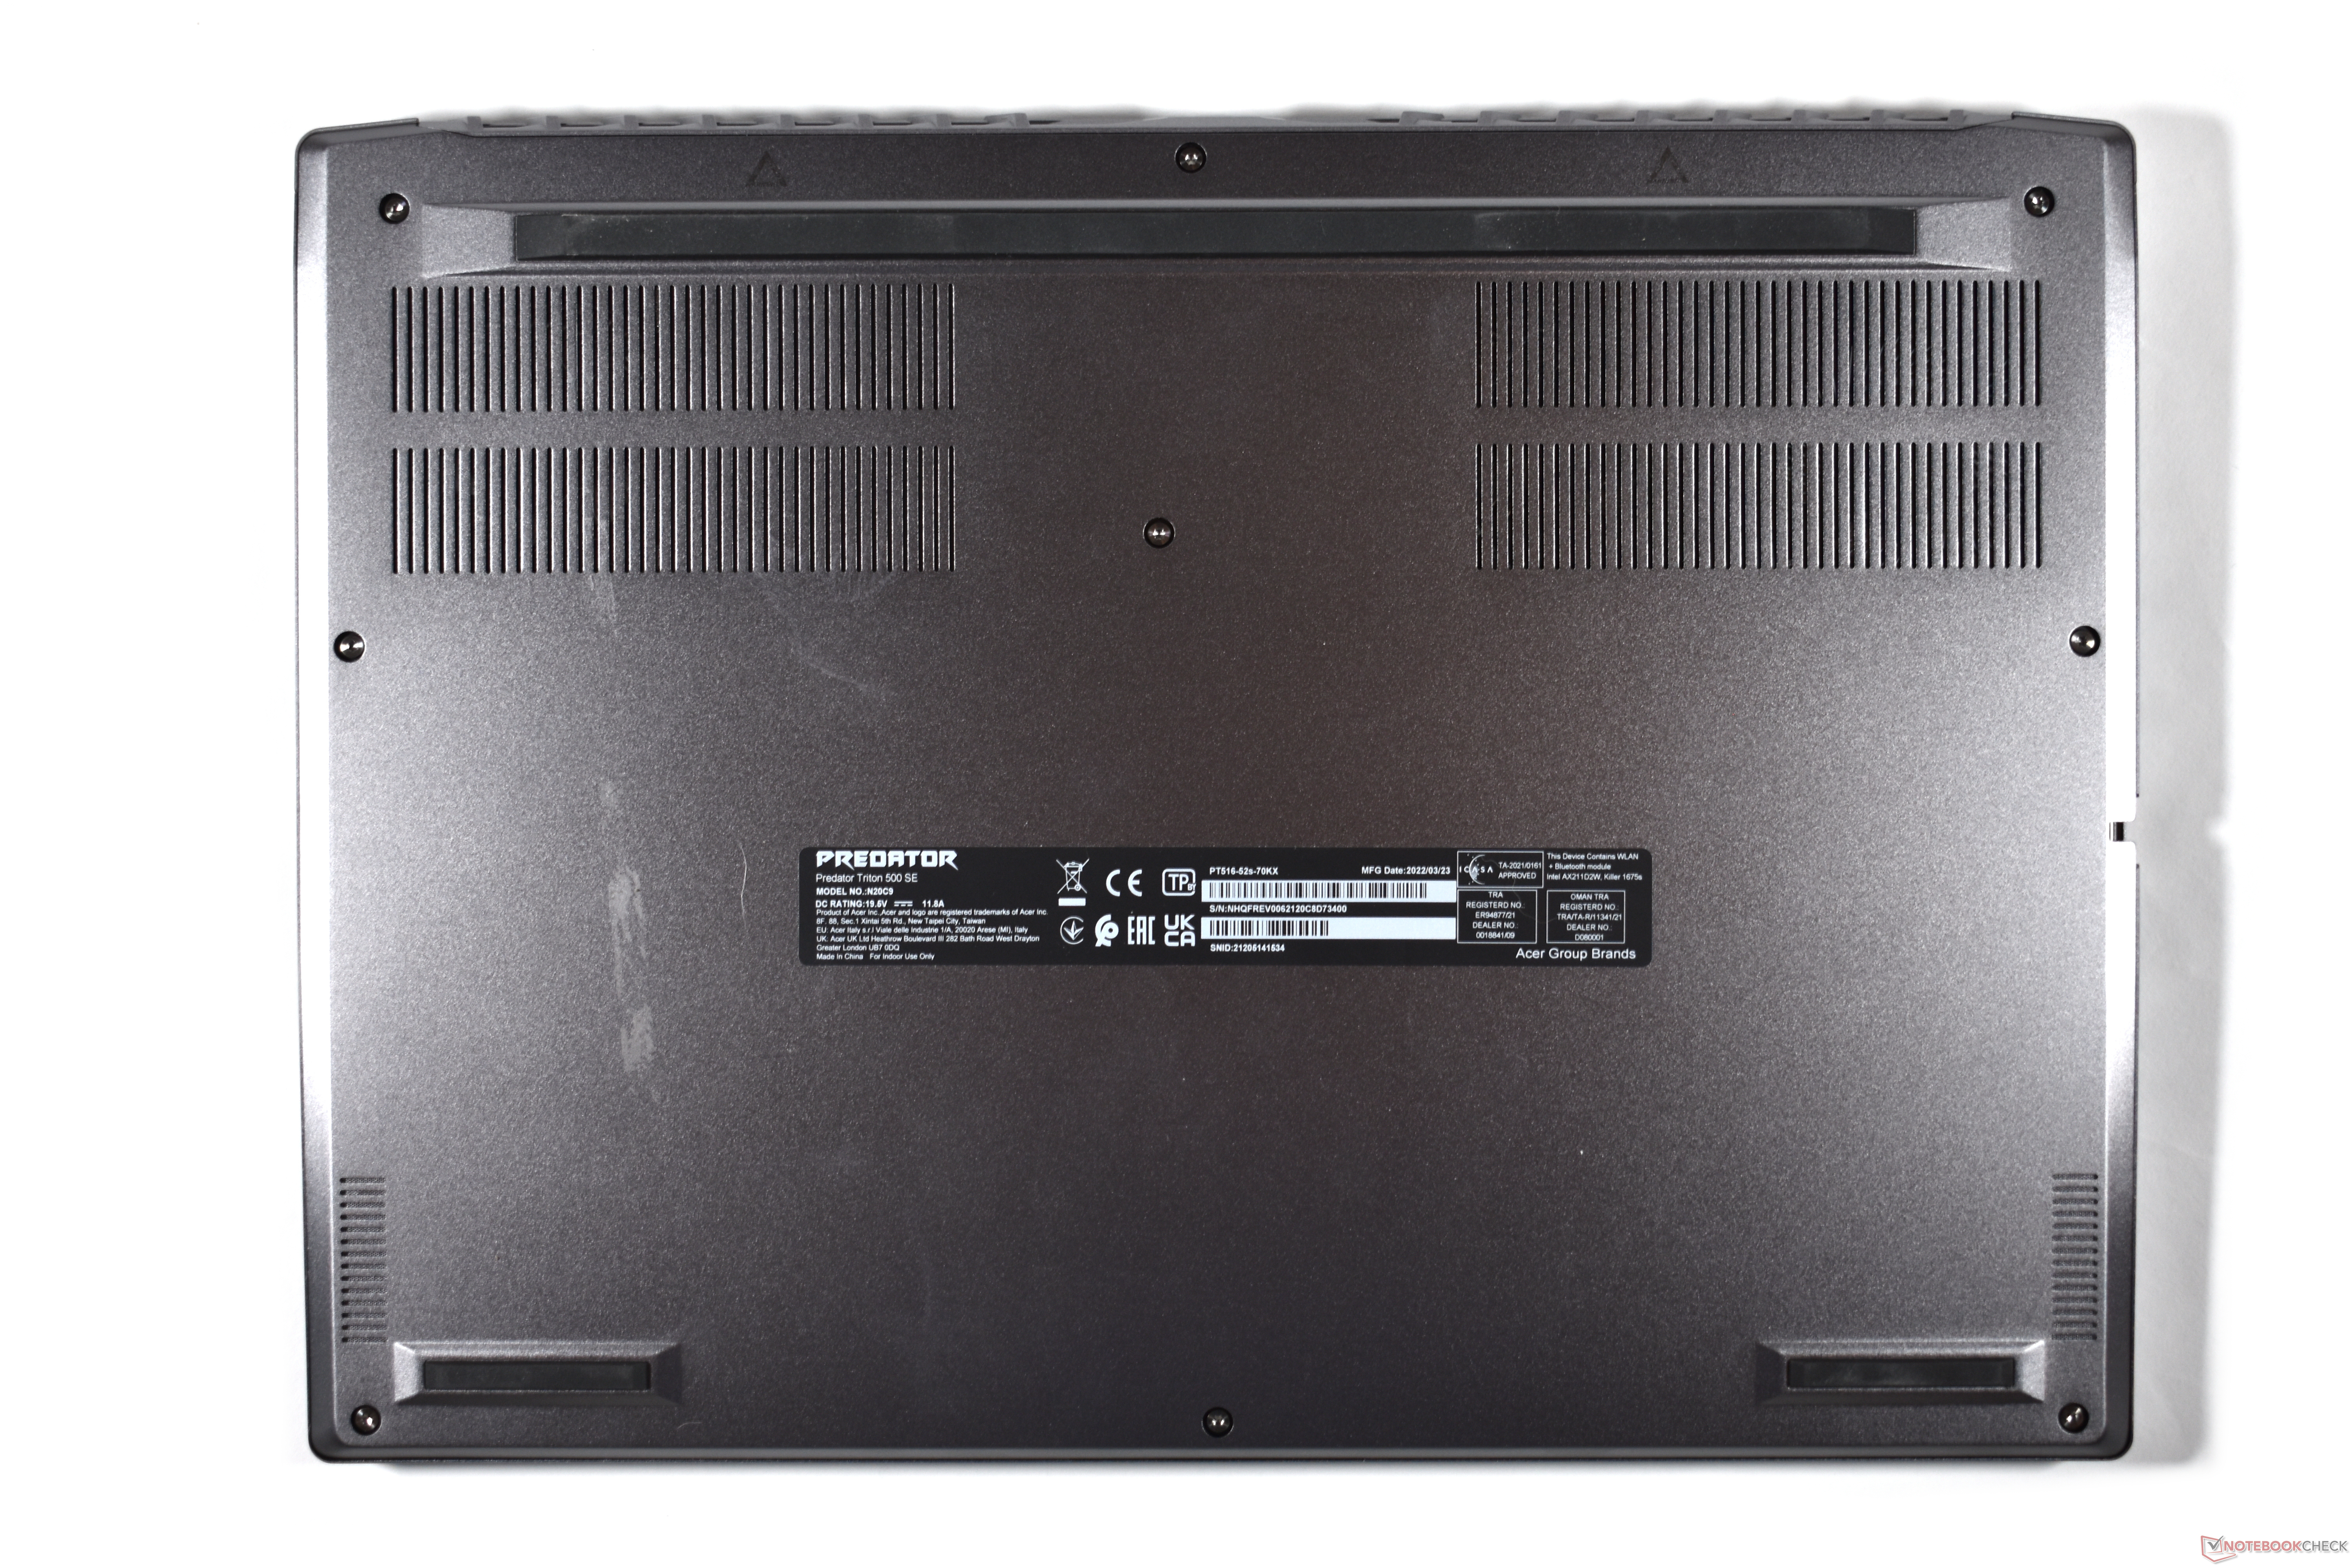
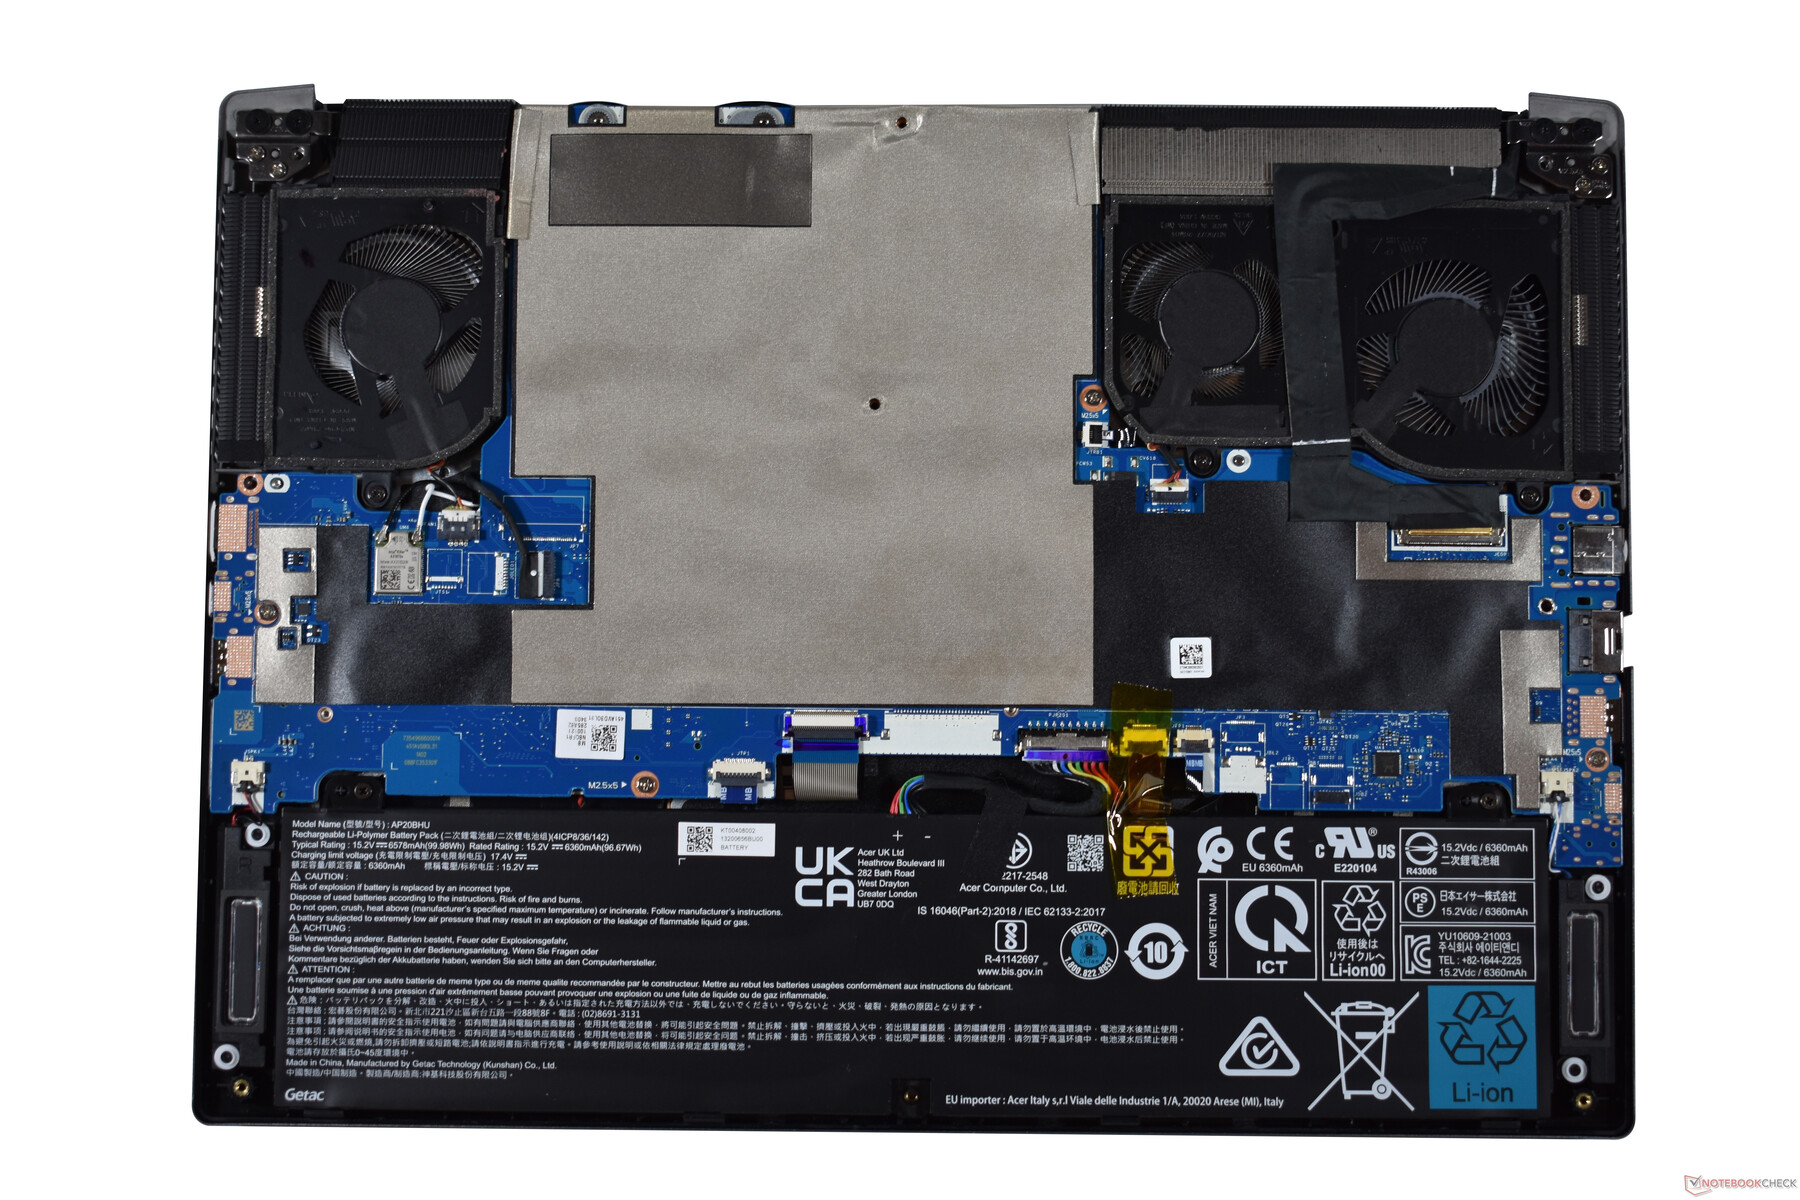
为了进入宏碁笔记本电脑内部的组件,你首先要卸下机箱底部的8颗Torx螺丝。底板还被额外的夹子固定,最好用塑料撬工具小心地松开。要做到这一点,以太网端口为自己提供了一个开始的地方。你只需要打开侧面和前面的塑料夹子,然后当你取下底板时,后面的夹子会自动松开。
然而,你不妨省点力气,因为在改变宏碁掠夺者Triton 500 SE的内部组件方面,你其实没有太多的选择。工作内存是焊接在一起的,如果不先拆下主板,就无法访问固态硬盘。但至少你可以更换电池,而且风扇也可以用来清洁。
担保
宏碁掠夺者Triton 500 SE提供了两年的提货和退货保证。因此,在出现缺陷的情况下,宏碁笔记本电脑在维修店内被取走和维修。
输入设备。宏碁Predator提供了一个良好的触摸板
键盘
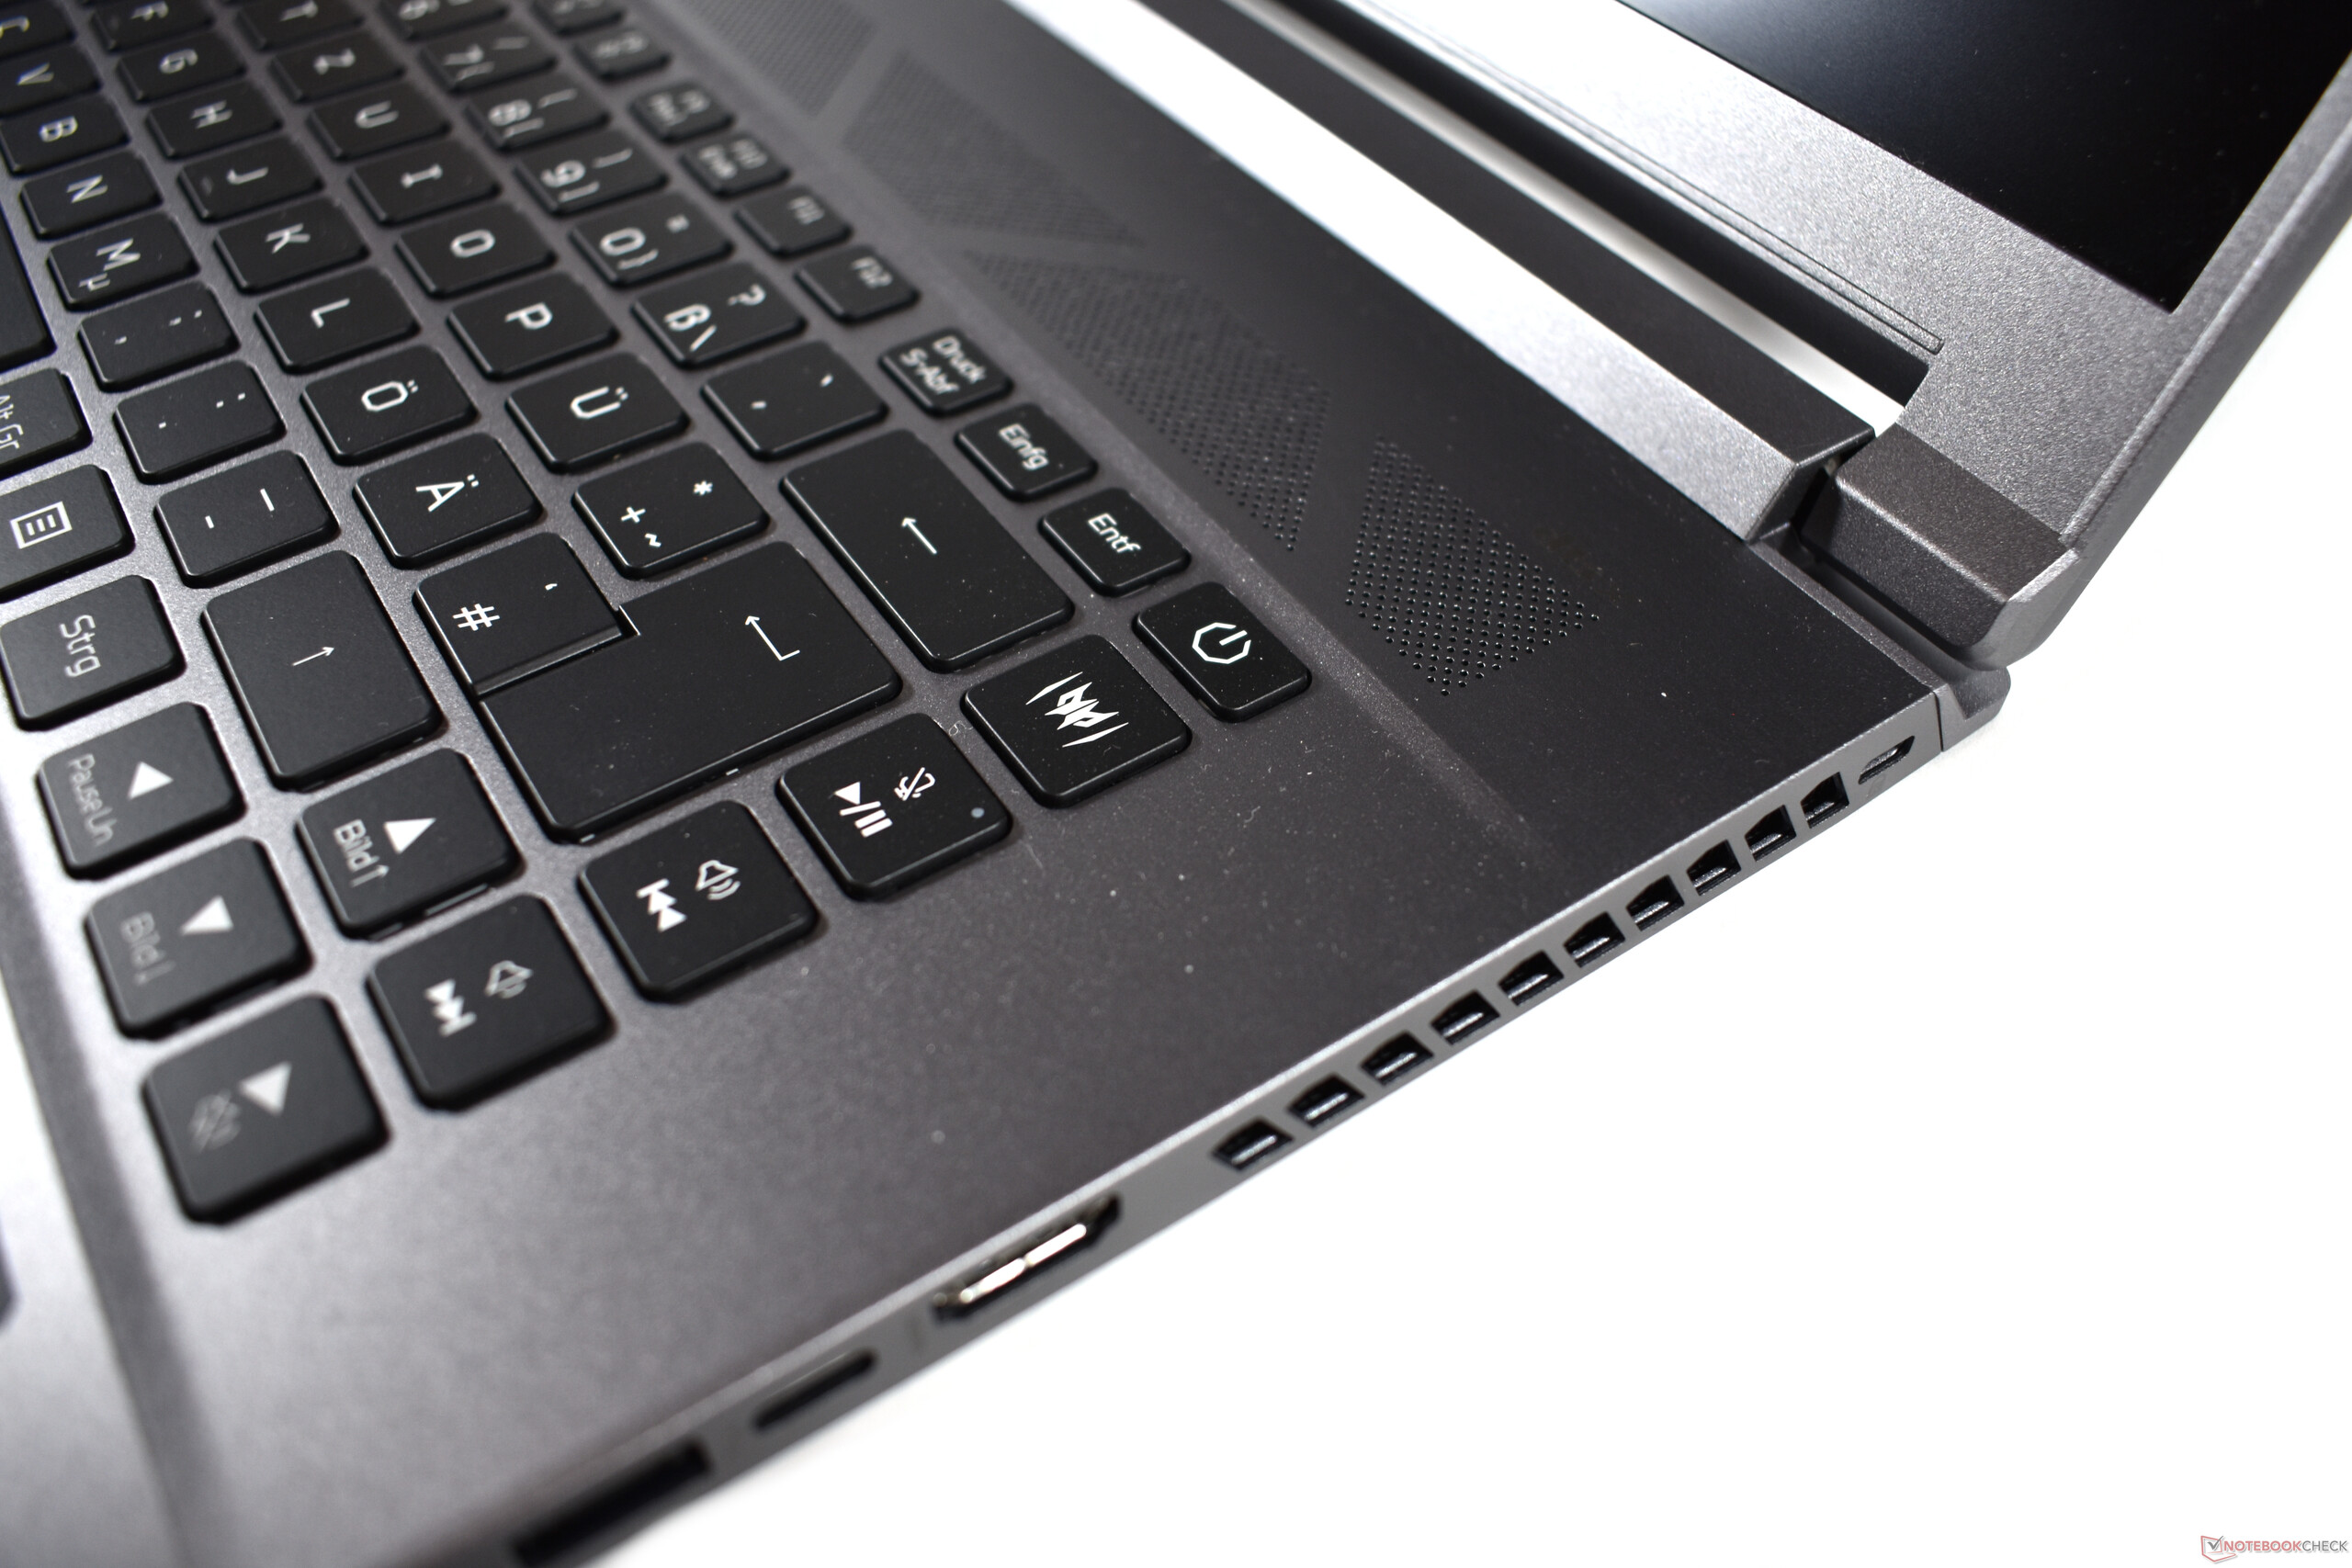
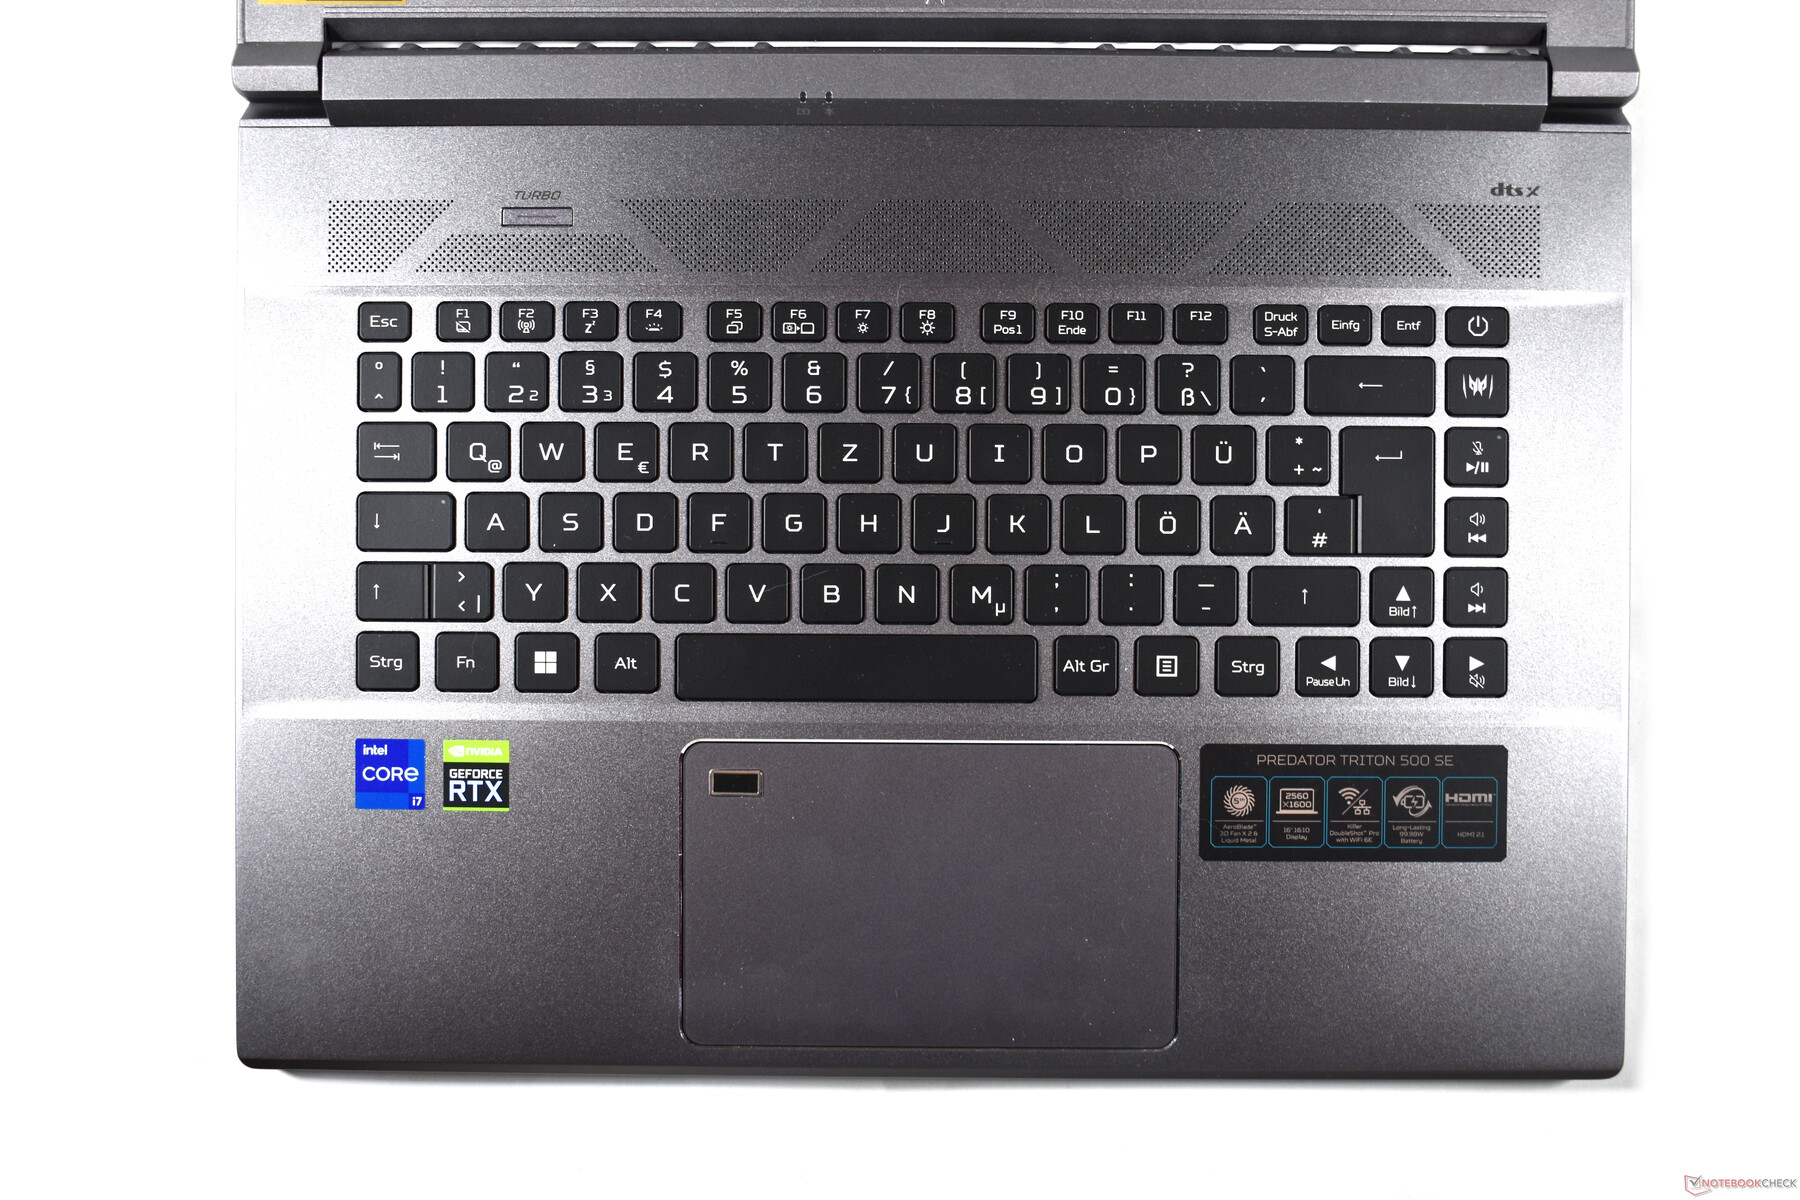
宏碁使用的是Chiclet风格的键盘,并采用了六个键行的布局。有趣的是,宏碁在Predator Triton 500 SE中放弃了添加数字块,因为我们通常在大型笔记本电脑中看到。这也意味着键盘被放置在机箱的中心,这在人体工程学上是很舒适的。另一个积极的方面是常规尺寸的方向键。另一方面,右边的Shift键必须要小一些才行,这在你试图使用它的时候是很烦人的。回车键右边的特殊按键也很不寻常。由于键盘的其他部分因为它们而变得稍小,这也可能成为更频繁的打字错误的一个原因。
我们估计,黑键提供的行程约为1.5毫米(约0.06英寸)。打字体验很好,按键提供了一个舒适的压力点和阻力,没有海绵的感觉。虽然打字体验不是绝对的顶级,但对于日常打字任务来说仍然足够。
我们应该提到背景照明作为一个相关的特殊功能。默认情况下,它整个是蓝色的,可以分四步调整。使用预装的PredatorSense软件,可以非常自由地调整颜色,你还可以激活各种效果,如缓慢闪烁或彩虹色的波浪效果。
触摸板
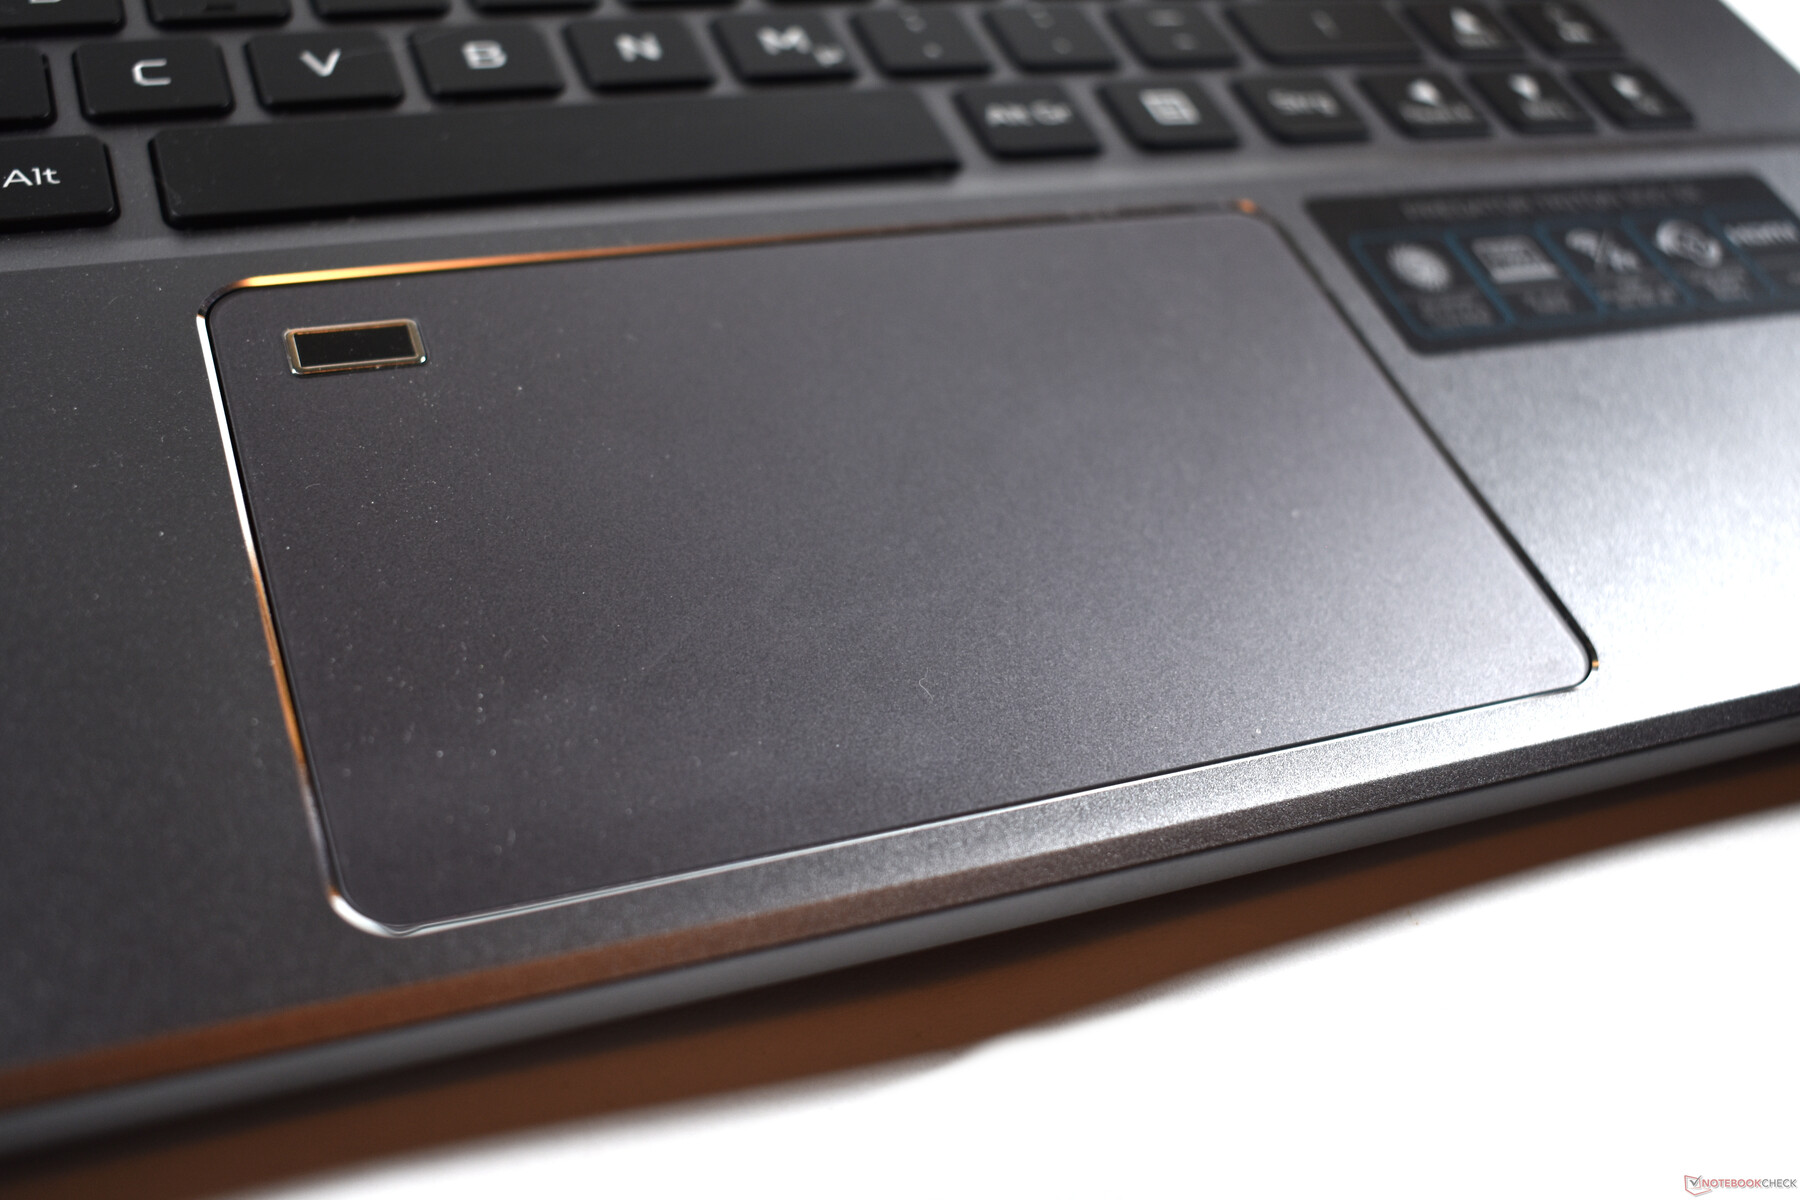
Acer Predator的触摸板尺寸为12.5 x 8厘米(约4.9 x 3.15英寸),这是一个相当大的尺寸。其表面光滑但不滑溜。由于其良好的滑动特性,可以毫不费力地控制鼠标指针,软件实施也很准确。
触摸板是一个ClickPad,相应地,你可以在底部区域按压表面。机械装置很安静,点击有一个明确的压力点。这是一个高质量的实现。
显示。宏碁以240赫兹的液晶显示器取悦玩家的心
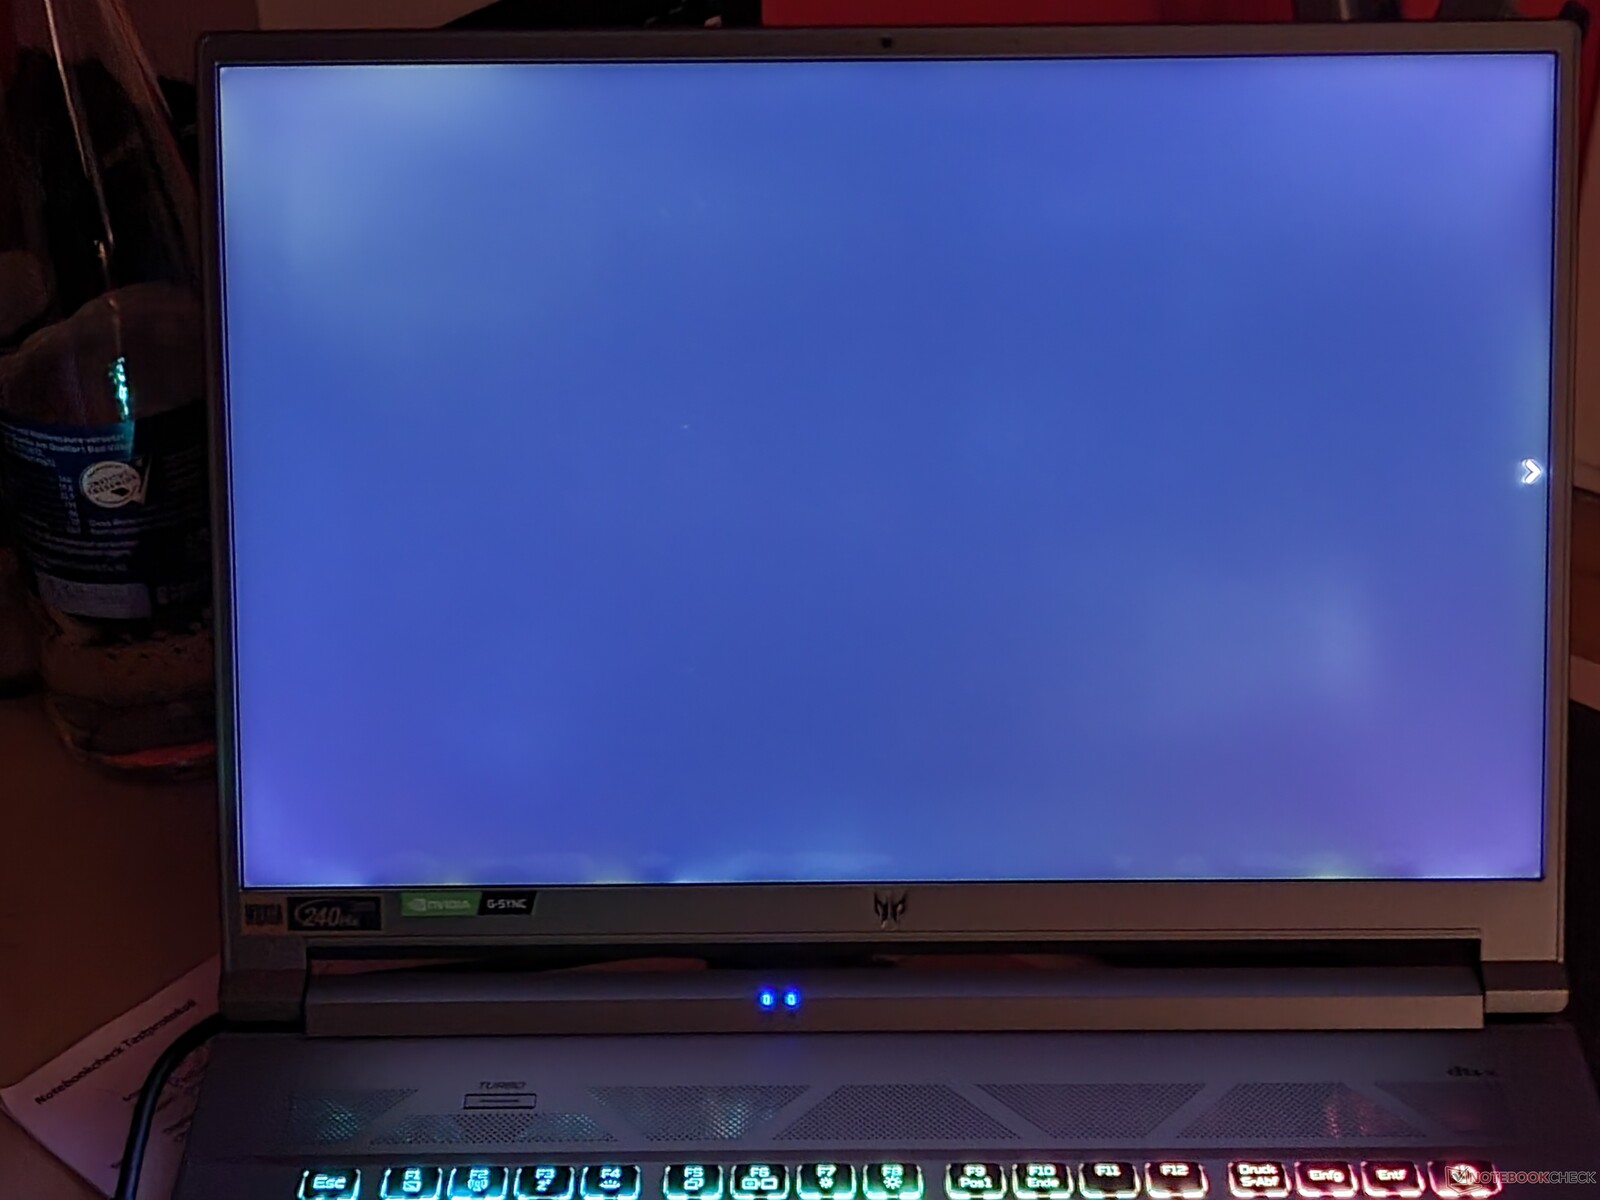
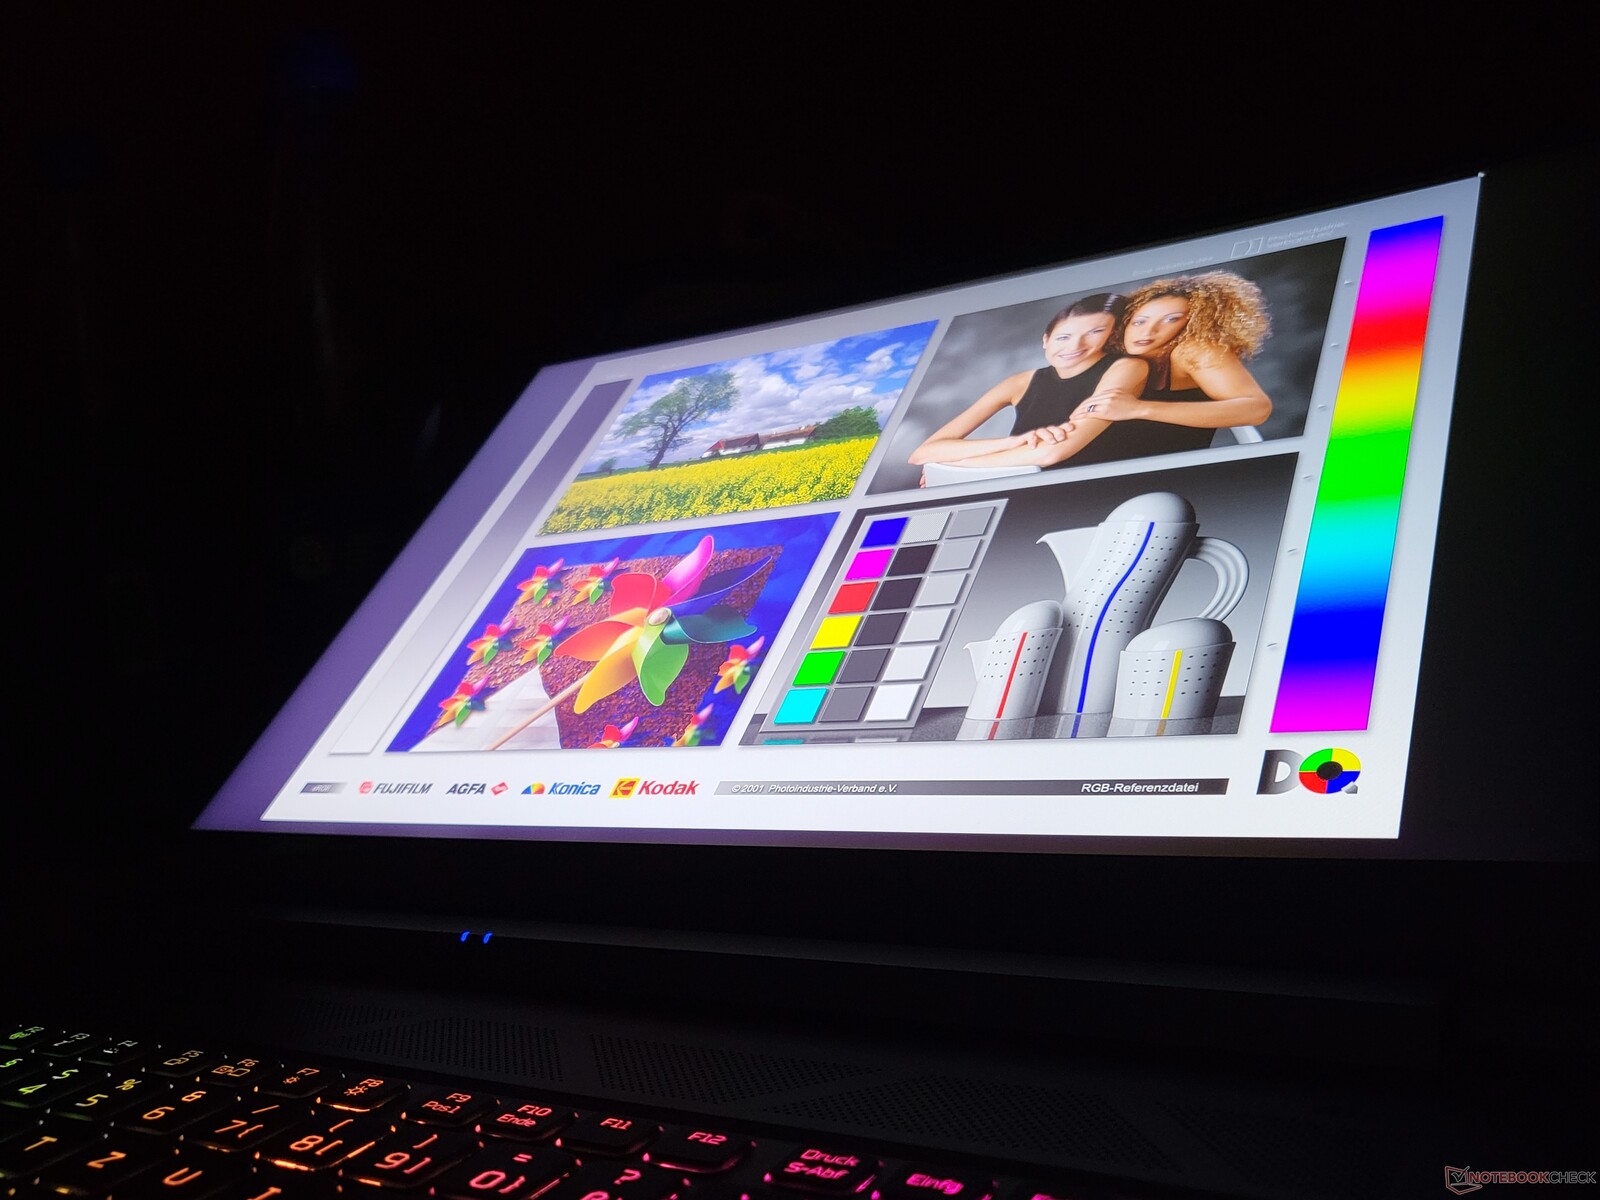
宏碁掠夺者Triton 500 SE始终配备相同的显示屏:16:10格式的16英寸IPS液晶显示器,提供2560 x 1600像素的分辨率(QHD和2.5k)。宏碁在这款笔记本电脑中不提供4K UHD显示屏。
另一方面,这里使用的面板还提供一些其他优势,例如高亮度。宏碁规定500cd/m²,这也是我们测量的最高值。该面板的平均亮度为468cd/m²,这尤其是因为显示屏底部边缘的亮度明显下降。然而,没有明显的阴影,用肉眼就可以发现。在这方面,只有 联想Legion 5 Pro能够在我们的直接比较中跟上宏碁捕食者的步伐。
显示器的响应时间也变得非常好。此外,该显示器提供240赫兹的刷新率,这使得运动看起来绝对流畅。
| |||||||||||||||||||||||||
Brightness Distribution: 80 %
Center on Battery: 498 cd/m²
Contrast: 1383:1 (Black: 0.36 cd/m²)
ΔE ColorChecker Calman: 1.77 | ∀{0.5-29.43 Ø4.71}
calibrated: 0.63
ΔE Greyscale Calman: 2.4 | ∀{0.09-98 Ø4.96}
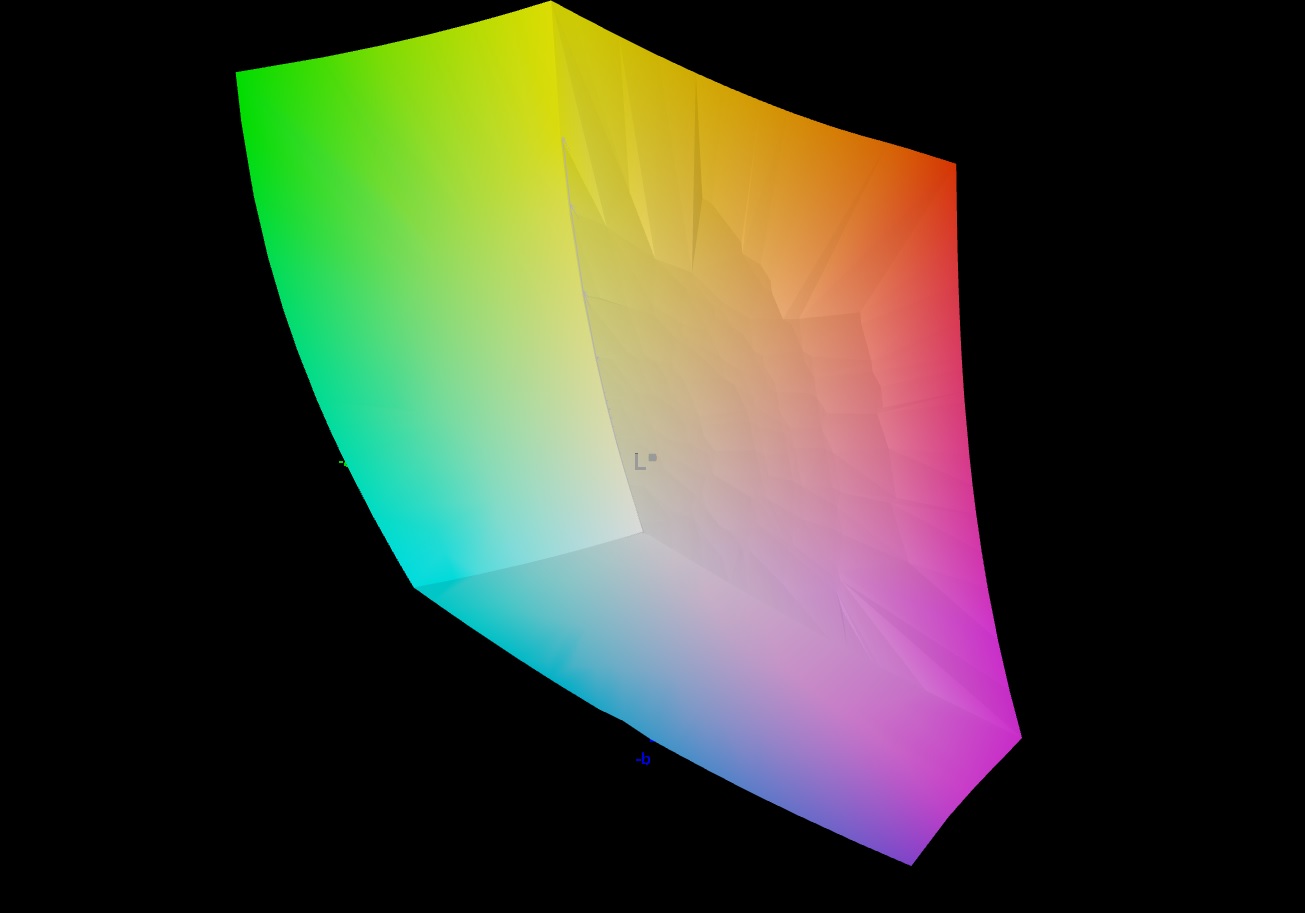
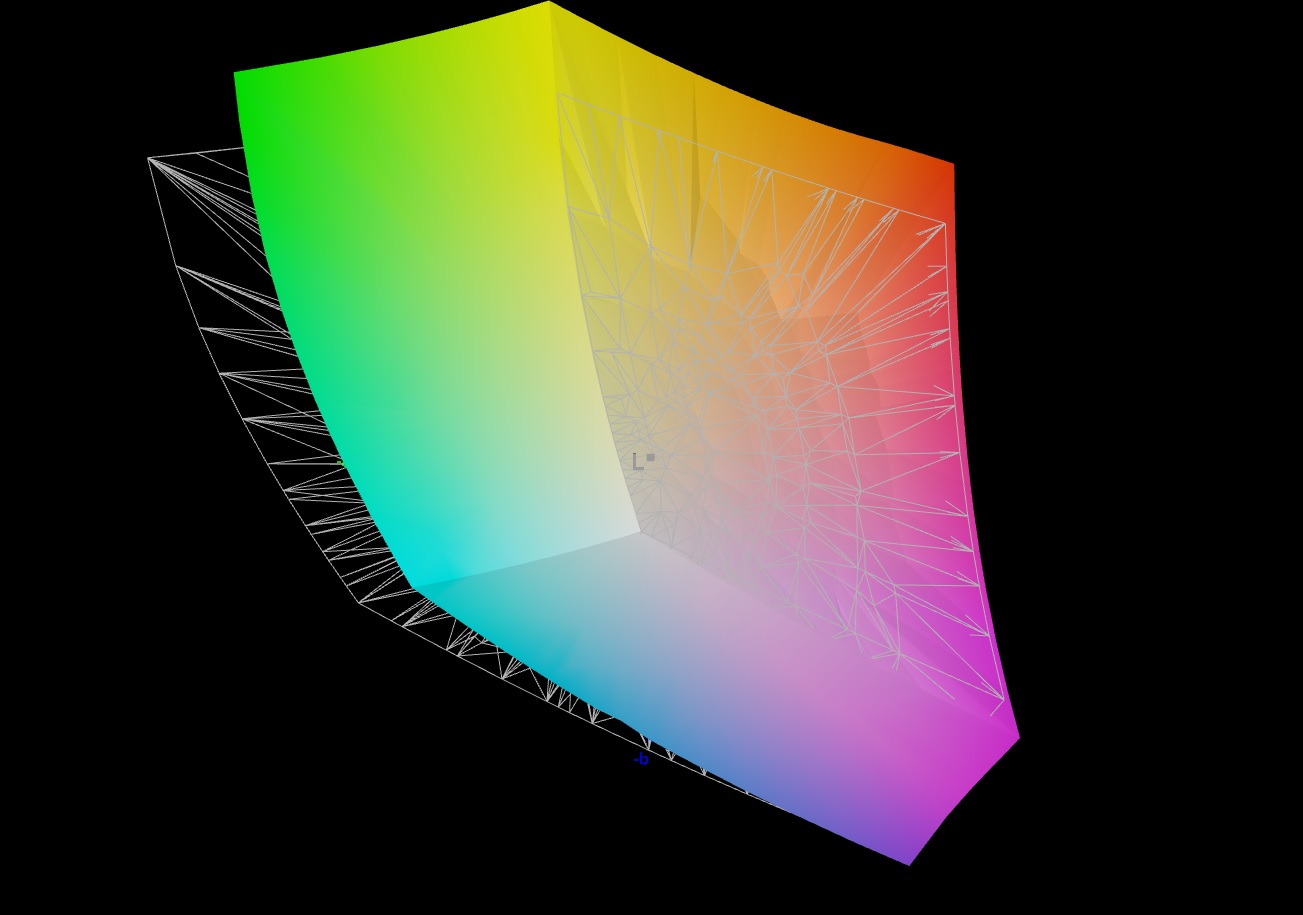
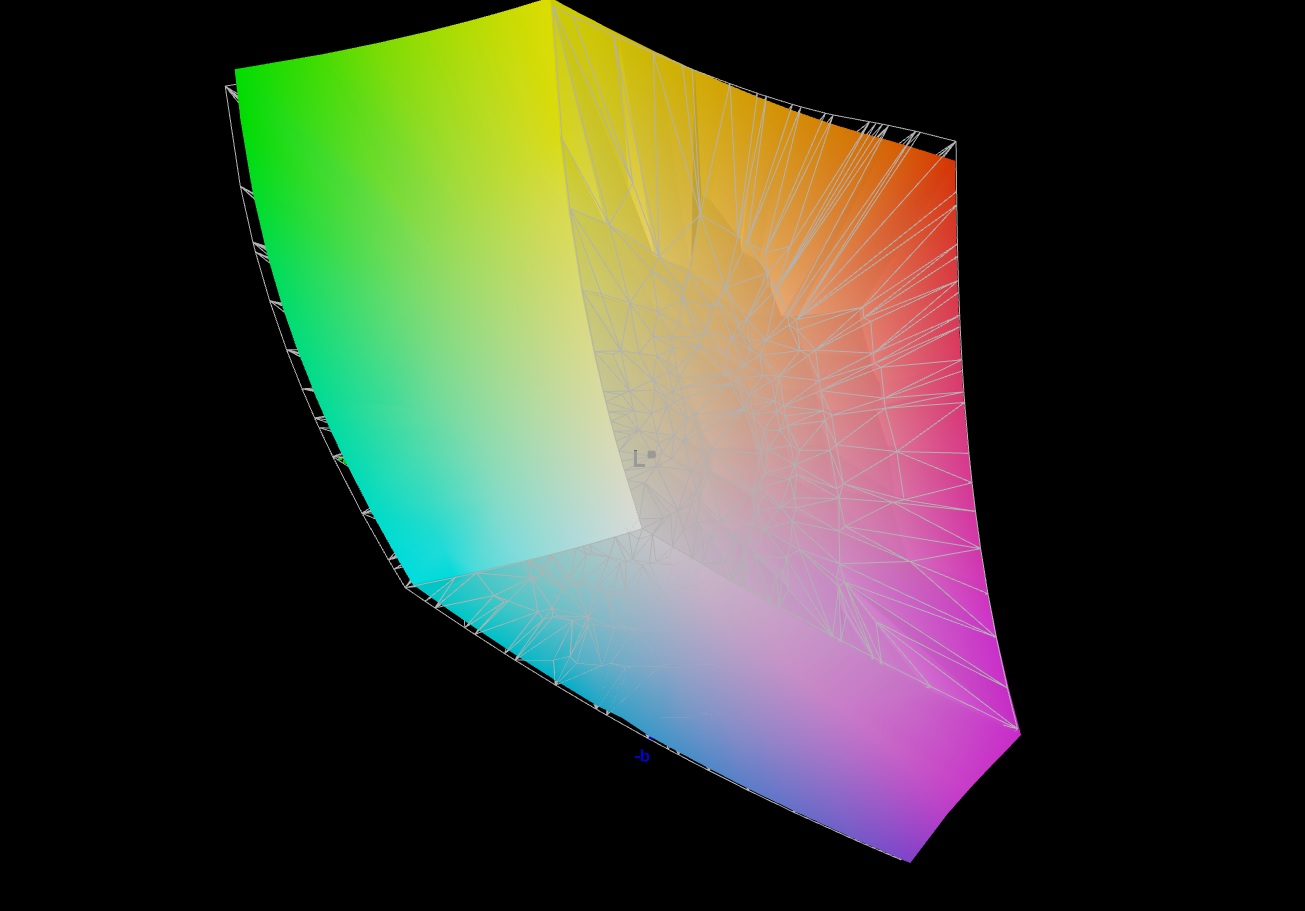
84.9% AdobeRGB 1998 (Argyll 3D)
100% sRGB (Argyll 3D)
97.3% Display P3 (Argyll 3D)
Gamma: 2.14
CCT: 7046 K
| Acer Predator Triton 500 SE PT516-52s-70KX NE160QDM-NZ2, IPS LED, 2560x1600, 16" | Razer Blade 17 RTX 3080 Ti BOE NE173QHM-NZ1, IPS, 2560x1440, 17.3" | Lenovo Legion 5 Pro 16 G7 i7 RTX 3070Ti NE160QDM-NY1, IPS, 2560x1600, 16" | MSI GE76 Raider AU Optronics B173HAN05.4 (AUOE295), IPS-Level, 1920x1080, 17.3" | |
|---|---|---|---|---|
| Display | 1% | -16% | -21% | |
| Display P3 Coverage (%) | 97.3 | 98.7 1% | 68.7 -29% | 63.1 -35% |
| sRGB Coverage (%) | 100 | 99.9 0% | 97.6 -2% | 94 -6% |
| AdobeRGB 1998 Coverage (%) | 84.9 | 86.2 2% | 70.9 -16% | 65.2 -23% |
| Response Times | -53% | -24% | 5% | |
| Response Time Grey 50% / Grey 80% * (ms) | 13.8 ? | 17.6 ? -28% | 17.6 ? -28% | 5.6 ? 59% |
| Response Time Black / White * (ms) | 6.4 ? | 11.4 ? -78% | 7.6 ? -19% | 9.6 ? -50% |
| PWM Frequency (Hz) | ||||
| Screen | -18% | -18% | -3% | |
| Brightness middle (cd/m²) | 498 | 335.9 -33% | 502 1% | 290 -42% |
| Brightness (cd/m²) | 468 | 294 -37% | 491 5% | 290 -38% |
| Brightness Distribution (%) | 80 | 75 -6% | 91 14% | 96 20% |
| Black Level * (cd/m²) | 0.36 | 0.38 -6% | 0.37 -3% | 0.23 36% |
| Contrast (:1) | 1383 | 884 -36% | 1357 -2% | 1261 -9% |
| Colorchecker dE 2000 * | 1.77 | 2.82 -59% | 2.7 -53% | 1.59 10% |
| Colorchecker dE 2000 max. * | 5.24 | 5.04 4% | 4.5 14% | 3.17 40% |
| Colorchecker dE 2000 calibrated * | 0.63 | 1.4 -122% | 0.87 -38% | |
| Greyscale dE 2000 * | 2.4 | 1.7 29% | 2.7 -13% | 2.5 -4% |
| Gamma | 2.14 103% | 2.14 103% | 2.44 90% | 2.253 98% |
| CCT | 7046 92% | 6382 102% | 6326 103% | 6640 98% |
| Total Average (Program / Settings) | -23% /
-19% | -19% /
-18% | -6% /
-6% |
* ... smaller is better
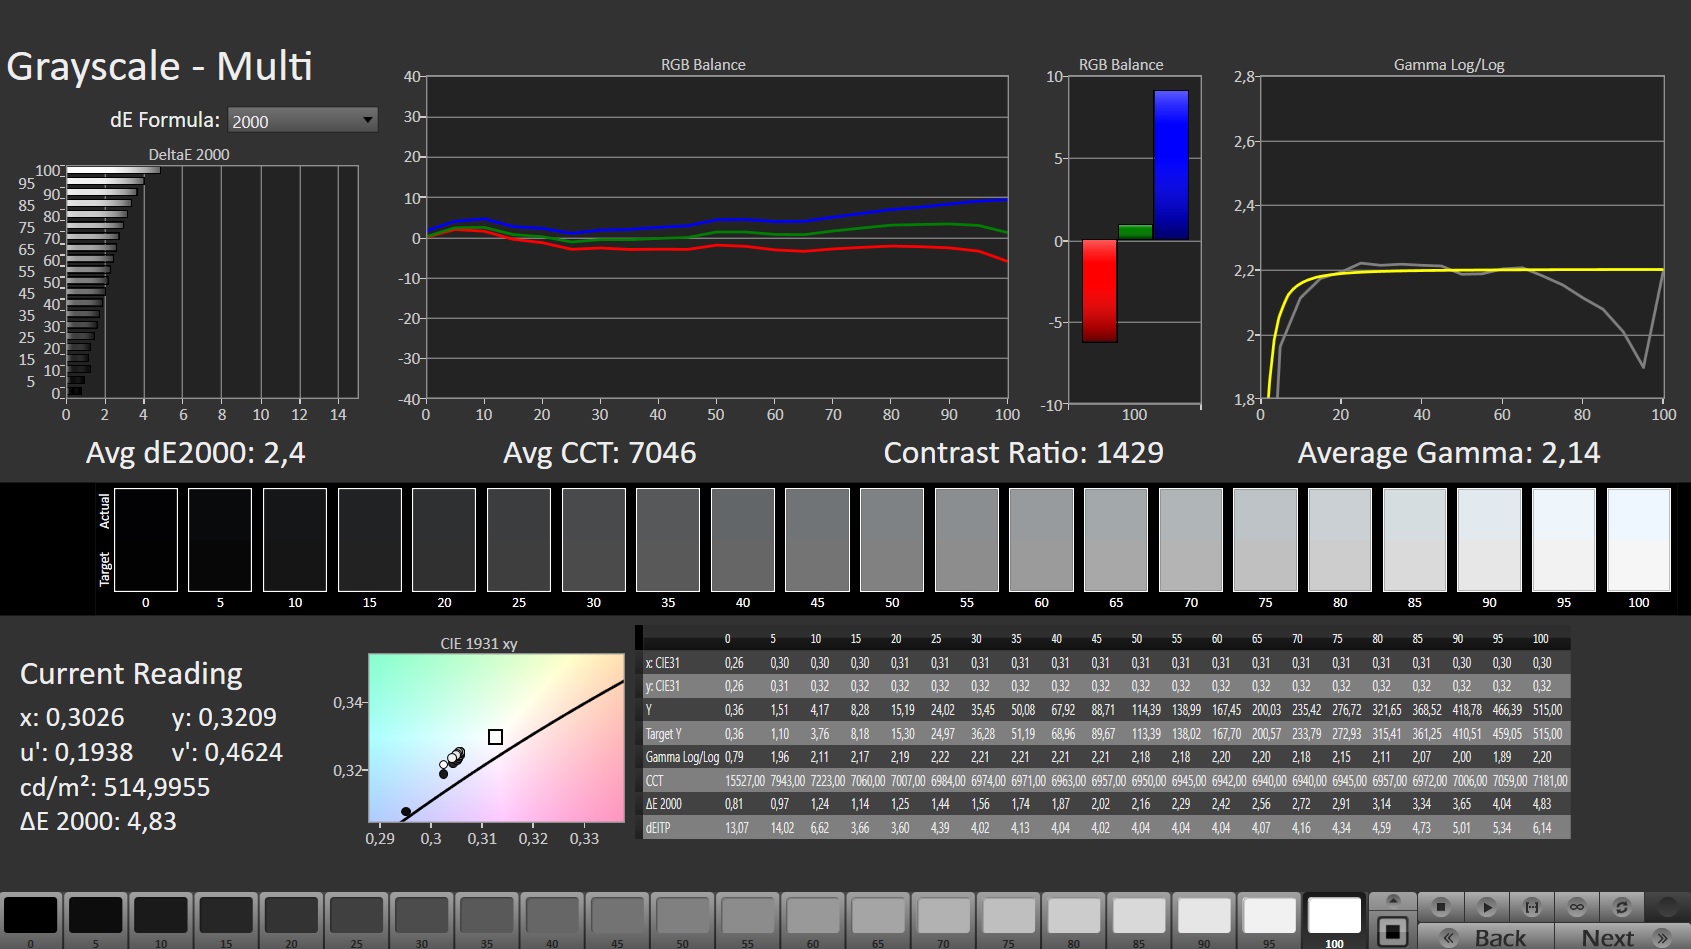

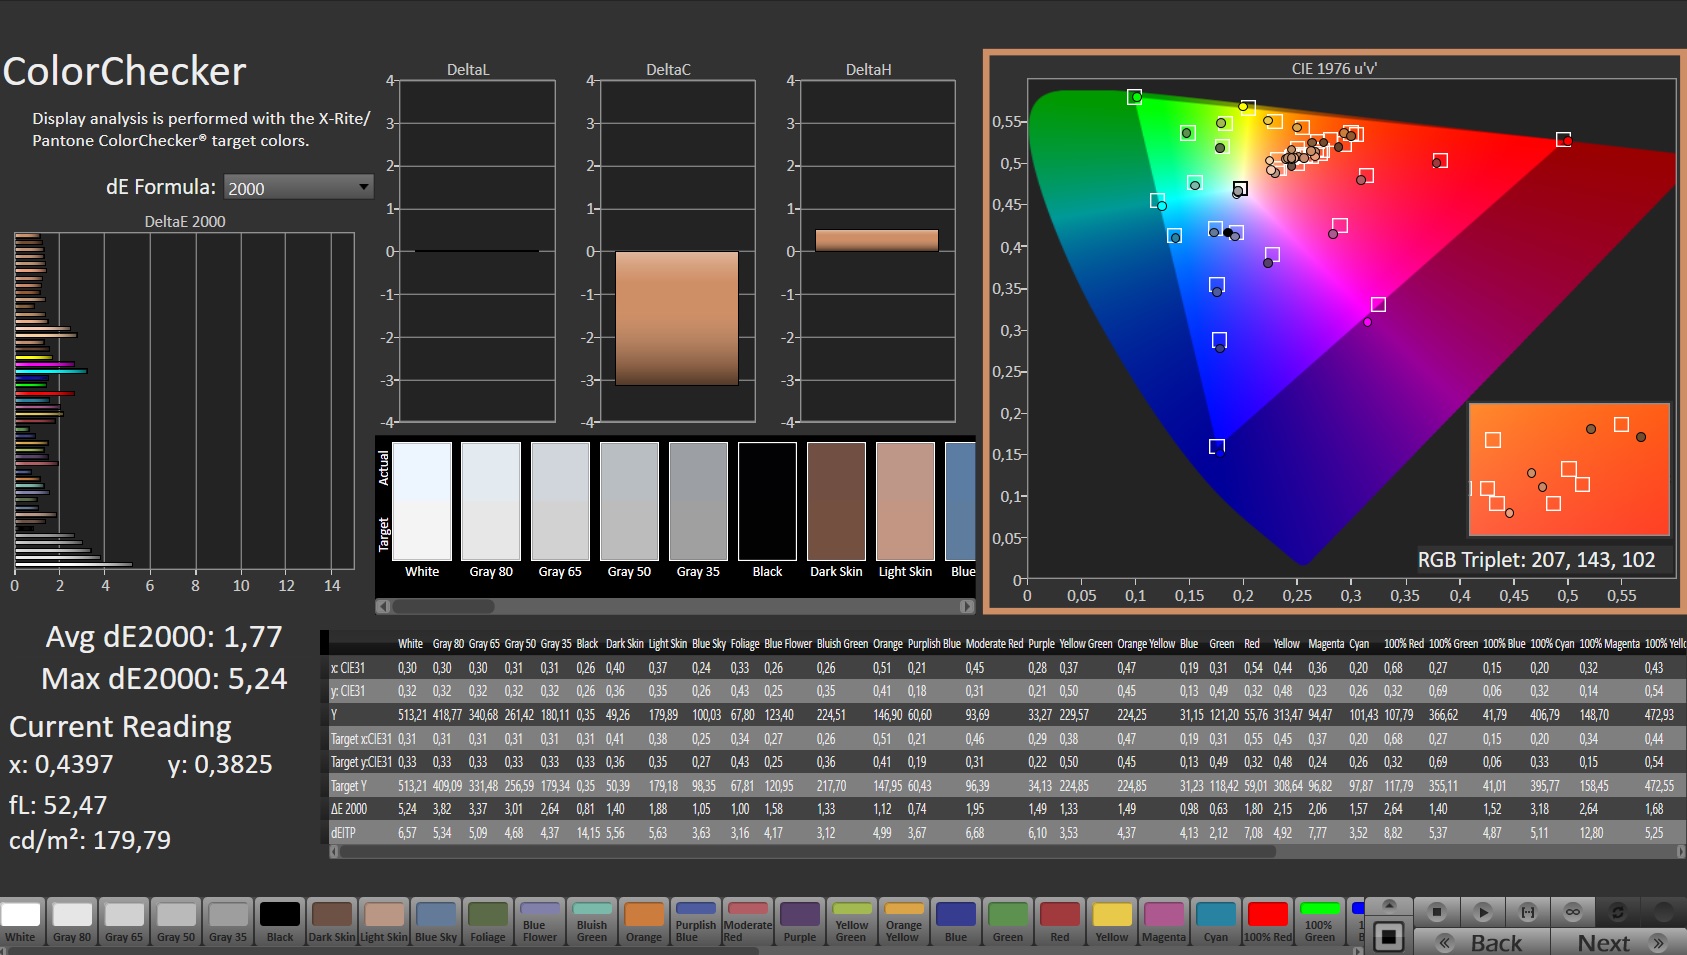
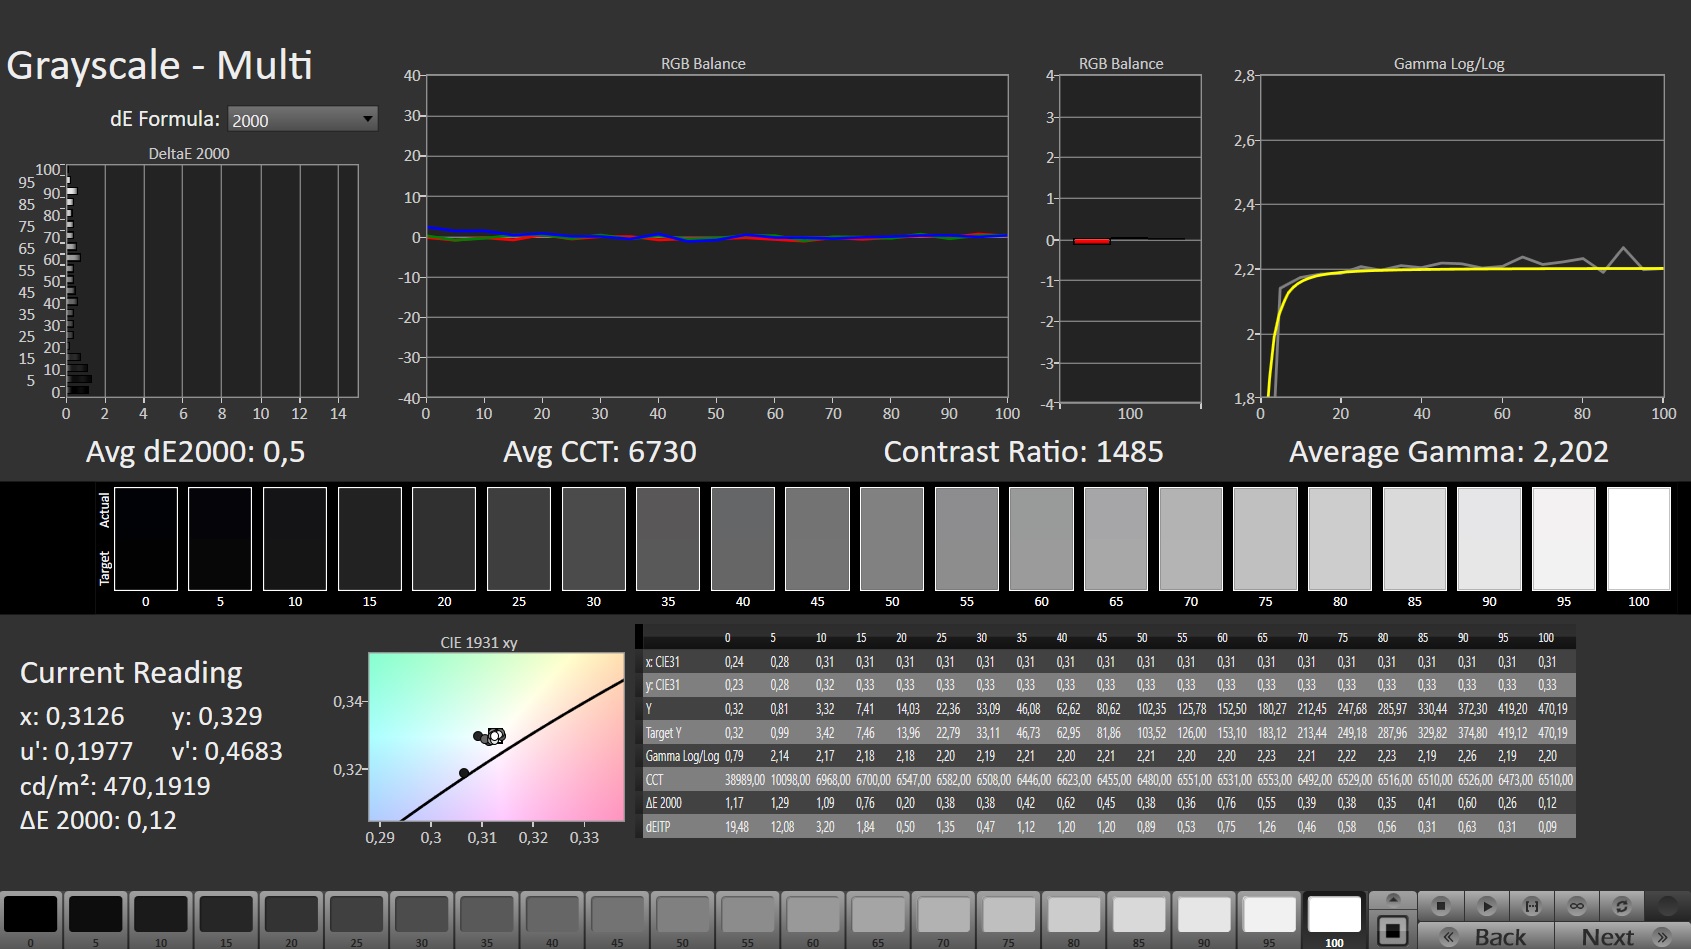
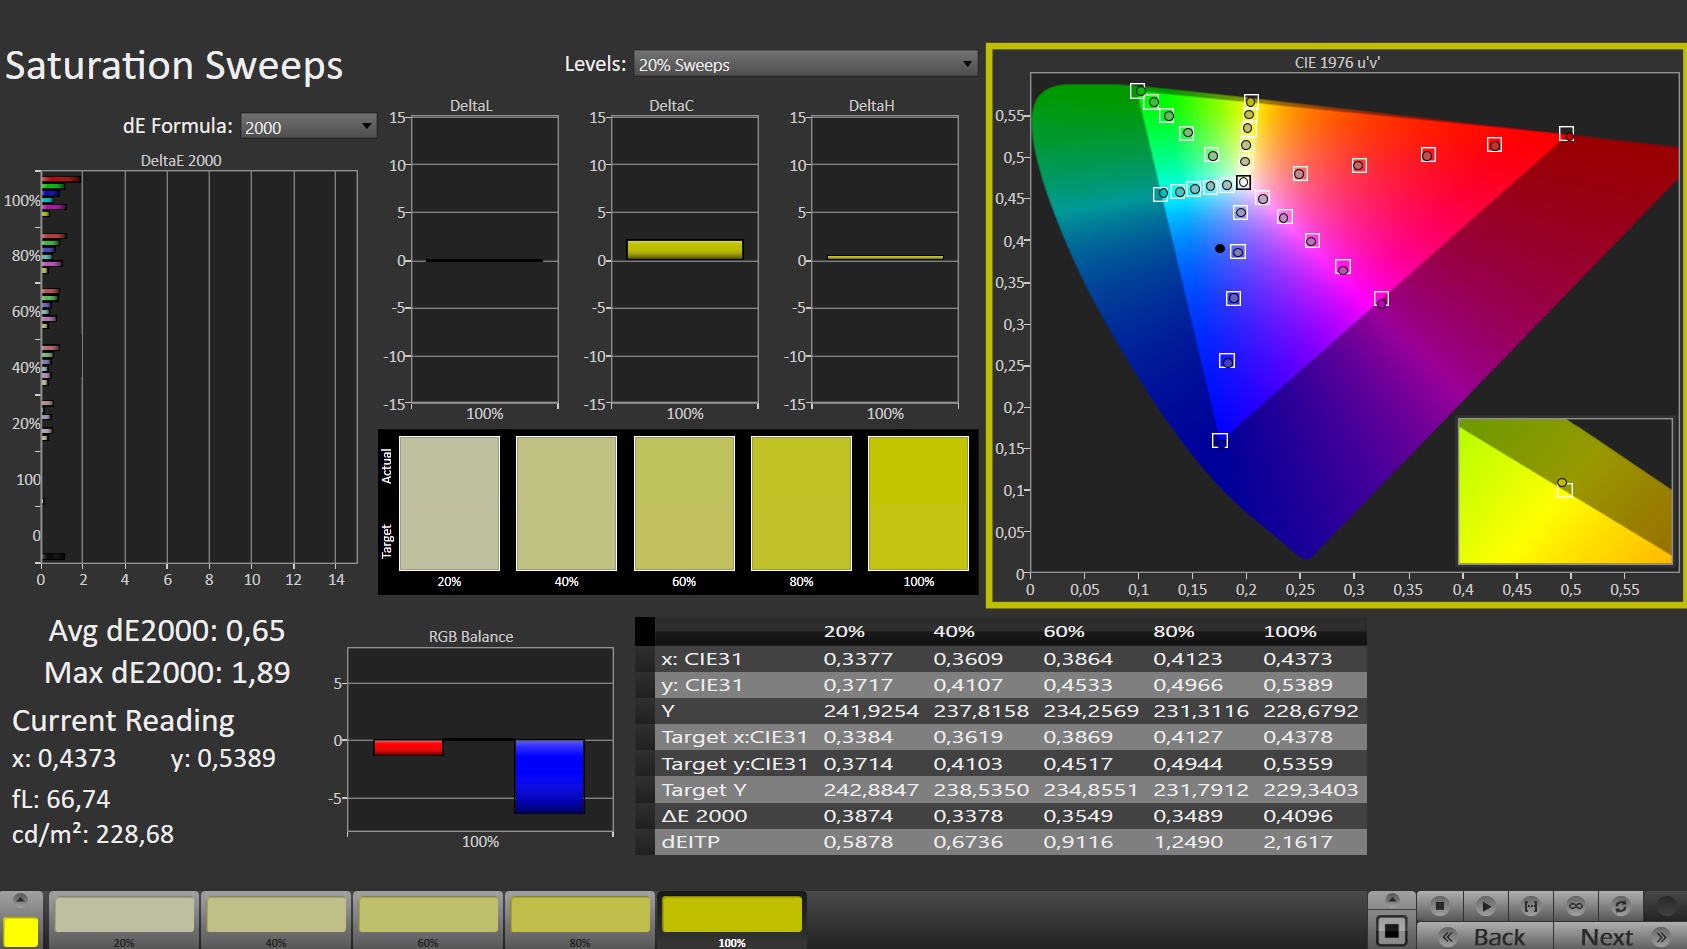
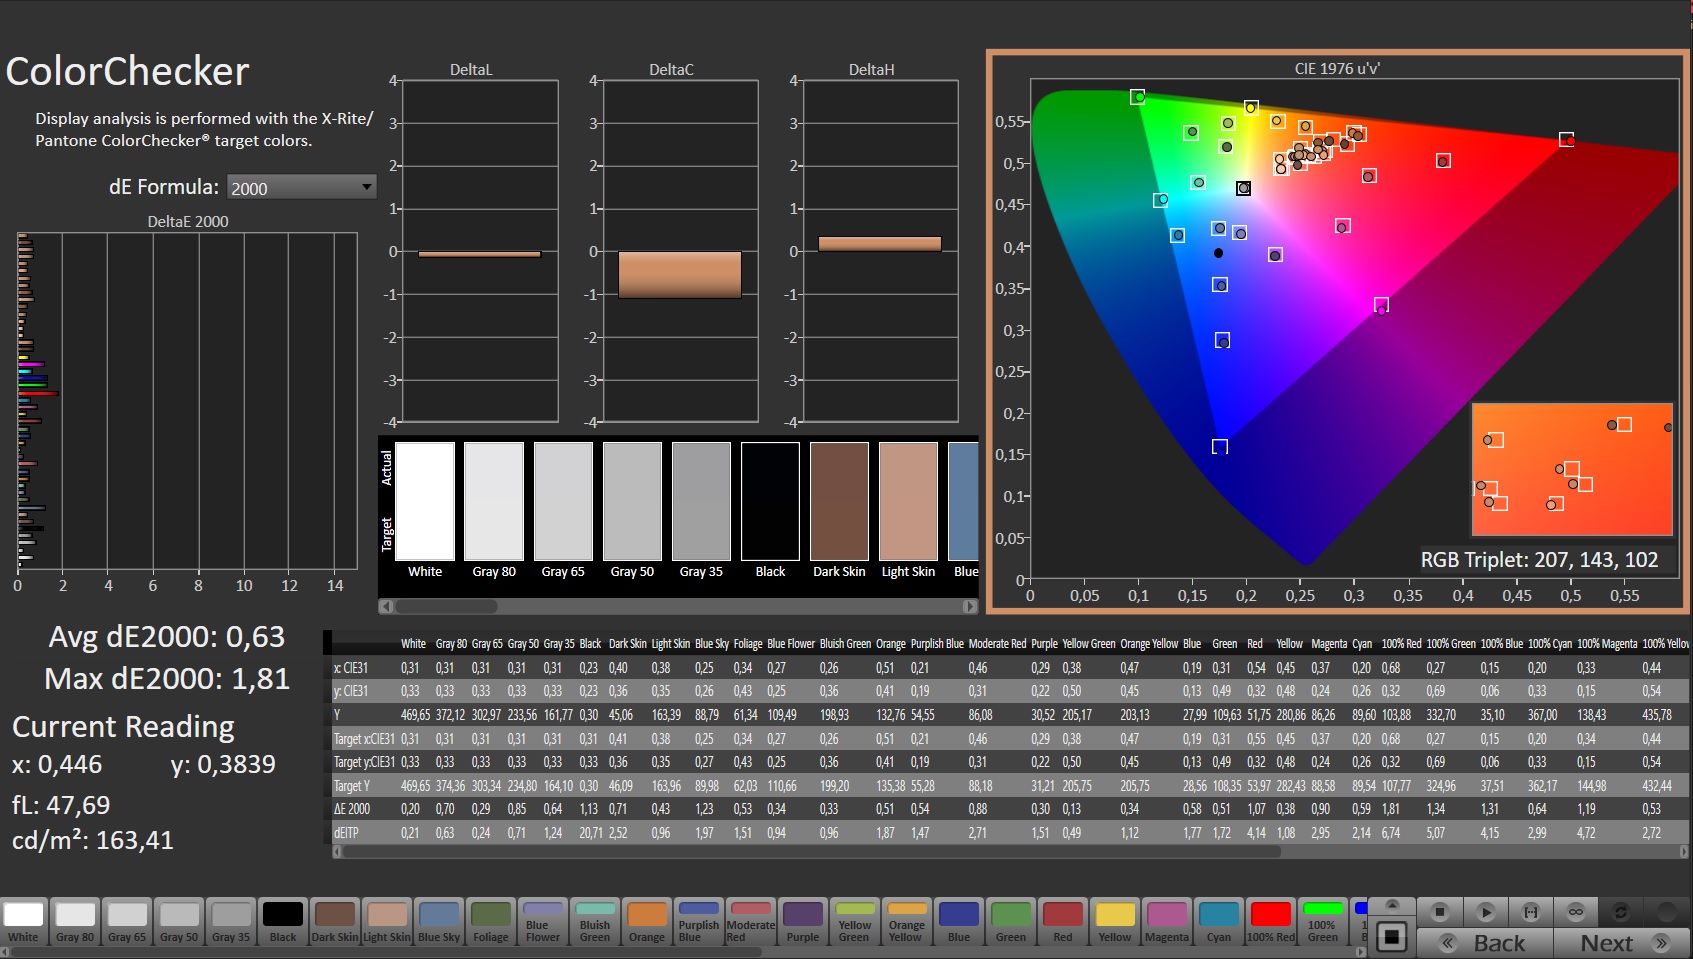
正如我们用CalMan和X-Rite i1 Pro 2色度计测量的那样,在交付状态下,显示器的色温略微过低。然而,这可以通过使用X-Rite i1 Profiler进行校准来补救。校准后,色彩再现相当准确。 像往常一样,我们创建的颜色配置文件可供您免费下载.
根据宏碁的说法,该显示器能够覆盖100%的小型sRGB色彩空间。我们的测量结果也证实了这一点,甚至更多:该显示器也能够几乎完全覆盖DCI-P3色彩空间。这也使得宏碁Predator Triton 500 SE适用于简单的图像和视频处理。
由于该显示器提供了哑光表面和高亮度,它也非常适合在户外使用。
Display Response Times
| ↔ Response Time Black to White | ||
|---|---|---|
| 6.4 ms ... rise ↗ and fall ↘ combined | ↗ 1.8 ms rise | 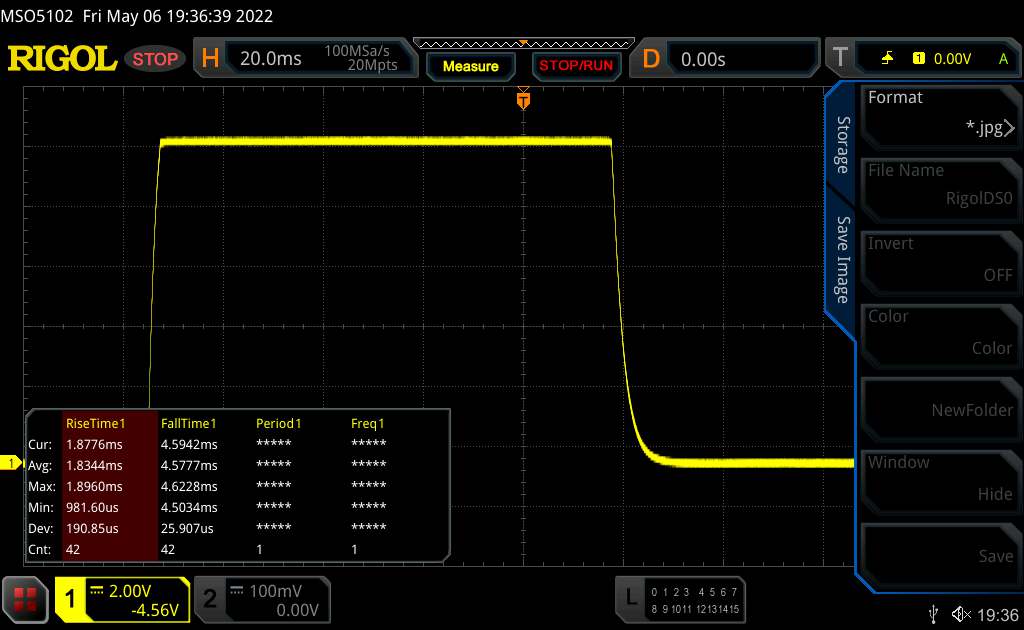 |
| ↘ 4.6 ms fall | ||
| The screen shows very fast response rates in our tests and should be very well suited for fast-paced gaming. In comparison, all tested devices range from 0.1 (minimum) to 240 (maximum) ms. » 20 % of all devices are better. This means that the measured response time is better than the average of all tested devices (19.8 ms). | ||
| ↔ Response Time 50% Grey to 80% Grey | ||
| 13.8 ms ... rise ↗ and fall ↘ combined | ↗ 6.3 ms rise | 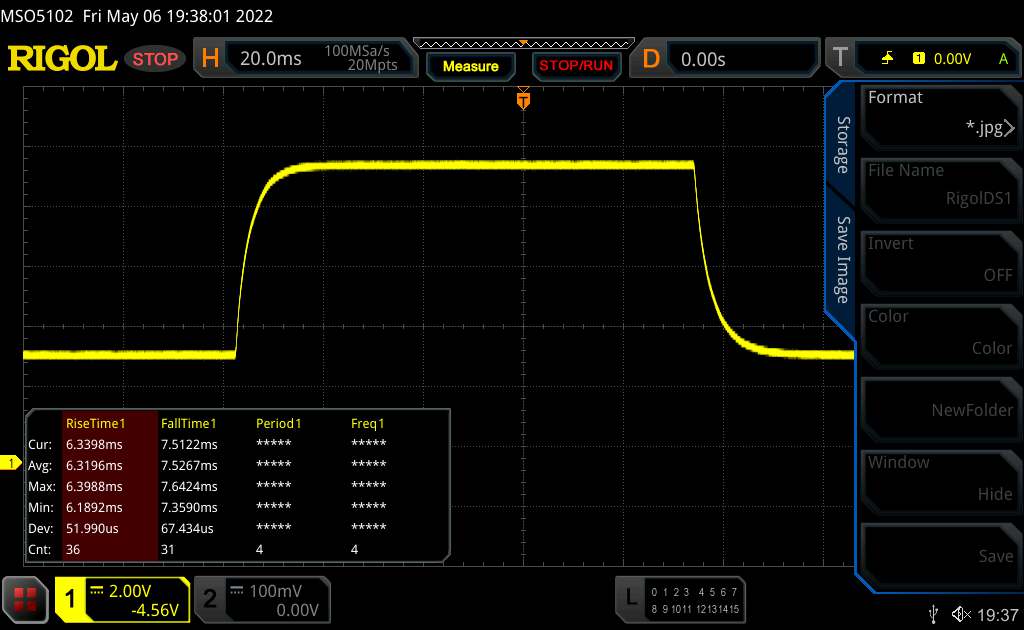 |
| ↘ 7.5 ms fall | ||
| The screen shows good response rates in our tests, but may be too slow for competitive gamers. In comparison, all tested devices range from 0.165 (minimum) to 636 (maximum) ms. » 28 % of all devices are better. This means that the measured response time is better than the average of all tested devices (31 ms). | ||
Screen Flickering / PWM (Pulse-Width Modulation)
| Screen flickering / PWM not detected | 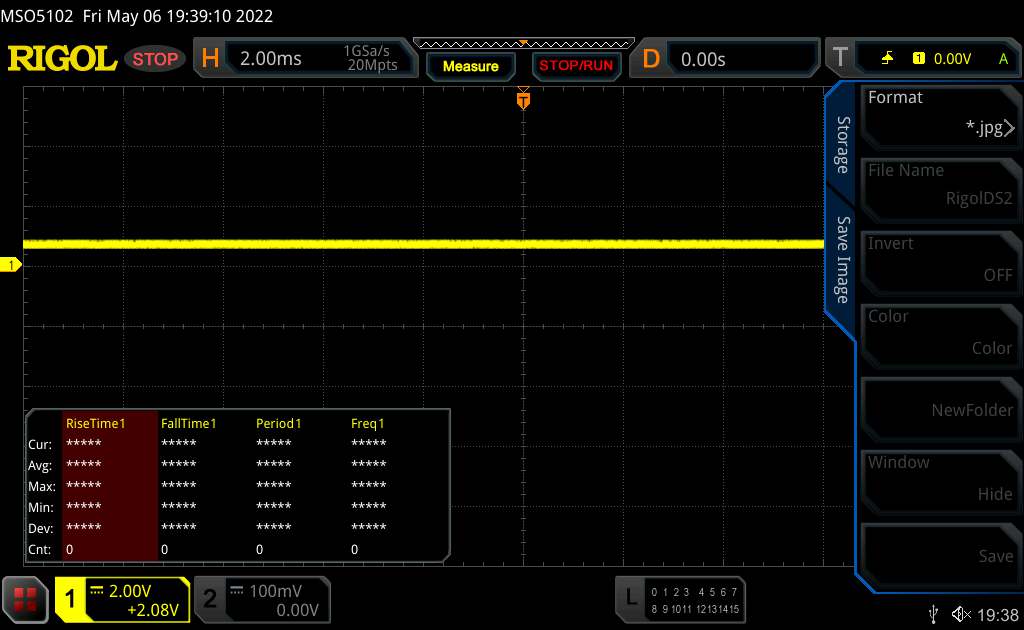 | ||
In comparison: 52 % of all tested devices do not use PWM to dim the display. If PWM was detected, an average of 7757 (minimum: 5 - maximum: 343500) Hz was measured. | |||
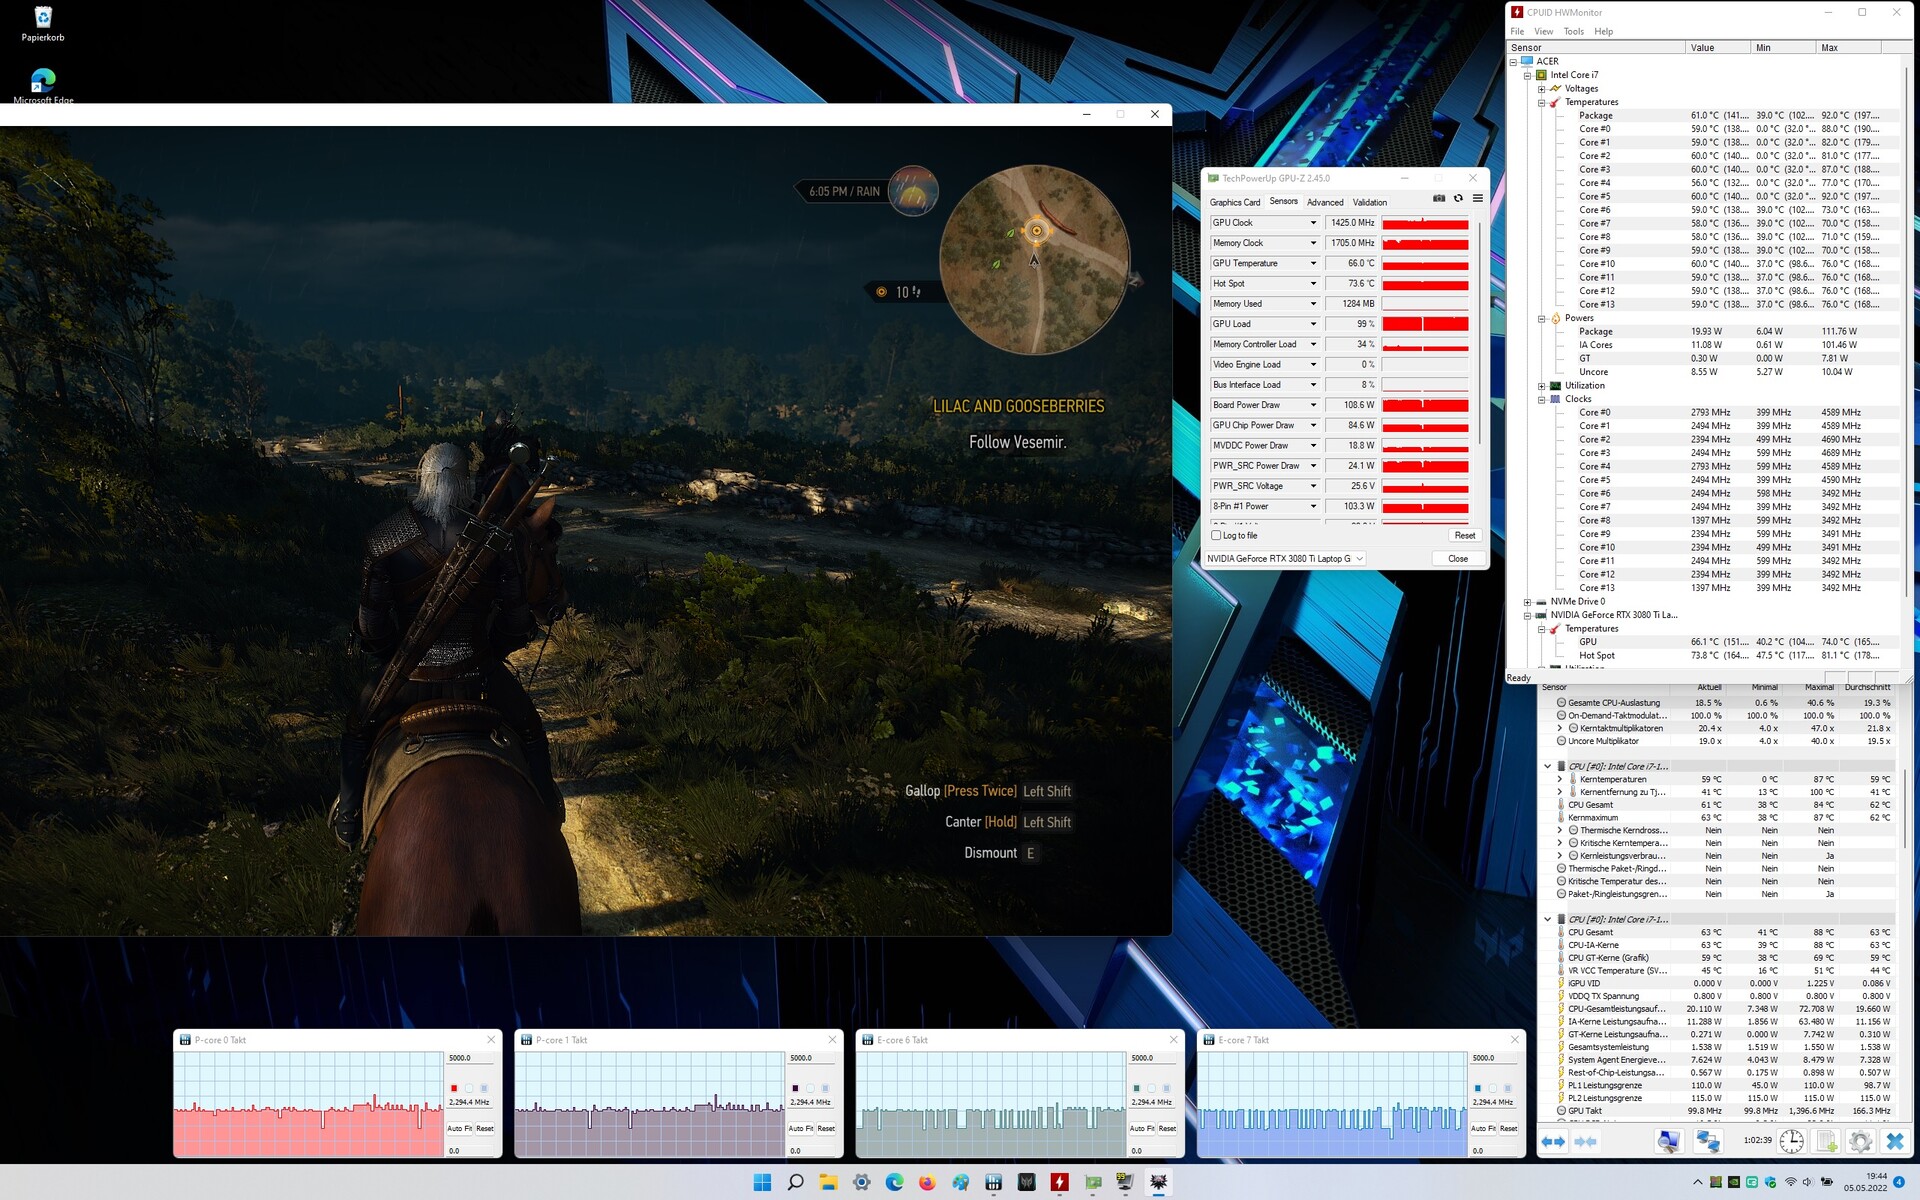
性能。Alder Lake CPU和GeForce RTX 3080 Ti带来强大的性能
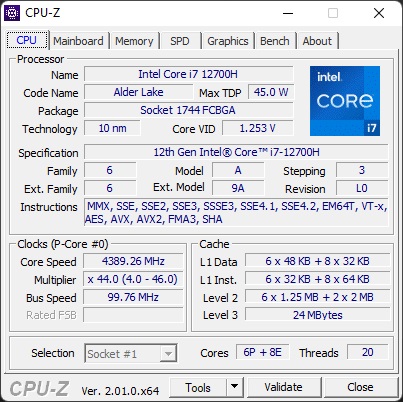
在我们测试的时候,宏碁掠夺者Triton 500 SE有两个版本:一个型号配备了英特尔酷睿i7-12700H和另一个带有 酷睿i9-12900H.由于还配备了 NvidiaGeForce RTX 3080 Ti是两款机型的共同点。i7型号提供16GB的内存,而在i9中,32GB的LPDDR5-5200被焊接在一起。同时,更昂贵的i9型号提供2TB的固态硬盘存储,而宏碁i7型号的笔记本电脑有1TB的固态硬盘。
测试条件
有各种性能模式,你可以通过 "PredatorSense "软件调整。静音、标准、极限和涡轮,后者迫使风扇以最大噪音水平持续运行。我们的性能测试是在极限模式下进行的,其结果是最高性能的功率限制为115瓦,CPU的持续消耗为95瓦。
处理器
ǞǞǞ英特尔酷睿i7-12700H是一个总共有14个内核的处理器。根据Alder Lake架构的混合结构,其中六个是 "大型 "性能核心,八个是 "小型 "效率核心。P核心的最高时钟速度为4.7 GHz(基本时钟速度:2.4 GHz),E核心的最高为3.5 GHz(1.8 GHz)。作为Alder Lake H系列的一部分,i7-12700H的TDP为45瓦,英特尔指定的最大消耗为115瓦。你可以在我们的《CPU比较列表》中找到更多信息和广泛的基准。 CPU比较列表.
宏碁能够从相对较薄的机箱中获得大量的性能,Razer Blade 17 ,在多核恒定性能方面可以明显超越,而其i7-12800H ,只是在单核性能方面更好。另一方面,与联想和微星的明显更厚的游戏笔记本相比,宏碁掠夺者Triton 500 SE有一个缺点。
在电池运行时,笔记本自动切换到标准性能模式,更快的模式无法使用。但性能也受到了额外的限制,虽然标准 模式在主电源运行时允许持续消耗80瓦,但在电池运行时却只有35瓦。在对CPU要求较高的3DMark 11物理得分中,它在电池运行时只达到9142分,而不是24020分(减去62%)。
Cinebench R15 Multi Constant Load Test
* ... smaller is better
AIDA64: FP32 Ray-Trace | FPU Julia | CPU SHA3 | CPU Queen | FPU SinJulia | FPU Mandel | CPU AES | CPU ZLib | FP64 Ray-Trace | CPU PhotoWorxx
| Performance rating | |
| Average of class Gaming | |
| MSI GE76 Raider | |
| Lenovo Legion 5 Pro 16 G7 i7 RTX 3070Ti | |
| Acer Predator Triton 500 SE PT516-52s-70KX | |
| Average Intel Core i7-12700H | |
| Razer Blade 17 RTX 3080 Ti | |
| AIDA64 / FP32 Ray-Trace | |
| Average of class Gaming (10227 - 85542, n=105, last 2 years) | |
| Average Intel Core i7-12700H (2585 - 17957, n=64) | |
| Lenovo Legion 5 Pro 16 G7 i7 RTX 3070Ti | |
| Acer Predator Triton 500 SE PT516-52s-70KX | |
| MSI GE76 Raider | |
| Razer Blade 17 RTX 3080 Ti | |
| AIDA64 / FPU Julia | |
| Average of class Gaming (51376 - 238426, n=105, last 2 years) | |
| Average Intel Core i7-12700H (12439 - 90760, n=64) | |
| Lenovo Legion 5 Pro 16 G7 i7 RTX 3070Ti | |
| Acer Predator Triton 500 SE PT516-52s-70KX | |
| MSI GE76 Raider | |
| Razer Blade 17 RTX 3080 Ti | |
| AIDA64 / CPU SHA3 | |
| Average of class Gaming (2180 - 10115, n=105, last 2 years) | |
| Lenovo Legion 5 Pro 16 G7 i7 RTX 3070Ti | |
| Acer Predator Triton 500 SE PT516-52s-70KX | |
| MSI GE76 Raider | |
| Average Intel Core i7-12700H (833 - 4242, n=64) | |
| Razer Blade 17 RTX 3080 Ti | |
| AIDA64 / CPU Queen | |
| Average of class Gaming (49785 - 173351, n=90, last 2 years) | |
| MSI GE76 Raider | |
| Razer Blade 17 RTX 3080 Ti | |
| Lenovo Legion 5 Pro 16 G7 i7 RTX 3070Ti | |
| Acer Predator Triton 500 SE PT516-52s-70KX | |
| Average Intel Core i7-12700H (57923 - 103202, n=63) | |
| AIDA64 / FPU SinJulia | |
| Average of class Gaming (4424 - 33636, n=105, last 2 years) | |
| MSI GE76 Raider | |
| Lenovo Legion 5 Pro 16 G7 i7 RTX 3070Ti | |
| Acer Predator Triton 500 SE PT516-52s-70KX | |
| Razer Blade 17 RTX 3080 Ti | |
| Average Intel Core i7-12700H (3249 - 9939, n=64) | |
| AIDA64 / FPU Mandel | |
| Average of class Gaming (25115 - 128721, n=105, last 2 years) | |
| Average Intel Core i7-12700H (7135 - 44760, n=64) | |
| Lenovo Legion 5 Pro 16 G7 i7 RTX 3070Ti | |
| Acer Predator Triton 500 SE PT516-52s-70KX | |
| MSI GE76 Raider | |
| Razer Blade 17 RTX 3080 Ti | |
| AIDA64 / CPU AES | |
| Average of class Gaming (39258 - 247074, n=105, last 2 years) | |
| Lenovo Legion 5 Pro 16 G7 i7 RTX 3070Ti | |
| Acer Predator Triton 500 SE PT516-52s-70KX | |
| MSI GE76 Raider | |
| Average Intel Core i7-12700H (31839 - 144360, n=64) | |
| Razer Blade 17 RTX 3080 Ti | |
| AIDA64 / CPU ZLib | |
| Average of class Gaming (574 - 2531, n=105, last 2 years) | |
| Lenovo Legion 5 Pro 16 G7 i7 RTX 3070Ti | |
| Acer Predator Triton 500 SE PT516-52s-70KX | |
| MSI GE76 Raider | |
| Average Intel Core i7-12700H (305 - 1171, n=64) | |
| Razer Blade 17 RTX 3080 Ti | |
| AIDA64 / FP64 Ray-Trace | |
| Average of class Gaming (5509 - 45446, n=105, last 2 years) | |
| Average Intel Core i7-12700H (1437 - 9692, n=64) | |
| Lenovo Legion 5 Pro 16 G7 i7 RTX 3070Ti | |
| Acer Predator Triton 500 SE PT516-52s-70KX | |
| MSI GE76 Raider | |
| Razer Blade 17 RTX 3080 Ti | |
| AIDA64 / CPU PhotoWorxx | |
| Average of class Gaming (12271 - 89891, n=105, last 2 years) | |
| Razer Blade 17 RTX 3080 Ti | |
| MSI GE76 Raider | |
| Acer Predator Triton 500 SE PT516-52s-70KX | |
| Lenovo Legion 5 Pro 16 G7 i7 RTX 3070Ti | |
| Average Intel Core i7-12700H (12863 - 52207, n=64) | |
系统性能
即使宏碁Predator Triton 500 SE在PCMark 10中仍然落后于竞争对手,但距离很小。该系统在日常操作中运行绝对平稳。
CrossMark: Overall | Productivity | Creativity | Responsiveness
| PCMark 10 / Score | |
| Average of class Gaming (5828 - 12414, n=93, last 2 years) | |
| MSI GE76 Raider | |
| Razer Blade 17 RTX 3080 Ti | |
| Lenovo Legion 5 Pro 16 G7 i7 RTX 3070Ti | |
| Acer Predator Triton 500 SE PT516-52s-70KX | |
| Average Intel Core i7-12700H, NVIDIA GeForce RTX 3080 Ti Laptop GPU (6868 - 7638, n=7) | |
| PCMark 10 / Essentials | |
| Razer Blade 17 RTX 3080 Ti | |
| Acer Predator Triton 500 SE PT516-52s-70KX | |
| MSI GE76 Raider | |
| Average of class Gaming (8810 - 11935, n=97, last 2 years) | |
| Average Intel Core i7-12700H, NVIDIA GeForce RTX 3080 Ti Laptop GPU (9987 - 11318, n=7) | |
| Lenovo Legion 5 Pro 16 G7 i7 RTX 3070Ti | |
| PCMark 10 / Productivity | |
| Average of class Gaming (6845 - 25323, n=95, last 2 years) | |
| MSI GE76 Raider | |
| Lenovo Legion 5 Pro 16 G7 i7 RTX 3070Ti | |
| Acer Predator Triton 500 SE PT516-52s-70KX | |
| Average Intel Core i7-12700H, NVIDIA GeForce RTX 3080 Ti Laptop GPU (8944 - 10726, n=7) | |
| Razer Blade 17 RTX 3080 Ti | |
| PCMark 10 / Digital Content Creation | |
| Average of class Gaming (7602 - 19954, n=95, last 2 years) | |
| MSI GE76 Raider | |
| Razer Blade 17 RTX 3080 Ti | |
| Lenovo Legion 5 Pro 16 G7 i7 RTX 3070Ti | |
| Acer Predator Triton 500 SE PT516-52s-70KX | |
| Average Intel Core i7-12700H, NVIDIA GeForce RTX 3080 Ti Laptop GPU (8956 - 12249, n=7) | |
| CrossMark / Overall | |
| Average of class Gaming (1366 - 2409, n=94, last 2 years) | |
| Lenovo Legion 5 Pro 16 G7 i7 RTX 3070Ti | |
| Acer Predator Triton 500 SE PT516-52s-70KX | |
| Average Intel Core i7-12700H, NVIDIA GeForce RTX 3080 Ti Laptop GPU (1761 - 1861, n=4) | |
| CrossMark / Productivity | |
| Lenovo Legion 5 Pro 16 G7 i7 RTX 3070Ti | |
| Average of class Gaming (1386 - 2254, n=94, last 2 years) | |
| Acer Predator Triton 500 SE PT516-52s-70KX | |
| Average Intel Core i7-12700H, NVIDIA GeForce RTX 3080 Ti Laptop GPU (1645 - 1800, n=4) | |
| CrossMark / Creativity | |
| Average of class Gaming (1343 - 2786, n=94, last 2 years) | |
| Lenovo Legion 5 Pro 16 G7 i7 RTX 3070Ti | |
| Average Intel Core i7-12700H, NVIDIA GeForce RTX 3080 Ti Laptop GPU (1936 - 2041, n=4) | |
| Acer Predator Triton 500 SE PT516-52s-70KX | |
| CrossMark / Responsiveness | |
| Lenovo Legion 5 Pro 16 G7 i7 RTX 3070Ti | |
| Acer Predator Triton 500 SE PT516-52s-70KX | |
| Average of class Gaming (1226 - 2334, n=94, last 2 years) | |
| Average Intel Core i7-12700H, NVIDIA GeForce RTX 3080 Ti Laptop GPU (1461 - 1868, n=4) | |
| PCMark 10 Score | 7539 points | |
Help | ||
| AIDA64 / Memory Copy | |
| Average of class Gaming (21750 - 129946, n=105, last 2 years) | |
| MSI GE76 Raider | |
| Razer Blade 17 RTX 3080 Ti | |
| Acer Predator Triton 500 SE PT516-52s-70KX | |
| Average Intel Core i7-12700H (25615 - 80511, n=64) | |
| Lenovo Legion 5 Pro 16 G7 i7 RTX 3070Ti | |
| AIDA64 / Memory Read | |
| Average of class Gaming (22956 - 118858, n=105, last 2 years) | |
| Acer Predator Triton 500 SE PT516-52s-70KX | |
| Razer Blade 17 RTX 3080 Ti | |
| MSI GE76 Raider | |
| Lenovo Legion 5 Pro 16 G7 i7 RTX 3070Ti | |
| Average Intel Core i7-12700H (25586 - 79442, n=64) | |
| AIDA64 / Memory Write | |
| Average of class Gaming (22297 - 135096, n=105, last 2 years) | |
| Razer Blade 17 RTX 3080 Ti | |
| MSI GE76 Raider | |
| Lenovo Legion 5 Pro 16 G7 i7 RTX 3070Ti | |
| Average Intel Core i7-12700H (23679 - 88660, n=64) | |
| Acer Predator Triton 500 SE PT516-52s-70KX | |
| AIDA64 / Memory Latency | |
| Acer Predator Triton 500 SE PT516-52s-70KX | |
| Average of class Gaming (75.3 - 259, n=105, last 2 years) | |
| Lenovo Legion 5 Pro 16 G7 i7 RTX 3070Ti | |
| MSI GE76 Raider | |
| Average Intel Core i7-12700H (76.2 - 133.9, n=62) | |
| Razer Blade 17 RTX 3080 Ti | |
* ... smaller is better
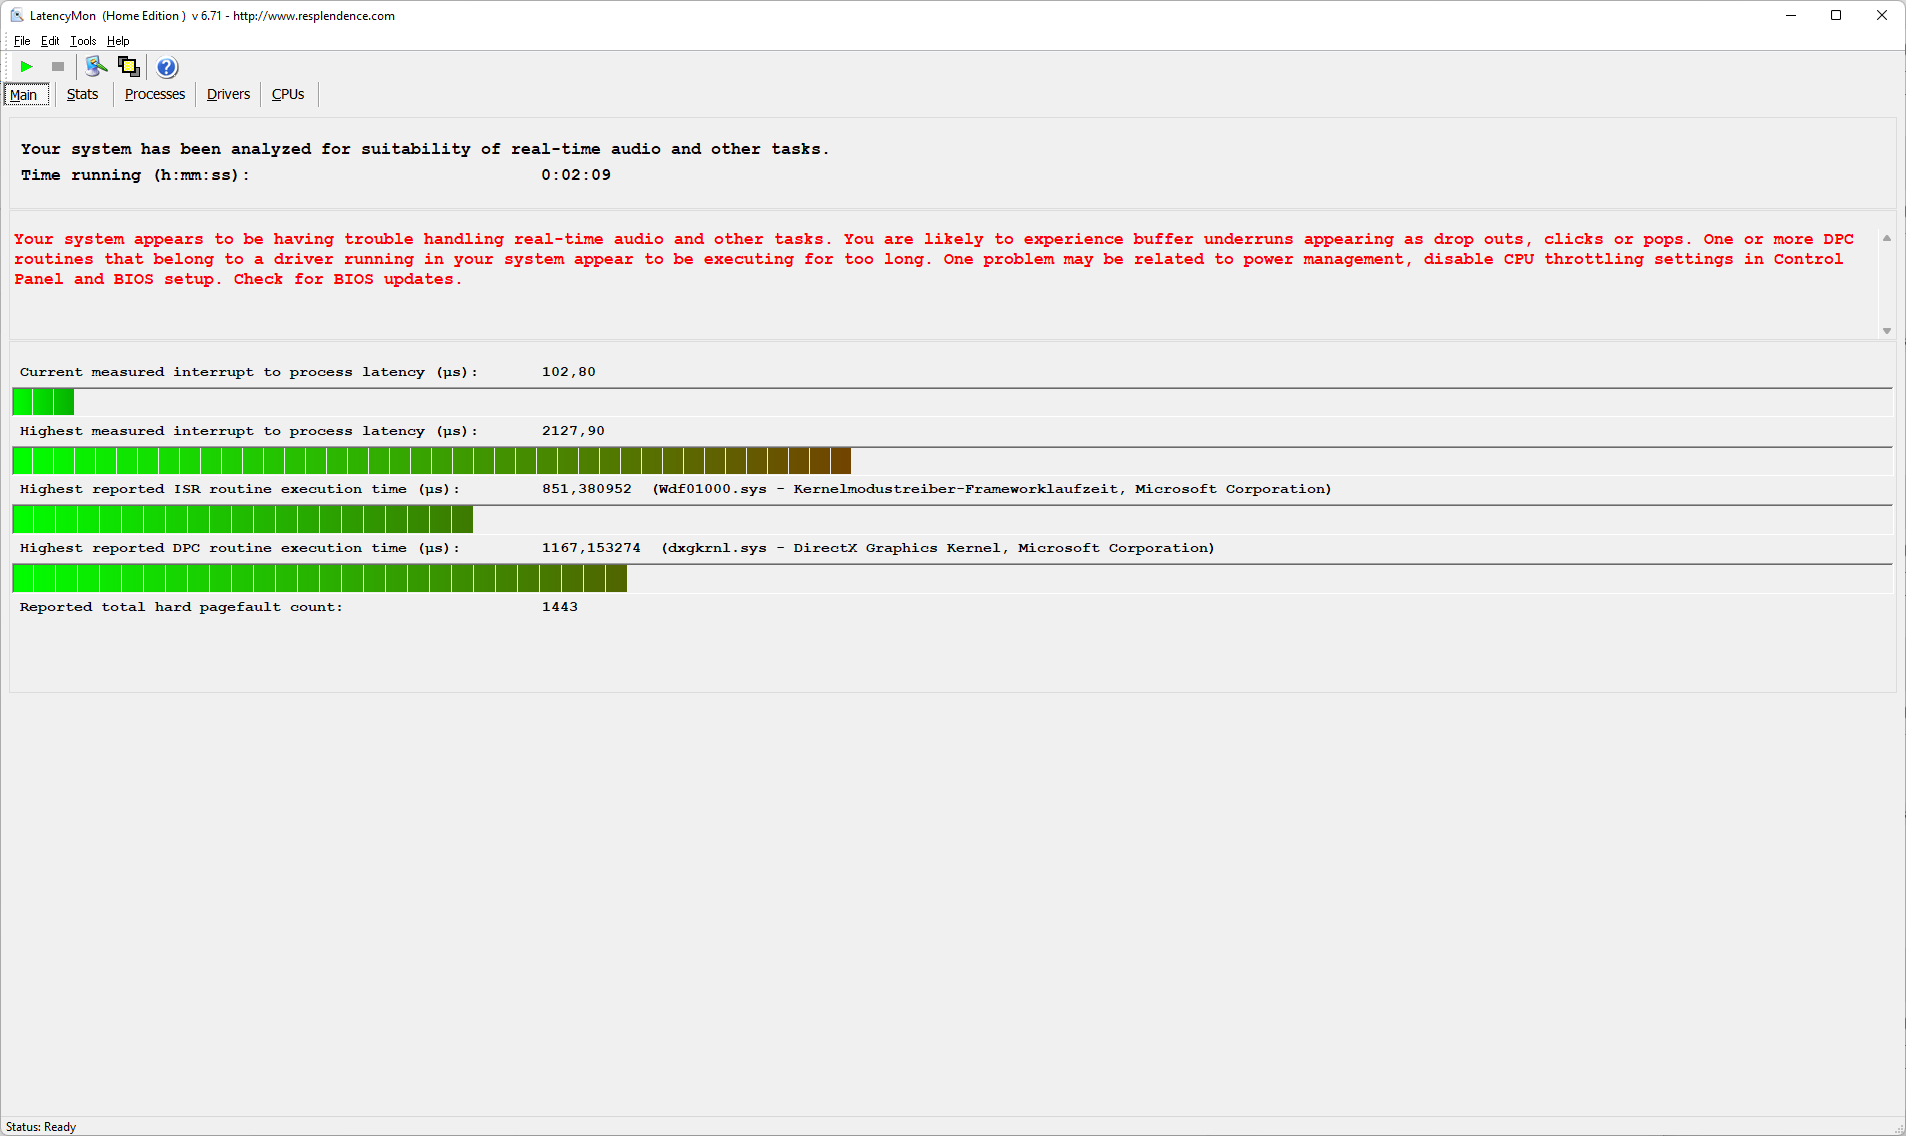
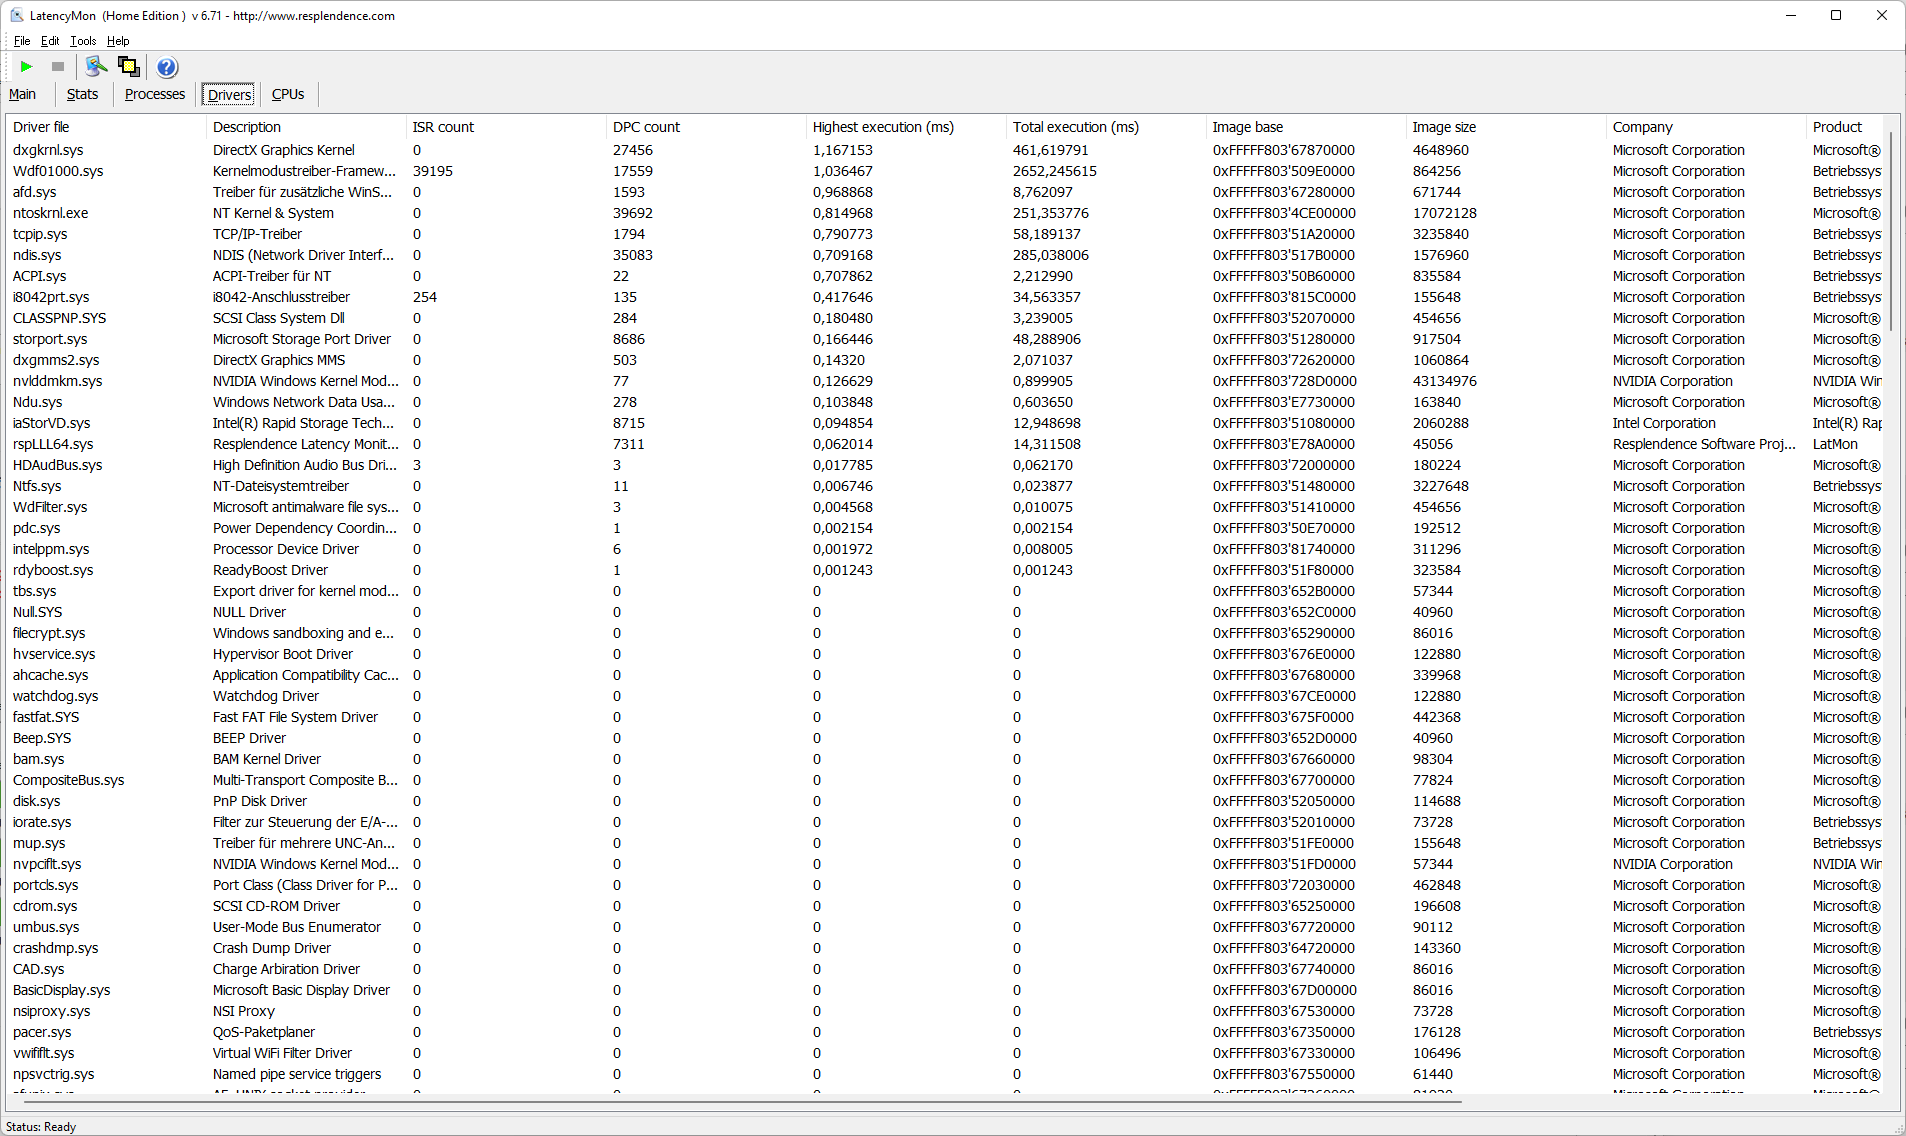
DPC延迟
宏碁掠夺者Triton 500 SE在DPC延迟方面存在问题,这可能导致在实时视频或音频处理过程中出现一些掉帧。
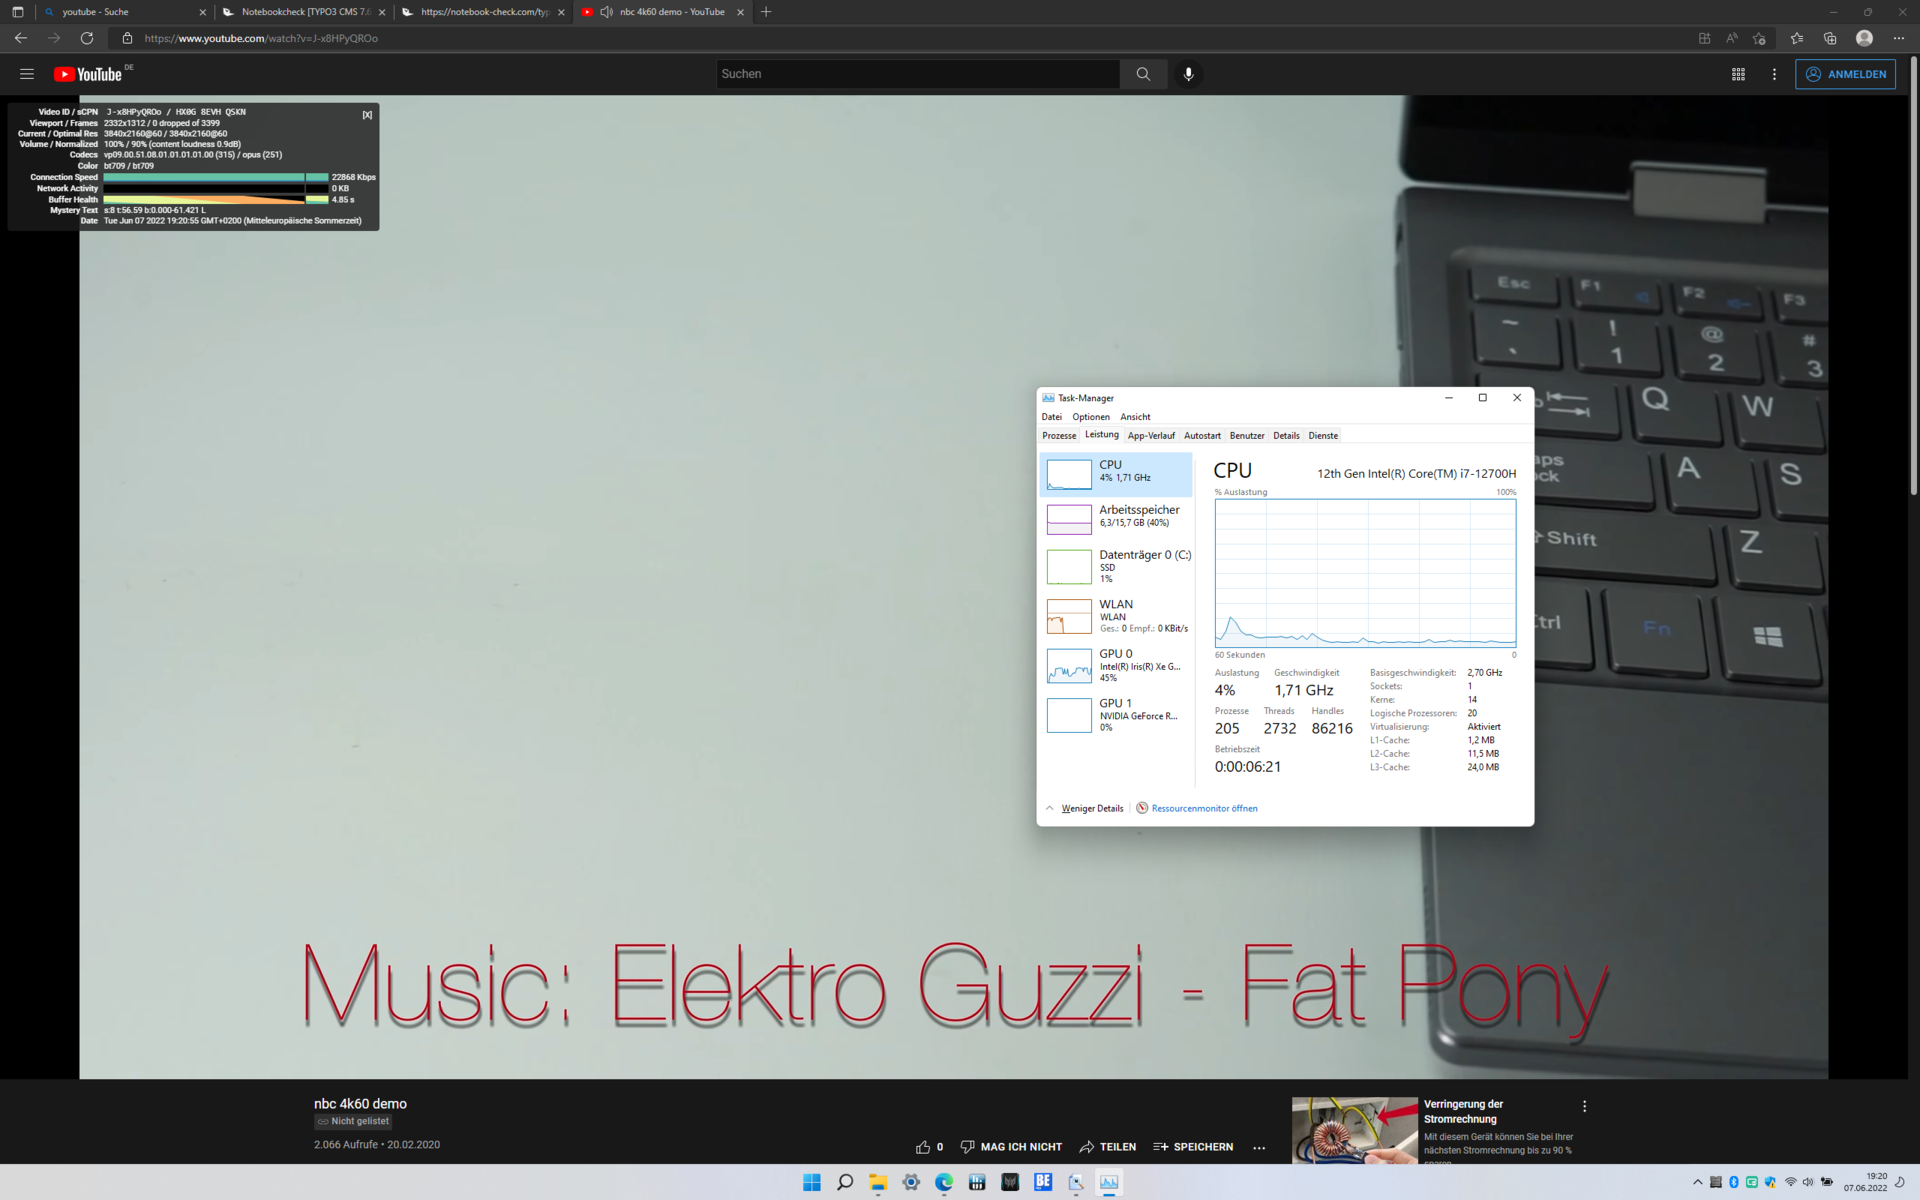
但至少在YouTube的测试中没有出现掉帧。
| DPC Latencies / LatencyMon - interrupt to process latency (max), Web, Youtube, Prime95 | |
| Acer Predator Triton 500 SE PT516-52s-70KX | |
| MSI GE76 Raider | |
| Razer Blade 17 RTX 3080 Ti | |
| Lenovo Legion 5 Pro 16 G7 i7 RTX 3070Ti | |
* ... smaller is better
存储解决方案
美光公司的NVMe固态硬盘使用最新的PCIe 4.0标准连接。它提供的容量为1TB,比竞争对手的三星固态硬盘略慢。然而,差异并不大,即使在持续的负载下,该固态硬盘也总是能提供其最大的性能。

* ... smaller is better
Constant Performance Reading: DiskSpd Read Loop, Queue Depth 8
图形卡
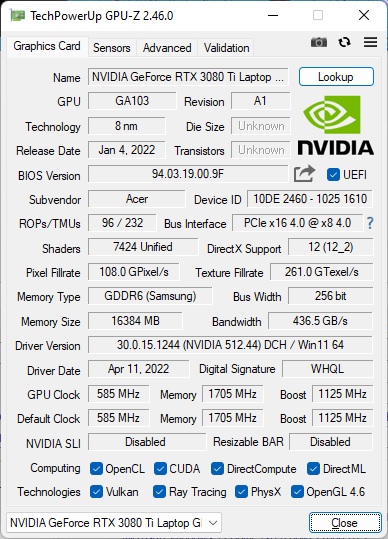
的NvidiaGeForce RTX 3080 Ti是Nvidia最强大的移动GPU之一。7,424个着色器单元应提供高达165瓦的消耗,使GPU的时钟速度达到1.59GHz。你可以了解与其他图形芯片的其他比较,在我们的 GPU列表.
不幸的是,在宏碁掠夺者Triton 500SE中,图形芯片并不能发挥其全部潜力。我们看到的不是完整的165瓦,而是115瓦的消耗。有了这个,宏碁笔记本电脑的表现比拥有相同GPU的竞争对手更差,而 Razer Blade 17和 MSI GE76 Raider分别快了14%和24%。笔记本电脑的 联想Legion 5 Pro与其名义上更差的 GeForce RTX 3070 Ti也平均快了约8%。
与CPU一样,在没有连接电源的情况下,GPU也明显被扼杀。在3DMark 11 GPU得分中,结果大约差81%,只有6,900分,而不是37,288分--在电池运行中,性能大幅下降。
| 3DMark 11 Performance | 32346 points | |
| 3DMark Cloud Gate Standard Score | 61970 points | |
| 3DMark Fire Strike Score | 25051 points | |
| 3DMark Time Spy Score | 11428 points | |
Help | ||
游戏性能
在3DMark测试中已经暗示的内容在游戏基准测试中得到确认。宏碁Predator Triton 500 SE无法完全跟上竞争对手的步伐。特别是 MSI GE76 Raider在所有领域都领先。
然而,这当然不意味着宏碁的笔记本电脑会是一台糟糕的游戏笔记本电脑。它仍然足够强大,甚至可以在最高细节水平的QHD分辨率下进行非常苛刻的游戏而没有任何问题。使用外部显示器的4K游戏也不应该构成任何重大问题。
| The Witcher 3 - 1920x1080 Ultra Graphics & Postprocessing (HBAO+) | |
| Average of class Gaming (104.7 - 240, n=7, last 2 years) | |
| MSI GE76 Raider | |
| Razer Blade 17 RTX 3080 Ti | |
| Average NVIDIA GeForce RTX 3080 Ti Laptop GPU (30 - 130.6, n=43) | |
| Lenovo Legion 5 Pro 16 G7 i7 RTX 3070Ti | |
| Acer Predator Triton 500 SE PT516-52s-70KX | |
| F1 2021 - 2560x1440 Ultra High Preset + Raytracing AA:T AF:16x | |
| MSI GE76 Raider | |
| Lenovo Legion 5 Pro 16 G7 i7 RTX 3070Ti | |
| Average NVIDIA GeForce RTX 3080 Ti Laptop GPU (30 - 120.1, n=19) | |
| Acer Predator Triton 500 SE PT516-52s-70KX | |
在我们的TheWitcher 3恒定负载测试中,我们没有看到任何性能下降,因此在日常游戏操作中应该不会出现节流现象。
The Witcher 3 FPS Chart
| low | med. | high | ultra | QHD | |
|---|---|---|---|---|---|
| GTA V (2015) | 185.7 | 182.8 | 176.1 | 113 | 91 |
| The Witcher 3 (2015) | 398 | 291 | 186.6 | 102.1 | |
| Dota 2 Reborn (2015) | 171.7 | 157.8 | 151.4 | 144 | |
| Final Fantasy XV Benchmark (2018) | 193.3 | 134.7 | 103.9 | 80.9 | |
| X-Plane 11.11 (2018) | 142.5 | 130.8 | 103.1 | ||
| Strange Brigade (2018) | 442 | 234 | 189.4 | 171.2 | 127.8 |
| F1 2021 (2021) | 384 | 287 | 246 | 121.9 | 91.7 |
排放物。宏碁笔记本电脑的风扇声音非常大
噪声排放
宏碁掠夺者Triton 500 SE对于耳朵敏感的人来说显然不是一个好选择。虽然它在空闲运行时基本保持安静,但情况并非总是如此,特别是在更激进的性能模式下,风扇会迅速打开,甚至在低活动时也是如此。
而当风扇运行时,它很快就会变得很吵。在我们的测试领域中,宏碁笔记本电脑产生的噪音水平最高,达到56 dB(a),尽管竞争对手也不怎么安静。唯一的例外是Razer Blade 17 ,它至少在平均负荷下只有适度的噪音。
Noise level
| Idle |
| 26 / 29 / 34 dB(A) |
| Load |
| 50 / 56 dB(A) |
 | ||
30 dB silent 40 dB(A) audible 50 dB(A) loud |
||
min: | ||
| Acer Predator Triton 500 SE PT516-52s-70KX GeForce RTX 3080 Ti Laptop GPU, i7-12700H, Micron 3400 1TB MTFDKBA1T0TFH | Razer Blade 17 RTX 3080 Ti GeForce RTX 3080 Ti Laptop GPU, i7-12800H, Samsung PM9A1 MZVL21T0HCLR | Lenovo Legion 5 Pro 16 G7 i7 RTX 3070Ti GeForce RTX 3070 Ti Laptop GPU, i7-12700H, Samsung PM9A1 MZVL21T0HCLR | MSI GE76 Raider GeForce RTX 3080 Ti Laptop GPU, i9-12900HK, Samsung PM9A1 MZVL22T0HBLB | |
|---|---|---|---|---|
| Noise | 15% | 3% | -1% | |
| off / environment * (dB) | 26 | 23.3 10% | 24.6 5% | 26 -0% |
| Idle Minimum * (dB) | 26 | 23.3 10% | 28.4 -9% | 26 -0% |
| Idle Average * (dB) | 29 | 23.3 20% | 28.4 2% | 27 7% |
| Idle Maximum * (dB) | 34 | 26.3 23% | 28.4 16% | 40 -18% |
| Load Average * (dB) | 50 | 38.2 24% | 49.4 1% | 50 -0% |
| Witcher 3 ultra * (dB) | 53 | 50.9 4% | 49.4 7% | 53 -0% |
| Load Maximum * (dB) | 56 | 49.1 12% | 54.7 2% | 53 5% |
* ... smaller is better
温度
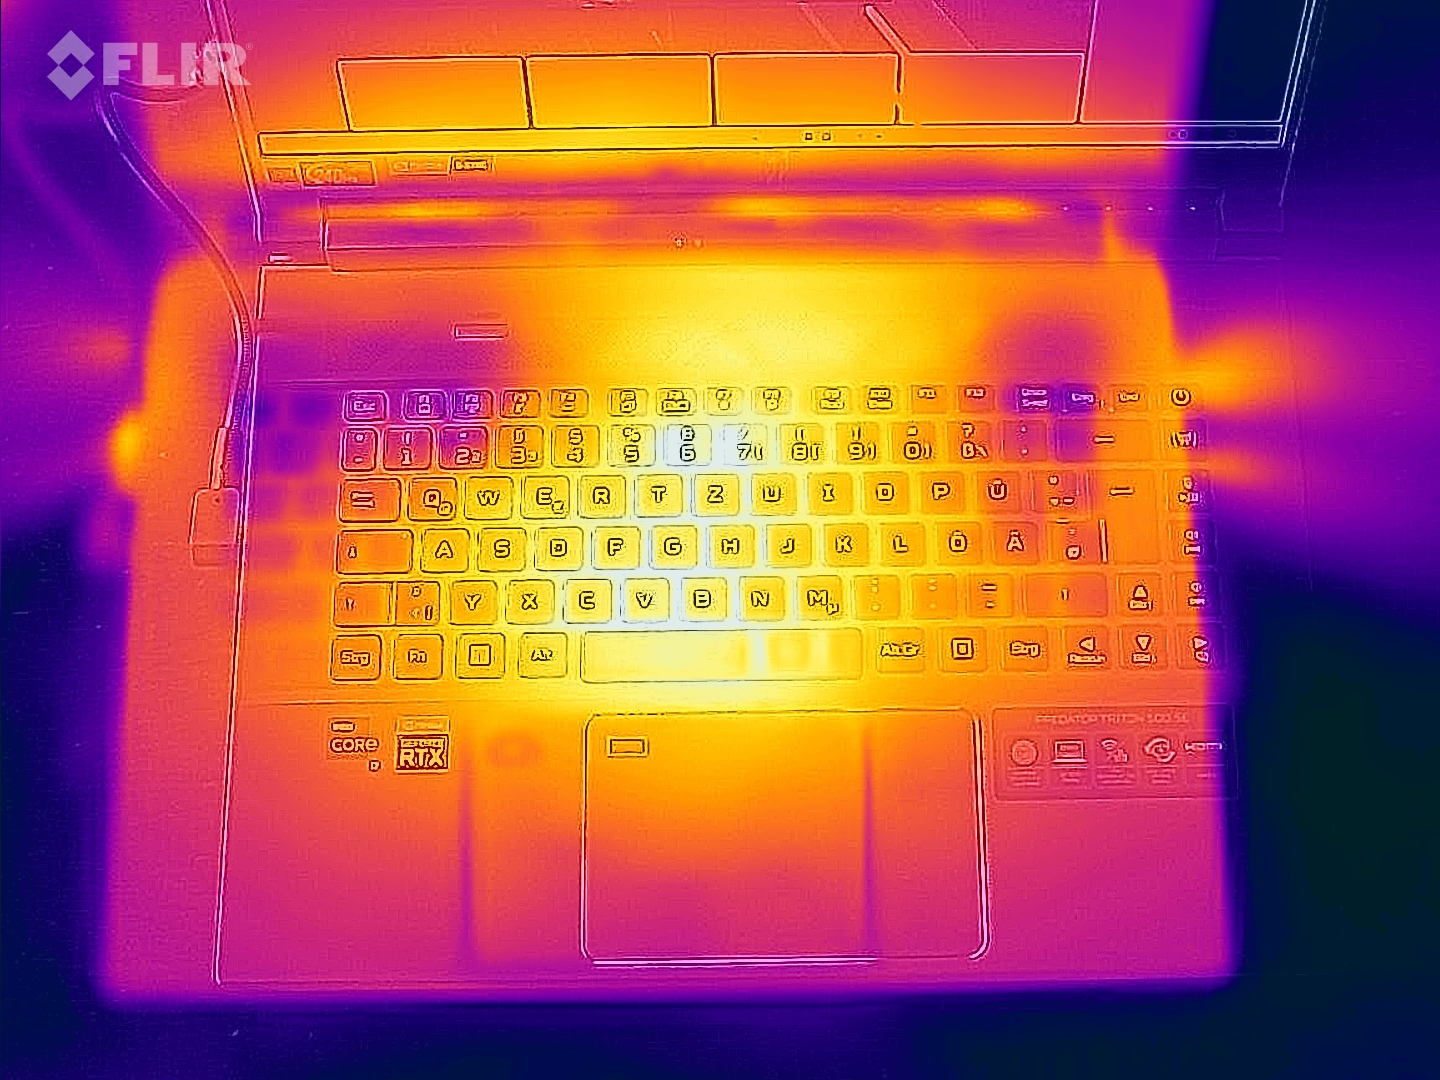
在空闲运行时,机箱温度已经比其他笔记本电脑略高。在负载情况下,宏碁Predator Triton 500 SE也明显发热。尽管底部的最高温度为49 ºC (120 ºF),仍然低于50 ºC (122 ºF)的临界值,但掌托的温度明显升高。这也适用于我们的TheWitcher 3测试,所以当用宏碁笔记本电脑玩游戏时,你也必须期待一些手汗。
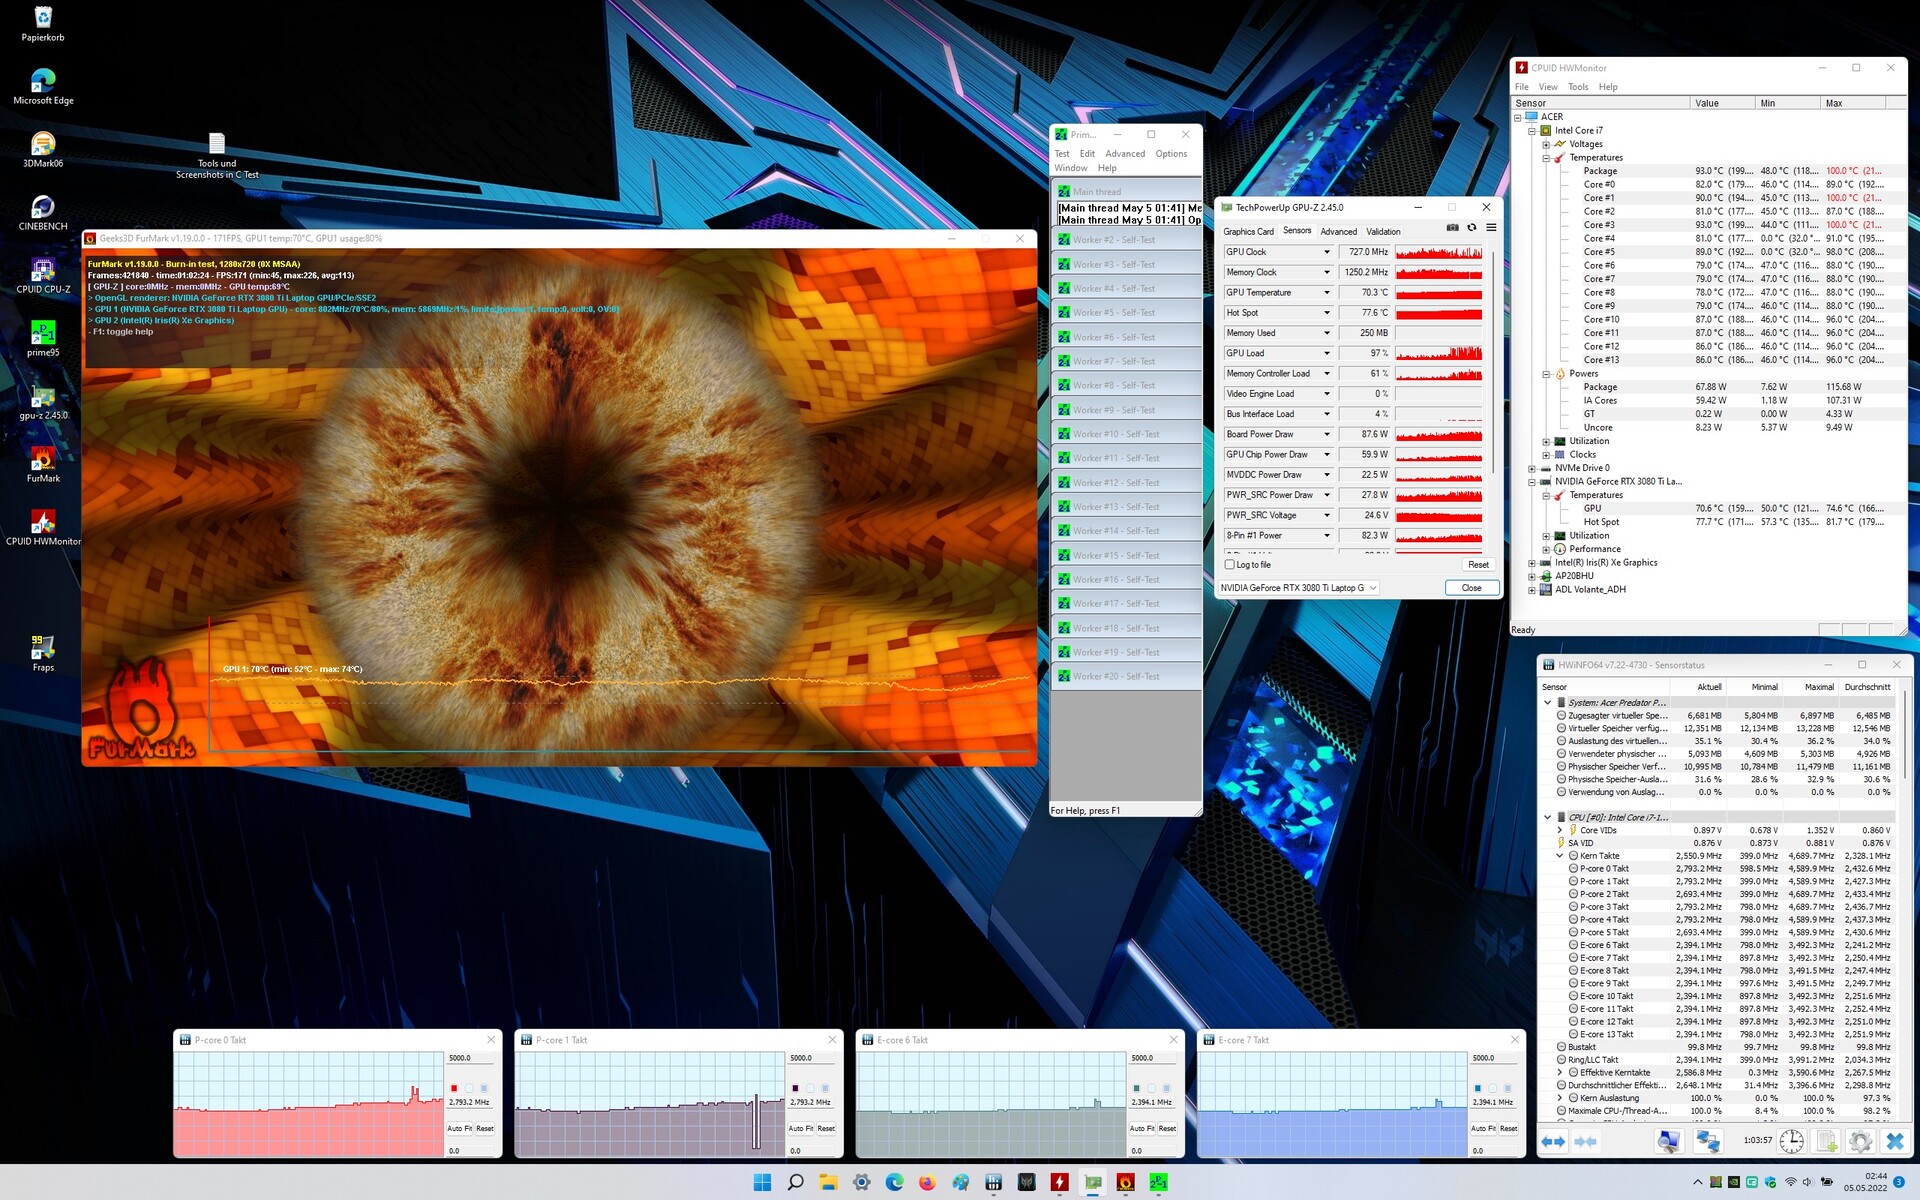
在TheWitcher 3 的负载情况下,我们测量到完全没有节流,这主要是由于负载主要放在GPU上,而不是CPU上的事实。在压力测试中,情况有所不同,图形芯片和处理器都必须放弃一些性能。一小时后,处理器仍然得到88瓦特,而GPU大约为60瓦特。
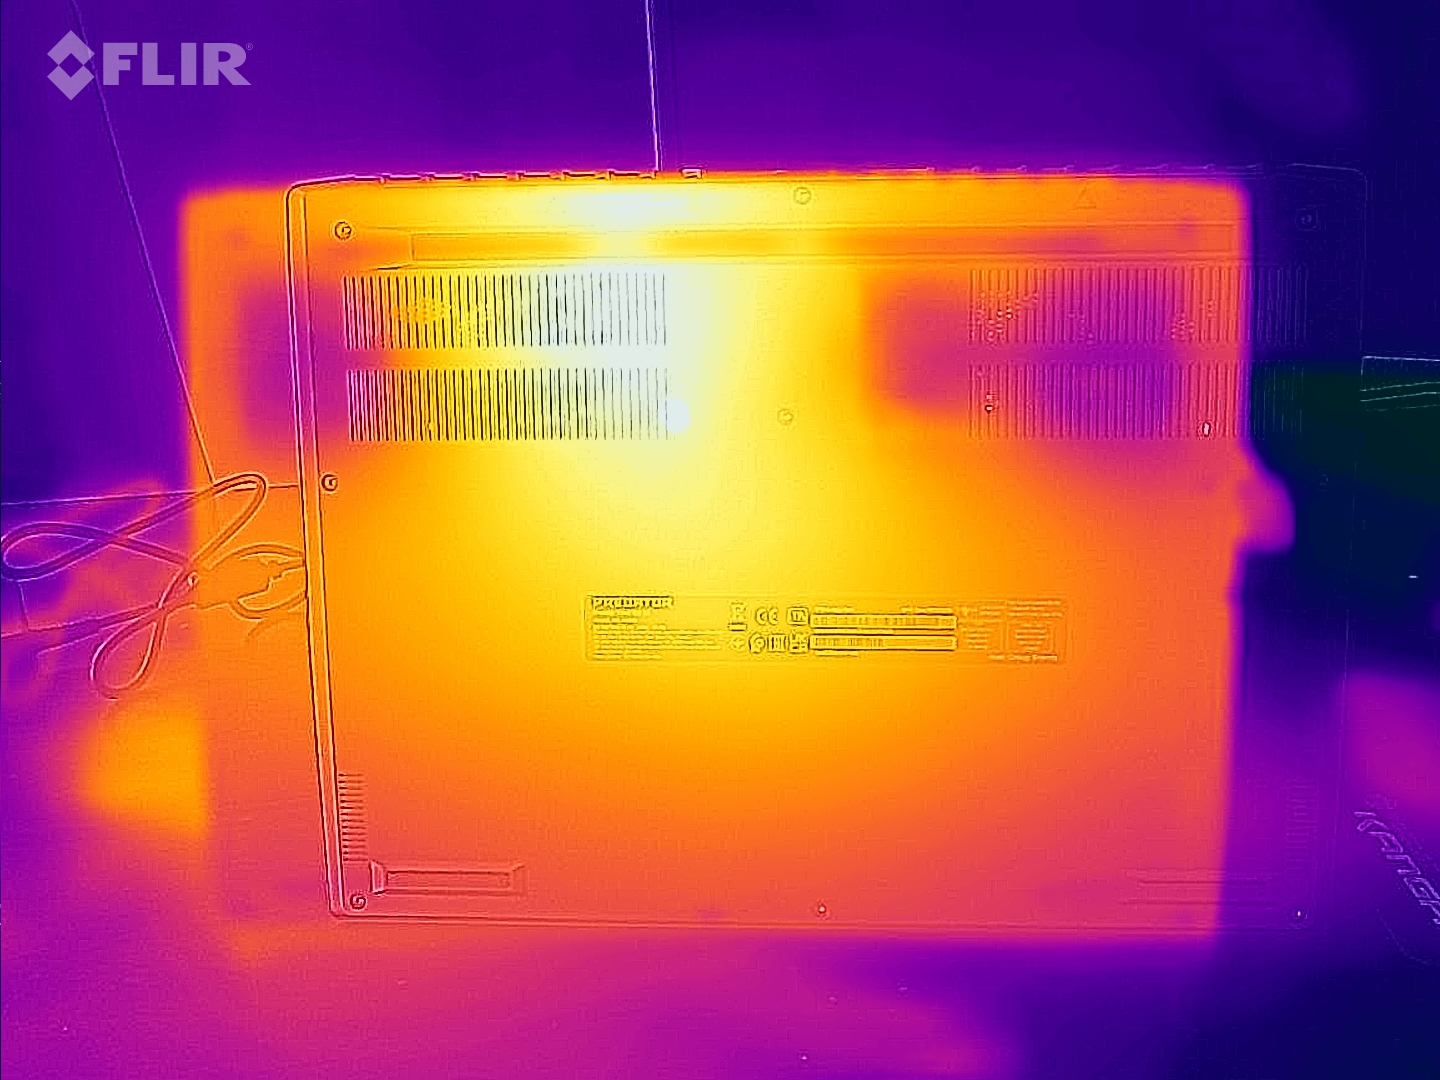
(-) The maximum temperature on the upper side is 47 °C / 117 F, compared to the average of 40.4 °C / 105 F, ranging from 21.2 to 68.8 °C for the class Gaming.
(-) The bottom heats up to a maximum of 49 °C / 120 F, compared to the average of 43.2 °C / 110 F
(+) In idle usage, the average temperature for the upper side is 29.8 °C / 86 F, compared to the device average of 33.9 °C / 93 F.
(-) Playing The Witcher 3, the average temperature for the upper side is 42.3 °C / 108 F, compared to the device average of 33.9 °C / 93 F.
(-) The palmrests and touchpad can get very hot to the touch with a maximum of 41 °C / 105.8 F.
(-) The average temperature of the palmrest area of similar devices was 28.8 °C / 83.8 F (-12.2 °C / -22 F).
| Acer Predator Triton 500 SE PT516-52s-70KX Intel Core i7-12700H, NVIDIA GeForce RTX 3080 Ti Laptop GPU | Razer Blade 17 RTX 3080 Ti Intel Core i7-12800H, NVIDIA GeForce RTX 3080 Ti Laptop GPU | Lenovo Legion 5 Pro 16 G7 i7 RTX 3070Ti Intel Core i7-12700H, NVIDIA GeForce RTX 3070 Ti Laptop GPU | MSI GE76 Raider Intel Core i9-12900HK, NVIDIA GeForce RTX 3080 Ti Laptop GPU | |
|---|---|---|---|---|
| Heat | -8% | -3% | -2% | |
| Maximum Upper Side * (°C) | 47 | 46 2% | 45.3 4% | 43 9% |
| Maximum Bottom * (°C) | 49 | 46.8 4% | 61.2 -25% | 47 4% |
| Idle Upper Side * (°C) | 31 | 36.2 -17% | 28.6 8% | 33 -6% |
| Idle Bottom * (°C) | 32 | 38.6 -21% | 31.4 2% | 37 -16% |
* ... smaller is better
发言人
键盘上方的扬声器是体面的,但不是很好。它们指向用户,提供平衡的声音,略微缺乏音量,但特别缺乏低音。在 Razer Blade 17显示了这一点可以做得更好。
Acer Predator Triton 500 SE PT516-52s-70KX audio analysis
(±) | speaker loudness is average but good (79 dB)
Bass 100 - 315 Hz
(-) | nearly no bass - on average 22.7% lower than median
(±) | linearity of bass is average (12.5% delta to prev. frequency)
Mids 400 - 2000 Hz
(+) | balanced mids - only 4.4% away from median
(+) | mids are linear (4.2% delta to prev. frequency)
Highs 2 - 16 kHz
(+) | balanced highs - only 3.6% away from median
(+) | highs are linear (5.3% delta to prev. frequency)
Overall 100 - 16.000 Hz
(±) | linearity of overall sound is average (19.5% difference to median)
Compared to same class
» 68% of all tested devices in this class were better, 7% similar, 26% worse
» The best had a delta of 6%, average was 18%, worst was 132%
Compared to all devices tested
» 49% of all tested devices were better, 7% similar, 44% worse
» The best had a delta of 4%, average was 23%, worst was 134%
Razer Blade 17 RTX 3080 Ti audio analysis
(±) | speaker loudness is average but good (81.5 dB)
Bass 100 - 315 Hz
(±) | reduced bass - on average 6.7% lower than median
(±) | linearity of bass is average (8.3% delta to prev. frequency)
Mids 400 - 2000 Hz
(+) | balanced mids - only 2.1% away from median
(+) | mids are linear (4.3% delta to prev. frequency)
Highs 2 - 16 kHz
(+) | balanced highs - only 0.7% away from median
(+) | highs are linear (1.7% delta to prev. frequency)
Overall 100 - 16.000 Hz
(+) | overall sound is linear (6.8% difference to median)
Compared to same class
» 0% of all tested devices in this class were better, 0% similar, 99% worse
» The best had a delta of 6%, average was 18%, worst was 132%
Compared to all devices tested
» 1% of all tested devices were better, 0% similar, 99% worse
» The best had a delta of 4%, average was 23%, worst was 134%
电源管理。宏碁掠夺者的电池寿命很一般
消耗功率
怠速运行时的最小功耗比竞争对手的要好。然而,在中度空闲消耗期间,对竞争对手的优势消失了。但至少,它可以击败 Razer Blade 17在所有情况下。
绝对峰值消耗为227瓦,这几乎正好是电源的极限,它可以提供最大230瓦的功率。
| Off / Standby | |
| Idle | |
| Load |
|
Key:
min: | |
| Acer Predator Triton 500 SE PT516-52s-70KX i7-12700H, GeForce RTX 3080 Ti Laptop GPU, Micron 3400 1TB MTFDKBA1T0TFH, IPS LED, 2560x1600, 16" | Razer Blade 17 RTX 3080 Ti i7-12800H, GeForce RTX 3080 Ti Laptop GPU, Samsung PM9A1 MZVL21T0HCLR, IPS, 2560x1440, 17.3" | Lenovo Legion 5 Pro 16 G7 i7 RTX 3070Ti i7-12700H, GeForce RTX 3070 Ti Laptop GPU, Samsung PM9A1 MZVL21T0HCLR, IPS, 2560x1600, 16" | MSI GE76 Raider i9-12900HK, GeForce RTX 3080 Ti Laptop GPU, Samsung PM9A1 MZVL22T0HBLB, IPS-Level, 1920x1080, 17.3" | Average of class Gaming | |
|---|---|---|---|---|---|
| Power Consumption | -105% | -9% | -24% | -17% | |
| Idle Minimum * (Watt) | 7 | 29.8 -326% | 8.6 -23% | 12 -71% | 13 ? -86% |
| Idle Average * (Watt) | 19 | 37.1 -95% | 17.6 7% | 17 11% | 19 ? -0% |
| Idle Maximum * (Watt) | 28 | 60.8 -117% | 18.5 34% | 28 -0% | 24.6 ? 12% |
| Load Average * (Watt) | 114 | 135.3 -19% | 110 4% | 118 -4% | 110.7 ? 3% |
| Witcher 3 ultra * (Watt) | 159 | 243 -53% | 227 -43% | 252 -58% | |
| Load Maximum * (Watt) | 227 | 273.1 -20% | 294.6 -30% | 272 -20% | 259 ? -14% |
* ... smaller is better
Power Consumption The Witcher 3 / Stress Test
Power Consumption With External Monitor
电池寿命
尽管电池容量为99.98Wh,根据飞行旅行的一些规定,这是笔记本电脑允许的最大容量,但在我们的Wi-Fi测试中,宏碁Predator Triton 500 SE在150cd/m²亮度下的电池寿命只达到了约5小时45分钟。在最大显示亮度下,运行时间减少了约1小时。
这意味着宏碁笔记本电脑是一个不适合长时间移动使用的设备,但这也是一般游戏笔记本电脑的情况,直接竞争对手在这方面也没有做得更好。
| Acer Predator Triton 500 SE PT516-52s-70KX i7-12700H, GeForce RTX 3080 Ti Laptop GPU, 99.98 Wh | Razer Blade 17 RTX 3080 Ti i7-12800H, GeForce RTX 3080 Ti Laptop GPU, 82 Wh | Lenovo Legion 5 Pro 16 G7 i7 RTX 3070Ti i7-12700H, GeForce RTX 3070 Ti Laptop GPU, 80 Wh | MSI GE76 Raider i9-12900HK, GeForce RTX 3080 Ti Laptop GPU, 99.99 Wh | Average of class Gaming | |
|---|---|---|---|---|---|
| Battery runtime | -27% | -34% | -11% | -2% | |
| H.264 (h) | 8.2 | 6.3 -23% | 8.32 ? 1% | ||
| WiFi v1.3 (h) | 5.7 | 5.5 -4% | 5.4 -5% | 5.1 -11% | 7.11 ? 25% |
| Load (h) | 2.2 | 1.1 -50% | 0.6 -73% | 1.502 ? -32% |
Pros
Cons
结论。宏碁掠夺者Triton 500 SE以高价提供优质性能
有吸引力的设计和强大的性能--这些都是宏碁在Predator Triton 500 SE中旨在结合的方面。经过我们的测试,我们可以说这项任务在很大程度上已经成功了。
简单和相对纤细的设计使Predator Triton比许多其他游戏代表更适合于日常工作。连接设备非常好,就像显示器一样,它的高色彩空间覆盖率和高刷新率尤其令人印象深刻。此外,2560 x 1600也是一个16英寸笔记本电脑的理想分辨率。在性能方面,宏碁笔记本电脑在最高细节设置和高分辨率下也能流畅地显示游戏。
然而,与竞争对手相比,在游戏性能方面也有一些劣势。主观上,宏碁错误地强调了CPU的性能,而对GPU的限制更为明显。同时,Predator Triton 500 SE也变得相当热,而且非常吵。除了这个弱点之外,我们还看到内部结构非常关键。内存是焊接在一起的,固态硬盘也是无法触及的。这导致在可维护性方面存在一些明显的缺陷,而键盘的布局也得到了较低的评价。电池寿命也不是很好,但这在游戏领域是比较正常的。但是,电池运行期间的性能也低得多,这绝对值得批评。
不能维持,但由于性能非常好,仍然值得推荐。Acer Predator Triton 500 SE
总的来说,缺乏可维护性是我们最大的抱怨点。但如果你不需要改变任何东西,宏碁掠夺者Triton 500 SE作为一款相对纤薄的游戏笔记本电脑,值得我们推荐。然而,我们绝对不应该无视其高昂的价格,当稍厚的外壳也可以接受时,你可以用更少的钱获得相当的性能--例如,联想Legion 5 Pro 。另一方面,你需要为Razer Blade 17 ,所以Predator Triton 500 SE作为它的替代品,值得考虑。
价格和可用性
宏碁掠夺者Triton 500 SE可从亚马逊起价1425美元,而高端型号的价格为3000美元(关联链接)。
Acer Predator Triton 500 SE PT516-52s-70KX
- 06/10/2022 v7 (old)
Benjamin Herzig
Price comparison

