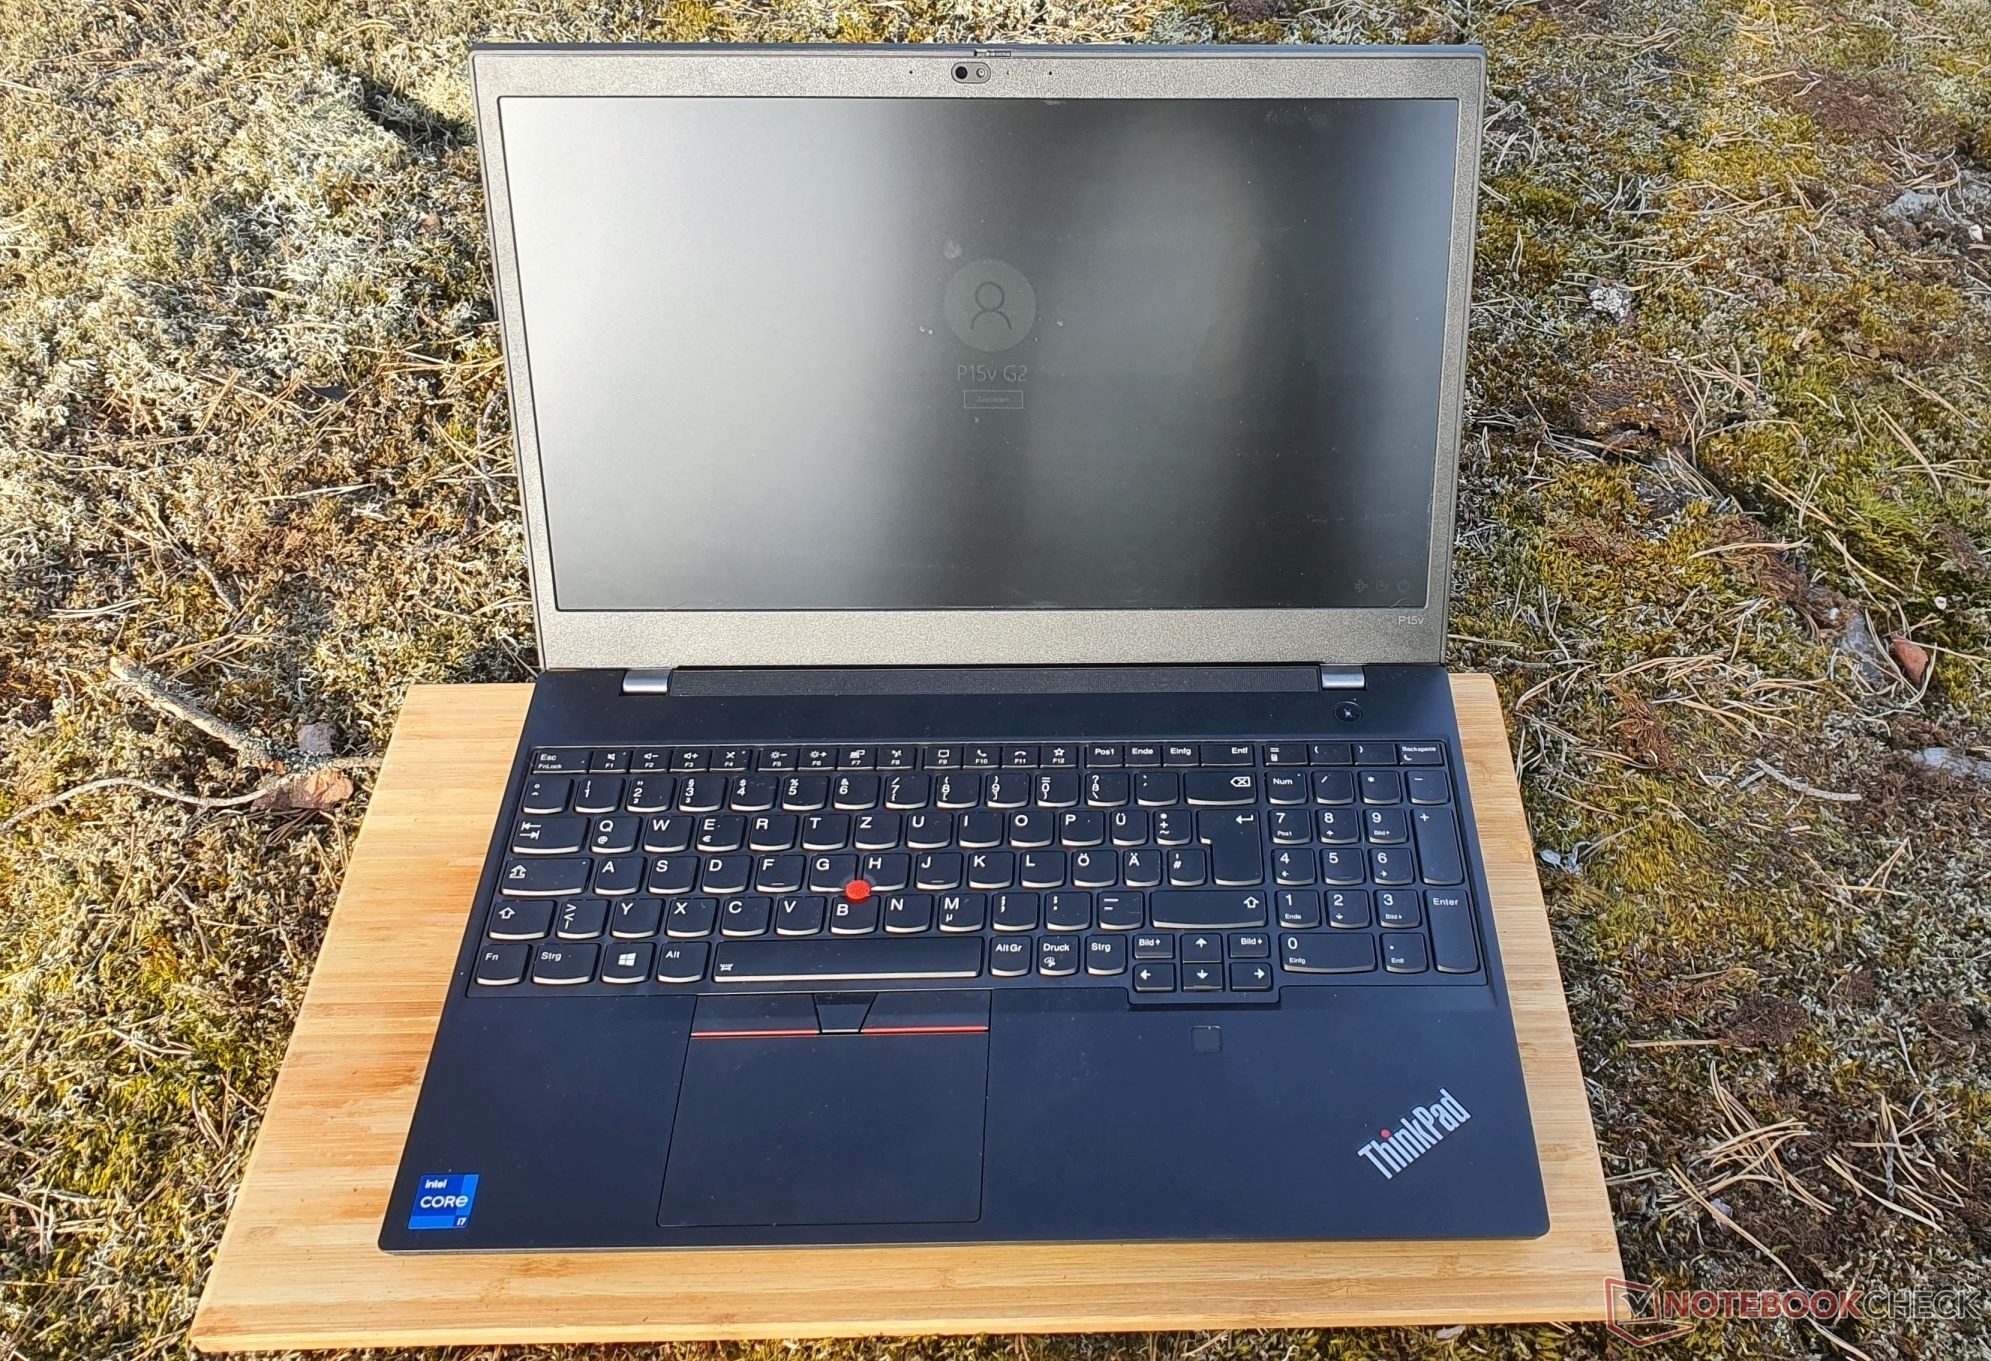
联想ThinkPad P15v G2笔记本电脑评论。经济实惠的商务工作站
联想ThinkPad P15v Gen2是一款15英寸的工作站,定位在ThinkPad P15s和 P15 与后者一样,它采用了英特尔 酷睿i7-11800H但可以选择Nvidia GeForce RTX A2000ThinkPad T15p Gen2使用较慢的Nvidia GeForce GTX 1650,它被配置为专业变体(Nvidia T1200) 在我们的P15v G2中。
这两款设备都可以配备4K显示屏(600尼特),就像T15p Gen1 。另一方面,更笨重的ThinkPad T15g是ThinkPad P15的工作站变体,已经转向了游戏方向。因此,P15v系列以不高的重量和价格(约1800欧元)提供强大的组件。联想宣传其工作站是为有创造力的人设计的:这种说法是否有道理,特别是在显示屏方面,将在下面的评论中揭晓。
国际读者请注意。联想ThinkPad P15v Gen2在其他国家也有不同的配置和不同的价格(例子见本评论末尾的 "价格和供应")。
| 型号 | 适用范围 |
|---|---|
| ThinkPad P15 | 经典工作站 |
| ThinkPad T15g | 游戏工作站 |
| ThinkPad P15s | 超极本工作站 |
| ThinkPad T15 | 商务 |
| ThinkPad P15v | 入门级工作站 |
| ThinkPad T15p | 商务性能 |
潜在的竞争对手比较
Rating | Date | Model | Weight | Height | Size | Resolution | Price |
|---|---|---|---|---|---|---|---|
| 86.2 % v7 (old) | 06 / 2022 | Lenovo ThinkPad P15v G2 21A9000XGE i7-11800H, T1200 Laptop GPU | 2.3 kg | 22.7 mm | 15.60" | 1920x1080 | |
| 87.2 % v7 (old) | 10 / 2021 | Lenovo ThinkPad P15 G2-20YQ001JGE i7-11800H, RTX A3000 Laptop GPU | 2.9 kg | 31.5 mm | 15.60" | 1920x1080 | |
| 86.3 % v7 (old) | Lenovo ThinkPad T15g-20UR000GGE i7-10750H, GeForce RTX 2070 Super Max-Q | 2.8 kg | 31.45 mm | 15.60" | 1920x1080 | ||
| 86.6 % v7 (old) | Lenovo ThinkPad T15p-20TN0006GE i7-10750H, GeForce GTX 1050 Mobile | 2.2 kg | 22.7 mm | 15.60" | 3840x2160 | ||
| 85.3 % v7 (old) | Lenovo ThinkPad P15s Gen2-20W6000GGE i7-1165G7, T500 Laptop GPU | 1.9 kg | 19.1 mm | 15.60" | 3840x2160 | ||
| 87.7 % v7 (old) | 07 / 2022 | HP ZBook Power 15 G8 313S5EA i7-11800H, T600 Laptop GPU | 2 kg | 22.8 mm | 15.60" | 1920x1080 | |
| 88.3 % v7 (old) | 10 / 2021 | Dell Precision 5000 5560 i7-11850H, RTX A2000 Laptop GPU | 2 kg | 18 mm | 15.60" | 3840x2400 |
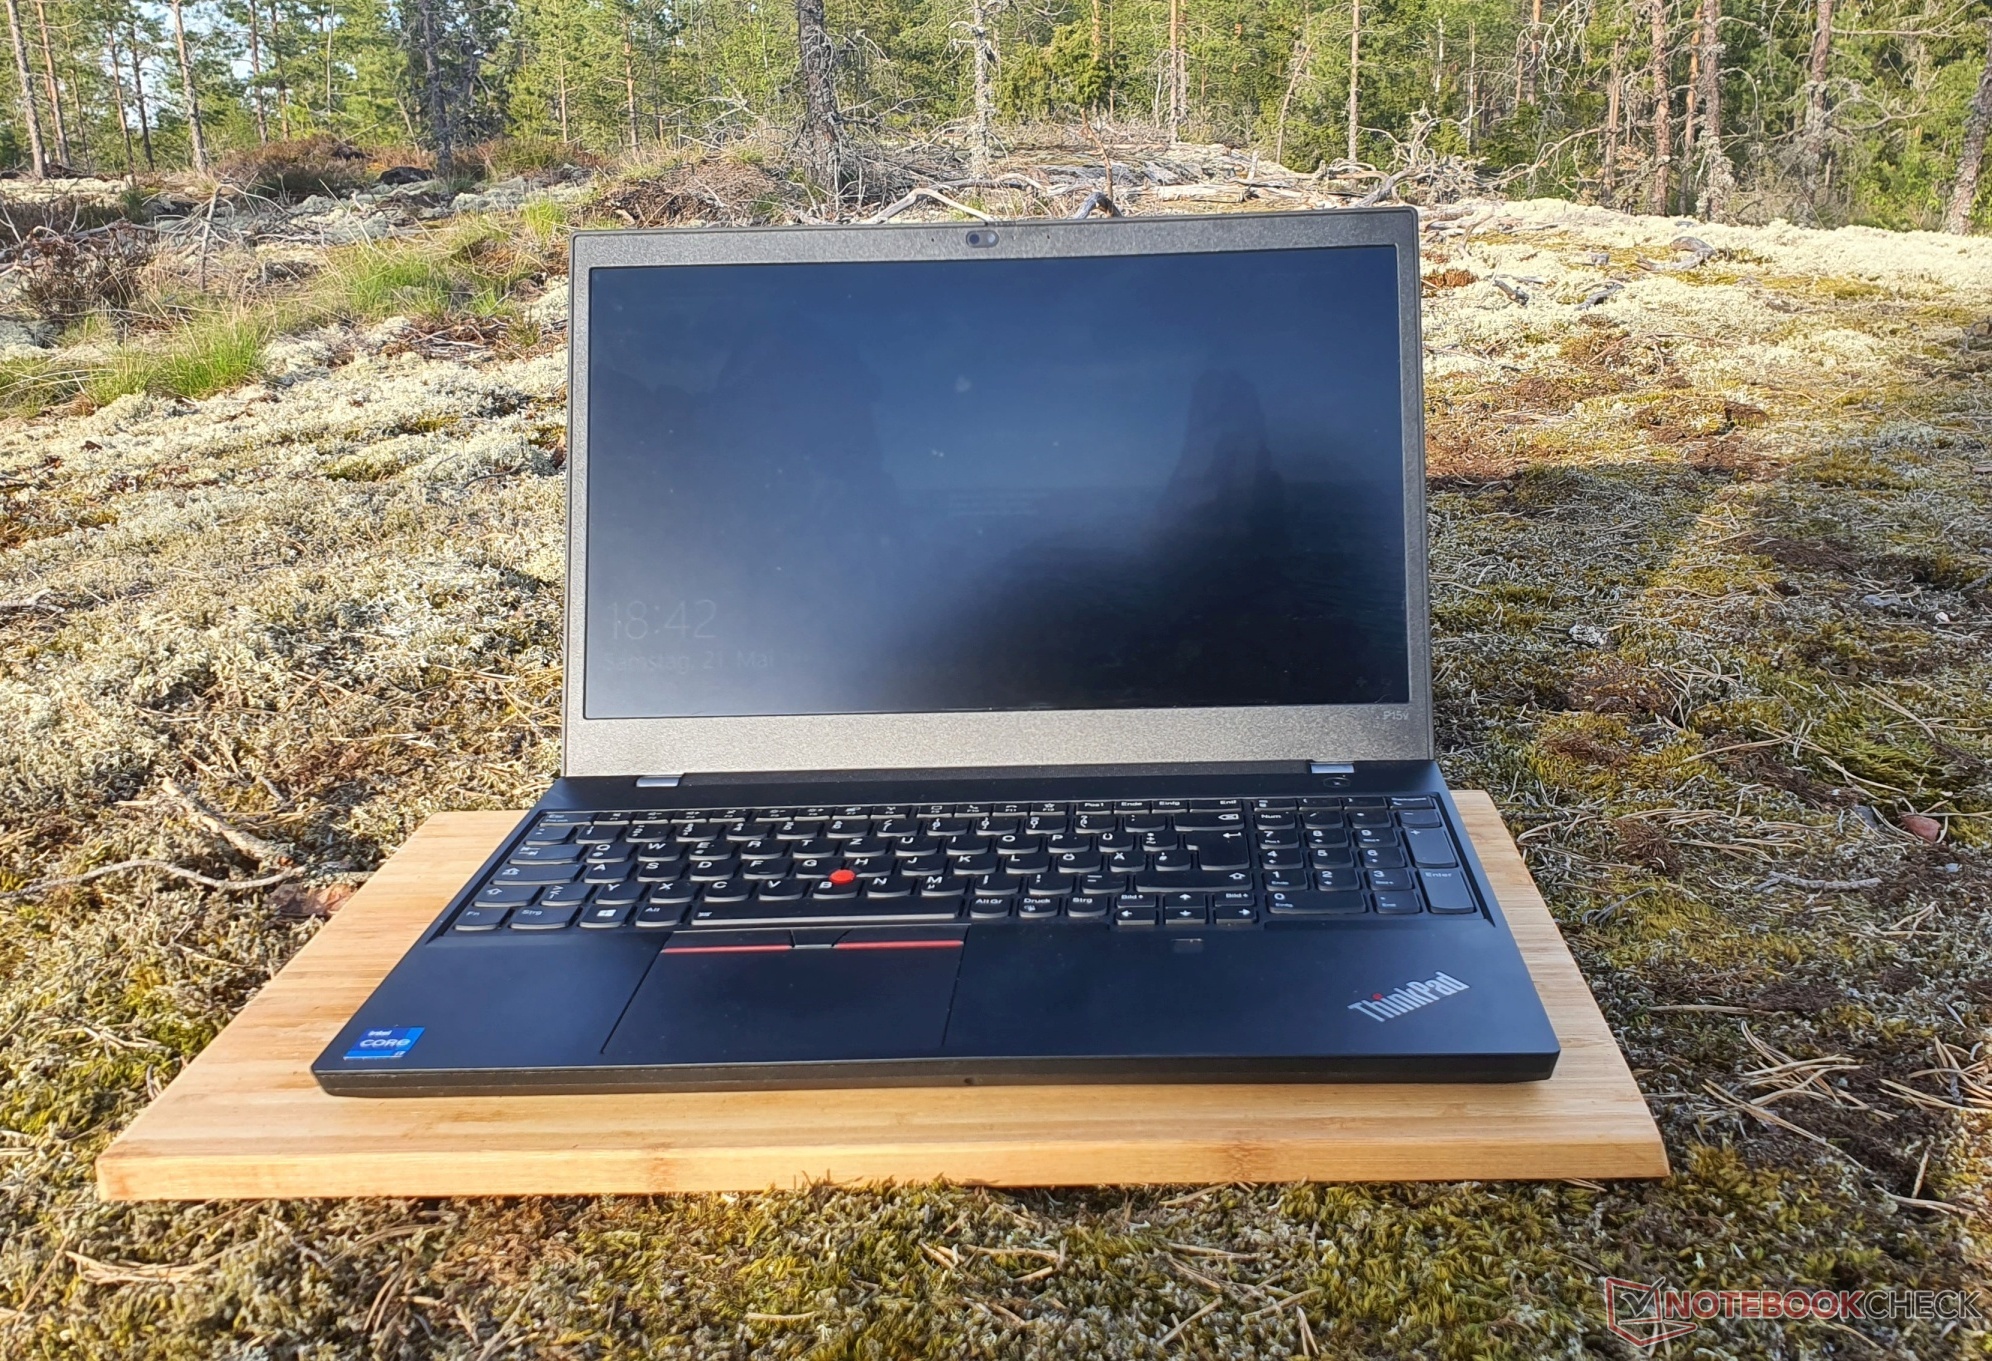
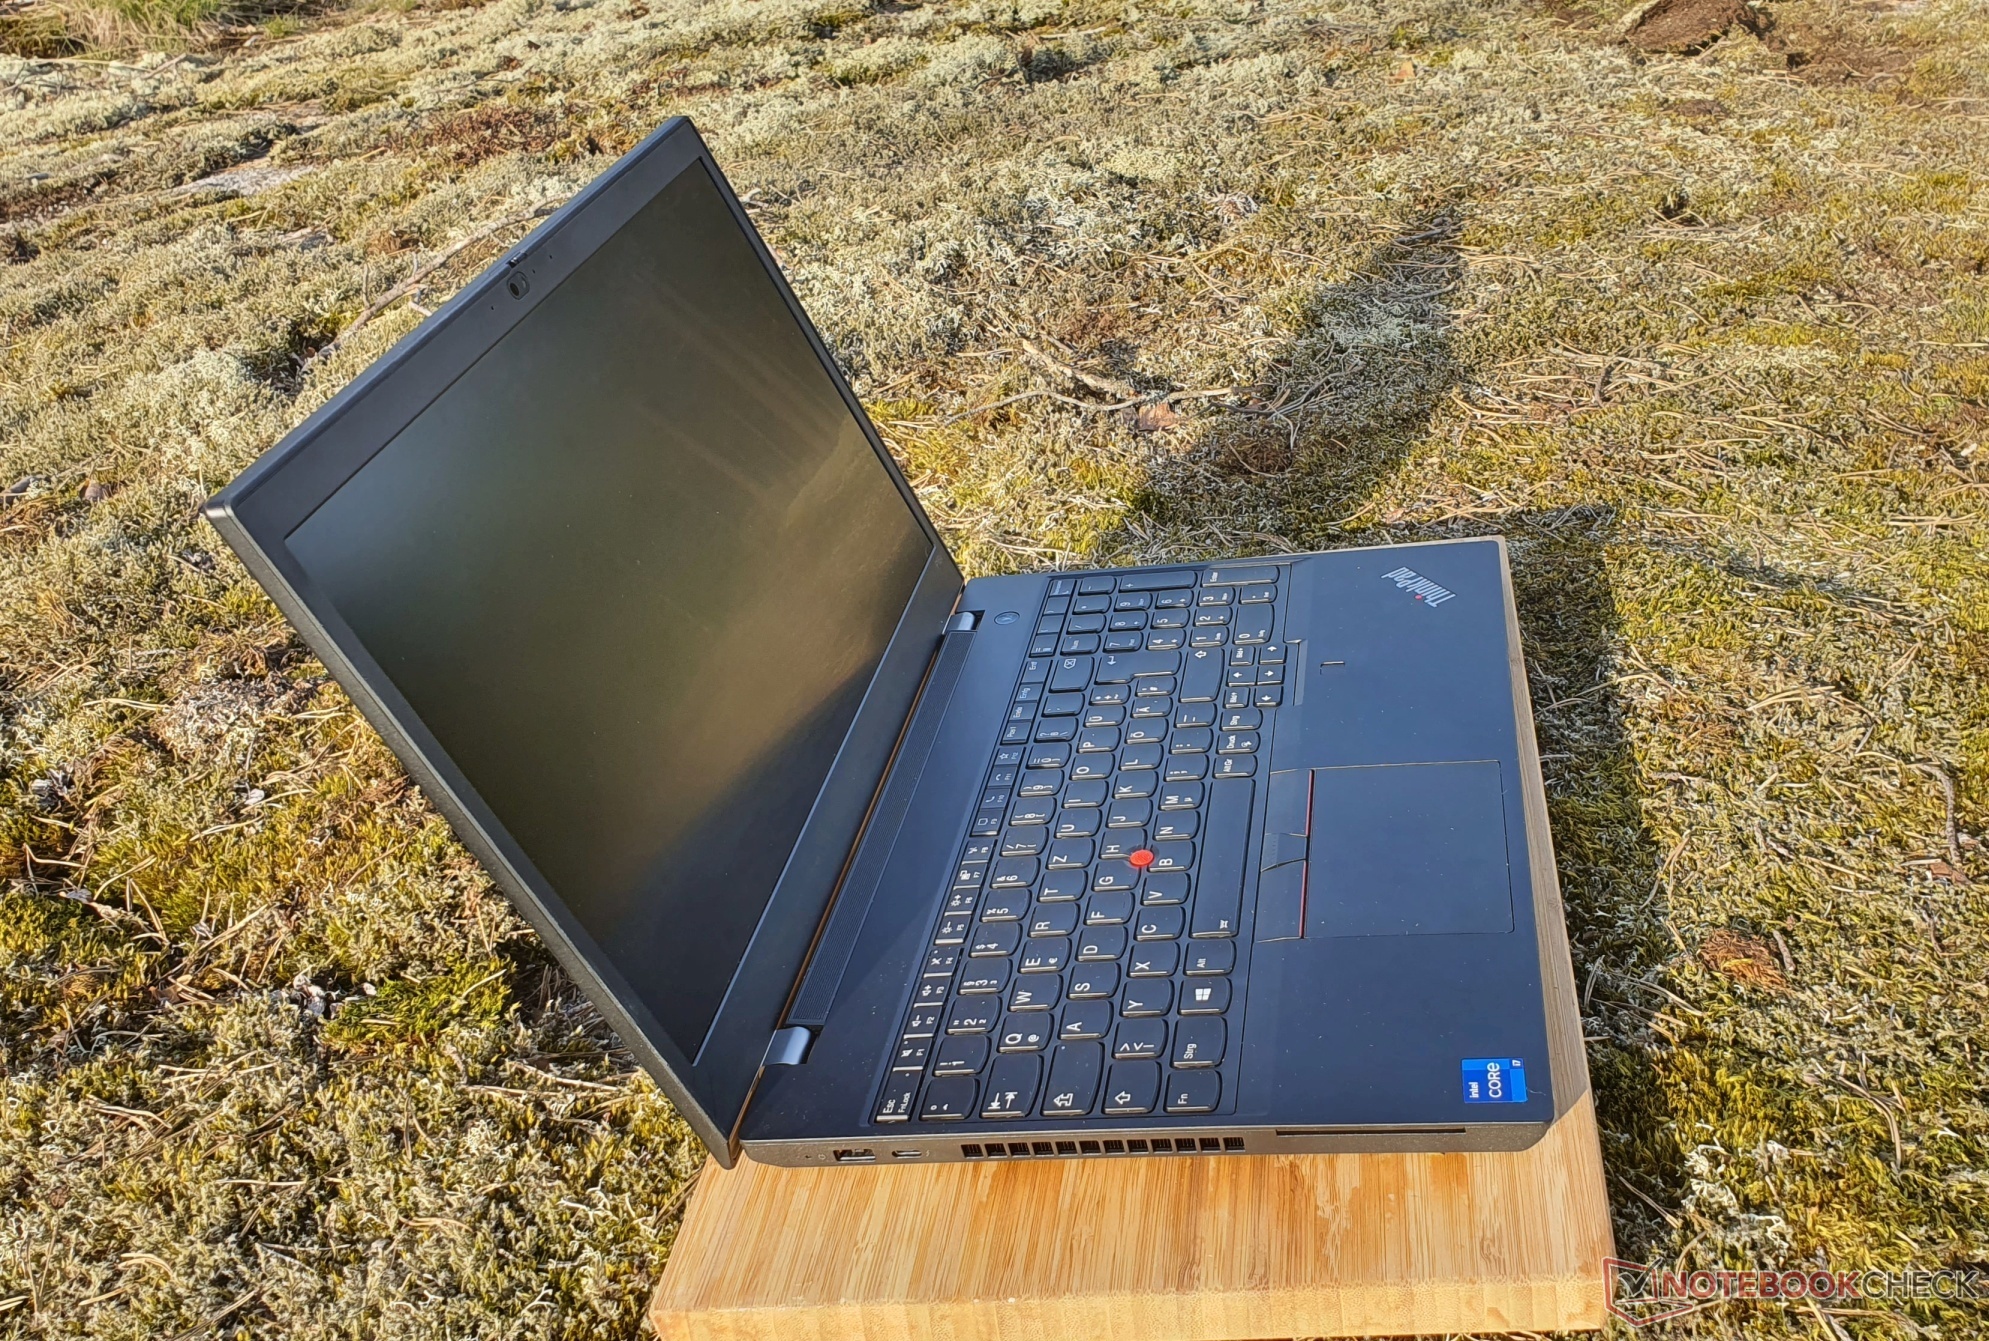
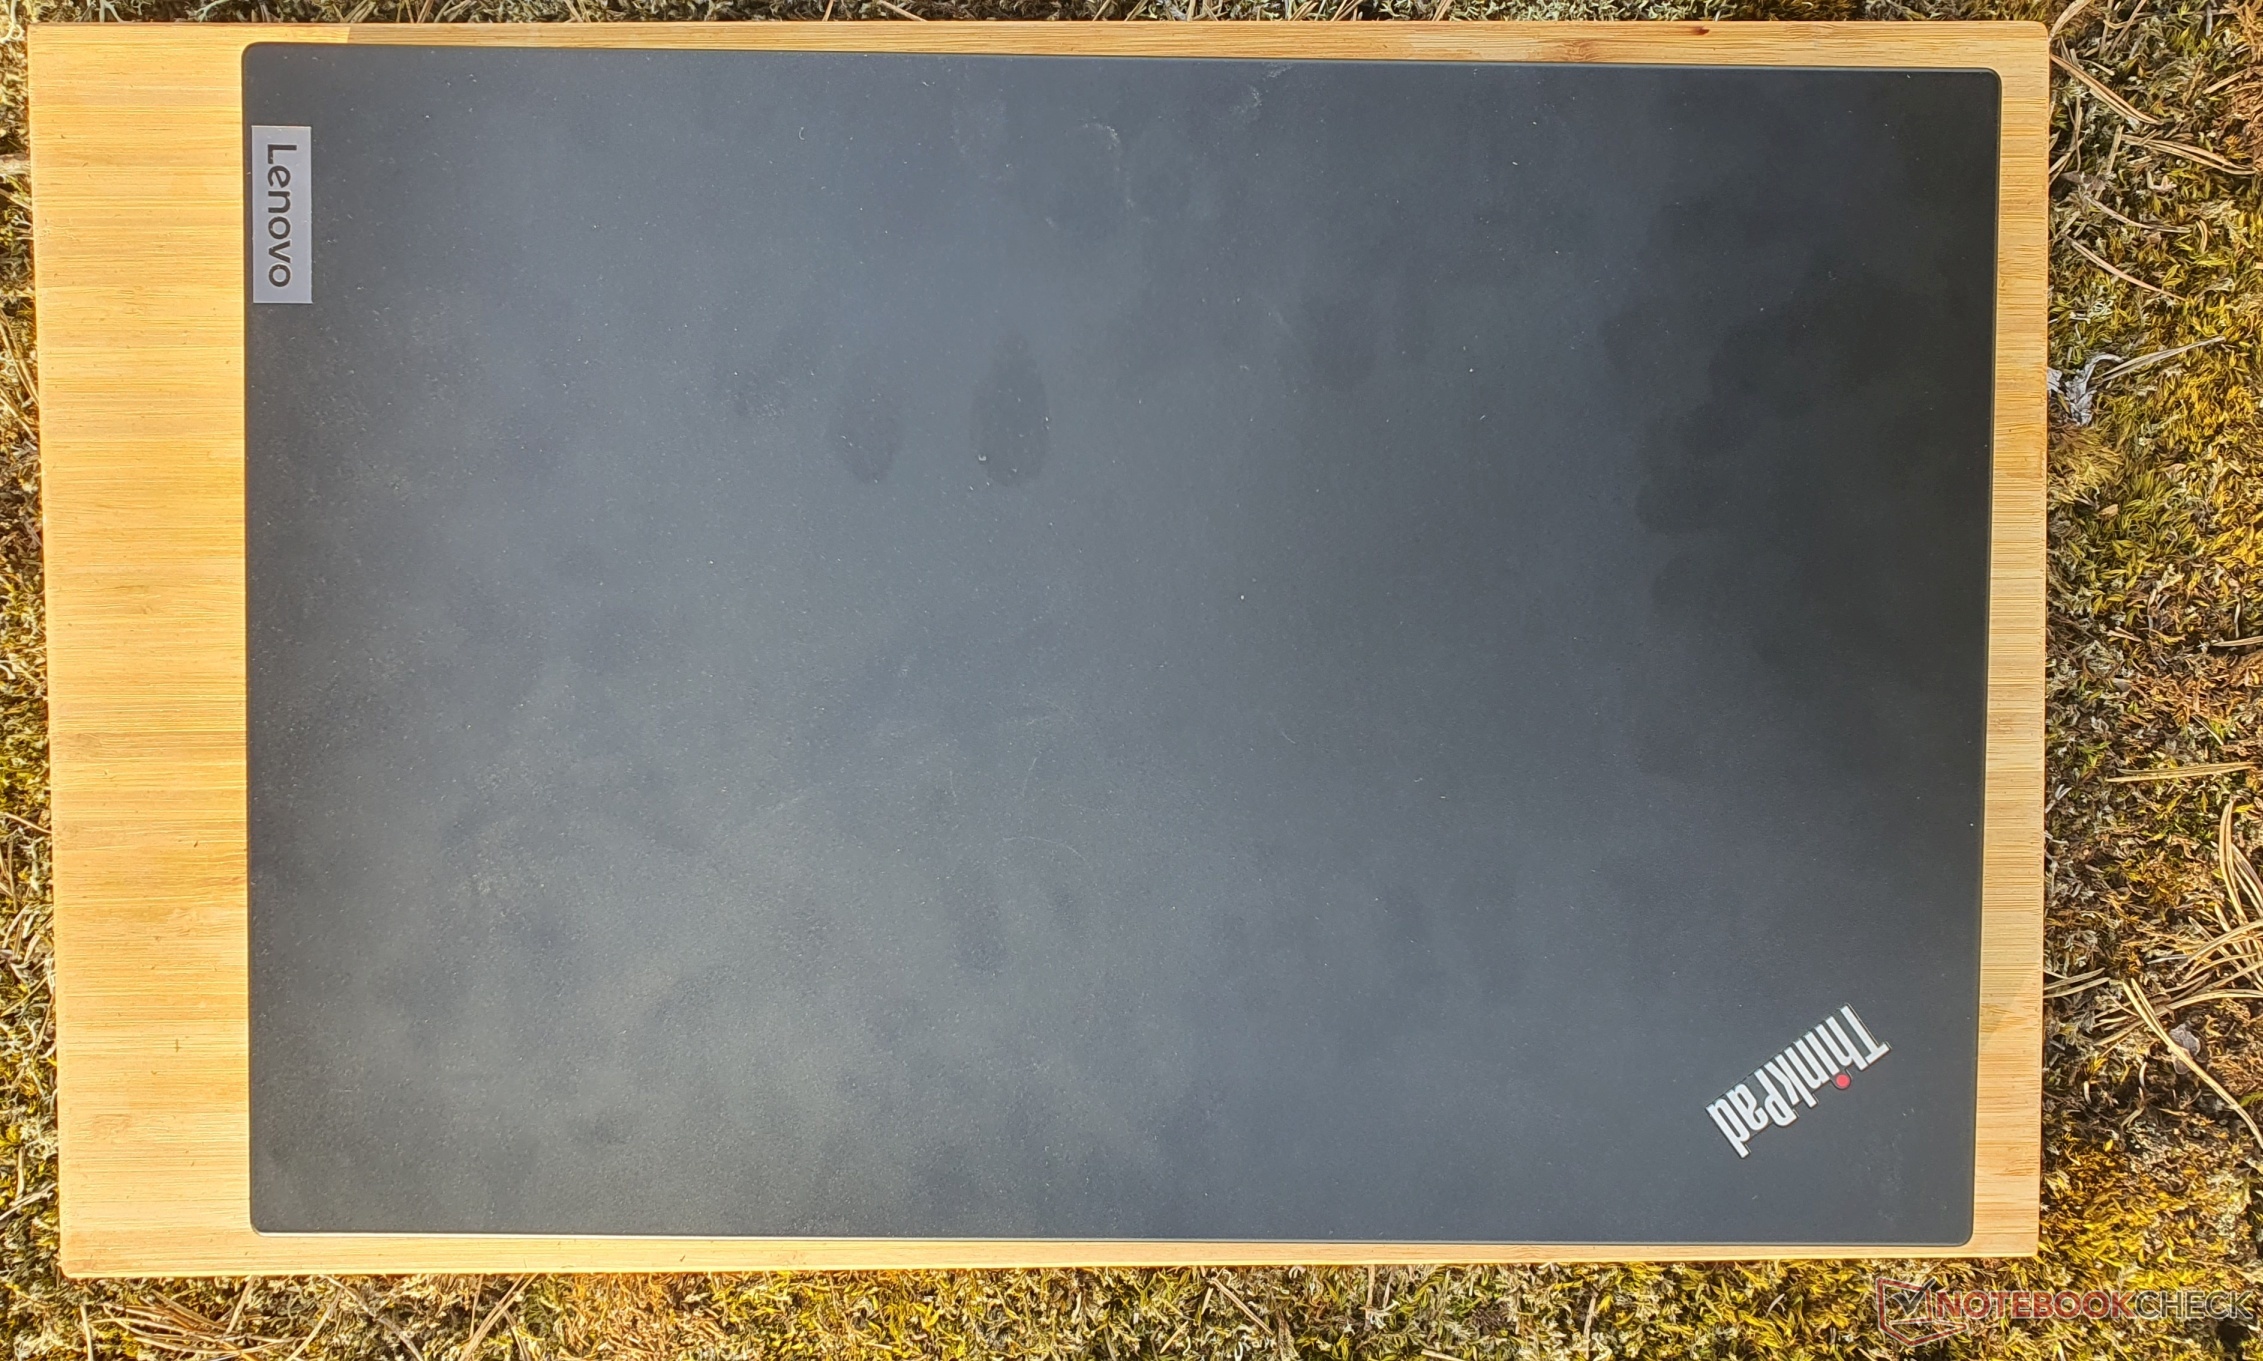
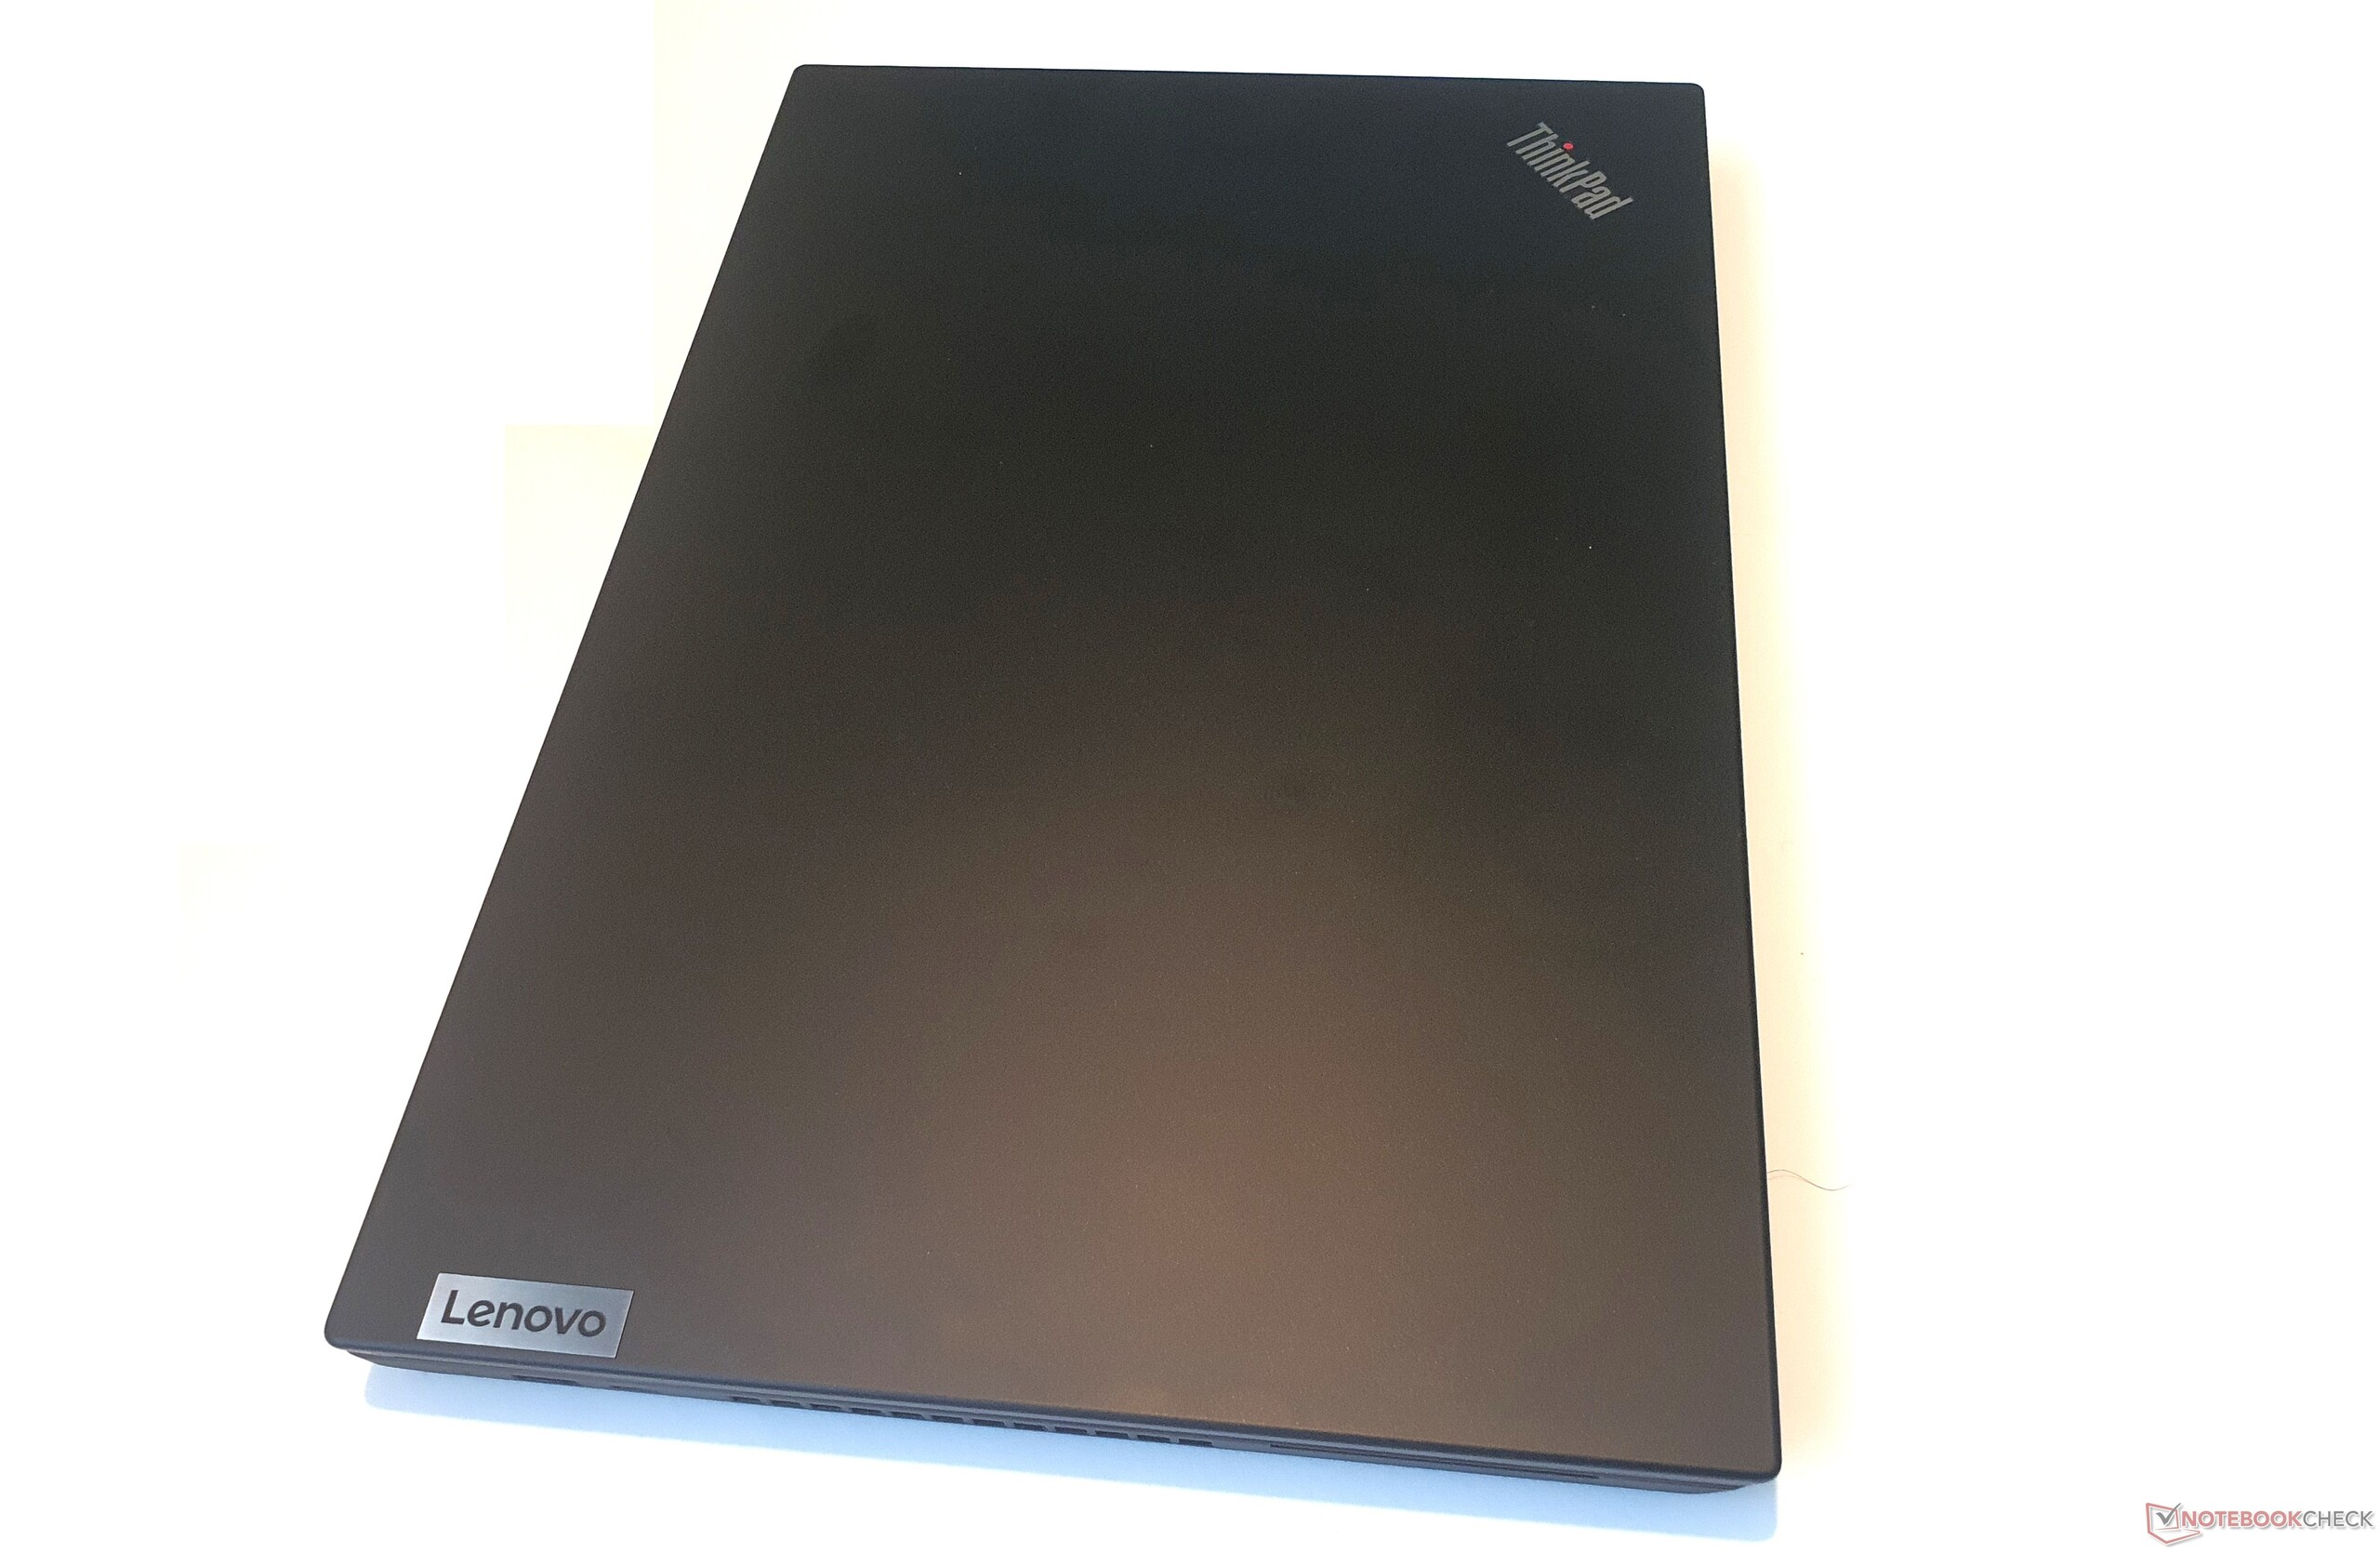
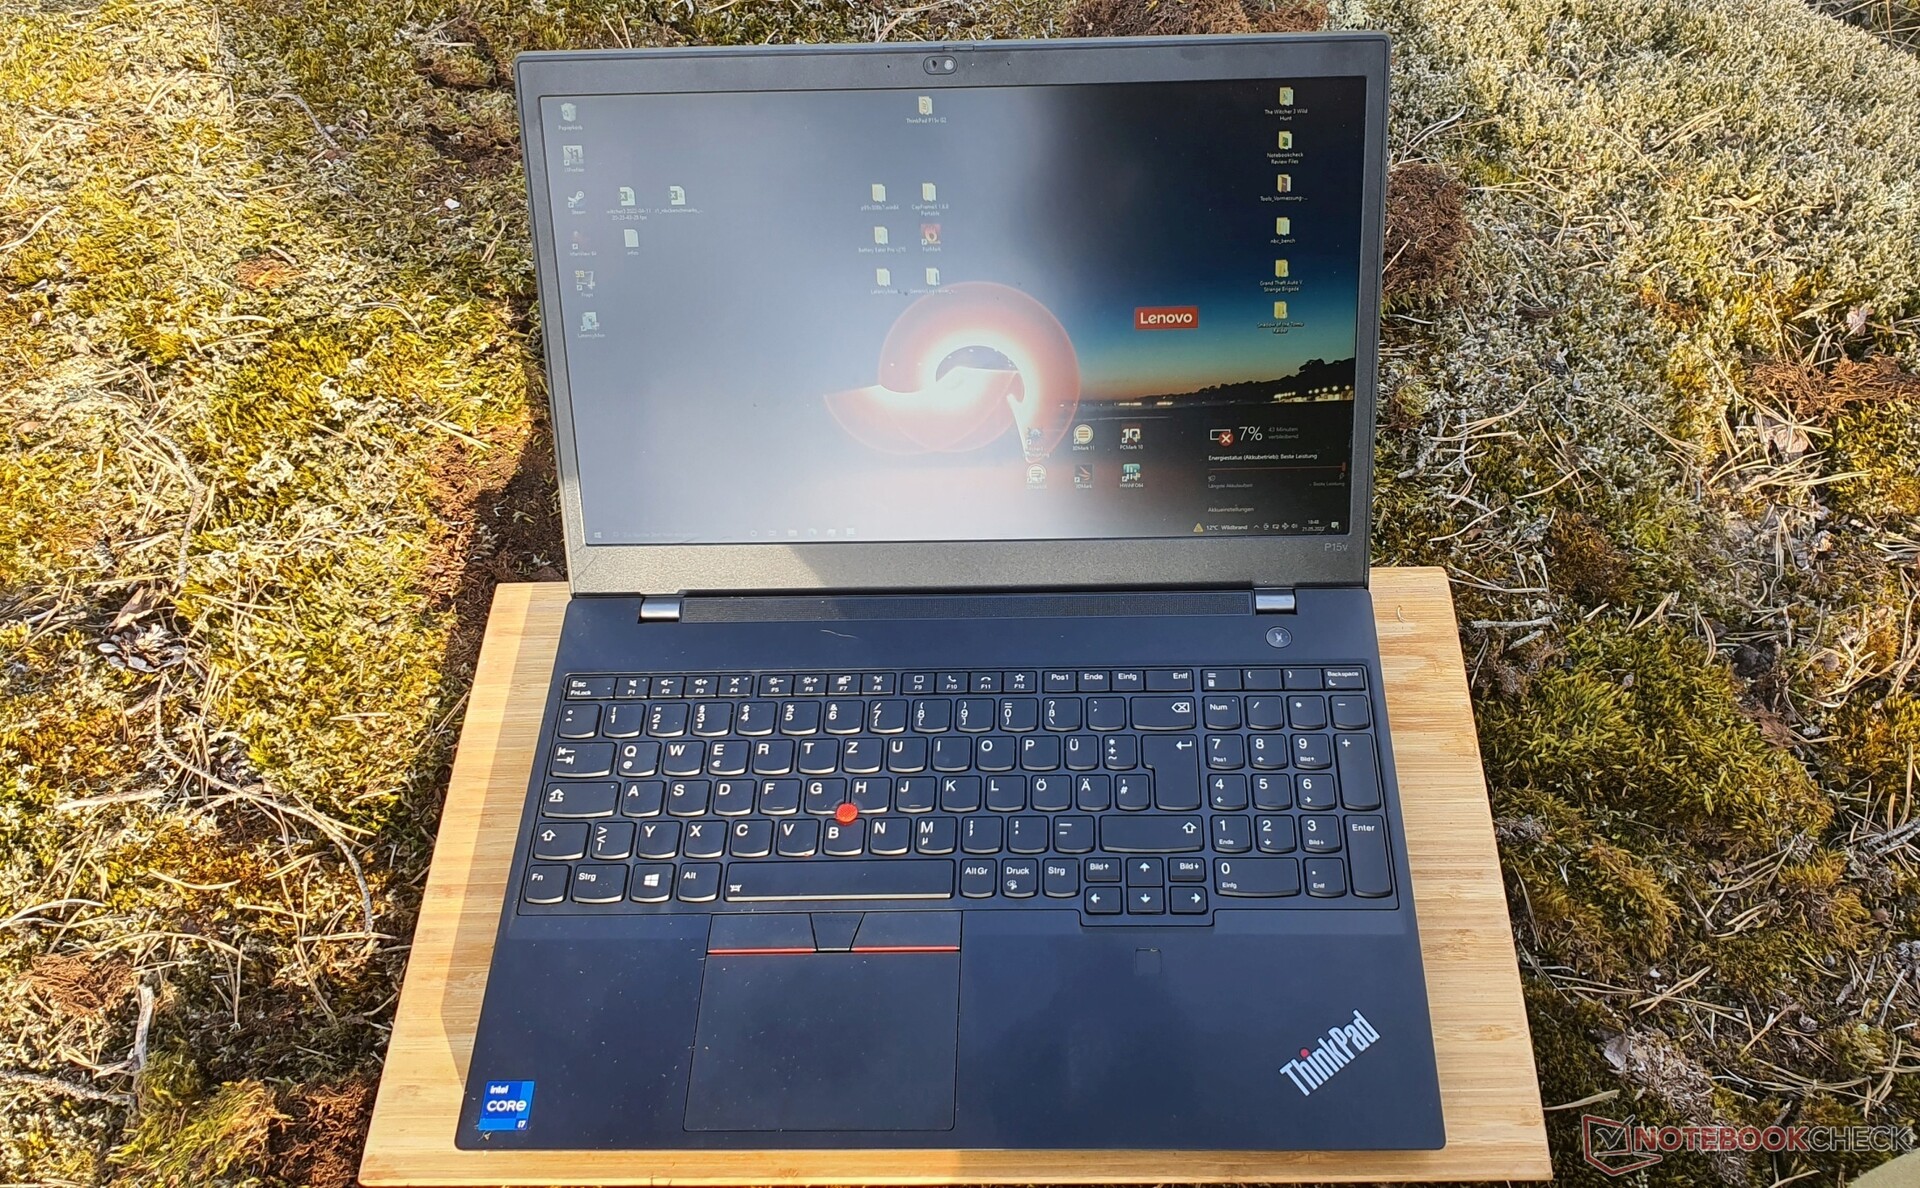
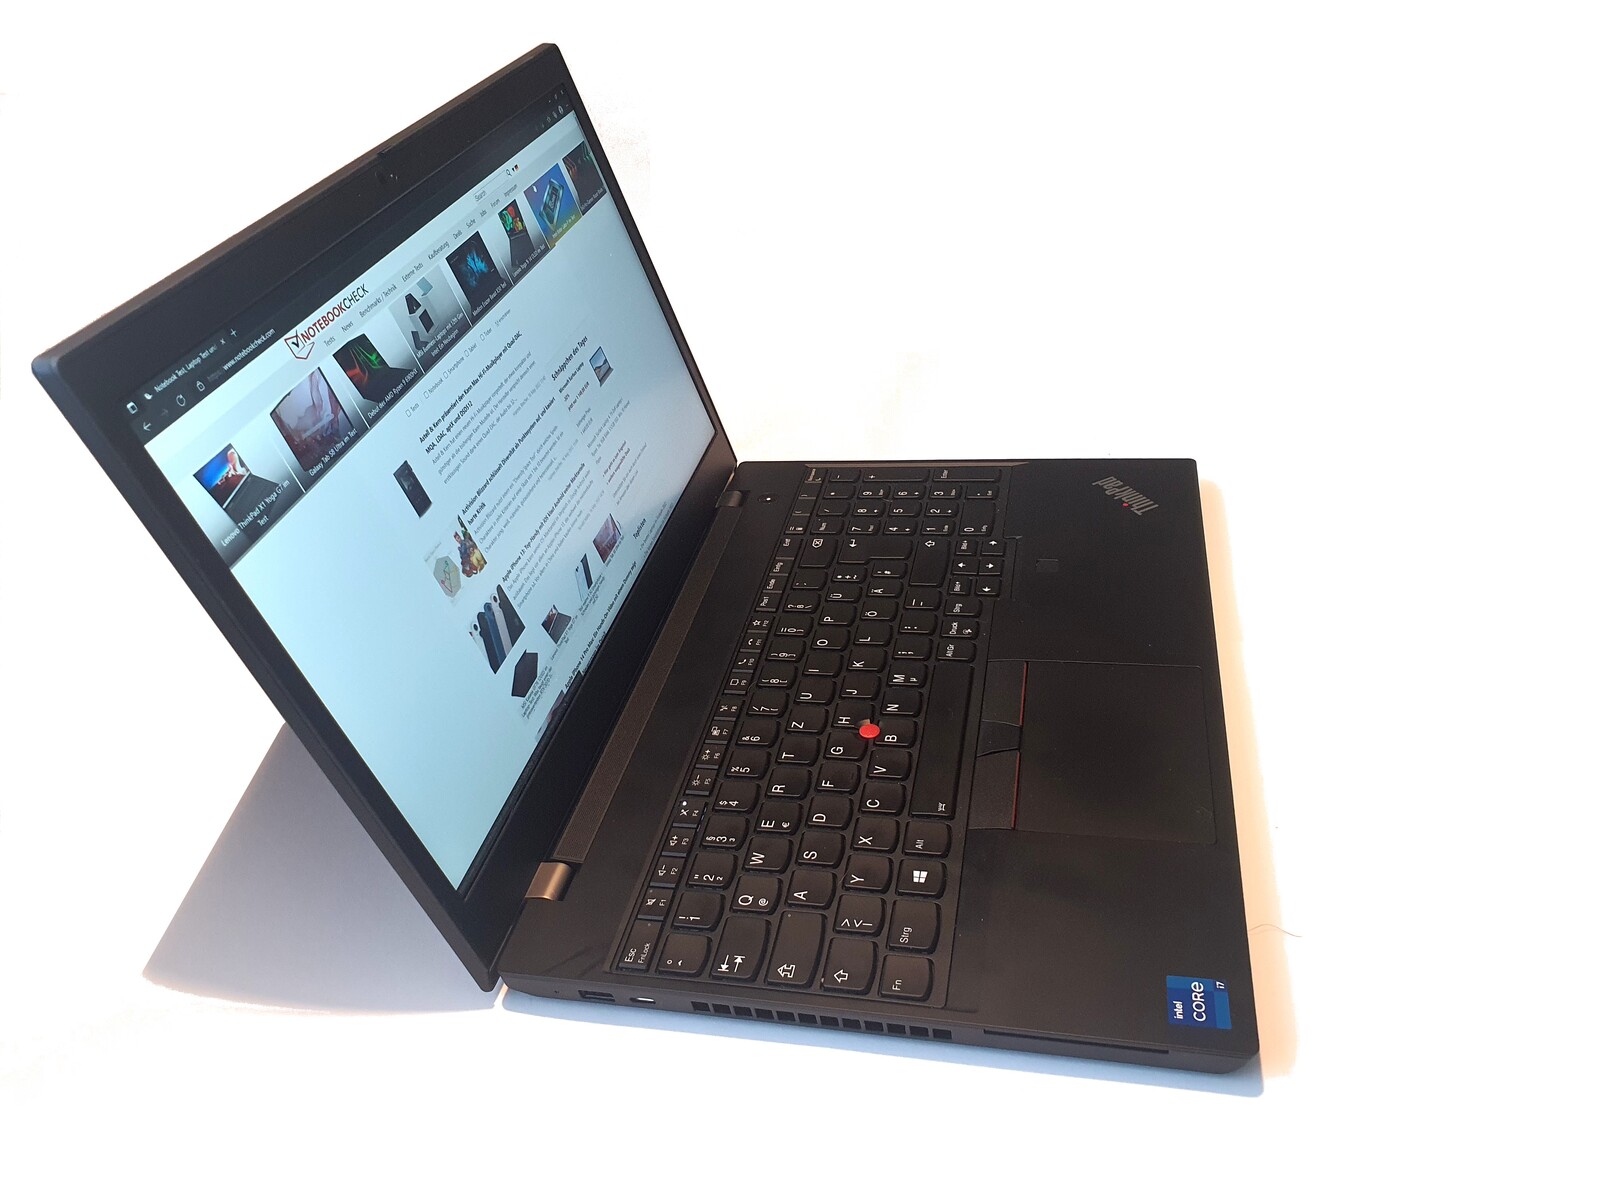
外壳:稳定的塑料,适用于哑光的ThinkPad

ThinkPad P15v的外壳看起来类似于壳相似。但更高(约3.6毫米)和更重(360克)。盖子也厚了很多,提供了更多的抗扭性,但仍然可以明显地扭动。
与ThinkPad T15p相同的外壳 盒子这里使用的是与ThinkPad T15p相同的外壳,这意味着周围都是稳定的哑光ABS塑料,但没有P15的玻璃纤维加固。此外,还缺少触觉上令人愉悦的橡胶涂层,这使得底部非常粗糙,就像经济型ThinkPad所知道的那样,例如L15或遥远的过去的ThinkPad R500。
做工上没有缺陷,稳定性也很高。镁合金加固的底座单元无论如何也不能扭曲,键盘单元只有在施加目标压力时才会在中间轻微弯曲。铰链非常紧绷,但仍然允许单手打开180°角。不幸的是,ThinkPad是一块吸附指纹的磁铁。
由于其更强大的显卡和整体更强大的冷却系统,ThinkPad P15和 T15g笔记本电脑明显更厚,约为31.5毫米,与22.7毫米的 "薄 "和因此更轻的P15v相比,导致600克的重量差异。
根据s-suffix(超薄),ThinkPad P15s甚至更薄、更轻。戴尔的Precision 5560依然以其14英寸的笔记本电脑尺寸无可匹敌,而惠普的ZBook Power 15的尺寸与ThinkPad P15v相似,但重量几乎轻了300克,为1.97公斤。
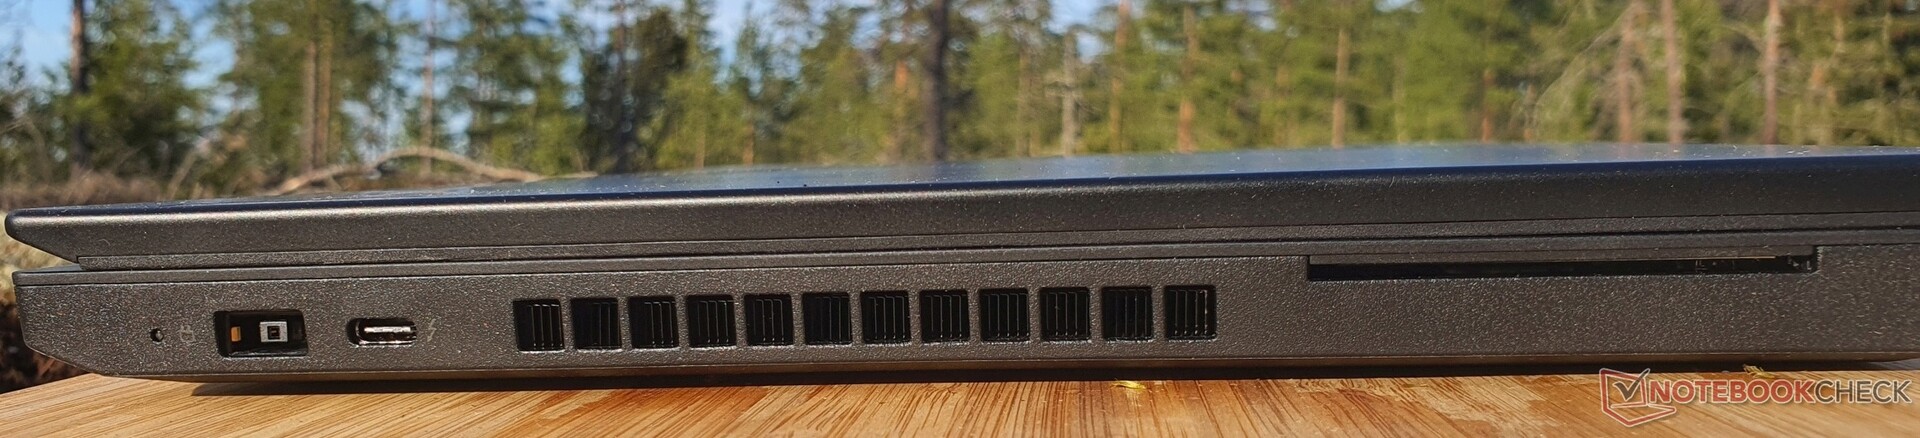
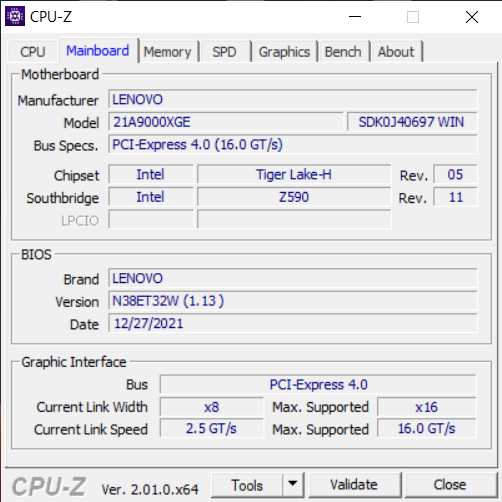
连接性。联想带固定Wi-Fi 6和SD读卡器
ThinkPad P15v G2提供了很多端口:左侧是专有的纤细充电端口和一个Thunderbolt 4端口,遗憾的是该端口不支持充电。此外,还有一个智能卡读卡器和通风槽,因此,在右侧使用鼠标时,废热不会构成问题。
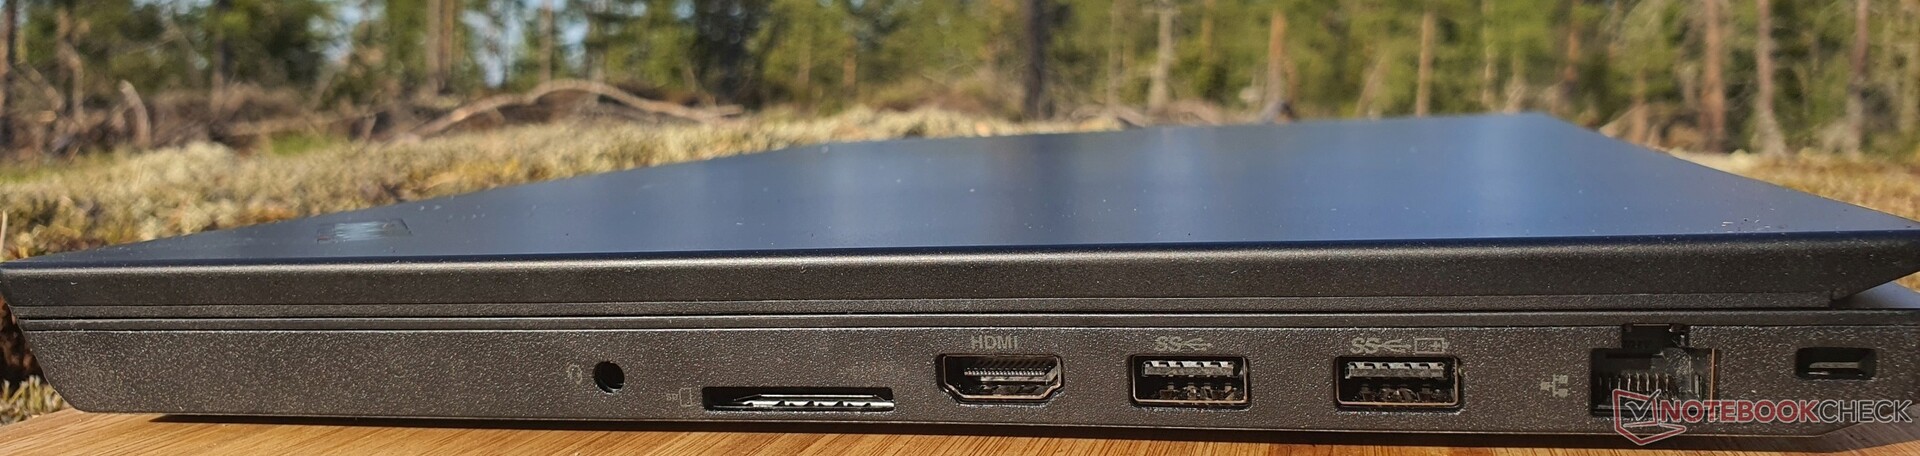
右侧的功能包括两个USB-A 3.2 Gen1(Always On)端口、HDMI 2.0、GBit以太网和一个全尺寸的SD读卡器,这些功能在P15s等纯商务ThinkPads中已经不再提供。带有WWAN的型号在设备背面有一个SIM卡插槽,如果没有配置WWAN,它可以作为一个μSD卡插槽。
SD卡阅读器
关于1GB文件的读取率,ThinkPad P15v G2在同类产品中名列前茅。然而,在复制测试中,它远远落后于ThinkPad P15的200 MB/s和 戴尔Precision 5560工作站的约96MB/s。
| SD Card Reader | |
| average JPG Copy Test (av. of 3 runs) | |
| Lenovo ThinkPad P15 G2-20YQ001JGE (AV Pro V60) | |
| Dell Precision 5000 5560 (AV Pro V60) | |
| Lenovo ThinkPad T15g-20UR000GGE (Toshiba Exceria Pro SDXC 64 GB UHS-II) | |
| Average of class Workstation (49.6 - 681, n=14, last 2 years) | |
| Lenovo ThinkPad P15v G2 21A9000XGE | |
| Lenovo ThinkPad T15p-20TN0006GE (Toshiba Exceria Pro SDXC 64 GB UHS-II) | |
| Lenovo ThinkPad P15s Gen2-20W6000GGE (AV Pro V60) | |
| maximum AS SSD Seq Read Test (1GB) | |
| Lenovo ThinkPad P15v G2 21A9000XGE | |
| Average of class Workstation (87.6 - 1455, n=14, last 2 years) | |
| Lenovo ThinkPad P15 G2-20YQ001JGE (AV Pro V60) | |
| Lenovo ThinkPad T15g-20UR000GGE (Toshiba Exceria Pro SDXC 64 GB UHS-II) | |
| Dell Precision 5000 5560 (AV Pro V60) | |
| Lenovo ThinkPad T15p-20TN0006GE (Toshiba Exceria Pro SDXC 64 GB UHS-II) | |
| Lenovo ThinkPad P15s Gen2-20W6000GGE (AV Pro V60) | |
沟通
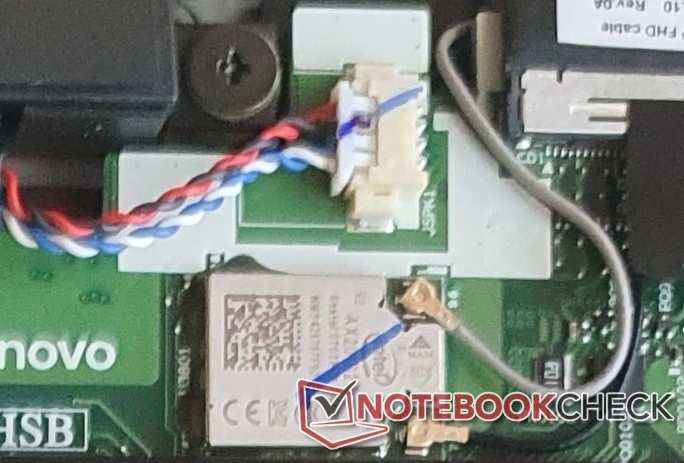
有RJ45以太网(1GBit/s)。还有英特尔的Wi-Fi 6 AX201(永久安装),这使得ThinkPad P15v G2的网络数据传输速度比通过电缆快10倍,这在竞争对手中属于高水平。 现有的M.2插槽(和相应的天线电缆)允许安装WWAN卡,但这也可以订购预装
| Networking | |
| iperf3 transmit AX12 | |
| HP ZBook Power 15 G8 313S5EA | |
| Lenovo ThinkPad T15g-20UR000GGE | |
| Lenovo ThinkPad P15v G2 21A9000XGE | |
| Lenovo ThinkPad T15p-20TN0006GE | |
| Lenovo ThinkPad P15 G2-20YQ001JGE | |
| Lenovo ThinkPad P15s Gen2-20W6000GGE | |
| Average Intel Wi-Fi 6 AX201 (49.8 - 1775, n=324) | |
| Dell Precision 5000 5560 | |
| iperf3 receive AX12 | |
| Lenovo ThinkPad T15g-20UR000GGE | |
| Lenovo ThinkPad P15 G2-20YQ001JGE | |
| Lenovo ThinkPad P15s Gen2-20W6000GGE | |
| Lenovo ThinkPad P15v G2 21A9000XGE | |
| Dell Precision 5000 5560 | |
| HP ZBook Power 15 G8 313S5EA | |
| Lenovo ThinkPad T15p-20TN0006GE | |
| Average Intel Wi-Fi 6 AX201 (136 - 1743, n=324) | |
网络摄像头

虽然相机只提供糟糕的720p,但可以看到用户的模型素质。


安全问题
像ThinkPad P15v这样的纯商务笔记本电脑提供了许多安全功能,如智能卡读卡器、掌托中的指纹识别器、Kensington安全锁、TPM 2.0,以及用于Windows Hello的红外摄像头和集成的ThinkShutter(网络摄像头快门)。
辅料
除了相当紧凑的135瓦超薄电源适配器,购买时没有任何配件。一个明确的对接端口也被省略了,由于不可能通过USB-C充电,所以缺乏Thunderbolt解决方案。只有将专有充电端口与Thunderbolt相结合的特殊对接方式可以使用:ThinkPad Thunderbolt 3 Workstation Dock Gen 2.
联想的包装不能说是真正的环保,即使包装和盒子都保持得非常简单。
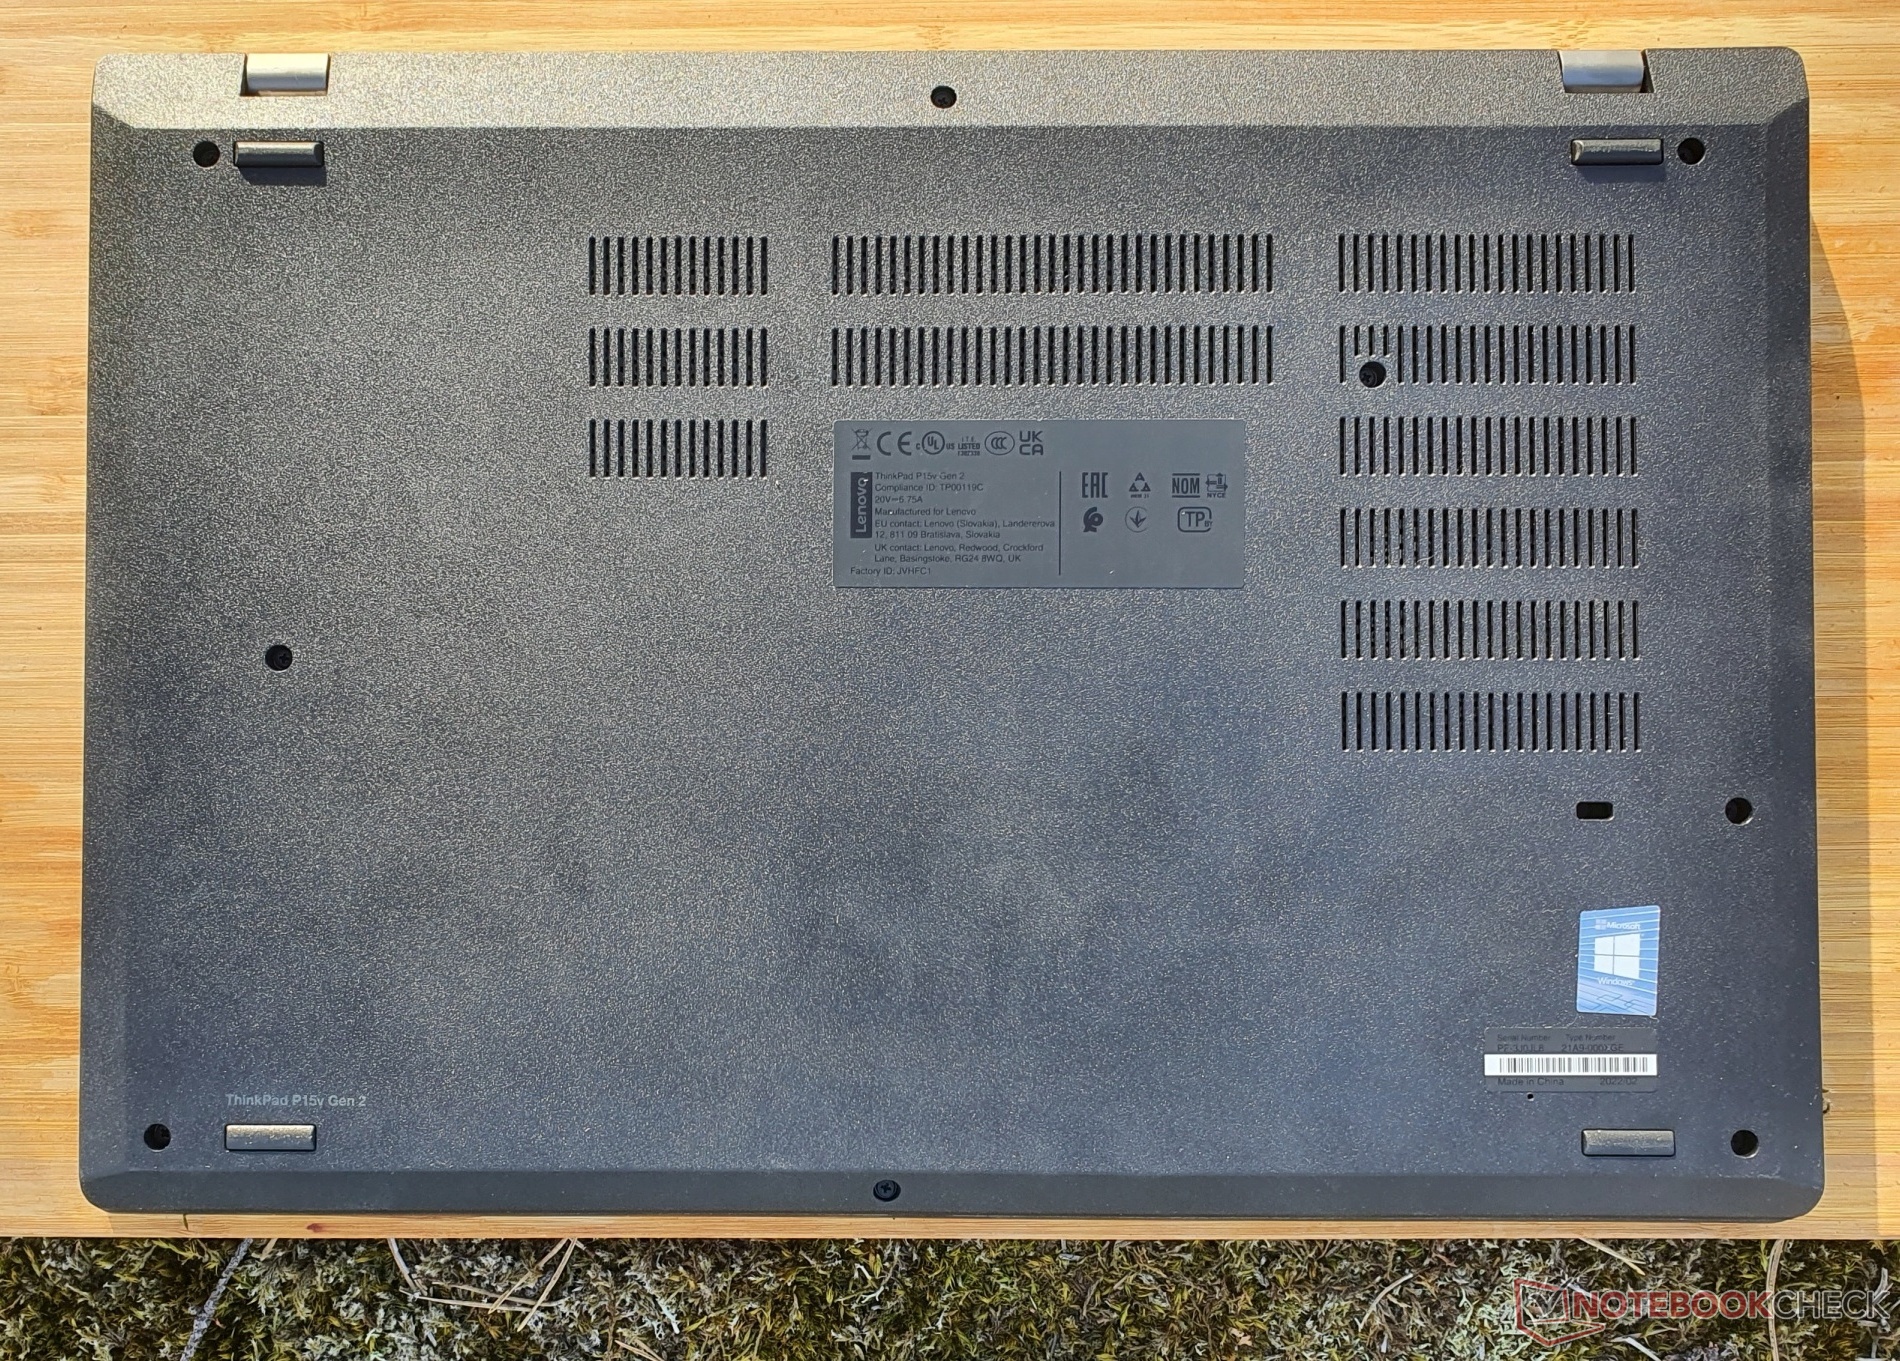
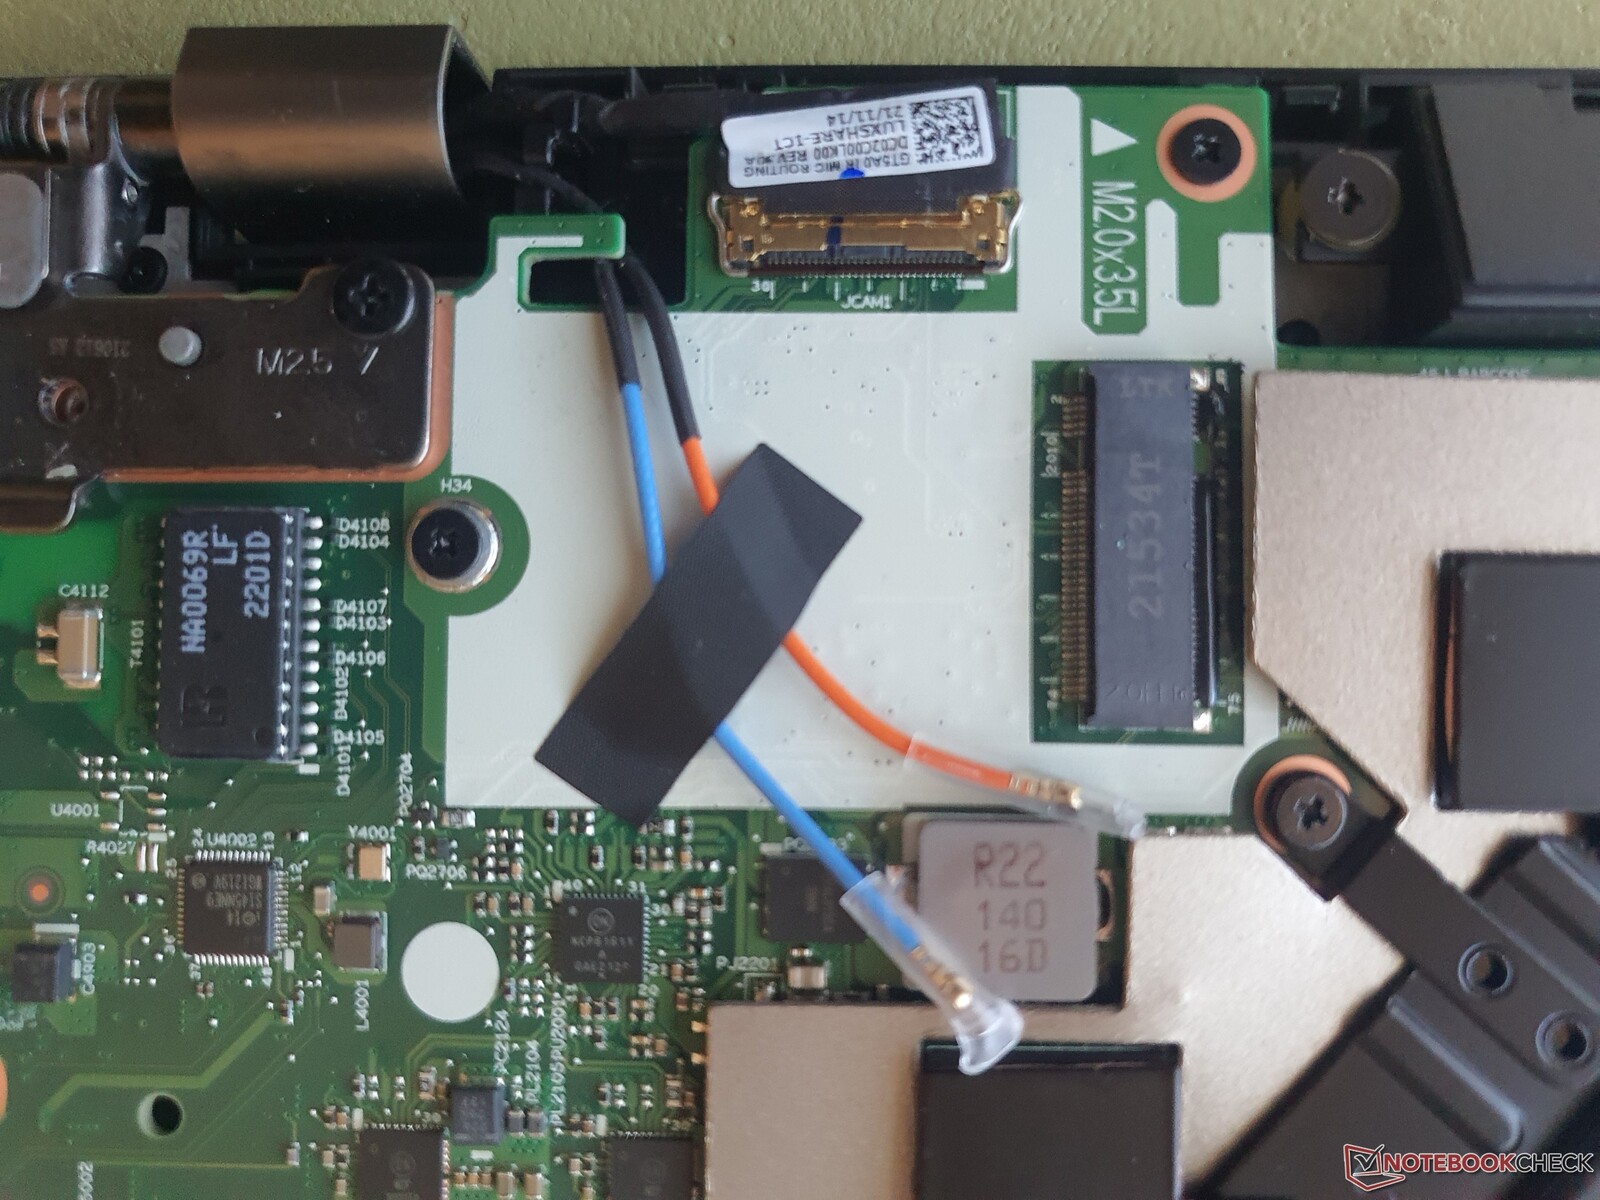
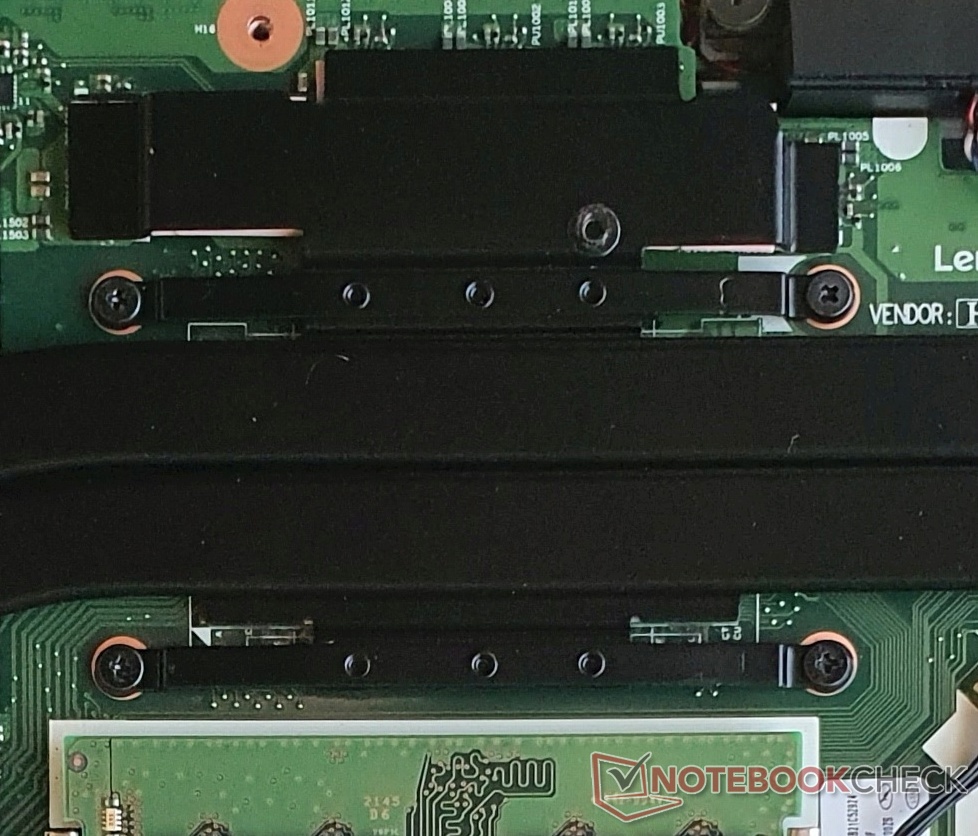
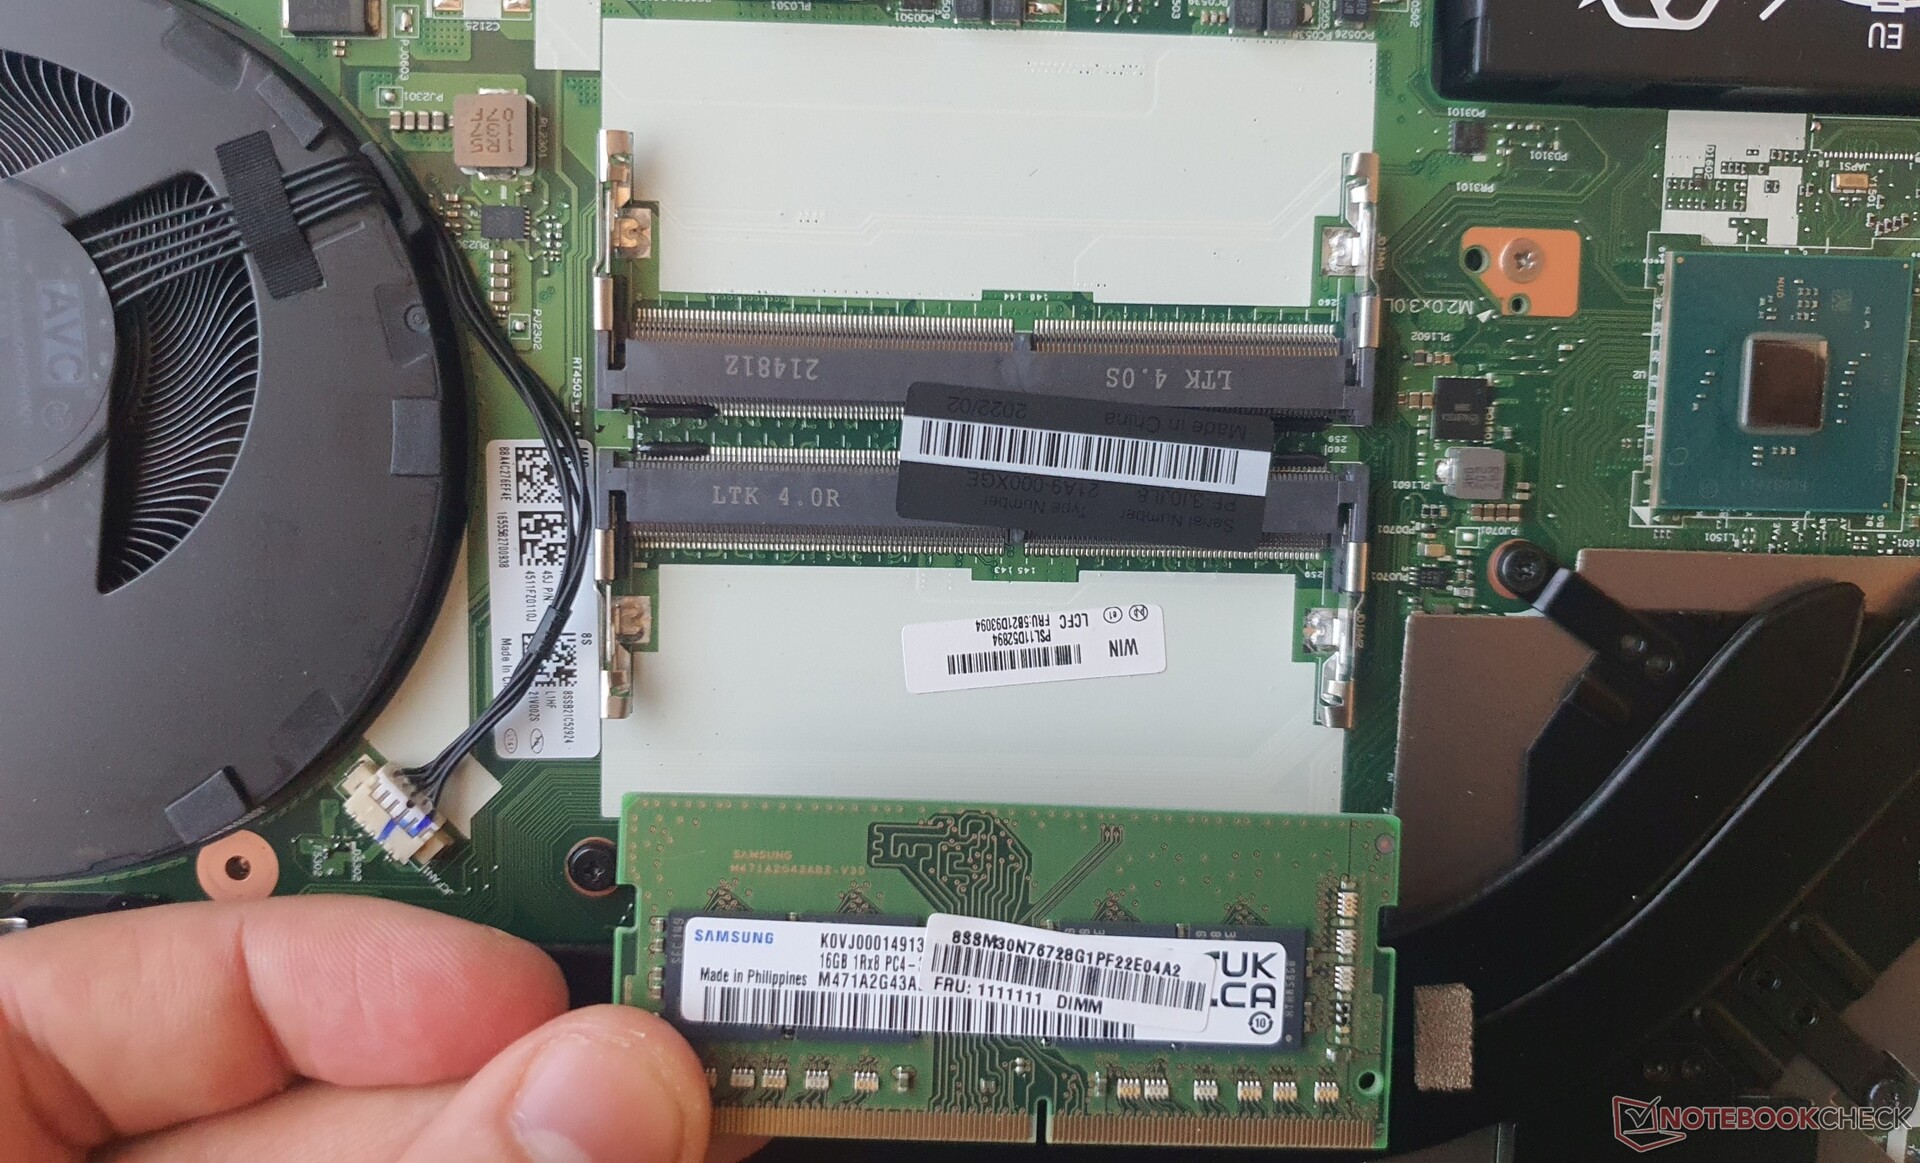
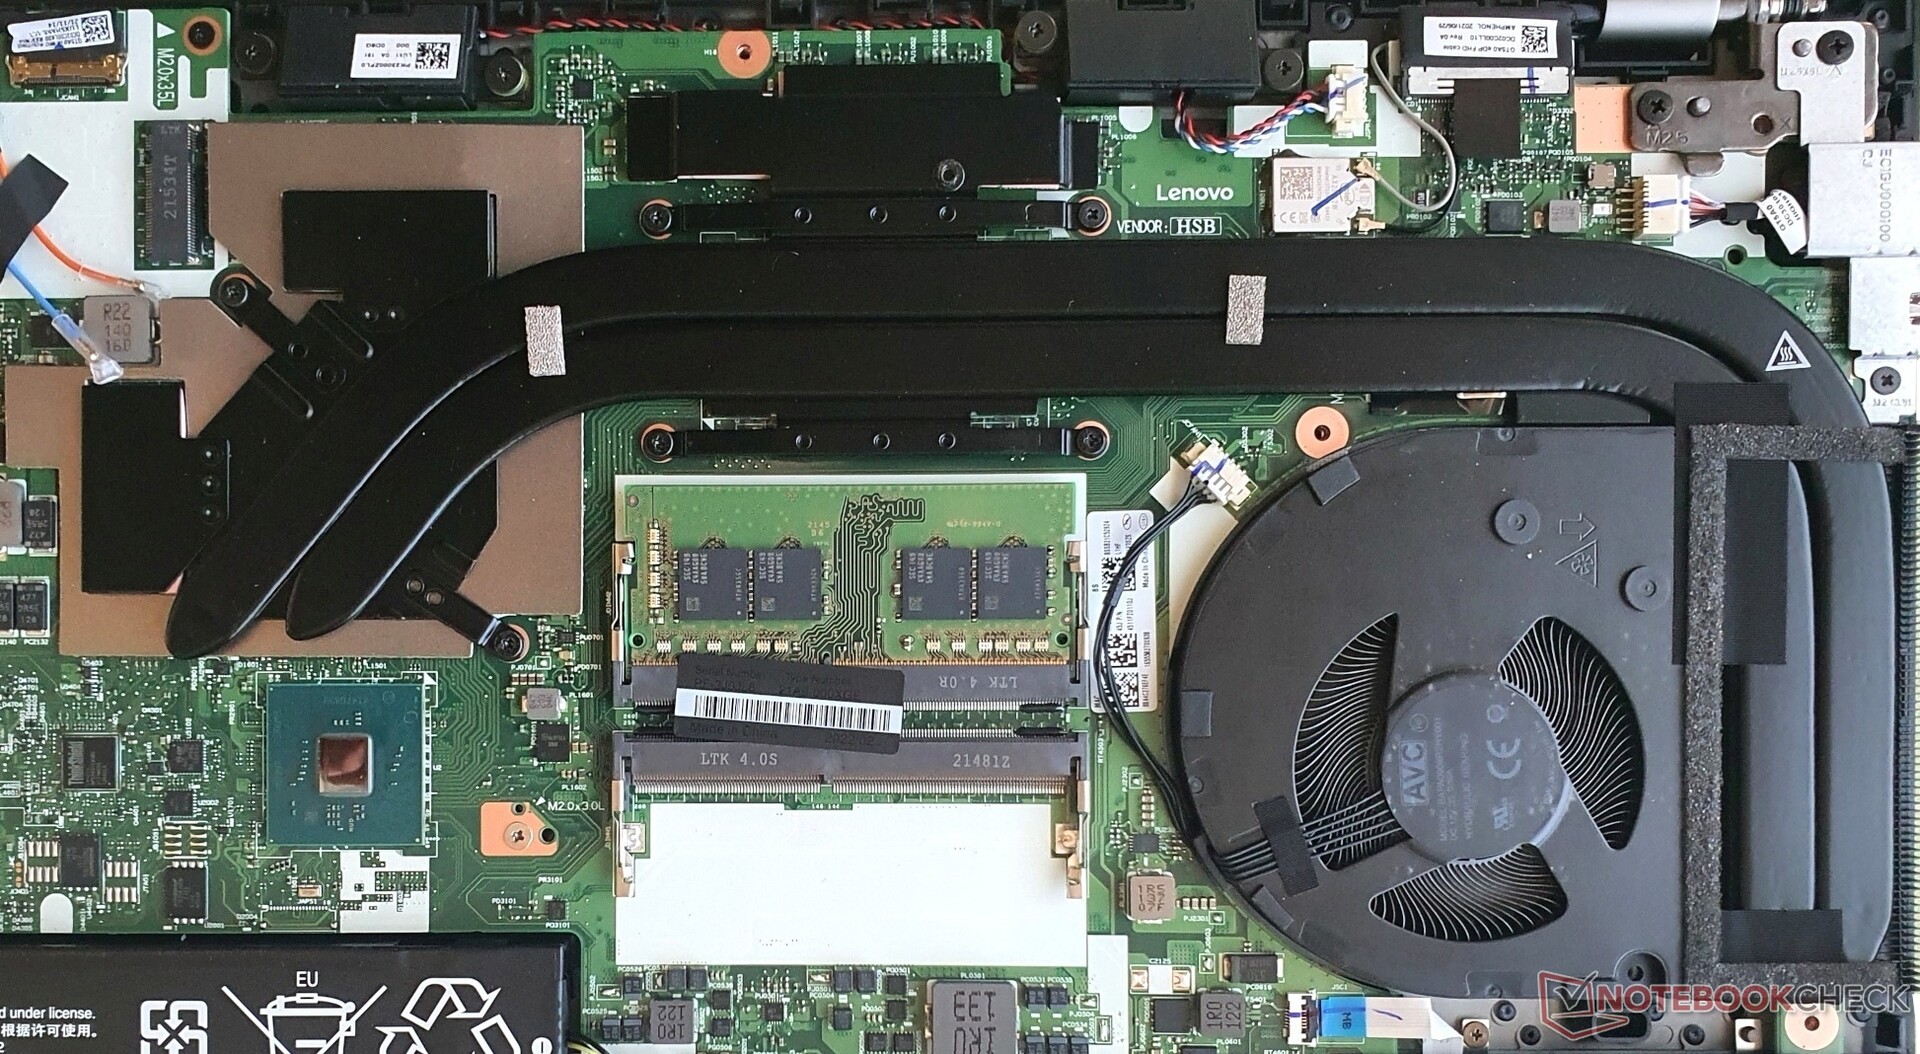
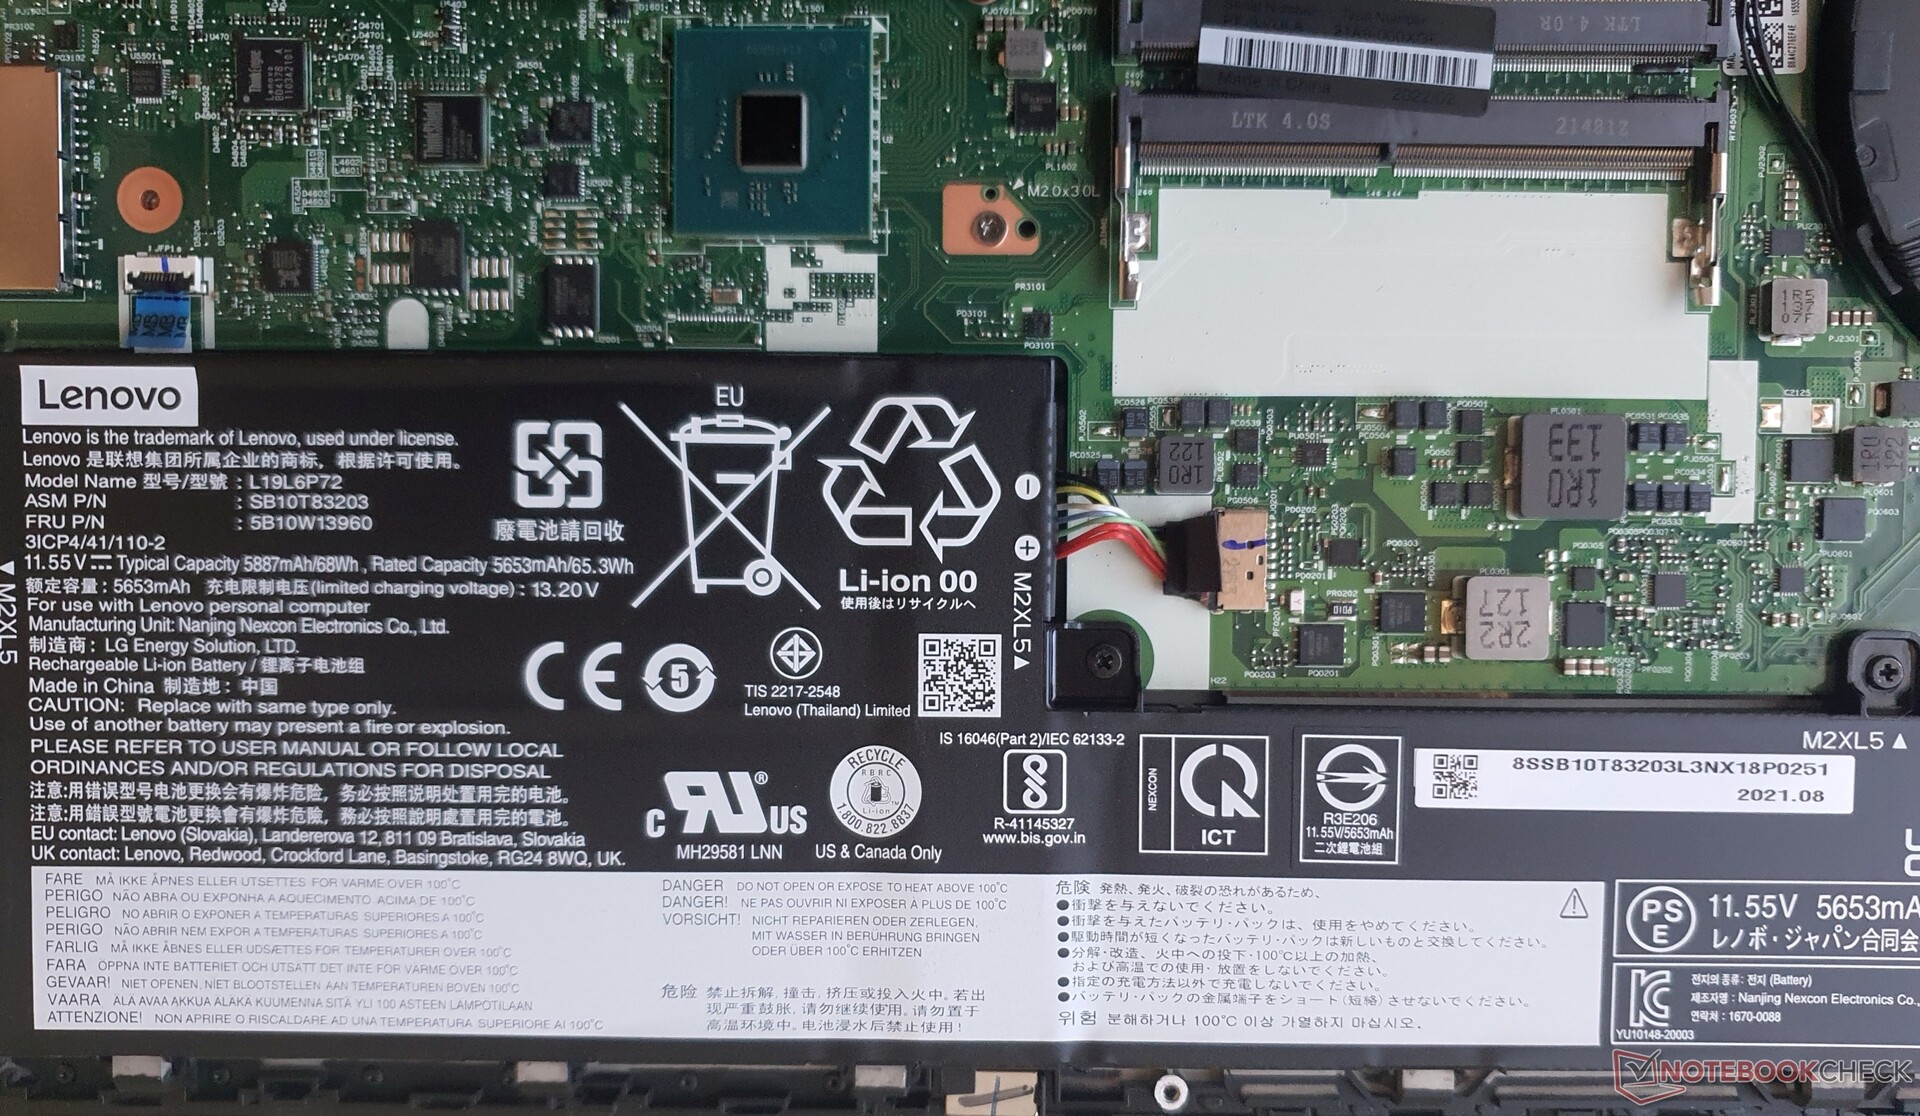
维护
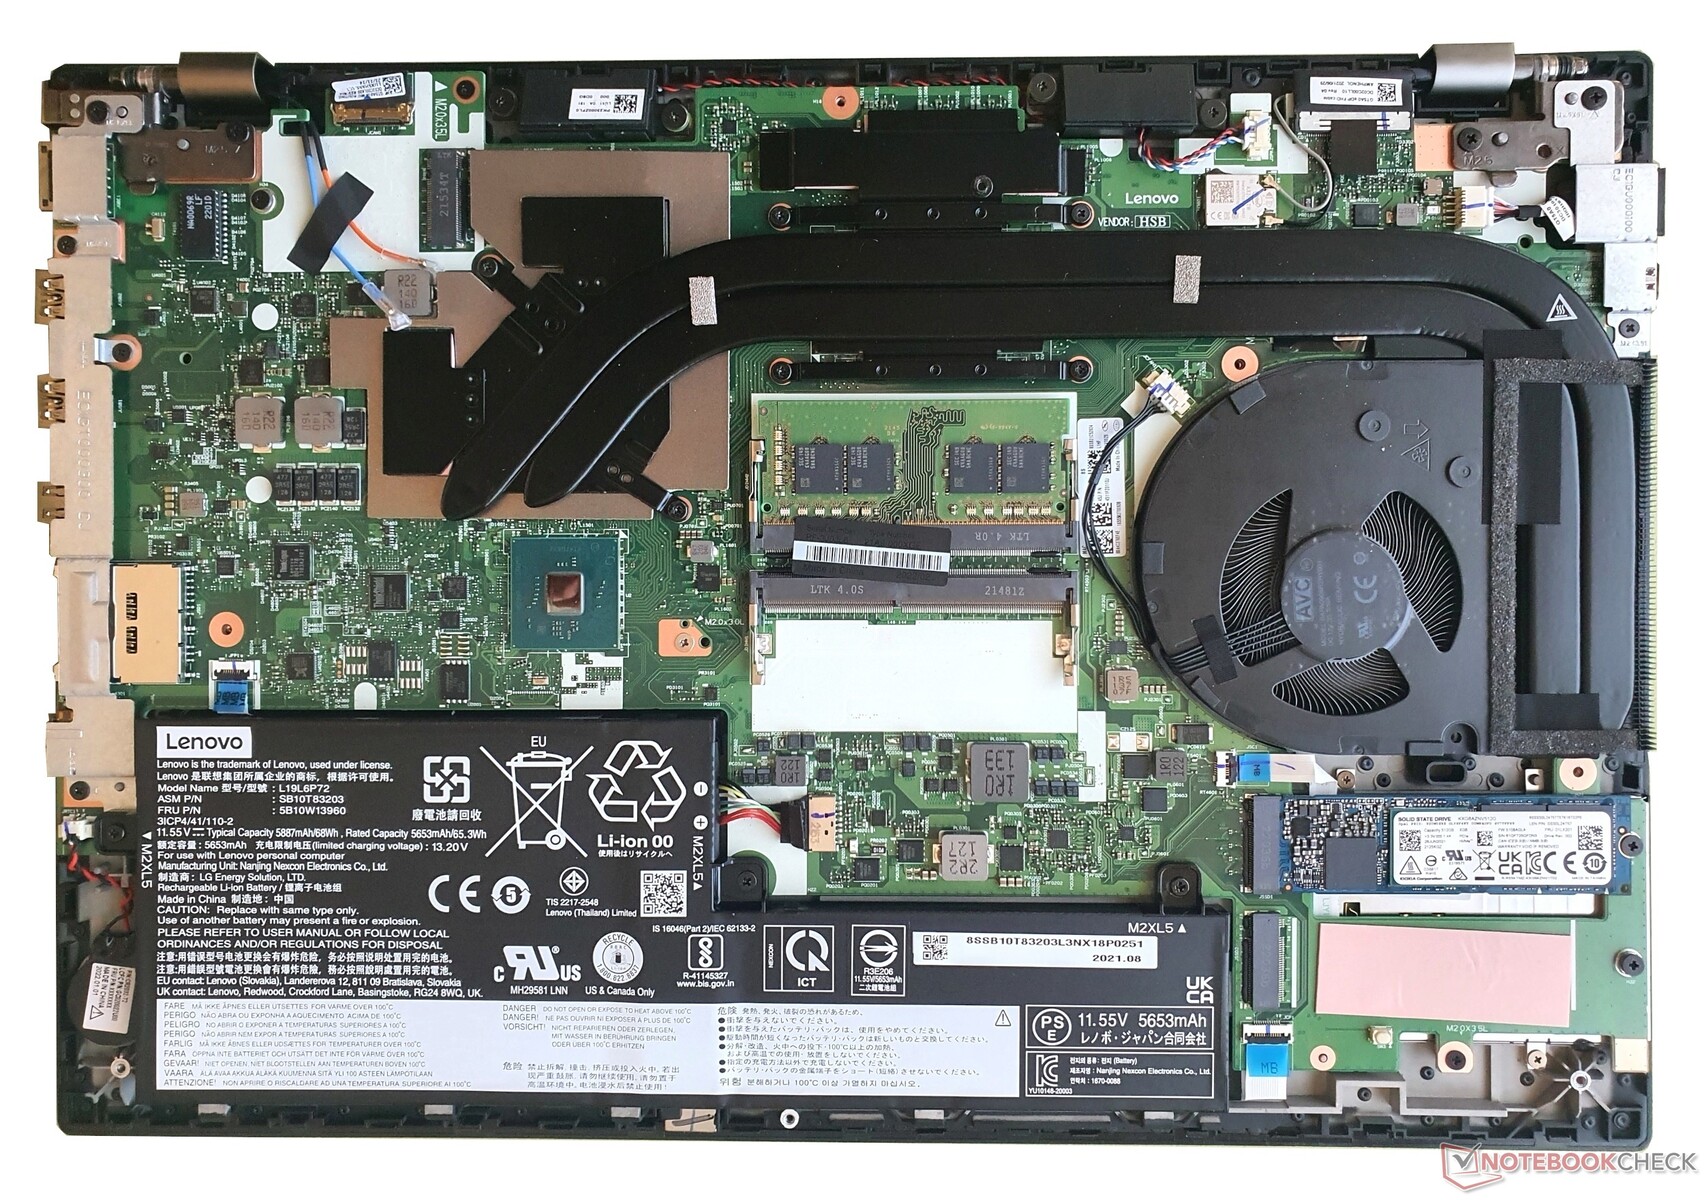
尽管有几个塑料夹子,底板还是相当容易拆卸。九颗螺丝很快就被松开了,而其中一些螺丝仍然卡在机箱里。打开后,你必须接触到内存(1个空闲插槽)、M.2-2280-SSD(1个空闲插槽)、可更换的风扇(包括热管)和68Wh电池,这也是可更换的。WLAN模块是永久性安装的。
另一个有用的方面是,如果键盘在多年打字后变得破旧或有缺陷,可以很容易地更换。
担保
和所有的高端ThinkPads(T/X/P系列)一样,联想德国公司为P15v G2笔记本电脑提供三年的保修,包括提货和退货。现场维修也是可以的,但要收取附加费,就像意外损坏保护、高级支持 或延长保修期至5年一样。
国际读者请注意。联想的保修政策可能因地区而异,所以一定要查看联想网站(如适用)的购买国家。
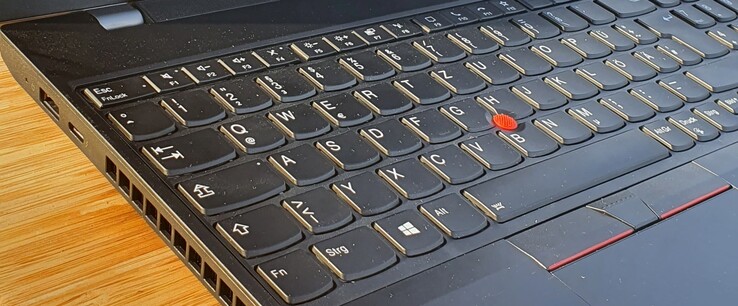
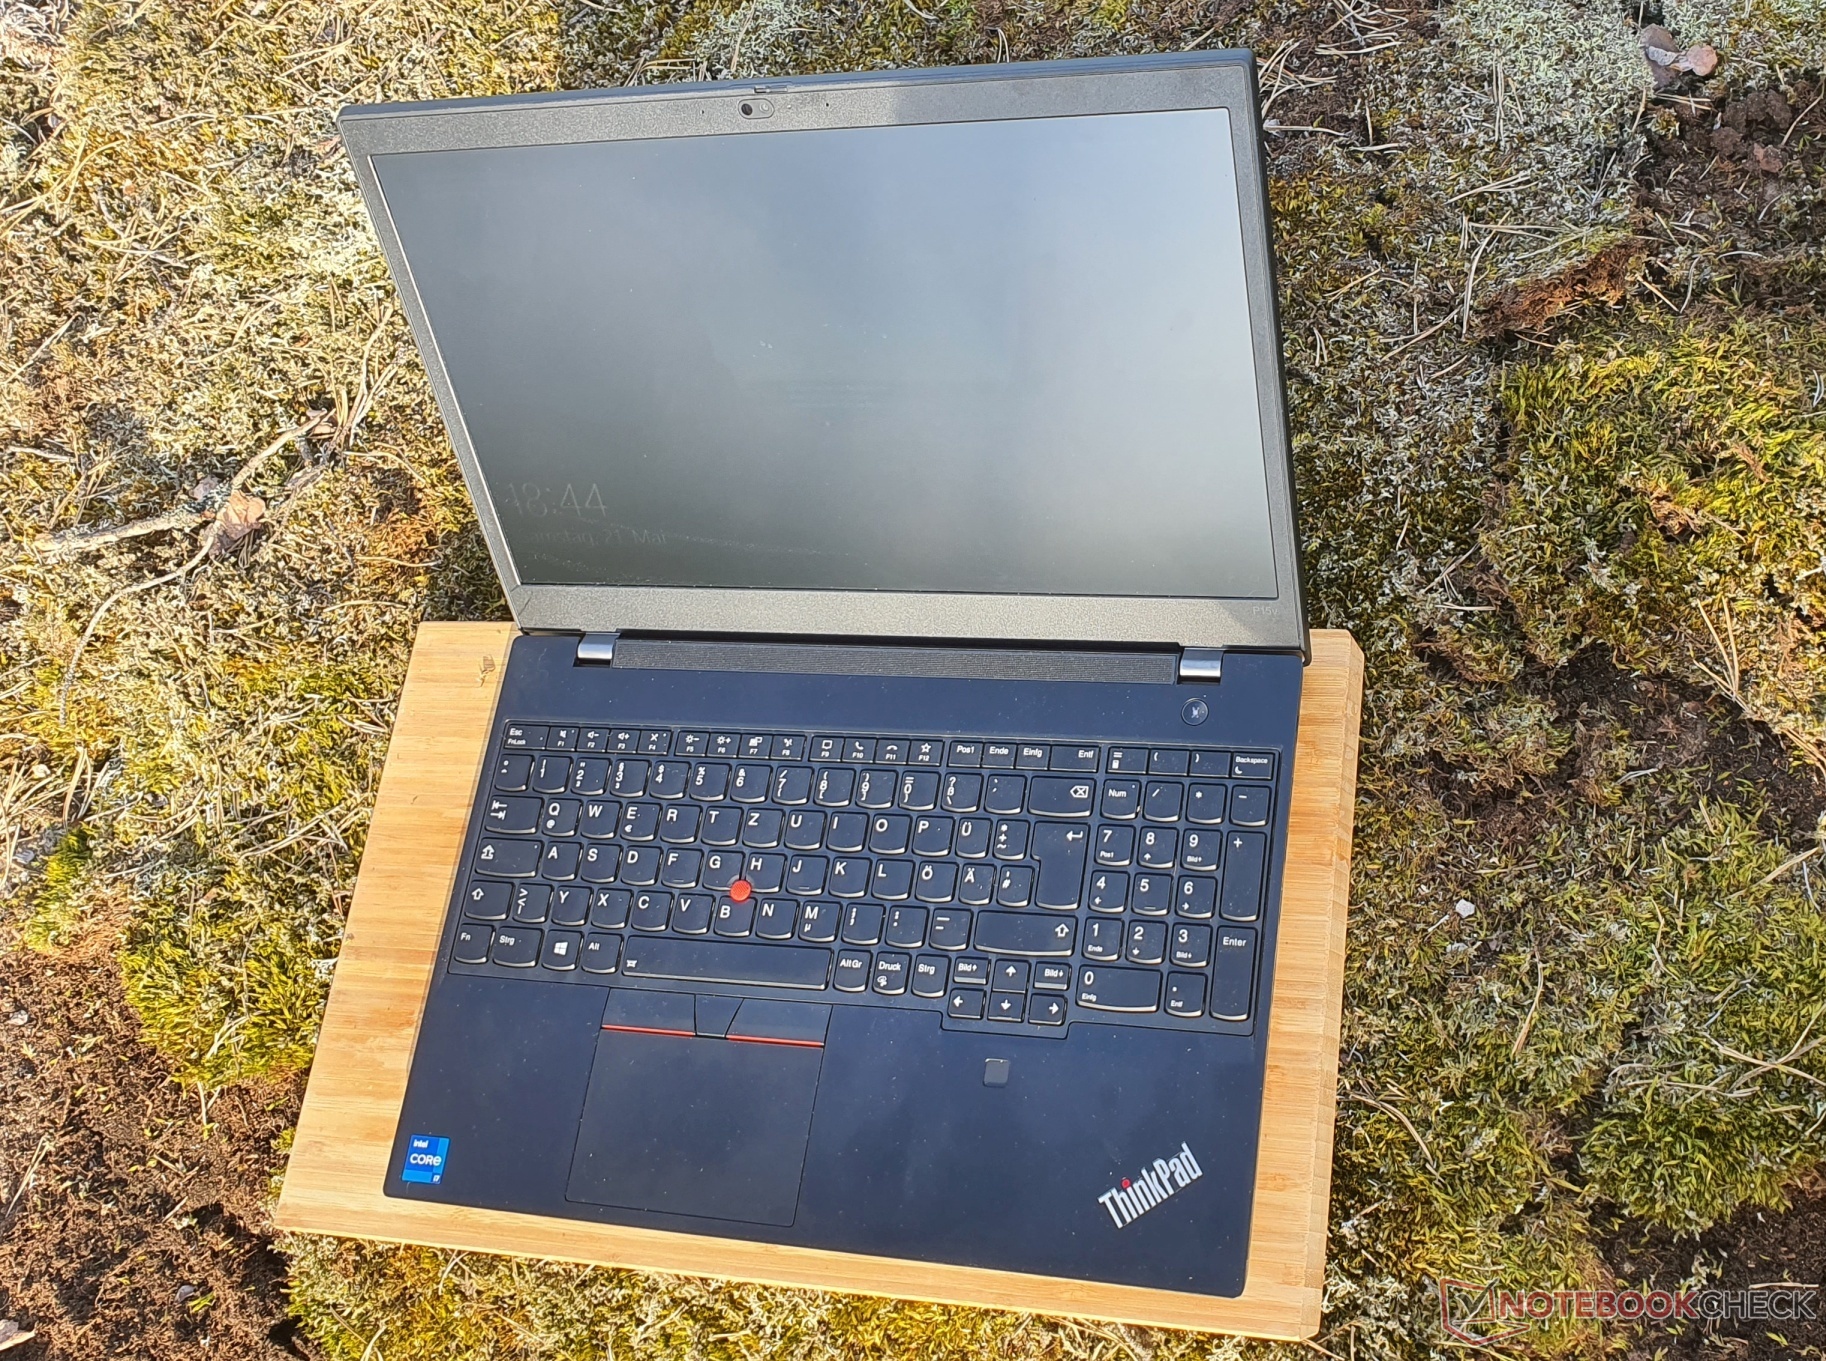
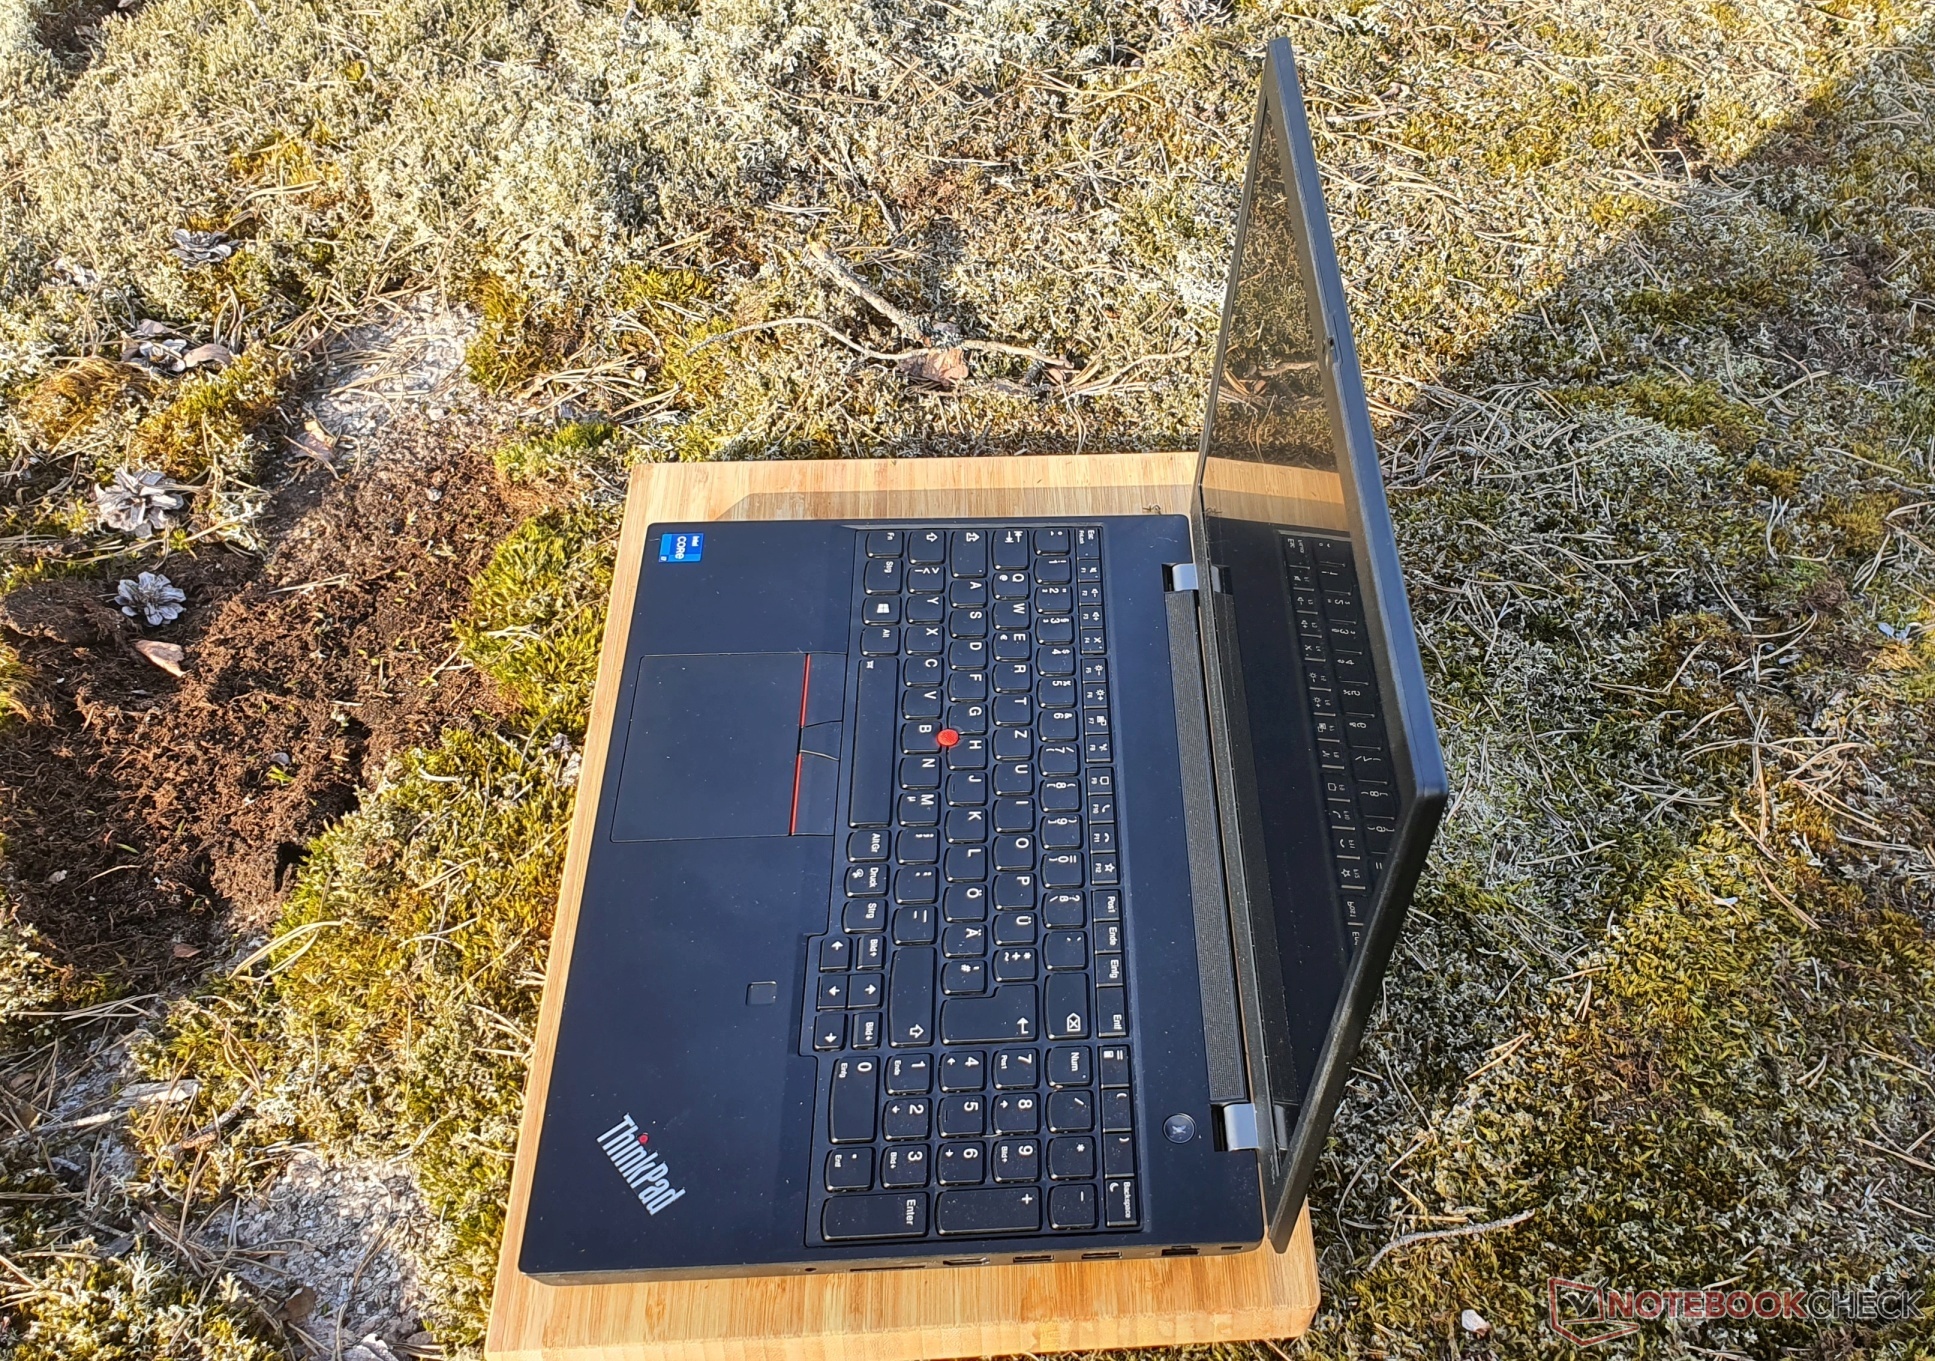
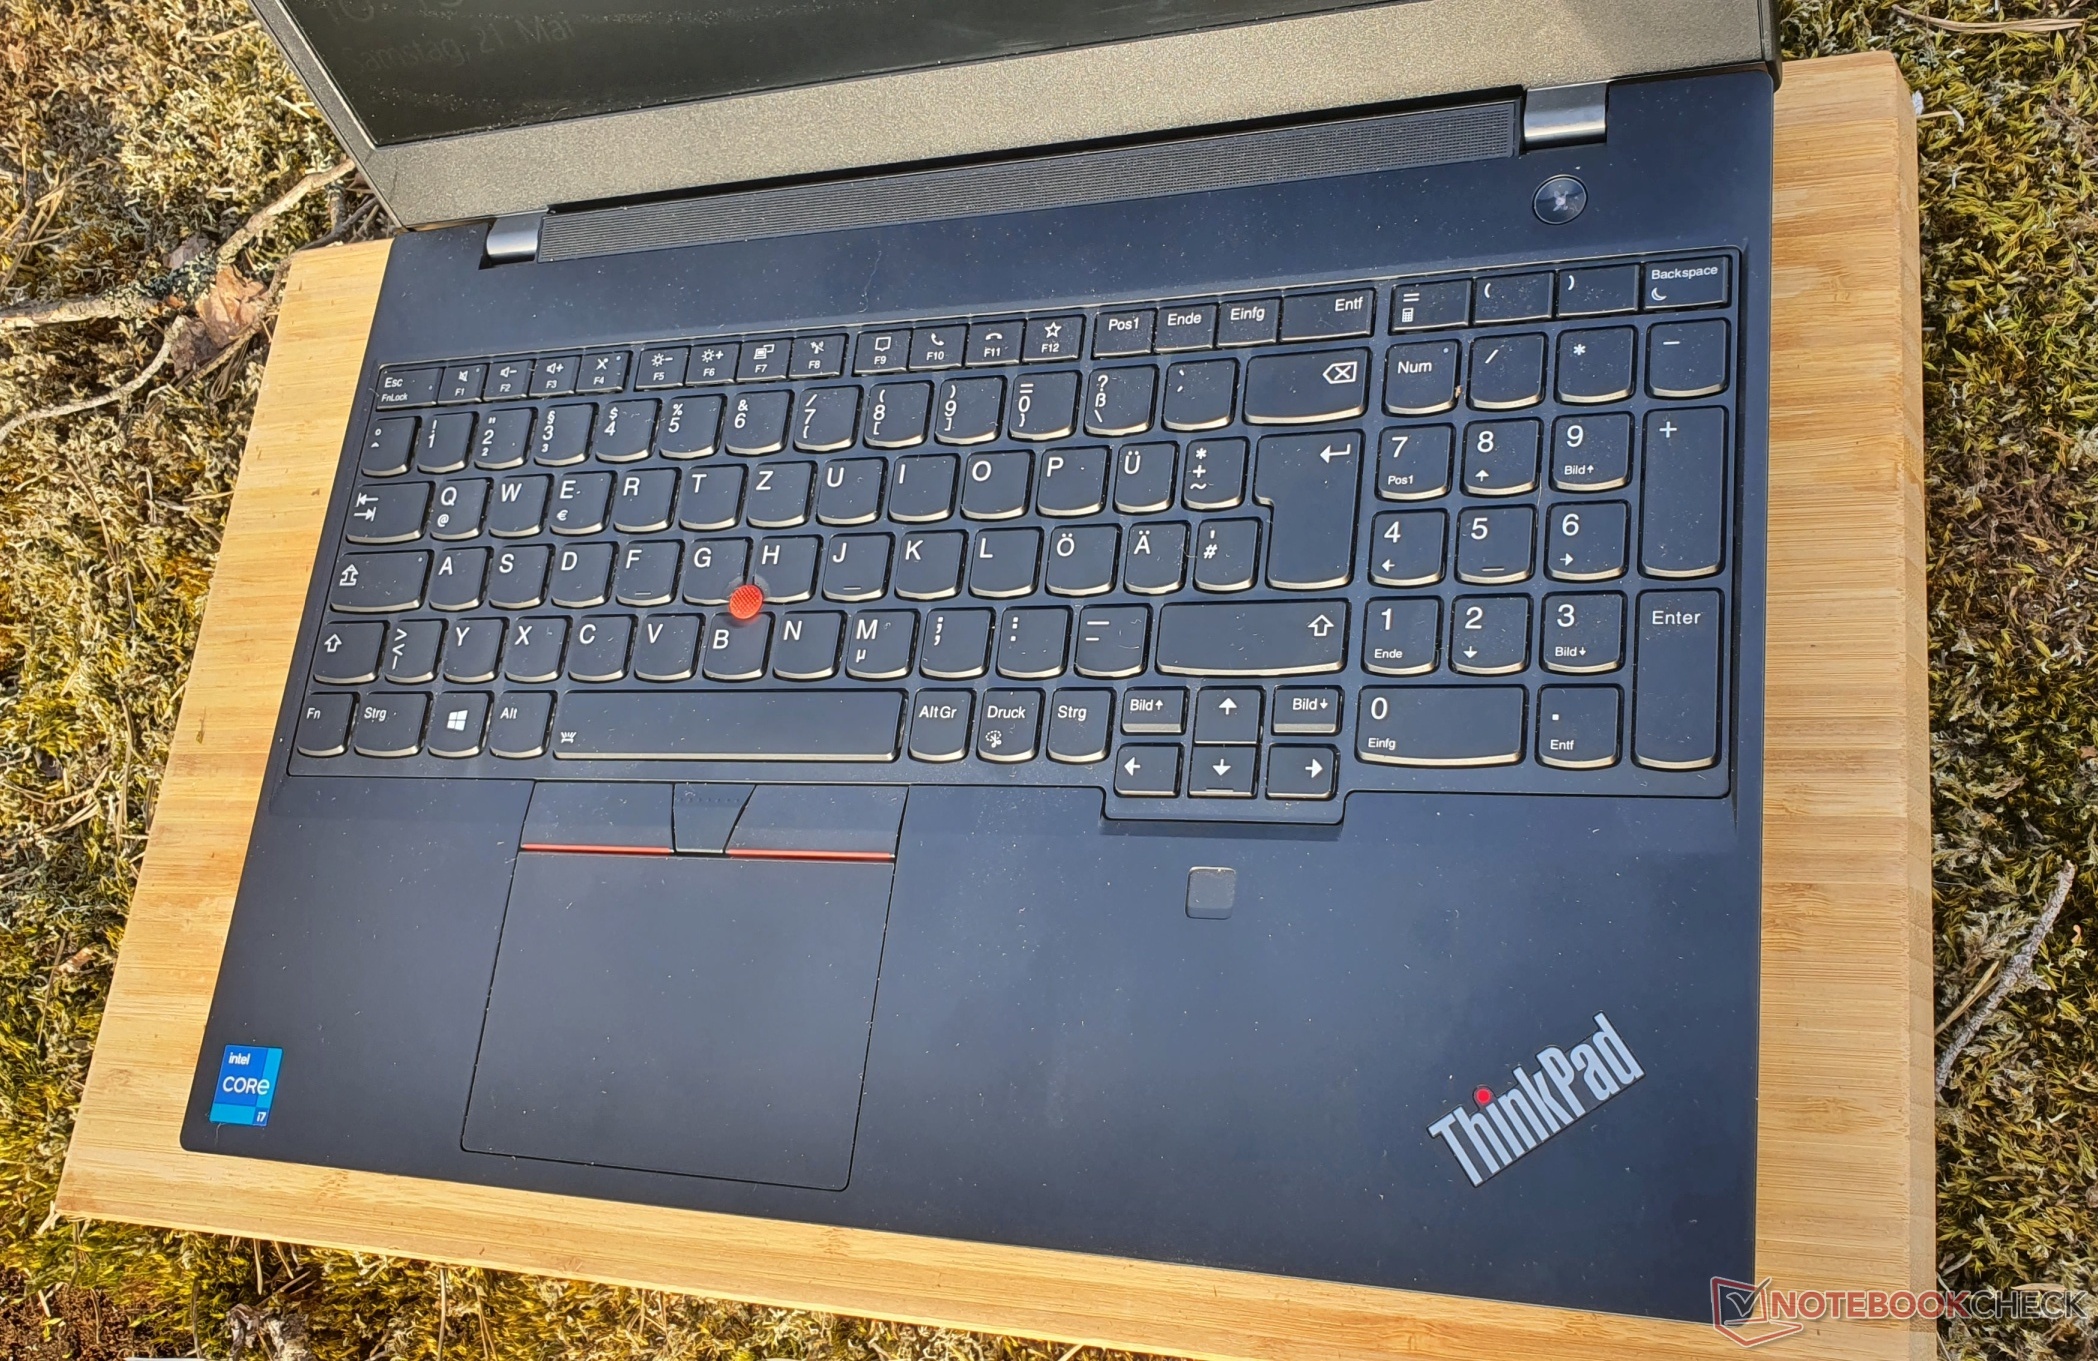
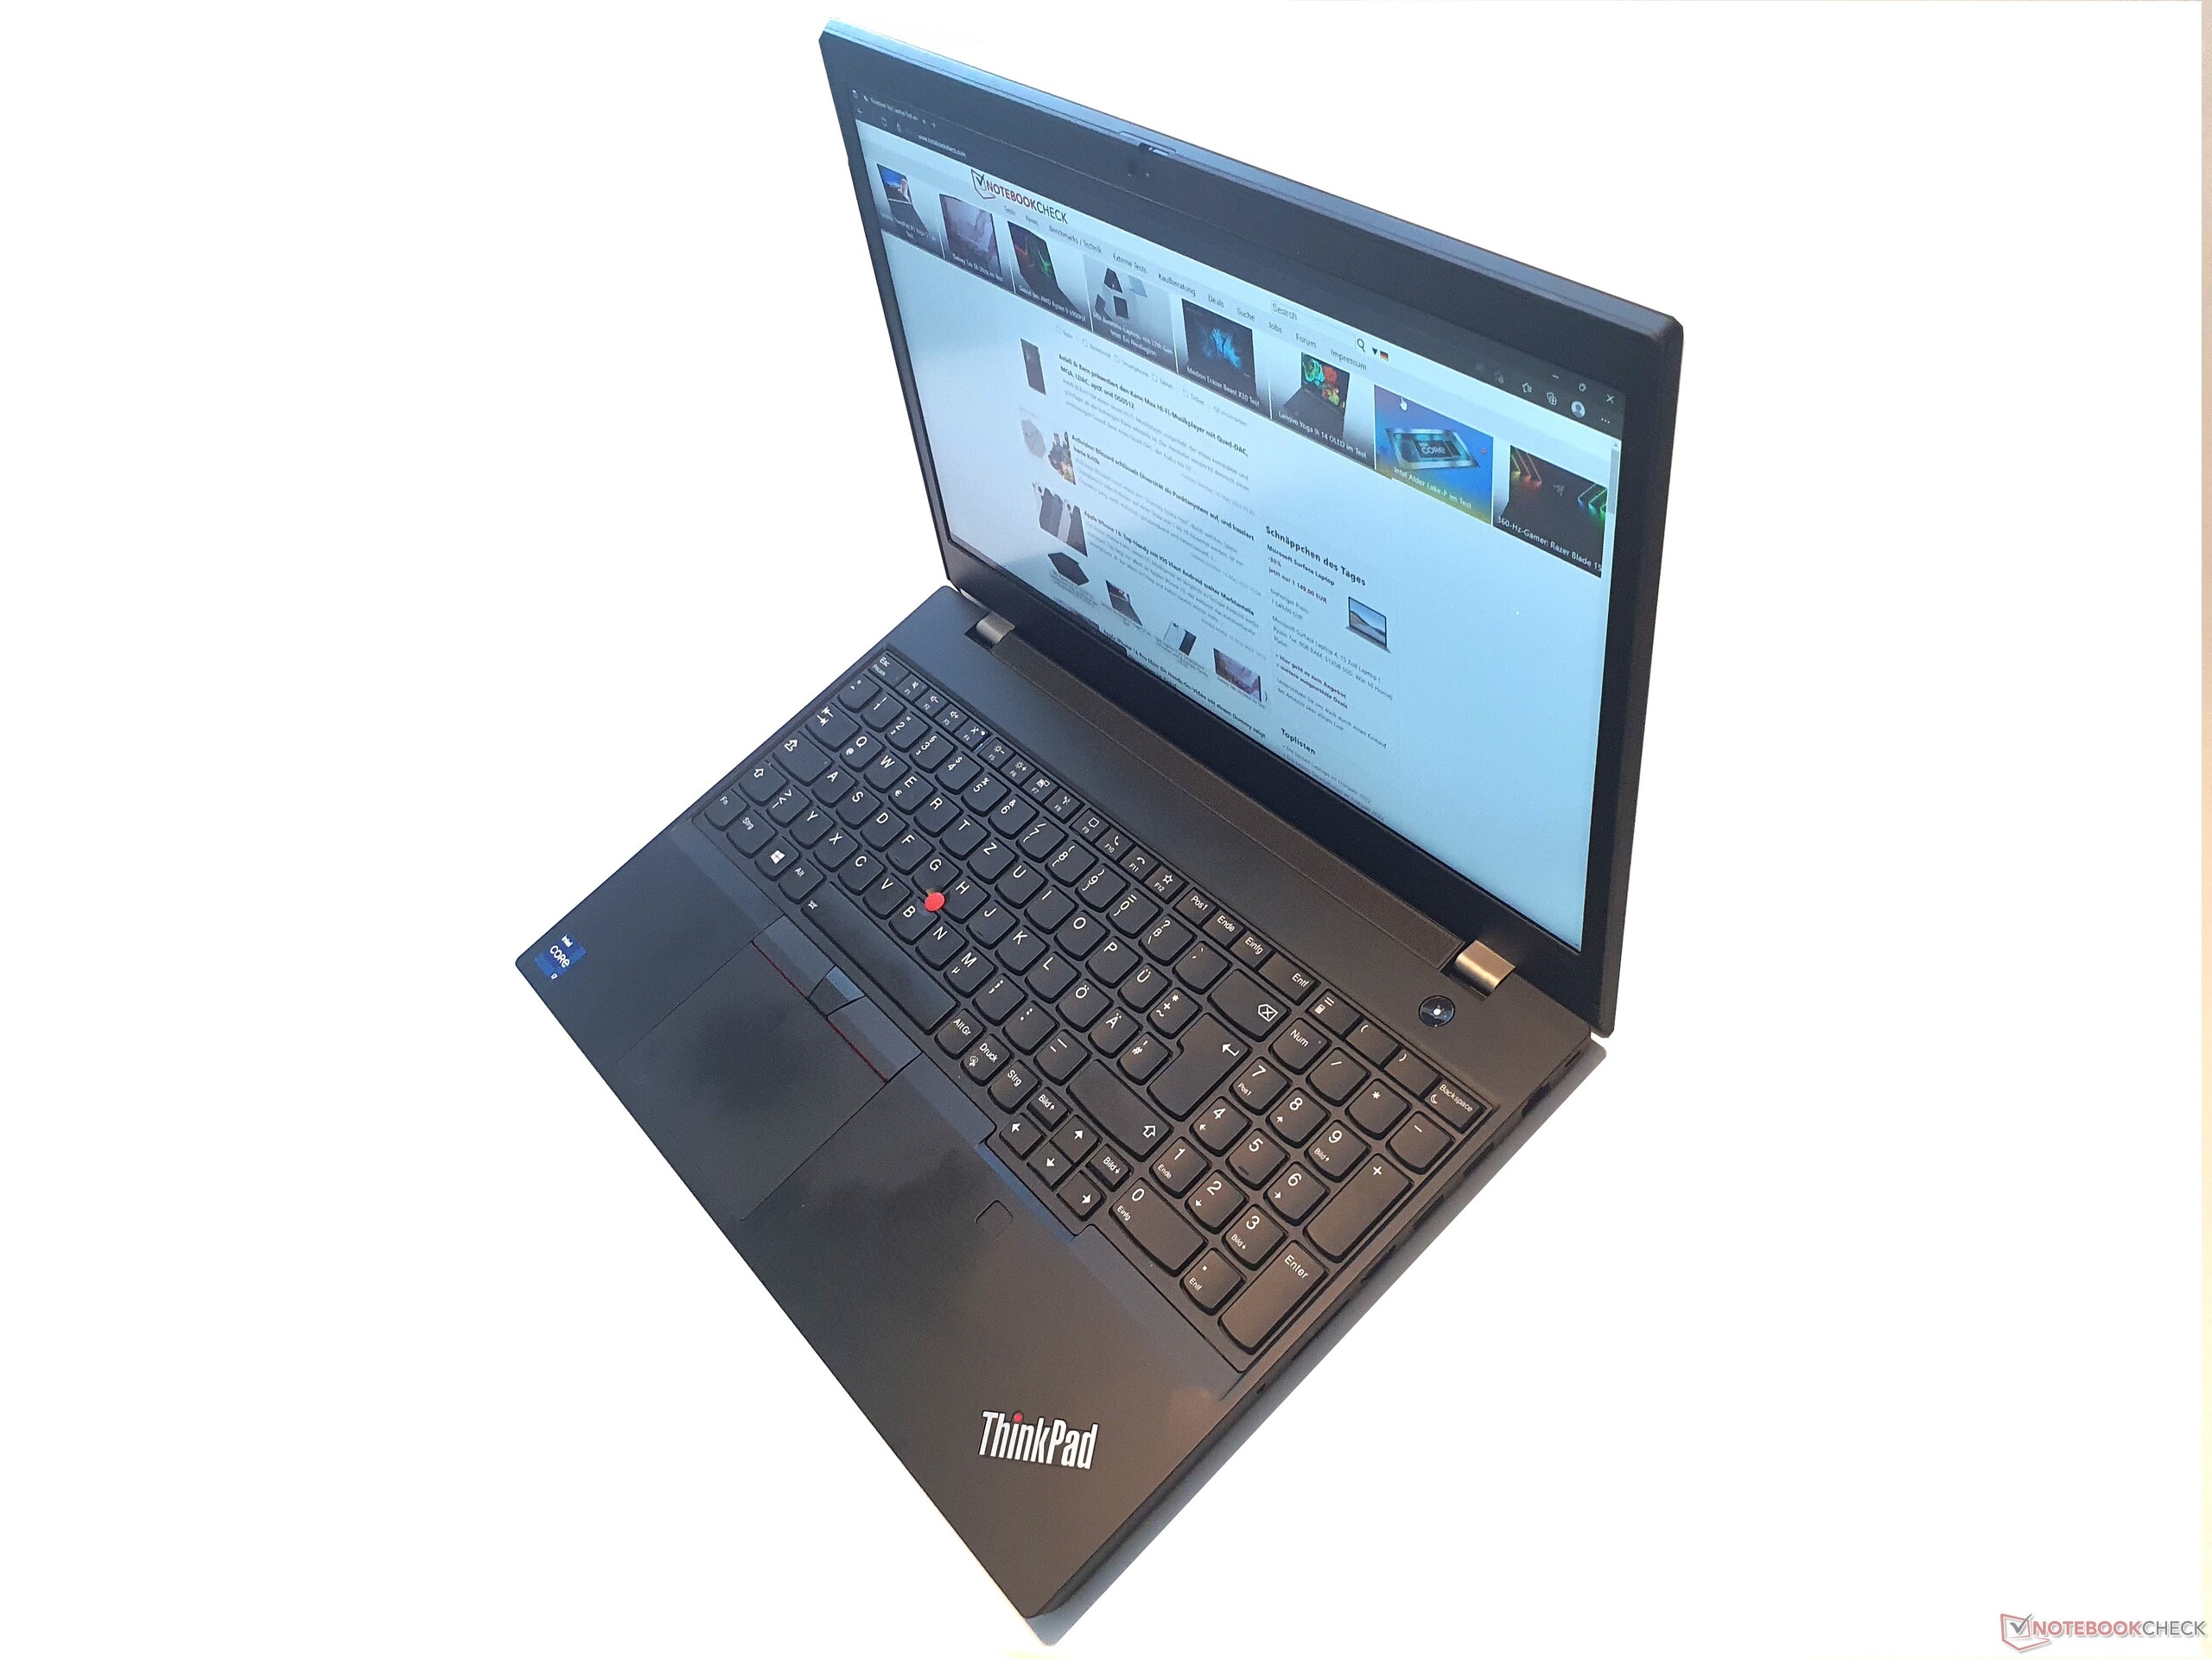
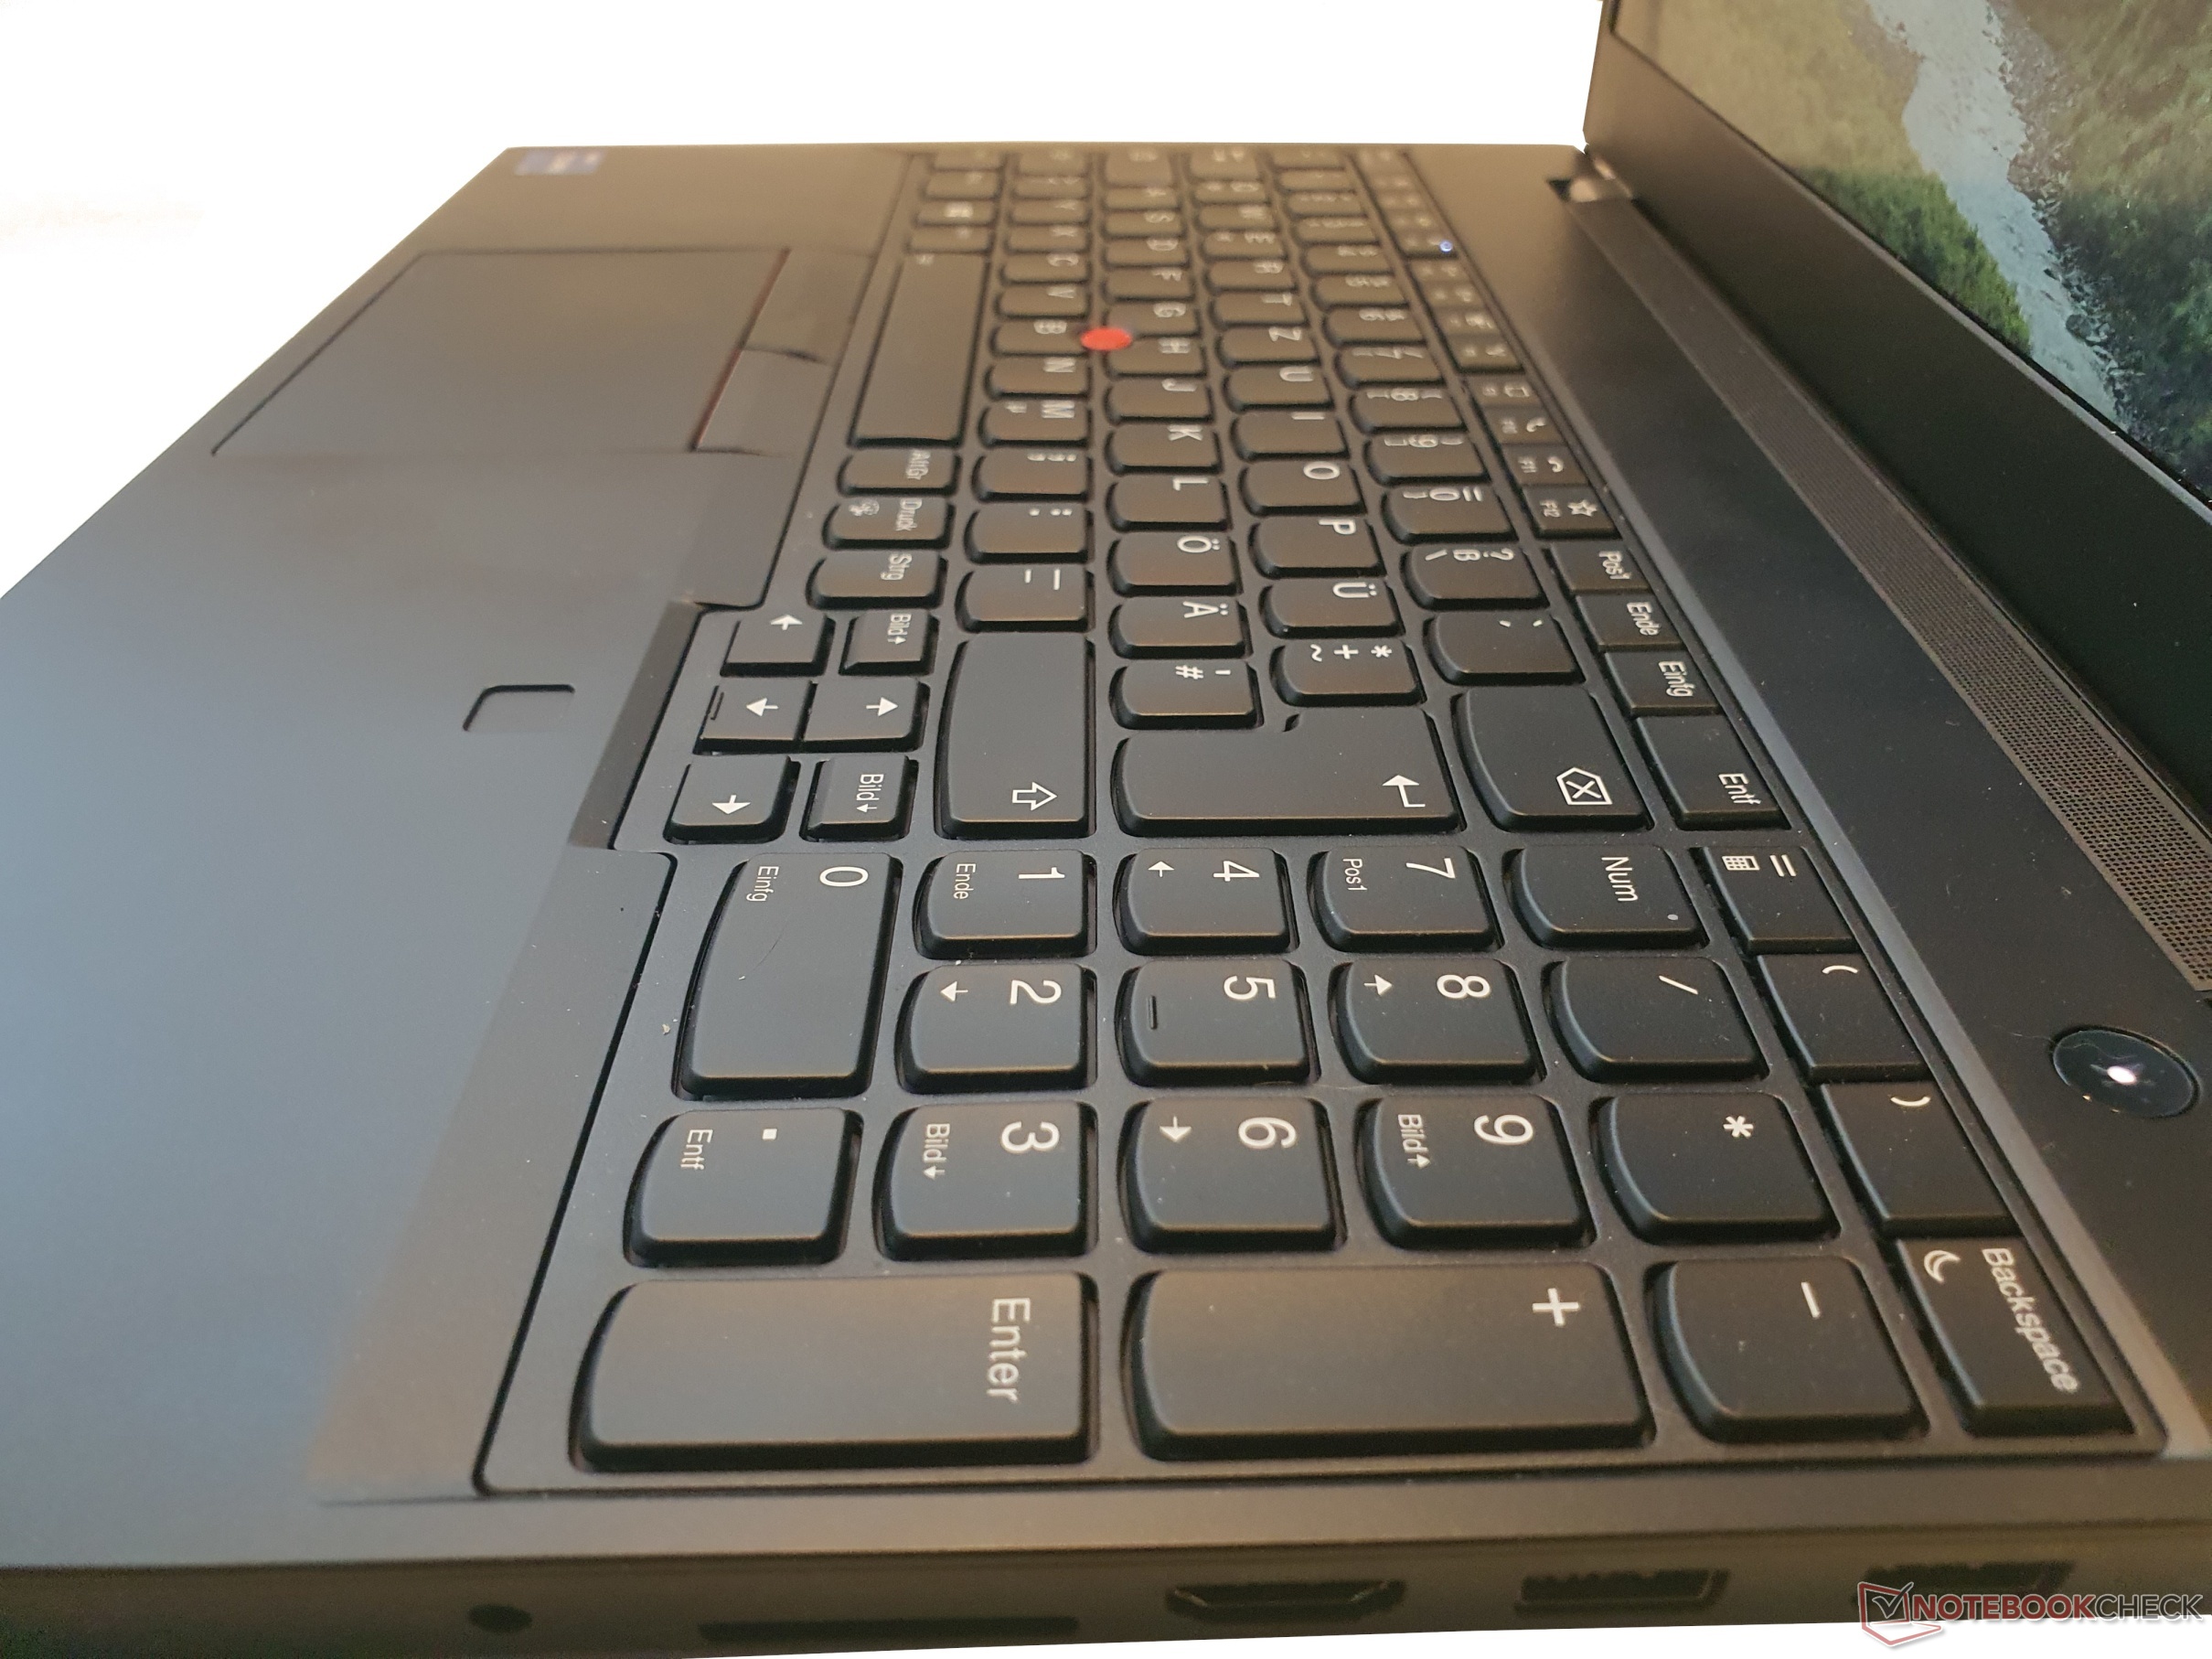
ThinkPad输入设备。联想有体面的1.8毫米行程
键盘
联想的防溅键盘使用起来非常舒适,其按键尺寸为15×15毫米,行程为1.8毫米。这在许多ThinkPad中已经被减少到1.5毫米。平滑、略微凹陷的按键的受力点很明显,行程也非常令人满意。另一方面,惠普ZBook Power 15的键盘有一个更清晰的压力点(在测试者看来),但行程更短。如有疑问,请在购买前对键盘进行测试。
总的来说,布局非常好,这也得益于专用导航和相当大的方向键。只有回车键左边的四个键和顶排的键有点小。还有一个数字键盘,这可以简化工作站相关数据的输入。即使在有针对性的压力下,键盘也不会屈服。背景照明有两个调整级别。
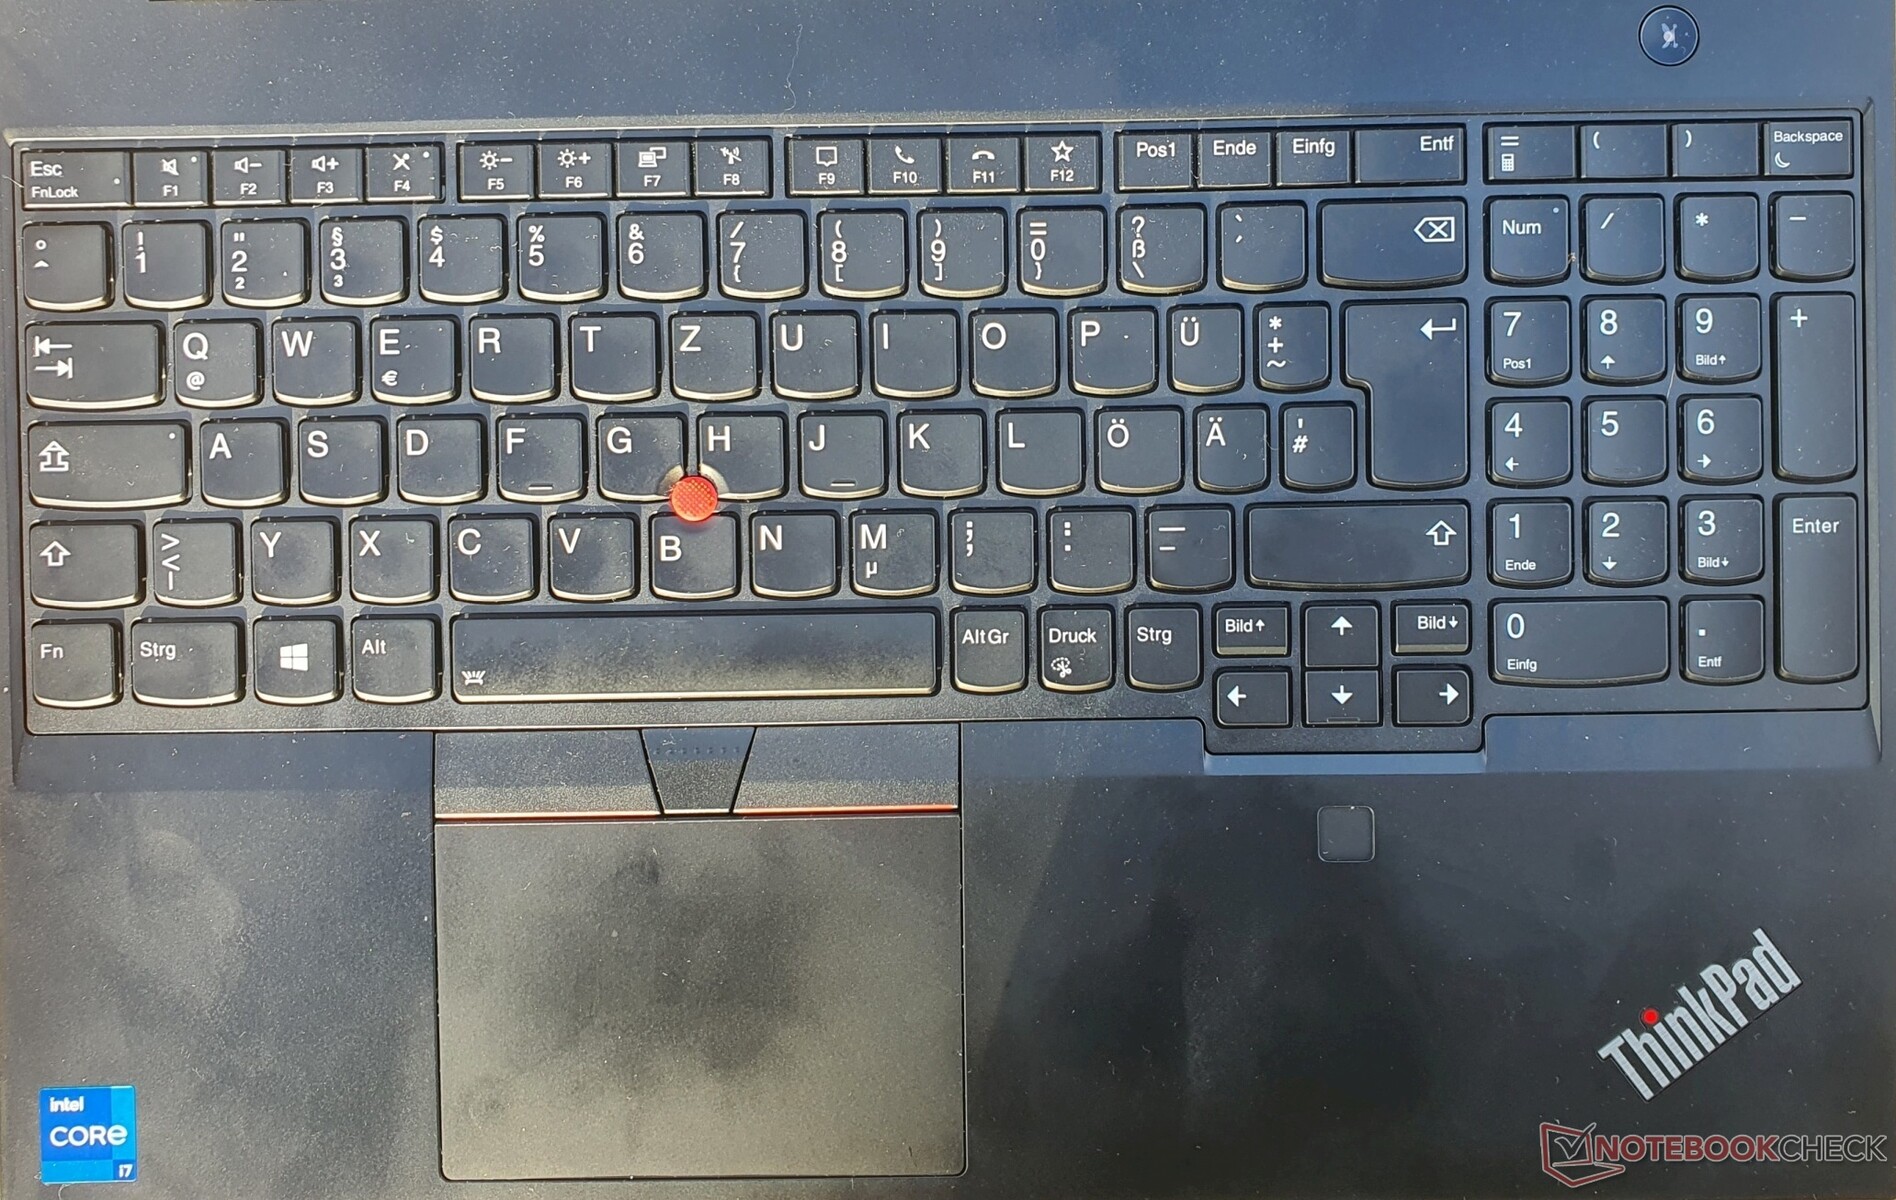
触摸板和TrackPoint
中等大小的触摸板尺寸为10 x 7厘米,有一个光滑的Mylar表面,具有良好的滑行质量。集成的点击按钮有一个完整的落点和一个精心设计的压力点。
只要稍加练习,TrackPoint和它的三个按钮就能非常准确地控制鼠标光标,其优点是你的手不必离开键盘。与中间的按钮结合起来进行滚动操作也很有用。
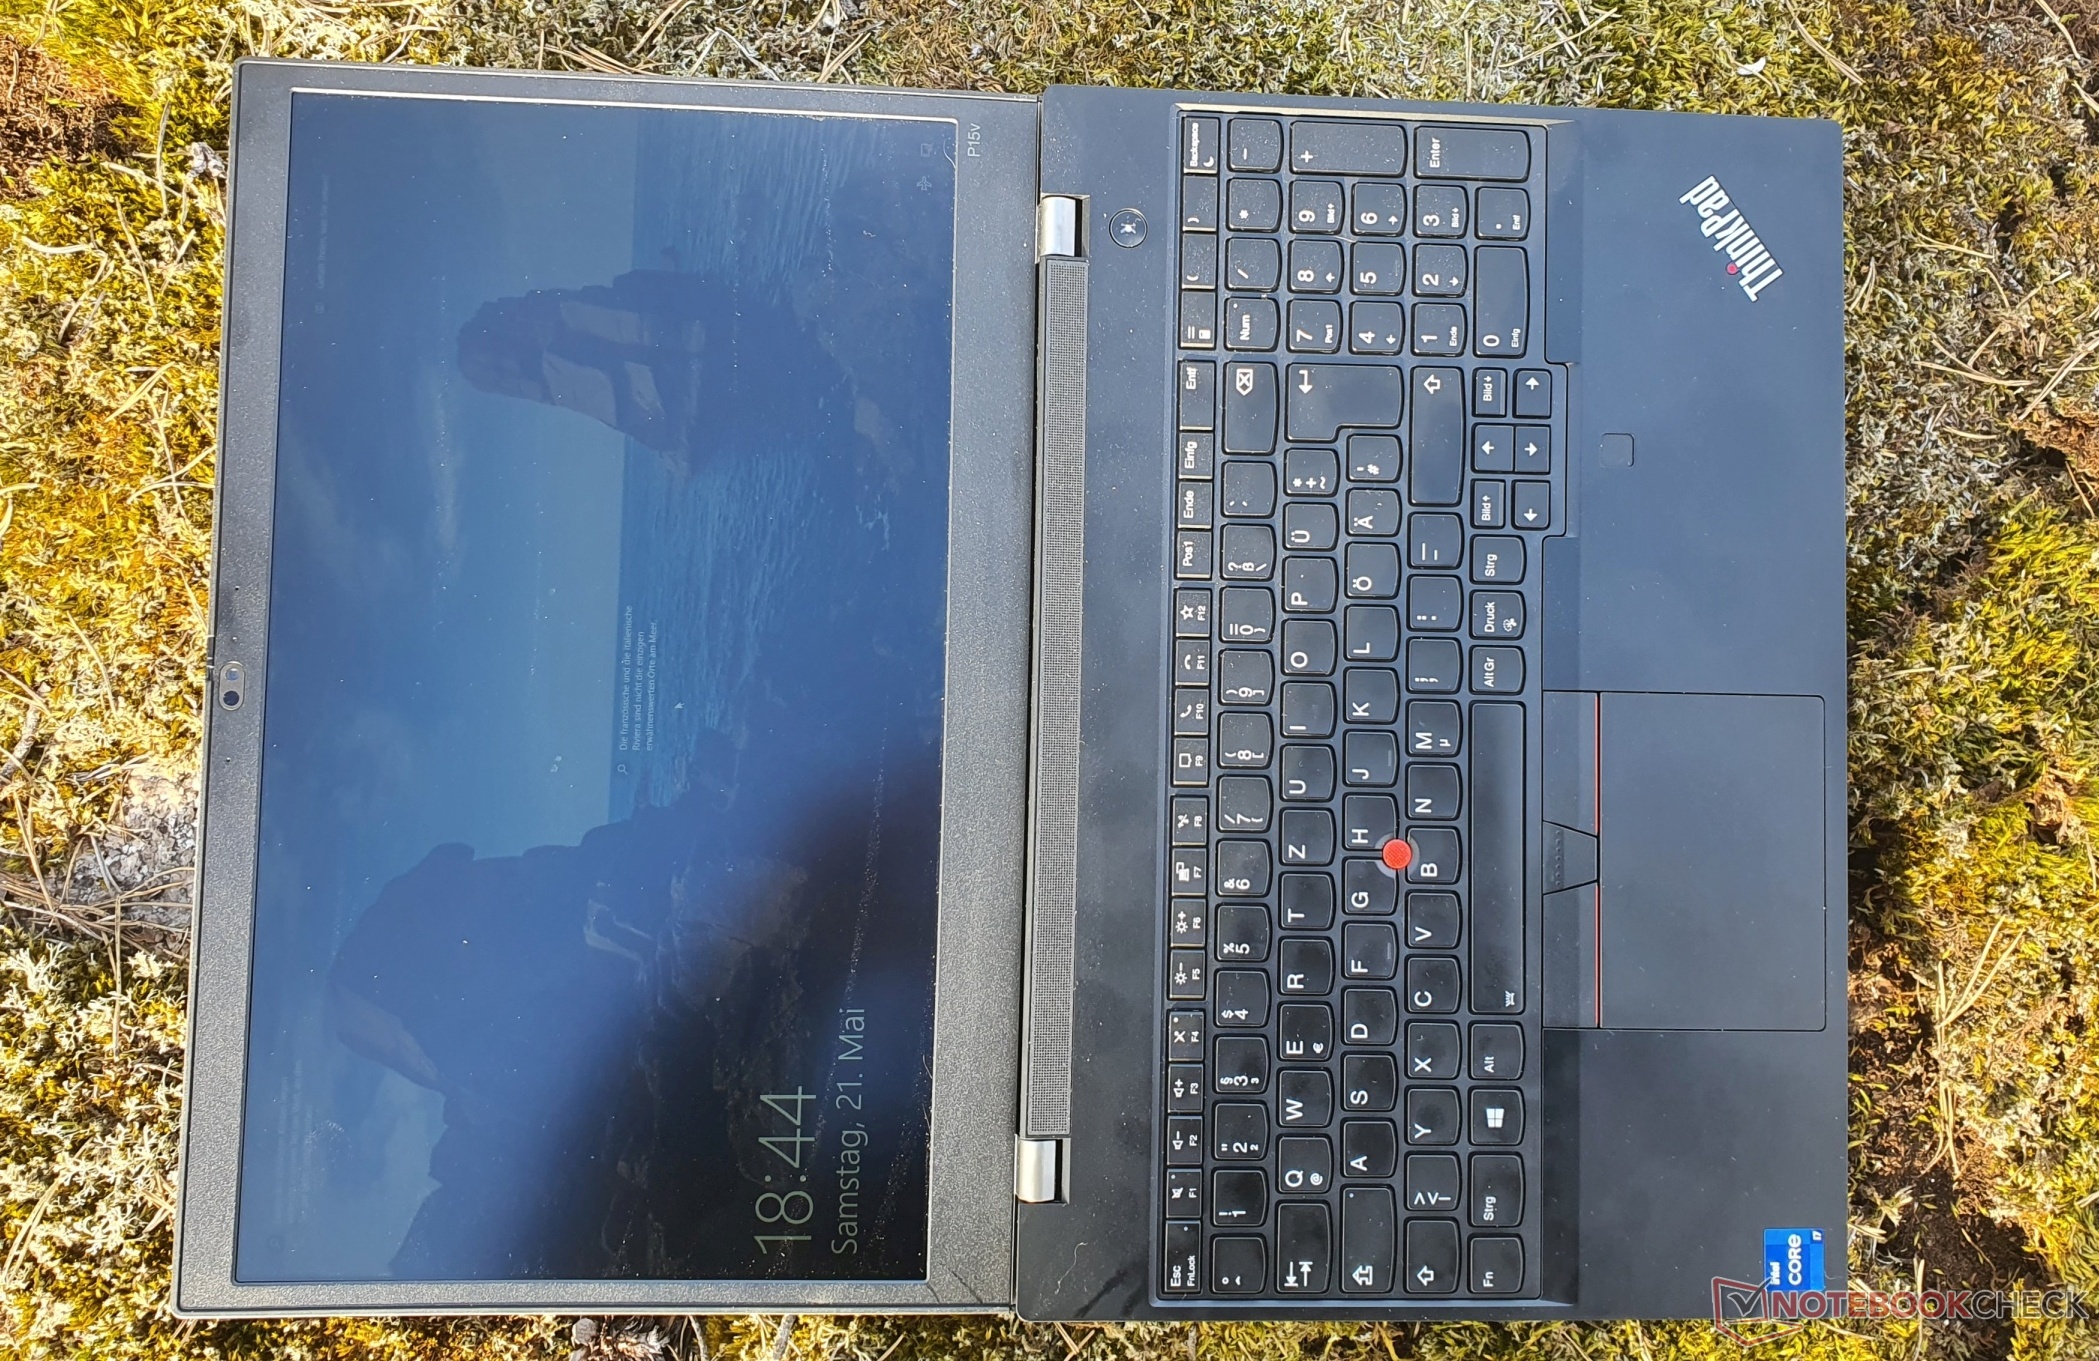
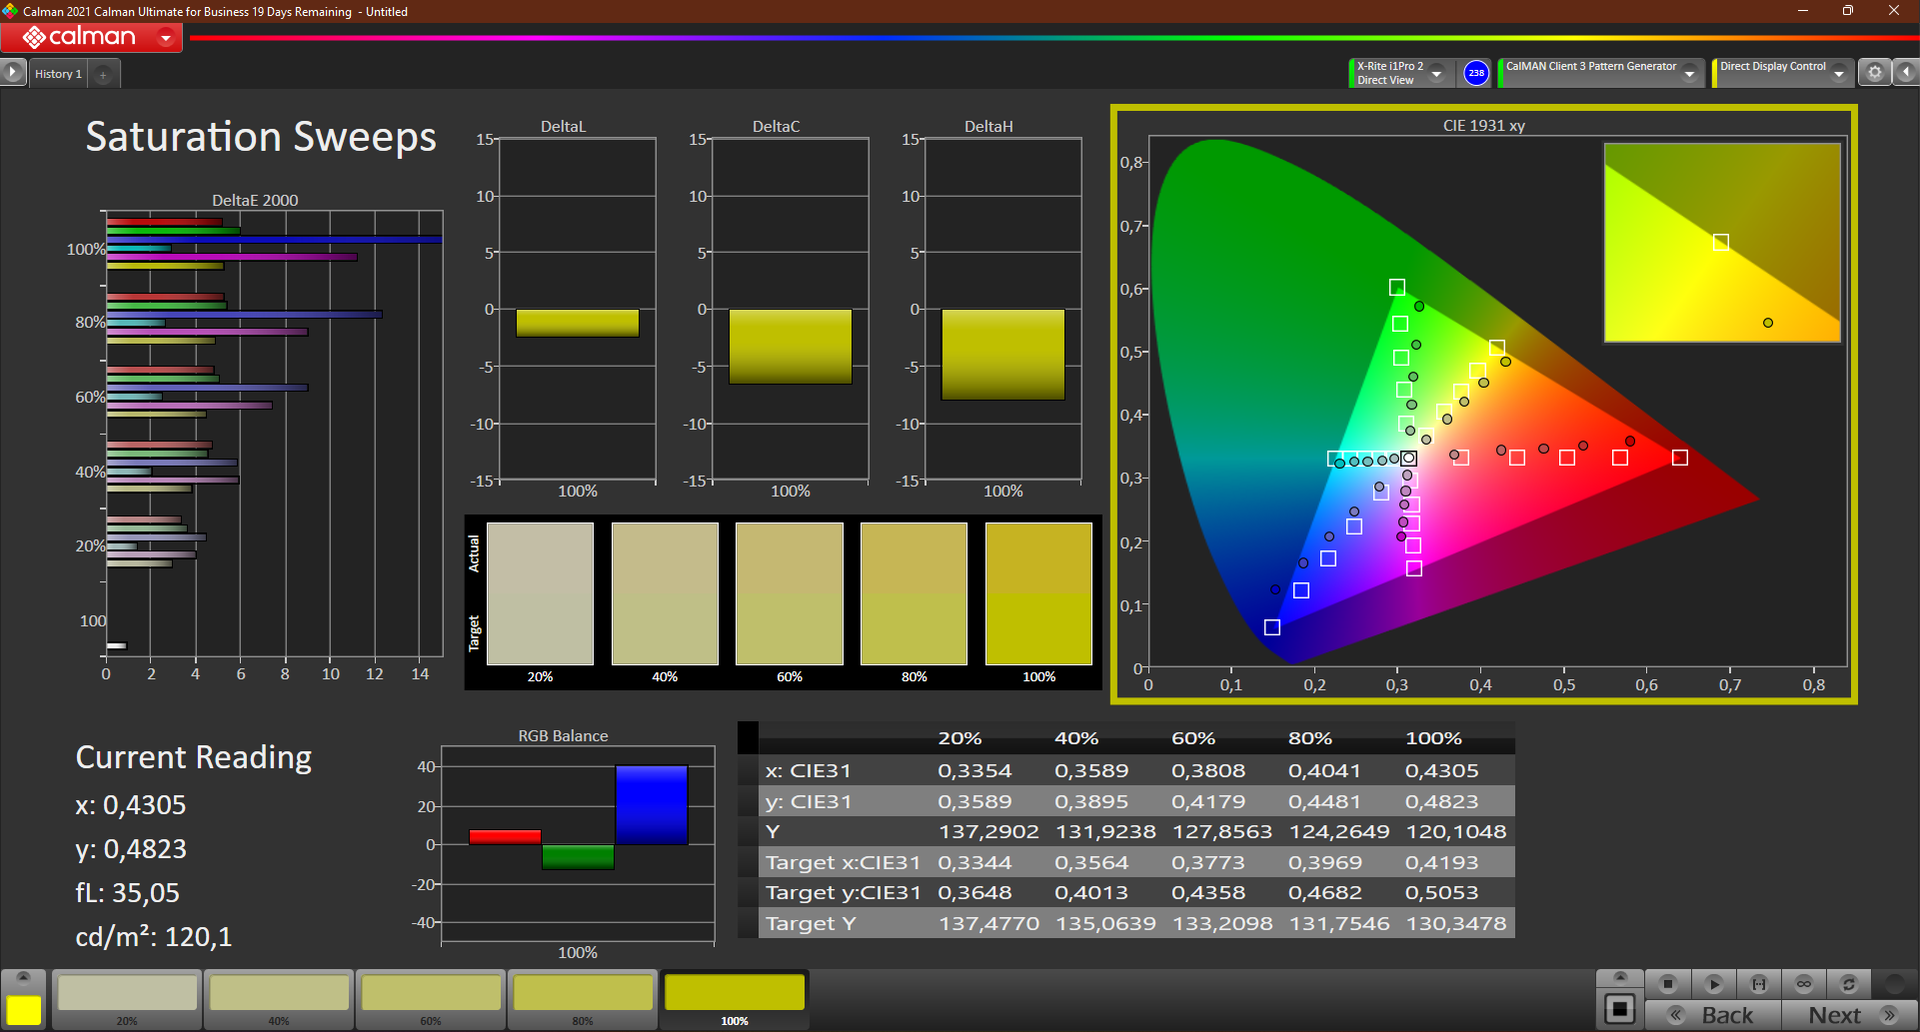
ThinkPad P15v G2的可选4K显示屏

联想为ThinkPad P15v G2提供了总共四种16:9格式的哑光15.6英寸显示屏选择:
FHD(1920x1080)IPS,300尼特,45% NTSC。
FHD (1920x1080) IPS触摸,300尼特,45% sRGB
FHD (1920x1080) IPS,300尼特,100% sRGB
UHD (3840x2160) IPS,600尼特 ,100% AdobeRGB, HDR400, X-Rite
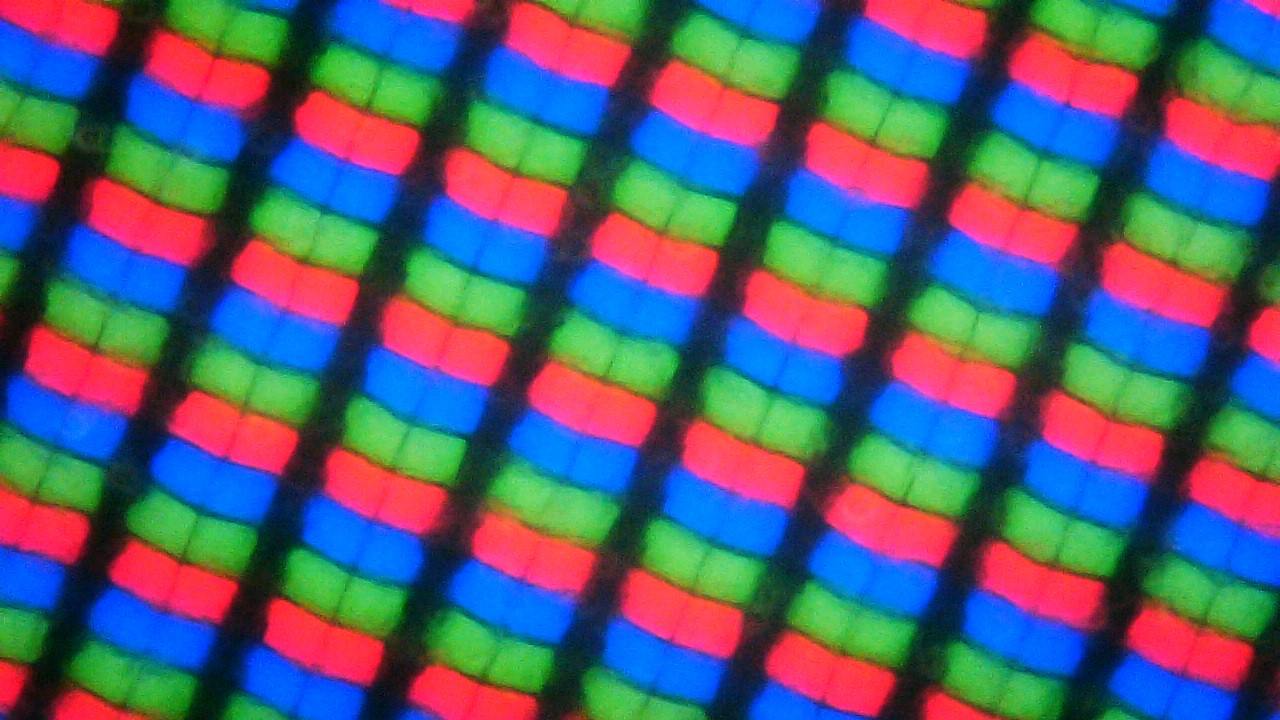
我们的面板代表了入门级的变体,其分辨率为1920x1080,因此显示的内容足够清晰。可以设置为100%的缩放比例也很有优势,可以提供更清晰的内容,防止缩放问题。
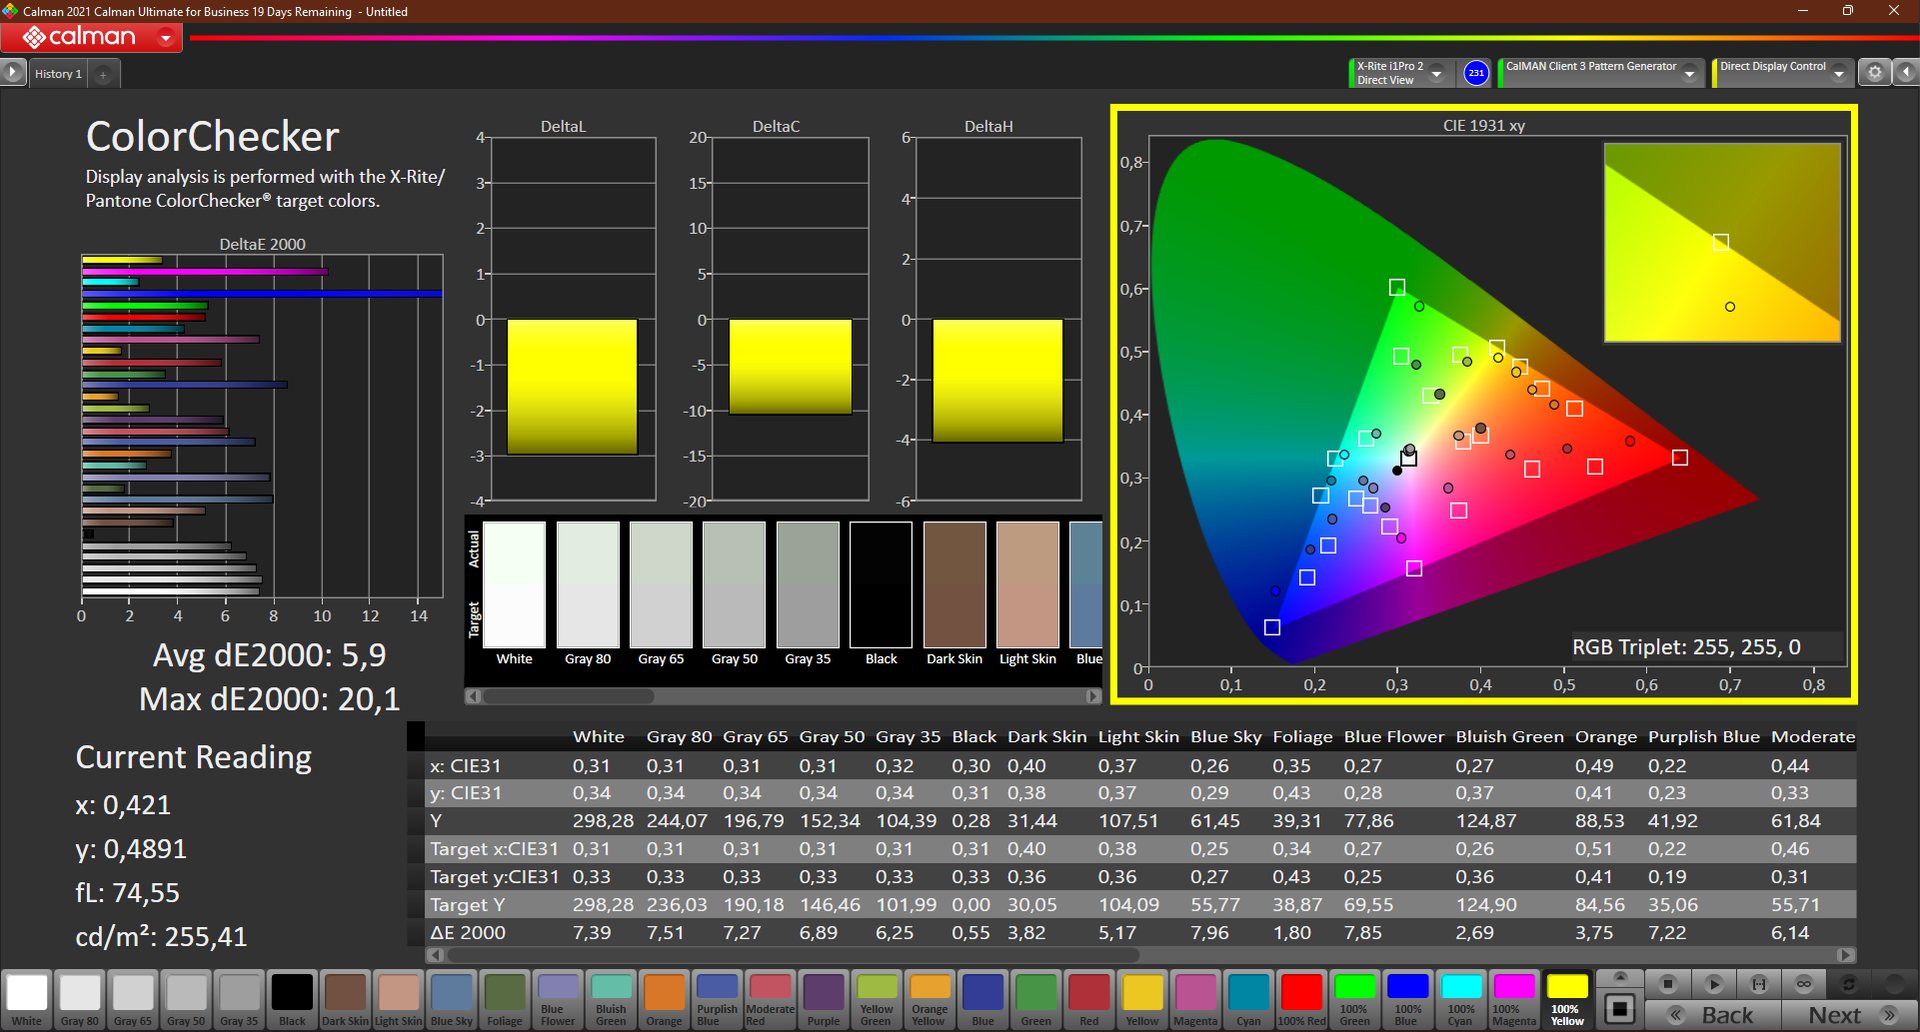
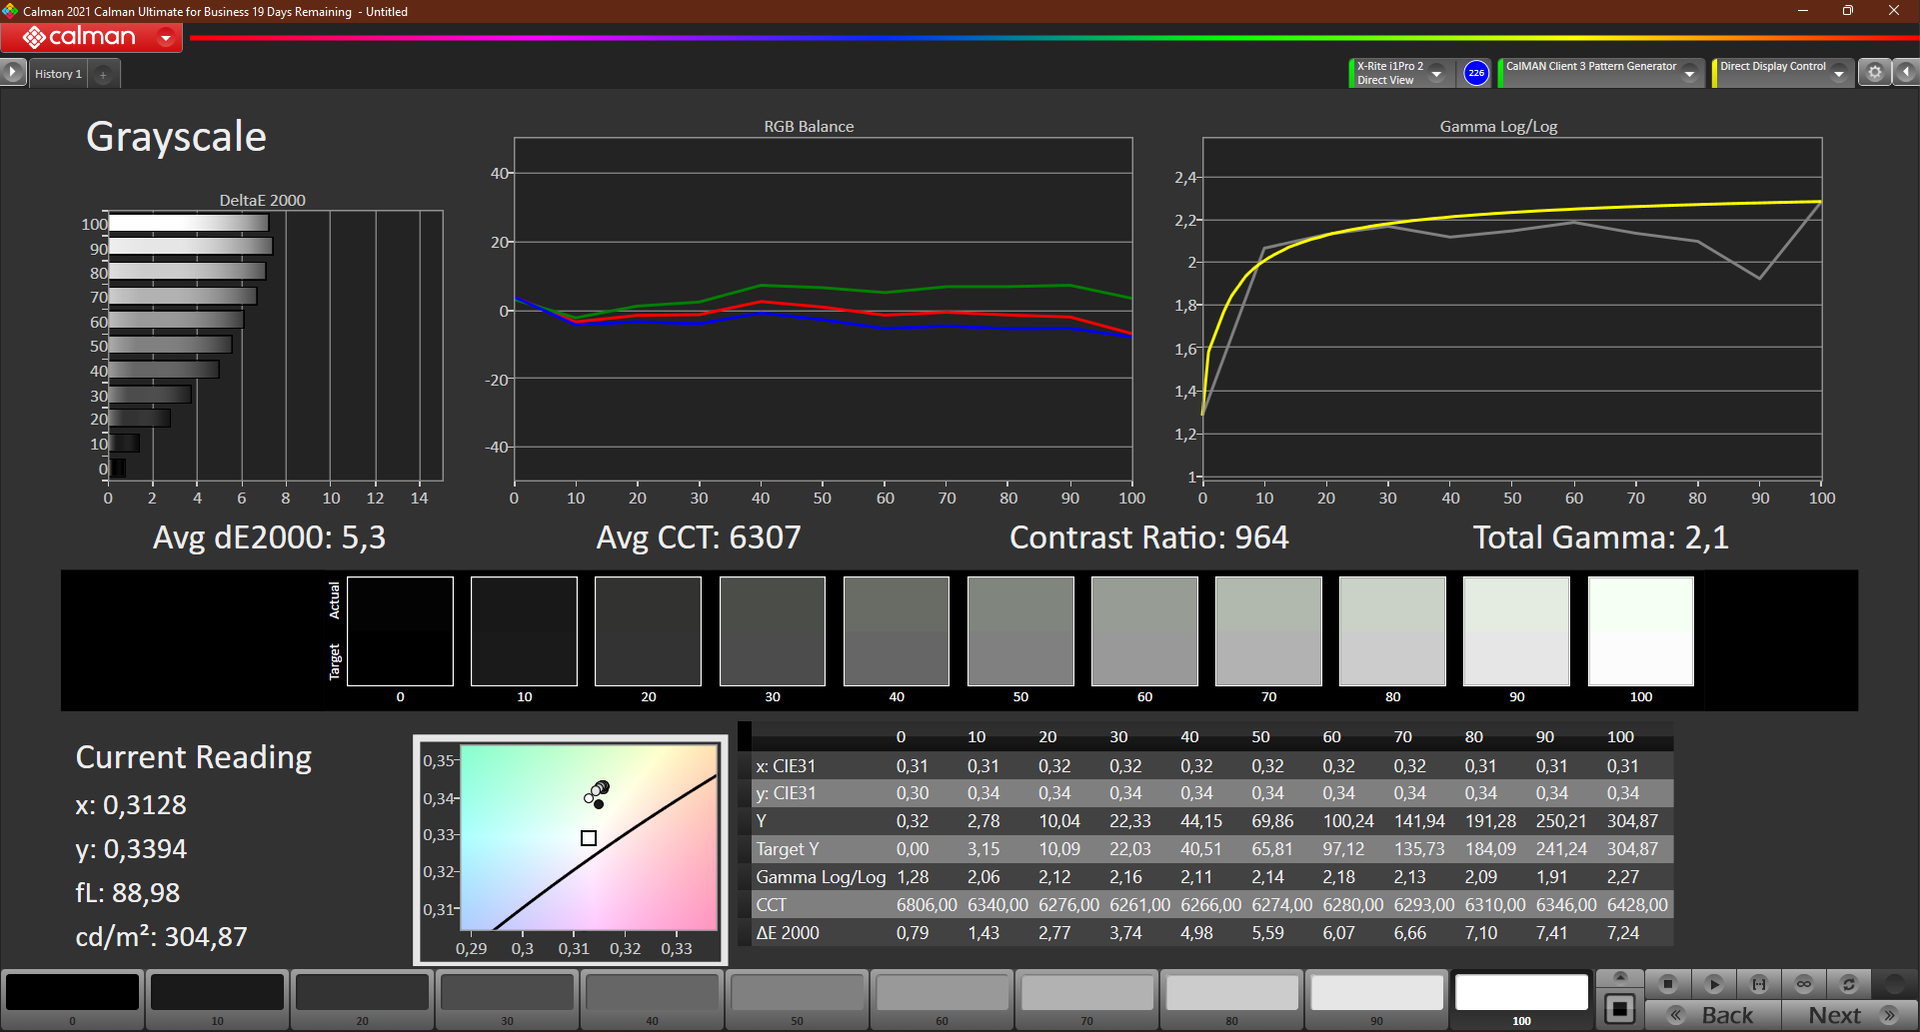
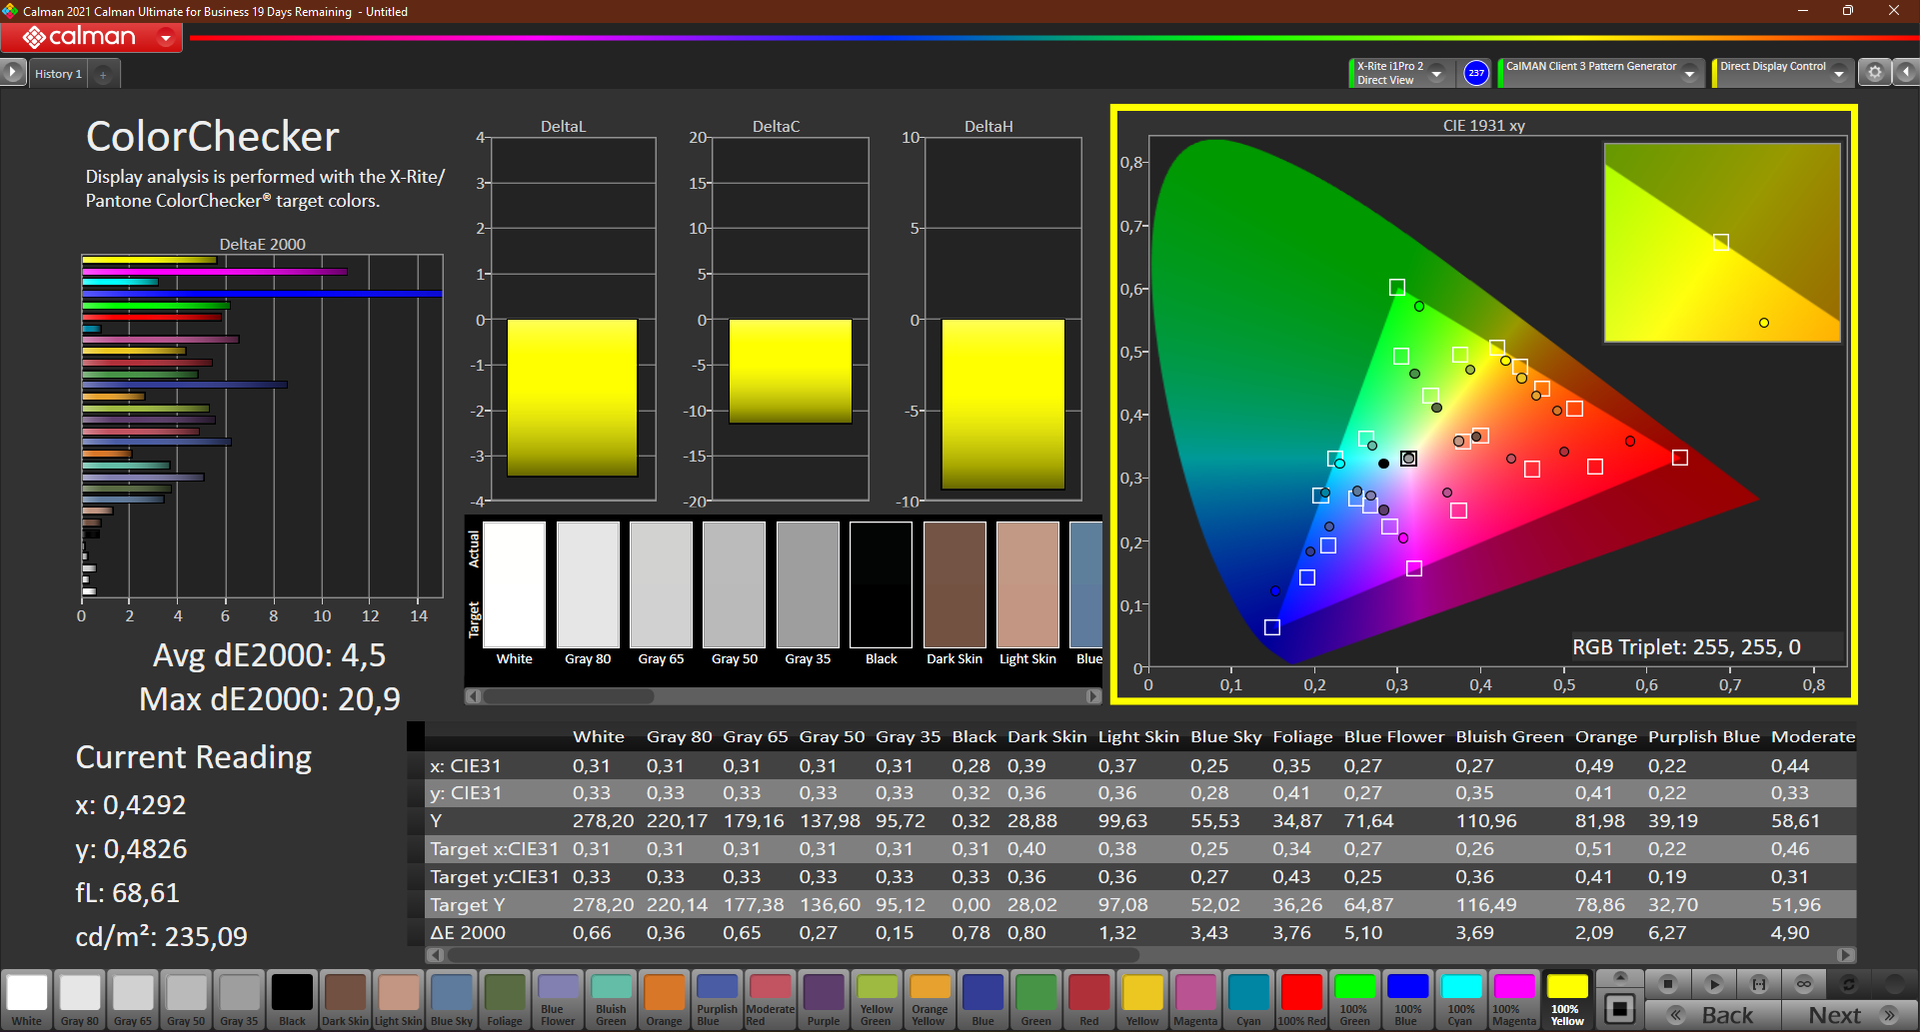
280尼特左右的亮度并不理想,但在室内仍可接受。953:1的对比度以及0.32的黑值也是可以的。校准的结果是更丰富的黑色,我们也能够将相应的DeltaE灰度值从5.3降低到一个良好的0.9。然而,Delta E色彩值仍然很高,为4.5。
从主观上讲,图像质量是好的,这主要是因为相对清晰的子像素和丰富的黑色。但惠普ZBook Power 15和所有其他比较设备在纸面上提供了更好的速率。该面板的响应时间一般到缓慢,因此不是游戏的最佳选择。没有检测到PWM闪烁。
| |||||||||||||||||||||||||
Brightness Distribution: 88 %
Center on Battery: 305 cd/m²
Contrast: 953:1 (Black: 0.32 cd/m²)
ΔE ColorChecker Calman: 5.9 | ∀{0.5-29.43 Ø4.73}
calibrated: 4.5
ΔE Greyscale Calman: 5.3 | ∀{0.09-98 Ø4.97}
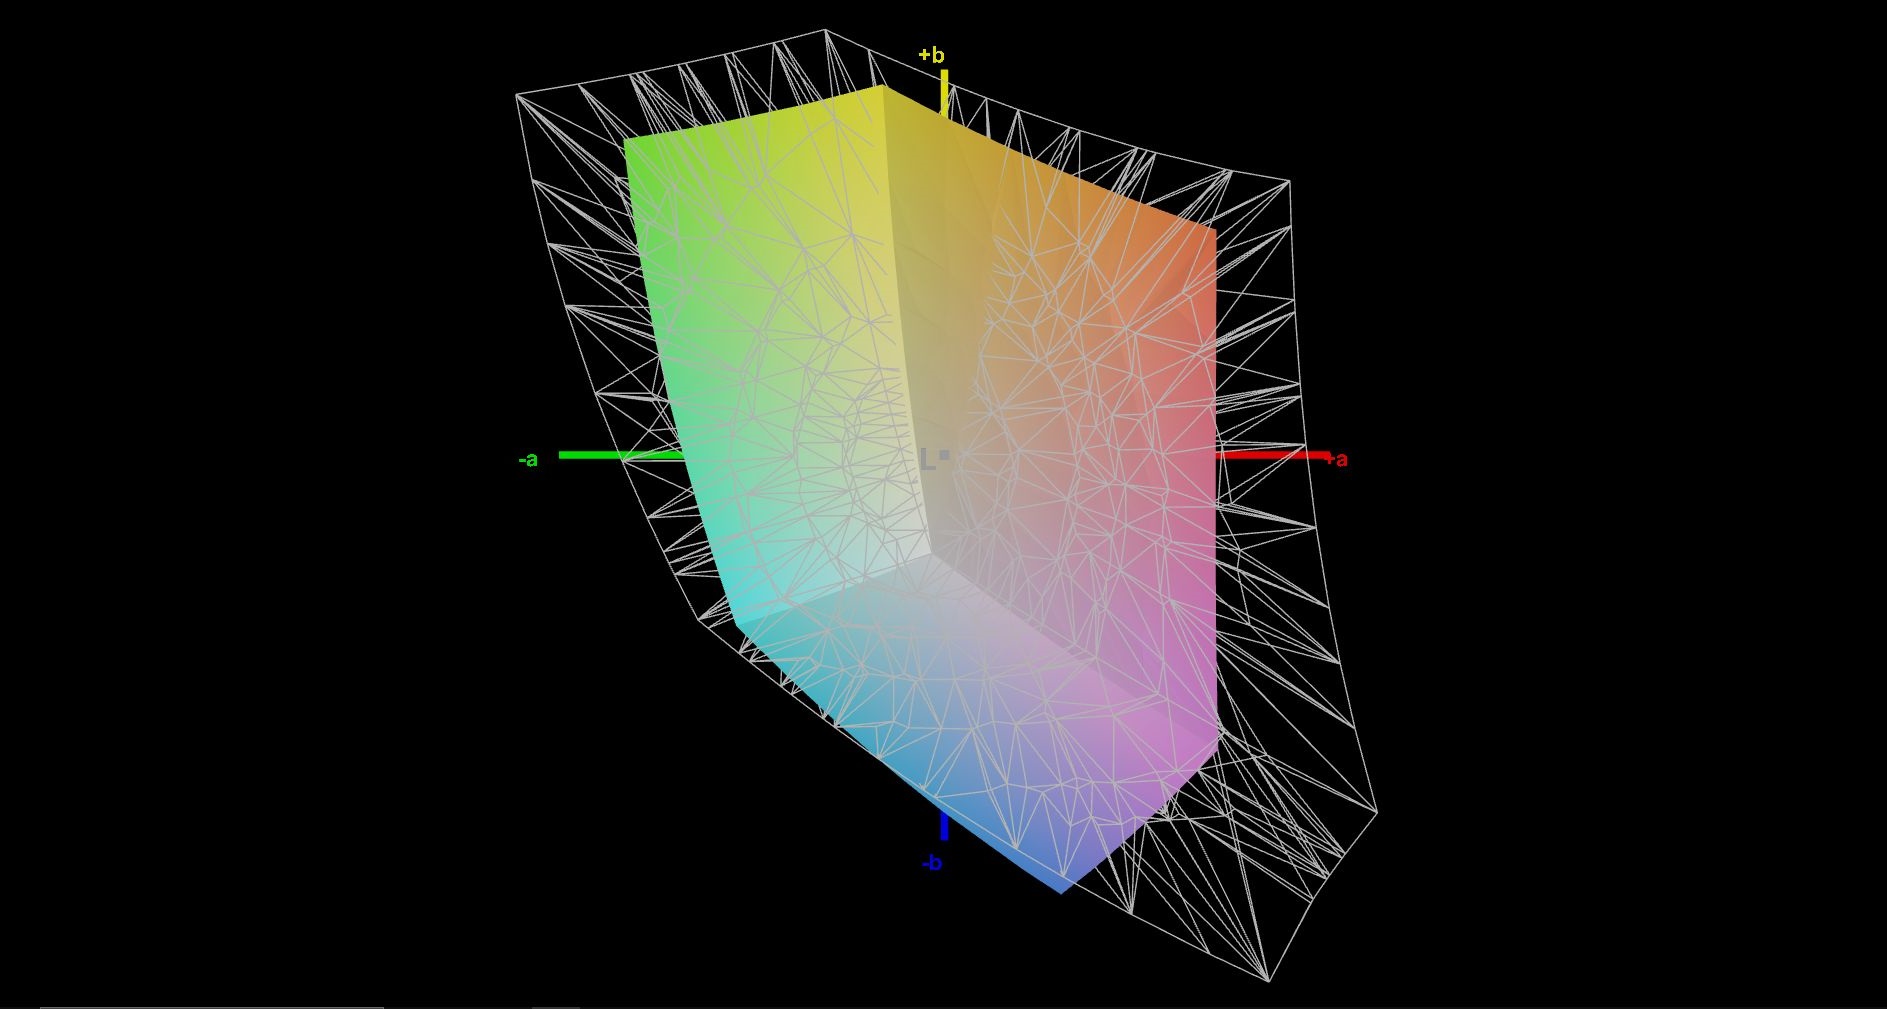
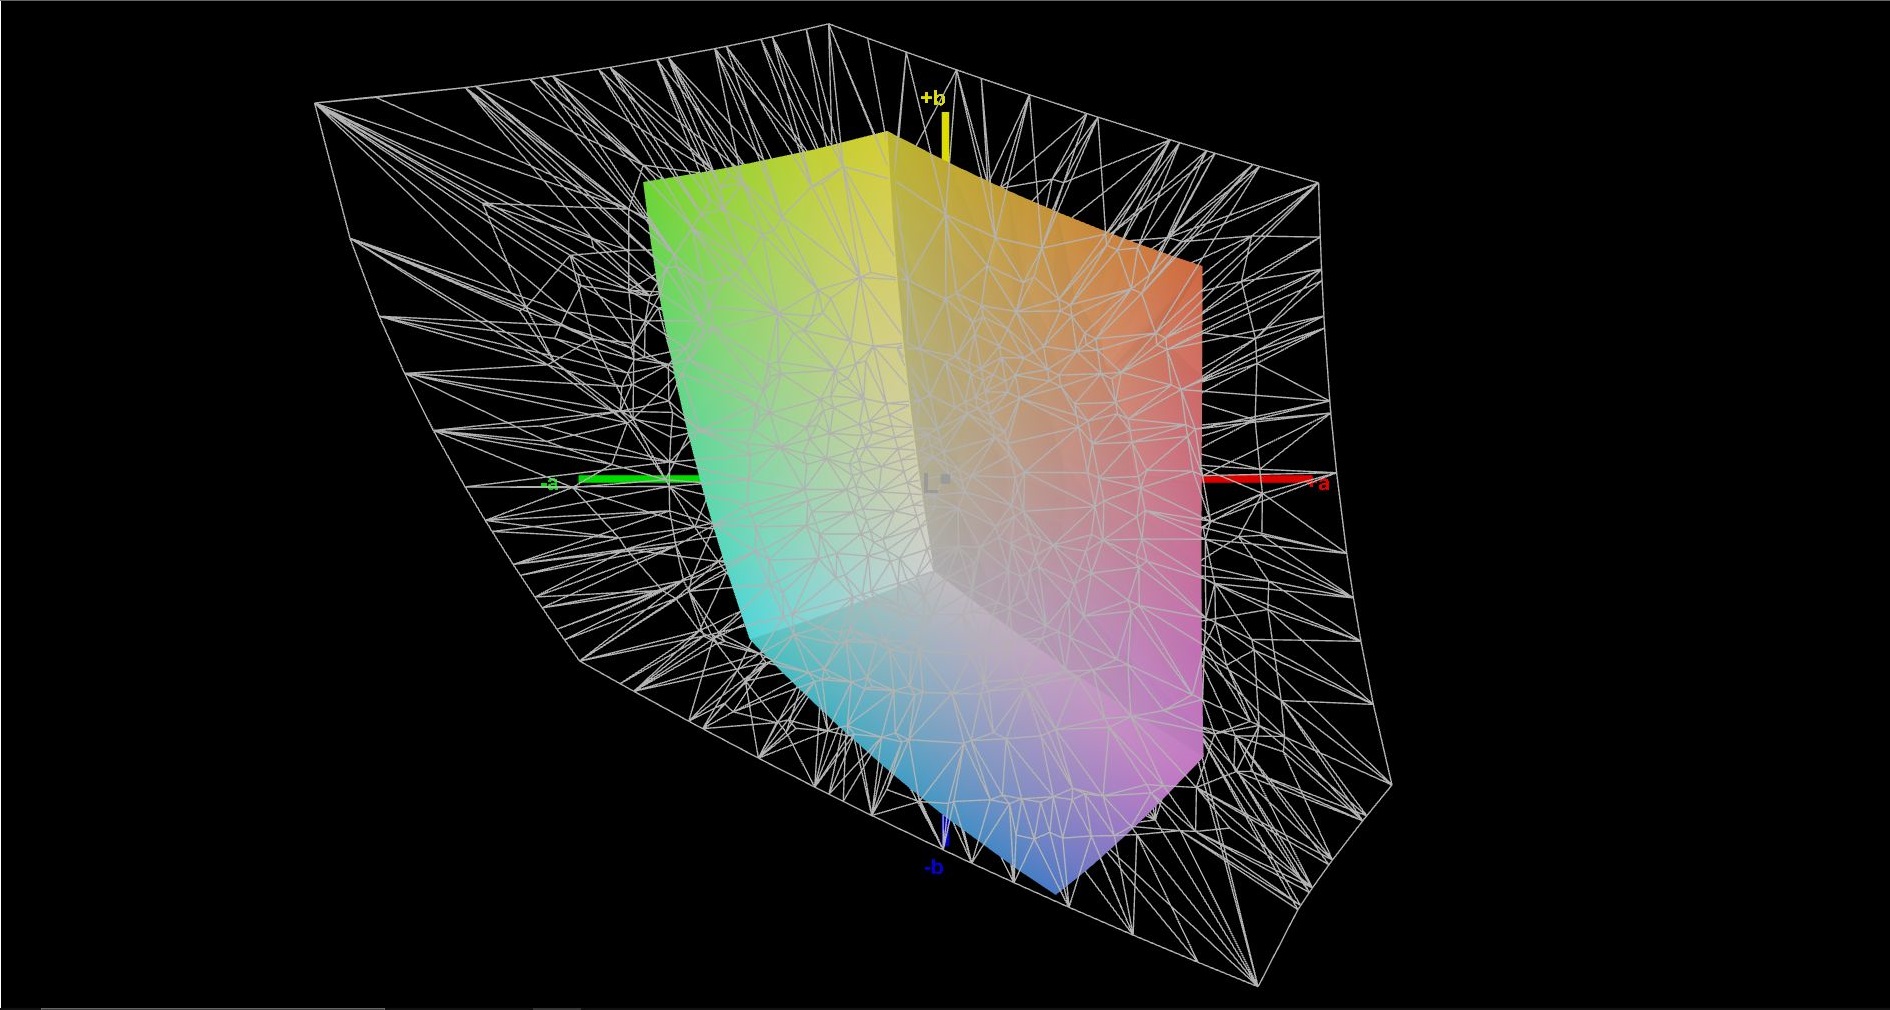
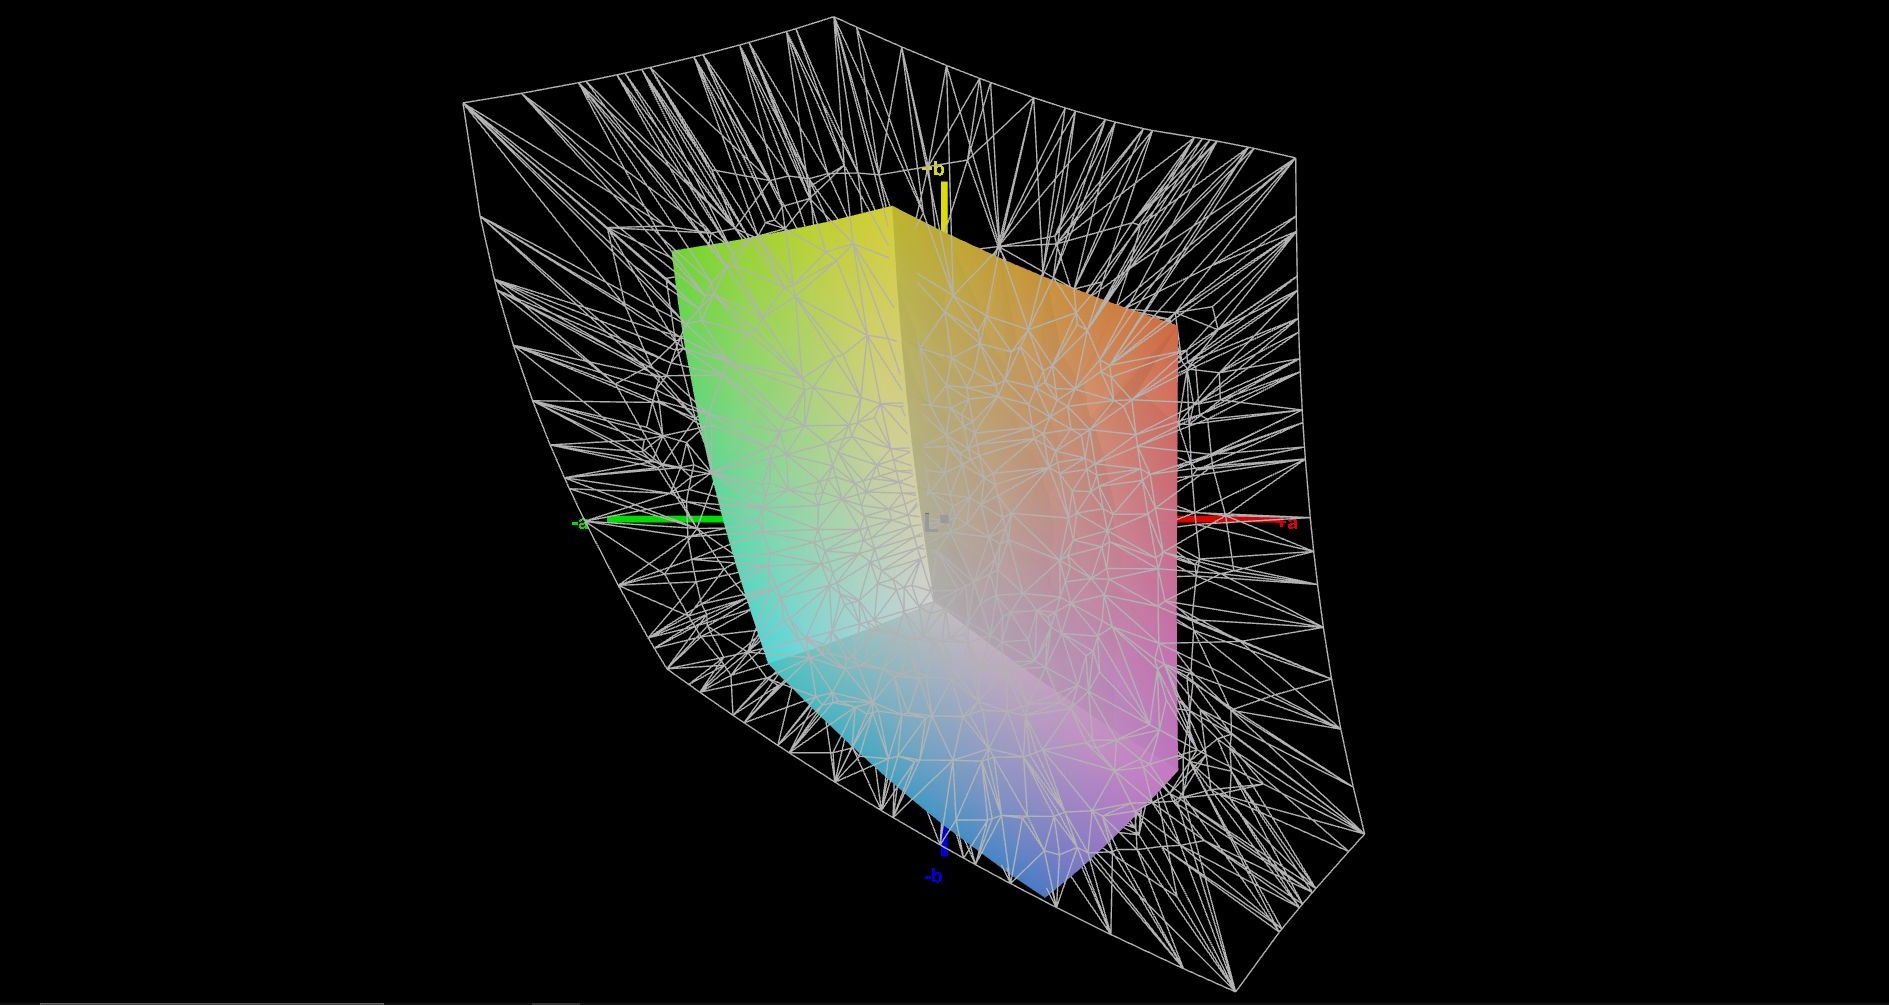
45.3% AdobeRGB 1998 (Argyll 3D)
65.1% sRGB (Argyll 3D)
43.7% Display P3 (Argyll 3D)
Gamma: 2.1
CCT: 6307 K
| Lenovo ThinkPad P15v G2 21A9000XGE N156HCA-EAC, IPS LED, 1920x1080, 15.6" | Lenovo ThinkPad P15 G2-20YQ001JGE N156HCE_GN1, IPS, 1920x1080, 15.6" | Lenovo ThinkPad T15g-20UR000GGE N156HCE-GN1, IPS, 1920x1080, 15.6" | Lenovo ThinkPad T15p-20TN0006GE MNF601EA1-1, IPS LED, 3840x2160, 15.6" | Lenovo ThinkPad P15s Gen2-20W6000GGE MNF601EA1-1, IPS LED, 3840x2160, 15.6" | HP ZBook Power 15 G8 313S5EA AUOA08B, IPS LED, 1920x1080, 15.6" | Dell Precision 5000 5560 Sharp LQ156R1, IPS, 3840x2400, 15.6" | |
|---|---|---|---|---|---|---|---|
| Display | 55% | 39% | 90% | 87% | 57% | 97% | |
| Display P3 Coverage (%) | 43.7 | 68.6 57% | 61.3 40% | 86.8 99% | 84.5 93% | 70.5 61% | 94.9 117% |
| sRGB Coverage (%) | 65.1 | 99.8 53% | 90.5 39% | 99.3 53% | 98.7 52% | 99 52% | 100 54% |
| AdobeRGB 1998 Coverage (%) | 45.3 | 70.6 56% | 62.3 38% | 98.5 117% | 97.8 116% | 71.3 57% | 100 121% |
| Response Times | 33% | 31% | 19% | 17% | -32% | -4% | |
| Response Time Grey 50% / Grey 80% * (ms) | 48 ? | 37.6 ? 22% | 38 ? 21% | 41.6 ? 13% | 40 ? 17% | 61 -27% | 47.2 ? 2% |
| Response Time Black / White * (ms) | 28 ? | 16 ? 43% | 16.8 ? 40% | 21.2 ? 24% | 23.2 ? 17% | 38 ? -36% | 30.4 ? -9% |
| PWM Frequency (Hz) | 26040 ? | 26040 ? | |||||
| Screen | 46% | 44% | 70% | 70% | 49% | 34% | |
| Brightness middle (cd/m²) | 305 | 498 63% | 504 65% | 595 95% | 604 98% | 393 29% | 501.5 64% |
| Brightness (cd/m²) | 281 | 490 74% | 476 69% | 594 111% | 609 117% | 385 37% | 467 66% |
| Brightness Distribution (%) | 88 | 95 8% | 90 2% | 94 7% | 91 3% | 78 -11% | 83 -6% |
| Black Level * (cd/m²) | 0.32 | 0.39 -22% | 0.34 -6% | 0.32 -0% | 0.34 -6% | 0.25 22% | 0.44 -38% |
| Contrast (:1) | 953 | 1277 34% | 1482 56% | 1859 95% | 1776 86% | 1572 65% | 1140 20% |
| Colorchecker dE 2000 * | 5.9 | 2.1 64% | 2.9 51% | 1.2 80% | 0.9 85% | 1.5 75% | 4.73 20% |
| Colorchecker dE 2000 max. * | 20.1 | 5.6 72% | 7.1 65% | 2.5 88% | 2.6 87% | 4.3 79% | 8.45 58% |
| Colorchecker dE 2000 calibrated * | 4.5 | 0.8 82% | 1.3 71% | 1 78% | 0.8 82% | 1.4 69% | 0.51 89% |
| Greyscale dE 2000 * | 5.3 | 3.4 36% | 4.3 19% | 1.4 74% | 1.1 79% | 1.3 75% | 3.6 32% |
| Gamma | 2.1 105% | 2.32 95% | 2.25 98% | 2.1 105% | 2.15 102% | 2.26 97% | 2.08 106% |
| CCT | 6307 103% | 7162 91% | 7265 89% | 6492 100% | 6656 98% | 6435 101% | 6447 101% |
| Color Space (Percent of AdobeRGB 1998) (%) | 57.7 | 85.3 | 84.5 | ||||
| Color Space (Percent of sRGB) (%) | 90.8 | 99.2 | 98.6 | ||||
| Total Average (Program / Settings) | 45% /
46% | 38% /
41% | 60% /
67% | 58% /
66% | 25% /
39% | 42% /
42% |
* ... smaller is better
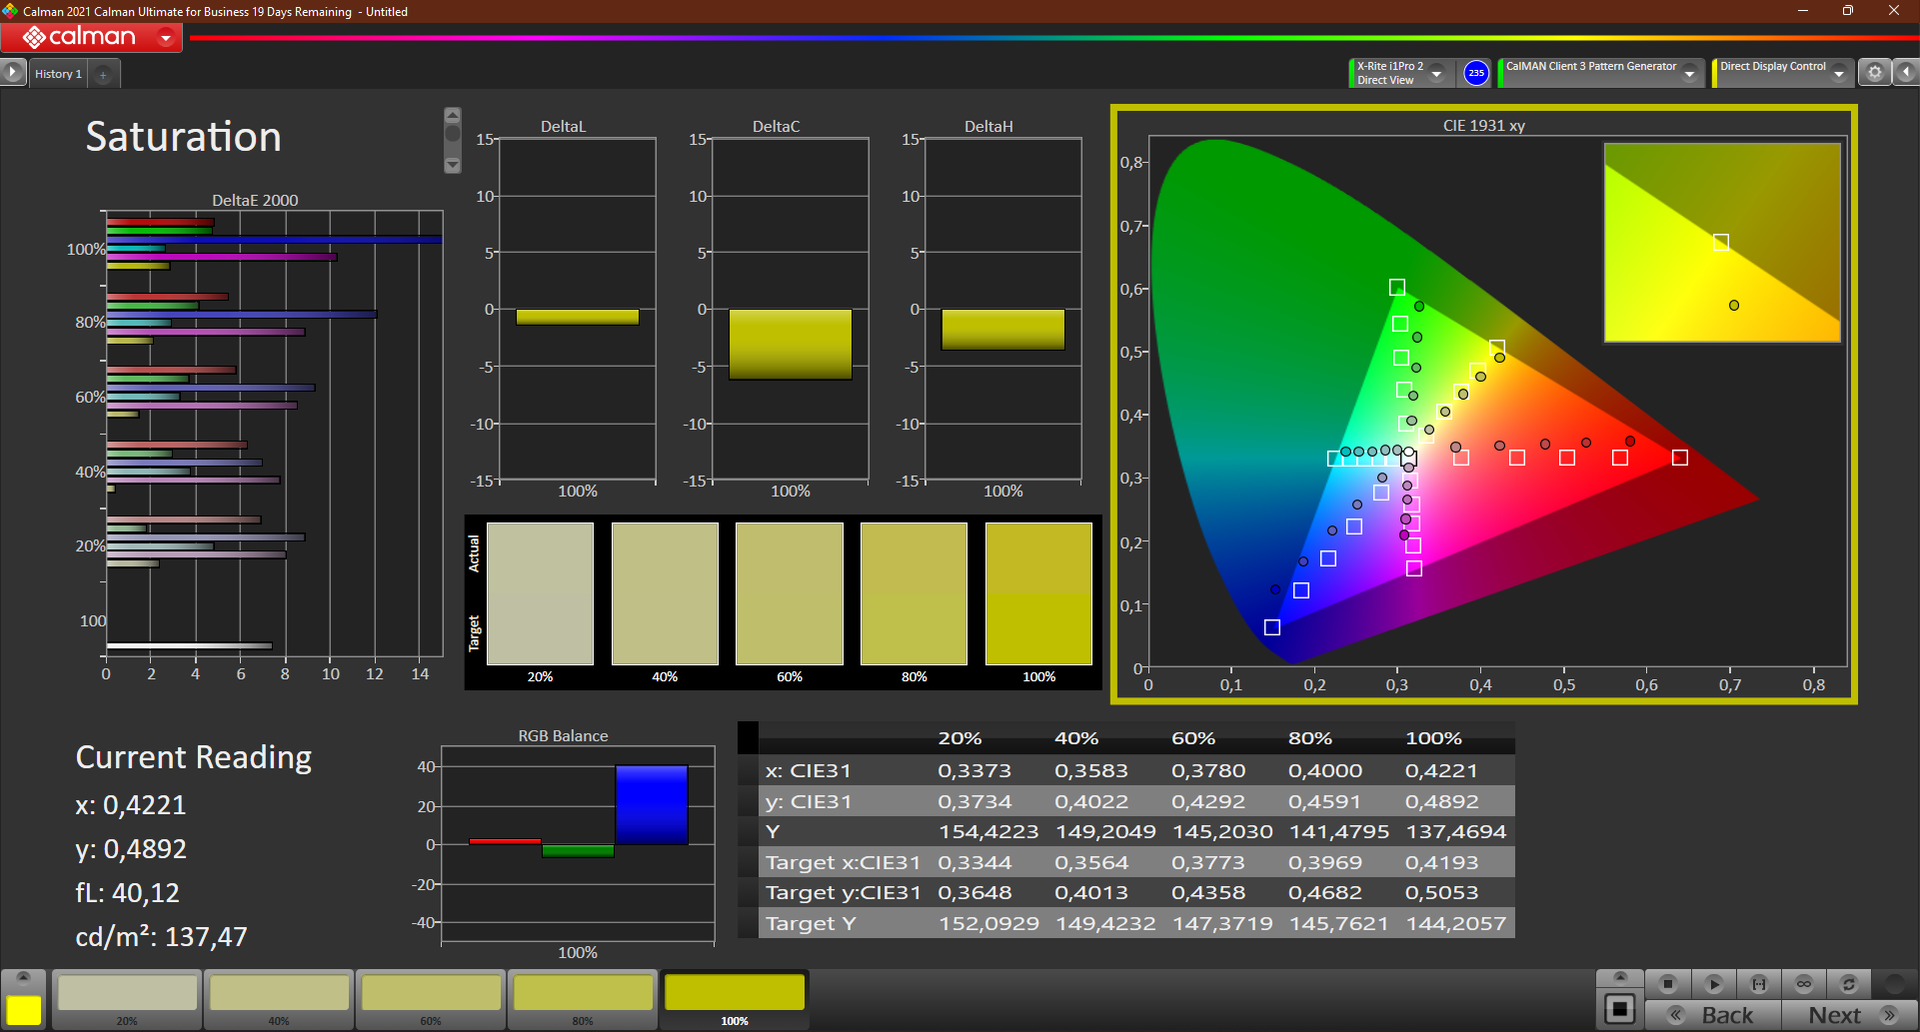
我们测量的最小的色彩空间(sRGB)的覆盖率仅为65%。如果你需要更大的色彩空间,你应该使用其他显示选项,因为我们测试的模型证明不适合雄心勃勃的图像编辑。
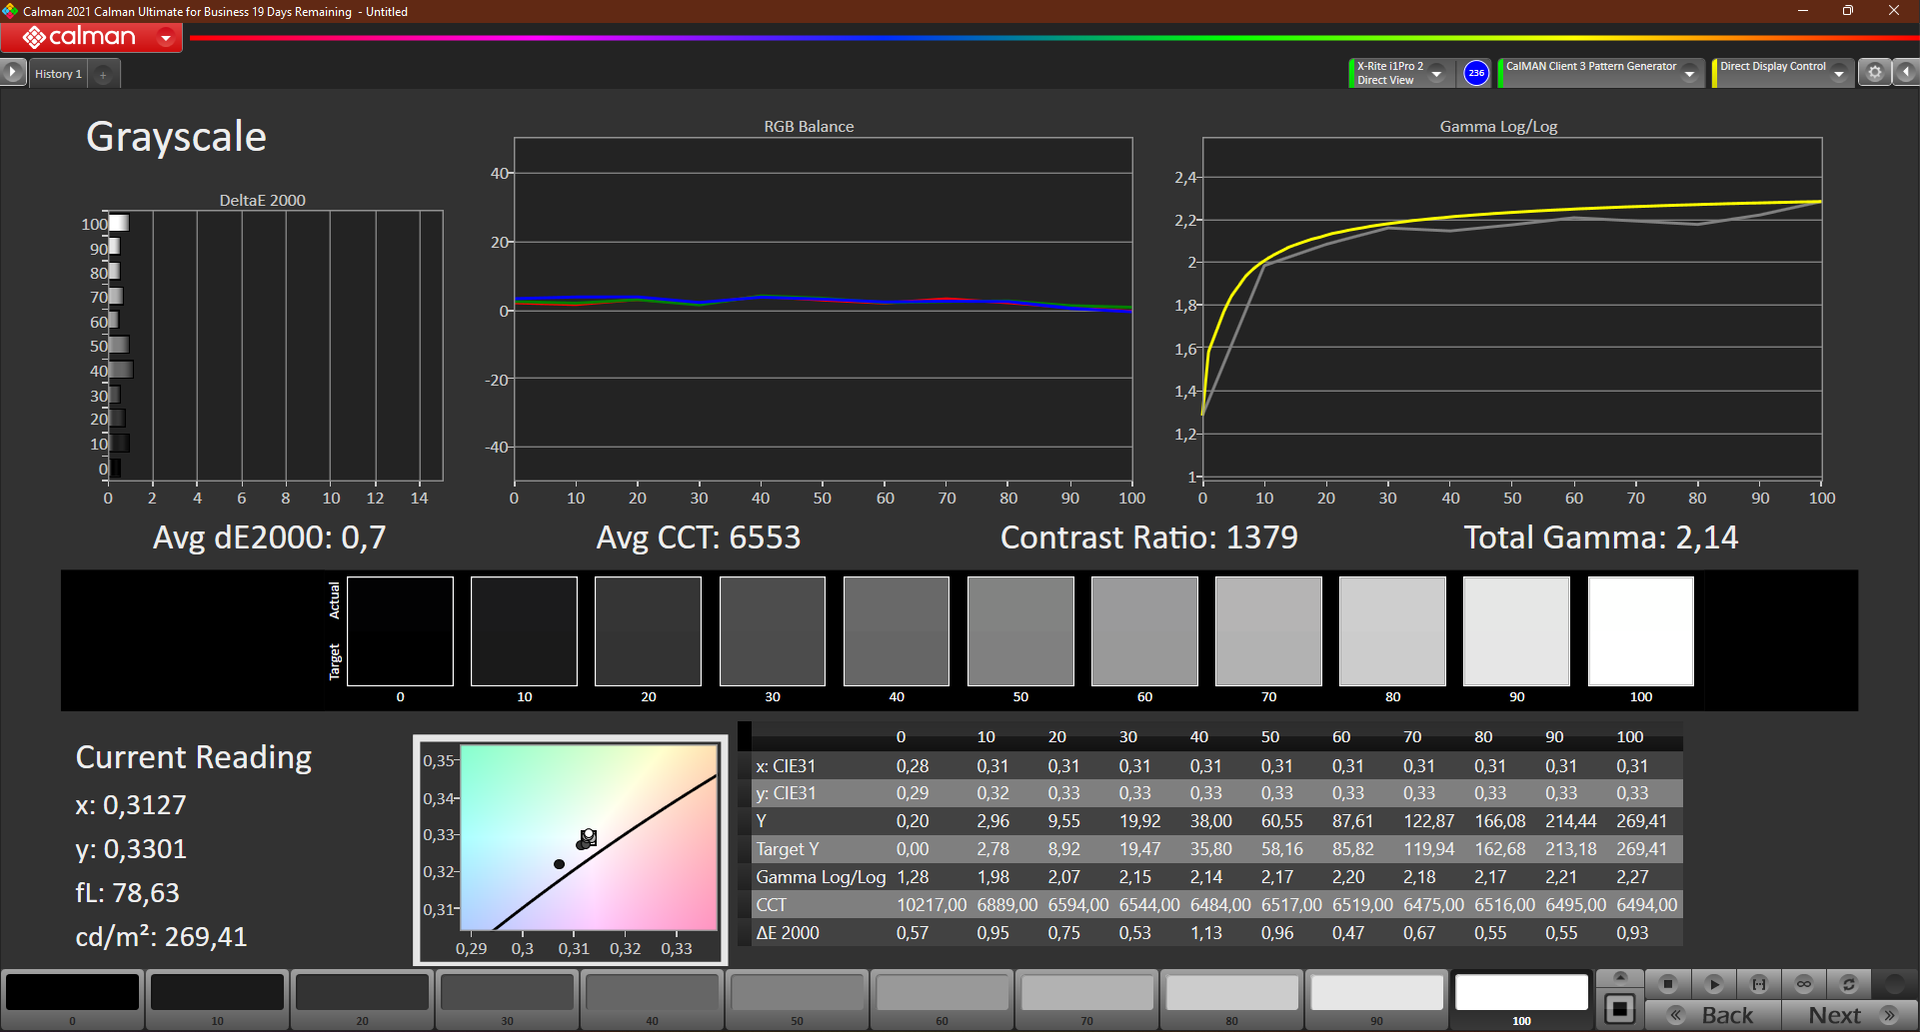
在使用CalMan和X-Rite i1 Pro 2色度计进行校准后,RGB平衡出现了一些改善。特别是蓝色的偏差很大,DeltaE值约为15。对比度也增加了45%,达到1,379:1。然而,由于这一过程,亮度下降了约20尼特。像往常一样,我们的ICC色彩配置文件可在照度图旁边下载。
Display Response Times
| ↔ Response Time Black to White | ||
|---|---|---|
| 28 ms ... rise ↗ and fall ↘ combined | ↗ 17 ms rise | 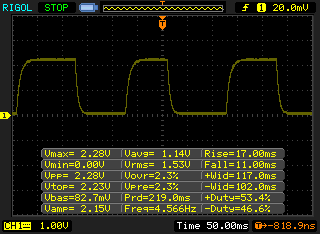 |
| ↘ 11 ms fall | ||
| The screen shows relatively slow response rates in our tests and may be too slow for gamers. In comparison, all tested devices range from 0.1 (minimum) to 240 (maximum) ms. » 71 % of all devices are better. This means that the measured response time is worse than the average of all tested devices (19.9 ms). | ||
| ↔ Response Time 50% Grey to 80% Grey | ||
| 48 ms ... rise ↗ and fall ↘ combined | ↗ 26 ms rise | 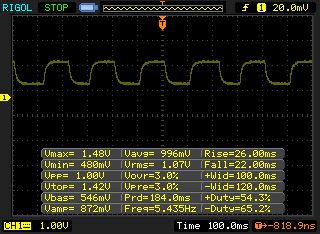 |
| ↘ 22 ms fall | ||
| The screen shows slow response rates in our tests and will be unsatisfactory for gamers. In comparison, all tested devices range from 0.165 (minimum) to 636 (maximum) ms. » 82 % of all devices are better. This means that the measured response time is worse than the average of all tested devices (31.1 ms). | ||
Screen Flickering / PWM (Pulse-Width Modulation)
| Screen flickering / PWM not detected | 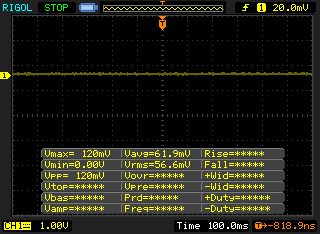 | ||
In comparison: 52 % of all tested devices do not use PWM to dim the display. If PWM was detected, an average of 7798 (minimum: 5 - maximum: 343500) Hz was measured. | |||
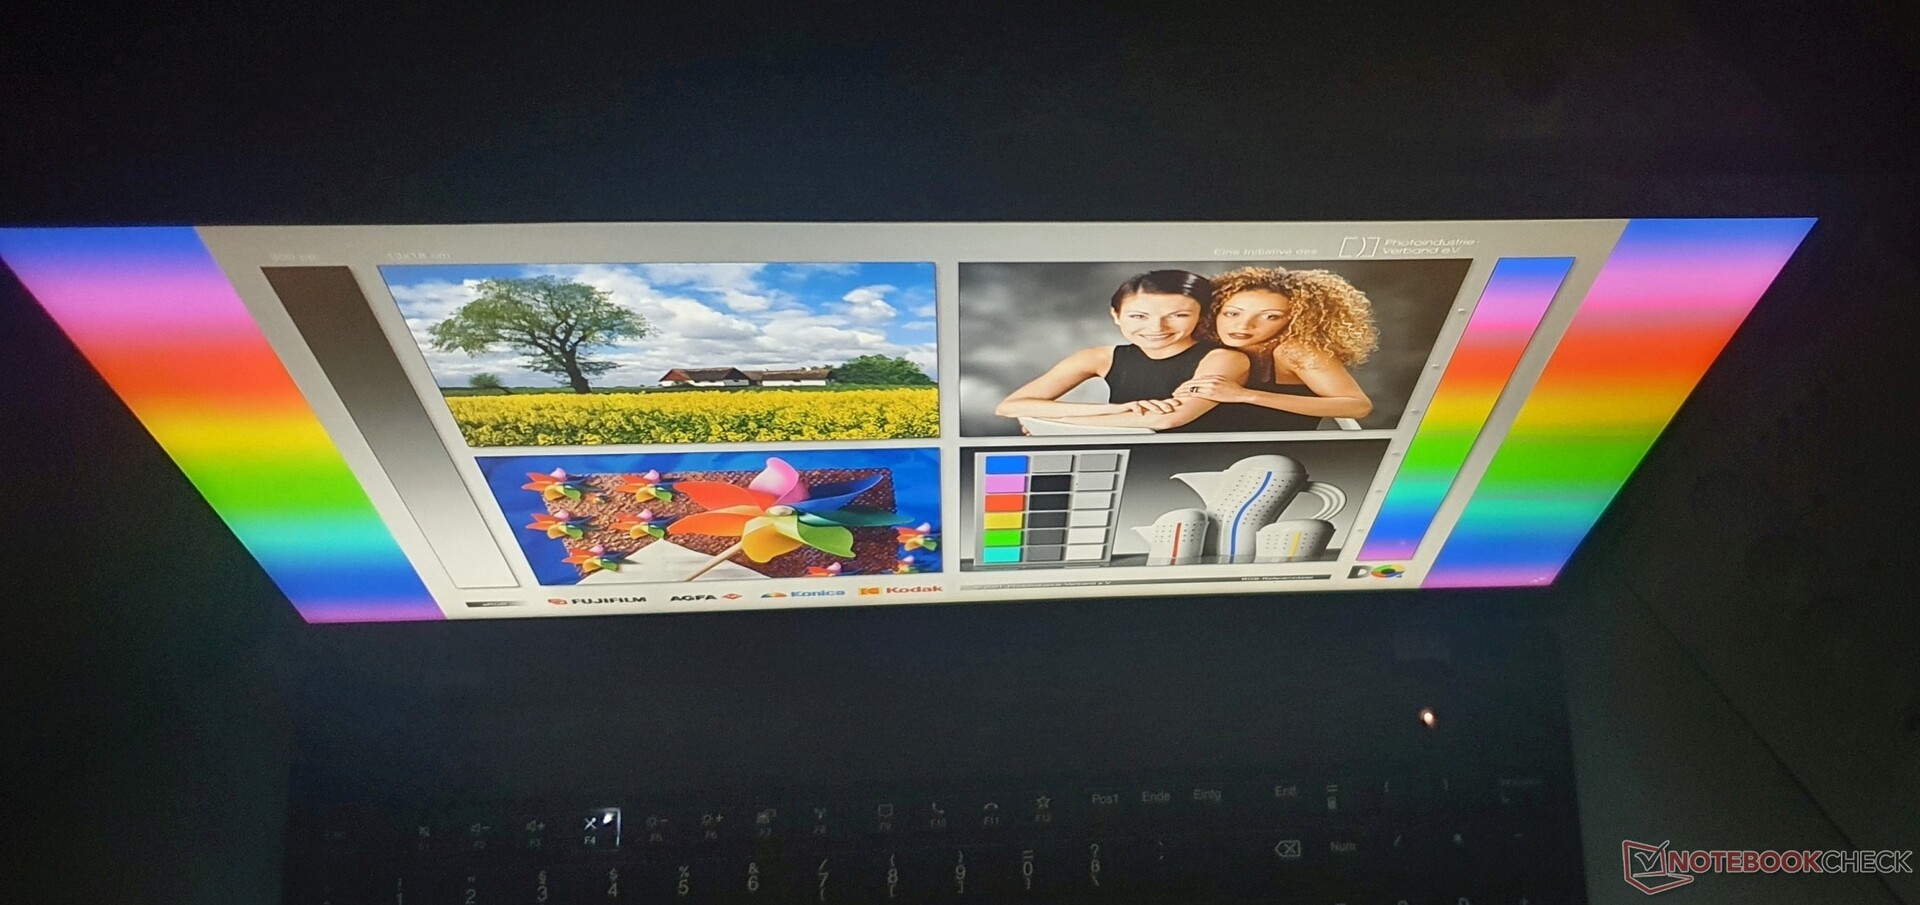
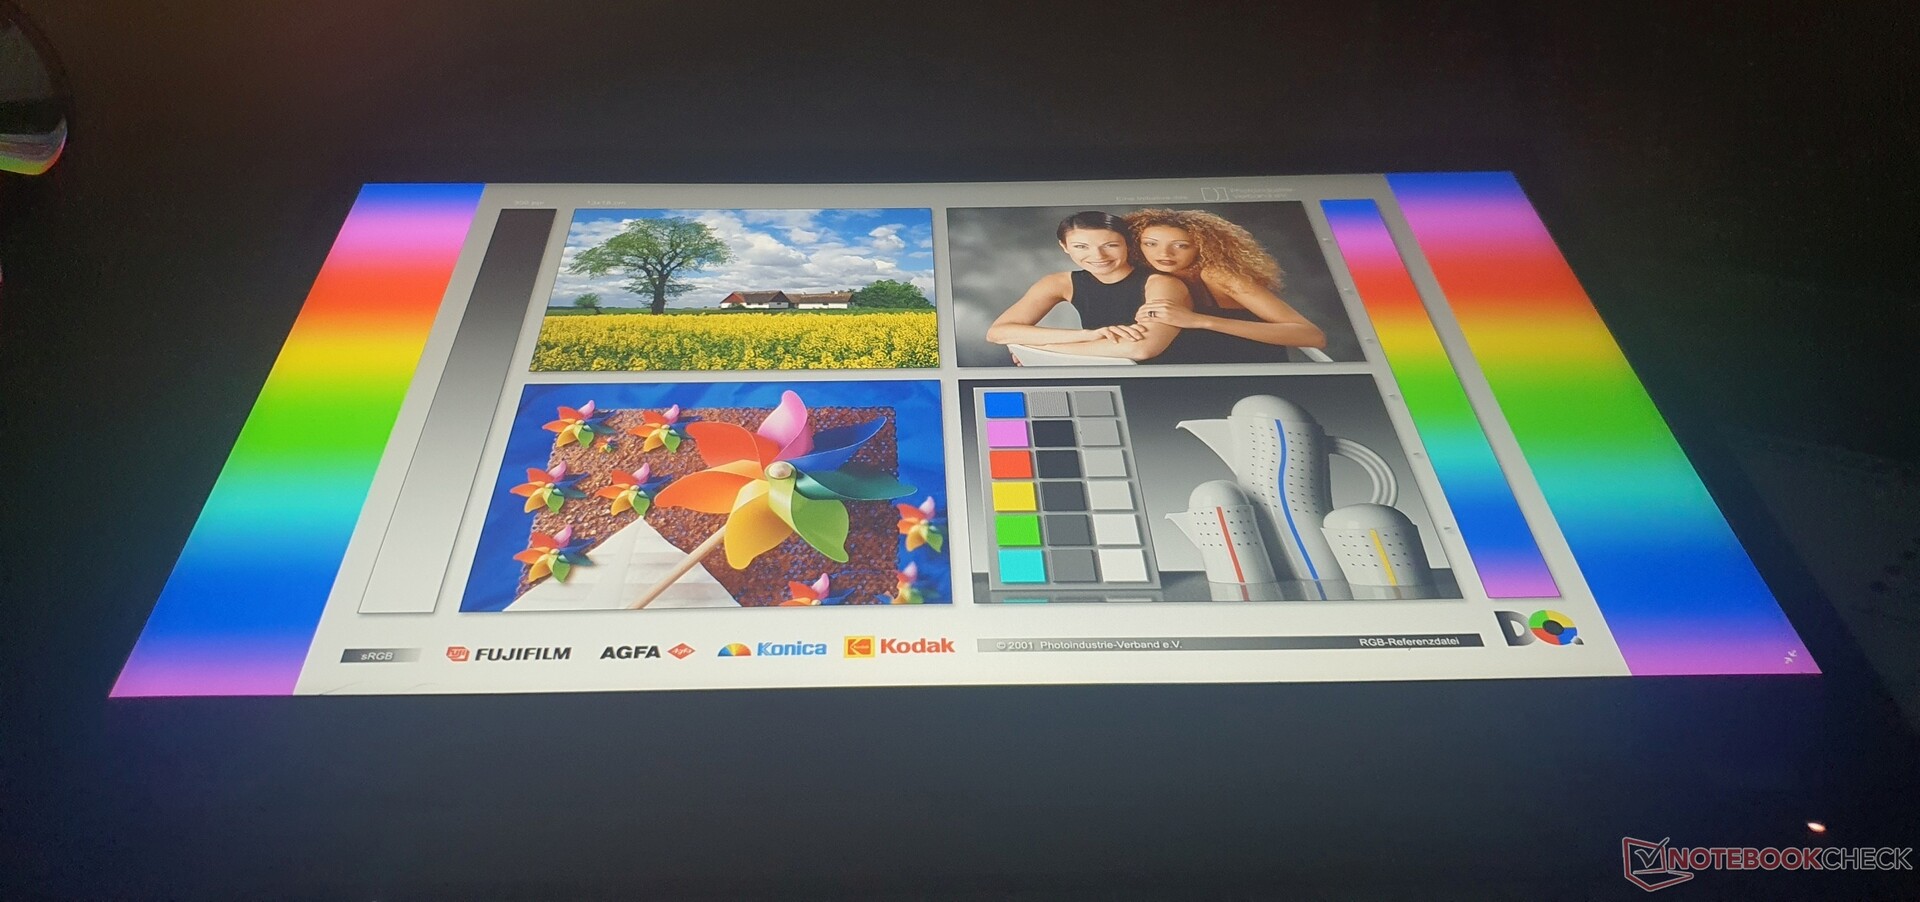
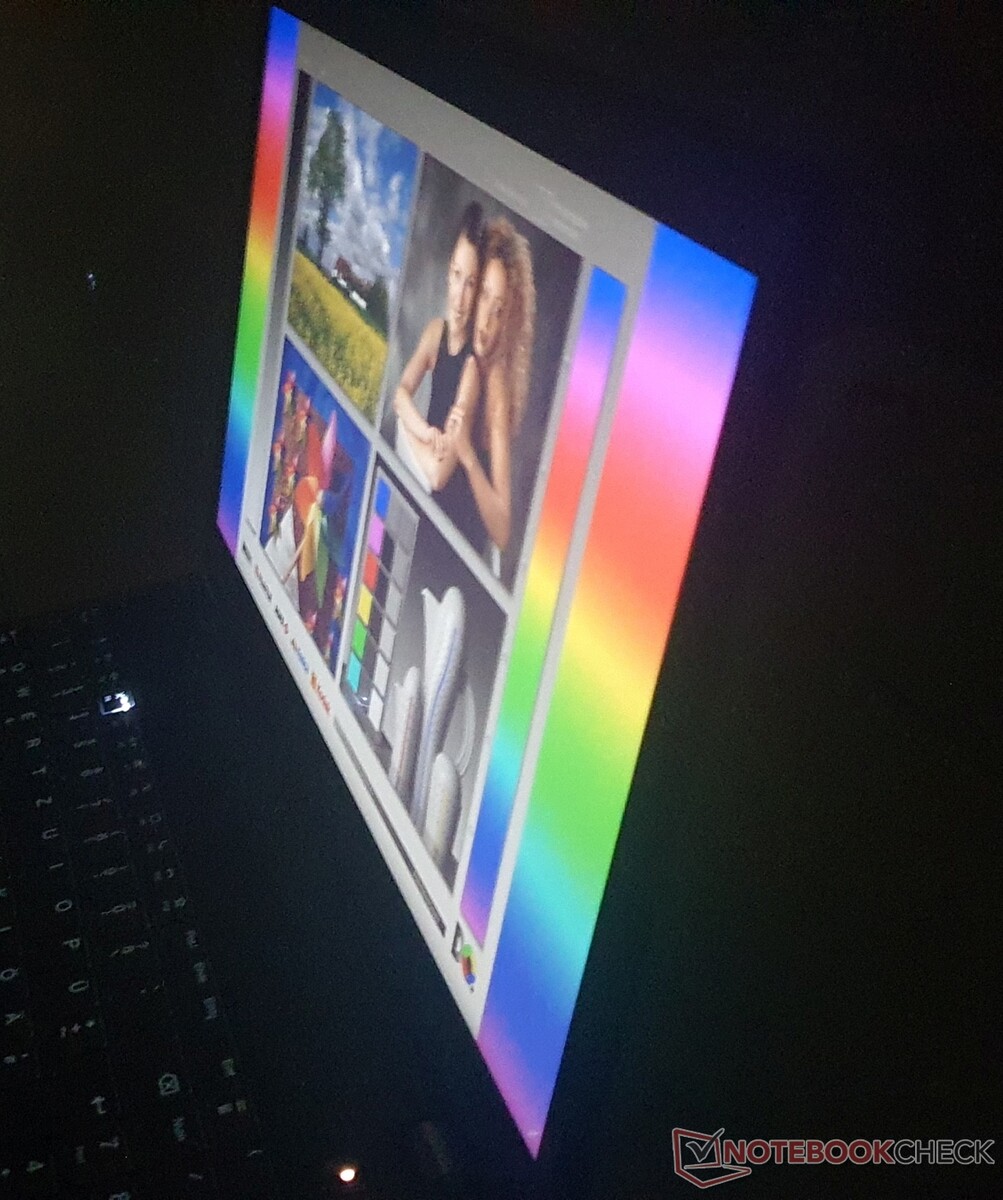
在阳光下的户外,尽管有磨砂表面,但280尼特的显示屏不够亮。但P15v可以在阴凉处使用。
显示屏的可读性在大约170°的视角下非常好,这是典型的IPS。OLED的表现甚至更好。
性能。ThinkPad P15v G2采用英特尔酷睿i9,性能更佳
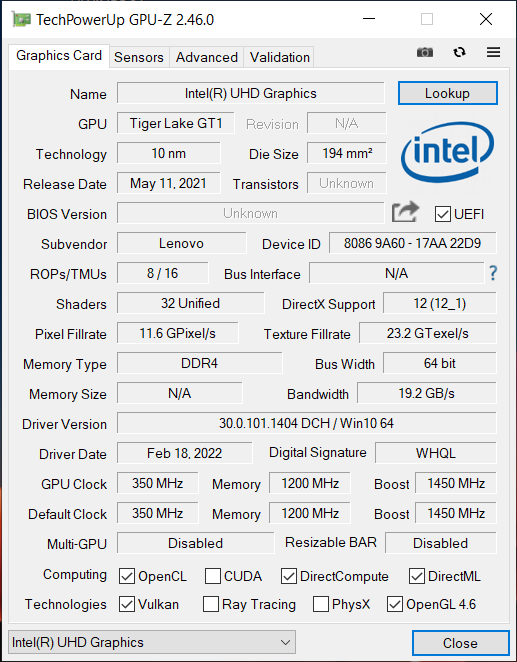
我们的审查模型配备了英特尔虎湖酷睿i7-11800H或者,你可以选择Core 酷睿i9-11950H。在图形方面,除了集成的 英特尔X-iGPU(32/16 EUs),你可以选择Nvidia T600, T1200(我们的型号)或一个 RTX A2000,每个都有ISV认证。至强CPU和ECC内存并不打算用于本应是廉价的工作站。
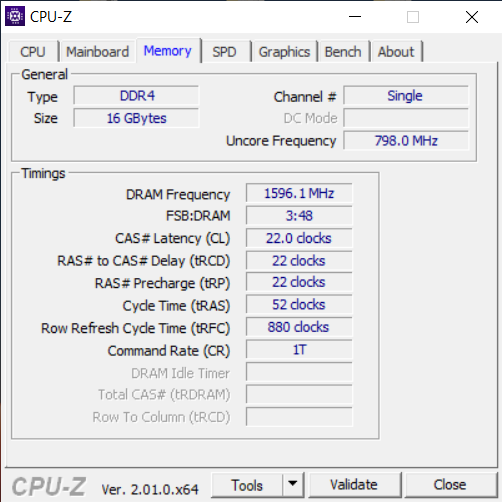
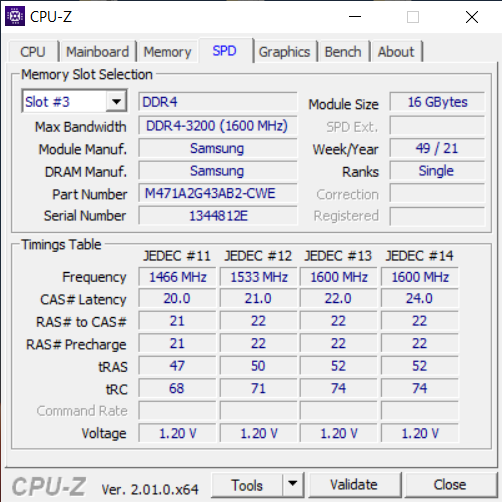
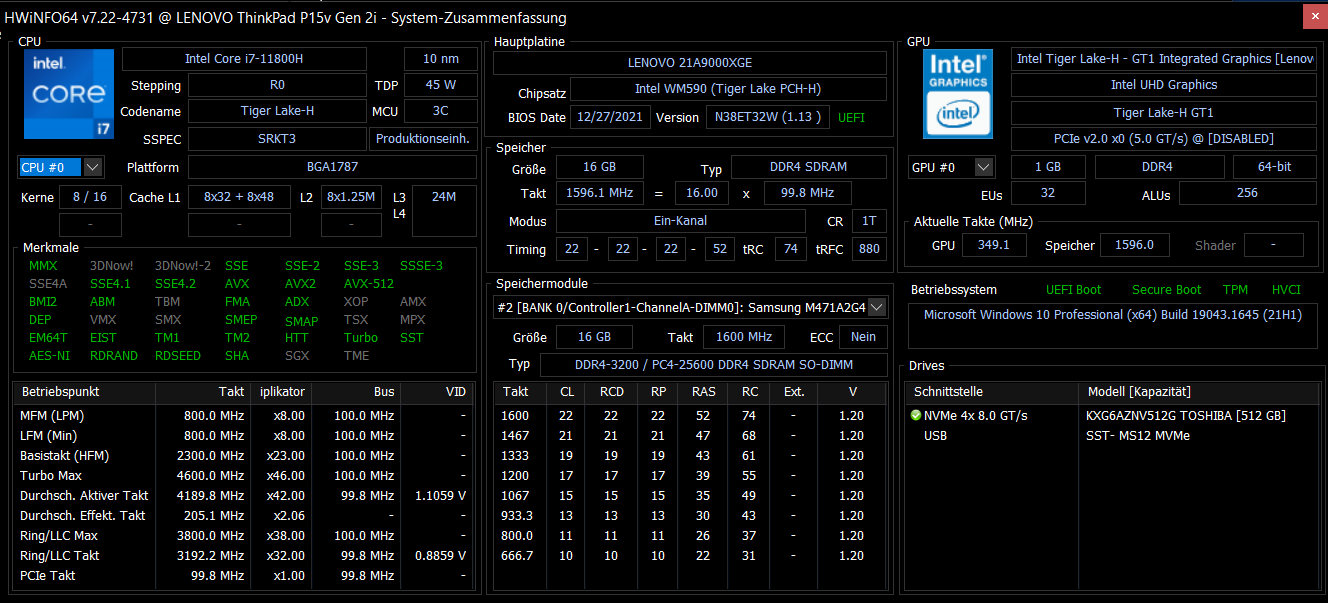
两个SODIMMs最多可容纳64GB的DDR4-3200内存,而我们的模型配备了一个单通道模式的16GB模块。还有两个PCIe 4.0插槽,每个插槽允许最大2TB的M.2 2280格式的NVMe SSD。
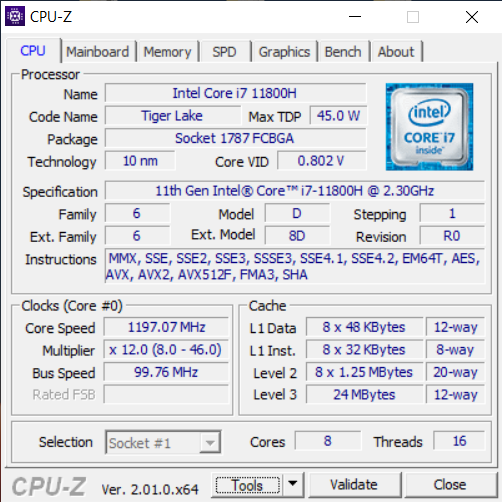
处理器
英特尔的 酷睿i7-11800H承诺以其八个核心提供大量的功率,但在ThinkPad P15v G2中,CPU的实际配置并不理想。在CB15循环过程中,多次达到4.6GHz,而平均为3.15GHz。在运行10次后,只能稳定地达到1400分。厚厚的 ThinkPad P15 G2在相同的CPU下实现了1768分。
即使是测试者的更薄的ThinkPad P1 G3在使用前代Core i9时也达到了持续的~1700分。在PL2(初始)下,109瓦中有87瓦被利用,但问题来自于超过PL1(50瓦)的60瓦(@4.6 GHz)的推动。结果是,CPU经常达到94℃的大关,并受到分阶段热节流的影响。
在一些应用中,大约25%的性能被浪费了。通过 "ThrottleStop "工具手动将TDP限制在50瓦甚至45瓦,也会导致波动的行为。有趣的是,在用Prime95进行压力测试时,在50瓦的恒定消耗下没有节流现象。更新BIOS也无济于事。 这种性能下降是否可以用更灵活的Core i9来弥补仍然是个问题,而且这种选择很昂贵。至少,前辈在这里的表现明显优于后者,但惠普的ZBook Power 15用同样的Core i7要快30%左右。
与工作站相关的OpenCL得分只有ThinkPad P15的一半,主要是由于较弱的GPU。在V-Ray 5 CUDA中,这种差异甚至更加极端。在电池模式下,性能下降了约20%(@45瓦)。
Cinebench R15 Multi Sustained Load
Cinebench R23: Multi Core | Single Core
Cinebench R20: CPU (Multi Core) | CPU (Single Core)
Cinebench R15: CPU Multi 64Bit | CPU Single 64Bit
Blender: v2.79 BMW27 CPU
7-Zip 18.03: 7z b 4 | 7z b 4 -mmt1
Geekbench 5.5: Multi-Core | Single-Core
HWBOT x265 Benchmark v2.2: 4k Preset
LibreOffice : 20 Documents To PDF
R Benchmark 2.5: Overall mean
V-Ray 5 Benchmark: GPU CUDA
Geekbench 5.5: OpenCL Score
SPECviewperf 13: Solidworks (sw-04) | Siemens NX (snx-03) | Showcase (showcase-02) | Medical (medical-02) | Maya (maya-05) | Energy (energy-02) | Creo (creo-02) | Catia (catia-05) | 3ds Max (3dsmax-06)
SPECviewperf 2020: 1920x1080 Solidworks (solidworks-05) | 1920x1080 Siemens NX (snx-04) | 1920x1080 Medical (medical-03) | 1920x1080 Maya (maya-06) | 1920x1080 Energy (energy-03) | 1920x1080 Creo (creo-03) | 1920x1080 CATIA (catia-06) | 1920x1080 3ds Max (3dsmax-07)
| CPU Performance rating | |
| Average of class Workstation | |
| Lenovo ThinkPad P15 G2-20YQ001JGE -1! | |
| Dell Precision 5000 5560 -4! | |
| Average Intel Core i7-11800H | |
| Lenovo ThinkPad T15g-20UR000GGE -1! | |
| HP ZBook Power 15 G8 313S5EA | |
| Lenovo ThinkPad T15p-20TN0006GE -18! | |
| Lenovo ThinkPad P15v G2 21A9000XGE -1! | |
| Lenovo ThinkPad P15s Gen2-20W6000GGE -1! | |
| Cinebench R23 / Multi Core | |
| Average of class Workstation (14055 - 38520, n=25, last 2 years) | |
| HP ZBook Power 15 G8 313S5EA | |
| Average Intel Core i7-11800H (6508 - 14088, n=48) | |
| Lenovo ThinkPad P15 G2-20YQ001JGE | |
| Lenovo ThinkPad P15v G2 21A9000XGE | |
| Dell Precision 5000 5560 | |
| Lenovo ThinkPad T15g-20UR000GGE | |
| Lenovo ThinkPad T15p-20TN0006GE | |
| Lenovo ThinkPad P15s Gen2-20W6000GGE | |
| Cinebench R23 / Single Core | |
| Average of class Workstation (1712 - 2228, n=25, last 2 years) | |
| HP ZBook Power 15 G8 313S5EA | |
| Dell Precision 5000 5560 | |
| Lenovo ThinkPad P15 G2-20YQ001JGE | |
| Average Intel Core i7-11800H (1386 - 1522, n=45) | |
| Lenovo ThinkPad P15s Gen2-20W6000GGE | |
| Lenovo ThinkPad T15g-20UR000GGE | |
| Lenovo ThinkPad T15p-20TN0006GE | |
| Cinebench R20 / CPU (Multi Core) | |
| Average of class Workstation (5471 - 15043, n=25, last 2 years) | |
| Average Intel Core i7-11800H (2498 - 5408, n=50) | |
| Lenovo ThinkPad P15 G2-20YQ001JGE | |
| HP ZBook Power 15 G8 313S5EA | |
| Dell Precision 5000 5560 | |
| Lenovo ThinkPad P15v G2 21A9000XGE | |
| Lenovo ThinkPad T15p-20TN0006GE | |
| Lenovo ThinkPad T15g-20UR000GGE | |
| Lenovo ThinkPad P15s Gen2-20W6000GGE | |
| Cinebench R20 / CPU (Single Core) | |
| Average of class Workstation (671 - 857, n=25, last 2 years) | |
| HP ZBook Power 15 G8 313S5EA | |
| Dell Precision 5000 5560 | |
| Lenovo ThinkPad P15 G2-20YQ001JGE | |
| Average Intel Core i7-11800H (520 - 586, n=47) | |
| Lenovo ThinkPad P15v G2 21A9000XGE | |
| Lenovo ThinkPad P15s Gen2-20W6000GGE | |
| Lenovo ThinkPad T15g-20UR000GGE | |
| Lenovo ThinkPad T15p-20TN0006GE | |
| Cinebench R15 / CPU Multi 64Bit | |
| Average of class Workstation (2489 - 5810, n=25, last 2 years) | |
| HP ZBook Power 15 G8 313S5EA | |
| HP ZBook Power 15 G8 313S5EA | |
| Average Intel Core i7-11800H (1342 - 2173, n=50) | |
| Lenovo ThinkPad P15 G2-20YQ001JGE | |
| Lenovo ThinkPad P15v G2 21A9000XGE | |
| Dell Precision 5000 5560 | |
| Lenovo ThinkPad T15g-20UR000GGE | |
| Lenovo ThinkPad T15p-20TN0006GE | |
| Lenovo ThinkPad P15s Gen2-20W6000GGE | |
| Cinebench R15 / CPU Single 64Bit | |
| Average of class Workstation (191.4 - 328, n=25, last 2 years) | |
| Dell Precision 5000 5560 | |
| HP ZBook Power 15 G8 313S5EA | |
| Lenovo ThinkPad P15 G2-20YQ001JGE | |
| Average Intel Core i7-11800H (201 - 231, n=46) | |
| Lenovo ThinkPad P15v G2 21A9000XGE | |
| Lenovo ThinkPad P15s Gen2-20W6000GGE | |
| Lenovo ThinkPad T15g-20UR000GGE | |
| Lenovo ThinkPad T15p-20TN0006GE | |
| Blender / v2.79 BMW27 CPU | |
| Lenovo ThinkPad P15s Gen2-20W6000GGE | |
| Lenovo ThinkPad T15p-20TN0006GE | |
| Lenovo ThinkPad T15g-20UR000GGE | |
| Lenovo ThinkPad P15v G2 21A9000XGE | |
| Dell Precision 5000 5560 | |
| Average Intel Core i7-11800H (217 - 454, n=46) | |
| Lenovo ThinkPad P15 G2-20YQ001JGE | |
| HP ZBook Power 15 G8 313S5EA | |
| Average of class Workstation (91 - 261, n=25, last 2 years) | |
| 7-Zip 18.03 / 7z b 4 | |
| Average of class Workstation (54741 - 116969, n=25, last 2 years) | |
| Lenovo ThinkPad P15 G2-20YQ001JGE | |
| HP ZBook Power 15 G8 313S5EA | |
| Average Intel Core i7-11800H (33718 - 56758, n=46) | |
| Dell Precision 5000 5560 | |
| Lenovo ThinkPad P15v G2 21A9000XGE | |
| Lenovo ThinkPad T15g-20UR000GGE | |
| Lenovo ThinkPad T15p-20TN0006GE | |
| Lenovo ThinkPad P15s Gen2-20W6000GGE | |
| 7-Zip 18.03 / 7z b 4 -mmt1 | |
| Average of class Workstation (5126 - 6960, n=25, last 2 years) | |
| Dell Precision 5000 5560 | |
| HP ZBook Power 15 G8 313S5EA | |
| Average Intel Core i7-11800H (5138 - 5732, n=46) | |
| Lenovo ThinkPad P15 G2-20YQ001JGE | |
| Lenovo ThinkPad P15s Gen2-20W6000GGE | |
| Lenovo ThinkPad T15g-20UR000GGE | |
| Lenovo ThinkPad P15v G2 21A9000XGE | |
| Lenovo ThinkPad T15p-20TN0006GE | |
| Geekbench 5.5 / Multi-Core | |
| Average of class Workstation (11542 - 25554, n=25, last 2 years) | |
| Lenovo ThinkPad P15 G2-20YQ001JGE | |
| Average Intel Core i7-11800H (4655 - 9851, n=40) | |
| HP ZBook Power 15 G8 313S5EA | |
| Lenovo ThinkPad T15g-20UR000GGE | |
| Lenovo ThinkPad P15v G2 21A9000XGE | |
| Lenovo ThinkPad T15p-20TN0006GE | |
| Lenovo ThinkPad P15s Gen2-20W6000GGE | |
| Geekbench 5.5 / Single-Core | |
| Average of class Workstation (1781 - 2183, n=25, last 2 years) | |
| Lenovo ThinkPad P15 G2-20YQ001JGE | |
| Average Intel Core i7-11800H (1429 - 1625, n=40) | |
| Lenovo ThinkPad P15s Gen2-20W6000GGE | |
| HP ZBook Power 15 G8 313S5EA | |
| Lenovo ThinkPad P15v G2 21A9000XGE | |
| Lenovo ThinkPad T15g-20UR000GGE | |
| Lenovo ThinkPad T15p-20TN0006GE | |
| HWBOT x265 Benchmark v2.2 / 4k Preset | |
| Average of class Workstation (14.4 - 40.5, n=25, last 2 years) | |
| Lenovo ThinkPad P15 G2-20YQ001JGE | |
| HP ZBook Power 15 G8 313S5EA | |
| Average Intel Core i7-11800H (7.38 - 17.4, n=46) | |
| Dell Precision 5000 5560 | |
| Lenovo ThinkPad P15v G2 21A9000XGE | |
| Lenovo ThinkPad T15g-20UR000GGE | |
| Lenovo ThinkPad T15p-20TN0006GE | |
| Lenovo ThinkPad P15s Gen2-20W6000GGE | |
| LibreOffice / 20 Documents To PDF | |
| Lenovo ThinkPad P15v G2 21A9000XGE | |
| Lenovo ThinkPad P15 G2-20YQ001JGE | |
| Lenovo ThinkPad T15g-20UR000GGE | |
| Dell Precision 5000 5560 | |
| Average of class Workstation (37.1 - 74.7, n=25, last 2 years) | |
| Average Intel Core i7-11800H (38.6 - 59.9, n=45) | |
| Lenovo ThinkPad P15s Gen2-20W6000GGE | |
| Lenovo ThinkPad T15p-20TN0006GE | |
| HP ZBook Power 15 G8 313S5EA | |
| R Benchmark 2.5 / Overall mean | |
| Lenovo ThinkPad T15p-20TN0006GE | |
| HP ZBook Power 15 G8 313S5EA | |
| Lenovo ThinkPad P15v G2 21A9000XGE | |
| Lenovo ThinkPad T15g-20UR000GGE | |
| Lenovo ThinkPad P15 G2-20YQ001JGE | |
| Average Intel Core i7-11800H (0.548 - 0.615, n=46) | |
| Lenovo ThinkPad P15s Gen2-20W6000GGE | |
| Dell Precision 5000 5560 | |
| Average of class Workstation (0.3825 - 0.603, n=25, last 2 years) | |
| V-Ray 5 Benchmark / GPU CUDA | |
| Average of class Workstation (260 - 3239, n=10, last 2 years) | |
| Average Intel Core i7-11800H (164 - 1238, n=16) | |
| Lenovo ThinkPad P15v G2 21A9000XGE | |
| HP ZBook Power 15 G8 313S5EA | |
| Geekbench 5.5 / OpenCL Score | |
| Average of class Workstation (33651 - 272866, n=25, last 2 years) | |
| Lenovo ThinkPad P15 G2-20YQ001JGE | |
| Lenovo ThinkPad T15g-20UR000GGE | |
| Average Intel Core i7-11800H (8476 - 129333, n=46) | |
| Lenovo ThinkPad P15v G2 21A9000XGE | |
| HP ZBook Power 15 G8 313S5EA | |
| Lenovo ThinkPad P15s Gen2-20W6000GGE | |
| Lenovo ThinkPad T15p-20TN0006GE | |
| SPECviewperf 13 / Solidworks (sw-04) | |
| Average of class Workstation (131.6 - 230, n=12, last 2 years) | |
| Lenovo ThinkPad P15 G2-20YQ001JGE | |
| Dell Precision 5000 5560 | |
| Lenovo ThinkPad P15v G2 21A9000XGE | |
| Average Intel Core i7-11800H (45.5 - 156.7, n=10) | |
| HP ZBook Power 15 G8 313S5EA | |
| Lenovo ThinkPad P15s Gen2-20W6000GGE | |
| Lenovo ThinkPad T15g-20UR000GGE | |
| SPECviewperf 13 / Siemens NX (snx-03) | |
| Average of class Workstation (160.8 - 879, n=12, last 2 years) | |
| Lenovo ThinkPad P15 G2-20YQ001JGE | |
| Dell Precision 5000 5560 | |
| Lenovo ThinkPad P15v G2 21A9000XGE | |
| HP ZBook Power 15 G8 313S5EA | |
| Average Intel Core i7-11800H (5.45 - 250, n=10) | |
| Lenovo ThinkPad P15s Gen2-20W6000GGE | |
| Lenovo ThinkPad T15g-20UR000GGE | |
| SPECviewperf 13 / Showcase (showcase-02) | |
| Average of class Workstation (31.7 - 319, n=12, last 2 years) | |
| Lenovo ThinkPad T15g-20UR000GGE | |
| Lenovo ThinkPad P15 G2-20YQ001JGE | |
| Average Intel Core i7-11800H (11.3 - 138, n=10) | |
| Dell Precision 5000 5560 | |
| Lenovo ThinkPad P15v G2 21A9000XGE | |
| HP ZBook Power 15 G8 313S5EA | |
| Lenovo ThinkPad P15s Gen2-20W6000GGE | |
| SPECviewperf 13 / Medical (medical-02) | |
| Average of class Workstation (82.7 - 363, n=12, last 2 years) | |
| Lenovo ThinkPad P15 G2-20YQ001JGE | |
| Dell Precision 5000 5560 | |
| Average Intel Core i7-11800H (4.96 - 89.2, n=10) | |
| Lenovo ThinkPad P15v G2 21A9000XGE | |
| Lenovo ThinkPad T15g-20UR000GGE | |
| HP ZBook Power 15 G8 313S5EA | |
| Lenovo ThinkPad P15s Gen2-20W6000GGE | |
| SPECviewperf 13 / Maya (maya-05) | |
| Average of class Workstation (125.7 - 448, n=7, last 2 years) | |
| Lenovo ThinkPad P15 G2-20YQ001JGE | |
| Lenovo ThinkPad T15g-20UR000GGE | |
| Average Intel Core i7-11800H (32 - 337, n=10) | |
| Dell Precision 5000 5560 | |
| Lenovo ThinkPad P15v G2 21A9000XGE | |
| HP ZBook Power 15 G8 313S5EA | |
| Lenovo ThinkPad P15s Gen2-20W6000GGE | |
| SPECviewperf 13 / Energy (energy-02) | |
| Average of class Workstation (2.77 - 174.7, n=12, last 2 years) | |
| Lenovo ThinkPad P15 G2-20YQ001JGE | |
| Dell Precision 5000 5560 | |
| Average Intel Core i7-11800H (1.15 - 41.2, n=10) | |
| Lenovo ThinkPad T15g-20UR000GGE | |
| Lenovo ThinkPad P15v G2 21A9000XGE | |
| HP ZBook Power 15 G8 313S5EA | |
| Lenovo ThinkPad P15s Gen2-20W6000GGE | |
| SPECviewperf 13 / Creo (creo-02) | |
| Average of class Workstation (120.1 - 589, n=12, last 2 years) | |
| Lenovo ThinkPad P15 G2-20YQ001JGE | |
| Dell Precision 5000 5560 | |
| Lenovo ThinkPad T15g-20UR000GGE | |
| Average Intel Core i7-11800H (22.5 - 225, n=10) | |
| Lenovo ThinkPad P15v G2 21A9000XGE | |
| HP ZBook Power 15 G8 313S5EA | |
| Lenovo ThinkPad P15s Gen2-20W6000GGE | |
| SPECviewperf 13 / Catia (catia-05) | |
| Average of class Workstation (162.7 - 552, n=12, last 2 years) | |
| Lenovo ThinkPad P15 G2-20YQ001JGE | |
| Dell Precision 5000 5560 | |
| Average Intel Core i7-11800H (31.9 - 257, n=10) | |
| Lenovo ThinkPad P15v G2 21A9000XGE | |
| HP ZBook Power 15 G8 313S5EA | |
| Lenovo ThinkPad T15g-20UR000GGE | |
| Lenovo ThinkPad P15s Gen2-20W6000GGE | |
| SPECviewperf 13 / 3ds Max (3dsmax-06) | |
| Average of class Workstation (80.8 - 422, n=12, last 2 years) | |
| Lenovo ThinkPad P15 G2-20YQ001JGE | |
| Lenovo ThinkPad T15g-20UR000GGE | |
| Average Intel Core i7-11800H (27.2 - 235, n=10) | |
| Dell Precision 5000 5560 | |
| Lenovo ThinkPad P15v G2 21A9000XGE | |
| HP ZBook Power 15 G8 313S5EA | |
| Lenovo ThinkPad P15s Gen2-20W6000GGE | |
| SPECviewperf 2020 / Solidworks (solidworks-05) | |
| Average of class Workstation (50.6 - 542, n=10, last 2 years) | |
| Lenovo ThinkPad T15g-20UR000GGE | |
| Lenovo ThinkPad P15 G2-20YQ001JGE | |
| Dell Precision 5000 5560 | |
| Average Intel Core i7-11800H (73.4 - 147.9, n=6) | |
| Lenovo ThinkPad P15v G2 21A9000XGE | |
| HP ZBook Power 15 G8 313S5EA | |
| Lenovo ThinkPad P15s Gen2-20W6000GGE | |
| SPECviewperf 2020 / Siemens NX (snx-04) | |
| Average of class Workstation (22.3 - 903, n=25, last 2 years) | |
| Lenovo ThinkPad P15 G2-20YQ001JGE | |
| Dell Precision 5000 5560 | |
| Lenovo ThinkPad P15v G2 21A9000XGE | |
| Average Intel Core i7-11800H (18.7 - 250, n=8) | |
| HP ZBook Power 15 G8 313S5EA | |
| Lenovo ThinkPad P15s Gen2-20W6000GGE | |
| Lenovo ThinkPad T15g-20UR000GGE | |
| SPECviewperf 2020 / Medical (medical-03) | |
| Average of class Workstation (28.8 - 227, n=25, last 2 years) | |
| Lenovo ThinkPad P15 G2-20YQ001JGE | |
| Dell Precision 5000 5560 | |
| Average Intel Core i7-11800H (18.7 - 42.7, n=8) | |
| Lenovo ThinkPad T15g-20UR000GGE | |
| Lenovo ThinkPad P15v G2 21A9000XGE | |
| HP ZBook Power 15 G8 313S5EA | |
| Lenovo ThinkPad P15s Gen2-20W6000GGE | |
| SPECviewperf 2020 / Maya (maya-06) | |
| Average of class Workstation (117.8 - 724, n=24, last 2 years) | |
| Lenovo ThinkPad P15 G2-20YQ001JGE | |
| Lenovo ThinkPad T15g-20UR000GGE | |
| Dell Precision 5000 5560 | |
| Average Intel Core i7-11800H (125 - 294, n=8) | |
| Lenovo ThinkPad P15v G2 21A9000XGE | |
| HP ZBook Power 15 G8 313S5EA | |
| Lenovo ThinkPad P15s Gen2-20W6000GGE | |
| SPECviewperf 2020 / Energy (energy-03) | |
| Average of class Workstation (2.78 - 176.7, n=25, last 2 years) | |
| Lenovo ThinkPad P15 G2-20YQ001JGE | |
| Dell Precision 5000 5560 | |
| Average Intel Core i7-11800H (16 - 43.1, n=8) | |
| Lenovo ThinkPad T15g-20UR000GGE | |
| Lenovo ThinkPad P15v G2 21A9000XGE | |
| HP ZBook Power 15 G8 313S5EA | |
| Lenovo ThinkPad P15s Gen2-20W6000GGE | |
| SPECviewperf 2020 / Creo (creo-03) | |
| Average of class Workstation (49.2 - 261, n=25, last 2 years) | |
| Lenovo ThinkPad P15 G2-20YQ001JGE | |
| Dell Precision 5000 5560 | |
| Average Intel Core i7-11800H (67.3 - 124.5, n=8) | |
| Lenovo ThinkPad T15g-20UR000GGE | |
| Lenovo ThinkPad P15v G2 21A9000XGE | |
| HP ZBook Power 15 G8 313S5EA | |
| Lenovo ThinkPad P15s Gen2-20W6000GGE | |
| SPECviewperf 2020 / CATIA (catia-06) | |
| Average of class Workstation (27.1 - 182.2, n=25, last 2 years) | |
| Lenovo ThinkPad P15 G2-20YQ001JGE | |
| Dell Precision 5000 5560 | |
| Average Intel Core i7-11800H (33.1 - 80.5, n=8) | |
| Lenovo ThinkPad T15g-20UR000GGE | |
| Lenovo ThinkPad P15v G2 21A9000XGE | |
| HP ZBook Power 15 G8 313S5EA | |
| Lenovo ThinkPad P15s Gen2-20W6000GGE | |
| SPECviewperf 2020 / 3ds Max (3dsmax-07) | |
| Average of class Workstation (24.7 - 251, n=25, last 2 years) | |
| Lenovo ThinkPad T15g-20UR000GGE | |
| Lenovo ThinkPad P15 G2-20YQ001JGE | |
| Average Intel Core i7-11800H (40.9 - 109.4, n=8) | |
| Dell Precision 5000 5560 | |
| Lenovo ThinkPad P15v G2 21A9000XGE | |
| HP ZBook Power 15 G8 313S5EA | |
| Lenovo ThinkPad P15s Gen2-20W6000GGE | |
* ... smaller is better
AIDA64: FP32 Ray-Trace | FPU Julia | CPU SHA3 | CPU Queen | FPU SinJulia | FPU Mandel | CPU AES | CPU ZLib | FP64 Ray-Trace | CPU PhotoWorxx
| Performance rating | |
| Average of class Workstation | |
| HP ZBook Power 15 G8 313S5EA | |
| Average Intel Core i7-11800H | |
| Lenovo ThinkPad P15v G2 21A9000XGE | |
| Lenovo ThinkPad T15g-20UR000GGE | |
| Lenovo ThinkPad T15p-20TN0006GE | |
| Lenovo ThinkPad P15s Gen2-20W6000GGE | |
| AIDA64 / FP32 Ray-Trace | |
| Average of class Workstation (10658 - 61611, n=25, last 2 years) | |
| HP ZBook Power 15 G8 313S5EA | |
| Average Intel Core i7-11800H (8772 - 15961, n=20) | |
| Lenovo ThinkPad P15v G2 21A9000XGE | |
| Lenovo ThinkPad T15g-20UR000GGE | |
| Lenovo ThinkPad T15p-20TN0006GE | |
| Lenovo ThinkPad P15s Gen2-20W6000GGE | |
| AIDA64 / FPU Julia | |
| Average of class Workstation (56664 - 186971, n=25, last 2 years) | |
| HP ZBook Power 15 G8 313S5EA | |
| Average Intel Core i7-11800H (39404 - 65636, n=20) | |
| Lenovo ThinkPad P15v G2 21A9000XGE | |
| Lenovo ThinkPad T15g-20UR000GGE | |
| Lenovo ThinkPad T15p-20TN0006GE | |
| Lenovo ThinkPad P15s Gen2-20W6000GGE | |
| AIDA64 / CPU SHA3 | |
| Average of class Workstation (2608 - 8975, n=25, last 2 years) | |
| HP ZBook Power 15 G8 313S5EA | |
| Average Intel Core i7-11800H (2599 - 4439, n=20) | |
| Lenovo ThinkPad P15v G2 21A9000XGE | |
| Lenovo ThinkPad T15g-20UR000GGE | |
| Lenovo ThinkPad T15p-20TN0006GE | |
| Lenovo ThinkPad P15s Gen2-20W6000GGE | |
| AIDA64 / CPU Queen | |
| Average of class Workstation (60778 - 144411, n=25, last 2 years) | |
| HP ZBook Power 15 G8 313S5EA | |
| Average Intel Core i7-11800H (85233 - 91941, n=20) | |
| Lenovo ThinkPad P15v G2 21A9000XGE | |
| Lenovo ThinkPad T15p-20TN0006GE | |
| Lenovo ThinkPad T15g-20UR000GGE | |
| Lenovo ThinkPad P15s Gen2-20W6000GGE | |
| AIDA64 / FPU SinJulia | |
| Average of class Workstation (8165 - 29343, n=25, last 2 years) | |
| HP ZBook Power 15 G8 313S5EA | |
| Average Intel Core i7-11800H (6420 - 9792, n=20) | |
| Lenovo ThinkPad P15v G2 21A9000XGE | |
| Lenovo ThinkPad T15p-20TN0006GE | |
| Lenovo ThinkPad T15g-20UR000GGE | |
| Lenovo ThinkPad P15s Gen2-20W6000GGE | |
| AIDA64 / FPU Mandel | |
| Average of class Workstation (27301 - 98153, n=25, last 2 years) | |
| HP ZBook Power 15 G8 313S5EA | |
| Average Intel Core i7-11800H (23365 - 39464, n=20) | |
| Lenovo ThinkPad P15v G2 21A9000XGE | |
| Lenovo ThinkPad T15g-20UR000GGE | |
| Lenovo ThinkPad T15p-20TN0006GE | |
| Lenovo ThinkPad P15s Gen2-20W6000GGE | |
| AIDA64 / CPU AES | |
| Average Intel Core i7-11800H (74617 - 149388, n=20) | |
| Average of class Workstation (56077 - 187841, n=25, last 2 years) | |
| HP ZBook Power 15 G8 313S5EA | |
| Lenovo ThinkPad P15v G2 21A9000XGE | |
| Lenovo ThinkPad P15s Gen2-20W6000GGE | |
| Lenovo ThinkPad T15p-20TN0006GE | |
| Lenovo ThinkPad T15g-20UR000GGE | |
| AIDA64 / CPU ZLib | |
| Average of class Workstation (742 - 2148, n=25, last 2 years) | |
| HP ZBook Power 15 G8 313S5EA | |
| Lenovo ThinkPad P15v G2 21A9000XGE | |
| Lenovo ThinkPad T15g-20UR000GGE | |
| Lenovo ThinkPad T15p-20TN0006GE | |
| Lenovo ThinkPad P15s Gen2-20W6000GGE | |
| Average Intel Core i7-11800H (461 - 830, n=43) | |
| AIDA64 / FP64 Ray-Trace | |
| Average of class Workstation (5580 - 32891, n=25, last 2 years) | |
| HP ZBook Power 15 G8 313S5EA | |
| Average Intel Core i7-11800H (4545 - 8717, n=21) | |
| Lenovo ThinkPad P15v G2 21A9000XGE | |
| Lenovo ThinkPad T15g-20UR000GGE | |
| Lenovo ThinkPad T15p-20TN0006GE | |
| Lenovo ThinkPad P15s Gen2-20W6000GGE | |
| AIDA64 / CPU PhotoWorxx | |
| Average of class Workstation (37151 - 93684, n=25, last 2 years) | |
| Lenovo ThinkPad P15s Gen2-20W6000GGE | |
| Lenovo ThinkPad T15g-20UR000GGE | |
| Average Intel Core i7-11800H (11898 - 26757, n=21) | |
| HP ZBook Power 15 G8 313S5EA | |
| Lenovo ThinkPad T15p-20TN0006GE | |
| Lenovo ThinkPad P15v G2 21A9000XGE | |
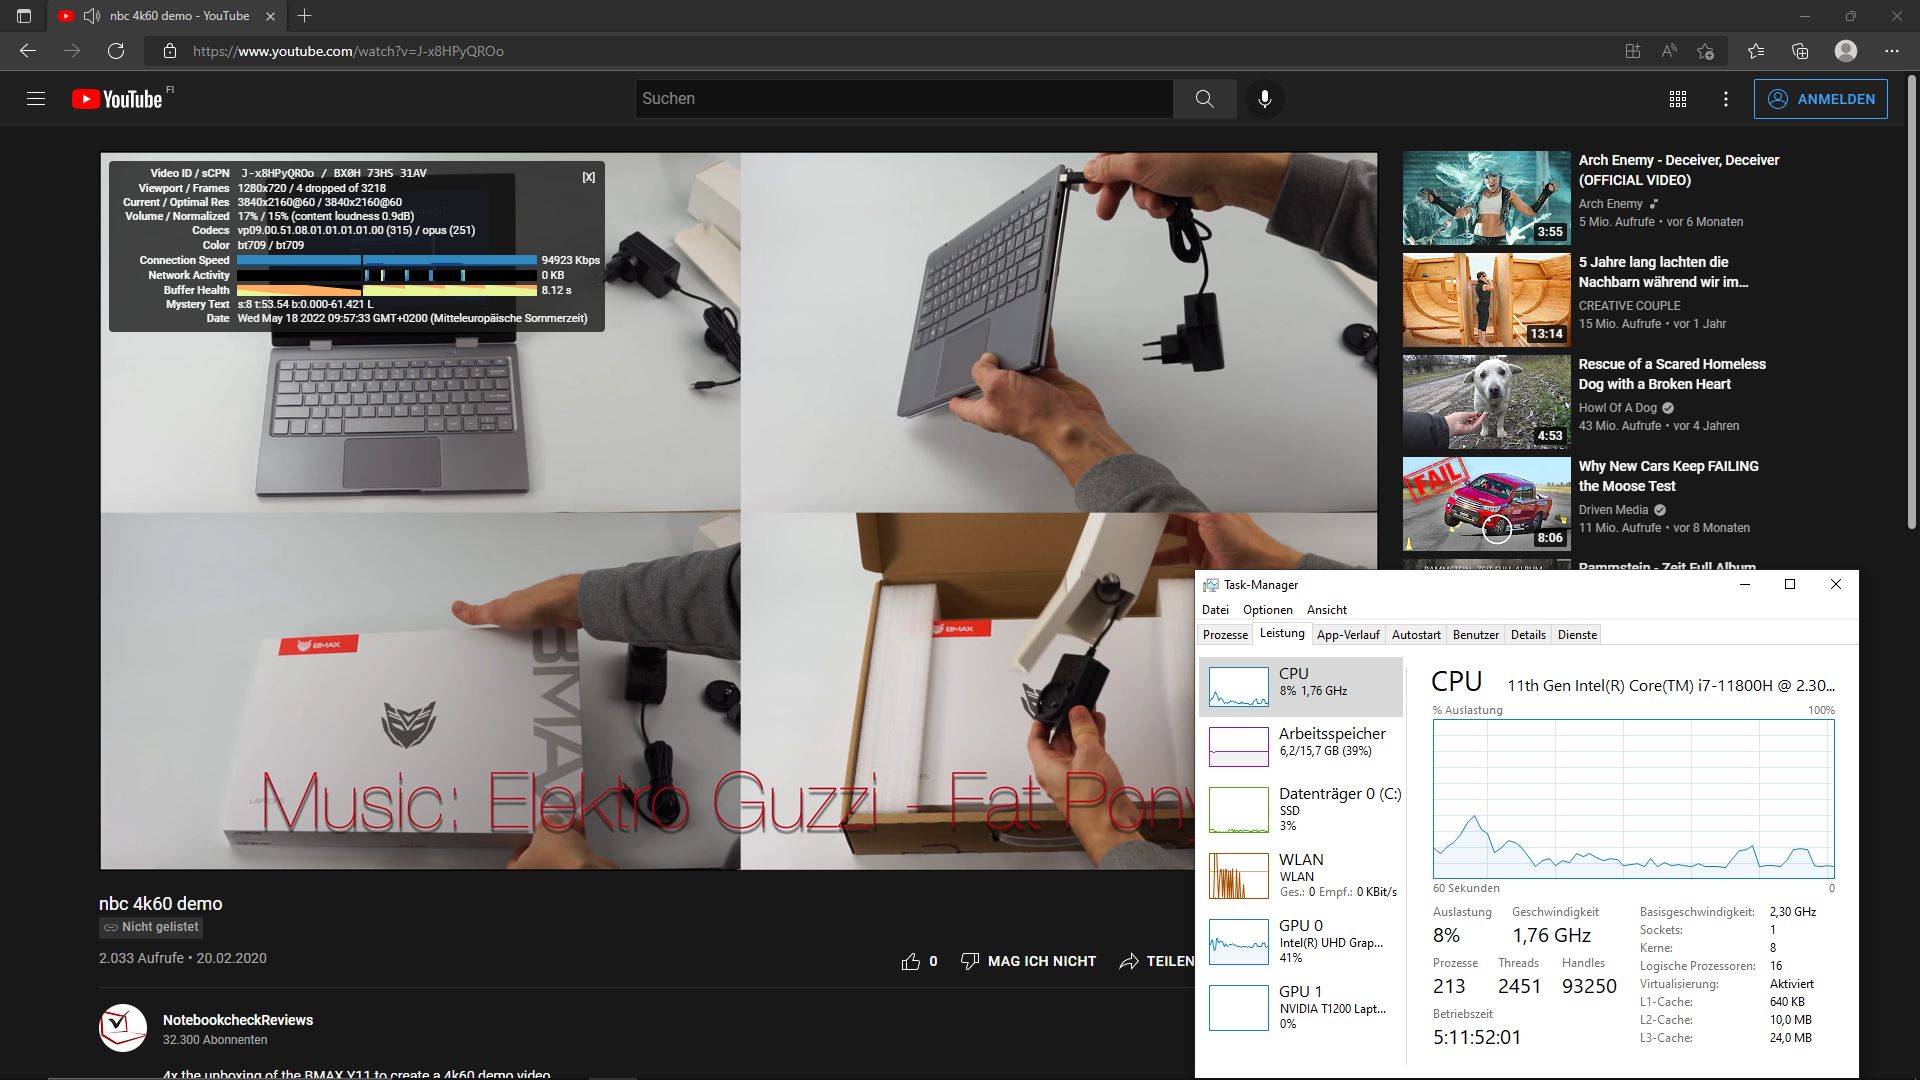
系统性能
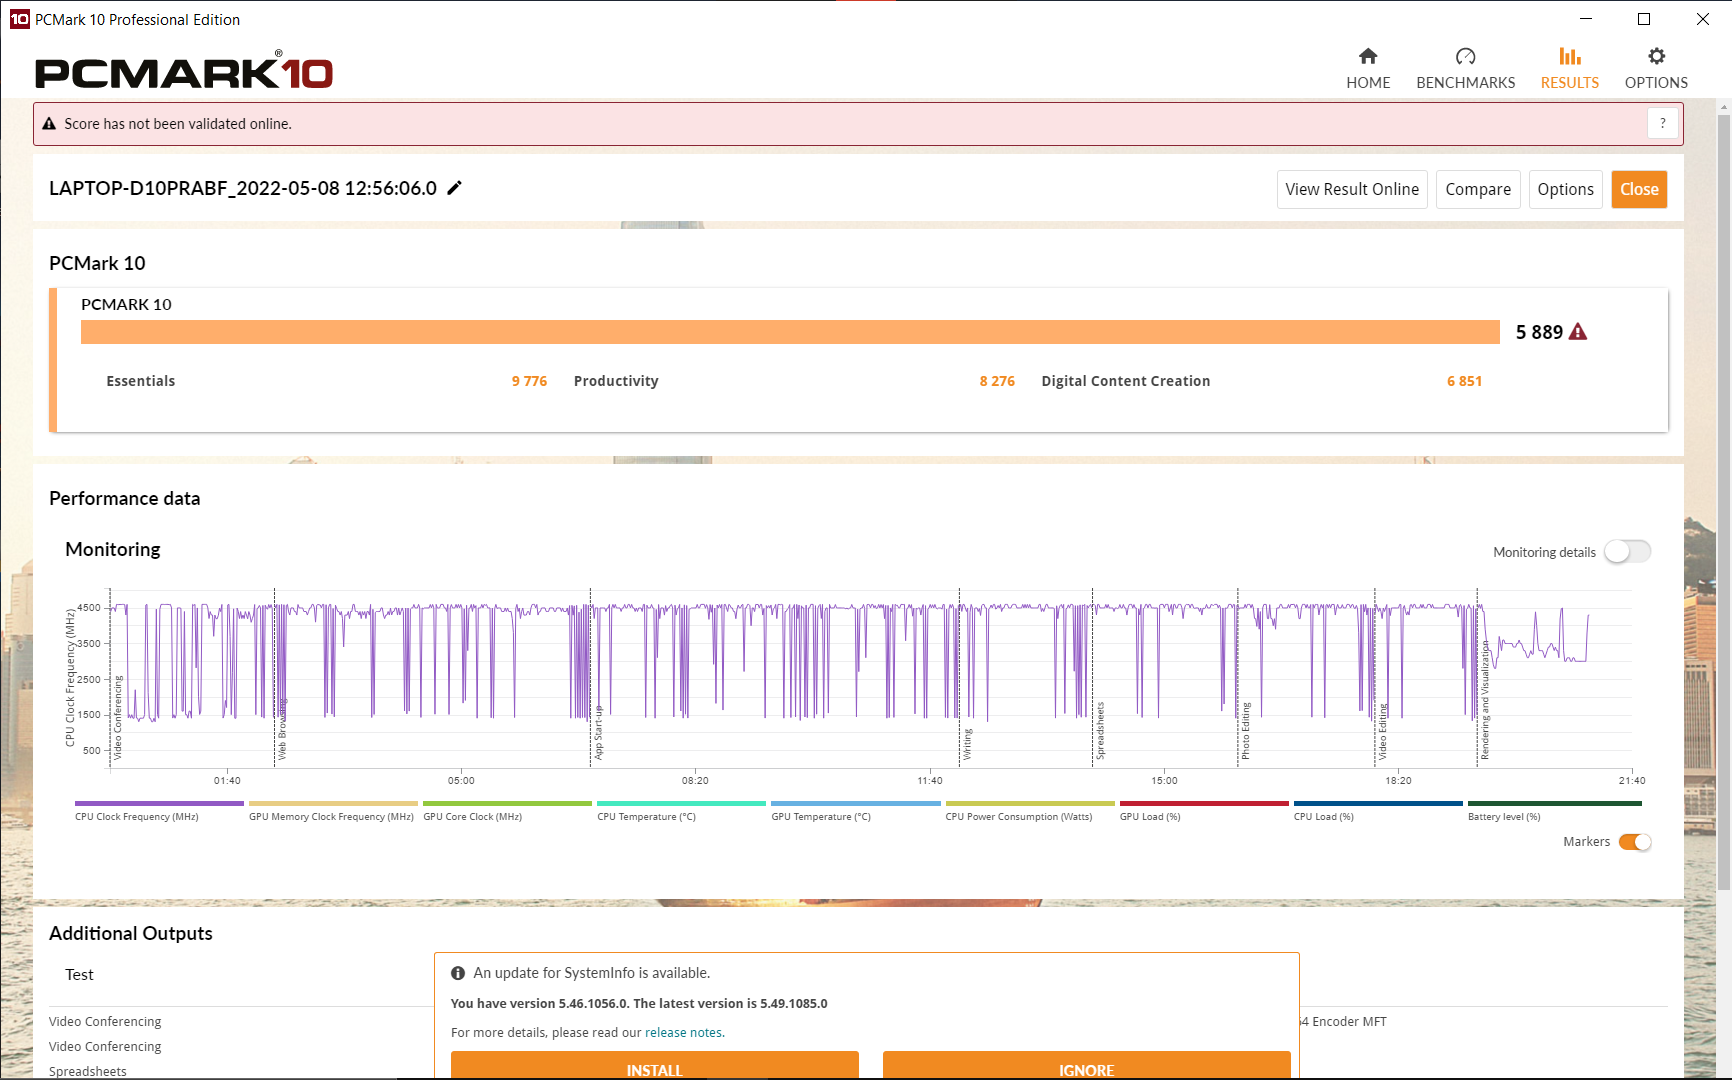
在播放4k YouTube视频时,用多个标签进行浏览,运行流畅。
基准测试结果处于良好水平,使用第二个内存模块(双通道模式)可以进一步提高。
CrossMark: Overall | Productivity | Creativity | Responsiveness
| PCMark 10 / Score | |
| Average of class Workstation (6436 - 10409, n=21, last 2 years) | |
| Dell Precision 5000 5560 | |
| Lenovo ThinkPad P15 G2-20YQ001JGE | |
| Lenovo ThinkPad T15g-20UR000GGE | |
| Average Intel Core i7-11800H, NVIDIA T1200 Laptop GPU (5889 - 6147, n=3) | |
| Lenovo ThinkPad P15v G2 21A9000XGE | |
| Lenovo ThinkPad P15s Gen2-20W6000GGE | |
| Lenovo ThinkPad T15p-20TN0006GE | |
| HP ZBook Power 15 G8 313S5EA | |
| PCMark 10 / Essentials | |
| Dell Precision 5000 5560 | |
| Average of class Workstation (9622 - 11157, n=21, last 2 years) | |
| Lenovo ThinkPad P15 G2-20YQ001JGE | |
| Average Intel Core i7-11800H, NVIDIA T1200 Laptop GPU (9776 - 9956, n=3) | |
| Lenovo ThinkPad P15v G2 21A9000XGE | |
| Lenovo ThinkPad P15s Gen2-20W6000GGE | |
| Lenovo ThinkPad T15g-20UR000GGE | |
| Lenovo ThinkPad T15p-20TN0006GE | |
| HP ZBook Power 15 G8 313S5EA | |
| PCMark 10 / Productivity | |
| Average of class Workstation (8789 - 20616, n=21, last 2 years) | |
| Lenovo ThinkPad P15s Gen2-20W6000GGE | |
| Dell Precision 5000 5560 | |
| Lenovo ThinkPad P15 G2-20YQ001JGE | |
| Average Intel Core i7-11800H, NVIDIA T1200 Laptop GPU (8276 - 8445, n=3) | |
| Lenovo ThinkPad P15v G2 21A9000XGE | |
| Lenovo ThinkPad T15g-20UR000GGE | |
| HP ZBook Power 15 G8 313S5EA | |
| Lenovo ThinkPad T15p-20TN0006GE | |
| PCMark 10 / Digital Content Creation | |
| Average of class Workstation (7744 - 15631, n=21, last 2 years) | |
| Lenovo ThinkPad P15 G2-20YQ001JGE | |
| Dell Precision 5000 5560 | |
| Lenovo ThinkPad T15g-20UR000GGE | |
| Average Intel Core i7-11800H, NVIDIA T1200 Laptop GPU (6851 - 7581, n=3) | |
| Lenovo ThinkPad P15v G2 21A9000XGE | |
| Lenovo ThinkPad T15p-20TN0006GE | |
| HP ZBook Power 15 G8 313S5EA | |
| Lenovo ThinkPad P15s Gen2-20W6000GGE | |
| CrossMark / Overall | |
| Average of class Workstation (1307 - 2267, n=24, last 2 years) | |
| HP ZBook Power 15 G8 313S5EA | |
| Average Intel Core i7-11800H, NVIDIA T1200 Laptop GPU (1367 - 1526, n=2) | |
| Lenovo ThinkPad P15v G2 21A9000XGE | |
| CrossMark / Productivity | |
| Average of class Workstation (1130 - 2122, n=24, last 2 years) | |
| HP ZBook Power 15 G8 313S5EA | |
| Average Intel Core i7-11800H, NVIDIA T1200 Laptop GPU (1389 - 1521, n=2) | |
| Lenovo ThinkPad P15v G2 21A9000XGE | |
| CrossMark / Creativity | |
| Average of class Workstation (1657 - 2725, n=24, last 2 years) | |
| HP ZBook Power 15 G8 313S5EA | |
| Average Intel Core i7-11800H, NVIDIA T1200 Laptop GPU (1430 - 1606, n=2) | |
| Lenovo ThinkPad P15v G2 21A9000XGE | |
| CrossMark / Responsiveness | |
| Average of class Workstation (993 - 2096, n=24, last 2 years) | |
| Average Intel Core i7-11800H, NVIDIA T1200 Laptop GPU (1137 - 1323, n=2) | |
| HP ZBook Power 15 G8 313S5EA | |
| Lenovo ThinkPad P15v G2 21A9000XGE | |
| PCMark 10 Score | 5889 points | |
Help | ||
| AIDA64 / Memory Copy | |
| Average of class Workstation (56003 - 164795, n=25, last 2 years) | |
| Lenovo ThinkPad P15s Gen2-20W6000GGE | |
| Average Intel Core i7-11800H (24508 - 48144, n=21) | |
| Lenovo ThinkPad T15g-20UR000GGE | |
| HP ZBook Power 15 G8 313S5EA | |
| Lenovo ThinkPad P15v G2 21A9000XGE | |
| Lenovo ThinkPad T15p-20TN0006GE | |
| AIDA64 / Memory Read | |
| Average of class Workstation (55795 - 121563, n=25, last 2 years) | |
| Lenovo ThinkPad P15s Gen2-20W6000GGE | |
| Average Intel Core i7-11800H (25882 - 50365, n=20) | |
| Lenovo ThinkPad T15g-20UR000GGE | |
| HP ZBook Power 15 G8 313S5EA | |
| Lenovo ThinkPad P15v G2 21A9000XGE | |
| Lenovo ThinkPad T15p-20TN0006GE | |
| AIDA64 / Memory Write | |
| Average of class Workstation (55663 - 214520, n=25, last 2 years) | |
| Lenovo ThinkPad P15s Gen2-20W6000GGE | |
| Lenovo ThinkPad T15g-20UR000GGE | |
| Average Intel Core i7-11800H (22240 - 46214, n=20) | |
| HP ZBook Power 15 G8 313S5EA | |
| Lenovo ThinkPad P15v G2 21A9000XGE | |
| Lenovo ThinkPad T15p-20TN0006GE | |
| AIDA64 / Memory Latency | |
| Average of class Workstation (84.5 - 165.2, n=25, last 2 years) | |
| Lenovo ThinkPad P15v G2 21A9000XGE | |
| Lenovo ThinkPad P15s Gen2-20W6000GGE | |
| Lenovo ThinkPad T15p-20TN0006GE | |
| HP ZBook Power 15 G8 313S5EA | |
| Lenovo ThinkPad T15g-20UR000GGE | |
| Average Intel Core i7-11800H (71.9 - 104.1, n=44) | |
* ... smaller is better
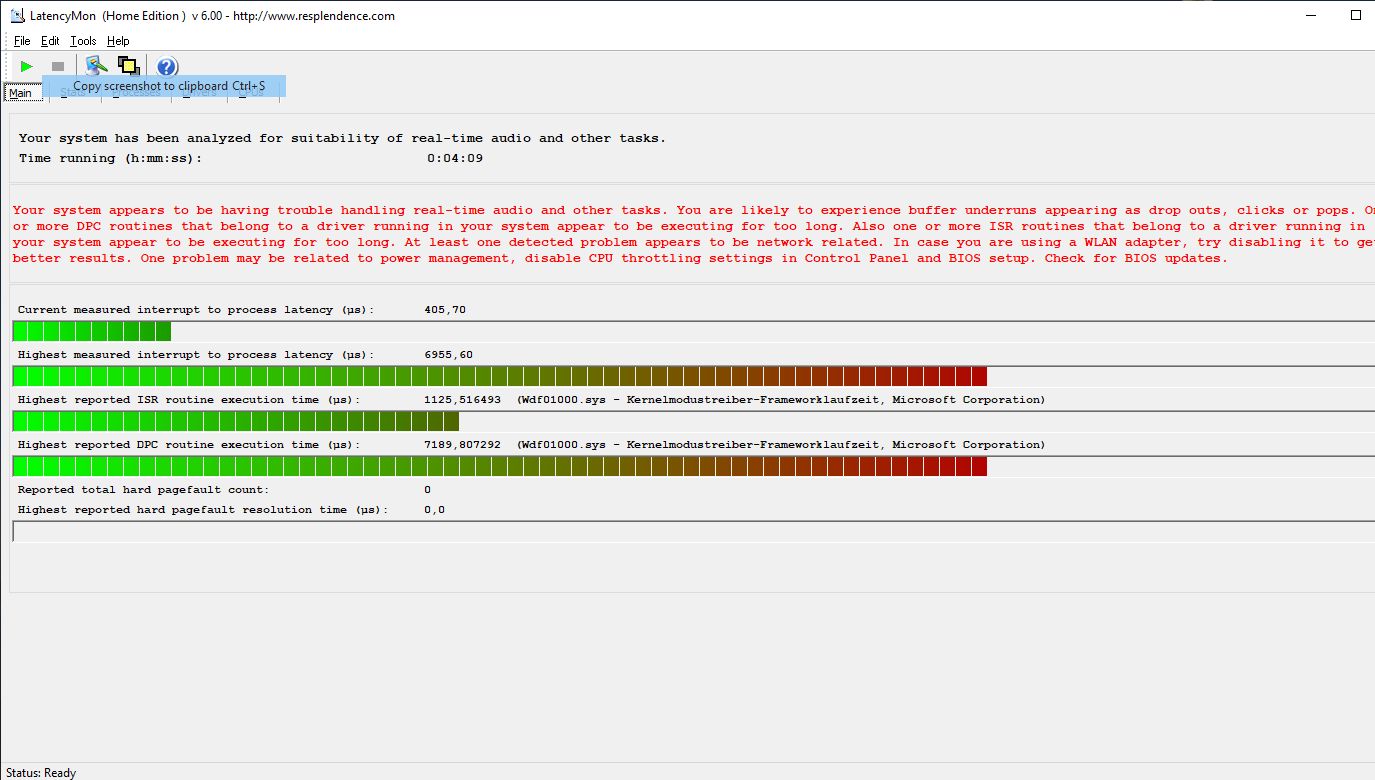
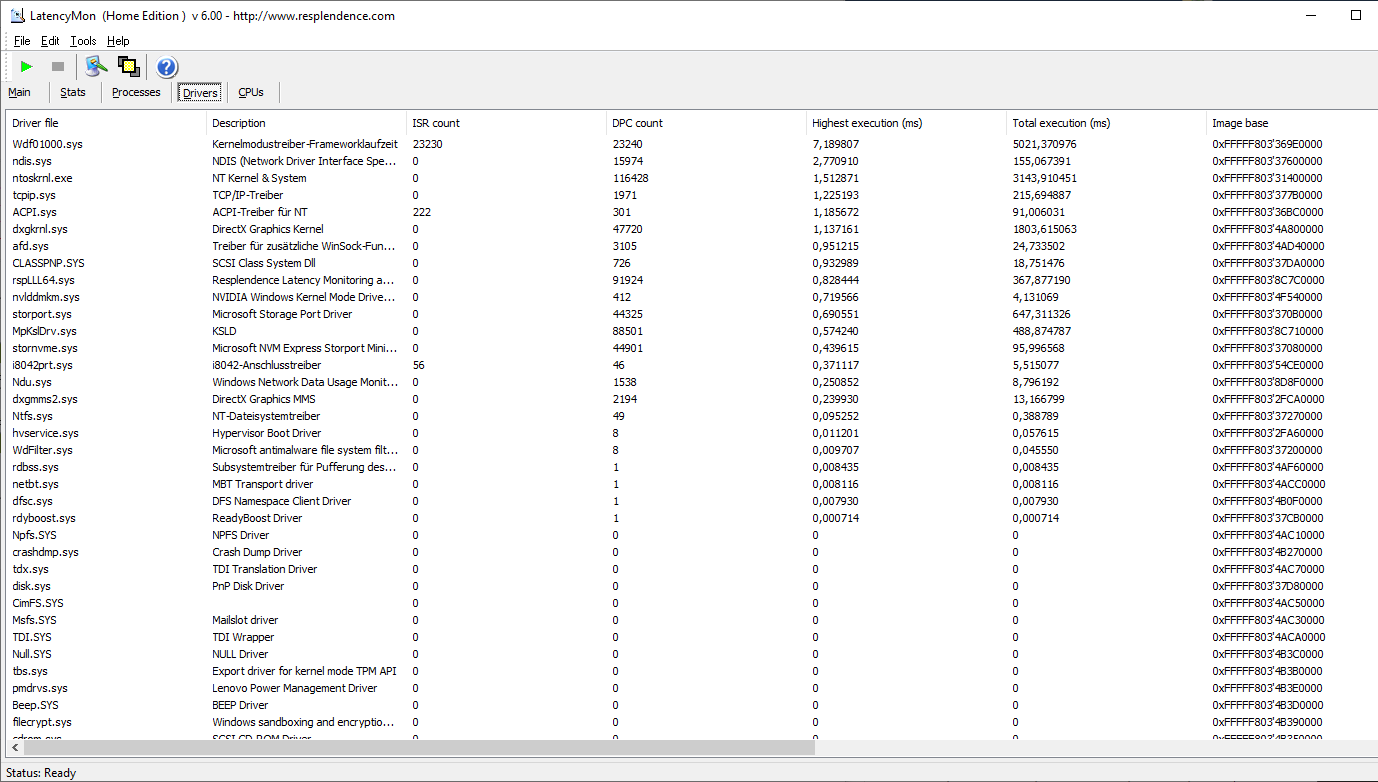
DPC延迟
像更厚的 ThinkPad P15 G2,在测试时,DPC延迟被证明在最新的驱动和BIOS下是很糟糕的。正如经常发生的那样,内核模块和网络驱动程序是负责任的。因此,P15v G2不适合进行实时视频和音频处理。 戴尔的Precision 5560在这方面表现得好得多。
| DPC Latencies / LatencyMon - interrupt to process latency (max), Web, Youtube, Prime95 | |
| Lenovo ThinkPad P15v G2 21A9000XGE | |
| Lenovo ThinkPad P15 G2-20YQ001JGE | |
| Lenovo ThinkPad P15s Gen2-20W6000GGE | |
| Lenovo ThinkPad T15g-20UR000GGE | |
| Lenovo ThinkPad T15p-20TN0006GE | |
| Dell Precision 5000 5560 | |
| HP ZBook Power 15 G8 313S5EA | |
* ... smaller is better
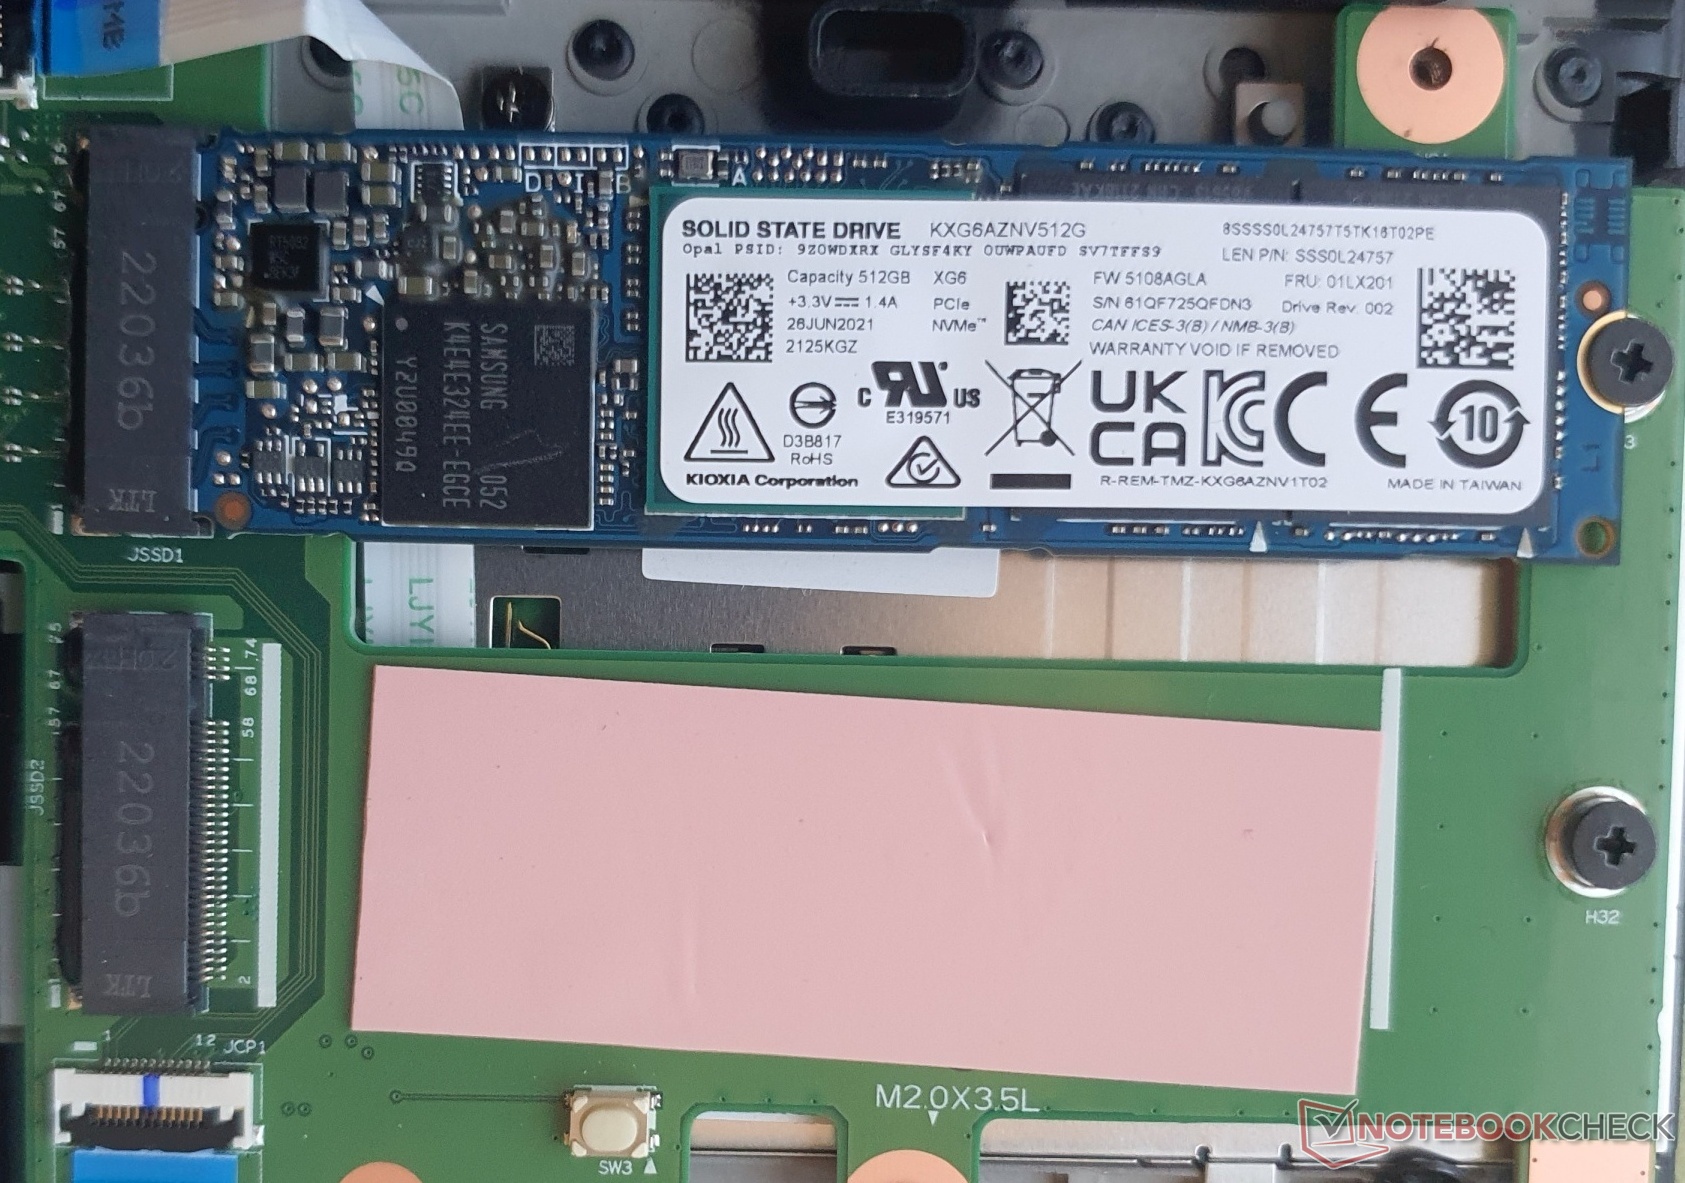
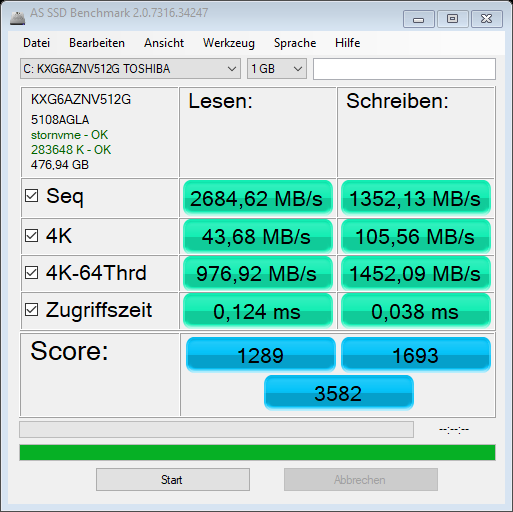
存储设备
东芝的NVMe SSD的容量为512GB。其速度符合PCIe 3.0的预期,但对于工作站来说不一定足够。
另一方面,你可以升级到两个更快的PCIe 4.0固态硬盘,还可以在RAID(0.1)配置中操作它们。惠普的ZBook Power 15 G8。 戴尔的Precision 5560和ThinkPad P15实现了大约两倍的速度。
| Lenovo ThinkPad P15v G2 21A9000XGE T1200 Laptop GPU, i7-11800H, Toshiba XG6 KXG6AZNV512G | Lenovo ThinkPad P15 G2-20YQ001JGE RTX A3000 Laptop GPU, i7-11800H, Kioxia XG7 KXG7AZNV512G | Lenovo ThinkPad T15g-20UR000GGE GeForce RTX 2070 Super Max-Q, i7-10750H, SK Hynix PC401 512GB M.2 (HFS512GD9TNG) | Lenovo ThinkPad T15p-20TN0006GE GeForce GTX 1050 Mobile, i7-10750H, WDC PC SN730 SDBQNTY-512GB | Lenovo ThinkPad P15s Gen2-20W6000GGE T500 Laptop GPU, i7-1165G7, WDC PC SN720 SDAQNTW-1T00 | Dell Precision 5000 5560 RTX A2000 Laptop GPU, i7-11850H, Samsung PM9A1 MZVL22T0HBLB | |
|---|---|---|---|---|---|---|
| AS SSD | 53% | 49% | 16% | 32% | 57% | |
| Seq Read (MB/s) | 2684 | 5105 90% | 2889 8% | 2505 -7% | 2796 4% | 5169 93% |
| Seq Write (MB/s) | 1352 | 1815 34% | 2424 79% | 1230 -9% | 2525 87% | 1986 47% |
| 4K Read (MB/s) | 43.68 | 47.46 9% | 55.6 27% | 42.4 -3% | 50.9 17% | 78 79% |
| 4K Write (MB/s) | 105.56 | 137.3 30% | 144.6 37% | 116.5 10% | 211.9 101% | 214.6 103% |
| 4K-64 Read (MB/s) | 976.92 | 2112 116% | 1569 61% | 1416 45% | 1505 54% | 1232 26% |
| 4K-64 Write (MB/s) | 1452.09 | 1702 17% | 1922 32% | 1809 25% | 949 -35% | 2719 87% |
| Access Time Read * (ms) | 0.124 | 0.065 48% | 0.07 44% | 0.109 12% | 0.081 35% | 0.024 81% |
| Access Time Write * (ms) | 0.038 | 0.03 21% | 0.026 32% | 0.032 16% | 0.019 50% | 0.059 -55% |
| Score Read (Points) | 1289 | 2670 107% | 1914 48% | 1708 33% | 1835 42% | 1827 42% |
| Score Write (Points) | 1693 | 2021 19% | 2309 36% | 2048 21% | 1413 -17% | 3133 85% |
| Score Total (Points) | 3582 | 5885 64% | 5185 45% | 4568 28% | 4177 17% | 5753 61% |
| Copy ISO MB/s (MB/s) | 1760.5 | 2054 17% | 2489 41% | 3201 82% | ||
| Copy Program MB/s (MB/s) | 355 | 714 101% | 728 105% | 415.8 17% | ||
| Copy Game MB/s (MB/s) | 849 | 1431 69% | 1670 97% | 1212 43% |
* ... smaller is better

| Drive Performance rating - Percent | |
| Average of class Workstation | |
| HP ZBook Power 15 G8 313S5EA | |
| Dell Precision 5000 5560 | |
| Lenovo ThinkPad P15 G2-20YQ001JGE | |
| Lenovo ThinkPad P15s Gen2-20W6000GGE | |
| Lenovo ThinkPad T15g-20UR000GGE | |
| Lenovo ThinkPad T15p-20TN0006GE | |
| Average Toshiba XG6 KXG6AZNV512G | |
| Lenovo ThinkPad P15v G2 21A9000XGE | |
* ... smaller is better
Sustained Read Performance: DiskSpd Read Loop, Queue Depth 8
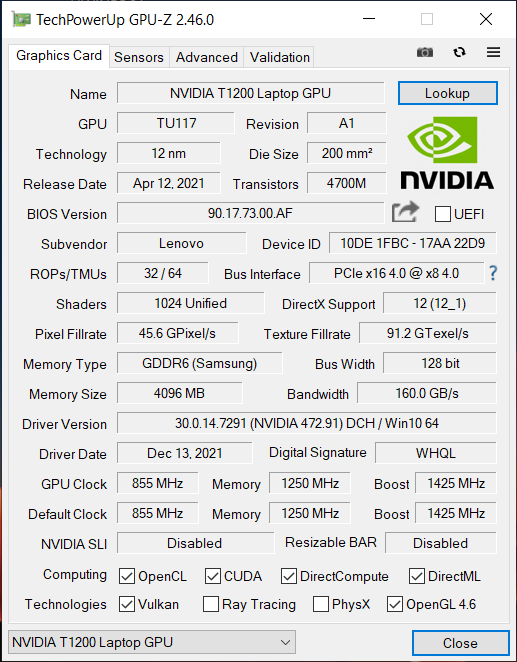
图形卡
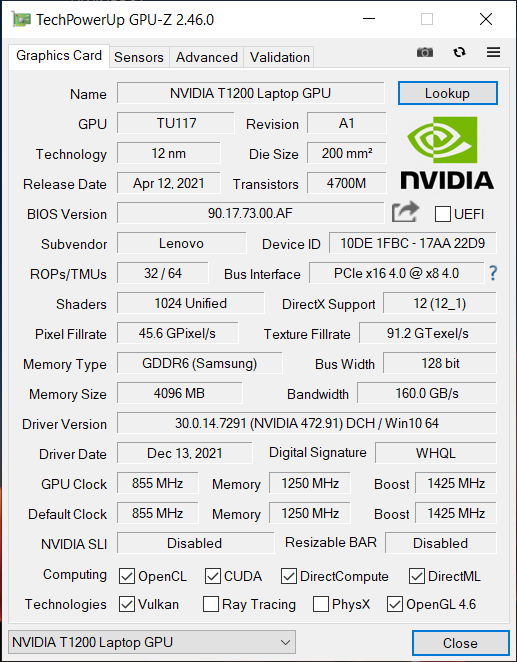
该 Nvidia T1200是GeForce 的专业变体 GTX 1650 Ti它有4GB GDDR6 VRAM,并被提升到1,425 MHz。它的速度是GTX 1050的两倍多。 GeForce GTX 1050的前辈和它的 姐妹型号在许多基准测试中。更大的差异来自于可选的 RTX A2000.
在电池模式下,40瓦的TGP减少到30瓦,时钟速度下降了250兆赫。性能因此而下降了15%。在这种情况下,CPU对待自己的共享TDP多了7瓦。
| 3DMark Performance rating - Percent | |
| Average of class Workstation | |
| Lenovo ThinkPad P15 G2-20YQ001JGE -1! | |
| Lenovo ThinkPad T15g-20UR000GGE -1! | |
| Dell Precision 5000 5560 | |
| Average NVIDIA T1200 Laptop GPU | |
| Lenovo ThinkPad P15v G2 21A9000XGE | |
| HP ZBook Power 15 G8 313S5EA | |
| Lenovo ThinkPad T15p-20TN0006GE -1! | |
| Lenovo ThinkPad P15s Gen2-20W6000GGE -1! | |
| 3DMark 11 - 1280x720 Performance GPU | |
| Average of class Workstation (10888 - 69594, n=25, last 2 years) | |
| Lenovo ThinkPad P15 G2-20YQ001JGE | |
| Lenovo ThinkPad T15g-20UR000GGE | |
| Dell Precision 5000 5560 | |
| Average NVIDIA T1200 Laptop GPU (12142 - 14614, n=3) | |
| Lenovo ThinkPad P15v G2 21A9000XGE | |
| HP ZBook Power 15 G8 313S5EA | |
| Lenovo ThinkPad T15p-20TN0006GE | |
| Lenovo ThinkPad P15s Gen2-20W6000GGE | |
| 3DMark | |
| 1280x720 Cloud Gate Standard Graphics | |
| Average of class Workstation (46927 - 152418, n=15, last 2 years) | |
| Lenovo ThinkPad P15v G2 21A9000XGE | |
| HP ZBook Power 15 G8 313S5EA | |
| Average NVIDIA T1200 Laptop GPU (46125 - 55529, n=2) | |
| Dell Precision 5000 5560 | |
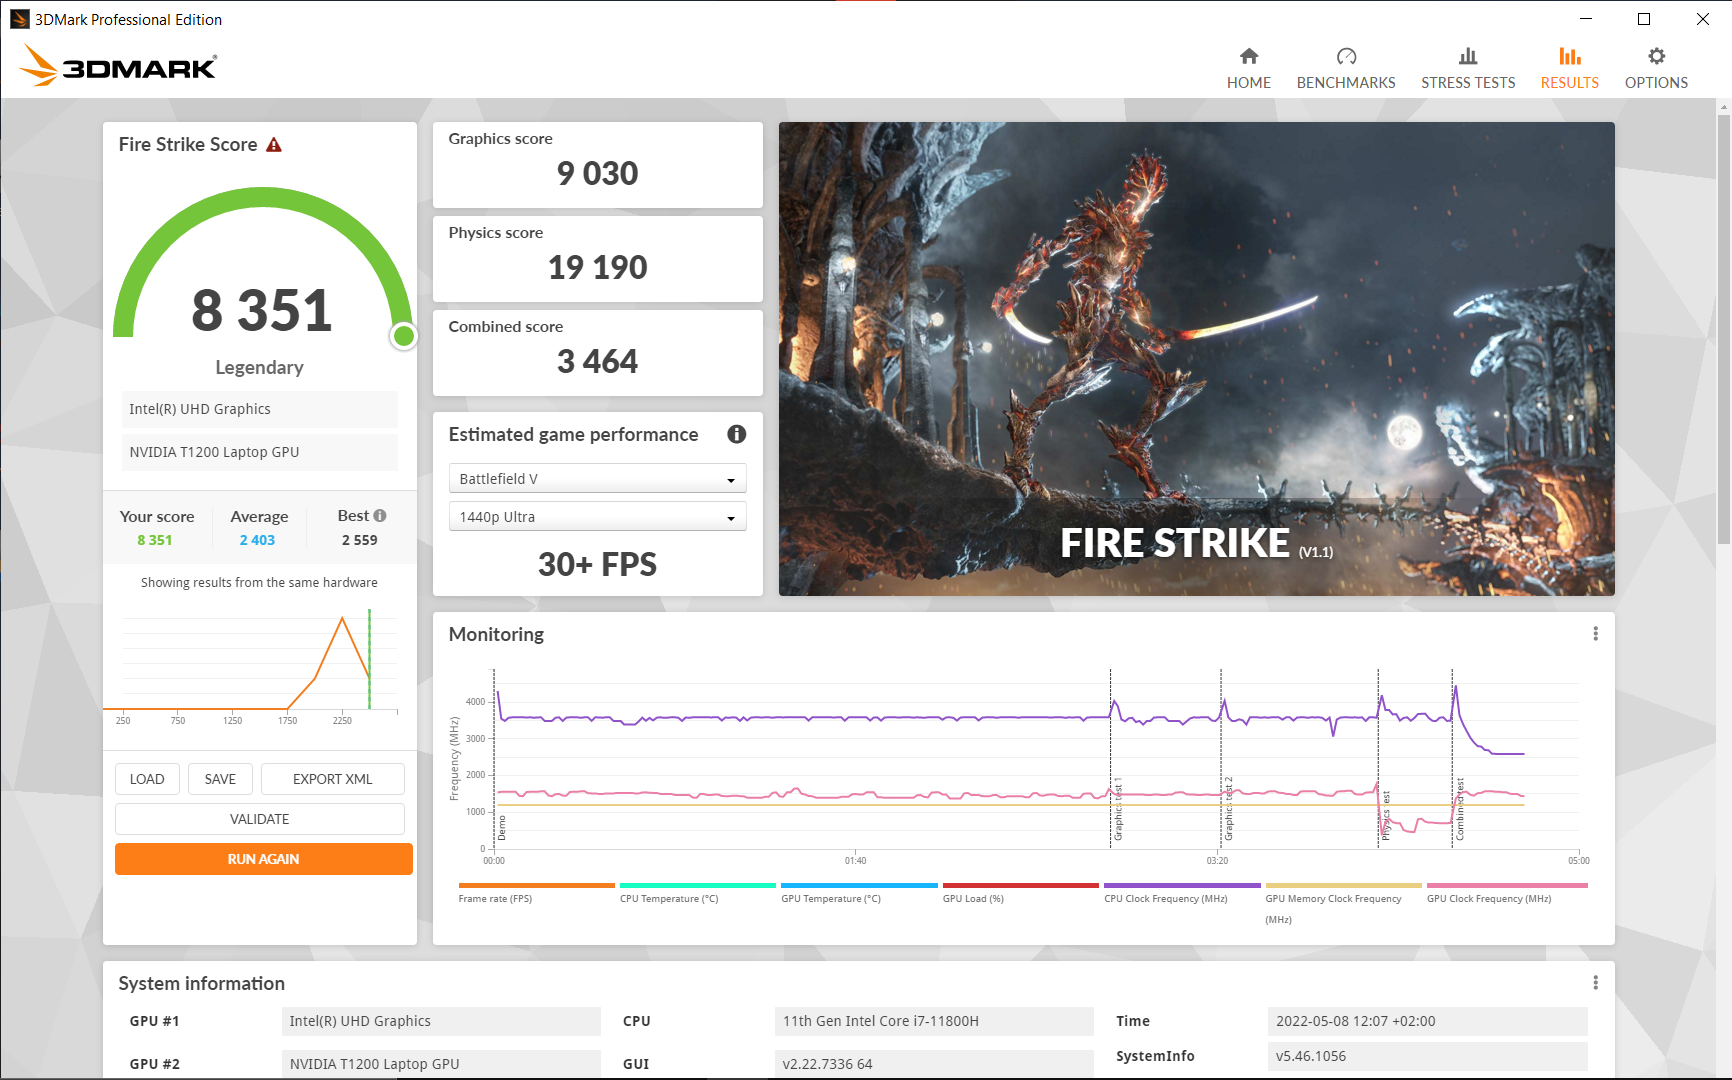
| 1920x1080 Fire Strike Graphics | |
| Average of class Workstation (7578 - 52560, n=25, last 2 years) | |
| Lenovo ThinkPad P15 G2-20YQ001JGE | |
| Lenovo ThinkPad T15g-20UR000GGE | |
| Dell Precision 5000 5560 | |
| Average NVIDIA T1200 Laptop GPU (9030 - 10266, n=3) | |
| Lenovo ThinkPad P15v G2 21A9000XGE | |
| HP ZBook Power 15 G8 313S5EA | |
| Lenovo ThinkPad T15p-20TN0006GE | |
| Lenovo ThinkPad P15s Gen2-20W6000GGE | |
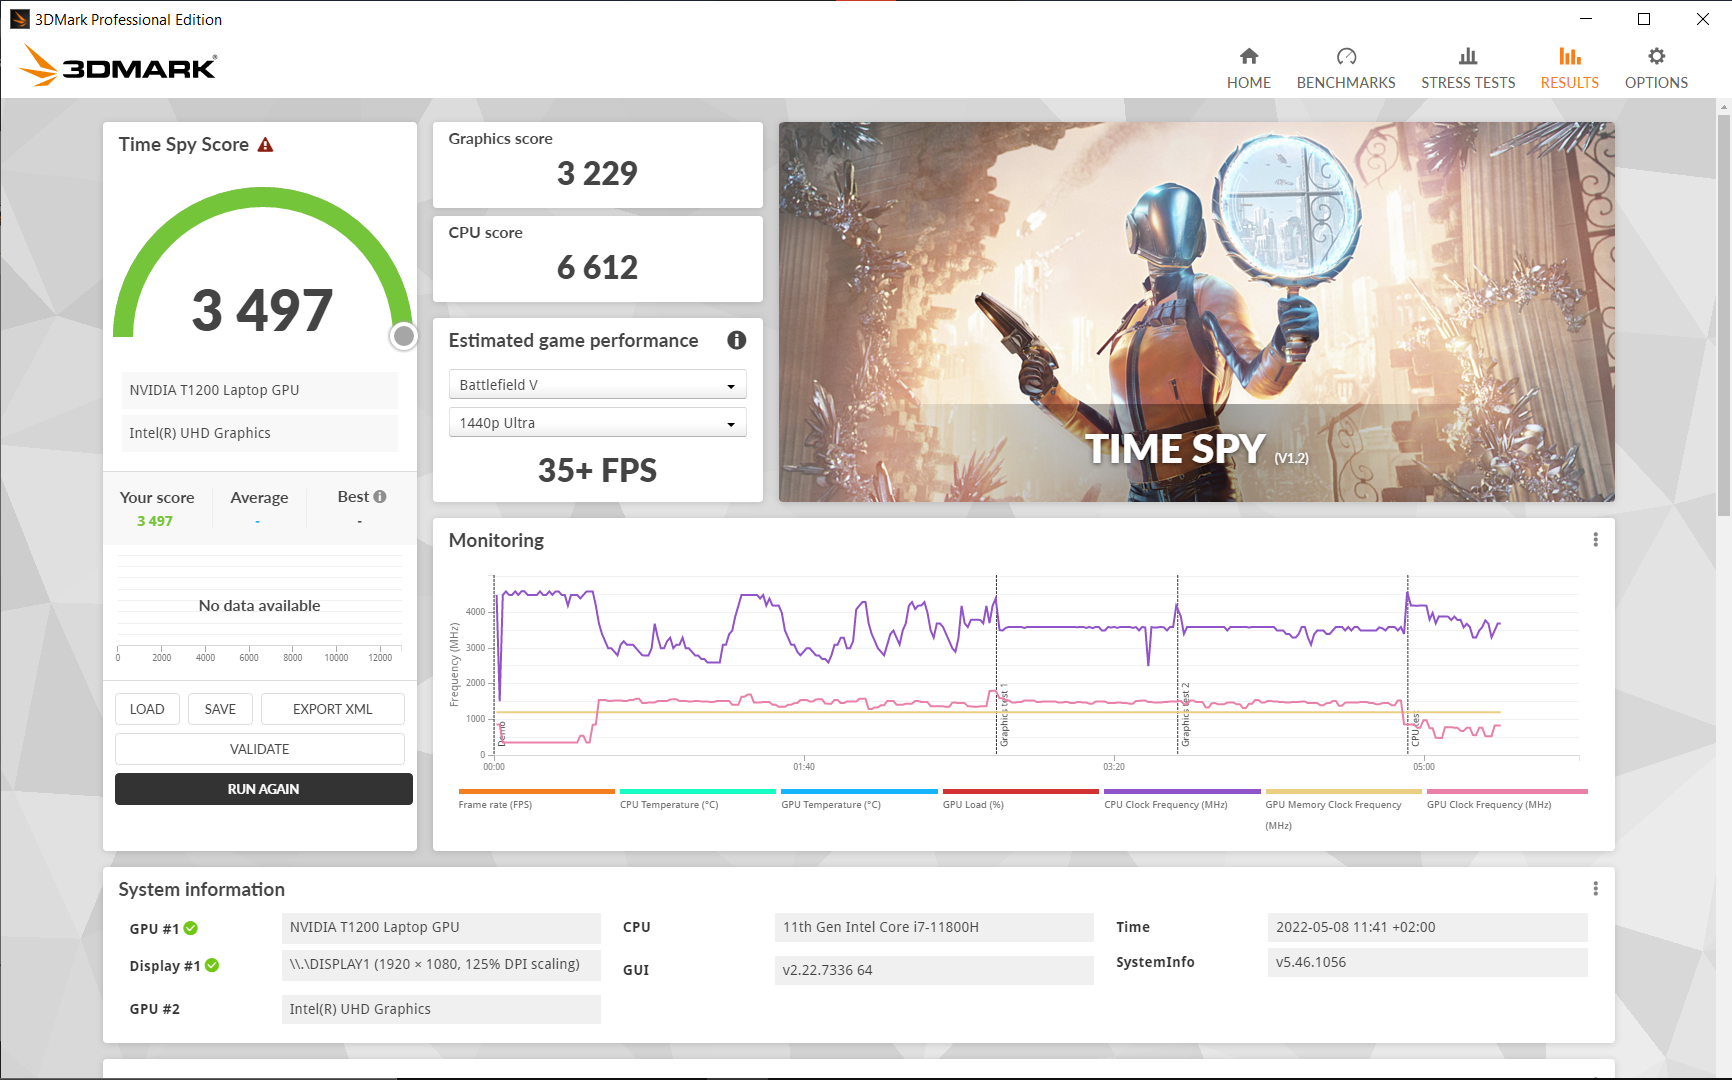
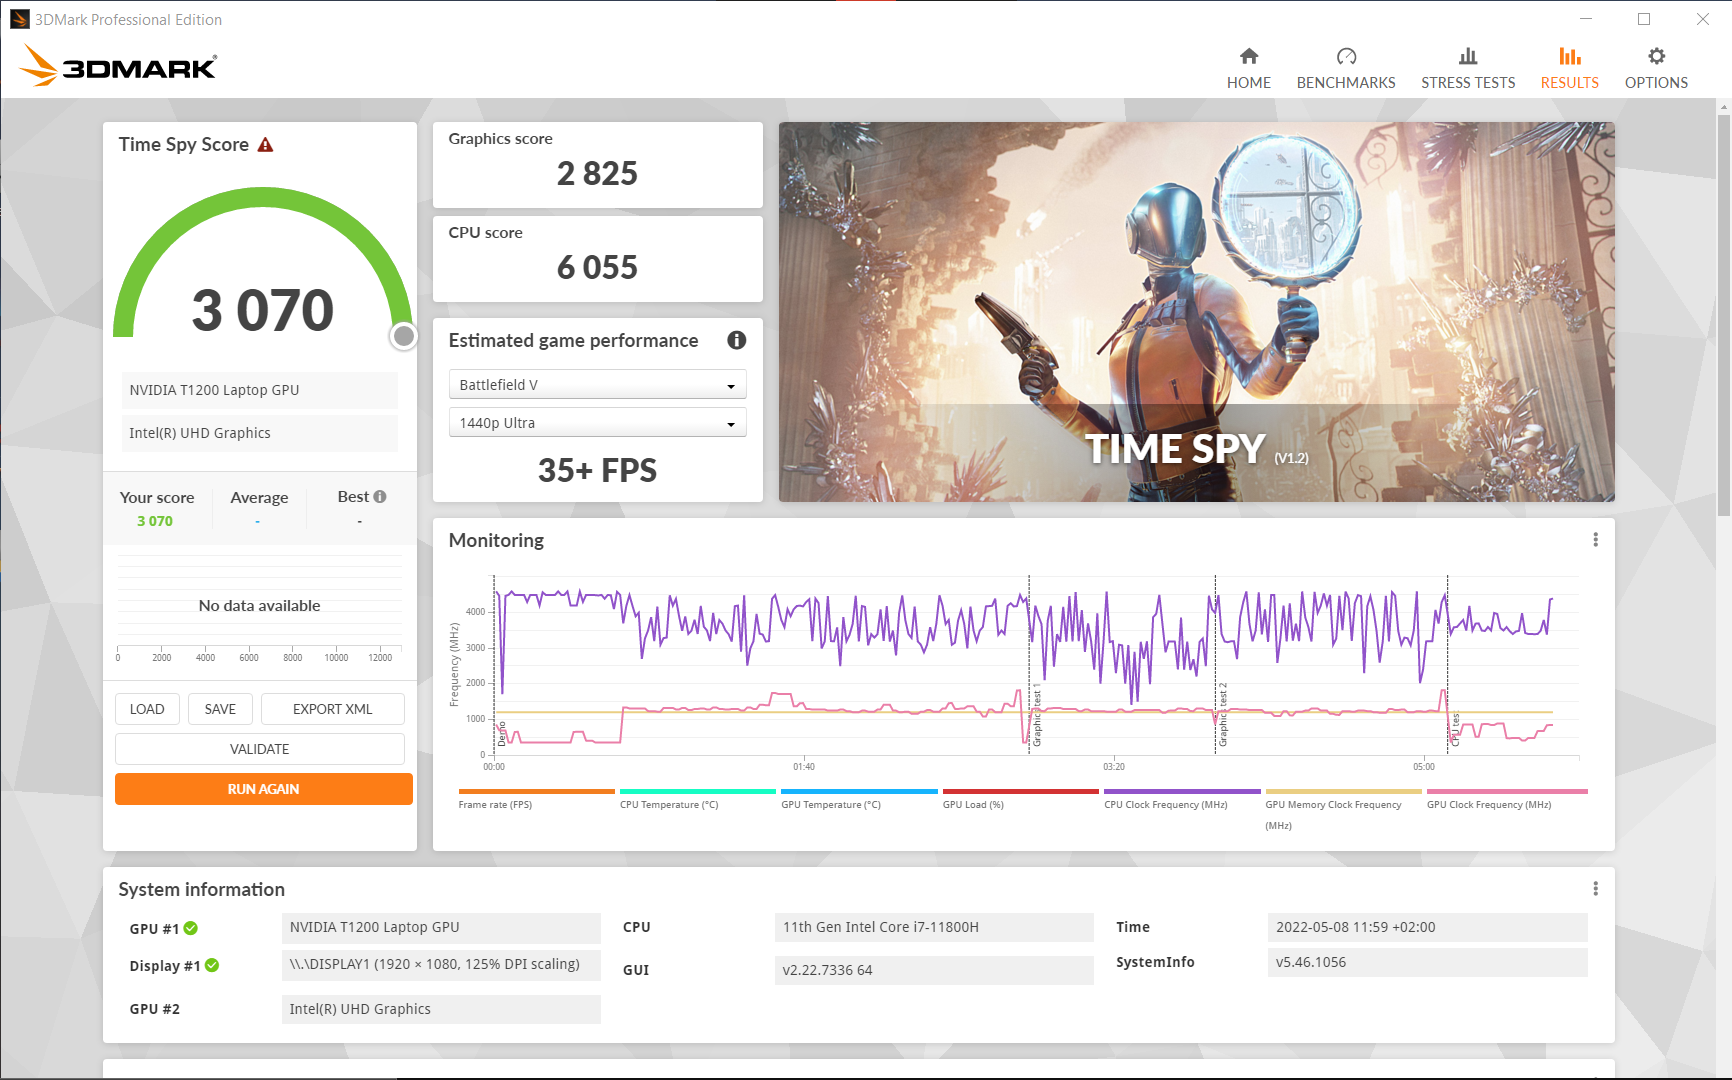
| 2560x1440 Time Spy Graphics | |
| Average of class Workstation (2725 - 24806, n=25, last 2 years) | |
| Lenovo ThinkPad P15 G2-20YQ001JGE | |
| Lenovo ThinkPad T15g-20UR000GGE | |
| Dell Precision 5000 5560 | |
| Average NVIDIA T1200 Laptop GPU (3229 - 3651, n=3) | |
| Lenovo ThinkPad P15v G2 21A9000XGE | |
| HP ZBook Power 15 G8 313S5EA | |
| Lenovo ThinkPad T15p-20TN0006GE | |
| Lenovo ThinkPad P15s Gen2-20W6000GGE | |
| 3DMark 06 Standard Score | 38139 points | |
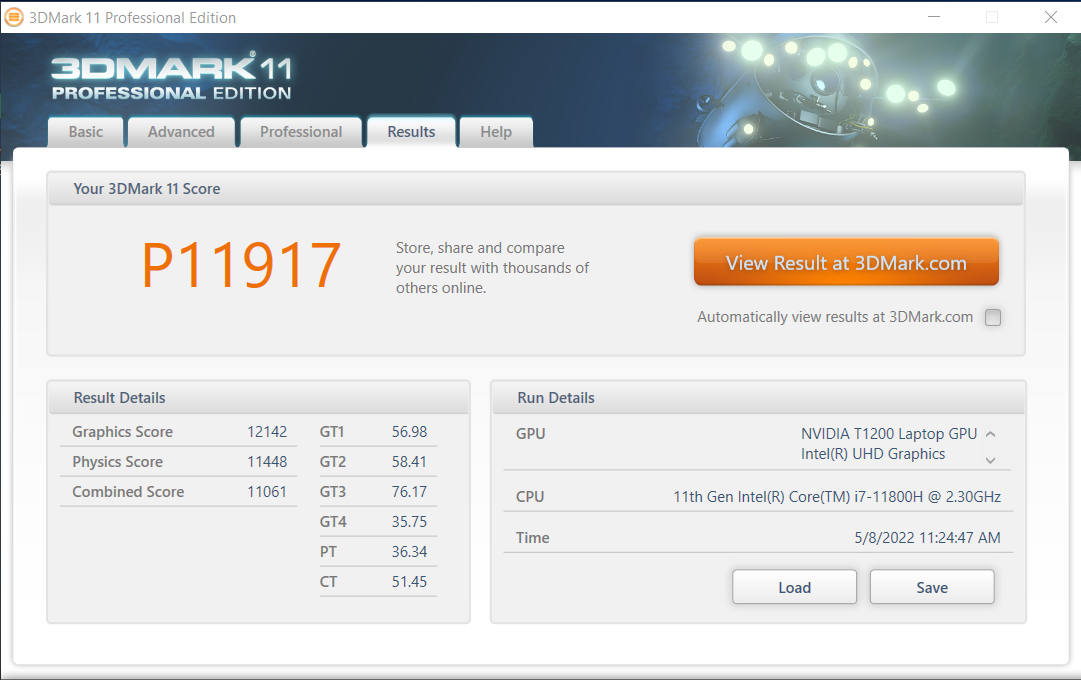
| 3DMark 11 Performance | 11917 points | |
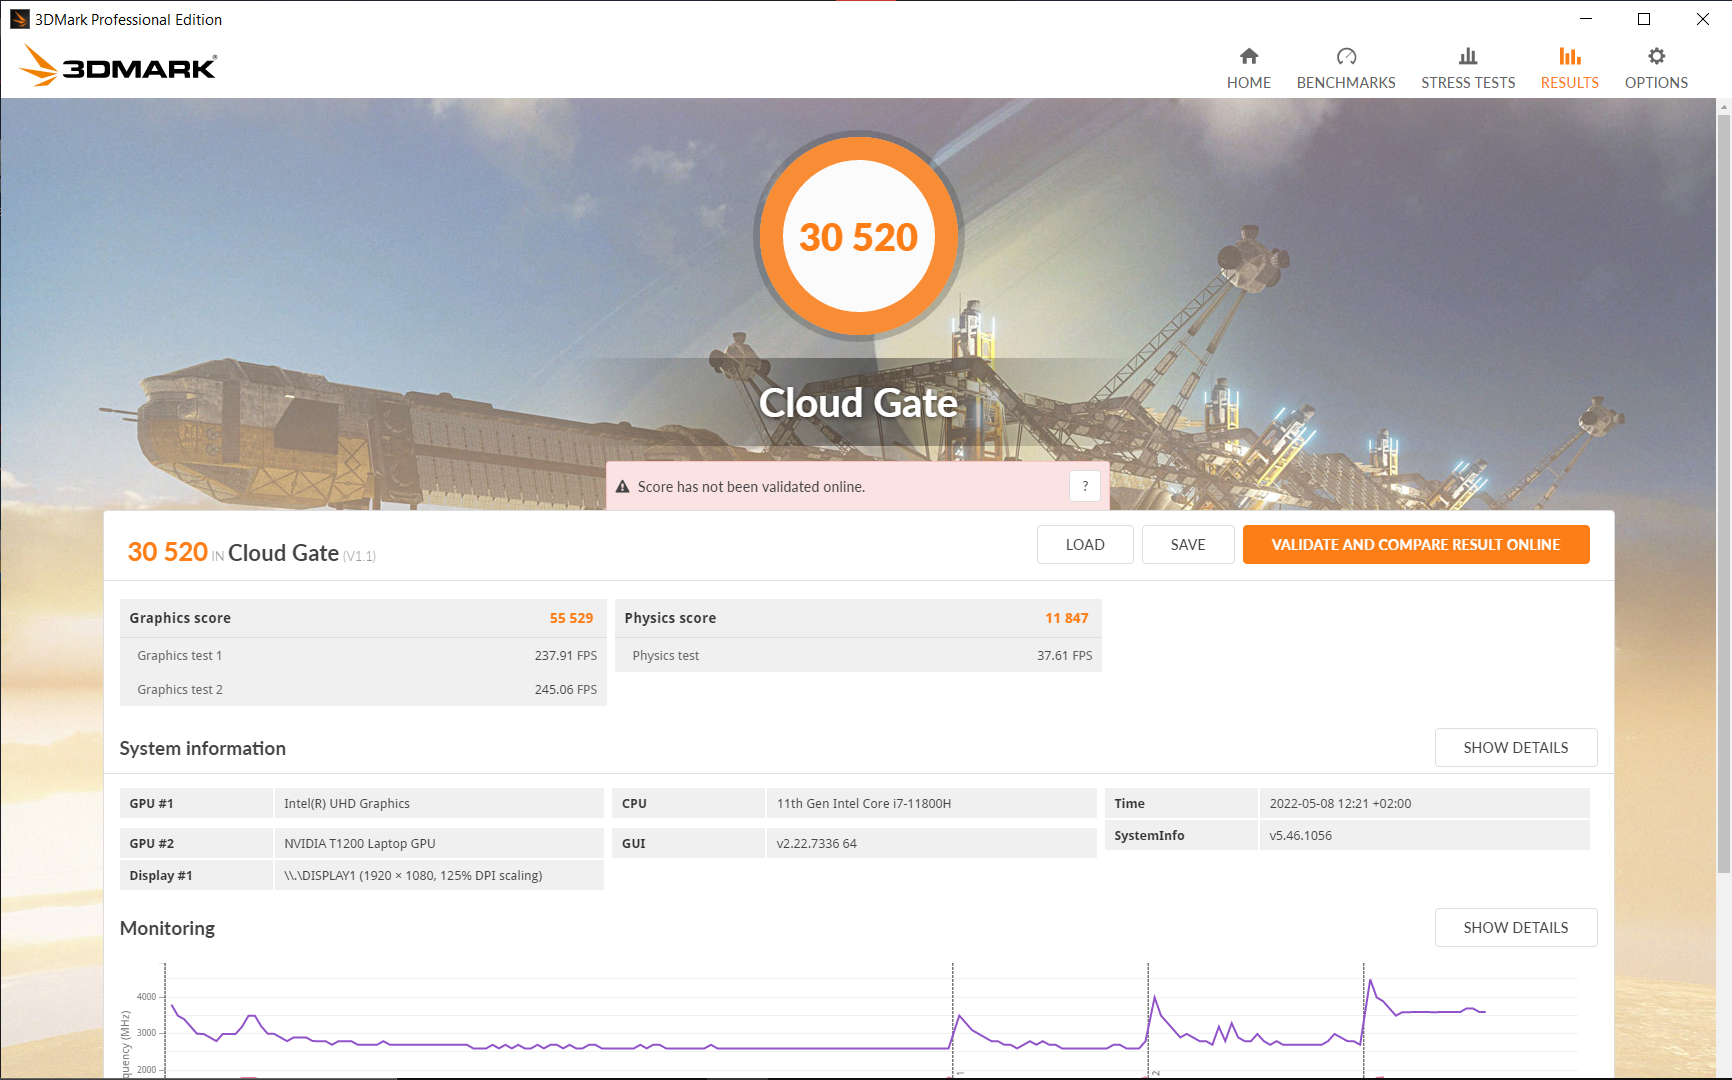
| 3DMark Cloud Gate Standard Score | 30520 points | |
| 3DMark Fire Strike Score | 8351 points | |
| 3DMark Time Spy Score | 3497 points | |
Help | ||
游戏性能
ǞǞǞ 锐迪亚T1200可以在高细节下运行旧游戏,没有任何问题。新游戏可以在中等细节下运行。在一小时的Witcher 3 测试中,没有发现性能下降的情况。
| The Witcher 3 | |
| 1920x1080 High Graphics & Postprocessing (Nvidia HairWorks Off) | |
| Lenovo ThinkPad P15 G2-20YQ001JGE | |
| Lenovo ThinkPad T15g-20UR000GGE | |
| Average of class Workstation (53.4 - 156.4, n=3, last 2 years) | |
| Dell Precision 5000 5560 | |
| Average NVIDIA T1200 Laptop GPU (59 - 72, n=3) | |
| Lenovo ThinkPad P15v G2 21A9000XGE | |
| HP ZBook Power 15 G8 313S5EA | |
| Lenovo ThinkPad T15p-20TN0006GE | |
| Lenovo ThinkPad P15s Gen2-20W6000GGE | |
| 1920x1080 Ultra Graphics & Postprocessing (HBAO+) | |
| Lenovo ThinkPad P15 G2-20YQ001JGE | |
| Lenovo ThinkPad T15g-20UR000GGE | |
| Average of class Workstation (26.3 - 91.7, n=3, last 2 years) | |
| Dell Precision 5000 5560 | |
| Average NVIDIA T1200 Laptop GPU (33.2 - 38, n=3) | |
| Lenovo ThinkPad P15v G2 21A9000XGE | |
| HP ZBook Power 15 G8 313S5EA | |
| Lenovo ThinkPad T15p-20TN0006GE | |
| Lenovo ThinkPad P15s Gen2-20W6000GGE | |
| Shadow of the Tomb Raider | |
| 1280x720 Lowest Preset | |
| Dell Precision 5000 5560 | |
| HP ZBook Power 15 G8 313S5EA | |
| Lenovo ThinkPad P15v G2 21A9000XGE | |
| Average NVIDIA T1200 Laptop GPU (n=1) | |
| Lenovo ThinkPad T15p-20TN0006GE | |
| 1920x1080 Medium Preset | |
| Dell Precision 5000 5560 | |
| Lenovo ThinkPad P15v G2 21A9000XGE | |
| Average NVIDIA T1200 Laptop GPU (n=1) | |
| HP ZBook Power 15 G8 313S5EA | |
| Lenovo ThinkPad T15p-20TN0006GE | |
| 1920x1080 High Preset AA:SM | |
| Dell Precision 5000 5560 | |
| Lenovo ThinkPad P15v G2 21A9000XGE | |
| Average NVIDIA T1200 Laptop GPU (n=1) | |
| HP ZBook Power 15 G8 313S5EA | |
| Lenovo ThinkPad T15p-20TN0006GE | |
| 1920x1080 Highest Preset AA:T | |
| Dell Precision 5000 5560 | |
| Lenovo ThinkPad P15v G2 21A9000XGE | |
| Average NVIDIA T1200 Laptop GPU (n=1) | |
| HP ZBook Power 15 G8 313S5EA | |
| Lenovo ThinkPad T15p-20TN0006GE | |
| Final Fantasy XV Benchmark | |
| 1280x720 Lite Quality | |
| Average of class Workstation (77.6 - 233, n=24, last 2 years) | |
| Lenovo ThinkPad P15 G2-20YQ001JGE | |
| Average NVIDIA T1200 Laptop GPU (88 - 103, n=3) | |
| Lenovo ThinkPad P15v G2 21A9000XGE | |
| Dell Precision 5000 5560 | |
| HP ZBook Power 15 G8 313S5EA | |
| Lenovo ThinkPad P15s Gen2-20W6000GGE | |
| 1920x1080 Standard Quality | |
| Average of class Workstation (38.2 - 232, n=25, last 2 years) | |
| Lenovo ThinkPad P15 G2-20YQ001JGE | |
| Dell Precision 5000 5560 | |
| Average NVIDIA T1200 Laptop GPU (49.5 - 56.5, n=3) | |
| Lenovo ThinkPad P15v G2 21A9000XGE | |
| HP ZBook Power 15 G8 313S5EA | |
| Lenovo ThinkPad P15s Gen2-20W6000GGE | |
| 1920x1080 High Quality | |
| Average of class Workstation (26.4 - 197.6, n=25, last 2 years) | |
| Lenovo ThinkPad P15 G2-20YQ001JGE | |
| Dell Precision 5000 5560 | |
| Average NVIDIA T1200 Laptop GPU (35 - 39, n=3) | |
| Lenovo ThinkPad P15v G2 21A9000XGE | |
| HP ZBook Power 15 G8 313S5EA | |
| Lenovo ThinkPad P15s Gen2-20W6000GGE | |
Witcher 3 FPS Chart
| low | med. | high | ultra | |
|---|---|---|---|---|
| BioShock Infinite (2013) | 352.2 | 235.8 | 207.9 | 88.1 |
| GTA V (2015) | 169.9 | 158.5 | 89.7 | 48.5 |
| The Witcher 3 (2015) | 59 | 33.2 | ||
| Dota 2 Reborn (2015) | 133.3 | 116.5 | 107.8 | 100.4 |
| Final Fantasy XV Benchmark (2018) | 88 | 49.5 | 35 | |
| X-Plane 11.11 (2018) | 96.2 | 77.5 | 64.8 | |
| Far Cry 5 (2018) | 107 | 60 | 53 | 51 |
| Strange Brigade (2018) | 208 | 84 | 68.5 | 59.3 |
| Shadow of the Tomb Raider (2018) | 96 | 59 | 48 | 39 |
| Mafia Definitive Edition (2020) | 84 | 43.4 | 39.2 | |
| Resident Evil Village (2021) | 114.3 | 64.3 | 57.9 | 49.8 |
| Riders Republic (2021) | 93 | 50 | 41 | 40 |
| Farming Simulator 22 (2021) | 171.9 | 96.6 | 70.1 | 61.2 |
| Dying Light 2 (2022) | 36.1 | 25.7 | 21.2 | |
| GRID Legends (2022) | 103 | 73 | 61.7 | 45.7 |
| Elden Ring (2022) | 52.9 | 47 | 39.5 | 36.8 |
| Elex 2 (2022) | 43.1 | 39.3 | 34.2 | 29.6 |
| Ghostwire Tokyo (2022) | 50.7 | 47.3 | 44.6 | 41.2 |
| Vampire Bloodhunt (2022) | 121.8 | 72.9 | 69.9 | 69.5 |
排放。安静的联想笔记本电脑,有热点
噪声
风扇在空转时和冲浪时都保持安静。只有在负载情况下,ThinkPad才会有明显的声音,为39分贝。我们在绝对压力测试中测得43.5分贝。在密集的网上冲浪时,风扇也变得很明显,但它并不响亮。没有检测到线圈的啸叫。
在我们的比较领域中的所有设备一般都比较响亮,例如惠普ZBook Power 15,它在负载情况下的噪音高出10%左右。
Noise level
| Idle |
| 25.21 / 25.21 / 25.21 dB(A) |
| Load |
| 39.09 / 43.53 dB(A) |
 | ||
30 dB silent 40 dB(A) audible 50 dB(A) loud |
||
min: | ||
| Lenovo ThinkPad P15v G2 21A9000XGE T1200 Laptop GPU, i7-11800H, Toshiba XG6 KXG6AZNV512G | Lenovo ThinkPad P15 G2-20YQ001JGE RTX A3000 Laptop GPU, i7-11800H, Kioxia XG7 KXG7AZNV512G | Lenovo ThinkPad T15g-20UR000GGE GeForce RTX 2070 Super Max-Q, i7-10750H, SK Hynix PC401 512GB M.2 (HFS512GD9TNG) | Lenovo ThinkPad T15p-20TN0006GE GeForce GTX 1050 Mobile, i7-10750H, WDC PC SN730 SDBQNTY-512GB | Lenovo ThinkPad P15s Gen2-20W6000GGE T500 Laptop GPU, i7-1165G7, WDC PC SN720 SDAQNTW-1T00 | HP ZBook Power 15 G8 313S5EA T600 Laptop GPU, i7-11800H, Samsung PM9A1 MZVL2512HCJQ | Dell Precision 5000 5560 RTX A2000 Laptop GPU, i7-11850H, Samsung PM9A1 MZVL22T0HBLB | |
|---|---|---|---|---|---|---|---|
| Noise | -8% | -1% | -13% | 5% | -10% | 8% | |
| off / environment * (dB) | 25.21 | 24.3 4% | 24 5% | 29.3 -16% | 24.3 4% | 25.54 -1% | 23.4 7% |
| Idle Minimum * (dB) | 25.21 | 24.3 4% | 24 5% | 29.3 -16% | 25.5 -1% | 25.54 -1% | 23.6 6% |
| Idle Average * (dB) | 25.21 | 24.3 4% | 24 5% | 29.3 -16% | 25.5 -1% | 25.54 -1% | 23.6 6% |
| Idle Maximum * (dB) | 25.21 | 28.6 -13% | 24 5% | 30.6 -21% | 25.5 -1% | 25.54 -1% | 23.6 6% |
| Load Average * (dB) | 39.09 | 47.5 -22% | 36.1 8% | 42.7 -9% | 35.65 9% | 48.85 -25% | 25.8 34% |
| Witcher 3 ultra * (dB) | 36.6 | 46 -26% | 42.7 -17% | 46.58 -27% | 40.1 -10% | ||
| Load Maximum * (dB) | 43.53 | 54.9 -26% | 46 -6% | 42.7 2% | 35.65 18% | 50.98 -17% | 41.4 5% |
* ... smaller is better
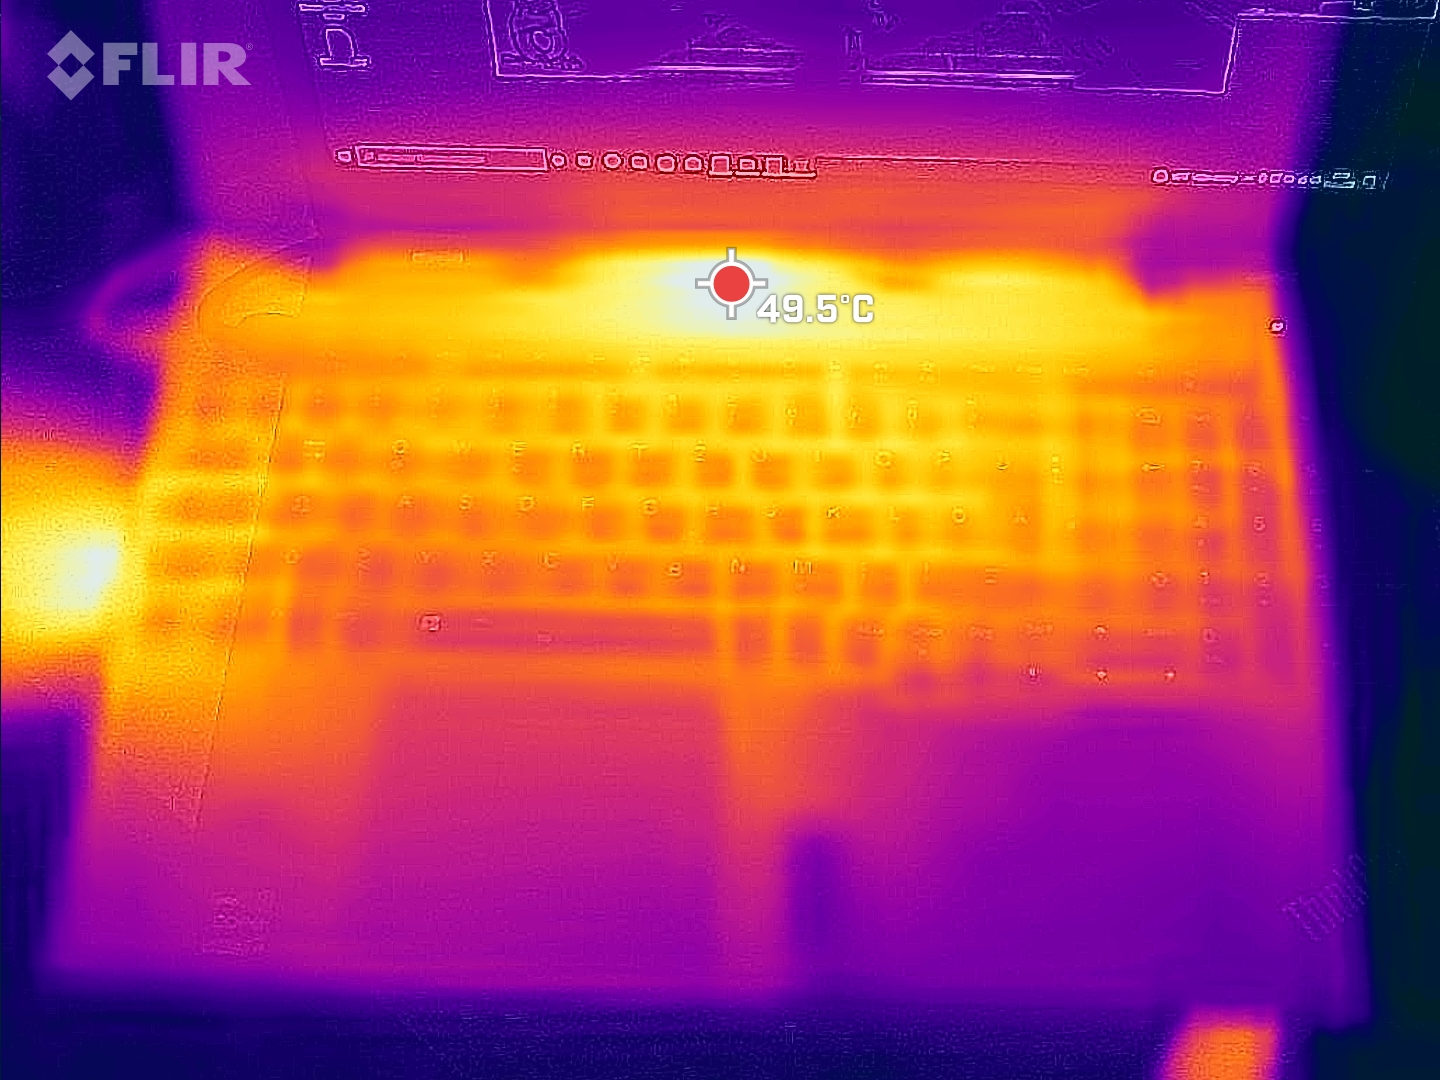
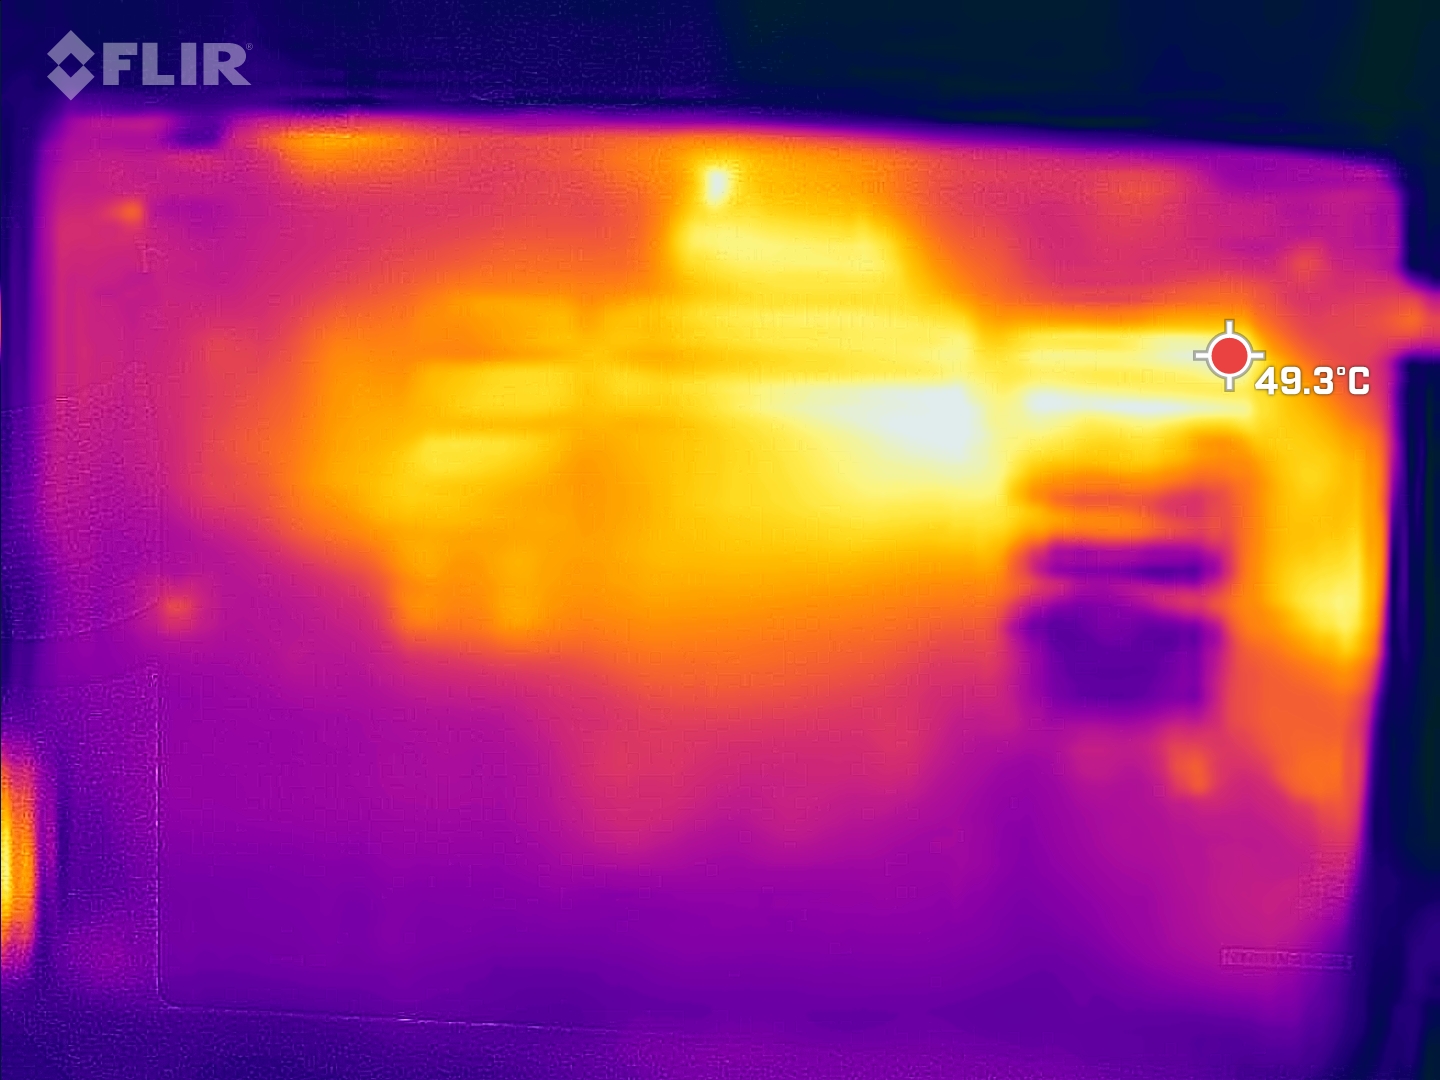
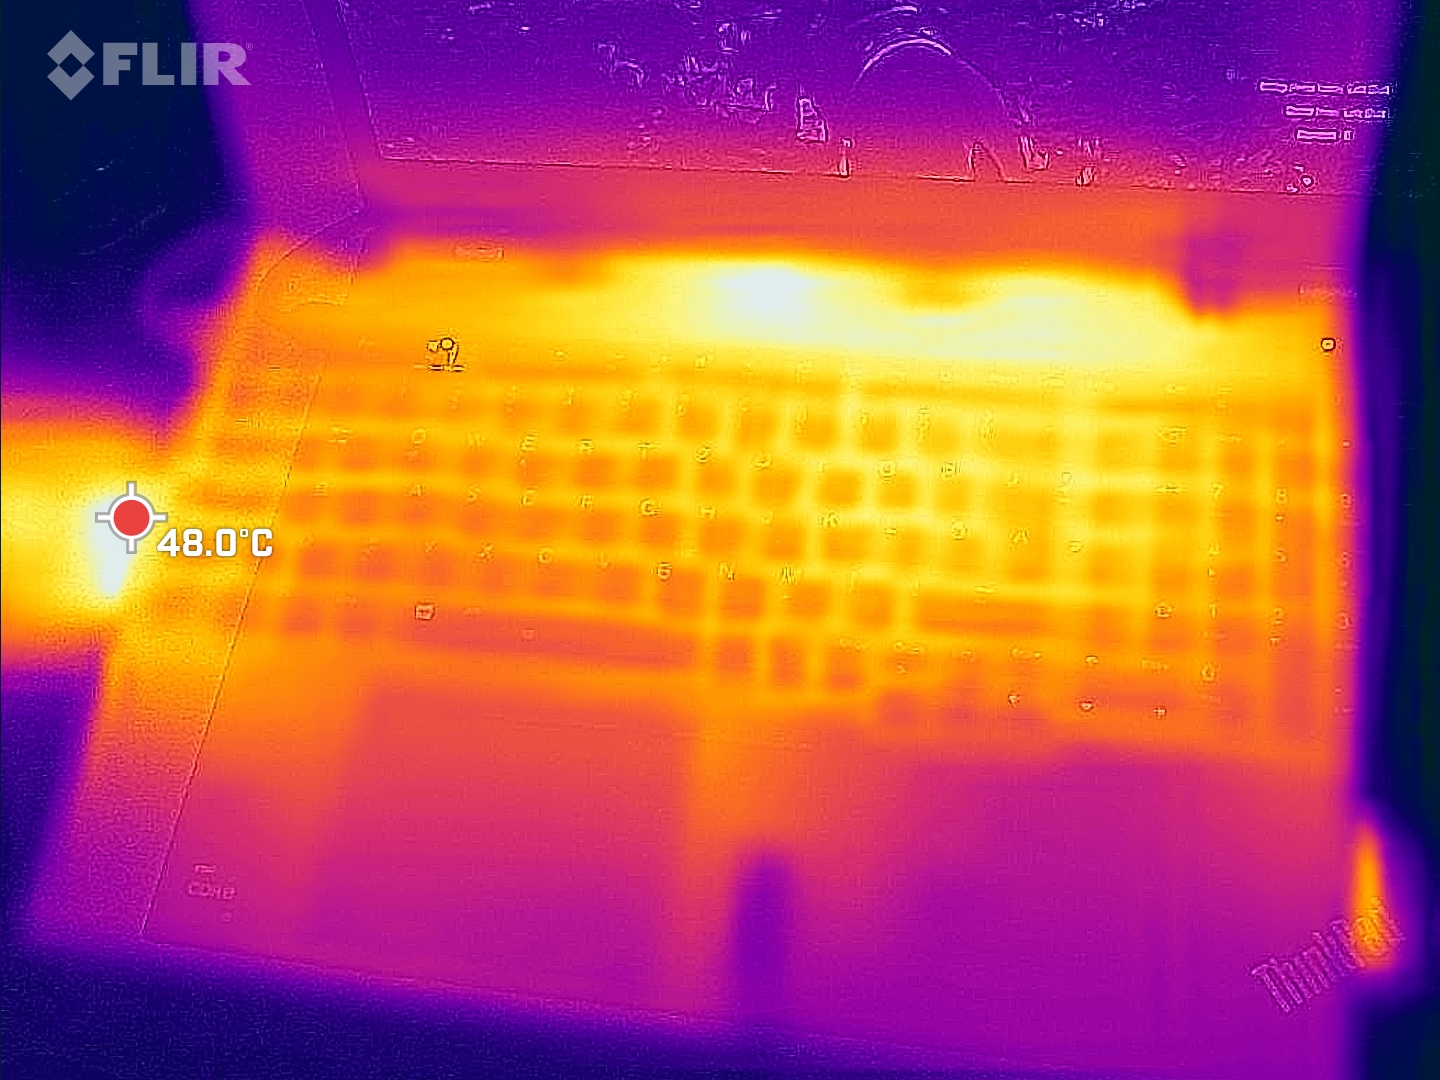
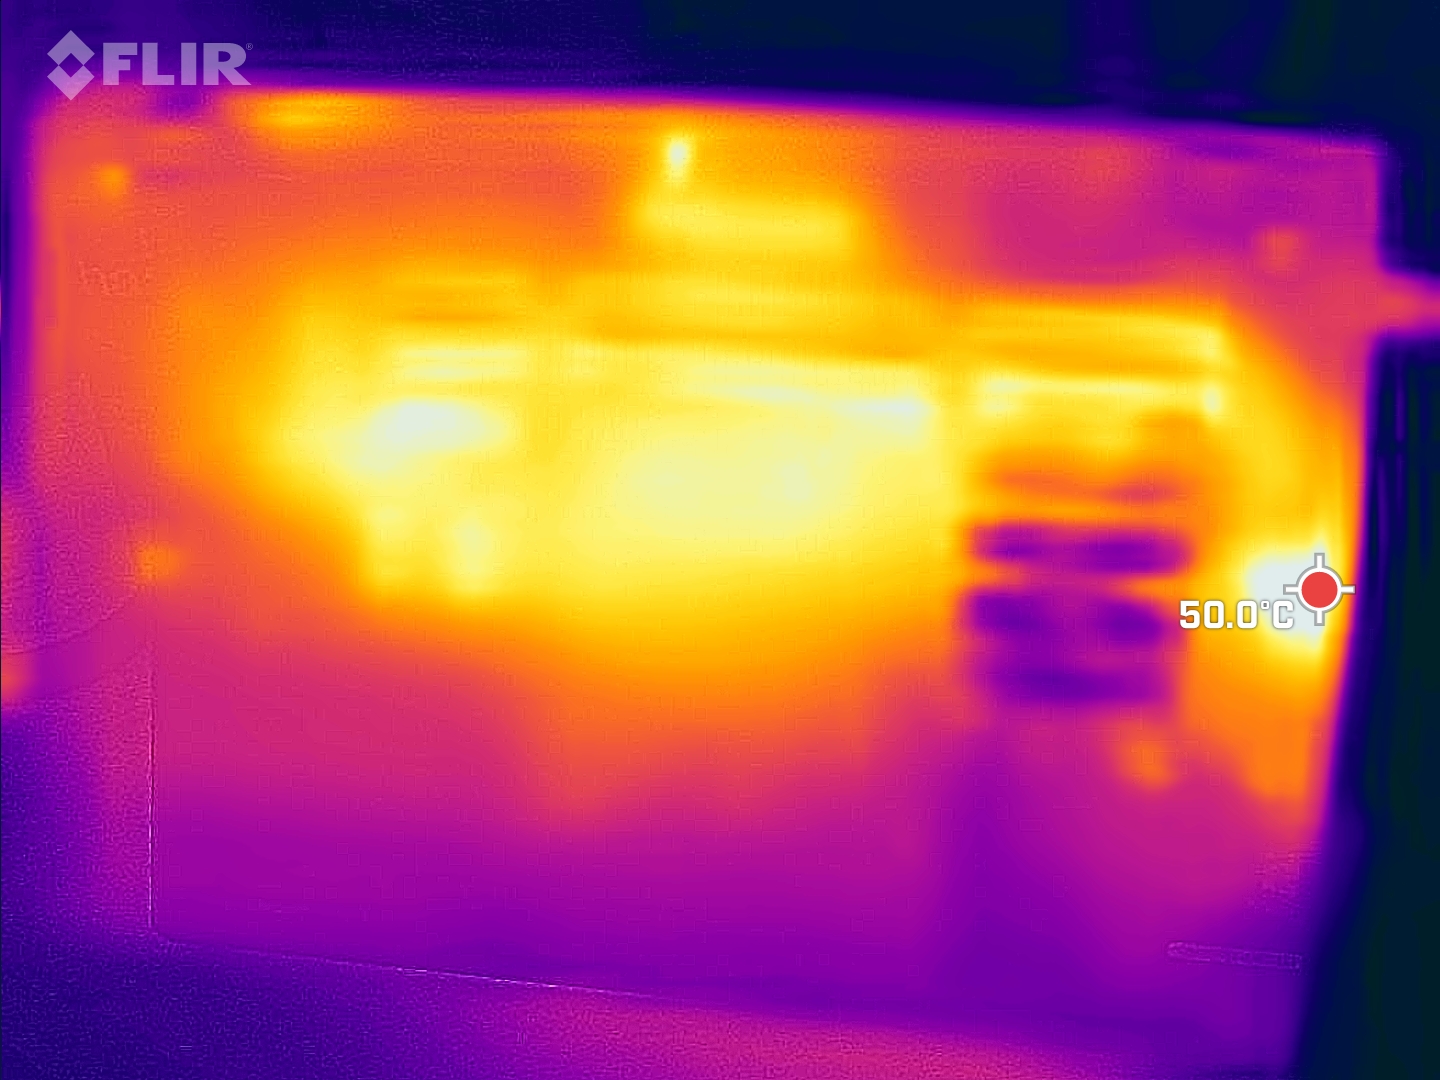
温度
在负载和游戏过程中,ThinkPad P15v变得非常热,在键盘上方的中心位置达到53.8℃。ZBook Power 15的温度要低得多,为41.5°C,但代价是噪音水平明显提高。
(-) The maximum temperature on the upper side is 53.8 °C / 129 F, compared to the average of 38.2 °C / 101 F, ranging from 22.2 to 69.8 °C for the class Workstation.
(-) The bottom heats up to a maximum of 52.1 °C / 126 F, compared to the average of 41.1 °C / 106 F
(+) In idle usage, the average temperature for the upper side is 25.6 °C / 78 F, compared to the device average of 32 °C / 90 F.
(-) Playing The Witcher 3, the average temperature for the upper side is 41.4 °C / 107 F, compared to the device average of 32 °C / 90 F.
(+) The palmrests and touchpad are reaching skin temperature as a maximum (35.6 °C / 96.1 F) and are therefore not hot.
(-) The average temperature of the palmrest area of similar devices was 27.8 °C / 82 F (-7.8 °C / -14.1 F).
| Lenovo ThinkPad P15v G2 21A9000XGE Intel Core i7-11800H, NVIDIA T1200 Laptop GPU | Lenovo ThinkPad P15 G2-20YQ001JGE Intel Core i7-11800H, NVIDIA RTX A3000 Laptop GPU | Lenovo ThinkPad T15g-20UR000GGE Intel Core i7-10750H, NVIDIA GeForce RTX 2070 Super Max-Q | Lenovo ThinkPad T15p-20TN0006GE Intel Core i7-10750H, NVIDIA GeForce GTX 1050 Mobile | Lenovo ThinkPad P15s Gen2-20W6000GGE Intel Core i7-1165G7, NVIDIA T500 Laptop GPU | HP ZBook Power 15 G8 313S5EA Intel Core i7-11800H, NVIDIA T600 Laptop GPU | Dell Precision 5000 5560 Intel Core i7-11850H, NVIDIA RTX A2000 Laptop GPU | |
|---|---|---|---|---|---|---|---|
| Heat | -5% | -15% | 4% | 2% | 17% | -6% | |
| Maximum Upper Side * (°C) | 53.8 | 49.7 8% | 47.7 11% | 53.8 -0% | 42.8 20% | 41.4 23% | 48.2 10% |
| Maximum Bottom * (°C) | 52.1 | 63.2 -21% | 62.1 -19% | 56.6 -9% | 59.1 -13% | 41.5 20% | 42.6 18% |
| Idle Upper Side * (°C) | 27.6 | 27.1 2% | 31.3 -13% | 24.7 11% | 26.4 4% | 23.8 14% | 34.8 -26% |
| Idle Bottom * (°C) | 27.7 | 29.8 -8% | 38.8 -40% | 24.2 13% | 28.9 -4% | 25 10% | 35.2 -27% |
* ... smaller is better
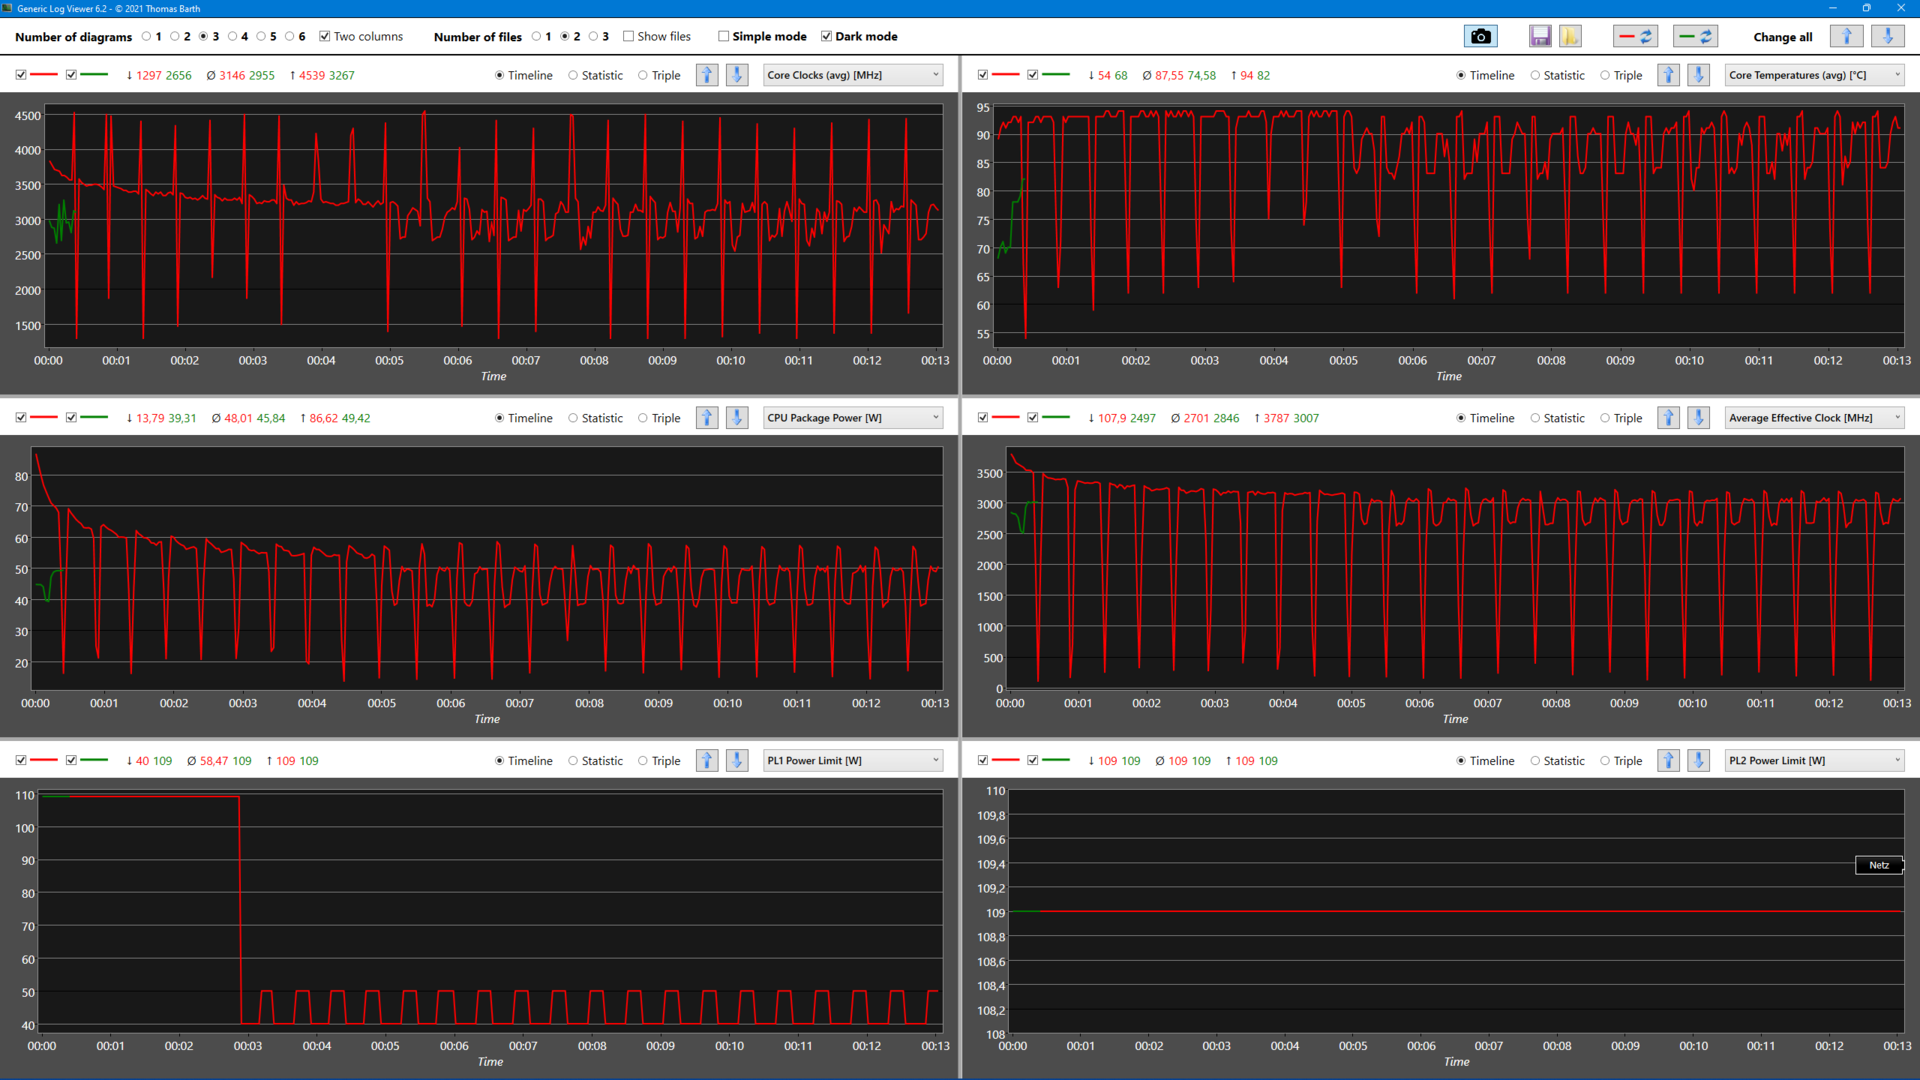
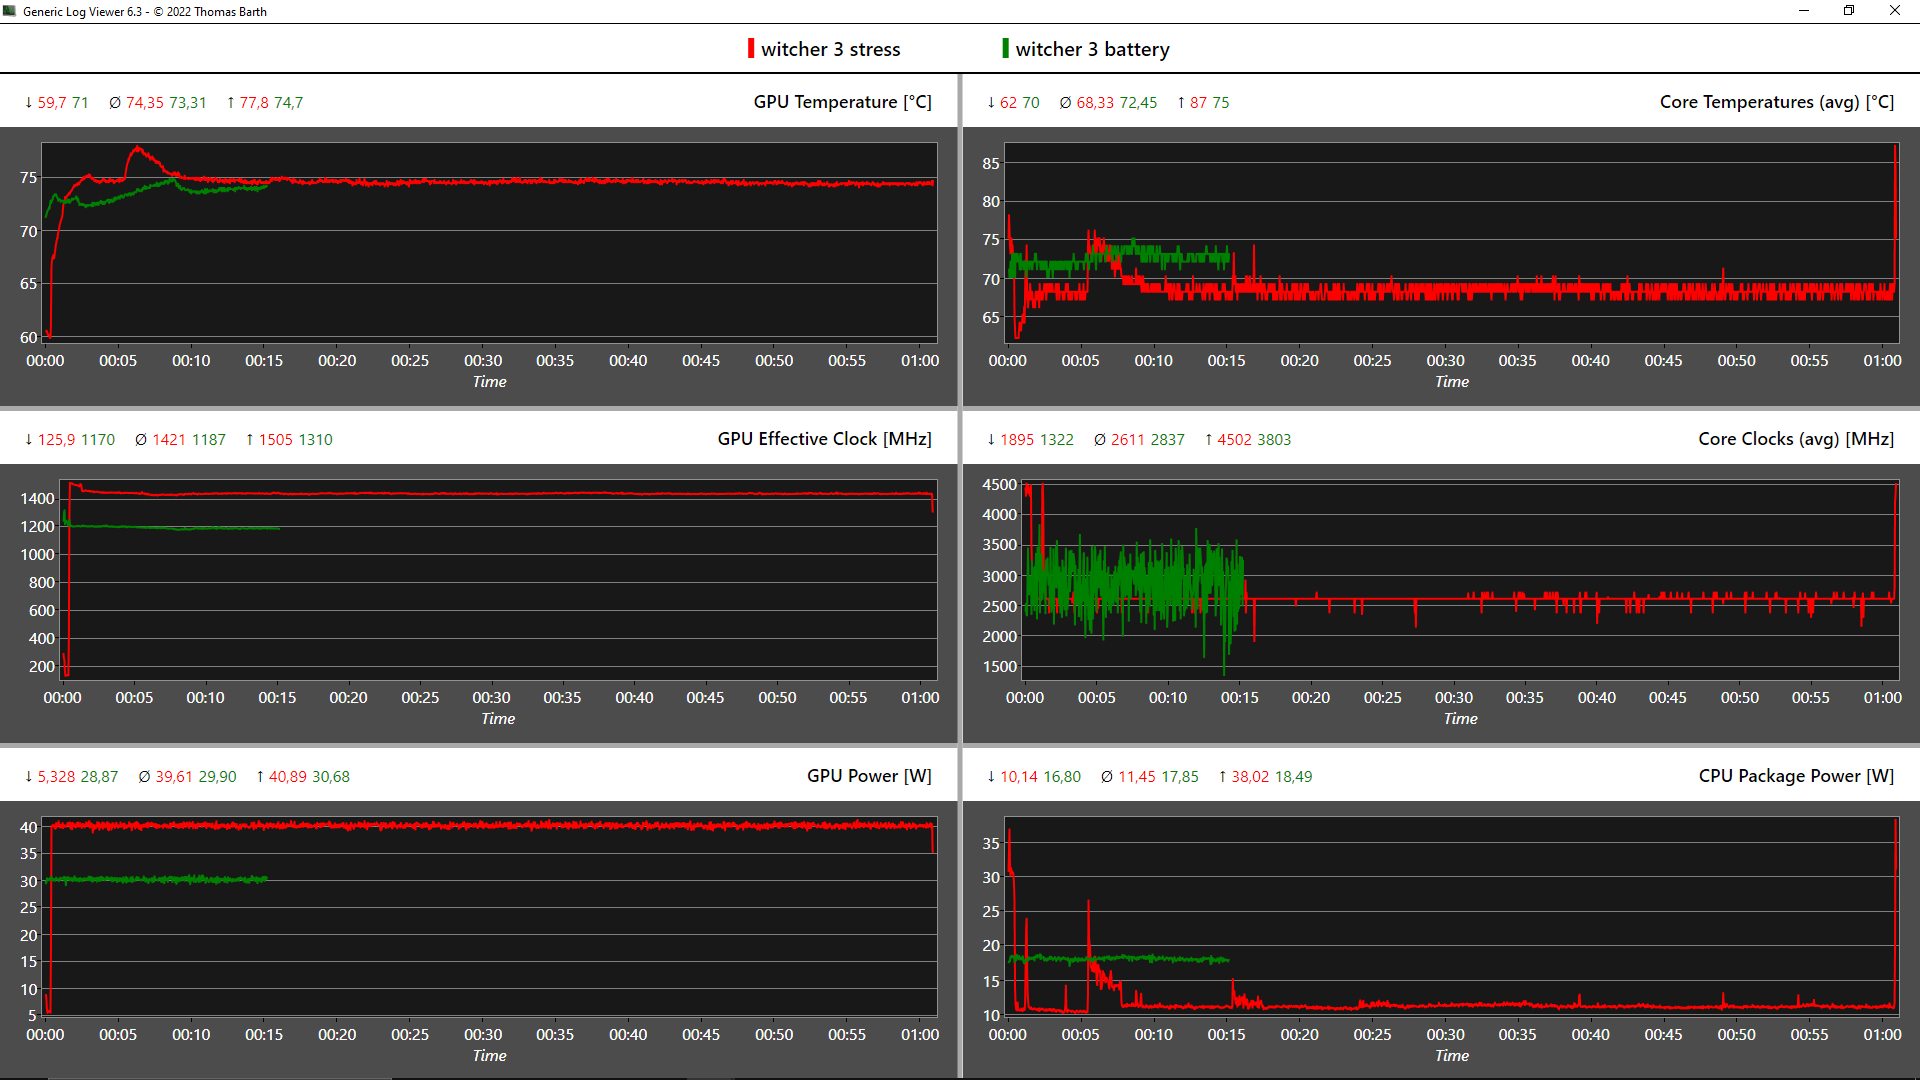
压力测试
经过一个小时的综合压力测试(FurMark + Prime95),CPU在2.15 GHz左右徘徊,仅略低于2.3 GHz的基础时钟。温度几乎达到94℃,消耗量为40瓦,而Nvidia GPU的消耗量为指定的35瓦,但在986兆赫时没有完全发挥其时钟潜力。
在纯粹的GPU压力下,显卡提取40瓦,因此在非临界温度下达到完整的1,445 MHz。在单纯的CPU压力下, 酷睿i7-11800H的时钟频率稳定在2.55GHz,消耗50瓦,温度高达91.6℃。
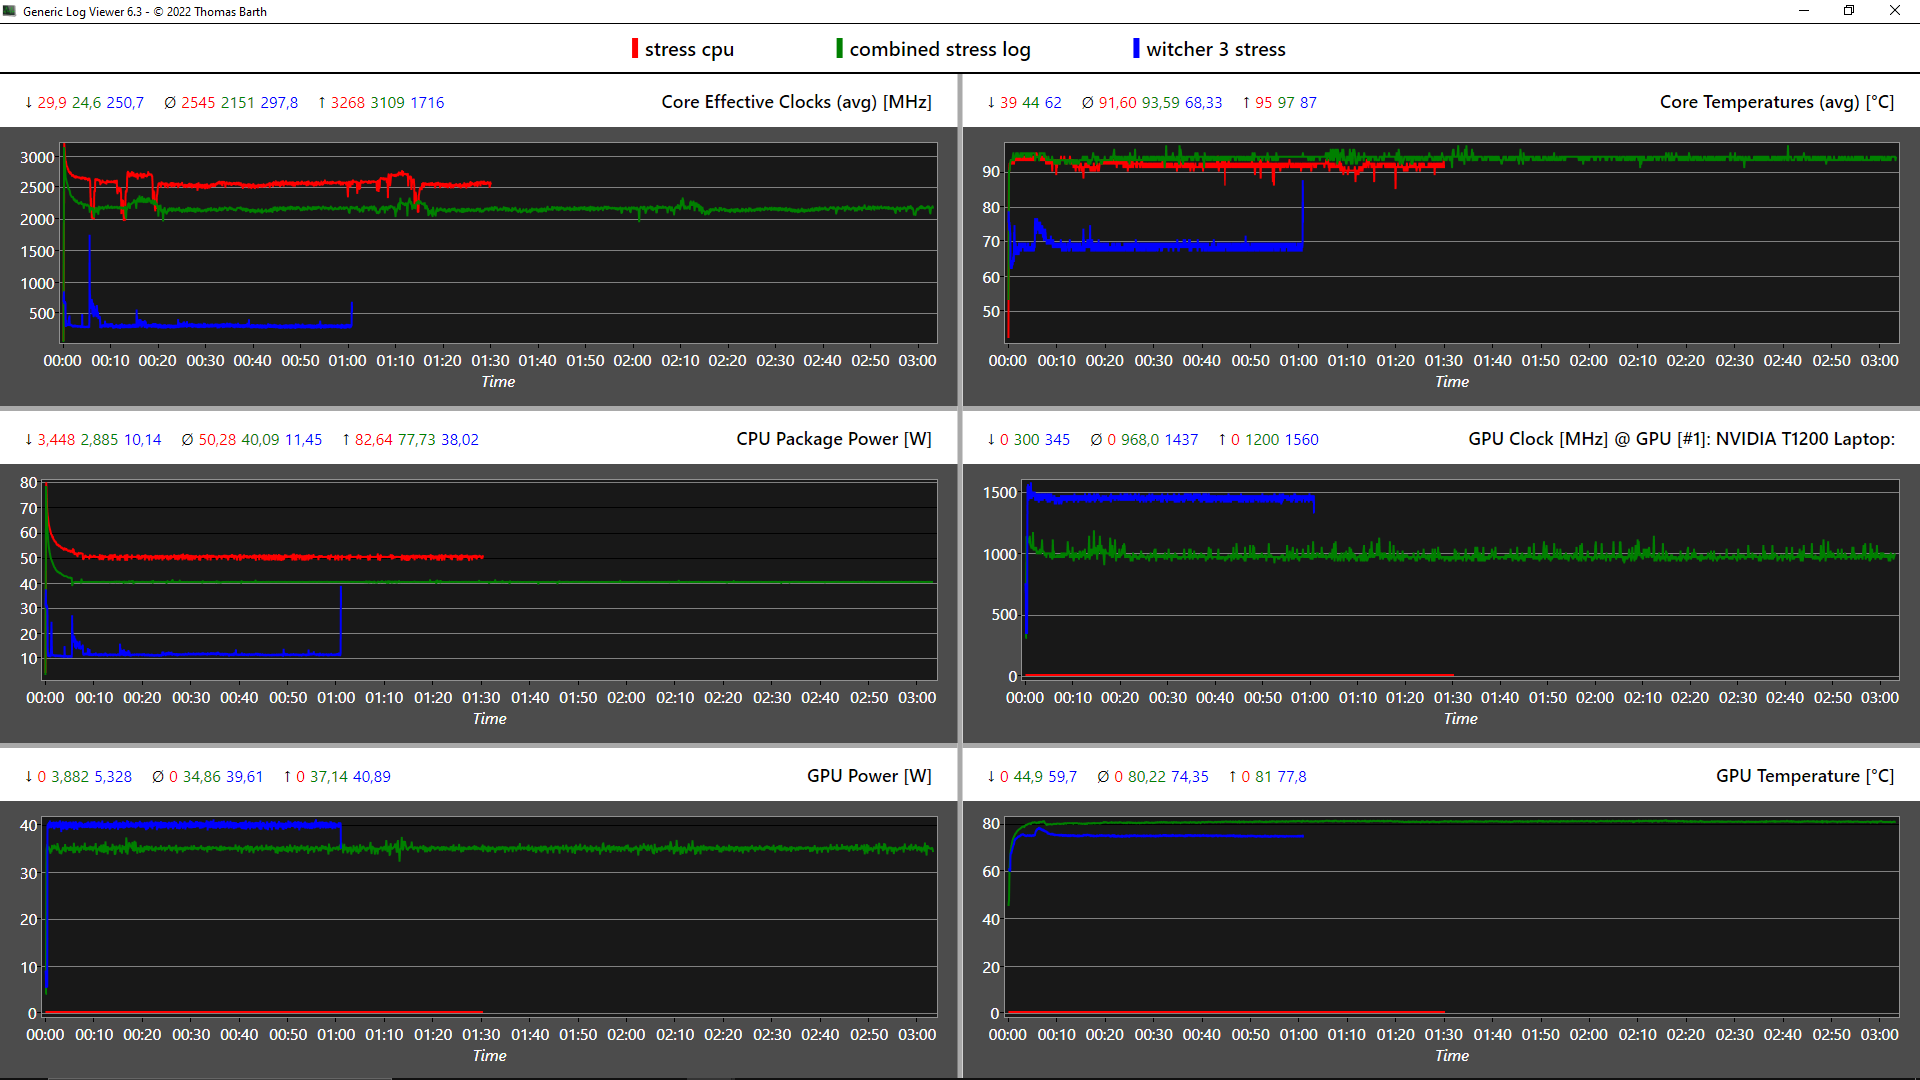
| CPU时钟(GHz) | GPU时钟(MHz) | CPU平均温度(℃) | GPU平均温度(℃) | |
| 系统空闲 | 1,2 | 300 | 42 | 44,8 |
| Prime95压力 | 2,5 | 300 | 91,6 | 46,4 |
| Prime95 + FurMark 压力 | 2,2 | 970 | 93,6 | 80,2 |
| Witcher 3 应力 | 0,3 | 1.445 | 68,3 | 74,4 |
发言人
向上的2x 2瓦扬声器不是特别响亮,但声音很清晰,低音在一定程度上也有。总的来说,它们达到了自己的目的,并超过了许多其他办公笔记本的扬声器。
Lenovo ThinkPad P15v G2 21A9000XGE audio analysis
(-) | not very loud speakers (70.7 dB)
Bass 100 - 315 Hz
(±) | reduced bass - on average 13.4% lower than median
(±) | linearity of bass is average (13.6% delta to prev. frequency)
Mids 400 - 2000 Hz
(+) | balanced mids - only 4.7% away from median
(+) | mids are linear (6.2% delta to prev. frequency)
Highs 2 - 16 kHz
(+) | balanced highs - only 3.2% away from median
(+) | highs are linear (5.7% delta to prev. frequency)
Overall 100 - 16.000 Hz
(±) | linearity of overall sound is average (21.2% difference to median)
Compared to same class
» 76% of all tested devices in this class were better, 6% similar, 18% worse
» The best had a delta of 7%, average was 17%, worst was 35%
Compared to all devices tested
» 59% of all tested devices were better, 7% similar, 34% worse
» The best had a delta of 4%, average was 24%, worst was 134%
HP ZBook Power 15 G8 313S5EA audio analysis
(±) | speaker loudness is average but good (72.3 dB)
Bass 100 - 315 Hz
(-) | nearly no bass - on average 23.3% lower than median
(±) | linearity of bass is average (11.8% delta to prev. frequency)
Mids 400 - 2000 Hz
(+) | balanced mids - only 2.5% away from median
(+) | mids are linear (5.1% delta to prev. frequency)
Highs 2 - 16 kHz
(+) | balanced highs - only 4.1% away from median
(+) | highs are linear (3.1% delta to prev. frequency)
Overall 100 - 16.000 Hz
(±) | linearity of overall sound is average (21.4% difference to median)
Compared to same class
» 77% of all tested devices in this class were better, 6% similar, 18% worse
» The best had a delta of 7%, average was 17%, worst was 35%
Compared to all devices tested
» 60% of all tested devices were better, 7% similar, 33% worse
» The best had a delta of 4%, average was 24%, worst was 134%
能源管理。ThinkPad P15v的平均水平
消耗功率
待机时1.6瓦的消耗表明,2天的运行时间是不可能的。另一方面,空闲率对于工作站来说是非常好的,只有ZBook Power 15能比它更出色。
在压力测试的开始阶段,消耗了127瓦,连续消耗了108瓦。因此,135瓦的电源有足够的规模,能够吸收任何负载高峰。对ThinkPad的完全充电大约持续90分钟。
| Off / Standby | |
| Idle | |
| Load |
|
Key:
min: | |
| Lenovo ThinkPad P15v G2 21A9000XGE i7-11800H, T1200 Laptop GPU, Toshiba XG6 KXG6AZNV512G, IPS LED, 1920x1080, 15.6" | Lenovo ThinkPad P15 G2-20YQ001JGE i7-11800H, RTX A3000 Laptop GPU, Kioxia XG7 KXG7AZNV512G, IPS, 1920x1080, 15.6" | Lenovo ThinkPad T15g-20UR000GGE i7-10750H, GeForce RTX 2070 Super Max-Q, SK Hynix PC401 512GB M.2 (HFS512GD9TNG), IPS, 1920x1080, 15.6" | Lenovo ThinkPad T15p-20TN0006GE i7-10750H, GeForce GTX 1050 Mobile, WDC PC SN730 SDBQNTY-512GB, IPS LED, 3840x2160, 15.6" | Lenovo ThinkPad P15s Gen2-20W6000GGE i7-1165G7, T500 Laptop GPU, WDC PC SN720 SDAQNTW-1T00, IPS LED, 3840x2160, 15.6" | HP ZBook Power 15 G8 313S5EA i7-11800H, T600 Laptop GPU, Samsung PM9A1 MZVL2512HCJQ, IPS LED, 1920x1080, 15.6" | Dell Precision 5000 5560 i7-11850H, RTX A2000 Laptop GPU, Samsung PM9A1 MZVL22T0HBLB, IPS, 3840x2400, 15.6" | Average NVIDIA T1200 Laptop GPU | Average of class Workstation | |
|---|---|---|---|---|---|---|---|---|---|
| Power Consumption | -31% | -36% | -20% | 6% | 23% | -38% | -23% | -50% | |
| Idle Minimum * (Watt) | 5.96 | 6.3 -6% | 5.8 3% | 6 -1% | 5.8 3% | 4.17 30% | 6.2 -4% | 7.85 ? -32% | 8.94 ? -50% |
| Idle Average * (Watt) | 8.37 | 10.7 -28% | 11.4 -36% | 12.8 -53% | 13.3 -59% | 6.32 24% | 13.9 -66% | 11.4 ? -36% | 13.8 ? -65% |
| Idle Maximum * (Watt) | 9.05 | 11.6 -28% | 13.9 -54% | 16.1 -78% | 15.6 -72% | 7.1 22% | 23.8 -163% | 12 ? -33% | 17.5 ? -93% |
| Load Average * (Watt) | 91.82 | 99.3 -8% | 93.2 -2% | 95.6 -4% | 43.2 53% | 80.41 12% | 95.7 -4% | 93.8 ? -2% | 95 ? -3% |
| Witcher 3 ultra * (Watt) | 102 | 154 -51% | 145 -42% | 84 18% | 37.1 64% | 62.3 39% | 87 15% | ||
| Load Maximum * (Watt) | 126.38 | 210 -66% | 234 -85% | 131.1 -4% | 67.3 47% | 110.18 13% | 132.6 -5% | 143.7 ? -14% | 175.2 ? -39% |
* ... smaller is better
Power Consumption Witcher 3 / Stresstest
Power Consumption Witcher 3 / Stress test (external monitor)
电池寿命
68Wh的电池能够为我们的Wi-Fi测试提供7.5小时的电力,与联想自己的说法相符。其他工作站用较大的电池实现了明显更长的运行时间。
惠普的ZBook Power 15在网络浏览方面的持续时间也明显更长,接近12.5小时。 戴尔的Precision 5560配备了4K显示屏,记录的时间只有6.5小时。
| Lenovo ThinkPad P15v G2 21A9000XGE i7-11800H, T1200 Laptop GPU, 68 Wh | Lenovo ThinkPad P15 G2-20YQ001JGE i7-11800H, RTX A3000 Laptop GPU, 94 Wh | Lenovo ThinkPad T15g-20UR000GGE i7-10750H, GeForce RTX 2070 Super Max-Q, 94 Wh | Lenovo ThinkPad T15p-20TN0006GE i7-10750H, GeForce GTX 1050 Mobile, 68 Wh | Lenovo ThinkPad P15s Gen2-20W6000GGE i7-1165G7, T500 Laptop GPU, 57 Wh | HP ZBook Power 15 G8 313S5EA i7-11800H, T600 Laptop GPU, 83 Wh | Dell Precision 5000 5560 i7-11850H, RTX A2000 Laptop GPU, 86 Wh | Average of class Workstation | |
|---|---|---|---|---|---|---|---|---|
| Battery runtime | 34% | 47% | 5% | 46% | 53% | 18% | 36% | |
| Reader / Idle (h) | 17.2 | 14.9 -13% | 12 -30% | 26.1 ? 52% | ||||
| H.264 (h) | 8 | 10 25% | 12.7 59% | 7.7 -4% | 9.9 24% | 10.1 26% | 9.51 ? 19% | |
| WiFi v1.3 (h) | 7.5 | 9.9 32% | 11.2 49% | 7.3 -3% | 7.7 3% | 12.3 64% | 6.3 -16% | 8.53 ? 14% |
| Load (h) | 0.9 | 1.3 44% | 1.2 33% | 1.1 22% | 1.9 111% | 2.1 133% | 1.8 100% | 1.429 ? 59% |
Pros
Cons
结论:ThinkPad P15v G2适合价格敏感的创意者?

ThinkPad P15v G2很好地平衡了商务笔记本和工作站之间的关系,考虑到它的目标群体可以不使用某些高端功能,如Xeon CPU、ECC内存、最快的硬件和其他一些东西。也就是说,尽管在某些情况下可以看到25%的下降,但性能总体上还是不错的。
如果主要使用外部显示器,显示选项仅能满足创意人士和CAD领域的需要,对于那些主要需要进行更复杂计算的人来说,价格也很合理。考虑到不到2000欧元的价格,图形性能是足够的,而且输入设备也处于较高的水平。在色彩空间覆盖率低的情况下,显示效果有些暗淡,这也是一些缺点。幸运的是,有一个4K选项。
连接性很广,ThinkPad很容易扩展。总的来说,它的整体得分很高,与更薄的 ThinkPad P15s.外壳也很坚固,即使其他ThinkPad有一个强化的显示盖。从感觉和外观上看,塑料的数量可能会让一些人不满意。电池运行时间不是最好的,但排放是面向商业的,非常好,除了一些远离键盘和掌托的小热点。出于对价格的考虑,冷却系统总体上保持得相当简单。通过USB-C充电也不能使用,Wi-Fi模块是焊接的。但可以加装WWAN。
ThinkPad P15v G2不一定需要酷睿i9和4K显示屏才能成为一个坚实的工作主力。虽然它主要因其合理的入门级价格而大放异彩,但它仍然是一款具有局限性的小众产品,特别是在显示屏和CPU方面。
除去姐妹机型(T15p G2),在同一价格段有两个直接替代品。惠普的ZBook Power 15,性能始终保持在较高的水平,有一个更明亮和更好的显示屏,一个精心设计的键盘以及更好的电池运行时间,但它也是令人讨厌的声音。戴尔的Precision 3651仅重1.79公斤,提供4K面板和USB-C充电。
价格和可用性
Lenovo ThinkPad P15v G2 21A9000XGE
- 05/30/2022 v7 (old)
Marvin Gollor
Price comparison

