微星造物主Z16P笔记本电脑在审查。使用i9和RTX 3080 Ti的创意工作
对于一个价格略低于4,500欧元(约合4,737美元)的设备来说,期望值应该被设定得相应地高。因此,组件清单读起来就像目前可用于笔记本电脑的最佳硬件的集合。凭借英特尔i9-12900H和NvidiaGeForce 3080 Ti,这台16英寸的笔记本电脑甚至可以与强大的游戏笔记本电脑竞争。
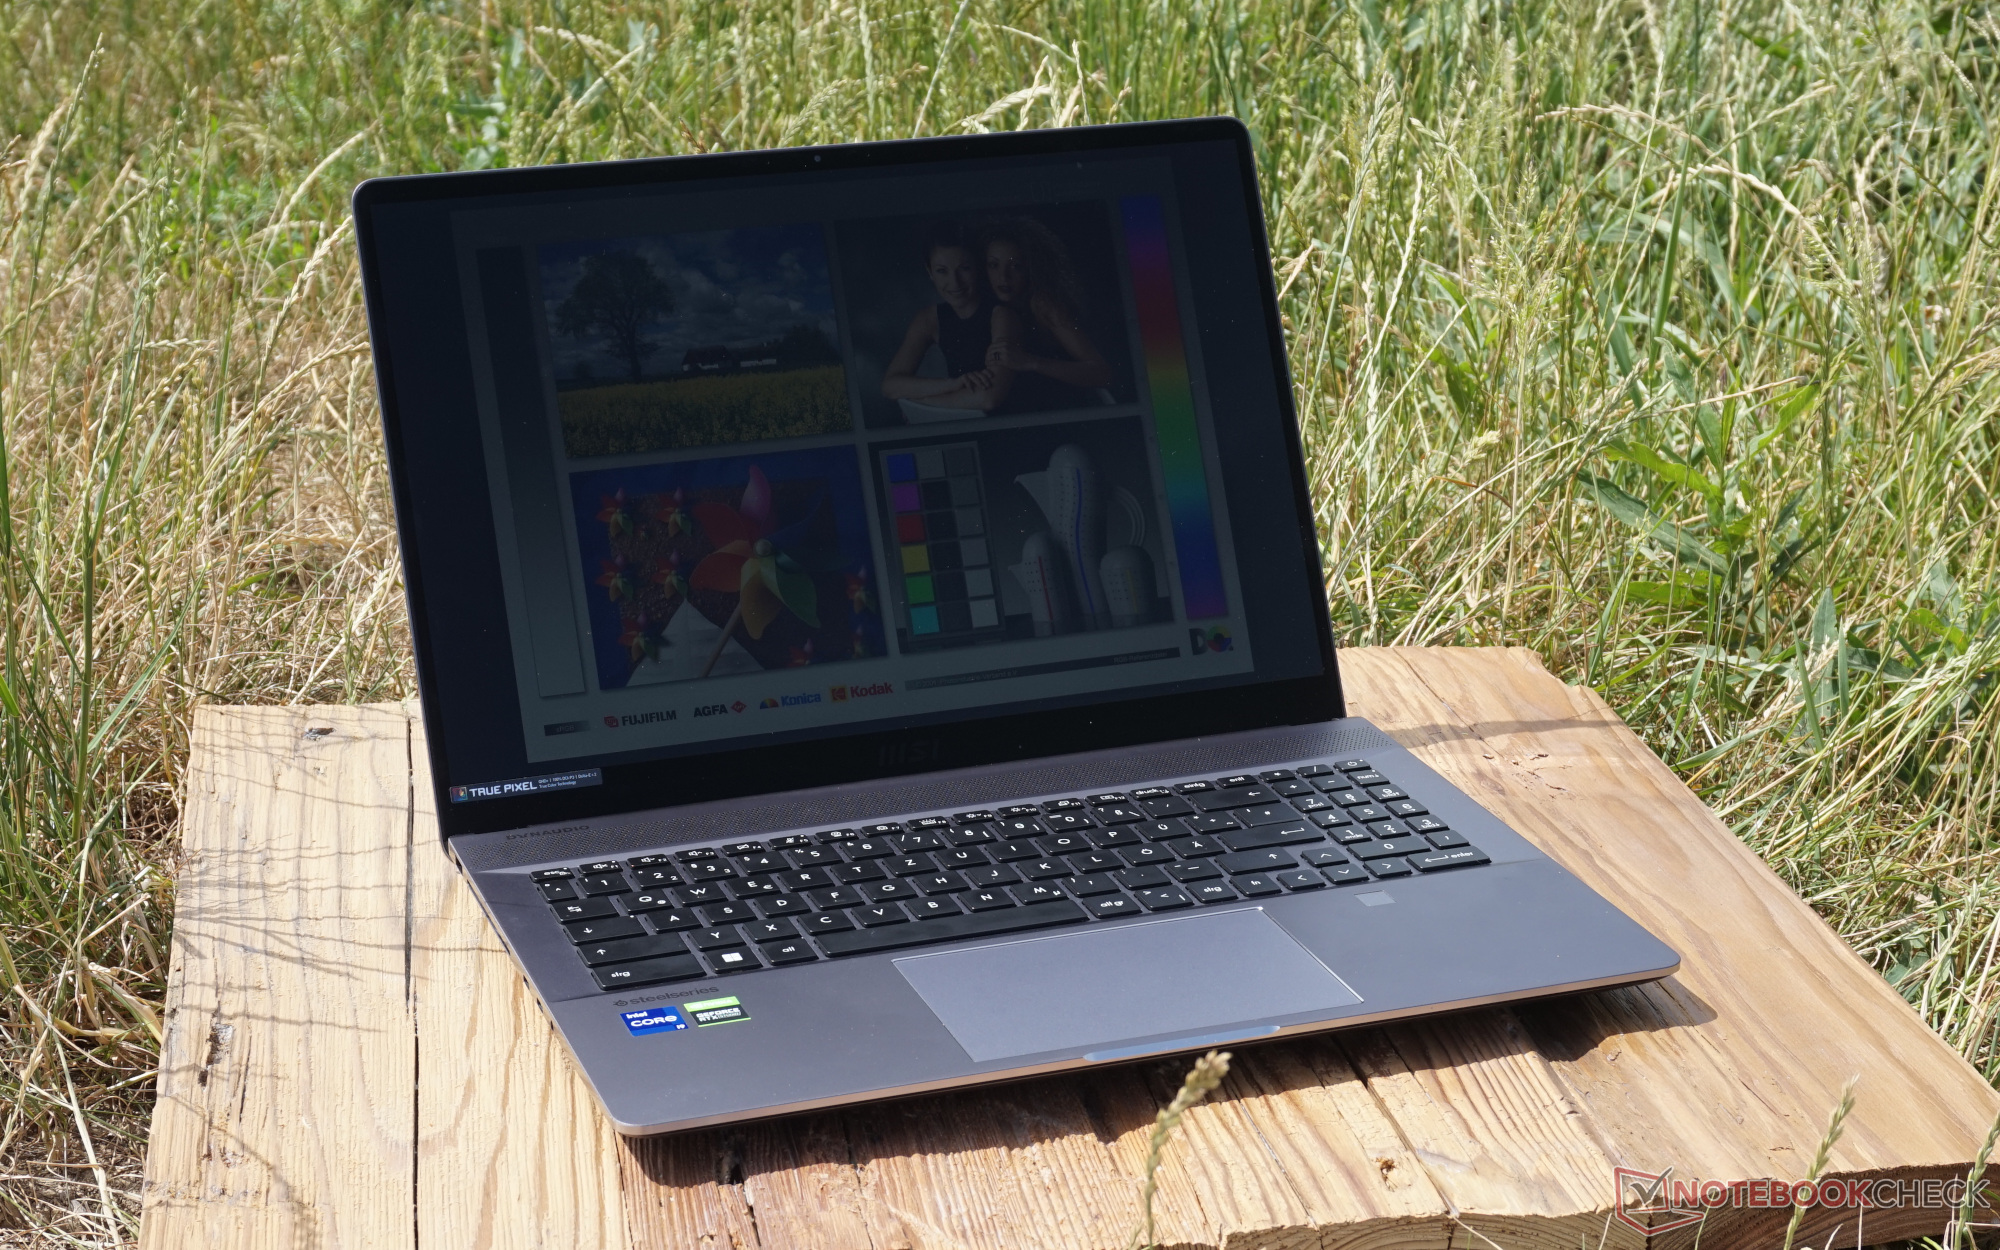
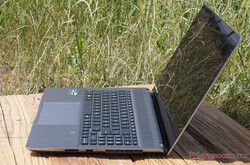
然而,差异甚至在你打开它之前就变得很明显。纤细而优雅的外壳在这种形式下仍然可以合理地存放在袋子或背包里。这看起来不像是一台游戏机,而像是一台工作设备。当然,这与显示屏相匹配,它经过预校准,几乎完全覆盖了DCI-P3色彩空间,非常适合视频编辑。
另一方面,4K或OLED被排除在外,但这不应该导致创意工作的任何限制。在如此小的空间里,粉丝们能如何应对几乎不受限制的英特尔阿尔德雷克处理器的压倒性能耗,还有待观察。
虽然我们审查了微星创造者Z16前代产品的图形芯片较小,"只有 "i7,我们现在有最大的版本,在其峰值时需要两倍的功率。也有两个不太强大的版本。配备i7-12700H和NvidiaGeForce RTX 3070 Ti的微星Creator Z16P的价格要低1000欧元(约1053美元),这取决于其他配置,但它仍然提供相同的显示器。一个中间的解决方案是通过选择NvidiaGeForce RTX 3080来节省显卡。
该Apple MacBook Pro 16 2021 M1 Max立即呈现出自己是一个合乎逻辑的比较设备。而技嘉Aero 16 YE5也是一个直接的竞争者。此外,还值得一看的是 Alienware x17 R2,它有类似的组件,但在设计上更注重于连续负载。
潜在的竞争对手比较
Rating | Date | Model | Weight | Height | Size | Resolution | Price |
|---|---|---|---|---|---|---|---|
| 83.7 % v7 (old) | 06 / 2022 | MSI Creator Z16P B12UHST i9-12900H, GeForce RTX 3080 Ti Laptop GPU | 2.4 kg | 20.4 mm | 16.00" | 2560x1600 | |
| 86.7 % v7 (old) | 11 / 2021 | MSI Creator Z16 A11UET-209 i7-11800H, GeForce RTX 3060 Laptop GPU | 2.2 kg | 15.9 mm | 16.00" | 2560x1600 | |
| 92.5 % v7 (old) | 11 / 2021 | Apple MacBook Pro 16 2021 M1 Max M1 Max, M1 Max 32-Core GPU | 2.2 kg | 16.8 mm | 16.20" | 3456x2234 | |
| 89.2 % v7 (old) | 05 / 2022 | Alienware x17 R2 P48E i9-12900HK, GeForce RTX 3080 Ti Laptop GPU | 3.1 kg | 20.9 mm | 17.30" | 1920x1080 | |
| 84.7 % v7 (old) | 03 / 2022 | Gigabyte Aero 16 YE5 i9-12900HK, GeForce RTX 3080 Ti Laptop GPU | 2.3 kg | 22.4 mm | 16.00" | 3840x2400 | |
| 87.2 % v7 (old) | 06 / 2022 | Acer Predator Triton 500 SE PT516-52s-70KX i7-12700H, GeForce RTX 3080 Ti Laptop GPU | 2.3 kg | 19.9 mm | 16.00" | 2560x1600 |
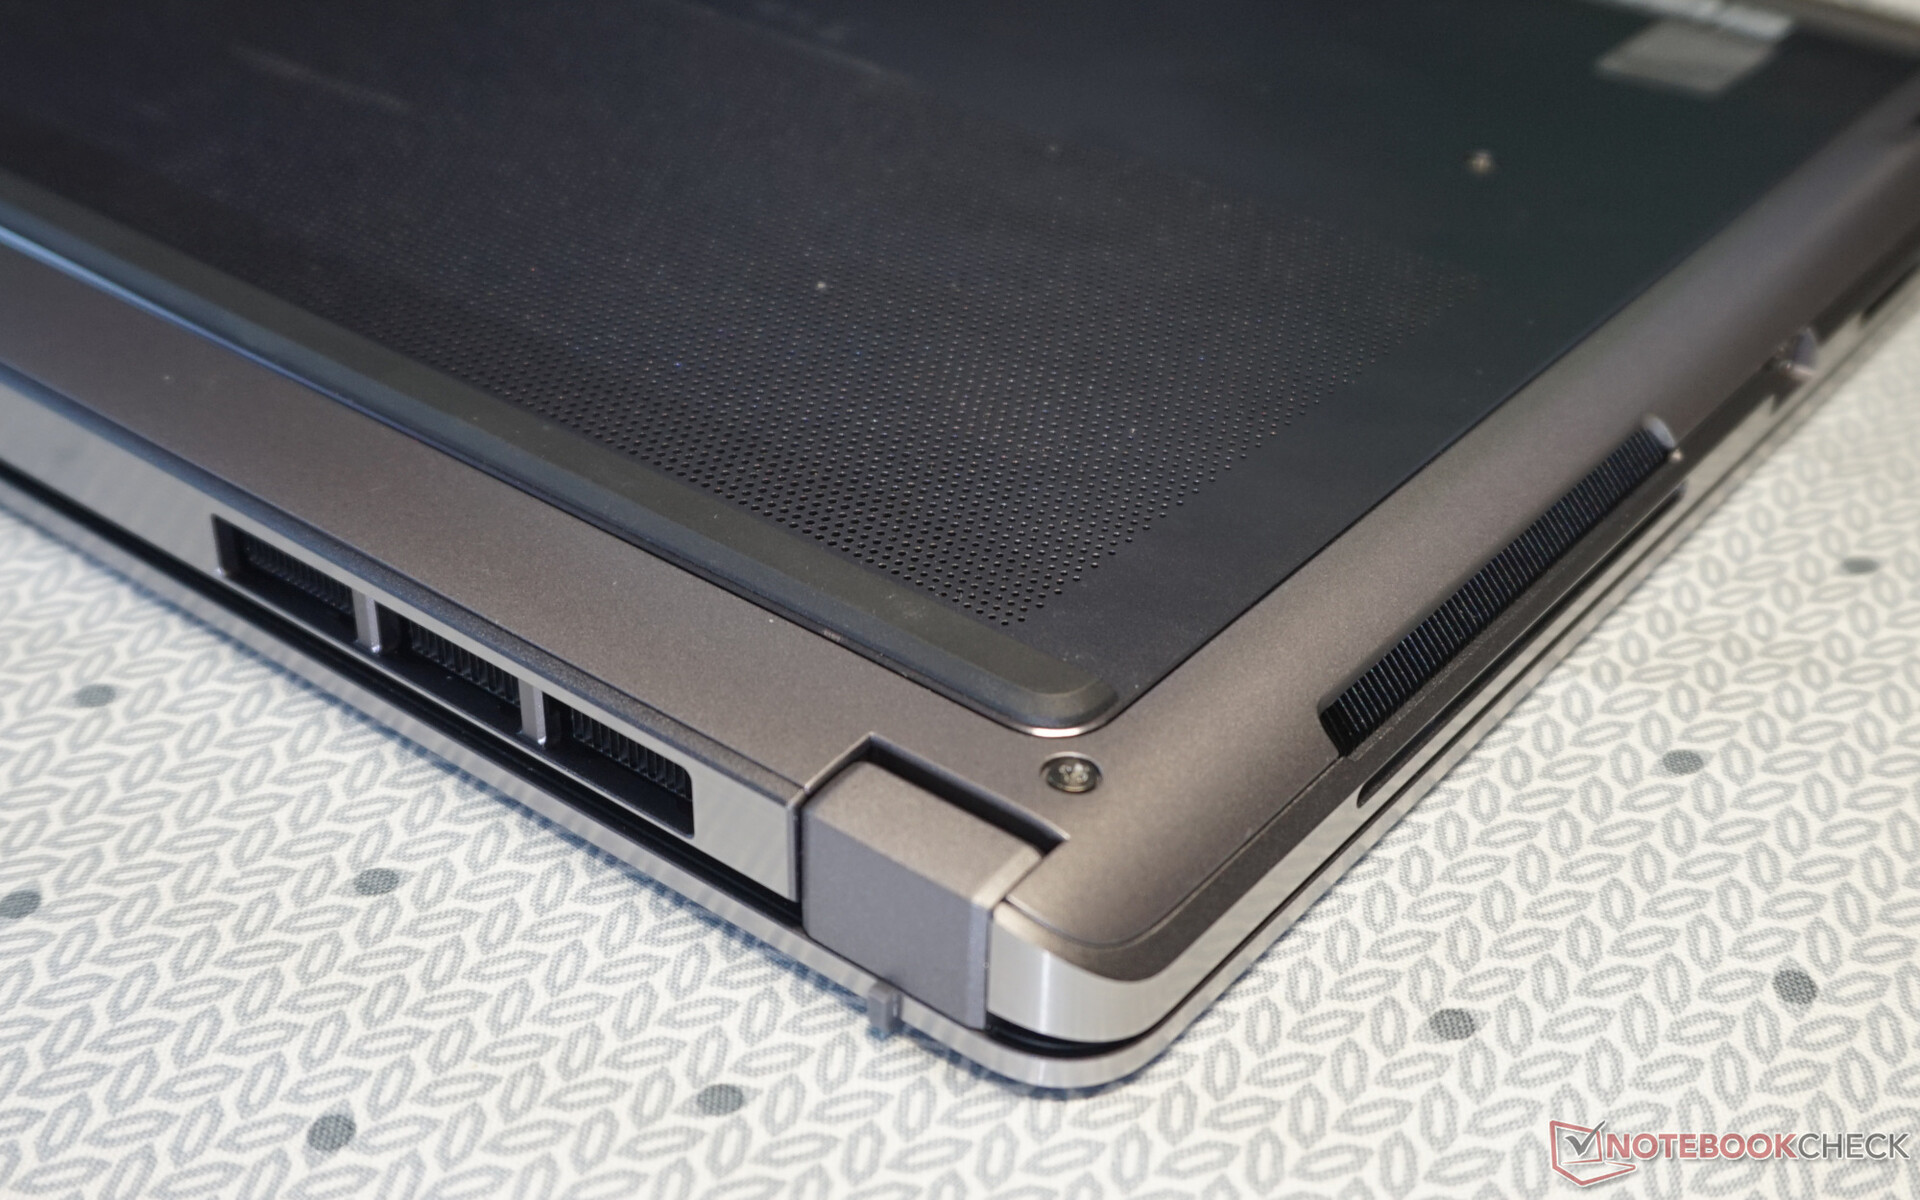
外壳 - 造物主的笔记本电脑被安置在一个坚固的机箱内
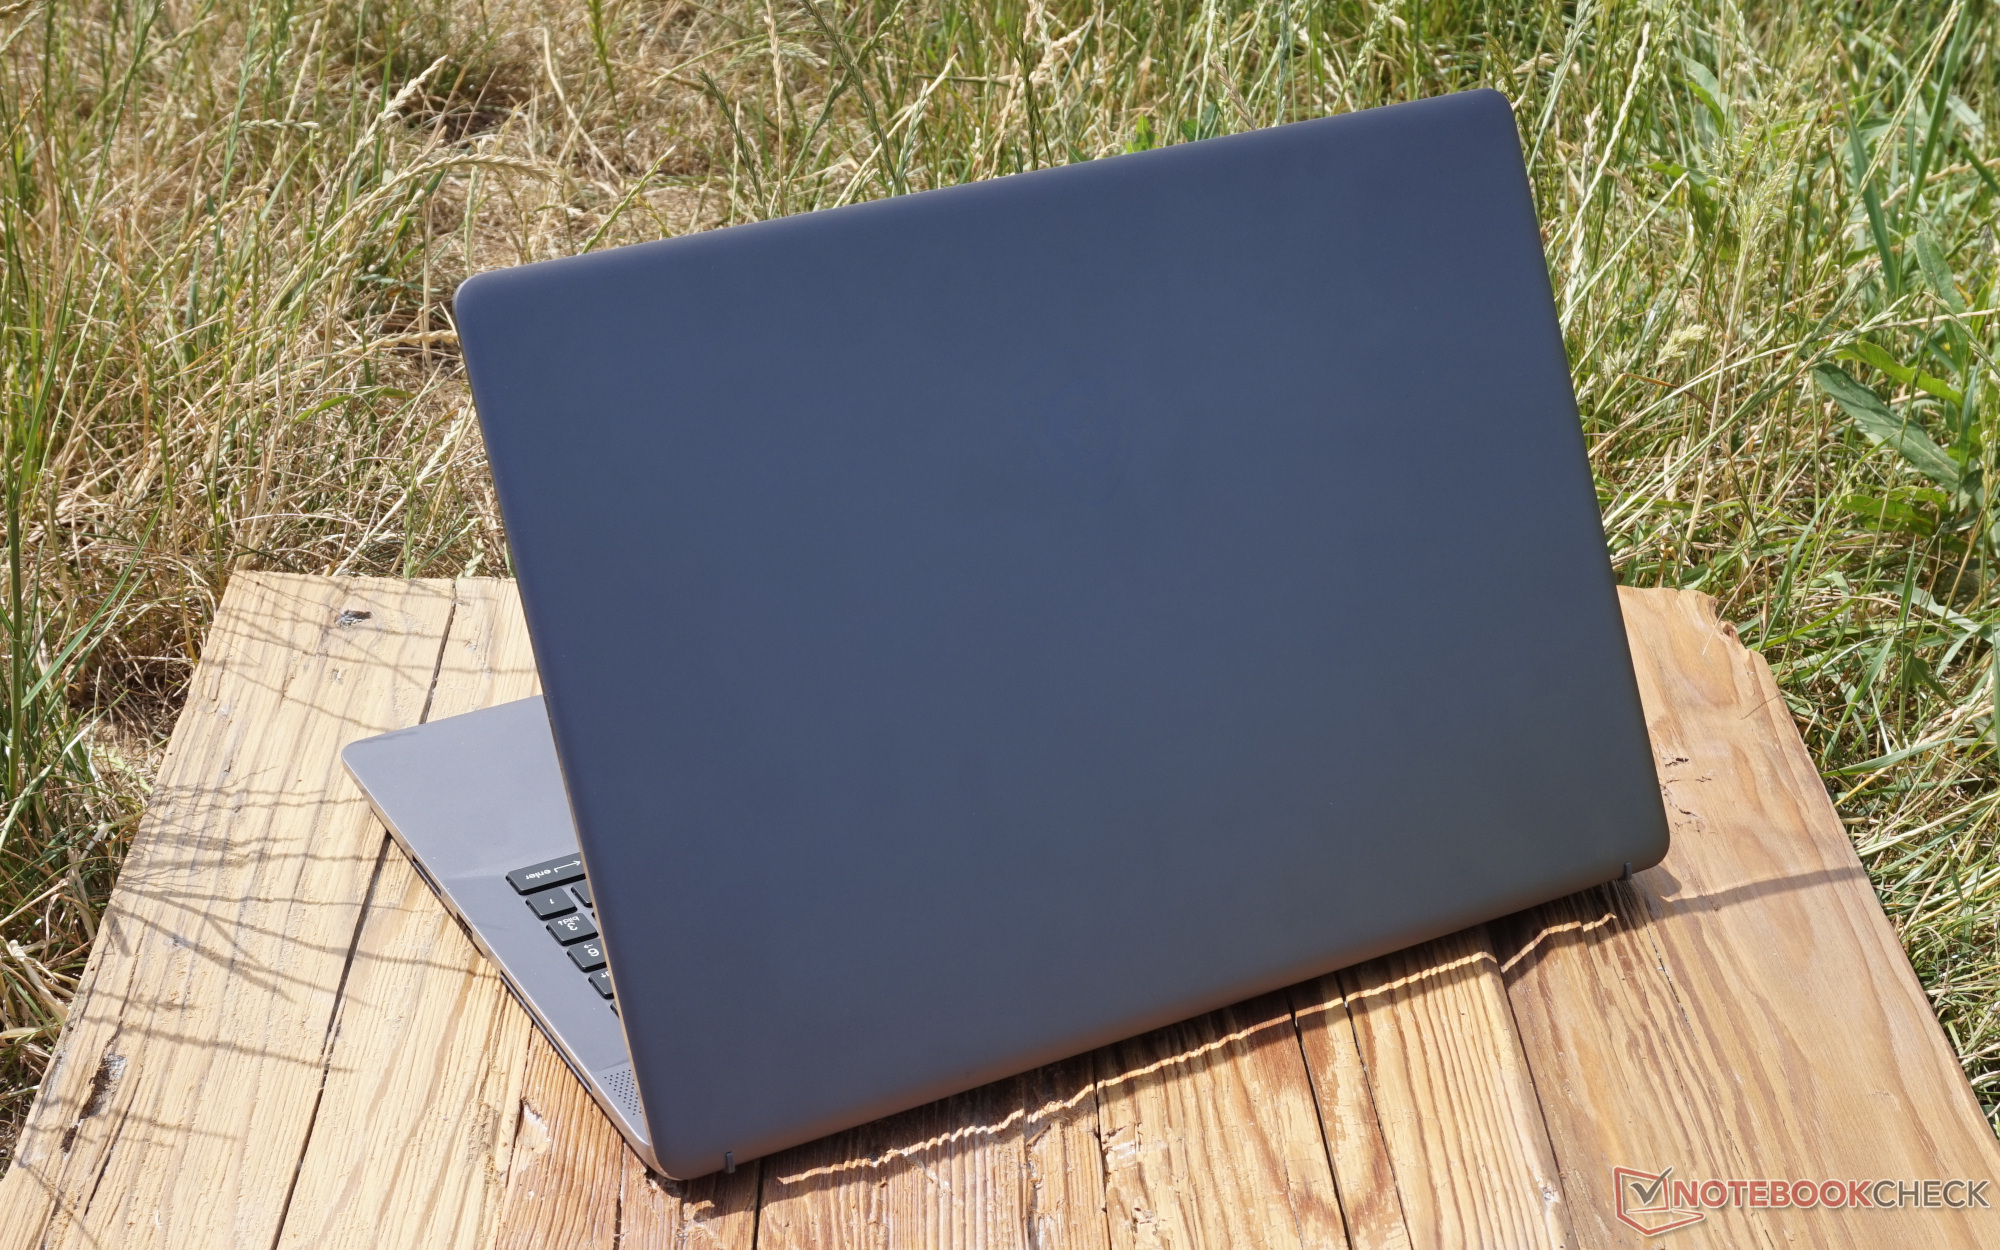
这款机箱不仅看起来很清醒,而且还相当高级。铝制显示盖和键盘框架为MSI Creator提供了高度的稳定性。此外,表面经过处理,几乎不可能在上面留下指纹。底盖的塑料决不是可见的,你只能感觉到它。
另一方面,引人注目的是其结构的坚固性。在任何时候都没有弯曲、让路或振动。即使当它打开时,你从一个角落拿着它,你最多只能感觉到变形,这绝对是2.4公斤的重量所必须实现的。我们也没有听到任何噪音。这种刚性在使用笔记本电脑时有积极作用。触摸屏几乎没有晃动,这是因为它用自己的小橡胶脚接触到表面的缘故。即使在大力打字的时候,键盘框架也没有受到影响。
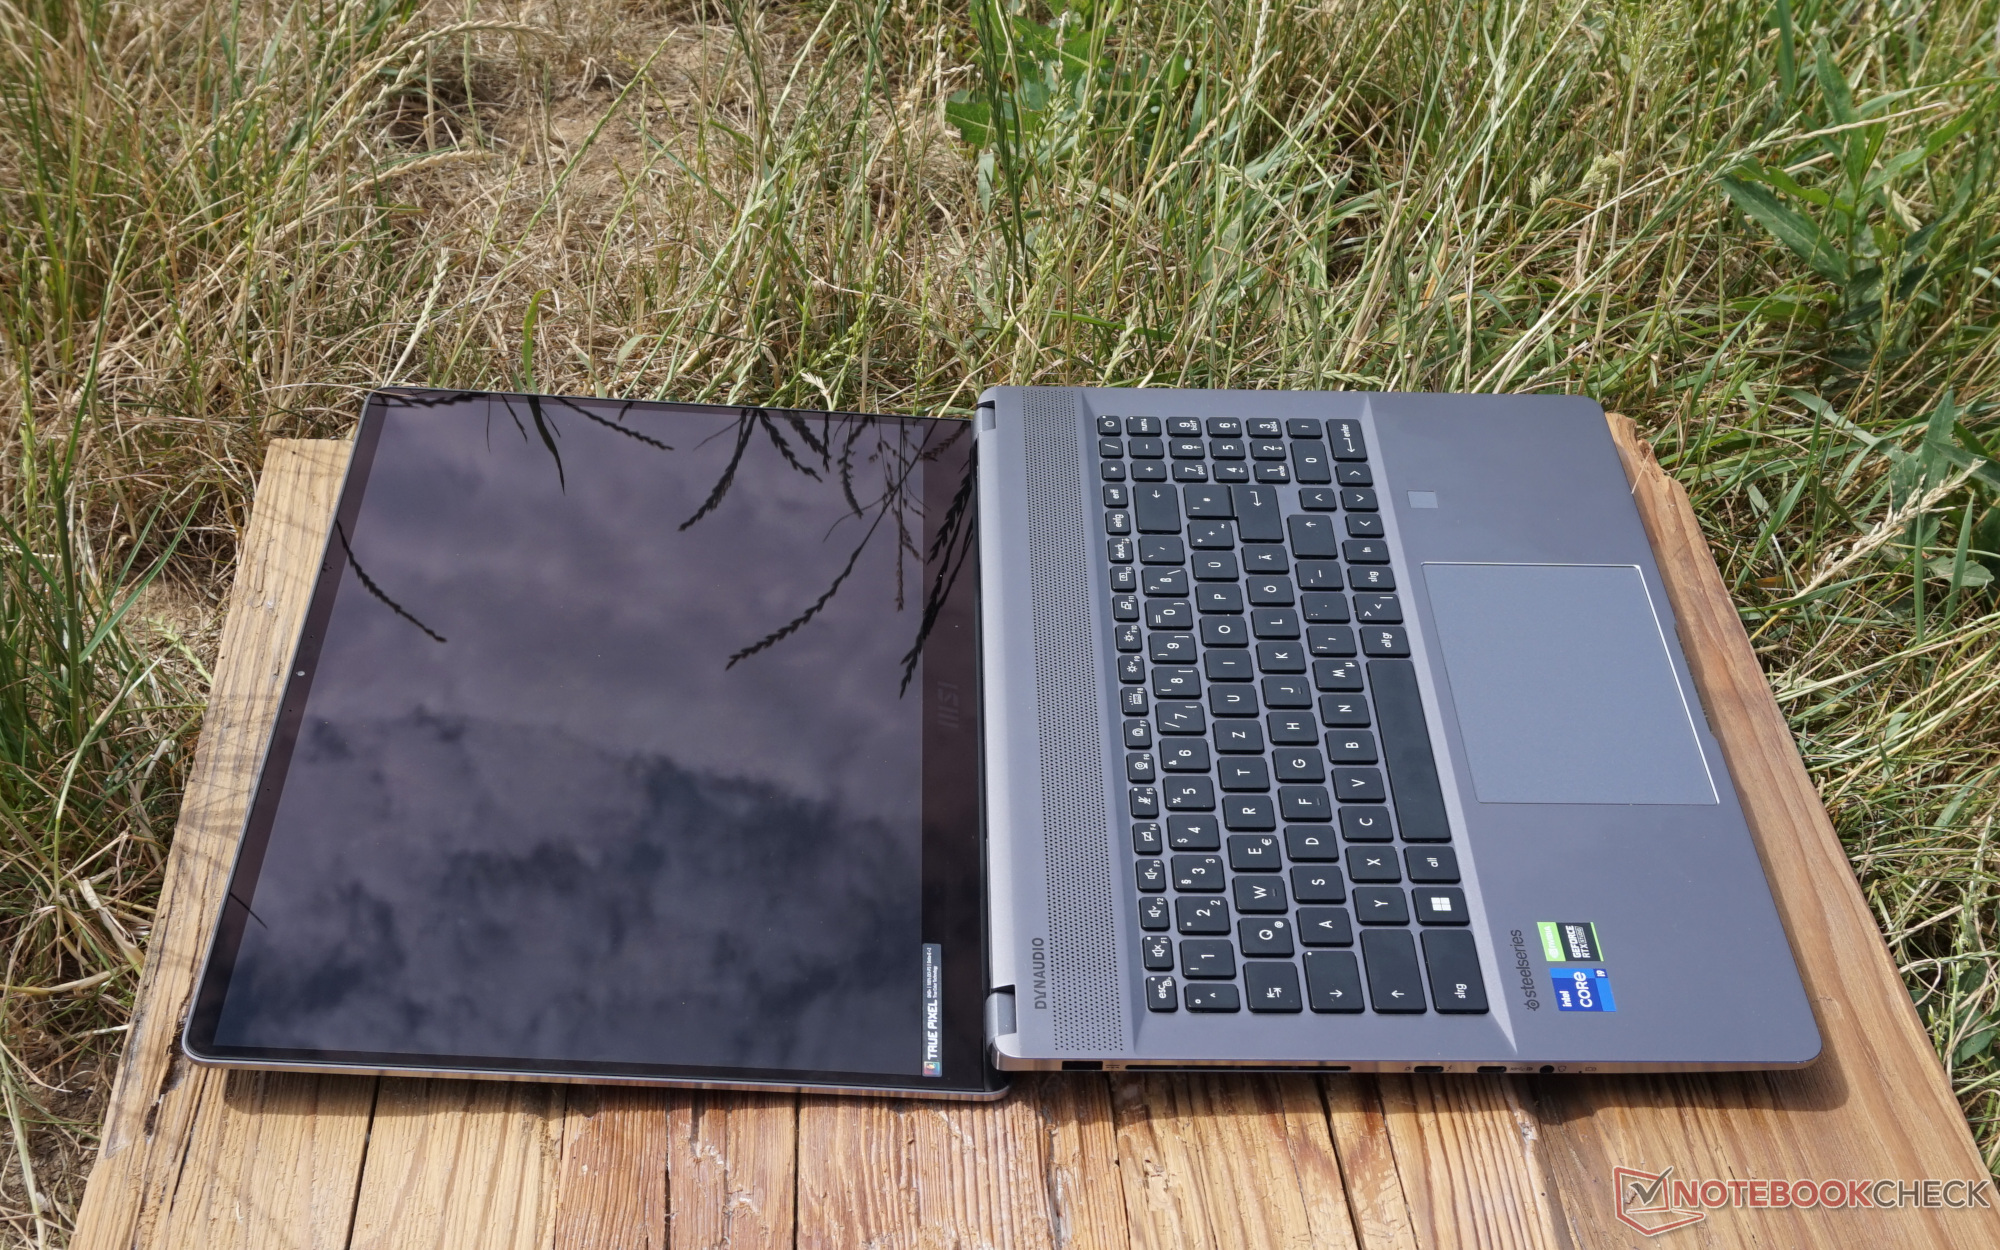
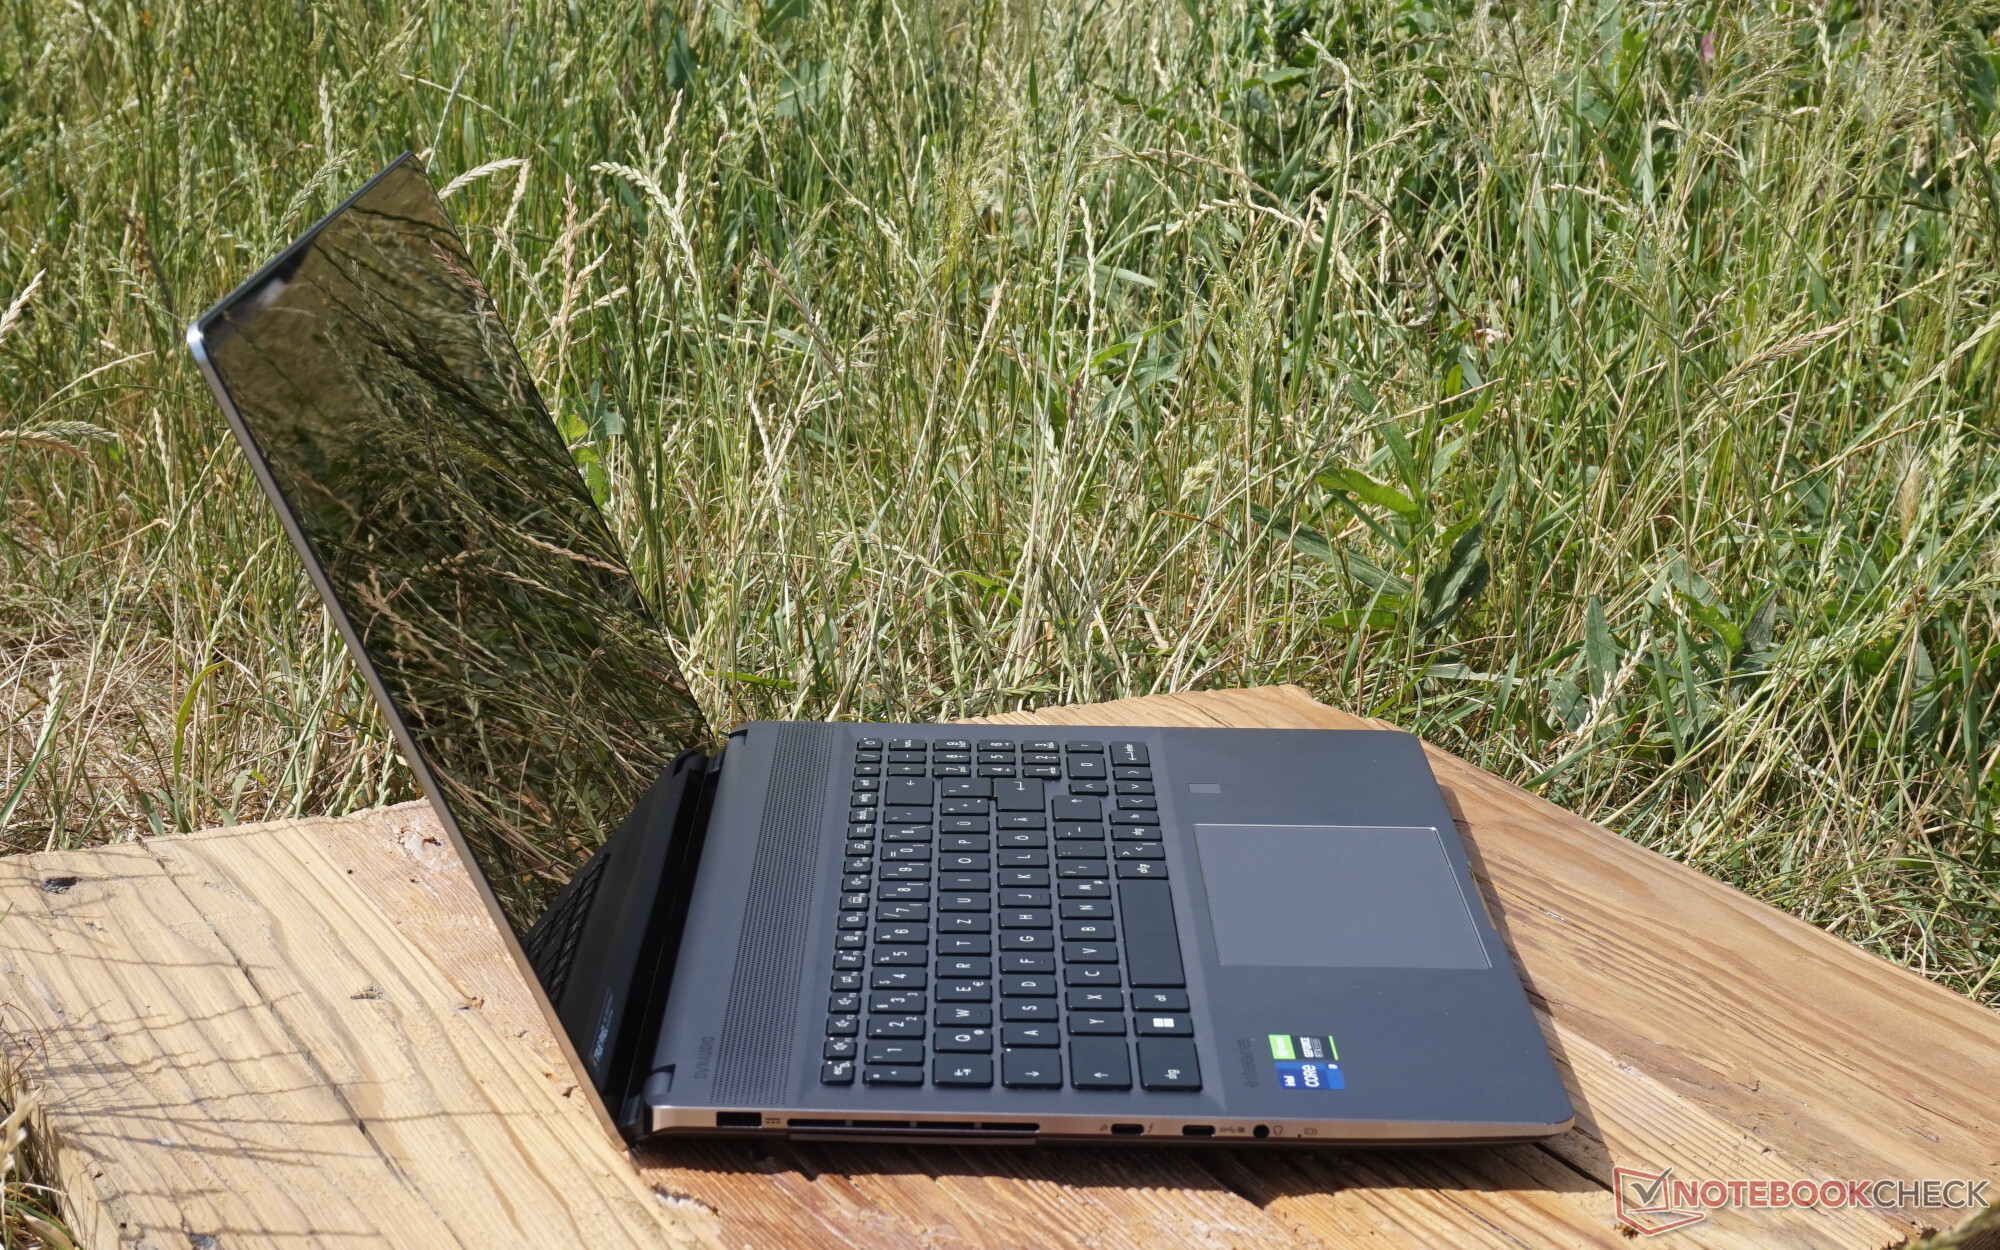
相比之下,其尺寸相当一般。其他用于媒体编辑的16英寸设备也同样宽、深、厚。显示屏边框是适当的苗条,侧面不到6毫米,顶部是10毫米。微星创造者Z16P只在重量上超过了竞争对手。然而,考虑到丰富的配置,这并不令人惊讶。
另一方面,具有类似组件的游戏笔记本电脑,如Alienware x17 R2,要重得多,体积也大得多。毕竟,这里需要更多的空间用于冷却。
连接性--只有TB4真正做到了微星创造者的公正性
连接性似乎相当差。单一的Thunderbolt 4端口特别引人注目,这正好对得起微星Z16P的高端部分。第二个USB-C端口只能管理10Gb/s,也就是四分之一。至少这里也可以连接一个显示器。然而,没有额外的HDMI输出,这在路上时常会很方便。
总的来说,与前代产品相比,有些东西已经改变了,但并不完全是为了更好。第二个Thunderbolt 4端口被移除。也只有一个USB-A端口。此外,USB-A端口现在在右边,而两个USB-C端口都在左边。如果最终没有包括一个全尺寸的卡槽,而不是一个microSD卡槽,我们可以说这是一个完全的退步。


SD卡阅读器
在端口方面相当一般的情况延续到了卡槽。使用我们的AV Pro microSD 128 GB V60参考卡,甚至不能达到所有多媒体笔记本电脑的平均数值。微星造物主Z16再一次展示了如何做得更好。
不可否认的是。即使是大的视频文件也能在很短的时间内复制出来。然而,而不是1至2分钟,微星Creator Z16P现在需要5分钟来读取25GB,例如。
| SD Card Reader - average JPG Copy Test (av. of 3 runs) | |
| MSI Creator Z16 A11UET-209 (AV Pro SD microSD 128 GB V60) | |
| Average of class Multimedia (23 - 531, n=37, last 2 years) | |
| MSI Creator Z16P B12UHST (AV PRO microSD 128 GB V60) | |
| Acer Predator Triton 500 SE PT516-52s-70KX (AV PRO microSD 128 GB V60) | |
沟通
杀手Wi-Fi 6E AX1675i几乎不可避免地将创意笔记本电脑放在了排名的首位。尽管对于这些传输速率来说,仍然需要一个相应能力的路由器,但一个现代的Fritzbox已经足以满足这个要求。
因此,快速的无线通信在一定程度上弥补了端口选择有限或缺乏LAN端口的缺陷。
网络摄像头
200万像素的分辨率确保了相对详细的图像,它在高质量和低数据量之间提供了一个明智的中间地带,特别是对于视频通话。
四向麦克风也有助于获得愉快的视频会议体验。从不同的方向和距离都能清晰地接收到声音,即使是在相反的方向说话。此外,还有两个软件解决方案,以进一步提高扬声器和麦克风中与环境噪声有关的声音。例如,这在处理街道噪音时效果相当好。


安全问题
这款高价位的笔记本电脑有两个可靠的安全功能,分别是红外传感器和指纹扫描仪。它们工作可靠,但它们没有更多的作用。
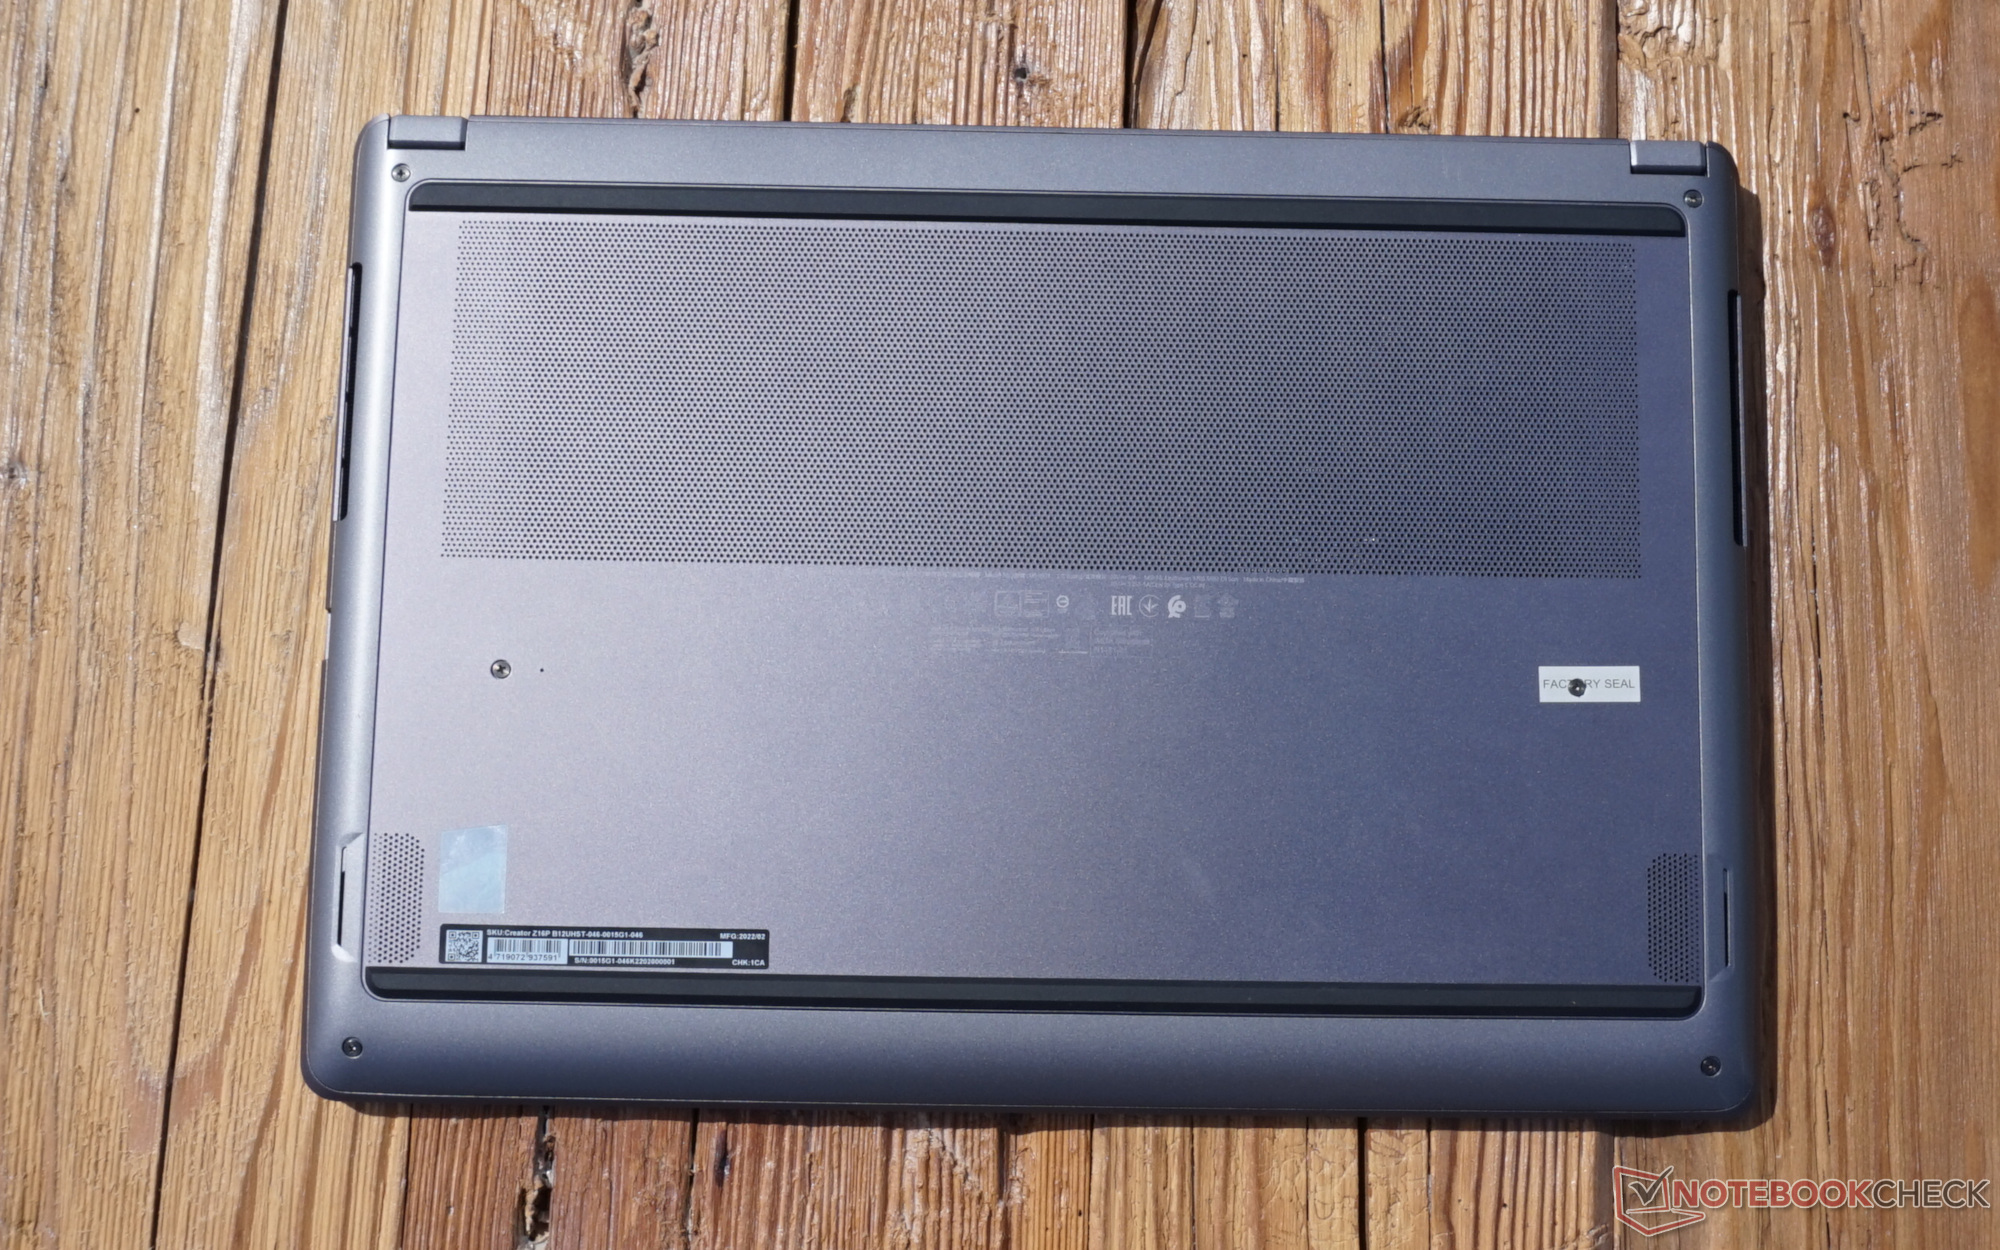
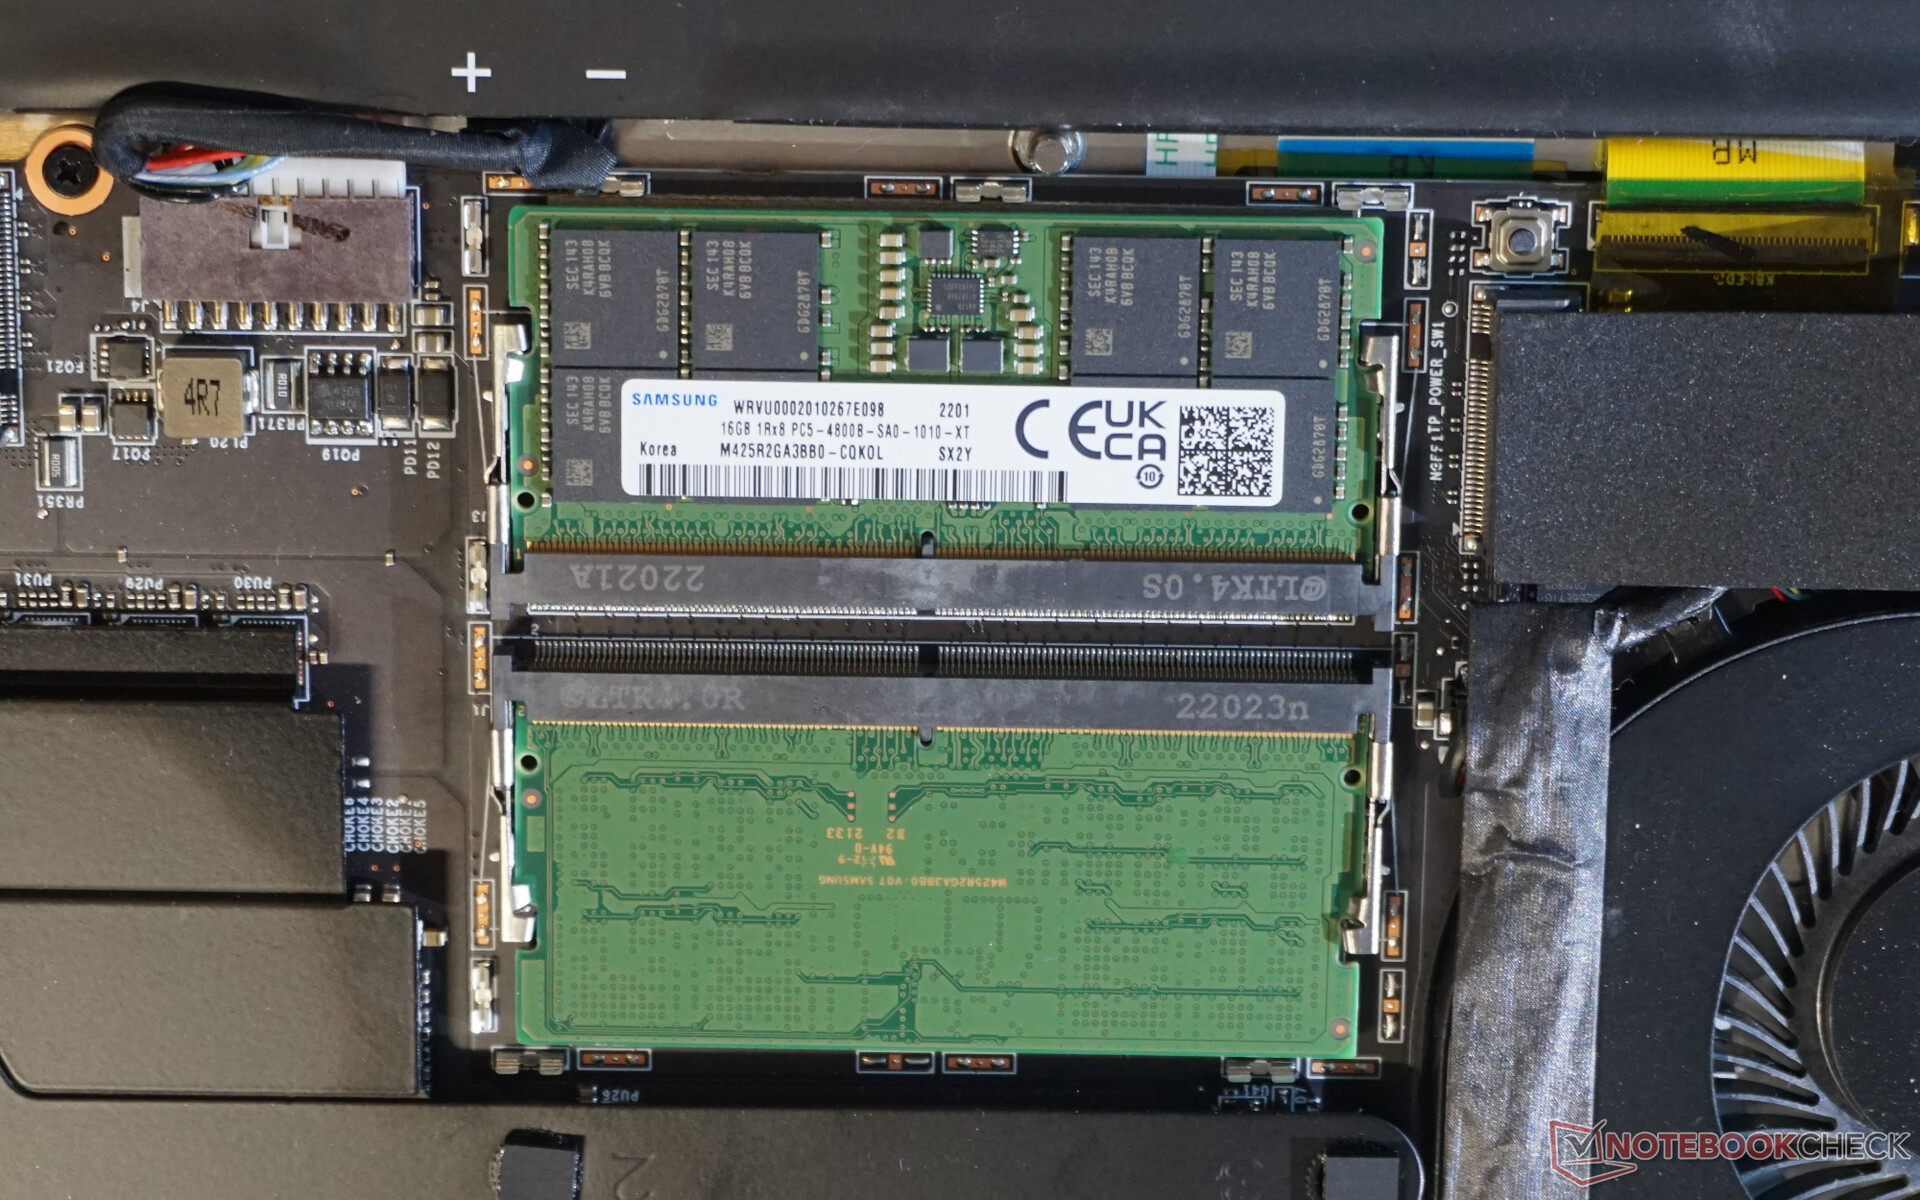
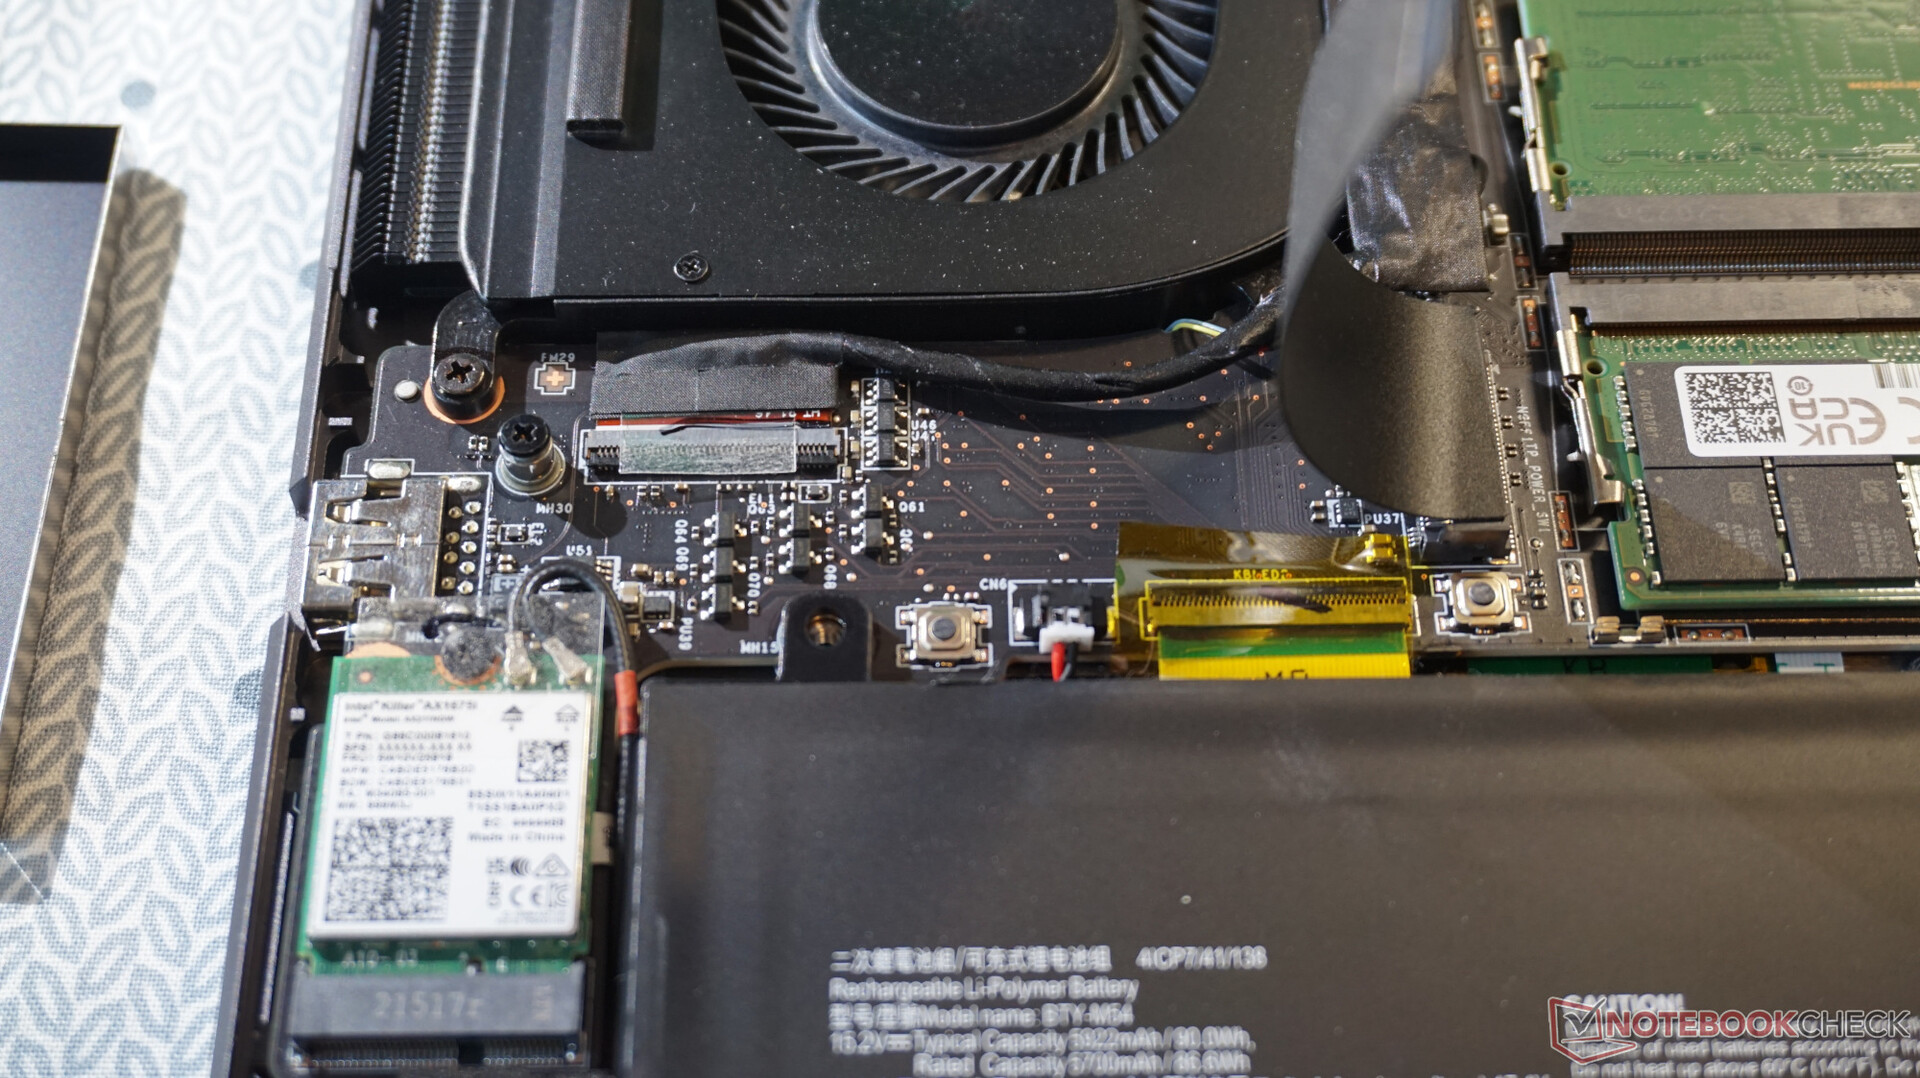
维护
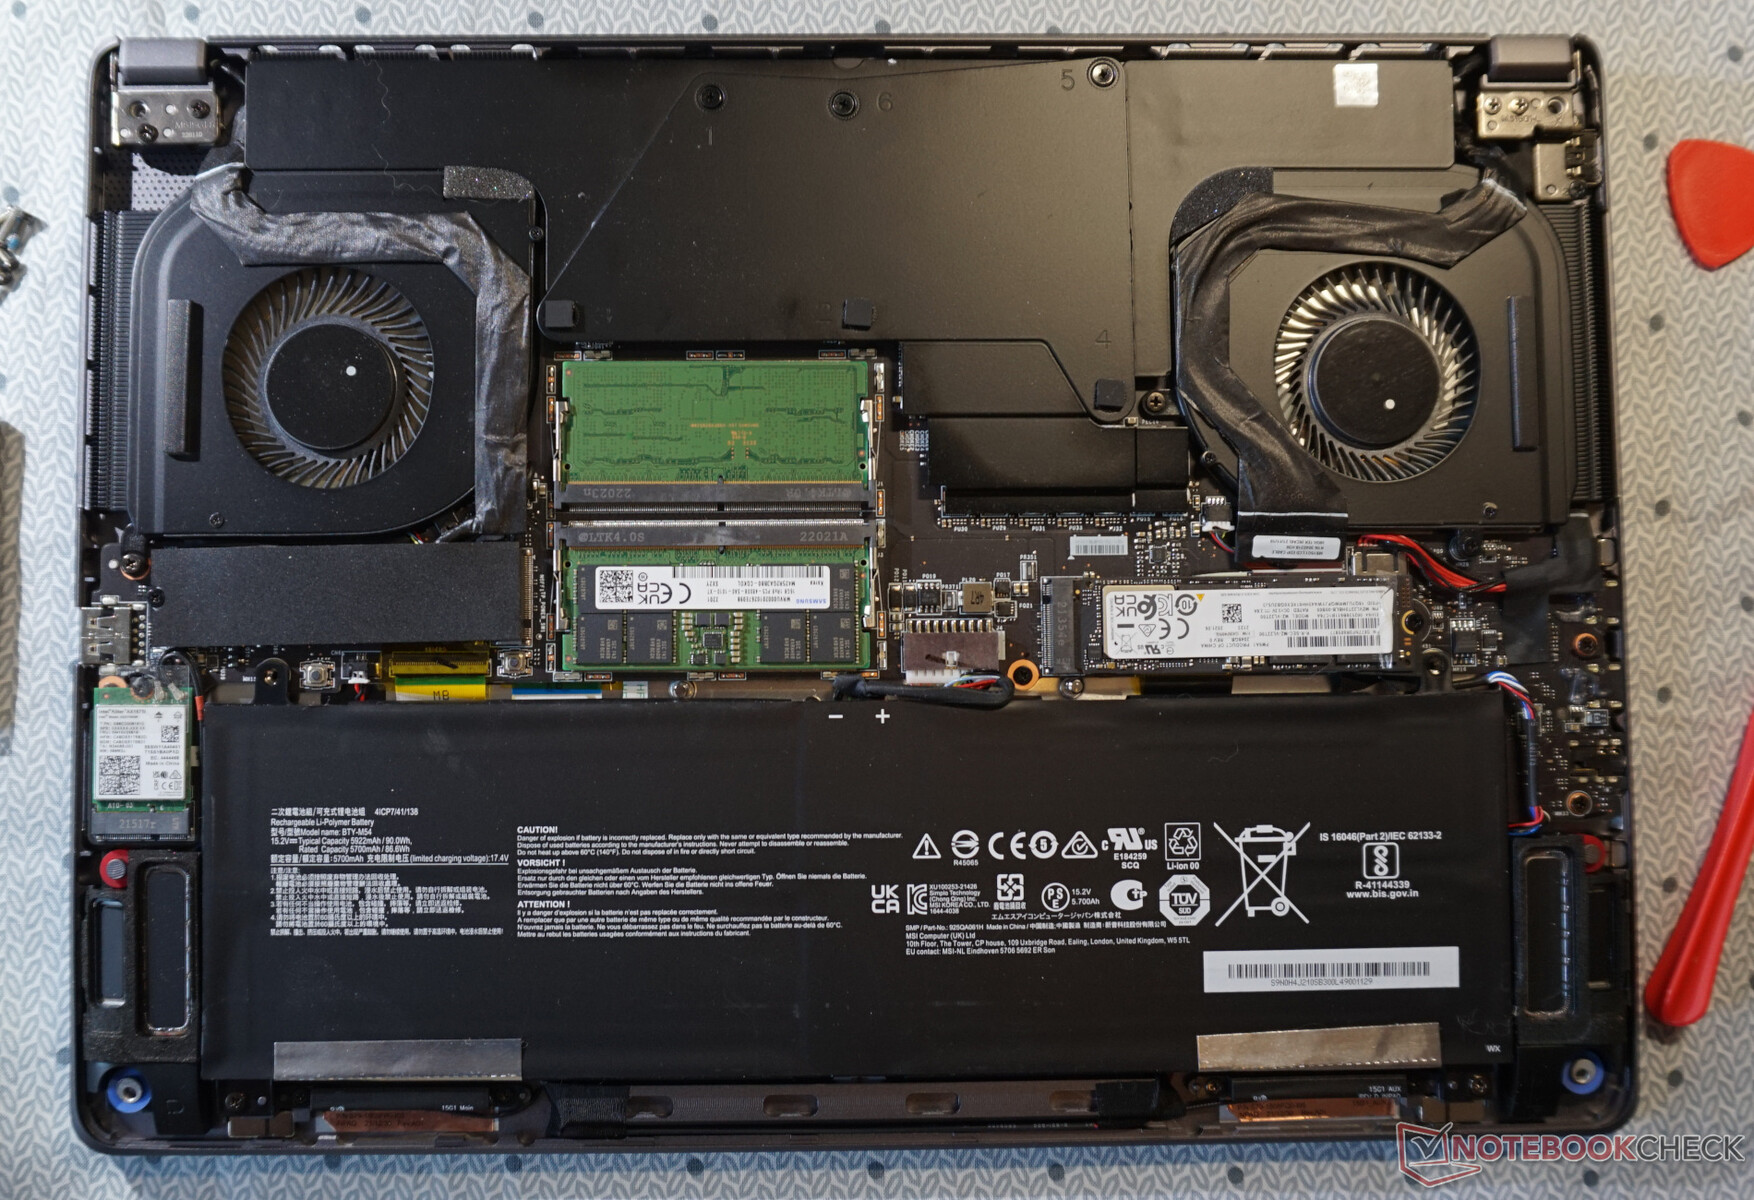
微星造物主Z16P是一个令人印象深刻的笔记本电脑应该如何打开的示范。诚然,其中一个螺丝是在密封之下。然而,这是立即可以识别的。你必须松开六个相同的十字头螺丝,之后,手指的力量就足够了(不过建议使用撬动工具),可以在不损坏的情况下拉开整个底盖。
第二个M.2插槽用于存储扩展,已经配备了一个散热盖。电池和RAM组件也可以不费吹灰之力地更换。清洁风扇也同样容易。
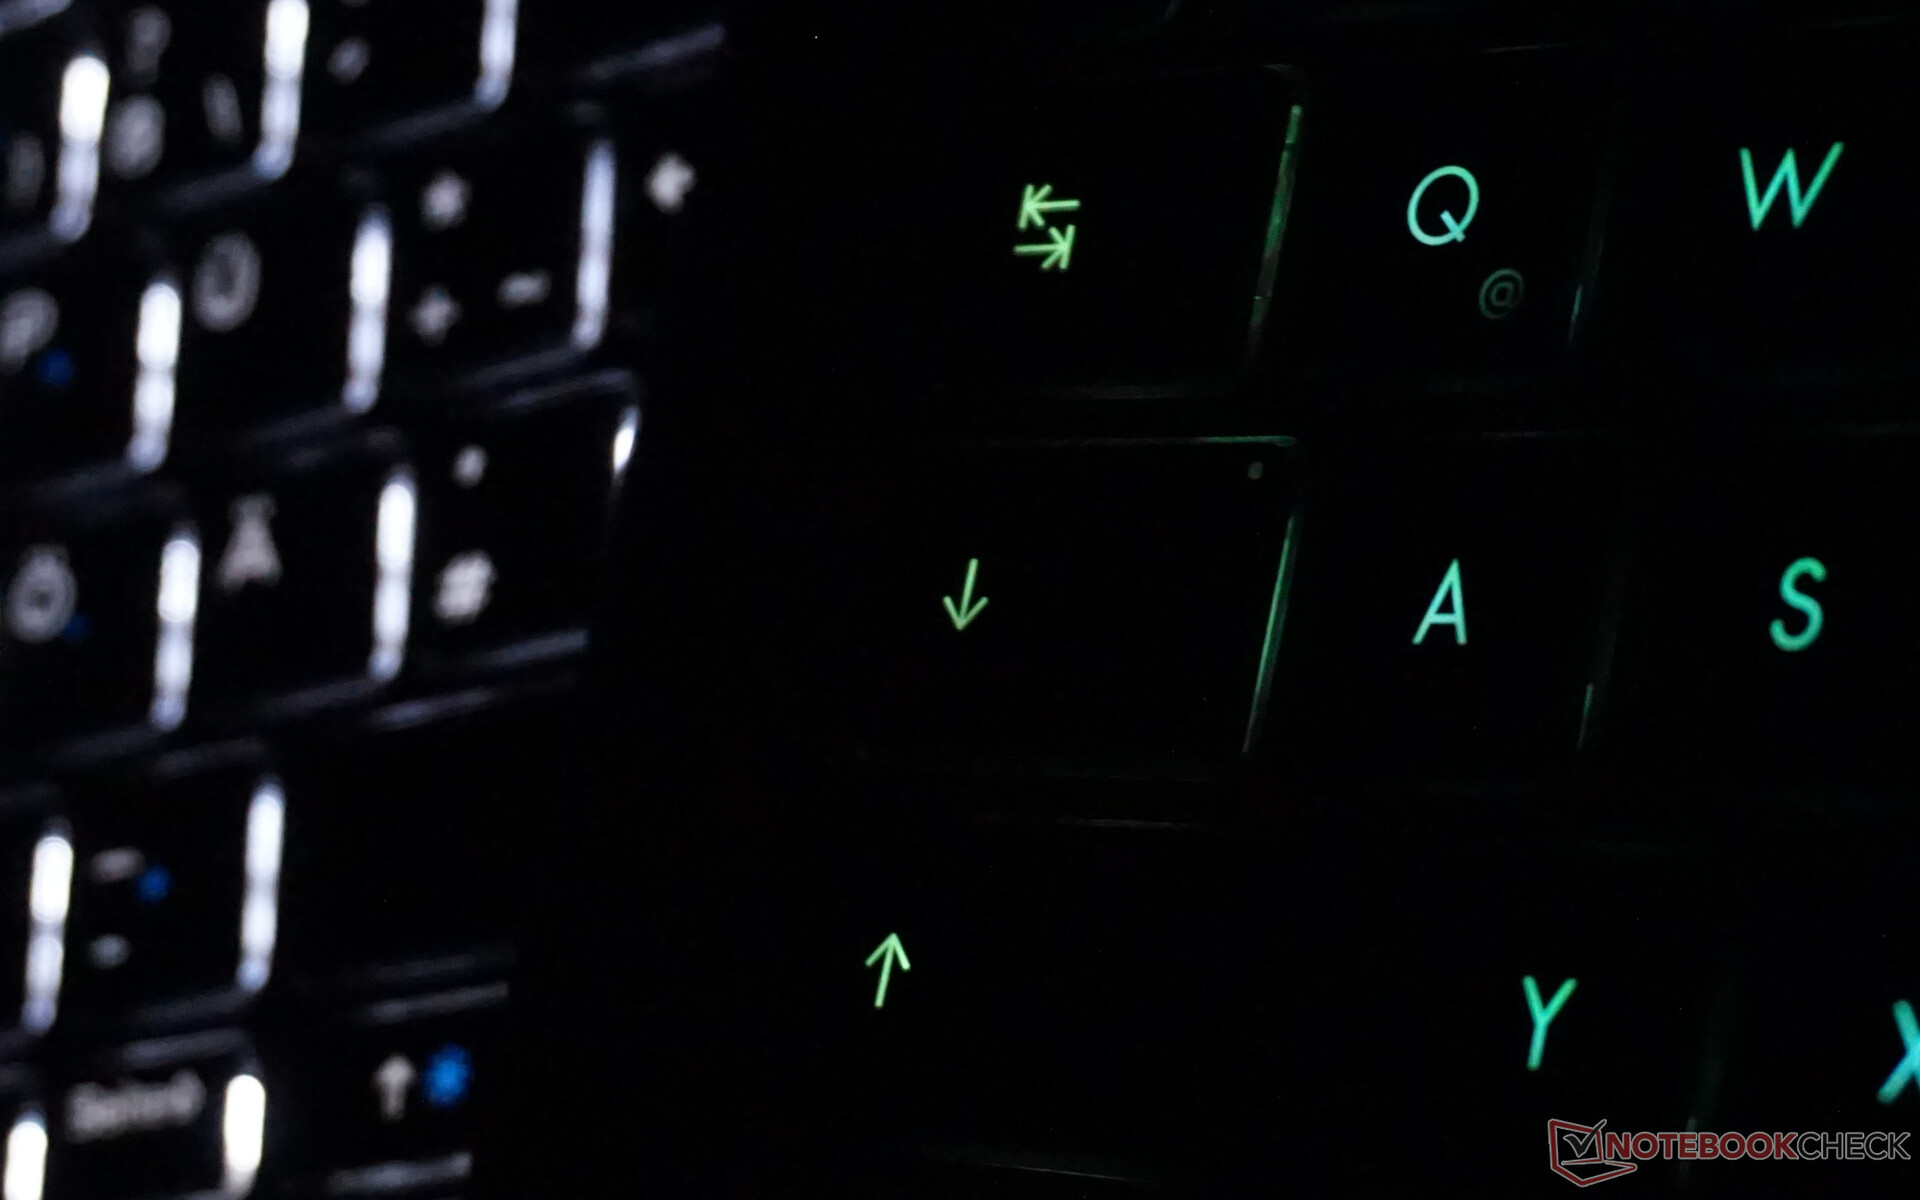
输入设备 - 彩色照明,精度有限
键盘
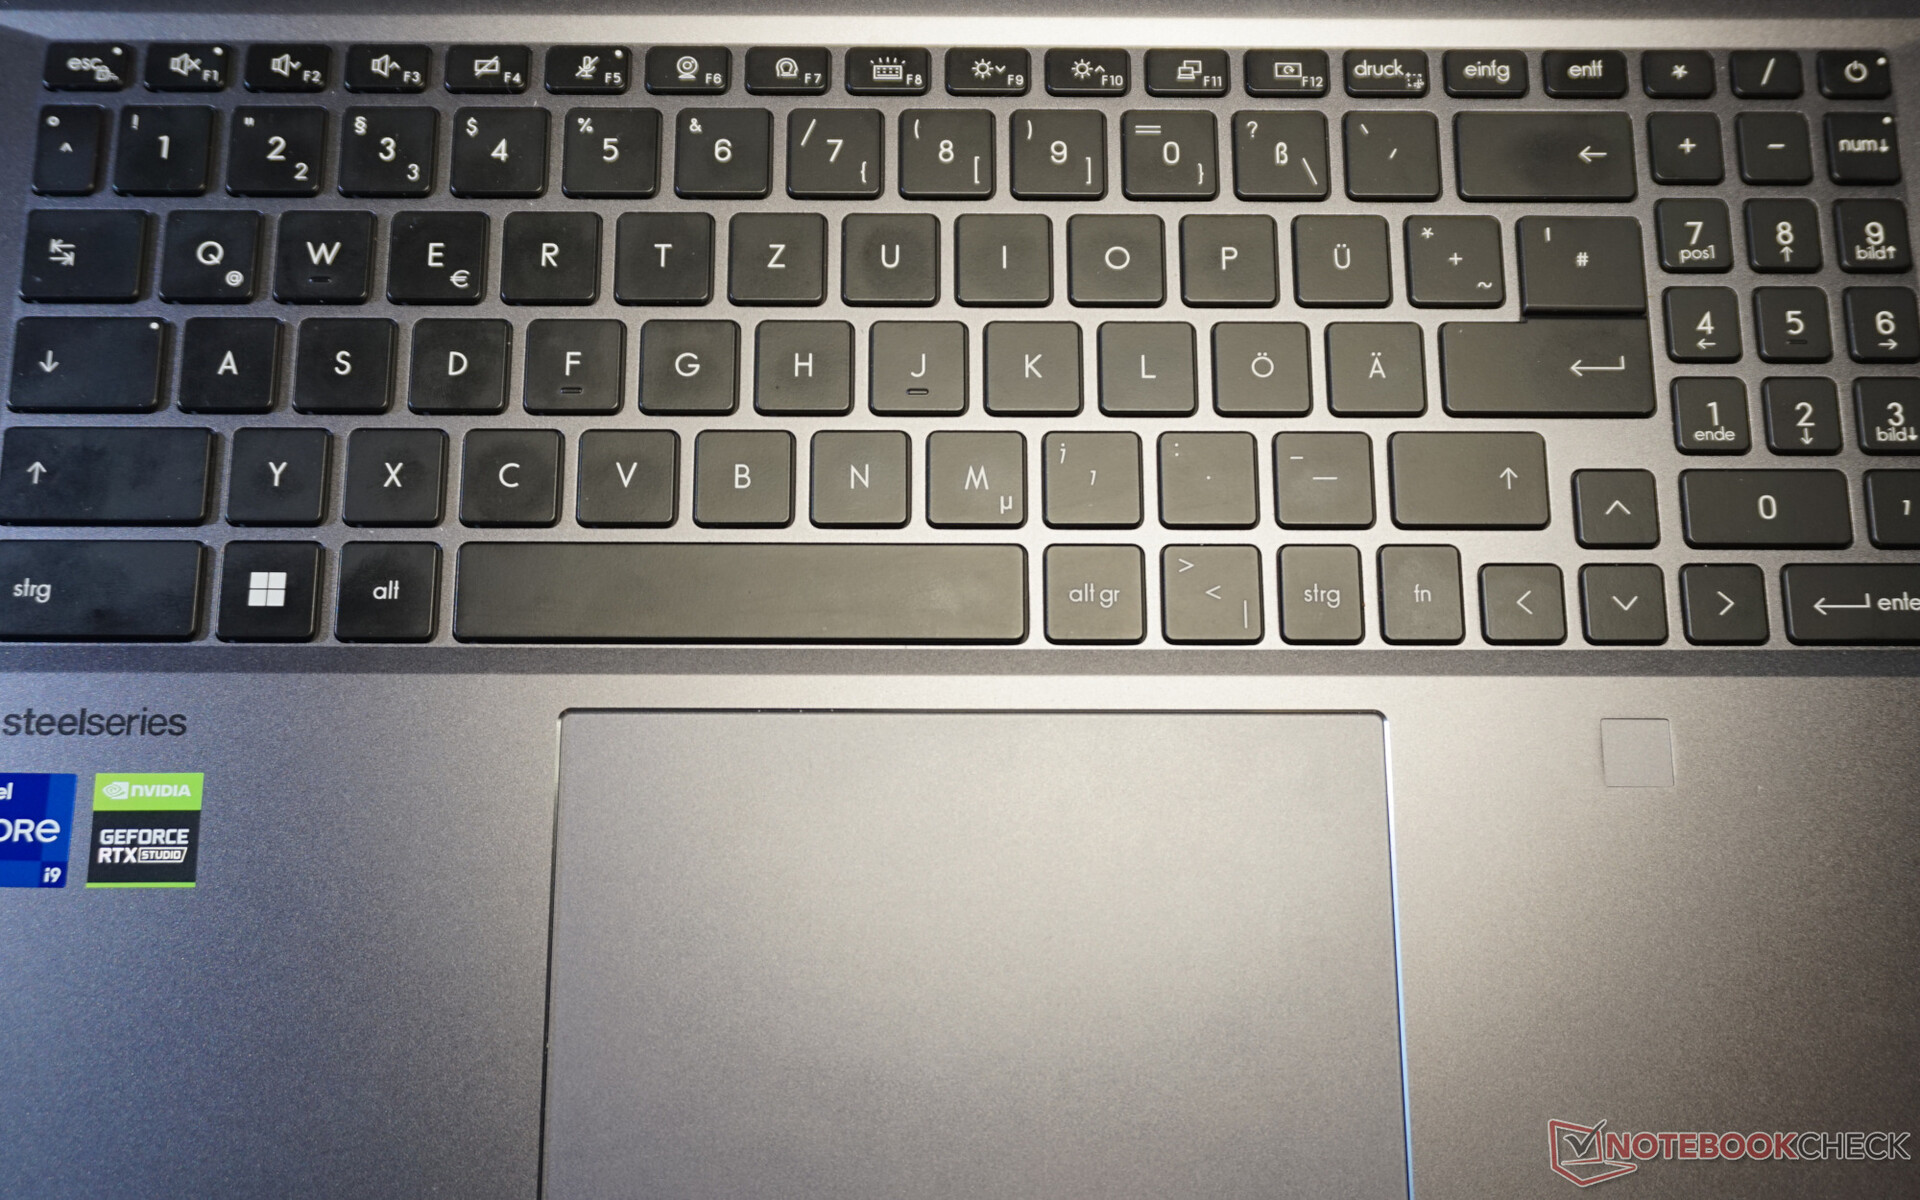
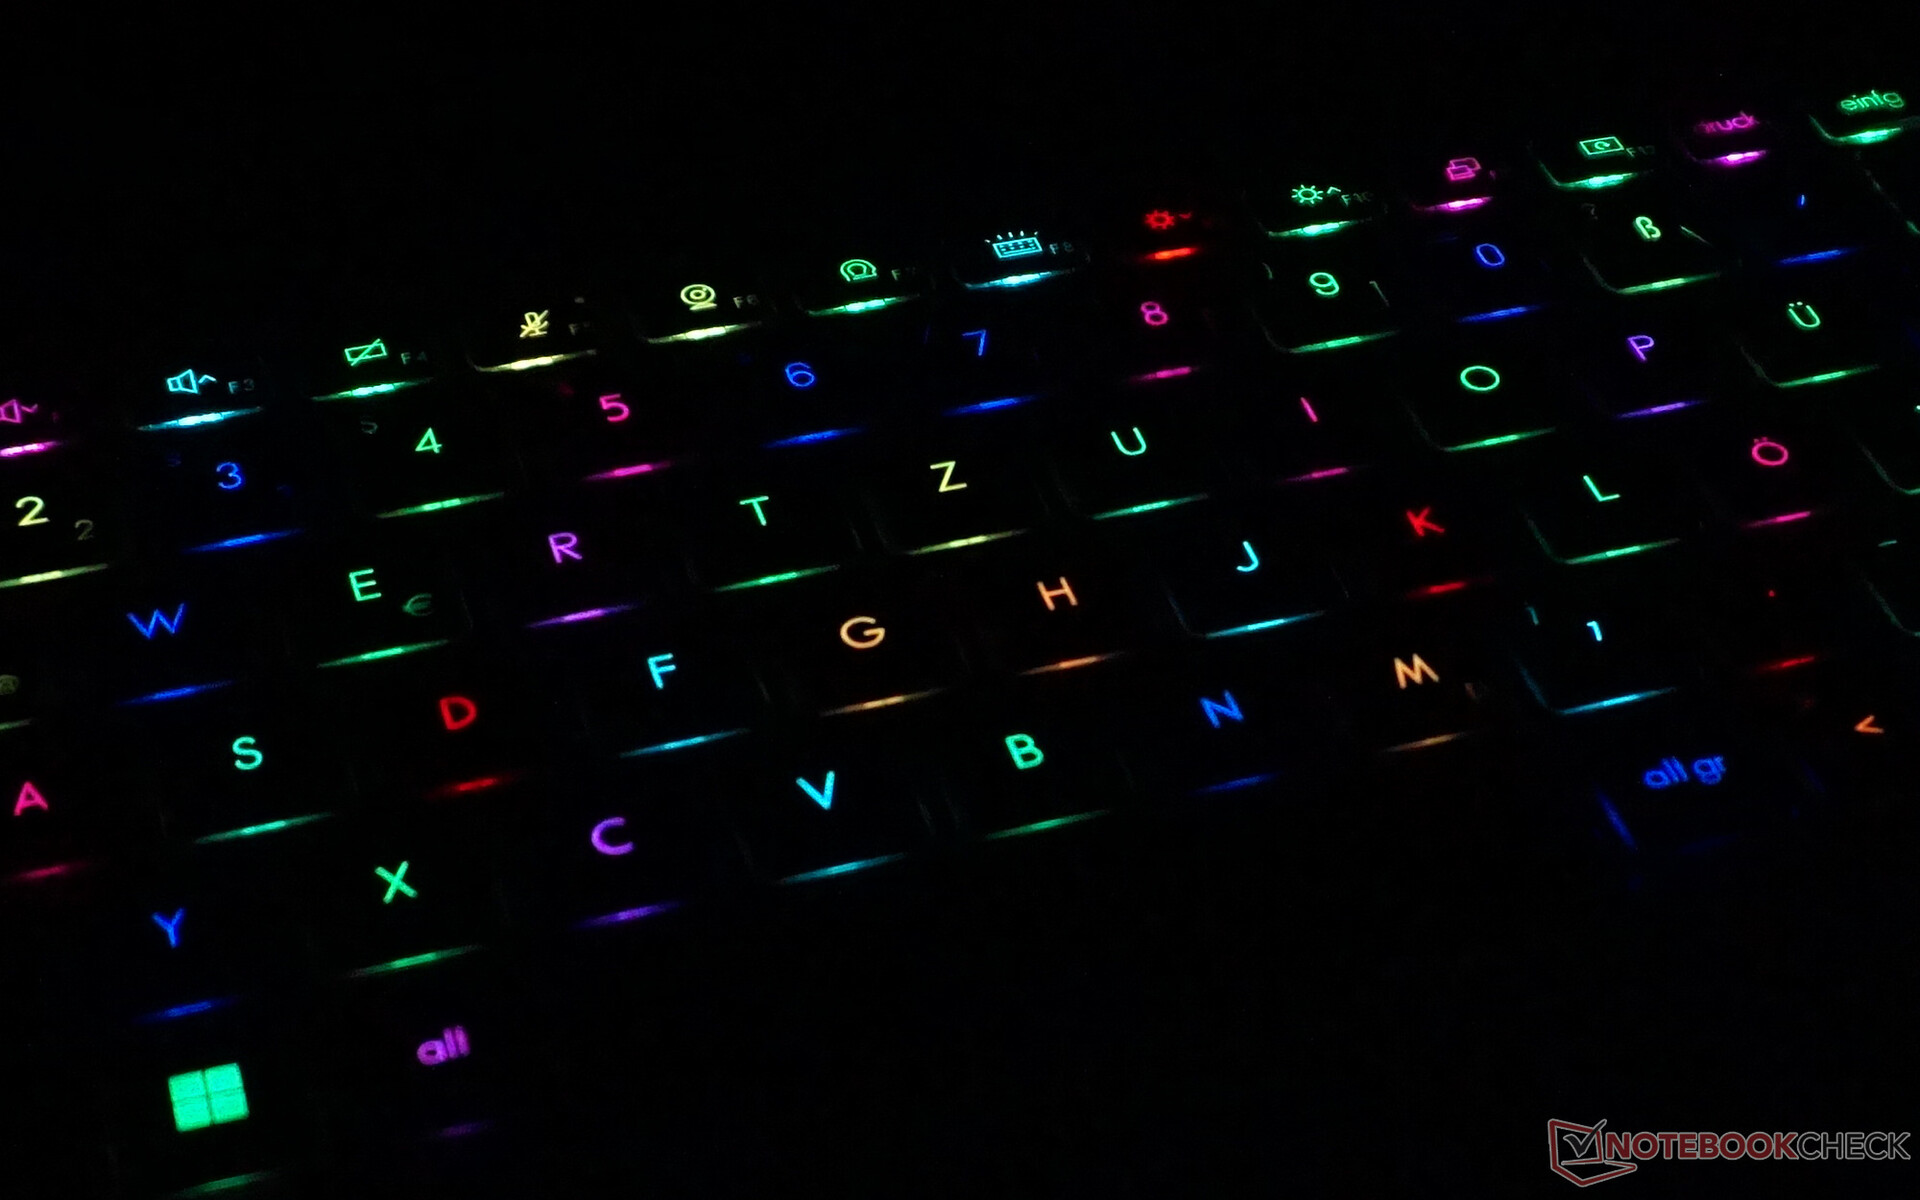
只要你开始使用微星造物主Z16P,丰富多彩的键盘照明就会脱颖而出。除了预设的效果外,你还可以选择自己的分配,甚至为每个单独的键单独选择。只有与某些传感器值或CPU负载的链接,例如,对我们来说没有作用。
键盘本身具有通常的标准尺寸,所以它也适合于匆忙打字的用户。然而,短行程造成的有限反馈从长远来看可能会变得有点麻烦。这对于笔记本电脑来说是完全可以接受的,尤其是反压的效果非常好。
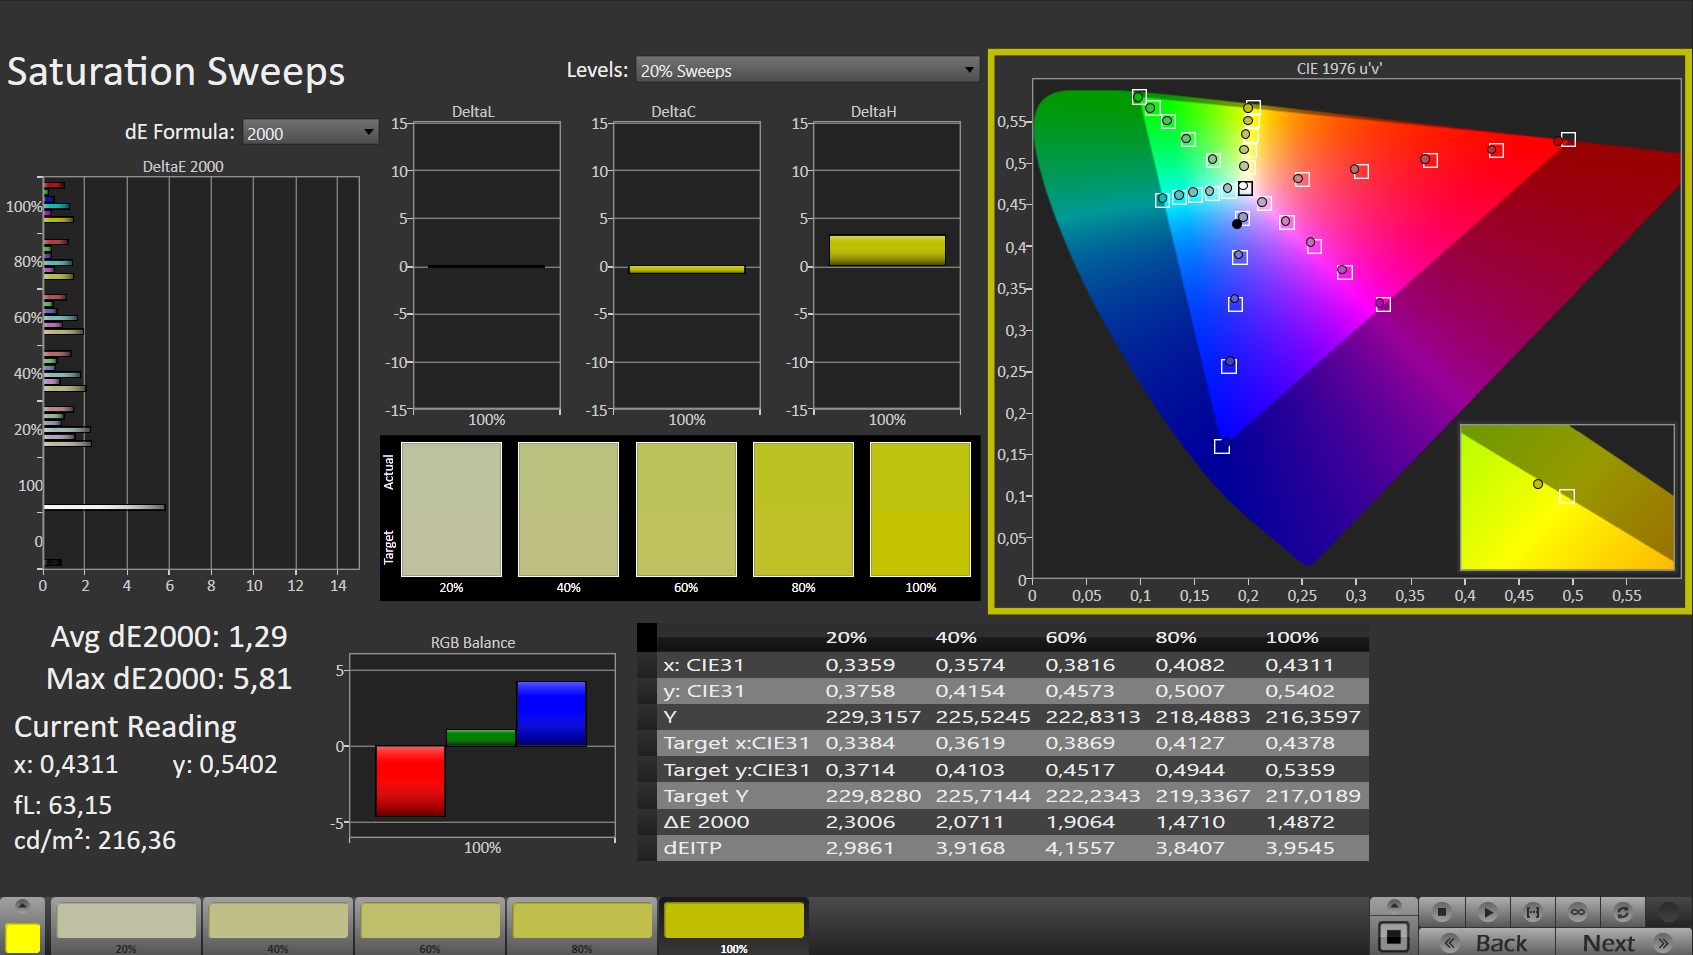
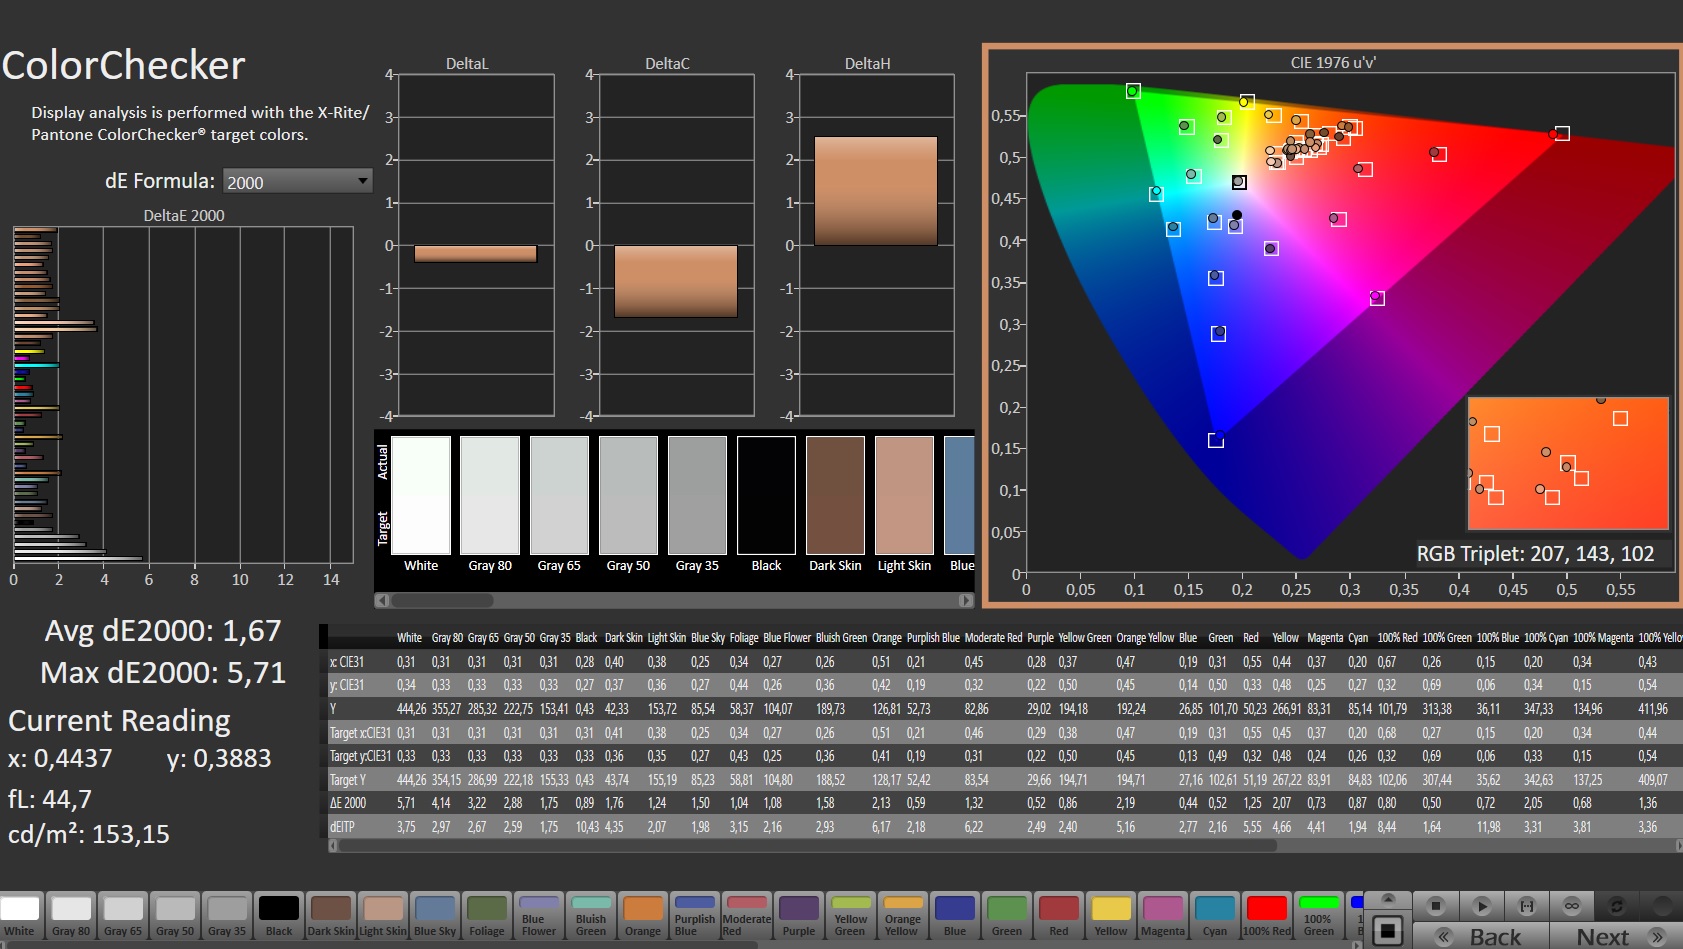
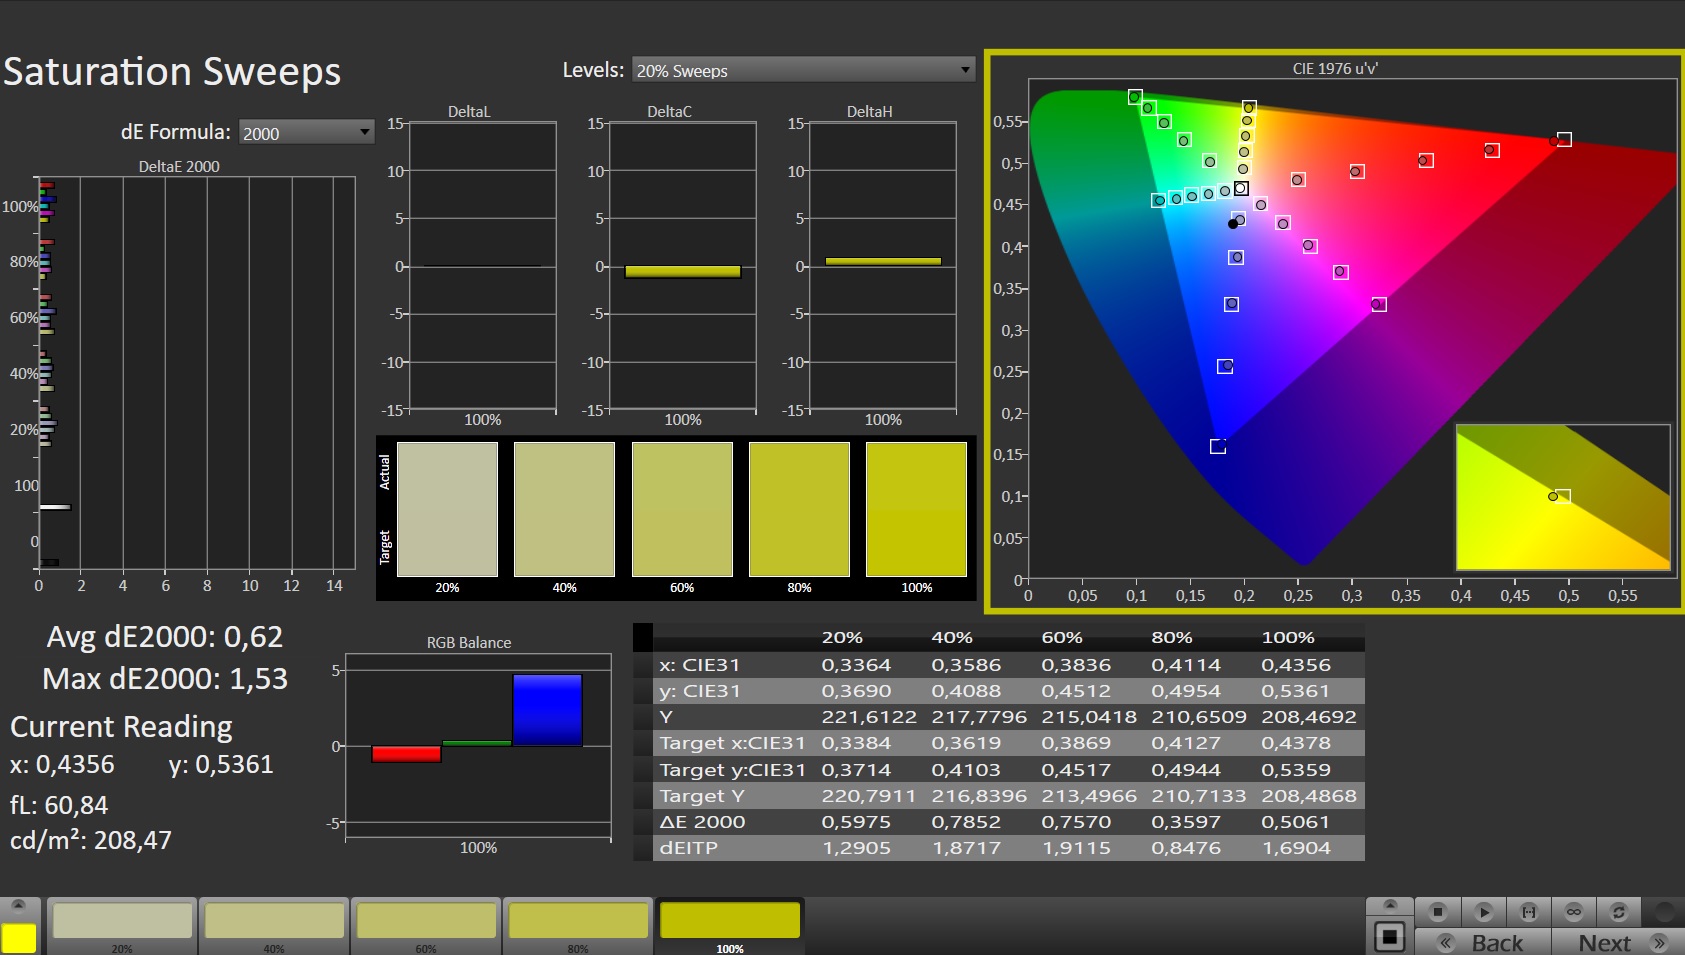
我们评测的模型在选择全白颜色设置和黄颜色设置时都出现了绿色的色调。微星公司给我们发来了以下声明作为回应。因为白色照明是由RGB照明的三种基本颜色组成的,根据环境光线和个人感觉,在技术公差范围内,键盘照明的各个颜色的再现可能会有个别差异。SteelSeries Engine 3可以用来根据自己的喜好优化外观,找到最合适的色调。
触摸板
特别是8x13厘米的触摸板,其舒适的尺寸有利于快速和多功能的操作。稍微粗糙的表面允许用一到四个手指精确输入。
缺少物理按键的情况就不那么理想了。至少,压力点和必要的强度感觉很奇怪。
触摸屏
牢固的铰链和两个小橡胶脚在使用触摸屏时提供足够的稳定性。它可以精确地使用,没有问题。然而,使用手指不可避免地留下痕迹,干扰了显示屏的高质量再现。
因此,强烈推荐的微星笔,尽管价格不菲,但并不包括在内。箱子里也没有笔的插槽,这当然可以找到。
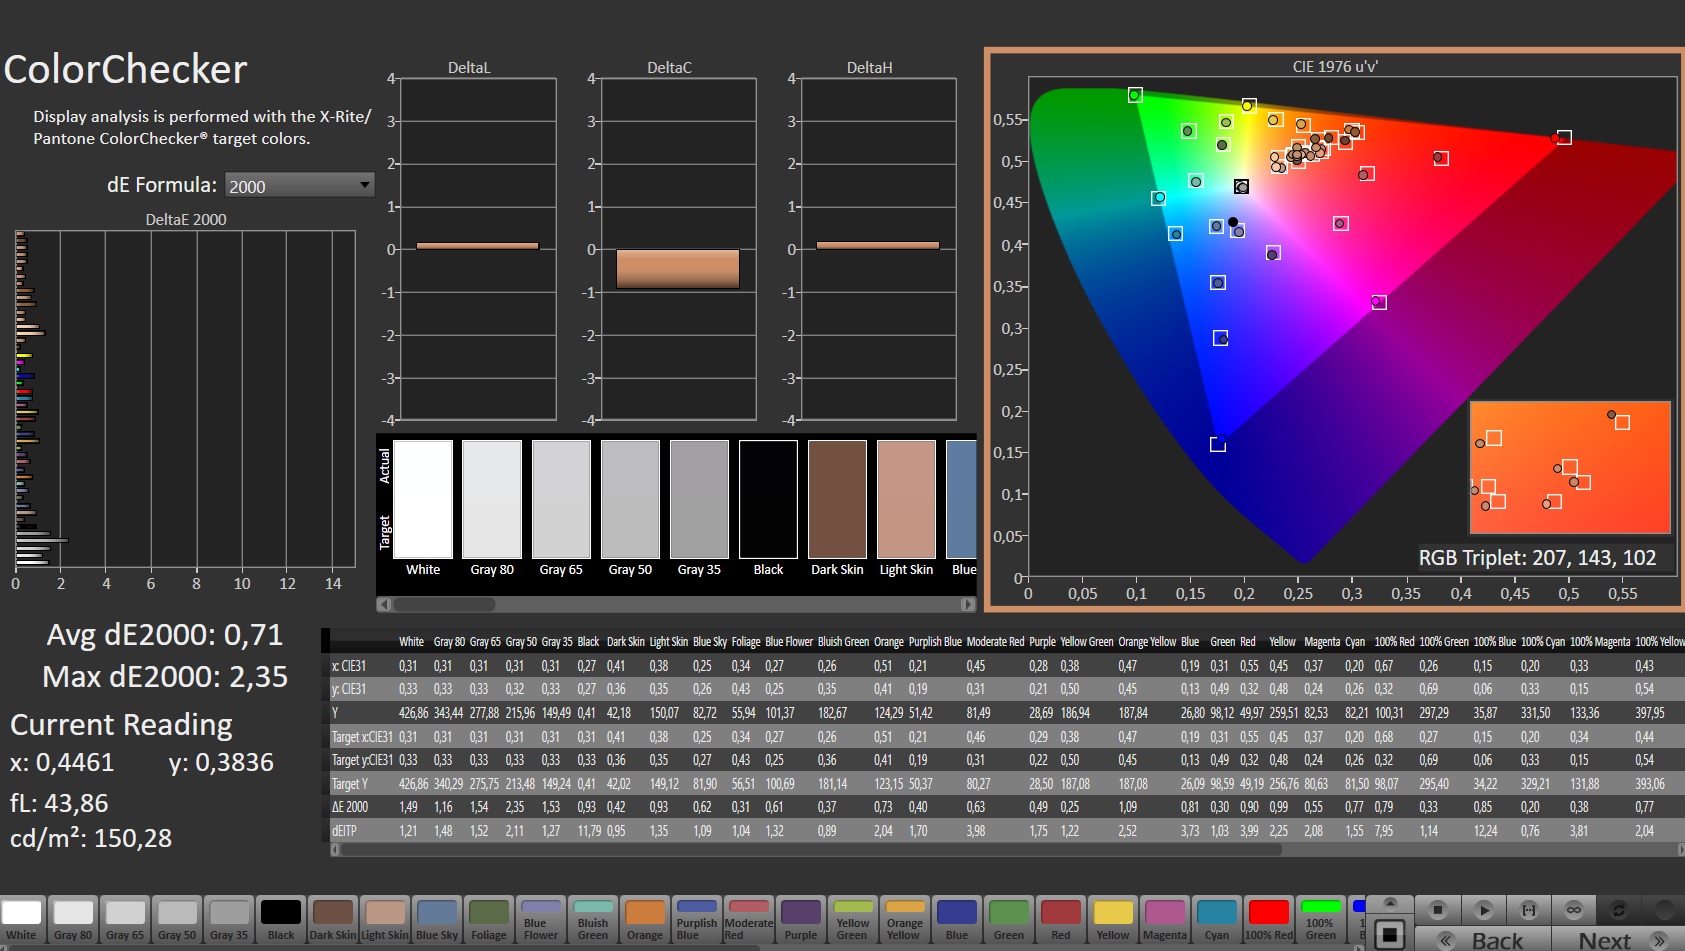
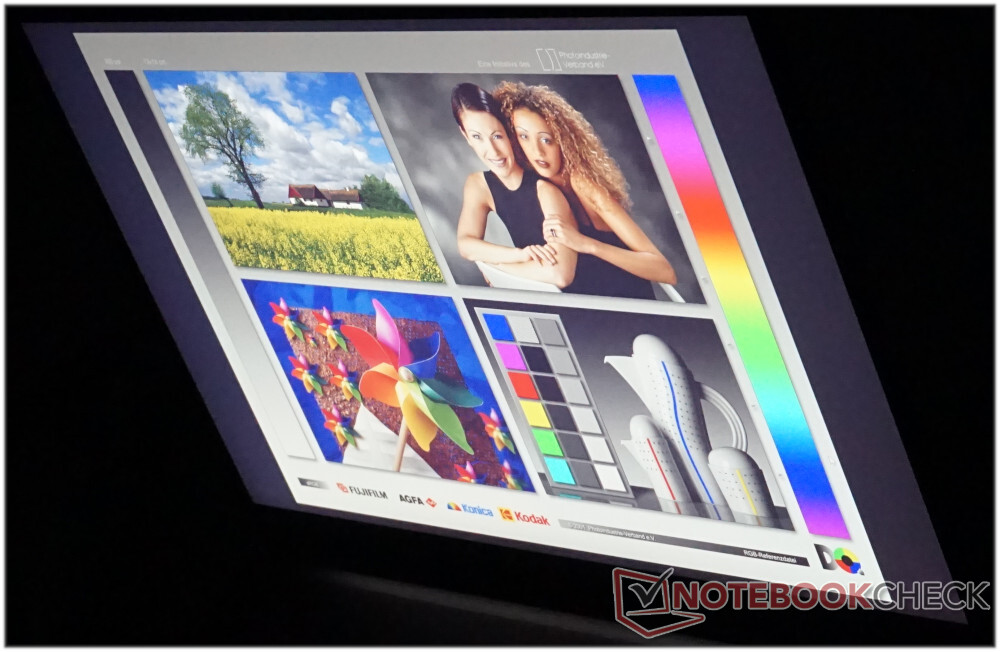
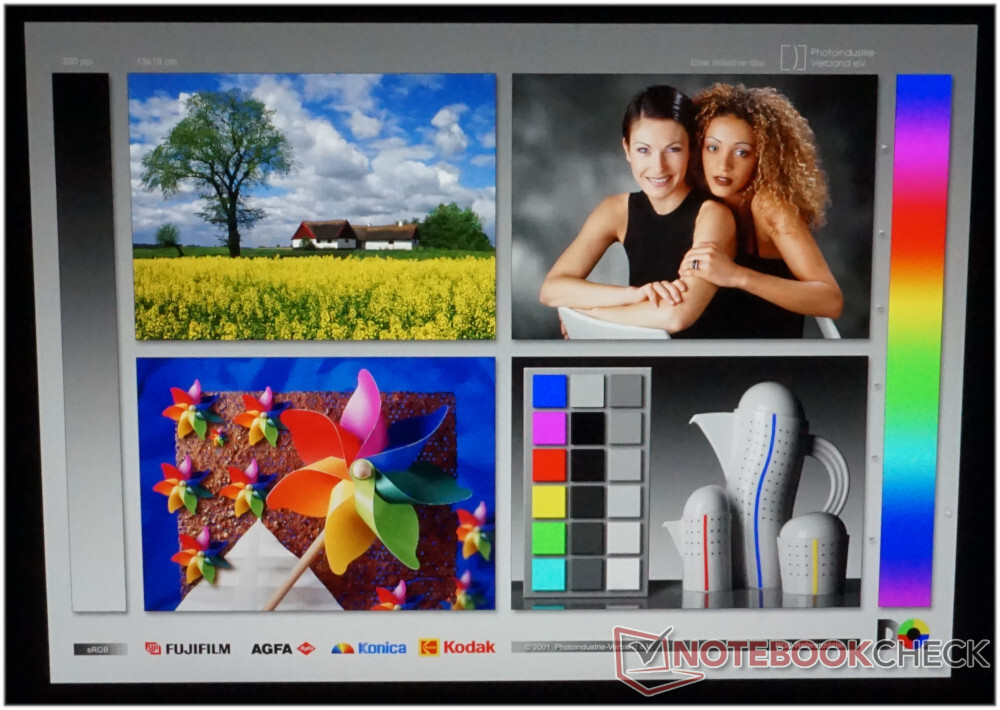
显示屏 - 造物主的笔记本电脑具有几乎完美的色彩准确性
即使没有OLED技术和4K分辨率,显示率也可以说是优秀的。在没有推荐的150%的放大率的情况下,尝试使用16英寸的对角线尺寸,表明QHD+分辨率的4MP(2,560x1,600像素)是完全足够的。此外,还有一个最大刷新率为165 hz。
其他图像速率与强大的整体印象相匹配。13毫秒的响应时间(灰到灰),良好的对比度值,以及略低于400cd/m²的平均亮度,基本上没有什么需要改进的地方。
微星在这里没有采用OLED显示屏也是有道理的。相反,这里使用的IPS面板并没有表现出任何PWM闪烁。另一方面,有了OLED面板,训练有素的眼睛会注意到黑条的平滑发展,特别是在较低的亮度水平。因此,想要和需要看快速视频序列以评估其质量的用户将在这里做出正确的选择。
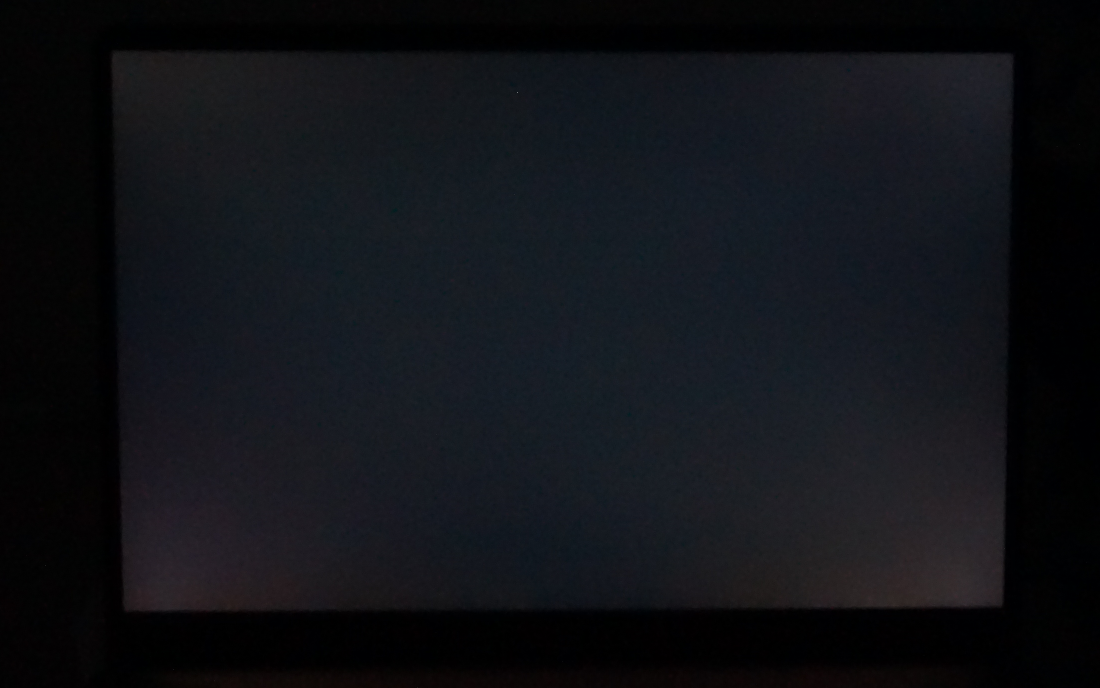
该技术的缺点是屏幕出血。结合略高于平均水平的亮度,在使用黑色背景时,可以在左下方和右下方看到轻微的光晕。
| |||||||||||||||||||||||||
Brightness Distribution: 86 %
Center on Battery: 428 cd/m²
Contrast: 1019:1 (Black: 0.42 cd/m²)
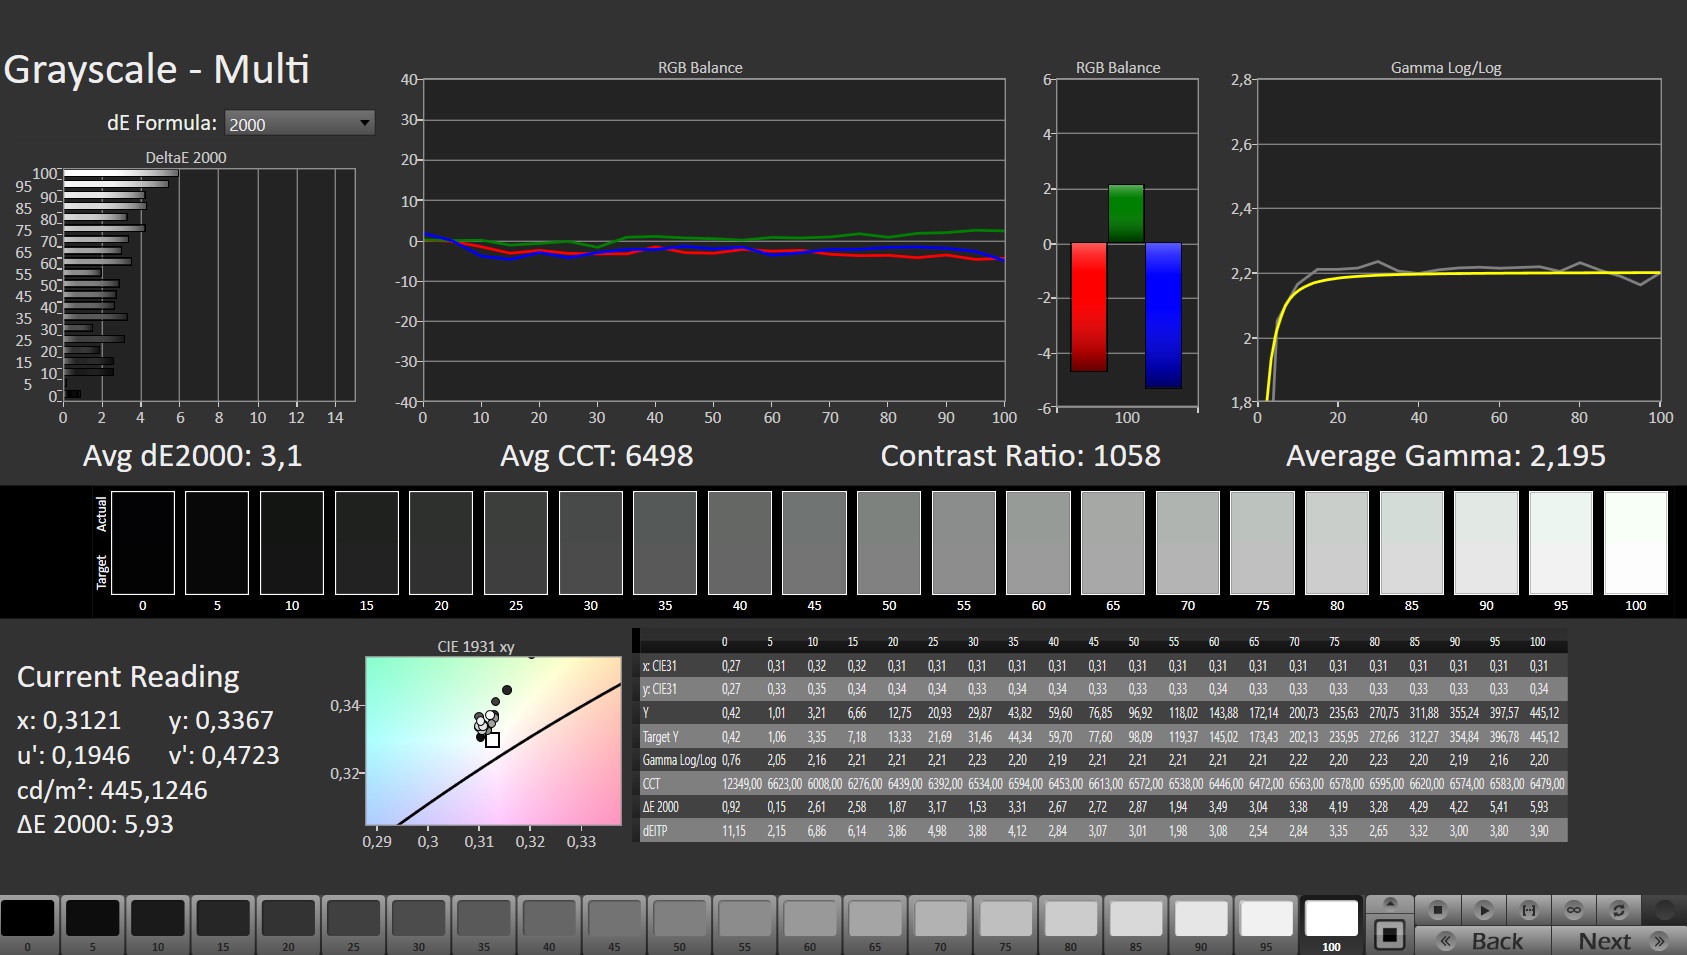
ΔE ColorChecker Calman: 1.67 | ∀{0.5-29.43 Ø4.71}
calibrated: 0.71
ΔE Greyscale Calman: 3.1 | ∀{0.09-98 Ø4.96}
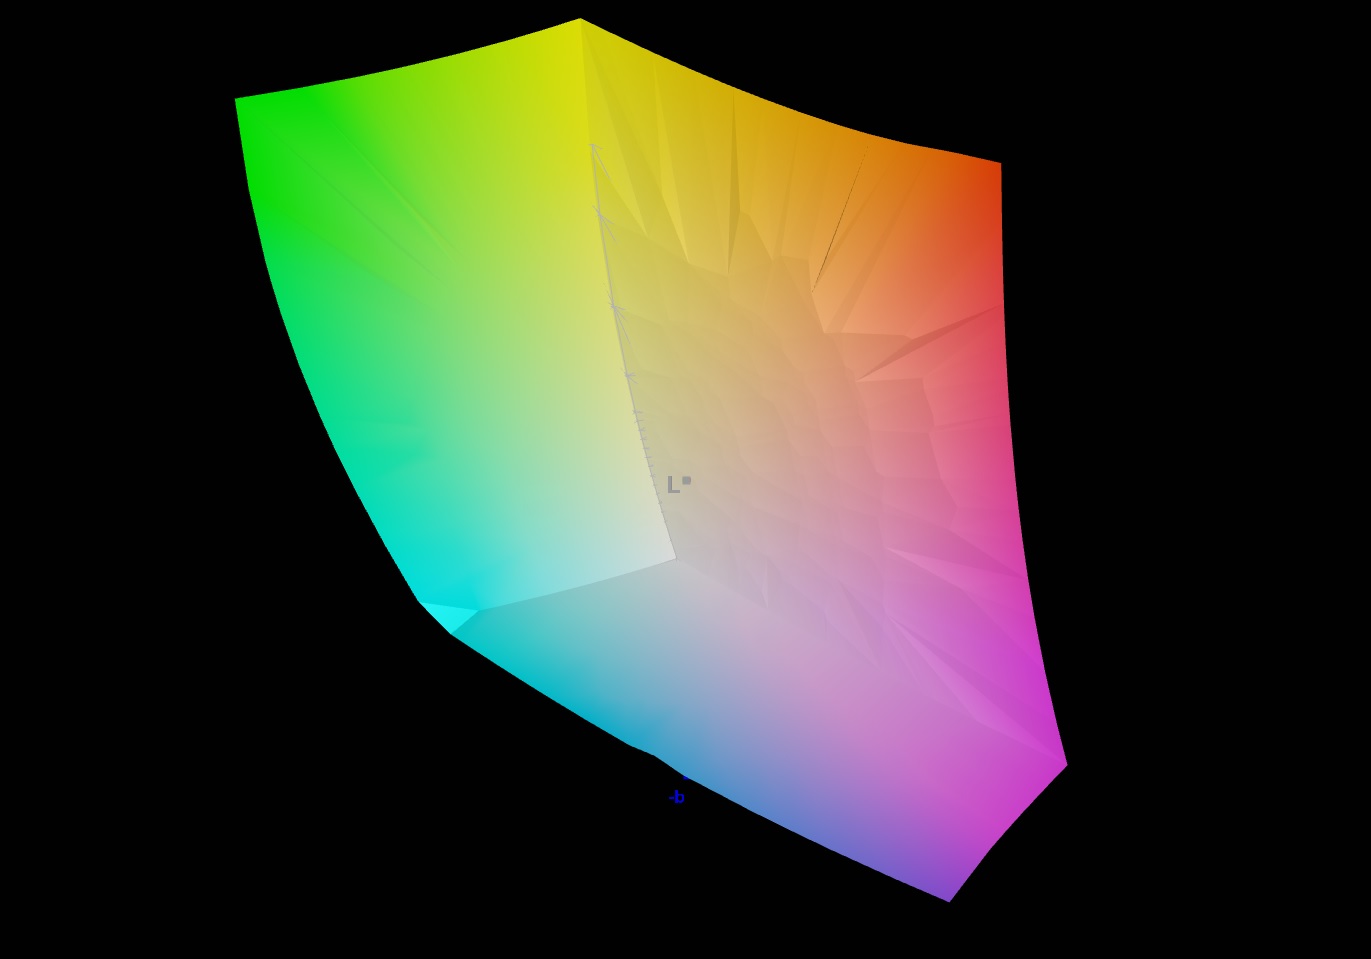
86.8% AdobeRGB 1998 (Argyll 3D)
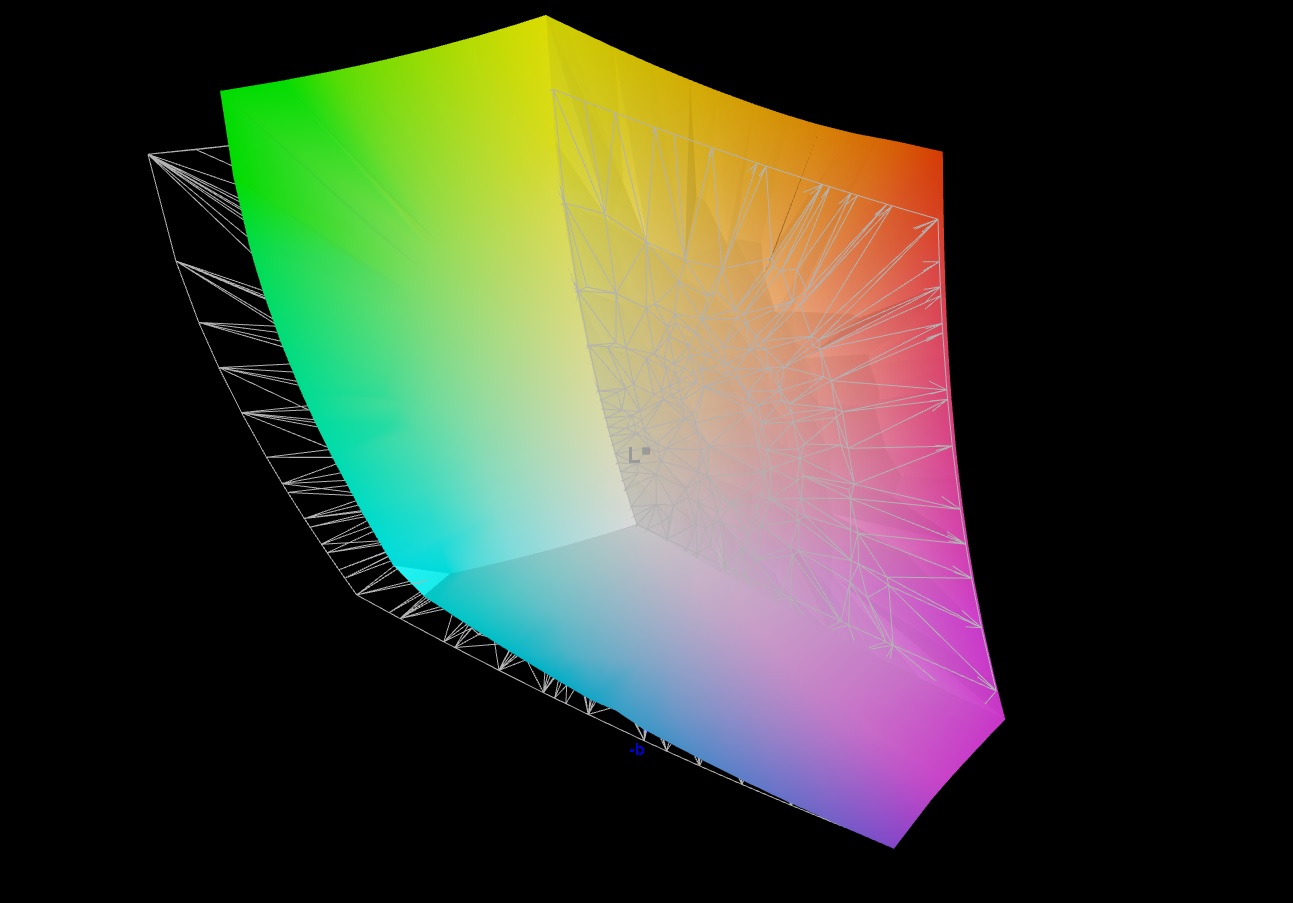
99.9% sRGB (Argyll 3D)
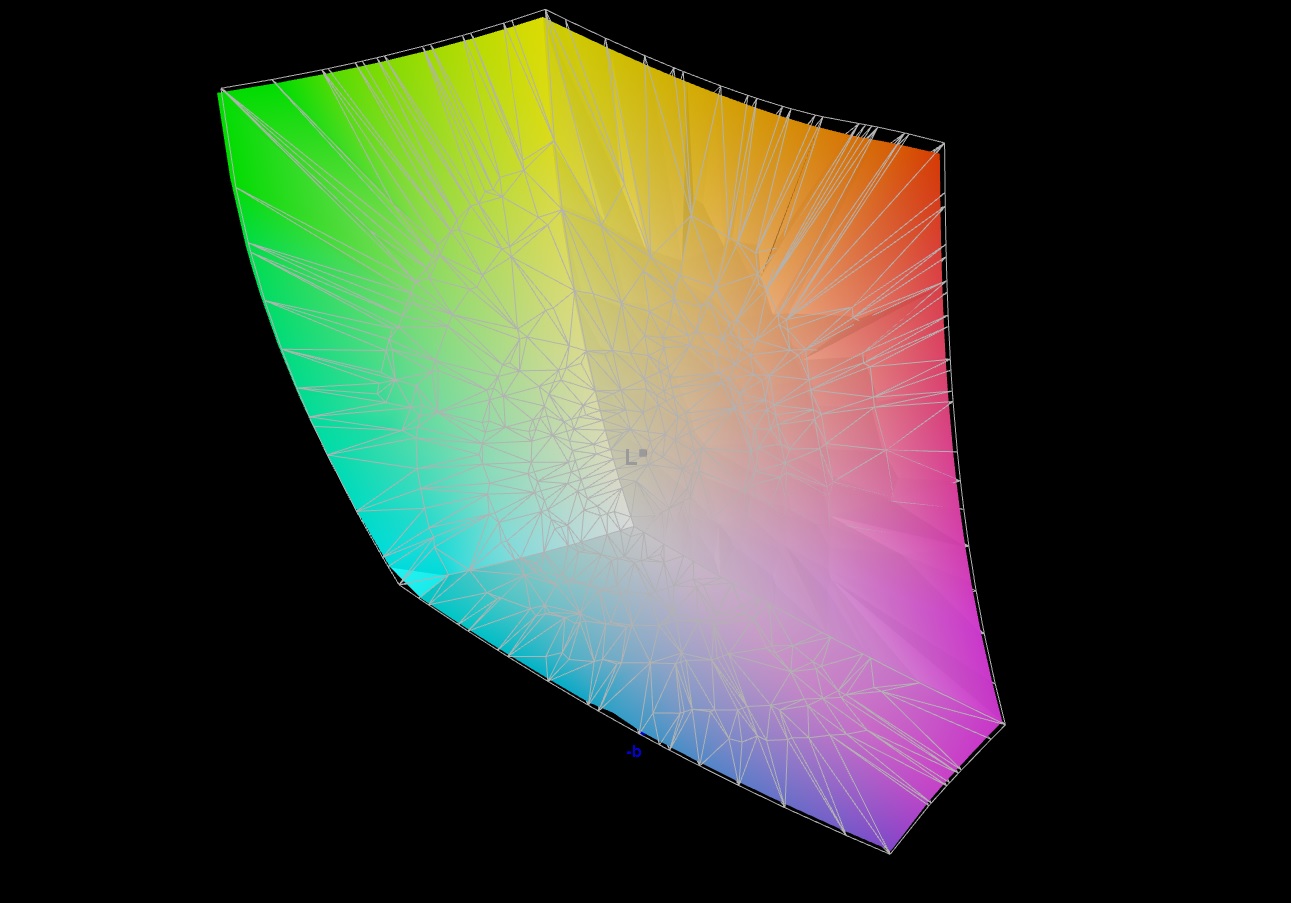
97.6% Display P3 (Argyll 3D)
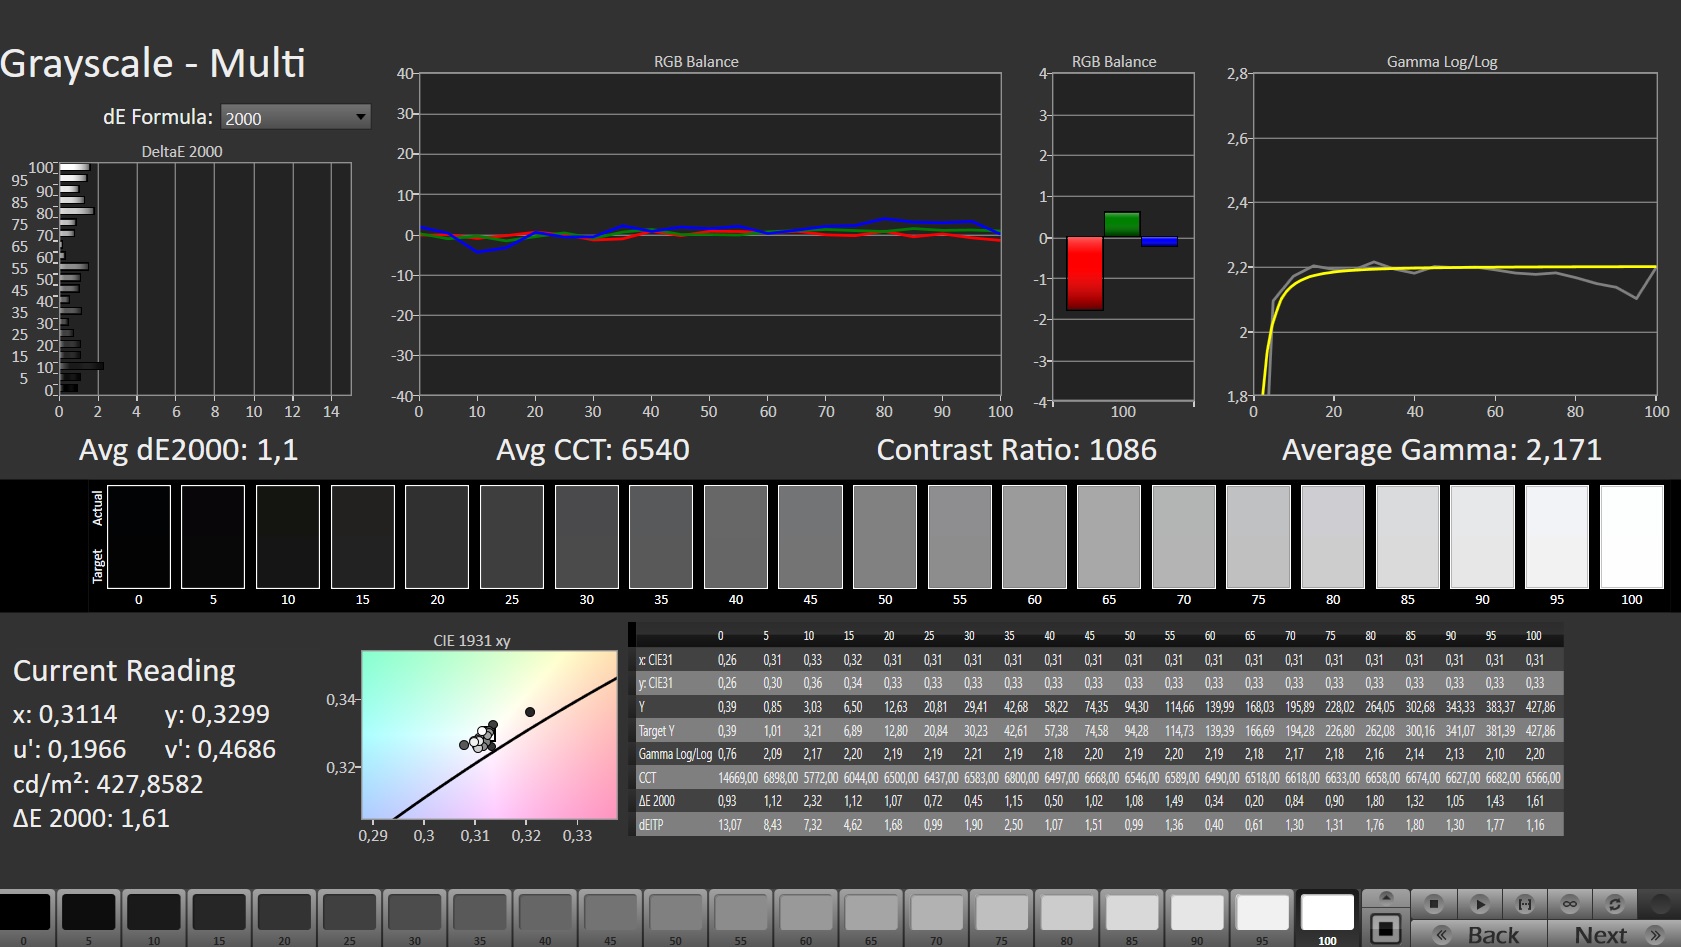
Gamma: 2.195
CCT: 6498 K
| MSI Creator Z16P B12UHST AUOD298, IPS True Pixel (~100% DCI-P3), 2560x1600, 16" | MSI Creator Z16 A11UET-209 AUO B160QAN02.P, IPS True Pixel, 2560x1600, 16" | Apple MacBook Pro 16 2021 M1 Max Mini-LED, 3456x2234, 16.2" | Gigabyte Aero 16 YE5 Samsung SDC416B, AMOLED, 3840x2400, 16" | Acer Predator Triton 500 SE PT516-52s-70KX NE160QDM-NZ2, IPS LED, 2560x1600, 16" | |
|---|---|---|---|---|---|
| Display | 4% | -1% | |||
| Display P3 Coverage (%) | 97.6 | 100 2% | 97.3 0% | ||
| sRGB Coverage (%) | 99.9 | 100 0% | 100 0% | ||
| AdobeRGB 1998 Coverage (%) | 86.8 | 96 11% | 84.9 -2% | ||
| Response Times | -9% | 75% | -4% | ||
| Response Time Grey 50% / Grey 80% * (ms) | 12.9 ? | 14 ? -9% | 2.4 ? 81% | 13.8 ? -7% | |
| Response Time Black / White * (ms) | 6.4 ? | 7 ? -9% | 2 ? 69% | 6.4 ? -0% | |
| PWM Frequency (Hz) | 60 ? | ||||
| Screen | -31% | 329% | 457% | 13% | |
| Brightness middle (cd/m²) | 428 | 375 -12% | 507 18% | 368 -14% | 498 16% |
| Brightness (cd/m²) | 394 | 348 -12% | 494 25% | 368 -7% | 468 19% |
| Brightness Distribution (%) | 86 | 89 3% | 96 12% | 93 8% | 80 -7% |
| Black Level * (cd/m²) | 0.42 | 0.41 2% | 0.02 95% | 0.01 98% | 0.36 14% |
| Contrast (:1) | 1019 | 915 -10% | 25350 2388% | 36800 3511% | 1383 36% |
| Colorchecker dE 2000 * | 1.67 | 2.59 -55% | 1.4 16% | 2.33 -40% | 1.77 -6% |
| Colorchecker dE 2000 max. * | 5.71 | 7.08 -24% | 2.8 51% | 4.34 24% | 5.24 8% |
| Colorchecker dE 2000 calibrated * | 0.71 | 2.18 -207% | 0.63 11% | ||
| Greyscale dE 2000 * | 3.1 | 1.88 39% | 2.3 26% | 0.8 74% | 2.4 23% |
| Gamma | 2.195 100% | 2.37 93% | 2.27 97% | 2.119 104% | 2.14 103% |
| CCT | 6498 100% | 6470 100% | 6792 96% | 6569 99% | 7046 92% |
| Total Average (Program / Settings) | -12% /
-20% | 329% /
329% | 266% /
380% | 3% /
8% |
* ... smaller is better
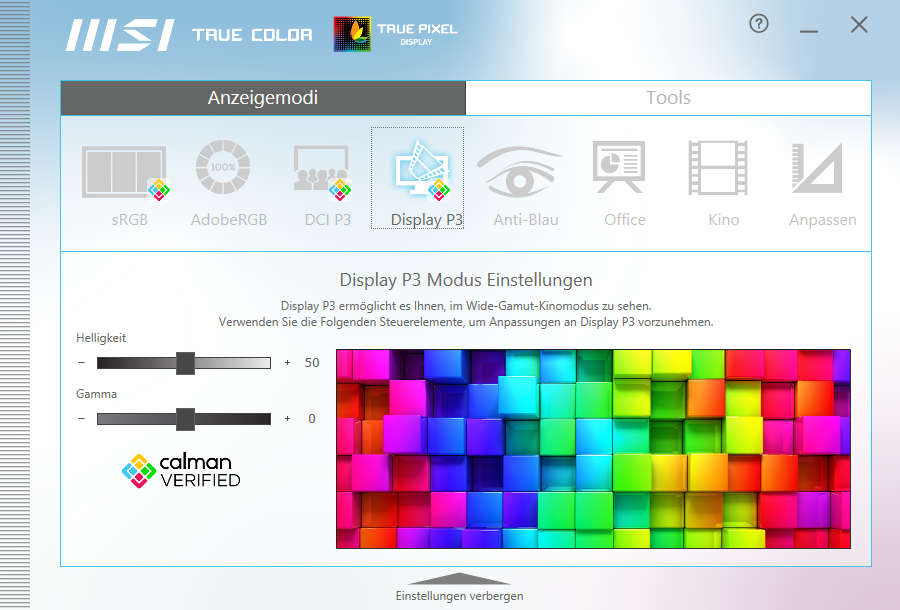
该显示器在这台多媒体笔记本电脑的所有变体中完全相同,应该是经过预校准的,并提供几乎完全覆盖DCI-P3色彩空间。这正是我们的测量所证实的。Delta E是1.67。这意味着用肉眼无法检测到任何色彩偏差。经过另一次校准,该值甚至降至0.71。在显示值旁边的字段中,可以下载带有颜色配置文件的相应文件。
DCI-P3的97.6%的可重现色彩空间也应满足专业要求,特别是在视频编辑方面。与前代产品相比,该显示器无法完全处理AdobeRGB色彩空间,该空间向绿色延伸得更远。
Display Response Times
| ↔ Response Time Black to White | ||
|---|---|---|
| 6.4 ms ... rise ↗ and fall ↘ combined | ↗ 2.6 ms rise | 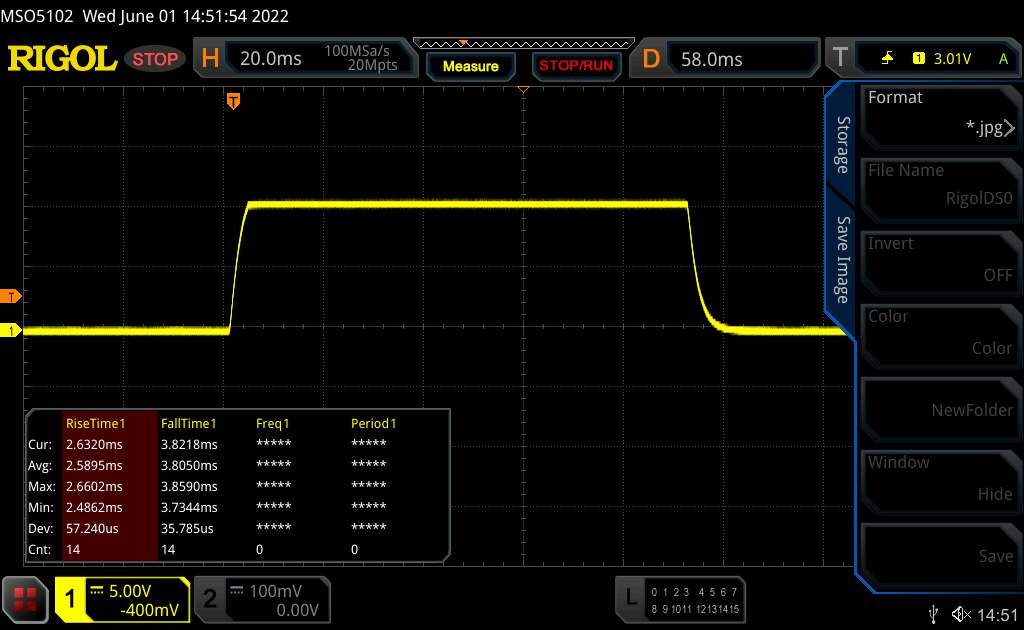 |
| ↘ 3.8 ms fall | ||
| The screen shows very fast response rates in our tests and should be very well suited for fast-paced gaming. In comparison, all tested devices range from 0.1 (minimum) to 240 (maximum) ms. » 20 % of all devices are better. This means that the measured response time is better than the average of all tested devices (19.8 ms). | ||
| ↔ Response Time 50% Grey to 80% Grey | ||
| 12.9 ms ... rise ↗ and fall ↘ combined | ↗ 6.4 ms rise | 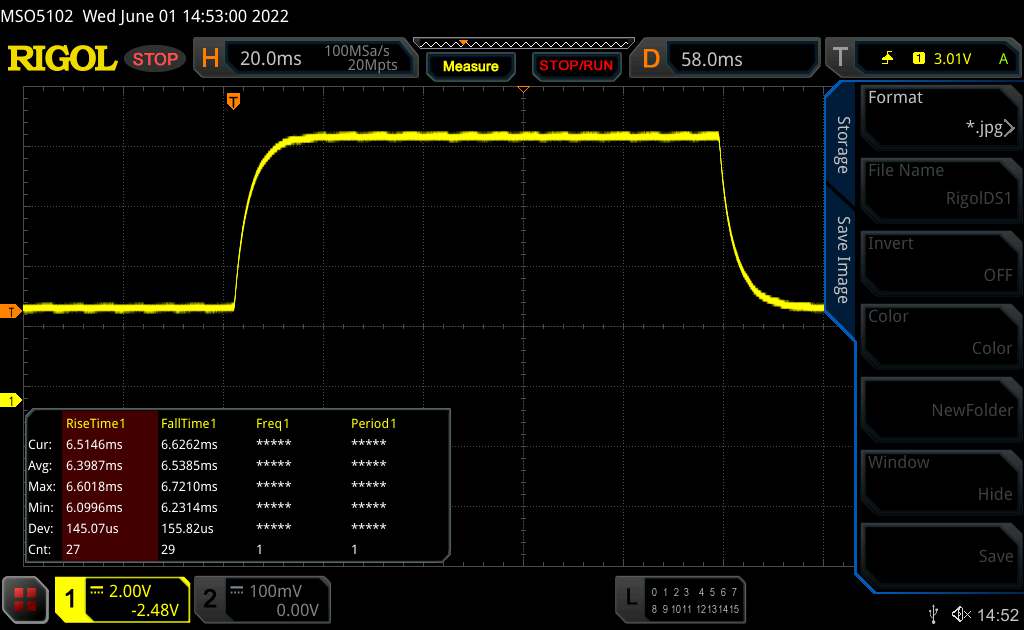 |
| ↘ 6.5 ms fall | ||
| The screen shows good response rates in our tests, but may be too slow for competitive gamers. In comparison, all tested devices range from 0.165 (minimum) to 636 (maximum) ms. » 27 % of all devices are better. This means that the measured response time is better than the average of all tested devices (31 ms). | ||
Screen Flickering / PWM (Pulse-Width Modulation)
| Screen flickering / PWM not detected | 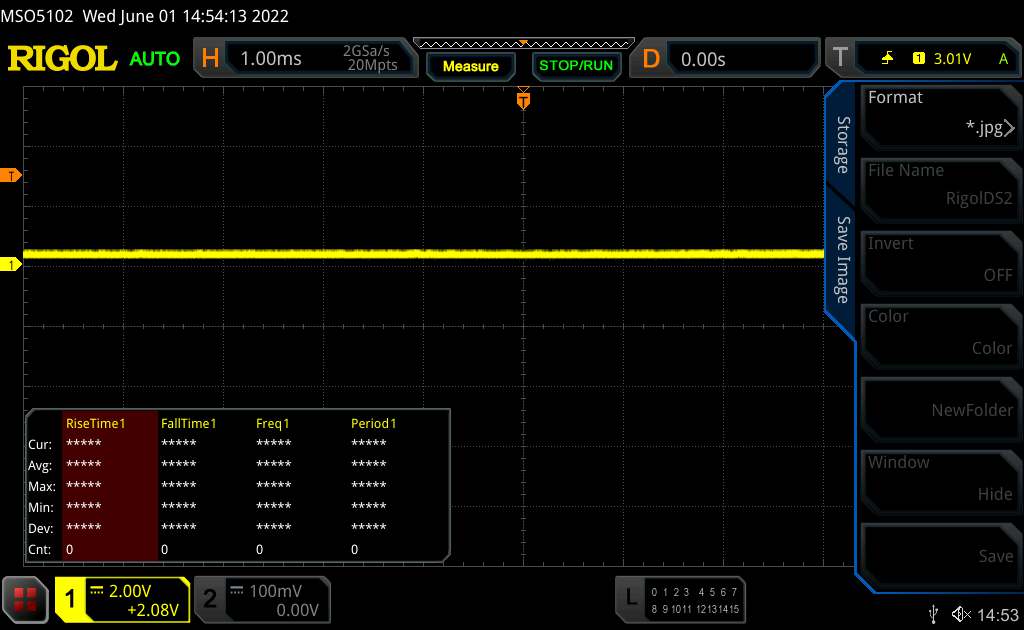 | ||
In comparison: 52 % of all tested devices do not use PWM to dim the display. If PWM was detected, an average of 7754 (minimum: 5 - maximum: 343500) Hz was measured. | |||
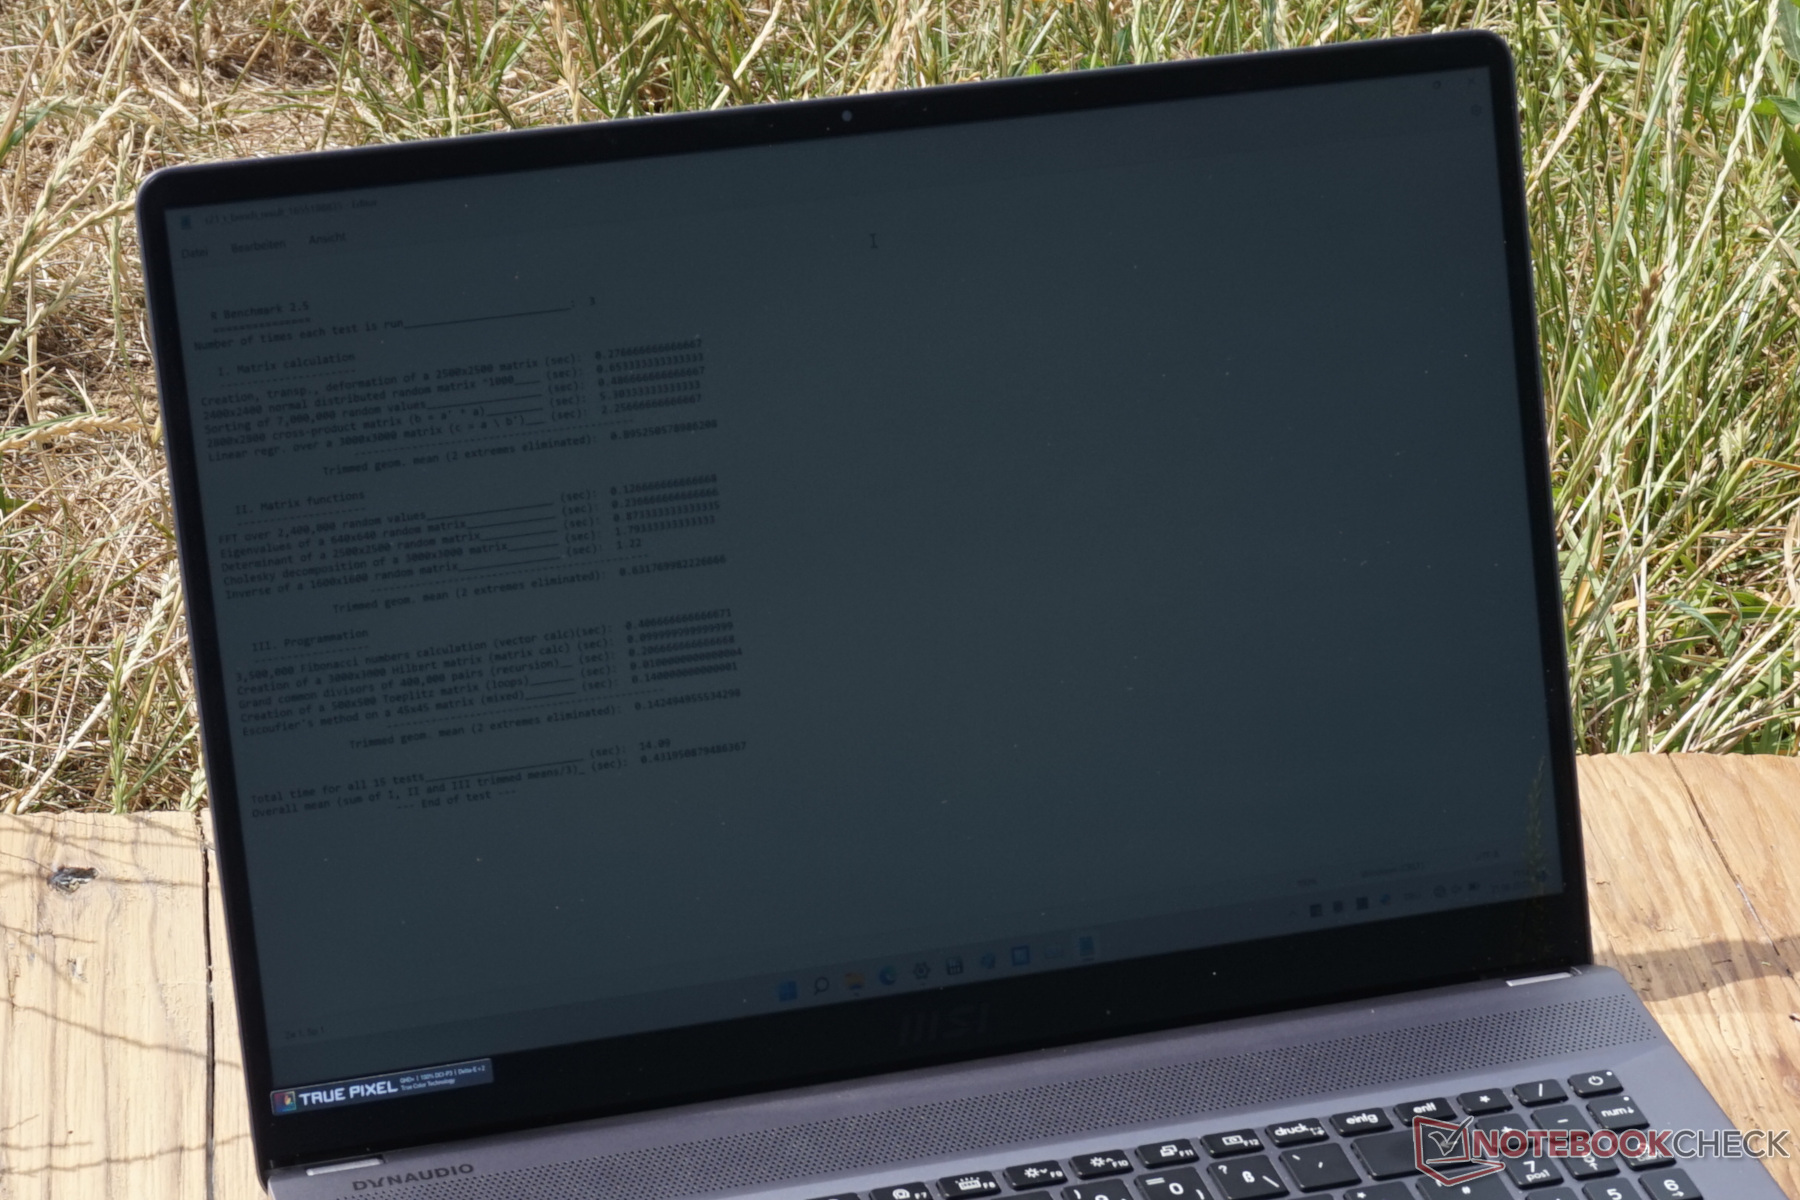
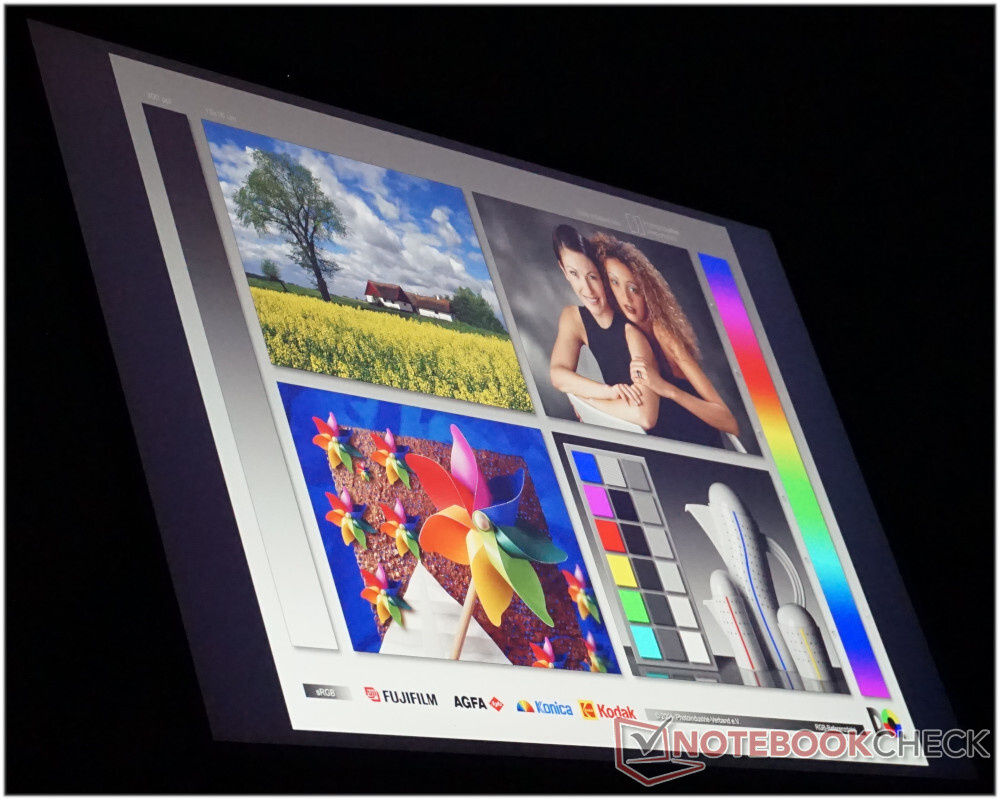
由于亮度相当高,即使在户外的阳光下,文字仍然清晰可见。只是颜色看起来有点淡。反光的表面几乎看不出来,至少在阳光直射下看不出来。然而,正如预期的那样,有来自天空的背景光是非常不利的。
在可视角度的稳定性方面,IPS面板没有显示出任何弱点。即使从几乎90度的角度看,也不会感觉到颜色失真。
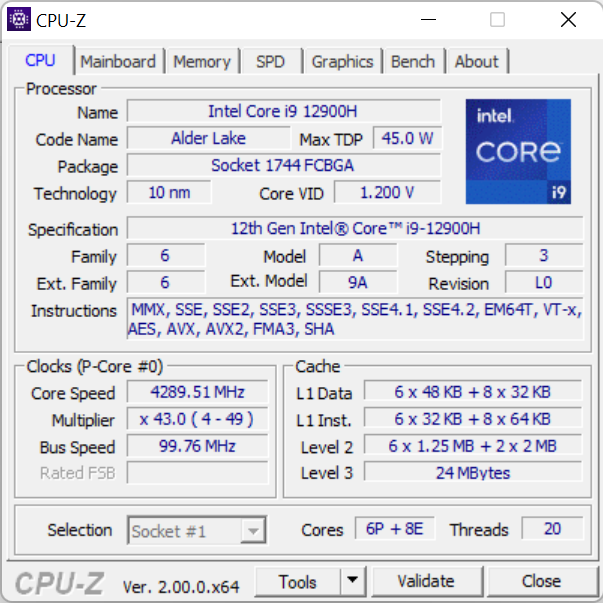
性能 - 比微星Z16P更快?很强悍!
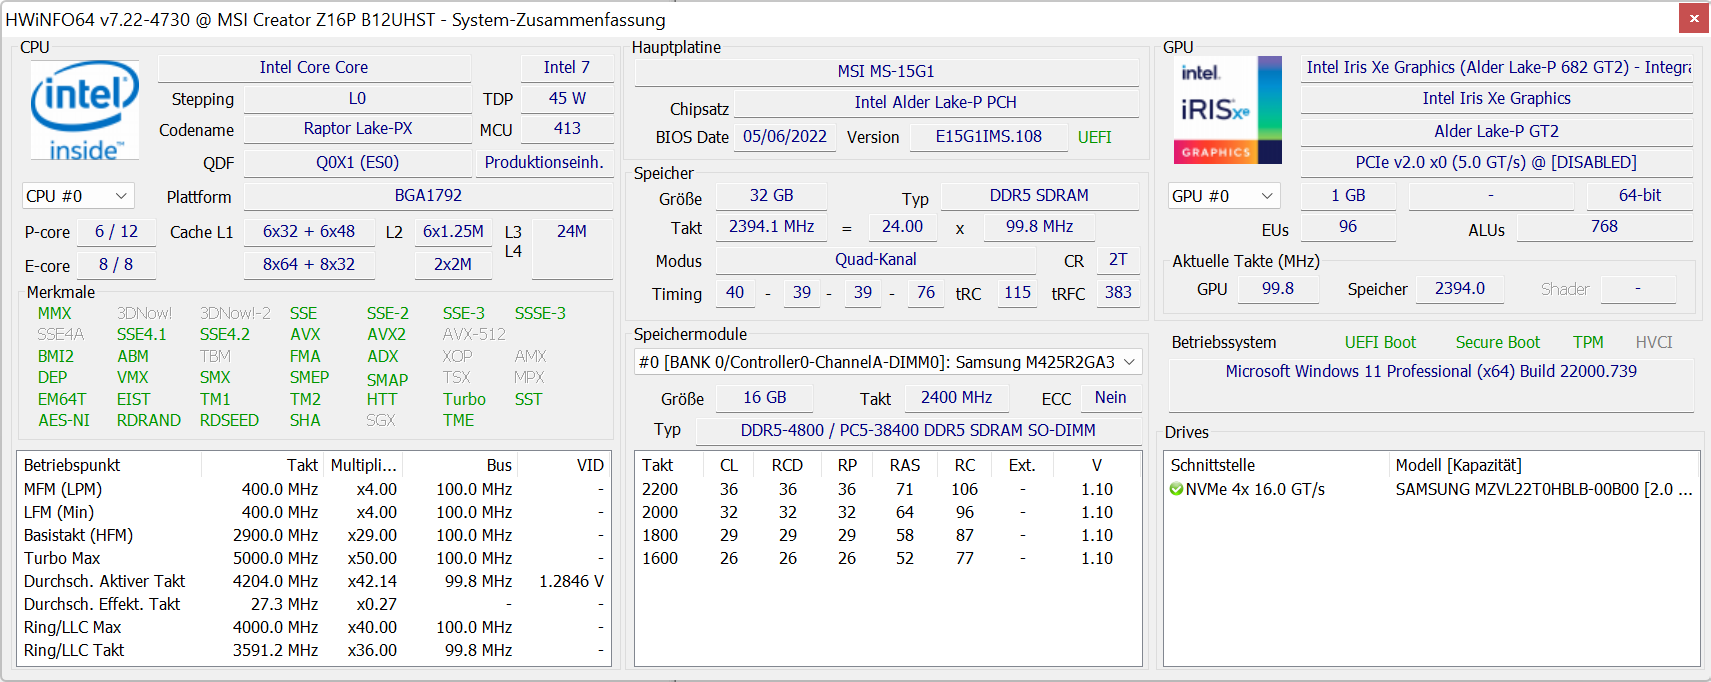
有了英特尔i9-12900H,NvidiaGeForce RTX 3080 Ti,32GB内存和PCIe 4.0固态硬盘,基本上没有角度来进一步提高硬件。
英特尔Alder Lake i9-12900H处理器有六个性能核心和八个效率核心,峰值达到5.0 GHz。这里共产生了20个线程。L3缓存也非常慷慨,为24MB。
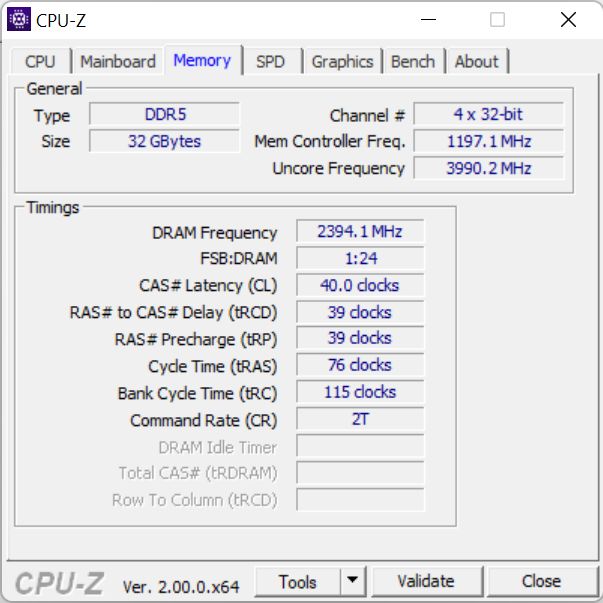
该CPU的最大支持内存为DDR5-4800,已安装。两个16GB的模块可以被两个32GB的模块取代,以达到64GB的总量。
除了我们评测的带有NvidiaGeForce RTX 3080 Ti的版本外,Z16P还出售带有RTX 3080和RTX 3070 Ti。
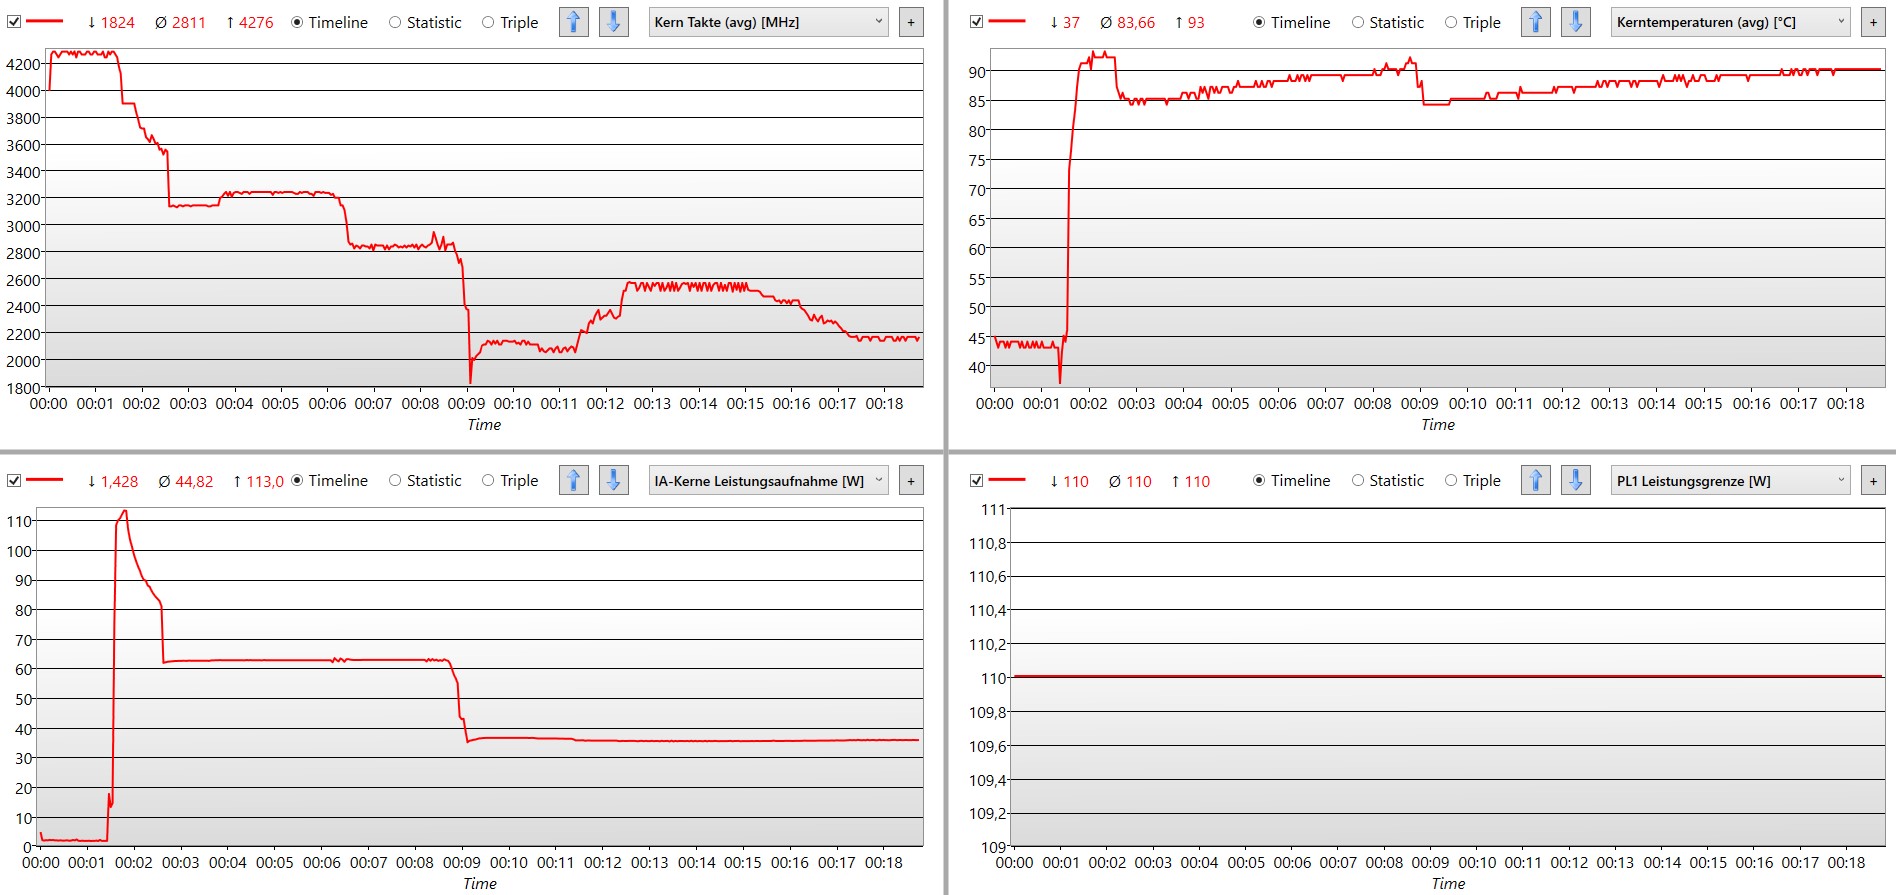
这些组件的一个共同点是它们的高功率消耗。诚然,这被限制在GPU的90瓦,这比游戏笔记本上要低得多。另一方面,处理器在短时间内被分配到160瓦,而110瓦则最多一分钟。我们的性能测试需要显示出超薄机箱的散热能力在多大程度上能够驱散大量的热量。
测试条件
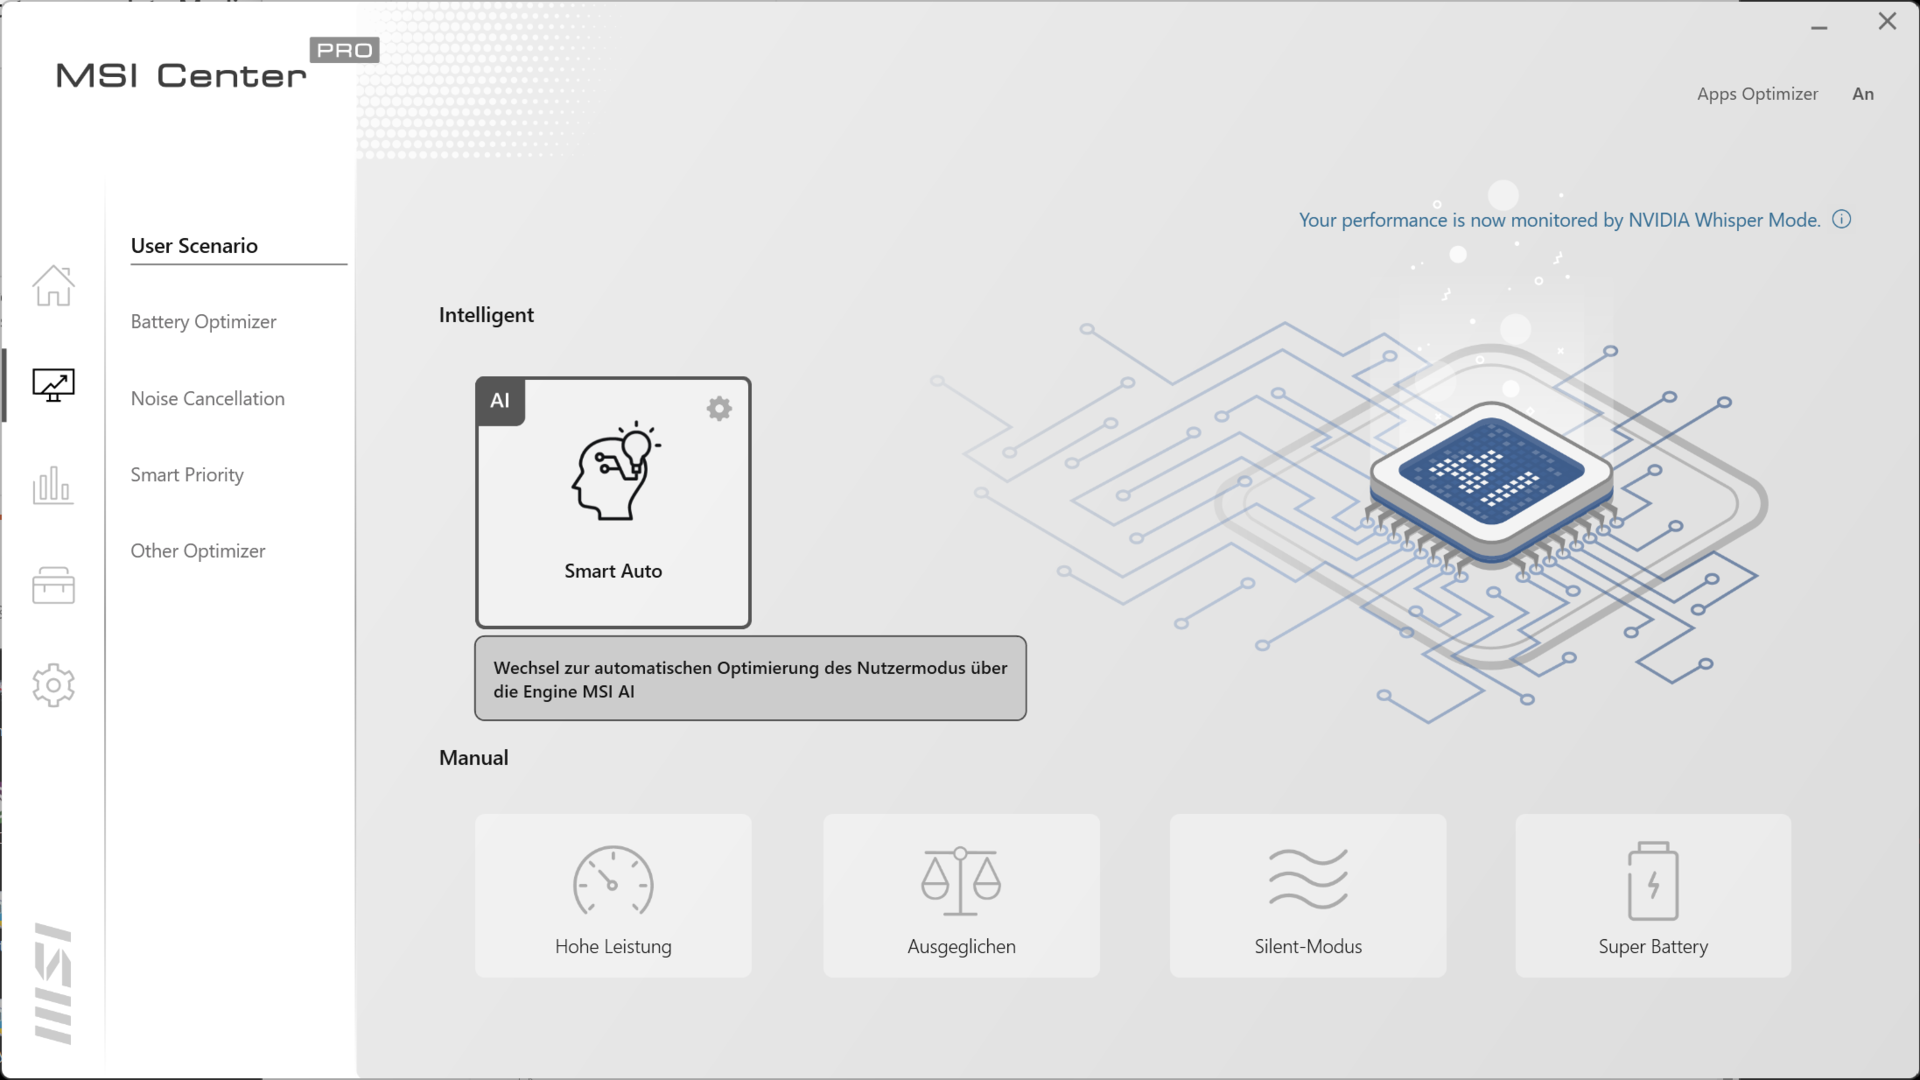
通过Center Pro,微星提供了一个软件解决方案,可以轻松地调整创造者笔记本电脑的性能,以满足当前的需求。原则上,我们尝试在 "智能自动 "模式下运行所有测试。在这种情况下,当系统自行改变其性能模式时,会通过短信息通知用户。
只有在游戏基准测试中,这不是很可靠,因为笔记本电脑不是为游戏设计的,而是为创造性工作设计的。高性能 "模式在这里提供了帮助。此外,"超级电池 "的效果也不应该被低估。这可以使电池寿命延长近30%。
处理器
这并不奇怪,因为i9-12900H在Cinebench耐力测试中名列前茅,这并不奇怪,因为它有14个核心,20个线程,峰值速度为5.0GHz。最重要的是,与前辈的i7-11800H的差距。i7-11800H是令人印象深刻的。
此外,可以看出,Creator Z16P只需要最小的冷却阶段,以便能够获得几乎全部的性能。虽然笔记本电脑虽然Alienware x17 R2游戏笔记本展示了如何做更好的冷却工作,但在耐力测试中下降近6%是可以接受的。
在压力测试中,情况有点不同。在没有任何喘息的情况下,需要大幅降低功耗和时钟速率。在这种特殊情况下,电源从110瓦下降到只有25瓦。然而,这种情况对于创作者的笔记本电脑来说其实并不现实。
在电池供电的情况下,性能基本上是瞬间降低的。
Cinebench R15 Multi endurance test
* ... smaller is better
AIDA64: FP32 Ray-Trace | FPU Julia | CPU SHA3 | CPU Queen | FPU SinJulia | FPU Mandel | CPU AES | CPU ZLib | FP64 Ray-Trace | CPU PhotoWorxx
| Performance rating | |
| Average of class Multimedia | |
| Lenovo ThinkPad X1 Extreme G4-20Y5CTO1WW (3050 Ti) | |
| Alienware x17 R2 P48E | |
| Acer Predator Triton 500 SE PT516-52s-70KX | |
| Average Intel Core i9-12900H | |
| MSI Creator Z16P B12UHST | |
| Gigabyte Aero 16 YE5 | |
| MSI Creator Z16 A11UET-209 -7! | |
| AIDA64 / FP32 Ray-Trace | |
| Average of class Multimedia (2214 - 50388, n=53, last 2 years) | |
| Lenovo ThinkPad X1 Extreme G4-20Y5CTO1WW (3050 Ti) | |
| Average Intel Core i9-12900H (4074 - 18289, n=29) | |
| Alienware x17 R2 P48E | |
| Acer Predator Triton 500 SE PT516-52s-70KX | |
| MSI Creator Z16P B12UHST | |
| Gigabyte Aero 16 YE5 | |
| AIDA64 / FPU Julia | |
| Average of class Multimedia (12867 - 201874, n=54, last 2 years) | |
| Lenovo ThinkPad X1 Extreme G4-20Y5CTO1WW (3050 Ti) | |
| Average Intel Core i9-12900H (22307 - 93236, n=29) | |
| Alienware x17 R2 P48E | |
| Acer Predator Triton 500 SE PT516-52s-70KX | |
| MSI Creator Z16P B12UHST | |
| Gigabyte Aero 16 YE5 | |
| AIDA64 / CPU SHA3 | |
| Lenovo ThinkPad X1 Extreme G4-20Y5CTO1WW (3050 Ti) | |
| Average of class Multimedia (626 - 8623, n=54, last 2 years) | |
| Alienware x17 R2 P48E | |
| Acer Predator Triton 500 SE PT516-52s-70KX | |
| Average Intel Core i9-12900H (1378 - 4215, n=29) | |
| MSI Creator Z16P B12UHST | |
| Gigabyte Aero 16 YE5 | |
| AIDA64 / CPU Queen | |
| Alienware x17 R2 P48E | |
| Gigabyte Aero 16 YE5 | |
| MSI Creator Z16P B12UHST | |
| Average Intel Core i9-12900H (78172 - 111241, n=28) | |
| Acer Predator Triton 500 SE PT516-52s-70KX | |
| Lenovo ThinkPad X1 Extreme G4-20Y5CTO1WW (3050 Ti) | |
| Average of class Multimedia (13483 - 181505, n=41, last 2 years) | |
| AIDA64 / FPU SinJulia | |
| Alienware x17 R2 P48E | |
| MSI Creator Z16P B12UHST | |
| Acer Predator Triton 500 SE PT516-52s-70KX | |
| Lenovo ThinkPad X1 Extreme G4-20Y5CTO1WW (3050 Ti) | |
| Gigabyte Aero 16 YE5 | |
| Average Intel Core i9-12900H (5709 - 10410, n=29) | |
| Average of class Multimedia (886 - 28794, n=54, last 2 years) | |
| AIDA64 / FPU Mandel | |
| Average of class Multimedia (6395 - 105740, n=53, last 2 years) | |
| Lenovo ThinkPad X1 Extreme G4-20Y5CTO1WW (3050 Ti) | |
| Average Intel Core i9-12900H (11257 - 45581, n=29) | |
| Alienware x17 R2 P48E | |
| Acer Predator Triton 500 SE PT516-52s-70KX | |
| MSI Creator Z16P B12UHST | |
| Gigabyte Aero 16 YE5 | |
| AIDA64 / CPU AES | |
| Lenovo ThinkPad X1 Extreme G4-20Y5CTO1WW (3050 Ti) | |
| Alienware x17 R2 P48E | |
| MSI Creator Z16P B12UHST | |
| Acer Predator Triton 500 SE PT516-52s-70KX | |
| Gigabyte Aero 16 YE5 | |
| Average Intel Core i9-12900H (31935 - 151546, n=29) | |
| Average of class Multimedia (8171 - 126790, n=54, last 2 years) | |
| AIDA64 / CPU ZLib | |
| Alienware x17 R2 P48E | |
| MSI Creator Z16P B12UHST | |
| Acer Predator Triton 500 SE PT516-52s-70KX | |
| Gigabyte Aero 16 YE5 | |
| Average of class Multimedia (143.8 - 2022, n=54, last 2 years) | |
| Average Intel Core i9-12900H (449 - 1193, n=29) | |
| MSI Creator Z16 A11UET-209 | |
| Lenovo ThinkPad X1 Extreme G4-20Y5CTO1WW (3050 Ti) | |
| AIDA64 / FP64 Ray-Trace | |
| Average of class Multimedia (1014 - 26875, n=54, last 2 years) | |
| MSI Creator Z16 A11UET-209 | |
| Lenovo ThinkPad X1 Extreme G4-20Y5CTO1WW (3050 Ti) | |
| Average Intel Core i9-12900H (2235 - 10511, n=29) | |
| Alienware x17 R2 P48E | |
| Acer Predator Triton 500 SE PT516-52s-70KX | |
| MSI Creator Z16P B12UHST | |
| Gigabyte Aero 16 YE5 | |
| AIDA64 / CPU PhotoWorxx | |
| Average of class Multimedia (8187 - 88154, n=54, last 2 years) | |
| MSI Creator Z16P B12UHST | |
| Gigabyte Aero 16 YE5 | |
| Average Intel Core i9-12900H (20960 - 48269, n=30) | |
| Acer Predator Triton 500 SE PT516-52s-70KX | |
| Alienware x17 R2 P48E | |
| MSI Creator Z16 A11UET-209 | |
| Lenovo ThinkPad X1 Extreme G4-20Y5CTO1WW (3050 Ti) | |
系统性能
正如预期的那样,微星造物主Z16P在系统性能方面的得分很高。传统的任务,如在无数的标签中浏览,中间有一点图像编辑,或视频通话,以及一般的多任务处理,根本不会给笔记本电脑带来任何麻烦。
因此,我们的PCMark 10测试也显示了一贯的优秀率,只有在以下情况下才会被超越 Alienware x17 R2.另一方面,我们的审查单位设法确保在多媒体笔记本电脑中名列前茅,与Alienware x17 R2相提并论。 Gigabyte Aero 16 YE5.
| PCMark 10 / Score | |
| Alienware x17 R2 P48E | |
| MSI Creator Z16P B12UHST | |
| Gigabyte Aero 16 YE5 | |
| Average of class Multimedia (4325 - 10386, n=52, last 2 years) | |
| Average Intel Core i9-12900H, NVIDIA GeForce RTX 3080 Ti Laptop GPU (7139 - 8083, n=6) | |
| Acer Predator Triton 500 SE PT516-52s-70KX | |
| MSI Creator Z16 A11UET-209 | |
| PCMark 10 / Essentials | |
| Alienware x17 R2 P48E | |
| MSI Creator Z16P B12UHST | |
| Gigabyte Aero 16 YE5 | |
| Average Intel Core i9-12900H, NVIDIA GeForce RTX 3080 Ti Laptop GPU (10254 - 11178, n=6) | |
| Acer Predator Triton 500 SE PT516-52s-70KX | |
| Average of class Multimedia (8025 - 11664, n=51, last 2 years) | |
| MSI Creator Z16 A11UET-209 | |
| PCMark 10 / Productivity | |
| Average of class Multimedia (7323 - 18233, n=51, last 2 years) | |
| MSI Creator Z16P B12UHST | |
| Alienware x17 R2 P48E | |
| Gigabyte Aero 16 YE5 | |
| Average Intel Core i9-12900H, NVIDIA GeForce RTX 3080 Ti Laptop GPU (9102 - 11186, n=6) | |
| Acer Predator Triton 500 SE PT516-52s-70KX | |
| MSI Creator Z16 A11UET-209 | |
| PCMark 10 / Digital Content Creation | |
| Alienware x17 R2 P48E | |
| Gigabyte Aero 16 YE5 | |
| MSI Creator Z16P B12UHST | |
| Average Intel Core i9-12900H, NVIDIA GeForce RTX 3080 Ti Laptop GPU (9847 - 12627, n=6) | |
| Acer Predator Triton 500 SE PT516-52s-70KX | |
| Average of class Multimedia (3651 - 16240, n=51, last 2 years) | |
| MSI Creator Z16 A11UET-209 | |
| PCMark 10 Score | 8083 points | |
Help | ||
| AIDA64 / Memory Copy | |
| Average of class Multimedia (11299 - 132135, n=54, last 2 years) | |
| MSI Creator Z16P B12UHST | |
| Gigabyte Aero 16 YE5 | |
| Acer Predator Triton 500 SE PT516-52s-70KX | |
| Average Intel Core i9-12900H (34438 - 74264, n=29) | |
| Alienware x17 R2 P48E | |
| MSI Creator Z16 A11UET-209 | |
| Lenovo ThinkPad X1 Extreme G4-20Y5CTO1WW (3050 Ti) | |
| AIDA64 / Memory Read | |
| Average of class Multimedia (11624 - 174586, n=54, last 2 years) | |
| Acer Predator Triton 500 SE PT516-52s-70KX | |
| MSI Creator Z16P B12UHST | |
| Gigabyte Aero 16 YE5 | |
| Average Intel Core i9-12900H (36365 - 74642, n=29) | |
| Alienware x17 R2 P48E | |
| Lenovo ThinkPad X1 Extreme G4-20Y5CTO1WW (3050 Ti) | |
| AIDA64 / Memory Write | |
| Average of class Multimedia (11755 - 134998, n=54, last 2 years) | |
| MSI Creator Z16P B12UHST | |
| Gigabyte Aero 16 YE5 | |
| Average Intel Core i9-12900H (32276 - 67858, n=29) | |
| Alienware x17 R2 P48E | |
| Acer Predator Triton 500 SE PT516-52s-70KX | |
| Lenovo ThinkPad X1 Extreme G4-20Y5CTO1WW (3050 Ti) | |
| AIDA64 / Memory Latency | |
| Average of class Multimedia (7 - 535, n=53, last 2 years) | |
| Acer Predator Triton 500 SE PT516-52s-70KX | |
| Alienware x17 R2 P48E | |
| MSI Creator Z16 A11UET-209 | |
| MSI Creator Z16P B12UHST | |
| Gigabyte Aero 16 YE5 | |
| Average Intel Core i9-12900H (74.7 - 118.1, n=28) | |
| Lenovo ThinkPad X1 Extreme G4-20Y5CTO1WW (3050 Ti) | |
* ... smaller is better
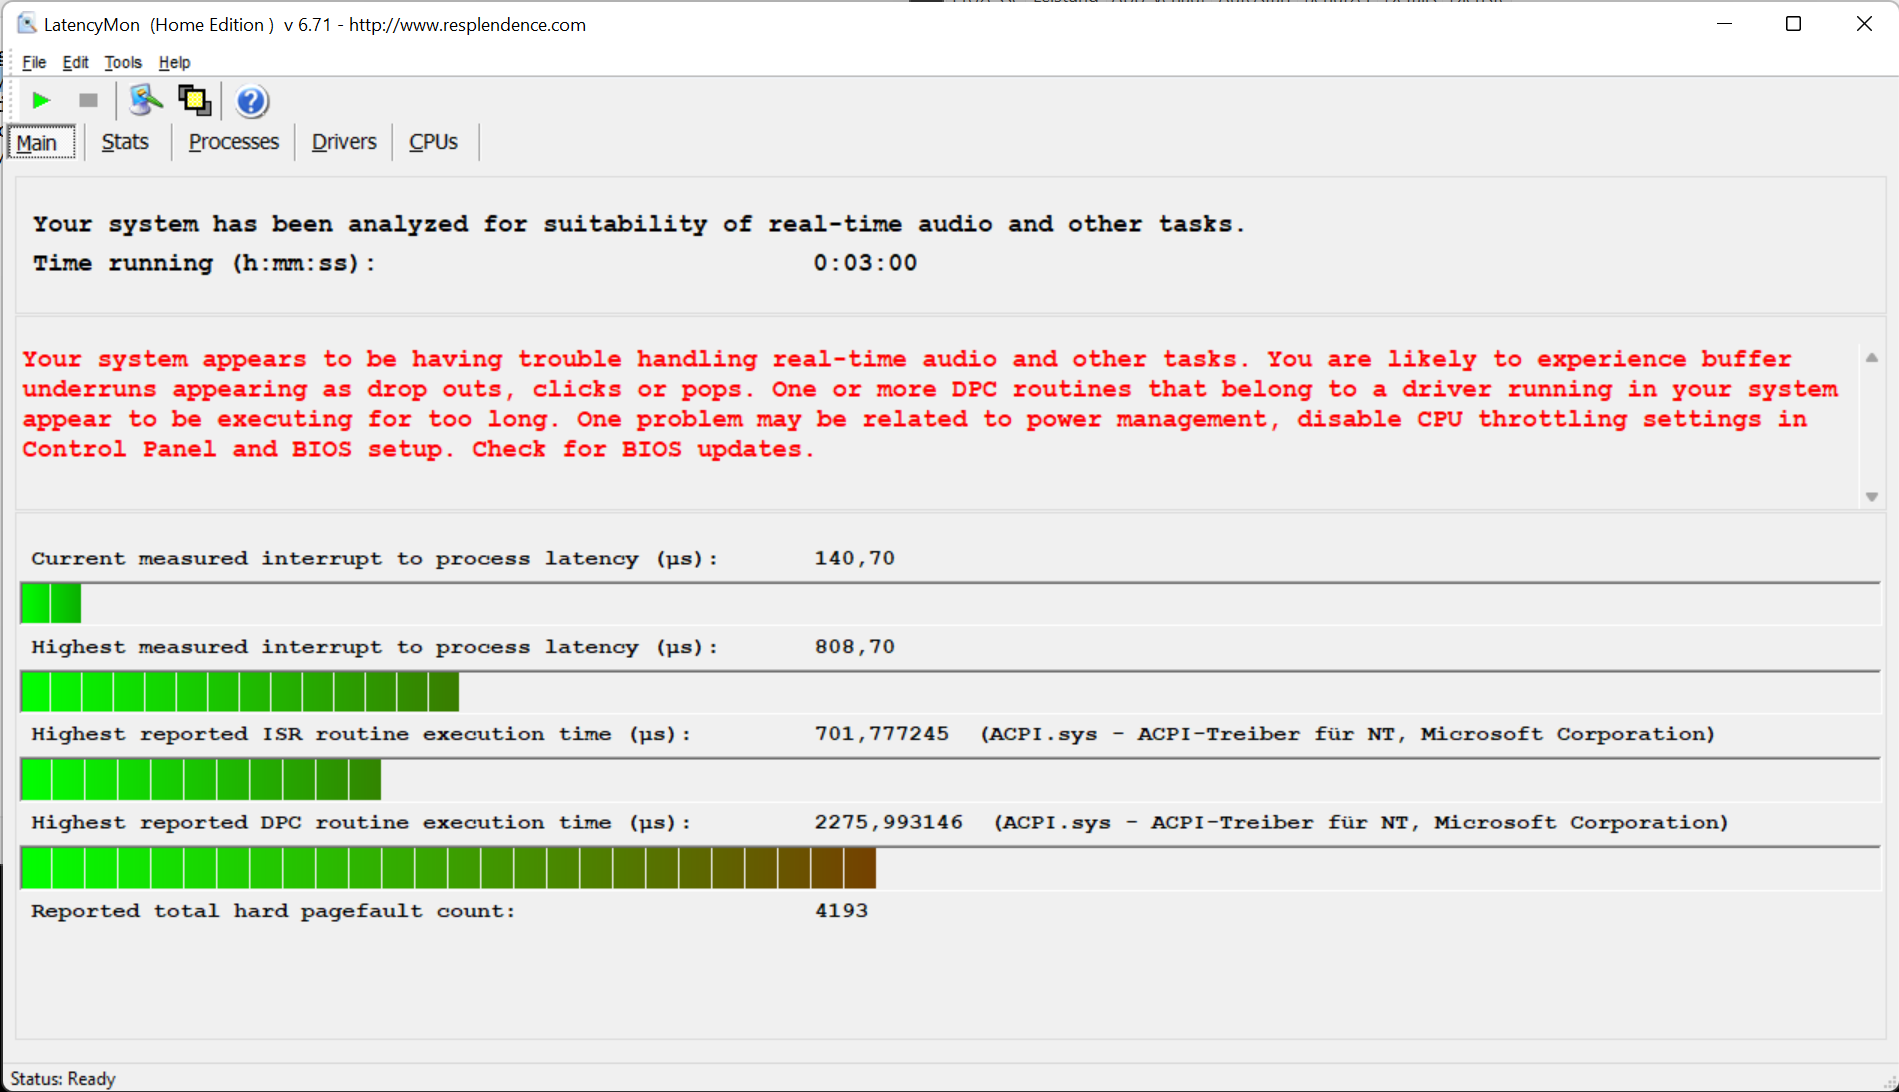
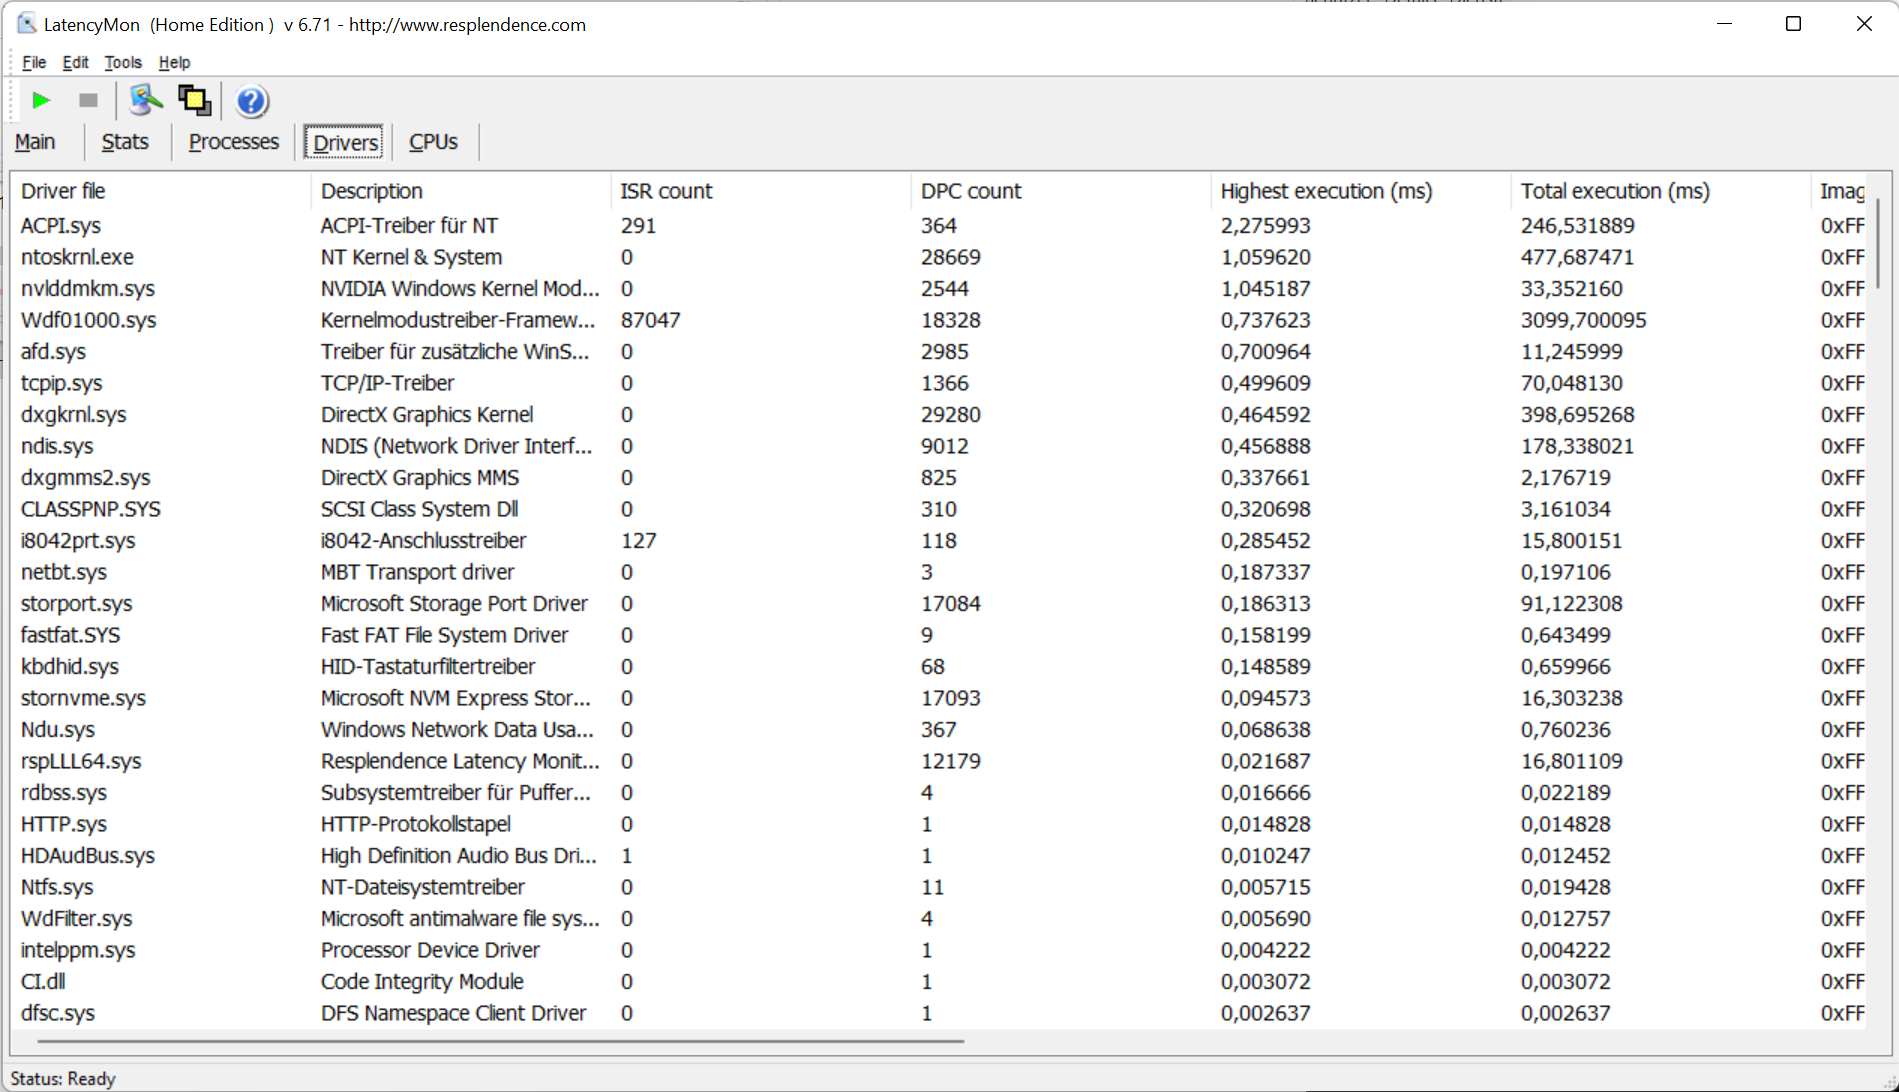
DPC延迟
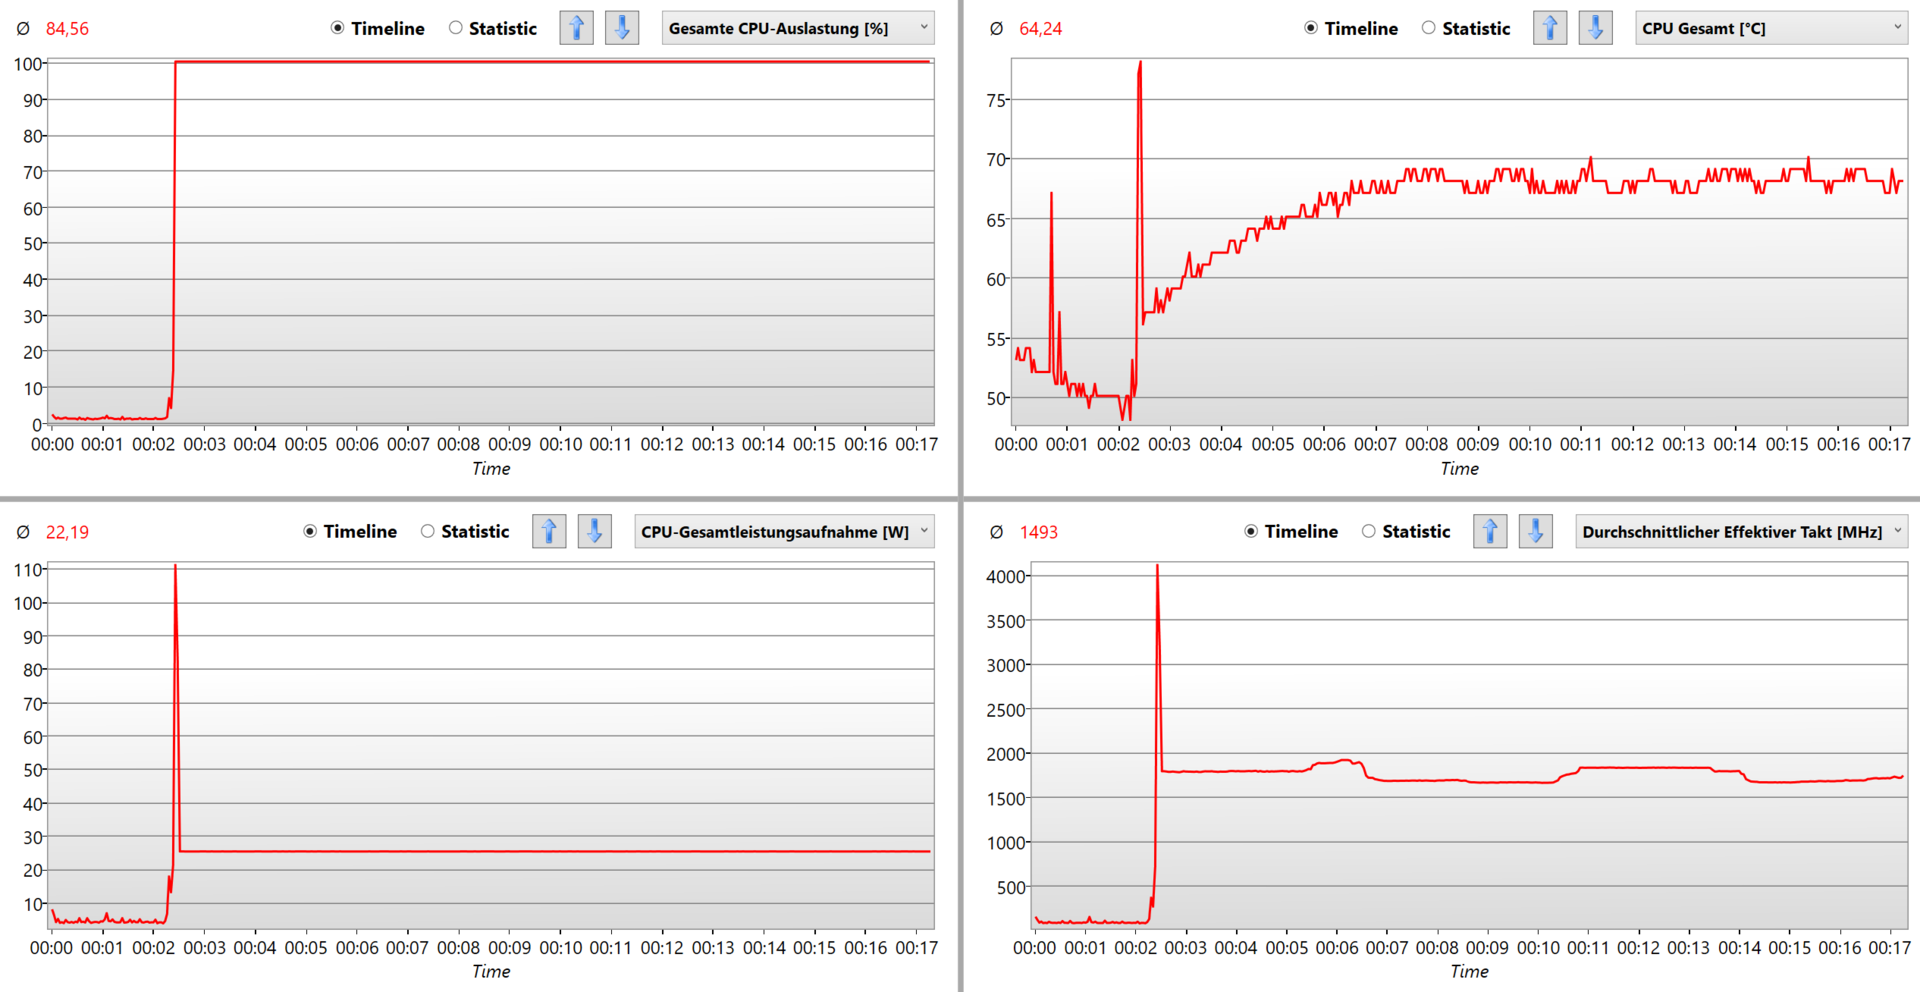
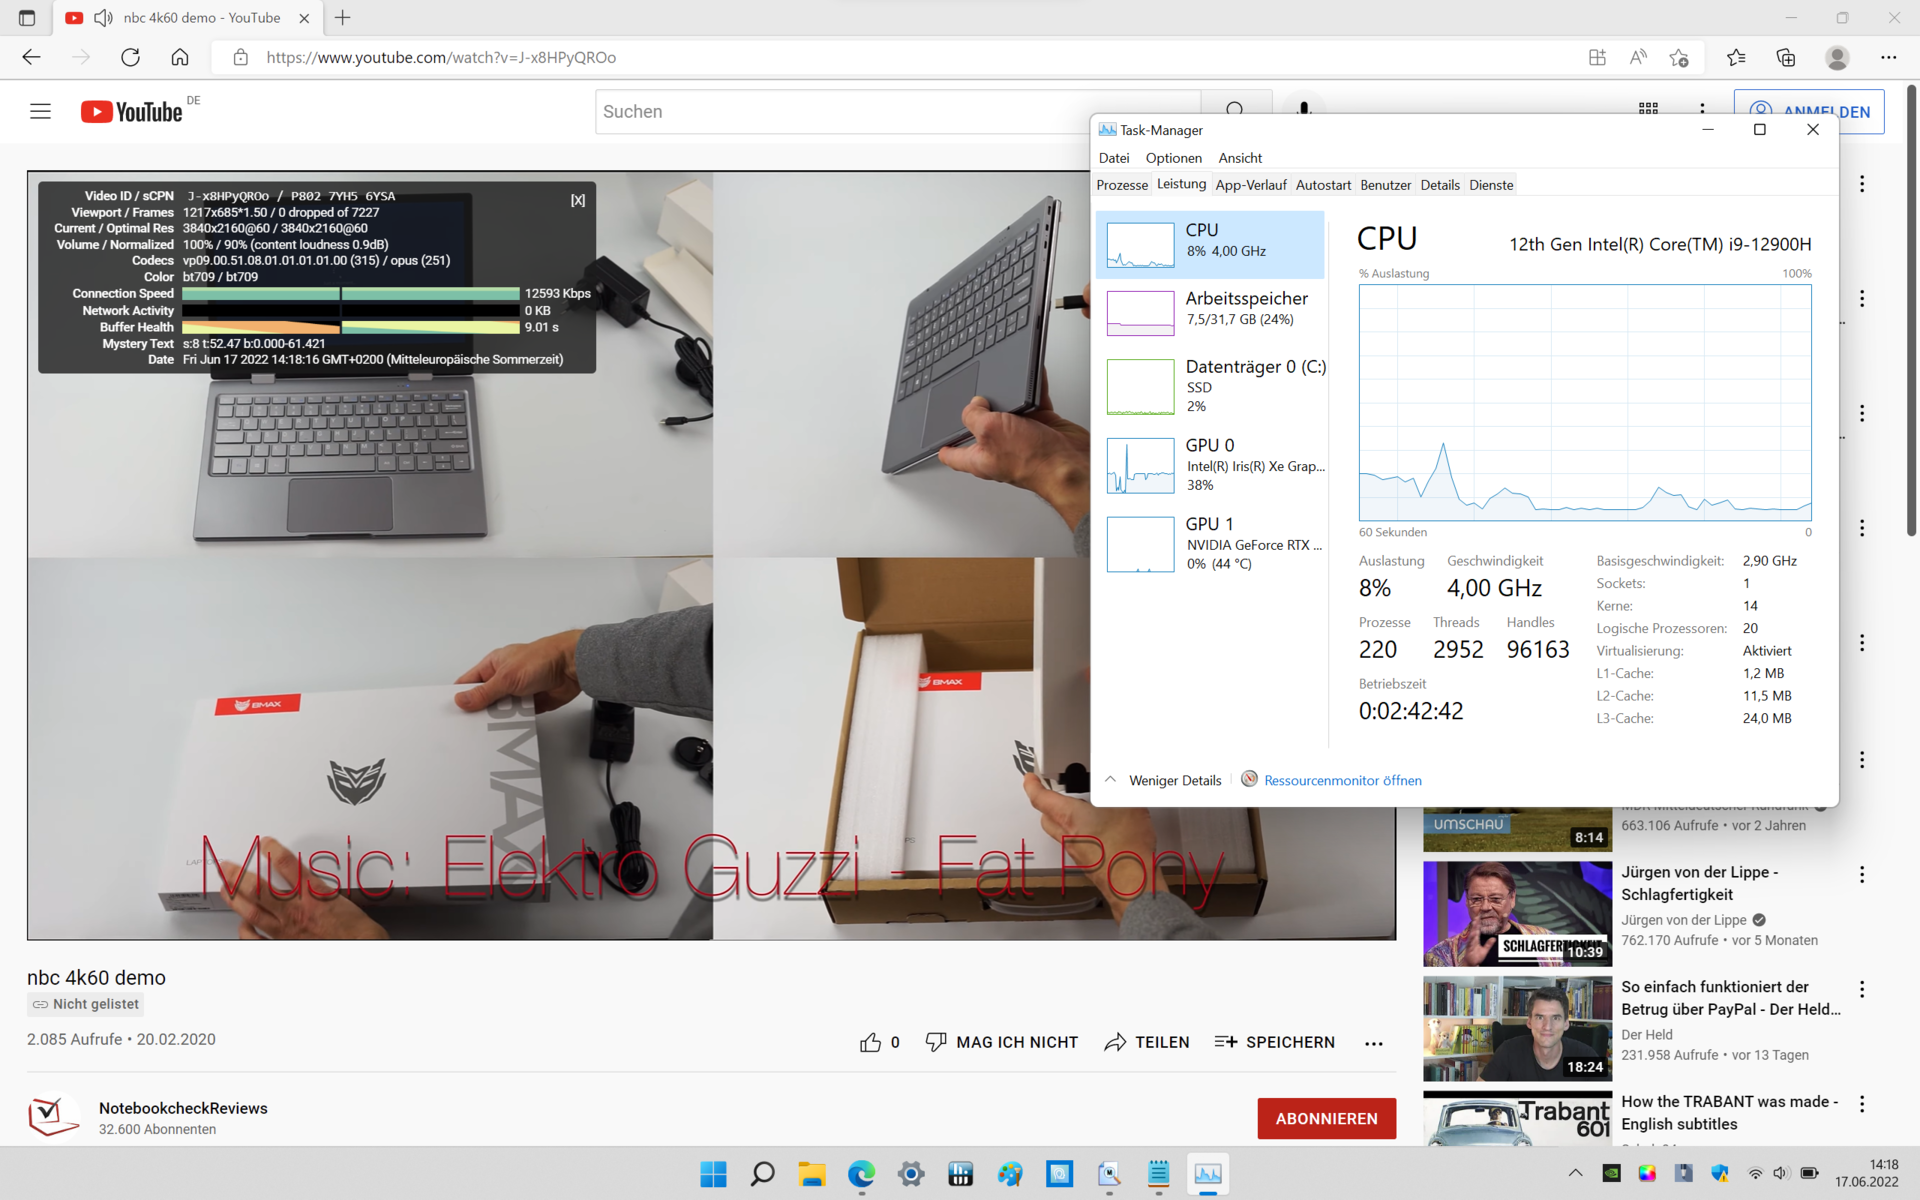
只有技嘉Aero 16 YE5在DPC延迟方面能够提供更好的速率。微星Creator只有不到800微秒,并不适合实时音频编辑。不过,4K视频播放掌握得很出色。系统负载保持在一个非常低的范围内,中间帧也没有掉。
| DPC Latencies / LatencyMon - interrupt to process latency (max), Web, Youtube, Prime95 | |
| MSI Creator Z16 A11UET-209 | |
| Acer Predator Triton 500 SE PT516-52s-70KX | |
| Alienware x17 R2 P48E | |
| MSI Creator Z16P B12UHST | |
| Gigabyte Aero 16 YE5 | |
* ... smaller is better
储存
固态硬盘可以充分挖掘其潜力。由于采用了PCIe 4.0接口,它的速度几乎达到了7000MB/s,甚至AS SSD拷贝基准测试的结果也几乎达到了3000MB/s。在耐久性测试中可以观察到下降的事实是由于内部温度过高造成的。这里达到了90°C(约194°F)的临界速率,固态硬盘就会节制其速度。
内置的2TB型号提供了不到1800GB的自由空间。你可以通过免费的M.2插槽轻松扩展存储容量,该插槽还配备了PCIe 4.0。

| MSI Creator Z16P B12UHST Samsung PM9A1 MZVL22T0HBLB | MSI Creator Z16 A11UET-209 Phison 1TB SM2801T24GKBB4S-E162 | Alienware x17 R2 P48E 2x Samsung PM9A1 1TB (RAID 0) | Gigabyte Aero 16 YE5 Phison ESR01TBMFCT | Acer Predator Triton 500 SE PT516-52s-70KX Micron 3400 1TB MTFDKBA1T0TFH | Average of class Multimedia | |
|---|---|---|---|---|---|---|
| Drive Performance rating | ||||||
| Percent (pt) | 82.8 | 54.5 -34% | 62.9 -24% | 86.8 5% | 71.5 -14% | 49.7 -40% |
| DiskSpd | -37% | -3% | 4% | -13% | -36% | |
| seq read (MB/s) | 4409 | 2561 -42% 2503 -43% | 4931 12% | 3819 -13% | 3595 -18% | 2924 ? -34% |
| seq write (MB/s) | 4357 | 2432 -44% 2421 -44% | 4819 11% | 4457 2% | 4599 6% | 3102 ? -29% |
| seq q8 t1 read (MB/s) | 6693 | 4999 -25% 4977 -26% | 13195 97% | 7028 5% | 6499 -3% | 5718 ? -15% |
| seq q8 t1 write (MB/s) | 4935 | 2425 -51% 2422 -51% | 8227 67% | 5004 1% | 4765 -3% | 4618 ? -6% |
| 4k q1 t1 read (MB/s) | 90.1 | 59.5 -34% 59 -35% | 79.3 -12% | 88.7 -2% | 70.3 -22% | 62.4 ? -31% |
| 4k q1 t1 write (MB/s) | 254 | 226 -11% 226 -11% | 170.2 -33% | 373 47% | 222 -13% | 157.5 ? -38% |
| 4k q32 t16 read (MB/s) | 4071 | 1649 -59% 1648 -60% | 874 -79% | 3555 -13% | 2750 -32% | 1396 ? -66% |
| 4k q32 t16 write (MB/s) | 3453 | 2426 -30% 2426 -30% | 461 -87% | 3612 5% | 2786 -19% | 984 ? -72% |
| AS SSD | -31% | -42% | 9% | -16% | -57% | |
| Score Total (Points) | 8935 | 6101 -32% | 4941 -45% | 9380 5% | 7009 -22% | 5053 ? -43% |
| Score Read (Points) | 3363 | 2347 -30% | 1948 -42% | 3634 8% | 2709 -19% | 1595 ? -53% |
| Score Write (Points) | 3919 | 2650 -32% | 2137 -45% | 3991 2% | 2930 -25% | 2703 ? -31% |
| Seq Read (MB/s) | 5367 | 3641 -32% | 6561.69 22% | 5588 4% | 4531.51 -16% | 4493 ? -16% |
| Seq Write (MB/s) | 3994 | 1557 -61% | 3480.87 -13% | 3267 -18% | 4186.78 5% | 3037 ? -24% |
| 4K Read (MB/s) | 80.4 | 69.3 -14% | 69.21 -14% | 109.4 36% | 64.38 -20% | 61.5 ? -24% |
| 4K Write (MB/s) | 225.3 | 226 0% | 184.49 -18% | 321.6 43% | 212.27 -6% | 184.5 ? -18% |
| 4K-64 Read (MB/s) | 2746 | 1913 -30% | 1223.07 -55% | 2966 8% | 2191.95 -20% | 1084 ? -61% |
| 4K-64 Write (MB/s) | 3294 | 2268 -31% | 1604.89 -51% | 3342 1% | 2298.82 -30% | 2215 ? -33% |
| Access Time Read * (ms) | 0.042 | 0.082 -95% | 0.03 29% | 0.056 -33% | 0.06171 ? -47% | |
| Access Time Write * (ms) | 0.02 | 0.017 15% | 0.066 -230% | 0.012 40% | 0.022 -10% | 0.07475 ? -274% |
| Total Average (Program / Settings) | -34% /
-35% | -23% /
-26% | 6% /
7% | -14% /
-15% | -44% /
-48% |
* ... smaller is better
Continuous load read: DiskSpd Read Loop, Queue Depth 8
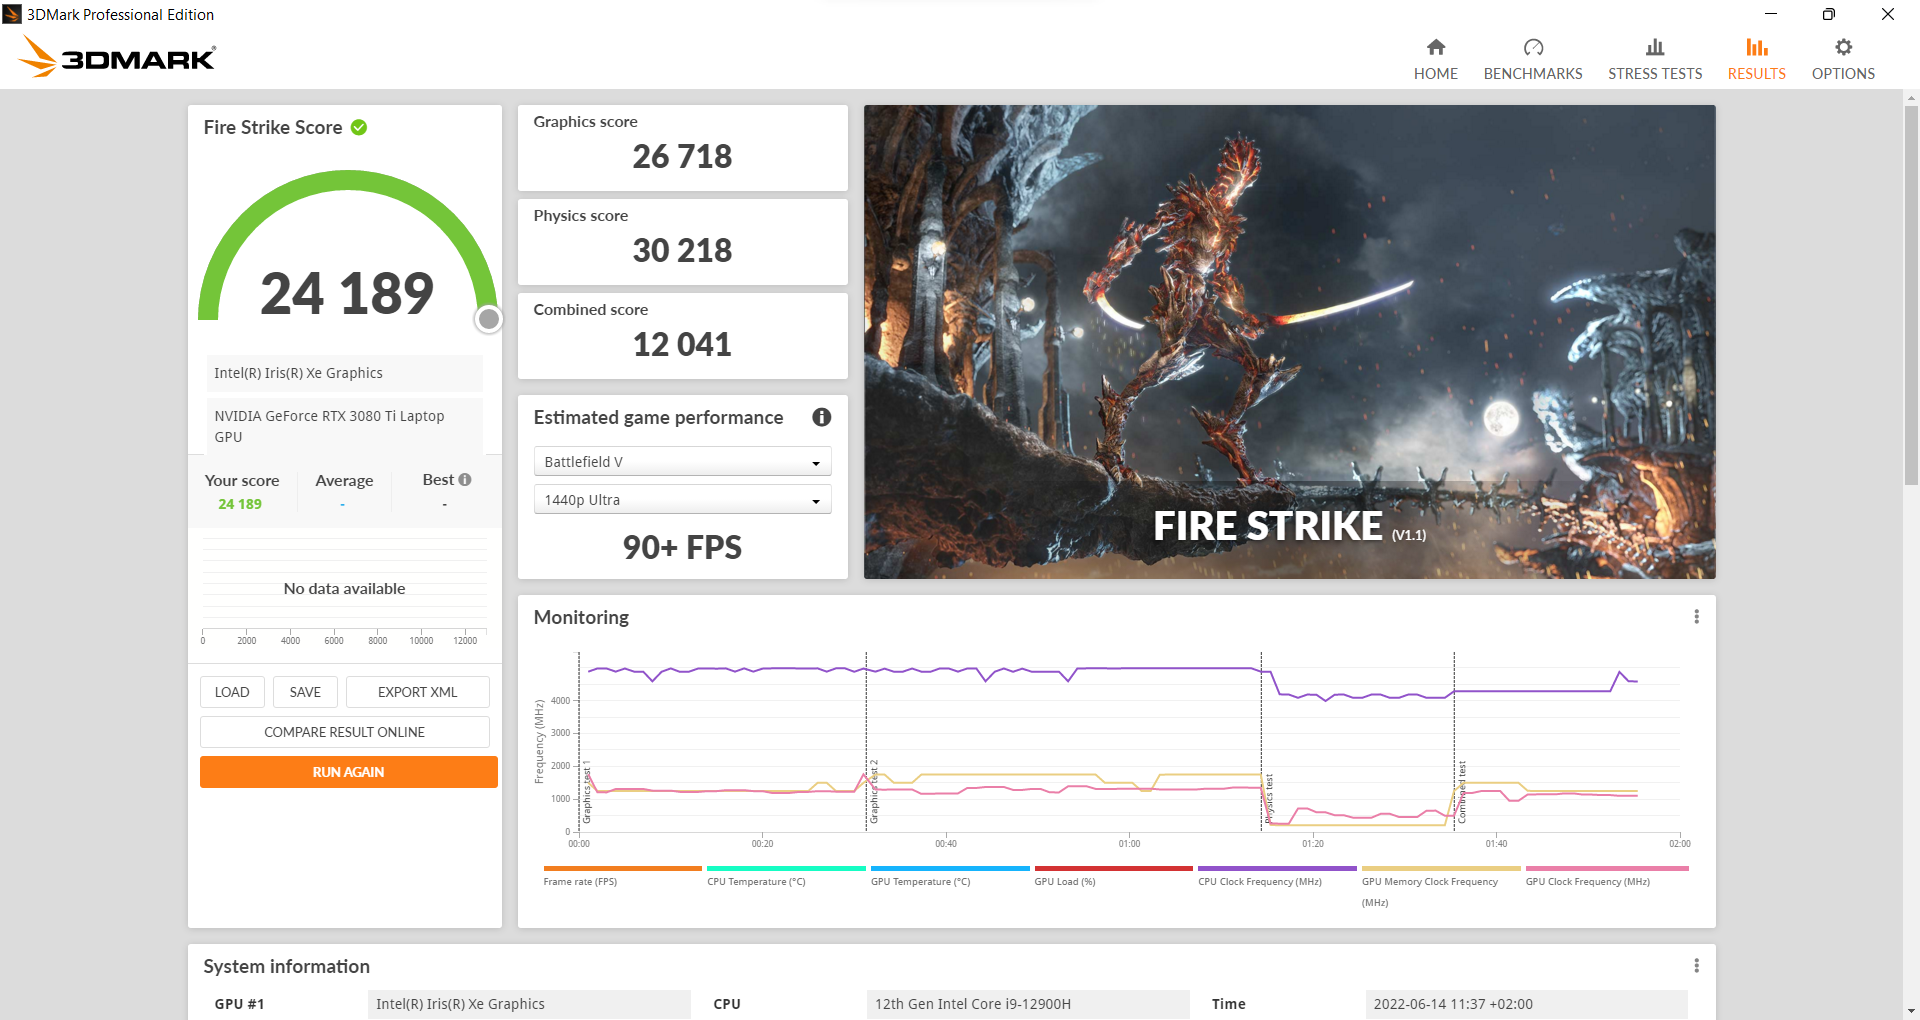
图形卡
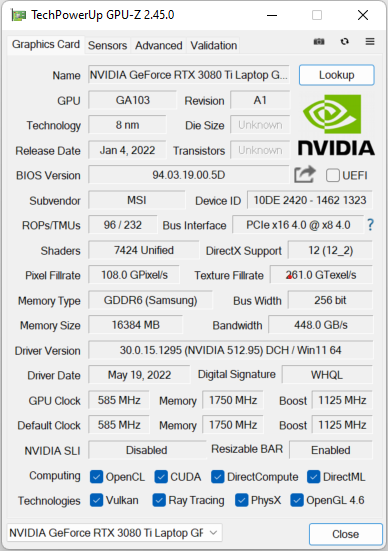
NvidiaGeForce RTX 3080 Ti在高端游戏笔记本电脑中很受欢迎。即使作为一个移动的替代品,它也提供了大量的图形处理能力。这就是微星造物主Z16P在多媒体笔记本电脑的平均价值上大幅领先的原因。此外,还有16GB的VRAM,用于高分辨率下的渲染任务。
| 3DMark 11 Performance | 14367 points | |
| 3DMark Cloud Gate Standard Score | 60157 points | |
| 3DMark Fire Strike Score | 24189 points | |
| 3DMark Time Spy Score | 10497 points | |
Help | ||
游戏性能

当然,游戏性能并不是创作者笔记本的主要重点。尽管如此,与游戏笔记本的差距并不大,这是由于前面提到的高性能RTX 3080 Ti。
很明显,这还不足以获得顶级排名之一。冷却性能对此来说太低了。此外,电源是有限的,因为否则笔记本内部会有更高的温度上升。而不是典型的115至135瓦,微星只给予其创造者的笔记本电脑最大90瓦的功率。在我们用TheWitcher 3 进行的压力测试中,这个速率在节流启动之前可以用很短的时间。
尽管如此,结果是体面的。在一些疲惫的视频编辑之后,寻求分心的用户至少可以以全高清分辨率和高细节播放最近的作品。然而,为此,需要随时有一个电源插座。集成GPU通常使用电池供电,这导致了相当大的性能损失。
| The Witcher 3 | |
| 1920x1080 High Graphics & Postprocessing (Nvidia HairWorks Off) | |
| Alienware x17 R2 P48E | |
| Average NVIDIA GeForce RTX 3080 Ti Laptop GPU (144 - 268, n=28) | |
| Acer Predator Triton 500 SE PT516-52s-70KX | |
| MSI Creator Z16P B12UHST | |
| Gigabyte Aero 16 YE5 | |
| Average of class Multimedia (22 - 224, n=7, last 2 years) | |
| MSI Creator Z16 A11UET-209 | |
| 1920x1080 Ultra Graphics & Postprocessing (HBAO+) | |
| Alienware x17 R2 P48E | |
| Average NVIDIA GeForce RTX 3080 Ti Laptop GPU (30 - 130.6, n=43) | |
| Acer Predator Triton 500 SE PT516-52s-70KX | |
| Gigabyte Aero 16 YE5 | |
| MSI Creator Z16P B12UHST | |
| MSI Creator Z16 A11UET-209 | |
| Average of class Multimedia (11 - 121, n=7, last 2 years) | |
| Elex 2 | |
| 1920x1080 High / On AA:FX AF:16x | |
| Gigabyte Aero 16 YE5 | |
| Average NVIDIA GeForce RTX 3080 Ti Laptop GPU (43 - 96, n=3) | |
| MSI Creator Z16P B12UHST | |
| 1920x1080 Ultra / On AA:SM AF:16x | |
| Gigabyte Aero 16 YE5 | |
| Average NVIDIA GeForce RTX 3080 Ti Laptop GPU (31 - 91, n=3) | |
| MSI Creator Z16P B12UHST | |
| 2560x1440 Ultra / On AA:SM AF:16x | |
| Average NVIDIA GeForce RTX 3080 Ti Laptop GPU (31 - 93, n=3) | |
| Gigabyte Aero 16 YE5 | |
| MSI Creator Z16P B12UHST | |
| Forza Horizon 5 | |
| 1920x1080 High Preset | |
| Average NVIDIA GeForce RTX 3080 Ti Laptop GPU (66 - 144, n=5) | |
| Gigabyte Aero 16 YE5 | |
| MSI Creator Z16P B12UHST | |
| 1920x1080 Extreme Preset | |
| Average NVIDIA GeForce RTX 3080 Ti Laptop GPU (48 - 95, n=5) | |
| Gigabyte Aero 16 YE5 | |
| MSI Creator Z16P B12UHST | |
| 2560x1440 Extreme Preset | |
| Average NVIDIA GeForce RTX 3080 Ti Laptop GPU (40 - 82, n=5) | |
| Gigabyte Aero 16 YE5 | |
| MSI Creator Z16P B12UHST | |
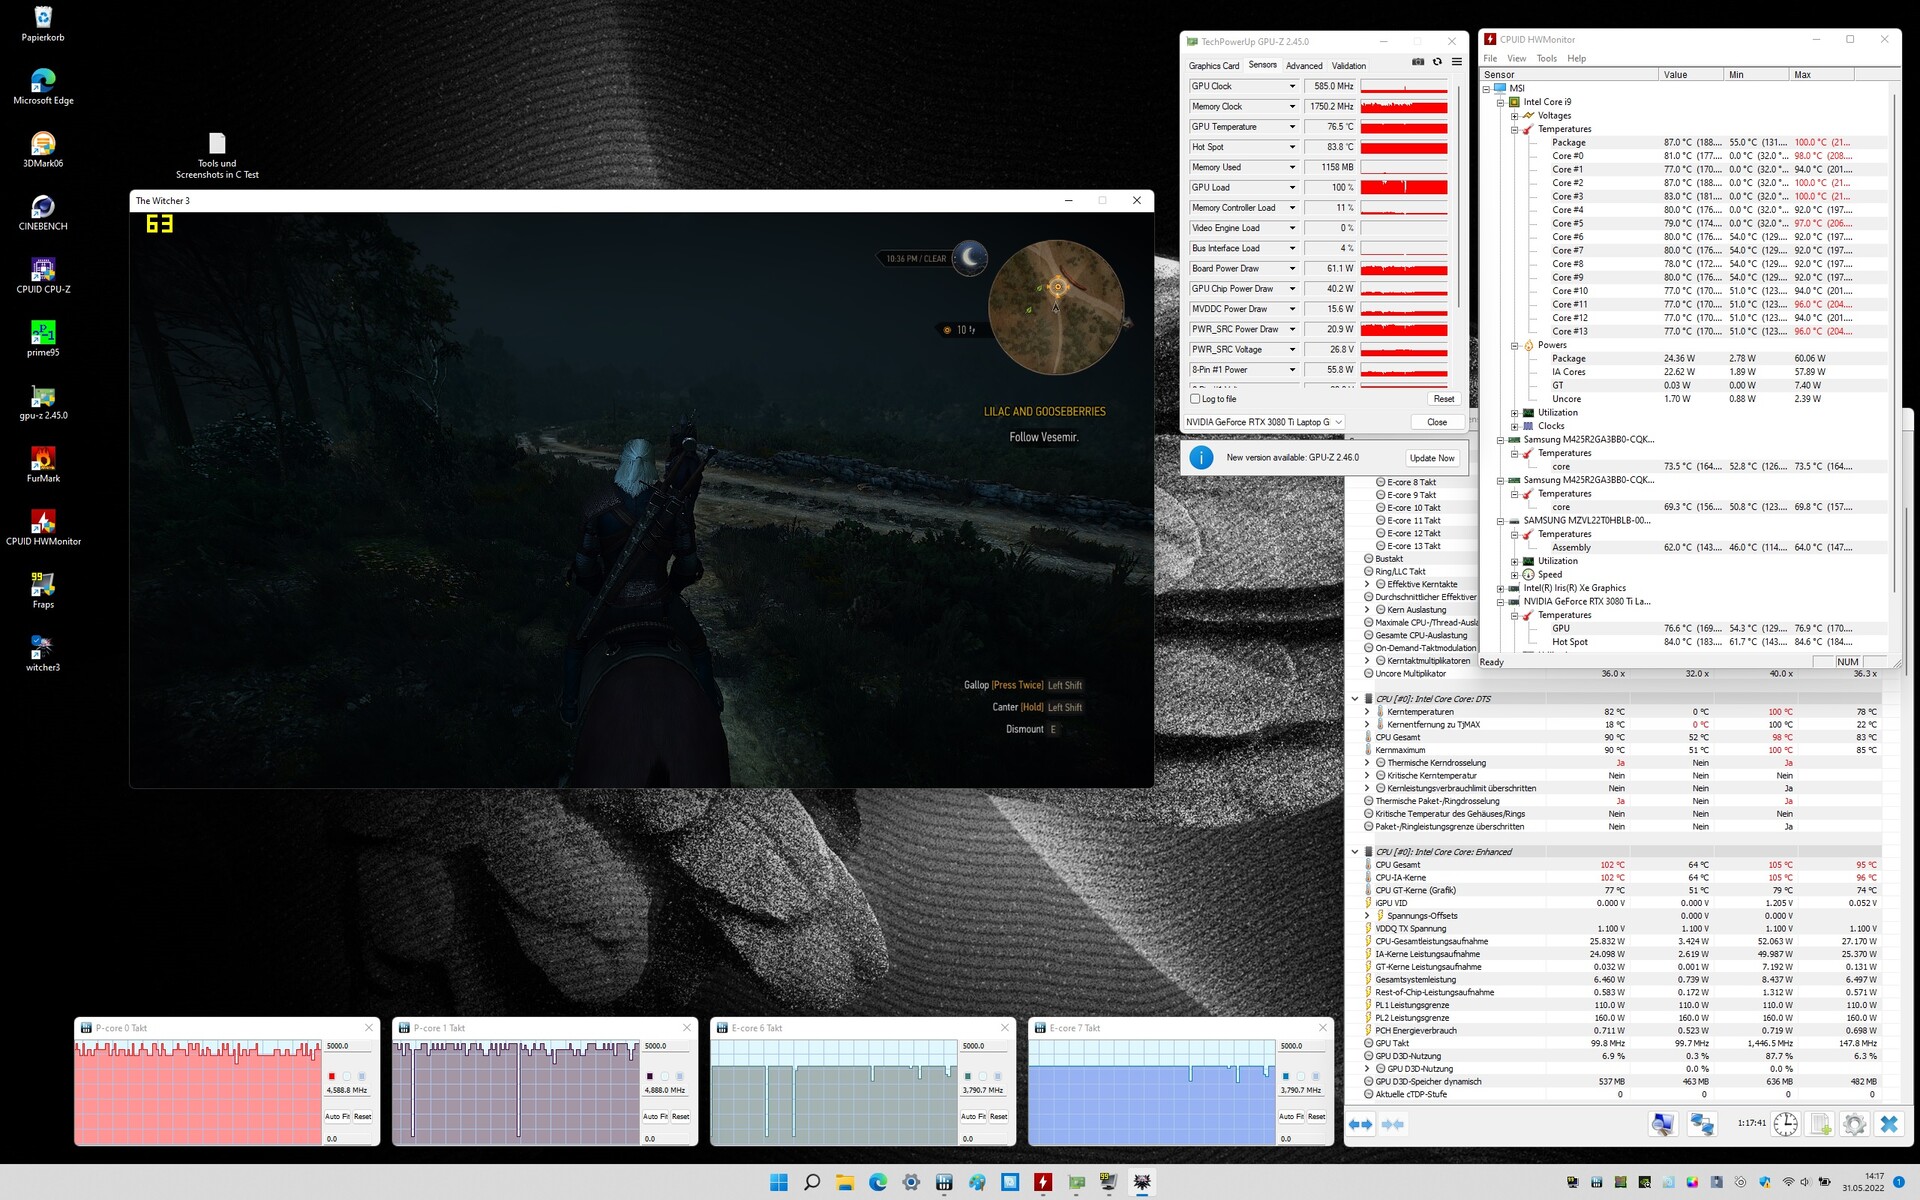
Witcher 3的FPS图表显示了一个强大的同时又特别纤薄的创作者笔记本电脑的典型趋势。从每秒90帧开始,系统必须迅速冷却,因为温度会达到100℃(约212°F)。为此,CPU和GPU的电源被大大限制。显卡最终只得到35瓦,而不是90瓦。笔记本电脑仍然很热,但它最终可以将温度维持在55 - 60帧。
为了便于比较,你可以看到一个 NvidiaGeForce RTX 3070,这实际上要弱得多。在技嘉A5 X1中,它得到了相当大的140瓦,并在一个相当大的机箱中进行相应的冷却。这导致在开始时有相同的速率,中档笔记本电脑也能稳固地保持。
The Witcher 3 FPS chart
| low | med. | high | ultra | QHD | |
|---|---|---|---|---|---|
| GTA V (2015) | 176.5 | 91.1 | 74.9 | ||
| The Witcher 3 (2015) | 145 | 68 | |||
| Dota 2 Reborn (2015) | 163.9 | 157.2 | |||
| Final Fantasy XV Benchmark (2018) | 93.7 | 69.6 | |||
| X-Plane 11.11 (2018) | 102 | ||||
| Far Cry 5 (2018) | 134 | 123 | 98 | ||
| Strange Brigade (2018) | 159 | 156.7 | 96.5 | ||
| Forza Horizon 5 (2021) | 66 | 48 | 40 | ||
| Elex 2 (2022) | 43 | 31 | 31 |
排放 - 微星Z16P通常很热,很少有噪音
噪声排放
我们喜欢风扇的调校方式。虽然它们在正常任务中也能听到,但它们从不具有侵略性。在负载情况下,会产生连续的、可明显感觉到的噪音。
纵观竞争对手,最大噪音水平为46分贝,仅次于MacBook Pro 16。 Apple MacBook Pro 16虽说它的耗电量要小得多。考虑到强大的组件,冷却系统是非常安静的。
Noise level
| Idle |
| 27 / 29 / 31 dB(A) |
| Load |
| 43 / 46 dB(A) |
 | ||
30 dB silent 40 dB(A) audible 50 dB(A) loud |
||
min: | ||
| MSI Creator Z16P B12UHST i9-12900H, GeForce RTX 3080 Ti Laptop GPU | MSI Creator Z16 A11UET-209 i7-11800H, GeForce RTX 3060 Laptop GPU | Apple MacBook Pro 16 2021 M1 Max M1 Max, M1 Max 32-Core GPU | Alienware x17 R2 P48E i9-12900HK, GeForce RTX 3080 Ti Laptop GPU | Gigabyte Aero 16 YE5 i9-12900HK, GeForce RTX 3080 Ti Laptop GPU | Acer Predator Triton 500 SE PT516-52s-70KX i7-12700H, GeForce RTX 3080 Ti Laptop GPU | |
|---|---|---|---|---|---|---|
| Noise | -6% | 10% | 9% | -8% | -10% | |
| off / environment * (dB) | 26 | 26.3 -1% | 24.2 7% | 22.7 13% | 25 4% | 26 -0% |
| Idle Minimum * (dB) | 27 | 26.3 3% | 24.2 10% | 23.1 14% | 30 -11% | 26 4% |
| Idle Average * (dB) | 29 | 26.3 9% | 24.2 17% | 23.1 20% | 32 -10% | 29 -0% |
| Idle Maximum * (dB) | 31 | 26.3 15% | 24.2 22% | 23.1 25% | 33 -6% | 34 -10% |
| Load Average * (dB) | 43 | 53.9 -25% | 42.9 -0% | 31.9 26% | 45 -5% | 50 -16% |
| Witcher 3 ultra * (dB) | 43 | 53.9 -25% | 39.5 8% | 52.5 -22% | 50 -16% | 53 -23% |
| Load Maximum * (dB) | 46 | 54.8 -19% | 42.9 7% | 52.5 -14% | 52 -13% | 56 -22% |
* ... smaller is better
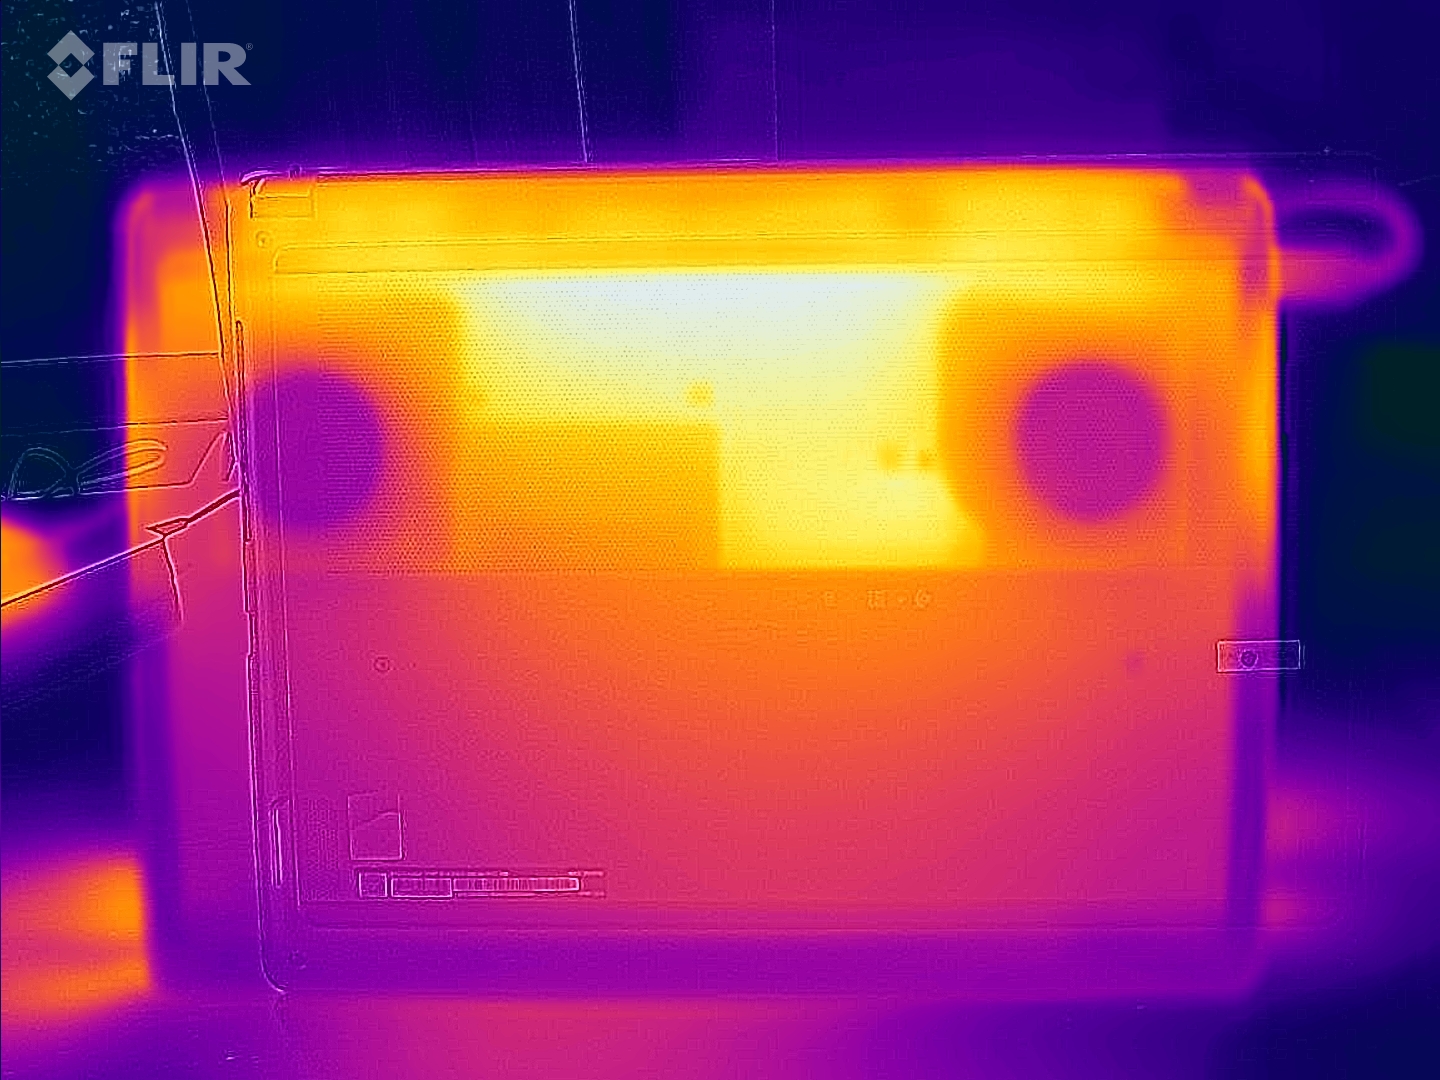
温度
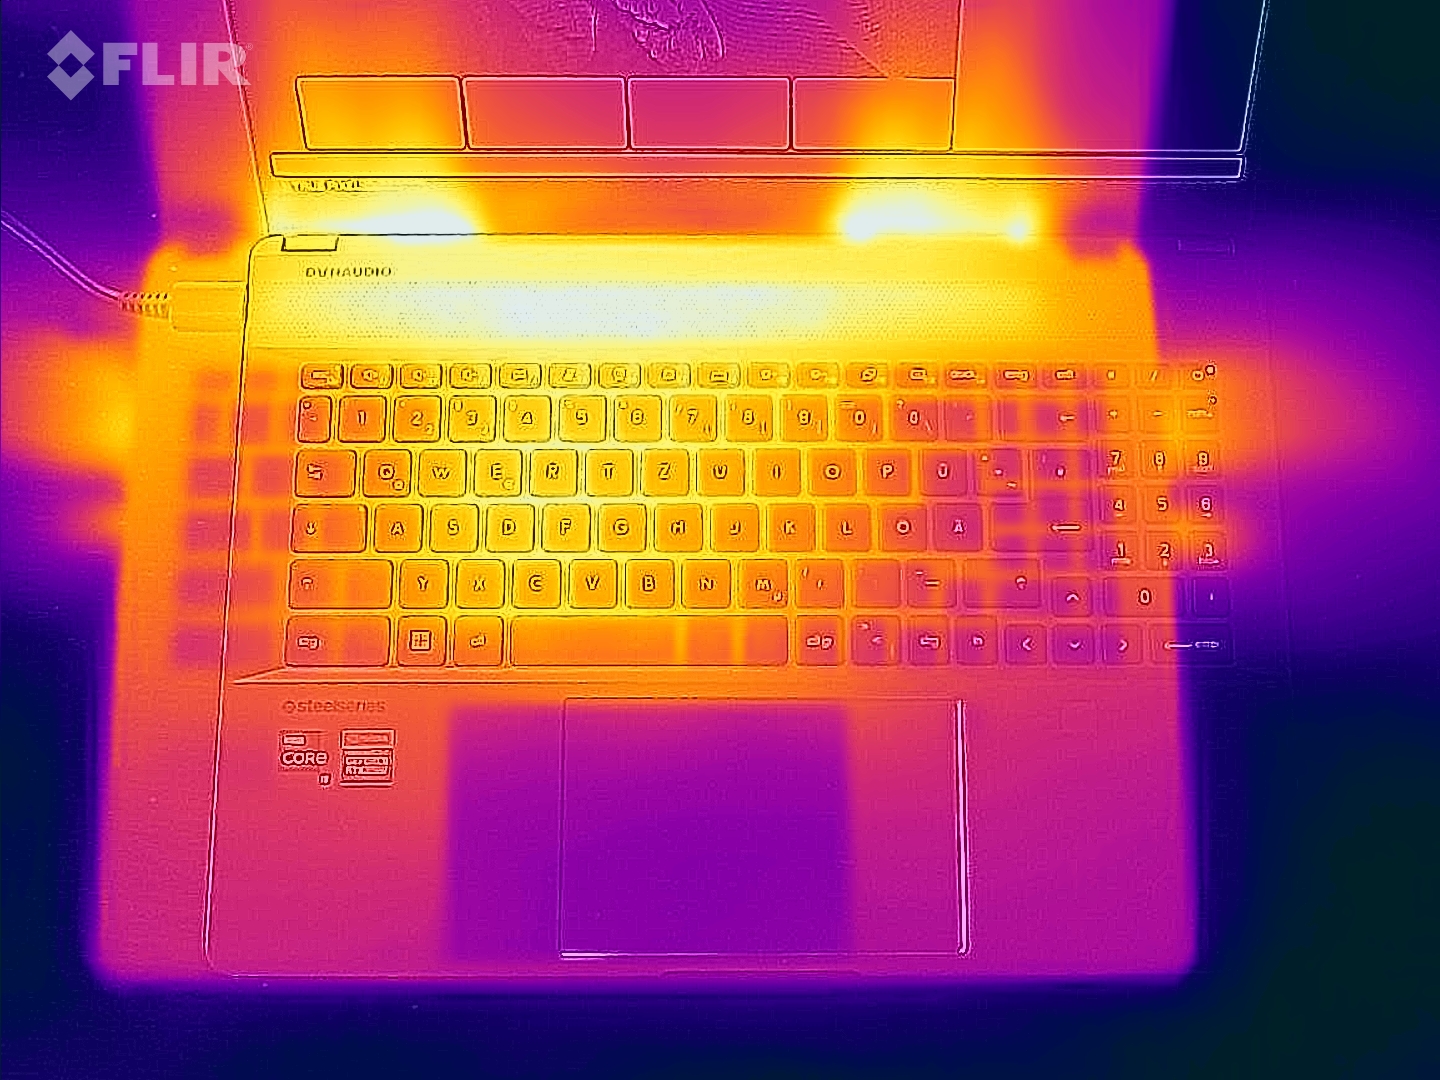
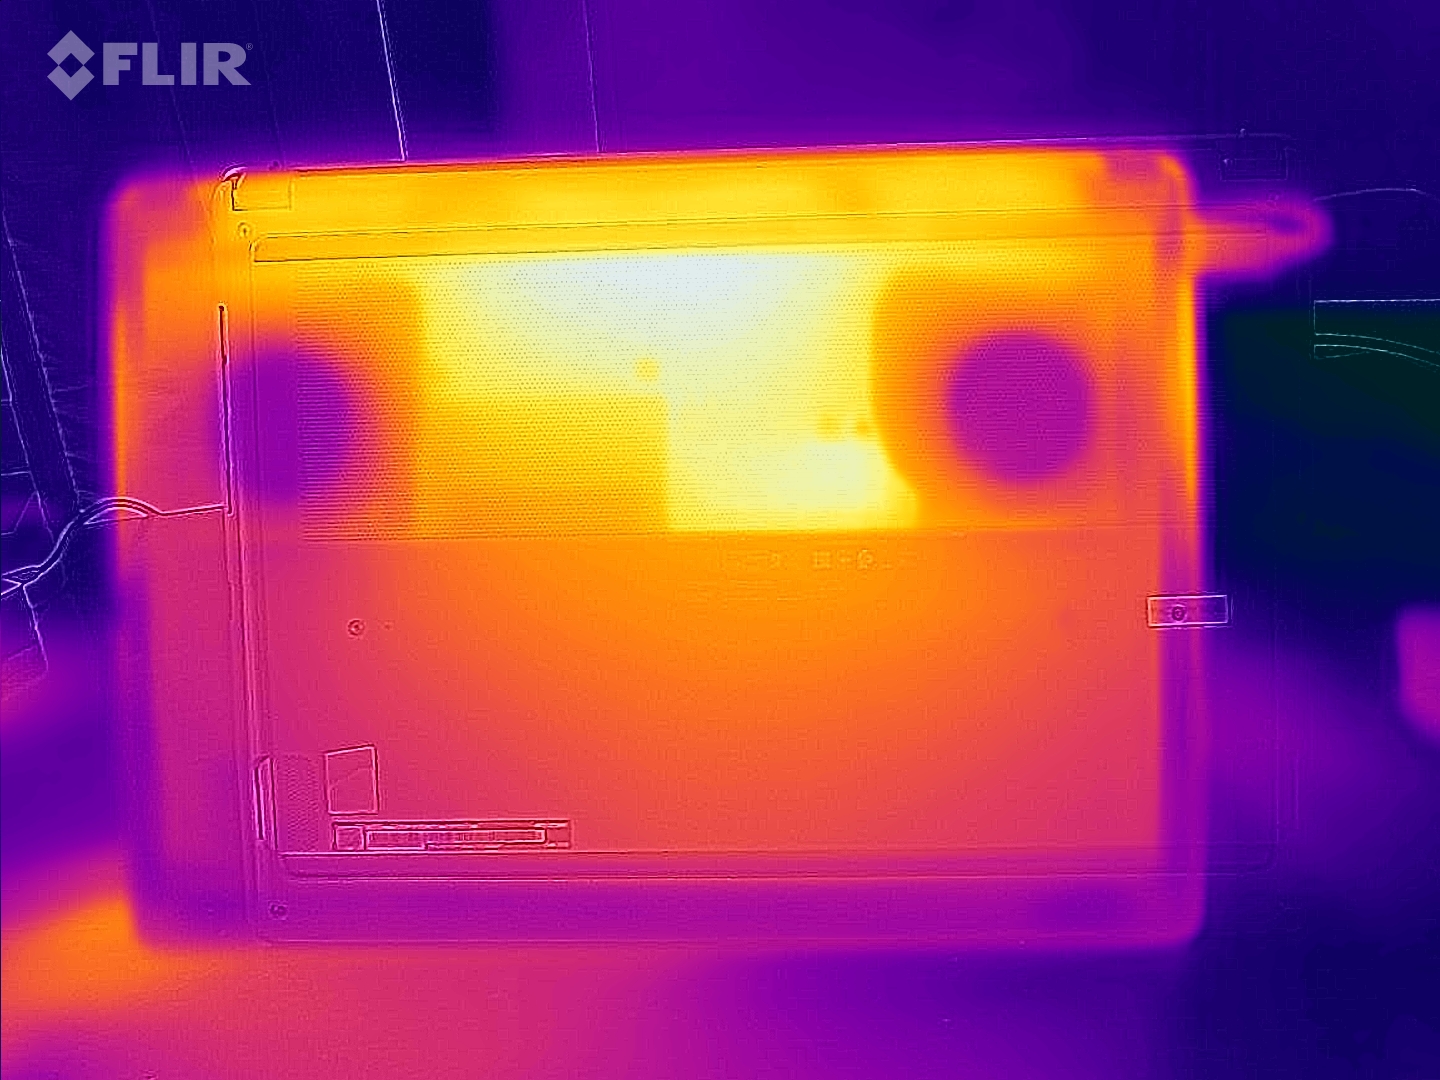
微星造物主Z16P的风扇转动得越安静,机箱内的温度就越高。当长时间需要最高性能时,例如在我们的性能测试中,键盘区域的温度甚至超过了60℃(约140°F)。
不幸的是,在正常使用中,情况并没有特别的不同。渲染一个全高清视频也需要时间。之后,你不会想马上开始在键盘上打字,而适当的冷却只有在之后的静音模式中才能提供。
此外,创造者的笔记本电脑基本上总是热的。只要浏览一下网页,机箱温度就会超过35℃(约95°F)。这并不意味着无法工作,但这一点也不令人愉快。
(-) The maximum temperature on the upper side is 67 °C / 153 F, compared to the average of 36.8 °C / 98 F, ranging from 21 to 71 °C for the class Multimedia.
(-) The bottom heats up to a maximum of 69 °C / 156 F, compared to the average of 39.1 °C / 102 F
(+) In idle usage, the average temperature for the upper side is 26.2 °C / 79 F, compared to the device average of 31.3 °C / 88 F.
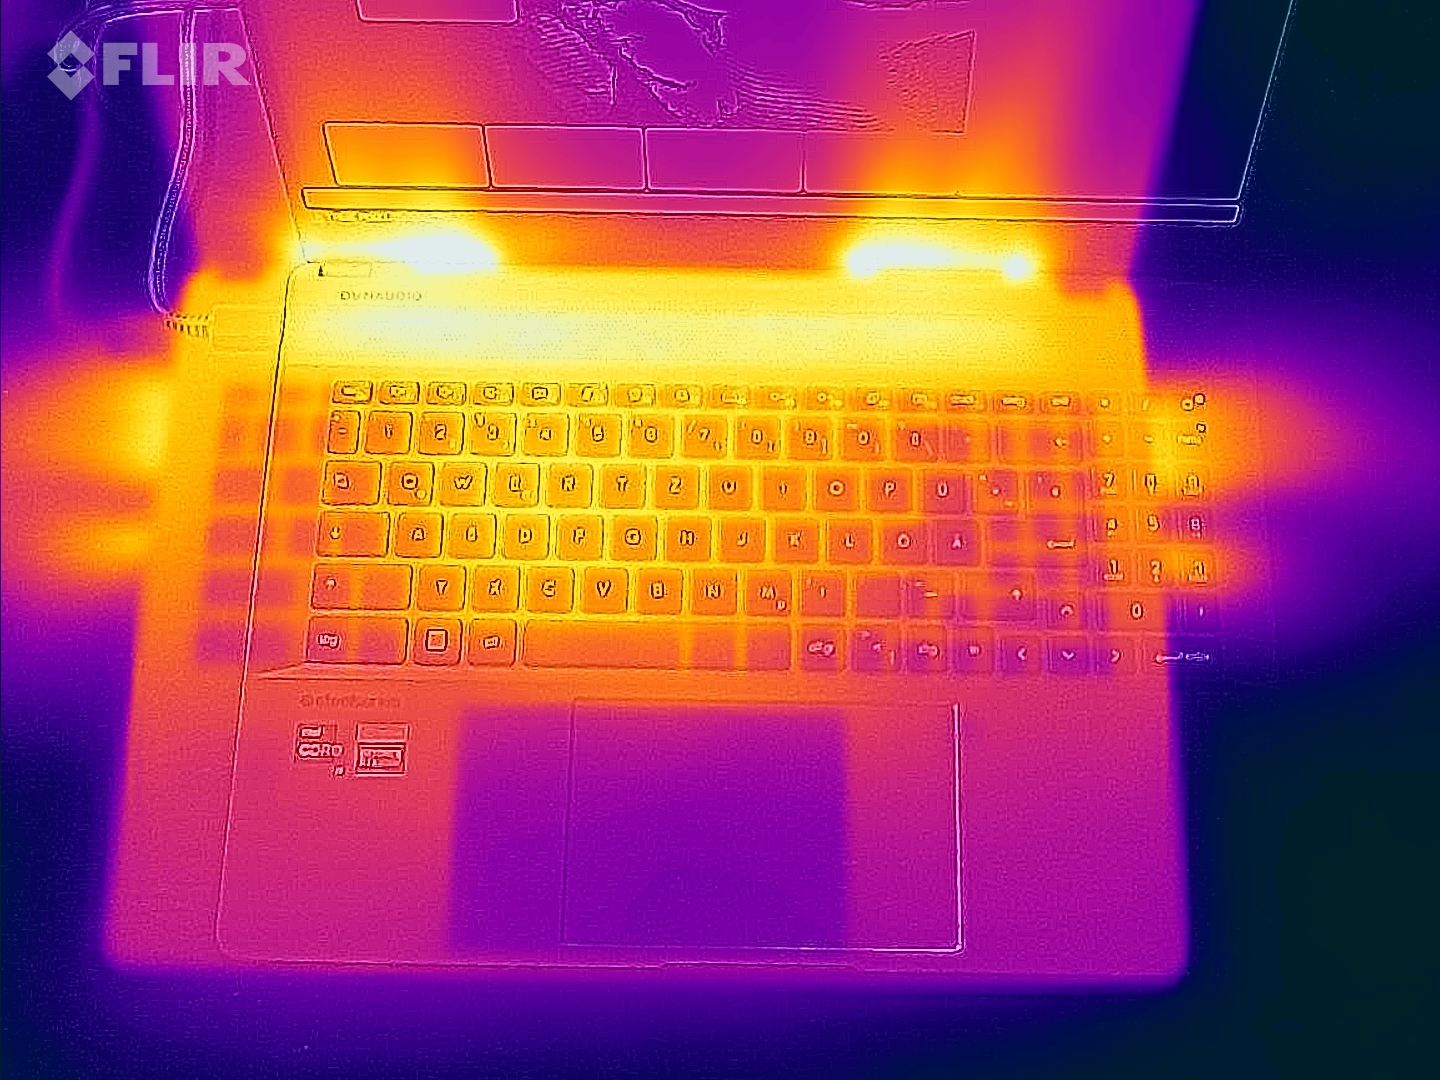
(-) Playing The Witcher 3, the average temperature for the upper side is 49 °C / 120 F, compared to the device average of 31.3 °C / 88 F.
(-) The palmrests and touchpad can get very hot to the touch with a maximum of 44 °C / 111.2 F.
(-) The average temperature of the palmrest area of similar devices was 28.7 °C / 83.7 F (-15.3 °C / -27.5 F).
| MSI Creator Z16P B12UHST i9-12900H, GeForce RTX 3080 Ti Laptop GPU | MSI Creator Z16 A11UET-209 i7-11800H, GeForce RTX 3060 Laptop GPU | Apple MacBook Pro 16 2021 M1 Max M1 Max, M1 Max 32-Core GPU | Alienware x17 R2 P48E i9-12900HK, GeForce RTX 3080 Ti Laptop GPU | Gigabyte Aero 16 YE5 i9-12900HK, GeForce RTX 3080 Ti Laptop GPU | Acer Predator Triton 500 SE PT516-52s-70KX i7-12700H, GeForce RTX 3080 Ti Laptop GPU | |
|---|---|---|---|---|---|---|
| Heat | 3% | 28% | 14% | 5% | 11% | |
| Maximum Upper Side * (°C) | 67 | 52.5 22% | 42.3 37% | 49.6 26% | 49 27% | 47 30% |
| Maximum Bottom * (°C) | 69 | 56.7 18% | 41.7 40% | 42.4 39% | 55 20% | 49 29% |
| Idle Upper Side * (°C) | 29 | 33.9 -17% | 23.9 18% | 29.2 -1% | 33 -14% | 31 -7% |
| Idle Bottom * (°C) | 29 | 32.7 -13% | 23.9 18% | 32 -10% | 33 -14% | 32 -10% |
* ... smaller is better
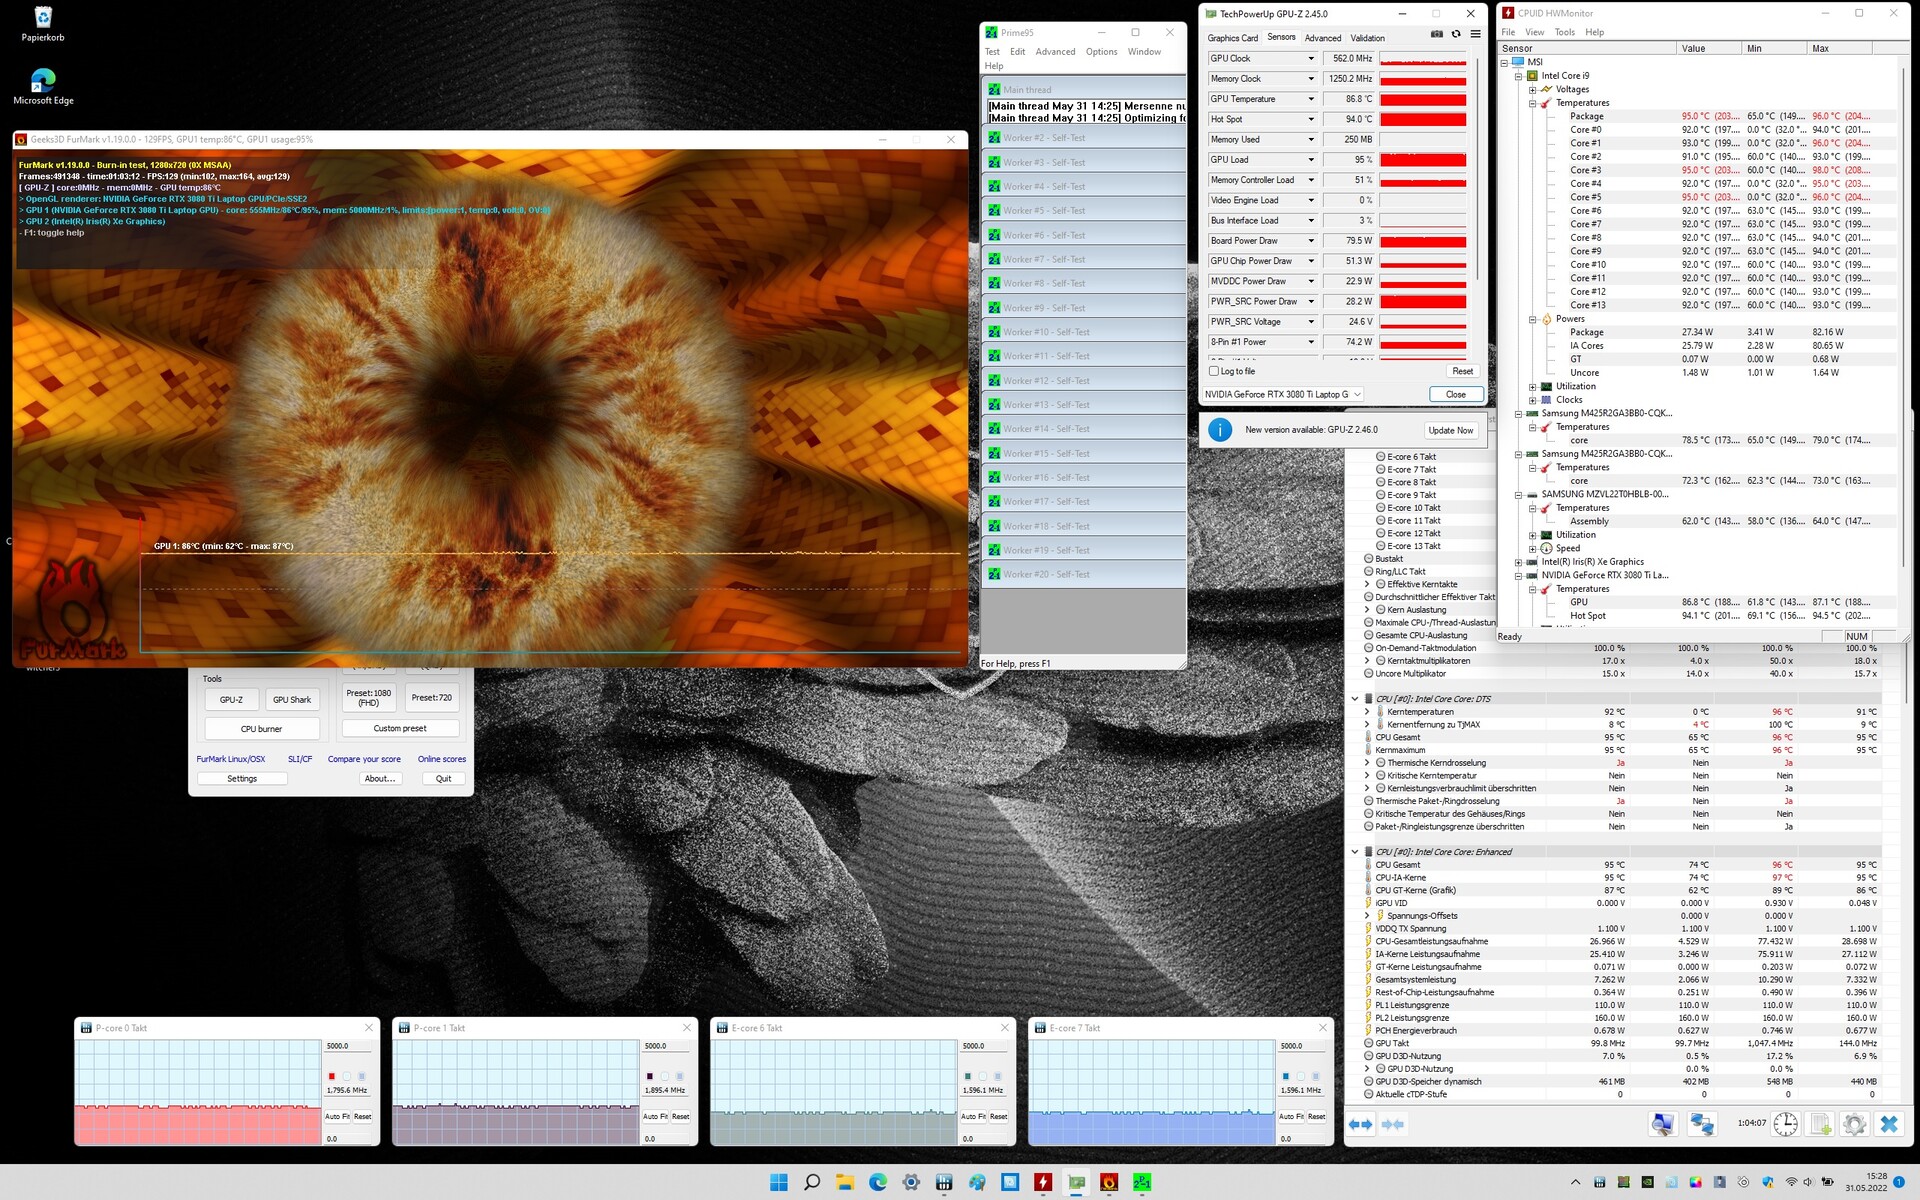
压力测试
与游戏笔记本电脑相比,Z16P创造者不太可能被迫长时间以峰值性能工作。最迟在5-10分钟的计算后至少应该有短暂的喘息,当在复杂的游戏世界中花费很长时间时,情况其实并不是这样的。
压力测试结果也相应较差,因为该设备并不是为此设计的。外壳发热严重,而内部测得的温度达到三位数。此外,该系统在启动后不久就大大降低了CPU和GPU的时钟速率以及功耗。不用说,这也是由于超薄的机箱和低水平的通风,这两者都不是为此设计的。
发言人
Dynaudio两路扬声器的音量立即令人印象深刻。在一个较大的房间或容易听到的环境噪音中,微星笔记本电脑上的内容仍然非常清晰可闻。
低音不一定是Z16P的优势。不过,中音和高音在某种程度上可以说服人。
一般来说,声音质量是不错的。不幸的是,当涉及到音乐时,吉他等的范围没有得到足够的强调。人声听起来有点过度放大。
MSI Creator Z16P B12UHST audio analysis
(+) | speakers can play relatively loud (91 dB)
Bass 100 - 315 Hz
(-) | nearly no bass - on average 17.9% lower than median
(±) | linearity of bass is average (11% delta to prev. frequency)
Mids 400 - 2000 Hz
(±) | higher mids - on average 5.8% higher than median
(+) | mids are linear (6.4% delta to prev. frequency)
Highs 2 - 16 kHz
(±) | higher highs - on average 7.2% higher than median
(+) | highs are linear (6.6% delta to prev. frequency)
Overall 100 - 16.000 Hz
(±) | linearity of overall sound is average (17% difference to median)
Compared to same class
» 46% of all tested devices in this class were better, 7% similar, 46% worse
» The best had a delta of 5%, average was 17%, worst was 45%
Compared to all devices tested
» 31% of all tested devices were better, 8% similar, 61% worse
» The best had a delta of 4%, average was 23%, worst was 134%
Apple MacBook Pro 16 2021 M1 Pro audio analysis
(+) | speakers can play relatively loud (84.7 dB)
Bass 100 - 315 Hz
(+) | good bass - only 3.8% away from median
(+) | bass is linear (5.2% delta to prev. frequency)
Mids 400 - 2000 Hz
(+) | balanced mids - only 1.3% away from median
(+) | mids are linear (2.1% delta to prev. frequency)
Highs 2 - 16 kHz
(+) | balanced highs - only 1.9% away from median
(+) | highs are linear (2.7% delta to prev. frequency)
Overall 100 - 16.000 Hz
(+) | overall sound is linear (4.6% difference to median)
Compared to same class
» 0% of all tested devices in this class were better, 0% similar, 100% worse
» The best had a delta of 5%, average was 17%, worst was 45%
Compared to all devices tested
» 0% of all tested devices were better, 0% similar, 100% worse
» The best had a delta of 4%, average was 23%, worst was 134%
能源管理--造物主笔记本电脑的典型消耗
能源消耗
在没有额外负载的情况下,微星造物主Z16P的平均功率为17瓦,当它还没有执行任何任务时,是不必要的耗能。然而,这对竞争对手来说也是如此,因为它有一个类似的配置。明亮的大显示屏需要大量的电力,即使是对CPU最轻的请求也会产生相当大的电力消耗。
峰值功率消耗为212瓦。因此,240瓦的电源适配器是非常合适的,即使在最大负荷下,它仍然可以为电池充电。同时,可以看到,CPU的PL1为110瓦,GPU为90瓦,实际上甚至达到了组合的最大功耗。
负载下的典型功耗为124瓦,属于其他多媒体笔记本电脑的范围。即使是Apple MacBook Pro 16 2021 M1 Max也不能真正使自己脱颖而出,尽管它的组件实际上要节俭得多,但它的功耗仍然只有Z16P的四分之三。
| Off / Standby | |
| Idle | |
| Load |
|
Key:
min: | |
| MSI Creator Z16P B12UHST i9-12900H, GeForce RTX 3080 Ti Laptop GPU | MSI Creator Z16 A11UET-209 i7-11800H, GeForce RTX 3060 Laptop GPU | Apple MacBook Pro 16 2021 M1 Max M1 Max, M1 Max 32-Core GPU | Gigabyte Aero 16 YE5 i9-12900HK, GeForce RTX 3080 Ti Laptop GPU | Acer Predator Triton 500 SE PT516-52s-70KX i7-12700H, GeForce RTX 3080 Ti Laptop GPU | Average of class Multimedia | |
|---|---|---|---|---|---|---|
| Power Consumption | 11% | 29% | -50% | -0% | 47% | |
| Idle Minimum * (Watt) | 11 | 9 18% | 5.4 51% | 26 -136% | 7 36% | 5.66 ? 49% |
| Idle Average * (Watt) | 17 | 14 18% | 16.4 4% | 30 -76% | 19 -12% | 10.2 ? 40% |
| Idle Maximum * (Watt) | 26 | 26.7 -3% | 16.7 36% | 37 -42% | 28 -8% | 12.5 ? 52% |
| Load Average * (Watt) | 124 | 119 4% | 94 24% | 127 -2% | 114 8% | 65.2 ? 47% |
| Witcher 3 ultra * (Watt) | 133.5 | 125 6% | 104 22% | 176 -32% | 159 -19% | |
| Load Maximum * (Watt) | 212 | 160 25% | 135 36% | 236 -11% | 227 -7% | 113.5 ? 46% |
* ... smaller is better
Energy consumption during our The Witcher 3 test / stress test
Energy consumption with an external monitor
电池寿命
不出所料,即使是90Wh的电池和针对长电池寿命的智能优化(微星中心的超级电池模式)也做不了什么。尽管RTX 3080 Ti在电池电量上仍然是禁用的,但明亮的显示屏和总共14个处理器核心仍然会造成损失。
即使在飞行模式下观看全高清视频,电池在不到6小时后就被耗尽。在我们的Wi-Fi测试后,创维笔记本电脑甚至提前半小时关机。当需要性能时,只有一个小时是现实的。
再一次的,Apple MacBook Pro 16再次证明了如何在这里做得更好。非常节俭的处理器(只要不太用力)显然处于领先地位,几乎正好是14小时的视频播放时间。但Z16P甚至与多媒体类的平均速率相距甚远,这再次归功于其强大的内部设备。
| MSI Creator Z16P B12UHST i9-12900H, GeForce RTX 3080 Ti Laptop GPU, 90 Wh | MSI Creator Z16 A11UET-209 i7-11800H, GeForce RTX 3060 Laptop GPU, 90 Wh | Apple MacBook Pro 16 2021 M1 Max M1 Max, M1 Max 32-Core GPU, 99.6 Wh | Gigabyte Aero 16 YE5 i9-12900HK, GeForce RTX 3080 Ti Laptop GPU, 99 Wh | Acer Predator Triton 500 SE PT516-52s-70KX i7-12700H, GeForce RTX 3080 Ti Laptop GPU, 99.98 Wh | Average of class Multimedia | |
|---|---|---|---|---|---|---|
| Battery runtime | 67% | 130% | 37% | 57% | 132% | |
| H.264 (h) | 5.8 | 17 193% | 7.5 29% | 8.2 41% | 17.1 ? 195% | |
| WiFi v1.3 (h) | 5.2 | 9.5 83% | 14.9 187% | 6.4 23% | 5.7 10% | 12.2 ? 135% |
| Load (h) | 1 | 1.5 50% | 1.1 10% | 1.6 60% | 2.2 120% | 1.664 ? 66% |
Pros
Cons
结论 - 高端笔记本电脑有几个优点和缺点

微星Z16P几乎没有什么需要改进的地方。这台创造者笔记本电脑为图像编辑、视频编辑、渲染等提供了巨大的性能资源。所有这些都呈现在一个预先校准的、尺寸适当的、高分辨率的显示屏上。其色彩空间、刷新率和面板技术也完全适合于专门从事视频复制和编辑的设备。
在外观方面,也没有什么可抱怨的。这款采用优雅的灰色和大量铝材的超薄笔记本电脑在做工方面看起来很有质量,同时又保持了谨慎。然而,当打开盖子后RGB键盘亮起时,很快就会发现桌上的东西不是商务笔记本电脑。此外,其他细节,如高于平均水平的网络摄像头,非常快的Wi-Fi,以及双向扬声器,可以使该笔记本电脑在竞争中脱颖而出。
在高价位上,Z16P创造者的目标是在多媒体笔记本电脑中占据顶尖地位。它并没有完全实现这一目标,因为它的超薄外壳配备了强大的组件,而且它的冷却系统在一定程度上受到了影响。
它的连接性不是很有说服力。特别是相比之下,失去了一个雷电4和一个USB-A。微星创造者Z16是令人困惑的。卡槽也失去了很多速度。键盘和触摸板也可以有更好的制造质量。而且,如果下次能有一支集成的手写笔就更好了。
另一方面,高热量的发展,以及适度的电池寿命是由于创造性的笔记本电脑的设计。不幸的是,将如此强大的组件放置在如此小的空间里,导致了一个从温暖到热的案例。而且,即使是大电池也不能维持很长时间的处理能力的事实也不令人惊讶。
竞争者并不遥远,尽管Z16P在涉及到系统性能时,尤其是在系统性能方面始终占据优势。这款 Gigabyte Aero 16 YE5例如,它与Z16P相当,而且由于其冷却效果稍好,似乎更适合于连续负载。自然地,MacBook Pro 16 M1 MaxApple MacBook Pro 16 M1 Max也不应该被排除在外。当涉及到原始计算能力时,它有一个短板,但它在电池寿命、冷却方面领先,通常它的软件配置也是如此。
然而,其他笔记本电脑是为游戏而设的。凭借更大的外壳和更全面的冷却,像Alienware x17 R2也可以在更长的时间内提供最大的性能。
最后,微星造物主Z16P提供的正是所需的。如此多的性能和合适的显示器结合在一个便携式设备中,几乎可以在任何地方处理复杂和精心设计的视频项目,所以也可以在贸易展览中,例如。然而,也值得看看两个较小的型号,因为由于过热造成的限制在这里并不十分明显。而且它们都不慢。
价格和可用性
在写这篇文章的时候,你可以在亚马逊上找到微星创造者Z16P的几乎相同的配置https://www.amazon.com/Creator-Z16P-B12UHST-039-i9-12900H-Creation/dp/B09SHRPVHD/?tag=nbcnewsnet-20约4350美元(Core i9-12900H,64GB内存,2TB NVMe SSD,RTX 3080 Ti,QHD+ 165 Hz触摸屏,Windows 11 Pro)。
MSI Creator Z16P B12UHST
- 06/23/2022 v7 (old)
Mario Petzold
Price comparison

