申科XMG Pro 17 E22评论。配备RTX 3080 Ti的游戏笔记本电脑提供的货物
乍一看,Schenker用XMG Pro 17 E22创造了一个真正的游戏笔记本电脑。虽然机箱不会赢得任何设计奖,但键盘在任何想要的颜色中都会闪闪发光,作为回报。大的通风口和相当厚的机箱使英特尔Alder Lake处理器,以及NvidiaGeForce RTX 3070 Ti或3080 Ti有足够的冷却,以确保相应的优秀性能率所需的高功率供应。花费大约2500至3500欧元(约合人民币2557至3840元),你可以配置一台雄心勃勃的中端笔记本电脑,或者如果你喜欢,可以配置一台相当出色的高端笔记本电脑,比如我们拥有的英特尔酷睿i9-12900H、NvidiaGeForce RTX 3080 Ti、32GB内存和1TB SSD。
但还有更多。也可以选择覆盖AdobeRGB色彩空间的预校准4K显示器,而不是典型的sRGB显示器,具有合适的QHD分辨率。然而,这使价格接近4000欧元(约合人民币4092元)。相当多的桌面系统在视频和图像编辑或渲染方面可能会落后。
因此,竞争者包括游戏笔记本电脑,如 宏碁掠夺者Triton 500SE,以及华硕ROG Zephyrus Duo 16,以及 Alienware x17 R2以及 MSI Raider GE77,这也是针对创作者的。
潜在的竞争对手比较
Rating | Date | Model | Weight | Height | Size | Resolution | Price |
|---|---|---|---|---|---|---|---|
| 85.4 % v7 (old) | 07 / 2022 | Schenker XMG Pro 17 E22 i9-12900H, GeForce RTX 3080 Ti Laptop GPU | 2.8 kg | 27 mm | 17.30" | 2560x1440 | |
| 86.8 % v7 (old) | 07 / 2022 | MSI Raider GE77 HX 12UHS i9-12900HX, GeForce RTX 3080 Ti Laptop GPU | 3.1 kg | 25.9 mm | 17.30" | 3840x2160 | |
| 87.2 % v7 (old) | 06 / 2022 | Acer Predator Triton 500 SE PT516-52s-70KX i7-12700H, GeForce RTX 3080 Ti Laptop GPU | 2.3 kg | 19.9 mm | 16.00" | 2560x1600 | |
| 84.7 % v7 (old) | 01 / 2022 | Schenker XMG Pro 17 (Late 2021, RTX 3080) i7-11800H, GeForce RTX 3080 Laptop GPU | 2.4 kg | 19.9 mm | 17.30" | 3840x2160 | |
| 88.2 % v7 (old) | 05 / 2022 | Asus ROG Zephyrus Duo 16 GX650RX R9 6900HX, GeForce RTX 3080 Ti Laptop GPU | 2.6 kg | 20.5 mm | 16.00" | 3840x2400 | |
| 80.3 % v7 (old) | 06 / 2022 | MSI Katana GF66 12UGS i7-12700H, GeForce RTX 3070 Ti Laptop GPU | 2.3 kg | 27.5 mm | 15.60" | 1920x1080 | |
| 89.2 % v7 (old) | 05 / 2022 | Alienware x17 R2 P48E i9-12900HK, GeForce RTX 3080 Ti Laptop GPU | 3.1 kg | 20.9 mm | 17.30" | 1920x1080 |
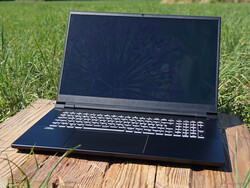
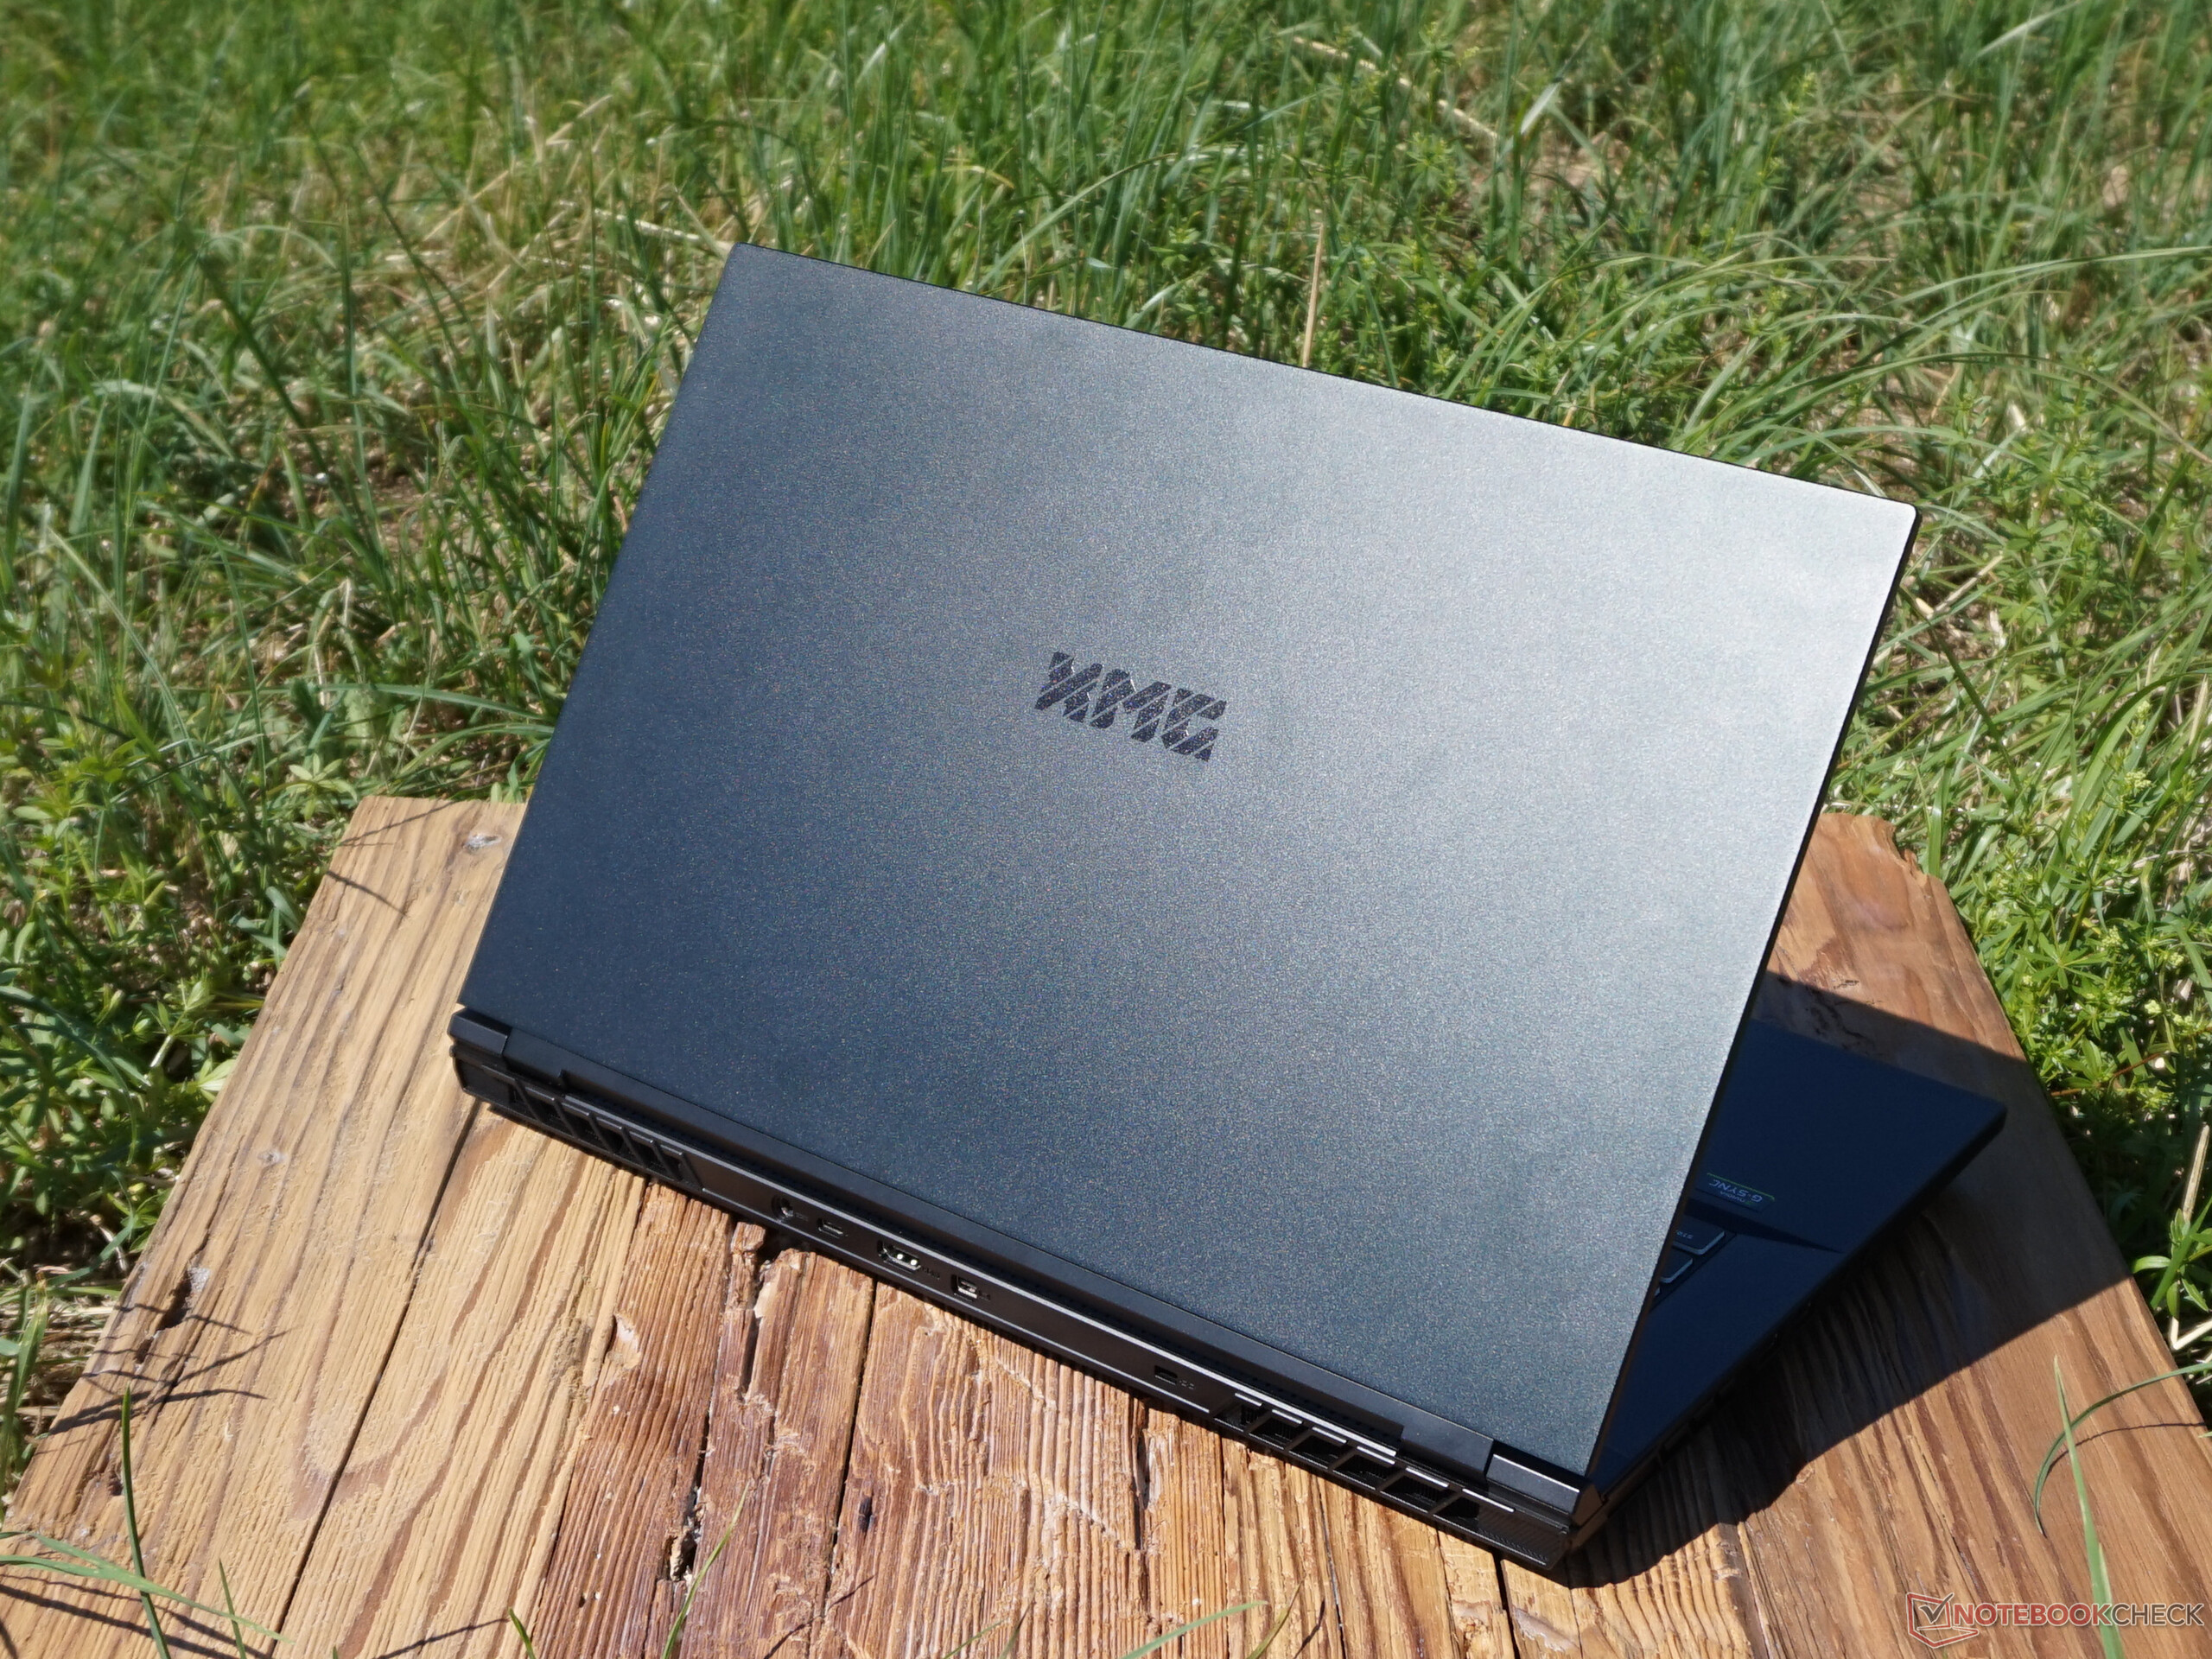
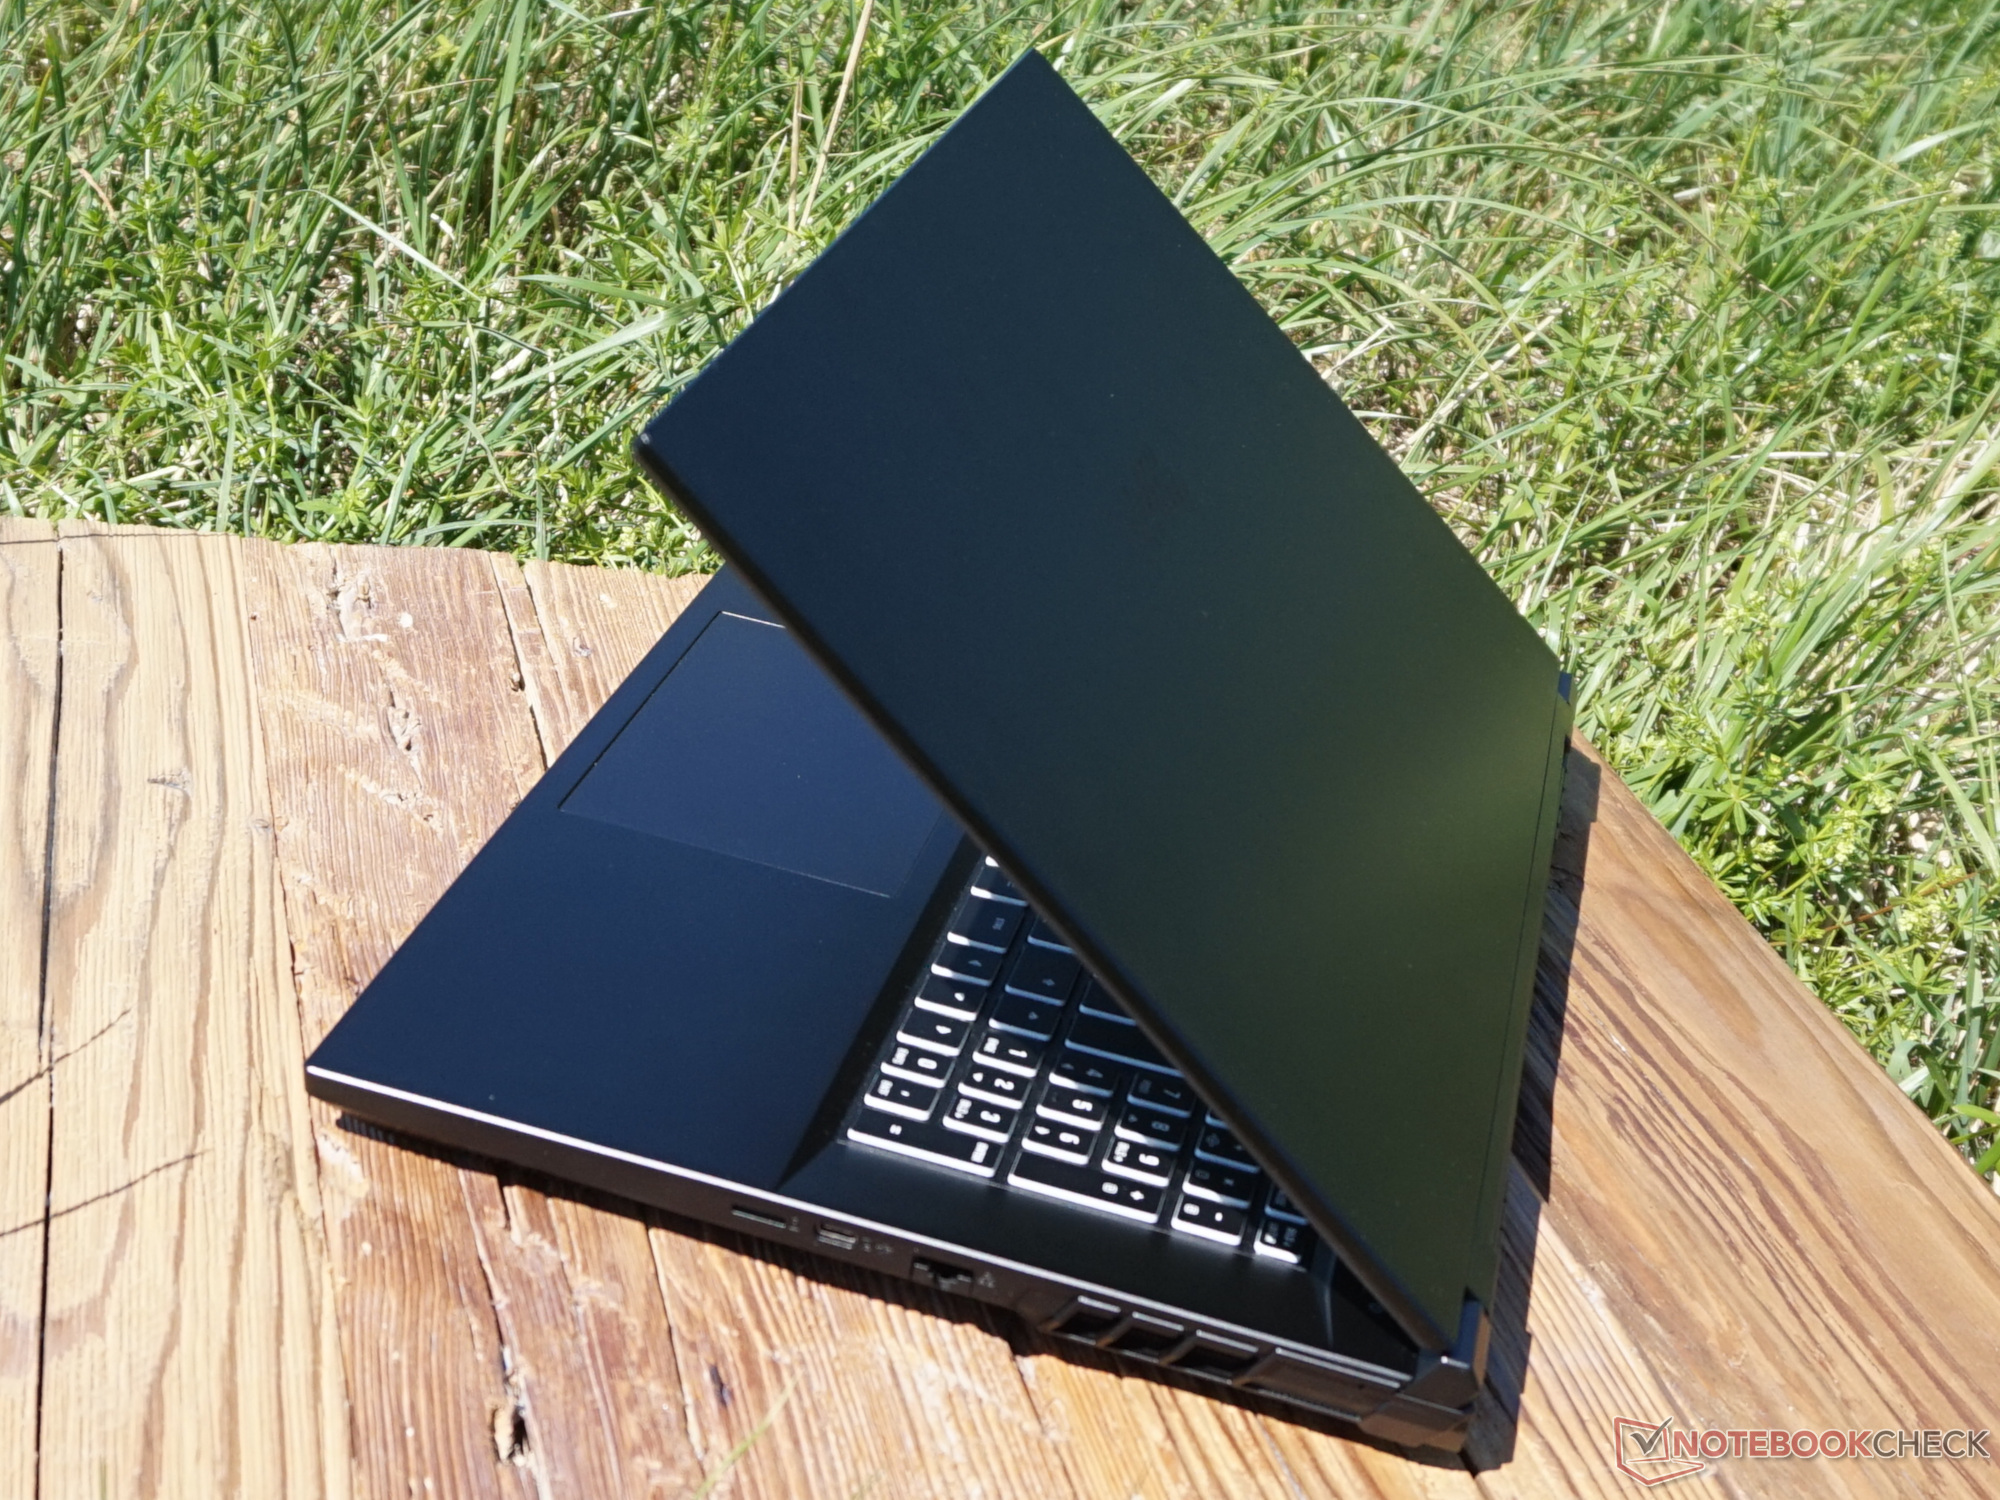
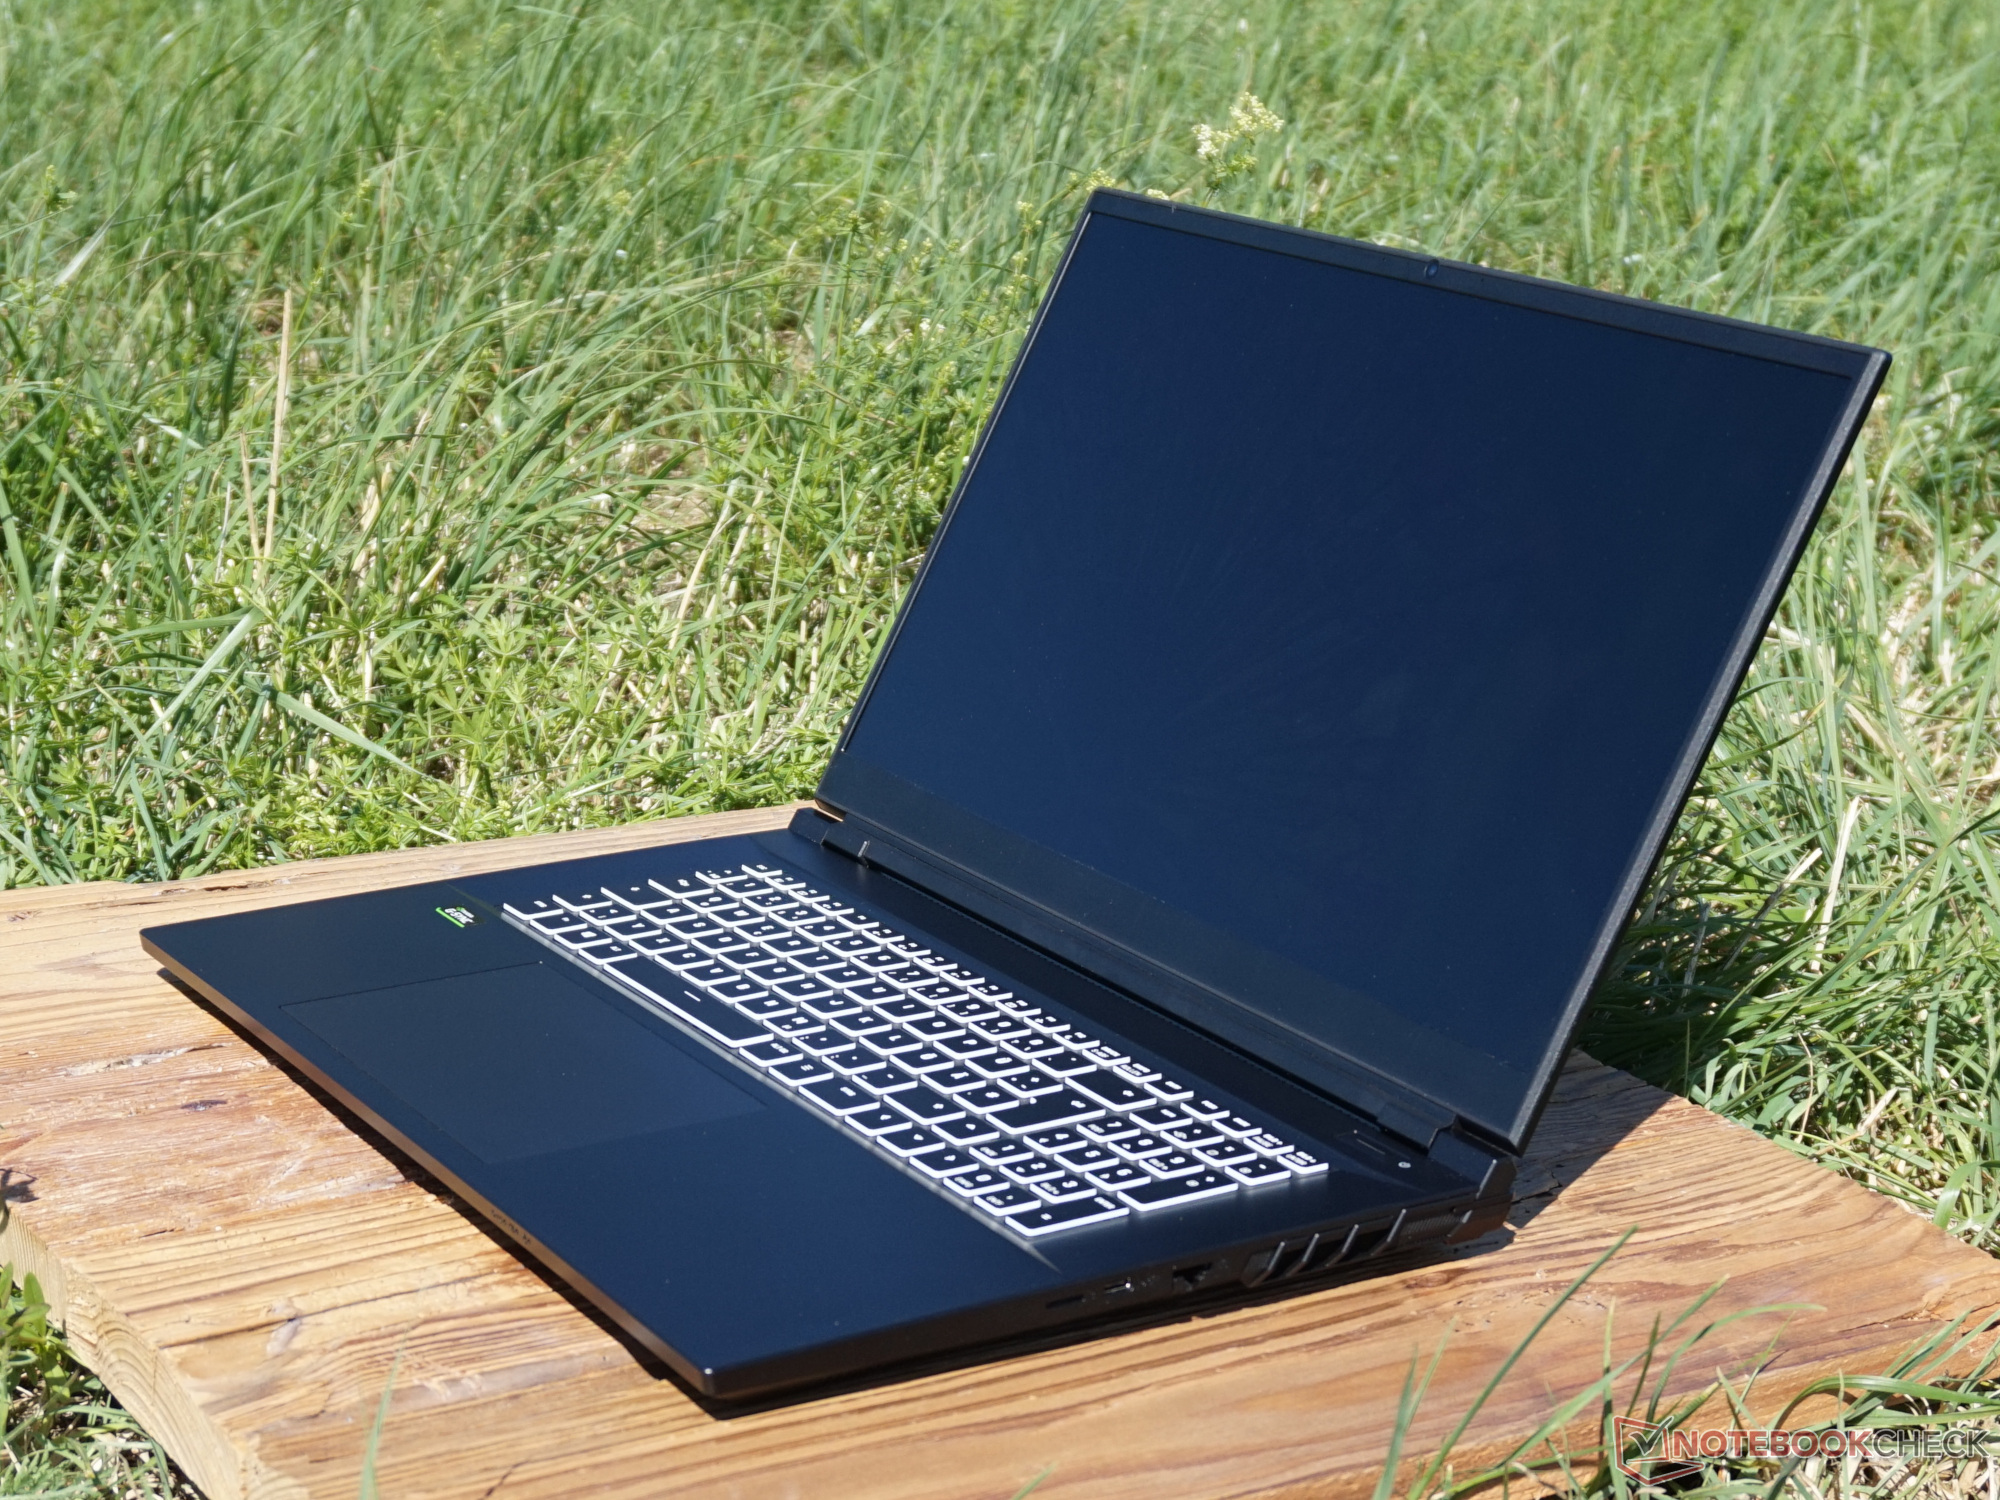
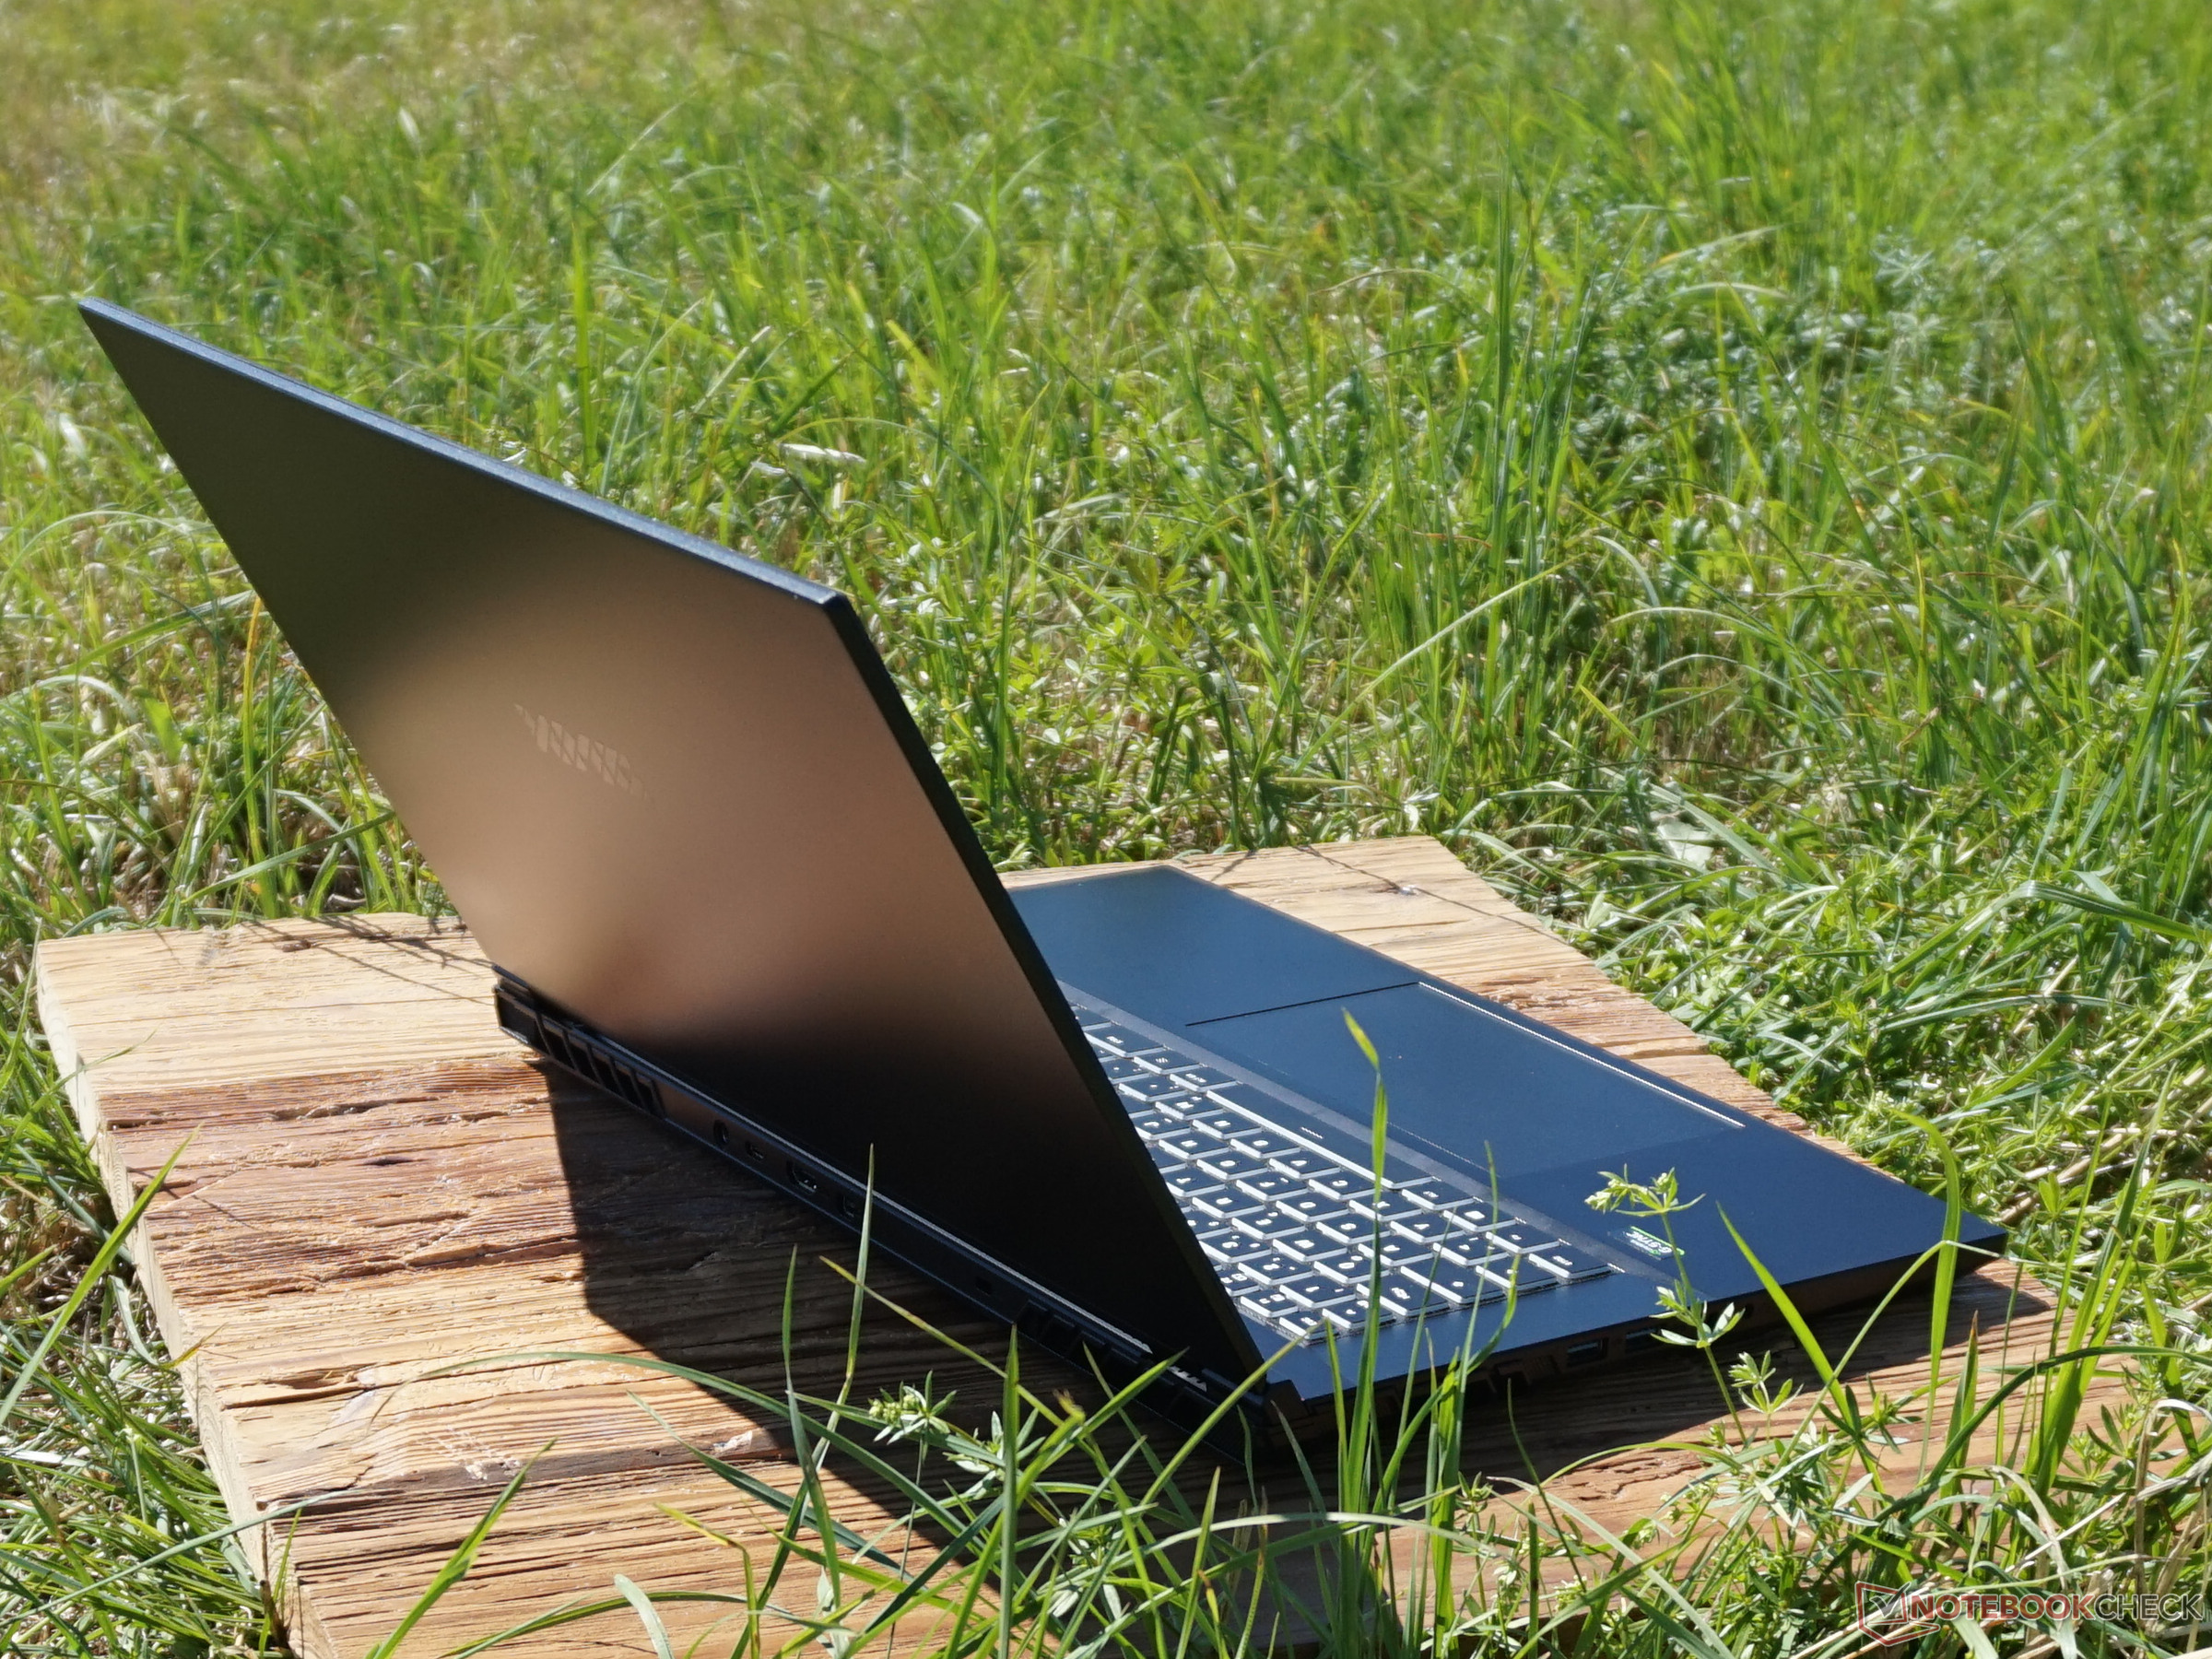
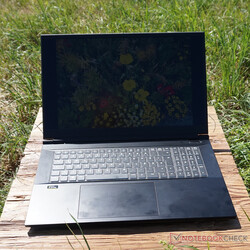
外壳 - 中等的游戏笔记本,有很多黑色的东西
黑色的外壳,其下部完全由塑料制成,看起来不那么优雅,但非常实用。只有显示器的背面是用铝制盖子固定的,也是黑色的。然而,考虑到17.3英寸的尺寸,其他任何东西都是令人惊讶的。不幸的是,这些表面都很容易受到指纹的影响。
屏幕可以用一只手舒适地打开,但随后它就有点摇晃了。总的来说,它给人的印象是稳定的,而且几乎不能扭动。这甚至适用于下面的部分。尽管有明显的重量,但当拿着一个角时,箱子几乎保持完全水平。金属部件比例较高的型号在这一点上并没有做得更好。
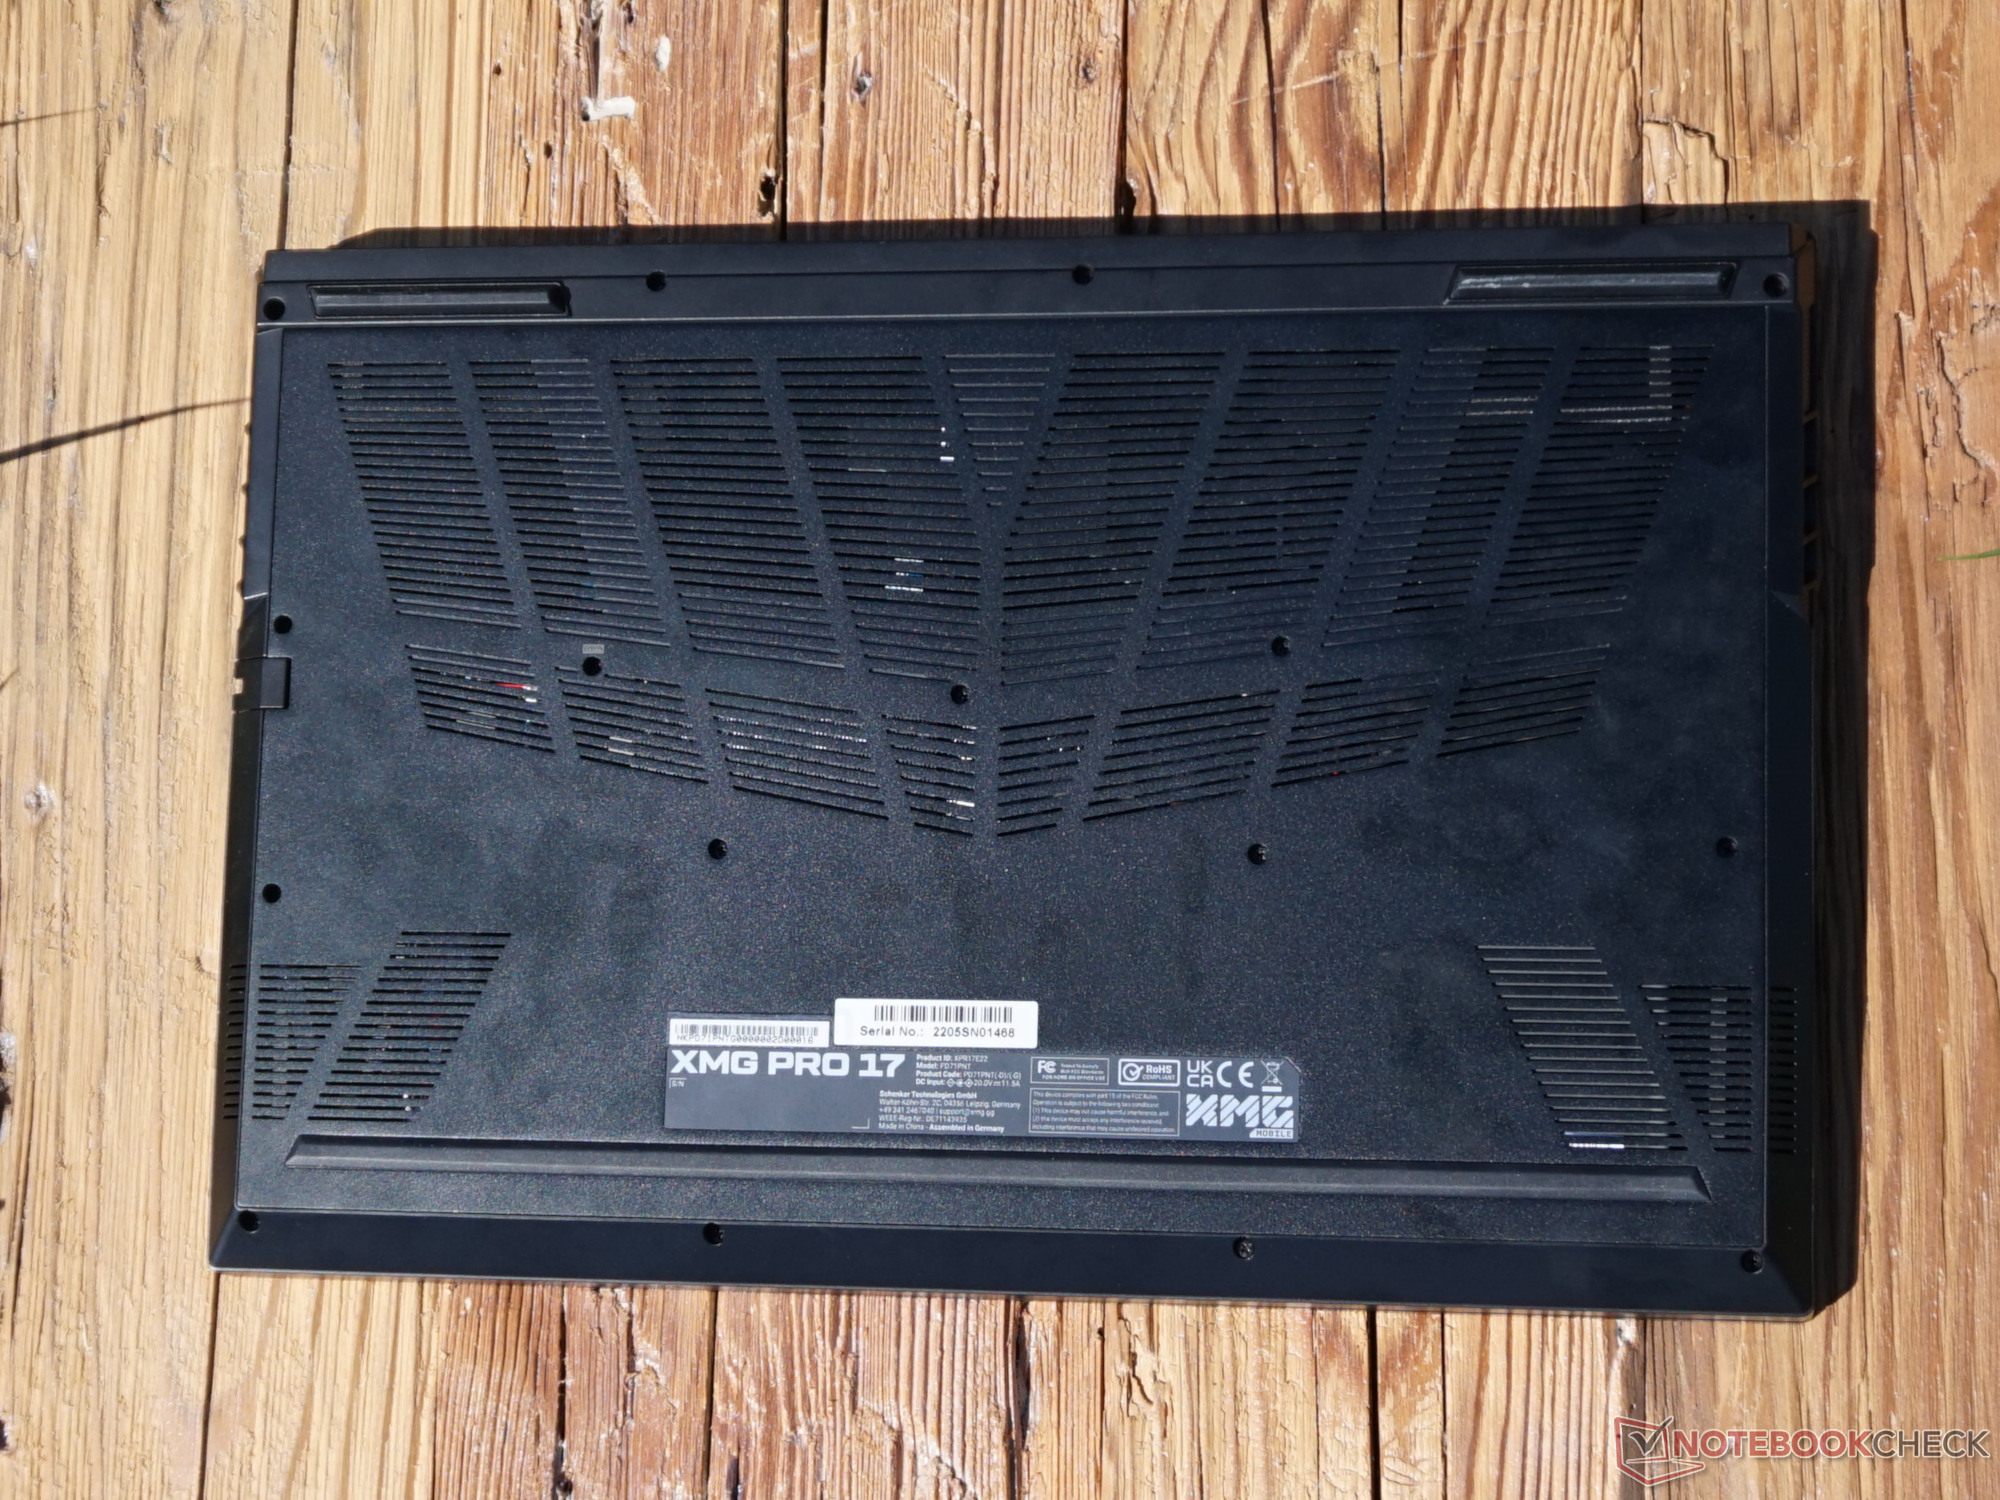
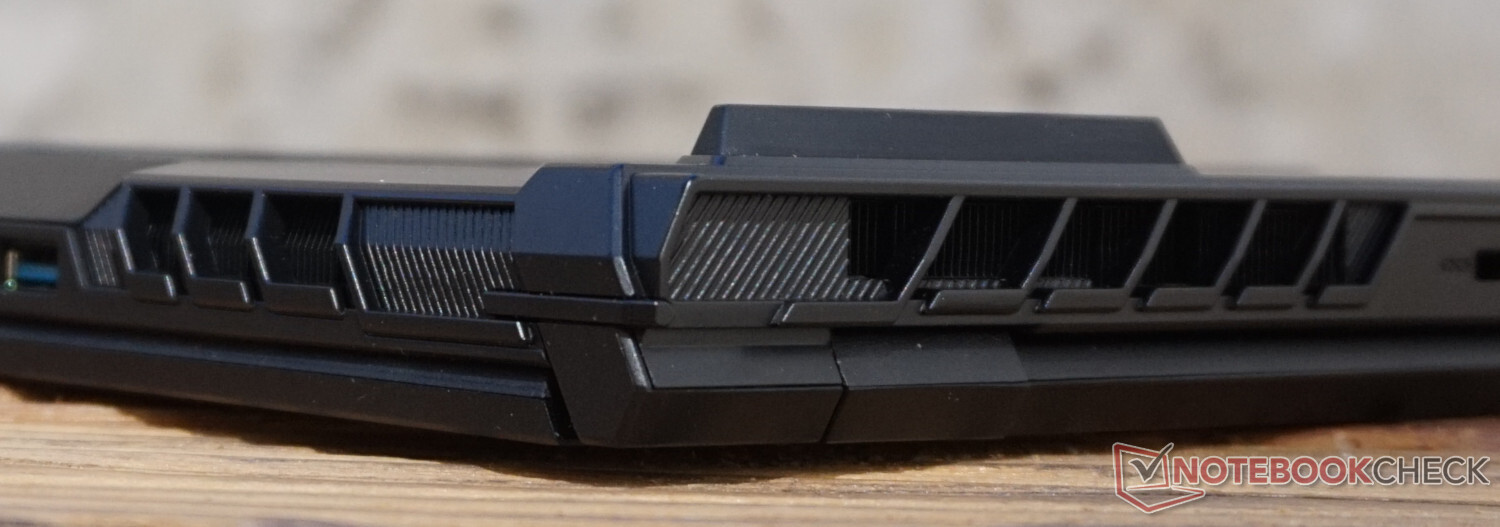
唯一值得注意的是延伸到整个笔记本周围的大型通风口。此外,底盖几乎在一半的表面上允许与环境进行空气交换。这也为放置笔记本电脑的位置提供了明确的依据。一个平坦的桌面,两侧和朝后有足够的空间。
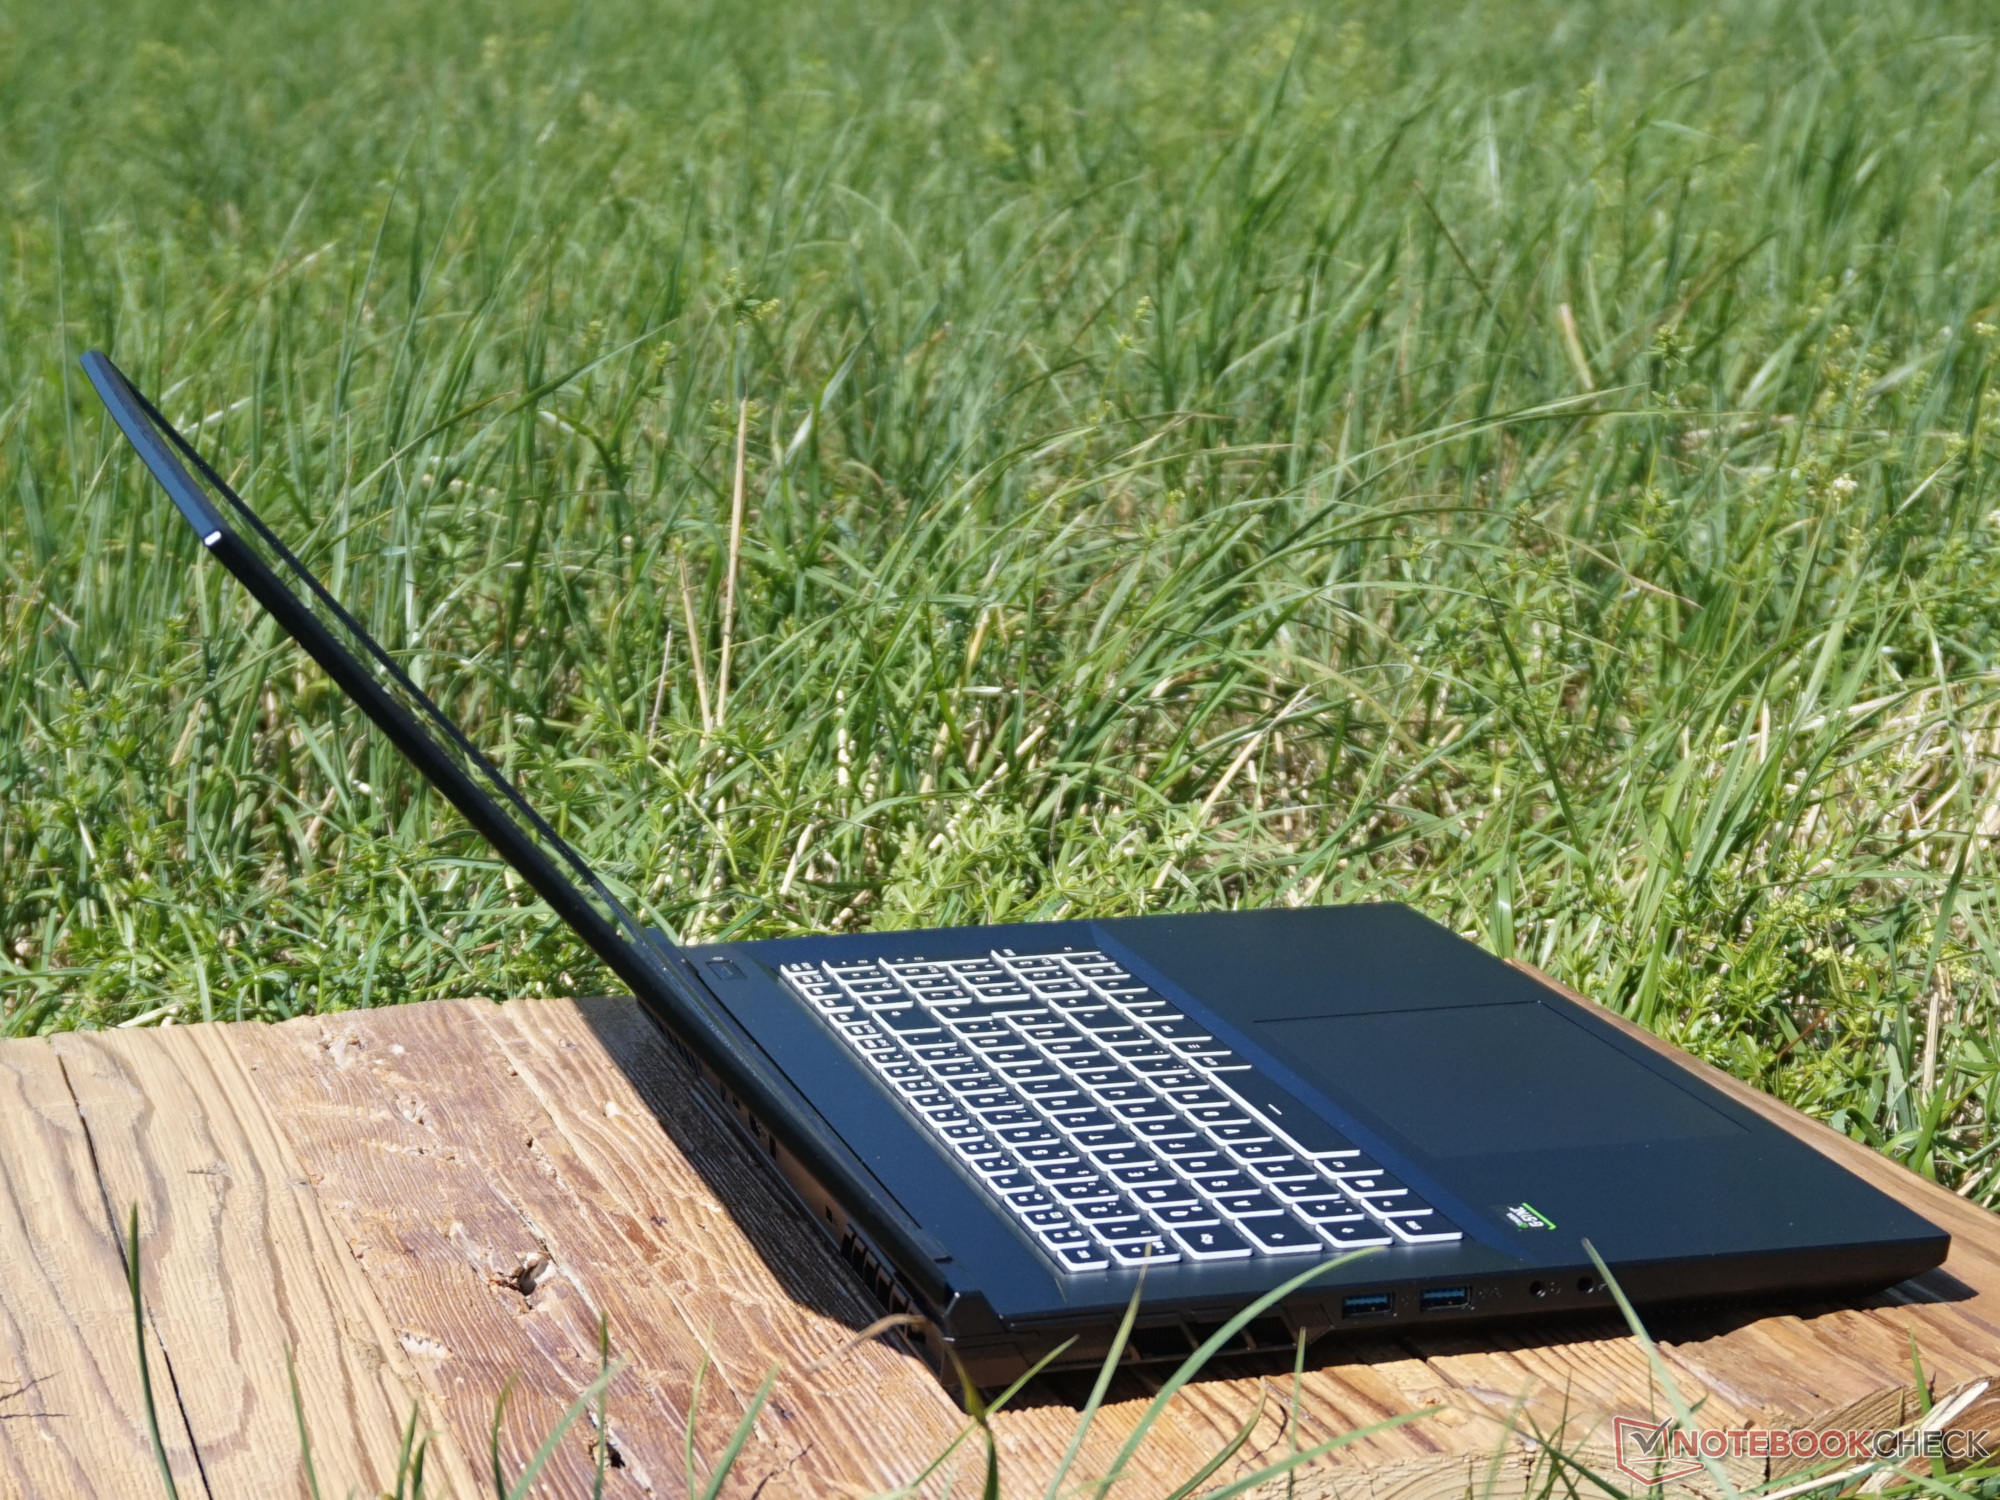
很难设计出一个更重更大的笔记本电脑。自然,这是由于大屏幕和强大的组件所带来的。同时,这些都在机箱内提供了足够的空间用于散热和通风。但是,XMG Pro 17 e22只有在有限的范围内才是真正的移动和便携。一个足够大和坚固的袋子是携带该设备的先决条件,该设备包括电源适配器在内重约3.5公斤。
你还必须考虑到,27毫米的厚度伴随着高度为5毫米的脚,这确保了足够的地面间隙,以便于冷却。
连接性 - 在五个显示器上进行游戏
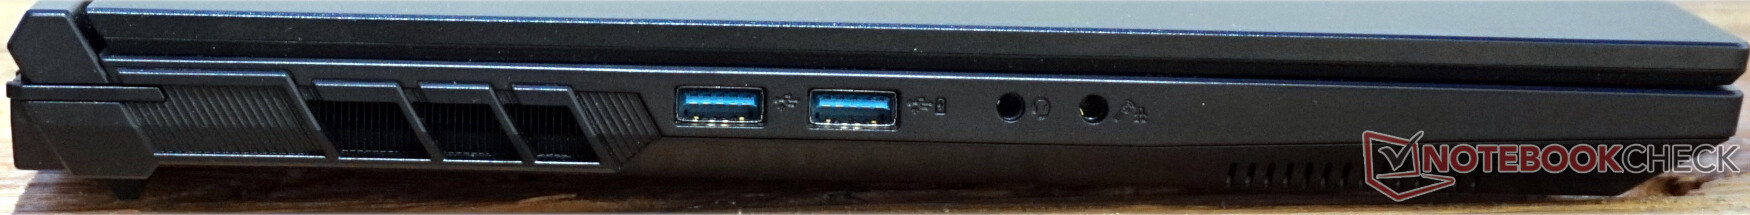
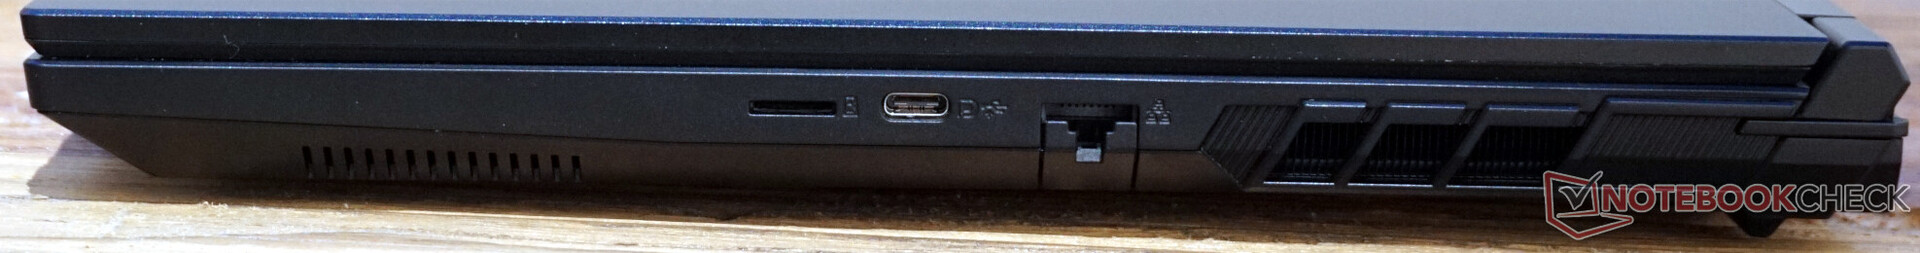
有足够空间的大箱子几乎什么都有。读卡器、LAN端口、4个USB端口和4个视频输出没有留下任何遗憾。
电源和三个视频端口放置在背面,使得工作空间很干净。特别是在作为工作站使用时,可变的显示器端口,每个都支持高达8K,可能是一个优势。另一方面,对于游戏来说,一个肯定足够了。
布局并不是那么完美无缺。两个USB-A端口都在左边,而且它们之间也只有6毫米的距离。这在大多数情况下是足够的,但U盘可能会相互阻隔。右边的另一个USB端口会改善整体设计。关于microSD卡的决定也没有意义。本来有足够的空间放置一个完整的卡槽。

SD卡阅读器
我们的参考卡,AV PRO microSD 128 GB V60,仍然离其潜力很远。与最高分以及游戏笔记本中的平均分的差距是相当大的。其他笔记本电脑如Alienware x17 R2 P48E能以三倍的速度复制、读取和覆写数据。
| SD Card Reader | |
| average JPG Copy Test (av. of 3 runs) | |
| Alienware x17 R2 P48E (AV Pro V60) | |
| Asus ROG Zephyrus Duo 16 GX650RX (AV PRO microSD 128 GB V60) | |
| Average of class Gaming (20.9 - 210, n=54, last 2 years) | |
| Acer Predator Triton 500 SE PT516-52s-70KX (AV PRO microSD 128 GB V60) | |
| Schenker XMG Pro 17 E22 (AV PRO microSD 128 GB V60) | |
| MSI Raider GE77 HX 12UHS (AV PRO microSD 128 GB V60) | |
| maximum AS SSD Seq Read Test (1GB) | |
| Alienware x17 R2 P48E (AV Pro V60) | |
| Asus ROG Zephyrus Duo 16 GX650RX (AV PRO microSD 128 GB V60) | |
| Average of class Gaming (25.5 - 261, n=51, last 2 years) | |
| Schenker XMG Pro 17 E22 (AV PRO microSD 128 GB V60) | |
| Acer Predator Triton 500 SE PT516-52s-70KX (AV PRO microSD 128 GB V60) | |
沟通
Wi-Fi模块完全没有理由抱怨。它的传输率在测试中保持绝对稳定,而且在技术上可能的范围内。
网络摄像头
由于采用了全高清分辨率,但遗憾的是只有30帧,图像质量可以接受。颜色偏差也是可以接受的,它们不会导致任何立即可见的颜色不准确。特别是当涉及到视频通话时,网络摄像头的配置很好。
麦克风也做得很好。如果你不直接对着它说话,质量会受到一些影响,但一般来说,独立于方向拾取用户声音的能力只对商务笔记本电脑很重要。


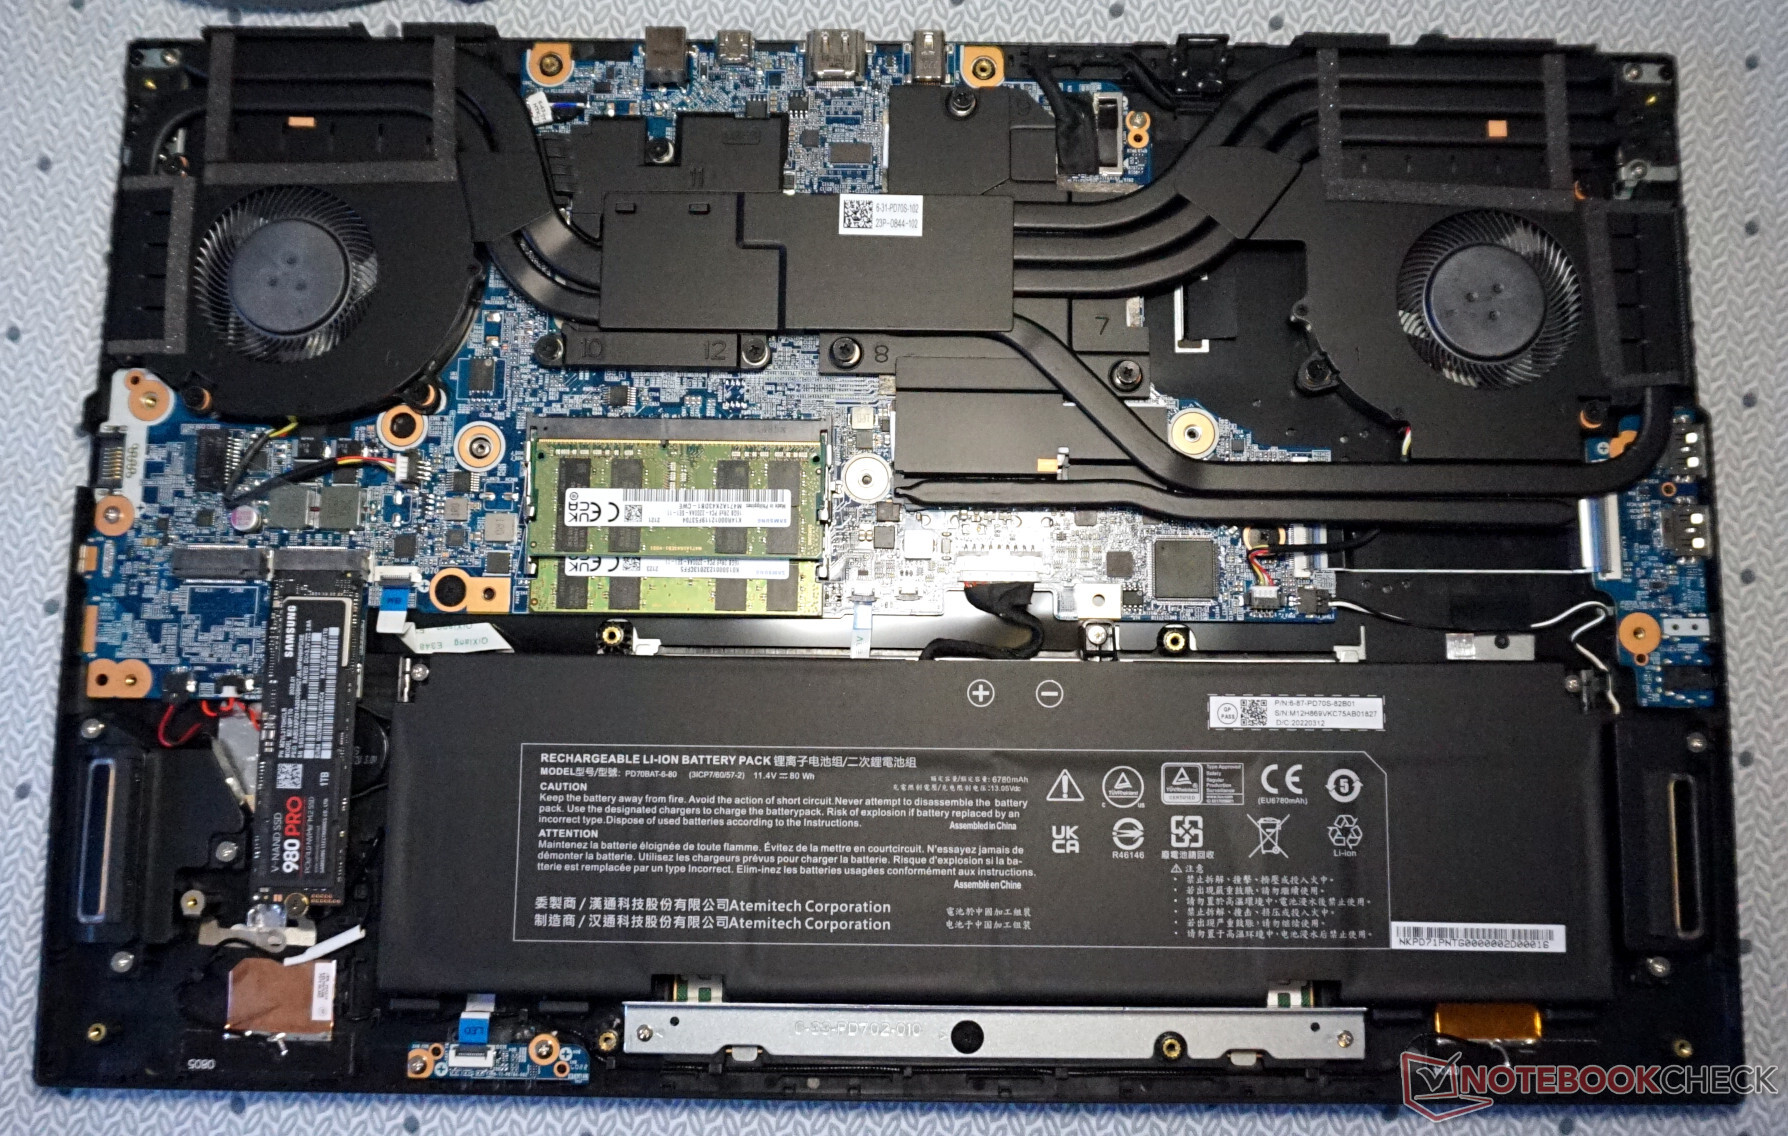
维护
在进行后期升级或清洁风扇方面没有任何障碍。虽然仍然需要卸下16颗螺丝,但它们都可以公开接触,而且长度相同。然后,整个底盖可以不费吹灰之力就被卸下。建议从铰链的地方开始。
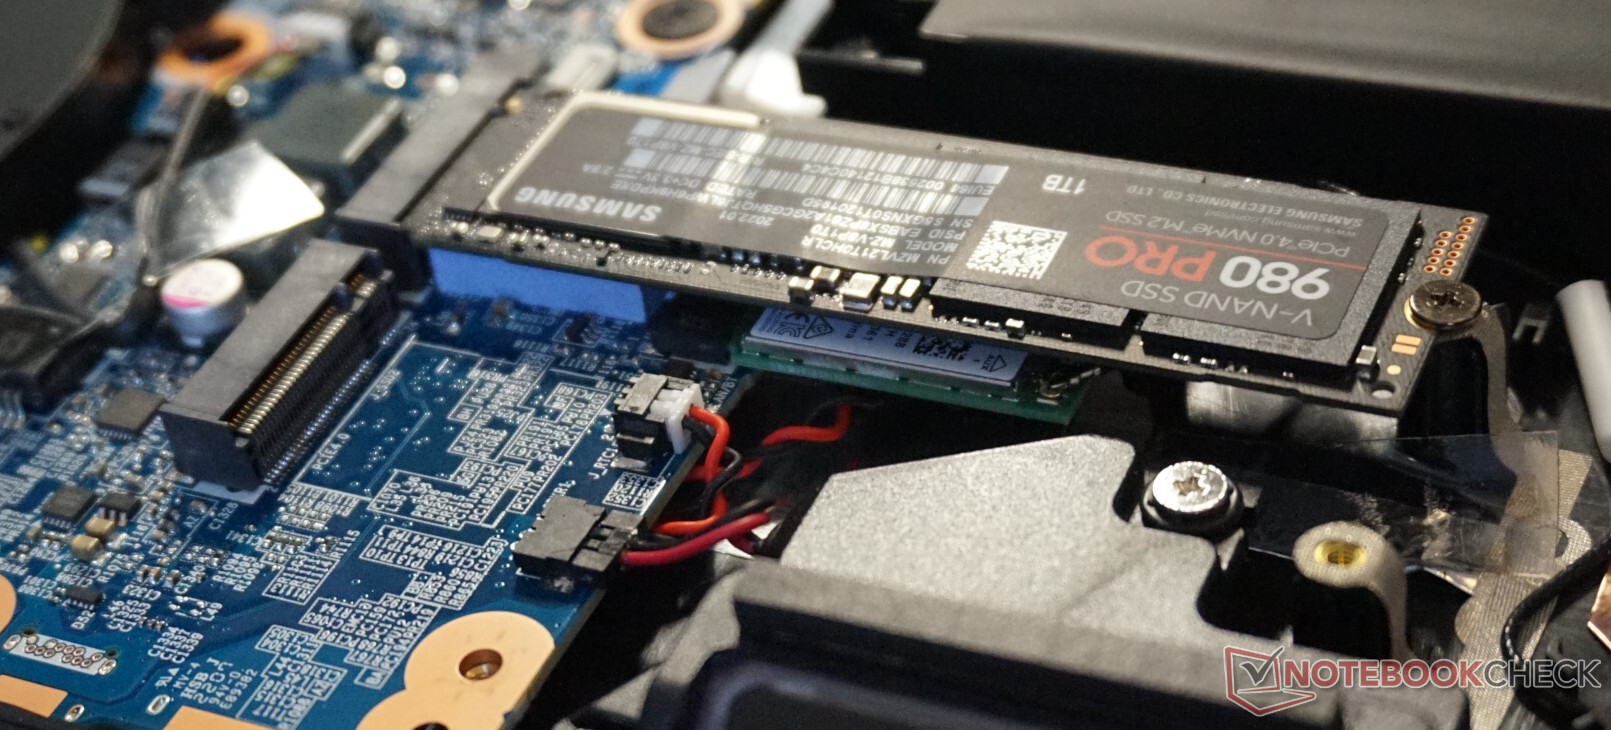
这样就可以接触到双风扇。电池也可以很容易地被更换。这更适用于内存和M.2 SSD。这里各有两个接口,要么在购买时就被占用,要么以后也可以升级。
Wi-Fi模块的位置很不寻常,因为它被直接放在固态硬盘的下面。它也可以被替换。总的来说,值得注意的是,无论是固态硬盘还是内存,都没有任何散热元件。这并不是最好的决定,因为内部温度会随着性能的提高而上升。
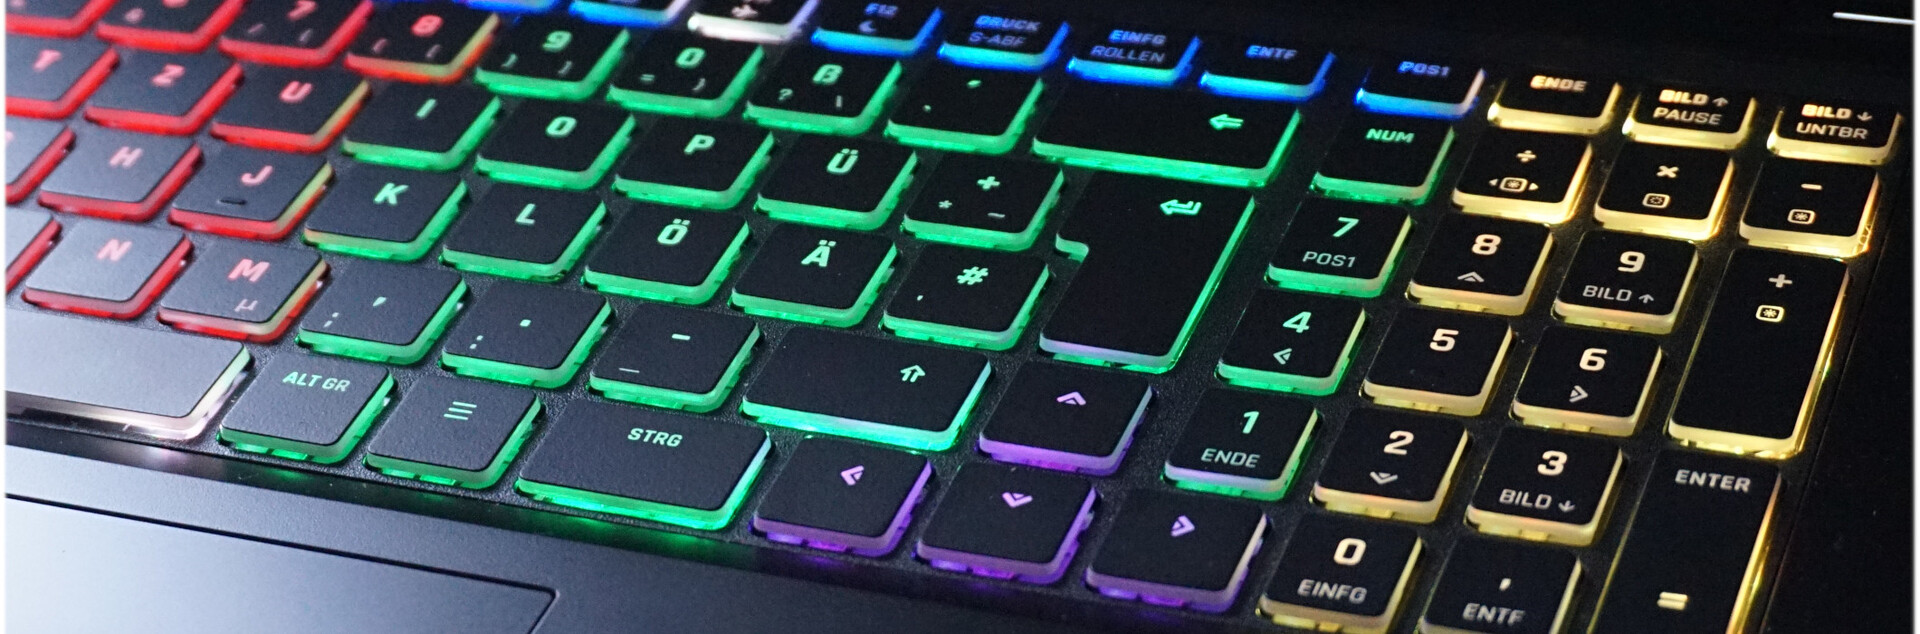
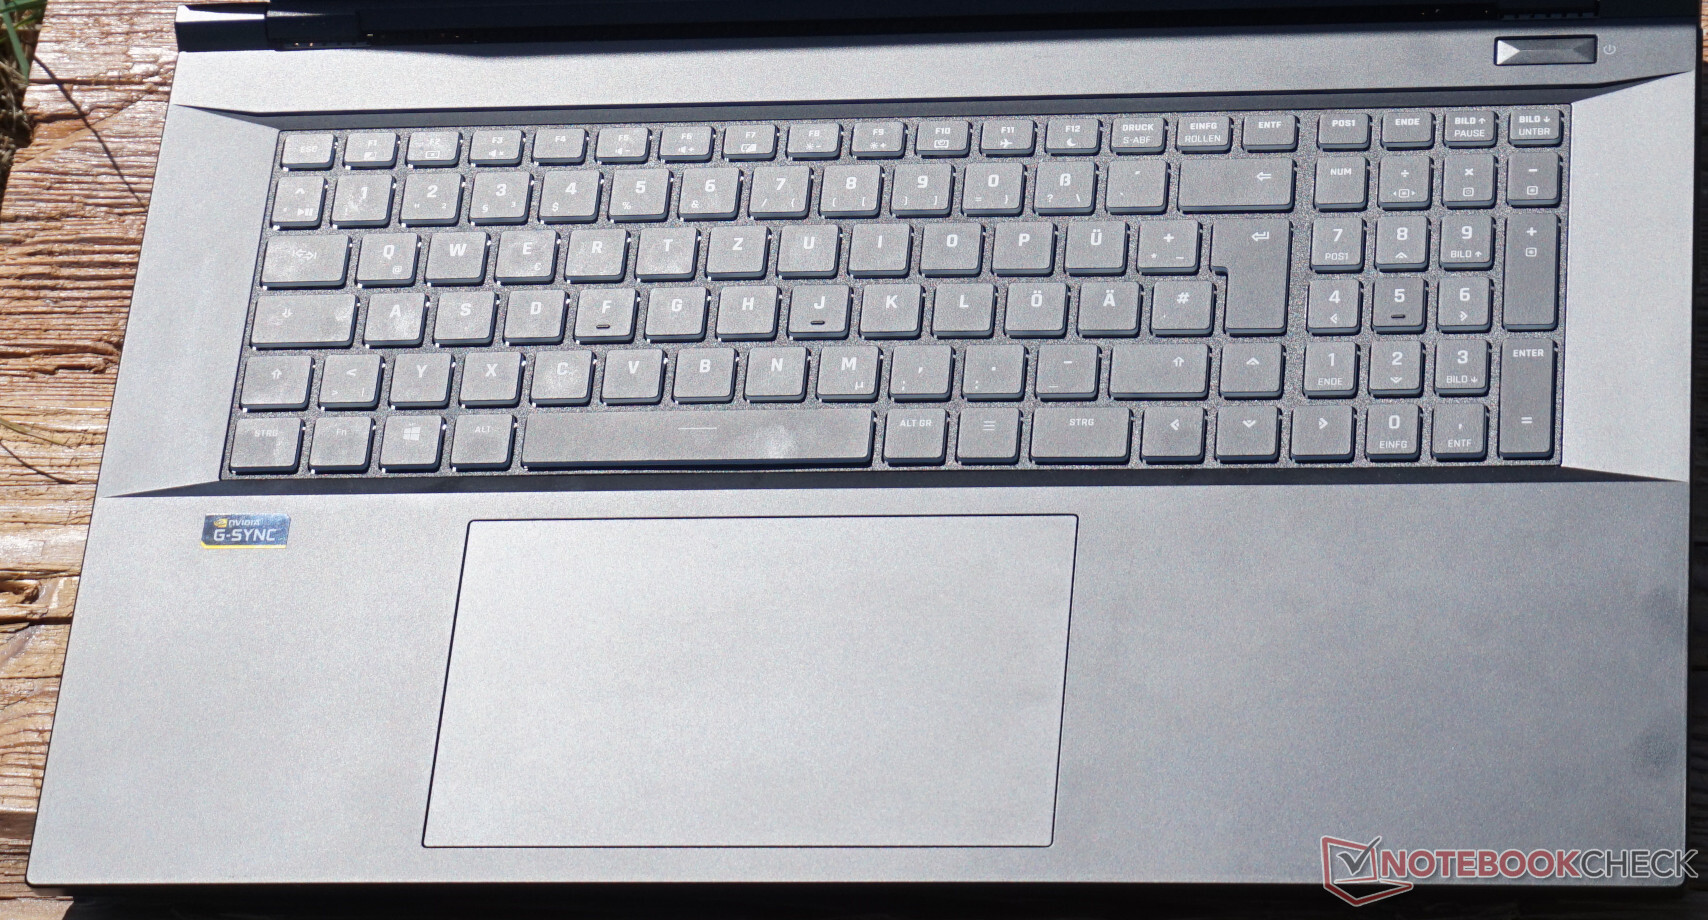
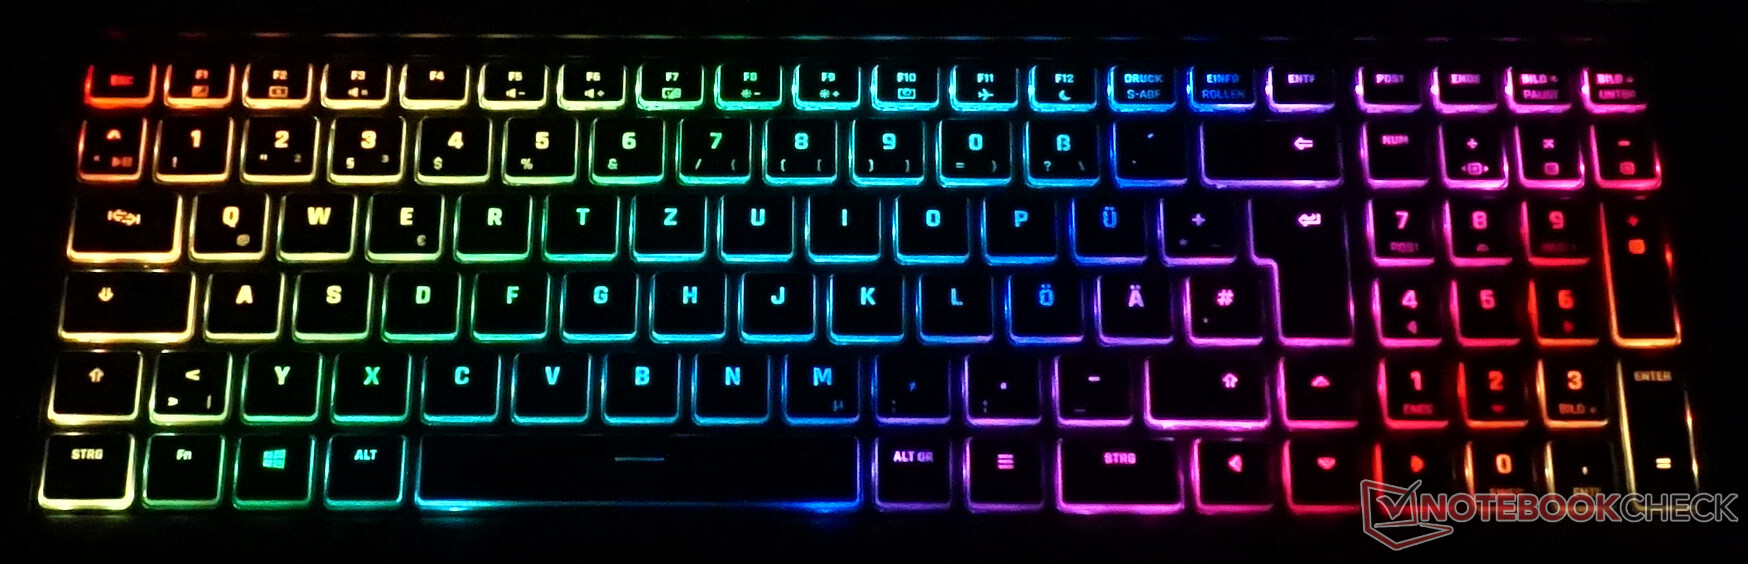
输入设备 - XMG Pro 17配备了一个值得信赖的游戏键盘
不用说,Schenker XMG Pro 17 E22有一个RGB键盘。除了一些流动的、脉动的和部分刺激性的颜色渐变外,每个键或某个区域都可以定制。应该赞扬的是1.5毫米的行程。这明显高于标准笔记本键盘。因此,打字是愉快的,这也是由于良好的反馈。只有略微弯曲的键盘框架可以做得更结实。
15 x 9厘米的触摸板反应精确,易于使用。触摸板下面的两个按键几乎是相反的,它们被隐蔽地放置在触摸板下面。压力点似乎并不精确,有时,只有更用力地按下才会触发一个动作。然而,由于鼠标几乎总是与游戏笔记本或工作站一起使用,只有少数用户会为此感到困扰。
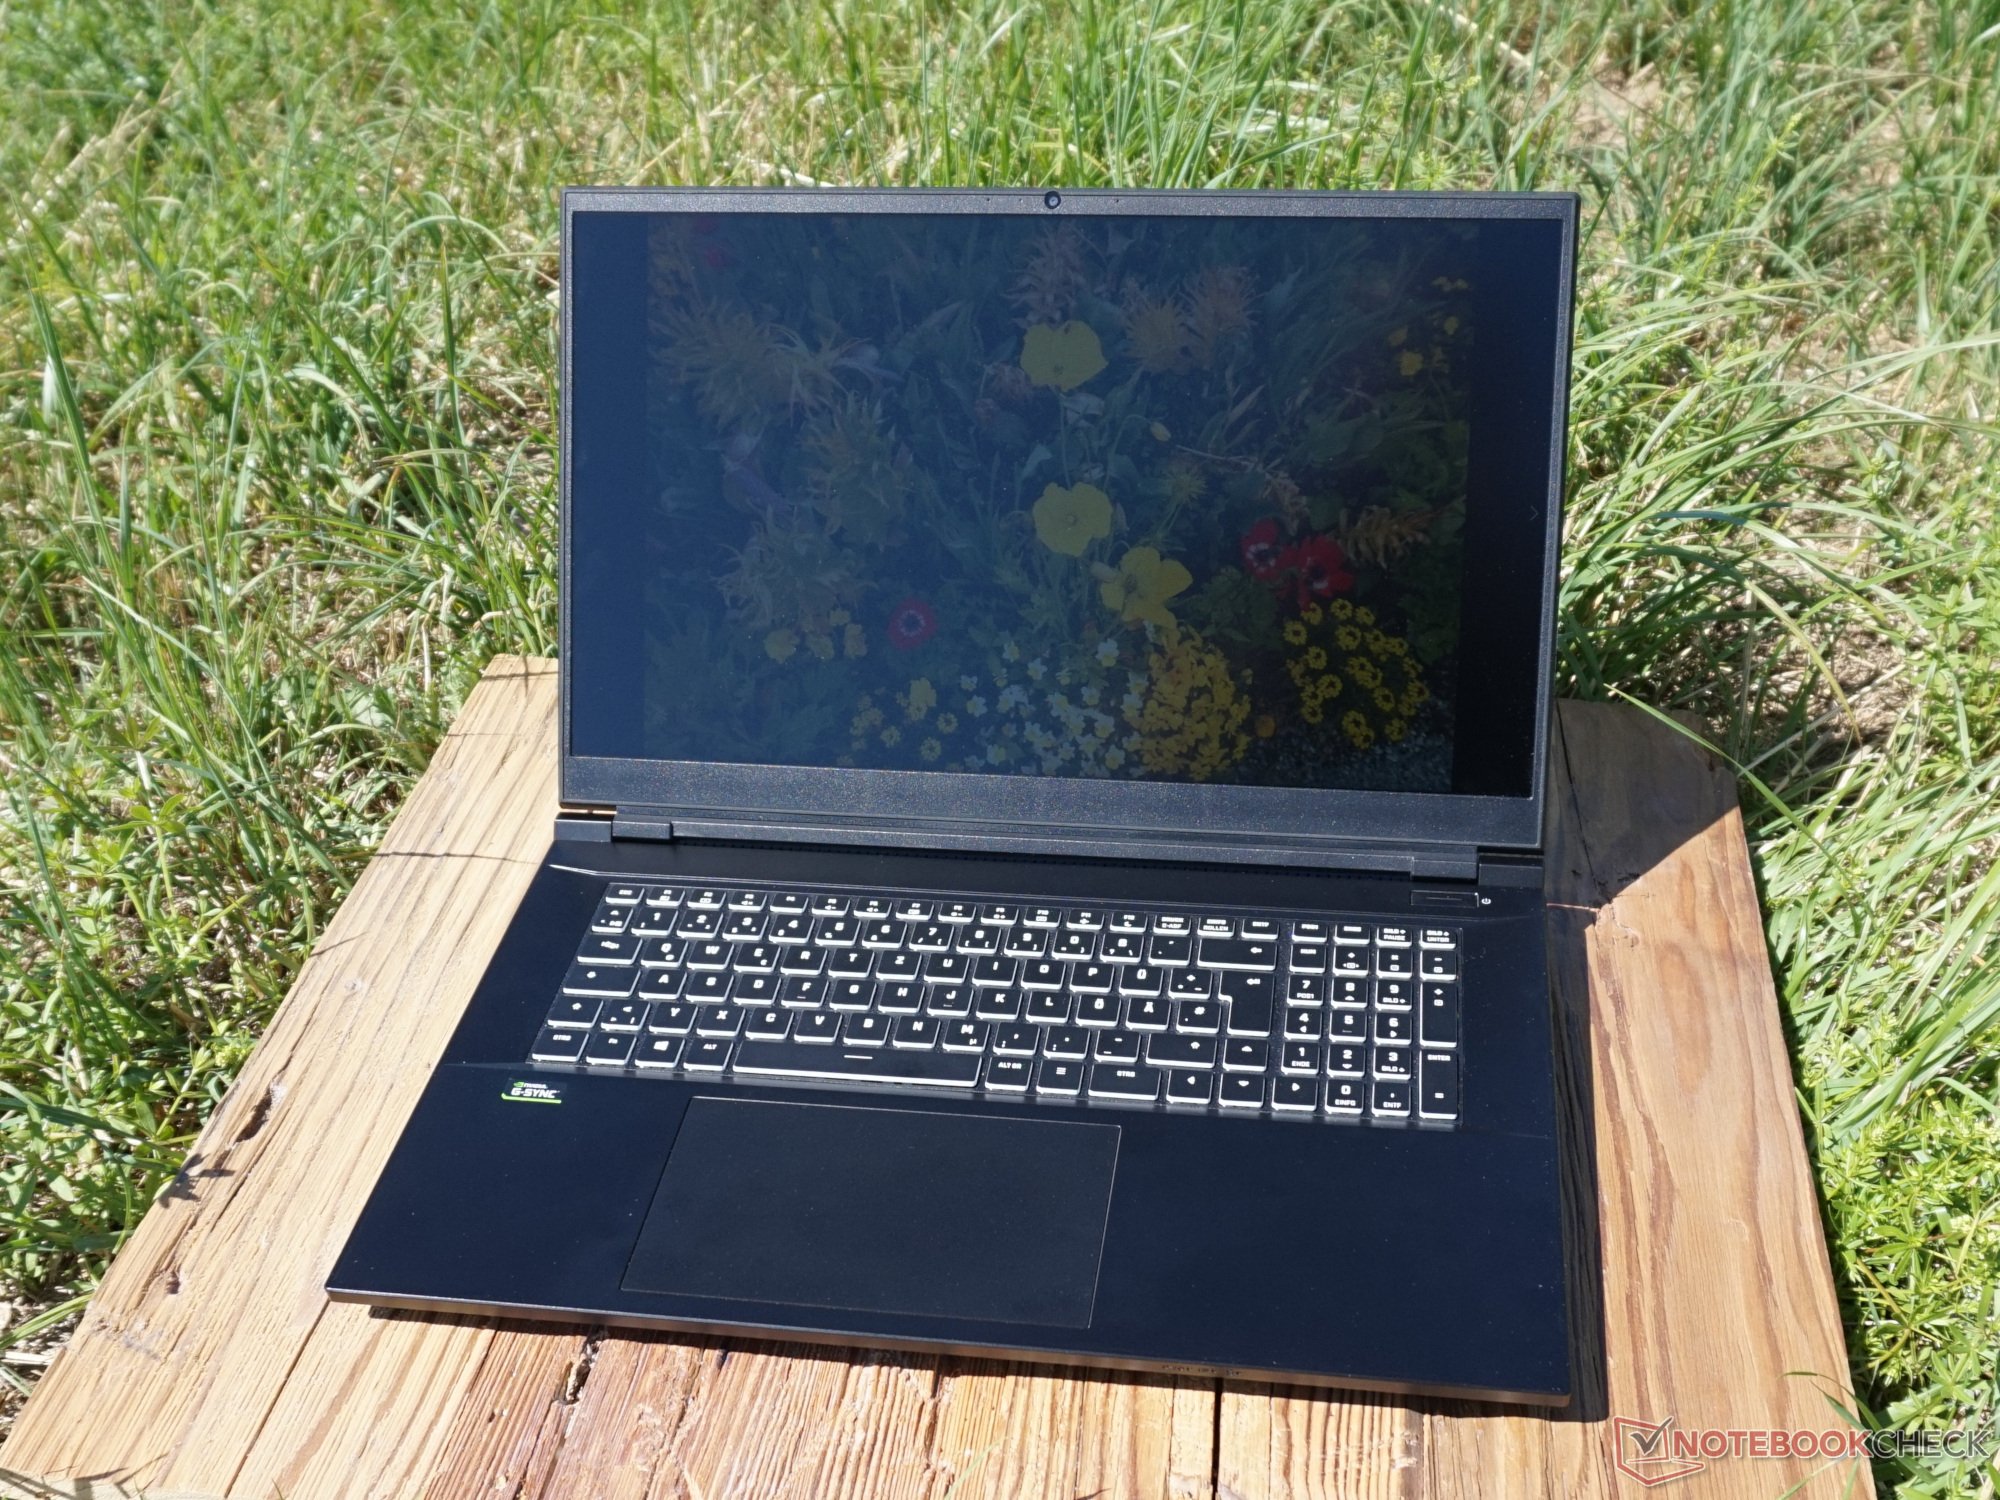
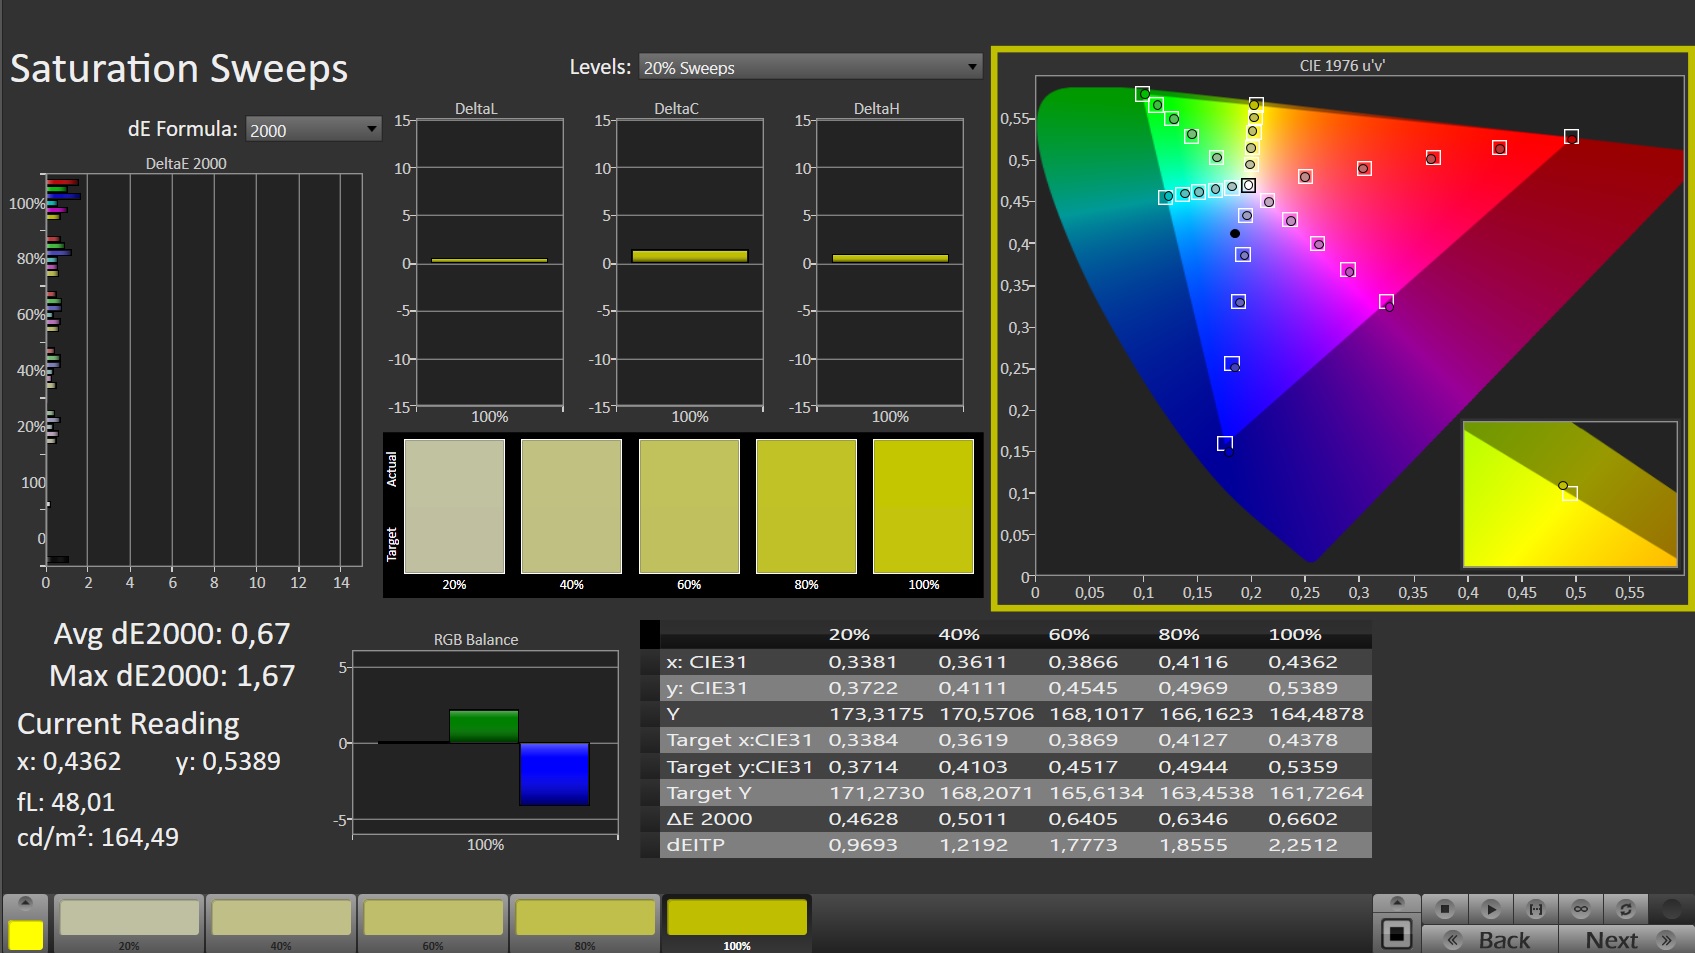
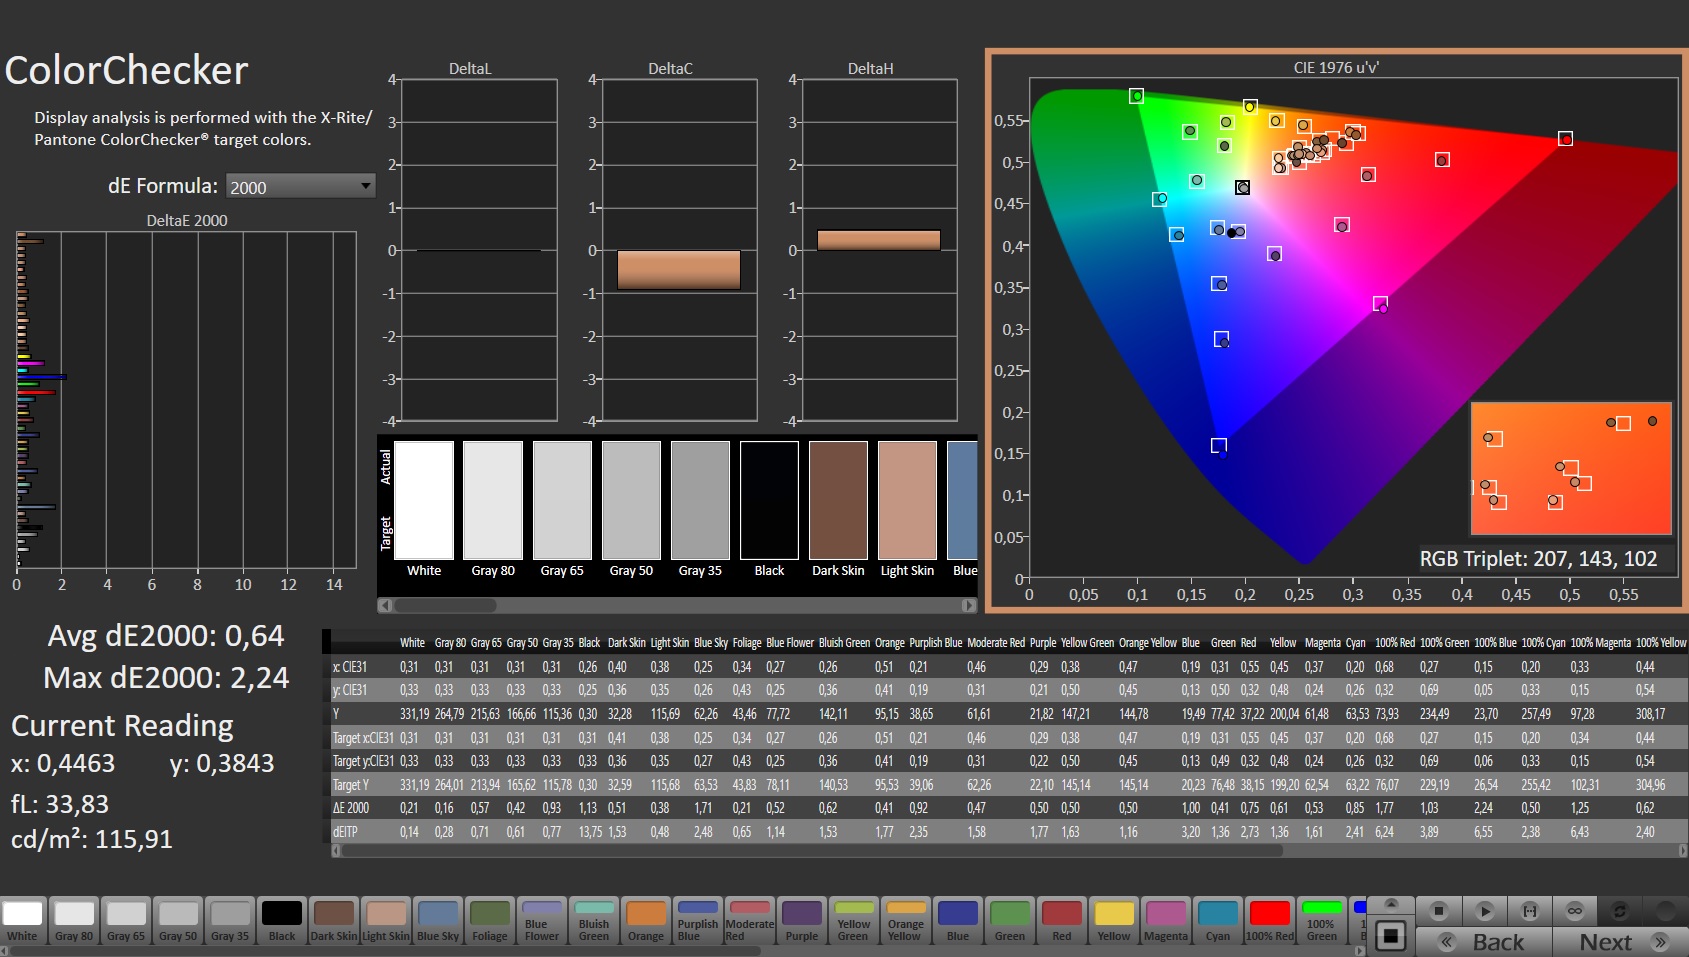
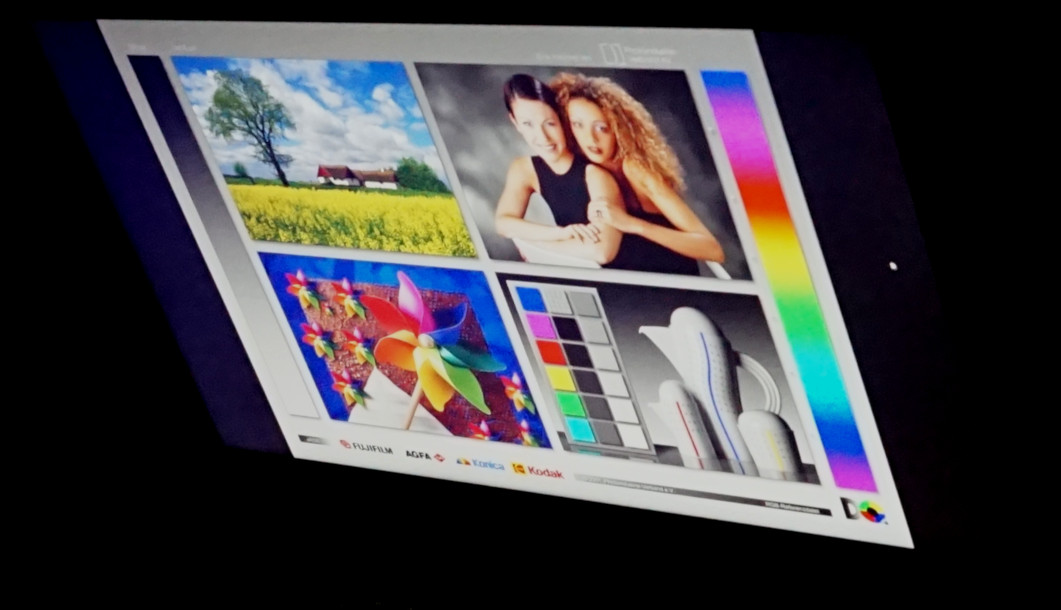
显示器--申克游戏笔记本的稳固率

我们评测的XMG Pro 17 E22具有一个几乎经典的游戏显示屏。最重要的方面是采用QHD分辨率,刷新率为165赫兹,以及sRGB色彩空间。此外,17.3英寸在短距离内看起来总是相当令人印象深刻。
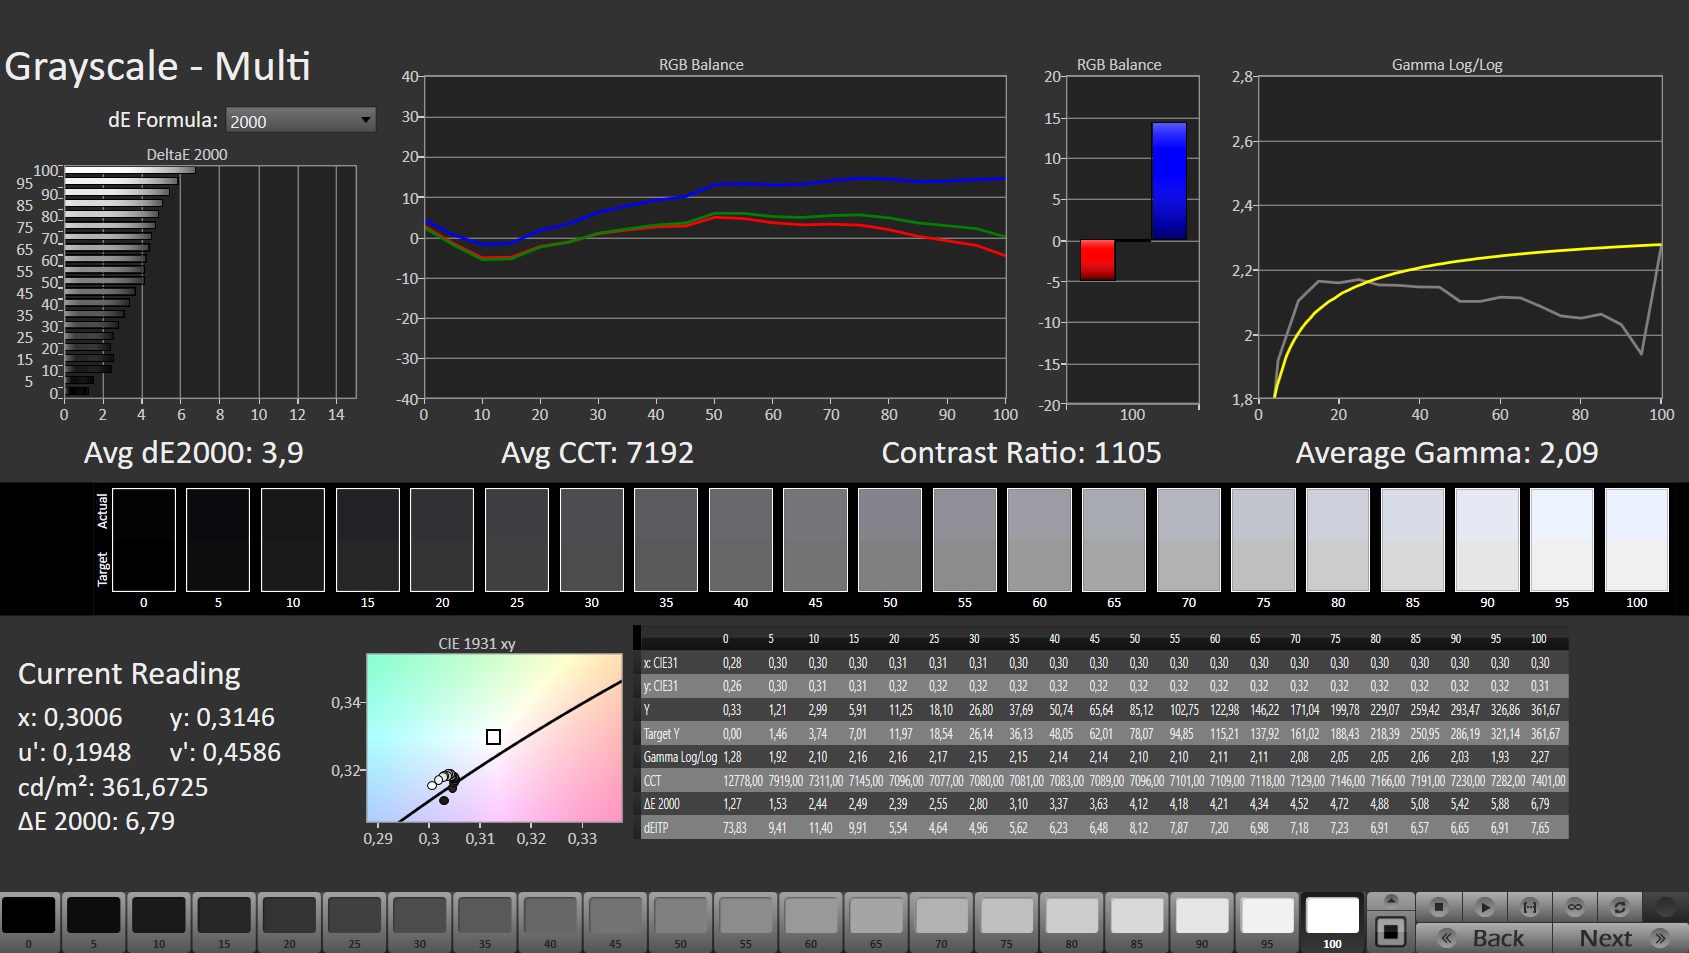
约1,100:1的对比度也是引人注目的。这表明了一个良好的黑色水平,因为最大亮度是相当温和的。仅低于300cd/m²的亮度几乎不足以看清户外的任何东西,也不足以显示HDR内容中的巨大对比度差异。不过,这两者对于游戏来说都不一定需要。
专业媒体编辑也可以使用AdobeRGB和400 cd/m²的4K显示器。这绝对是在旅途中执行高要求任务的一个选择。否则,有这么多视频端口可用,以后也可以连接适当的显示器。
我们没有注意到不同亮度下的PWM闪烁。
| |||||||||||||||||||||||||
Brightness Distribution: 83 %
Center on Battery: 349 cd/m²
Contrast: 1091:1 (Black: 0.32 cd/m²)
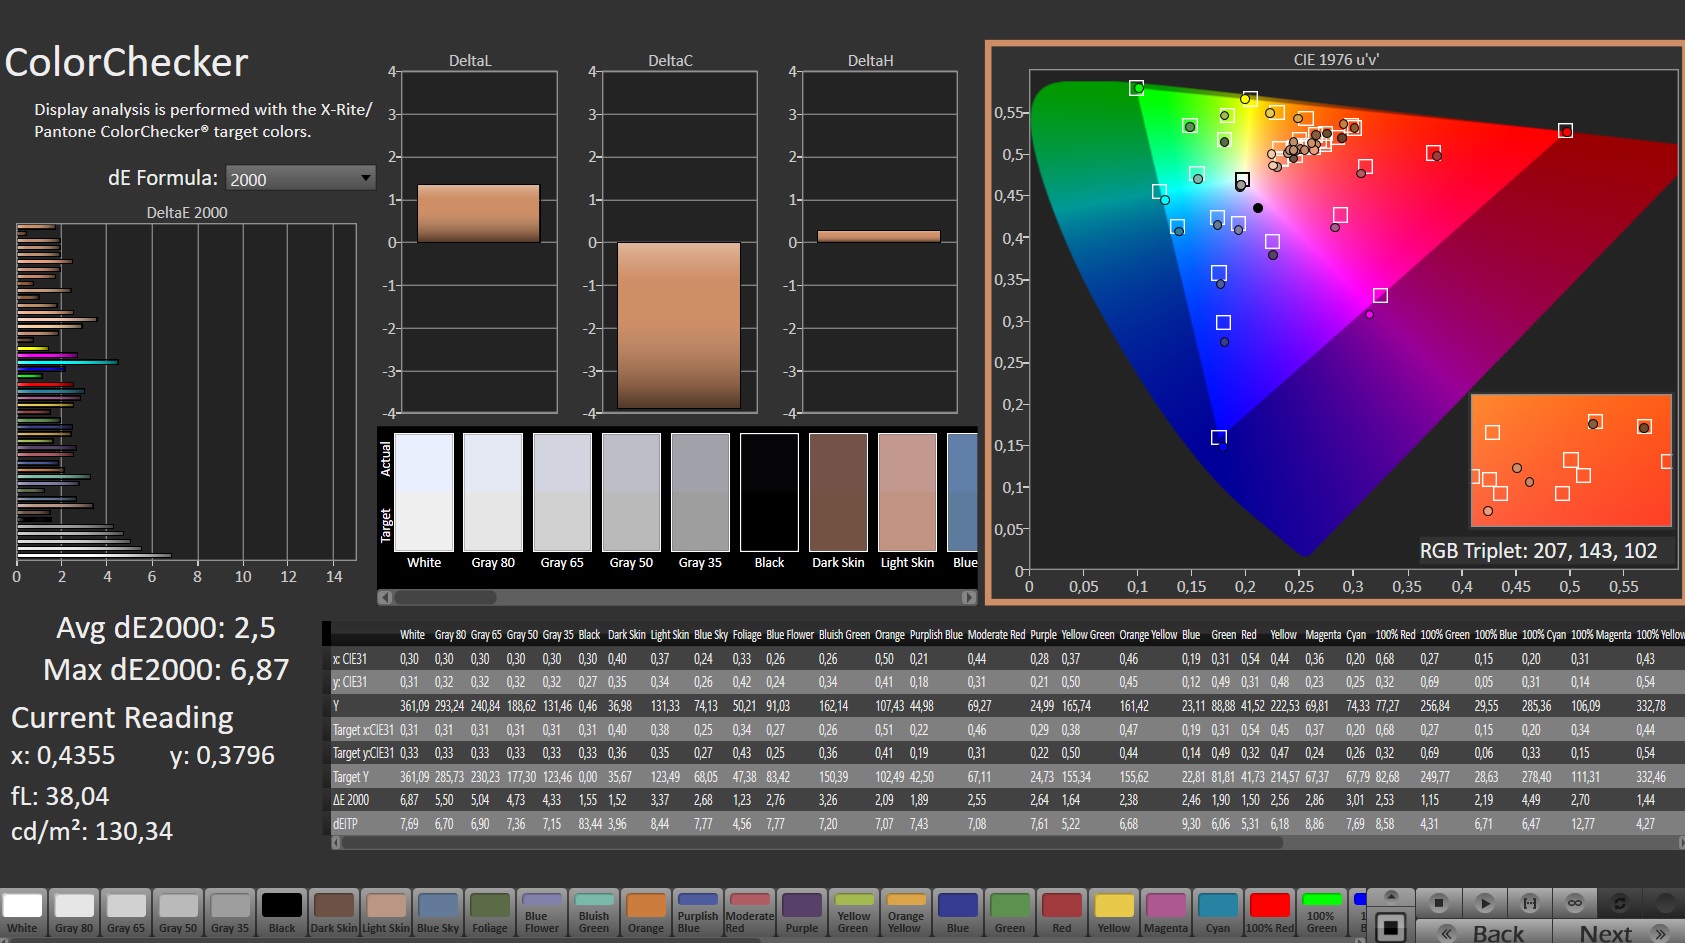
ΔE ColorChecker Calman: 2.5 | ∀{0.5-29.43 Ø4.73}
calibrated: 0.64
ΔE Greyscale Calman: 3.9 | ∀{0.09-98 Ø4.97}
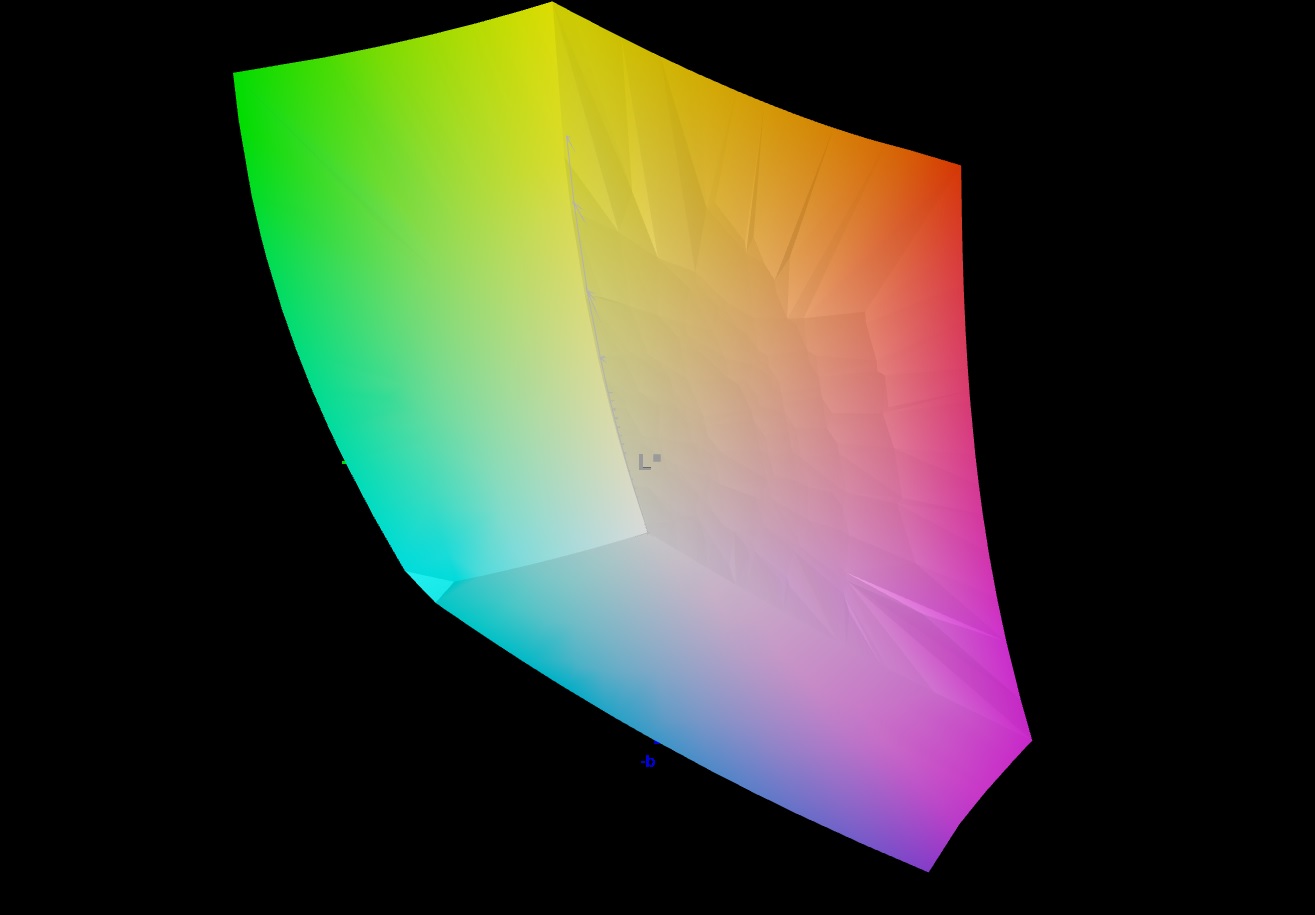
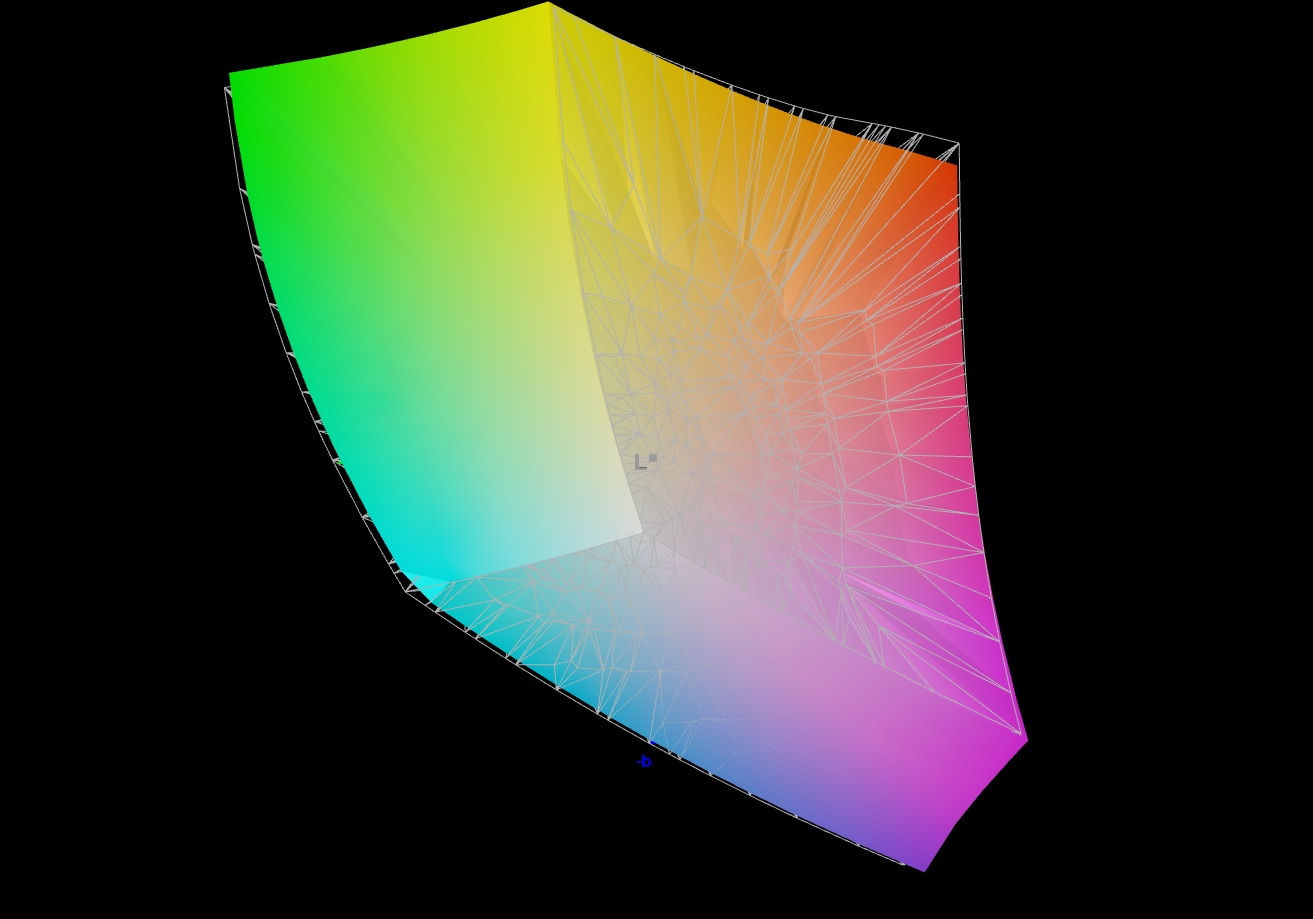
85.2% AdobeRGB 1998 (Argyll 3D)
99.9% sRGB (Argyll 3D)
97.5% Display P3 (Argyll 3D)
Gamma: 2.09
CCT: 7192 K
| Schenker XMG Pro 17 E22 BOE099D, IPS, 2560x1440, 17.3" | MSI Raider GE77 HX 12UHS AU Optronics B173ZAN06.1, IPS, 3840x2160, 17.3" | Acer Predator Triton 500 SE PT516-52s-70KX NE160QDM-NZ2, IPS LED, 2560x1600, 16" | Schenker XMG Pro 17 (Late 2021, RTX 3080) AUO B173ZAN3.0 (AUO309B), IPS, 3840x2160, 17.3" | Asus ROG Zephyrus Duo 16 GX650RX BOE NE160QAM-NX1, IPS-Level, 3840x2400, 16" | MSI Katana GF66 12UGS AU Optronics AUOAF90, IPS, 1920x1080, 15.6" | Alienware x17 R2 P48E AU Optronics B173HAN, IPS, 1920x1080, 17.3" | |
|---|---|---|---|---|---|---|---|
| Display | 0% | 0% | 2% | 1% | -52% | -9% | |
| Display P3 Coverage (%) | 97.5 | 96.6 -1% | 97.3 0% | 87.1 -11% | 98 1% | 39.1 -60% | 79.2 -19% |
| sRGB Coverage (%) | 99.9 | 99.8 0% | 100 0% | 100 0% | 99.9 0% | 58.3 -42% | 99.8 0% |
| AdobeRGB 1998 Coverage (%) | 85.2 | 85.8 1% | 84.9 0% | 100 17% | 86.3 1% | 40.4 -53% | 79.6 -7% |
| Response Times | 6% | -75% | -573% | -76% | -480% | -83% | |
| Response Time Grey 50% / Grey 80% * (ms) | 5.4 ? | 5.8 ? -7% | 13.8 ? -156% | 46.8 ? -767% | 14.6 ? -170% | 40 ? -641% | 12.4 ? -130% |
| Response Time Black / White * (ms) | 6.8 ? | 5.6 ? 18% | 6.4 ? 6% | 32.6 ? -379% | 5.6 ? 18% | 28.4 ? -318% | 9.2 ? -35% |
| PWM Frequency (Hz) | |||||||
| Screen | -61% | 21% | -66% | -10% | -79% | -2% | |
| Brightness middle (cd/m²) | 349 | 381 9% | 498 43% | 475 36% | 459 32% | 227 -35% | 365.4 5% |
| Brightness (cd/m²) | 319 | 371 16% | 468 47% | 451 41% | 434 36% | 225 -29% | 344 8% |
| Brightness Distribution (%) | 83 | 84 1% | 80 -4% | 84 1% | 88 6% | 90 8% | 85 2% |
| Black Level * (cd/m²) | 0.32 | 0.52 -63% | 0.36 -13% | 0.34 -6% | 0.44 -38% | 0.21 34% | 0.29 9% |
| Contrast (:1) | 1091 | 733 -33% | 1383 27% | 1397 28% | 1043 -4% | 1081 -1% | 1260 15% |
| Colorchecker dE 2000 * | 2.5 | 1.77 29% | 5.84 -134% | 2.97 -19% | 4.19 -68% | 3.17 -27% | |
| Colorchecker dE 2000 max. * | 6.87 | 5.24 24% | 9.97 -45% | 8.13 -18% | 17.45 -154% | 7.69 -12% | |
| Colorchecker dE 2000 calibrated * | 0.64 | 2.53 -295% | 0.63 2% | 3.51 -448% | 1.03 -61% | 3.81 -495% | 0.51 20% |
| Greyscale dE 2000 * | 3.9 | 2.4 38% | 6.56 -68% | 4.9 -26% | 2.7 31% | 5.3 -36% | |
| Gamma | 2.09 105% | 2.14 103% | 2.42 91% | 2.235 98% | 2.208 100% | 2.18 101% | |
| CCT | 7192 90% | 7046 92% | 6376 102% | 6775 96% | 6176 105% | 5879 111% | |
| Total Average (Program / Settings) | -18% /
-32% | -18% /
3% | -212% /
-124% | -28% /
-17% | -204% /
-130% | -31% /
-15% |
* ... smaller is better
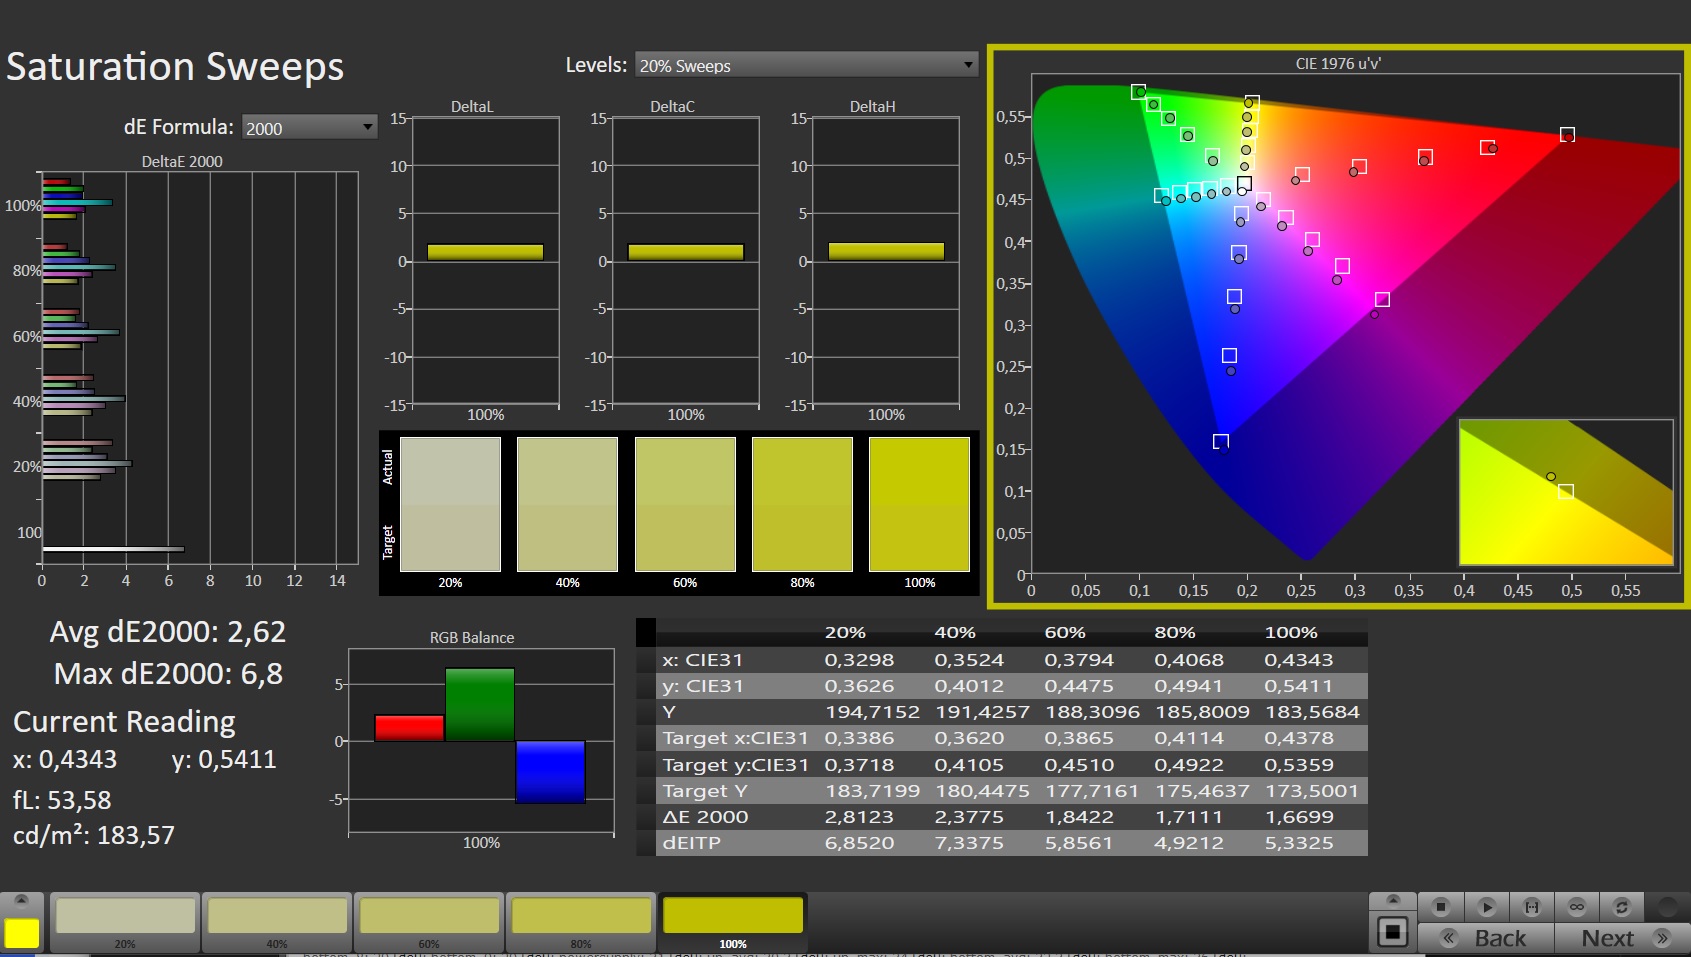
正如申克公司所承诺的那样,我们在XMG Pro 17 E22的显示屏上测量到几乎完全覆盖了sRGB色彩空间。例如,用于电影制作的DCI-P3,也几乎完全覆盖。AdobeRGB色彩空间,包括更大的绿色和蓝色范围,仍然覆盖了80%以上。在任何情况下,该显示器都证明了其丰富的色彩。
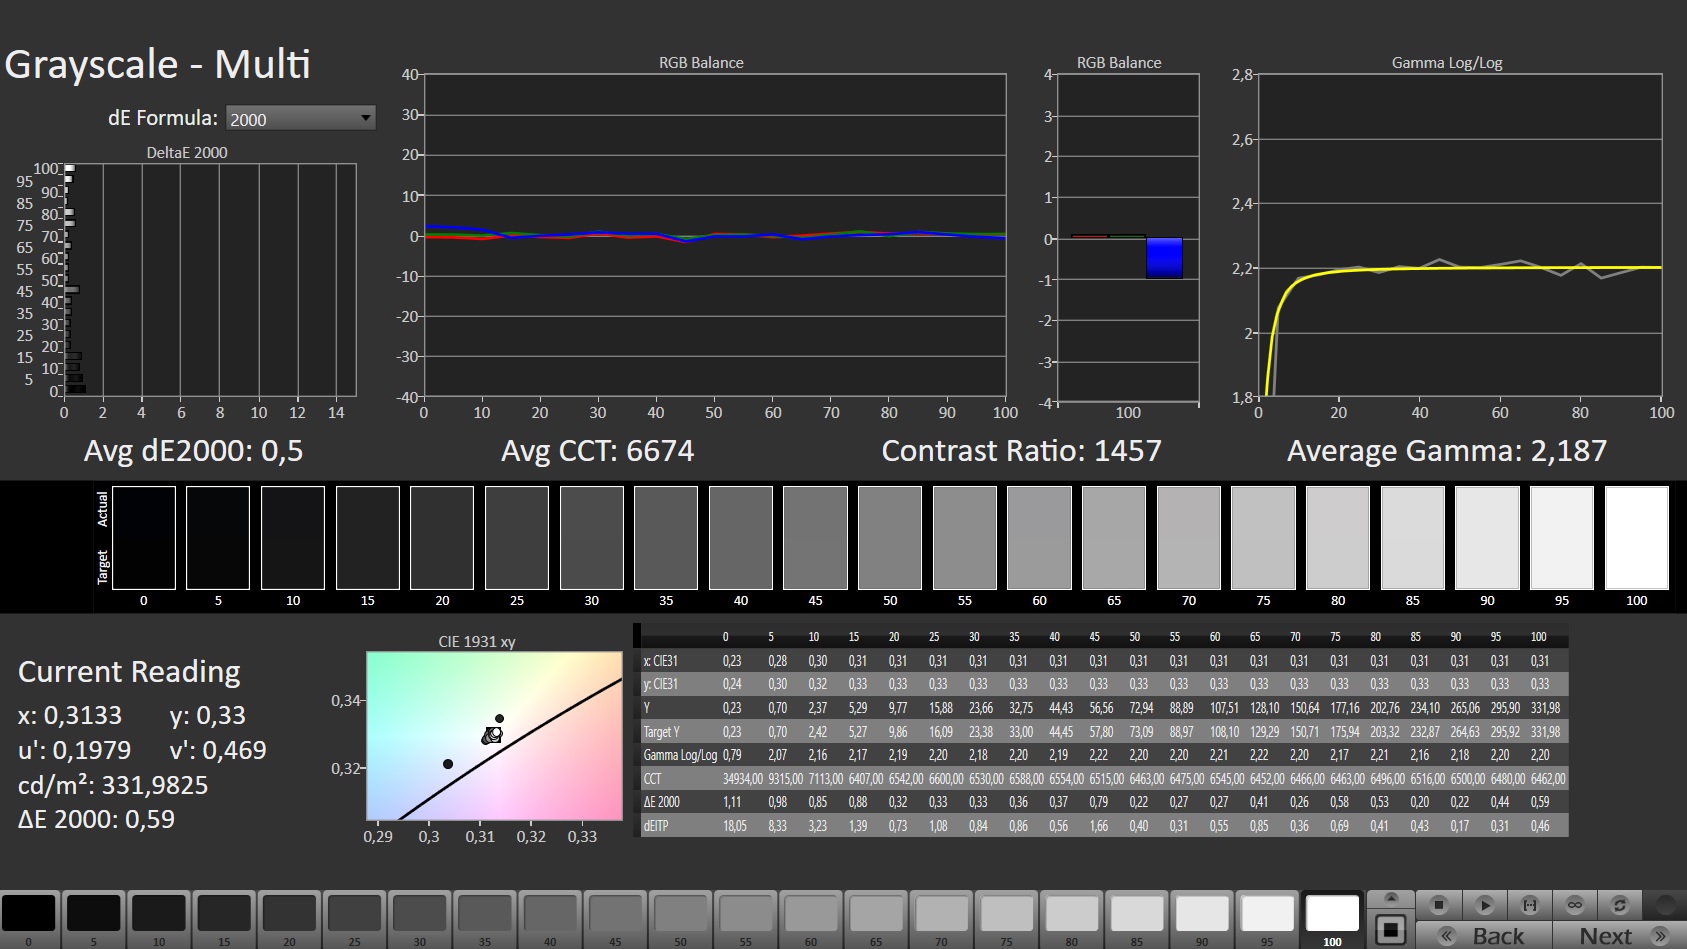
而且它的调校非常准确。即使在校准之前,我们测量的DeltaE为2.5。肉眼不再能感觉到小于3的颜色偏差。之后,该值下降到只有0.6,这一事实清楚地说明了该面板的作用。相应的色彩配置文件可在包含显示器细节的盒子里下载。

Display Response Times
| ↔ Response Time Black to White | ||
|---|---|---|
| 6.8 ms ... rise ↗ and fall ↘ combined | ↗ 2.9 ms rise | 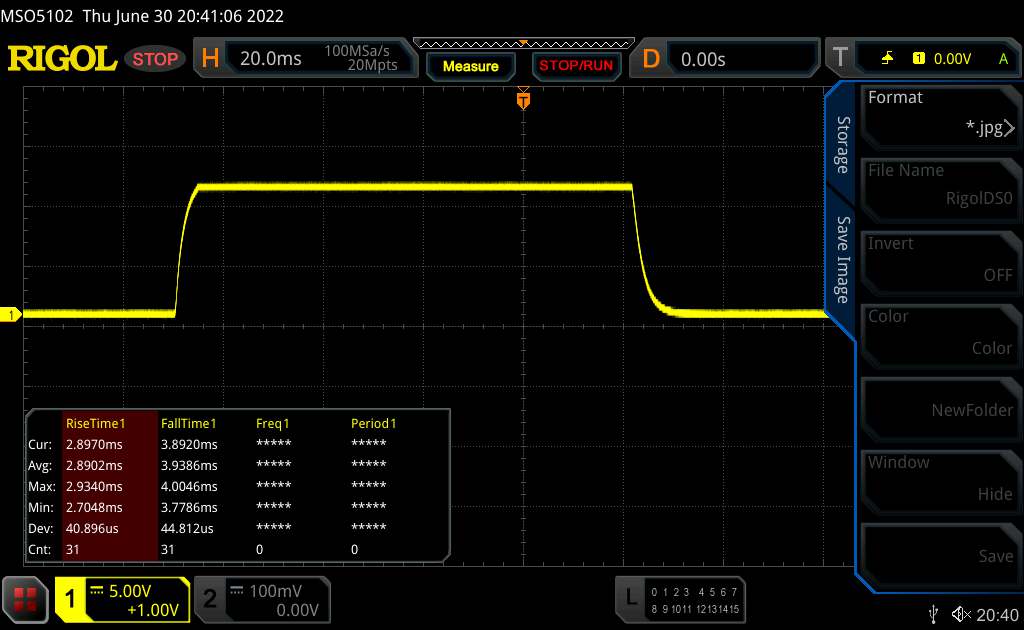 |
| ↘ 3.9 ms fall | ||
| The screen shows very fast response rates in our tests and should be very well suited for fast-paced gaming. In comparison, all tested devices range from 0.1 (minimum) to 240 (maximum) ms. » 21 % of all devices are better. This means that the measured response time is better than the average of all tested devices (19.9 ms). | ||
| ↔ Response Time 50% Grey to 80% Grey | ||
| 5.4 ms ... rise ↗ and fall ↘ combined | ↗ 2.3 ms rise |  |
| ↘ 3.1 ms fall | ||
| The screen shows very fast response rates in our tests and should be very well suited for fast-paced gaming. In comparison, all tested devices range from 0.165 (minimum) to 636 (maximum) ms. » 18 % of all devices are better. This means that the measured response time is better than the average of all tested devices (31.1 ms). | ||
Screen Flickering / PWM (Pulse-Width Modulation)
| Screen flickering / PWM not detected | 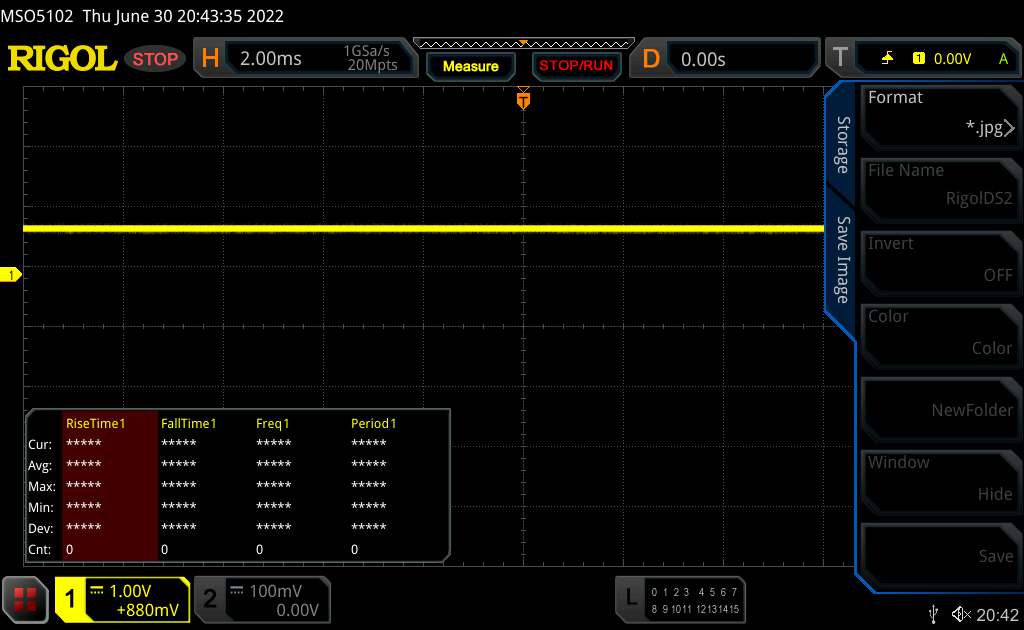 | ||
In comparison: 52 % of all tested devices do not use PWM to dim the display. If PWM was detected, an average of 7794 (minimum: 5 - maximum: 343500) Hz was measured. | |||
申克的游戏笔记本电脑不一定是真正的便携式,这就是为什么显示器在阳光下的可用性只是很少被要求。尽管峰值亮度相当低,但特别是文本仍然容易阅读。
相反,在太亮的环境下,颜色会褪色。然而,在阴暗的阳台上应该不会出现明显的问题,特别是由于略带哑光的显示屏在防止恼人的反射方面做得很好。
正如预期的那样,IPS面板在任何视角下都很容易辨认。即使远远超过45°范围,也没有颜色或对比度的变化。


性能 - i9和RTX 3080 Ti有很大的空间
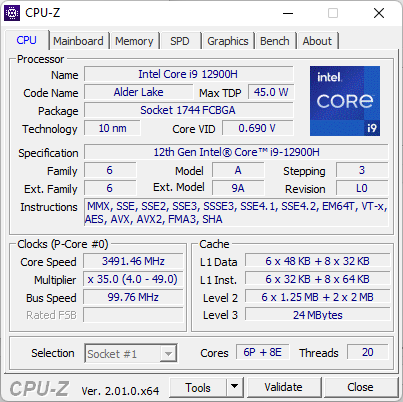
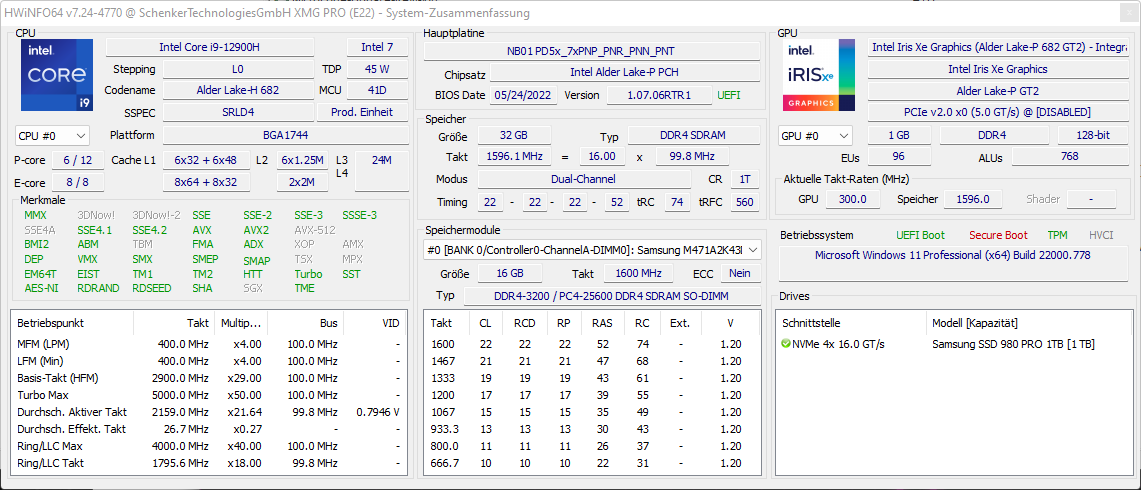
Schenker XMG Pro 17 E22当然也不缺乏性能资源。有了i9-12900H英特尔桤木湖处理器和 NvidiaGeForce RTX 3080 Ti,该系统使用的硬件已被证明是快速的,它甚至为高度复杂的程序做好了准备。
有了i7-12700H和RTX 3070 Ti,仍然可以节省处理器以及显卡的费用。这种入门级变体对于现代游戏来说仍然是绰绰有余的,即使有些游戏不能以完整的细节播放。不过,如果游戏是重点,RTX 3080 Ti至少看起来很合理,而稍逊的处理器应该不会造成任何问题。
如果XMG Pro 17 E22打算同时作为工作站和游戏笔记本电脑,建议使用最大配置,最好结合至少32GB的内存。
测试条件
宽敞的机箱允许高功率消耗,因为有足够的空间进行冷却。在短时间内,处理器有125瓦可供支配。显卡的消耗量高达155瓦,其中25瓦可以以 "动态提升 "的形式从CPU中转出。
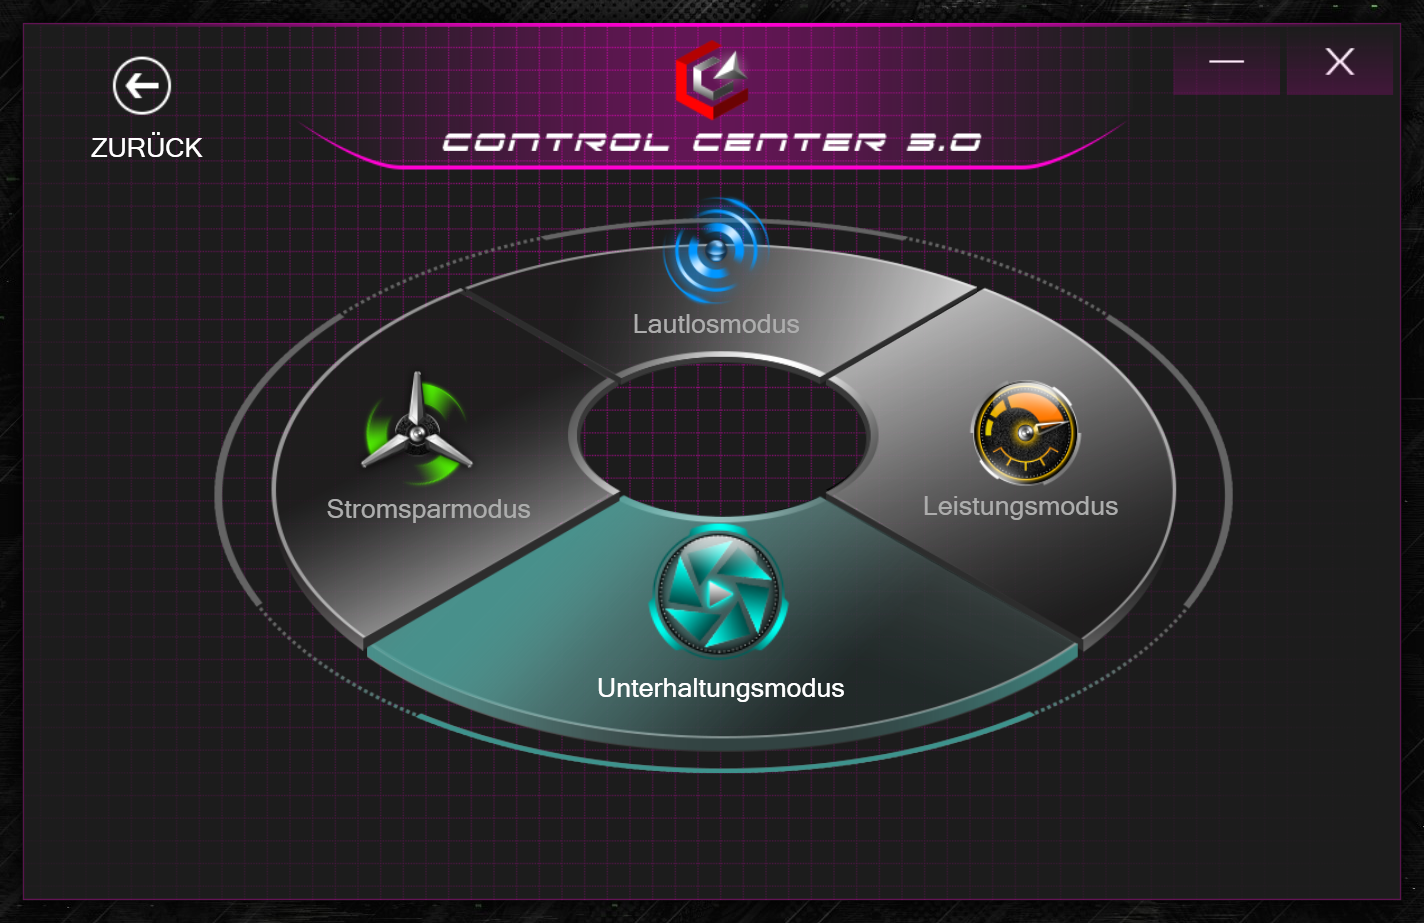
有四种模式可供选择,以使这种性能适应各自的任务或工作环境。我们在做基准测试时总是使用性能模式。此外,还有一个略微缩小的娱乐模式,一个令人难以置信的高效静音模式(这个名字绝不准确),以及一个省电模式,在用电池供电的情况下,可以再增加近10%的电池寿命。
有趣的是,静音模式的功耗设置甚至比省电模式更低。这种模式相应地凉爽、安静,但风扇总是可以听到,你可以在日常工作中不必忍受明显的性能损失。
| 概况 | PL1 | PL2 |
|---|---|---|
| 性能模式 | 115 W | 125 W |
| 娱乐模式 | 65 W | 115 W |
| 静音模式 | 35 W | 65 W |
| 省电模式 | 45 W | 65 W |
处理器
共有14个内核和20个线程,没有什么能撼动英特尔酷睿i9-12900H。该处理器的最大时钟频率为5GHz,也说明了其性能。特别是,"桤木湖 "型号可以明显超过英特尔前几代CPU的性能。在我们的Cinebench R15耐力测试中,AMD也被甩在后面。我们的CPU基准测试文章提供了不同处理器的性能率的完整概述。
然而,由于Schenker "只 "允许最大125瓦,XMG Pro 17 E22在更长的时间内允许115瓦,即使是配备i7-12700H的笔记本电脑也能与之匹配。其他具有相同CPU的游戏笔记本,如 华硕ROG Strix Scar 15 G533ZW,只是允许更高的功耗,这自然会提高原始处理器的性能。在这种特定情况下,功耗增加15%就会转化为10%的结果。不过,增加的冷却要求对图形性能的影响程度是另一回事。
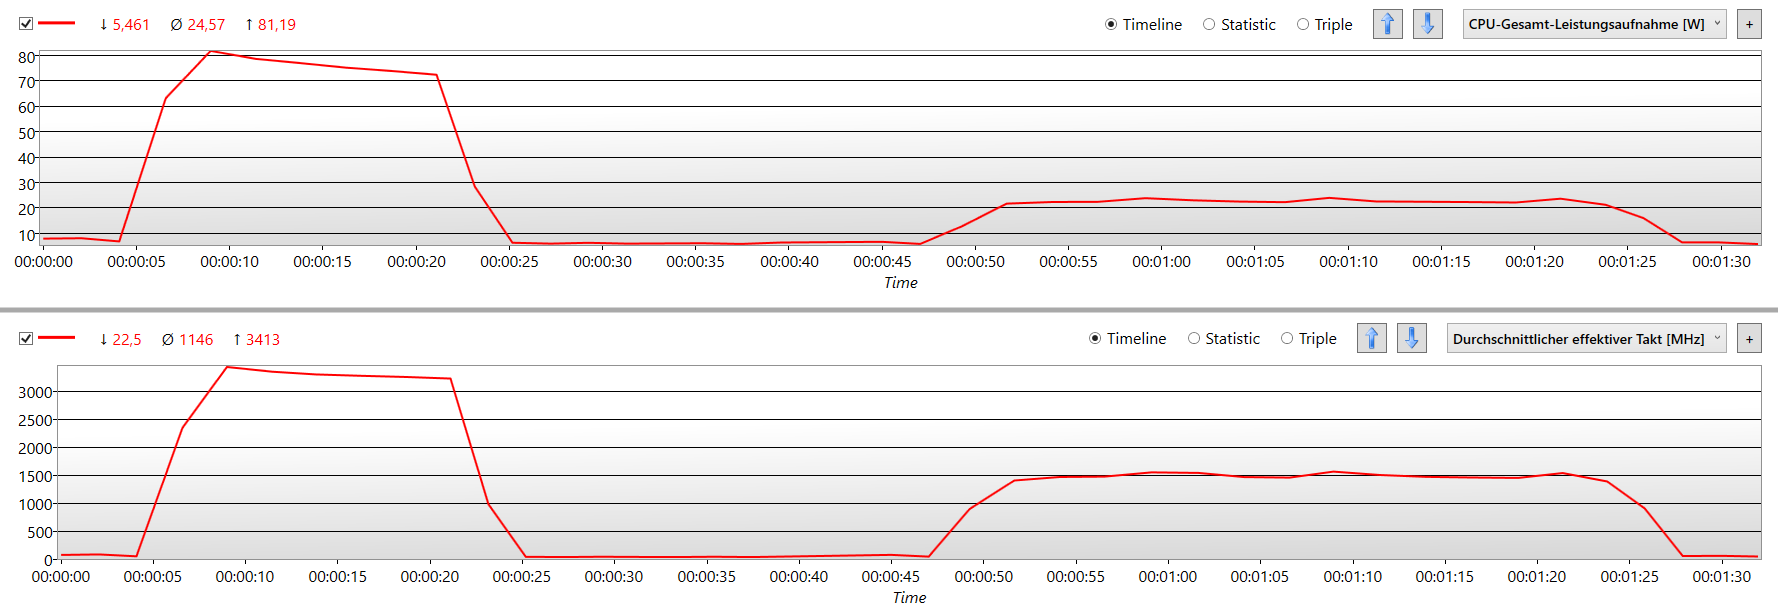
在电池模式下,处理能力会大大降低。处理器只被允许使用略低于25瓦的功率。注册的时钟频率也从3.5GHz降至1.5GHz。因此,与最高性能相比,Cinebench R15的得分下降了大约一半。
Cinebench R15 Multi endurance test
Cinebench R23: Multi Core | Single Core
Cinebench R20: CPU (Multi Core) | CPU (Single Core)
Cinebench R15: CPU Multi 64Bit | CPU Single 64Bit
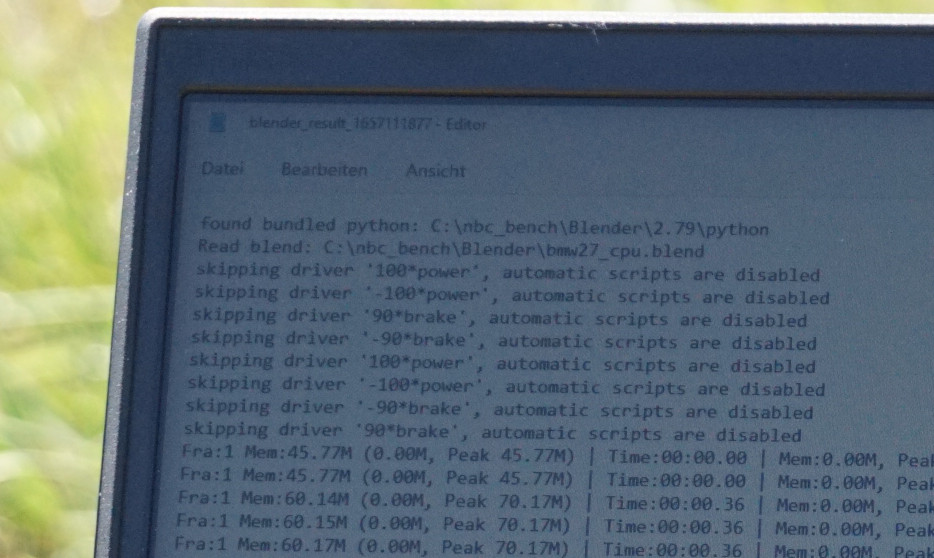
Blender: v2.79 BMW27 CPU
7-Zip 18.03: 7z b 4 | 7z b 4 -mmt1
Geekbench 5.5: Multi-Core | Single-Core
HWBOT x265 Benchmark v2.2: 4k Preset
LibreOffice : 20 Documents To PDF
R Benchmark 2.5: Overall mean
| CPU Performance rating | |
| Average of class Gaming | |
| MSI Raider GE77 HX 12UHS | |
| Alienware x17 R2 P48E | |
| Schenker XMG Pro 17 E22 | |
| Acer Predator Triton 500 SE PT516-52s-70KX | |
| Average Intel Core i9-12900H | |
| MSI Katana GF66 12UGS | |
| Asus ROG Zephyrus Duo 16 GX650RX | |
| Schenker XMG Pro 17 (Late 2021, RTX 3080) | |
| Cinebench R23 / Multi Core | |
| Average of class Gaming (10488 - 40970, n=112, last 2 years) | |
| MSI Raider GE77 HX 12UHS | |
| Alienware x17 R2 P48E | |
| MSI Katana GF66 12UGS | |
| Schenker XMG Pro 17 E22 | |
| Acer Predator Triton 500 SE PT516-52s-70KX | |
| Average Intel Core i9-12900H (7359 - 19648, n=28) | |
| Asus ROG Zephyrus Duo 16 GX650RX | |
| Schenker XMG Pro 17 (Late 2021, RTX 3080) | |
| Cinebench R23 / Single Core | |
| Average of class Gaming (1166 - 2356, n=112, last 2 years) | |
| Schenker XMG Pro 17 E22 | |
| MSI Raider GE77 HX 12UHS | |
| Alienware x17 R2 P48E | |
| Average Intel Core i9-12900H (1634 - 1930, n=28) | |
| MSI Katana GF66 12UGS | |
| Acer Predator Triton 500 SE PT516-52s-70KX | |
| Asus ROG Zephyrus Duo 16 GX650RX | |
| Schenker XMG Pro 17 (Late 2021, RTX 3080) | |
| Cinebench R20 / CPU (Multi Core) | |
| Average of class Gaming (4029 - 16108, n=111, last 2 years) | |
| MSI Raider GE77 HX 12UHS | |
| Alienware x17 R2 P48E | |
| Schenker XMG Pro 17 E22 | |
| MSI Katana GF66 12UGS | |
| Acer Predator Triton 500 SE PT516-52s-70KX | |
| Average Intel Core i9-12900H (2681 - 7471, n=28) | |
| Asus ROG Zephyrus Duo 16 GX650RX | |
| Schenker XMG Pro 17 (Late 2021, RTX 3080) | |
| Cinebench R20 / CPU (Single Core) | |
| Average of class Gaming (442 - 895, n=111, last 2 years) | |
| MSI Raider GE77 HX 12UHS | |
| Schenker XMG Pro 17 E22 | |
| Alienware x17 R2 P48E | |
| Average Intel Core i9-12900H (624 - 738, n=28) | |
| MSI Katana GF66 12UGS | |
| Acer Predator Triton 500 SE PT516-52s-70KX | |
| Asus ROG Zephyrus Duo 16 GX650RX | |
| Schenker XMG Pro 17 (Late 2021, RTX 3080) | |
| Cinebench R15 / CPU Multi 64Bit | |
| Average of class Gaming (1578 - 6271, n=111, last 2 years) | |
| MSI Raider GE77 HX 12UHS | |
| Alienware x17 R2 P48E | |
| MSI Katana GF66 12UGS | |
| MSI Katana GF66 12UGS | |
| Schenker XMG Pro 17 E22 | |
| Acer Predator Triton 500 SE PT516-52s-70KX | |
| Average Intel Core i9-12900H (1395 - 3077, n=28) | |
| Asus ROG Zephyrus Duo 16 GX650RX | |
| Schenker XMG Pro 17 (Late 2021, RTX 3080) | |
| Cinebench R15 / CPU Single 64Bit | |
| Average of class Gaming (188.8 - 343, n=111, last 2 years) | |
| MSI Raider GE77 HX 12UHS | |
| Schenker XMG Pro 17 E22 | |
| Alienware x17 R2 P48E | |
| MSI Katana GF66 12UGS | |
| MSI Katana GF66 12UGS | |
| Average Intel Core i9-12900H (235 - 277, n=29) | |
| Asus ROG Zephyrus Duo 16 GX650RX | |
| Acer Predator Triton 500 SE PT516-52s-70KX | |
| Schenker XMG Pro 17 (Late 2021, RTX 3080) | |
| Blender / v2.79 BMW27 CPU | |
| MSI Katana GF66 12UGS | |
| Schenker XMG Pro 17 (Late 2021, RTX 3080) | |
| Average Intel Core i9-12900H (160 - 451, n=28) | |
| Asus ROG Zephyrus Duo 16 GX650RX | |
| Acer Predator Triton 500 SE PT516-52s-70KX | |
| Schenker XMG Pro 17 E22 | |
| Alienware x17 R2 P48E | |
| Average of class Gaming (80 - 330, n=109, last 2 years) | |
| MSI Raider GE77 HX 12UHS | |
| 7-Zip 18.03 / 7z b 4 | |
| Average of class Gaming (33491 - 148086, n=110, last 2 years) | |
| MSI Raider GE77 HX 12UHS | |
| Alienware x17 R2 P48E | |
| Schenker XMG Pro 17 E22 | |
| Acer Predator Triton 500 SE PT516-52s-70KX | |
| Asus ROG Zephyrus Duo 16 GX650RX | |
| Average Intel Core i9-12900H (34684 - 76677, n=28) | |
| MSI Katana GF66 12UGS | |
| Schenker XMG Pro 17 (Late 2021, RTX 3080) | |
| 7-Zip 18.03 / 7z b 4 -mmt1 | |
| Average of class Gaming (4199 - 7436, n=110, last 2 years) | |
| MSI Raider GE77 HX 12UHS | |
| Schenker XMG Pro 17 E22 | |
| MSI Katana GF66 12UGS | |
| Average Intel Core i9-12900H (5302 - 6289, n=28) | |
| Alienware x17 R2 P48E | |
| Asus ROG Zephyrus Duo 16 GX650RX | |
| Schenker XMG Pro 17 (Late 2021, RTX 3080) | |
| Acer Predator Triton 500 SE PT516-52s-70KX | |
| Geekbench 5.5 / Multi-Core | |
| Average of class Gaming (6460 - 27010, n=110, last 2 years) | |
| MSI Raider GE77 HX 12UHS | |
| Alienware x17 R2 P48E | |
| Acer Predator Triton 500 SE PT516-52s-70KX | |
| Schenker XMG Pro 17 E22 | |
| Average Intel Core i9-12900H (8519 - 14376, n=31) | |
| MSI Katana GF66 12UGS | |
| Asus ROG Zephyrus Duo 16 GX650RX | |
| Schenker XMG Pro 17 (Late 2021, RTX 3080) | |
| Geekbench 5.5 / Single-Core | |
| Average of class Gaming (986 - 2474, n=110, last 2 years) | |
| MSI Raider GE77 HX 12UHS | |
| Alienware x17 R2 P48E | |
| Schenker XMG Pro 17 E22 | |
| Average Intel Core i9-12900H (1631 - 1897, n=31) | |
| MSI Katana GF66 12UGS | |
| Acer Predator Triton 500 SE PT516-52s-70KX | |
| Schenker XMG Pro 17 (Late 2021, RTX 3080) | |
| Asus ROG Zephyrus Duo 16 GX650RX | |
| HWBOT x265 Benchmark v2.2 / 4k Preset | |
| Average of class Gaming (11.5 - 44.3, n=110, last 2 years) | |
| MSI Raider GE77 HX 12UHS | |
| Alienware x17 R2 P48E | |
| Schenker XMG Pro 17 E22 | |
| Acer Predator Triton 500 SE PT516-52s-70KX | |
| Asus ROG Zephyrus Duo 16 GX650RX | |
| Average Intel Core i9-12900H (8.05 - 22.5, n=28) | |
| Schenker XMG Pro 17 (Late 2021, RTX 3080) | |
| MSI Katana GF66 12UGS | |
| LibreOffice / 20 Documents To PDF | |
| Average of class Gaming (19 - 88.8, n=110, last 2 years) | |
| Schenker XMG Pro 17 (Late 2021, RTX 3080) | |
| Asus ROG Zephyrus Duo 16 GX650RX | |
| MSI Raider GE77 HX 12UHS | |
| Average Intel Core i9-12900H (36.8 - 59.8, n=28) | |
| Acer Predator Triton 500 SE PT516-52s-70KX | |
| Alienware x17 R2 P48E | |
| Schenker XMG Pro 17 E22 | |
| MSI Katana GF66 12UGS | |
| R Benchmark 2.5 / Overall mean | |
| Schenker XMG Pro 17 (Late 2021, RTX 3080) | |
| Asus ROG Zephyrus Duo 16 GX650RX | |
| Acer Predator Triton 500 SE PT516-52s-70KX | |
| Average Intel Core i9-12900H (0.4218 - 0.506, n=28) | |
| MSI Katana GF66 12UGS | |
| Schenker XMG Pro 17 E22 | |
| Alienware x17 R2 P48E | |
| Average of class Gaming (0.3439 - 0.759, n=111, last 2 years) | |
| MSI Raider GE77 HX 12UHS | |
* ... smaller is better
AIDA64: FP32 Ray-Trace | FPU Julia | CPU SHA3 | CPU Queen | FPU SinJulia | FPU Mandel | CPU AES | CPU ZLib | FP64 Ray-Trace | CPU PhotoWorxx
| Performance rating | |
| Average of class Gaming | |
| MSI Raider GE77 HX 12UHS | |
| Asus ROG Zephyrus Duo 16 GX650RX | |
| Schenker XMG Pro 17 (Late 2021, RTX 3080) | |
| Alienware x17 R2 P48E | |
| Acer Predator Triton 500 SE PT516-52s-70KX | |
| Average Intel Core i9-12900H | |
| Schenker XMG Pro 17 E22 | |
| MSI Katana GF66 12UGS | |
| AIDA64 / FP32 Ray-Trace | |
| Average of class Gaming (10227 - 85542, n=109, last 2 years) | |
| MSI Raider GE77 HX 12UHS | |
| Asus ROG Zephyrus Duo 16 GX650RX | |
| Schenker XMG Pro 17 (Late 2021, RTX 3080) | |
| Average Intel Core i9-12900H (4074 - 18289, n=29) | |
| Alienware x17 R2 P48E | |
| Acer Predator Triton 500 SE PT516-52s-70KX | |
| MSI Katana GF66 12UGS | |
| Schenker XMG Pro 17 E22 | |
| AIDA64 / FPU Julia | |
| Average of class Gaming (51376 - 238426, n=109, last 2 years) | |
| MSI Raider GE77 HX 12UHS | |
| Asus ROG Zephyrus Duo 16 GX650RX | |
| Schenker XMG Pro 17 (Late 2021, RTX 3080) | |
| Average Intel Core i9-12900H (22307 - 93236, n=29) | |
| Alienware x17 R2 P48E | |
| Acer Predator Triton 500 SE PT516-52s-70KX | |
| MSI Katana GF66 12UGS | |
| Schenker XMG Pro 17 E22 | |
| AIDA64 / CPU SHA3 | |
| Average of class Gaming (2180 - 9817, n=109, last 2 years) | |
| MSI Raider GE77 HX 12UHS | |
| Schenker XMG Pro 17 (Late 2021, RTX 3080) | |
| Asus ROG Zephyrus Duo 16 GX650RX | |
| Alienware x17 R2 P48E | |
| Acer Predator Triton 500 SE PT516-52s-70KX | |
| Schenker XMG Pro 17 E22 | |
| Average Intel Core i9-12900H (1378 - 4215, n=29) | |
| MSI Katana GF66 12UGS | |
| AIDA64 / CPU Queen | |
| Average of class Gaming (49785 - 173351, n=100, last 2 years) | |
| Alienware x17 R2 P48E | |
| Schenker XMG Pro 17 E22 | |
| Asus ROG Zephyrus Duo 16 GX650RX | |
| MSI Raider GE77 HX 12UHS | |
| Average Intel Core i9-12900H (78172 - 111241, n=28) | |
| MSI Katana GF66 12UGS | |
| Acer Predator Triton 500 SE PT516-52s-70KX | |
| Schenker XMG Pro 17 (Late 2021, RTX 3080) | |
| AIDA64 / FPU SinJulia | |
| Average of class Gaming (4424 - 33636, n=109, last 2 years) | |
| Asus ROG Zephyrus Duo 16 GX650RX | |
| MSI Raider GE77 HX 12UHS | |
| Alienware x17 R2 P48E | |
| Acer Predator Triton 500 SE PT516-52s-70KX | |
| Schenker XMG Pro 17 (Late 2021, RTX 3080) | |
| MSI Katana GF66 12UGS | |
| Schenker XMG Pro 17 E22 | |
| Average Intel Core i9-12900H (5709 - 10410, n=29) | |
| AIDA64 / FPU Mandel | |
| Average of class Gaming (25115 - 128721, n=109, last 2 years) | |
| Asus ROG Zephyrus Duo 16 GX650RX | |
| MSI Raider GE77 HX 12UHS | |
| Schenker XMG Pro 17 (Late 2021, RTX 3080) | |
| Average Intel Core i9-12900H (11257 - 45581, n=29) | |
| Alienware x17 R2 P48E | |
| Acer Predator Triton 500 SE PT516-52s-70KX | |
| MSI Katana GF66 12UGS | |
| Schenker XMG Pro 17 E22 | |
| AIDA64 / CPU AES | |
| MSI Raider GE77 HX 12UHS | |
| Schenker XMG Pro 17 (Late 2021, RTX 3080) | |
| Asus ROG Zephyrus Duo 16 GX650RX | |
| Alienware x17 R2 P48E | |
| Average of class Gaming (39258 - 247074, n=109, last 2 years) | |
| Acer Predator Triton 500 SE PT516-52s-70KX | |
| Schenker XMG Pro 17 E22 | |
| MSI Katana GF66 12UGS | |
| Average Intel Core i9-12900H (31935 - 151546, n=29) | |
| AIDA64 / CPU ZLib | |
| Average of class Gaming (574 - 2531, n=109, last 2 years) | |
| MSI Raider GE77 HX 12UHS | |
| Alienware x17 R2 P48E | |
| Acer Predator Triton 500 SE PT516-52s-70KX | |
| Schenker XMG Pro 17 E22 | |
| MSI Katana GF66 12UGS | |
| Average Intel Core i9-12900H (449 - 1193, n=29) | |
| Asus ROG Zephyrus Duo 16 GX650RX | |
| Schenker XMG Pro 17 (Late 2021, RTX 3080) | |
| AIDA64 / FP64 Ray-Trace | |
| Average of class Gaming (5509 - 45446, n=109, last 2 years) | |
| MSI Raider GE77 HX 12UHS | |
| Asus ROG Zephyrus Duo 16 GX650RX | |
| Schenker XMG Pro 17 (Late 2021, RTX 3080) | |
| Average Intel Core i9-12900H (2235 - 10511, n=29) | |
| Alienware x17 R2 P48E | |
| Acer Predator Triton 500 SE PT516-52s-70KX | |
| MSI Katana GF66 12UGS | |
| Schenker XMG Pro 17 E22 | |
| AIDA64 / CPU PhotoWorxx | |
| MSI Raider GE77 HX 12UHS | |
| Average of class Gaming (12271 - 89891, n=109, last 2 years) | |
| Average Intel Core i9-12900H (20960 - 48269, n=30) | |
| Acer Predator Triton 500 SE PT516-52s-70KX | |
| Alienware x17 R2 P48E | |
| Asus ROG Zephyrus Duo 16 GX650RX | |
| Schenker XMG Pro 17 E22 | |
| MSI Katana GF66 12UGS | |
| Schenker XMG Pro 17 (Late 2021, RTX 3080) | |
系统性能
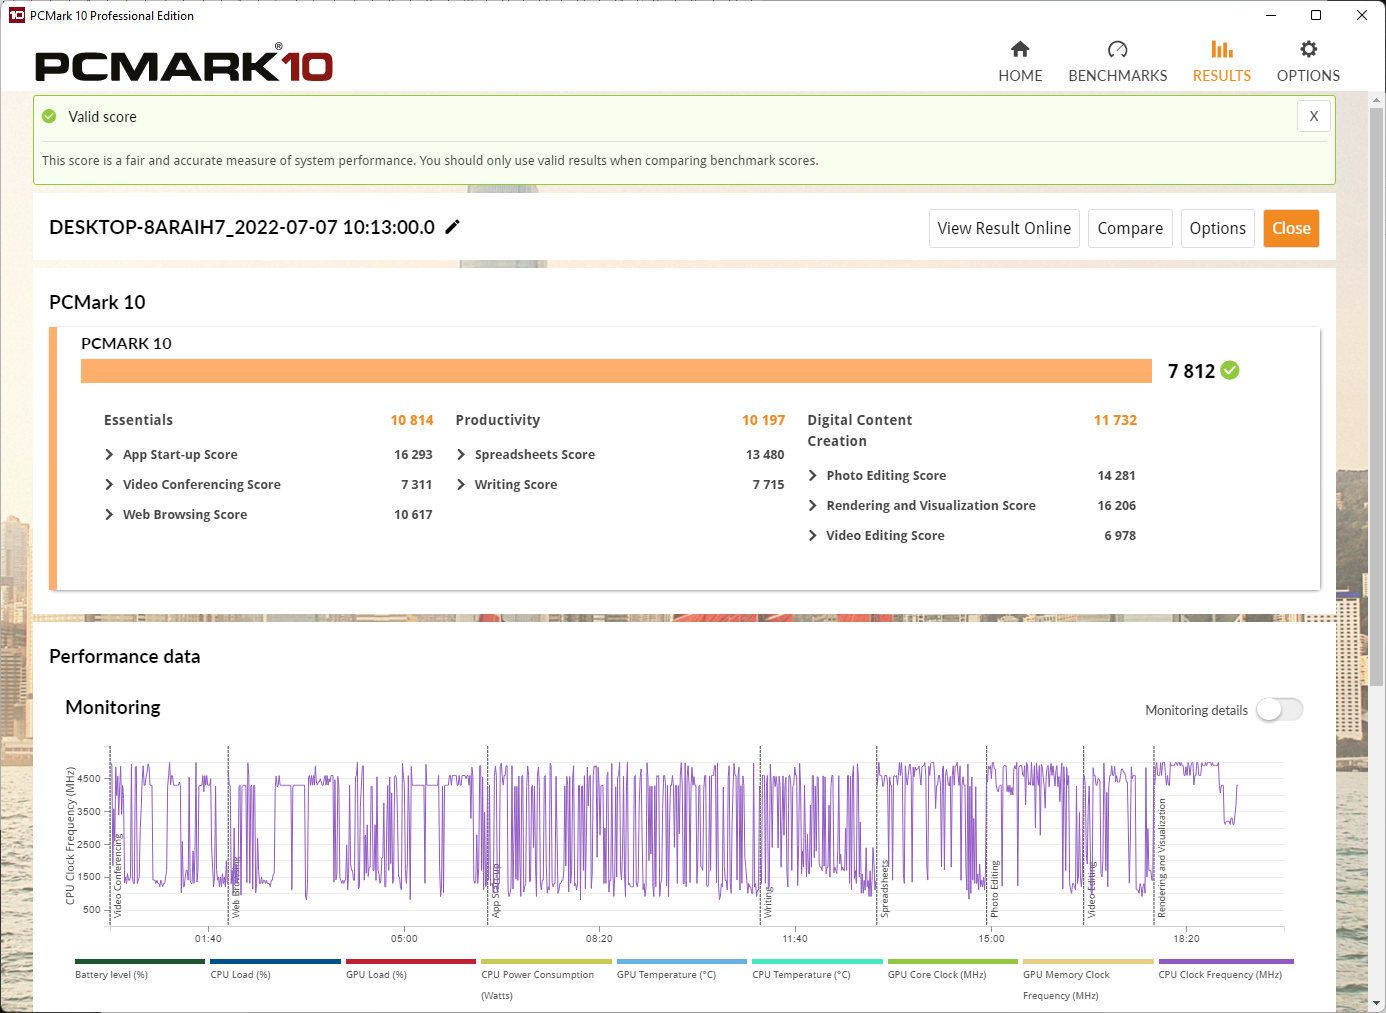
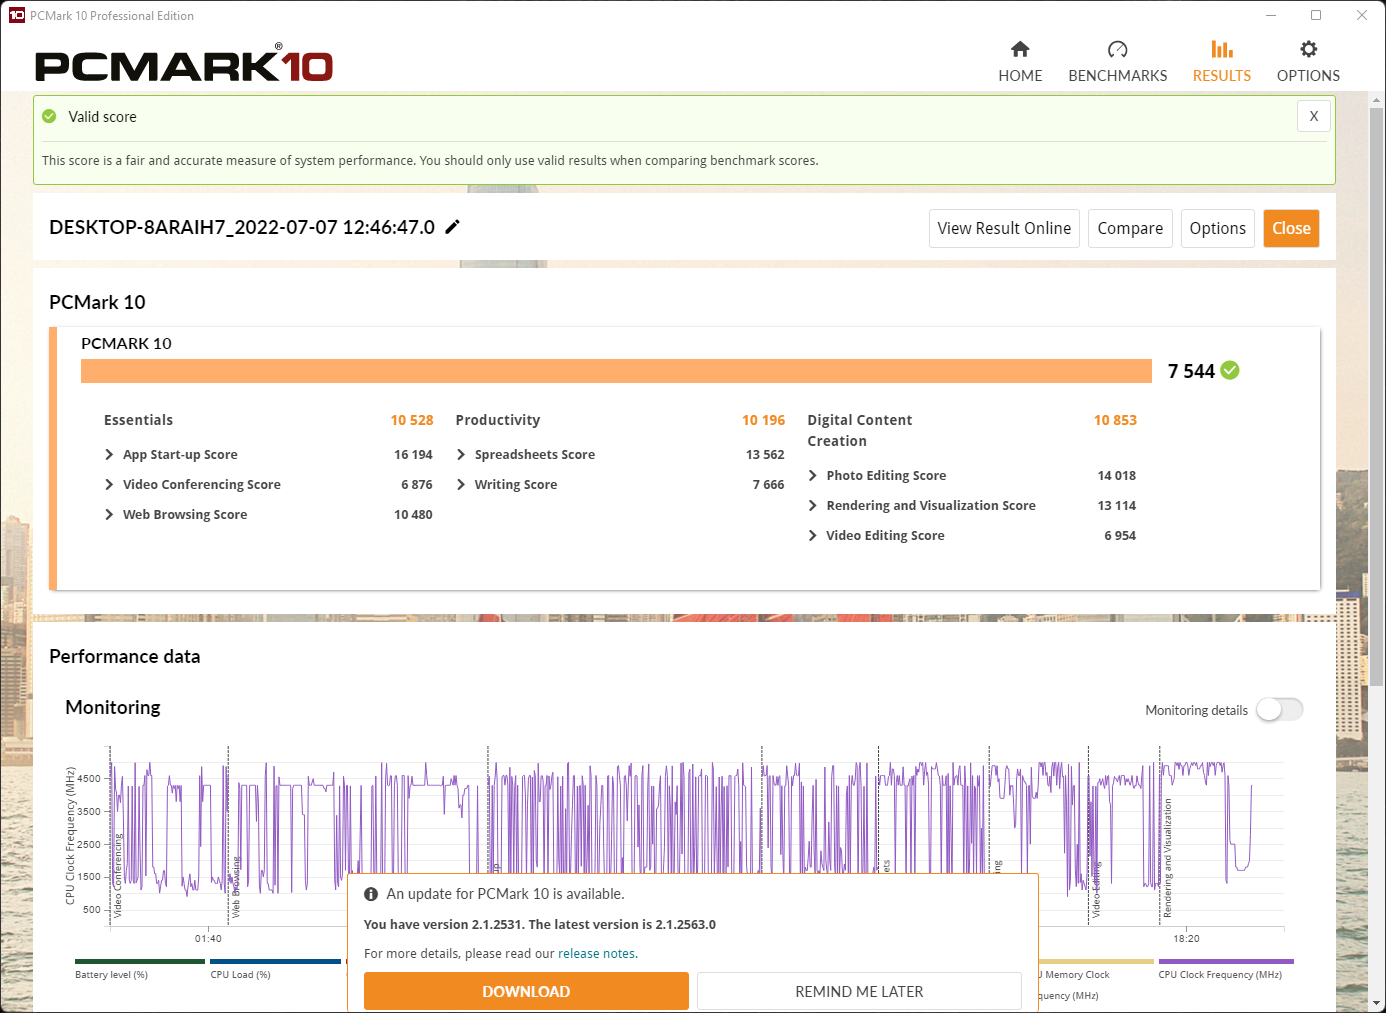
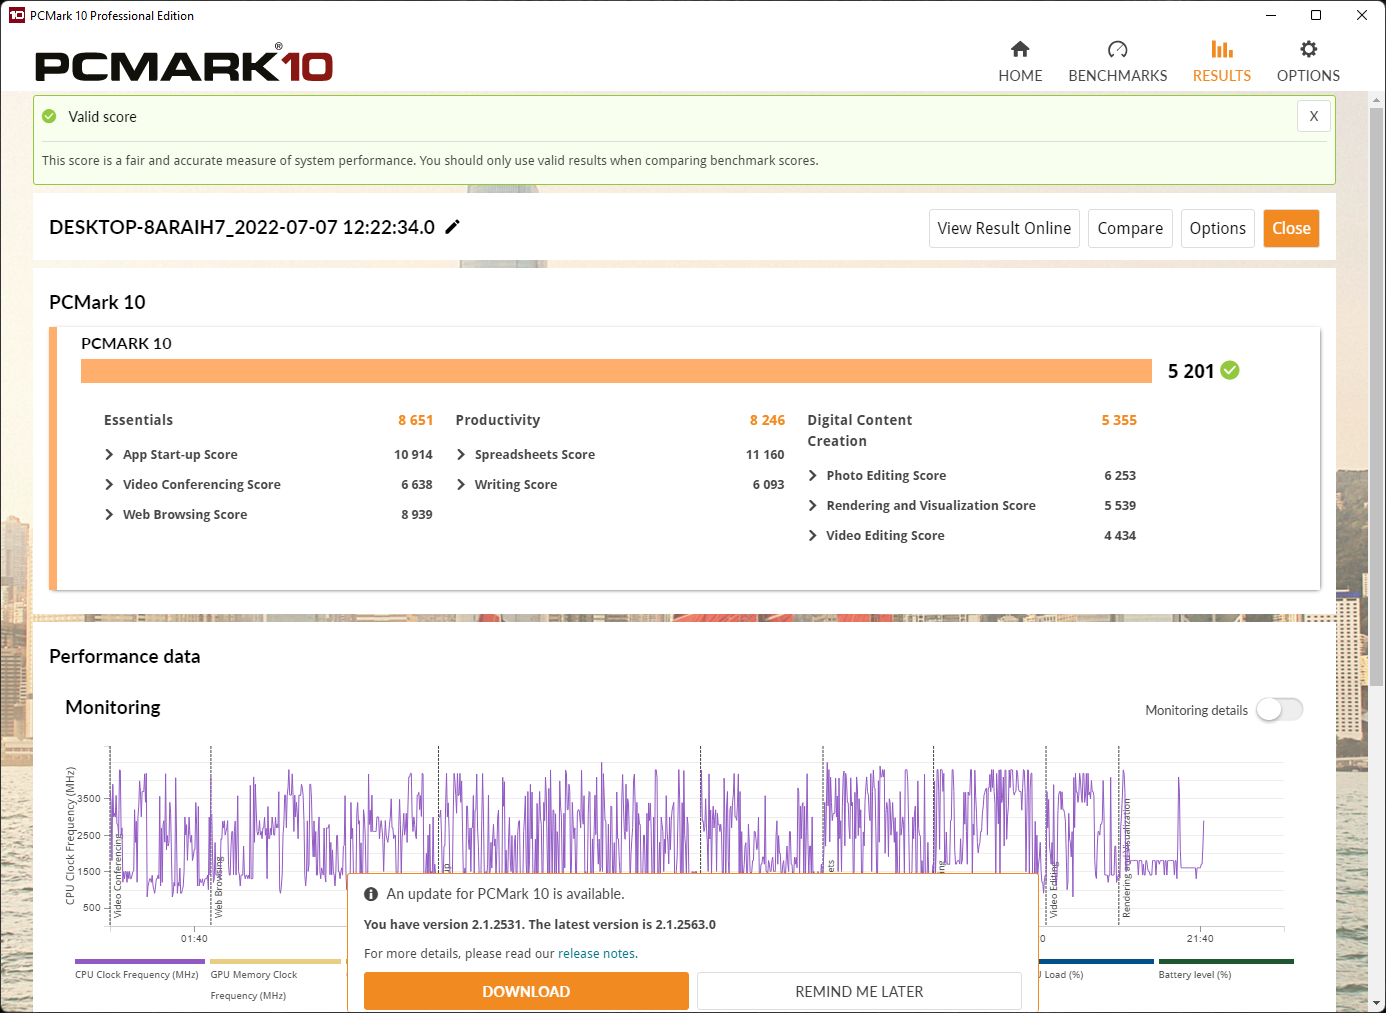
XMG Pro 17在PCMark 10中排名很高。在这个非常现实的测试中,它的得分刚刚超过相同配置型号的平均分。MSI Raider GE77,在纸面上甚至更强大,但却落后12%。
这个结果可以在使用笔记本时得到验证。同时打开的程序的数量几乎是不相关的。总有足够的性能可用。
然而,最显著的事实是,静音模式下的速率就足以达到相同的分数。这意味着,用户不必为了顺利使用笔记本电脑而忍受一个响亮的风扇或一个过于温暖的箱子。此外,在这种模式下,游戏FPS只下降了大约10%到20%。
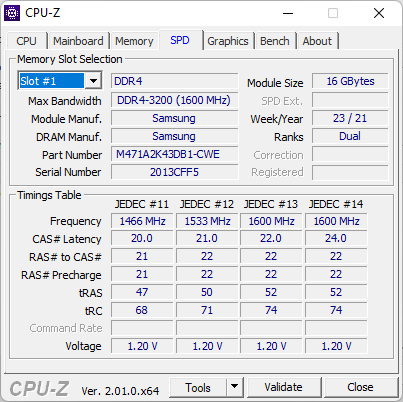
申克公司决定不使用DDR5内存,这对系统性能有一定的影响。其主要原因是模块的价格较低,而与DDR4相比,预期的改进在几个百分点之间。
CrossMark: Overall | Productivity | Creativity | Responsiveness
| PCMark 10 / Score | |
| Average of class Gaming (5828 - 11574, n=95, last 2 years) | |
| Alienware x17 R2 P48E | |
| Schenker XMG Pro 17 E22 | |
| Average Intel Core i9-12900H, NVIDIA GeForce RTX 3080 Ti Laptop GPU (7139 - 8083, n=6) | |
| Acer Predator Triton 500 SE PT516-52s-70KX | |
| MSI Katana GF66 12UGS | |
| Schenker XMG Pro 17 (Late 2021, RTX 3080) | |
| MSI Raider GE77 HX 12UHS | |
| Asus ROG Zephyrus Duo 16 GX650RX | |
| PCMark 10 / Essentials | |
| Alienware x17 R2 P48E | |
| Schenker XMG Pro 17 E22 | |
| Average Intel Core i9-12900H, NVIDIA GeForce RTX 3080 Ti Laptop GPU (10254 - 11178, n=6) | |
| Acer Predator Triton 500 SE PT516-52s-70KX | |
| Average of class Gaming (8810 - 12600, n=99, last 2 years) | |
| MSI Katana GF66 12UGS | |
| Schenker XMG Pro 17 (Late 2021, RTX 3080) | |
| MSI Raider GE77 HX 12UHS | |
| Asus ROG Zephyrus Duo 16 GX650RX | |
| PCMark 10 / Productivity | |
| Average of class Gaming (6845 - 18766, n=97, last 2 years) | |
| Schenker XMG Pro 17 E22 | |
| Alienware x17 R2 P48E | |
| Average Intel Core i9-12900H, NVIDIA GeForce RTX 3080 Ti Laptop GPU (9102 - 11186, n=6) | |
| MSI Katana GF66 12UGS | |
| MSI Raider GE77 HX 12UHS | |
| Acer Predator Triton 500 SE PT516-52s-70KX | |
| Schenker XMG Pro 17 (Late 2021, RTX 3080) | |
| Asus ROG Zephyrus Duo 16 GX650RX | |
| PCMark 10 / Digital Content Creation | |
| Average of class Gaming (7602 - 19657, n=97, last 2 years) | |
| Alienware x17 R2 P48E | |
| Schenker XMG Pro 17 E22 | |
| Average Intel Core i9-12900H, NVIDIA GeForce RTX 3080 Ti Laptop GPU (9847 - 12627, n=6) | |
| Acer Predator Triton 500 SE PT516-52s-70KX | |
| MSI Katana GF66 12UGS | |
| Schenker XMG Pro 17 (Late 2021, RTX 3080) | |
| MSI Raider GE77 HX 12UHS | |
| Asus ROG Zephyrus Duo 16 GX650RX | |
| CrossMark / Overall | |
| MSI Raider GE77 HX 12UHS | |
| Average of class Gaming (1366 - 2409, n=97, last 2 years) | |
| MSI Katana GF66 12UGS | |
| Alienware x17 R2 P48E | |
| Acer Predator Triton 500 SE PT516-52s-70KX | |
| Average Intel Core i9-12900H, NVIDIA GeForce RTX 3080 Ti Laptop GPU (1696 - 1965, n=3) | |
| Asus ROG Zephyrus Duo 16 GX650RX | |
| CrossMark / Productivity | |
| MSI Raider GE77 HX 12UHS | |
| MSI Katana GF66 12UGS | |
| Average of class Gaming (1386 - 2254, n=97, last 2 years) | |
| Alienware x17 R2 P48E | |
| Acer Predator Triton 500 SE PT516-52s-70KX | |
| Average Intel Core i9-12900H, NVIDIA GeForce RTX 3080 Ti Laptop GPU (1622 - 1870, n=3) | |
| Asus ROG Zephyrus Duo 16 GX650RX | |
| CrossMark / Creativity | |
| MSI Raider GE77 HX 12UHS | |
| Average of class Gaming (1343 - 2729, n=97, last 2 years) | |
| Alienware x17 R2 P48E | |
| Average Intel Core i9-12900H, NVIDIA GeForce RTX 3080 Ti Laptop GPU (1855 - 2135, n=3) | |
| Acer Predator Triton 500 SE PT516-52s-70KX | |
| MSI Katana GF66 12UGS | |
| Asus ROG Zephyrus Duo 16 GX650RX | |
| CrossMark / Responsiveness | |
| MSI Katana GF66 12UGS | |
| MSI Raider GE77 HX 12UHS | |
| Acer Predator Triton 500 SE PT516-52s-70KX | |
| Asus ROG Zephyrus Duo 16 GX650RX | |
| Average of class Gaming (1226 - 2334, n=97, last 2 years) | |
| Alienware x17 R2 P48E | |
| Average Intel Core i9-12900H, NVIDIA GeForce RTX 3080 Ti Laptop GPU (1483 - 1777, n=3) | |
| PCMark 10 Score | 7812 points | |
Help | ||
| AIDA64 / Memory Copy | |
| Average of class Gaming (21750 - 129946, n=109, last 2 years) | |
| MSI Raider GE77 HX 12UHS | |
| Acer Predator Triton 500 SE PT516-52s-70KX | |
| Average Intel Core i9-12900H (34438 - 74264, n=29) | |
| Alienware x17 R2 P48E | |
| Asus ROG Zephyrus Duo 16 GX650RX | |
| Schenker XMG Pro 17 (Late 2021, RTX 3080) | |
| Schenker XMG Pro 17 E22 | |
| MSI Katana GF66 12UGS | |
| AIDA64 / Memory Read | |
| Average of class Gaming (22956 - 118858, n=109, last 2 years) | |
| MSI Raider GE77 HX 12UHS | |
| Acer Predator Triton 500 SE PT516-52s-70KX | |
| Average Intel Core i9-12900H (36365 - 74642, n=29) | |
| Alienware x17 R2 P48E | |
| Asus ROG Zephyrus Duo 16 GX650RX | |
| Schenker XMG Pro 17 (Late 2021, RTX 3080) | |
| MSI Katana GF66 12UGS | |
| Schenker XMG Pro 17 E22 | |
| AIDA64 / Memory Write | |
| Average of class Gaming (22297 - 135096, n=109, last 2 years) | |
| MSI Raider GE77 HX 12UHS | |
| Average Intel Core i9-12900H (32276 - 67858, n=29) | |
| Asus ROG Zephyrus Duo 16 GX650RX | |
| Alienware x17 R2 P48E | |
| Acer Predator Triton 500 SE PT516-52s-70KX | |
| MSI Katana GF66 12UGS | |
| Schenker XMG Pro 17 E22 | |
| Schenker XMG Pro 17 (Late 2021, RTX 3080) | |
| AIDA64 / Memory Latency | |
| Acer Predator Triton 500 SE PT516-52s-70KX | |
| Average of class Gaming (75.3 - 259, n=109, last 2 years) | |
| Alienware x17 R2 P48E | |
| MSI Katana GF66 12UGS | |
| Schenker XMG Pro 17 (Late 2021, RTX 3080) | |
| Asus ROG Zephyrus Duo 16 GX650RX | |
| Schenker XMG Pro 17 E22 | |
| Average Intel Core i9-12900H (74.7 - 118.1, n=28) | |
| MSI Raider GE77 HX 12UHS | |
* ... smaller is better
DPC延迟
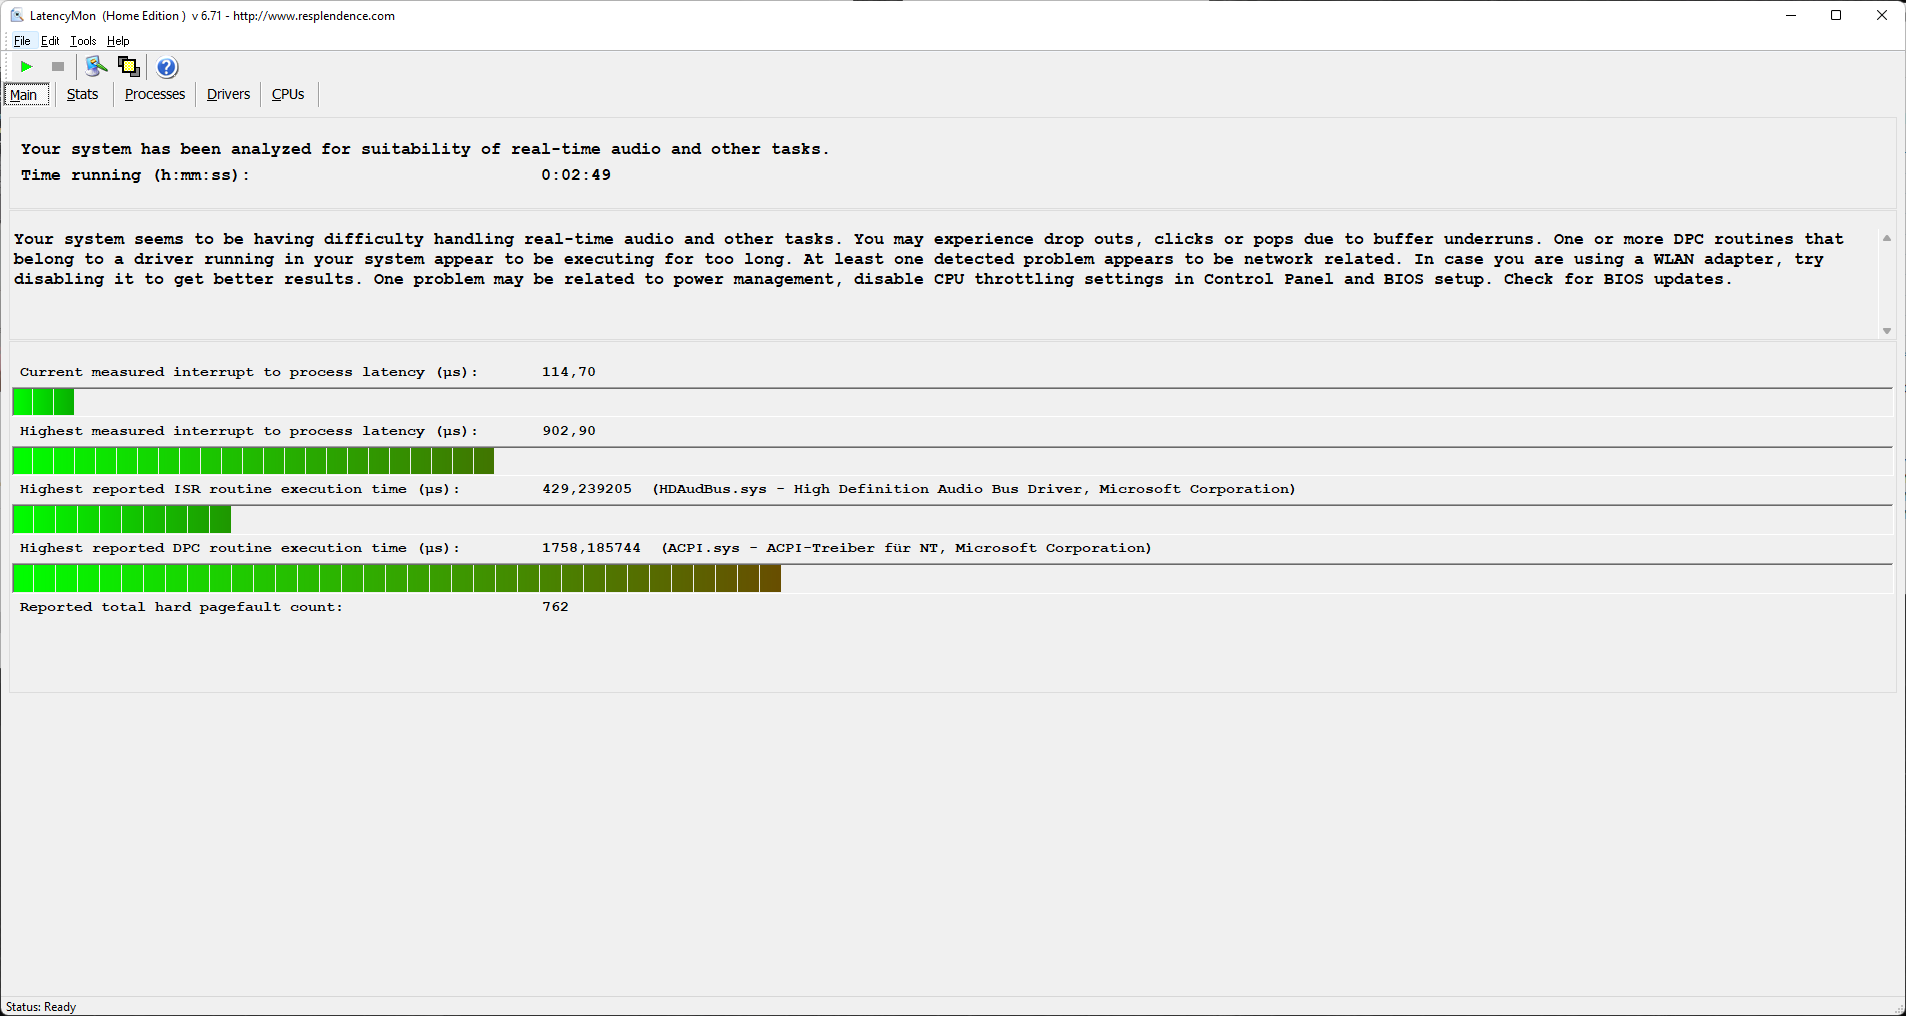
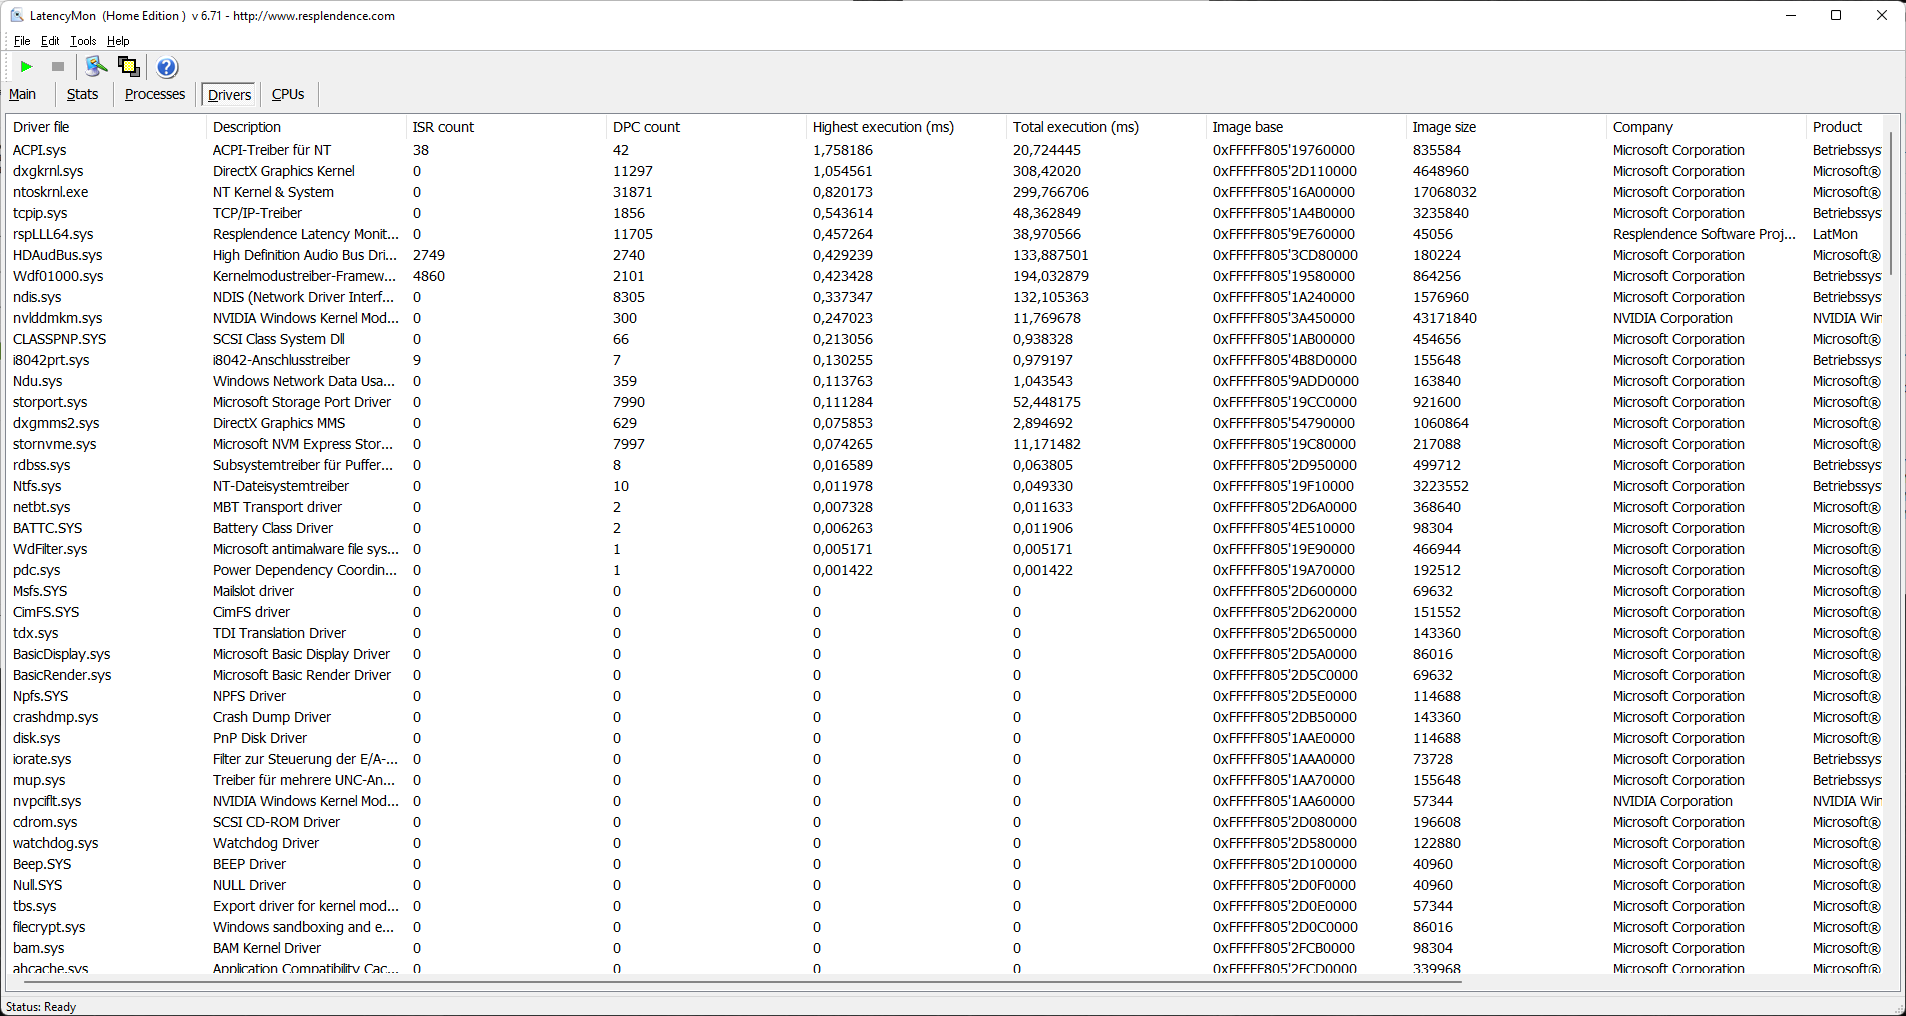
与竞争对手相比,Schenker XMG Pro 17 E22在DPC延迟方面的得分相当合格。然而,这还不足以进行现场音频编辑,例如,即使最高中断值保持在千分之一秒以下。电源管理和DirectX驱动导致最长的停顿。
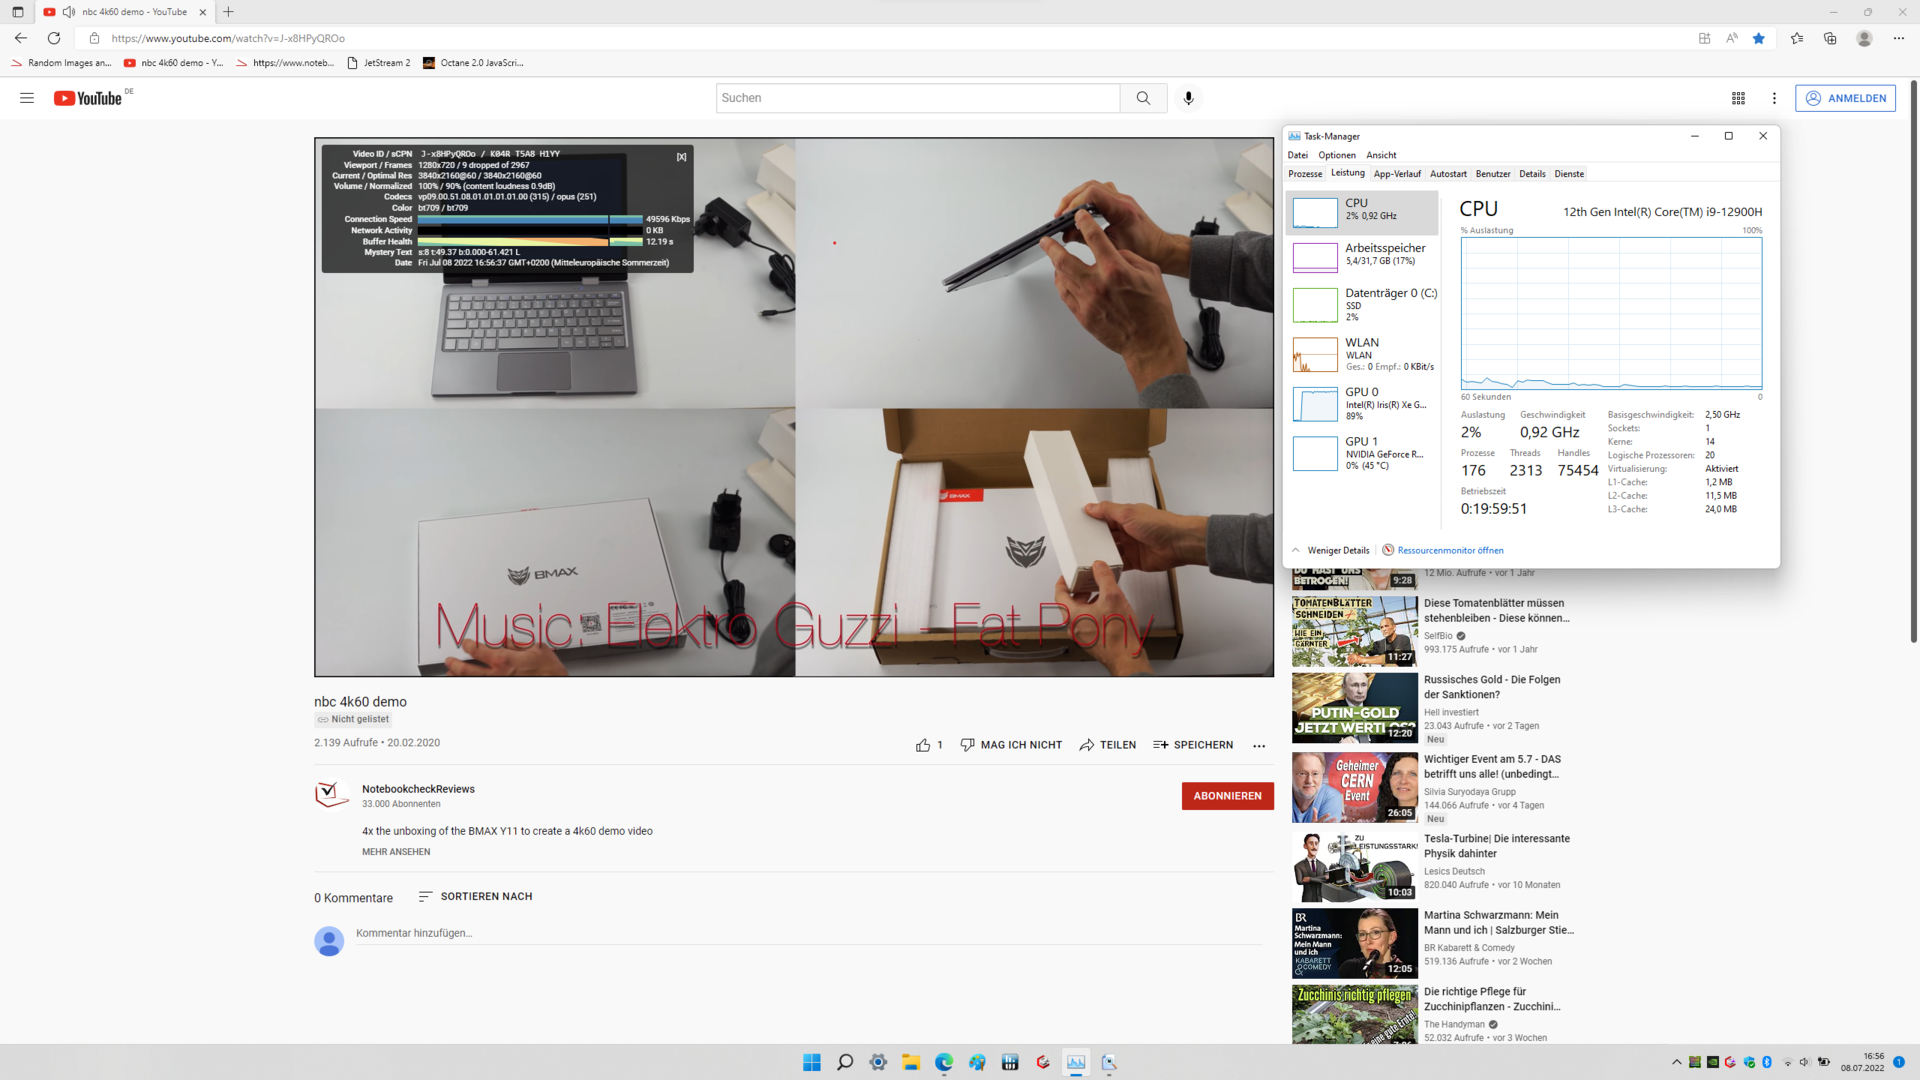
YouTube 4K视频的播放也不完全完美。那9个掉帧--如截图所见--并不多。然而,一个游戏工作站应该能够做得更好。
| DPC Latencies / LatencyMon - interrupt to process latency (max), Web, Youtube, Prime95 | |
| Acer Predator Triton 500 SE PT516-52s-70KX | |
| MSI Raider GE77 HX 12UHS | |
| Schenker XMG Pro 17 (Late 2021, RTX 3080) | |
| Alienware x17 R2 P48E | |
| Schenker XMG Pro 17 E22 | |
| MSI Katana GF66 12UGS | |
| Asus ROG Zephyrus Duo 16 GX650RX | |
* ... smaller is better
储存
内置的三星SSD 980 Pro提供了预期的速率。至少在连续读取时,它达到了PCIe 4.0所允许的传输速率。然而,在长时间的负载过程中,散热的缺乏变得很明显。这只有在传输大量数据时才是决定性的因素,而在日常使用中几乎不起作用。
尽管如此, Acer Predator Triton 500 SE就证明了固态硬盘的性能并不一定要下降。

| Schenker XMG Pro 17 E22 Samsung SSD 980 Pro 1TB MZ-V8P1T0BW | MSI Raider GE77 HX 12UHS Samsung PM9A1 MZVL22T0HBLB | Acer Predator Triton 500 SE PT516-52s-70KX Micron 3400 1TB MTFDKBA1T0TFH | Schenker XMG Pro 17 (Late 2021, RTX 3080) Samsung SSD 980 Pro 1TB MZ-V8P1T0BW | Asus ROG Zephyrus Duo 16 GX650RX 2x Samsung SSD 980 Pro 2TB MZ-V8P2T0 (RAID 0) | MSI Katana GF66 12UGS Micron 2450 1TB MTFDKBA1T0TFK | Alienware x17 R2 P48E 2x Samsung PM9A1 1TB (RAID 0) | Average Samsung SSD 980 Pro 1TB MZ-V8P1T0BW | Average of class Gaming | |
|---|---|---|---|---|---|---|---|---|---|
| Drive Performance rating | |||||||||
| Percent (pt) | 73.4 | 78.5 7% | 67.3 -8% | 76.7 4% | 75.9 3% | 60 -18% | 60.8 -17% | 67.1 -9% | 62.8 -14% |
| DiskSpd | 5% | -5% | 3% | 34% | -20% | 9% | -5% | -9% | |
| seq read (MB/s) | 3141 | 3713 18% | 3595 14% | 4285 36% | 4903 56% | 2031 -35% | 4931 57% | 3877 ? 23% | 3481 ? 11% |
| seq write (MB/s) | 3391 | 3706 9% | 4599 36% | 4325 28% | 7889 133% | 3365 -1% | 4819 42% | 3893 ? 15% | 3924 ? 16% |
| seq q8 t1 read (MB/s) | 6766 | 6695 -1% | 6499 -4% | 6666 -1% | 10557 56% | 3372 -50% | 13195 95% | 6544 ? -3% | 7291 ? 8% |
| seq q8 t1 write (MB/s) | 4993 | 4959 -1% | 4765 -5% | 5006 0% | 9830 97% | 3390 -32% | 8227 65% | 4879 ? -2% | 5766 ? 15% |
| 4k q1 t1 read (MB/s) | 67.2 | 83 24% | 70.3 5% | 93.6 39% | 73.1 9% | 70.9 6% | 79.3 18% | 79.9 ? 19% | 69.7 ? 4% |
| 4k q1 t1 write (MB/s) | 279 | 286 3% | 222 -20% | 248 -11% | 359 29% | 403 44% | 170.2 -39% | 217 ? -22% | 201 ? -28% |
| 4k q32 t16 read (MB/s) | 4260 | 4075 -4% | 2750 -35% | 4198 -1% | 2390 -44% | 1849 -57% | 874 -79% | 3197 ? -25% | 2326 ? -45% |
| 4k q32 t16 write (MB/s) | 3961 | 3503 -12% | 2786 -30% | 1225 -69% | 1542 -61% | 2571 -35% | 461 -88% | 2341 ? -41% | 1930 ? -51% |
| AS SSD | 9% | -14% | 8% | 5% | -85% | -39% | -14% | -19% | |
| Score Total (Points) | 9047 | 8951 -1% | 7009 -23% | 9011 0% | 6635 -27% | 7793 -14% | 4941 -45% | 7334 ? -19% | 6815 ? -25% |
| Score Read (Points) | 3276 | 3399 4% | 2709 -17% | 3372 3% | 2619 -20% | 2741 -16% | 1948 -41% | 2811 ? -14% | 2252 ? -31% |
| Score Write (Points) | 4151 | 3882 -6% | 2930 -29% | 3980 -4% | 2556 -38% | 3640 -12% | 2137 -49% | 3159 ? -24% | 3481 ? -16% |
| Seq Read (MB/s) | 4559 | 5053.82 11% | 4531.51 -1% | 5315 17% | 5344.88 17% | 3061.5 -33% | 6561.69 44% | 4838 ? 6% | 5490 ? 20% |
| Seq Write (MB/s) | 3548 | 3628.78 2% | 4186.78 18% | 3920 10% | 7663.27 116% | 3002.92 -15% | 3480.87 -2% | 3490 ? -2% | 3914 ? 10% |
| 4K Read (MB/s) | 63.1 | 82.47 31% | 64.38 2% | 86.2 37% | 68.93 9% | 89.53 42% | 69.21 10% | 72 ? 14% | 70 ? 11% |
| 4K Write (MB/s) | 254.1 | 247.61 -3% | 212.27 -16% | 220.6 -13% | 328.69 29% | 339.58 34% | 184.49 -27% | 188.8 ? -26% | 215 ? -15% |
| 4K-64 Read (MB/s) | 2757 | 2811.14 2% | 2191.95 -20% | 2754 0% | 2015.68 -27% | 2345.25 -15% | 1223.07 -56% | 2234 ? -19% | 1633 ? -41% |
| 4K-64 Write (MB/s) | 3543 | 3271.86 -8% | 2298.82 -35% | 3367 -5% | 1460.96 -59% | 2999.99 -15% | 1604.89 -55% | 2622 ? -26% | 2875 ? -19% |
| Access Time Read * (ms) | 0.073 | 0.03 59% | 0.034 53% | 0.053 27% | 0.07 4% | 0.03 59% | 0.04075 ? 44% | 0.06415 ? 12% | |
| Access Time Write * (ms) | 0.018 | 0.017 6% | 0.022 -22% | 0.019 -6% | 0.013 28% | 0.18 -900% | 0.066 -267% | 0.03363 ? -87% | 0.03953 ? -120% |
| Total Average (Program / Settings) | 7% /
7% | -9% /
-10% | 5% /
6% | 14% /
17% | -41% /
-56% | -16% /
-19% | -9% /
-10% | -14% /
-15% |
* ... smaller is better
Continuous load read: DiskSpd Read Loop, Queue Depth 8
图形卡
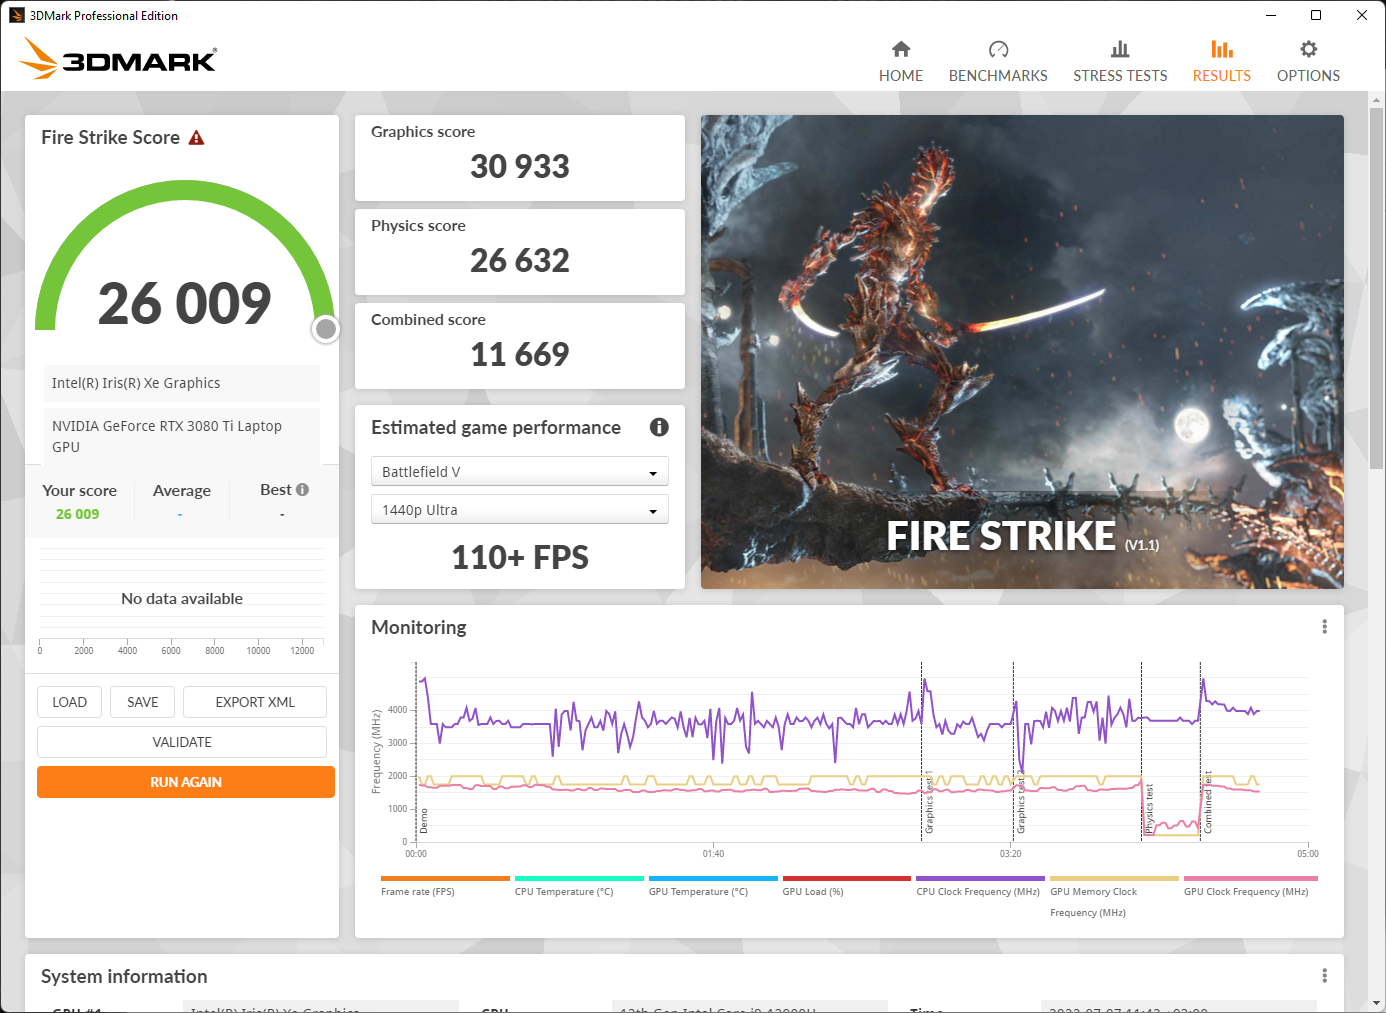

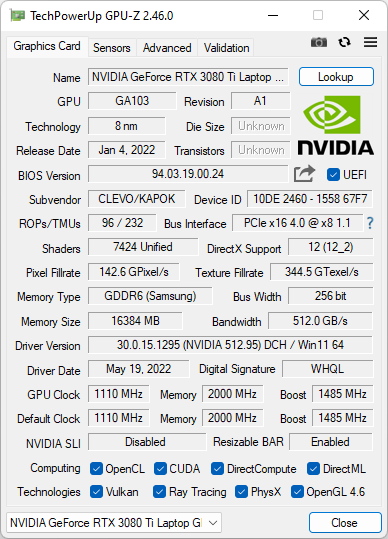
我们审查的Schenker XMG Pro 17 E22配备了NvidiaGeForce RTX 3080 Ti,有16GB的VRAM。它是实现最高图形性能的理想选择。即使是在分辨率高于QHD的外部显示器上运行的最新游戏,也不应该对该GPU构成任何问题。
同时,当涉及到性能时,其功耗是至关重要的,而这又与笔记本电脑的冷却能力有关。155瓦(包括25瓦的Boost)至少是一个高于平均水平的数值,它将XMG Pro推到了我们排名的首位。虽然MSI Raider GE77和Alienware x17 R2 P48E在3DMark基准测试中表现更好,但它们都消耗了175瓦的最大功率。另一方面,积分的差异仍然要小得多,这意味着申克笔记本电脑绝对可以从其耗电量中吸取更多的性能。
我们的GPU基准测试文章提供了关于各种显卡性能的概述。
| 3DMark 11 Performance | 32392 points | |
| 3DMark Cloud Gate Standard Score | 55629 points | |
| 3DMark Fire Strike Score | 26009 points | |
| 3DMark Time Spy Score | 12314 points | |
Help | ||
游戏性能
一般来说,由于高图形性能和良好的冷却效果,新的和要求高的游戏可以顺利地玩,而不牺牲细节。你还可以连接一个4K显示器。有了大的视频内存,即使是高于QHD的分辨率也不是问题。
看一眼测试的游戏也可以看出,XMG Pro 17在某些时候大大超过了具有相同显卡的笔记本电脑的平均水平。除了高功率的电源外,强劲而响亮的通风装置也是原因之一。
| Forza Horizon 5 | |
| 1920x1080 High Preset | |
| Schenker XMG Pro 17 E22 | |
| Average NVIDIA GeForce RTX 3080 Ti Laptop GPU (66 - 144, n=5) | |
| 1920x1080 Extreme Preset | |
| Schenker XMG Pro 17 E22 | |
| Average NVIDIA GeForce RTX 3080 Ti Laptop GPU (48 - 95, n=5) | |
| 2560x1440 Extreme Preset | |
| Schenker XMG Pro 17 E22 | |
| Average NVIDIA GeForce RTX 3080 Ti Laptop GPU (40 - 82, n=5) | |
| Elex 2 | |
| 1920x1080 High / On AA:FX AF:16x | |
| Schenker XMG Pro 17 E22 | |
| Average NVIDIA GeForce RTX 3080 Ti Laptop GPU (43 - 96, n=3) | |
| 1920x1080 Ultra / On AA:SM AF:16x | |
| Schenker XMG Pro 17 E22 | |
| Average NVIDIA GeForce RTX 3080 Ti Laptop GPU (31 - 91, n=3) | |
| 2560x1440 Ultra / On AA:SM AF:16x | |
| Schenker XMG Pro 17 E22 | |
| Average NVIDIA GeForce RTX 3080 Ti Laptop GPU (31 - 93, n=3) | |
系统性能随着时间的推移保持稳定,因为里面的两个风扇以及众多的通风口都有适当的尺寸。在我们的耐力测试中,《Witcher 3 》以最大的细节运行,其波动在百分之几的范围内。在较长的时间内,我们也没有发现帧率有较大的下降。
The Witcher 3 FPS diagram
| low | med. | high | ultra | QHD | |
|---|---|---|---|---|---|
| GTA V (2015) | 177.5 | 116.6 | 93.5 | ||
| The Witcher 3 (2015) | 210 | 112 | |||
| Dota 2 Reborn (2015) | 164.5 | 155.8 | |||
| Final Fantasy XV Benchmark (2018) | 120.2 | 91.1 | |||
| X-Plane 11.11 (2018) | 115.5 | ||||
| Far Cry 5 (2018) | 153 | 136 | 120 | ||
| Strange Brigade (2018) | 238 | 207 | 149.1 | ||
| Forza Horizon 5 (2021) | 144 | 91 | 79 | ||
| Elex 2 (2022) | 96 | 91 | 93 |
排放 - 巧妙配置的游戏笔记本电脑
噪声排放
申克的笔记本电脑很少是完全无声的。几乎所有的时候都能在背景中听到一种柔和的、但令人愉快的均匀的风扇噪音。然而,由于其平均34分贝,它通常可以被忽略,而且从长远来看,它也很难让人讨厌。
当需要真正的性能时,情况就不同了。这主要是指游戏中的情况。在这里,这两个风扇必须展示它们的能力,它们产生的噪音水平不能再被忽视,当门打开时,在隔壁房间也能清楚地听到。在超过50分贝时,几乎不可避免地建议使用耳机。然而,即使在高速情况下,恼人的速度变化或明显的升速也绝对听不到。
静音模式值得称道。虽然这个名字完全是误导性的,但降低的功耗导致了非常令人愉快的风扇行为。系统性能仍然出奇地好,因此,Schenker笔记本电脑也可以在需要保持安静的环境中使用。这种模式尤其应该在办公室、家庭办公室或其他需要集中精力的地方使用,它甚至配得上一台工作站。编辑一段视频需要多花几分钟的时间,这很少会让人感到困扰。
Noise level
| Idle |
| 26 / 34 / 42 dB(A) |
| Load |
| 58 / 58 dB(A) |
 | ||
30 dB silent 40 dB(A) audible 50 dB(A) loud |
||
min: | ||
| Schenker XMG Pro 17 E22 i9-12900H, GeForce RTX 3080 Ti Laptop GPU | MSI Raider GE77 HX 12UHS i9-12900HX, GeForce RTX 3080 Ti Laptop GPU | Acer Predator Triton 500 SE PT516-52s-70KX i7-12700H, GeForce RTX 3080 Ti Laptop GPU | Schenker XMG Pro 17 (Late 2021, RTX 3080) i7-11800H, GeForce RTX 3080 Laptop GPU | Asus ROG Zephyrus Duo 16 GX650RX R9 6900HX, GeForce RTX 3080 Ti Laptop GPU | MSI Katana GF66 12UGS i7-12700H, GeForce RTX 3070 Ti Laptop GPU | Alienware x17 R2 P48E i9-12900HK, GeForce RTX 3080 Ti Laptop GPU | |
|---|---|---|---|---|---|---|---|
| Noise | 1% | 8% | 9% | 16% | 16% | 23% | |
| off / environment * (dB) | 26 | 26 -0% | 26 -0% | 24 8% | 26 -0% | 26 -0% | 22.7 13% |
| Idle Minimum * (dB) | 26 | 26 -0% | 26 -0% | 24 8% | 26 -0% | 27 -4% | 23.1 11% |
| Idle Average * (dB) | 34 | 34 -0% | 29 15% | 31.26 8% | 27 21% | 28 18% | 23.1 32% |
| Idle Maximum * (dB) | 42 | 46 -10% | 34 19% | 38.64 8% | 29 31% | 31 26% | 23.1 45% |
| Load Average * (dB) | 58 | 50 14% | 50 14% | 48.11 17% | 41 29% | 44 24% | 31.9 45% |
| Witcher 3 ultra * (dB) | 57 | 55 4% | 53 7% | 51.5 10% | 48 16% | 44 23% | 52.5 8% |
| Load Maximum * (dB) | 58 | 57 2% | 56 3% | 56.74 2% | 50 14% | 45 22% | 52.5 9% |
* ... smaller is better
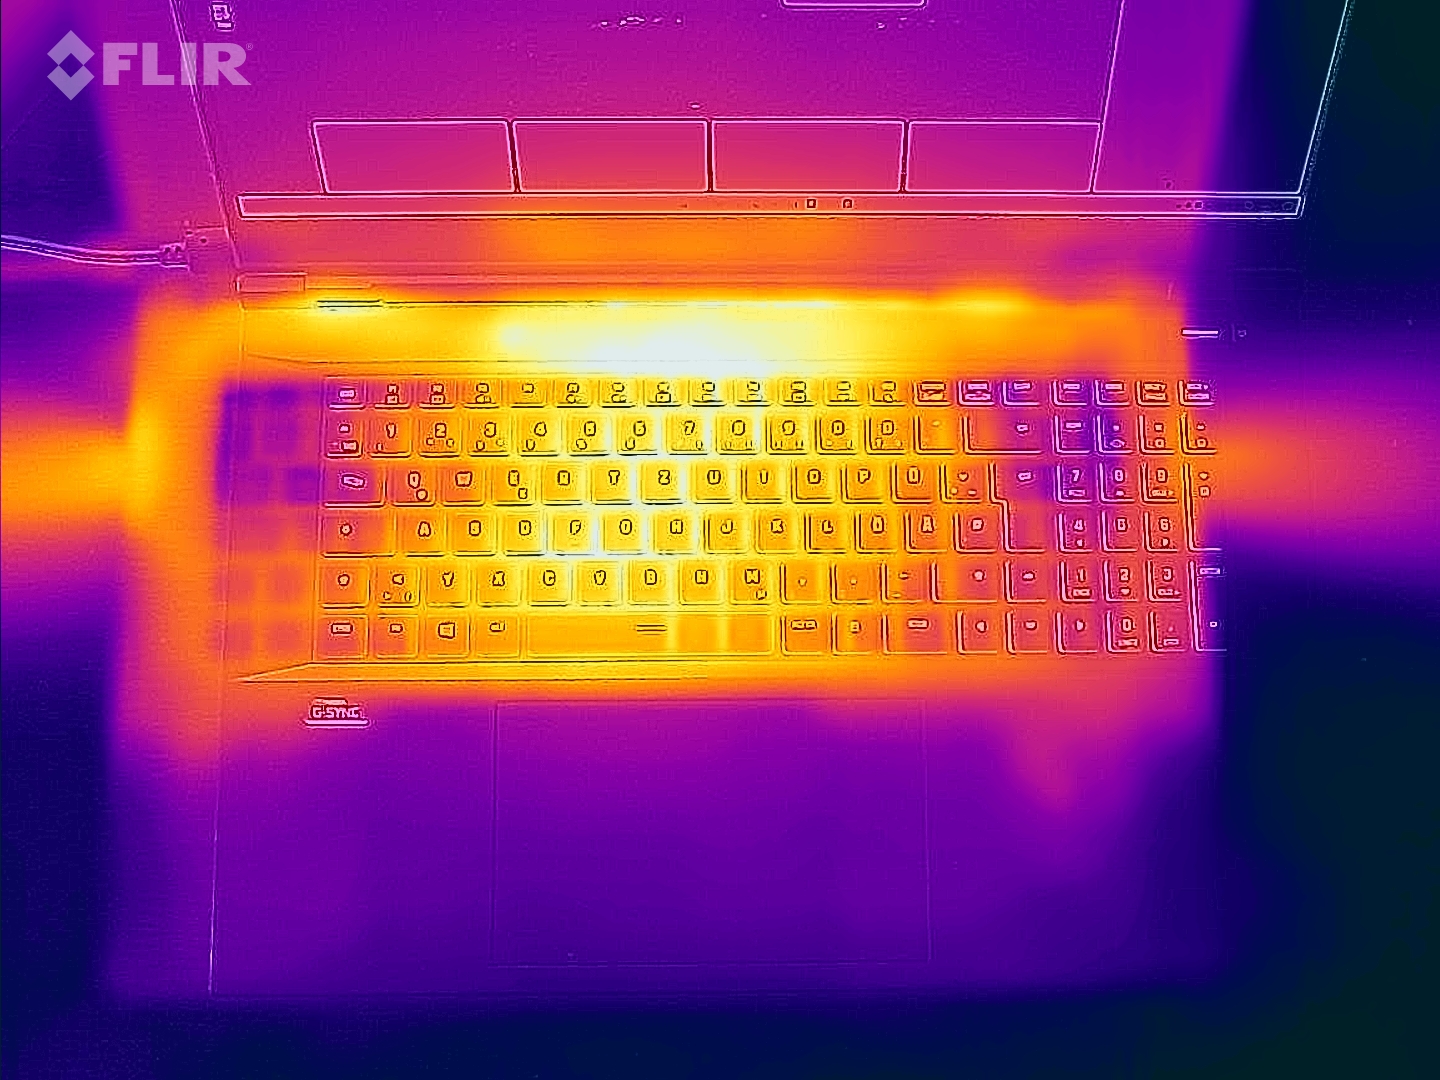
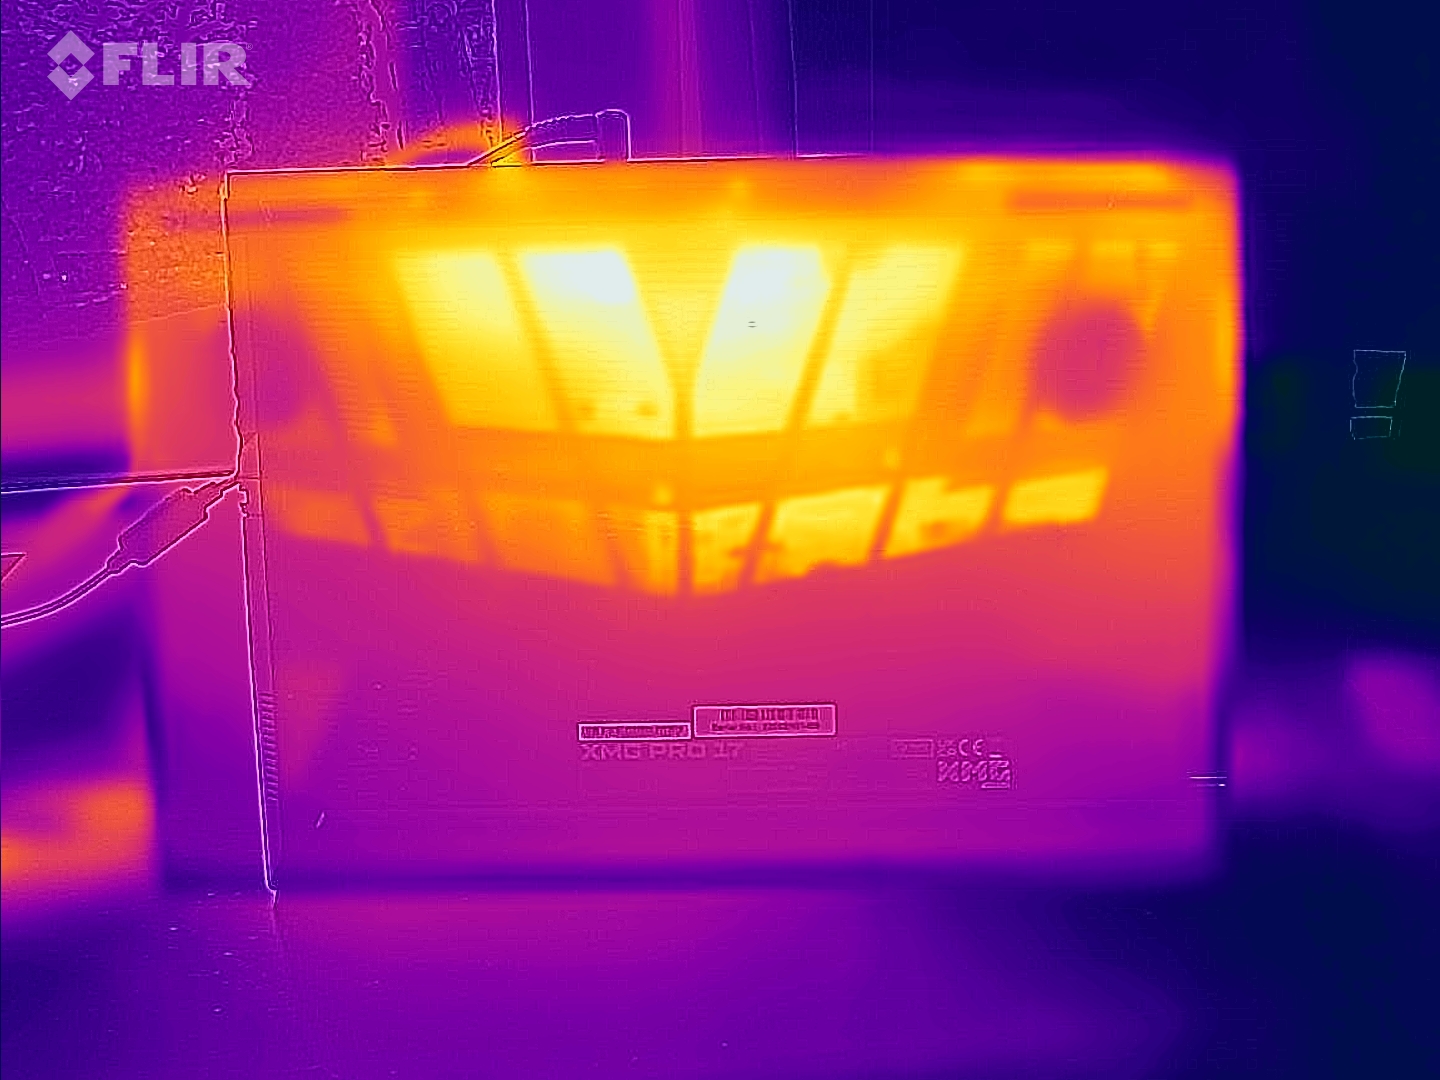
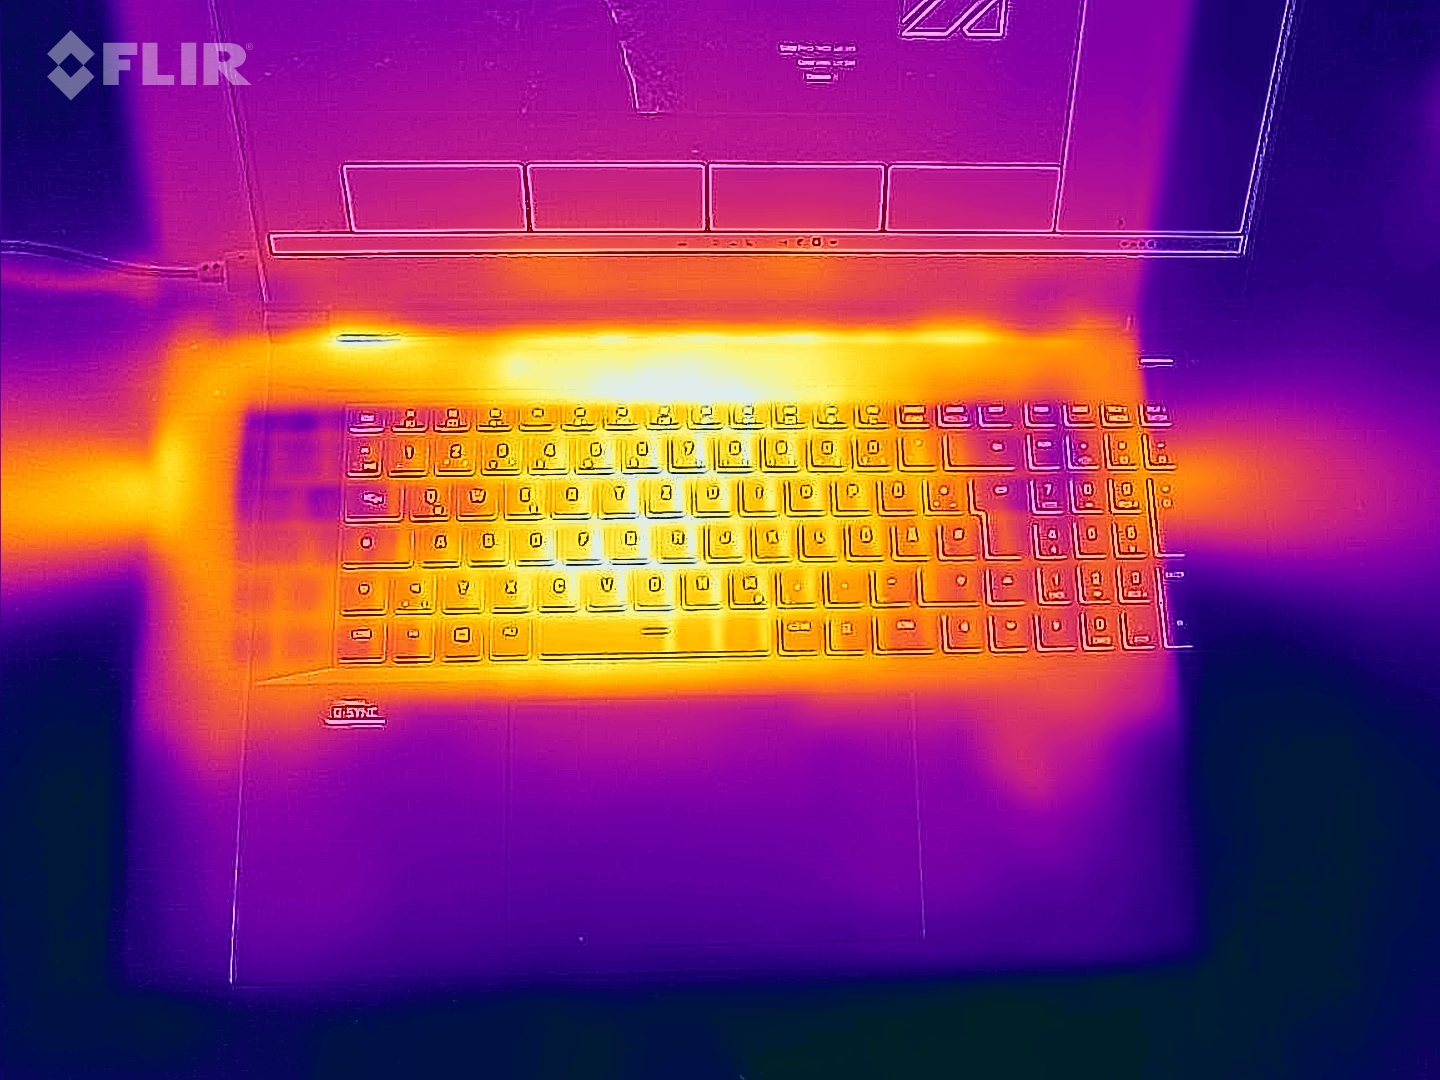
温度
即使是日常工作,也会导致键盘上部区域的温度略有上升。然后,Schenker XMG的外壳超过了30 °C (~86 °F),但这几乎是不明显的。另一方面,掌托则完全保持低温。但下面也没有内置硬件。
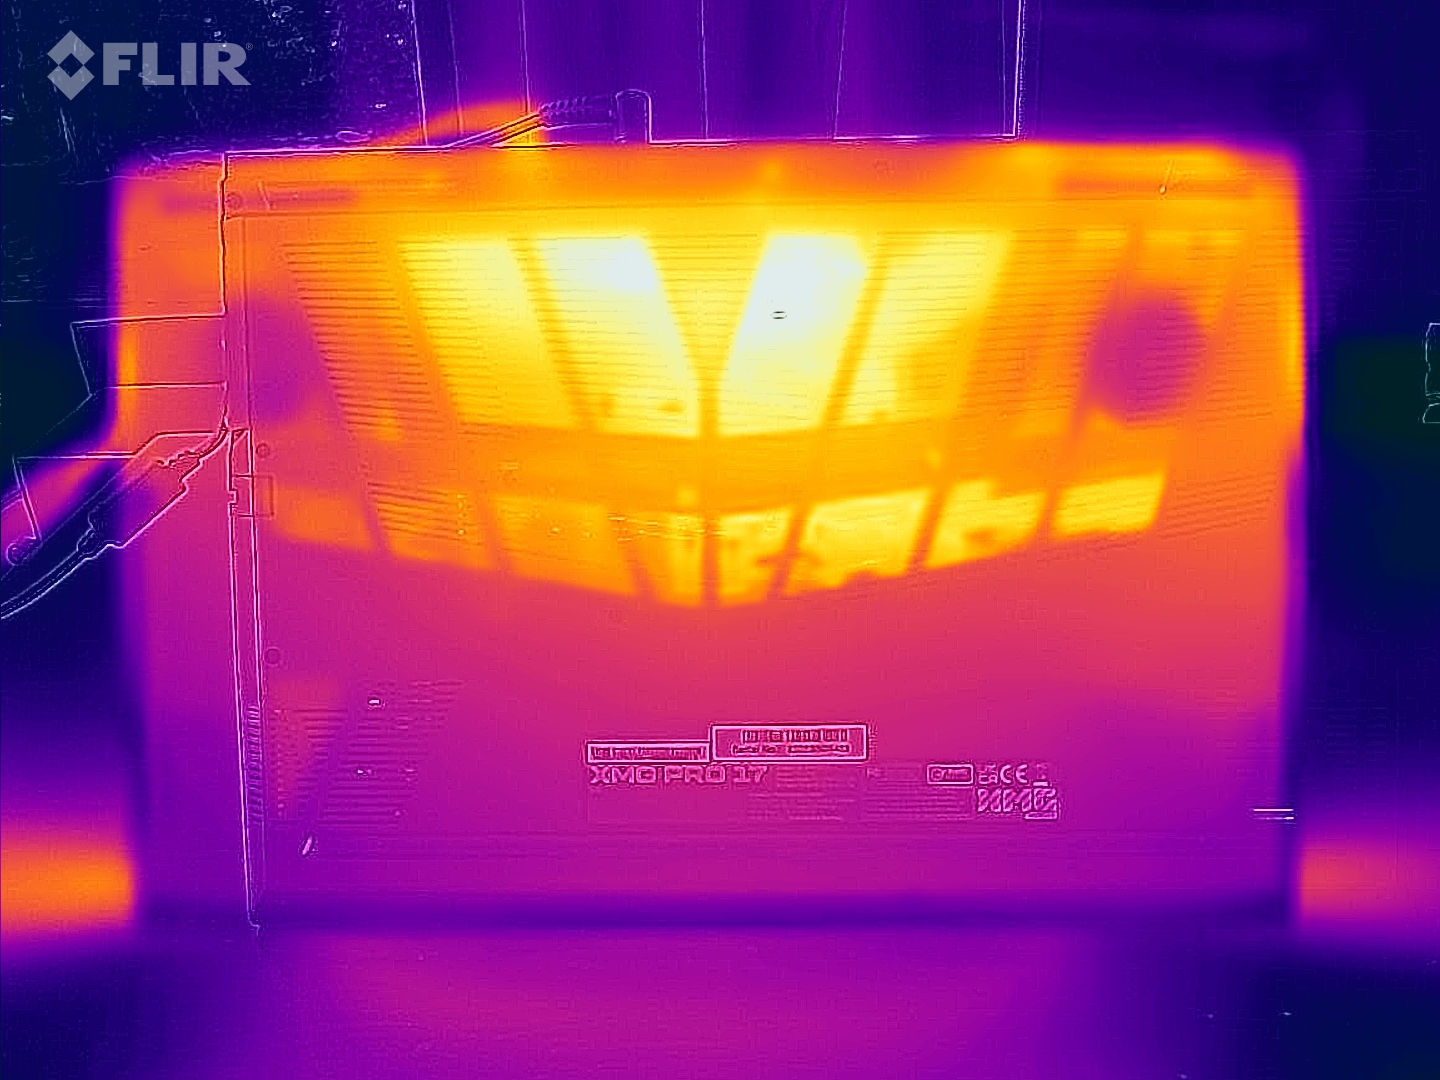
如果要求增加,机箱就会变热,但它仍然低于手指打字变得非常不舒服的阈值。另一方面,在某些情况下,底部的温度会上升到60℃(约140°F)。这解释了异常高的橡胶脚,例如。因此,光滑的表面始终是强制性的。
(-) The maximum temperature on the upper side is 56 °C / 133 F, compared to the average of 40.4 °C / 105 F, ranging from 21.2 to 68.8 °C for the class Gaming.
(-) The bottom heats up to a maximum of 60 °C / 140 F, compared to the average of 43.2 °C / 110 F
(+) In idle usage, the average temperature for the upper side is 30.3 °C / 87 F, compared to the device average of 33.9 °C / 93 F.
(-) Playing The Witcher 3, the average temperature for the upper side is 44.9 °C / 113 F, compared to the device average of 33.9 °C / 93 F.
(+) The palmrests and touchpad are reaching skin temperature as a maximum (33 °C / 91.4 F) and are therefore not hot.
(-) The average temperature of the palmrest area of similar devices was 28.8 °C / 83.8 F (-4.2 °C / -7.6 F).
| Schenker XMG Pro 17 E22 Intel Core i9-12900H, NVIDIA GeForce RTX 3080 Ti Laptop GPU | MSI Raider GE77 HX 12UHS Intel Core i9-12900HX, NVIDIA GeForce RTX 3080 Ti Laptop GPU | Acer Predator Triton 500 SE PT516-52s-70KX Intel Core i7-12700H, NVIDIA GeForce RTX 3080 Ti Laptop GPU | Schenker XMG Pro 17 (Late 2021, RTX 3080) Intel Core i7-11800H, NVIDIA GeForce RTX 3080 Laptop GPU | Asus ROG Zephyrus Duo 16 GX650RX AMD Ryzen 9 6900HX, NVIDIA GeForce RTX 3080 Ti Laptop GPU | MSI Katana GF66 12UGS Intel Core i7-12700H, NVIDIA GeForce RTX 3070 Ti Laptop GPU | Alienware x17 R2 P48E Intel Core i9-12900HK, NVIDIA GeForce RTX 3080 Ti Laptop GPU | |
|---|---|---|---|---|---|---|---|
| Heat | -6% | 14% | 9% | 12% | -8% | 16% | |
| Maximum Upper Side * (°C) | 56 | 53 5% | 47 16% | 53 5% | 45 20% | 61 -9% | 49.6 11% |
| Maximum Bottom * (°C) | 60 | 58 3% | 49 18% | 68 -13% | 50 17% | 55 8% | 42.4 29% |
| Idle Upper Side * (°C) | 34 | 38 -12% | 31 9% | 27 21% | 33 3% | 43 -26% | 29.2 14% |
| Idle Bottom * (°C) | 36 | 43 -19% | 32 11% | 28 22% | 33 8% | 38 -6% | 32 11% |
* ... smaller is better
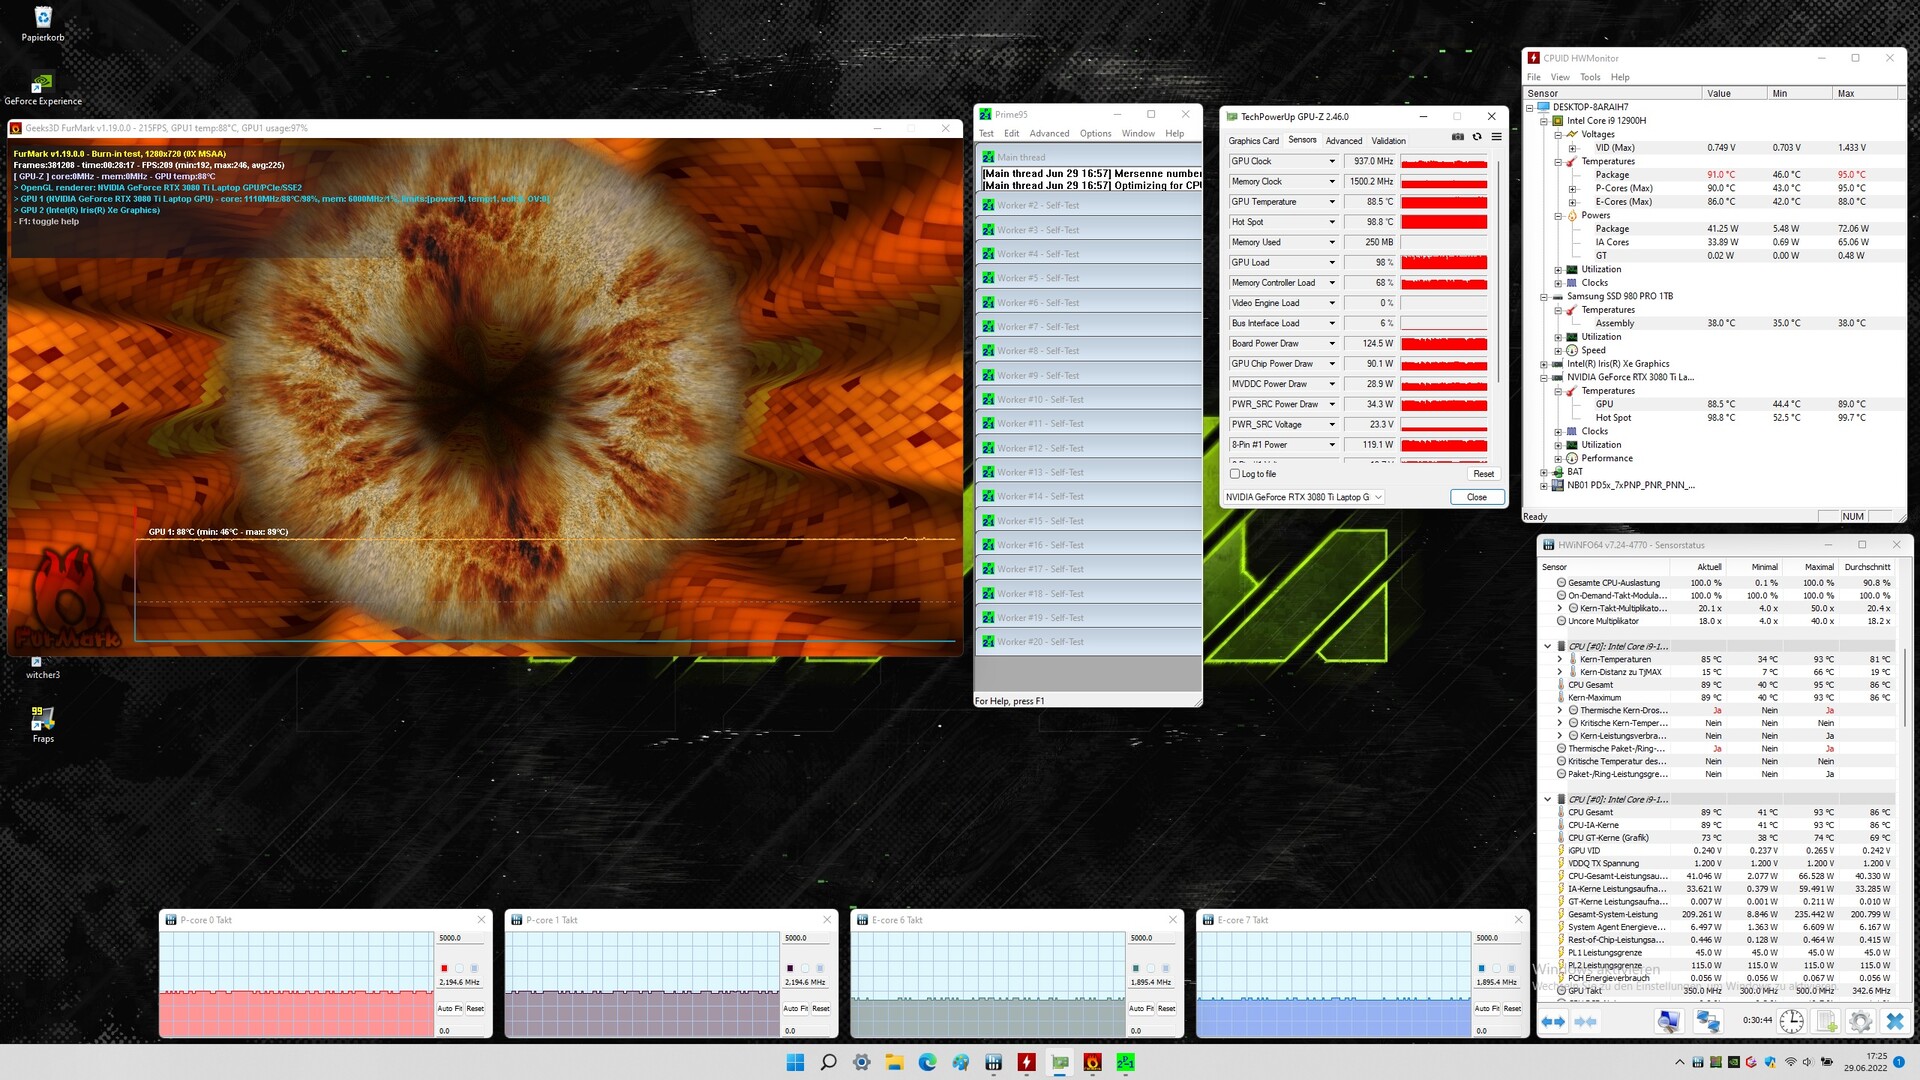
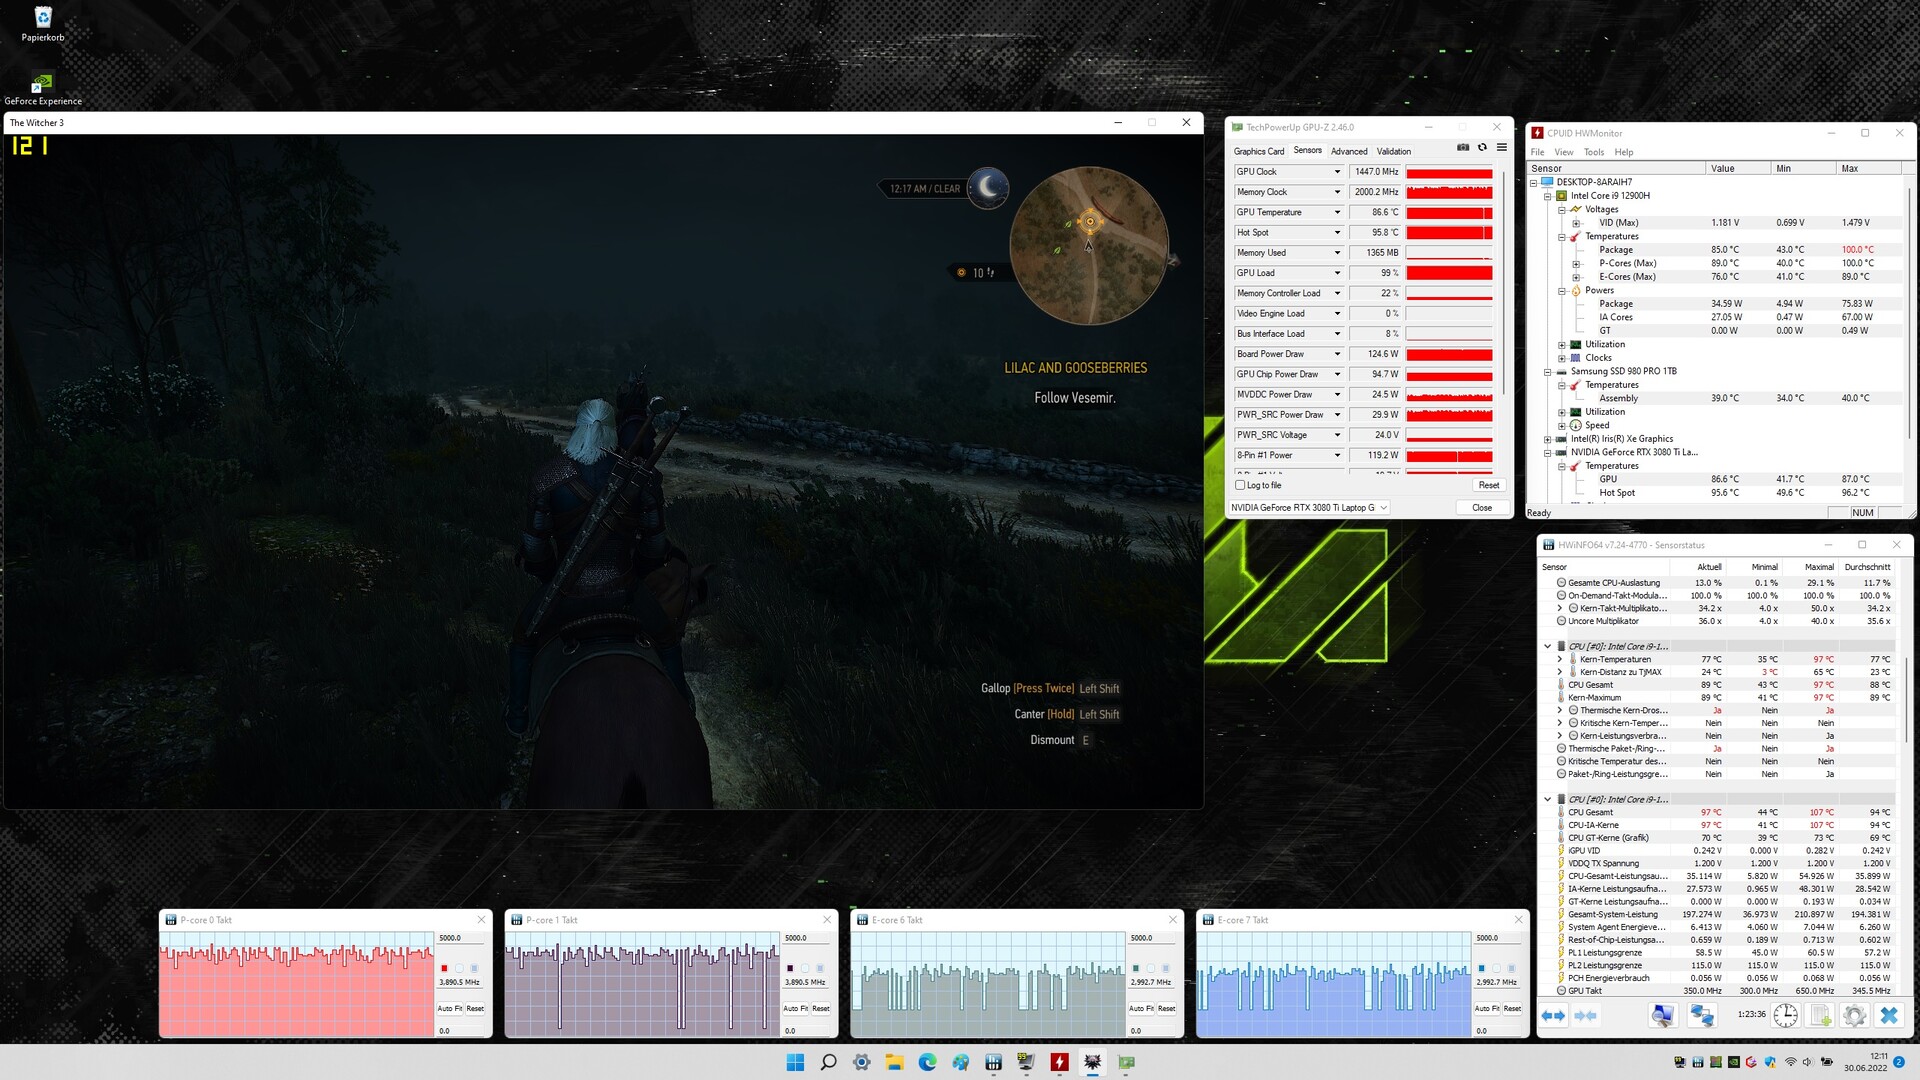
压力测试
在高负载期间,处理器的最高温度会迅速达到。在95 °C(~203 °F)时,系统开始降低其功耗。当只有CPU被加载时,短时间内可用的125瓦中大约还有50瓦。
如果显卡也受到压力,处理器的功耗甚至降到了25瓦以下。而另一方面,即使是长期使用,GPU也能消耗近140瓦的电量。尽管这时的风扇吹得像个小涡轮机,但它设法使所有的传感器远低于100°C(约212.0)。该系统始终以恒定的性能运行。该系统以恒定的性能稳定地运行,并保持其温度。
发言人
在打开的笔记本电脑的图片中,你可以很清楚地看到,扬声器是比较大的。这反映在最大音量上。即使在嘈杂的环境中也足够了,而且最重要的是,在最大音量下没有任何声音失真。
但总的来说,再现质量不能与最好的笔记本电脑竞争,如 Apple MacBook Pro 16.低音的范围有点弱。然而,音频质量对于游戏来说是足够的。如果你不让你的期望值过高,你也可以听音乐。
Schenker XMG Pro 17 E22 audio analysis
(±) | speaker loudness is average but good (77 dB)
Bass 100 - 315 Hz
(±) | reduced bass - on average 14.2% lower than median
(±) | linearity of bass is average (13.7% delta to prev. frequency)
Mids 400 - 2000 Hz
(+) | balanced mids - only 3.3% away from median
(+) | mids are linear (2.8% delta to prev. frequency)
Highs 2 - 16 kHz
(+) | balanced highs - only 3.7% away from median
(+) | highs are linear (5.4% delta to prev. frequency)
Overall 100 - 16.000 Hz
(±) | linearity of overall sound is average (17% difference to median)
Compared to same class
» 45% of all tested devices in this class were better, 12% similar, 43% worse
» The best had a delta of 6%, average was 18%, worst was 132%
Compared to all devices tested
» 30% of all tested devices were better, 8% similar, 62% worse
» The best had a delta of 4%, average was 24%, worst was 134%
Apple MacBook Pro 16 2021 M1 Pro audio analysis
(+) | speakers can play relatively loud (84.7 dB)
Bass 100 - 315 Hz
(+) | good bass - only 3.8% away from median
(+) | bass is linear (5.2% delta to prev. frequency)
Mids 400 - 2000 Hz
(+) | balanced mids - only 1.3% away from median
(+) | mids are linear (2.1% delta to prev. frequency)
Highs 2 - 16 kHz
(+) | balanced highs - only 1.9% away from median
(+) | highs are linear (2.7% delta to prev. frequency)
Overall 100 - 16.000 Hz
(+) | overall sound is linear (4.6% difference to median)
Compared to same class
» 0% of all tested devices in this class were better, 0% similar, 100% worse
» The best had a delta of 5%, average was 17%, worst was 45%
Compared to all devices tested
» 0% of all tested devices were better, 0% similar, 100% worse
» The best had a delta of 4%, average was 24%, worst was 134%
能源管理 - XMG Pro 17非常耗电
能源消耗
至少对于拥有如此强大配置的游戏笔记本电脑来说,XMG Pro 17 E22在没有负载的情况下是相当节俭的。仅低于17瓦的功率远远低于RTX 3080 Ti的平均水平。然而,其他采用Alder Lake处理器的笔记本电脑几乎能够跟上。
尽管如此,在最大负荷下需要266瓦。考虑到处理器和显卡单独被允许在至少80秒内分别消耗115瓦和130瓦,这并不令人惊讶。额外的25瓦升压仅从CPU转移到GPU。
| Off / Standby | |
| Idle | |
| Load |
|
Key:
min: | |
| Schenker XMG Pro 17 E22 i9-12900H, GeForce RTX 3080 Ti Laptop GPU | MSI Raider GE77 HX 12UHS i9-12900HX, GeForce RTX 3080 Ti Laptop GPU | Acer Predator Triton 500 SE PT516-52s-70KX i7-12700H, GeForce RTX 3080 Ti Laptop GPU | Schenker XMG Pro 17 (Late 2021, RTX 3080) i7-11800H, GeForce RTX 3080 Laptop GPU | Asus ROG Zephyrus Duo 16 GX650RX R9 6900HX, GeForce RTX 3080 Ti Laptop GPU | Alienware x17 R2 P48E i9-12900HK, GeForce RTX 3080 Ti Laptop GPU | Average NVIDIA GeForce RTX 3080 Ti Laptop GPU | Average of class Gaming | |
|---|---|---|---|---|---|---|---|---|
| Power Consumption | -15% | 12% | 3% | -12% | -55% | -18% | 2% | |
| Idle Minimum * (Watt) | 13 | 13 -0% | 7 46% | 13.6 -5% | 19 -46% | 24.1 -85% | 17.2 ? -32% | 13.2 ? -2% |
| Idle Average * (Watt) | 17 | 19 -12% | 19 -12% | 19.4 -14% | 24 -41% | 28.5 -68% | 23.3 ? -37% | 18.9 ? -11% |
| Idle Maximum * (Watt) | 26 | 29 -12% | 28 -8% | 27.7 -7% | 31 -19% | 60 -131% | 30.8 ? -18% | 24.3 ? 7% |
| Load Average * (Watt) | 120 | 143 -19% | 114 5% | 110 8% | 104 13% | 128.7 -7% | 121.2 ? -1% | 108 ? 10% |
| Witcher 3 ultra * (Watt) | 221 | 247 -12% | 159 28% | 170 23% | 186.5 16% | 254 -15% | ||
| Load Maximum * (Watt) | 266 | 352 -32% | 227 15% | 227 15% | 256 4% | 323 -21% | 276 ? -4% | 254 ? 5% |
* ... smaller is better
Energy consumption during The Witcher 3 / stress test
Energy consumption with an external monitor
电池寿命
鉴于系统性能很高,80Wh的电池在续航能力方面无法表现出色。在视频测试中只有4:30小时,与满负荷的90分钟一样,低于平均水平。在Wi-Fi测试中至少达到了近7小时。
然而,我们不会期望电池的整体印象有什么不同。游戏笔记本和工作站一般是为了运输而从一个插座到另一个插座,但它们不应该能够赢得耐力赛。这就是说,省电模式有点令人失望。差距只有10%左右,这几乎使该模式成为多余。
伴随着的是非常长的充电时间。放电的电池在大约2小时后才达到其最大容量的80%。充满电可能需要将近4个小时。
| Schenker XMG Pro 17 E22 i9-12900H, GeForce RTX 3080 Ti Laptop GPU, 80 Wh | MSI Raider GE77 HX 12UHS i9-12900HX, GeForce RTX 3080 Ti Laptop GPU, 99.99 Wh | Acer Predator Triton 500 SE PT516-52s-70KX i7-12700H, GeForce RTX 3080 Ti Laptop GPU, 99.98 Wh | Schenker XMG Pro 17 (Late 2021, RTX 3080) i7-11800H, GeForce RTX 3080 Laptop GPU, 73 Wh | Asus ROG Zephyrus Duo 16 GX650RX R9 6900HX, GeForce RTX 3080 Ti Laptop GPU, 90 Wh | Alienware x17 R2 P48E i9-12900HK, GeForce RTX 3080 Ti Laptop GPU, 87 Wh | Average of class Gaming | |
|---|---|---|---|---|---|---|---|
| Battery runtime | 18% | 36% | 6% | 28% | -59% | 27% | |
| H.264 (h) | 4.6 | 6.5 41% | 8.2 78% | 5.2 13% | 9.3 102% | 8.26 ? 80% | |
| WiFi v1.3 (h) | 6.8 | 5.4 -21% | 5.7 -16% | 5.7 -16% | 7.8 15% | 2 -71% | 7.02 ? 3% |
| Load (h) | 1.5 | 2 33% | 2.2 47% | 1.8 20% | 1 -33% | 0.8 -47% | 1.47 ? -2% |
Pros
Cons
结论 - 削减了角落,但在性能方面没有。
看一下性能率,这是游戏笔记本电脑的决定性因素,令人高兴。Schenker XMG Pro 17显示,它在最大性能以及连续负载方面都有一个最佳配置。
虽然这还不足以获得绝对的顶级排名,但相对较高的功耗和清晰可闻的通风,使优秀的硬件能够释放其潜力。在任何情况下,最近的游戏和未来的大多数游戏都会对这个硬件感到满意。想连接4K显示器或同等电视的用户,即使这样也不必做出任何牺牲。
Schenker XMG Pro 17 E22完全专注于性能,而电池、显示器和设计充其量只能算是一般。
此外,端口配置也很有说服力。首先,多个视频输出允许将笔记本电脑整合到一个广泛的工作站。然而,它本来可以包括一个成熟的卡槽。
这种节俭也像一条红线贯穿了游戏笔记本的结构。显示屏的亮度很低,但当然,对于任何办公桌来说都是足够的。内存仍然使用DDR4,当涉及到游戏性能时,这至少要花费几个小的百分点。此外,还有有限的移动性,虽然这在这个领域几乎没有起到什么作用。尽管如此,申克笔记本电脑仍然是最重最厚的机型之一,其耐力也是有限的。
这些许多小的弱点玷污了整体印象,但肯定不是该笔记本在游戏和工作时给人的印象。有一些更快的游戏设备,如 MSI Raider GE77,但XMG Pro 17 E22肯定可以跟上华硕ROG Zephyrus Duo 16 - 在一个更有吸引力的价格上。笔记本电脑Acer Predator Triton 500 SE也在同一水平线上,但它在几乎所有的基准测试中都有点滞后。
申克笔记本电脑可能相当大,而且不完全是时尚的,但作为回报,它提供了令人惊讶的坚实的性能率,配得上游戏工作站。
价格和可用性
配备英特尔酷睿i7-12700H和NvidiaGeForce RTX 3070 Ti的基本型号起价为2500欧元(约合人民币2552元),但没有操作系统。对于带有4K显示器和AdobeRGB的顶级配置,以及i9-12900H和RTX 3080 Ti,你将不得不掏出至少3500欧元(约3573美元)。当然,这个价格会根据配置的不同而增加。可以在Bestware选择所需的配置。.
Schenker XMG Pro 17 E22
- 07/18/2022 v7 (old)
Mario Petzold
Price comparison

