华硕ProArt StudioBook Pro 16 W7600笔记本电脑在审查:强大而轻便的工作站
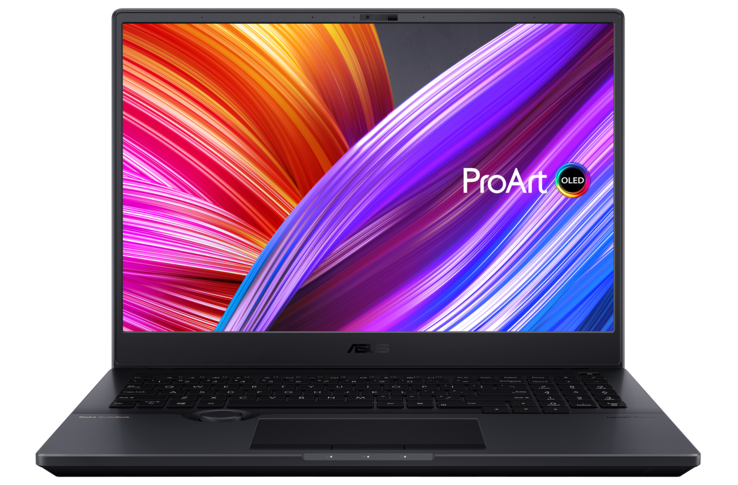
通过ProArt Studiobook Pro 16,华硕为创意专业人士推出了一个新的笔记本系列。这款创作型笔记本采用了16:10长宽比的4K OLED HDR显示屏,从而提供了更大的工作面。此外,还有一个华硕表盘,可以用来控制各种创意工具,因此应该是为了简化设计师的工作。制造商在设备方面拿出了大杀器,因为不仅有英特尔第三代至强CPU,而且还有工作站的GPU Nvidia RTX A5000.因此,该系列针对的是专业用户,应该可以处理3D渲染或高分辨率视频编辑等复杂任务。由于华硕德国公司提供给我们的测试装置是一个预先样品,该设备还没有得到我们的评级。
竞争对手包括HP ZBook Fury 15 G8 ,这是一款配置相同的工作站,以及HP ZBook Studio 15 G8 和戴尔Precision 5560 。
Possible competitors in comparison
Rating | Date | Model | Weight | Height | Size | Resolution | Price |
|---|---|---|---|---|---|---|---|
v (old) | 12 / 2021 | Asus ProArt StudioBook 16 W7600H5A-2BL2 W-11955M, RTX A5000 Laptop GPU | 2.4 kg | 21.4 mm | 16.00" | 3840x2400 | |
| 90.3 % v7 (old) | 10 / 2021 | HP ZBook Fury 15 G8 i9-11950H, RTX A5000 Laptop GPU | 2.5 kg | 25.9 mm | 15.60" | 3840x2160 | |
| 87.8 % v7 (old) | 08 / 2021 | HP ZBook Studio 15 G8 i9-11950H, GeForce RTX 3070 Laptop GPU | 1.9 kg | 18 mm | 15.60" | 3840x2160 | |
| 88.3 % v7 (old) | 10 / 2021 | Dell Precision 5000 5560 i7-11850H, RTX A2000 Laptop GPU | 2 kg | 18 mm | 15.60" | 3840x2400 |
案例
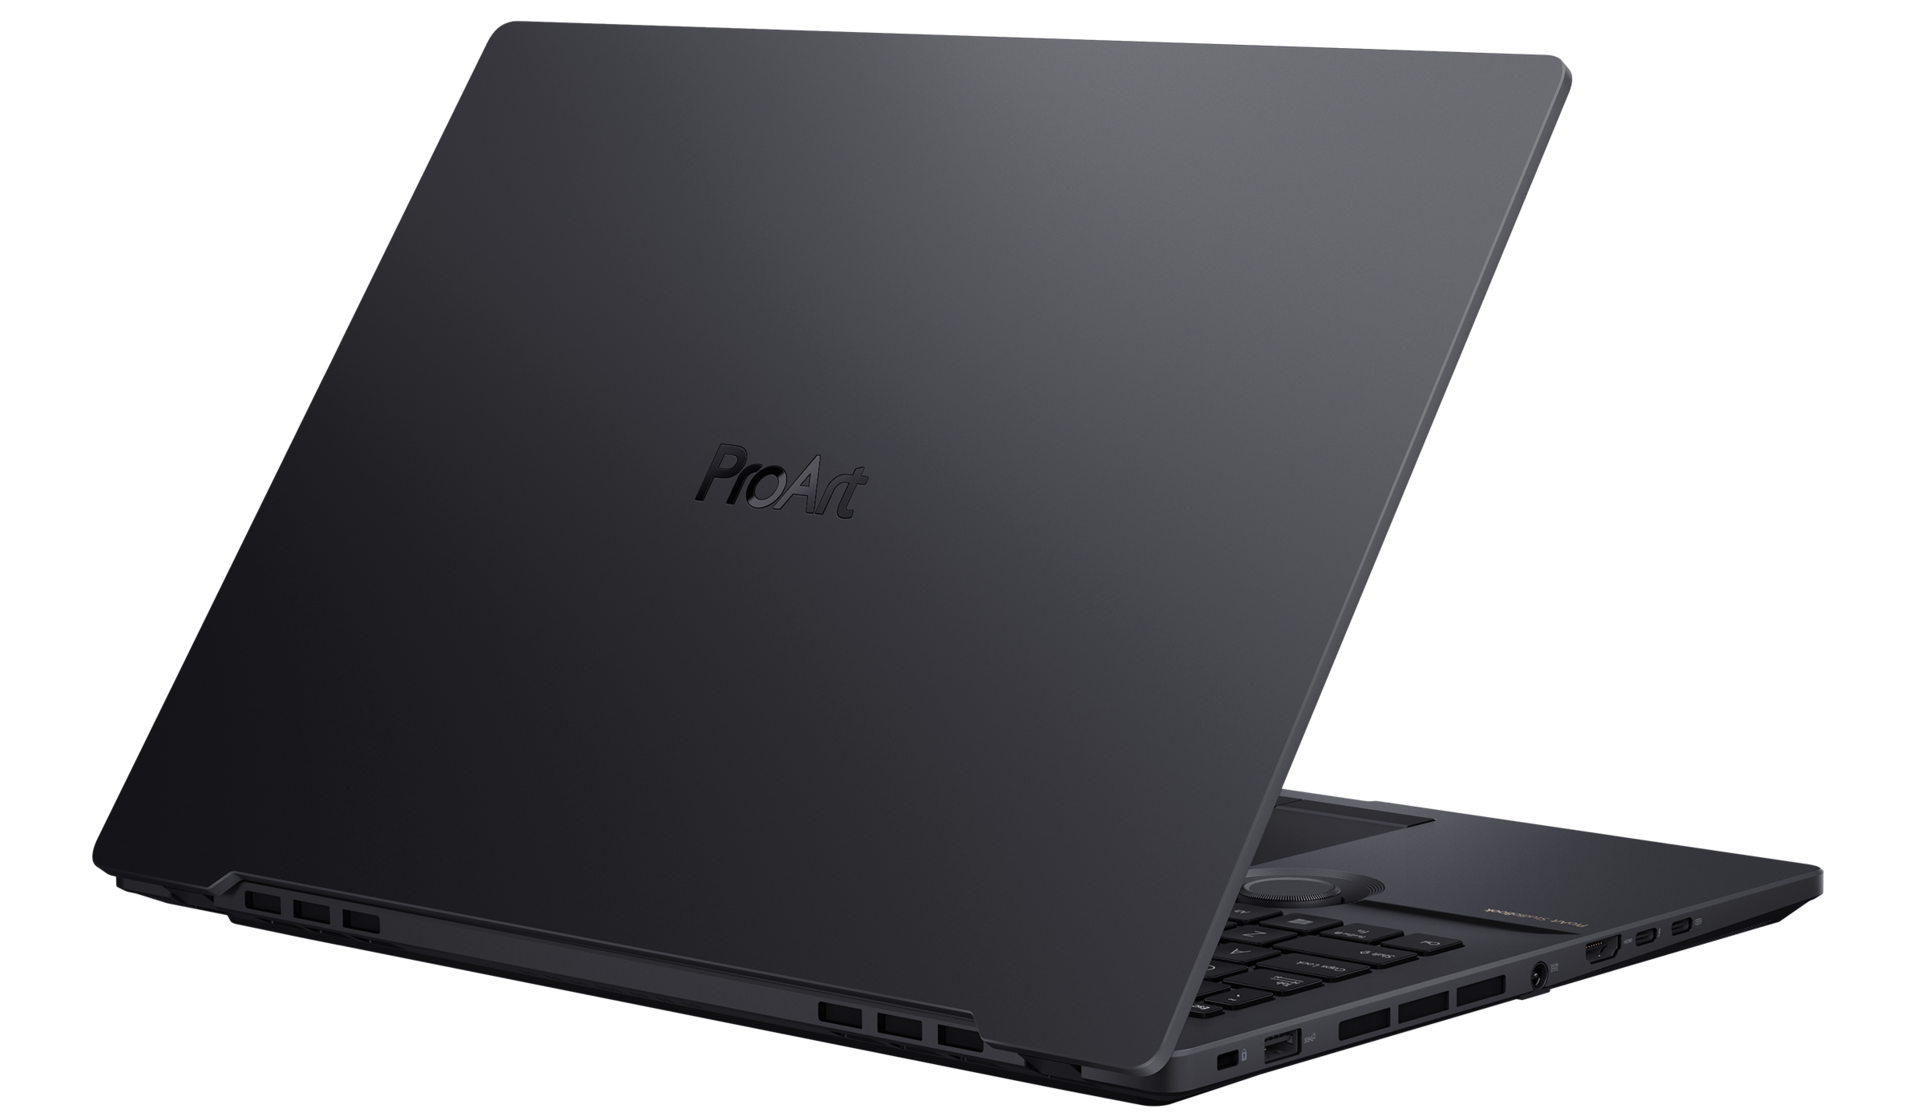
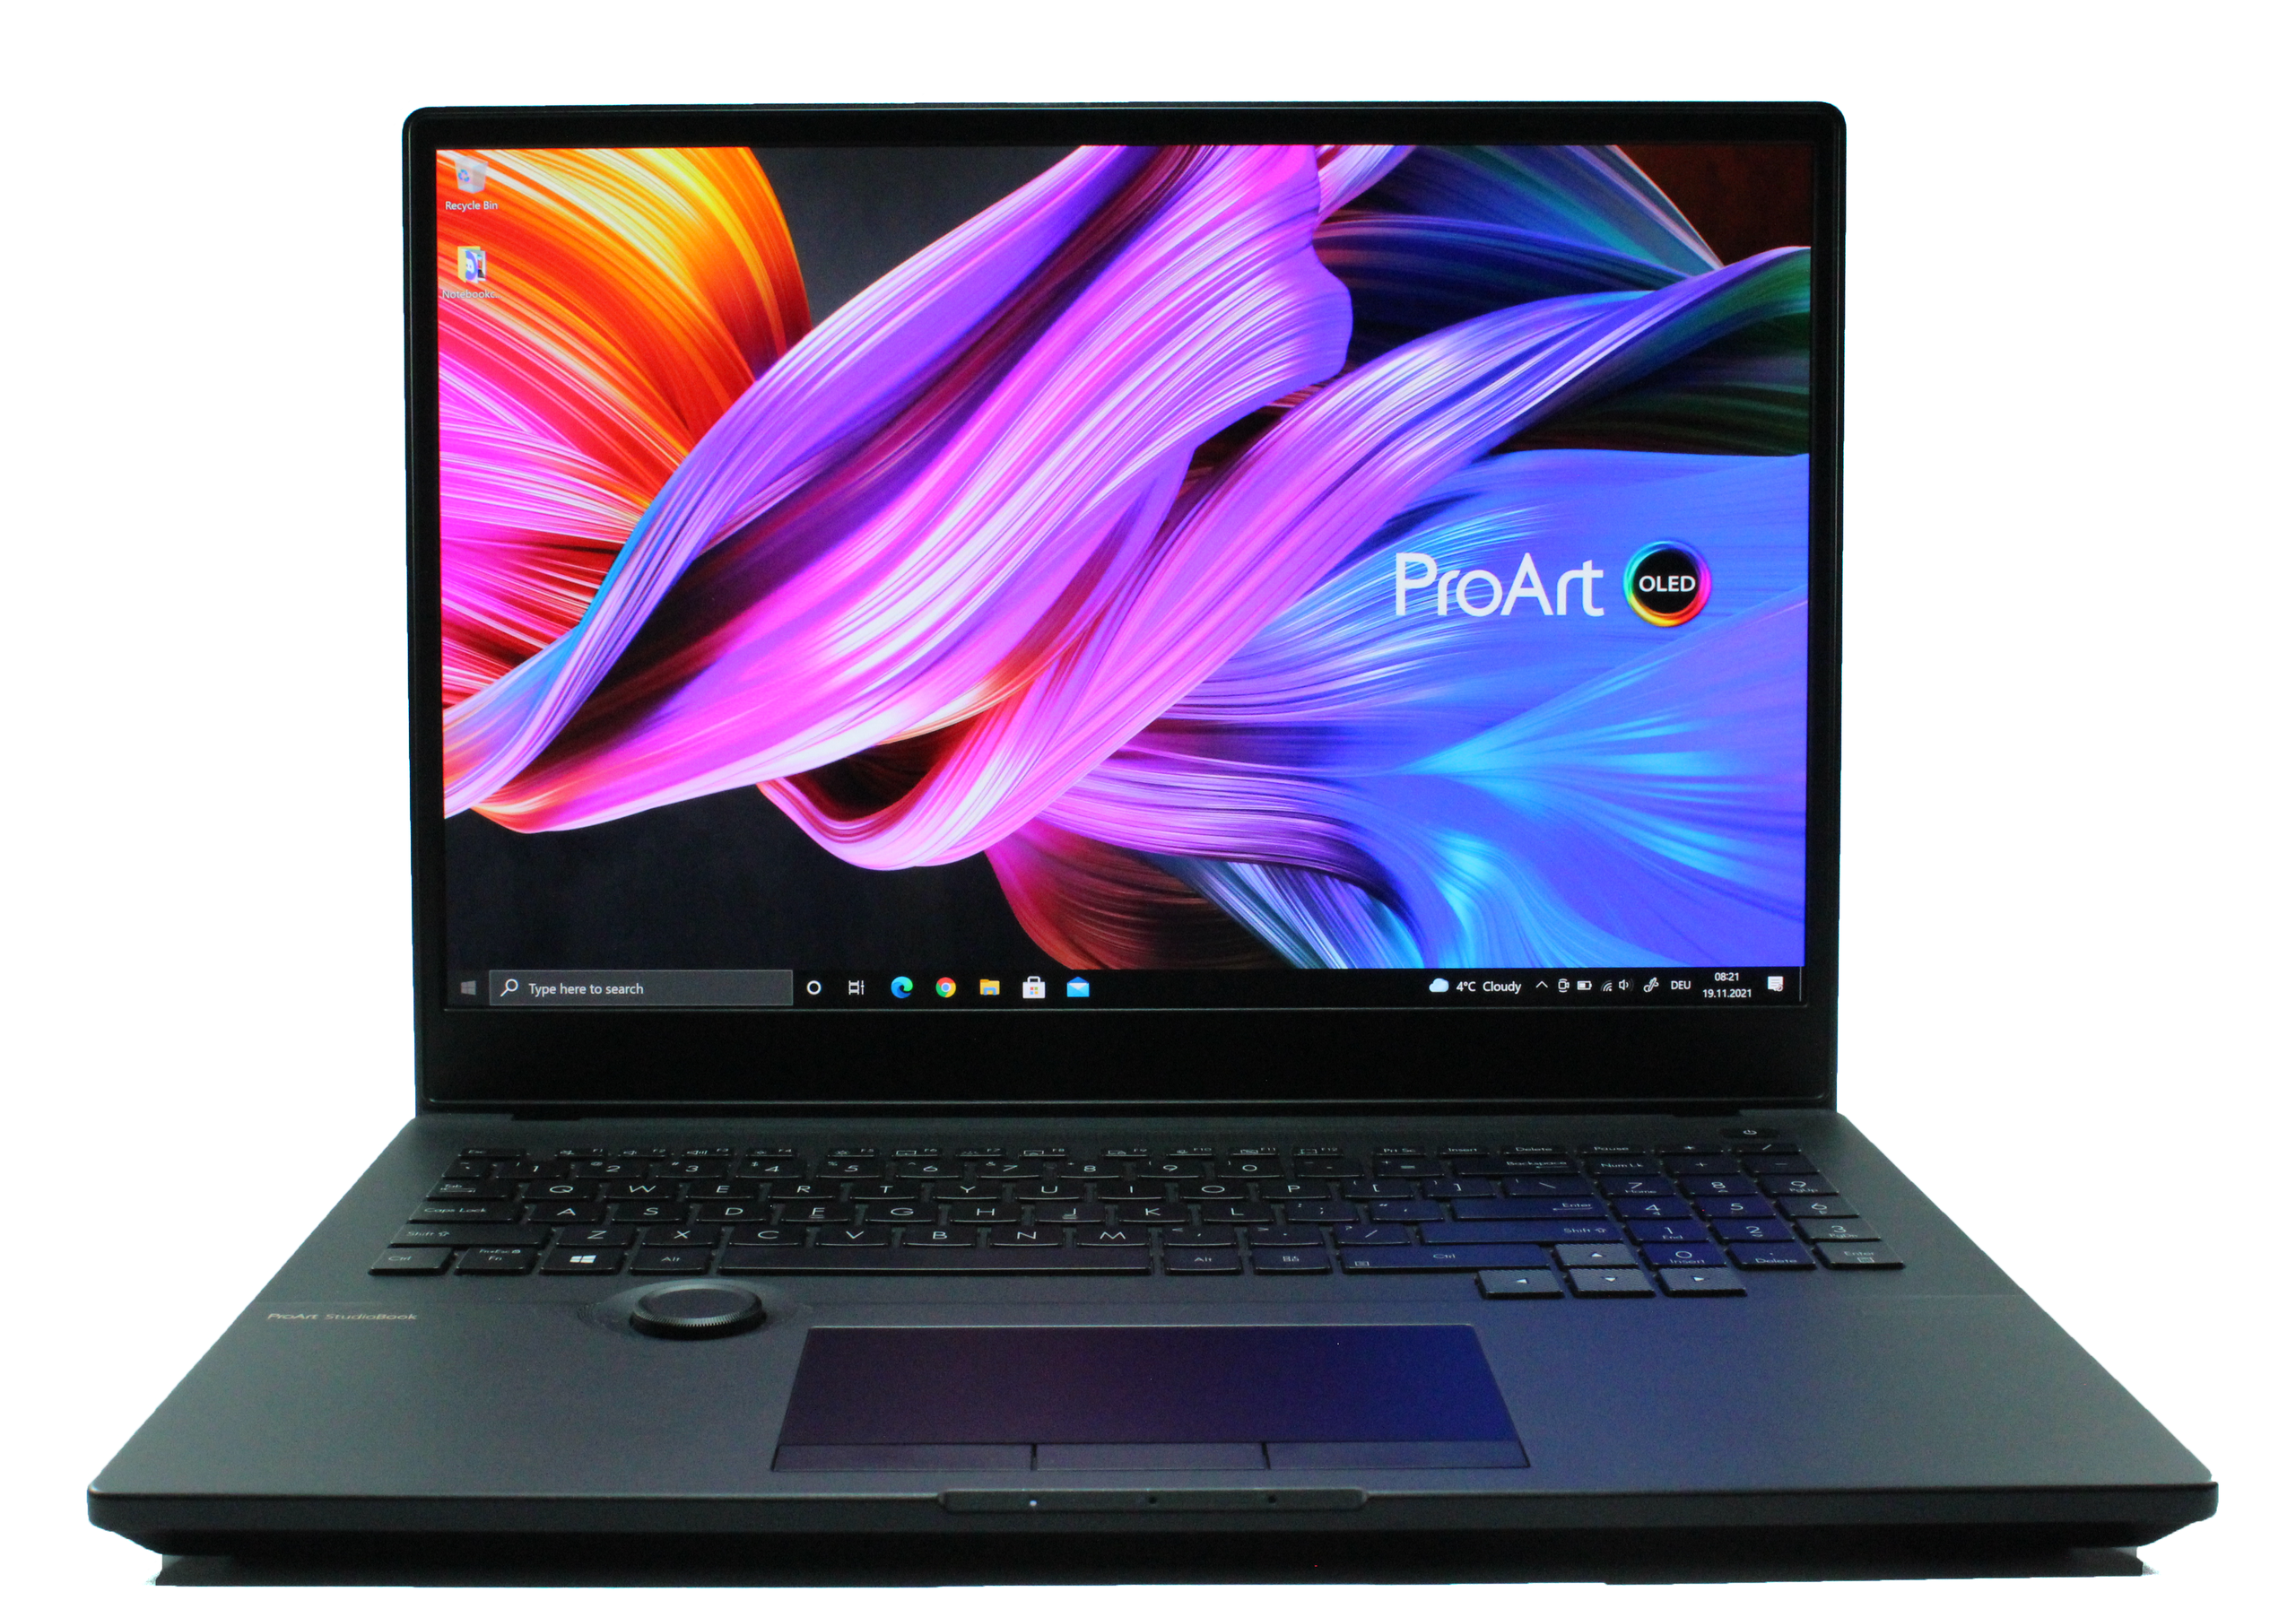
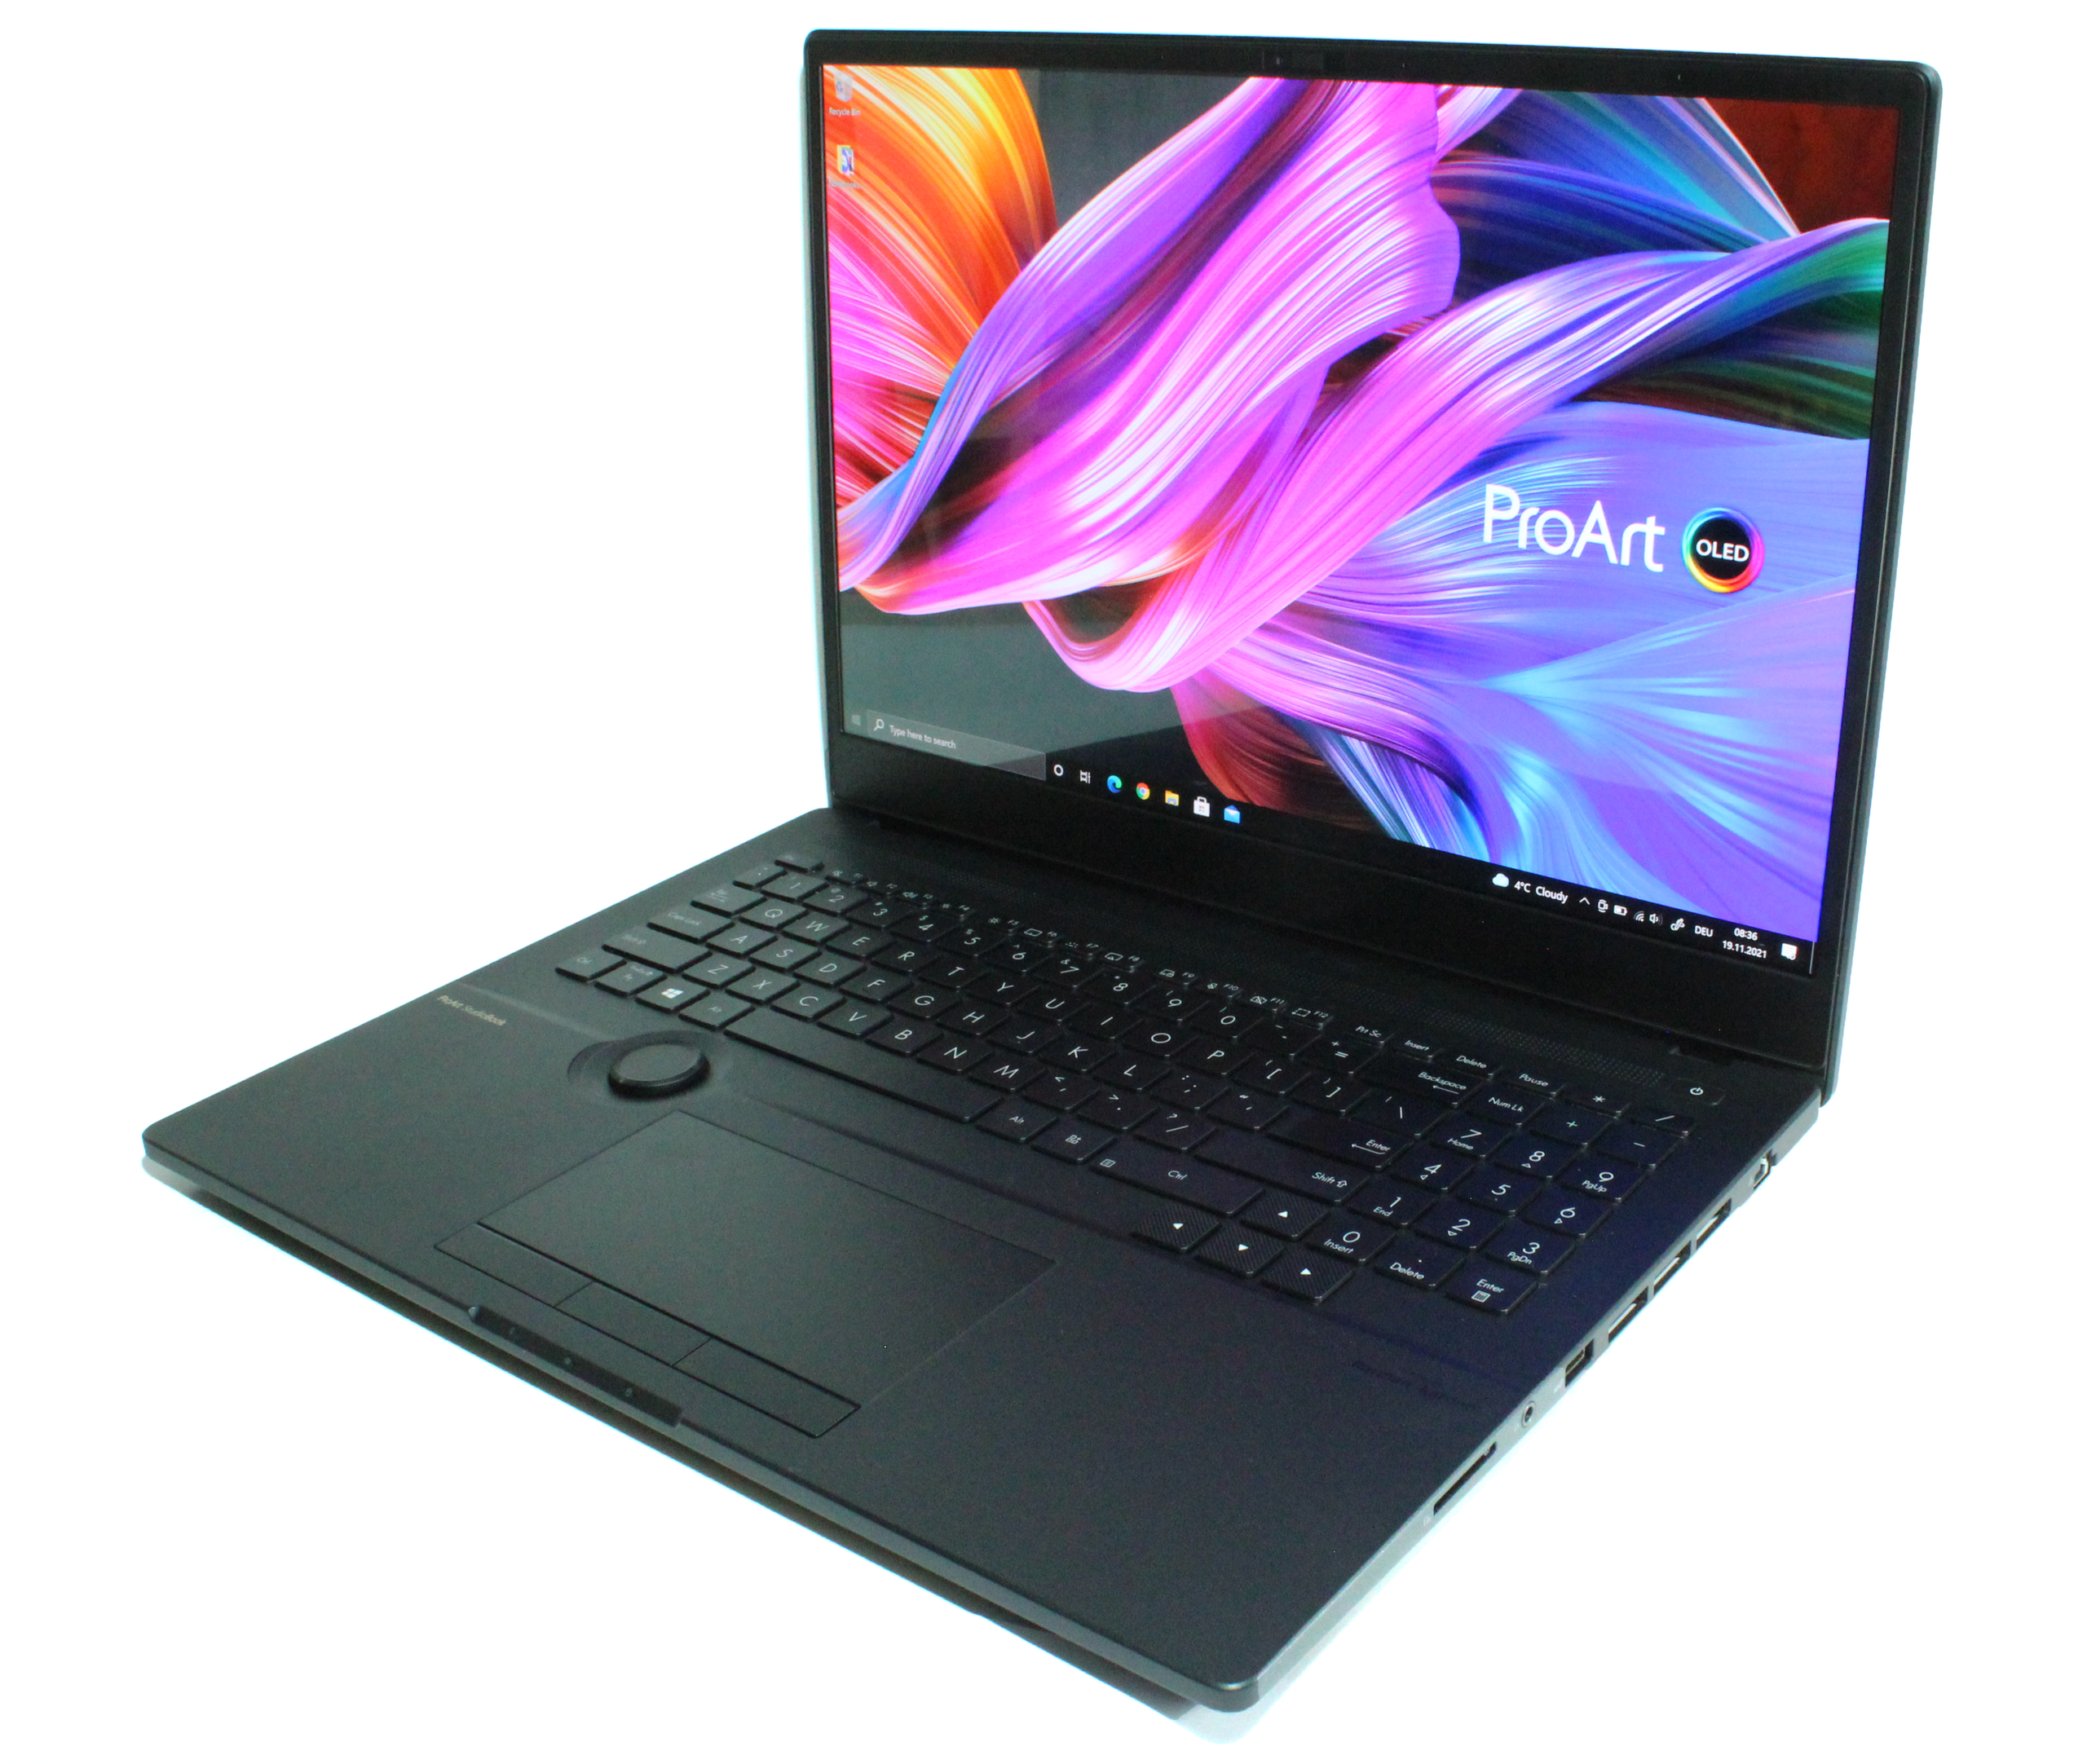
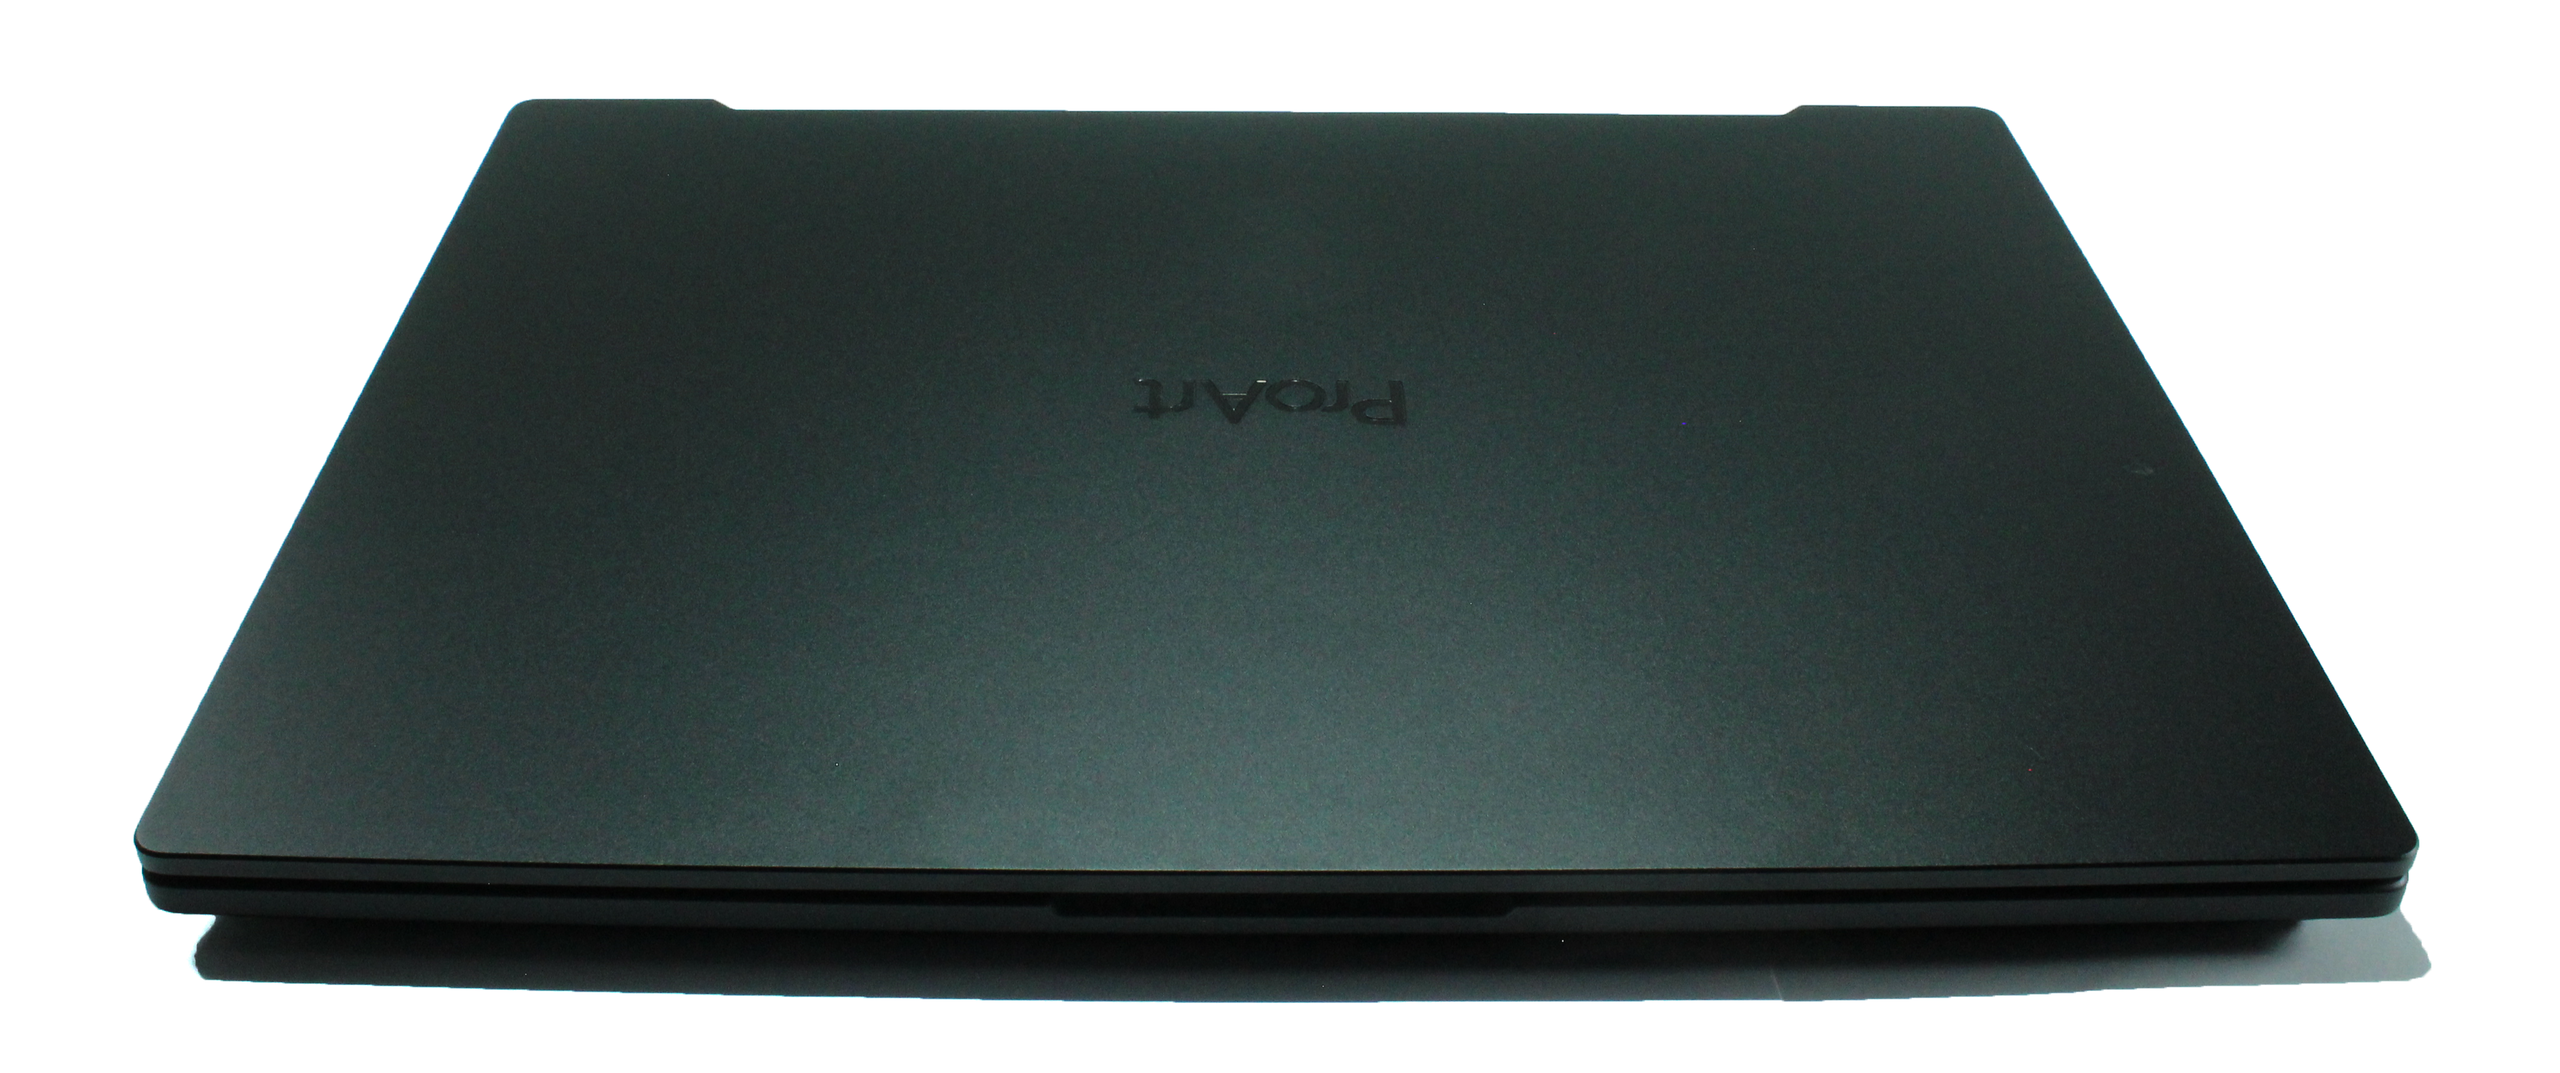
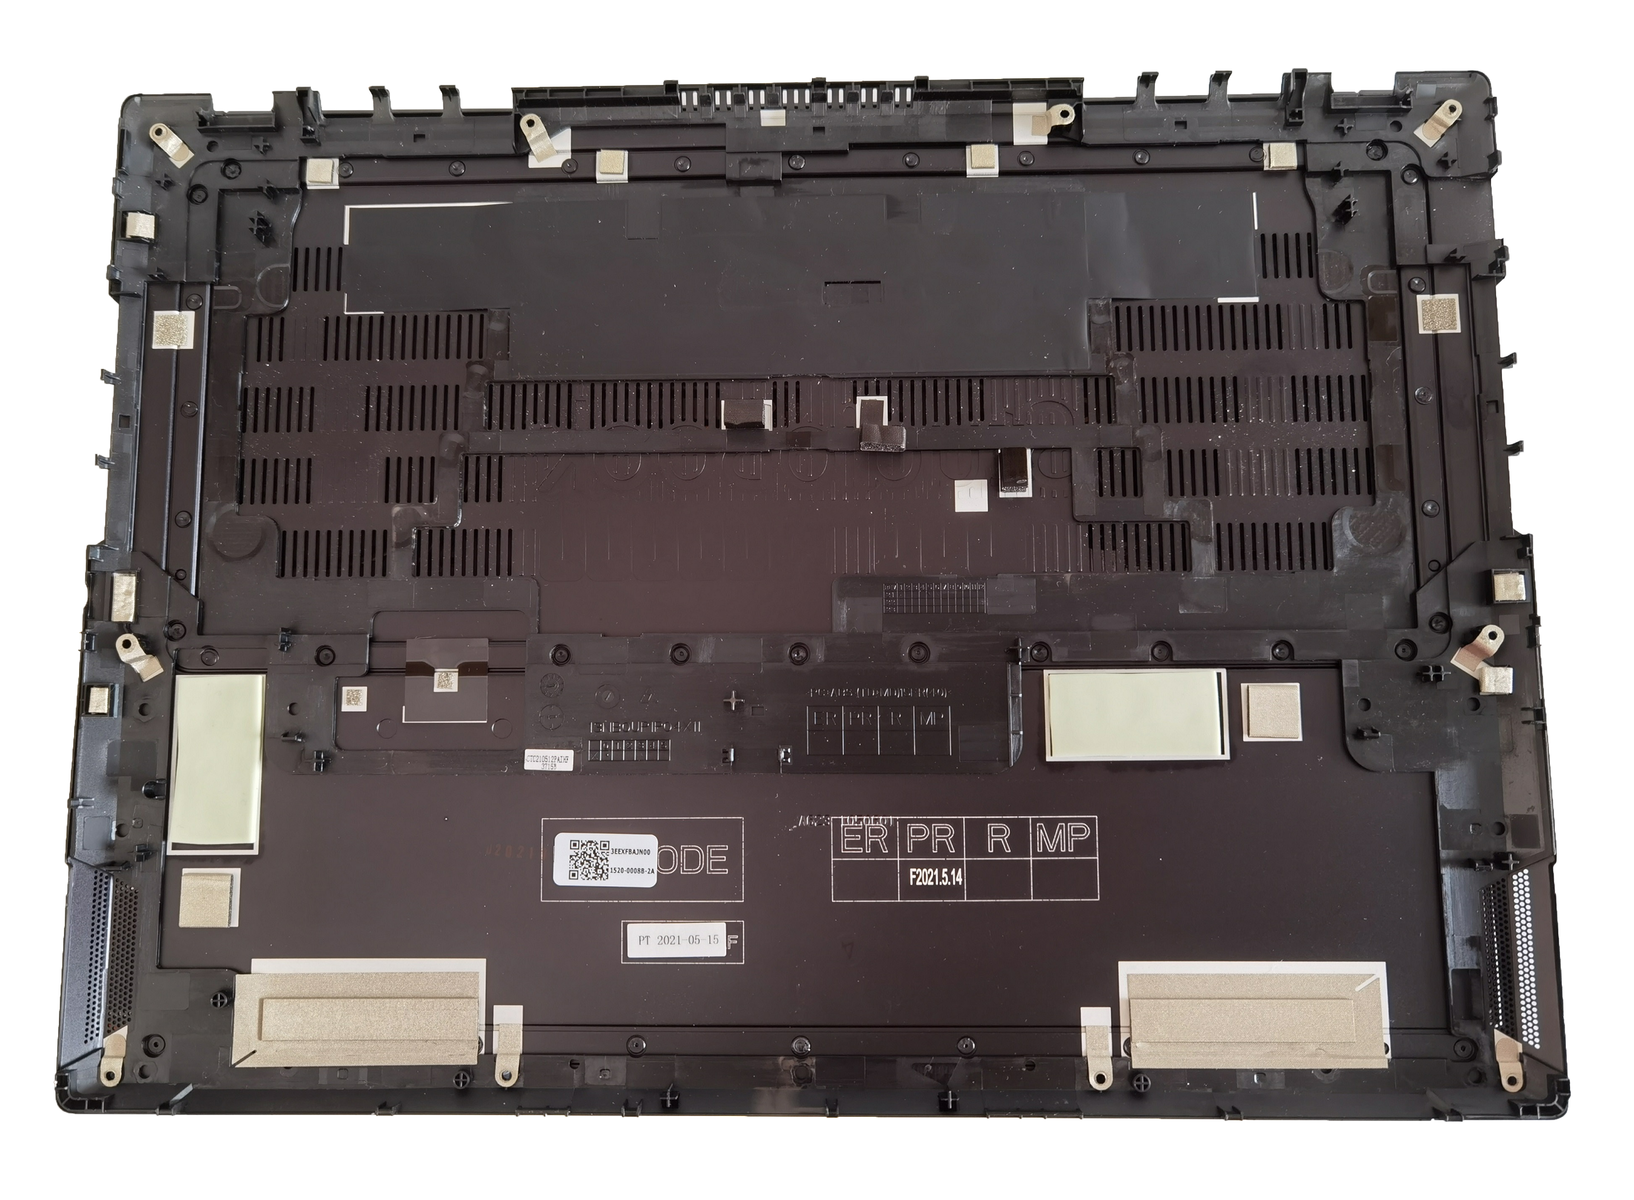
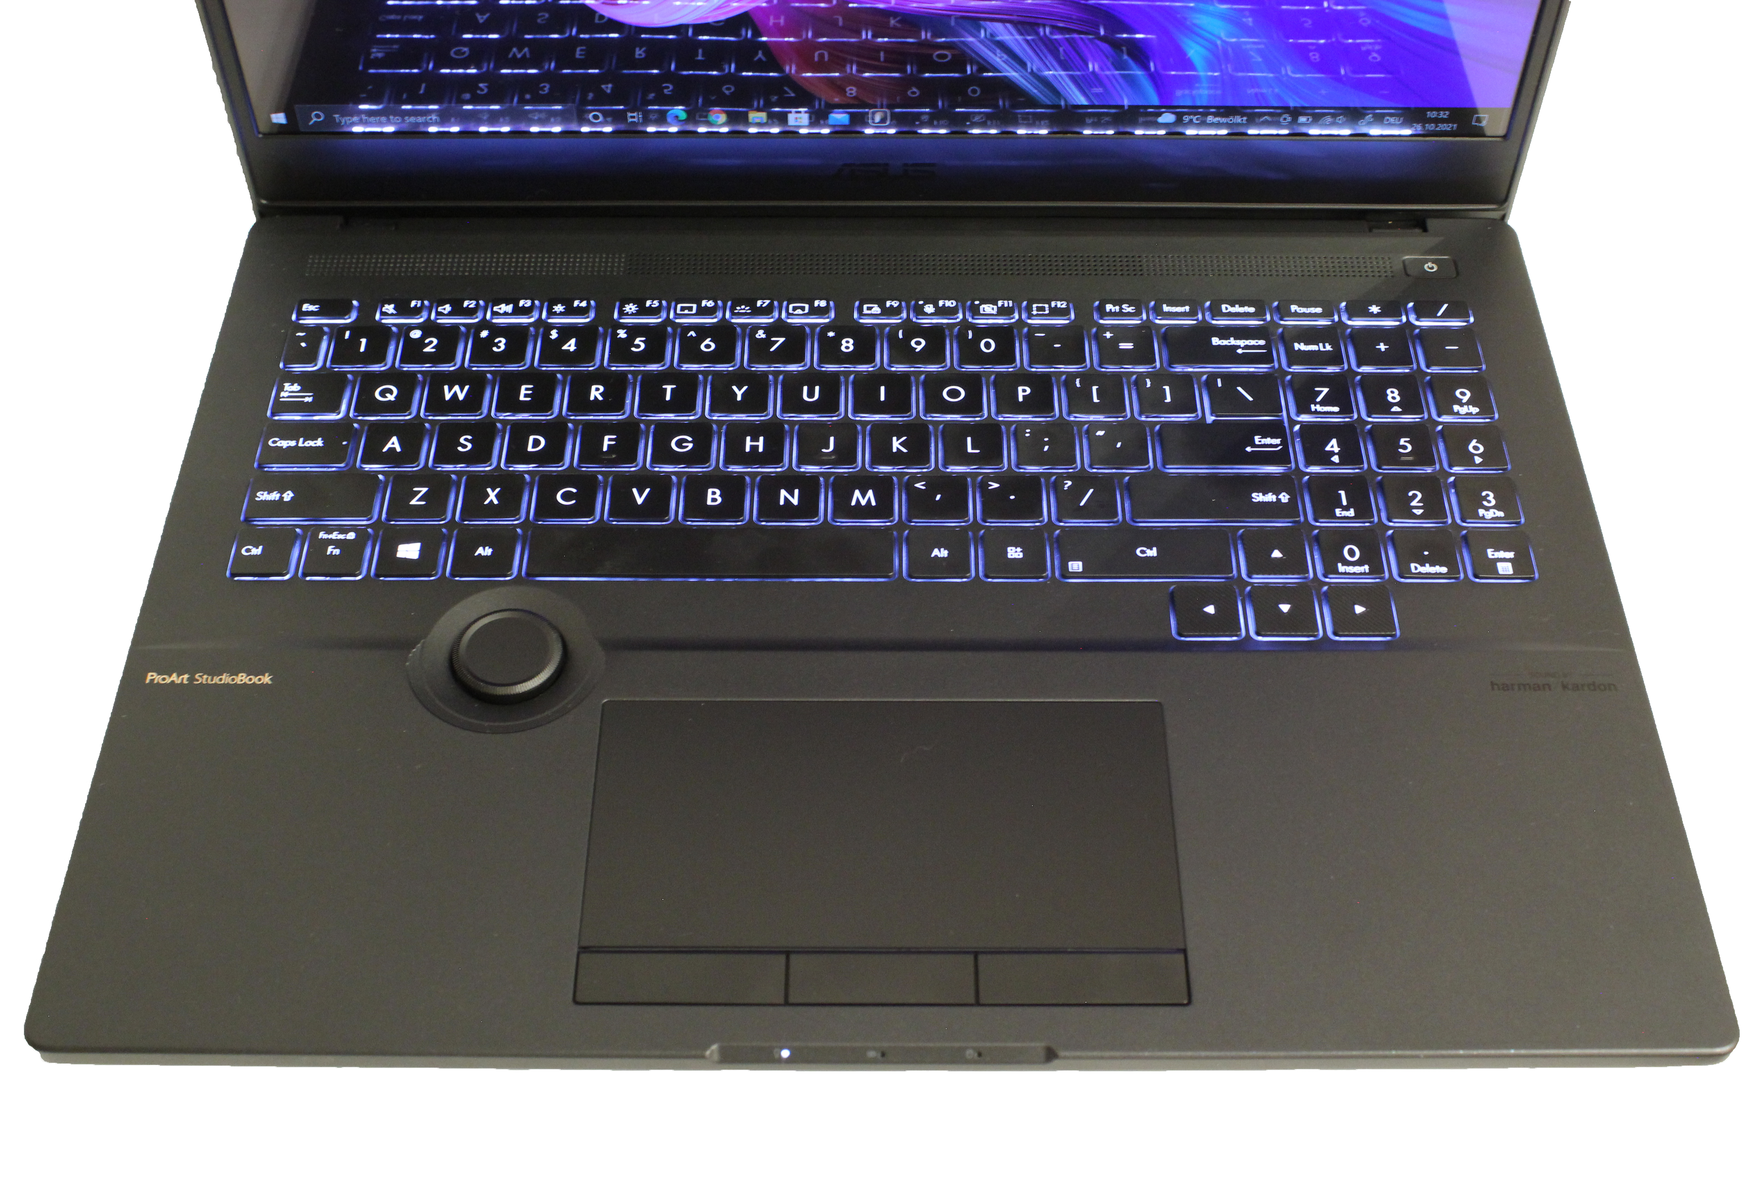
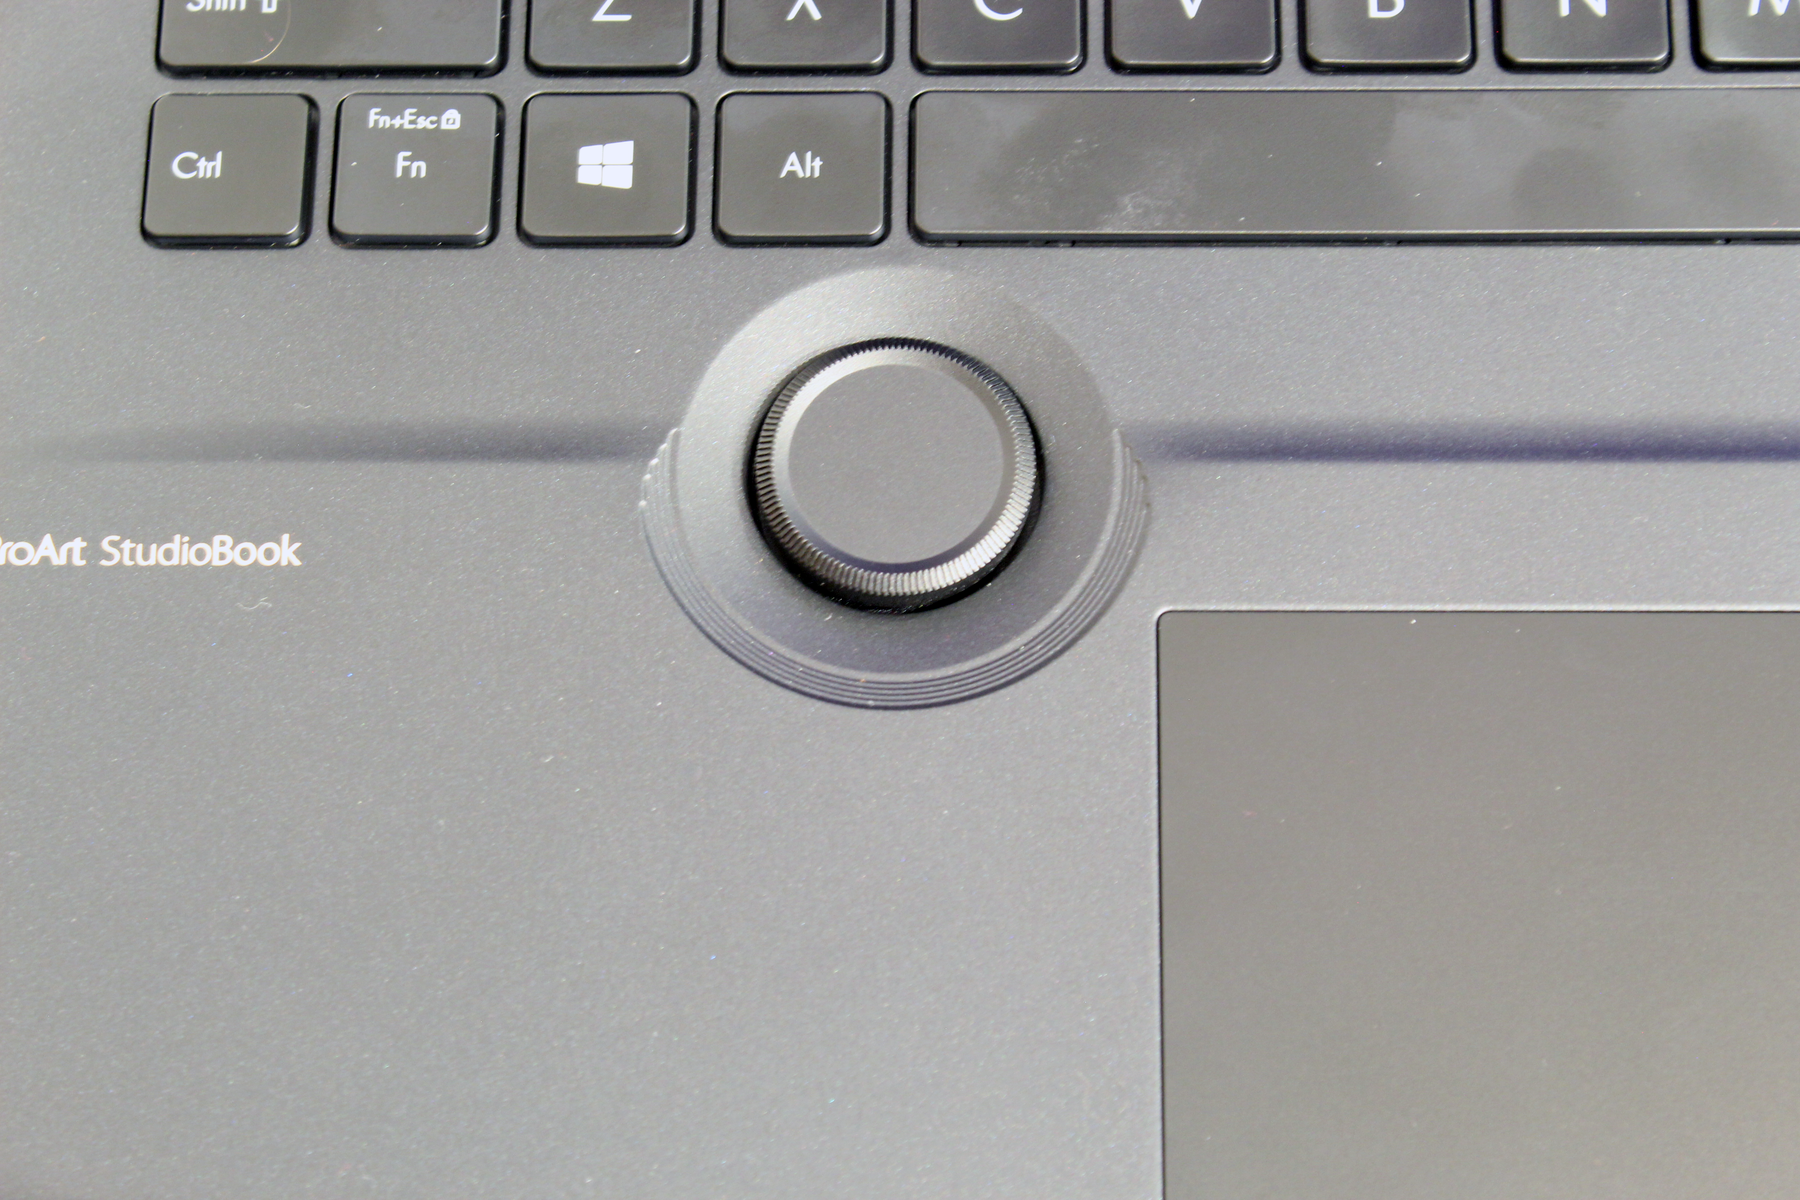
华硕ProArt StudioBook 16的外壳非常结实,2.4公斤的重量对于它的尺寸来说是比较轻的。外壳由金属制成,并涂有镁合金,这使其具有哑光、闪光和也比较粗糙的表面。该设备的一个特殊功能是华硕拨号控制器,它被嵌入到触控板旁边,例如,可以使控制图像和视频编辑程序中的一些功能特别精确。此外,华硕拨号控制器还可用于快速调整系统的亮度或音量。华硕ProArt StudioBook 16的设计很得体,键盘、触控板和华硕拨号器的排列看起来非常整齐。这款机箱的突出之处在于其高脚,这应该是为了让用户在打字时更加舒适。这些高脚导致键盘比掌托高。华硕还在支架的背面中央做了一个凹槽,让更多的新鲜空气通过,以优化设备的冷却。
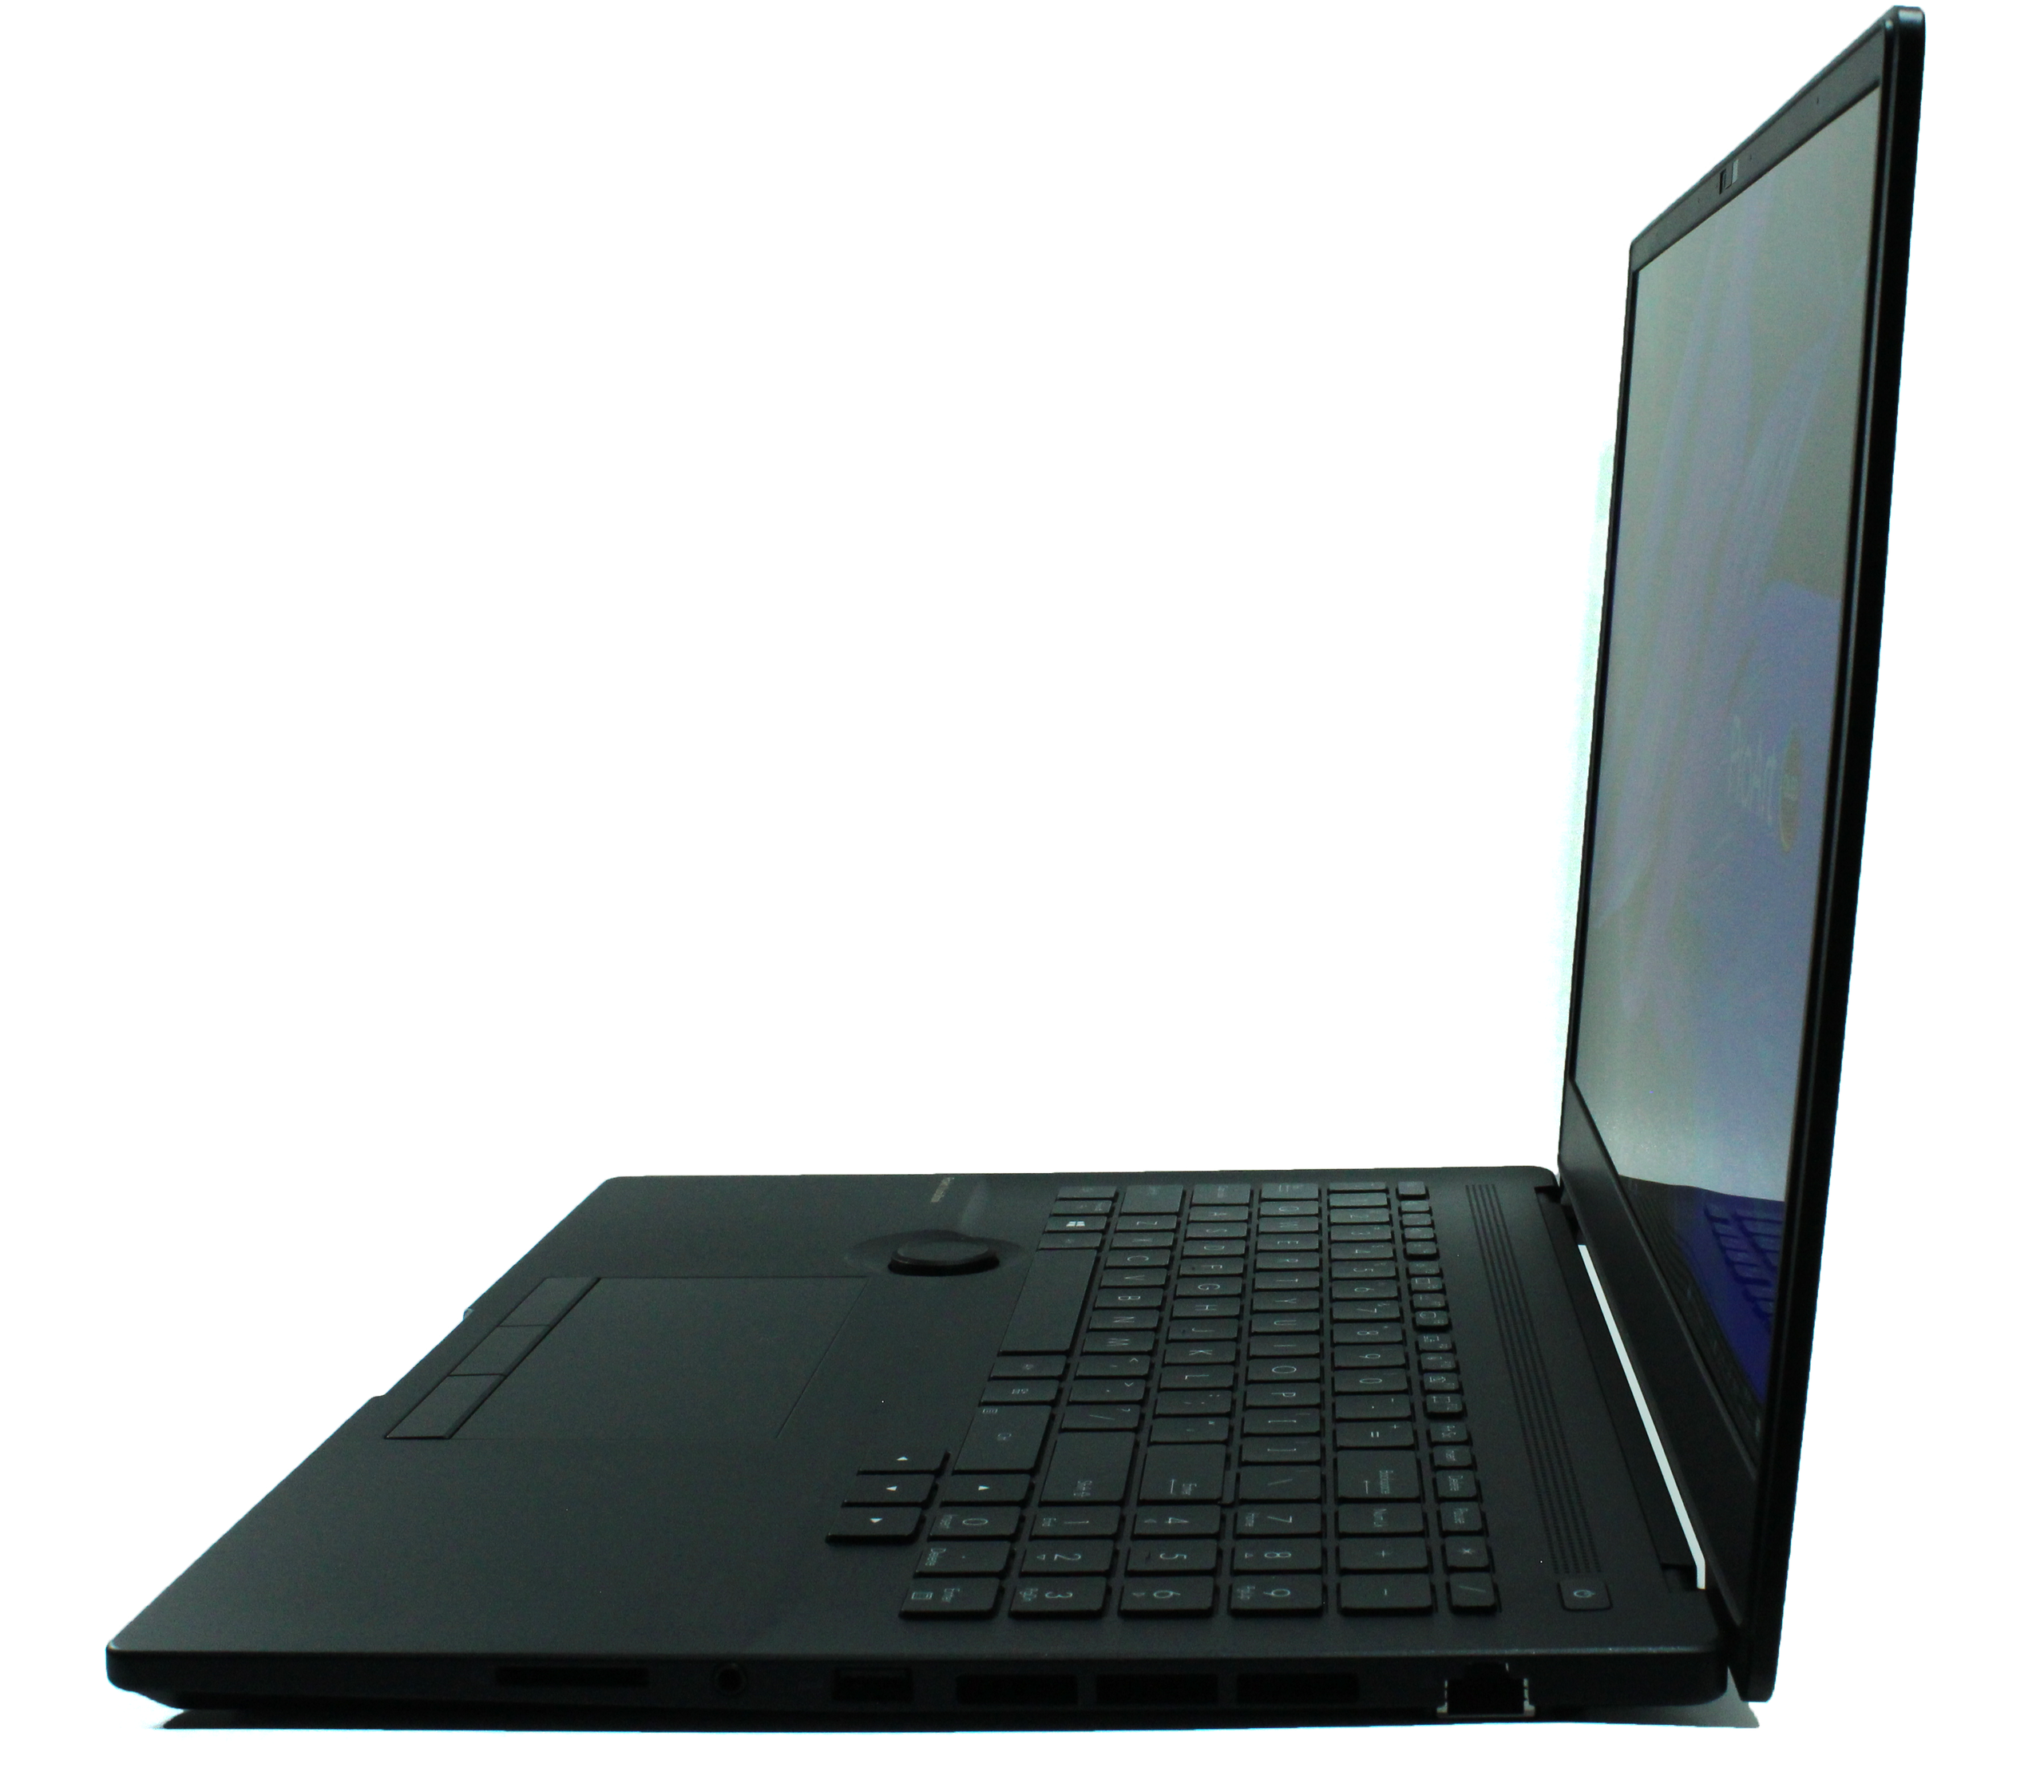
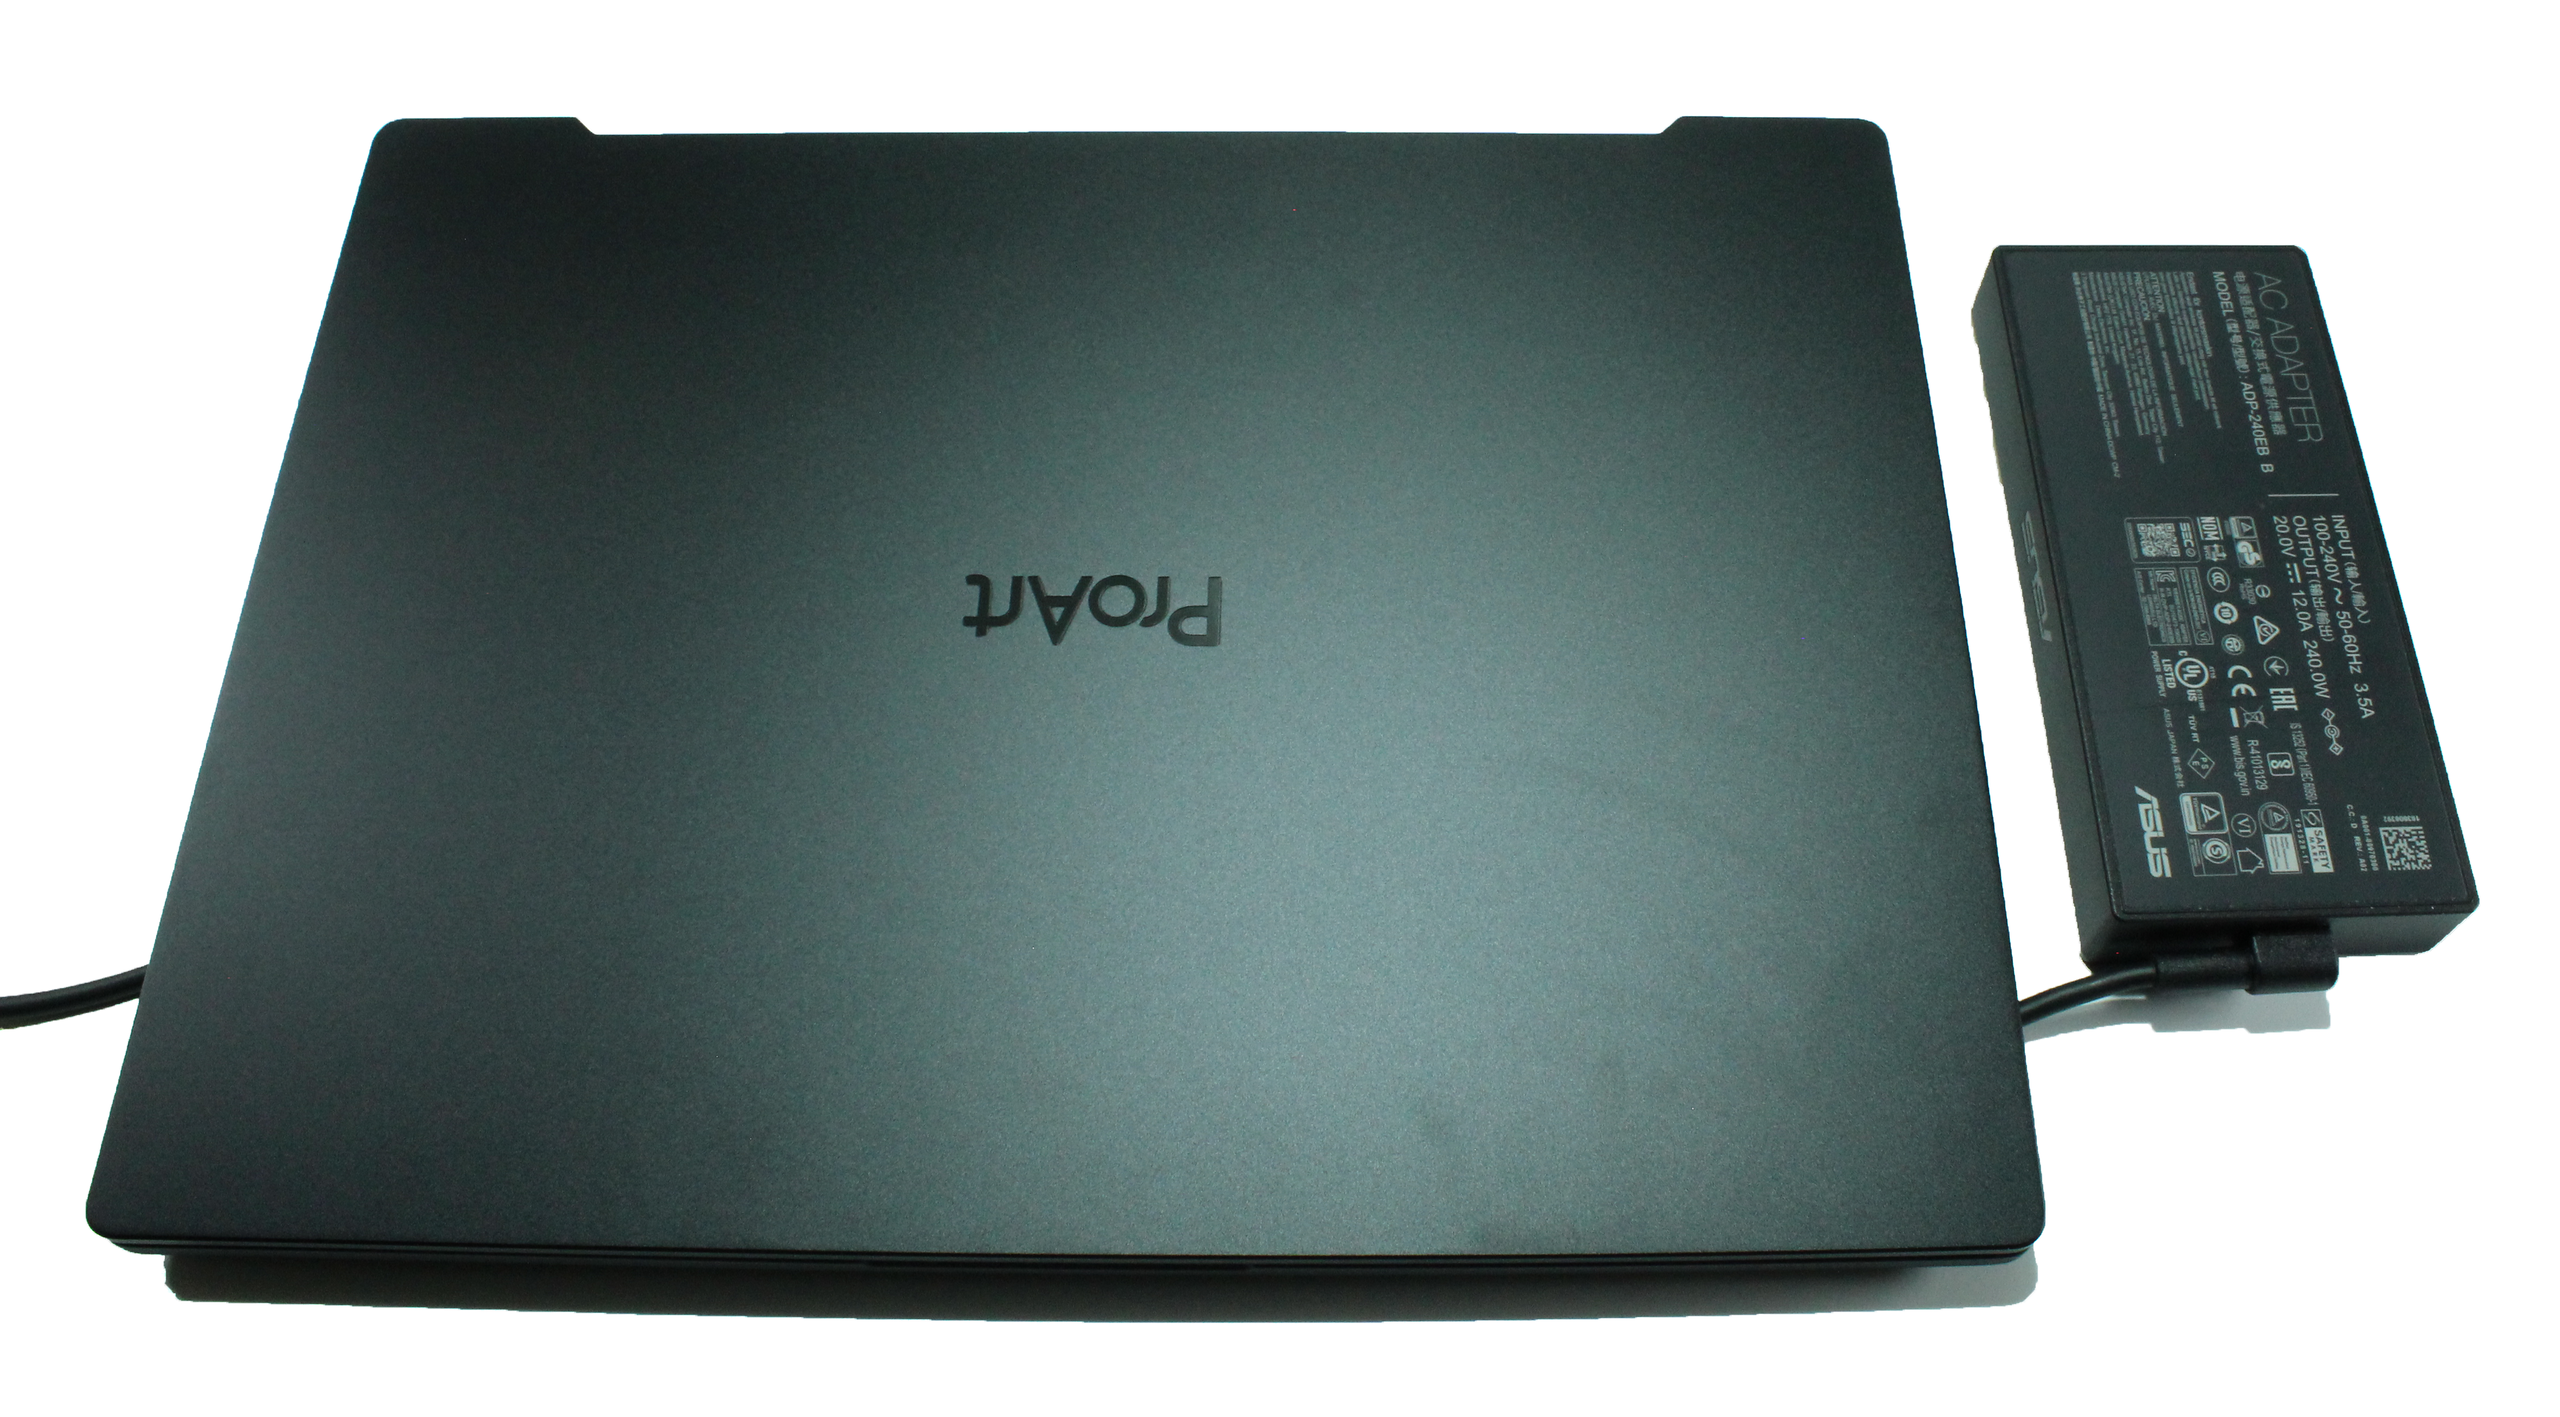
华硕ProArt StudioBook拥有16英寸显示屏,整体高度只有2.1厘米,令人惊讶的是它很苗条。虽然 惠普ZBook Fury显示屏较小,外部略窄,但比我们的设备高了近半厘米。除了ZBook Fury之外,所有对手在重量方面都明显领先。
装备
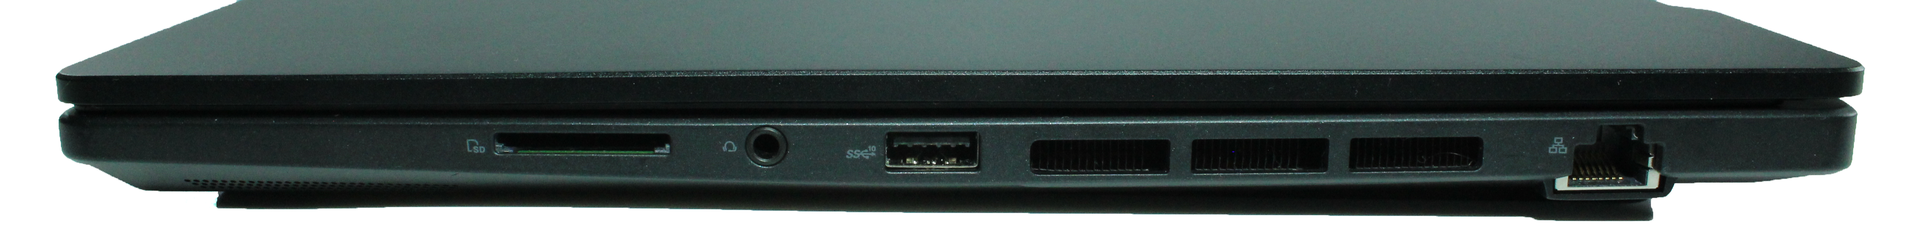
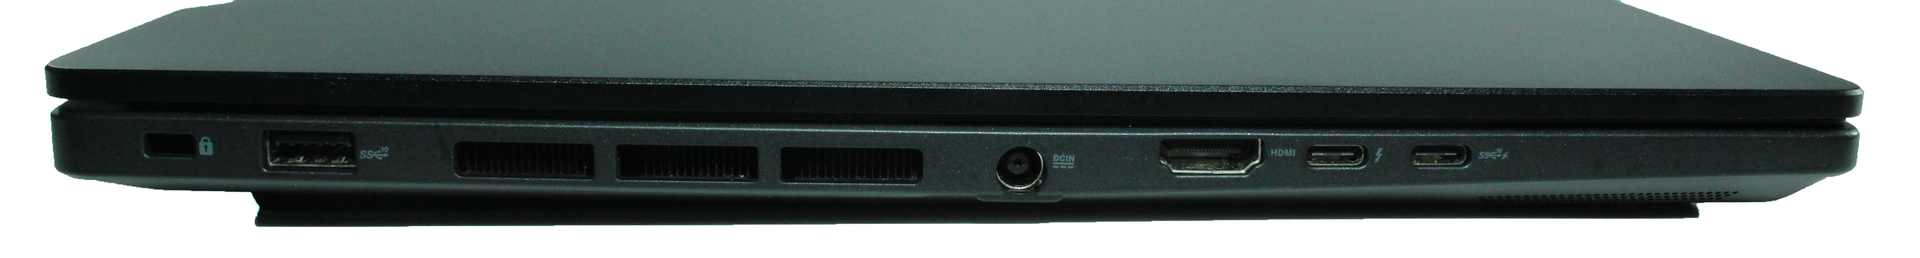
笔记本的端口分布在两边:在左边,有Kensington Lock、USB-A 3.2 Gen.2、电源接口、HDMI 2.1、Thunderbolt 4和一个USB-C 3.2 Gen 2端口,此外还有冷却系统的通风口。通风口就像左边一样延伸到右边的位置。右侧还有一个全尺寸的SD读卡器、一个3.5毫米的组合插孔、USB-A 3.2 Gen.2和千兆网。Thunderbolt 4和USB-C端口都支持Power Delivery,并允许各连接一个显示器。这些端口的间距足够大,当所有端口都被占用时,不会影响用户的舒适度。只有冷却系统的出风口位于笔记本的背面。
SD卡阅读器
在我们的预生产设备中,集成的SD卡读卡器的传输率是比较差的。使用我们的AV PRO 128 GB V60参考存储卡,甚至连平均数据吞吐量都达不到。
| SD Card Reader | |
| average JPG Copy Test (av. of 3 runs) | |
| Dell Precision 5000 5560 (AV Pro V60) | |
| Average of class Workstation (49.6 - 681, n=14, last 2 years) | |
| HP ZBook Fury 15 G8 (AV Pro V60) | |
| HP ZBook Studio 15 G8 (AV Pro V60) | |
| Asus ProArt StudioBook 16 W7600H5A-2BL2 (AV Pro SD microSD 128 GB V60) | |
| maximum AS SSD Seq Read Test (1GB) | |
| Average of class Workstation (87.6 - 1455, n=14, last 2 years) | |
| Dell Precision 5000 5560 (AV Pro V60) | |
| HP ZBook Studio 15 G8 (AV Pro V60) | |
| HP ZBook Fury 15 G8 (AV Pro V60) | |
| Asus ProArt StudioBook 16 W7600H5A-2BL2 (AV Pro SD microSD 128 GB V60) | |
沟通
在我们的性能测试中,安装在预生产设备中的英特尔Wi-Fi AX201无法发挥其性能潜力,最终比平均水平落后20%至60%。
网络摄像头
我们测试设备中的720p网络摄像头的摄像质量非常差。与大多数竞争对手一样,它缺乏图像清晰度和色彩准确性。

")
")


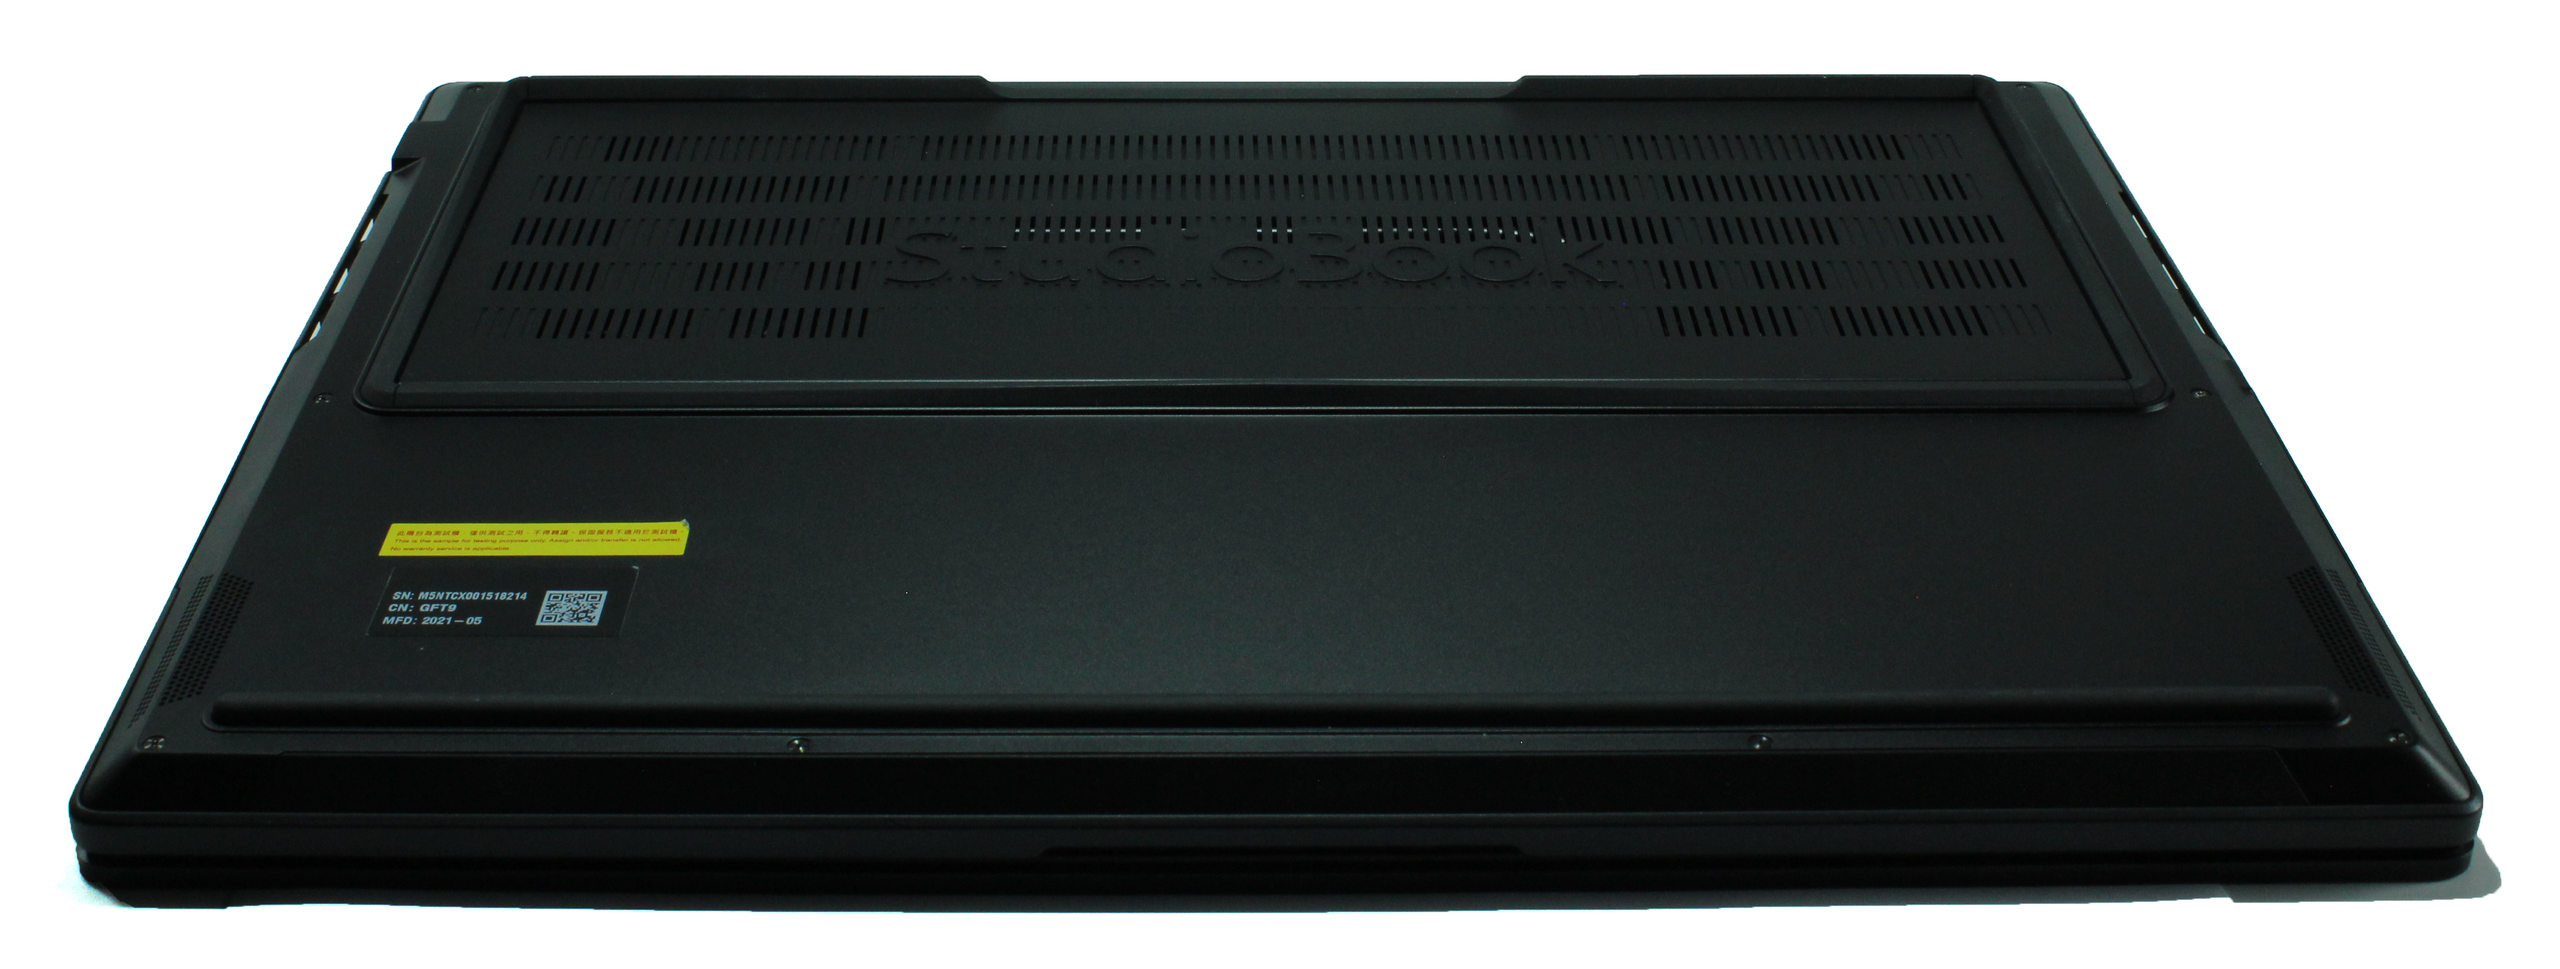
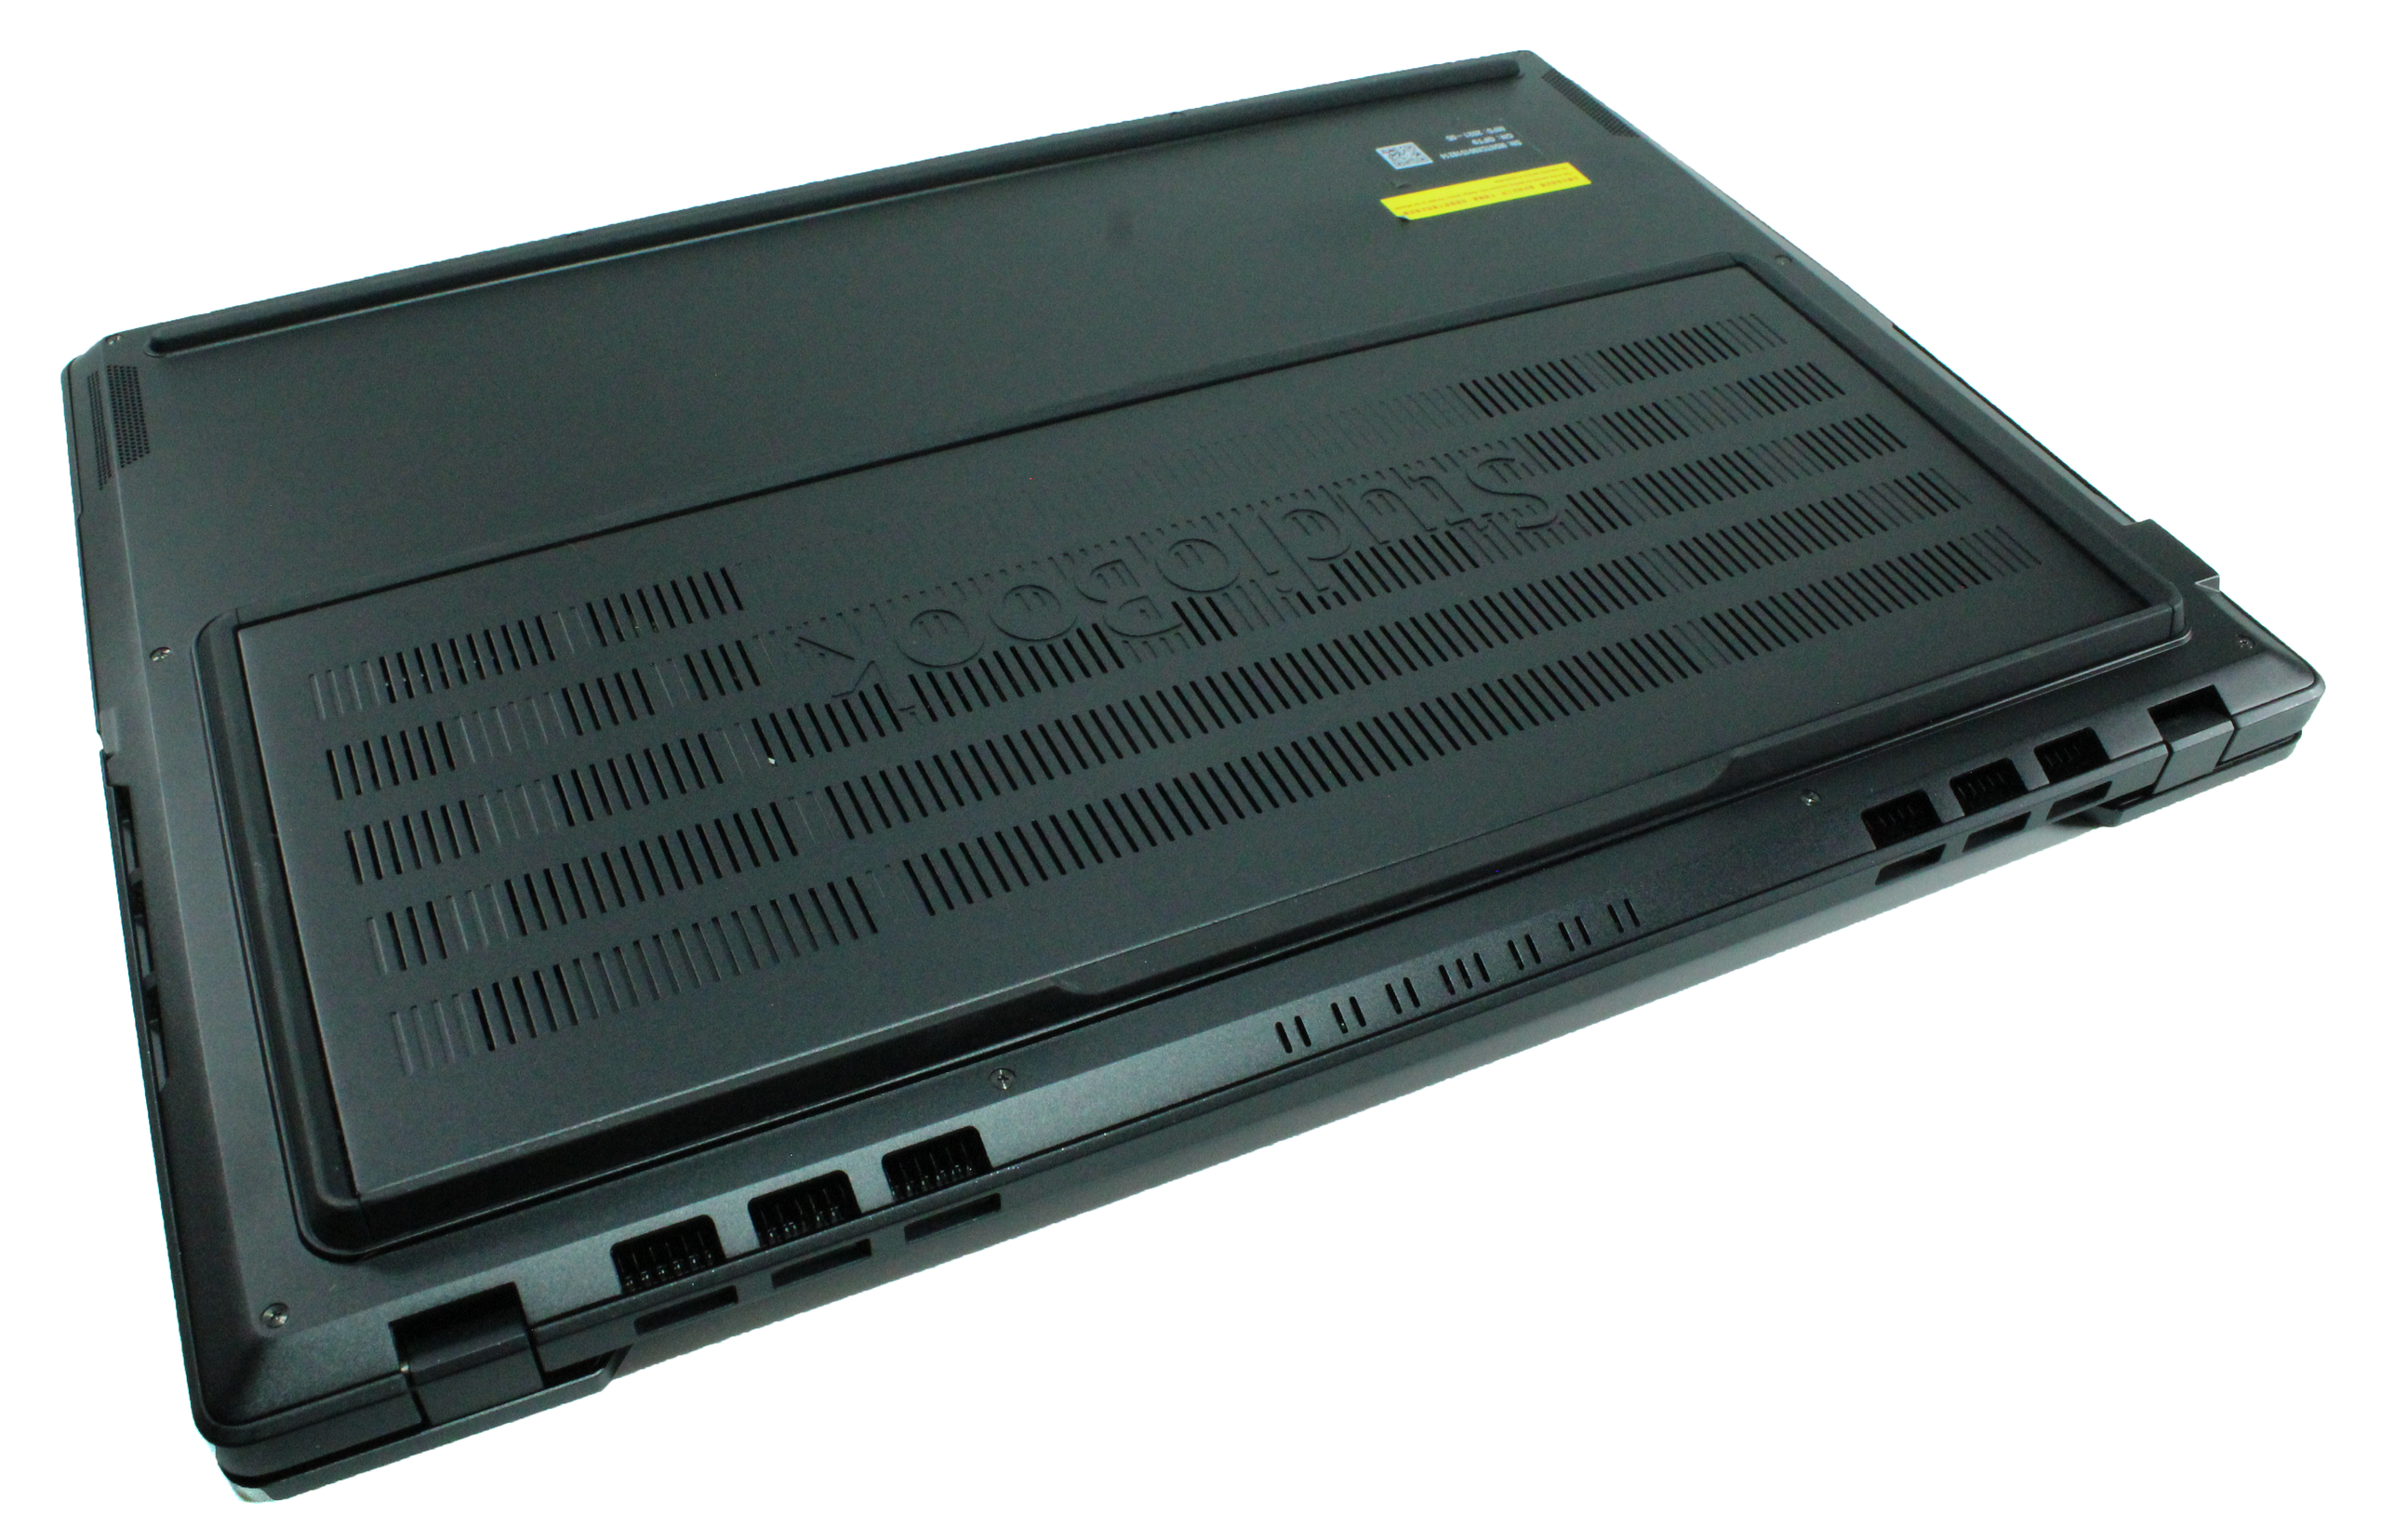
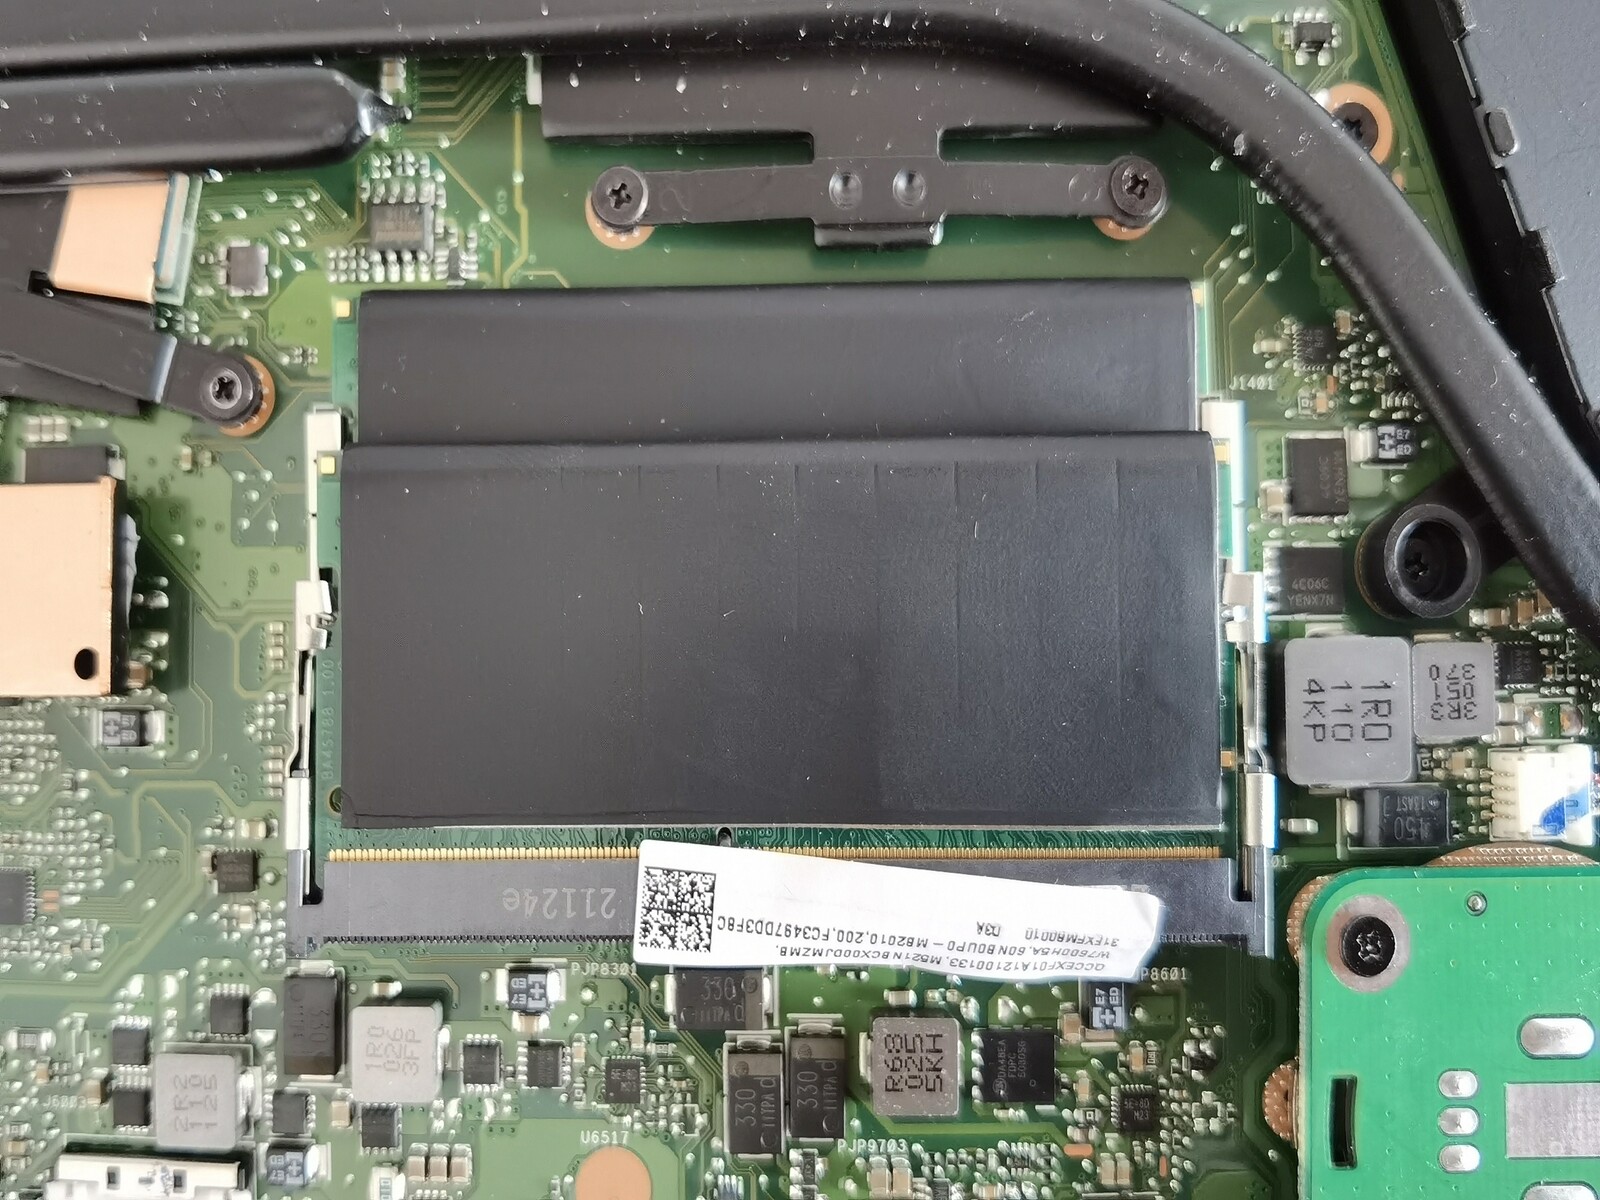
维护
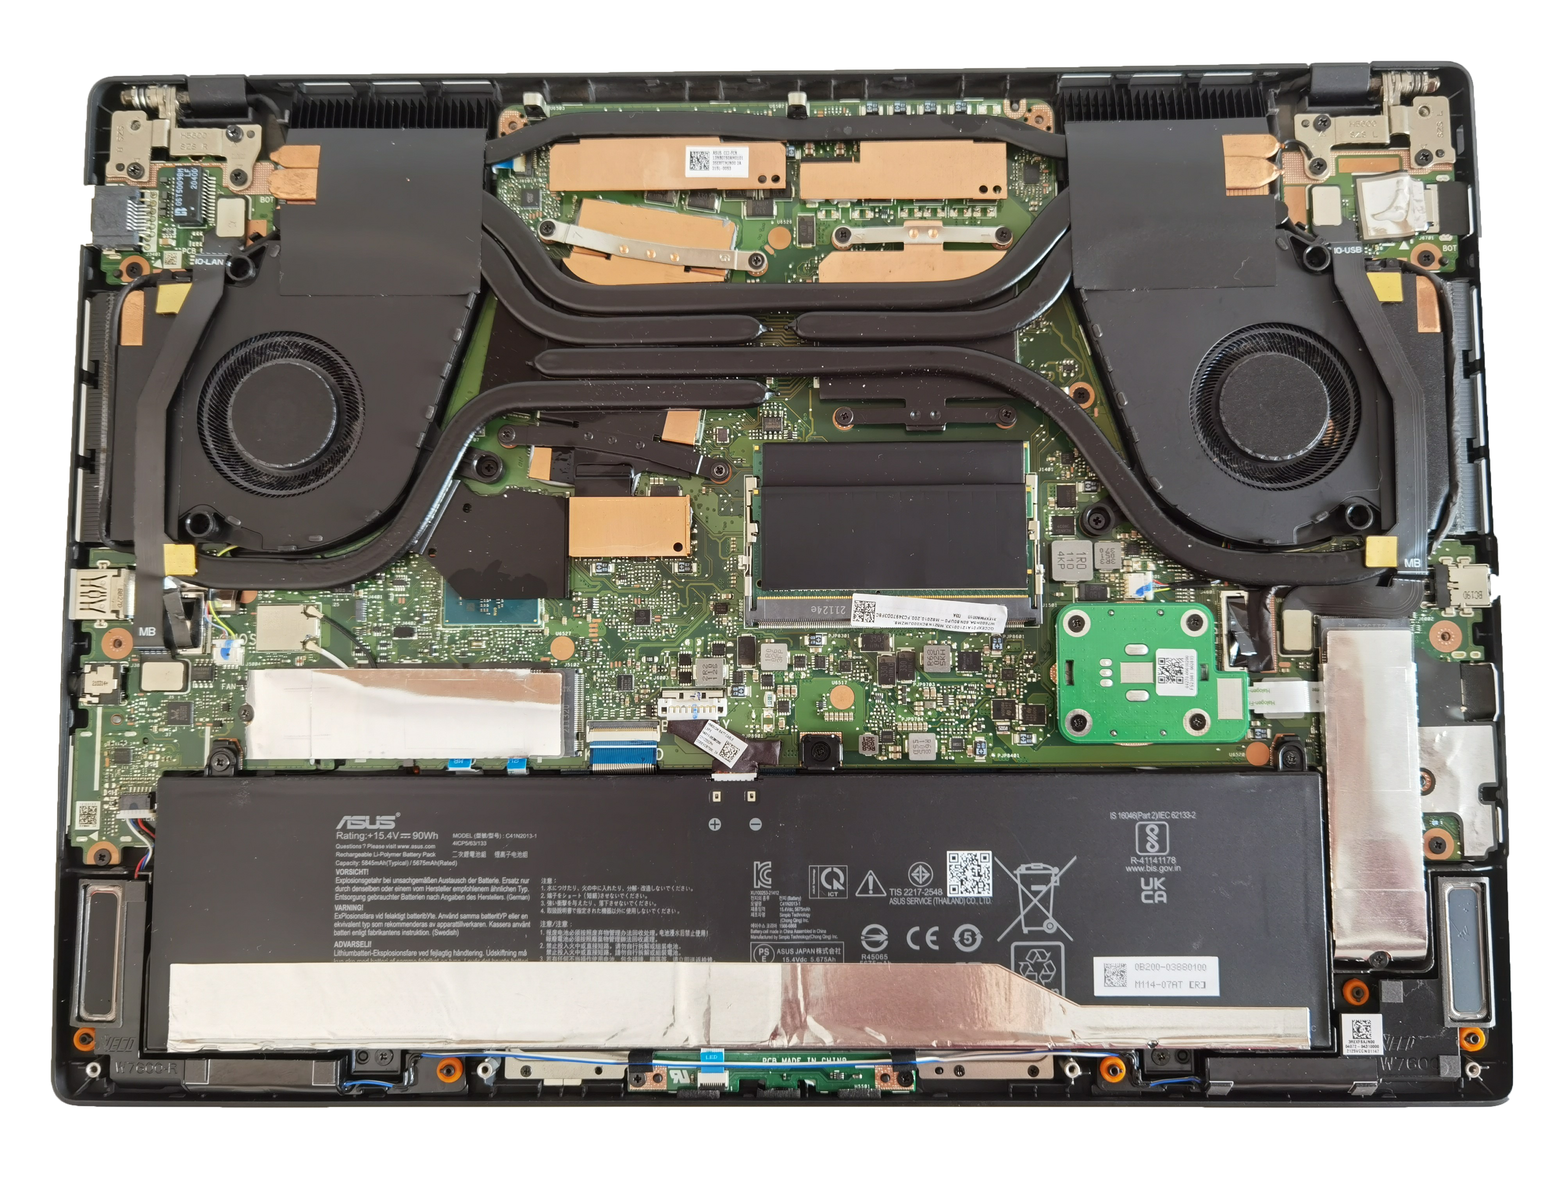
底板可以通过松开10个十字螺丝轻松地拆下来。在里面,用户可以直接接触到内存和固态硬盘的插槽,在我们的评测单元中,这些插槽都被完全占用。相应地,风扇也可以通过这种方式进行清洁。值得一提的是,冷却电路还覆盖了芯片组,甚至内存和SSD也有被动冷却。对于后者,底板上有额外的导热垫。
输入设备。使用华硕表盘的专业工作
键盘
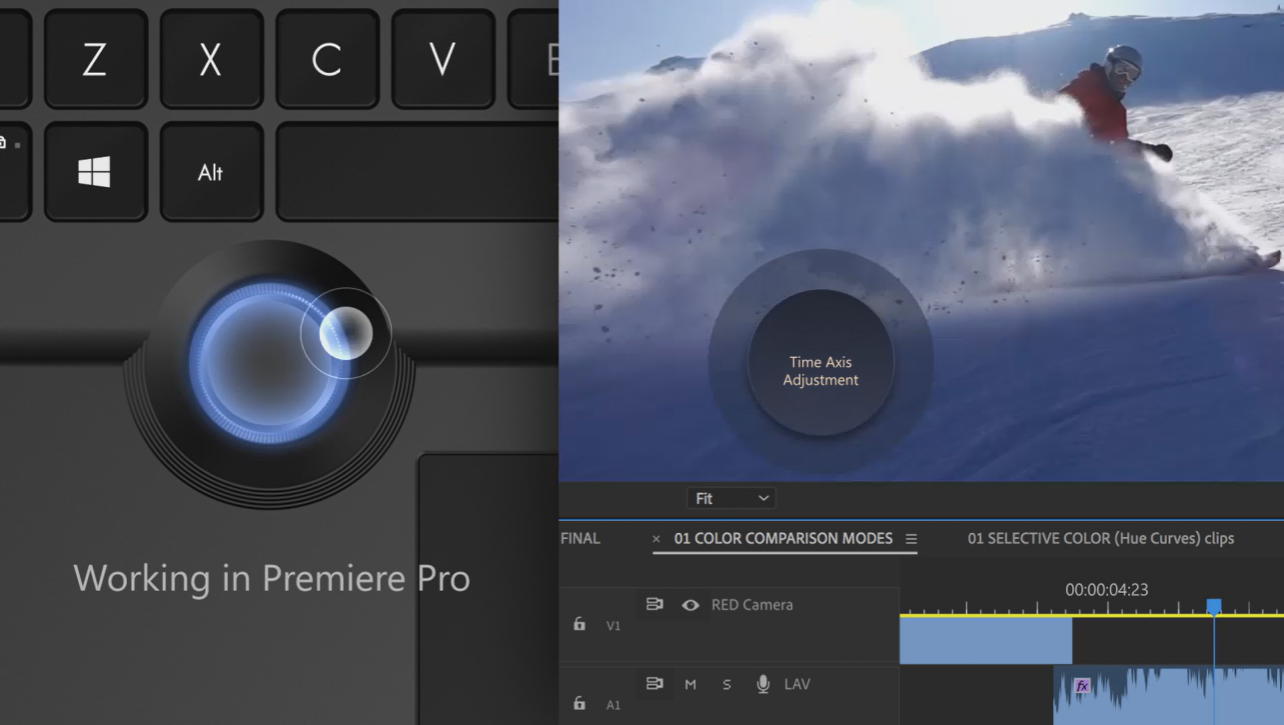
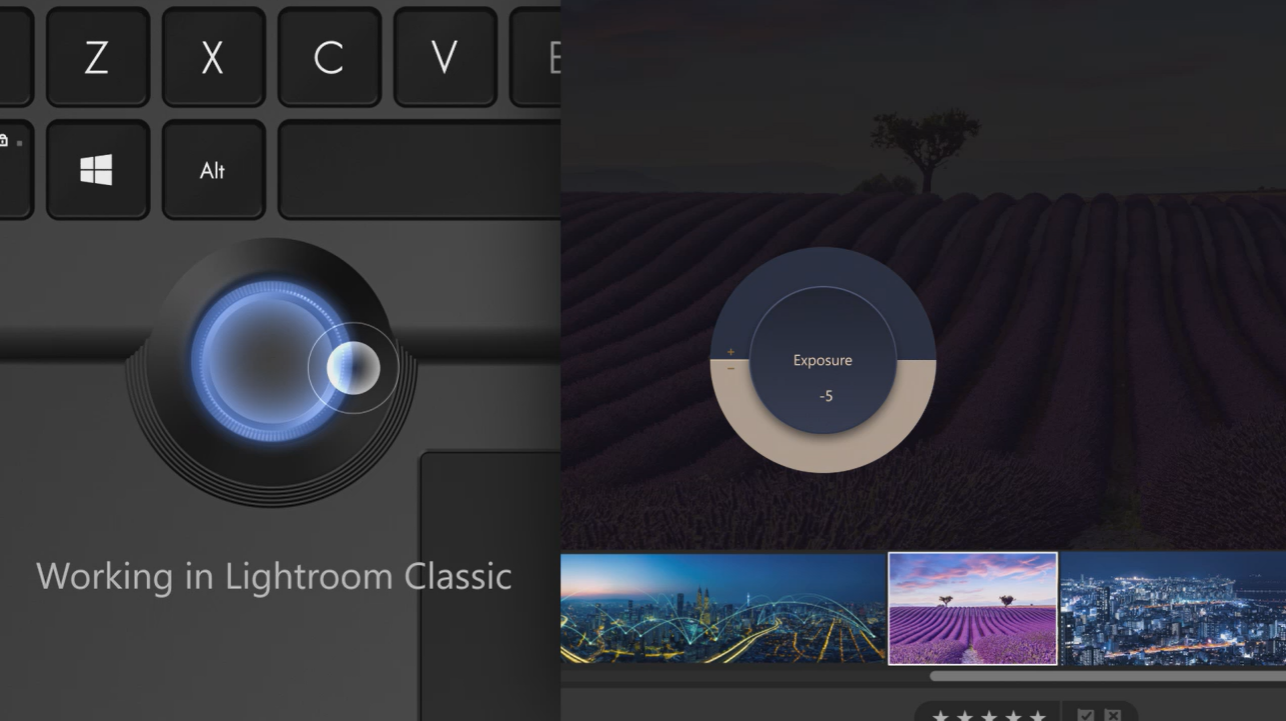
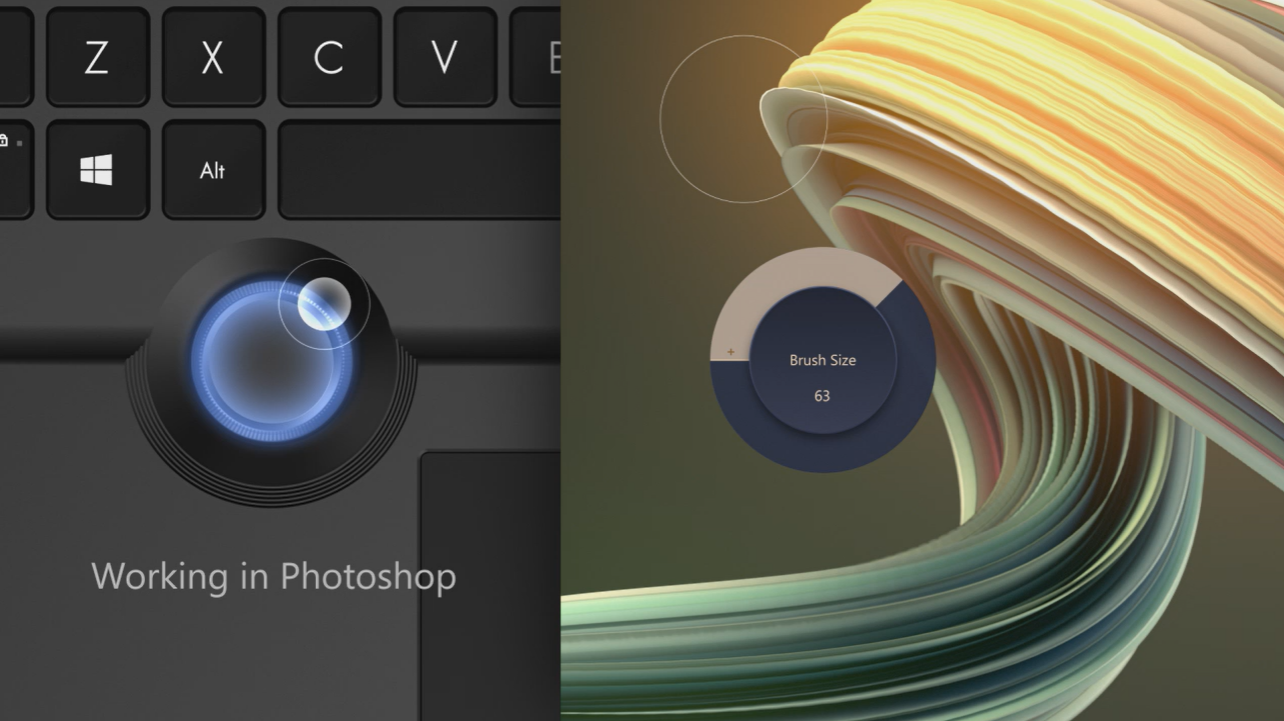
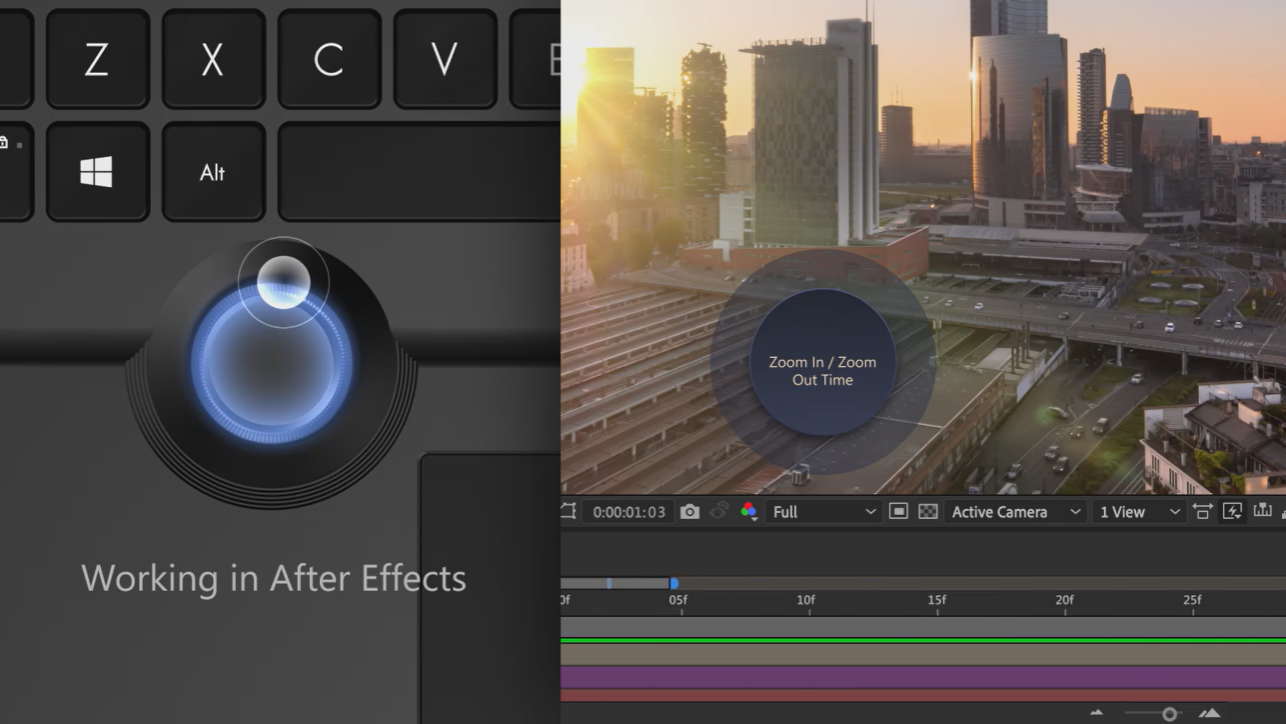
华硕ProArt Studiobook 16的键盘的特点是具有良好的压力点。键盘有正常的大小,尽管表面比较粗糙,但打字时感觉非常舒适。敲击键盘的声音比较小,不会被认为是烦人的。键盘的照明可以在三个级别上进行调整。此外,还有华硕拨号控制器:由于圆形控制器的边缘符合人体工程学,可以非常精确地进行设置,而且也非常安静。例如,你可以直观地控制Photoshop中的画笔,或通过转盘轻松改变图层。缩放、导航或调整色彩平衡或色调,用表盘控制器应该很容易。我们的图片库显示了一些使用拨号控制器的例子。
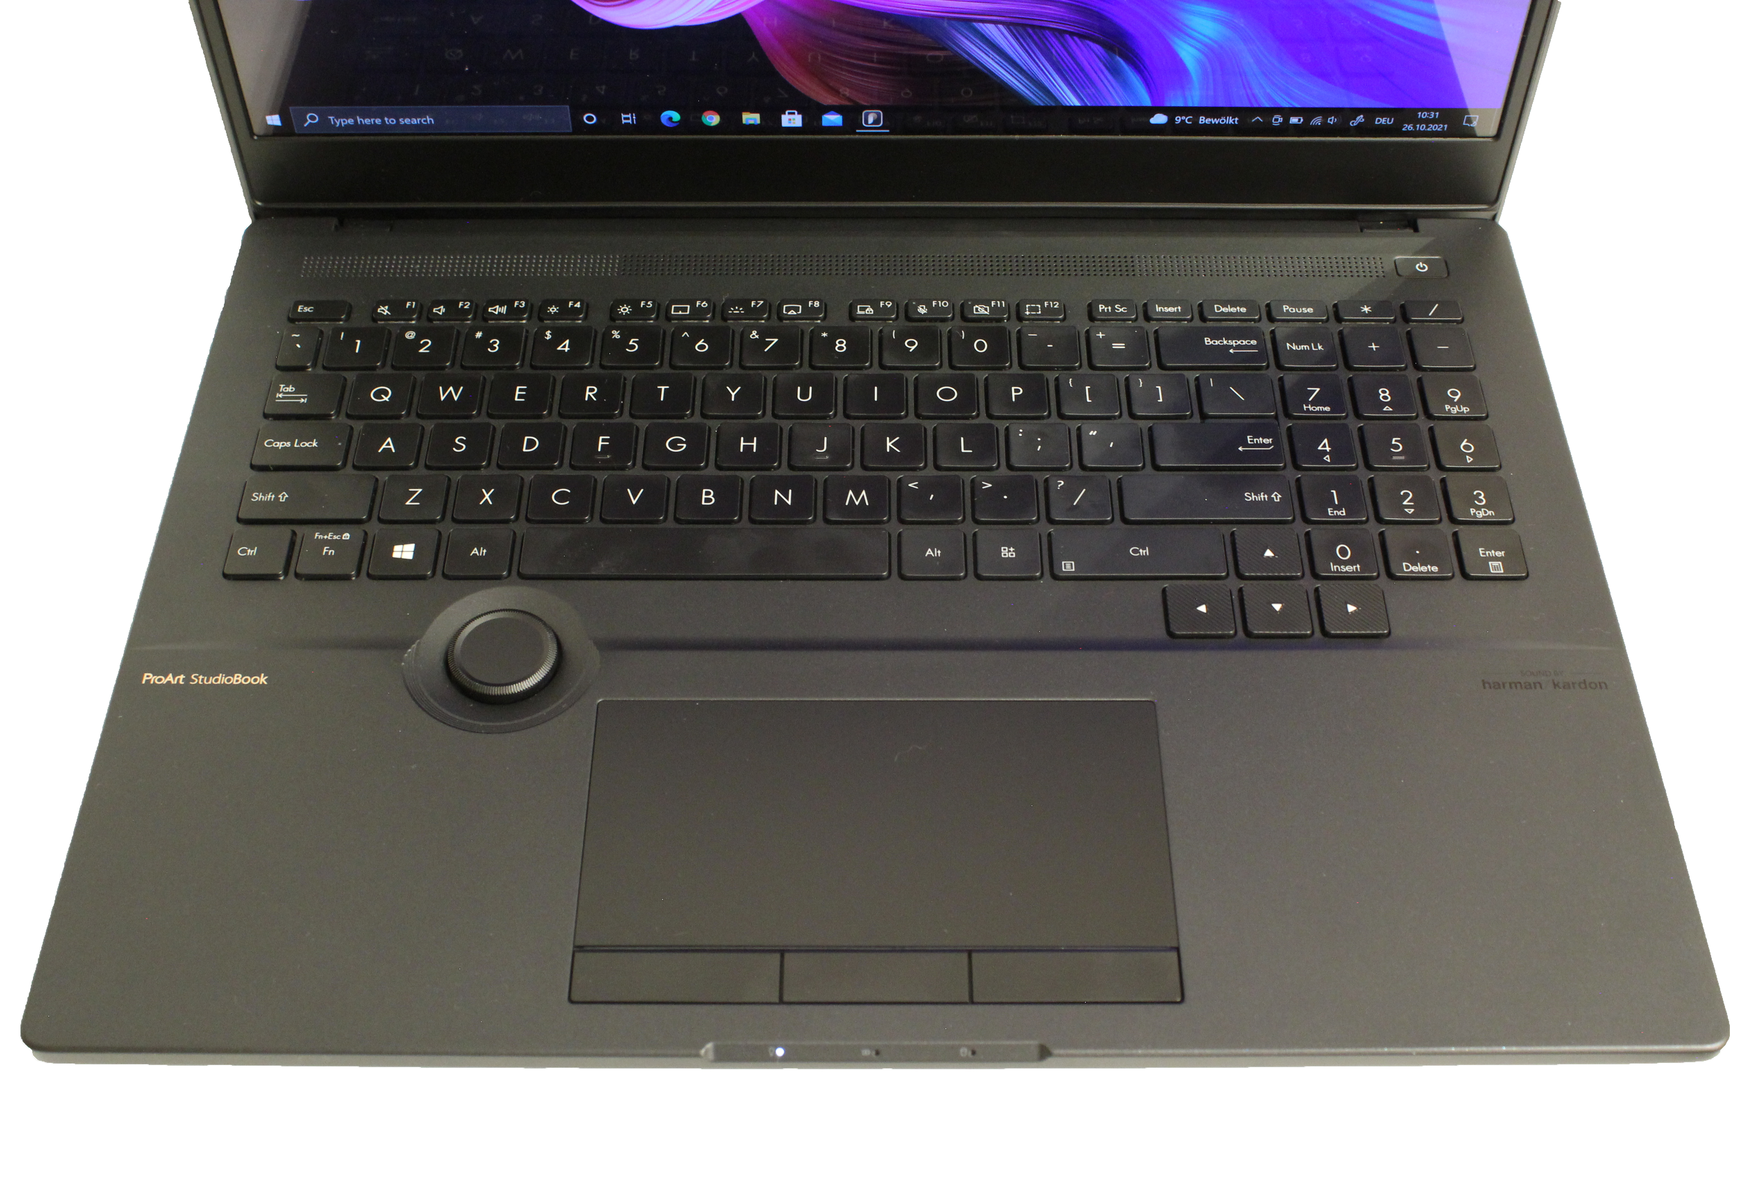
触摸板
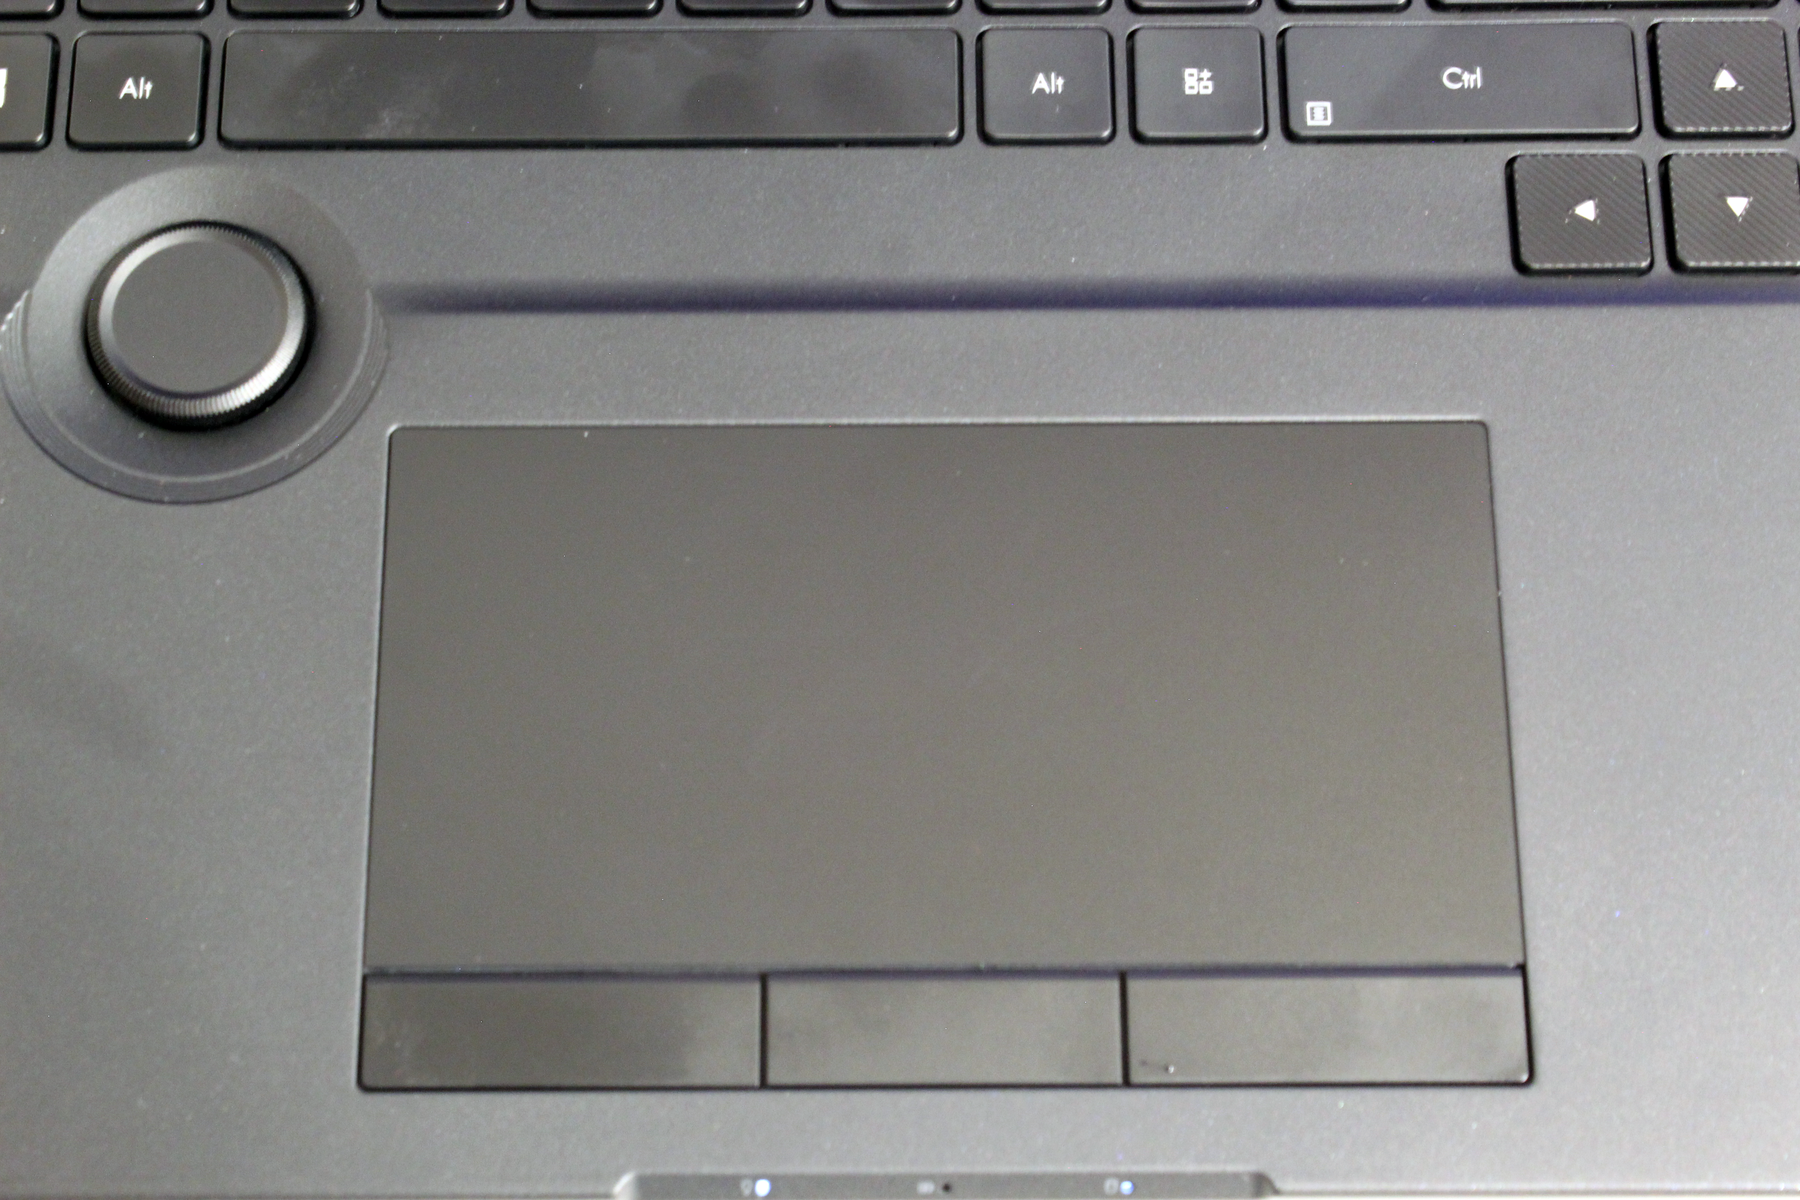
我们的预生产样品的触摸板为用户提供了一个大的表面,以及非常好的滑行性能。同样,多点触摸功能,如滚动或切换标签在这里也能顺利工作。特殊的3个按钮的触摸板适用于需要集中控制应用功能的3D设计师,如平移、旋转或绕圈。与华硕拨号盘结合起来,这两个功能对创意专业人士来说是一个真正的梦之队。
显示。世界上第一个16:10格式的4K OLED HDR面板

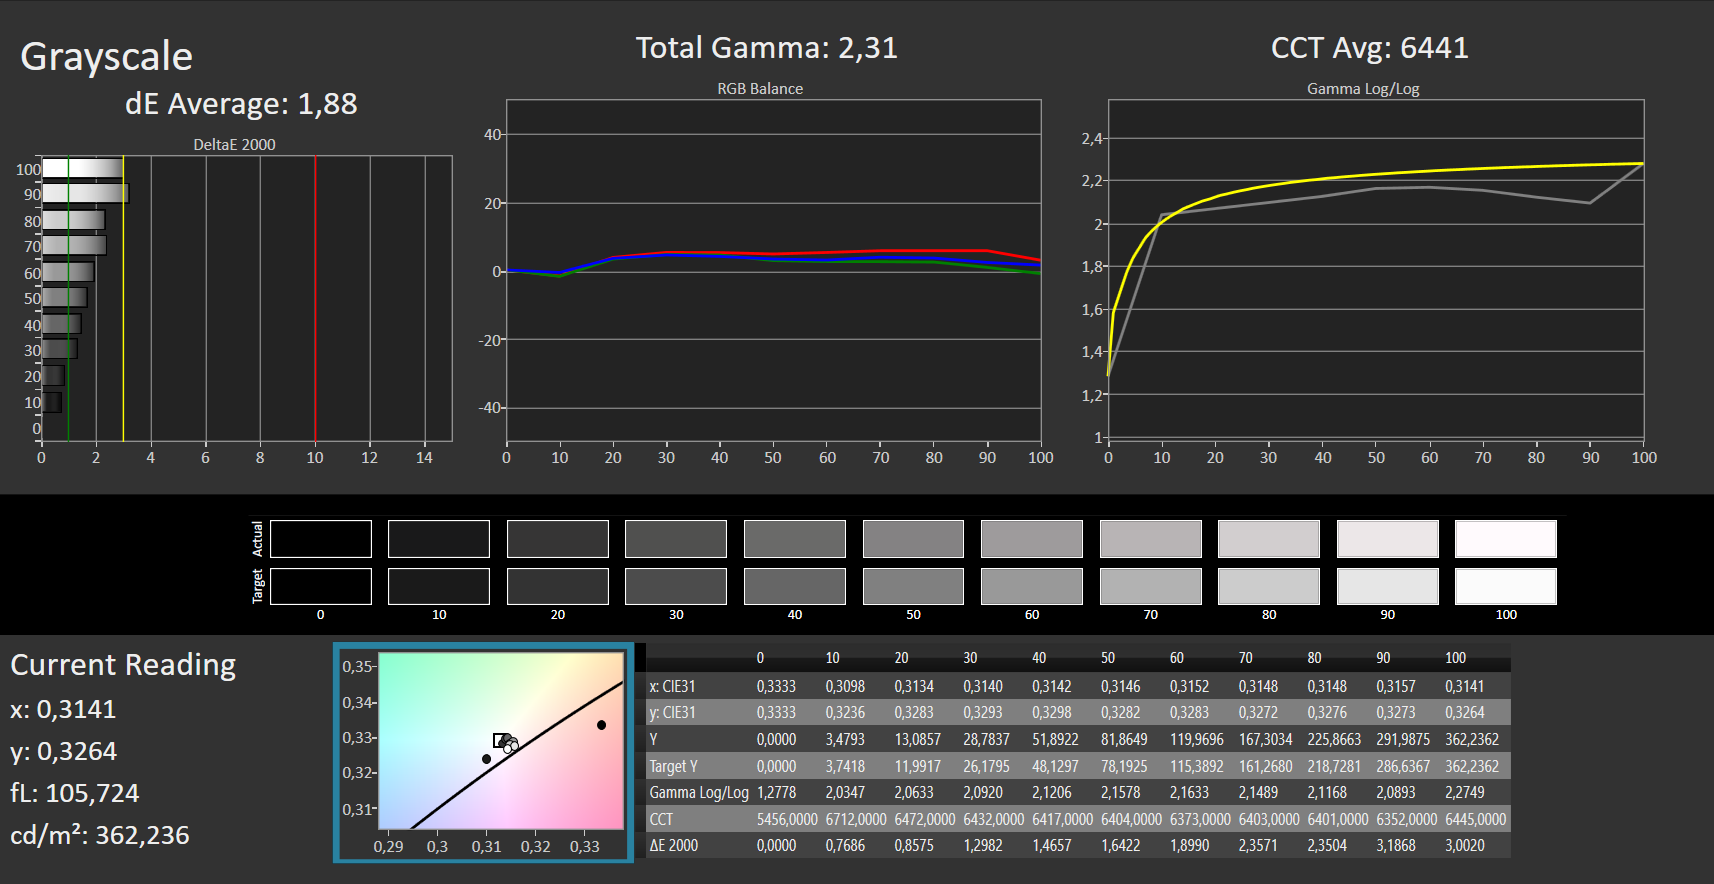
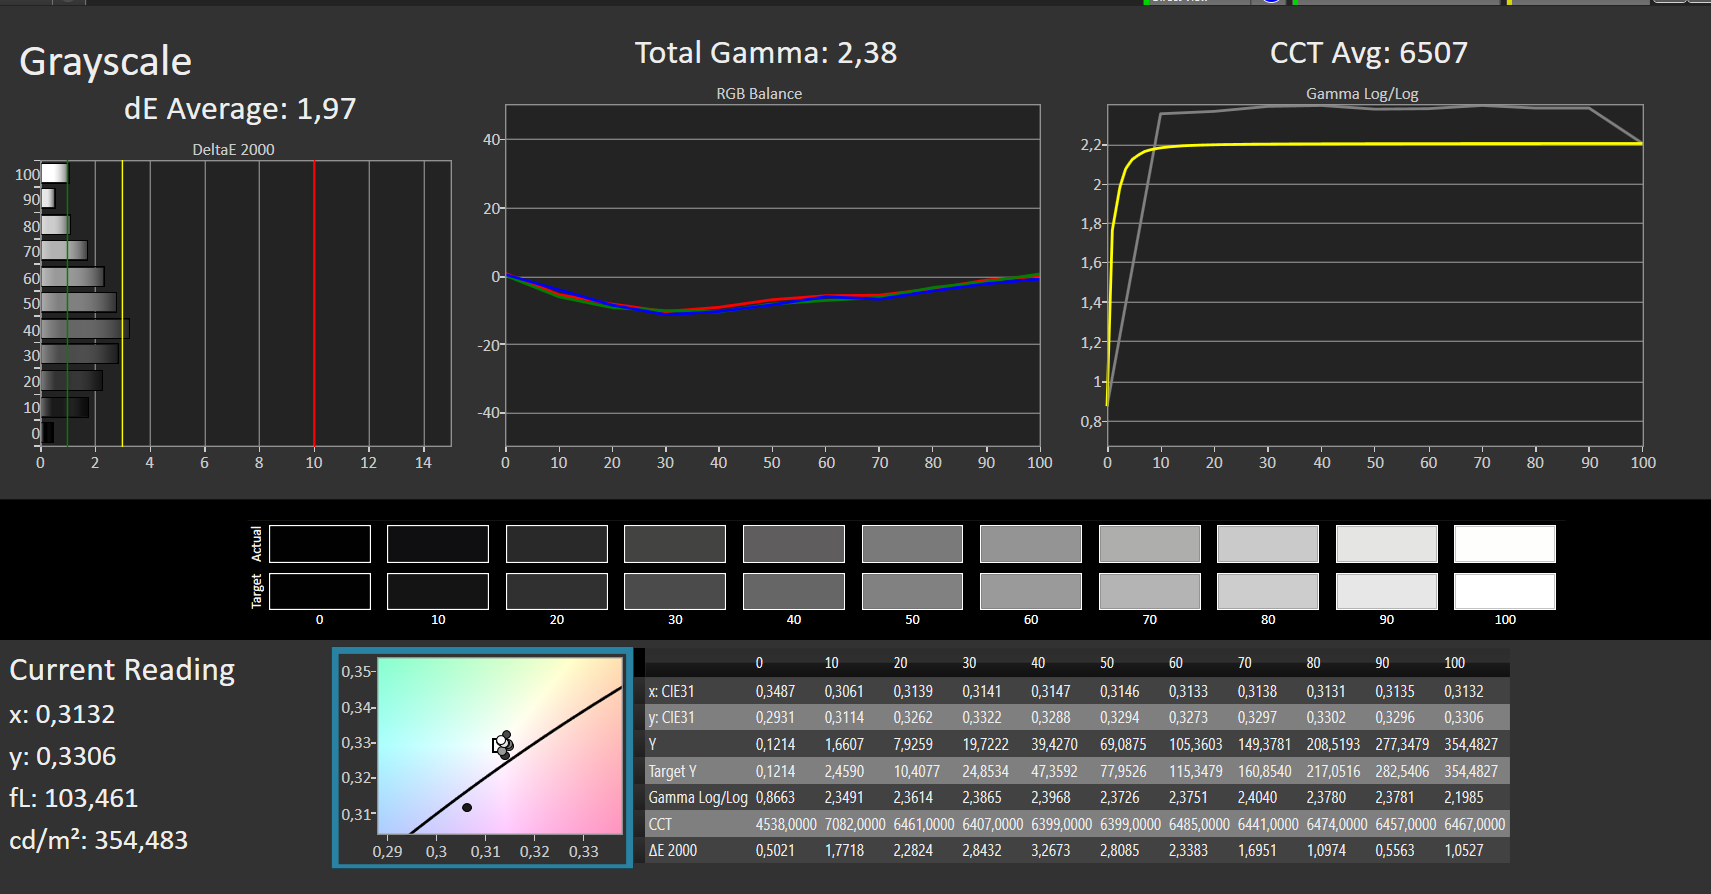
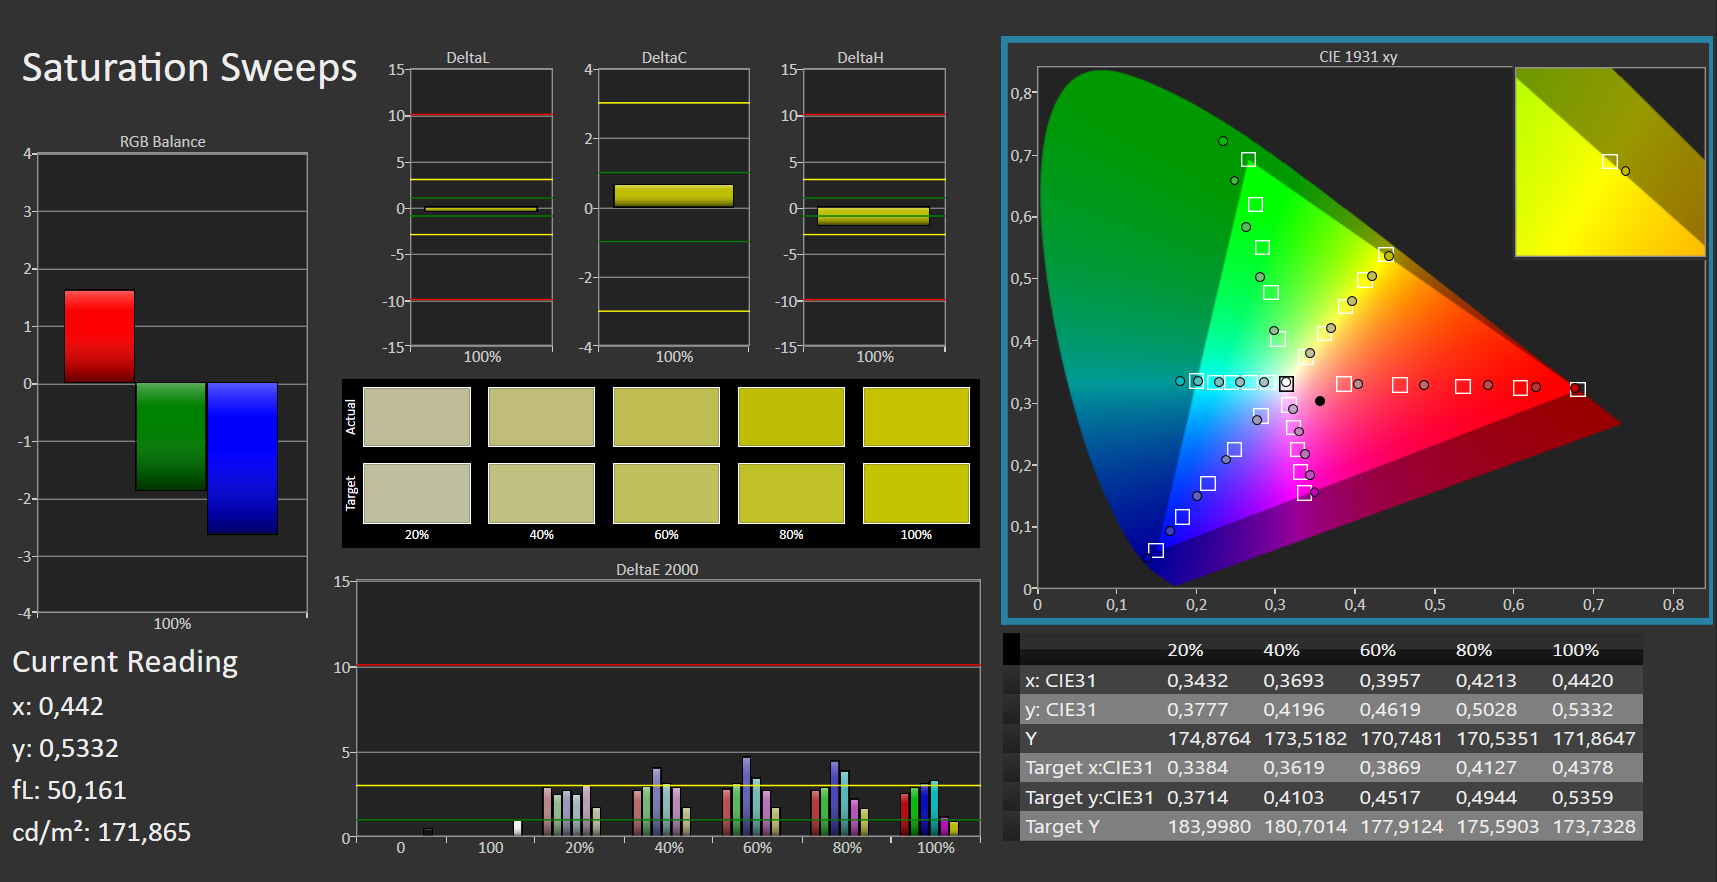
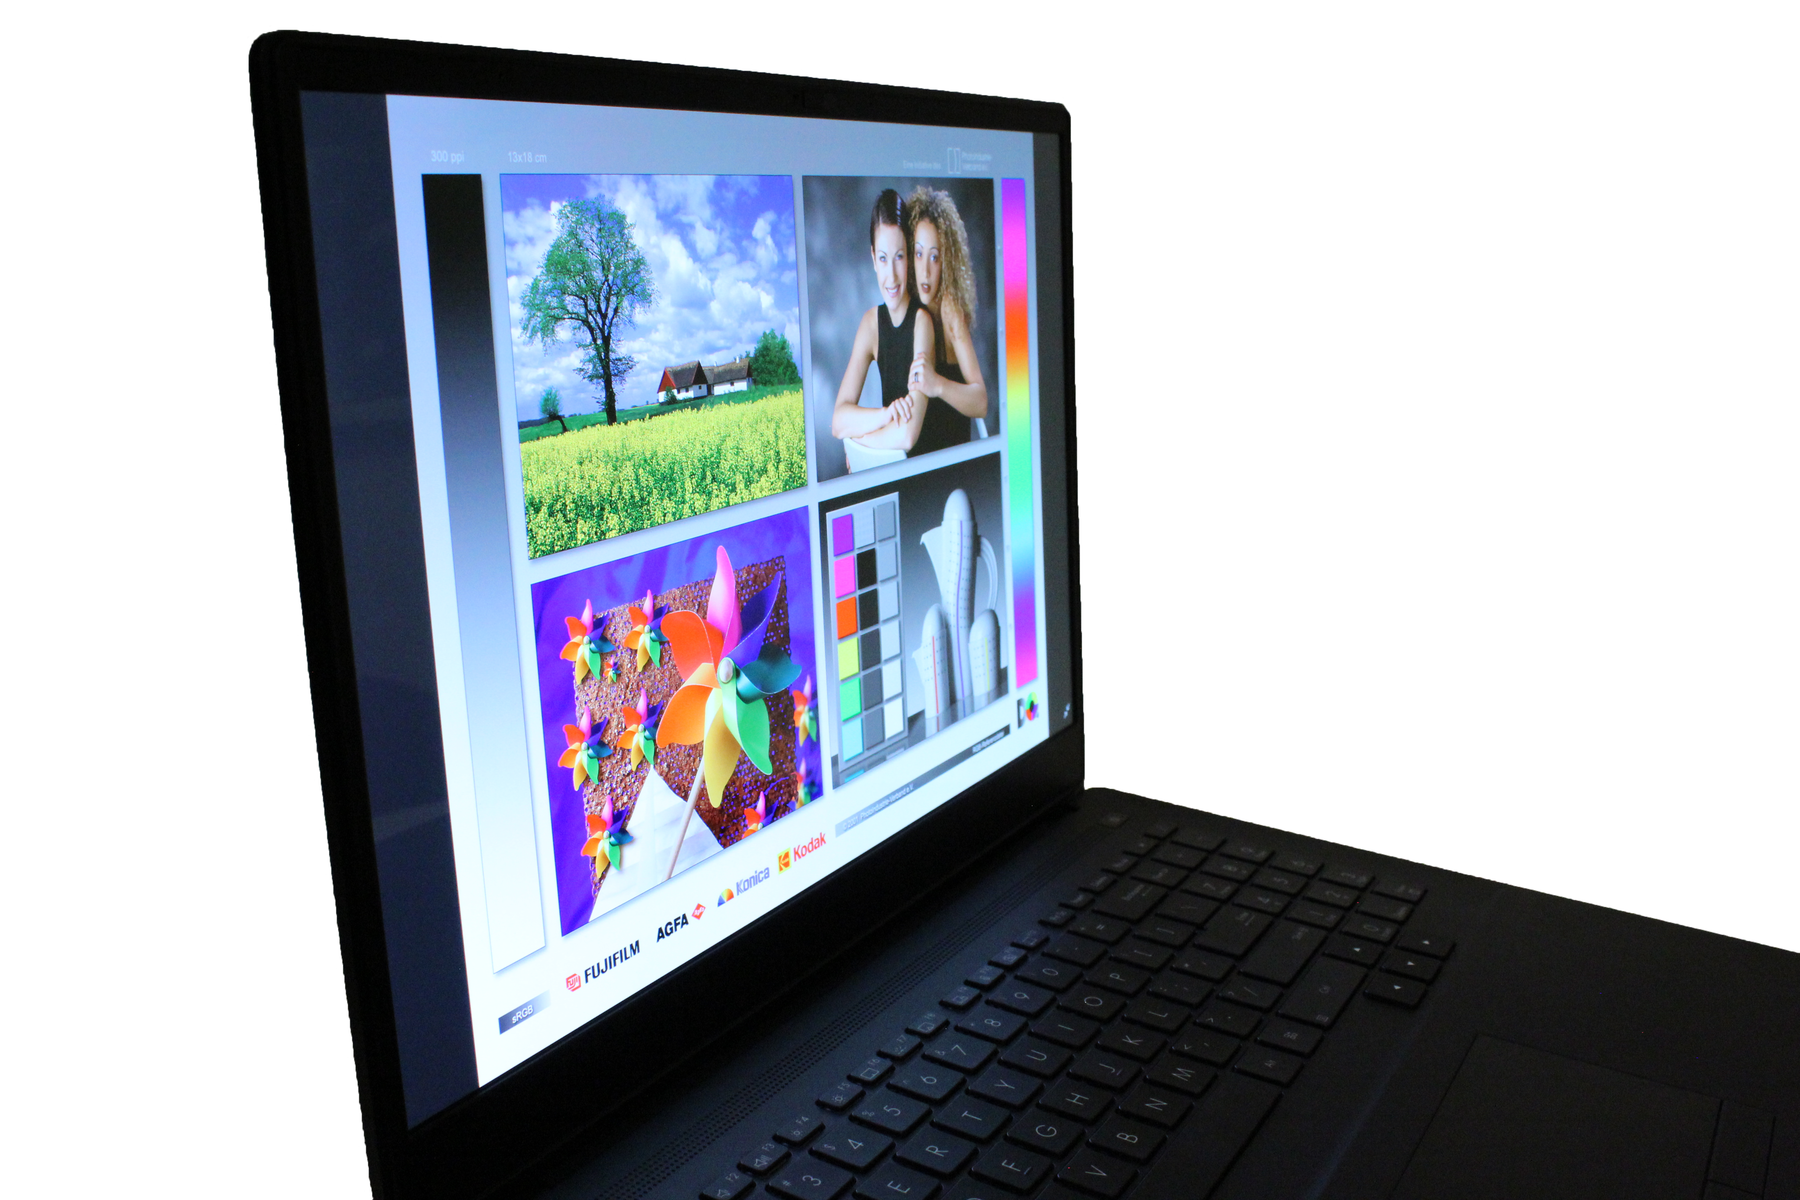
我们的评测样品有4K OLED HDR面板,屏幕对角线为16英寸,长宽比为16:10。它给人的第一印象很好,具有OLED面板的典型优势。此外,由于有潘通认证,它有非常好的工厂校准,因此完全适合编辑图片和视频。96%的照度是非常好的,只有最大亮度可以做得更好。除此之外,在测试中,我们可以在80%及以下的亮度水平上检测到频率为240赫兹的直流调光的PWM。竞争也可以得到一些分数:例如。 惠普ZBook Fury配备了不反光的120赫兹显示屏和更明亮的面板。然而,它也有一些缺点,比如画面的颗粒感,更多的光晕和更差的校准。
由于我们的预生产样品有一个OLED面板,所以没有屏幕渗漏。
| |||||||||||||||||||||||||
Brightness Distribution: 96 %
Center on Battery: 354 cd/m²
Contrast: ∞:1 (Black: 0 cd/m²)
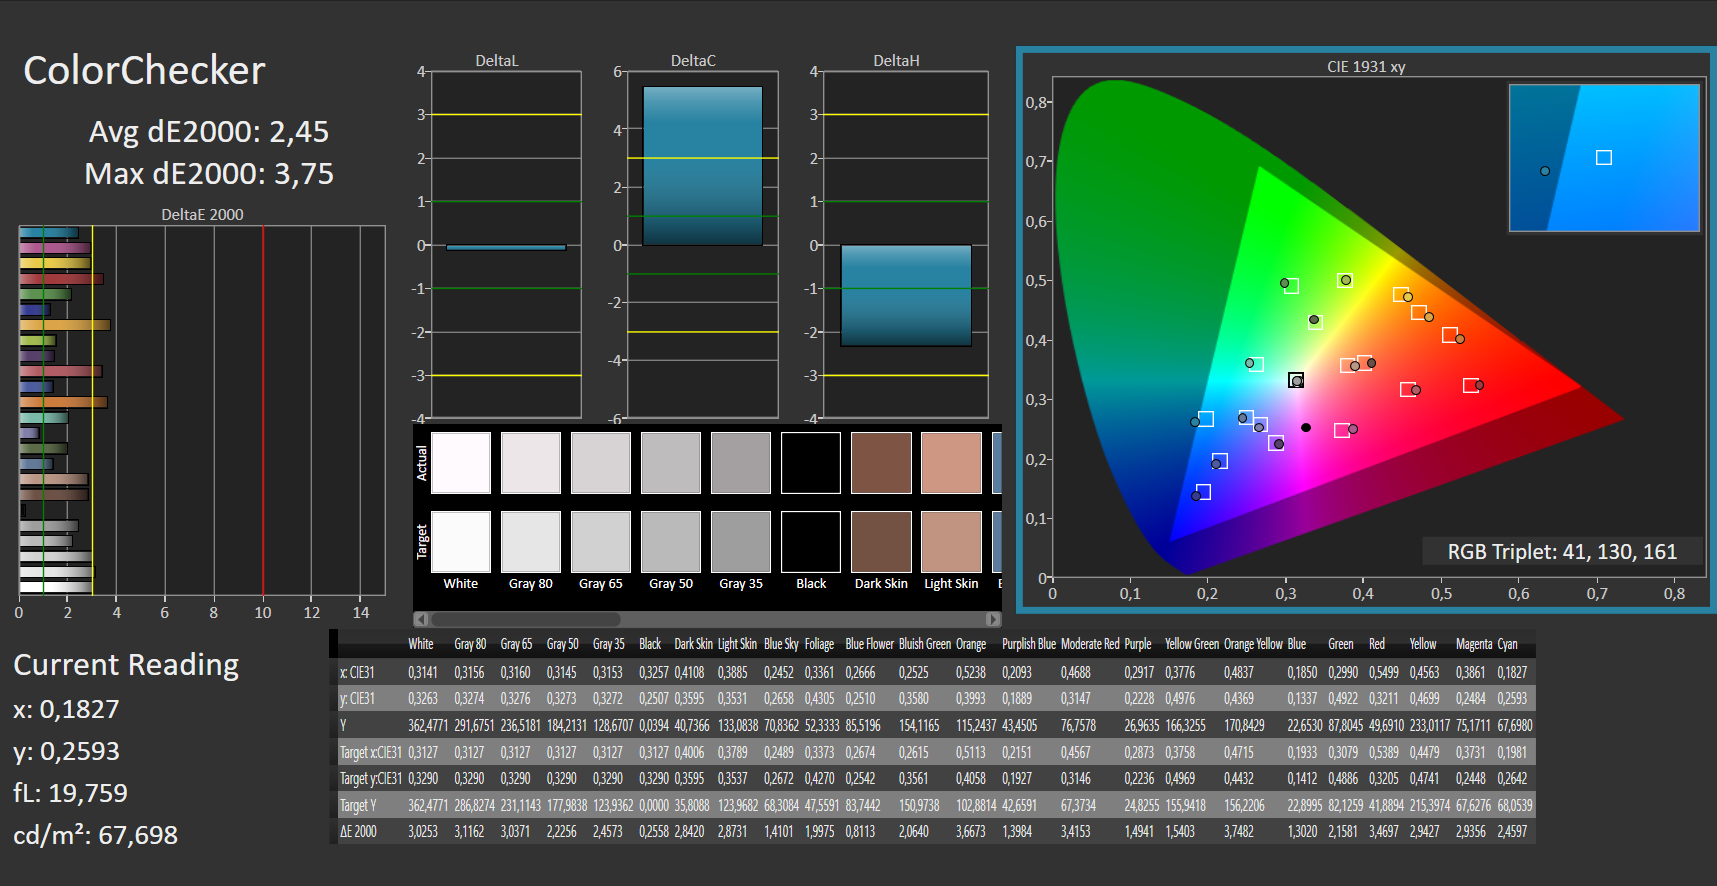
ΔE ColorChecker Calman: 2.45 | ∀{0.5-29.43 Ø4.71}
calibrated: 2.77
ΔE Greyscale Calman: 1.88 | ∀{0.09-98 Ø4.96}
98.6% AdobeRGB 1998 (Argyll 3D)
100% sRGB (Argyll 3D)
99.9% Display P3 (Argyll 3D)
Gamma: 2.31
CCT: 6441 K
| Asus ProArt StudioBook 16 W7600H5A-2BL2 ATNA60YV02-0, OLED, 3840x2400, 16" | HP ZBook Fury 15 G8 BOE0969, IPS, 3840x2160, 15.6" | HP ZBook Studio 15 G8 SDC4145, OLED, 3840x2160, 15.6" | Dell Precision 5000 5560 Sharp LQ156R1, IPS, 3840x2400, 15.6" | |
|---|---|---|---|---|
| Display | -5% | -1% | -1% | |
| Display P3 Coverage (%) | 99.9 | 95.9 -4% | 99.9 0% | 94.9 -5% |
| sRGB Coverage (%) | 100 | 100 0% | 100 0% | 100 0% |
| AdobeRGB 1998 Coverage (%) | 98.6 | 87.3 -11% | 95.3 -3% | 100 1% |
| Response Times | -545% | -20% | -1840% | |
| Response Time Grey 50% / Grey 80% * (ms) | 2 ? | 14.8 ? -640% | 2.4 ? -20% | 47.2 ? -2260% |
| Response Time Black / White * (ms) | 2 ? | 11 ? -450% | 2.4 ? -20% | 30.4 ? -1420% |
| PWM Frequency (Hz) | 240 ? | 240.4 ? | ||
| Screen | -40% | -36% | -24% | |
| Brightness middle (cd/m²) | 353 | 626 77% | 379.6 8% | 501.5 42% |
| Brightness (cd/m²) | 360 | 589 64% | 380 6% | 467 30% |
| Brightness Distribution (%) | 96 | 87 -9% | 95 -1% | 83 -14% |
| Black Level * (cd/m²) | 0.58 | 0.44 | ||
| Colorchecker dE 2000 * | 2.45 | 5.41 -121% | 5.15 -110% | 4.73 -93% |
| Colorchecker dE 2000 max. * | 3.75 | 9.05 -141% | 7.79 -108% | 8.45 -125% |
| Colorchecker dE 2000 calibrated * | 2.77 | 0.6 78% | 3.1 -12% | 0.51 82% |
| Greyscale dE 2000 * | 1.88 | 6.2 -230% | 2.6 -38% | 3.6 -91% |
| Gamma | 2.31 95% | 2.66 83% | 1.99 111% | 2.08 106% |
| CCT | 6441 101% | 6101 107% | 6166 105% | 6447 101% |
| Contrast (:1) | 1079 | 1140 | ||
| Total Average (Program / Settings) | -197% /
-116% | -19% /
-25% | -622% /
-321% |
* ... smaller is better
由于采用了4K OLED HDR显示屏,我们的预生产样品提供了极高的对比度和丰富、深沉的黑色。该面板完全覆盖了DCI-P3和sRGB色彩空间,在AdobeRGB 1998色彩空间中也提供了非常好的数值,达到了98.6%。此外,还有一个非常高的图像清晰度,提供了一个非常好的画面,这意味着该显示器符合专业图形编辑的要求。


我们的预生产测试样品只在有限的范围内适合于户外使用。350cd/m²的亮度和光面显示屏,即使在阴凉处,你的视野也已经很差了。在竞争者中惠普ZBook Fury由于安装了亮度超过600cd/m²的IPS面板,可以做得更好。
Display Response Times
| ↔ Response Time Black to White | ||
|---|---|---|
| 2 ms ... rise ↗ and fall ↘ combined | ↗ 1 ms rise |  |
| ↘ 1 ms fall | ||
| The screen shows very fast response rates in our tests and should be very well suited for fast-paced gaming. In comparison, all tested devices range from 0.1 (minimum) to 240 (maximum) ms. » 11 % of all devices are better. This means that the measured response time is better than the average of all tested devices (19.8 ms). | ||
| ↔ Response Time 50% Grey to 80% Grey | ||
| 2 ms ... rise ↗ and fall ↘ combined | ↗ 1 ms rise |  |
| ↘ 1 ms fall | ||
| The screen shows very fast response rates in our tests and should be very well suited for fast-paced gaming. In comparison, all tested devices range from 0.165 (minimum) to 636 (maximum) ms. » 10 % of all devices are better. This means that the measured response time is better than the average of all tested devices (31 ms). | ||
Screen Flickering / PWM (Pulse-Width Modulation)
| Screen flickering / PWM detected | 240 Hz | ≤ 80 % brightness setting |  |
The display backlight flickers at 240 Hz (worst case, e.g., utilizing PWM) Flickering detected at a brightness setting of 80 % and below. There should be no flickering or PWM above this brightness setting. The frequency of 240 Hz is relatively low, so sensitive users will likely notice flickering and experience eyestrain at the stated brightness setting and below. In comparison: 52 % of all tested devices do not use PWM to dim the display. If PWM was detected, an average of 7757 (minimum: 5 - maximum: 343500) Hz was measured. | |||
由于内置的OLED HDR面板,华硕ProArt Studiobook Pro 16 OLED的视角即使在非常倾斜的角度也很稳定。
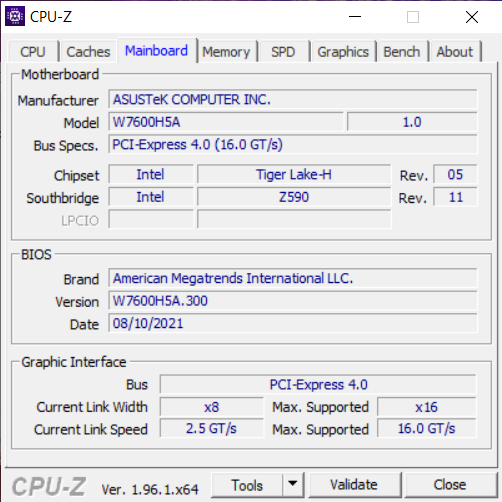
性能。高级别的性能和复杂的冷却系统
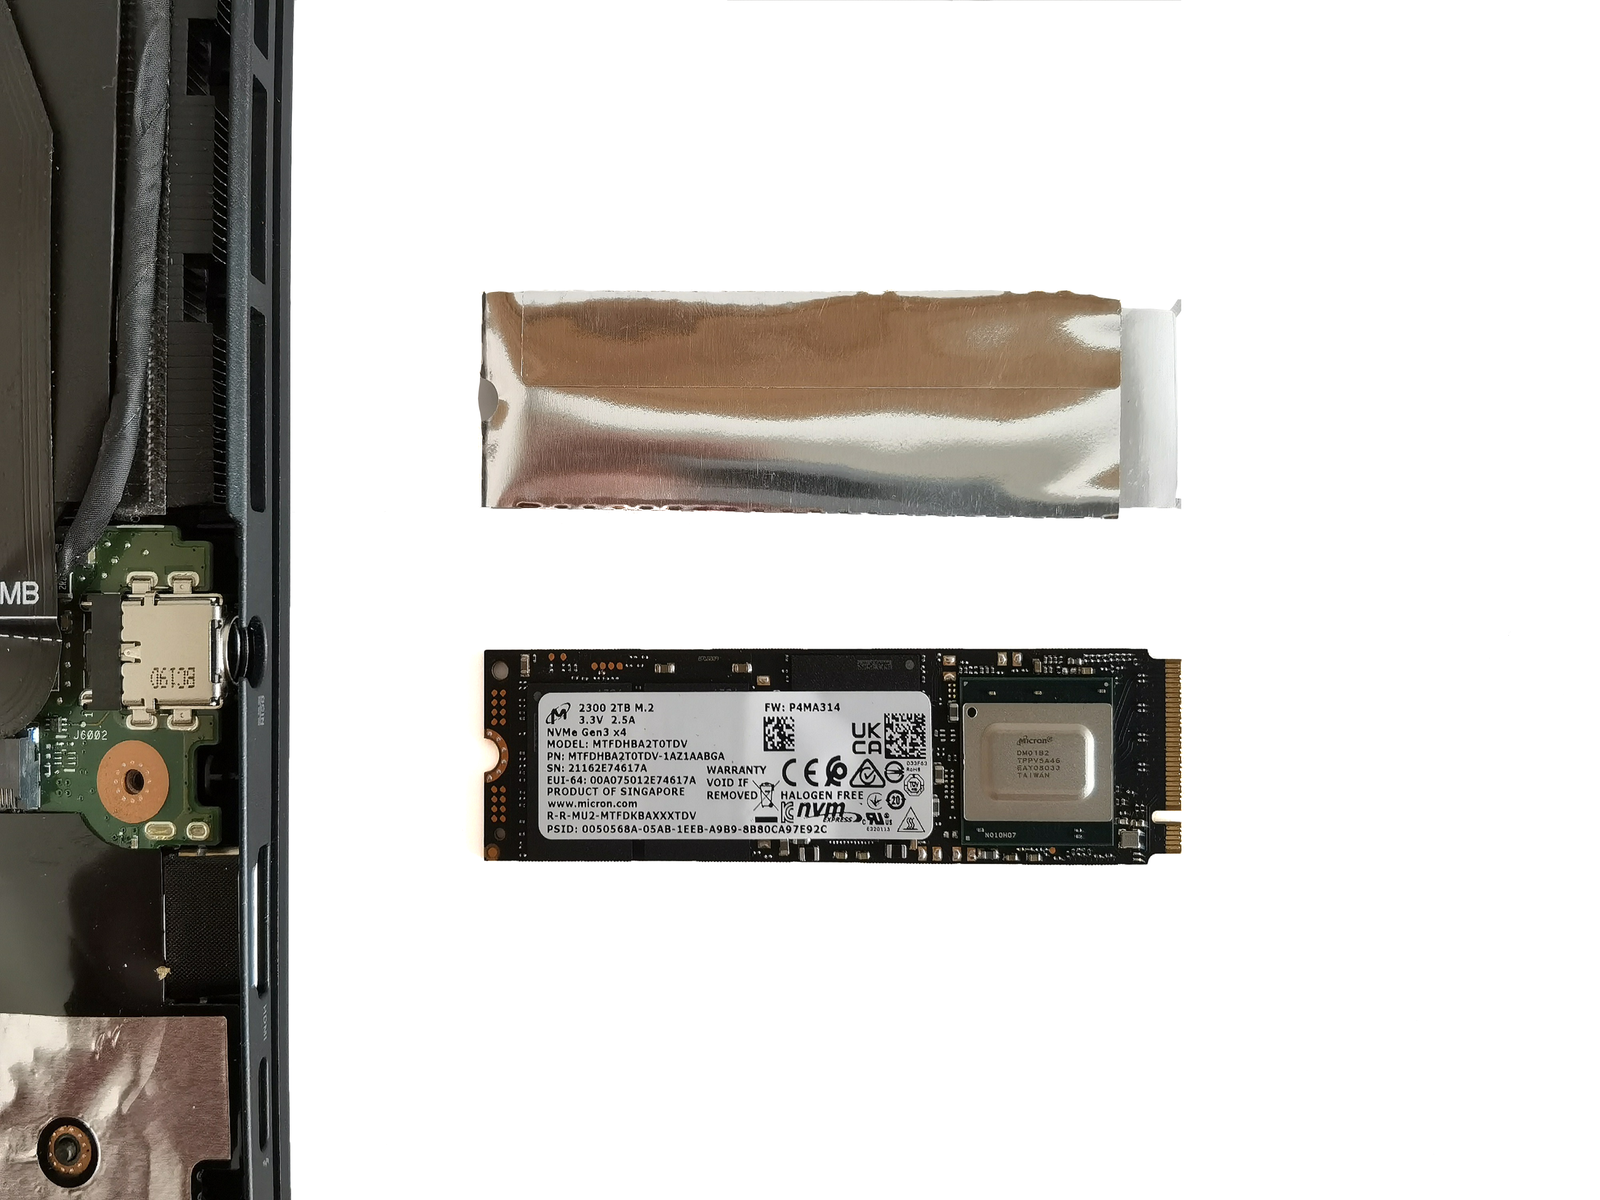
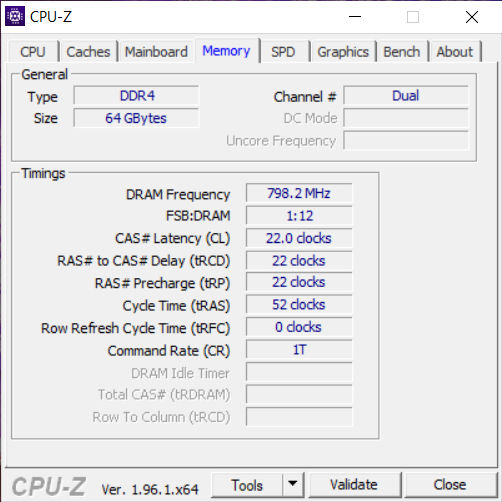
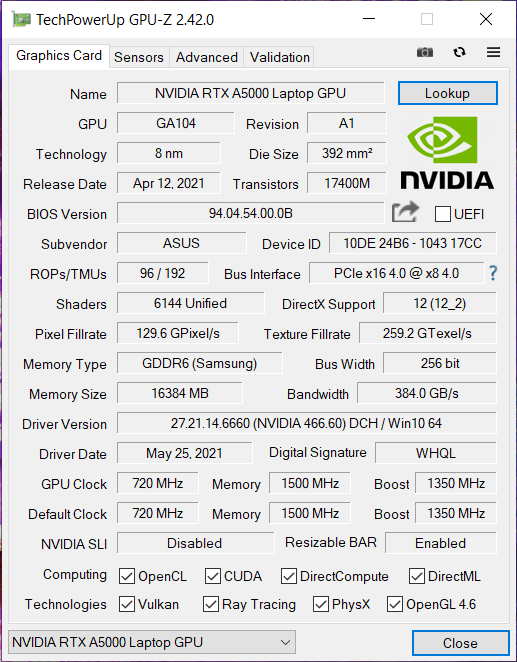
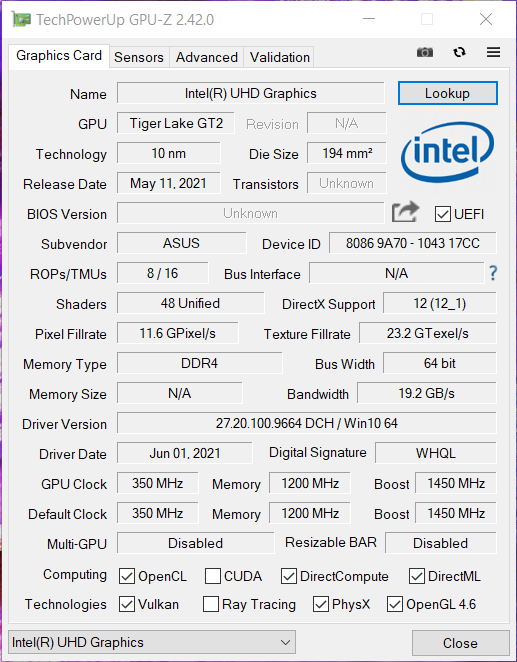
华硕不做任何妥协,依靠英特尔和Nvidia目前为工作站提供的最新和最强大的组件。因此,一个 英特尔至强W-11955与64GB DDR4内存和2TB NVMe SSD Raid 0阵列一起在内部工作。图形负载分布在Nvidia RTX A5000和基于XE架构的英特尔UHD Graphics 。我们设备中安装的工作内存是ECC内存,时钟频率为3200MHz。不幸的是,SSD插槽只支持使用PCIe Gen.3的NVMe SSD。从配置的其他部分来看,PCIe Gen.4可能更合适。其他配置是否会出现是个问题,但这还有待观察。
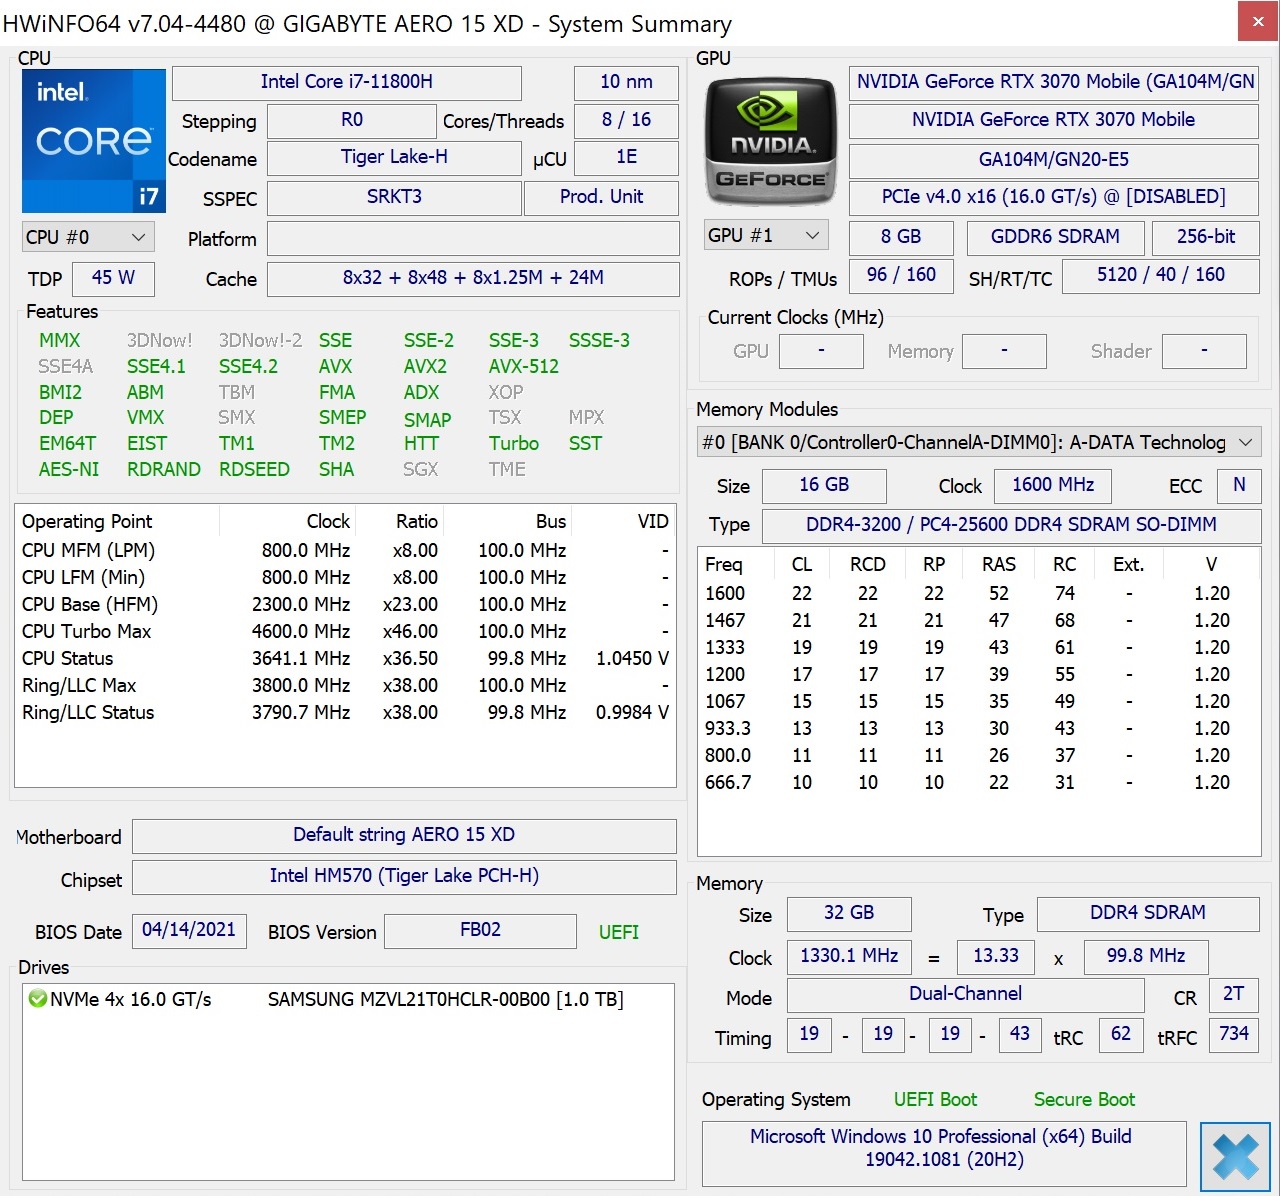
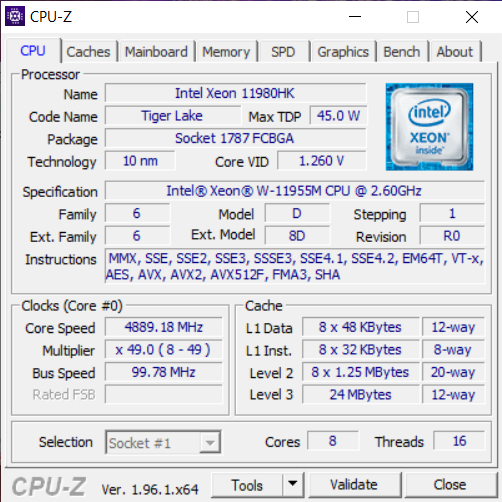
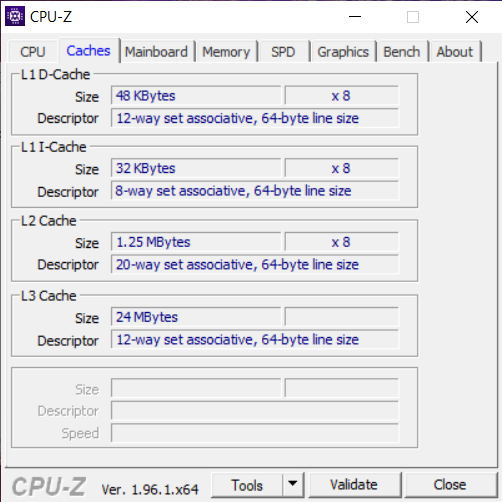
处理器
现在让我们来谈谈老虎湖八核CPU,它在2021年第二季度推出。这款 英特尔至强W11955M是为移动工作站设计的,采用新的10纳米SuperFin工艺制造,相比之下 英特尔酷睿i9-11950H此外,还提供对ECC内存的支持。该芯片的TDP为45瓦,但在我们的测试样本中配置较高,并根据应用场景增加到永久性的54瓦。处理器内核的时钟频率为2.6至5GHz,支持DDR4-3200内存。
在我们的Cinebench Multi耐力测试中,性能达到了预期水平,因此很容易就超过了 惠普ZBook Fury的 英特尔酷睿i9-11950H安装。一方面,这也是由于安装的冷却系统,它也是为140W的综合TDP设计的。我们在性能模式下对该设备进行了测试,该模式在华硕ProArt Creator Hub中可用,并能根据所需任务动态调整冷却。对于日常任务,有标准模式,应用程序也允许将风扇设置为全速。然而,在测试中,这并不代表什么附加价值,除了当风扇以5,600转/分钟的高转速运行时,有必要戴上耳机。在电池模式下,该系统将我们的设备从54瓦降至15瓦,这在性能上也很明显。有关该处理器的更多细节可以在我们的 CPU部分
Cinebench R15 Multi endurance test
Cinebench R20: CPU (Multi Core) | CPU (Single Core)
Cinebench R15: CPU Multi 64Bit | CPU Single 64Bit
Blender: v2.79 BMW27 CPU
7-Zip 18.03: 7z b 4 | 7z b 4 -mmt1
Geekbench 5.5: Multi-Core | Single-Core
HWBOT x265 Benchmark v2.2: 4k Preset
LibreOffice : 20 Documents To PDF
R Benchmark 2.5: Overall mean
SPECviewperf 2020: 1920x1080 Solidworks (solidworks-05) | 1920x1080 Siemens NX (snx-04) | 1920x1080 Medical (medical-03) | 1920x1080 Maya (maya-06) | 1920x1080 Energy (energy-03) | 1920x1080 Creo (creo-03) | 1920x1080 CATIA (catia-06) | 1920x1080 3ds Max (3dsmax-07) | 3840x2160 Solidworks (solidworks-05) | 3840x2160 Siemens NX (snx-04) | 3840x2160 Medical (medical-03) | 3840x2160 Maya (maya-06) | 3840x2160 Energy (energy-03) | 3840x2160 Creo (creo-03) | 3840x2160 CATIA (catia-06) | 3840x2160 3ds Max (3dsmax-07)
| Cinebench R23 / Multi Core | |
| Average of class Workstation (14621 - 38520, n=23, last 2 years) | |
| Schenker XMG Ultra 17 Rocket Lake | |
| MSI GS76 Stealth 11UH | |
| HP ZBook Fury 15 G8 | |
| HP ZBook Studio 15 G8 | |
| Average Intel Xeon W-11955M (10862 - 12412, n=2) | |
| Asus ProArt StudioBook 16 W7600H5A-2BL2 | |
| Dell Precision 5000 5560 | |
| Cinebench R23 / Single Core | |
| Average of class Workstation (1712 - 2228, n=23, last 2 years) | |
| Schenker XMG Ultra 17 Rocket Lake | |
| HP ZBook Fury 15 G8 | |
| MSI GS76 Stealth 11UH | |
| HP ZBook Studio 15 G8 | |
| Average Intel Xeon W-11955M (1480 - 1621, n=2) | |
| Dell Precision 5000 5560 | |
| Asus ProArt StudioBook 16 W7600H5A-2BL2 | |
| Cinebench R20 / CPU (Multi Core) | |
| Average of class Workstation (5760 - 15043, n=23, last 2 years) | |
| Schenker XMG Ultra 17 Rocket Lake | |
| MSI GS76 Stealth 11UH | |
| HP ZBook Fury 15 G8 | |
| HP ZBook Studio 15 G8 | |
| Asus ProArt StudioBook 16 W7600H5A-2BL2 | |
| Average Intel Xeon W-11955M (n=1) | |
| Dell Precision 5000 5560 | |
| Cinebench R20 / CPU (Single Core) | |
| Average of class Workstation (671 - 857, n=23, last 2 years) | |
| Schenker XMG Ultra 17 Rocket Lake | |
| HP ZBook Fury 15 G8 | |
| HP ZBook Studio 15 G8 | |
| MSI GS76 Stealth 11UH | |
| Dell Precision 5000 5560 | |
| Asus ProArt StudioBook 16 W7600H5A-2BL2 | |
| Average Intel Xeon W-11955M (n=1) | |
| Cinebench R15 / CPU Multi 64Bit | |
| Average of class Workstation (2489 - 5810, n=23, last 2 years) | |
| Schenker XMG Ultra 17 Rocket Lake | |
| MSI GS76 Stealth 11UH | |
| Asus ProArt StudioBook 16 W7600H5A-2BL2 | |
| Average Intel Xeon W-11955M (n=1) | |
| HP ZBook Studio 15 G8 | |
| HP ZBook Fury 15 G8 | |
| Dell Precision 5000 5560 | |
| Cinebench R15 / CPU Single 64Bit | |
| Average of class Workstation (191.4 - 328, n=23, last 2 years) | |
| Schenker XMG Ultra 17 Rocket Lake | |
| HP ZBook Fury 15 G8 | |
| MSI GS76 Stealth 11UH | |
| HP ZBook Studio 15 G8 | |
| Dell Precision 5000 5560 | |
| Asus ProArt StudioBook 16 W7600H5A-2BL2 | |
| Average Intel Xeon W-11955M (n=1) | |
| Blender / v2.79 BMW27 CPU | |
| Dell Precision 5000 5560 | |
| Asus ProArt StudioBook 16 W7600H5A-2BL2 | |
| Average Intel Xeon W-11955M (n=1) | |
| HP ZBook Fury 15 G8 | |
| HP ZBook Studio 15 G8 | |
| MSI GS76 Stealth 11UH | |
| Schenker XMG Ultra 17 Rocket Lake | |
| Average of class Workstation (91 - 222, n=23, last 2 years) | |
| 7-Zip 18.03 / 7z b 4 | |
| Average of class Workstation (60489 - 116969, n=23, last 2 years) | |
| Schenker XMG Ultra 17 Rocket Lake | |
| MSI GS76 Stealth 11UH | |
| HP ZBook Fury 15 G8 | |
| HP ZBook Studio 15 G8 | |
| Asus ProArt StudioBook 16 W7600H5A-2BL2 | |
| Average Intel Xeon W-11955M (n=1) | |
| Dell Precision 5000 5560 | |
| 7-Zip 18.03 / 7z b 4 -mmt1 | |
| Average of class Workstation (5126 - 6960, n=23, last 2 years) | |
| Schenker XMG Ultra 17 Rocket Lake | |
| HP ZBook Studio 15 G8 | |
| HP ZBook Fury 15 G8 | |
| Dell Precision 5000 5560 | |
| MSI GS76 Stealth 11UH | |
| Asus ProArt StudioBook 16 W7600H5A-2BL2 | |
| Average Intel Xeon W-11955M (n=1) | |
| Geekbench 5.5 / Multi-Core | |
| Average of class Workstation (11542 - 25554, n=23, last 2 years) | |
| Schenker XMG Ultra 17 Rocket Lake | |
| MSI GS76 Stealth 11UH | |
| Average Intel Xeon W-11955M (8349 - 9766, n=2) | |
| Asus ProArt StudioBook 16 W7600H5A-2BL2 | |
| HP ZBook Studio 15 G8 | |
| Geekbench 5.5 / Single-Core | |
| Average of class Workstation (1783 - 2183, n=23, last 2 years) | |
| Schenker XMG Ultra 17 Rocket Lake | |
| HP ZBook Studio 15 G8 | |
| MSI GS76 Stealth 11UH | |
| Average Intel Xeon W-11955M (1487 - 1686, n=2) | |
| Asus ProArt StudioBook 16 W7600H5A-2BL2 | |
| HWBOT x265 Benchmark v2.2 / 4k Preset | |
| Average of class Workstation (17.8 - 40.5, n=23, last 2 years) | |
| Schenker XMG Ultra 17 Rocket Lake | |
| MSI GS76 Stealth 11UH | |
| HP ZBook Studio 15 G8 | |
| HP ZBook Fury 15 G8 | |
| Asus ProArt StudioBook 16 W7600H5A-2BL2 | |
| Average Intel Xeon W-11955M (n=1) | |
| Dell Precision 5000 5560 | |
| LibreOffice / 20 Documents To PDF | |
| HP ZBook Fury 15 G8 | |
| MSI GS76 Stealth 11UH | |
| HP ZBook Studio 15 G8 | |
| Dell Precision 5000 5560 | |
| Average of class Workstation (37.1 - 74.7, n=23, last 2 years) | |
| Schenker XMG Ultra 17 Rocket Lake | |
| Asus ProArt StudioBook 16 W7600H5A-2BL2 | |
| Average Intel Xeon W-11955M (n=1) | |
| R Benchmark 2.5 / Overall mean | |
| Asus ProArt StudioBook 16 W7600H5A-2BL2 | |
| Average Intel Xeon W-11955M (n=1) | |
| HP ZBook Studio 15 G8 | |
| HP ZBook Fury 15 G8 | |
| Dell Precision 5000 5560 | |
| MSI GS76 Stealth 11UH | |
| Schenker XMG Ultra 17 Rocket Lake | |
| Average of class Workstation (0.3825 - 0.603, n=23, last 2 years) | |
| SPECviewperf 2020 / Solidworks (solidworks-05) | |
| Asus ProArt StudioBook 16 W7600H5A-2BL2 | |
| Average Intel Xeon W-11955M (n=1) | |
| Average of class Workstation (50.6 - 542, n=9, last 2 years) | |
| HP ZBook Fury 15 G8 | |
| Dell Precision 5000 5560 | |
| SPECviewperf 2020 / Siemens NX (snx-04) | |
| Average of class Workstation (22.3 - 903, n=23, last 2 years) | |
| Asus ProArt StudioBook 16 W7600H5A-2BL2 | |
| Average Intel Xeon W-11955M (n=1) | |
| HP ZBook Fury 15 G8 | |
| Dell Precision 5000 5560 | |
| SPECviewperf 2020 / Medical (medical-03) | |
| Average of class Workstation (28.8 - 227, n=23, last 2 years) | |
| Asus ProArt StudioBook 16 W7600H5A-2BL2 | |
| Average Intel Xeon W-11955M (n=1) | |
| HP ZBook Fury 15 G8 | |
| Dell Precision 5000 5560 | |
| SPECviewperf 2020 / Maya (maya-06) | |
| Average of class Workstation (117.8 - 724, n=22, last 2 years) | |
| Asus ProArt StudioBook 16 W7600H5A-2BL2 | |
| Average Intel Xeon W-11955M (n=1) | |
| HP ZBook Fury 15 G8 | |
| Dell Precision 5000 5560 | |
| SPECviewperf 2020 / Energy (energy-03) | |
| Average of class Workstation (17.3 - 176.7, n=23, last 2 years) | |
| Asus ProArt StudioBook 16 W7600H5A-2BL2 | |
| Average Intel Xeon W-11955M (n=1) | |
| HP ZBook Fury 15 G8 | |
| Dell Precision 5000 5560 | |
| SPECviewperf 2020 / Creo (creo-03) | |
| Asus ProArt StudioBook 16 W7600H5A-2BL2 | |
| Average Intel Xeon W-11955M (n=1) | |
| Average of class Workstation (49.2 - 261, n=23, last 2 years) | |
| HP ZBook Fury 15 G8 | |
| Dell Precision 5000 5560 | |
| SPECviewperf 2020 / CATIA (catia-06) | |
| Asus ProArt StudioBook 16 W7600H5A-2BL2 | |
| Average Intel Xeon W-11955M (n=1) | |
| HP ZBook Fury 15 G8 | |
| Average of class Workstation (27.1 - 182.2, n=23, last 2 years) | |
| Dell Precision 5000 5560 | |
| SPECviewperf 2020 / 3ds Max (3dsmax-07) | |
| Asus ProArt StudioBook 16 W7600H5A-2BL2 | |
| Average Intel Xeon W-11955M (n=1) | |
| Average of class Workstation (24.7 - 251, n=23, last 2 years) | |
| HP ZBook Fury 15 G8 | |
| Dell Precision 5000 5560 | |
| SPECviewperf 2020 / Solidworks (solidworks-05) | |
| Asus ProArt StudioBook 16 W7600H5A-2BL2 | |
| Average Intel Xeon W-11955M (n=1) | |
| HP ZBook Fury 15 G8 | |
| Dell Precision 5000 5560 | |
| SPECviewperf 2020 / Siemens NX (snx-04) | |
| Average of class Workstation (30.6 - 561, n=11, last 2 years) | |
| Asus ProArt StudioBook 16 W7600H5A-2BL2 | |
| Average Intel Xeon W-11955M (n=1) | |
| HP ZBook Fury 15 G8 | |
| Dell Precision 5000 5560 | |
| SPECviewperf 2020 / Medical (medical-03) | |
| Average of class Workstation (20.3 - 96.8, n=12, last 2 years) | |
| Average Intel Xeon W-11955M (n=1) | |
| Asus ProArt StudioBook 16 W7600H5A-2BL2 | |
| HP ZBook Fury 15 G8 | |
| Dell Precision 5000 5560 | |
| SPECviewperf 2020 / Maya (maya-06) | |
| Average of class Workstation (132 - 380, n=12, last 2 years) | |
| Asus ProArt StudioBook 16 W7600H5A-2BL2 | |
| Average Intel Xeon W-11955M (n=1) | |
| HP ZBook Fury 15 G8 | |
| Dell Precision 5000 5560 | |
| SPECviewperf 2020 / Energy (energy-03) | |
| Asus ProArt StudioBook 16 W7600H5A-2BL2 | |
| Average Intel Xeon W-11955M (n=1) | |
| Average of class Workstation (15.8 - 74.3, n=12, last 2 years) | |
| HP ZBook Fury 15 G8 | |
| Dell Precision 5000 5560 | |
| SPECviewperf 2020 / Creo (creo-03) | |
| Average of class Workstation (47.2 - 185.7, n=12, last 2 years) | |
| HP ZBook Fury 15 G8 | |
| Asus ProArt StudioBook 16 W7600H5A-2BL2 | |
| Average Intel Xeon W-11955M (n=1) | |
| Dell Precision 5000 5560 | |
| SPECviewperf 2020 / CATIA (catia-06) | |
| Average of class Workstation (44 - 106, n=12, last 2 years) | |
| Asus ProArt StudioBook 16 W7600H5A-2BL2 | |
| Average Intel Xeon W-11955M (n=1) | |
| HP ZBook Fury 15 G8 | |
| Dell Precision 5000 5560 | |
| SPECviewperf 2020 / 3ds Max (3dsmax-07) | |
| Average of class Workstation (47.4 - 154.7, n=12, last 2 years) | |
| Asus ProArt StudioBook 16 W7600H5A-2BL2 | |
| Average Intel Xeon W-11955M (n=1) | |
| HP ZBook Fury 15 G8 | |
| Dell Precision 5000 5560 | |
* ... smaller is better
系统性能
系统性能也是--根据预期--高于所有的对手。华硕ProArt Studiobook 16只能承认输给了桌面上的同类产品 申克XMG Ultra 17与英特尔酷睿i9 11900K和 联想Thinkpad P1.我们无法确定该系统在日常使用中的任何问题,所有任务的执行都没有延迟。只有在打开和关闭程序时,主电源和电池操作之间的微小差异是明显的。
| PCMark 10 / Score | |
| Average of class Workstation (6563 - 10409, n=19, last 2 years) | |
| Schenker XMG Ultra 17 Rocket Lake | |
| Lenovo ThinkPad P1 G4-20Y4S0KS00 | |
| Asus ProArt StudioBook 16 W7600H5A-2BL2 | |
| Average Intel Xeon W-11955M, NVIDIA RTX A5000 Laptop GPU (n=1) | |
| HP ZBook Fury 15 G8 | |
| HP ZBook Studio 15 G8 | |
| Dell Precision 5000 5560 | |
| PCMark 10 / Essentials | |
| Schenker XMG Ultra 17 Rocket Lake | |
| Lenovo ThinkPad P1 G4-20Y4S0KS00 | |
| Dell Precision 5000 5560 | |
| Average of class Workstation (9622 - 11157, n=19, last 2 years) | |
| Asus ProArt StudioBook 16 W7600H5A-2BL2 | |
| Average Intel Xeon W-11955M, NVIDIA RTX A5000 Laptop GPU (n=1) | |
| HP ZBook Fury 15 G8 | |
| HP ZBook Studio 15 G8 | |
| PCMark 10 / Productivity | |
| Average of class Workstation (8789 - 20616, n=19, last 2 years) | |
| Schenker XMG Ultra 17 Rocket Lake | |
| Dell Precision 5000 5560 | |
| Asus ProArt StudioBook 16 W7600H5A-2BL2 | |
| Average Intel Xeon W-11955M, NVIDIA RTX A5000 Laptop GPU (n=1) | |
| Lenovo ThinkPad P1 G4-20Y4S0KS00 | |
| HP ZBook Fury 15 G8 | |
| HP ZBook Studio 15 G8 | |
| PCMark 10 / Digital Content Creation | |
| Average of class Workstation (8108 - 15631, n=19, last 2 years) | |
| Schenker XMG Ultra 17 Rocket Lake | |
| Lenovo ThinkPad P1 G4-20Y4S0KS00 | |
| Asus ProArt StudioBook 16 W7600H5A-2BL2 | |
| Average Intel Xeon W-11955M, NVIDIA RTX A5000 Laptop GPU (n=1) | |
| HP ZBook Fury 15 G8 | |
| HP ZBook Studio 15 G8 | |
| Dell Precision 5000 5560 | |
| PCMark 10 Score | 6951 points | |
Help | ||
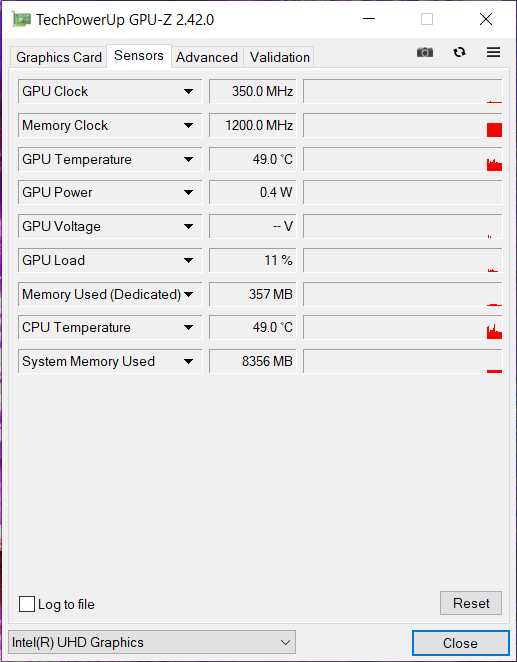
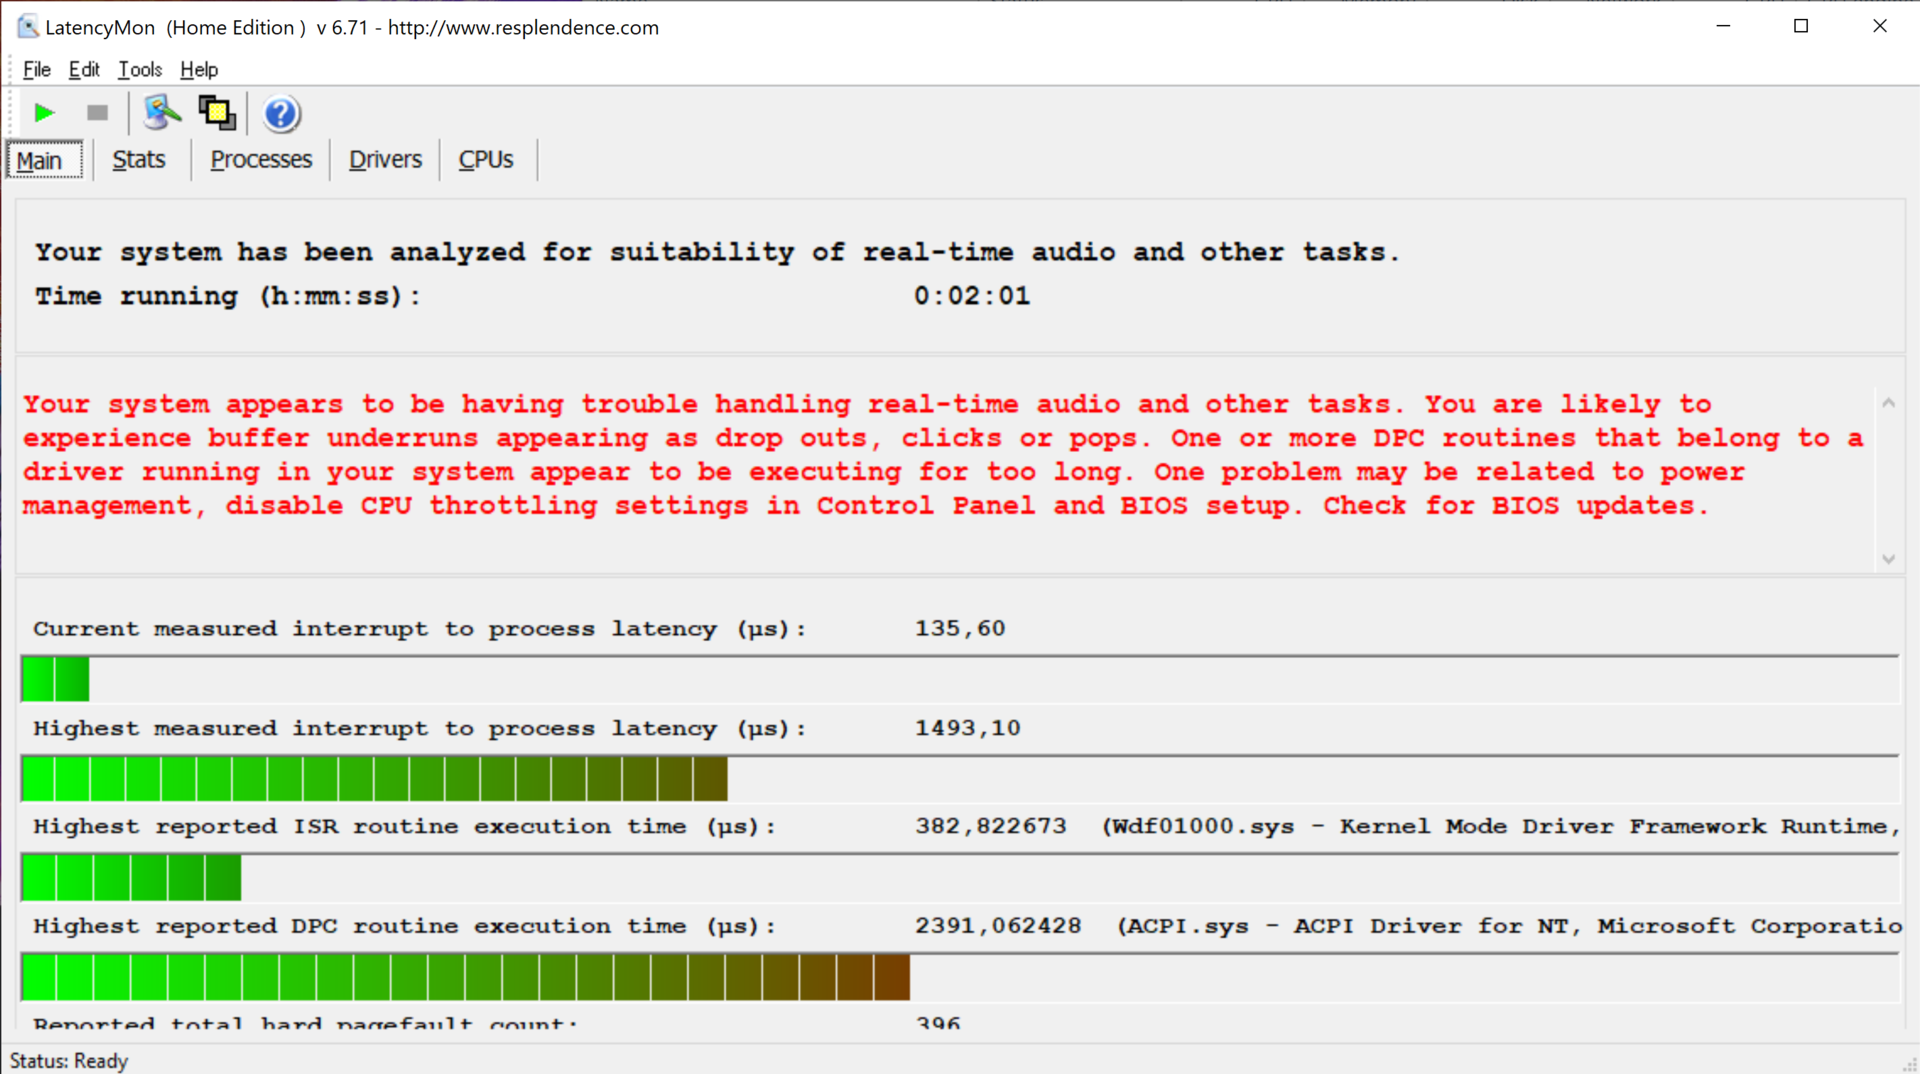
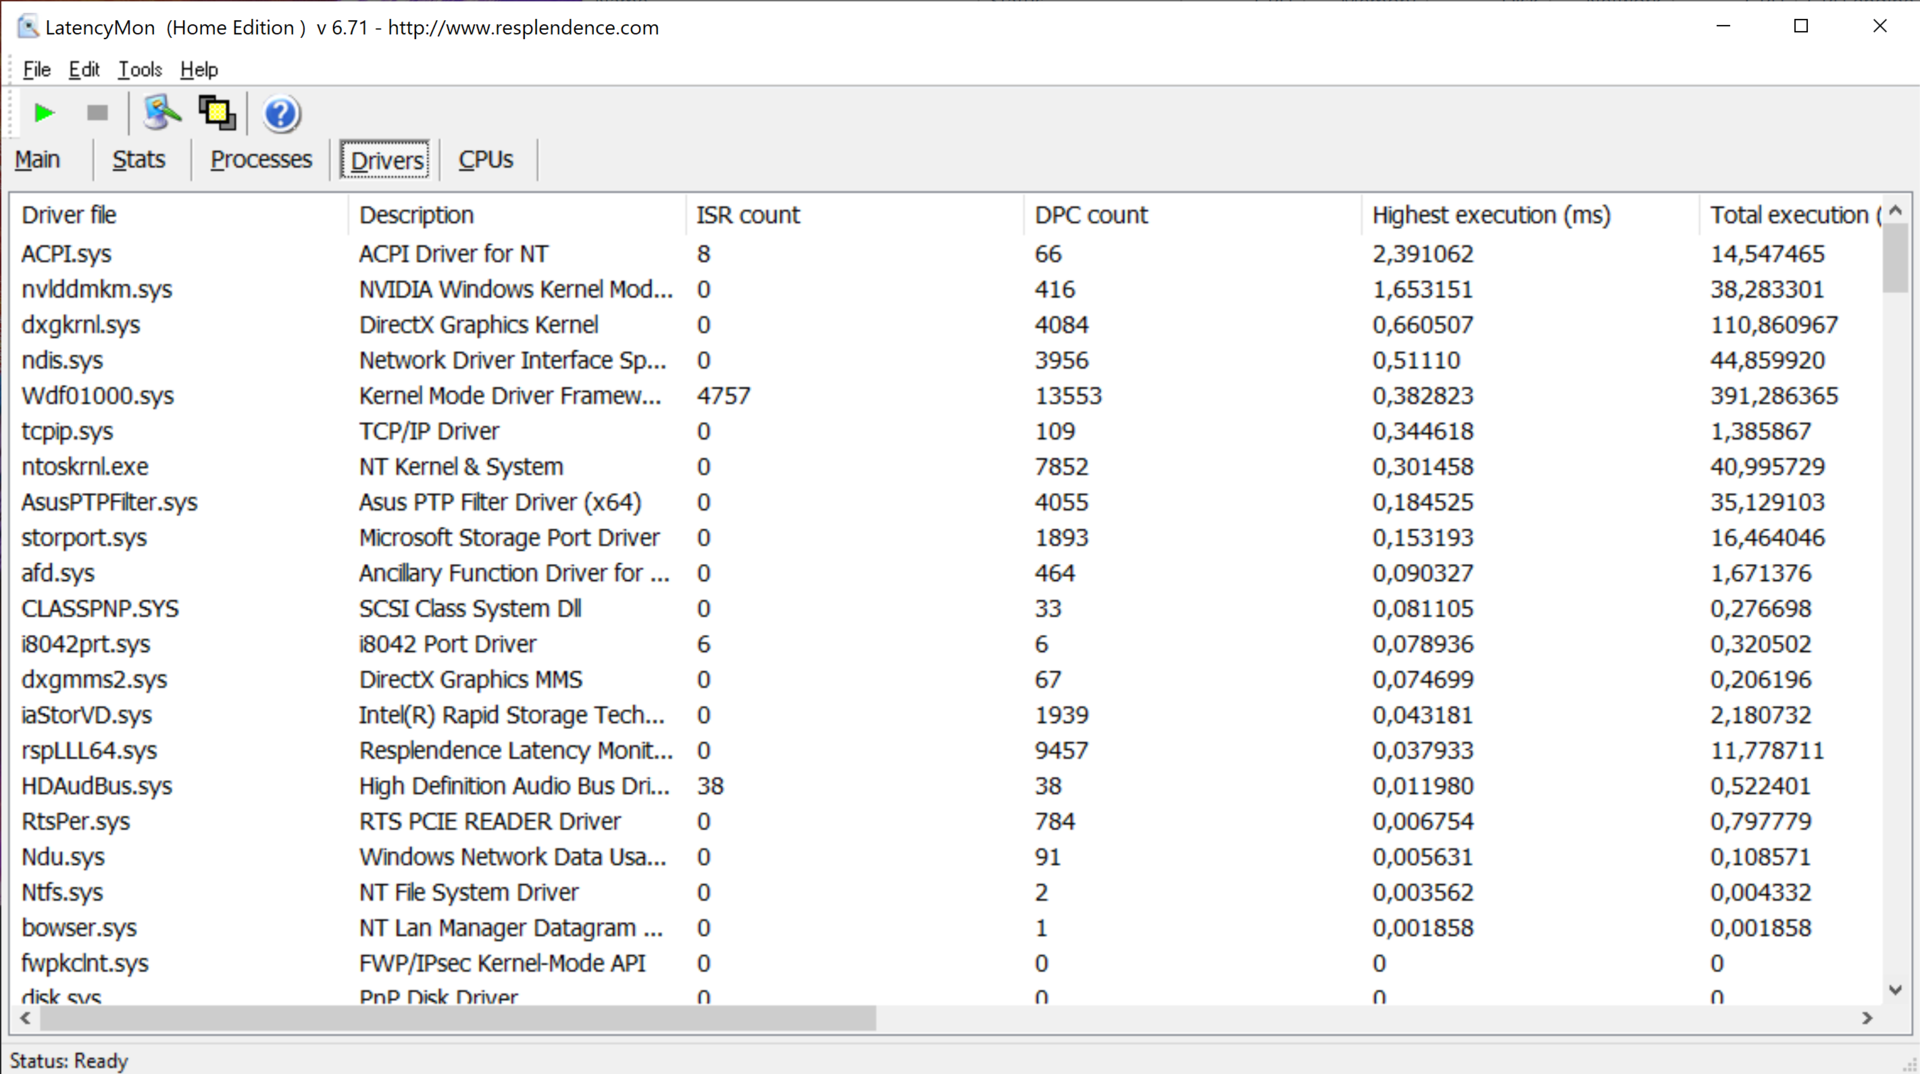
DPC延迟
由于我们测试设备的预期用途包括处理音频和视频文件,DPC延迟可能会导致问题。测试表明需要在延迟方面进行优化,我们的设备本身在Youtube视频测试中也有掉帧。
| DPC Latencies / LatencyMon - interrupt to process latency (max), Web, Youtube, Prime95 | |
| HP ZBook Studio 15 G8 | |
| Asus ProArt StudioBook 16 W7600H5A-2BL2 | |
| Dell Precision 5000 5560 | |
| HP ZBook Fury 15 G8 | |
* ... smaller is better
储存
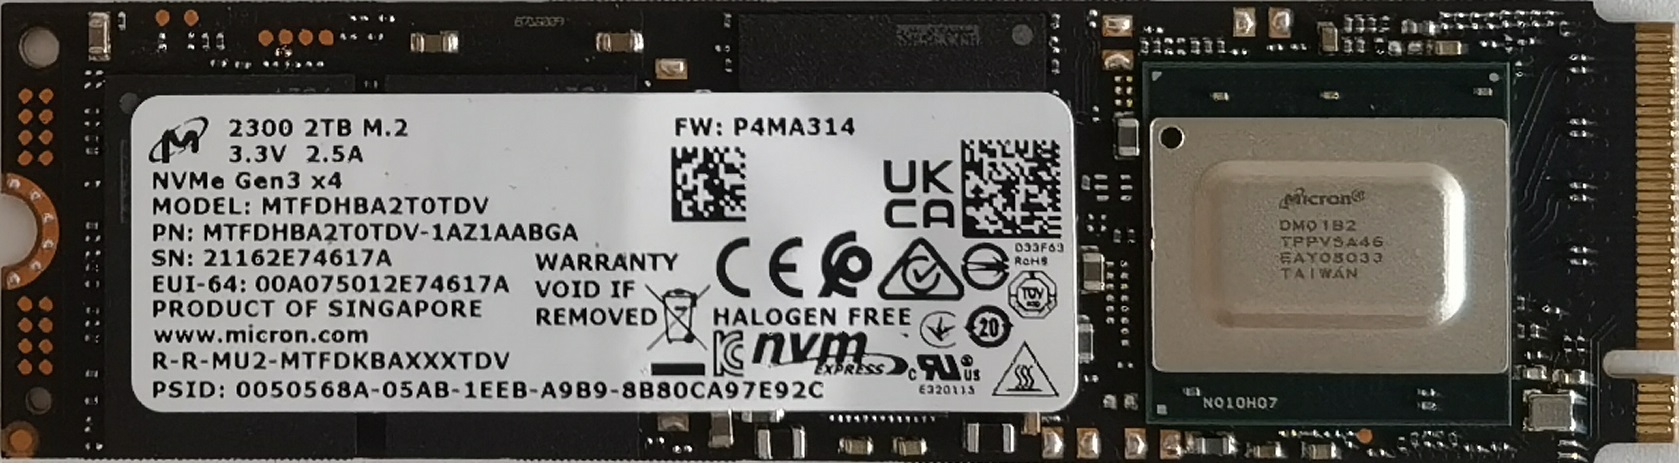
预生产设备理论上支持2x个PCIe 4.0的M.2 NVMe SSD,所以为什么华硕在这里的RAID 0配置中安装两个PCIe 3.0的SSD是值得怀疑的。在AS SSD基准测试和Crystal DiskMark中,这些表现相当平庸,甚至是单块PCIe 3.0的SSD在 惠普Zbook Fury在一些基准测试部分落后于我们的配置。在这里,我们也看到了优化的需要。华硕可以依靠PCIe 4.0存储单元或者应该优化驱动程序。
| Asus ProArt StudioBook 16 W7600H5A-2BL2 2x Micron 2300 2TB MTFDHBA2T0TDV (RAID 0) | HP ZBook Fury 15 G8 Samsung PM981a MZVLB1T0HBLR | Schenker XMG Ultra 17 Rocket Lake Samsung SSD 980 Pro 2TB MZ-V8P2T0 | HP ZBook Studio 15 G8 Samsung PM981a MZVLB2T0HALB | Dell Precision 5000 5560 Samsung PM9A1 MZVL22T0HBLB | Lenovo ThinkPad P1 G4-20Y4S0KS00 Samsung PM9A1 MZVL21T0HCLR | Average 2x Micron 2300 2TB MTFDHBA2T0TDV (RAID 0) | |
|---|---|---|---|---|---|---|---|
| CrystalDiskMark 5.2 / 6 | 38% | 174% | 44% | 110% | 0% | ||
| Write 4K (MB/s) | 105.6 | 96.3 -9% | 240 127% | 110.5 5% | 172.4 63% | 105.6 ? 0% | |
| Read 4K (MB/s) | 50.2 | 51.5 3% | 87.8 75% | 51.8 3% | 78.8 57% | 50.2 ? 0% | |
| Write Seq (MB/s) | 445.6 | 1942 336% | 4281 861% | 2071 365% | 2991 571% | 446 ? 0% | |
| Read Seq (MB/s) | 753 | 2504 233% | 4228 461% | 2505 233% | 3351 345% | 753 ? 0% | |
| Write 4K Q32T1 (MB/s) | 2713 | 346.6 -87% | 696 -74% | 429.8 -84% | 459.2 -83% | 2713 ? 0% | |
| Read 4K Q32T1 (MB/s) | 2399 | 408 -83% | 778 -68% | 418.3 -83% | 484.3 -80% | 2399 ? 0% | |
| Write Seq Q32T1 (MB/s) | 5378 | 3019 -44% | 5195 -3% | 3060 -43% | 4761 -11% | 5378 ? 0% | |
| Read Seq Q32T1 (MB/s) | 6189 | 3514 -43% | 7099 15% | 3539 -43% | 7071 14% | 6189 ? 0% | |
| AS SSD | -21% | 80% | 14% | 35% | 85% | 0% | |
| Seq Read (MB/s) | 4317 | 2937 -32% | 5010 16% | 2953 -32% | 5169 20% | 4526 5% | 4317 ? 0% |
| Seq Write (MB/s) | 2037 | 1688 -17% | 3974 95% | 1691 -17% | 1986 -3% | 3988 96% | 2037 ? 0% |
| 4K Read (MB/s) | 48.97 | 44.27 -10% | 51.9 6% | 43.98 -10% | 78 59% | 82.9 69% | 49 ? 0% |
| 4K Write (MB/s) | 112.4 | 105.8 -6% | 156.8 40% | 105.4 -6% | 214.6 91% | 207.5 85% | 112.4 ? 0% |
| 4K-64 Read (MB/s) | 1253 | 873 -30% | 2611 108% | 1065 -15% | 1232 -2% | 2751 120% | 1253 ? 0% |
| 4K-64 Write (MB/s) | 1473 | 1996 36% | 3859 162% | 1957 33% | 2719 85% | 3270 122% | 1473 ? 0% |
| Access Time Read * (ms) | 0.045 | 0.048 -7% | 0.072 -60% | 0.04 11% | 0.024 47% | 0.024 47% | 0.045 ? -0% |
| Access Time Write * (ms) | 0.083 | 0.107 -29% | 0.026 69% | 0.105 -27% | 0.059 29% | 0.021 75% | 0.083 ? -0% |
| Score Read (Points) | 1765 | 1211 -31% | 3164 79% | 1404 -20% | 1827 4% | 3287 86% | 1765 ? 0% |
| Score Write (Points) | 1722 | 2271 32% | 4414 156% | 2232 30% | 3133 82% | 3876 125% | 1722 ? 0% |
| Score Total (Points) | 4256 | 4046 -5% | 9134 115% | 4297 1% | 5753 35% | 8821 107% | 4256 ? 0% |
| Copy ISO MB/s (MB/s) | 2441 | 901 -63% | 3424 40% | 2474 1% | 3201 31% | 2441 ? 0% | |
| Copy Program MB/s (MB/s) | 395.7 | 118.7 -70% | 1091 176% | 1074 171% | 415.8 5% | 396 ? 0% | |
| Copy Game MB/s (MB/s) | 1115 | 372 -67% | 2365 112% | 1929 73% | 1212 9% | 1115 ? 0% | |
| Total Average (Program / Settings) | 9% /
0% | 127% /
114% | 29% /
25% | 73% /
62% | 85% /
85% | 0% /
0% |
* ... smaller is better

Constant Performance Reading: DiskSpd Read Loop, Queue Depth 8
图形卡
由于安装了冷却系统和高达110瓦的TDP,所以 RTX A5000在纯图形性能方面是令人信服的,因此比惠普ZBook Fury领先15%至20%。 惠普ZBook Fury在合成基准测试中领先惠普ZBook Fury。
| 3DMark Fire Strike Score | 22819 points | |
| 3DMark Fire Strike Extreme Score | 12825 points | |
| 3DMark Time Spy Score | 10157 points | |
Help | ||
游戏性能
虽然我们的预生产设备没有为游戏进行优化,但它仍然可以在QHD下处理大多数标题。然而,该显示器被限制在60赫兹。在竞争对手中,只有真正的游戏强者--如Schenker XMG Ultra--能明显超过我们的评测样品。总体而言,华硕ProArt Studiobook Pro 16的游戏性能处于RTX 3080的较低水平。
正如预期的那样,游戏性能在电池电量上非常有限。
| The Witcher 3 | |
| 1920x1080 High Graphics & Postprocessing (Nvidia HairWorks Off) | |
| Schenker XMG Ultra 17 Rocket Lake | |
| MSI GS76 Stealth 11UH | |
| Average of class Workstation (n=1last 2 years) | |
| HP ZBook Studio 15 G8 | |
| Average NVIDIA RTX A5000 Laptop GPU (124 - 179, n=3) | |
| HP ZBook Fury 15 G8 | |
| Asus ProArt StudioBook 16 W7600H5A-2BL2 | |
| Dell Precision 5000 5560 | |
| 1920x1080 Ultra Graphics & Postprocessing (HBAO+) | |
| Schenker XMG Ultra 17 Rocket Lake | |
| MSI GS76 Stealth 11UH | |
| Average of class Workstation (n=1last 2 years) | |
| Average NVIDIA RTX A5000 Laptop GPU (81.7 - 98.3, n=3) | |
| Asus ProArt StudioBook 16 W7600H5A-2BL2 | |
| HP ZBook Fury 15 G8 | |
| HP ZBook Studio 15 G8 | |
| Dell Precision 5000 5560 | |
| Dota 2 Reborn | |
| 3840x2160 ultra (3/3) best looking | |
| Average of class Workstation (103.5 - 170.9, n=9, last 2 years) | |
| Asus ProArt StudioBook 16 W7600H5A-2BL2 | |
| MSI GS76 Stealth 11UH | |
| Average NVIDIA RTX A5000 Laptop GPU (95 - 118, n=2) | |
| HP ZBook Fury 15 G8 | |
| HP ZBook Studio 15 G8 | |
| Dell Precision 5000 5560 | |
| 1920x1080 ultra (3/3) best looking | |
| Schenker XMG Ultra 17 Rocket Lake | |
| Average of class Workstation (50.7 - 178.4, n=23, last 2 years) | |
| MSI GS76 Stealth 11UH | |
| HP ZBook Fury 15 G8 | |
| Average NVIDIA RTX A5000 Laptop GPU (117 - 131, n=2) | |
| Dell Precision 5000 5560 | |
| Asus ProArt StudioBook 16 W7600H5A-2BL2 | |
| HP ZBook Studio 15 G8 | |
| 1920x1080 high (2/3) | |
| Schenker XMG Ultra 17 Rocket Lake | |
| MSI GS76 Stealth 11UH | |
| Average of class Workstation (52.1 - 199.8, n=23, last 2 years) | |
| HP ZBook Fury 15 G8 | |
| HP ZBook Studio 15 G8 | |
| Average NVIDIA RTX A5000 Laptop GPU (124 - 140, n=2) | |
| Dell Precision 5000 5560 | |
| Asus ProArt StudioBook 16 W7600H5A-2BL2 | |
| Metro Exodus | |
| 3840x2160 Ultra Quality AF:16x | |
| HP ZBook Fury 15 G8 | |
| Average NVIDIA RTX A5000 Laptop GPU (24 - 28.5, n=2) | |
| Asus ProArt StudioBook 16 W7600H5A-2BL2 | |
| 2560x1440 Ultra Quality AF:16x | |
| HP ZBook Fury 15 G8 | |
| Average NVIDIA RTX A5000 Laptop GPU (41 - 46.3, n=2) | |
| Asus ProArt StudioBook 16 W7600H5A-2BL2 | |
| Dell Precision 5000 5560 | |
| 1920x1080 Ultra Quality AF:16x | |
| HP ZBook Fury 15 G8 | |
| Average NVIDIA RTX A5000 Laptop GPU (55 - 59.8, n=2) | |
| Asus ProArt StudioBook 16 W7600H5A-2BL2 | |
| Dell Precision 5000 5560 | |
| 1920x1080 High Quality AF:16x | |
| HP ZBook Fury 15 G8 | |
| Average NVIDIA RTX A5000 Laptop GPU (69 - 74.5, n=2) | |
| Asus ProArt StudioBook 16 W7600H5A-2BL2 | |
| Dell Precision 5000 5560 | |
| F1 2020 | |
| 3840x2160 Ultra High Preset AA:T AF:16x | |
| Asus ProArt StudioBook 16 W7600H5A-2BL2 | |
| Average NVIDIA RTX A5000 Laptop GPU (n=1) | |
| 1920x1080 Ultra High Preset AA:T AF:16x | |
| Asus ProArt StudioBook 16 W7600H5A-2BL2 | |
| Average NVIDIA RTX A5000 Laptop GPU (n=1) | |
| 1920x1080 High Preset AA:T AF:16x | |
| Asus ProArt StudioBook 16 W7600H5A-2BL2 | |
| Average NVIDIA RTX A5000 Laptop GPU (n=1) | |
| F1 2021 | |
| 3840x2160 Ultra High Preset + Raytracing AA:T AF:16x | |
| Asus ProArt StudioBook 16 W7600H5A-2BL2 | |
| MSI GS76 Stealth 11UH | |
| Average NVIDIA RTX A5000 Laptop GPU (38 - 53.6, n=3) | |
| HP ZBook Fury 15 G8 | |
| 2560x1440 Ultra High Preset + Raytracing AA:T AF:16x | |
| MSI GS76 Stealth 11UH | |
| Asus ProArt StudioBook 16 W7600H5A-2BL2 | |
| Average NVIDIA RTX A5000 Laptop GPU (59 - 88.2, n=3) | |
| HP ZBook Fury 15 G8 | |
| Dell Precision 5000 5560 | |
| 1920x1080 Ultra High Preset + Raytracing AA:T AF:16x | |
| MSI GS76 Stealth 11UH | |
| Asus ProArt StudioBook 16 W7600H5A-2BL2 | |
| Average NVIDIA RTX A5000 Laptop GPU (85 - 109, n=3) | |
| HP ZBook Fury 15 G8 | |
| Dell Precision 5000 5560 | |
| 1920x1080 High Preset AA:T AF:16x | |
| MSI GS76 Stealth 11UH | |
| Asus ProArt StudioBook 16 W7600H5A-2BL2 | |
| Average NVIDIA RTX A5000 Laptop GPU (122 - 161, n=3) | |
| HP ZBook Fury 15 G8 | |
| Dell Precision 5000 5560 | |
| Cyberpunk 2077 1.0 | |
| 3840x2160 Ultra Preset | |
| Average NVIDIA RTX A5000 Laptop GPU (16.7 - 25, n=2) | |
| Asus ProArt StudioBook 16 W7600H5A-2BL2 | |
| 2560x1440 Ultra Preset | |
| Average NVIDIA RTX A5000 Laptop GPU (37.1 - 51, n=2) | |
| Asus ProArt StudioBook 16 W7600H5A-2BL2 | |
| 1920x1080 Ultra Preset | |
| Schenker XMG Ultra 17 Rocket Lake | |
| Average NVIDIA RTX A5000 Laptop GPU (58.6 - 78, n=2) | |
| Asus ProArt StudioBook 16 W7600H5A-2BL2 | |
| 1920x1080 High Preset | |
| Schenker XMG Ultra 17 Rocket Lake | |
| Average NVIDIA RTX A5000 Laptop GPU (68.1 - 90, n=2) | |
| Asus ProArt StudioBook 16 W7600H5A-2BL2 | |
在我们用TheWitcher 3 (FHD/Ultra)进行的60分钟测试中,性能在整个测试中保持相对稳定。
Witcher 3 FPS Diagramm
| low | med. | high | ultra | QHD | 4K | |
|---|---|---|---|---|---|---|
| GTA V (2015) | 180 | 175 | 158 | 85.8 | 82.2 | 76.3 |
| The Witcher 3 (2015) | 321 | 217.9 | 124 | 89.9 | 54.8 | |
| Dota 2 Reborn (2015) | 144 | 136 | 124 | 117 | 118 | |
| Final Fantasy XV Benchmark (2018) | 184 | 123 | 91.8 | 70.6 | 41 | |
| X-Plane 11.11 (2018) | 117 | 102 | 81.6 | 52 | ||
| Far Cry 5 (2018) | 76 | 69 | 62 | 60 | 58 | 36 |
| Strange Brigade (2018) | 419 | 231 | 192 | 160 | 129 | |
| Metro Exodus (2019) | 148 | 126 | 69 | 55 | 41 | 24 |
| F1 2020 (2020) | 253 | 181 | 164 | 133 | 63.1 | |
| Cyberpunk 2077 1.0 (2020) | 114.6 | 83.1 | 68.1 | 58.6 | 37.1 | 16.7 |
| F1 2021 (2021) | 269 | 171 | 159 | 104 | 82.8 | 48.7 |
排放。高性能需要付出代价
噪声排放
即使在空闲状态下,风扇也有自己的发言权,几乎没有静止过。在负载情况下,风扇的声音清晰可闻,并能适应所需的性能。在ProArt Creator Hub中可以对风扇速度进行各种设置。用户可以选择三种模式。标准模式、性能模式和全风扇速度。在测试中,事实证明,全风扇速度下的优势是非常微弱的。
Noise level
| Idle |
| 26 / 26 / 26.5 dB(A) |
| Load |
| 42 / 43 dB(A) |
 | ||
30 dB silent 40 dB(A) audible 50 dB(A) loud |
||
min: | ||
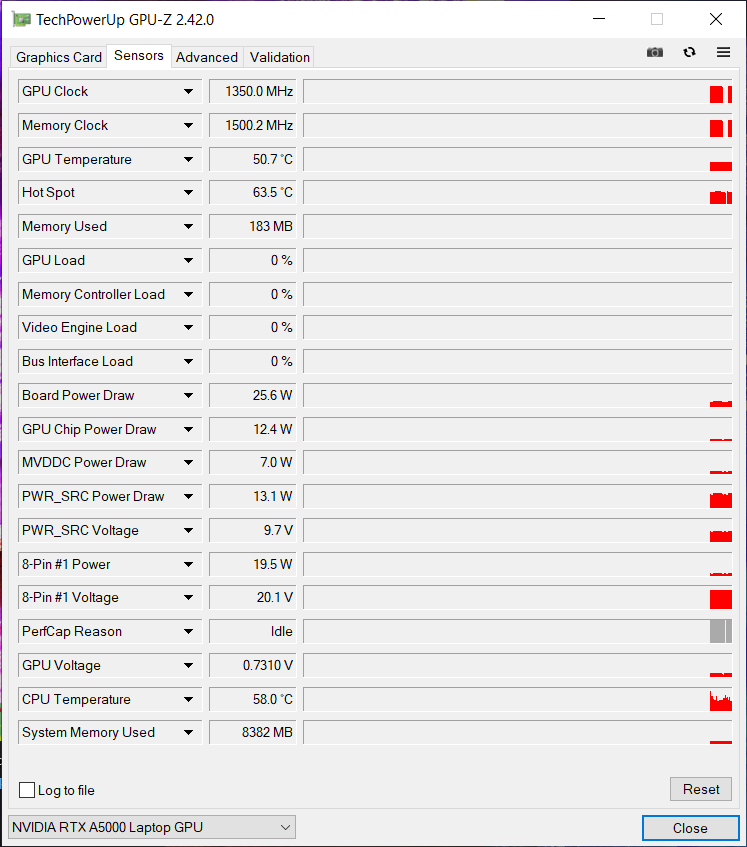
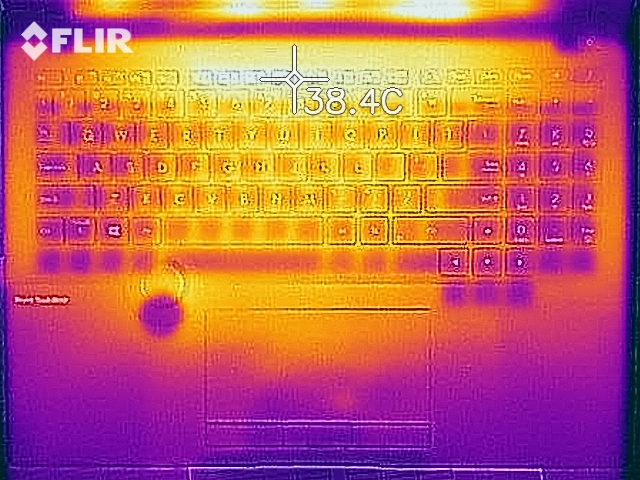
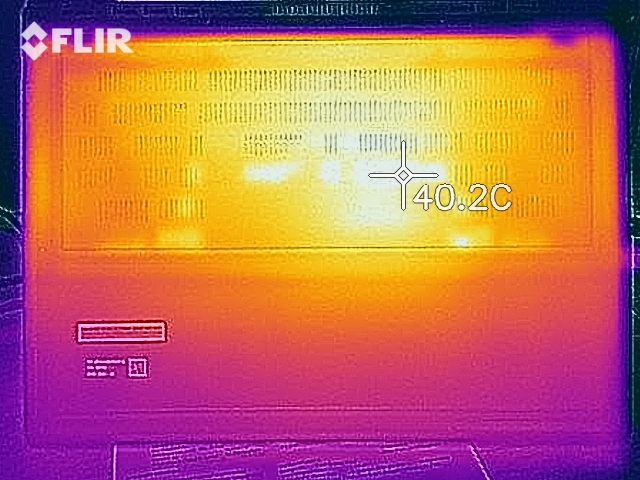
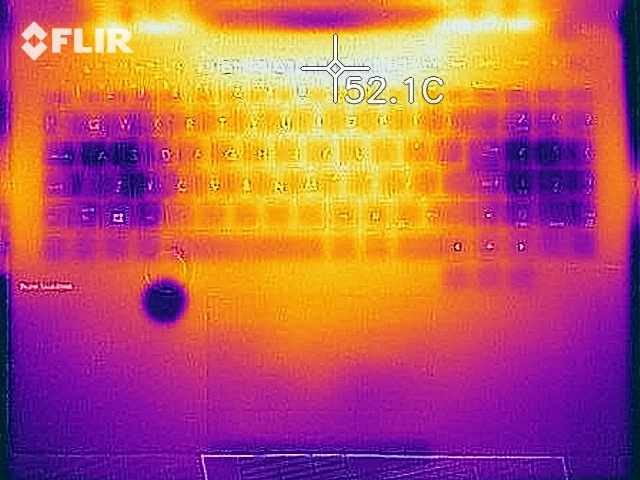
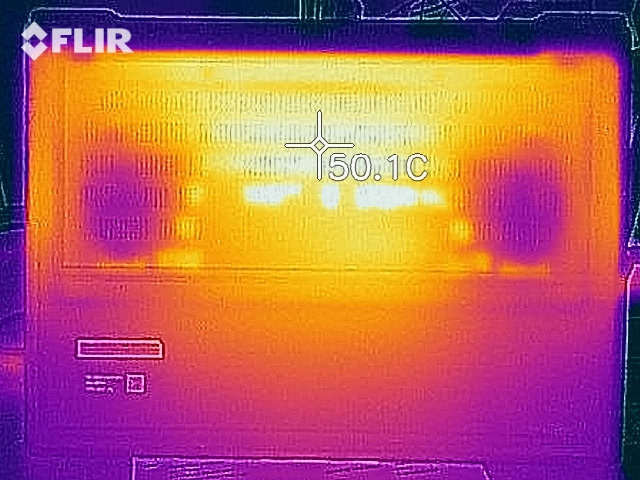
温度
大量的电力会产生大量的废热。这也是我们的预生产样品的情况,因为该设备从未真正保持冷却。随着CPU的大量负载,温度很快超过100℃。另一方面,GPU做得更好一些,只达到80℃多一点。表面温度也相应适中。
(-) The maximum temperature on the upper side is 45.7 °C / 114 F, compared to the average of 38.2 °C / 101 F, ranging from 22.2 to 69.8 °C for the class Workstation.
(-) The bottom heats up to a maximum of 48.3 °C / 119 F, compared to the average of 41.1 °C / 106 F
(+) In idle usage, the average temperature for the upper side is 31.6 °C / 89 F, compared to the device average of 32 °C / 90 F.
(+) The palmrests and touchpad are reaching skin temperature as a maximum (35.2 °C / 95.4 F) and are therefore not hot.
(-) The average temperature of the palmrest area of similar devices was 27.8 °C / 82 F (-7.4 °C / -13.4 F).
发言人
ProArt Studiobook Pro 16的音频质量非常好,非常平衡。在较低和较高的音量下,良好、干净和饱满的声音以及丰富的低音都特别突出。
Asus ProArt StudioBook 16 W7600H5A-2BL2 audio analysis
(±) | speaker loudness is average but good (76 dB)
Bass 100 - 315 Hz
(-) | nearly no bass - on average 17% lower than median
(±) | linearity of bass is average (10.4% delta to prev. frequency)
Mids 400 - 2000 Hz
(+) | balanced mids - only 1.2% away from median
(+) | mids are linear (5.1% delta to prev. frequency)
Highs 2 - 16 kHz
(±) | higher highs - on average 5.1% higher than median
(+) | highs are linear (4.9% delta to prev. frequency)
Overall 100 - 16.000 Hz
(±) | linearity of overall sound is average (16.5% difference to median)
Compared to same class
» 46% of all tested devices in this class were better, 7% similar, 47% worse
» The best had a delta of 7%, average was 17%, worst was 35%
Compared to all devices tested
» 28% of all tested devices were better, 6% similar, 66% worse
» The best had a delta of 4%, average was 23%, worst was 134%
HP ZBook Fury 15 G8 audio analysis
(±) | speaker loudness is average but good (79.8 dB)
Bass 100 - 315 Hz
(±) | reduced bass - on average 10.6% lower than median
(±) | linearity of bass is average (8.8% delta to prev. frequency)
Mids 400 - 2000 Hz
(+) | balanced mids - only 3.9% away from median
(+) | mids are linear (4.8% delta to prev. frequency)
Highs 2 - 16 kHz
(+) | balanced highs - only 2.9% away from median
(+) | highs are linear (5.3% delta to prev. frequency)
Overall 100 - 16.000 Hz
(+) | overall sound is linear (11.9% difference to median)
Compared to same class
» 17% of all tested devices in this class were better, 4% similar, 79% worse
» The best had a delta of 7%, average was 17%, worst was 35%
Compared to all devices tested
» 9% of all tested devices were better, 2% similar, 89% worse
» The best had a delta of 4%, average was 23%, worst was 134%
电源管理。Studiobook的电池运行时间不长
能源消耗
最低12.4瓦,最高25瓦的空闲功耗略高于 惠普ZBook Fury.
电源的大小超过240瓦,但最大能耗只有134瓦。这一点在TheWitcher 3 上变得更加明显,其能耗仍为132瓦。由于这是一个预生产样品,我们假设最大能耗仍将被调整,以有利于性能。
| Off / Standby | |
| Idle | |
| Load |
|
Key:
min: | |
| Asus ProArt StudioBook 16 W7600H5A-2BL2 W-11955M, RTX A5000 Laptop GPU, 2x Micron 2300 2TB MTFDHBA2T0TDV (RAID 0), OLED, 3840x2400, 16" | HP ZBook Fury 15 G8 i9-11950H, RTX A5000 Laptop GPU, Samsung PM981a MZVLB1T0HBLR, IPS, 3840x2160, 15.6" | HP ZBook Studio 15 G8 i9-11950H, GeForce RTX 3070 Laptop GPU, Samsung PM981a MZVLB2T0HALB, OLED, 3840x2160, 15.6" | Dell Precision 5000 5560 i7-11850H, RTX A2000 Laptop GPU, Samsung PM9A1 MZVL22T0HBLB, IPS, 3840x2400, 15.6" | Lenovo ThinkPad P1 G4-20Y4S0KS00 i7-11850H, GeForce RTX 3070 Laptop GPU, Samsung PM9A1 MZVL21T0HCLR, IPS LED, 3840x2400, 16" | Schenker XMG Ultra 17 Rocket Lake i9-11900K, GeForce RTX 3080 Laptop GPU, Samsung SSD 980 Pro 2TB MZ-V8P2T0, IPS, 1920x1080, 17.3" | Average NVIDIA RTX A5000 Laptop GPU | Average of class Workstation | |
|---|---|---|---|---|---|---|---|---|
| Power Consumption | -2% | -8% | 22% | 3% | -201% | -5% | 13% | |
| Idle Minimum * (Watt) | 12.4 | 8.3 33% | 11 11% | 6.2 50% | 8.1 35% | 62 -400% | 10.4 ? 16% | 9.11 ? 27% |
| Idle Average * (Watt) | 16.5 | 19.9 -21% | 18.8 -14% | 13.9 16% | 20.2 -22% | 64 -288% | 18.3 ? -11% | 13.8 ? 16% |
| Idle Maximum * (Watt) | 25 | 21.8 13% | 31.7 -27% | 23.8 5% | 21.9 12% | 69 -176% | 22.3 ? 11% | 17.9 ? 28% |
| Load Average * (Watt) | 132 | 110.9 16% | 105.2 20% | 95.7 27% | 88.2 33% | 183 -39% | 125.1 ? 5% | 96 ? 27% |
| Witcher 3 ultra * (Watt) | 132 | 165 -25% | 148 -12% | 87 34% | 149 -13% | 297 -125% | ||
| Load Maximum * (Watt) | 134 | 171.8 -28% | 171.8 -28% | 132.6 1% | 170.6 -27% | 368 -175% | 195.8 ? -46% | 180.3 ? -35% |
* ... smaller is better
Energy consumption during The Witcher 3 / stress test
电池寿命
我们的预生产设备的电池运行时间参差不齐,落后于整个竞争对手。在我们的标准化WLAN测试中,测试设备在300分钟后就耗尽了气力。
| Asus ProArt StudioBook 16 W7600H5A-2BL2 W-11955M, RTX A5000 Laptop GPU, 90 Wh | HP ZBook Fury 15 G8 i9-11950H, RTX A5000 Laptop GPU, 94 Wh | HP ZBook Studio 15 G8 i9-11950H, GeForce RTX 3070 Laptop GPU, 83 Wh | Dell Precision 5000 5560 i7-11850H, RTX A2000 Laptop GPU, 86 Wh | Lenovo ThinkPad P1 G4-20Y4S0KS00 i7-11850H, GeForce RTX 3070 Laptop GPU, 90 Wh | Average of class Workstation | |
|---|---|---|---|---|---|---|
| Battery runtime | 24% | 24% | 26% | 170% | 266% | |
| H.264 (h) | 1.8 | 7.2 300% | 10.1 ? 461% | |||
| WiFi v1.3 (h) | 5 | 6.2 24% | 6.2 24% | 6.3 26% | 7 40% | 8.55 ? 71% |
| Witcher 3 ultra (h) | 1.6 | |||||
| Load (h) | 1.8 | 1.8 | 1.2 | 1.441 ? | ||
| Reader / Idle (h) | 12.9 | 12 | 26.1 ? |
判决书
华硕ProArt Studiobook Pro 16给人的第一印象是相当坚实。轻巧而优雅的外壳以其镁合金材质而令人信服。这里的一个特殊功能是嵌入式华硕拨号控制器,它允许用户在图像和视频编辑程序中非常精确地执行一些特殊功能。键盘不仅能以良好的压力点保持自己的状态,而且还能以普遍提供的舒适打字。触摸板提供了良好的滑行性能,并有足够的表面,即使它不是太大。端口的位置很好,符合现代要求。
预产样品的第一次性能测试留下了一些问题的答案,但它们给了我们一个预期性能的清晰画面。图形性能与低TDP RTX 3080相当。系统性能持续良好,在日常使用中没有给我们任何批评的理由。尽管如此,我们认为,在产品发布之前,华硕仍有一些东西需要优化。最大功耗约为134瓦,这对240瓦的电源来说并不公平,令人震惊。
华硕ProArt Studiobook Pro 16在图像质量和色彩空间覆盖方面为移动工作站设立了新标准。尤其令人印象深刻的是高质量和轻量级的外壳、16:10格式的4K OLED HDR面板以及华硕表盘控制器等功能。
另一方面,OLED显示屏是一流的,拥有各种认证和16:10格式。非常好的工厂校准在这里也很突出,使这个面板适用于专业的图片和视频编辑。华硕ProArt Studiobook Pro 16的音频质量也令人惊讶:它非常好,以干净的声音和丰富的低音而引人注目。在我们的预生产单元中,风扇的特性是相当冲动的:风扇几乎没有静止过,而是根据所需的性能进行适应性的操作。然而,它们是清晰可闻的,并产生较高的背景噪音,但对于设备的性能和尺寸来说是可以接受的。
价格和可用性
由于它是一个系列前的设备,我们不给这个测试的评级。我们想指出的是,很多规格仍然可以由制造商调整,直到该系列的发布。预计交货日期和价格还不知道。
Price comparison
