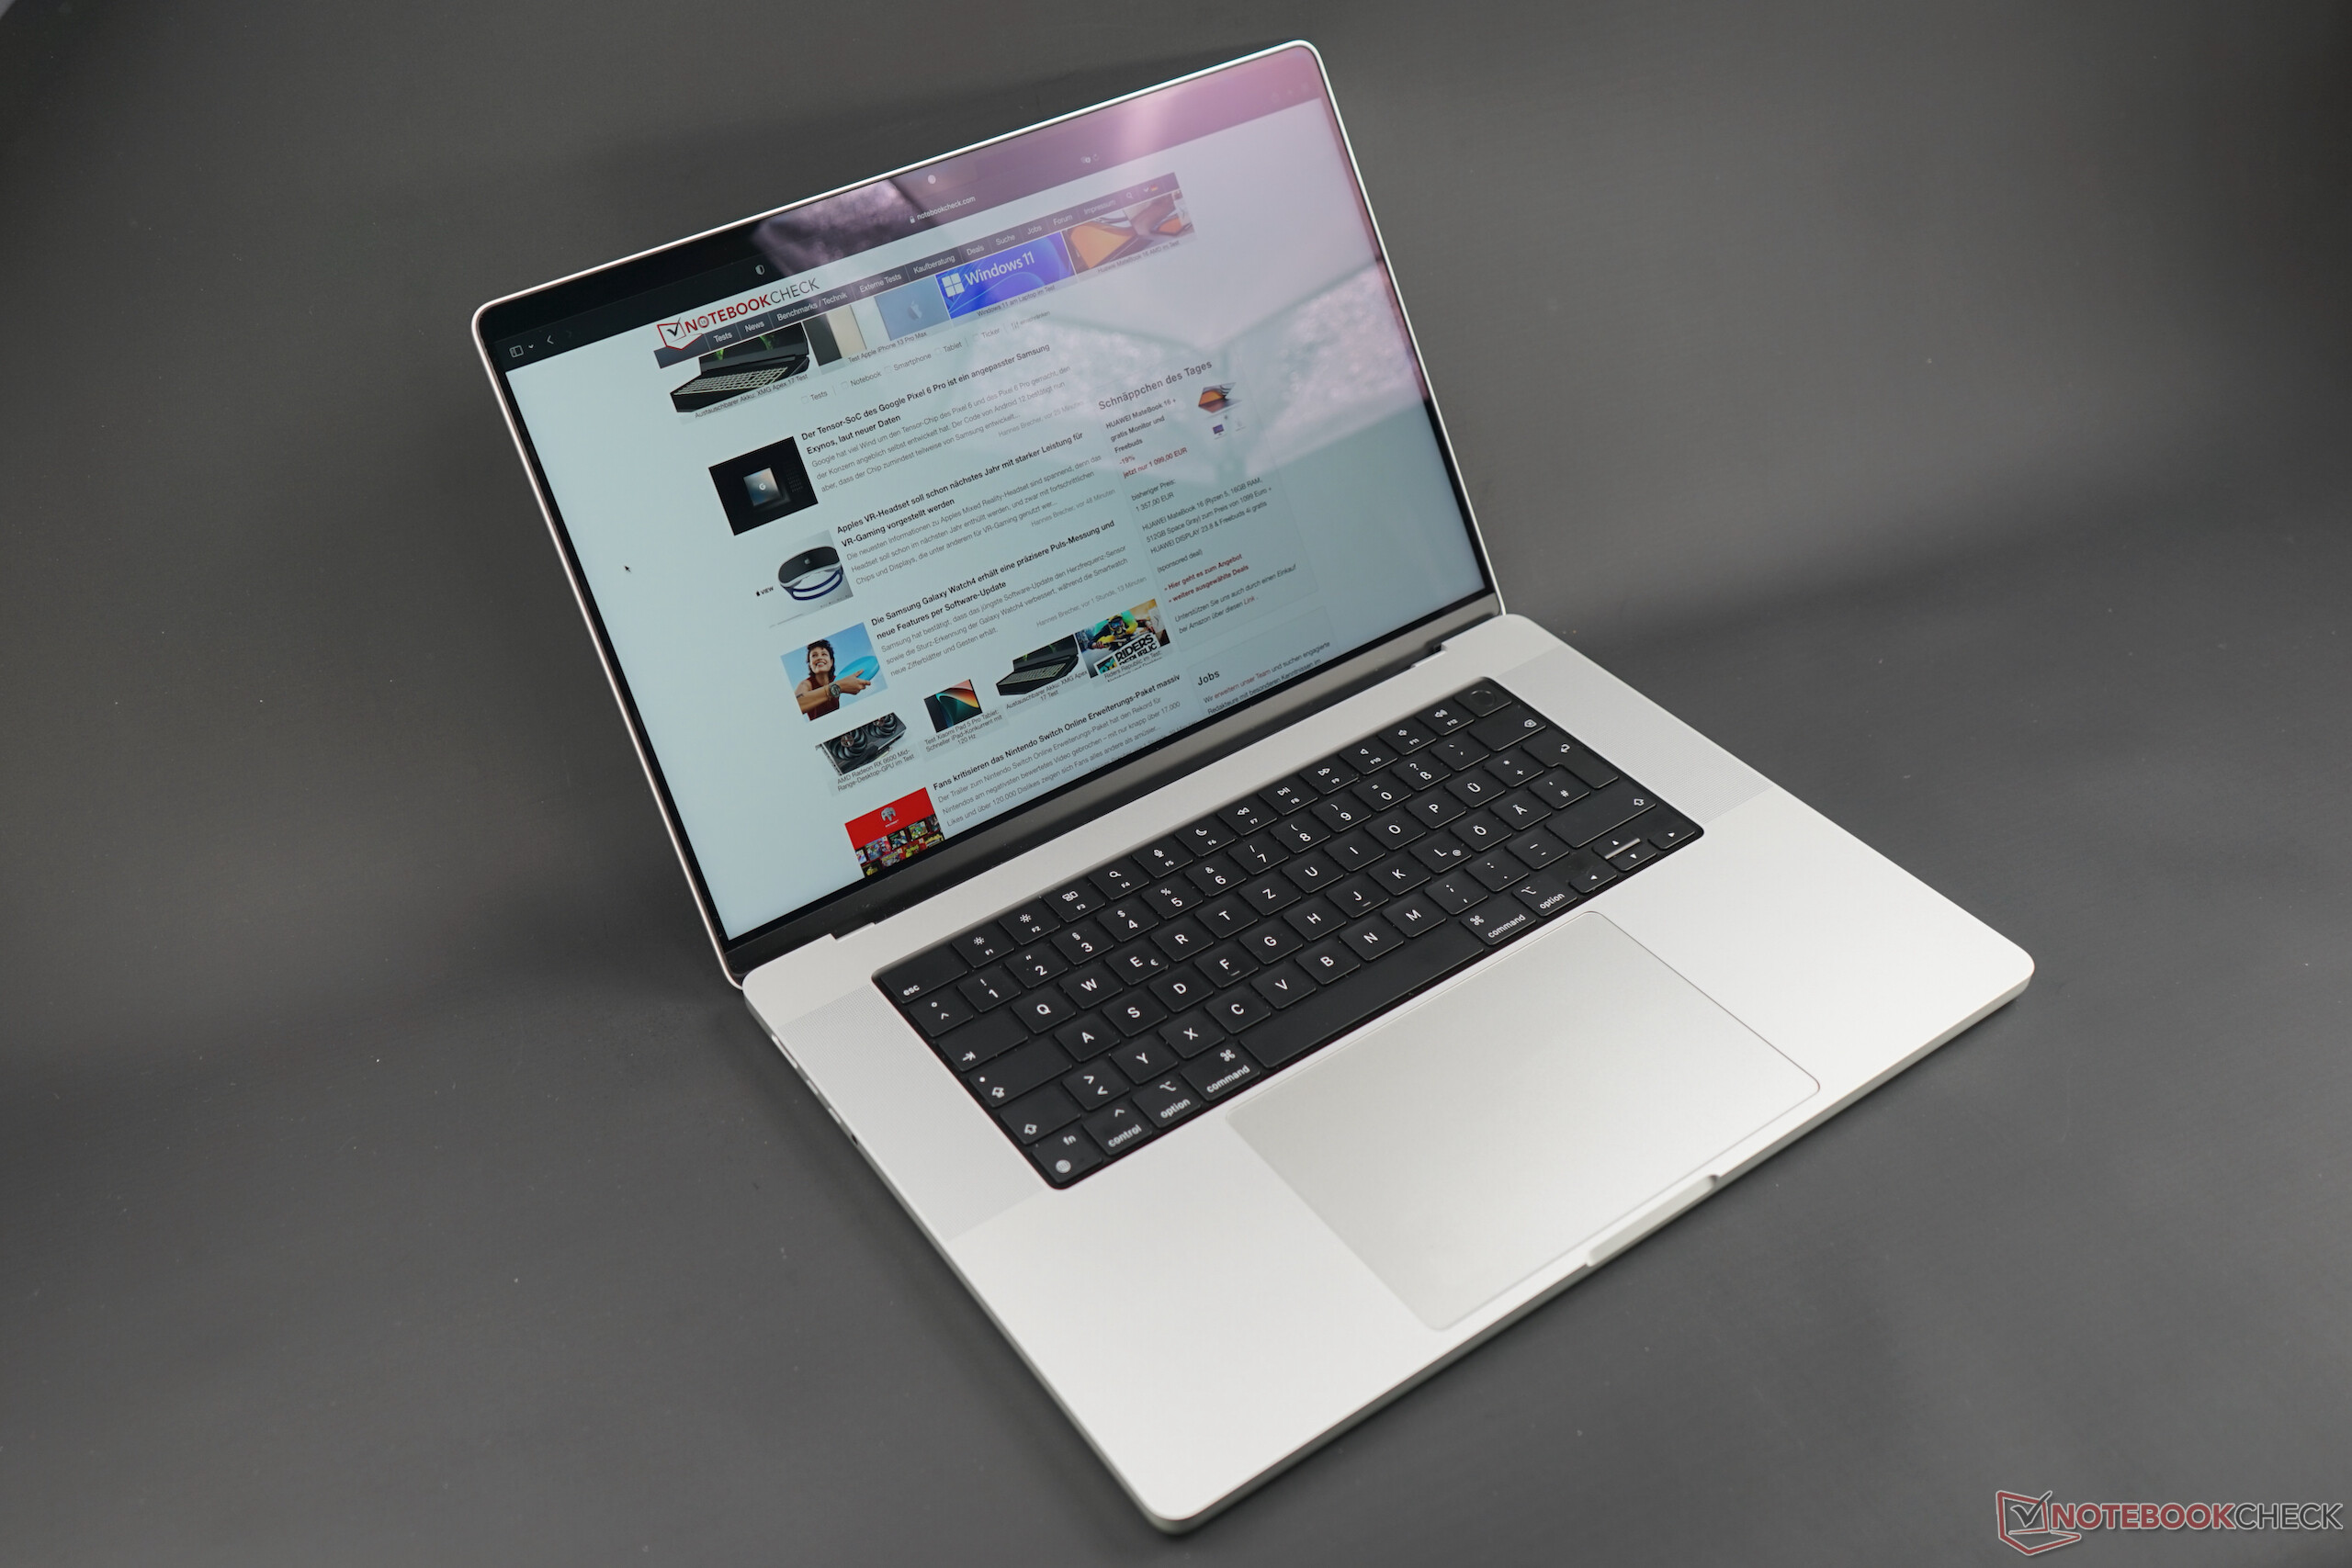
Apple MacBook Pro 16 2021 M1 Pro回顾--最适合内容创作者的多媒体笔记本电脑?

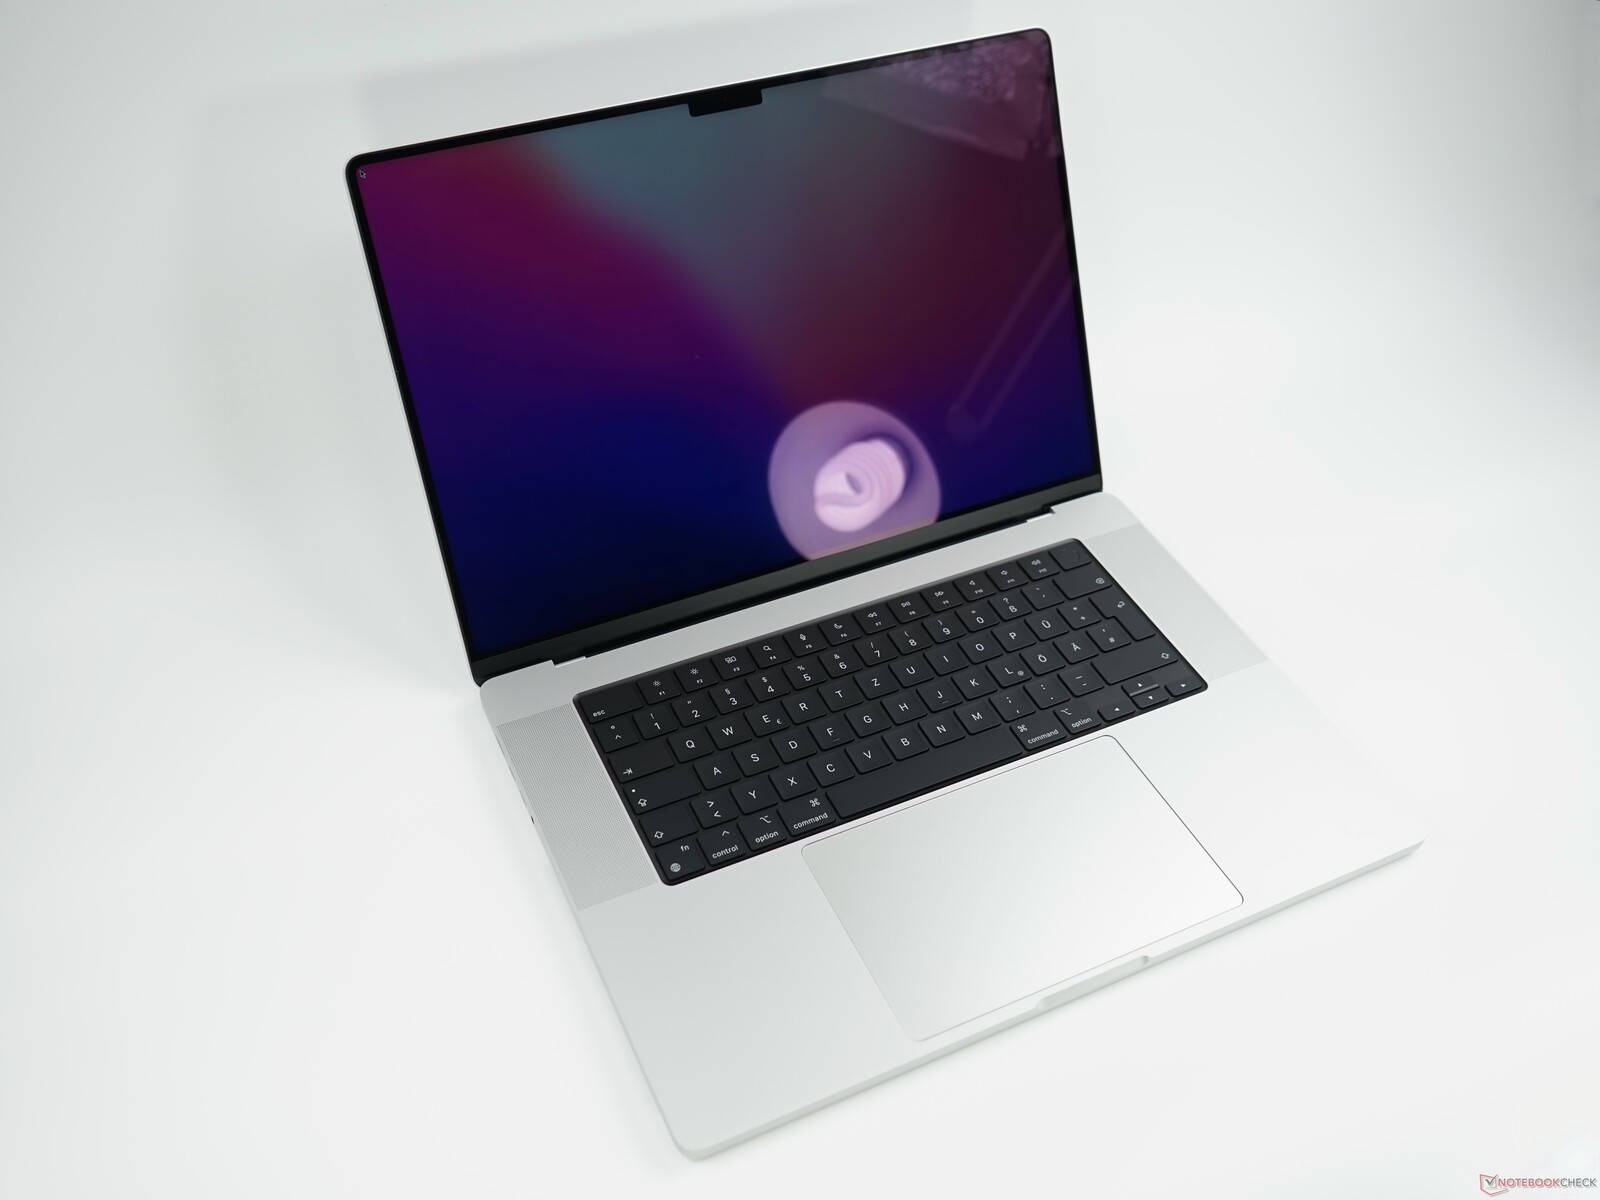
除了新的MacBook Pro 14,我们已经评测过了,Apple ,还推出了完全翻新的较大的MacBook Pro 16版本。它也可以使用新的M1 Pro和M1 Max芯片,并结合16英寸Mini-LED屏幕。我们的评测单位是配备16个GPU核心的M1 Pro SoC的型号;配备M1 Max和32个GPU核心的MacBook Pro 16的评测将在几天后进行。
我们在Apple"在线商店 "购买了我们的评论单元。它是配备M1 Pro SoC和16GB内存的基本型号;我们只勾选了较大的1TB固态硬盘。这个配置的价格是2979欧元(约合3,409美元)。
Comparison of potential competitors
Rating | Date | Model | Weight | Height | Size | Resolution | Price |
|---|---|---|---|---|---|---|---|
| 93.2 % v7 (old) | 11 / 2021 | Apple MacBook Pro 16 2021 M1 Pro M1 Pro, M1 Pro 16-Core GPU | 2.2 kg | 16.8 mm | 16.20" | 3456x2234 | |
| 89.7 % v7 (old) | 11 / 2019 | Apple MacBook Pro 16 2019 i9 5500M i9-9880H, Radeon Pro 5500M | 2 kg | 16.2 mm | 16.00" | 3072x1920 | |
| 89.8 % v7 (old) | 11 / 2021 | Lenovo ThinkPad P1 G4-20Y4S0KS00 i7-11850H, GeForce RTX 3070 Laptop GPU | 2 kg | 17.7 mm | 16.00" | 3840x2400 | |
| 88.4 % v7 (old) | 09 / 2021 | Dell XPS 15 9510 11800H RTX 3050 Ti OLED i7-11800H, GeForce RTX 3050 Ti Laptop GPU | 1.9 kg | 18 mm | 15.60" | 3456x2160 | |
| 87.8 % v7 (old) | 08 / 2021 | HP ZBook Studio 15 G8 i9-11950H, GeForce RTX 3070 Laptop GPU | 1.9 kg | 18 mm | 15.60" | 3840x2160 | |
| 88.9 % v7 (old) | 10 / 2021 | Razer Blade 15 Advanced (Mid 2021) i7-11800H, GeForce RTX 3080 Laptop GPU | 2 kg | 16.99 mm | 15.60" | 1920x1080 |
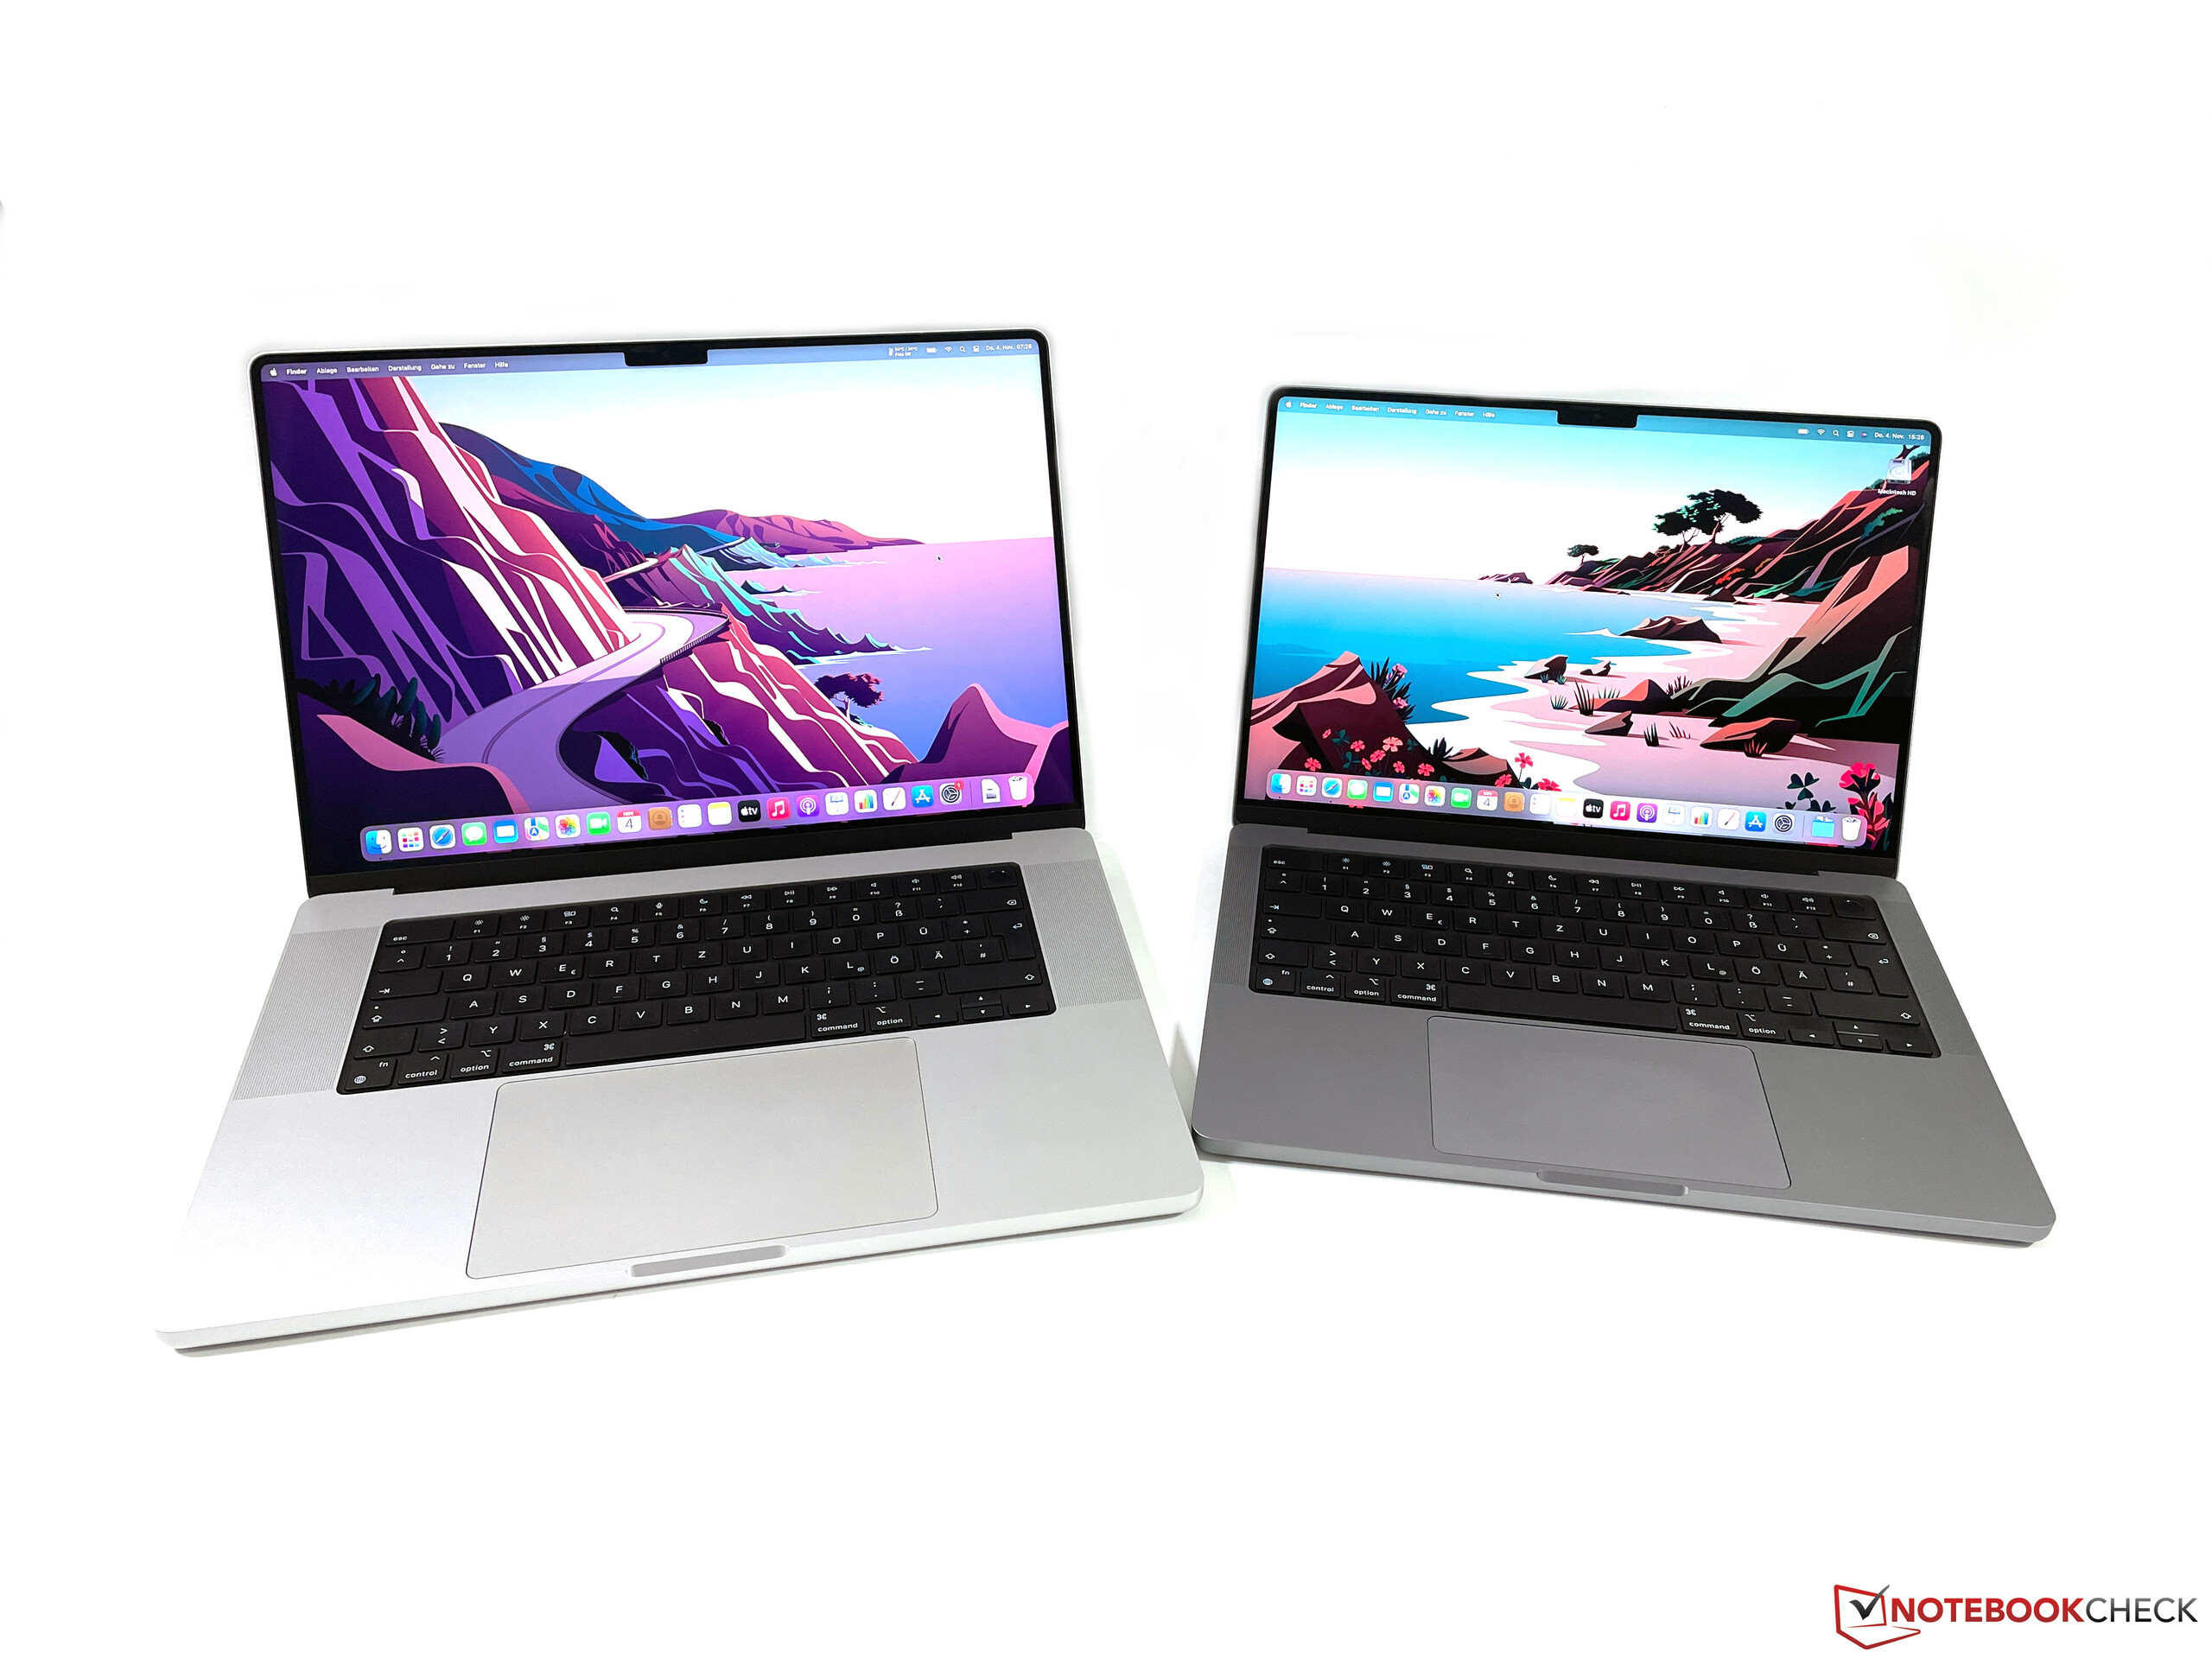
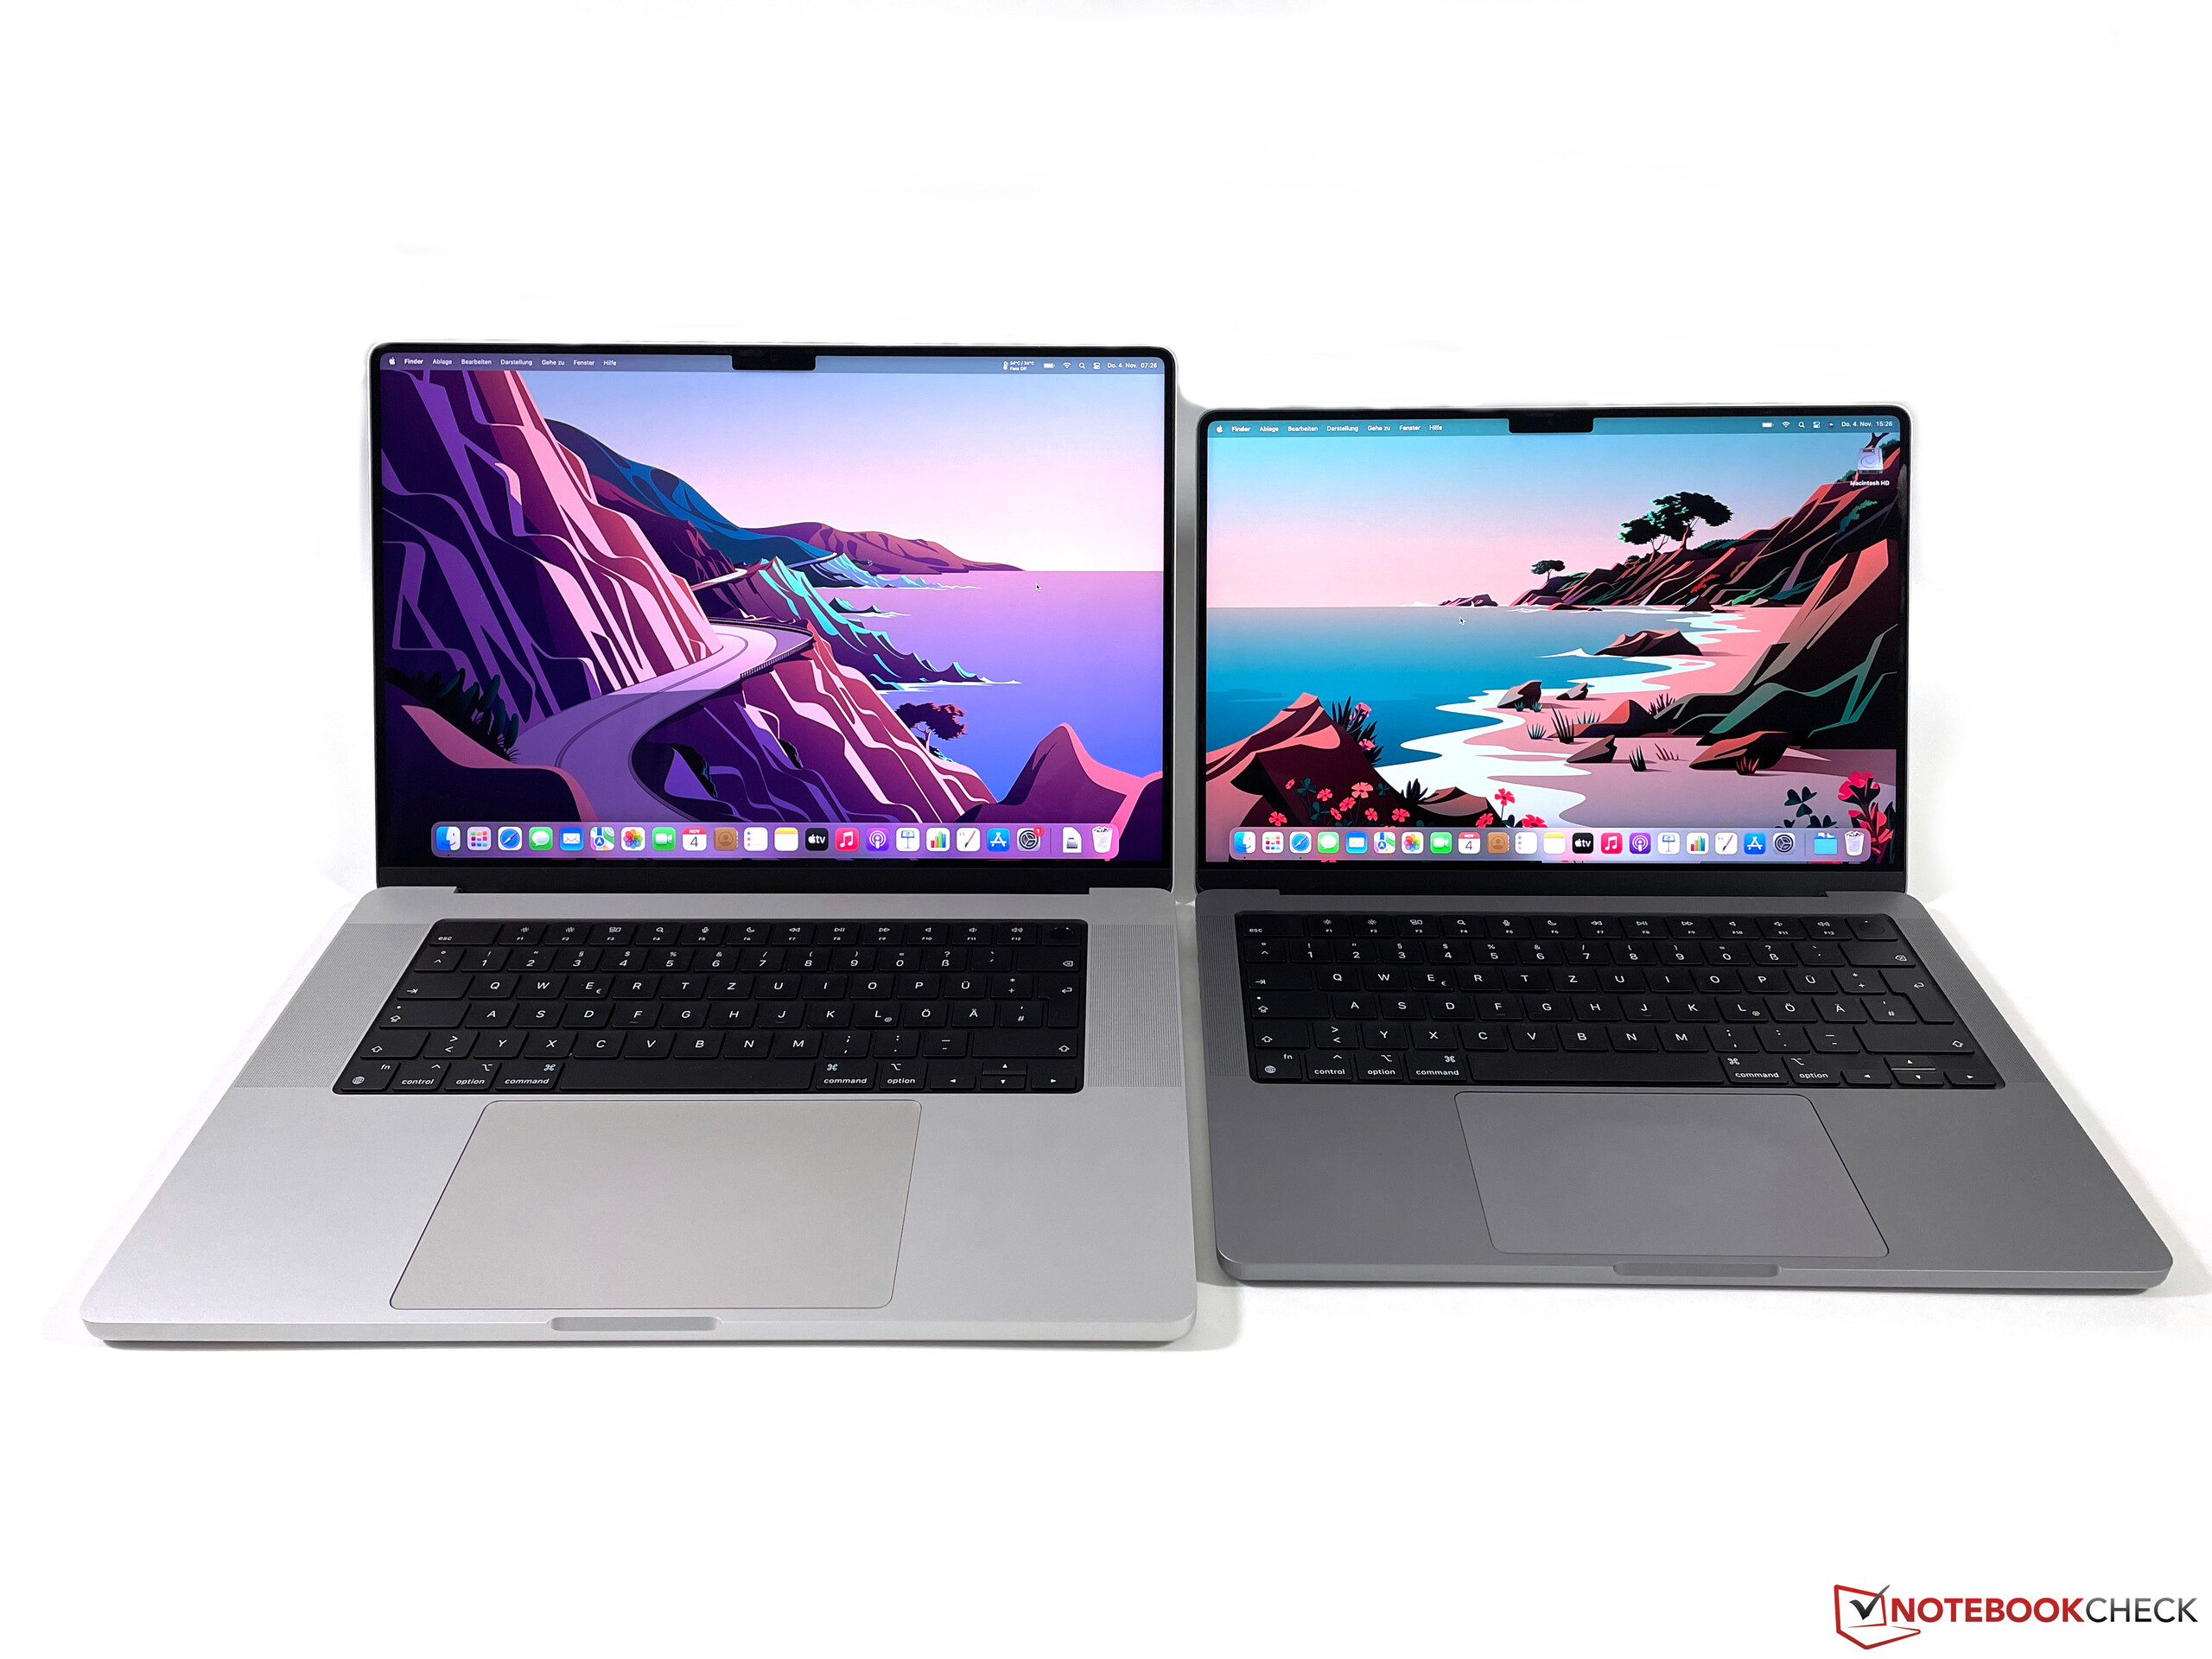
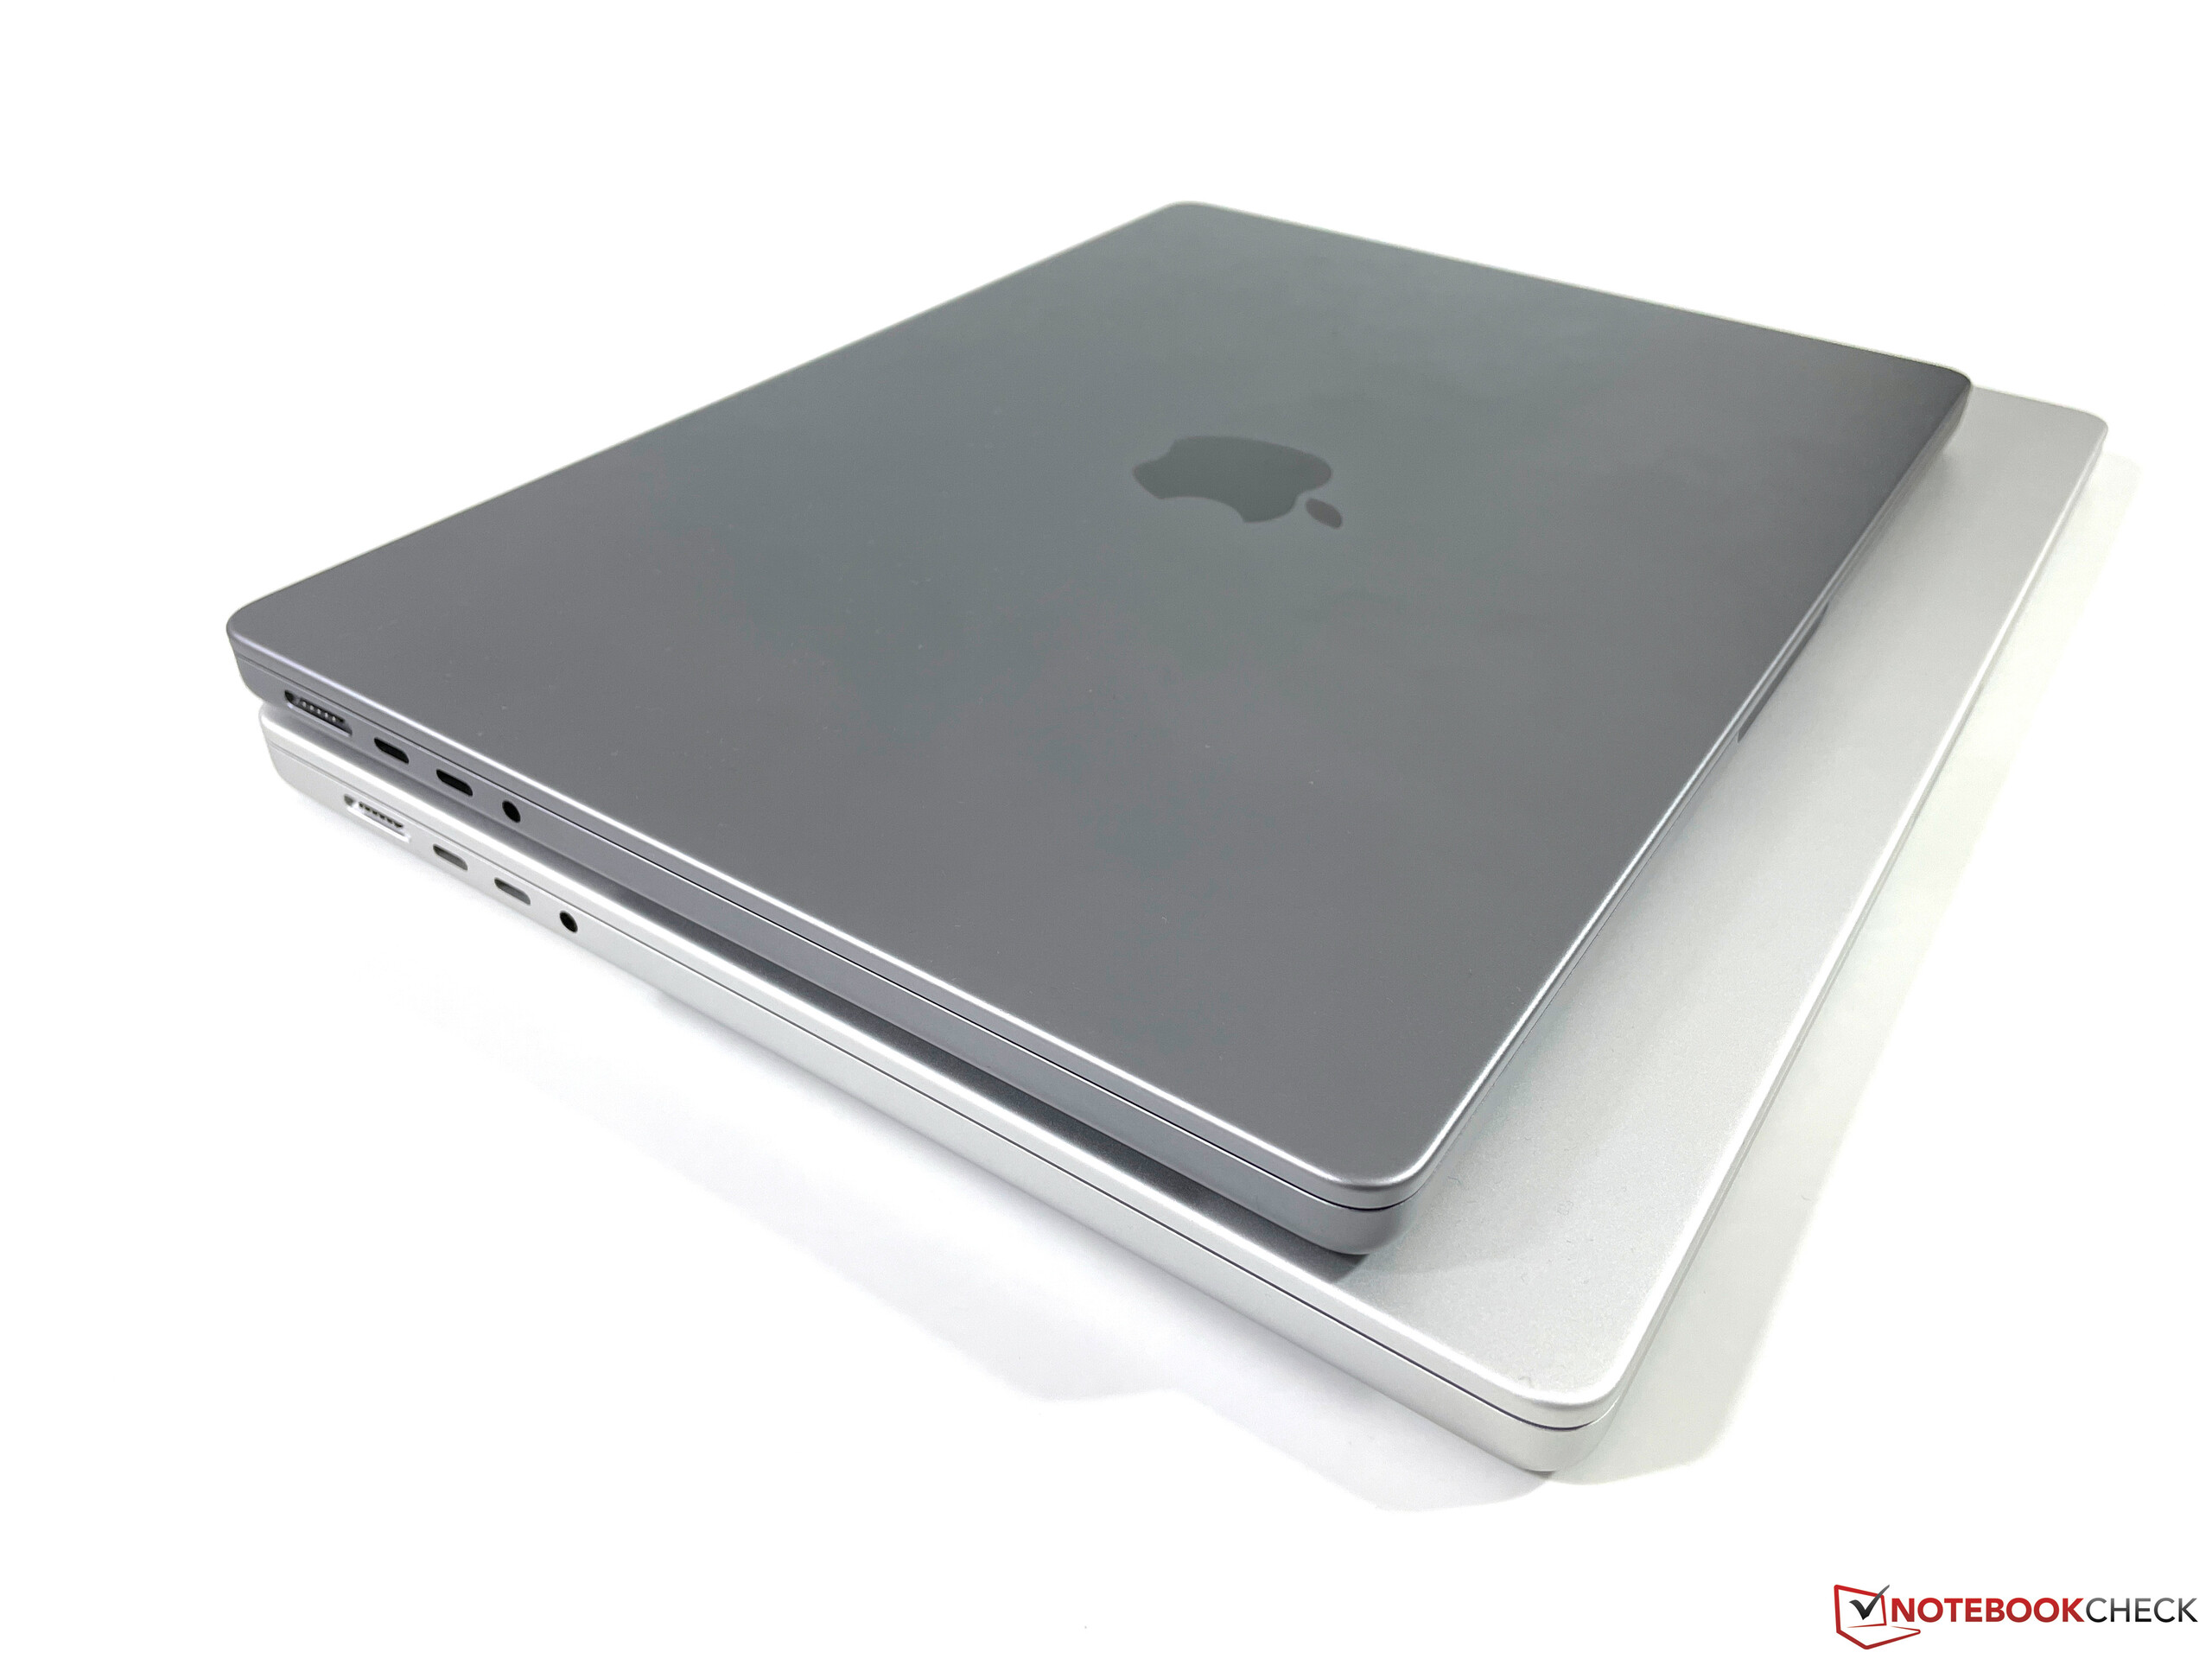
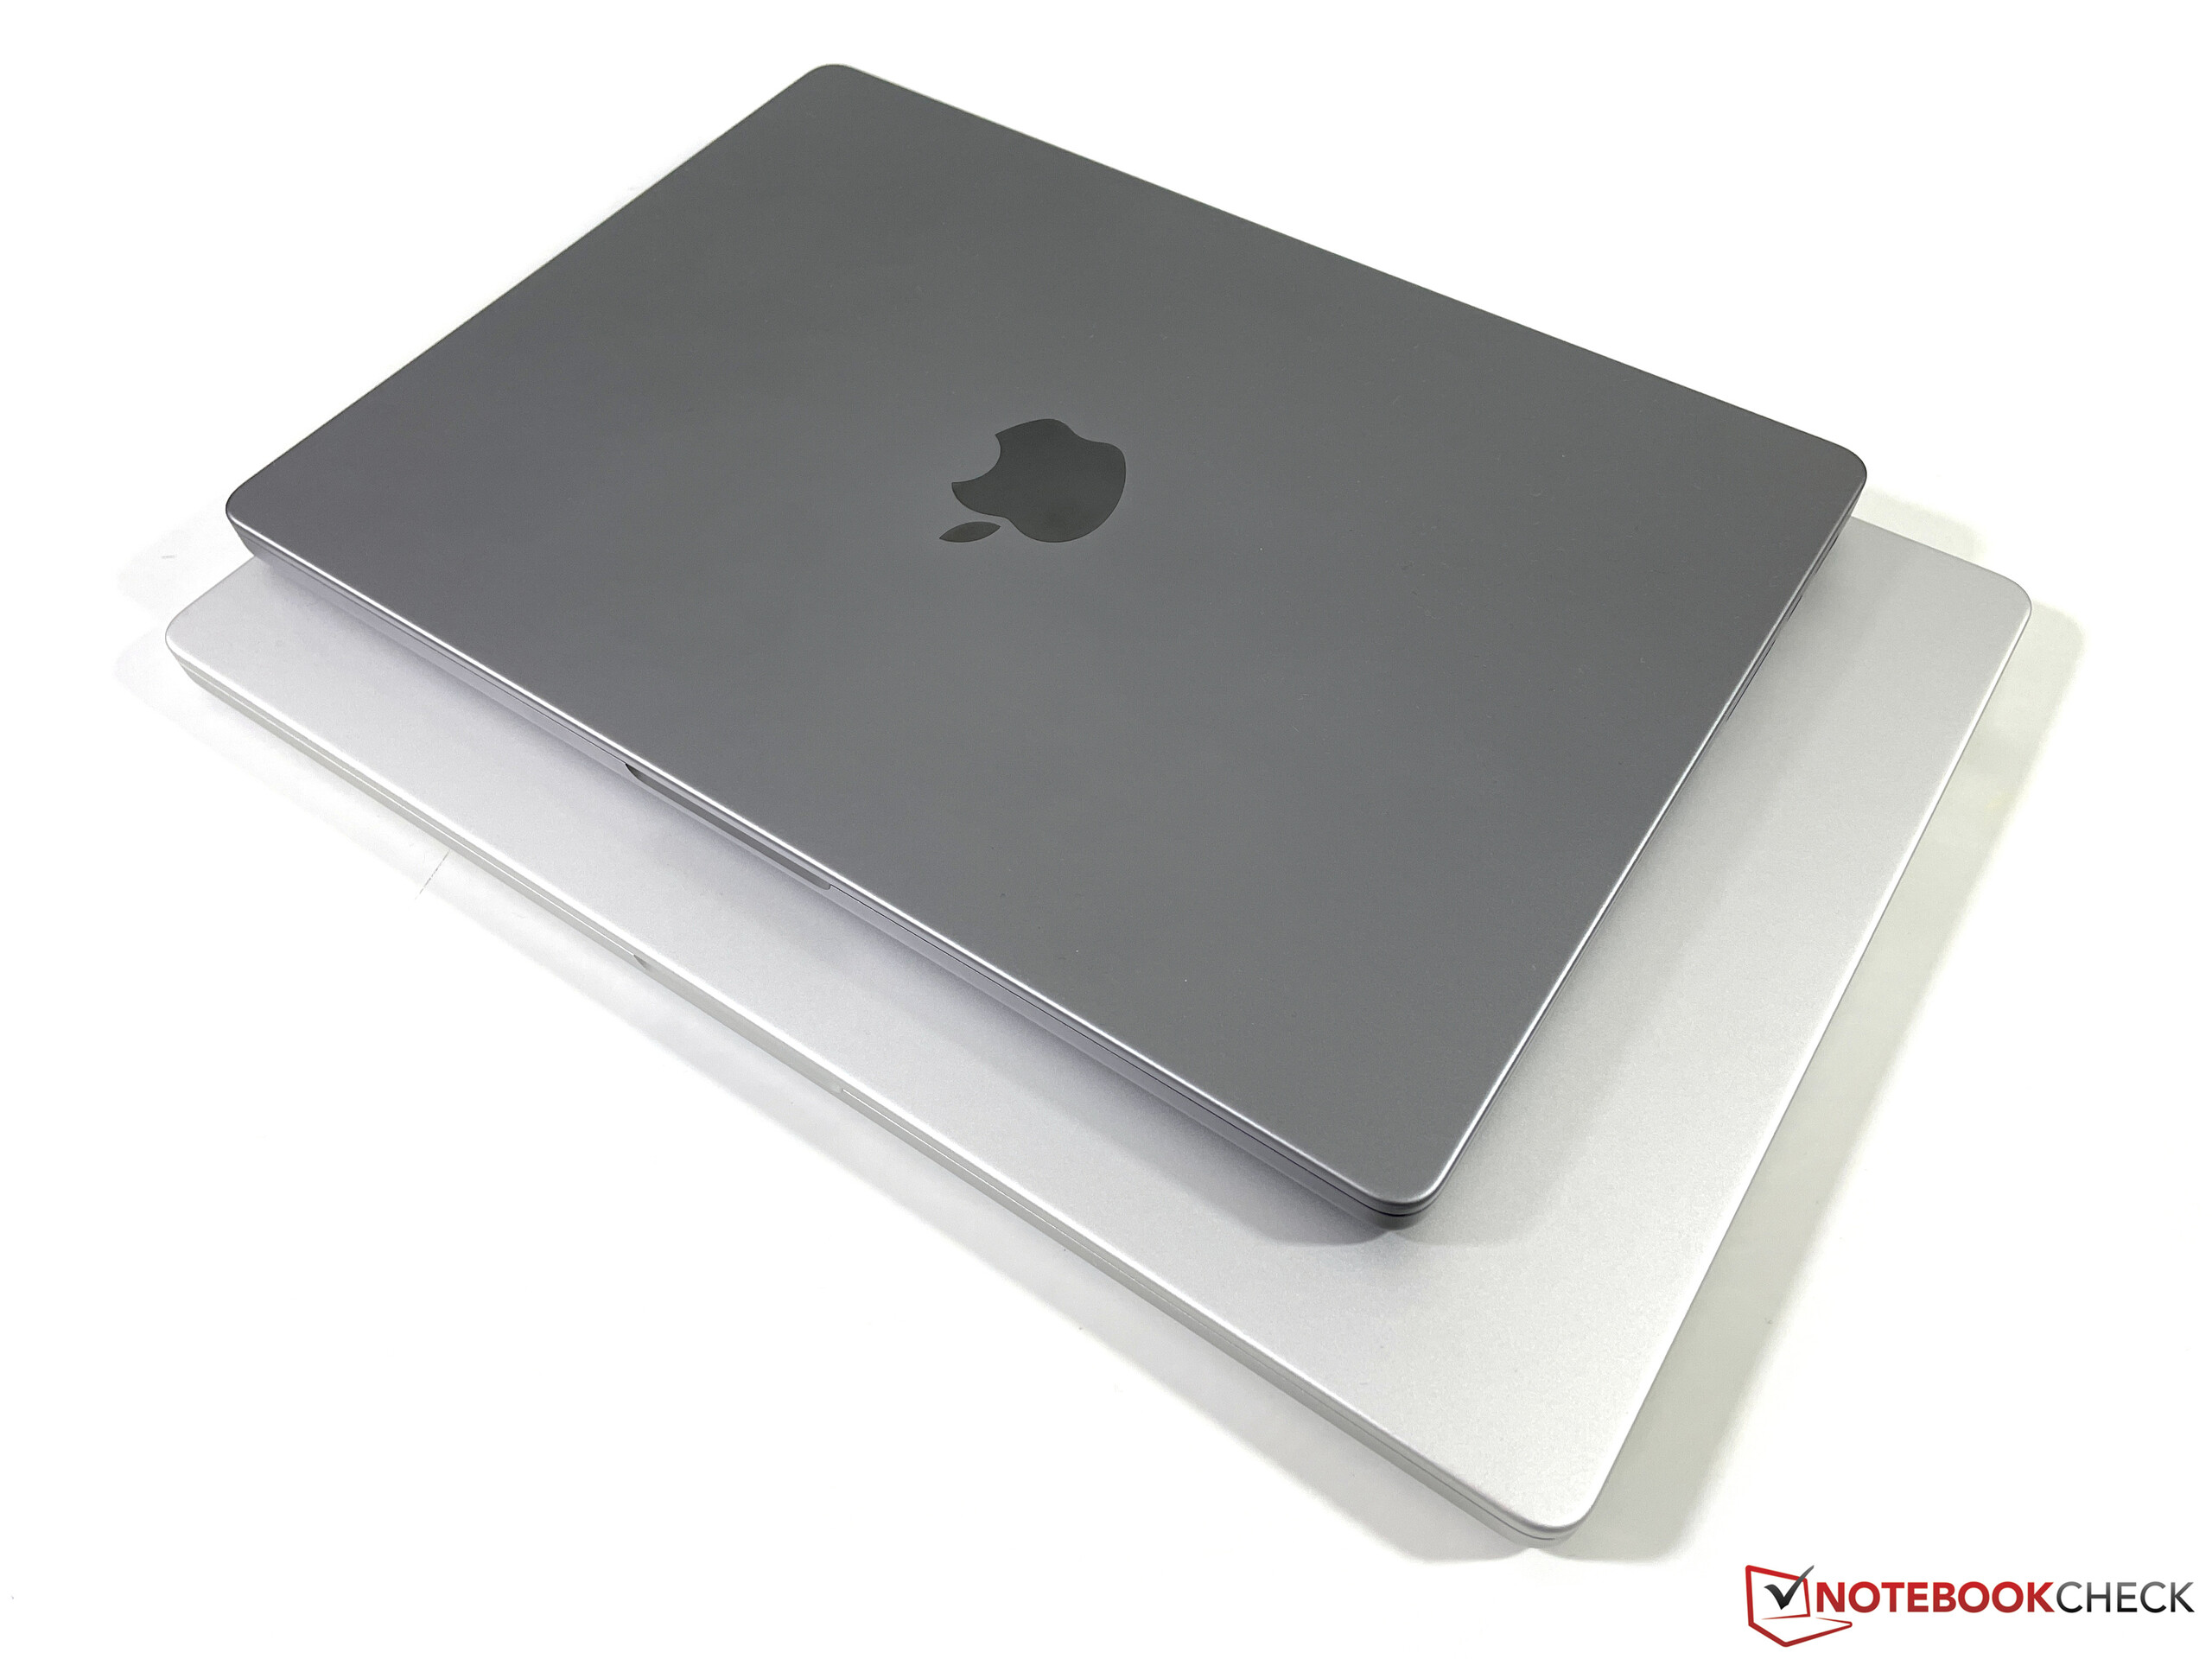
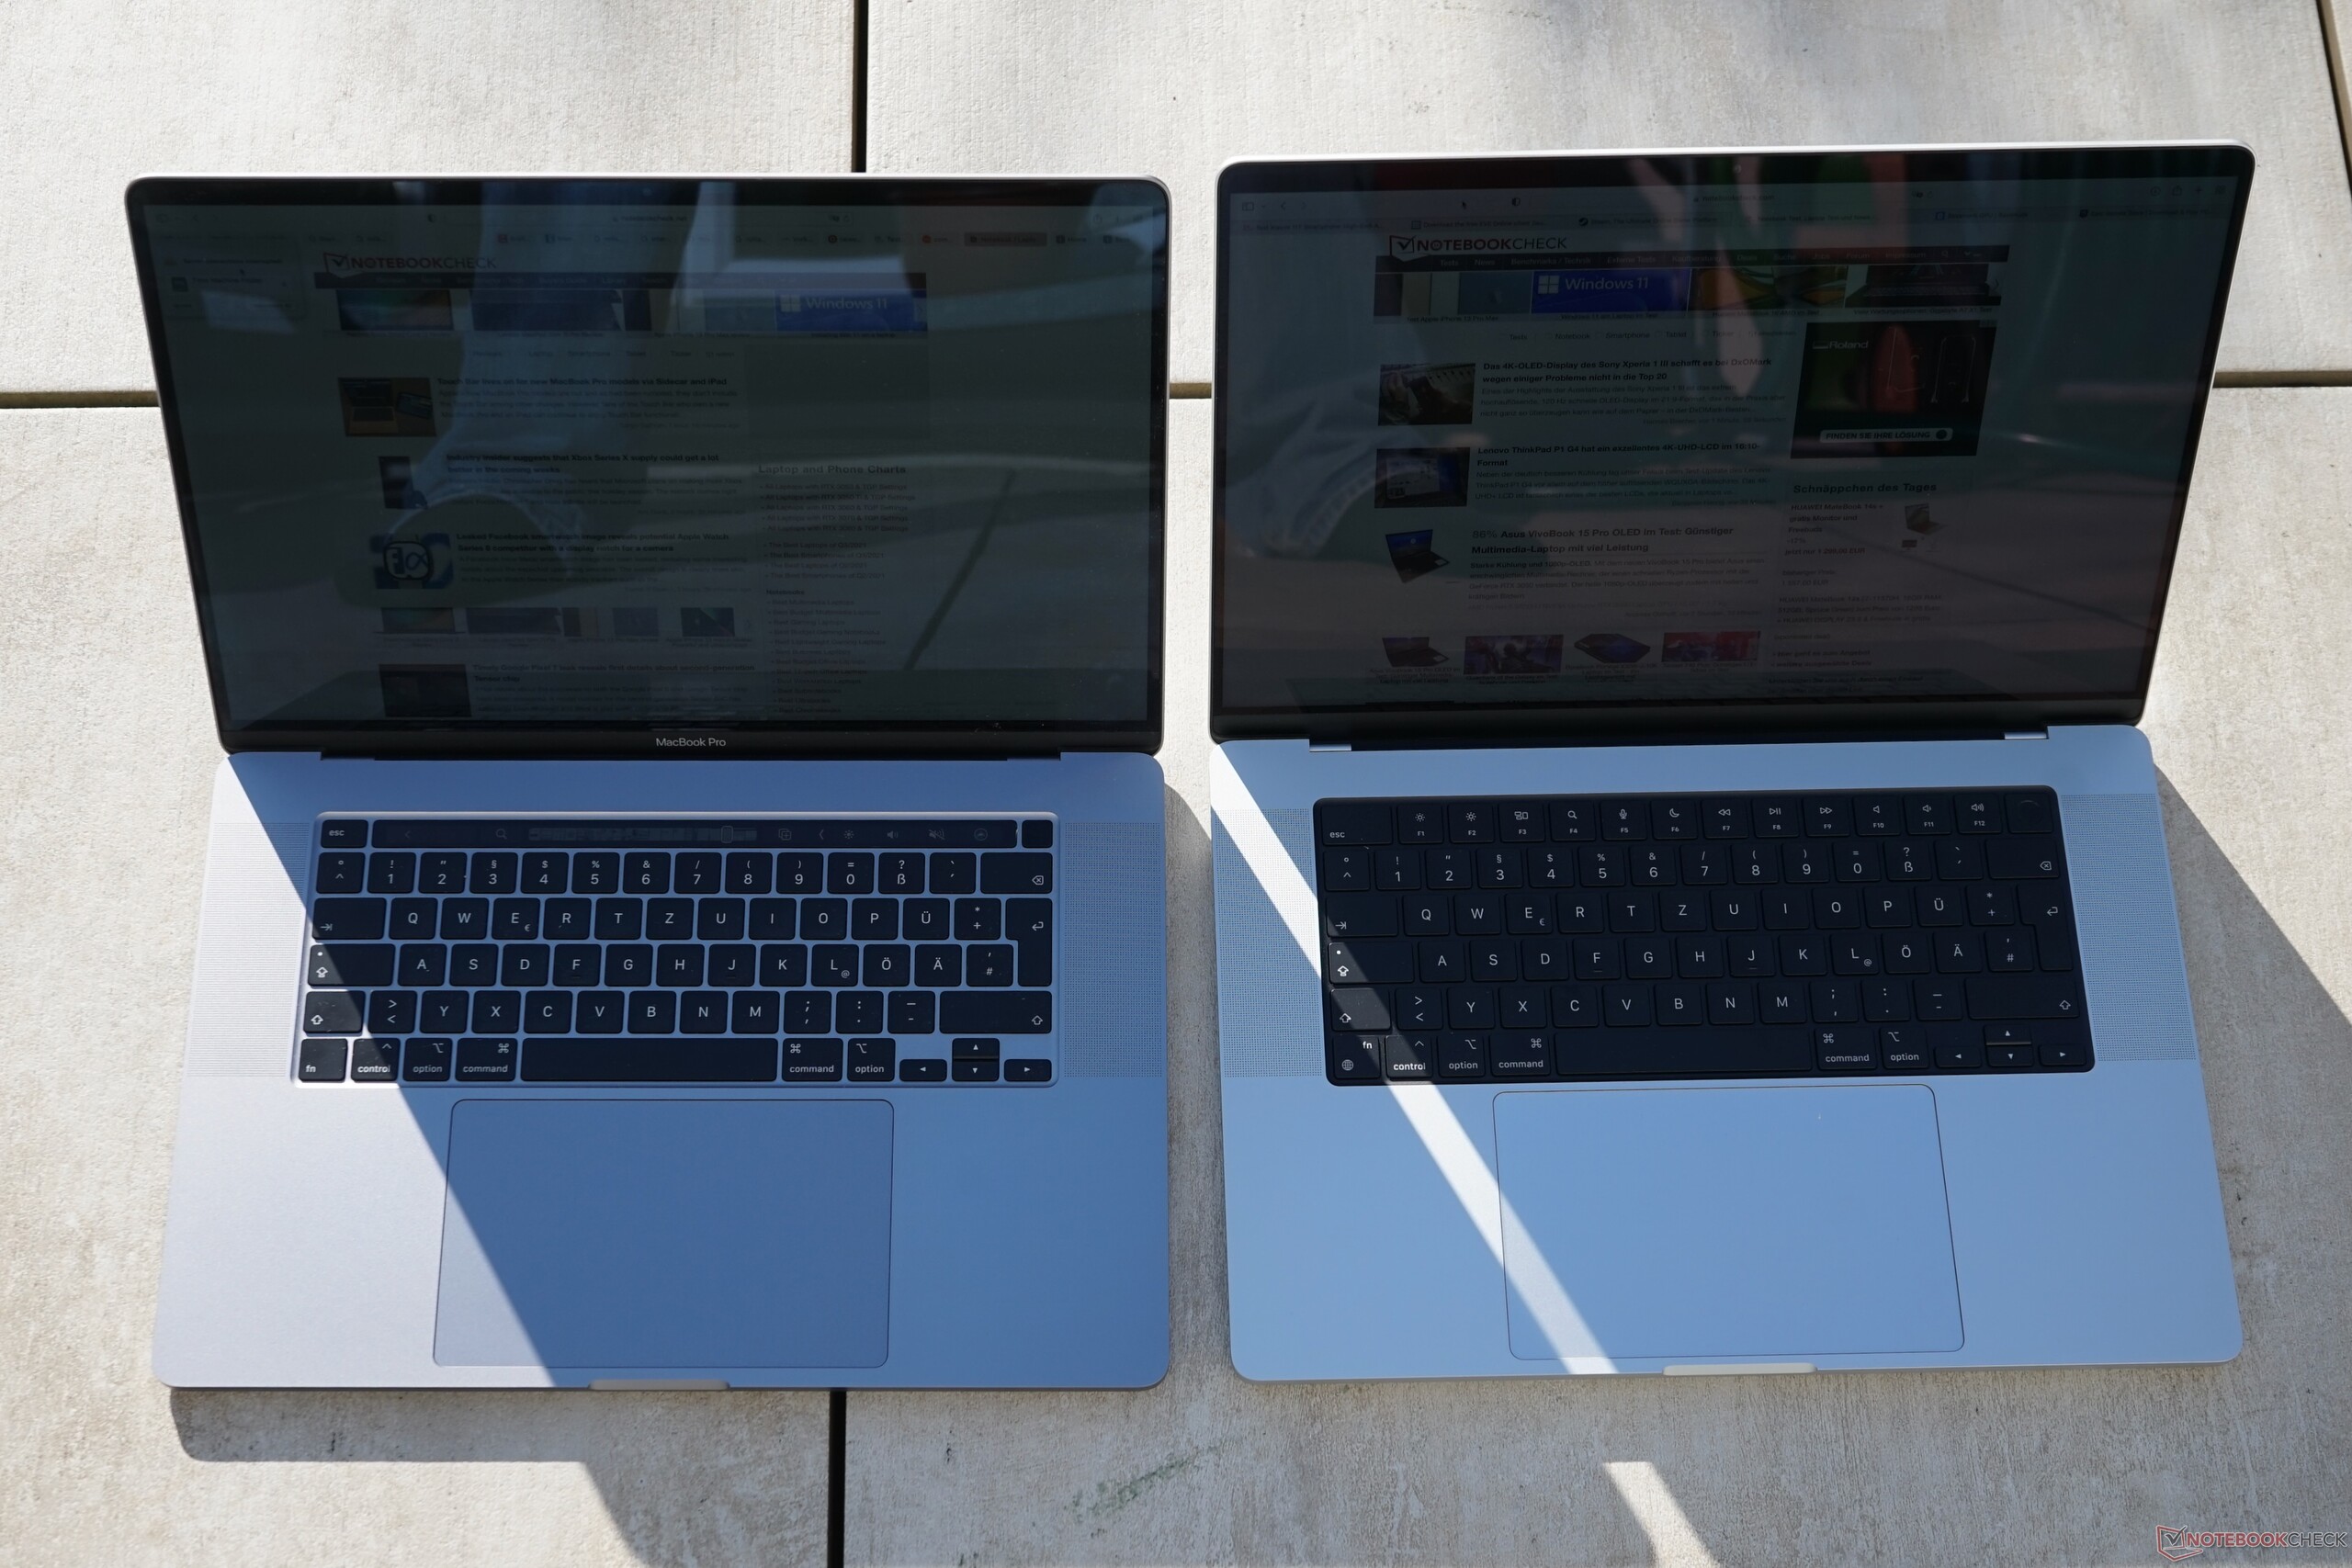
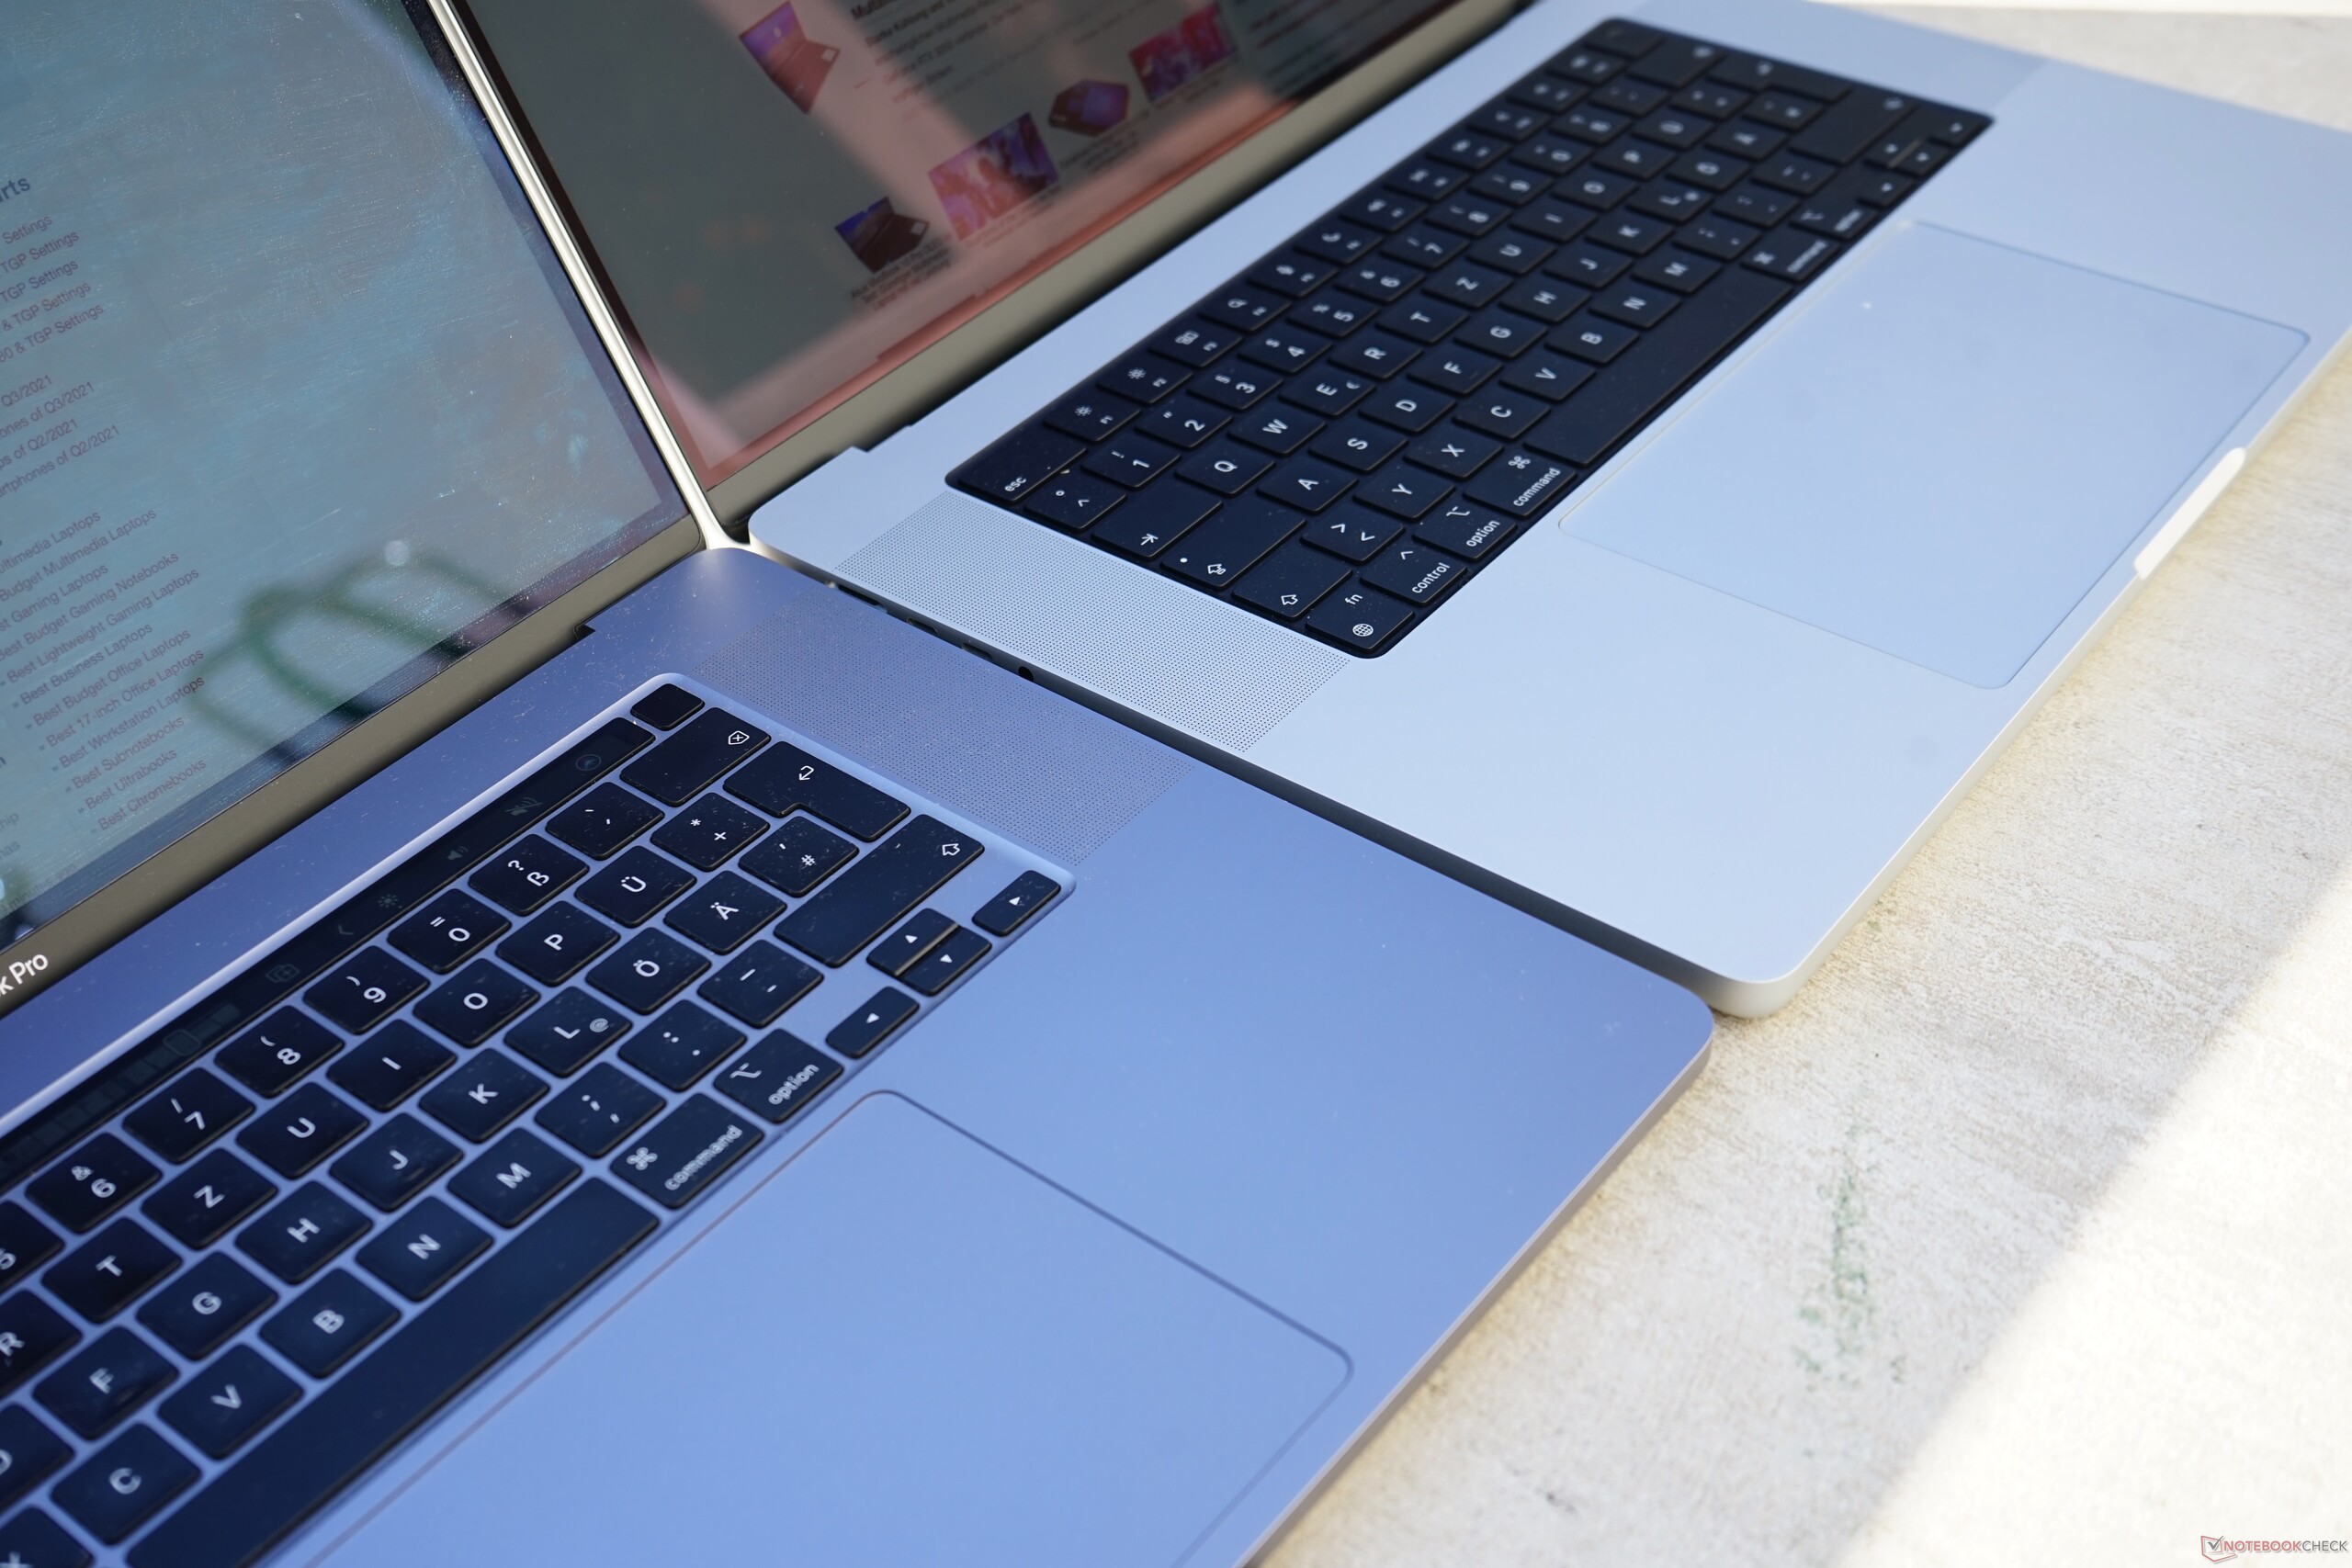
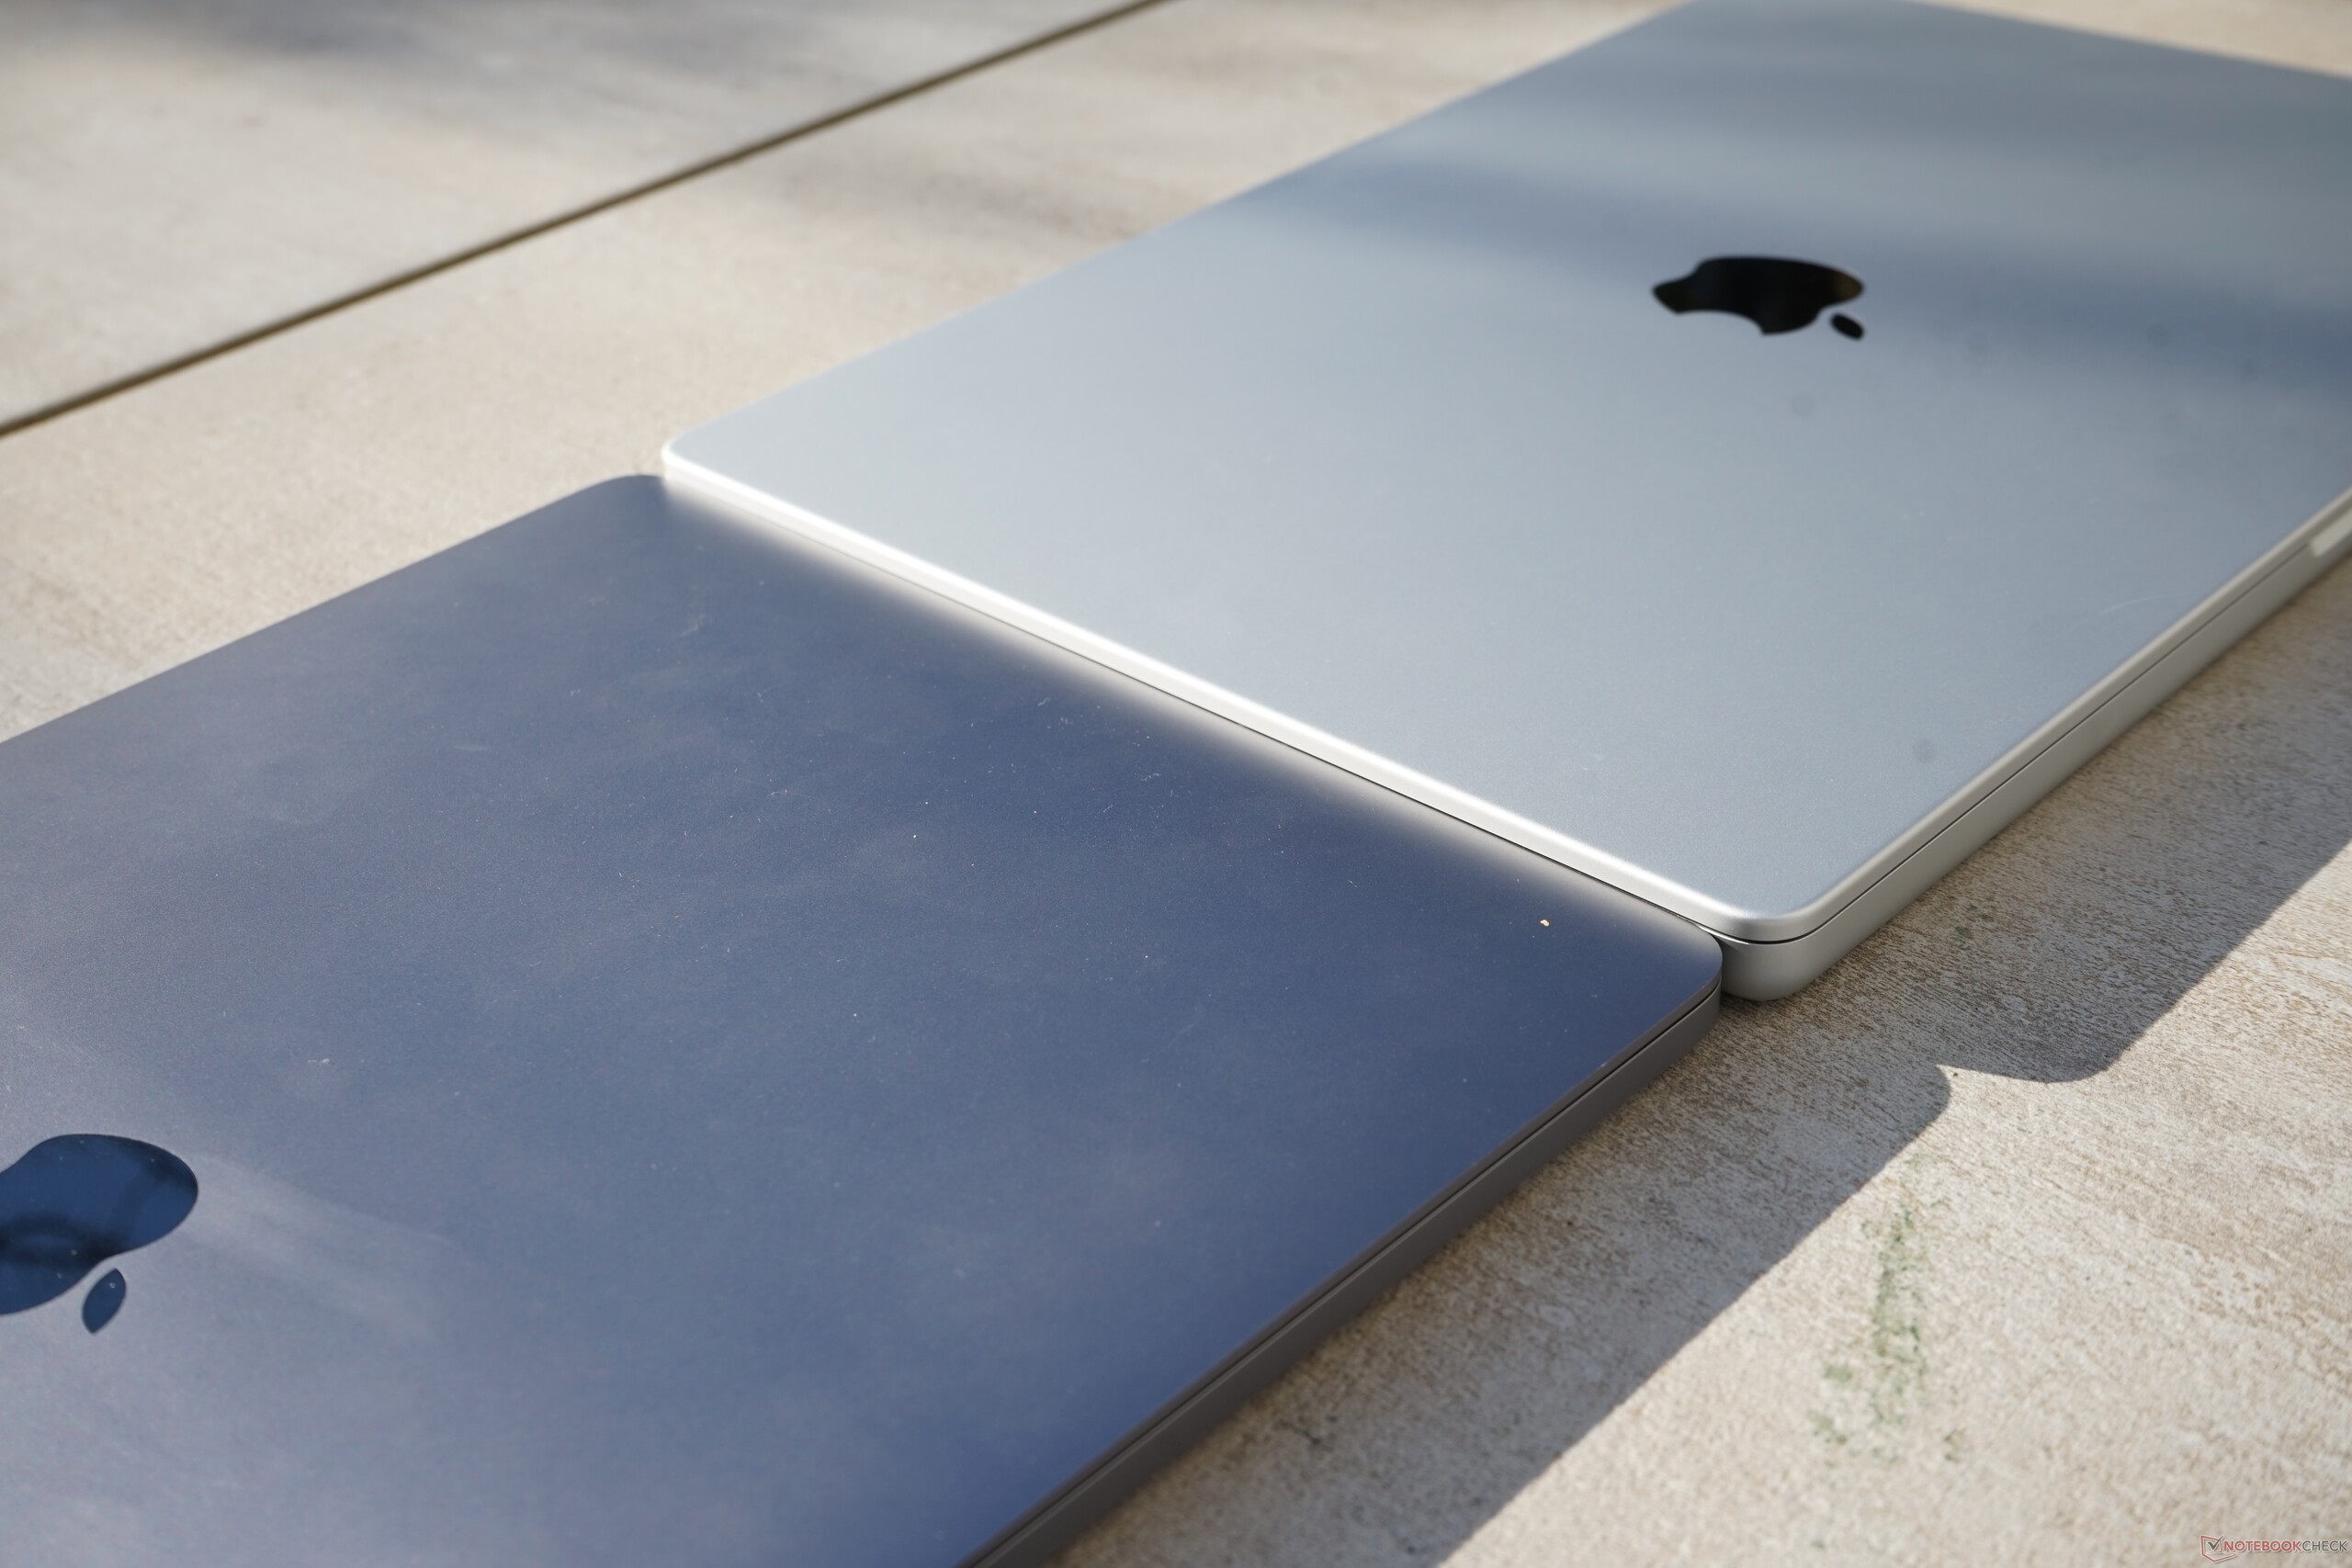
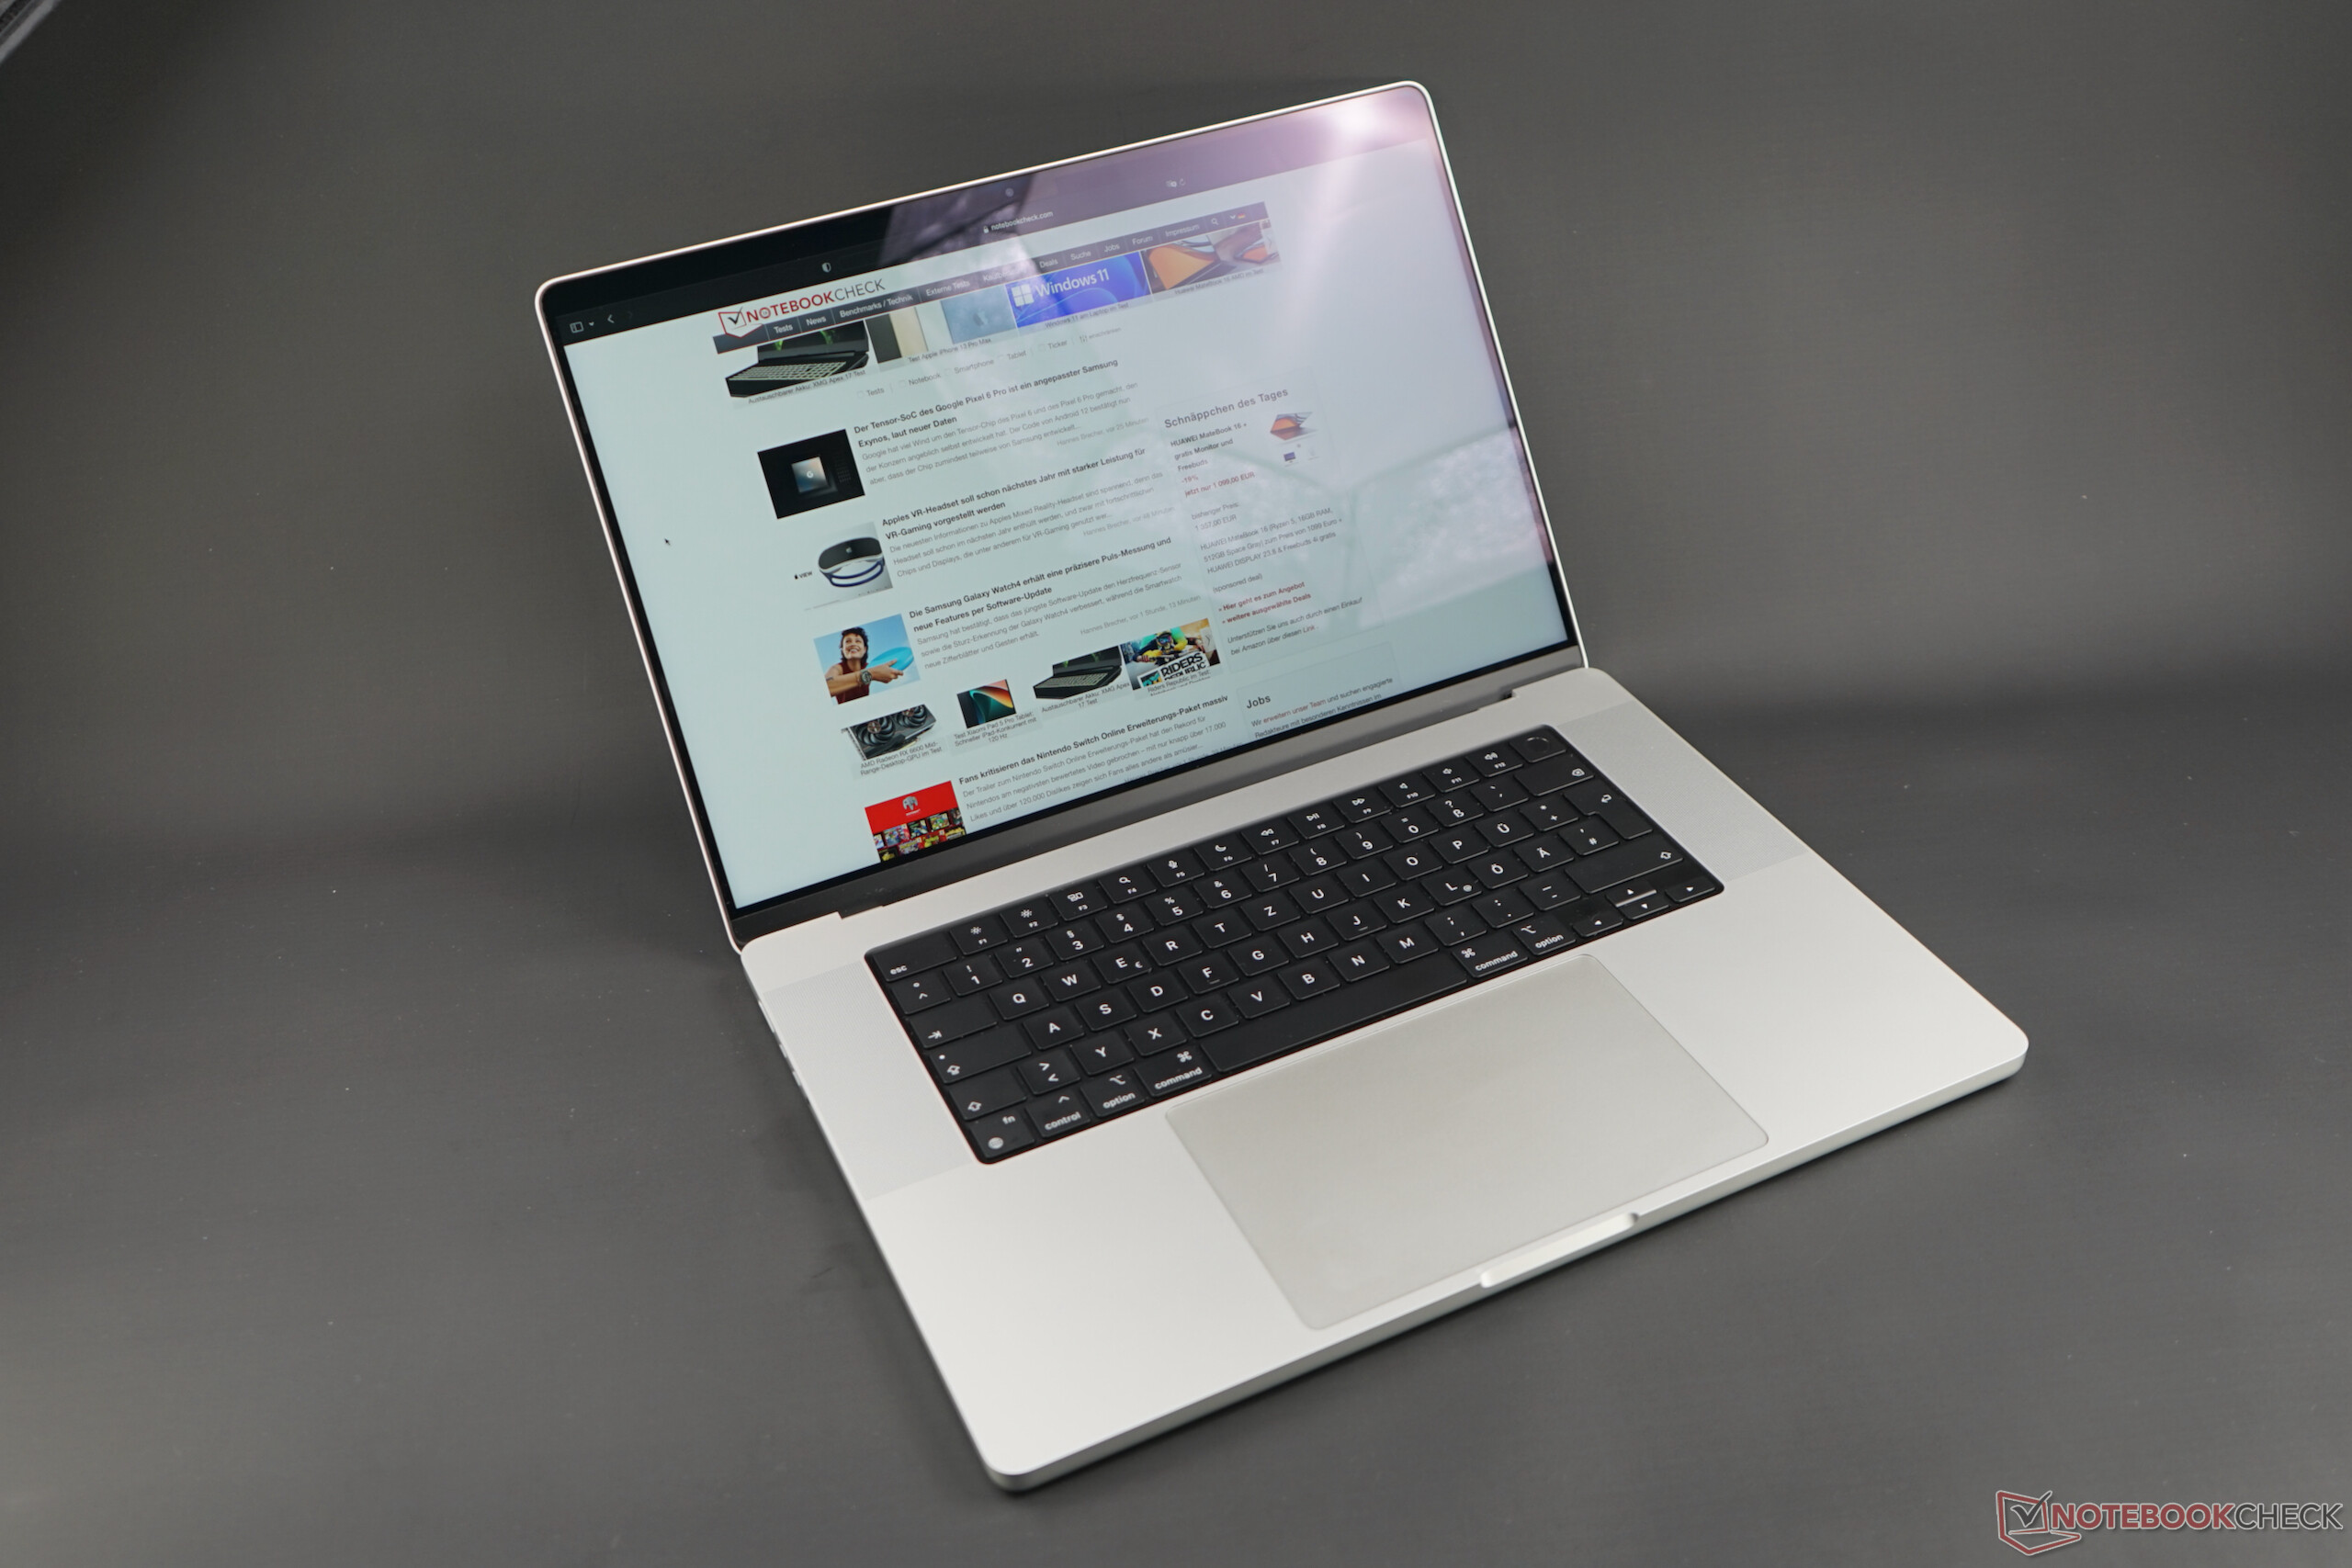
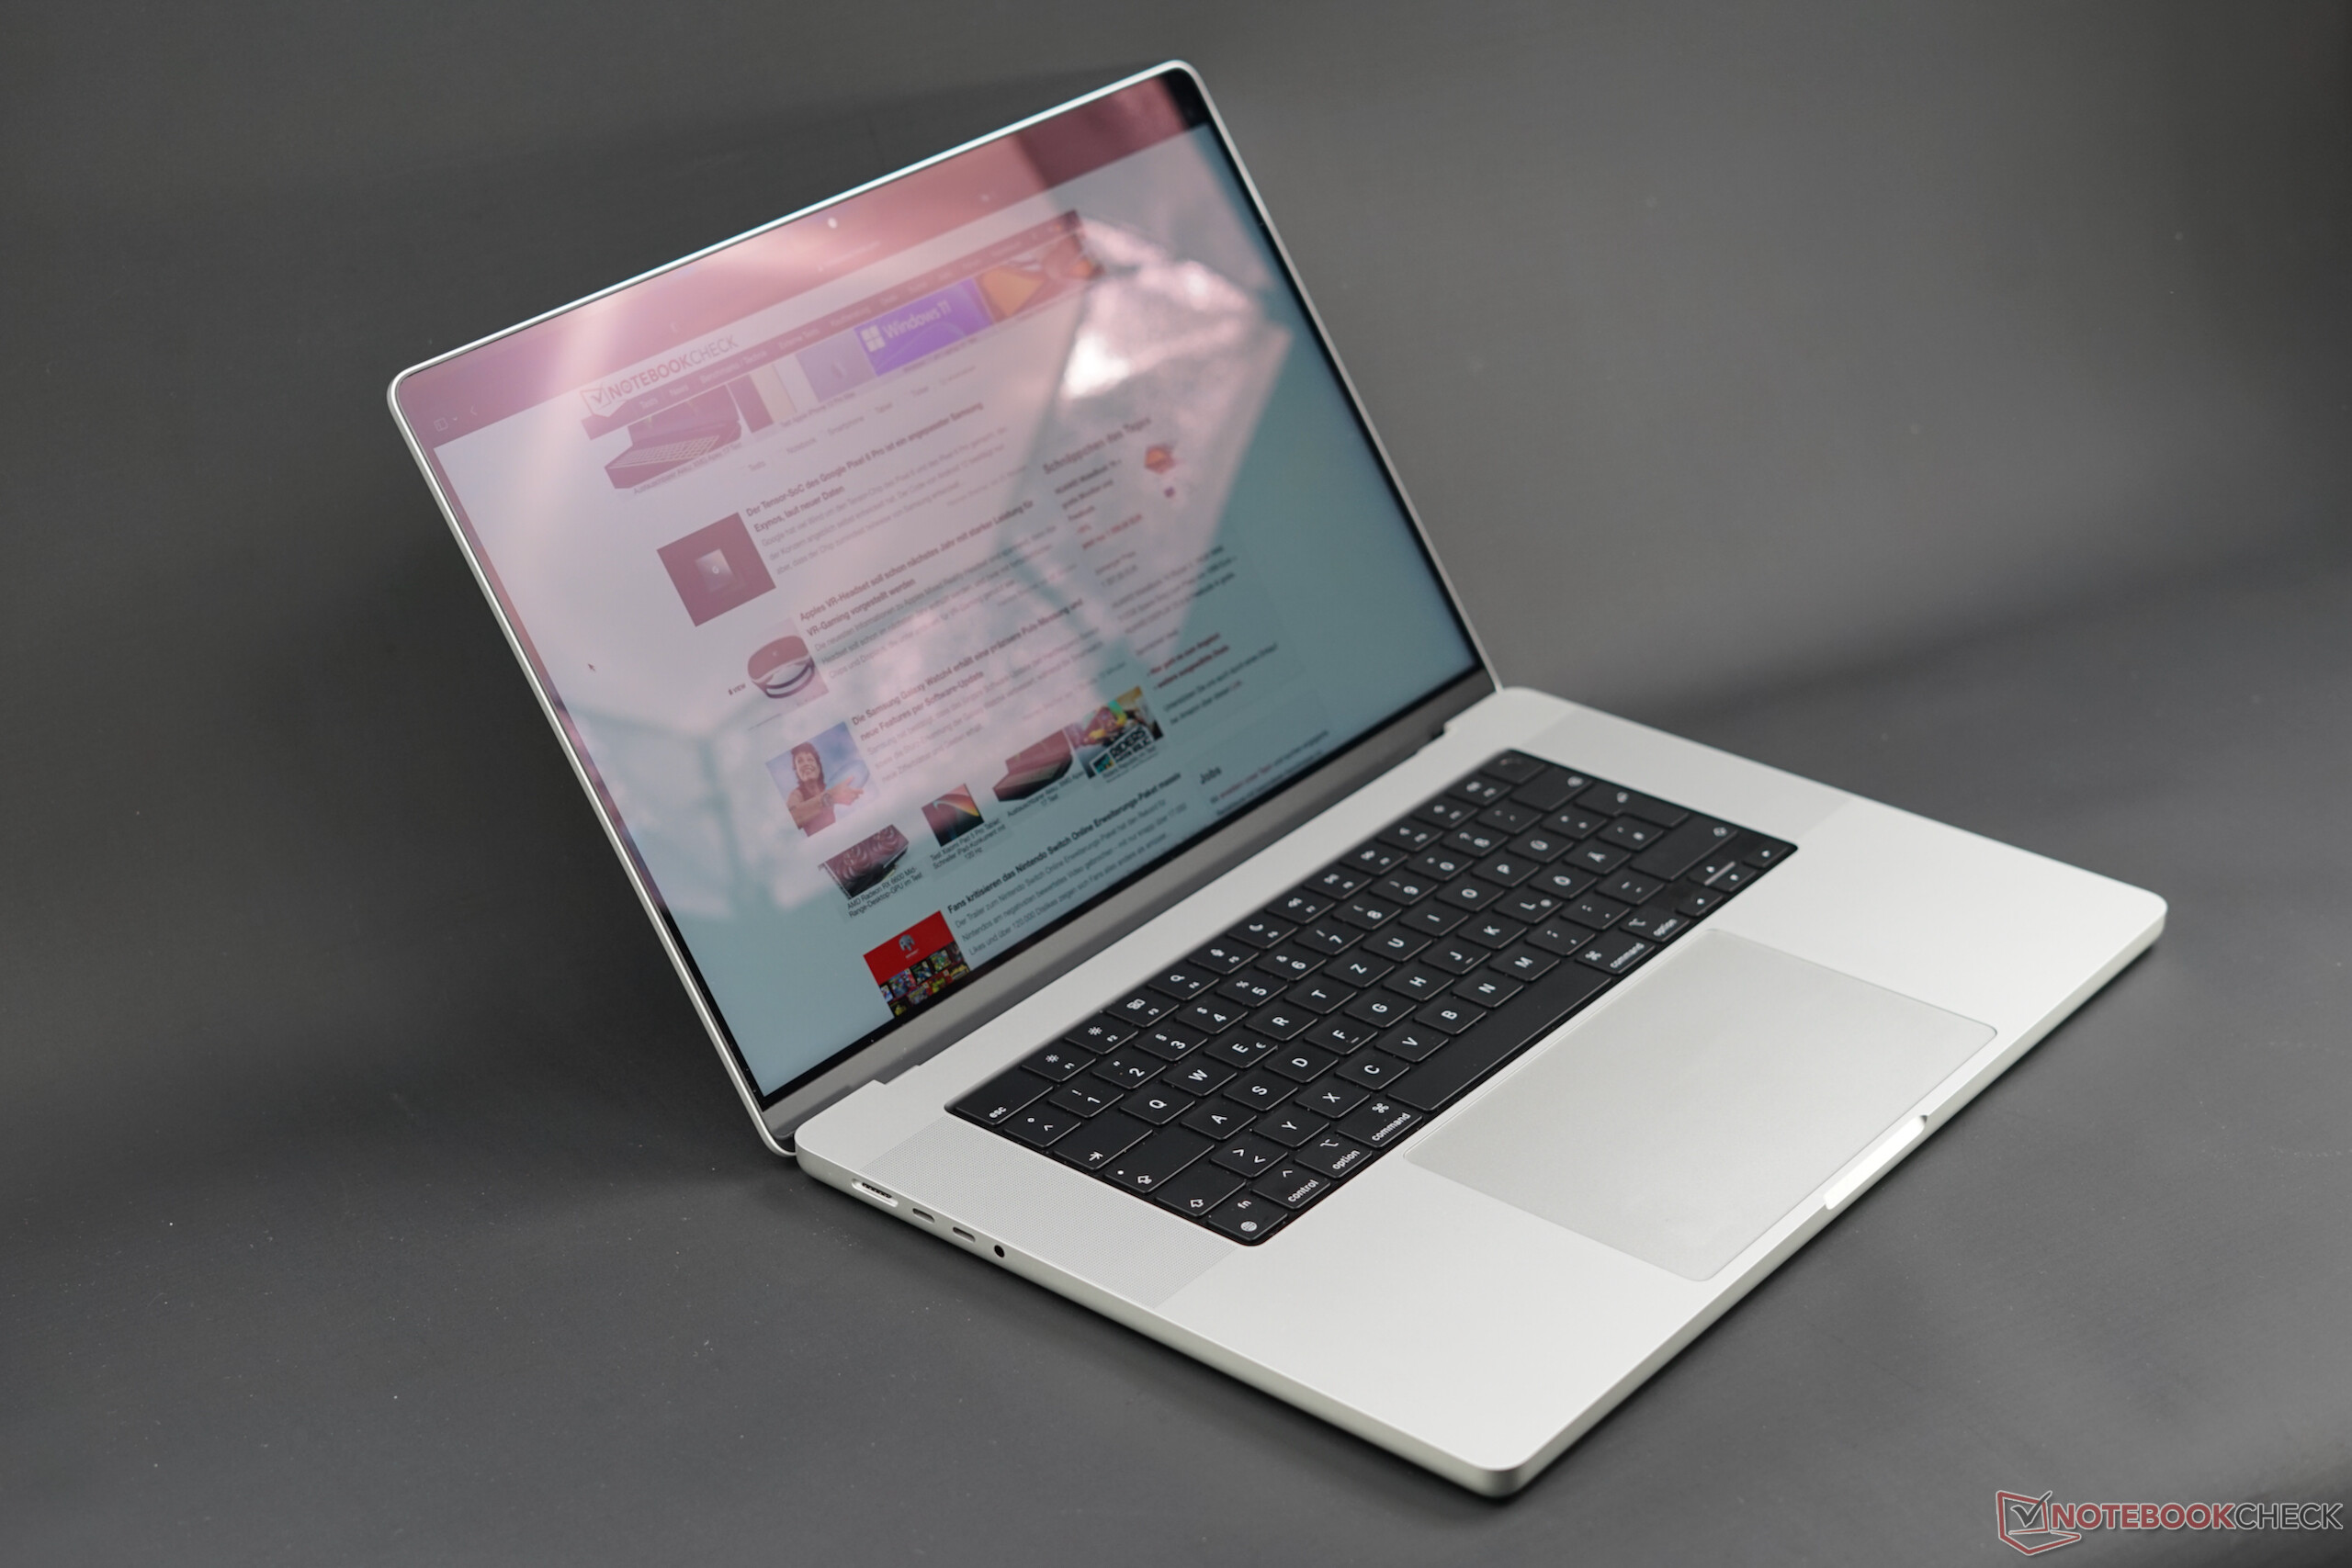
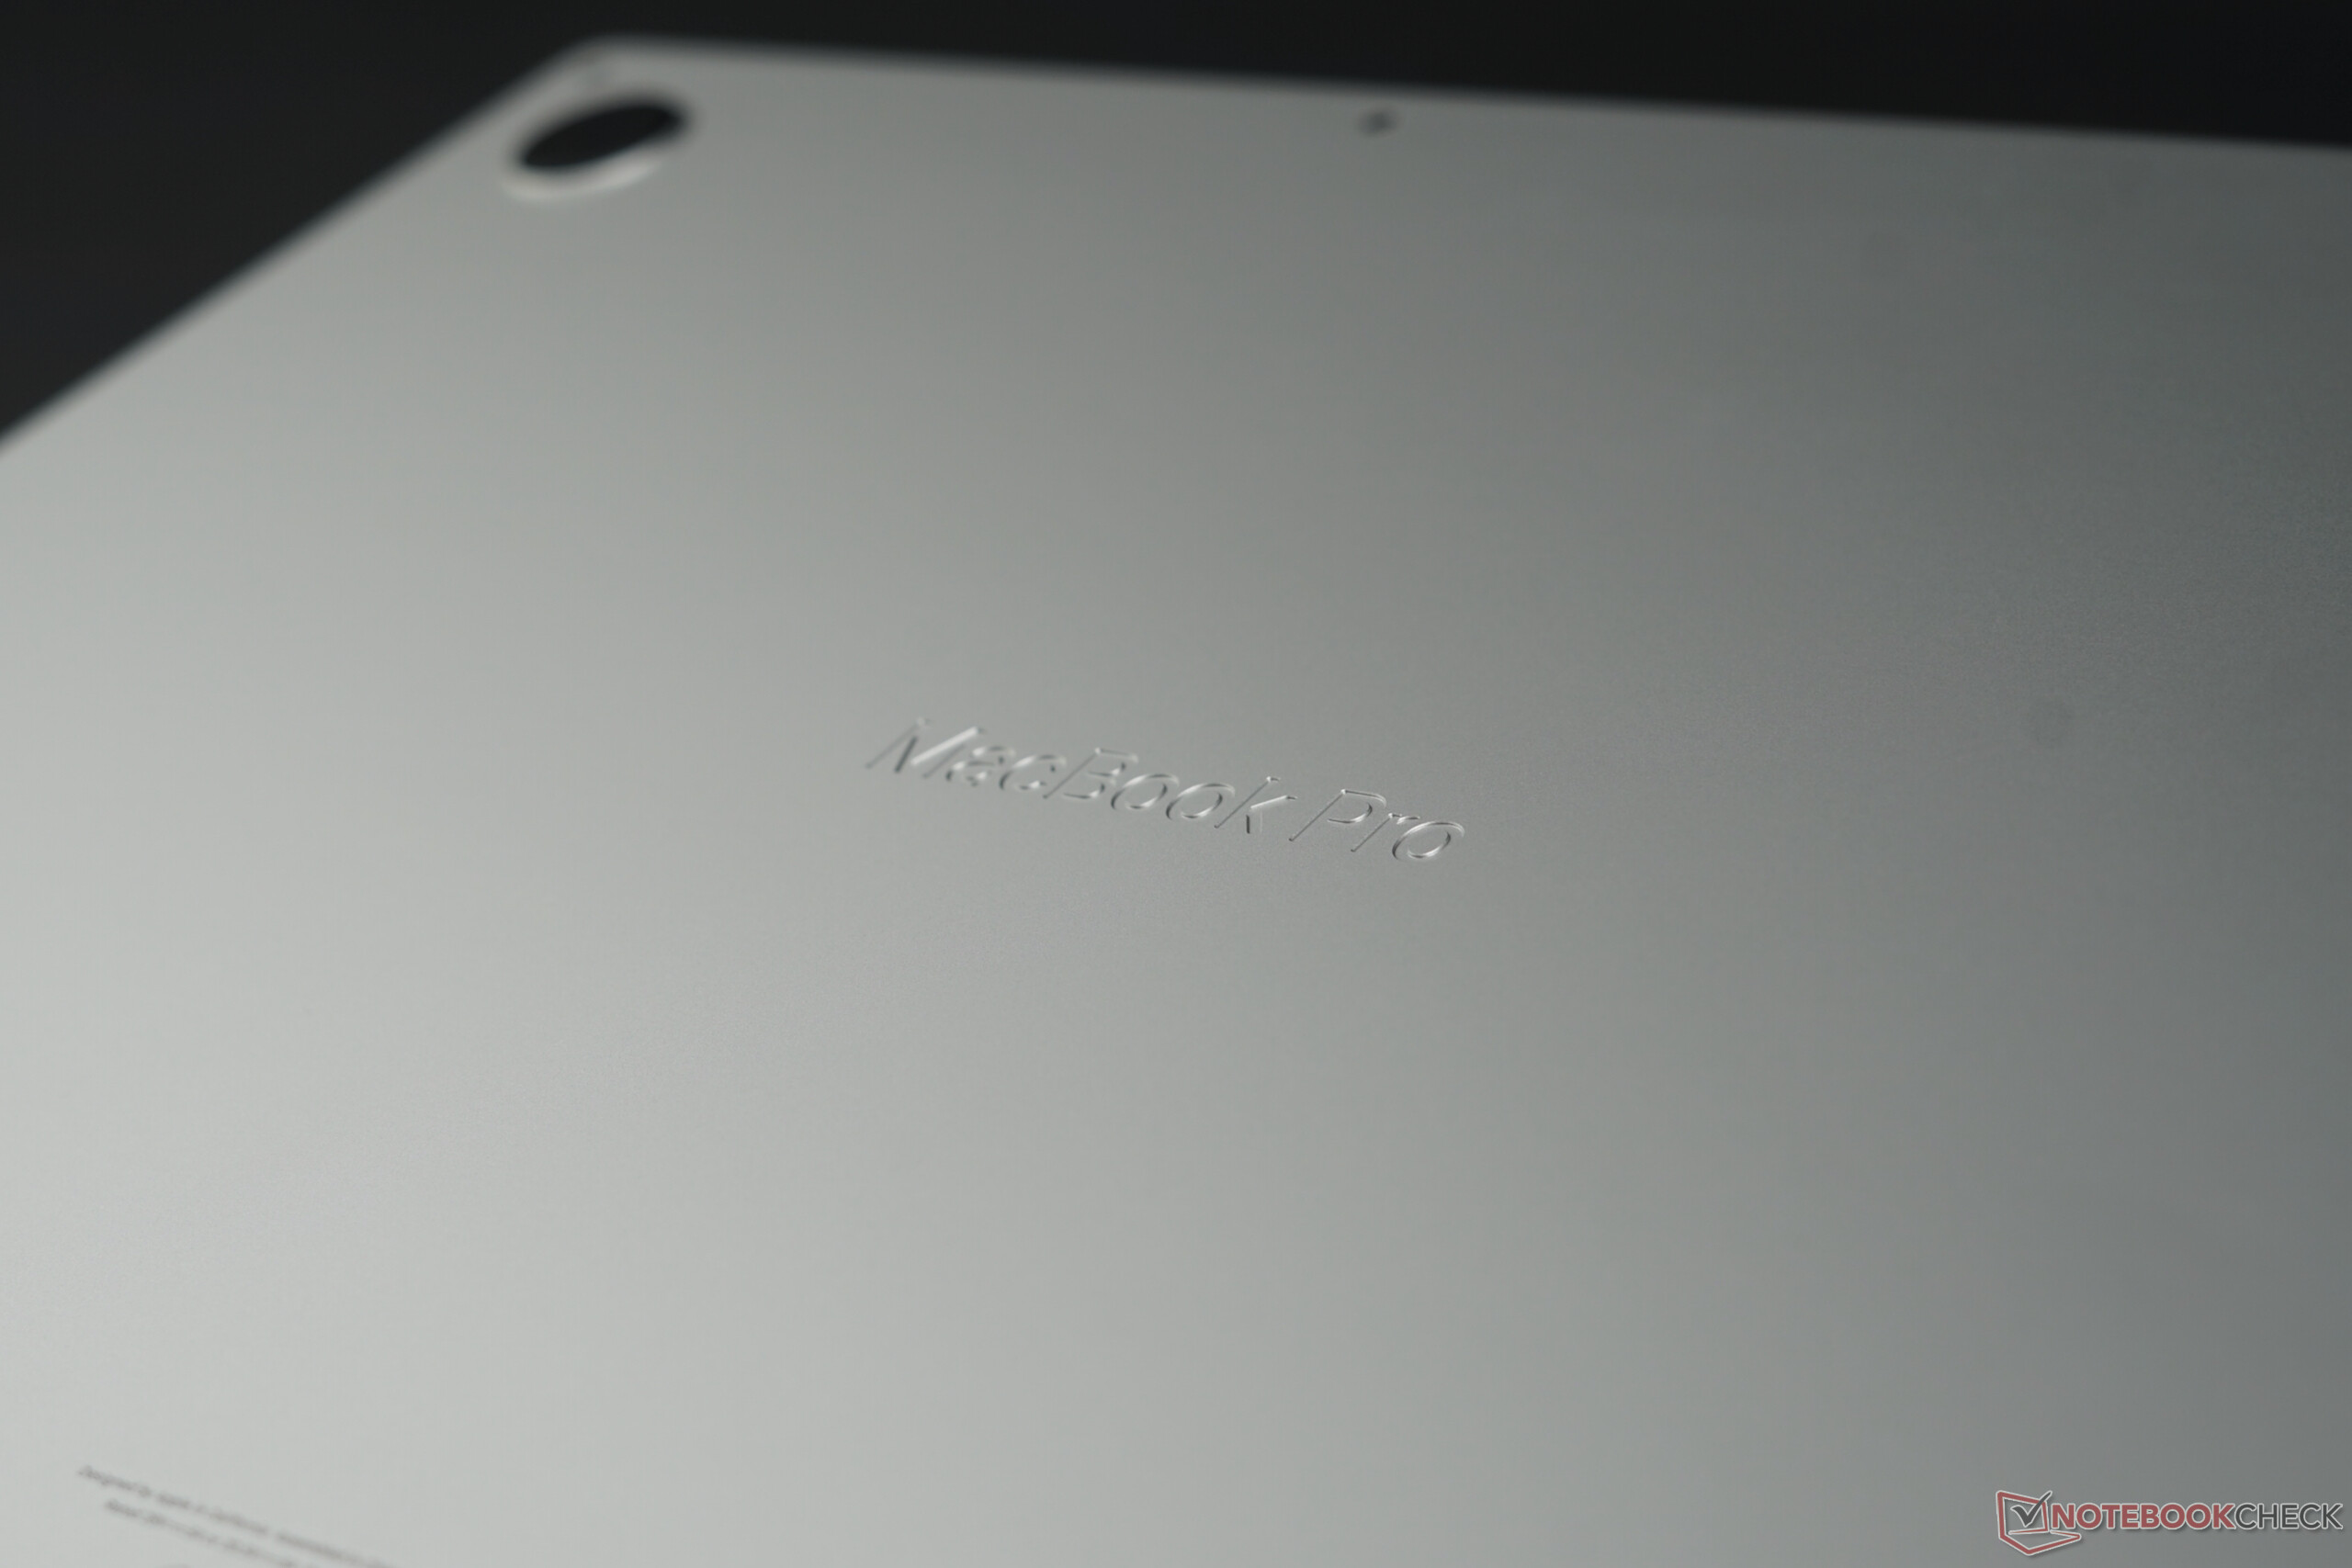
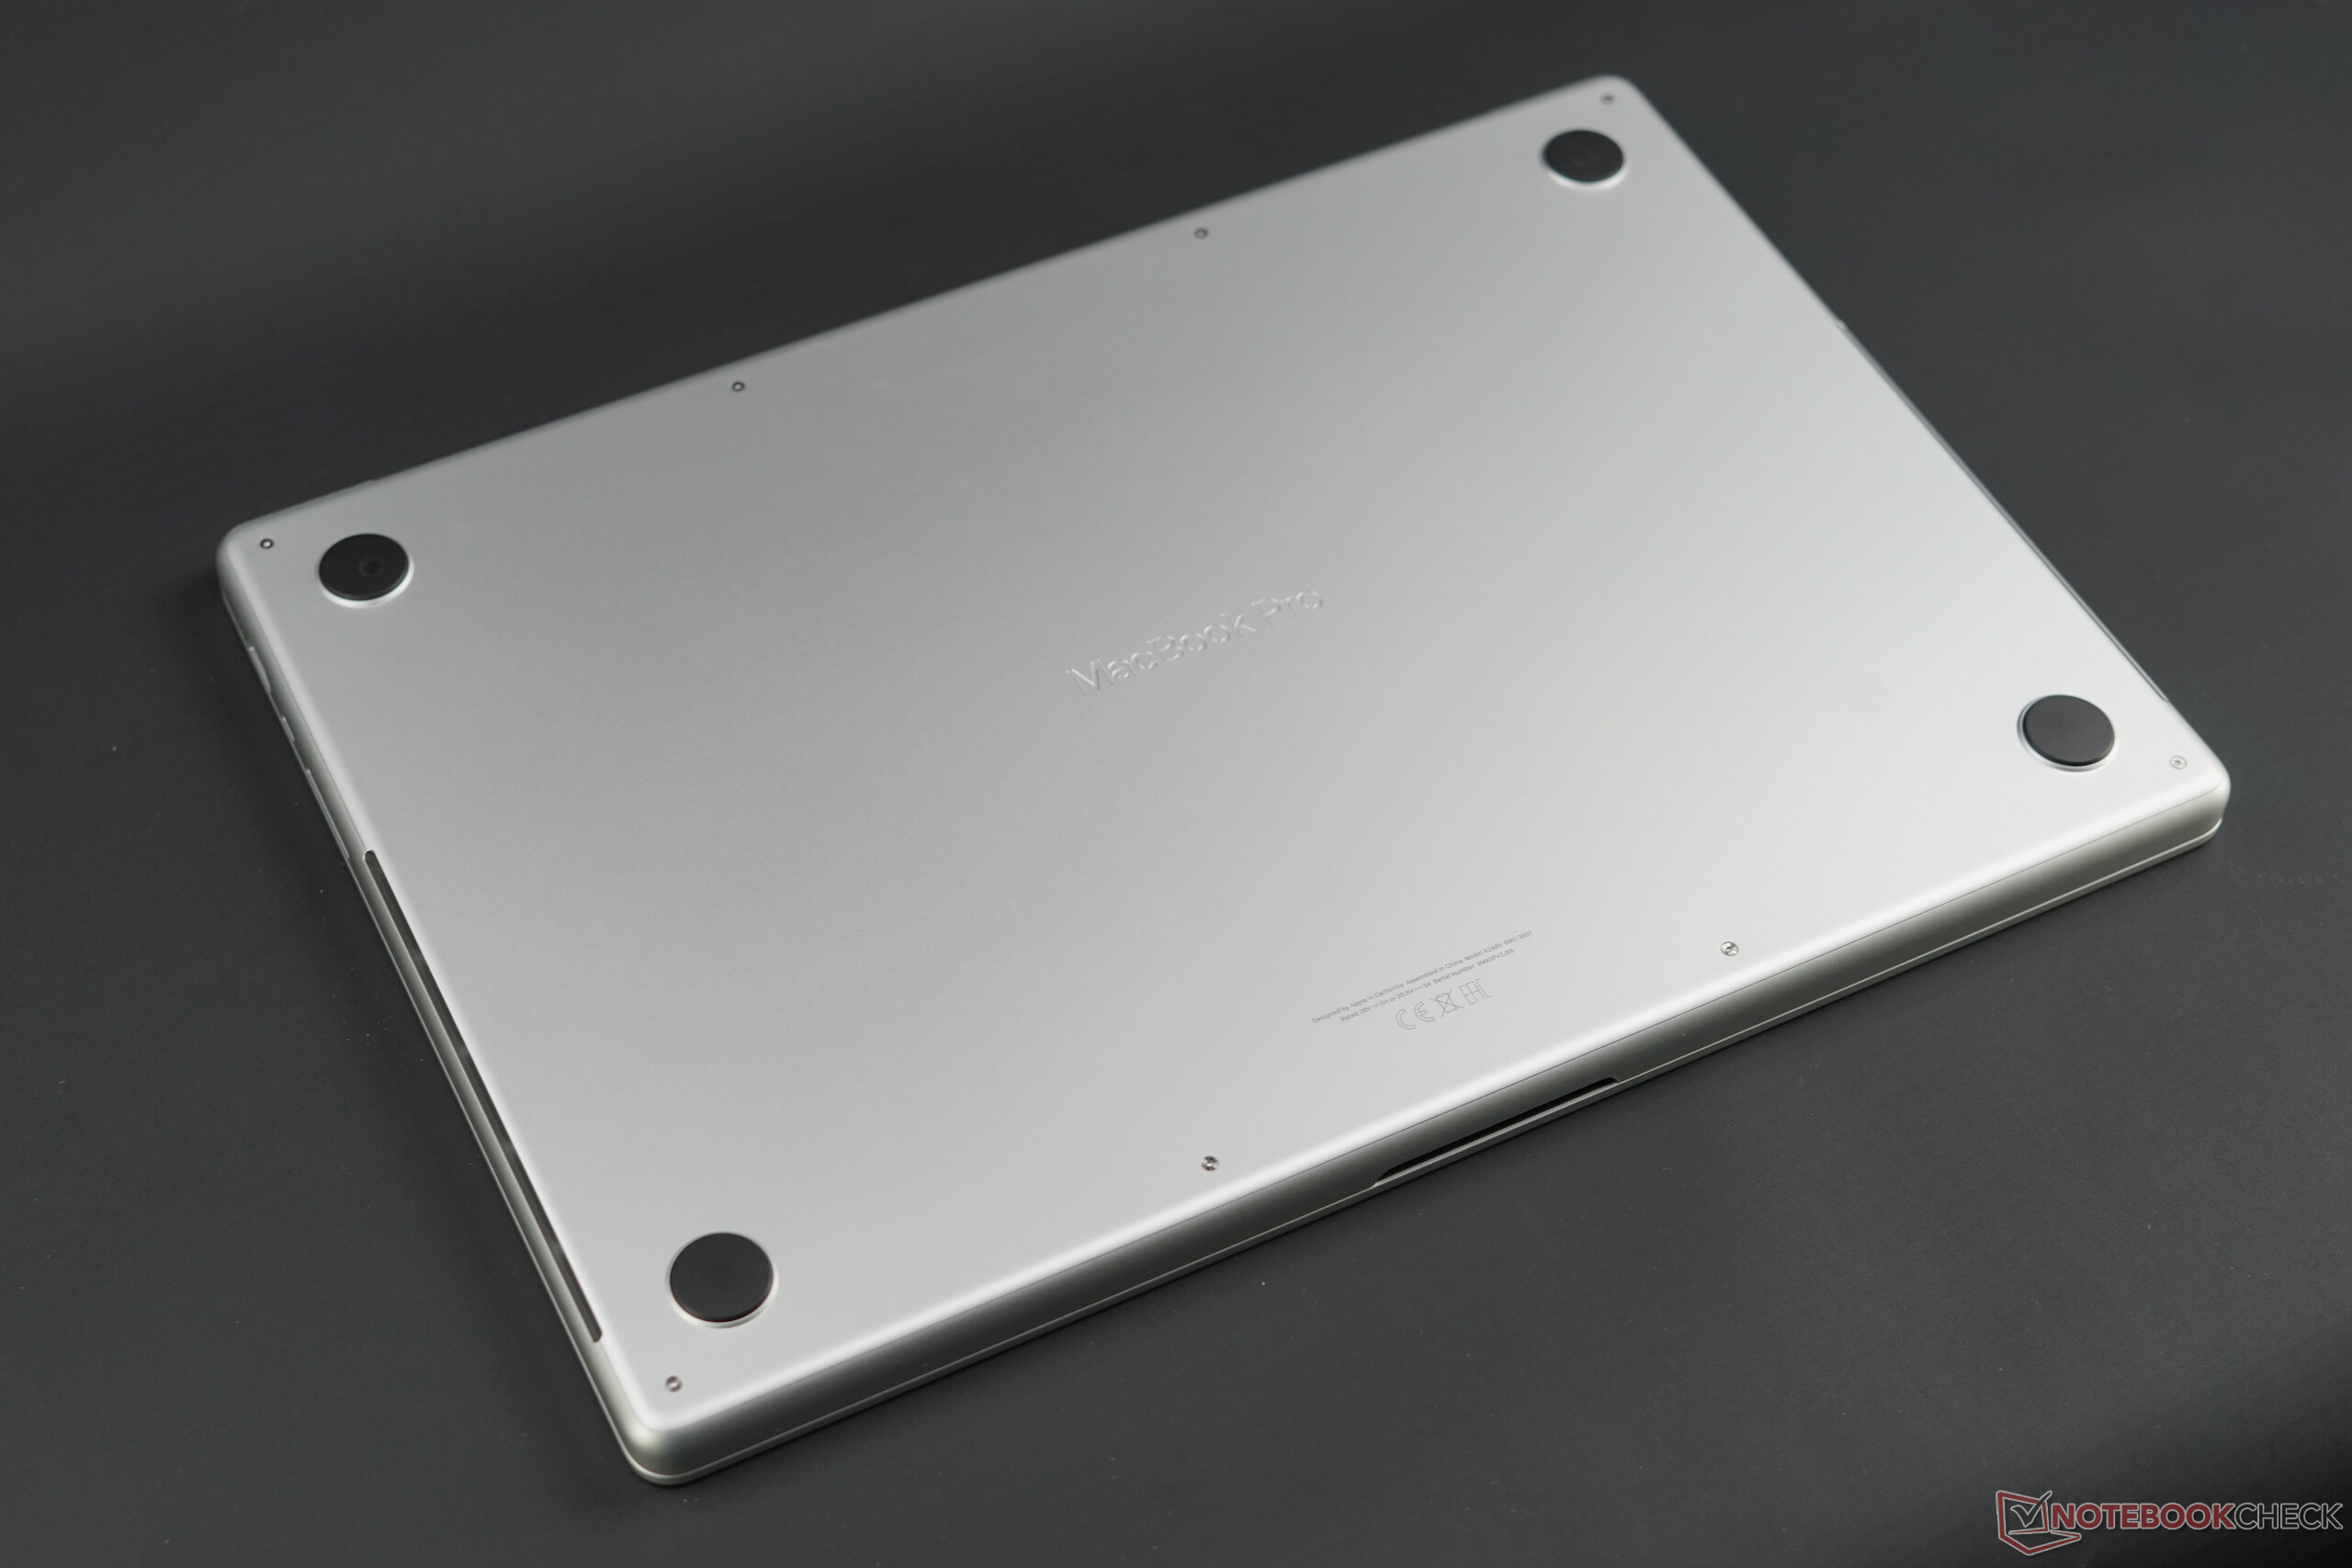
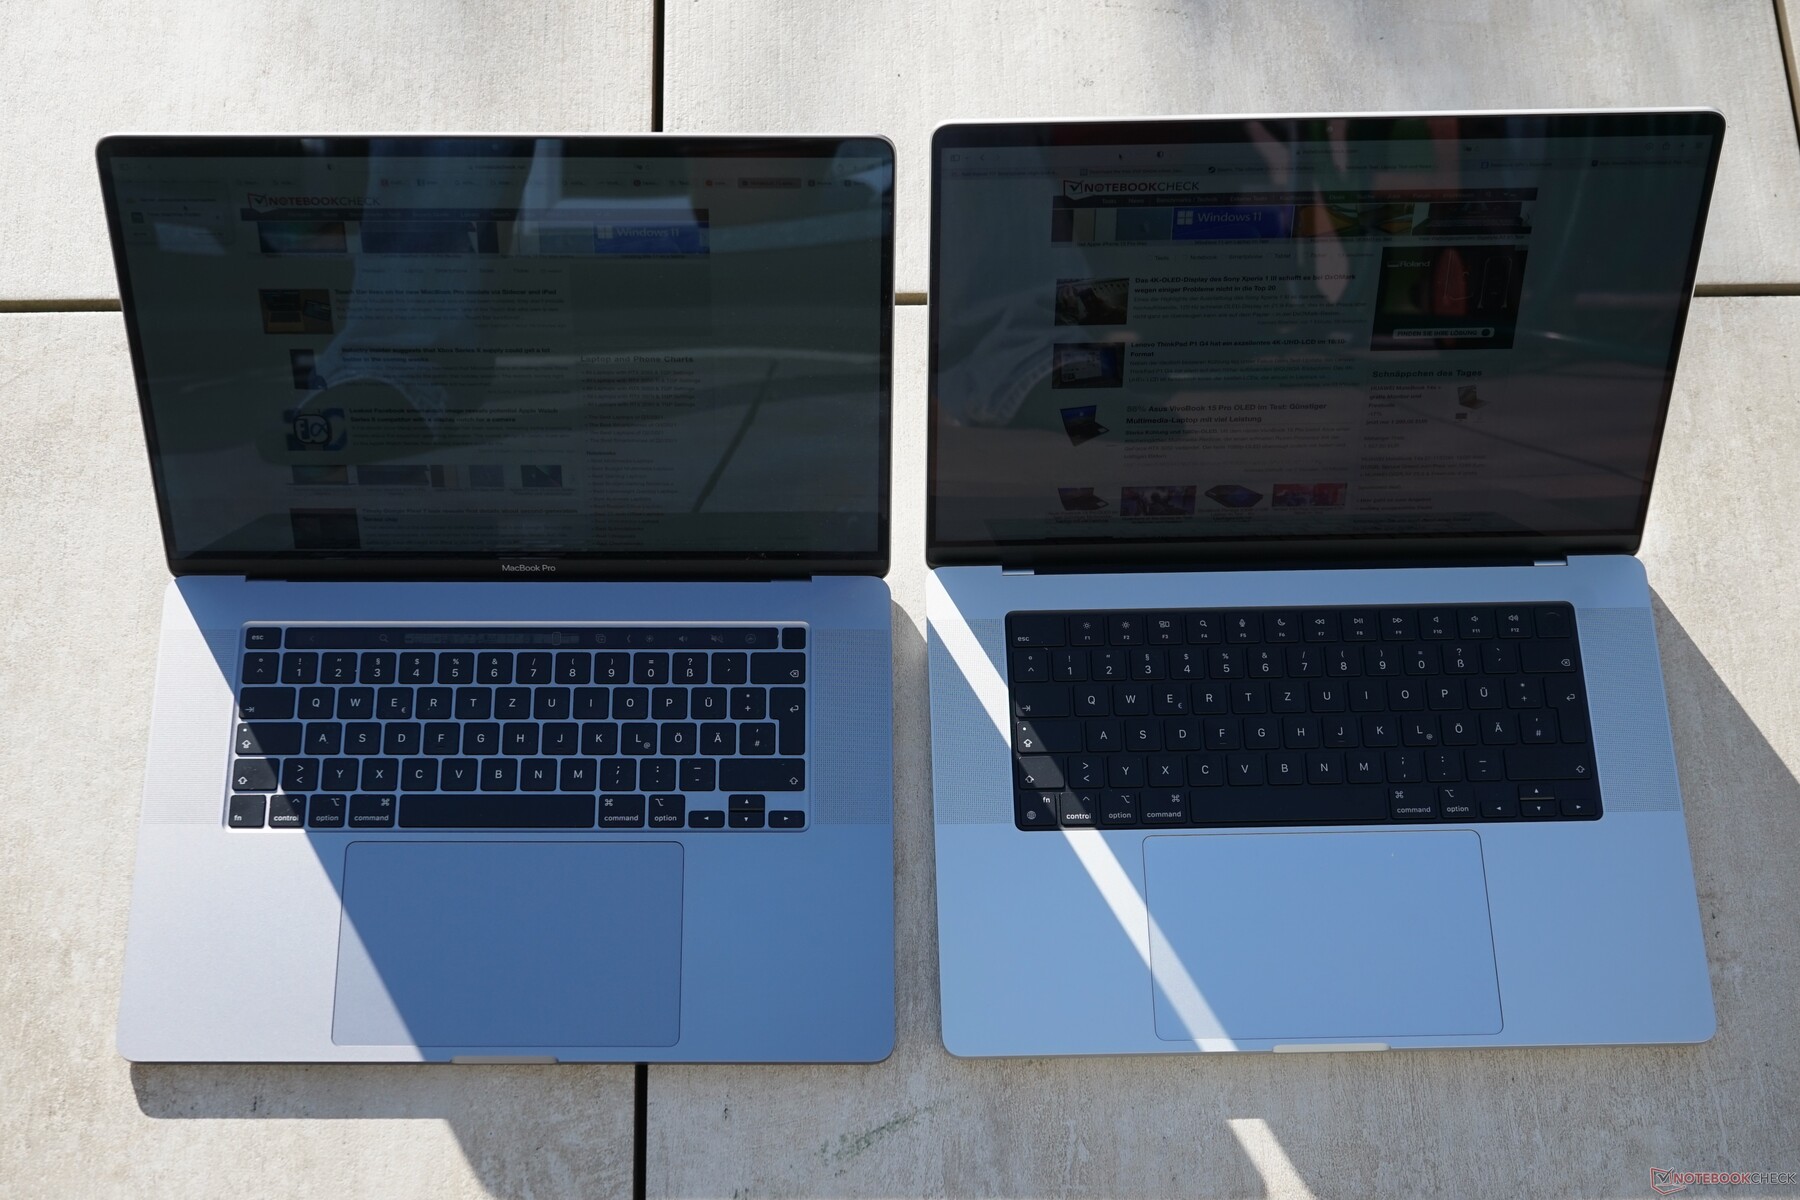
外壳 - 新款MacBook Pro 16更显笨重
两款新机型MacBook Pro 16和MacBook Pro 14的底盘设计。MacBook Pro 14是相同的,而且都感觉相当笨重,因为机箱不是锥形的,所以机箱高度在任何地方都基本相同。然而,新的MBP之间的主观差异MBP 16和旧的MBP 16之间的主观差异,与新的MacBook Pro 14和旧的13英寸机型之间的差异相比,并不那么明显。13英寸机型.不过新机型仍然明显比旧的MBP 16厚(见下面的对比图片)。
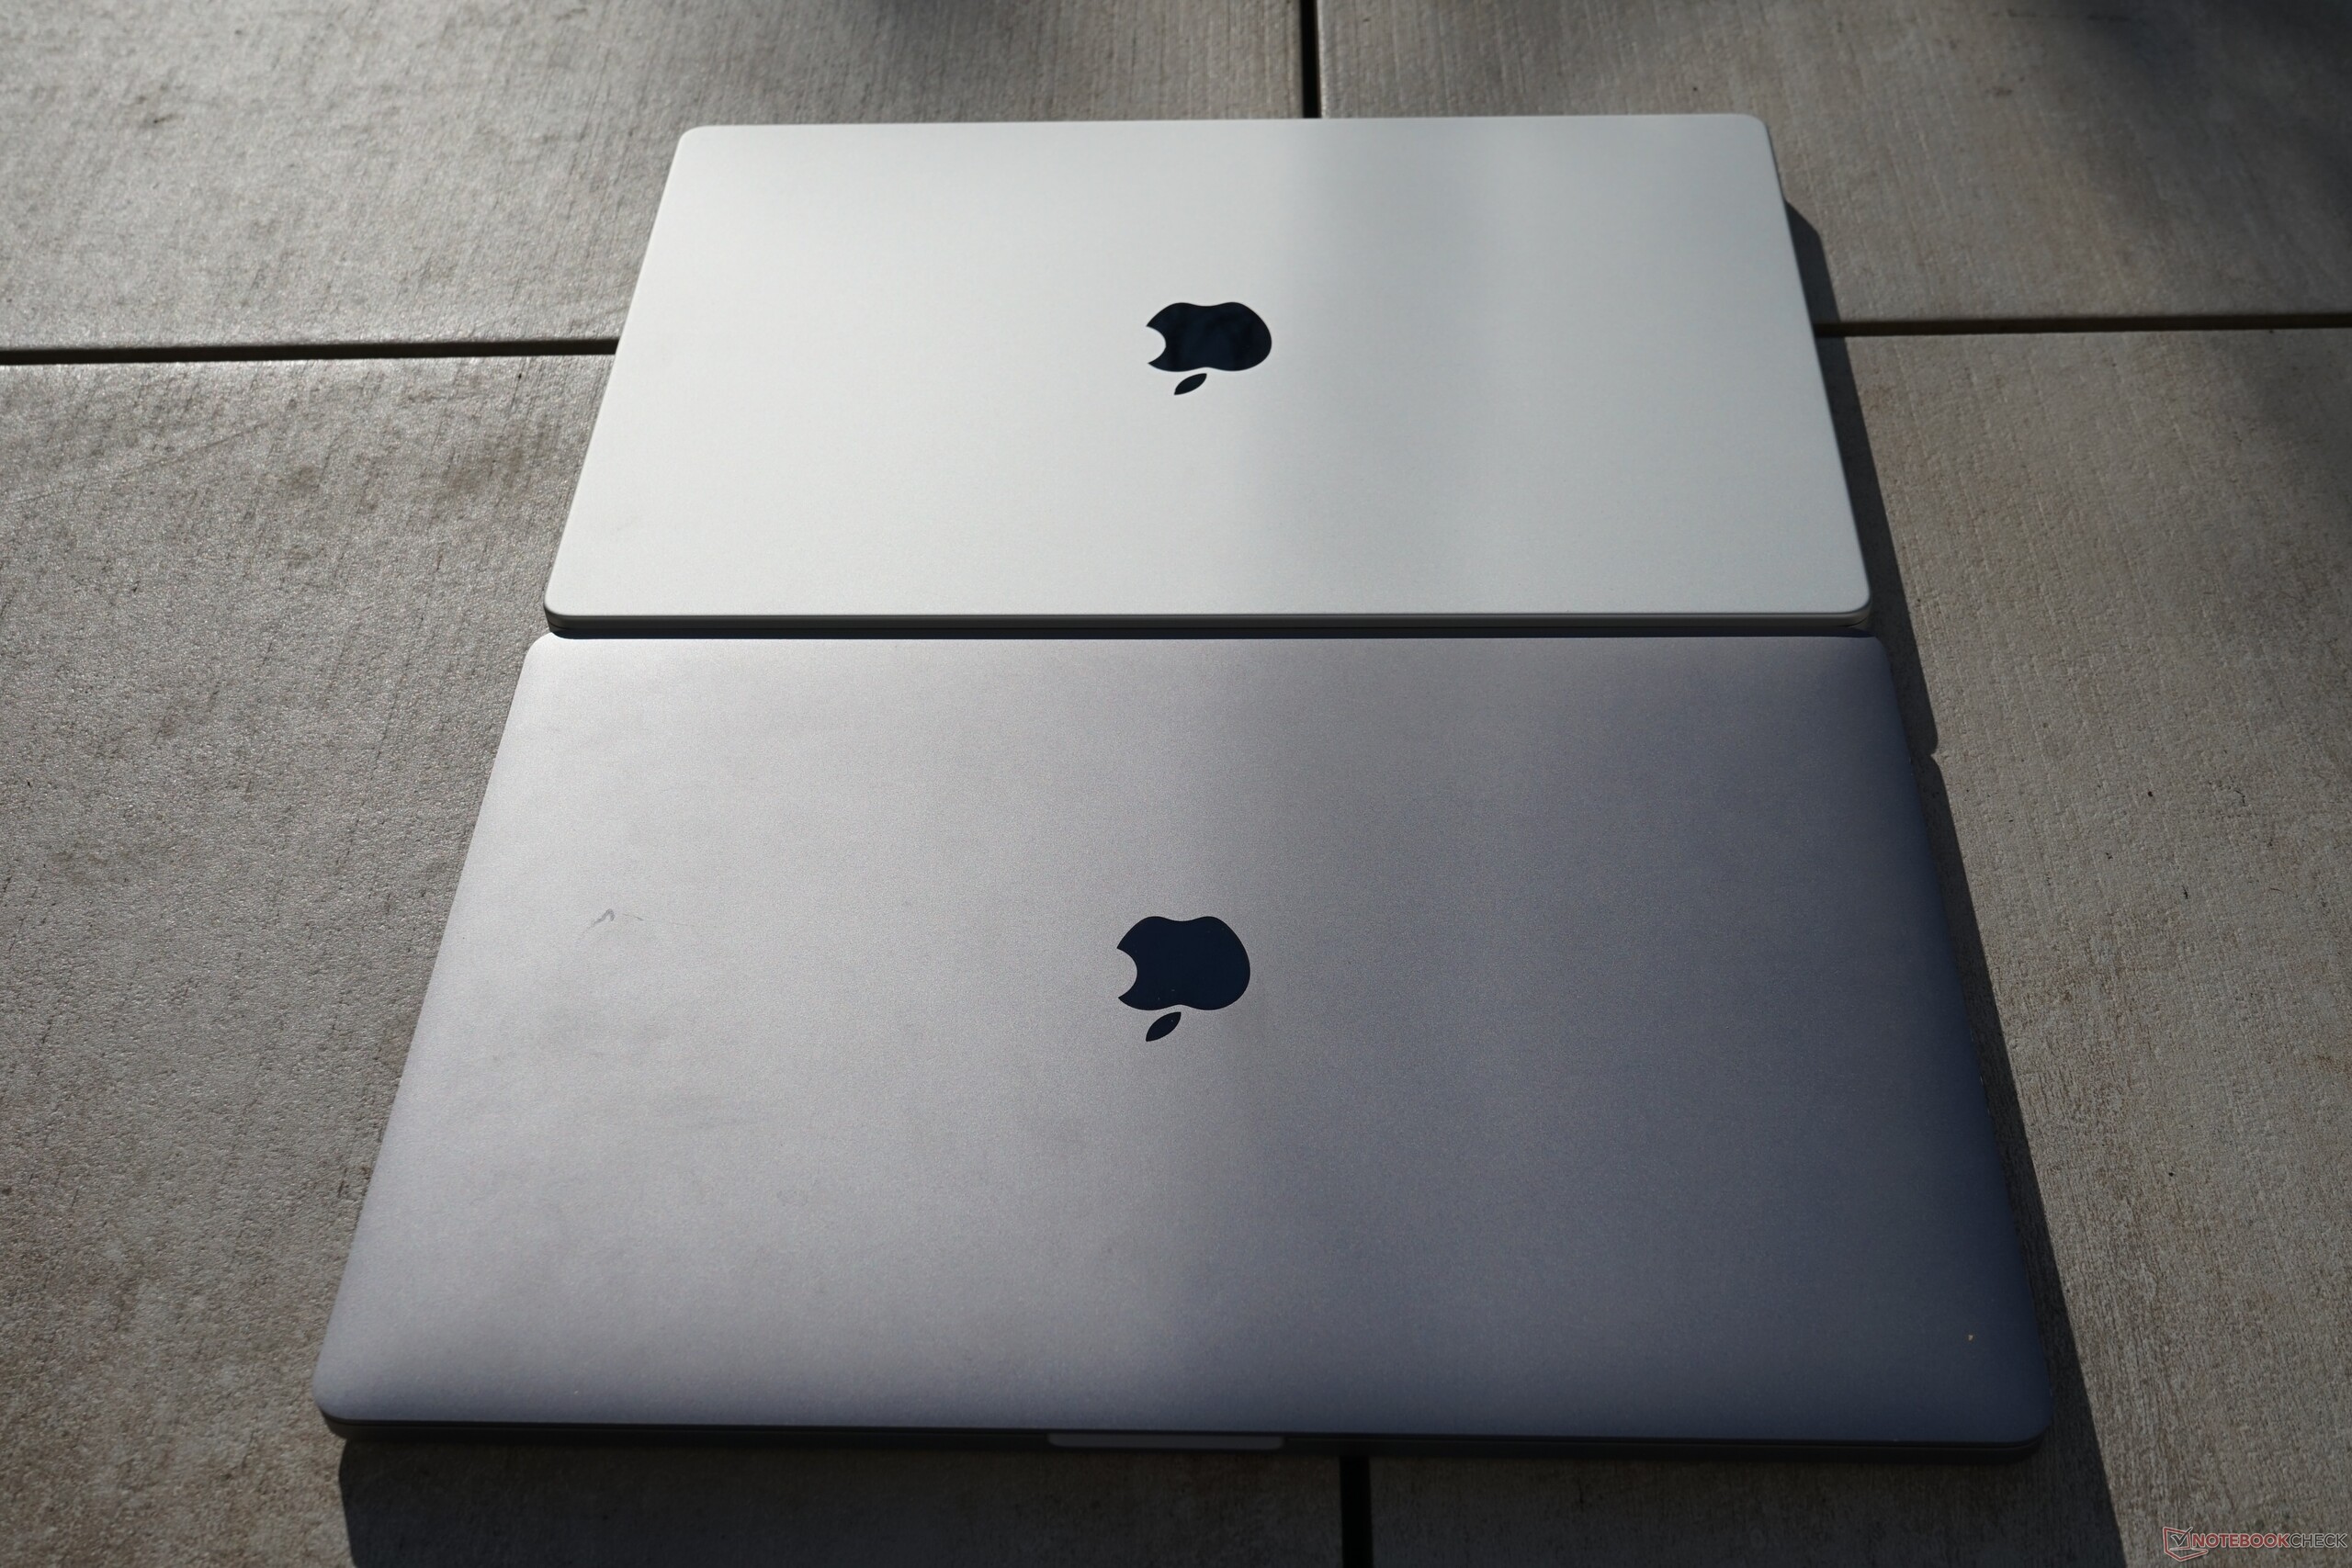
机箱本身的质量再次基本无懈可击(就像较小的MBP 14)。 Apple,铝制一体式机身设计再次给人留下了非常高质量的印象,两种颜色(银色和太空灰)都不太容易受到灰尘或指纹的影响。底座非常结实,没有吱吱嘎嘎的声音。盖子总体上也非常坚固,但与较小的MBP 14类似,我们可以再次用集中的压力在屏幕上激起一些涟漪,尽管这在实践中不应该是一个问题。
铰链也给较大的MacBook Pro留下了良好的印象。用一只手打开盖子没有问题,而且在小角度下不会自动掉下来,但是在调整打开角度(最大135度)时,与较小的兄弟姐妹相比,弹跳的幅度略大。这是由于屏幕面积较大的缘故。
新机型比老款MacBook Pro 16更笨重,但与Windows的竞争对手相比,情况有所不同,比如16英寸的竞争对手联想ThinkPad X1 Extreme G4.其他对手的占地面积较小,但它们也配备了略小的15.6英寸面板。不过,MacBook更纤细。它的重量约为2.1公斤,比竞争对手要重一些,但差别不大。
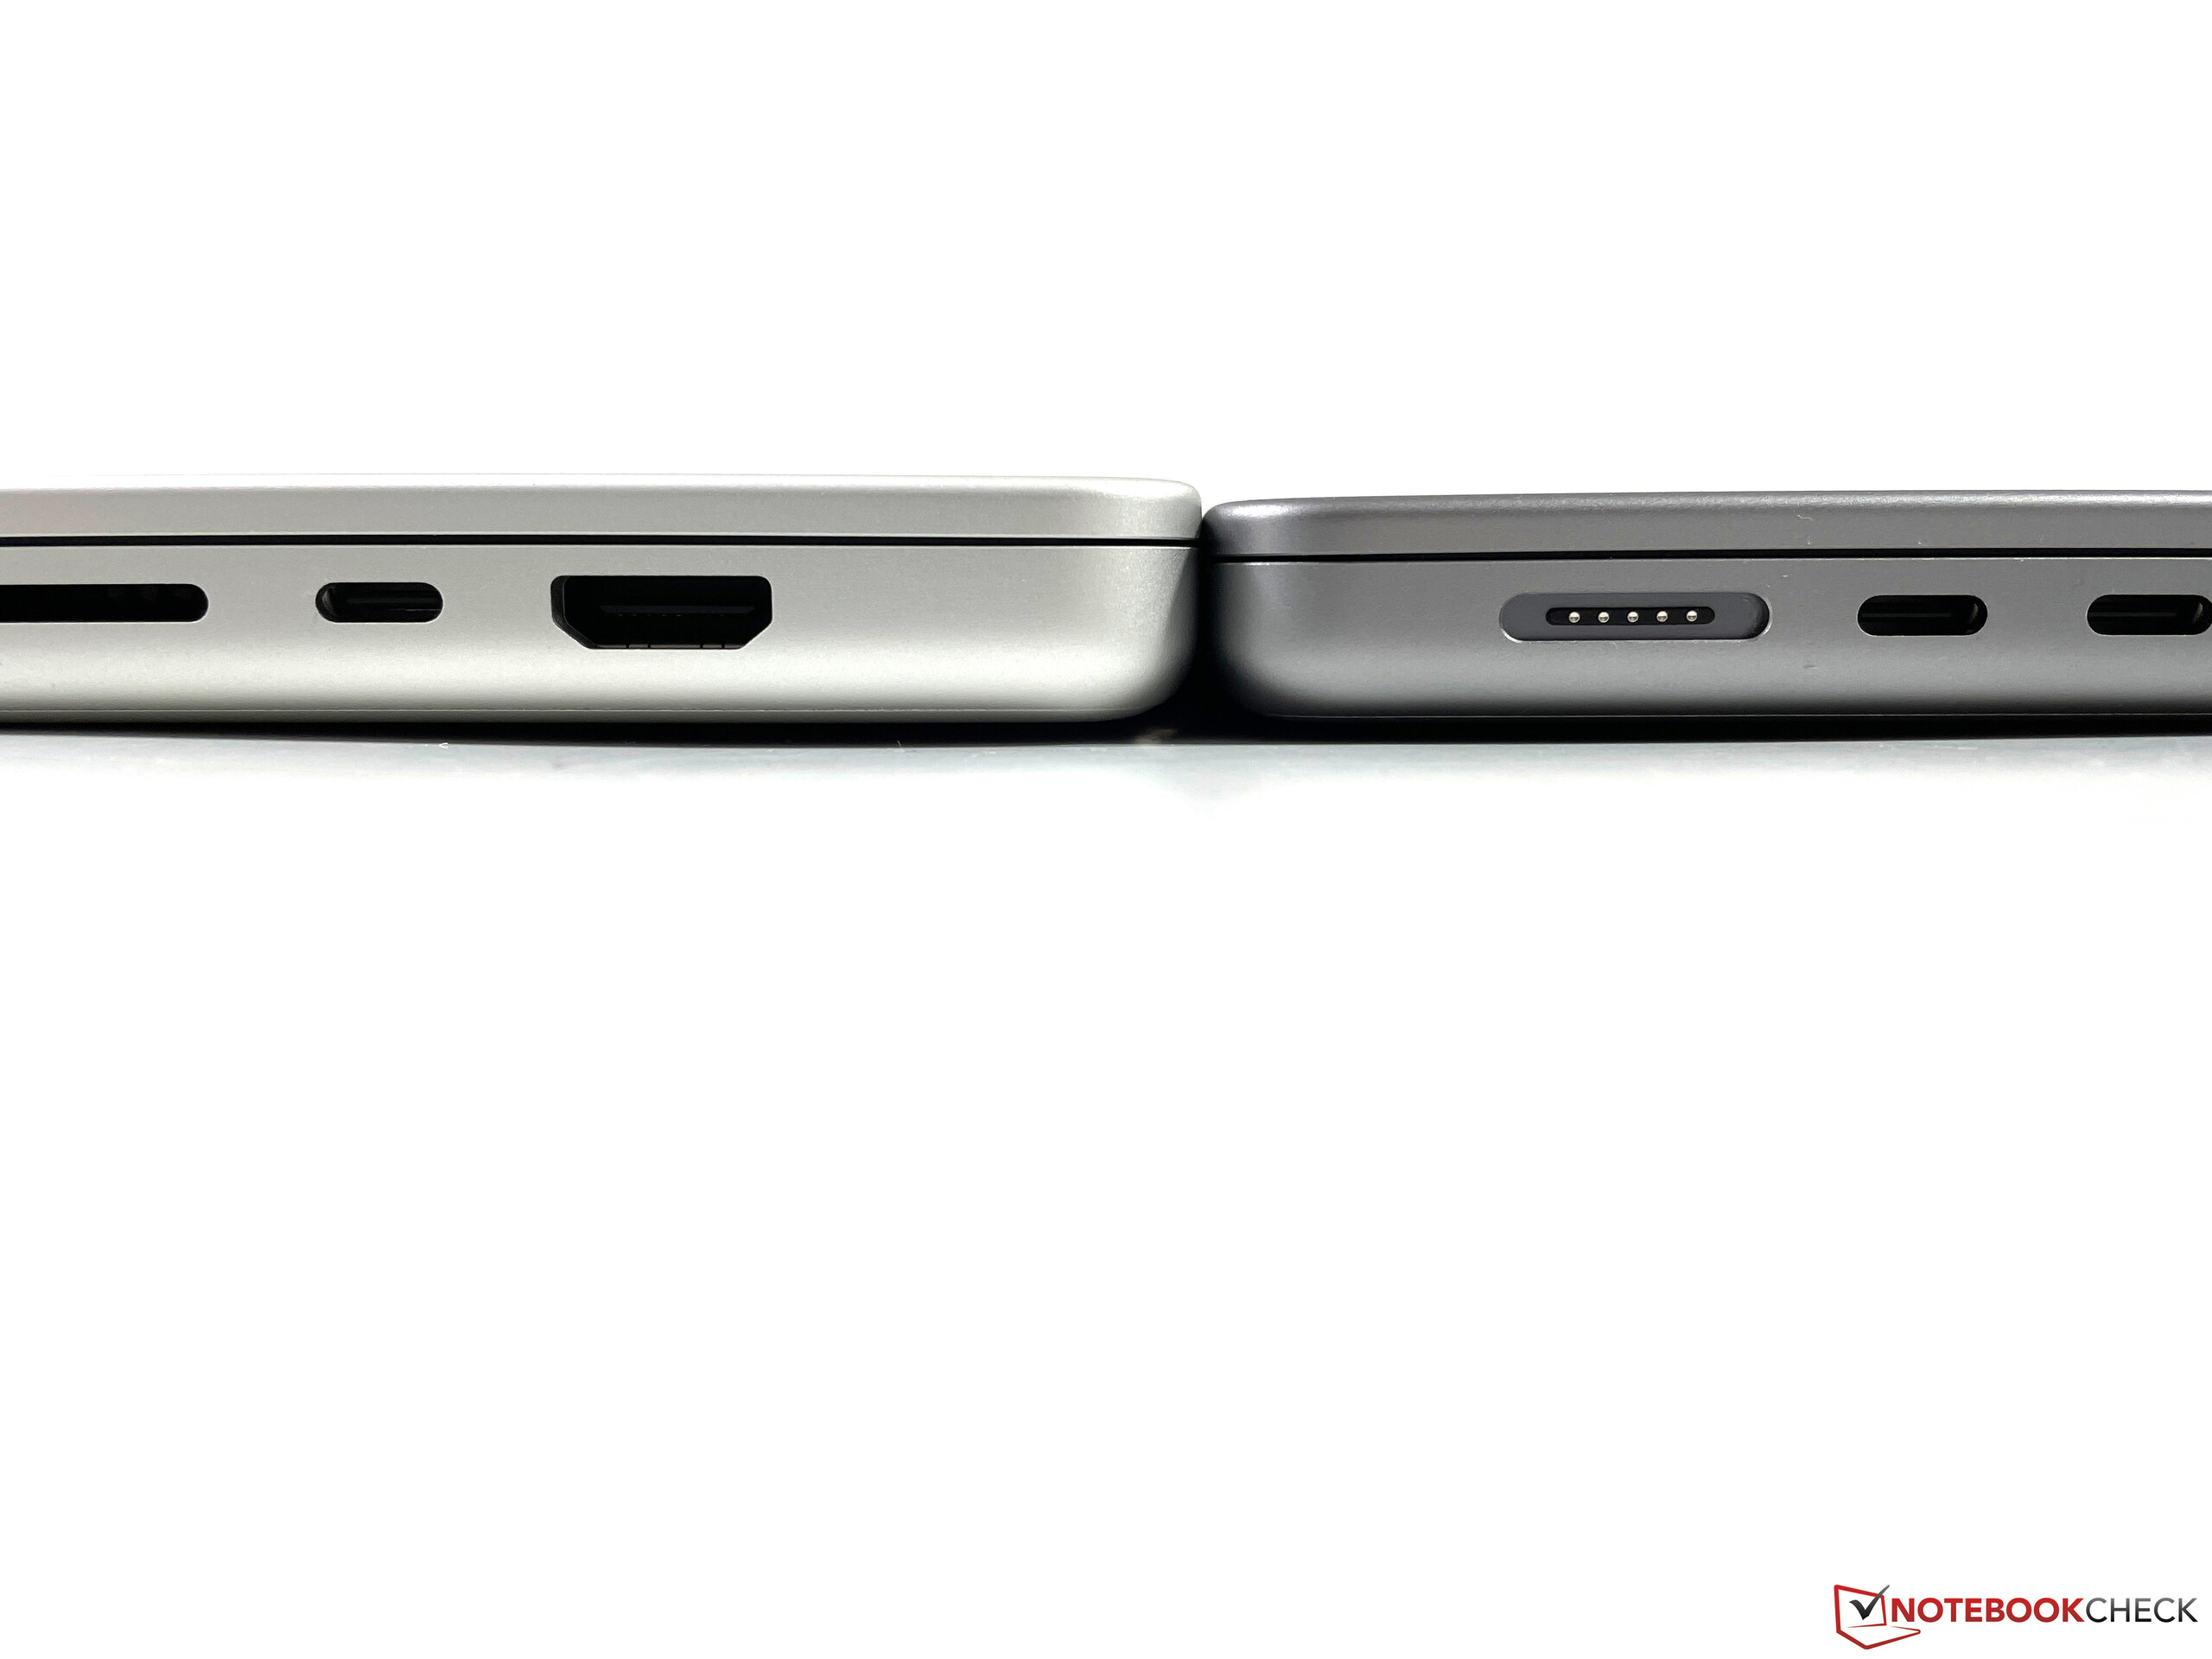
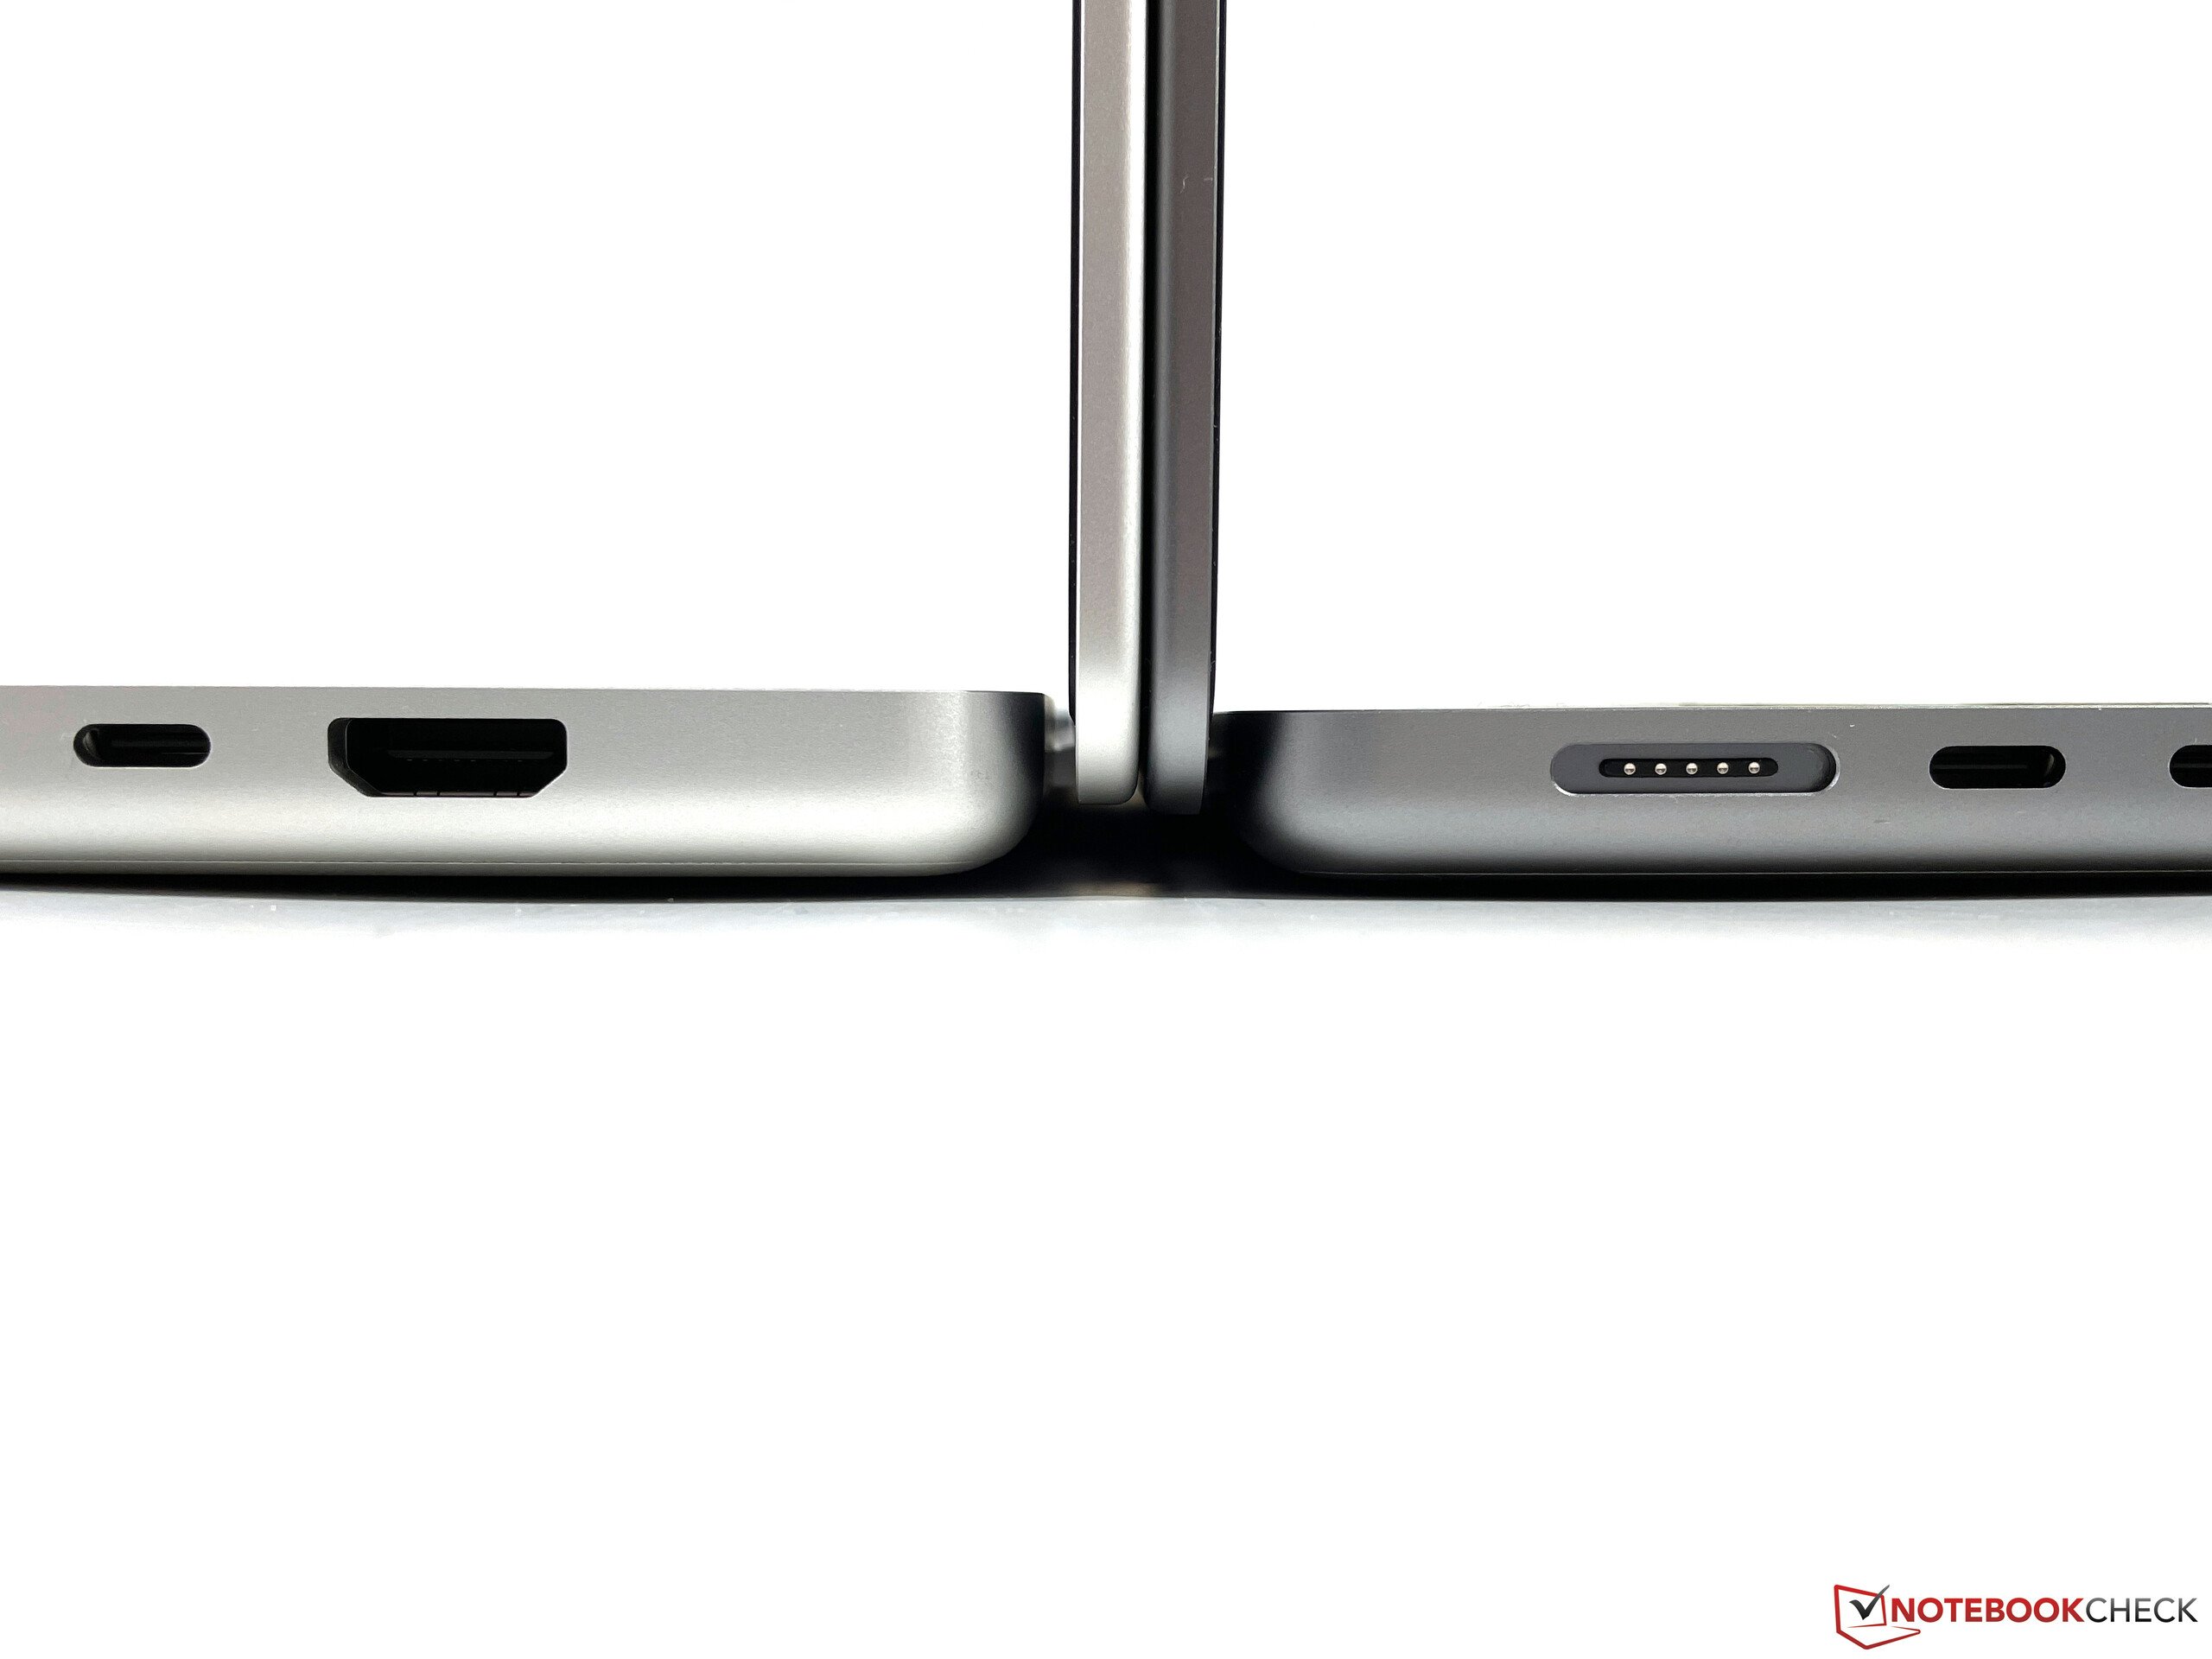
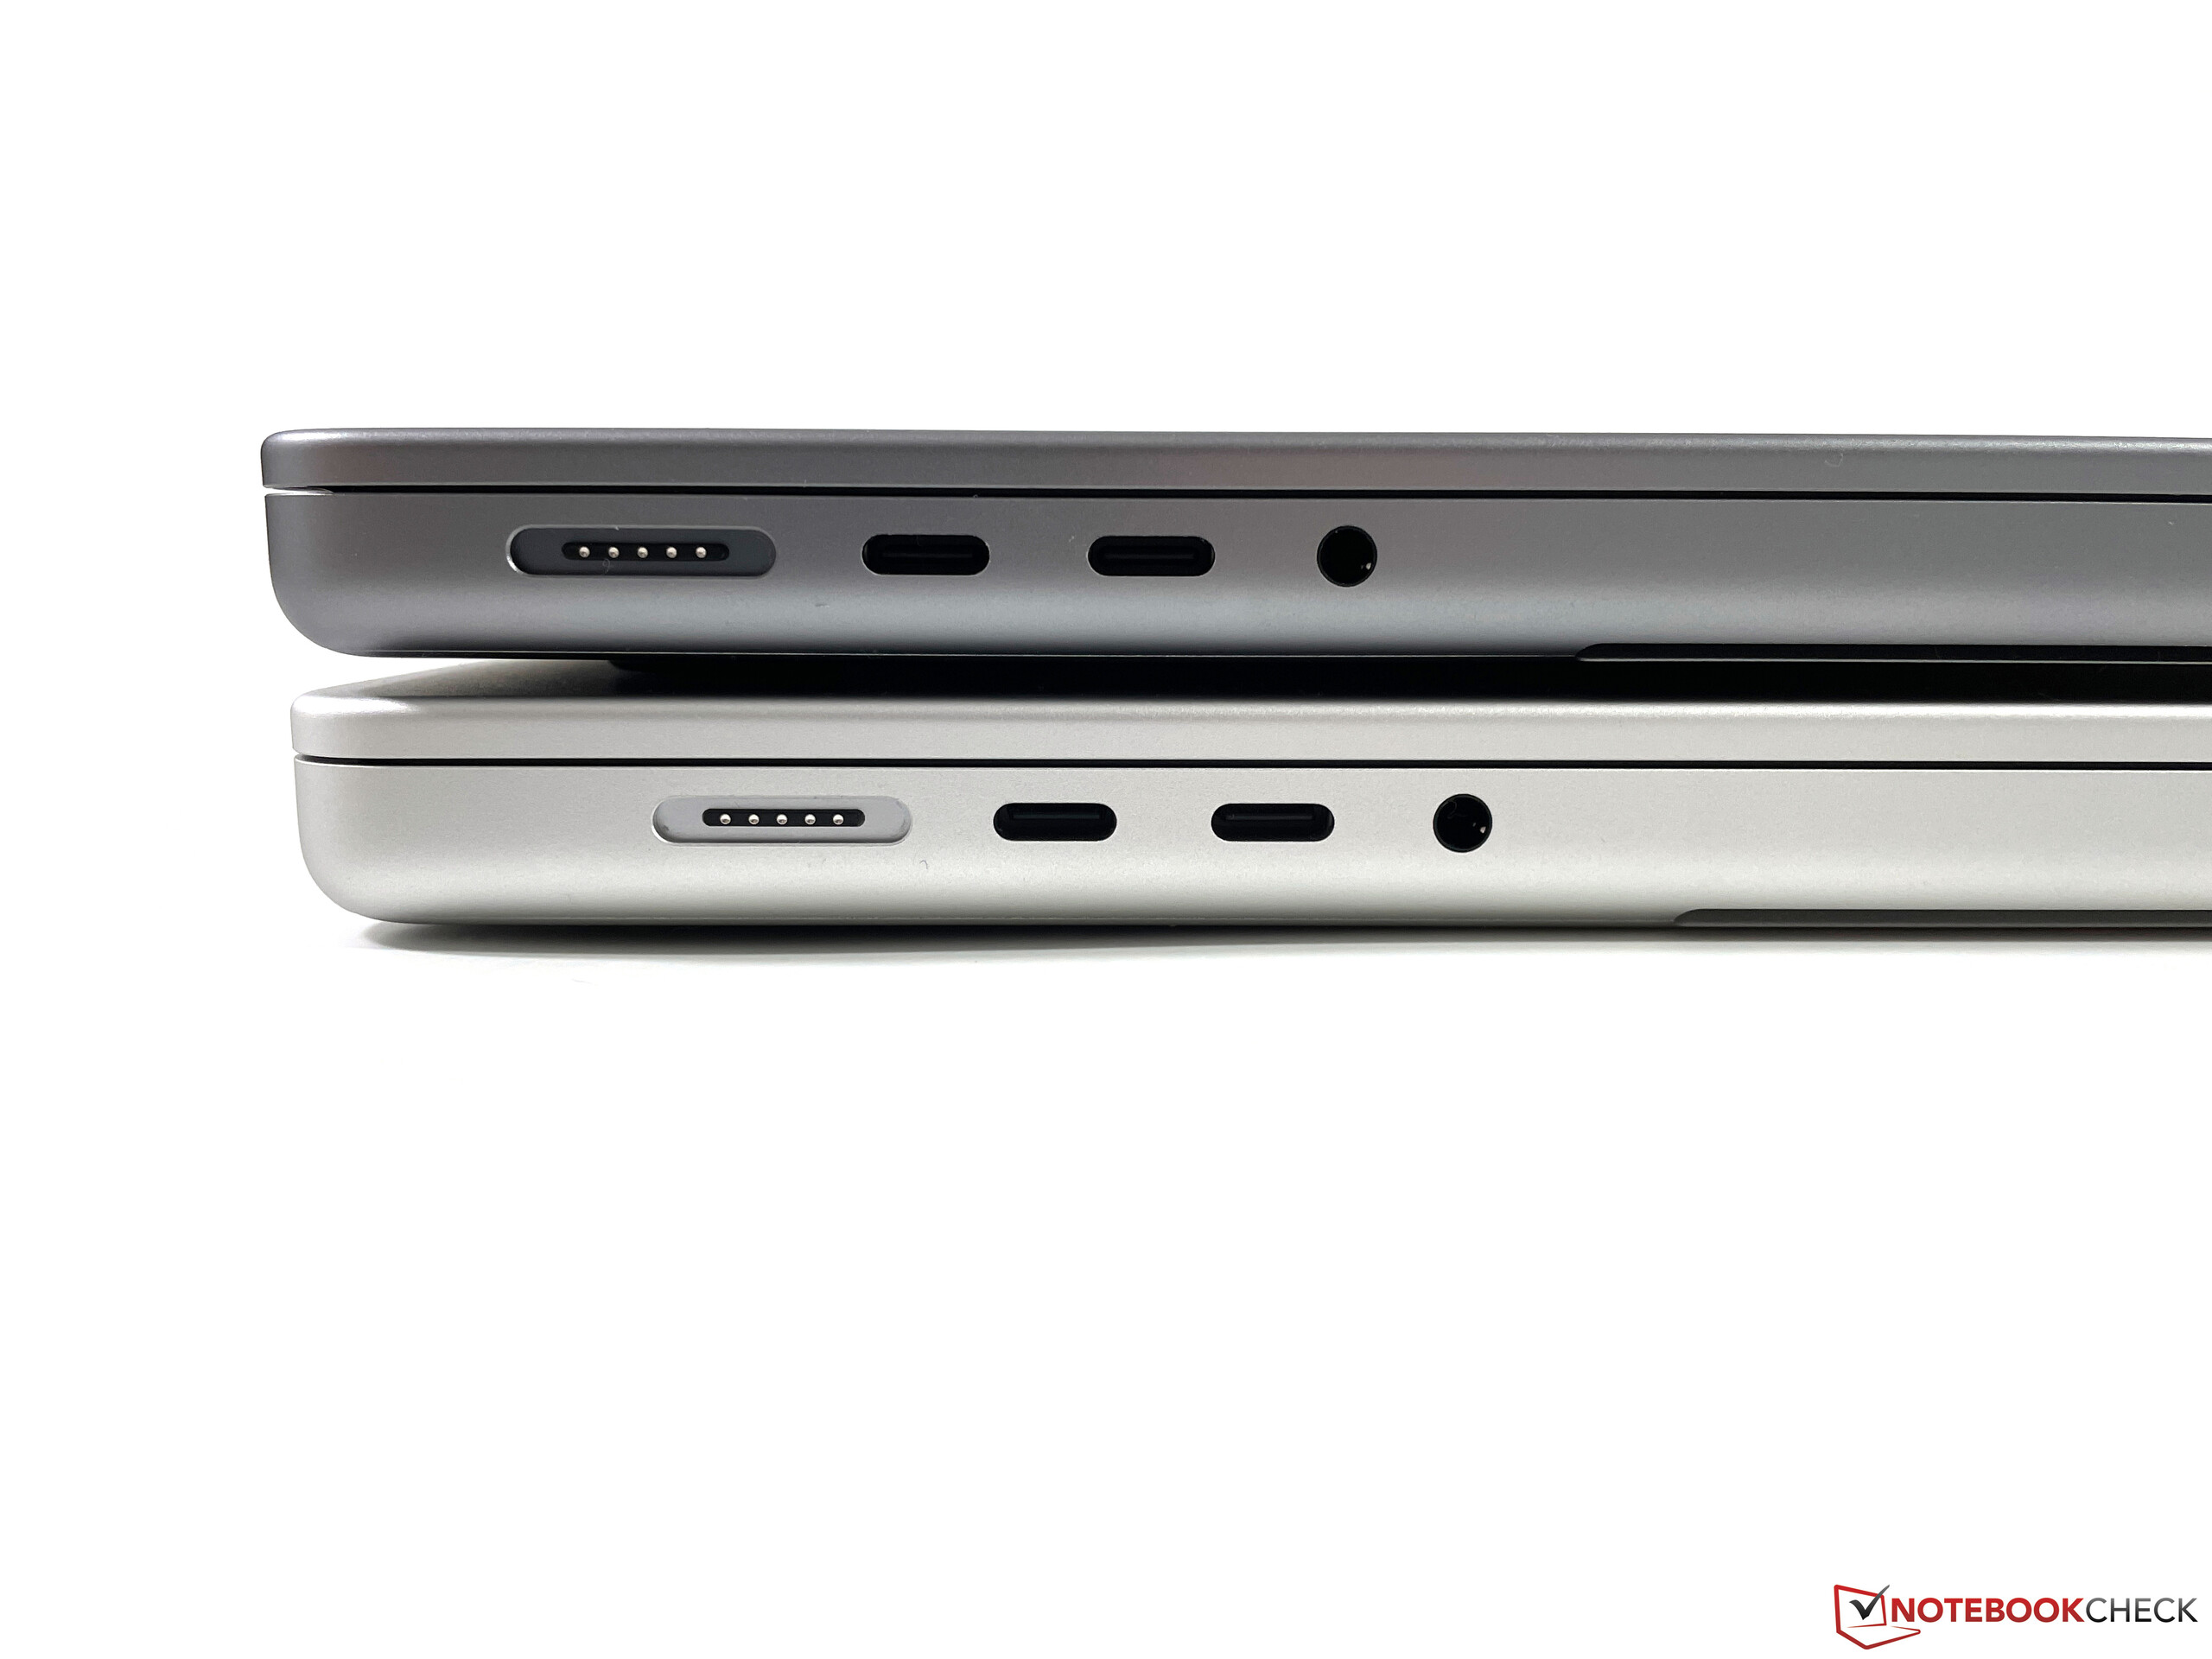
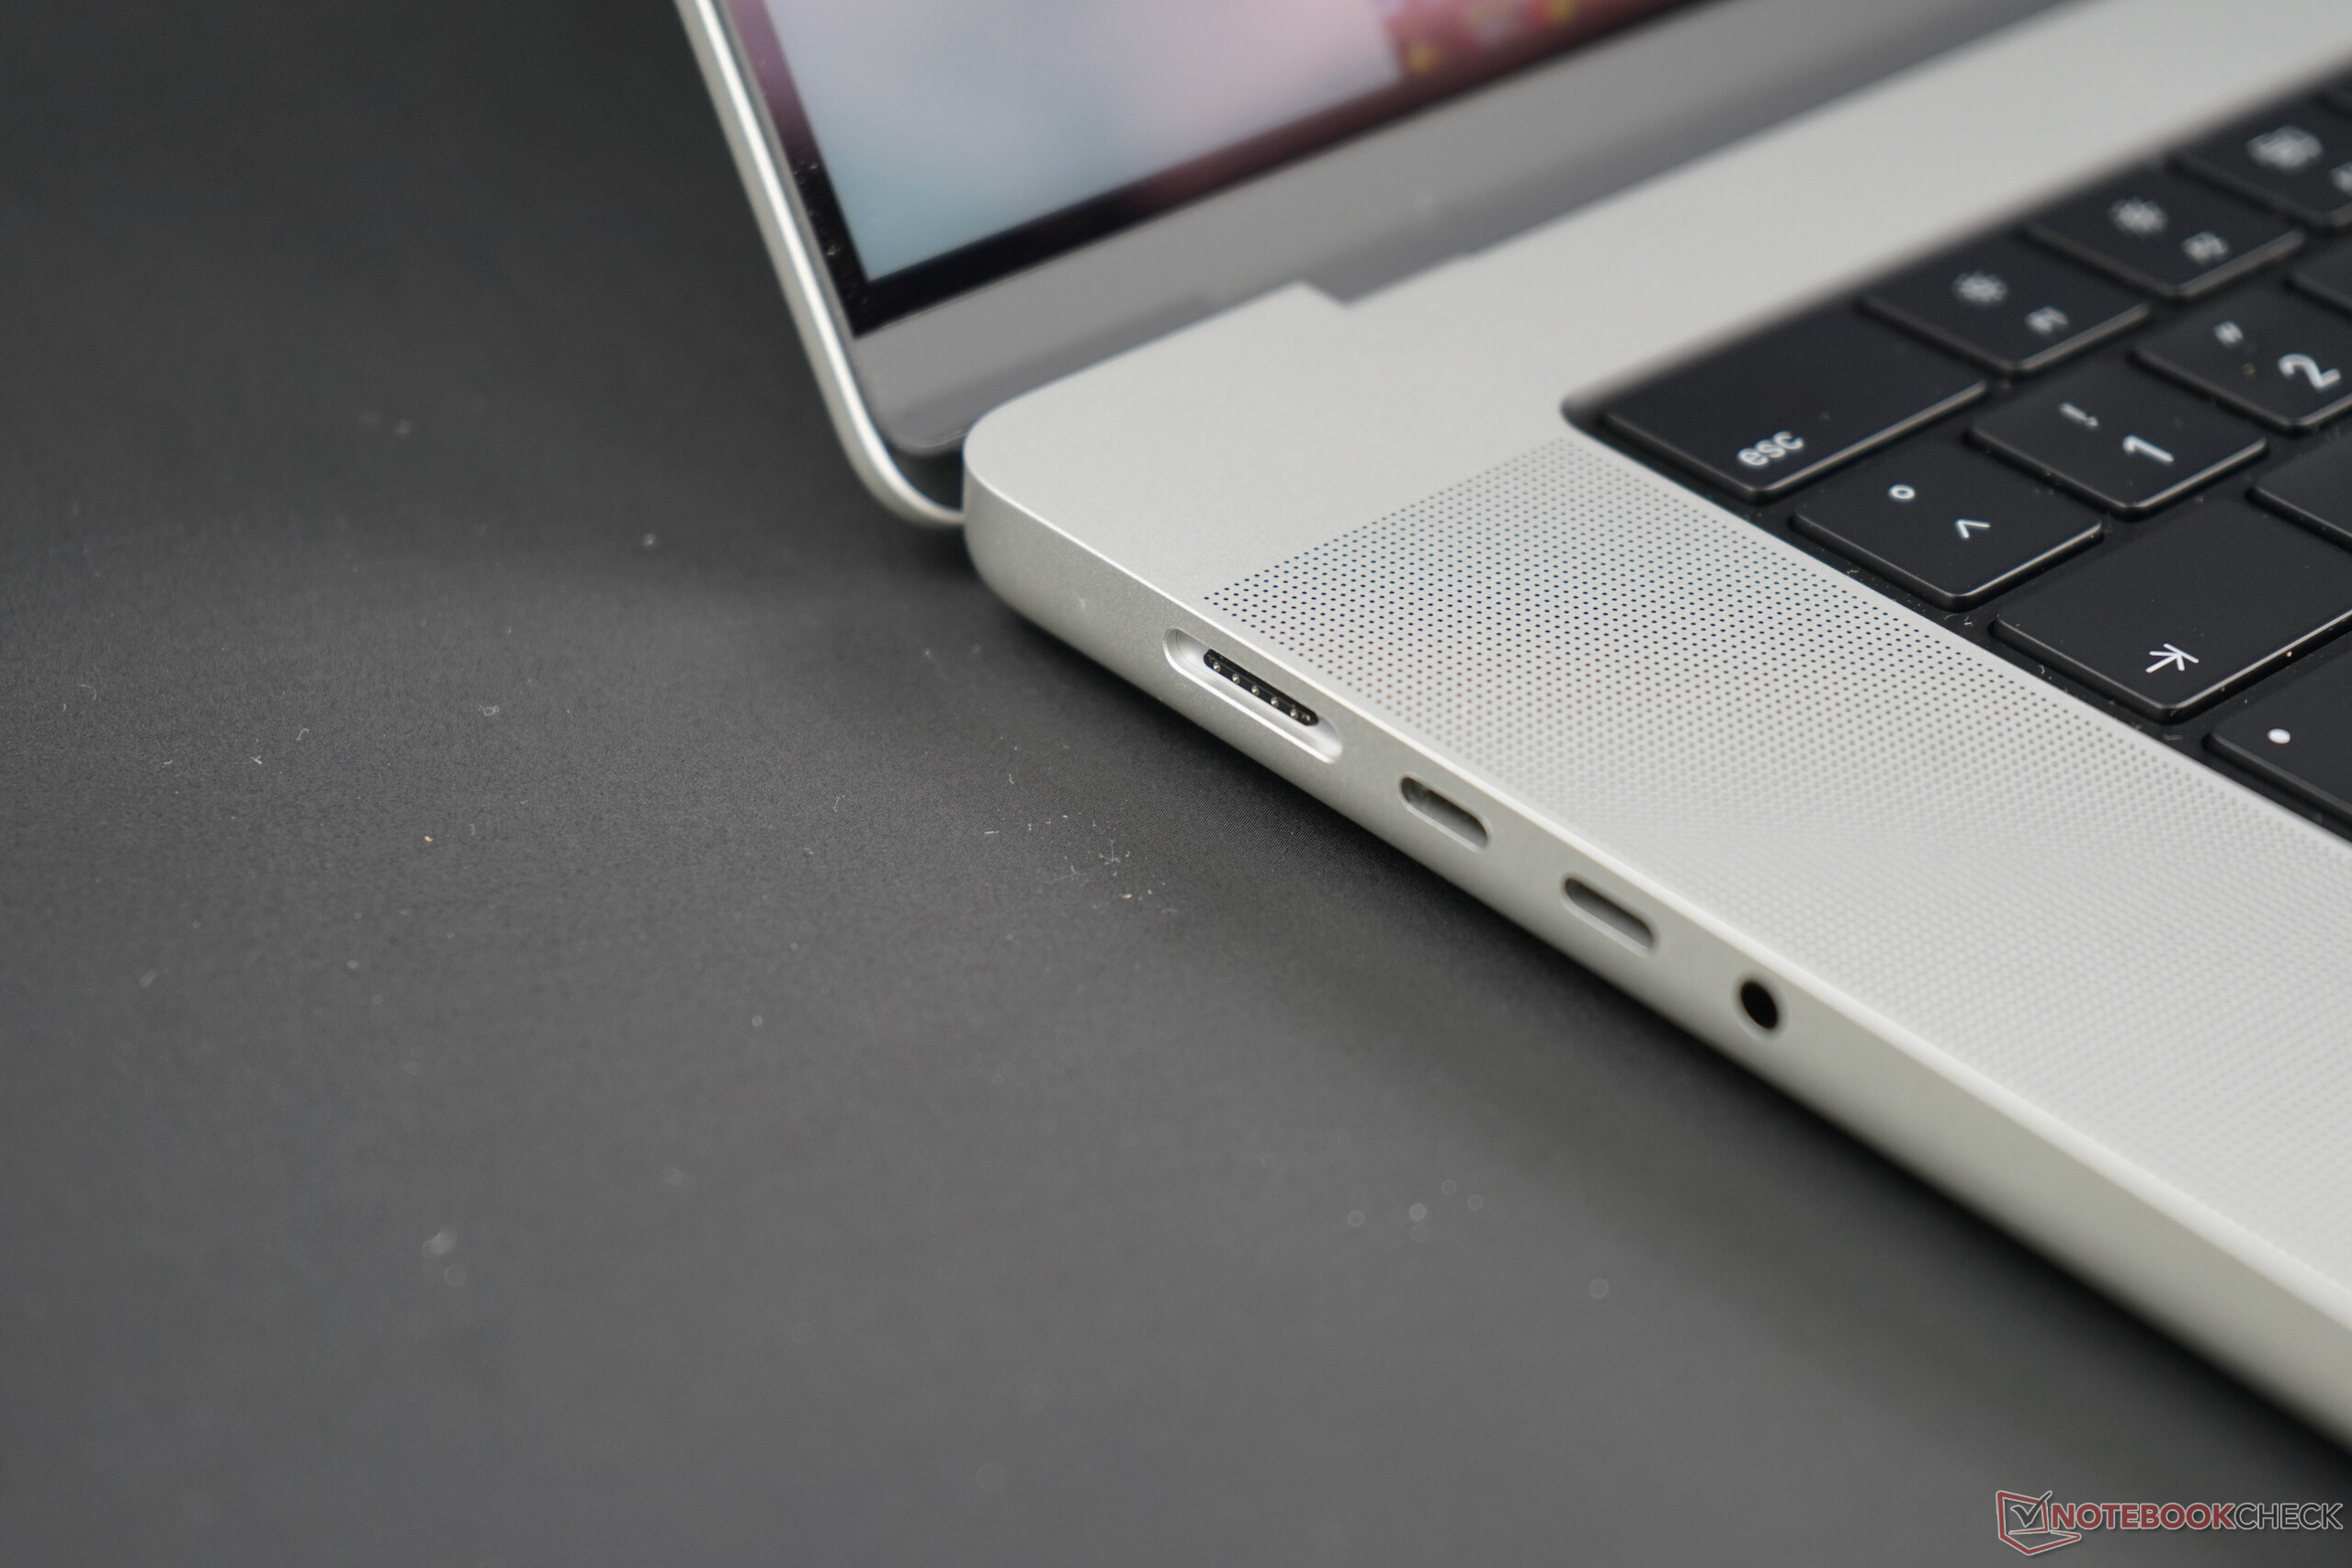
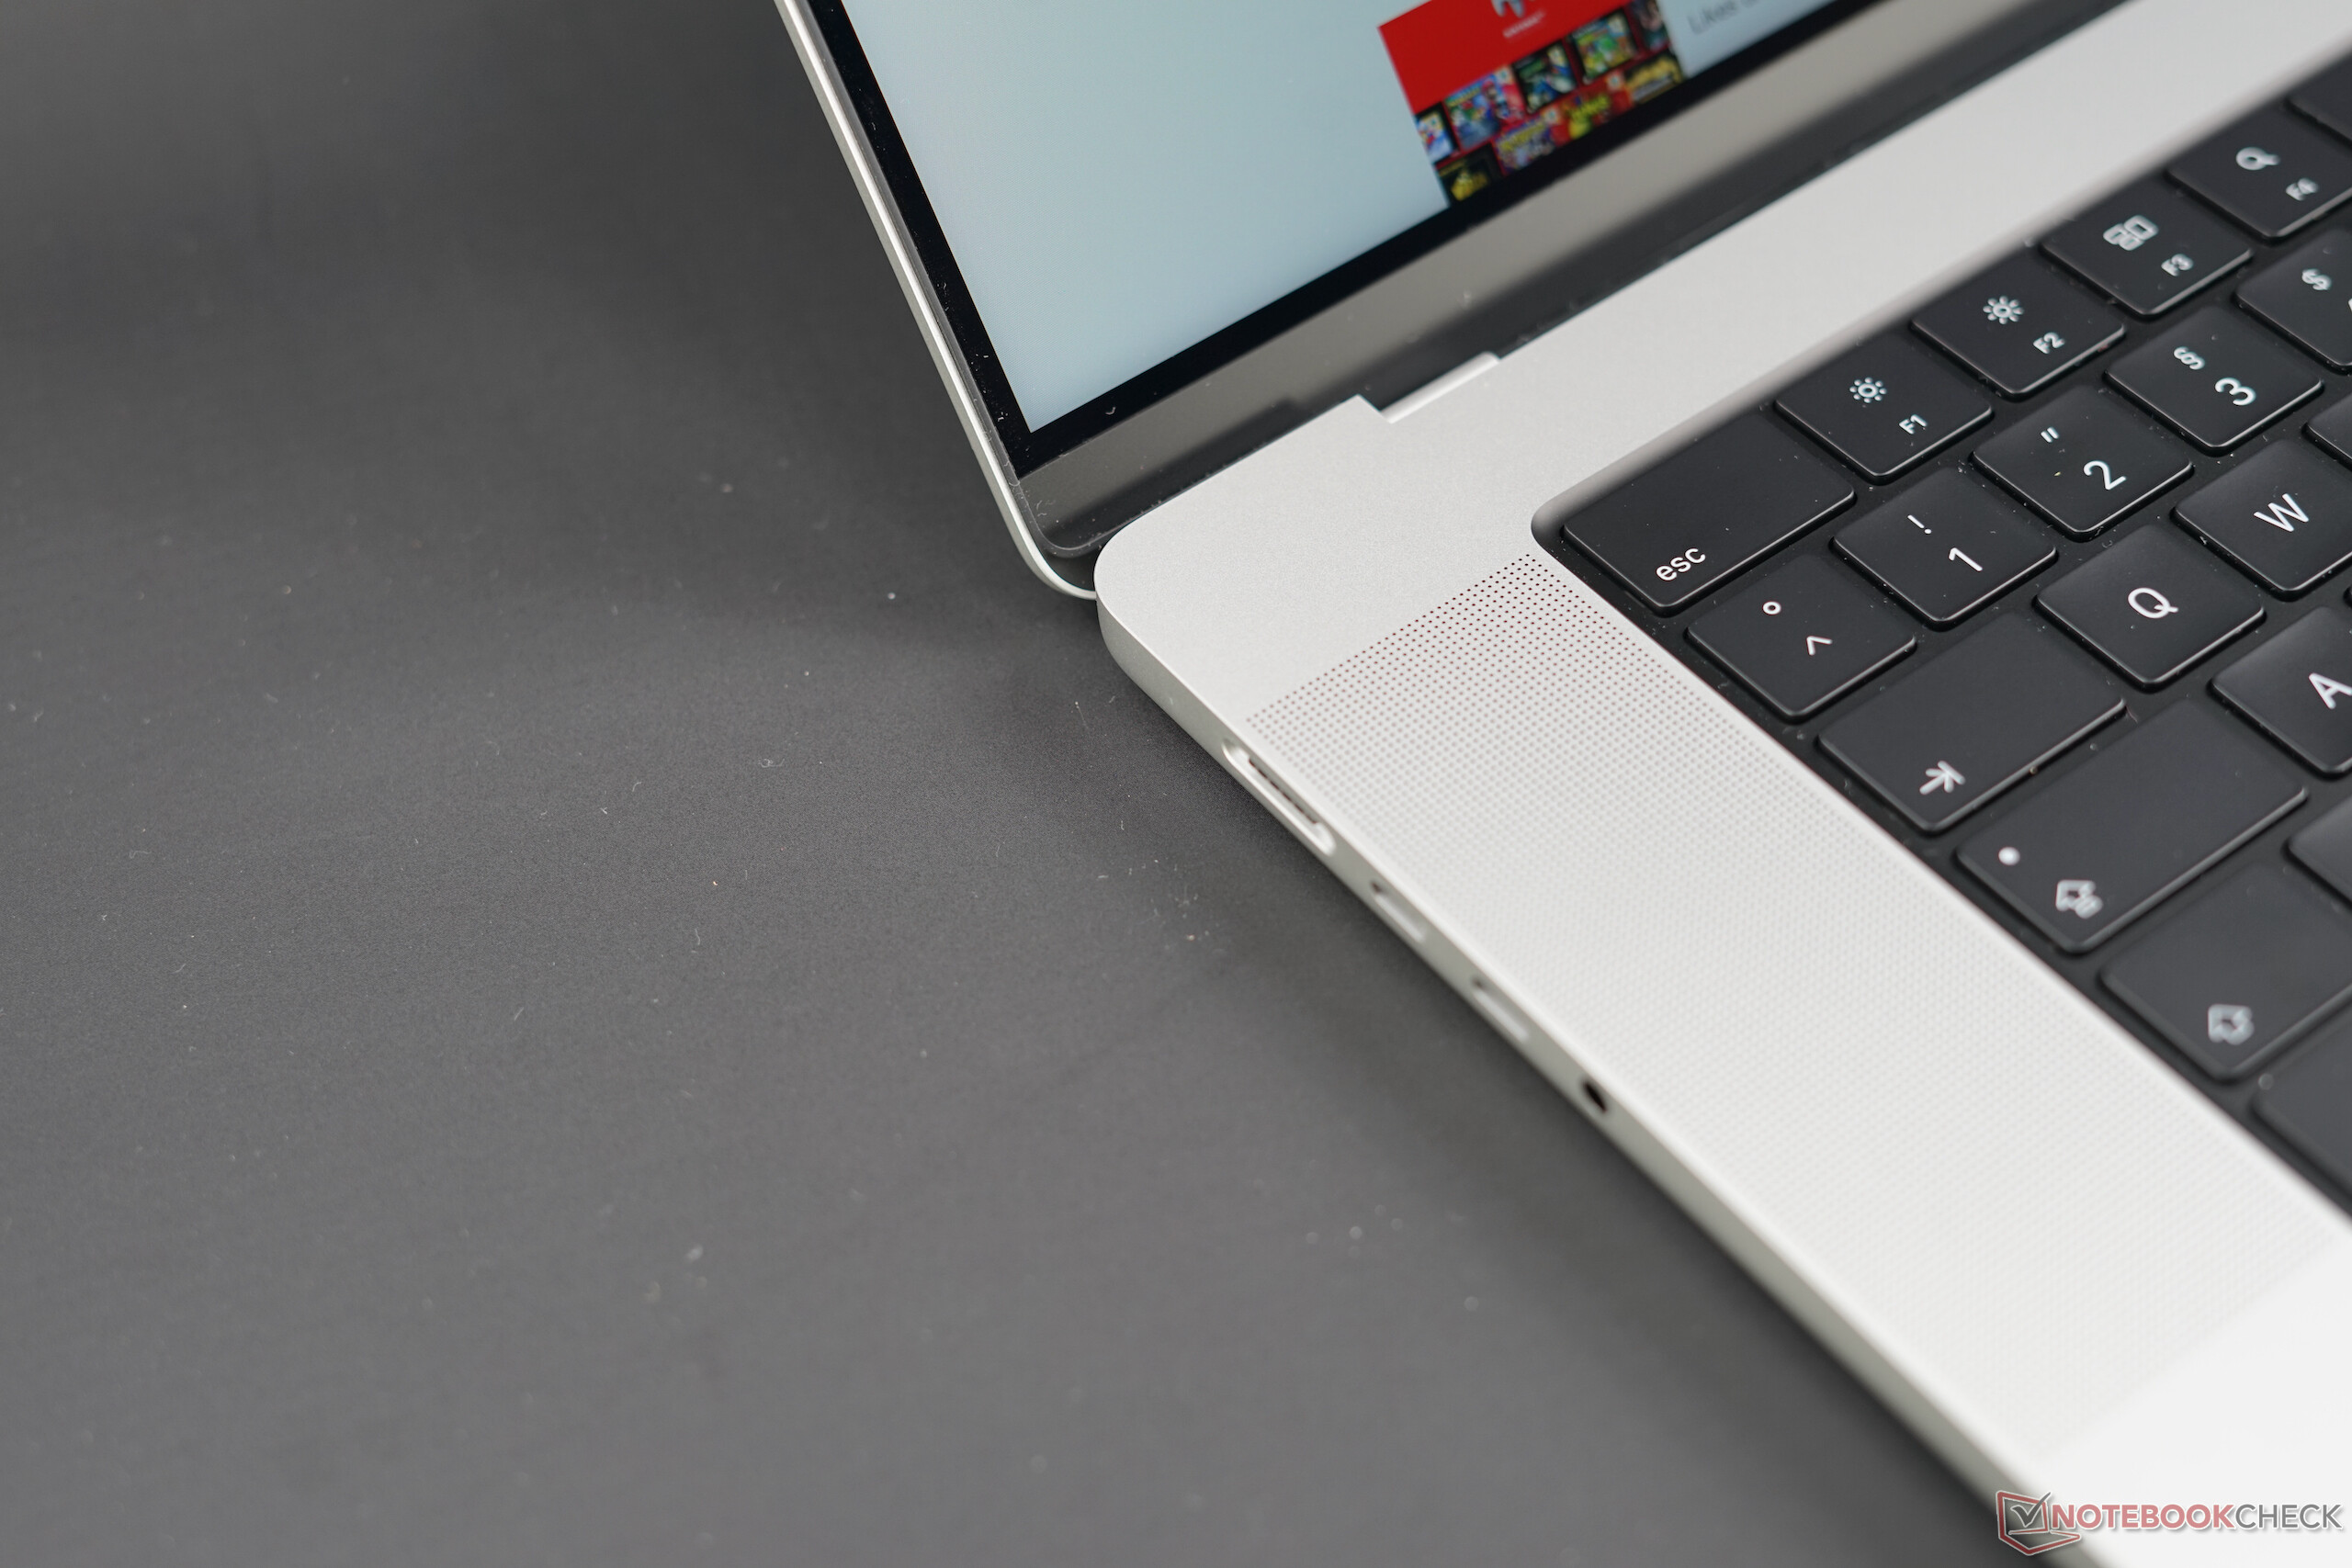
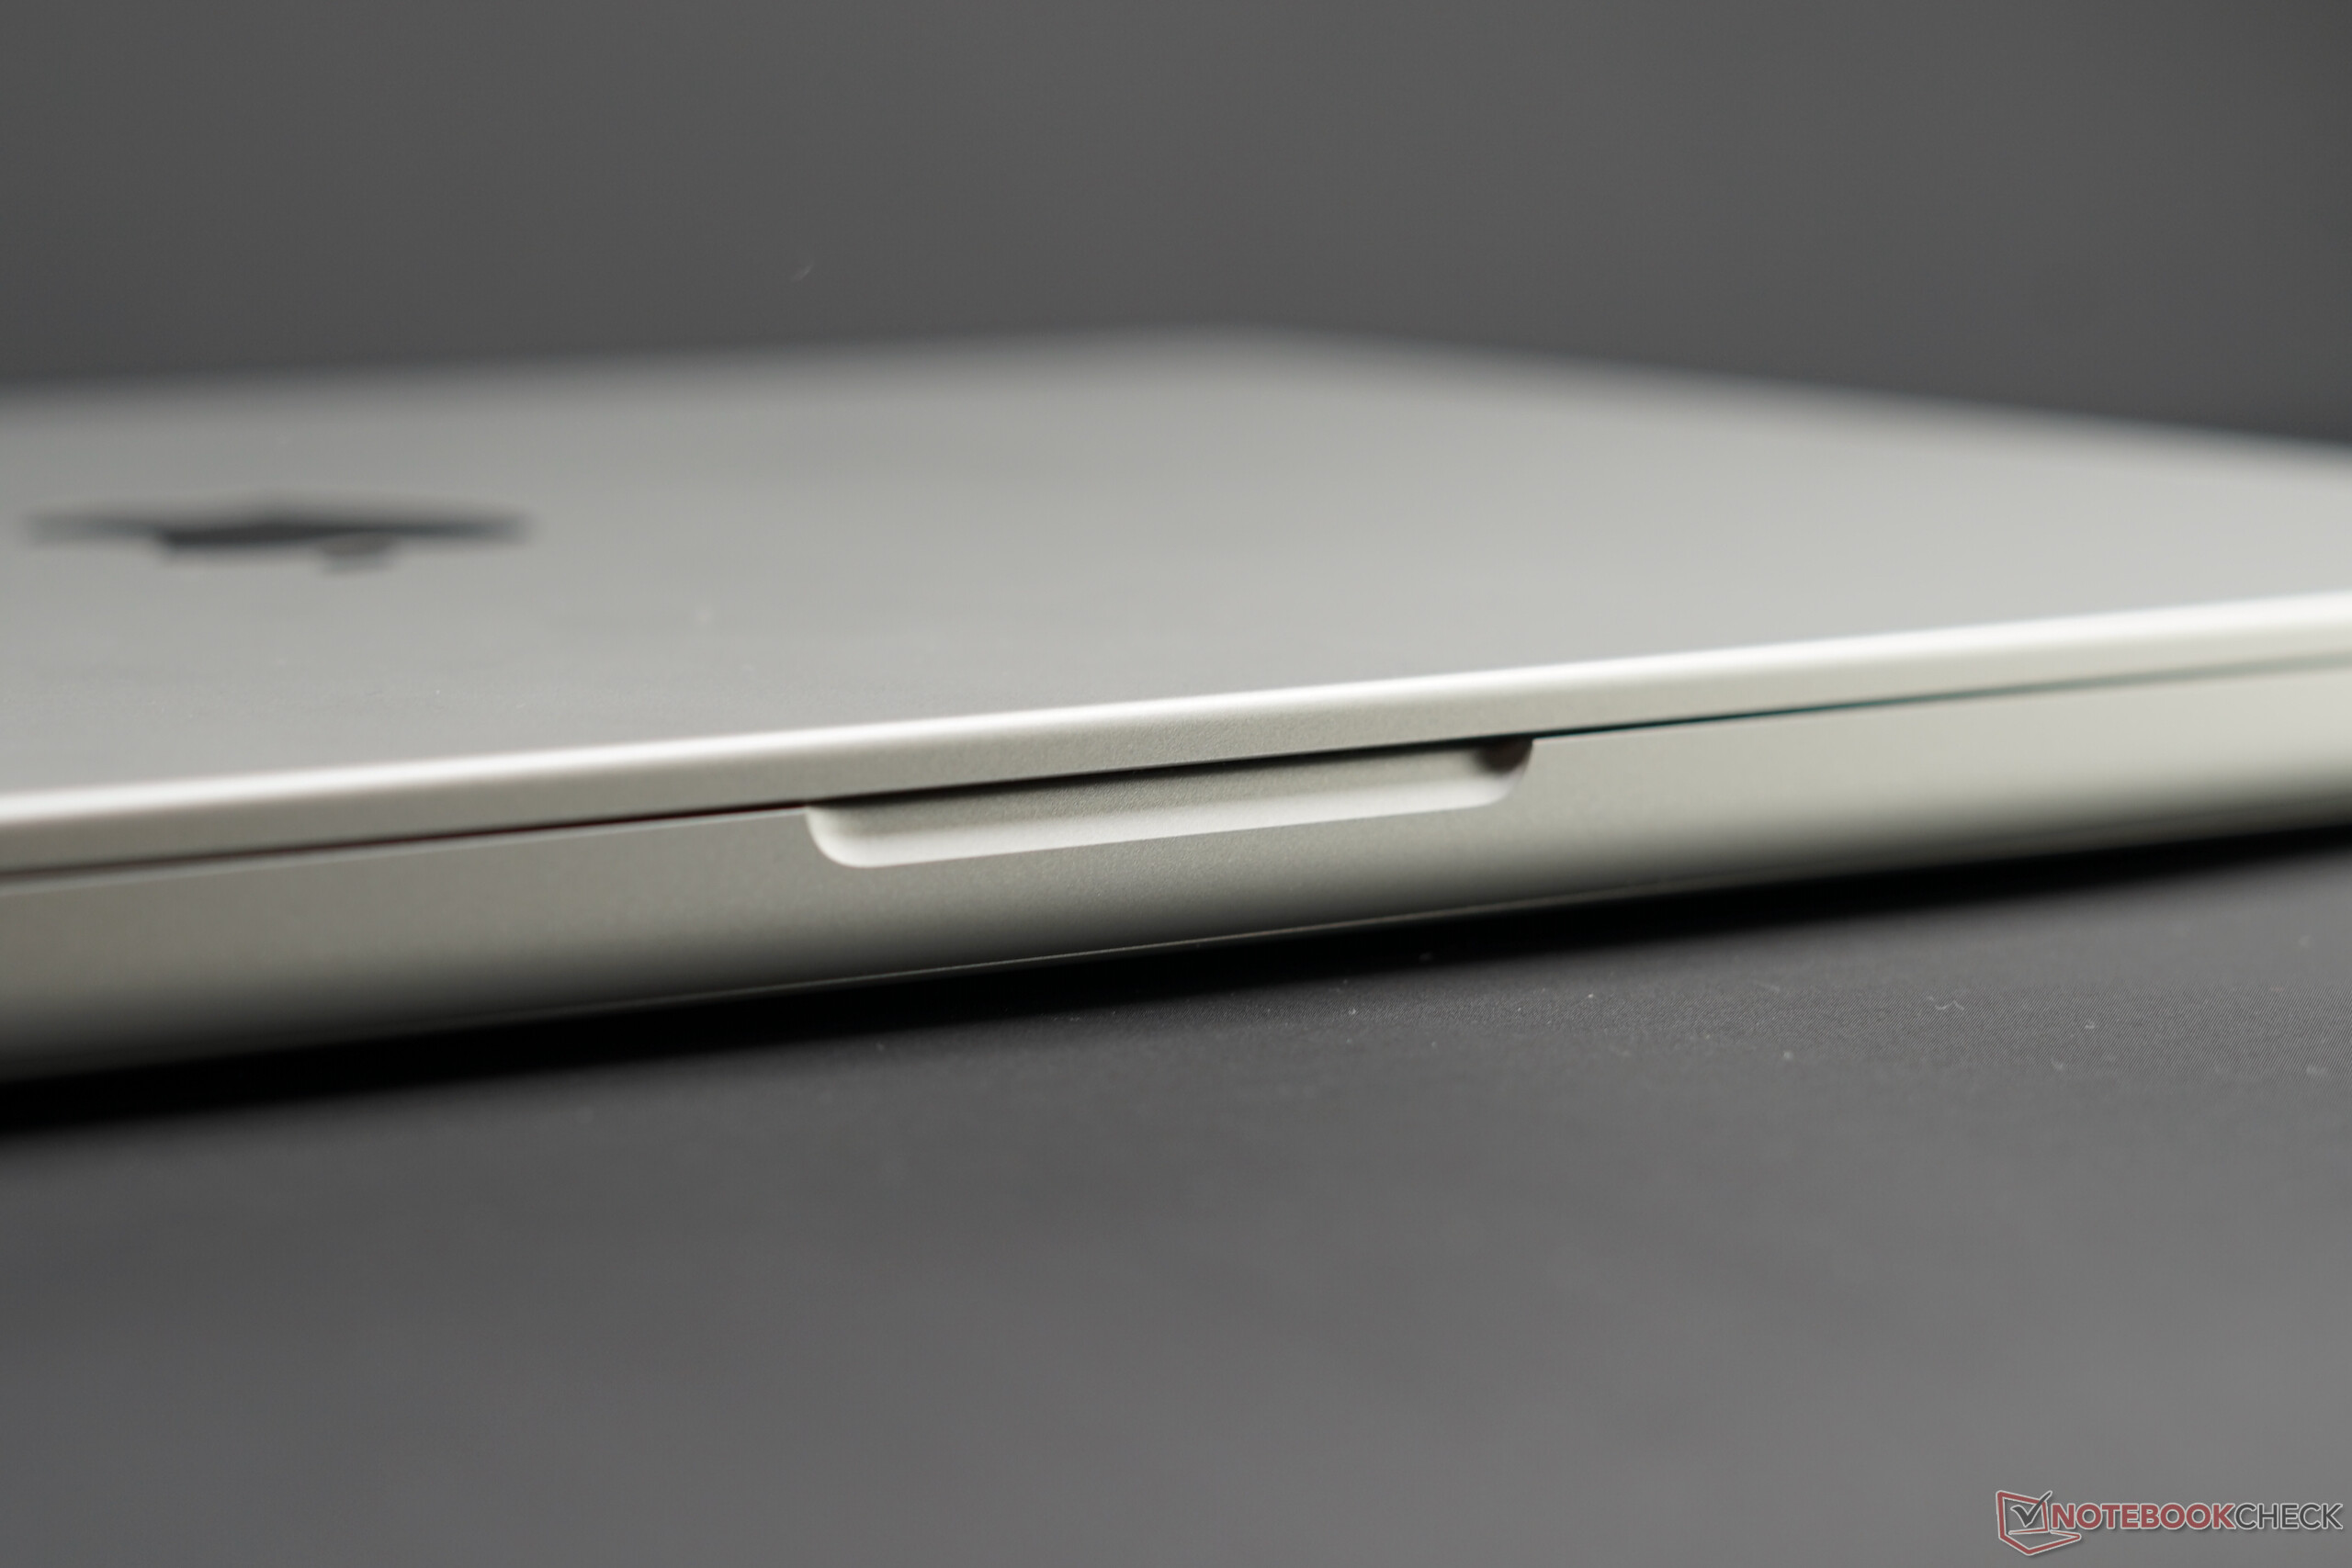
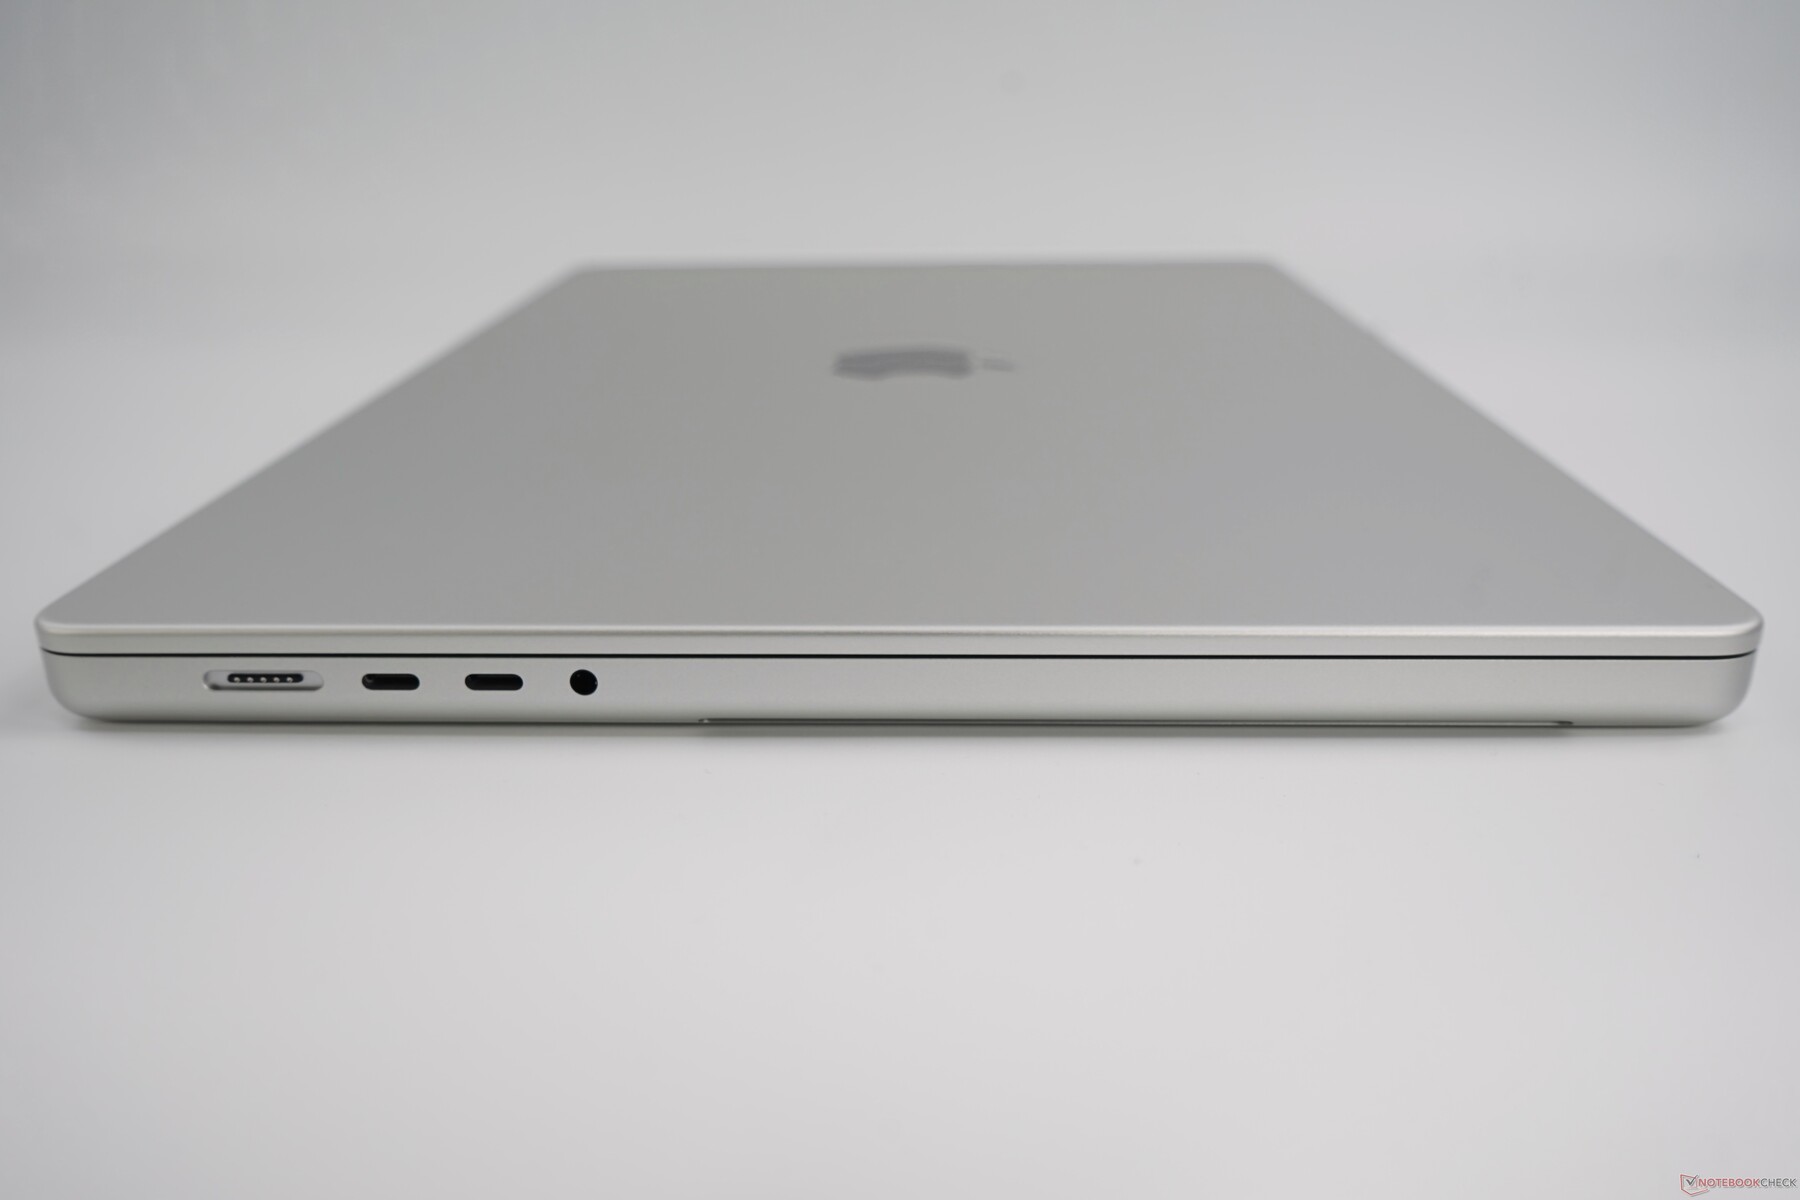
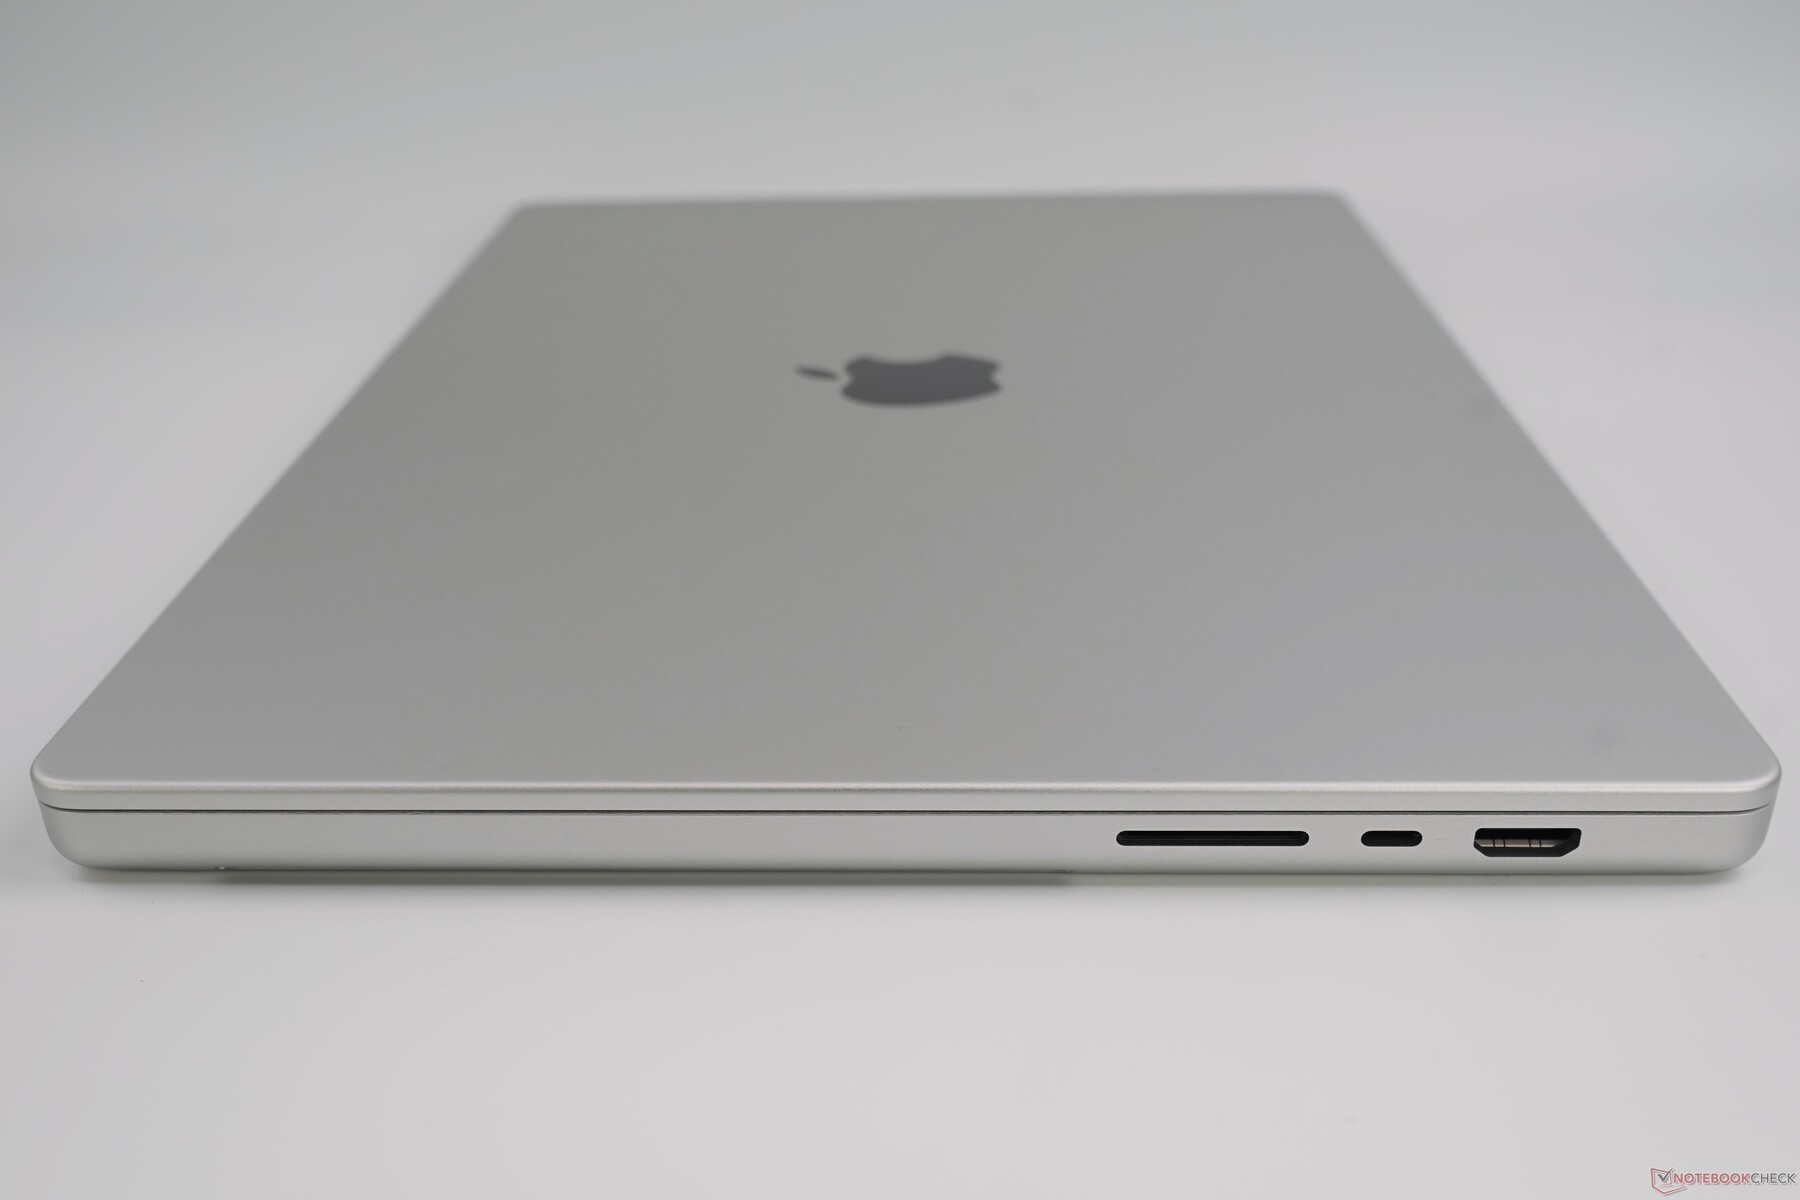
连接性 - MagSafe回来了
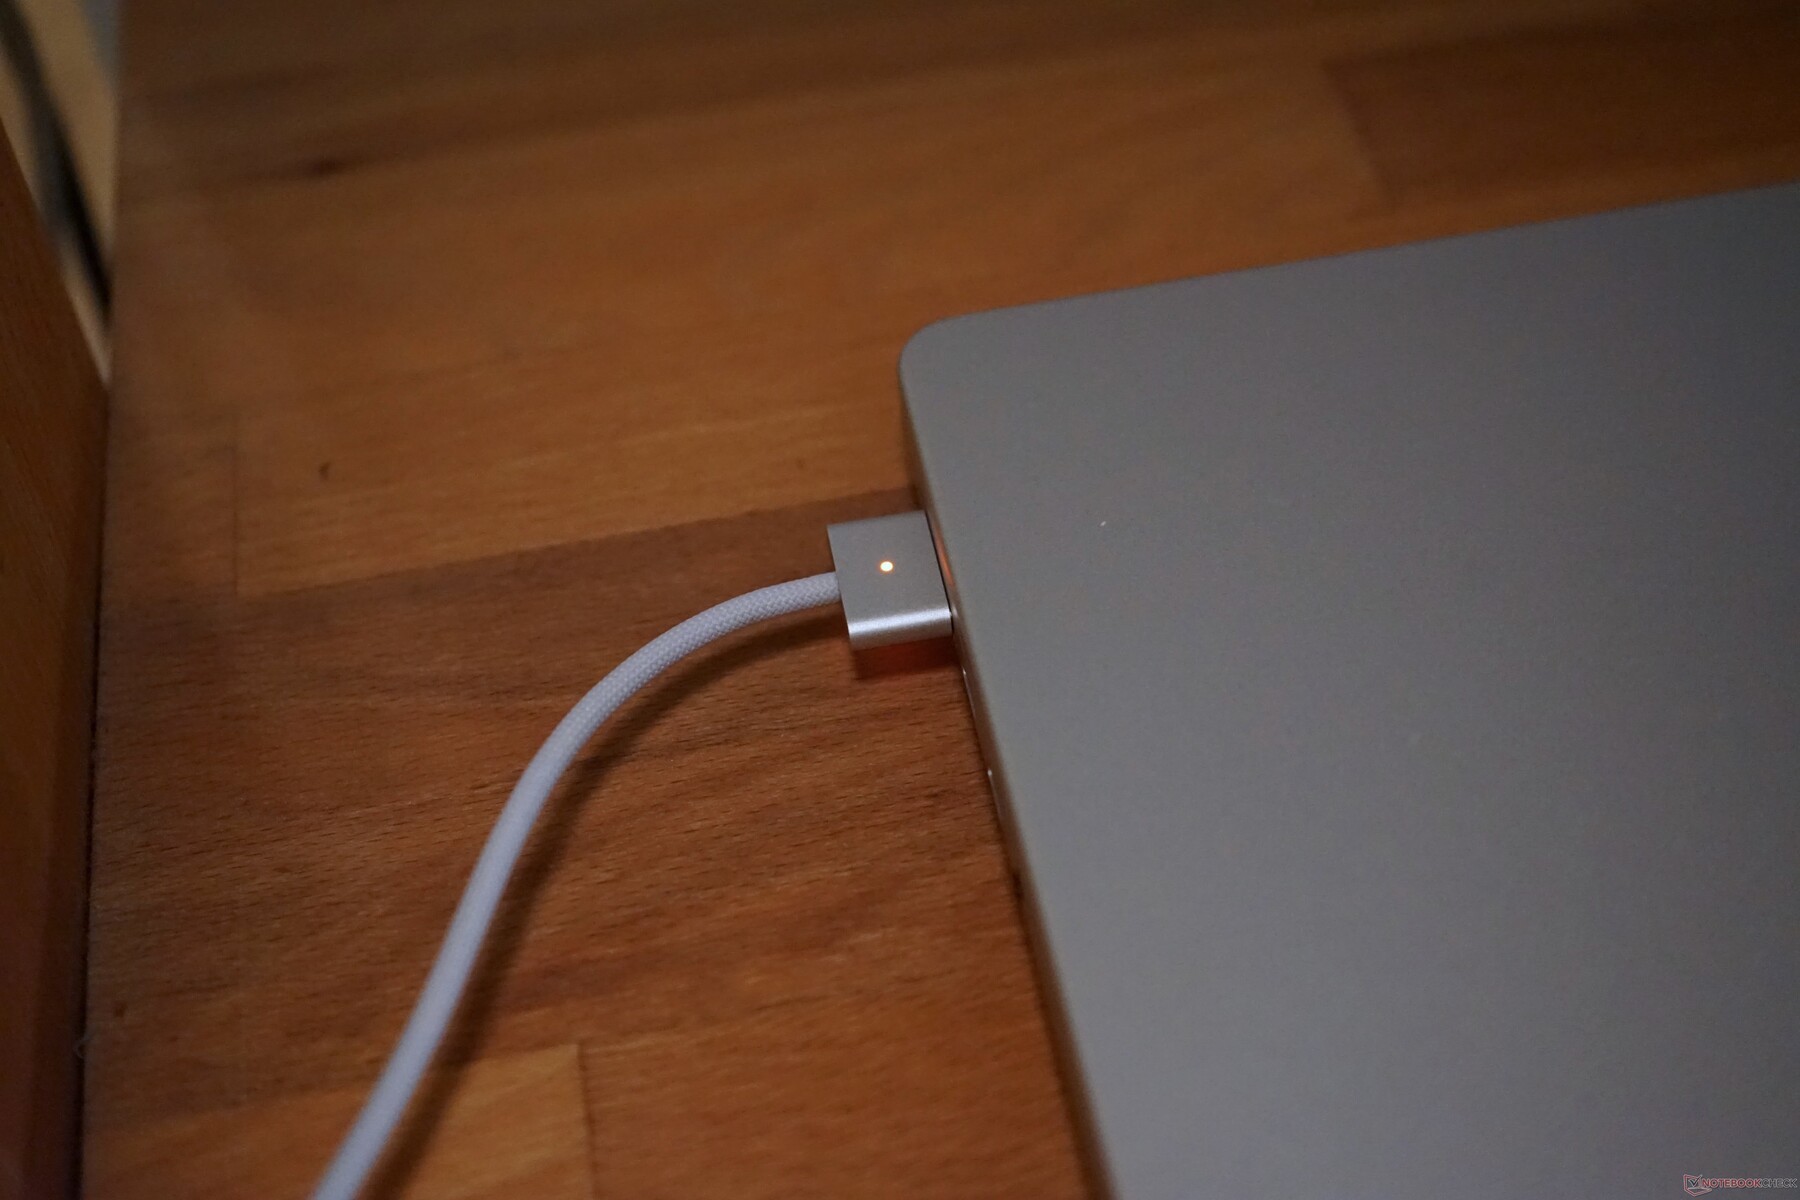
从纸面上看,新的MacBook Pro 16可能失去了一个Thunderbolt端口,因为现在你 "只 "得到三个而不是四个USB-C端口(更新为Thunderbolt 4)。然而,无论如何,其中一个TB端口通常会被电源适配器挡住,现在由MagSafe连接器负责,它已经回归。你也可以通过USB-C为MBP 16充电,但最多只能达到100瓦。还有两个熟悉的连接器也卷土重来。HDMI输出以及SDCX读卡器。一个USB-A端口可能也会适合,但缺乏它意味着你可能会不时地需要适配器。
端口标准只有Thunderbolt 4是最新的,而HDMI只支持2.0标准,所以外部4K显示器被限制在60 Hz。配备M1 Pro的SKU可以驱动多达两个外部4K屏幕,频率为60 Hz,而配备M1 Max的SKU可以驱动多达三个外部6K屏幕(60 Hz)和一个额外的4K显示器(60 Hz)。
每个Thunderbolt 4端口都通过40GB/s接口连接,我们设法用一个外部固态硬盘获得超过2.5GB/s的传输率。外接显示器和扩展坞仍有一些问题(传输率限于USB 3.0速度),但这是由新的macOS Monterey造成的。
SD卡阅读器
当我们从参考卡(Angelbird AV Pro V60 UHS-II)复制图片时,我们确定最大传输速率为121 MB/s。这里仍有改进的余地,因为竞争对手如戴尔XPS 15或联想的ThinkPad P1 G4管理更高的传输速率。
| SD Card Reader - average JPG Copy Test (av. of 3 runs) | |
| Dell XPS 15 9510 11800H RTX 3050 Ti OLED (AV Pro V60) | |
| Lenovo ThinkPad P1 G4-20Y30017GE (AV PRO V60) | |
| Average of class Multimedia (23 - 531, n=43, last 2 years) | |
| Apple MacBook Pro 16 2021 M1 Pro (Angelbird AV Pro V60) | |
| HP ZBook Studio 15 G8 (AV Pro V60) | |
沟通
Apple'的MacBook Pro 16不支持最新的Wi-Fi 6E标准,这在高端笔记本电脑中越来越普遍。制造商列出的最大传输速度为1.2Gbps,这意味着它只支持80MHz的Wi-Fi连接。根据路由器的不同,可能会有轻微的差异(华硕ROG Rapture管理的传输速率比我们的参考路由器Netgear Nighthawk RAX120略好),但支持160 MHz的Windows竞争者在这方面肯定有优势。
网络摄像头


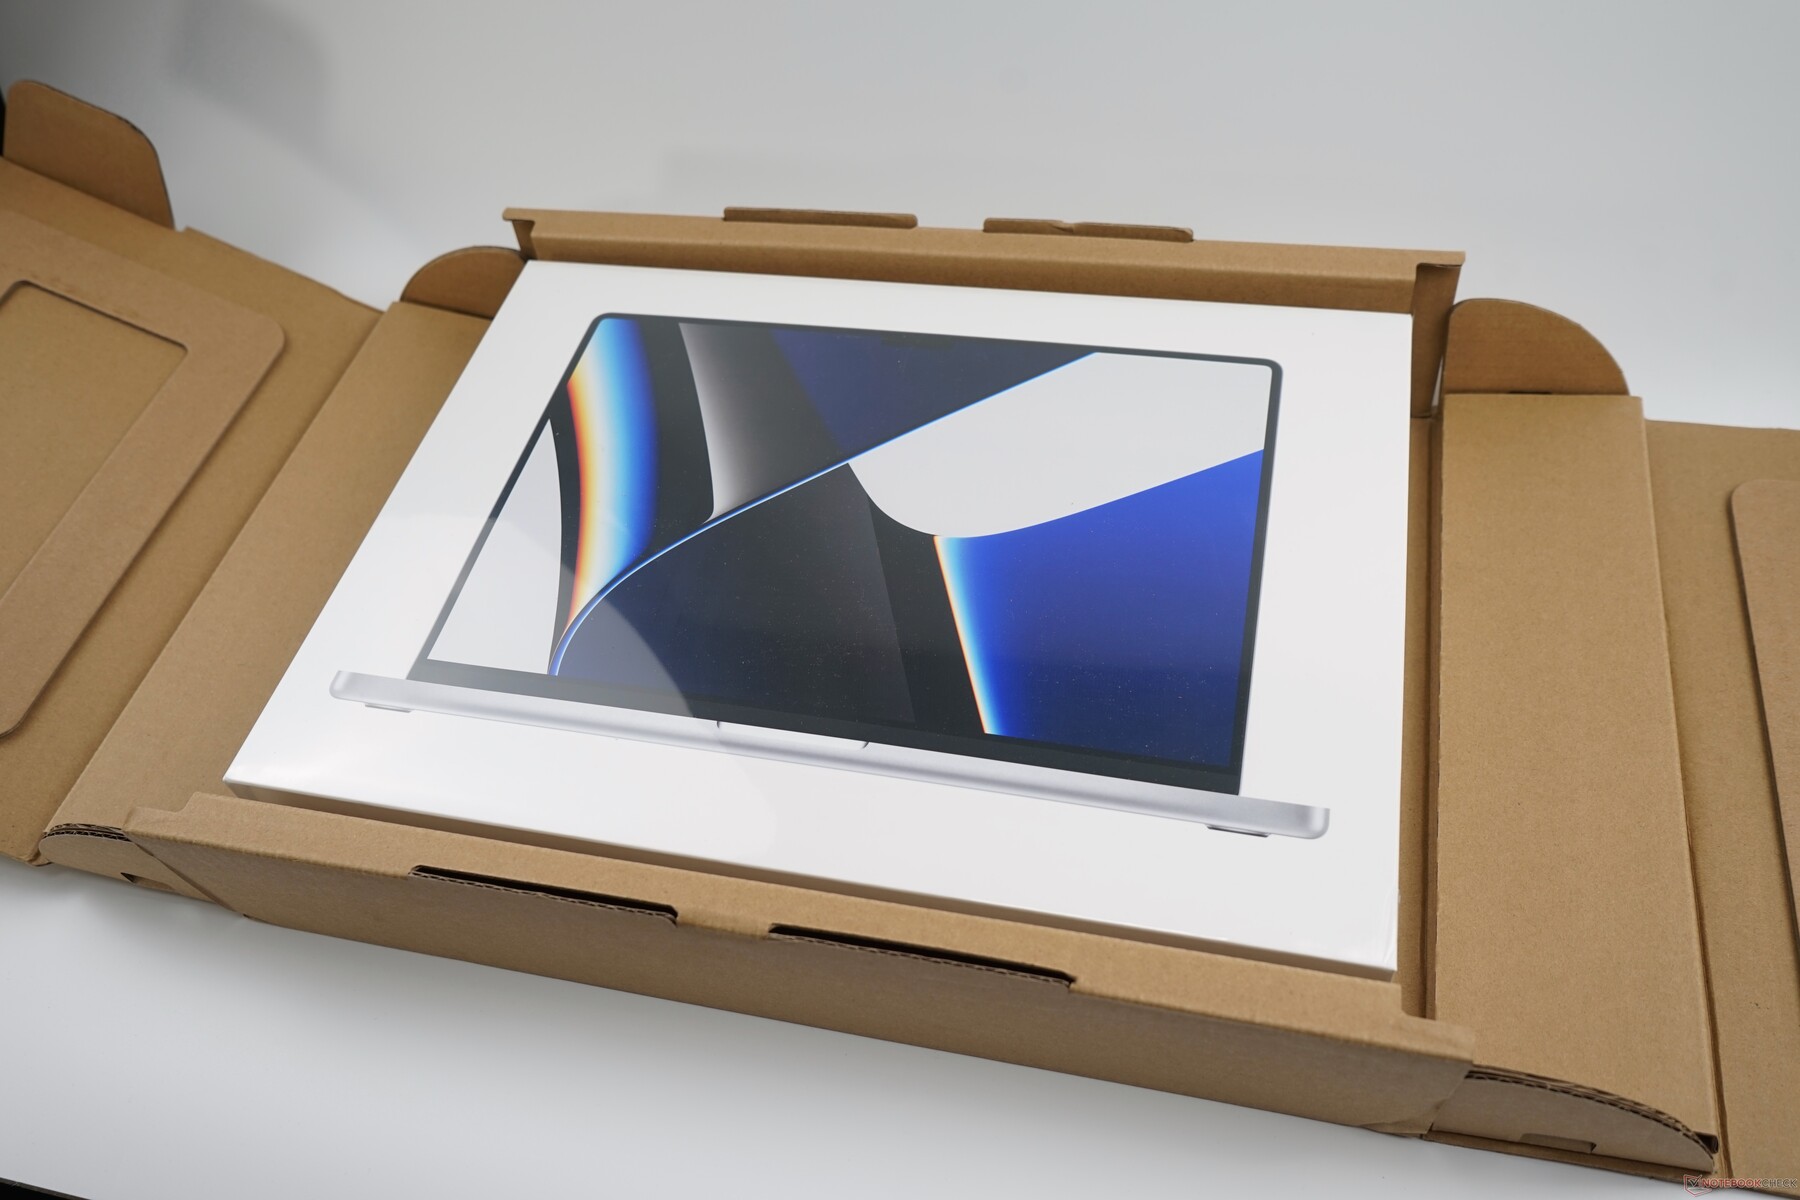
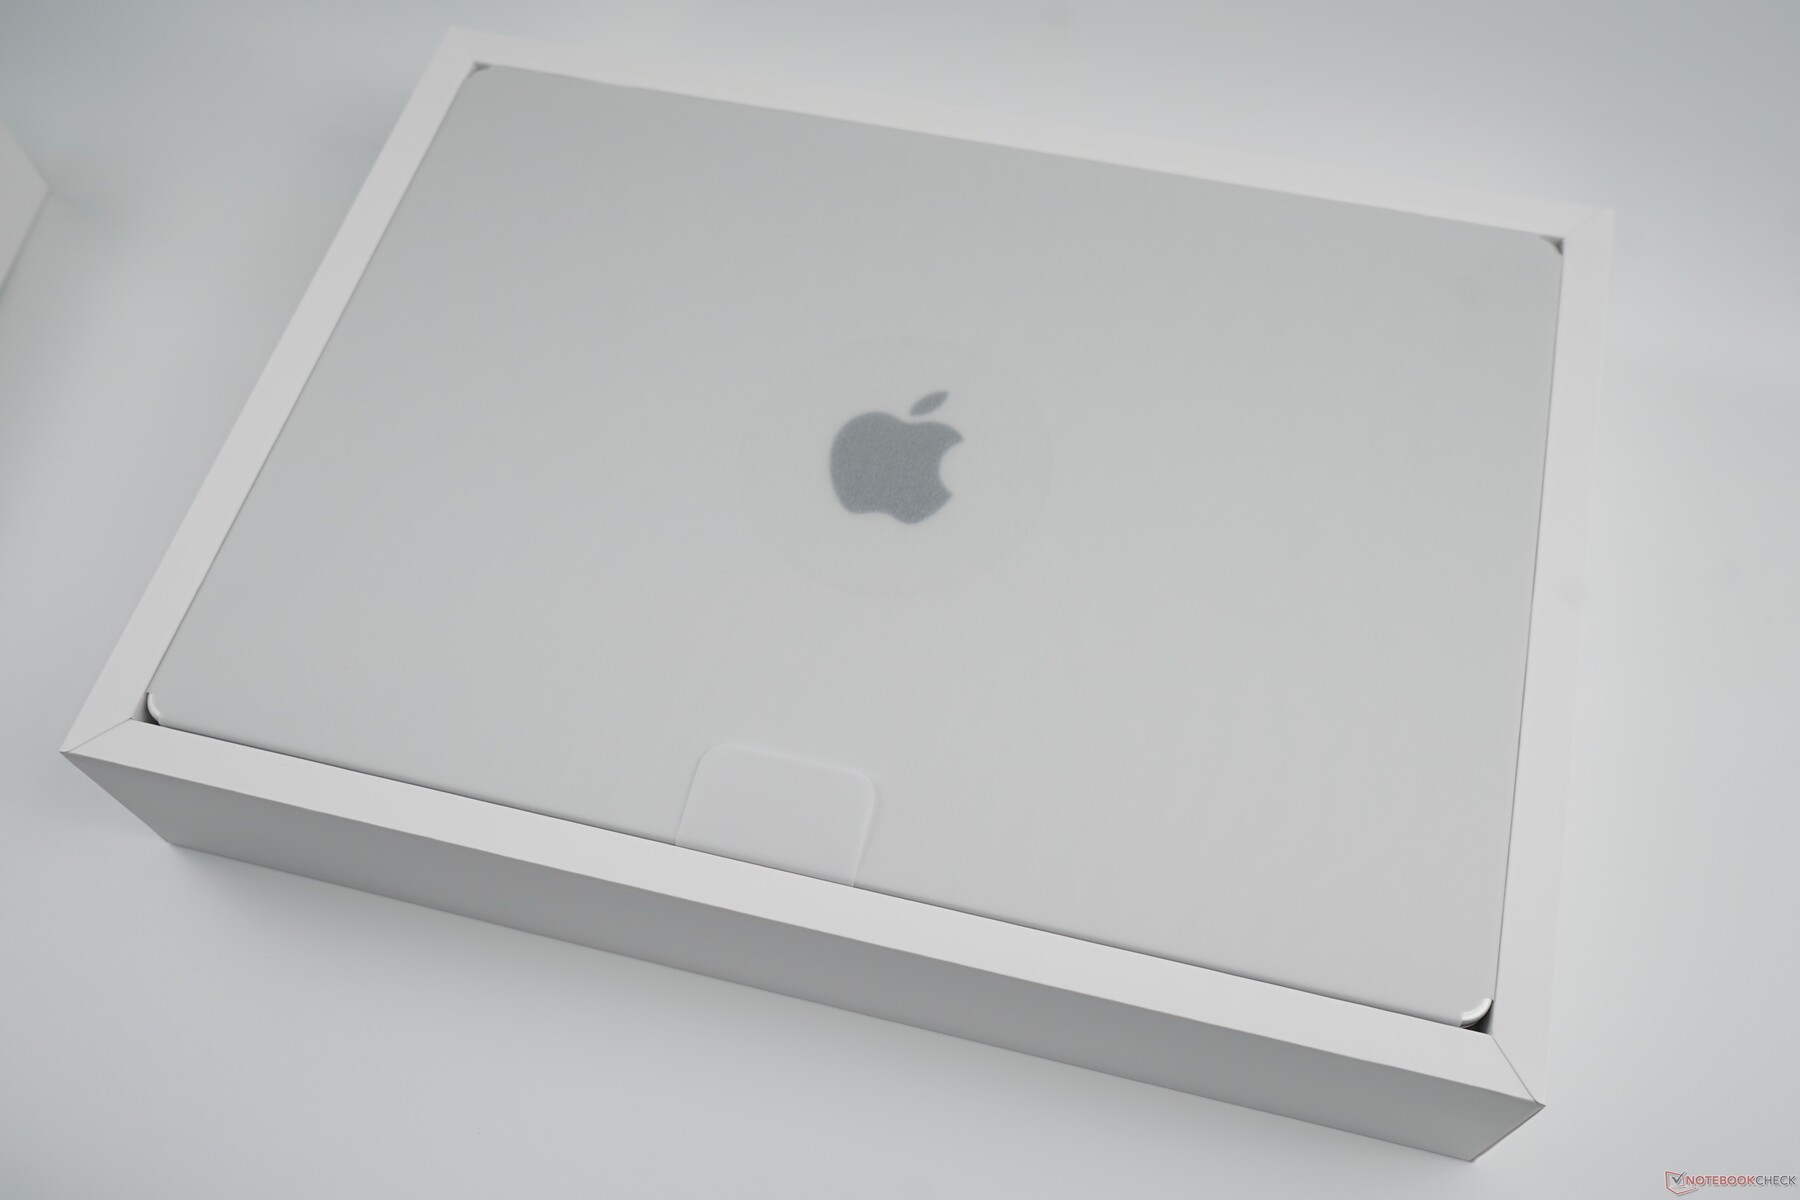
辅料
Apple ,所有型号的MacBook Pro 16都配有一个140瓦的电源适配器和一条充电线(USB-C到MagSafe 3,两米)。除了一些服务手册和两张黑色的Apple 标志贴纸,盒子里没有任何附件。
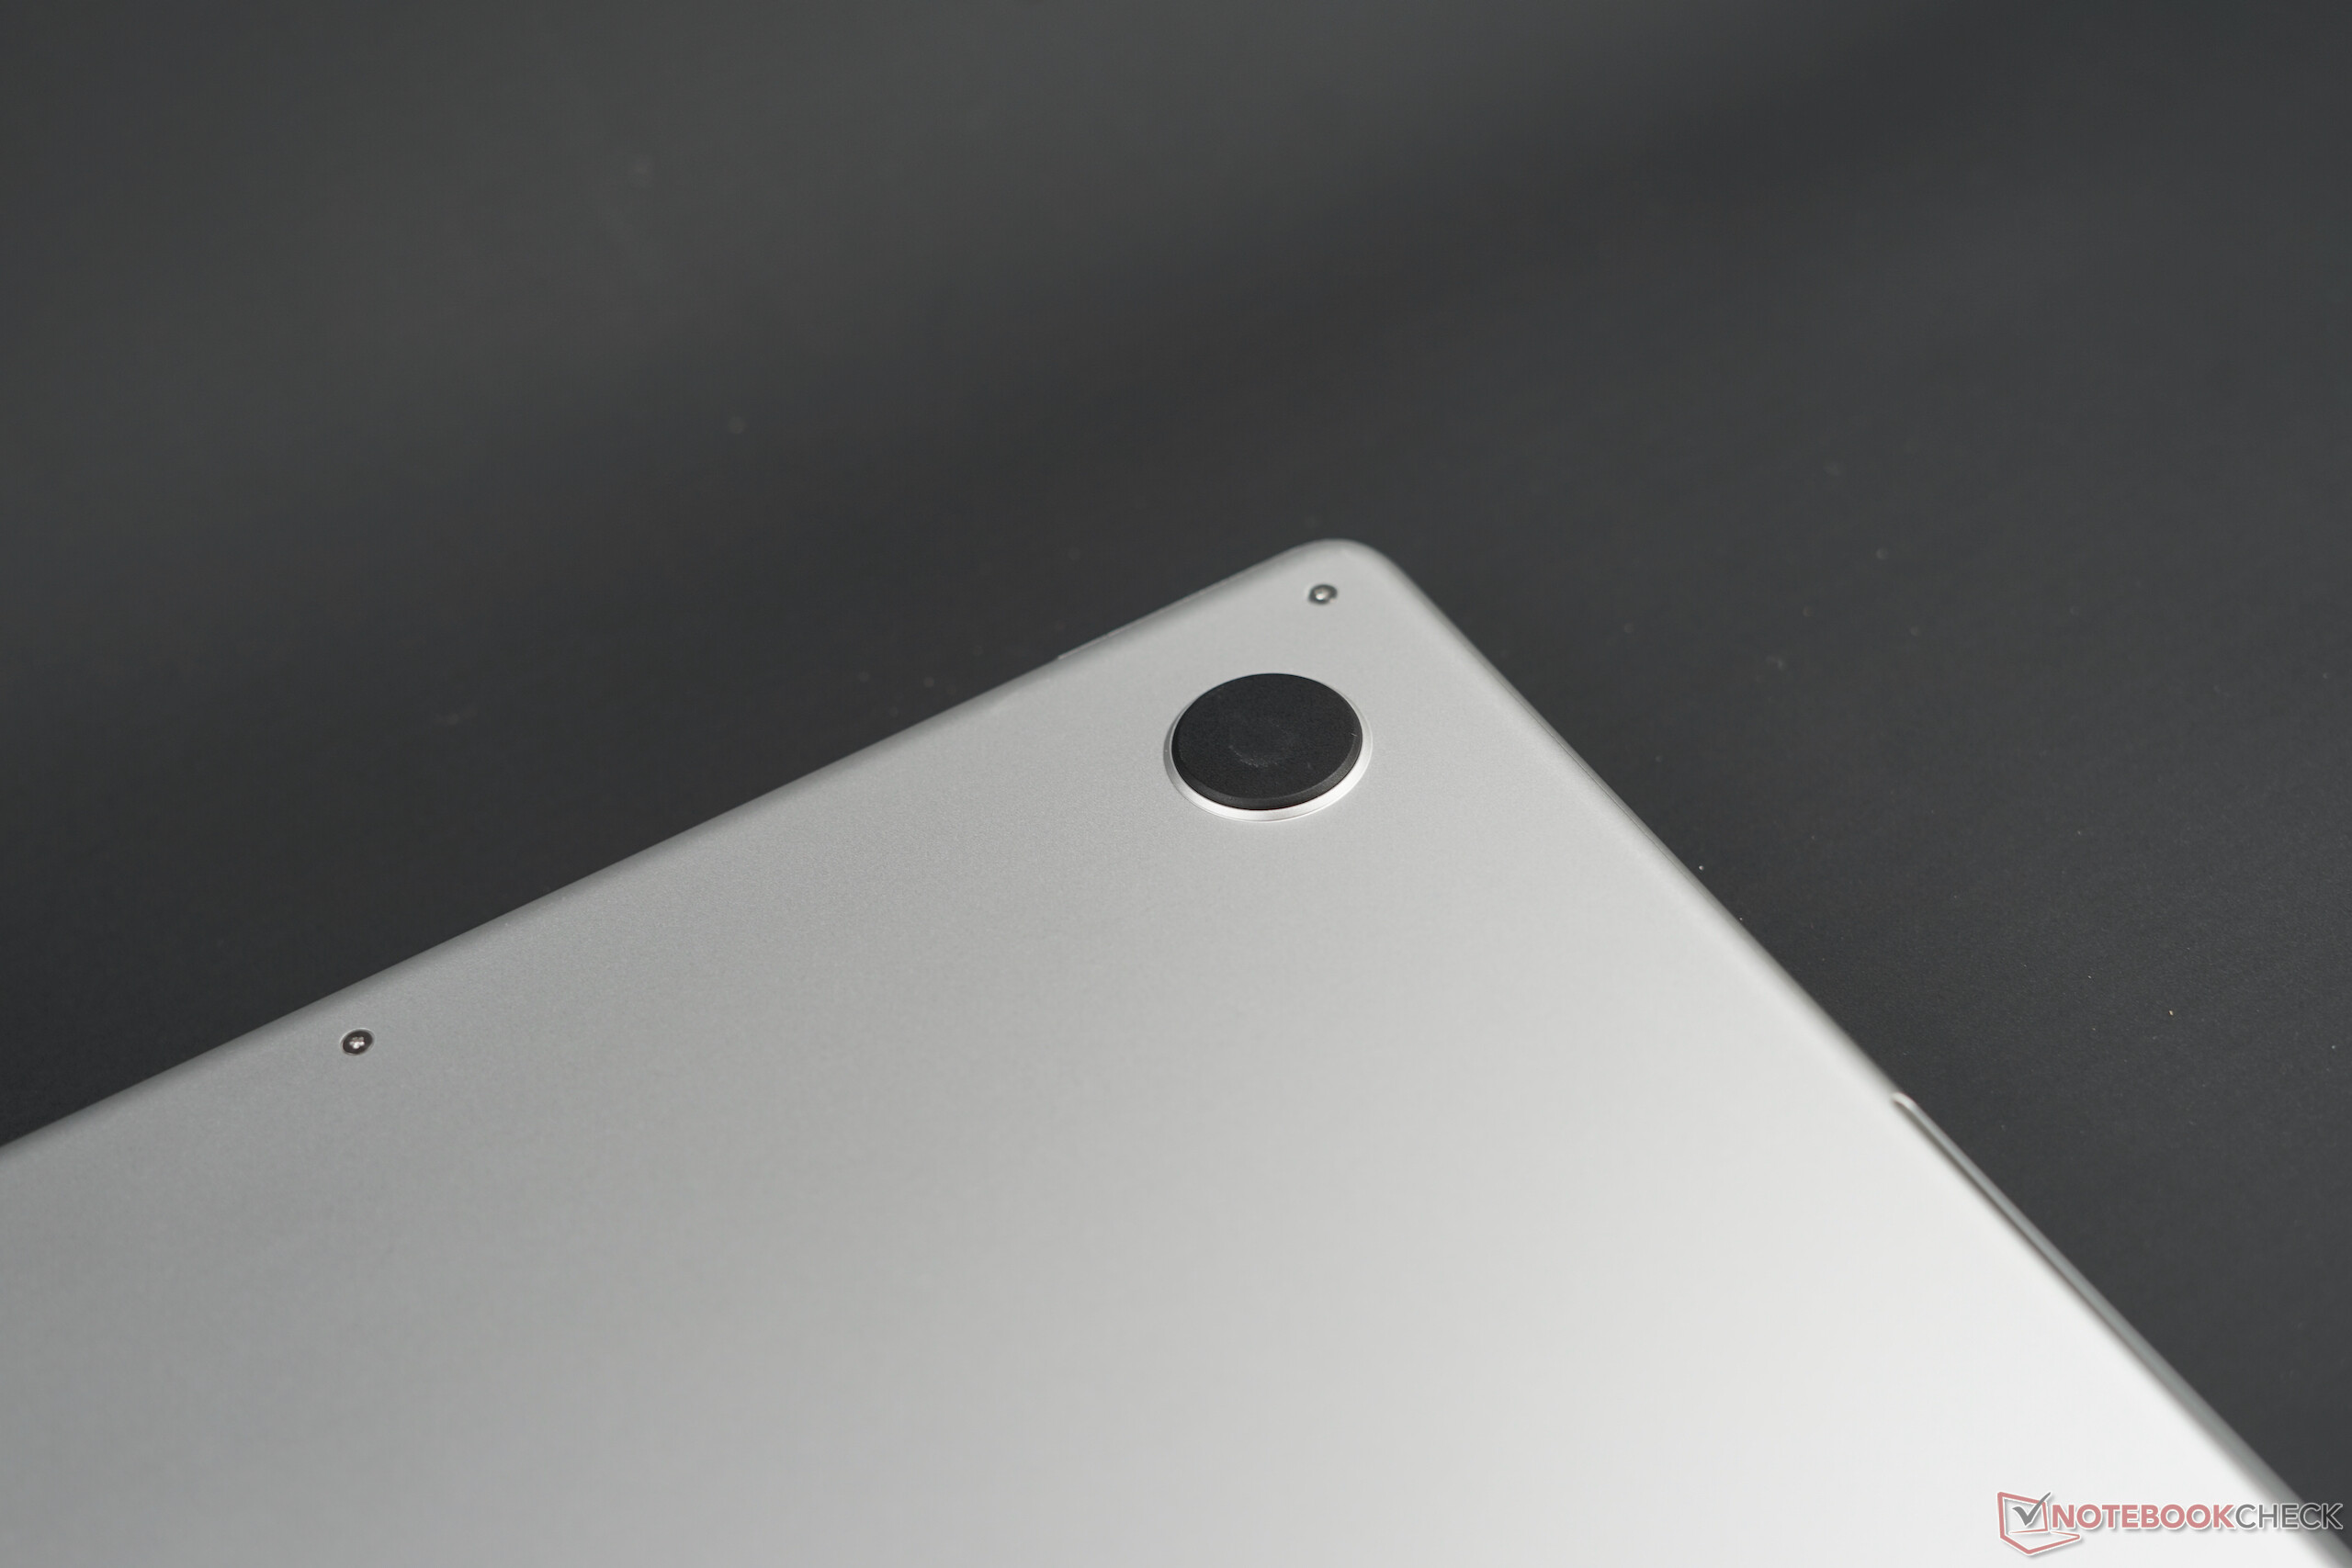
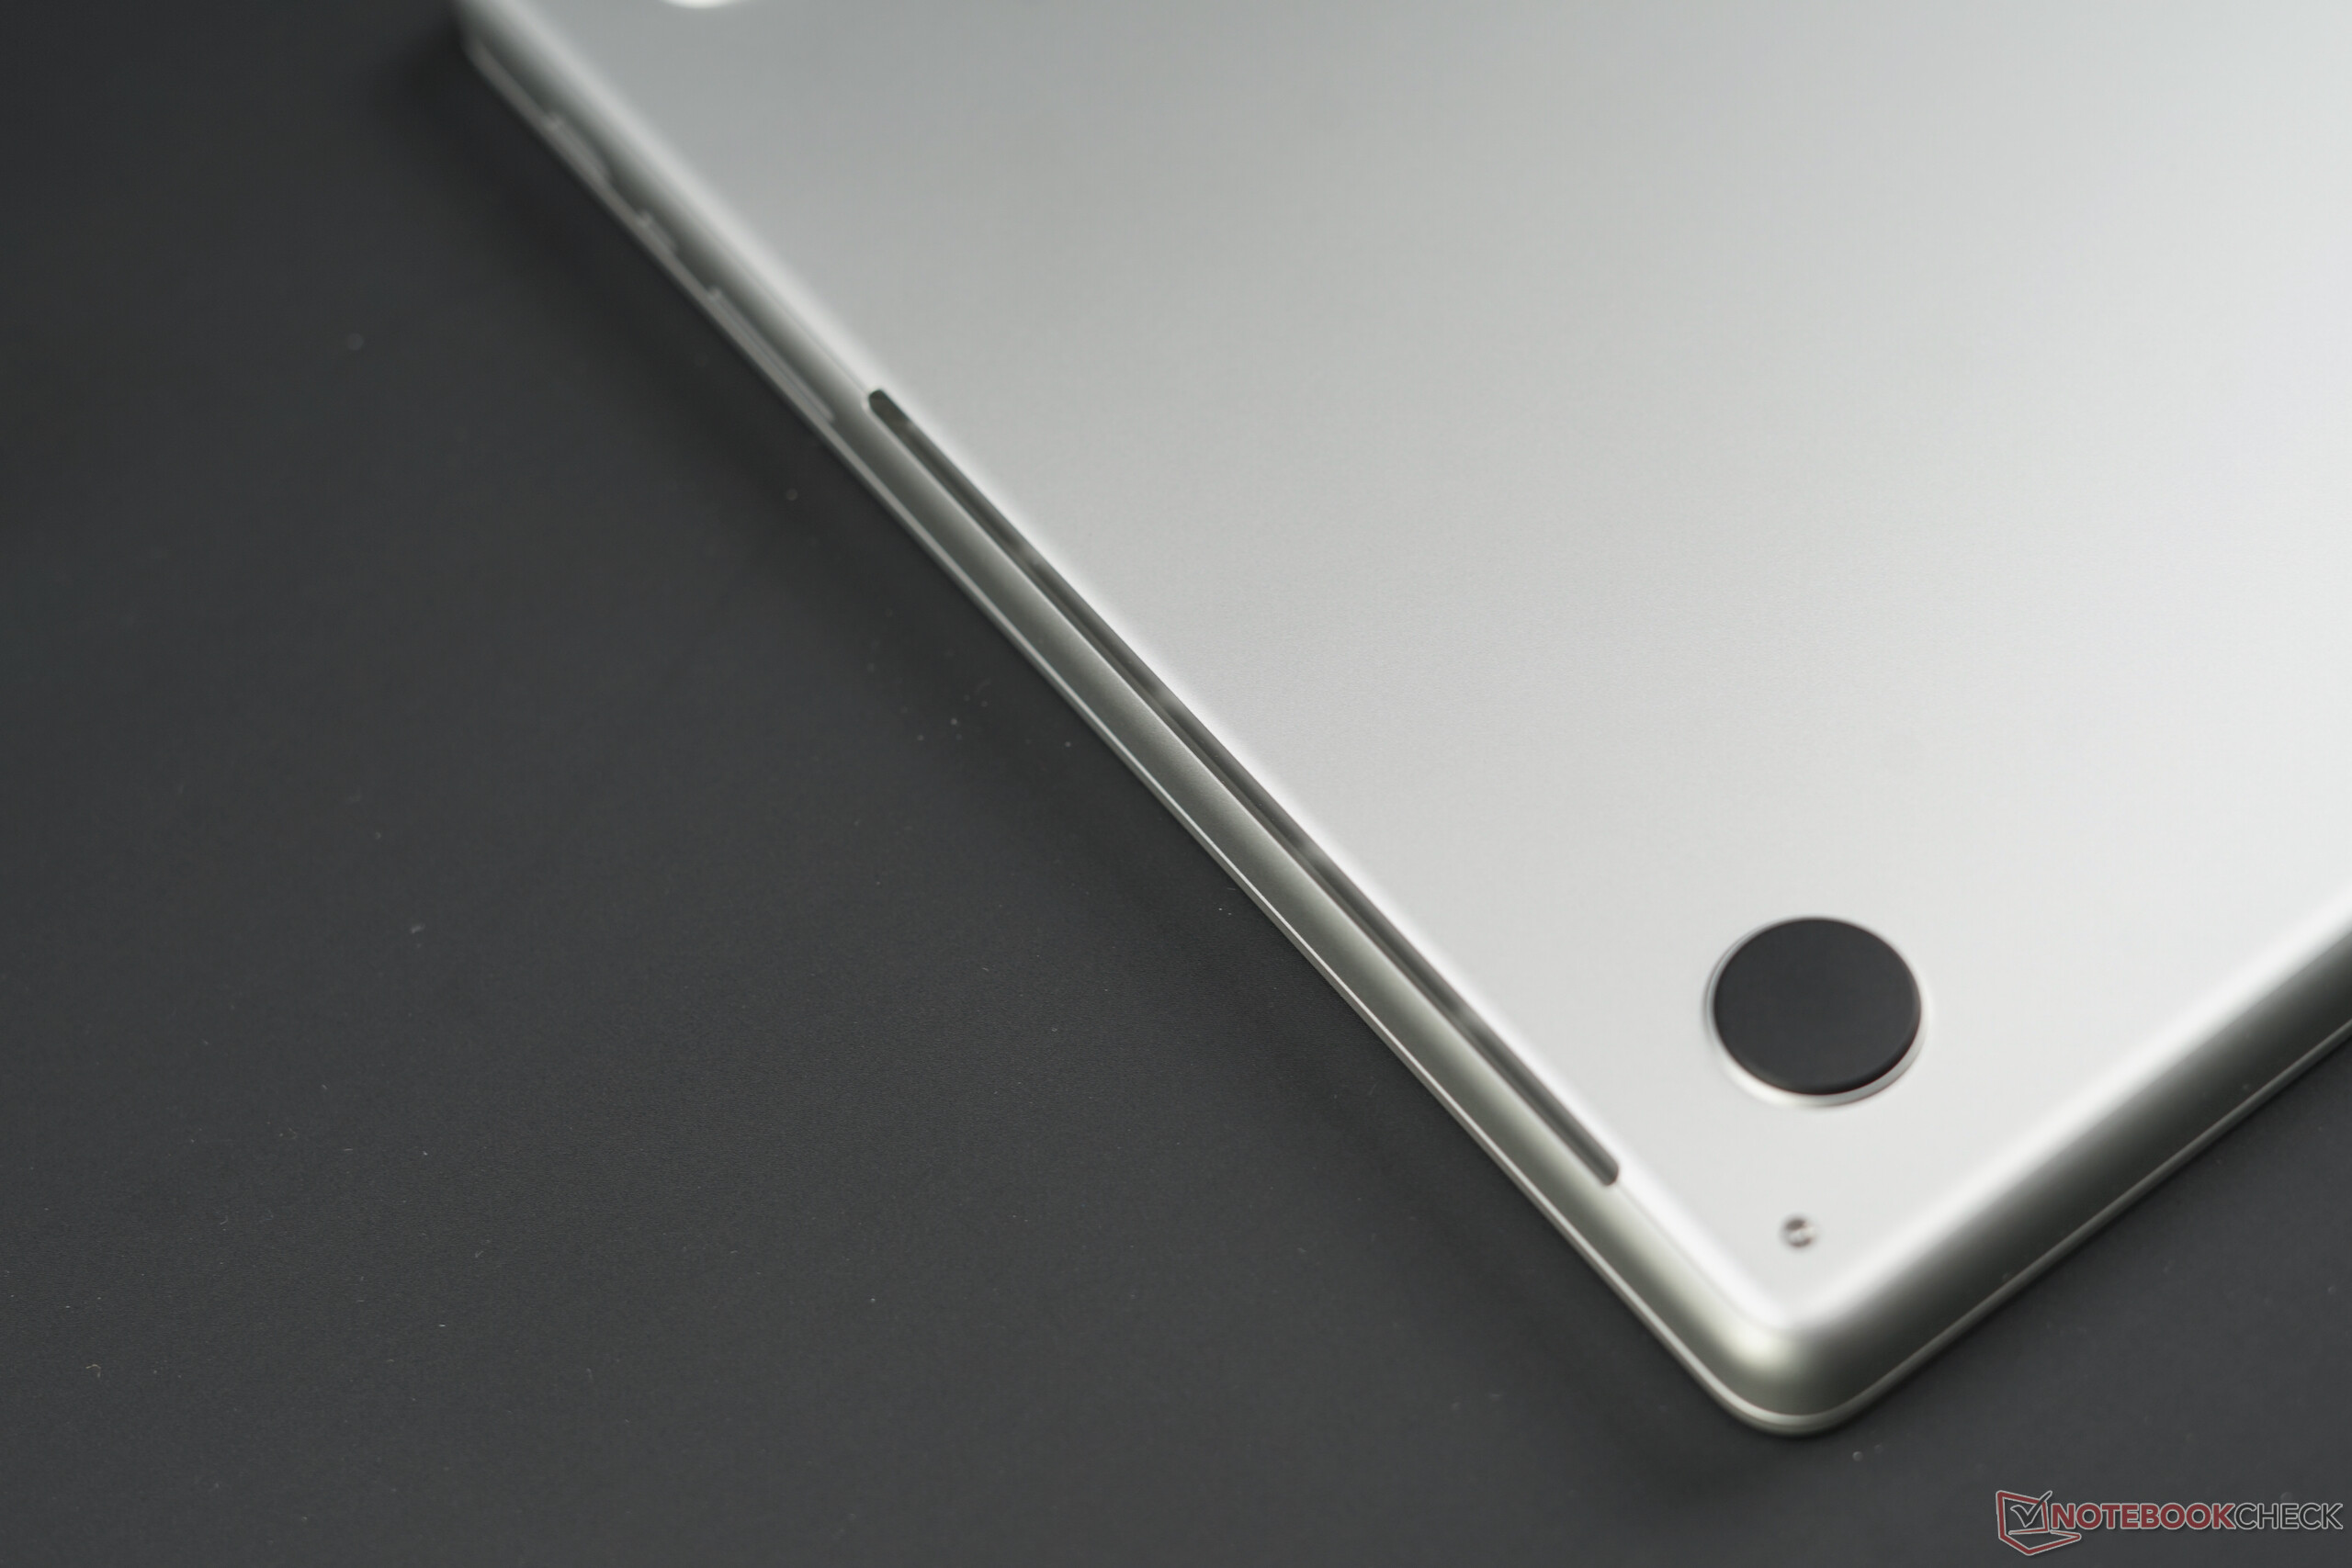
维护
像往常一样,底板是由五角螺丝固定的,相当容易拆卸。你将不得不把盖子推到前面,当你想把它放回去时,这可能是一个棘手的问题。你可以清洁两个风扇,但也就这样了。据我们来自iFixit的同事说,电池现在更容易更换,而且端口也没有焊接。
担保
保修期只有一年。你可以再加两年,费用为399欧元(约457美元)。
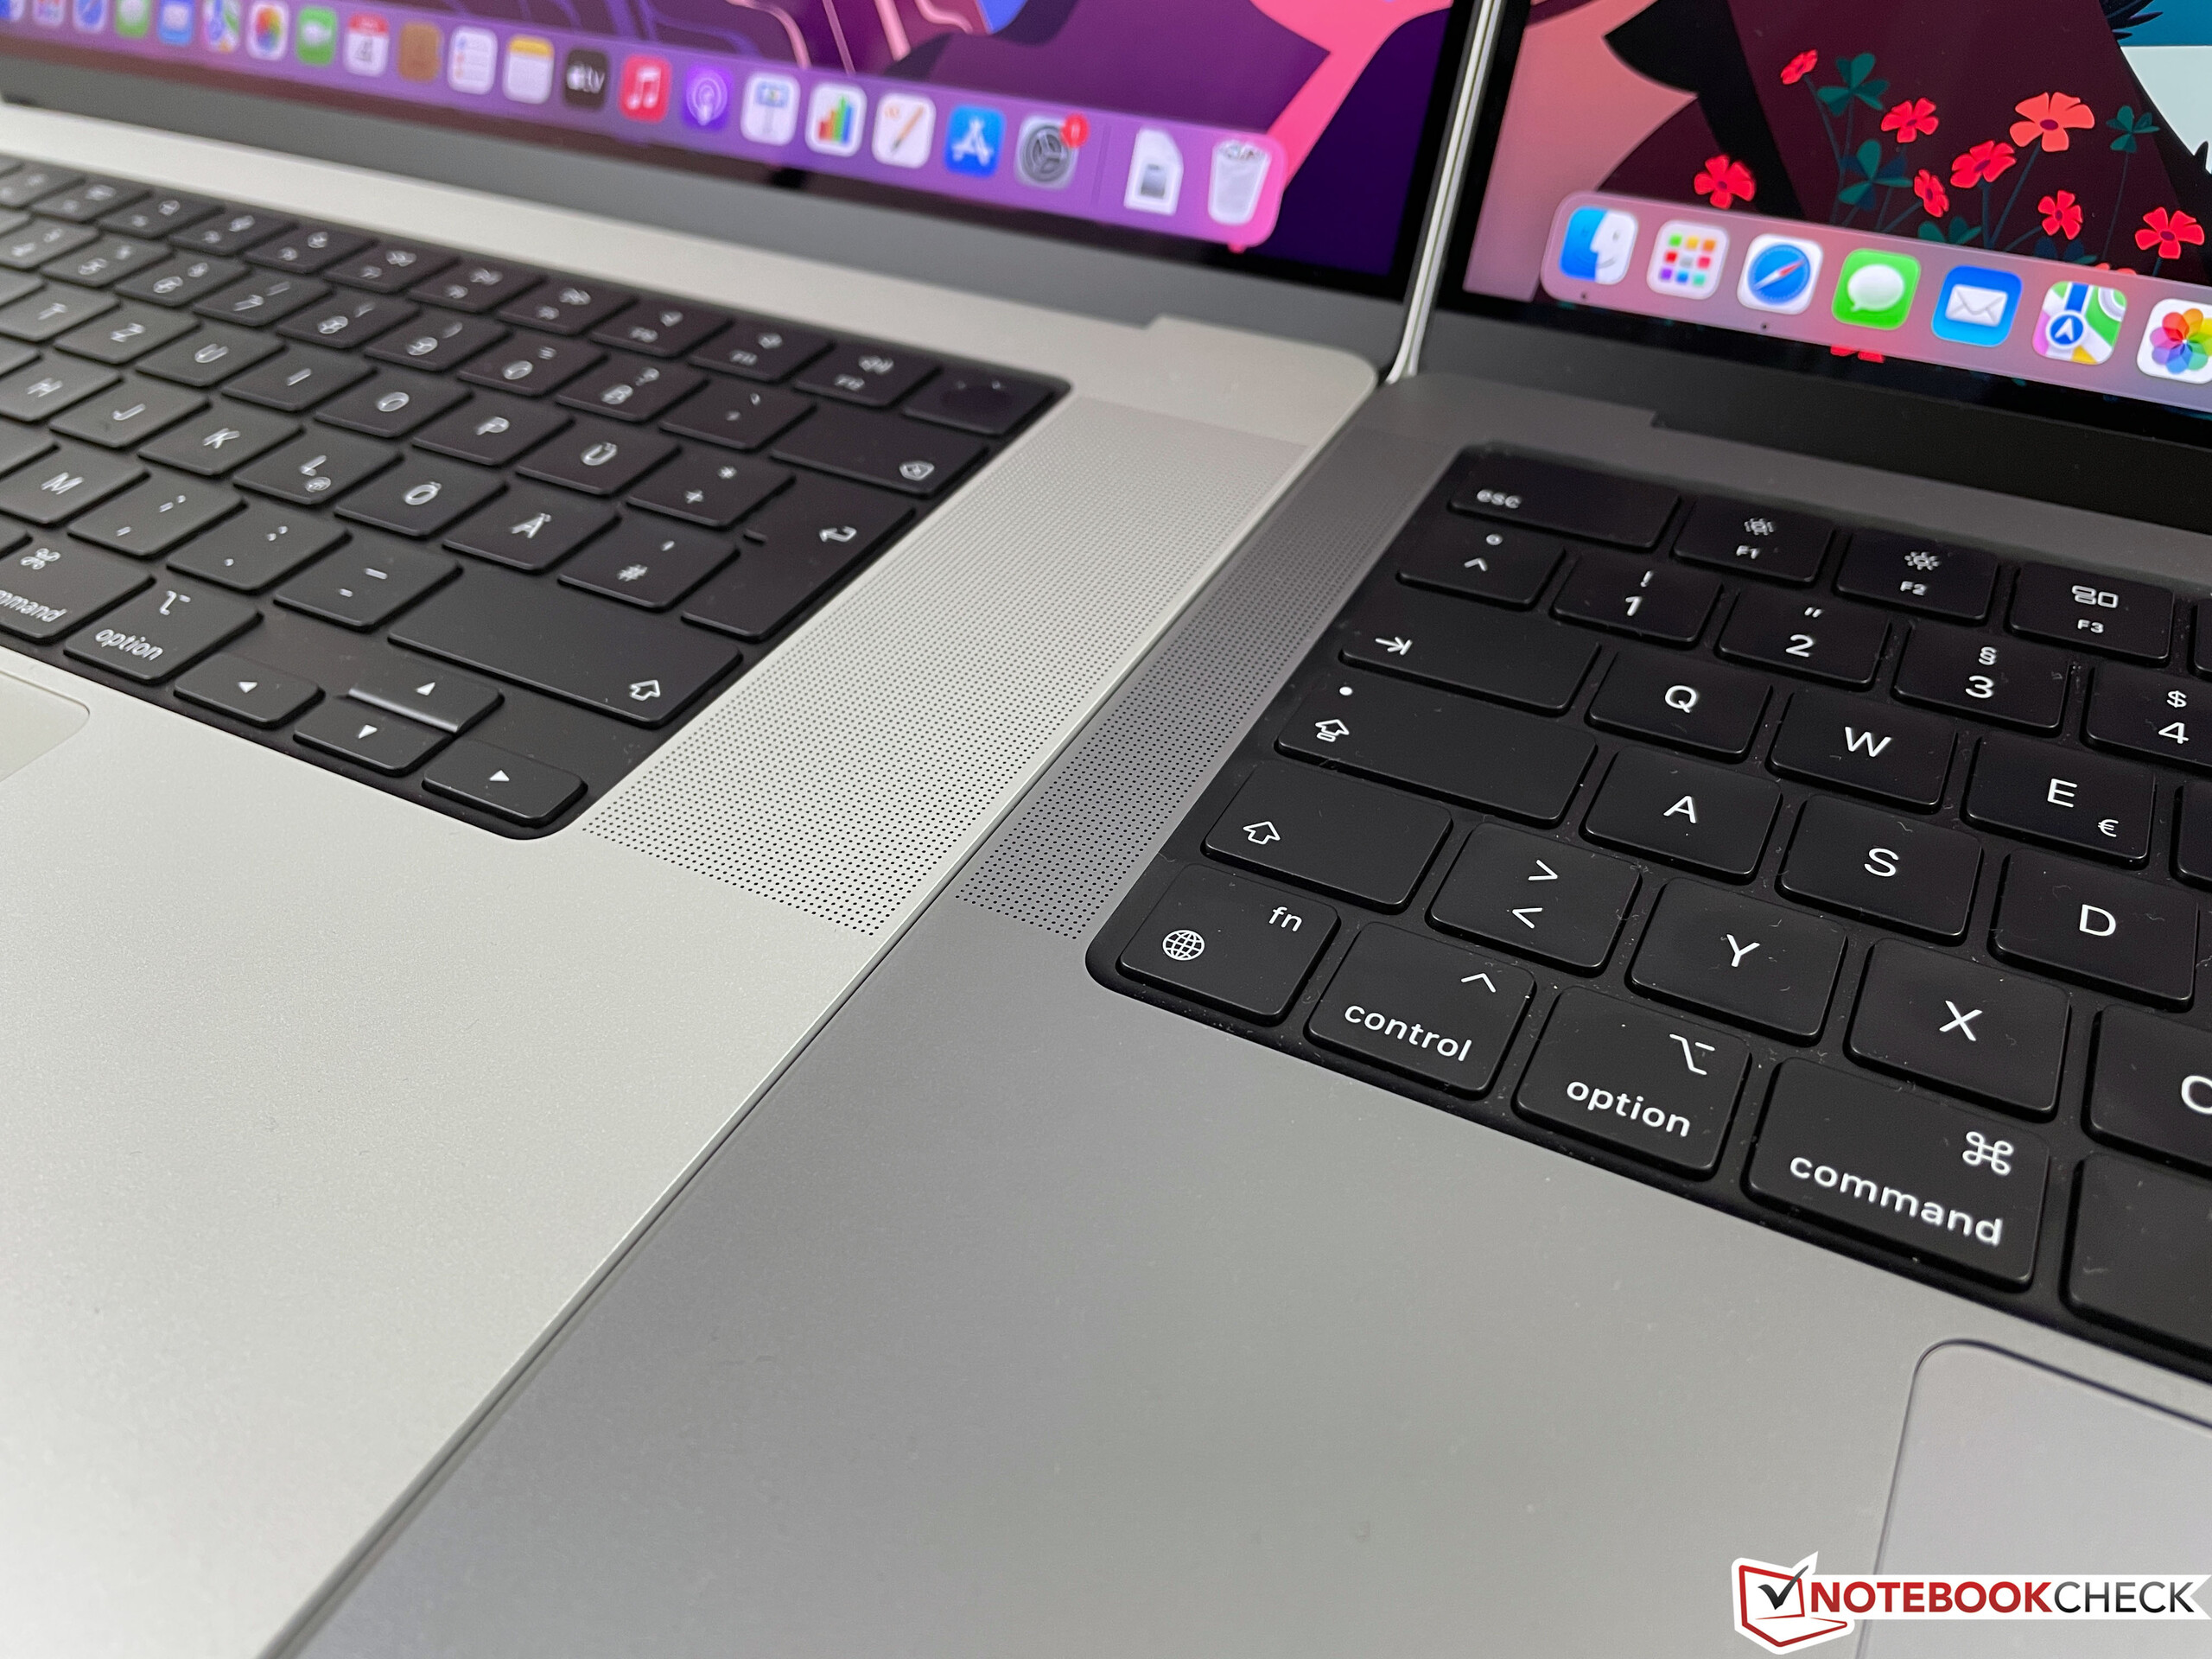
输入设备 - 魔术键盘和触摸识别
键盘
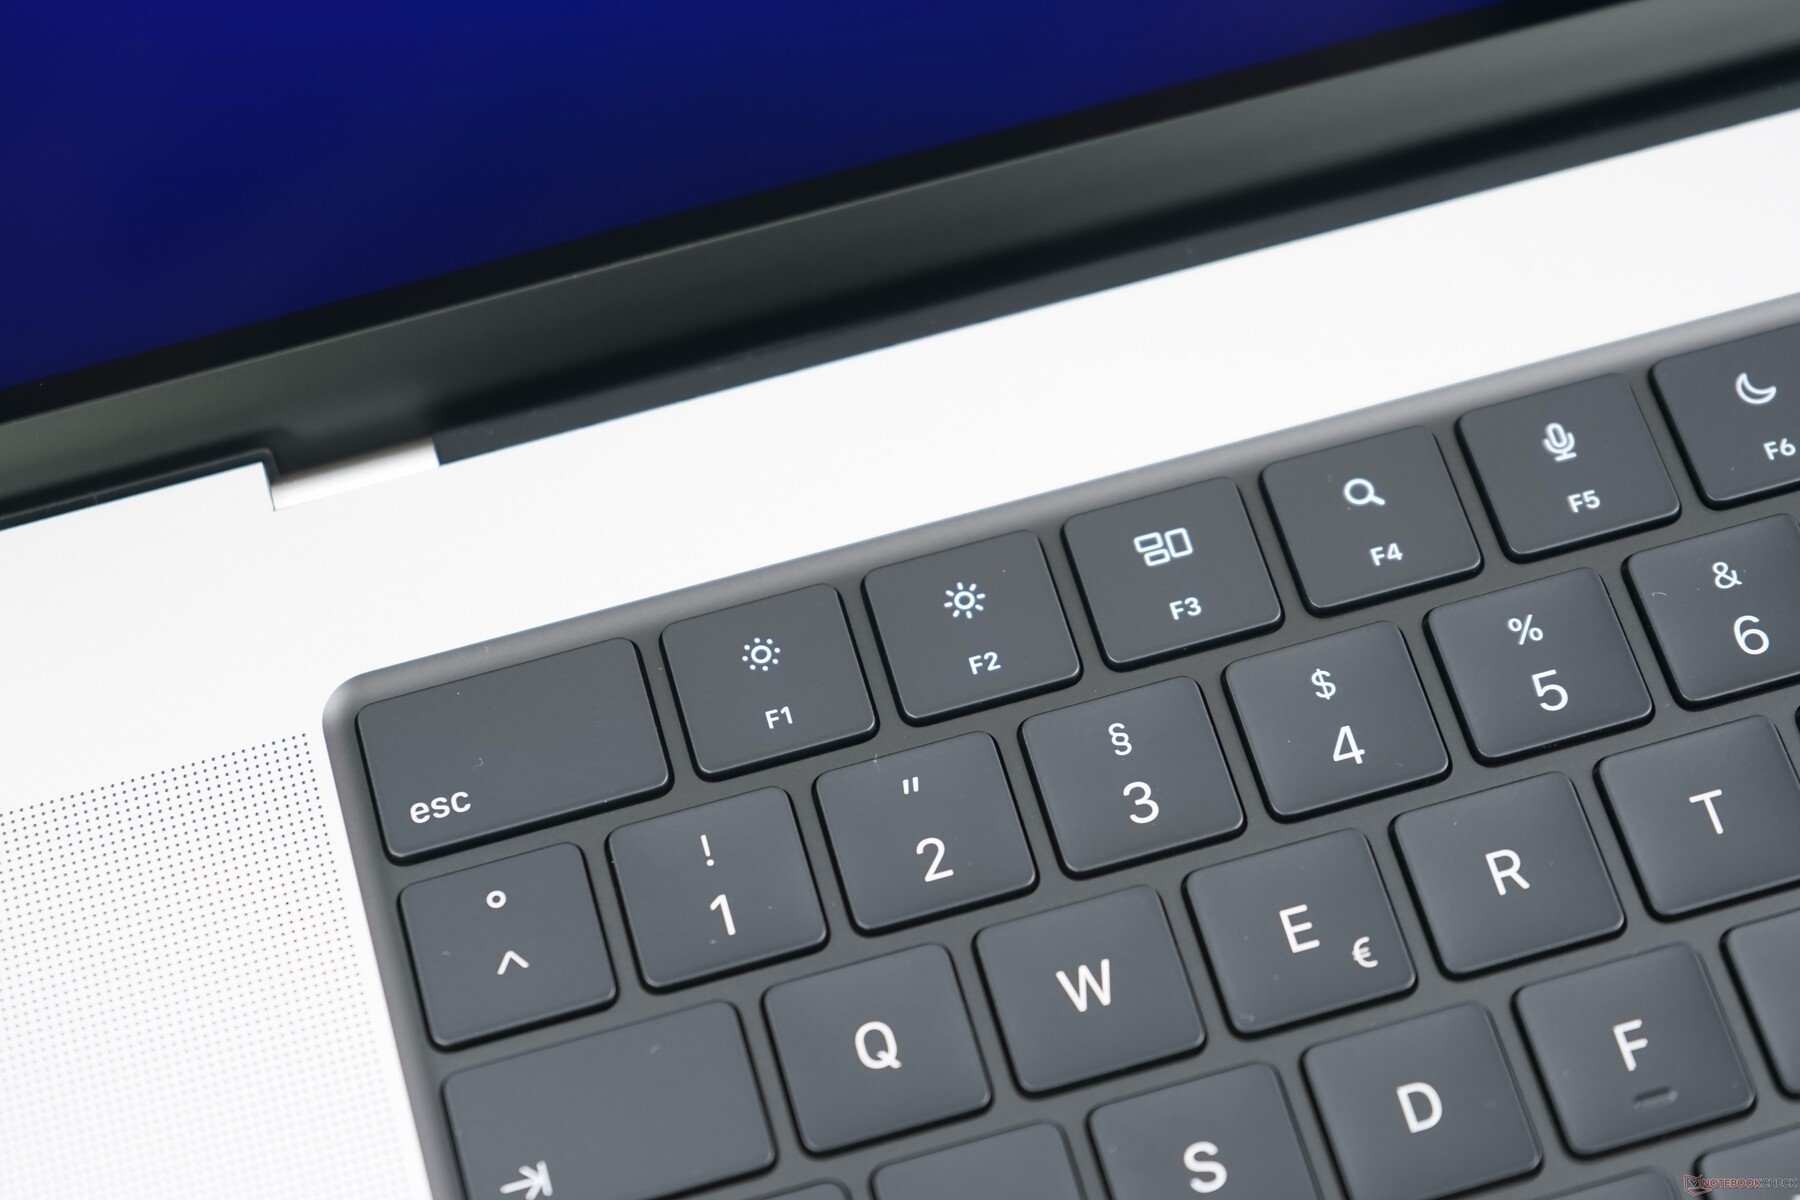
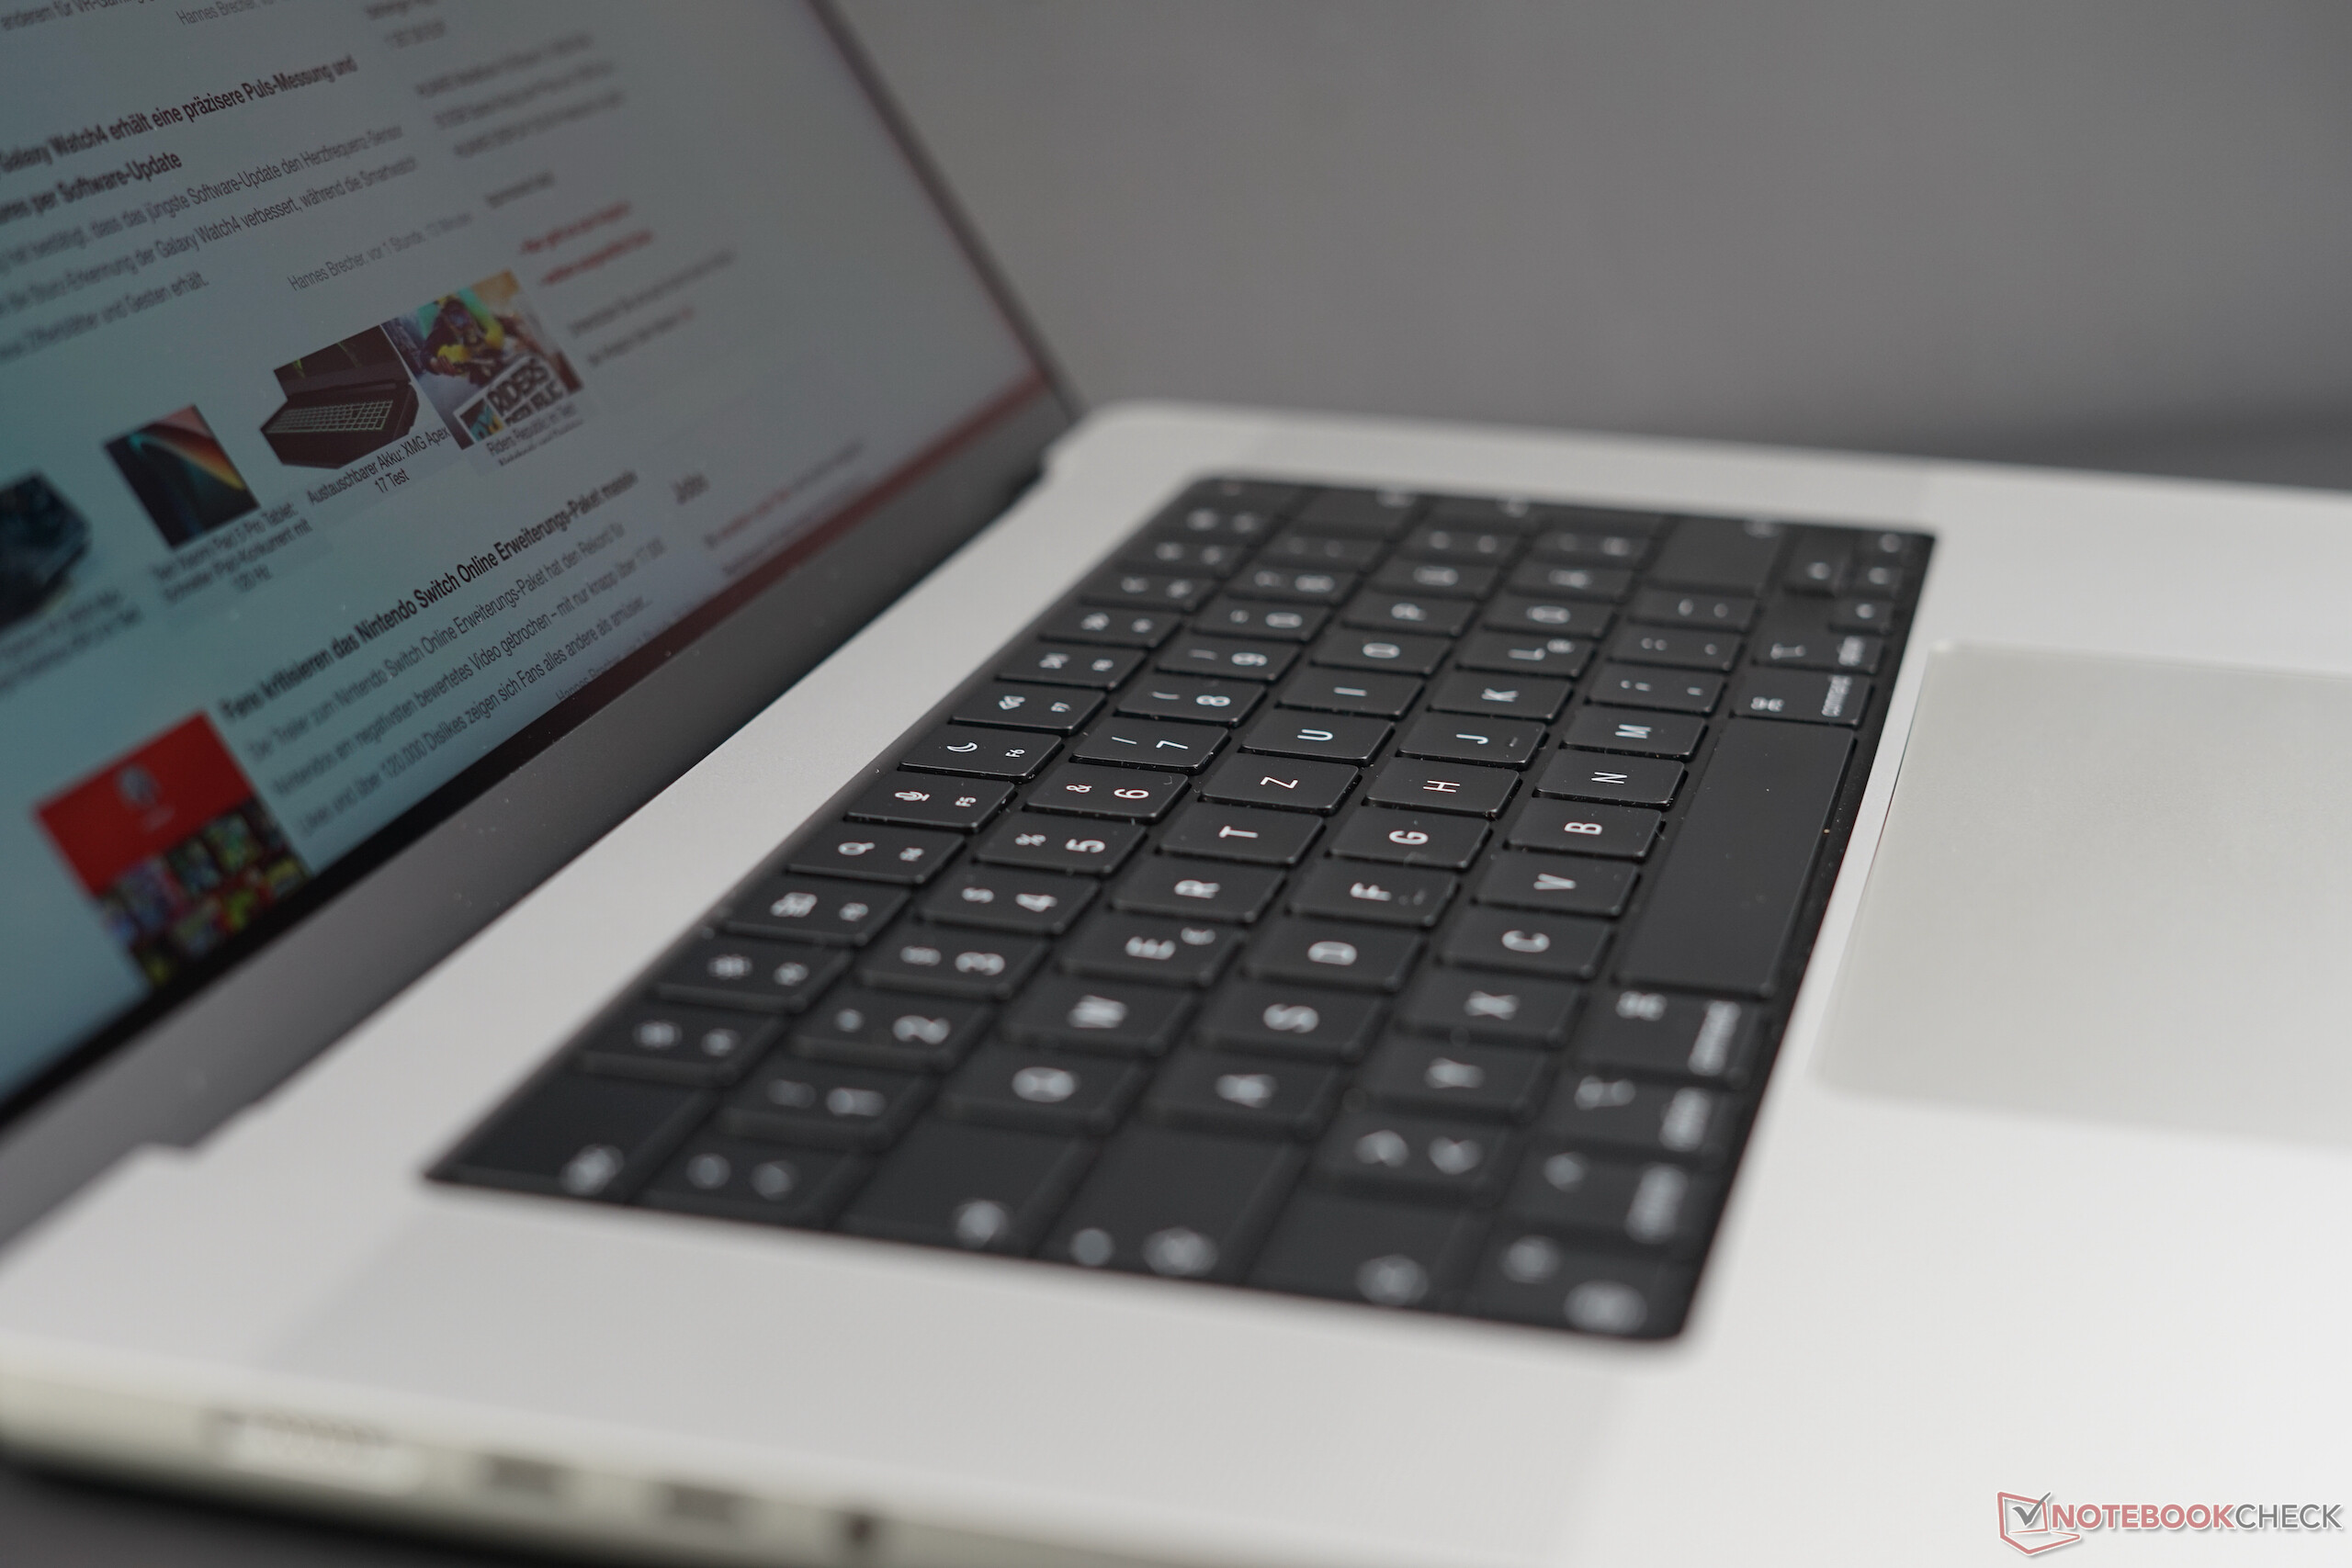
Apple ,保留了其熟悉的标准剪刀键的键盘,新键盘的打字体验与旧键盘几乎没有区别。MBP 16.敲击键盘的声音只是稍微有点闷。该键盘也用于其他MacBook机型,仍然以非常精确和均匀的反馈而令人信服,但考虑到更厚的基础单元,我们希望看到更多的键程。这也是一个品味问题,你可以非常迅速和舒适地打字,但在这个价格段有更好和更舒适的键盘的设备。
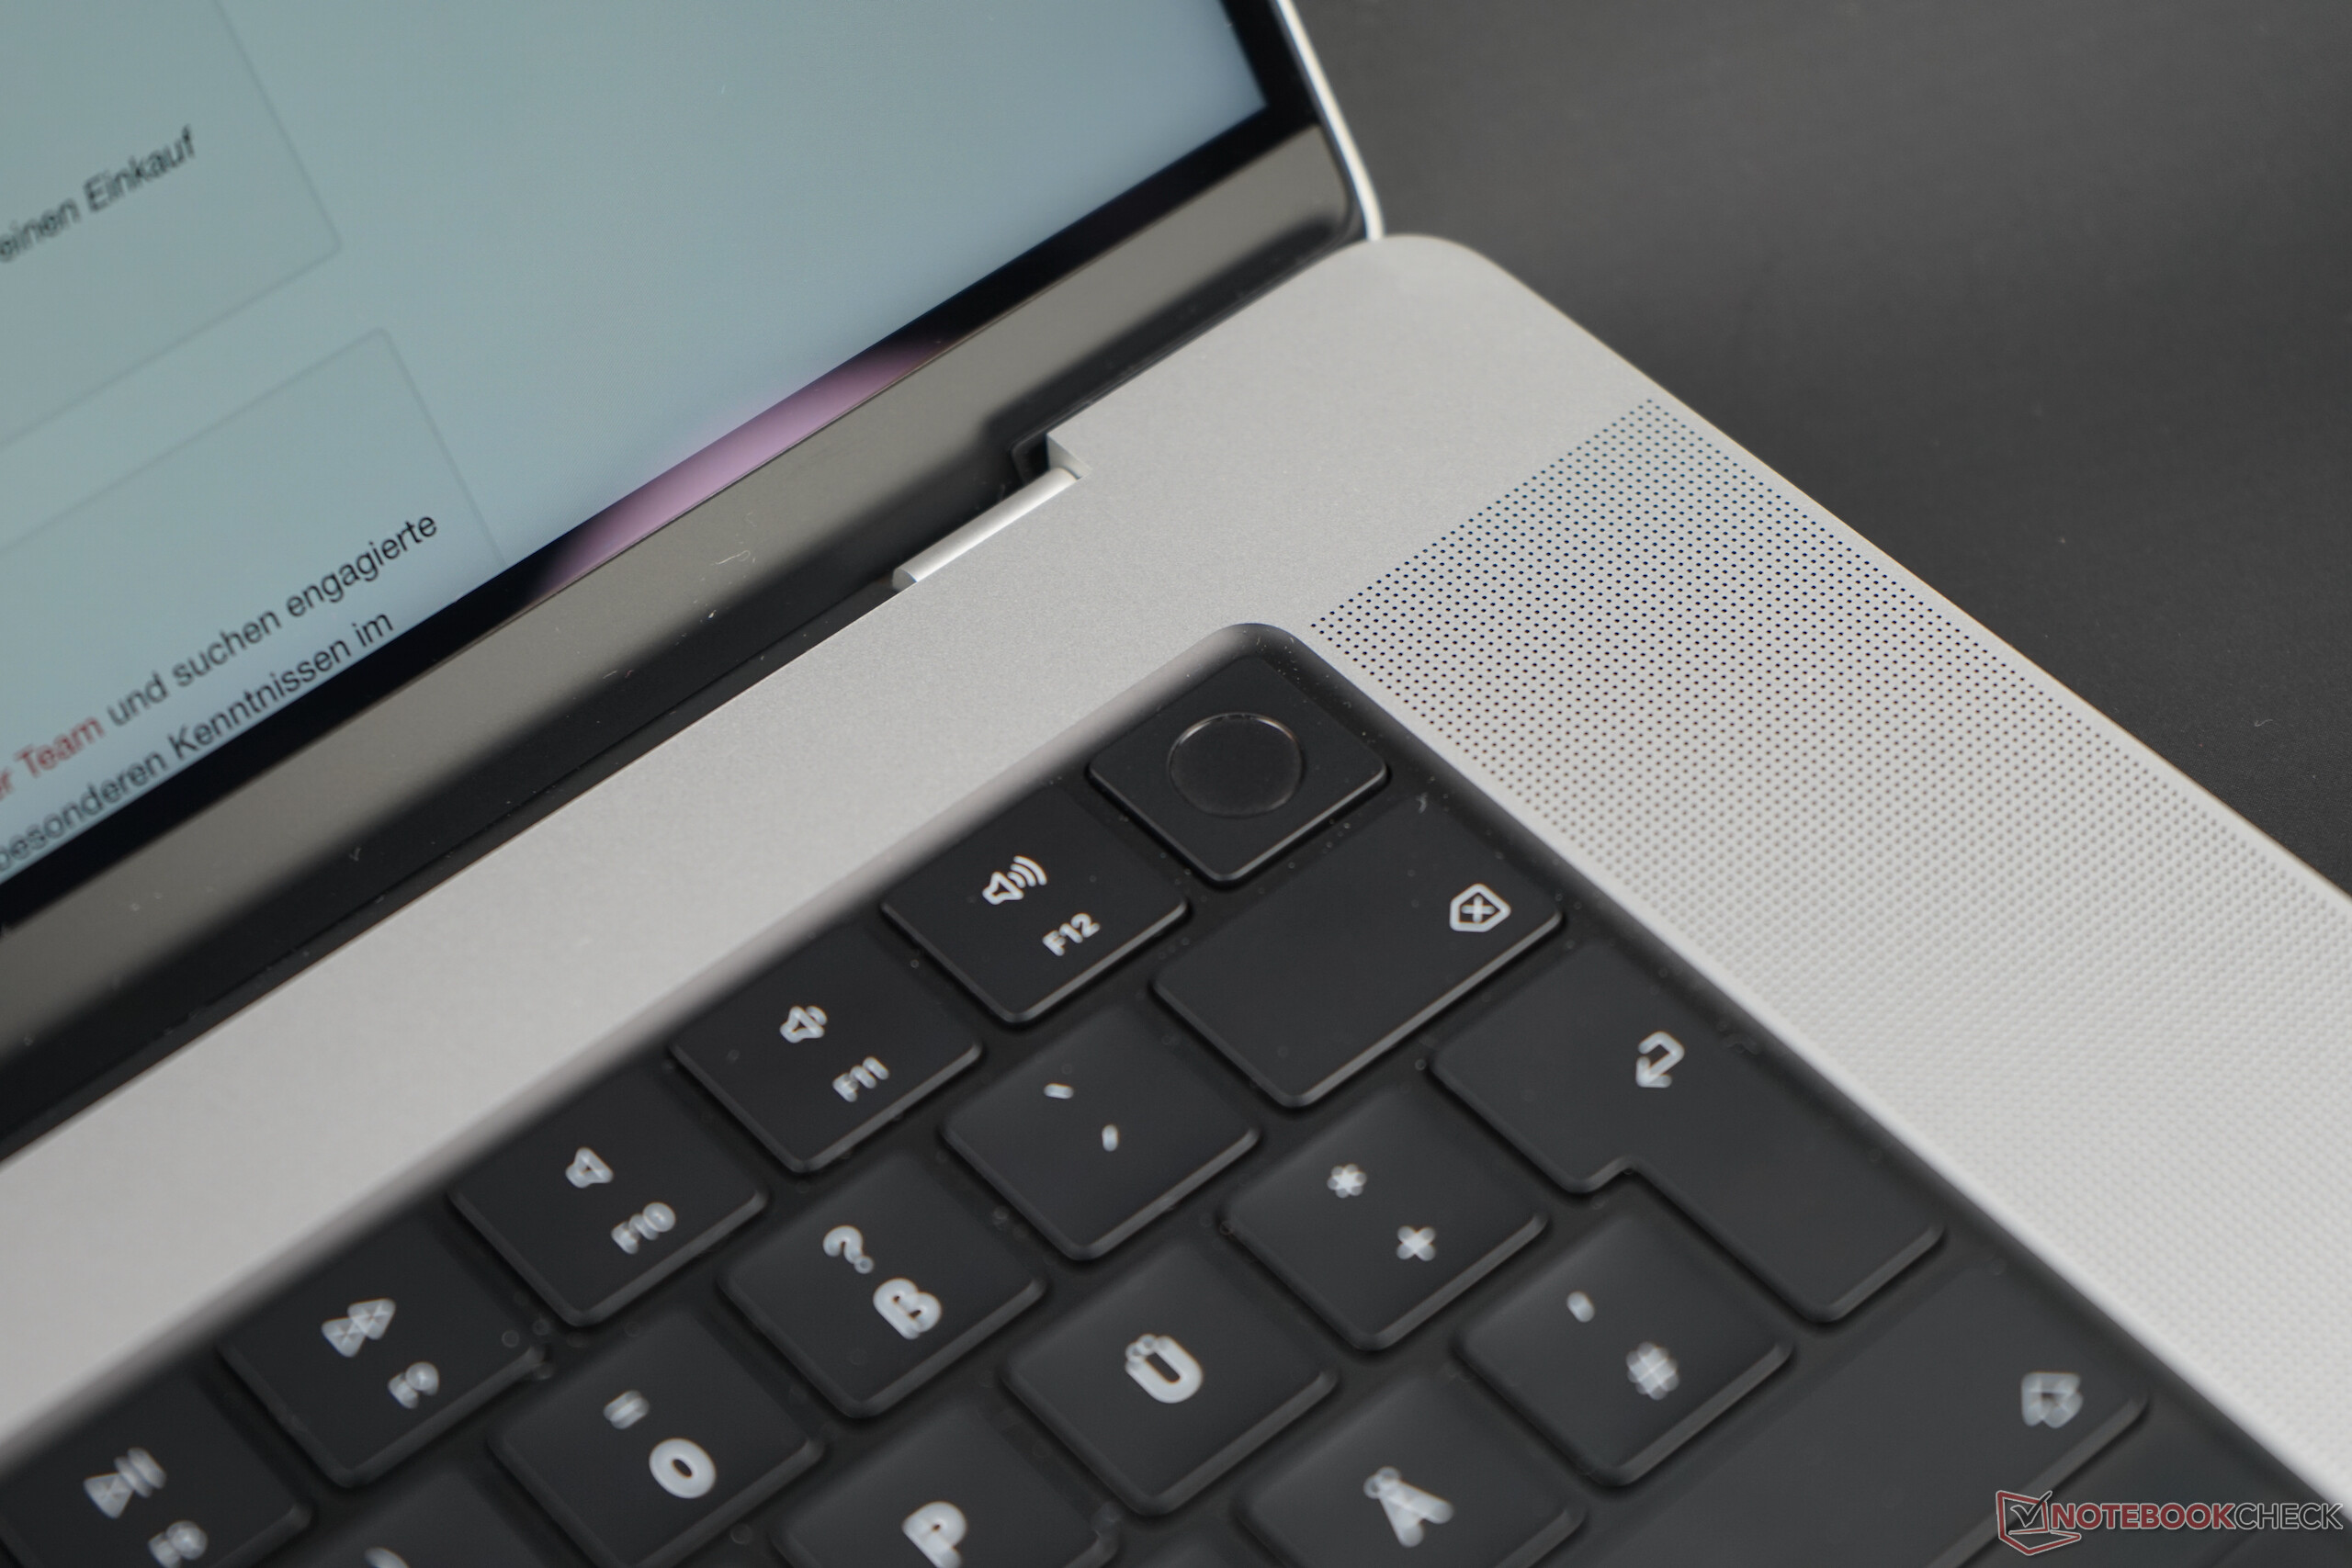
制造商现在使用黑色作为按键之间的空间,这在以前的版本中曾经是机箱的颜色。旧型号的Touch Bar也被标准功能键所取代,与目前的MacBook Air相反,它的垂直高度与所有其他按键相同。Apple ,在键盘照明方面肯定仍然领先于竞争对手,它可以自动激活/停用,强度可以按非常精细的步骤调整。大多数竞争对手只提供两到三个亮度级别,而且往往没有传感器。
Touch-ID指纹扫描仪位于右上角的电源按钮内,一个环形物突出了它,但这只是一个视觉噱头。
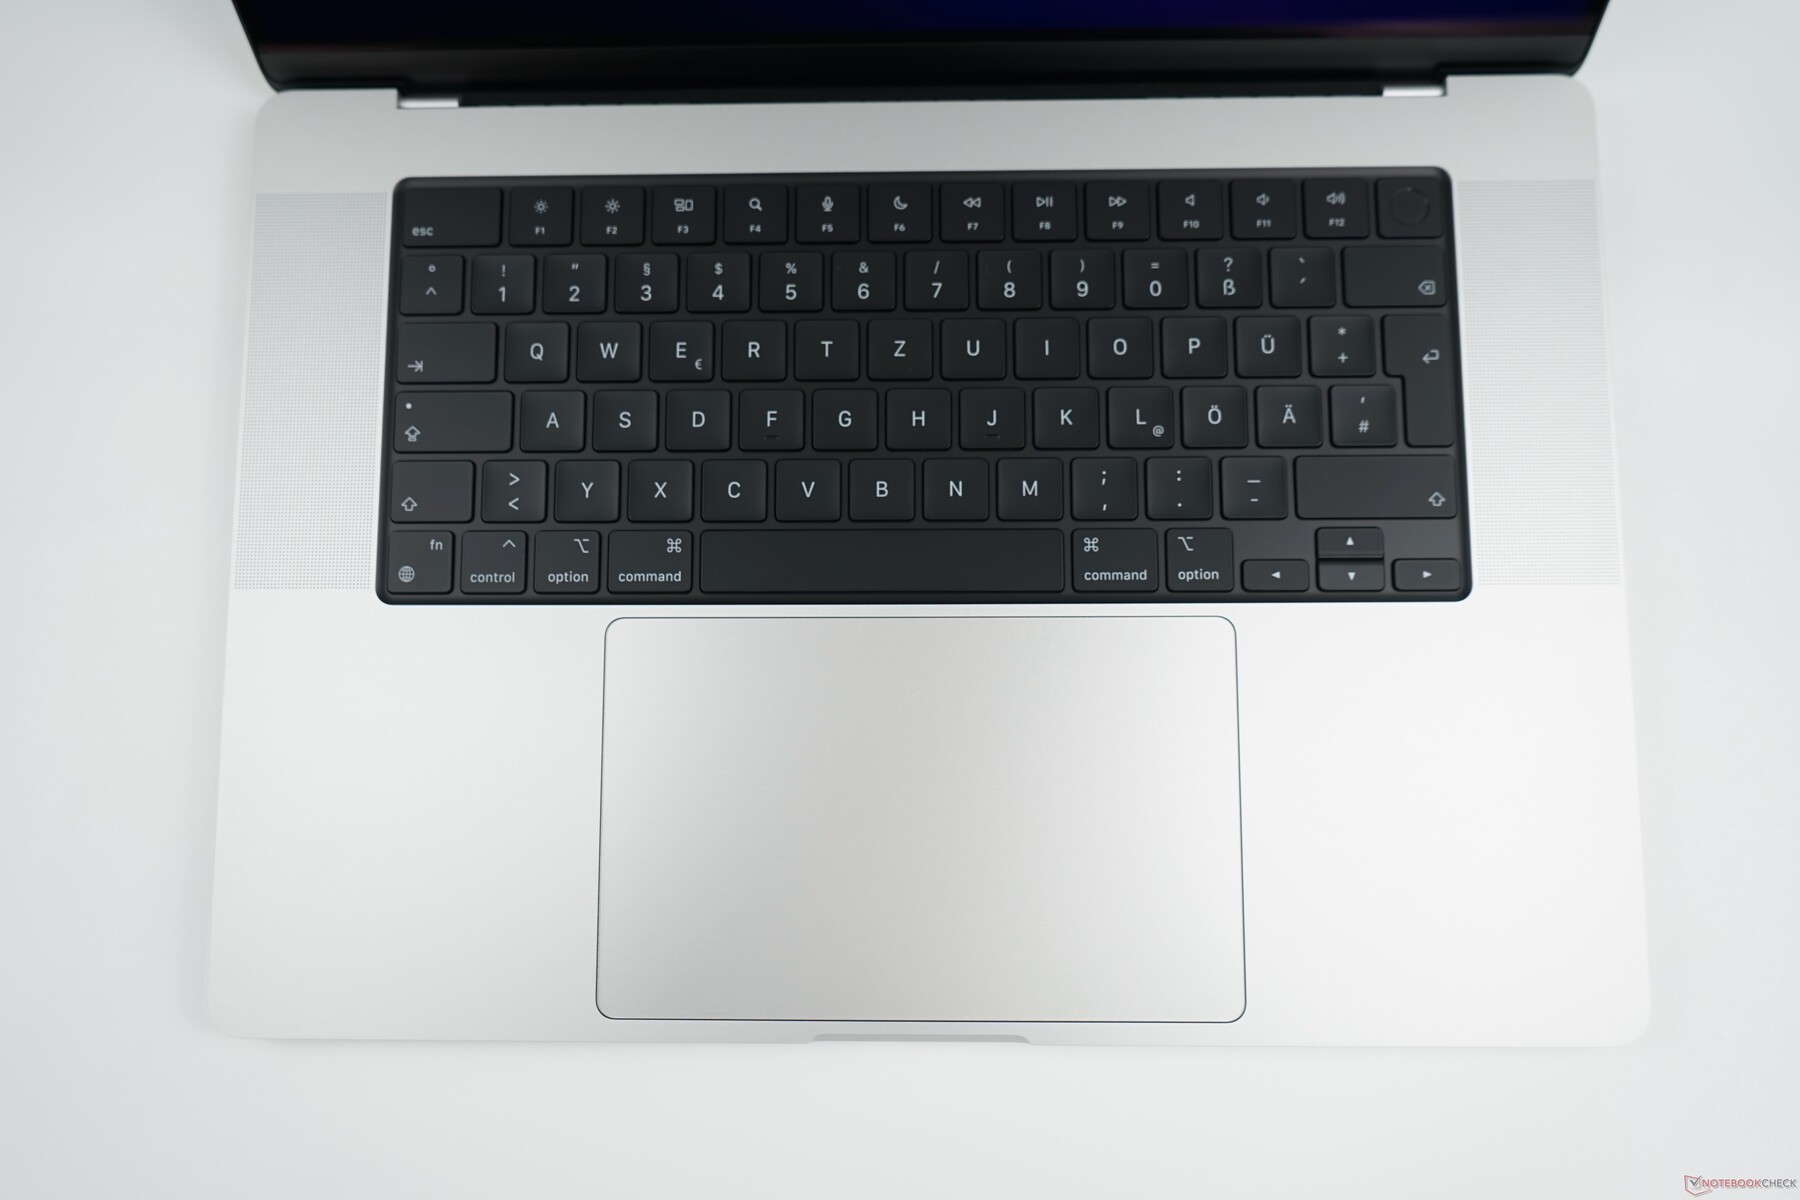
触摸板
Apple 也仍然是TrackPad方面的基准,因为光标控制(包括手势)与操作系统的结合是完美无缺的。滑行能力非常好,而且有很多选项可以配置(比如用三个手指移动窗口)。
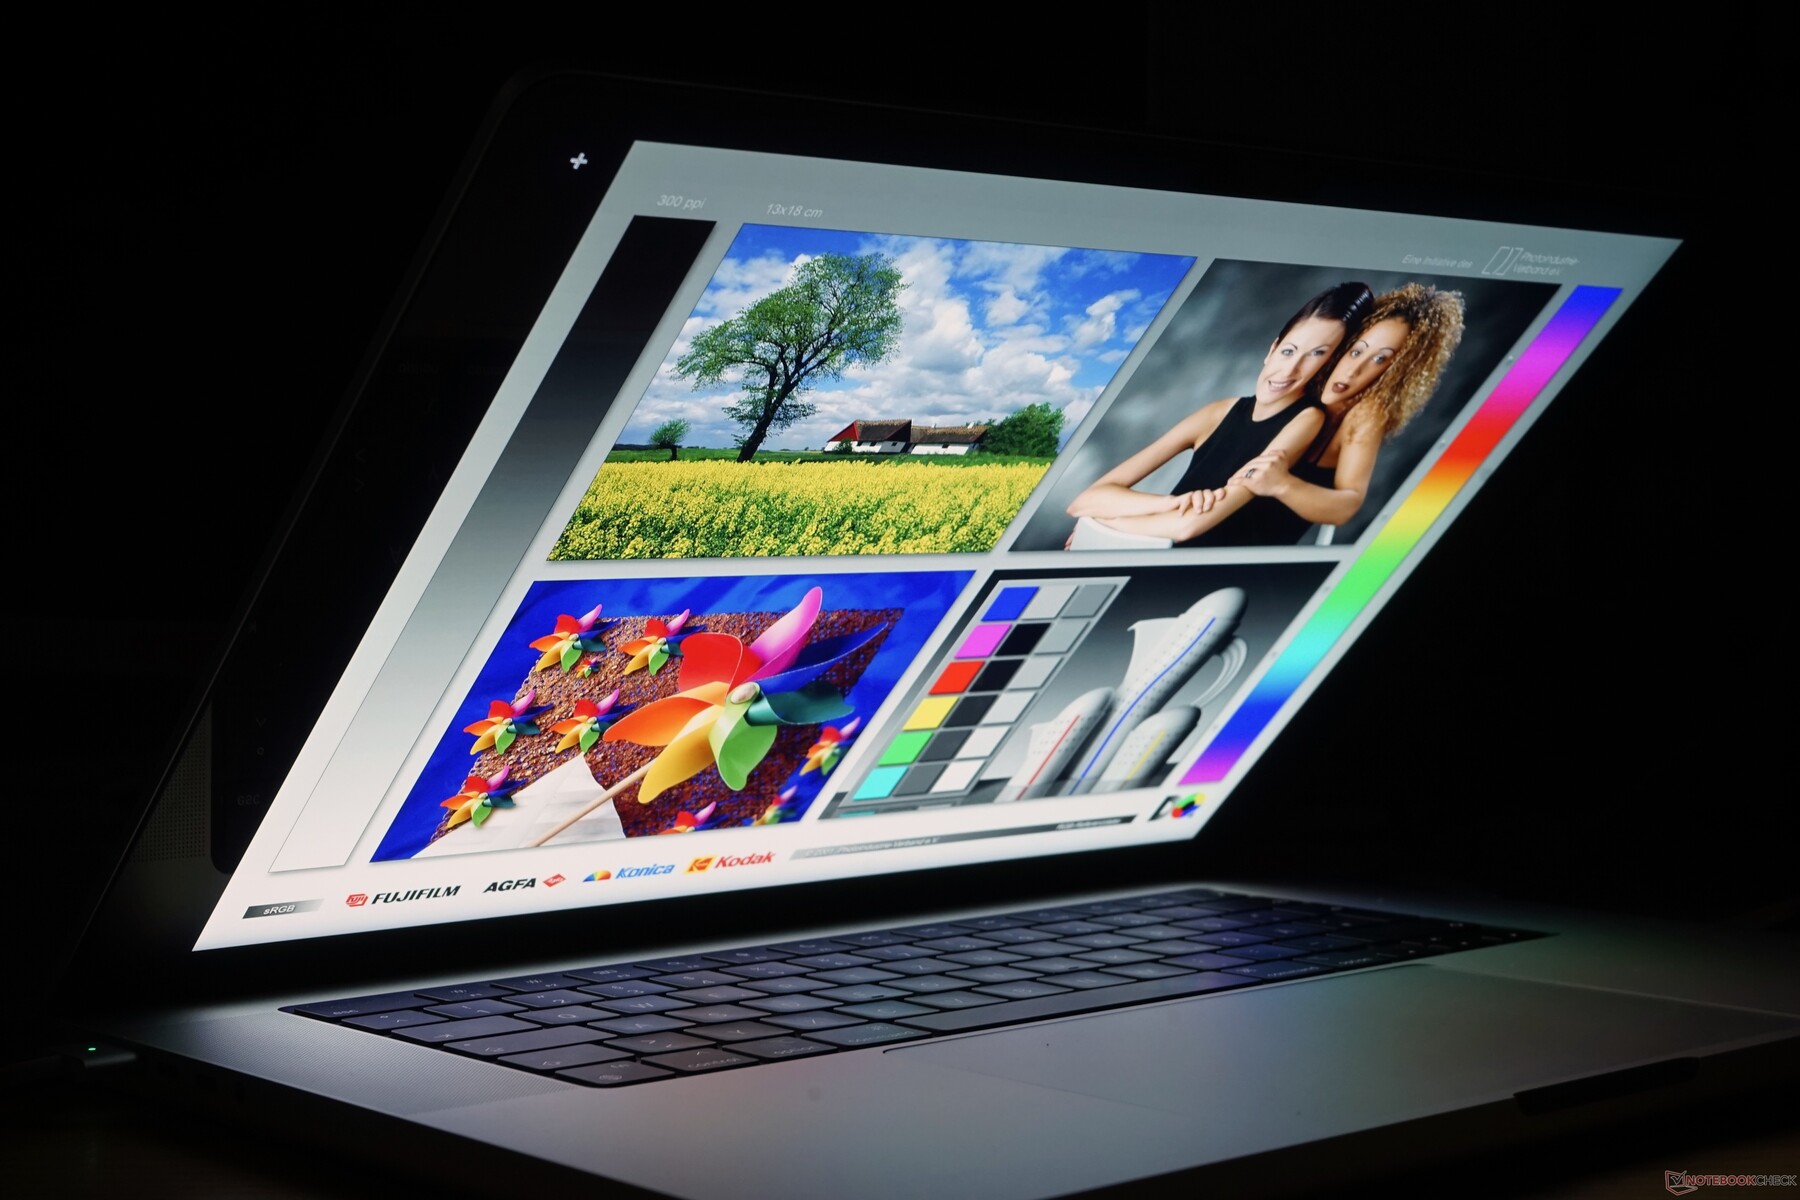
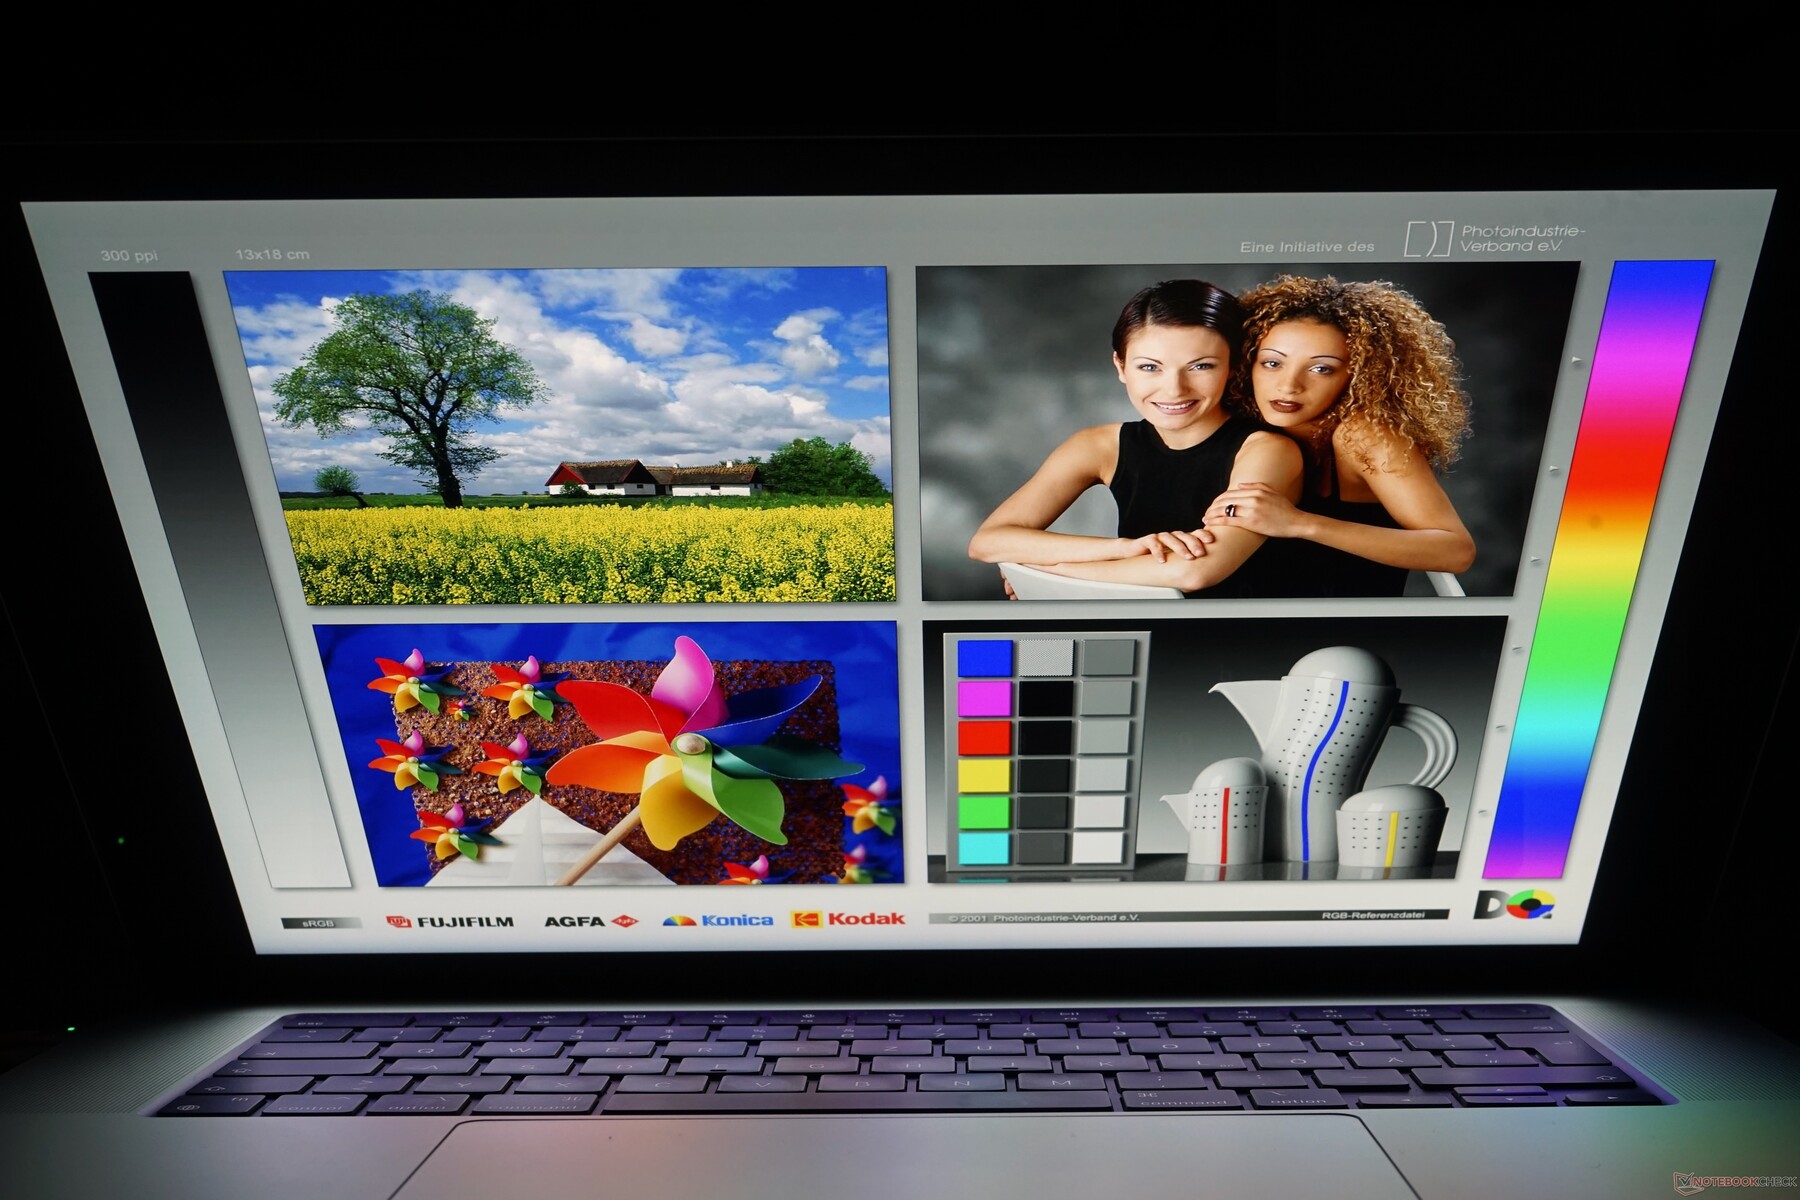
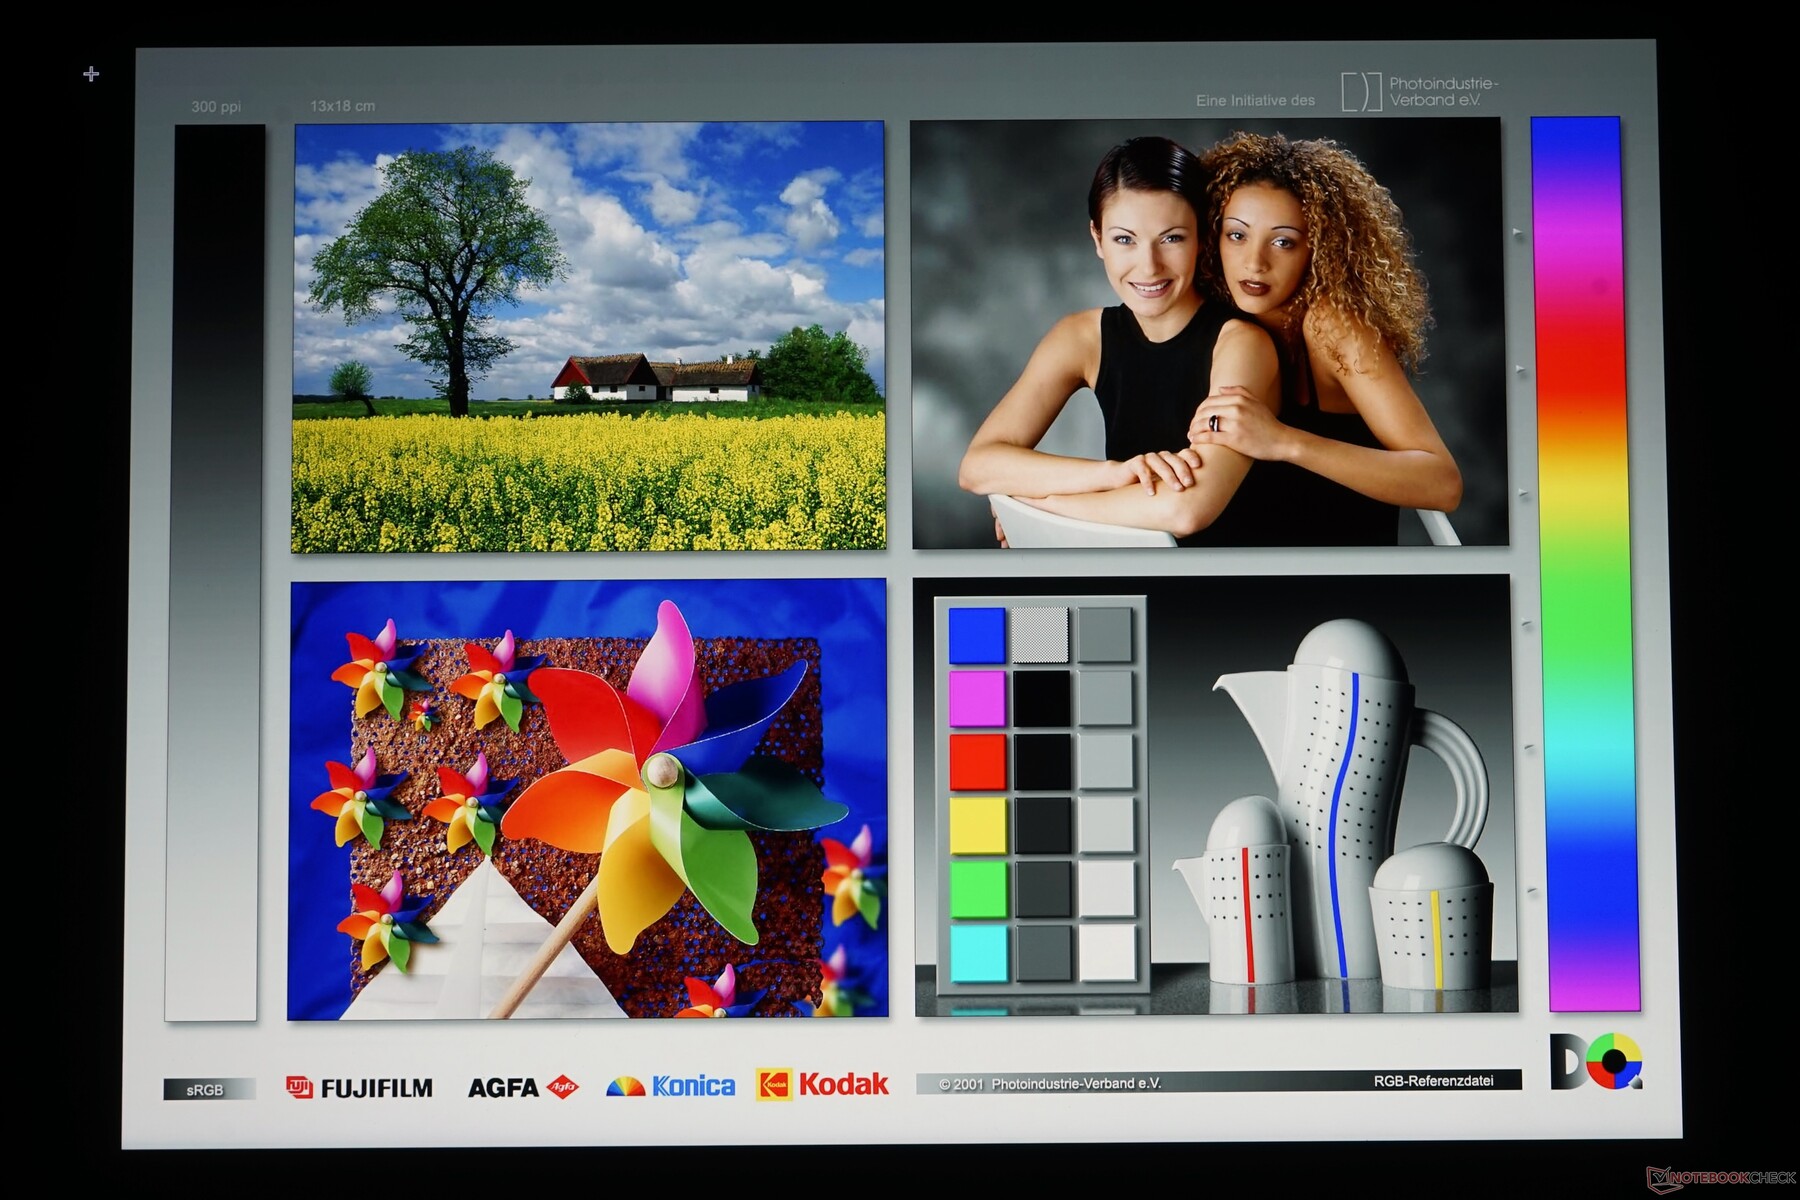
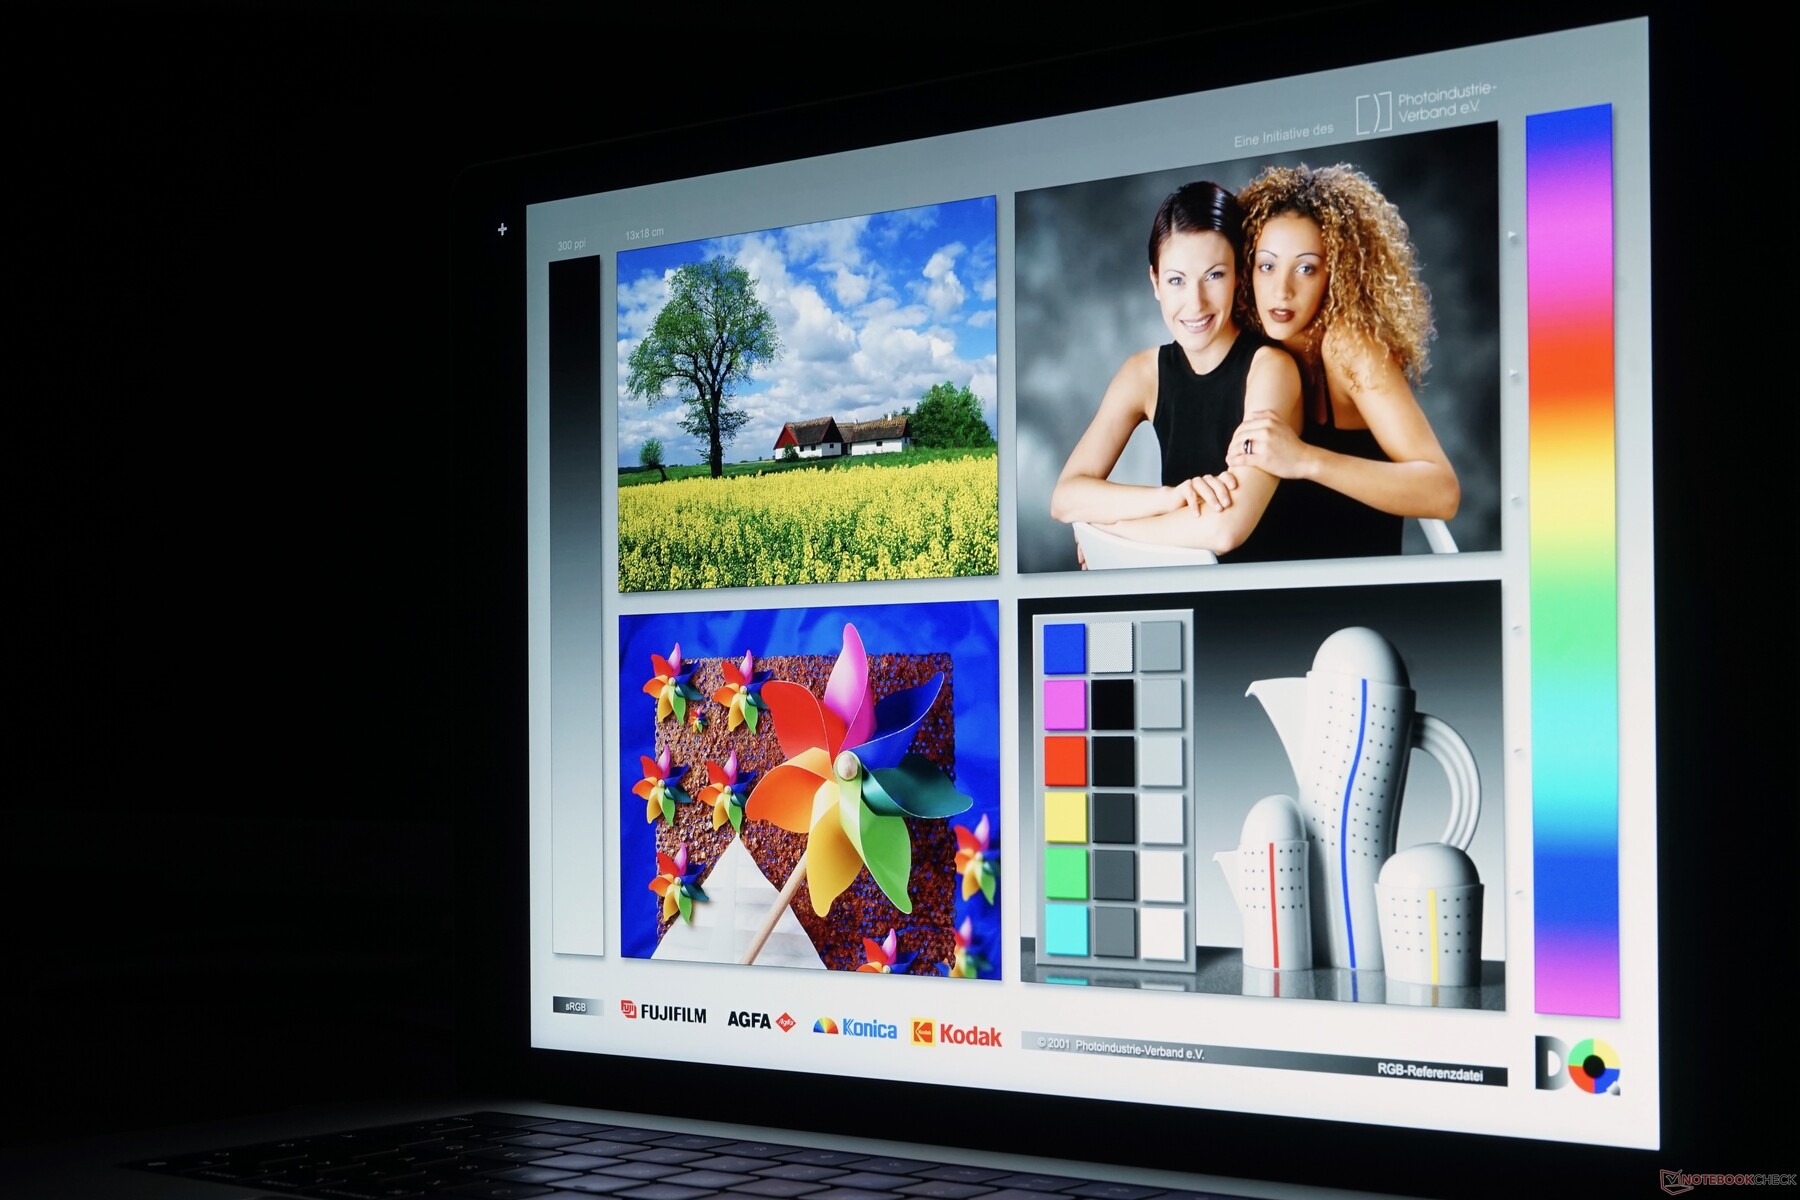
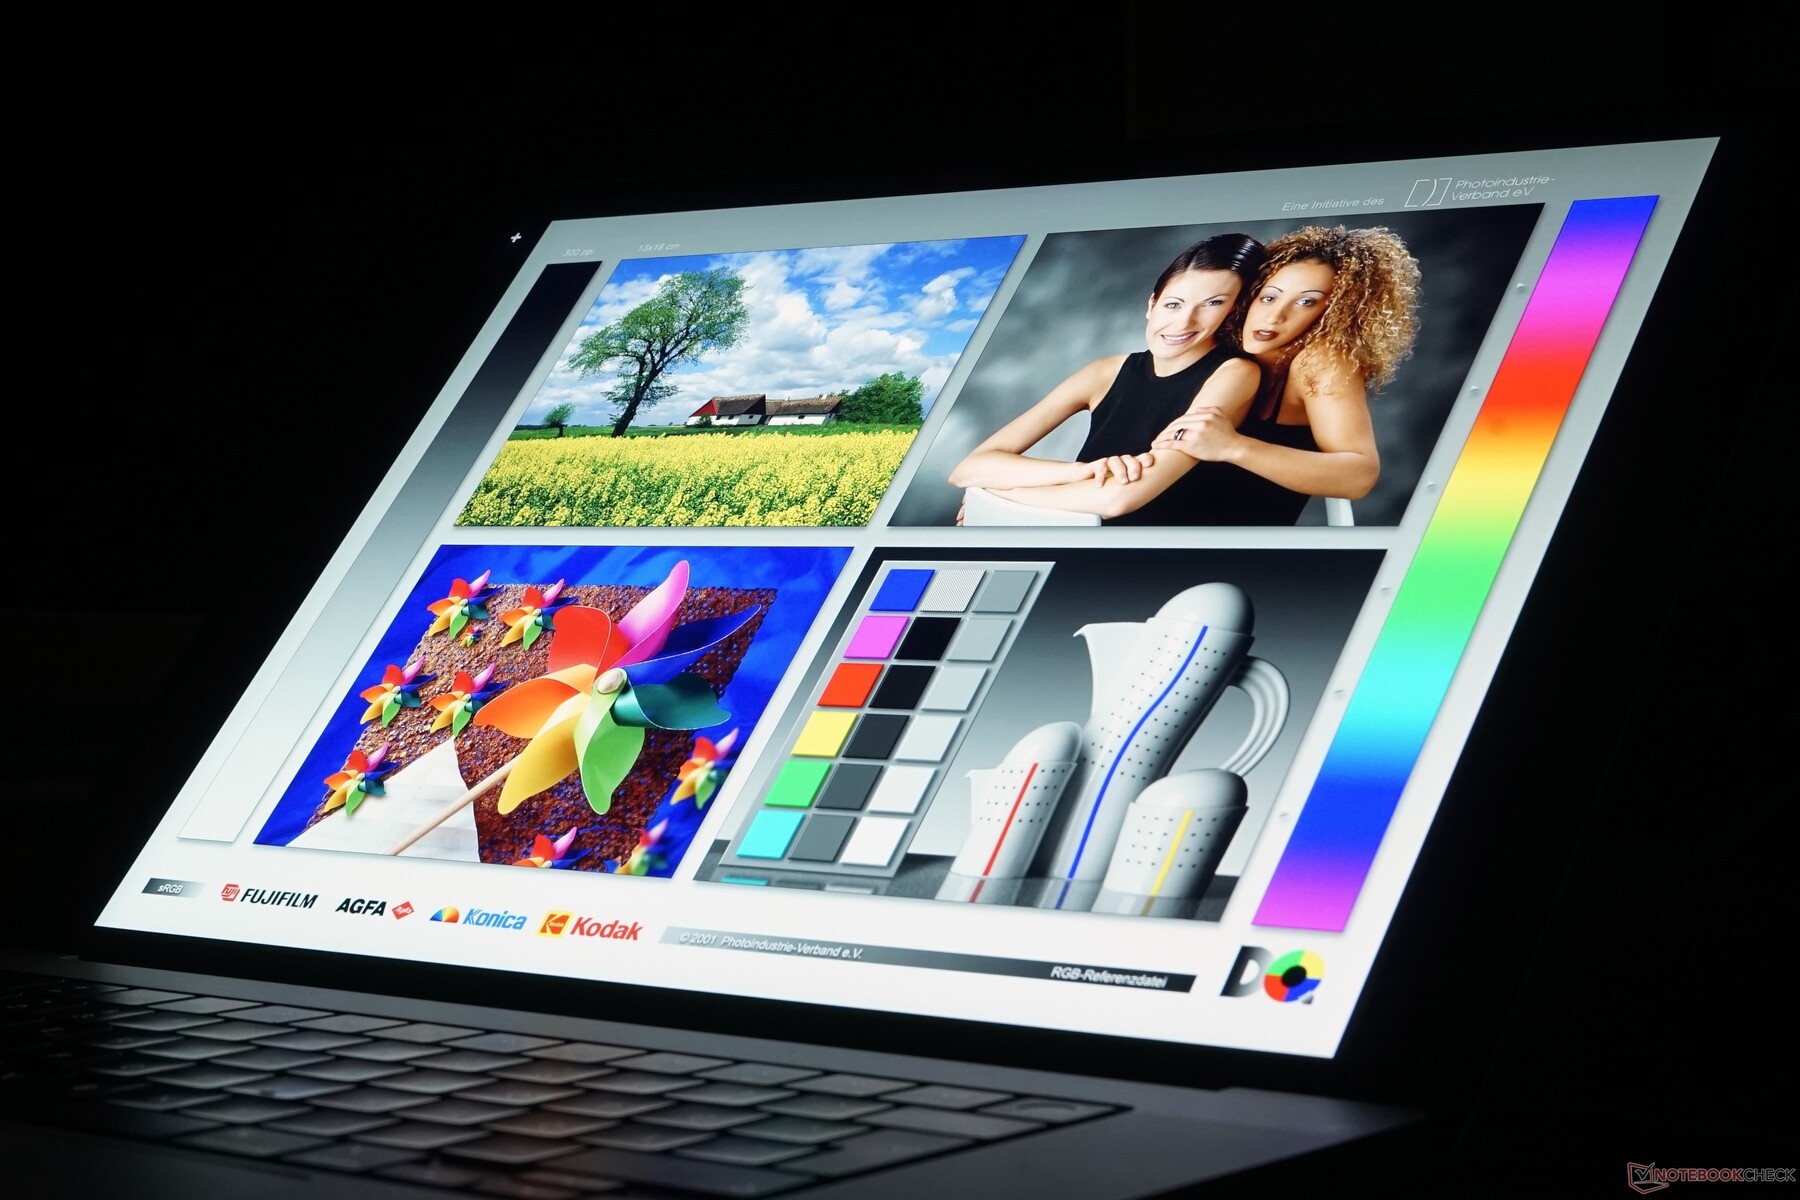
显示屏 - 液体视网膜XDR迷你LED
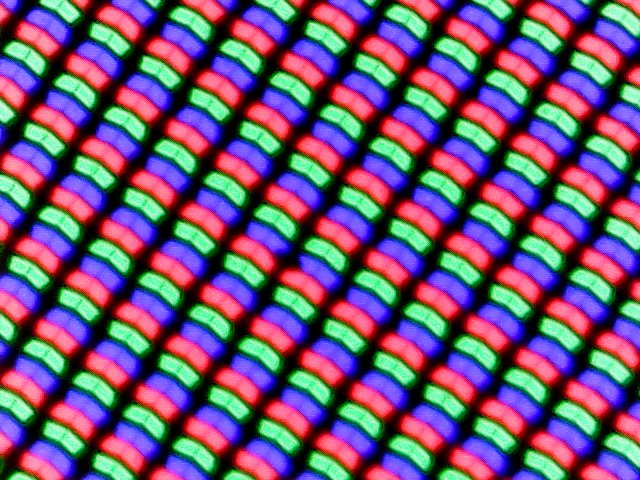
Apple ,14英寸和16英寸MacBook Pro机型的像素密度都达到了255 ppi。由于显示屏显然更大,分辨率也更高。Apple ,而不是IPS屏幕,现在使用Mini-LED面板。它可以管理极低的黑值和非常高的对比度,类似于OLED面板。然而,由于该技术,当明亮的内容显示在黑暗的背景上时,会出现明显的光晕效果。不过这只是一个小小的批评,因为主观的画面印象非常好。所有的内容都非常清晰明了,因为尽管分辨率很高,但macOS没有任何缩放问题,黑色是真正的黑色,这导致了极高的图像对比度。特别是HDR的内容看起来很好,而且视角的稳定性也很好。
像在较小的MacBook Pro 14 Apple,官方的亮度规格只适用于HDR图像。在APL为50的情况下(平均画面水平,明亮和黑暗内容的均匀分布),我们可以测量到高达1620尼特的峰值亮度,在完全白色的图像(至少是带有小黑边的16:9视频)中仍然非常好的1174尼特,所以我们可以确认Apple的说法。然而,这在大多数时候并没有真正的帮助,因为大多数日常的东西使用SDR内容,其中亮度再次被限制在500尼特多一点,这与前代产品相当。迷你LED面板有一个优势,因为它有卓越的对比度。只要有HDR图像的应用(例如Final Cut的预览窗口)需要更多的亮度,面板就会提供。
在15kHz左右的持续PWM闪烁是另一个问题,我们甚至可以在最大HDR亮度下检测到它。这个频率非常高,对大多数用户来说不是问题,但如果你对闪烁非常敏感,新MacBook Pro 16的面板就不适合你了。这种持续的闪烁也使人很难确定响应时间。根据我们的测量,它们是相当慢的,但你在实践中并没有真正注意到重影。看起来,Apple,动态刷新率高达120赫兹的专业运动技术有一定的帮助。例如,当你浏览操作系统时,你会注意到更平滑的过渡,但并不是所有Apple自己的应用程序都支持更高的刷新率。Safari浏览器就是这些应用之一,所以还不要指望更平滑的滚动。
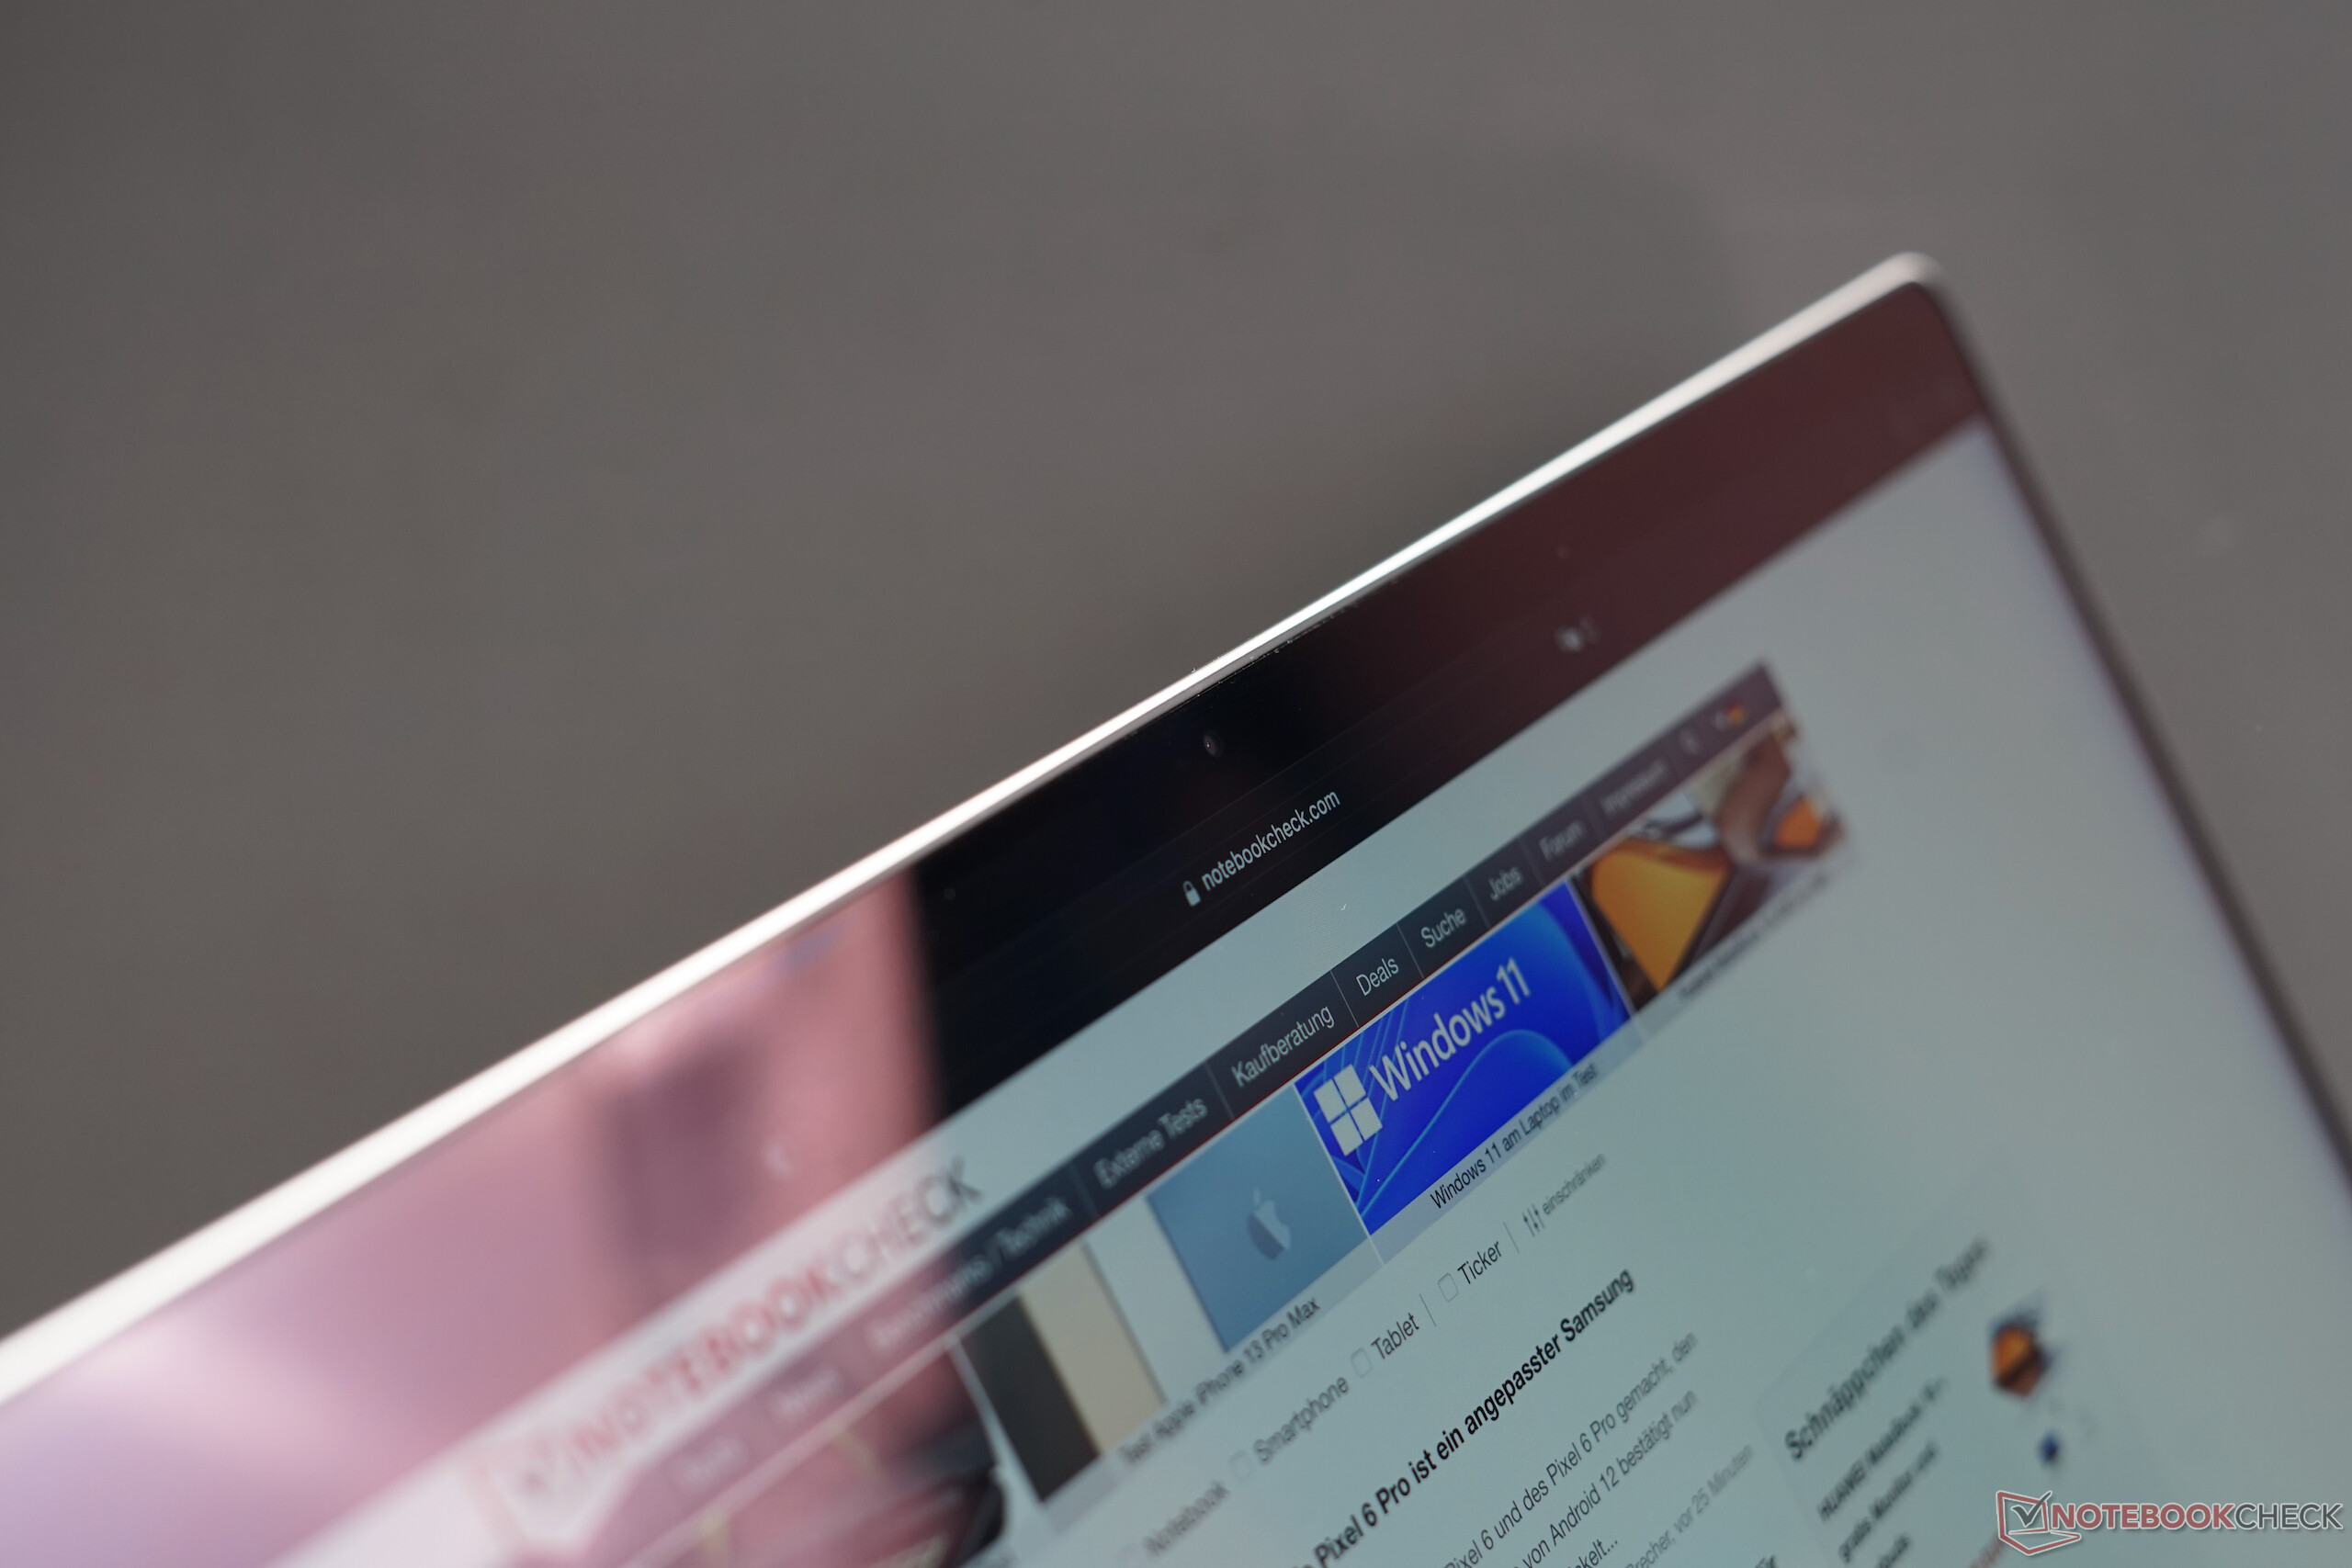
凹槽和它旁边的区域(用于菜单项)基本上位于常规的16:10长宽比屏幕之上,并没有挡住面板的任何部分。凹槽看起来不是很吸引人,而且还可能存在一些功能问题,但是已经有工具可以将菜单栏涂黑,所以你永远不会看到凹槽。
| |||||||||||||||||||||||||
Brightness Distribution: 95 %
Center on Battery: 514 cd/m²
Contrast: 25700:1 (Black: 0.02 cd/m²)
ΔE ColorChecker Calman: 1.4 | ∀{0.5-29.43 Ø4.73}
ΔE Greyscale Calman: 2.3 | ∀{0.09-98 Ø4.97}
88% AdobeRGB 1998 (Argyll 3D)
100% sRGB (Argyll 3D)
99.1% Display P3 (Argyll 3D)
Gamma: 2.27
CCT: 6792 K
| Apple MacBook Pro 16 2021 M1 Pro Liquid Retina XDR, Mini-LED, 3456x2234, 16.2" | Apple MacBook Pro 16 2019 i9 5500M APPA044, IPS, 3072x1920, 16" | Lenovo ThinkPad P1 G4-20Y4S0KS00 LP160UQ1-SPB1, IPS LED, 3840x2400, 16" | Dell XPS 15 9510 11800H RTX 3050 Ti OLED SDC414D, OLED, 3456x2160, 15.6" | HP ZBook Studio 15 G8 SDC4145, OLED, 3840x2160, 15.6" | Razer Blade 15 Advanced (Mid 2021) TL156VDXP02-0, IPS, 1920x1080, 15.6" | Apple MacBook Pro 14 2021 M1 Pro Entry Mini-LED, 3024x1964, 14.2" | |
|---|---|---|---|---|---|---|---|
| Display | -1% | 4% | 3% | -19% | 0% | ||
| Display P3 Coverage (%) | 99.1 | 85.7 -14% | 99.9 1% | 99.9 1% | 66.9 -32% | 99.3 0% | |
| sRGB Coverage (%) | 100 | 99.4 -1% | 100 0% | 100 0% | 97.1 -3% | ||
| AdobeRGB 1998 Coverage (%) | 88 | 98.9 12% | 98.1 11% | 95.3 8% | 69 -22% | ||
| Response Times | 20% | 19% | 95% | 96% | 90% | 10% | |
| Response Time Grey 50% / Grey 80% * (ms) | 42.8 ? | 52.4 ? -22% | 55.2 ? -29% | 3.6 ? 92% | 2.4 ? 94% | 4.2 ? 90% | 58.4 ? -36% |
| Response Time Black / White * (ms) | 91.6 ? | 34.9 ? 62% | 31.2 ? 66% | 2.8 ? 97% | 2.4 ? 97% | 10 ? 89% | 40.4 ? 56% |
| PWM Frequency (Hz) | 14880 | 131700 | 59.5 ? | 240.4 ? | 14880 | ||
| Screen | -262% | -269% | -49% | -85% | -227% | 35% | |
| Brightness middle (cd/m²) | 514 | 519 1% | 630 23% | 362 -30% | 379.6 -26% | 353.4 -31% | 489 -5% |
| Brightness (cd/m²) | 497 | 477 -4% | 622 25% | 367 -26% | 380 -24% | 340 -32% | 479 -4% |
| Brightness Distribution (%) | 95 | 86 -9% | 90 -5% | 97 2% | 95 0% | 92 -3% | 94 -1% |
| Black Level * (cd/m²) | 0.02 | 0.39 -1850% | 0.41 -1950% | 0.06 -200% | 0.31 -1450% | 0.01 50% | |
| Contrast (:1) | 25700 | 1331 -95% | 1537 -94% | 6033 -77% | 1140 -96% | 48900 90% | |
| Colorchecker dE 2000 * | 1.4 | 2.28 -63% | 2.2 -57% | 2.1 -50% | 5.15 -268% | 2.17 -55% | 0.8 43% |
| Colorchecker dE 2000 max. * | 2.8 | 6.54 -134% | 5 -79% | 4.1 -46% | 7.79 -178% | 5.69 -103% | 1.3 54% |
| Greyscale dE 2000 * | 2.3 | 0.9 61% | 2.7 -17% | 1.4 39% | 2.6 -13% | 3.4 -48% | 1.1 52% |
| Gamma | 2.27 97% | 2145 0% | 2.26 97% | 2.18 101% | 1.99 111% | 2.2 100% | 2.24 98% |
| CCT | 6792 96% | 6572 99% | 6886 94% | 6608 98% | 6166 105% | 6830 95% | |
| Colorchecker dE 2000 calibrated * | 0.86 | 1 | 2.5 | 3.1 | 1.05 | ||
| Color Space (Percent of AdobeRGB 1998) (%) | 78 | ||||||
| Total Average (Program / Settings) | -121% /
-205% | -84% /
-163% | 17% /
-14% | 5% /
-28% | -52% /
-130% | 15% /
27% |
* ... smaller is better
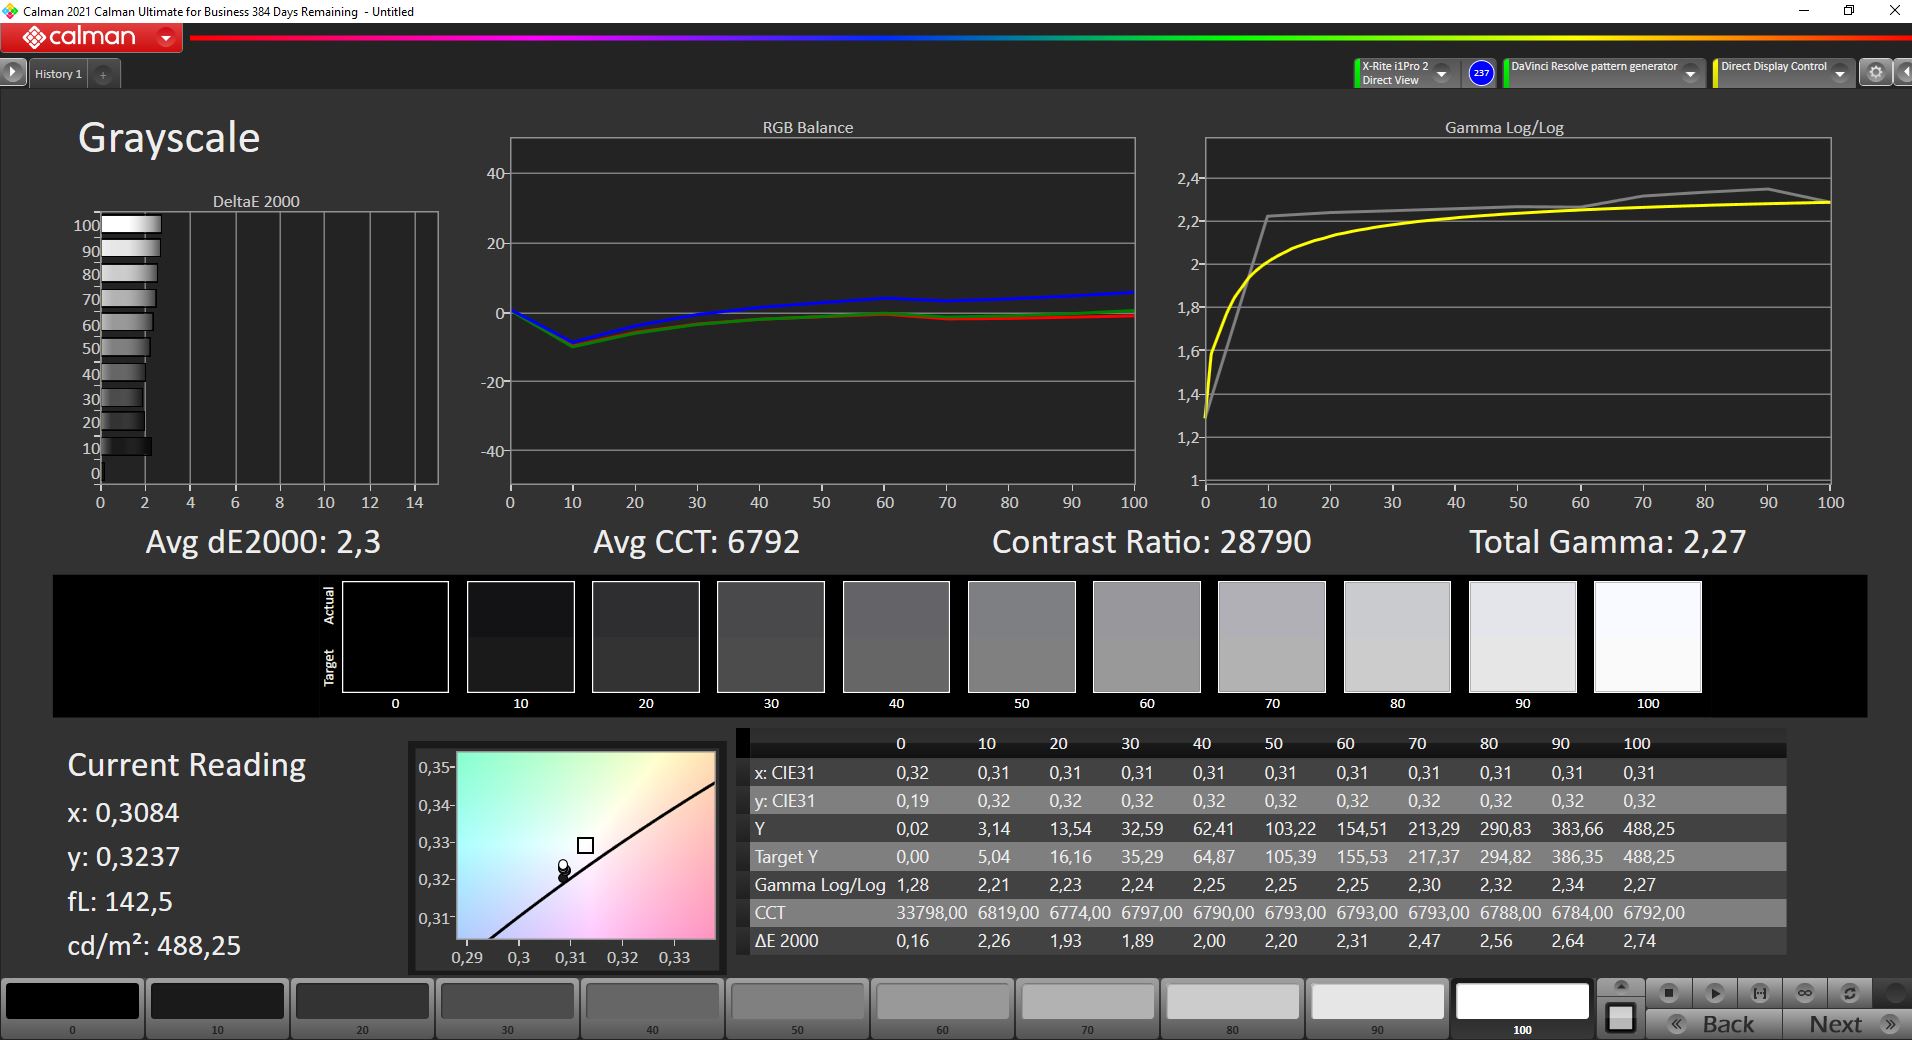
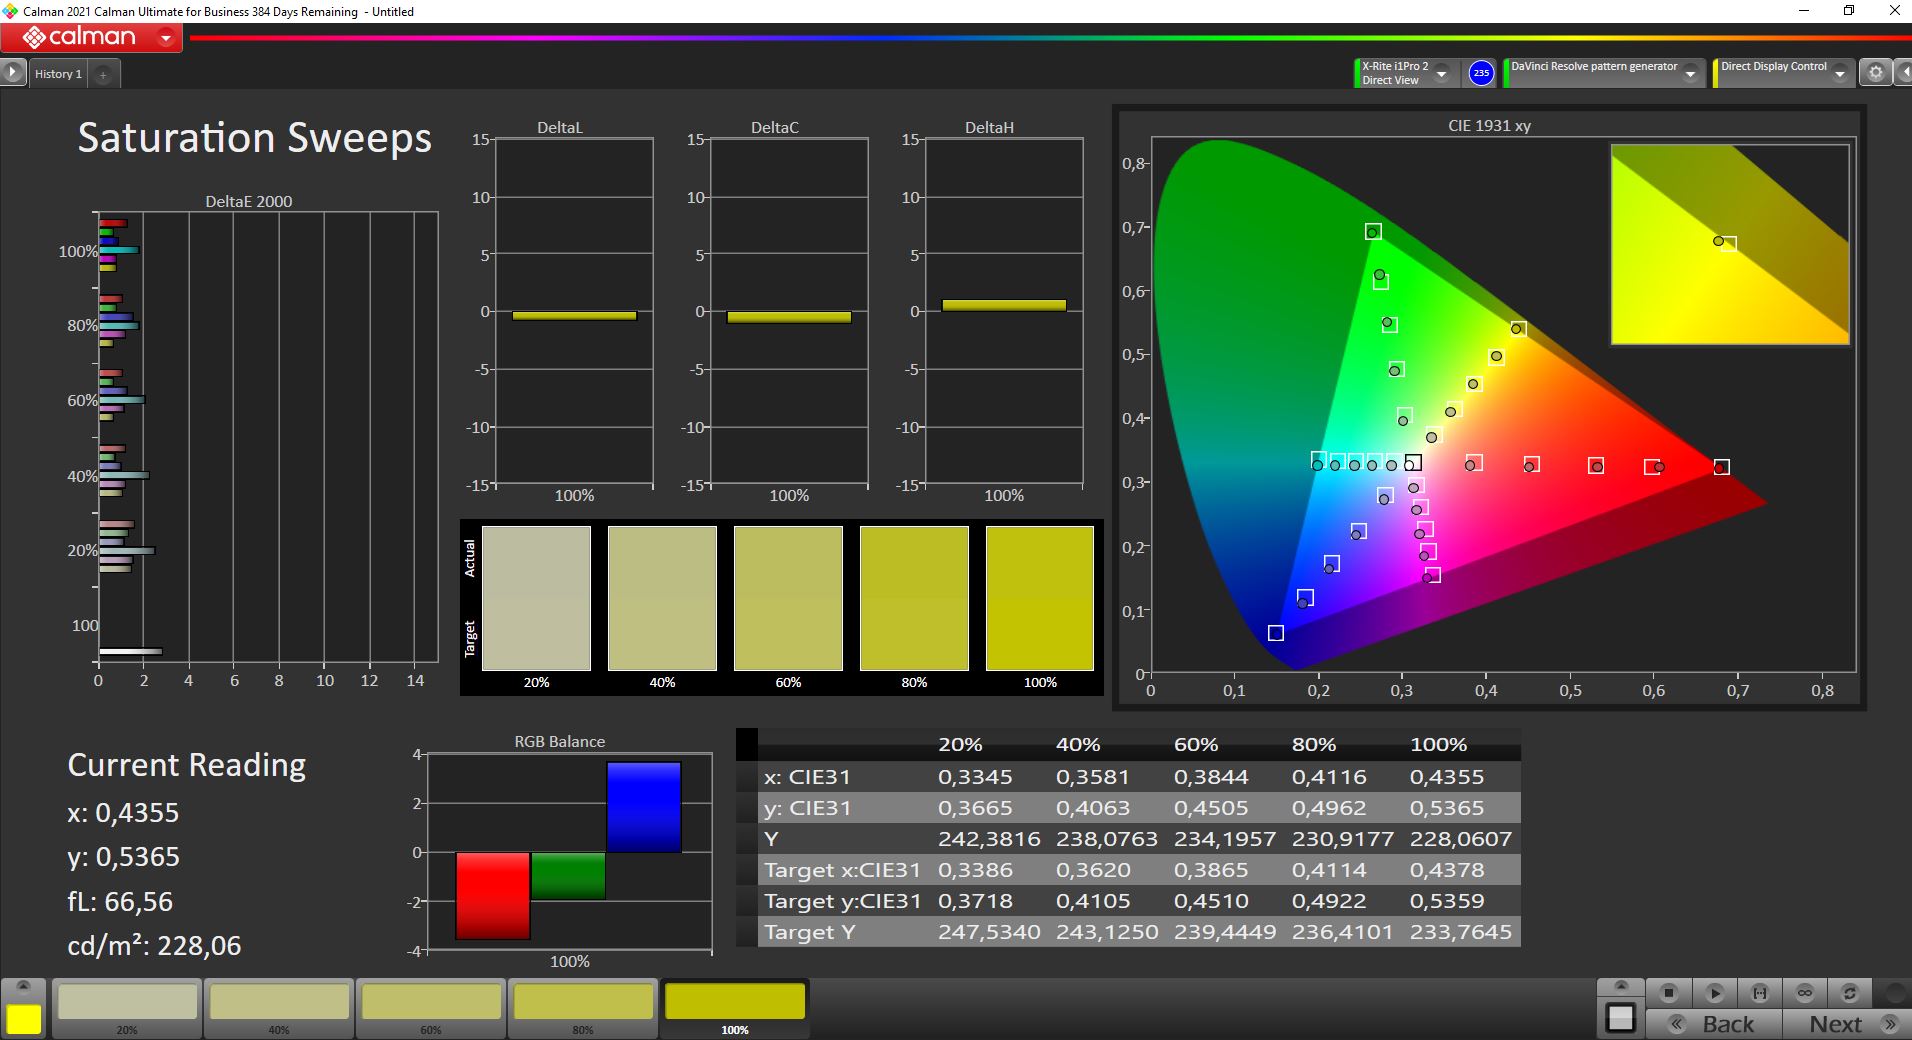
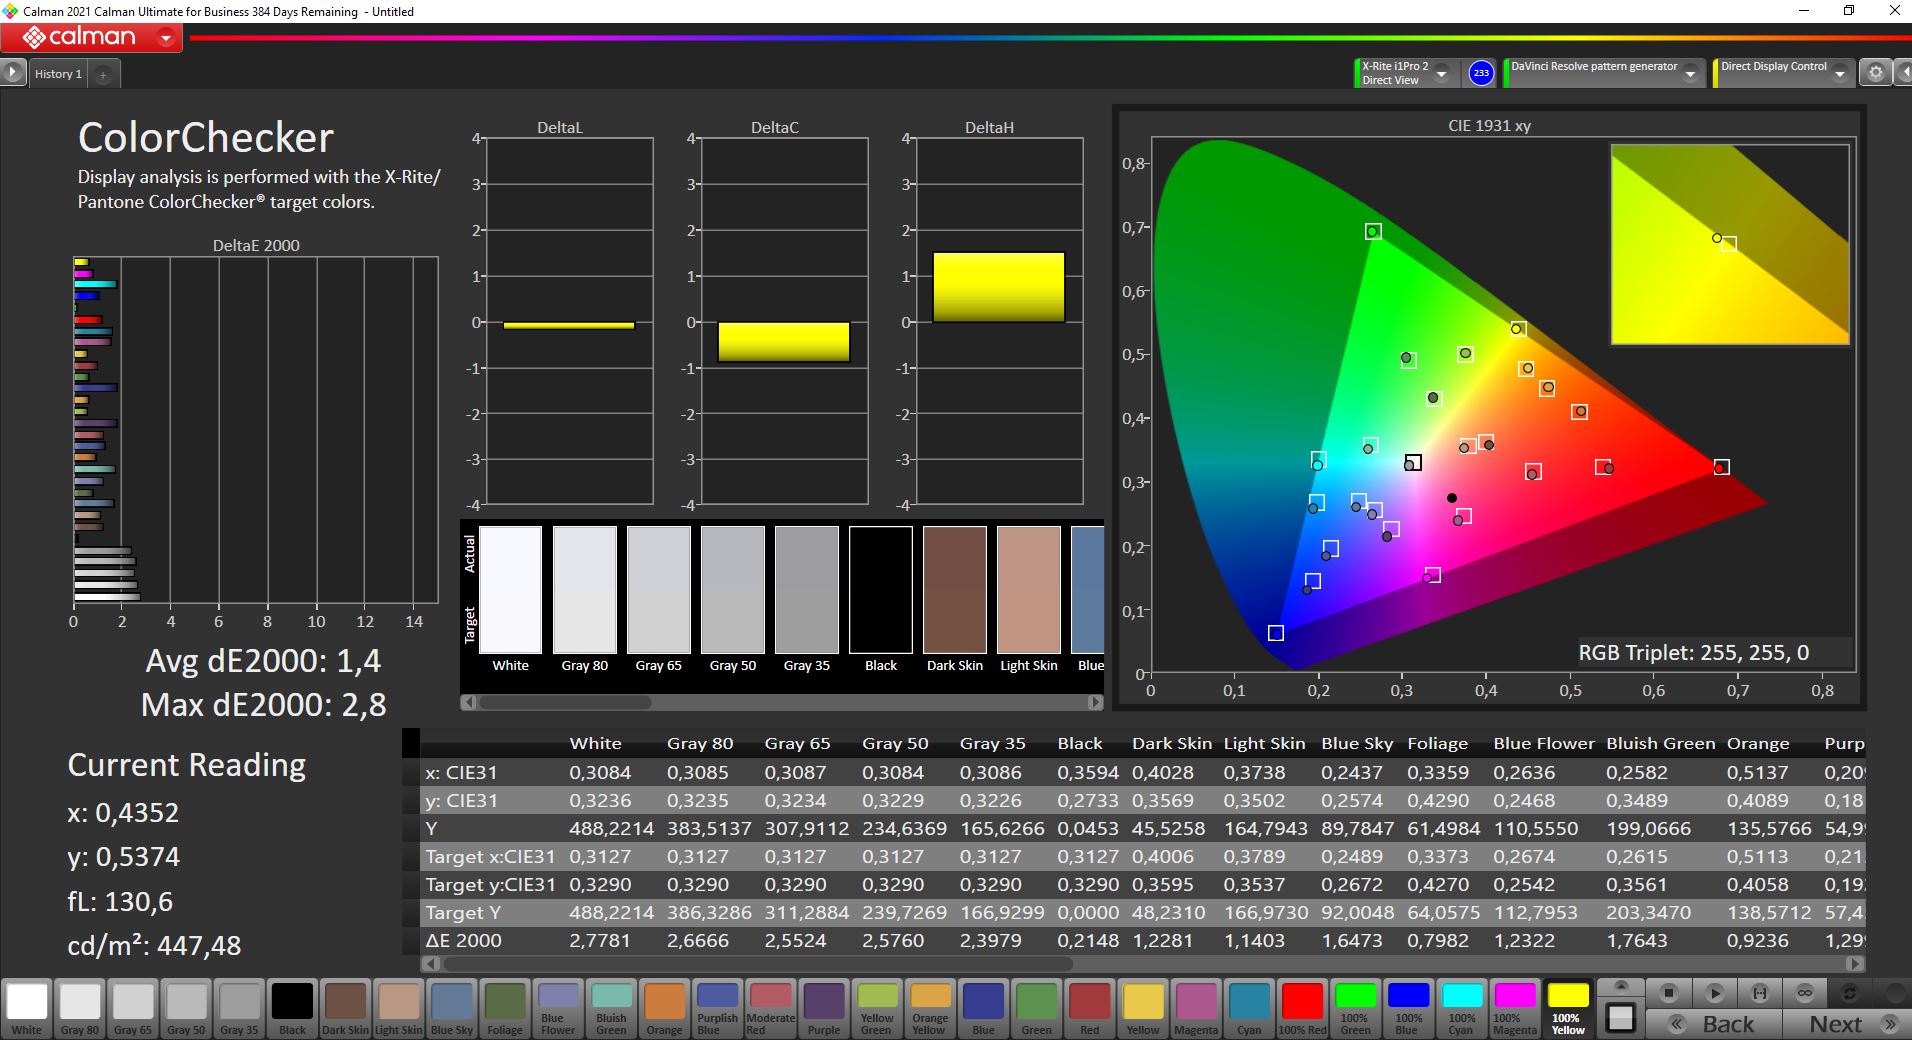
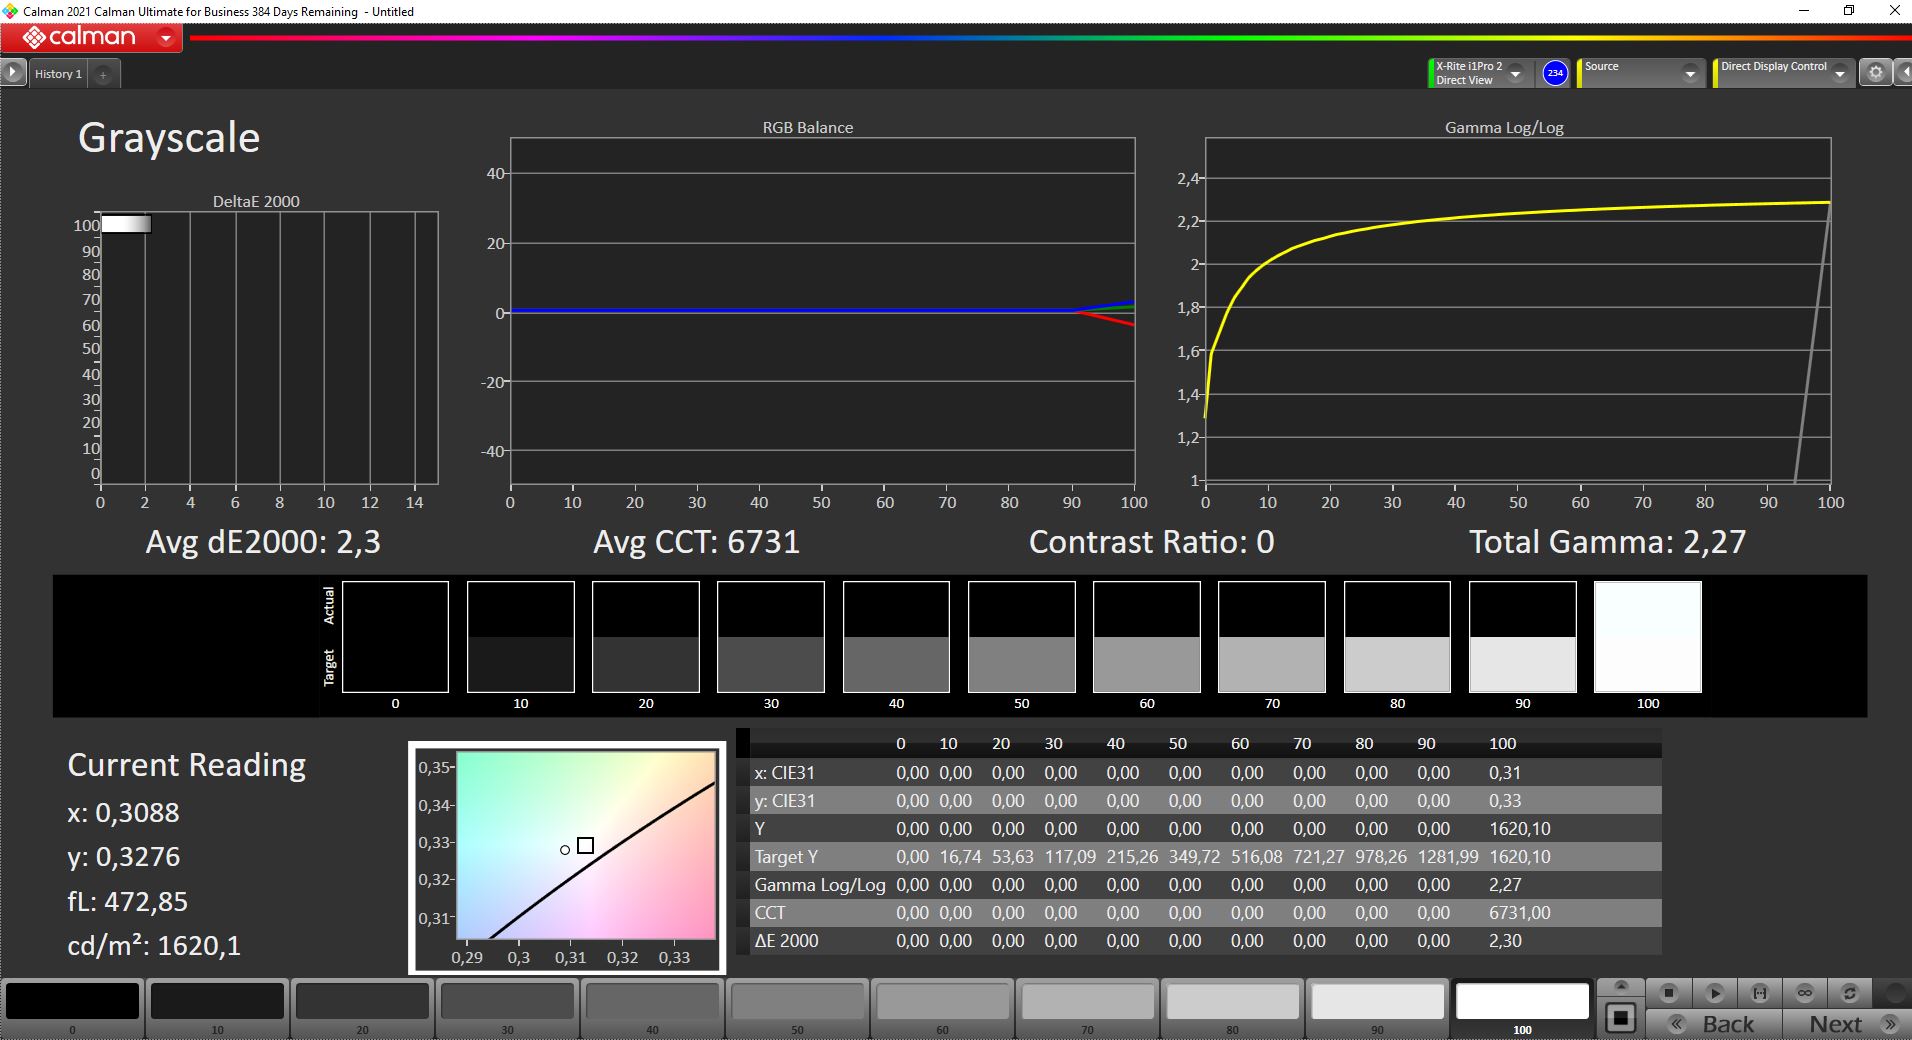
我们用专业的CalMAN软件和X-Rite i1 Pro 2分光光度计进行的分析表明,新的MBP 16的面板校准与14英寸设备相比并不出色。 14英寸设备开箱即用。色温略微过冷,灰度中存在轻微的偏蓝。不幸的是,我们无法用我们的设备校准该面板。虽然颜色以及灰度的DeltaE-2000平均偏差都已经小于3,所以这是在一个非常高的水平上的呻吟,对图片/视频编辑没有任何限制。
Display Response Times
| ↔ Response Time Black to White | ||
|---|---|---|
| 91.6 ms ... rise ↗ and fall ↘ combined | ↗ 76 ms rise | 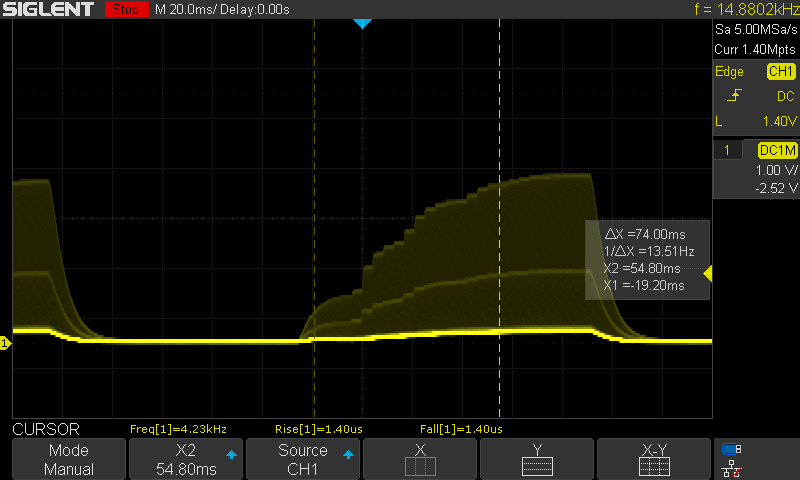 |
| ↘ 15.6 ms fall | ||
| The screen shows slow response rates in our tests and will be unsatisfactory for gamers. In comparison, all tested devices range from 0.1 (minimum) to 240 (maximum) ms. » 100 % of all devices are better. This means that the measured response time is worse than the average of all tested devices (19.9 ms). | ||
| ↔ Response Time 50% Grey to 80% Grey | ||
| 42.8 ms ... rise ↗ and fall ↘ combined | ↗ 19.6 ms rise | 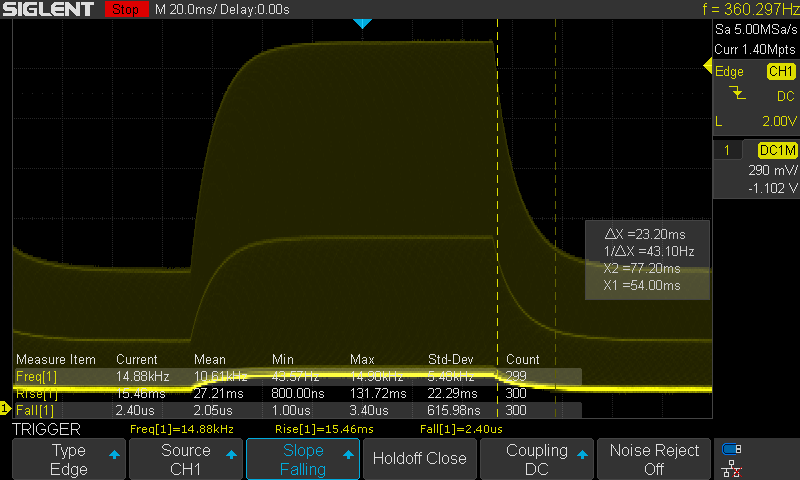 |
| ↘ 23.2 ms fall | ||
| The screen shows slow response rates in our tests and will be unsatisfactory for gamers. In comparison, all tested devices range from 0.165 (minimum) to 636 (maximum) ms. » 70 % of all devices are better. This means that the measured response time is worse than the average of all tested devices (31.1 ms). | ||
Screen Flickering / PWM (Pulse-Width Modulation)
| Screen flickering / PWM detected | 14880 Hz |  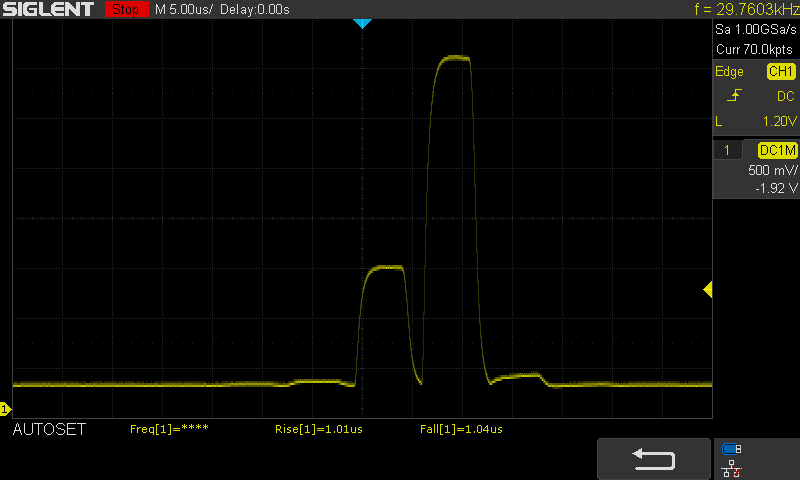 | |
The display backlight flickers at 14880 Hz (worst case, e.g., utilizing PWM) . The frequency of 14880 Hz is quite high, so most users sensitive to PWM should not notice any flickering. In comparison: 52 % of all tested devices do not use PWM to dim the display. If PWM was detected, an average of 7794 (minimum: 5 - maximum: 343500) Hz was measured. | |||
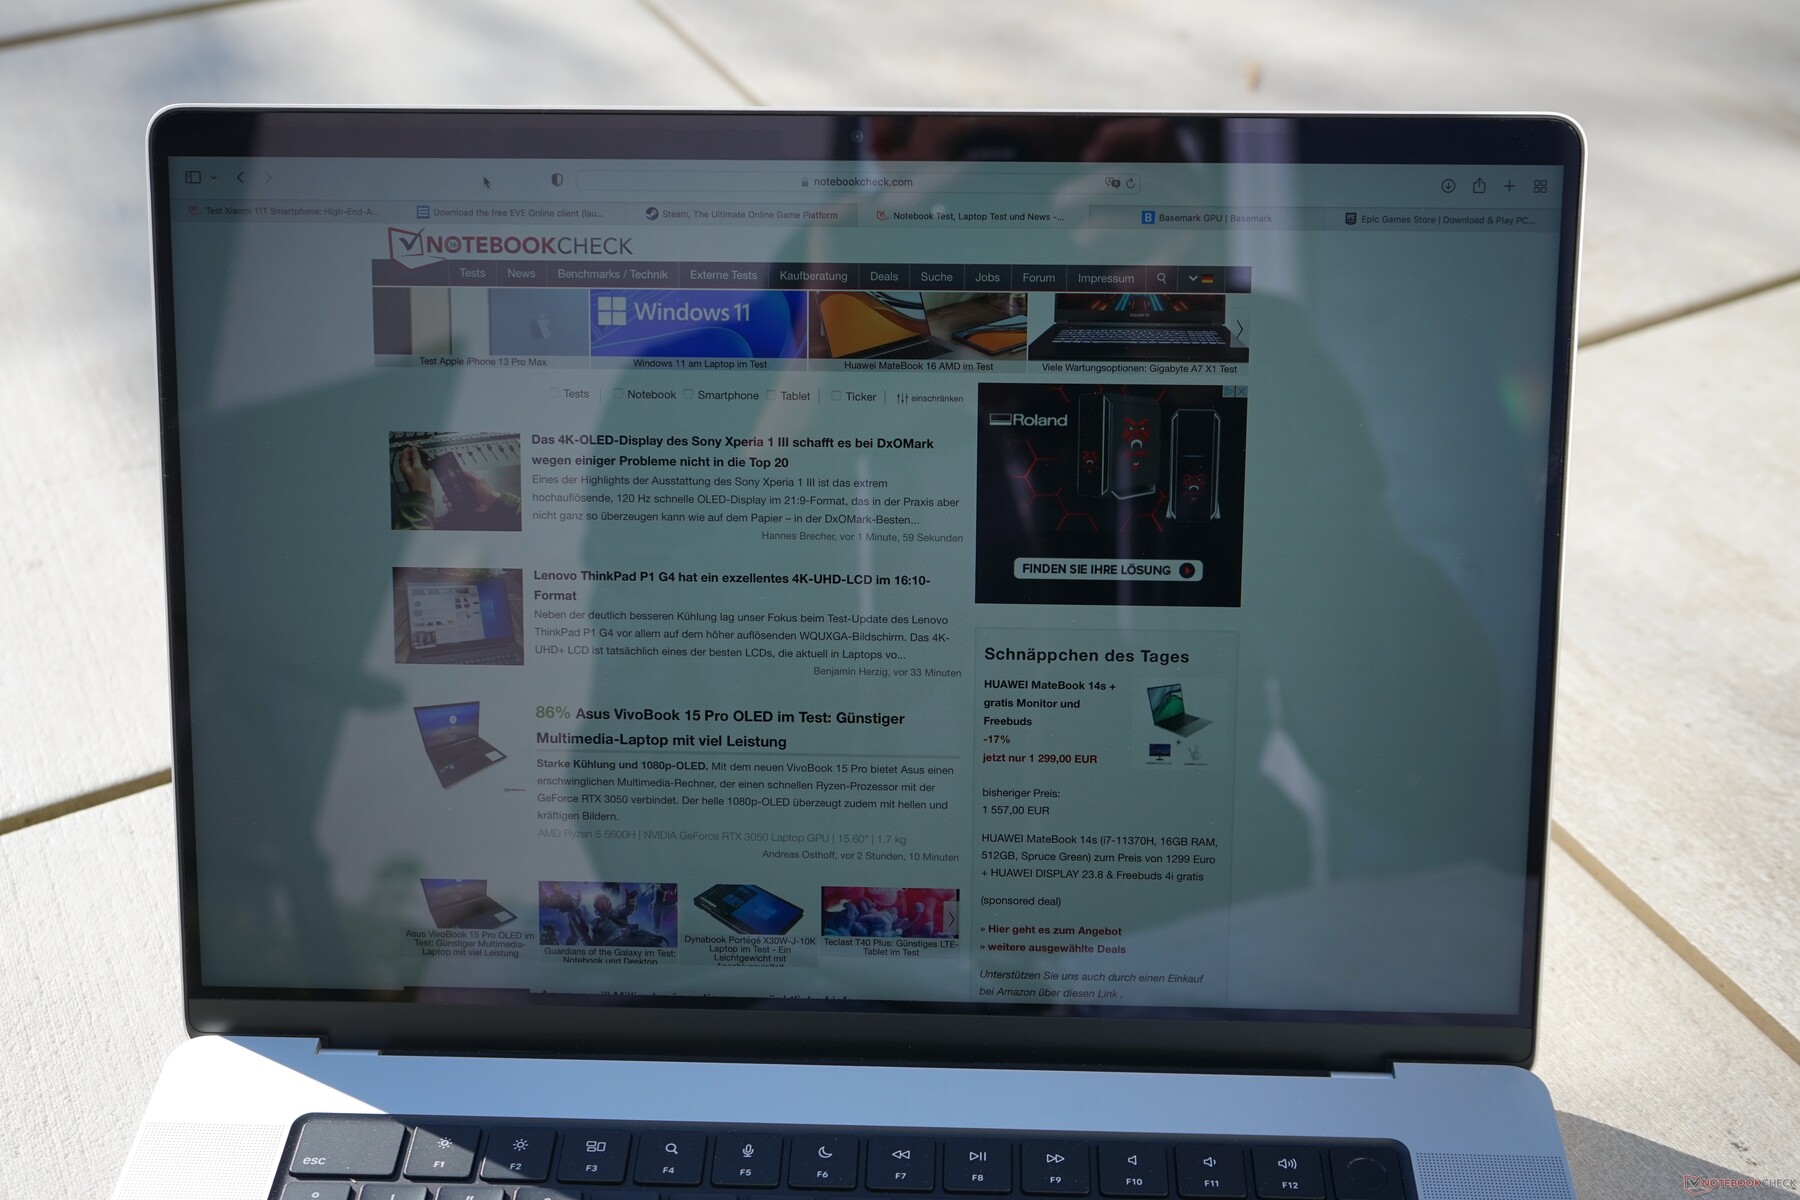
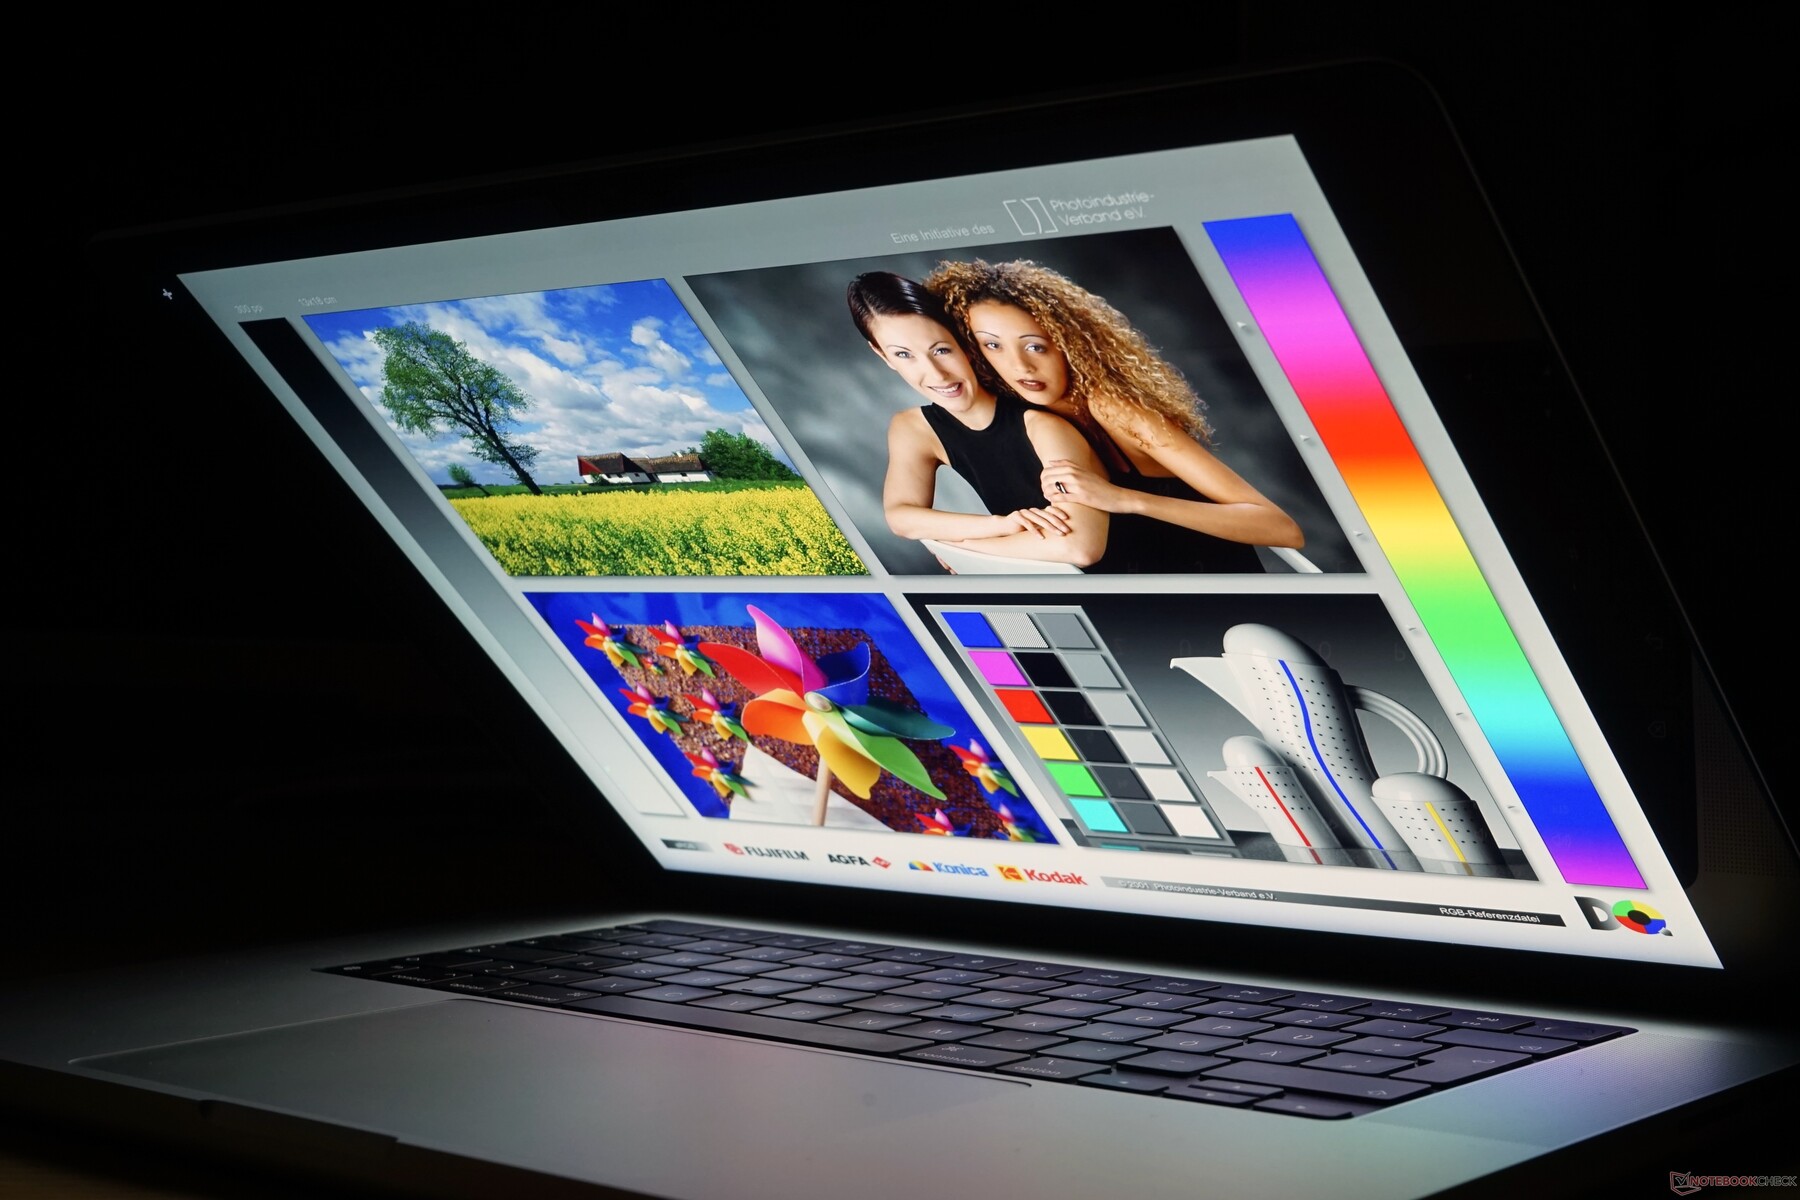
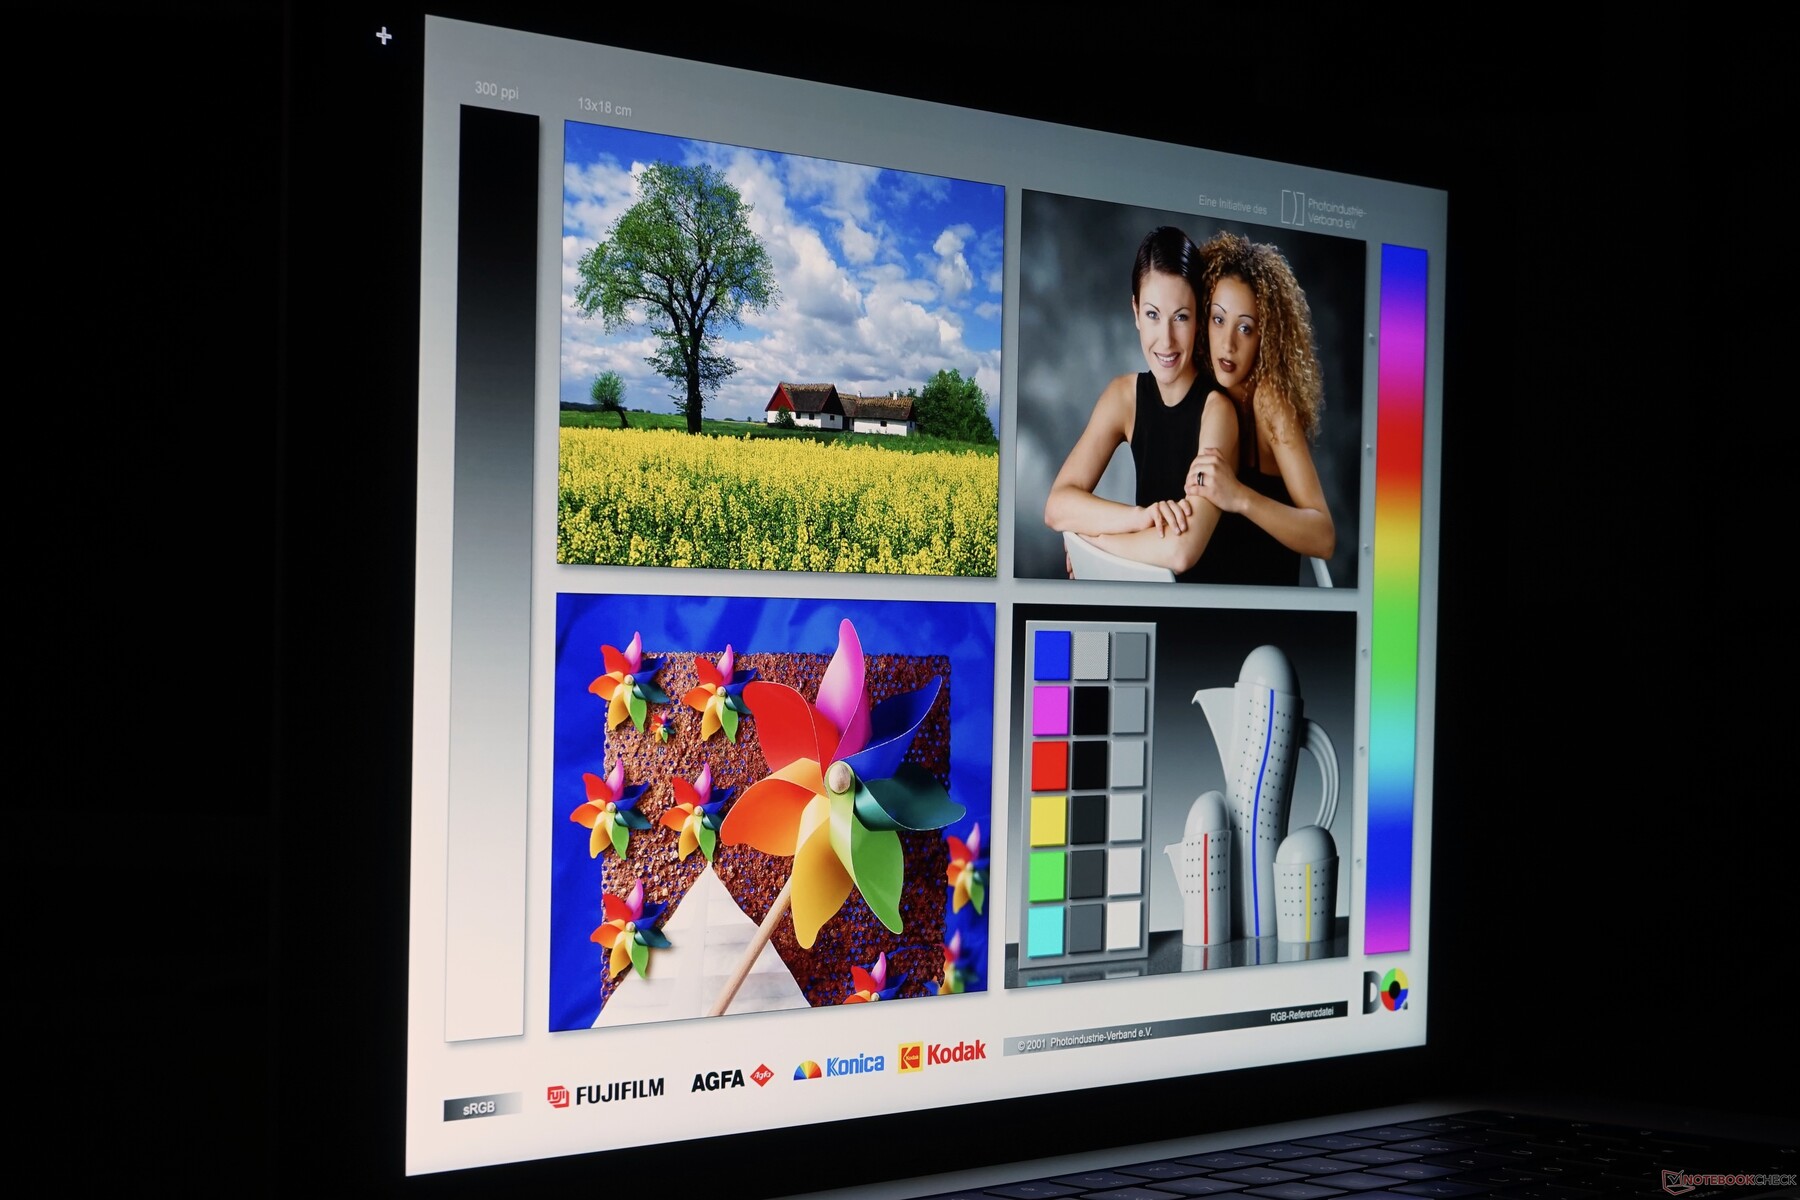
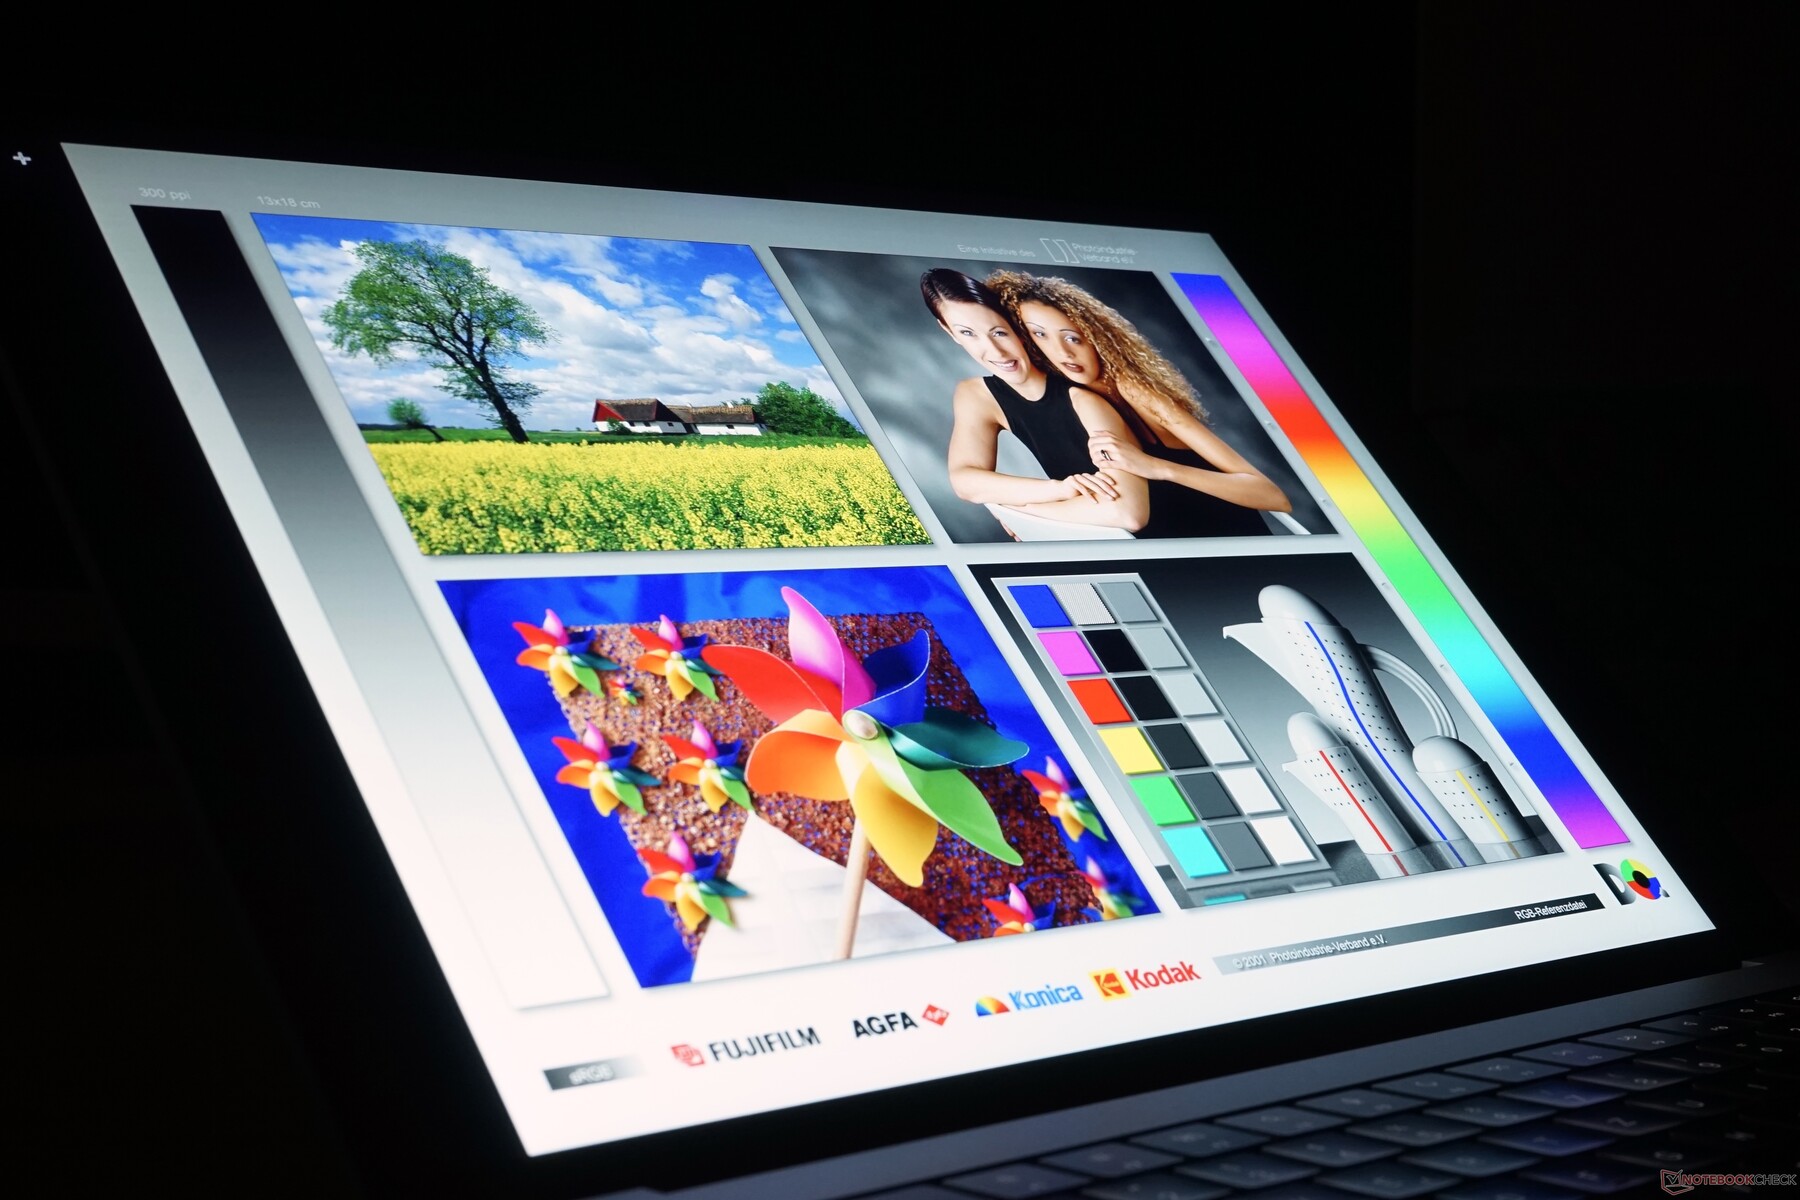
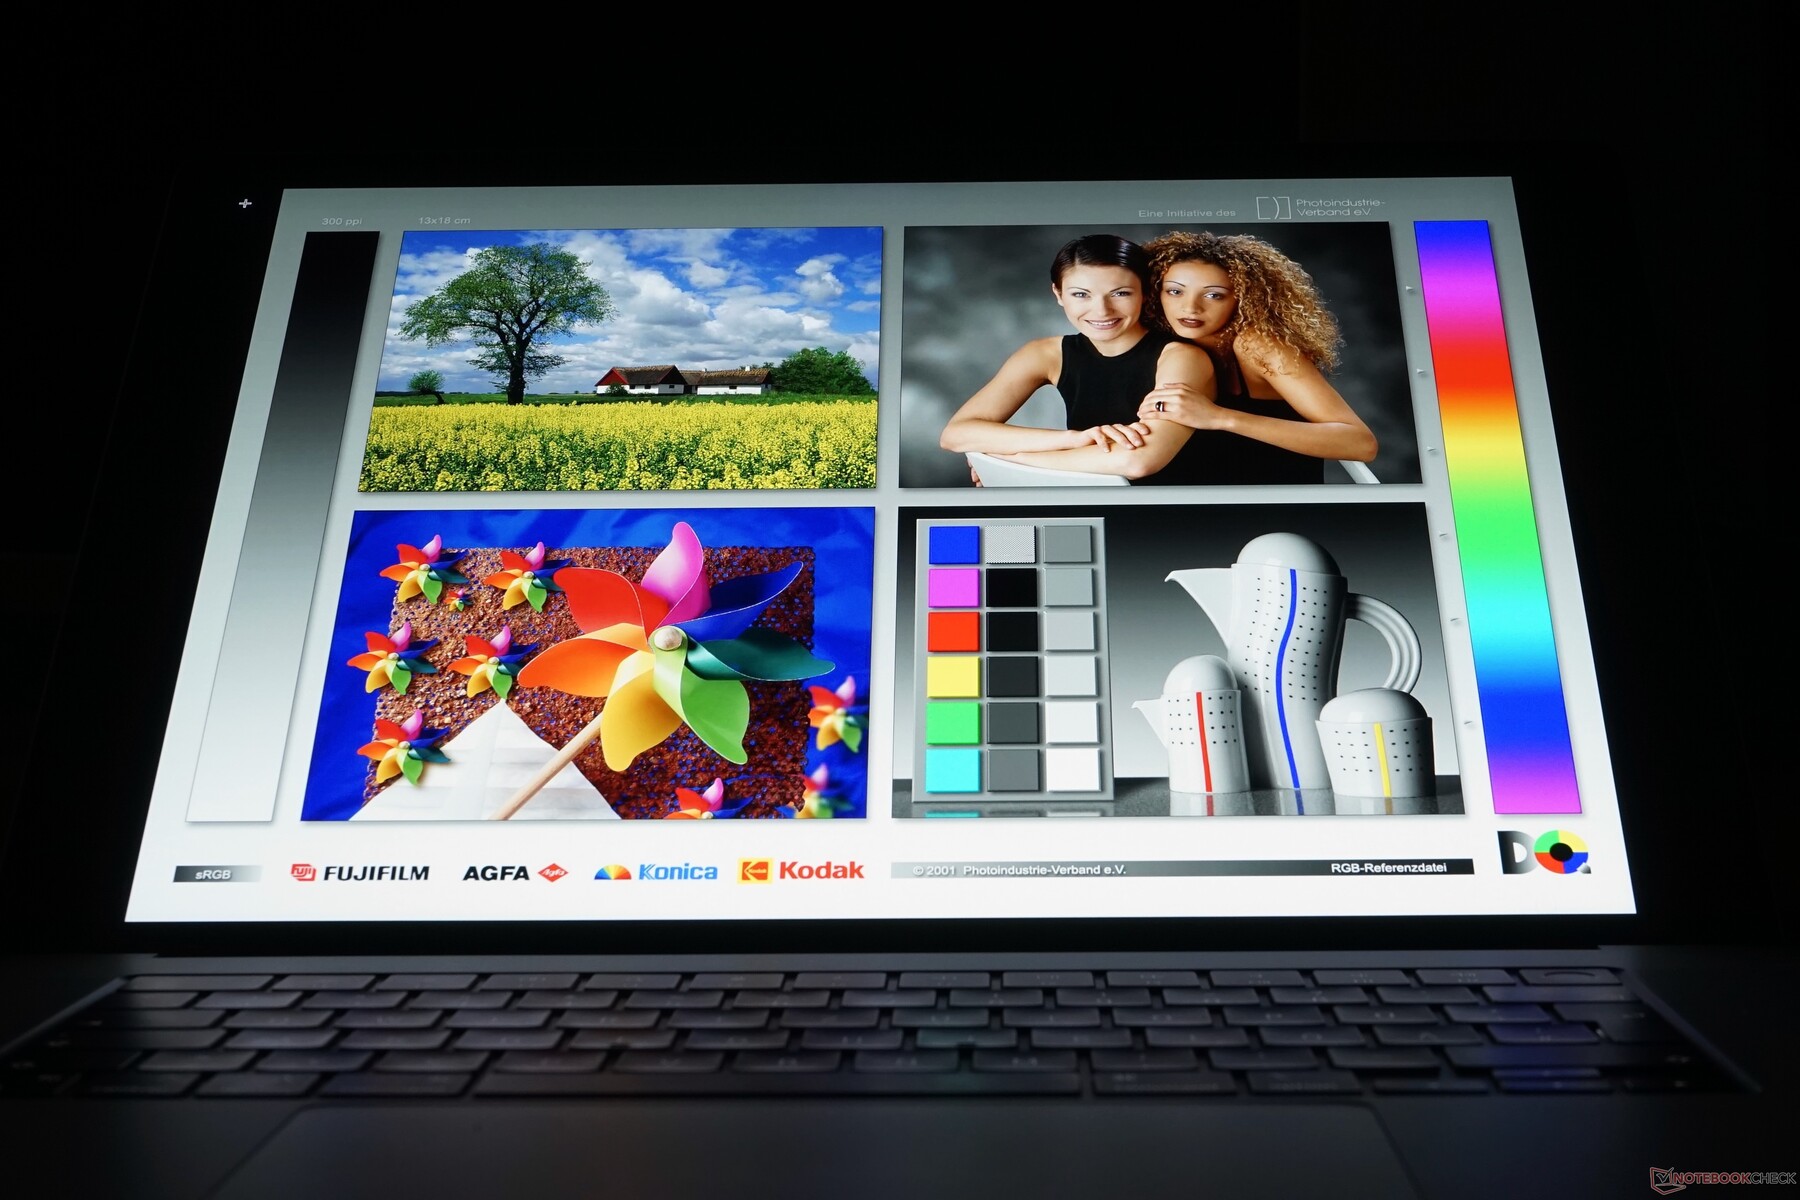
MacBook Pro 16确实有一个光亮的屏幕表面,但它不像其他许多有光亮显示屏或触摸屏的笔记本电脑那样反光。只要你避免反射,即使在较亮的环境中,你仍然可以相当舒适地在户外工作,但该面板显然会从更高的亮度水平中受益。如果你看到Apple's specs并希望改善户外能力,你会在这方面感到失望。
性能 - 带有10/16个核心的M1 Pro
不同于较小的MacBook Pro 14,较大的16英寸机型总是以完整版本的M1 Pro SoC发货,所以你得到10个CPU核心(2个效率核心和8个性能核心)与16个GPU核心的组合。如果你选择类似的组件,这两个型号的价格差异只有230欧元(约263美元)。
| SoC | CPU Cores | GPU Cores | RAM | 附加价格 |
|---|---|---|---|---|
| M1 Pro | 2个效率核心和8个性能核心 | 16 | 16或32 GB | |
| M1 Max | 2个效率核心和8个性能核心 | 24 | 32或64GB | 230欧元(~263美元) |
| M1 Max | 2个效率核心和8个性能核心 | 32 | 32或64GB | 410欧元(~469美元) |
Apple 还提供两个版本的新M1 Max芯片(有24或32个GPU核心)作为可选升级。CPU性能将基本保持不变;一些应用程序可能从更多的内存中受益。你可以用M1 Pro升级到32GB内存,用M1 Max一路升级到64GB。
处理器 - 具有10个核心的M1 Pro
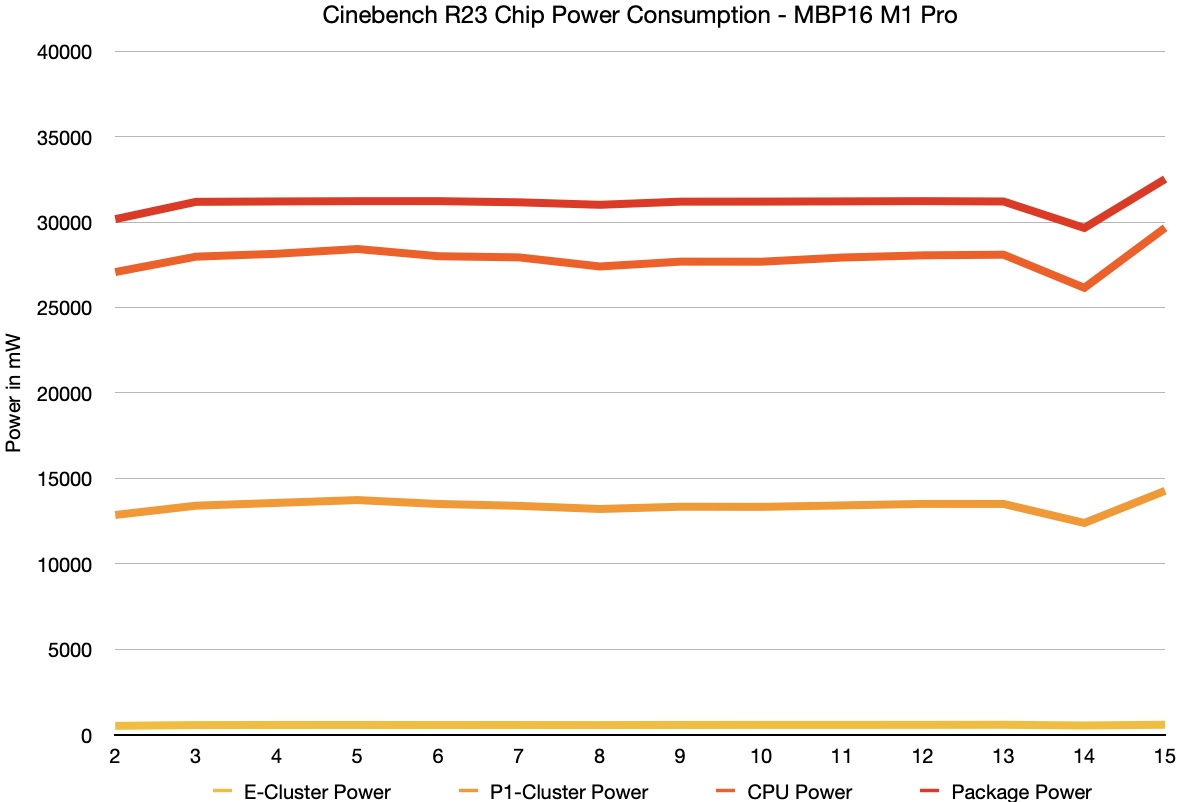
M1 Pro由两个效率集群(两个核心,最高2,064 MHz)与两个性能集群相结合,每个集群有4个核心(最高3.2 GHz)。核心的基本架构与去年的Apple M1 SoC没有区别,例如MacBook Air和MacBook Pro 13使用的就是这种系统。这意味着单核性能也具有可比性,可选的M1 Max芯片也是如此。Apple ,在这方面可以跟上AMD和英特尔的现代移动处理器,但效率更高(~7 W封装和4 W核心与~20 W @英特尔和~15 W @AMD)。
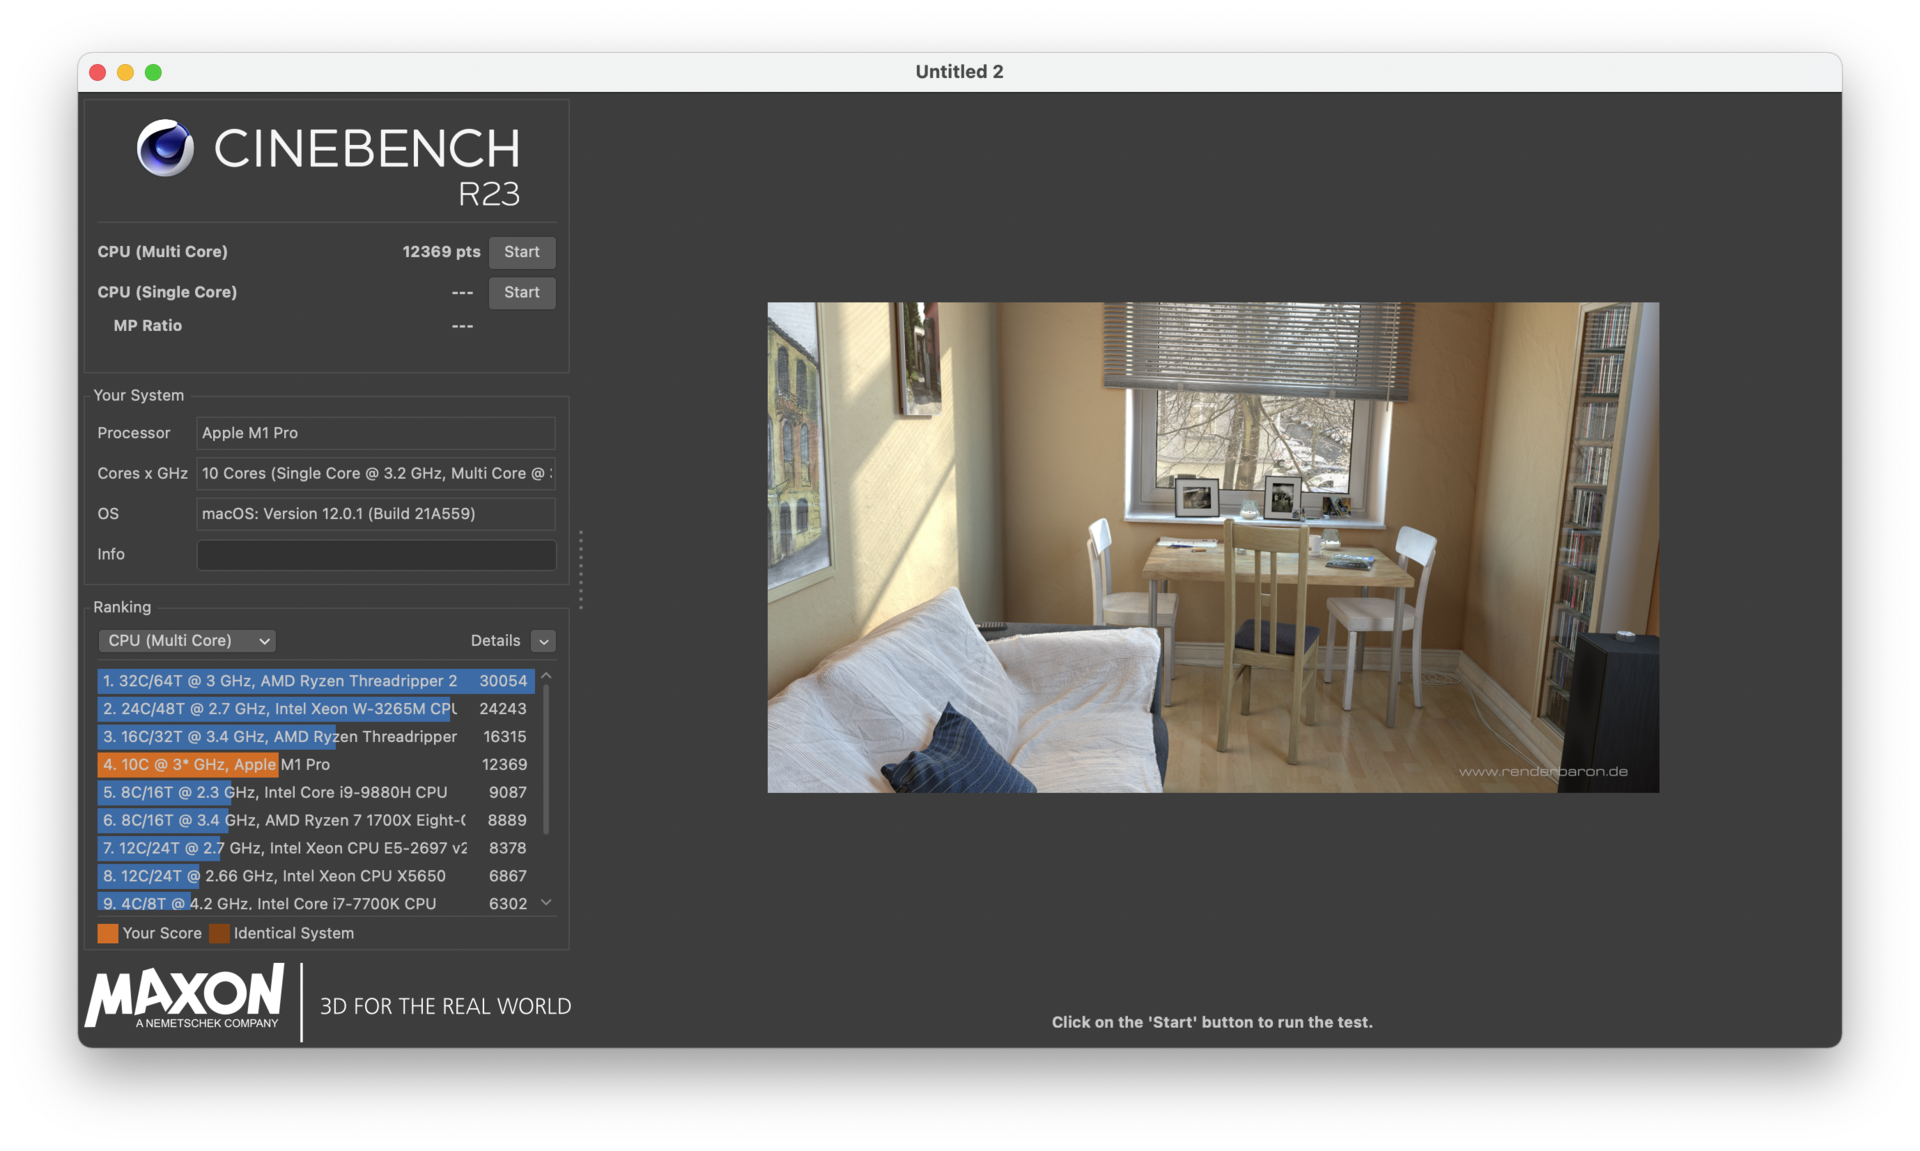
在MacBook Pro 16上原生运行的Cinebench R23 Multi测试,其结果是封装功耗为~30W,核心功耗为~27W。这与目前的AMD Ryzen 7 5800U(Zen 3,8个核心,16个线程),但性能较低(~20%),与较小的8核M1 Pro芯片。AMD和英特尔都有在45W领域性能更强的移动CPU,但它们的耗电量也更大。新款MacBook Pro 16的一个主要优势是性能稳定,无论是在持续工作负荷下还是在电池电量下都是如此。更多的CPU基准测试可在 这里.
Cinebench R15 Multi Loop
Cinebench R23: Multi Core | Single Core
Cinebench R20: CPU (Multi Core) | CPU (Single Core)
Cinebench R15: CPU Multi 64Bit | CPU Single 64Bit
Blender: v2.79 BMW27 CPU
7-Zip 18.03: 7z b 4 | 7z b 4 -mmt1
Geekbench 5.5: Multi-Core | Single-Core
HWBOT x265 Benchmark v2.2: 4k Preset
LibreOffice : 20 Documents To PDF
R Benchmark 2.5: Overall mean
| CPU Performance rating | |
| Average of class Multimedia | |
| Apple MacBook Pro 14 2021 M1 Pro Entry -8! | |
| Apple MacBook Pro 16 2021 M1 Pro -5! | |
| Average Apple M1 Pro -5! | |
| Lenovo ThinkPad P1 G4-20Y4S0KS00 | |
| HP ZBook Studio 15 G8 | |
| Razer Blade 15 Advanced (Mid 2021) -2! | |
| Dell XPS 15 9510 11800H RTX 3050 Ti OLED | |
| Apple MacBook Pro 16 2019 i9 5500M | |
| Cinebench R23 / Multi Core | |
| Average of class Multimedia (4861 - 33362, n=81, last 2 years) | |
| Apple MacBook Pro 16 2021 M1 Pro | |
| Average Apple M1 Pro (n=1) | |
| Razer Blade 15 Advanced (Mid 2021) | |
| HP ZBook Studio 15 G8 | |
| Lenovo ThinkPad P1 G4-20Y4S0KS00 | |
| Dell XPS 15 9510 11800H RTX 3050 Ti OLED | |
| Apple MacBook Pro 14 2021 M1 Pro Entry | |
| Apple MacBook Pro 16 2019 i9 5500M | |
| Apple MacBook Pro 16 2019 i9 5500M | |
| Cinebench R23 / Single Core | |
| Average of class Multimedia (1128 - 2459, n=73, last 2 years) | |
| HP ZBook Studio 15 G8 | |
| Lenovo ThinkPad P1 G4-20Y4S0KS00 | |
| Apple MacBook Pro 16 2021 M1 Pro | |
| Average Apple M1 Pro (n=1) | |
| Apple MacBook Pro 14 2021 M1 Pro Entry | |
| Razer Blade 15 Advanced (Mid 2021) | |
| Dell XPS 15 9510 11800H RTX 3050 Ti OLED | |
| Apple MacBook Pro 16 2019 i9 5500M | |
| Cinebench R20 / CPU (Multi Core) | |
| Average of class Multimedia (1887 - 12912, n=64, last 2 years) | |
| Razer Blade 15 Advanced (Mid 2021) | |
| Lenovo ThinkPad P1 G4-20Y4S0KS00 | |
| HP ZBook Studio 15 G8 | |
| Dell XPS 15 9510 11800H RTX 3050 Ti OLED | |
| Apple MacBook Pro 16 2019 i9 5500M | |
| Apple MacBook Pro 16 2019 i9 5500M | |
| Apple MacBook Pro 16 2021 M1 Pro | |
| Average Apple M1 Pro (n=1) | |
| Cinebench R20 / CPU (Single Core) | |
| Average of class Multimedia (425 - 853, n=64, last 2 years) | |
| HP ZBook Studio 15 G8 | |
| Lenovo ThinkPad P1 G4-20Y4S0KS00 | |
| Razer Blade 15 Advanced (Mid 2021) | |
| Dell XPS 15 9510 11800H RTX 3050 Ti OLED | |
| Apple MacBook Pro 16 2019 i9 5500M | |
| Apple MacBook Pro 16 2019 i9 5500M | |
| Apple MacBook Pro 16 2021 M1 Pro | |
| Average Apple M1 Pro (n=1) | |
| Cinebench R15 / CPU Multi 64Bit | |
| Average of class Multimedia (856 - 5224, n=68, last 2 years) | |
| Dell XPS 15 9510 11800H RTX 3050 Ti OLED | |
| Dell XPS 15 9510 11800H RTX 3050 Ti OLED | |
| Lenovo ThinkPad P1 G4-20Y4S0KS00 | |
| Razer Blade 15 Advanced (Mid 2021) | |
| HP ZBook Studio 15 G8 | |
| Apple MacBook Pro 16 2021 M1 Pro | |
| Average Apple M1 Pro (n=1) | |
| Apple MacBook Pro 16 2019 i9 5500M | |
| Apple MacBook Pro 16 2019 i9 5500M | |
| Apple MacBook Pro 14 2021 M1 Pro Entry | |
| Cinebench R15 / CPU Single 64Bit | |
| Average of class Multimedia (184.8 - 326, n=66, last 2 years) | |
| HP ZBook Studio 15 G8 | |
| Lenovo ThinkPad P1 G4-20Y4S0KS00 | |
| Dell XPS 15 9510 11800H RTX 3050 Ti OLED | |
| Razer Blade 15 Advanced (Mid 2021) | |
| Apple MacBook Pro 14 2021 M1 Pro Entry | |
| Apple MacBook Pro 16 2021 M1 Pro | |
| Average Apple M1 Pro (n=1) | |
| Apple MacBook Pro 16 2019 i9 5500M | |
| Apple MacBook Pro 16 2019 i9 5500M | |
| Blender / v2.79 BMW27 CPU | |
| Apple MacBook Pro 16 2019 i9 5500M | |
| Dell XPS 15 9510 11800H RTX 3050 Ti OLED | |
| Razer Blade 15 Advanced (Mid 2021) | |
| Lenovo ThinkPad P1 G4-20Y4S0KS00 | |
| HP ZBook Studio 15 G8 | |
| Average of class Multimedia (100 - 557, n=65, last 2 years) | |
| Apple MacBook Pro 16 2021 M1 Pro | |
| Average Apple M1 Pro (n=1) | |
| 7-Zip 18.03 / 7z b 4 | |
| Average of class Multimedia (29095 - 130368, n=62, last 2 years) | |
| Razer Blade 15 Advanced (Mid 2021) | |
| Lenovo ThinkPad P1 G4-20Y4S0KS00 | |
| HP ZBook Studio 15 G8 | |
| Dell XPS 15 9510 11800H RTX 3050 Ti OLED | |
| Apple MacBook Pro 16 2019 i9 5500M | |
| 7-Zip 18.03 / 7z b 4 -mmt1 | |
| Average of class Multimedia (3666 - 7545, n=63, last 2 years) | |
| HP ZBook Studio 15 G8 | |
| Lenovo ThinkPad P1 G4-20Y4S0KS00 | |
| Razer Blade 15 Advanced (Mid 2021) | |
| Dell XPS 15 9510 11800H RTX 3050 Ti OLED | |
| Apple MacBook Pro 16 2019 i9 5500M | |
| Geekbench 5.5 / Multi-Core | |
| Average of class Multimedia (4652 - 20422, n=62, last 2 years) | |
| Apple MacBook Pro 16 2021 M1 Pro | |
| Average Apple M1 Pro (n=1) | |
| Apple MacBook Pro 14 2021 M1 Pro Entry | |
| Lenovo ThinkPad P1 G4-20Y4S0KS00 | |
| Dell XPS 15 9510 11800H RTX 3050 Ti OLED | |
| HP ZBook Studio 15 G8 | |
| Apple MacBook Pro 16 2019 i9 5500M | |
| Geekbench 5.5 / Single-Core | |
| Average of class Multimedia (805 - 2974, n=62, last 2 years) | |
| Apple MacBook Pro 14 2021 M1 Pro Entry | |
| Apple MacBook Pro 16 2021 M1 Pro | |
| Average Apple M1 Pro (n=1) | |
| HP ZBook Studio 15 G8 | |
| Lenovo ThinkPad P1 G4-20Y4S0KS00 | |
| Dell XPS 15 9510 11800H RTX 3050 Ti OLED | |
| Apple MacBook Pro 16 2019 i9 5500M | |
| HWBOT x265 Benchmark v2.2 / 4k Preset | |
| Average of class Multimedia (5.26 - 36.1, n=63, last 2 years) | |
| Razer Blade 15 Advanced (Mid 2021) | |
| HP ZBook Studio 15 G8 | |
| Lenovo ThinkPad P1 G4-20Y4S0KS00 | |
| Dell XPS 15 9510 11800H RTX 3050 Ti OLED | |
| Apple MacBook Pro 16 2019 i9 5500M | |
| LibreOffice / 20 Documents To PDF | |
| Apple MacBook Pro 16 2019 i9 5500M | |
| Apple MacBook Pro 16 2019 i9 5500M | |
| Average of class Multimedia (23.9 - 146.7, n=64, last 2 years) | |
| HP ZBook Studio 15 G8 | |
| Dell XPS 15 9510 11800H RTX 3050 Ti OLED | |
| Razer Blade 15 Advanced (Mid 2021) | |
| Lenovo ThinkPad P1 G4-20Y4S0KS00 | |
| R Benchmark 2.5 / Overall mean | |
| Apple MacBook Pro 16 2019 i9 5500M | |
| Apple MacBook Pro 16 2019 i9 5500M | |
| Dell XPS 15 9510 11800H RTX 3050 Ti OLED | |
| HP ZBook Studio 15 G8 | |
| Razer Blade 15 Advanced (Mid 2021) | |
| Lenovo ThinkPad P1 G4-20Y4S0KS00 | |
| Average of class Multimedia (0.3604 - 0.947, n=63, last 2 years) | |
* ... smaller is better
系统性能
新的MacBook Pro 16是一台非常快的多媒体笔记本电脑,所有任务的执行都非常快,没有明显的延迟。由于Rosetta 2,你也可以使用英特尔应用程序,而且效果很好,但当你使用Photoshop或Premiere Pro等复杂的应用程序时,你会注意到性能上的差异,M1版本要快得多。我们包括了PugetBench的结果,但它们并不具有真正的代表性,因为它们只在模拟的英特尔版本的Adobe应用程序中运行。
跨平台基准测试CrossMark显示,配备M1 Pro的MacBook Pro 16比小型的MacBook Pro 14的优势,但ThinkPad P1 G4配有酷睿i7和GeForce RTX 3070更快。这显然取决于你使用的软件,如果你能利用ProRes,例如,配备M1芯片的MacBooks将有巨大优势。
CrossMark: Overall | Productivity | Creativity | Responsiveness
Photoshop PugetBench: Overall Score | GPU Score | General Score | Filter Score
Premiere Pro PugetBench: Overall Score 0.9 | Export 0.9 | Live Playback 0.9 | GPU 0.9
| Blackmagic RAW Speed Test / 12:1 8K Metal | |
| Average of class Multimedia (78 - 430, n=7, last 2 years) | |
| Apple MacBook Pro 16 2021 M1 Pro | |
| Average Apple M1 Pro, Apple M1 Pro 16-Core GPU (n=1) | |
| Apple MacBook Pro 14 2021 M1 Pro Entry | |
| Apple MacBook Pro 16 2019 i9 5500M | |
| Blackmagic RAW Speed Test / 12:1 8K CPU | |
| Average of class Multimedia (44 - 102, n=7, last 2 years) | |
| Apple MacBook Pro 16 2019 i9 5500M | |
| Apple MacBook Pro 16 2021 M1 Pro | |
| Average Apple M1 Pro, Apple M1 Pro 16-Core GPU (n=1) | |
| Apple MacBook Pro 14 2021 M1 Pro Entry | |
| CrossMark / Overall | |
| Average of class Multimedia (866 - 2728, n=67, last 2 years) | |
| Lenovo ThinkPad P1 G4-20Y4S0KS00 | |
| Apple MacBook Pro 16 2021 M1 Pro | |
| Average Apple M1 Pro, Apple M1 Pro 16-Core GPU (n=1) | |
| Apple MacBook Pro 14 2021 M1 Pro Entry | |
| Apple MacBook Pro 16 2019 i9 5500M | |
| CrossMark / Productivity | |
| Average of class Multimedia (931 - 2489, n=67, last 2 years) | |
| Lenovo ThinkPad P1 G4-20Y4S0KS00 | |
| Apple MacBook Pro 16 2021 M1 Pro | |
| Average Apple M1 Pro, Apple M1 Pro 16-Core GPU (n=1) | |
| Apple MacBook Pro 14 2021 M1 Pro Entry | |
| Apple MacBook Pro 16 2019 i9 5500M | |
| CrossMark / Creativity | |
| Average of class Multimedia (907 - 3465, n=67, last 2 years) | |
| Apple MacBook Pro 16 2021 M1 Pro | |
| Average Apple M1 Pro, Apple M1 Pro 16-Core GPU (n=1) | |
| Apple MacBook Pro 14 2021 M1 Pro Entry | |
| Lenovo ThinkPad P1 G4-20Y4S0KS00 | |
| Apple MacBook Pro 16 2019 i9 5500M | |
| CrossMark / Responsiveness | |
| Average of class Multimedia (605 - 2024, n=67, last 2 years) | |
| Lenovo ThinkPad P1 G4-20Y4S0KS00 | |
| Apple MacBook Pro 16 2021 M1 Pro | |
| Average Apple M1 Pro, Apple M1 Pro 16-Core GPU (n=1) | |
| Apple MacBook Pro 14 2021 M1 Pro Entry | |
| Apple MacBook Pro 16 2019 i9 5500M | |
| Photoshop PugetBench / Overall Score | |
| Lenovo ThinkPad P1 G4-20Y4S0KS00 | |
| Lenovo ThinkPad X1 Extreme G4-20Y5CTO1WW (3050 Ti) | |
| Apple MacBook Pro 16 2021 M1 Pro | |
| Average Apple M1 Pro, Apple M1 Pro 16-Core GPU (n=1) | |
| Apple MacBook Pro 16 2019 i9 5500M | |
| Apple MacBook Pro 14 2021 M1 Pro Entry | |
| Photoshop PugetBench / GPU Score | |
| Lenovo ThinkPad P1 G4-20Y4S0KS00 | |
| Apple MacBook Pro 16 2021 M1 Pro | |
| Average Apple M1 Pro, Apple M1 Pro 16-Core GPU (n=1) | |
| Lenovo ThinkPad X1 Extreme G4-20Y5CTO1WW (3050 Ti) | |
| Apple MacBook Pro 14 2021 M1 Pro Entry | |
| Apple MacBook Pro 16 2019 i9 5500M | |
| Photoshop PugetBench / General Score | |
| Lenovo ThinkPad P1 G4-20Y4S0KS00 | |
| Apple MacBook Pro 16 2021 M1 Pro | |
| Average Apple M1 Pro, Apple M1 Pro 16-Core GPU (n=1) | |
| Apple MacBook Pro 14 2021 M1 Pro Entry | |
| Lenovo ThinkPad X1 Extreme G4-20Y5CTO1WW (3050 Ti) | |
| Apple MacBook Pro 16 2019 i9 5500M | |
| Photoshop PugetBench / Filter Score | |
| Lenovo ThinkPad P1 G4-20Y4S0KS00 | |
| Lenovo ThinkPad X1 Extreme G4-20Y5CTO1WW (3050 Ti) | |
| Apple MacBook Pro 16 2019 i9 5500M | |
| Apple MacBook Pro 16 2021 M1 Pro | |
| Average Apple M1 Pro, Apple M1 Pro 16-Core GPU (n=1) | |
| Apple MacBook Pro 14 2021 M1 Pro Entry | |
| Premiere Pro PugetBench / Overall Score 0.9 | |
| Apple MacBook Pro 14 2021 M1 Pro Entry | |
| Lenovo ThinkPad P1 G4-20Y4S0KS00 | |
| Apple MacBook Pro 16 2021 M1 Pro | |
| Average Apple M1 Pro, Apple M1 Pro 16-Core GPU (n=1) | |
| Lenovo ThinkPad X1 Extreme G4-20Y5CTO1WW (3050 Ti) | |
| Premiere Pro PugetBench / Export 0.9 | |
| Lenovo ThinkPad P1 G4-20Y4S0KS00 | |
| Lenovo ThinkPad X1 Extreme G4-20Y5CTO1WW (3050 Ti) | |
| Apple MacBook Pro 16 2021 M1 Pro | |
| Average Apple M1 Pro, Apple M1 Pro 16-Core GPU (n=1) | |
| Apple MacBook Pro 14 2021 M1 Pro Entry | |
| Premiere Pro PugetBench / Live Playback 0.9 | |
| Apple MacBook Pro 14 2021 M1 Pro Entry | |
| Apple MacBook Pro 16 2021 M1 Pro | |
| Average Apple M1 Pro, Apple M1 Pro 16-Core GPU (n=1) | |
| Lenovo ThinkPad P1 G4-20Y4S0KS00 | |
| Lenovo ThinkPad X1 Extreme G4-20Y5CTO1WW (3050 Ti) | |
| Premiere Pro PugetBench / GPU 0.9 | |
| Lenovo ThinkPad P1 G4-20Y4S0KS00 | |
| Lenovo ThinkPad X1 Extreme G4-20Y5CTO1WW (3050 Ti) | |
| Apple MacBook Pro 16 2021 M1 Pro | |
| Average Apple M1 Pro, Apple M1 Pro 16-Core GPU (n=1) | |
| Apple MacBook Pro 14 2021 M1 Pro Entry | |
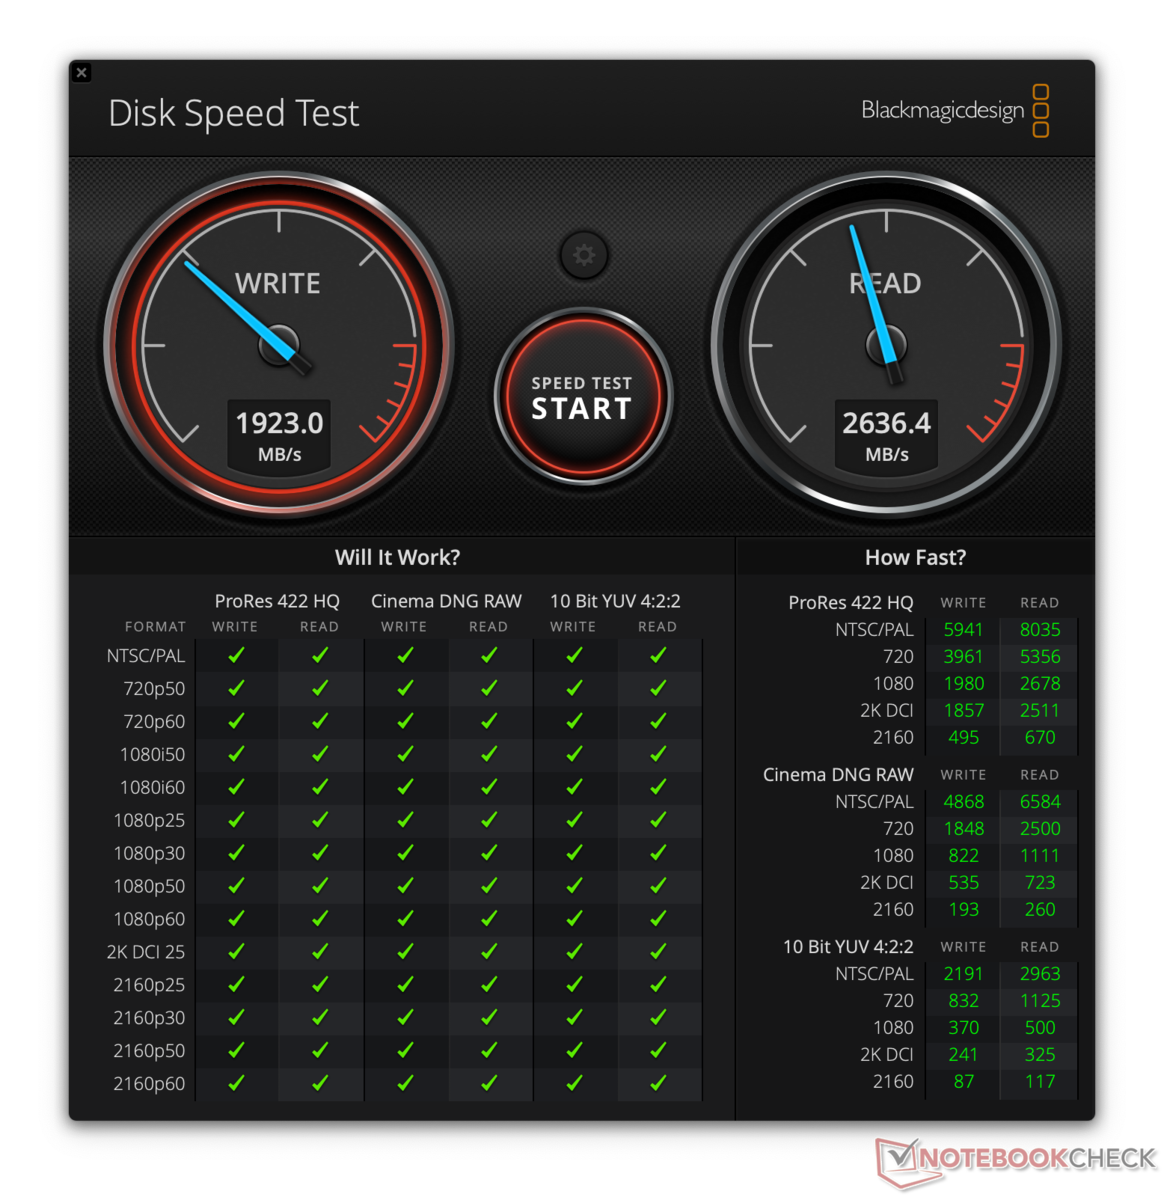
存储设备
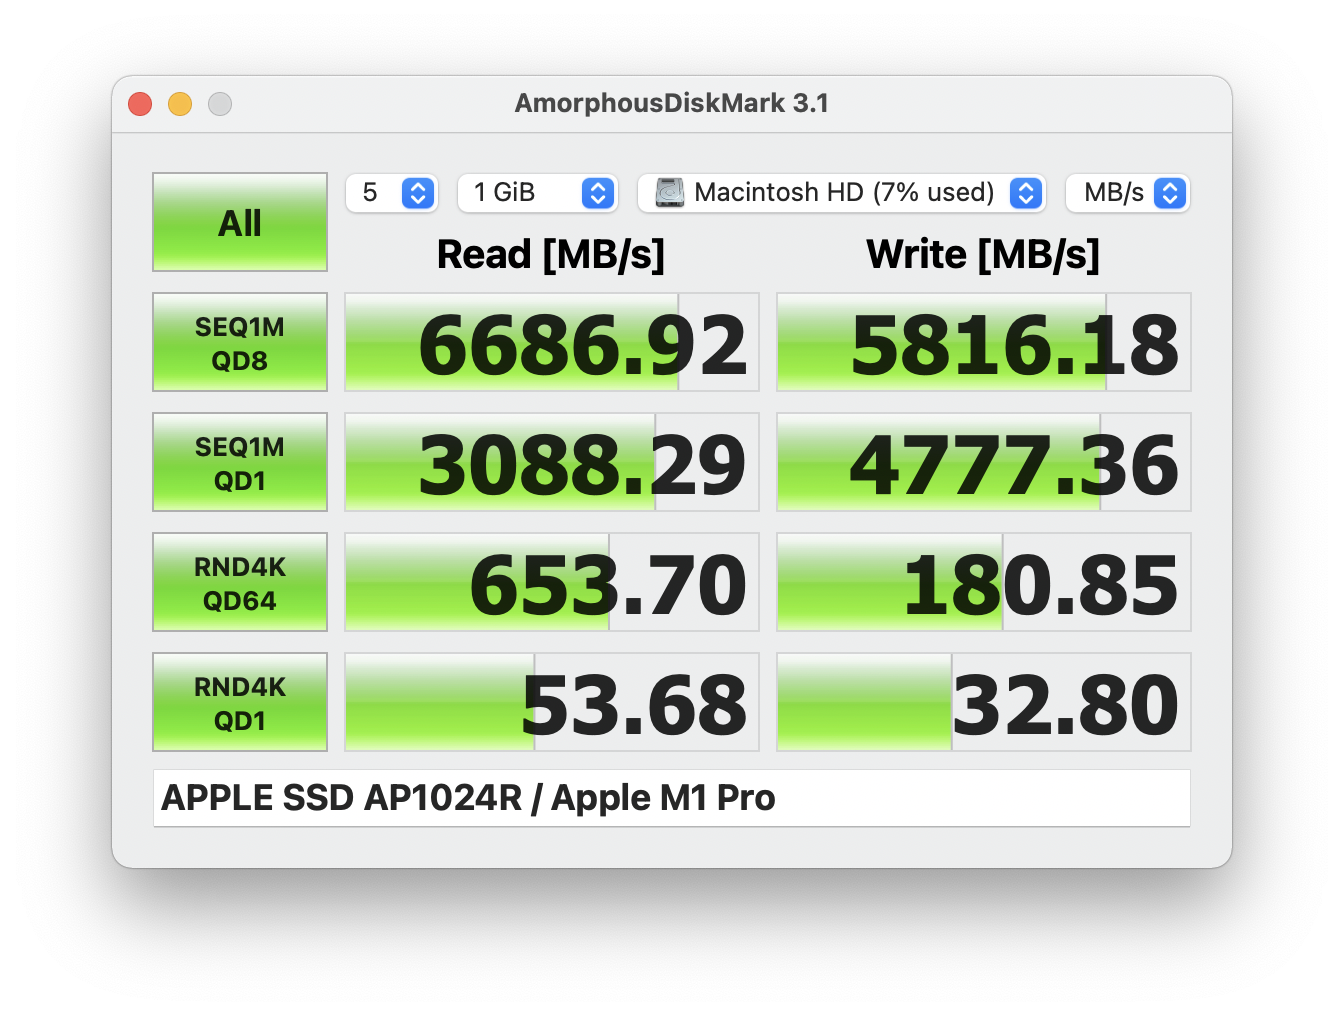
Apple ,新的MacBook Pro机型采用更快的PCIe 4.0存储。基本型号配备的是512GB固态硬盘;我们的测试装置配备的是可选的1TB硬盘。读取性能与较小的固态硬盘相似,但1TB型号在写入性能方面更快。总而言之,传输率非常好,超过5GB/s。在AmorphousDiskMark 3.1中,我们也看到非常好的结果。只有4K写入结果与高端PCIe固态硬盘相比相当低。Apple ,提供高达8TB的内部固态硬盘存储,但价格是天文数字(从512GB的固态硬盘跳到8TB是2760欧元(约3158美元))。更多的SSD基准数据列在 这里.
| Drive Performance rating - Percent | |
| Average of class Multimedia | |
| Apple MacBook Pro 16 2021 M1 Pro | |
| Average Apple SSD AP1024R | |
| Apple MacBook Pro 14 2021 M1 Pro Entry | |
| Apple MacBook Pro 16 2019 i9 5500M | |
GPU性能
与较小的MBP 14 Apple ,MBP 16只配备了最快的M1 Pro SoC,它提供10个CPU内核和16个GPU内核。与14核GPU相比,其优势仅有8-12%,这取决于基准测试,所以并不很大。Nvidia的RTX 3050 Ti在戴尔XPS 15明显更快,而在性能方面与Apple iGPU最接近的对手是专用的GeForce GTX 1650来自Nvidia。然而,M1 iGPU的效率更高,需要的电力更少。
游戏性能
与Windows笔记本电脑相比,MacBook Pro 16的游戏能力要有限得多,因为没有那么多游戏。只有一些游戏对macOS有原生支持,一些游戏可以模拟或通过CrossWare等附加软件运行(如通过Steam的TheWitcher 3或GTA V),但MacBook就是不属于游戏设备。显然,你也可以利用Apple"自己的街机游戏集 "的优势。
我们进行的游戏基准测试显示,新的MacBook Pro 16比MBP 14稍有优势。MBP 14配备14核GPU和旧的MacBook Pro 16配备专用的Radeon Pro 5500M.
| low | med. | high | ultra | |
|---|---|---|---|---|
| Deus Ex Mankind Divided (2016) | 54.2 | 43.1 | ||
| Civilization 6 (2016) | 45.5 | 45.5 | ||
| Shadow of the Tomb Raider (2018) | 63 | 57 | 50 | |
| Total War: Three Kingdoms (2019) | 114 | 69.6 | 43.8 | 31.8 |
| Borderlands 3 (2019) | 56.6 | 48 | 34.8 | 26.2 |
排放 - MBP 16非常安静
系统噪音
与14英寸机型相比,MacBook Pro 16的两个风扇要安静得多。14英寸机型即使在最大负荷的情况下,旋转速度也不会超过3000转/分钟,这导致了约37分贝(A)。如果你只对处理器或显卡施加压力,你几乎听不到超过27 dB(A)的声音(在游戏期间也是如此),因此,尽管性能很高,但该设备在正常环境下根本听不到。你可以通过工具将风扇手动设置到最大速度(约49 dB(A)),但我们在测试中从未达到这个水平。我们没有注意到任何电子噪音(如线圈啸叫)。
Noise level
| Idle |
| 24.7 / 24.7 / 24.7 dB(A) |
| Load |
| 26.1 / 37.4 dB(A) |
 | ||
30 dB silent 40 dB(A) audible 50 dB(A) loud |
||
min: | ||
| Apple MacBook Pro 16 2021 M1 Pro M1 Pro 16-Core GPU, M1 Pro, Apple SSD AP1024R | Apple MacBook Pro 16 2019 i9 5500M Radeon Pro 5500M, i9-9880H, Apple SSD AP1024 7171 | Lenovo ThinkPad P1 G4-20Y4S0KS00 GeForce RTX 3070 Laptop GPU, i7-11850H, Samsung PM9A1 MZVL21T0HCLR | Dell XPS 15 9510 11800H RTX 3050 Ti OLED GeForce RTX 3050 Ti Laptop GPU, i7-11800H, Micron 2300 512GB MTFDHBA512TDV | HP ZBook Studio 15 G8 GeForce RTX 3070 Laptop GPU, i9-11950H, Samsung PM981a MZVLB2T0HALB | Razer Blade 15 Advanced (Mid 2021) GeForce RTX 3080 Laptop GPU, i7-11800H, SSSTC CA6-8D1024 | Apple MacBook Pro 14 2021 M1 Pro Entry M1 Pro 14-Core GPU, M1 Pro 8-Core, Apple SSD AP0512 | |
|---|---|---|---|---|---|---|---|
| Noise | -29% | -13% | -4% | -15% | -18% | -7% | |
| off / environment * (dB) | 24.7 | 29.8 -21% | 23.8 4% | 23.8 4% | 23.5 5% | 25.1 -2% | 24.8 -0% |
| Idle Minimum * (dB) | 24.7 | 29.9 -21% | 23.8 4% | 23.8 4% | 25.3 -2% | 25.3 -2% | 24.8 -0% |
| Idle Average * (dB) | 24.7 | 29.9 -21% | 23.8 4% | 23.8 4% | 25.3 -2% | 25.3 -2% | 24.8 -0% |
| Idle Maximum * (dB) | 24.7 | 29.9 -21% | 28.3 -15% | 23.8 4% | 25.3 -2% | 25.3 -2% | 24.8 -0% |
| Load Average * (dB) | 26.1 | 43 -65% | 38.6 -48% | 36 -38% | 41.2 -58% | 42 -61% | 27.8 -7% |
| Load Maximum * (dB) | 37.4 | 46.1 -23% | 47.4 -27% | 38.2 -2% | 49.4 -32% | 51.6 -38% | 49.5 -32% |
| Witcher 3 ultra * (dB) | 45.4 | 47.4 | 36 | 49.4 | 45.6 | 27.8 |
* ... smaller is better
温度
冷却系统在M1 Pro上没有问题,尽管有安静的风扇,但在负载下表面温度并不高。特别是键盘比较小的MBP 14保持较低的温度。在大多数日常工作中,你几乎不会注意到任何升温,M1 Pro的高效架构在这方面肯定会得到回报,因为Windows的竞争对手会达到明显的高温度。在压力测试中,M1 Pro的性能也很稳定,这对于强大的Windows笔记本电脑来说是不可能的事。
(±) The maximum temperature on the upper side is 41 °C / 106 F, compared to the average of 36.8 °C / 98 F, ranging from 21 to 71 °C for the class Multimedia.
(+) The bottom heats up to a maximum of 39 °C / 102 F, compared to the average of 39.1 °C / 102 F
(+) In idle usage, the average temperature for the upper side is 22.8 °C / 73 F, compared to the device average of 31.3 °C / 88 F.
(+) The palmrests and touchpad are cooler than skin temperature with a maximum of 29 °C / 84.2 F and are therefore cool to the touch.
(±) The average temperature of the palmrest area of similar devices was 28.7 °C / 83.7 F (-0.3 °C / -0.5 F).
发言人
新款MacBook Pro 16中的扬声器与旧款中已经很出色的声音系统相比有所改进。旧型号甚至性能略好于MacBook Pro 14在频率图上的表现。从主观上讲,考虑到机箱的尺寸,声音非常好,由于有四个低音单元,甚至有一些低音来自于薄薄的机箱。具有6个扬声器的音响系统也支持3D音频,而且效果出奇地好。
Apple MacBook Pro 16 2021 M1 Pro audio analysis
(+) | speakers can play relatively loud (84.7 dB)
Bass 100 - 315 Hz
(+) | good bass - only 3.8% away from median
(+) | bass is linear (5.2% delta to prev. frequency)
Mids 400 - 2000 Hz
(+) | balanced mids - only 1.3% away from median
(+) | mids are linear (2.1% delta to prev. frequency)
Highs 2 - 16 kHz
(+) | balanced highs - only 1.9% away from median
(+) | highs are linear (2.7% delta to prev. frequency)
Overall 100 - 16.000 Hz
(+) | overall sound is linear (4.6% difference to median)
Compared to same class
» 0% of all tested devices in this class were better, 0% similar, 100% worse
» The best had a delta of 5%, average was 17%, worst was 45%
Compared to all devices tested
» 0% of all tested devices were better, 0% similar, 100% worse
» The best had a delta of 4%, average was 24%, worst was 134%
Apple MacBook Pro 14 2021 M1 Pro Entry audio analysis
(+) | speakers can play relatively loud (84.9 dB)
Bass 100 - 315 Hz
(+) | good bass - only 4.3% away from median
(+) | bass is linear (5.9% delta to prev. frequency)
Mids 400 - 2000 Hz
(+) | balanced mids - only 1.1% away from median
(+) | mids are linear (1.9% delta to prev. frequency)
Highs 2 - 16 kHz
(+) | balanced highs - only 2.9% away from median
(+) | highs are linear (3% delta to prev. frequency)
Overall 100 - 16.000 Hz
(+) | overall sound is linear (5.6% difference to median)
Compared to same class
» 2% of all tested devices in this class were better, 1% similar, 97% worse
» The best had a delta of 5%, average was 17%, worst was 45%
Compared to all devices tested
» 0% of all tested devices were better, 0% similar, 100% worse
» The best had a delta of 4%, average was 24%, worst was 134%
Apple MacBook Pro 16 2019 i9 5500M audio analysis
(+) | speakers can play relatively loud (82.3 dB)
Bass 100 - 315 Hz
(+) | good bass - only 2.3% away from median
(+) | bass is linear (5% delta to prev. frequency)
Mids 400 - 2000 Hz
(+) | balanced mids - only 2.7% away from median
(+) | mids are linear (3.4% delta to prev. frequency)
Highs 2 - 16 kHz
(+) | balanced highs - only 2.1% away from median
(+) | highs are linear (2.6% delta to prev. frequency)
Overall 100 - 16.000 Hz
(+) | overall sound is linear (6.9% difference to median)
Compared to same class
» 5% of all tested devices in this class were better, 1% similar, 94% worse
» The best had a delta of 5%, average was 17%, worst was 45%
Compared to all devices tested
» 1% of all tested devices were better, 0% similar, 99% worse
» The best had a delta of 4%, average was 24%, worst was 134%
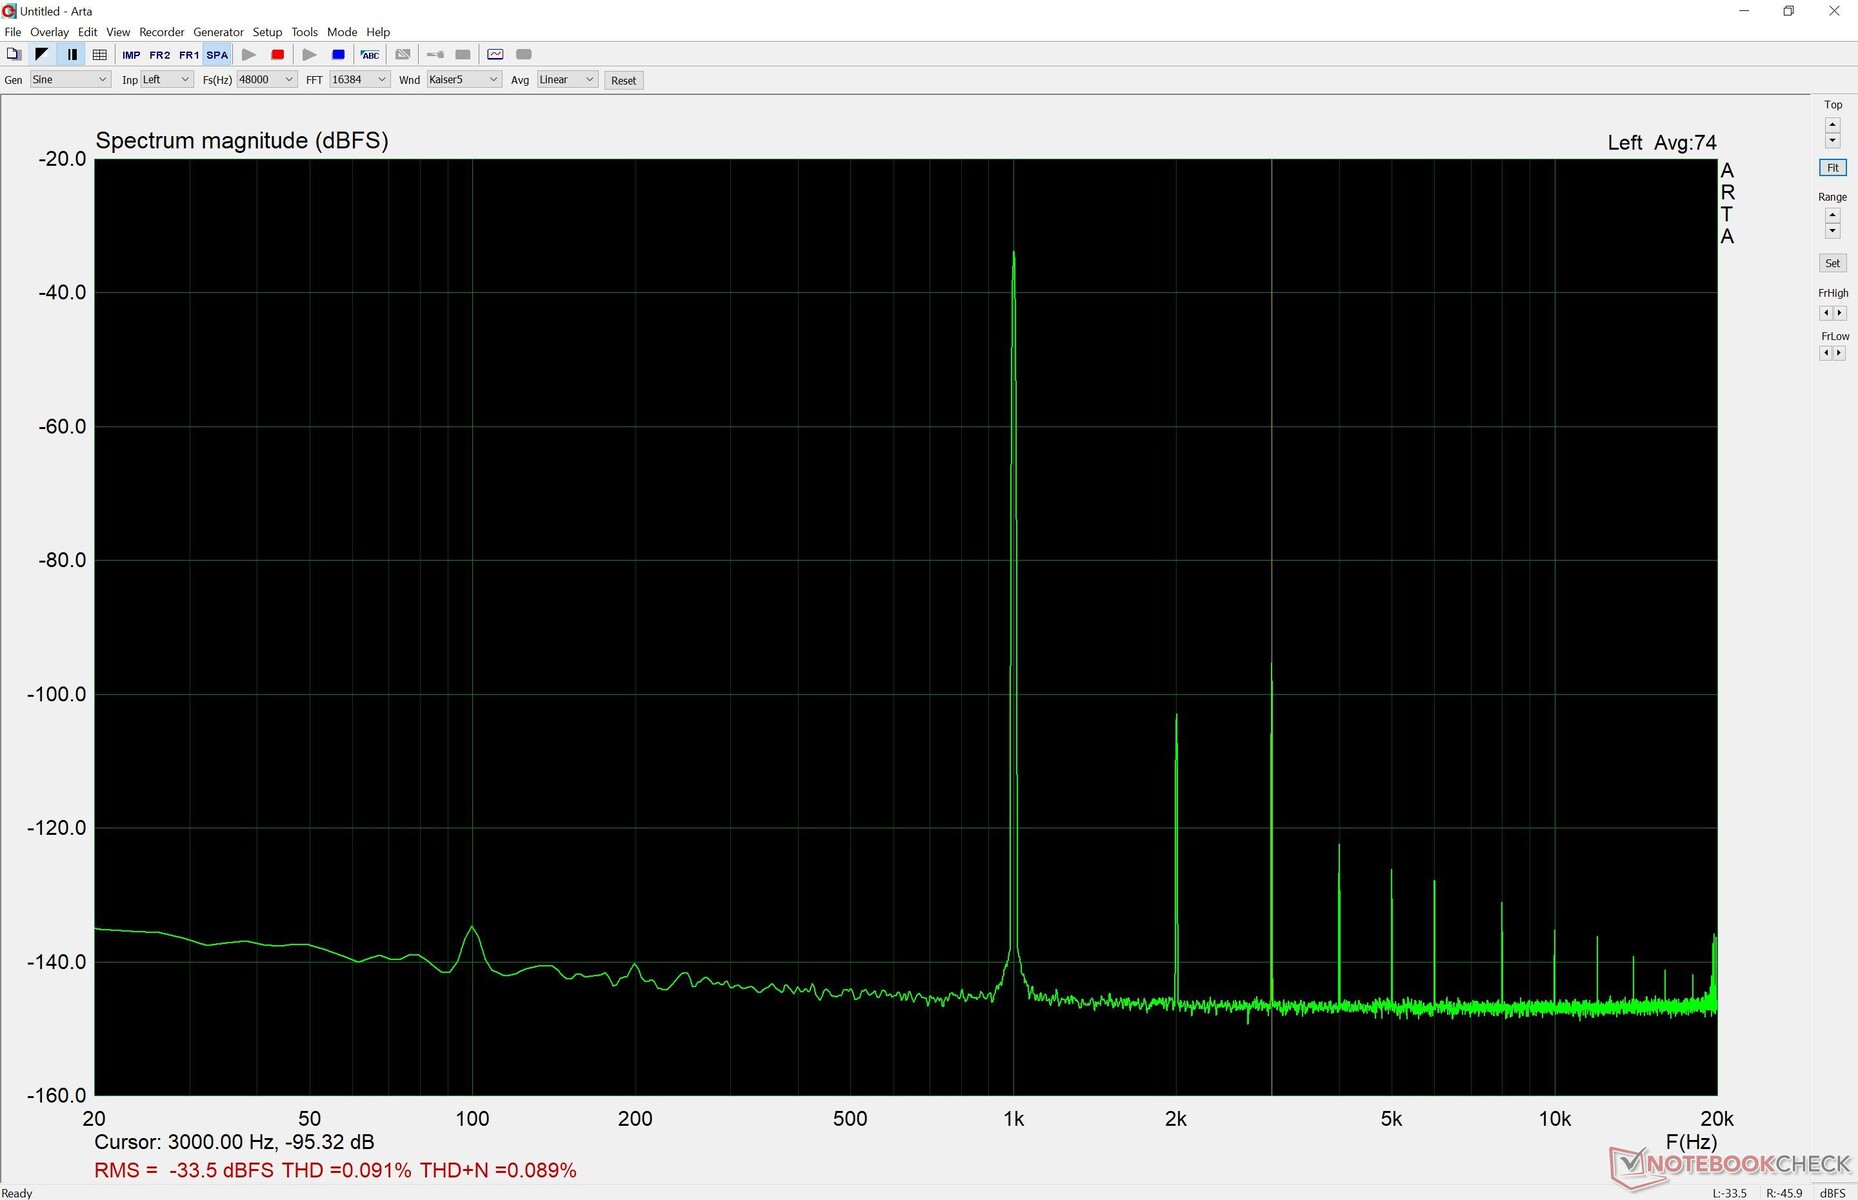
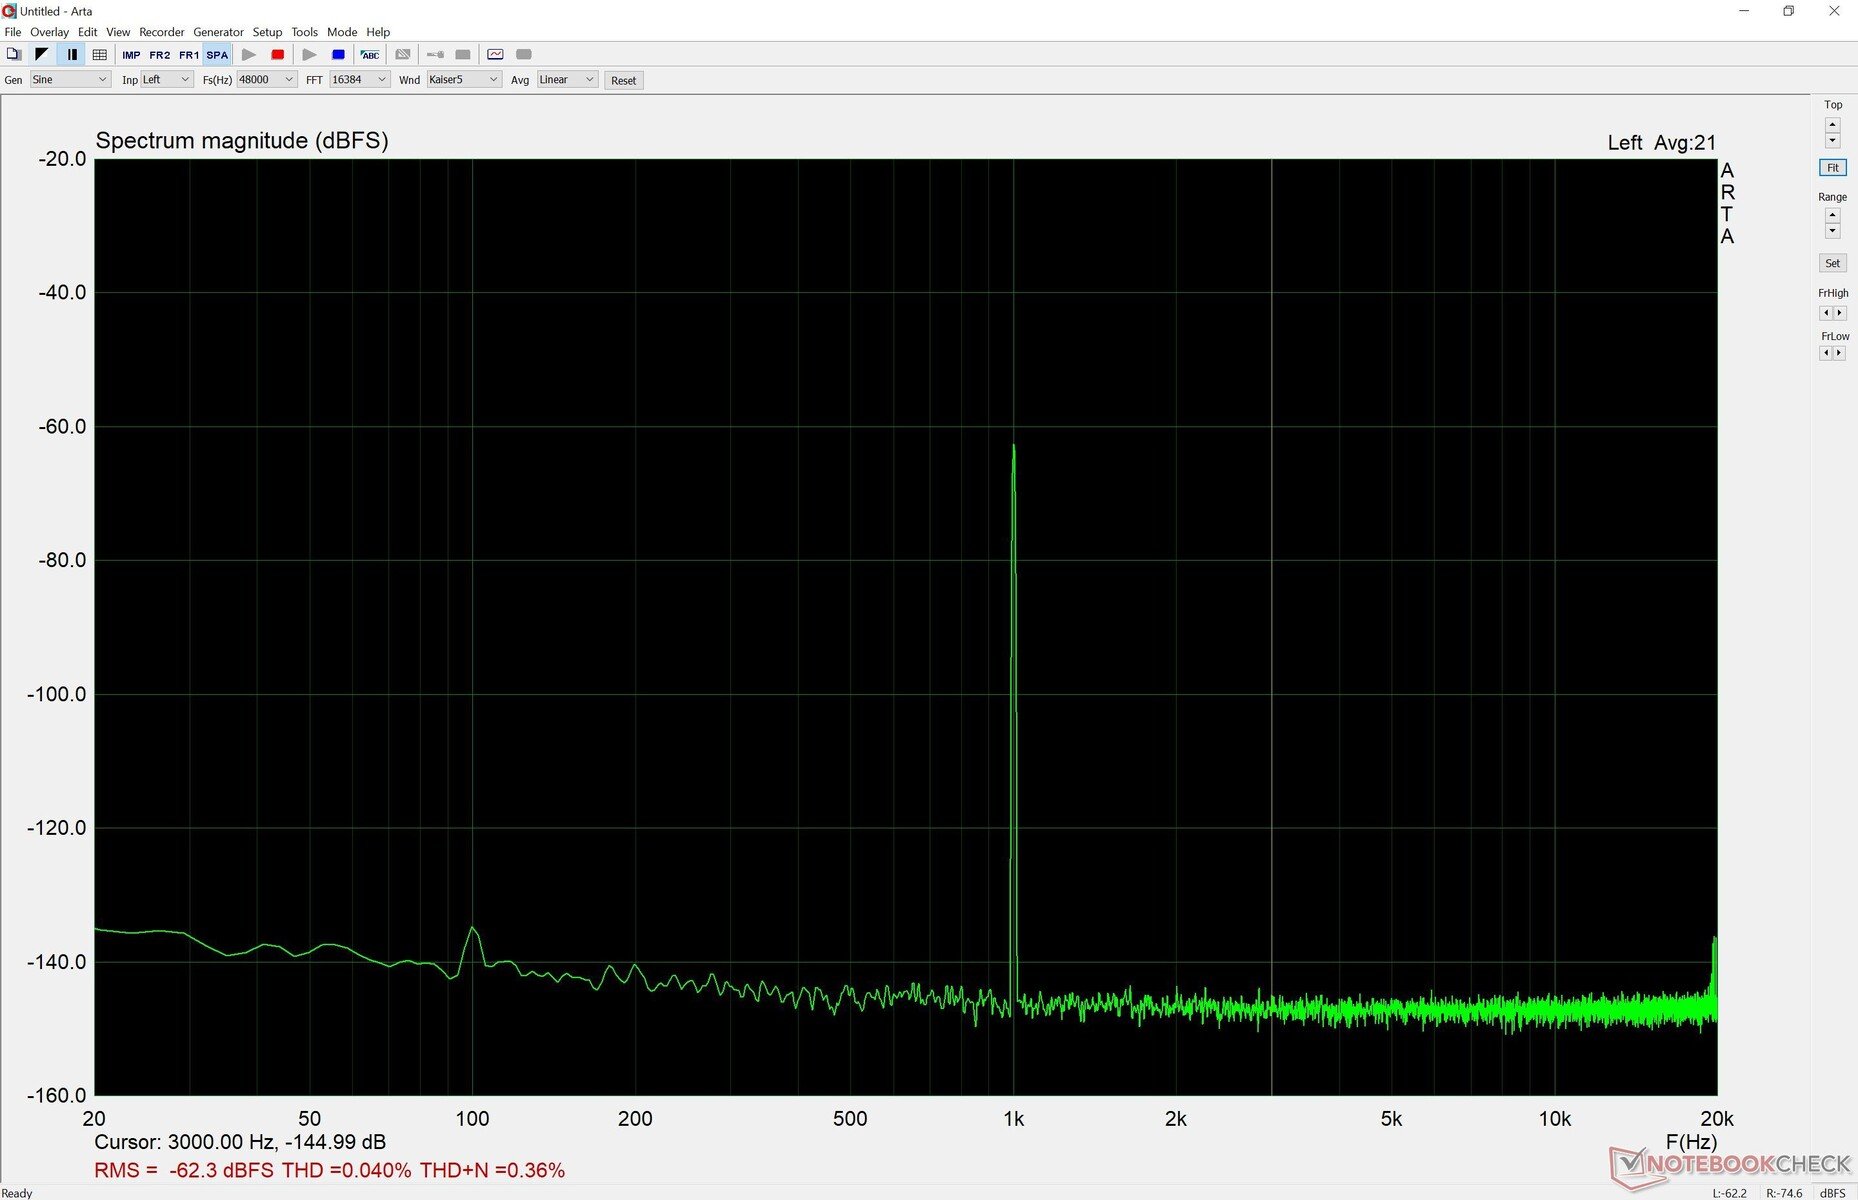
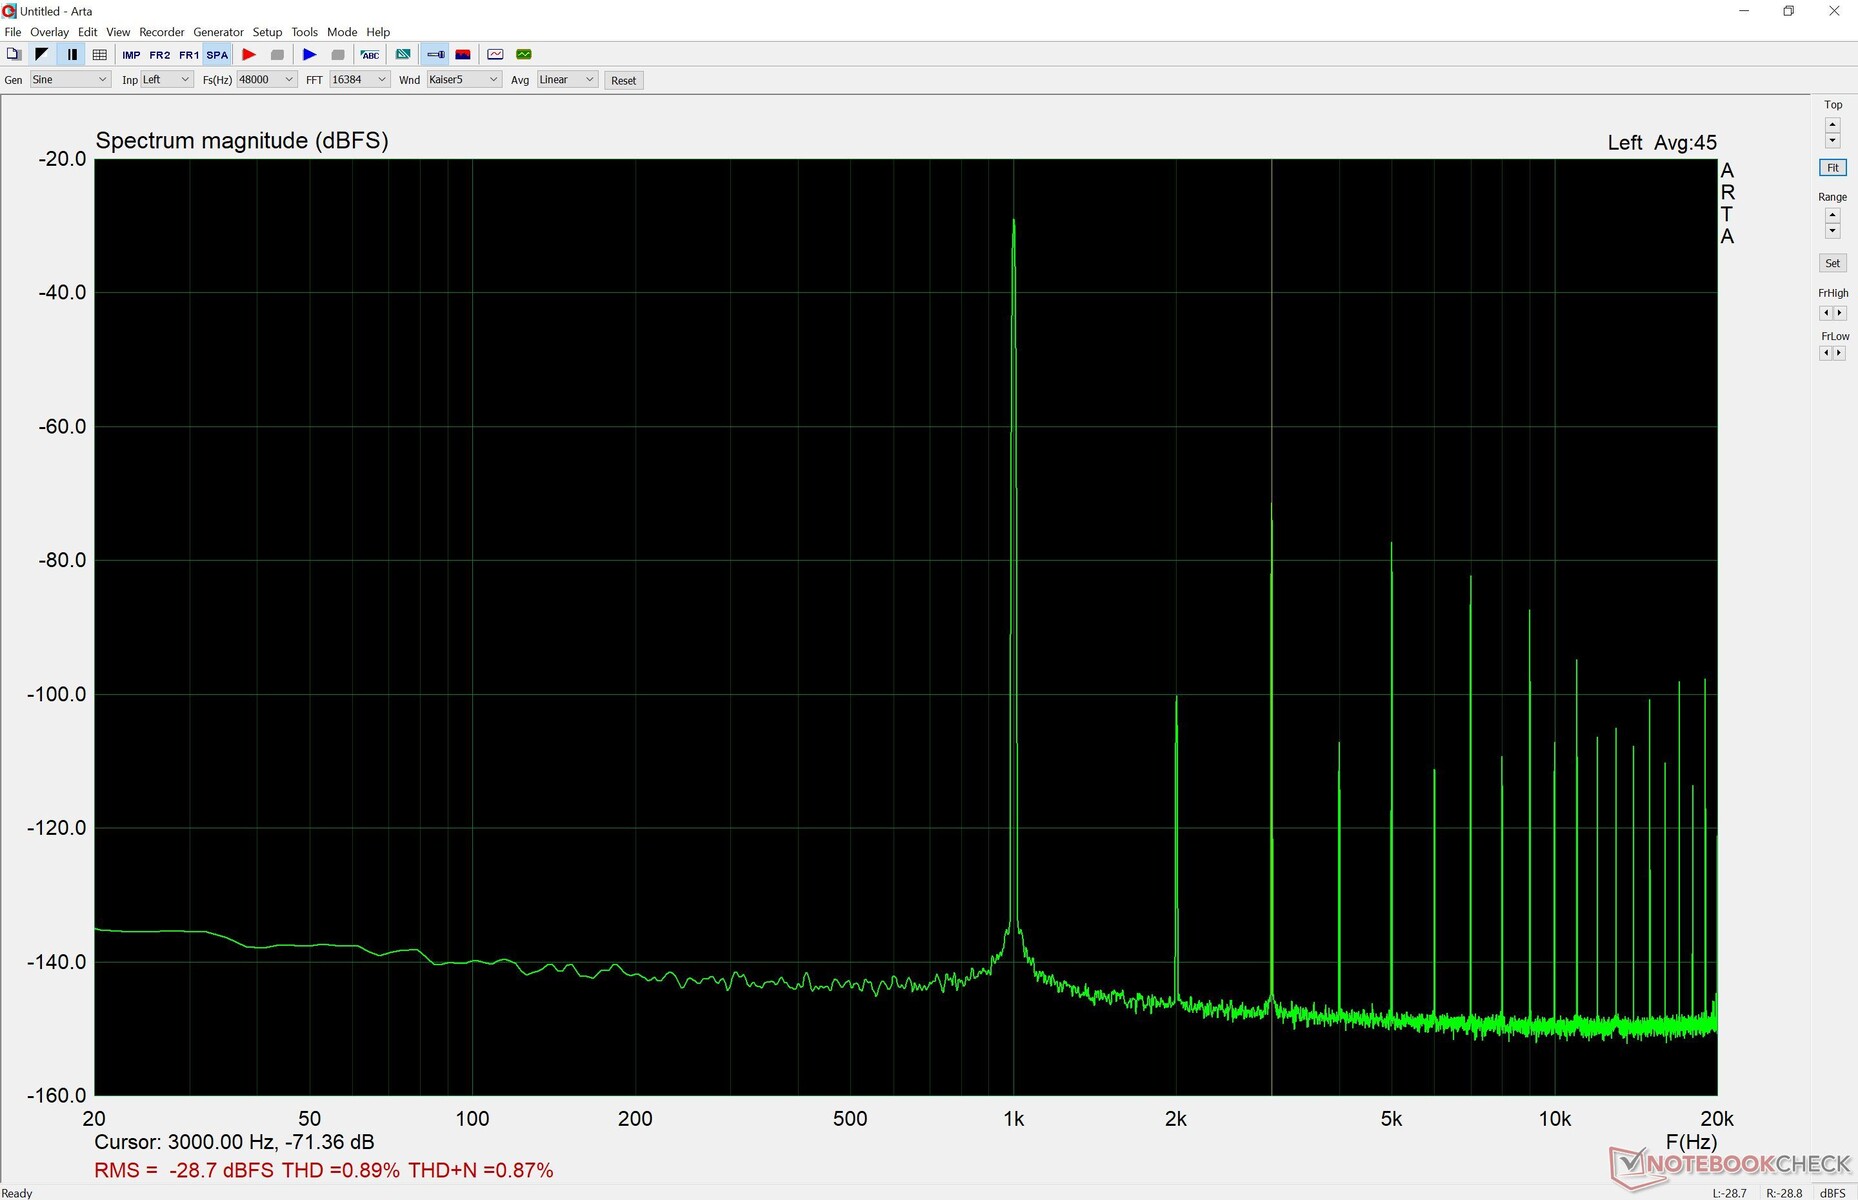
Apple 还改进了集成的耳机插孔,它现在支持阻抗更高的耳机,但我们的测量清楚地表明,在更高的音量下有失真现象。这意味着它不能取代高质量的外部放大器,但它现在支持高阻抗的耳机。
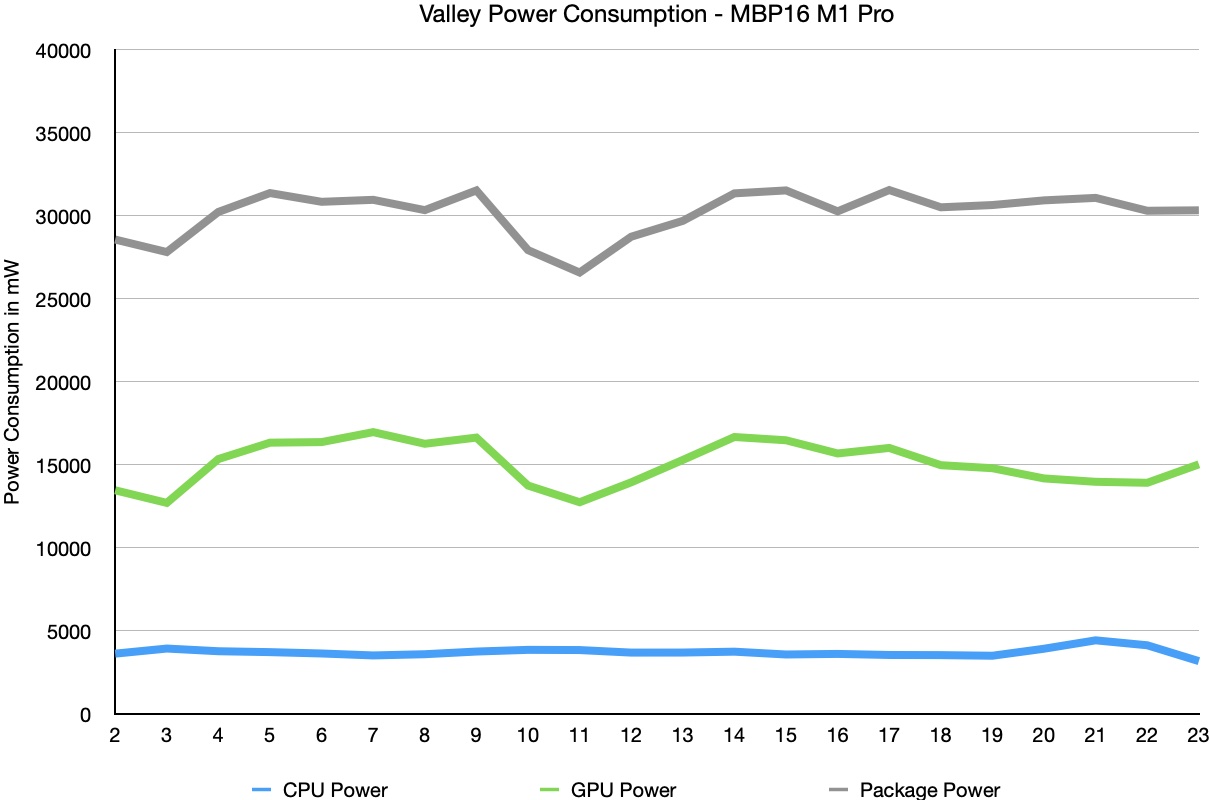
能源管理--M1 Pro非常高效
消耗功率
我们的空闲测量结果显示,与之前使用SDR内容的MacBook Pro 16类似,但当你消耗HDR内容时,会出现高达30W的峰值。我们确定负载下的平均功率略高于50W,在压力测试中高达90W,这意味着MBP 16再次比Windows的竞争对手高效得多。对于MBP 16的基本型号来说,140W的电源适配器几乎太强大了,我们有点惊讶Apple ,没有省钱,只用96W的电源适配器发货。这将不支持快速充电,但这也是较小的MBP 14的基本型号的情况。较小的MBP 14的基本型号也是如此,该型号默认使用67瓦的电源。
| Off / Standby | |
| Idle | |
| Load |
|
Key:
min: | |
| Apple MacBook Pro 16 2021 M1 Pro M1 Pro, M1 Pro 16-Core GPU, Apple SSD AP1024R, Mini-LED, 3456x2234, 16.2" | Apple MacBook Pro 16 2019 i9 5500M i9-9880H, Radeon Pro 5500M, Apple SSD AP1024 7171, IPS, 3072x1920, 16" | Lenovo ThinkPad P1 G4-20Y4S0KS00 i7-11850H, GeForce RTX 3070 Laptop GPU, Samsung PM9A1 MZVL21T0HCLR, IPS LED, 3840x2400, 16" | Dell XPS 15 9510 11800H RTX 3050 Ti OLED i7-11800H, GeForce RTX 3050 Ti Laptop GPU, Micron 2300 512GB MTFDHBA512TDV, OLED, 3456x2160, 15.6" | HP ZBook Studio 15 G8 i9-11950H, GeForce RTX 3070 Laptop GPU, Samsung PM981a MZVLB2T0HALB, OLED, 3840x2160, 15.6" | Razer Blade 15 Advanced (Mid 2021) i7-11800H, GeForce RTX 3080 Laptop GPU, SSSTC CA6-8D1024, IPS, 1920x1080, 15.6" | Apple MacBook Pro 14 2021 M1 Pro Entry M1 Pro 8-Core, M1 Pro 14-Core GPU, Apple SSD AP0512, Mini-LED, 3024x1964, 14.2" | Average Apple M1 Pro 16-Core GPU | Average of class Multimedia | |
|---|---|---|---|---|---|---|---|---|---|
| Power Consumption | -9% | -58% | -17% | -87% | -145% | 24% | 0% | -1% | |
| Idle Minimum * (Watt) | 5 | 3.7 26% | 8.1 -62% | 7.6 -52% | 11 -120% | 19.5 -290% | 2.9 42% | 5 ? -0% | 5.71 ? -14% |
| Idle Average * (Watt) | 15.1 | 12.1 20% | 20.2 -34% | 9.9 34% | 18.8 -25% | 23.3 -54% | 11.6 23% | 15.1 ? -0% | 10.1 ? 33% |
| Idle Maximum * (Watt) | 15.5 | 17 -10% | 21.9 -41% | 10.8 30% | 31.7 -105% | 40.1 -159% | 11.9 23% | 15.5 ? -0% | 12.4 ? 20% |
| Load Average * (Watt) | 54 | 91.5 -69% | 88.2 -63% | 81 -50% | 105.2 -95% | 98.9 -83% | 49.5 8% | 54 ? -0% | 65 ? -20% |
| Load Maximum * (Watt) | 90 | 102.3 -14% | 170.6 -90% | 131 -46% | 171.8 -91% | 214 -138% | 68.5 24% | 90 ? -0% | 112.2 ? -25% |
| Witcher 3 ultra * (Watt) | 103 | 149 | 76.2 | 148 | 174 | 58.2 |
* ... smaller is better
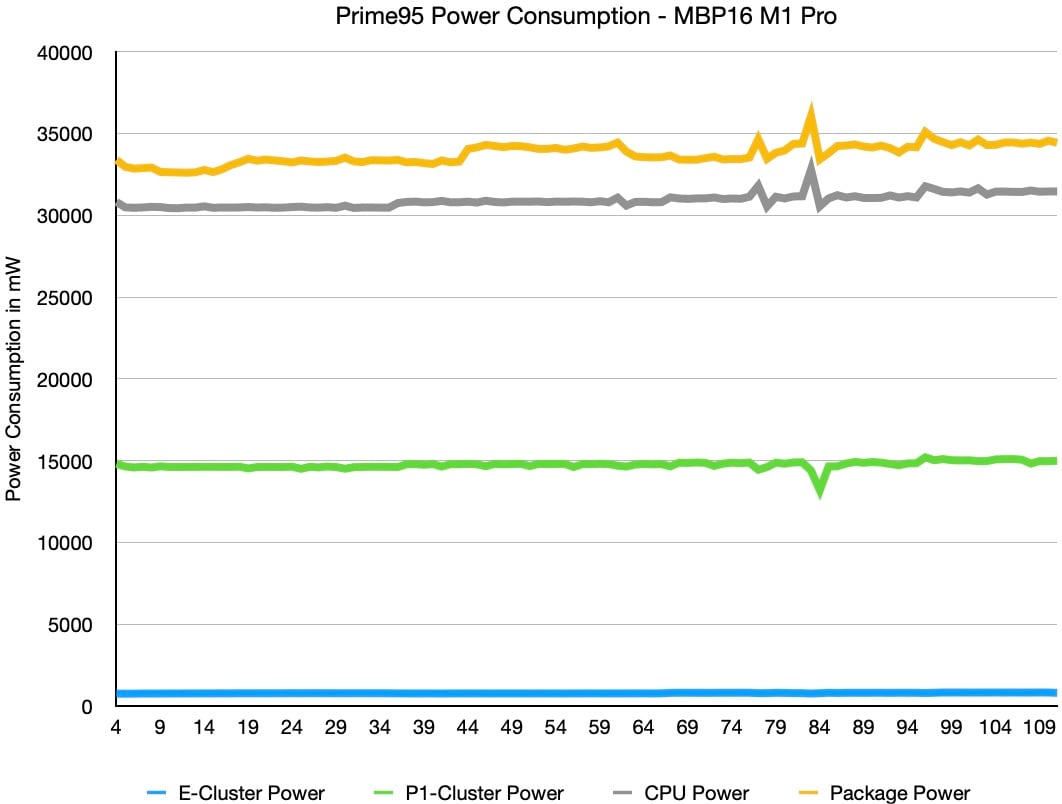
当我们看一下内部消耗时,M1 Pro也是非常高效的(通过powermetrics),在基准测试开始时没有节流或涡轮增压峰值。
电池运行时间
16英寸MacBook Pro的电池容量为99.6Wh,因此与较小的MBP 14(69.9Wh)相比要高得多,在我们的测试中,电池运行时间也更好。我们的Wi-Fi测试在调整亮度为150尼特的情况下运行了近17个小时,在最大SDR亮度下仍有8小时左右。与以前的macOS版本相反,我们在使用全屏模式时没有看到差异。在我们采用M1 Max SoC的MBP 16(目前也在评测中)的测试装置上,一个最大亮度的HDR视频运行了约4.5小时,这比较小的MBP 14的4小时要长一些。另一方面,150尼特的标准视频可运行约17.5小时。
140瓦的电源适配器支持快速充电,30分钟后可获得50%的容量。你也可以通过USB-C端口为MBP 16充电,但它们不支持快速充电。
我们没有注意到电池供电时CPU或GPU的性能下降。与Windows竞争产品相比,这是MacBook Pro 16的又一优势,在Windows竞争产品中,强大的系统在电池供电时总是会降低性能(尤其是dGPU)。
| Apple MacBook Pro 16 2021 M1 Pro M1 Pro, M1 Pro 16-Core GPU, 99.6 Wh | Apple MacBook Pro 16 2019 i9 5500M i9-9880H, Radeon Pro 5500M, 99.8 Wh | Lenovo ThinkPad P1 G4-20Y4S0KS00 i7-11850H, GeForce RTX 3070 Laptop GPU, 90 Wh | Dell XPS 15 9510 11800H RTX 3050 Ti OLED i7-11800H, GeForce RTX 3050 Ti Laptop GPU, 86 Wh | HP ZBook Studio 15 G8 i9-11950H, GeForce RTX 3070 Laptop GPU, 83 Wh | Razer Blade 15 Advanced (Mid 2021) i7-11800H, GeForce RTX 3080 Laptop GPU, 80 Wh | Apple MacBook Pro 14 2021 M1 Pro Entry M1 Pro 8-Core, M1 Pro 14-Core GPU, 69.9 Wh | Average of class Multimedia | |
|---|---|---|---|---|---|---|---|---|
| Battery runtime | -37% | -59% | -50% | -63% | -65% | -17% | -18% | |
| H.264 (h) | 17.5 | 9.7 -45% | 7.2 -59% | 10.4 -41% | 15 -14% | 16.4 ? -6% | ||
| WiFi v1.3 (h) | 16.9 | 12 -29% | 7 -59% | 7 -59% | 6.2 -63% | 5.9 -65% | 13.6 -20% | 12 ? -29% |
| Witcher 3 ultra (h) | 0.9 | |||||||
| Load (h) | 1 | 1.2 | 1.8 | 1.8 | 1.2 | 1.675 ? | ||
| Reader / Idle (h) | 12.9 | 25.2 ? |
Pros
Cons
结论 - 新设计在MacBook Pro 16上效果更好
与较小的14英寸机型相比,新的MacBook Pro 16给人留下的整体印象略好。 较小的14英寸机型.笨重的机箱设计并不十分明显,M1 Pro的完整版更有说服力。冷却解决方案也更安静,在大多数任务中,你几乎听不到更多安静的杂音。Apple"自己的处理器的高效率提高了几个方面。除了安静的风扇之外,它还提供了良好的性能数据,而且性能非常稳定,无论是在主电源还是电池电源上。其他配有专用GPU的多媒体笔记本电脑在这些方面无法与新的MBP 16相提并论。
当我们谈及屏幕时,我们几乎可以重复我们对MBP 14的评价。图像质量非常好,尤其是HDR内容。标准SDR内容的500尼特的限制应该由Apple ,我们会在户外欣赏到更高的亮度值。持续的PWM闪烁也会给一些用户带来问题。
采用Mini-LED技术的新型液体视网膜XDR显示屏并不完美,但其画质令人惊叹,尤其是HDR内容。与较小的14英寸机型相比,扬声器的效果也更好一些。
连接标准也没有真正满足高端期望,因为Wi-Fi模块、HDMI端口以及读卡器都有改进的余地。此外,几乎没有任何维护选项,存储和内存升级也非常昂贵。然而,好在Apple ,仍然提供那么多的内部存储(高达8TB)。
新款MacBook Pro 16是一款令人印象深刻的多媒体笔记本电脑,绝对是内容创作者的最佳设备之一,特别是当他们在处理HDR内容时。尽管性能很高,但该设备保持非常安静和凉爽,这在目前的同类Windows笔记本电脑上是不可能的。
凭借高性能和HDR面板,新MacBook Pro 16主要是为内容创作者设计的,如果他们需要更多的内存和/或更多的GPU性能,他们可能会从升级到可选的M1 Max芯片中受益。如果你不确定你是否需要升级,你可能用M1 Pro就可以了。与MBP 14不同,更大的MBP 16不提供较慢的M1 Pro版本,因此更容易选择适合你的SKU。
如果你只是想买一台高端多媒体笔记本电脑,拥有出色的屏幕、长的电池运行时间和出色的扬声器,并且愿意支付高价,那么MacBook Pro 16也是一个好选择。然而,你应该知道,MacBook Pro不是游戏笔记本电脑,因为macOS的大片游戏不多。在这种情况下,我们会推荐一个Windows设备来代替它(如戴尔XPS 15或联想ThinkPad X1 Extreme G4),因为有更多的游戏可用。其他领域(如CAD、工程)也取决于软件支持。
价格和可用性
新款MacBook Pro 16的供应目前是有限的。最好的选择是在Apple"零售店 "提货,在那里你可以以2699美元的价格买到我们的测试设备和1TB SDD,或者以2499美元买到512GB SSD存储的基本型号。
Apple MacBook Pro 16 2021 M1 Pro
- 11/13/2021 v7 (old)
Andreas Osthoff
Price comparison

