戴尔XPS 17 9720 RTX 3060笔记本电脑回顾。比以前快50%的处理器
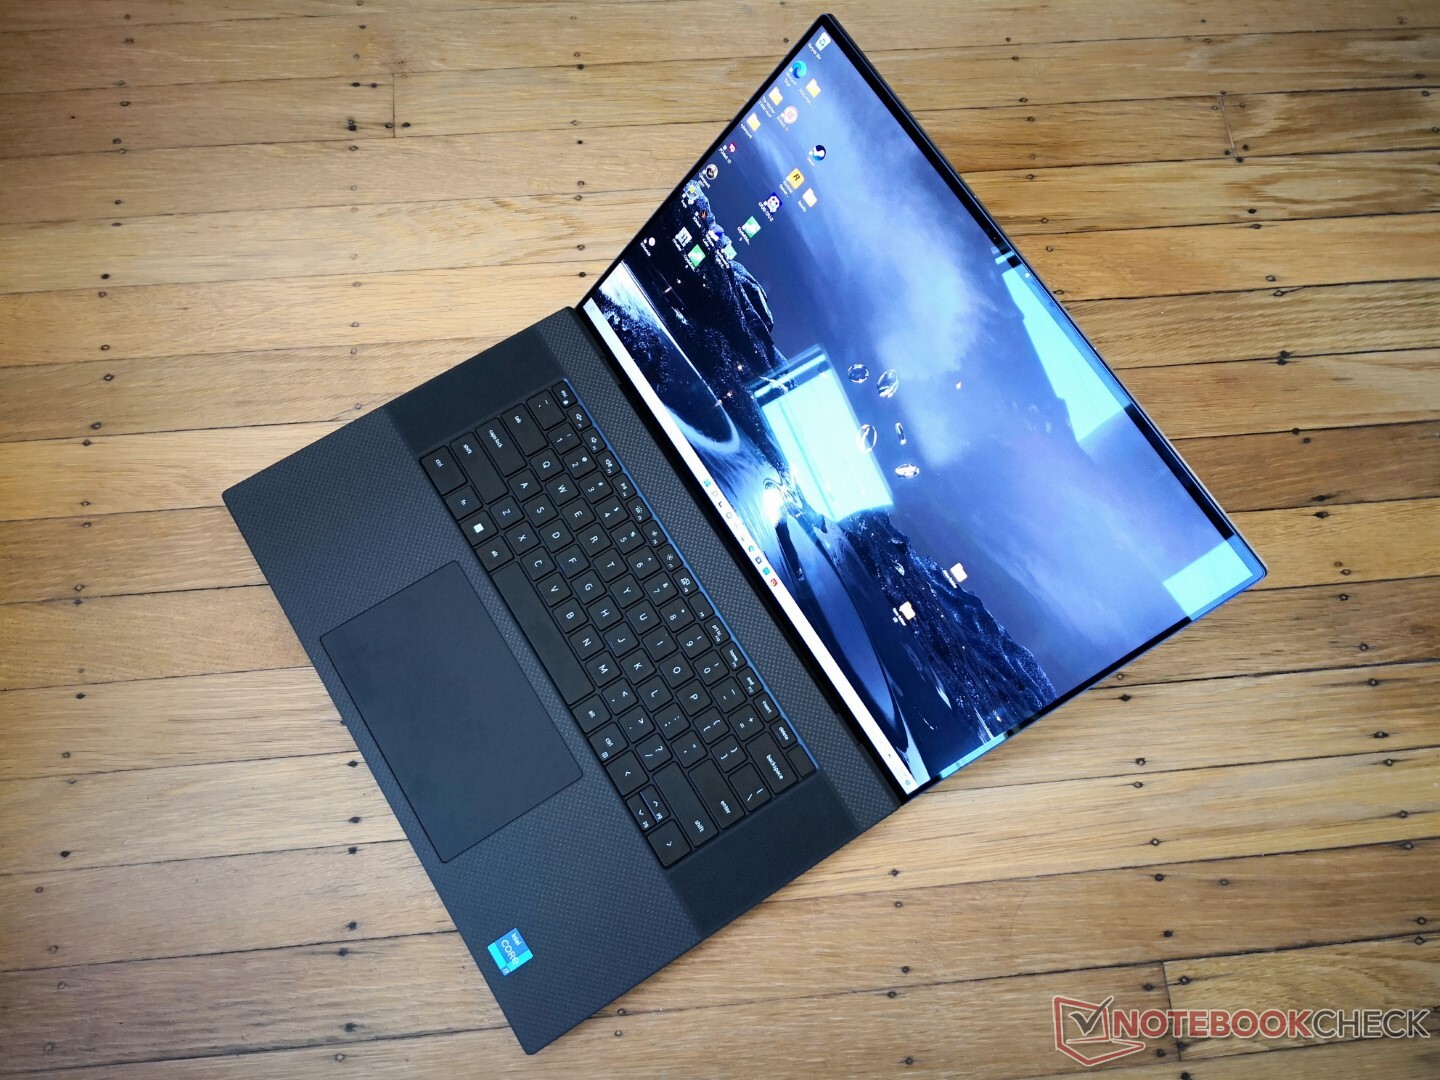
戴尔XPS 17 9720是始于2020年XPS 17 9700的17.0英寸XPS 17系列的第三次迭代。虽然XPS 17 9700和2021年的9710版本会分别搭载第10代和第11代英特尔CPU,但2022年的9720在组合中加入了第12代CPU和DDR5内存选项。其他核心特征,如机箱和GPU选项与XPS 17 9700或9710完全相同,因此我们建议查看我们的 关于该系列的现有评论以了解更多关于该机型的物理特征。
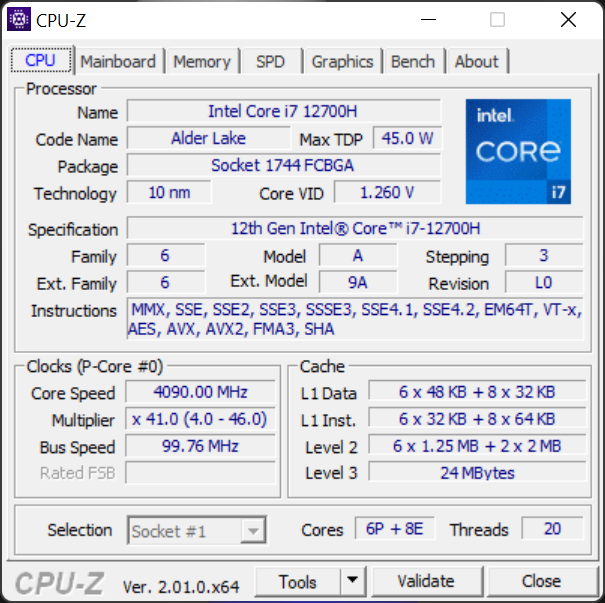
我们的评测单位是一个中高端配置,配备酷睿i7-12700H处理器,UHD+(3840 x 2400)IPS触摸屏,以及GeForce RTX 3060 GPU,价格约为3000美元。其他SKU也有i5-12500H、i9-12900HK、GeForce RTX 3050 Ti、1200p显示屏,或仅集成显卡。
XPS 17 9720的竞争者包括17.3英寸的多媒体或专业消费者笔记本电脑,如 技嘉Aero 17, Razer Blade 17, HP Envy 17, 或 联想Legion 5 17.
更多戴尔评论。
潜在的竞争对手比较
Rating | Date | Model | Weight | Height | Size | Resolution | Price |
|---|---|---|---|---|---|---|---|
| 88.8 % v7 (old) | 06 / 2022 | Dell XPS 17 9720 RTX 3060 i7-12700H, GeForce RTX 3060 Laptop GPU | 2.5 kg | 19.5 mm | 17.00" | 3840x2400 | |
| 82.4 % v7 (old) | 08 / 2021 | HP Envy 17-cg i5-1135G7, GeForce MX450 | 2.7 kg | 19.3 mm | 17.30" | 1920x1080 | |
| 87.9 % v7 (old) | 09 / 2021 | Dell XPS 17 9710 Core i7 RTX 3060 i7-11800H, GeForce RTX 3060 Laptop GPU | 2.5 kg | 19.5 mm | 17.00" | 3840x2400 | |
| 87.9 % v7 (old) | 08 / 2020 | Dell XPS 17 9700 Core i7 RTX 2060 Max-Q i7-10875H, GeForce RTX 2060 Max-Q | 2.5 kg | 19.5 mm | 17.00" | 3840x2400 | |
| 85.2 % v7 (old) | 02 / 2022 | Lenovo Legion 5 17ACH6H-82JY0003GE R5 5600H, GeForce RTX 3060 Laptop GPU | 3.1 kg | 24.3 mm | 17.30" | 1920x1080 | |
| 76.5 % v7 (old) | 05 / 2022 | Asus VivoBook 17 F712JA-AU708W i7-1065G7, Iris Plus Graphics G7 (Ice Lake 64 EU) | 2.2 kg | 21.4 mm | 17.30" | 1920x1080 | |
| 90.1 % v7 (old) | 05 / 2022 | Razer Blade 17 (i7-12800H, RTX 3070 Ti) i7-12800H, GeForce RTX 3070 Ti Laptop GPU | 2.8 kg | 19.9 mm | 17.30" | 2560x1440 |
SD卡阅读器
| SD Card Reader | |
| average JPG Copy Test (av. of 3 runs) | |
| Dell XPS 17 9720 RTX 3060 (Toshiba Exceria Pro SDXC 64 GB UHS-II) | |
| Dell XPS 17 9700 Core i7 RTX 2060 Max-Q (Toshiba Exceria Pro SDXC 64 GB UHS-II) | |
| Dell XPS 17 9710 Core i7 RTX 3060 (AV PRO microSD 128 GB V60) | |
| Razer Blade 17 (i7-12800H, RTX 3070 Ti) | |
| Lenovo Legion 5 17ACH6H-82JY0003GE (AV Pro SD microSD 128 GB V60) | |
| HP Envy 17-cg (AV Pro microSD 128 GB V60) | |
| Asus VivoBook 17 F712JA-AU708W (AV Pro SD microSD 128 GB V60) | |
| maximum AS SSD Seq Read Test (1GB) | |
| Dell XPS 17 9720 RTX 3060 (Toshiba Exceria Pro SDXC 64 GB UHS-II) | |
| Dell XPS 17 9700 Core i7 RTX 2060 Max-Q (Toshiba Exceria Pro SDXC 64 GB UHS-II) | |
| Razer Blade 17 (i7-12800H, RTX 3070 Ti) | |
| Dell XPS 17 9710 Core i7 RTX 3060 (AV PRO microSD 128 GB V60) | |
| Lenovo Legion 5 17ACH6H-82JY0003GE (AV Pro SD microSD 128 GB V60) | |
| HP Envy 17-cg (AV Pro microSD 128 GB V60) | |
| Asus VivoBook 17 F712JA-AU708W (AV Pro SD microSD 128 GB V60) | |
通讯 - 无Wi-Fi 6E
戴尔将WLAN从XPS 17 9710的英特尔AX1650升级到了XPS 17 9720的英特尔AX1675(或AX211)。较新的芯片支持Wi-Fi 6E,但该功能在XPS 17 9720上被禁用,就像我们在XPS 15 9520上发现的那样。 我们在XPS 15 9520上发现的情况.因此,用户将只能连接到2.4GHz或5GHz网络,而不是6GHz网络。
| Networking | |
| iperf3 transmit AX12 | |
| HP Envy 17-cg | |
| Dell XPS 17 9710 Core i7 RTX 3060 | |
| Asus VivoBook 17 F712JA-AU708W | |
| Lenovo Legion 5 17ACH6H-82JY0003GE | |
| Dell XPS 17 9700 Core i7 RTX 2060 Max-Q | |
| iperf3 receive AX12 | |
| HP Envy 17-cg | |
| Dell XPS 17 9710 Core i7 RTX 3060 | |
| Dell XPS 17 9700 Core i7 RTX 2060 Max-Q | |
| Asus VivoBook 17 F712JA-AU708W | |
| Lenovo Legion 5 17ACH6H-82JY0003GE | |
| iperf3 receive AXE11000 | |
| Dell XPS 17 9720 RTX 3060 | |
| iperf3 transmit AXE11000 | |
| Dell XPS 17 9720 RTX 3060 | |
网络摄像头
相机仍然只是720p,没有隐私快门。较低的原生分辨率与高分辨率的显示屏搭配得很差,画面难免有些混浊。戴尔说,现在红外和RGB传感器是分开的,性能更好,但像素密度仍然很低。相比之下,Razer Blade 17配备了一个更高分辨率的1080p网络摄像头。
仍然支持Windows Hello。


维护
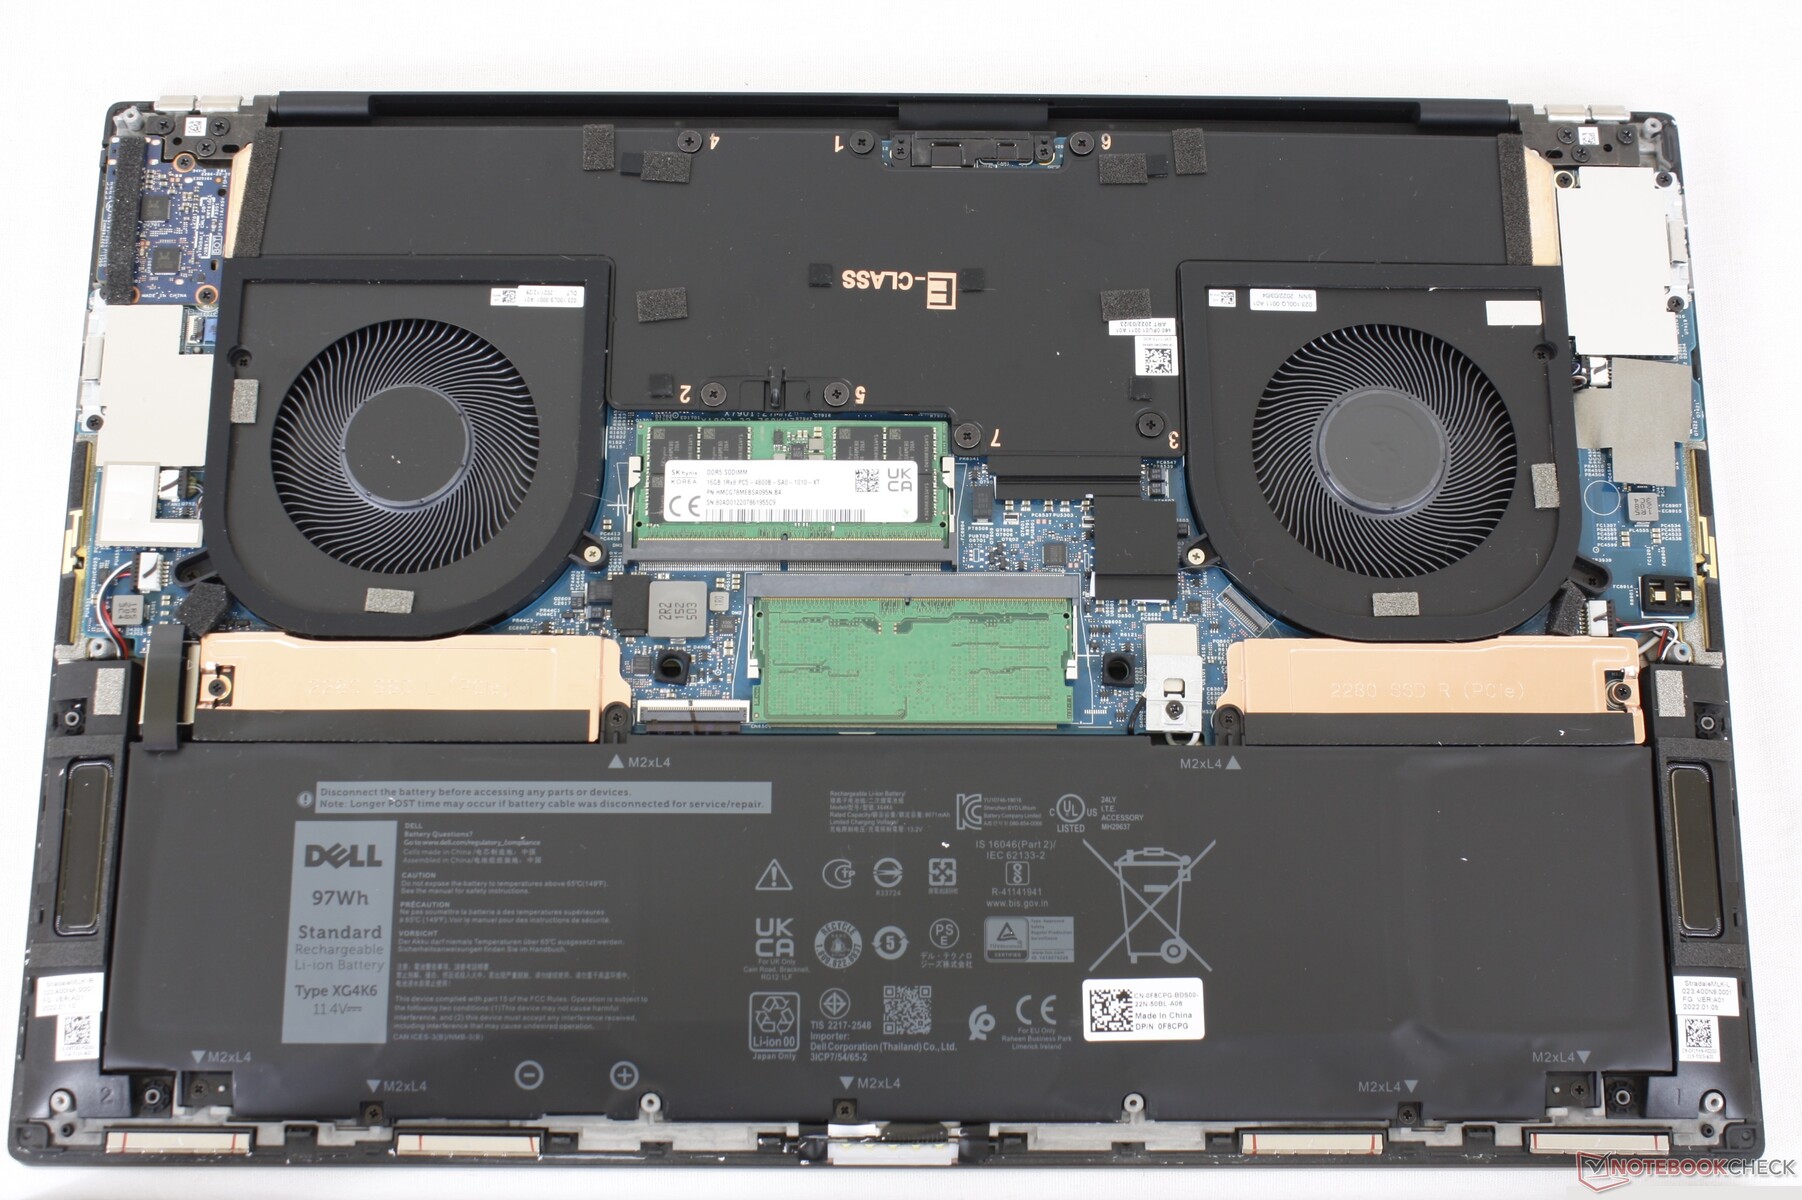
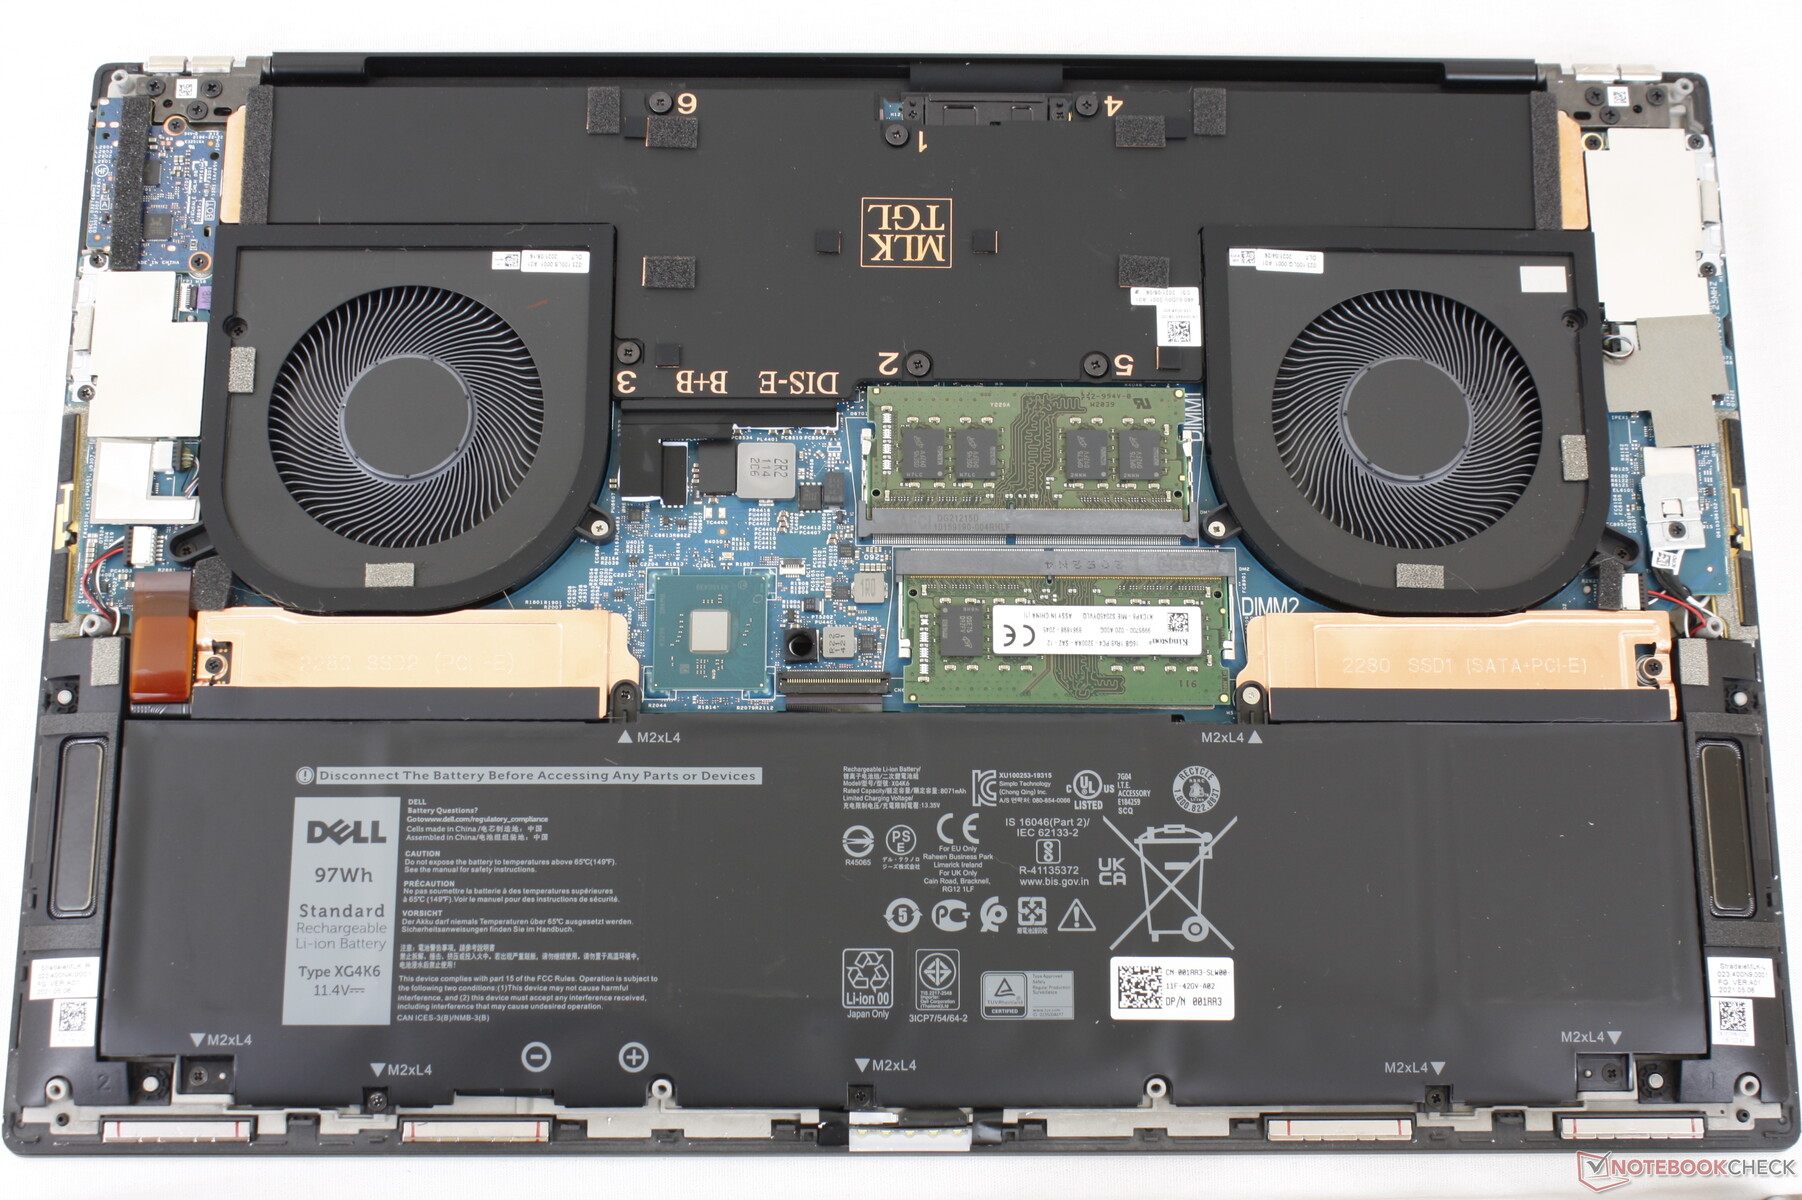
配件和保修
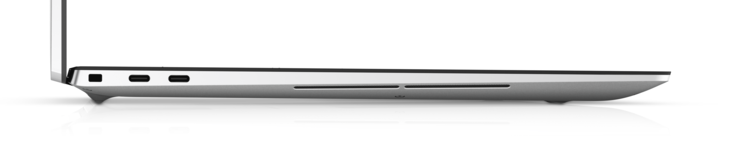
XPS 17 9720配备了与XPS 15 9520、XPS 17 9710和XPS 17 9700相同的130瓦交流适配器和USB-C转HDMI和USB-A适配器。如果在美国购买,则适用基本的一年有限制造商保修。
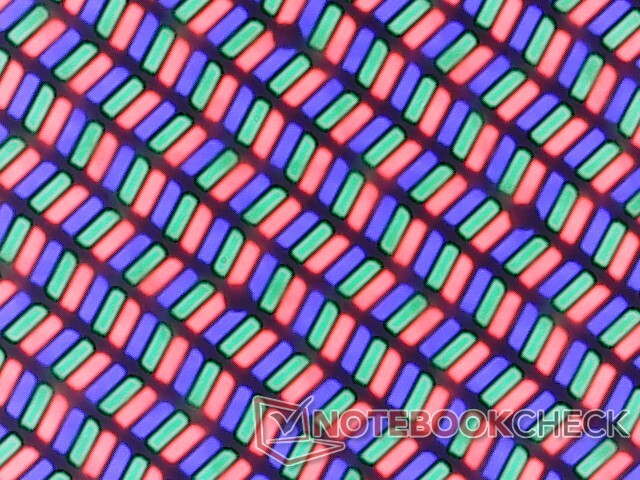
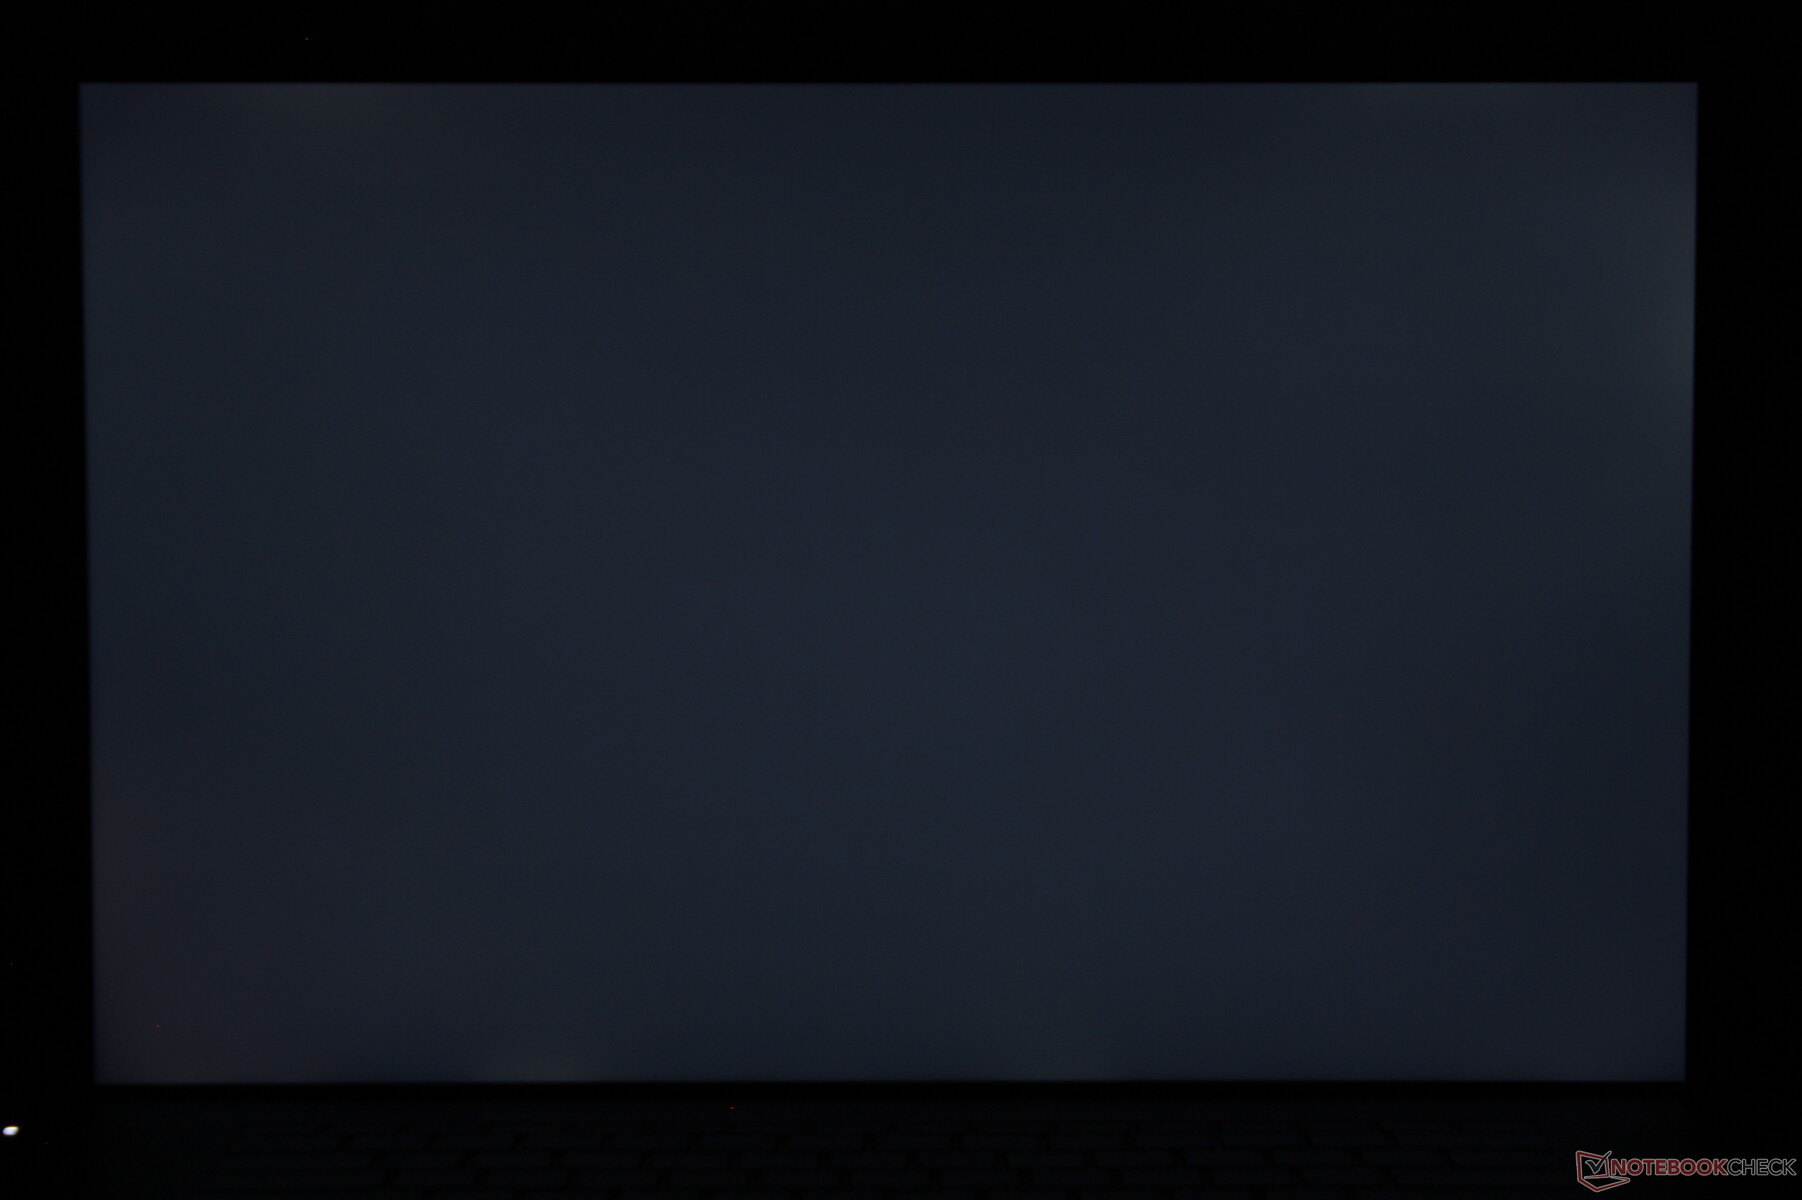
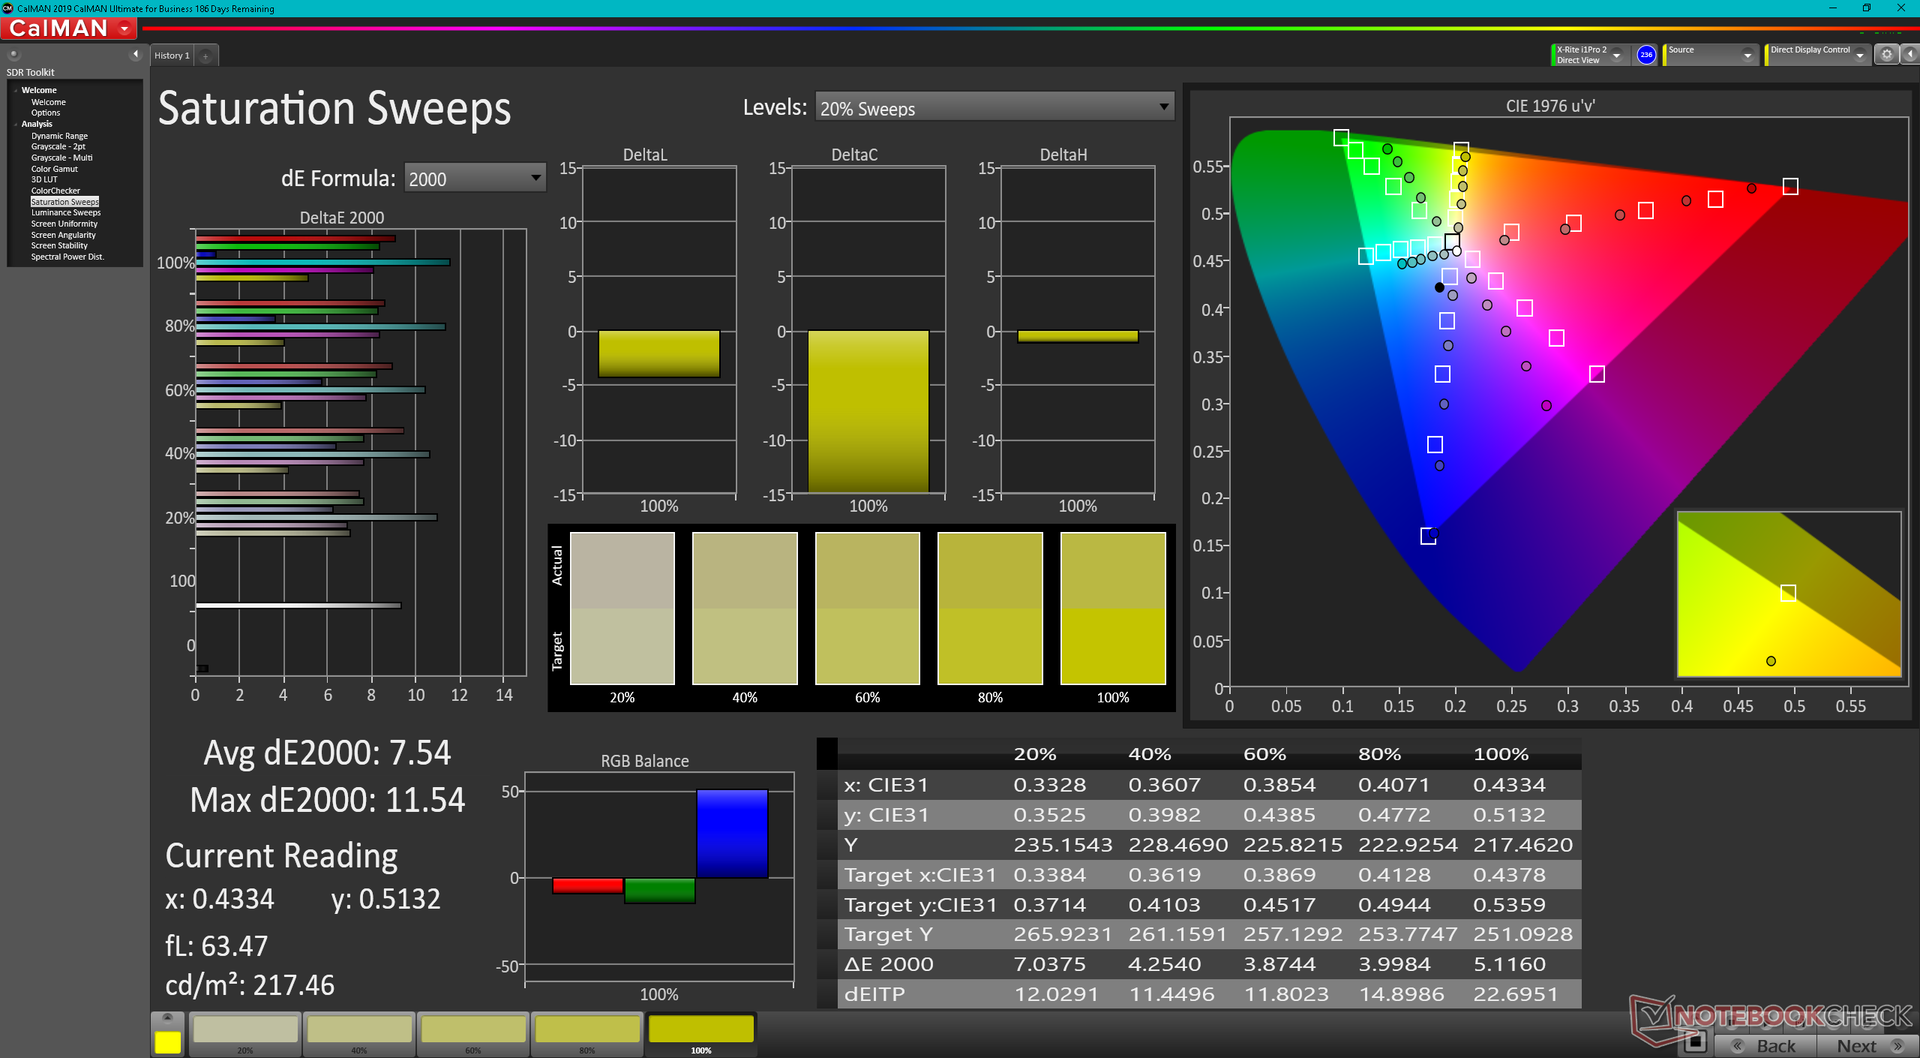
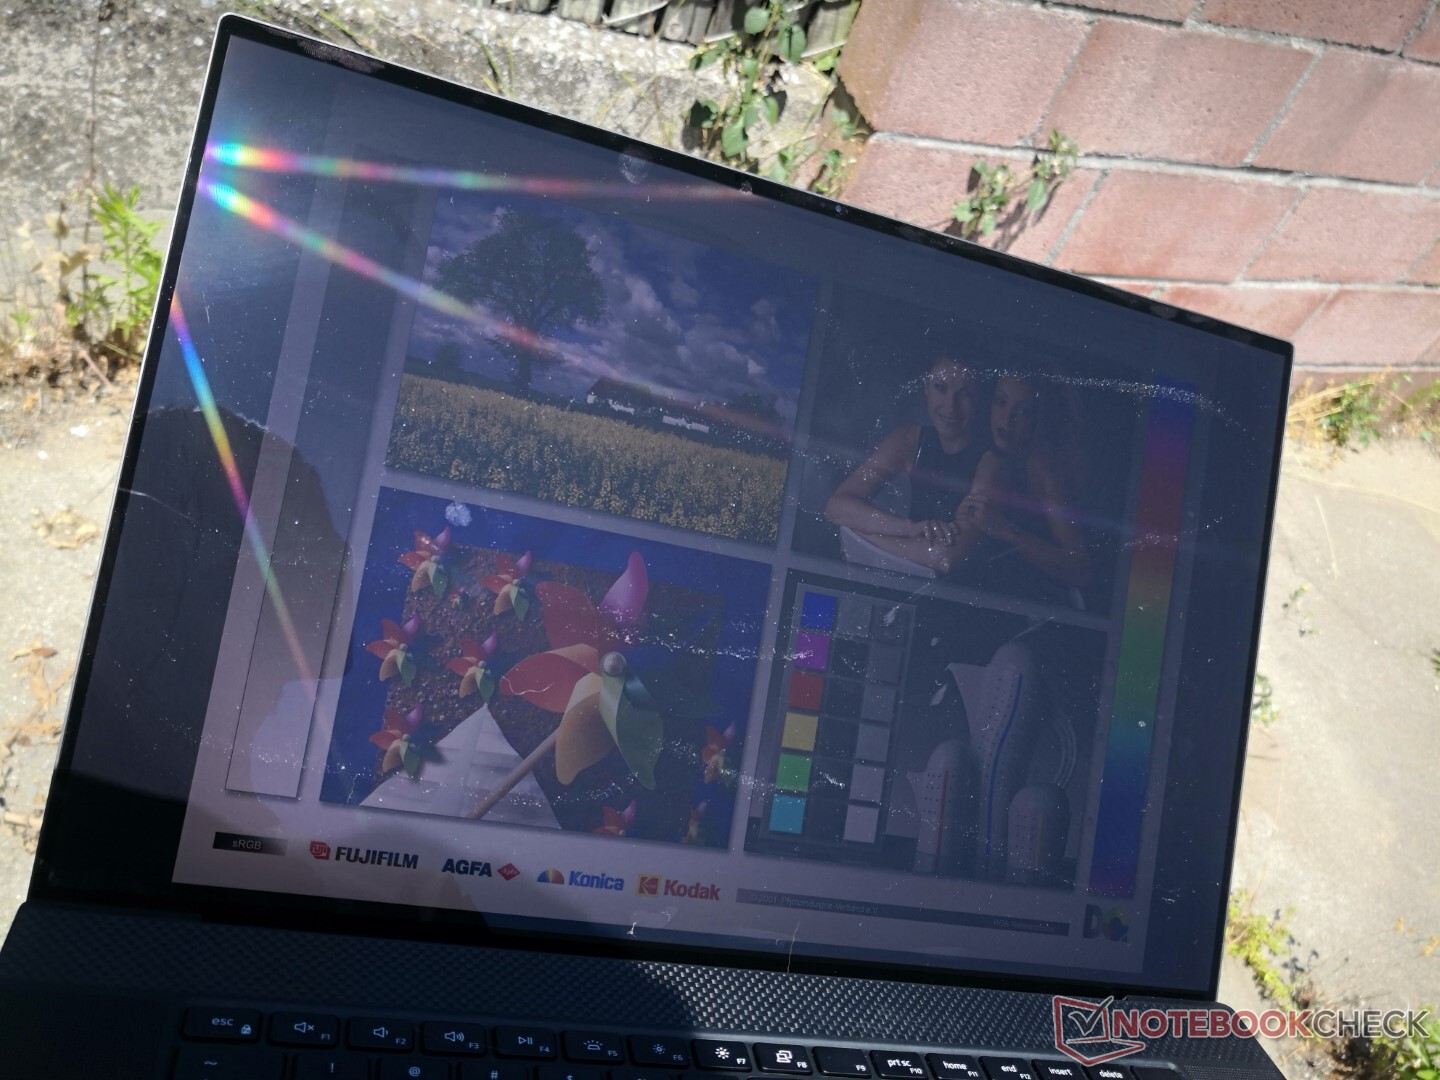
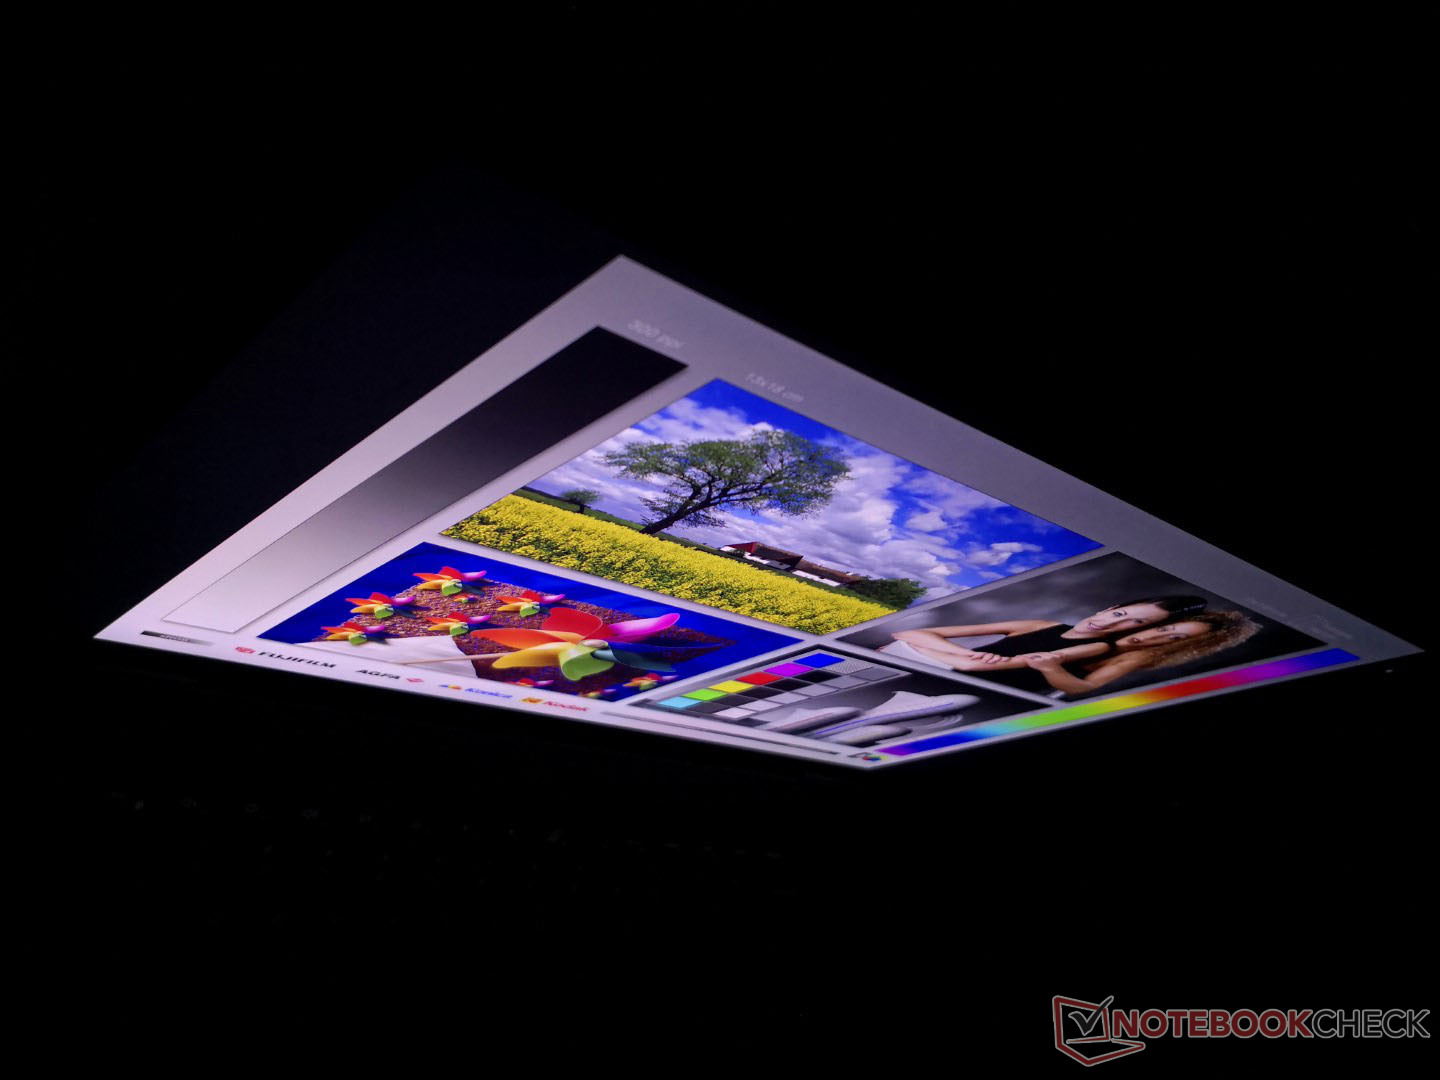
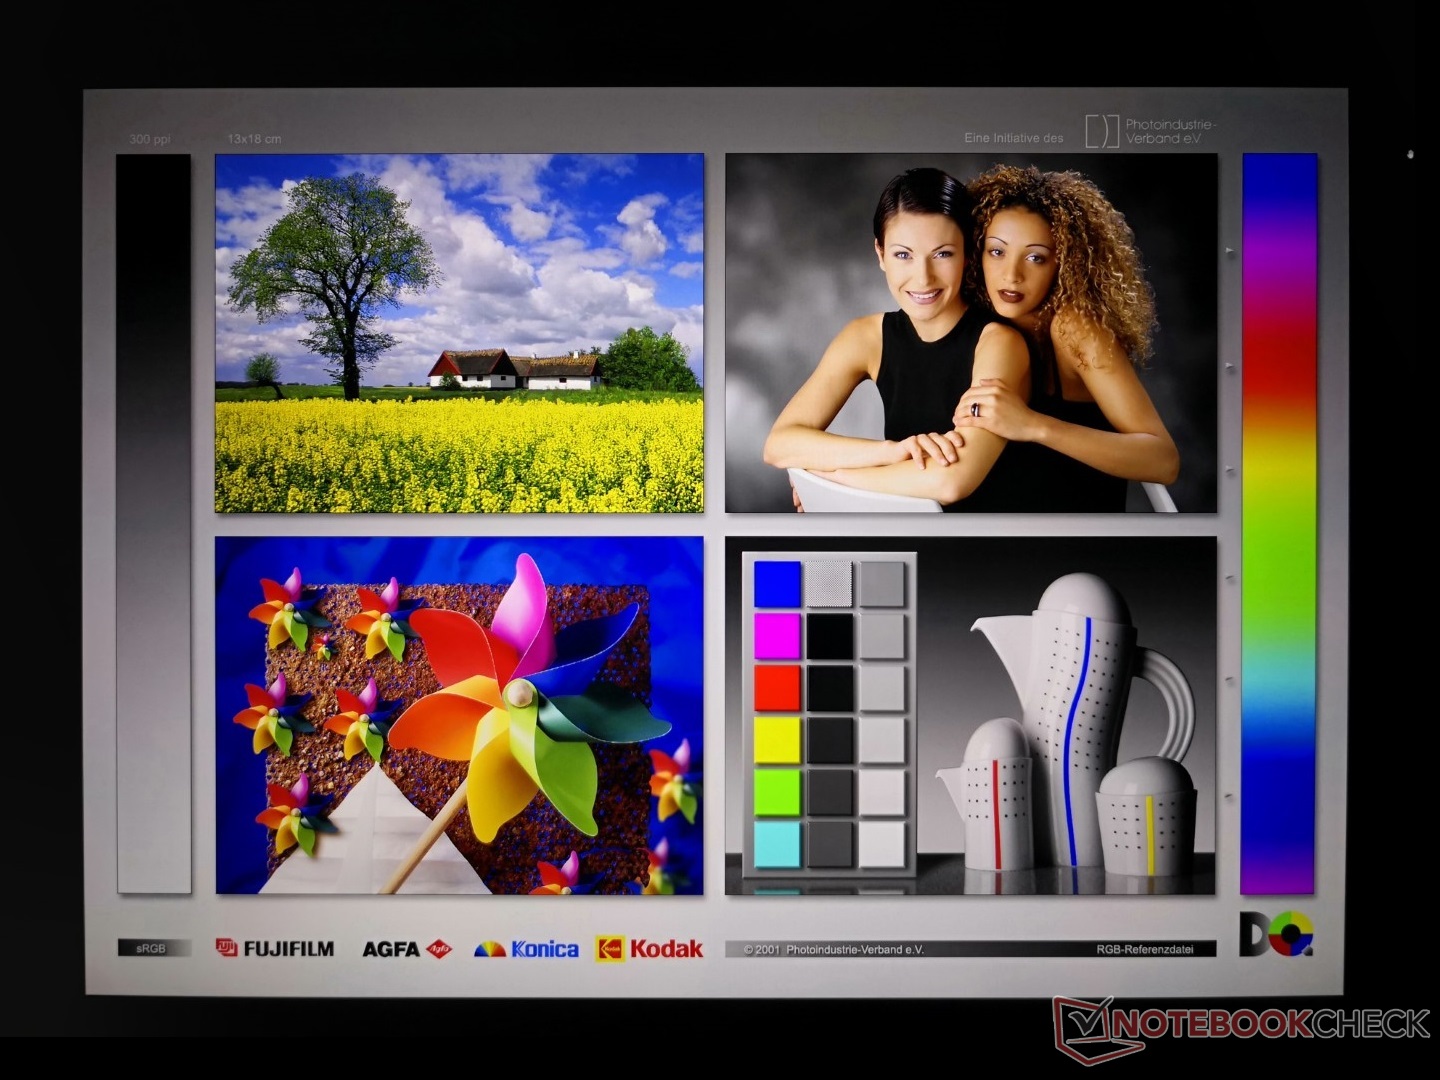
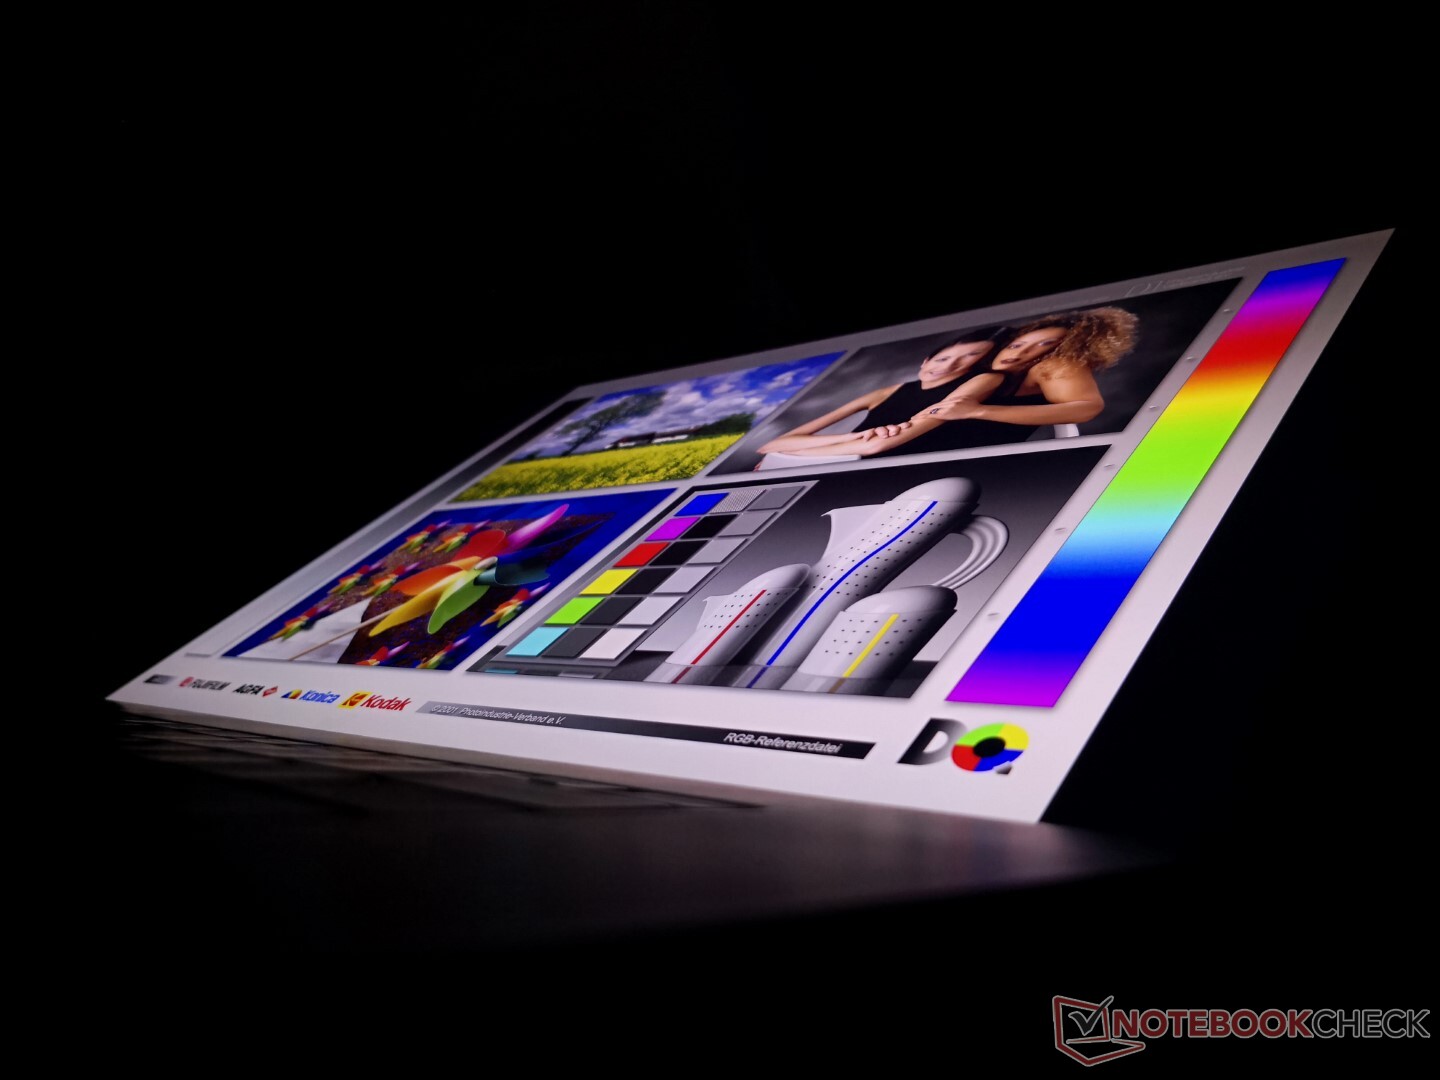
显示器 - 16:10 60 Hz IPS
有两个显示选项可供选择(1200p和2400p),而XPS 15 9520上有三个。我们设备上的面板与XPS 17 9710或9700上的夏普LQ170R1 IPS面板相同,这意味着自最初的2020型号以来,观看体验没有改变。这是一个优秀的显示器,现在仍然是,特别是在相对于其他IPS面板的对比度方面,但我们希望在未来看到90赫兹刷新率或更快的选项,类似于在最新的 IdeaPad Slim 7i Pro或即将推出的 Zenbook Pro 14 Duo.
| |||||||||||||||||||||||||
Brightness Distribution: 85 %
Center on Battery: 512.7 cd/m²
Contrast: 1602:1 (Black: 0.32 cd/m²)
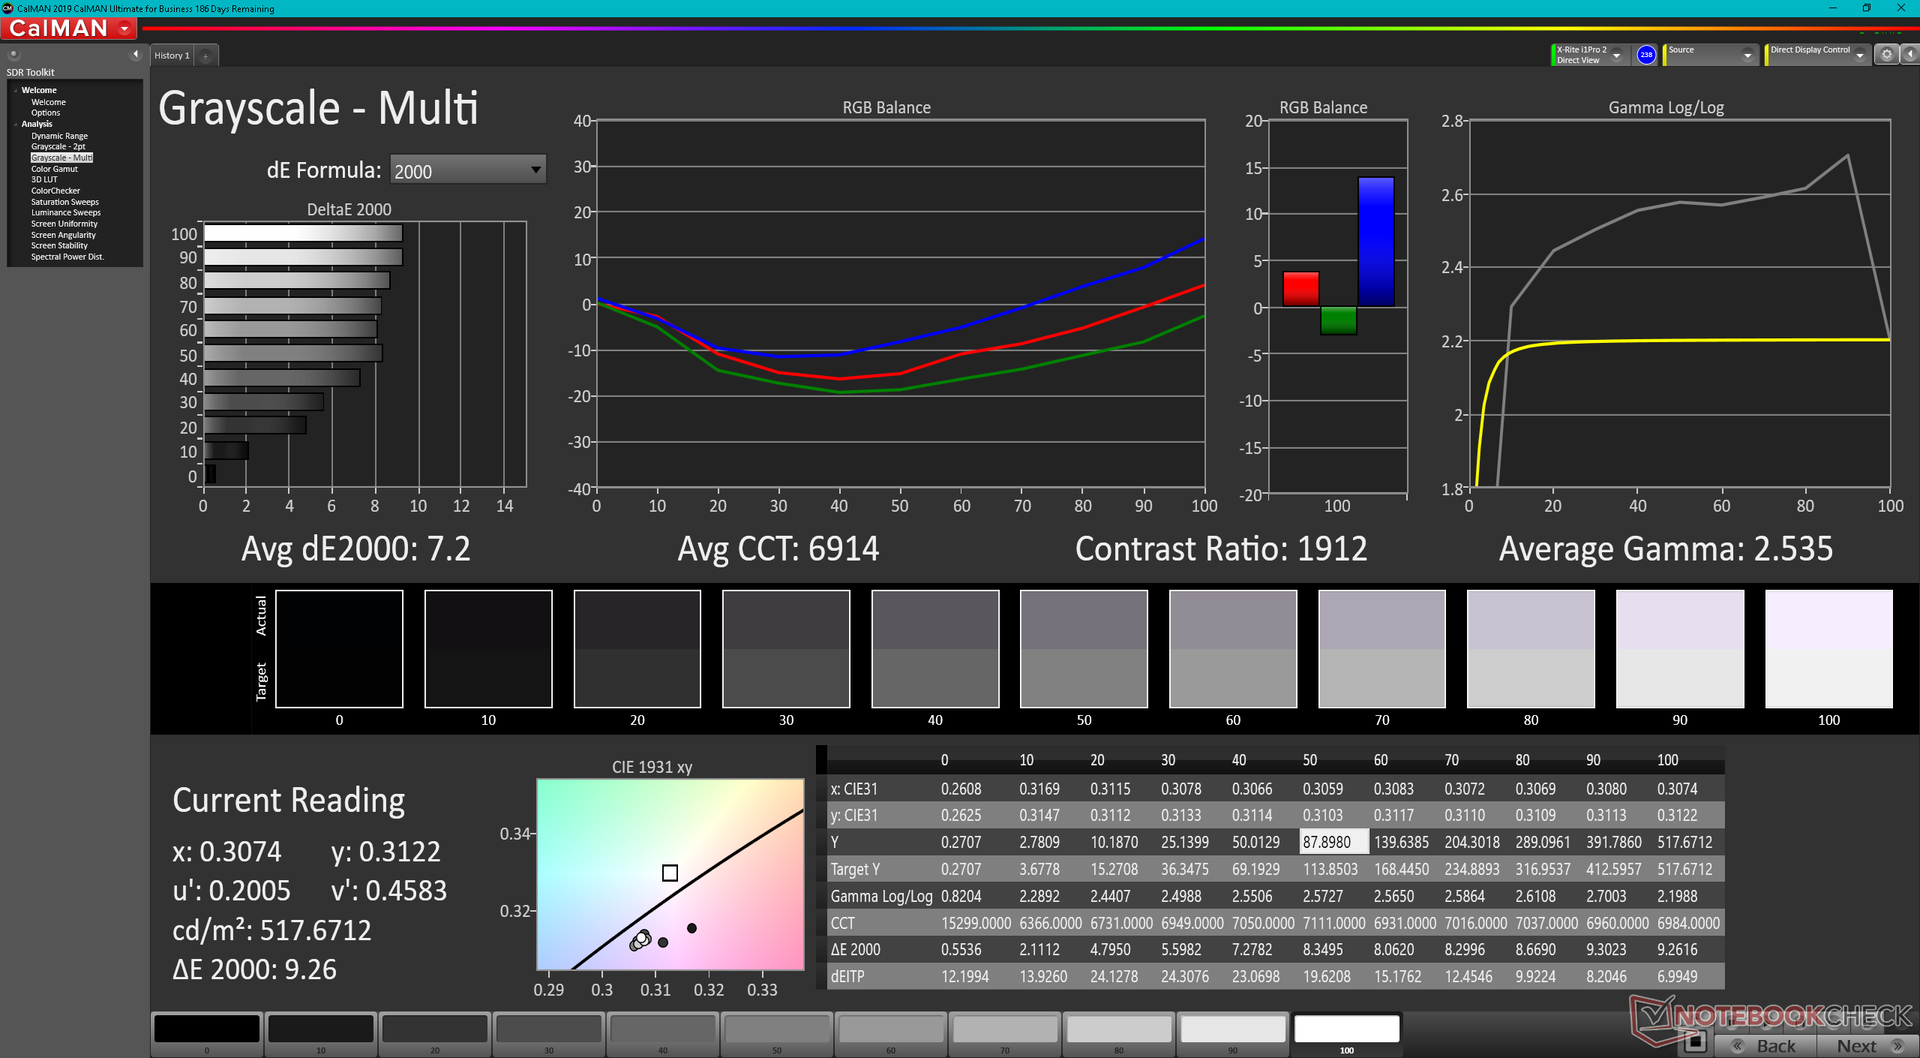
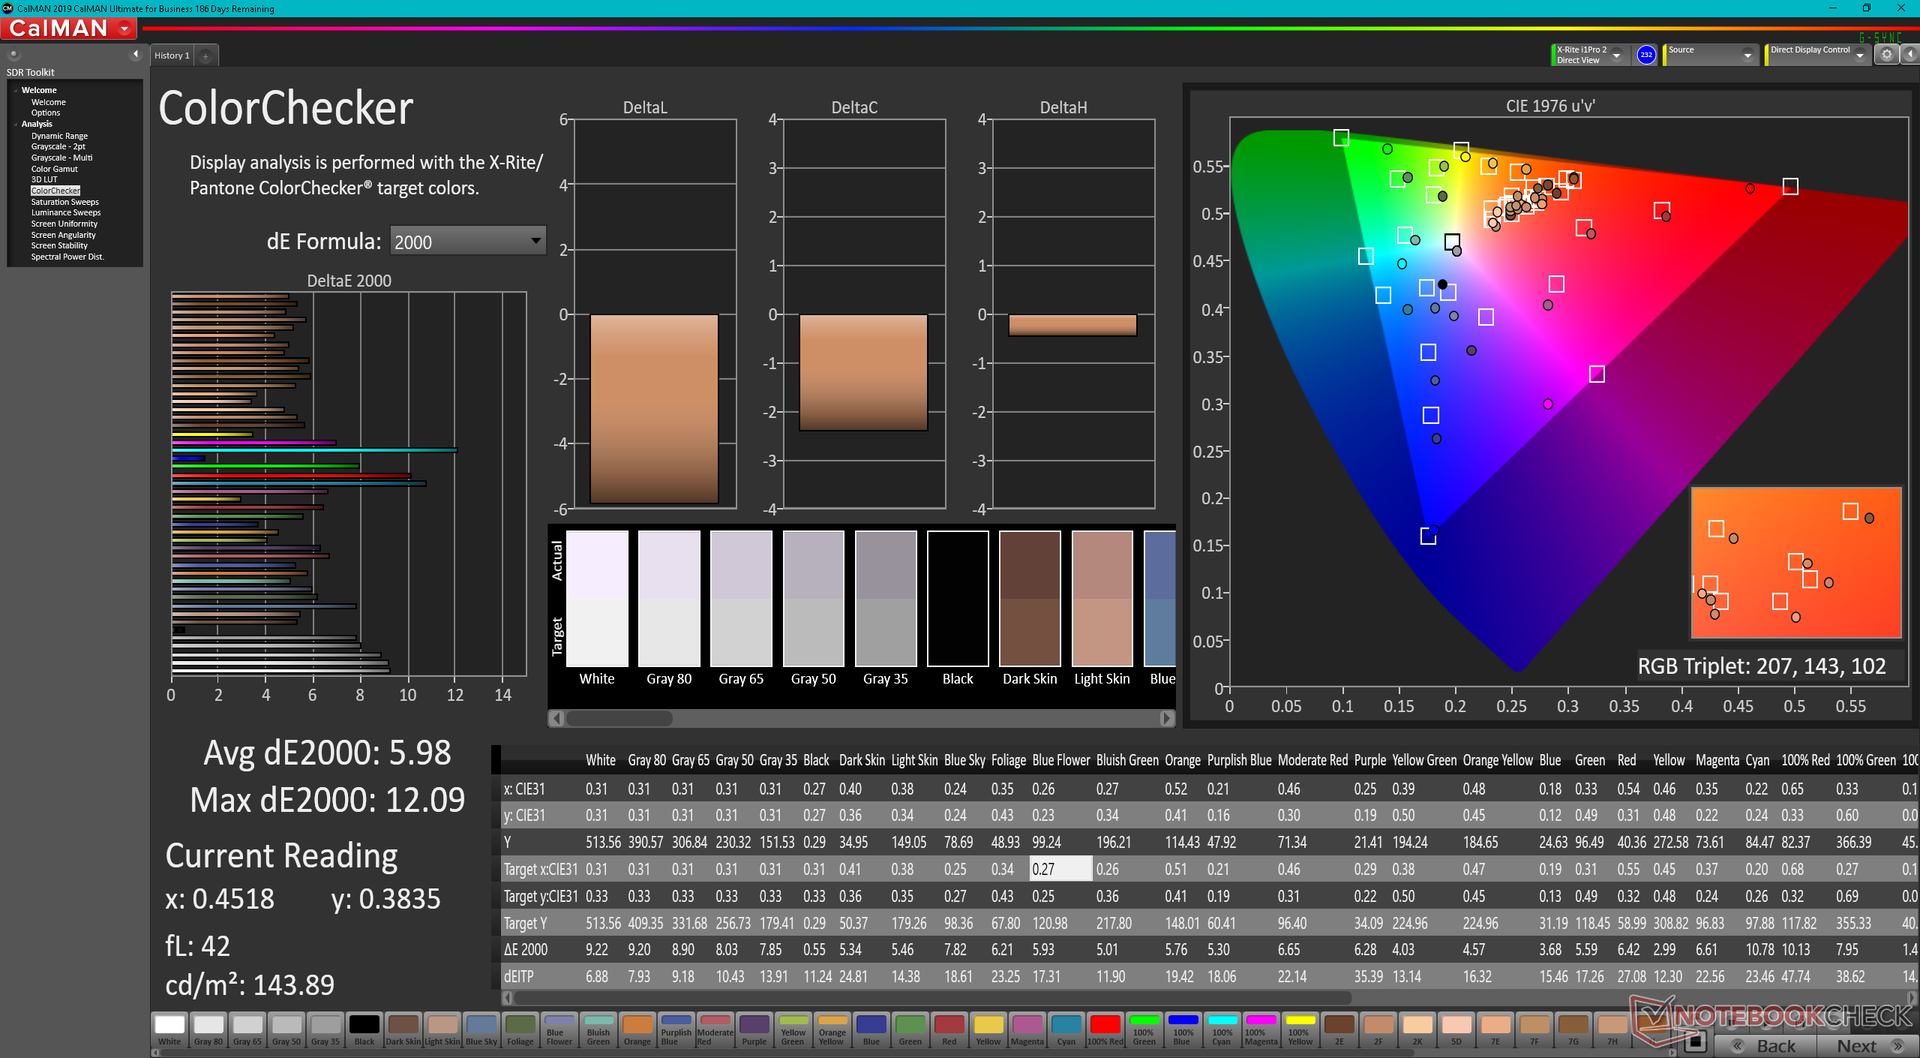
ΔE ColorChecker Calman: 5.98 | ∀{0.5-29.43 Ø4.72}
ΔE Greyscale Calman: 7.2 | ∀{0.09-98 Ø4.97}
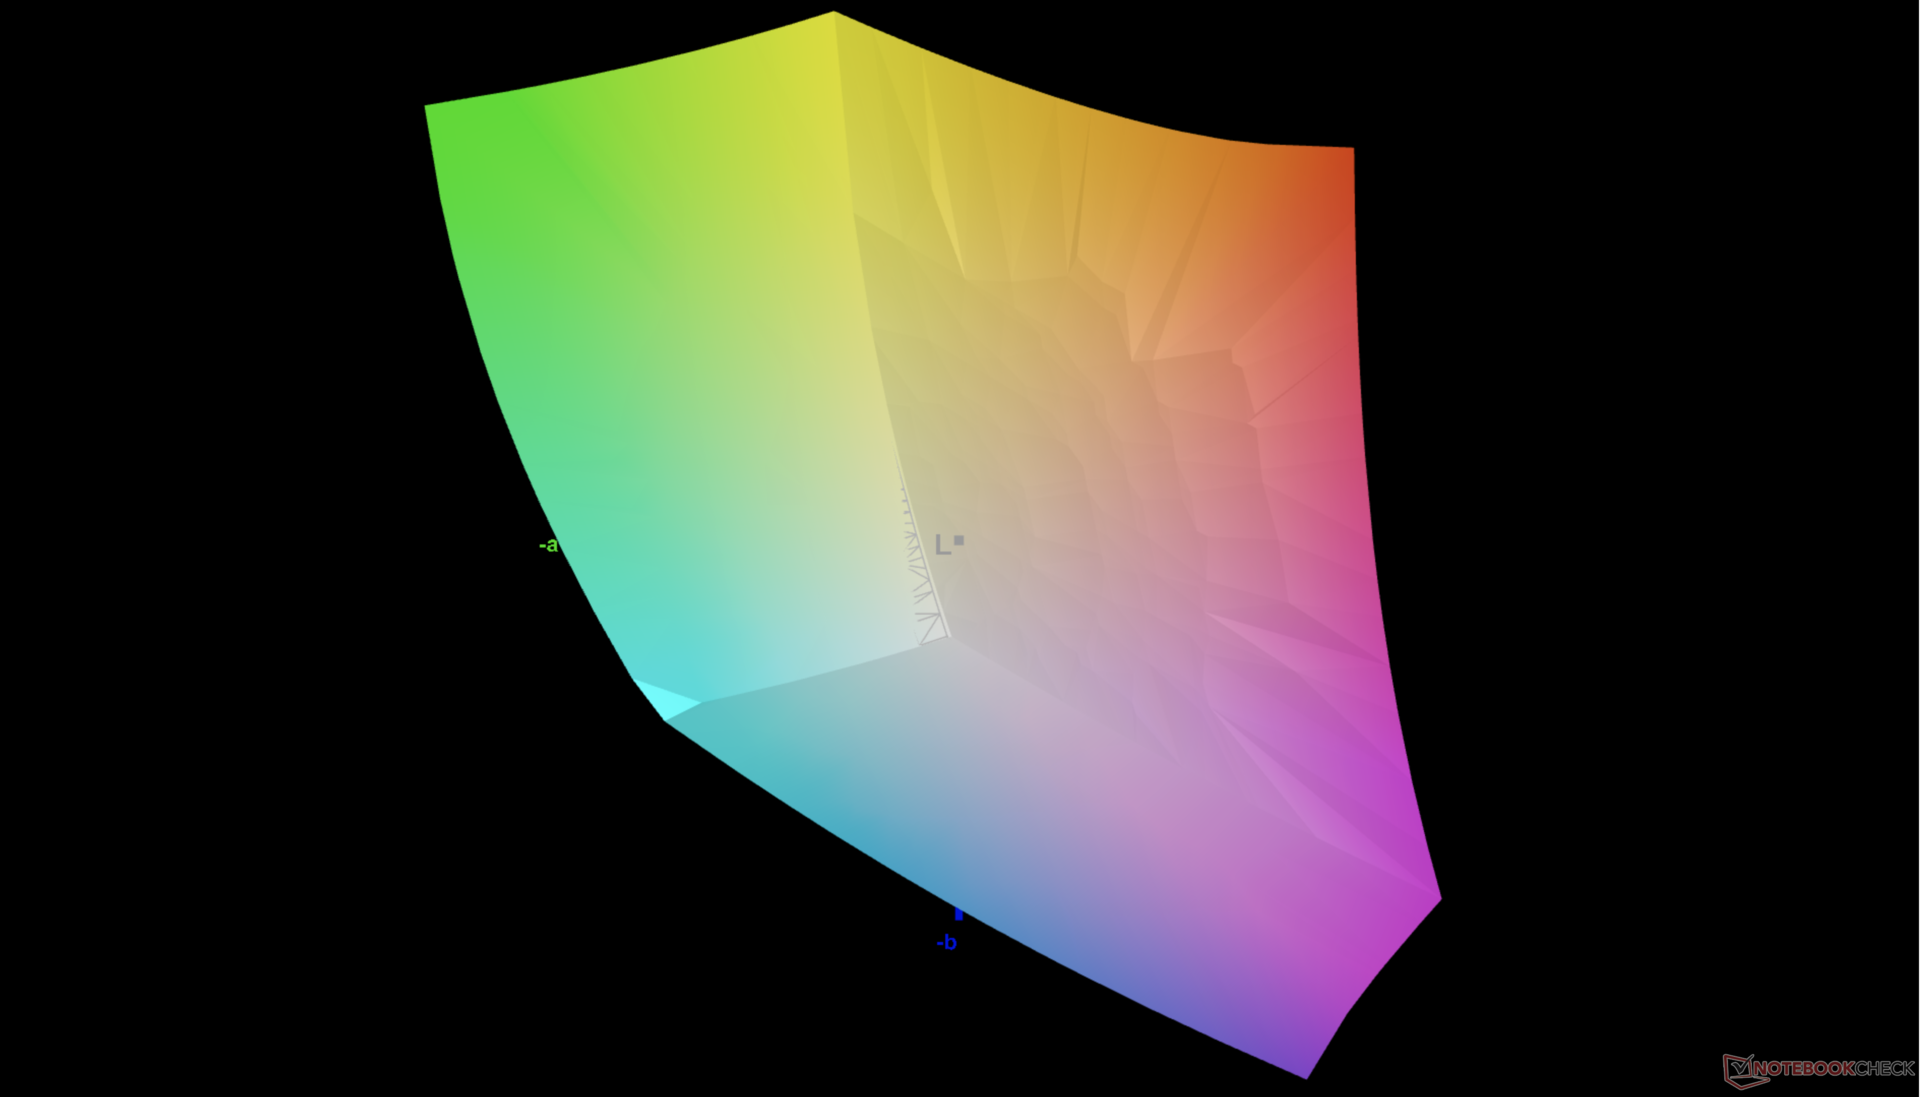
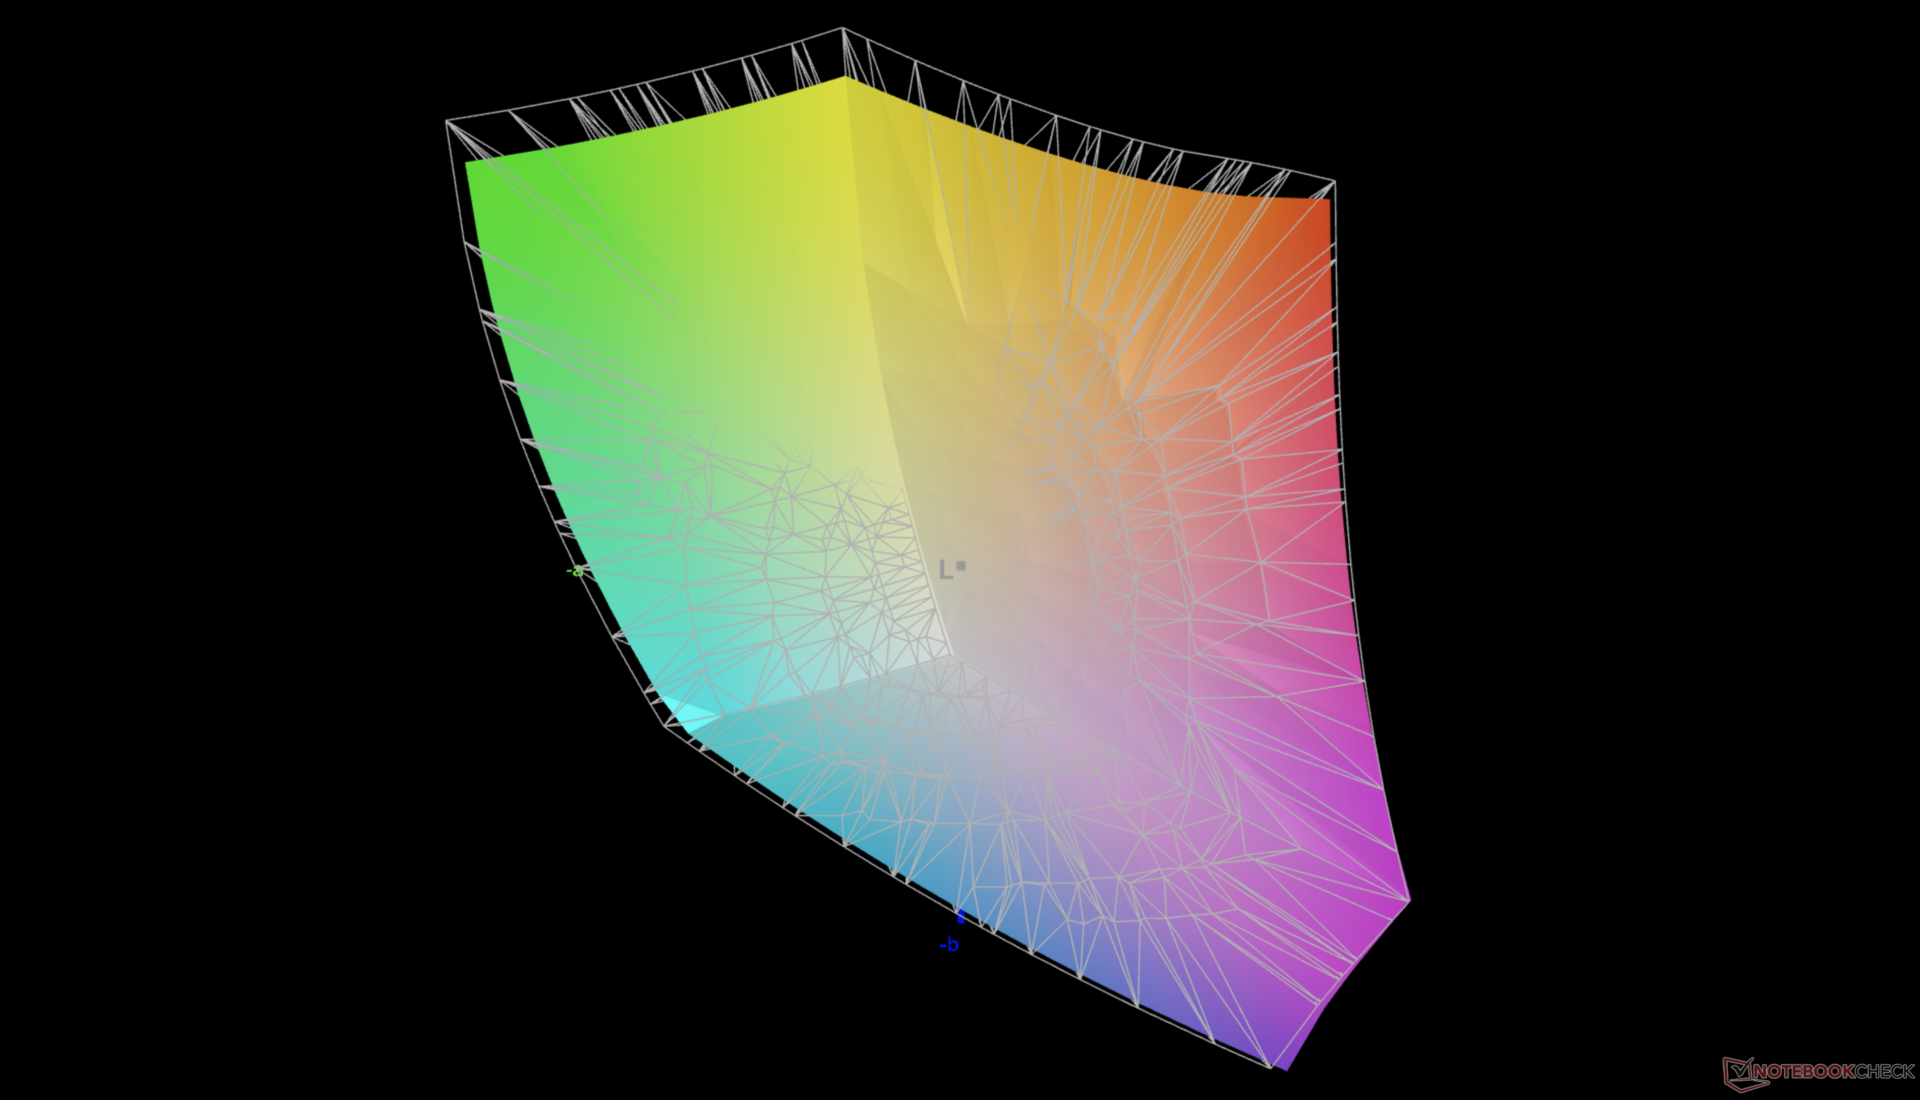
85.3% AdobeRGB 1998 (Argyll 3D)
100% sRGB (Argyll 3D)
92.9% Display P3 (Argyll 3D)
Gamma: 2.54
CCT: 6914 K
| Dell XPS 17 9720 RTX 3060 Sharp LQ170R1, IPS, 3840x2400, 17" | Dell XPS 17 9700 Core i7 RTX 2060 Max-Q Sharp LQ170R1, IPS, 3840x2400, 17" | Dell XPS 17 9700 i5-10300H SHP14D7, IPS, 1920x1200, 17.3" | HP Envy 17-cg AU Optronics AUO439D, IPS, 1920x1080, 17.3" | Lenovo Legion 5 17ACH6H-82JY0003GE LEN173FHD, IPS, 1920x1080, 17.3" | Asus VivoBook 17 F712JA-AU708W BOE NV173FHM-N49, IPS, 1920x1080, 17.3" | Razer Blade 17 (i7-12800H, RTX 3070 Ti) BOE CQ NE173QHM-NZ1 (BOE09F9), IPS, 2560x1440, 17.3" | |
|---|---|---|---|---|---|---|---|
| Display | 5% | -9% | -17% | -18% | -50% | 2% | |
| Display P3 Coverage (%) | 92.9 | 90.5 -3% | 77.4 -17% | 68 -27% | 64.8 -30% | 39.53 -57% | 97.9 5% |
| sRGB Coverage (%) | 100 | 100 0% | 100 0% | 95 -5% | 97.2 -3% | 58.85 -41% | 99.9 0% |
| AdobeRGB 1998 Coverage (%) | 85.3 | 99.8 17% | 76.6 -10% | 69 -19% | 66.7 -22% | 40.84 -52% | 85.5 0% |
| Response Times | 5% | -13% | 19% | 73% | 57% | 69% | |
| Response Time Grey 50% / Grey 80% * (ms) | 51.2 ? | 51.2 ? -0% | 60.4 ? -18% | 40 ? 22% | 15 ? 71% | 22 ? 57% | 15.2 ? 70% |
| Response Time Black / White * (ms) | 35.2 ? | 32 ? 9% | 37.6 ? -7% | 30 ? 15% | 9 ? 74% | 15 ? 57% | 11.2 ? 68% |
| PWM Frequency (Hz) | 2500 ? | ||||||
| Screen | 20% | 33% | 6% | 16% | -16% | -9% | |
| Brightness middle (cd/m²) | 512.7 | 539.4 5% | 636 24% | 347 -32% | 323 -37% | 269 -48% | 341 -33% |
| Brightness (cd/m²) | 463 | 494 7% | 580 25% | 329 -29% | 305 -34% | 263 -43% | 308 -33% |
| Brightness Distribution (%) | 85 | 84 -1% | 86 1% | 89 5% | 89 5% | 88 4% | 82 -4% |
| Black Level * (cd/m²) | 0.32 | 0.32 -0% | 0.34 -6% | 0.27 16% | 0.25 22% | 0.3 6% | 0.45 -41% |
| Contrast (:1) | 1602 | 1686 5% | 1871 17% | 1285 -20% | 1292 -19% | 897 -44% | 758 -53% |
| Colorchecker dE 2000 * | 5.98 | 4.12 31% | 2.4 60% | 3.75 37% | 1.87 69% | 5.8 3% | 4.16 30% |
| Colorchecker dE 2000 max. * | 12.09 | 7.65 37% | 3.5 71% | 7.53 38% | 4.84 60% | 18.46 -53% | 8.14 33% |
| Greyscale dE 2000 * | 7.2 | 1.5 79% | 2 72% | 4.88 32% | 2.57 64% | 3.64 49% | 5.09 29% |
| Gamma | 2.54 87% | 2.15 102% | 2.08 106% | 2.53 87% | 2.42 91% | 2.35 94% | 2.48 89% |
| CCT | 6914 94% | 6438 101% | 6704 97% | 6624 98% | 7012 93% | 6995 93% | 6884 94% |
| Colorchecker dE 2000 calibrated * | 3.91 | 1.5 | 0.92 | 3 | |||
| Color Space (Percent of AdobeRGB 1998) (%) | 90.4 | 67.5 | |||||
| Color Space (Percent of sRGB) (%) | 100 | 100 | |||||
| Total Average (Program / Settings) | 10% /
14% | 4% /
16% | 3% /
3% | 24% /
17% | -3% /
-12% | 21% /
5% |
* ... smaller is better
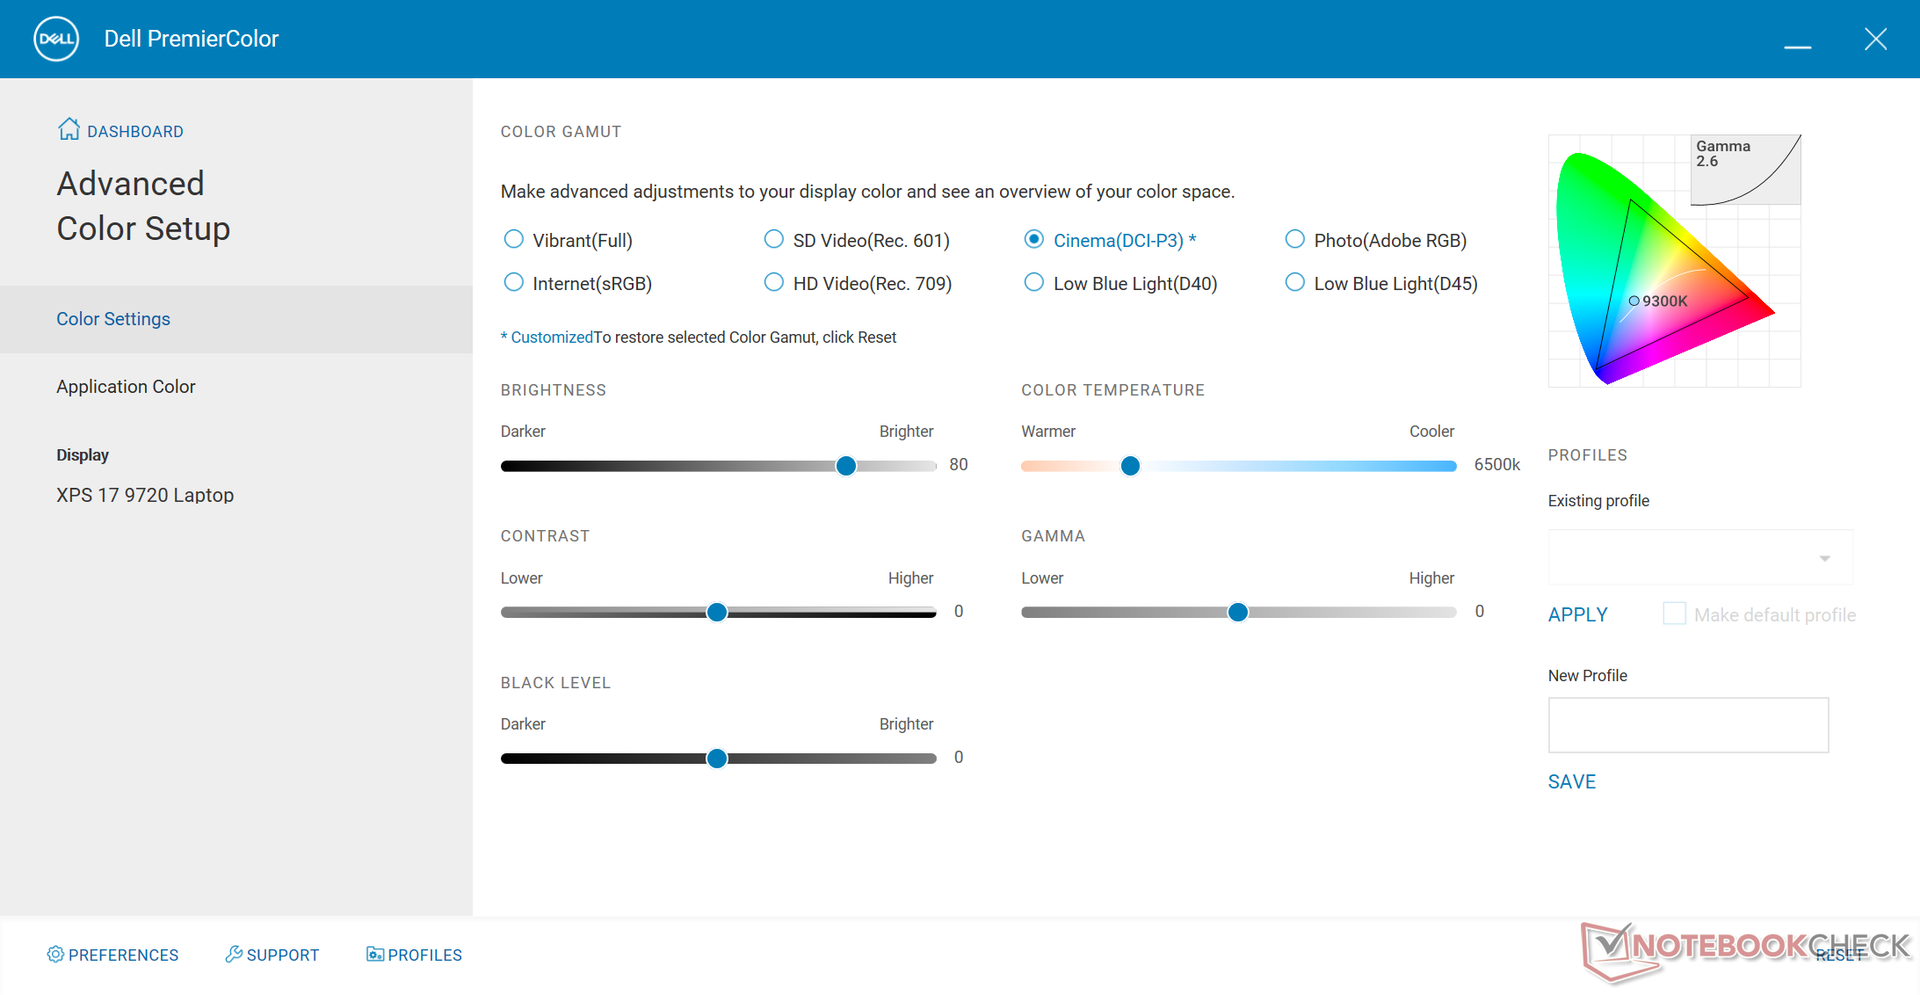
通过Dell PremierColor软件设置为DCI-P3色彩标准时,色温比预期的要高。与许多专业笔记本电脑不同,如戴尔Precision 、技嘉Aero或惠普ZBook系列,XPS系列在出厂时没有经过X-Rite校准。为了更好地利用面板的宽色域,有必要进行终端用户校准。
Display Response Times
| ↔ Response Time Black to White | ||
|---|---|---|
| 35.2 ms ... rise ↗ and fall ↘ combined | ↗ 18.8 ms rise | 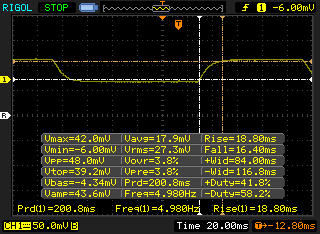 |
| ↘ 16.4 ms fall | ||
| The screen shows slow response rates in our tests and will be unsatisfactory for gamers. In comparison, all tested devices range from 0.1 (minimum) to 240 (maximum) ms. » 93 % of all devices are better. This means that the measured response time is worse than the average of all tested devices (19.9 ms). | ||
| ↔ Response Time 50% Grey to 80% Grey | ||
| 51.2 ms ... rise ↗ and fall ↘ combined | ↗ 26 ms rise | 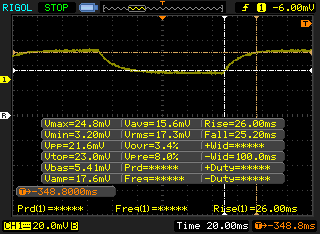 |
| ↘ 25.2 ms fall | ||
| The screen shows slow response rates in our tests and will be unsatisfactory for gamers. In comparison, all tested devices range from 0.165 (minimum) to 636 (maximum) ms. » 88 % of all devices are better. This means that the measured response time is worse than the average of all tested devices (31.1 ms). | ||
Screen Flickering / PWM (Pulse-Width Modulation)
| Screen flickering / PWM not detected |  | ||
In comparison: 52 % of all tested devices do not use PWM to dim the display. If PWM was detected, an average of 7784 (minimum: 5 - maximum: 343500) Hz was measured. | |||
业绩 - 阿尔德湖-H公司提高警惕
测试条件
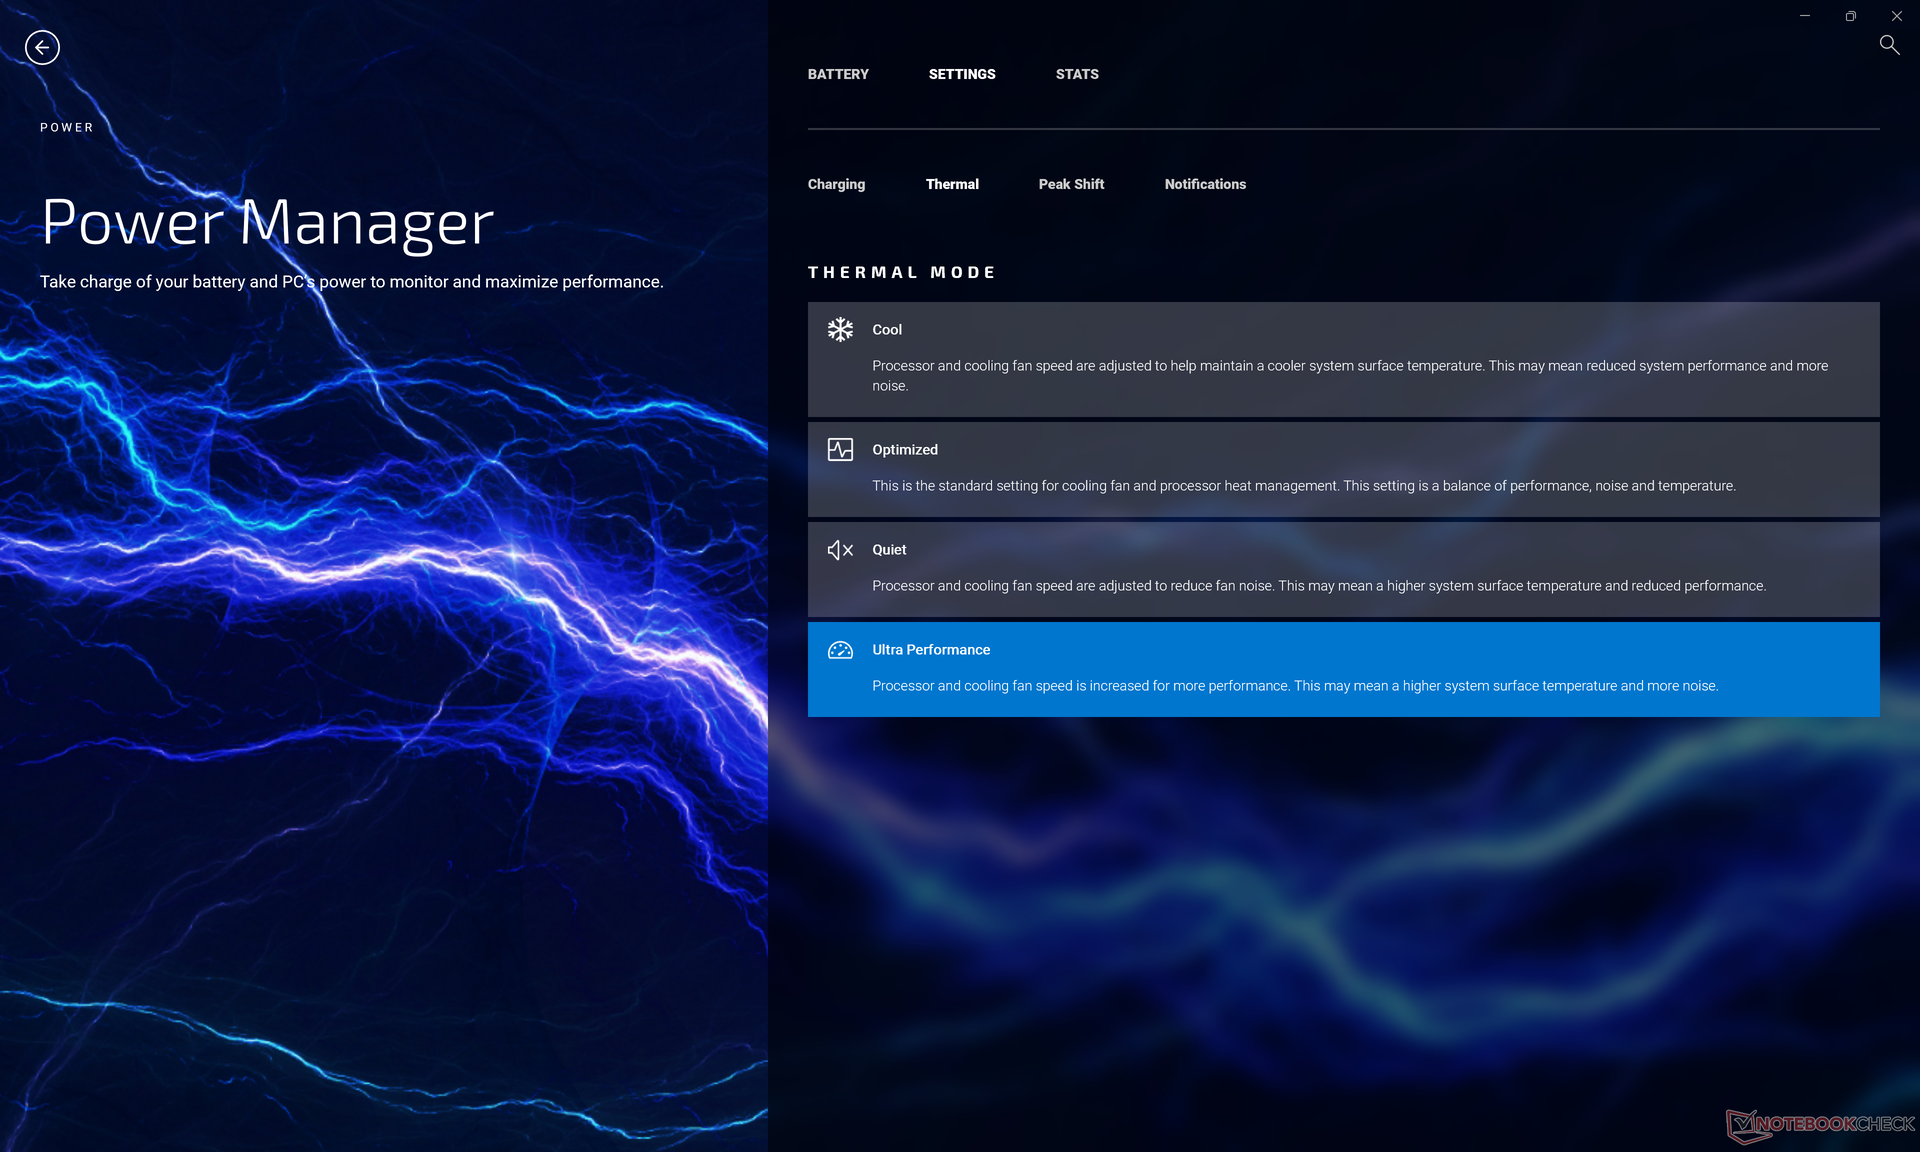
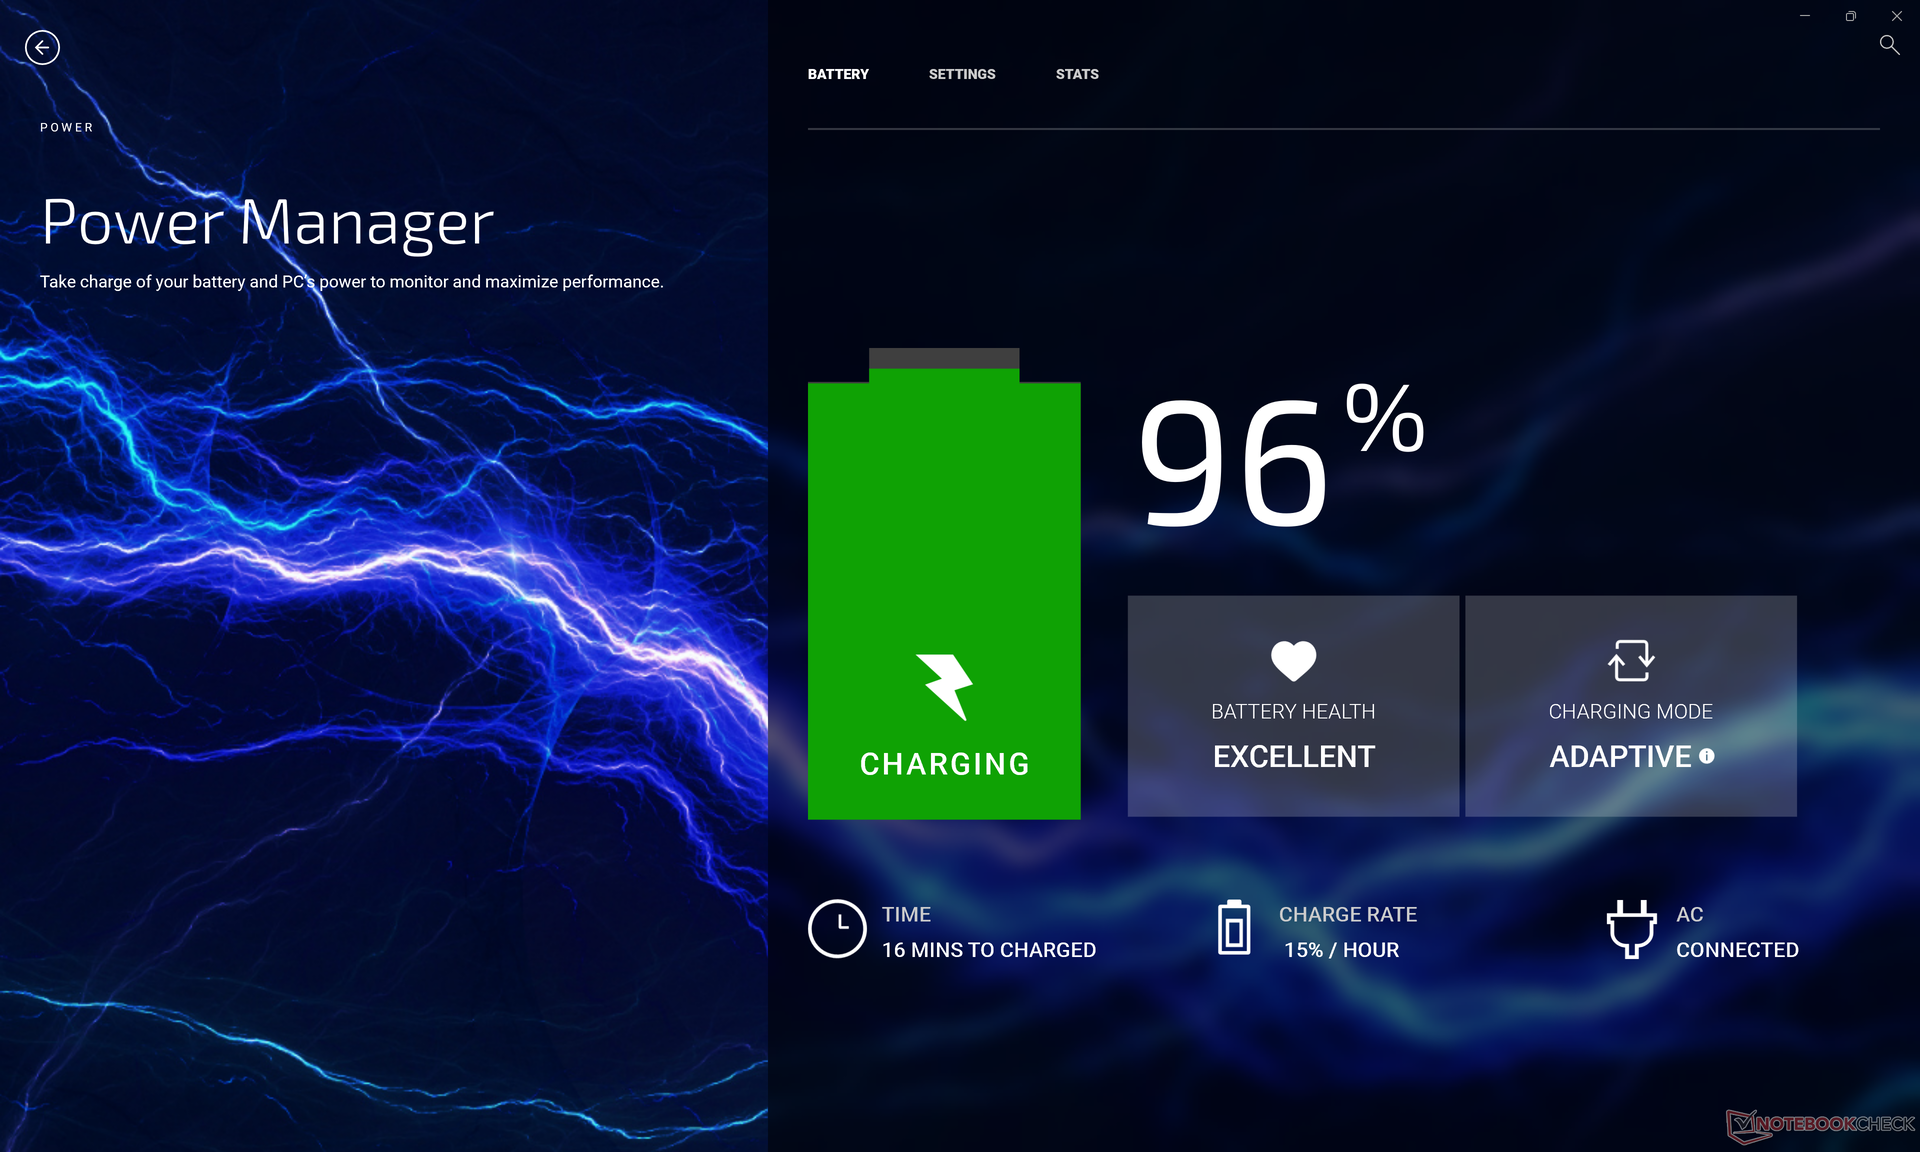
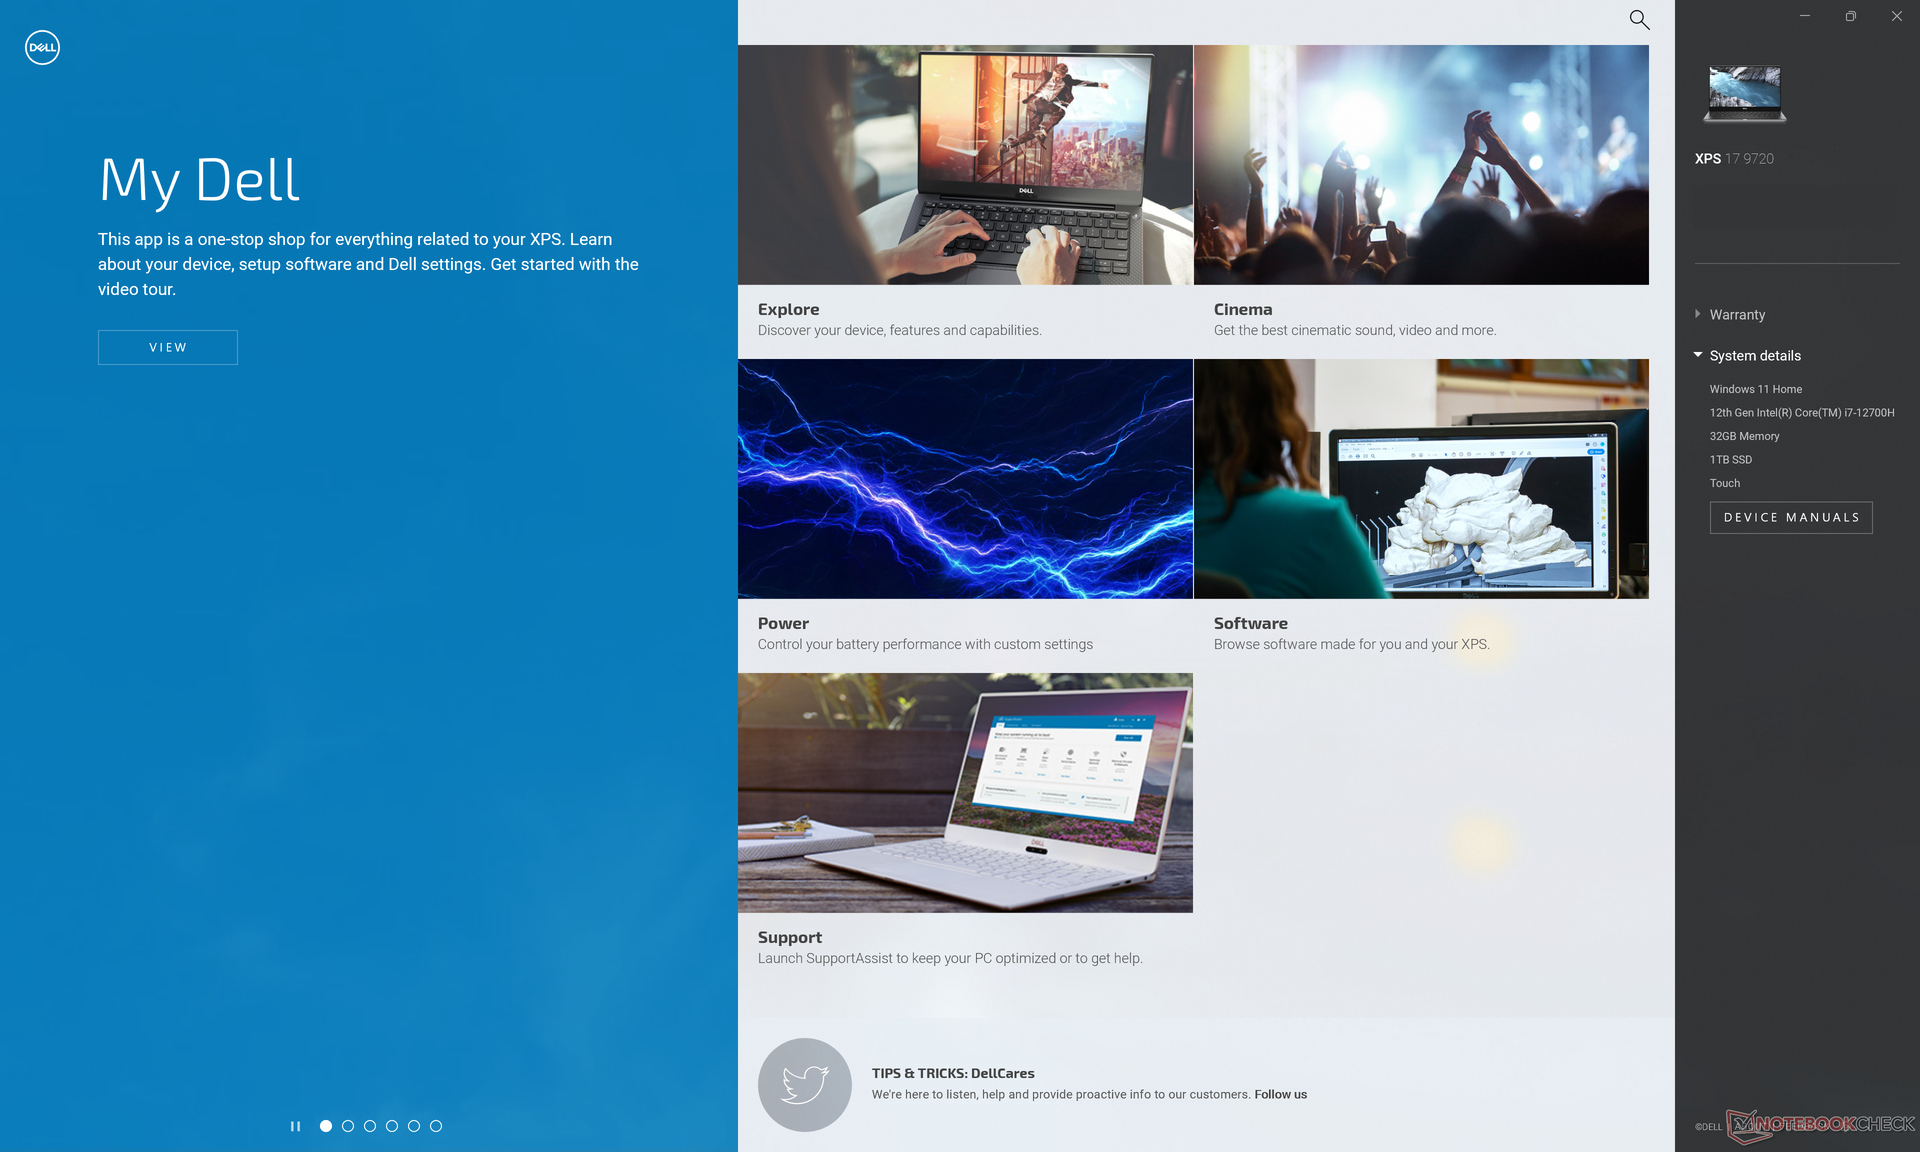
在运行以下任何基准测试之前,我们的设备通过 "我的戴尔 "软件被设置为超性能模式,以获得尽可能高的分数。我们建议用户熟悉我的戴尔、戴尔更新和PremierColor软件,因为系统的关键功能是通过这些应用程序切换的。
Optimus 1.0是集成GPU和独立的GeForce RTX 3060之间自动图形切换的标准配置。由于XPS 17不是一台游戏机,所以不支持内部自适应同步和MUX。
处理器
CineBench xT基准测试和某些AIDA64分测试比配备上一代的XPS 15 9710快50%。 酷睿i7-11800H以代表处理器性能的显著同比改善。然而,在其他测试中,包括Blender和HWBOT x265,收益要小得多,但平均收益仍然大于我们在XPS 17 9700和XPS 17 9710之间观察到的情况。
奇怪的是, 酷睿i7-12700H在一些AIDA64基准测试中落后于第十代酷睿i7-10875H,如下图所示。
一些采用相同的酷睿i7-12800H CPU的较厚的笔记本电脑能够以更高的时钟频率运行该处理器,速度最高可达20%,如在 惠普Omen 16.
循环运行CineBench R15 xT显示,在长期承受极端处理负荷时,没有出现重大的性能节流问题。
Cinebench R15 Multi Loop
Cinebench R23: Multi Core | Single Core
Cinebench R15: CPU Multi 64Bit | CPU Single 64Bit
Blender: v2.79 BMW27 CPU
7-Zip 18.03: 7z b 4 | 7z b 4 -mmt1
Geekbench 5.5: Multi-Core | Single-Core
HWBOT x265 Benchmark v2.2: 4k Preset
LibreOffice : 20 Documents To PDF
R Benchmark 2.5: Overall mean
| Cinebench R20 / CPU (Multi Core) | |
| Alienware x17 R2 P48E | |
| Dell XPS 17 9720 RTX 3060 | |
| Razer Blade 17 RTX 3080 Ti | |
| Average Intel Core i7-12700H (1576 - 7407, n=64) | |
| Alienware x17 RTX 3080 P48E | |
| Asus ROG Strix G17 G713QE-RB74 | |
| MSI GS76 Stealth 11UH | |
| Dell XPS 17 9710 Core i7 RTX 3060 | |
| Dell XPS 17 9700 Core i7 RTX 2060 Max-Q | |
| Schenker XMG Core 17 (Early 2021) | |
| Acer Nitro 5 AN517-53-54DQ | |
| Asus ROG Zephyrus S GX701GXR | |
| Dell XPS 17 9700 i5-10300H | |
| Cinebench R20 / CPU (Single Core) | |
| Alienware x17 R2 P48E | |
| Razer Blade 17 RTX 3080 Ti | |
| Average Intel Core i7-12700H (300 - 704, n=64) | |
| Dell XPS 17 9720 RTX 3060 | |
| MSI GS76 Stealth 11UH | |
| Alienware x17 RTX 3080 P48E | |
| Dell XPS 17 9710 Core i7 RTX 3060 | |
| Asus ROG Strix G17 G713QE-RB74 | |
| Acer Nitro 5 AN517-53-54DQ | |
| Dell XPS 17 9700 Core i7 RTX 2060 Max-Q | |
| Schenker XMG Core 17 (Early 2021) | |
| Dell XPS 17 9700 i5-10300H | |
| Asus ROG Zephyrus S GX701GXR | |
| Cinebench R23 / Multi Core | |
| Alienware x17 R2 P48E | |
| Dell XPS 17 9720 RTX 3060 | |
| Average Intel Core i7-12700H (4032 - 19330, n=64) | |
| Razer Blade 17 RTX 3080 Ti | |
| Alienware x17 RTX 3080 P48E | |
| MSI GS76 Stealth 11UH | |
| Asus ROG Strix G17 G713QE-RB74 | |
| Dell XPS 17 9710 Core i7 RTX 3060 | |
| Schenker XMG Core 17 (Early 2021) | |
| Acer Nitro 5 AN517-53-54DQ | |
| Cinebench R23 / Single Core | |
| Alienware x17 R2 P48E | |
| Razer Blade 17 RTX 3080 Ti | |
| Dell XPS 17 9720 RTX 3060 | |
| Average Intel Core i7-12700H (778 - 1826, n=63) | |
| MSI GS76 Stealth 11UH | |
| Alienware x17 RTX 3080 P48E | |
| Dell XPS 17 9710 Core i7 RTX 3060 | |
| Acer Nitro 5 AN517-53-54DQ | |
| Asus ROG Strix G17 G713QE-RB74 | |
| Schenker XMG Core 17 (Early 2021) | |
| Cinebench R15 / CPU Multi 64Bit | |
| Alienware x17 R2 P48E | |
| Average Intel Core i7-12700H (1379 - 2916, n=70) | |
| Razer Blade 17 RTX 3080 Ti | |
| Dell XPS 17 9720 RTX 3060 | |
| Alienware x17 RTX 3080 P48E | |
| MSI GS76 Stealth 11UH | |
| Asus ROG Strix G17 G713QE-RB74 | |
| Dell XPS 17 9710 Core i7 RTX 3060 | |
| Dell XPS 17 9700 Core i7 RTX 2060 Max-Q | |
| Schenker XMG Core 17 (Early 2021) | |
| Asus ROG Zephyrus S GX701GXR | |
| Acer Nitro 5 AN517-53-54DQ | |
| Dell XPS 17 9700 i5-10300H | |
| Cinebench R15 / CPU Single 64Bit | |
| Alienware x17 R2 P48E | |
| Razer Blade 17 RTX 3080 Ti | |
| Dell XPS 17 9720 RTX 3060 | |
| Average Intel Core i7-12700H (113 - 263, n=65) | |
| MSI GS76 Stealth 11UH | |
| Asus ROG Strix G17 G713QE-RB74 | |
| Dell XPS 17 9710 Core i7 RTX 3060 | |
| Alienware x17 RTX 3080 P48E | |
| Acer Nitro 5 AN517-53-54DQ | |
| Dell XPS 17 9700 Core i7 RTX 2060 Max-Q | |
| Schenker XMG Core 17 (Early 2021) | |
| Dell XPS 17 9700 i5-10300H | |
| Asus ROG Zephyrus S GX701GXR | |
| Blender / v2.79 BMW27 CPU | |
| Dell XPS 17 9700 i5-10300H | |
| Acer Nitro 5 AN517-53-54DQ | |
| Dell XPS 17 9700 Core i7 RTX 2060 Max-Q | |
| Schenker XMG Core 17 (Early 2021) | |
| Dell XPS 17 9710 Core i7 RTX 3060 | |
| MSI GS76 Stealth 11UH | |
| Asus ROG Strix G17 G713QE-RB74 | |
| Average Intel Core i7-12700H (168 - 732, n=63) | |
| Razer Blade 17 RTX 3080 Ti | |
| Alienware x17 RTX 3080 P48E | |
| Dell XPS 17 9720 RTX 3060 | |
| Alienware x17 R2 P48E | |
| 7-Zip 18.03 / 7z b 4 | |
| Dell XPS 17 9720 RTX 3060 | |
| Alienware x17 R2 P48E | |
| Razer Blade 17 RTX 3080 Ti | |
| Average Intel Core i7-12700H (22844 - 73067, n=63) | |
| Asus ROG Strix G17 G713QE-RB74 | |
| Alienware x17 RTX 3080 P48E | |
| MSI GS76 Stealth 11UH | |
| Dell XPS 17 9710 Core i7 RTX 3060 | |
| Dell XPS 17 9700 Core i7 RTX 2060 Max-Q | |
| Schenker XMG Core 17 (Early 2021) | |
| Acer Nitro 5 AN517-53-54DQ | |
| Dell XPS 17 9700 i5-10300H | |
| 7-Zip 18.03 / 7z b 4 -mmt1 | |
| Razer Blade 17 RTX 3080 Ti | |
| Alienware x17 R2 P48E | |
| Dell XPS 17 9720 RTX 3060 | |
| Average Intel Core i7-12700H (2743 - 5972, n=63) | |
| MSI GS76 Stealth 11UH | |
| Asus ROG Strix G17 G713QE-RB74 | |
| Dell XPS 17 9710 Core i7 RTX 3060 | |
| Schenker XMG Core 17 (Early 2021) | |
| Alienware x17 RTX 3080 P48E | |
| Dell XPS 17 9700 Core i7 RTX 2060 Max-Q | |
| Acer Nitro 5 AN517-53-54DQ | |
| Dell XPS 17 9700 i5-10300H | |
| Geekbench 5.5 / Multi-Core | |
| Alienware x17 R2 P48E | |
| Razer Blade 17 RTX 3080 Ti | |
| Dell XPS 17 9720 RTX 3060 | |
| Average Intel Core i7-12700H (5144 - 13745, n=64) | |
| MSI GS76 Stealth 11UH | |
| Dell XPS 17 9700 Core i7 RTX 2060 Max-Q | |
| Schenker XMG Core 17 (Early 2021) | |
| Acer Nitro 5 AN517-53-54DQ | |
| Dell XPS 17 9700 i5-10300H | |
| Geekbench 5.5 / Single-Core | |
| Alienware x17 R2 P48E | |
| Razer Blade 17 RTX 3080 Ti | |
| Average Intel Core i7-12700H (803 - 1851, n=64) | |
| Dell XPS 17 9720 RTX 3060 | |
| MSI GS76 Stealth 11UH | |
| Acer Nitro 5 AN517-53-54DQ | |
| Dell XPS 17 9700 Core i7 RTX 2060 Max-Q | |
| Schenker XMG Core 17 (Early 2021) | |
| Dell XPS 17 9700 i5-10300H | |
| HWBOT x265 Benchmark v2.2 / 4k Preset | |
| Alienware x17 R2 P48E | |
| Alienware x17 RTX 3080 P48E | |
| Razer Blade 17 RTX 3080 Ti | |
| Average Intel Core i7-12700H (4.67 - 21.8, n=64) | |
| Dell XPS 17 9720 RTX 3060 | |
| MSI GS76 Stealth 11UH | |
| Asus ROG Strix G17 G713QE-RB74 | |
| Dell XPS 17 9710 Core i7 RTX 3060 | |
| Dell XPS 17 9700 Core i7 RTX 2060 Max-Q | |
| Schenker XMG Core 17 (Early 2021) | |
| Acer Nitro 5 AN517-53-54DQ | |
| Dell XPS 17 9700 i5-10300H | |
| LibreOffice / 20 Documents To PDF | |
| Schenker XMG Core 17 (Early 2021) | |
| Asus ROG Strix G17 G713QE-RB74 | |
| Dell XPS 17 9700 i5-10300H | |
| Acer Nitro 5 AN517-53-54DQ | |
| MSI GS76 Stealth 11UH | |
| Dell XPS 17 9700 Core i7 RTX 2060 Max-Q | |
| Alienware x17 RTX 3080 P48E | |
| Razer Blade 17 RTX 3080 Ti | |
| Average Intel Core i7-12700H (34.2 - 95.3, n=63) | |
| Dell XPS 17 9710 Core i7 RTX 3060 | |
| Dell XPS 17 9720 RTX 3060 | |
| Alienware x17 R2 P48E | |
| R Benchmark 2.5 / Overall mean | |
| Dell XPS 17 9700 i5-10300H | |
| Acer Nitro 5 AN517-53-54DQ | |
| Dell XPS 17 9700 Core i7 RTX 2060 Max-Q | |
| Schenker XMG Core 17 (Early 2021) | |
| Alienware x17 RTX 3080 P48E | |
| Dell XPS 17 9710 Core i7 RTX 3060 | |
| MSI GS76 Stealth 11UH | |
| Asus ROG Strix G17 G713QE-RB74 | |
| Average Intel Core i7-12700H (0.4441 - 1.052, n=63) | |
| Dell XPS 17 9720 RTX 3060 | |
| Razer Blade 17 RTX 3080 Ti | |
| Alienware x17 R2 P48E | |
Cinebench R23: Multi Core | Single Core
Cinebench R15: CPU Multi 64Bit | CPU Single 64Bit
Blender: v2.79 BMW27 CPU
7-Zip 18.03: 7z b 4 | 7z b 4 -mmt1
Geekbench 5.5: Multi-Core | Single-Core
HWBOT x265 Benchmark v2.2: 4k Preset
LibreOffice : 20 Documents To PDF
R Benchmark 2.5: Overall mean
* ... smaller is better
| AIDA64 / FP32 Ray-Trace | |
| Eurocom RX315 NH57AF1 | |
| Lenovo Legion 5 17ACH6H-82JY0003GE | |
| Average Intel Core i7-12700H (2585 - 17957, n=64) | |
| Dell XPS 17 9700 Core i7 RTX 2060 Max-Q | |
| Razer Blade 17 (i7-12800H, RTX 3070 Ti) | |
| Dell XPS 17 9720 RTX 3060 | |
| Asus VivoBook 17 F712JA-AU708W | |
| AIDA64 / FPU SinJulia | |
| Eurocom RX315 NH57AF1 | |
| Razer Blade 17 (i7-12800H, RTX 3070 Ti) | |
| Lenovo Legion 5 17ACH6H-82JY0003GE | |
| Average Intel Core i7-12700H (3249 - 9939, n=64) | |
| Dell XPS 17 9720 RTX 3060 | |
| Dell XPS 17 9700 Core i7 RTX 2060 Max-Q | |
| Asus VivoBook 17 F712JA-AU708W | |
| AIDA64 / FP64 Ray-Trace | |
| Eurocom RX315 NH57AF1 | |
| Lenovo Legion 5 17ACH6H-82JY0003GE | |
| Average Intel Core i7-12700H (1437 - 9692, n=64) | |
| Dell XPS 17 9700 Core i7 RTX 2060 Max-Q | |
| Dell XPS 17 9720 RTX 3060 | |
| Razer Blade 17 (i7-12800H, RTX 3070 Ti) | |
| Asus VivoBook 17 F712JA-AU708W | |
| AIDA64 / CPU PhotoWorxx | |
| Dell XPS 17 9720 RTX 3060 | |
| Average Intel Core i7-12700H (12863 - 52207, n=64) | |
| Razer Blade 17 (i7-12800H, RTX 3070 Ti) | |
| Dell XPS 17 9700 Core i7 RTX 2060 Max-Q | |
| Eurocom RX315 NH57AF1 | |
| Asus VivoBook 17 F712JA-AU708W | |
| Lenovo Legion 5 17ACH6H-82JY0003GE | |
系统性能
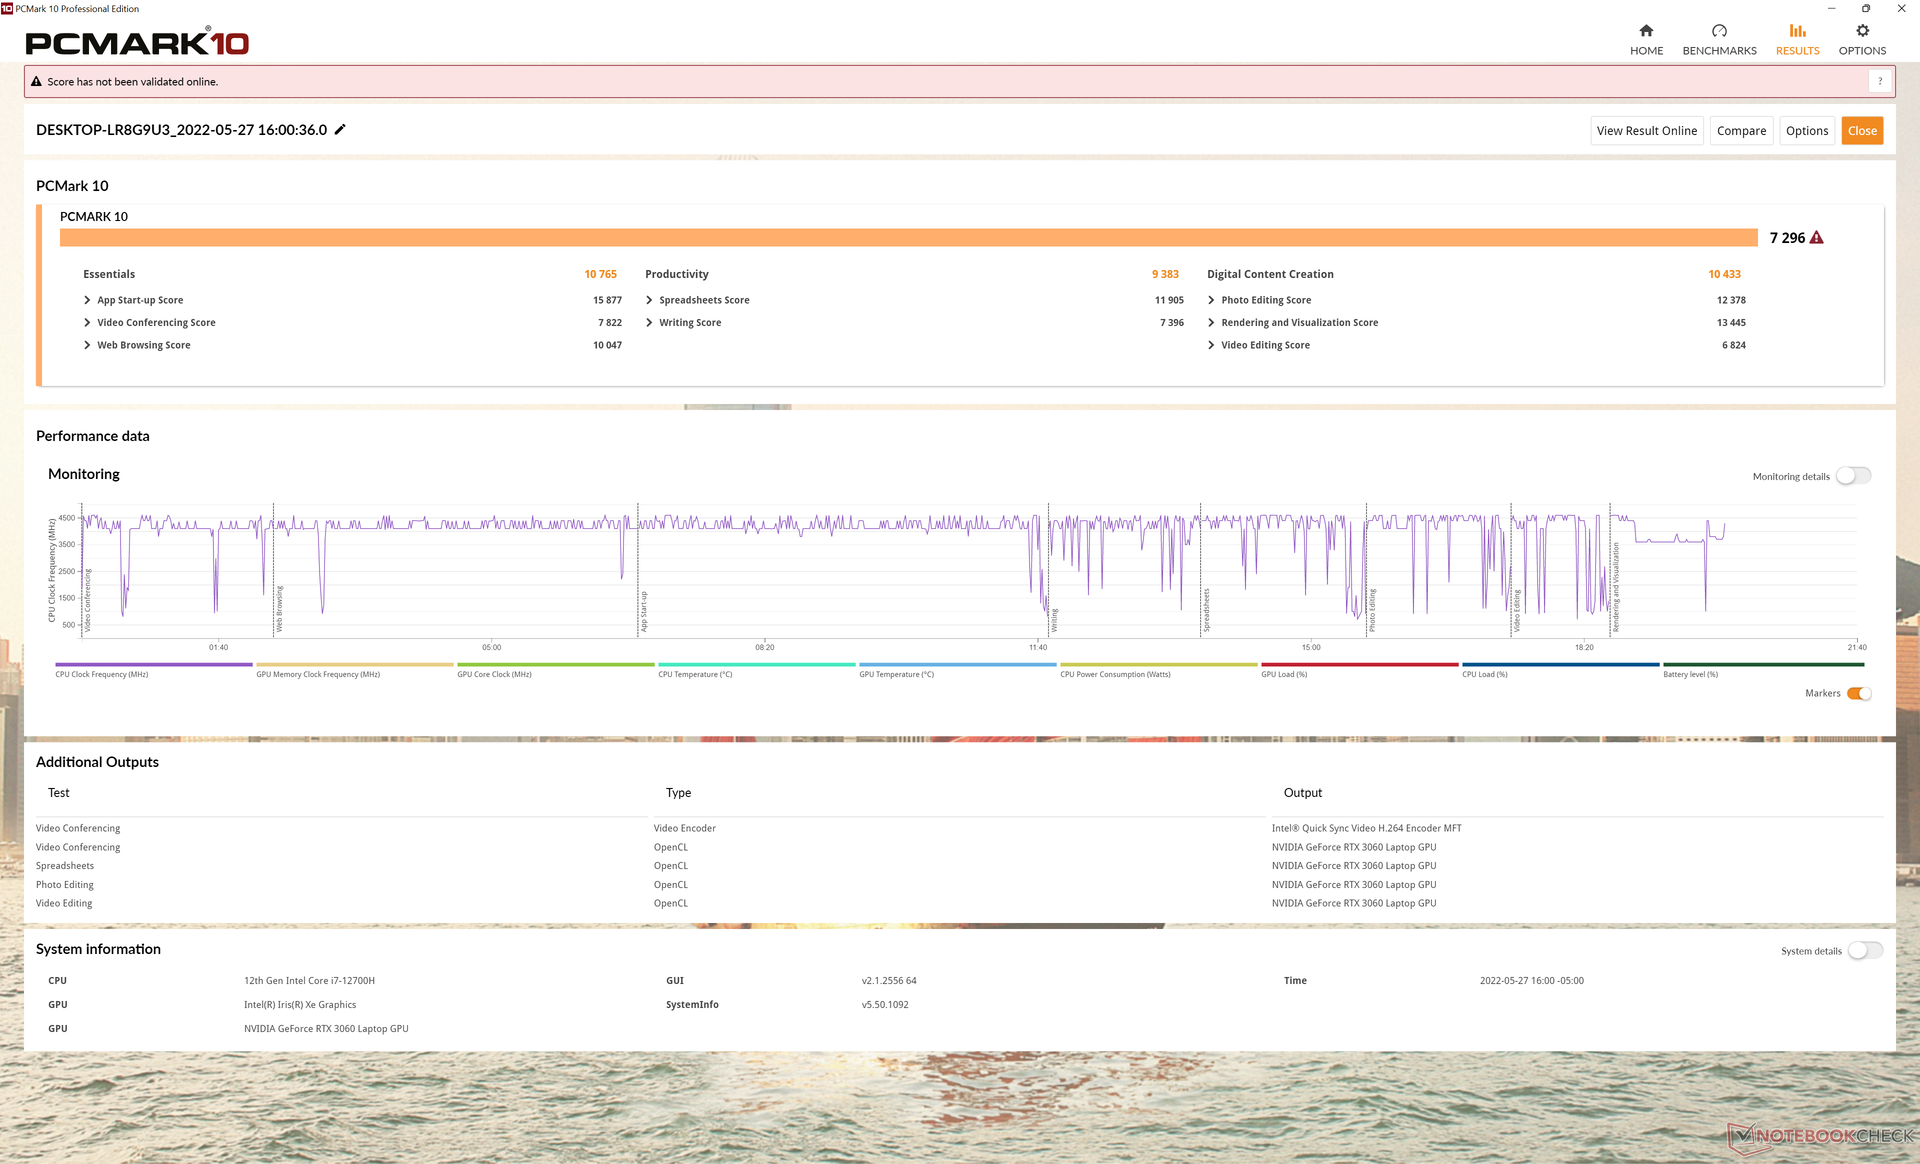
PCMark 10的结果一直高于我们在XPS 17 9710上记录的结果,如果只是勉强的话。我们的XPS 17 9720的成绩仍然是多媒体类别中最快的一些。
我们在设备上遇到了一个错误,在睡眠模式下,功耗会奇怪地稳定在40W,而不是通常的<2W,导致表面温度非常高,浪费了能源。通过 "我的戴尔 "切换电源配置文件似乎可以暂时解决这个问题。
CrossMark: Overall | Productivity | Creativity | Responsiveness
| PCMark 10 / Score | |
| Average of class Multimedia (4325 - 10386, n=57, last 2 years) | |
| Dell XPS 17 9720 RTX 3060 | |
| Razer Blade 17 (i7-12800H, RTX 3070 Ti) | |
| Average Intel Core i7-12700H, NVIDIA GeForce RTX 3060 Laptop GPU (5986 - 8156, n=12) | |
| Dell XPS 17 9710 Core i7 RTX 3060 | |
| Lenovo Legion 5 17ACH6H-82JY0003GE | |
| Dell XPS 17 9700 Core i7 RTX 2060 Max-Q | |
| HP Envy 17-cg | |
| Asus VivoBook 17 F712JA-AU708W | |
| PCMark 10 / Essentials | |
| Dell XPS 17 9720 RTX 3060 | |
| Average Intel Core i7-12700H, NVIDIA GeForce RTX 3060 Laptop GPU (9289 - 12144, n=12) | |
| Average of class Multimedia (8025 - 11664, n=56, last 2 years) | |
| Razer Blade 17 (i7-12800H, RTX 3070 Ti) | |
| Dell XPS 17 9710 Core i7 RTX 3060 | |
| Lenovo Legion 5 17ACH6H-82JY0003GE | |
| Dell XPS 17 9700 Core i7 RTX 2060 Max-Q | |
| HP Envy 17-cg | |
| Asus VivoBook 17 F712JA-AU708W | |
| PCMark 10 / Productivity | |
| Average of class Multimedia (7323 - 18233, n=56, last 2 years) | |
| Dell XPS 17 9720 RTX 3060 | |
| Average Intel Core i7-12700H, NVIDIA GeForce RTX 3060 Laptop GPU (6161 - 10362, n=12) | |
| Razer Blade 17 (i7-12800H, RTX 3070 Ti) | |
| Lenovo Legion 5 17ACH6H-82JY0003GE | |
| Dell XPS 17 9710 Core i7 RTX 3060 | |
| HP Envy 17-cg | |
| Dell XPS 17 9700 Core i7 RTX 2060 Max-Q | |
| Asus VivoBook 17 F712JA-AU708W | |
| PCMark 10 / Digital Content Creation | |
| Razer Blade 17 (i7-12800H, RTX 3070 Ti) | |
| Average Intel Core i7-12700H, NVIDIA GeForce RTX 3060 Laptop GPU (8950 - 12554, n=12) | |
| Average of class Multimedia (3651 - 16240, n=56, last 2 years) | |
| Dell XPS 17 9720 RTX 3060 | |
| Dell XPS 17 9710 Core i7 RTX 3060 | |
| Lenovo Legion 5 17ACH6H-82JY0003GE | |
| Dell XPS 17 9700 Core i7 RTX 2060 Max-Q | |
| HP Envy 17-cg | |
| Asus VivoBook 17 F712JA-AU708W | |
| CrossMark / Overall | |
| Dell XPS 17 9720 RTX 3060 | |
| Average of class Multimedia (866 - 2728, n=66, last 2 years) | |
| Average Intel Core i7-12700H, NVIDIA GeForce RTX 3060 Laptop GPU (1649 - 2017, n=11) | |
| Razer Blade 17 (i7-12800H, RTX 3070 Ti) | |
| Lenovo Legion 5 17ACH6H-82JY0003GE | |
| Asus VivoBook 17 F712JA-AU708W | |
| CrossMark / Productivity | |
| Dell XPS 17 9720 RTX 3060 | |
| Average of class Multimedia (931 - 2489, n=66, last 2 years) | |
| Average Intel Core i7-12700H, NVIDIA GeForce RTX 3060 Laptop GPU (1536 - 1958, n=11) | |
| Razer Blade 17 (i7-12800H, RTX 3070 Ti) | |
| Lenovo Legion 5 17ACH6H-82JY0003GE | |
| Asus VivoBook 17 F712JA-AU708W | |
| CrossMark / Creativity | |
| Average of class Multimedia (907 - 3465, n=66, last 2 years) | |
| Dell XPS 17 9720 RTX 3060 | |
| Average Intel Core i7-12700H, NVIDIA GeForce RTX 3060 Laptop GPU (1816 - 2084, n=11) | |
| Razer Blade 17 (i7-12800H, RTX 3070 Ti) | |
| Lenovo Legion 5 17ACH6H-82JY0003GE | |
| Asus VivoBook 17 F712JA-AU708W | |
| CrossMark / Responsiveness | |
| Dell XPS 17 9720 RTX 3060 | |
| Average Intel Core i7-12700H, NVIDIA GeForce RTX 3060 Laptop GPU (1210 - 2207, n=11) | |
| Razer Blade 17 (i7-12800H, RTX 3070 Ti) | |
| Average of class Multimedia (605 - 2024, n=66, last 2 years) | |
| Lenovo Legion 5 17ACH6H-82JY0003GE | |
| Asus VivoBook 17 F712JA-AU708W | |
| PCMark 10 Score | 7296 points | |
Help | ||
| AIDA64 / Memory Copy | |
| Dell XPS 17 9720 RTX 3060 | |
| Average Intel Core i7-12700H (25615 - 80511, n=64) | |
| Razer Blade 17 (i7-12800H, RTX 3070 Ti) | |
| Dell XPS 17 9700 Core i7 RTX 2060 Max-Q | |
| Lenovo Legion 5 17ACH6H-82JY0003GE | |
| Asus VivoBook 17 F712JA-AU708W | |
| AIDA64 / Memory Read | |
| Dell XPS 17 9720 RTX 3060 | |
| Average Intel Core i7-12700H (25586 - 79442, n=64) | |
| Razer Blade 17 (i7-12800H, RTX 3070 Ti) | |
| Lenovo Legion 5 17ACH6H-82JY0003GE | |
| Dell XPS 17 9700 Core i7 RTX 2060 Max-Q | |
| Asus VivoBook 17 F712JA-AU708W | |
| AIDA64 / Memory Write | |
| Dell XPS 17 9720 RTX 3060 | |
| Average Intel Core i7-12700H (23679 - 88660, n=64) | |
| Razer Blade 17 (i7-12800H, RTX 3070 Ti) | |
| Dell XPS 17 9700 Core i7 RTX 2060 Max-Q | |
| Lenovo Legion 5 17ACH6H-82JY0003GE | |
| Asus VivoBook 17 F712JA-AU708W | |
* ... smaller is better
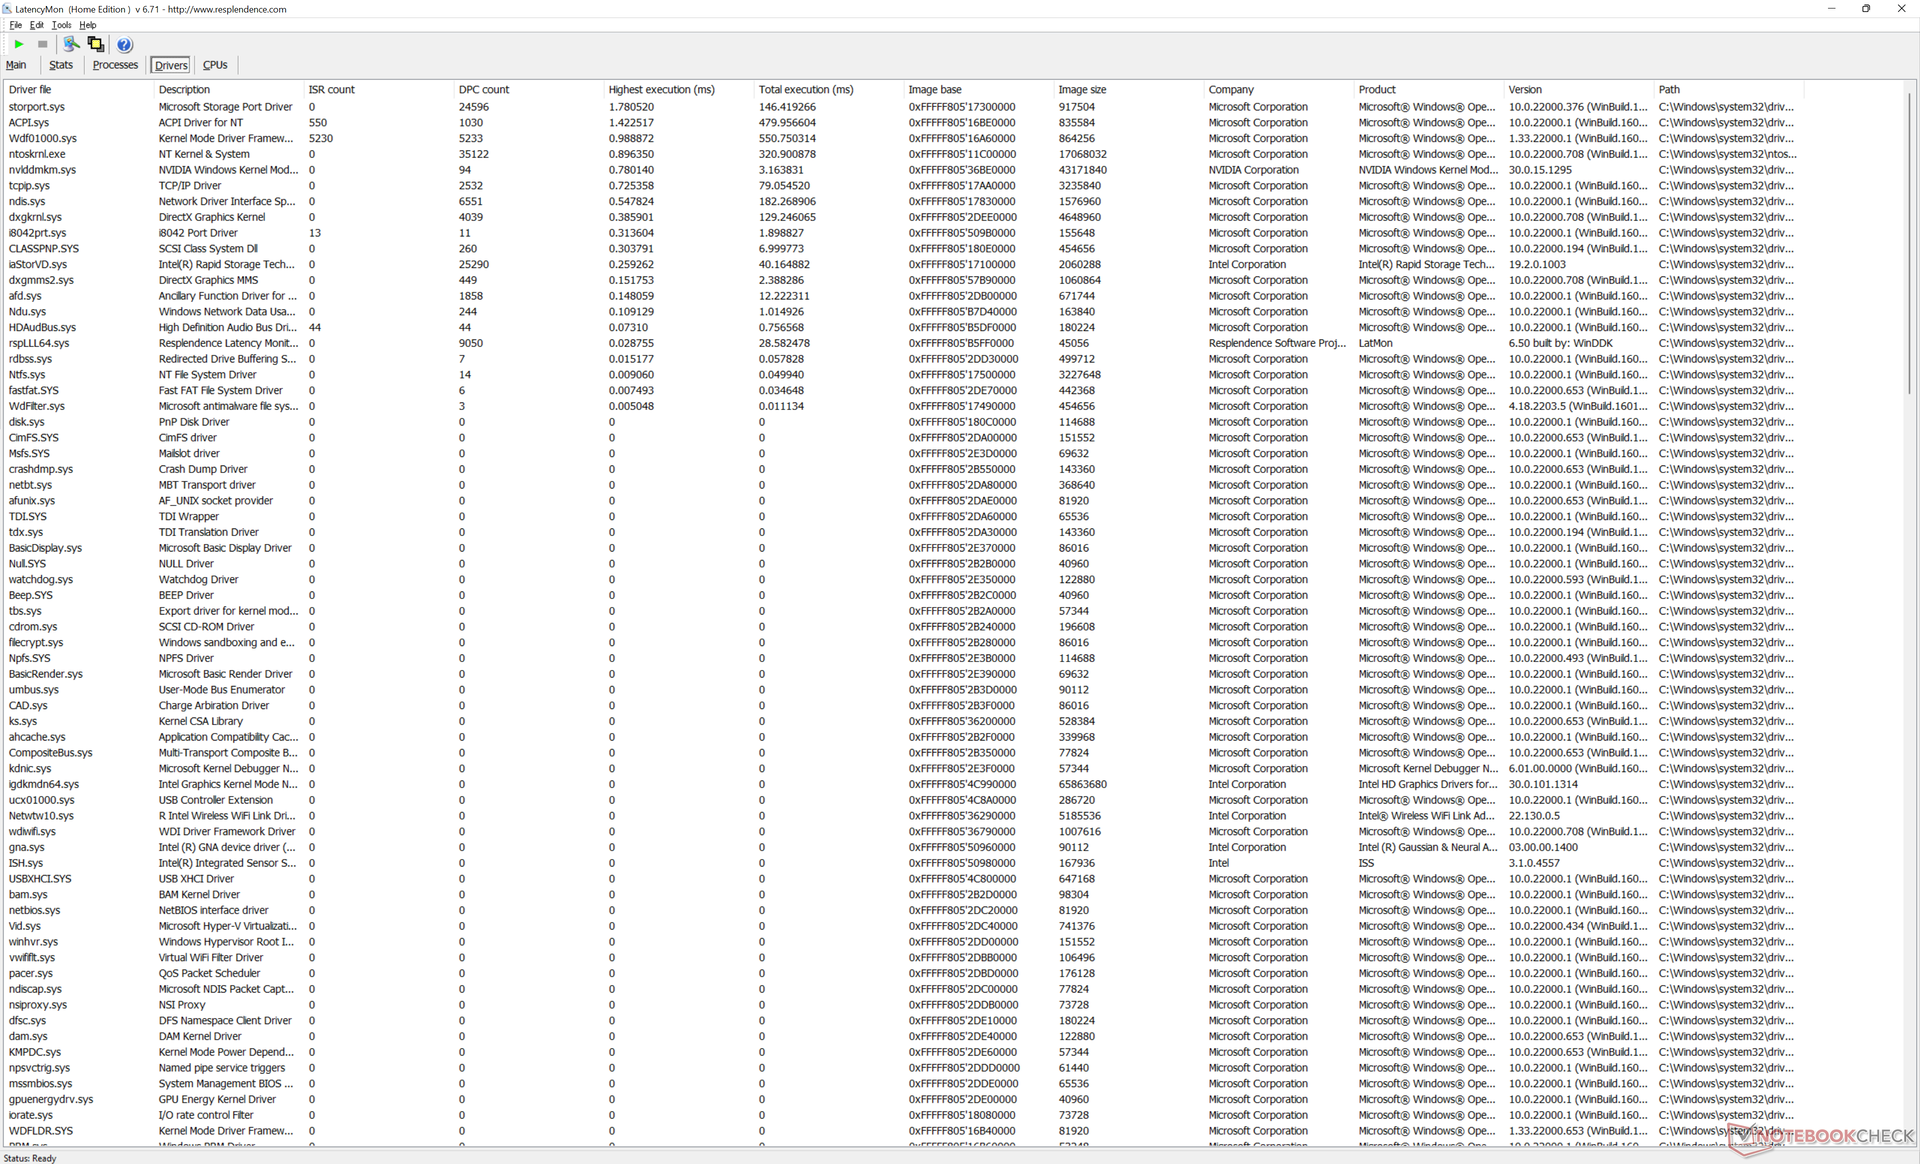
DPC延时
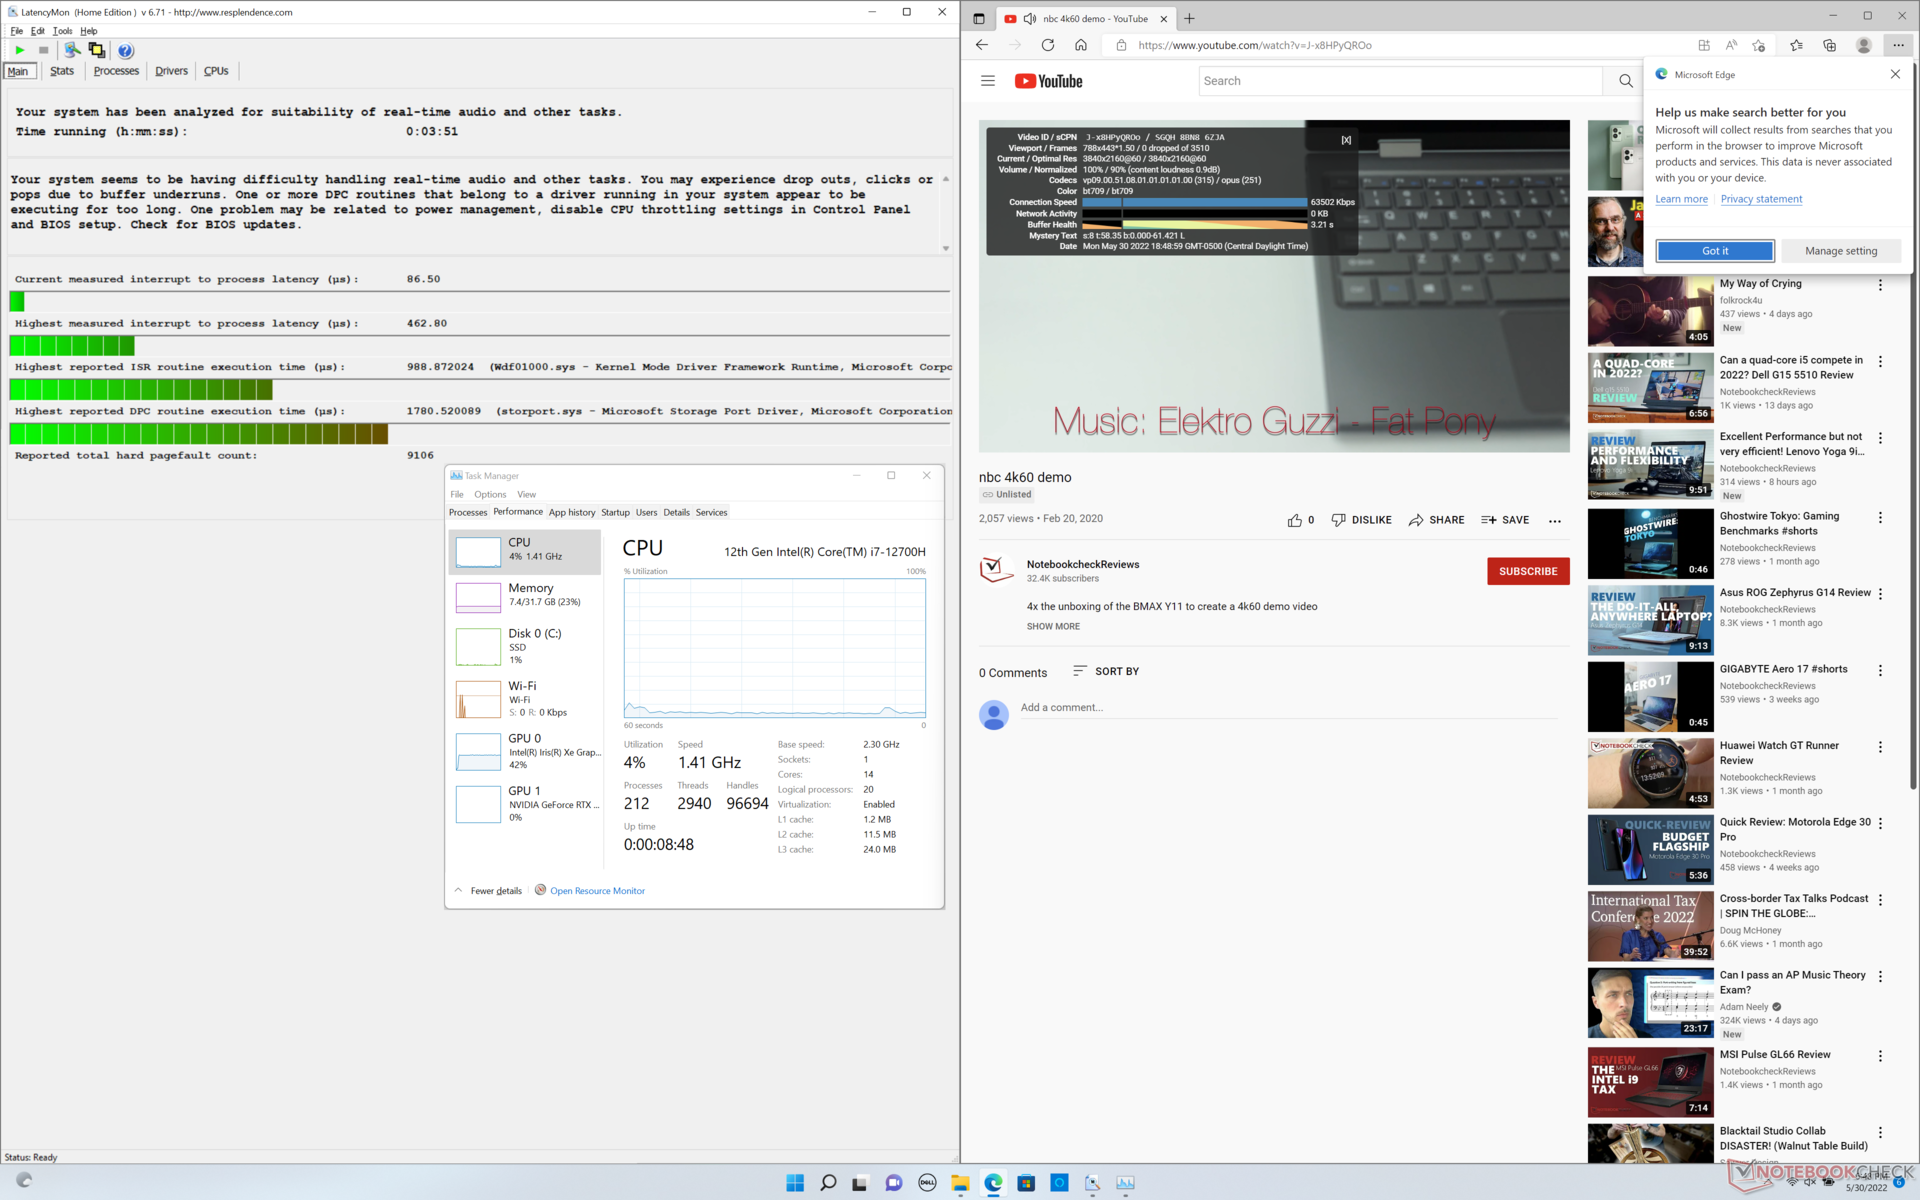
LatencyMon显示,在我们的主页上打开多个浏览器标签时,存在轻微的DPC问题,就像我们在XPS 17 9710和9700上观察到的那样。在60FPS下的4K视频播放是完全流畅的,没有掉帧,这是任何由Core H驱动的多媒体笔记本电脑所期望的。
| DPC Latencies / LatencyMon - interrupt to process latency (max), Web, Youtube, Prime95 | |
| HP Envy 17-cg | |
| Lenovo Legion 5 17ACH6H-82JY0003GE | |
| Asus VivoBook 17 F712JA-AU708W | |
| Razer Blade 17 (i7-12800H, RTX 3070 Ti) | |
| Dell XPS 17 9700 Core i7 RTX 2060 Max-Q | |
| Dell XPS 17 9710 Core i7 RTX 3060 | |
| Dell XPS 17 9720 RTX 3060 | |
* ... smaller is better
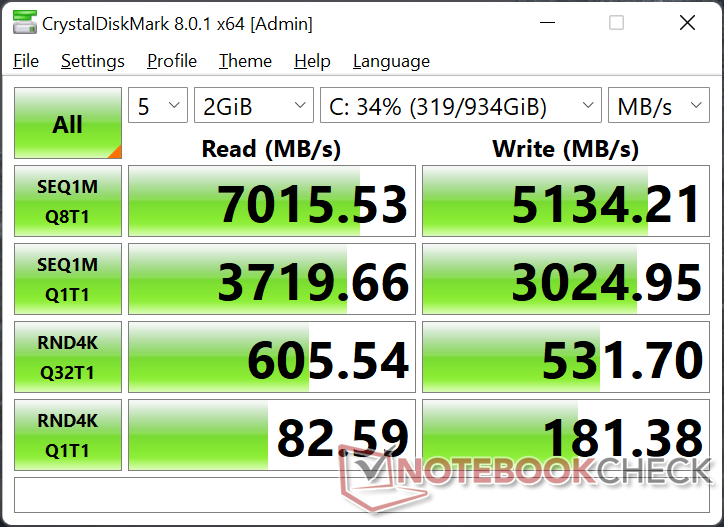
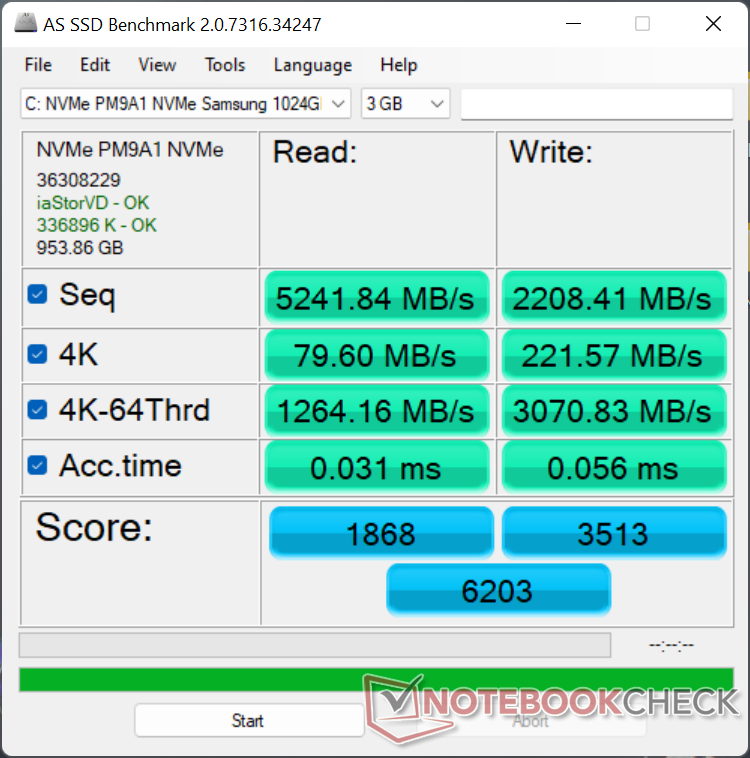
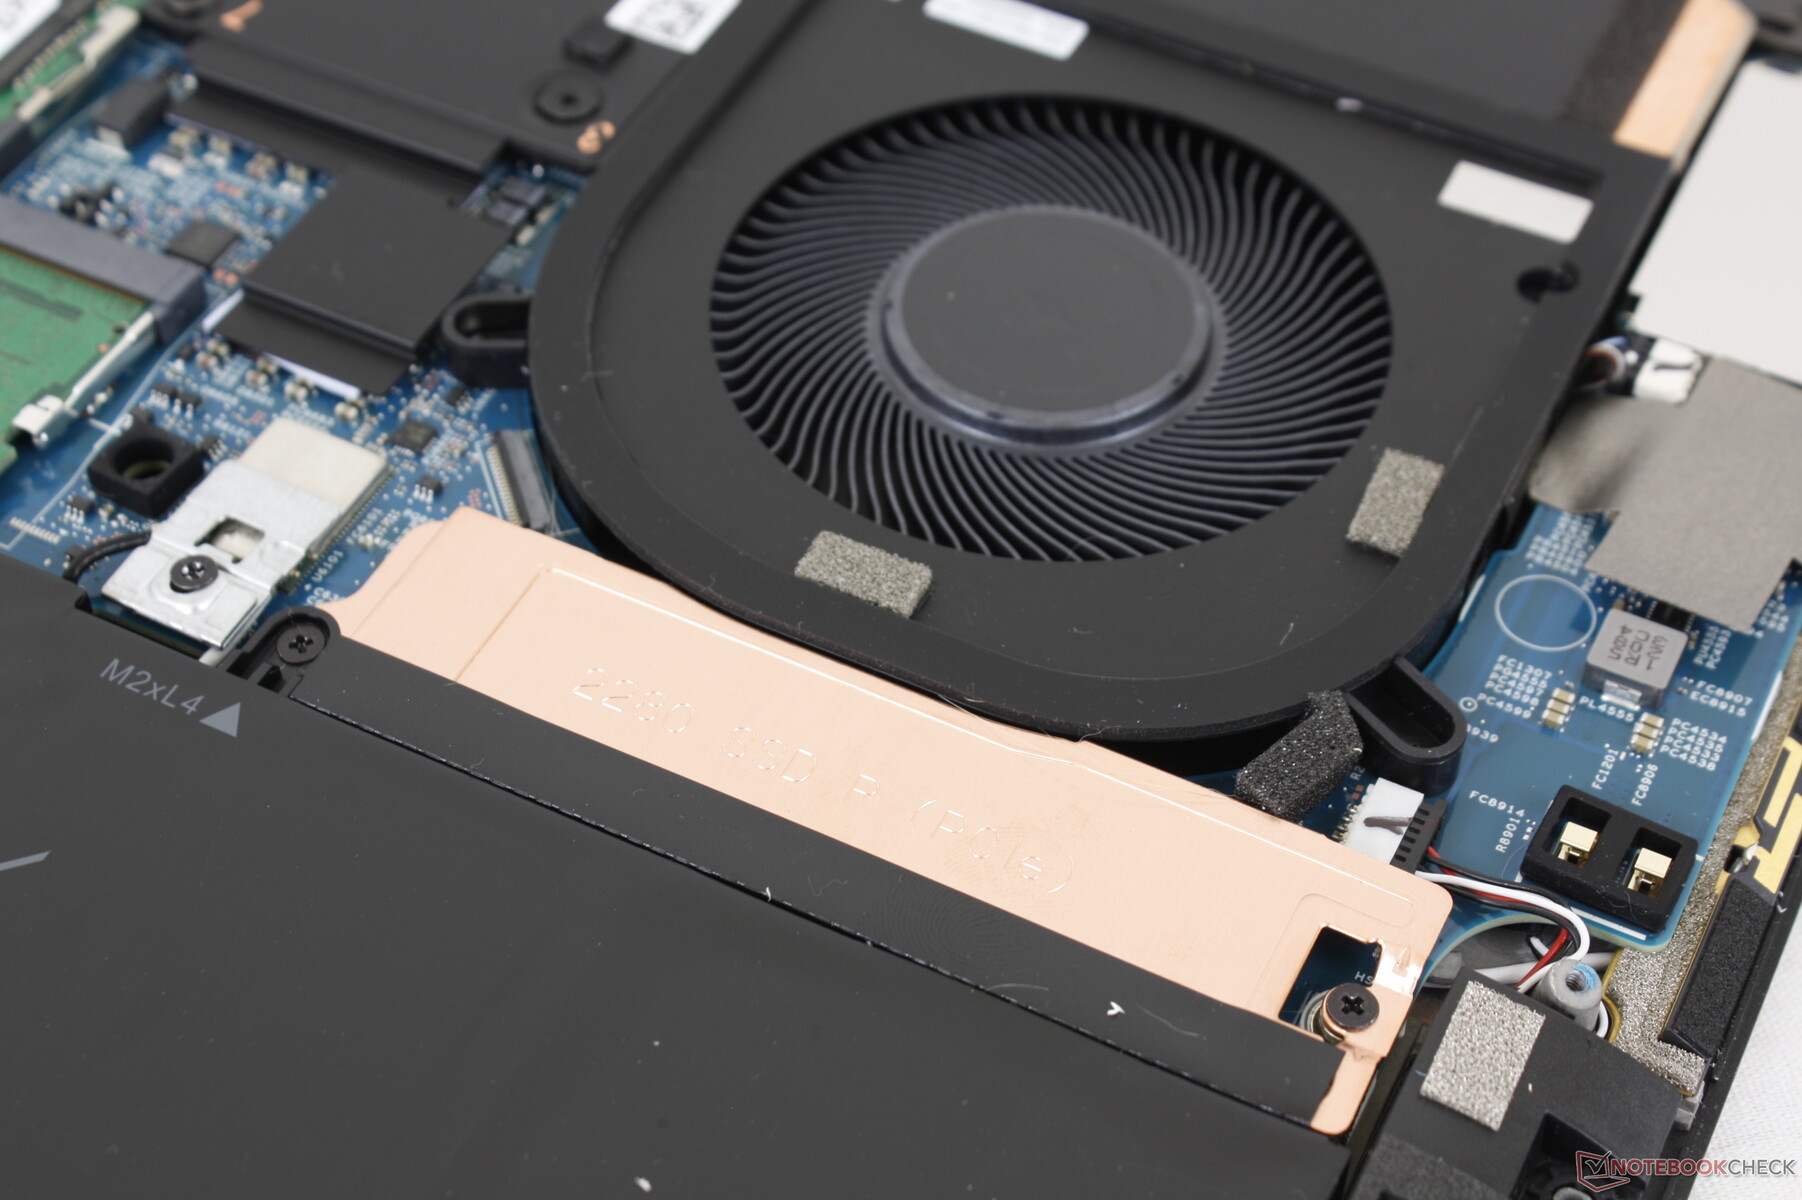
存储设备
XPS 17 9710发货时,PCIe4 x4 NVMe固态硬盘还没有广泛使用,因此SKU只能用PCIe3 x4选项代替。值得庆幸的是,如今PCIe4驱动器更加普遍,很高兴看到XPS 17 9720采用了快速的三星PM9A1解决方案。我们的压力测试显示,在我们的设备中的驱动器将没有问题,保持其最大的连续读取速率超过7000 MB / s的长时间,而不需要节流,虽然整体性能仍然比我们记录在Razer Blade 17配备相同的1TB三星硬盘。

* ... smaller is better
Disk Throttling: DiskSpd Read Loop, Queue Depth 8
GPU性能
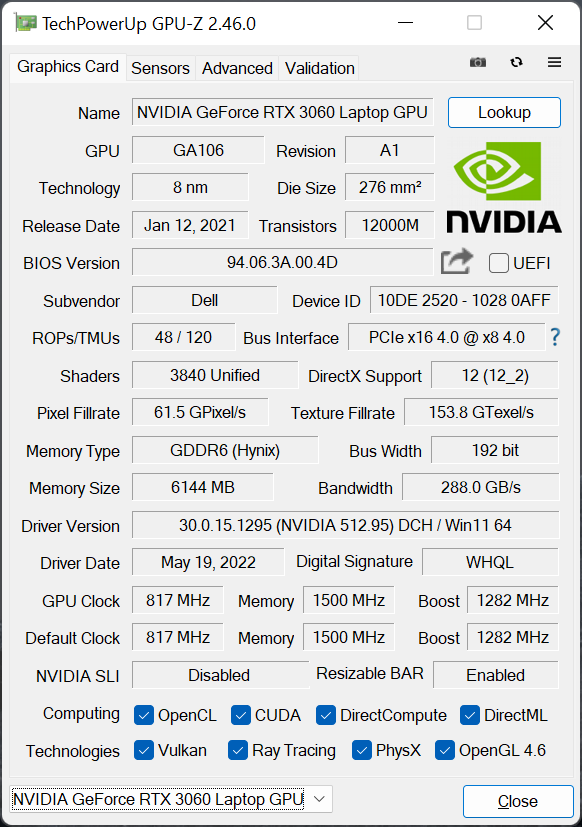
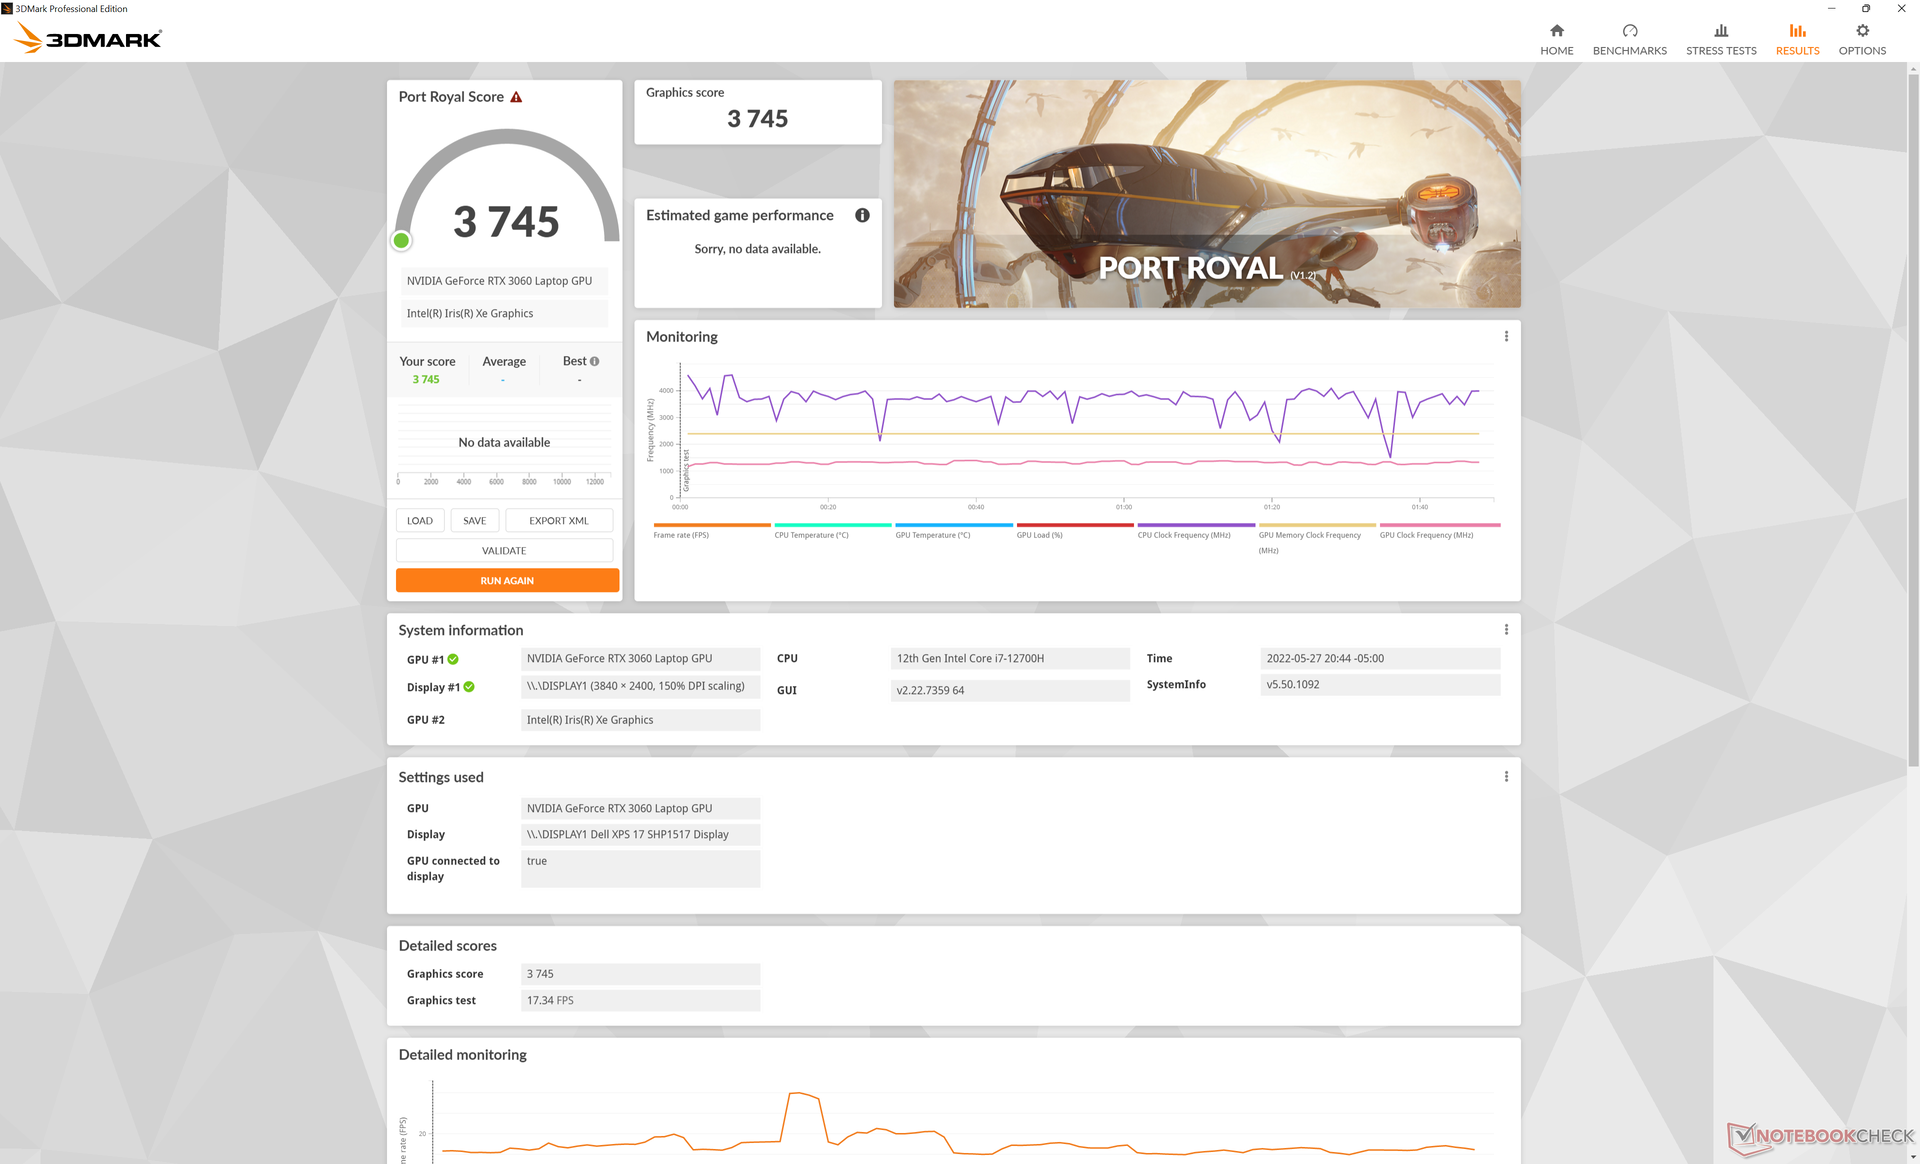
戴尔已经将GeForce RTX 3060 TGP从XPS 17 9710的70W降至XPS 17 9720的65W。虽然戴尔宣传9720的GPU为60瓦,但我们可以确认,Nvidia的控制面板显示为65瓦,这与我们在测试中的独立结果更接近。根据3DMark基准测试和测试的GPU游戏,其效果是原始图形性能下降10%,如 Witcher 3最终幻想15》或《奇异旅团》。
当与具有相同GeForce RTX 3060 GPU的平均笔记本电脑相比,XPS 17 9720中的GPU慢了大约20%。值得注意的是,其他大多数配备RTX 3060的笔记本电脑通常以80W或更高的TGP上限为目标。至少,这里的GPU仍然比原来XPS 17 9700中的RTX 2060 Max-Q ,好了大约15%。同时,降级到RTX 3050 Ti SKU将导致25%至30%的性能下降。
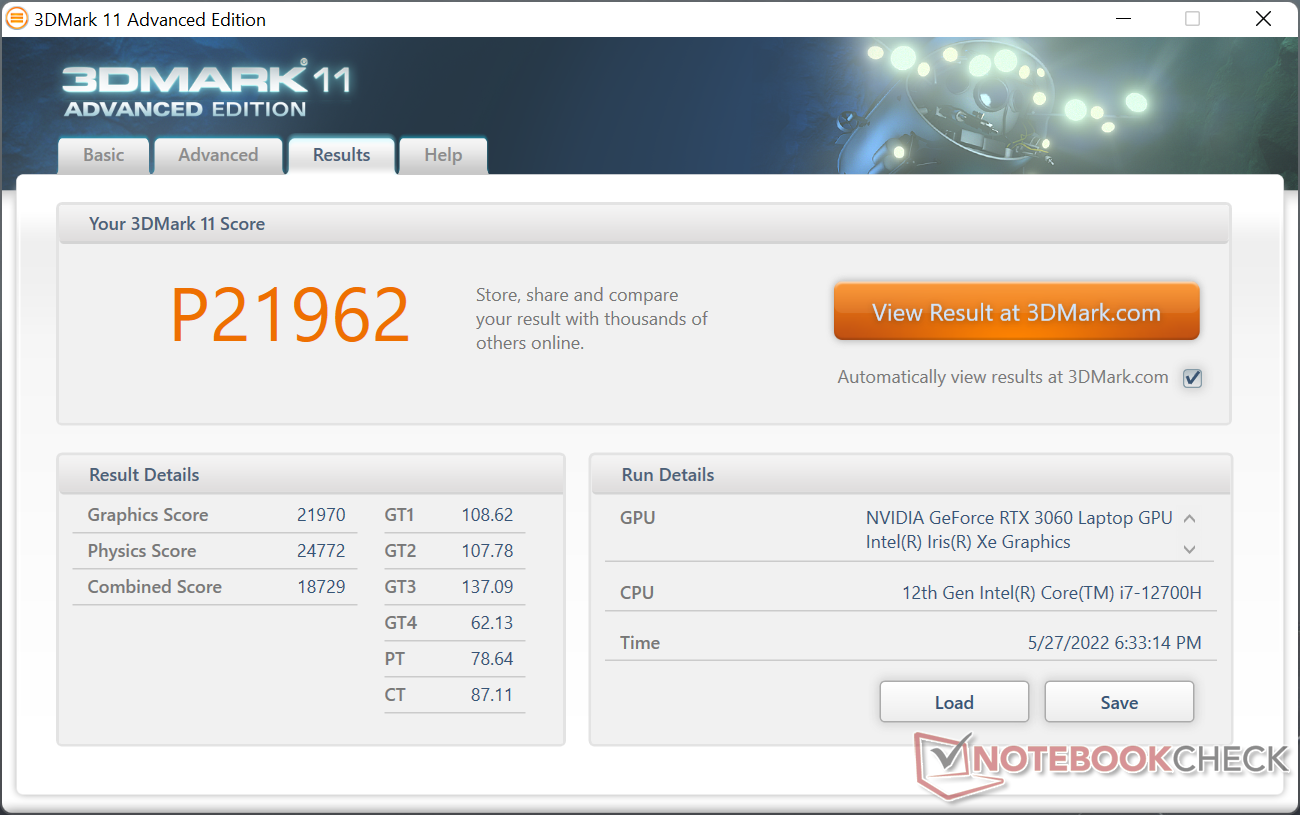
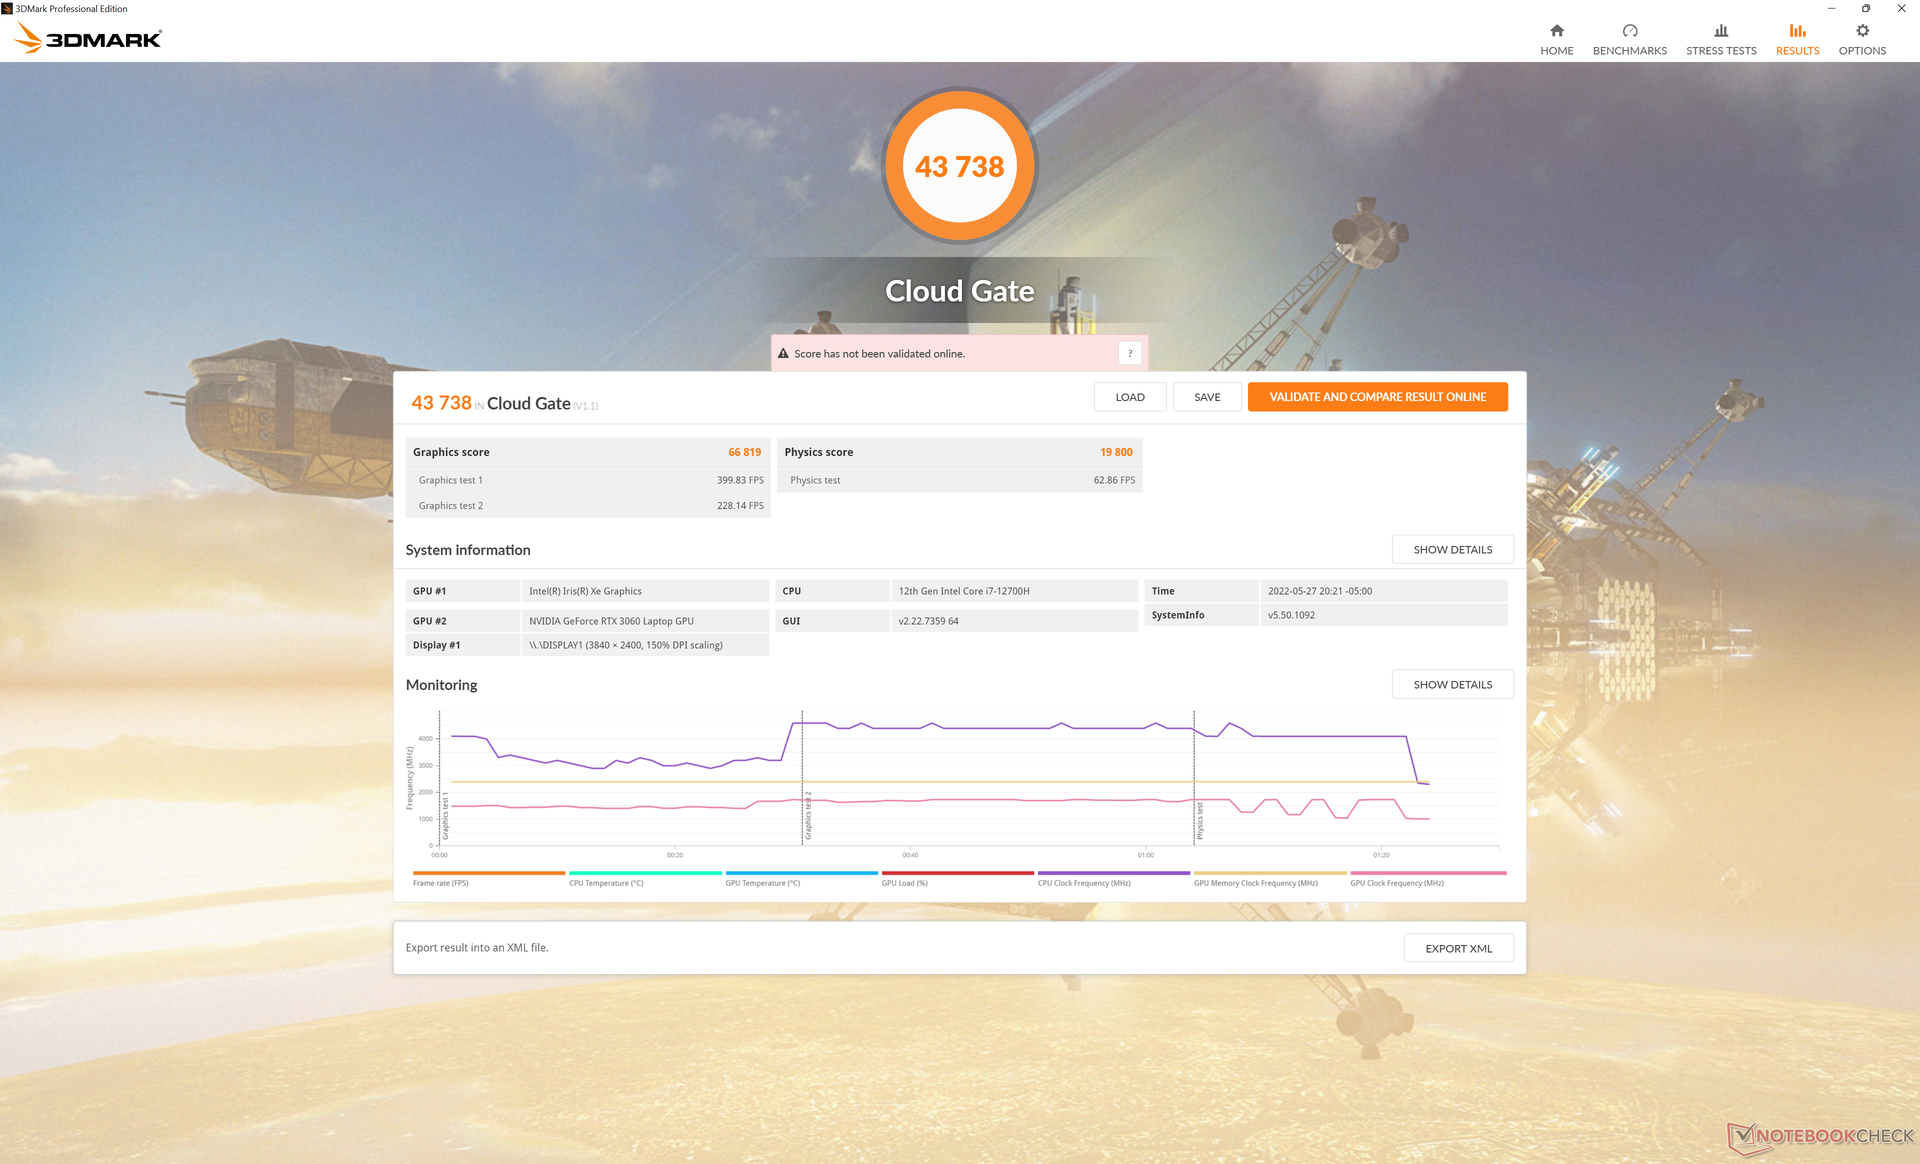
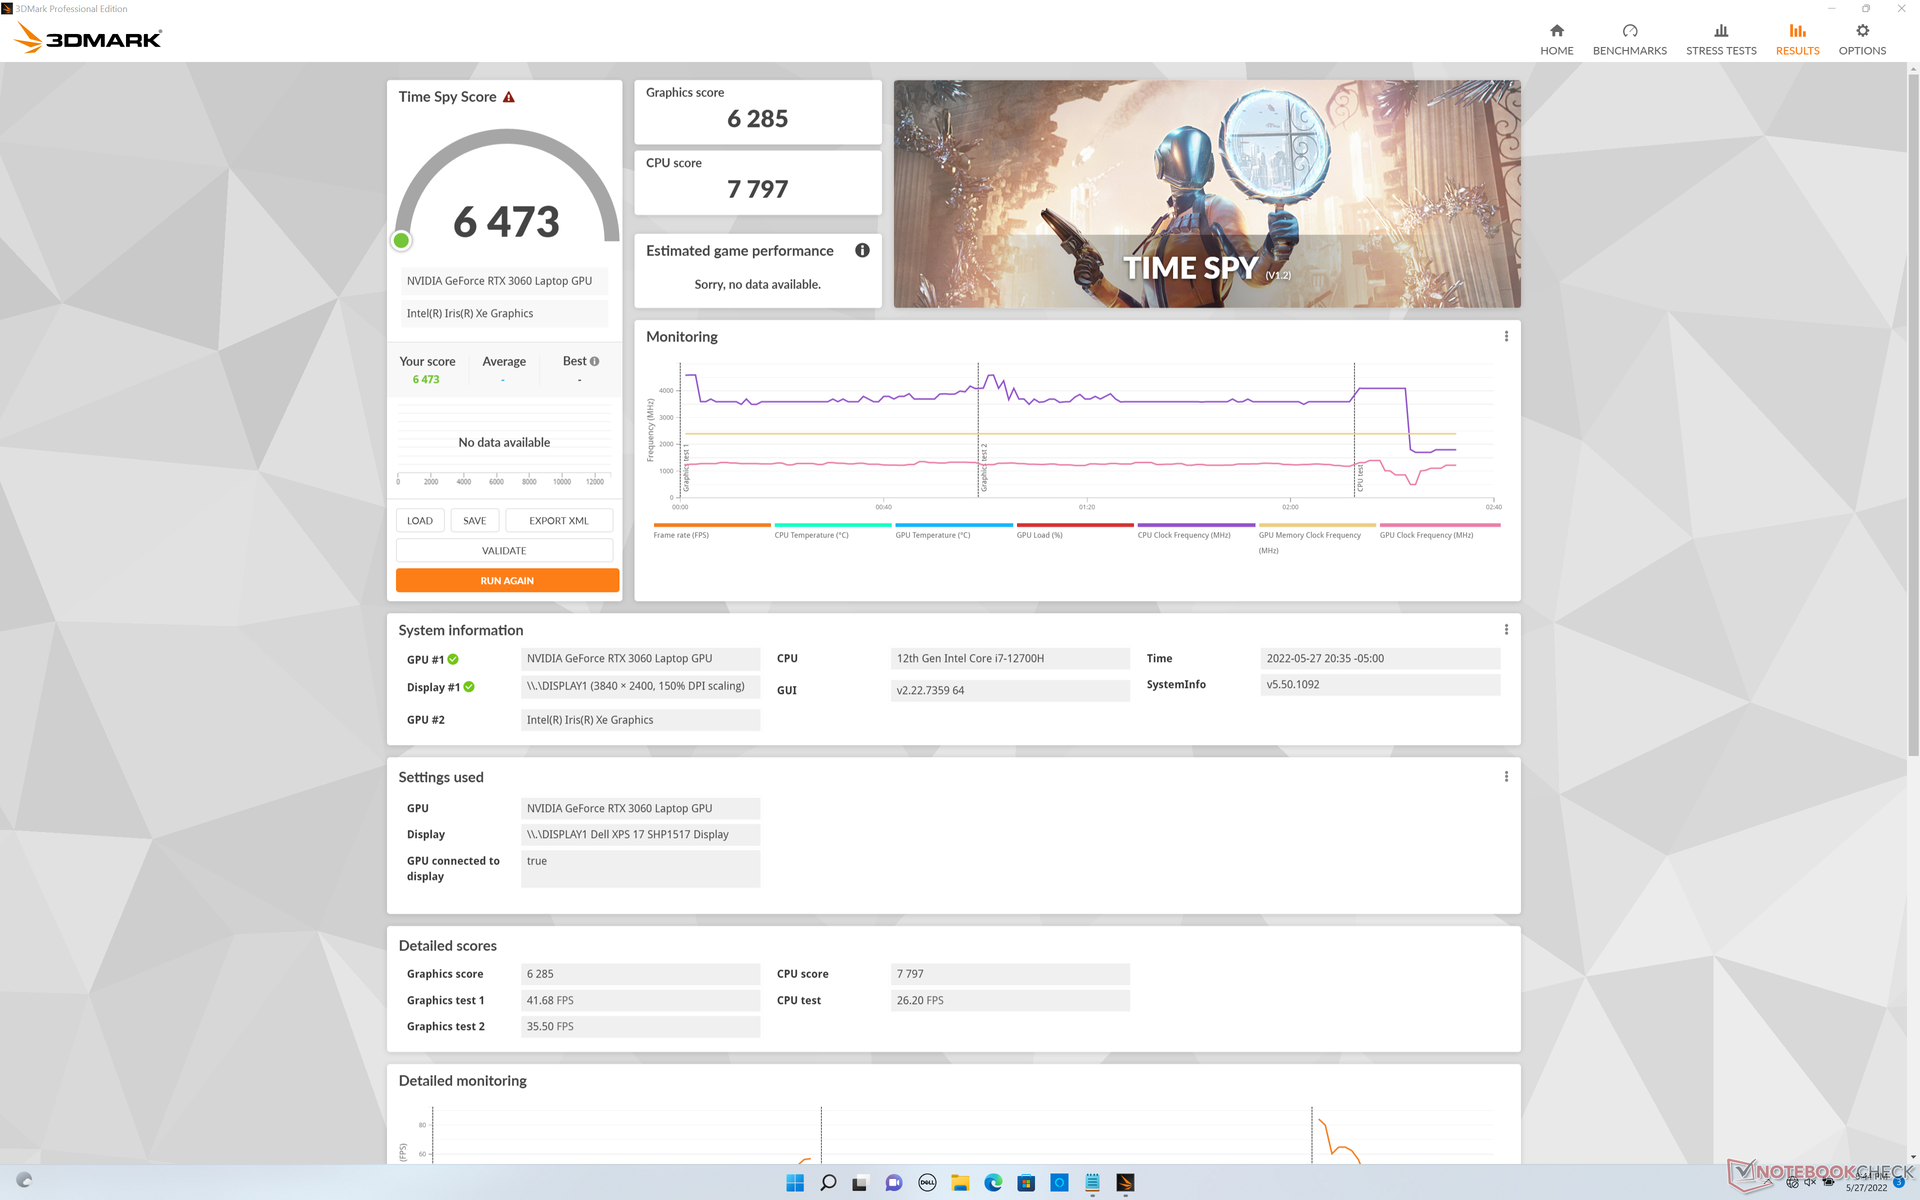
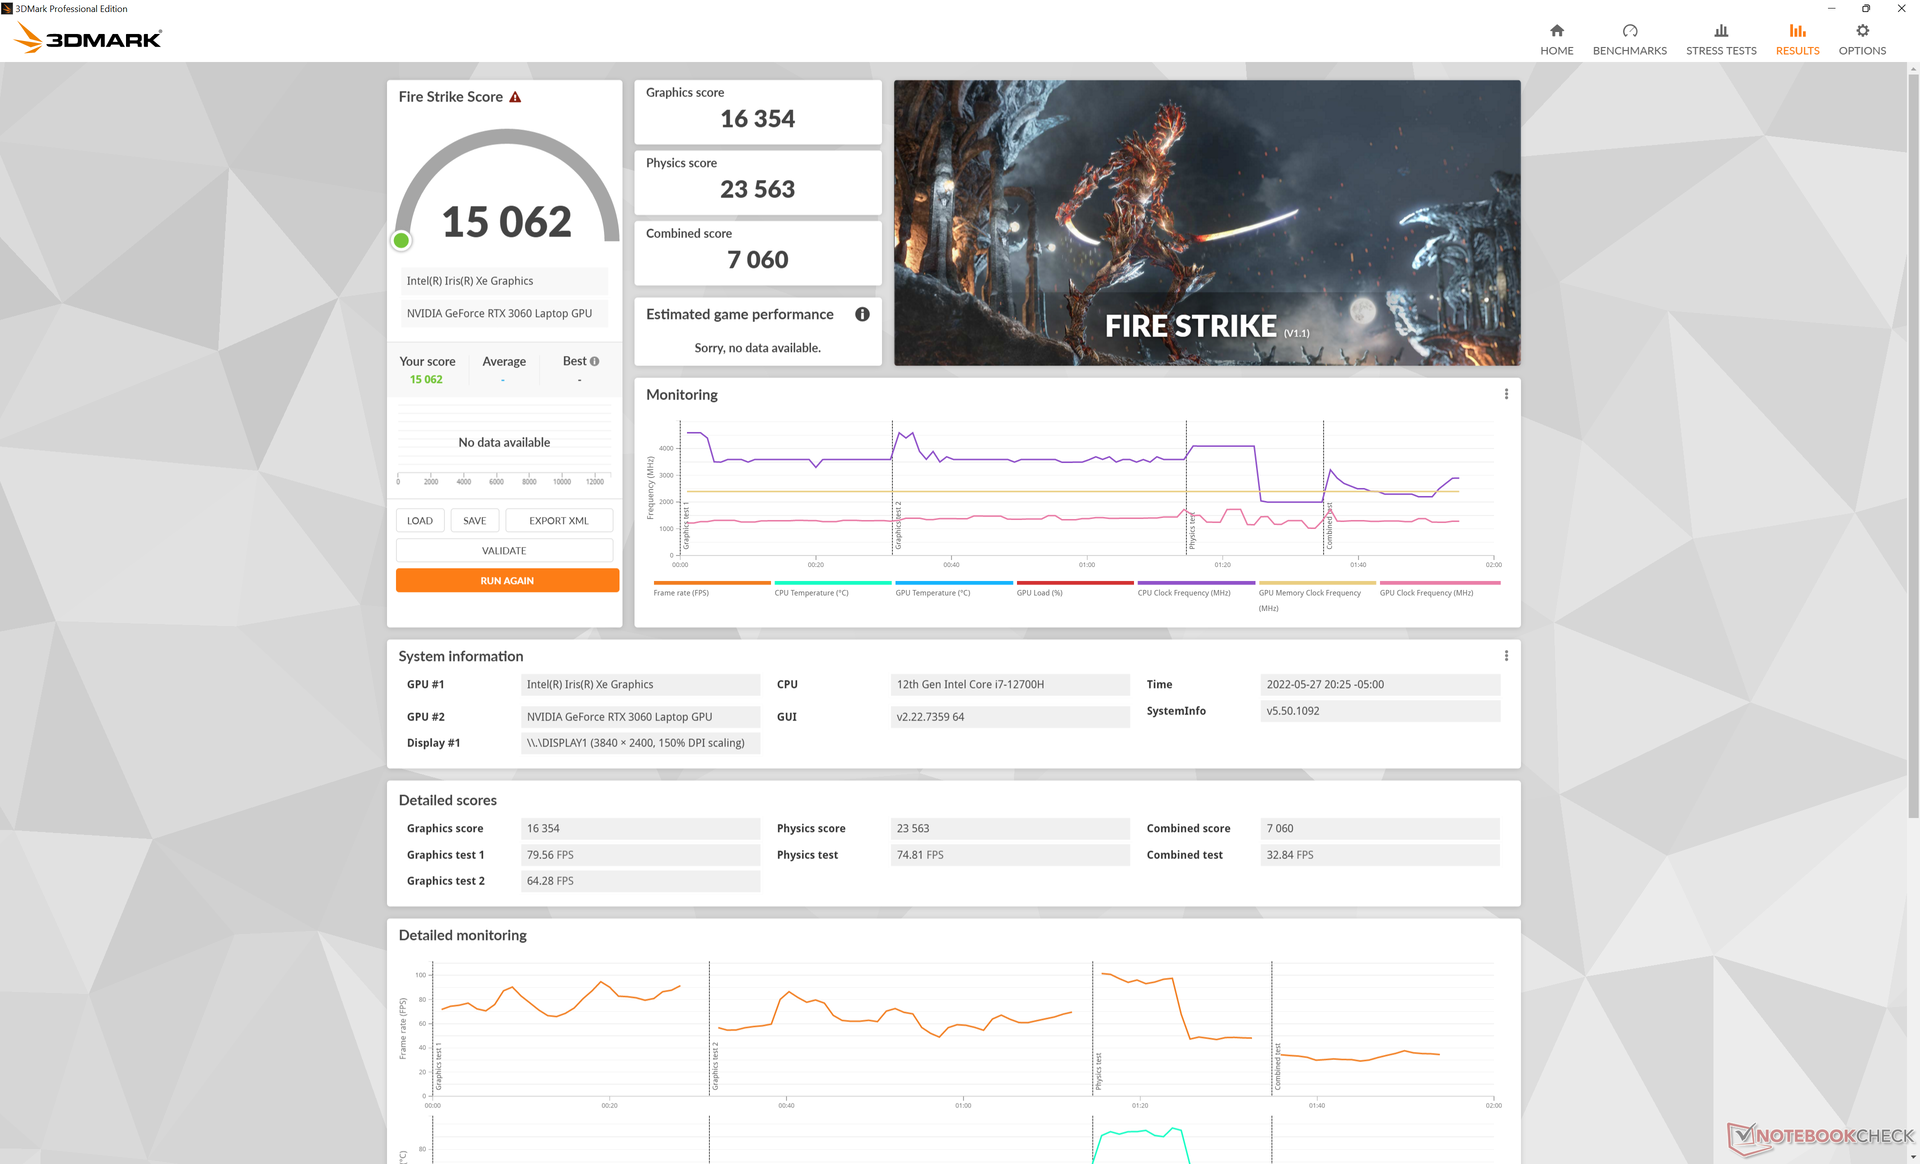
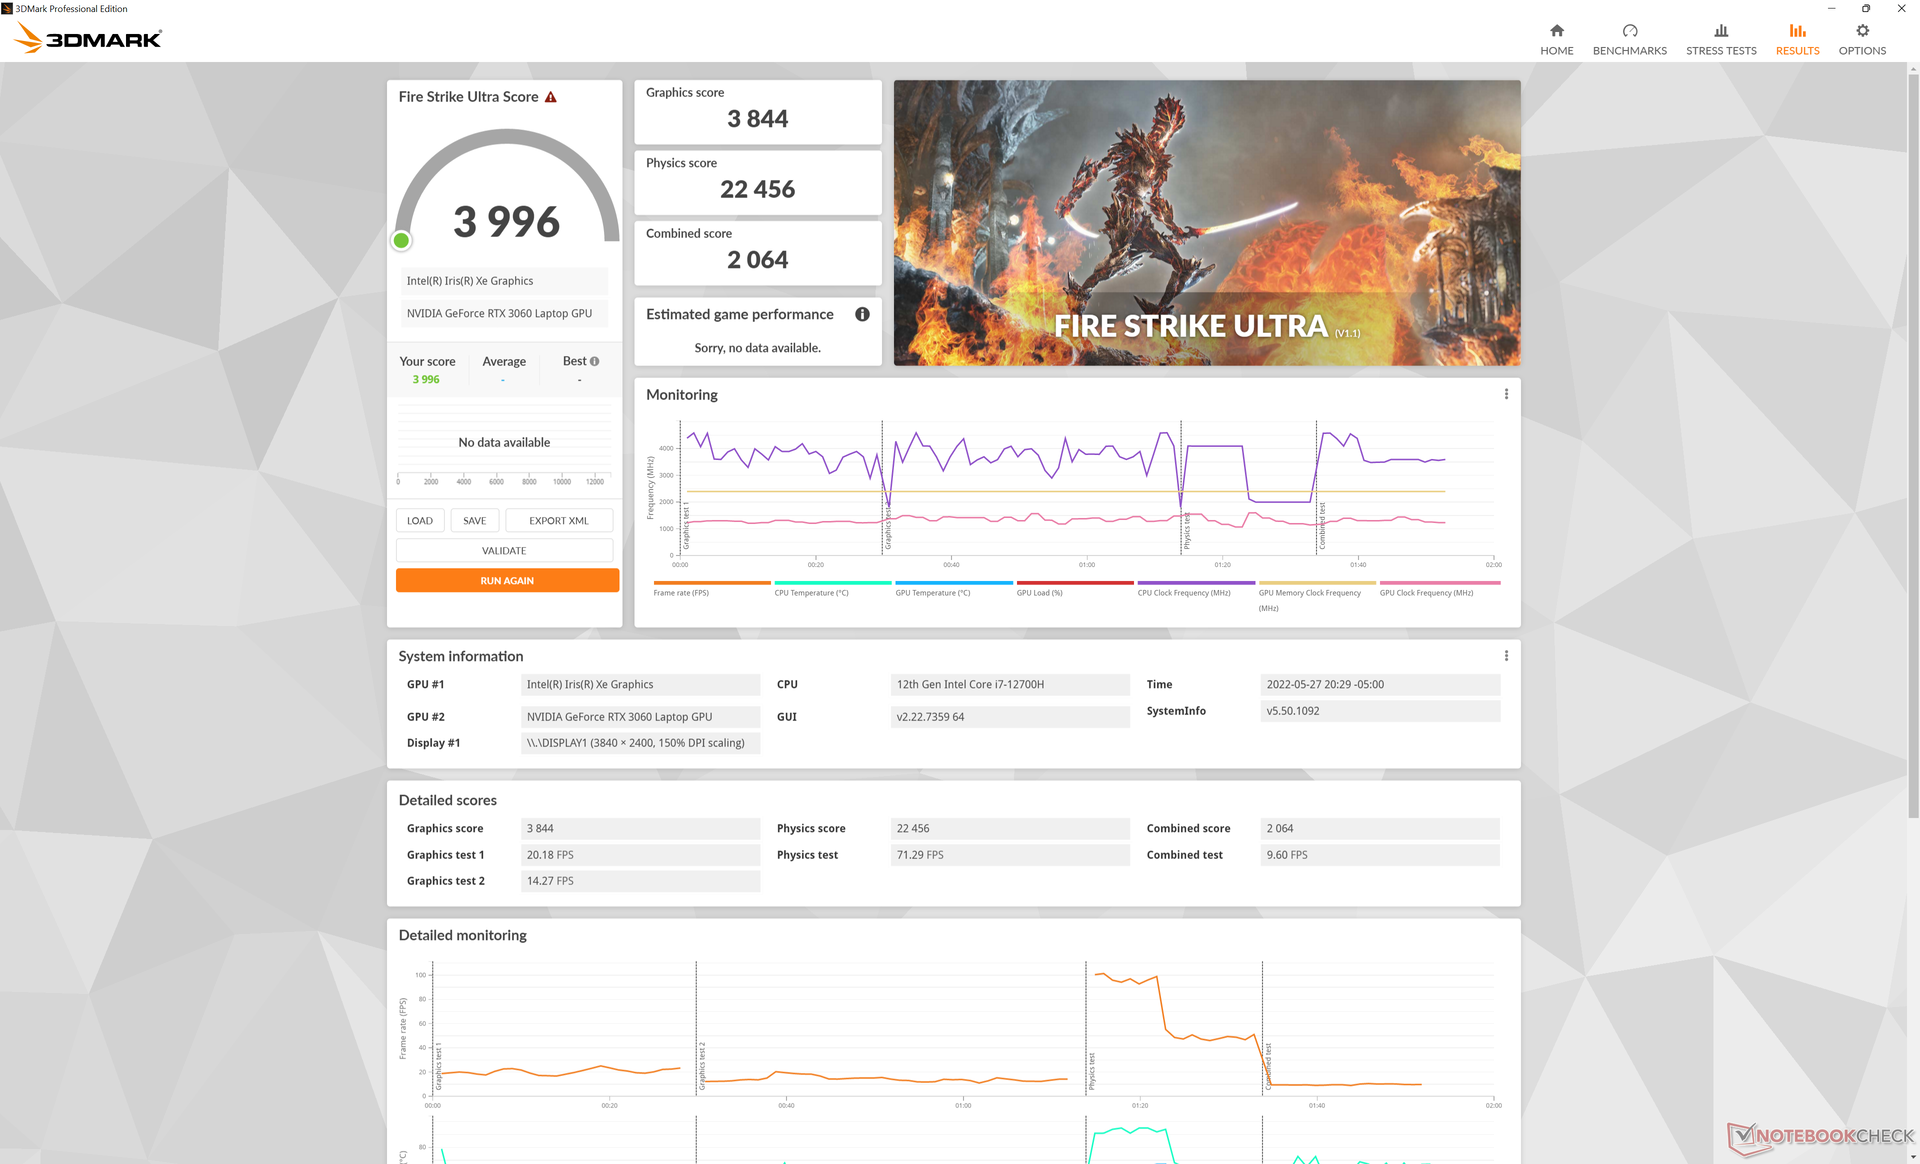
| 3DMark 11 Performance | 21962 points | |
| 3DMark Cloud Gate Standard Score | 43738 points | |
| 3DMark Fire Strike Score | 15062 points | |
| 3DMark Time Spy Score | 6473 points | |
Help | ||
Witcher 3 FPS Chart
| low | med. | high | ultra | QHD | 4K | |
|---|---|---|---|---|---|---|
| GTA V (2015) | 186.6 | 179 | 152.8 | 83.8 | 63.4 | |
| The Witcher 3 (2015) | 347.7 | 214.6 | 133.9 | 67.8 | ||
| Dota 2 Reborn (2015) | 185.7 | 169.9 | 163 | 133.5 | 84.6 | |
| Final Fantasy XV Benchmark (2018) | 137.9 | 90.5 | 69.3 | 49.1 | 28.3 | |
| X-Plane 11.11 (2018) | 133.3 | 111.6 | 93.8 | 92.3 | ||
| Strange Brigade (2018) | 352 | 162.6 | 130.6 | 113.4 | 82.3 | |
| Cyberpunk 2077 1.6 (2022) | 95.4 | 78.1 | 60 | 48.9 | 29 | 11.6 |
排放物--游戏笔记本的噪音和温度
系统噪音
自最初的XPS 17 9700以来,风扇的噪音和行为没有改变,这意味着在游戏或运行其他高负载时,风扇的最高噪音仍将达到近50分贝(A)。在这种紧张的条件下,其噪音与许多游戏笔记本电脑相当。
当引入中高负荷时,风扇会很快从静音脉冲到噪音,因此,如果不需要额外的马力,我们建议使用静音电源配置文件来限制风扇脉冲。
Noise level
| Idle |
| 24.1 / 24.1 / 24.1 dB(A) |
| Load |
| 43.2 / 48 dB(A) |
 | ||
30 dB silent 40 dB(A) audible 50 dB(A) loud |
||
min: | ||
| Dell XPS 17 9720 RTX 3060 GeForce RTX 3060 Laptop GPU, i7-12700H, Samsung PM9A1 MZVL21T0HCLR | HP Envy 17-cg GeForce MX450, i5-1135G7, Samsung PM991 MZVLQ1T0HALB | Dell XPS 17 9710 Core i7 RTX 3060 GeForce RTX 3060 Laptop GPU, i7-11800H, Micron 2300 1TB MTFDHBA1T0TDV | Dell XPS 17 9700 Core i7 RTX 2060 Max-Q GeForce RTX 2060 Max-Q, i7-10875H, Micron 2200S 1TB MTFDHBA1T0TCK | Lenovo Legion 5 17ACH6H-82JY0003GE GeForce RTX 3060 Laptop GPU, R5 5600H, Samsung PM991a MZALQ512HBLU | Asus VivoBook 17 F712JA-AU708W Iris Plus Graphics G7 (Ice Lake 64 EU), i7-1065G7, Kingston OM8PCP3512F-AB | Razer Blade 17 (i7-12800H, RTX 3070 Ti) GeForce RTX 3070 Ti Laptop GPU, i7-12800H, Samsung PM9A1 MZVL21T0HCLR | |
|---|---|---|---|---|---|---|---|
| Noise | -9% | -5% | -10% | -6% | -14% | 4% | |
| off / environment * (dB) | 23.8 | 26 -9% | 25.5 -7% | 28 -18% | 25 -5% | 29.6 -24% | 23 3% |
| Idle Minimum * (dB) | 24.1 | 26 -8% | 25.2 -5% | 28 -16% | 25 -4% | 31.4 -30% | 23 5% |
| Idle Average * (dB) | 24.1 | 31.7 -32% | 25.2 -5% | 28 -16% | 25 -4% | 31.4 -30% | 23 5% |
| Idle Maximum * (dB) | 24.1 | 25.2 -5% | 28 -16% | 30.5 -27% | 31.4 -30% | 23 5% | |
| Load Average * (dB) | 43.2 | 43.2 -0% | 45.9 -6% | 43.2 -0% | 37.5 13% | 36.1 16% | 36.92 15% |
| Witcher 3 ultra * (dB) | 48 | 49 -2% | 49 -2% | 50 -4% | |||
| Load Maximum * (dB) | 48 | 46.6 3% | 50.4 -5% | 50.5 -5% | 51 -6% | 40.1 16% | 50 -4% |
* ... smaller is better
温度
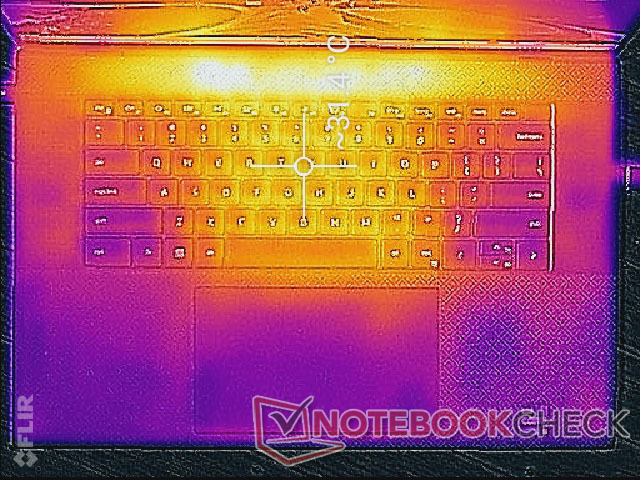
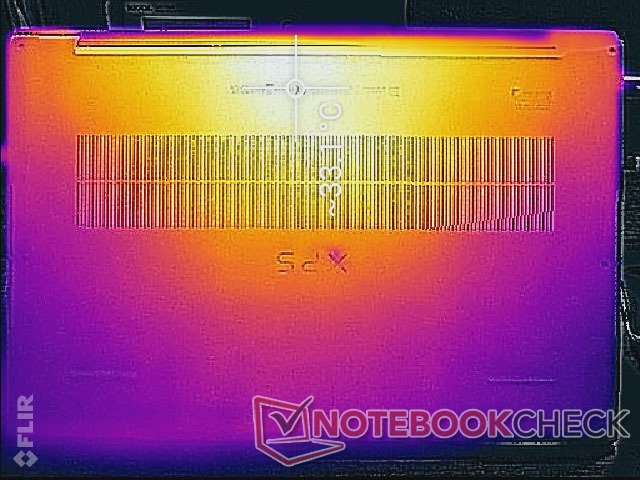
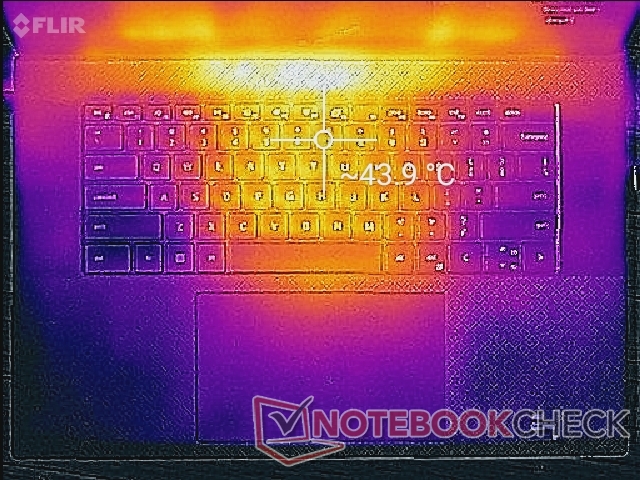
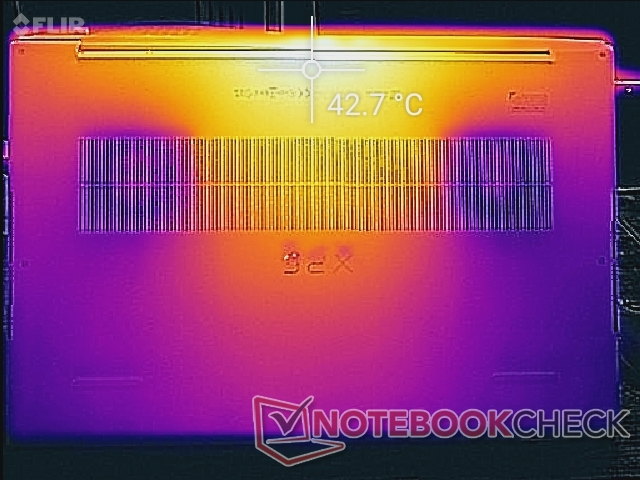
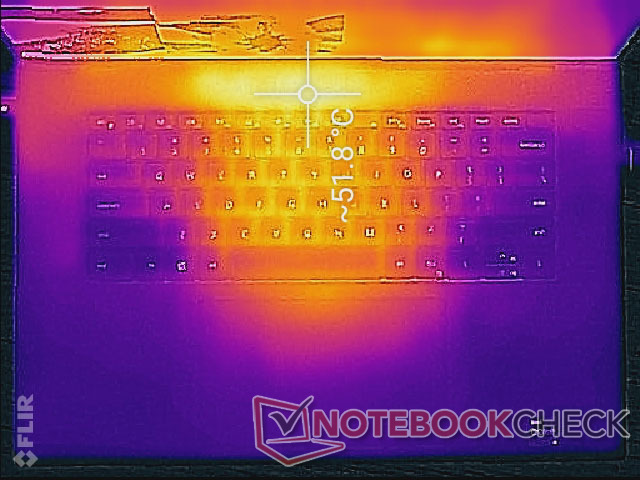
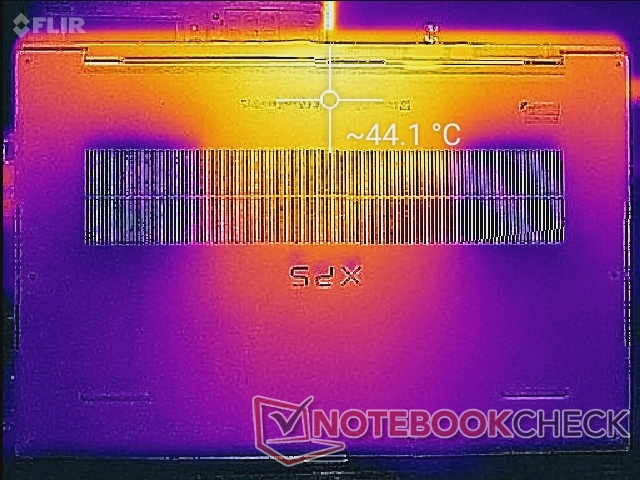
当长时间运行压力负荷时,顶部和底部的热点可以分别达到52℃和44℃以上。这些区域战略性地朝向机箱后部,远离掌托和大多数按键。然而,底面仍然会感到非常温暖,因为底板是一整块的金属。
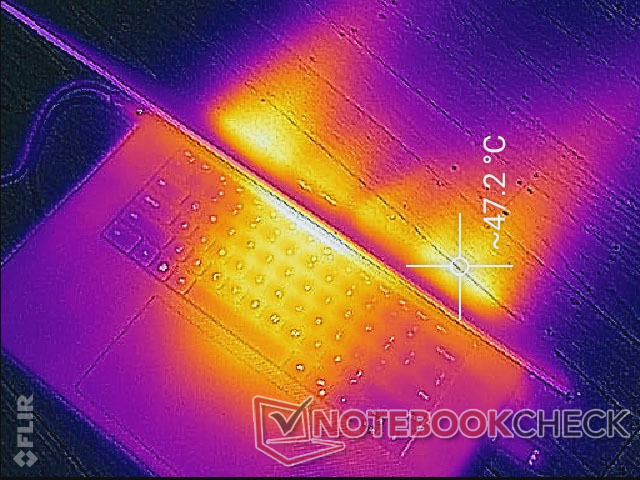
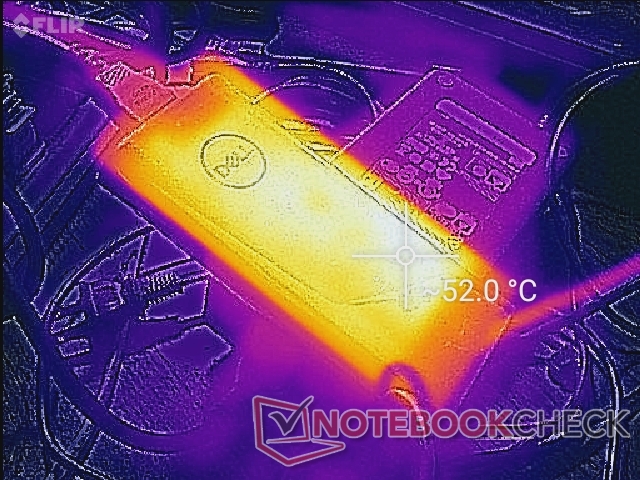
(-) The maximum temperature on the upper side is 51.8 °C / 125 F, compared to the average of 36.8 °C / 98 F, ranging from 21 to 71 °C for the class Multimedia.
(±) The bottom heats up to a maximum of 44.2 °C / 112 F, compared to the average of 39.1 °C / 102 F
(+) In idle usage, the average temperature for the upper side is 28.6 °C / 83 F, compared to the device average of 31.3 °C / 88 F.
(±) Playing The Witcher 3, the average temperature for the upper side is 33.9 °C / 93 F, compared to the device average of 31.3 °C / 88 F.
(+) The palmrests and touchpad are reaching skin temperature as a maximum (33.2 °C / 91.8 F) and are therefore not hot.
(-) The average temperature of the palmrest area of similar devices was 28.7 °C / 83.7 F (-4.5 °C / -8.1 F).
| Dell XPS 17 9720 RTX 3060 Intel Core i7-12700H, NVIDIA GeForce RTX 3060 Laptop GPU | HP Envy 17-cg Intel Core i5-1135G7, NVIDIA GeForce MX450 | Dell XPS 17 9710 Core i7 RTX 3060 Intel Core i7-11800H, NVIDIA GeForce RTX 3060 Laptop GPU | Dell XPS 17 9700 Core i7 RTX 2060 Max-Q Intel Core i7-10875H, NVIDIA GeForce RTX 2060 Max-Q | Lenovo Legion 5 17ACH6H-82JY0003GE AMD Ryzen 5 5600H, NVIDIA GeForce RTX 3060 Laptop GPU | Asus VivoBook 17 F712JA-AU708W Intel Core i7-1065G7, Intel Iris Plus Graphics G7 (Ice Lake 64 EU) | Razer Blade 17 (i7-12800H, RTX 3070 Ti) Intel Core i7-12800H, NVIDIA GeForce RTX 3070 Ti Laptop GPU | |
|---|---|---|---|---|---|---|---|
| Heat | 14% | 1% | -1% | 2% | 12% | 6% | |
| Maximum Upper Side * (°C) | 51.8 | 45.9 11% | 50.2 3% | 53 -2% | 42.2 19% | 40.2 22% | 43 17% |
| Maximum Bottom * (°C) | 44.2 | 49.7 -12% | 38.4 13% | 39.2 11% | 50.9 -15% | 47.9 -8% | 44 -0% |
| Idle Upper Side * (°C) | 34.8 | 24.2 30% | 37.6 -8% | 37 -6% | 34.3 1% | 27.3 22% | 32 8% |
| Idle Bottom * (°C) | 33.2 | 24.8 25% | 34.2 -3% | 35.8 -8% | 32 4% | 28.9 13% | 34 -2% |
* ... smaller is better
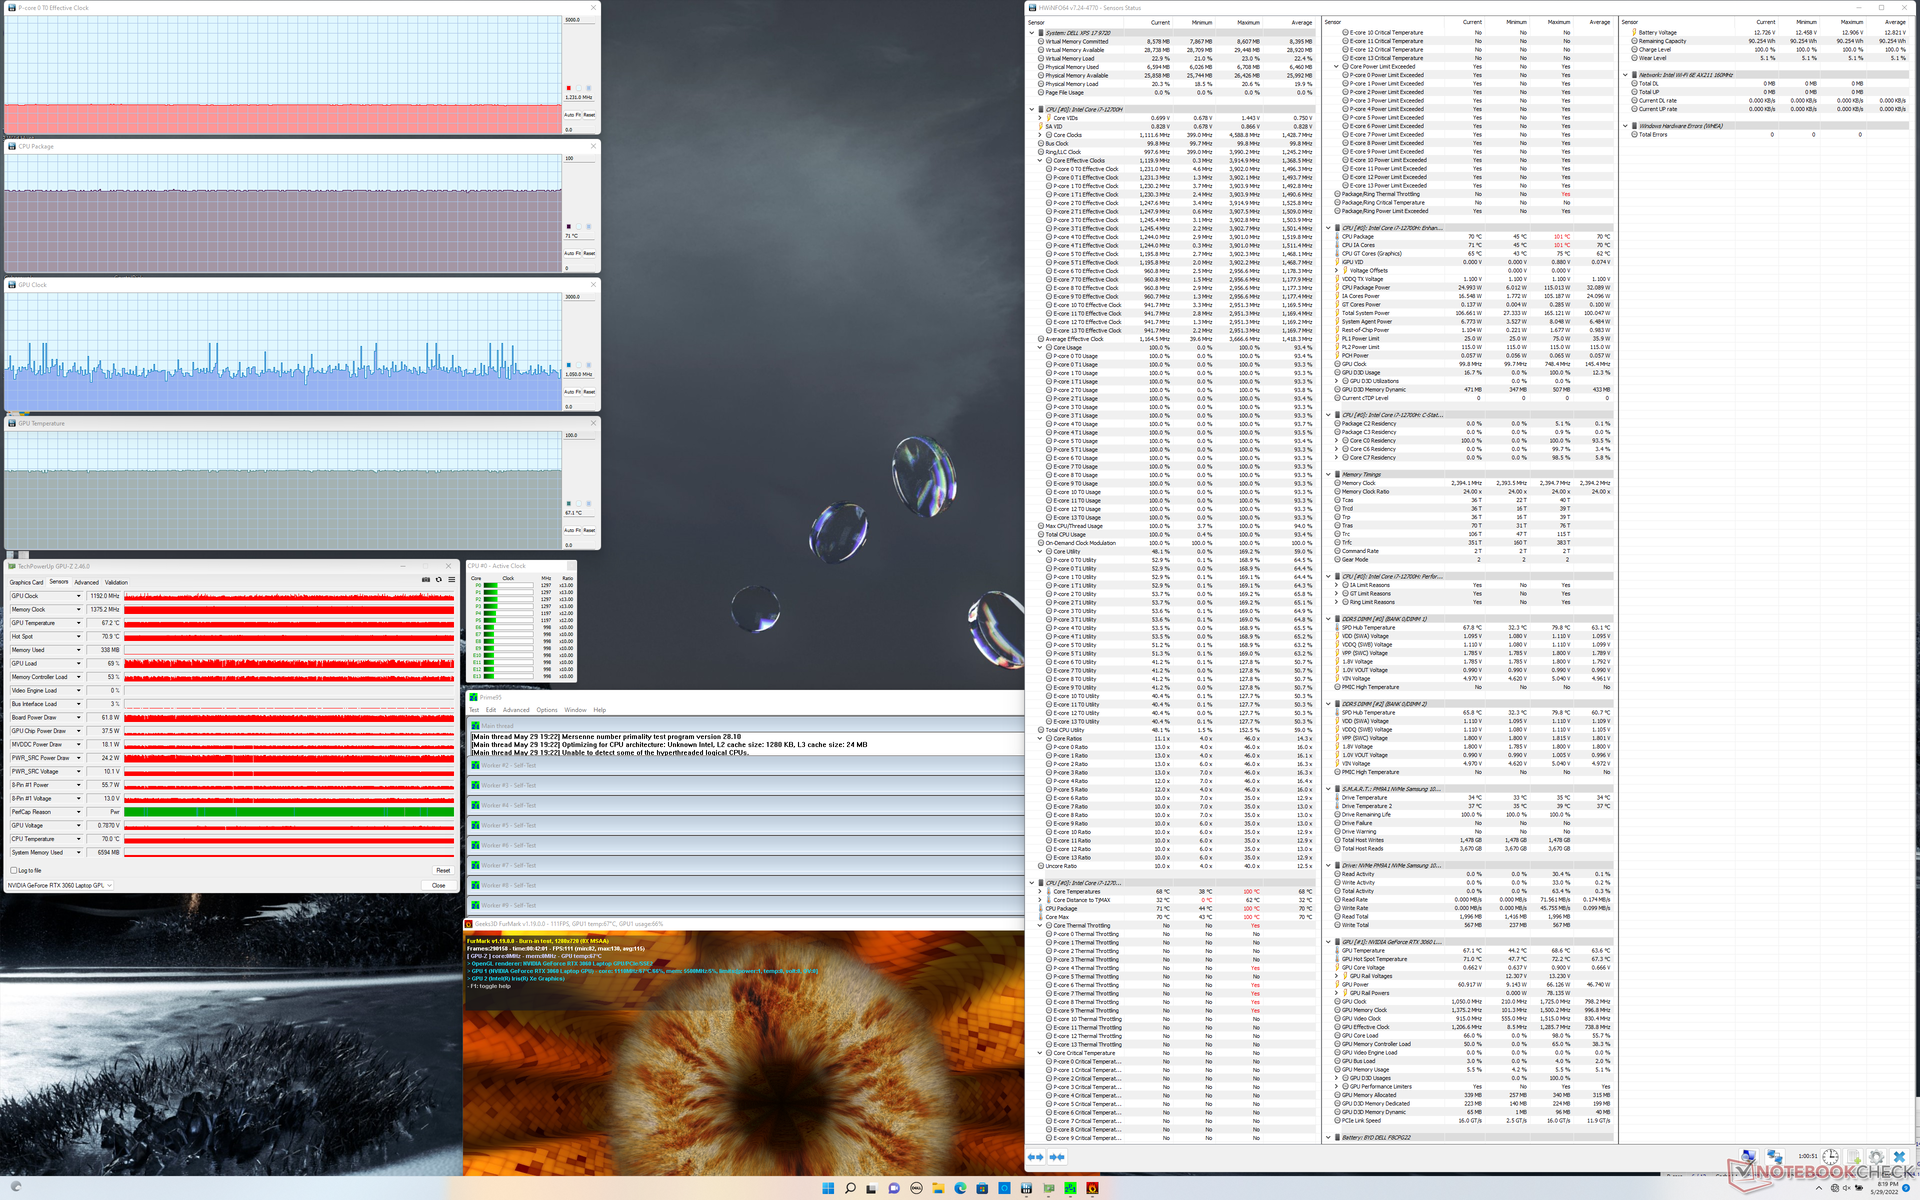
压力测试
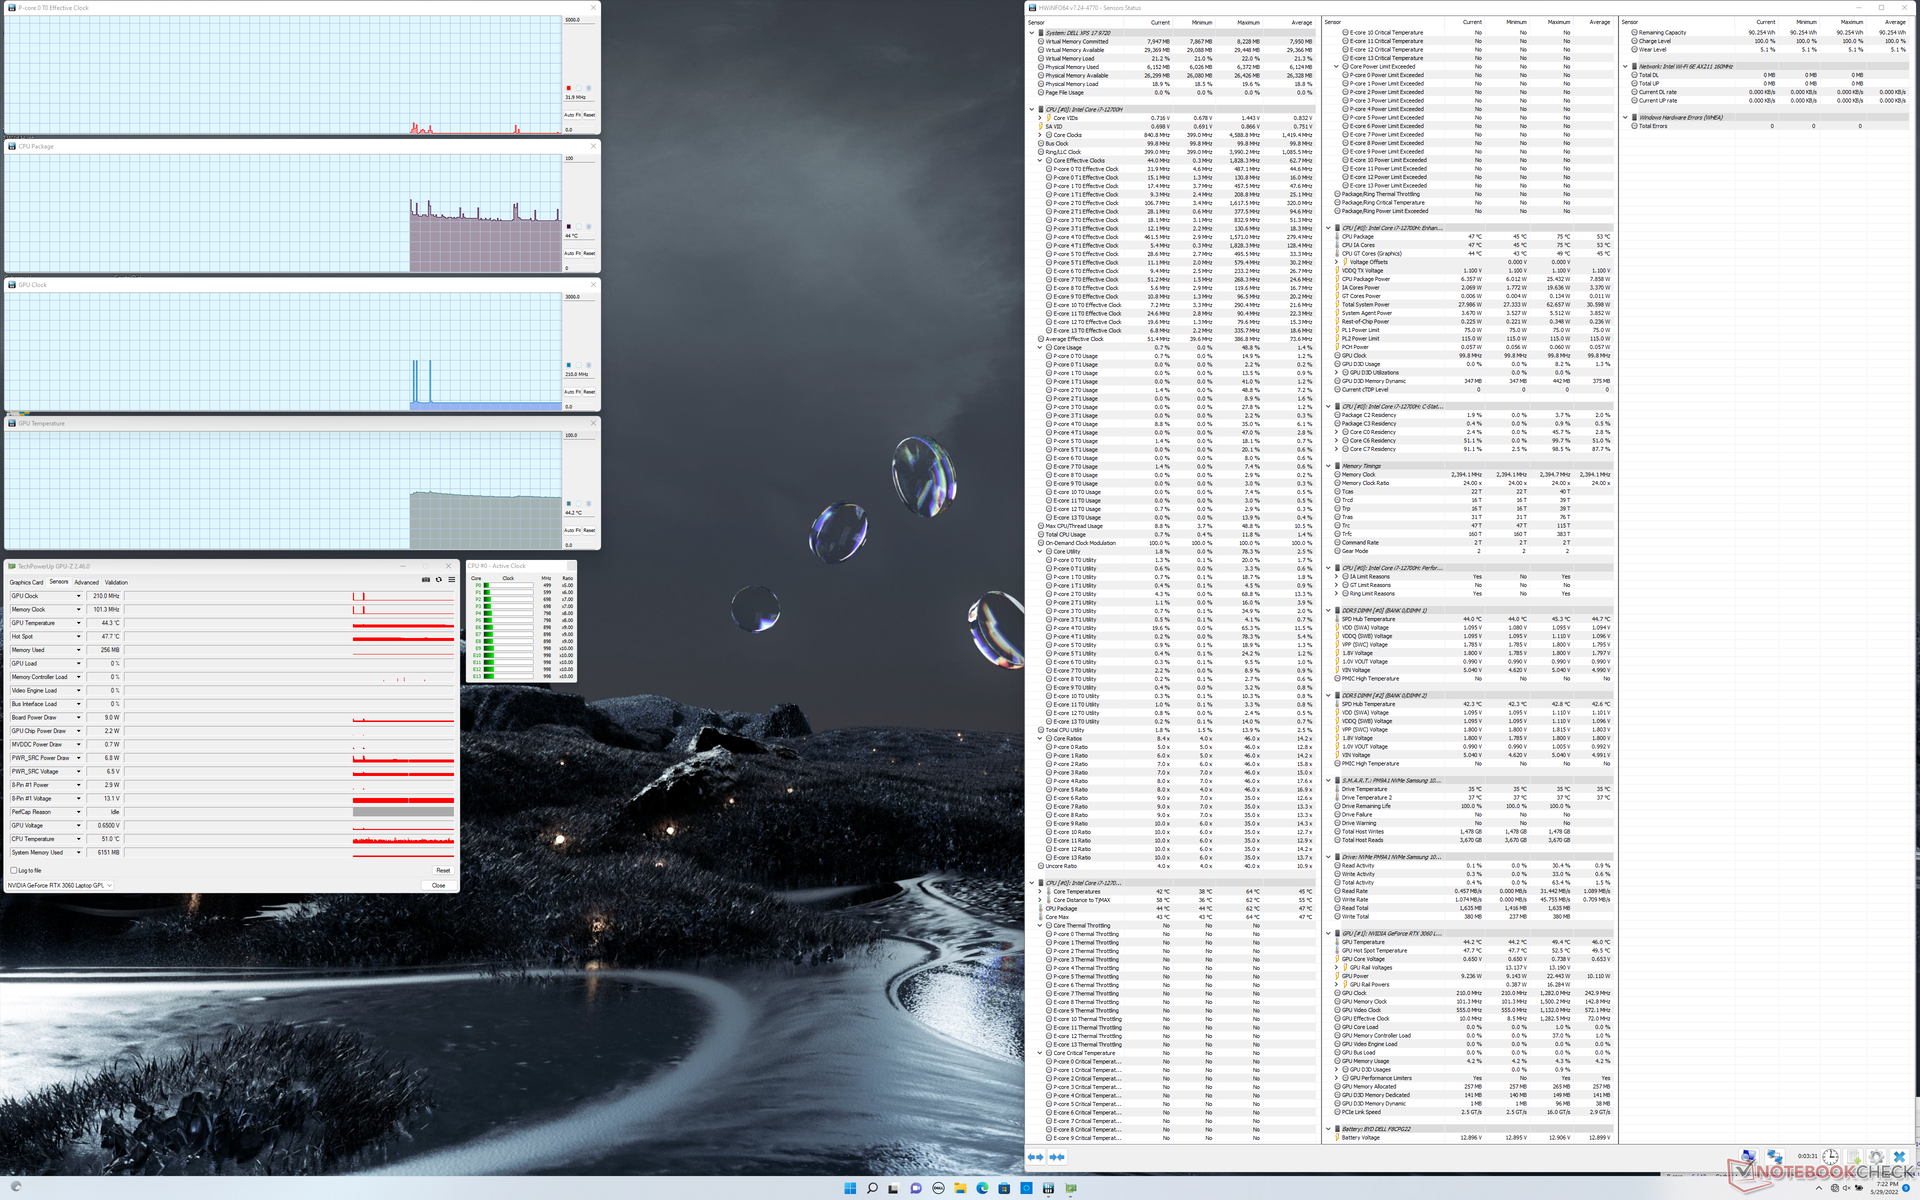
与Core i7-11800H XPS 17 9710相比,我们的9720设备可以达到更高的初始功耗(115W对87W),同时稳定在更低的核心温度(75C对82C)和相同的功耗(55W)。因此,XPS系统只能在热限制开始之前短时间内利用桤木湖平台更高的TDP范围或时钟速率。
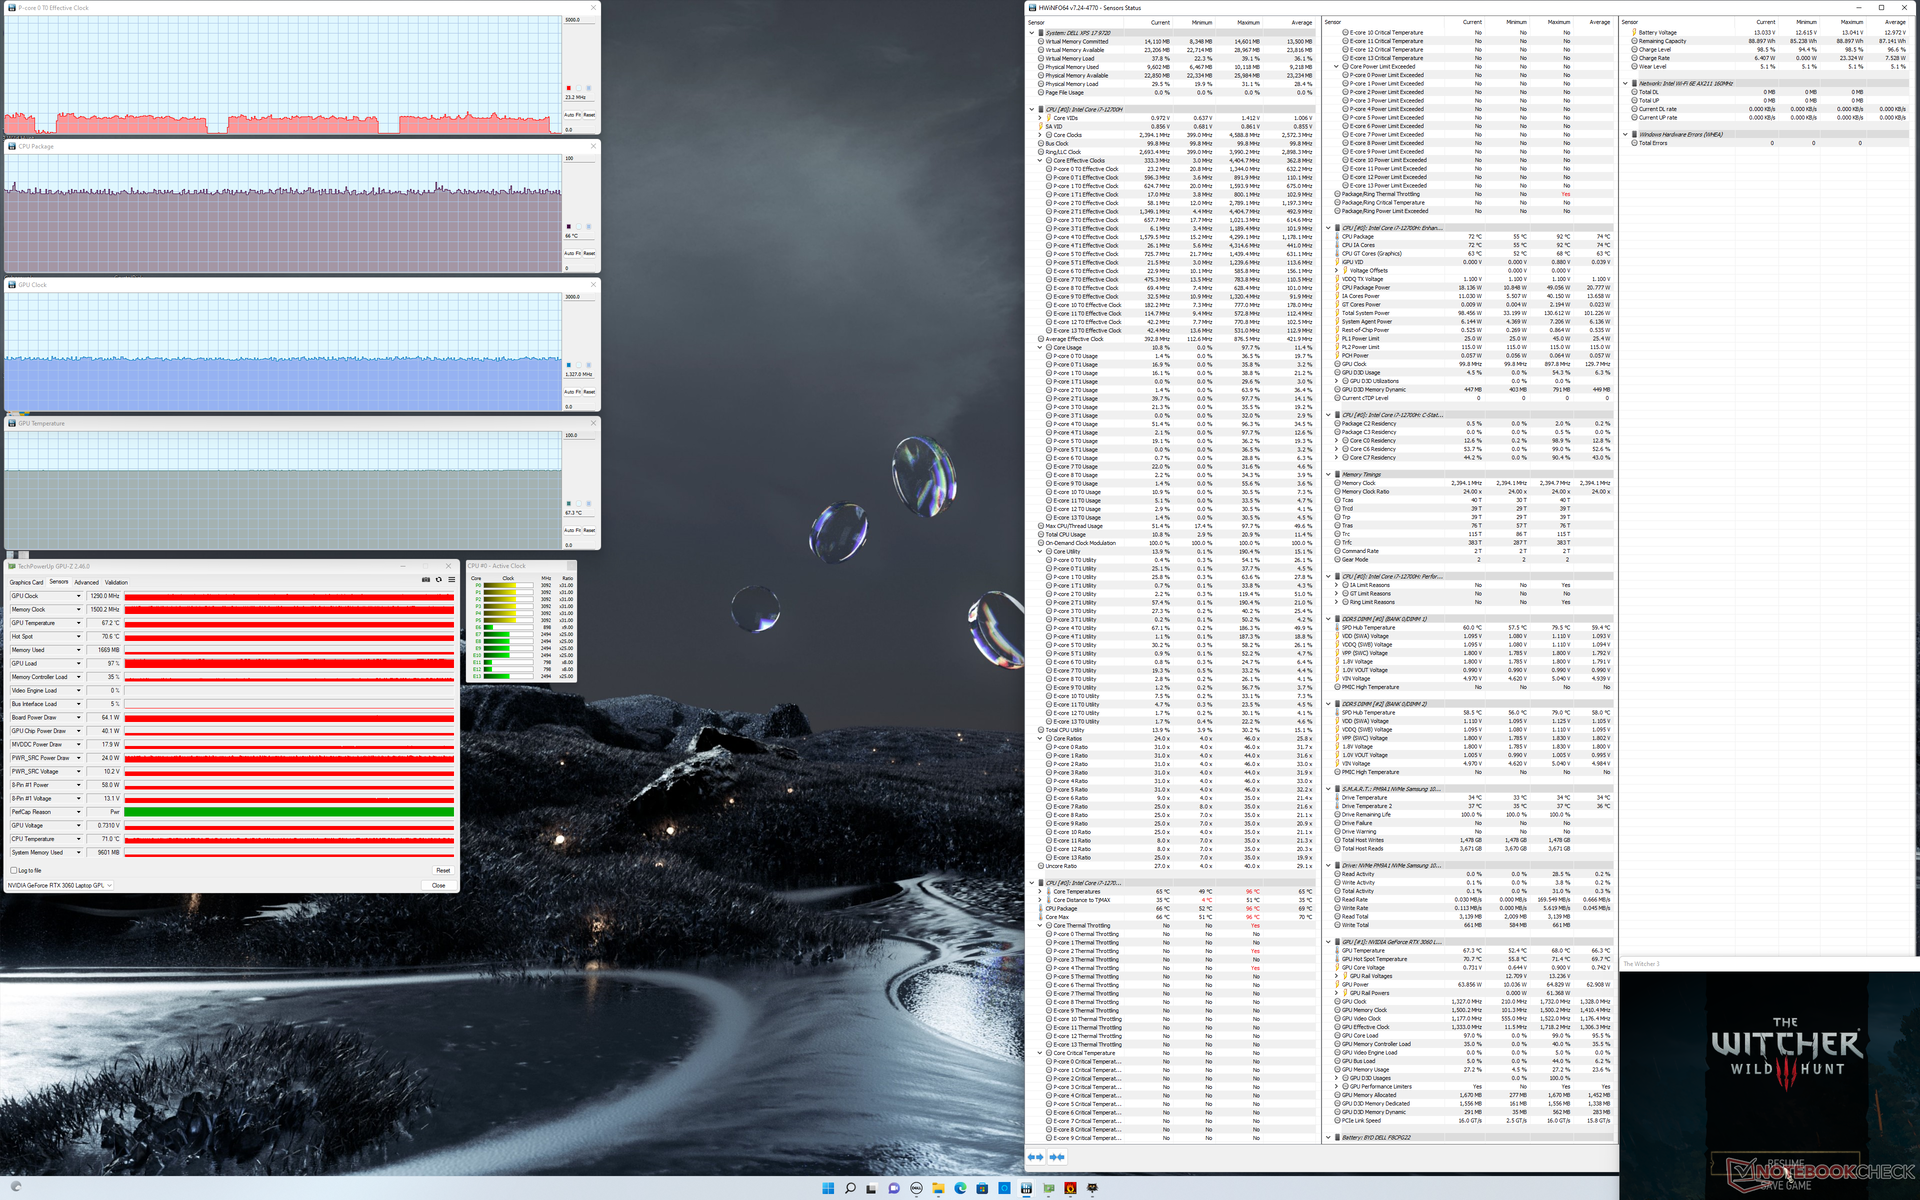
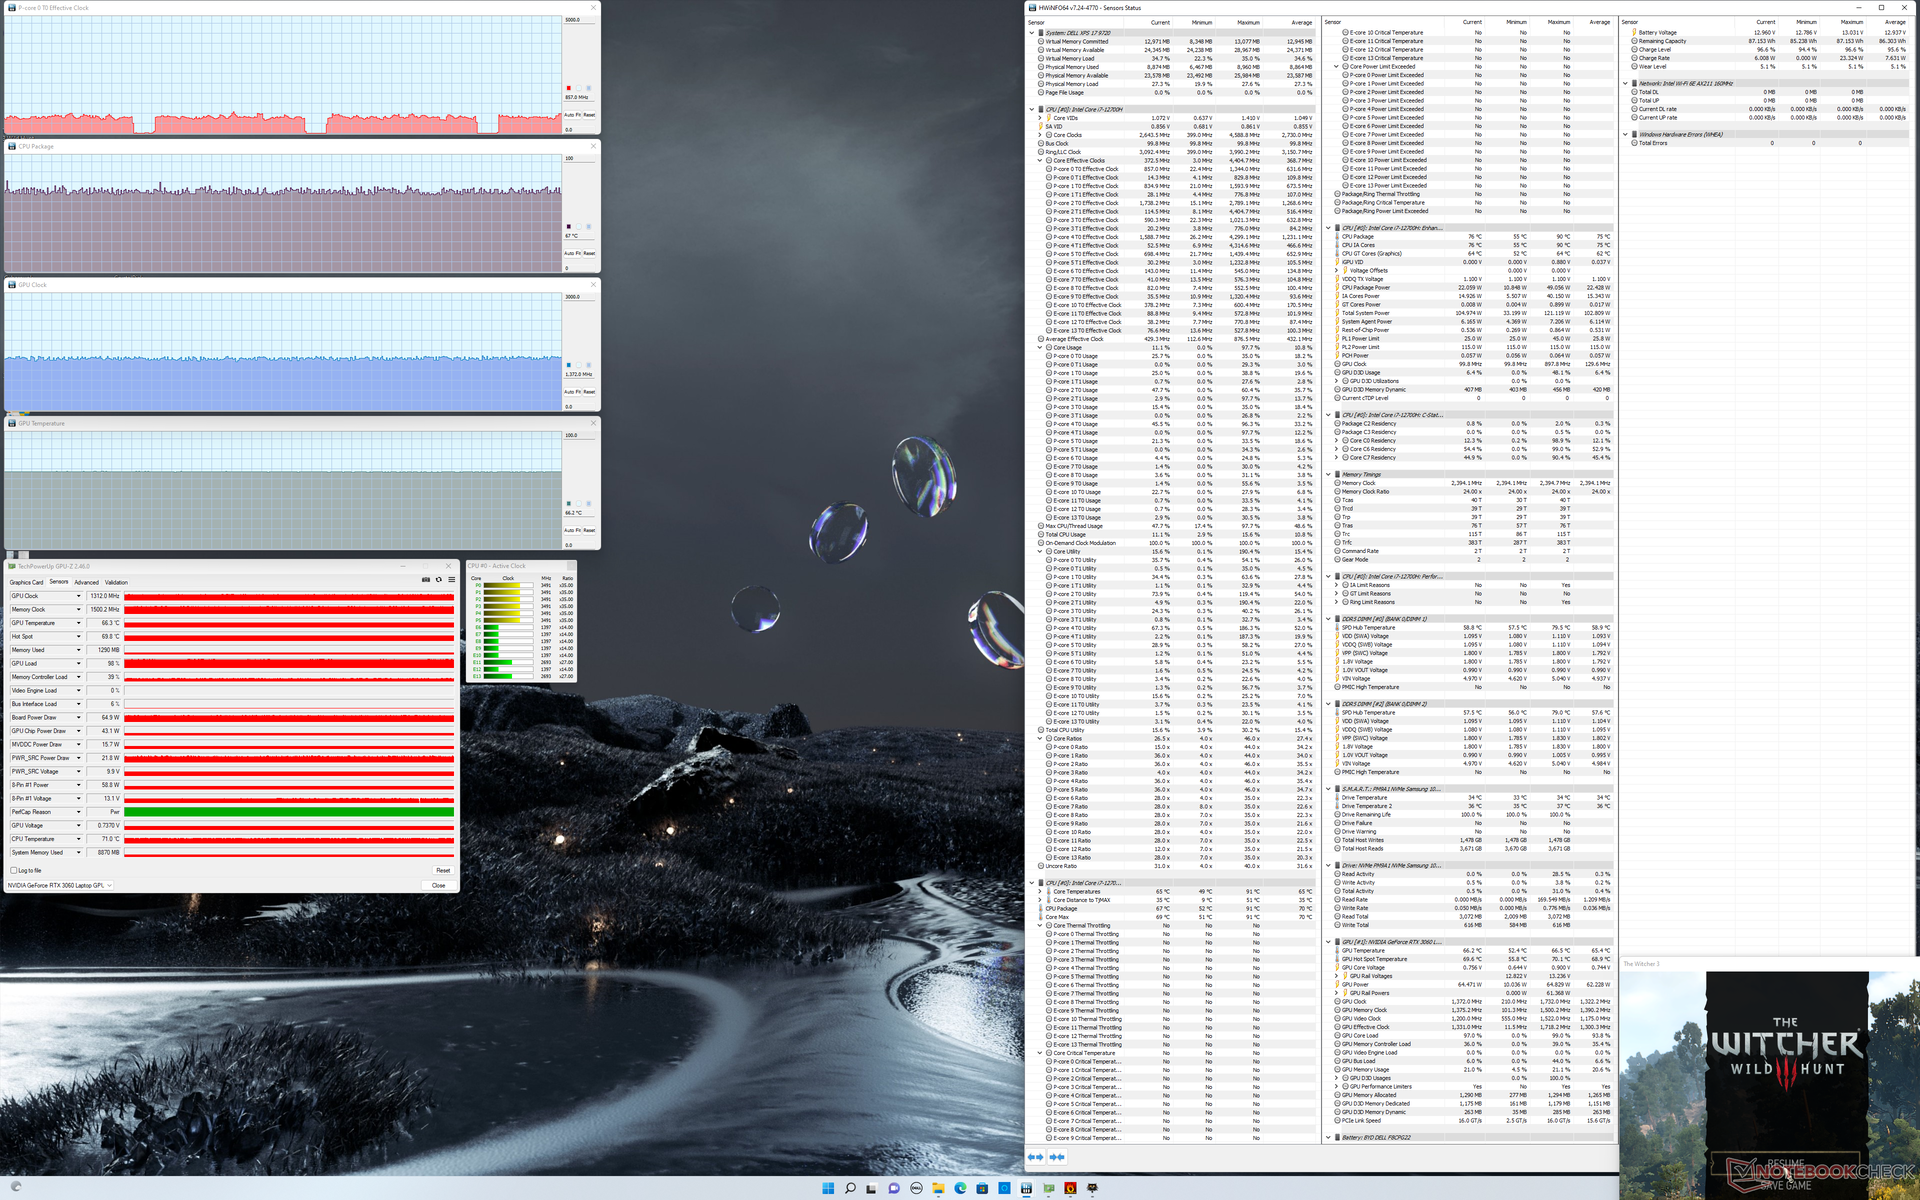
运行时的GPU时钟速率、温度和板卡功耗 Witcher 3将分别稳定在1312MHz、66C和65W,而XPS 17 9710的时钟频率为1530MHz、67C和69W。整体上同比图形性能较慢反映了我们上面记录的3DMark结果较差。
在超性能模式下运行与优化模式相比,GPU的性能提升似乎可以忽略不计。
用电池运行限制了CPU和GPU的性能。在电池供电的情况下,Fire Strike ,物理和图形得分分别为14770和24927分,而在主电源供电的情况下,得分分别为16354和23563分。
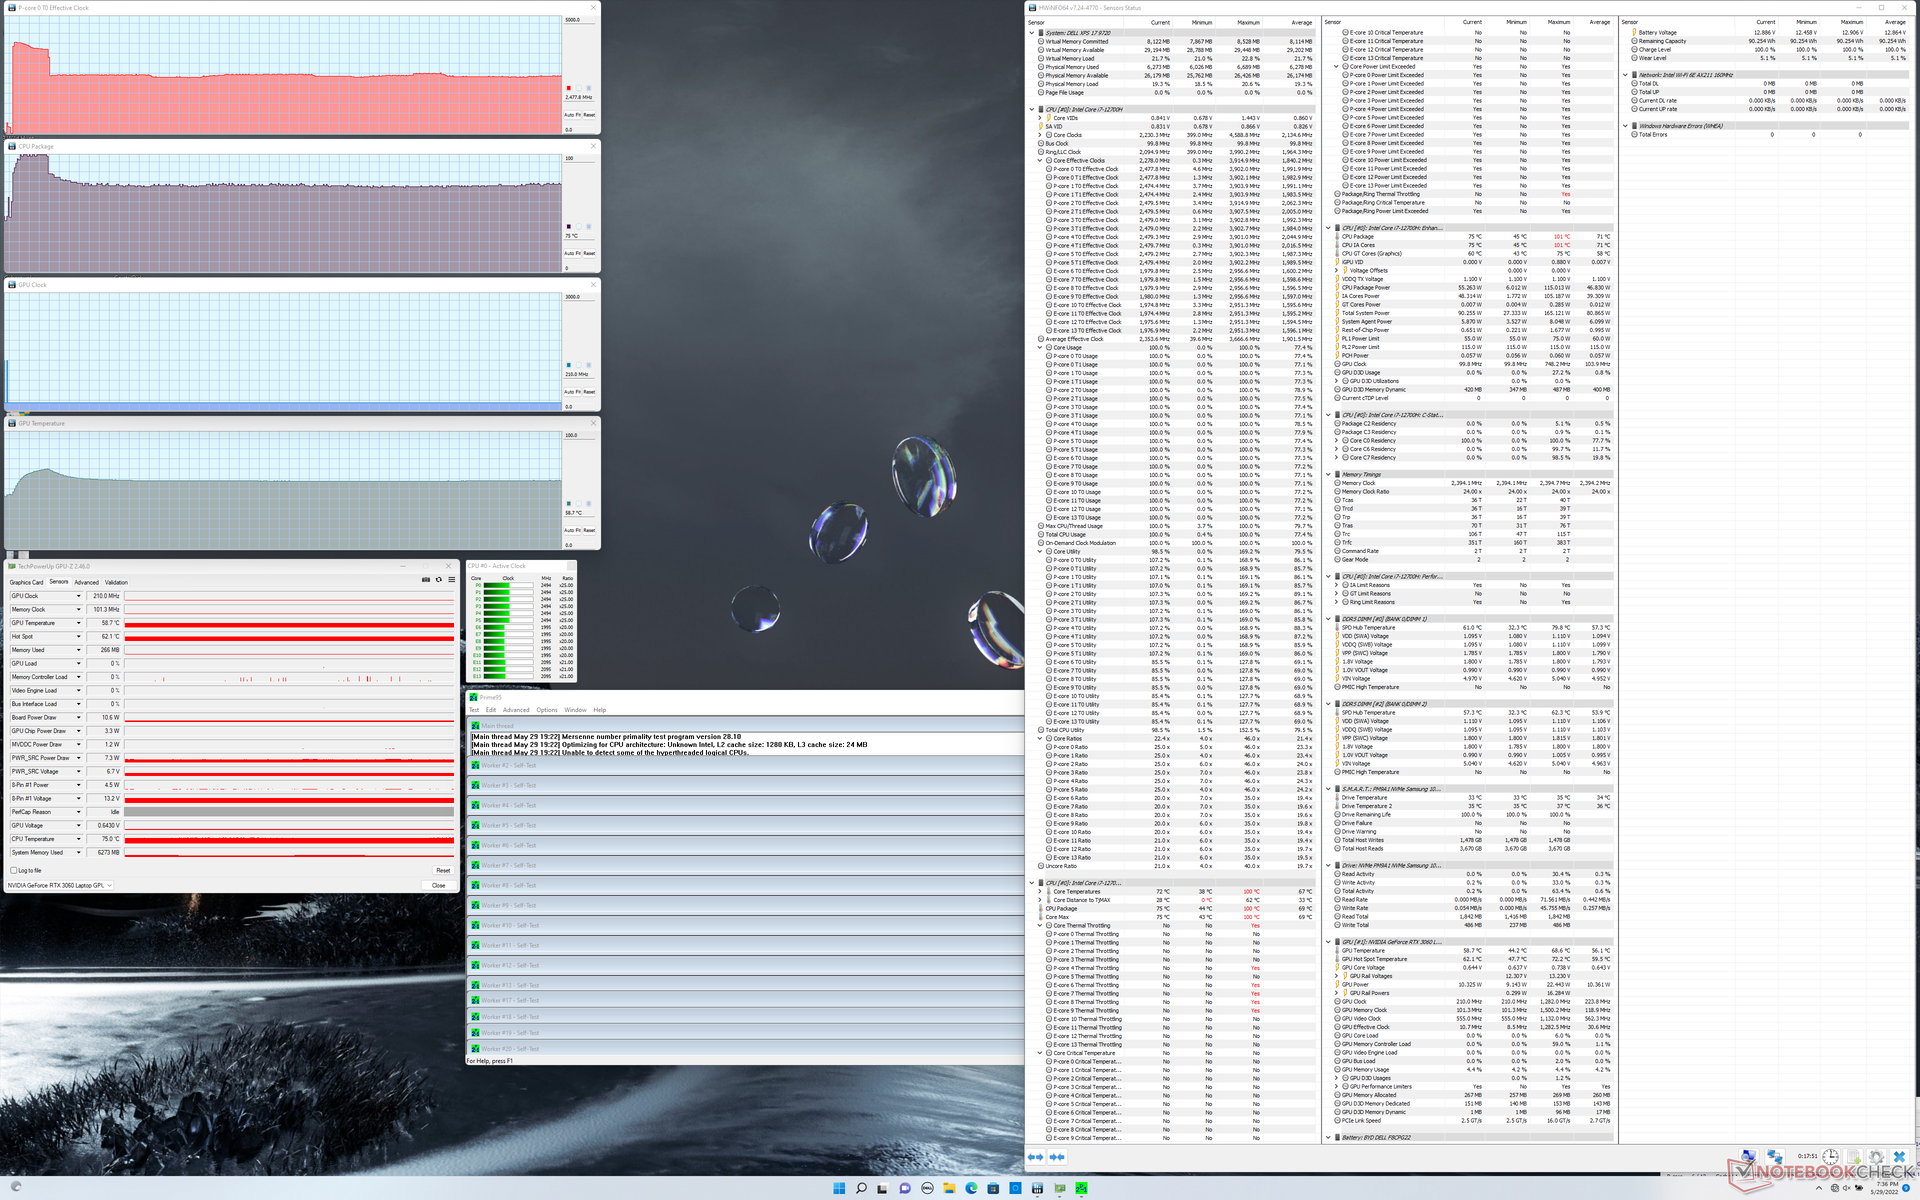
| CPU时钟(GHz) | GPU时钟(MHz) | CPU平均温度(℃) | GPU平均温度(℃) | |
| 系统空闲 | -- | -- | 44 | 44 |
| Prime95压力 | 2.5 | -- | 75 | 59 |
| Prime95 + FurMark 压力 | ||||
| Witcher 3 压力(优化模式) | ~0.7 | 1290 | 66 | 67 |
| Witcher 3 压力(超性能模式) | ~0.8 | 1312 | 67 | 66 |
发言人
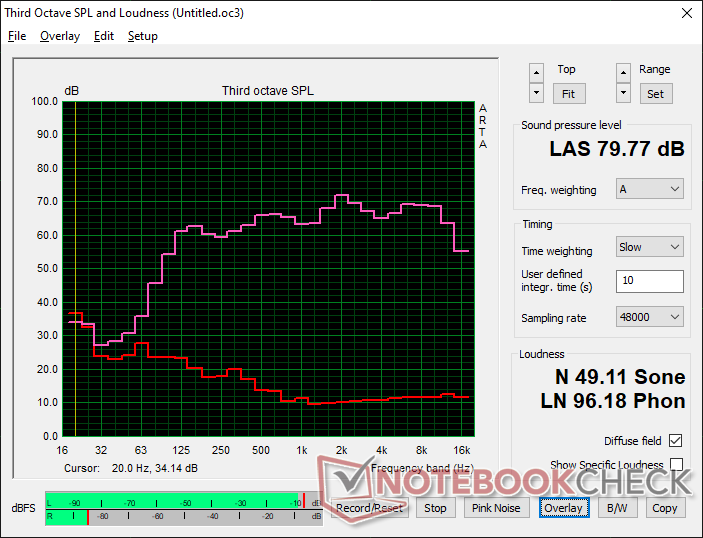
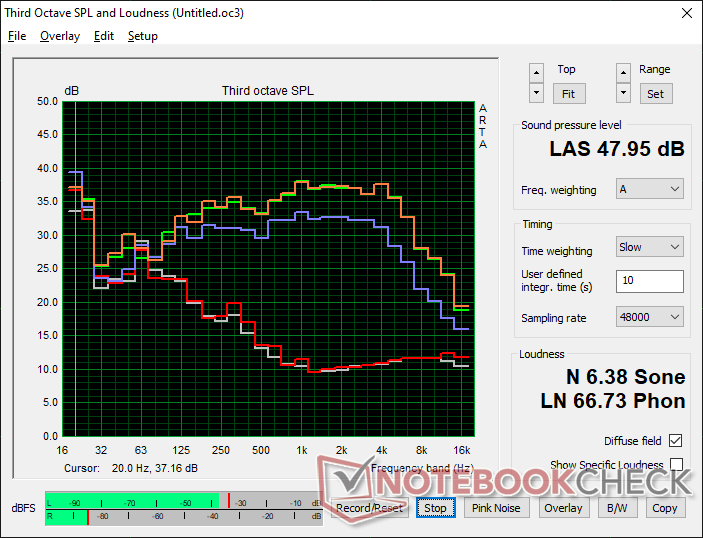
Dell XPS 17 9720 RTX 3060 audio analysis
(±) | speaker loudness is average but good (79.8 dB)
Bass 100 - 315 Hz
(±) | reduced bass - on average 5.2% lower than median
(±) | linearity of bass is average (7% delta to prev. frequency)
Mids 400 - 2000 Hz
(+) | balanced mids - only 2.2% away from median
(+) | mids are linear (3.8% delta to prev. frequency)
Highs 2 - 16 kHz
(+) | balanced highs - only 2.8% away from median
(+) | highs are linear (3.1% delta to prev. frequency)
Overall 100 - 16.000 Hz
(+) | overall sound is linear (8.3% difference to median)
Compared to same class
» 9% of all tested devices in this class were better, 2% similar, 89% worse
» The best had a delta of 5%, average was 17%, worst was 45%
Compared to all devices tested
» 2% of all tested devices were better, 1% similar, 97% worse
» The best had a delta of 4%, average was 24%, worst was 134%
Apple MacBook Pro 16 2021 M1 Pro audio analysis
(+) | speakers can play relatively loud (84.7 dB)
Bass 100 - 315 Hz
(+) | good bass - only 3.8% away from median
(+) | bass is linear (5.2% delta to prev. frequency)
Mids 400 - 2000 Hz
(+) | balanced mids - only 1.3% away from median
(+) | mids are linear (2.1% delta to prev. frequency)
Highs 2 - 16 kHz
(+) | balanced highs - only 1.9% away from median
(+) | highs are linear (2.7% delta to prev. frequency)
Overall 100 - 16.000 Hz
(+) | overall sound is linear (4.6% difference to median)
Compared to same class
» 0% of all tested devices in this class were better, 0% similar, 100% worse
» The best had a delta of 5%, average was 17%, worst was 45%
Compared to all devices tested
» 0% of all tested devices were better, 0% similar, 100% worse
» The best had a delta of 4%, average was 24%, worst was 134%
能源管理--更高的涡轮增压功率消耗
消耗功率
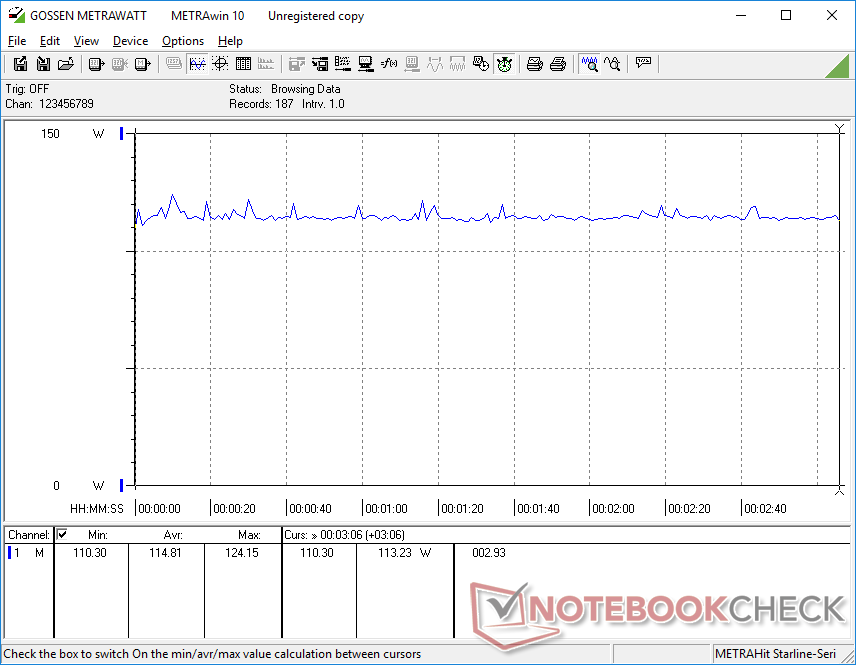
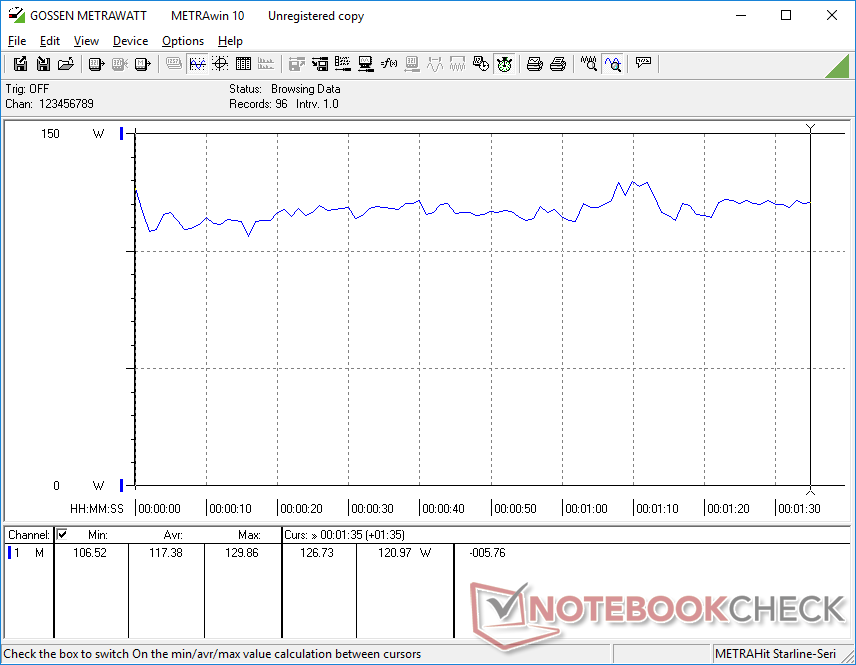
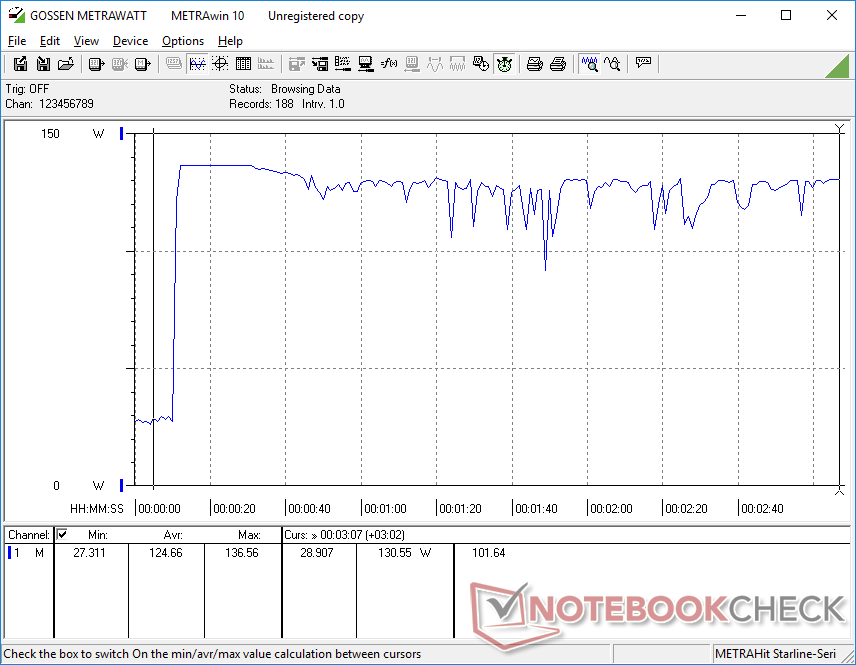
XPS 17 9700 出现了充电问题该系统无法从130瓦的交流适配器中获取超过100瓦的电量。值得庆幸的是,戴尔在后续的XPS 17 9710上解决了这个问题,9720也不例外。当运行 Witcher 3时,我们的9720设备会消耗115W,几乎与我们在旧版9710上记录的相同。XPS 15系列和XPS 17系列仍然是市场上唯一配备130 W USB-C适配器的机型。
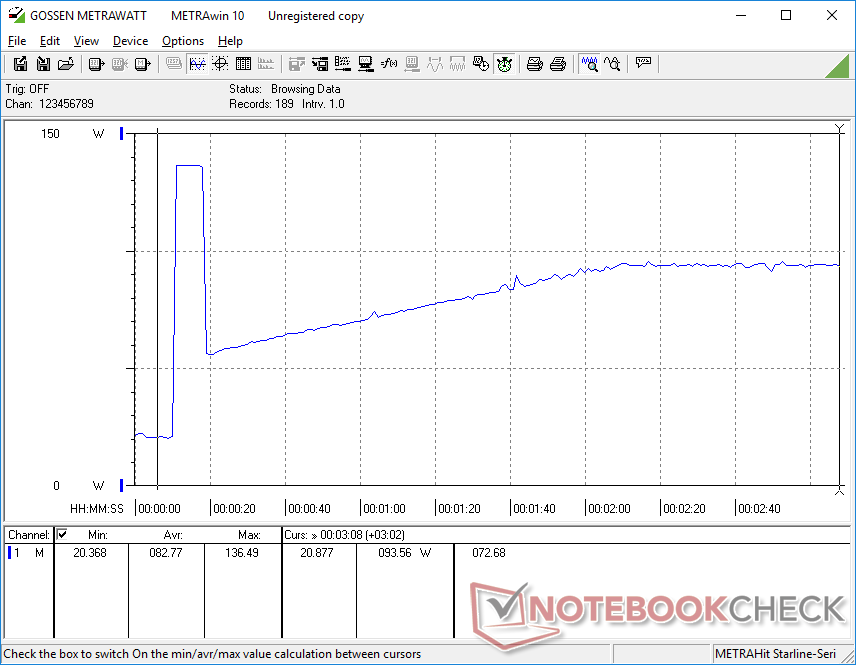
值得注意的是,在测试开始时,运行Prime95时的功耗比9710略高,然后稳定在每台94W左右。因此,第12代CPU的较高功耗是短暂的,然后才变得与采用第11代处理器的9710机型相似。
在游戏或运行高负荷时,充电速度明显减慢。当运行 Witcher 3例如,当以13%的电池容量和交流电运行时,电池在一小时内只会再增加12%。
| Off / Standby | |
| Idle | |
| Load |
|
Key:
min: | |
| Dell XPS 17 9720 RTX 3060 i7-12700H, GeForce RTX 3060 Laptop GPU, Samsung PM9A1 MZVL21T0HCLR, IPS, 3840x2400, 17" | HP Envy 17-cg i5-1135G7, GeForce MX450, Samsung PM991 MZVLQ1T0HALB, IPS, 1920x1080, 17.3" | Dell XPS 17 9710 Core i7 RTX 3060 i7-11800H, GeForce RTX 3060 Laptop GPU, Micron 2300 1TB MTFDHBA1T0TDV, IPS, 3840x2400, 17" | Dell XPS 17 9700 Core i7 RTX 2060 Max-Q i7-10875H, GeForce RTX 2060 Max-Q, Micron 2200S 1TB MTFDHBA1T0TCK, IPS, 3840x2400, 17" | Lenovo Legion 5 17ACH6H-82JY0003GE R5 5600H, GeForce RTX 3060 Laptop GPU, Samsung PM991a MZALQ512HBLU, IPS, 1920x1080, 17.3" | Asus VivoBook 17 F712JA-AU708W i7-1065G7, Iris Plus Graphics G7 (Ice Lake 64 EU), Kingston OM8PCP3512F-AB, IPS, 1920x1080, 17.3" | Razer Blade 17 (i7-12800H, RTX 3070 Ti) i7-12800H, GeForce RTX 3070 Ti Laptop GPU, Samsung PM9A1 MZVL21T0HCLR, IPS, 2560x1440, 17.3" | |
|---|---|---|---|---|---|---|---|
| Power Consumption | 46% | 3% | 7% | -40% | 61% | -54% | |
| Idle Minimum * (Watt) | 5.9 | 3.8 36% | 7.5 -27% | 5.8 2% | 15.6 -164% | 4.2 29% | 14.4 -144% |
| Idle Average * (Watt) | 15.8 | 9.4 41% | 15.7 1% | 20.6 -30% | 20.7 -31% | 7.9 50% | 20 -27% |
| Idle Maximum * (Watt) | 26.7 | 10.1 62% | 23.1 13% | 21 21% | 22.9 14% | 8.8 67% | 21.5 19% |
| Load Average * (Watt) | 117.4 | 64.4 45% | 87.2 26% | 104.7 11% | 134 -14% | 29.7 75% | 119 -1% |
| Witcher 3 ultra * (Watt) | 114.8 | 64.4 44% | 116 -1% | 99.2 14% | 135 -18% | 28.8 75% | 218 -90% |
| Load Maximum * (Watt) | 136.6 | 68 50% | 131.6 4% | 107.6 21% | 170 -24% | 44 68% | 248 -82% |
* ... smaller is better
Power Consumption Witcher 3 / Stresstest
Power Consumption external Monitor
电池寿命
运行时间与上一代9710或9700机型相比没有明显变化。在集成GPU处于激活状态的情况下,使用平衡或优化电源配置文件时,预计实际的WLAN使用时间略低于9小时。假设你没有运行上面提到的任何苛刻的应用程序,从空电到满电只需2个多小时。
| Dell XPS 17 9720 RTX 3060 i7-12700H, GeForce RTX 3060 Laptop GPU, 97 Wh | HP Envy 17-cg i5-1135G7, GeForce MX450, 55.67 Wh | Dell XPS 17 9710 Core i7 RTX 3060 i7-11800H, GeForce RTX 3060 Laptop GPU, 97 Wh | Dell XPS 17 9700 Core i7 RTX 2060 Max-Q i7-10875H, GeForce RTX 2060 Max-Q, 97 Wh | Lenovo Legion 5 17ACH6H-82JY0003GE R5 5600H, GeForce RTX 3060 Laptop GPU, 80 Wh | Asus VivoBook 17 F712JA-AU708W i7-1065G7, Iris Plus Graphics G7 (Ice Lake 64 EU), 32 Wh | Razer Blade 17 (i7-12800H, RTX 3070 Ti) i7-12800H, GeForce RTX 3070 Ti Laptop GPU, 82 Wh | |
|---|---|---|---|---|---|---|---|
| Battery runtime | 46% | 74% | 56% | 21% | 11% | 24% | |
| WiFi v1.3 (h) | 8.7 | 7.9 -9% | 7.6 -13% | 9.7 11% | 4.4 -49% | 4.4 -49% | 5.9 -32% |
| Load (h) | 1 | 2 100% | 2.6 160% | 2 100% | 1.9 90% | 1.7 70% | 1.8 80% |
| Reader / Idle (h) | 17.7 | 17.7 | 23.8 | 5.5 | |||
| H.264 (h) | 3.5 | 4.9 |
Pros
Cons
结论--关于CPU的一切
对更新的CPU没有什么可抱怨的。虽然Alder Lake平台确实可能非常耗电,但性能提升至少是可敬的。知道自己可以利用额外性能的强大用户肯定会欣赏这方面的权衡。
戴尔XPS 17 9720引入了一个全新的处理器,与旧的第10代和第11代产品相比,性能有明显的提升。然而,在CPU之外,XPS 17 9710或9700的相同缺点仍然存在。
不幸的是,在这个设计的两年里,有一些小的缺点还没有得到解决。网络摄像头的视频质量仍然很差,在运行高要求的负载时,充电速度明显变慢,盖子的握力很差,很难打开,而且仍然没有网络摄像头隐私快门或Wi-Fi 6E支持。GPU似乎突然受到了打击,这对XPS的爱好者来说可能是一颗难以吞咽的药丸。与具有更多功能的替代品相比,XPS 17 9720的最大优势是,如 技嘉Aero 17的最大优势仍然是其更紧凑的机箱尺寸和16:10的长宽比。
价格和可用性
Dell XPS 17 9720 RTX 3060
- 05/31/2022 v7 (old)
Allen Ngo
Price comparison

