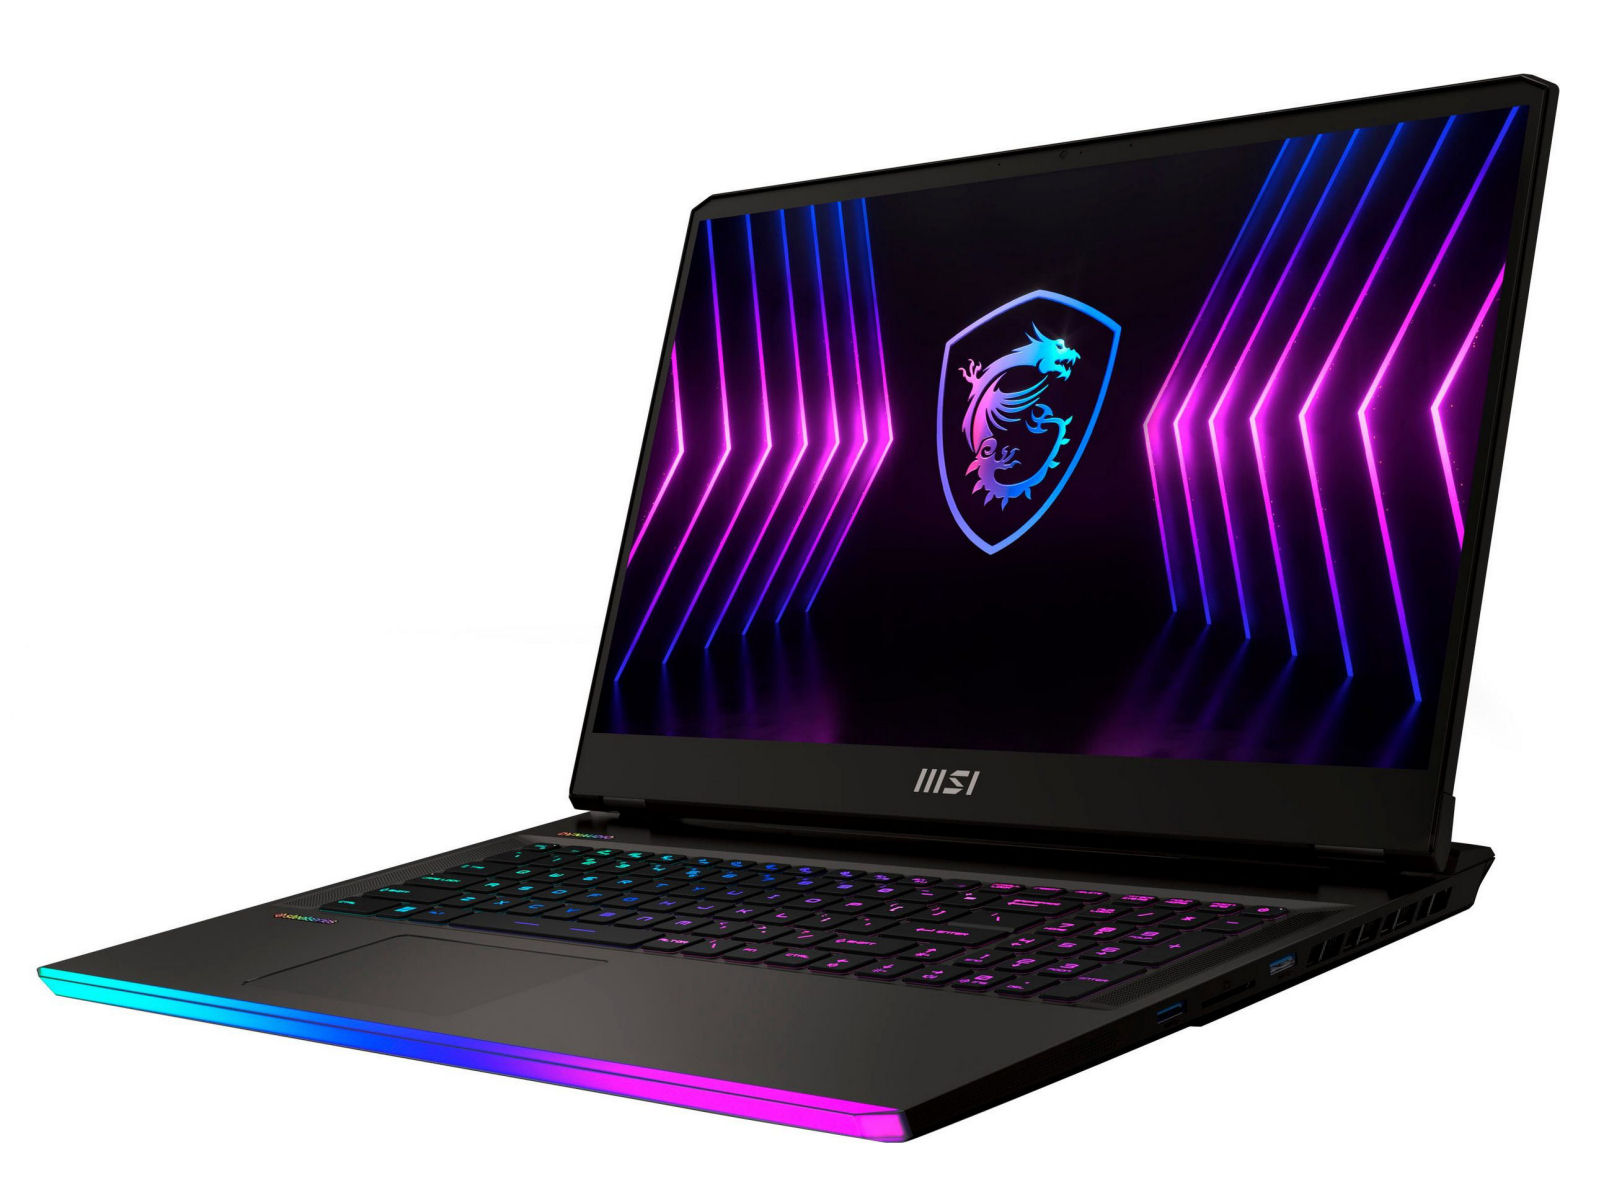
微星Raider GE77 HX 12UHS在审查中。具有顶级性能的4K游戏笔记本

微星Raider GE77 HX 12UHS是针对游戏玩家和创意用户的。因此,我们的配置配备了最新和最强大的硬件。 酷睿i9-12900HXCPU。 GeForce RTX 3080 Ti LaptopGPU,64GB内存,以及一个4K屏幕(17.3英寸)。我们的模型价格约为5,200美元。与 MSI Raider GE66 12UHS,我们最近刚刚审查了15.6英寸的版本。竞争者包括类似的强大(和昂贵)的笔记本电脑,如 Alienware x17 R2 P48E, Medion Erazer Beast X30,以及 Razer Blade 17(2022年初).
潜在的竞争对手比较
Rating | Date | Model | Weight | Height | Size | Resolution | Price |
|---|---|---|---|---|---|---|---|
| 86.8 % v7 (old) | 07 / 2022 | MSI Raider GE77 HX 12UHS i9-12900HX, GeForce RTX 3080 Ti Laptop GPU | 3.1 kg | 25.9 mm | 17.30" | 3840x2160 | |
| 89.9 % v7 (old) | 07 / 2022 | Razer Blade 17 Early 2022 i9-12900H, GeForce RTX 3080 Ti Laptop GPU | 2.8 kg | 19.9 mm | 17.30" | 3840x2160 | |
| 89.2 % v7 (old) | 05 / 2022 | Alienware x17 R2 P48E i9-12900HK, GeForce RTX 3080 Ti Laptop GPU | 3.1 kg | 20.9 mm | 17.30" | 1920x1080 | |
| 86.7 % v7 (old) | 05 / 2022 | Medion Erazer Beast X30 i9-12900HK, GeForce RTX 3080 Ti Laptop GPU | 2.2 kg | 23 mm | 17.30" | 2560x1440 |
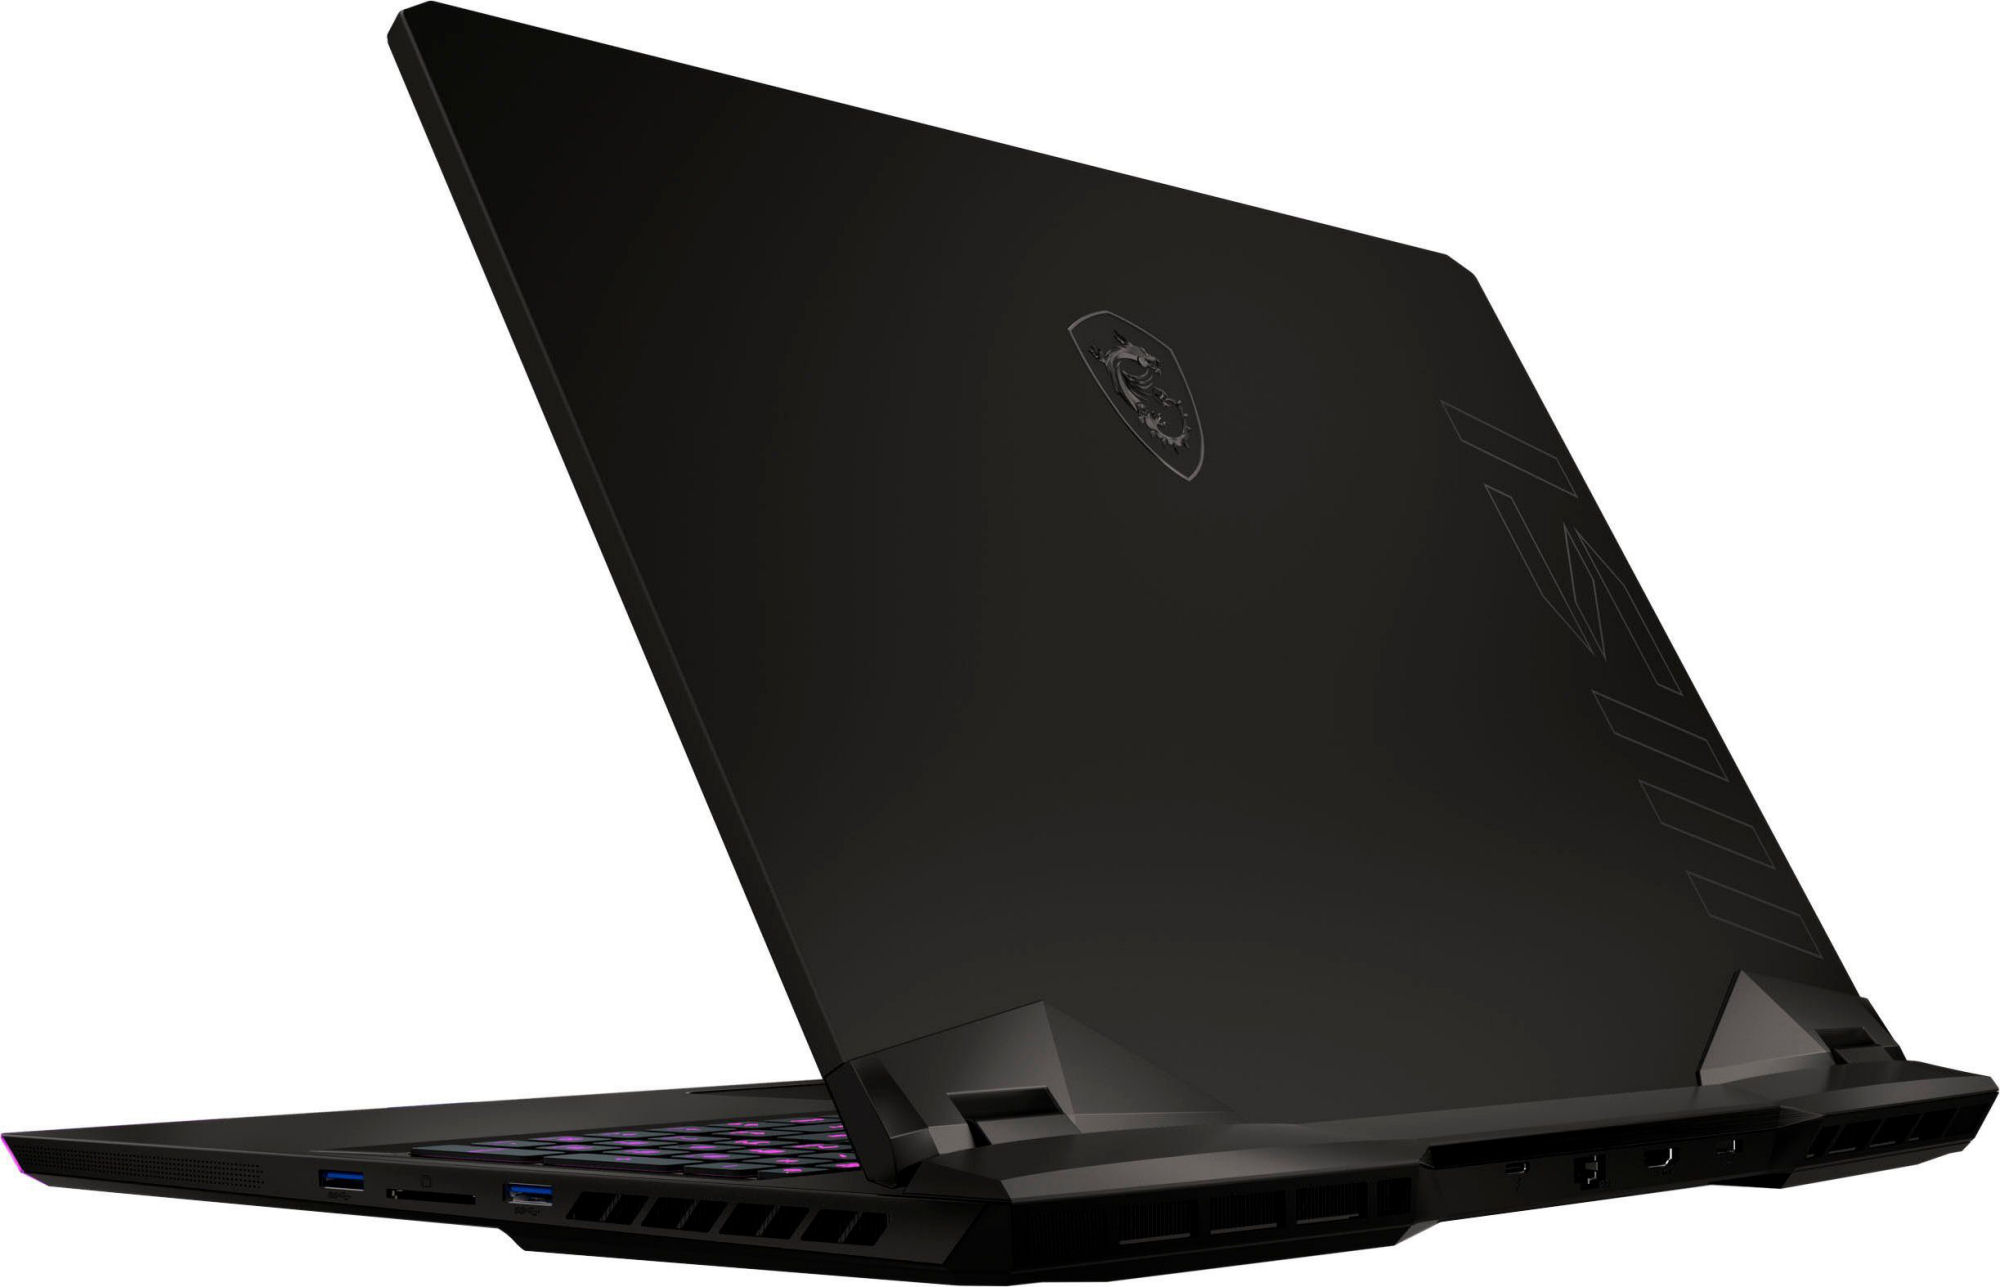
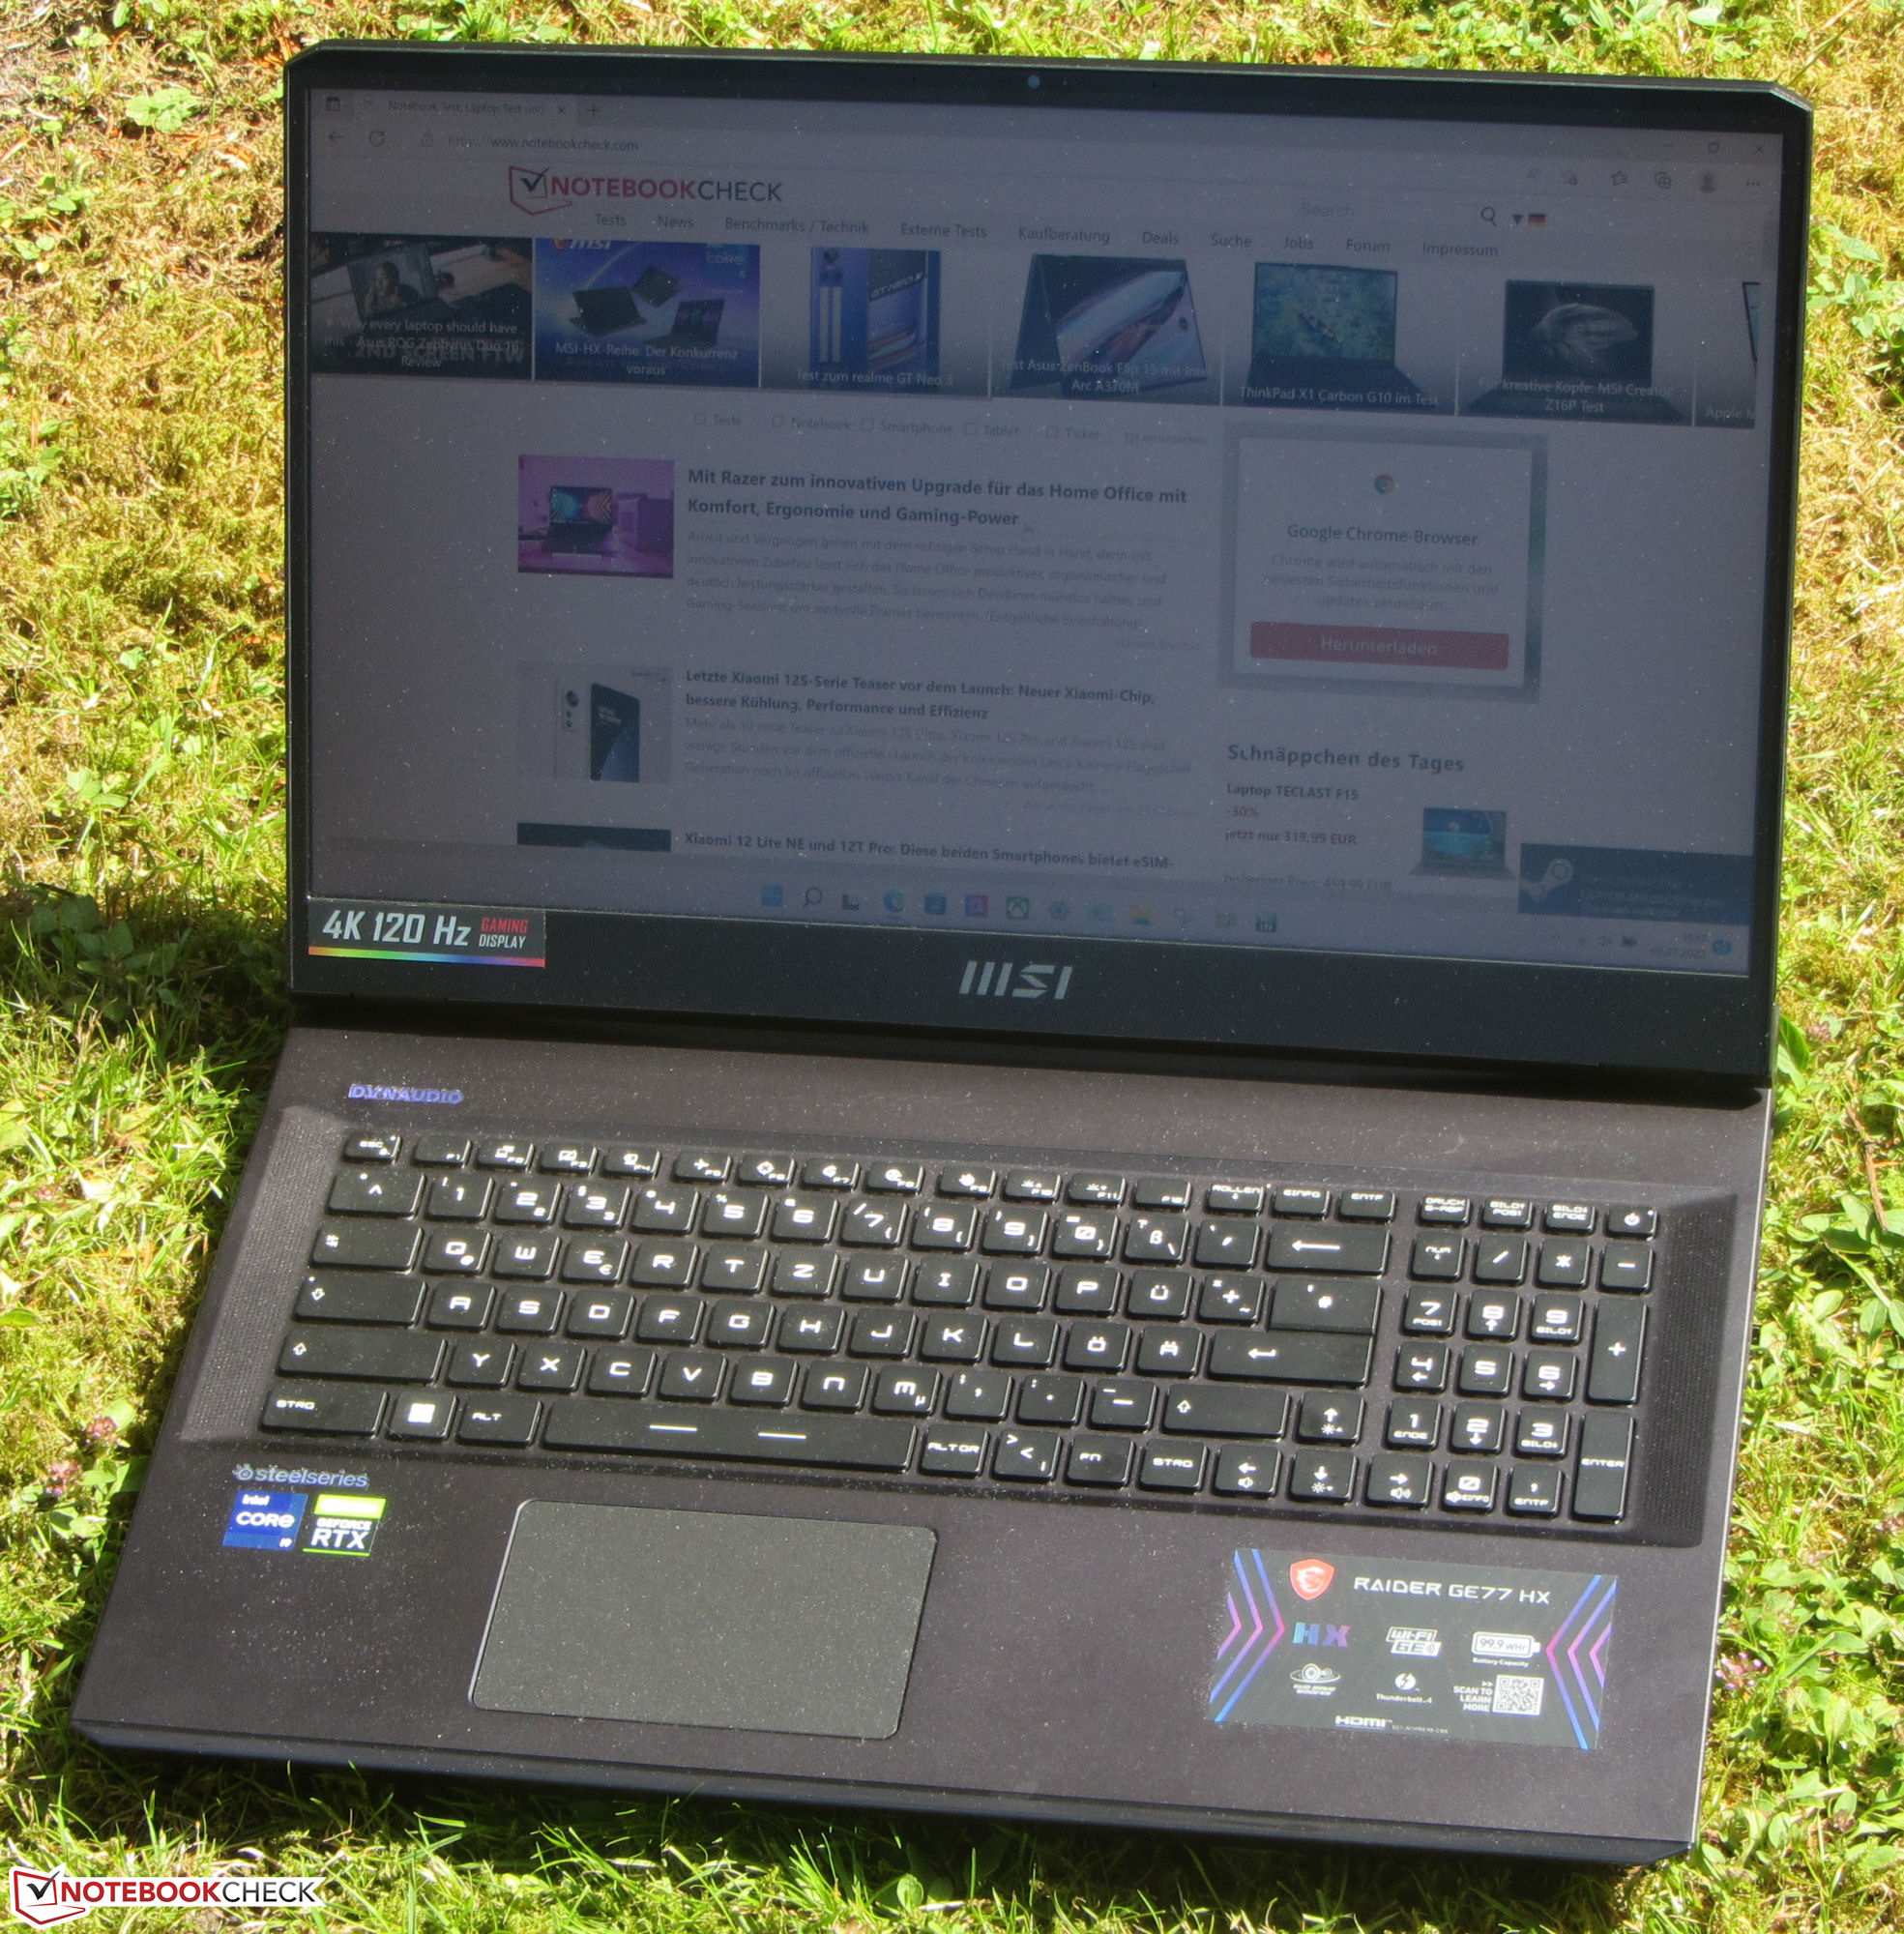
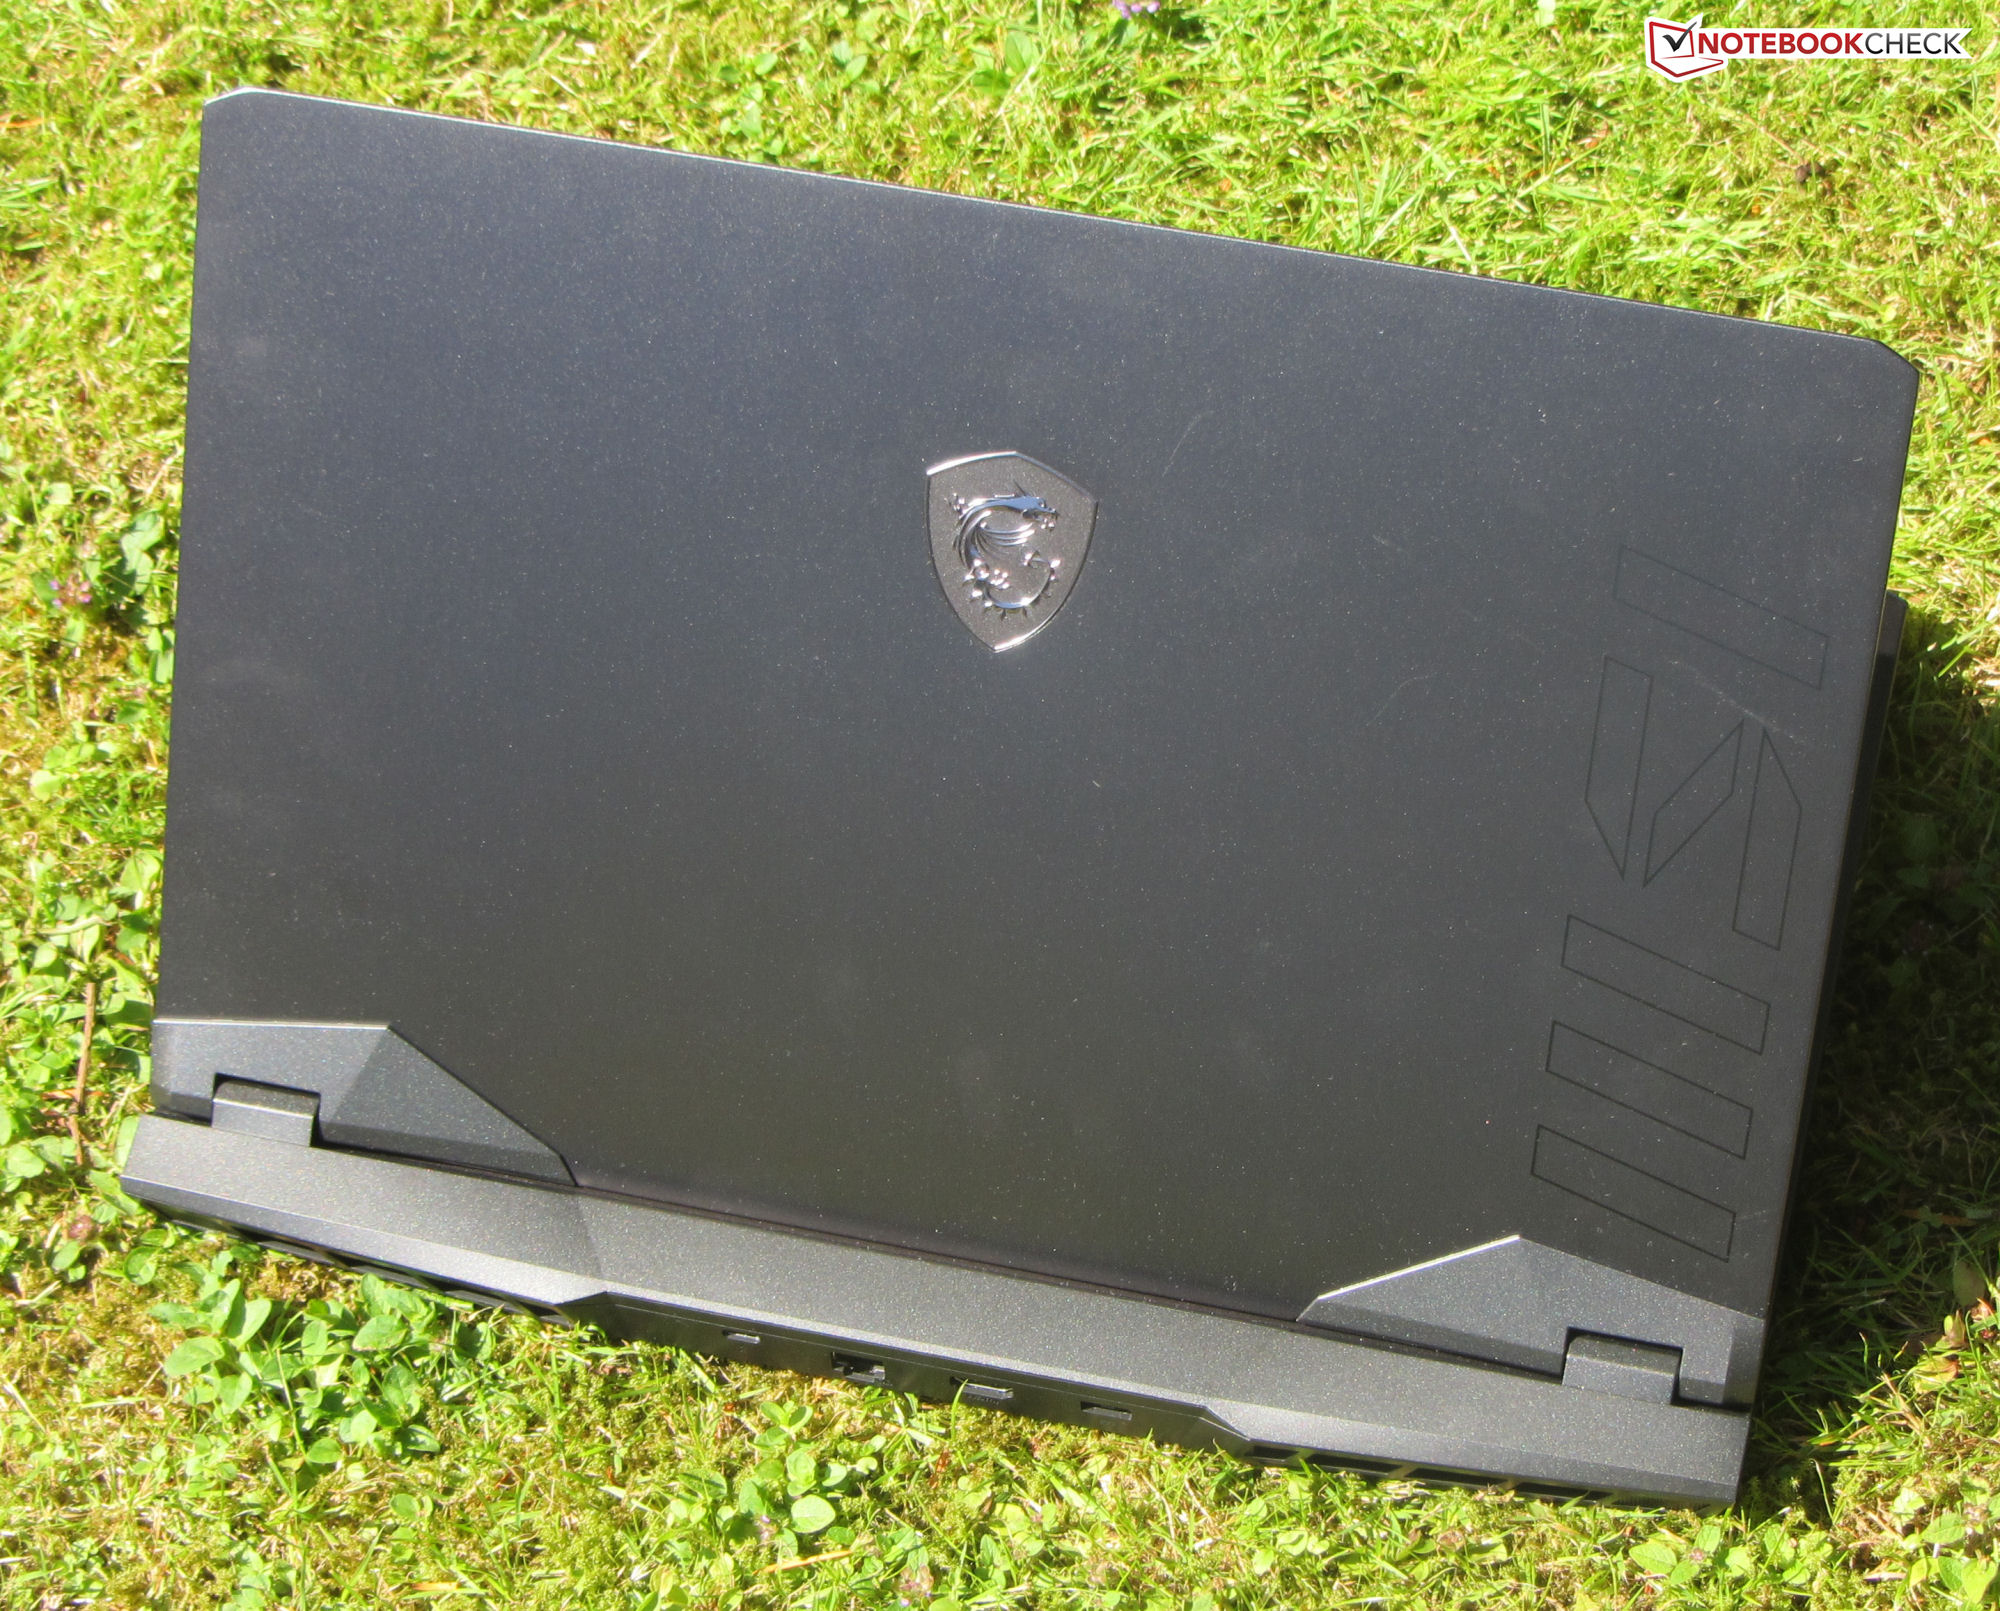
机箱 - GE77,带有微妙的金属底盘
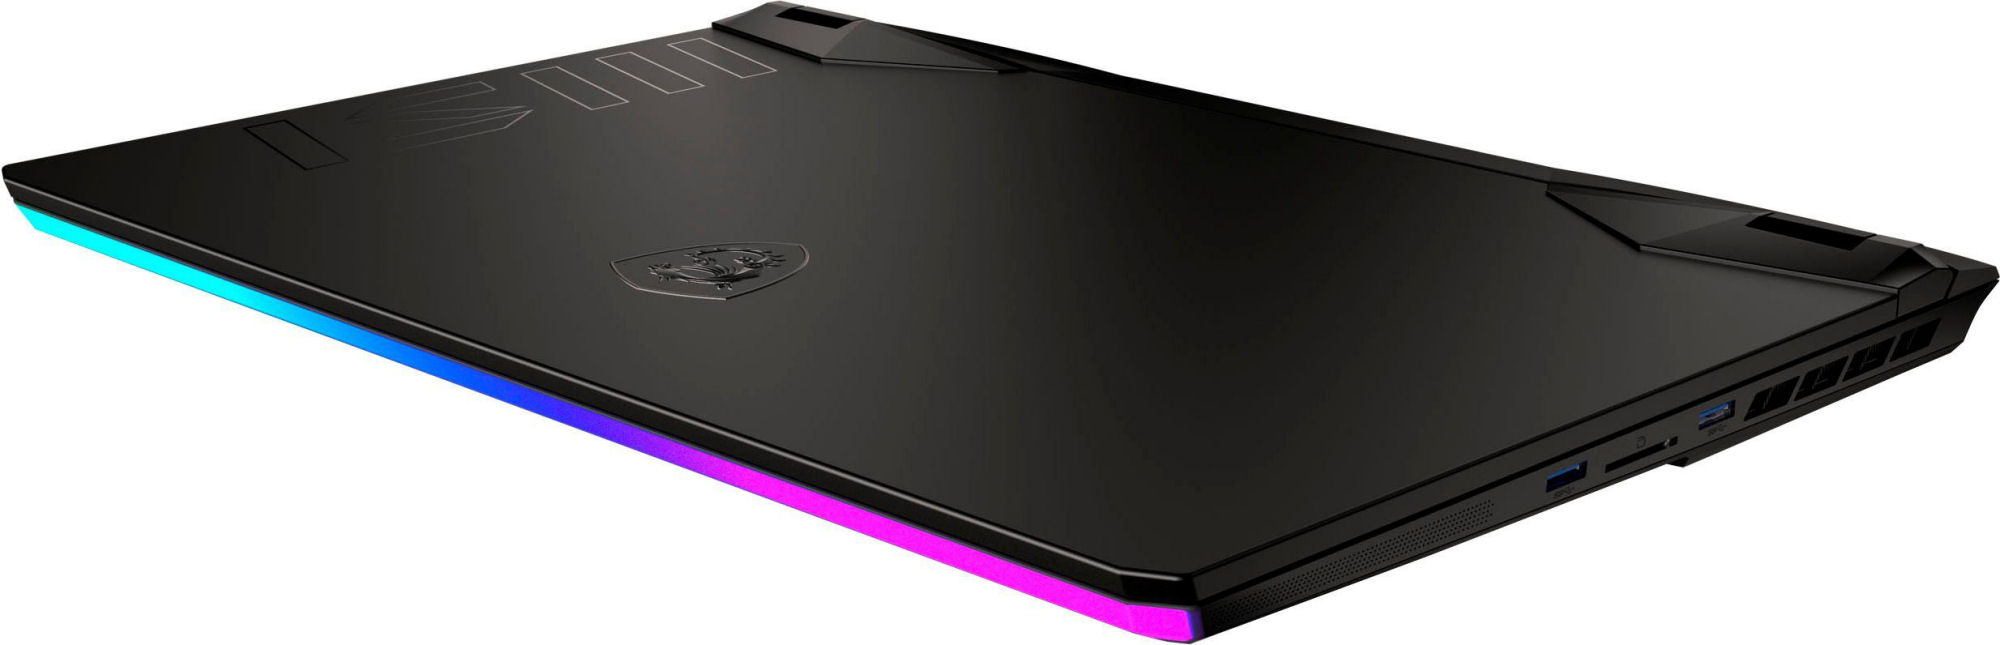
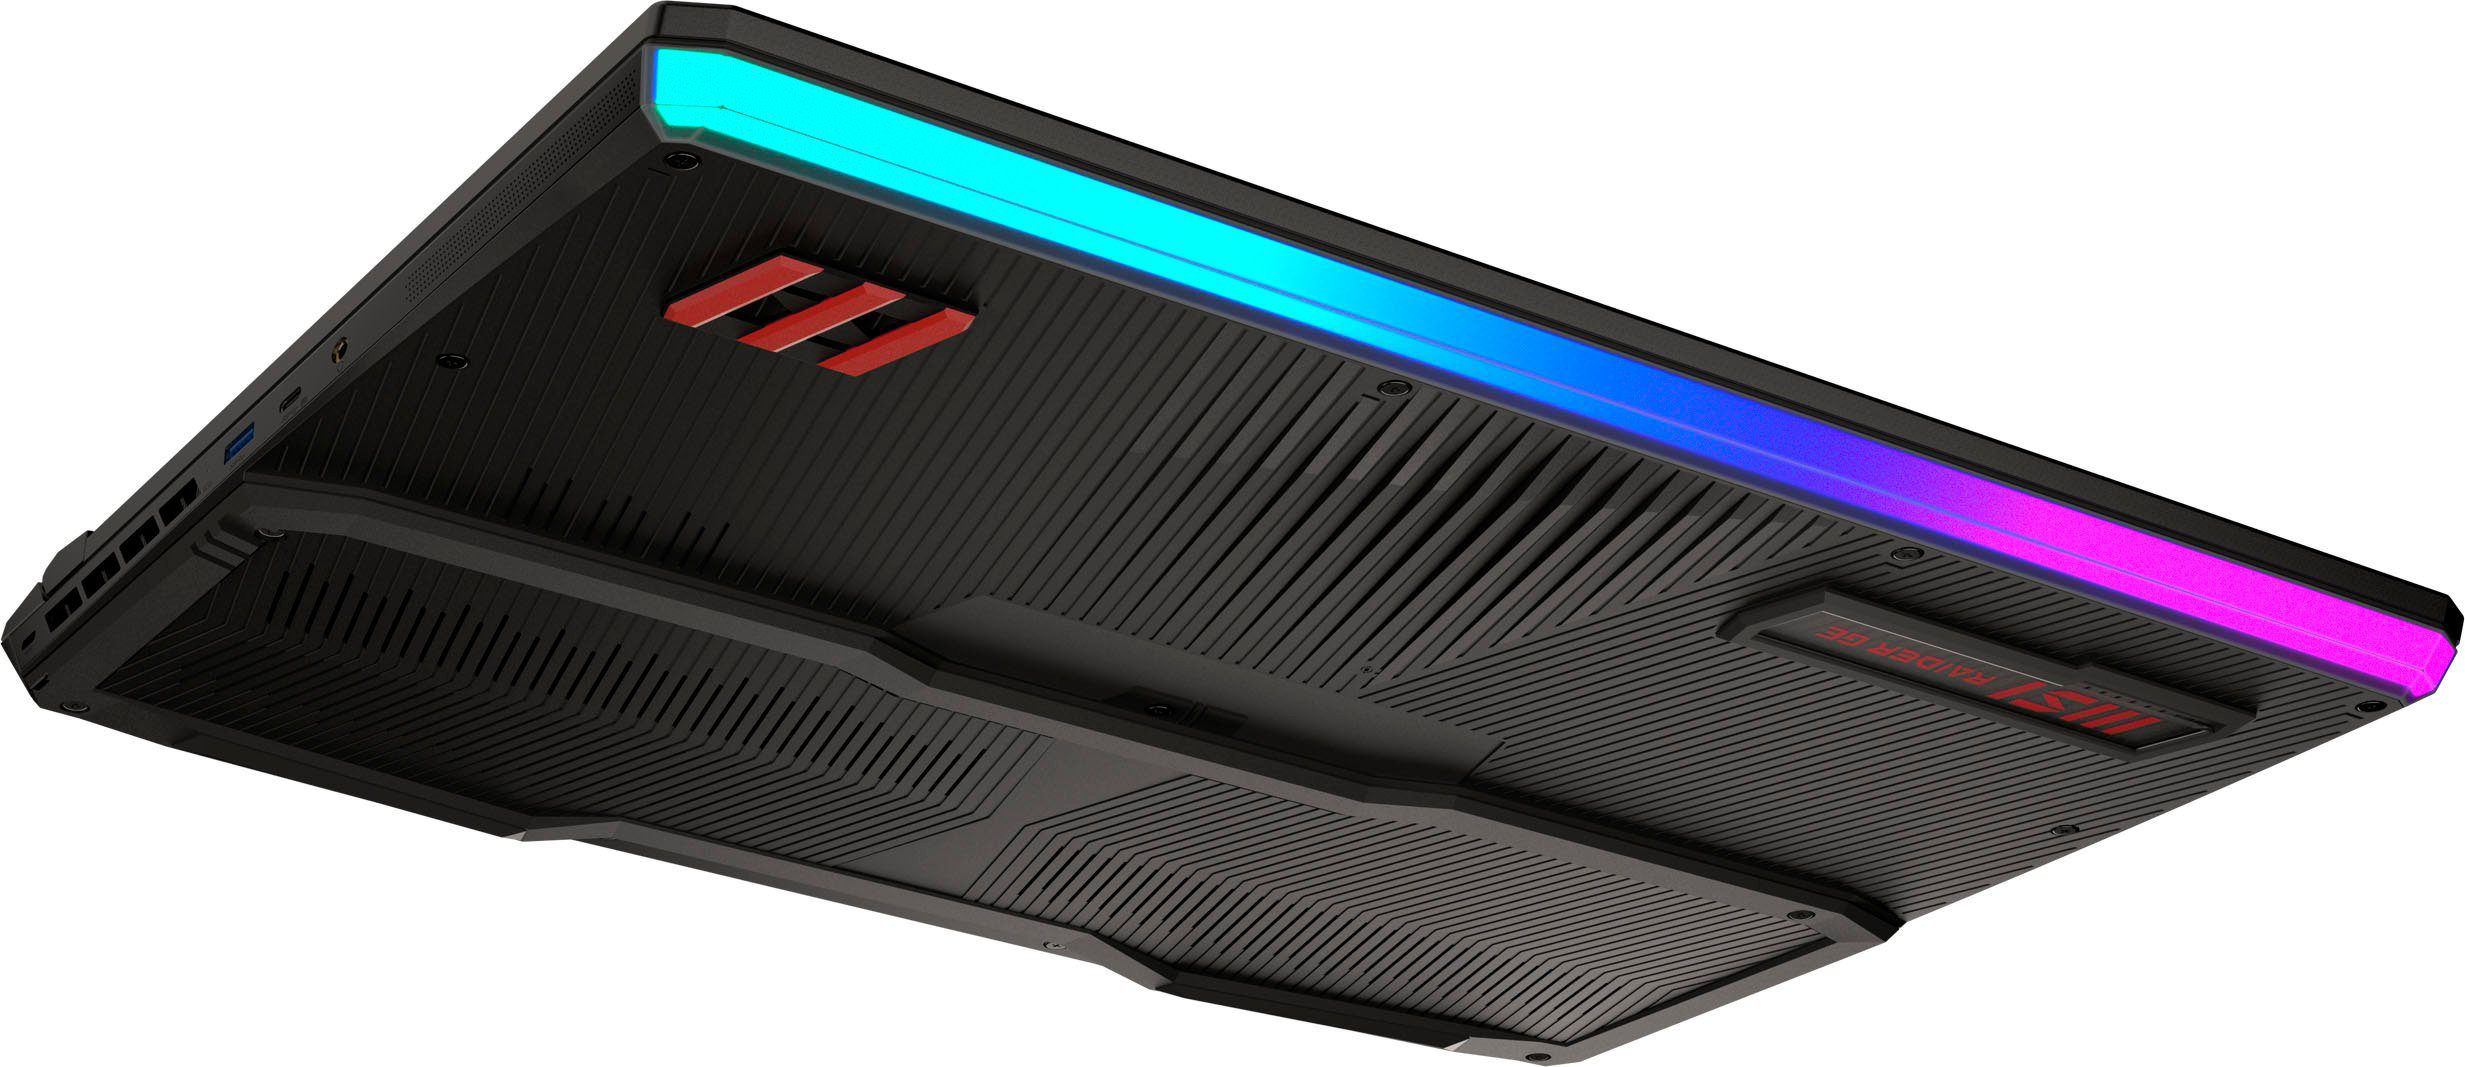
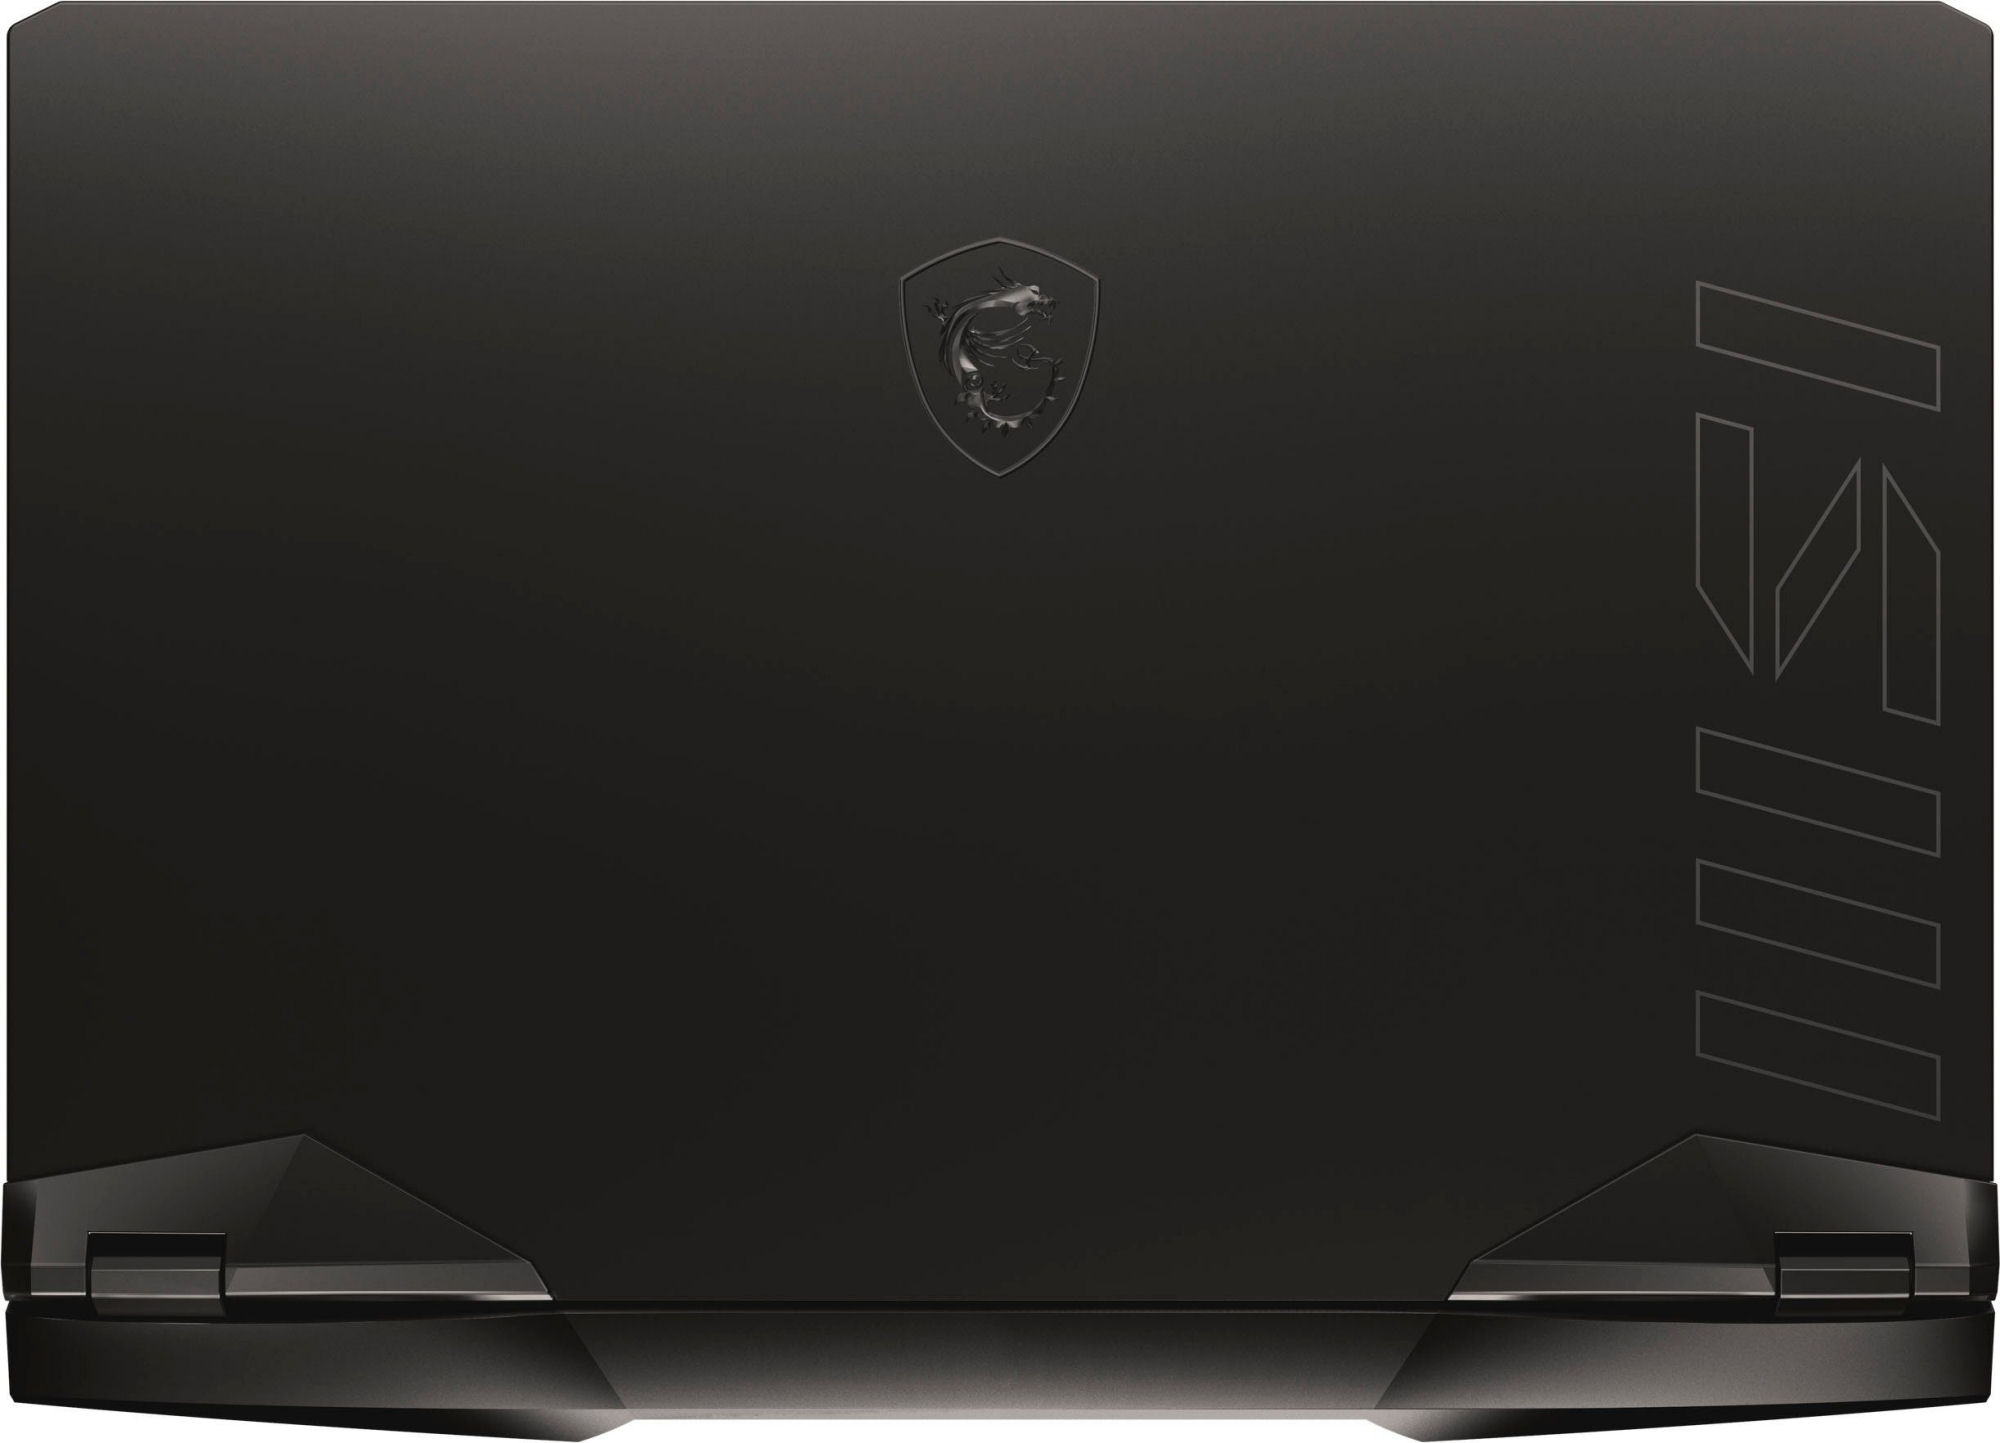
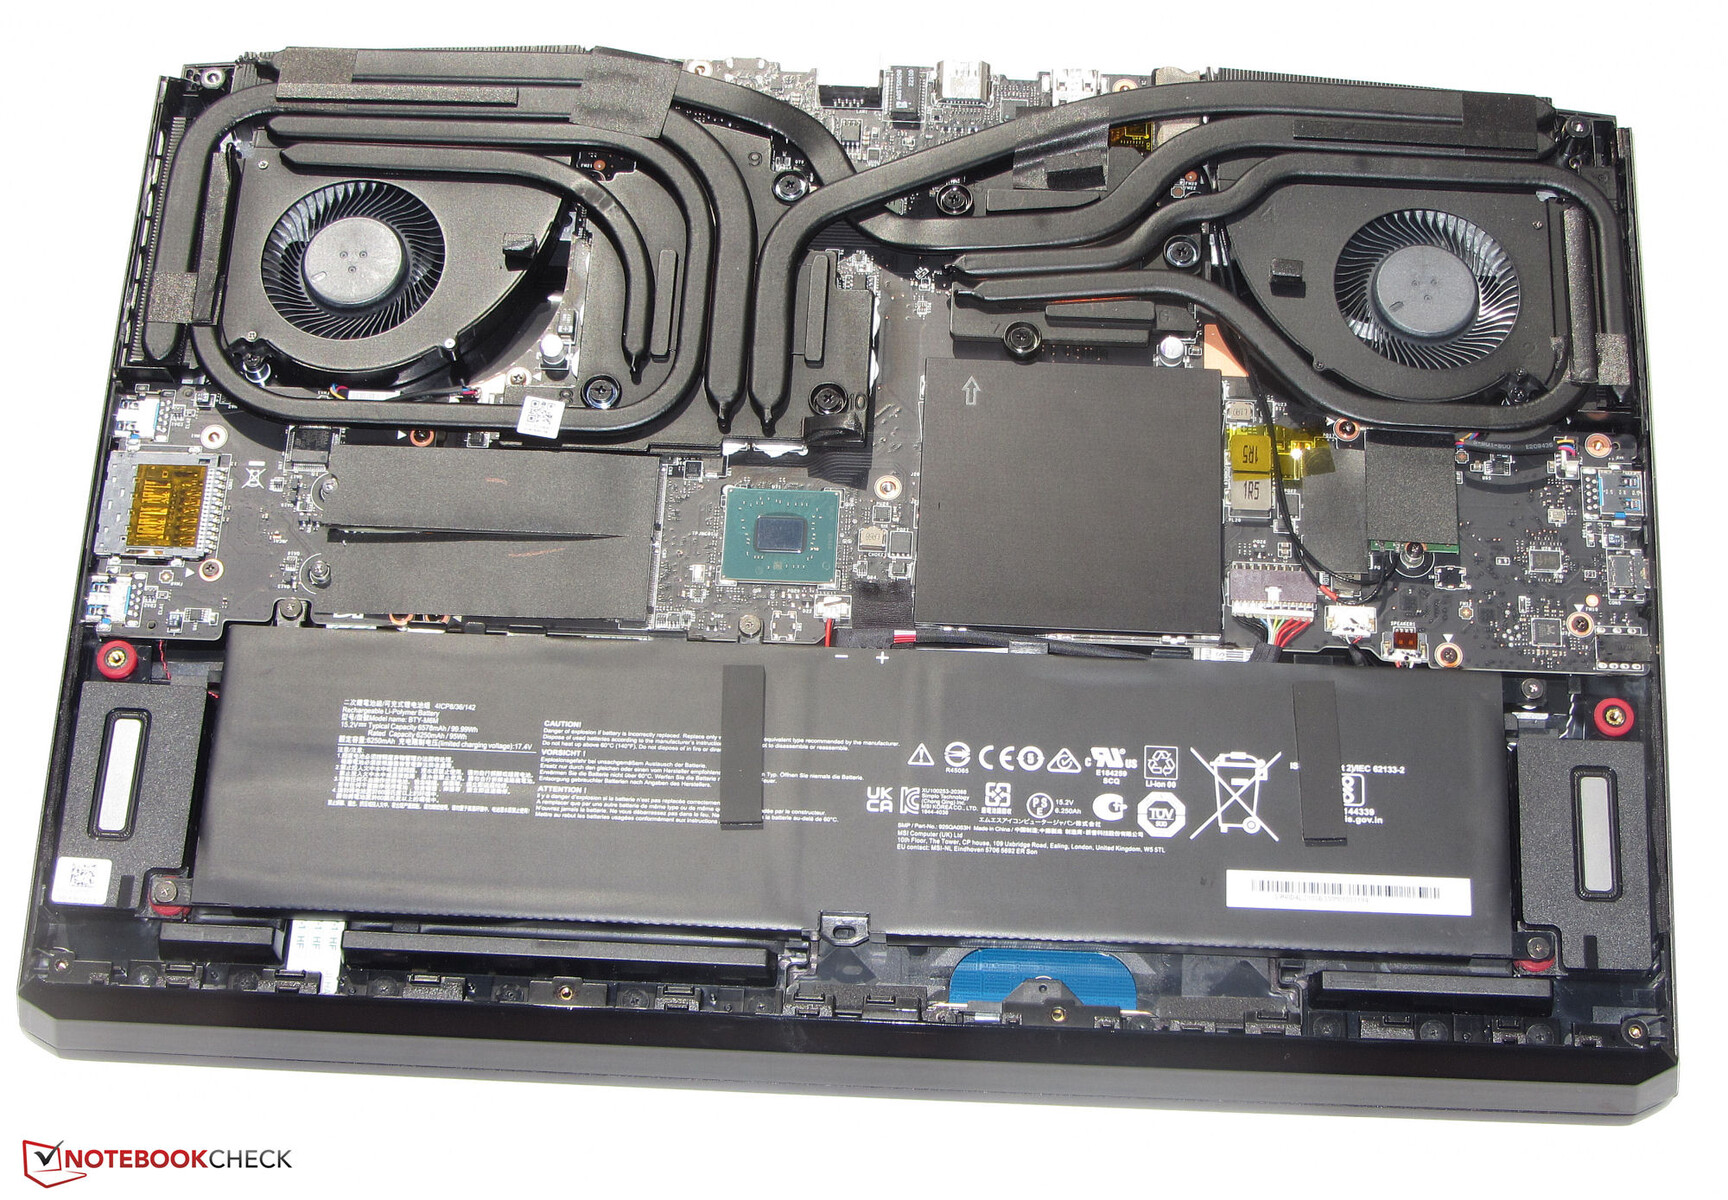
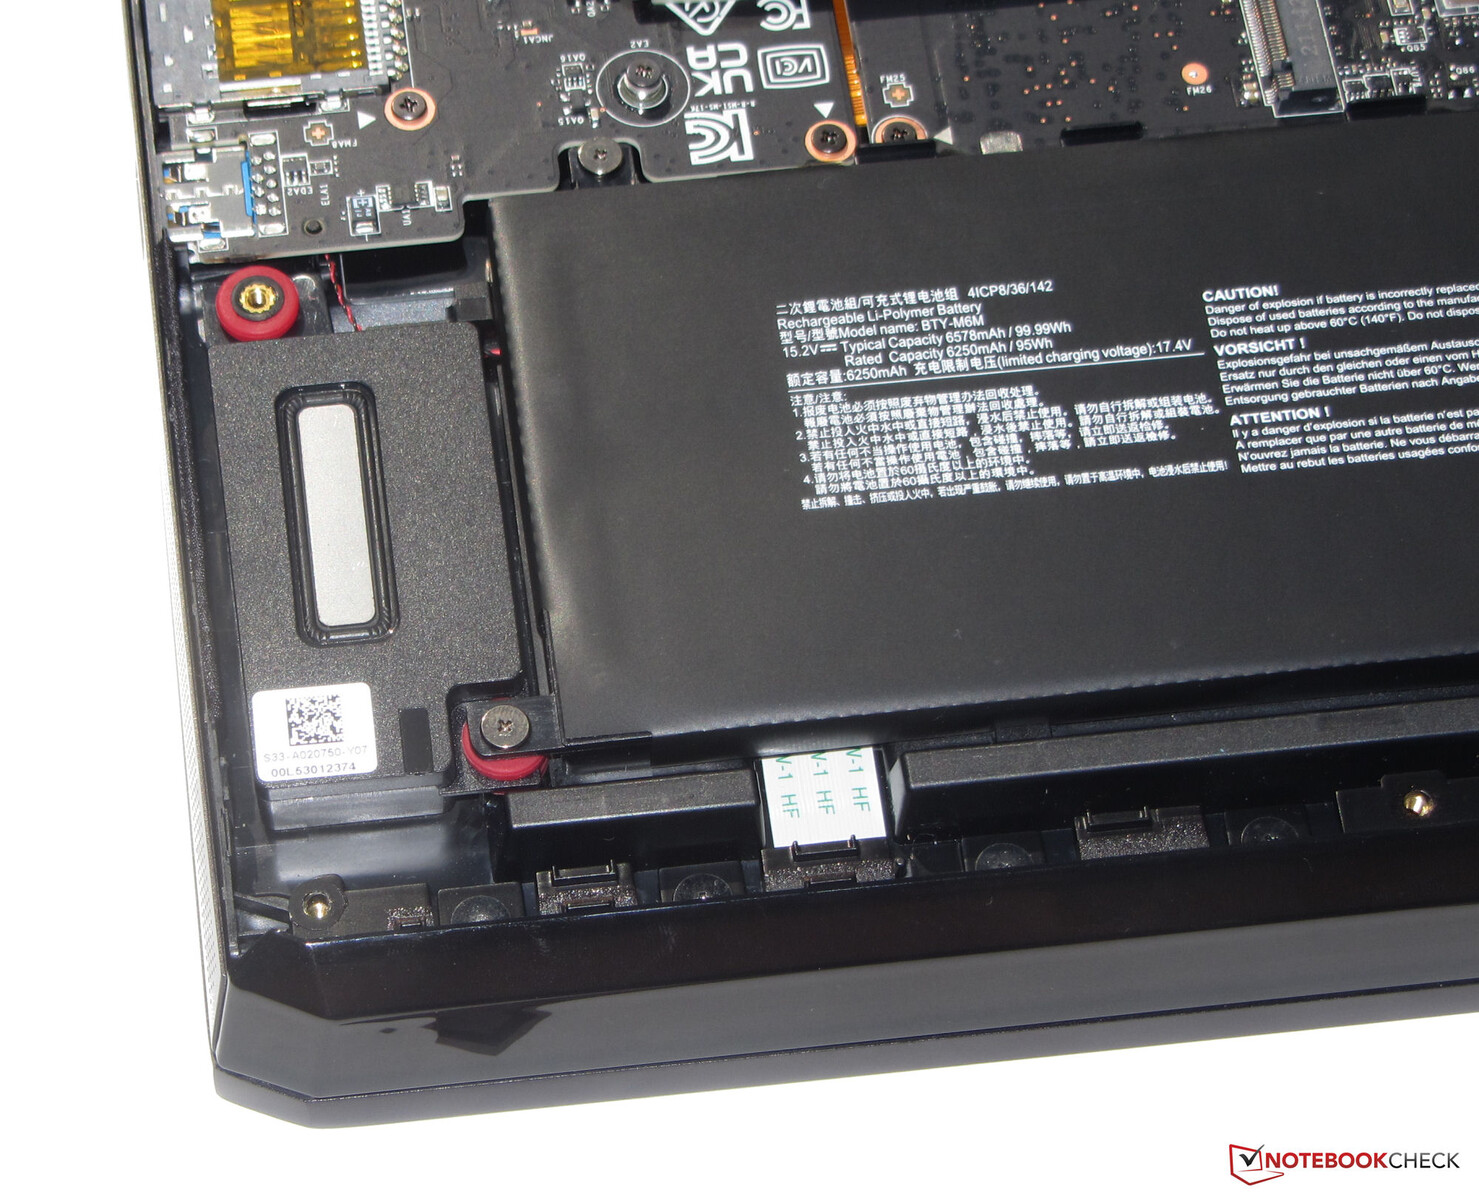
Raider的组件占据了一个金属机箱,表面是哑光黑色的,很光滑。有一个面向用户的LED灯带,可以在基本单元上关闭,这使得原本缺乏色彩点缀的机箱可以有多彩的灯光效果。因此,没有什么能阻止用户在专业场合使用该设备。微星笔记本电脑的外观因相当薄的边框而进一步增强。内部电池(用螺丝固定,不是用胶水)以及其余的硬件都可以在拆下底板后接触到。
我们没有注意到17.3英寸设备的任何制造缺陷。间隙均匀,没有多余的材料突起。底部设备对来自角落的扭曲非常有抵抗力,而盖子可以轻微扭曲。两者都在正常范围内。铰链将盖子牢牢地固定住,但也允许有一些晃动。盖子可以打开,最大角度约为140度。它也可以用一只手打开。

在我们的比较中,微星笔记本电脑和 笔记本和Alienware x17 R2是最重的设备。在尺寸方面,GE77属于平均范围--不像刀锋那样紧凑。 刀锋和 X30,但明显比X17更紧凑。
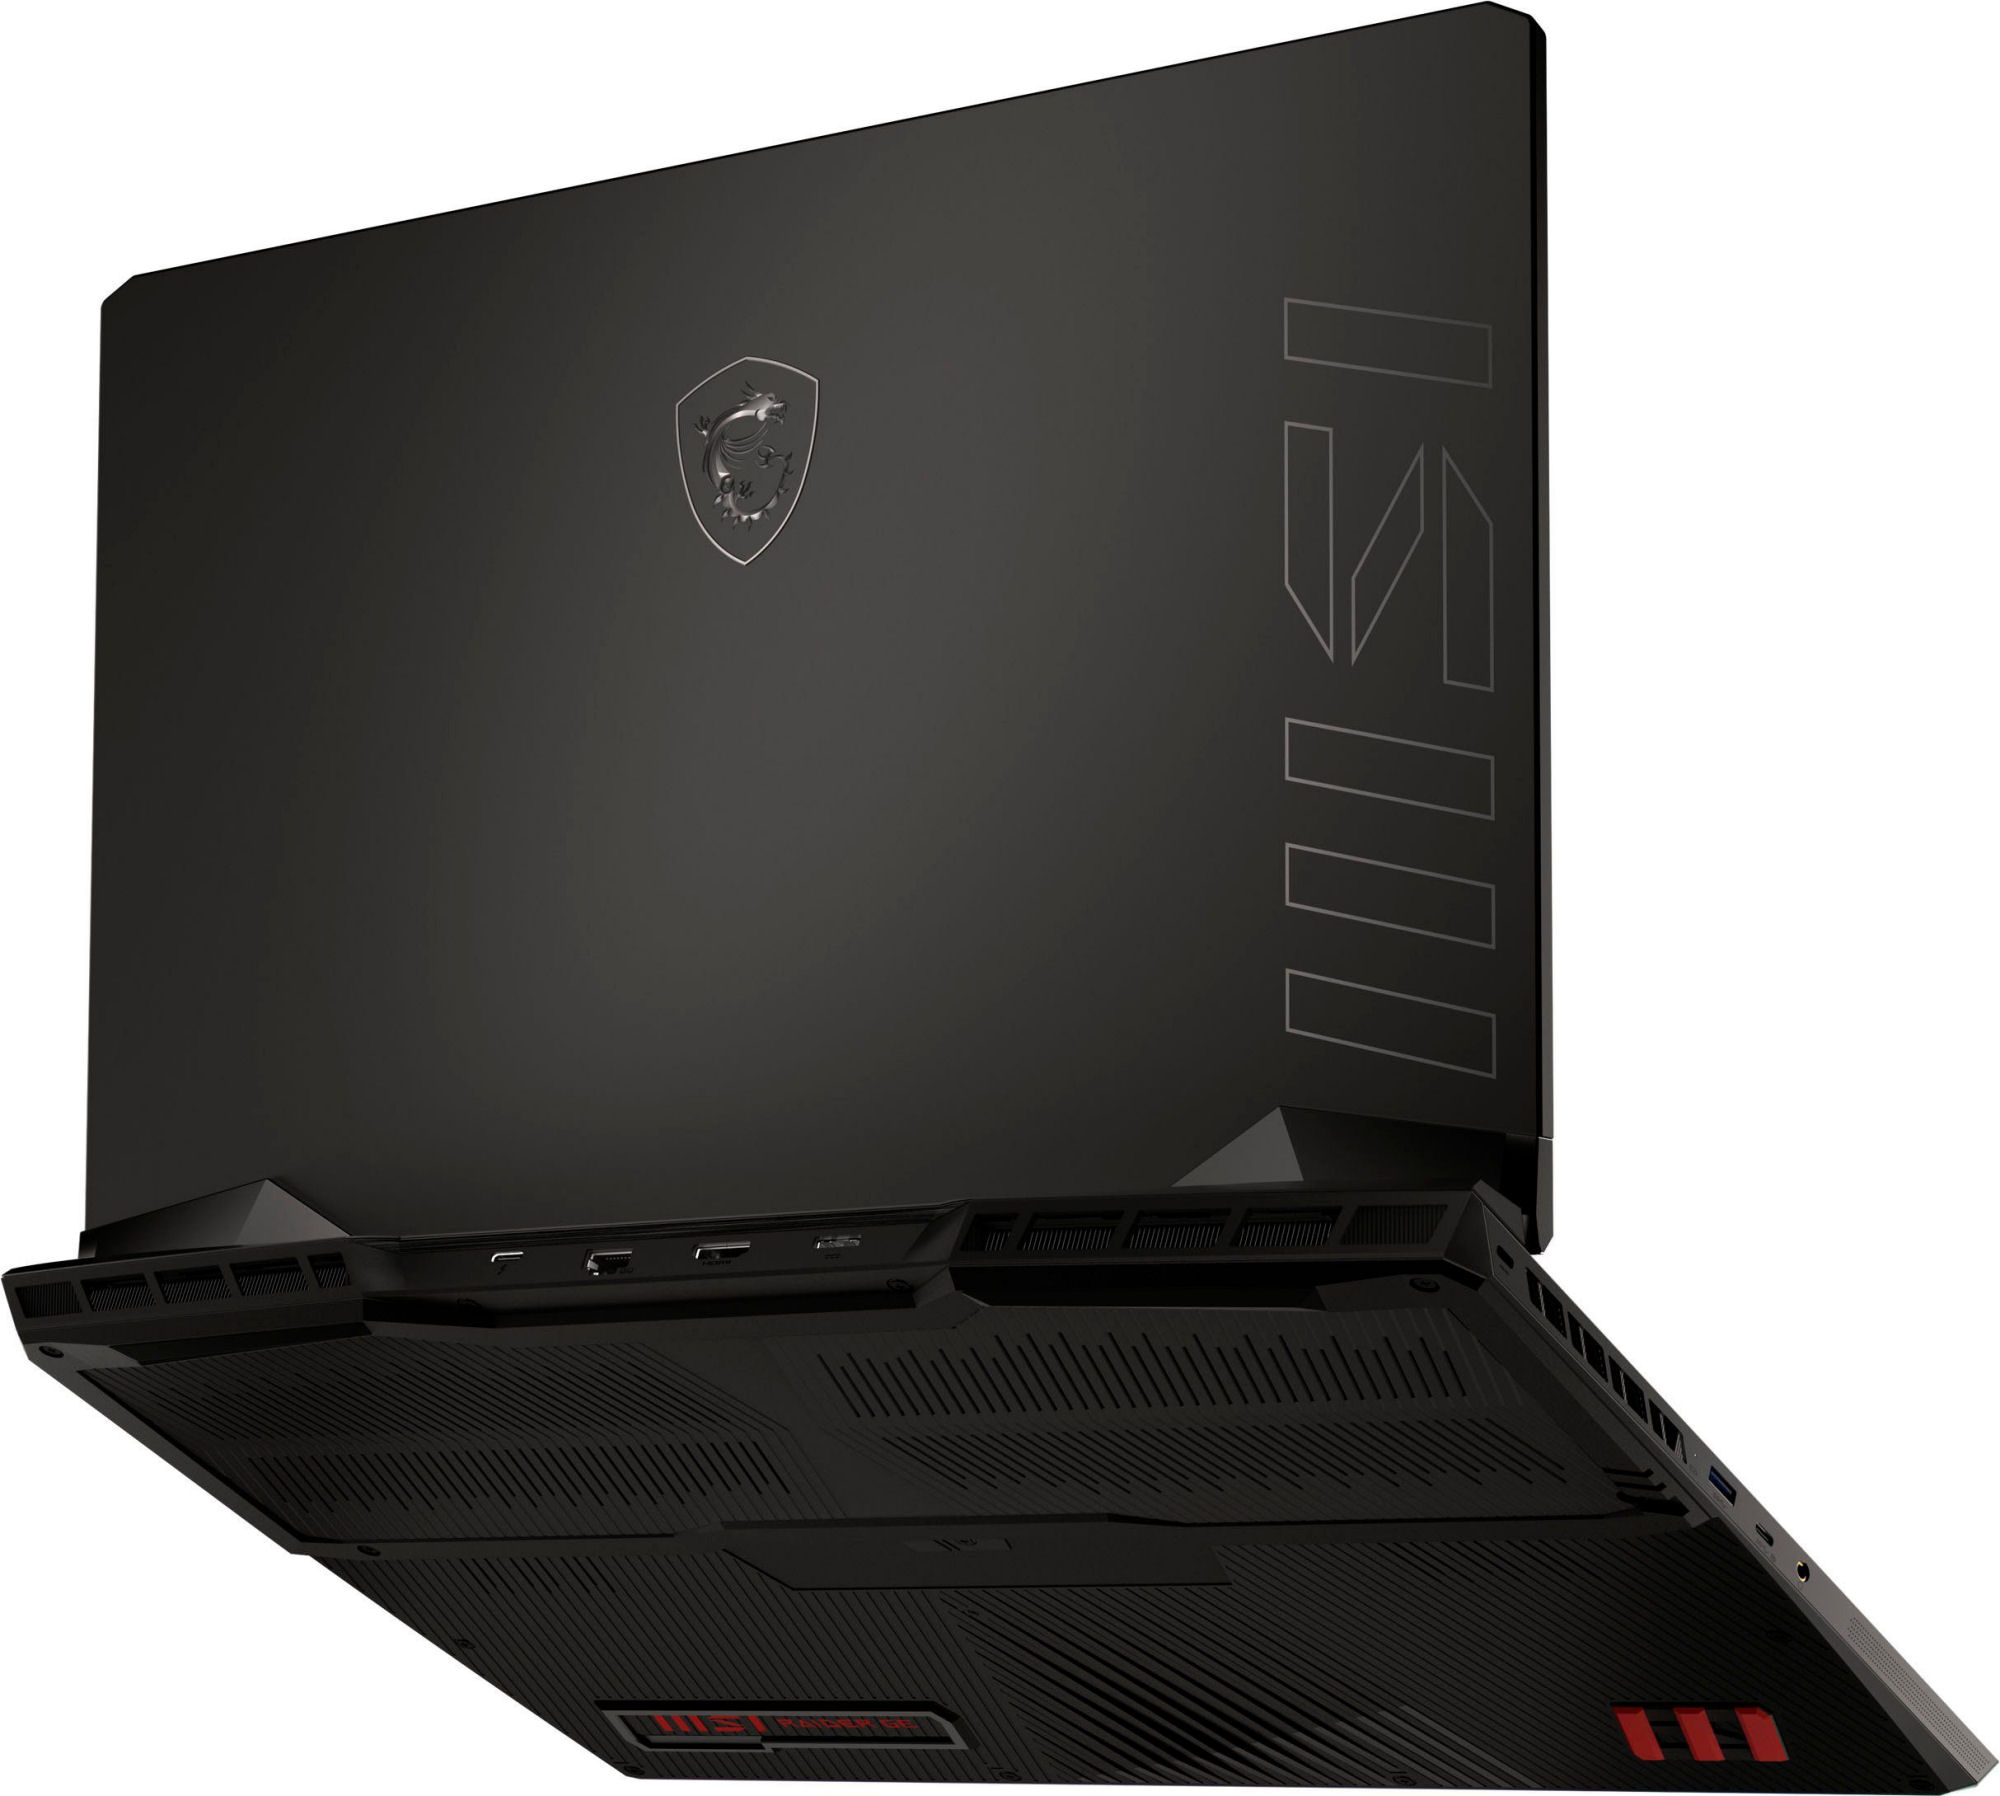
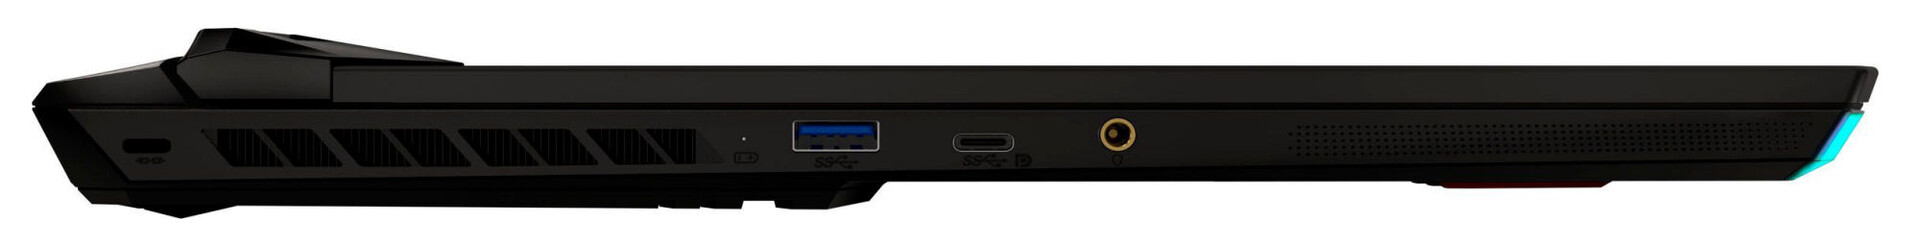
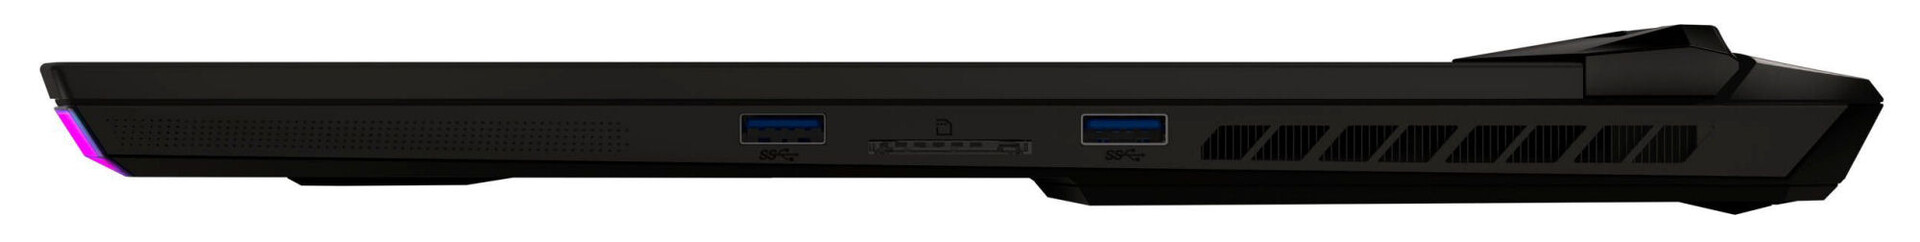
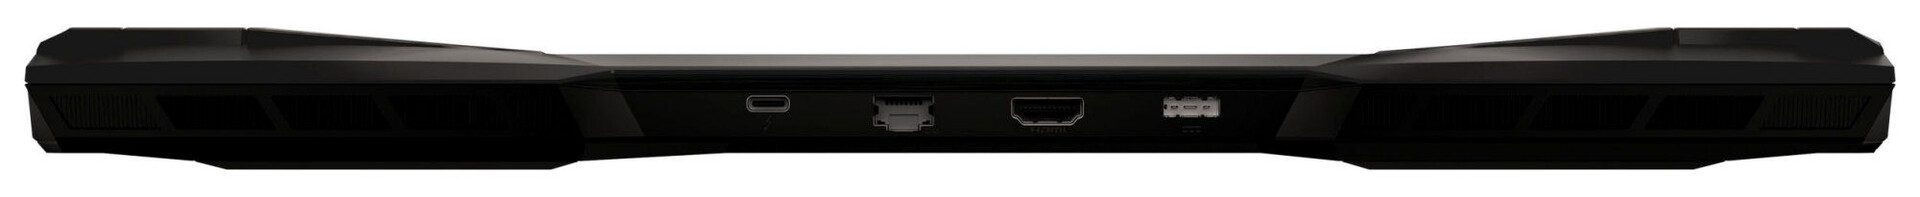
连接性 - 微星系统与Thunderbolt 4
GE77有三个USB-A端口(1个USB 3.2 Gen 2,2个USB 3.2 Gen 1)和两个USB-C端口(1个Thunderbolt 4,1个USB 3.2 Gen 2)。后者通过USB-C支持DisplayPort,但不支持Power Delivery。总的来说,该系统有三个视频输出(2个DP,1个HDMI)。此外,还有一个组合音频插孔,一个2.5-Gb/s以太网端口和一个电缆锁端口。
机箱的三面都有端口。两个视频输出,以太网端口和AC适配器端口都在机箱的背面。这简化了电缆管理,使电缆不容易被挡住。
SD卡阅读器
| SD Card Reader - average JPG Copy Test (av. of 3 runs) | |
| Alienware x17 R2 P48E (AV Pro V60) | |
| Razer Blade 17 Early 2022 (AV PRO microSD 128 GB V60) | |
| Average of class Gaming (20.9 - 210, n=54, last 2 years) | |
| Medion Erazer Beast X30 (AV PRO microSD 128 GB V60) | |
| MSI Raider GE77 HX 12UHS (AV PRO microSD 128 GB V60) | |
沟通
在最佳条件下(附近没有其他Wi-Fi设备,笔记本电脑和服务器之间的距离较小),我们记录了出色的Wi-Fi传输率,并用尽了Wi-Fi芯片的能力(Killer AX1675i = Intel AX211; 802.11 ax)。
还有一个以太网芯片(Killer E3100G,2.5Gb/s)用于有线通信。
| Networking - iperf3 receive AXE11000 6GHz | |
| MSI Raider GE77 HX 12UHS | |
| Average of class Gaming (975 - 1775, n=35, last 2 years) | |
| Average Killer Wi-Fi 6E AX1675i 160MHz Wireless Network Adapter (1327 - 1788, n=20) | |
网络摄像头
该网络摄像头以1920 x 1080的最大分辨率捕捉图像。色彩的准确性是缺乏的。颜色偏离了其理想值。没有机械的网络摄像头盖。


辅料
笔记本电脑配有常规文件(快速入门指南、保修信息)。
维护
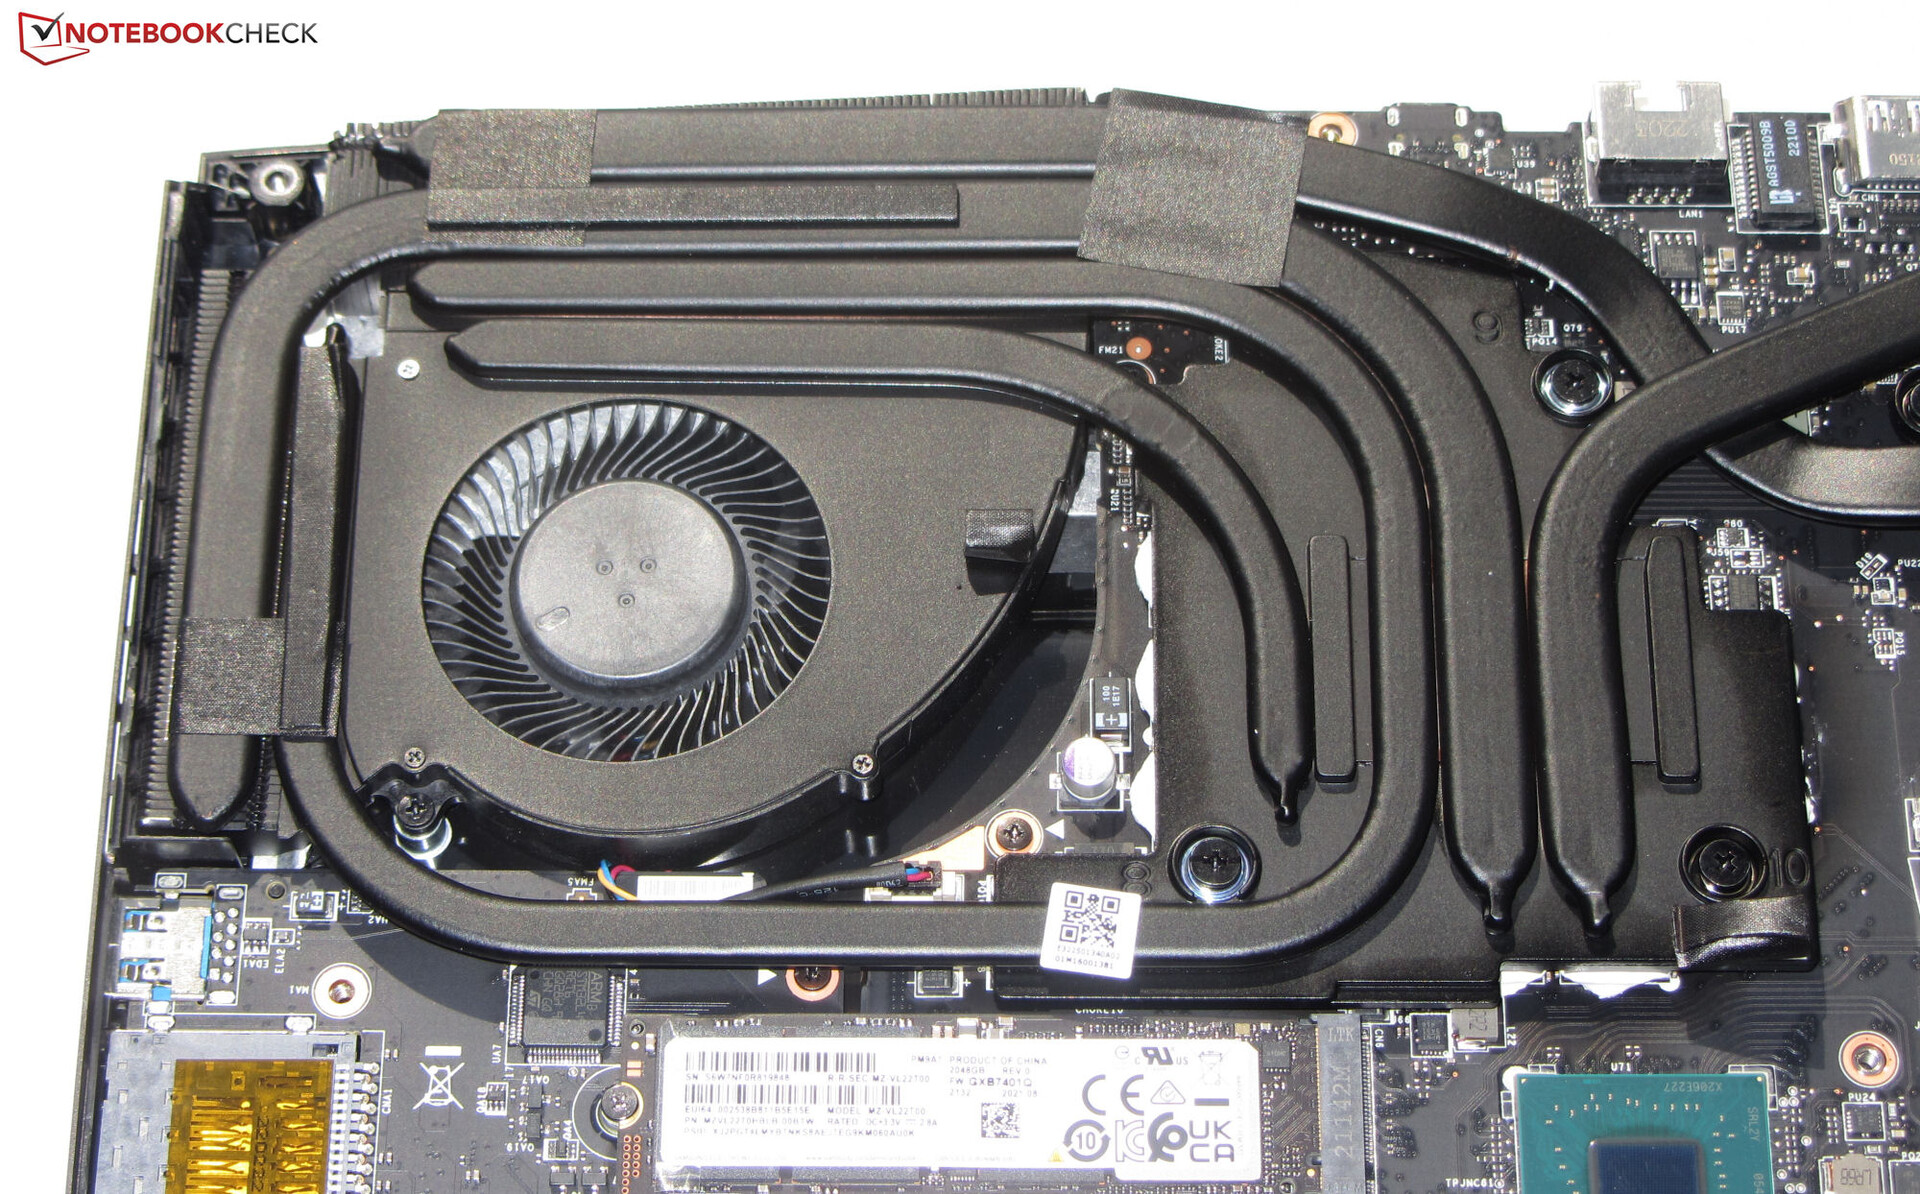
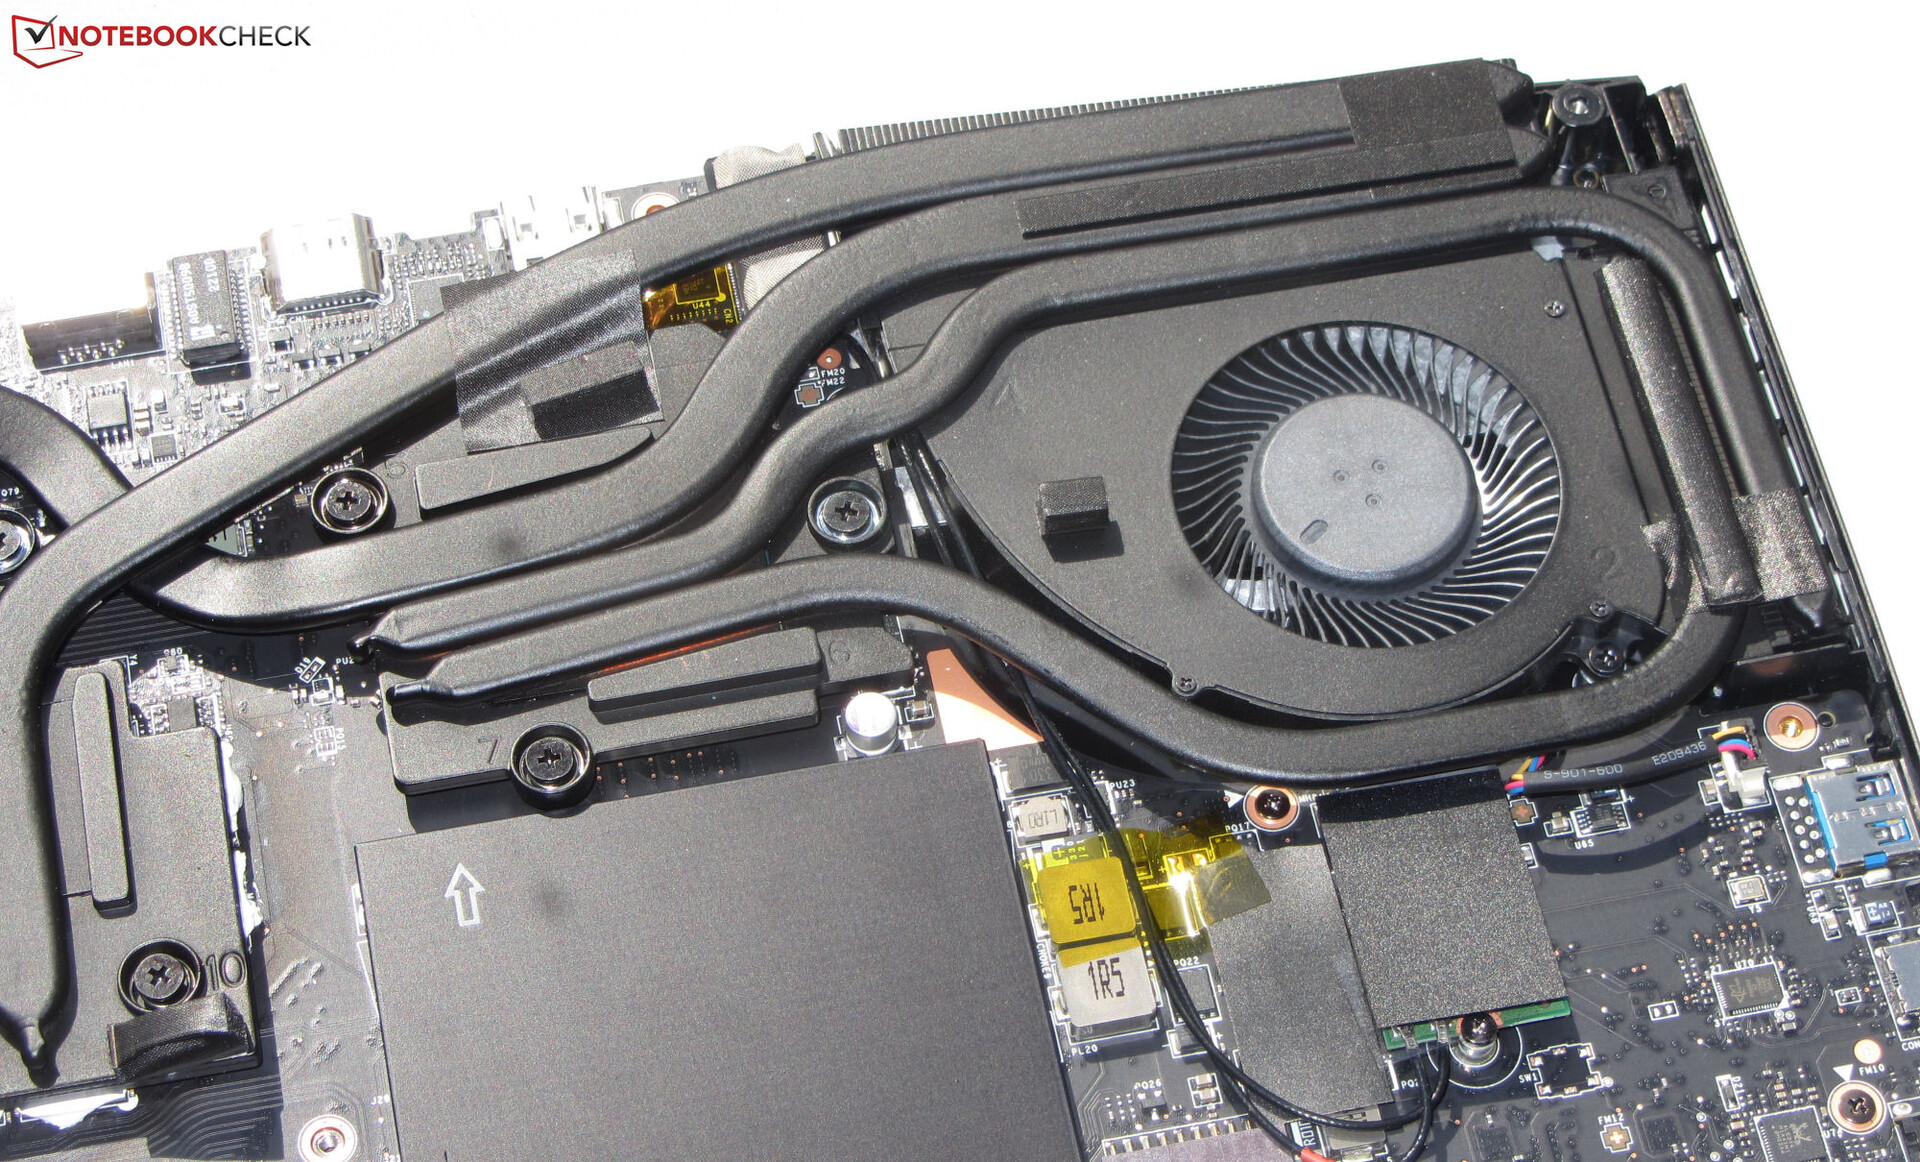
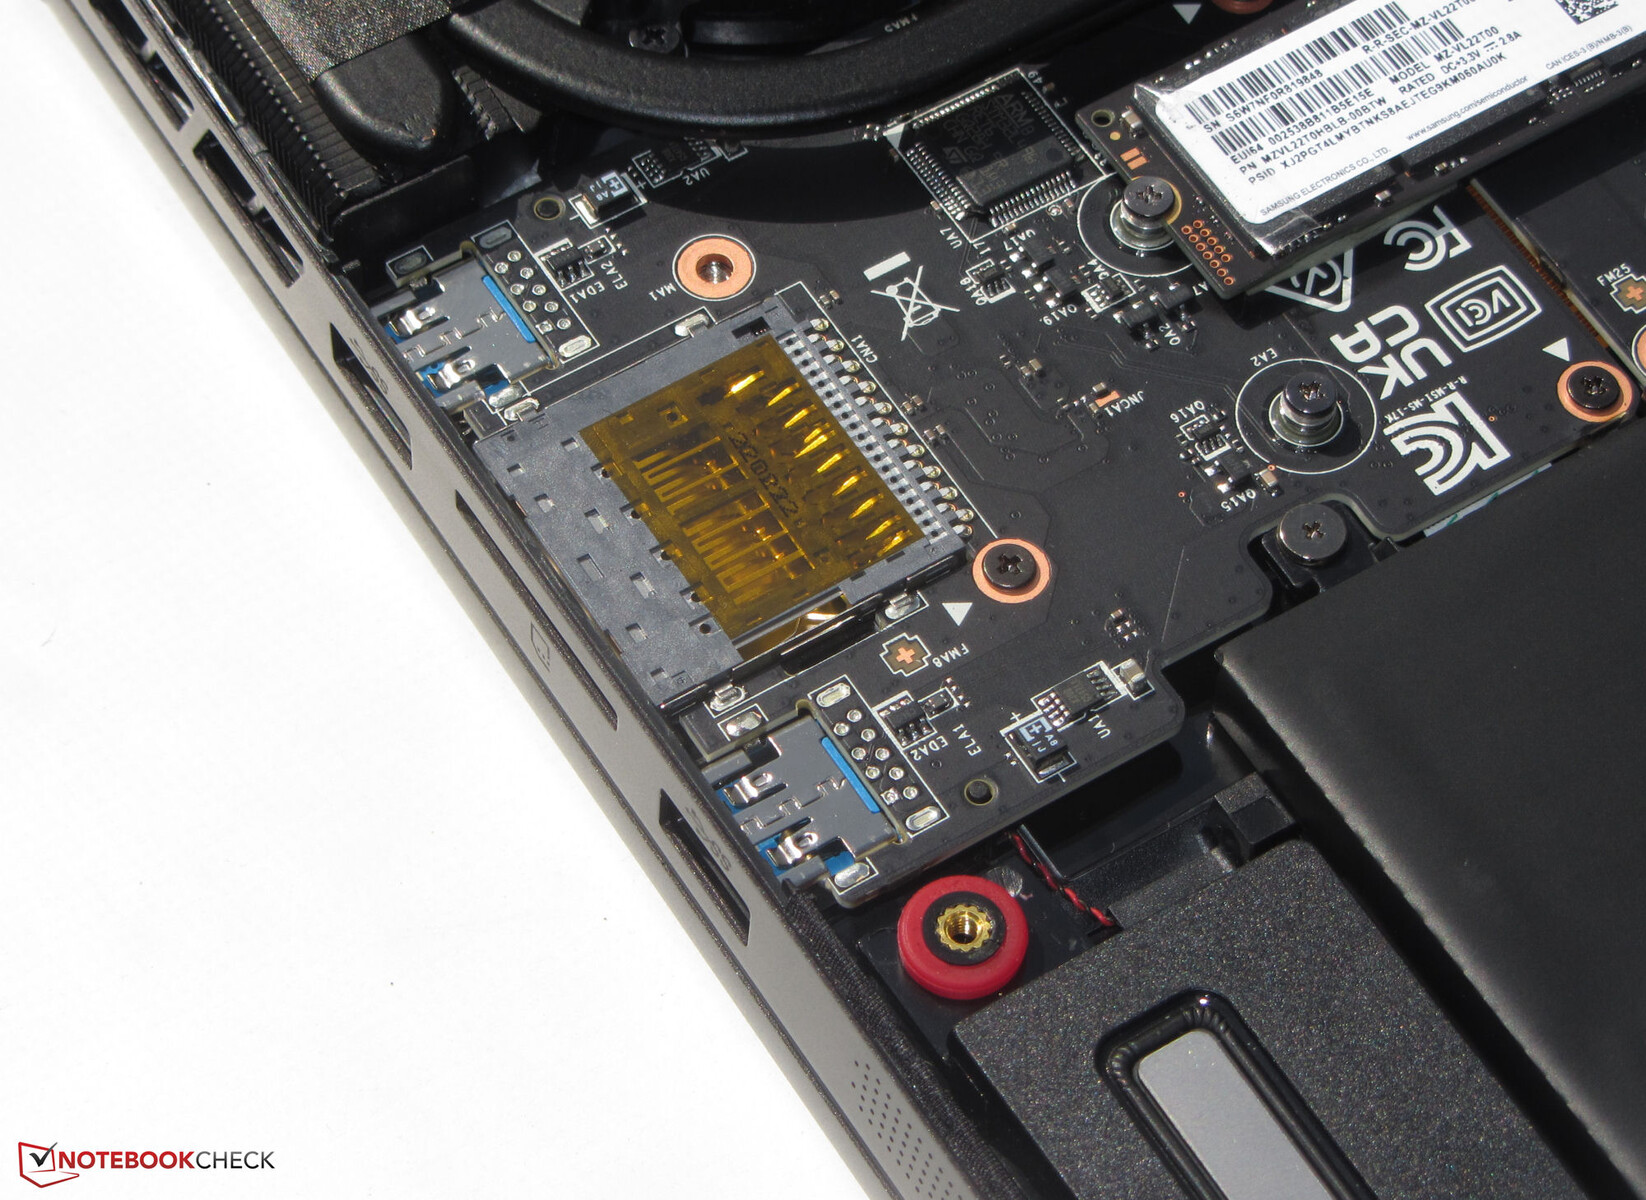
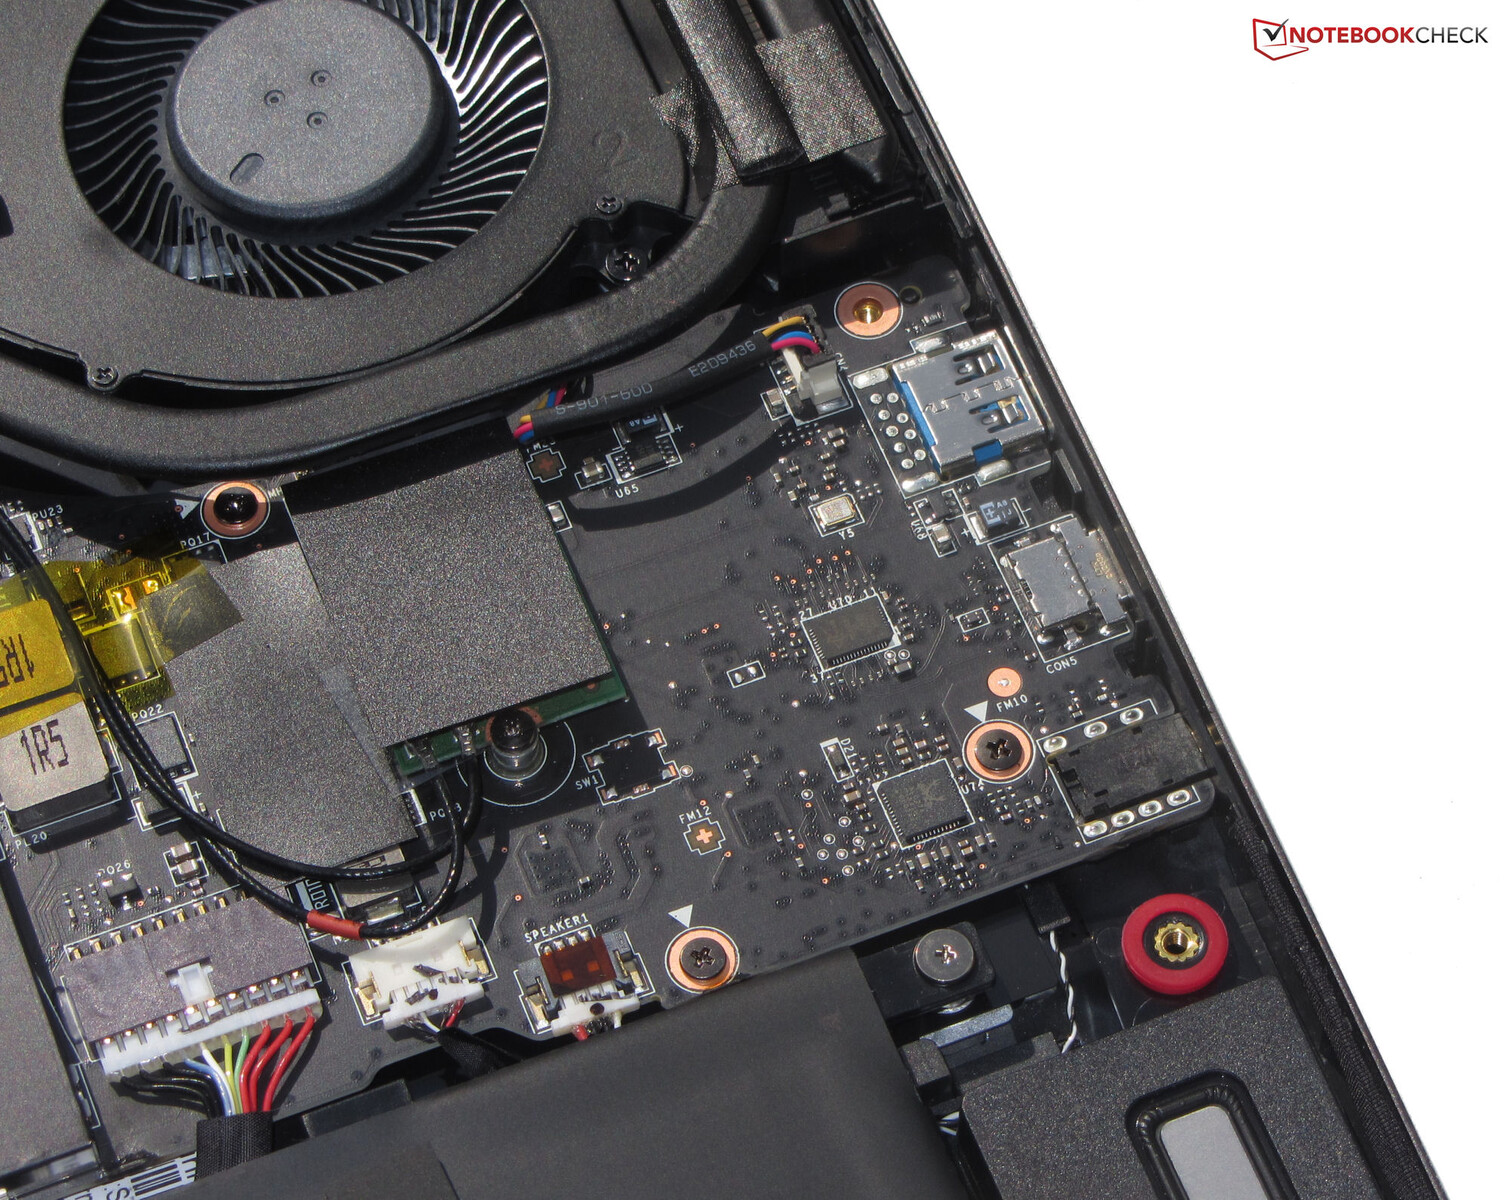
维护和升级可以不费吹灰之力进行。松开底部的所有螺丝后,底板可以相当容易地被卸下--一个有锋利边缘的物体在这里可能有帮助。然后,用户可以接触到固态硬盘(PCIe4,M.2-2280)、次级固态硬盘插槽(PCIe4,M.2-2280)、Wi-Fi模块、电池、内存(隐藏在一个额外的、紧密相连的盖子下面)、扬声器和风扇。
担保
微星提供标准的一年有限保修。保修期延长至两年和三年的费用分别为80美元和140美元。
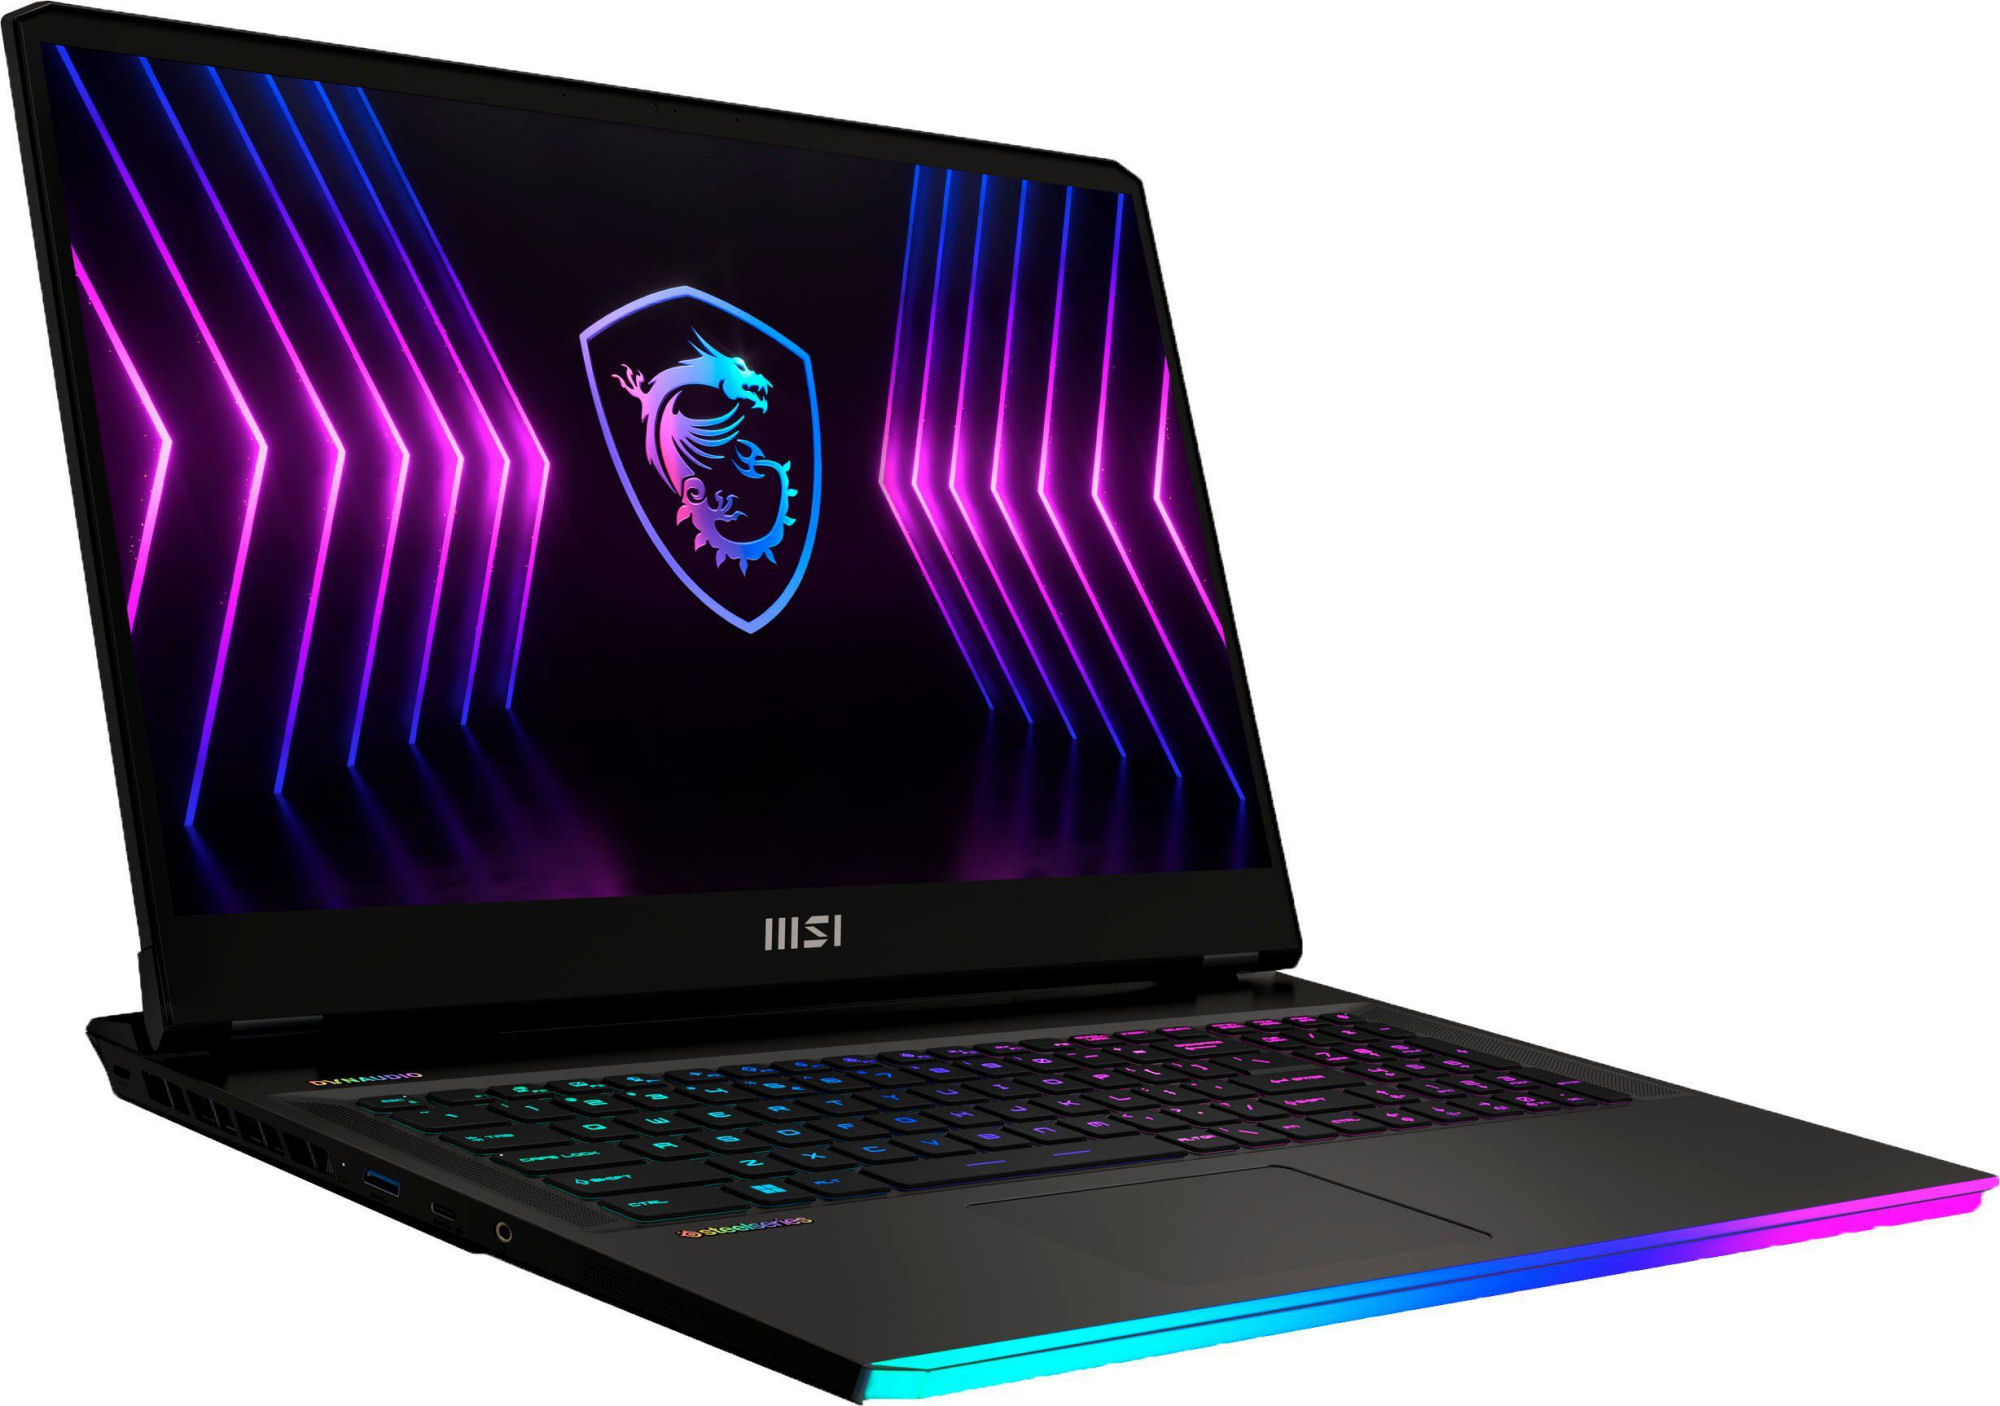
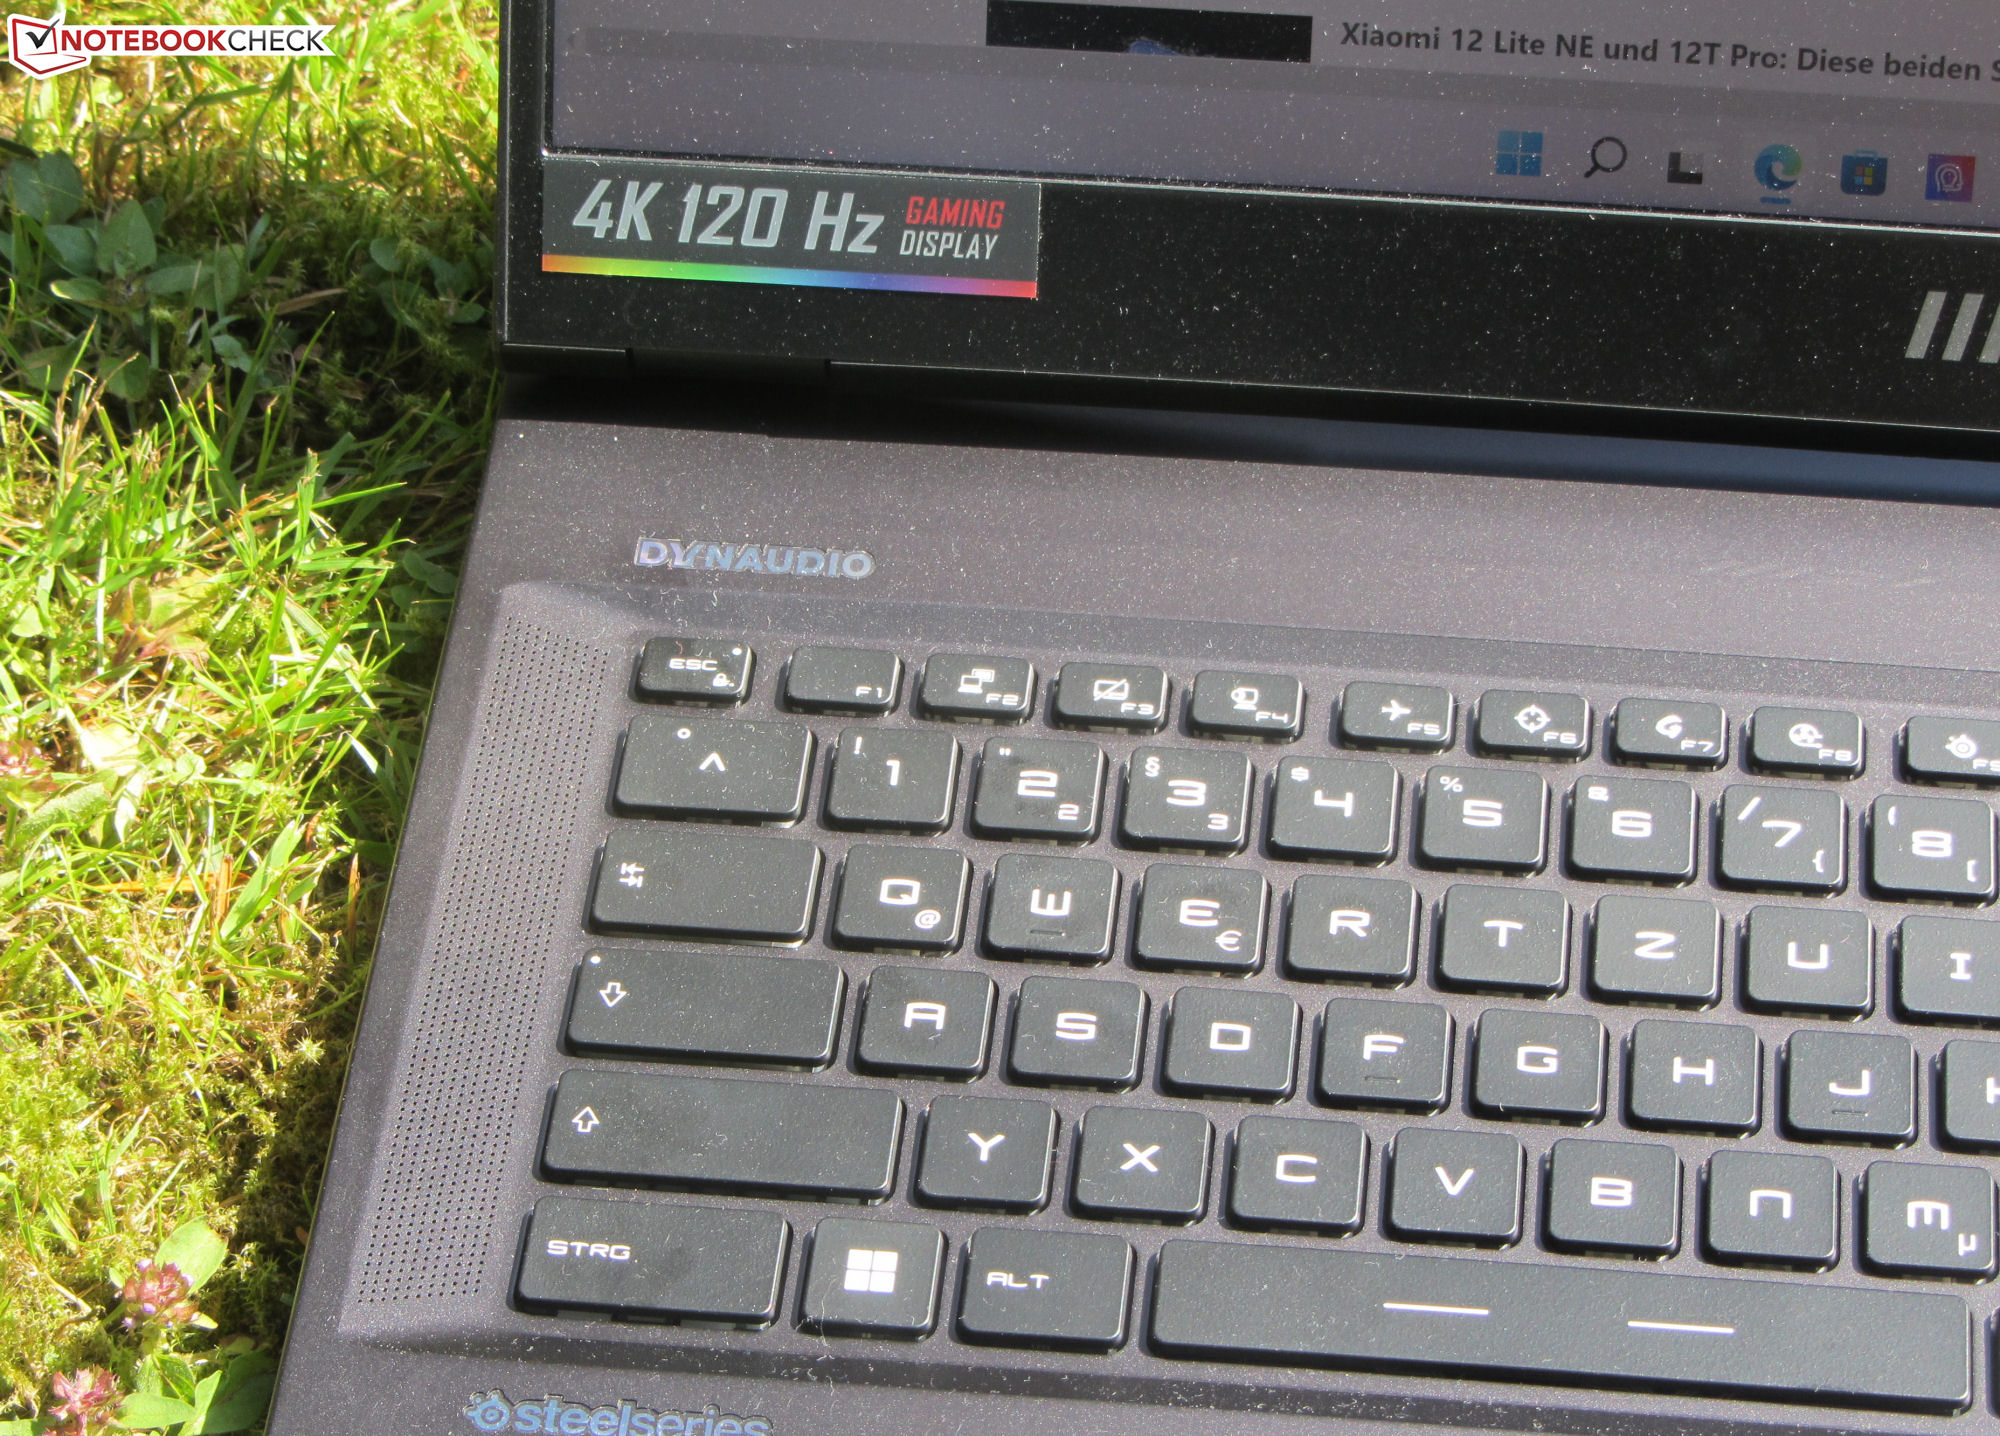
输入设备 - 带有RGB背光的键盘
键盘
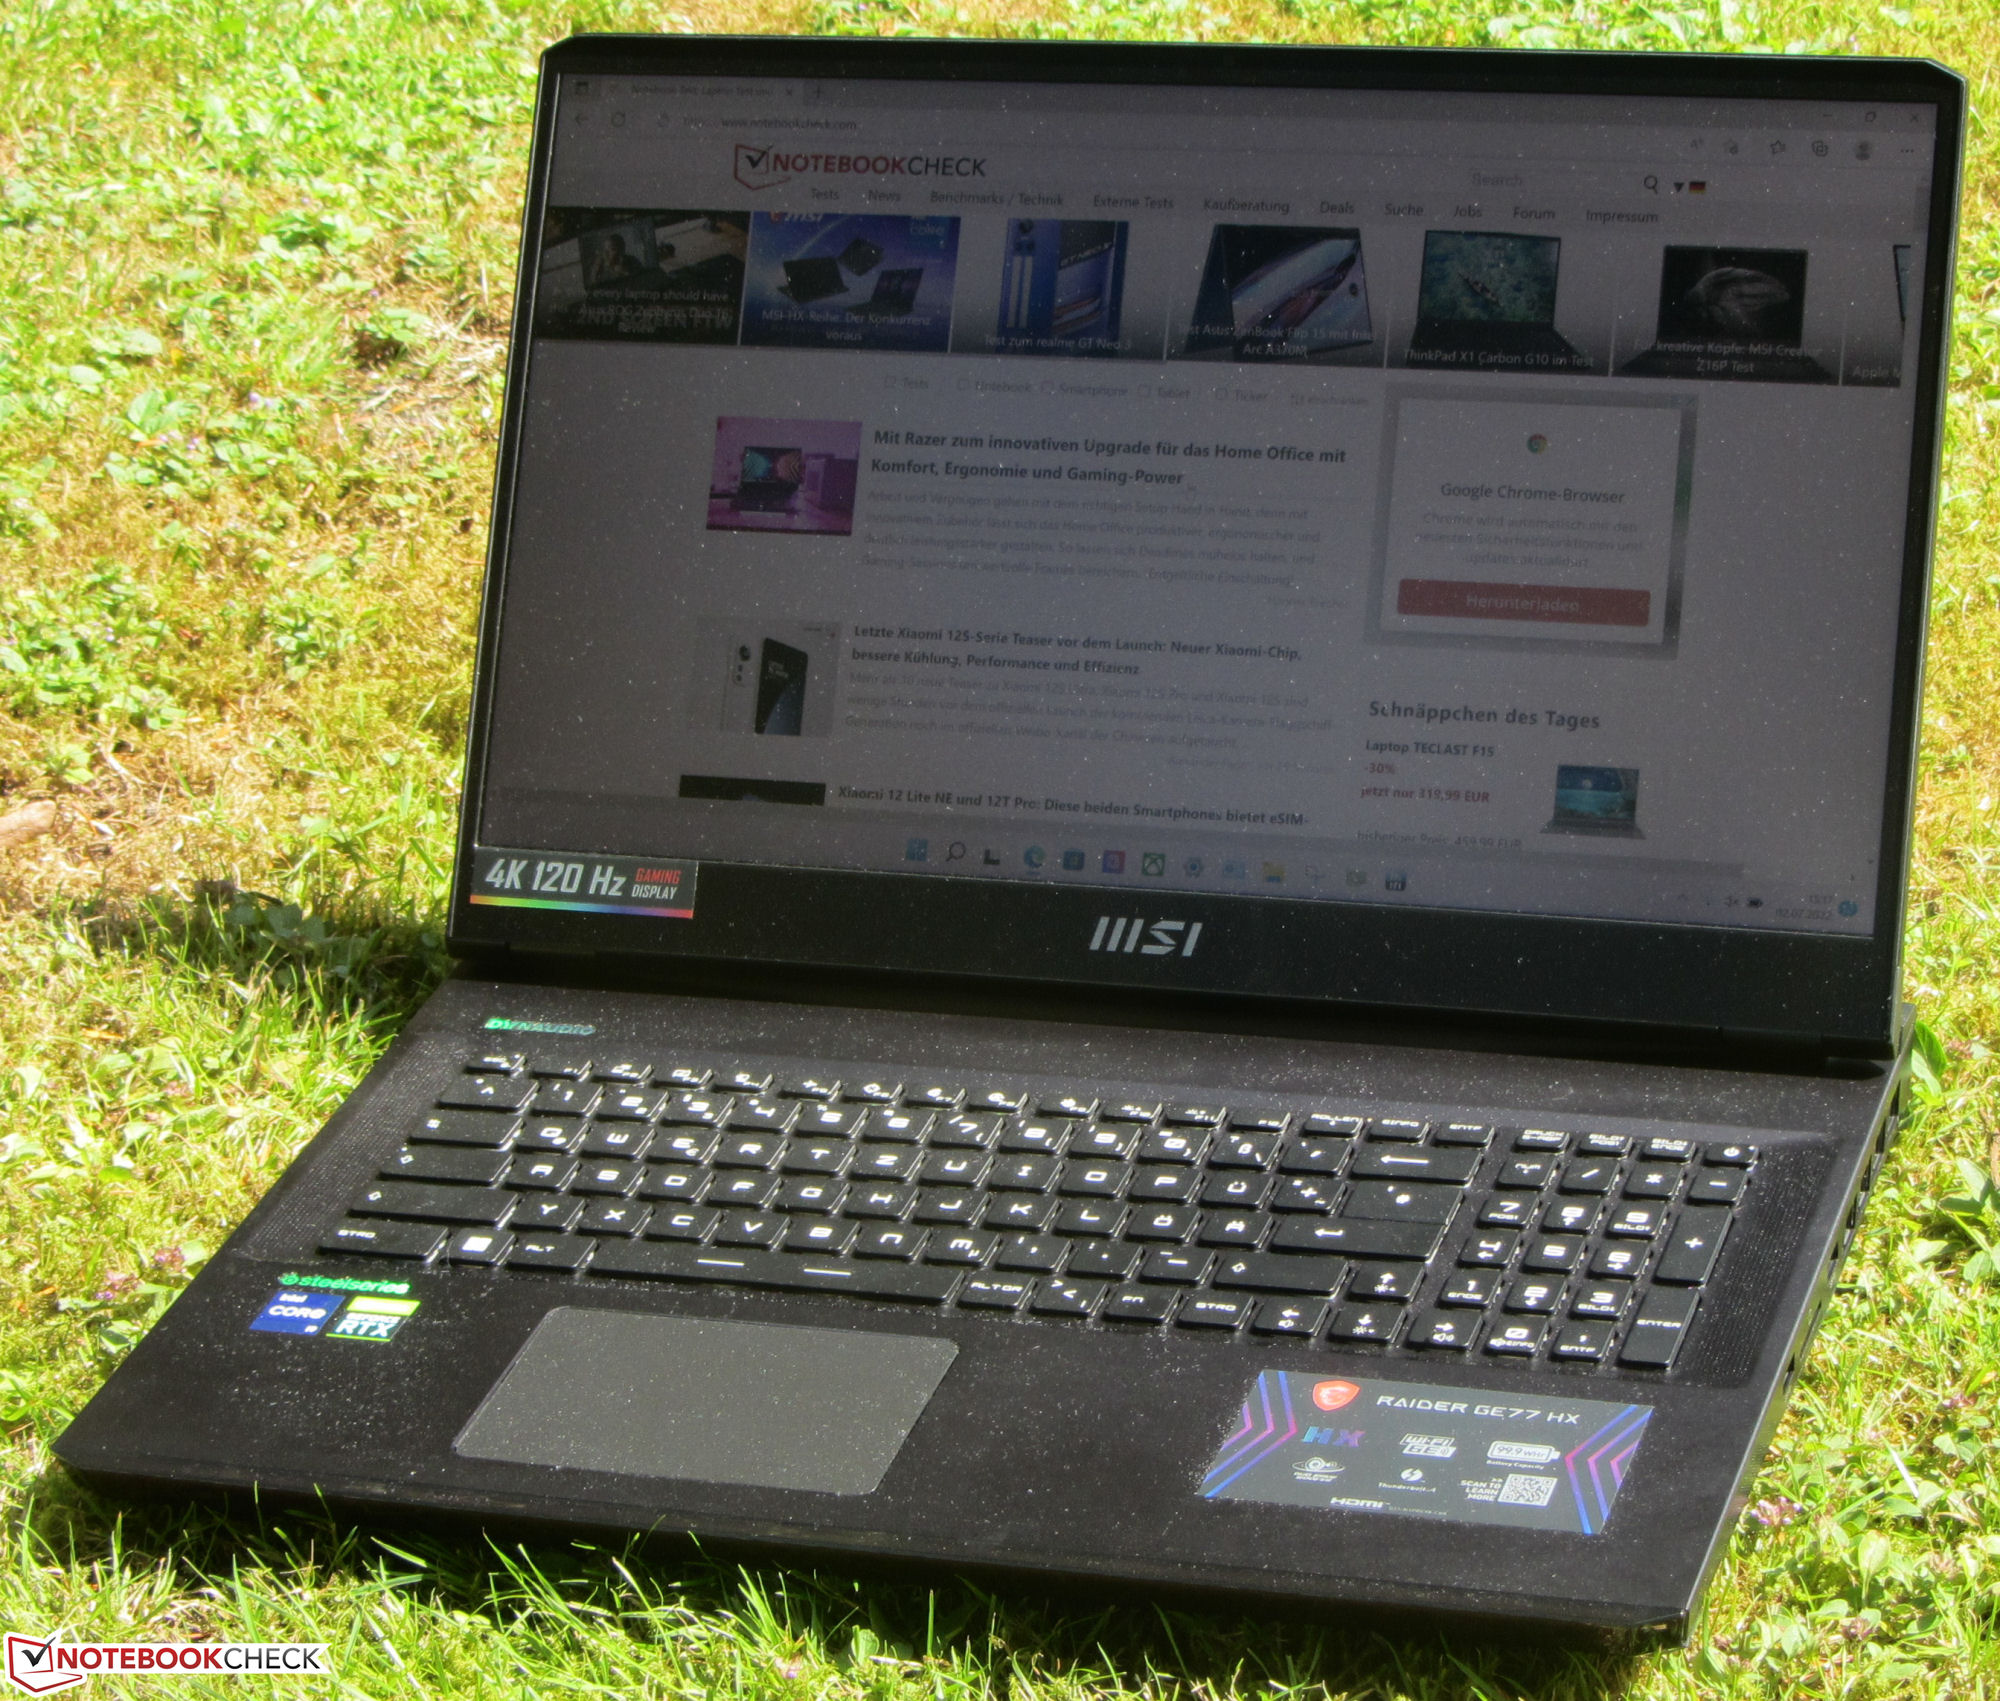
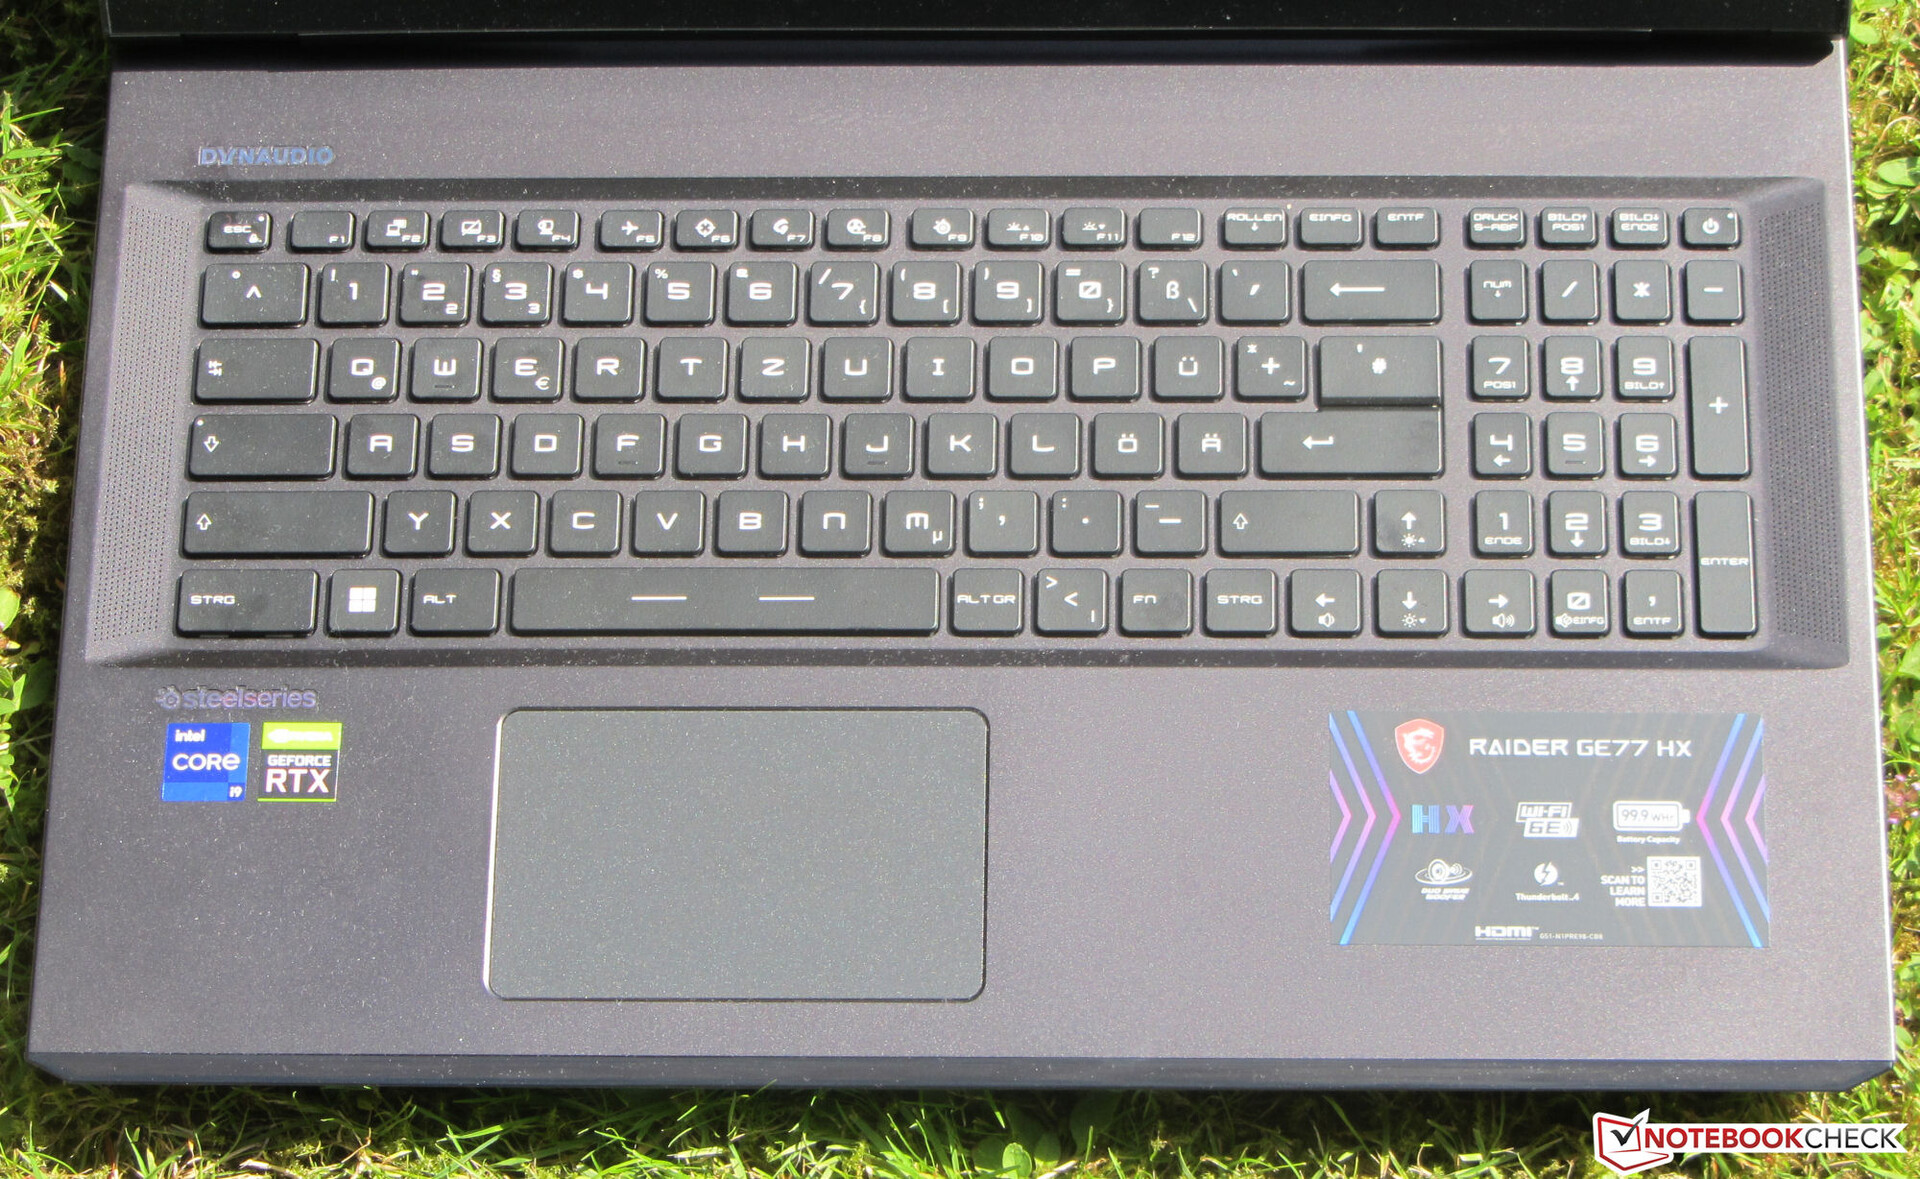
背光Chiclet键盘的平坦、略微粗糙的按键具有适度的行程和明显的启动点。键盘的反馈还算不错。在打字的时候,键盘几乎没有移动。按照微星一贯的设计,"Fn "键并不在人们期望的其他笔记本电脑的位置上。键盘背光灯有三个亮度设置,可以通过两个功能键控制。总的来说,微星提供了一个适合日常使用的键盘。
触摸板
支持多点触摸的ClickPad(约10.5 x 6.5厘米或4.13 x 2.56英寸)的光滑表面具有良好的滑行性能。垫子在所有的角落里都有良好的反应。它提供短程和一个明显的启动点。
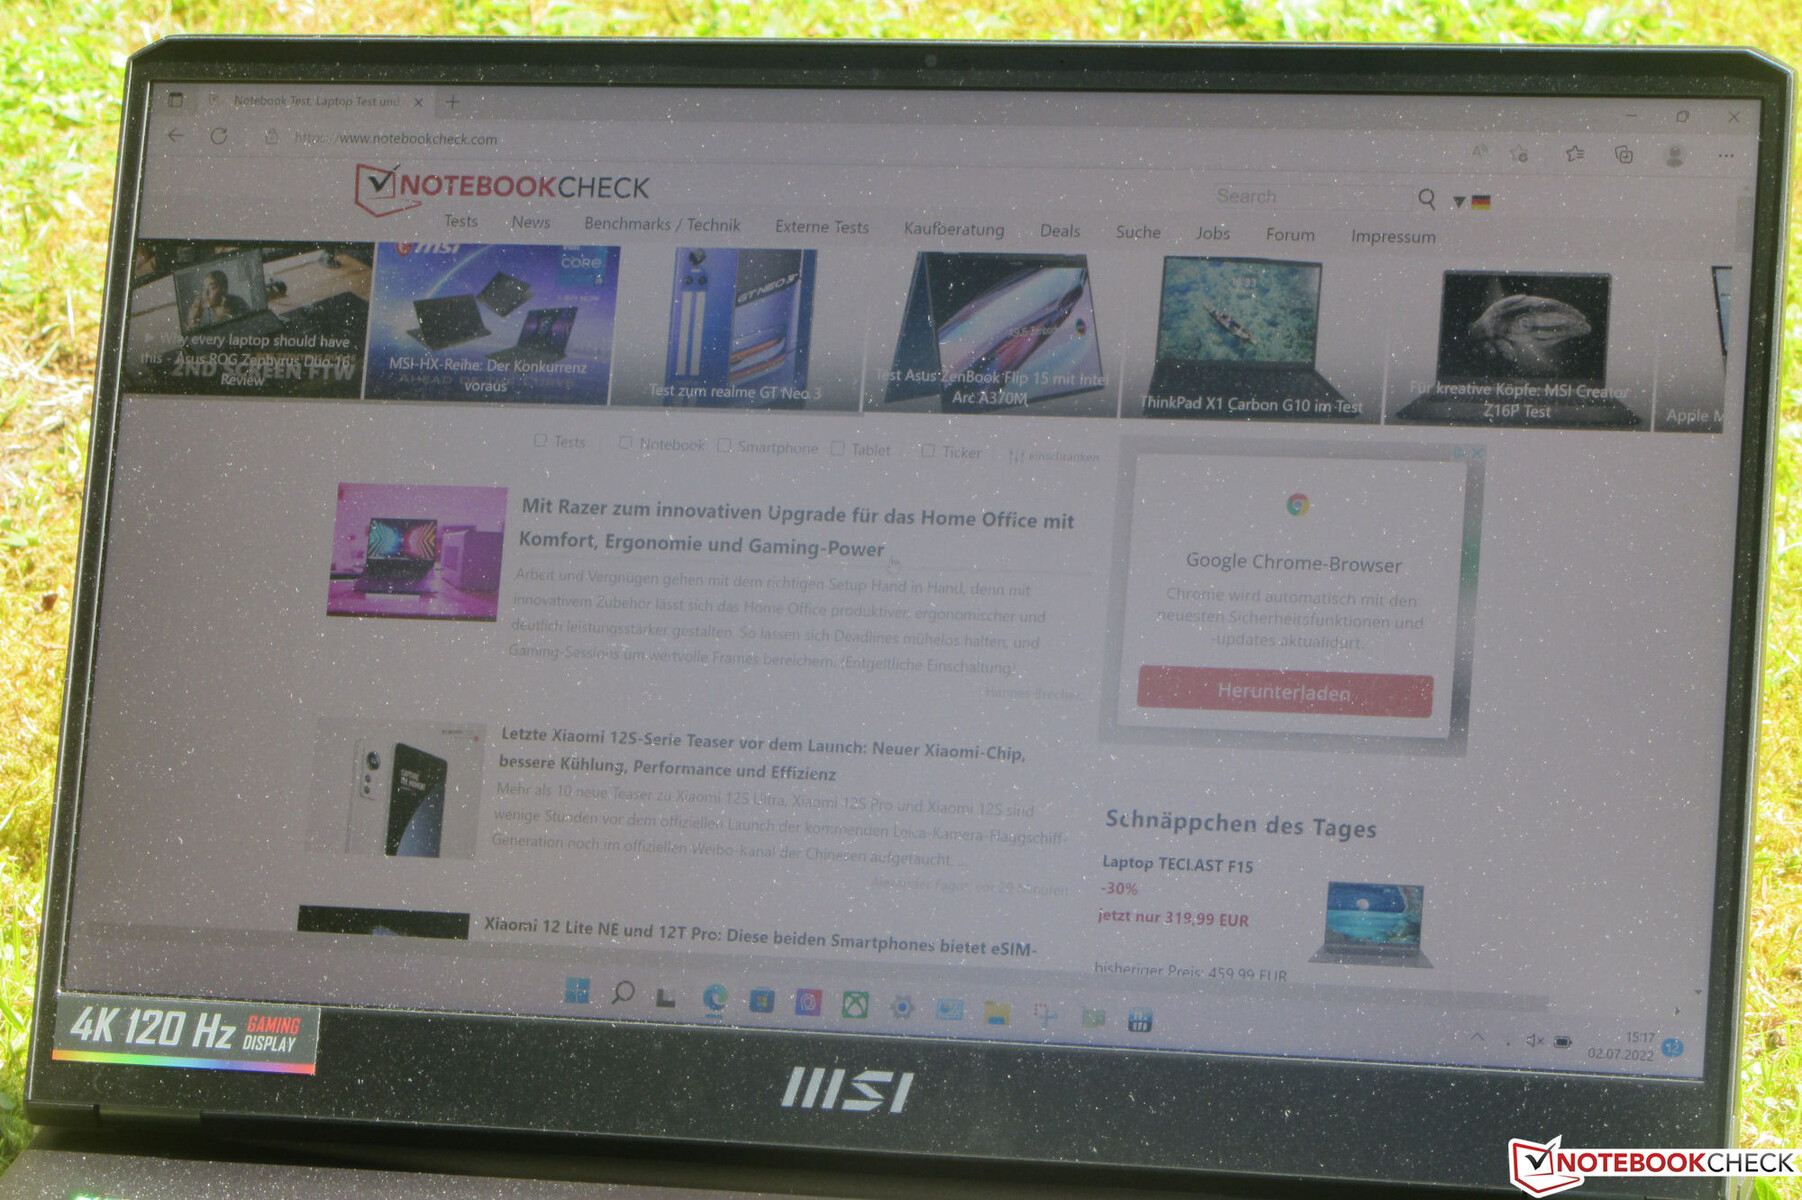
显示器 - IPS面板
虽然哑光17.3英寸显示屏(3840 x 2160像素)的亮度(371.2尼特)超过了所需的最低值(> 300尼特),但对比度却乏善可陈(733:1)--我们对一台售价5200欧元的笔记本电脑期望更高。作为参考,我们认为1000:1和更高的数值是好的。120-Hz面板的响应时间很短。我们也没有发现任何PWM的闪烁。
| |||||||||||||||||||||||||
Brightness Distribution: 84 %
Center on Battery: 381 cd/m²
Contrast: 733:1 (Black: 0.52 cd/m²)
calibrated: 2.53
85.8% AdobeRGB 1998 (Argyll 3D)
99.8% sRGB (Argyll 3D)
96.6% Display P3 (Argyll 3D)
| MSI Raider GE77 HX 12UHS AU Optronics B173ZAN06.1, IPS, 3840x2160, 17.3" | Razer Blade 17 Early 2022 AU Optronics B173ZAN06.9, IPS, 3840x2160, 17.3" | Alienware x17 R2 P48E AU Optronics B173HAN, IPS, 1920x1080, 17.3" | Medion Erazer Beast X30 BOE CQ NE173QHM-NZ3, IPS, 2560x1440, 17.3" | |
|---|---|---|---|---|
| Display | 2% | -8% | -17% | |
| Display P3 Coverage (%) | 96.6 | 99.4 3% | 79.2 -18% | 67.7 -30% |
| sRGB Coverage (%) | 99.8 | 100 0% | 99.8 0% | 97.6 -2% |
| AdobeRGB 1998 Coverage (%) | 85.8 | 87.3 2% | 79.6 -7% | 69.2 -19% |
| Response Times | -15% | -89% | -102% | |
| Response Time Grey 50% / Grey 80% * (ms) | 5.8 ? | 7.5 ? -29% | 12.4 ? -114% | 14.7 ? -153% |
| Response Time Black / White * (ms) | 5.6 ? | 5.6 ? -0% | 9.2 ? -64% | 8.4 ? -50% |
| PWM Frequency (Hz) | ||||
| Screen | 35% | 31% | 24% | |
| Brightness middle (cd/m²) | 381 | 503 32% | 365.4 -4% | 377 -1% |
| Brightness (cd/m²) | 371 | 486 31% | 344 -7% | 352 -5% |
| Brightness Distribution (%) | 84 | 84 0% | 85 1% | 86 2% |
| Black Level * (cd/m²) | 0.52 | 0.44 15% | 0.29 44% | 0.32 38% |
| Contrast (:1) | 733 | 1143 56% | 1260 72% | 1178 61% |
| Colorchecker dE 2000 calibrated * | 2.53 | 0.6 76% | 0.51 80% | 1.3 49% |
| Colorchecker dE 2000 * | 1.08 | 3.17 | 2.91 | |
| Colorchecker dE 2000 max. * | 4.54 | 7.69 | 6.78 | |
| Greyscale dE 2000 * | 1.3 | 5.3 | 3.4 | |
| Gamma | 2.151 102% | 2.18 101% | 2.109 104% | |
| CCT | 6541 99% | 5879 111% | 7273 89% | |
| Total Average (Program / Settings) | 7% /
17% | -22% /
-2% | -32% /
-10% |
* ... smaller is better
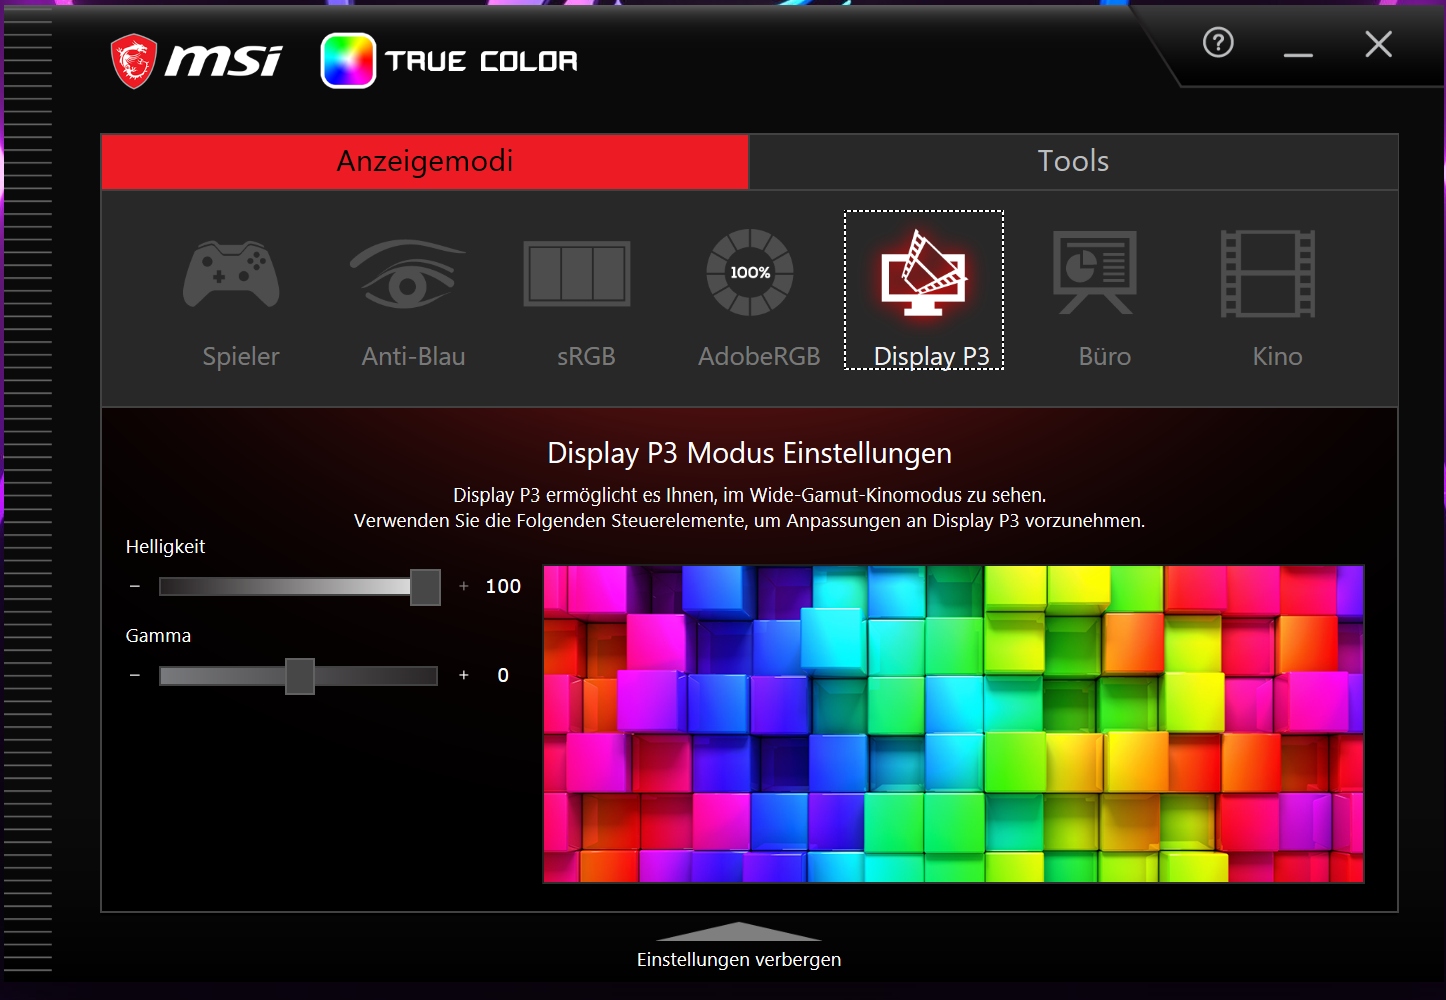
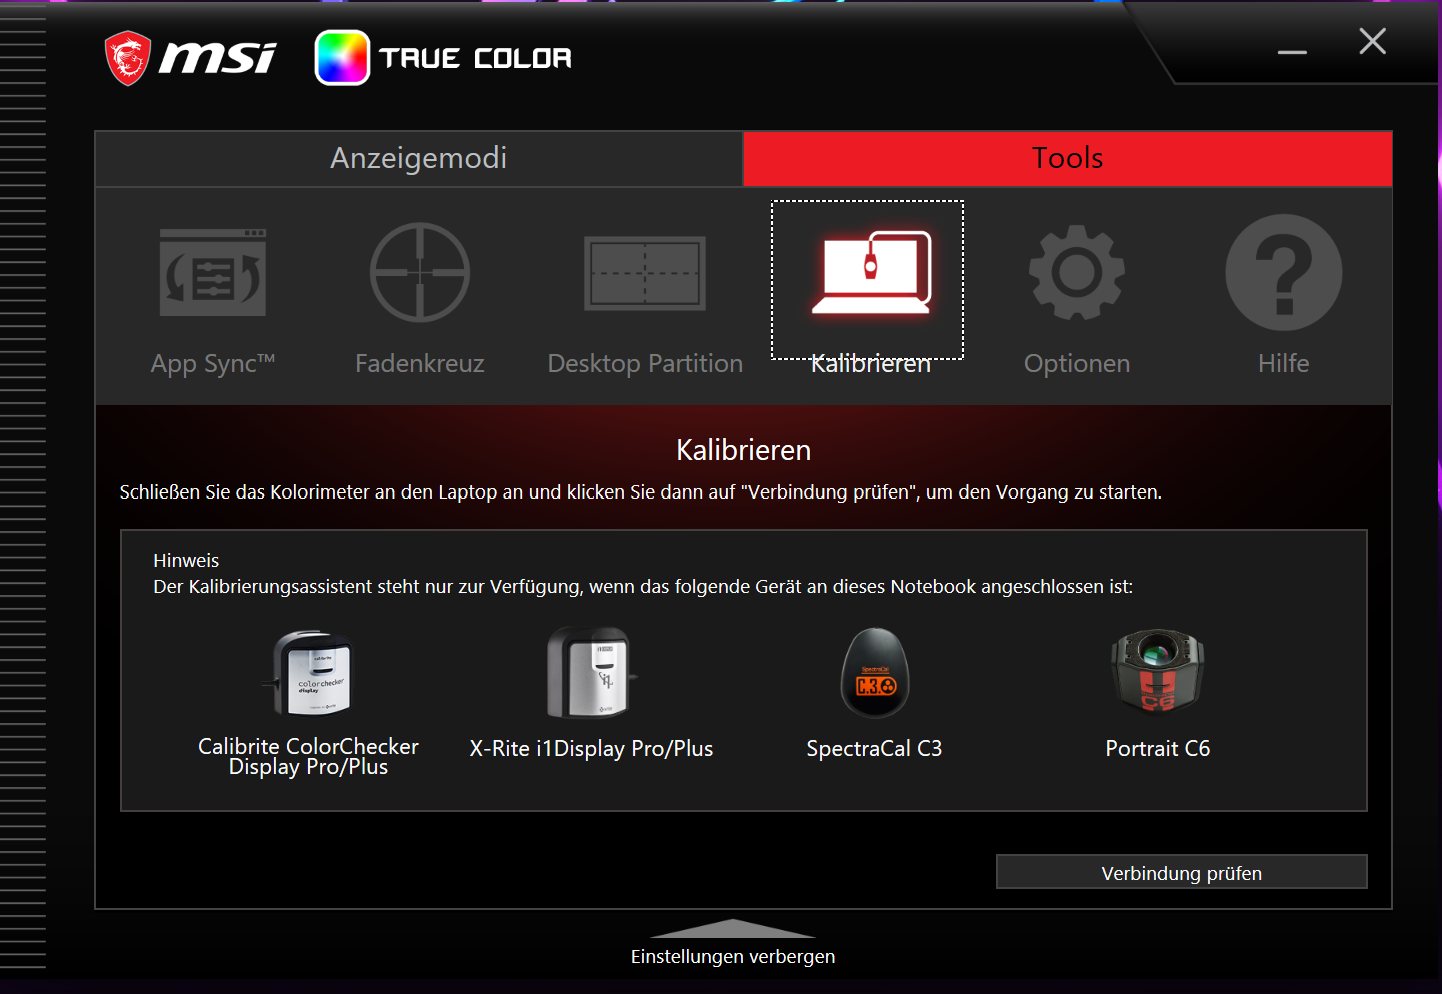
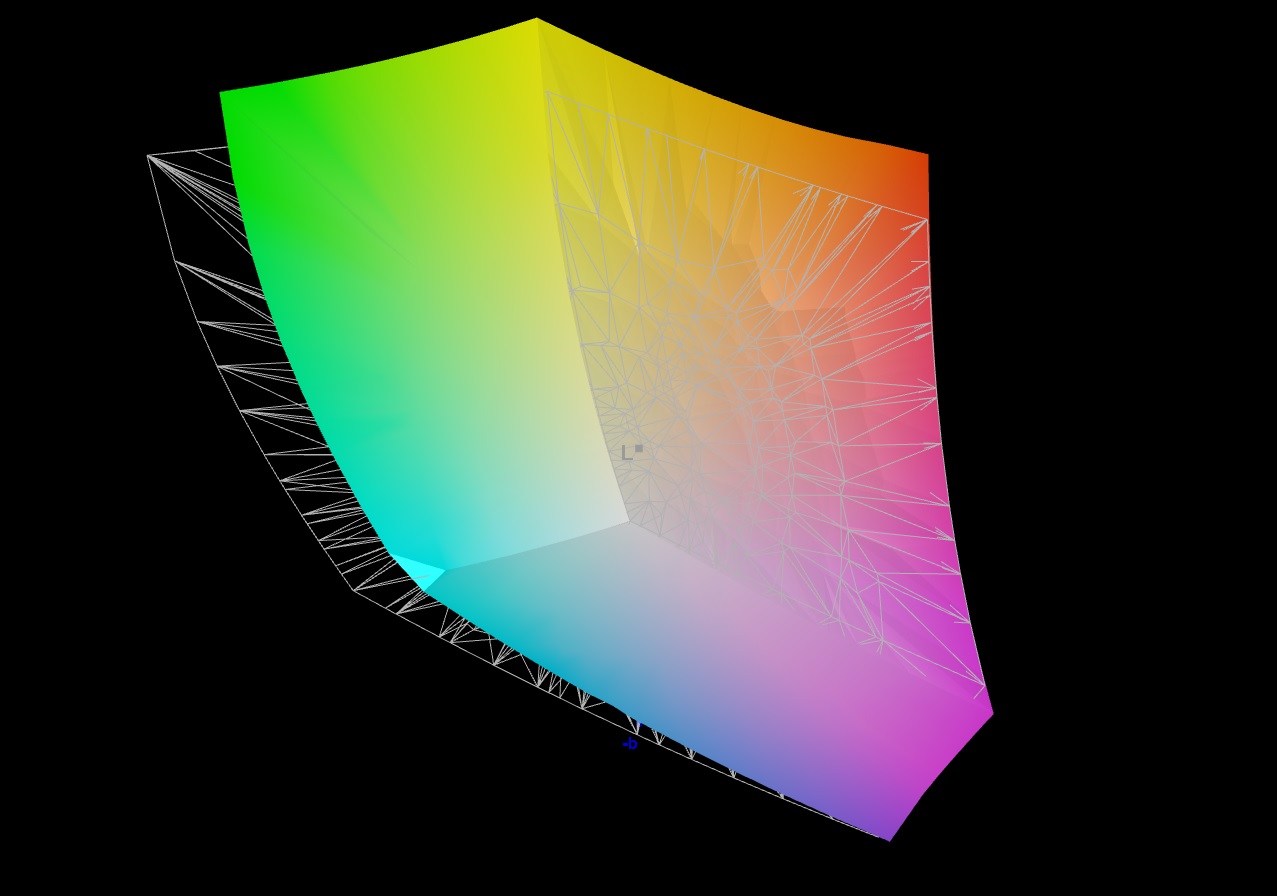
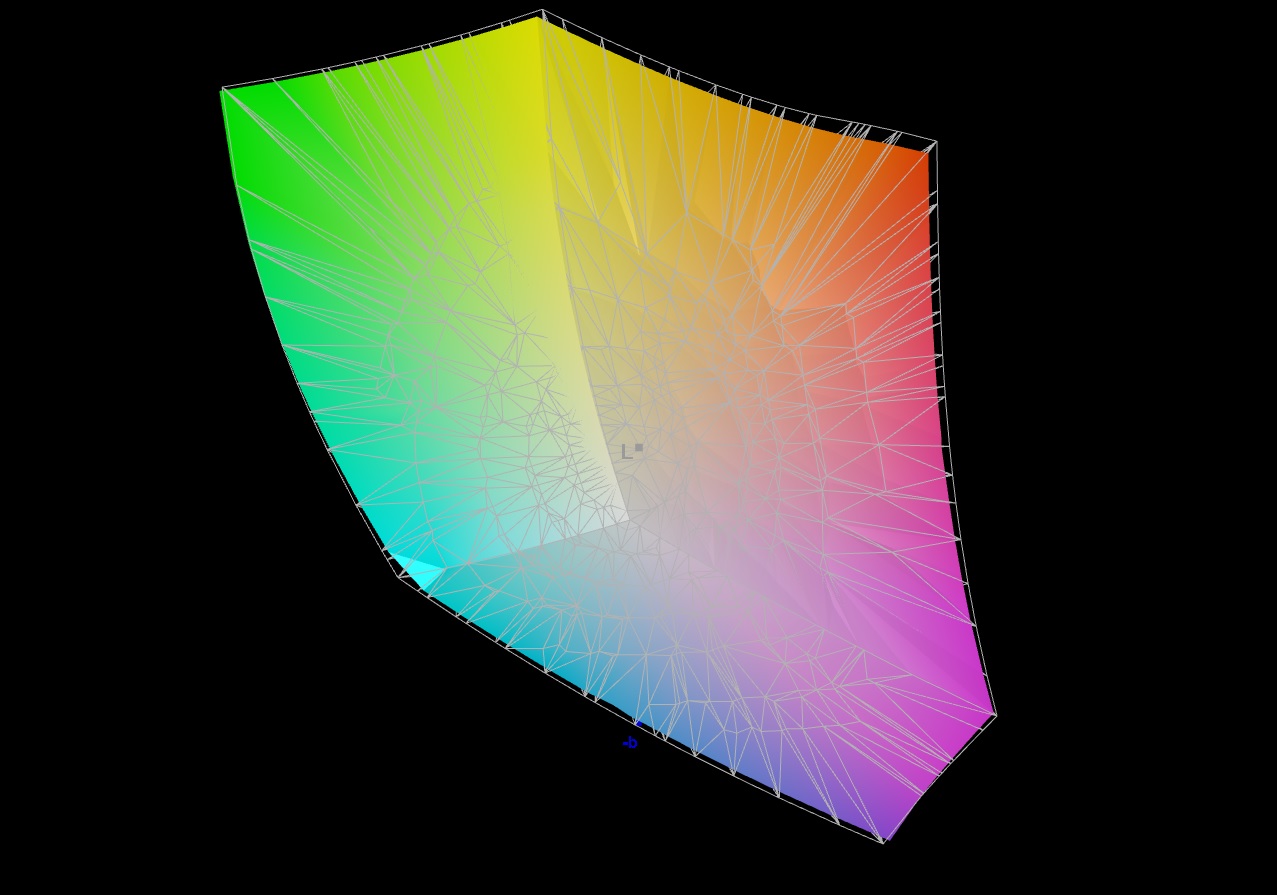
预装的微星真彩软件允许用户为特定的色彩空间或使用情况调整色彩。我们使用了预设的 "Display P3"。然而。出厂时的色彩准确性相当差--不管预设选择如何。所有的颜色都显得过于夸张和乳白色,测量值完全不对。这不可能是微星的意图。
我们怀疑True Color软件、预装的色彩配置文件和/或iGPU或其驱动程序相互干扰。为什么?一旦启用dGPU模式(=笔记本只使用GeForce GPU),显示器看起来非常棒,颜色也变得准确。这种差异是立即可以看到的。
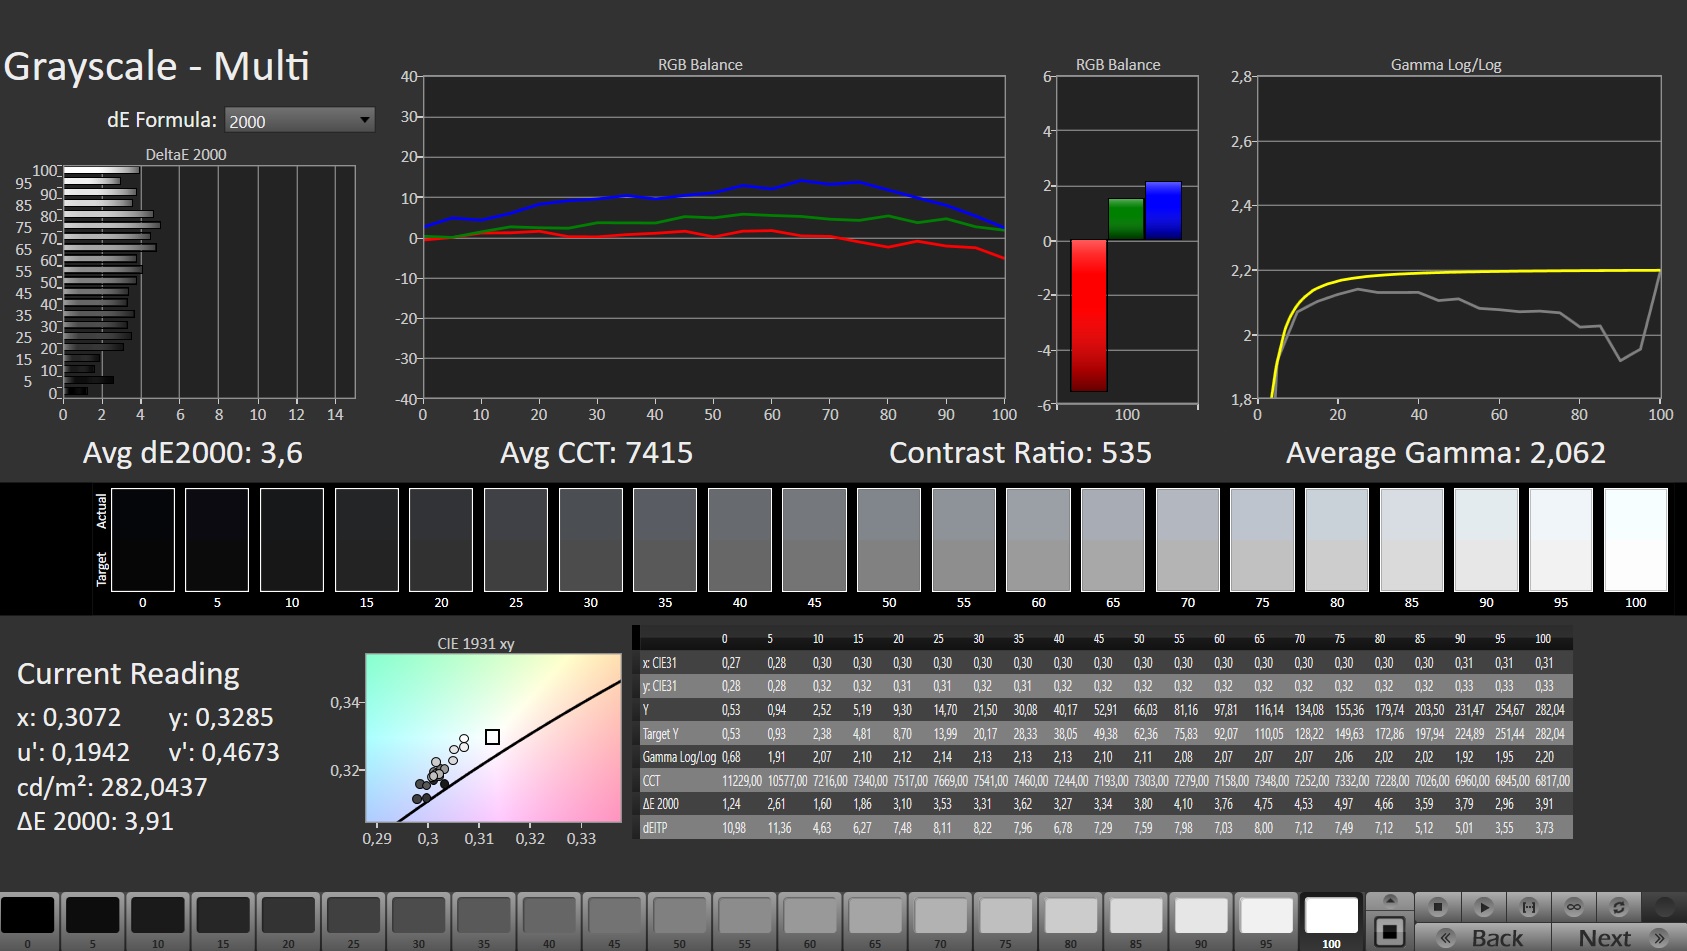
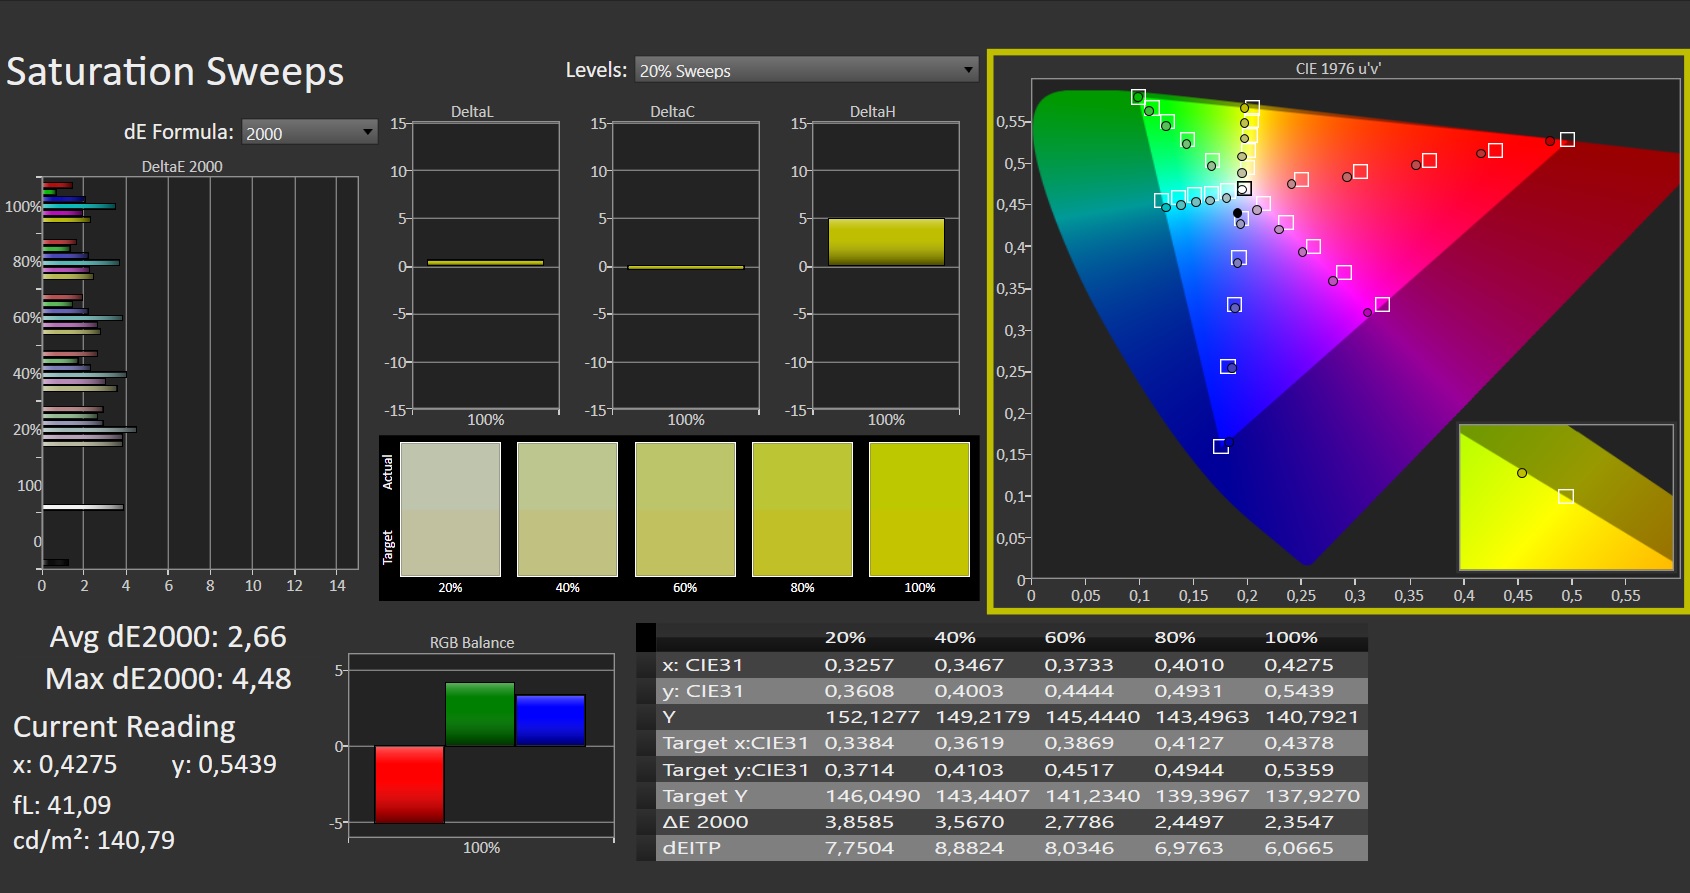
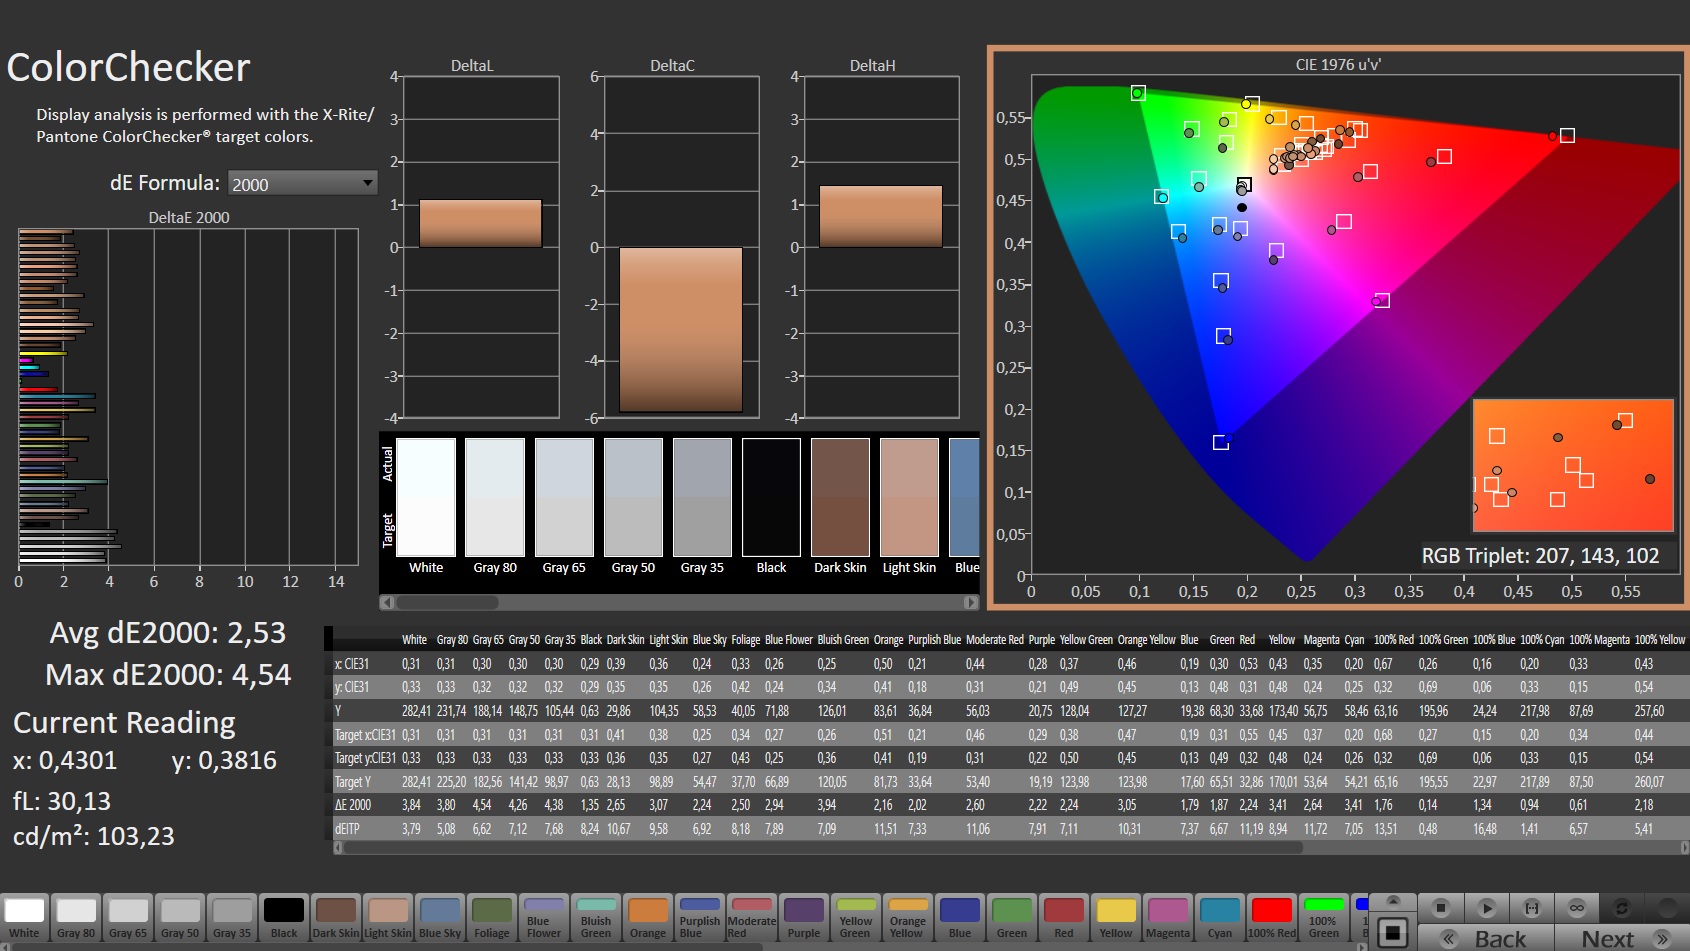
显示屏的校准(Optimus模式)带来了明显的改善。色彩偏差落在理想的范围内(deltaE<3),灰度显得更加均匀。屏幕能够完全显示sRGB(100%)和DCI-P3(97%)色彩空间,并且几乎完全显示,以及86%的AdobeRGB色彩空间。
注意:根据我们的校准,链接的颜色配置文件会改变颜色。

Display Response Times
| ↔ Response Time Black to White | ||
|---|---|---|
| 5.6 ms ... rise ↗ and fall ↘ combined | ↗ 1.9 ms rise | 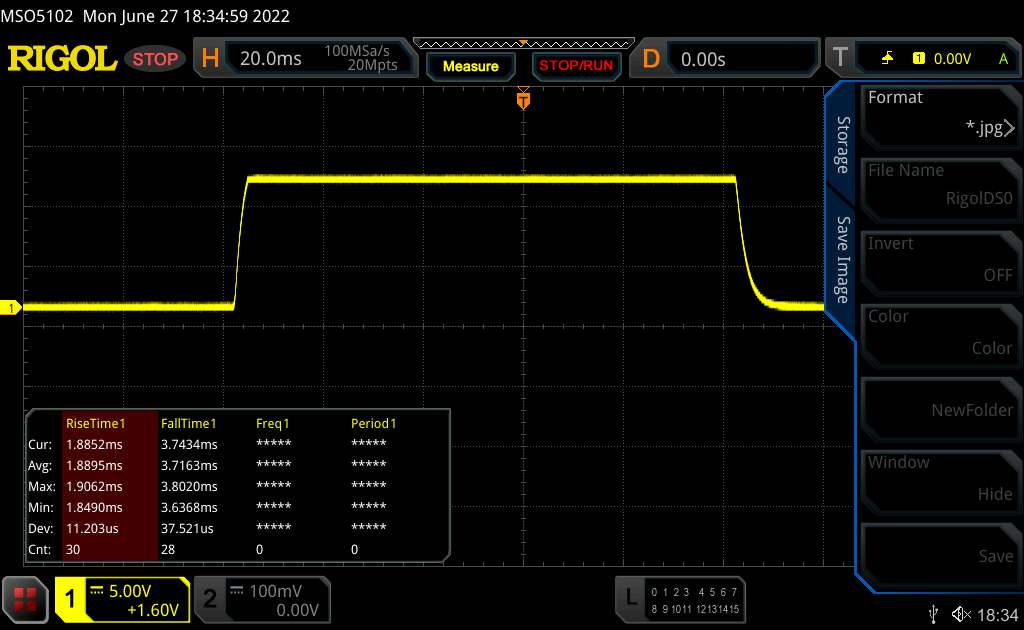 |
| ↘ 3.7 ms fall | ||
| The screen shows very fast response rates in our tests and should be very well suited for fast-paced gaming. In comparison, all tested devices range from 0.1 (minimum) to 240 (maximum) ms. » 18 % of all devices are better. This means that the measured response time is better than the average of all tested devices (19.8 ms). | ||
| ↔ Response Time 50% Grey to 80% Grey | ||
| 5.8 ms ... rise ↗ and fall ↘ combined | ↗ 1.6 ms rise | 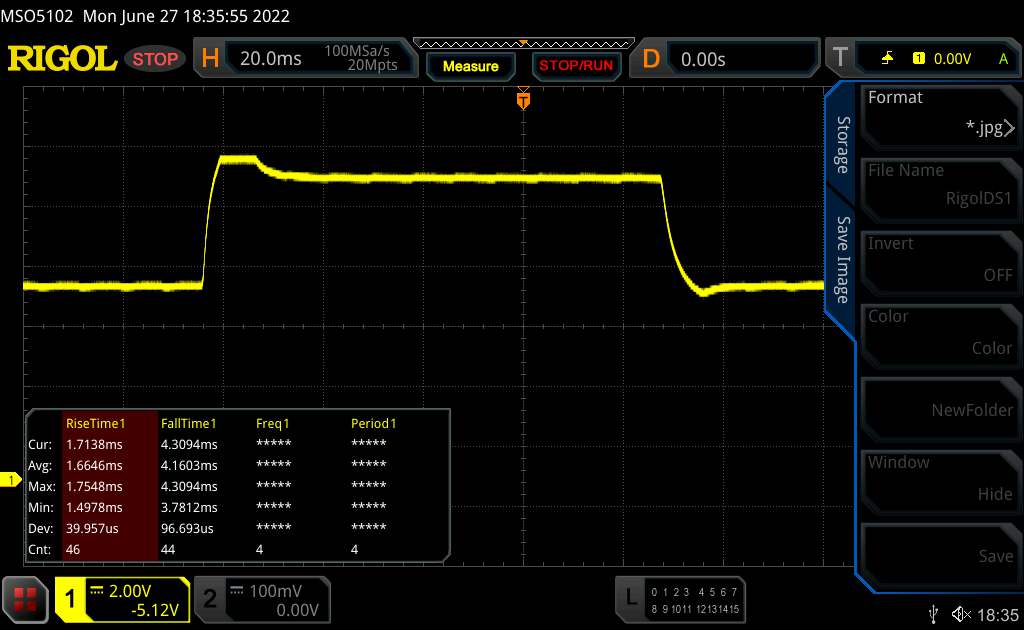 |
| ↘ 4.2 ms fall | ||
| The screen shows very fast response rates in our tests and should be very well suited for fast-paced gaming. In comparison, all tested devices range from 0.165 (minimum) to 636 (maximum) ms. » 19 % of all devices are better. This means that the measured response time is better than the average of all tested devices (31 ms). | ||
Screen Flickering / PWM (Pulse-Width Modulation)
| Screen flickering / PWM not detected |  | ||
In comparison: 52 % of all tested devices do not use PWM to dim the display. If PWM was detected, an average of 7757 (minimum: 5 - maximum: 343500) Hz was measured. | |||
IPS面板具有良好的可视角度,从任何位置都可以阅读。在户外,只要阳光不是太亮,就可以阅读屏幕内容。

业绩--安培和阿尔德湖的光芒
通过Raider GE77 HX 12UHS,微星提供了一个高性能的17.3英寸笔记本电脑,可以满足所有苛刻的场景。
测试条件
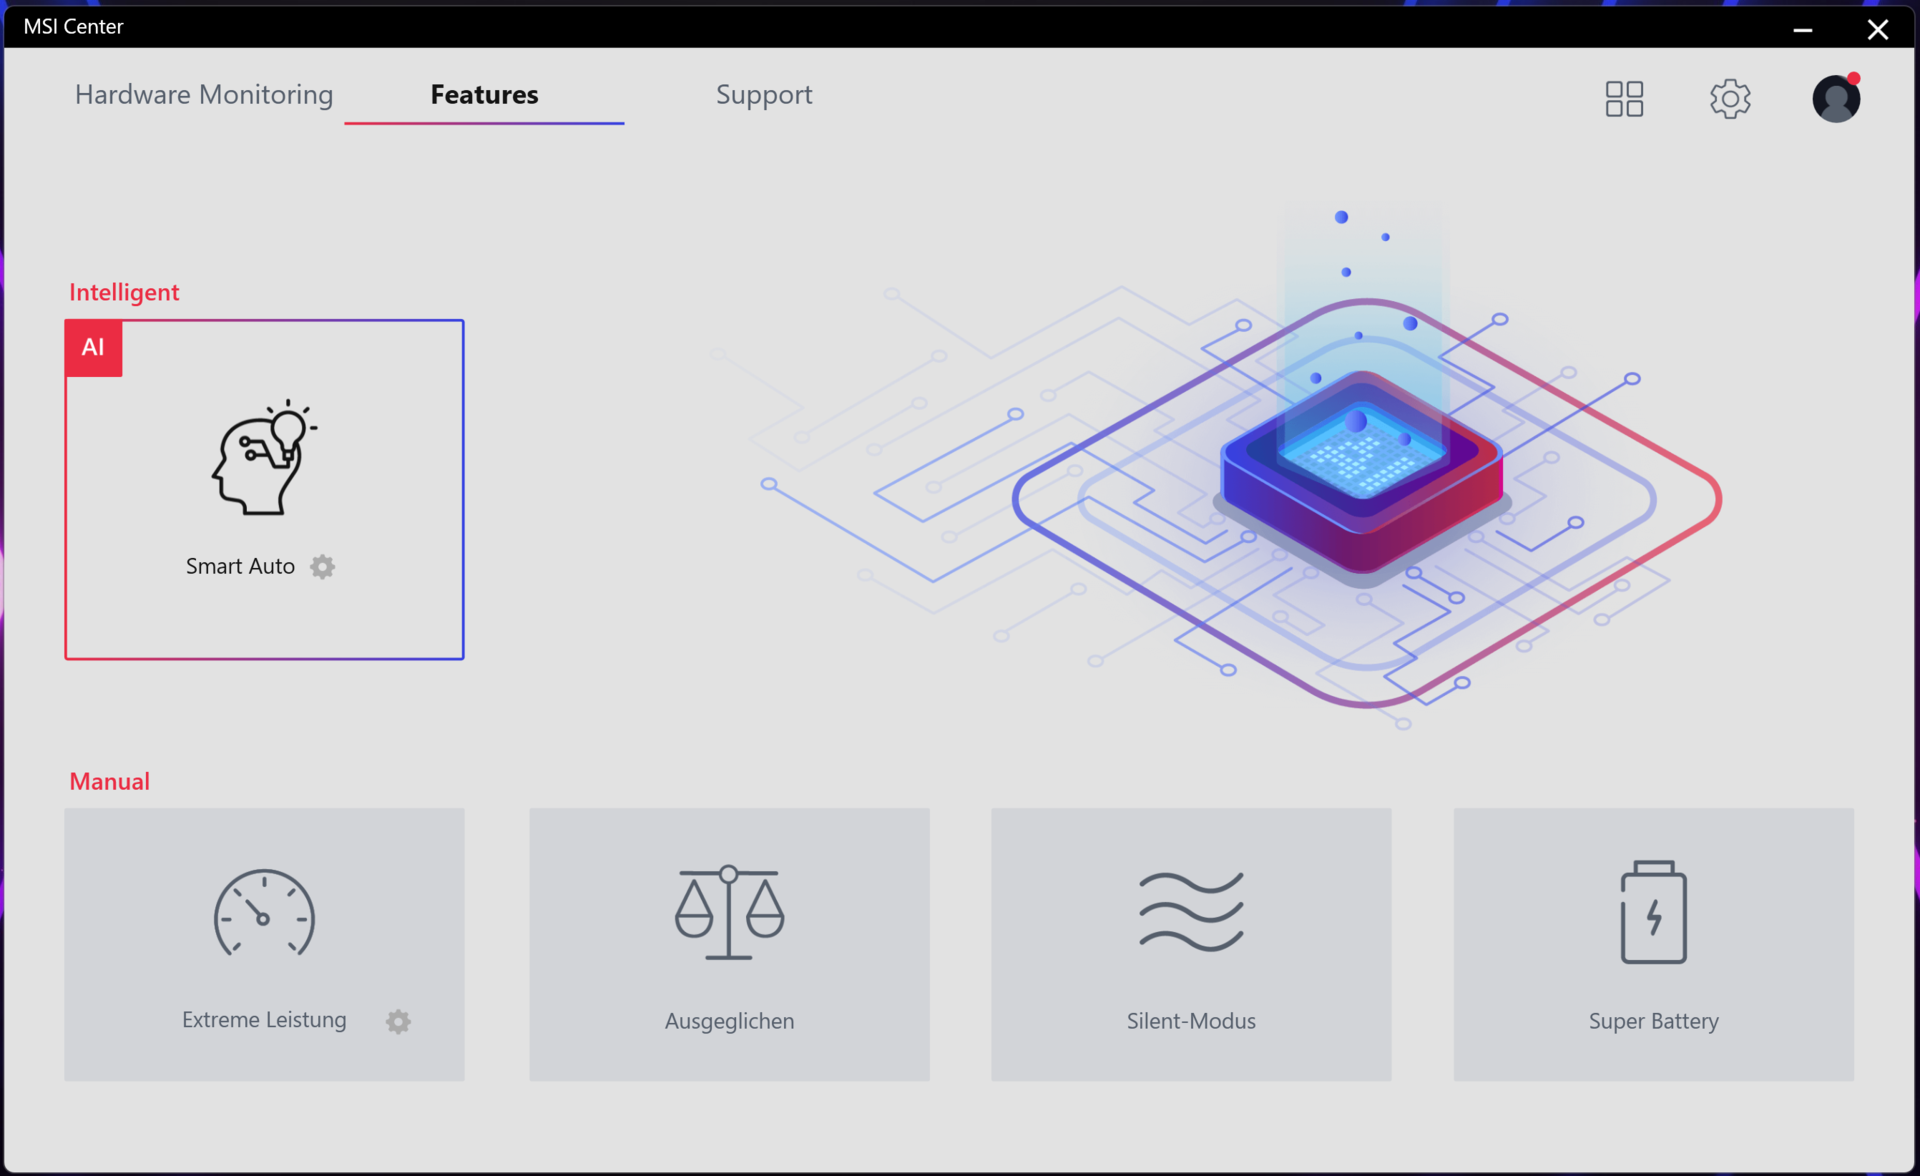
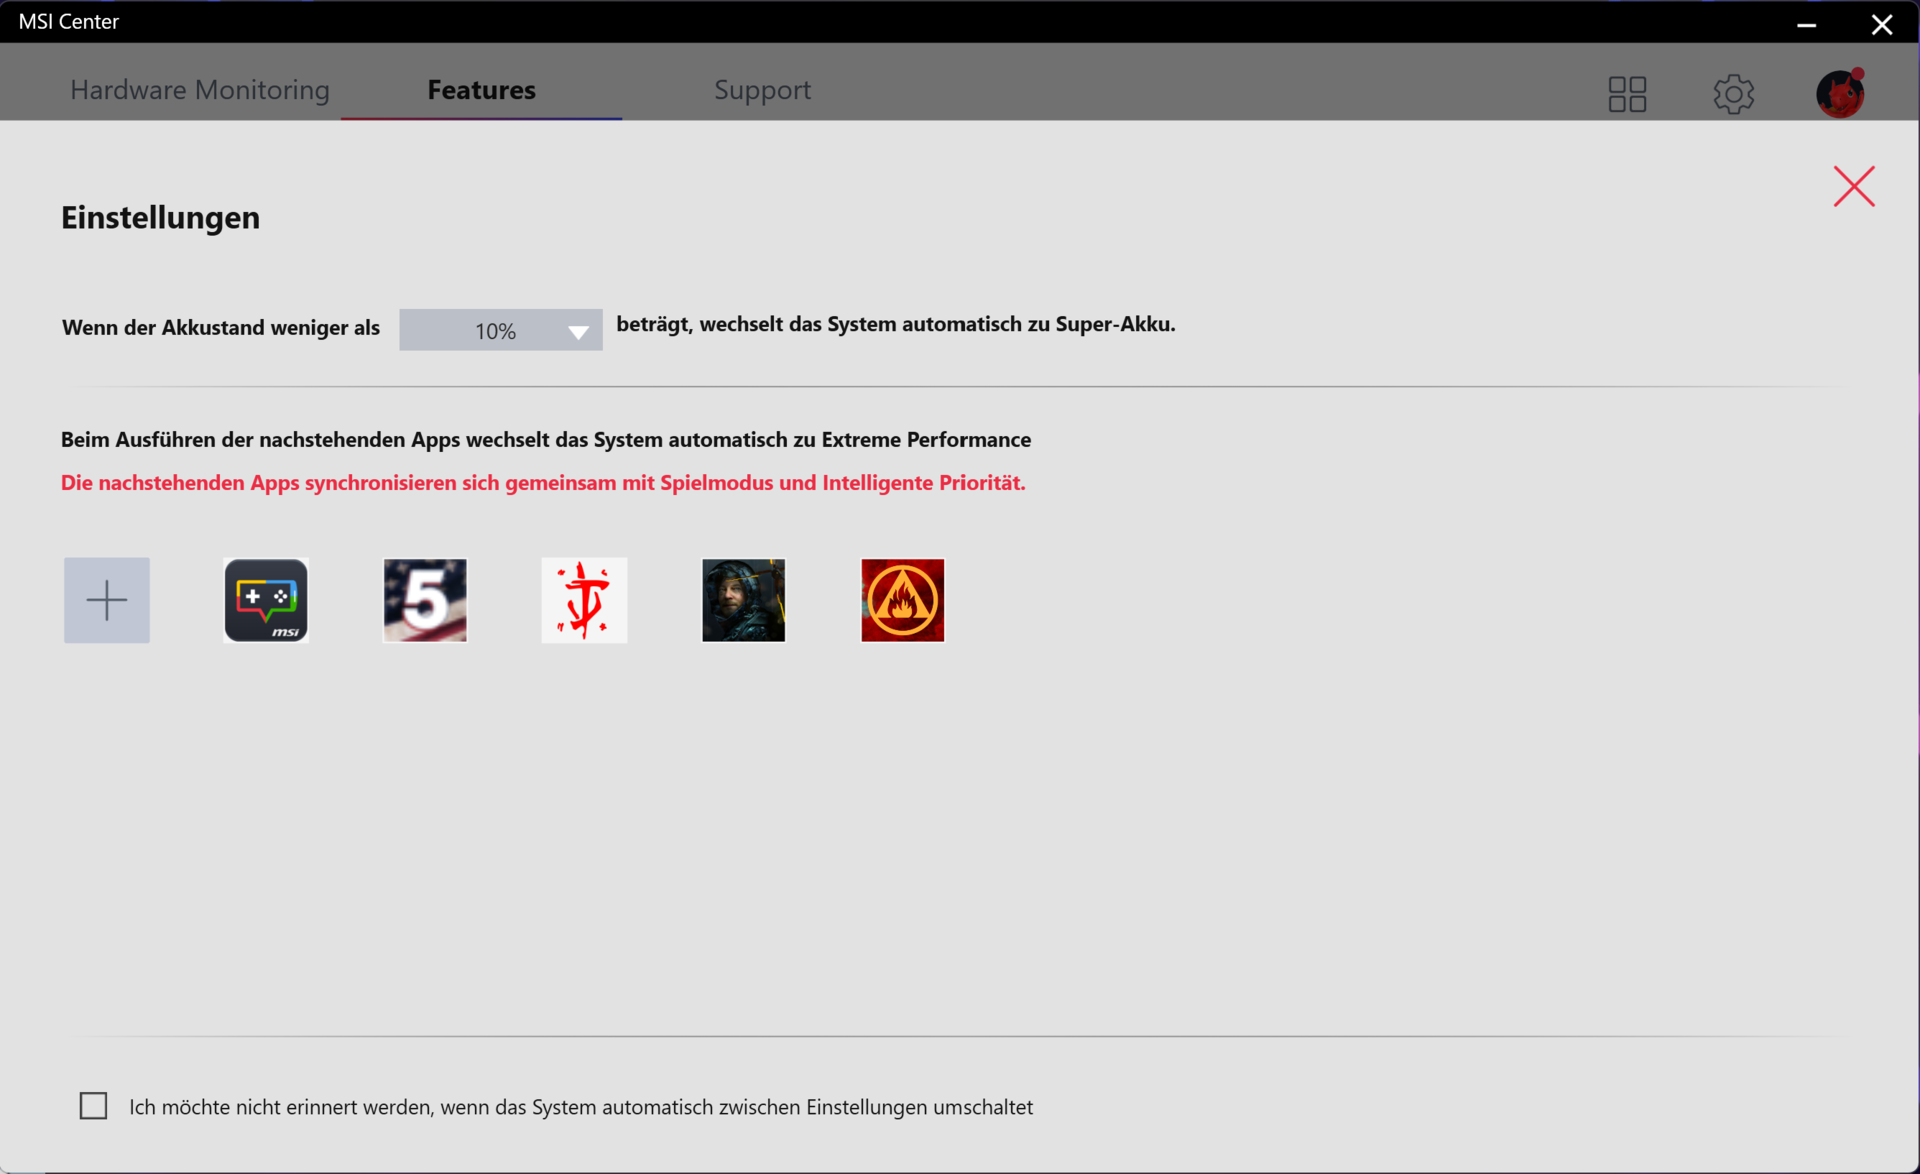
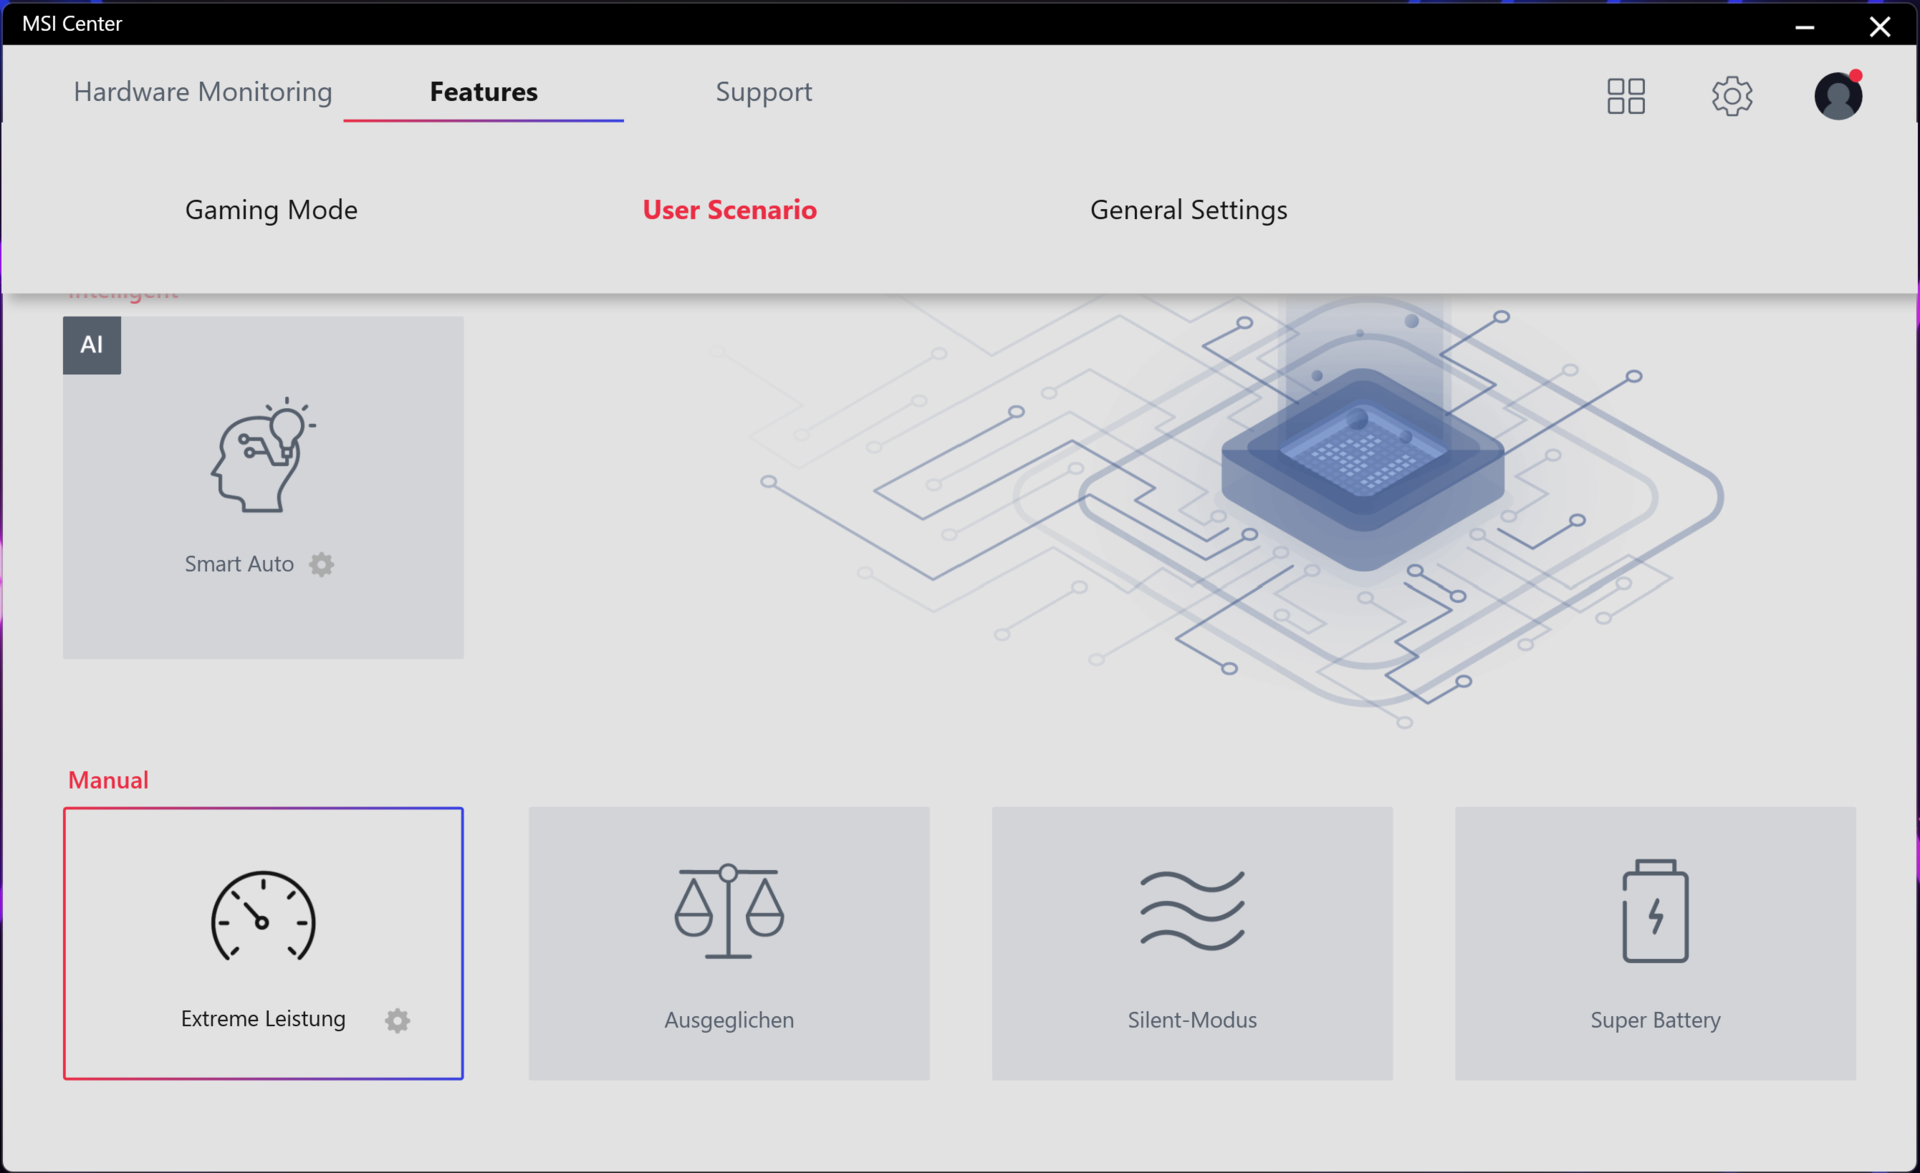
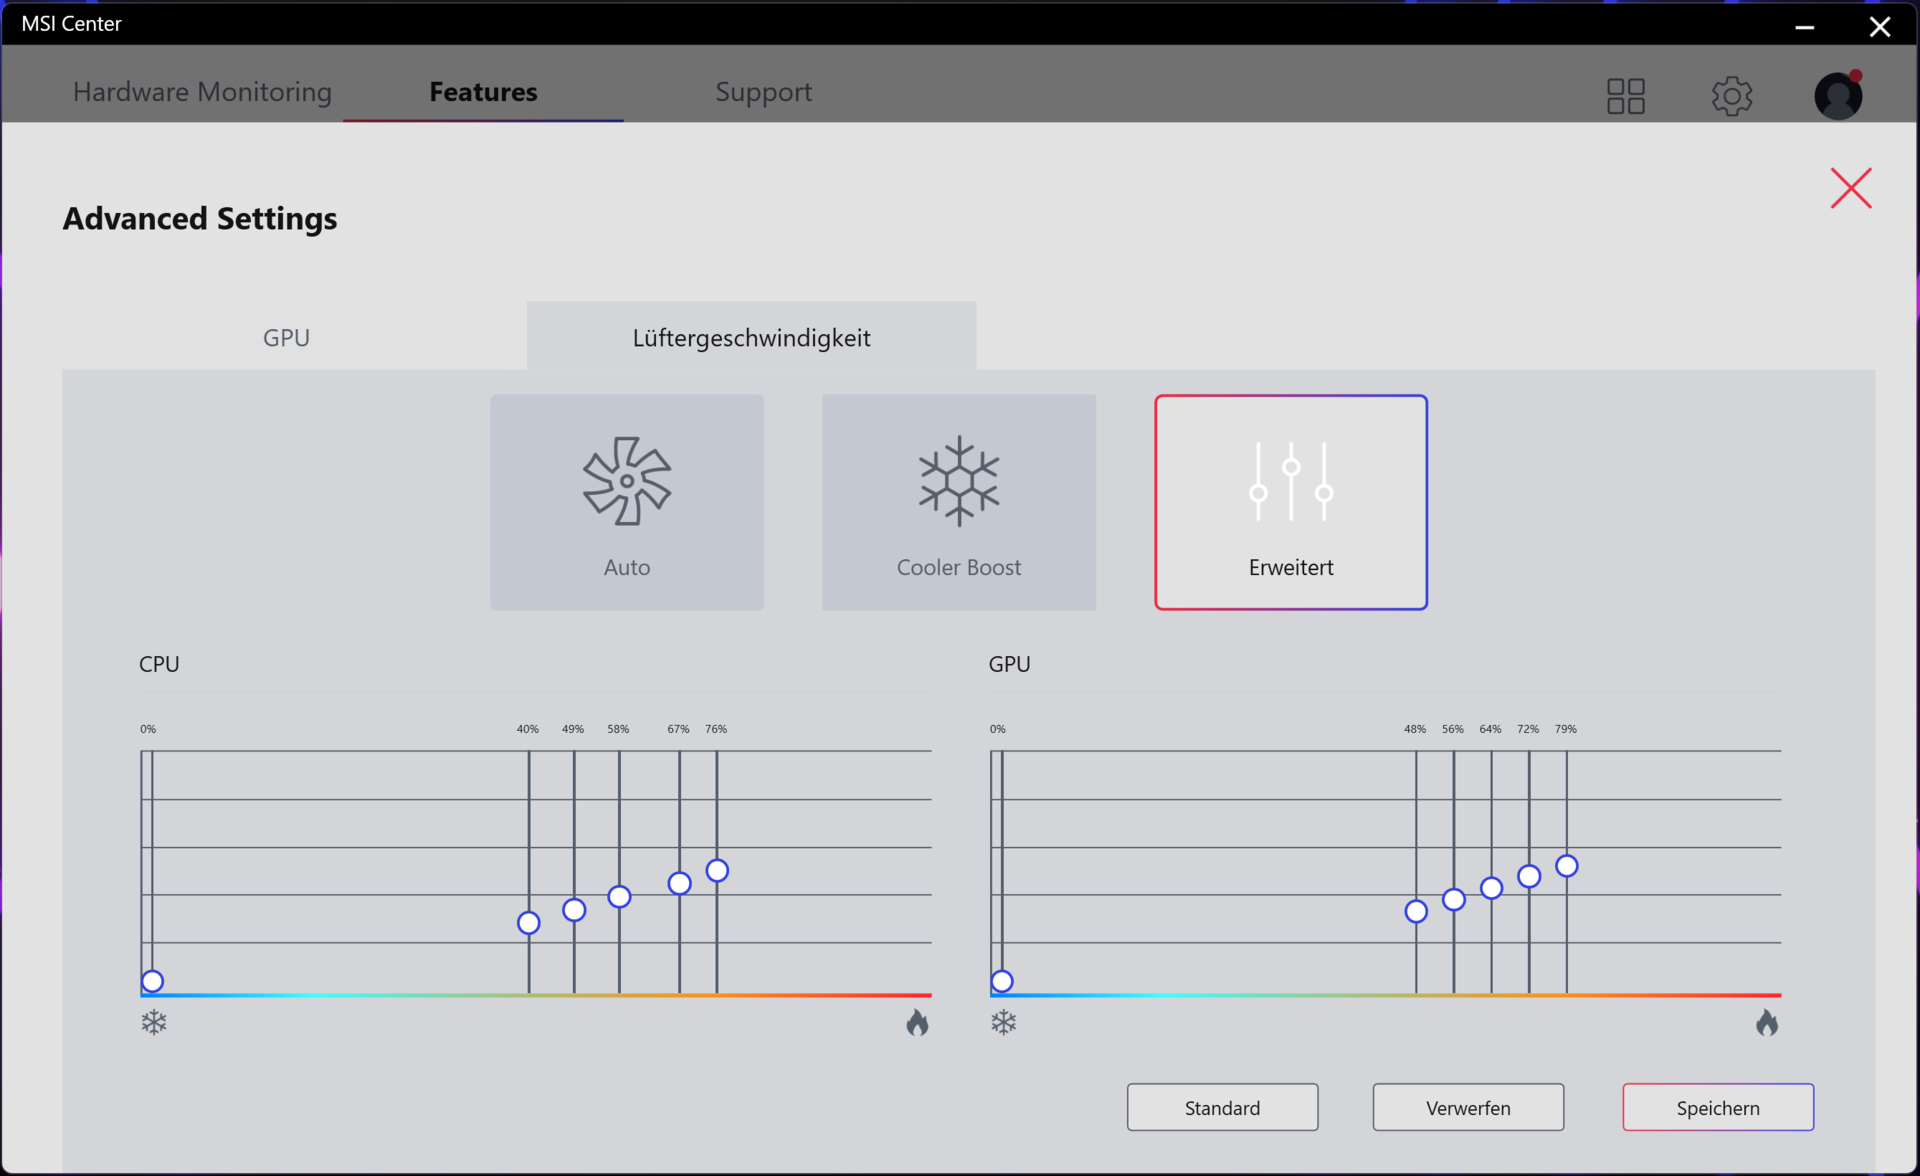
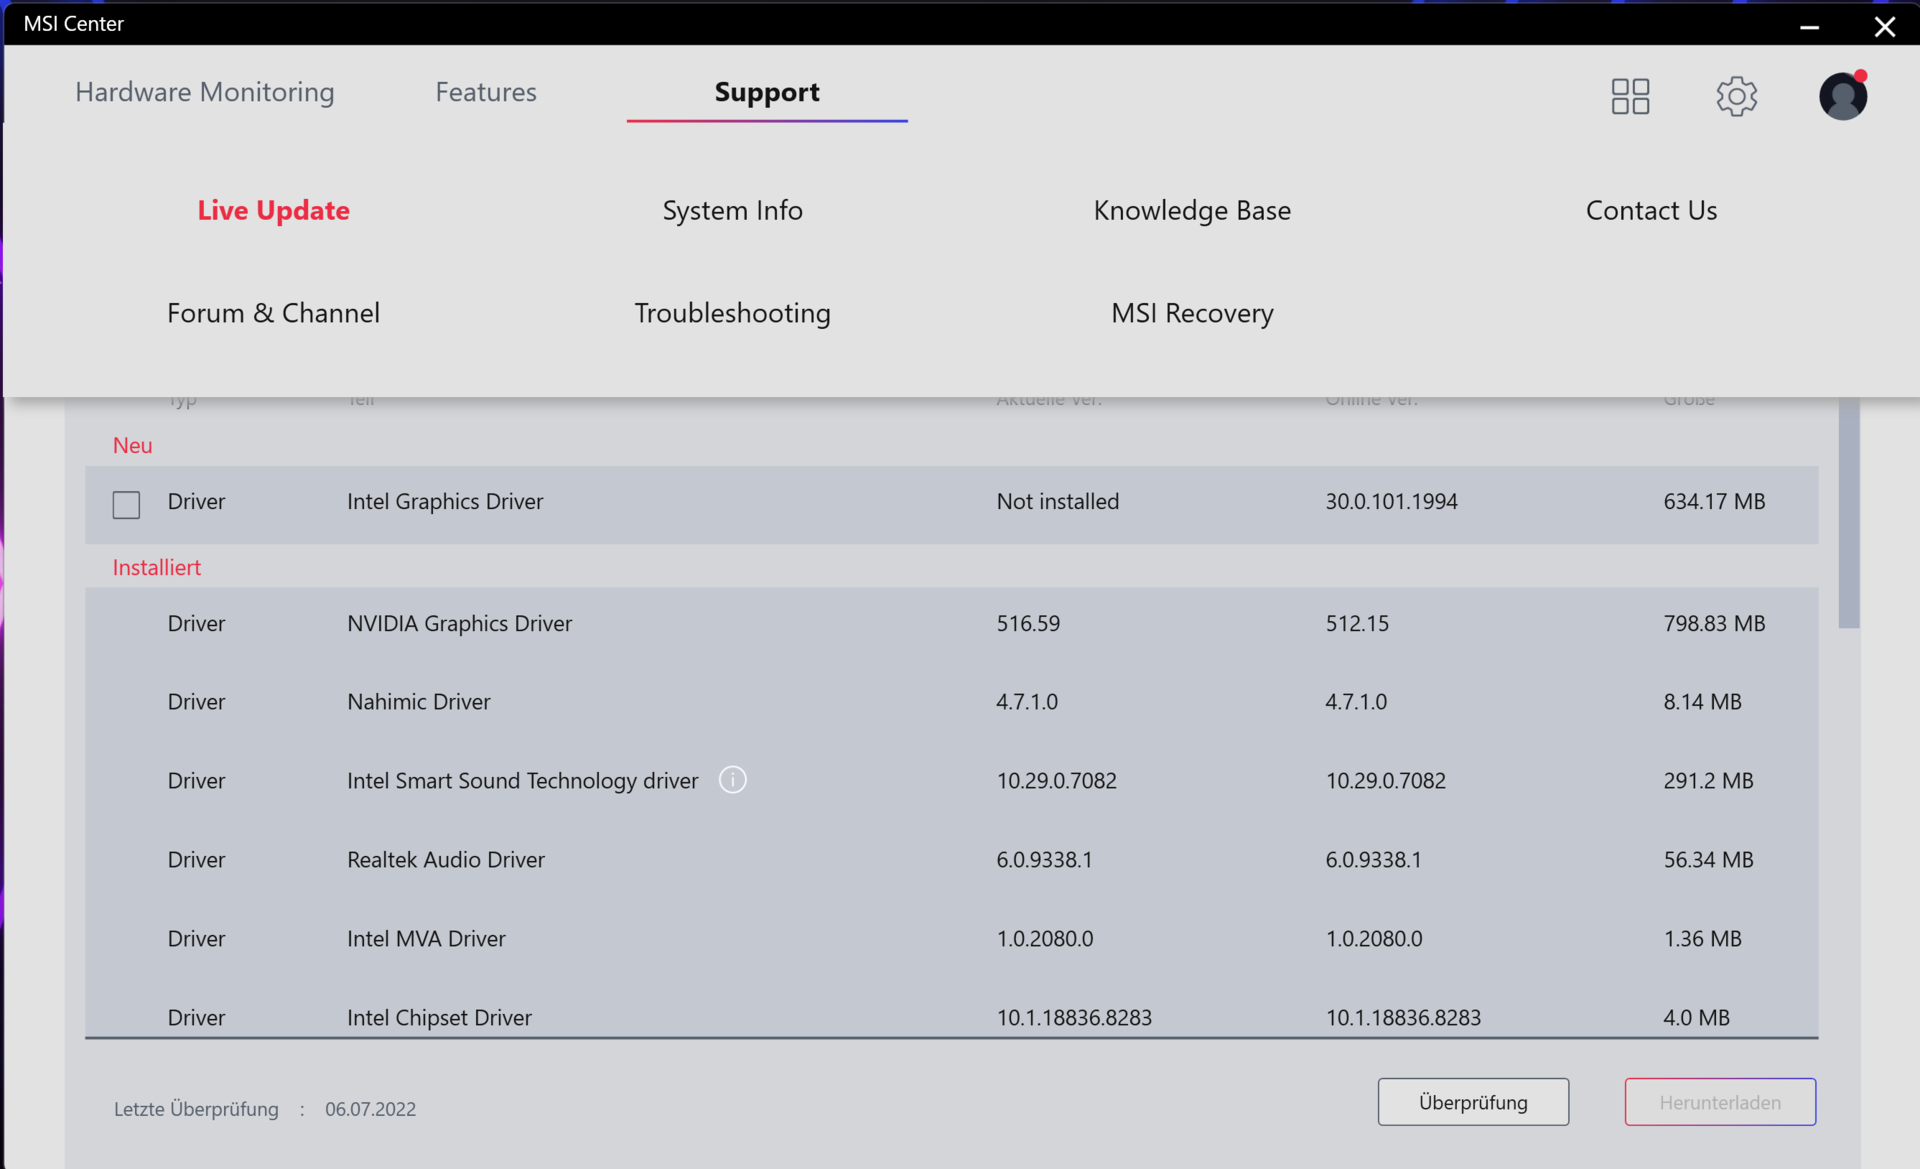
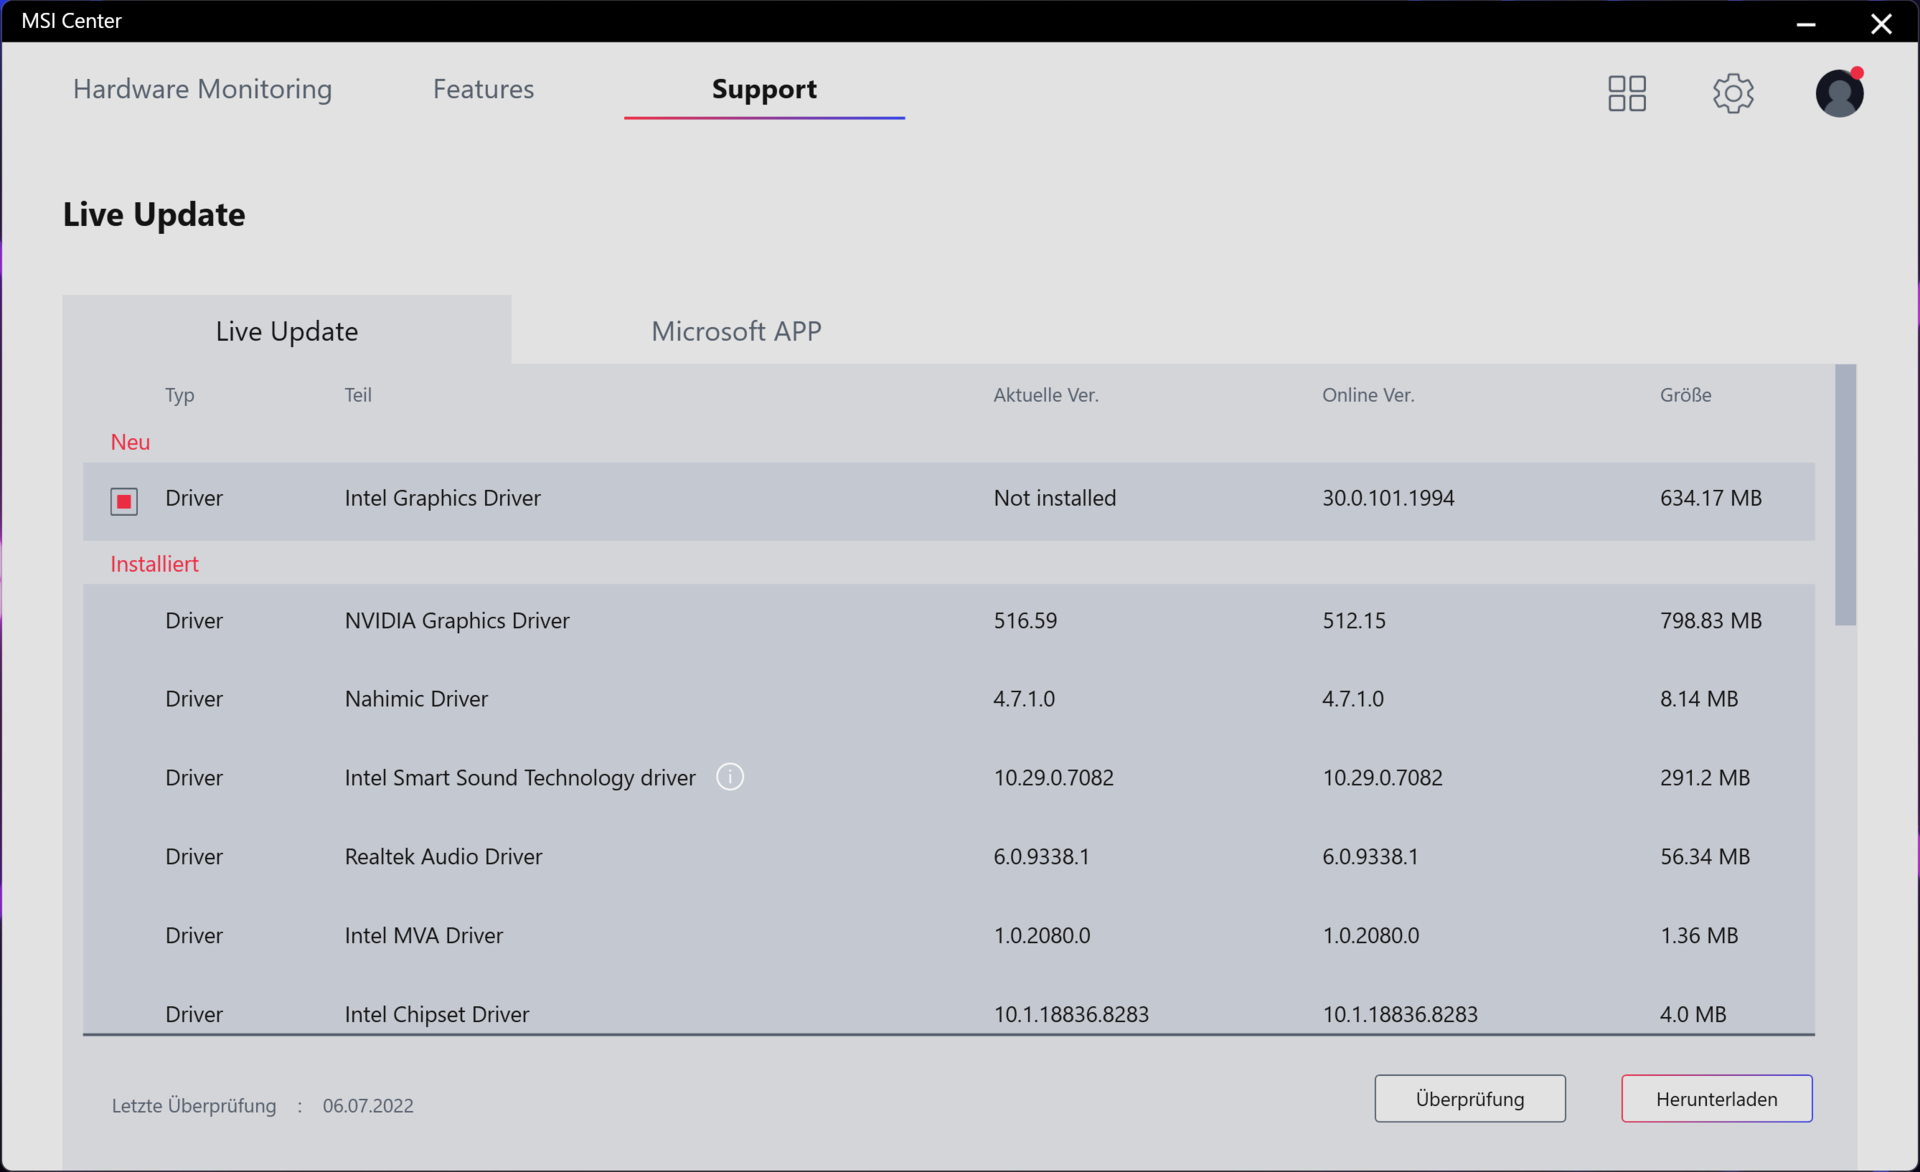
用户可以通过预装的微星中心软件在四个电源配置文件之间手动切换。当启用--就像我们所做的--通用的、基于人工智能的 "智能自动 "功能时,微星中心会根据当前的情况自动选择配置文件。该功能还允许用户创建一个应用程序列表,在启动时启用 "极端性能 "配置文件。
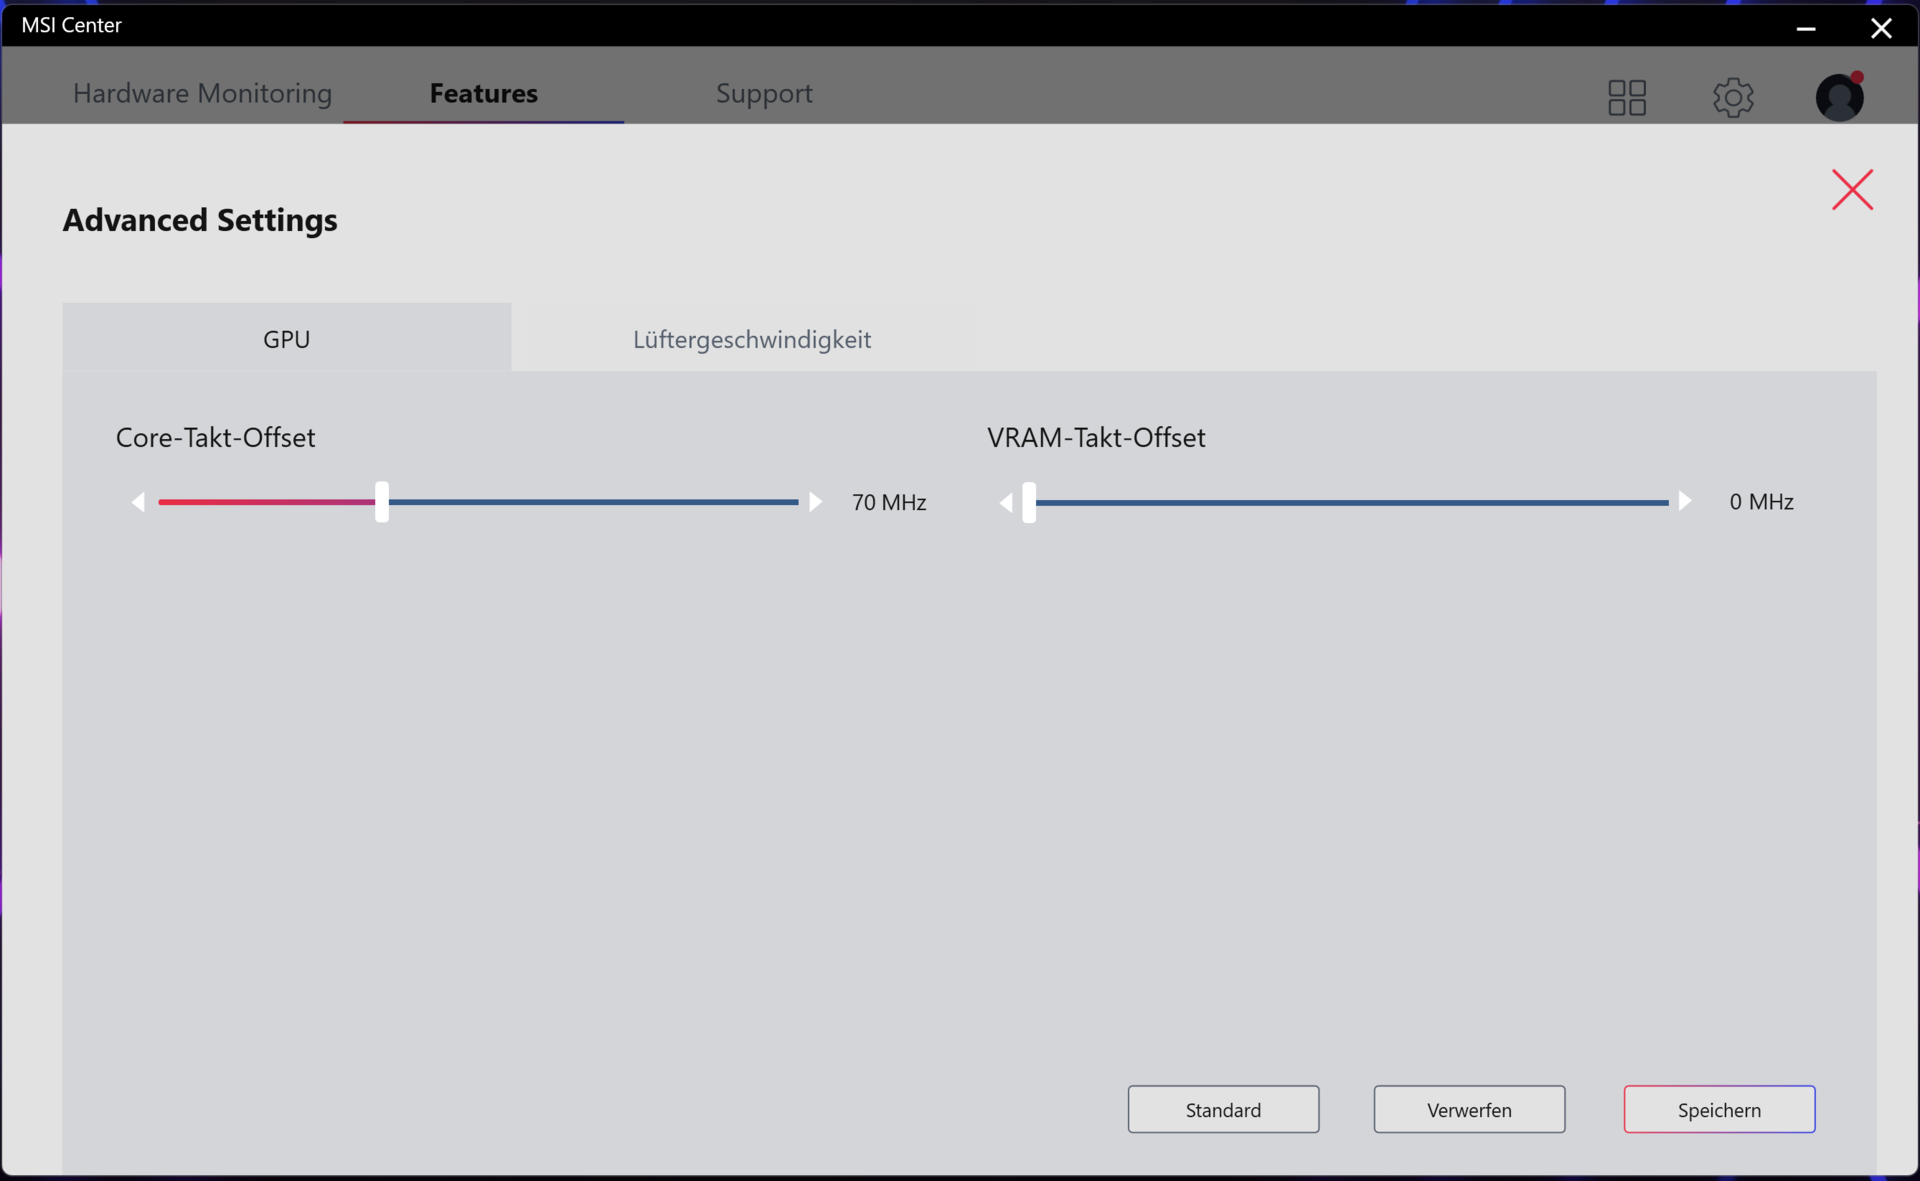
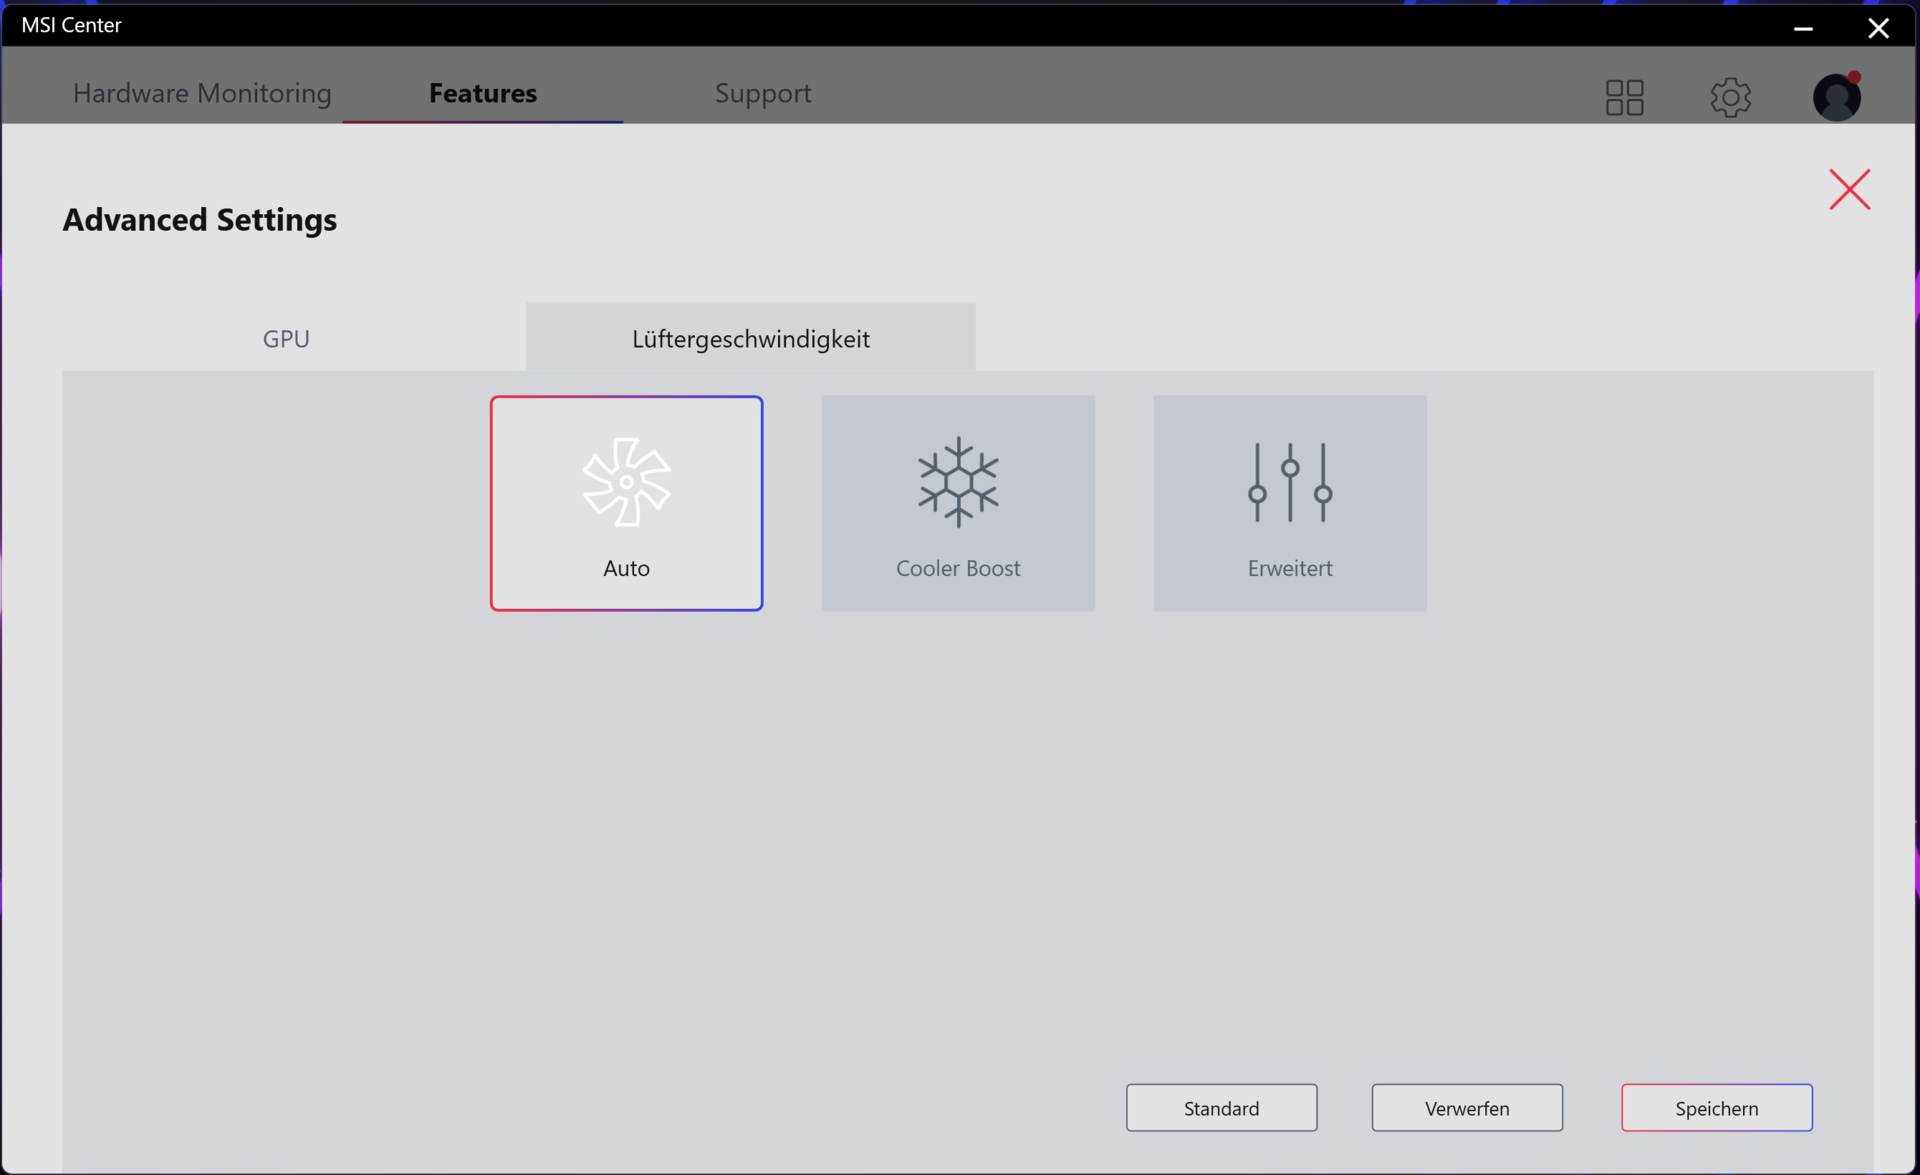
极限配置文件 "提供了各种调整选项。例如,有可能对GPU和VRAM进行超频。此外,用户可以访问风扇控制。这里的选项有 "自动"、"Cooler Boost"(风扇以最大速度运行)和 "高级"(可调整的风扇曲线)。
错误,基准优化,还是有用的功能?在使用 "静音模式 "时,通过我们的基准测试套件运行产生了一些奇怪的结果。启动某些基准测试会导致微星中心自动切换到 "极端性能 "配置文件。Cinebench基准测试和AIDA64基准测试就是这种情况。
| 极端性能 | 平衡模式 | 静音模式 | 超级电池 | |
|---|---|---|---|---|
| 功率限制1 | 115瓦 | 110瓦 | 30瓦 | 15瓦 |
| 功率限制2 | 180瓦 | 150瓦 | 30瓦 | 15瓦 |
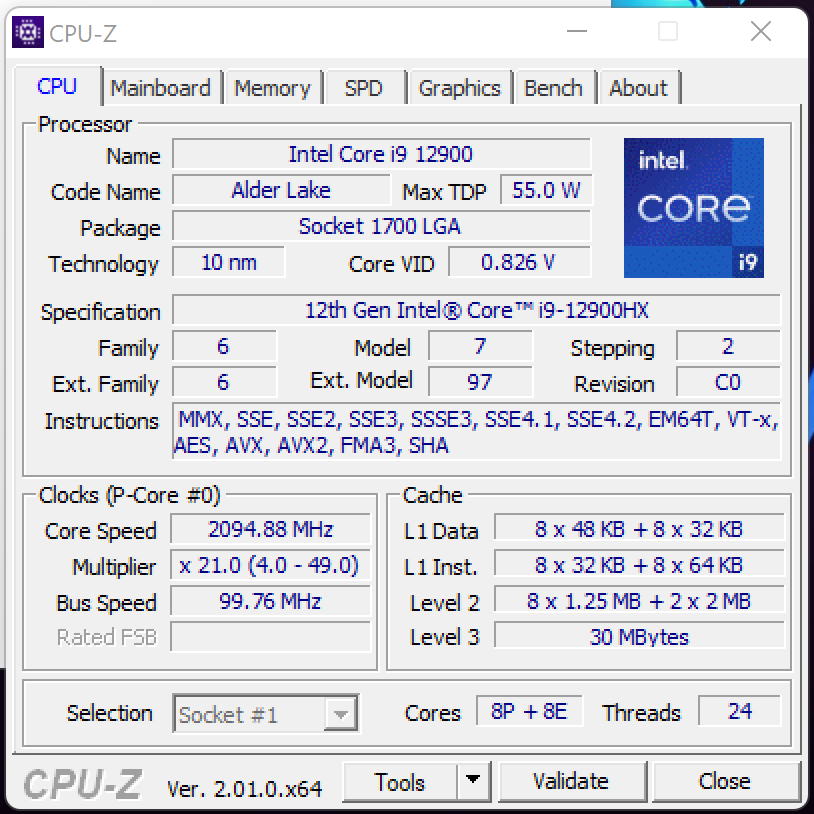
处理器
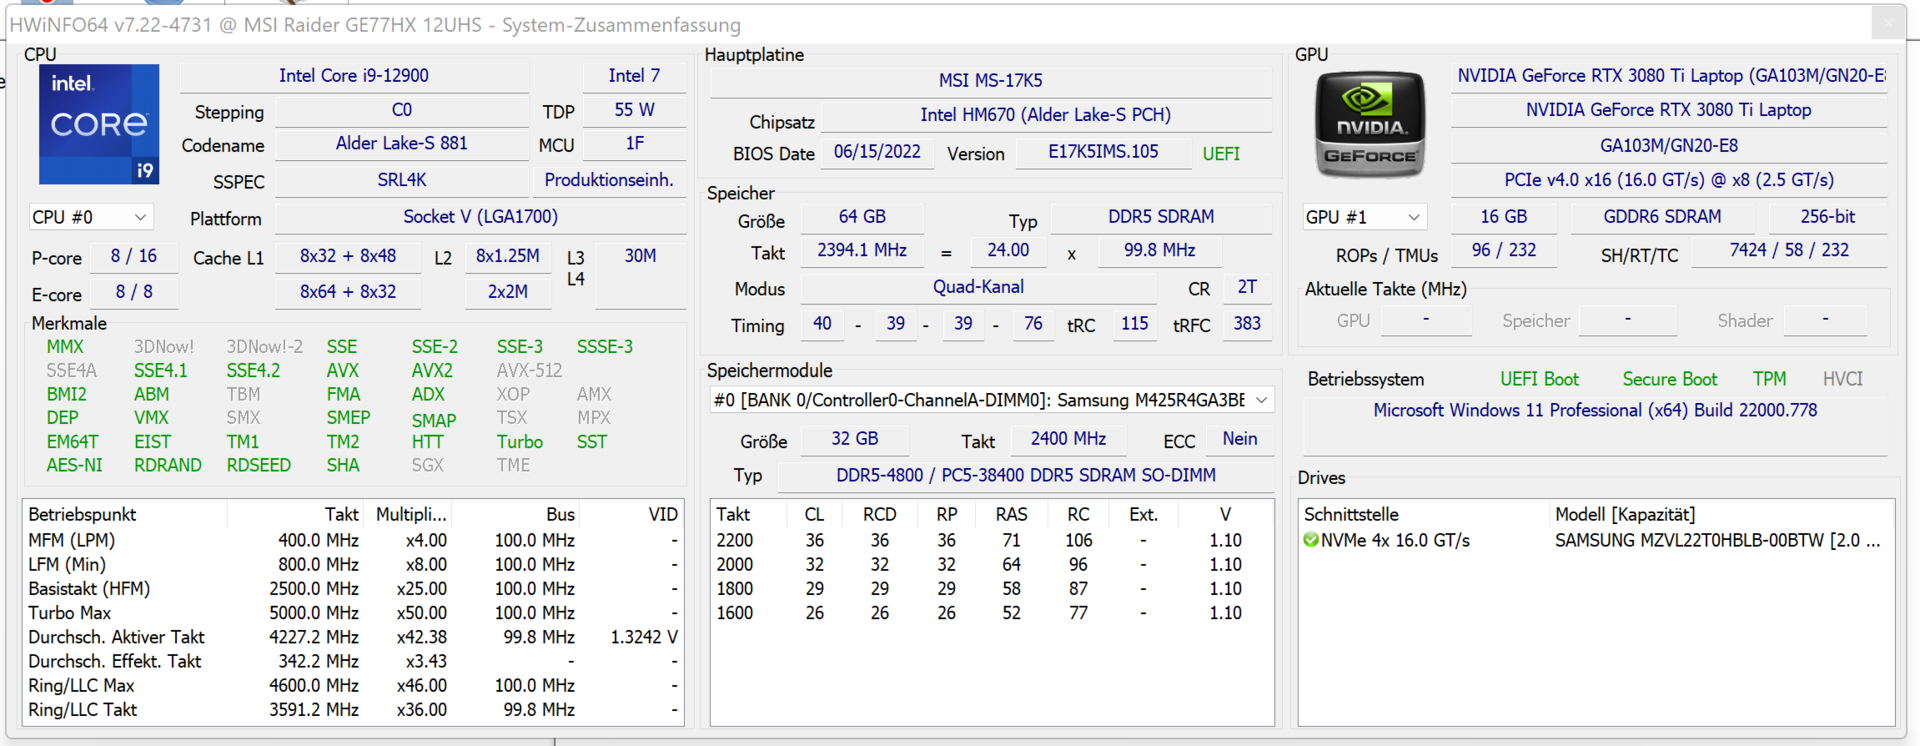
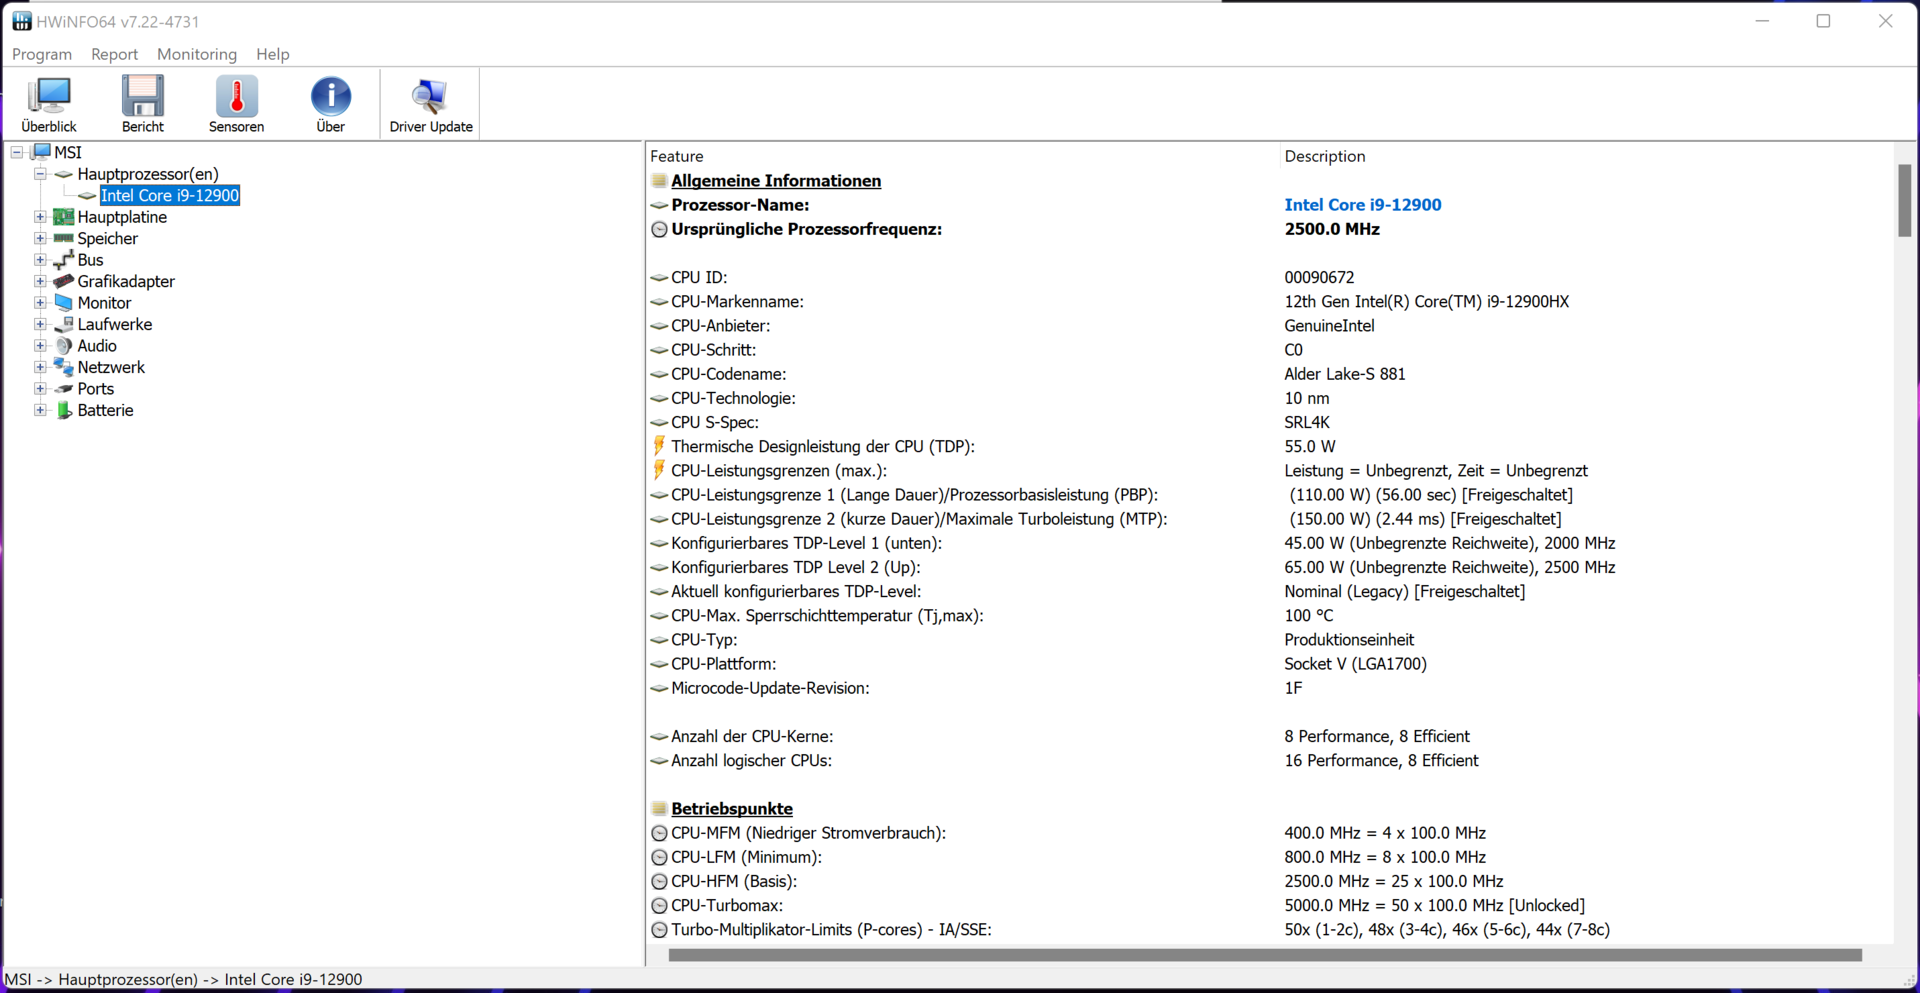
该 酷睿i7-12900HX处理器(Alder Lake)包括八个性能核心(超线程,2.3至5 GHz)和八个效率核心(无超线程,1.7至3.6 GHz)。总共有24个逻辑CPU核心。
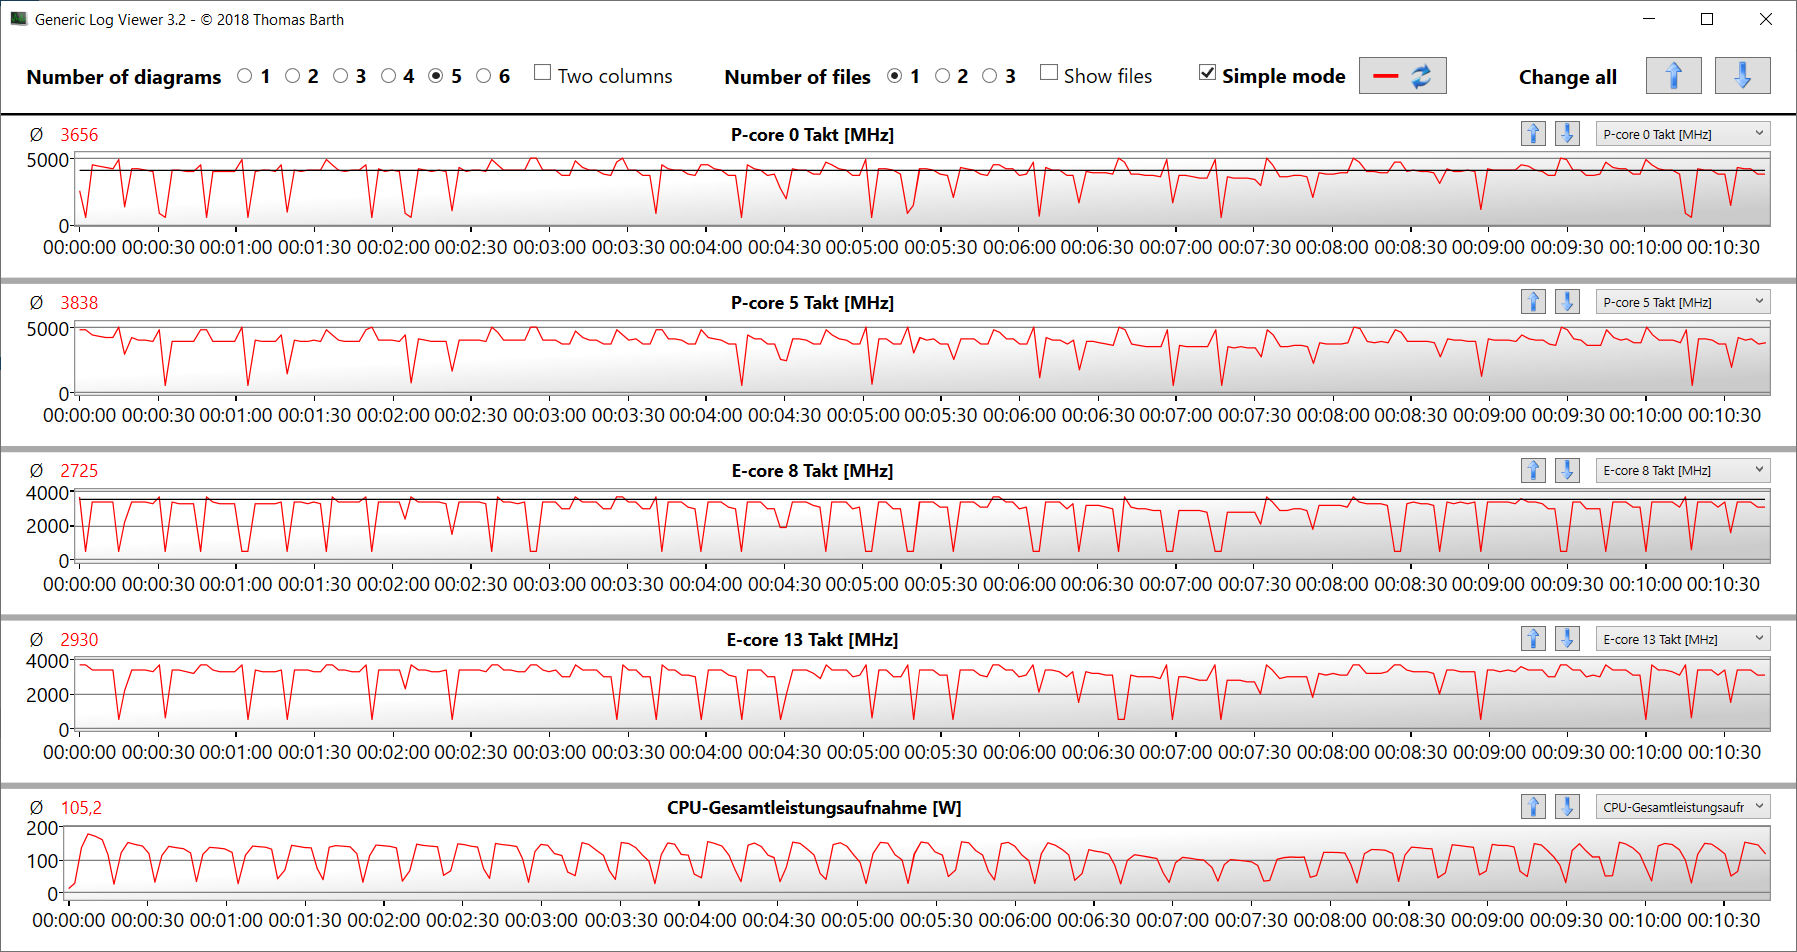
在整个Cinebench R15多基准测试(P核:4.4至4.5 GHz,E核:3.3至3.4 GHz)和单线程测试(P核:500 MHz至5 GHz,E核:400 MHz至3.6 GHz)中,时钟速度仍然很高。在电池模式下,单线程时钟速率相似(P核:400 MHz至4.8 GHz,E核:400 MHz至3.6 GHz),而多线程时钟速度(P核:1.7至2.6 GHz,E核:1.4至2 GHz)则不同。
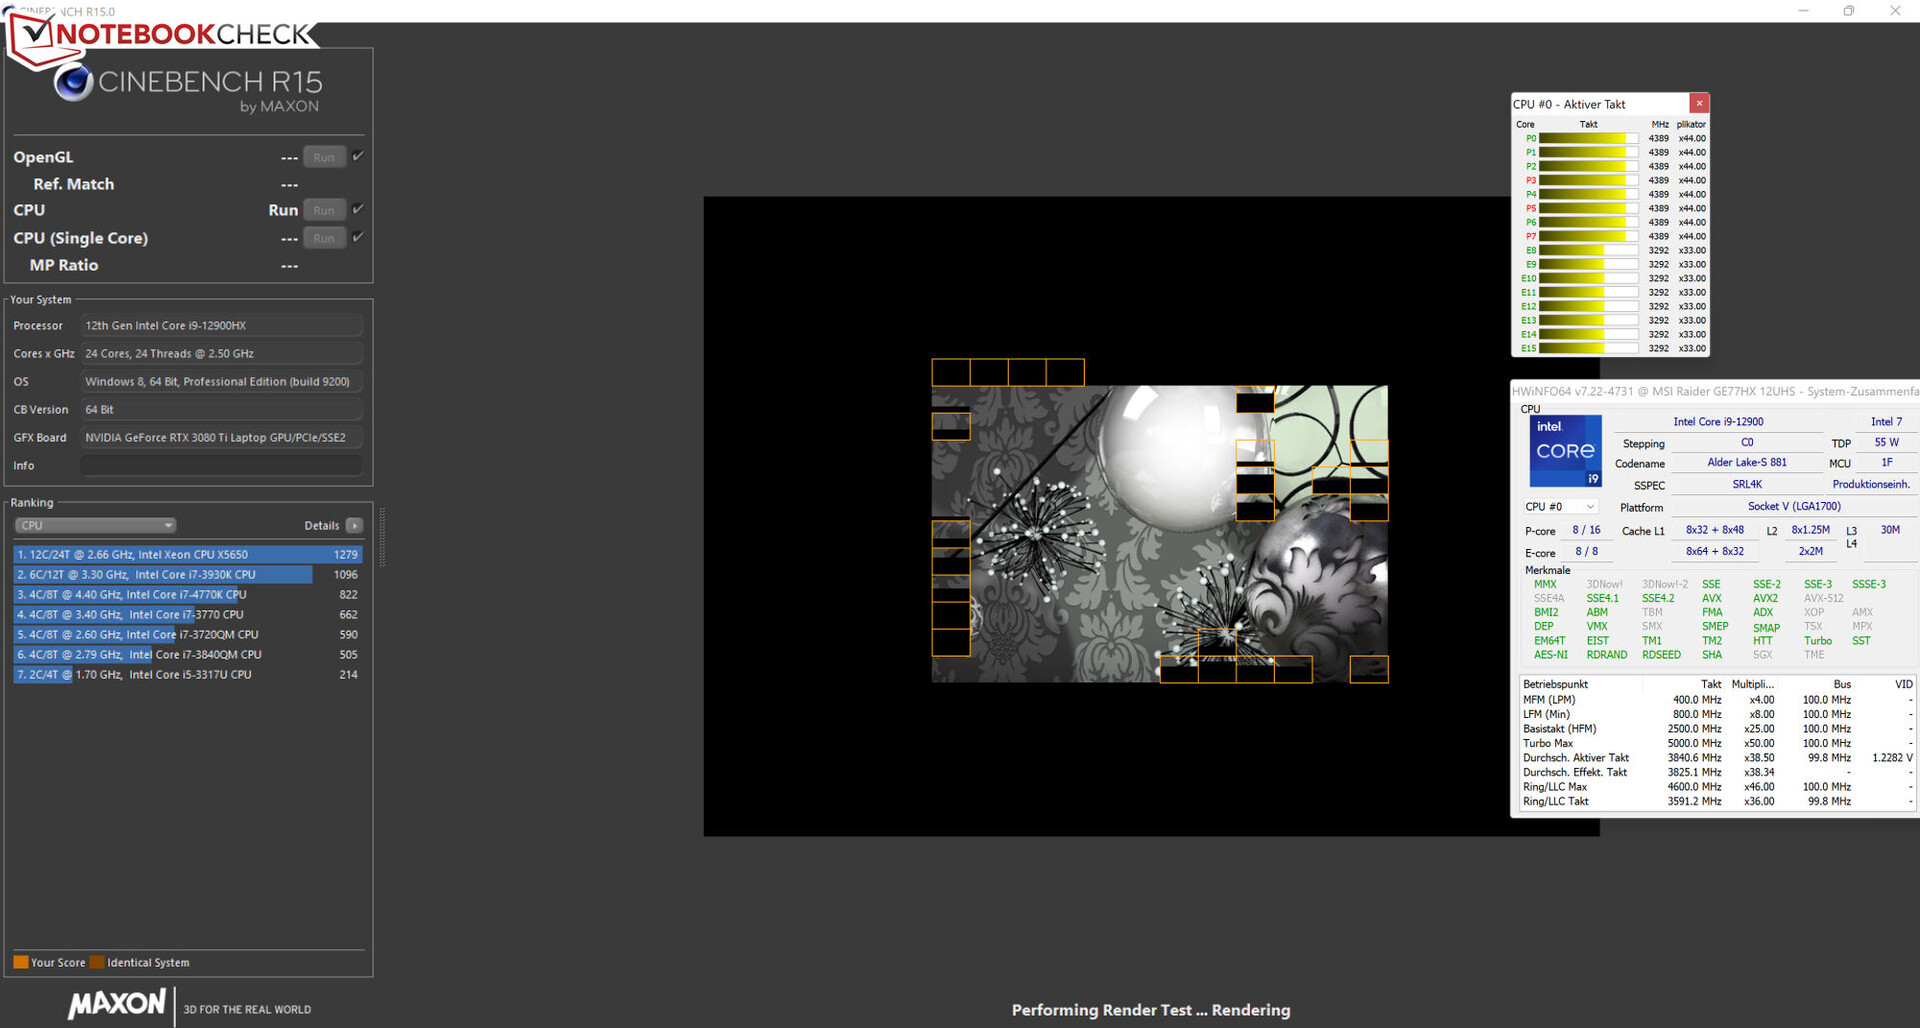
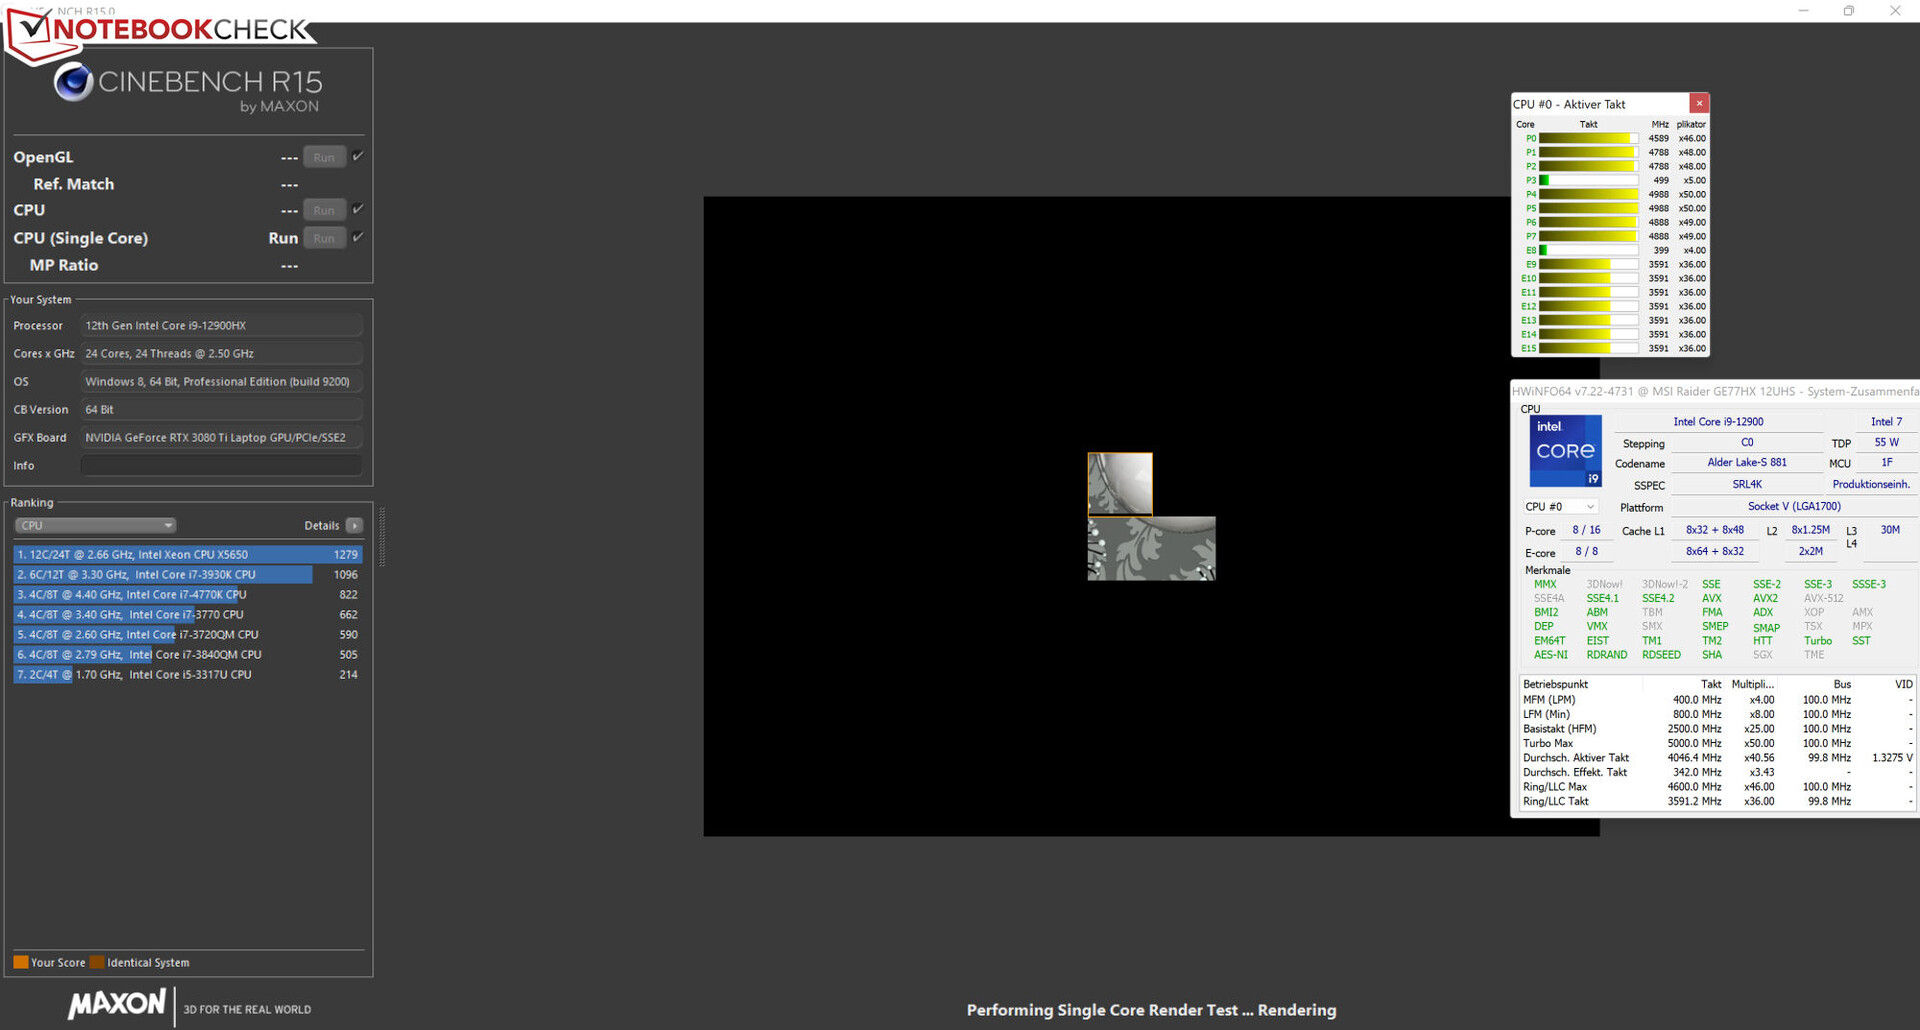
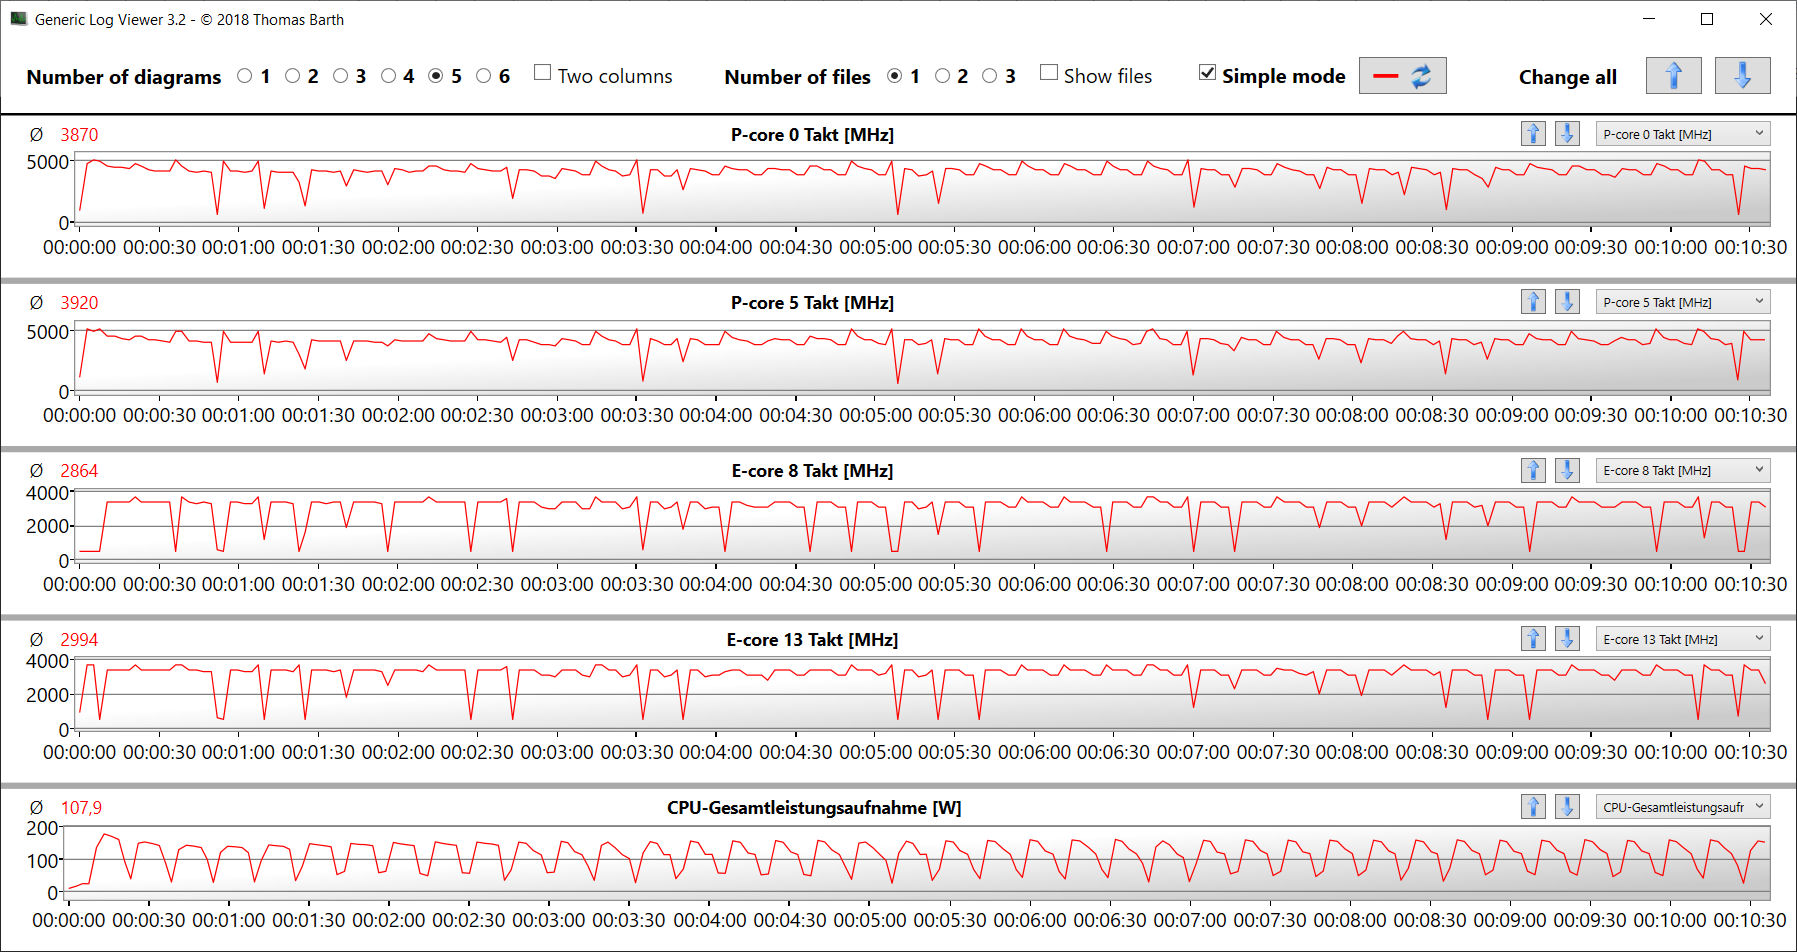
我们通过循环运行Cinebench R15 Multi基准测试来确定CPU涡轮是否在主电源上长期处于激活状态。在这里,我们观察到持续的高时钟速度。配置文件 "极端性能 "使性能水平更加均匀。
Cinebench R15 Multi Loop
| CPU Performance rating - Percent | |
| Average of class Gaming | |
| MSI Raider GE77 HX 12UHS | |
| MSI Raider GE77 HX 12UHS | |
| Average Intel Core i9-12900HX | |
| Alienware x17 R2 P48E | |
| Medion Erazer Beast X30 | |
| Razer Blade 17 Early 2022 | |
| Cinebench R23 | |
| Multi Core | |
| Average of class Gaming (10488 - 42661, n=107, last 2 years) | |
| MSI Raider GE77 HX 12UHS (Extreme Leistung) | |
| MSI Raider GE77 HX 12UHS | |
| Average Intel Core i9-12900HX (18337 - 23482, n=8) | |
| Medion Erazer Beast X30 | |
| Alienware x17 R2 P48E | |
| Razer Blade 17 Early 2022 | |
| Single Core | |
| Average of class Gaming (1166 - 2415, n=107, last 2 years) | |
| Average Intel Core i9-12900HX (1897 - 1936, n=8) | |
| Razer Blade 17 Early 2022 | |
| MSI Raider GE77 HX 12UHS | |
| Alienware x17 R2 P48E | |
| MSI Raider GE77 HX 12UHS (Extreme Leistung) | |
| Medion Erazer Beast X30 | |
| Cinebench R20 | |
| CPU (Multi Core) | |
| Average of class Gaming (4029 - 16433, n=106, last 2 years) | |
| MSI Raider GE77 HX 12UHS (Extreme Leistung) | |
| MSI Raider GE77 HX 12UHS | |
| Average Intel Core i9-12900HX (7037 - 9042, n=8) | |
| Medion Erazer Beast X30 | |
| Alienware x17 R2 P48E | |
| Razer Blade 17 Early 2022 | |
| CPU (Single Core) | |
| Average of class Gaming (442 - 913, n=106, last 2 years) | |
| MSI Raider GE77 HX 12UHS | |
| Average Intel Core i9-12900HX (728 - 745, n=8) | |
| MSI Raider GE77 HX 12UHS (Extreme Leistung) | |
| Alienware x17 R2 P48E | |
| Razer Blade 17 Early 2022 | |
| Medion Erazer Beast X30 | |
| Cinebench R15 | |
| CPU Multi 64Bit | |
| Average of class Gaming (1578 - 6330, n=105, last 2 years) | |
| MSI Raider GE77 HX 12UHS | |
| MSI Raider GE77 HX 12UHS (Extreme Leistung) | |
| Average Intel Core i9-12900HX (2830 - 3652, n=8) | |
| Alienware x17 R2 P48E | |
| Medion Erazer Beast X30 | |
| Razer Blade 17 Early 2022 | |
| CPU Single 64Bit | |
| Average of class Gaming (188.8 - 350, n=106, last 2 years) | |
| MSI Raider GE77 HX 12UHS | |
| Average Intel Core i9-12900HX (274 - 282, n=8) | |
| MSI Raider GE77 HX 12UHS (Extreme Leistung) | |
| Alienware x17 R2 P48E | |
| Razer Blade 17 Early 2022 | |
| Medion Erazer Beast X30 | |
| Blender - v2.79 BMW27 CPU | |
| Razer Blade 17 Early 2022 | |
| Medion Erazer Beast X30 | |
| Alienware x17 R2 P48E | |
| Average Intel Core i9-12900HX (144 - 201, n=8) | |
| MSI Raider GE77 HX 12UHS | |
| Average of class Gaming (79 - 330, n=104, last 2 years) | |
| MSI Raider GE77 HX 12UHS (Extreme Leistung) | |
| 7-Zip 18.03 | |
| 7z b 4 | |
| Average of class Gaming (33491 - 148086, n=105, last 2 years) | |
| MSI Raider GE77 HX 12UHS (Extreme Leistung) | |
| MSI Raider GE77 HX 12UHS | |
| Average Intel Core i9-12900HX (69778 - 88128, n=7) | |
| Medion Erazer Beast X30 | |
| Alienware x17 R2 P48E | |
| Razer Blade 17 Early 2022 | |
| 7z b 4 -mmt1 | |
| Average of class Gaming (4199 - 7436, n=105, last 2 years) | |
| MSI Raider GE77 HX 12UHS | |
| Average Intel Core i9-12900HX (6165 - 6358, n=7) | |
| MSI Raider GE77 HX 12UHS (Extreme Leistung) | |
| Razer Blade 17 Early 2022 | |
| Alienware x17 R2 P48E | |
| Medion Erazer Beast X30 | |
| Geekbench 5.5 | |
| Multi-Core | |
| Average of class Gaming (6460 - 28263, n=105, last 2 years) | |
| MSI Raider GE77 HX 12UHS (Extreme Leistung) | |
| MSI Raider GE77 HX 12UHS | |
| Average Intel Core i9-12900HX (15116 - 16925, n=8) | |
| Alienware x17 R2 P48E | |
| Medion Erazer Beast X30 | |
| Razer Blade 17 Early 2022 | |
| Single-Core | |
| Average of class Gaming (986 - 2474, n=105, last 2 years) | |
| MSI Raider GE77 HX 12UHS | |
| Average Intel Core i9-12900HX (1874 - 1949, n=8) | |
| MSI Raider GE77 HX 12UHS (Extreme Leistung) | |
| Alienware x17 R2 P48E | |
| Razer Blade 17 Early 2022 | |
| Medion Erazer Beast X30 | |
| HWBOT x265 Benchmark v2.2 - 4k Preset | |
| Average of class Gaming (11.5 - 44.4, n=105, last 2 years) | |
| MSI Raider GE77 HX 12UHS (Extreme Leistung) | |
| MSI Raider GE77 HX 12UHS | |
| Average Intel Core i9-12900HX (19.6 - 26.6, n=7) | |
| Alienware x17 R2 P48E | |
| Medion Erazer Beast X30 | |
| Razer Blade 17 Early 2022 | |
| LibreOffice - 20 Documents To PDF | |
| Average of class Gaming (33.2 - 88.8, n=105, last 2 years) | |
| Medion Erazer Beast X30 | |
| MSI Raider GE77 HX 12UHS | |
| Alienware x17 R2 P48E | |
| Razer Blade 17 Early 2022 | |
| Average Intel Core i9-12900HX (33.6 - 42.4, n=7) | |
| MSI Raider GE77 HX 12UHS (Extreme Leistung) | |
| R Benchmark 2.5 - Overall mean | |
| Medion Erazer Beast X30 | |
| Razer Blade 17 Early 2022 | |
| Alienware x17 R2 P48E | |
| Average of class Gaming (0.3439 - 0.759, n=106, last 2 years) | |
| MSI Raider GE77 HX 12UHS | |
| MSI Raider GE77 HX 12UHS (Extreme Leistung) | |
| Average Intel Core i9-12900HX (0.4159 - 0.4242, n=7) | |
* ... smaller is better
AIDA64: FP32 Ray-Trace | FPU Julia | CPU SHA3 | CPU Queen | FPU SinJulia | FPU Mandel | CPU AES | CPU ZLib | FP64 Ray-Trace | CPU PhotoWorxx
| Performance rating | |
| Average of class Gaming | |
| MSI Raider GE77 HX 12UHS | |
| MSI Raider GE77 HX 12UHS | |
| Average Intel Core i9-12900HX | |
| Alienware x17 R2 P48E | |
| Medion Erazer Beast X30 | |
| Razer Blade 17 Early 2022 | |
| AIDA64 / FP32 Ray-Trace | |
| Average of class Gaming (10227 - 85542, n=105, last 2 years) | |
| MSI Raider GE77 HX 12UHS (v6.70.6000, Extreme Leistung) | |
| MSI Raider GE77 HX 12UHS (v6.70.6000) | |
| Average Intel Core i9-12900HX (11535 - 22183, n=7) | |
| Alienware x17 R2 P48E (v6.50.5800) | |
| Medion Erazer Beast X30 (v6.50.5800) | |
| Razer Blade 17 Early 2022 (v6.50.5800) | |
| AIDA64 / FPU Julia | |
| Average of class Gaming (51376 - 238426, n=105, last 2 years) | |
| MSI Raider GE77 HX 12UHS (v6.70.6000) | |
| MSI Raider GE77 HX 12UHS (v6.70.6000, Extreme Leistung) | |
| Average Intel Core i9-12900HX (52916 - 110093, n=7) | |
| Alienware x17 R2 P48E (v6.50.5800) | |
| Medion Erazer Beast X30 (v6.50.5800) | |
| Razer Blade 17 Early 2022 (v6.50.5800) | |
| AIDA64 / CPU SHA3 | |
| Average of class Gaming (2180 - 10115, n=105, last 2 years) | |
| MSI Raider GE77 HX 12UHS (v6.70.6000) | |
| MSI Raider GE77 HX 12UHS (v6.70.6000, Extreme Leistung) | |
| Average Intel Core i9-12900HX (3559 - 5123, n=7) | |
| Alienware x17 R2 P48E (v6.50.5800) | |
| Medion Erazer Beast X30 (v6.50.5800) | |
| Razer Blade 17 Early 2022 (v6.50.5800) | |
| AIDA64 / CPU Queen | |
| Average of class Gaming (49785 - 173351, n=90, last 2 years) | |
| Alienware x17 R2 P48E (v6.50.5800) | |
| Medion Erazer Beast X30 (v6.50.5800) | |
| Average Intel Core i9-12900HX (101029 - 104457, n=7) | |
| MSI Raider GE77 HX 12UHS (v6.70.6000) | |
| MSI Raider GE77 HX 12UHS (v6.70.6000, Extreme Leistung) | |
| Razer Blade 17 Early 2022 (v6.50.5800) | |
| AIDA64 / FPU SinJulia | |
| Average of class Gaming (4424 - 33636, n=105, last 2 years) | |
| MSI Raider GE77 HX 12UHS (v6.70.6000, Extreme Leistung) | |
| MSI Raider GE77 HX 12UHS (v6.70.6000) | |
| Average Intel Core i9-12900HX (10475 - 13062, n=7) | |
| Alienware x17 R2 P48E (v6.50.5800) | |
| Medion Erazer Beast X30 (v6.50.5800) | |
| Razer Blade 17 Early 2022 (v6.50.5800) | |
| AIDA64 / FPU Mandel | |
| Average of class Gaming (25115 - 128721, n=105, last 2 years) | |
| MSI Raider GE77 HX 12UHS (v6.70.6000, Extreme Leistung) | |
| MSI Raider GE77 HX 12UHS (v6.70.6000) | |
| Average Intel Core i9-12900HX (31779 - 53628, n=7) | |
| Alienware x17 R2 P48E (v6.50.5800) | |
| Medion Erazer Beast X30 (v6.50.5800) | |
| Razer Blade 17 Early 2022 (v6.50.5800) | |
| AIDA64 / CPU AES | |
| MSI Raider GE77 HX 12UHS (v6.70.6000) | |
| MSI Raider GE77 HX 12UHS (v6.70.6000, Extreme Leistung) | |
| Average Intel Core i9-12900HX (125268 - 183146, n=7) | |
| Average of class Gaming (39258 - 247074, n=105, last 2 years) | |
| Alienware x17 R2 P48E (v6.50.5800) | |
| Medion Erazer Beast X30 (v6.50.5800) | |
| Razer Blade 17 Early 2022 (v6.50.5800) | |
| AIDA64 / CPU ZLib | |
| Average of class Gaming (574 - 2531, n=105, last 2 years) | |
| MSI Raider GE77 HX 12UHS (v6.70.6000) | |
| MSI Raider GE77 HX 12UHS (v6.70.6000, Extreme Leistung) | |
| Average Intel Core i9-12900HX (990 - 1408, n=7) | |
| Alienware x17 R2 P48E (v6.50.5800) | |
| Medion Erazer Beast X30 (v6.50.5800) | |
| Razer Blade 17 Early 2022 (v6.50.5800) | |
| AIDA64 / FP64 Ray-Trace | |
| Average of class Gaming (5509 - 45446, n=105, last 2 years) | |
| MSI Raider GE77 HX 12UHS (v6.70.6000, Extreme Leistung) | |
| MSI Raider GE77 HX 12UHS (v6.70.6000) | |
| Average Intel Core i9-12900HX (6663 - 11913, n=7) | |
| Alienware x17 R2 P48E (v6.50.5800) | |
| Medion Erazer Beast X30 (v6.50.5800) | |
| Razer Blade 17 Early 2022 (v6.50.5800) | |
| AIDA64 / CPU PhotoWorxx | |
| MSI Raider GE77 HX 12UHS (v6.70.6000) | |
| MSI Raider GE77 HX 12UHS (v6.70.6000, Extreme Leistung) | |
| Average of class Gaming (12271 - 89891, n=105, last 2 years) | |
| Average Intel Core i9-12900HX (40239 - 47710, n=7) | |
| Medion Erazer Beast X30 (v6.50.5800) | |
| Razer Blade 17 Early 2022 (v6.50.5800) | |
| Alienware x17 R2 P48E (v6.50.5800) | |
系统性能
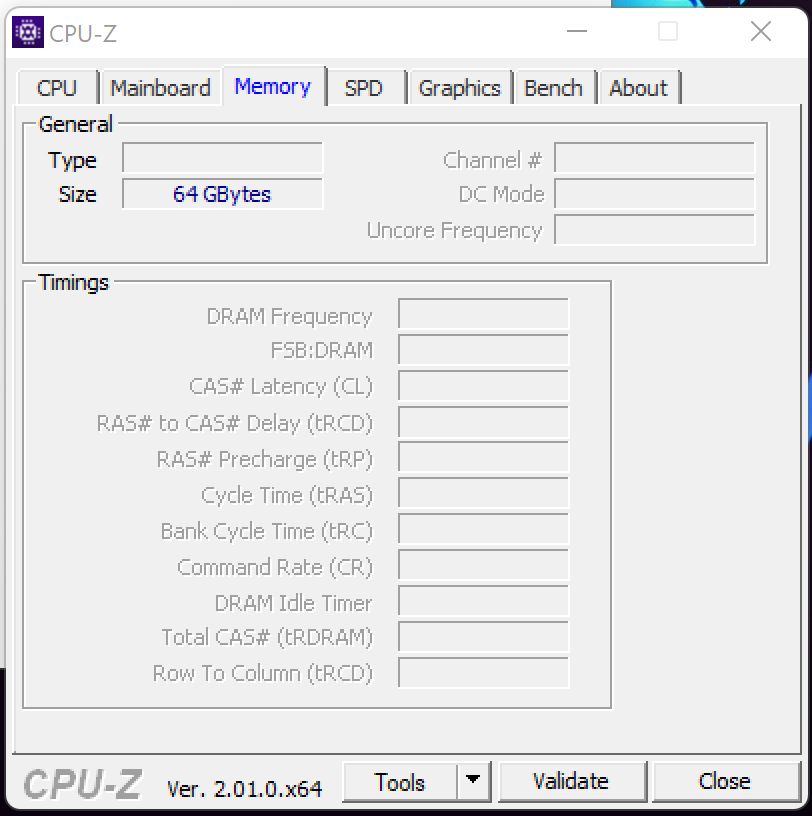
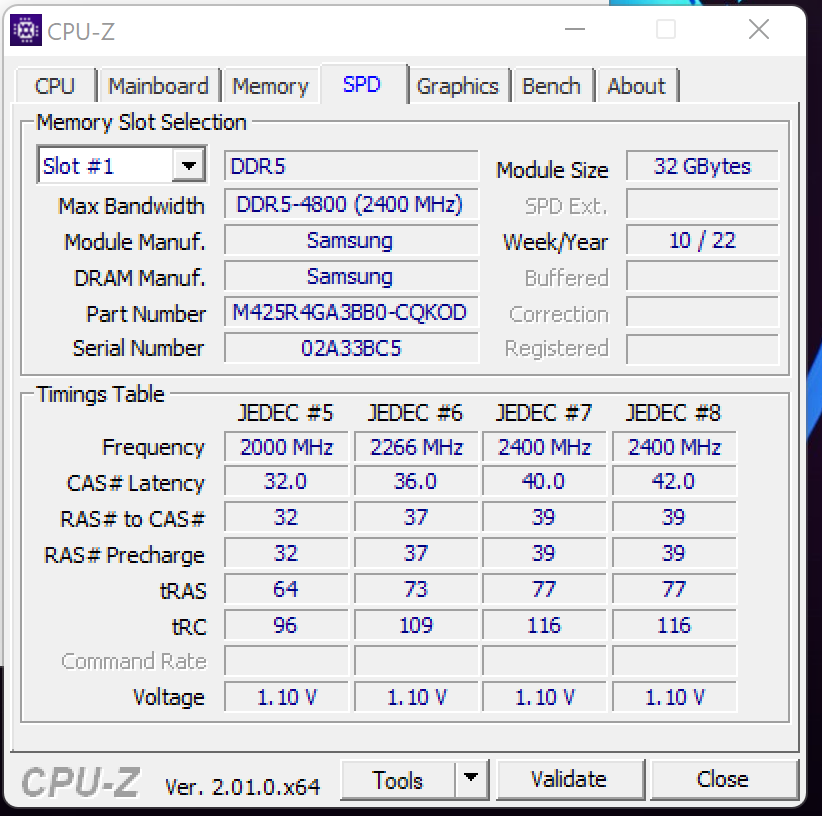
GE77是目前市场上最快的笔记本电脑之一。24个逻辑CPU核心和一个最大TGP的RTX 3080 Ti GPU的组合使该系统适合任何苛刻的使用情况--无论是视频编辑、游戏还是渲染。DDR4-4800内存的传输率高于平均水平。这可能源于CPU的缓存,与其他英特尔处理器相比,该特定型号的缓存更大。此外,该系统在PCMark基准测试中取得了良好的成绩。
CrossMark: Overall | Productivity | Creativity | Responsiveness
| PCMark 10 / Score | |
| Average of class Gaming (5828 - 12414, n=93, last 2 years) | |
| MSI Raider GE77 HX 12UHS (dGPU, Extreme Leistung) | |
| Alienware x17 R2 P48E | |
| Average Intel Core i9-12900HX, NVIDIA GeForce RTX 3080 Ti Laptop GPU (6812 - 8636, n=6) | |
| Medion Erazer Beast X30 | |
| Razer Blade 17 Early 2022 | |
| MSI Raider GE77 HX 12UHS | |
| PCMark 10 / Essentials | |
| Alienware x17 R2 P48E | |
| MSI Raider GE77 HX 12UHS (dGPU, Extreme Leistung) | |
| Average of class Gaming (8810 - 11935, n=97, last 2 years) | |
| Average Intel Core i9-12900HX, NVIDIA GeForce RTX 3080 Ti Laptop GPU (9598 - 11192, n=6) | |
| Razer Blade 17 Early 2022 | |
| Medion Erazer Beast X30 | |
| MSI Raider GE77 HX 12UHS | |
| PCMark 10 / Productivity | |
| Average of class Gaming (6845 - 25323, n=95, last 2 years) | |
| MSI Raider GE77 HX 12UHS (dGPU, Extreme Leistung) | |
| Average Intel Core i9-12900HX, NVIDIA GeForce RTX 3080 Ti Laptop GPU (9365 - 10932, n=6) | |
| Alienware x17 R2 P48E | |
| MSI Raider GE77 HX 12UHS | |
| Medion Erazer Beast X30 | |
| Razer Blade 17 Early 2022 | |
| PCMark 10 / Digital Content Creation | |
| Average of class Gaming (7602 - 19954, n=95, last 2 years) | |
| MSI Raider GE77 HX 12UHS (dGPU, Extreme Leistung) | |
| Alienware x17 R2 P48E | |
| Average Intel Core i9-12900HX, NVIDIA GeForce RTX 3080 Ti Laptop GPU (9543 - 14291, n=6) | |
| Medion Erazer Beast X30 | |
| Razer Blade 17 Early 2022 | |
| MSI Raider GE77 HX 12UHS | |
| CrossMark / Overall | |
| MSI Raider GE77 HX 12UHS | |
| MSI Raider GE77 HX 12UHS (dGPU, Extreme Leistung) | |
| Average Intel Core i9-12900HX, NVIDIA GeForce RTX 3080 Ti Laptop GPU (2108 - 2170, n=5) | |
| Average of class Gaming (1366 - 2409, n=94, last 2 years) | |
| Alienware x17 R2 P48E | |
| Razer Blade 17 Early 2022 | |
| Medion Erazer Beast X30 | |
| CrossMark / Productivity | |
| MSI Raider GE77 HX 12UHS | |
| MSI Raider GE77 HX 12UHS (dGPU, Extreme Leistung) | |
| Average Intel Core i9-12900HX, NVIDIA GeForce RTX 3080 Ti Laptop GPU (1978 - 2047, n=5) | |
| Average of class Gaming (1386 - 2254, n=94, last 2 years) | |
| Alienware x17 R2 P48E | |
| Razer Blade 17 Early 2022 | |
| Medion Erazer Beast X30 | |
| CrossMark / Creativity | |
| MSI Raider GE77 HX 12UHS | |
| Average Intel Core i9-12900HX, NVIDIA GeForce RTX 3080 Ti Laptop GPU (2288 - 2366, n=5) | |
| MSI Raider GE77 HX 12UHS (dGPU, Extreme Leistung) | |
| Average of class Gaming (1343 - 2786, n=94, last 2 years) | |
| Alienware x17 R2 P48E | |
| Medion Erazer Beast X30 | |
| Razer Blade 17 Early 2022 | |
| CrossMark / Responsiveness | |
| MSI Raider GE77 HX 12UHS | |
| Average Intel Core i9-12900HX, NVIDIA GeForce RTX 3080 Ti Laptop GPU (1991 - 2090, n=5) | |
| MSI Raider GE77 HX 12UHS (dGPU, Extreme Leistung) | |
| Average of class Gaming (1226 - 2334, n=94, last 2 years) | |
| Alienware x17 R2 P48E | |
| Razer Blade 17 Early 2022 | |
| Medion Erazer Beast X30 | |
| PCMark 8 Home Score Accelerated v2 | 4209 points | |
| PCMark 8 Creative Score Accelerated v2 | 6879 points | |
| PCMark 8 Work Score Accelerated v2 | 5259 points | |
| PCMark 10 Score | 6993 points | |
Help | ||
| AIDA64 / Memory Copy | |
| Average of class Gaming (21750 - 129946, n=105, last 2 years) | |
| MSI Raider GE77 HX 12UHS | |
| MSI Raider GE77 HX 12UHS (v6.70.6000, Extreme Leistung) | |
| Average Intel Core i9-12900HX (62852 - 70863, n=7) | |
| Medion Erazer Beast X30 (v6.50.5800) | |
| Razer Blade 17 Early 2022 (v6.50.5800) | |
| Alienware x17 R2 P48E (v6.50.5800) | |
| AIDA64 / Memory Read | |
| Average of class Gaming (22956 - 118858, n=105, last 2 years) | |
| MSI Raider GE77 HX 12UHS | |
| MSI Raider GE77 HX 12UHS (v6.70.6000, Extreme Leistung) | |
| Average Intel Core i9-12900HX (62140 - 72930, n=7) | |
| Medion Erazer Beast X30 (v6.50.5800) | |
| Razer Blade 17 Early 2022 (v6.50.5800) | |
| Alienware x17 R2 P48E (v6.50.5800) | |
| AIDA64 / Memory Write | |
| Average of class Gaming (22297 - 135096, n=105, last 2 years) | |
| MSI Raider GE77 HX 12UHS (v6.70.6000, Extreme Leistung) | |
| MSI Raider GE77 HX 12UHS (v6.70.6000) | |
| Medion Erazer Beast X30 (v6.50.5800) | |
| Average Intel Core i9-12900HX (60001 - 68782, n=7) | |
| Razer Blade 17 Early 2022 (v6.50.5800) | |
| Alienware x17 R2 P48E (v6.50.5800) | |
| AIDA64 / Memory Latency | |
| Average of class Gaming (75.3 - 259, n=105, last 2 years) | |
| Alienware x17 R2 P48E (v6.50.5800) | |
| Average Intel Core i9-12900HX (83.9 - 93.4, n=7) | |
| MSI Raider GE77 HX 12UHS (v6.70.6000, Extreme Leistung) | |
| MSI Raider GE77 HX 12UHS (v6.70.6000) | |
| Medion Erazer Beast X30 (v6.50.5800) | |
* ... smaller is better
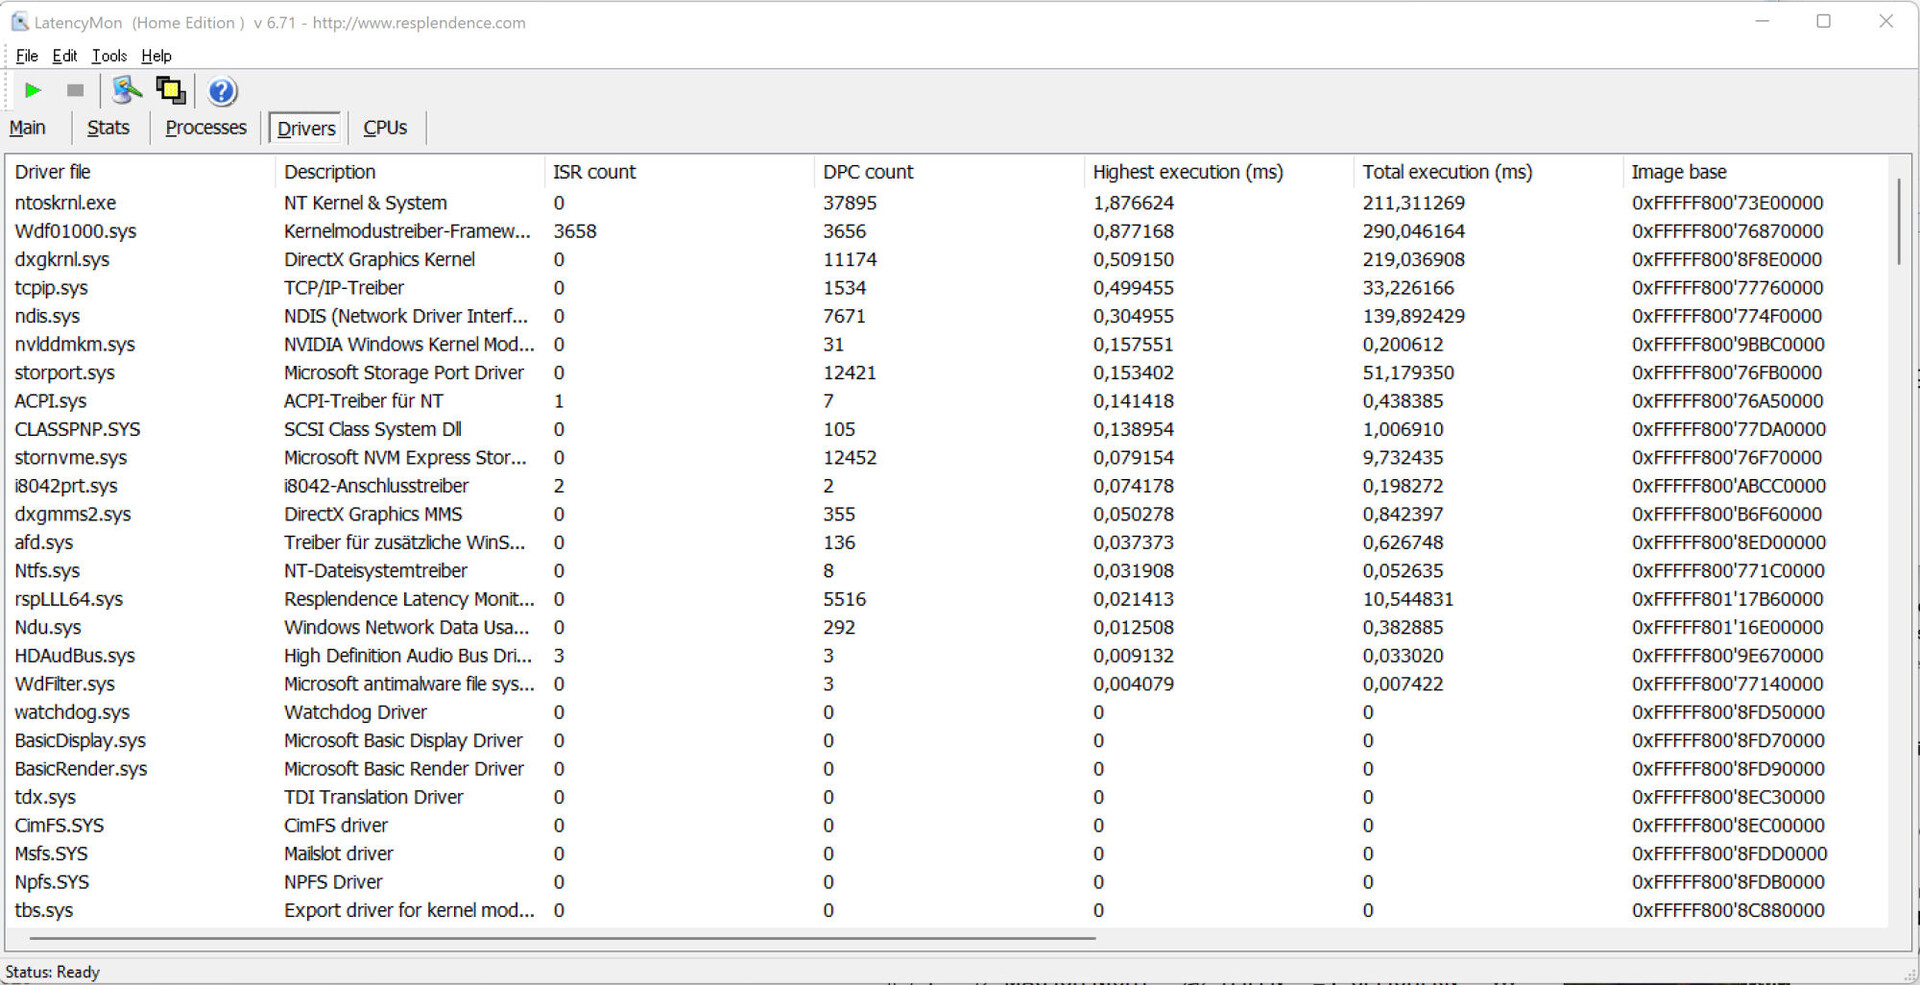
DPC延迟
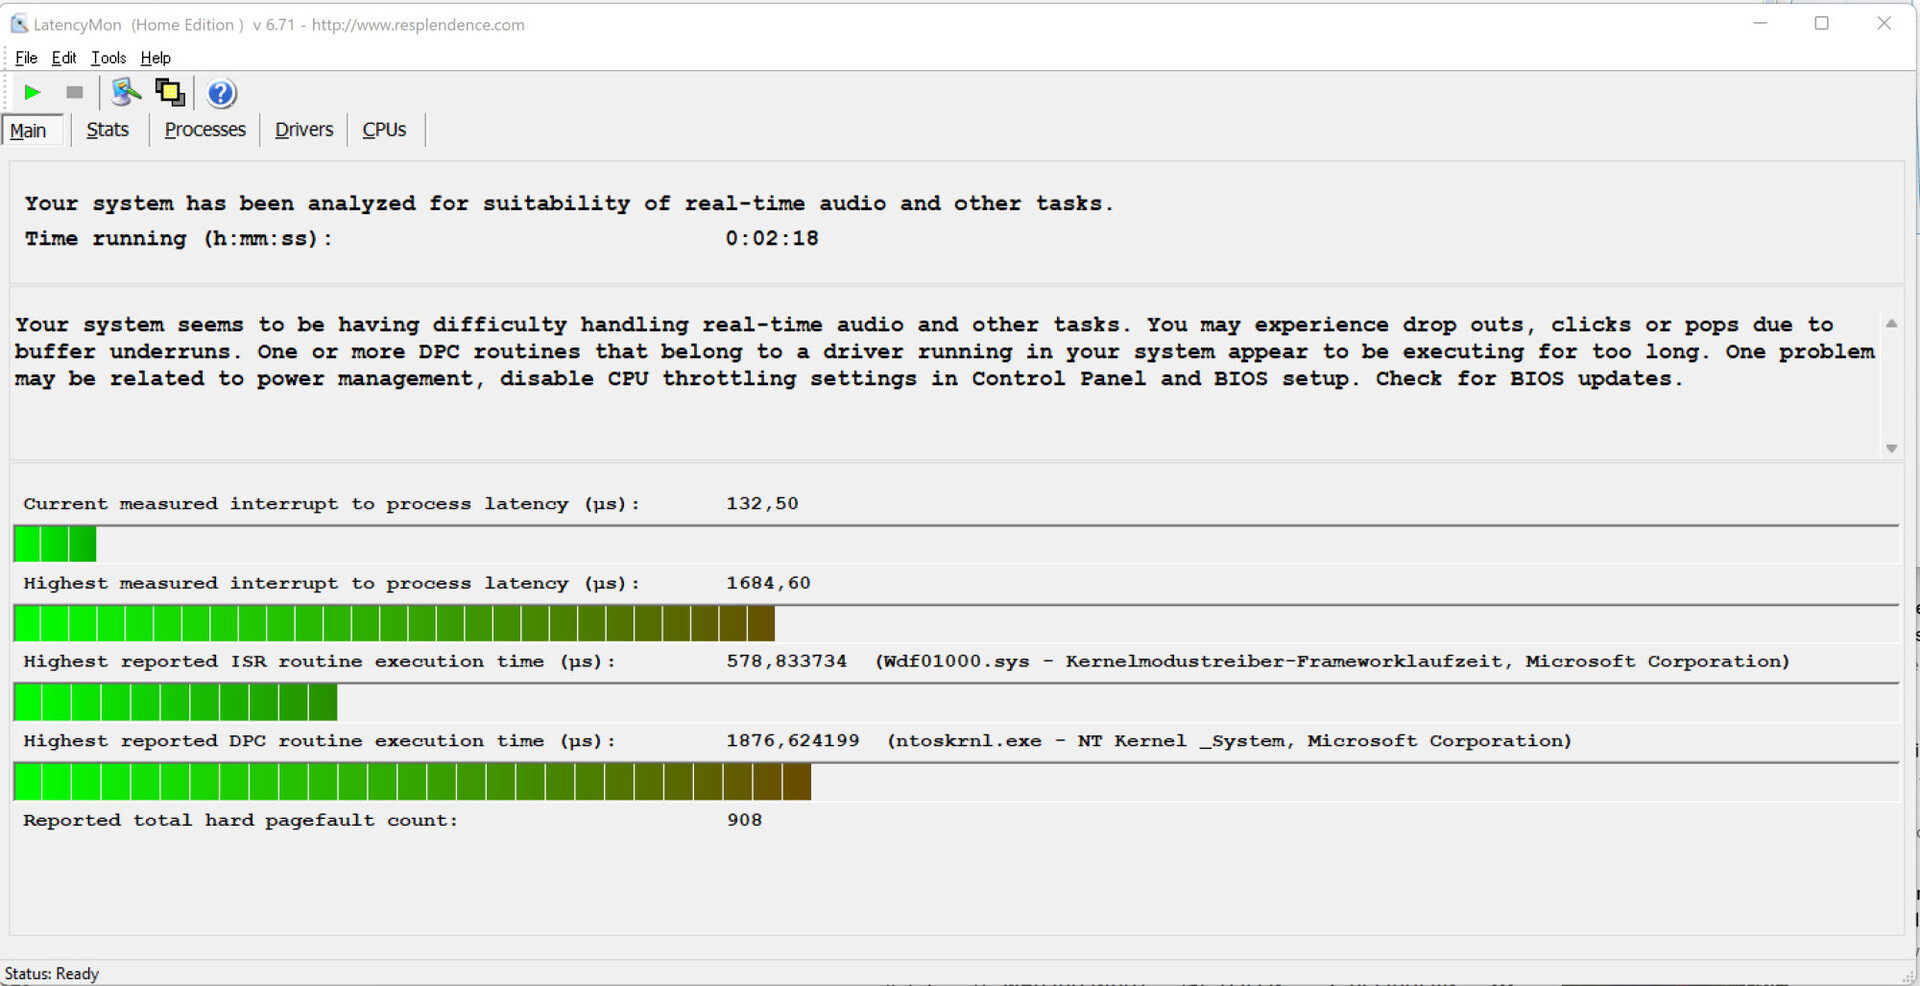
标准化的延迟监测测试(网页浏览、4K视频播放、Prime95高负荷)显示DPC的延迟有些问题。该系统似乎并不适合实时编辑视频和音频。未来的软件更新可能会改善或加剧这种情况。
| DPC Latencies / LatencyMon - interrupt to process latency (max), Web, Youtube, Prime95 | |
| MSI Raider GE77 HX 12UHS | |
| Alienware x17 R2 P48E | |
| Medion Erazer Beast X30 | |
| Razer Blade 17 Early 2022 | |
* ... smaller is better
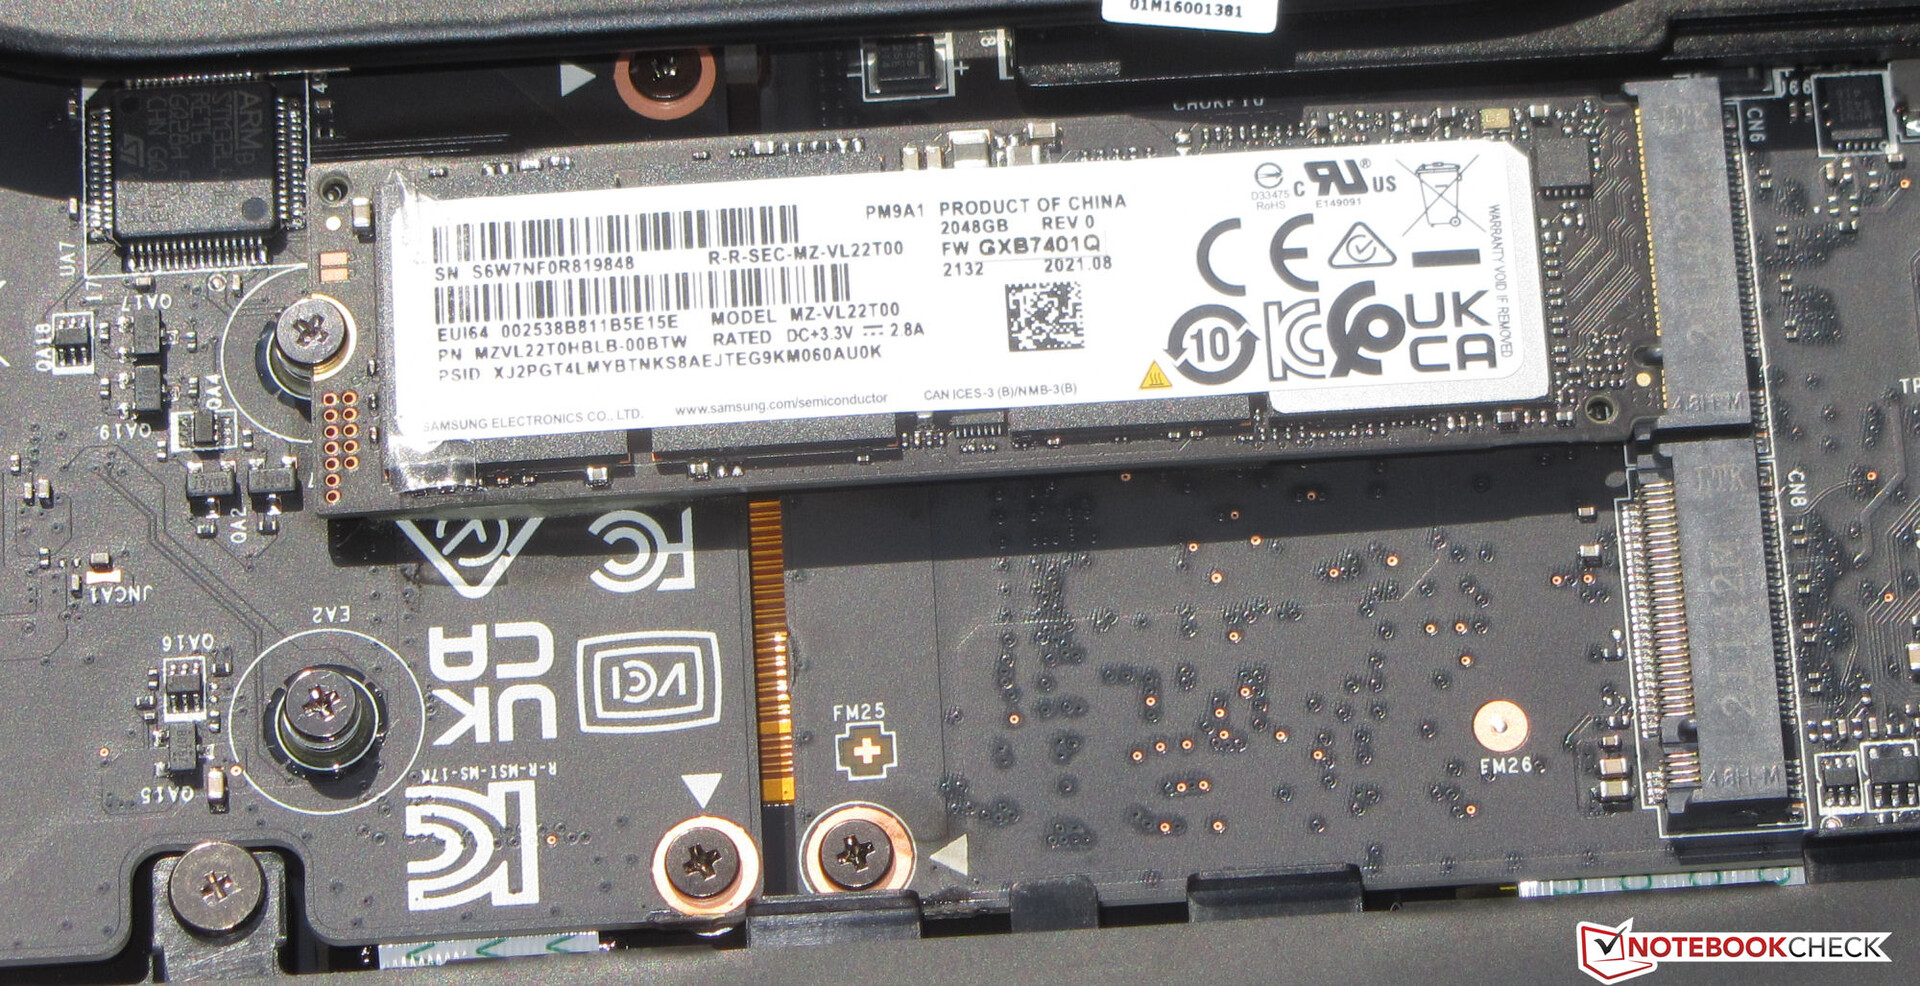
存储解决方案
微星为Raider配备了一块来自三星的2TB SSD(PCIe4,M.2-2280),具有出色的传输速度。还有空间可以安装第二块PCIe4固态硬盘。

| Drive Performance rating - Percent | |
| MSI Raider GE77 HX 12UHS | |
| Medion Erazer Beast X30 | |
| Razer Blade 17 Early 2022 | |
| Average Samsung PM9A1 MZVL22T0HBLB | |
| Average of class Gaming | |
| Alienware x17 R2 P48E | |
* ... smaller is better
Disk Throttling: DiskSpd Read Loop, Queue Depth 8
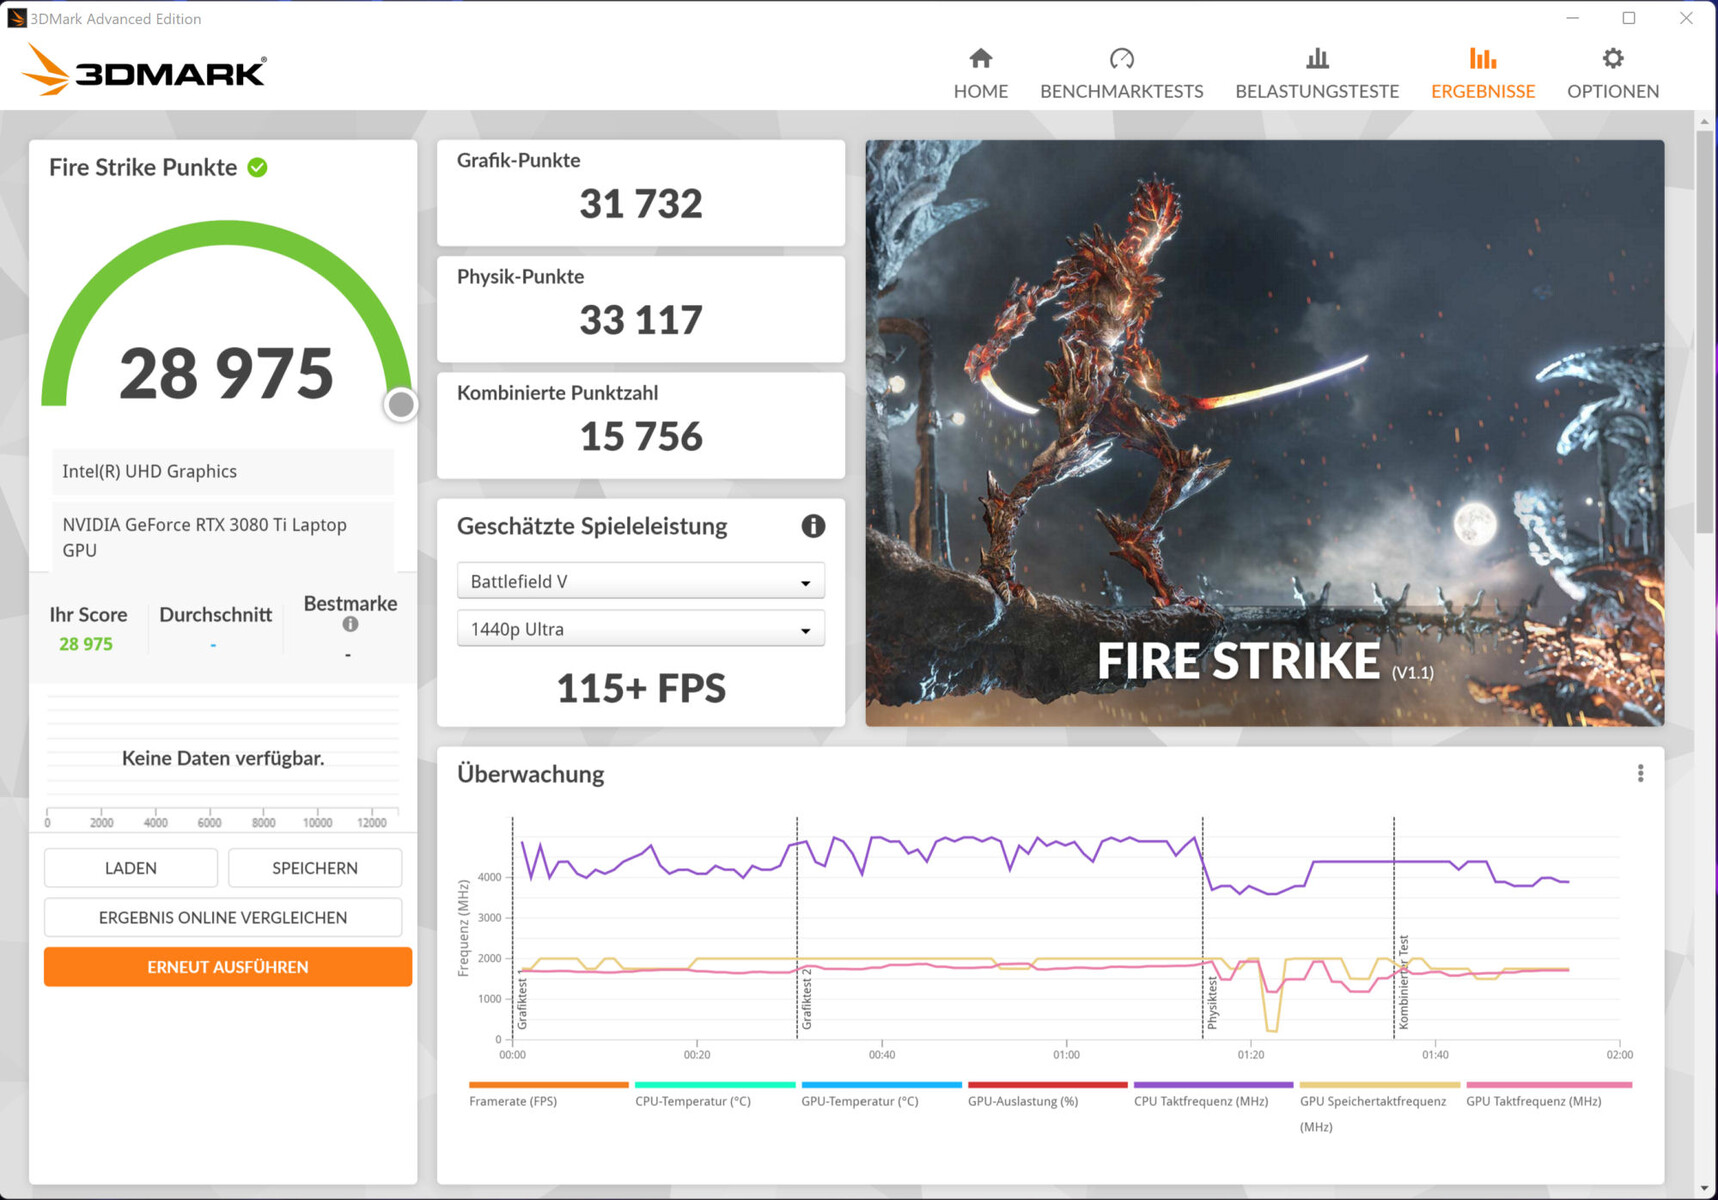
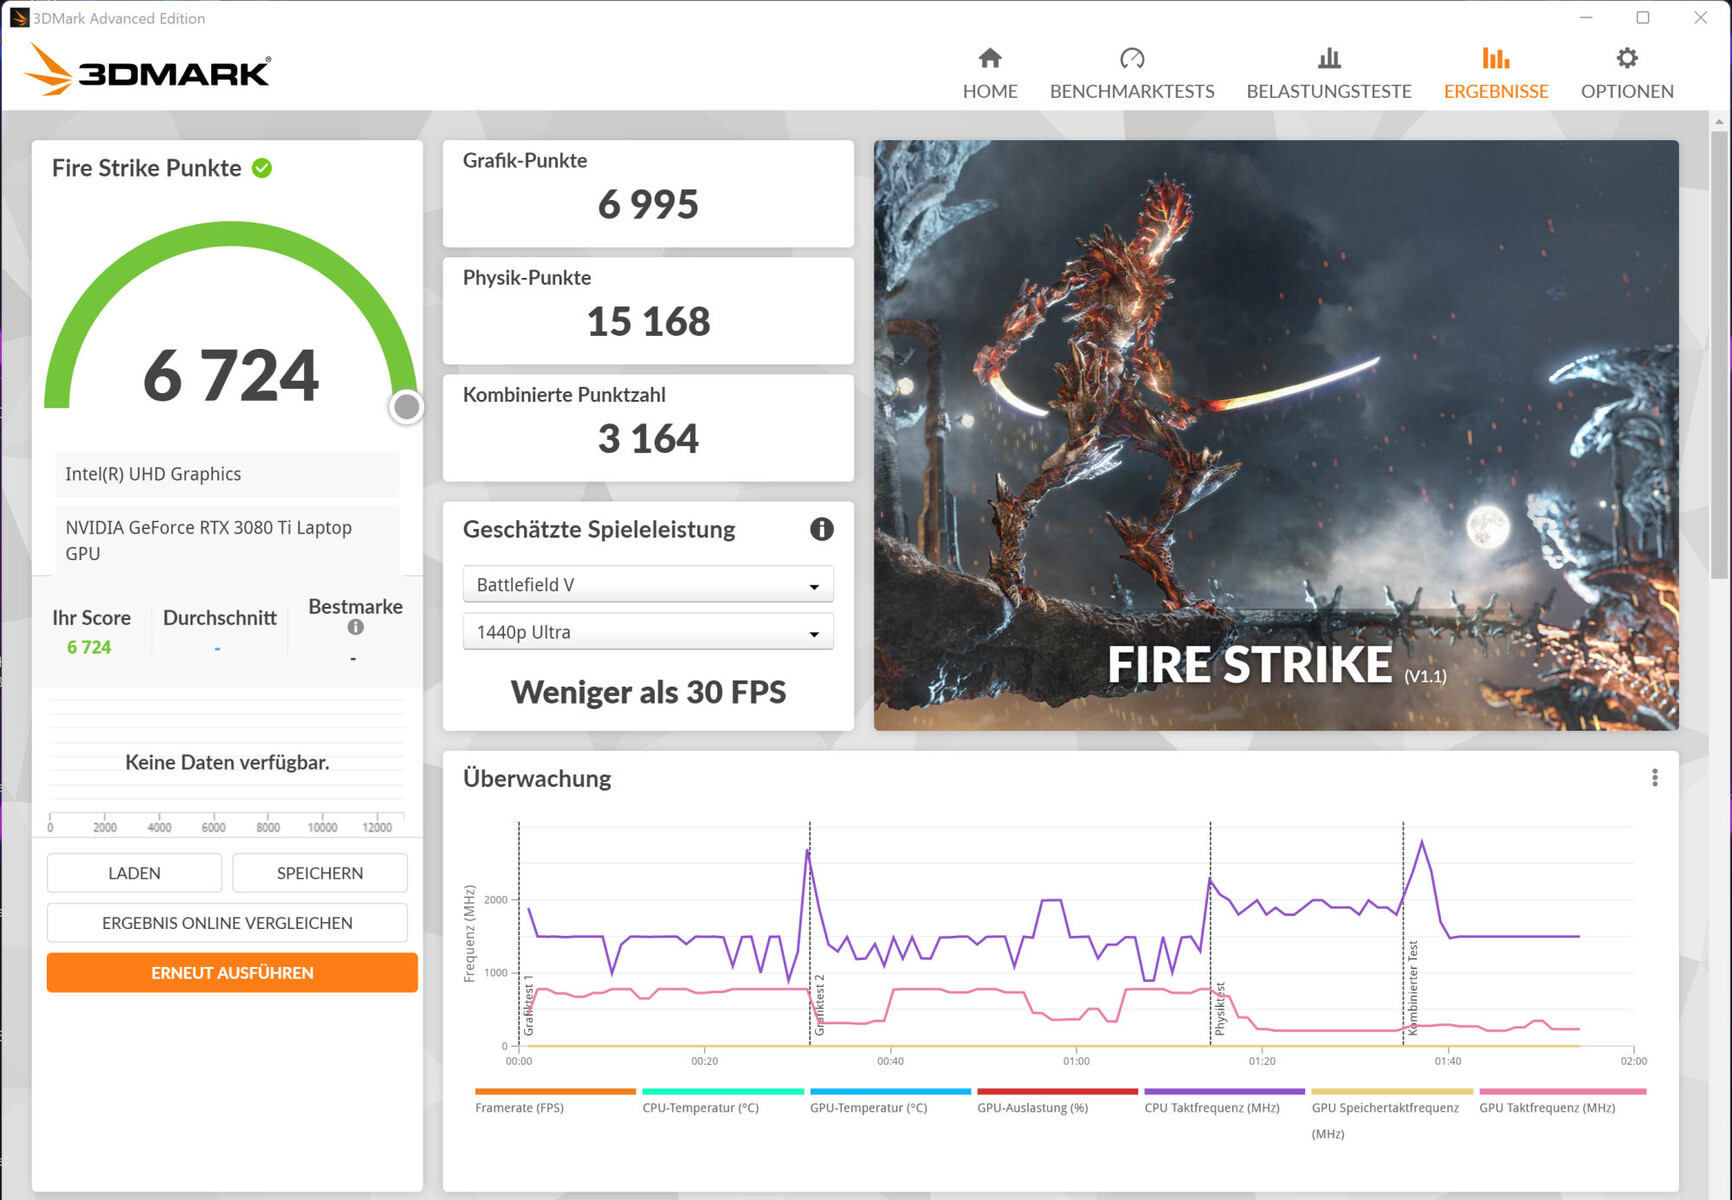
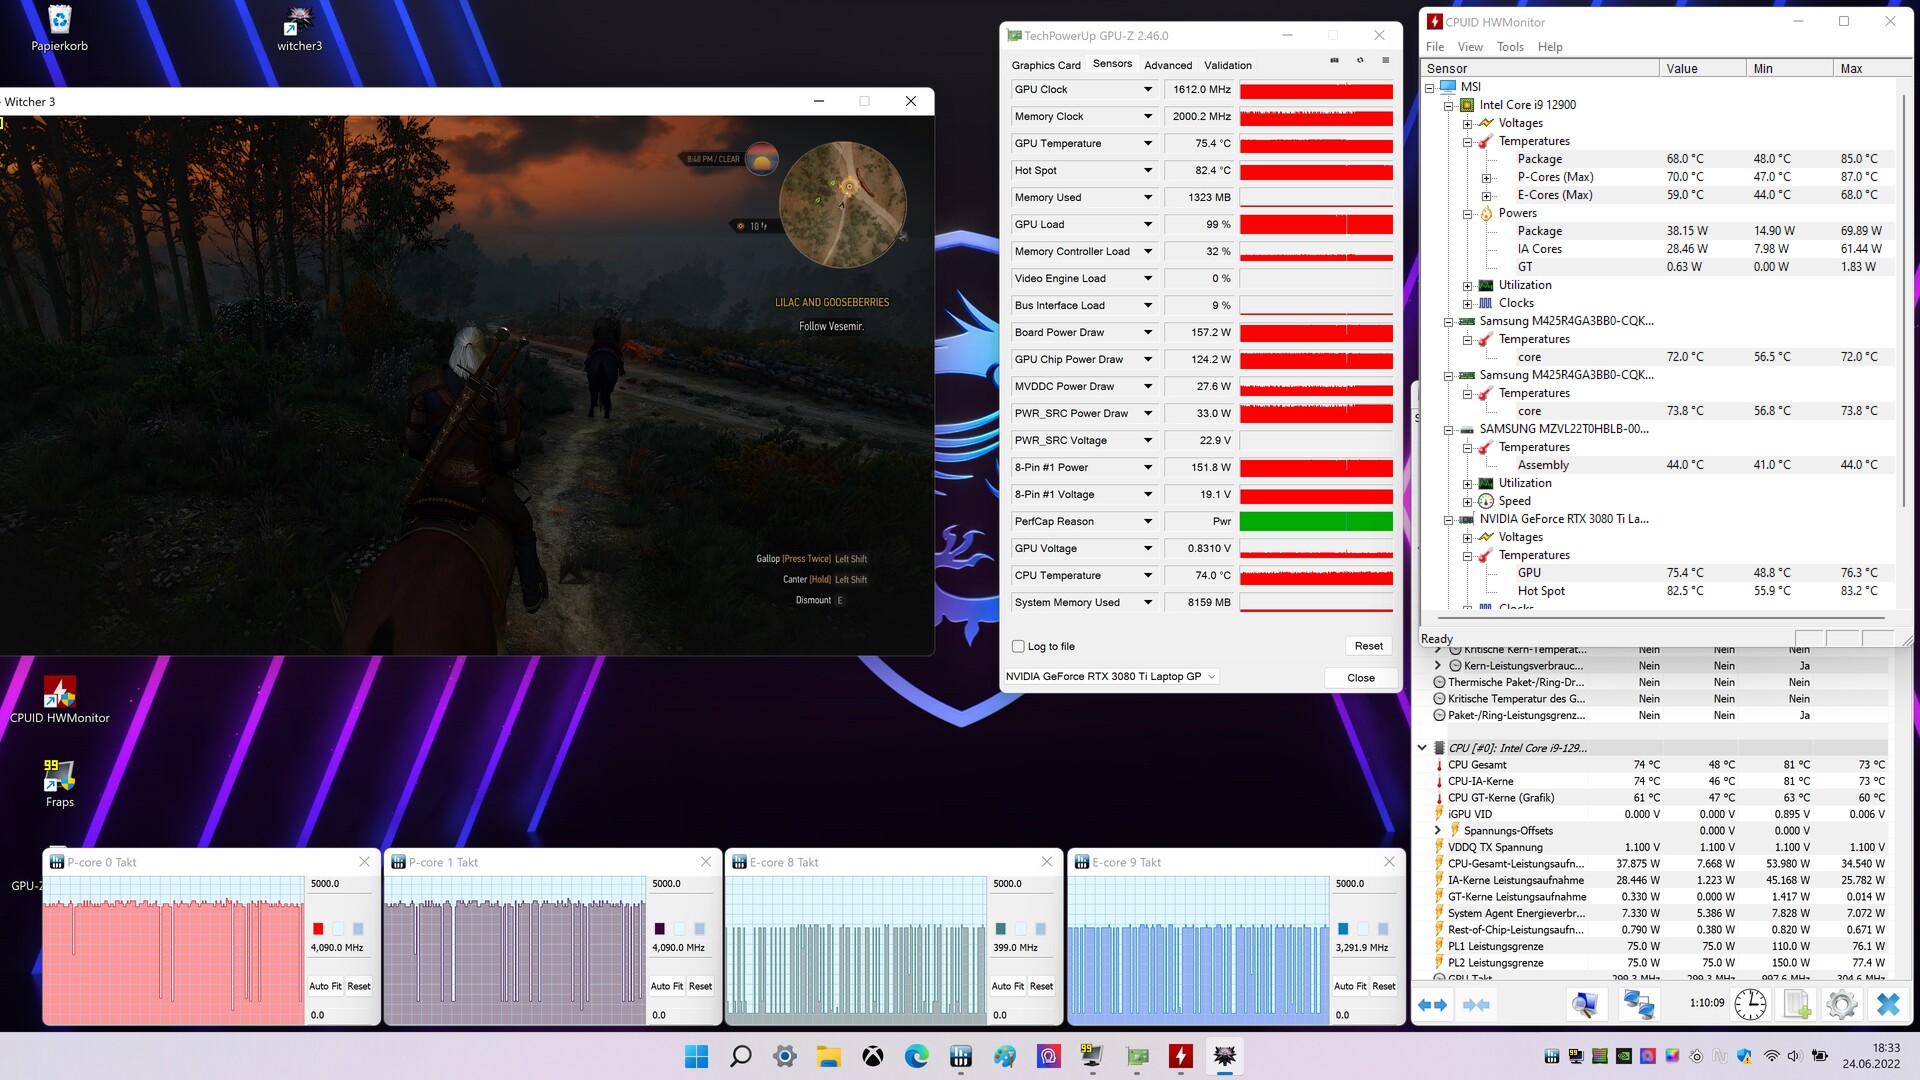
GPU性能
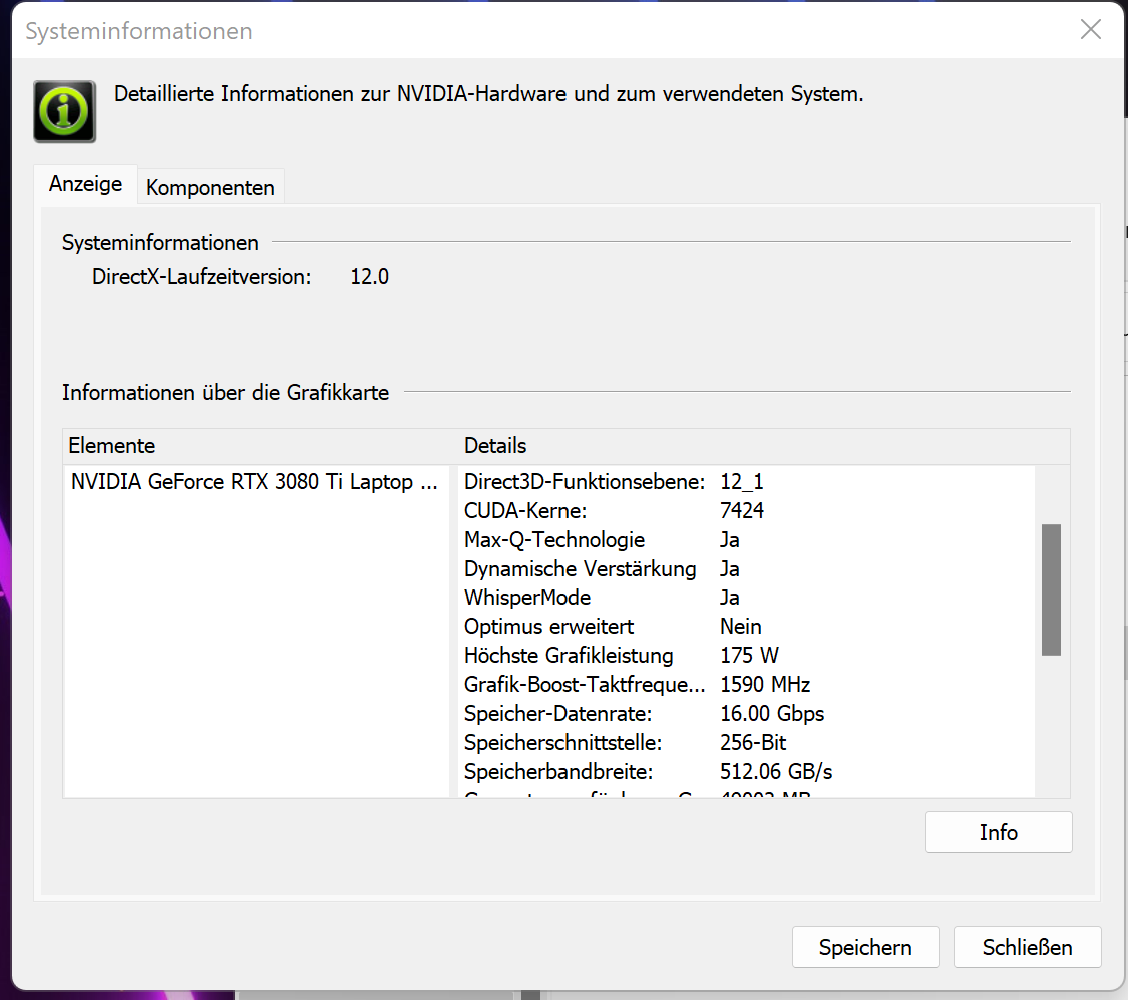
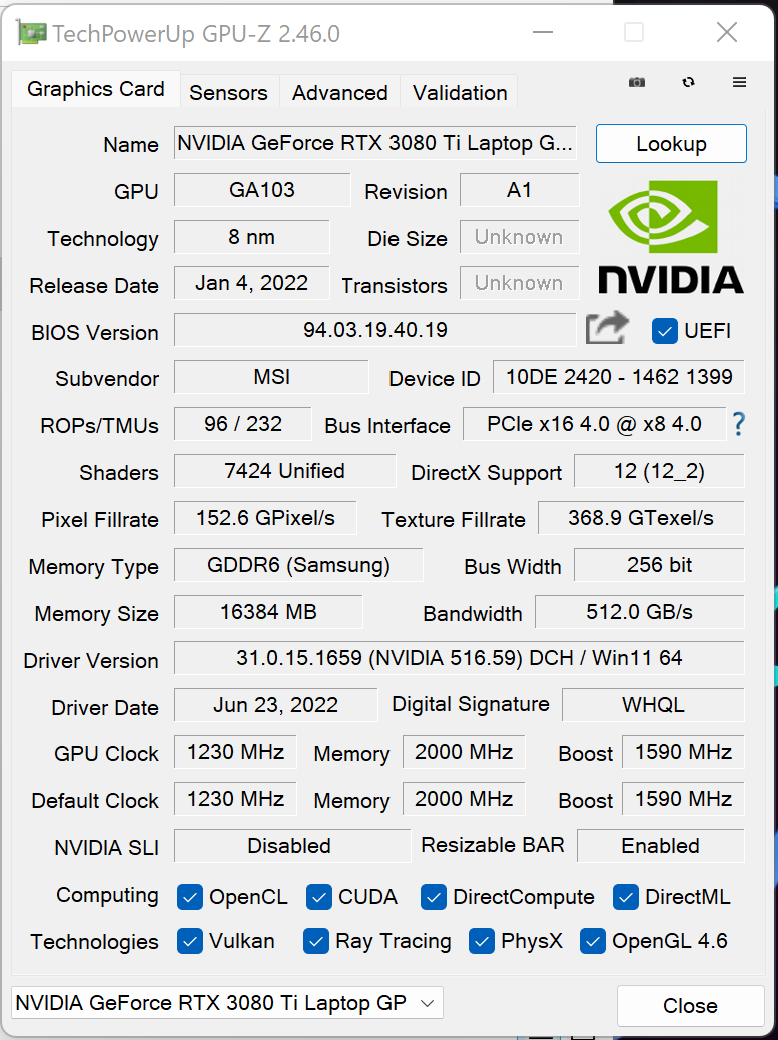
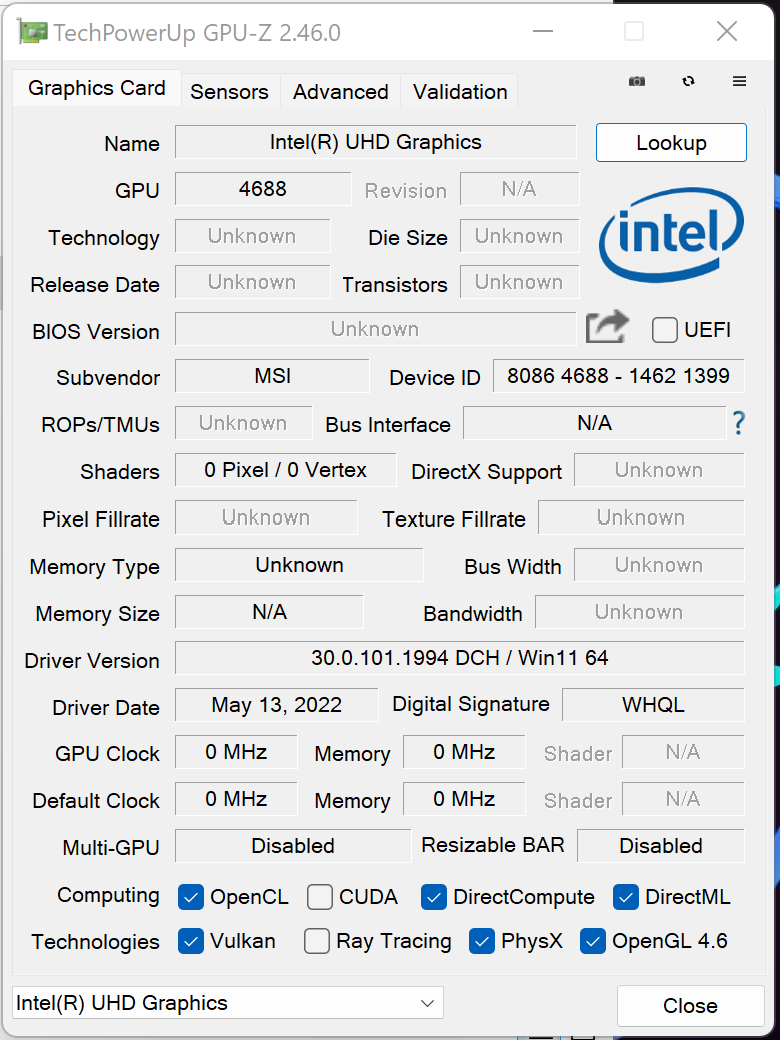
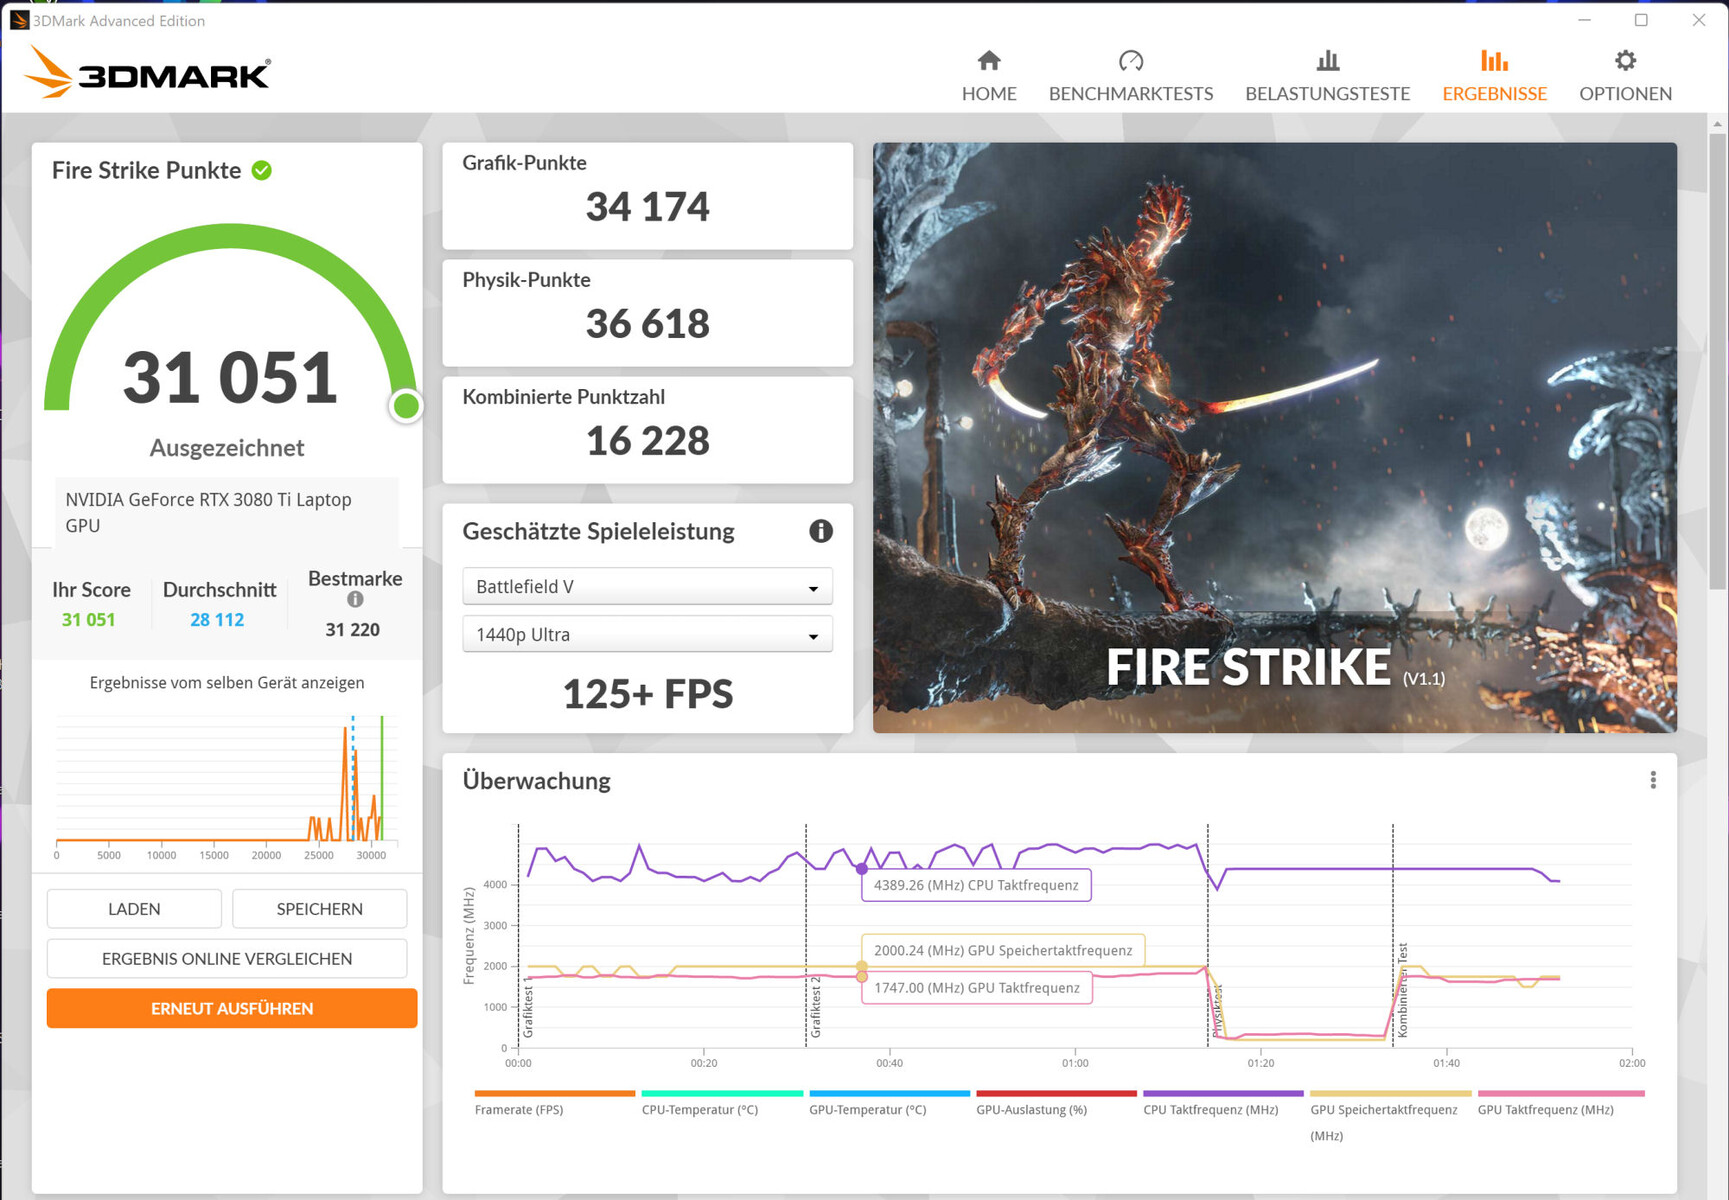
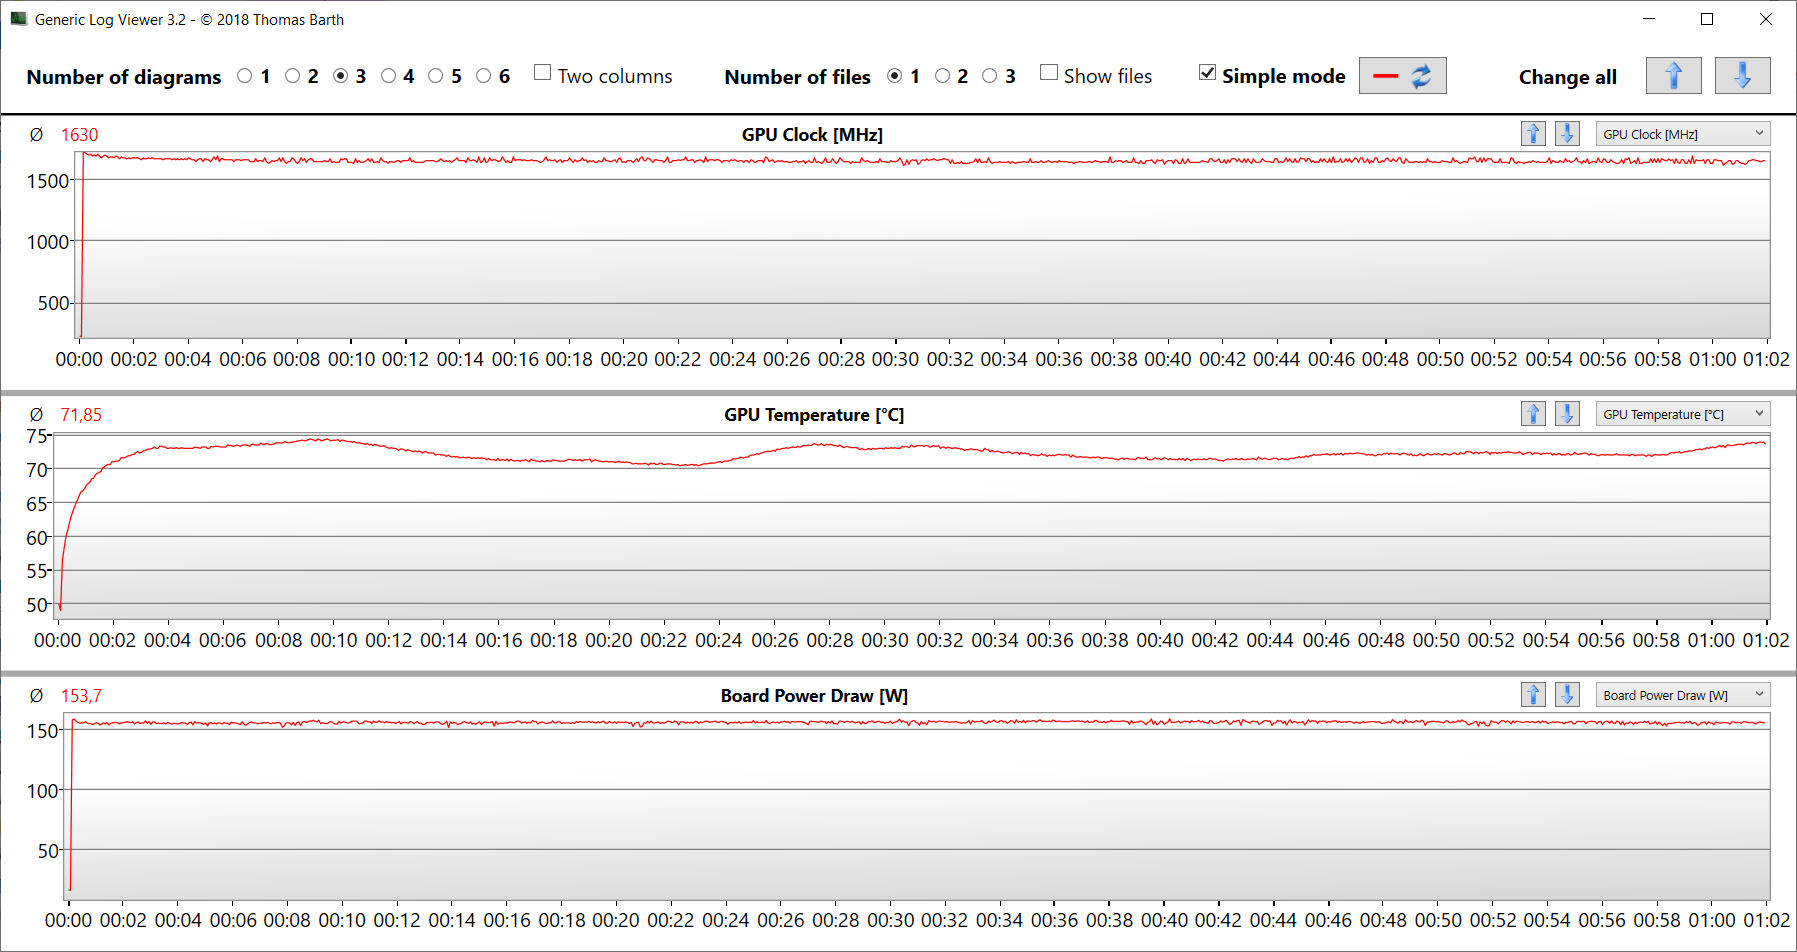
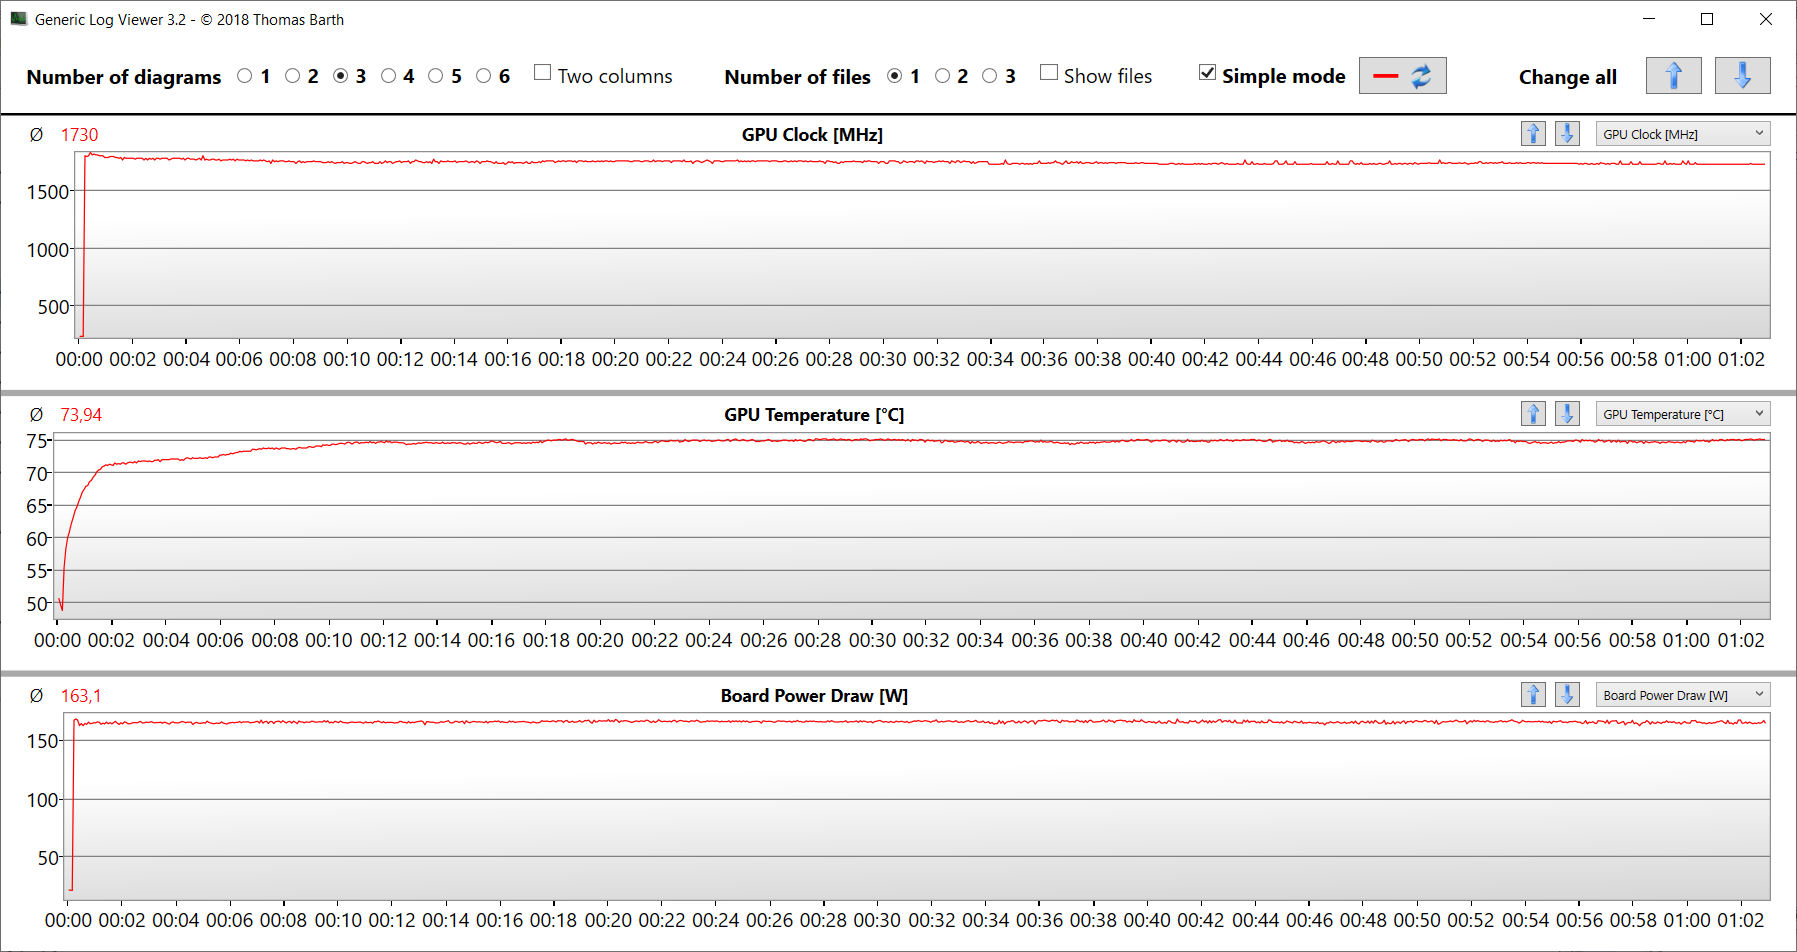
RTX 3000 GPU的实际性能取决于几个因素。冷却方案、内存配置以及制造商在Nvidia规定的限度内选择的最大TGP。对于已安装的 GeForce RTX 3080 Ti笔记本GPU,微星设定的最大TGP为175瓦。该GPU可以访问快速的GDDR6显存(16384 MB)。
基准测试结果超过了我们之前RTX 3080 Ti测量的平均值。通过将电源配置文件 "极端性能 "与通过GeForce GPU的直接视频输出相结合,我们测得了我们从该GPU看到的一些最高分数。然而,正如我们的TheWitcher 3测试显示,TGP范围没有被完全用尽。高级优化不被支持。因此,在dGPU和Optimus之间切换需要重新启动。
然而,这并没有结束。微星中心软件为GPU和VRAM提供超频设置。当然,选择超频的用户要自己承担风险。超频功能可以在电源配置文件 "极端性能 "下找到(选择配置文件,然后点击齿轮)。
| 3DMark Performance rating - Percent | |
| Average of class Gaming | |
| MSI Raider GE77 HX 12UHS | |
| Alienware x17 R2 P48E | |
| MSI Raider GE77 HX 12UHS | |
| Razer Blade 17 Early 2022 | |
| Medion Erazer Beast X30 | |
| Average NVIDIA GeForce RTX 3080 Ti Laptop GPU | |
| 3DMark 11 - 1280x720 Performance GPU | |
| Average of class Gaming (21841 - 80022, n=104, last 2 years) | |
| MSI Raider GE77 HX 12UHS | |
| Alienware x17 R2 P48E | |
| MSI Raider GE77 HX 12UHS (dGPU, Extreme Leistung) | |
| Razer Blade 17 Early 2022 | |
| Medion Erazer Beast X30 | |
| Average NVIDIA GeForce RTX 3080 Ti Laptop GPU (13920 - 45841, n=45) | |
| 3DMark | |
| 1920x1080 Fire Strike Graphics | |
| Average of class Gaming (12242 - 62849, n=115, last 2 years) | |
| MSI Raider GE77 HX 12UHS (dGPU, Extreme Leistung) | |
| Alienware x17 R2 P48E | |
| MSI Raider GE77 HX 12UHS | |
| Medion Erazer Beast X30 | |
| Razer Blade 17 Early 2022 | |
| Average NVIDIA GeForce RTX 3080 Ti Laptop GPU (6928 - 34439, n=43) | |
| 2560x1440 Time Spy Graphics | |
| Average of class Gaming (5012 - 26212, n=115, last 2 years) | |
| Alienware x17 R2 P48E | |
| MSI Raider GE77 HX 12UHS (dGPU, Extreme Leistung) | |
| MSI Raider GE77 HX 12UHS | |
| Razer Blade 17 Early 2022 | |
| Medion Erazer Beast X30 | |
| Average NVIDIA GeForce RTX 3080 Ti Laptop GPU (4921 - 13835, n=43) | |
| 2560x1440 Port Royal Graphics | |
| Average of class Gaming (4395 - 17286, n=71, last 2 years) | |
| MSI Raider GE77 HX 12UHS (dGPU, Extreme Leistung) | |
| Alienware x17 R2 P48E | |
| MSI Raider GE77 HX 12UHS | |
| Razer Blade 17 Early 2022 | |
| Average NVIDIA GeForce RTX 3080 Ti Laptop GPU (6423 - 8462, n=28) | |
| Medion Erazer Beast X30 | |
V-Ray Benchmark Next 4.10: GPU | CPU
Geekbench 5.5: OpenCL Score
SPECviewperf 13: Solidworks (sw-04) | Siemens NX (snx-03) | Showcase (showcase-02) | Medical (medical-02) | Maya (maya-05) | Energy (energy-02) | Creo (creo-02) | Catia (catia-05) | 3ds Max (3dsmax-06)
| V-Ray 5 Benchmark / GPU RTX | |
| Average of class Gaming (1146 - 4363, n=33, last 2 years) | |
| MSI Raider GE77 HX 12UHS (5.0.1, Extreme Leistung) | |
| MSI Raider GE77 HX 12UHS (5.0.1) | |
| Razer Blade 17 Early 2022 (5.0.1) | |
| MSI Raider GE77 HX 12UHS (5.0.1, dGPU, Extreme Leistung) | |
| Medion Erazer Beast X30 (5.0.1) | |
| Average NVIDIA GeForce RTX 3080 Ti Laptop GPU (1225 - 1915, n=19) | |
| V-Ray 5 Benchmark / GPU CUDA | |
| Average of class Gaming (887 - 3288, n=33, last 2 years) | |
| MSI Raider GE77 HX 12UHS (5.0.1, Extreme Leistung) | |
| Razer Blade 17 Early 2022 (5.0.1) | |
| MSI Raider GE77 HX 12UHS (5.0.1) | |
| MSI Raider GE77 HX 12UHS (5.0.1, dGPU, Extreme Leistung) | |
| Medion Erazer Beast X30 (5.0.1) | |
| Average NVIDIA GeForce RTX 3080 Ti Laptop GPU (846 - 1384, n=20) | |
| V-Ray 5 Benchmark / CPU | |
| Average of class Gaming (5864 - 30302, n=32, last 2 years) | |
| MSI Raider GE77 HX 12UHS (5.0.1, dGPU, Extreme Leistung) | |
| MSI Raider GE77 HX 12UHS (5.0.1) | |
| MSI Raider GE77 HX 12UHS (5.0.1, Extreme Leistung) | |
| Alienware x17 R2 P48E (5.0.1) | |
| Average NVIDIA GeForce RTX 3080 Ti Laptop GPU (3692 - 15811, n=25) | |
| Medion Erazer Beast X30 (5.0.1) | |
| Razer Blade 17 Early 2022 (5.0.1) | |
| V-Ray Benchmark Next 4.10 / GPU | |
| Average of class Gaming (427 - 1627, n=99, last 2 years) | |
| MSI Raider GE77 HX 12UHS (v4.10.07 ) | |
| Medion Erazer Beast X30 (v4.10.07 ) | |
| MSI Raider GE77 HX 12UHS (v4.10.07, Extreme Leistung) | |
| MSI Raider GE77 HX 12UHS (v4.10.07, dGPU, Extreme Leistung) | |
| Average NVIDIA GeForce RTX 3080 Ti Laptop GPU (311 - 552, n=35) | |
| Razer Blade 17 Early 2022 (v4.10.07 ) | |
| V-Ray Benchmark Next 4.10 / CPU | |
| Average of class Gaming (10048 - 45327, n=97, last 2 years) | |
| MSI Raider GE77 HX 12UHS (v4.10.07, Extreme Leistung) | |
| MSI Raider GE77 HX 12UHS (v4.10.07, dGPU, Extreme Leistung) | |
| MSI Raider GE77 HX 12UHS (v4.10.07 ) | |
| Medion Erazer Beast X30 (v4.10.07 ) | |
| Average NVIDIA GeForce RTX 3080 Ti Laptop GPU (5564 - 23947, n=35) | |
| Razer Blade 17 Early 2022 (v4.10.07 ) | |
| Geekbench 5.5 / OpenCL Score | |
| Average of class Gaming (80702 - 277970, n=101, last 2 years) | |
| MSI Raider GE77 HX 12UHS | |
| MSI Raider GE77 HX 12UHS (Extreme Leistung) | |
| Alienware x17 R2 P48E | |
| Medion Erazer Beast X30 | |
| Average NVIDIA GeForce RTX 3080 Ti Laptop GPU (88580 - 151633, n=41) | |
| Razer Blade 17 Early 2022 | |
| SPECviewperf 13 / Solidworks (sw-04) | |
| Razer Blade 17 Early 2022 (dGPU, 175W) | |
| MSI Raider GE77 HX 12UHS | |
| Average NVIDIA GeForce RTX 3080 Ti Laptop GPU (62.9 - 133.4, n=8) | |
| Average of class Gaming (n=1last 2 years) | |
| SPECviewperf 13 / Siemens NX (snx-03) | |
| MSI Raider GE77 HX 12UHS | |
| Razer Blade 17 Early 2022 (dGPU, 175W) | |
| Average NVIDIA GeForce RTX 3080 Ti Laptop GPU (18.3 - 25.3, n=8) | |
| Average of class Gaming (n=1last 2 years) | |
| SPECviewperf 13 / Showcase (showcase-02) | |
| Razer Blade 17 Early 2022 (dGPU, 175W) | |
| MSI Raider GE77 HX 12UHS | |
| Average NVIDIA GeForce RTX 3080 Ti Laptop GPU (110 - 175, n=8) | |
| Average of class Gaming (n=1last 2 years) | |
| SPECviewperf 13 / Medical (medical-02) | |
| Razer Blade 17 Early 2022 (dGPU, 175W) | |
| MSI Raider GE77 HX 12UHS | |
| Average NVIDIA GeForce RTX 3080 Ti Laptop GPU (65.3 - 79.1, n=8) | |
| Average of class Gaming (n=1last 2 years) | |
| SPECviewperf 13 / Maya (maya-05) | |
| Razer Blade 17 Early 2022 (dGPU, 175W) | |
| Average NVIDIA GeForce RTX 3080 Ti Laptop GPU (212 - 430, n=8) | |
| MSI Raider GE77 HX 12UHS | |
| Average of class Gaming (n=1last 2 years) | |
| SPECviewperf 13 / Energy (energy-02) | |
| MSI Raider GE77 HX 12UHS | |
| Razer Blade 17 Early 2022 (dGPU, 175W) | |
| Average NVIDIA GeForce RTX 3080 Ti Laptop GPU (19.3 - 27.3, n=8) | |
| Average of class Gaming (n=1last 2 years) | |
| SPECviewperf 13 / Creo (creo-02) | |
| Razer Blade 17 Early 2022 (dGPU, 175W) | |
| MSI Raider GE77 HX 12UHS | |
| Average NVIDIA GeForce RTX 3080 Ti Laptop GPU (177.4 - 311, n=8) | |
| Average of class Gaming (n=1last 2 years) | |
| SPECviewperf 13 / Catia (catia-05) | |
| Razer Blade 17 Early 2022 (dGPU, 175W) | |
| MSI Raider GE77 HX 12UHS | |
| Average NVIDIA GeForce RTX 3080 Ti Laptop GPU (130.4 - 190.3, n=8) | |
| Average of class Gaming (n=1last 2 years) | |
| SPECviewperf 13 / 3ds Max (3dsmax-06) | |
| Razer Blade 17 Early 2022 (dGPU, 175W) | |
| MSI Raider GE77 HX 12UHS | |
| Average NVIDIA GeForce RTX 3080 Ti Laptop GPU (161 - 260, n=8) | |
| Average of class Gaming (n=1last 2 years) | |
| 3DMark 06 Standard Score | 58305 points | |
| 3DMark 11 Performance | 36734 points | |
| 3DMark Cloud Gate Standard Score | 61721 points | |
| 3DMark Fire Strike Score | 28975 points | |
| 3DMark Time Spy Score | 13320 points | |
Help | ||
游戏性能
该硬件允许在高至最高设置下进行4K游戏。帧率范围高于RTX 3080 Ti的平均水平。通过GeForce GPU切换到直接视频输出,会导致数值的增加。很多时候,GE77会产生一些我们所见过的这种GPU的最高帧率。
| The Witcher 3 - 1920x1080 Ultra Graphics & Postprocessing (HBAO+) | |
| Average of class Gaming (104.7 - 240, n=7, last 2 years) | |
| MSI Raider GE77 HX 12UHS (dGPU, Extreme Leistung) | |
| Alienware x17 R2 P48E | |
| MSI Raider GE77 HX 12UHS | |
| Razer Blade 17 Early 2022 | |
| Medion Erazer Beast X30 | |
| Average NVIDIA GeForce RTX 3080 Ti Laptop GPU (30 - 130.6, n=43) | |
| Dota 2 Reborn | |
| 3840x2160 ultra (3/3) best looking | |
| Average of class Gaming (114.9 - 199.2, n=32, last 2 years) | |
| MSI Raider GE77 HX 12UHS (dGPU, Extreme Leistung) | |
| MSI Raider GE77 HX 12UHS (Extreme Leistung) | |
| MSI Raider GE77 HX 12UHS | |
| Average NVIDIA GeForce RTX 3080 Ti Laptop GPU (70.8 - 155.6, n=19) | |
| Razer Blade 17 Early 2022 | |
| 1920x1080 ultra (3/3) best looking | |
| MSI Raider GE77 HX 12UHS (Extreme Leistung) | |
| MSI Raider GE77 HX 12UHS (dGPU, Extreme Leistung) | |
| MSI Raider GE77 HX 12UHS | |
| Alienware x17 R2 P48E | |
| Average of class Gaming (84.8 - 248, n=107, last 2 years) | |
| Medion Erazer Beast X30 | |
| Average NVIDIA GeForce RTX 3080 Ti Laptop GPU (29.9 - 170.5, n=45) | |
| Razer Blade 17 Early 2022 | |
| X-Plane 11.11 | |
| 3840x2160 high (fps_test=3) | |
| MSI Raider GE77 HX 12UHS (dGPU, Extreme Leistung) | |
| MSI Raider GE77 HX 12UHS | |
| MSI Raider GE77 HX 12UHS (Extreme Leistung) | |
| Average of class Gaming (60 - 124.1, n=32, last 2 years) | |
| Average NVIDIA GeForce RTX 3080 Ti Laptop GPU (32.9 - 109.5, n=20) | |
| Razer Blade 17 Early 2022 | |
| 1920x1080 high (fps_test=3) | |
| MSI Raider GE77 HX 12UHS (dGPU, Extreme Leistung) | |
| MSI Raider GE77 HX 12UHS | |
| MSI Raider GE77 HX 12UHS (Extreme Leistung) | |
| Alienware x17 R2 P48E | |
| Average NVIDIA GeForce RTX 3080 Ti Laptop GPU (32.6 - 127, n=45) | |
| Medion Erazer Beast X30 | |
| Average of class Gaming (55.5 - 143.5, n=109, last 2 years) | |
| Razer Blade 17 Early 2022 | |
| Final Fantasy XV Benchmark | |
| 3840x2160 High Quality | |
| Average of class Gaming (49.1 - 111.8, n=33, last 2 years) | |
| MSI Raider GE77 HX 12UHS (1.3, dGPU, Extreme Leistung) | |
| MSI Raider GE77 HX 12UHS (1.3, Extreme Leistung) | |
| MSI Raider GE77 HX 12UHS (1.3) | |
| Razer Blade 17 Early 2022 (1.3) | |
| Average NVIDIA GeForce RTX 3080 Ti Laptop GPU (35.1 - 61.2, n=18) | |
| 1920x1080 High Quality | |
| Average of class Gaming (41 - 215, n=95, last 2 years) | |
| MSI Raider GE77 HX 12UHS (1.3, dGPU, Extreme Leistung) | |
| MSI Raider GE77 HX 12UHS (1.3, Extreme Leistung) | |
| MSI Raider GE77 HX 12UHS (1.3) | |
| Alienware x17 R2 P48E (1.3) | |
| Average NVIDIA GeForce RTX 3080 Ti Laptop GPU (30.7 - 140.6, n=42) | |
| Razer Blade 17 Early 2022 (1.3) | |
| Medion Erazer Beast X30 (1.3) | |
| GTA V | |
| 1920x1080 Highest AA:4xMSAA + FX AF:16x | |
| MSI Raider GE77 HX 12UHS (Extreme Leistung) | |
| MSI Raider GE77 HX 12UHS (dGPU, Extreme Leistung) | |
| MSI Raider GE77 HX 12UHS | |
| Average of class Gaming (48.3 - 186.9, n=94, last 2 years) | |
| Alienware x17 R2 P48E | |
| Average NVIDIA GeForce RTX 3080 Ti Laptop GPU (30 - 139.2, n=42) | |
| Medion Erazer Beast X30 | |
| Razer Blade 17 Early 2022 | |
| 3840x2160 Highest AA:4xMSAA + FX AF:16x | |
| Average of class Gaming (53.9 - 123.2, n=25, last 2 years) | |
| MSI Raider GE77 HX 12UHS (Extreme Leistung) | |
| MSI Raider GE77 HX 12UHS (dGPU, Extreme Leistung) | |
| MSI Raider GE77 HX 12UHS | |
| Razer Blade 17 Early 2022 | |
| Average NVIDIA GeForce RTX 3080 Ti Laptop GPU (37.7 - 67.2, n=14) | |
| Strange Brigade | |
| 3840x2160 ultra AA:ultra AF:16 | |
| Average of class Gaming (83 - 187.2, n=34, last 2 years) | |
| MSI Raider GE77 HX 12UHS (1.47.22.14 D3D12, dGPU, Extreme Leistung) | |
| MSI Raider GE77 HX 12UHS (1.47.22.14 D3D12, Extreme Leistung) | |
| MSI Raider GE77 HX 12UHS (1.47.22.14 D3D12) | |
| Razer Blade 17 Early 2022 (1.47.22.14 D3D12) | |
| Average NVIDIA GeForce RTX 3080 Ti Laptop GPU (61.7 - 100.7, n=15) | |
| 1920x1080 ultra AA:ultra AF:16 | |
| Average of class Gaming (76.3 - 458, n=87, last 2 years) | |
| MSI Raider GE77 HX 12UHS (1.47.22.14 D3D12, dGPU, Extreme Leistung) | |
| Alienware x17 R2 P48E (1.47.22.14 D3D12) | |
| MSI Raider GE77 HX 12UHS (1.47.22.14 D3D12, Extreme Leistung) | |
| MSI Raider GE77 HX 12UHS (1.47.22.14 D3D12) | |
| Razer Blade 17 Early 2022 (1.47.22.14 D3D12) | |
| Medion Erazer Beast X30 (1.47.22.14 D3D12) | |
| Average NVIDIA GeForce RTX 3080 Ti Laptop GPU (42.3 - 224, n=41) | |
| F1 2021 | |
| 1920x1080 Ultra High Preset + Raytracing AA:T AF:16x | |
| MSI Raider GE77 HX 12UHS (874931, dGPU, Extreme Leistung) | |
| MSI Raider GE77 HX 12UHS (874931) | |
| MSI Raider GE77 HX 12UHS (874931, Extreme Leistung) | |
| Razer Blade 17 Early 2022 (874931) | |
| Medion Erazer Beast X30 (874931) | |
| Average NVIDIA GeForce RTX 3080 Ti Laptop GPU (30.2 - 160.6, n=30) | |
| 3840x2160 Ultra High Preset + Raytracing AA:T AF:16x | |
| MSI Raider GE77 HX 12UHS (874931, dGPU, Extreme Leistung) | |
| MSI Raider GE77 HX 12UHS (874931, Extreme Leistung) | |
| MSI Raider GE77 HX 12UHS (874931) | |
| Razer Blade 17 Early 2022 (874931) | |
| Average NVIDIA GeForce RTX 3080 Ti Laptop GPU (41.1 - 70.2, n=18) | |
为了确定帧率是否在很长一段时间内保持一致,我们在全高清分辨率和最高质量设置下运行游戏 "TheWitcher 3" 60分钟。在整个测试过程中,角色没有被移动。我们没有注意到任何帧率的下降。
Witcher 3 FPS Chart
| low | med. | high | ultra | QHD | 4K | |
|---|---|---|---|---|---|---|
| GTA V (2015) | 186.8 | 187 | 184.3 | 136 | 121.1 | 122 |
| The Witcher 3 (2015) | 498 | 392 | 249 | 126.7 | 62.1 | |
| Dota 2 Reborn (2015) | 203 | 184 | 174.8 | 165.7 | 144.7 | |
| Final Fantasy XV Benchmark (2018) | 217 | 175.6 | 132 | 98.6 | 57.9 | |
| X-Plane 11.11 (2018) | 172.8 | 152.3 | 121.1 | 103 | ||
| Far Cry 5 (2018) | 214 | 176 | 167 | 156 | 131 | 73 |
| Strange Brigade (2018) | 505 | 291 | 234 | 209 | 159.9 | 96.6 |
| F1 2021 (2021) | 354 | 243 | 207 | 133.8 | 104.3 | 64 |
排放--MSI系统在负载下会有噪音
系统噪音
即使在怠速和低负载情况下,风扇控制也不能完全顺利地工作。例如,风扇有时会静止不动,以获得完全无声的体验;在其他时候,它们变得非常明显(高达46 dB(A))。在负载情况下,微星笔记本电脑产生非常高的最大噪音水平,高达55分贝(A)(Witcher 3 测试)或57分贝(A)(压力测试)。
对于安静的操作,建议使用 "静音模式"。这样系统会更安静,但不是完全静音--同时性能也会大大降低。
Noise level
| Idle |
| 26 / 34 / 46 dB(A) |
| Load |
| 50 / 57 dB(A) |
 | ||
30 dB silent 40 dB(A) audible 50 dB(A) loud |
||
min: | ||
| MSI Raider GE77 HX 12UHS Intel Core i9-12900HX, NVIDIA GeForce RTX 3080 Ti Laptop GPU | Razer Blade 17 Early 2022 Intel Core i9-12900H, NVIDIA GeForce RTX 3080 Ti Laptop GPU | Alienware x17 R2 P48E Intel Core i9-12900HK, NVIDIA GeForce RTX 3080 Ti Laptop GPU | Medion Erazer Beast X30 Intel Core i9-12900HK, NVIDIA GeForce RTX 3080 Ti Laptop GPU | |
|---|---|---|---|---|
| Noise | 10% | 22% | 8% | |
| off / environment * (dB) | 26 | 26 -0% | 22.7 13% | 26 -0% |
| Idle Minimum * (dB) | 26 | 26 -0% | 23.1 11% | 27 -4% |
| Idle Average * (dB) | 34 | 27 21% | 23.1 32% | 29 15% |
| Idle Maximum * (dB) | 46 | 32 30% | 23.1 50% | 34 26% |
| Load Average * (dB) | 50 | 50 -0% | 31.9 36% | 48 4% |
| Witcher 3 ultra * (dB) | 55 | 51 7% | 52.5 5% | 51 7% |
| Load Maximum * (dB) | 57 | 51 11% | 52.5 8% | 53 7% |
* ... smaller is better
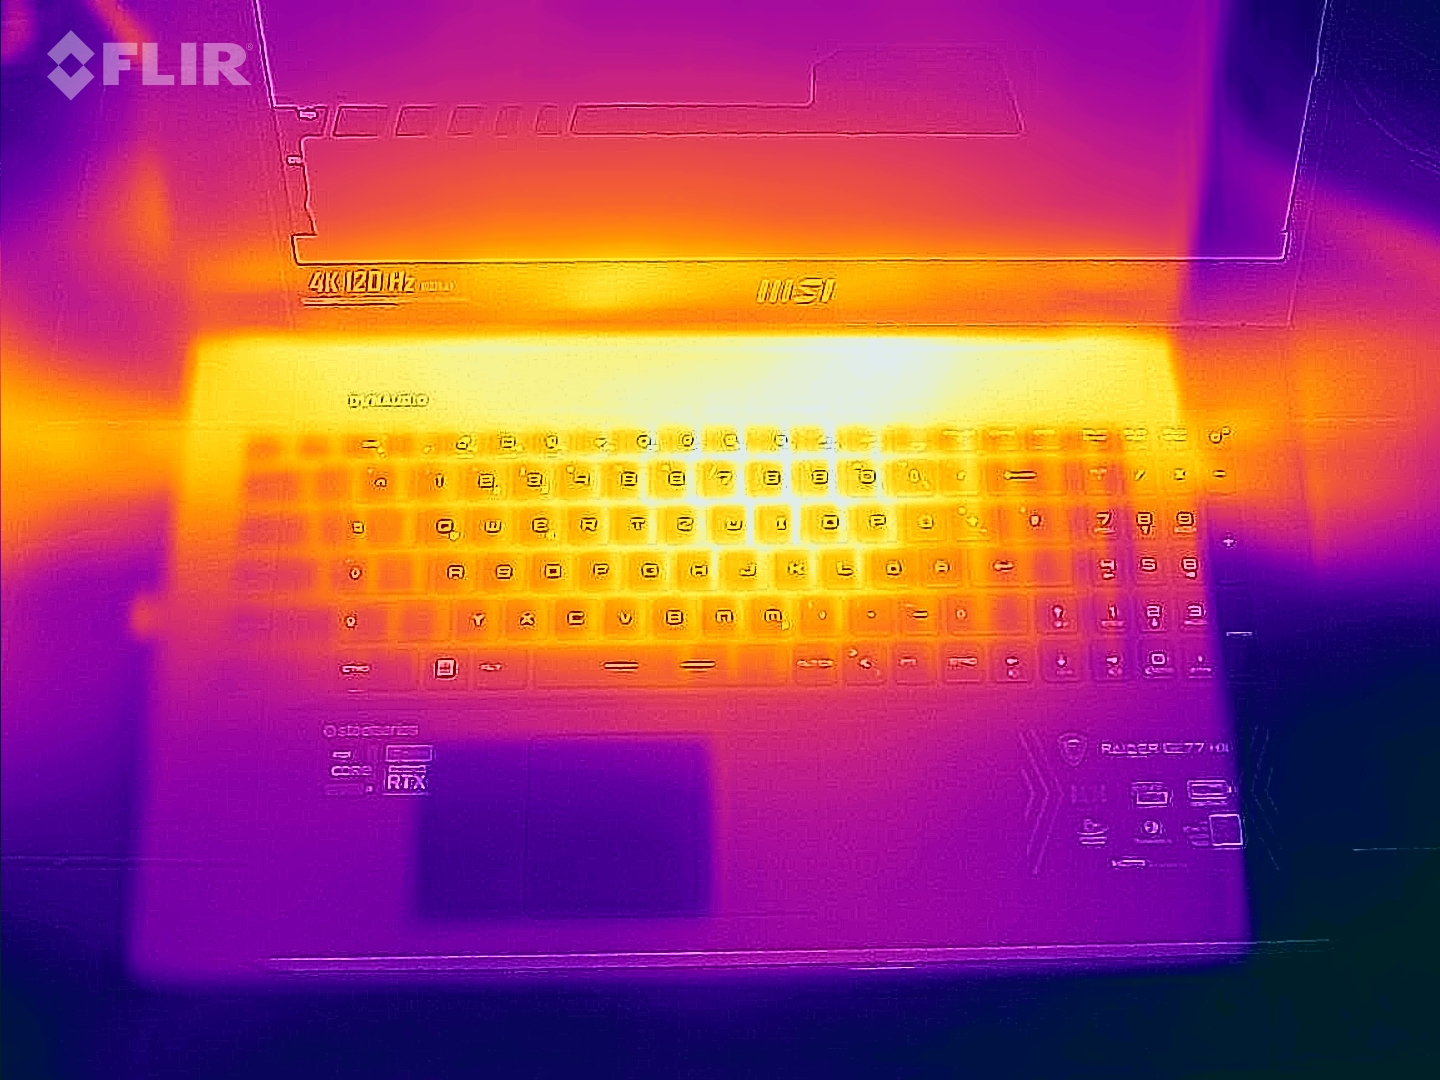
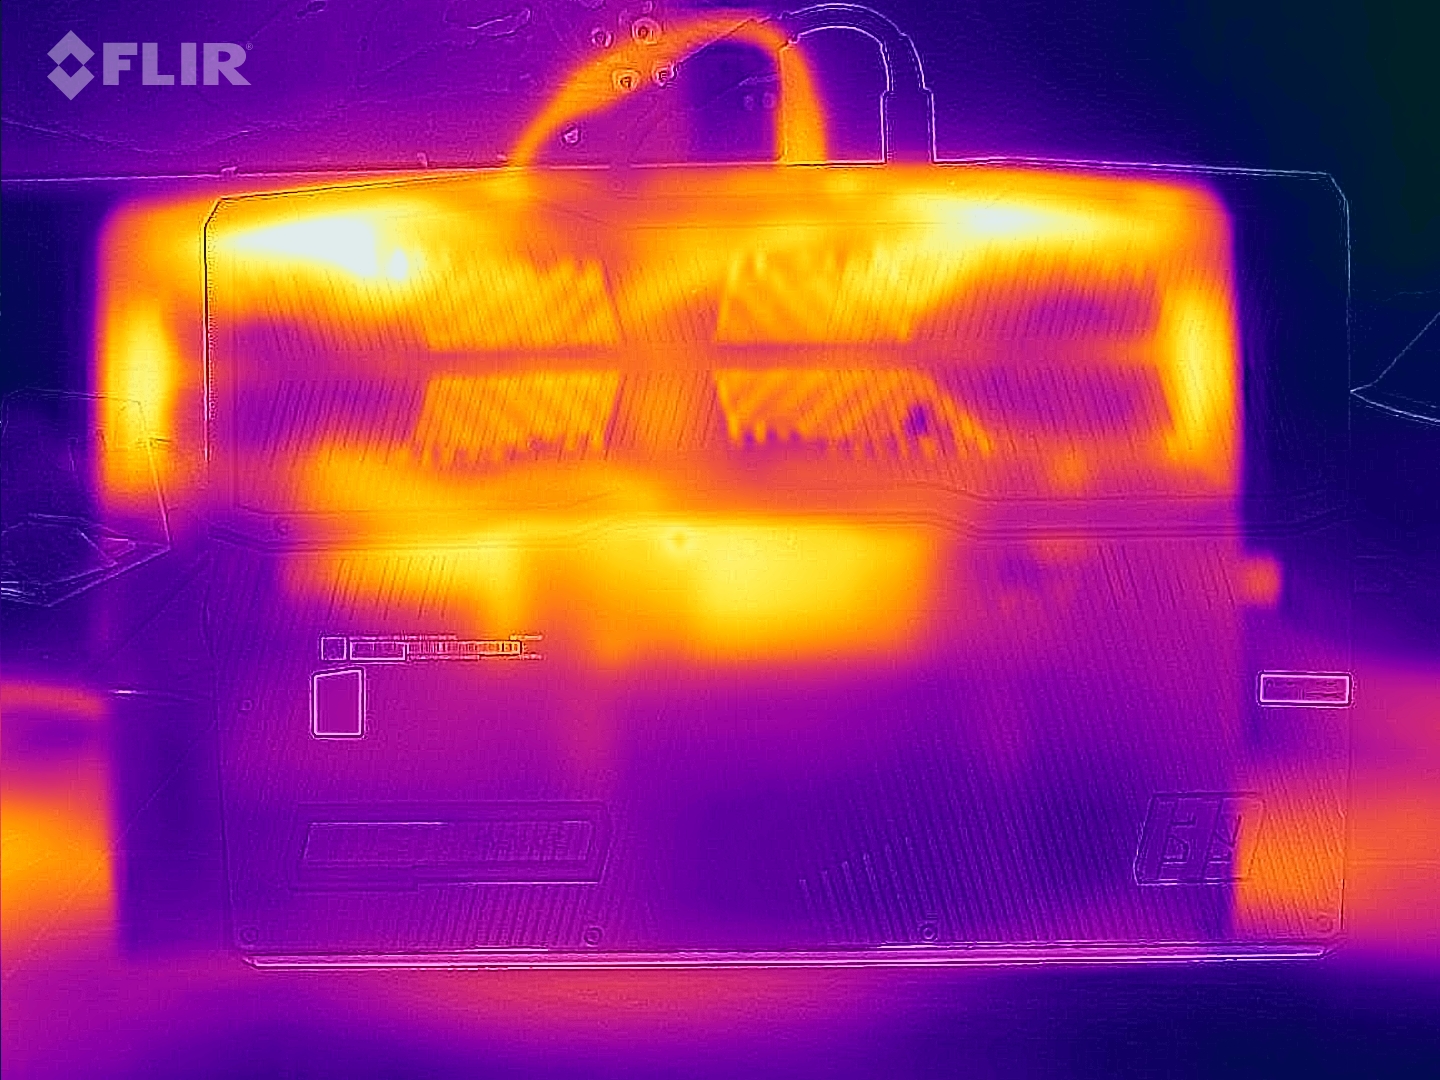
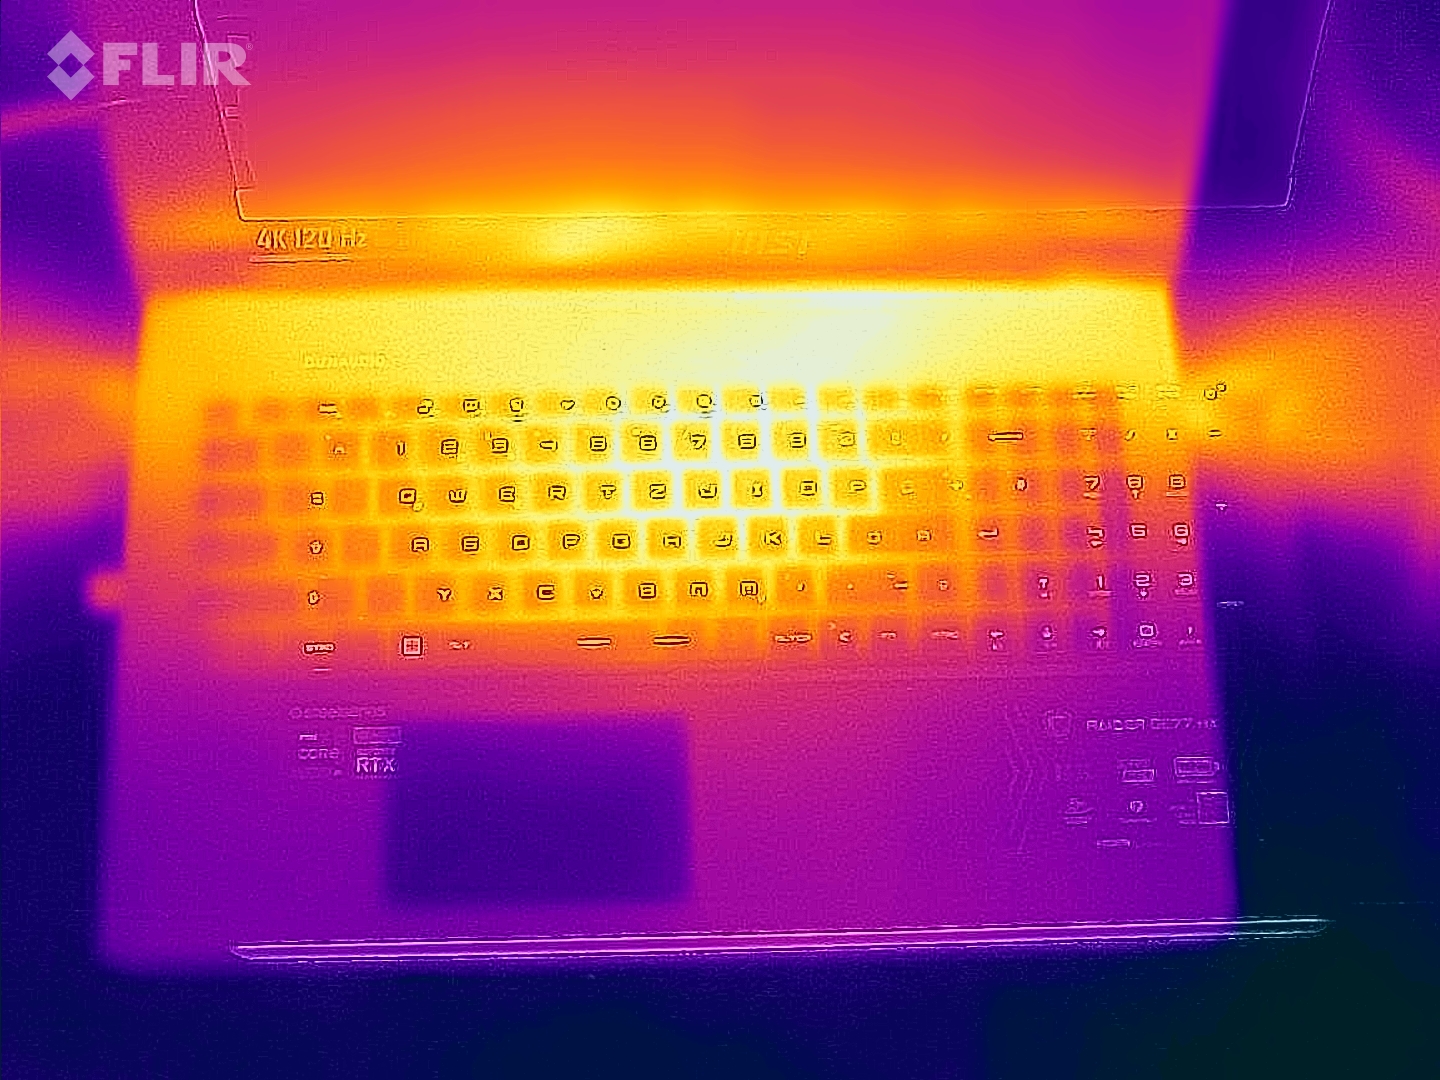
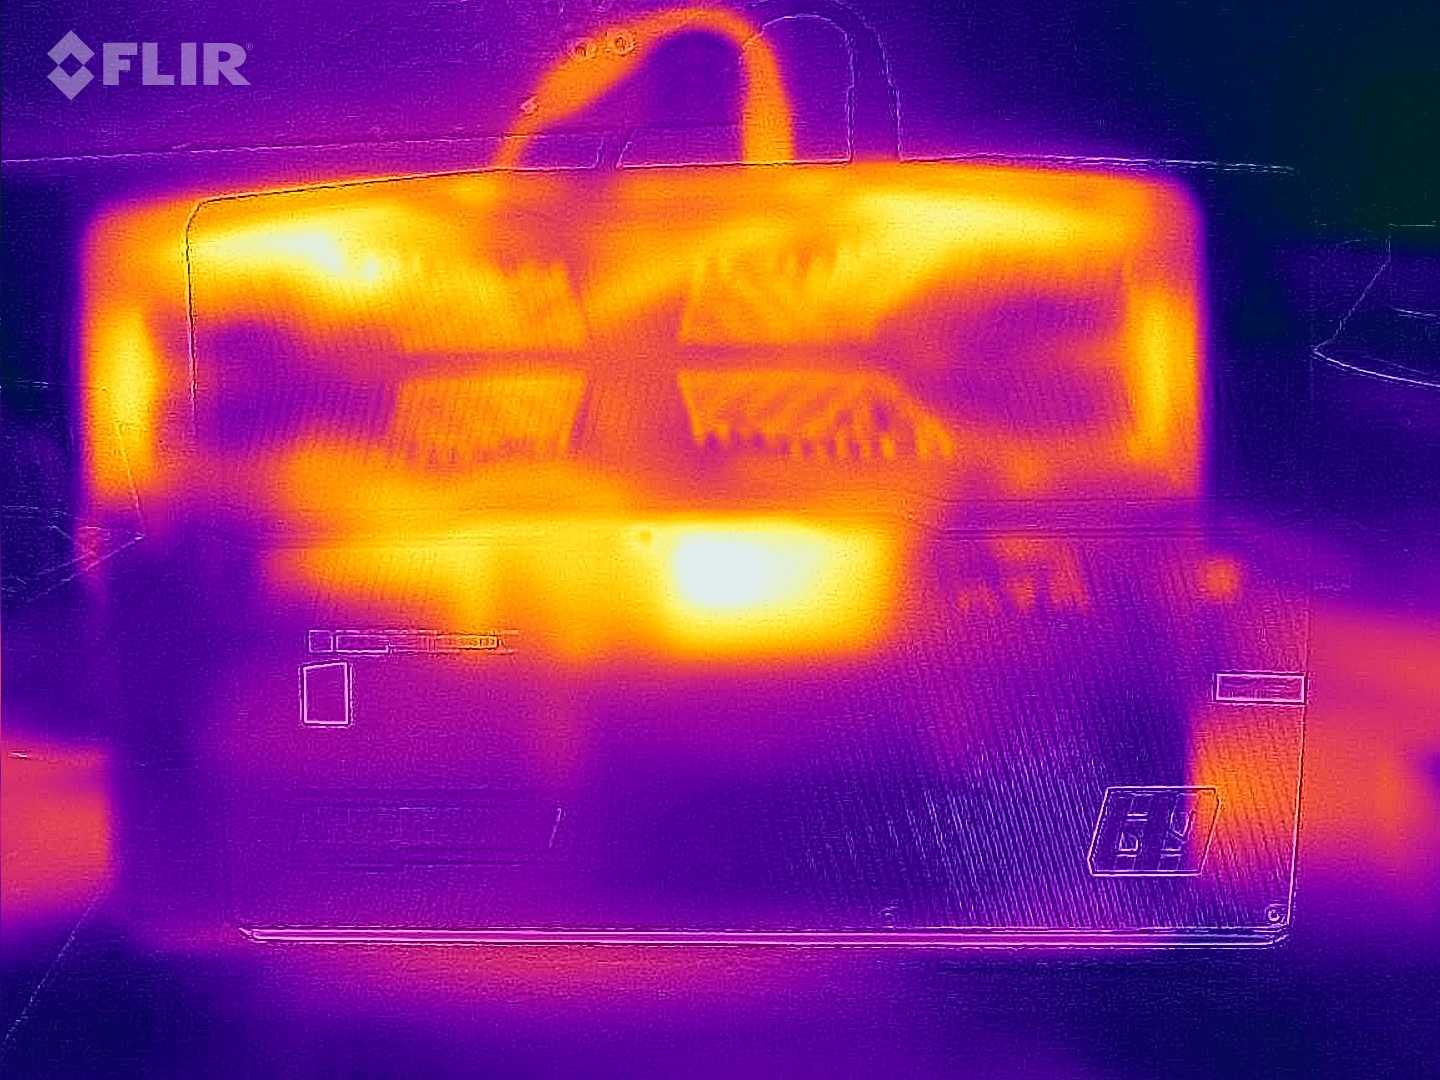
温度
在日常使用中(办公室、网络),表面温度保持在可接受的范围内。在负载情况下(压力测试,Witcher 3 测试),笔记本电脑会明显发热,但不会过度。用户也不必担心CPU的温度。
(-) The maximum temperature on the upper side is 53 °C / 127 F, compared to the average of 40.4 °C / 105 F, ranging from 21.2 to 68.8 °C for the class Gaming.
(-) The bottom heats up to a maximum of 58 °C / 136 F, compared to the average of 43.2 °C / 110 F
(±) In idle usage, the average temperature for the upper side is 34.8 °C / 95 F, compared to the device average of 33.9 °C / 93 F.
(-) Playing The Witcher 3, the average temperature for the upper side is 44.1 °C / 111 F, compared to the device average of 33.9 °C / 93 F.
(+) The palmrests and touchpad are reaching skin temperature as a maximum (35 °C / 95 F) and are therefore not hot.
(-) The average temperature of the palmrest area of similar devices was 28.8 °C / 83.8 F (-6.2 °C / -11.2 F).
| MSI Raider GE77 HX 12UHS Intel Core i9-12900HX, NVIDIA GeForce RTX 3080 Ti Laptop GPU | Razer Blade 17 Early 2022 Intel Core i9-12900H, NVIDIA GeForce RTX 3080 Ti Laptop GPU | Alienware x17 R2 P48E Intel Core i9-12900HK, NVIDIA GeForce RTX 3080 Ti Laptop GPU | Medion Erazer Beast X30 Intel Core i9-12900HK, NVIDIA GeForce RTX 3080 Ti Laptop GPU | |
|---|---|---|---|---|
| Heat | 7% | 21% | 5% | |
| Maximum Upper Side * (°C) | 53 | 50 6% | 49.6 6% | 55 -4% |
| Maximum Bottom * (°C) | 58 | 56 3% | 42.4 27% | 62 -7% |
| Idle Upper Side * (°C) | 38 | 36 5% | 29.2 23% | 32 16% |
| Idle Bottom * (°C) | 43 | 38 12% | 32 26% | 36 16% |
* ... smaller is better
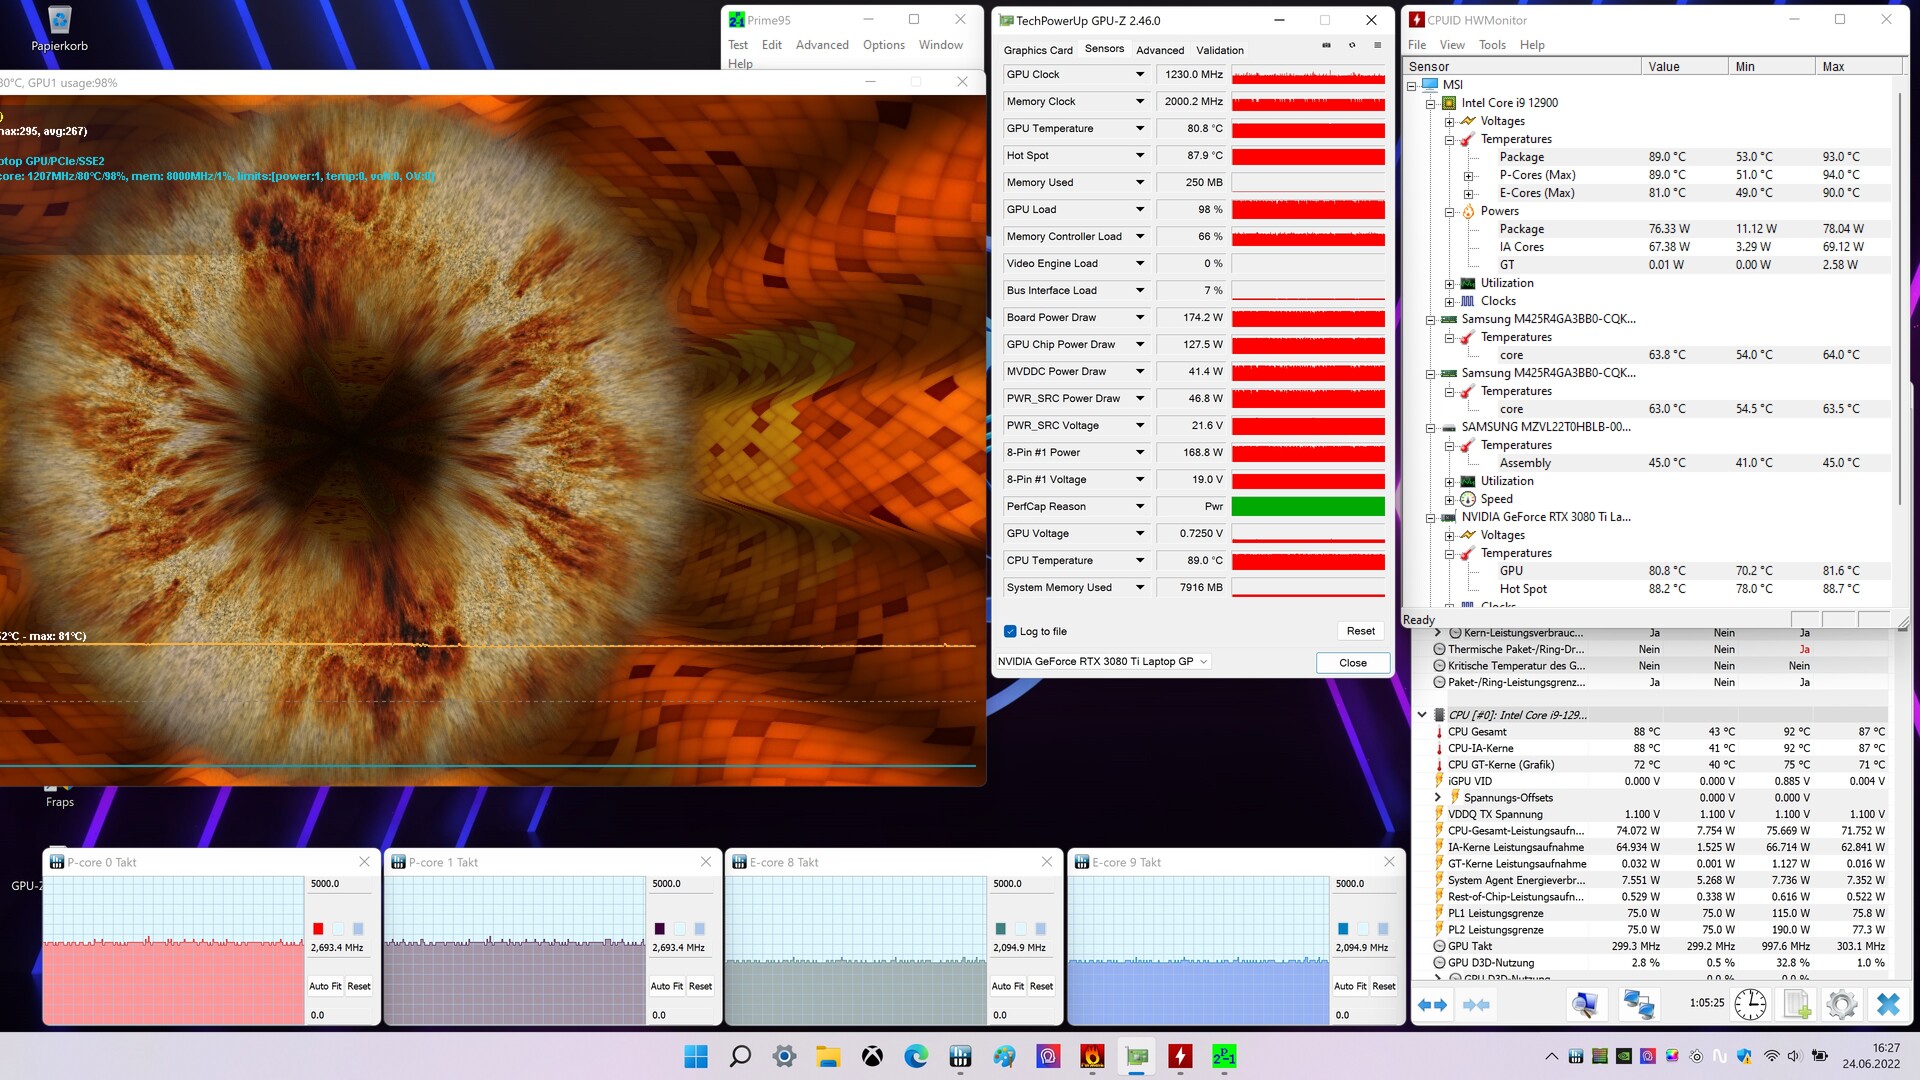
压力测试
在压力测试的开始阶段(运行Prime95和FurMark至少一个小时),CPU和GPU都以高速运行。随后,时钟速度下降到1.3(CPU)和1100 MHz(GPU)。压力测试代表了一种极端情况。我们用这个测试来确定系统在全负荷下是否保持稳定。
发言人
这款笔记本电脑配备了两个扬声器和两个低音炮,它们共同产生了体面的声音--尽管稍微多一点低音也无妨。为了获得更好的声音体验,建议使用耳机或外部扬声器。
MSI Raider GE77 HX 12UHS audio analysis
(+) | speakers can play relatively loud (85 dB)
Bass 100 - 315 Hz
(±) | reduced bass - on average 11% lower than median
(±) | linearity of bass is average (11.3% delta to prev. frequency)
Mids 400 - 2000 Hz
(+) | balanced mids - only 4.3% away from median
(+) | mids are linear (3.2% delta to prev. frequency)
Highs 2 - 16 kHz
(+) | balanced highs - only 2.3% away from median
(+) | highs are linear (5% delta to prev. frequency)
Overall 100 - 16.000 Hz
(+) | overall sound is linear (11% difference to median)
Compared to same class
» 7% of all tested devices in this class were better, 3% similar, 89% worse
» The best had a delta of 6%, average was 18%, worst was 132%
Compared to all devices tested
» 6% of all tested devices were better, 2% similar, 92% worse
» The best had a delta of 4%, average was 23%, worst was 134%
Razer Blade 17 Early 2022 audio analysis
(+) | speakers can play relatively loud (83 dB)
Bass 100 - 315 Hz
(±) | reduced bass - on average 7.4% lower than median
(±) | linearity of bass is average (9.7% delta to prev. frequency)
Mids 400 - 2000 Hz
(+) | balanced mids - only 3% away from median
(+) | mids are linear (3.7% delta to prev. frequency)
Highs 2 - 16 kHz
(+) | balanced highs - only 2.5% away from median
(+) | highs are linear (6.1% delta to prev. frequency)
Overall 100 - 16.000 Hz
(+) | overall sound is linear (9.2% difference to median)
Compared to same class
» 3% of all tested devices in this class were better, 1% similar, 96% worse
» The best had a delta of 6%, average was 18%, worst was 132%
Compared to all devices tested
» 3% of all tested devices were better, 1% similar, 96% worse
» The best had a delta of 4%, average was 23%, worst was 134%
能源管理--电池寿命尚可的游戏笔记本电脑
能源消耗
闲置期间的能源消耗符合我们对所安装硬件的预期。在进行 Witcher 3和压力测试期间,耗电量分别上升到平均247瓦和352瓦--后者的数值代表了一个暂时的峰值。虽然功耗在整个测试过程中保持稳定,但在压力测试中却出现波动。 Witcher 3虽然功耗在整个测试过程中保持稳定,但在压力测试过程中会出现波动。附带的330瓦交流适配器的尺寸足够大。
| Off / Standby | |
| Idle | |
| Load |
|
Key:
min: | |
| MSI Raider GE77 HX 12UHS Intel Core i9-12900HX, NVIDIA GeForce RTX 3080 Ti Laptop GPU | Razer Blade 17 Early 2022 Intel Core i9-12900H, NVIDIA GeForce RTX 3080 Ti Laptop GPU | Alienware x17 R2 P48E Intel Core i9-12900HK, NVIDIA GeForce RTX 3080 Ti Laptop GPU | Medion Erazer Beast X30 Intel Core i9-12900HK, NVIDIA GeForce RTX 3080 Ti Laptop GPU | Average NVIDIA GeForce RTX 3080 Ti Laptop GPU | Average of class Gaming | |
|---|---|---|---|---|---|---|
| Power Consumption | -3% | -38% | 16% | -5% | 13% | |
| Idle Minimum * (Watt) | 13 | 17 -31% | 24.1 -85% | 12 8% | 17.2 ? -32% | 13 ? -0% |
| Idle Average * (Watt) | 19 | 23 -21% | 28.5 -50% | 16 16% | 23.3 ? -23% | 19 ? -0% |
| Idle Maximum * (Watt) | 29 | 34 -17% | 60 -107% | 22 24% | 30.8 ? -6% | 24.6 ? 15% |
| Load Average * (Watt) | 143 | 120 16% | 128.7 10% | 118 17% | 121.2 ? 15% | 110.7 ? 23% |
| Witcher 3 ultra * (Watt) | 247 | 229 7% | 254 -3% | 223 10% | ||
| Load Maximum * (Watt) | 352 | 243 31% | 323 8% | 290 18% | 276 ? 22% | 259 ? 26% |
* ... smaller is better
Consumption Witcher 3 / Stress Test
Consumption external Monitor
电池寿命
在我们的Wi-Fi(通过脚本定期访问网站)和视频(短片Big Buck Bunny(H.264编解码器,FHD))测试中,这台17.3英寸笔记本电脑的运行时间分别达到了5:24小时和6:29小时。在这两项测试中,笔记本电脑的节能功能被禁用,显示亮度被设置为150尼特。对于视频测试,无线模块也被禁用。
| MSI Raider GE77 HX 12UHS i9-12900HX, GeForce RTX 3080 Ti Laptop GPU, 99.99 Wh | Razer Blade 17 Early 2022 i9-12900H, GeForce RTX 3080 Ti Laptop GPU, 82 Wh | Alienware x17 R2 P48E i9-12900HK, GeForce RTX 3080 Ti Laptop GPU, 87 Wh | Medion Erazer Beast X30 i9-12900HK, GeForce RTX 3080 Ti Laptop GPU, 91.2 Wh | Average of class Gaming | |
|---|---|---|---|---|---|
| Battery runtime | -25% | -61% | 1% | 5% | |
| Reader / Idle (h) | 9.8 | 7.1 -28% | 3.9 -60% | 7.7 -21% | 8.27 ? -16% |
| H.264 (h) | 6.5 | 4.8 -26% | 6.4 -2% | 8.32 ? 28% | |
| WiFi v1.3 (h) | 5.4 | 3.8 -30% | 2 -63% | 5.7 6% | 7.11 ? 32% |
| Load (h) | 2 | 1.7 -15% | 0.8 -60% | 2.4 20% | 1.502 ? -25% |
Pros
Cons
评语--花大钱买大动力
对于我们配置的Raider GE77,微星要求大约5,200美元。对于这个价格,买家得到了一个非常强大的笔记本电脑,用于苛刻的应用,如视频编辑,渲染和4K游戏。
微星Raider GE77 HX 12 UHS是目前最强大的笔记本电脑之一。
主要部件包括一个 酷睿i9-12900HXCPU,一个 GeForce RTX 3080 Ti 笔记本电脑GPU(175瓦的TGP,16GB的VRAM),以及64GB的内存,这使得整体性能水平很高。特别是GeForce GPU的得分是我们从该芯片看到的最高得分。
CPU和GPU都能够以持续的高时钟速度运行。相对较高的热量和噪音排放符合我们对这个设备级别的期望。电池寿命约为5.5至6.5小时,对于一台强大的4K笔记本电脑来说是不错的。雷电4端口允许通过外部GPU或对接解决方案实现额外的扩展性。
哑光4K显示屏(IPS,120赫兹)提供足够的最大亮度,响应时间短,色彩空间覆盖好。然而,它在对比度方面有所欠缺。虽然颜色精度在出厂时就有偏差,但这可以通过校准来解决。我们怀疑微星真彩软件、预装的颜色配置文件和/或iGPU或其驱动程序之间存在冲突。对于这个价格类别的笔记本电脑来说,这是不可接受的。
该Razer Blade 17(2022年初)是GE77的一个潜在替代品。虽然它的整体性能水平低于微星系统,但它更紧凑、更轻。在电池寿命方面,它无法与雷蛇竞争。
价格和可用性
MSI Raider GE77 HX 12UHS的各种配置可在MSI的官方商店购买 (Core i9-12800HX, RTX 3080 Ti, FHD 360 Hz, 1 TB SSD)和在线零售商,如Xotic PC(Core i9-12900HX, RTX 3080 Ti, QHD 240 Hz, 1 TB SSD),价格分别为3000美元和3700美元左右。
MSI Raider GE77 HX 12UHS
- 07/12/2022 v7 (old)
Sascha Mölck
Price comparison

