Apple MacBook Pro 16 2021 M1 Max 笔记本电脑评论。全面的性能,没有节流
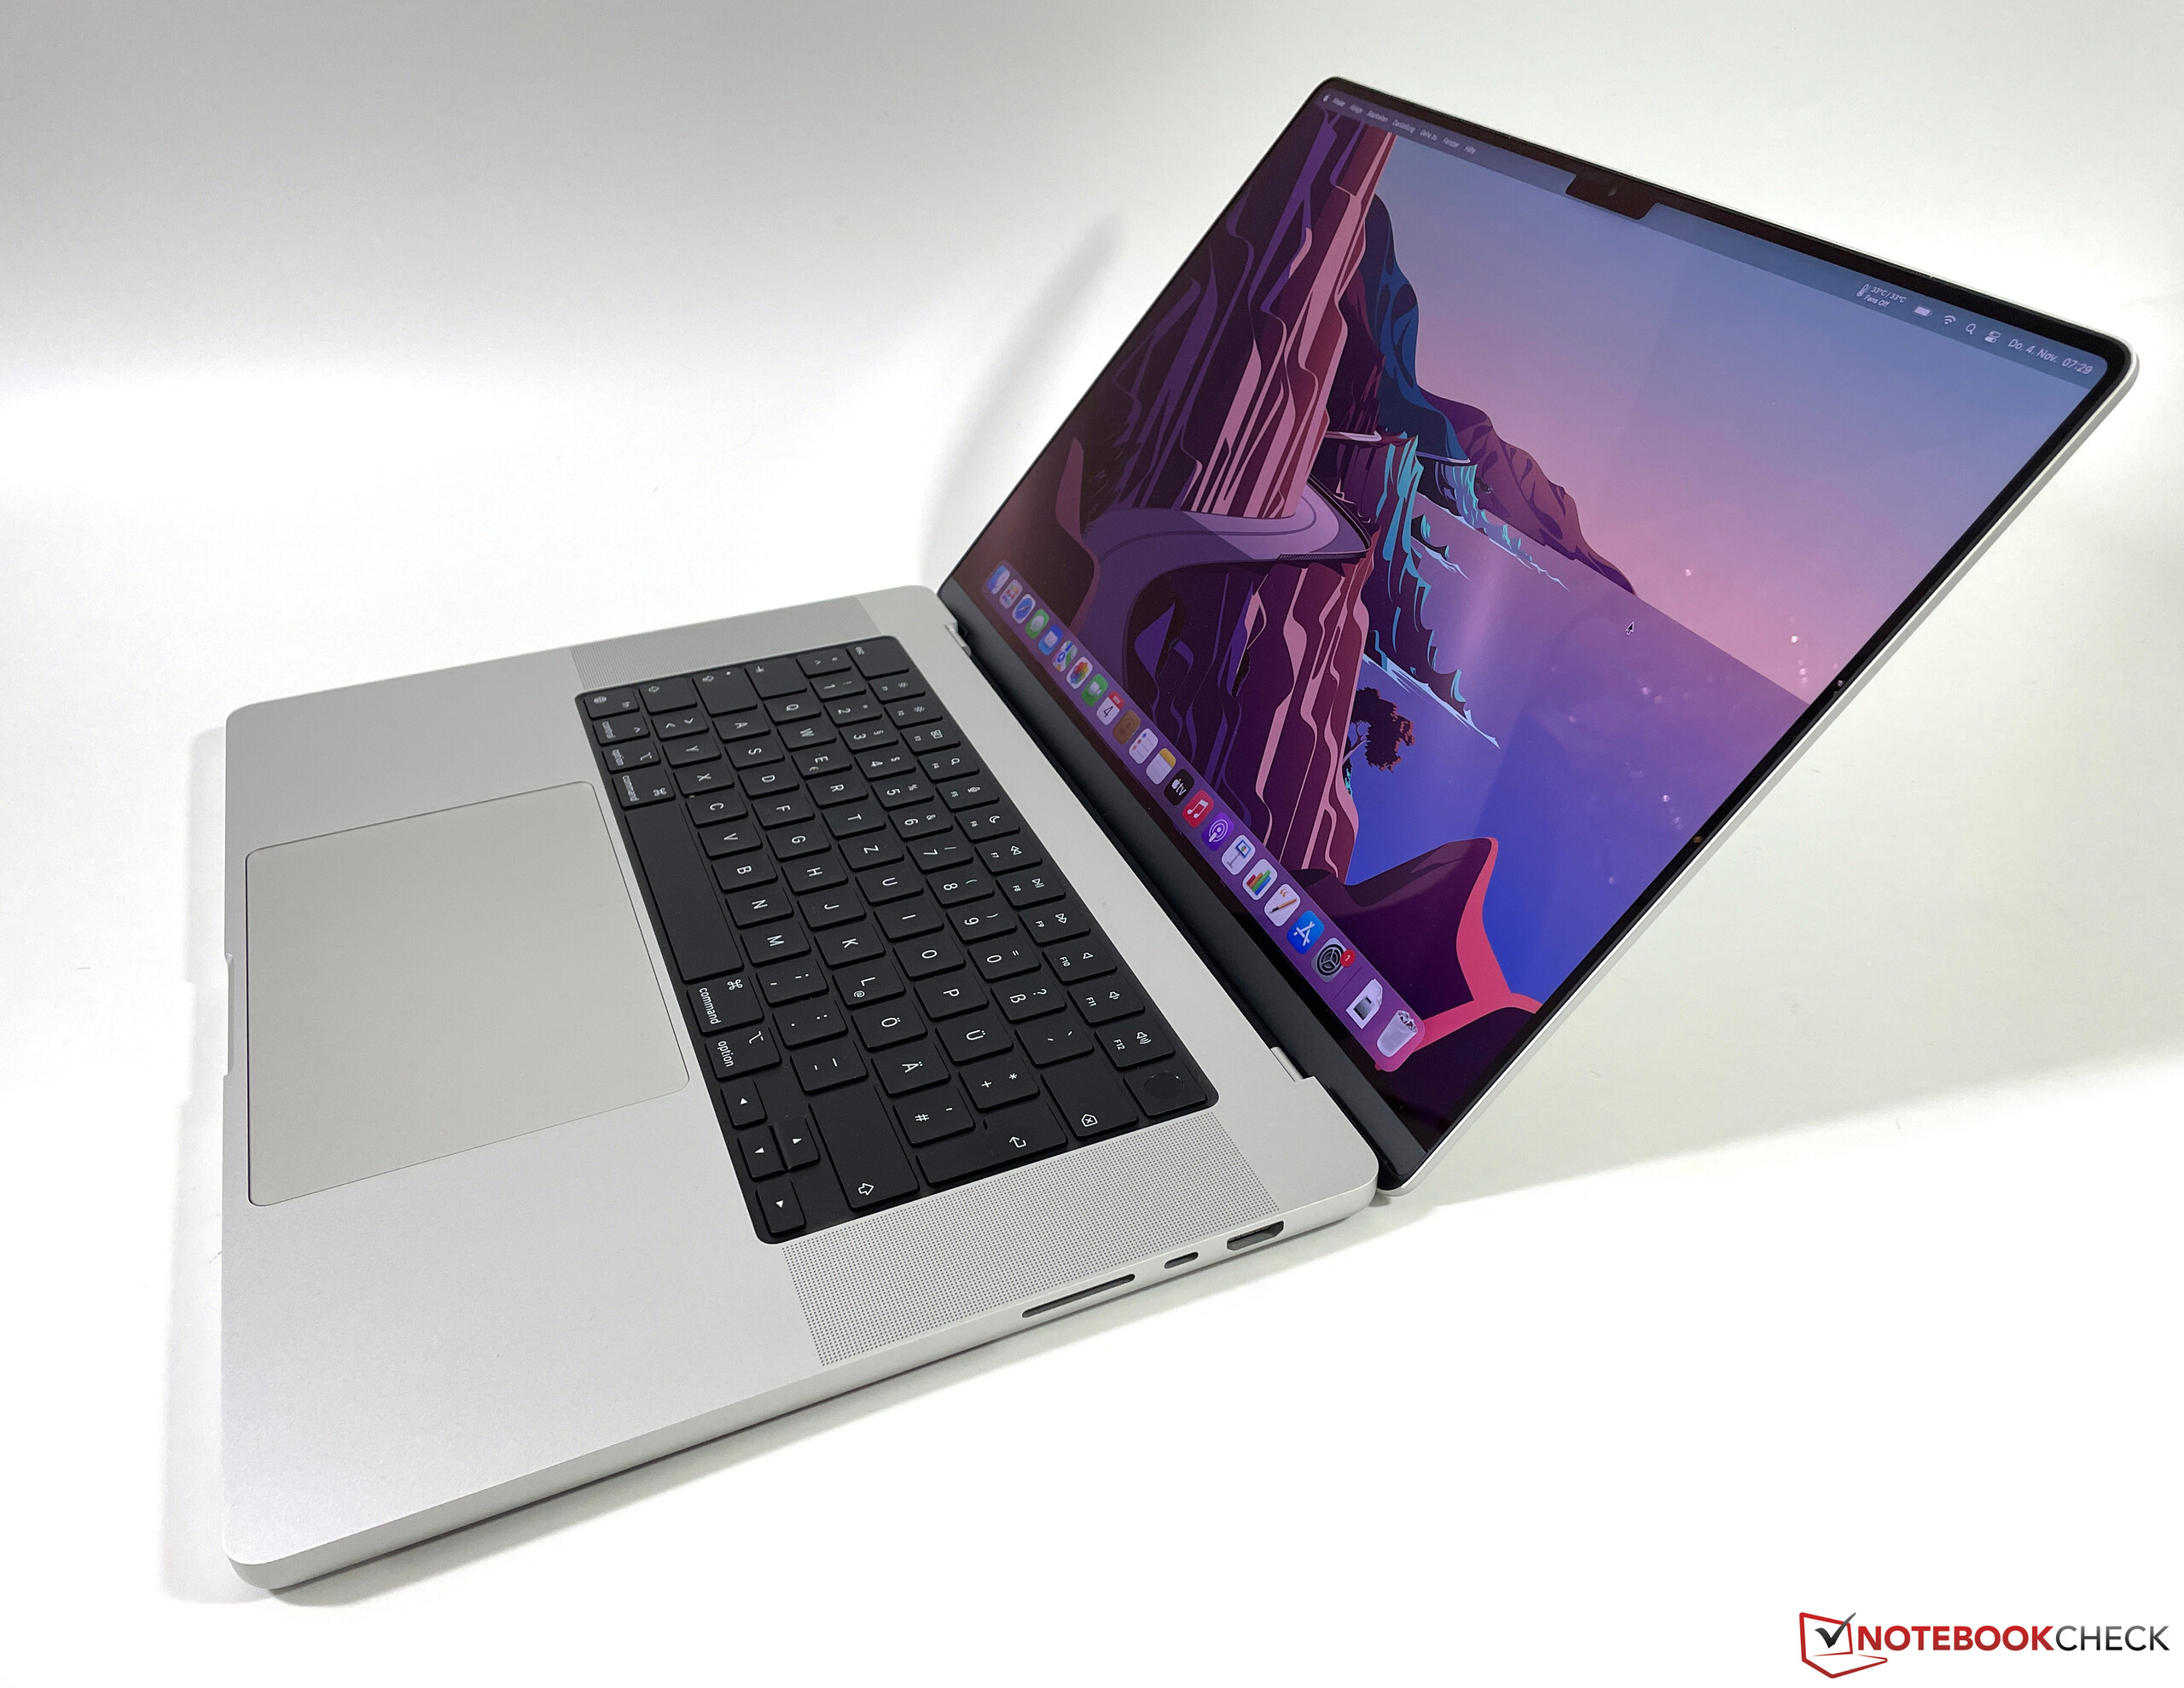
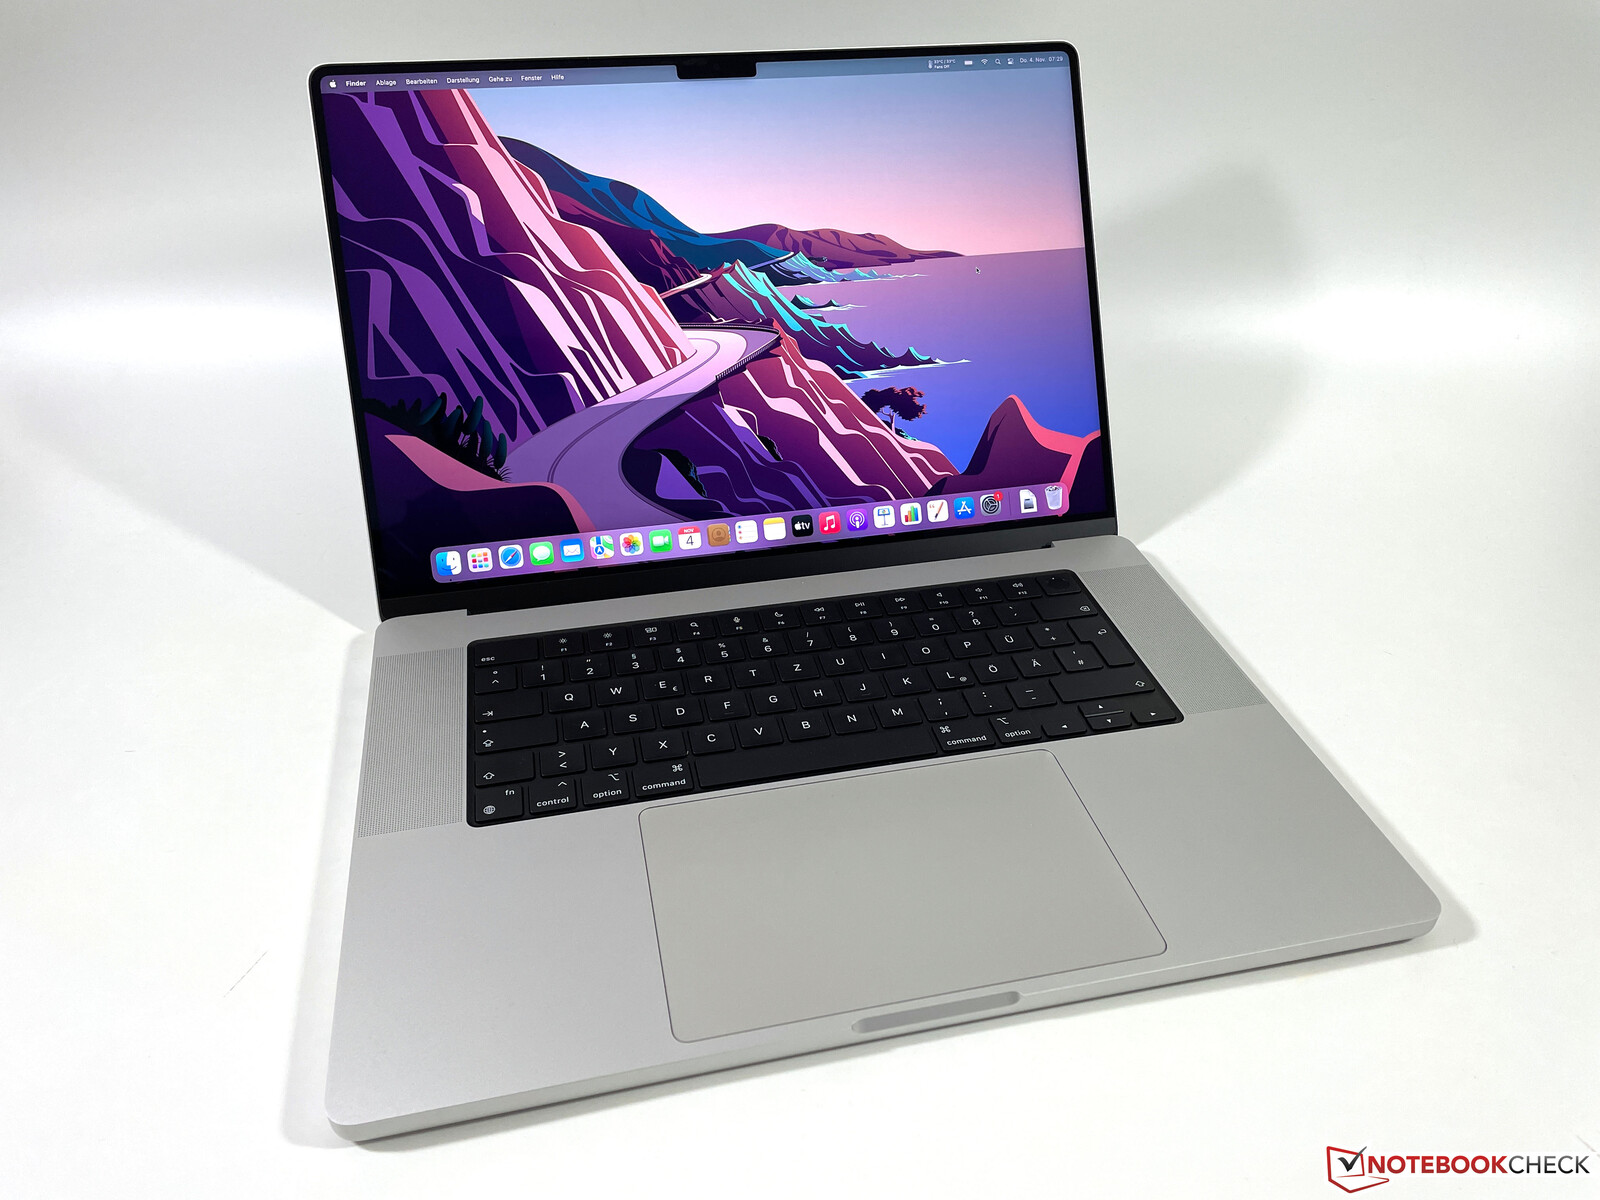
我们已经审查了入门级的MacBook Pro 16与Apple's M1 Pro SoC。现在是时候仔细看看来自库比蒂诺的最强大的设备,配备M1 Max SoC、32个GPU内核和64GB内存的MacBook Pro 16。结合2TB PCIe 4.0固态硬盘,它的零售价为4769欧元。
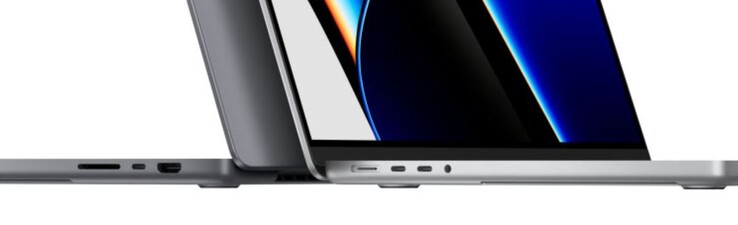
在这篇文章中,我们将重点讨论M1 Max与配备M1 Pro的MBP 16相比的性能差异,以及对温度和风扇行为的影响。配备M1 Max的设备还有一个额外的性能模式,我们将进行测试。所有其他部分,如机箱、连接、输入设备、屏幕和扬声器都与之前的评测设备相同,所以请看我们的综合评测,了解所有细节。
Potential competitors in comparison
Rating | Date | Model | Weight | Height | Size | Resolution | Price |
|---|---|---|---|---|---|---|---|
| 92.5 % v7 (old) | 11 / 2021 | Apple MacBook Pro 16 2021 M1 Max M1 Max, M1 Max 32-Core GPU | 2.2 kg | 16.8 mm | 16.20" | 3456x2234 | |
| 93.2 % v7 (old) | 11 / 2021 | Apple MacBook Pro 16 2021 M1 Pro M1 Pro, M1 Pro 16-Core GPU | 2.2 kg | 16.8 mm | 16.20" | 3456x2234 | |
| 89.8 % v7 (old) | 11 / 2021 | Lenovo ThinkPad P1 G4-20Y4S0KS00 i7-11850H, GeForce RTX 3070 Laptop GPU | 2 kg | 17.7 mm | 16.00" | 3840x2400 | |
| 87.8 % v7 (old) | 08 / 2021 | HP ZBook Studio 15 G8 i9-11950H, GeForce RTX 3070 Laptop GPU | 1.9 kg | 18 mm | 15.60" | 3840x2160 | |
| 88.9 % v7 (old) | 10 / 2021 | Razer Blade 15 Advanced (Mid 2021) i7-11800H, GeForce RTX 3080 Laptop GPU | 2 kg | 16.99 mm | 15.60" | 1920x1080 | |
| 87.9 % v7 (old) | 09 / 2021 | Dell XPS 17 9710 Core i7 RTX 3060 i7-11800H, GeForce RTX 3060 Laptop GPU | 2.5 kg | 19.5 mm | 17.00" | 3840x2400 |

性能 -Apple M1 Max,有32个GPU核心
审查设置
新款MacBook Pro 16 2021配备了M1 Max处理器有一个可选的性能模式。然而,它只影响风扇速度,因此影响负载下的表面温度,但与标准自动设置没有性能差异。我们在默认的自动模式下进行了以下所有的基准测试和测量。可选的省电模式将把M1 Max的封装功率限制在30W,这意味着系统将保持沉默,即使在压力下也是如此。
处理器
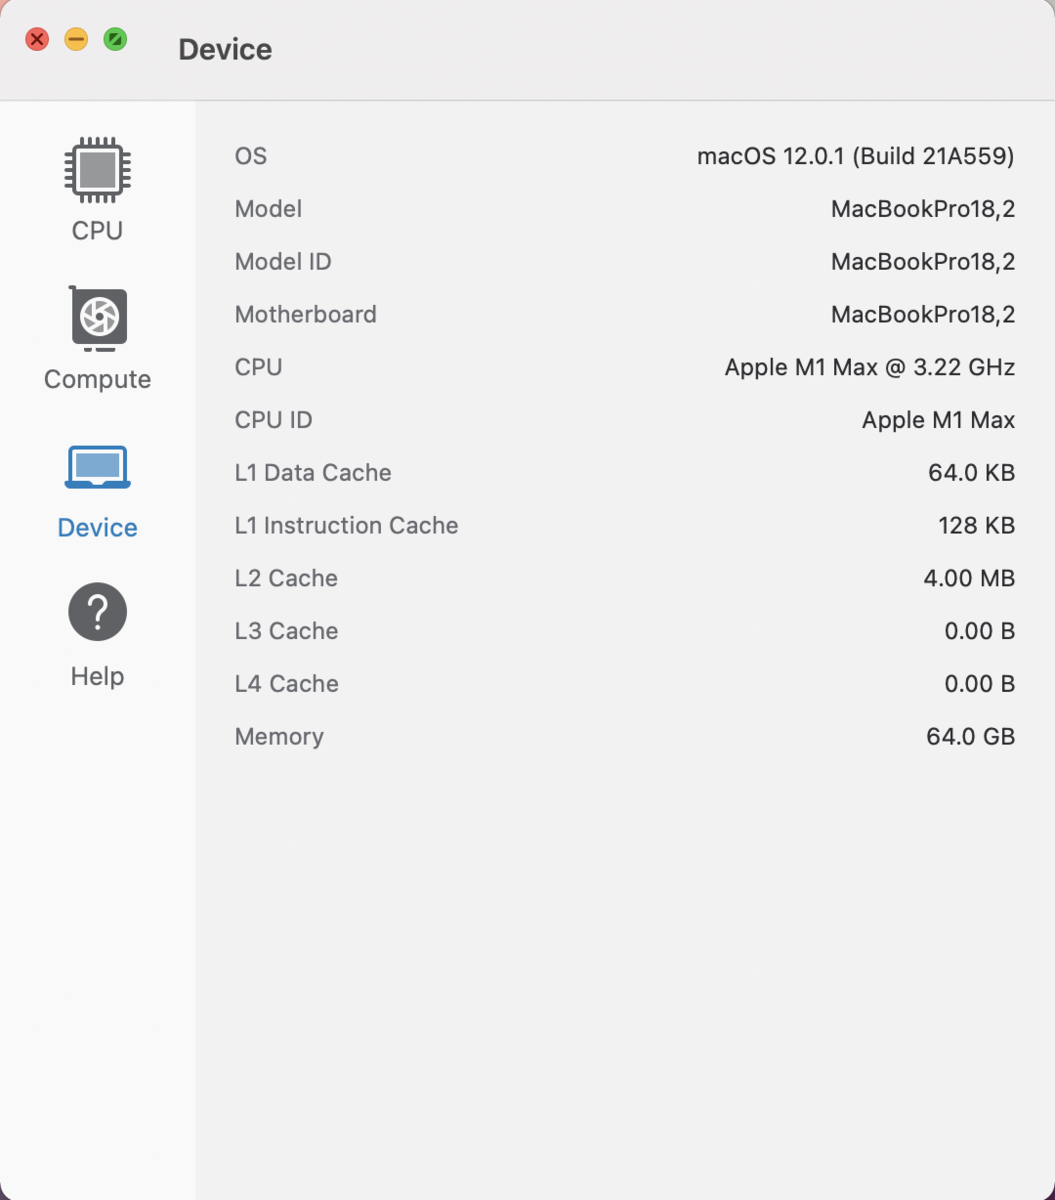
的CPU部分。Apple M1 Max有10个内核(1个有2个内核的效率集群+2个各有4个内核的性能集群),基本上与M1 Pro因此,我们可以在此简短地介绍一下。在多核基准测试中,我们确定最大消耗约为29瓦(约34瓦的封装功率),无论是在持续工作负荷下还是在电池电量下。与M1 Pro相比,这些消耗值略高,但这是由更大的芯片与额外的GPU核心、更大的缓存和更多的RAM造成的。我们的基准测试结果,正如预期的那样,几乎与M1 Pro相同,只有轻微的波动。
单核和多核的结果都与竞争对手相当,但他们都配备了45W的CPU,而实际上往往需要更多的功率。另外,几乎所有的Windows竞争者都会降低电池电量的CPU性能。
Cinebench R15 Multi Loop
Cinebench R23: Multi Core | Single Core
Cinebench R20: CPU (Multi Core) | CPU (Single Core)
Cinebench R15: CPU Multi 64Bit | CPU Single 64Bit
Blender: v2.79 BMW27 CPU
Geekbench 5.5: Multi-Core | Single-Core
| CPU Performance rating | |
| Average of class Multimedia | |
| Lenovo ThinkPad P1 G4-20Y4S0KS00 | |
| HP ZBook Studio 15 G8 | |
| Apple MacBook Pro 16 2021 M1 Pro | |
| Average Apple M1 Max | |
| Apple MacBook Pro 16 2021 M1 Max | |
| Razer Blade 15 Advanced (Mid 2021) -2! | |
| Dell XPS 17 9710 Core i7 RTX 3060 -2! | |
| Cinebench R23 / Multi Core | |
| Average of class Multimedia (4861 - 33362, n=65, last 2 years) | |
| Average Apple M1 Max (12385 - 12396, n=3) | |
| Apple MacBook Pro 16 2021 M1 Max | |
| Apple MacBook Pro 16 2021 M1 Pro | |
| Razer Blade 15 Advanced (Mid 2021) | |
| HP ZBook Studio 15 G8 | |
| Lenovo ThinkPad P1 G4-20Y4S0KS00 | |
| Dell XPS 17 9710 Core i7 RTX 3060 | |
| Cinebench R23 / Single Core | |
| Average of class Multimedia (1128 - 2459, n=64, last 2 years) | |
| HP ZBook Studio 15 G8 | |
| Lenovo ThinkPad P1 G4-20Y4S0KS00 | |
| Apple MacBook Pro 16 2021 M1 Pro | |
| Average Apple M1 Max (1530 - 1536, n=3) | |
| Apple MacBook Pro 16 2021 M1 Max | |
| Razer Blade 15 Advanced (Mid 2021) | |
| Dell XPS 17 9710 Core i7 RTX 3060 | |
| Cinebench R20 / CPU (Multi Core) | |
| Average of class Multimedia (1887 - 12912, n=56, last 2 years) | |
| Razer Blade 15 Advanced (Mid 2021) | |
| Lenovo ThinkPad P1 G4-20Y4S0KS00 | |
| HP ZBook Studio 15 G8 | |
| Dell XPS 17 9710 Core i7 RTX 3060 | |
| Average Apple M1 Max (2735 - 2753, n=3) | |
| Apple MacBook Pro 16 2021 M1 Max | |
| Apple MacBook Pro 16 2021 M1 Pro | |
| Cinebench R20 / CPU (Single Core) | |
| Average of class Multimedia (425 - 853, n=56, last 2 years) | |
| HP ZBook Studio 15 G8 | |
| Lenovo ThinkPad P1 G4-20Y4S0KS00 | |
| Razer Blade 15 Advanced (Mid 2021) | |
| Dell XPS 17 9710 Core i7 RTX 3060 | |
| Apple MacBook Pro 16 2021 M1 Pro | |
| Average Apple M1 Max (390 - 395, n=3) | |
| Apple MacBook Pro 16 2021 M1 Max | |
| Cinebench R15 / CPU Multi 64Bit | |
| Average of class Multimedia (856 - 5224, n=60, last 2 years) | |
| Lenovo ThinkPad P1 G4-20Y4S0KS00 | |
| Razer Blade 15 Advanced (Mid 2021) | |
| Dell XPS 17 9710 Core i7 RTX 3060 | |
| HP ZBook Studio 15 G8 | |
| Apple MacBook Pro 16 2021 M1 Max | |
| Average Apple M1 Max (1689 - 1693, n=3) | |
| Apple MacBook Pro 16 2021 M1 Pro | |
| Cinebench R15 / CPU Single 64Bit | |
| Average of class Multimedia (184.8 - 326, n=58, last 2 years) | |
| HP ZBook Studio 15 G8 | |
| Lenovo ThinkPad P1 G4-20Y4S0KS00 | |
| Razer Blade 15 Advanced (Mid 2021) | |
| Dell XPS 17 9710 Core i7 RTX 3060 | |
| Apple MacBook Pro 16 2021 M1 Pro | |
| Average Apple M1 Max (197 - 210, n=3) | |
| Apple MacBook Pro 16 2021 M1 Max | |
| Blender / v2.79 BMW27 CPU | |
| Dell XPS 17 9710 Core i7 RTX 3060 | |
| Razer Blade 15 Advanced (Mid 2021) | |
| Lenovo ThinkPad P1 G4-20Y4S0KS00 | |
| HP ZBook Studio 15 G8 | |
| Average of class Multimedia (100 - 557, n=57, last 2 years) | |
| Apple MacBook Pro 16 2021 M1 Max | |
| Average Apple M1 Max (187 - 190, n=3) | |
| Apple MacBook Pro 16 2021 M1 Pro | |
| Geekbench 5.5 / Multi-Core | |
| Average of class Multimedia (4652 - 20422, n=55, last 2 years) | |
| Apple MacBook Pro 16 2021 M1 Max | |
| Average Apple M1 Max (12563 - 12818, n=4) | |
| Apple MacBook Pro 16 2021 M1 Pro | |
| Lenovo ThinkPad P1 G4-20Y4S0KS00 | |
| HP ZBook Studio 15 G8 | |
| Geekbench 5.5 / Single-Core | |
| Average of class Multimedia (805 - 2974, n=55, last 2 years) | |
| Average Apple M1 Max (1764 - 1798, n=4) | |
| Apple MacBook Pro 16 2021 M1 Max | |
| Apple MacBook Pro 16 2021 M1 Pro | |
| HP ZBook Studio 15 G8 | |
| Lenovo ThinkPad P1 G4-20Y4S0KS00 | |
* ... smaller is better
系统性能
毫不奇怪,MacBook Pro 16 2021的高端SKU显然是一个非常强大和反应巨大的笔记本电脑。在日常工作中,或者当你只强调CPU时,你不会注意到与配备M1 Pro的入门级设备有什么区别。 入门级单位的M1 Pro不过。这也得到了跨系统基准测试CrossMark的支持,这两个设备非常相似。BlackMagic RAW速度测试显示了较大缓存的优势,因为CPU测试显示了7%的小优势。
我们还对Adobe Photoshop以及Adobe Premiere Pro进行了两个PugetBench测试。M1 Max的表现明显好于M1 Pro,但你应该对结果谨慎一些,因为这些基准测试只与英特尔版本的应用程序兼容。这些都是通过Rosetta 2模拟的,它可以工作,但与本地版本相比,性能明显较差。这些在实践中会快得多,但我们不能确定确切的性能优势。
CrossMark: Overall | Productivity | Creativity | Responsiveness
Photoshop PugetBench: Overall Score | GPU Score | General Score | Filter Score
Premiere Pro PugetBench: Overall Score 0.9 | Export 0.9 | Live Playback 0.9 | GPU 0.9
Jetstream 2: 2.0 Total
WebXPRT 3: Overall
Speedometer 2.0: Result 2.0
| Blackmagic RAW Speed Test / 12:1 8K Metal | |
| Average of class Multimedia (78 - 430, n=7, last 2 years) | |
| Apple MacBook Pro 16 2021 M1 Max | |
| Average Apple M1 Max, Apple M1 Max 32-Core GPU (200 - 202, n=2) | |
| Apple MacBook Pro 16 2021 M1 Pro | |
| Apple MacBook Pro 14 2021 M1 Pro Entry | |
| Apple MacBook Pro 16 2019 i9 5500M | |
| Blackmagic RAW Speed Test / 12:1 8K CPU | |
| Average of class Multimedia (44 - 102, n=7, last 2 years) | |
| Apple MacBook Pro 16 2019 i9 5500M | |
| Average Apple M1 Max, Apple M1 Max 32-Core GPU (29 - 30, n=2) | |
| Apple MacBook Pro 16 2021 M1 Max | |
| Apple MacBook Pro 16 2021 M1 Pro | |
| Apple MacBook Pro 14 2021 M1 Pro Entry | |
| CrossMark / Overall | |
| Average of class Multimedia (866 - 2728, n=59, last 2 years) | |
| Lenovo ThinkPad P1 G4-20Y4S0KS00 | |
| Average Apple M1 Max, Apple M1 Max 32-Core GPU (1586 - 1621, n=2) | |
| Apple MacBook Pro 16 2021 M1 Max | |
| Apple MacBook Pro 16 2021 M1 Pro | |
| Apple MacBook Pro 14 2021 M1 Pro Entry | |
| Apple MacBook Air 2020 M1 Entry | |
| Apple MacBook Pro 16 2019 i9 5500M | |
| CrossMark / Productivity | |
| Average of class Multimedia (931 - 2489, n=59, last 2 years) | |
| Lenovo ThinkPad P1 G4-20Y4S0KS00 | |
| Average Apple M1 Max, Apple M1 Max 32-Core GPU (1361 - 1385, n=2) | |
| Apple MacBook Pro 16 2021 M1 Max | |
| Apple MacBook Pro 16 2021 M1 Pro | |
| Apple MacBook Pro 14 2021 M1 Pro Entry | |
| Apple MacBook Air 2020 M1 Entry | |
| Apple MacBook Pro 16 2019 i9 5500M | |
| CrossMark / Creativity | |
| Average of class Multimedia (907 - 3465, n=59, last 2 years) | |
| Average Apple M1 Max, Apple M1 Max 32-Core GPU (2102 - 2153, n=2) | |
| Apple MacBook Pro 16 2021 M1 Max | |
| Apple MacBook Pro 16 2021 M1 Pro | |
| Apple MacBook Pro 14 2021 M1 Pro Entry | |
| Lenovo ThinkPad P1 G4-20Y4S0KS00 | |
| Apple MacBook Air 2020 M1 Entry | |
| Apple MacBook Pro 16 2019 i9 5500M | |
| CrossMark / Responsiveness | |
| Average of class Multimedia (605 - 2024, n=59, last 2 years) | |
| Lenovo ThinkPad P1 G4-20Y4S0KS00 | |
| Average Apple M1 Max, Apple M1 Max 32-Core GPU (1080 - 1107, n=2) | |
| Apple MacBook Pro 16 2021 M1 Max | |
| Apple MacBook Pro 16 2021 M1 Pro | |
| Apple MacBook Pro 14 2021 M1 Pro Entry | |
| Apple MacBook Air 2020 M1 Entry | |
| Apple MacBook Pro 16 2019 i9 5500M | |
| Photoshop PugetBench / Overall Score | |
| Lenovo ThinkPad P1 G4-20Y4S0KS00 | |
| Average Apple M1 Max, Apple M1 Max 32-Core GPU (809 - 989, n=2) | |
| Apple MacBook Pro 16 2021 M1 Max | |
| Apple MacBook Pro 16 2021 M1 Pro | |
| Apple MacBook Pro 16 2019 i9 5500M | |
| Apple MacBook Pro 14 2021 M1 Pro Entry | |
| Apple MacBook Air 2020 M1 Entry | |
| Photoshop PugetBench / GPU Score | |
| Lenovo ThinkPad P1 G4-20Y4S0KS00 | |
| Average Apple M1 Max, Apple M1 Max 32-Core GPU (98.5 - 108.1, n=2) | |
| Apple MacBook Pro 16 2021 M1 Max | |
| Apple MacBook Pro 16 2021 M1 Pro | |
| Apple MacBook Pro 14 2021 M1 Pro Entry | |
| Apple MacBook Pro 16 2019 i9 5500M | |
| Apple MacBook Air 2020 M1 Entry | |
| Photoshop PugetBench / General Score | |
| Average Apple M1 Max, Apple M1 Max 32-Core GPU (86.5 - 97.2, n=2) | |
| Lenovo ThinkPad P1 G4-20Y4S0KS00 | |
| Apple MacBook Pro 16 2021 M1 Max | |
| Apple MacBook Pro 16 2021 M1 Pro | |
| Apple MacBook Pro 14 2021 M1 Pro Entry | |
| Apple MacBook Pro 16 2019 i9 5500M | |
| Apple MacBook Air 2020 M1 Entry | |
| Photoshop PugetBench / Filter Score | |
| Lenovo ThinkPad P1 G4-20Y4S0KS00 | |
| Average Apple M1 Max, Apple M1 Max 32-Core GPU (75.2 - 100.6, n=2) | |
| Apple MacBook Pro 16 2021 M1 Max | |
| Apple MacBook Pro 16 2019 i9 5500M | |
| Apple MacBook Pro 16 2021 M1 Pro | |
| Apple MacBook Pro 14 2021 M1 Pro Entry | |
| Apple MacBook Air 2020 M1 Entry | |
| Premiere Pro PugetBench / Overall Score 0.9 | |
| Apple MacBook Pro 16 2021 M1 Max | |
| Average Apple M1 Max, Apple M1 Max 32-Core GPU (862 - 1080, n=2) | |
| Apple MacBook Pro 14 2021 M1 Pro Entry | |
| Lenovo ThinkPad P1 G4-20Y4S0KS00 | |
| Apple MacBook Pro 16 2021 M1 Pro | |
| Apple MacBook Air 2020 M1 Entry | |
| Premiere Pro PugetBench / Export 0.9 | |
| Average Apple M1 Max, Apple M1 Max 32-Core GPU (53.2 - 90.9, n=2) | |
| Lenovo ThinkPad P1 G4-20Y4S0KS00 | |
| Apple MacBook Pro 16 2021 M1 Max | |
| Apple MacBook Pro 16 2021 M1 Pro | |
| Apple MacBook Pro 14 2021 M1 Pro Entry | |
| Apple MacBook Air 2020 M1 Entry | |
| Premiere Pro PugetBench / Live Playback 0.9 | |
| Apple MacBook Pro 16 2021 M1 Max | |
| Apple MacBook Pro 14 2021 M1 Pro Entry | |
| Average Apple M1 Max, Apple M1 Max 32-Core GPU (106 - 216, n=2) | |
| Apple MacBook Pro 16 2021 M1 Pro | |
| Lenovo ThinkPad P1 G4-20Y4S0KS00 | |
| Apple MacBook Air 2020 M1 Entry | |
| Premiere Pro PugetBench / GPU 0.9 | |
| Lenovo ThinkPad P1 G4-20Y4S0KS00 | |
| Average Apple M1 Max, Apple M1 Max 32-Core GPU (54.8 - 55.8, n=2) | |
| Apple MacBook Pro 16 2021 M1 Max | |
| Apple MacBook Pro 16 2021 M1 Pro | |
| Apple MacBook Pro 14 2021 M1 Pro Entry | |
| Apple MacBook Air 2020 M1 Entry | |
| Jetstream 2 / 2.0 Total | |
| Average of class Multimedia (287 - 481, n=30, last 2 years) | |
| Average Apple M1 Max, Apple M1 Max 32-Core GPU (215 - 215, n=2) | |
| Apple MacBook Pro 16 2021 M1 Max | |
| Apple MacBook Pro 16 2021 M1 Pro | |
| Apple MacBook Pro 14 2021 M1 Pro Entry | |
| HP ZBook Studio 15 G8 | |
| Apple MacBook Air 2020 M1 Entry | |
| Apple MacBook Air 2020 M1 Entry | |
| Dell XPS 17 9710 Core i7 RTX 3060 | |
| Razer Blade 15 Advanced (Mid 2021) | |
| Apple MacBook Pro 13 Late 2020 M1 Entry (8 / 256 GB) | |
| Speedometer 2.0 / Result 2.0 | |
| Average of class Multimedia (337 - 946, n=29, last 2 years) | |
| Average Apple M1 Max, Apple M1 Max 32-Core GPU (272 - 349, n=2) | |
| Apple MacBook Pro 16 2021 M1 Pro | |
| Apple MacBook Pro 16 2021 M1 Max | |
| Apple MacBook Air 2020 M1 Entry | |
| Apple MacBook Air 2020 M1 Entry | |
| Apple MacBook Pro 14 2021 M1 Pro Entry | |
| Apple MacBook Pro 13 Late 2020 M1 Entry (8 / 256 GB) | |
存储设备
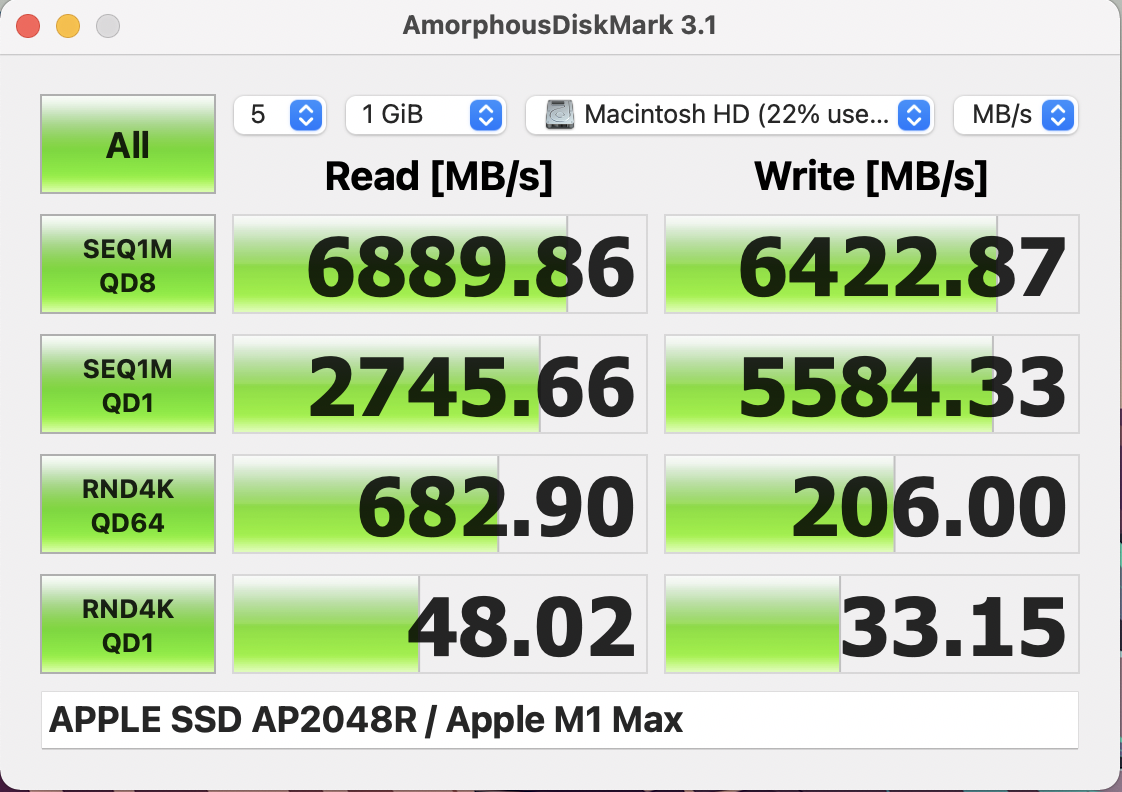
我们的评测装置配备了快速的PCIe 4.0固态硬盘,存储容量为2TB。在初始设置后,你可以使用1.97TB来存放自己的文件。在基准测试中,该硬盘管理着近7GB/s的出色传输率。你可以为MacBook Pro配备高达8TB的固态硬盘存储,但Apple ,并为此收取高昂的费用(与2TB固态硬盘相比,+2070欧元)。更多的SSD基准测试可在我们的 技术部分.
GPU性能 - 32个GPU核心
高端版本的MacBook Pro 16 2021配备了最快的M1 Max,配备了四个GPU集群,每个集群有八个核心。我们可以确定,在基准测试期间,GPU的最大消耗为44W,结果比 配备16个GPU核心的M1 Pro与16个GPU核心的M1 Pro相比,结果要好得多,优势在60%至95%之间。在MacBook上原生运行的Wild Life Extreme Unlimited基准测试,显示了与GeForce RTX 3070尽管M1 Max甚至不需要一半的功率。图形性能在电池供电时也完全稳定。
你可以在MacBook Pro 16上玩游戏,但可用游戏的数量是很大的限制。目前只有少数原生游戏,有些可以模拟。我们的游戏基准测试再次显示出比M1 Pro有大约70-80%的优势。M1 Pro而《古墓丽影》的性能与快速版本的M1 Pro大致相当。GeForce RTX 3060.然而,再次出现的问题是,这是一个模拟的标题。
像CrossWare这样的应用程序增加了对Windows游戏的支持,如Witcher 3 或GTA V,其性能实际上并不差。作为一个例子,我们在下面的视频中拍摄了《GTA V》的基准测试序列。你可以清楚地看到,在超级设置(1920 x 1200像素)下,性能非常好,但有明显的停顿。你仍然可以像这样玩游戏,但是MacBook Pro 16,即使有强大的M1 Max,也不是一台游戏笔记本电脑。
| low | med. | high | ultra | |
|---|---|---|---|---|
| Shadow of the Tomb Raider (2018) | 140 | 104 | 97 | 87 |
| Total War: Three Kingdoms (2019) | 201 | 127 | 80 | 59 |
| Borderlands 3 (2019) | 65.5 | 55.3 | 47.6 | 40.7 |
系统噪音
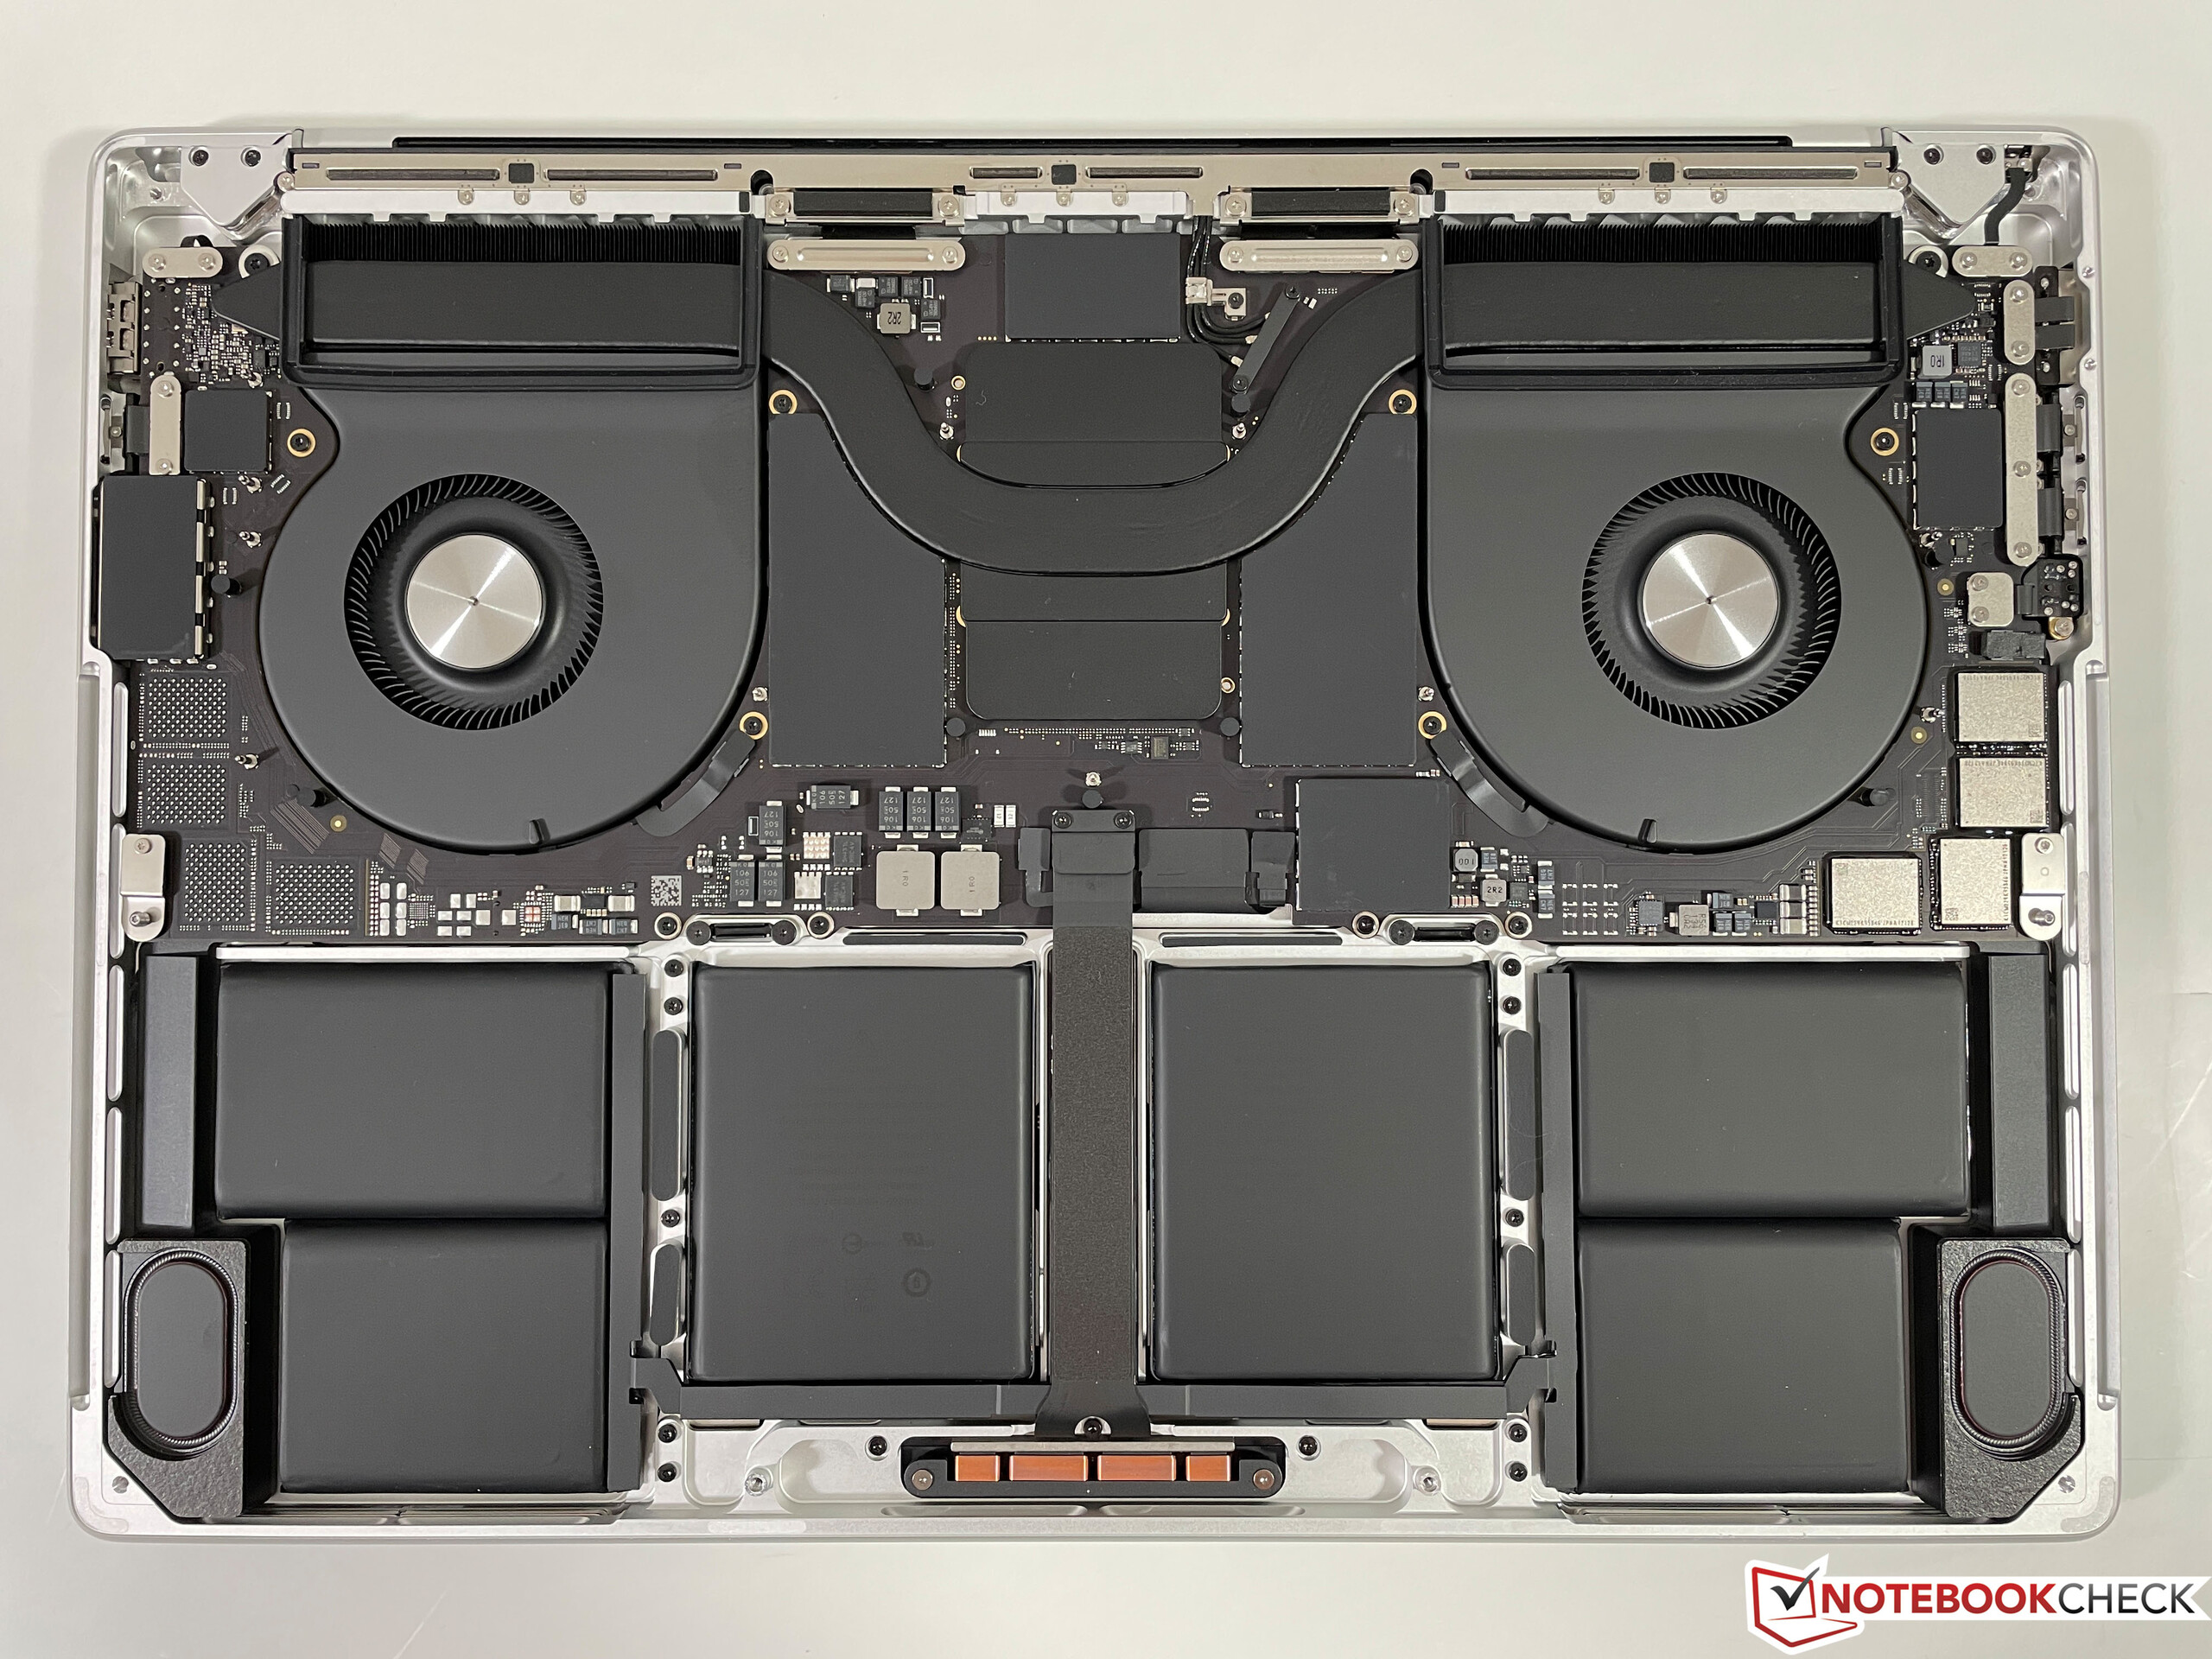
配备M1 Max处理器的MacBook Pro 16在空转和轻度工作负荷时是无声的,因为风扇是关闭的,也没有其他电子噪音(如线圈啸叫)。纯粹的CPU负载将导致最低的风扇转速(1600转/分),几乎听不到任何声音。只有当你开始给32个GPU核心施加压力时,它才会变得更响亮。
相比之下,MacBook Pro 16 M1 Max的风扇可以达到更高的最大速度(左侧为5348转/分钟,右侧为5776转/分钟)。 M1 Pro单元(分别为4280和4750转/分)。然而,这些最高速度是相当理论上的,因为只有一种情况下我们可以达到最高速度。我们不得不在正常模式下开始进行压力测试(CB R23和3DMark Wildlife Extreme),几分钟后切换到性能模式。然后,MBP 16会在几分钟内将风扇速度提高到最大值,这导致了55.6 dB(A)的响声。一段时间后,风扇将在4400转/分钟时趋于平稳(49.5 dB(A))。如果你用性能模式开始压力测试,风扇转速将在4000(47.3 dB(A))和4900rpm(52 dB(A))之间波动,平均为4400rpm(49.5 dB(A))。就像我们之前说的,没有性能优势,所以使用性能模式没有意义。
如果你只是把能量设置放在默认的自动模式下,压力测试的结果只有3600转/分钟,结果是42.9分贝(A)。在我们对Witcher 3 ,风扇转速会有一些波动,平均为3200转/分(39.5 dB(A))的游戏测试。在PugetBench基准测试(Premiere Pro)中,我们也可以观察到3600转/分钟,但请记住,这是应用程序的模拟版本。整体的风扇噪音是一个非常方便的杂音,你仍然可以在没有耳机的情况下非常舒适地工作。所有这些结果对于主电源以及电池电源都是相同的。
可选的节能模式将把M1 Max的封装功率限制在30W,这导致了完全无声的操作,即使在压力测试期间也是如此。
Noise level
| Idle |
| 24.2 / 24.2 / 24.2 dB(A) |
| Load |
| 42.9 / 42.9 dB(A) |
 | ||
30 dB silent 40 dB(A) audible 50 dB(A) loud |
||
min: | ||
| Apple MacBook Pro 16 2021 M1 Max M1 Max 32-Core GPU, M1 Max, Apple SSD AP2048R | Apple MacBook Pro 16 2021 M1 Pro M1 Pro 16-Core GPU, M1 Pro, Apple SSD AP1024R | Lenovo ThinkPad P1 G4-20Y4S0KS00 GeForce RTX 3070 Laptop GPU, i7-11850H, Samsung PM9A1 MZVL21T0HCLR | HP ZBook Studio 15 G8 GeForce RTX 3070 Laptop GPU, i9-11950H, Samsung PM981a MZVLB2T0HALB | Razer Blade 15 Advanced (Mid 2021) GeForce RTX 3080 Laptop GPU, i7-11800H, SSSTC CA6-8D1024 | Dell XPS 17 9710 Core i7 RTX 3060 GeForce RTX 3060 Laptop GPU, i7-11800H, Micron 2300 1TB MTFDHBA1T0TDV | |
|---|---|---|---|---|---|---|
| Noise | 7% | -4% | -7% | -7% | -9% | |
| off / environment * (dB) | 24.2 | 24.7 -2% | 23.8 2% | 23.5 3% | 25.1 -4% | 25.5 -5% |
| Idle Minimum * (dB) | 24.2 | 24.7 -2% | 23.8 2% | 25.3 -5% | 25.3 -5% | 25.2 -4% |
| Idle Average * (dB) | 24.2 | 24.7 -2% | 23.8 2% | 25.3 -5% | 25.3 -5% | 25.2 -4% |
| Idle Maximum * (dB) | 24.2 | 24.7 -2% | 28.3 -17% | 25.3 -5% | 25.3 -5% | 25.2 -4% |
| Load Average * (dB) | 42.9 | 26.1 39% | 38.6 10% | 41.2 4% | 42 2% | 45.9 -7% |
| Witcher 3 ultra * (dB) | 39.5 | 47.4 -20% | 49.4 -25% | 45.6 -15% | 49 -24% | |
| Load Maximum * (dB) | 42.9 | 37.4 13% | 47.4 -10% | 49.4 -15% | 51.6 -20% | 50.4 -17% |
* ... smaller is better
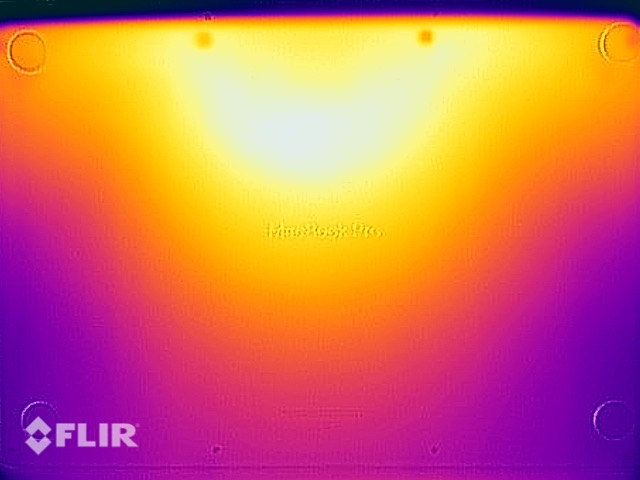
温度
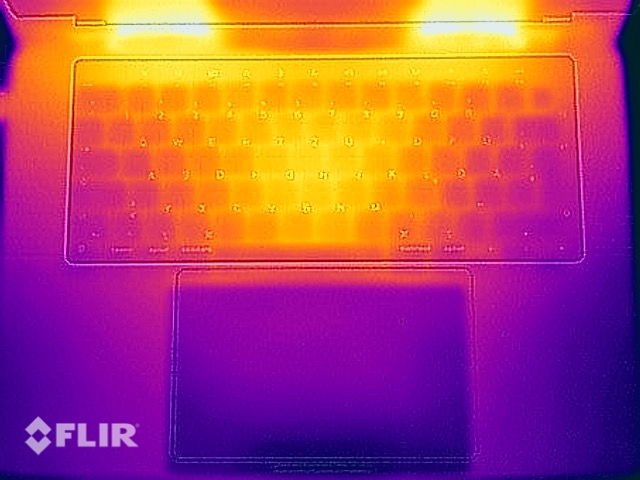
新的MacBook Pro 16没有任何温度问题,因为在日常工作中,你几乎不会注意到任何较热的表面,即使你真的给设备施加压力,温度也完全不关键。
与我们的标准程序(Cinebench R15 + FurMark)相反,我们使用两个本地应用程序Cinebench R23和3DMark Wildlife Extreme(每个应用程序的压力测试)对MacBook Pro进行压力测试。我们设法用这种组合得到了最高的消耗数字。与强大的Windows笔记本电脑相反,在一小时的测试过程中,性能坚如磐石,表面温度仍然很低。我们只能在基本单元的顶部和底部测量到大约42℃。在Witcher 3 测试中,由于风扇速度较低,机箱变得稍微暖和一些,但这种差异几乎不值得注意。
我们还用可选的性能模式进行了压力测试,并查看了温度。如前所述,它并不影响性能,但由于较高的风扇速度,表面温度甚至更低,高达39.9℃。总而言之,考虑到性能水平和风扇的噪音,这些结果是非常好的。即使是PSU的温度也完全没有问题,高达43℃。
当我们使用外部显示器时,我们无法注意到在风扇速度或表面温度方面的差异。
(±) The maximum temperature on the upper side is 42.3 °C / 108 F, compared to the average of 36.8 °C / 98 F, ranging from 21 to 71 °C for the class Multimedia.
(±) The bottom heats up to a maximum of 41.7 °C / 107 F, compared to the average of 39.1 °C / 102 F
(+) In idle usage, the average temperature for the upper side is 23.5 °C / 74 F, compared to the device average of 31.3 °C / 88 F.
(±) Playing The Witcher 3, the average temperature for the upper side is 36.9 °C / 98 F, compared to the device average of 31.3 °C / 88 F.
(+) The palmrests and touchpad are cooler than skin temperature with a maximum of 30.2 °C / 86.4 F and are therefore cool to the touch.
(±) The average temperature of the palmrest area of similar devices was 28.7 °C / 83.7 F (-1.5 °C / -2.7 F).
用可选的性能模式进行表面温度压力测试。
(+) The maximum temperature on the upper side is 39.9 °C / 104 F, compared to the average of 36.8 °C / 98 F, ranging from 21 to 71 °C for the class Multimedia.
(+) The bottom heats up to a maximum of 38.7 °C / 102 F, compared to the average of 39.1 °C / 102 F
(+) The palmrests and touchpad are cooler than skin temperature with a maximum of 25.9 °C / 78.6 F and are therefore cool to the touch.
(+) The average temperature of the palmrest area of similar devices was 28.7 °C / 83.7 F (+2.8 °C / 5.1 F).
| Apple MacBook Pro 16 2021 M1 Max Apple M1 Max, Apple M1 Max 32-Core GPU | Apple MacBook Pro 16 2021 M1 Pro Apple M1 Pro, Apple M1 Pro 16-Core GPU | Lenovo ThinkPad P1 G4-20Y4S0KS00 Intel Core i7-11850H, NVIDIA GeForce RTX 3070 Laptop GPU | HP ZBook Studio 15 G8 Intel Core i9-11950H, NVIDIA GeForce RTX 3070 Laptop GPU | Razer Blade 15 Advanced (Mid 2021) Intel Core i7-11800H, NVIDIA GeForce RTX 3080 Laptop GPU | Dell XPS 17 9710 Core i7 RTX 3060 Intel Core i7-11800H, NVIDIA GeForce RTX 3060 Laptop GPU | |
|---|---|---|---|---|---|---|
| Heat | 2% | -23% | -21% | -38% | -28% | |
| Maximum Upper Side * (°C) | 42.3 | 41 3% | 51 -21% | 49 -16% | 51 -21% | 50.2 -19% |
| Maximum Bottom * (°C) | 41.7 | 39 6% | 53.5 -28% | 54.2 -30% | 52 -25% | 38.4 8% |
| Idle Upper Side * (°C) | 23.9 | 24 -0% | 28.8 -21% | 26.2 -10% | 35.2 -47% | 37.6 -57% |
| Idle Bottom * (°C) | 23.9 | 24 -0% | 29.3 -23% | 30.2 -26% | 37.8 -58% | 34.2 -43% |
* ... smaller is better
能源管理--M1 Max消耗更多电力
消耗功率
与配备M1 Max的设备相比,配备M1 Max的MacBook Pro 16的空闲消耗略高。的设备相比,空闲消耗略高。这是由额外的GPU核心、更大的缓存和更多的RAM造成的。我们还设法测量了在播放HDR视频时,面板达到全HDR亮度时的峰值消耗,高达30W。
我们可以看到最大的封装功率几乎为90W(更准确地说是86W),但由于基准序列的变化而存在波动。你可以在下面的图表中很好地看到这种行为,在我们的压力测试中,消耗量在90和高达135瓦之间波动。它将反复冲击更高的数字,平均消耗量为115瓦特。游戏(通过Steam/CrossWare的Witcher 3 测试)的结果是稳定的消耗超过100瓦特(~61瓦特的封装功率)。140瓦的电源适配器足以覆盖全部压力下的峰值。
| Off / Standby | |
| Idle | |
| Load |
|
Key:
min: | |
| Apple MacBook Pro 16 2021 M1 Max M1 Max, M1 Max 32-Core GPU, 99.6 Wh | Apple MacBook Pro 16 2021 M1 Pro M1 Pro, M1 Pro 16-Core GPU, 99.6 Wh | Lenovo ThinkPad P1 G4-20Y4S0KS00 i7-11850H, GeForce RTX 3070 Laptop GPU, 90 Wh | HP ZBook Studio 15 G8 i9-11950H, GeForce RTX 3070 Laptop GPU, 83 Wh | Razer Blade 15 Advanced (Mid 2021) i7-11800H, GeForce RTX 3080 Laptop GPU, 80 Wh | Dell XPS 17 9710 Core i7 RTX 3060 i7-11800H, GeForce RTX 3060 Laptop GPU, 97 Wh | Average of class Multimedia | |
|---|---|---|---|---|---|---|---|
| Power Consumption | 20% | -28% | -48% | -96% | -13% | 21% | |
| Idle Minimum * (Watt) | 5.4 | 5 7% | 8.1 -50% | 11 -104% | 19.5 -261% | 7.5 -39% | 5.62 ? -4% |
| Idle Average * (Watt) | 16.4 | 15.1 8% | 20.2 -23% | 18.8 -15% | 23.3 -42% | 15.7 4% | 10.2 ? 38% |
| Idle Maximum * (Watt) | 16.7 | 15.5 7% | 21.9 -31% | 31.7 -90% | 40.1 -140% | 23.1 -38% | 12.5 ? 25% |
| Load Average * (Watt) | 94 | 54 43% | 88.2 6% | 105.2 -12% | 98.9 -5% | 87.2 7% | 65 ? 31% |
| Witcher 3 ultra * (Watt) | 104 | 149 -43% | 148 -42% | 174 -67% | 116 -12% | ||
| Load Maximum * (Watt) | 135 | 90 33% | 170.6 -26% | 171.8 -27% | 214 -59% | 131.6 3% | 111.9 ? 17% |
* ... smaller is better
Power Consumption Witcher 3 / Stress test
电池运行时间
略高的消耗值对电池运行时间也有影响,与MBP 16 M1 Max相比,MBP 16 M1 Max的结果有点短。 M1 Pro单元.在150尼特(略高于SDR最大亮度的50%)下进行的Wi-Fi测试确定了将近15个小时,因此比M1 Pro设备少了2个小时。当我们使用500尼特的最大SDR亮度时,这一结果下降到7小时多一点。在窗口或全屏模式下,Safari浏览器没有区别。
我们的标准h.264测试视频在150尼特下运行了17个小时,因此与带M1 Pro的MBP 16相比,只少了30分钟。我们还检查了在YouTube上以最大亮度播放4K HDR视频时的电池运行时间,结果是运行时间为4:37小时。目前这已经不可能了,因为有报告说HDR视频有问题,而且YouTube目前在新的MacBook Pro型号(也是14英寸)上不提供HDR视频。
性能不受电池电量的限制,即使你对CPU以及GPU都有压力。考虑到压力测试期间平均消耗115W,这是令人惊讶的,因此,99.6Wh的电池在这种情况下不会持续很长时间。63分钟的结果是可能的,因为当电池水平达到5%的剩余容量时,性能就会大量减少到13W的封装功率,这是仅50分钟后的情况。
| Apple MacBook Pro 16 2021 M1 Max M1 Max, M1 Max 32-Core GPU, 99.6 Wh | Apple MacBook Pro 16 2021 M1 Pro M1 Pro, M1 Pro 16-Core GPU, 99.6 Wh | Lenovo ThinkPad P1 G4-20Y4S0KS00 i7-11850H, GeForce RTX 3070 Laptop GPU, 90 Wh | HP ZBook Studio 15 G8 i9-11950H, GeForce RTX 3070 Laptop GPU, 83 Wh | Razer Blade 15 Advanced (Mid 2021) i7-11800H, GeForce RTX 3080 Laptop GPU, 80 Wh | Dell XPS 17 9710 Core i7 RTX 3060 i7-11800H, GeForce RTX 3060 Laptop GPU, 97 Wh | Average of class Multimedia | |
|---|---|---|---|---|---|---|---|
| Battery runtime | 8% | -34% | 3% | -60% | 44% | 11% | |
| H.264 (h) | 17 | 17.5 3% | 7.2 -58% | 16.8 ? -1% | |||
| WiFi v1.3 (h) | 14.9 | 16.9 13% | 7 -53% | 6.2 -58% | 5.9 -60% | 7.6 -49% | 12.3 ? -17% |
| Load (h) | 1.1 | 1.2 9% | 1.8 64% | 2.6 136% | 1.645 ? 50% | ||
| Reader / Idle (h) | 12.9 | 17.7 | 24.9 ? |
Pros
Cons
结论--M1 Max的性能和凉爽的操作让人信服
MacBook Pro 16 2021配备了包括32个GPU核心的最快版本的M1 Max处理器,不仅性能令人信服,而且主要是温度低,以及相对安静的风扇。强大的冷却解决方案和高效的芯片设计在这里肯定会得到回报,因为即使在最大负荷下,温度也是完全不挑剔的。而且你甚至可以在电池电源上使用最大性能,这在这个性能范围内是迄今为止闻所未闻的。另一方面,可选的性能模式会导致风扇声音稍大,表面温度较低,但我们认为这并不是真正必要的。
笔记本电脑的性能M1 Max和M1 Pro在CPU方面基本相同,最大的区别是GPU核心的数量。你是否真的需要额外的动力,显然取决于你的使用场景。如果你编辑大量的视频或计划使用更多的外部屏幕,那么M1 Max就是你的选择。但如果你只是在寻找一台高端多媒体笔记本电脑,那么我们推荐基本型号的MacBook Pro 16和M1 Pro。
新款MacBook Pro 16 2021的高端型号不仅因M1 Max SoC增加的图形性能而令人信服,而且还具有出色的排放效果。
否则,你会得到我们在对MBP 16基本型号的深入审查中已经讨论过的同样的优点和缺点。由于伟大的Mini-LED屏幕和出色的扬声器,没有什么可抱怨的,尽管在连接方面仍有改进的余地,例如。MacBook Pro也不会适合每个用户。如果你只想用一台设备处理所有事情,而且还喜欢玩一些游戏,那么你几乎只能使用强大的Windows笔记本电脑,如ThinkPad X1 Extreme G4,Razer Blade 15, 或戴尔XPS 17(XPS 15)。 XPS 15没有类似的强大GPU)。如果你依赖的是MacBook无法使用的软件,也会出现这种情况。
价格和可用性
新款MacBook Pro 16的供应目前是有限的。最好的选择是在Apple's零售店之一提货,在那里你可以以4299美元的价格买到我们的测试装置和2TB SDD。
Apple MacBook Pro 16 2021 M1 Max
- 11/24/2021 v7 (old)
Andreas Osthoff
Price comparison

