Gigabyte Aero 16 YE5评测。紧凑型4K多媒体笔记本

Gigabyte的Aero 16是一个融合了紧凑的游戏笔记本、便携式工作站和创意者的笔记本电脑。它采用了Core i9-12900HK(桤木湖)和NVIDIA GeForce RTX 3080 Ti Laptop GPU GPU - Benchmarks and Specs GeForce RTX 3080 Ti。它的主要竞争对手有:联想 ThinkPad X1 Extreme G4, 申科XMG Pro 15 (Late 2021), 惠普ZBook Studio 15 G8, Apple MacBook Pro 16 2021 M1 Max 笔记本电脑评论。全面的性能,没有节流 Apple MacBook Pro 16 2021 M1 Max,以及Razer Blade 15 2022。
潜在的竞争对手比较
Rating | Date | Model | Weight | Height | Size | Resolution | Price |
|---|---|---|---|---|---|---|---|
| 84.7 % v7 (old) | 03 / 2022 | Gigabyte Aero 16 YE5 i9-12900HK, GeForce RTX 3080 Ti Laptop GPU | 2.3 kg | 22.4 mm | 16.00" | 3840x2400 | |
| 88.3 % v7 (old) | 12 / 2021 | Lenovo ThinkPad X1 Extreme G4-20Y50040GE i9-11950H, GeForce RTX 3080 Laptop GPU | 1.9 kg | 18.2 mm | 16.00" | 3840x2400 | |
| 92.5 % v7 (old) | 11 / 2021 | Apple MacBook Pro 16 2021 M1 Max M1 Max, M1 Max 32-Core GPU | 2.2 kg | 16.8 mm | 16.20" | 3456x2234 | |
| 87.8 % v7 (old) | 08 / 2021 | HP ZBook Studio 15 G8 i9-11950H, GeForce RTX 3070 Laptop GPU | 1.9 kg | 18 mm | 15.60" | 3840x2160 | |
| 84.6 % v7 (old) | 01 / 2022 | Schenker XMG Pro 15 (Late 2021) i7-11800H, GeForce RTX 3080 Laptop GPU | 2 kg | 19.8 mm | 15.60" | 3840x2160 | |
| 89.1 % v7 (old) | 03 / 2022 | Razer Blade 15 2022 i7-12800H, GeForce RTX 3080 Ti Laptop GPU | 2.1 kg | 16.99 mm | 15.60" | 2560x1440 |
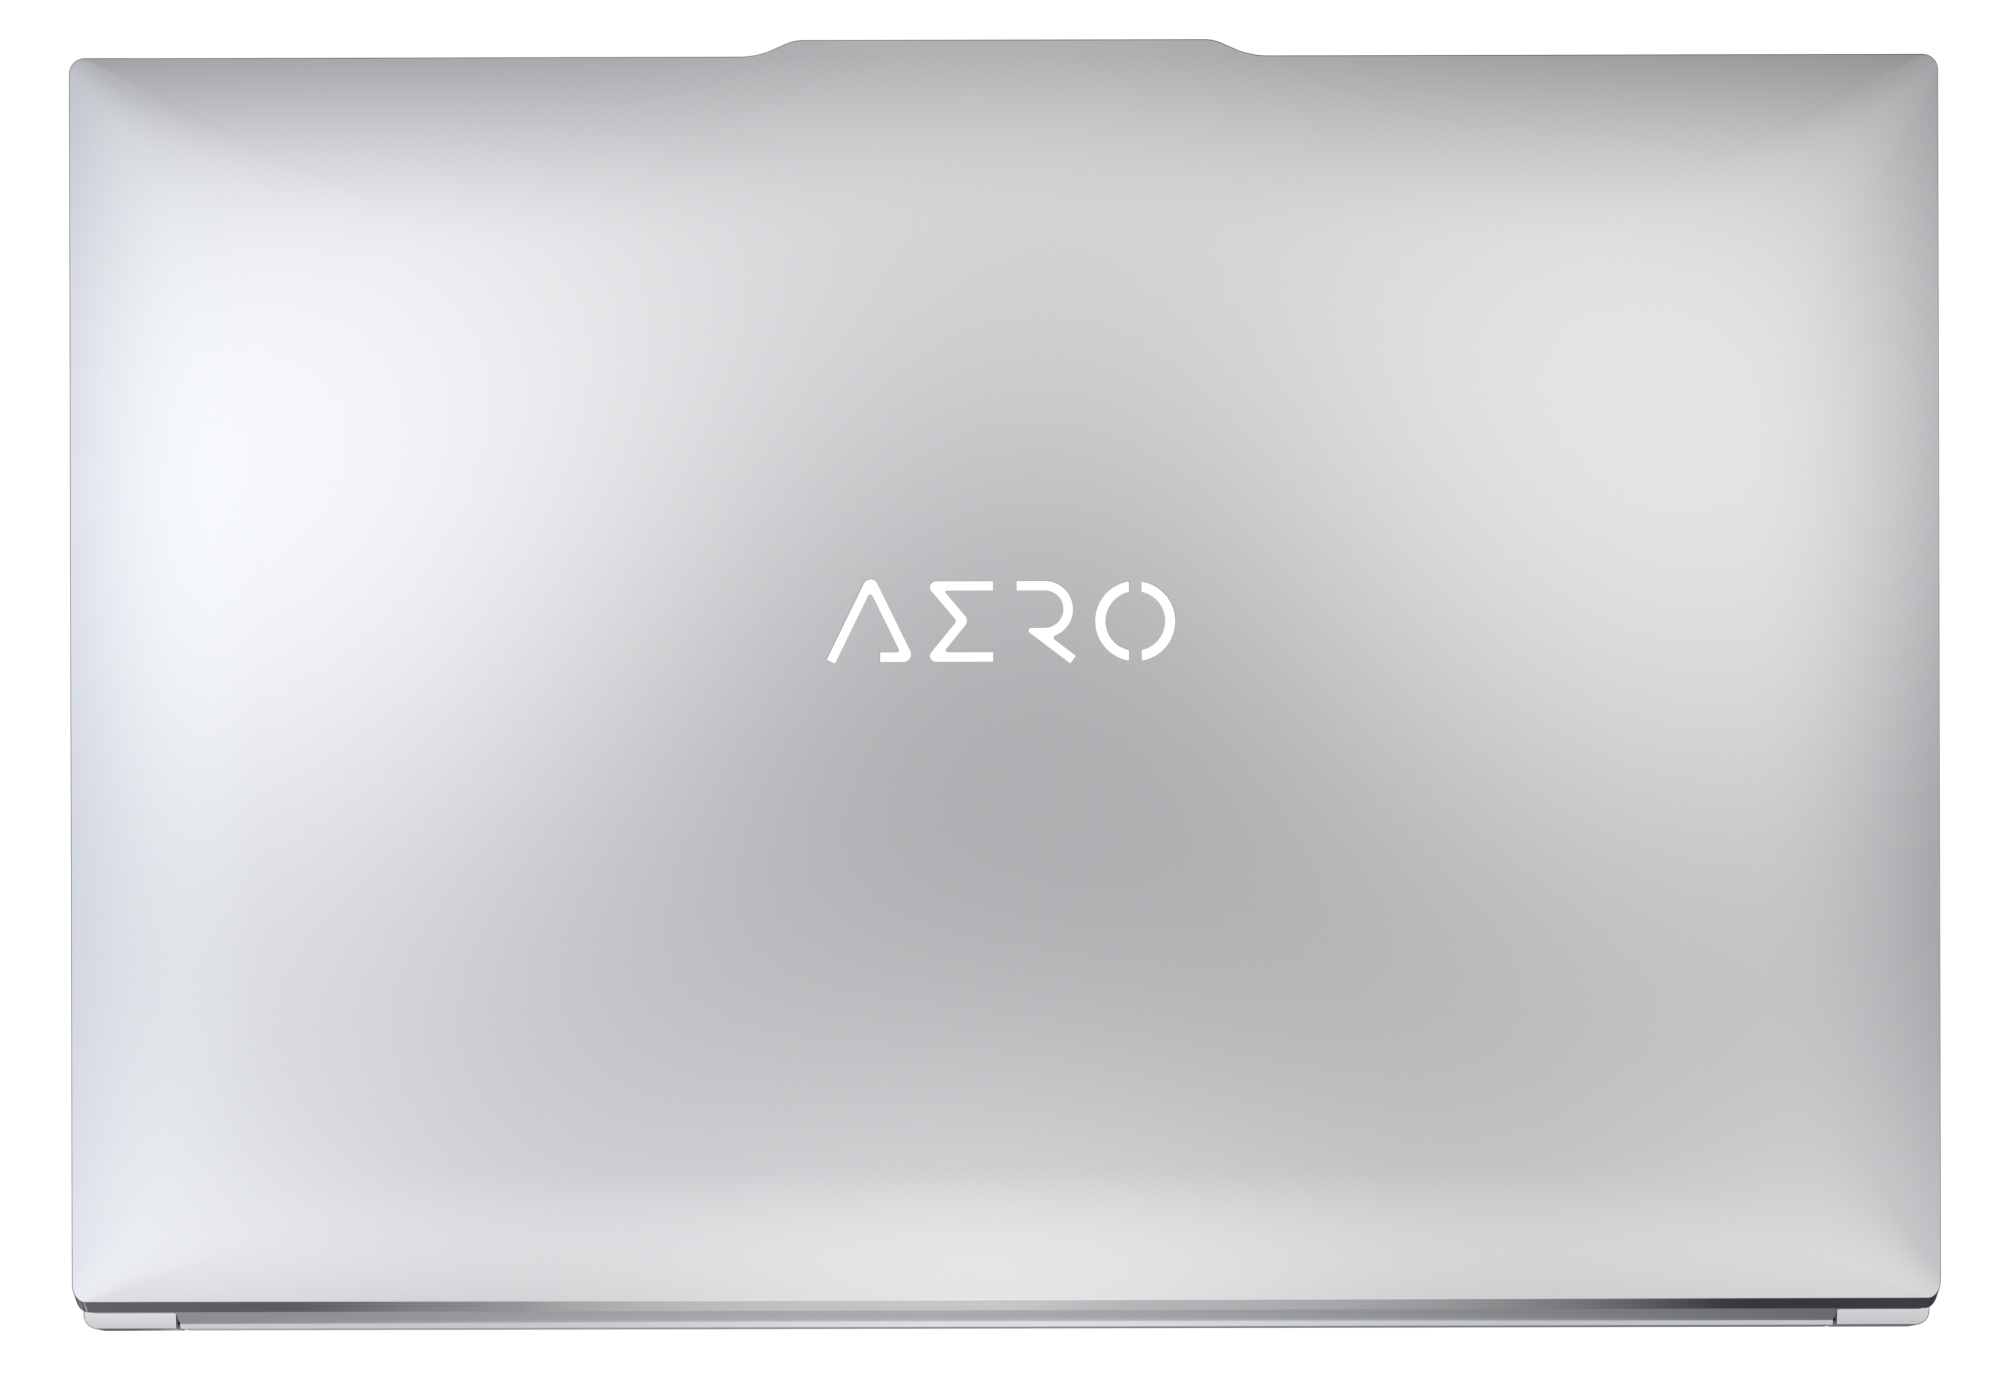
外壳 - 带有坚固的金属外壳的Aero
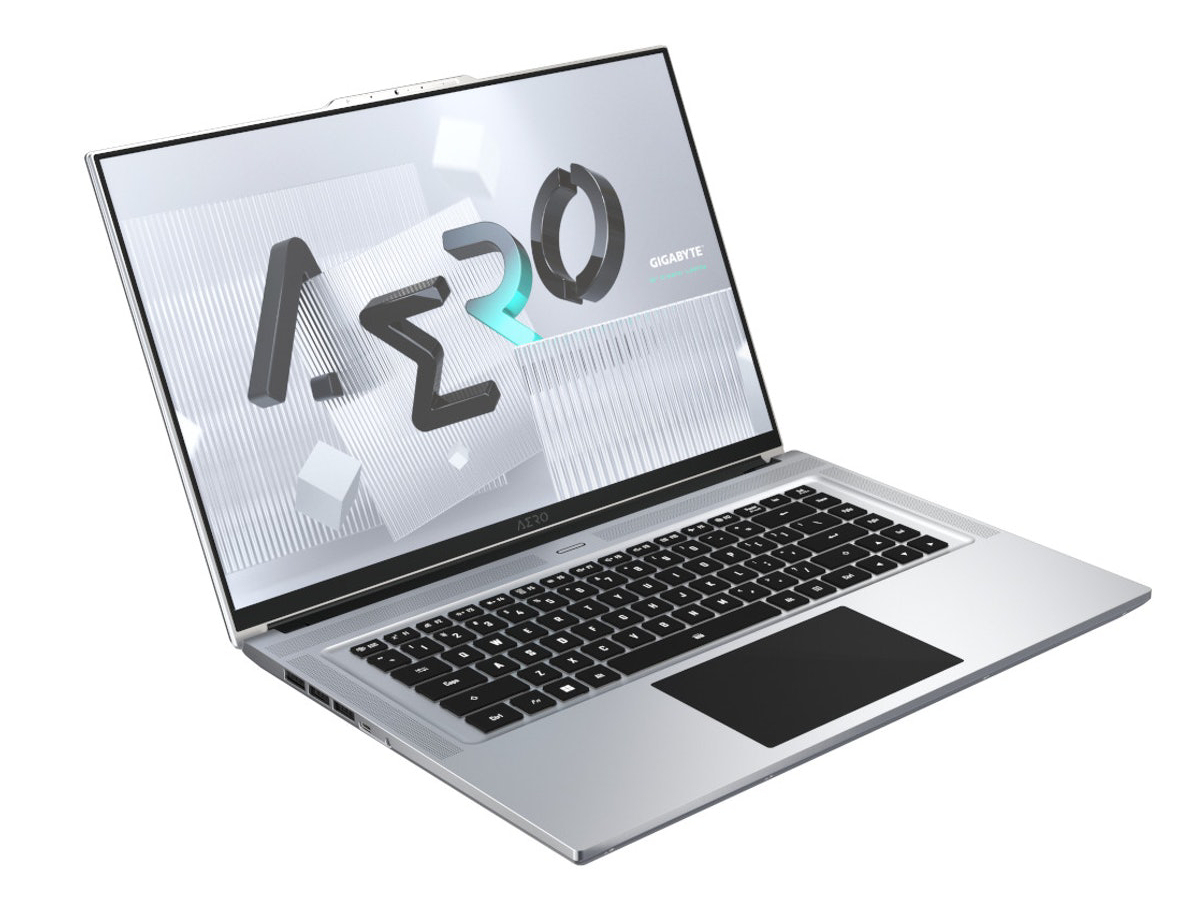
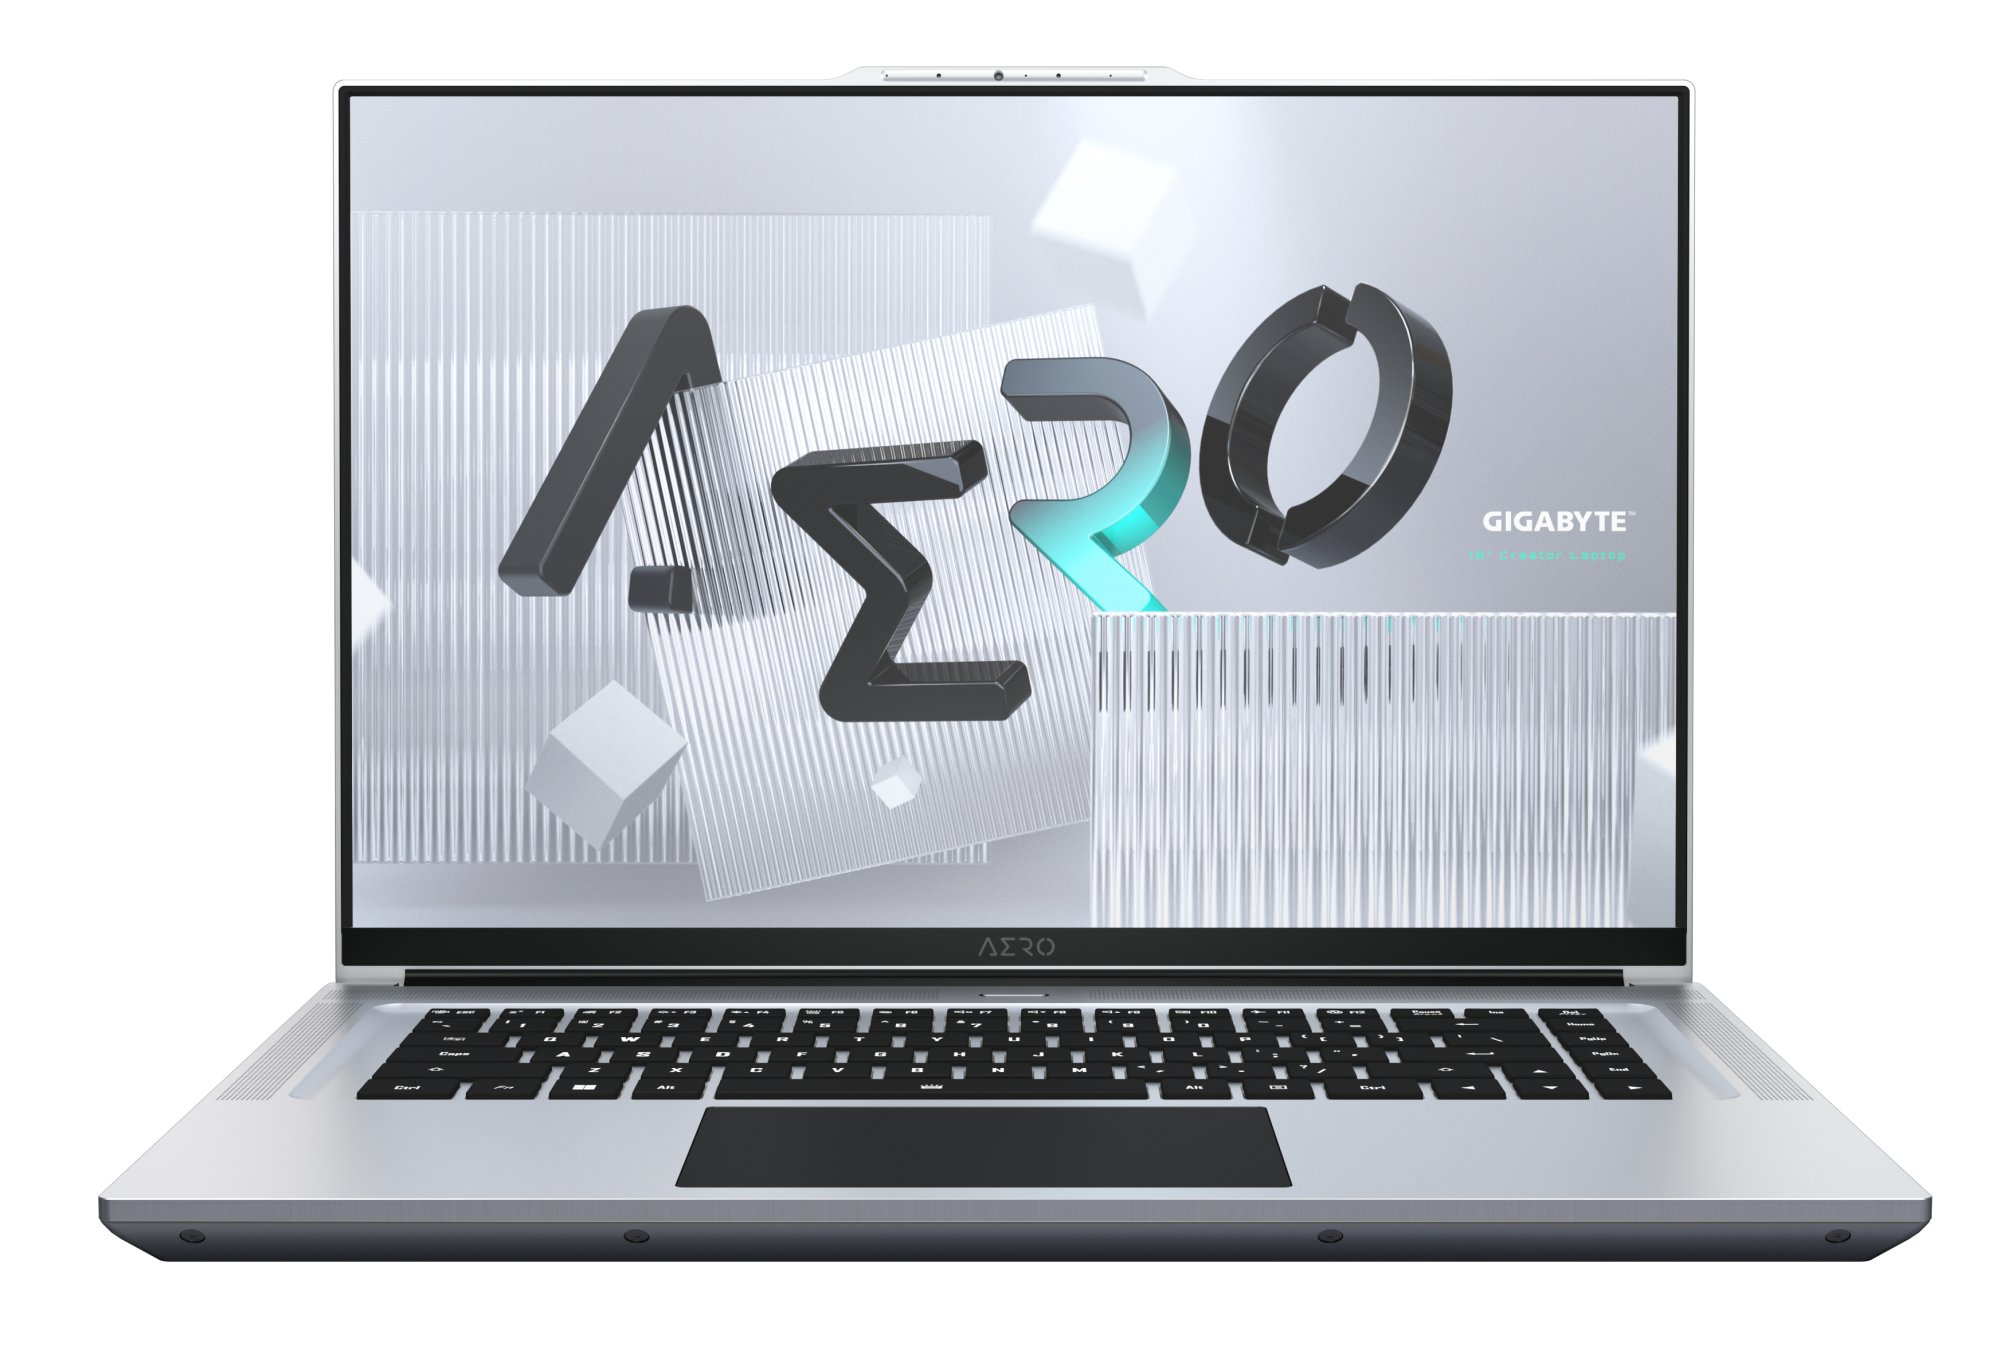
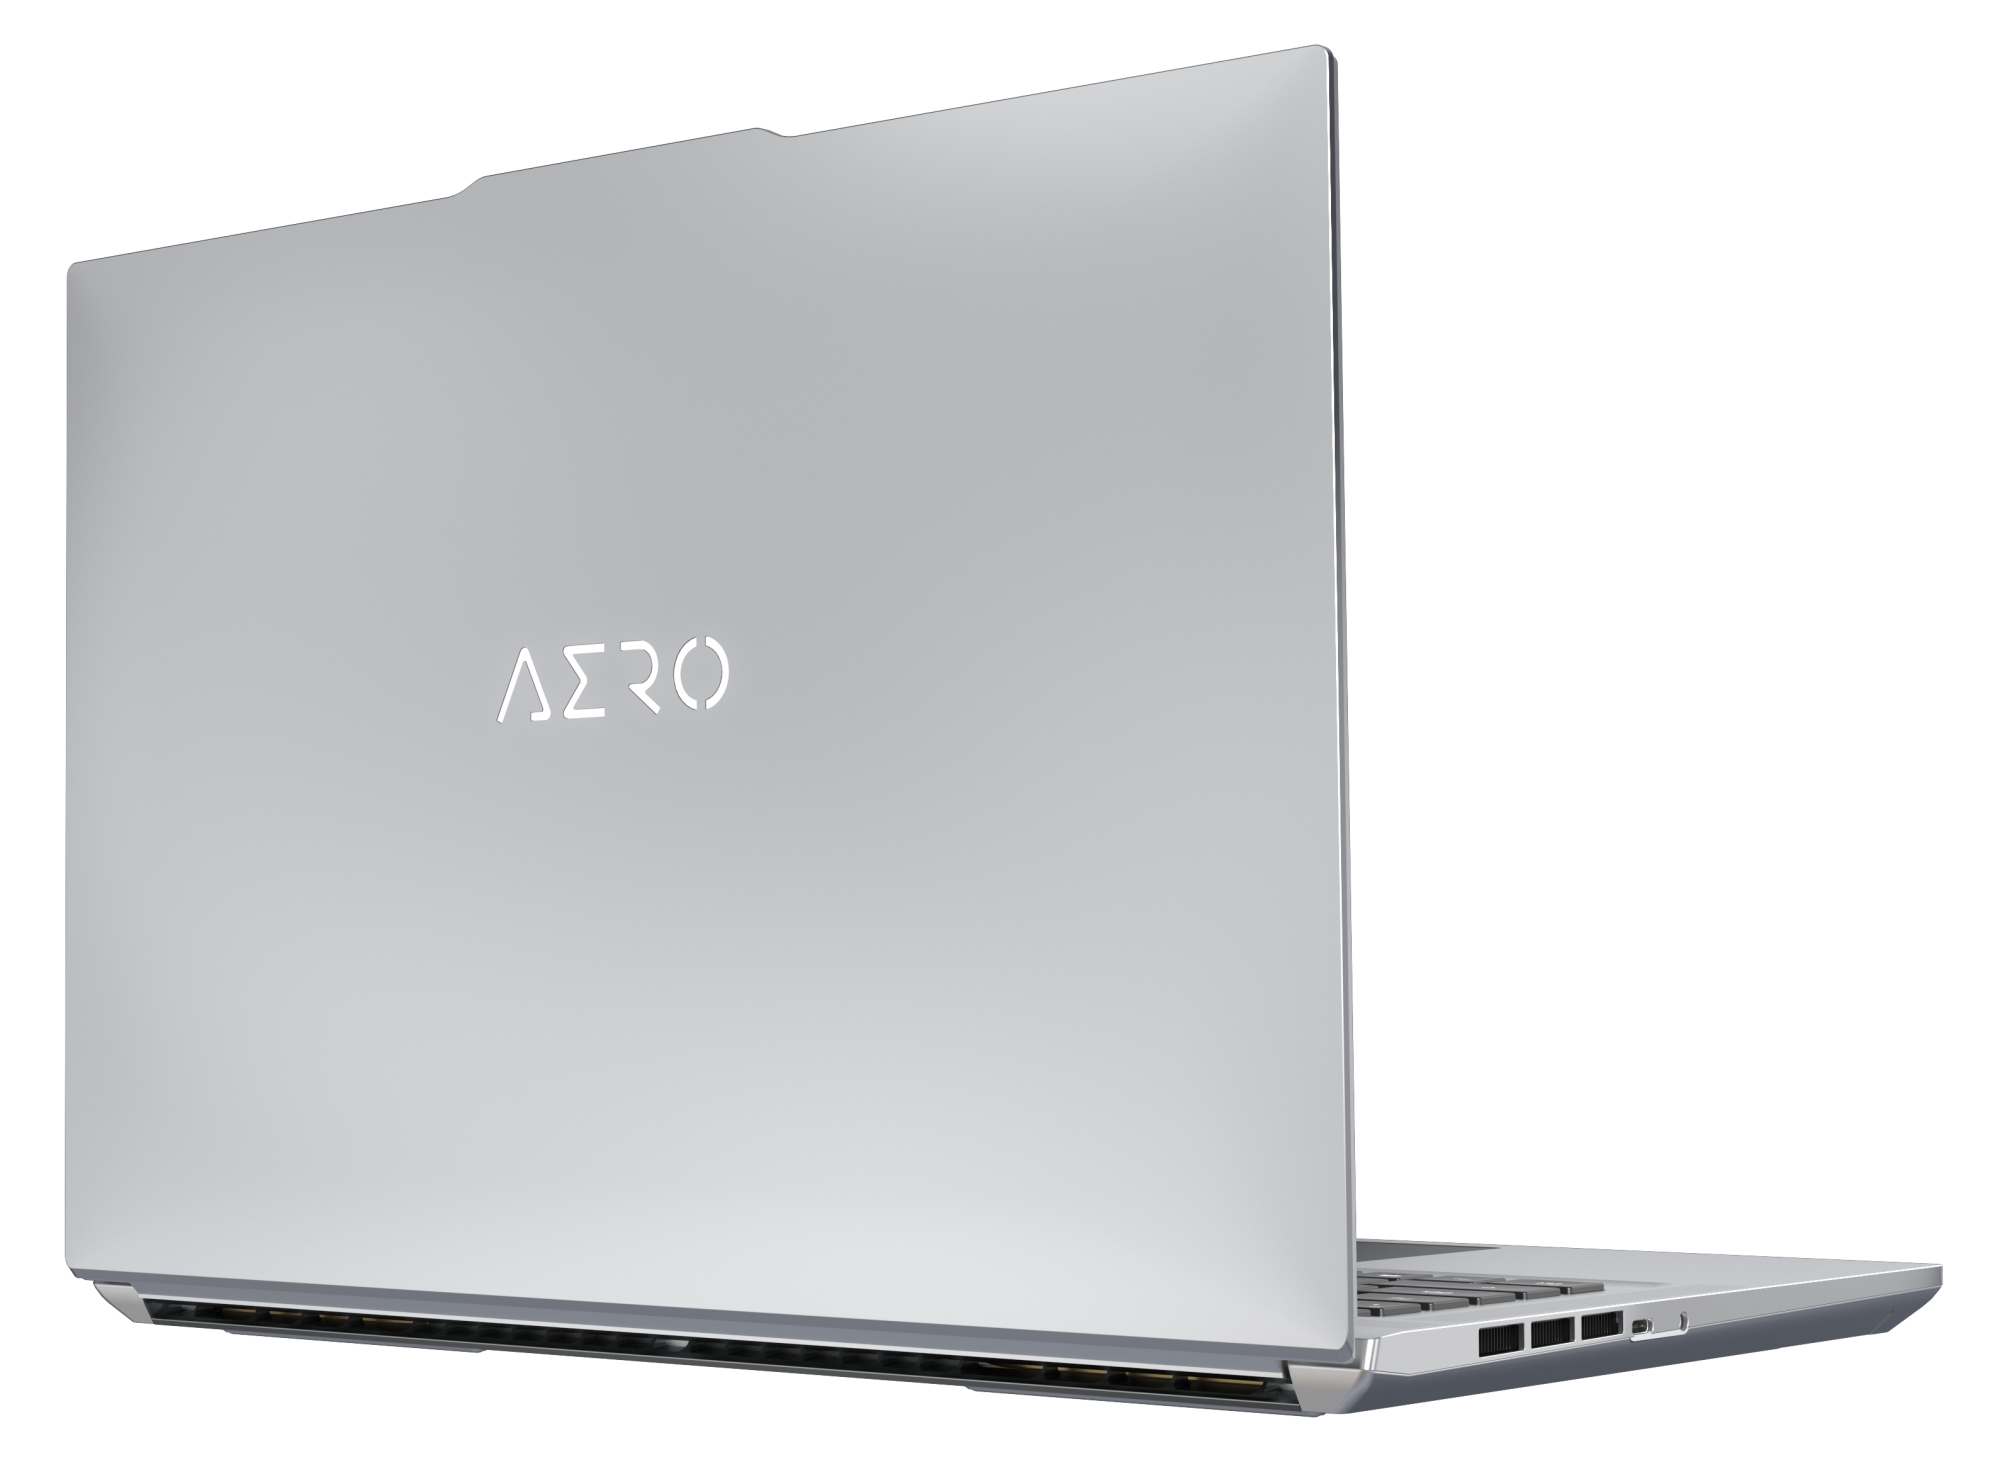
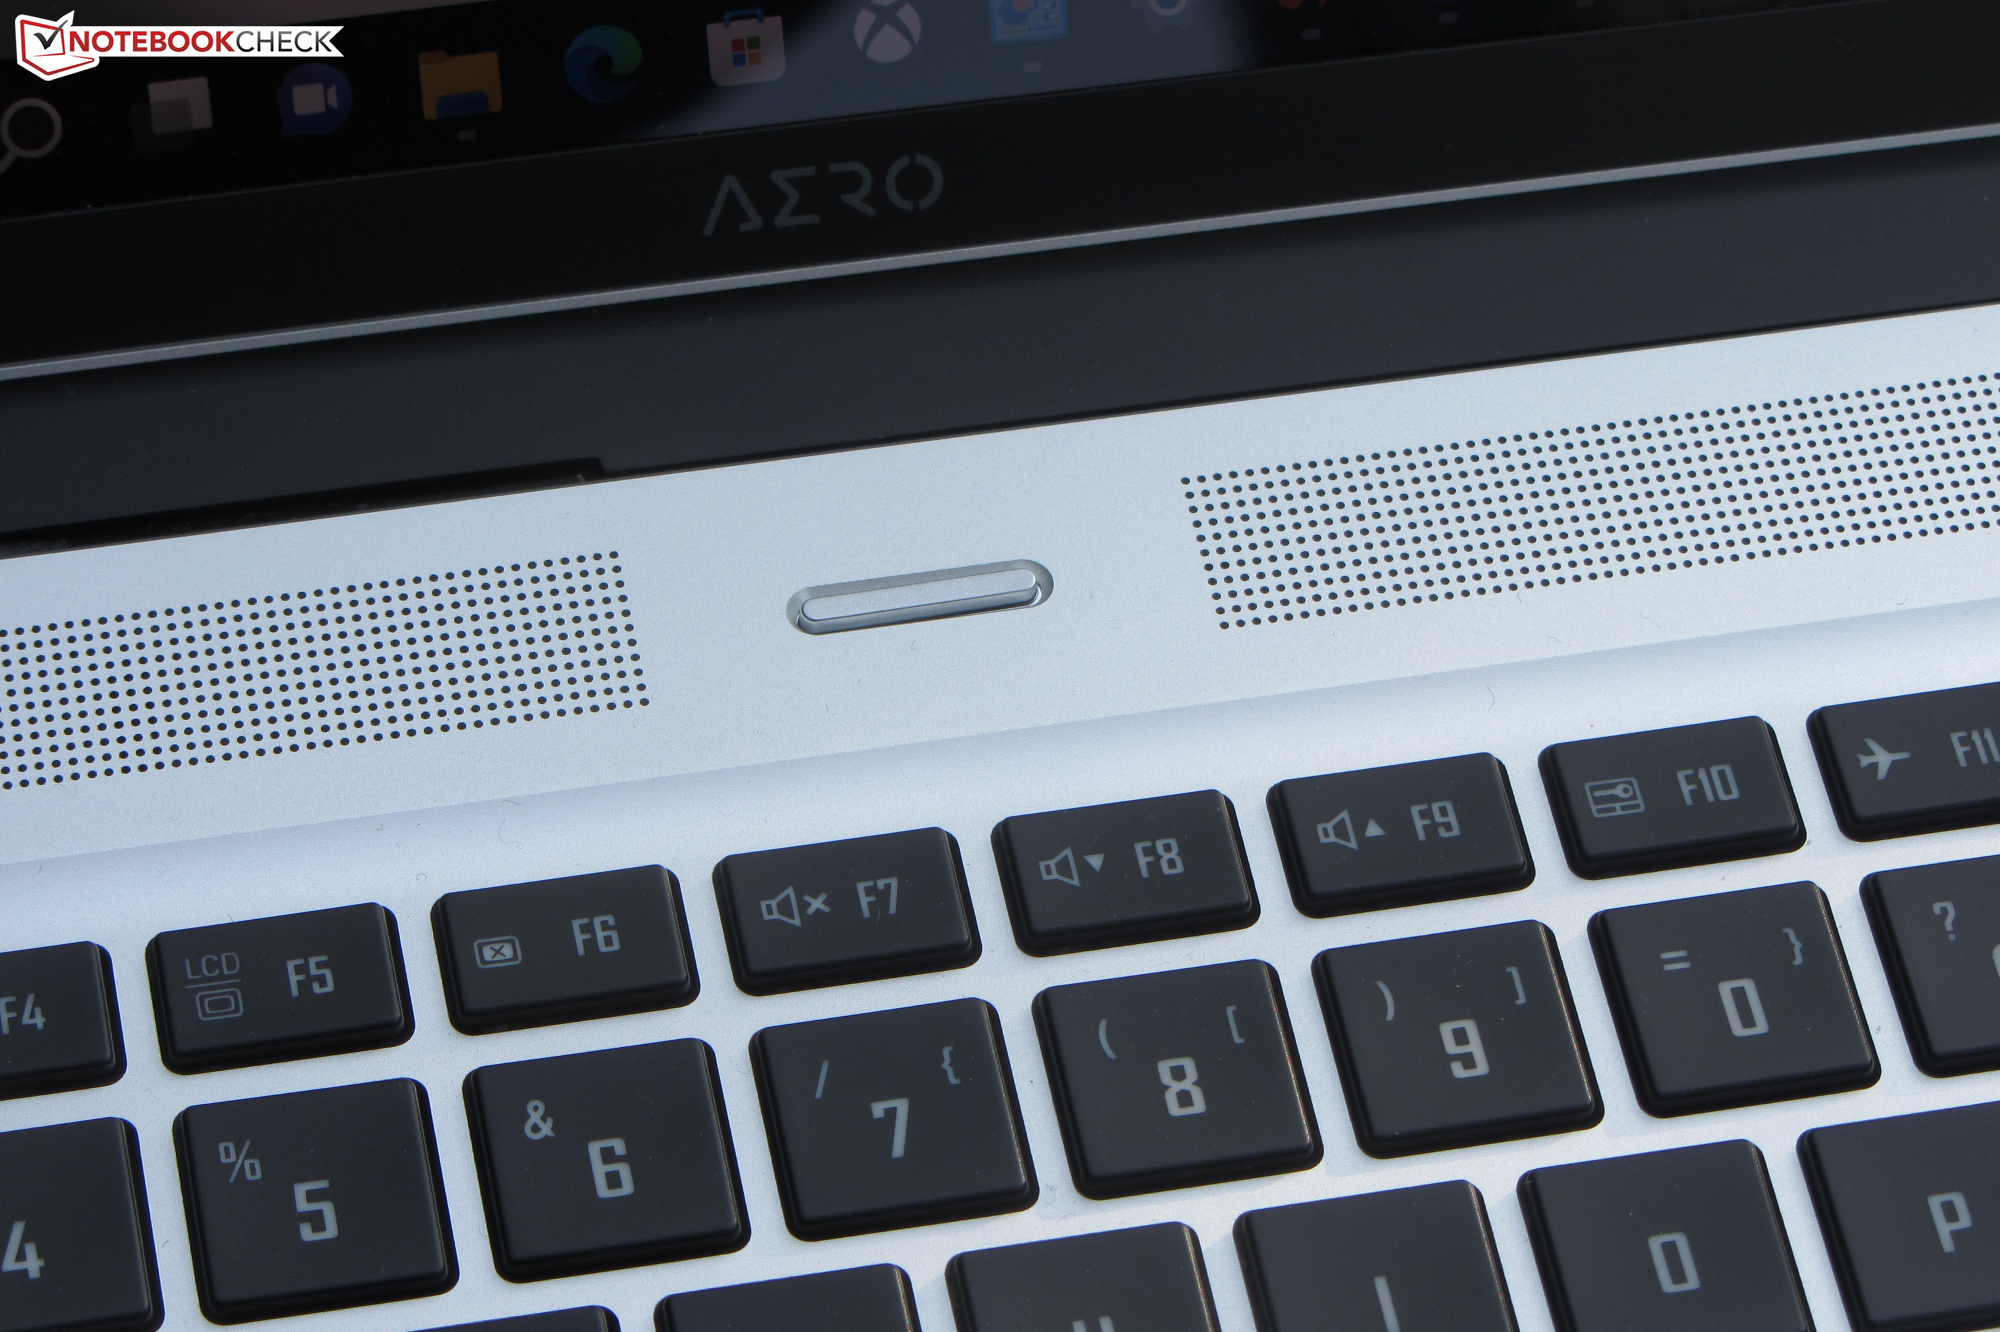
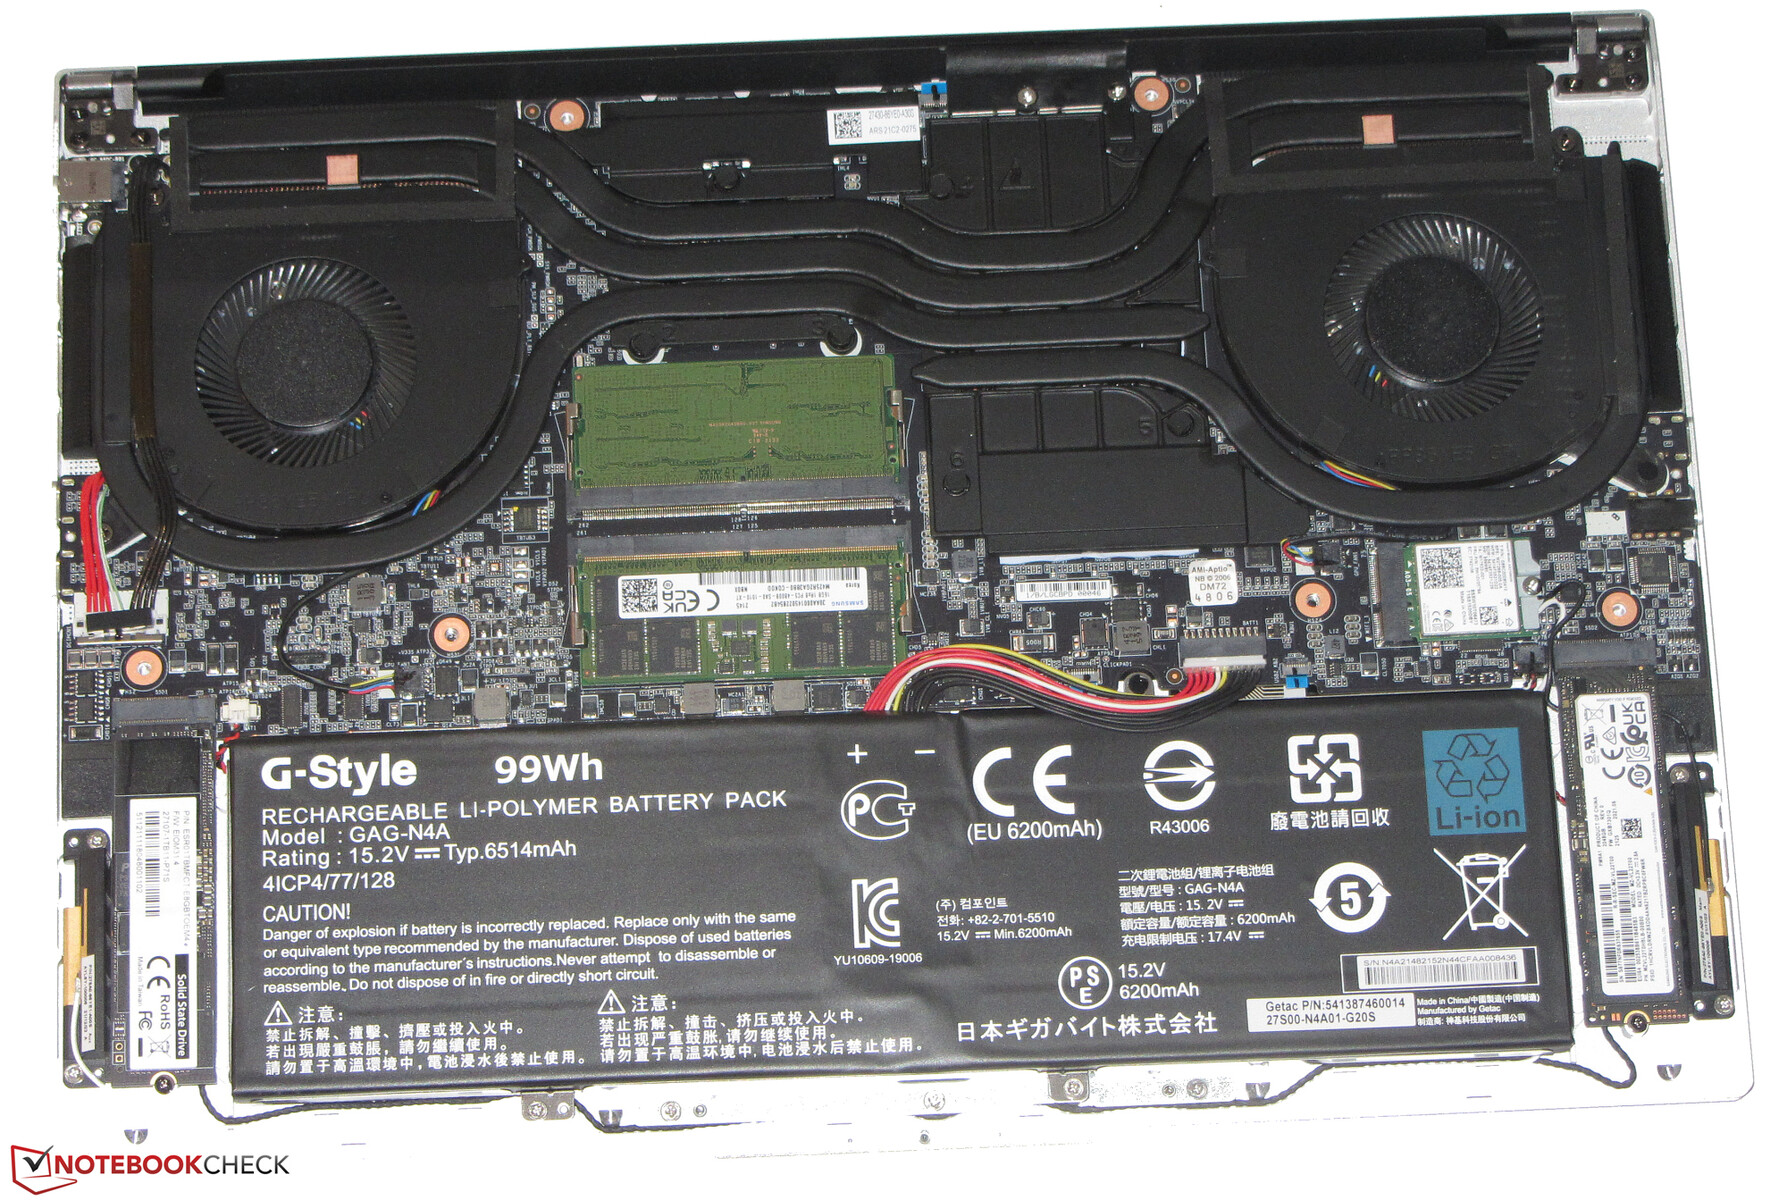
Aero 16采用了好看的紧凑型银色金属外壳,表面哑光光滑。各种黑色元素,如键盘、触控板、显示屏边框和铰链盖,作为设计上的点缀,显示屏盖子背面的背光Aero标志也是如此。通过移除底盖,可以很容易地接触到内部。电池是不可更换的。
整体建造质量很好。面板缝隙一致,我们也没有发现缝隙的突起。刚性很好,底座几乎没有翘曲,盖子也只是轻微翘曲和弯曲。铰链很牢固,能够将显示器牢牢地固定在原位,不会有太大的晃动。它的最大打开角度约为125-130°,可以单手打开和调整。
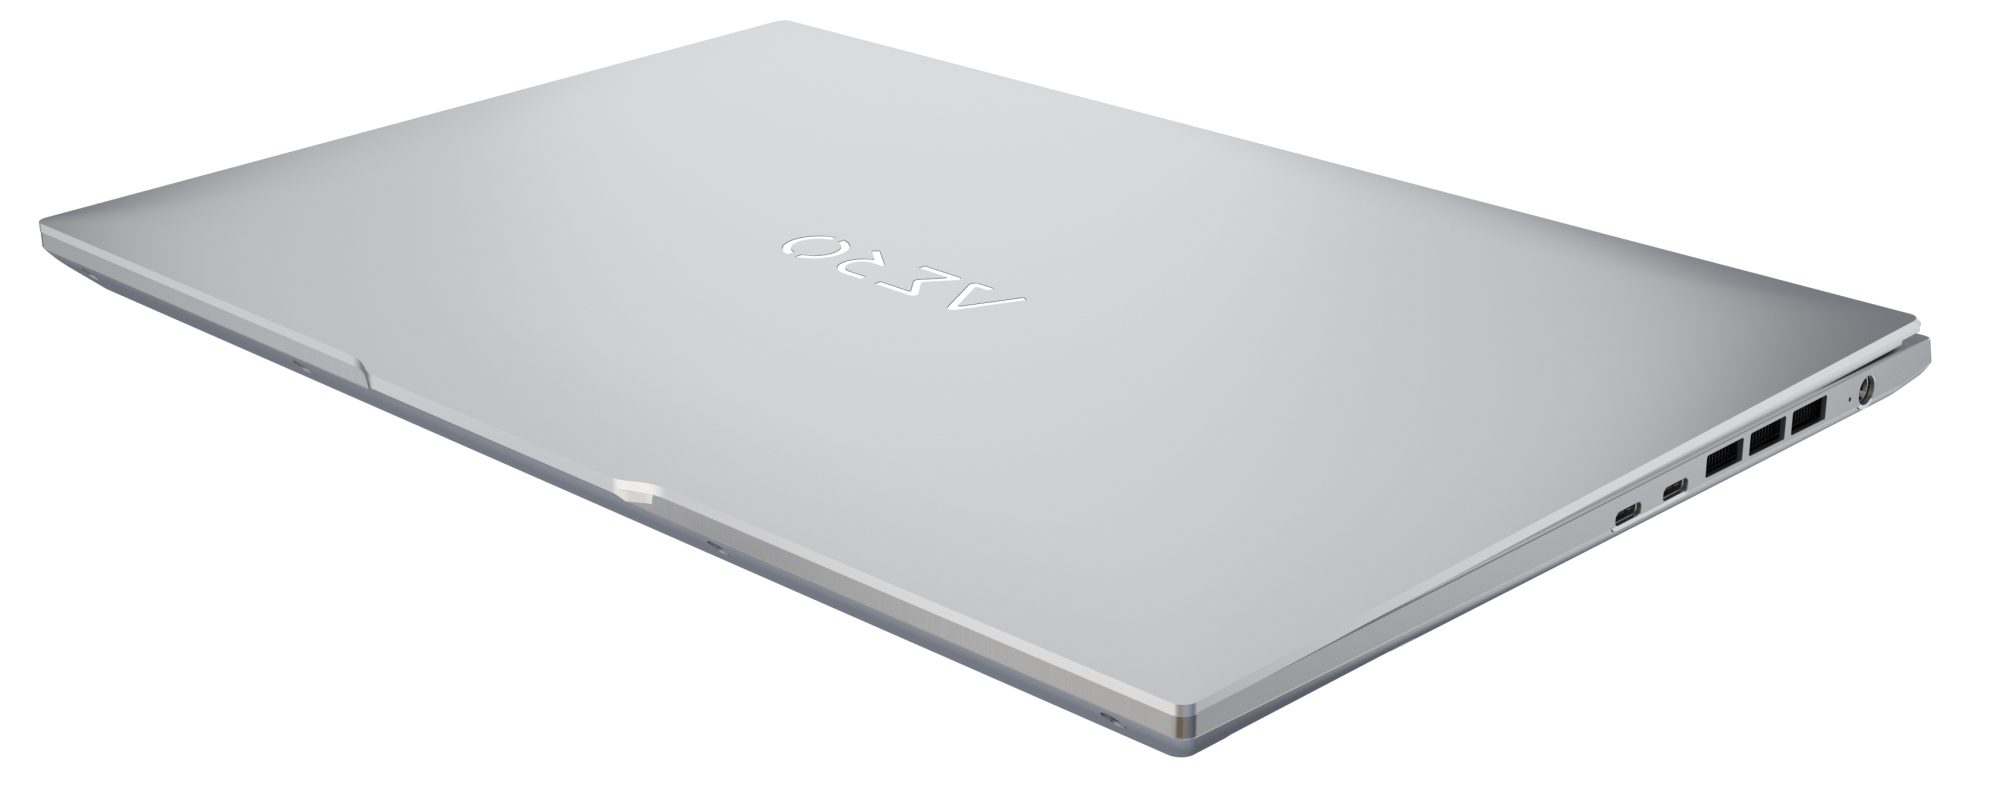
在我们的测试组中,Aero是较大的设备之一,而且是最重的设备,只有很小的差距。它的重量为2.3公斤(5.07磅),比联想ThinkPad X1 Extreme G4评论。酷睿i9和RTX3080带来的最佳Mutlimedia笔记本电脑? 的联想ThinkPad X1 Extreme G4 重400克(0.88磅)。
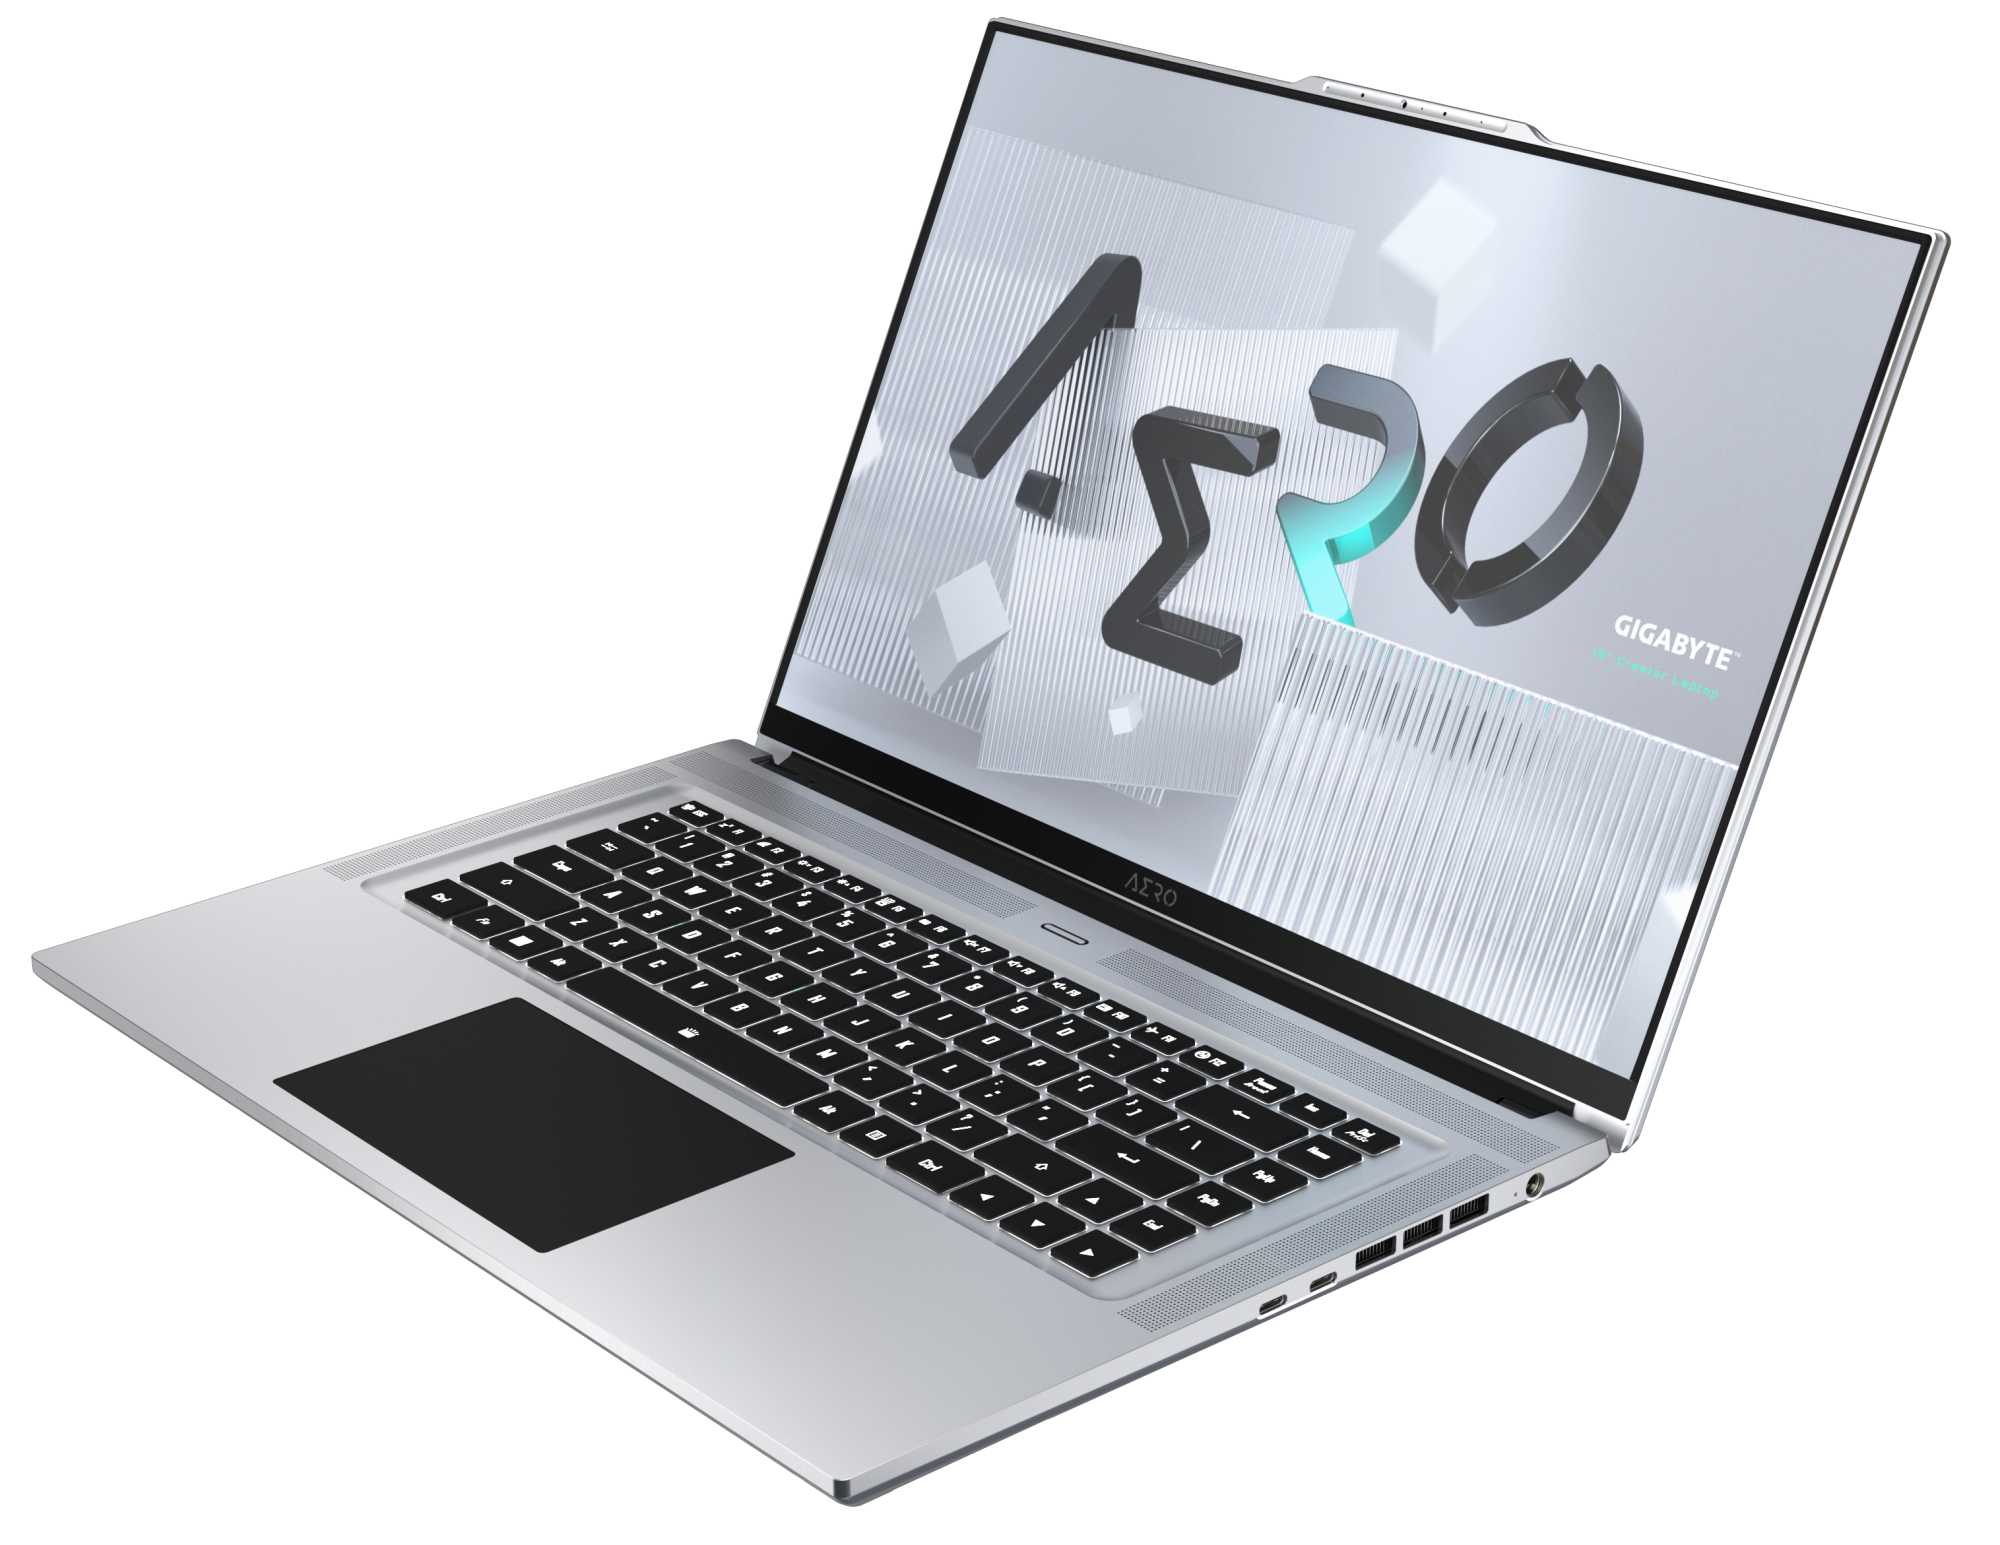
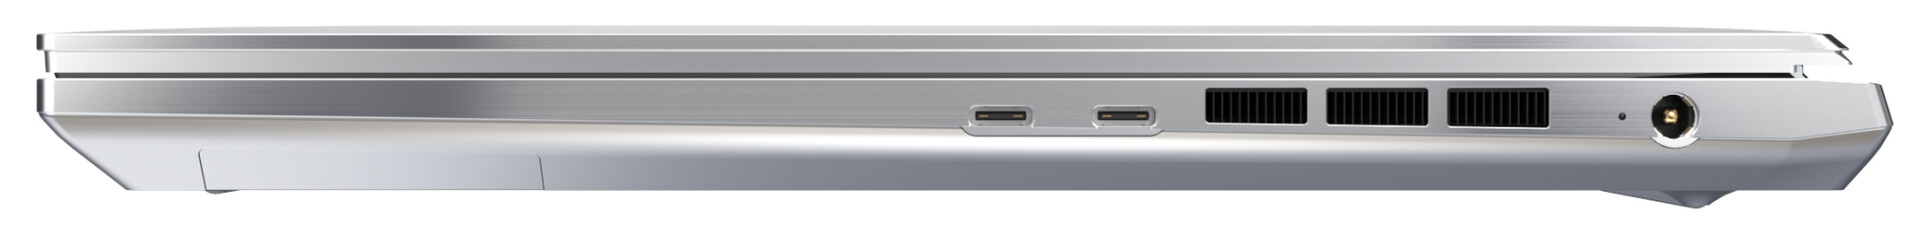
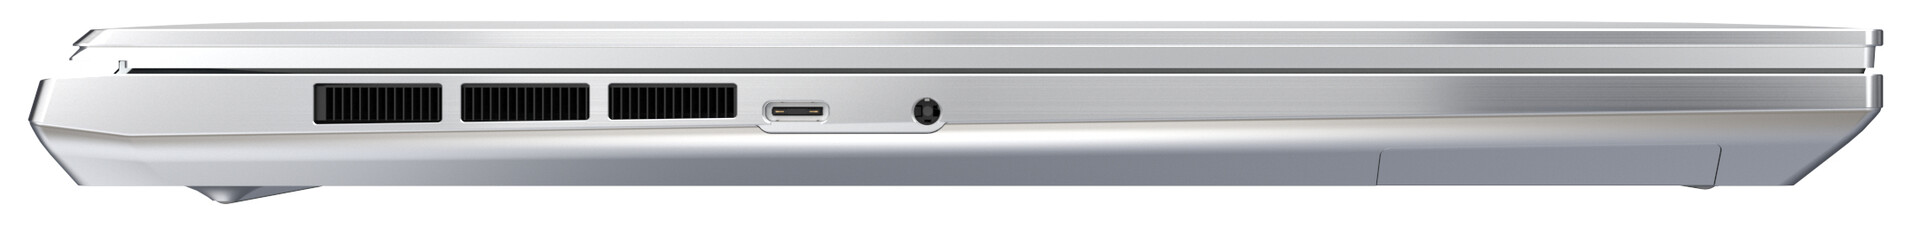
连接性 - 带有USB-C的技嘉笔记本
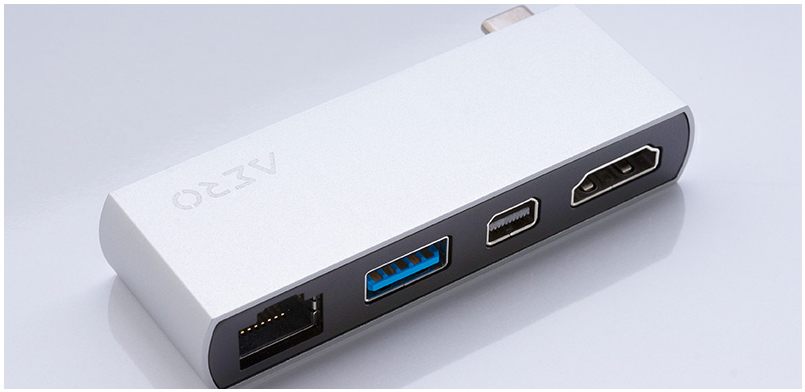
除了一个充电端口和一个耳机插孔外,我们发现该设备上总共有三个USB-C端口,其中两个支持Thunderbolt 4,一个仅限于USB 3.2 Gen 2。所有端口都带有DisplayPort信号,后部的Thunderbolt 4端口还支持Power Delivery,用于用USB-C电源为电池充电,该电源的额定功率必须在45W以上。附带的Aero集线器增加了更多常见的端口,如HDMI、Mini DisplayPort、USB-A和以太网。
沟通
内置的AX210 Wi-Fi调制解调器由英特尔制造,支持802.11a/b/g/n/ac/ax。在理想的条件下(附近没有其他Wi-Fi设备,笔记本和服务器之间距离很近),它的数据传输率总体上非常好。
| Networking | |
| iperf3 receive AXE11000 | |
| Average of class Multimedia (682 - 1818, n=54, last 2 years) | |
| Gigabyte Aero 16 YE5 | |
| iperf3 transmit AXE11000 | |
| Gigabyte Aero 16 YE5 | |
| Average of class Multimedia (606 - 1978, n=54, last 2 years) | |
网络摄像头
90万像素的网络摄像头在1280 x 720的分辨率下运行,颜色不是特别准确,DeltaE偏差为9。


辅料
除了通常的文书工作(快速入门指南、保修信息手册),该设备还配有一个USB-C集线器。
维护
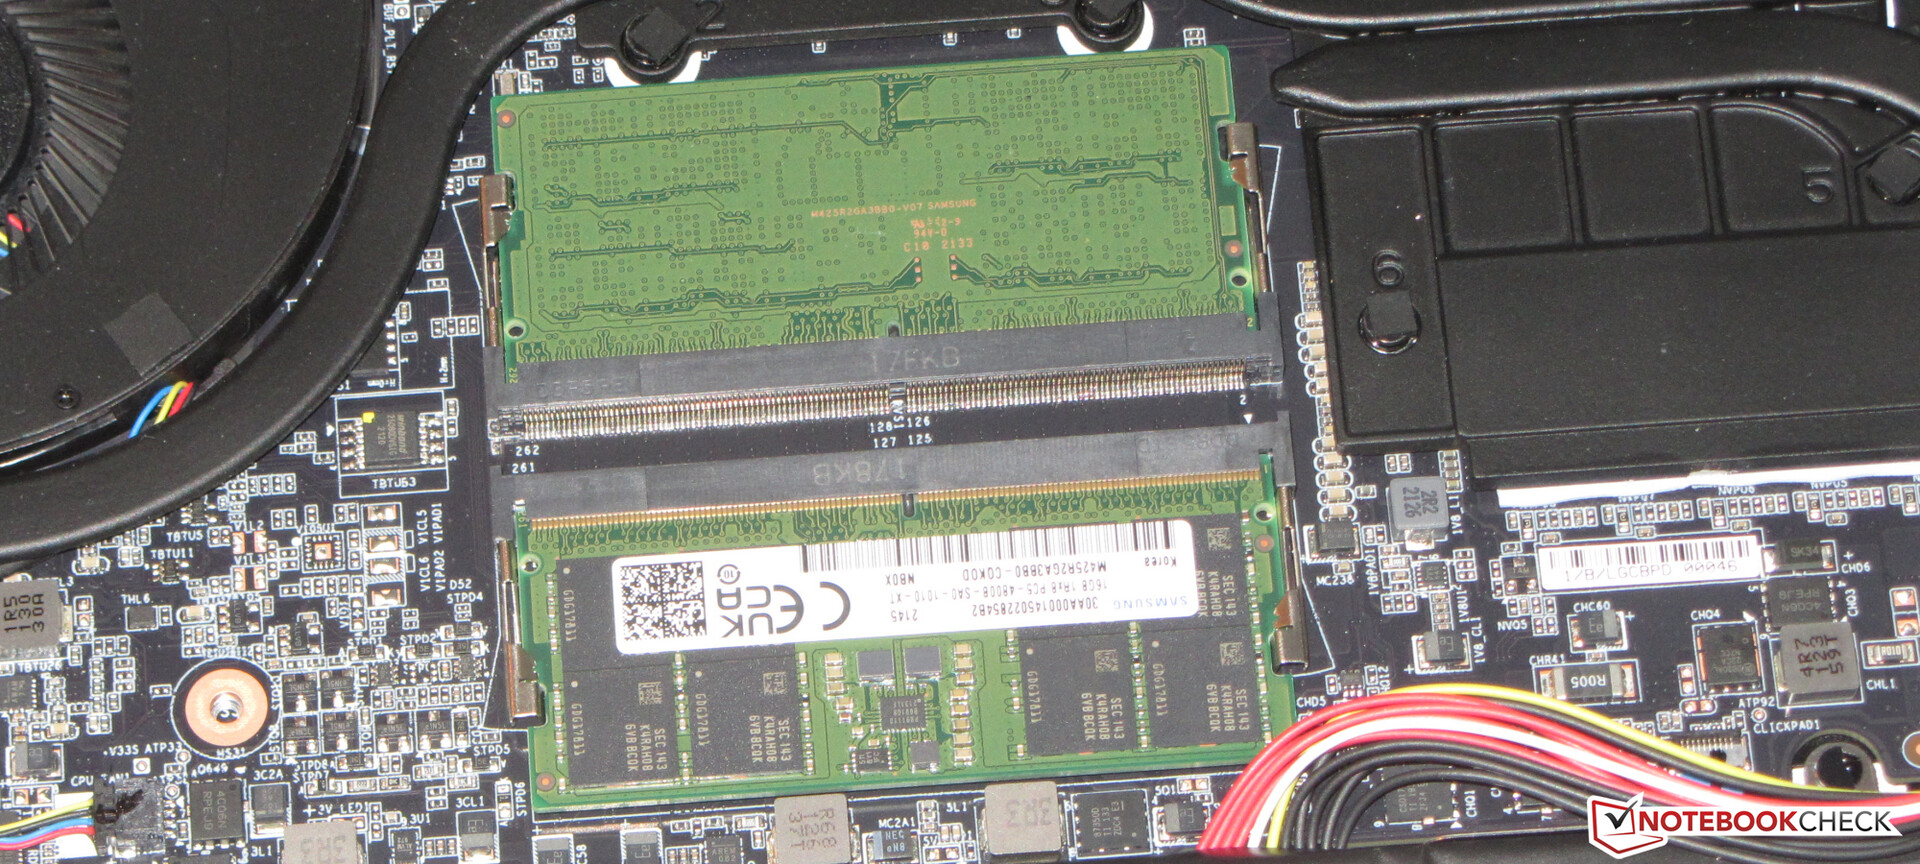
维修和升级相对来说比较容易进行。拧开底部的每一颗螺丝后,可以用一个小铲子轻松地将盖子拆下来。一旦取下,你就可以接触到两个固态硬盘、Wi-Fi调制解调器、内存和风扇。
担保
像往常一样,欧洲客户得到两年的有限保修,而美国客户再次被限制在只有12个月。技嘉公司不提供任何延长保修期的服务。
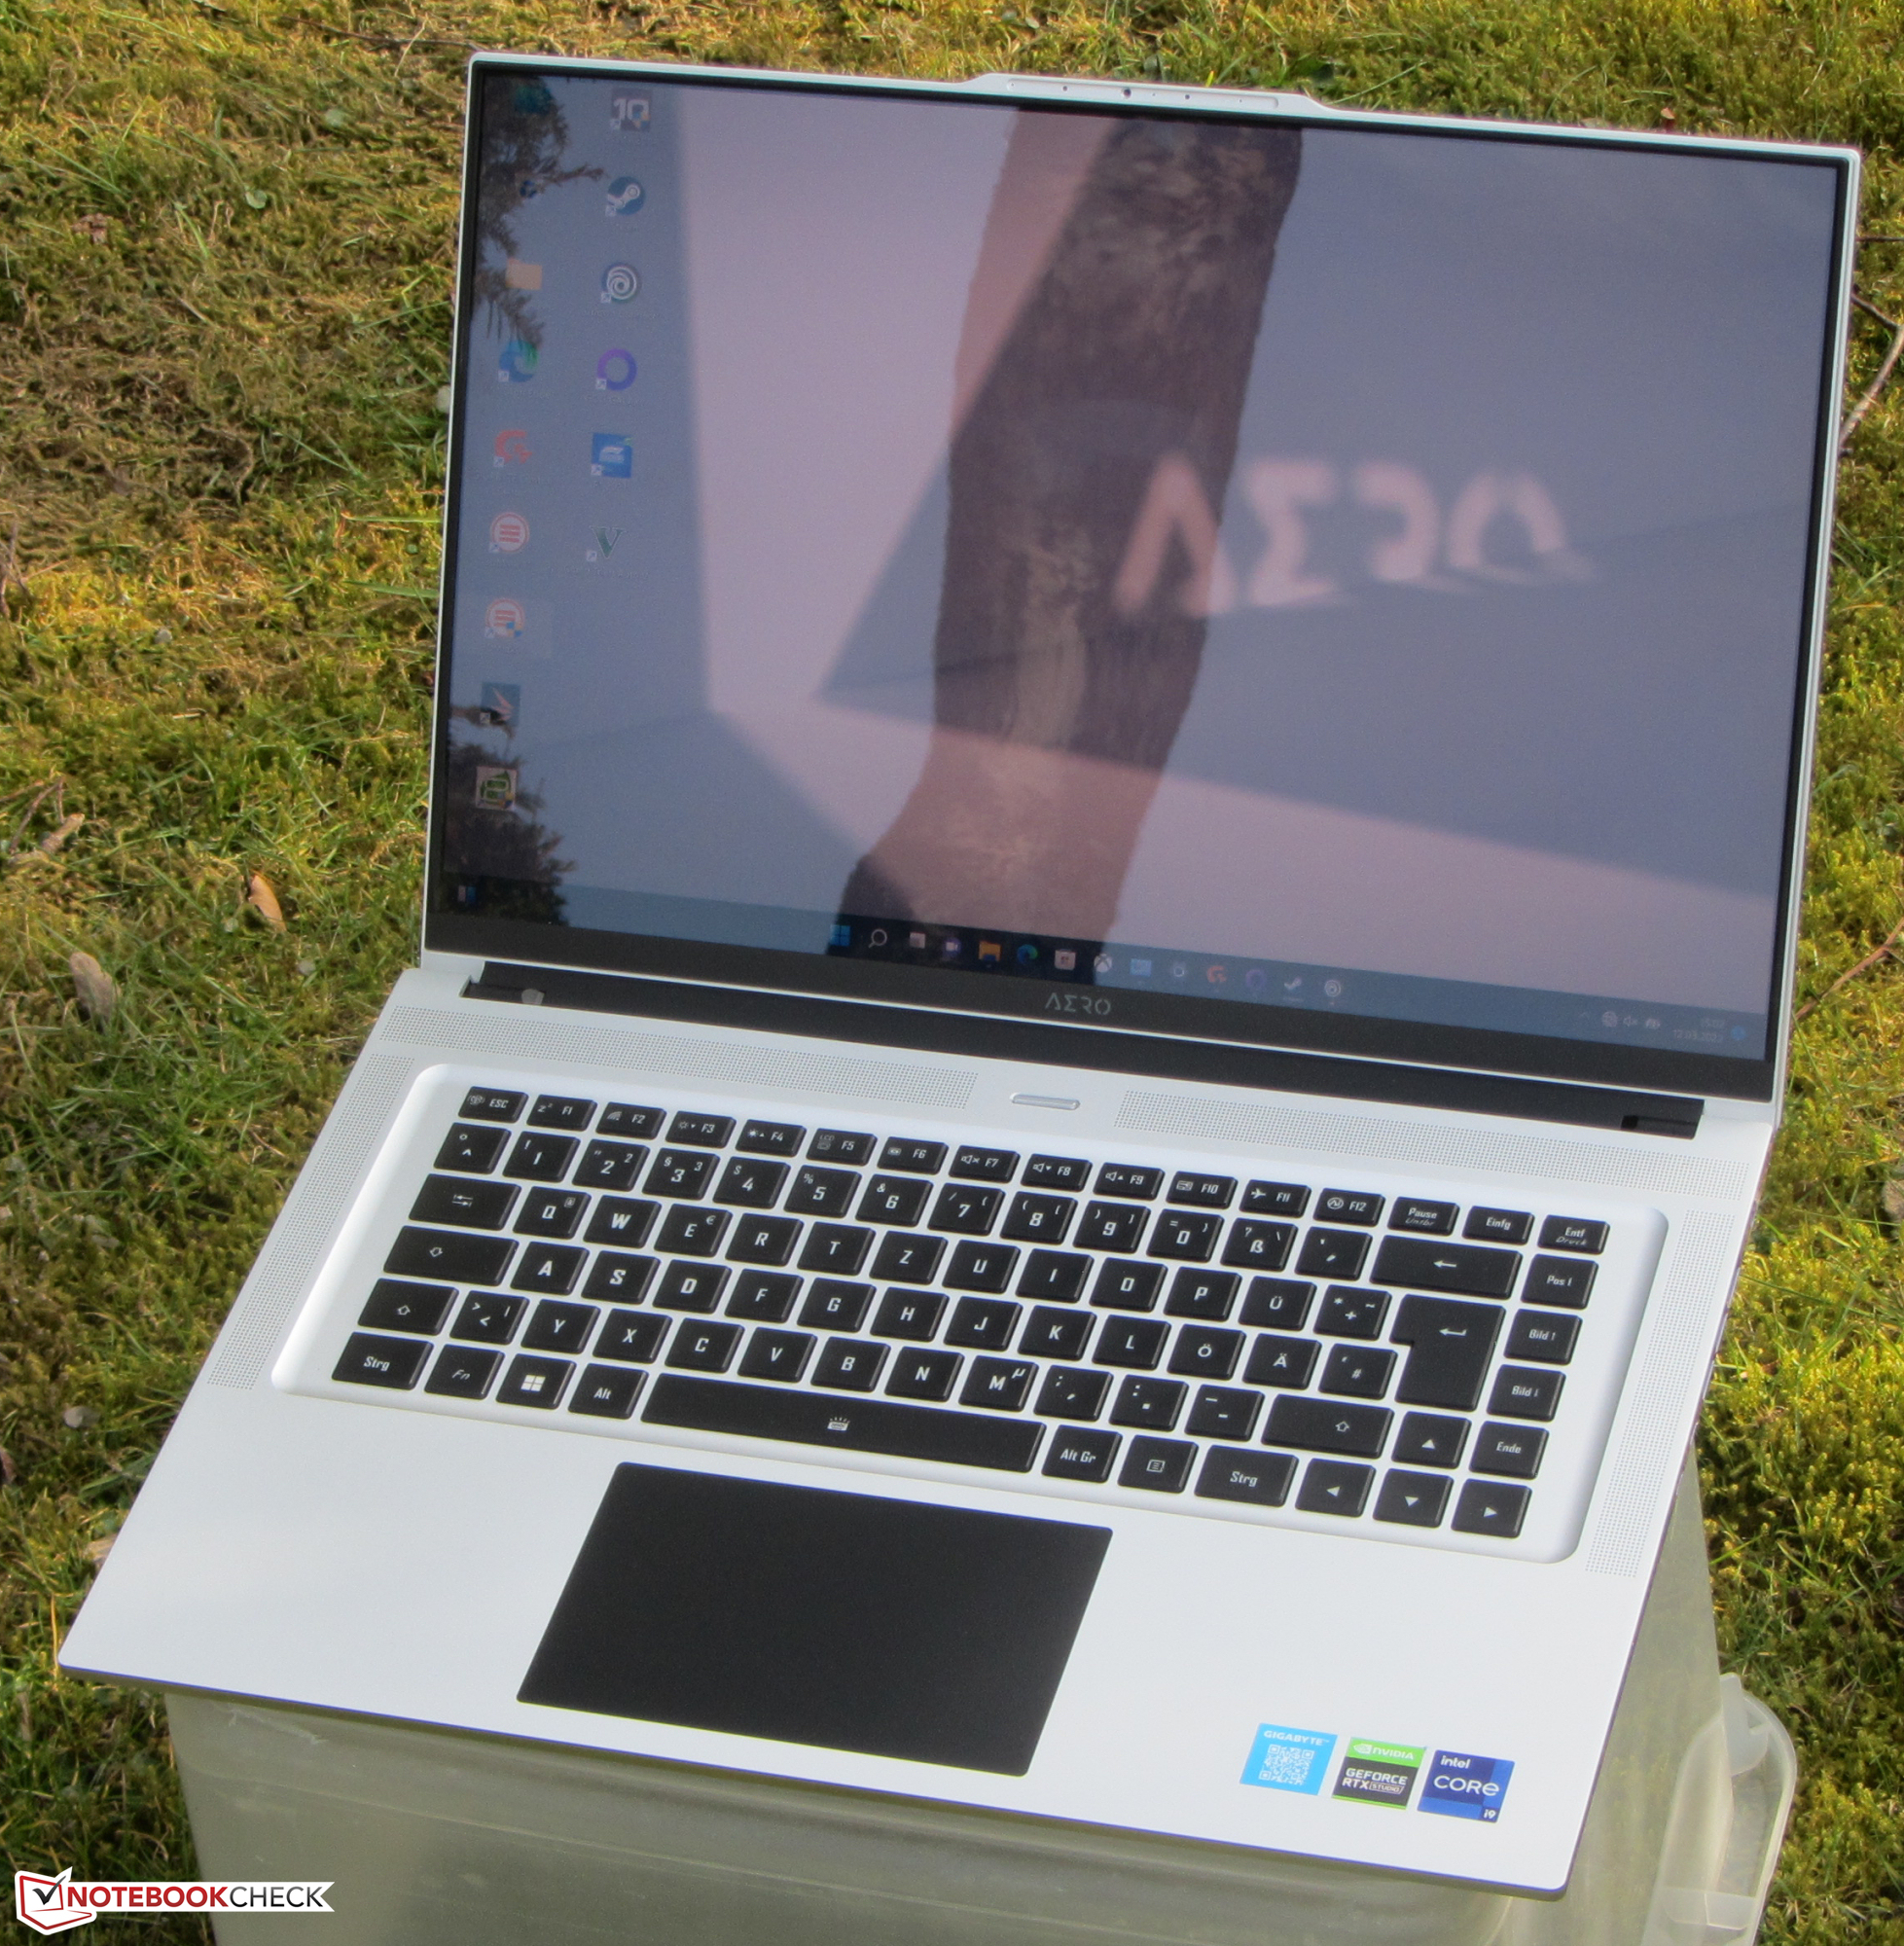
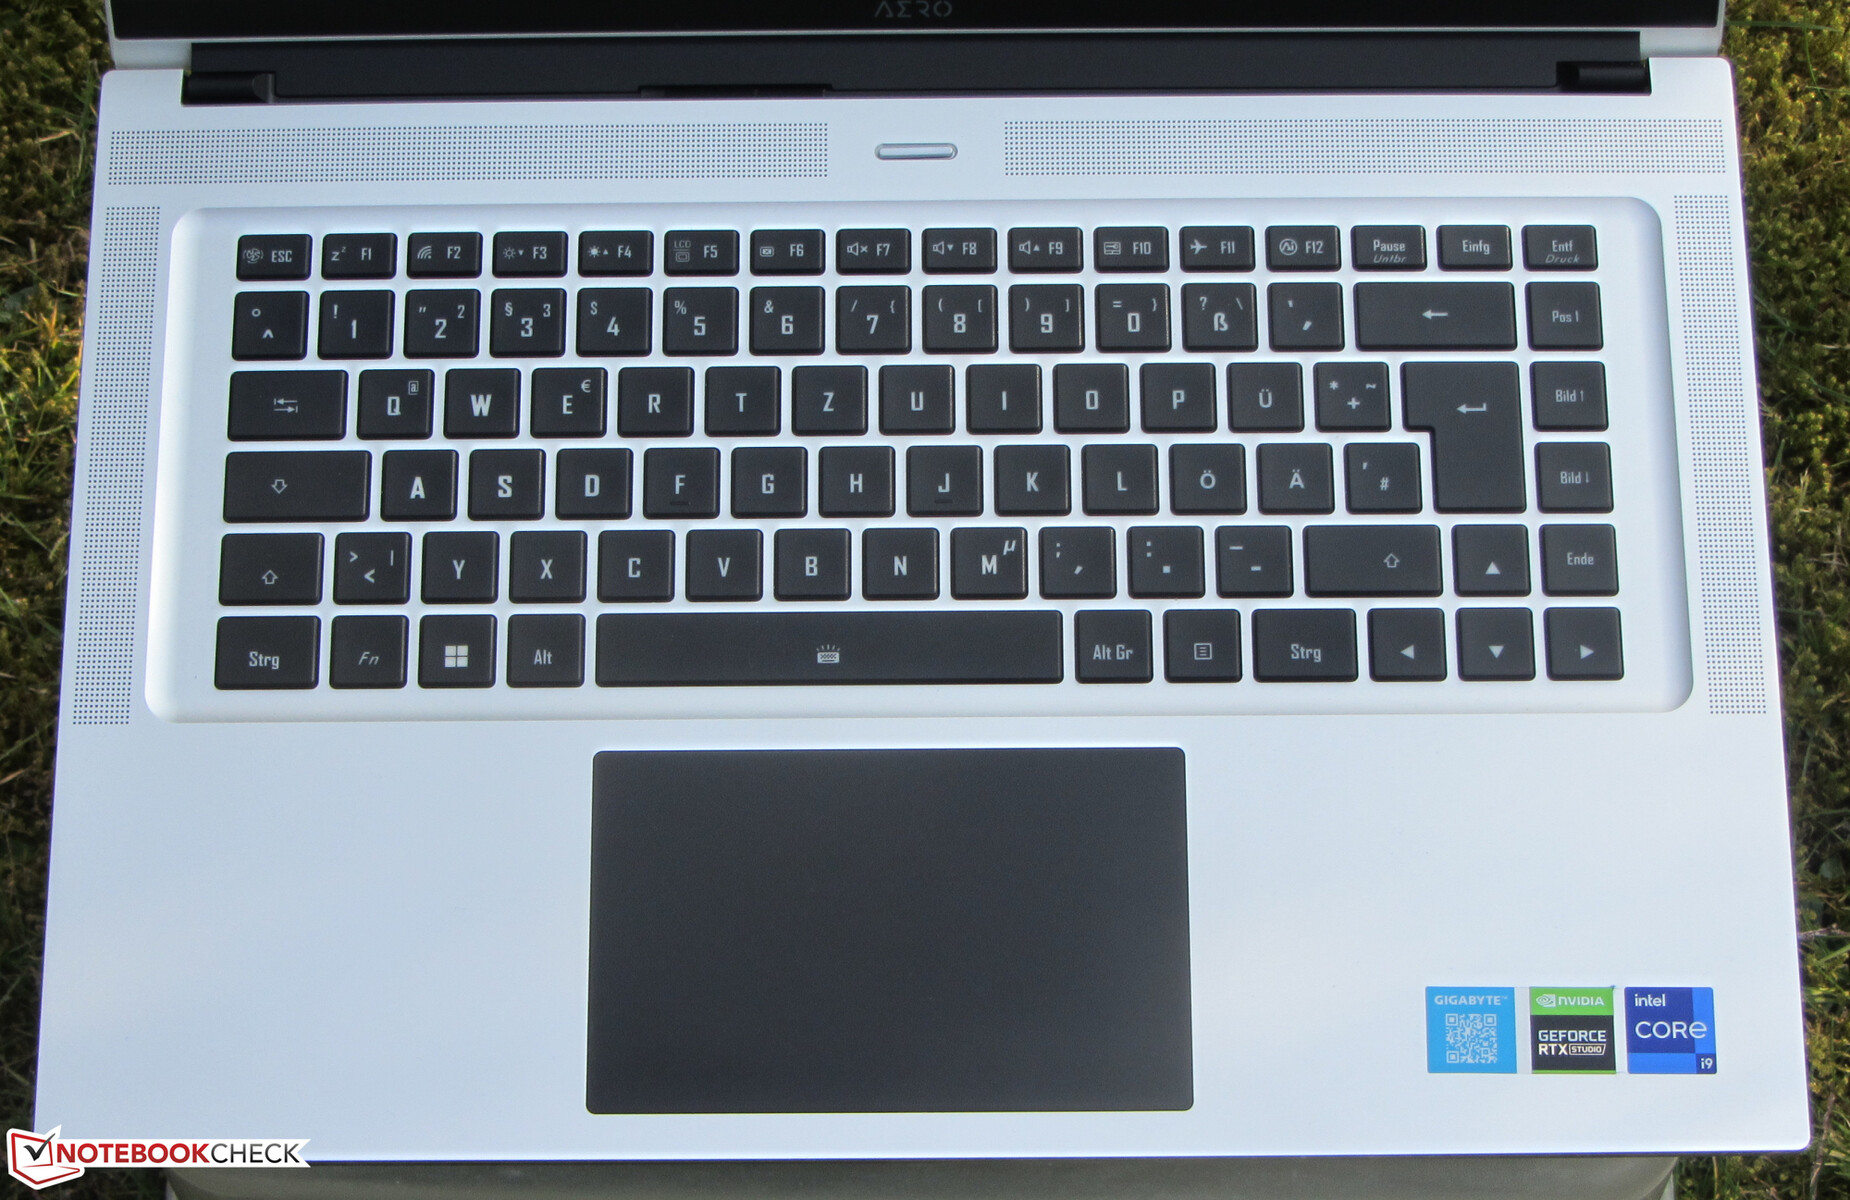
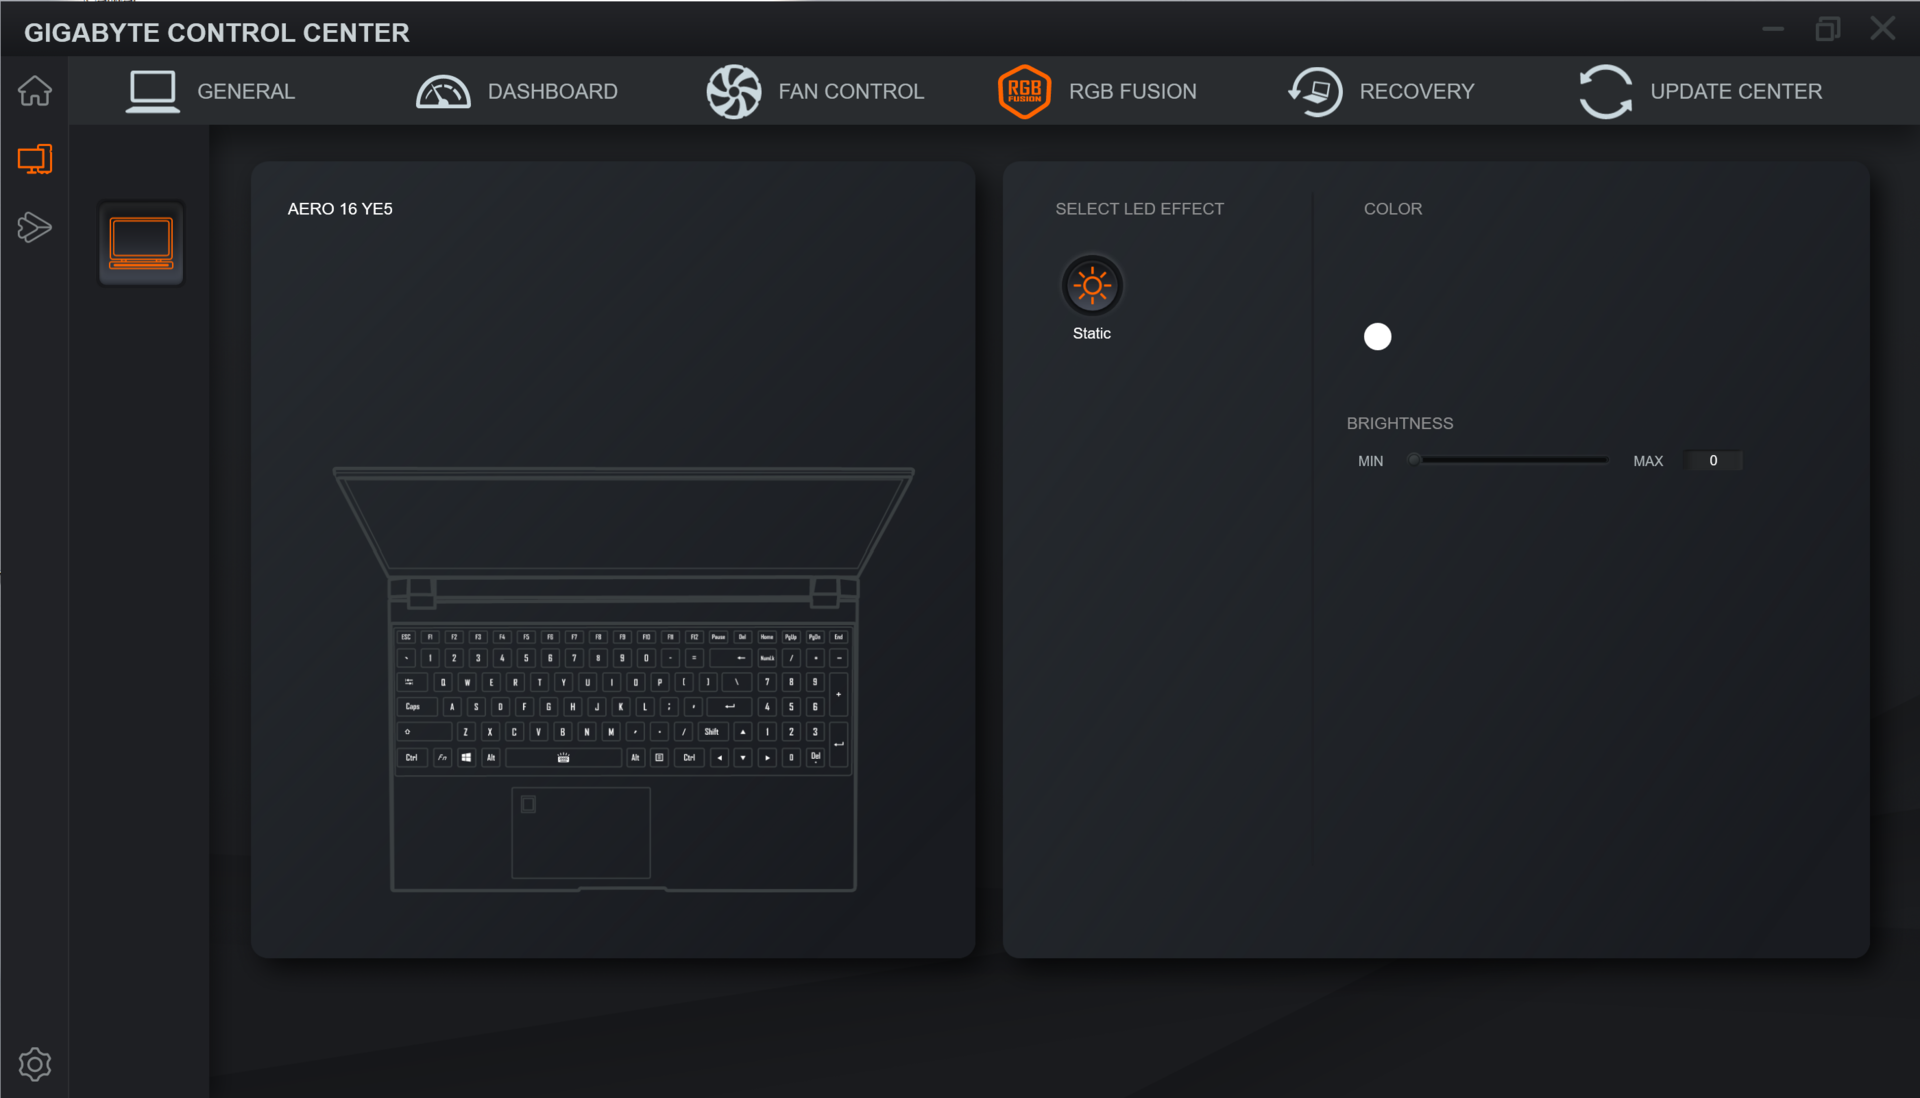
输入设备 - 带背光键盘的技嘉笔记本电脑
键盘
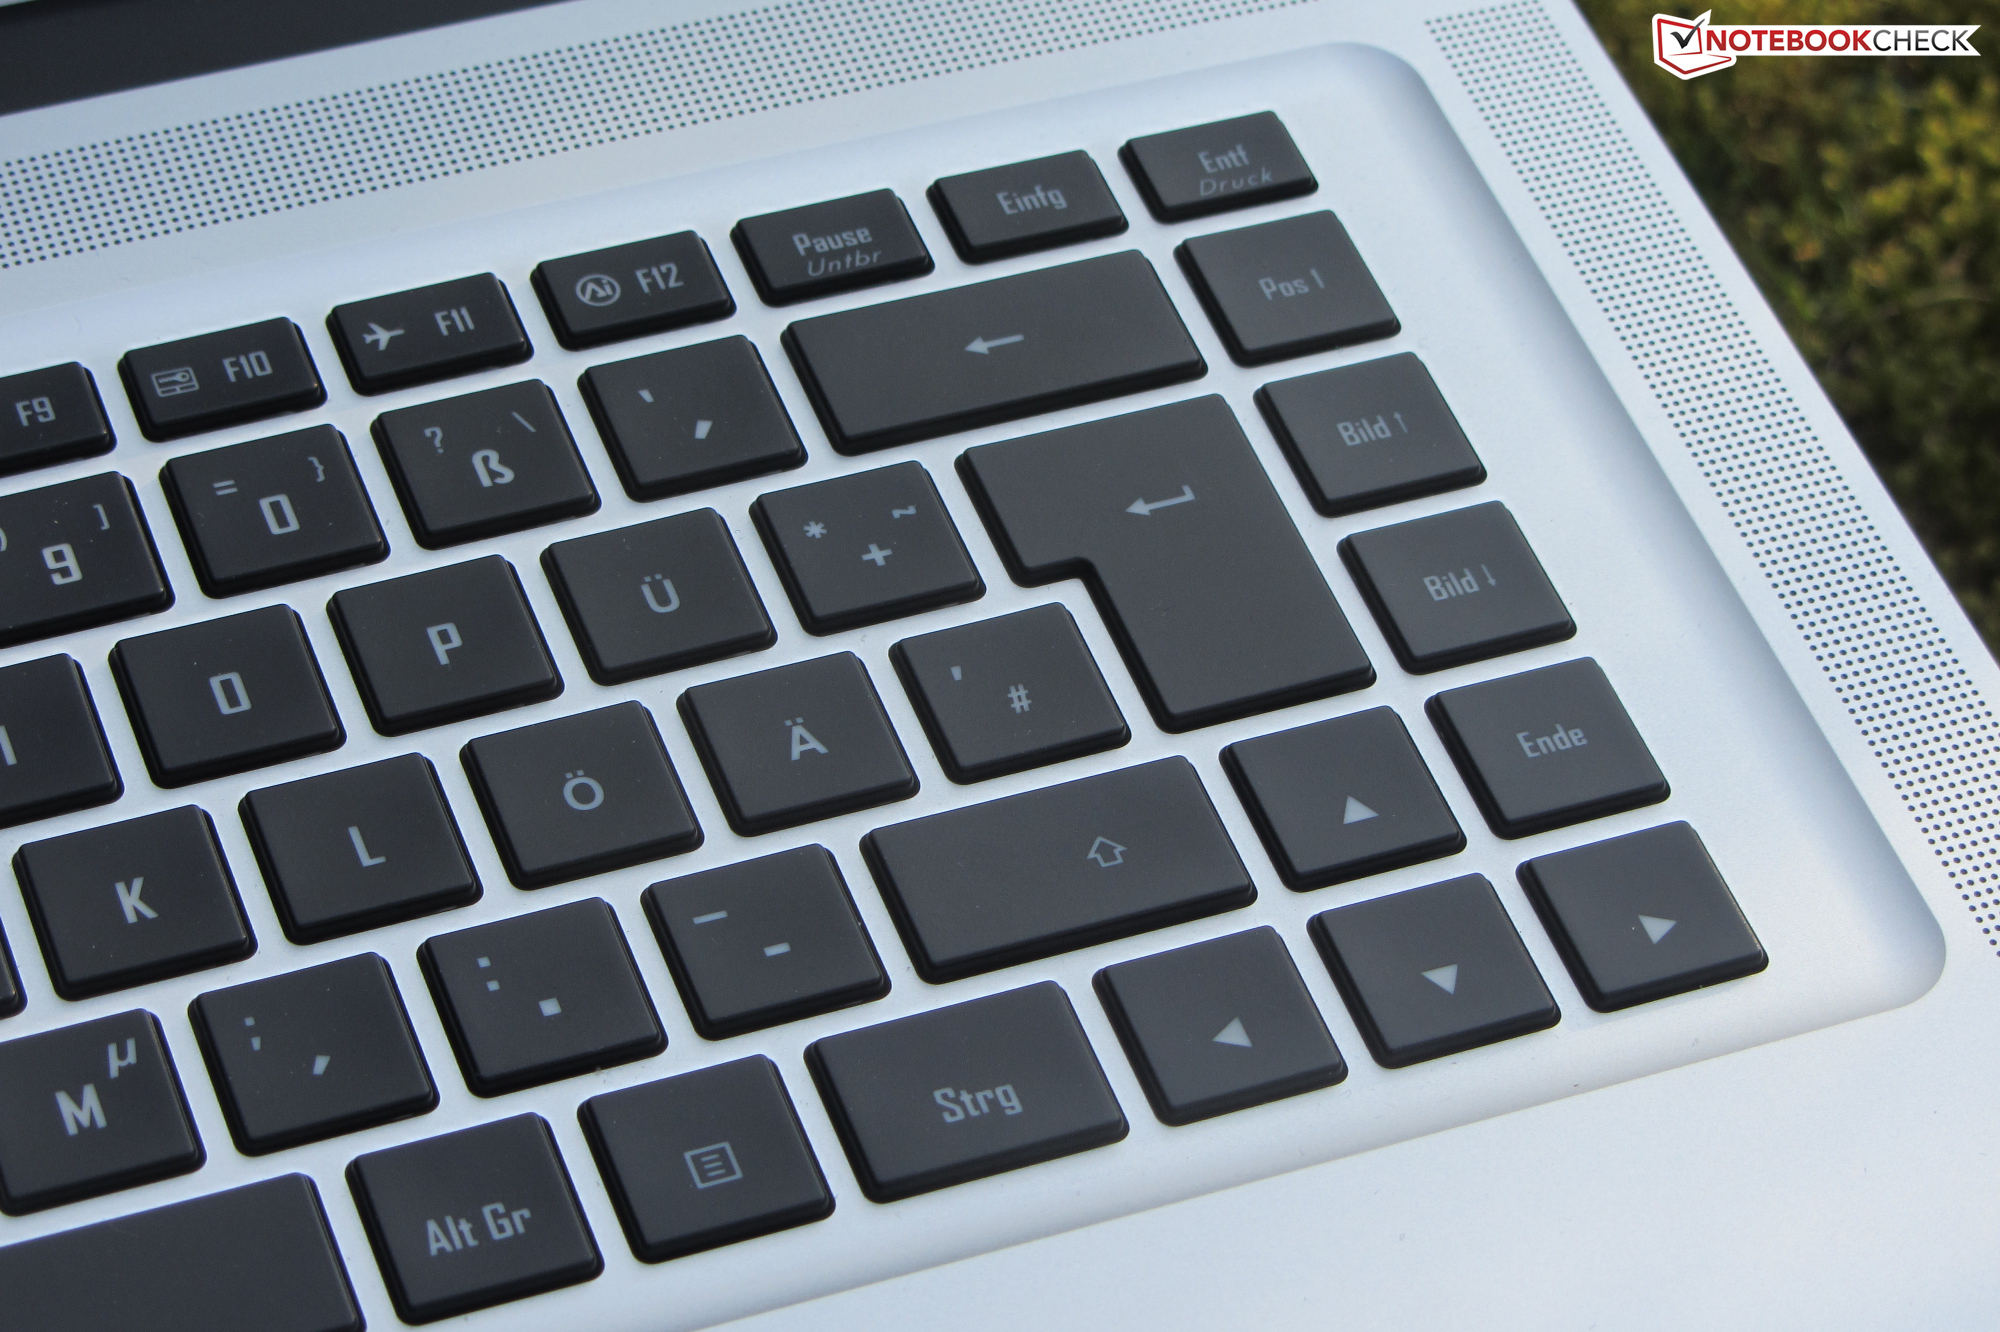
背光Chiclet键盘相当平滑,键程适中,强调点清晰,反馈和阻力都很好。键盘在打字时不会弯曲。两段式背光由一个功能键控制。综合考虑,这款技嘉键盘对于日常使用来说是不错的。
触摸板
多点触控板(12.1 x 7.6厘米/4.8 x 3英寸)非常光滑,具有很好的可用性。它可以检测到用户的输入,直到其边缘,其集成的按钮具有相当浅的行程,有一个明显的强调点。
显示屏 - OLED带来的深黑色
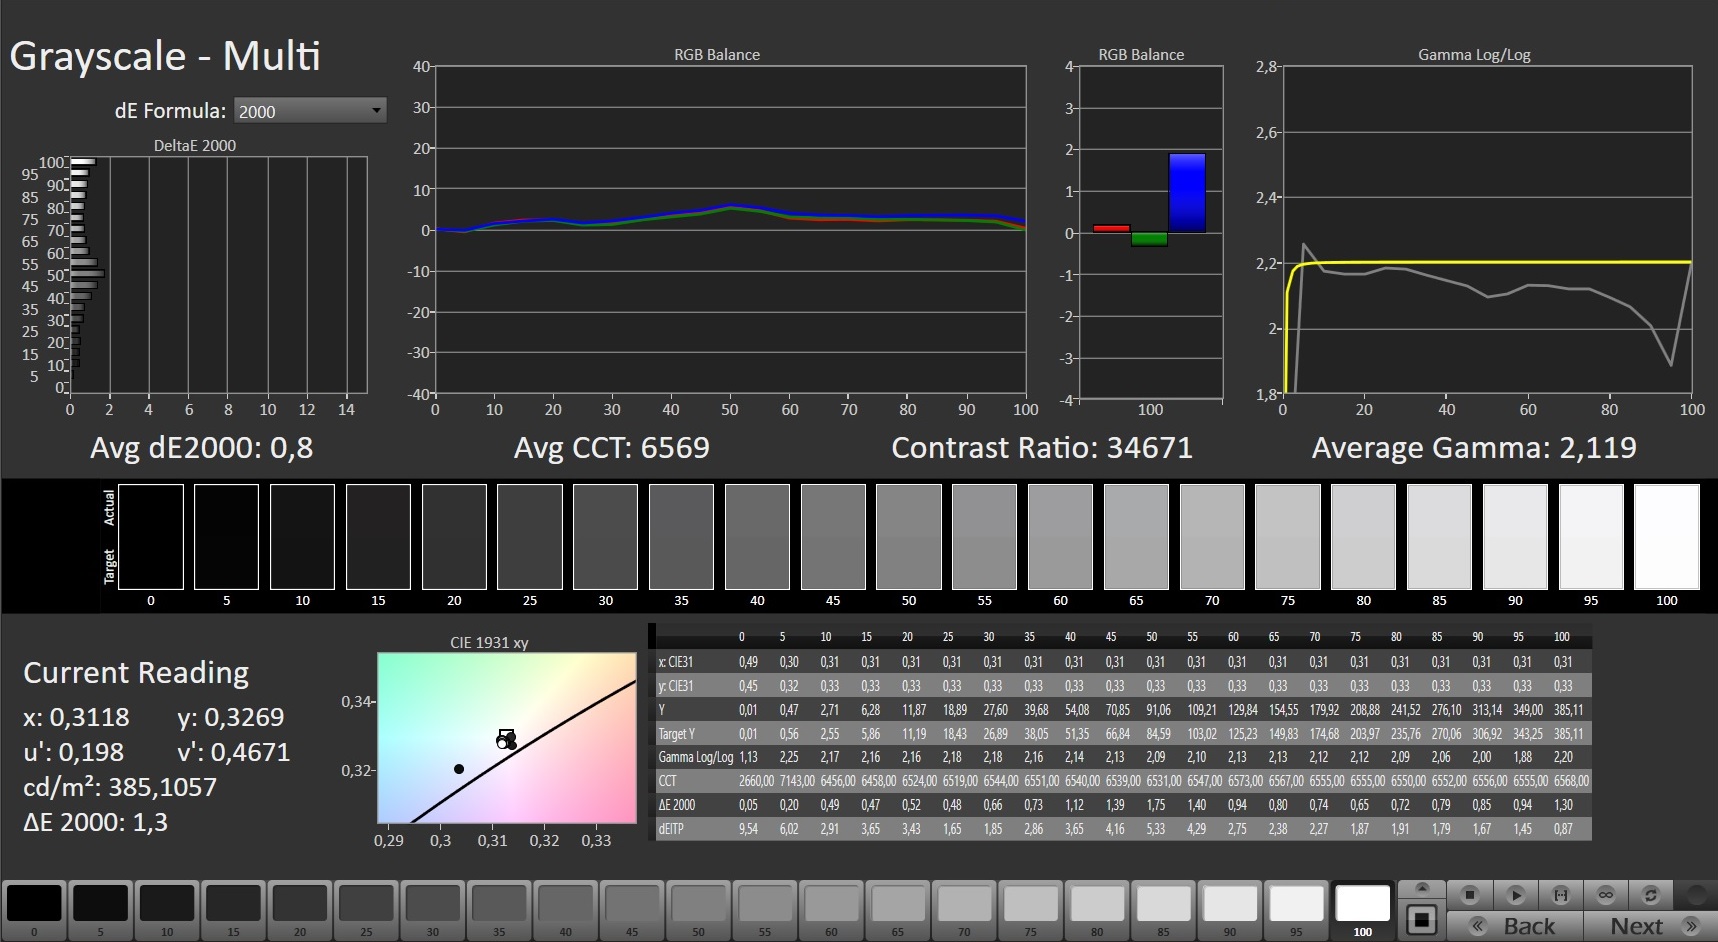
Aero 16配备了一个反射式16:10的16英寸4K OLED显示屏(3840 x 2400),对比度为36000:1,黑度为0.01,响应时间短。它的峰值亮度为367.6尼特,还可以,但远不及它的一些竞争对手,如Macbook Pro 16。
在58%及以下的亮度水平下,我们发现PWM闪烁的频率为60赫兹,在低于26%的亮度水平下增加到240赫兹。敏感的用户可能会因为这种低频率而感到头痛和眼疲劳。
| |||||||||||||||||||||||||
Brightness Distribution: 93 %
Center on Battery: 368 cd/m²
Contrast: 36800:1 (Black: 0.01 cd/m²)
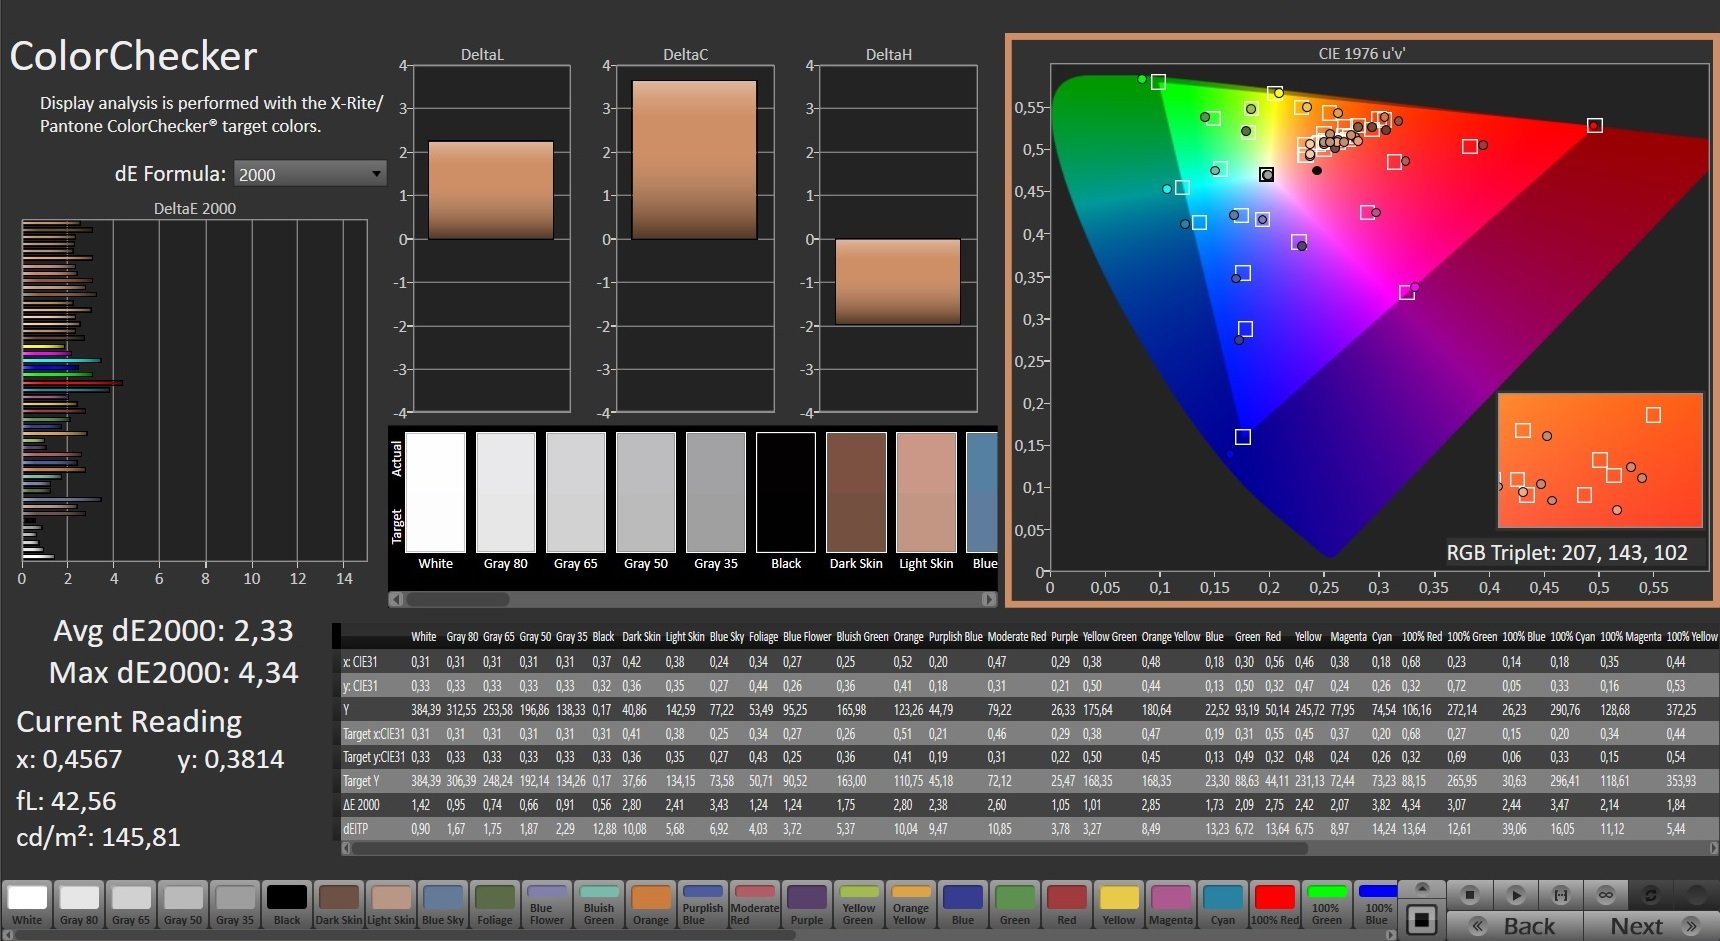
ΔE ColorChecker Calman: 2.33 | ∀{0.5-29.43 Ø4.71}
ΔE Greyscale Calman: 0.8 | ∀{0.09-98 Ø4.96}
Gamma: 2.119
CCT: 6569 K
| Gigabyte Aero 16 YE5 Samsung SDC416B, AMOLED, 3840x2400, 16" | Apple MacBook Pro 16 2021 M1 Max Mini-LED, 3456x2234, 16.2" | HP ZBook Studio 15 G8 SDC4145, OLED, 3840x2160, 15.6" | Schenker XMG Pro 15 (Late 2021) Samsung ATNA56WR14-0, OLED, 3840x2160, 15.6" | Razer Blade 15 2022 Sharp LQ156T1JW03, IPS, 2560x1440, 15.6" | Lenovo ThinkPad X1 Extreme G4-20Y5CTO1WW (3050 Ti) LP160UQ1-SPB1, IPS LED, 3840x2400, 16" | |
|---|---|---|---|---|---|---|
| Display | ||||||
| Display P3 Coverage (%) | 99.9 | 81.2 | 99.1 | 84.3 | ||
| sRGB Coverage (%) | 100 | 97.7 | 99.9 | 98.3 | ||
| AdobeRGB 1998 Coverage (%) | 95.3 | 89.1 | 86.8 | 97.8 | ||
| Response Times | -10% | -7% | -490% | -2200% | ||
| Response Time Grey 50% / Grey 80% * (ms) | 2.4 ? | 2.4 ? -0% | 3.2 ? -33% | 14.4 ? -500% | 60 ? -2400% | |
| Response Time Black / White * (ms) | 2 ? | 2.4 ? -20% | 1.6 ? 20% | 11.6 ? -480% | 42 ? -2000% | |
| PWM Frequency (Hz) | 60 ? | 240.4 ? | 60 ? | |||
| Screen | -21% | -70% | -58% | -328% | -587% | |
| Brightness middle (cd/m²) | 368 | 507 38% | 379.6 3% | 443 20% | 286 -22% | 639 74% |
| Brightness (cd/m²) | 368 | 494 34% | 380 3% | 434 18% | 271 -26% | 612 66% |
| Brightness Distribution (%) | 93 | 96 3% | 95 2% | 94 1% | 89 -4% | 84 -10% |
| Black Level * (cd/m²) | 0.01 | 0.02 -100% | 0.02 -100% | 0.25 -2400% | 0.47 -4600% | |
| Contrast (:1) | 36800 | 25350 -31% | 22150 -40% | 1144 -97% | 1360 -96% | |
| Colorchecker dE 2000 * | 2.33 | 1.4 40% | 5.15 -121% | 3.73 -60% | 2.74 -18% | 2.2 6% |
| Colorchecker dE 2000 max. * | 4.34 | 2.8 35% | 7.79 -79% | 8.12 -87% | 5.21 -20% | 5.3 -22% |
| Greyscale dE 2000 * | 0.8 | 2.3 -187% | 2.6 -225% | 2.5 -213% | 1.1 -38% | 1.7 -113% |
| Gamma | 2.119 104% | 2.27 97% | 1.99 111% | 2.001 110% | 2.2 100% | 2.31 95% |
| CCT | 6569 99% | 6792 96% | 6166 105% | 6522 100% | 6408 101% | 6390 102% |
| Colorchecker dE 2000 calibrated * | 3.1 | 2.52 | 1.4 | |||
| Total Average (Program / Settings) | -21% /
-21% | -40% /
-55% | -33% /
-47% | -409% /
-361% | -1394% /
-910% |
* ... smaller is better
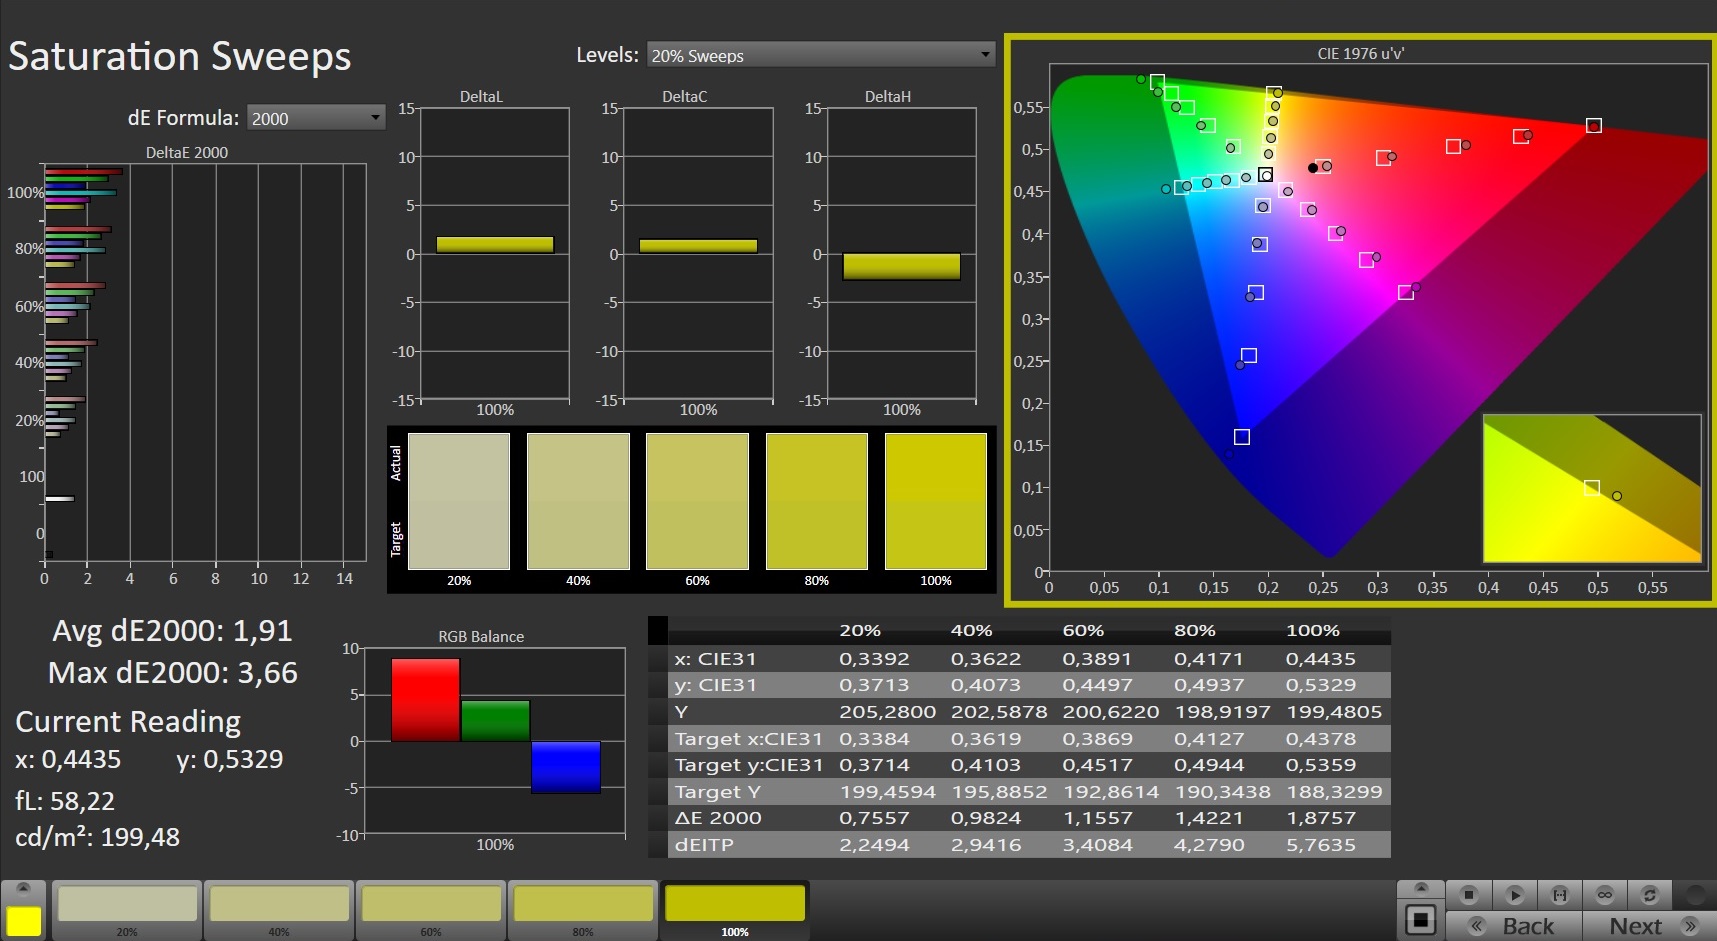
该显示器经过X-Rite Pantone认证,以确保自然的色彩表现,正如预期的那样,颜色偏差非常小,开箱后无法察觉。我们也没有发现蓝色色调的证据。在审查过程中,我们通常会向你展示并评论我们的色彩空间覆盖读数。然而,我们决定暂时保留这些数据,因为它们与技嘉的官方规格相差甚远,而且我们不能排除我们的测试设备在这个时候出现问题。
Display Response Times
| ↔ Response Time Black to White | ||
|---|---|---|
| 2 ms ... rise ↗ and fall ↘ combined | ↗ 1 ms rise | 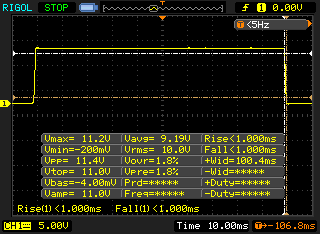 |
| ↘ 1 ms fall | ||
| The screen shows very fast response rates in our tests and should be very well suited for fast-paced gaming. In comparison, all tested devices range from 0.1 (minimum) to 240 (maximum) ms. » 11 % of all devices are better. This means that the measured response time is better than the average of all tested devices (19.8 ms). | ||
| ↔ Response Time 50% Grey to 80% Grey | ||
| 2.4 ms ... rise ↗ and fall ↘ combined | ↗ 1.2 ms rise | 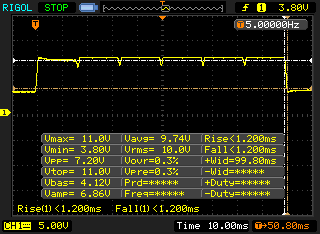 |
| ↘ 1.2 ms fall | ||
| The screen shows very fast response rates in our tests and should be very well suited for fast-paced gaming. In comparison, all tested devices range from 0.165 (minimum) to 636 (maximum) ms. » 11 % of all devices are better. This means that the measured response time is better than the average of all tested devices (31 ms). | ||
Screen Flickering / PWM (Pulse-Width Modulation)
| Screen flickering / PWM detected | 60 Hz | ≤ 58 % brightness setting | 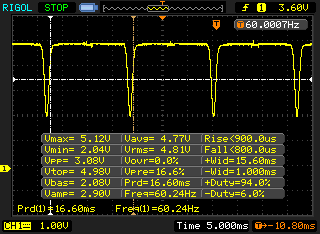 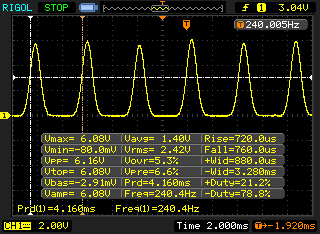 |
The display backlight flickers at 60 Hz (worst case, e.g., utilizing PWM) Flickering detected at a brightness setting of 58 % and below. There should be no flickering or PWM above this brightness setting. The frequency of 60 Hz is very low, so the flickering may cause eyestrain and headaches after extended use. In comparison: 52 % of all tested devices do not use PWM to dim the display. If PWM was detected, an average of 7754 (minimum: 5 - maximum: 343500) Hz was measured. | |||
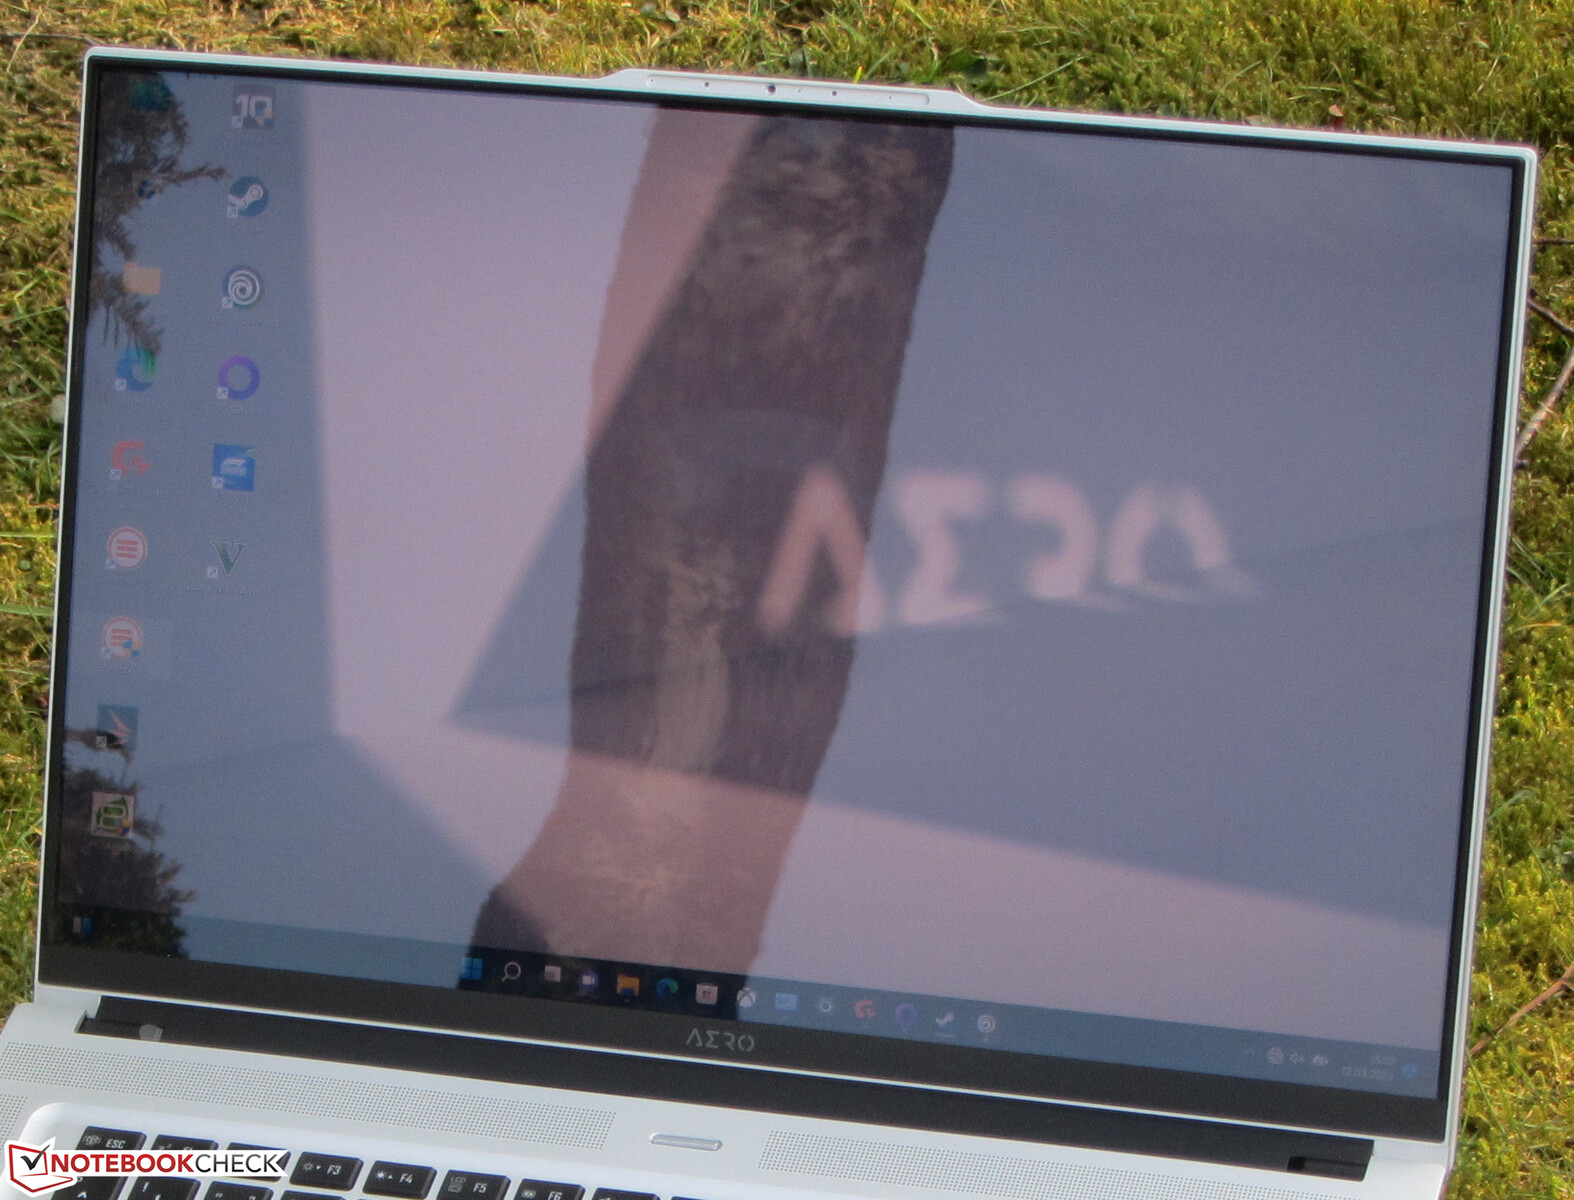
该面板提供了非常宽的视角,从任何位置都可以轻松阅读。在户外,我们发现反光涂层极大地阻碍了可用性。

性能 - 具有尖端性能的技嘉笔记本电脑
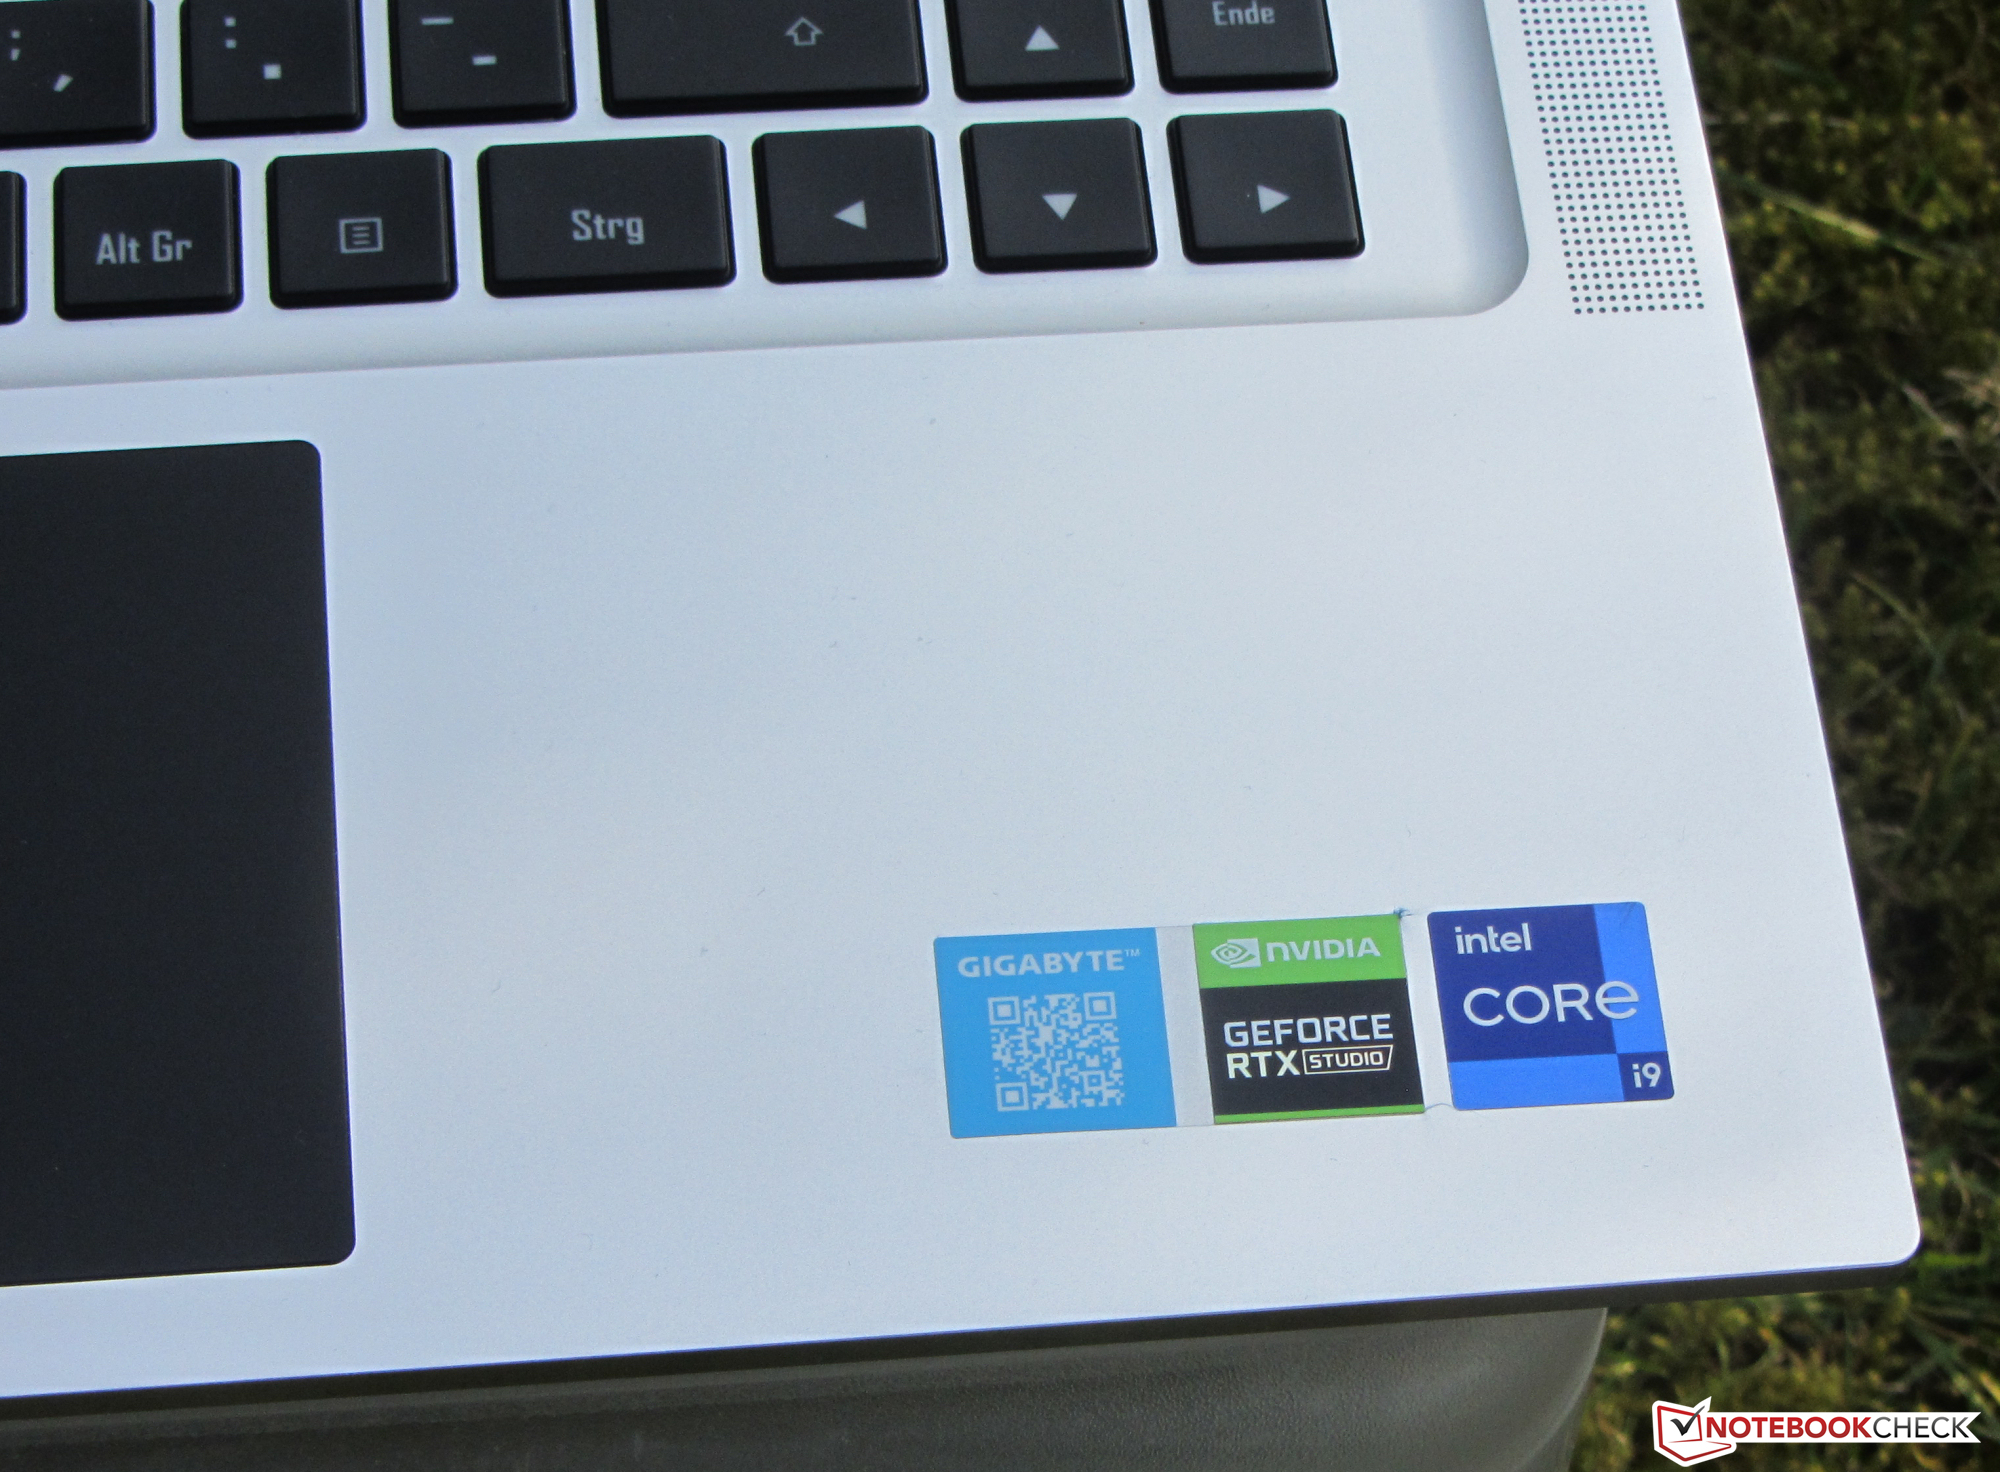
Gigabyte Aero 16是一款功能强大的紧凑型16英寸笔记本,在所有领域都具有高度通用的可用性。其GeForce RTX Studio认证确保了高性能、优化的驱动程序、良好的软件兼容性和高色彩空间覆盖率。
测试条件
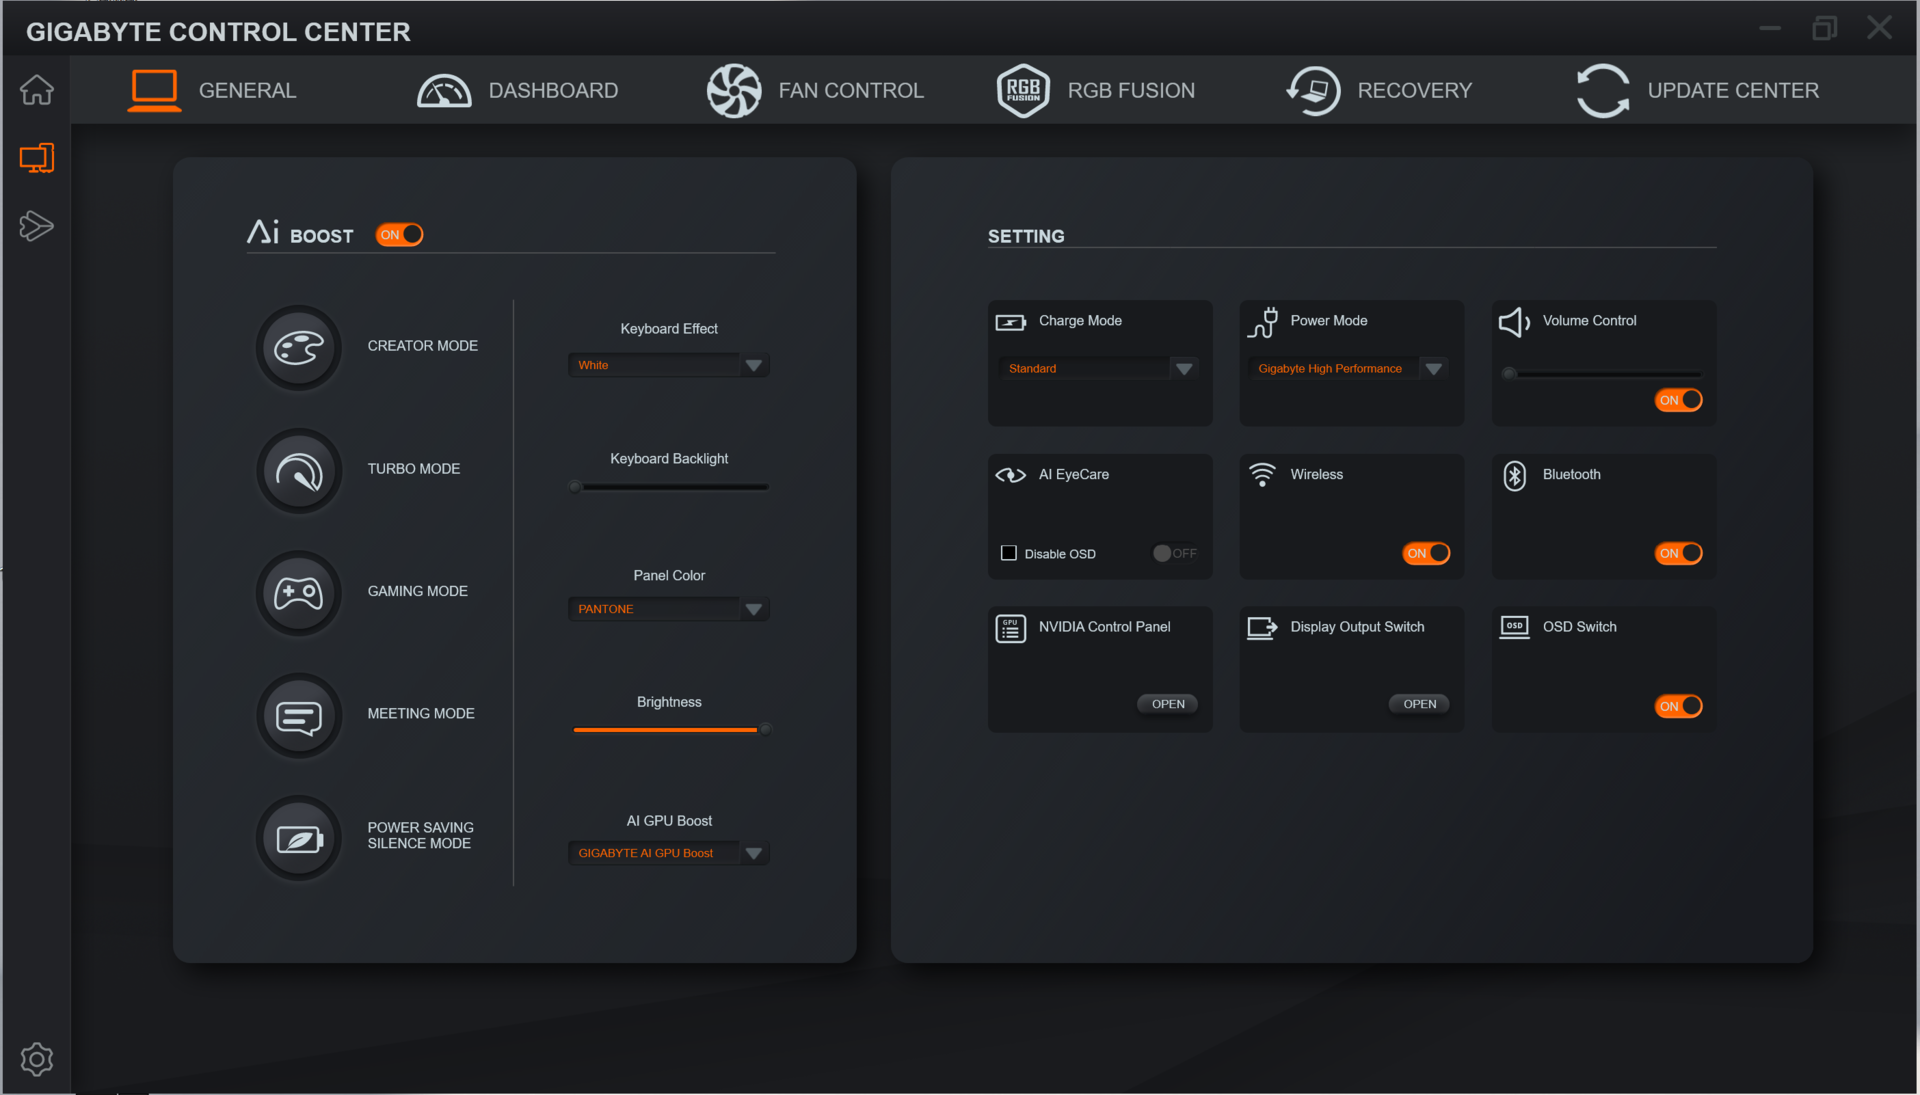
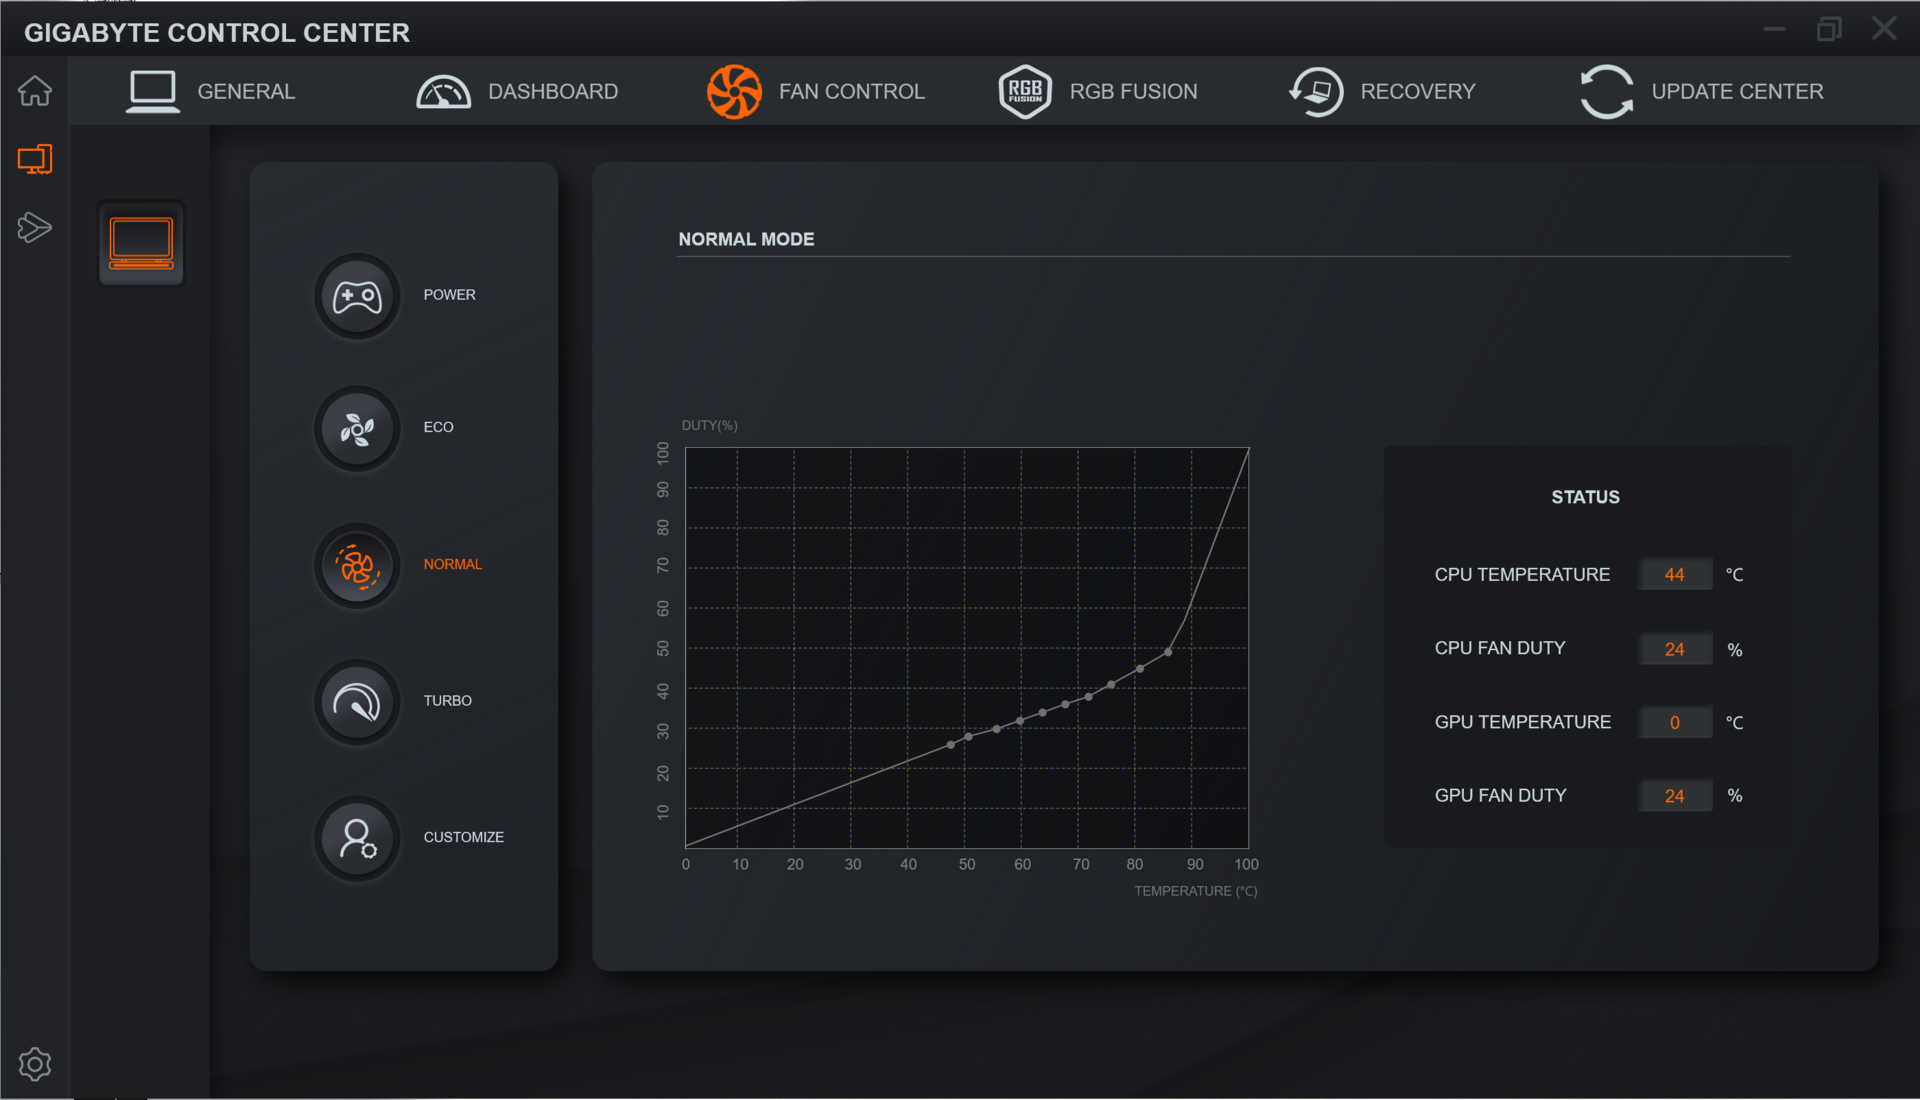
该设备预装了技嘉控制中心,提供各种性能配置文件。这些不仅影响CPU和GPU的性能,而且还影响亮度和显示器的色温。我们决定将我们的命运托付给附带的人工智能模式,让控制中心做出决定并为我们选择最佳配置文件。
此外,我们在手动启用 "省电静音模式 "和 "加速模式 "的情况下运行了一些基准测试。后者并不特别适合长时间使用,因为它能瞬间和永久地将风扇升到最大速度。
| 创造者模式 | 涡轮模式 | 游戏模式 | 会议模式 | 省电静音模式 | |
|---|---|---|---|---|---|
| 功率限制1 | 86瓦 | 86瓦 | 62瓦 | 15瓦 | 15瓦 |
| 功率限制 2 | 115 瓦 | 115 瓦 | 115 瓦 | 30 瓦 | 30 瓦 |
处理器
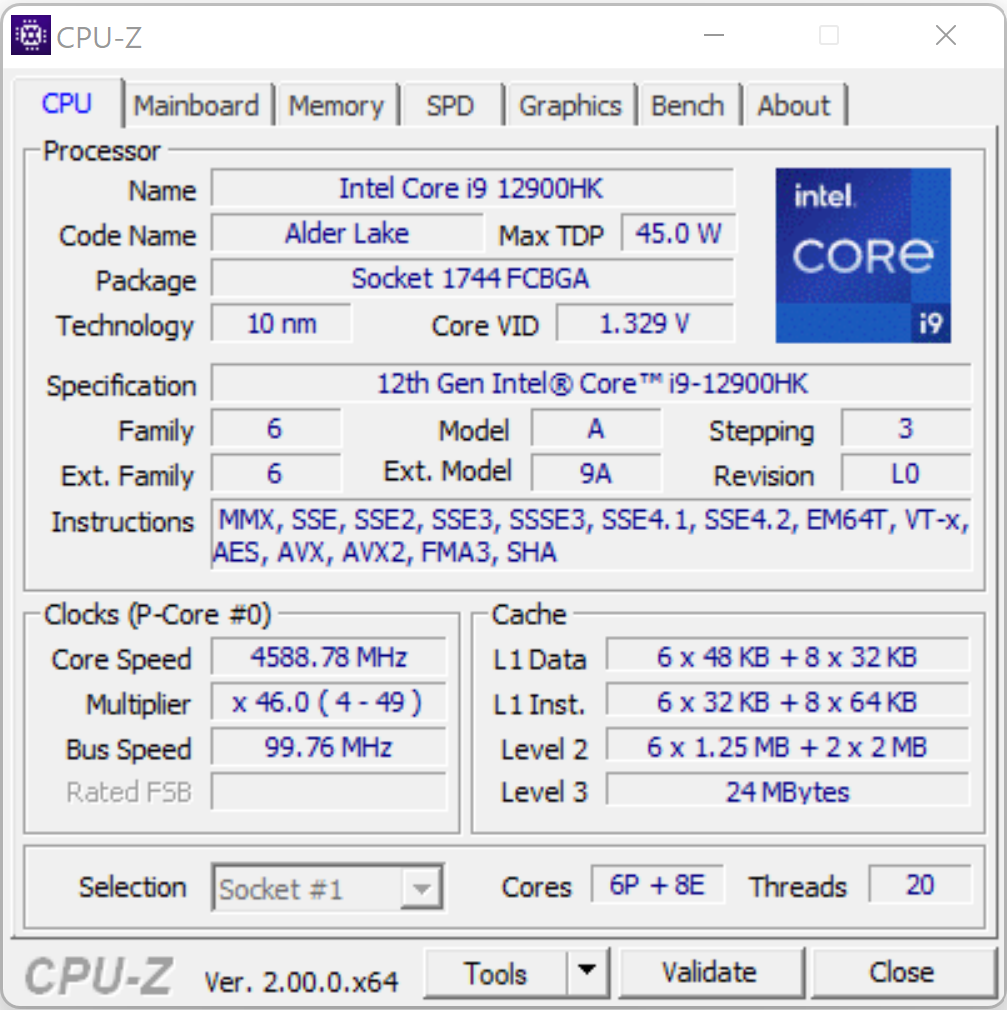
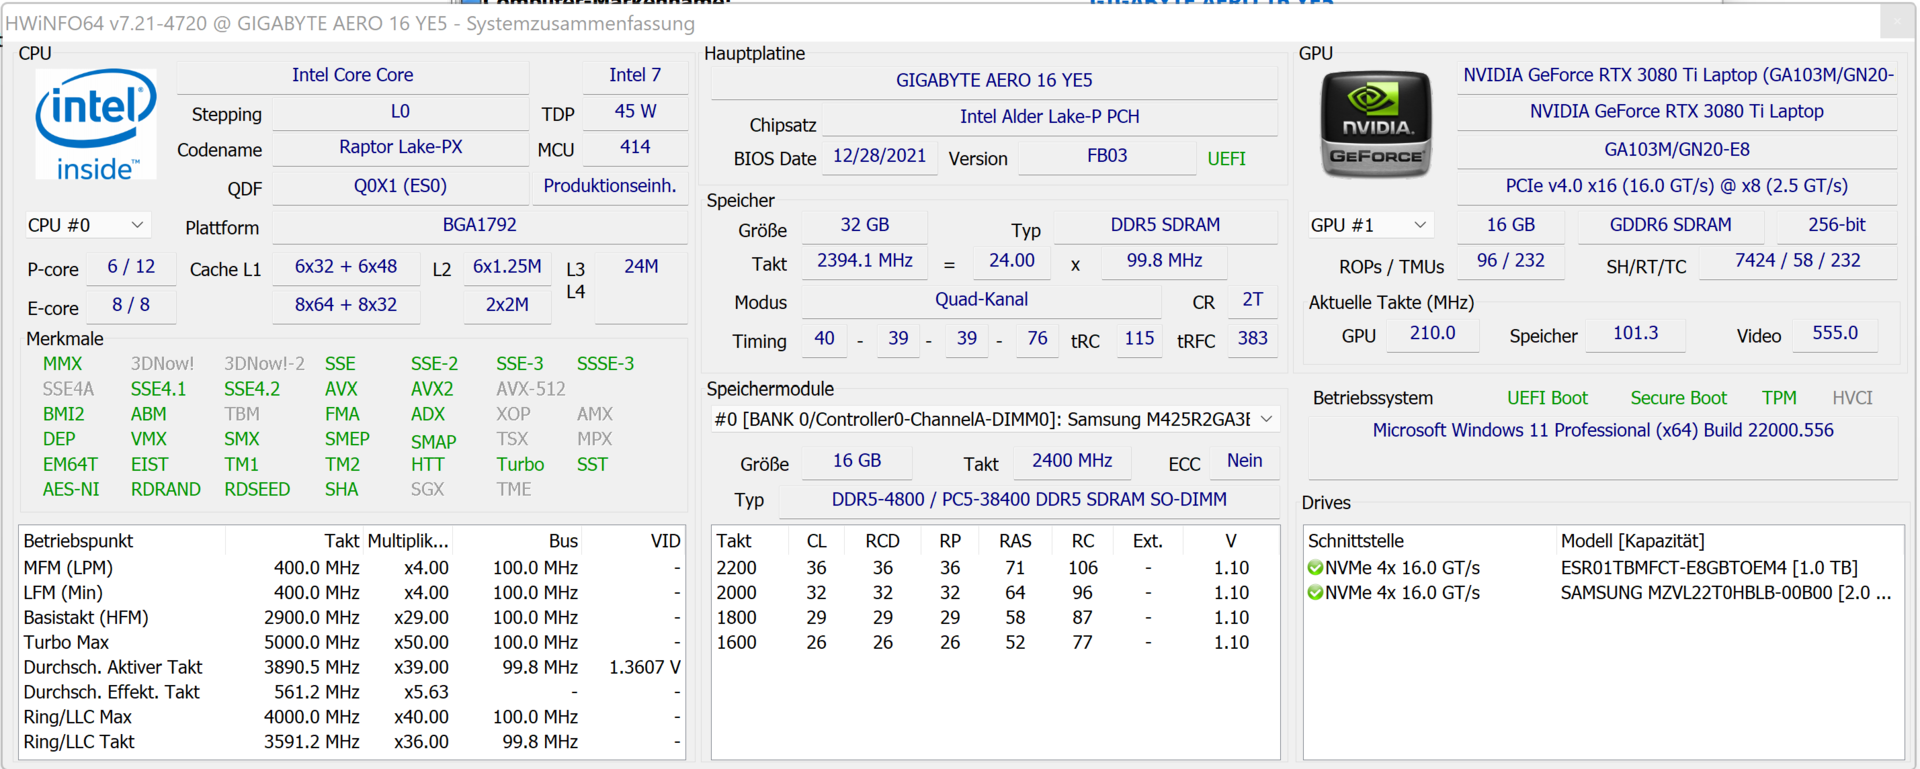
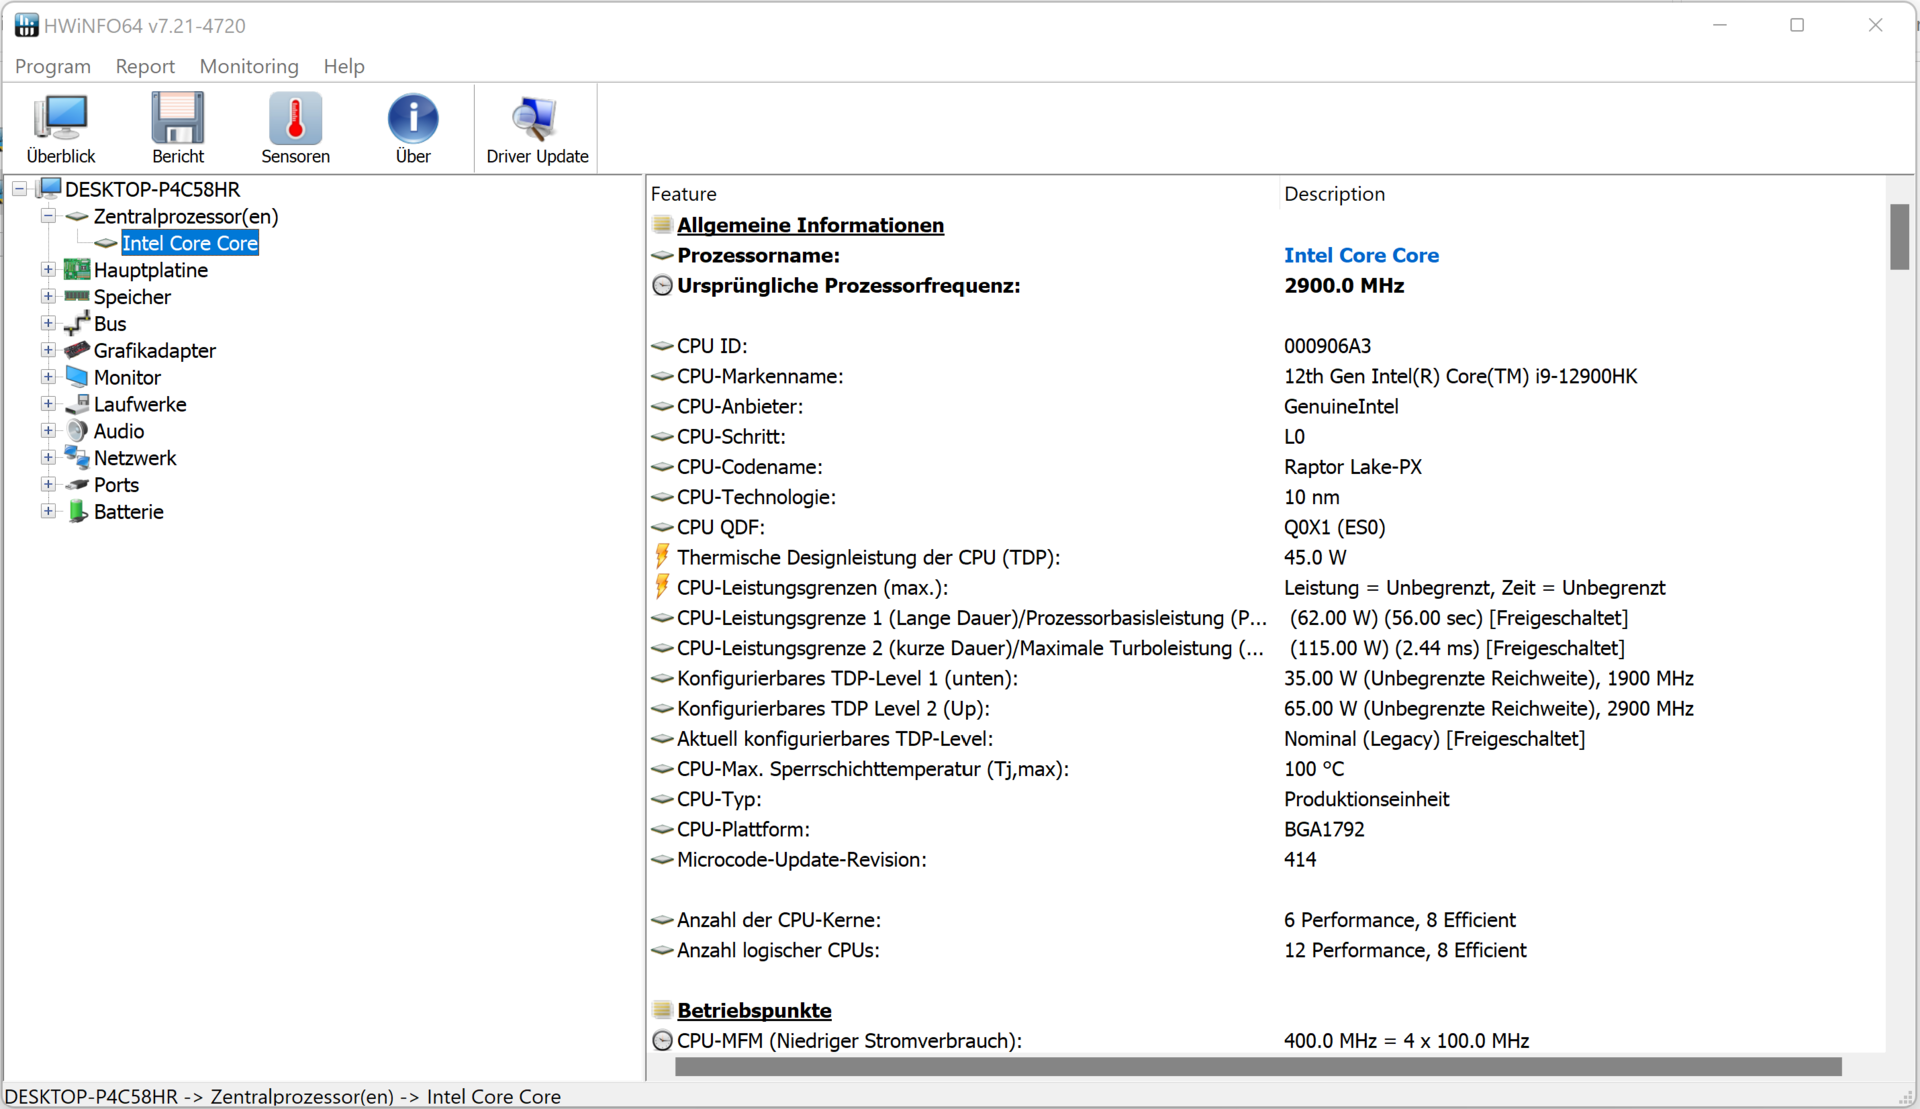
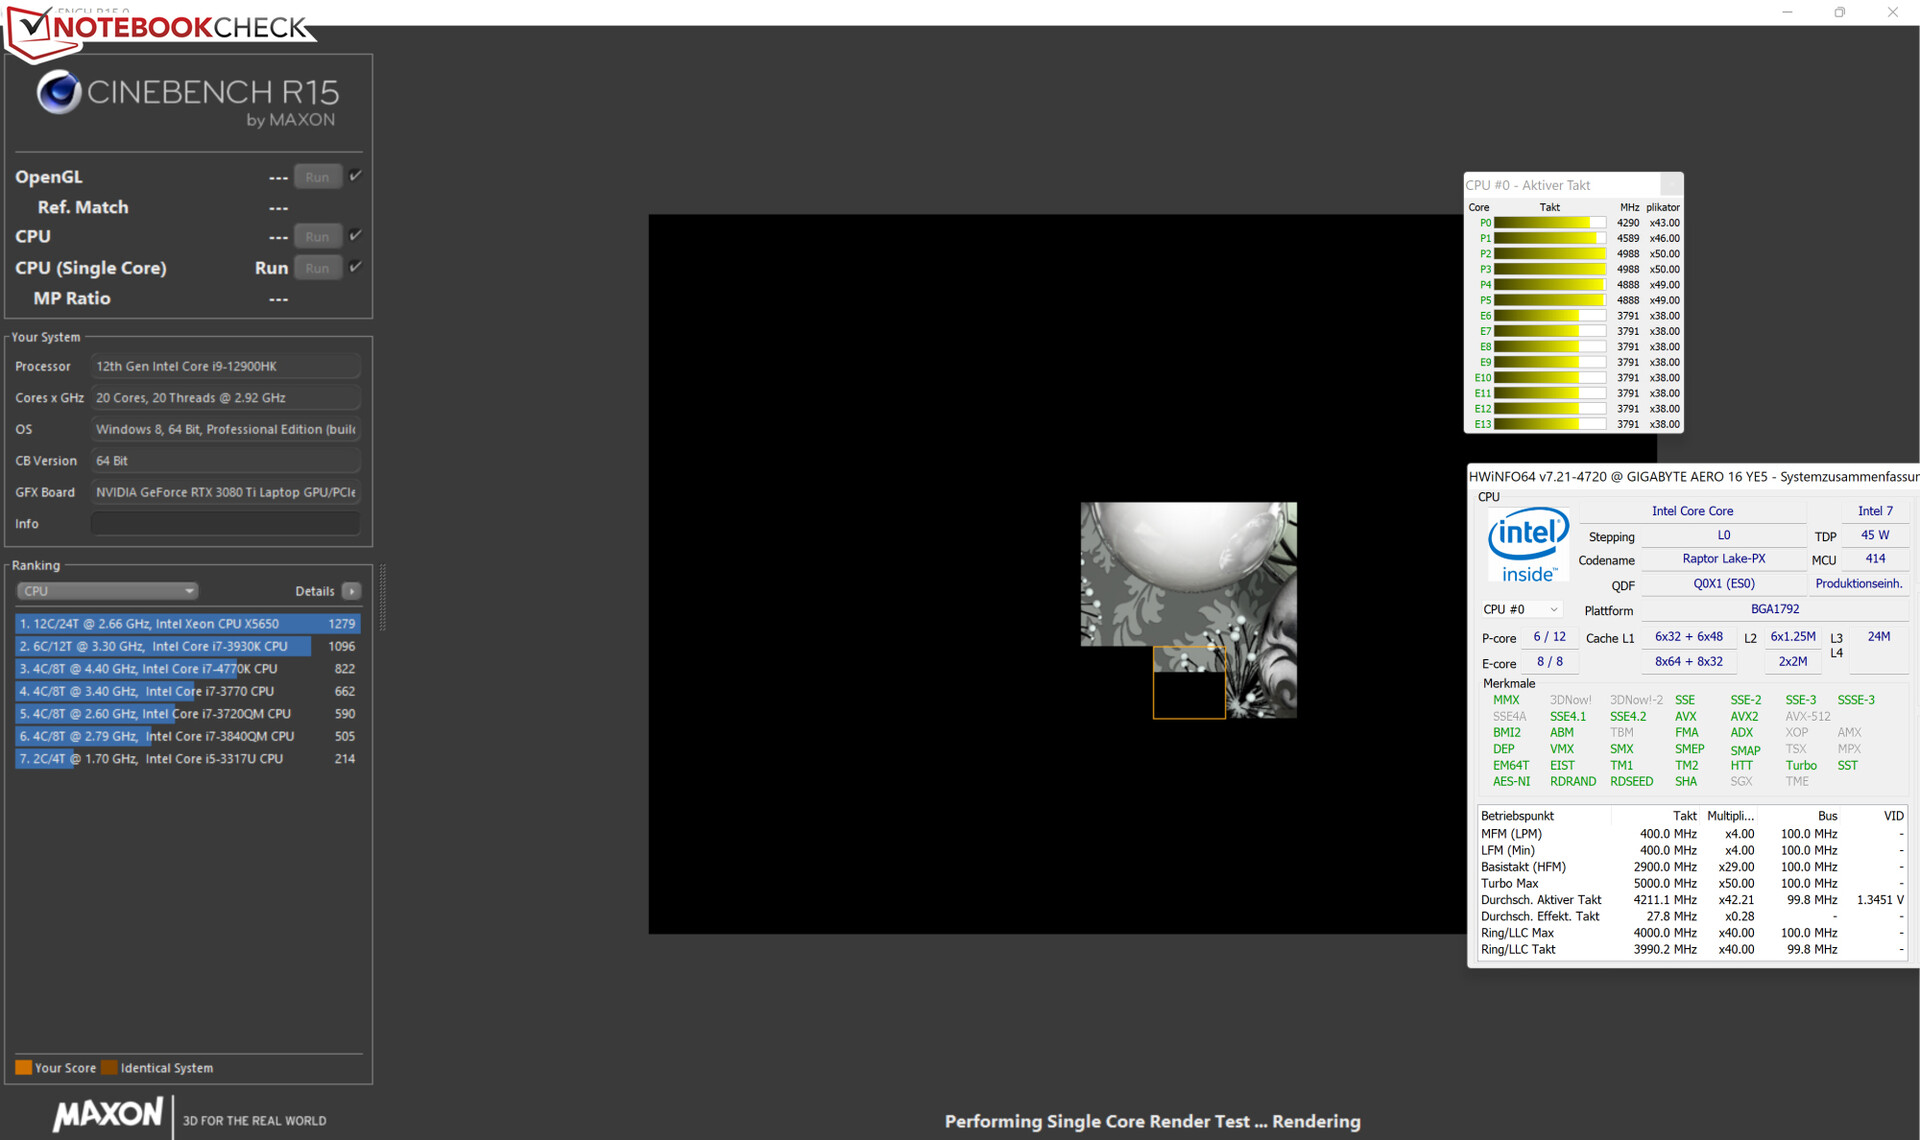
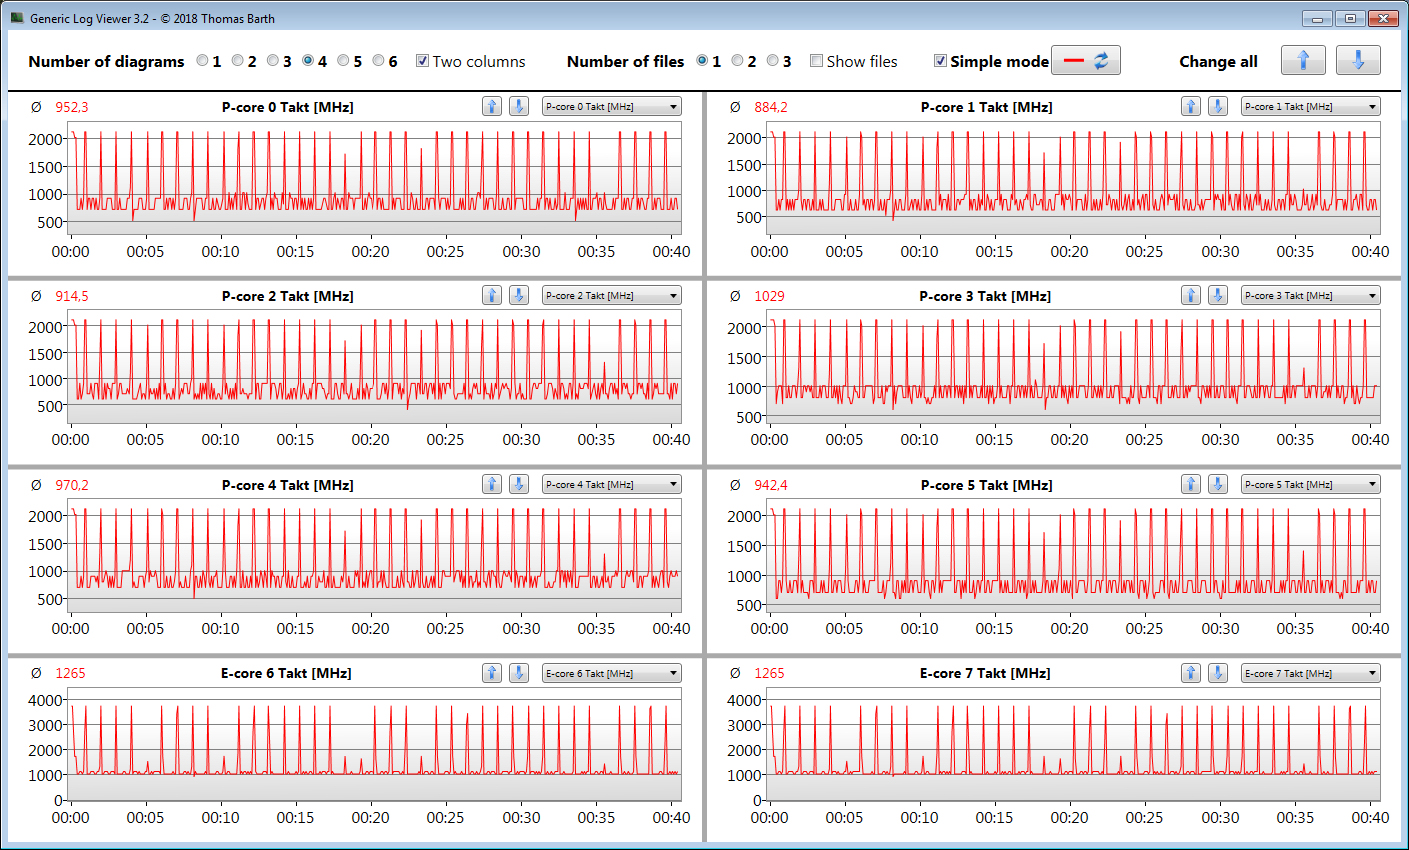
英特尔的Alder LakeCore i9-12900HK具有六个性能核心,超线程运行在2.5至5GHz之间,以及八个不含超线程的效率核心,运行在1.8至3.8GHz。两者相加,总共有20个可用的CPU核心。由于解锁了乘数,该CPU也可以很容易地超频。
当运行我们的CineBench R15基准时,CPU以非常高(多线程:P-cores 4-4.1 GHz,E-cores:3-3.1 GHz)甚至最高(单线程:P-cores 4.3-5 GHz,E-cores:3.8 GHz)时钟速度运行。在电池上,这些都被大大降低了。
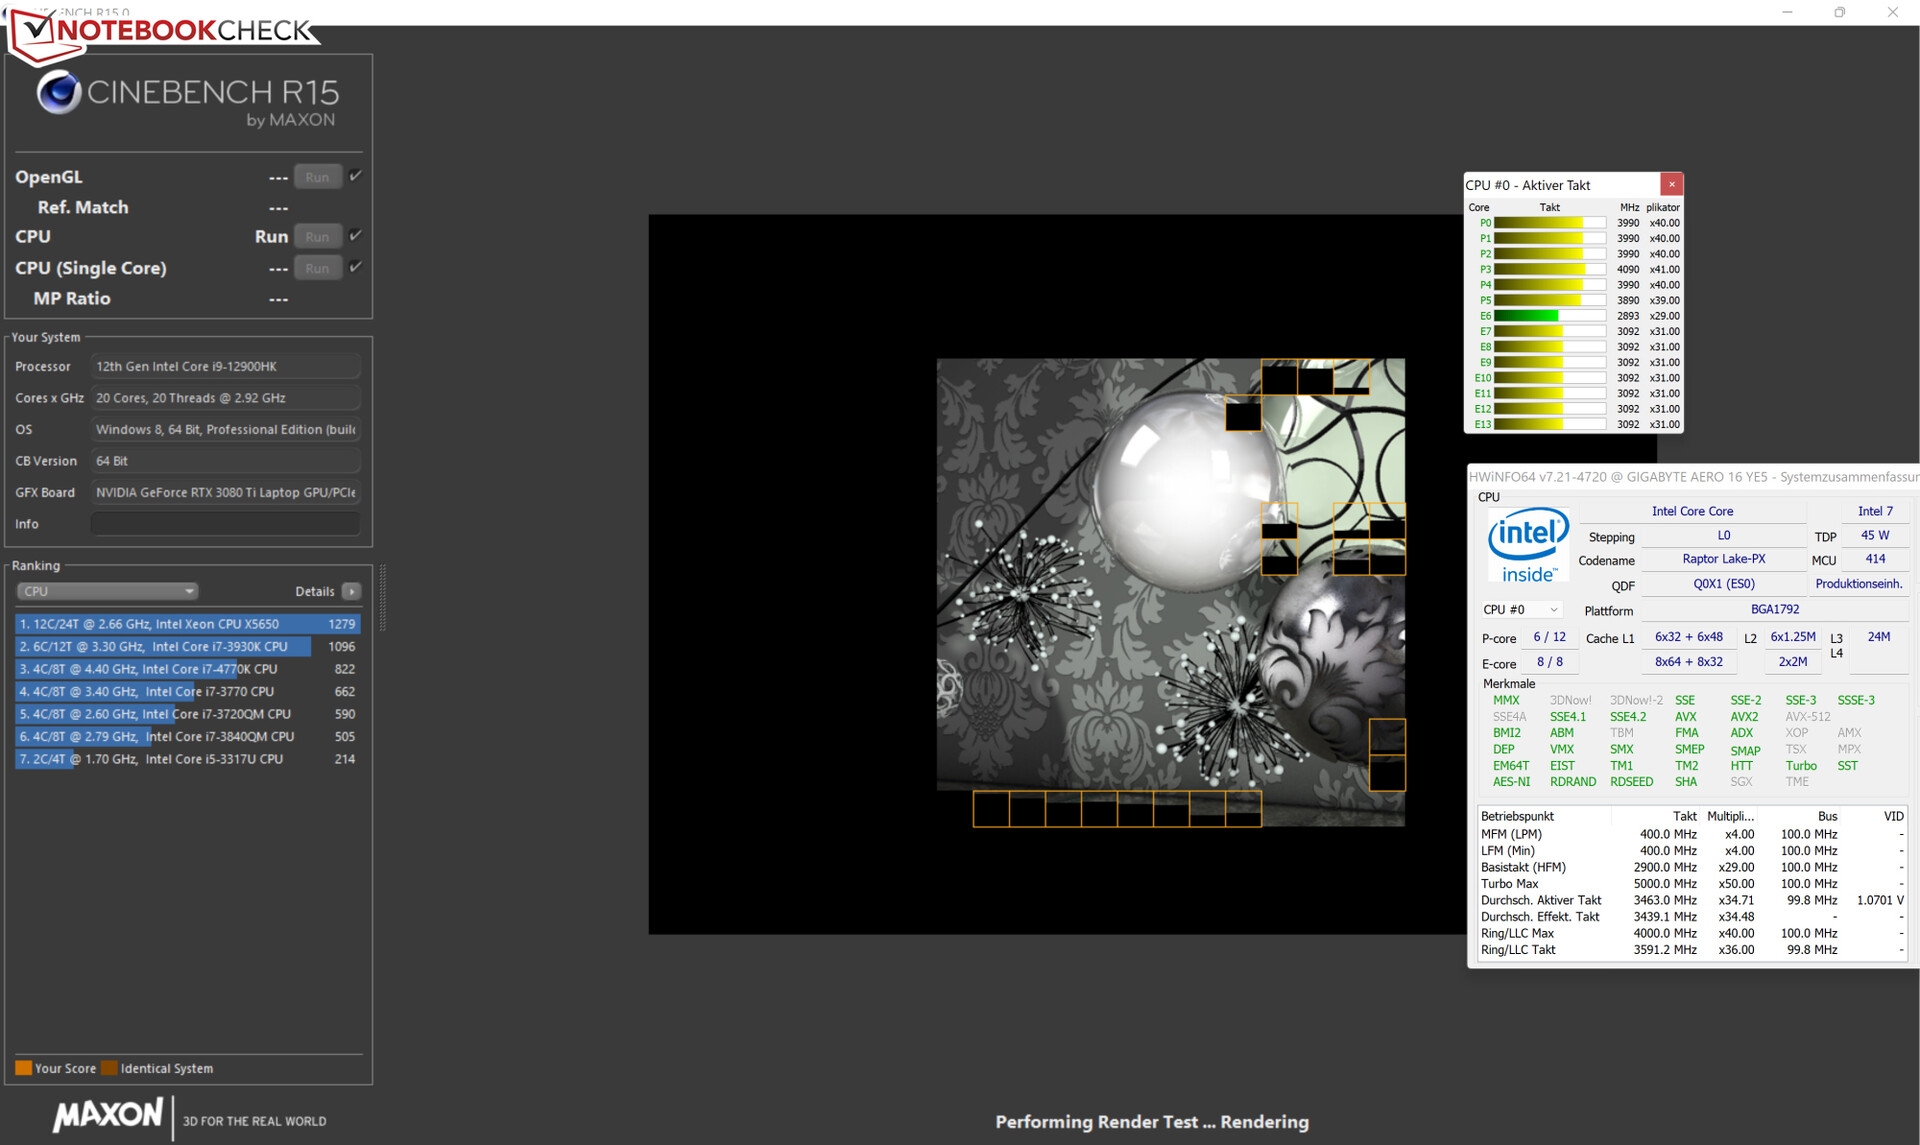
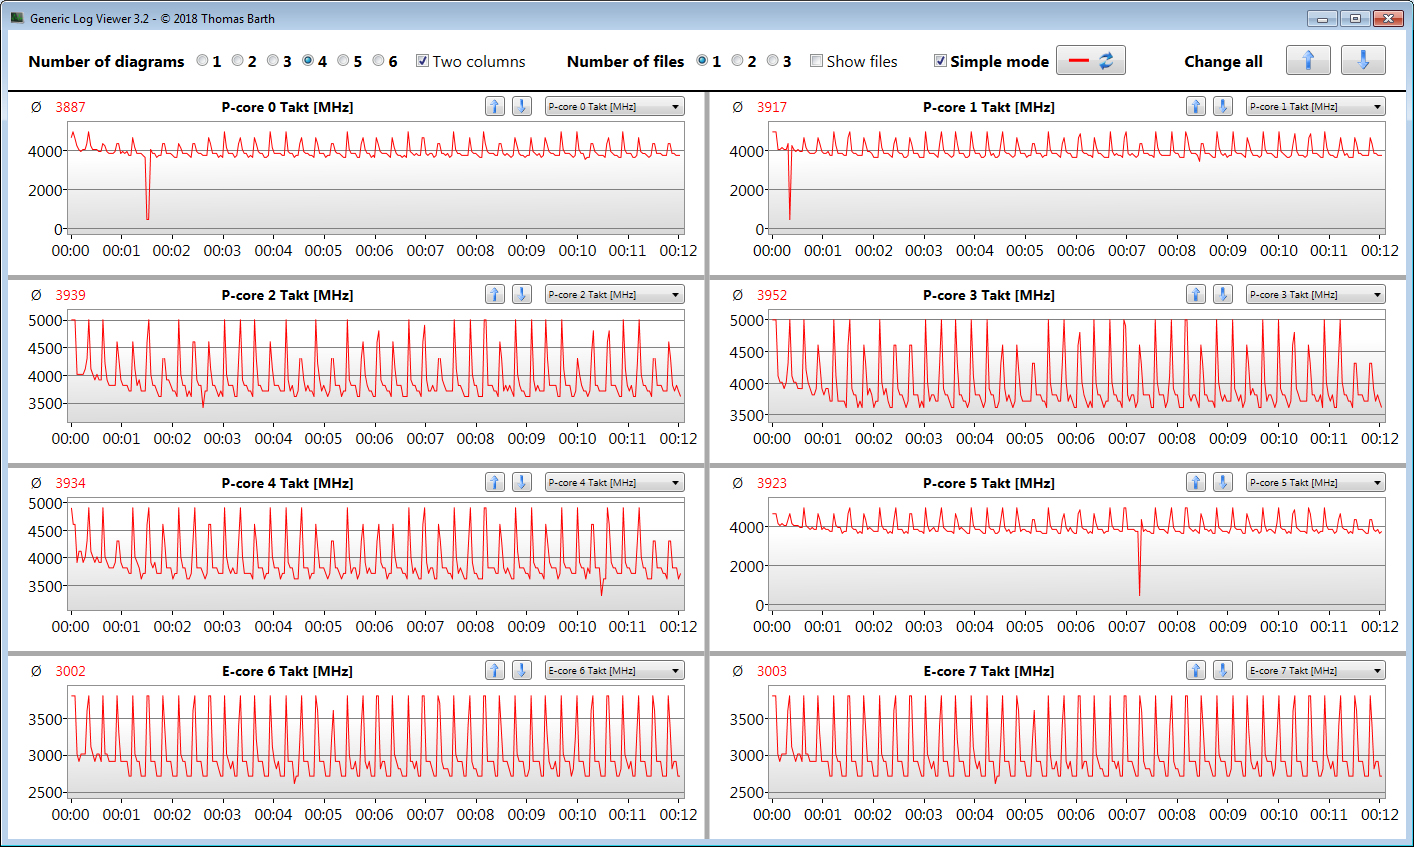
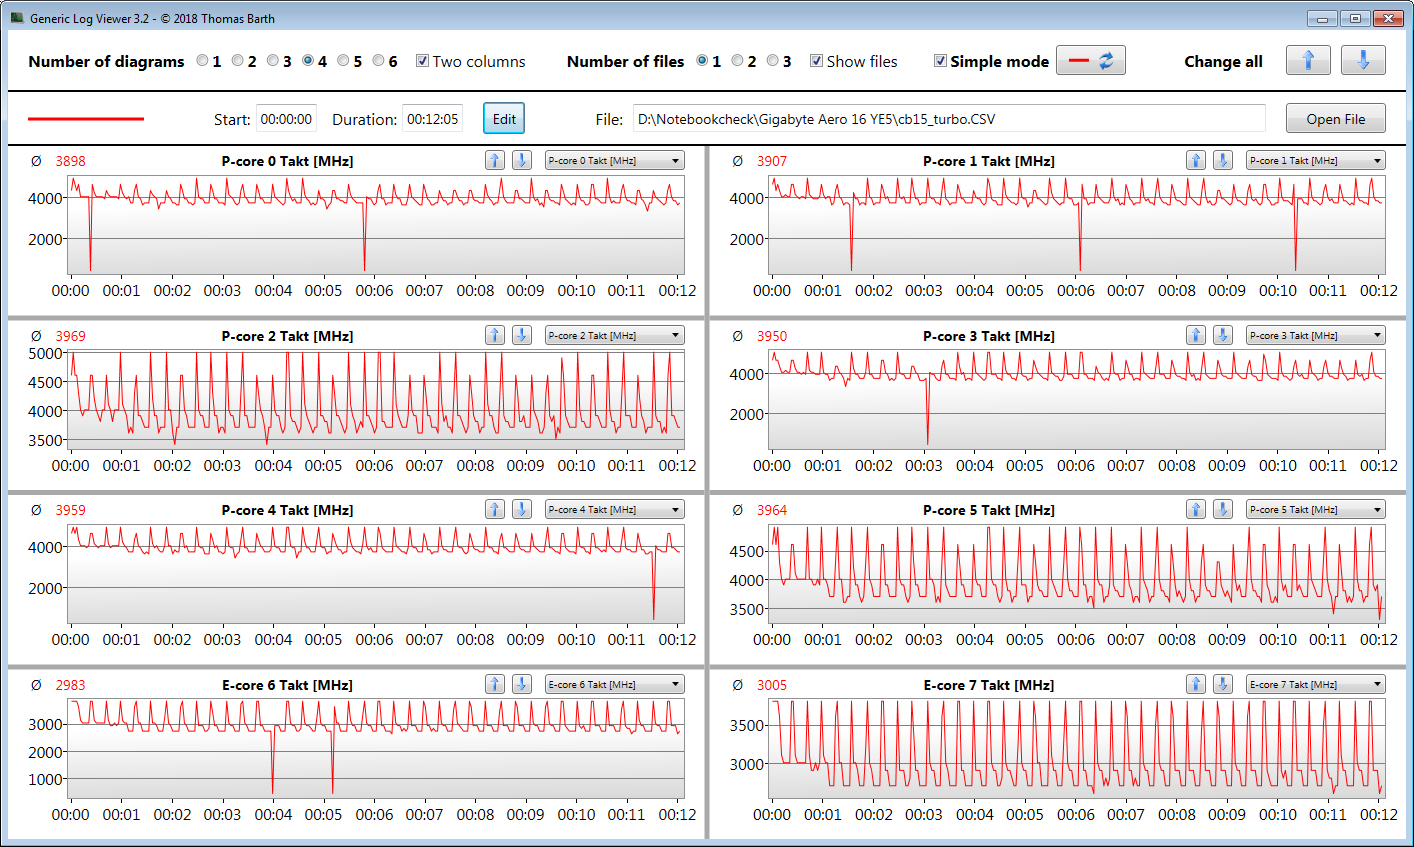
我们在CineBench R15多线程测试中至少循环运行30分钟,以确定一个处理器是否能够在持续负载下利用高涡轮增压时钟速度。Aero 16在性能和效率核心上都成功地保持了最初的高水准。手动启用 "涡轮增压模式 "没有任何积极作用。
Cinebench R15 Multi Loop
| Cinebench R23 | |
| Multi Core | |
| Gigabyte Aero 16 YE5 (Turbo Mode) | |
| Gigabyte Aero 16 YE5 | |
| Average of class Multimedia (4861 - 33362, n=74, last 2 years) | |
| Average Intel Core i9-12900HK (4796 - 19282, n=14) | |
| Razer Blade 15 2022 | |
| Schenker XMG Pro 15 (Late 2021) | |
| Apple MacBook Pro 16 2021 M1 Max | |
| HP ZBook Studio 15 G8 | |
| Lenovo ThinkPad X1 Extreme G4-20Y50040GE | |
| Gigabyte Aero 16 YE5 (Silence Mode) | |
| Single Core | |
| Average of class Multimedia (1128 - 2459, n=66, last 2 years) | |
| Gigabyte Aero 16 YE5 | |
| Gigabyte Aero 16 YE5 (Turbo Mode) | |
| Razer Blade 15 2022 | |
| Average Intel Core i9-12900HK (819 - 1940, n=15) | |
| Lenovo ThinkPad X1 Extreme G4-20Y50040GE | |
| HP ZBook Studio 15 G8 | |
| Apple MacBook Pro 16 2021 M1 Max | |
| Schenker XMG Pro 15 (Late 2021) | |
| Gigabyte Aero 16 YE5 (Silence Mode) | |
| Cinebench R20 | |
| CPU (Multi Core) | |
| Gigabyte Aero 16 YE5 (Turbo Mode) | |
| Gigabyte Aero 16 YE5 | |
| Average of class Multimedia (1887 - 12912, n=57, last 2 years) | |
| Average Intel Core i9-12900HK (1828 - 7366, n=14) | |
| Razer Blade 15 2022 | |
| Schenker XMG Pro 15 (Late 2021) | |
| HP ZBook Studio 15 G8 | |
| Lenovo ThinkPad X1 Extreme G4-20Y50040GE | |
| Apple MacBook Pro 16 2021 M1 Max | |
| Gigabyte Aero 16 YE5 (Silence Mode) | |
| CPU (Single Core) | |
| Gigabyte Aero 16 YE5 (Turbo Mode) | |
| Average of class Multimedia (425 - 853, n=57, last 2 years) | |
| Razer Blade 15 2022 | |
| Gigabyte Aero 16 YE5 | |
| Average Intel Core i9-12900HK (316 - 739, n=14) | |
| Lenovo ThinkPad X1 Extreme G4-20Y50040GE | |
| HP ZBook Studio 15 G8 | |
| Schenker XMG Pro 15 (Late 2021) | |
| Apple MacBook Pro 16 2021 M1 Max | |
| Gigabyte Aero 16 YE5 (Silence Mode) | |
| Cinebench R15 | |
| CPU Multi 64Bit | |
| Gigabyte Aero 16 YE5 (Turbo Mode) | |
| Gigabyte Aero 16 YE5 | |
| Average of class Multimedia (856 - 5224, n=61, last 2 years) | |
| Average Intel Core i9-12900HK (965 - 2944, n=14) | |
| Razer Blade 15 2022 | |
| Lenovo ThinkPad X1 Extreme G4-20Y50040GE (BIOS 1.13) | |
| Lenovo ThinkPad X1 Extreme G4-20Y50040GE (BIOS 1.10) | |
| Schenker XMG Pro 15 (Late 2021) | |
| HP ZBook Studio 15 G8 | |
| Apple MacBook Pro 16 2021 M1 Max (Rosetta 2) | |
| Gigabyte Aero 16 YE5 (Silence Mode) | |
| CPU Single 64Bit | |
| Average of class Multimedia (184.8 - 326, n=59, last 2 years) | |
| Gigabyte Aero 16 YE5 | |
| Gigabyte Aero 16 YE5 (Turbo Mode) | |
| Razer Blade 15 2022 | |
| Lenovo ThinkPad X1 Extreme G4-20Y50040GE | |
| Average Intel Core i9-12900HK (119 - 279, n=14) | |
| HP ZBook Studio 15 G8 | |
| Schenker XMG Pro 15 (Late 2021) | |
| Apple MacBook Pro 16 2021 M1 Max (Rosetta 2) | |
| Gigabyte Aero 16 YE5 (Silence Mode) | |
| Blender - v2.79 BMW27 CPU | |
| HP ZBook Studio 15 G8 | |
| Average of class Multimedia (100 - 557, n=58, last 2 years) | |
| Schenker XMG Pro 15 (Late 2021) | |
| Razer Blade 15 2022 | |
| Average Intel Core i9-12900HK (172.5 - 483, n=13) | |
| Gigabyte Aero 16 YE5 | |
| Apple MacBook Pro 16 2021 M1 Max (Blender 3.0 beta for mac) | |
| Gigabyte Aero 16 YE5 (Turbo Mode) | |
| 7-Zip 18.03 | |
| 7z b 4 | |
| Gigabyte Aero 16 YE5 (Turbo Mode) | |
| Gigabyte Aero 16 YE5 | |
| Average Intel Core i9-12900HK (25736 - 75564, n=14) | |
| Razer Blade 15 2022 | |
| Average of class Multimedia (26062 - 130368, n=55, last 2 years) | |
| Schenker XMG Pro 15 (Late 2021) | |
| HP ZBook Studio 15 G8 | |
| Gigabyte Aero 16 YE5 (Silence Mode) | |
| 7z b 4 -mmt1 | |
| Gigabyte Aero 16 YE5 | |
| Gigabyte Aero 16 YE5 (Turbo Mode) | |
| Average of class Multimedia (3666 - 7545, n=56, last 2 years) | |
| HP ZBook Studio 15 G8 | |
| Razer Blade 15 2022 | |
| Schenker XMG Pro 15 (Late 2021) | |
| Average Intel Core i9-12900HK (2898 - 6186, n=14) | |
| Gigabyte Aero 16 YE5 (Silence Mode) | |
| Geekbench 5.5 | |
| Multi-Core | |
| Gigabyte Aero 16 YE5 (Turbo Mode) | |
| Gigabyte Aero 16 YE5 | |
| Average of class Multimedia (4652 - 20422, n=56, last 2 years) | |
| Apple MacBook Pro 16 2021 M1 Max | |
| Razer Blade 15 2022 | |
| Average Intel Core i9-12900HK (5869 - 14294, n=13) | |
| Schenker XMG Pro 15 (Late 2021) | |
| Lenovo ThinkPad X1 Extreme G4-20Y50040GE | |
| HP ZBook Studio 15 G8 | |
| Gigabyte Aero 16 YE5 (Silence Mode) | |
| Single-Core | |
| Average of class Multimedia (805 - 2974, n=56, last 2 years) | |
| Gigabyte Aero 16 YE5 (Turbo Mode) | |
| Gigabyte Aero 16 YE5 | |
| Apple MacBook Pro 16 2021 M1 Max | |
| Razer Blade 15 2022 | |
| HP ZBook Studio 15 G8 | |
| Average Intel Core i9-12900HK (843 - 1918, n=13) | |
| Lenovo ThinkPad X1 Extreme G4-20Y50040GE | |
| Schenker XMG Pro 15 (Late 2021) | |
| Gigabyte Aero 16 YE5 (Silence Mode) | |
| HWBOT x265 Benchmark v2.2 - 4k Preset | |
| Gigabyte Aero 16 YE5 (Turbo Mode) | |
| Average of class Multimedia (5.26 - 36.1, n=56, last 2 years) | |
| Gigabyte Aero 16 YE5 | |
| Razer Blade 15 2022 | |
| Average Intel Core i9-12900HK (5.33 - 21.6, n=14) | |
| Schenker XMG Pro 15 (Late 2021) | |
| HP ZBook Studio 15 G8 | |
| Lenovo ThinkPad X1 Extreme G4-20Y50040GE | |
| Gigabyte Aero 16 YE5 (Silence Mode) | |
| LibreOffice - 20 Documents To PDF | |
| Gigabyte Aero 16 YE5 (Silence Mode) | |
| Razer Blade 15 2022 | |
| Average of class Multimedia (23.9 - 146.7, n=57, last 2 years) | |
| Schenker XMG Pro 15 (Late 2021) | |
| HP ZBook Studio 15 G8 | |
| Average Intel Core i9-12900HK (34.8 - 89.1, n=14) | |
| Gigabyte Aero 16 YE5 | |
| Lenovo ThinkPad X1 Extreme G4-20Y50040GE | |
| Gigabyte Aero 16 YE5 (Turbo Mode) | |
| R Benchmark 2.5 - Overall mean | |
| Gigabyte Aero 16 YE5 (Silence Mode) | |
| HP ZBook Studio 15 G8 | |
| Schenker XMG Pro 15 (Late 2021) | |
| Lenovo ThinkPad X1 Extreme G4-20Y50040GE | |
| Average Intel Core i9-12900HK (0.4155 - 0.994, n=14) | |
| Razer Blade 15 2022 | |
| Average of class Multimedia (0.3604 - 0.947, n=56, last 2 years) | |
| Gigabyte Aero 16 YE5 (Turbo Mode) | |
| Gigabyte Aero 16 YE5 | |
* ... smaller is better
AIDA64: FP32 Ray-Trace | FPU Julia | CPU SHA3 | CPU Queen | FPU SinJulia | FPU Mandel | CPU AES | CPU ZLib | FP64 Ray-Trace | CPU PhotoWorxx
| Performance rating | |
| Average of class Multimedia | |
| Schenker XMG Pro 15 (Late 2021) | |
| Lenovo ThinkPad X1 Extreme G4-20Y50040GE | |
| HP ZBook Studio 15 G8 | |
| Gigabyte Aero 16 YE5 | |
| Gigabyte Aero 16 YE5 | |
| Average Intel Core i9-12900HK | |
| Razer Blade 15 2022 | |
| Gigabyte Aero 16 YE5 | |
| AIDA64 / FP32 Ray-Trace | |
| Average of class Multimedia (2214 - 50388, n=53, last 2 years) | |
| Schenker XMG Pro 15 (Late 2021) (v6.50.5800) | |
| Lenovo ThinkPad X1 Extreme G4-20Y50040GE (v6.50.5800) | |
| HP ZBook Studio 15 G8 (v6.33.5700) | |
| Average Intel Core i9-12900HK (2677 - 13948, n=15) | |
| Gigabyte Aero 16 YE5 (v6.50.5800, Turbo Mode) | |
| Gigabyte Aero 16 YE5 (v6.50.5800) | |
| Razer Blade 15 2022 (v6.50.5800) | |
| Gigabyte Aero 16 YE5 (v6.50.5800, Silence Mode) | |
| AIDA64 / FPU Julia | |
| Average of class Multimedia (12867 - 201874, n=54, last 2 years) | |
| Schenker XMG Pro 15 (Late 2021) (v6.50.5800) | |
| Lenovo ThinkPad X1 Extreme G4-20Y50040GE (v6.50.5800) | |
| HP ZBook Studio 15 G8 (v6.33.5700) | |
| Average Intel Core i9-12900HK (12762 - 70764, n=15) | |
| Gigabyte Aero 16 YE5 (v6.50.5800, Turbo Mode) | |
| Gigabyte Aero 16 YE5 (v6.50.5800) | |
| Razer Blade 15 2022 (v6.50.5800) | |
| Gigabyte Aero 16 YE5 (v6.50.5800, Silence Mode) | |
| AIDA64 / CPU SHA3 | |
| Schenker XMG Pro 15 (Late 2021) (v6.50.5800) | |
| Lenovo ThinkPad X1 Extreme G4-20Y50040GE (v6.50.5800) | |
| HP ZBook Studio 15 G8 (v6.33.5700) | |
| Average of class Multimedia (626 - 8623, n=54, last 2 years) | |
| Gigabyte Aero 16 YE5 (v6.50.5800, Turbo Mode) | |
| Gigabyte Aero 16 YE5 (v6.50.5800) | |
| Average Intel Core i9-12900HK (841 - 3504, n=15) | |
| Razer Blade 15 2022 (v6.50.5800) | |
| Gigabyte Aero 16 YE5 (v6.50.5800, Silence Mode) | |
| AIDA64 / CPU Queen | |
| Gigabyte Aero 16 YE5 (v6.50.5800, Turbo Mode) | |
| Gigabyte Aero 16 YE5 (v6.50.5800) | |
| HP ZBook Studio 15 G8 (v6.33.5700) | |
| Lenovo ThinkPad X1 Extreme G4-20Y50040GE (v6.50.5800) | |
| Average Intel Core i9-12900HK (60202 - 107161, n=15) | |
| Razer Blade 15 2022 (v6.50.5800) | |
| Schenker XMG Pro 15 (Late 2021) (v6.50.5800) | |
| Average of class Multimedia (13483 - 181505, n=41, last 2 years) | |
| Gigabyte Aero 16 YE5 (v6.50.5800, Silence Mode) | |
| AIDA64 / FPU SinJulia | |
| Lenovo ThinkPad X1 Extreme G4-20Y50040GE (v6.50.5800) | |
| Gigabyte Aero 16 YE5 (v6.50.5800, Turbo Mode) | |
| HP ZBook Studio 15 G8 (v6.33.5700) | |
| Schenker XMG Pro 15 (Late 2021) (v6.50.5800) | |
| Gigabyte Aero 16 YE5 (v6.50.5800) | |
| Razer Blade 15 2022 (v6.50.5800) | |
| Average Intel Core i9-12900HK (3225 - 10402, n=15) | |
| Average of class Multimedia (886 - 28794, n=54, last 2 years) | |
| Gigabyte Aero 16 YE5 (v6.50.5800, Silence Mode) | |
| AIDA64 / FPU Mandel | |
| Average of class Multimedia (6395 - 105740, n=53, last 2 years) | |
| Schenker XMG Pro 15 (Late 2021) (v6.50.5800) | |
| Lenovo ThinkPad X1 Extreme G4-20Y50040GE (v6.50.5800) | |
| HP ZBook Studio 15 G8 (v6.33.5700) | |
| Average Intel Core i9-12900HK (7417 - 34233, n=15) | |
| Gigabyte Aero 16 YE5 (v6.50.5800, Turbo Mode) | |
| Gigabyte Aero 16 YE5 (v6.50.5800) | |
| Razer Blade 15 2022 (v6.50.5800) | |
| Gigabyte Aero 16 YE5 (v6.50.5800, Silence Mode) | |
| AIDA64 / CPU AES | |
| Lenovo ThinkPad X1 Extreme G4-20Y50040GE (v6.50.5800) | |
| Schenker XMG Pro 15 (Late 2021) (v6.50.5800) | |
| Gigabyte Aero 16 YE5 (v6.50.5800, Turbo Mode) | |
| Gigabyte Aero 16 YE5 (v6.50.5800) | |
| HP ZBook Studio 15 G8 (v6.33.5700) | |
| Average Intel Core i9-12900HK (32382 - 112498, n=15) | |
| Average of class Multimedia (8171 - 126790, n=54, last 2 years) | |
| Razer Blade 15 2022 (v6.50.5800) | |
| Gigabyte Aero 16 YE5 (v6.50.5800, Silence Mode) | |
| AIDA64 / CPU ZLib | |
| Gigabyte Aero 16 YE5 (v6.50.5800, Turbo Mode) | |
| Gigabyte Aero 16 YE5 (v6.50.5800) | |
| Average of class Multimedia (143.8 - 2022, n=54, last 2 years) | |
| Average Intel Core i9-12900HK (314 - 1209, n=15) | |
| Razer Blade 15 2022 (v6.50.5800) | |
| Lenovo ThinkPad X1 Extreme G4-20Y50040GE (v6.50.5800) | |
| Schenker XMG Pro 15 (Late 2021) (v6.50.5800) | |
| HP ZBook Studio 15 G8 (v6.33.5700) | |
| Gigabyte Aero 16 YE5 (v6.50.5800, Silence Mode) | |
| AIDA64 / FP64 Ray-Trace | |
| Average of class Multimedia (1014 - 26875, n=54, last 2 years) | |
| Schenker XMG Pro 15 (Late 2021) (v6.50.5800) | |
| Lenovo ThinkPad X1 Extreme G4-20Y50040GE (v6.50.5800) | |
| HP ZBook Studio 15 G8 (v6.33.5700) | |
| Average Intel Core i9-12900HK (1501 - 7616, n=15) | |
| Gigabyte Aero 16 YE5 (v6.50.5800, Turbo Mode) | |
| Gigabyte Aero 16 YE5 (v6.50.5800) | |
| Razer Blade 15 2022 (v6.50.5800) | |
| Gigabyte Aero 16 YE5 (v6.50.5800, Silence Mode) | |
| AIDA64 / CPU PhotoWorxx | |
| Average of class Multimedia (8187 - 88154, n=54, last 2 years) | |
| Razer Blade 15 2022 (v6.50.5800) | |
| Gigabyte Aero 16 YE5 (v6.50.5800) | |
| Gigabyte Aero 16 YE5 (v6.50.5800, Turbo Mode) | |
| Average Intel Core i9-12900HK (24446 - 42462, n=15) | |
| Schenker XMG Pro 15 (Late 2021) (v6.50.5800) | |
| Gigabyte Aero 16 YE5 (v6.50.5800, Silence Mode) | |
| HP ZBook Studio 15 G8 (v6.33.5700) | |
| Lenovo ThinkPad X1 Extreme G4-20Y50040GE (v6.50.5800) | |
系统性能
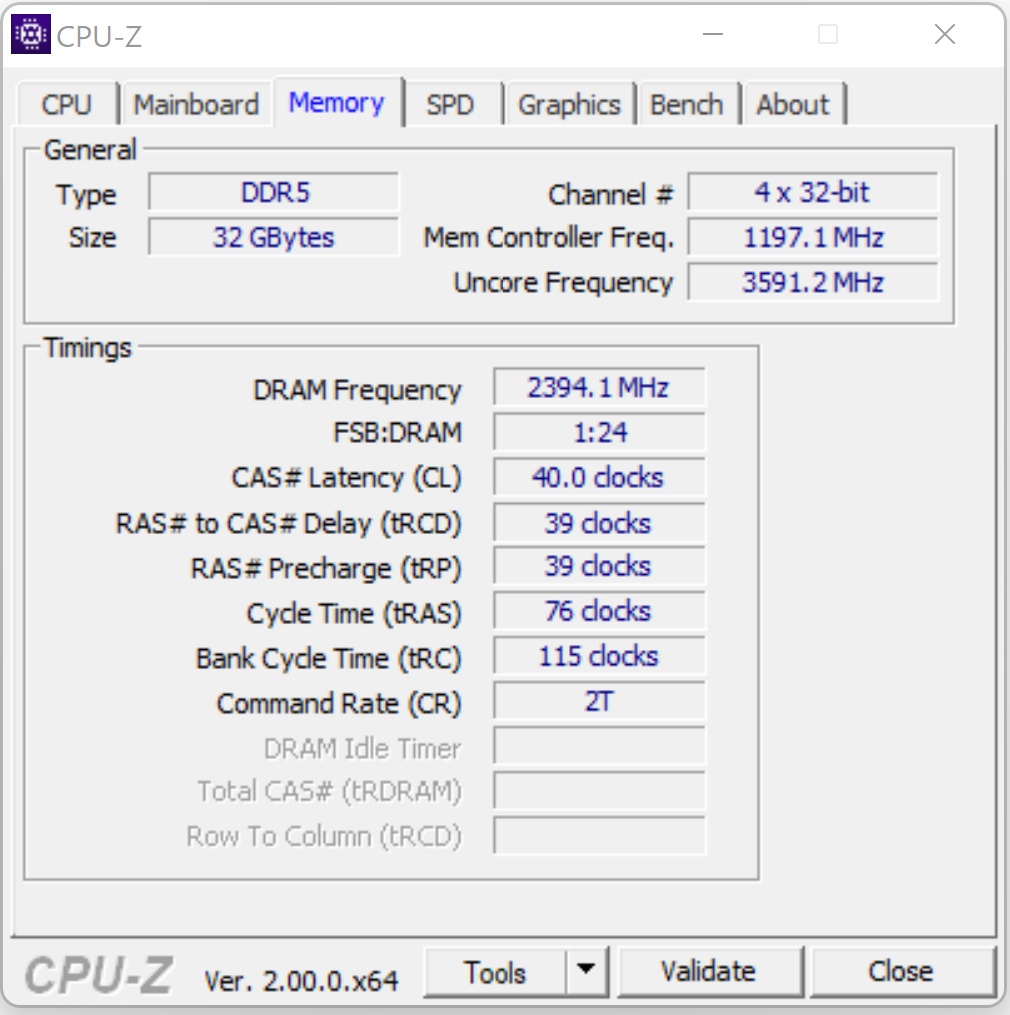
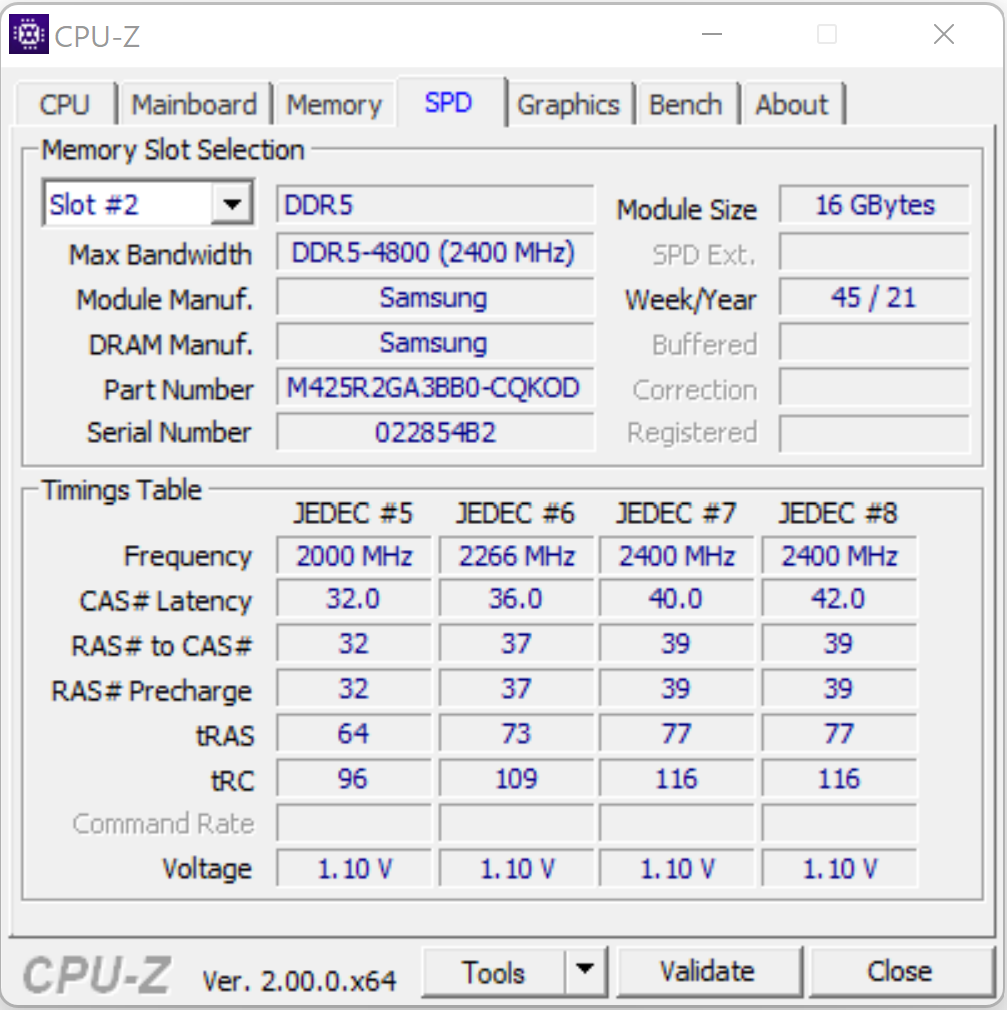
不出所料,由于其强大的内部硬件,整体系统性能非常快速和流畅。这台电脑在所有的应用测试中都表现得非常出色。双通道DDR5内存接口进一步提高了整体性能,出色的PCMark基准测试结果就证明了这一点。
| PCMark 8 Home Score Accelerated v2 | 4775 points | |
| PCMark 8 Creative Score Accelerated v2 | 6920 points | |
| PCMark 8 Work Score Accelerated v2 | 5343 points | |
| PCMark 10 Score | 7816 points | |
Help | ||
CrossMark: Overall | Productivity | Creativity | Responsiveness
| PCMark 10 / Score | |
| Average Intel Core i9-12900HK, NVIDIA GeForce RTX 3080 Ti Laptop GPU (7149 - 8186, n=5) | |
| Gigabyte Aero 16 YE5 | |
| Average of class Multimedia (4325 - 10386, n=52, last 2 years) | |
| Razer Blade 15 2022 | |
| Lenovo ThinkPad X1 Extreme G4-20Y50040GE | |
| PCMark 10 / Essentials | |
| Gigabyte Aero 16 YE5 | |
| Average Intel Core i9-12900HK, NVIDIA GeForce RTX 3080 Ti Laptop GPU (9870 - 11205, n=5) | |
| Razer Blade 15 2022 | |
| Lenovo ThinkPad X1 Extreme G4-20Y50040GE | |
| Average of class Multimedia (8025 - 11664, n=51, last 2 years) | |
| PCMark 10 / Productivity | |
| Average of class Multimedia (7323 - 18233, n=51, last 2 years) | |
| Gigabyte Aero 16 YE5 | |
| Average Intel Core i9-12900HK, NVIDIA GeForce RTX 3080 Ti Laptop GPU (9173 - 10422, n=5) | |
| Razer Blade 15 2022 | |
| Lenovo ThinkPad X1 Extreme G4-20Y50040GE | |
| PCMark 10 / Digital Content Creation | |
| Average Intel Core i9-12900HK, NVIDIA GeForce RTX 3080 Ti Laptop GPU (10951 - 13098, n=5) | |
| Razer Blade 15 2022 | |
| Gigabyte Aero 16 YE5 | |
| Average of class Multimedia (3651 - 16240, n=51, last 2 years) | |
| Lenovo ThinkPad X1 Extreme G4-20Y50040GE | |
| CrossMark / Overall | |
| Gigabyte Aero 16 YE5 | |
| Average of class Multimedia (866 - 2728, n=60, last 2 years) | |
| Average Intel Core i9-12900HK, NVIDIA GeForce RTX 3080 Ti Laptop GPU (970 - 2138, n=5) | |
| Lenovo ThinkPad X1 Extreme G4-20Y50040GE | |
| Apple MacBook Pro 16 2021 M1 Max | |
| CrossMark / Productivity | |
| Gigabyte Aero 16 YE5 | |
| Average of class Multimedia (931 - 2489, n=60, last 2 years) | |
| Average Intel Core i9-12900HK, NVIDIA GeForce RTX 3080 Ti Laptop GPU (921 - 2038, n=5) | |
| Lenovo ThinkPad X1 Extreme G4-20Y50040GE | |
| Apple MacBook Pro 16 2021 M1 Max | |
| CrossMark / Creativity | |
| Gigabyte Aero 16 YE5 | |
| Average of class Multimedia (907 - 3465, n=60, last 2 years) | |
| Apple MacBook Pro 16 2021 M1 Max | |
| Average Intel Core i9-12900HK, NVIDIA GeForce RTX 3080 Ti Laptop GPU (1007 - 2210, n=5) | |
| Lenovo ThinkPad X1 Extreme G4-20Y50040GE | |
| CrossMark / Responsiveness | |
| Gigabyte Aero 16 YE5 | |
| Average Intel Core i9-12900HK, NVIDIA GeForce RTX 3080 Ti Laptop GPU (1012 - 2234, n=5) | |
| Lenovo ThinkPad X1 Extreme G4-20Y50040GE | |
| Average of class Multimedia (605 - 2024, n=60, last 2 years) | |
| Apple MacBook Pro 16 2021 M1 Max | |
| AIDA64 / Memory Copy | |
| Average of class Multimedia (11299 - 132135, n=54, last 2 years) | |
| Razer Blade 15 2022 | |
| Gigabyte Aero 16 YE5 | |
| Average Intel Core i9-12900HK (42967 - 62959, n=15) | |
| Lenovo ThinkPad X1 Extreme G4-20Y50040GE | |
| AIDA64 / Memory Read | |
| Average of class Multimedia (11624 - 174586, n=54, last 2 years) | |
| Razer Blade 15 2022 | |
| Gigabyte Aero 16 YE5 | |
| Average Intel Core i9-12900HK (44419 - 66989, n=15) | |
| Lenovo ThinkPad X1 Extreme G4-20Y50040GE | |
| AIDA64 / Memory Write | |
| Average of class Multimedia (11755 - 134998, n=54, last 2 years) | |
| Razer Blade 15 2022 | |
| Gigabyte Aero 16 YE5 | |
| Average Intel Core i9-12900HK (42144 - 65268, n=15) | |
| Lenovo ThinkPad X1 Extreme G4-20Y50040GE | |
| AIDA64 / Memory Latency | |
| Average of class Multimedia (7 - 535, n=53, last 2 years) | |
| Gigabyte Aero 16 YE5 | |
| Lenovo ThinkPad X1 Extreme G4-20Y50040GE | |
| Average Intel Core i9-12900HK (79.9 - 109, n=15) | |
| Razer Blade 15 2022 | |
* ... smaller is better
DPC延迟
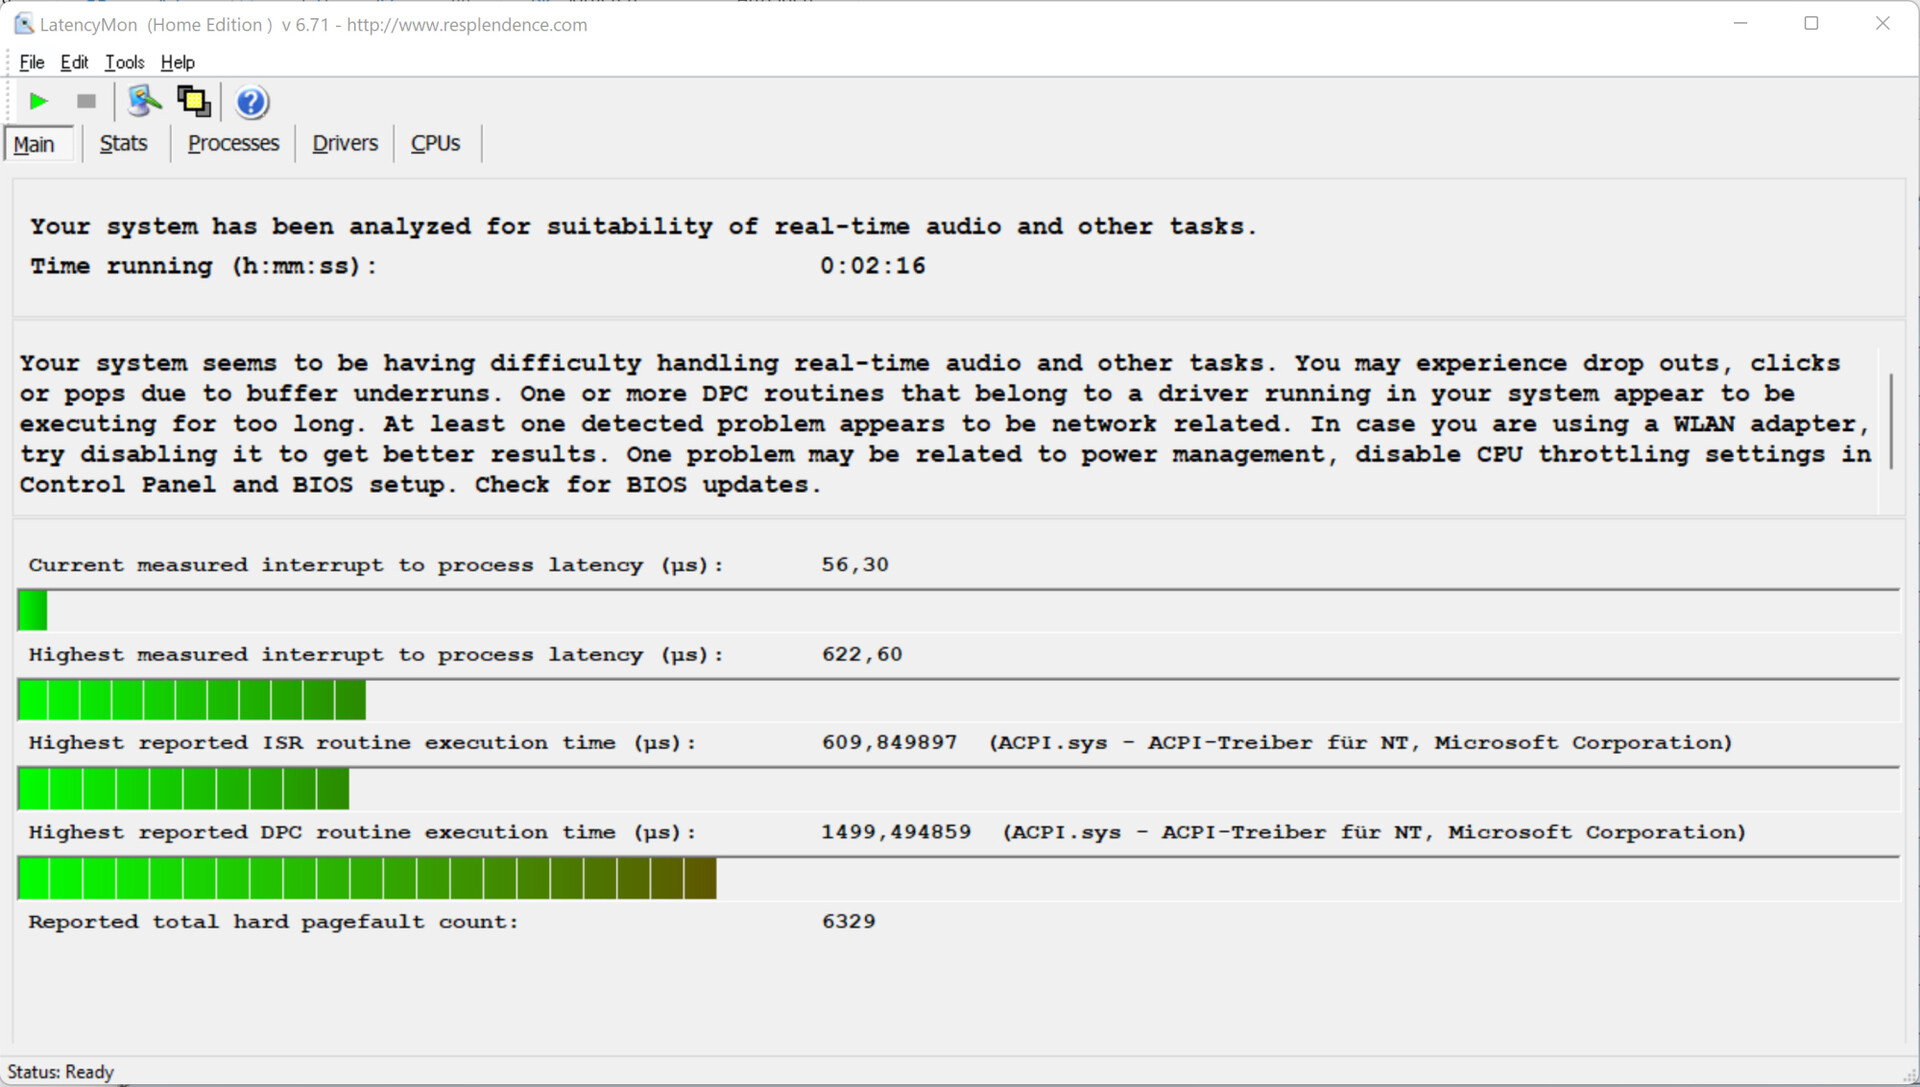
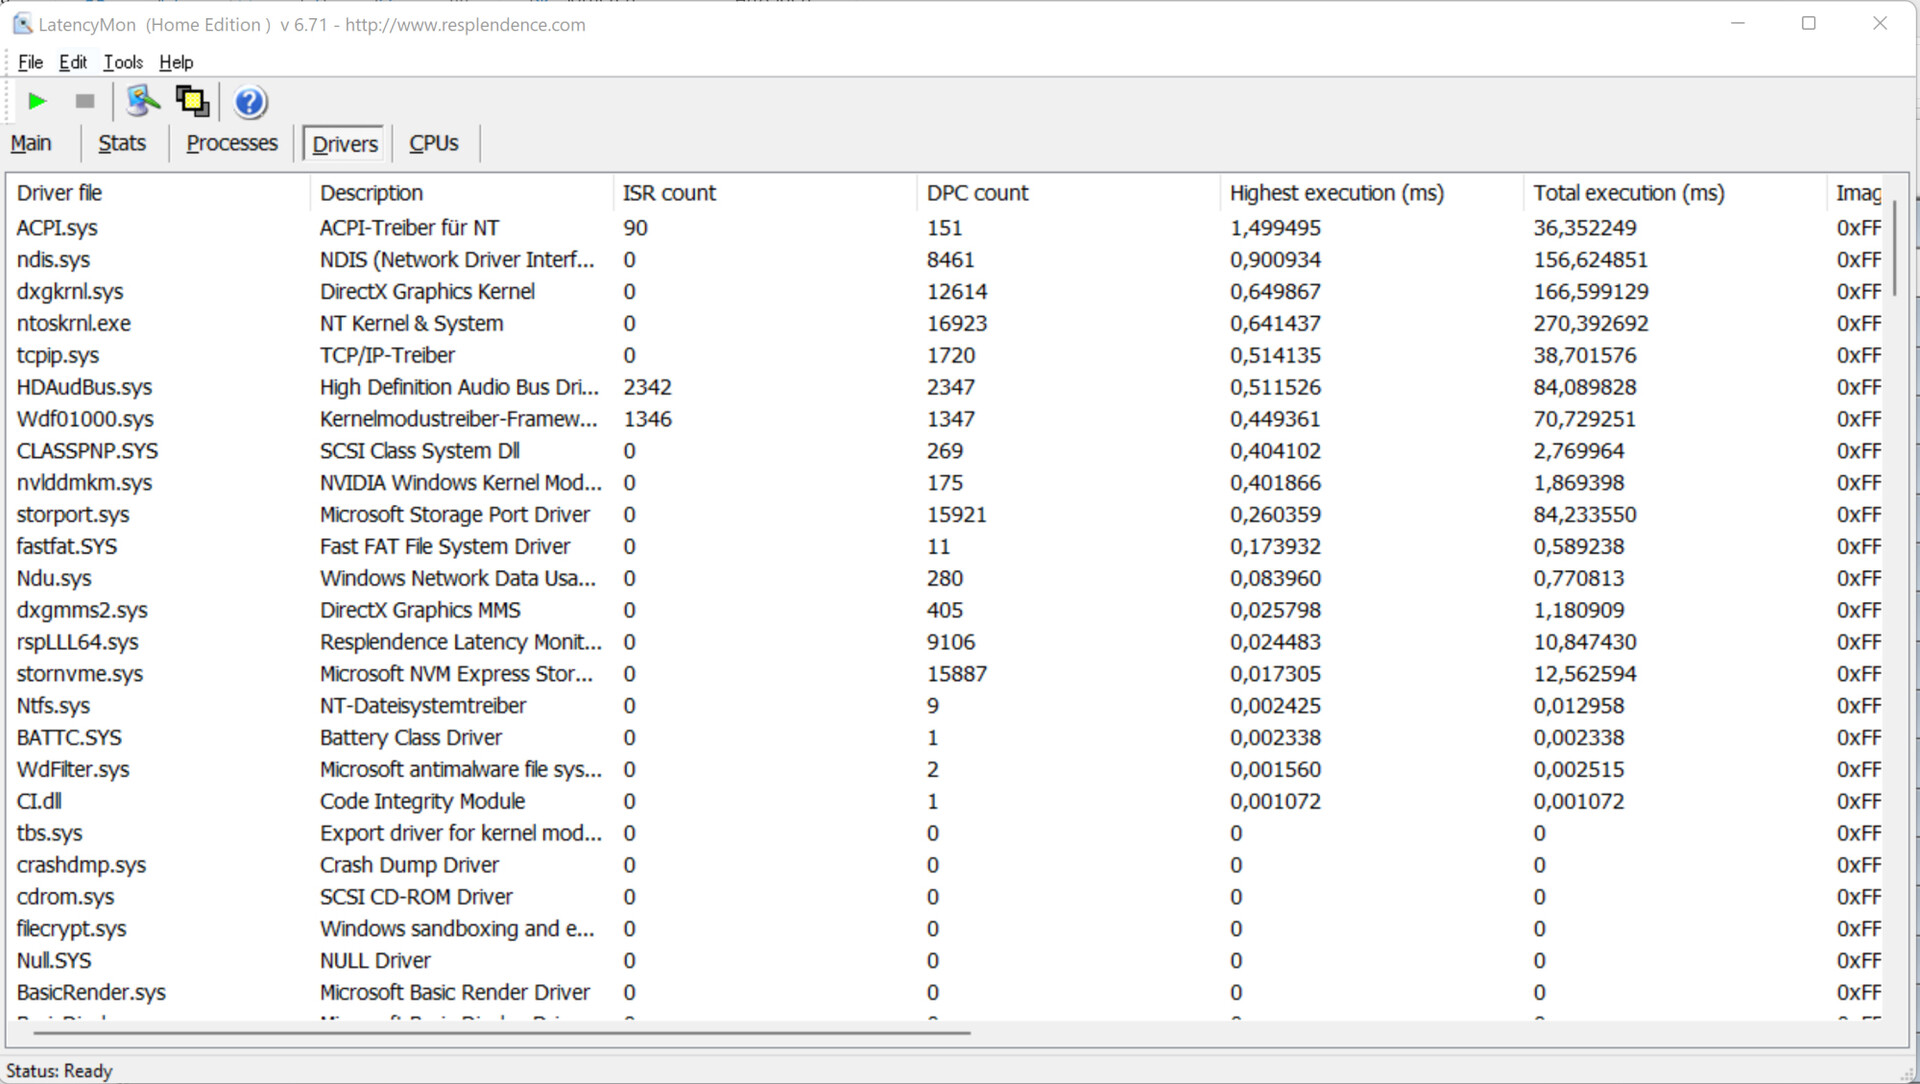
在我们的标准化延迟监测测试中(浏览网页、4K视频播放、Prime95高负荷),我们能够检测到一些DPC延迟不一致的情况。Aero 16似乎并不特别适合于视频和音频编辑。说到这里,它的一些竞争对手遭受了更高的DPC延迟。在过去,我们发现DPC延迟可以通过软件更新的时间来改善。不幸的是,相反的情况也有可能发生。
| DPC Latencies / LatencyMon - interrupt to process latency (max), Web, Youtube, Prime95 | |
| Lenovo ThinkPad X1 Extreme G4-20Y50040GE | |
| HP ZBook Studio 15 G8 | |
| Razer Blade 15 2022 | |
| Schenker XMG Pro 15 (Late 2021) | |
| Gigabyte Aero 16 YE5 | |
* ... smaller is better
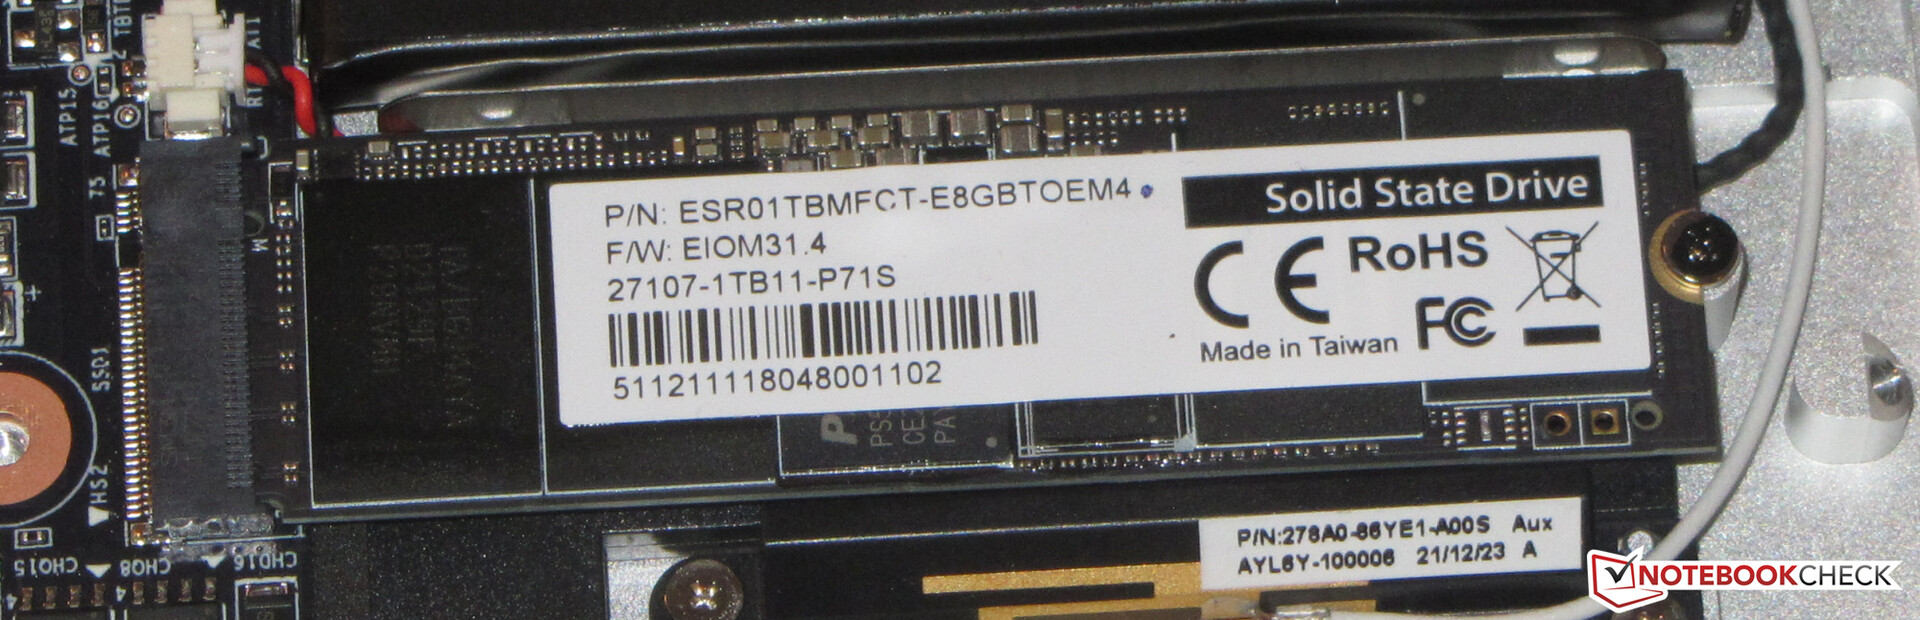
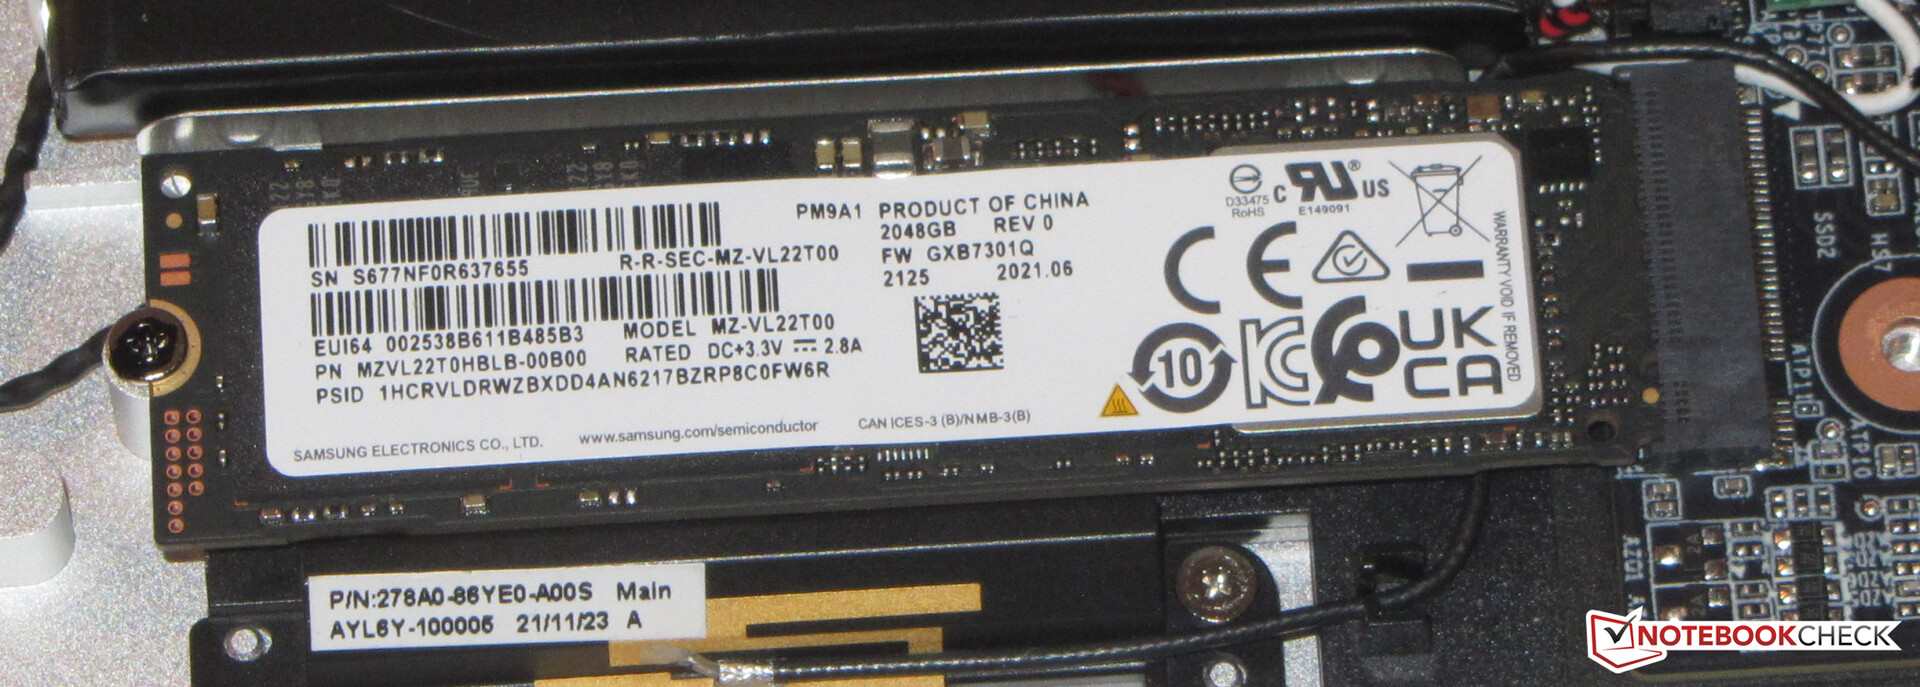
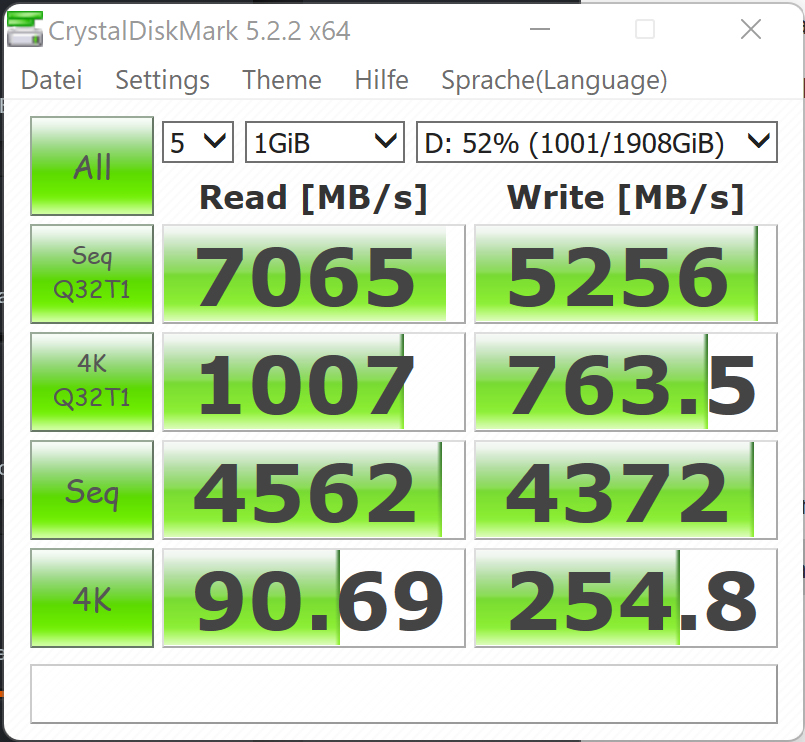
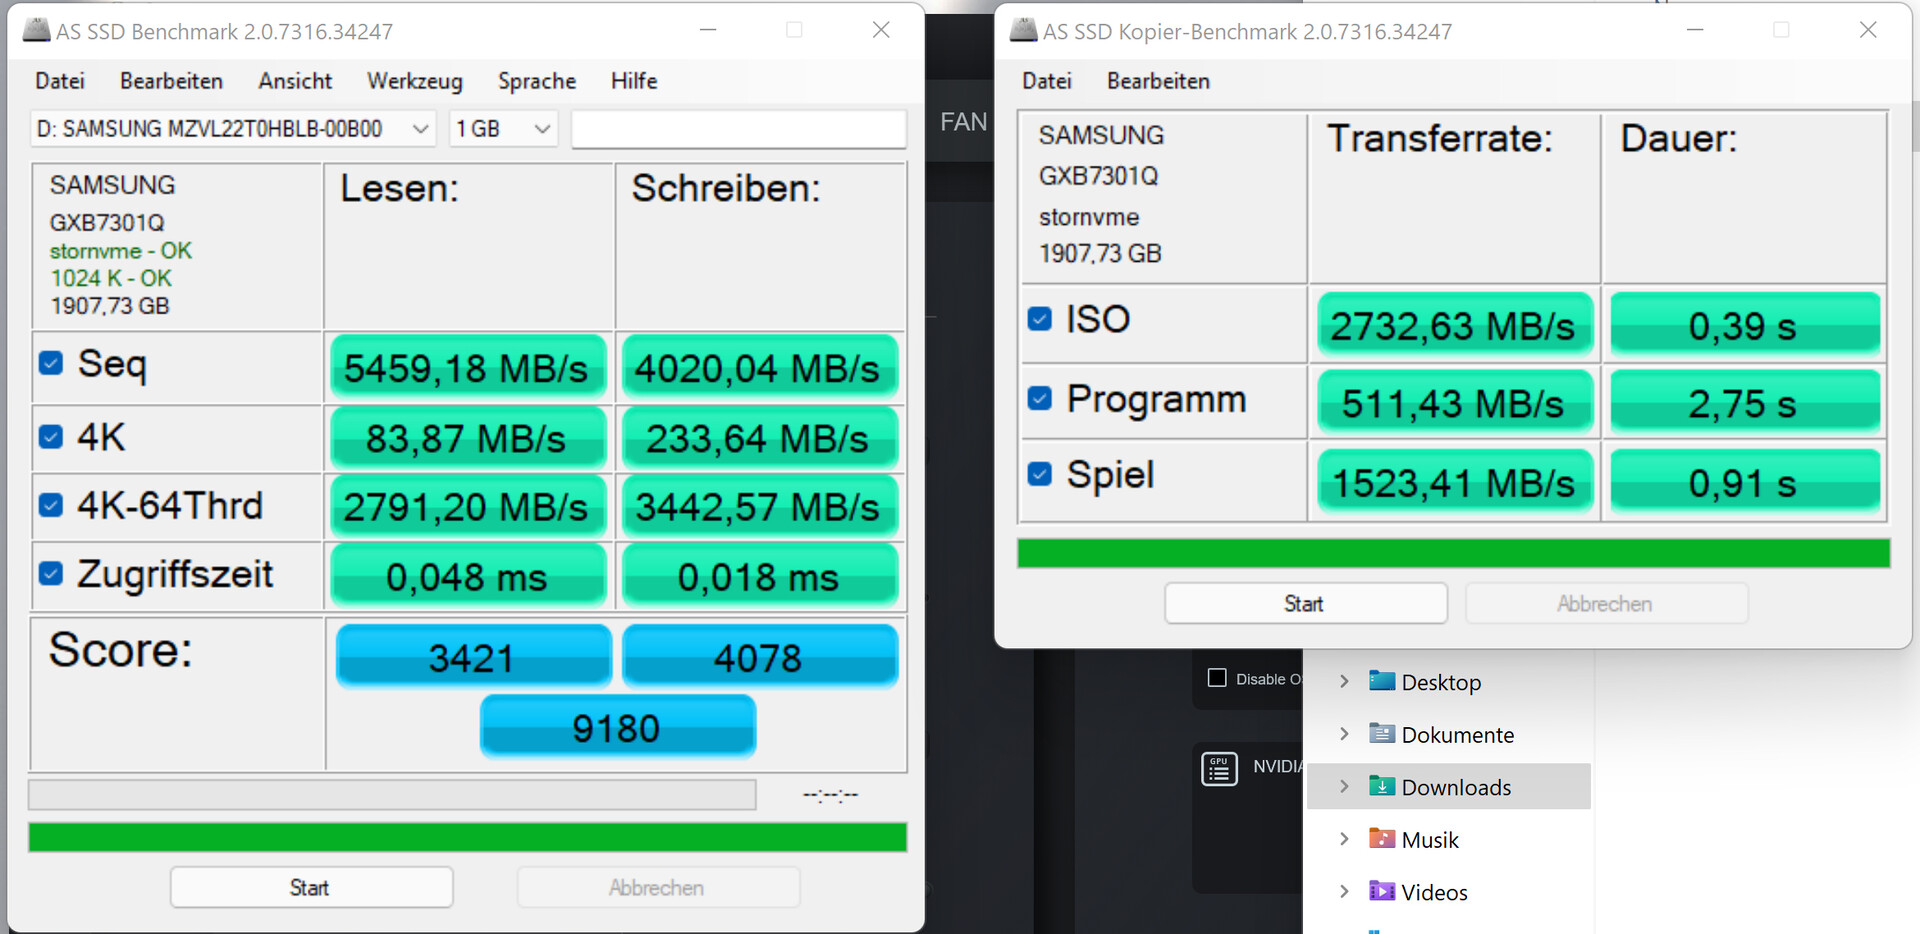
存储设备
我们的评测单元安装了两块固态硬盘,一块是2TB的三星M.2-2280,另一块是1TB的Phison M.2-2280,后者用于操作系统。由于其PCIe 4.0接口,这两块固态硬盘的表现令人钦佩,而且速度非常快。

* ... smaller is better
Sustained Read: DiskSpd Read Loop, Queue Depth 8
图形性能
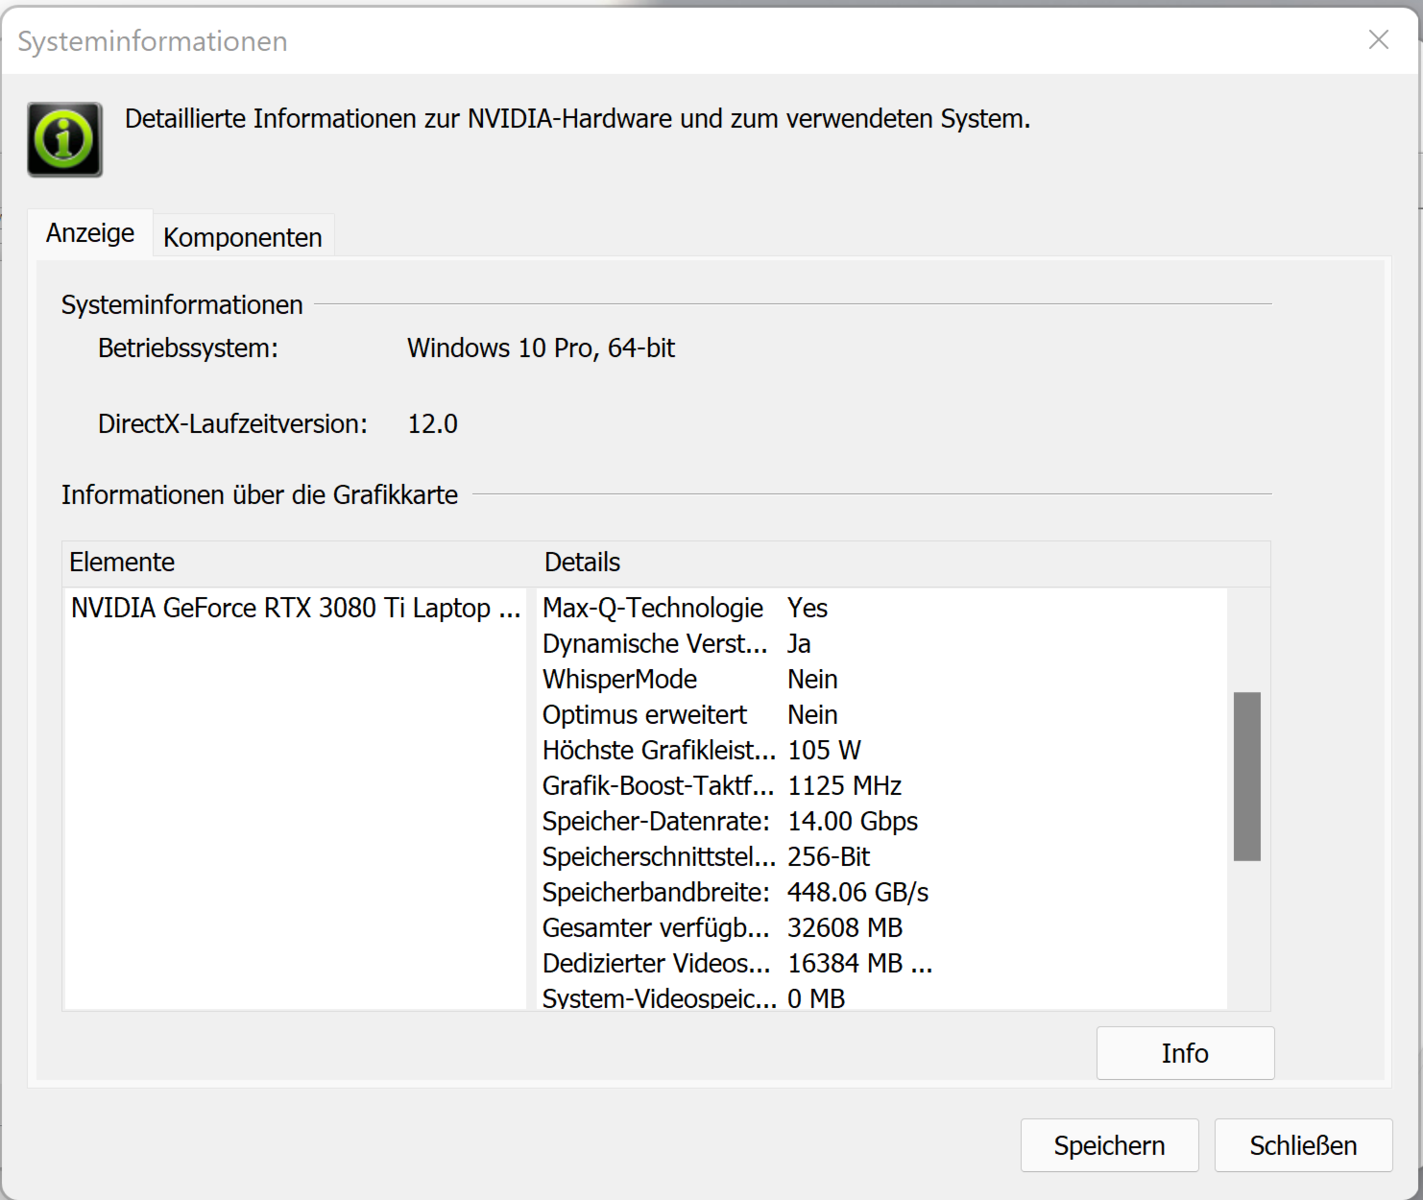
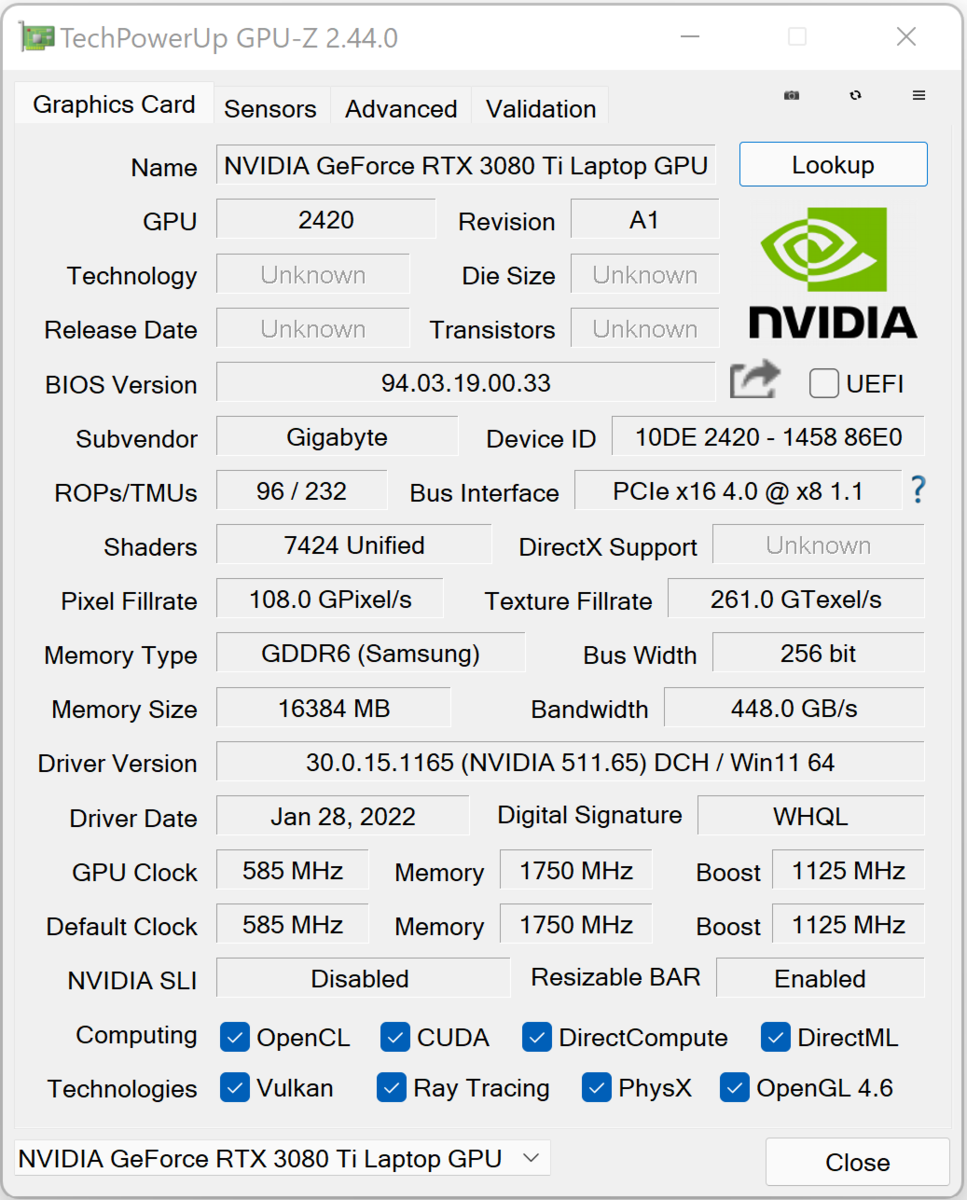
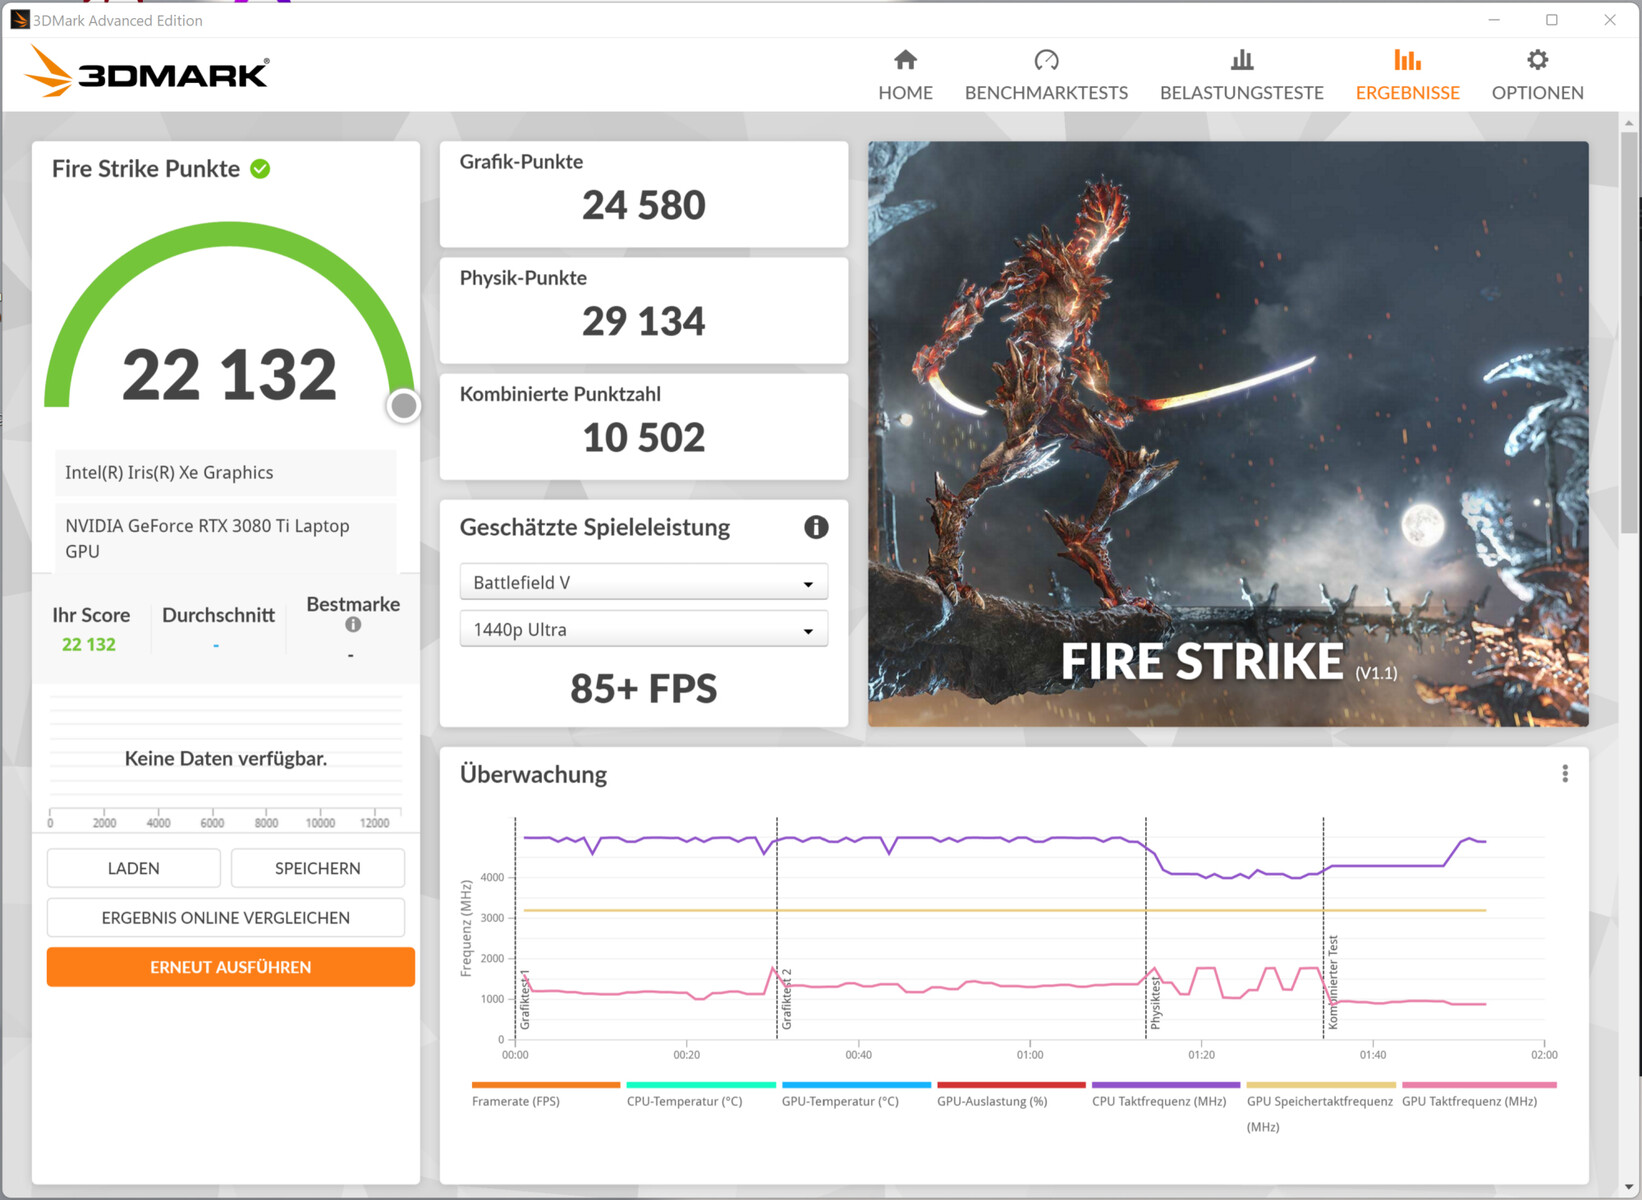
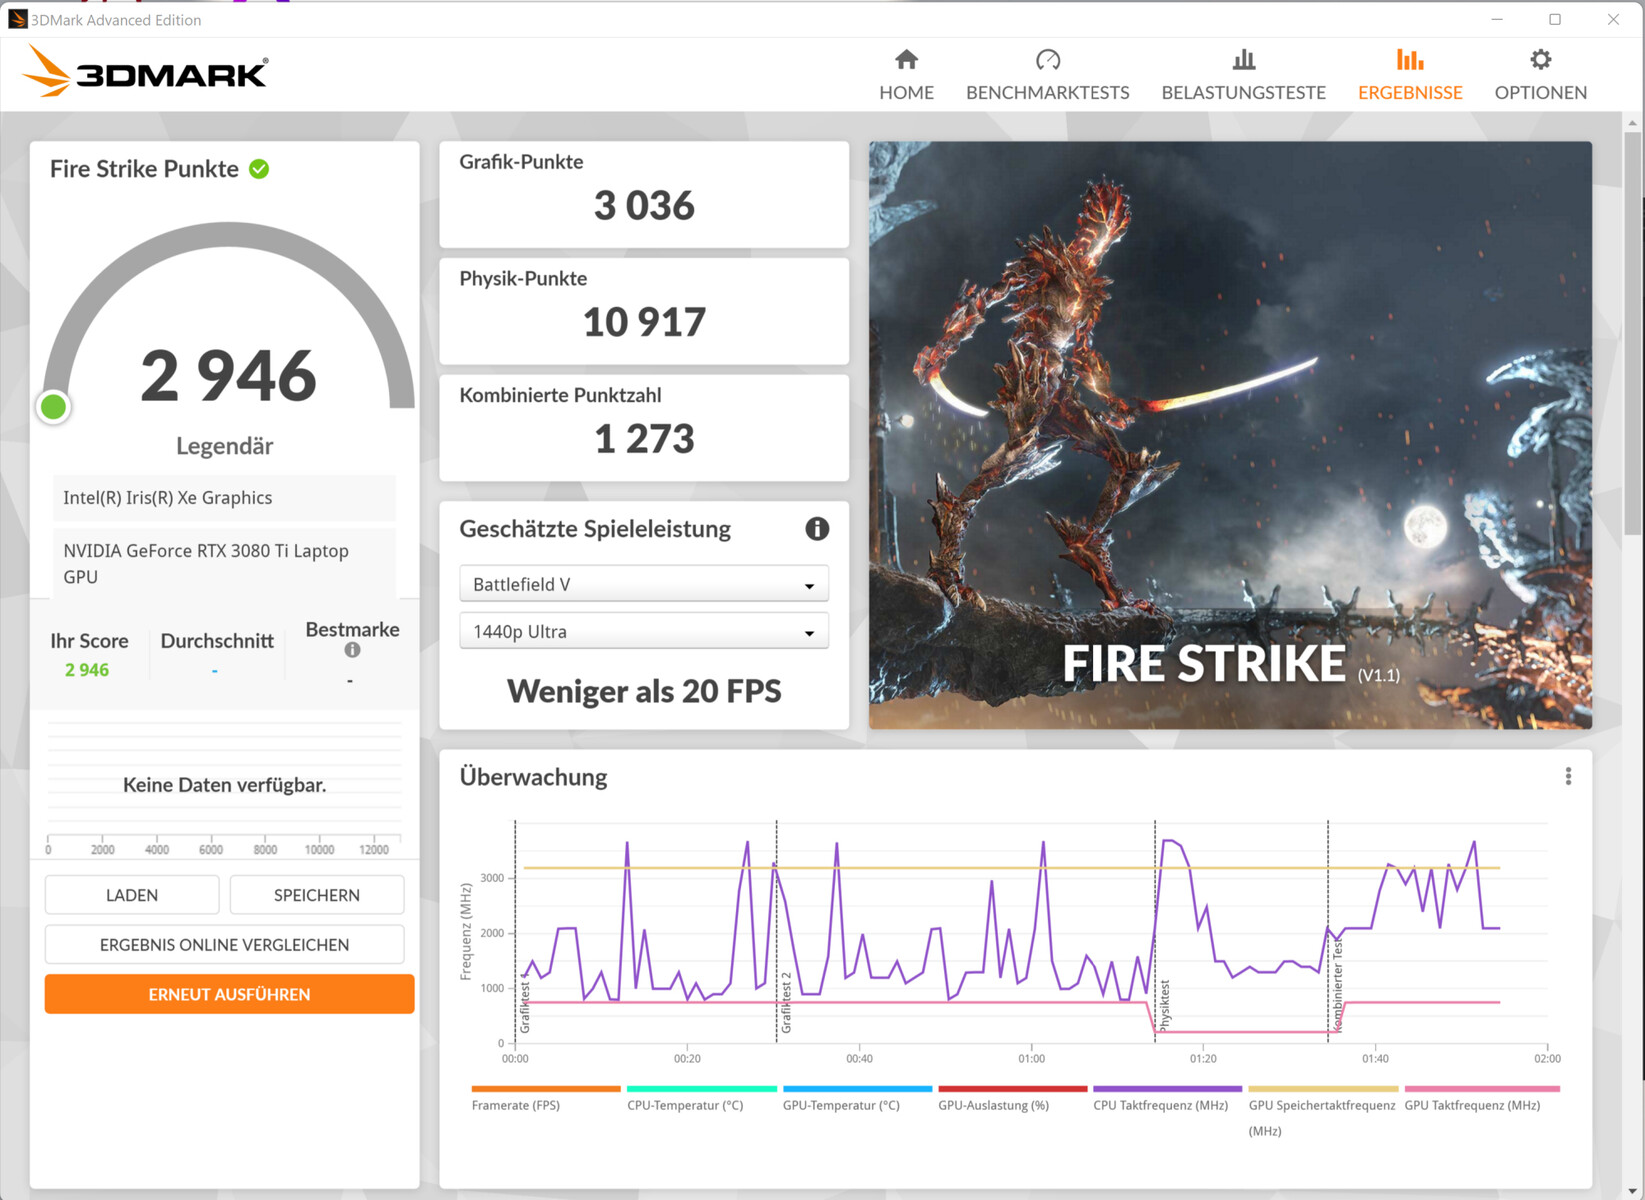
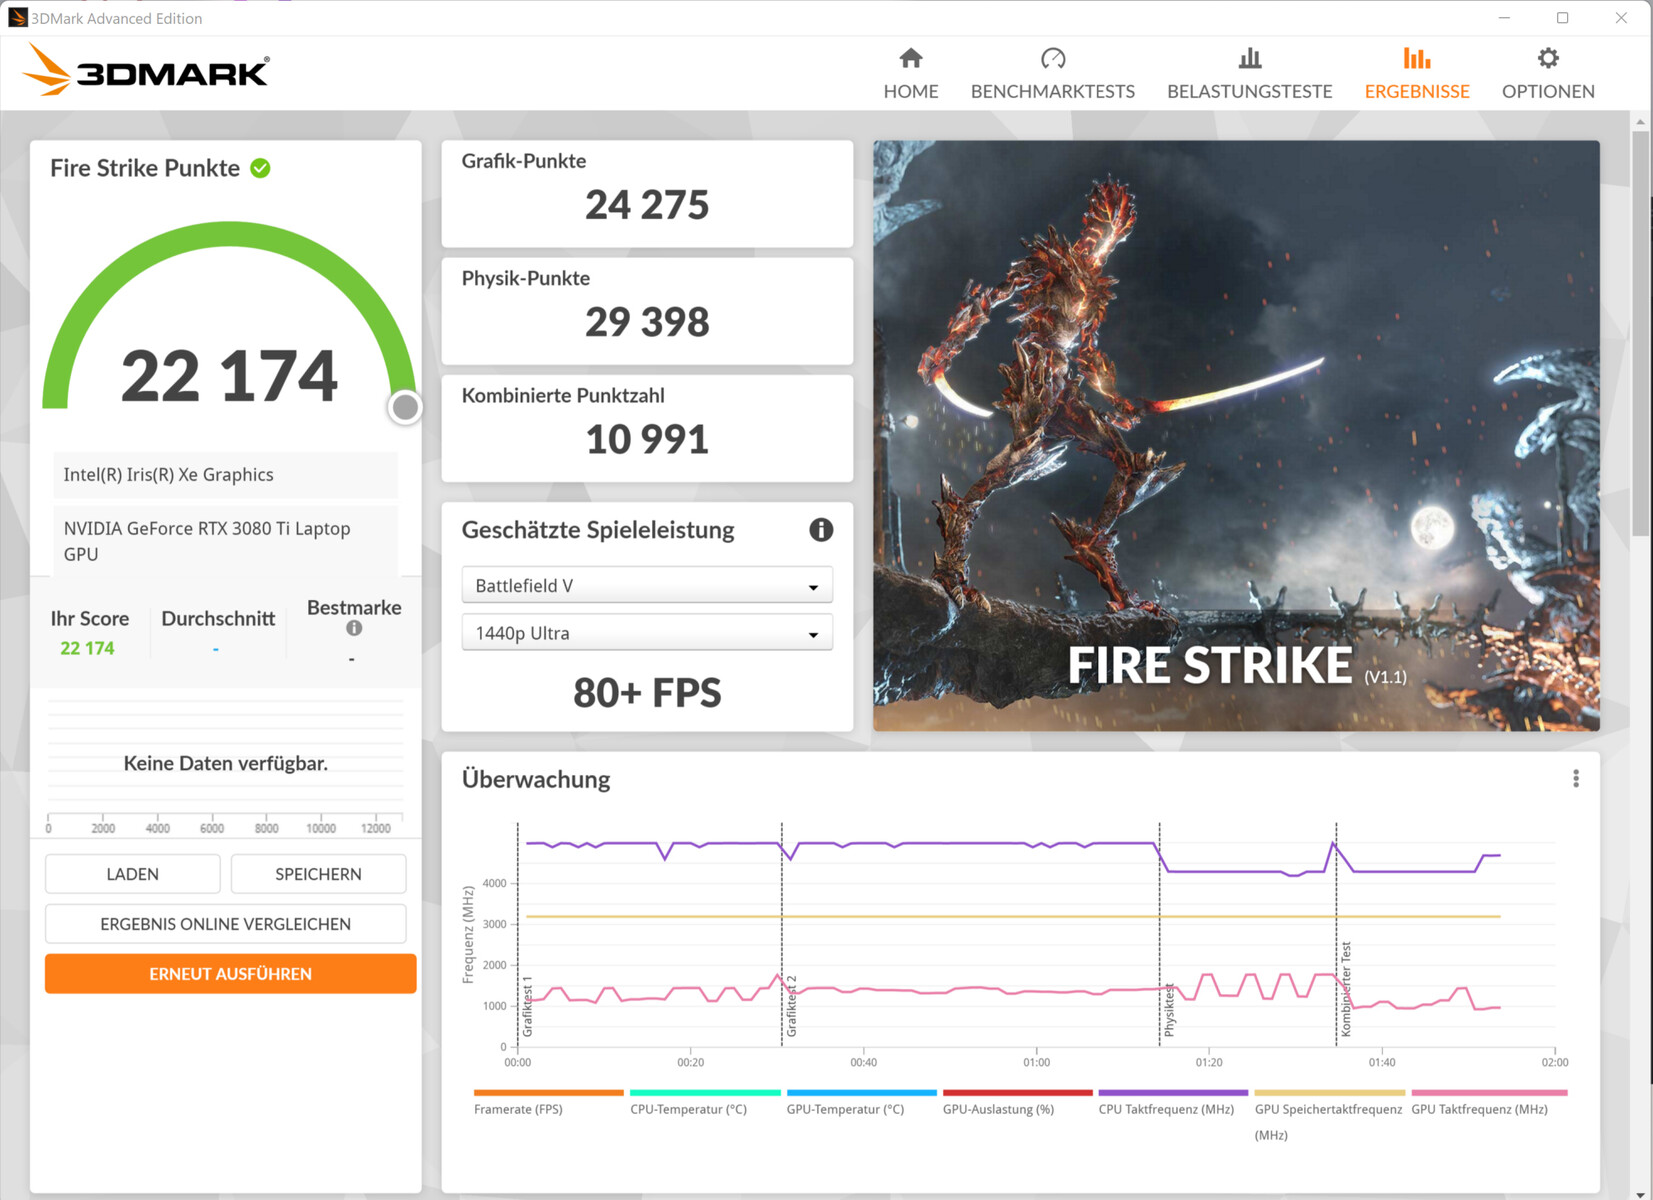
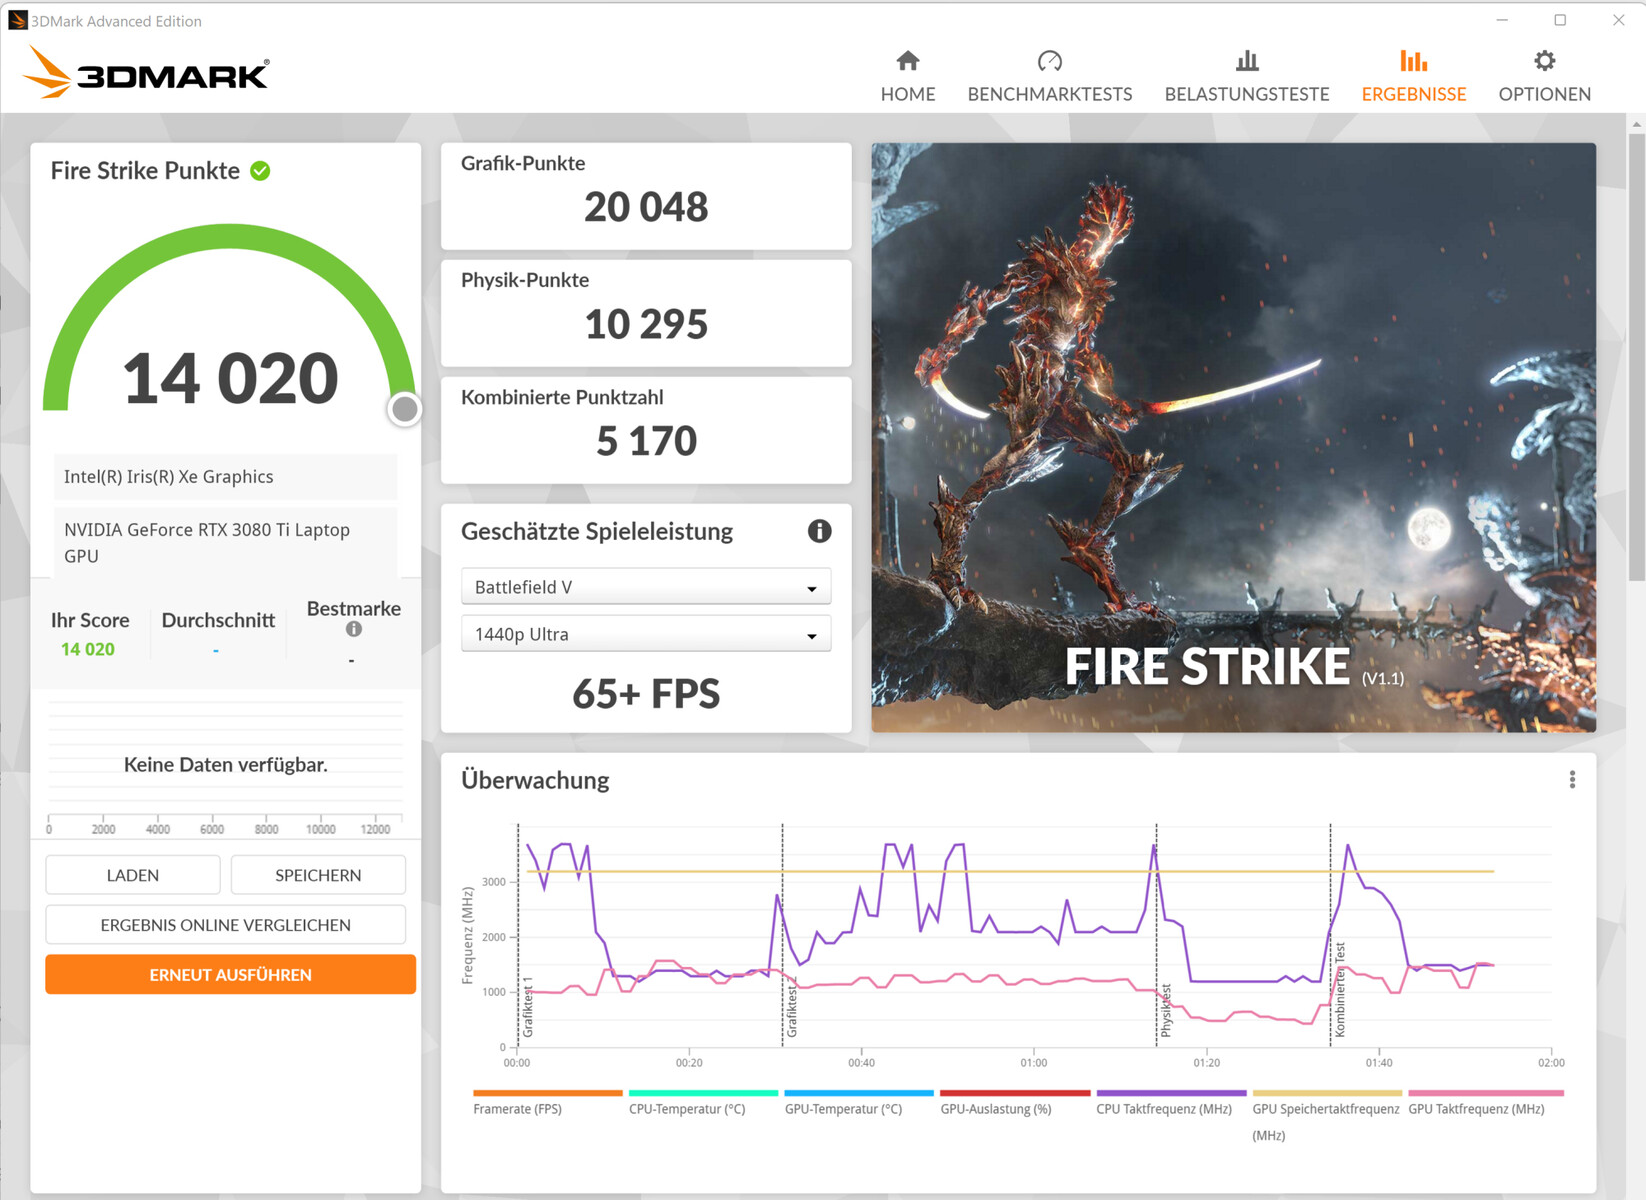
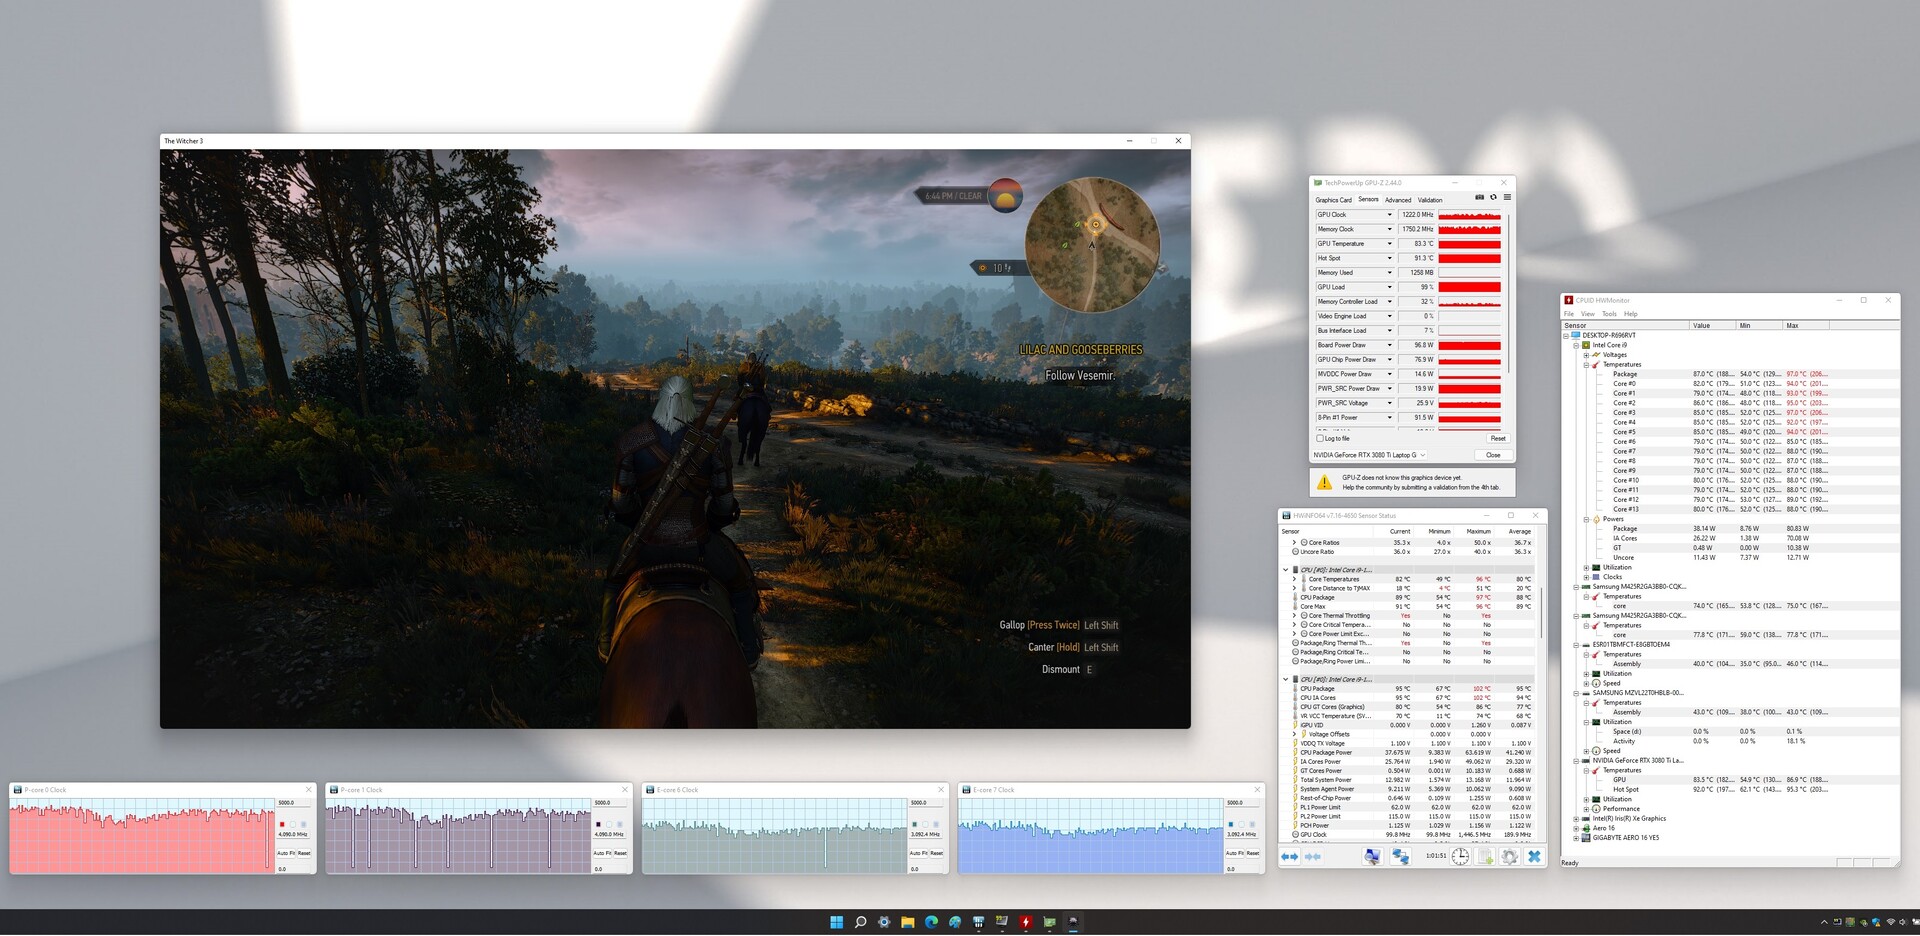
正如我们所知,RTX 3000的真正性能取决于许多因素,如冷却、内存配置和OEM在Nvidia预定的限制范围内设置的最大TGP。在Aero 16中,技嘉选择了GeForce RTX 3080 Ti LaptopGPU,最大TGP为105 W(90 W + 15 W Dynamic Boost)。
在我们的基准测试中,由于其相对较低的TGP,该设备的表现比之前测试的所有RTX 3080 Ti设备的平均速度要慢。此外,我们的Witcher 3 测试显示,这个最大的TGP不能长时间保持。Razer Blade 15,它配备了完全相同的GPU,表现明显更好,这要归功于其额外的5W TGP空间。
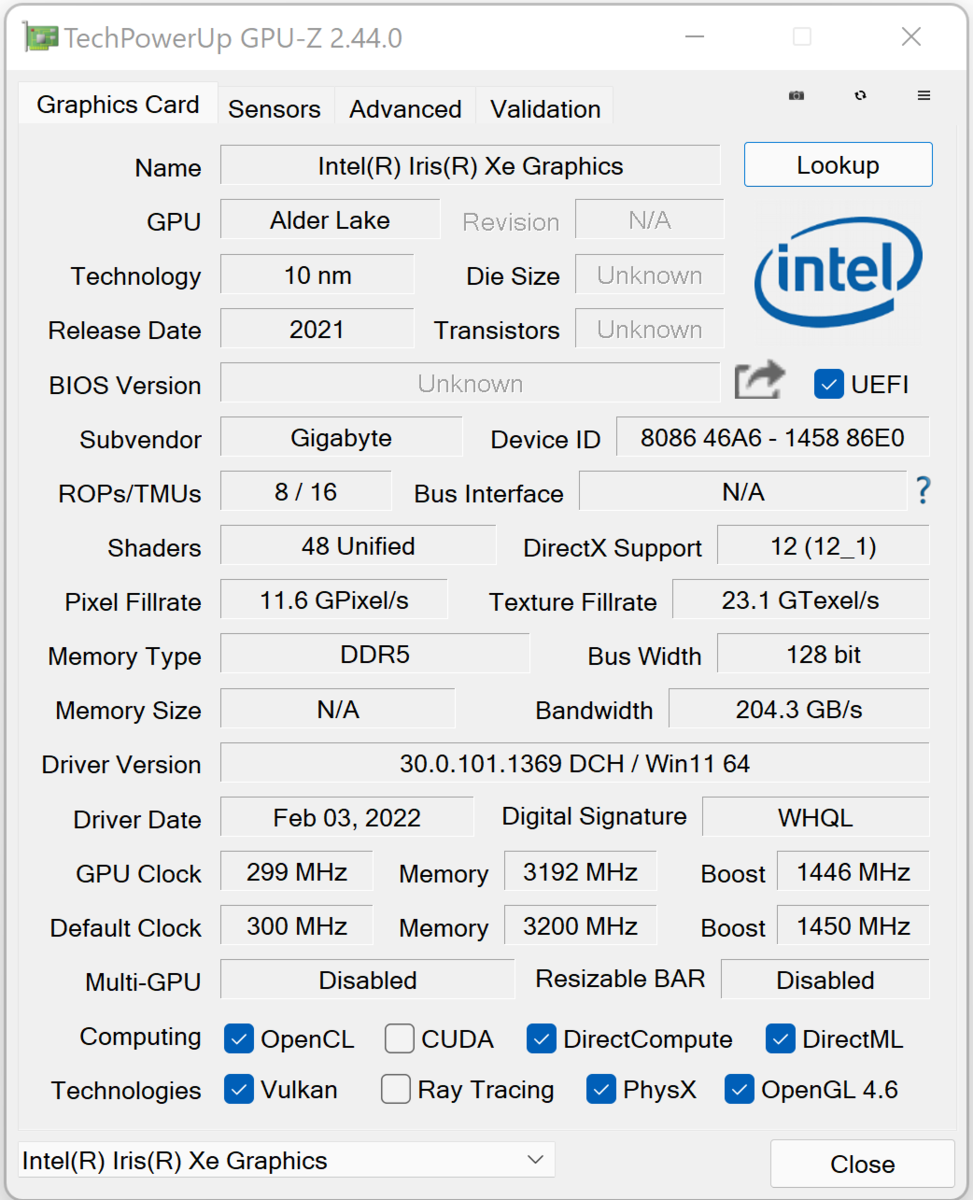
该GPU可以访问总共16GB的GDDR6 VRAM,而且该笔记本支持在专用GPU和集成的Iris Xe Graphics G7(Nvidia Optimus)之间动态按需切换GPU。
| 3DMark 06 Standard Score | 55891 points | |
| 3DMark 11 Performance | 30249 points | |
| 3DMark Cloud Gate Standard Score | 45491 points | |
| 3DMark Fire Strike Score | 22132 points | |
| 3DMark Time Spy Score | 9875 points | |
Help | ||
| 3DMark 11 - 1280x720 Performance GPU | |
| Average NVIDIA GeForce RTX 3080 Ti Laptop GPU (13920 - 45841, n=45) | |
| Razer Blade 15 2022 | |
| Schenker XMG Pro 15 (Late 2021) | |
| Gigabyte Aero 16 YE5 (Turbo Mode) | |
| Lenovo ThinkPad X1 Extreme G4-20Y50040GE | |
| Gigabyte Aero 16 YE5 | |
| Gigabyte Aero 16 YE5 (Silence Mode) | |
| HP ZBook Studio 15 G8 | |
| Average of class Multimedia (3749 - 60002, n=55, last 2 years) | |
| SPECviewperf 2020 | |
| 3840x2160 3ds Max (3dsmax-07) | |
| Average NVIDIA GeForce RTX 3080 Ti Laptop GPU (69.5 - 144, n=7) | |
| Gigabyte Aero 16 YE5 | |
| Gigabyte Aero 16 YE5 (Turbo Mode) | |
| Gigabyte Aero 16 YE5 (Silence Mode) | |
| 3840x2160 CATIA (catia-06) | |
| Average NVIDIA GeForce RTX 3080 Ti Laptop GPU (30.3 - 69.6, n=7) | |
| Gigabyte Aero 16 YE5 | |
| Gigabyte Aero 16 YE5 (Turbo Mode) | |
| Gigabyte Aero 16 YE5 (Silence Mode) | |
| 3840x2160 Creo (creo-03) | |
| Gigabyte Aero 16 YE5 (Turbo Mode) | |
| Average NVIDIA GeForce RTX 3080 Ti Laptop GPU (49 - 93.3, n=7) | |
| Gigabyte Aero 16 YE5 | |
| Gigabyte Aero 16 YE5 (Silence Mode) | |
| 3840x2160 Energy (energy-03) | |
| Average NVIDIA GeForce RTX 3080 Ti Laptop GPU (27.7 - 118.7, n=7) | |
| Gigabyte Aero 16 YE5 | |
| Gigabyte Aero 16 YE5 (Turbo Mode) | |
| Gigabyte Aero 16 YE5 (Silence Mode) | |
| 3840x2160 Maya (maya-06) | |
| Average NVIDIA GeForce RTX 3080 Ti Laptop GPU (137.4 - 345, n=7) | |
| Gigabyte Aero 16 YE5 (Turbo Mode) | |
| Gigabyte Aero 16 YE5 | |
| Gigabyte Aero 16 YE5 (Silence Mode) | |
| 3840x2160 Medical (medical-03) | |
| Average NVIDIA GeForce RTX 3080 Ti Laptop GPU (13.2 - 34.3, n=7) | |
| Gigabyte Aero 16 YE5 | |
| Gigabyte Aero 16 YE5 (Turbo Mode) | |
| Gigabyte Aero 16 YE5 (Silence Mode) | |
| 3840x2160 Siemens NX (snx-04) | |
| Average NVIDIA GeForce RTX 3080 Ti Laptop GPU (15.5 - 21.1, n=7) | |
| Gigabyte Aero 16 YE5 (Turbo Mode) | |
| Gigabyte Aero 16 YE5 | |
| Gigabyte Aero 16 YE5 (Silence Mode) | |
| 3840x2160 Solidworks (solidworks-05) | |
| Average NVIDIA GeForce RTX 3080 Ti Laptop GPU (87.9 - 255, n=4) | |
| Gigabyte Aero 16 YE5 | |
| Gigabyte Aero 16 YE5 (Turbo Mode) | |
| Gigabyte Aero 16 YE5 (Silence Mode) | |
| 1920x1080 3ds Max (3dsmax-07) | |
| Average NVIDIA GeForce RTX 3080 Ti Laptop GPU (99.2 - 153, n=6) | |
| Gigabyte Aero 16 YE5 | |
| Gigabyte Aero 16 YE5 (Turbo Mode) | |
| Average of class Multimedia (n=1last 2 years) | |
| Gigabyte Aero 16 YE5 (Silence Mode) | |
| 1920x1080 CATIA (catia-06) | |
| Average NVIDIA GeForce RTX 3080 Ti Laptop GPU (51.8 - 78.7, n=6) | |
| Average of class Multimedia (n=1last 2 years) | |
| Gigabyte Aero 16 YE5 (Turbo Mode) | |
| Gigabyte Aero 16 YE5 | |
| Gigabyte Aero 16 YE5 (Silence Mode) | |
| 1920x1080 Creo (creo-03) | |
| Gigabyte Aero 16 YE5 (Turbo Mode) | |
| Average of class Multimedia (n=1last 2 years) | |
| Average NVIDIA GeForce RTX 3080 Ti Laptop GPU (55.3 - 114.7, n=6) | |
| Gigabyte Aero 16 YE5 | |
| Gigabyte Aero 16 YE5 (Silence Mode) | |
| 1920x1080 Energy (energy-03) | |
| Average of class Multimedia (n=1last 2 years) | |
| Average NVIDIA GeForce RTX 3080 Ti Laptop GPU (19.6 - 27, n=6) | |
| Gigabyte Aero 16 YE5 | |
| Gigabyte Aero 16 YE5 (Turbo Mode) | |
| Gigabyte Aero 16 YE5 (Silence Mode) | |
| 1920x1080 Maya (maya-06) | |
| Average NVIDIA GeForce RTX 3080 Ti Laptop GPU (248 - 456, n=6) | |
| Gigabyte Aero 16 YE5 (Turbo Mode) | |
| Gigabyte Aero 16 YE5 | |
| Gigabyte Aero 16 YE5 (Silence Mode) | |
| 1920x1080 Medical (medical-03) | |
| Average NVIDIA GeForce RTX 3080 Ti Laptop GPU (33 - 40.2, n=6) | |
| Gigabyte Aero 16 YE5 | |
| Gigabyte Aero 16 YE5 (Turbo Mode) | |
| Average of class Multimedia (n=1last 2 years) | |
| Gigabyte Aero 16 YE5 (Silence Mode) | |
| 1920x1080 Siemens NX (snx-04) | |
| Average of class Multimedia (n=1last 2 years) | |
| Gigabyte Aero 16 YE5 (Turbo Mode) | |
| Average NVIDIA GeForce RTX 3080 Ti Laptop GPU (18.1 - 25, n=6) | |
| Gigabyte Aero 16 YE5 | |
| Gigabyte Aero 16 YE5 (Silence Mode) | |
| 1920x1080 Solidworks (solidworks-05) | |
| Average of class Multimedia (n=1last 2 years) | |
| Gigabyte Aero 16 YE5 | |
| Gigabyte Aero 16 YE5 (Turbo Mode) | |
| Average NVIDIA GeForce RTX 3080 Ti Laptop GPU (174.7 - 211, n=3) | |
| Gigabyte Aero 16 YE5 (Silence Mode) | |
| Geekbench 5.5 - OpenCL Score | |
| Average NVIDIA GeForce RTX 3080 Ti Laptop GPU (88580 - 151633, n=41) | |
| Gigabyte Aero 16 YE5 (Turbo Mode) | |
| Gigabyte Aero 16 YE5 | |
| Razer Blade 15 2022 | |
| Lenovo ThinkPad X1 Extreme G4-20Y50040GE | |
| Gigabyte Aero 16 YE5 (Silence Mode) | |
| Schenker XMG Pro 15 (Late 2021) | |
| Average of class Multimedia (11562 - 217159, n=56, last 2 years) | |
| Apple MacBook Pro 16 2021 M1 Max | |
| GFXBench | |
| on screen Aztec Ruins High Tier Onscreen | |
| Apple MacBook Pro 16 2021 M1 Max | |
| Gigabyte Aero 16 YE5 (DX11) | |
| Average NVIDIA GeForce RTX 3080 Ti Laptop GPU (n=1) | |
| Average of class Multimedia (36.8 - 133.5, n=10, last 2 years) | |
| 2560x1440 Aztec Ruins High Tier Offscreen | |
| Apple MacBook Pro 16 2021 M1 Max | |
| Average NVIDIA GeForce RTX 3080 Ti Laptop GPU (262 - 328, n=2) | |
| Gigabyte Aero 16 YE5 (DX11) | |
| Average of class Multimedia (73.3 - 516, n=11, last 2 years) | |
| on screen Aztec Ruins Normal Tier Onscreen | |
| Gigabyte Aero 16 YE5 (DX11) | |
| Average NVIDIA GeForce RTX 3080 Ti Laptop GPU (n=1) | |
| Apple MacBook Pro 16 2021 M1 Max | |
| Average of class Multimedia (52 - 177.1, n=9, last 2 years) | |
| 1920x1080 Aztec Ruins Normal Tier Offscreen | |
| Apple MacBook Pro 16 2021 M1 Max | |
| Gigabyte Aero 16 YE5 (DX11) | |
| Average NVIDIA GeForce RTX 3080 Ti Laptop GPU (n=1) | |
| Average of class Multimedia (178.3 - 1302, n=11, last 2 years) | |
| V-Ray 5 Benchmark | |
| GPU RTX | |
| Average NVIDIA GeForce RTX 3080 Ti Laptop GPU (1225 - 1915, n=19) | |
| Lenovo ThinkPad X1 Extreme G4-20Y50040GE (5.0.1) | |
| Gigabyte Aero 16 YE5 (5.0.1) | |
| Schenker XMG Pro 15 (Late 2021) (5.0.1) | |
| Average of class Multimedia (370 - 1956, n=5, last 2 years) | |
| Gigabyte Aero 16 YE5 (5.0.1, Silence Mode) | |
| GPU CUDA | |
| Average NVIDIA GeForce RTX 3080 Ti Laptop GPU (846 - 1384, n=20) | |
| Gigabyte Aero 16 YE5 (5.0.1, Turbo Mode) | |
| Gigabyte Aero 16 YE5 (5.0.1) | |
| Schenker XMG Pro 15 (Late 2021) (5.0.1) | |
| Average of class Multimedia (335 - 1482, n=5, last 2 years) | |
| Lenovo ThinkPad X1 Extreme G4-20Y50040GE (5.0.1) | |
| Gigabyte Aero 16 YE5 (5.0.1, Silence Mode) | |
| CPU | |
| Gigabyte Aero 16 YE5 (5.0.1, Turbo Mode) | |
| Average NVIDIA GeForce RTX 3080 Ti Laptop GPU (3692 - 15811, n=25) | |
| Gigabyte Aero 16 YE5 (5.0.1) | |
| Razer Blade 15 2022 (5.0.1) | |
| Schenker XMG Pro 15 (Late 2021) | |
| Lenovo ThinkPad X1 Extreme G4-20Y50040GE (5.0.1) | |
| Average of class Multimedia (3126 - 14552, n=24, last 2 years) | |
| Gigabyte Aero 16 YE5 (5.0.1, Silence Mode) | |
| V-Ray Benchmark Next 4.10 | |
| GPU | |
| Average NVIDIA GeForce RTX 3080 Ti Laptop GPU (311 - 552, n=35) | |
| Gigabyte Aero 16 YE5 (v4.10.07 ) | |
| Gigabyte Aero 16 YE5 (v4.10.07, Turbo Mode) | |
| Schenker XMG Pro 15 (Late 2021) (v4.10.07 ) | |
| Gigabyte Aero 16 YE5 (v4.10.07, Silence Mode) | |
| Average of class Multimedia (32 - 1191, n=53, last 2 years) | |
| CPU | |
| Gigabyte Aero 16 YE5 (v4.10.07, Turbo Mode) | |
| Average NVIDIA GeForce RTX 3080 Ti Laptop GPU (5564 - 23947, n=35) | |
| Average of class Multimedia (4772 - 35165, n=53, last 2 years) | |
| Gigabyte Aero 16 YE5 (v4.10.07 ) | |
| Schenker XMG Pro 15 (Late 2021) (v4.10.07 ) | |
| Gigabyte Aero 16 YE5 (v4.10.07, Silence Mode) | |
游戏性能
由于其强大的硬件,Aero 16可以在FHD分辨率和最大细节下流畅地运行所有当前游戏。更高的分辨率也是如此,尽管有时会降低细节。总的来说,这款笔记本的表现比配备RTX 3080 Ti的普通设备略慢。
| The Witcher 3 | |
| 1920x1080 Ultra Graphics & Postprocessing (HBAO+) | |
| Average NVIDIA GeForce RTX 3080 Ti Laptop GPU (30 - 130.6, n=43) | |
| Razer Blade 15 2022 | |
| Schenker XMG Pro 15 (Late 2021) | |
| Gigabyte Aero 16 YE5 (Turbo Mode) | |
| Gigabyte Aero 16 YE5 | |
| Lenovo ThinkPad X1 Extreme G4-20Y50040GE | |
| HP ZBook Studio 15 G8 | |
| Gigabyte Aero 16 YE5 (SIlence Mode) | |
| Average of class Multimedia (11 - 121, n=7, last 2 years) | |
| 3840x2160 High Graphics & Postprocessing (Nvidia HairWorks Off) | |
| Average NVIDIA GeForce RTX 3080 Ti Laptop GPU (62.1 - 94.3, n=8) | |
| Schenker XMG Pro 15 (Late 2021) | |
| Average of class Multimedia (61 - 71, n=2, last 2 years) | |
| Gigabyte Aero 16 YE5 | |
| HP ZBook Studio 15 G8 | |
| Dota 2 Reborn | |
| 1920x1080 ultra (3/3) best looking | |
| Gigabyte Aero 16 YE5 | |
| Gigabyte Aero 16 YE5 (Turbo Mode) | |
| Razer Blade 15 2022 | |
| Average NVIDIA GeForce RTX 3080 Ti Laptop GPU (29.9 - 170.5, n=45) | |
| Schenker XMG Pro 15 (Late 2021) | |
| HP ZBook Studio 15 G8 | |
| Lenovo ThinkPad X1 Extreme G4-20Y50040GE | |
| Average of class Multimedia (29 - 179.9, n=59, last 2 years) | |
| Gigabyte Aero 16 YE5 (Silence Mode) | |
| 3840x2160 ultra (3/3) best looking | |
| Average of class Multimedia (106.4 - 139.3, n=4, last 2 years) | |
| Average NVIDIA GeForce RTX 3080 Ti Laptop GPU (70.8 - 155.6, n=19) | |
| Gigabyte Aero 16 YE5 (Turbo Mode) | |
| Schenker XMG Pro 15 (Late 2021) | |
| Gigabyte Aero 16 YE5 | |
| HP ZBook Studio 15 G8 | |
| Gigabyte Aero 16 YE5 (Silence Mode) | |
| Lenovo ThinkPad X1 Extreme G4-20Y50040GE | |
| X-Plane 11.11 | |
| 1920x1080 high (fps_test=3) | |
| Razer Blade 15 2022 | |
| Gigabyte Aero 16 YE5 | |
| Gigabyte Aero 16 YE5 (Turbo Mode) | |
| Average NVIDIA GeForce RTX 3080 Ti Laptop GPU (32.6 - 127, n=45) | |
| Schenker XMG Pro 15 (Late 2021) | |
| HP ZBook Studio 15 G8 | |
| Lenovo ThinkPad X1 Extreme G4-20Y50040GE | |
| Gigabyte Aero 16 YE5 (Silence Mode) | |
| Average of class Multimedia (16.9 - 141.1, n=54, last 2 years) | |
| 3840x2160 high (fps_test=3) | |
| Average NVIDIA GeForce RTX 3080 Ti Laptop GPU (32.9 - 109.5, n=20) | |
| Gigabyte Aero 16 YE5 (Turbo Mode) | |
| Gigabyte Aero 16 YE5 | |
| Average of class Multimedia (63.4 - 114.7, n=4, last 2 years) | |
| Schenker XMG Pro 15 (Late 2021) | |
| HP ZBook Studio 15 G8 | |
| Gigabyte Aero 16 YE5 (Silence Mode) | |
| Lenovo ThinkPad X1 Extreme G4-20Y50040GE | |
| Final Fantasy XV Benchmark | |
| 1920x1080 High Quality | |
| Average NVIDIA GeForce RTX 3080 Ti Laptop GPU (30.7 - 140.6, n=42) | |
| Razer Blade 15 2022 (1.3) | |
| Schenker XMG Pro 15 (Late 2021) (1.3) | |
| Gigabyte Aero 16 YE5 (1.3, Turbo Mode) | |
| Gigabyte Aero 16 YE5 (1.3) | |
| HP ZBook Studio 15 G8 (1.3) | |
| Lenovo ThinkPad X1 Extreme G4-20Y50040GE (1.3) | |
| Average of class Multimedia (7.61 - 144.4, n=57, last 2 years) | |
| 3840x2160 High Quality | |
| Average of class Multimedia (42 - 83.4, n=4, last 2 years) | |
| Average NVIDIA GeForce RTX 3080 Ti Laptop GPU (35.1 - 61.2, n=18) | |
| Schenker XMG Pro 15 (Late 2021) (1.3) | |
| Gigabyte Aero 16 YE5 (1.3, Turbo Mode) | |
| Gigabyte Aero 16 YE5 (1.3) | |
| Lenovo ThinkPad X1 Extreme G4-20Y50040GE (1.3) | |
| HP ZBook Studio 15 G8 (1.3) | |
| Gigabyte Aero 16 YE5 (1.3, Silence Mode) | |
| GTA V | |
| 1920x1080 Highest AA:4xMSAA + FX AF:16x | |
| Razer Blade 15 2022 | |
| Gigabyte Aero 16 YE5 (Turbo Mode) | |
| Gigabyte Aero 16 YE5 | |
| Average NVIDIA GeForce RTX 3080 Ti Laptop GPU (30 - 139.2, n=42) | |
| Schenker XMG Pro 15 (Late 2021) | |
| Average of class Multimedia (7.92 - 141.6, n=55, last 2 years) | |
| Gigabyte Aero 16 YE5 (Silence Mode) | |
| 3840x2160 Highest AA:4xMSAA + FX AF:16x | |
| Average of class Multimedia (39.3 - 90.1, n=2, last 2 years) | |
| Average NVIDIA GeForce RTX 3080 Ti Laptop GPU (37.7 - 67.2, n=14) | |
| Schenker XMG Pro 15 (Late 2021) | |
| Gigabyte Aero 16 YE5 (Turbo Mode) | |
| Gigabyte Aero 16 YE5 | |
| Gigabyte Aero 16 YE5 (Silence Mode) | |
| Strange Brigade | |
| 1920x1080 ultra AA:ultra AF:16 | |
| Average NVIDIA GeForce RTX 3080 Ti Laptop GPU (42.3 - 224, n=41) | |
| Razer Blade 15 2022 (1.47.22.14 D3D12) | |
| Schenker XMG Pro 15 (Late 2021) (1.47.22.14 D3D12) | |
| Gigabyte Aero 16 YE5 (1.47.22.14 D3D12, Turbo Mode) | |
| Gigabyte Aero 16 YE5 (1.47.22.14 D3D12) | |
| Gigabyte Aero 16 YE5 (1.47.22.14 D3D12, Silence Mode) | |
| Average of class Multimedia (13.3 - 303, n=57, last 2 years) | |
| 3840x2160 ultra AA:ultra AF:16 | |
| Average of class Multimedia (68.4 - 151.4, n=2, last 2 years) | |
| Average NVIDIA GeForce RTX 3080 Ti Laptop GPU (61.7 - 100.7, n=15) | |
| Schenker XMG Pro 15 (Late 2021) (1.47.22.14 D3D12) | |
| Gigabyte Aero 16 YE5 (1.47.22.14 D3D12, Turbo Mode) | |
| Gigabyte Aero 16 YE5 (1.47.22.14 D3D12) | |
| Gigabyte Aero 16 YE5 (1.47.22.14 D3D12, Silence Mode) | |
| F1 2021 | |
| 1920x1080 Ultra High Preset + Raytracing AA:T AF:16x | |
| Average NVIDIA GeForce RTX 3080 Ti Laptop GPU (30.2 - 160.6, n=30) | |
| Schenker XMG Pro 15 (Late 2021) (831795) | |
| Gigabyte Aero 16 YE5 (852849, Turbo Mode) | |
| Gigabyte Aero 16 YE5 (852849) | |
| Gigabyte Aero 16 YE5 (852849, Silence Mode) | |
| 3840x2160 Ultra High Preset + Raytracing AA:T AF:16x | |
| Average NVIDIA GeForce RTX 3080 Ti Laptop GPU (41.1 - 70.2, n=18) | |
| Gigabyte Aero 16 YE5 (852849, Turbo Mode) | |
| Schenker XMG Pro 15 (Late 2021) (831795) | |
| Gigabyte Aero 16 YE5 (852849) | |
| Gigabyte Aero 16 YE5 (852849, Silence Mode) | |
| Riders Republic | |
| 1920x1080 Ultra Preset | |
| Average NVIDIA GeForce RTX 3080 Ti Laptop GPU (92 - 129, n=3) | |
| Schenker XMG Pro 15 (Late 2021) | |
| Gigabyte Aero 16 YE5 | |
| 3840x2160 Ultra Preset | |
| Average NVIDIA GeForce RTX 3080 Ti Laptop GPU (39 - 56, n=2) | |
| Schenker XMG Pro 15 (Late 2021) | |
| Gigabyte Aero 16 YE5 | |
| Forza Horizon 5 | |
| 1920x1080 Extreme Preset | |
| Schenker XMG Pro 15 (Late 2021) | |
| Average NVIDIA GeForce RTX 3080 Ti Laptop GPU (48 - 95, n=5) | |
| Gigabyte Aero 16 YE5 | |
| 3840x2160 Extreme Preset | |
| Average NVIDIA GeForce RTX 3080 Ti Laptop GPU (38 - 61, n=2) | |
| Schenker XMG Pro 15 (Late 2021) | |
| Gigabyte Aero 16 YE5 | |
| Rainbow Six Extraction | |
| 1920x1080 Ultra Preset (with Fixed Resolution Quality) | |
| Average NVIDIA GeForce RTX 3080 Ti Laptop GPU (128 - 169, n=3) | |
| Gigabyte Aero 16 YE5 | |
| 3840x2160 Ultra Preset (with Fixed Resolution Quality) | |
| Average NVIDIA GeForce RTX 3080 Ti Laptop GPU (44 - 57, n=2) | |
| Gigabyte Aero 16 YE5 | |
| GRID Legends | |
| 1920x1080 Ultra Preset | |
| Average NVIDIA GeForce RTX 3080 Ti Laptop GPU (100.4 - 102.6, n=2) | |
| Gigabyte Aero 16 YE5 | |
| 3840x2160 Ultra Preset | |
| Gigabyte Aero 16 YE5 | |
| Average NVIDIA GeForce RTX 3080 Ti Laptop GPU (n=1) | |
| Cyberpunk 2077 1.6 | |
| 1920x1080 Ultra Preset | |
| Average NVIDIA GeForce RTX 3080 Ti Laptop GPU (54 - 144.1, n=16) | |
| Gigabyte Aero 16 YE5 | |
| 3840x2160 Ultra Preset | |
| Average NVIDIA GeForce RTX 3080 Ti Laptop GPU (19.6 - 32.4, n=6) | |
| Gigabyte Aero 16 YE5 | |
| 1920x1080 Ray Tracing Ultra Preset (DLSS off) | |
| Gigabyte Aero 16 YE5 | |
| Average NVIDIA GeForce RTX 3080 Ti Laptop GPU (39.2 - 49.9, n=7) | |
| 3840x2160 Ray Tracing Ultra Preset (DLSS off) | |
| Average NVIDIA GeForce RTX 3080 Ti Laptop GPU (9.22 - 12.3, n=3) | |
| Gigabyte Aero 16 YE5 | |
| Elex 2 | |
| 1920x1080 Ultra / On AA:SM AF:16x | |
| Gigabyte Aero 16 YE5 | |
| Average NVIDIA GeForce RTX 3080 Ti Laptop GPU (31 - 91, n=3) | |
| 3840x2160 Ultra / On AA:SM AF:16x | |
| Gigabyte Aero 16 YE5 | |
| Average NVIDIA GeForce RTX 3080 Ti Laptop GPU (n=1) | |
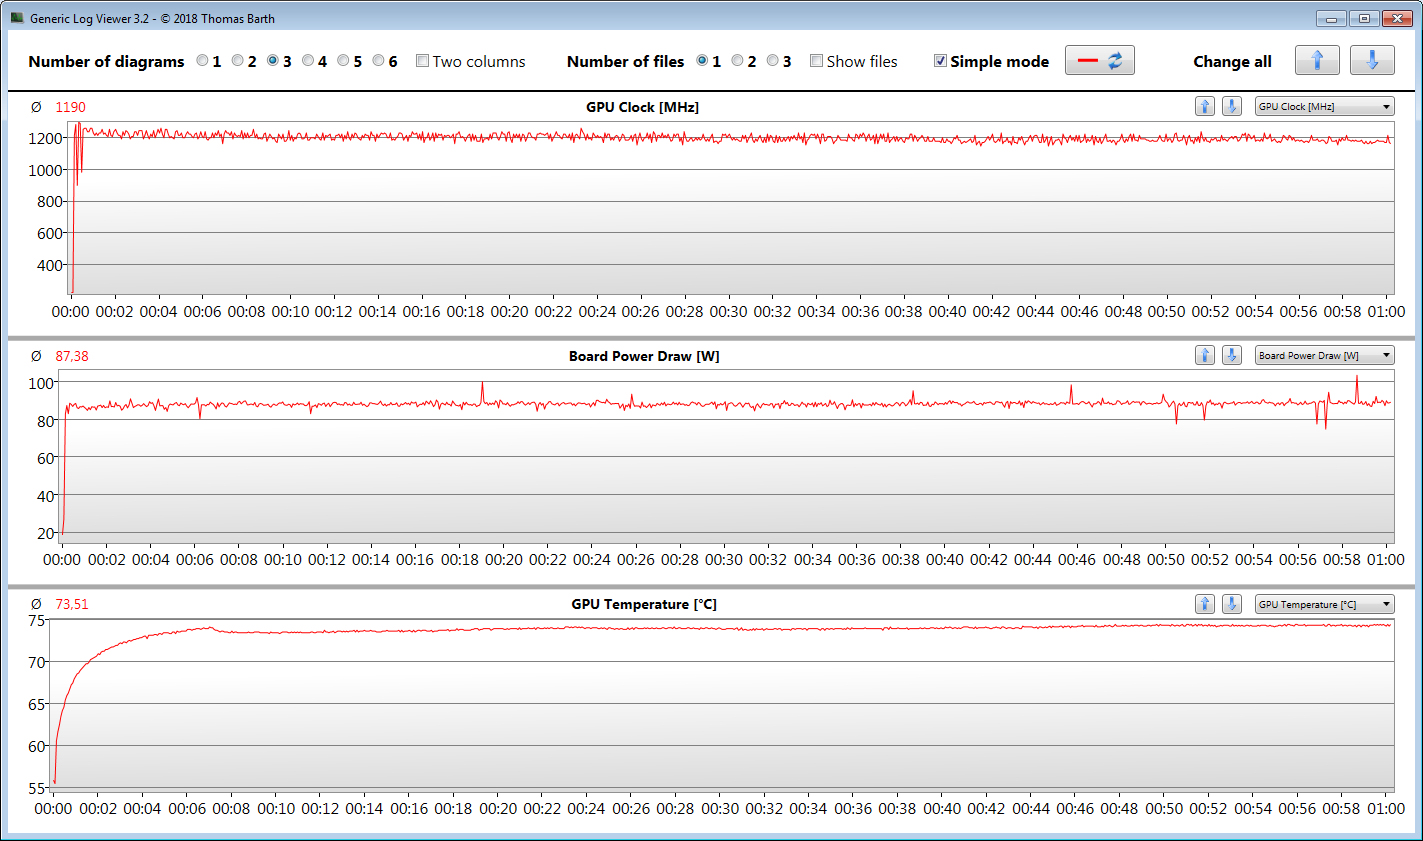
我们在FHD和最大细节下运行Witcher 3 ,持续60分钟,以确定一个设备是否能够在长时间内保持一致的高水平性能。在整个测试过程中,头像是静止的,以确保可比性。在这种情况下,我们没有发现在整个测试中帧率下降的证据。
Witcher 3 FPS Graph
| low | med. | high | ultra | QHD | 4K | |
|---|---|---|---|---|---|---|
| GTA V (2015) | 187 | 185 | 179 | 113 | 82.7 | 78.2 |
| The Witcher 3 (2015) | 408 | 278 | 144 | 92.2 | 64 | |
| Dota 2 Reborn (2015) | 191 | 176 | 168 | 160 | 112 | |
| Final Fantasy XV Benchmark (2018) | 195 | 110 | 85.8 | 64.8 | 40.1 | |
| X-Plane 11.11 (2018) | 154 | 134 | 108 | 78.6 | ||
| Far Cry 5 (2018) | 189 | 141 | 130 | 122 | 86 | 45 |
| Strange Brigade (2018) | 424 | 200 | 168 | 151 | 113 | 68.4 |
| F1 2021 (2021) | 383 | 236 | 196 | 103 | 84 | 47.3 |
| Riders Republic (2021) | 202 | 126 | 101 | 92 | 65 | 39 |
| Forza Horizon 5 (2021) | 221 | 131 | 116 | 72 | 61 | 38 |
| Rainbow Six Extraction (2022) | 185 | 160 | 157 | 128 | 87 | 44 |
| Dying Light 2 (2022) | 97.1 | 79 | 69.2 | 49.6 | 27.3 | |
| GRID Legends (2022) | 206.6 | 159.5 | 139.2 | 100.4 | 81 | 54.4 |
| Cyberpunk 2077 1.6 (2022) | 121.7 | 96.4 | 72.4 | 73.2 | 39.7 | 19.6 |
| Elex 2 (2022) | 93.5 | 89.5 | 76.5 | 70.3 | 48.1 | 28.2 |
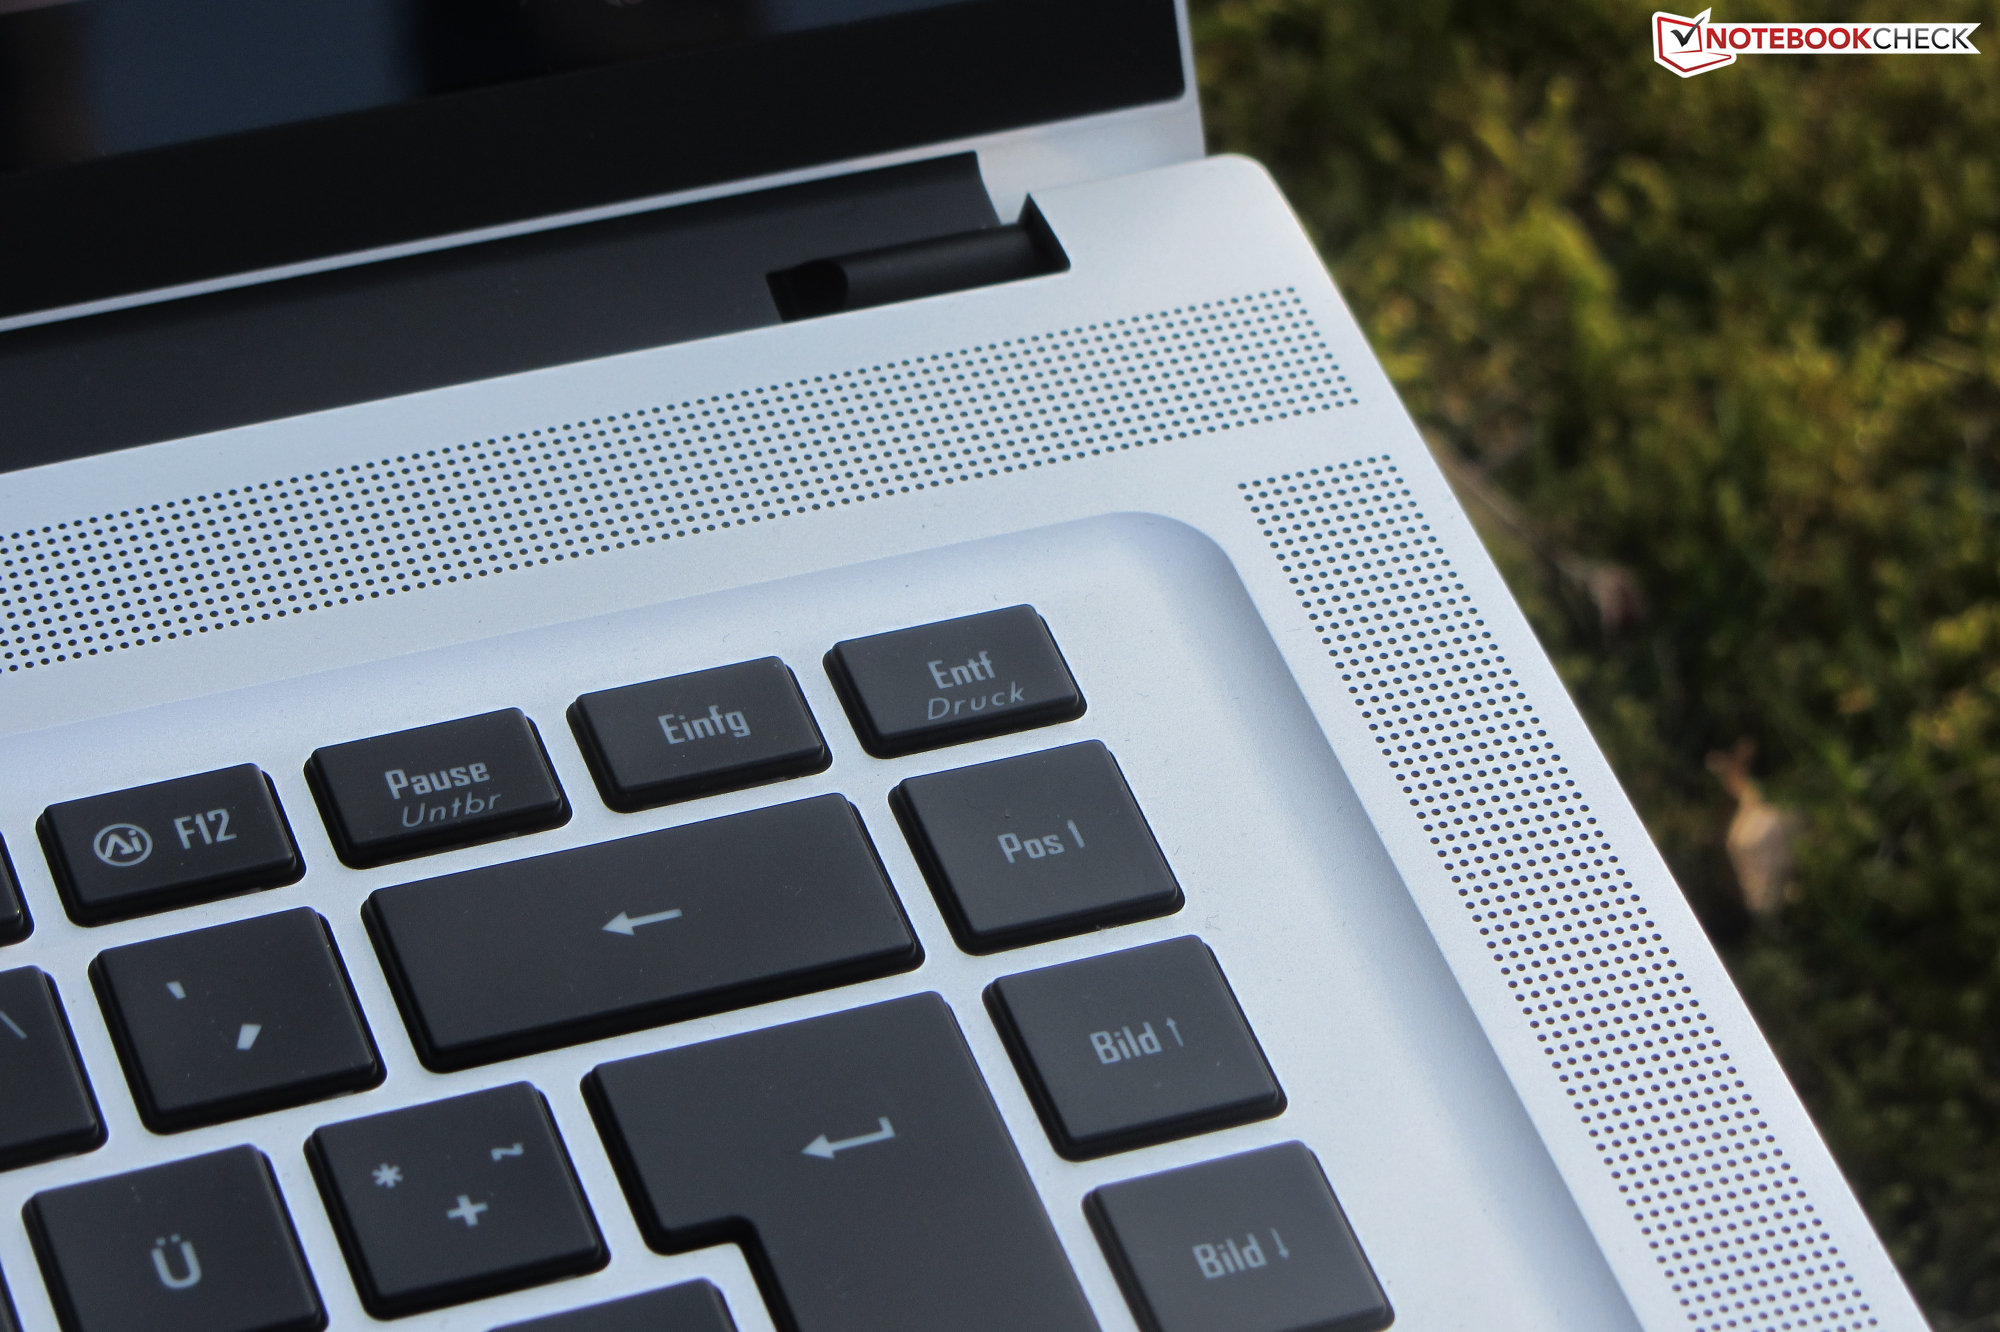
排放--Aero发出大量的噪音
噪声排放
在日常使用中(办公室、互联网),这两个风扇仍然不显眼,总体上比较安静。然而,在负载情况下,它们的转速上升,很快就变得非常明显。不幸的是,它们在高转速下也会产生明显的啸叫声。通过选择 "省电静音模式 "配置文件,可以大大降低噪音排放,尽管要牺牲性能。
Noise level
| Idle |
| 30 / 32 / 33 dB(A) |
| Load |
| 45 / 52 dB(A) |
 | ||
30 dB silent 40 dB(A) audible 50 dB(A) loud |
||
min: | ||
| Gigabyte Aero 16 YE5 GeForce RTX 3080 Ti Laptop GPU, i9-12900HK | Lenovo ThinkPad X1 Extreme G4-20Y50040GE GeForce RTX 3080 Laptop GPU, i9-11950H | Apple MacBook Pro 16 2021 M1 Max M1 Max 32-Core GPU, M1 Max | HP ZBook Studio 15 G8 GeForce RTX 3070 Laptop GPU, i9-11950H | Schenker XMG Pro 15 (Late 2021) GeForce RTX 3080 Laptop GPU, i7-11800H | Razer Blade 15 2022 GeForce RTX 3080 Ti Laptop GPU, i7-12800H | |
|---|---|---|---|---|---|---|
| Noise | 10% | 17% | 11% | -12% | 8% | |
| off / environment * (dB) | 25 | 24.7 1% | 24.2 3% | 23.5 6% | 24 4% | 25.4 -2% |
| Idle Minimum * (dB) | 30 | 24.7 18% | 24.2 19% | 25.3 16% | 31 -3% | 26.2 13% |
| Idle Average * (dB) | 32 | 24.7 23% | 24.2 24% | 25.3 21% | 37 -16% | 26.2 18% |
| Idle Maximum * (dB) | 33 | 28.1 15% | 24.2 27% | 25.3 23% | 41 -24% | 28.4 14% |
| Load Average * (dB) | 45 | 42.5 6% | 42.9 5% | 41.2 8% | 56 -24% | 44.7 1% |
| Witcher 3 ultra * (dB) | 50 | 46.4 7% | 39.5 21% | 49.4 1% | 53 -6% | 44.7 11% |
| Load Maximum * (dB) | 52 | 52.1 -0% | 42.9 17% | 49.4 5% | 58 -12% | 51.9 -0% |
* ... smaller is better
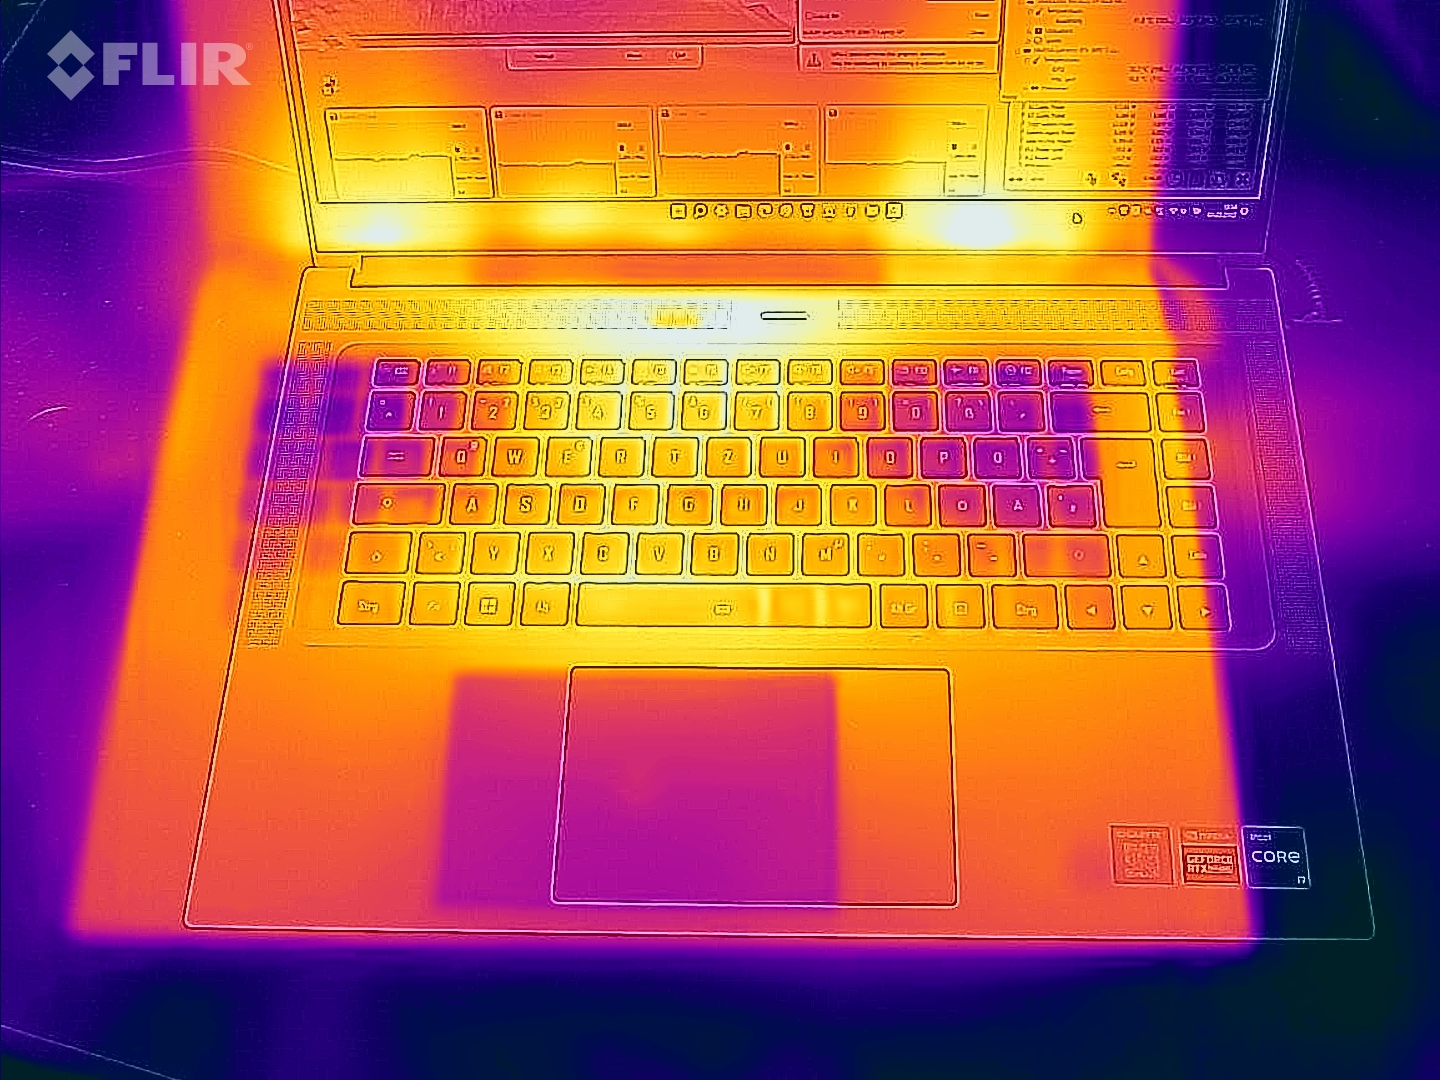
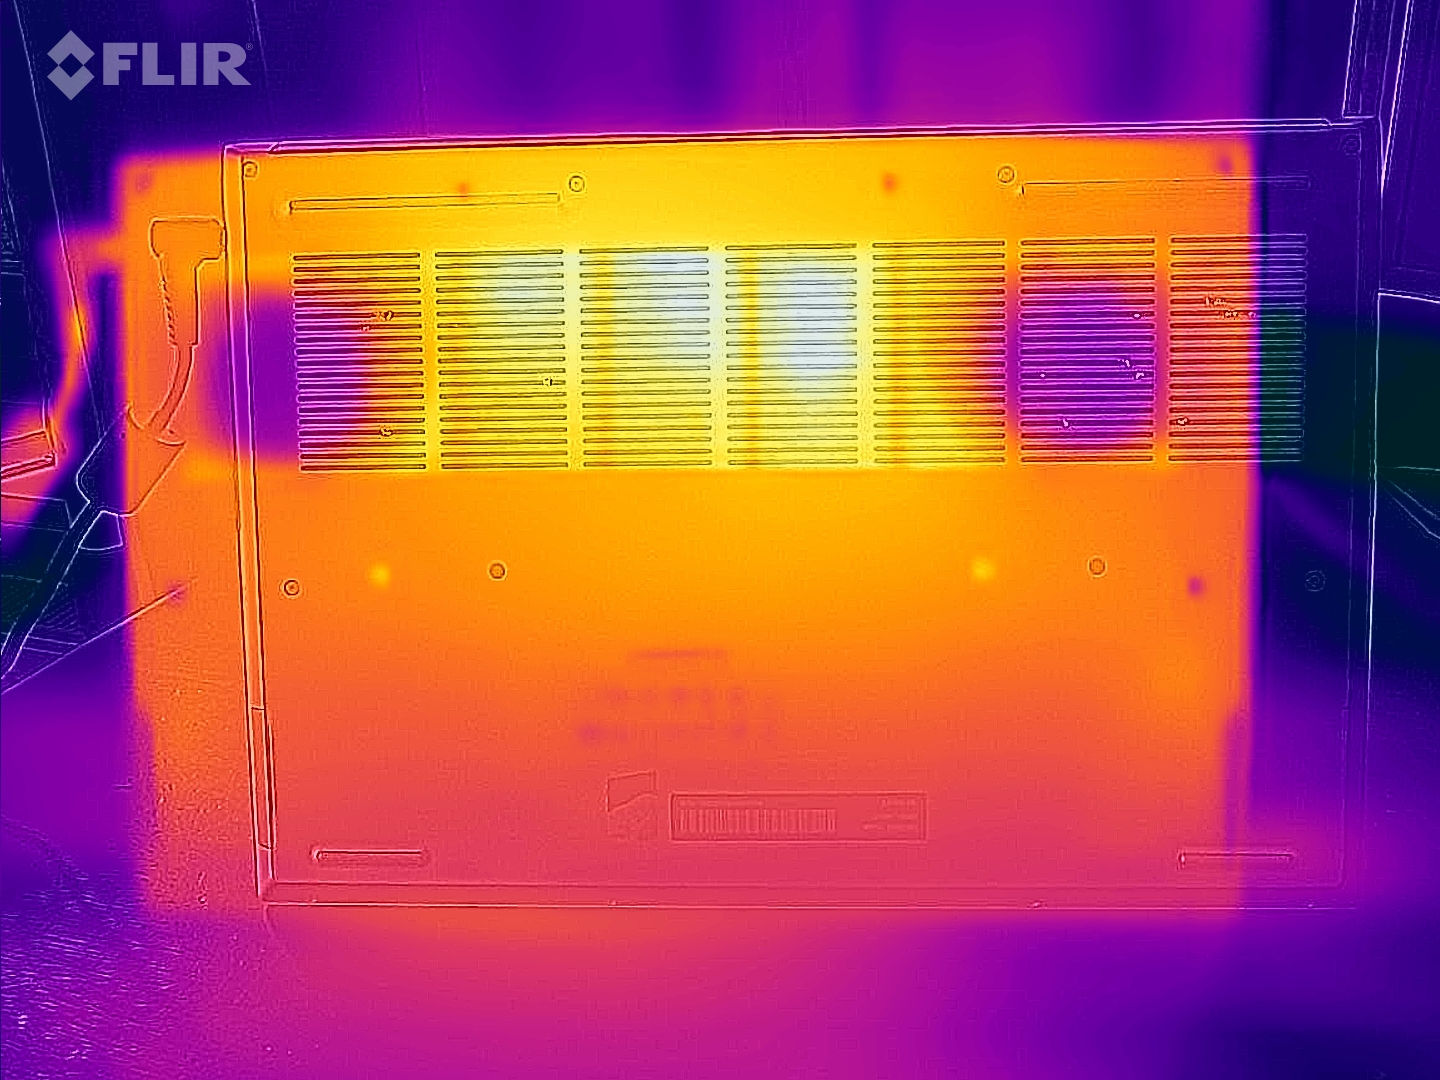
温度
在日常使用中(办公室、互联网),机箱温度仍然相当低。在负载(压力测试,Witcher 3 )下,它的温度急剧上升,热点高达60℃。
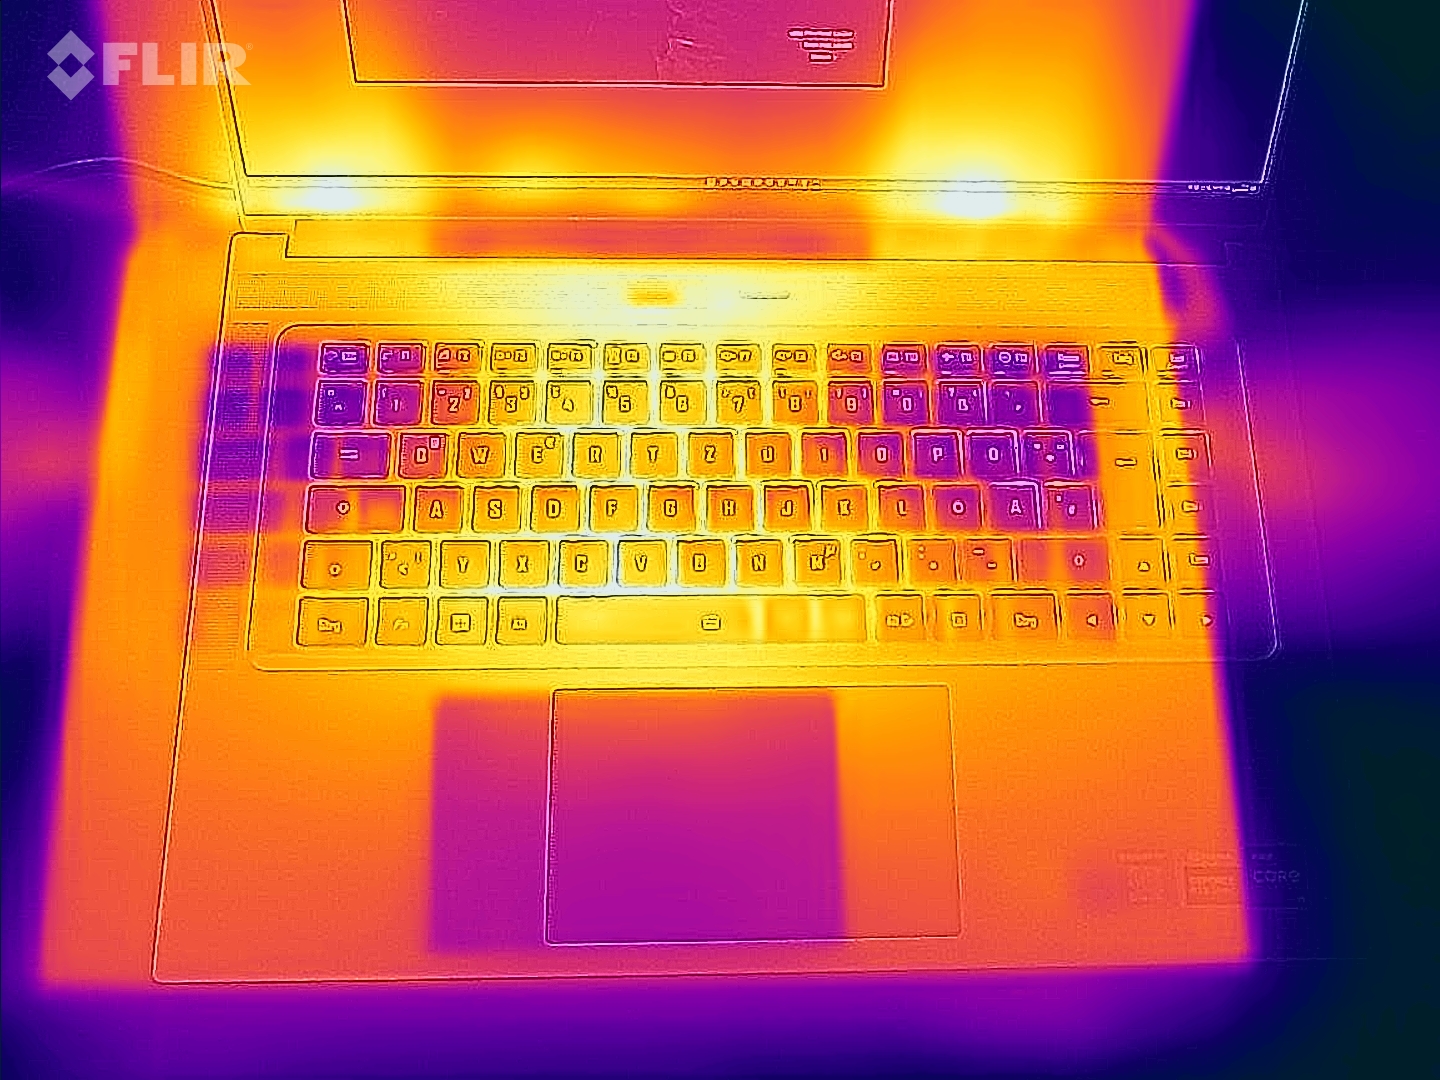
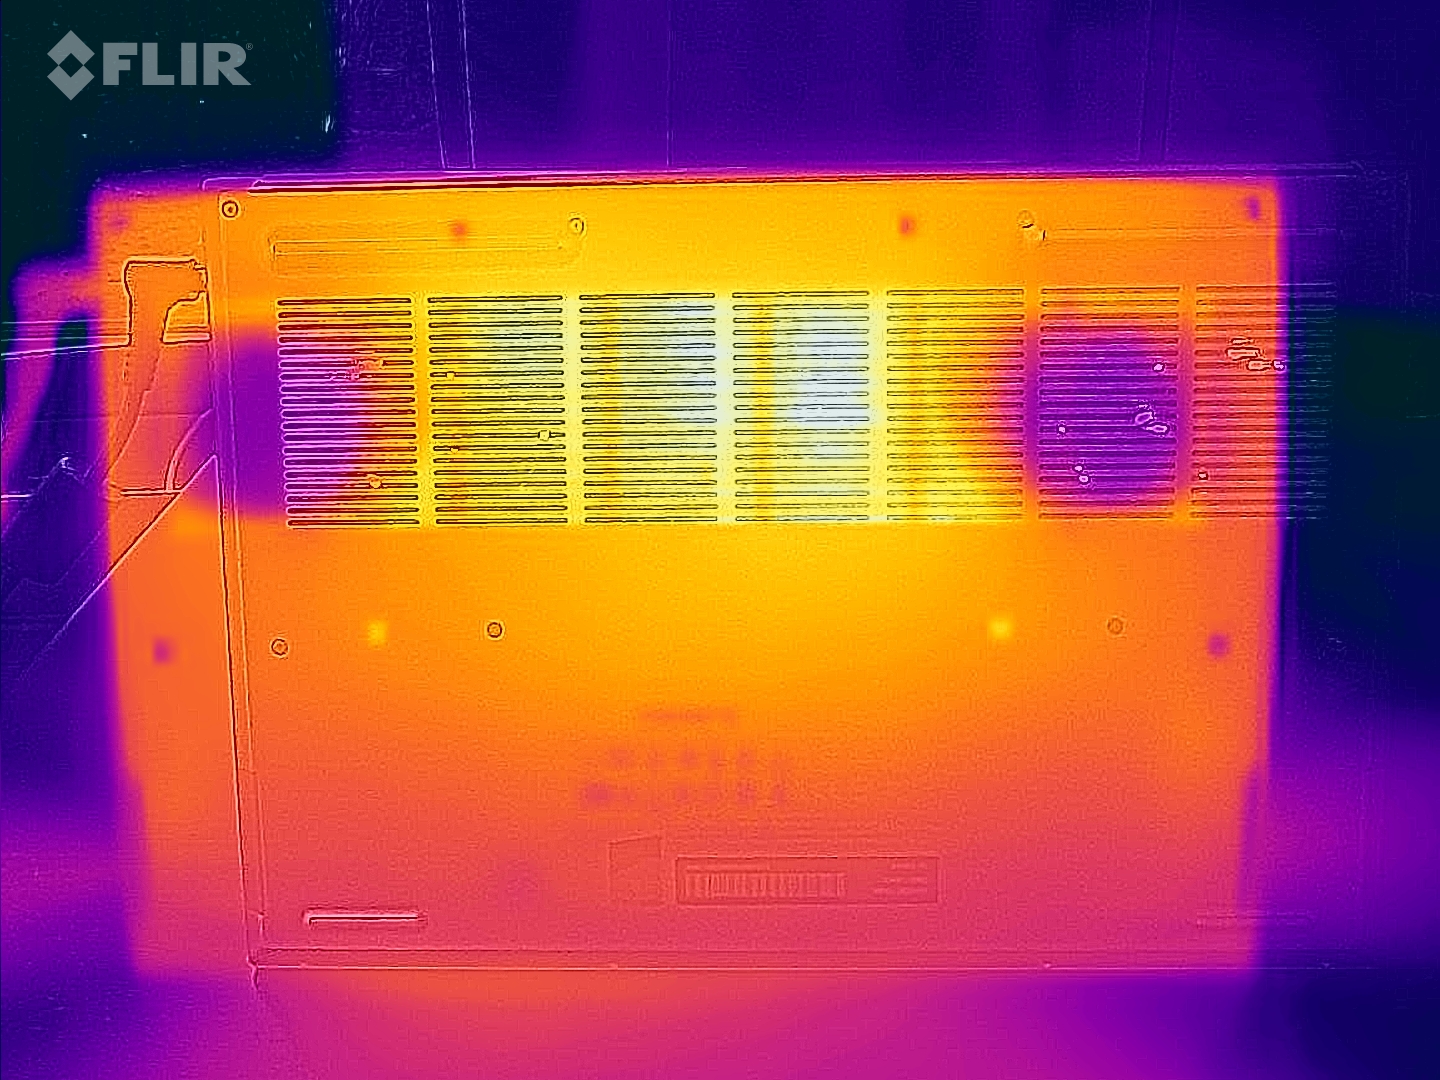
(-) The maximum temperature on the upper side is 49 °C / 120 F, compared to the average of 36.8 °C / 98 F, ranging from 21 to 71 °C for the class Multimedia.
(-) The bottom heats up to a maximum of 55 °C / 131 F, compared to the average of 39.1 °C / 102 F
(+) In idle usage, the average temperature for the upper side is 31.1 °C / 88 F, compared to the device average of 31.3 °C / 88 F.
(-) Playing The Witcher 3, the average temperature for the upper side is 48.3 °C / 119 F, compared to the device average of 31.3 °C / 88 F.
(-) The palmrests and touchpad can get very hot to the touch with a maximum of 45 °C / 113 F.
(-) The average temperature of the palmrest area of similar devices was 28.7 °C / 83.7 F (-16.3 °C / -29.3 F).
| Gigabyte Aero 16 YE5 Intel Core i9-12900HK, NVIDIA GeForce RTX 3080 Ti Laptop GPU | Lenovo ThinkPad X1 Extreme G4-20Y50040GE Intel Core i9-11950H, NVIDIA GeForce RTX 3080 Laptop GPU | Apple MacBook Pro 16 2021 M1 Max Apple M1 Max, Apple M1 Max 32-Core GPU | HP ZBook Studio 15 G8 Intel Core i9-11950H, NVIDIA GeForce RTX 3070 Laptop GPU | Schenker XMG Pro 15 (Late 2021) Intel Core i7-11800H, NVIDIA GeForce RTX 3080 Laptop GPU | Razer Blade 15 2022 Intel Core i7-12800H, NVIDIA GeForce RTX 3080 Ti Laptop GPU | |
|---|---|---|---|---|---|---|
| Heat | 6% | 24% | 8% | 2% | -4% | |
| Maximum Upper Side * (°C) | 49 | 51.4 -5% | 42.3 14% | 49 -0% | 44 10% | 50 -2% |
| Maximum Bottom * (°C) | 55 | 55.9 -2% | 41.7 24% | 54.2 1% | 60 -9% | 47 15% |
| Idle Upper Side * (°C) | 33 | 27.2 18% | 23.9 28% | 26.2 21% | 30 9% | 37.4 -13% |
| Idle Bottom * (°C) | 33 | 28.8 13% | 23.9 28% | 30.2 8% | 34 -3% | 38.4 -16% |
* ... smaller is better
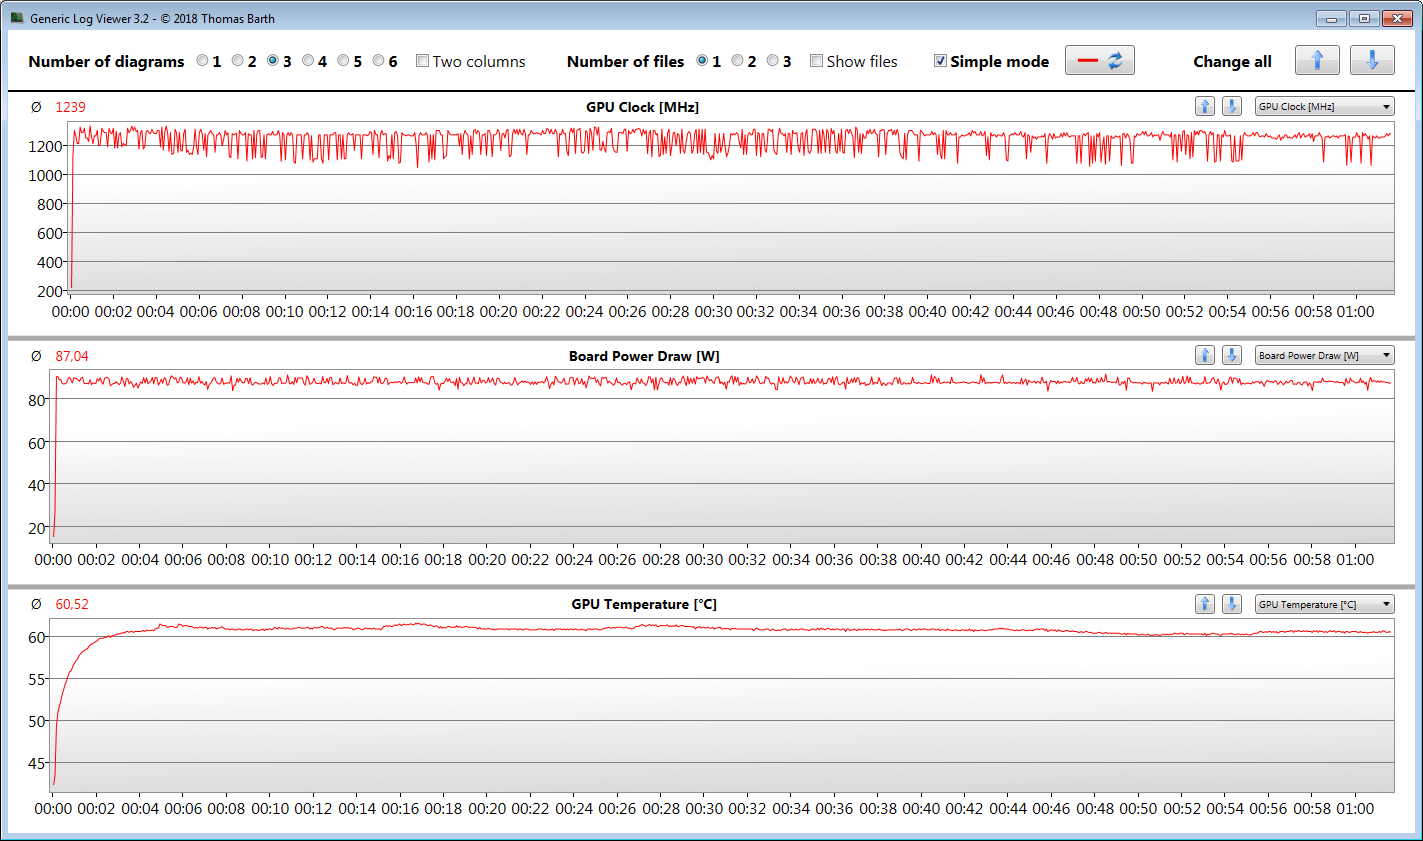
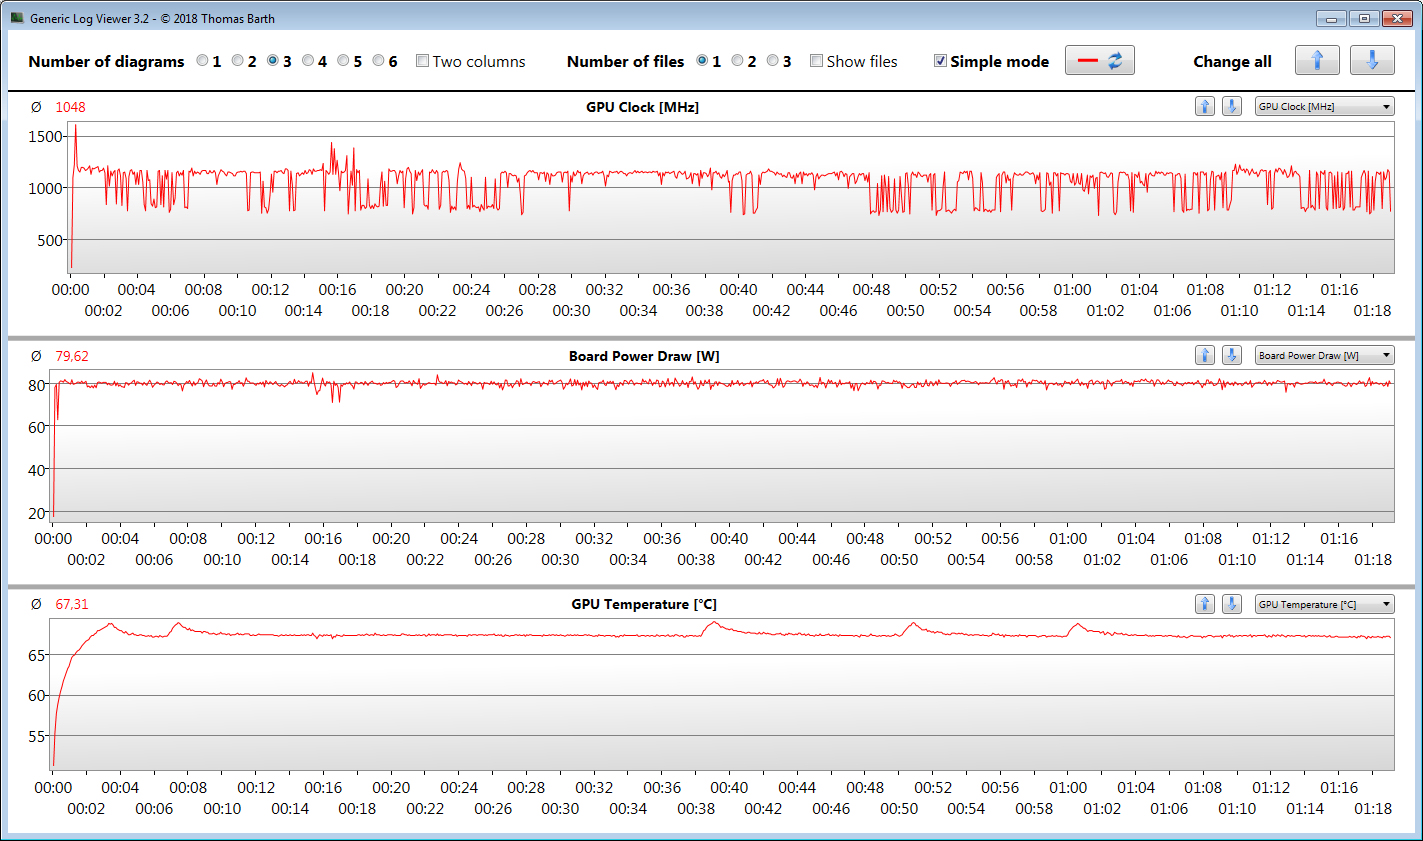
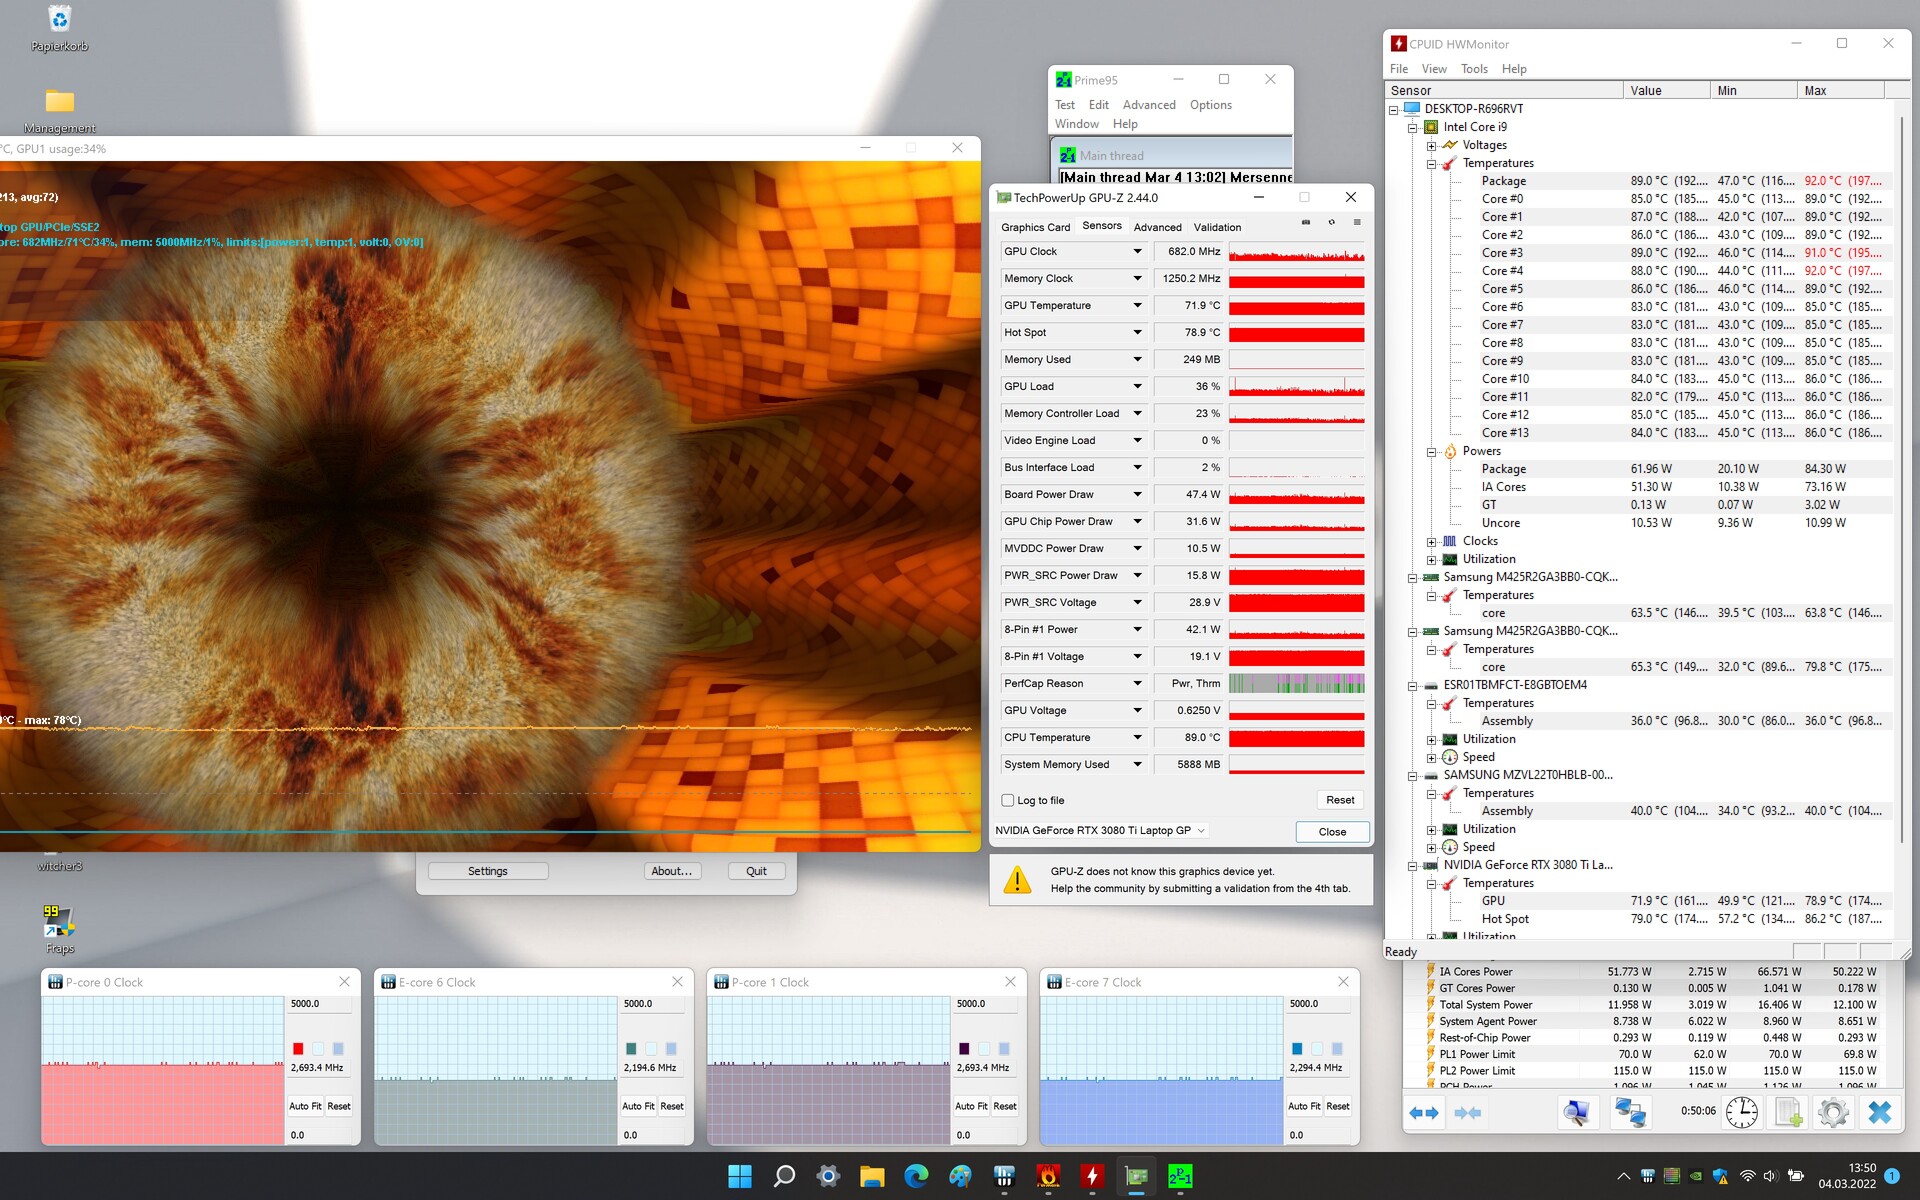
压力测试
我们的压力测试是在CPU运行在2.7GHz(P-cores)和2.2-2.3GHz(E-cores),GPU运行在600-700MHz之间时完成的。请记住,我们的压力测试是一种极端的负载情况,在日常使用中不会发生。我们用这个测试来确定潜在的节流和稳定性问题。
发言人
该设备的立体声扬声器产生了一个体面的声音,但缺乏低音,最大音量相对较高。我们建议使用耳机或外部扬声器以获得更好的音频体验。
Gigabyte Aero 16 YE5 audio analysis
(+) | speakers can play relatively loud (85 dB)
Bass 100 - 315 Hz
(-) | nearly no bass - on average 25.6% lower than median
(-) | bass is not linear (15.5% delta to prev. frequency)
Mids 400 - 2000 Hz
(+) | balanced mids - only 4.8% away from median
(+) | mids are linear (5.8% delta to prev. frequency)
Highs 2 - 16 kHz
(+) | balanced highs - only 2% away from median
(+) | highs are linear (3.1% delta to prev. frequency)
Overall 100 - 16.000 Hz
(±) | linearity of overall sound is average (16.6% difference to median)
Compared to same class
» 44% of all tested devices in this class were better, 7% similar, 50% worse
» The best had a delta of 5%, average was 17%, worst was 45%
Compared to all devices tested
» 29% of all tested devices were better, 6% similar, 65% worse
» The best had a delta of 4%, average was 23%, worst was 134%
Razer Blade 15 2022 audio analysis
(+) | speakers can play relatively loud (90.9 dB)
Bass 100 - 315 Hz
(-) | nearly no bass - on average 21% lower than median
(±) | linearity of bass is average (9.7% delta to prev. frequency)
Mids 400 - 2000 Hz
(+) | balanced mids - only 3.9% away from median
(+) | mids are linear (3.9% delta to prev. frequency)
Highs 2 - 16 kHz
(+) | balanced highs - only 4.2% away from median
(±) | linearity of highs is average (7.8% delta to prev. frequency)
Overall 100 - 16.000 Hz
(±) | linearity of overall sound is average (15.7% difference to median)
Compared to same class
» 37% of all tested devices in this class were better, 7% similar, 57% worse
» The best had a delta of 6%, average was 18%, worst was 132%
Compared to all devices tested
» 24% of all tested devices were better, 5% similar, 71% worse
» The best had a delta of 4%, average was 23%, worst was 134%
能源管理--整体电池寿命尚可
消耗功率
我们没有发现Aero 16的功耗有任何不一致的地方,它被确定为达到了这种特定硬件的预期水平。在压力测试的早期,我们检测到一个高达236瓦的短时峰值,它很快下降到一个更合理的180瓦。我们的Witcher 3 ,完成了184瓦的平均功耗。相应地,所包含的230瓦电源的尺寸是比较充分的。
| Off / Standby | |
| Idle | |
| Load |
|
Key:
min: | |
| Gigabyte Aero 16 YE5 i9-12900HK, GeForce RTX 3080 Ti Laptop GPU | Lenovo ThinkPad X1 Extreme G4-20Y50040GE i9-11950H, GeForce RTX 3080 Laptop GPU | Apple MacBook Pro 16 2021 M1 Max M1 Max, M1 Max 32-Core GPU | HP ZBook Studio 15 G8 i9-11950H, GeForce RTX 3070 Laptop GPU | Schenker XMG Pro 15 (Late 2021) i7-11800H, GeForce RTX 3080 Laptop GPU | Razer Blade 15 2022 i7-12800H, GeForce RTX 3080 Ti Laptop GPU | Average of class Multimedia | |
|---|---|---|---|---|---|---|---|
| Power Consumption | 34% | 48% | 28% | 17% | -6% | 62% | |
| Idle Minimum * (Watt) | 26 | 12.3 53% | 5.4 79% | 11 58% | 20 23% | 33.2 -28% | 5.66 ? 78% |
| Idle Average * (Watt) | 30 | 22.8 24% | 16.4 45% | 18.8 37% | 22 27% | 36.4 -21% | 10.2 ? 66% |
| Idle Maximum * (Watt) | 37 | 13.9 62% | 16.7 55% | 31.7 14% | 26 30% | 37.6 -2% | 12.5 ? 66% |
| Load Average * (Watt) | 127 | 95.4 25% | 94 26% | 105.2 17% | 103 19% | 116.7 8% | 65.2 ? 49% |
| Witcher 3 ultra * (Watt) | 176 | 154 12% | 104 41% | 148 16% | 186 -6% | 172 2% | |
| Load Maximum * (Watt) | 236 | 170.7 28% | 135 43% | 171.8 27% | 218 8% | 228.6 3% | 113.5 ? 52% |
* ... smaller is better
Power Consumption Witcher 3 / stress test
Power Consumption with External Monitor
电池寿命
在我们的Wi-Fi(通过脚本加载网站)和视频播放测试(以FHD格式循环播放H.264编码的Big Buck Bunny短片)中,Aero 16的电池寿命分别为6:21和7:32小时。在这两项测试中,所有的省电功能都被禁用,显示亮度被正常化为150尼特。此外,在视频播放测试中,我们还禁用了所有通信模块。

| Gigabyte Aero 16 YE5 i9-12900HK, GeForce RTX 3080 Ti Laptop GPU, 99 Wh | Lenovo ThinkPad X1 Extreme G4-20Y50040GE i9-11950H, GeForce RTX 3080 Laptop GPU, 90 Wh | Apple MacBook Pro 16 2021 M1 Max M1 Max, M1 Max 32-Core GPU, 99.6 Wh | HP ZBook Studio 15 G8 i9-11950H, GeForce RTX 3070 Laptop GPU, 83 Wh | Schenker XMG Pro 15 (Late 2021) i7-11800H, GeForce RTX 3080 Laptop GPU, 73 Wh | Razer Blade 15 2022 i7-12800H, GeForce RTX 3080 Ti Laptop GPU, 80 Wh | Average of class Multimedia | |
|---|---|---|---|---|---|---|---|
| Battery runtime | -11% | 76% | 18% | -8% | -23% | 101% | |
| Reader / Idle (h) | 8.9 | 12.9 45% | 10.6 19% | 24.9 ? 180% | |||
| H.264 (h) | 7.5 | 6.9 -8% | 17 127% | 6.5 -13% | 17.1 ? 128% | ||
| WiFi v1.3 (h) | 6.4 | 6.8 6% | 14.9 133% | 6.2 -3% | 5.2 -19% | 4.9 -23% | 12.2 ? 91% |
| Load (h) | 1.6 | 1.1 -31% | 1.1 -31% | 1.8 13% | 1.3 -19% | 1.664 ? 4% |
Pros
Cons
Verdict Aero 16:适合游戏玩家和创意者的便携式笔记本电脑
视频和照片编辑、渲染和游戏是Aero 16的主要使用情况。它允许在最大的细节中进行FHD游戏,并在更高的分辨率下进行游戏,但细节减少。它的Core i9-12900HK CPU和GeForce RTX 3080 TiGPU,TGP为105W,确保高水平的性能。
该设备在负载情况下发热相当明显,而且发出大量噪音,不幸的是其中包括明显的风扇啸叫。通过选择 "省电静音模式 "配置文件,可以显著降低噪音排放,尽管要牺牲性能。
Gigabyte的Aero 16 YE5是一款为游戏玩家和创意人士精心制作的笔记本。然而,它并不是完全没有缺点的。
对于像这样一台拥有4K显示屏的强大笔记本电脑来说,电池寿命是不错的。电池可以用附带的电源或通用的USB-C充电器充电,只要它的额定功率至少为45W。后面的两个Thunderbolt 4端口支持Power Delivery。此外,它的两个Thunderbolt 4端口允许广泛的外部外设连接,例如,码头或甚至外部GPU。
内置的16:10 OLED显示屏以3840 x 2400的高分辨率运行,毫无疑问是Aero 16的亮点。它提供了良好的亮度、出色的对比度、宽广的视角、短的响应时间和巨大的色彩空间覆盖。反过来说,它是有光泽的,而且在一定的亮度阈值以下会出现PWM闪烁。
Aero 16的一个很好的替代品是Razer Blade 15,它具有更多的GPU性能,不需要随身携带集线器或额外的加密狗。作为回报,其电池寿命较短。如果你正在寻找高性能和出色的电池寿命之间的良好组合,
Apple MacBook Pro 16 2021 M1 Max可能是最佳选择。说到这里,你还需要记住,Apple 笔记本电脑的最大缺陷是无法升级固态硬盘和内存。
价格和可用性
在写这篇文章的时候,技嘉Aero 16已经在技嘉的主页上上市了但还没有任何地方可以购买。
Gigabyte Aero 16 YE5
- 03/28/2022 v7 (old)
Sascha Mölck
Price comparison

