华硕ROG Zephyrus Duo 16回顾。一个不寻常的游戏笔记本,拥有良好的电池寿命

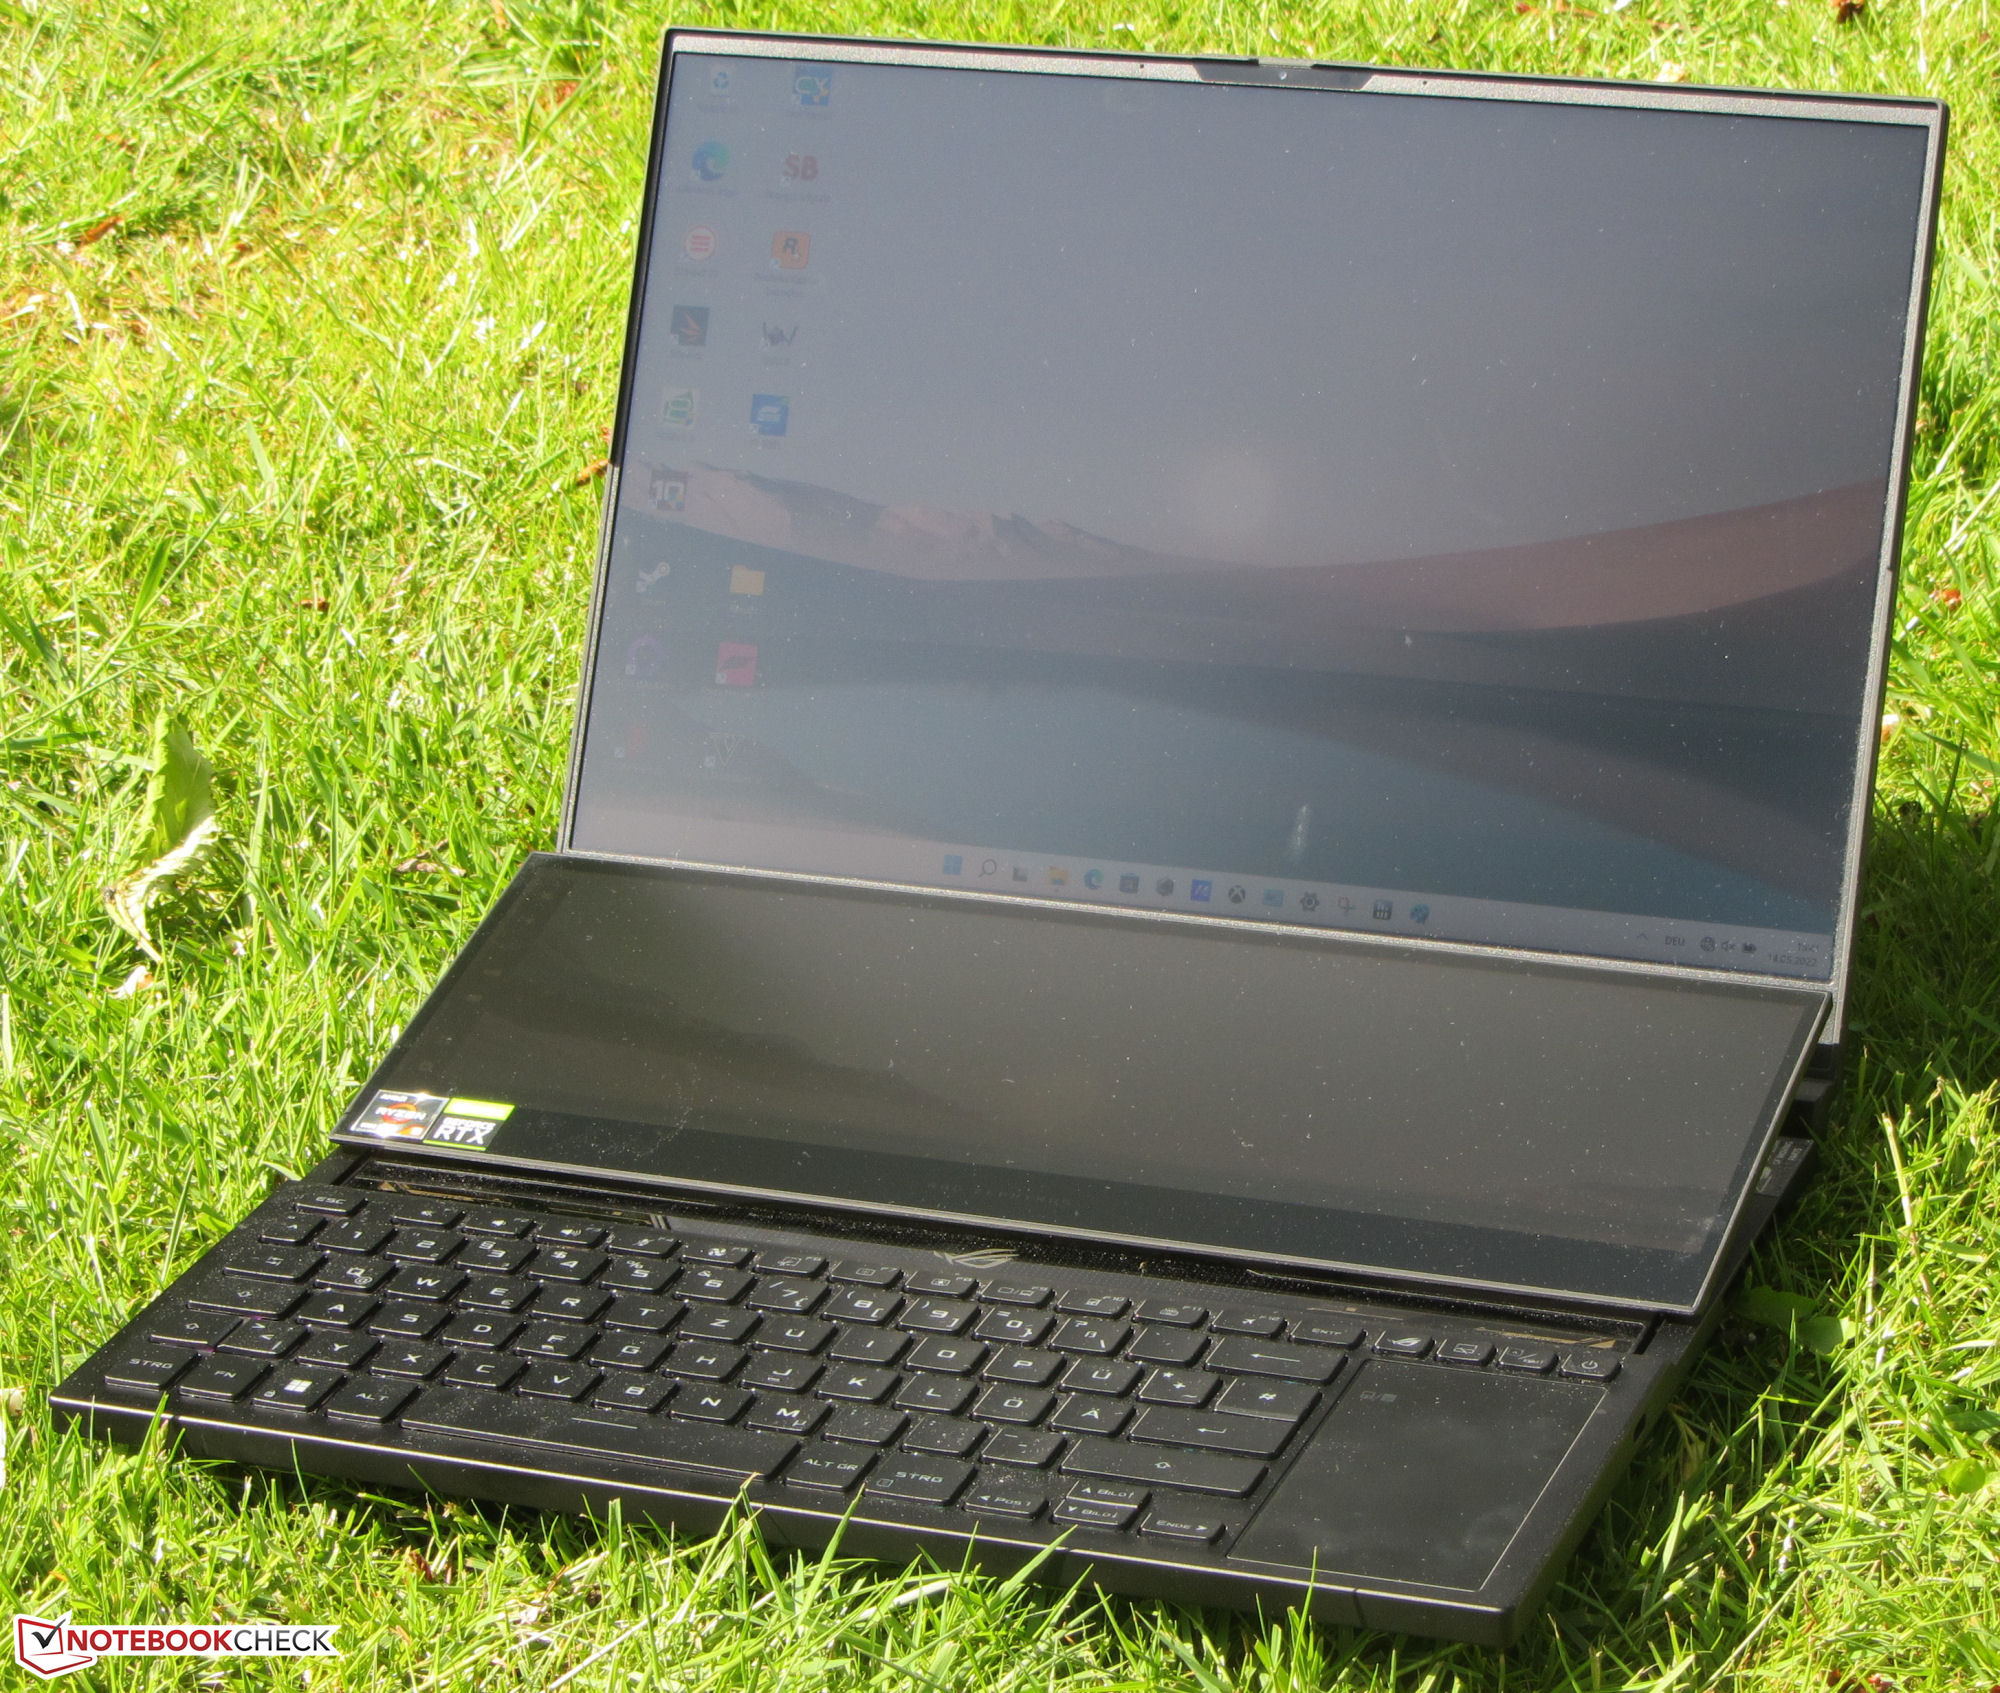
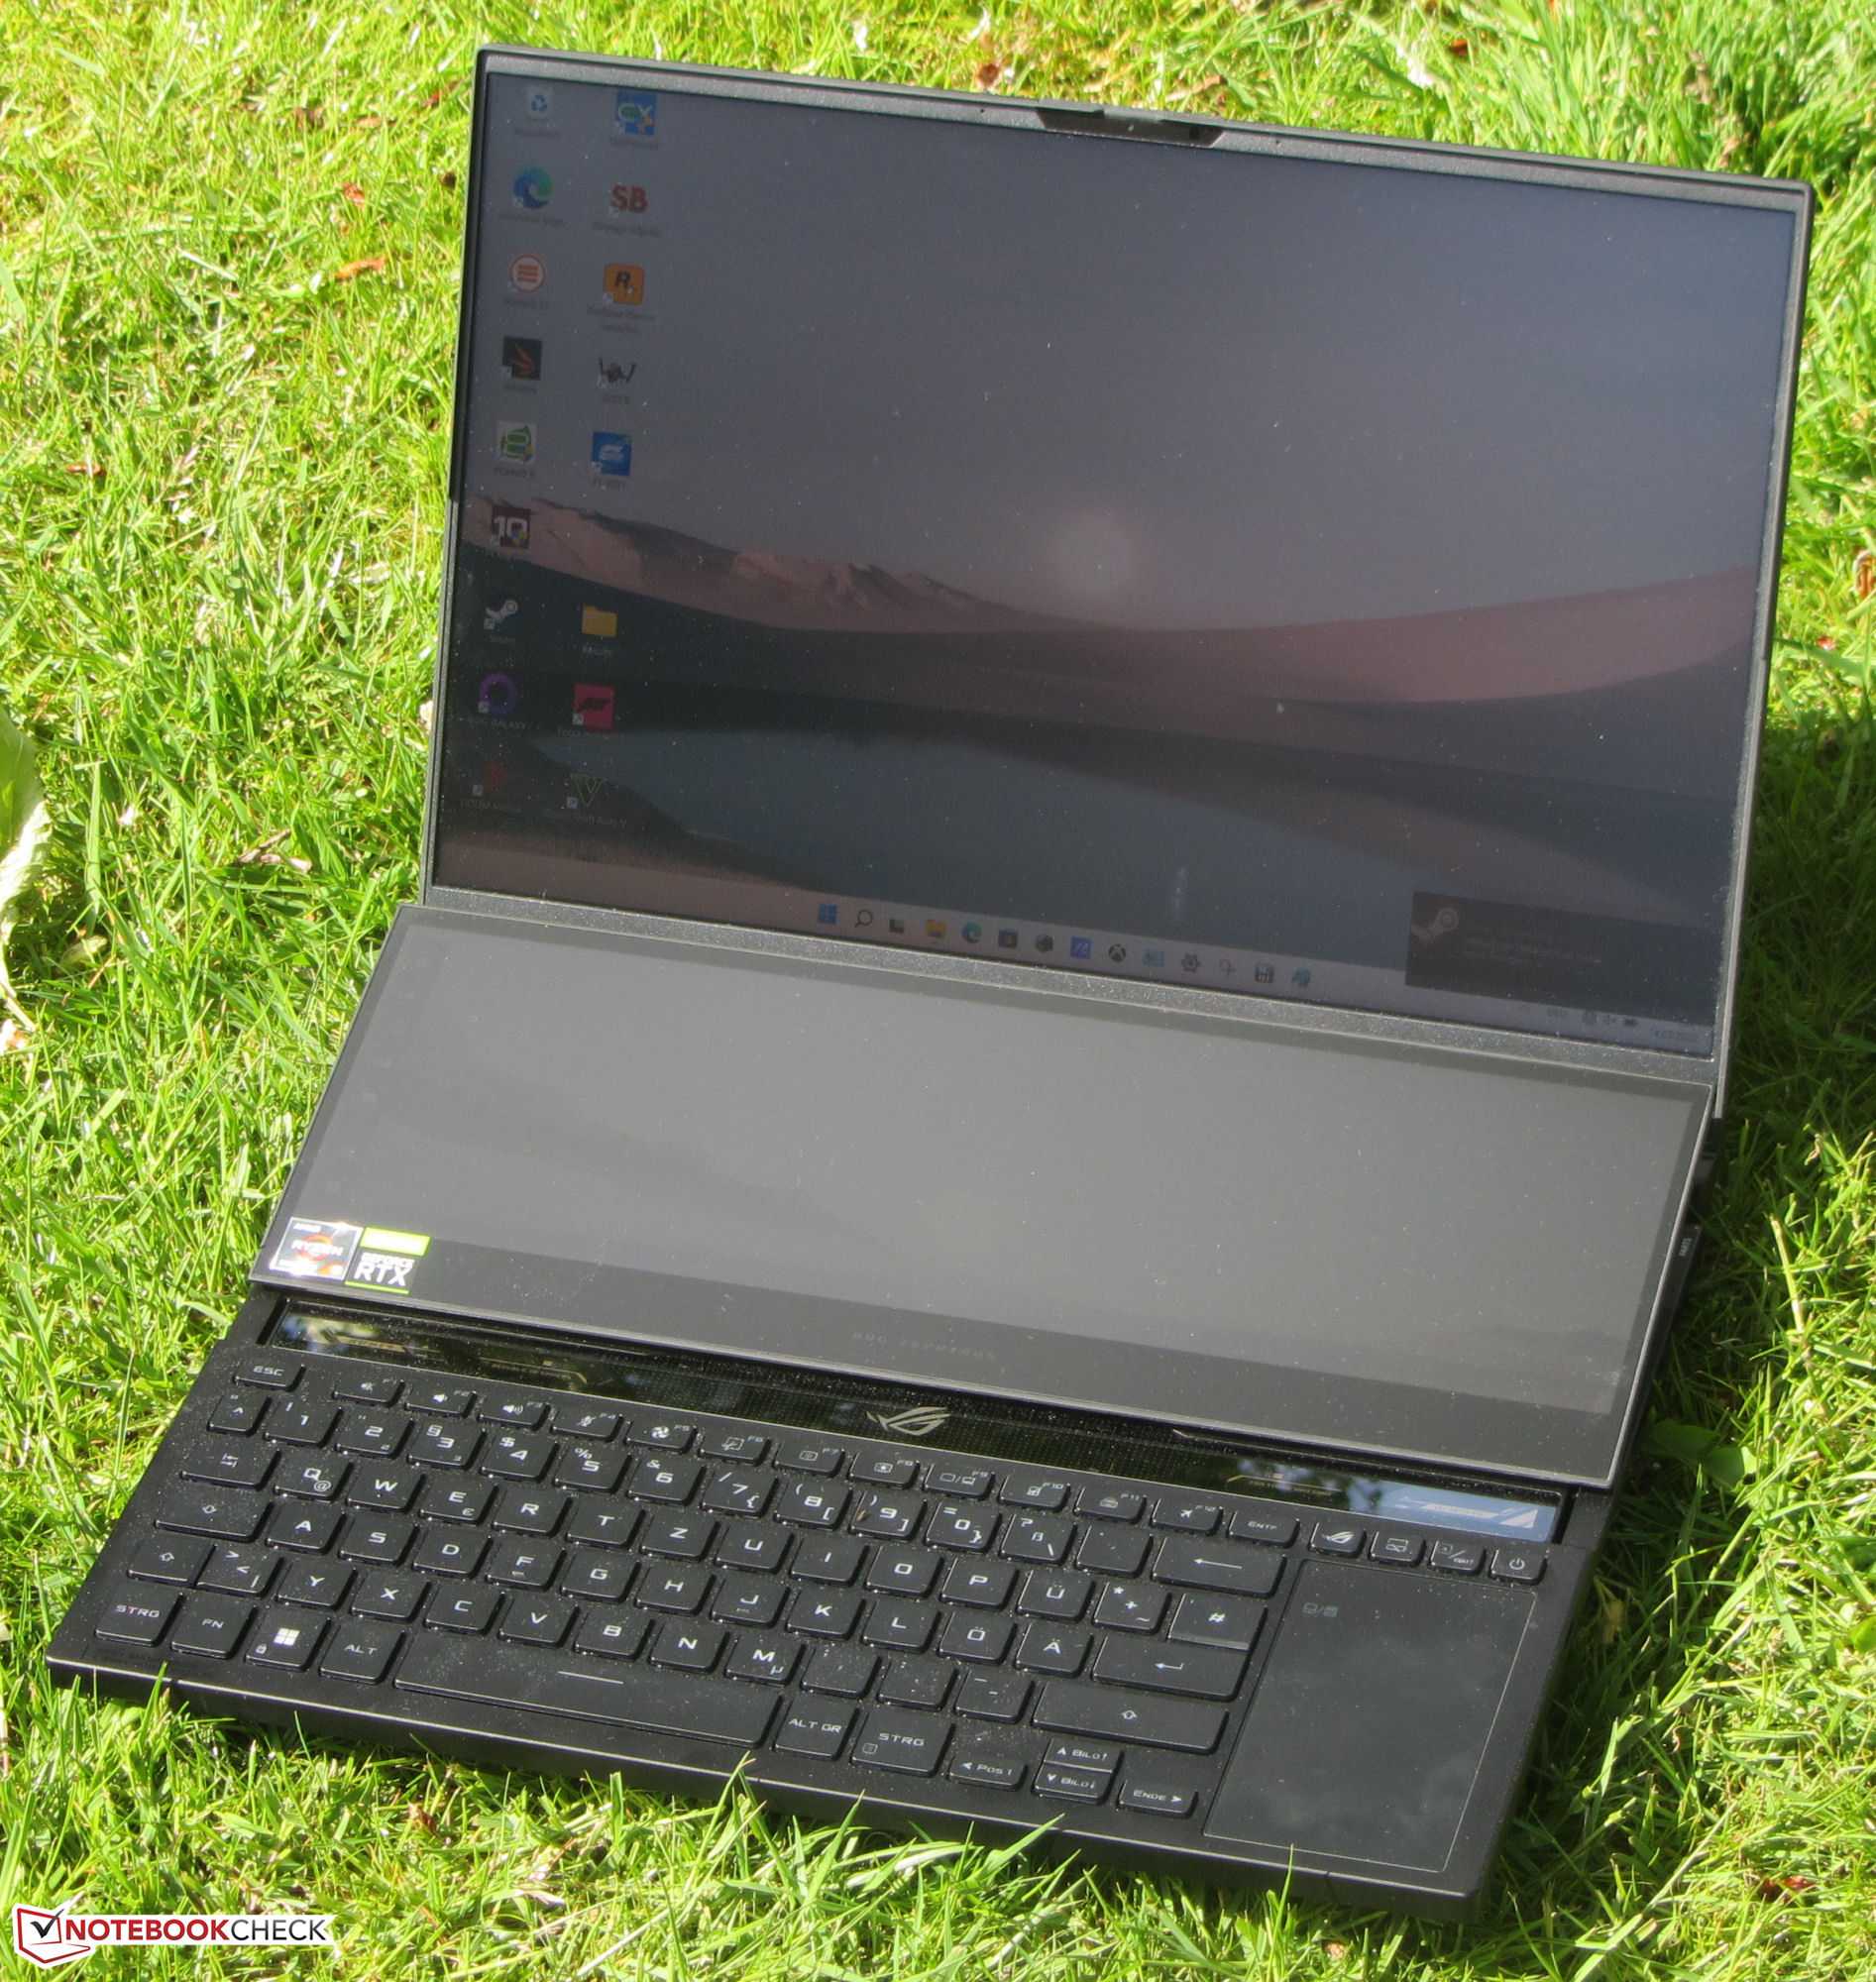
通过Zephyrus Duo 16,华硕为游戏玩家、流媒体和内容创作者推出了一款笔记本电脑,其最引人注目的特点立即变得明显。放在键盘上方的是第二个显示屏,包括触摸屏功能(Screenpad Plus)。竞争对手包括如下设备 Razer Blade 15 Advanced Model,以及Gigabyte Aero 16 YE5, 微星MSI GE76 Raider,Medion Erazer Beast X30Medion Erazer Beast X30,以及 Apple MacBook Pro 16 2021.
潜在的竞争对手比较
Rating | Date | Model | Weight | Height | Size | Resolution | Price |
|---|---|---|---|---|---|---|---|
| 88.2 % v7 (old) | 05 / 2022 | Asus ROG Zephyrus Duo 16 GX650RX R9 6900HX, GeForce RTX 3080 Ti Laptop GPU | 2.6 kg | 20.5 mm | 16.00" | 3840x2400 | |
| 92.5 % v7 (old) | 11 / 2021 | Apple MacBook Pro 16 2021 M1 Max M1 Max, M1 Max 32-Core GPU | 2.2 kg | 16.8 mm | 16.20" | 3456x2234 | |
| 88.3 % v7 (old) | 05 / 2022 | Razer Blade 15 Advanced Model Early 2022 i7-12800H, GeForce RTX 3080 Ti Laptop GPU | 2.1 kg | 16.99 mm | 15.60" | 1920x1080 | |
| 87.5 % v7 (old) | 01 / 2022 | MSI GE76 Raider i9-12900HK, GeForce RTX 3080 Ti Laptop GPU | 3 kg | 26 mm | 17.30" | 1920x1080 | |
| 86.7 % v7 (old) | 05 / 2022 | Medion Erazer Beast X30 i9-12900HK, GeForce RTX 3080 Ti Laptop GPU | 2.2 kg | 23 mm | 17.30" | 2560x1440 | |
| 84.7 % v7 (old) | 03 / 2022 | Gigabyte Aero 16 YE5 i9-12900HK, GeForce RTX 3080 Ti Laptop GPU | 2.3 kg | 22.4 mm | 16.00" | 3840x2400 |
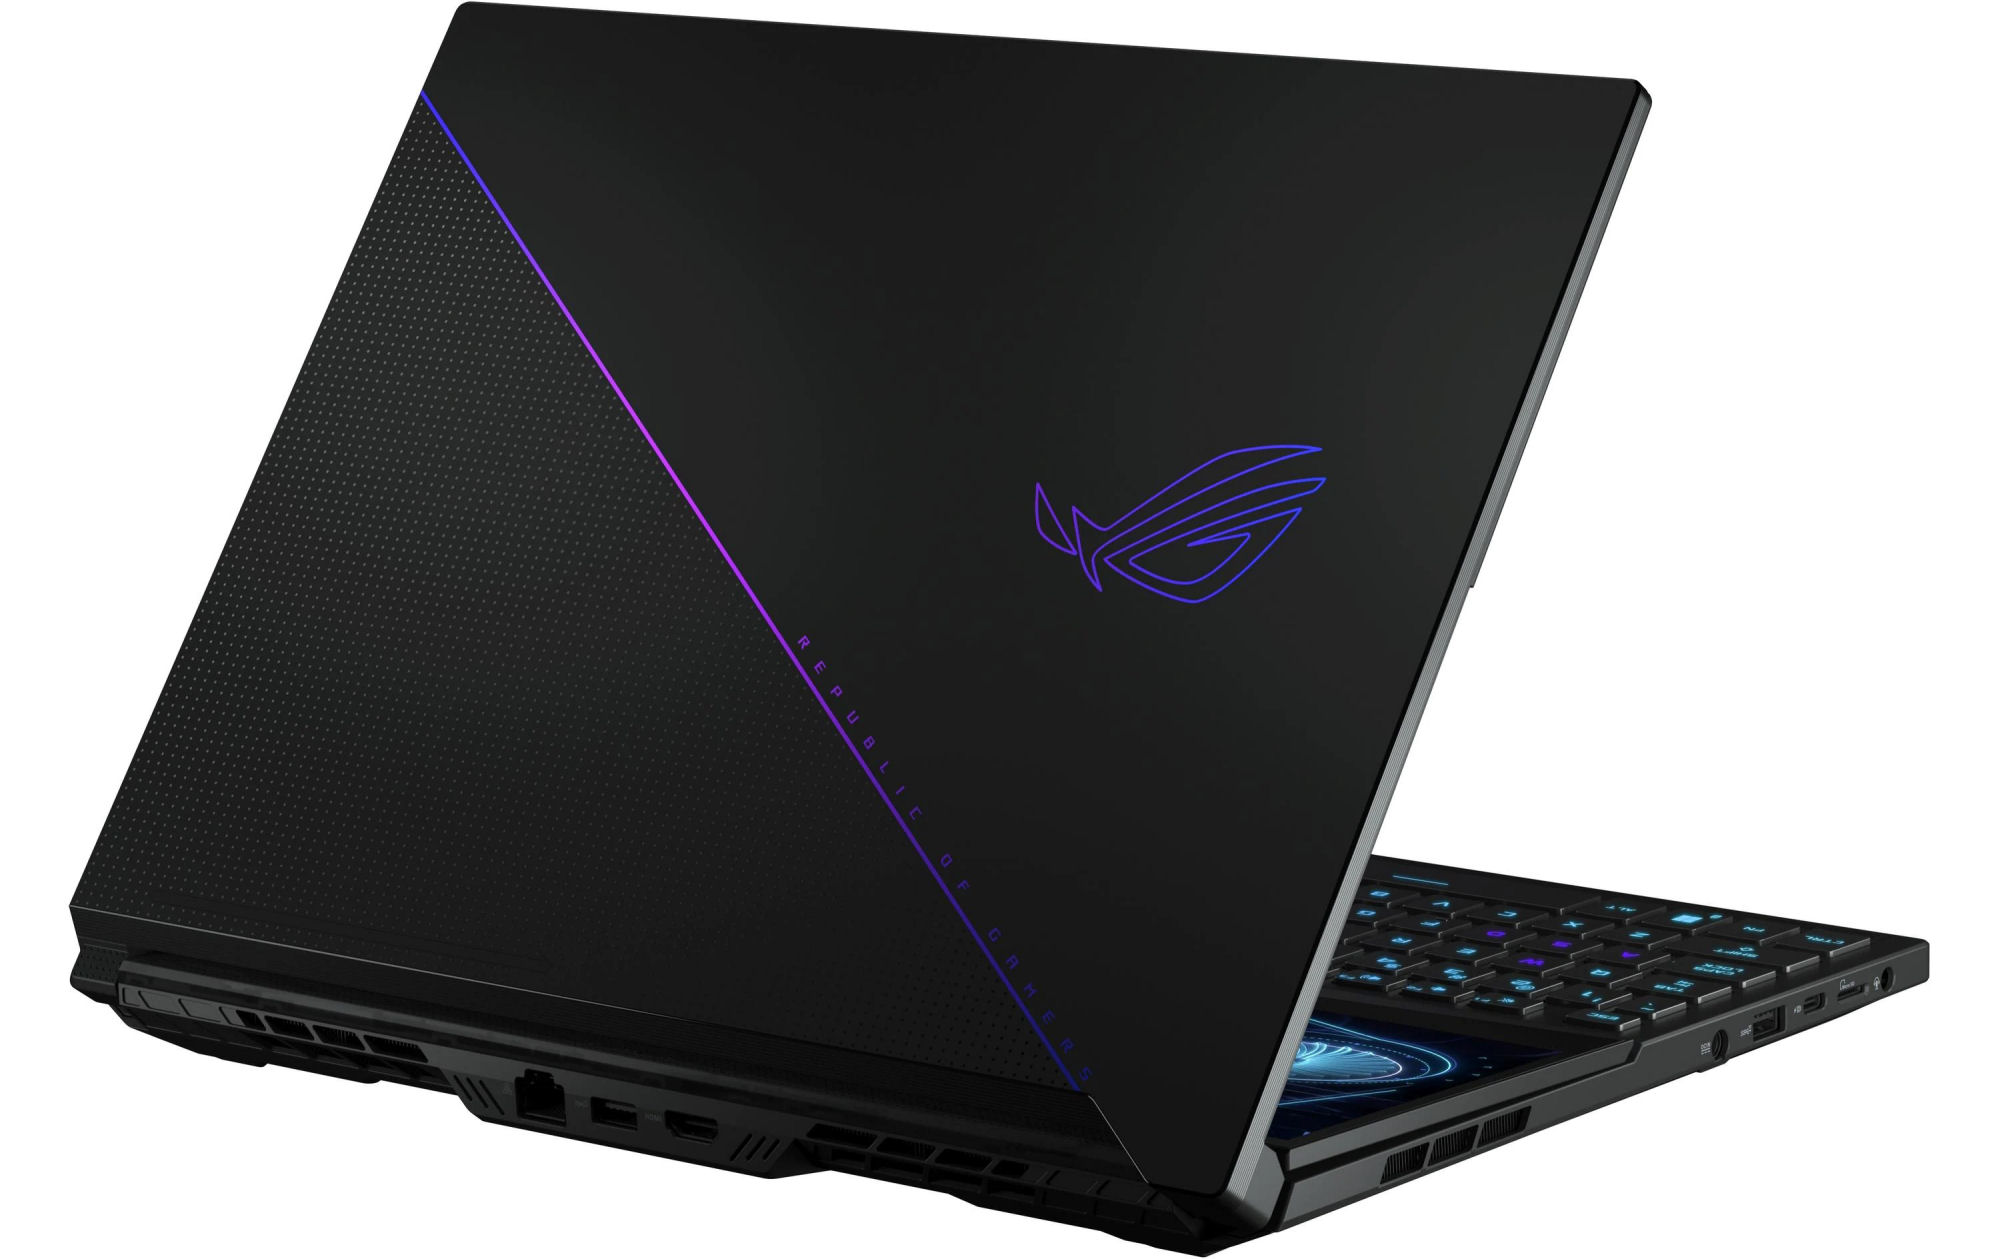
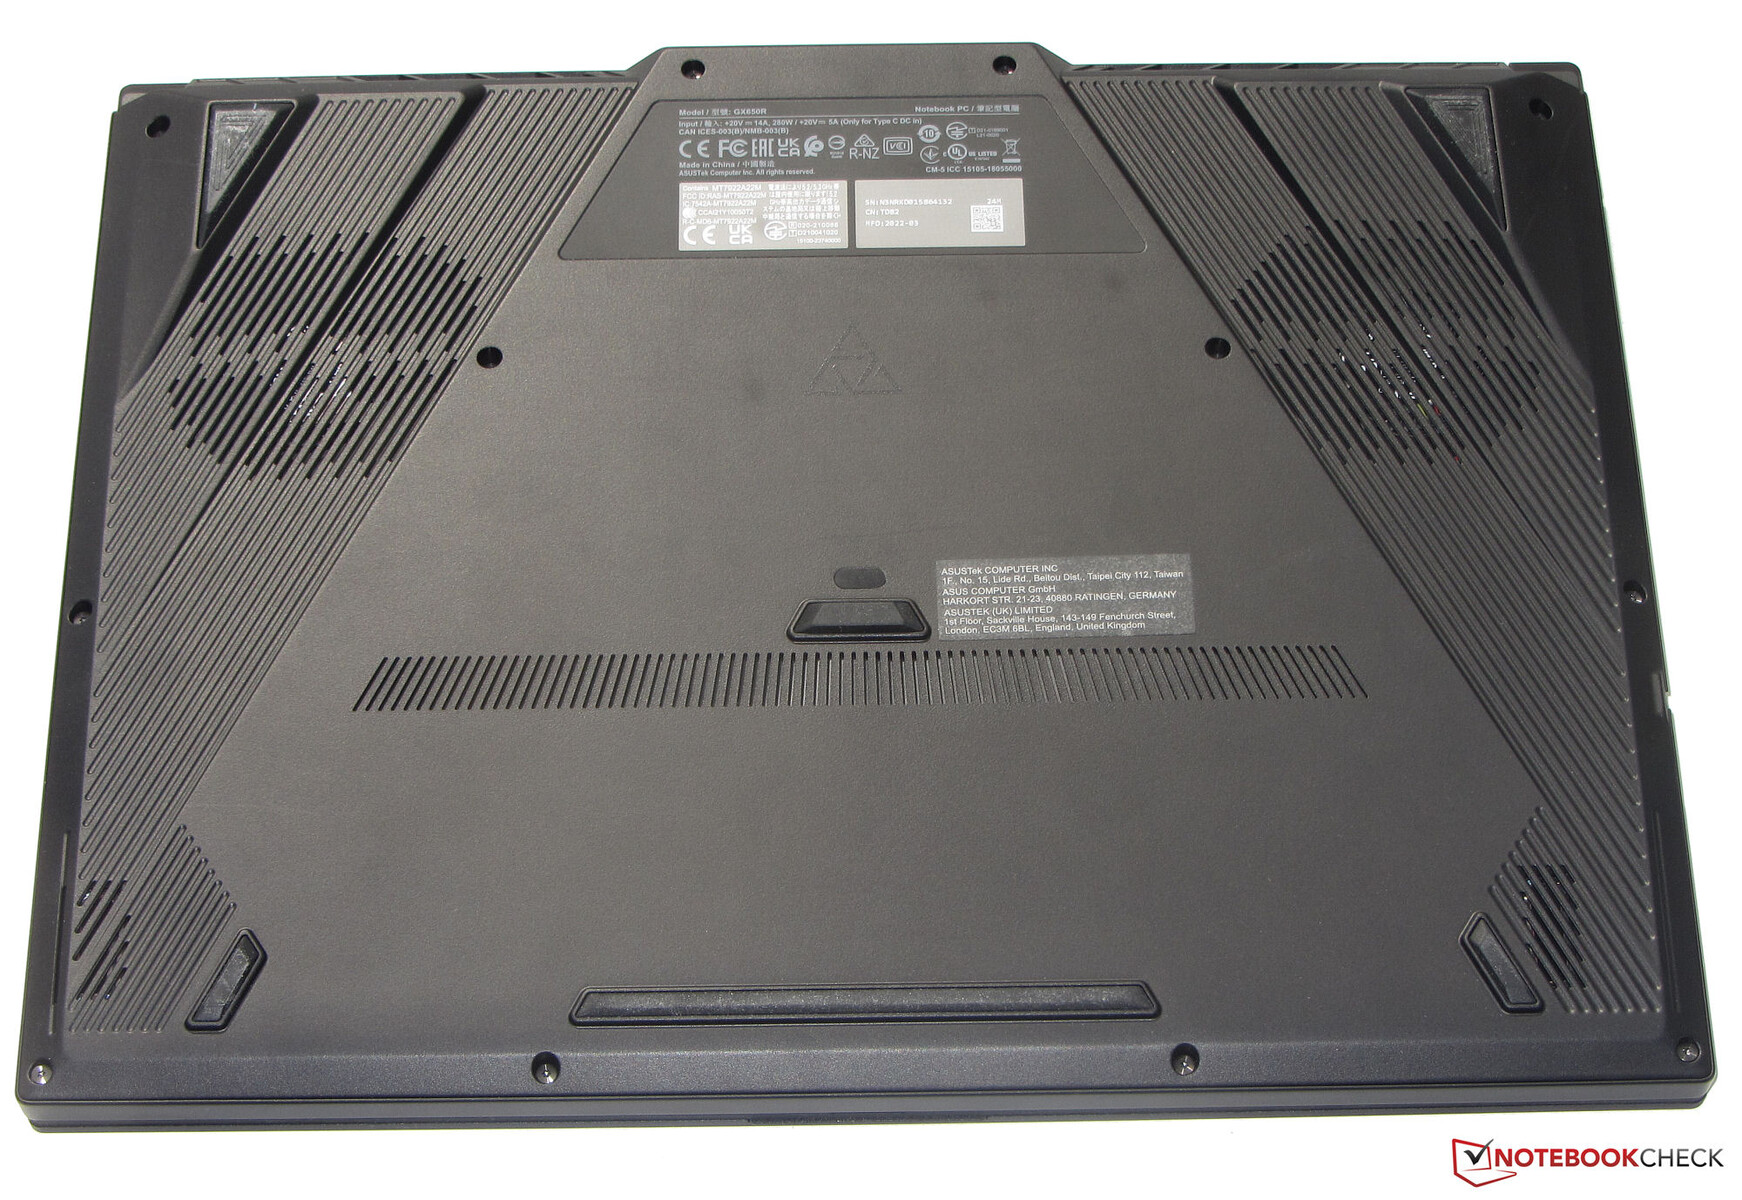
外壳 - GX650采用坚固的金属外壳
哑光的黑色金属外壳提供了良好的做工。没有明显的缝隙,也没有明显的尖锐边缘。另一个积极的方面是,基本单元不能被扭曲。另一方面,盖子可以使用更多的硬度。铰链能够将盖子紧紧地固定在位置上。最大开启角度约为130度,你可以用一只手打开盖子。
一旦你打开显示屏盖子,Screenpad(具有触摸屏功能的第二个显示屏)就会以大约15度的固定角度向用户升起。此外,它还向主屏幕方向移动约2厘米(约0.8英寸)。由此产生的缝隙显示了一块透明的塑料板,在某些地方可以看到机箱的内部。 Screenpad的提升不仅有人体工程学的原因,而且在显示屏下面还有通风口,使空气流进机箱。


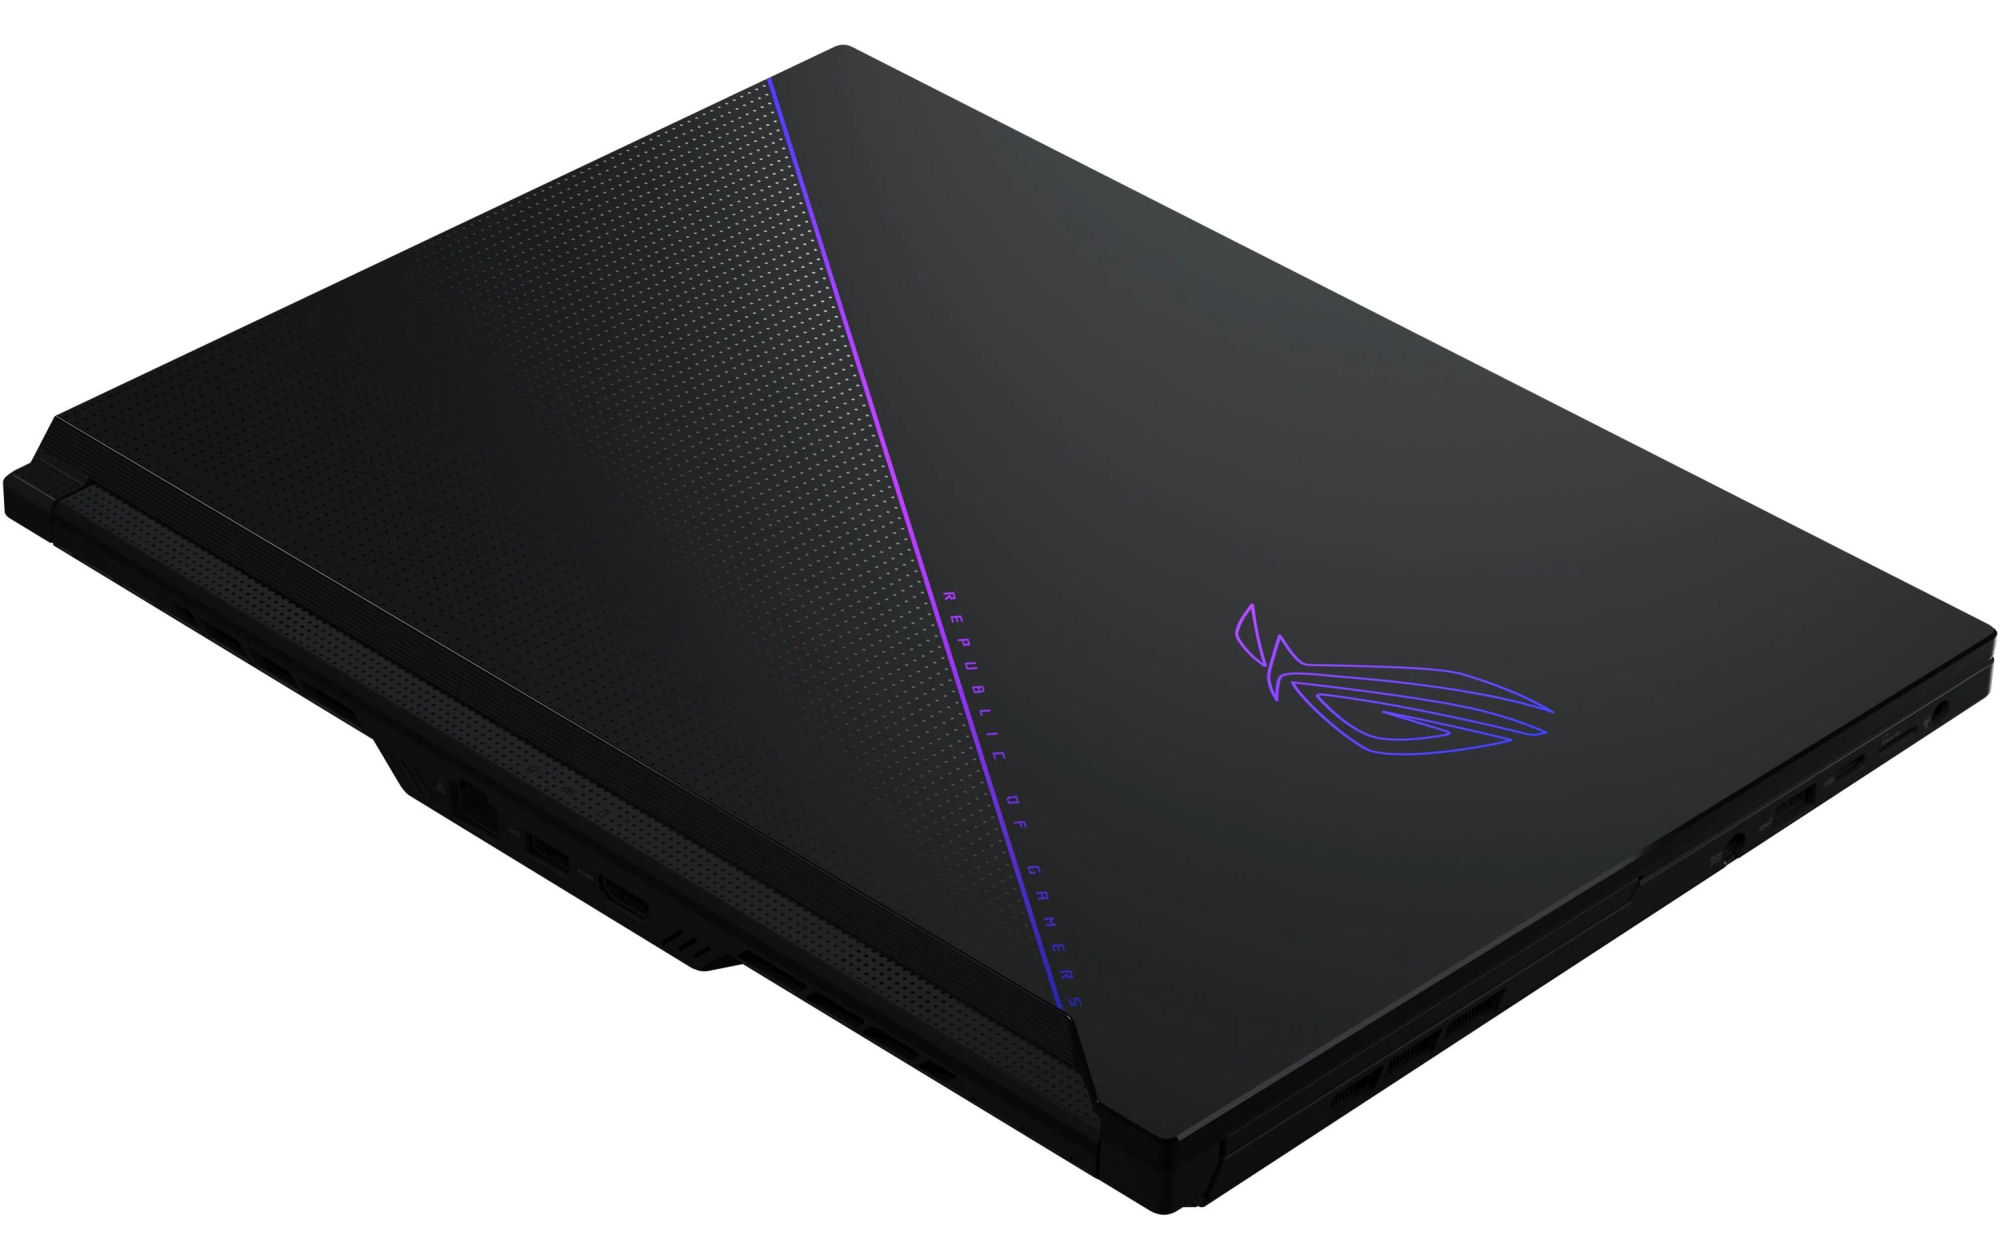

Zephyrus是我们比较领域中较重的笔记本电脑之一。只有 MSI GE76 Raider更重。其尺寸也比同类的16英寸笔记本电脑略大,如 MacBook Pro 16.
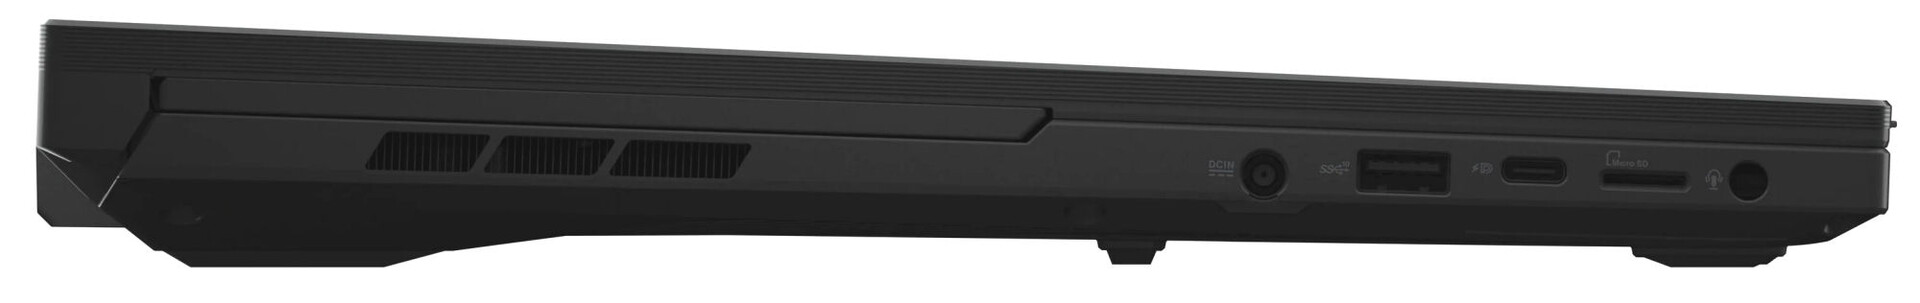
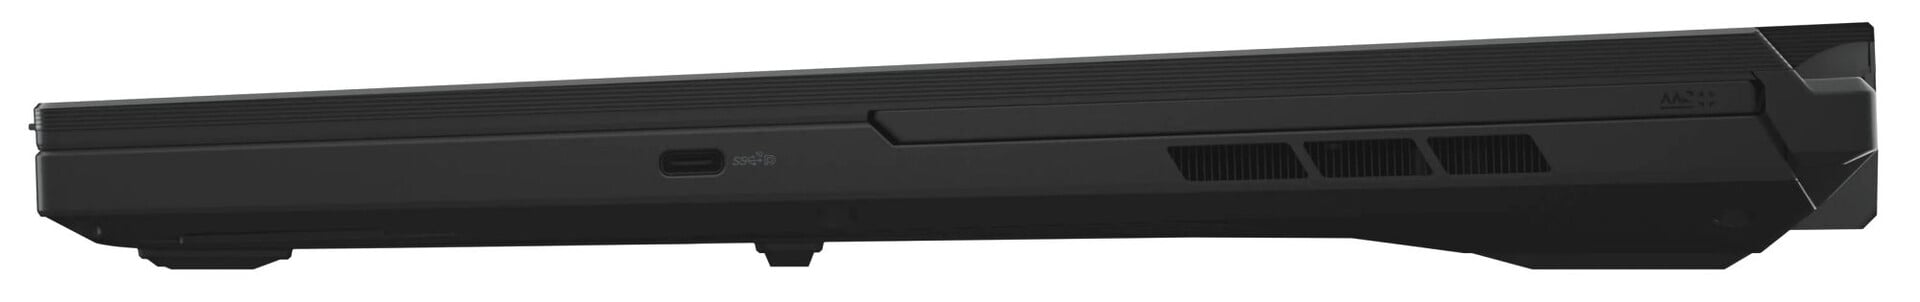
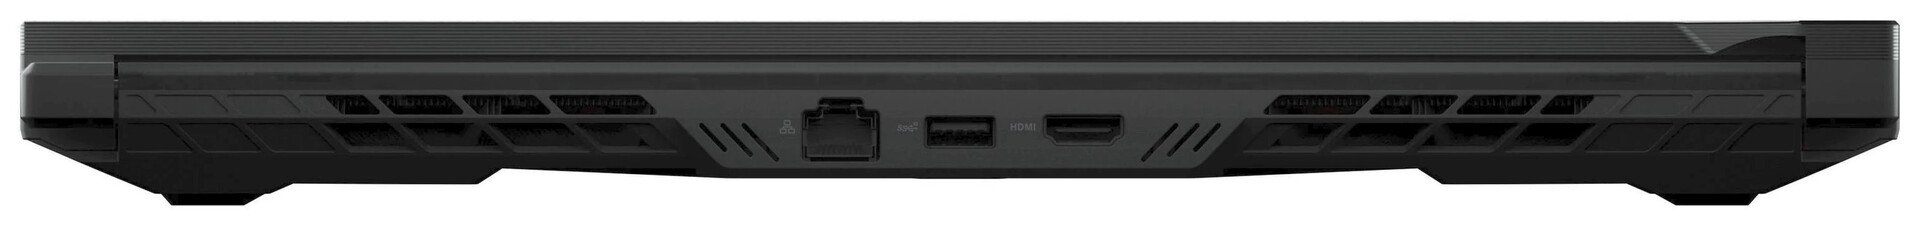
设备--Zephyrus不提供Thunderbolt 4。
所有四个USB连接(2个USB-A,2个USB-C)都支持USB 3.2 Gen 2标准。两个USB-C端口中的一个提供电源交付,两个端口都通过USB-C支持DisplayPort。有了这个,该笔记本电脑提供了三个视频输出端口和HDMI 2.1连接。连接由一个组合音频端口和一个千兆以太网端口完成。
SD卡阅读器
MicroSD存储卡读卡器是快速型号之一,使用我们的AV PRO microSD 128 GB V60参考存储卡,最大传输速率为155 MB/s(传输250个jpg图像文件,每个约5MB)和185 MB/s(复制大数据块)。
| SD Card Reader | |
| average JPG Copy Test (av. of 3 runs) | |
| Razer Blade 15 Advanced Model Early 2022 (AV PRO microSD 128 GB V60) | |
| Asus ROG Zephyrus Duo 16 GX650RX (AV PRO microSD 128 GB V60) | |
| Average of class Gaming (20.9 - 210, n=54, last 2 years) | |
| MSI GE76 Raider (AV PRO microSD 128 GB V60) | |
| Medion Erazer Beast X30 (AV PRO microSD 128 GB V60) | |
| maximum AS SSD Seq Read Test (1GB) | |
| Asus ROG Zephyrus Duo 16 GX650RX (AV PRO microSD 128 GB V60) | |
| Average of class Gaming (25.5 - 261, n=51, last 2 years) | |
| Medion Erazer Beast X30 (AV PRO microSD 128 GB V60) | |
沟通
在最佳条件下确定的WLAN传输率(附近没有额外的WLAN设备,笔记本电脑和服务器PC距离很近)结果非常好,与WiFi芯片(联发科MT7922;802.11 ax,WiFi 6E)的能力相符。有线网络连接由Realtek的千兆以太网芯片(RTL8125)处理。
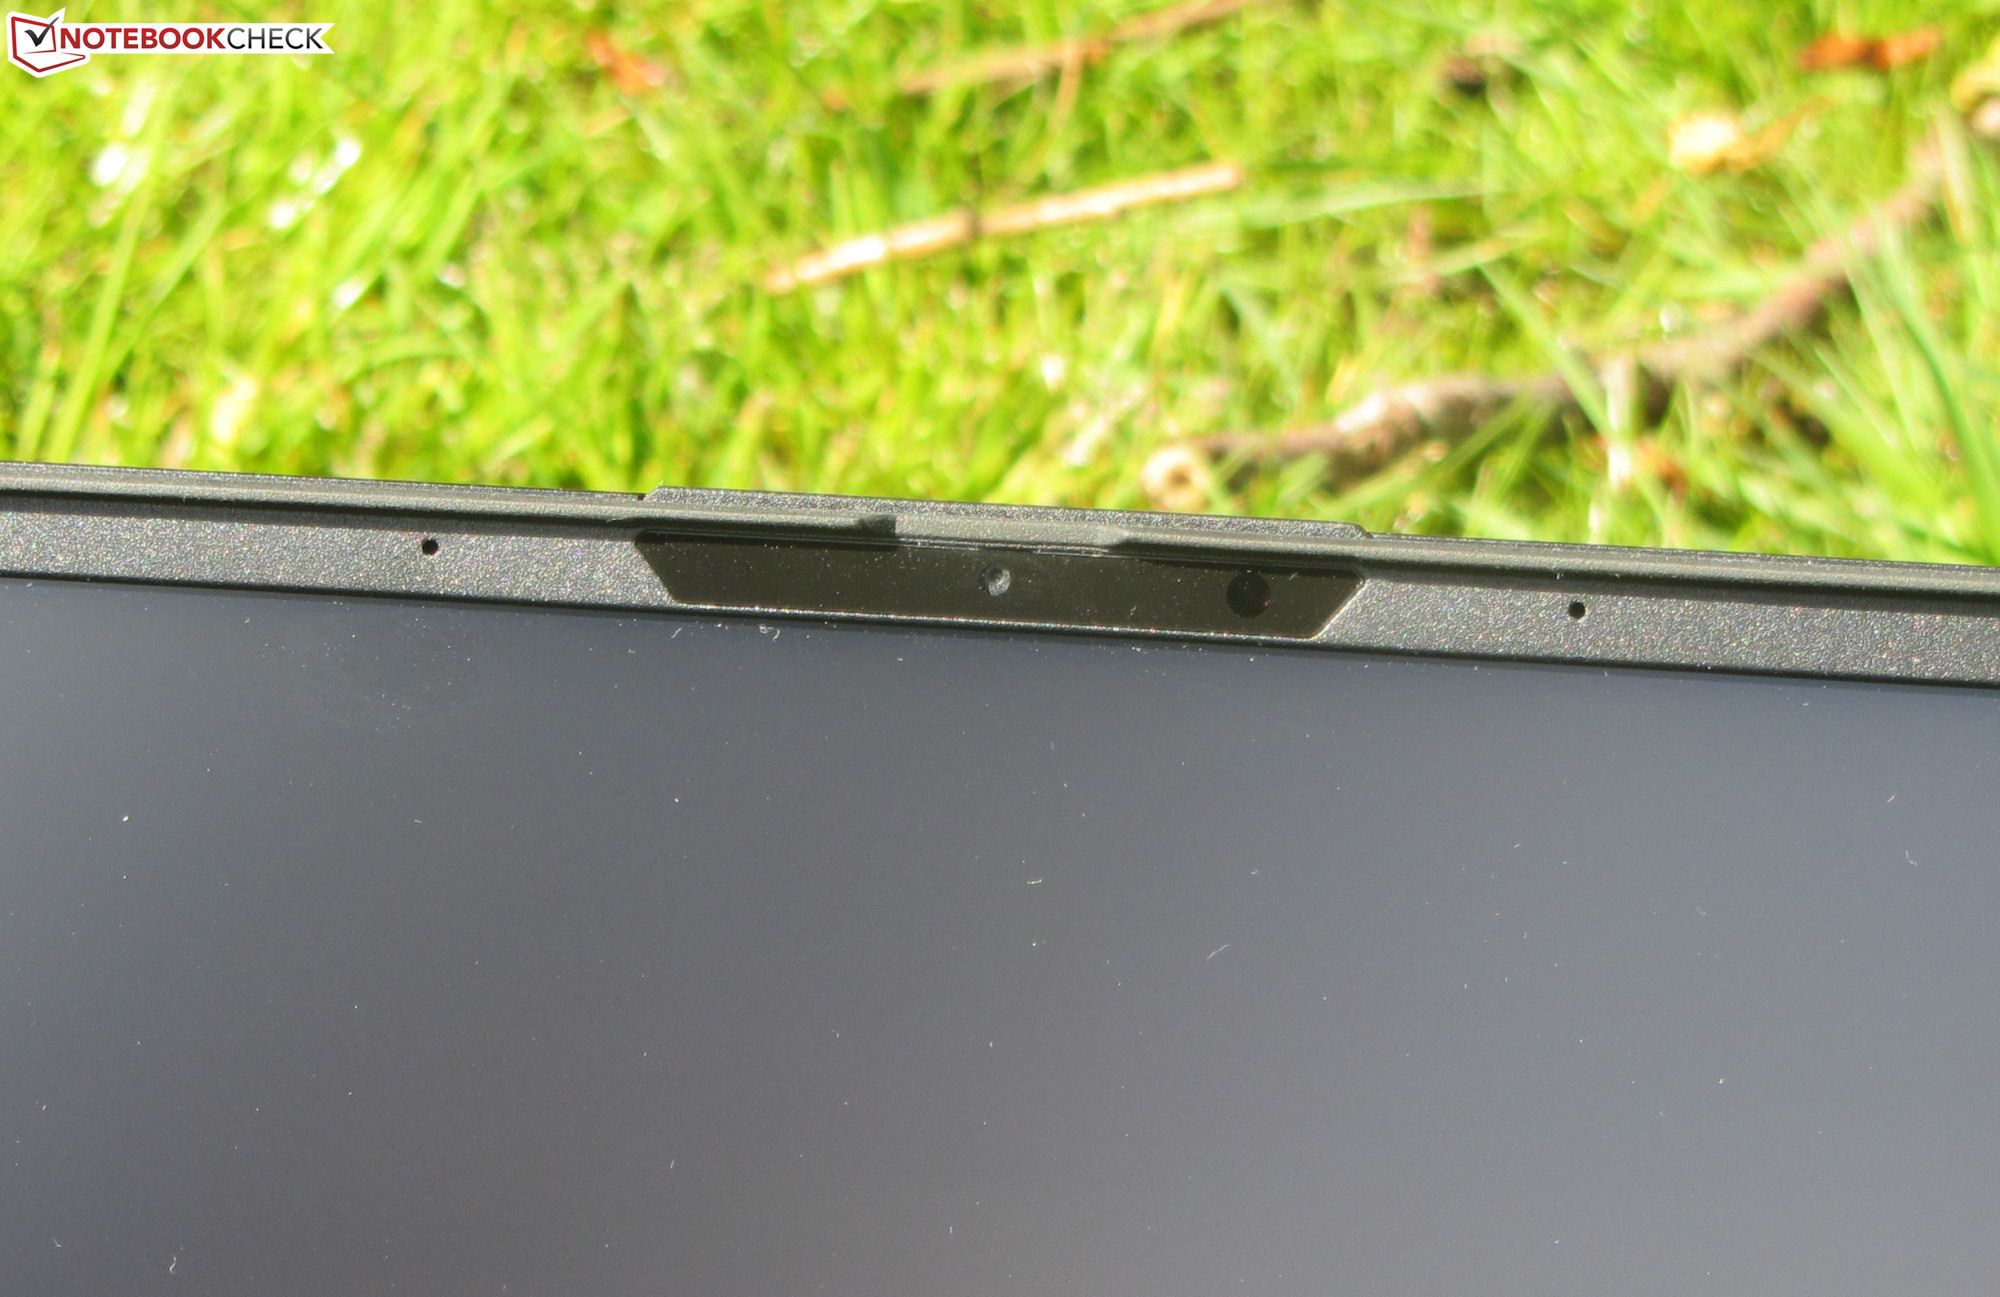
网络摄像头
Zephyrus的0.9MP网络摄像头产生的图像最大分辨率为1280 x 720像素。它缺乏色彩准确性,颜色与目标有很大偏差。该摄像头不具备机械盖。

")
")
辅料
除了通常的文件(快速启动手册和保修信息)外,该笔记本电脑还包括一个橡胶掌托。
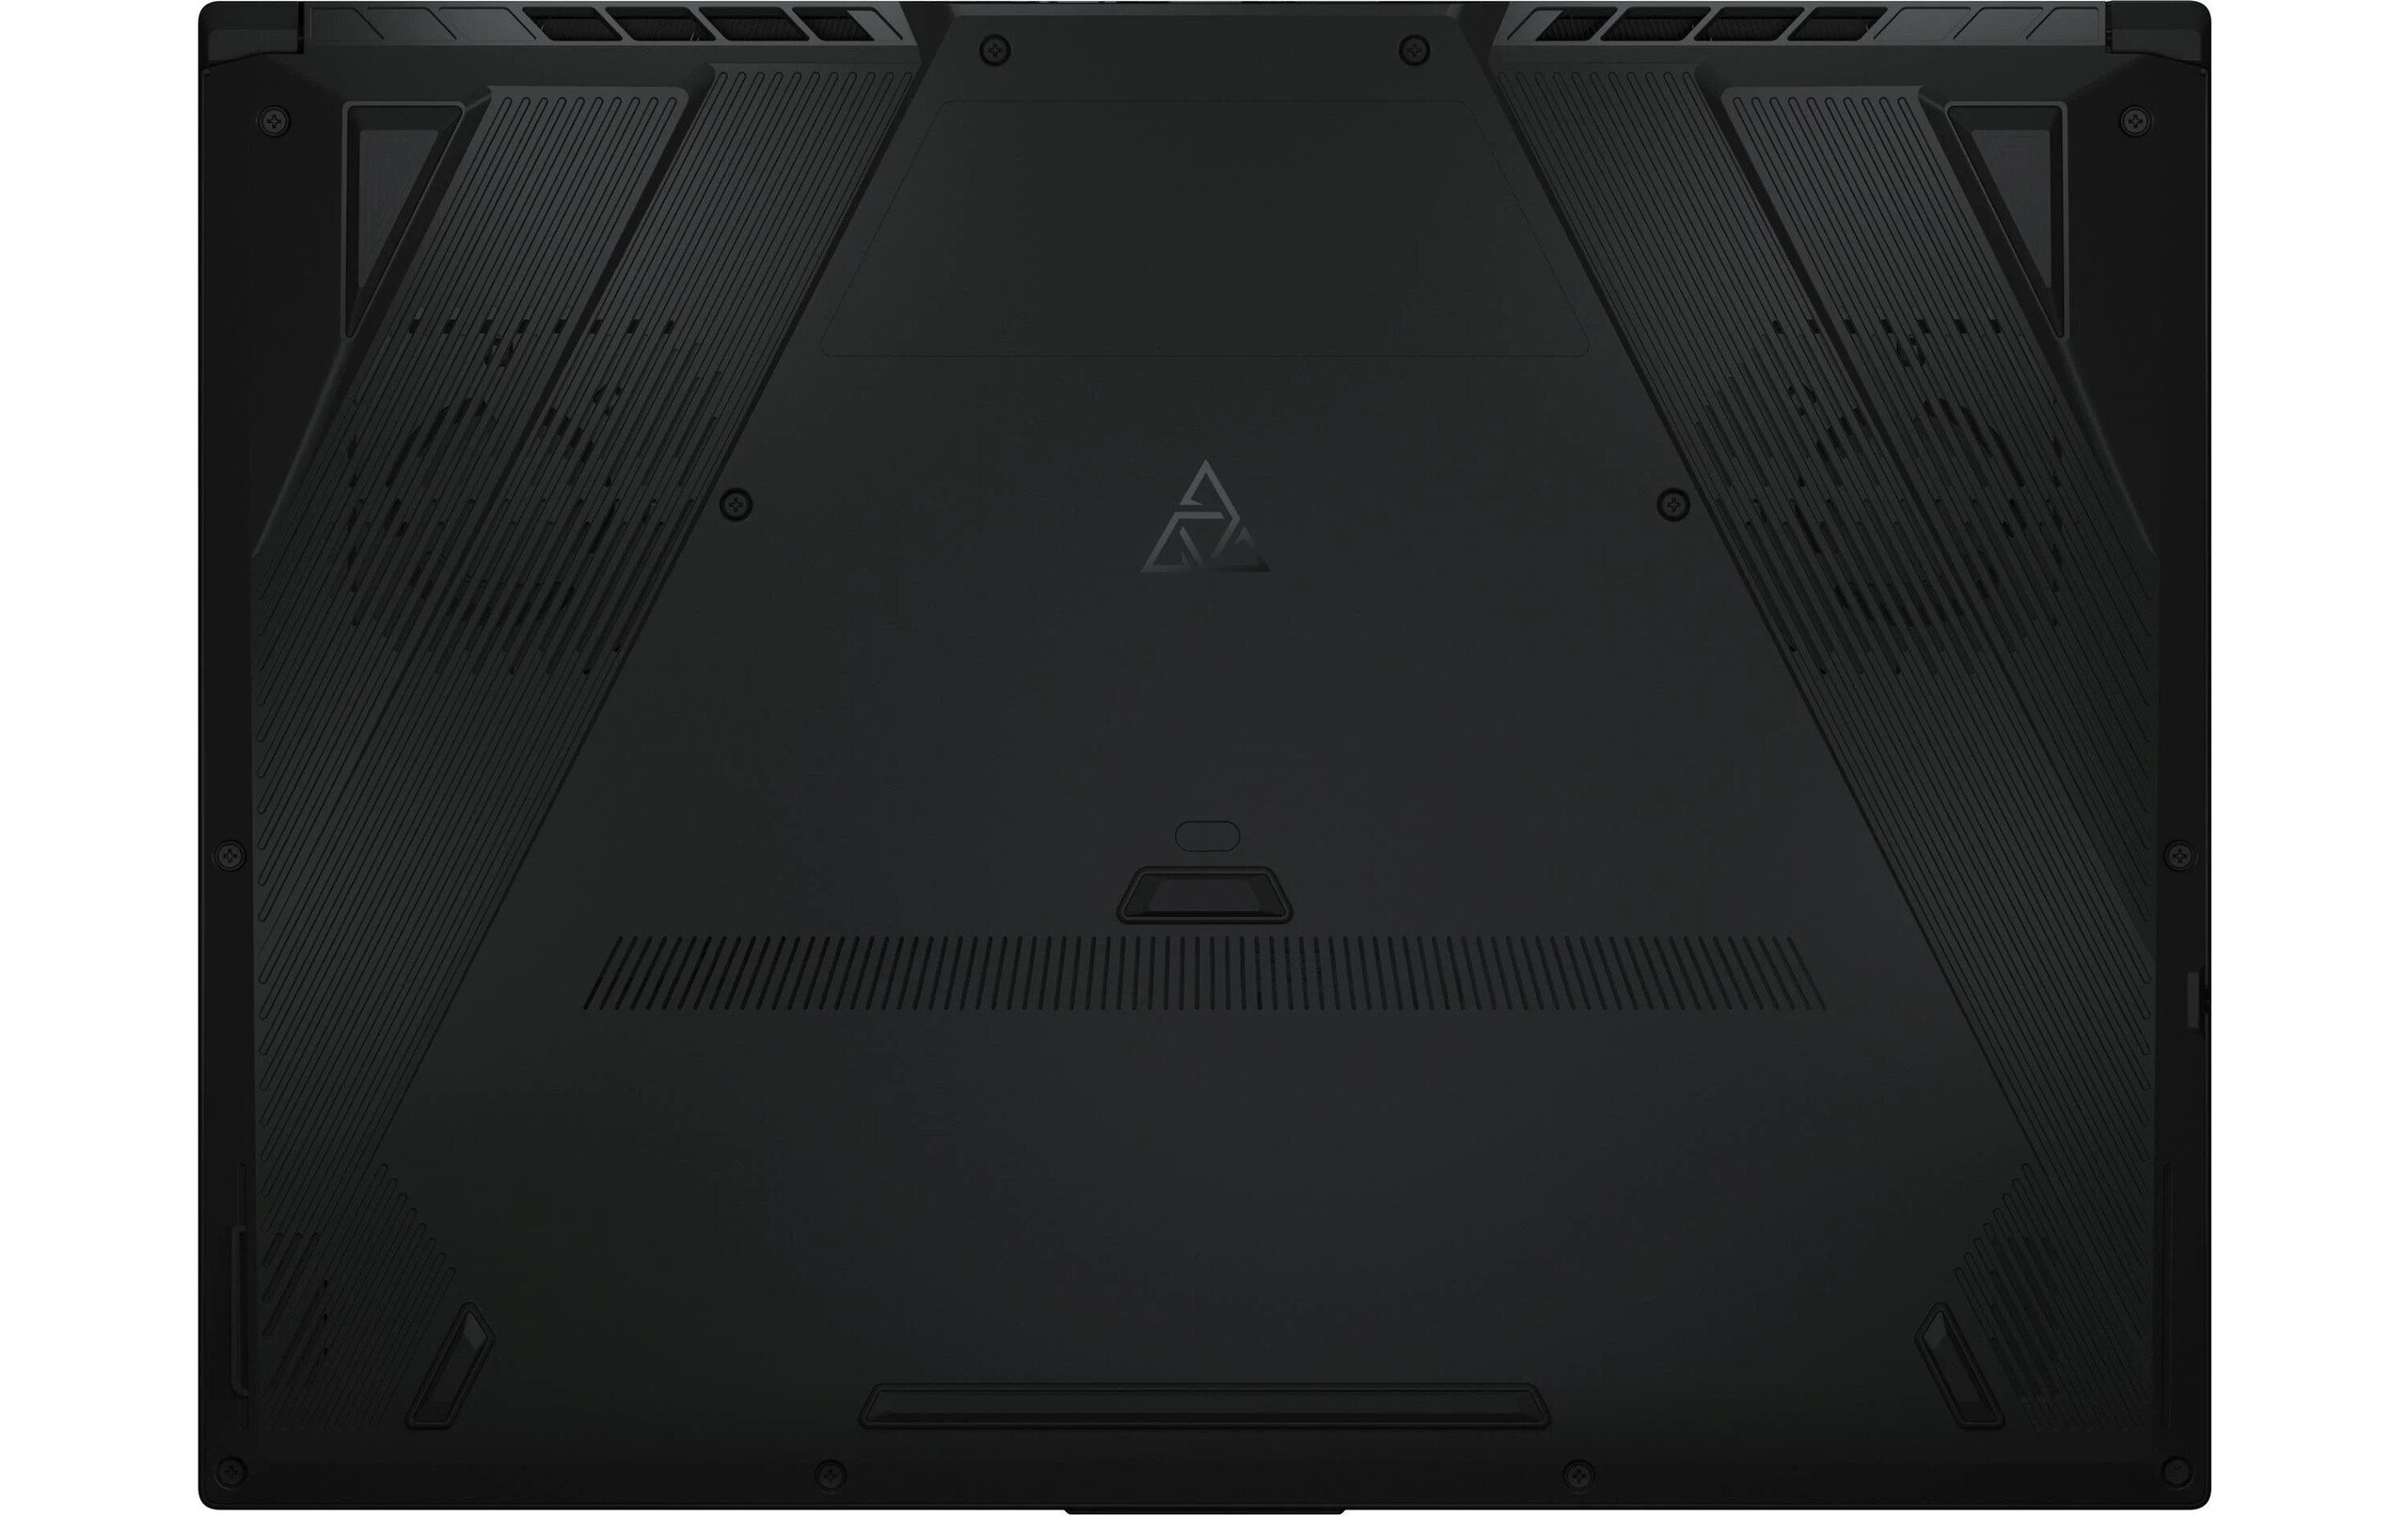
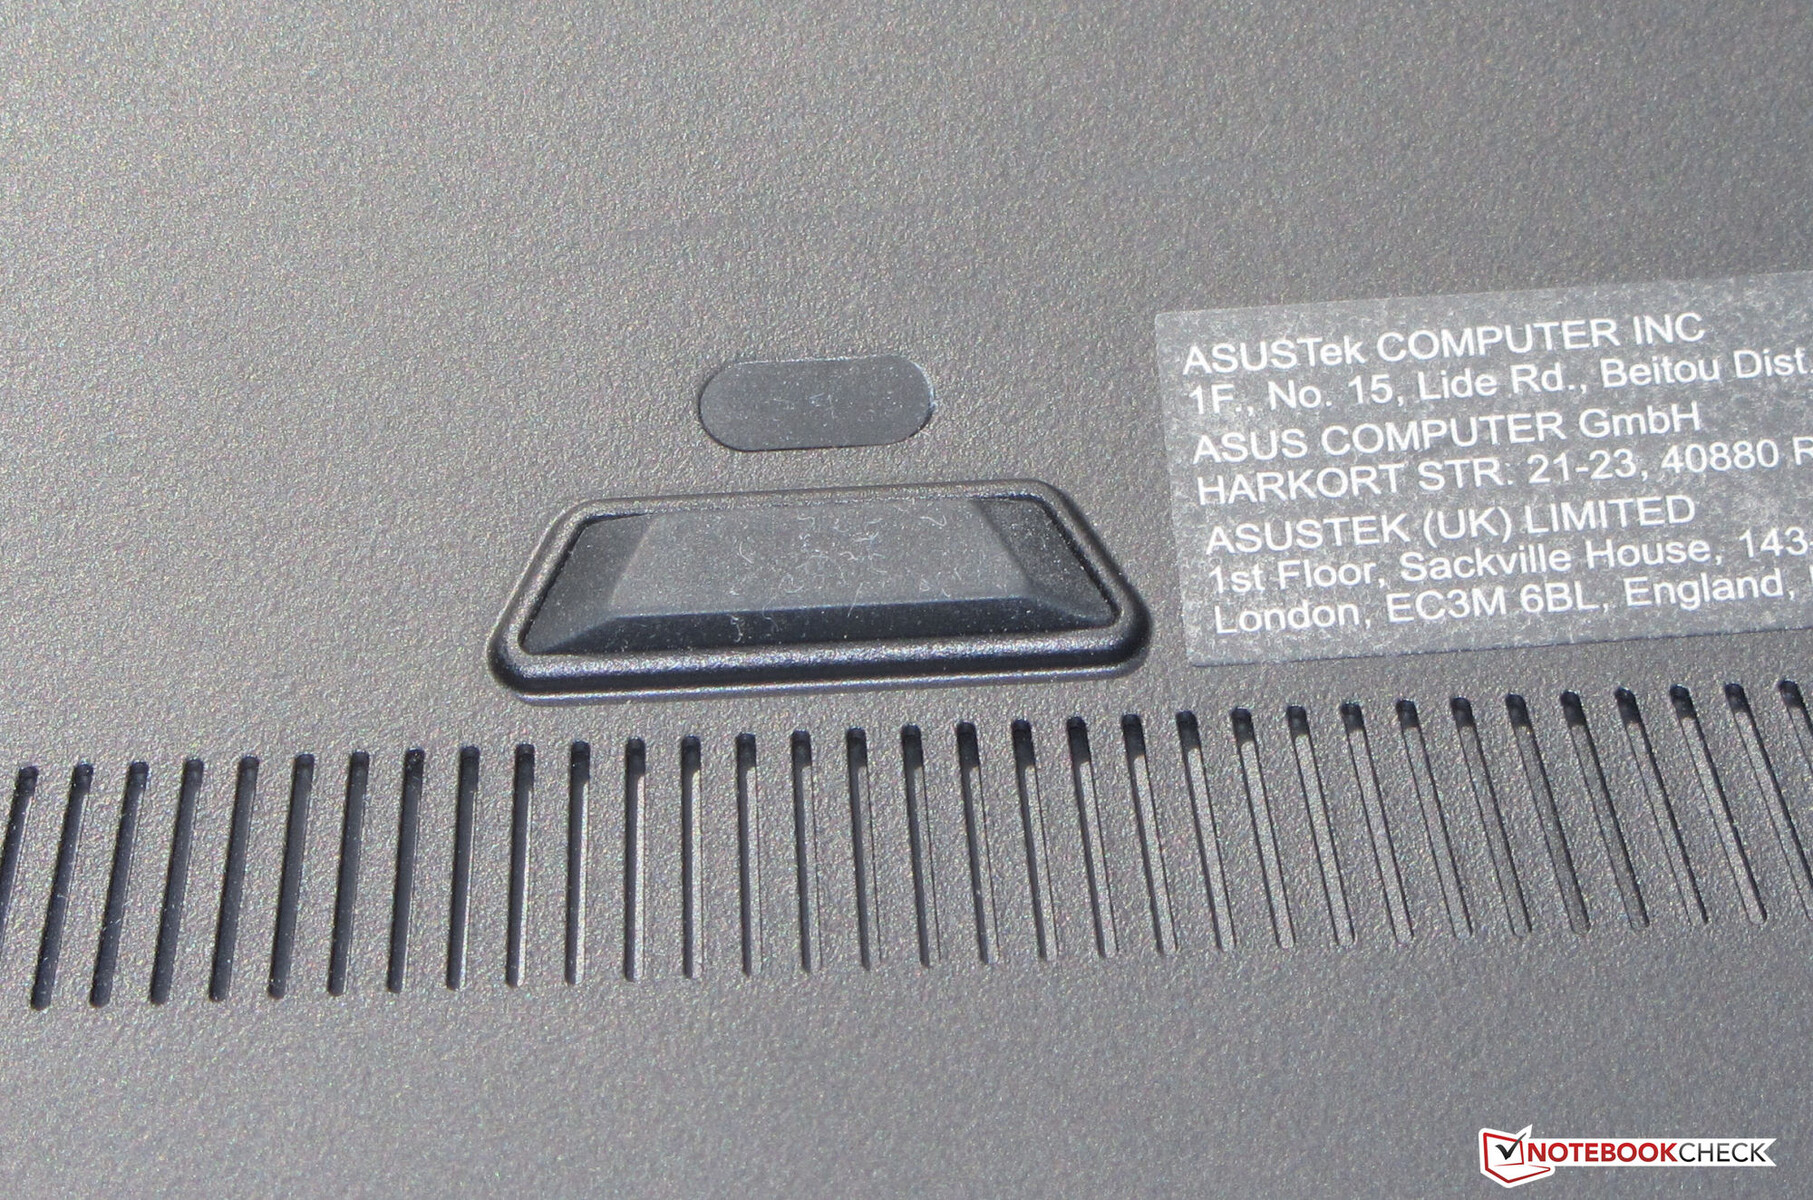
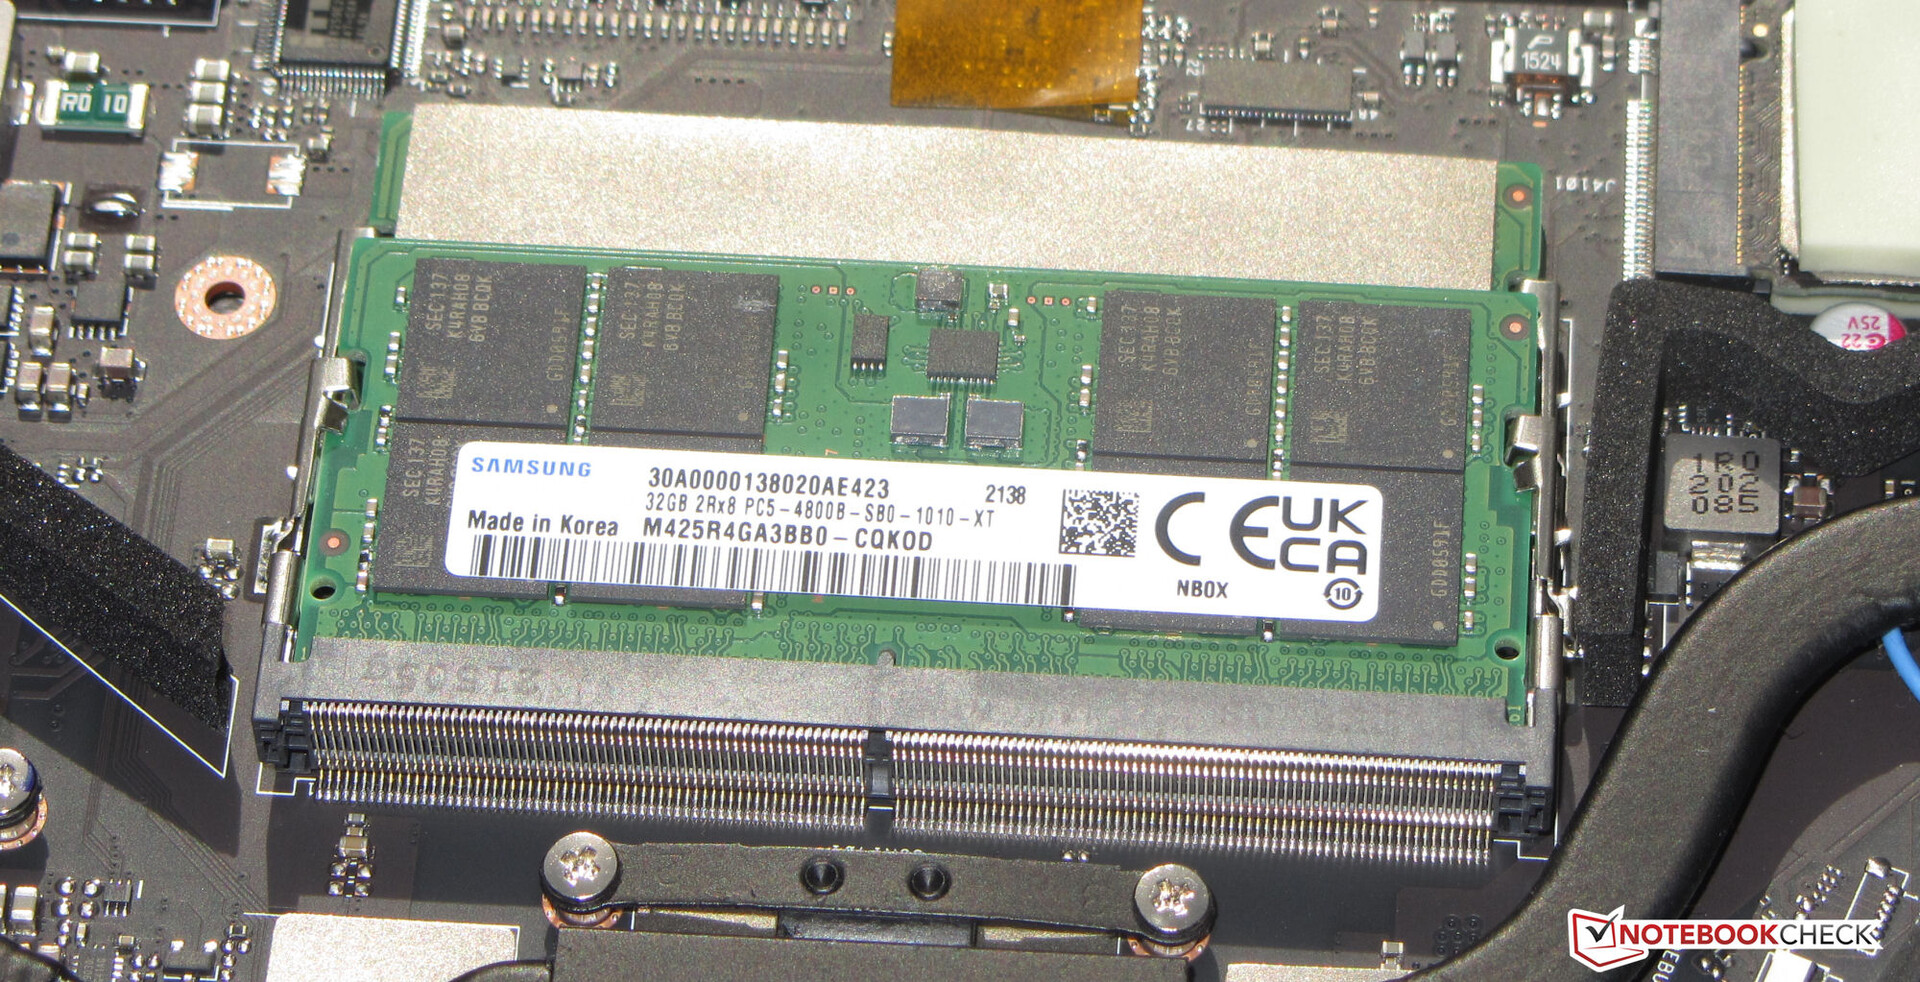
维护
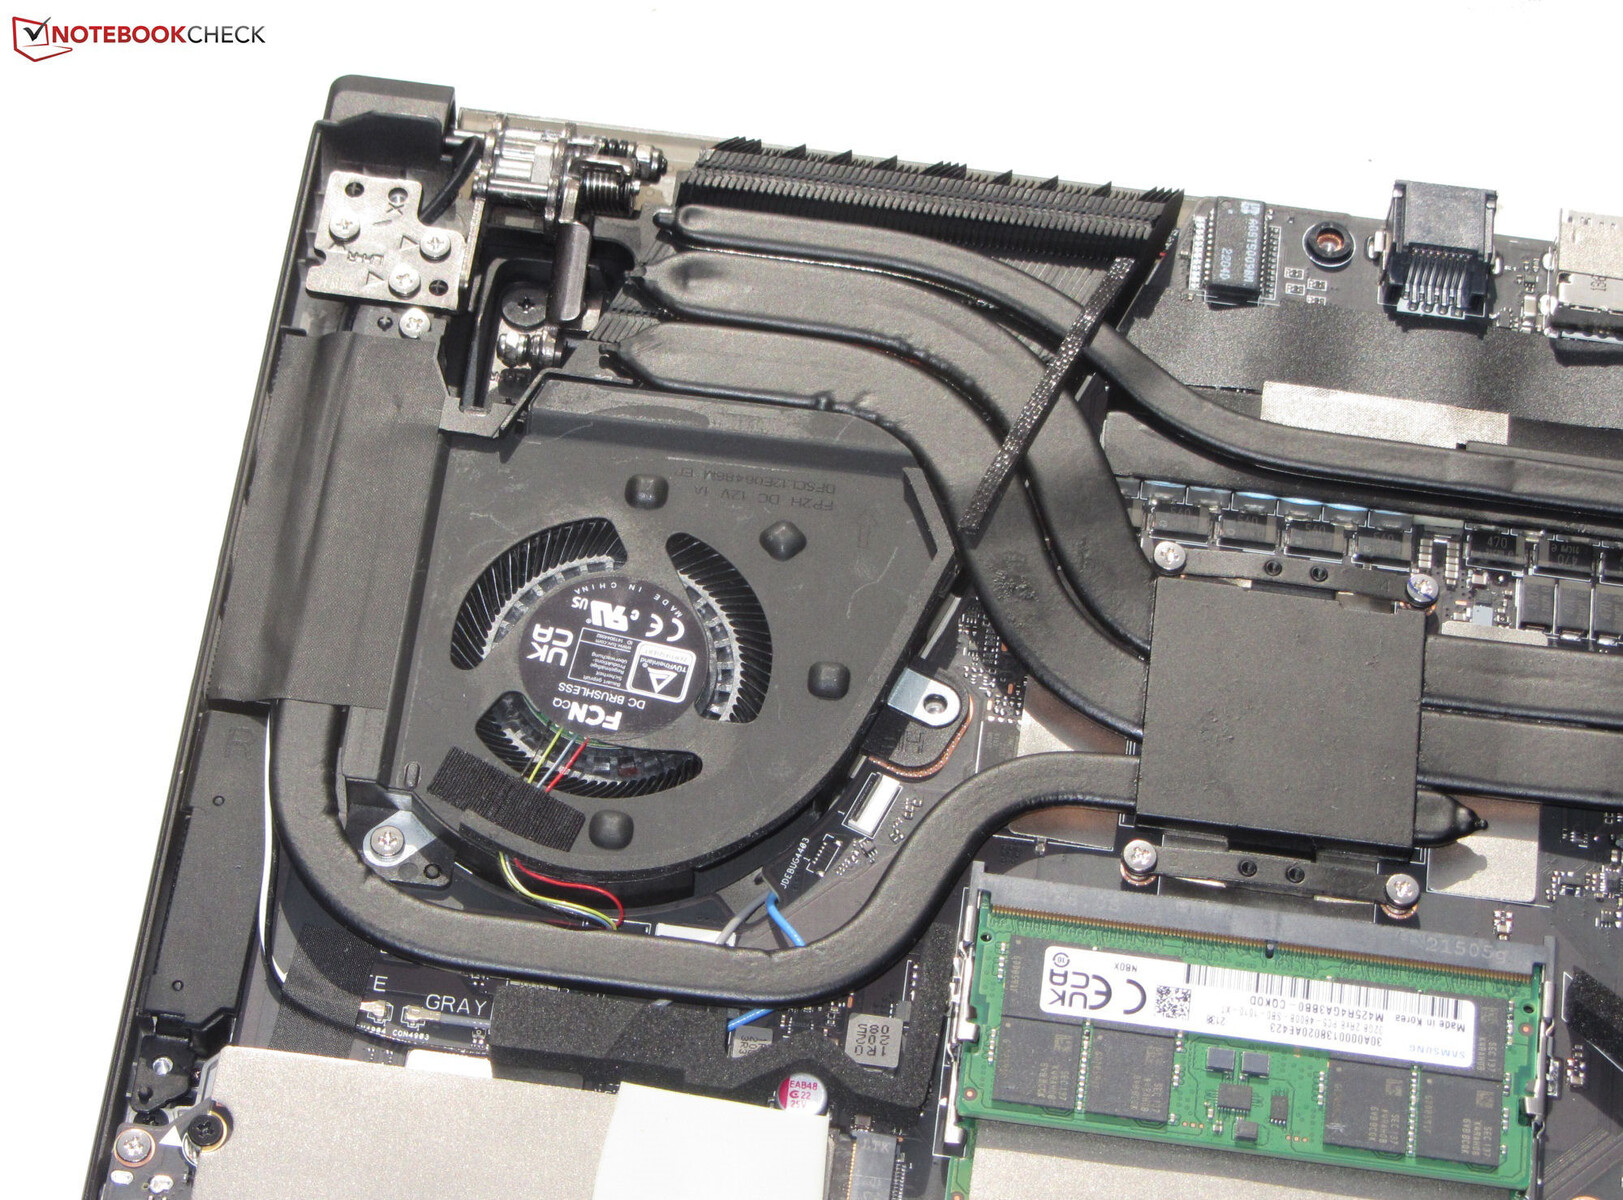
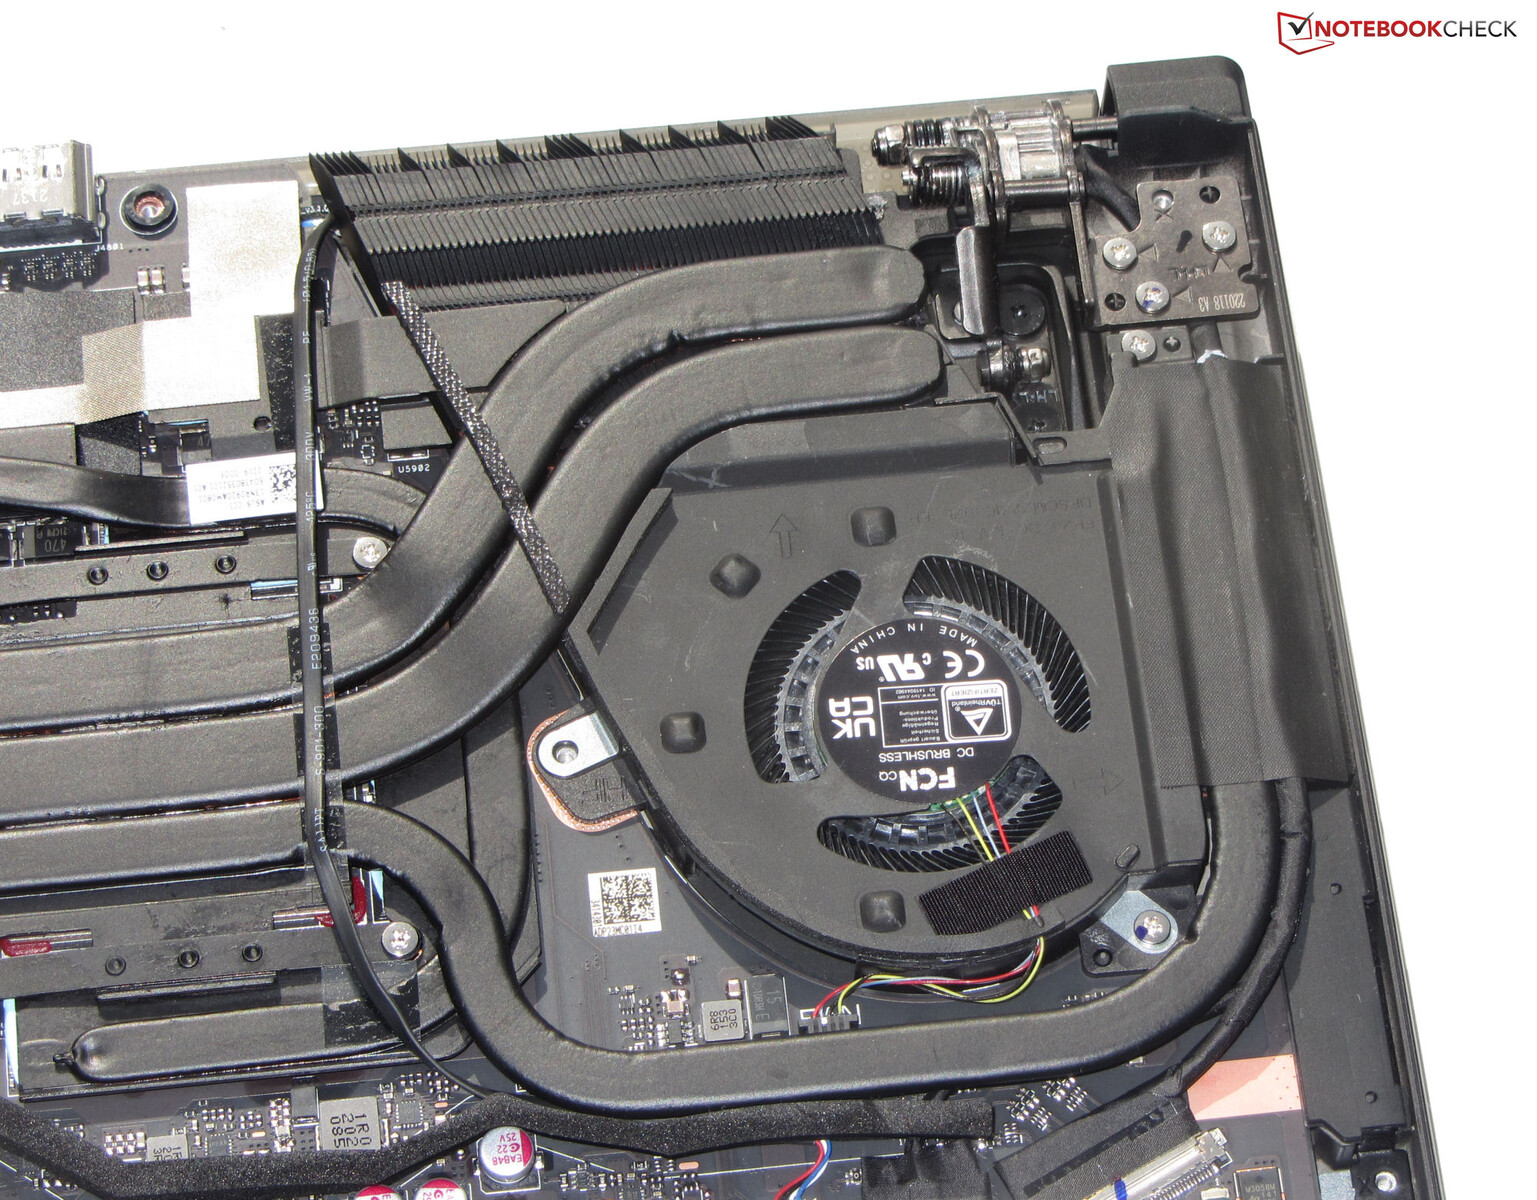
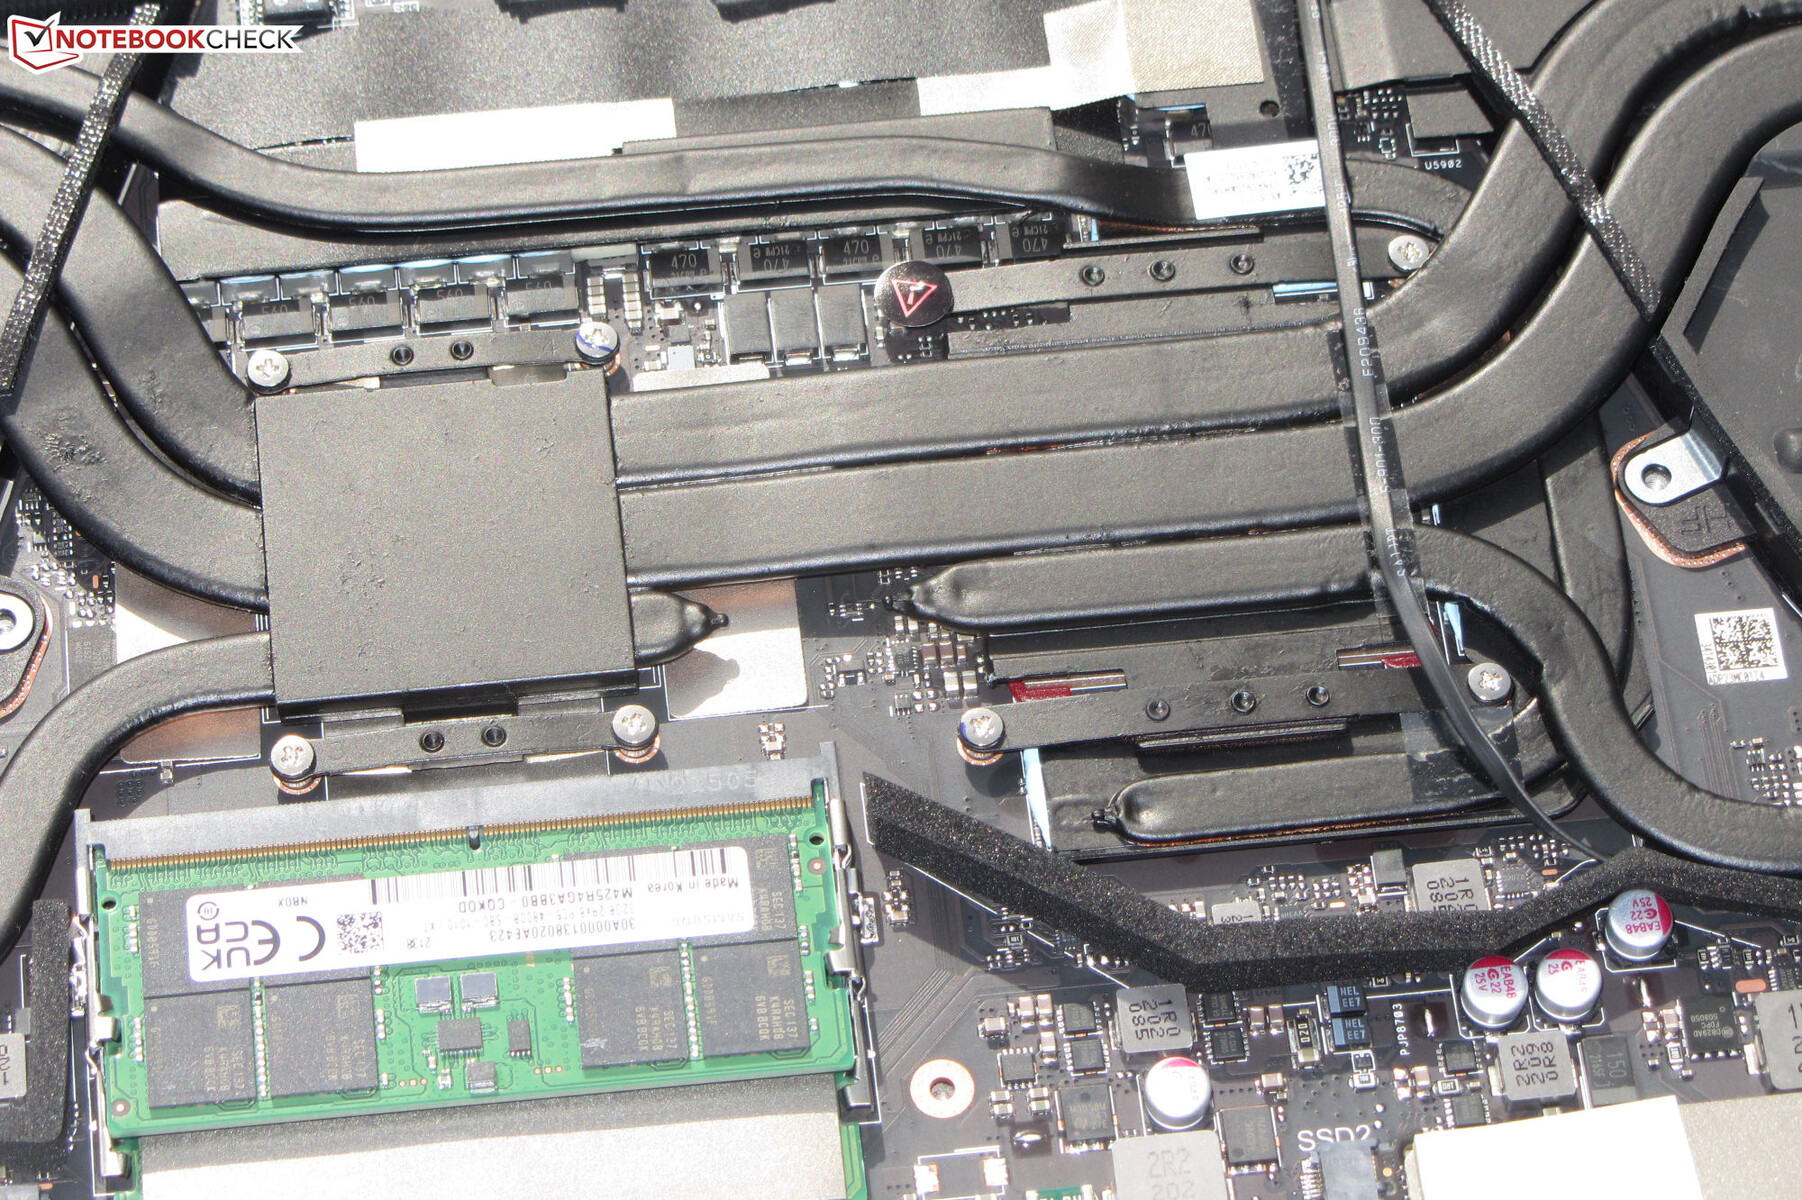
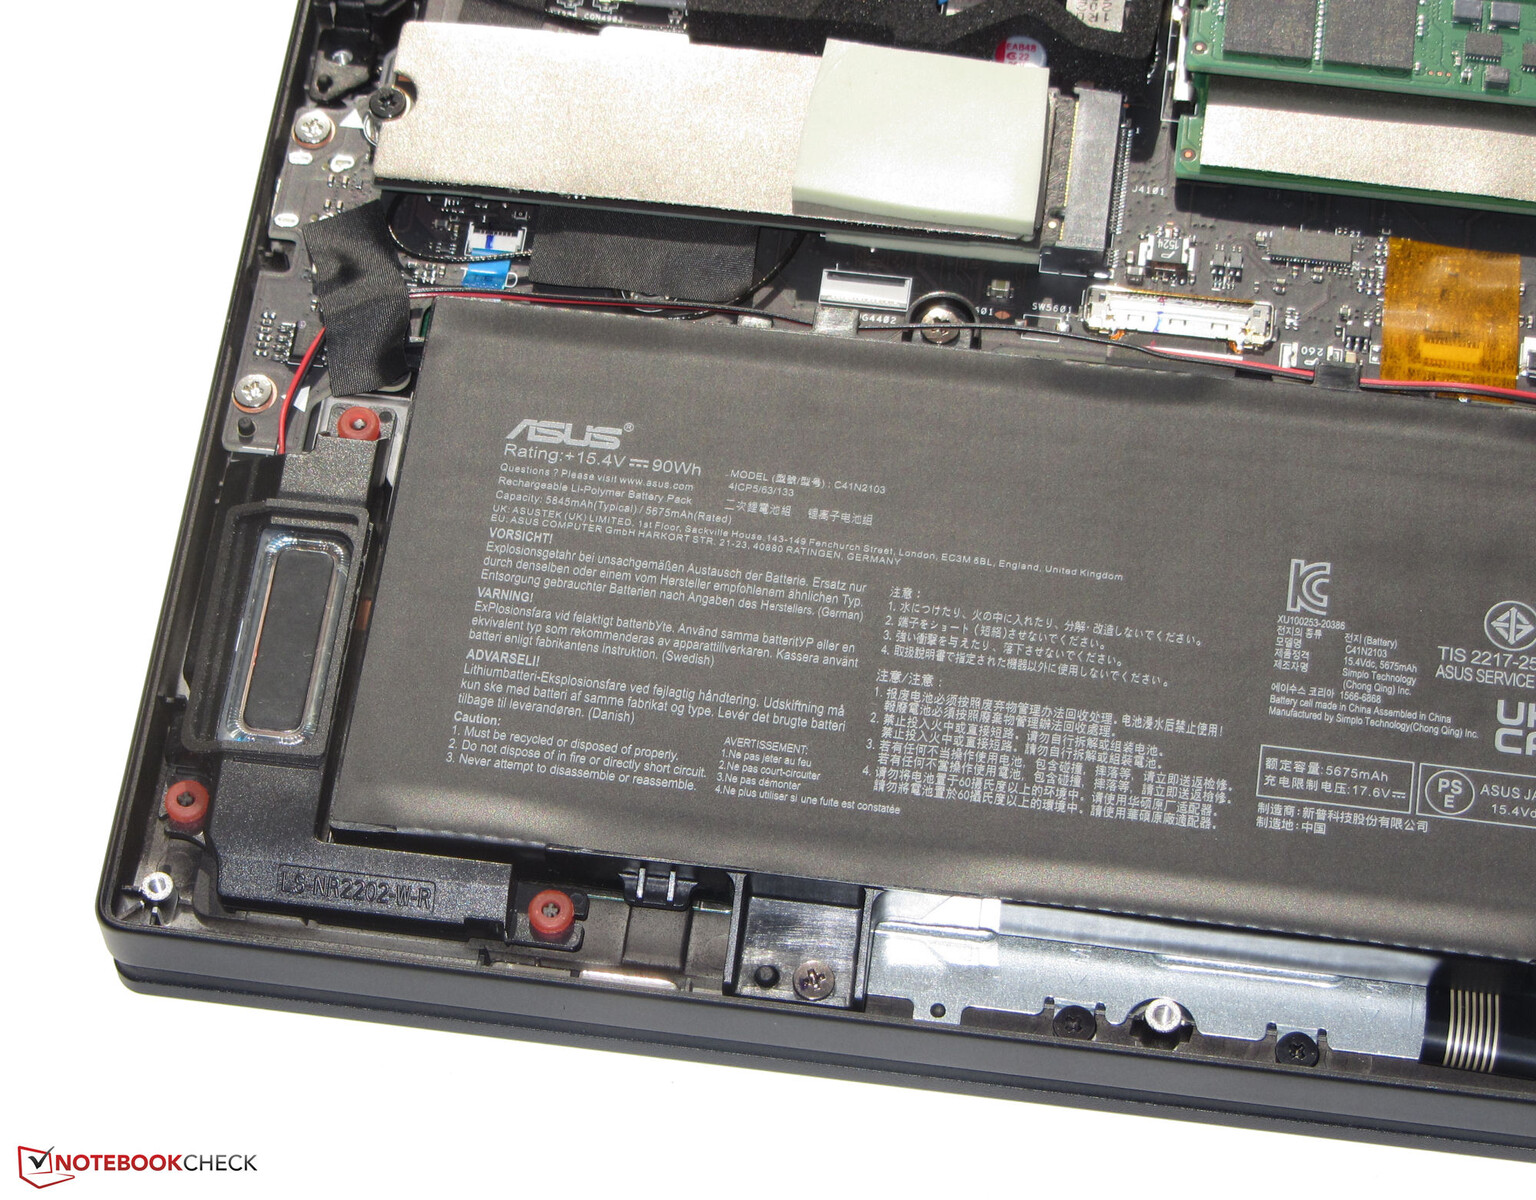
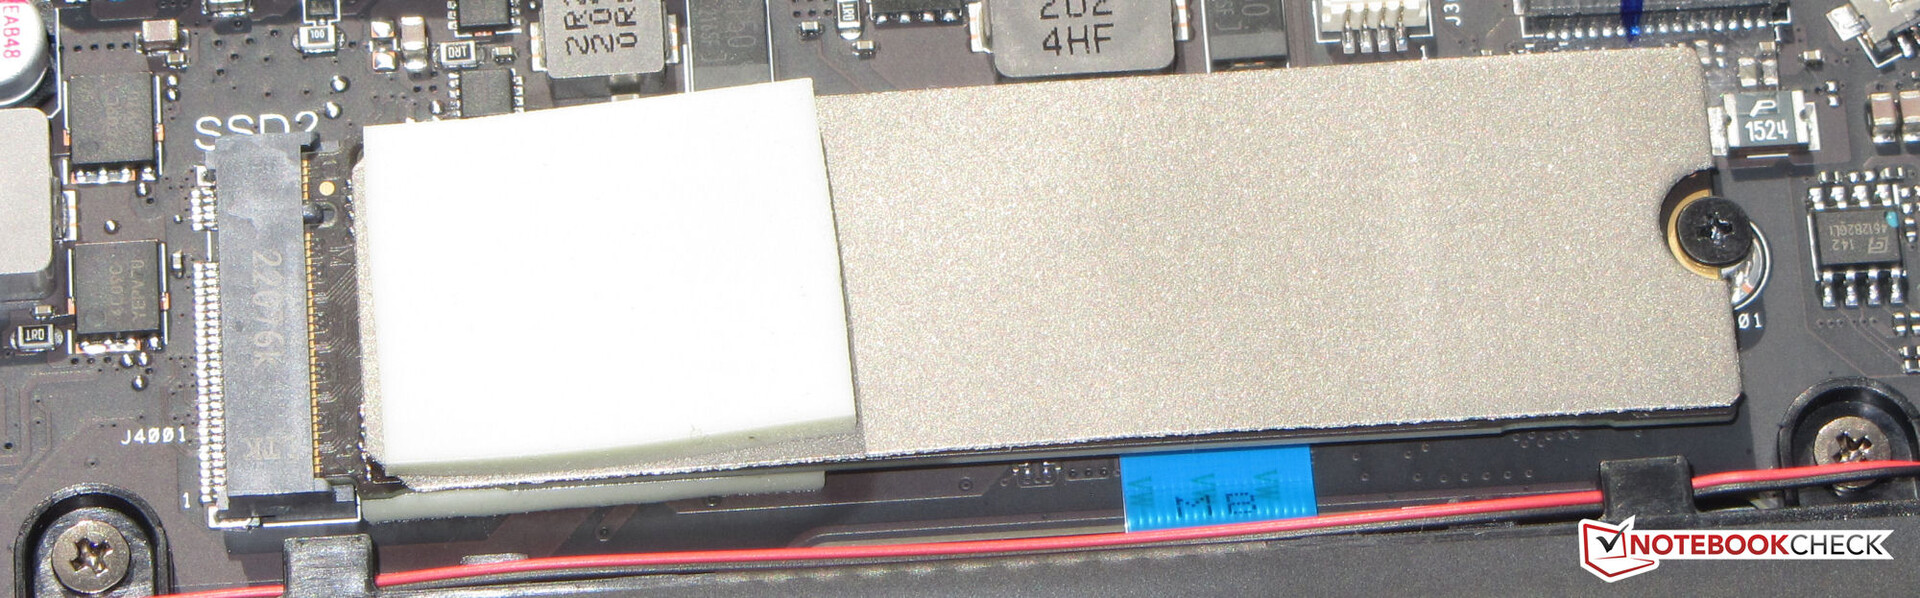
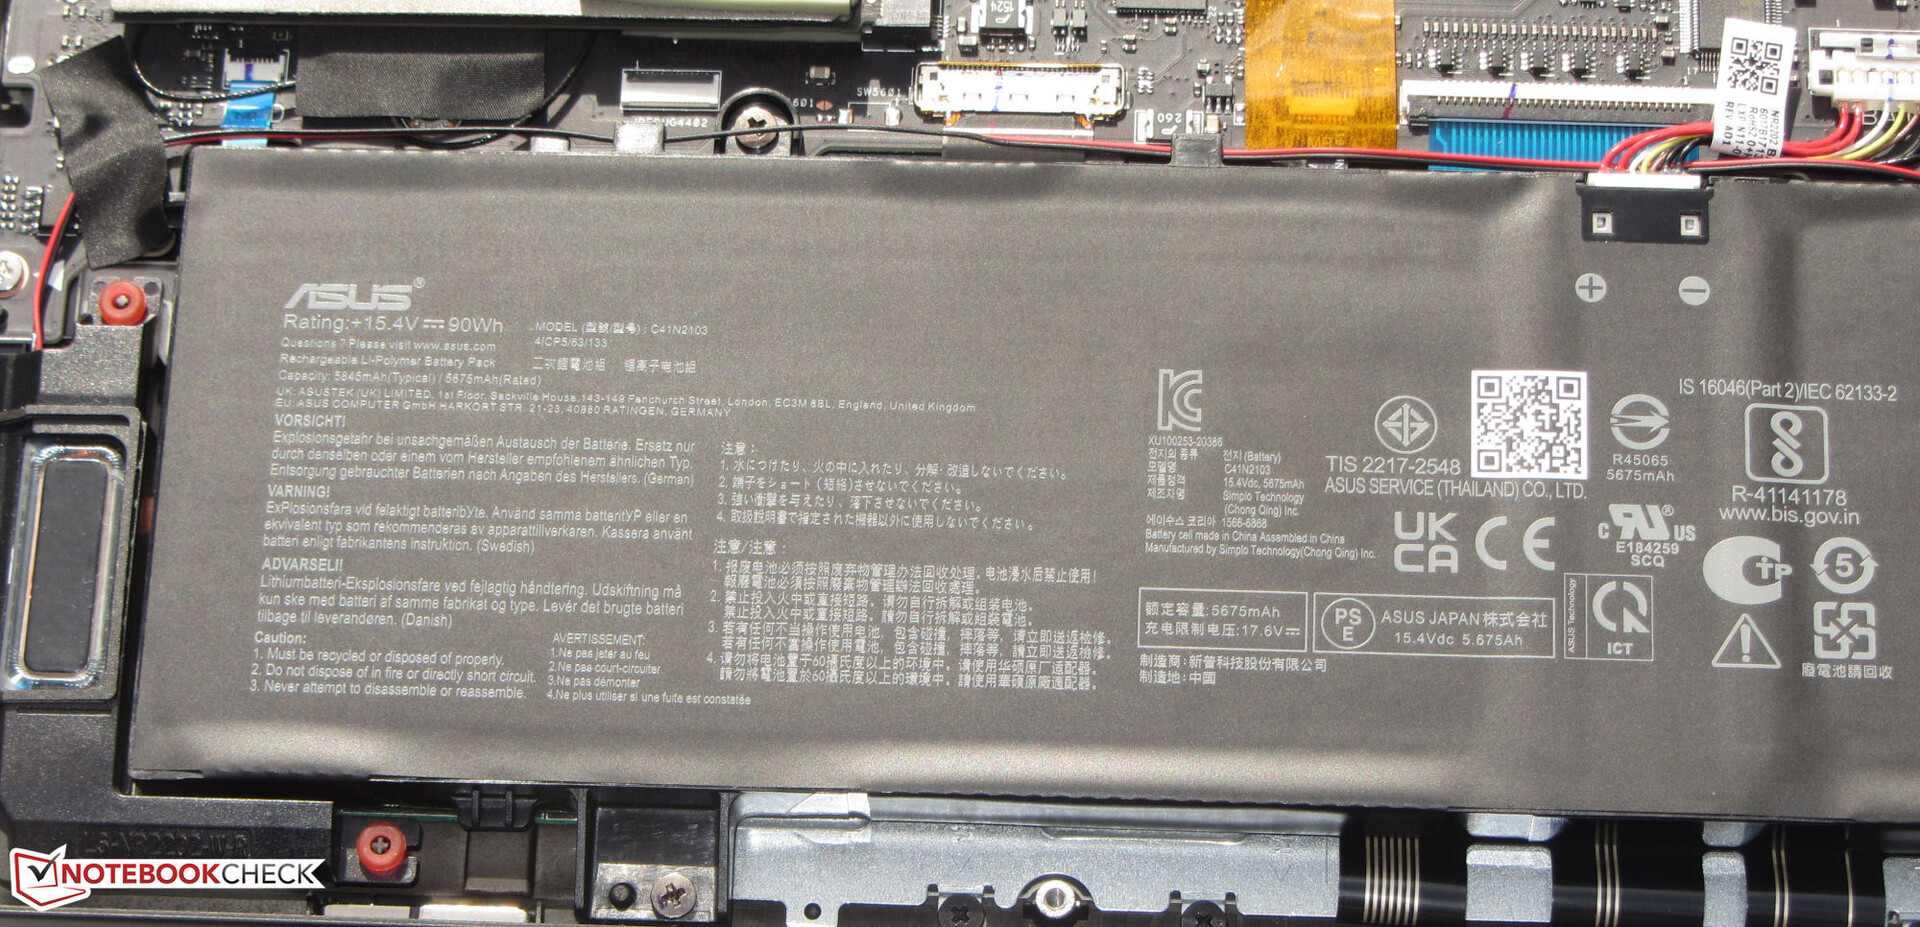
要取下机箱的底部,首先要取下底部的螺丝。但你需要注意,因为机箱中间的一颗螺丝被一块小橡胶板覆盖。机箱的背面也被一些夹子固定住,可以通过一些小心的扭动或借助于扁平的撬动工具来松开。拆下机箱底部后,你可以看到工作内存库(两个都占用)、两个固态硬盘(PCIe 4)、风扇和电池。

担保
华硕为Zephyrus提供2年的保修。延长保修期至3年需要额外支付129欧元(约136美元)。
输入设备 - 华硕笔记本电脑的第二个显示屏
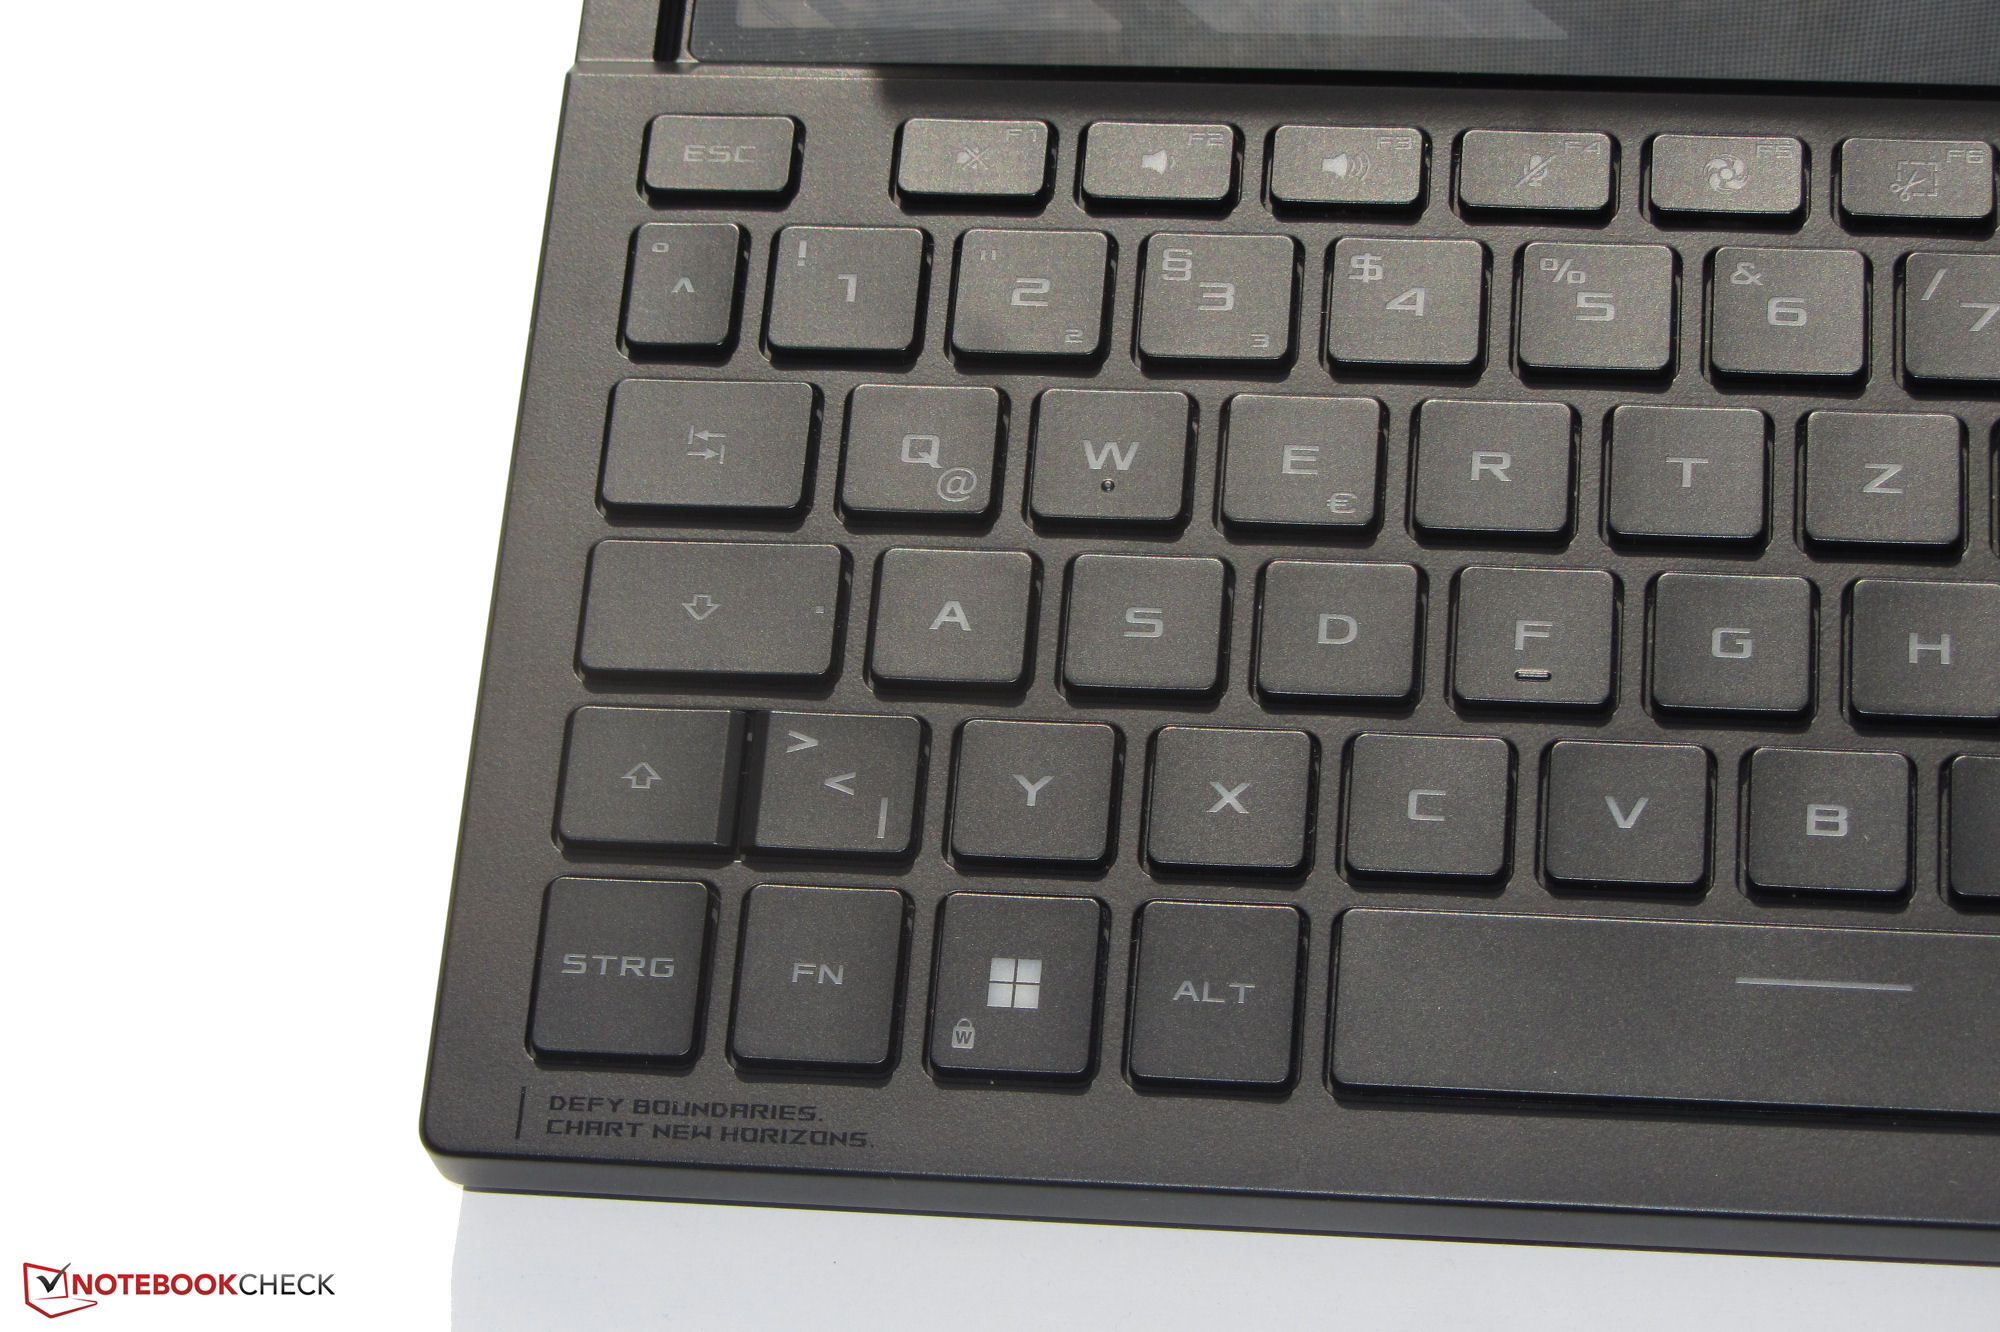
键盘
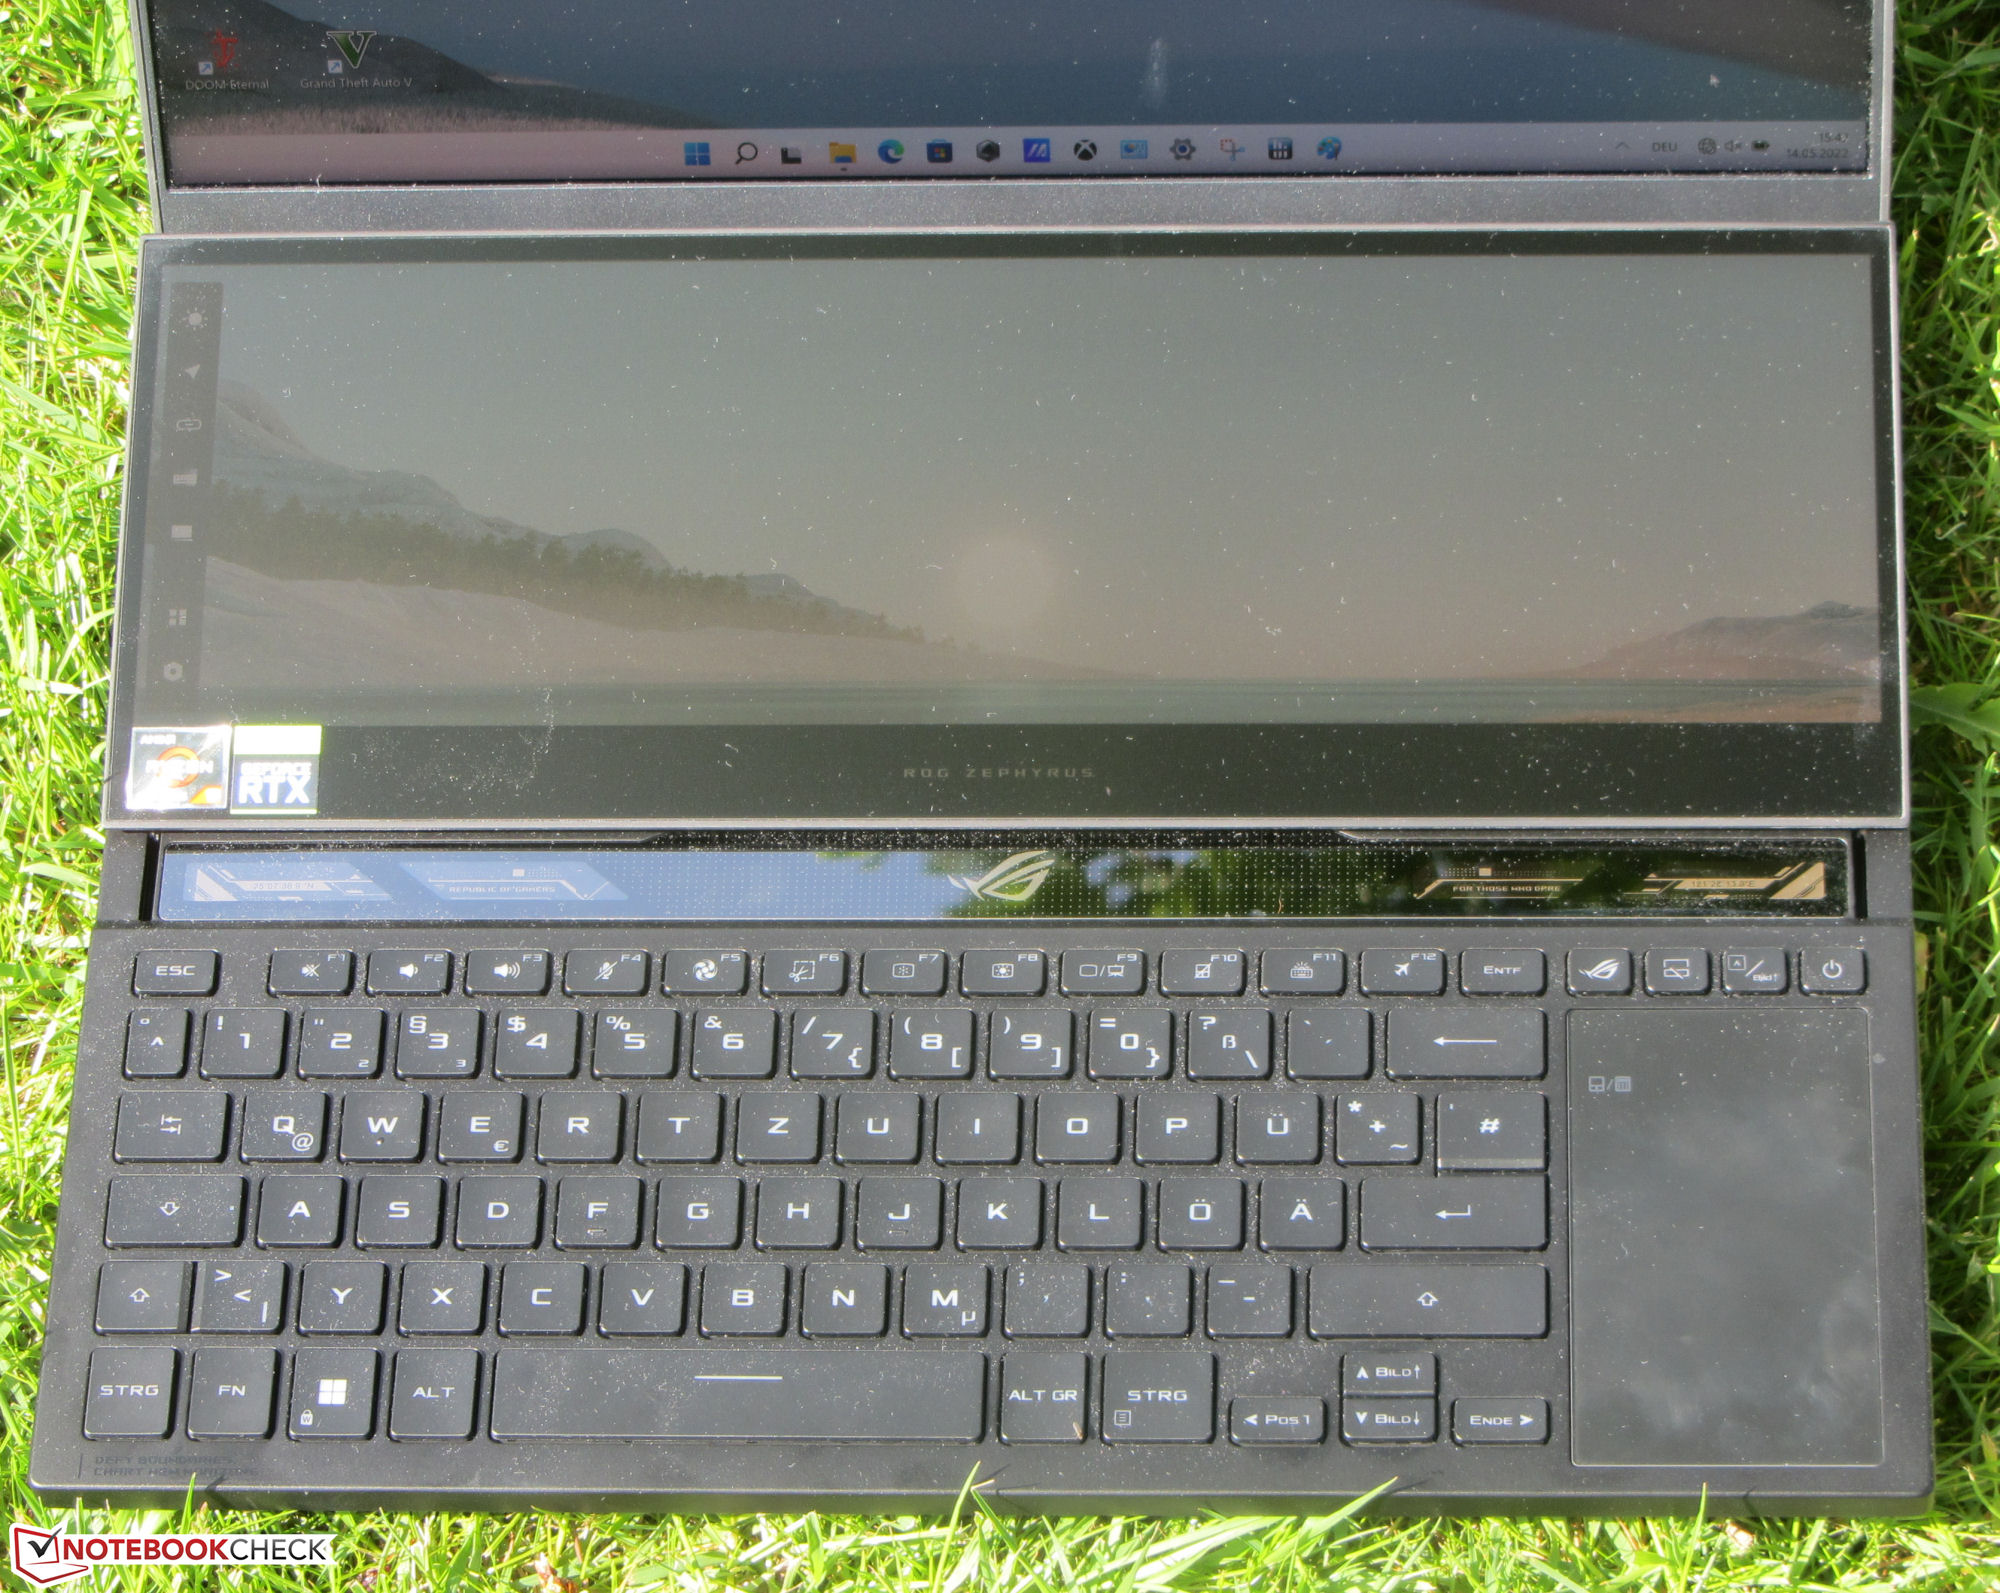
只有当你使用附带的由橡胶制成的掌托(深度:约5.5厘米,2.2英寸,有角度)时,键盘才可以舒适地打字。虽然它做得相当好,但它真的只在固定的表面上工作。发光小键盘的光滑按键行程短,压力点清晰。键的阻力还可以,键盘在打字时不会弯曲。三段式RGB照明是通过一个功能键控制的。总的来说,华硕在这里提供了一个适合日常工作的键盘。
触摸板
一个纵向的具有多点触摸功能的点击板(~5.8 x 9.6厘米,~2.3 x 3.8英寸)可作为鼠标的替代品。其光滑的表面有利于手指的滑动。鼠标垫有一个短的行程和清晰的压力点。敲击键盘上的相应符号将显示一个数字键盘。
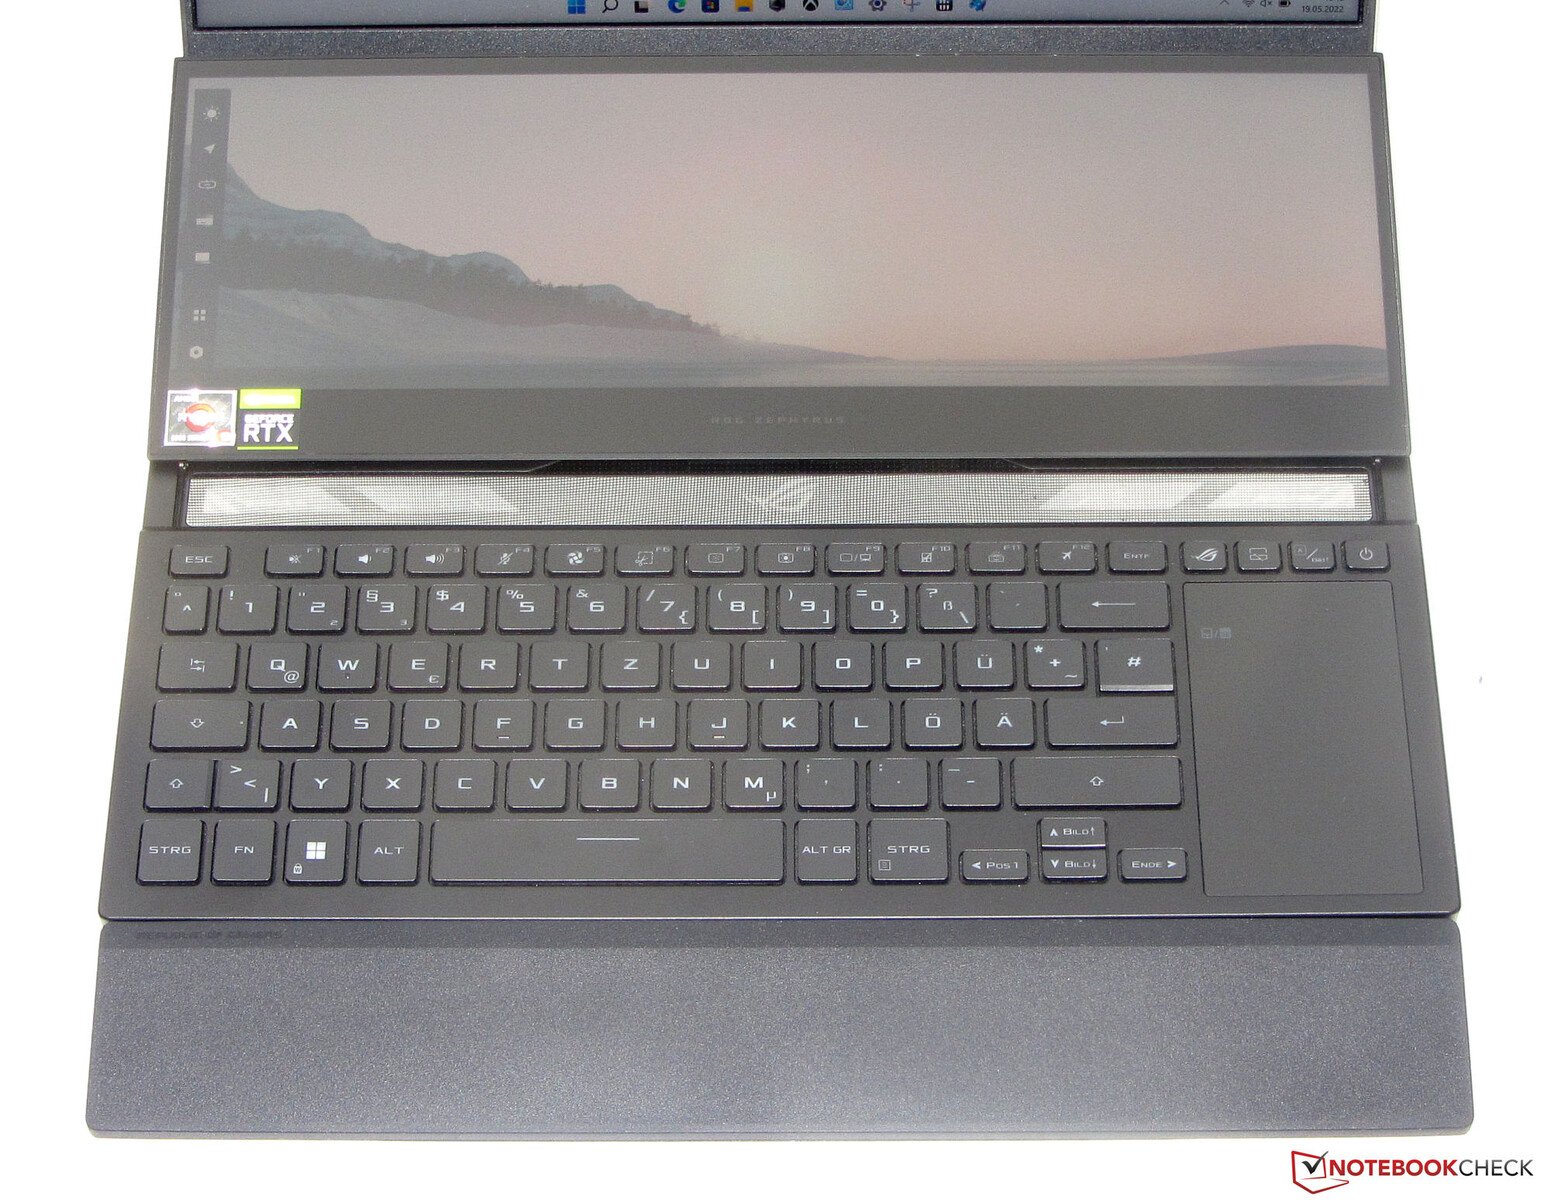
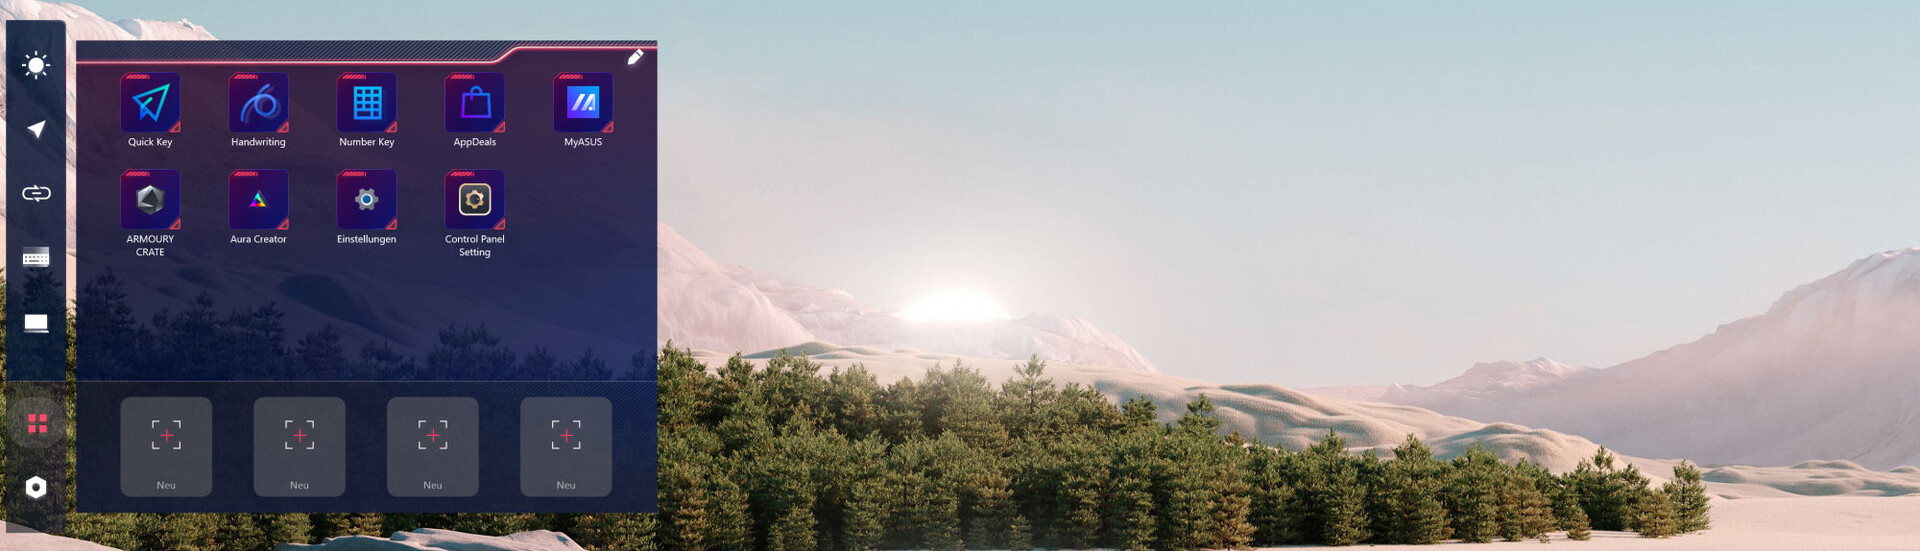
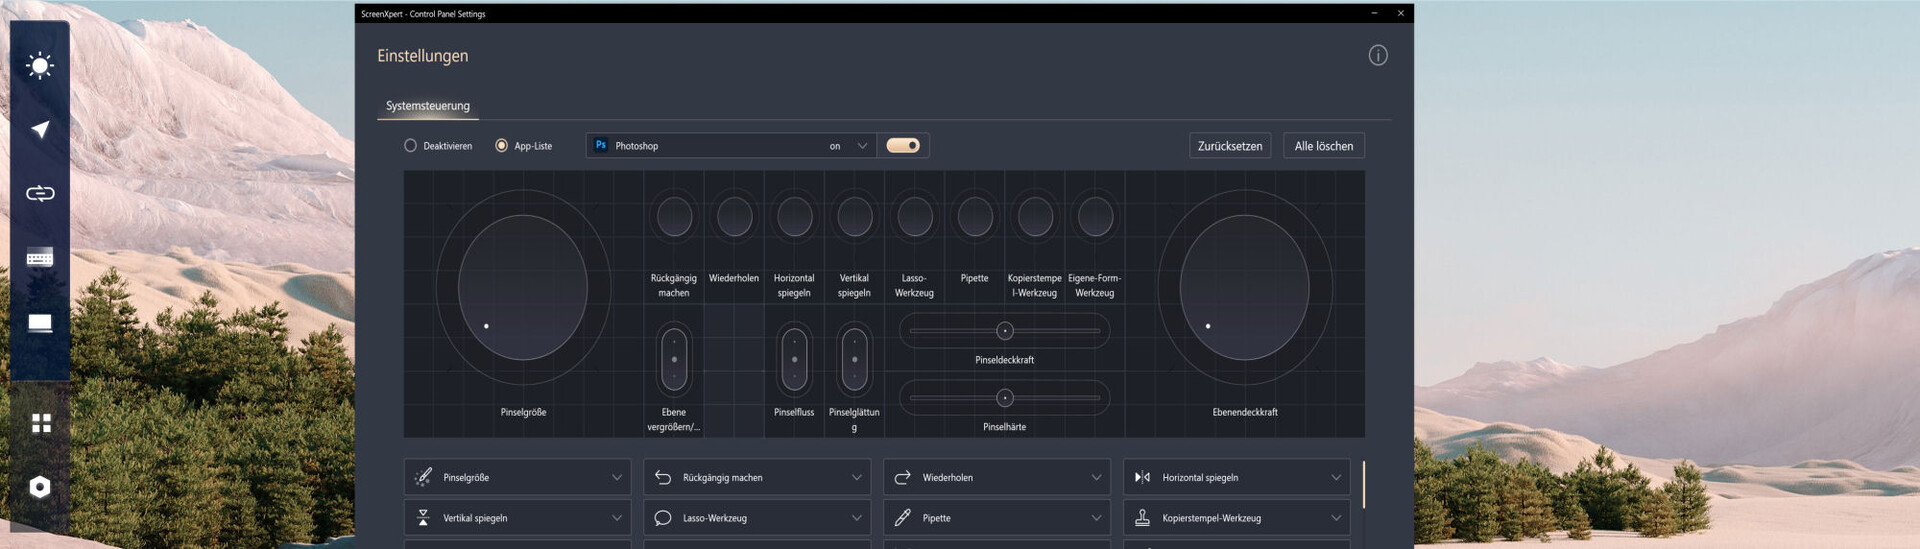
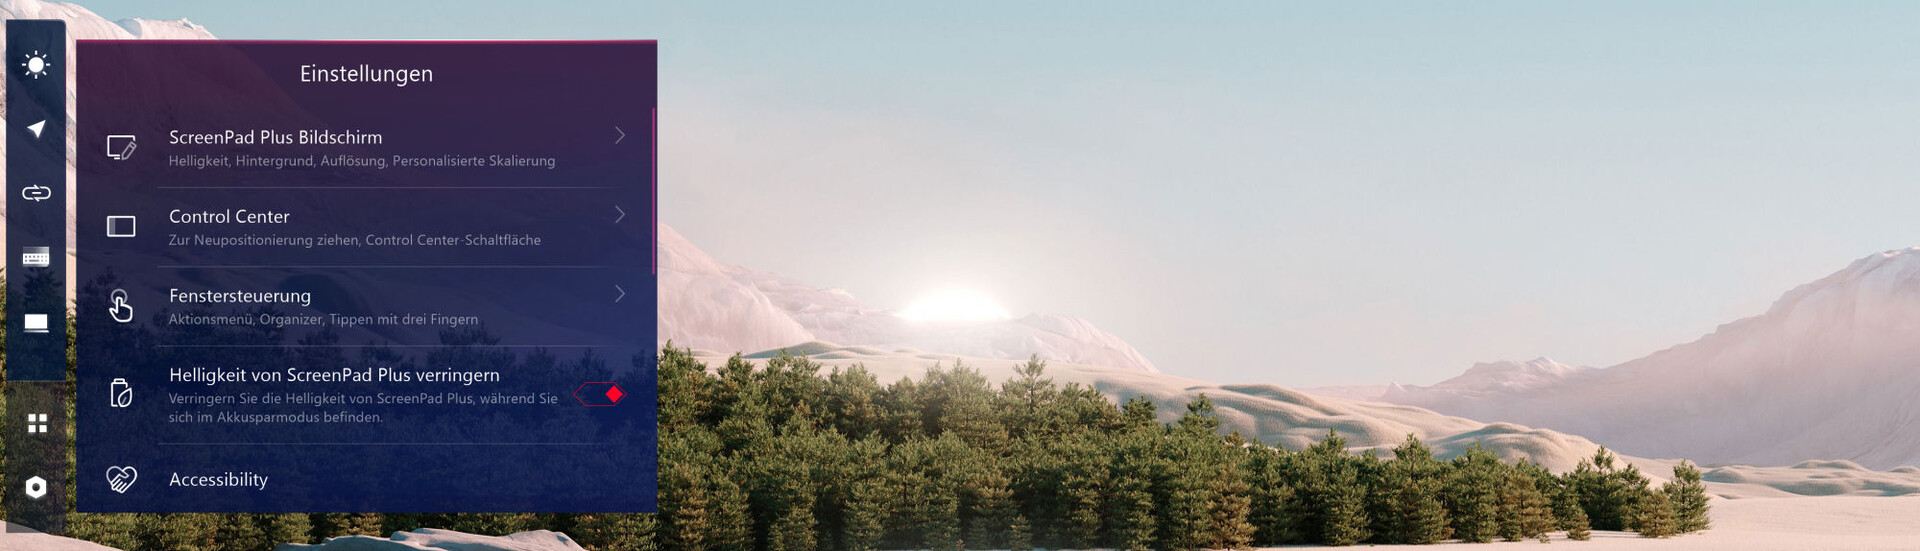
华硕Screenpad Plus
还有一个额外的输入选项,即Screenpad Plus(14英寸,3840 x 1100像素,哑光),这是一个包括触摸屏功能(支持主动输入笔)的第二个显示屏。它的行为与任何其他插入式外部显示器一样,可以通过单独的键打开和关闭。
屏幕板提供了将应用程序或其导航元素移动到触摸屏上的选项。例如,当游戏在主屏幕上运行时,我们可以将聊天窗口移到屏幕板上。
有几个预装的小应用程序,让人对Screenpad的可能性有了印象。例如,有一个计算器和一个手写输入区域,一个快速键应用程序捆绑了经常使用的功能,如剪切、复制和粘贴。

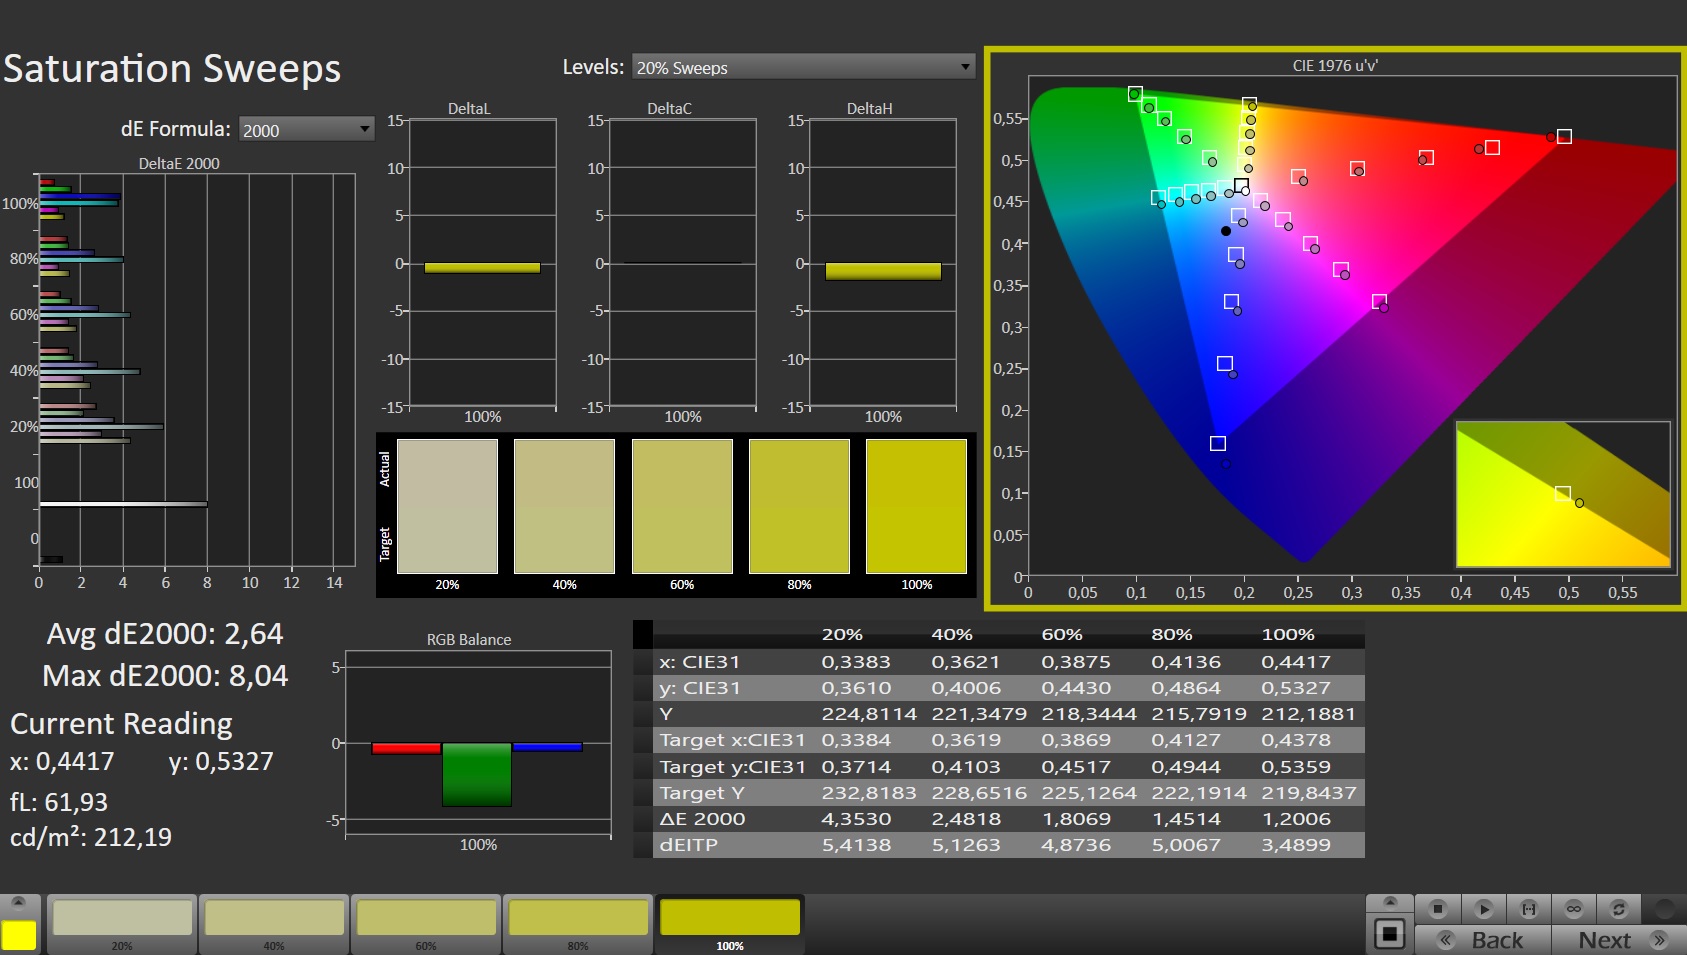
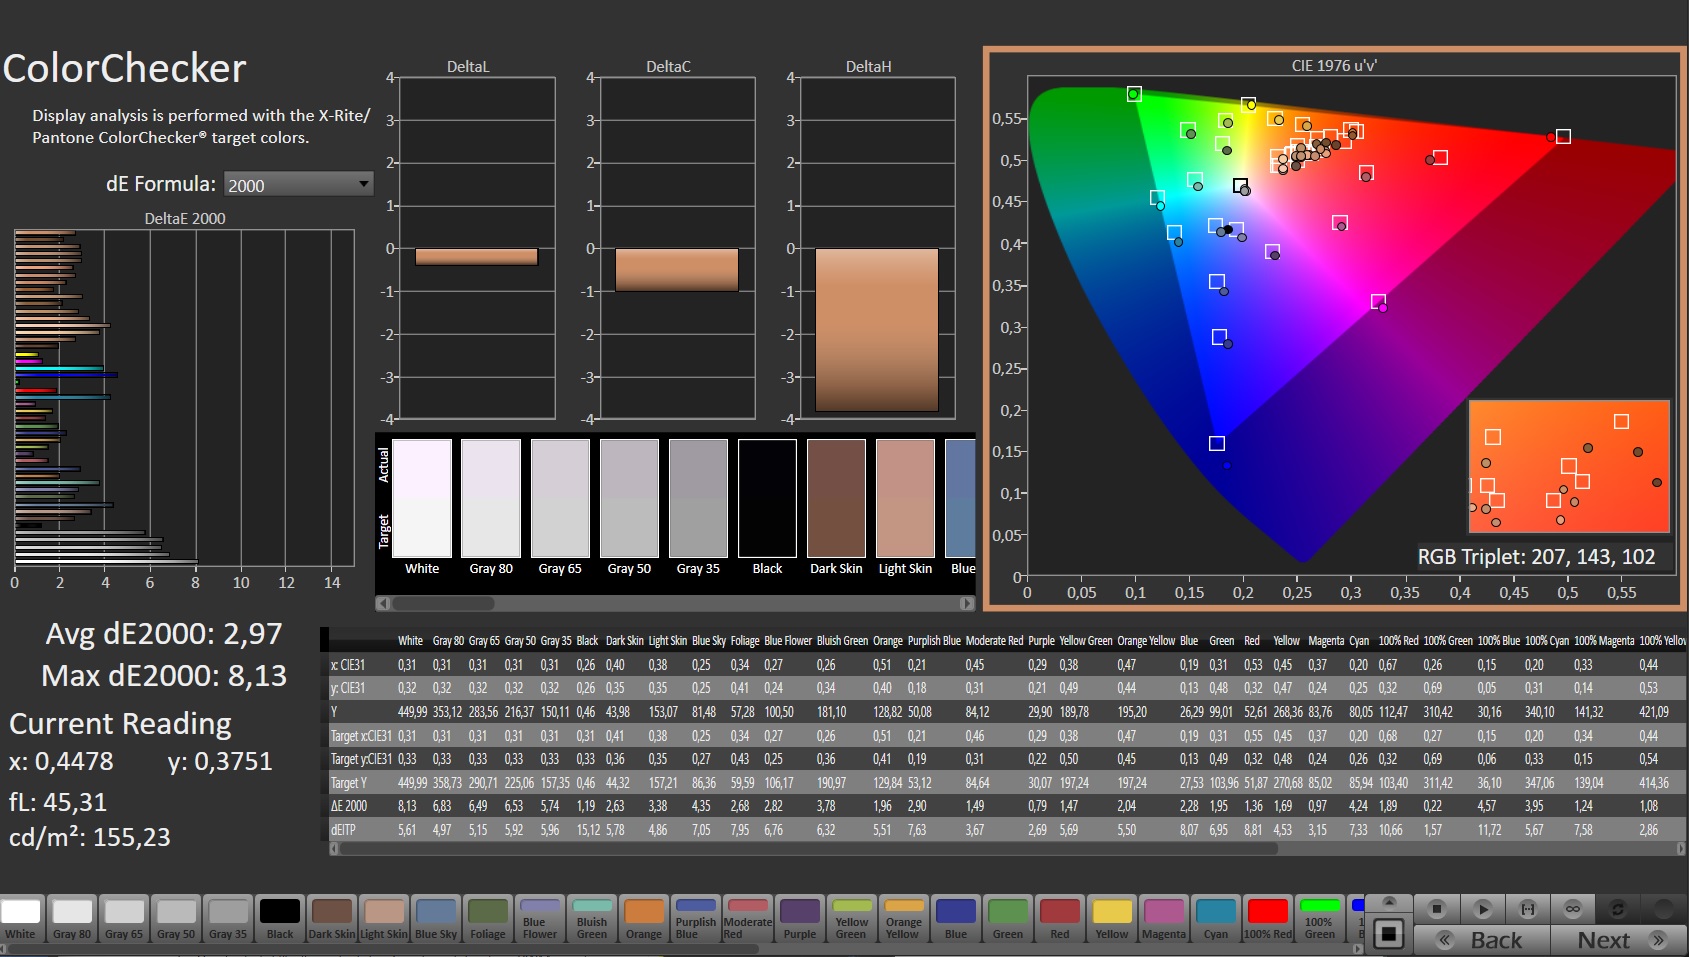
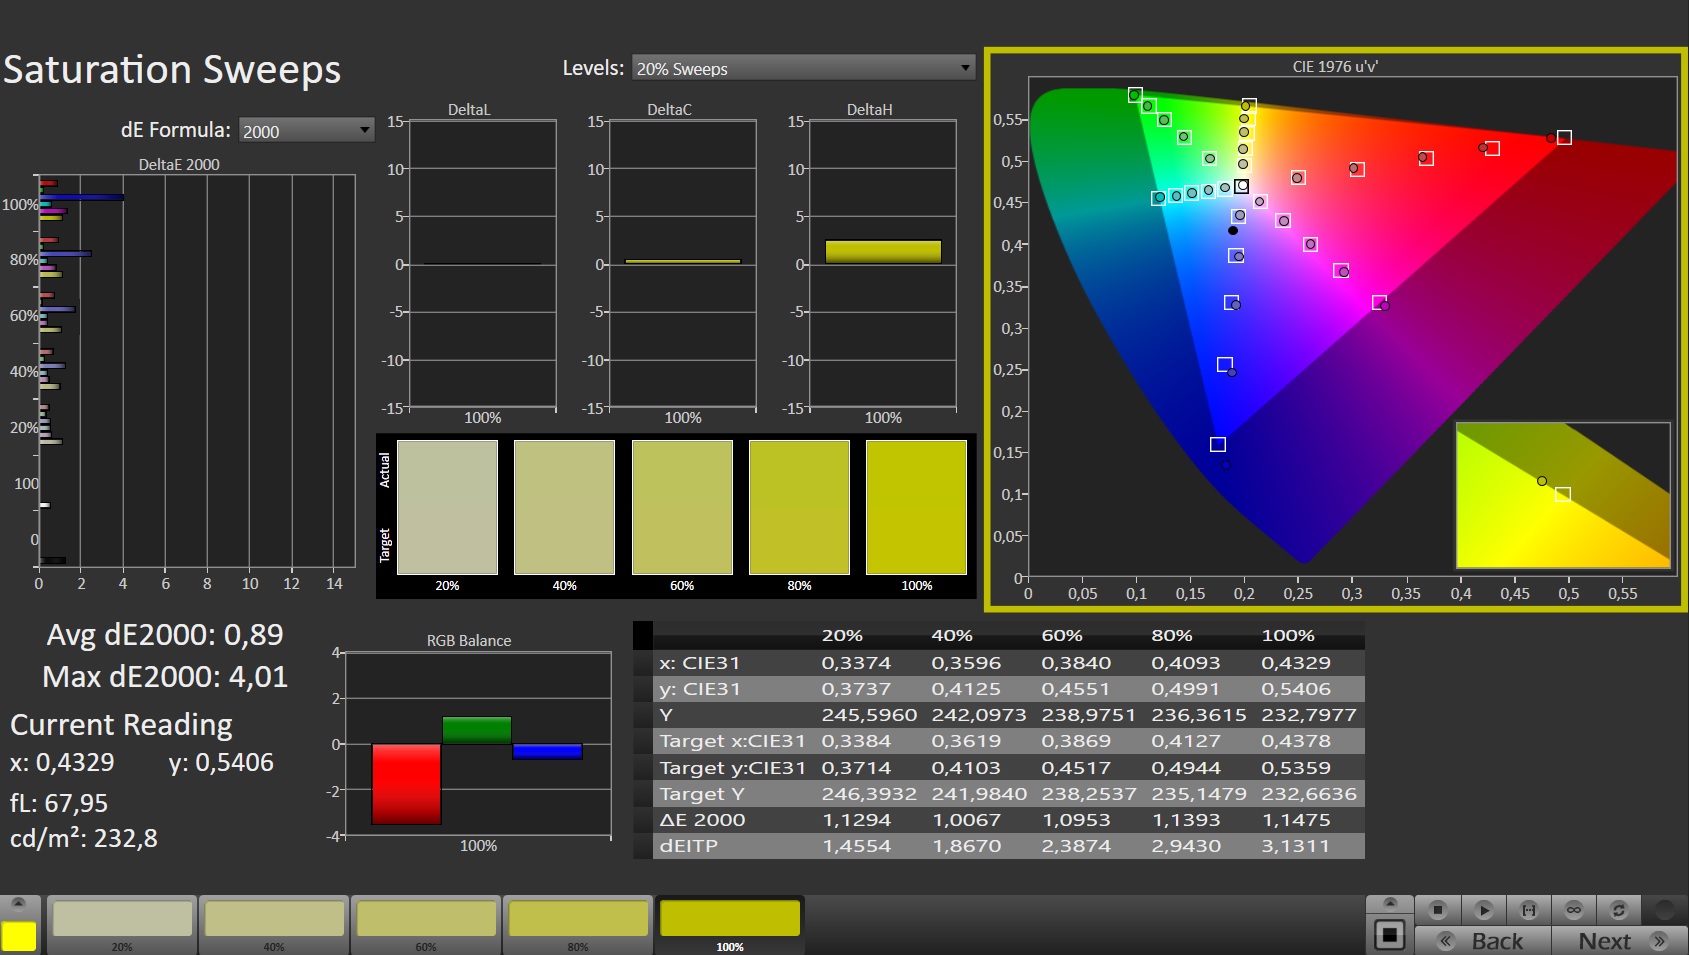
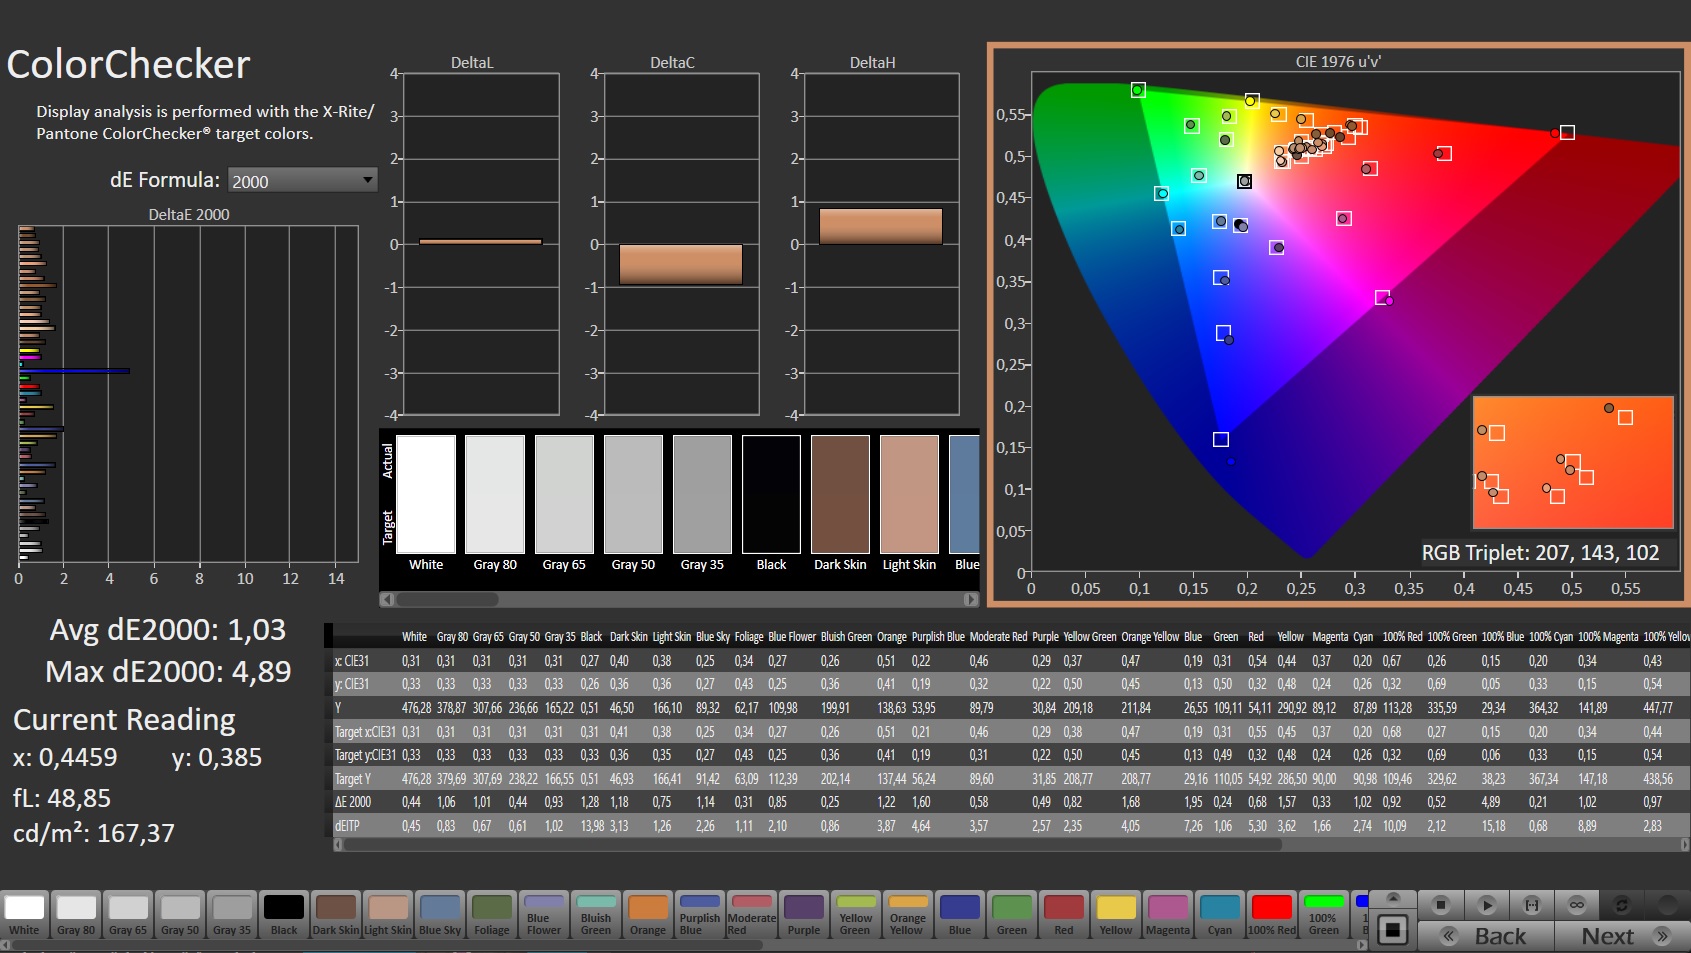
显示 - 良好的色彩再现
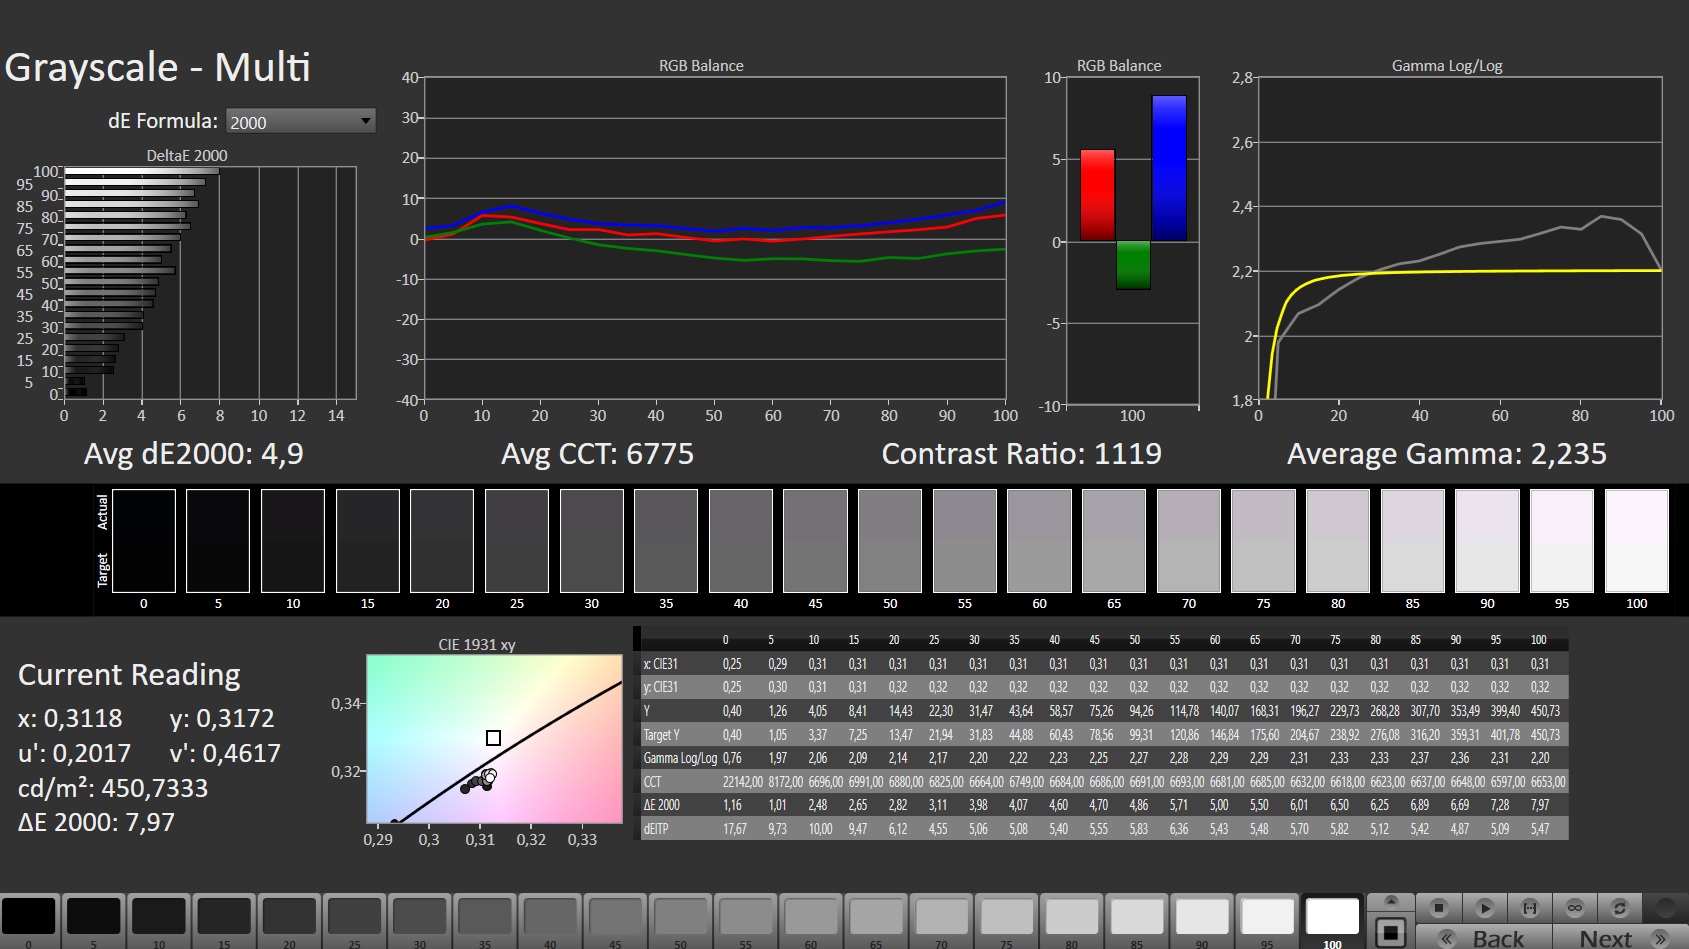
哑光16英寸显示屏(3840 x 2400像素)的亮度(433.9 cd/m²)和对比度(1043:1)符合要求。积极的一点是快速响应时间和缺乏PWM闪烁。
该显示器支持AMD的FreeSync技术,该技术可以动态地调整显示器的刷新率和GPU的帧率,使之相互适应。通过这种方式,创建的图像应该是尽可能平滑的,特别是在电脑游戏期间。
| |||||||||||||||||||||||||
Brightness Distribution: 88 %
Center on Battery: 459 cd/m²
Contrast: 1043:1 (Black: 0.44 cd/m²)
ΔE ColorChecker Calman: 2.97 | ∀{0.5-29.43 Ø4.72}
calibrated: 1.03
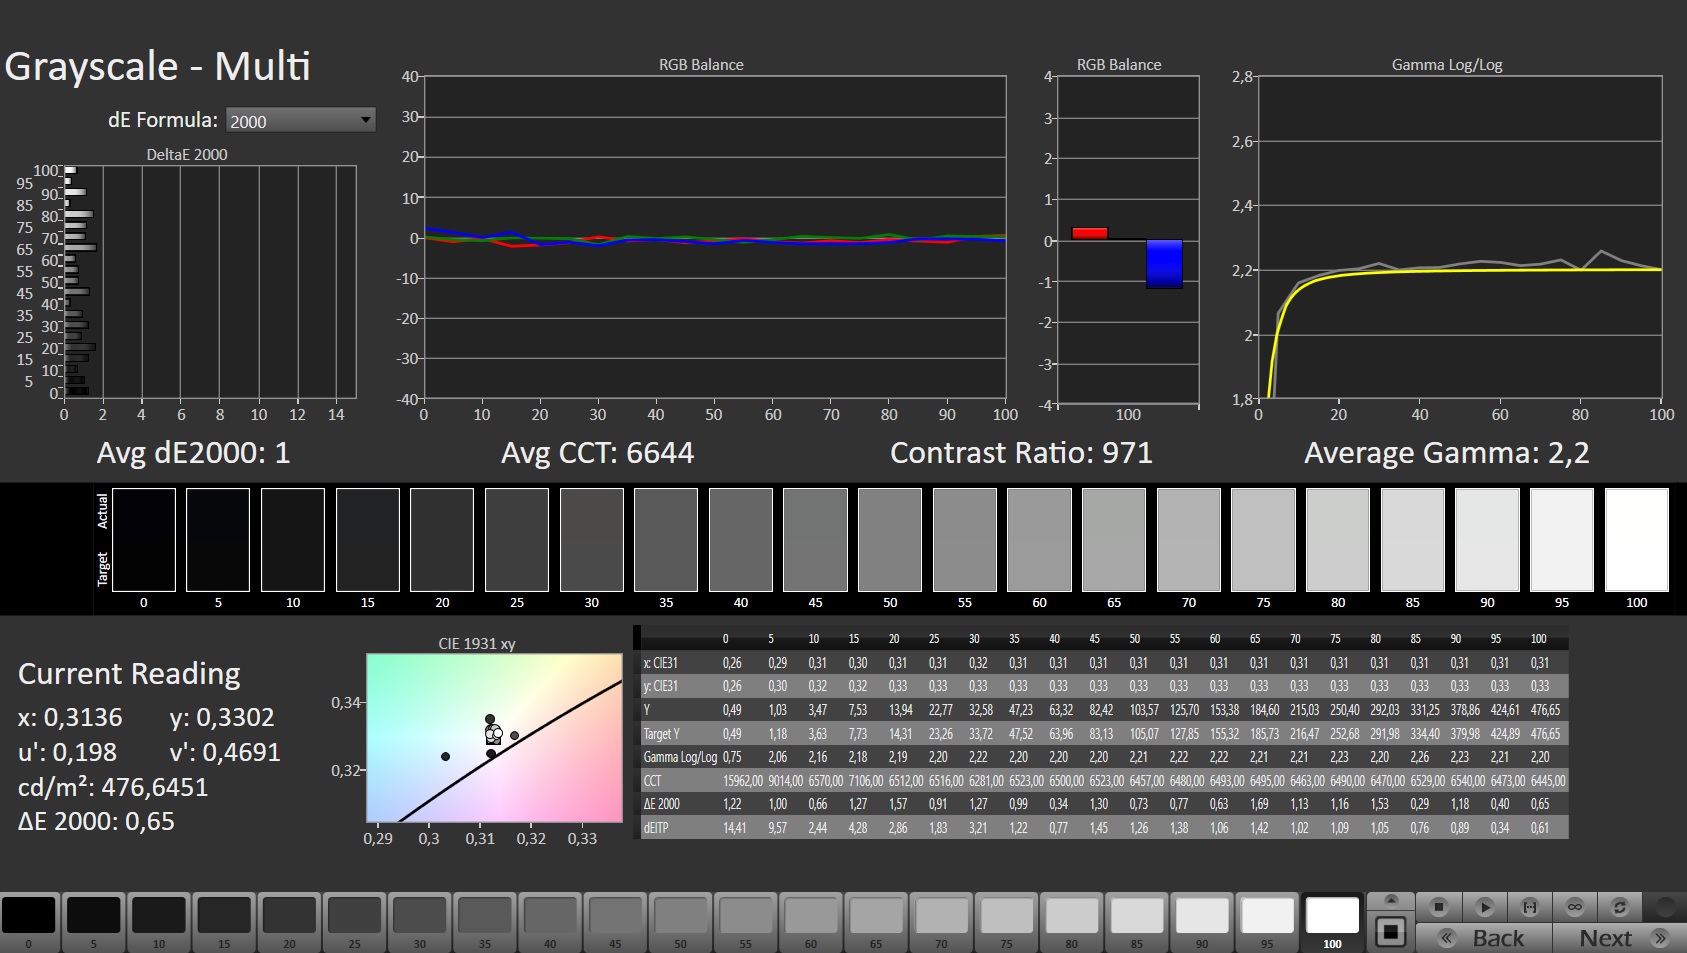
ΔE Greyscale Calman: 4.9 | ∀{0.09-98 Ø4.97}
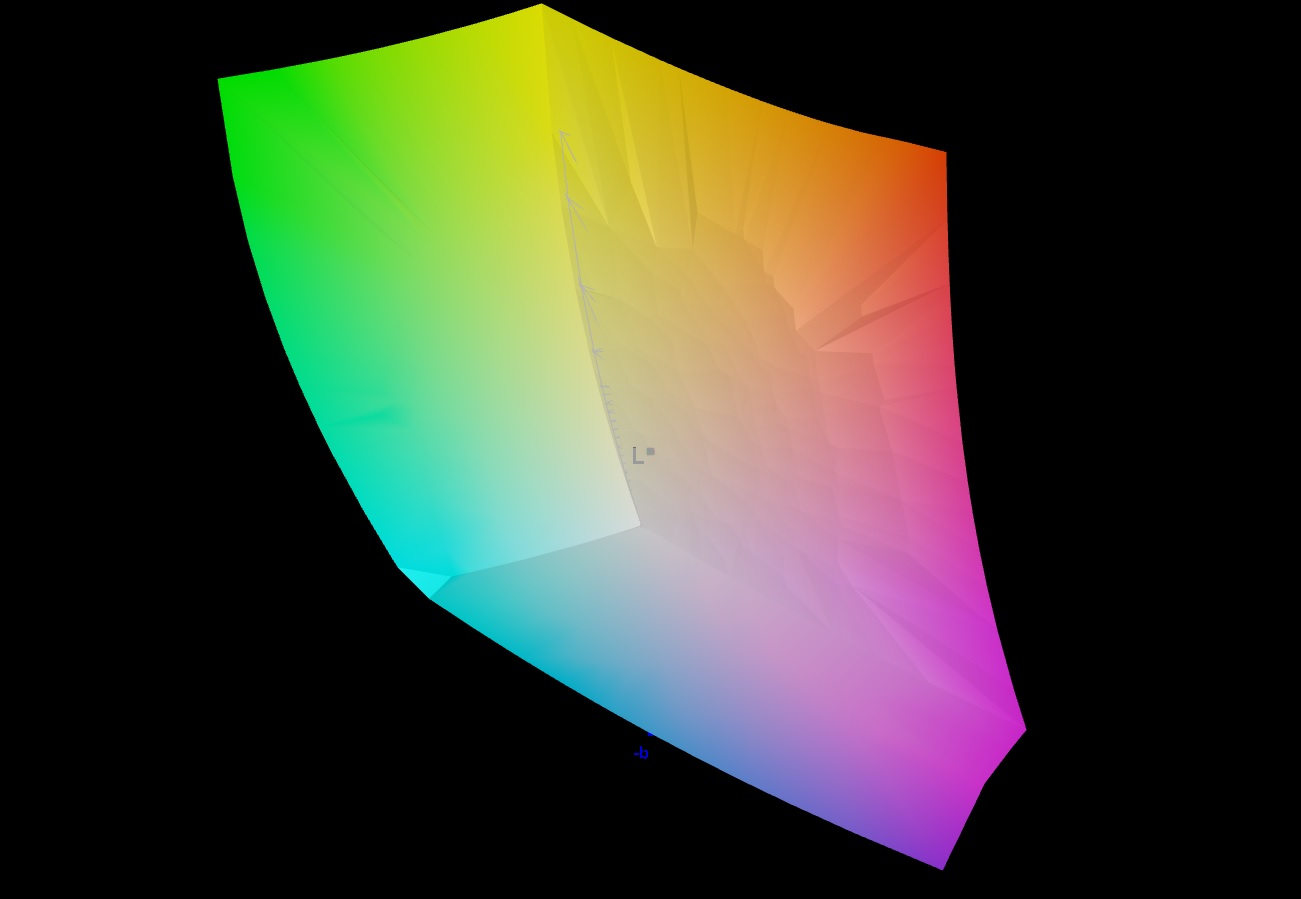
86.3% AdobeRGB 1998 (Argyll 3D)
99.9% sRGB (Argyll 3D)
98% Display P3 (Argyll 3D)
Gamma: 2.235
CCT: 6775 K
| Asus ROG Zephyrus Duo 16 GX650RX BOE NE160QAM-NX1, IPS-Level, 3840x2400, 16" | Apple MacBook Pro 16 2021 M1 Max Mini-LED, 3456x2234, 16.2" | Razer Blade 15 Advanced Model Early 2022 TL156VDXP02-0, IPS, 1920x1080, 15.6" | MSI GE76 Raider AU Optronics B173HAN05.4 (AUOE295), IPS-Level, 1920x1080, 17.3" | Medion Erazer Beast X30 BOE CQ NE173QHM-NZ3, IPS, 2560x1440, 17.3" | Gigabyte Aero 16 YE5 Samsung SDC416B, AMOLED, 3840x2400, 16" | |
|---|---|---|---|---|---|---|
| Display | -23% | -22% | -18% | |||
| Display P3 Coverage (%) | 98 | 65.3 -33% | 63.1 -36% | 67.7 -31% | ||
| sRGB Coverage (%) | 99.9 | 85.1 -15% | 94 -6% | 97.6 -2% | ||
| AdobeRGB 1998 Coverage (%) | 86.3 | 67.4 -22% | 65.2 -24% | 69.2 -20% | ||
| Response Times | -9% | -5% | -26% | 74% | ||
| Response Time Grey 50% / Grey 80% * (ms) | 14.6 ? | 4.3 ? 71% | 5.6 ? 62% | 14.7 ? -1% | 2.4 ? 84% | |
| Response Time Black / White * (ms) | 5.6 ? | 10.5 ? -88% | 9.6 ? -71% | 8.4 ? -50% | 2 ? 64% | |
| PWM Frequency (Hz) | 60 ? | |||||
| Screen | 329% | 27% | 20% | 3% | 456% | |
| Brightness middle (cd/m²) | 459 | 507 10% | 330 -28% | 290 -37% | 377 -18% | 368 -20% |
| Brightness (cd/m²) | 434 | 494 14% | 315 -27% | 290 -33% | 352 -19% | 368 -15% |
| Brightness Distribution (%) | 88 | 96 9% | 89 1% | 96 9% | 86 -2% | 93 6% |
| Black Level * (cd/m²) | 0.44 | 0.02 95% | 0.24 45% | 0.23 48% | 0.32 27% | 0.01 98% |
| Contrast (:1) | 1043 | 25350 2330% | 1375 32% | 1261 21% | 1178 13% | 36800 3428% |
| Colorchecker dE 2000 * | 2.97 | 1.4 53% | 1.47 51% | 1.59 46% | 2.91 2% | 2.33 22% |
| Colorchecker dE 2000 max. * | 8.13 | 2.8 66% | 2.73 66% | 3.17 61% | 6.78 17% | 4.34 47% |
| Colorchecker dE 2000 calibrated * | 1.03 | 0.63 39% | 0.87 16% | 1.3 -26% | ||
| Greyscale dE 2000 * | 4.9 | 2.3 53% | 1.8 63% | 2.5 49% | 3.4 31% | 0.8 84% |
| Gamma | 2.235 98% | 2.27 97% | 2.282 96% | 2.253 98% | 2.109 104% | 2.119 104% |
| CCT | 6775 96% | 6792 96% | 6499 100% | 6640 98% | 7273 89% | 6569 99% |
| Total Average (Program / Settings) | 329% /
329% | -2% /
11% | -2% /
8% | -14% /
-6% | 265% /
380% |
* ... smaller is better
显示器的X Rite Pantone认证确保了非常自然的色彩再现。相应地,色彩显示在交付状态下已经相当准确。虽然颜色偏差仍在目标范围内,但校准仍会带来明显的改善。屏幕几乎能够完全显示sRGB(99.9%)和DCI-P3(98%)色彩空间,86%的AdobeRGB色彩空间也被覆盖。


Display Response Times
| ↔ Response Time Black to White | ||
|---|---|---|
| 5.6 ms ... rise ↗ and fall ↘ combined | ↗ 2 ms rise | 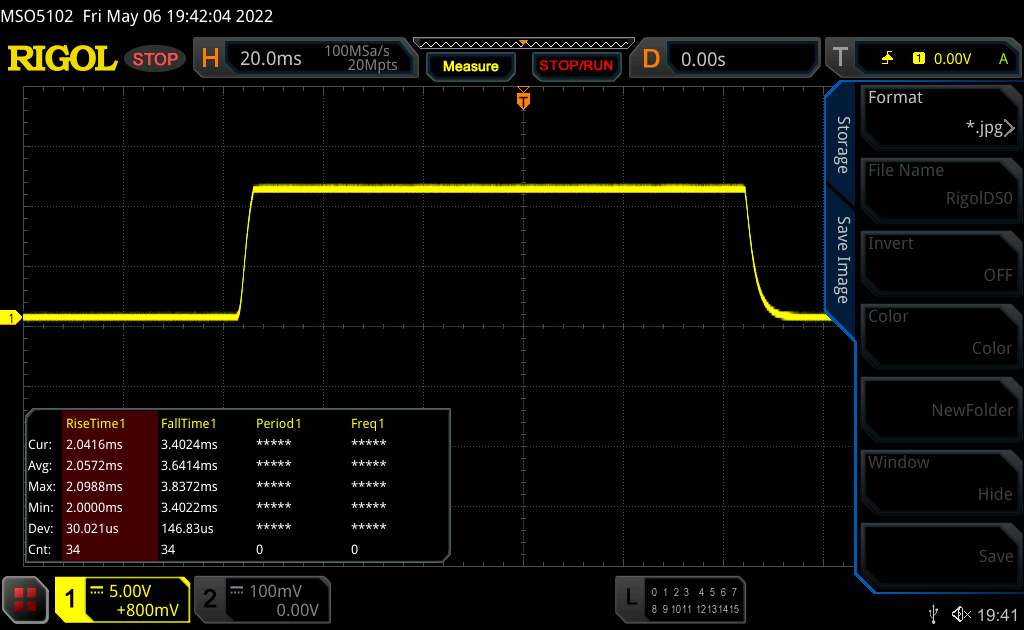 |
| ↘ 3.6 ms fall | ||
| The screen shows very fast response rates in our tests and should be very well suited for fast-paced gaming. In comparison, all tested devices range from 0.1 (minimum) to 240 (maximum) ms. » 18 % of all devices are better. This means that the measured response time is better than the average of all tested devices (19.8 ms). | ||
| ↔ Response Time 50% Grey to 80% Grey | ||
| 14.6 ms ... rise ↗ and fall ↘ combined | ↗ 6.7 ms rise | 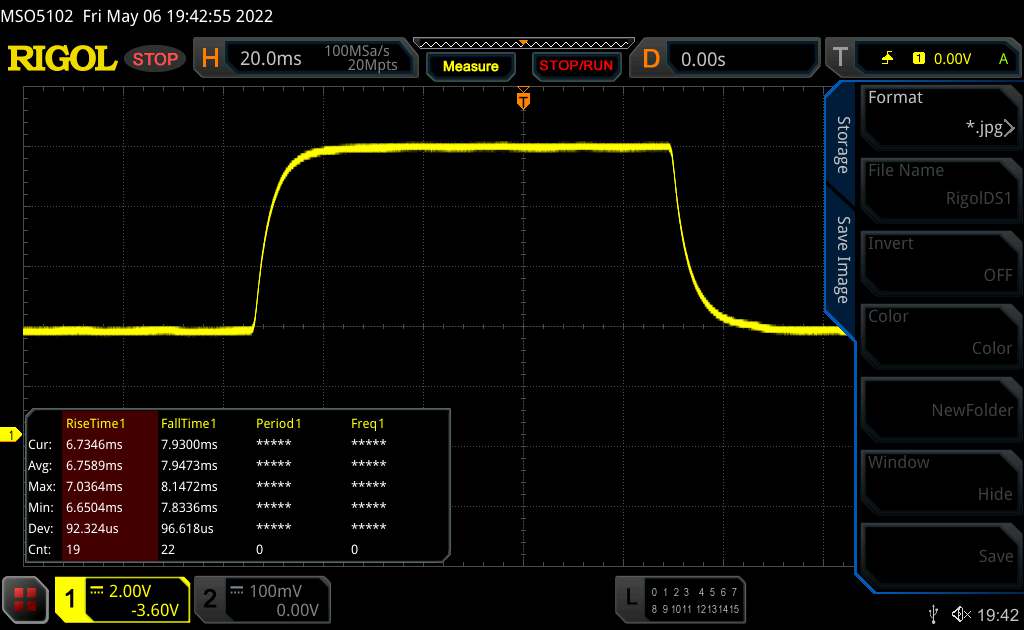 |
| ↘ 7.9 ms fall | ||
| The screen shows good response rates in our tests, but may be too slow for competitive gamers. In comparison, all tested devices range from 0.165 (minimum) to 636 (maximum) ms. » 29 % of all devices are better. This means that the measured response time is better than the average of all tested devices (31 ms). | ||
Screen Flickering / PWM (Pulse-Width Modulation)
| Screen flickering / PWM not detected |  | ||
In comparison: 52 % of all tested devices do not use PWM to dim the display. If PWM was detected, an average of 7763 (minimum: 5 - maximum: 343500) Hz was measured. | |||
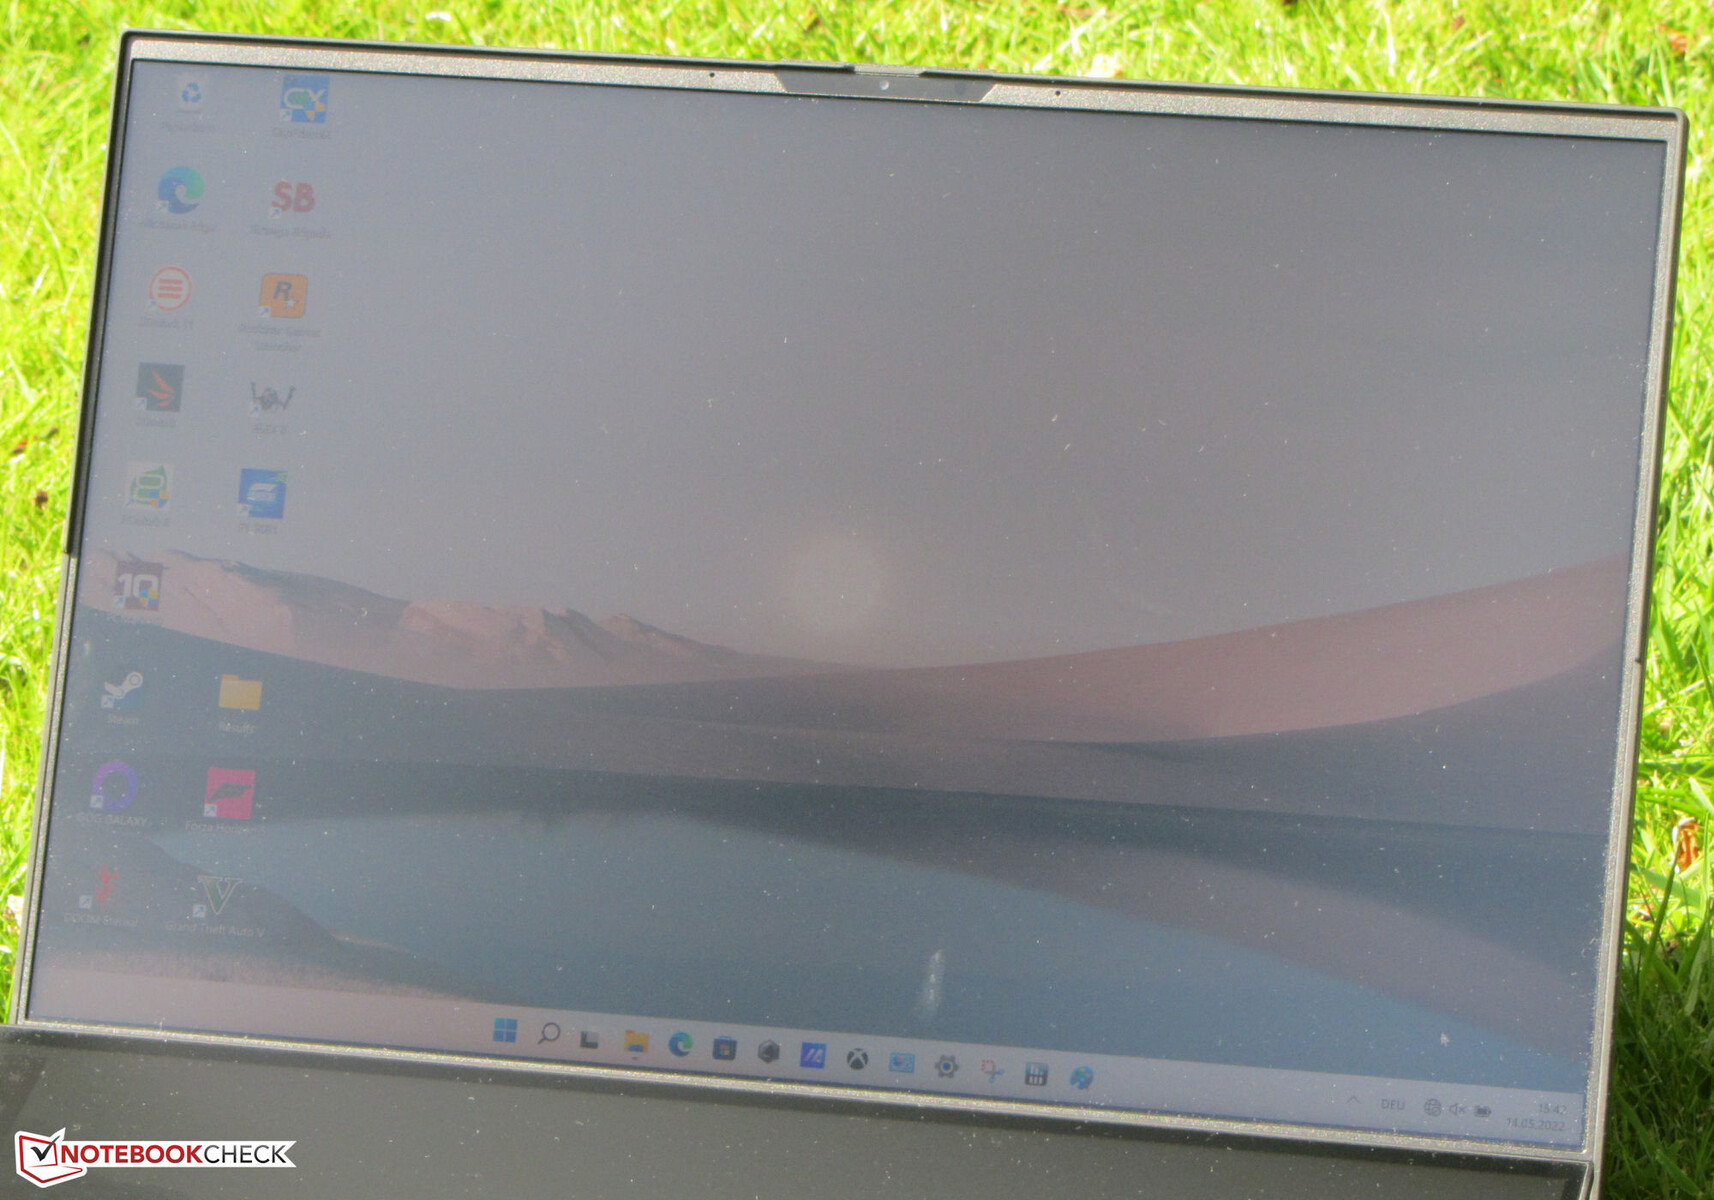
IPS面板的可视角度很稳定,可以从任何角度阅读。如果阳光不是太亮,显示屏可以在户外阅读。

表演 - 伦勃朗与安培的相遇
通过Zephyrus Duo 16 GX650RX,华硕提供了一款16英寸笔记本电脑,主要定位为游戏笔记本电脑。然而,该设备也是针对流媒体和内容创作者的。
测试条件
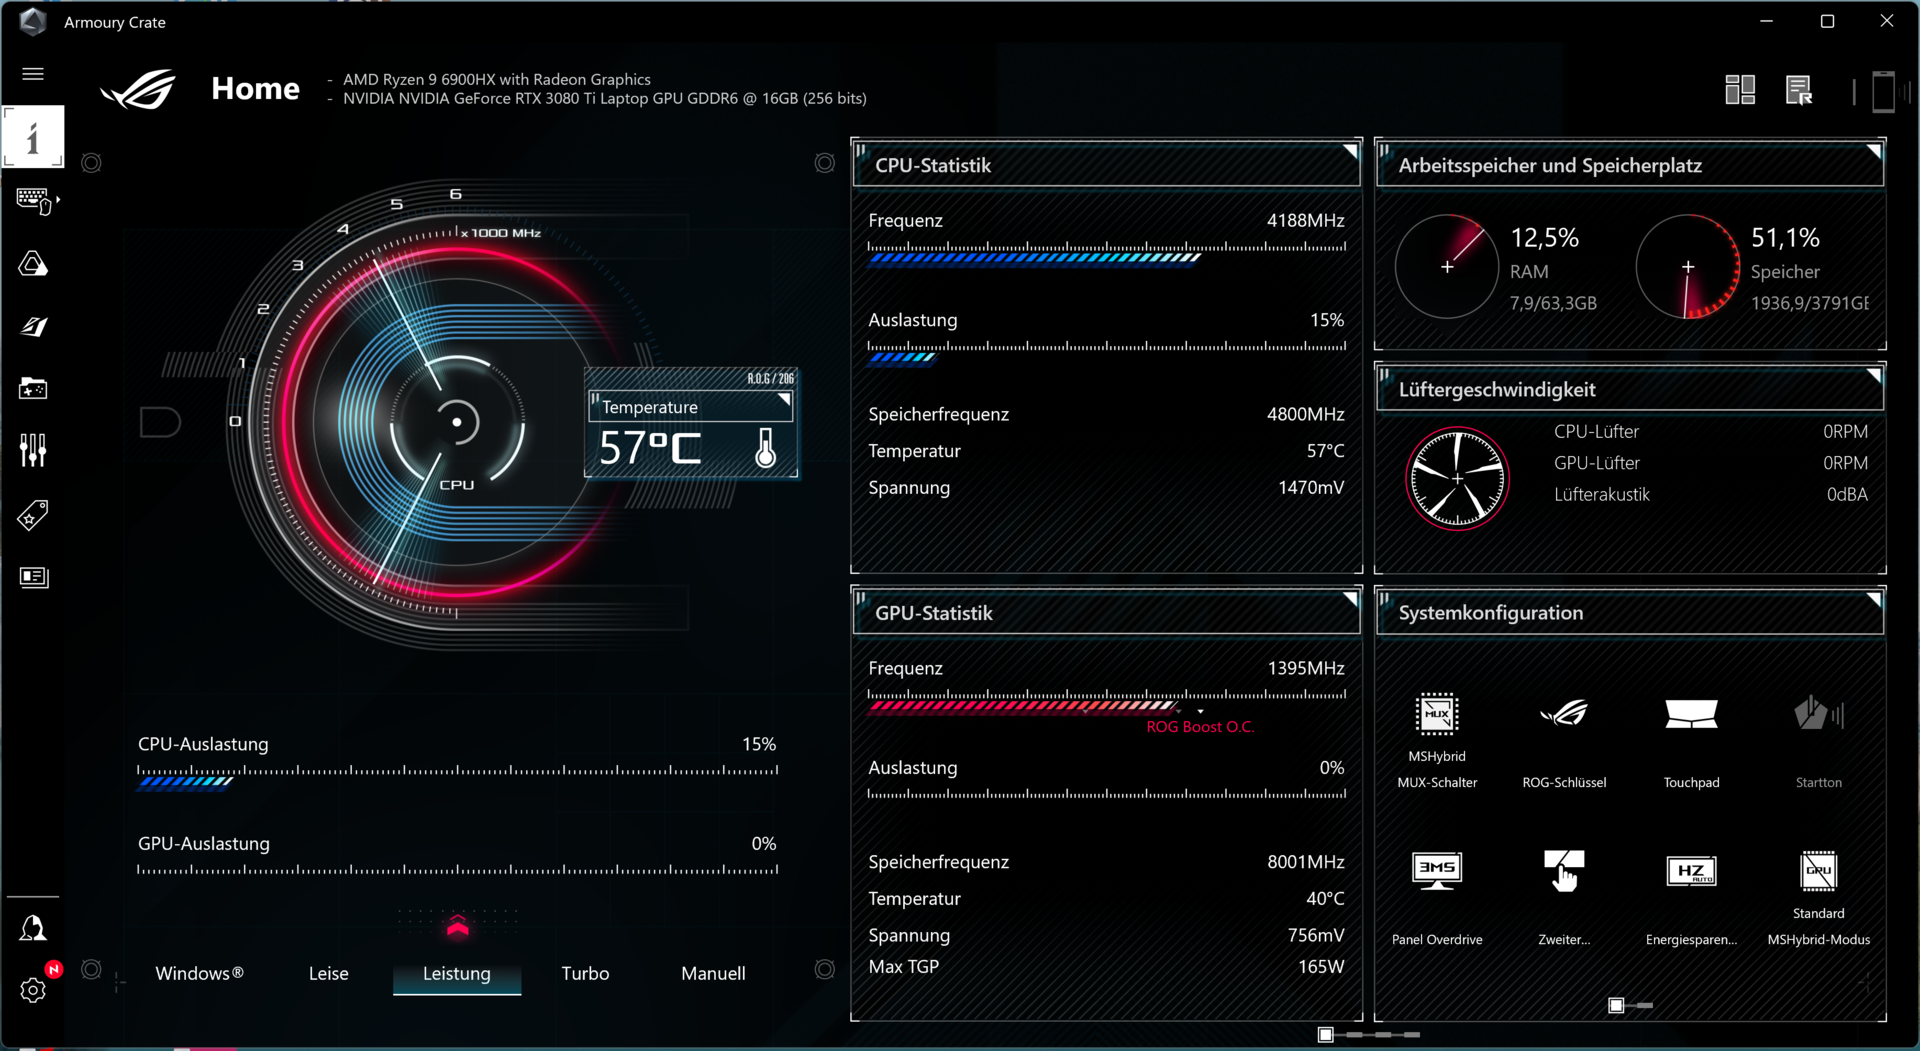
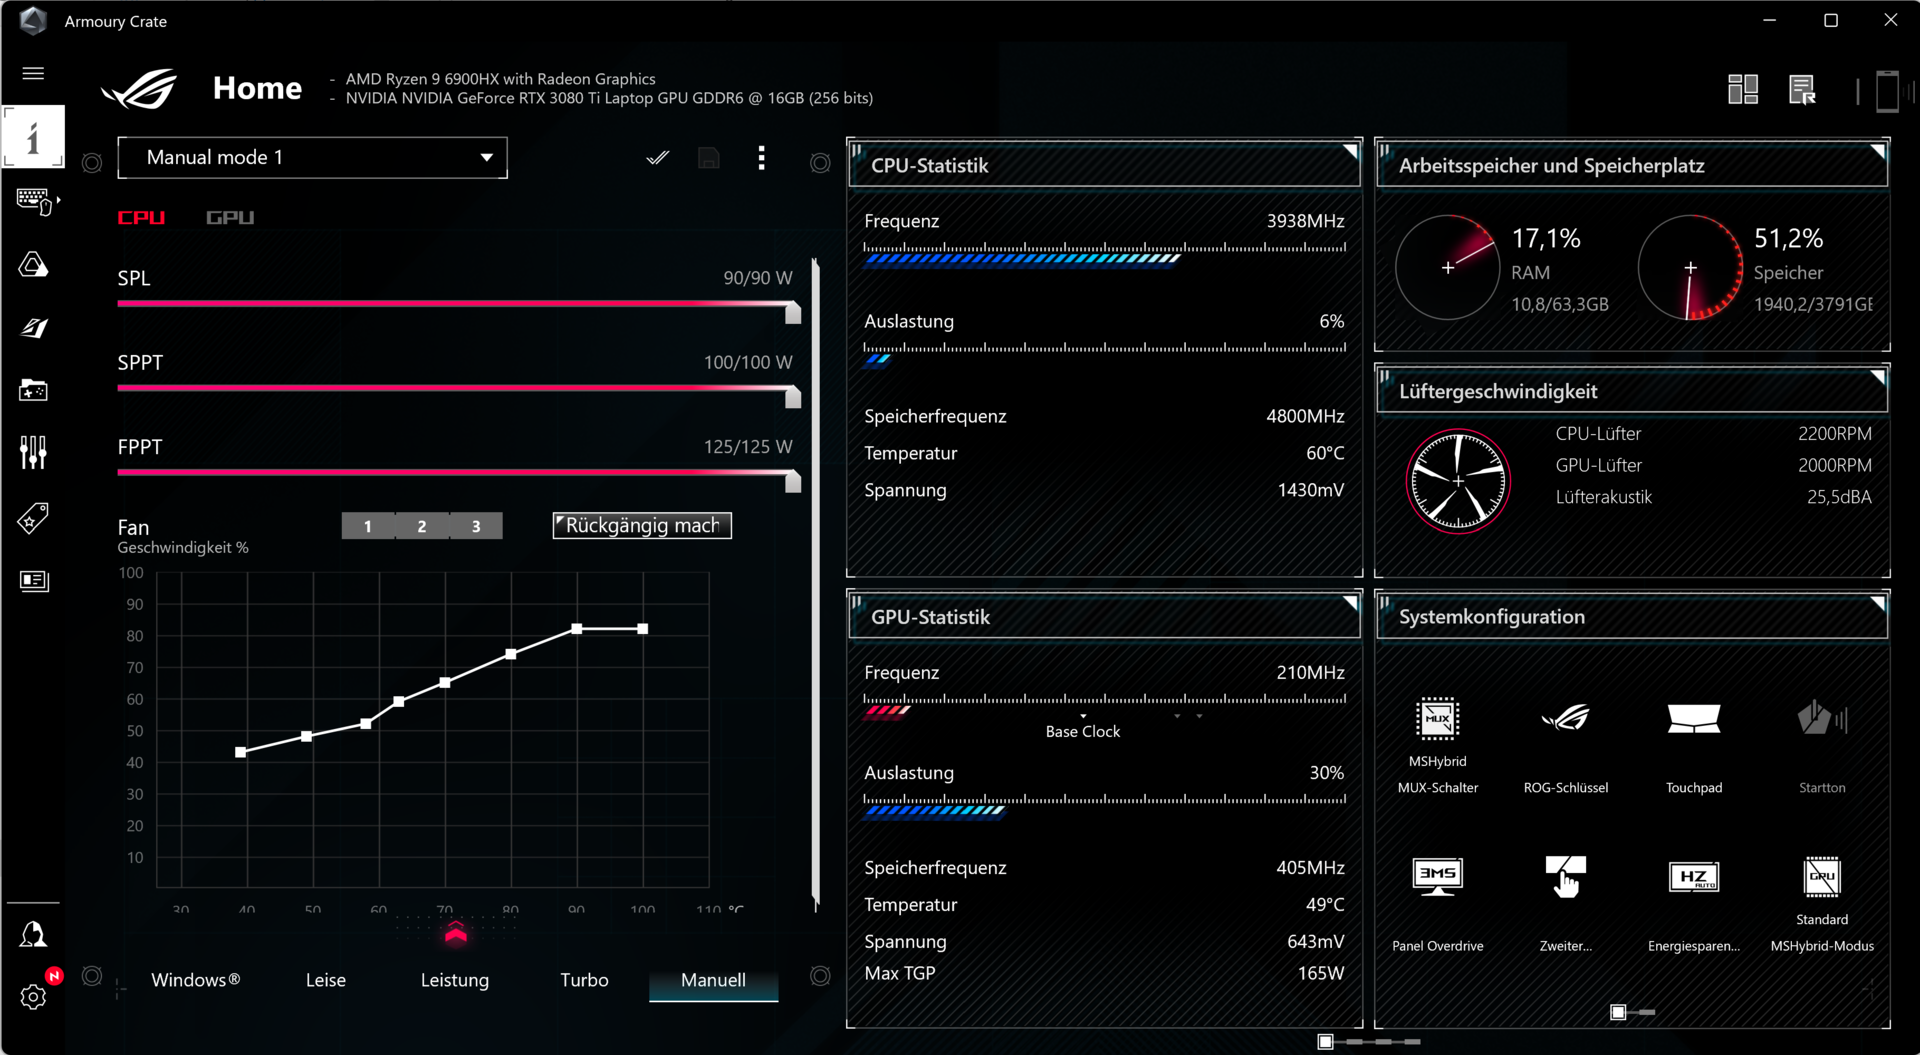
笔记本电脑提供三个制造商特定的性能配置文件("静音"、"性能 "和 "涡轮"),你可以通过使用 "Fn "+"F5 "组合键在它们之间切换。涡轮增压 "配置文件只能在主电源操作中使用。我们的电池测试是使用 "静音 "模式进行的,所有的基准测试都是在 "性能 "模式下进行的。
| 性能 | 涡轮增压 | 静音 | |
|---|---|---|---|
| 功率限制1 | 80瓦 | 100瓦 | 70瓦 |
| 功率限制2 | 80瓦 | 125瓦 | 70瓦 |
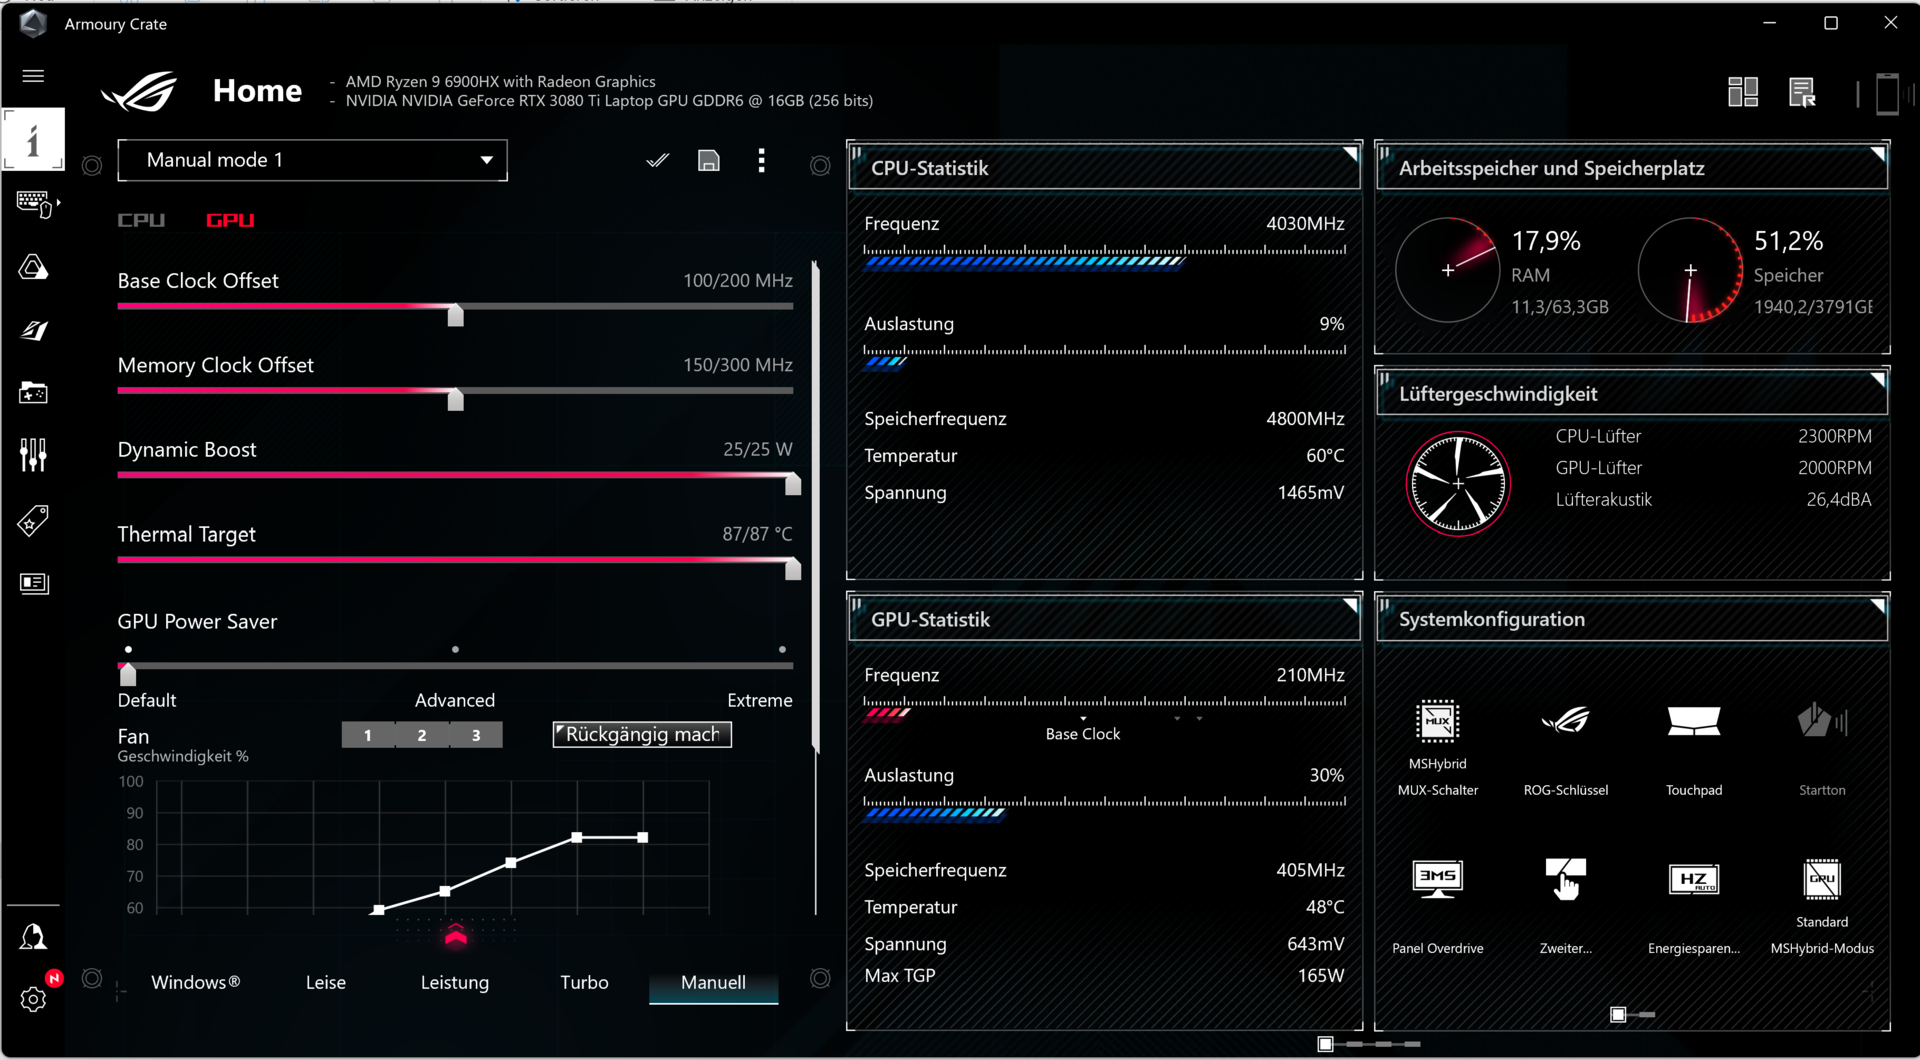
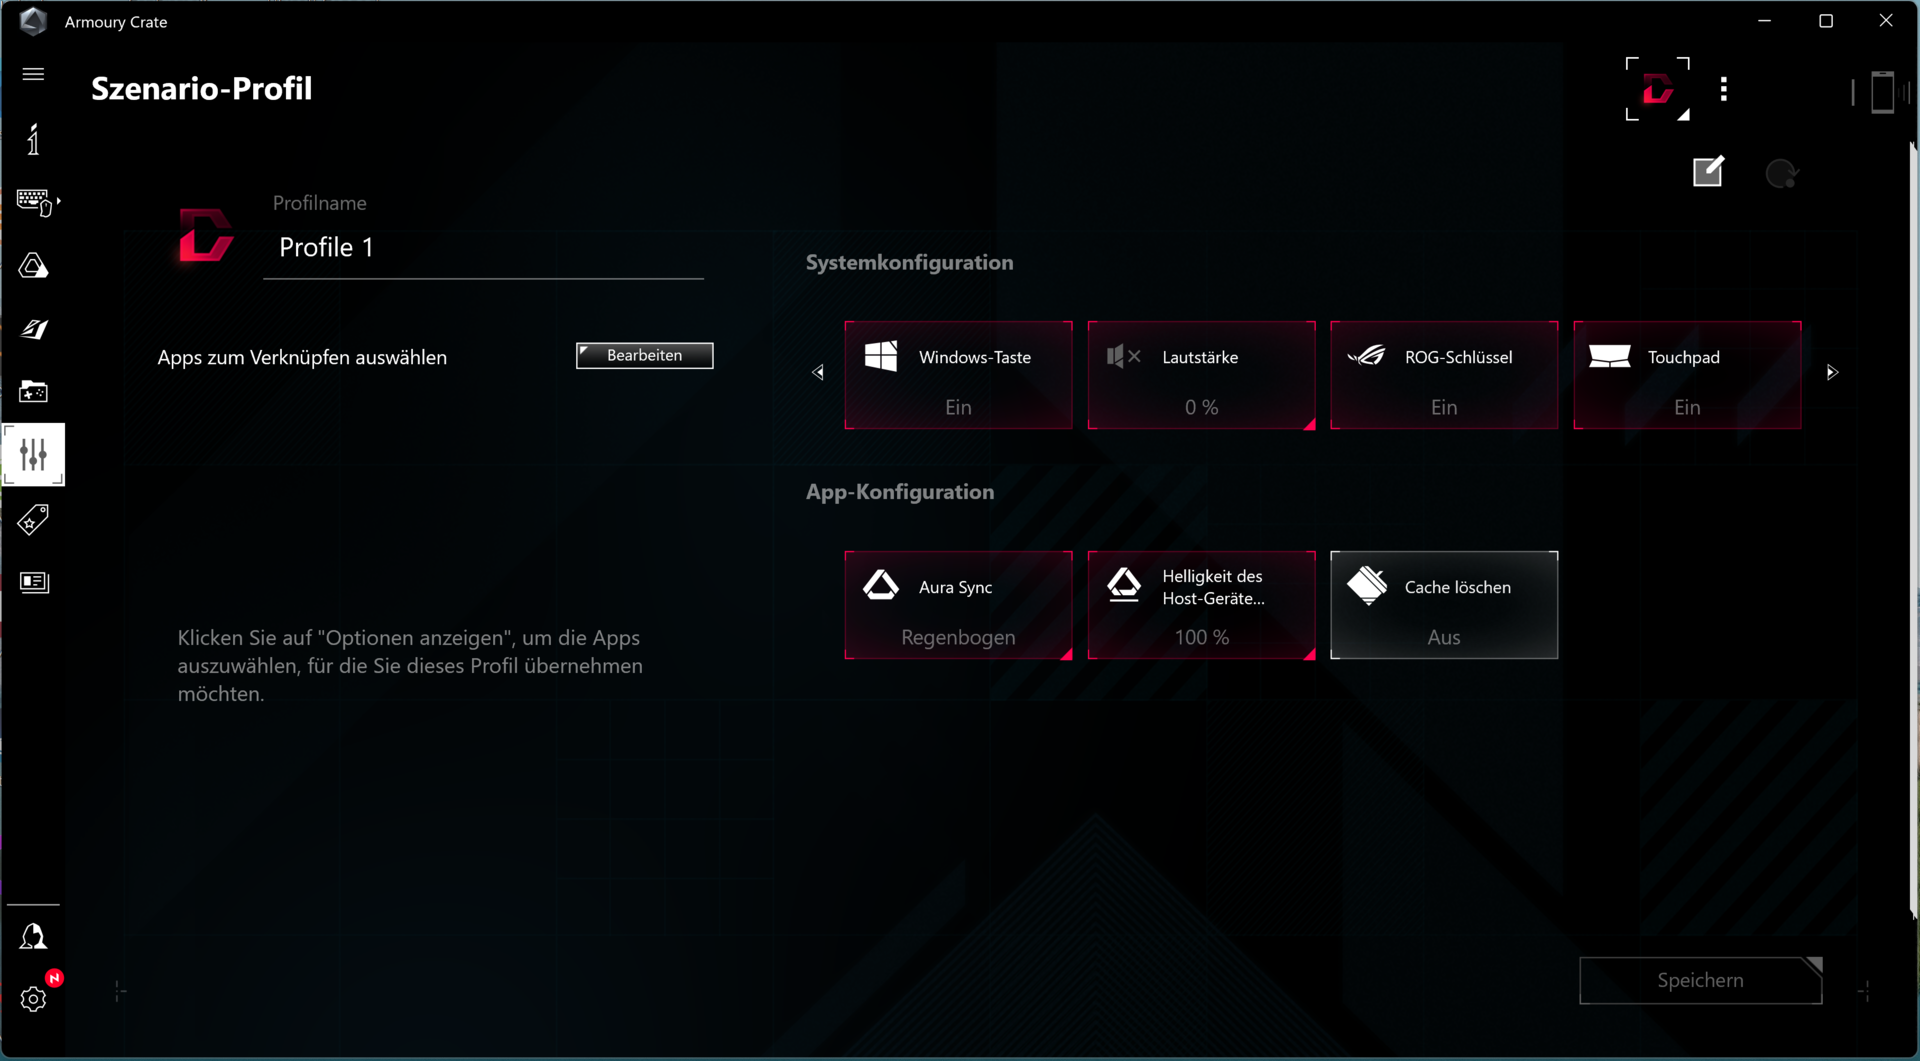
预装的Armoury Crate软件允许你创建个人配置文件("手动")。例如,我们单独配置了CPU的功率限制和GPU的动态提升。你还可以对图形存储进行超频。
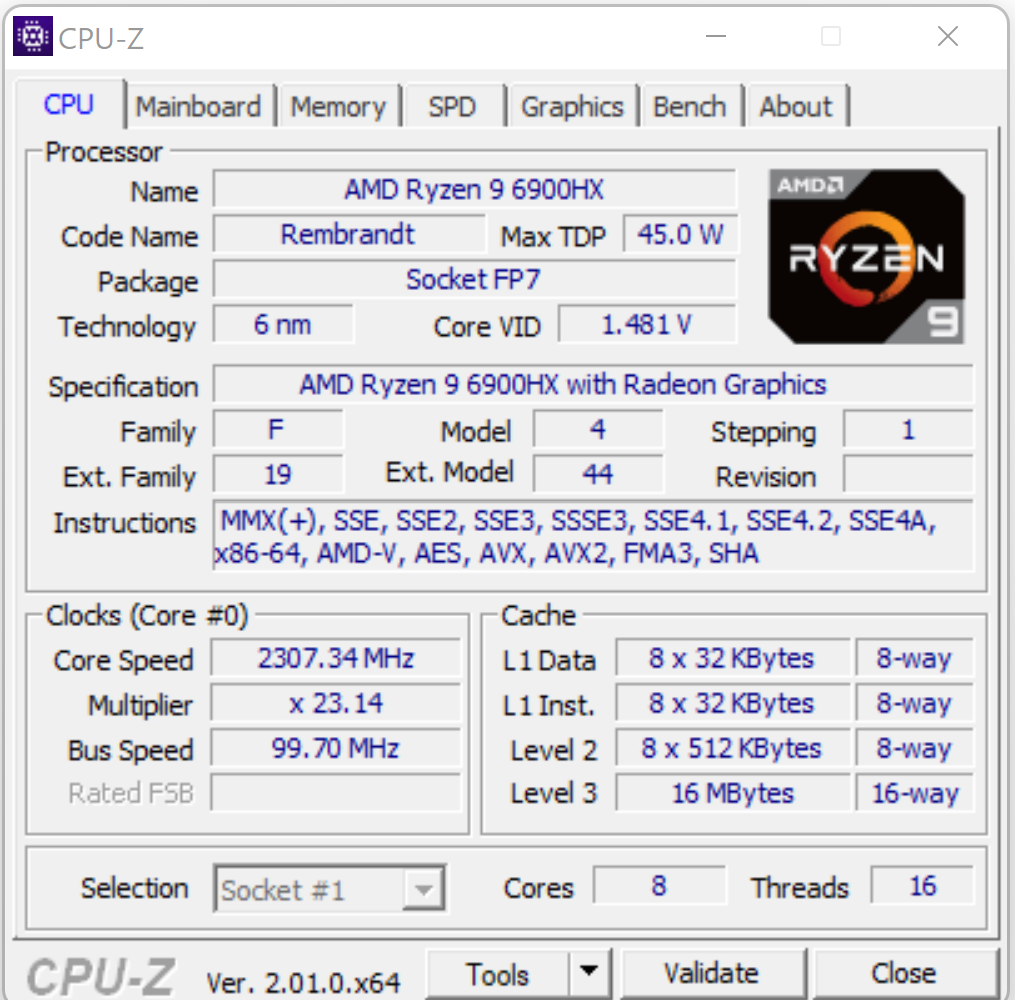
处理器
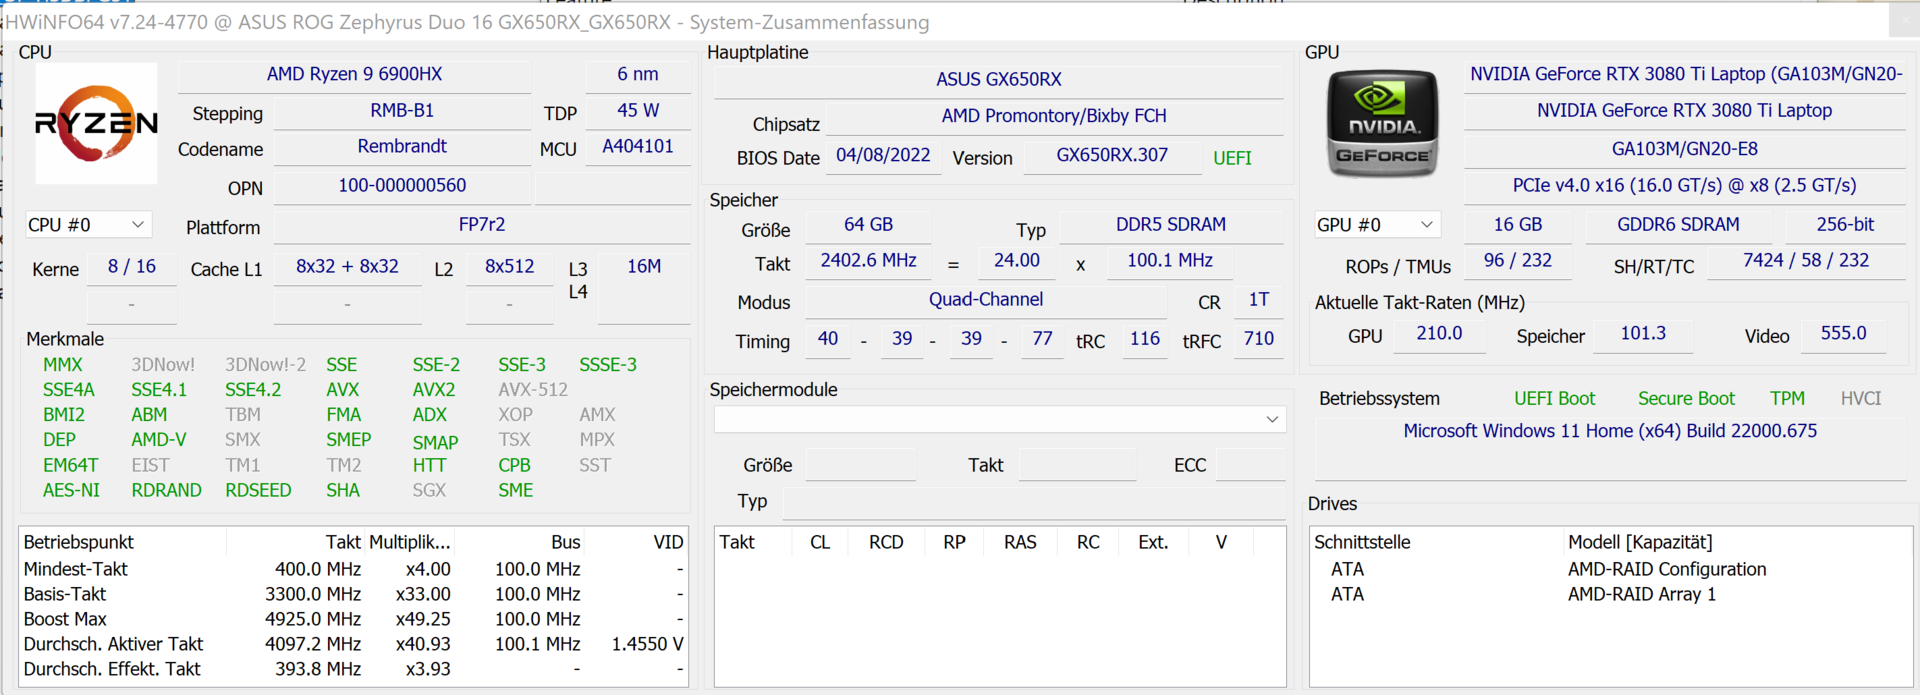
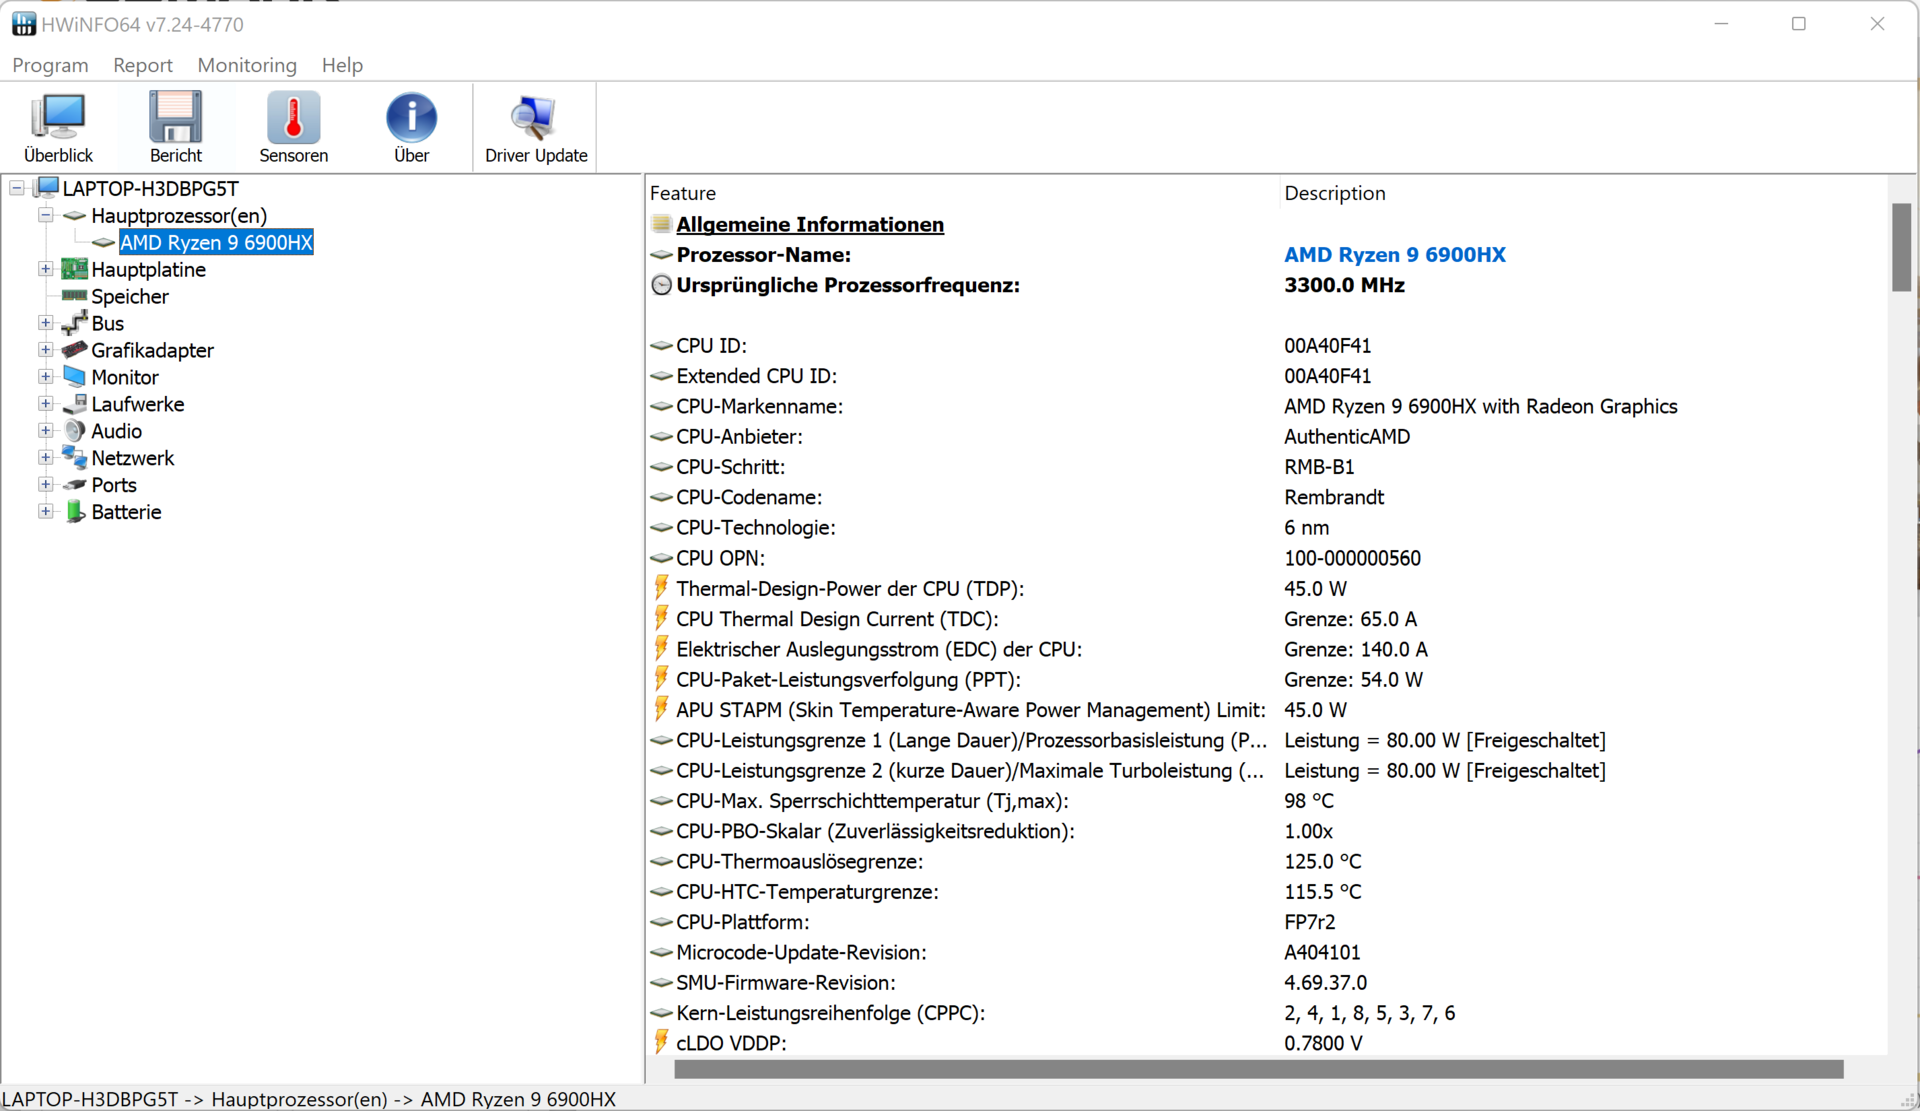
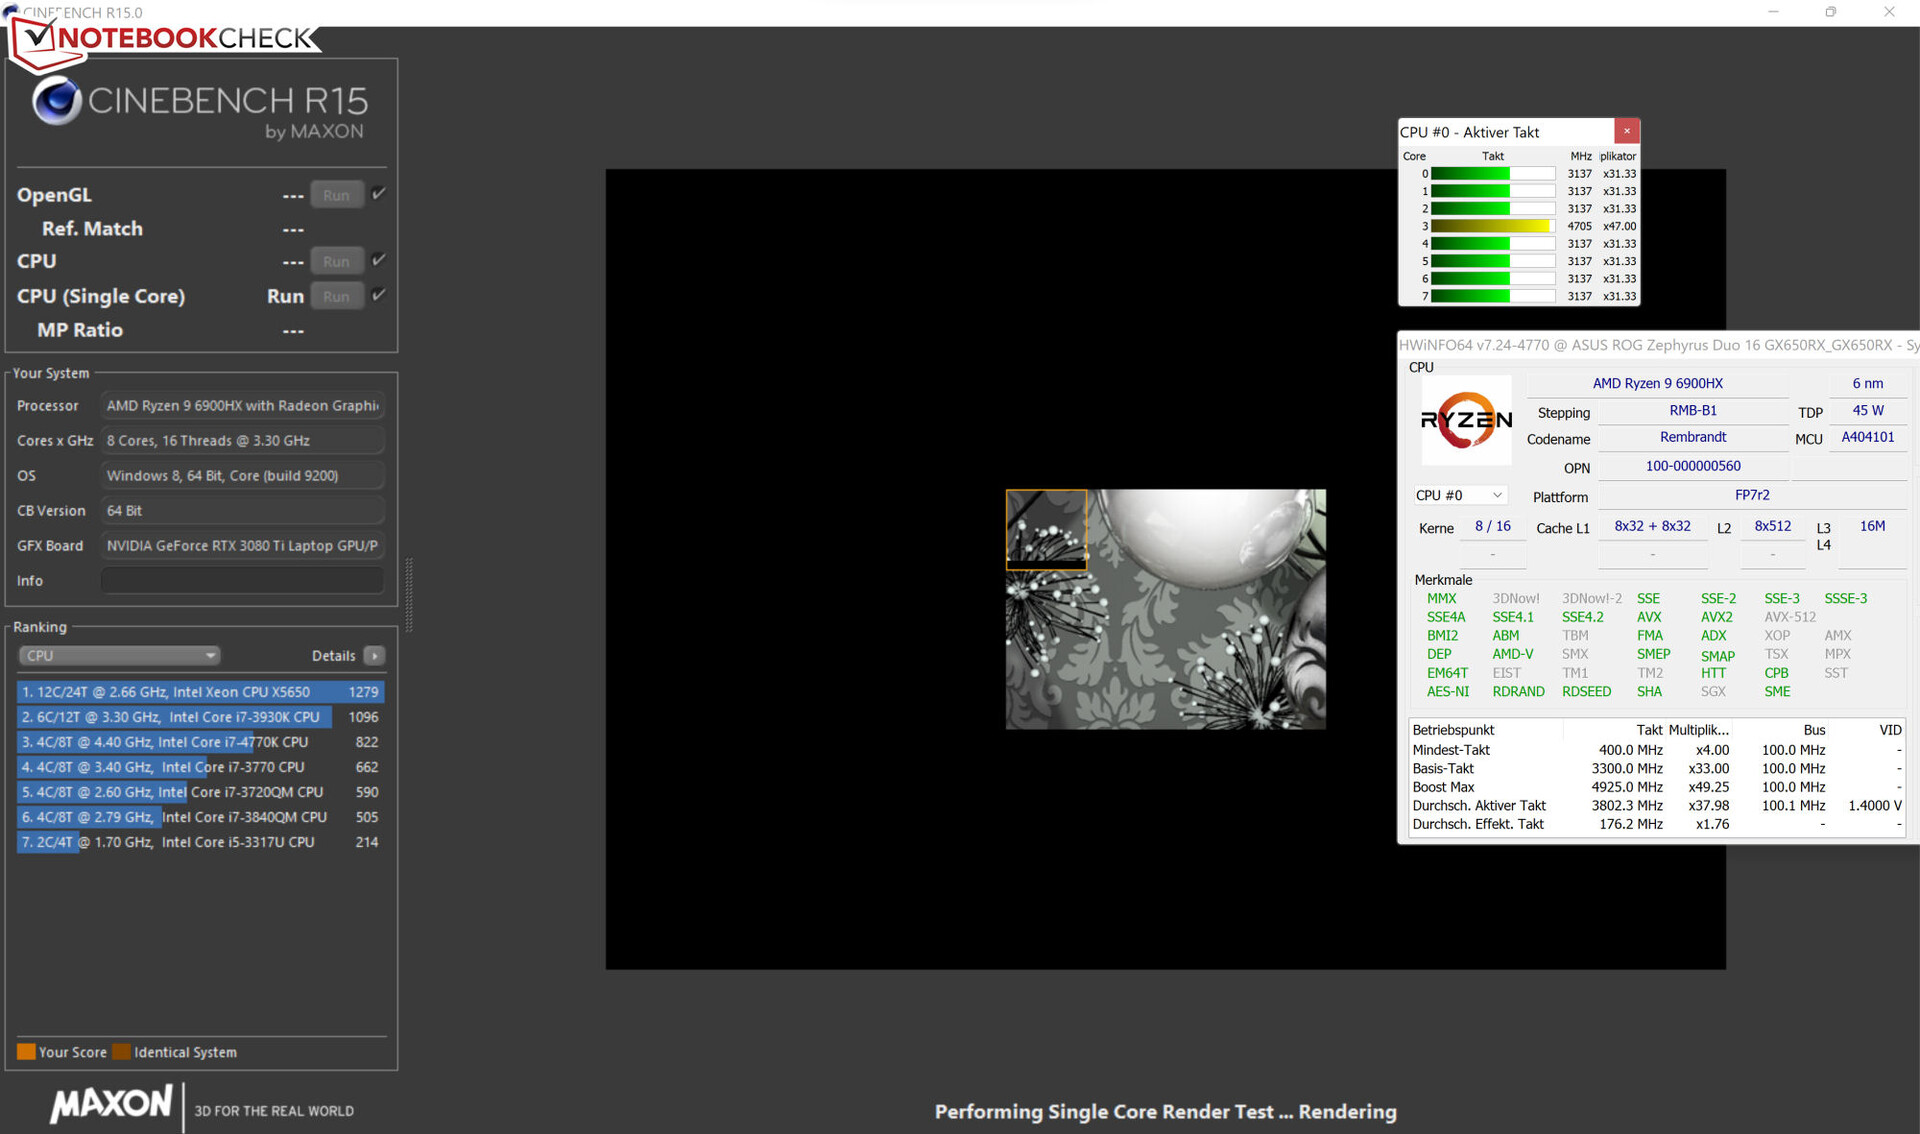
的CPU部分 Ryzen 9-6900HXAPU(Rembrandt)由一个八核处理器组成,以3.3 GHz的基本时钟速度运行。该速度可以通过涡轮增压提高到4.9GHz。支持同步多线程(每个核心两个线程)。
Cinebench R15基准测试的多线程测试短暂地以4至4.4GHz的时钟速度运行,而单线程测试则在3.1至4.7GHz之间。在电池运行中,CPU运行在3至4.1GHz(多线程)和2至4.7GHz(单线程)。

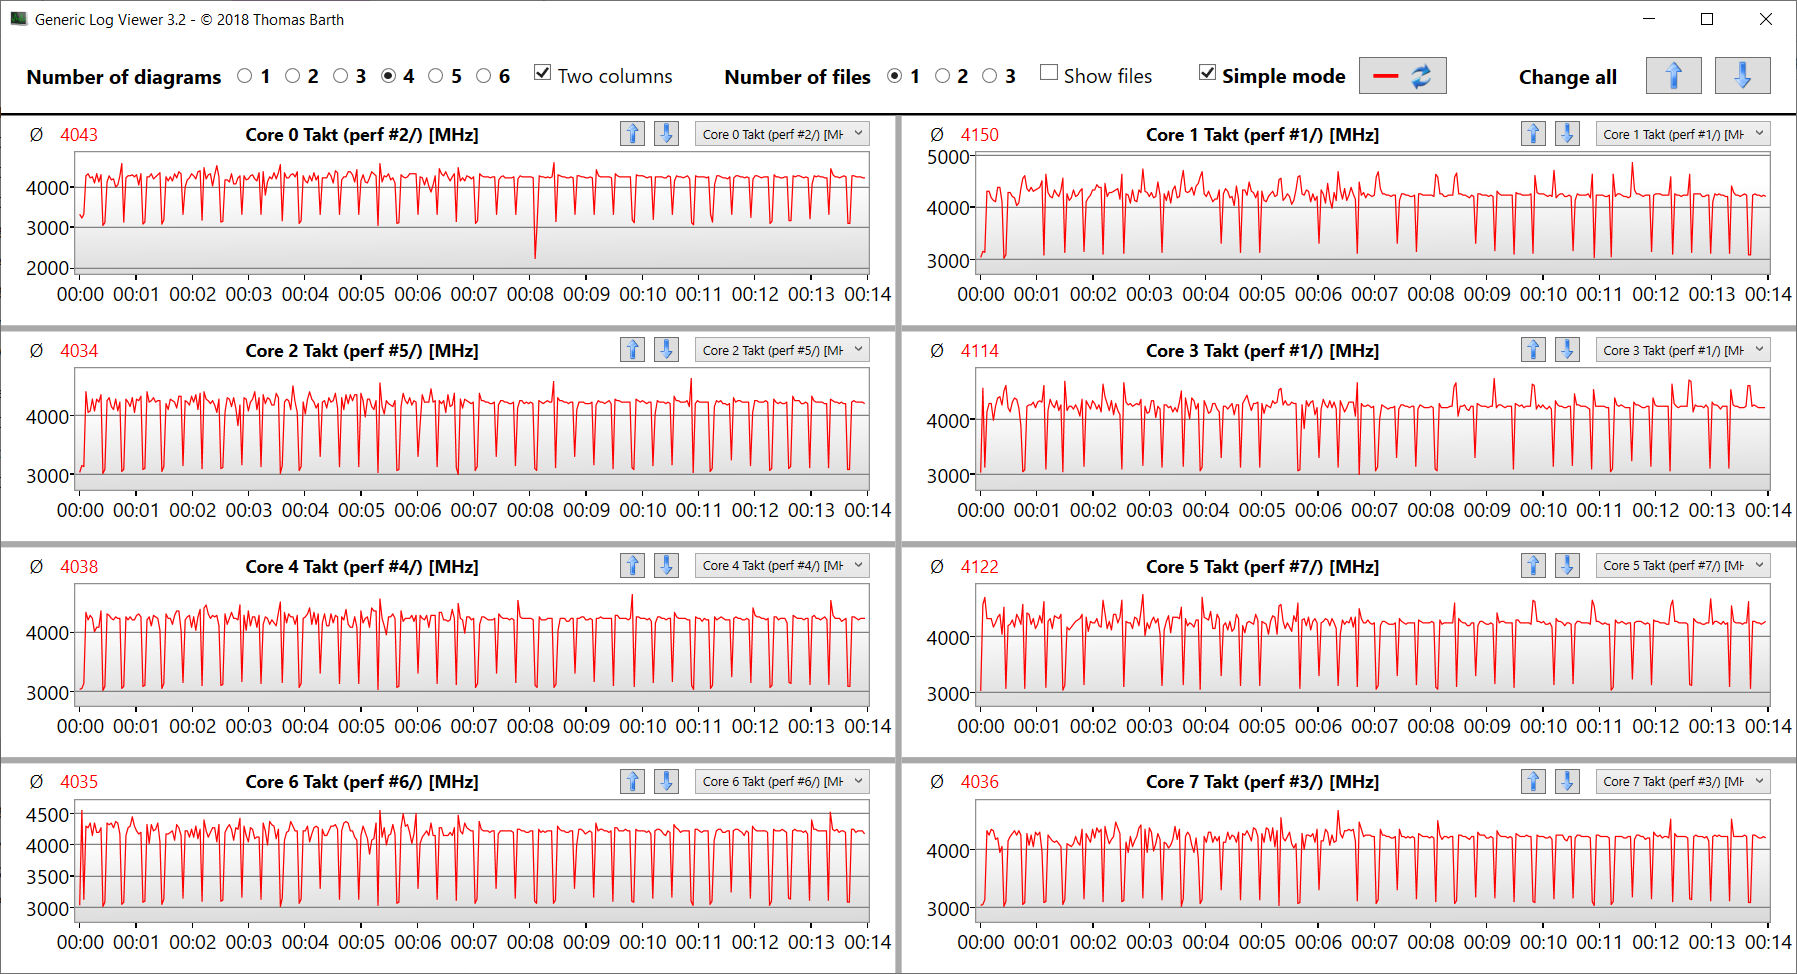
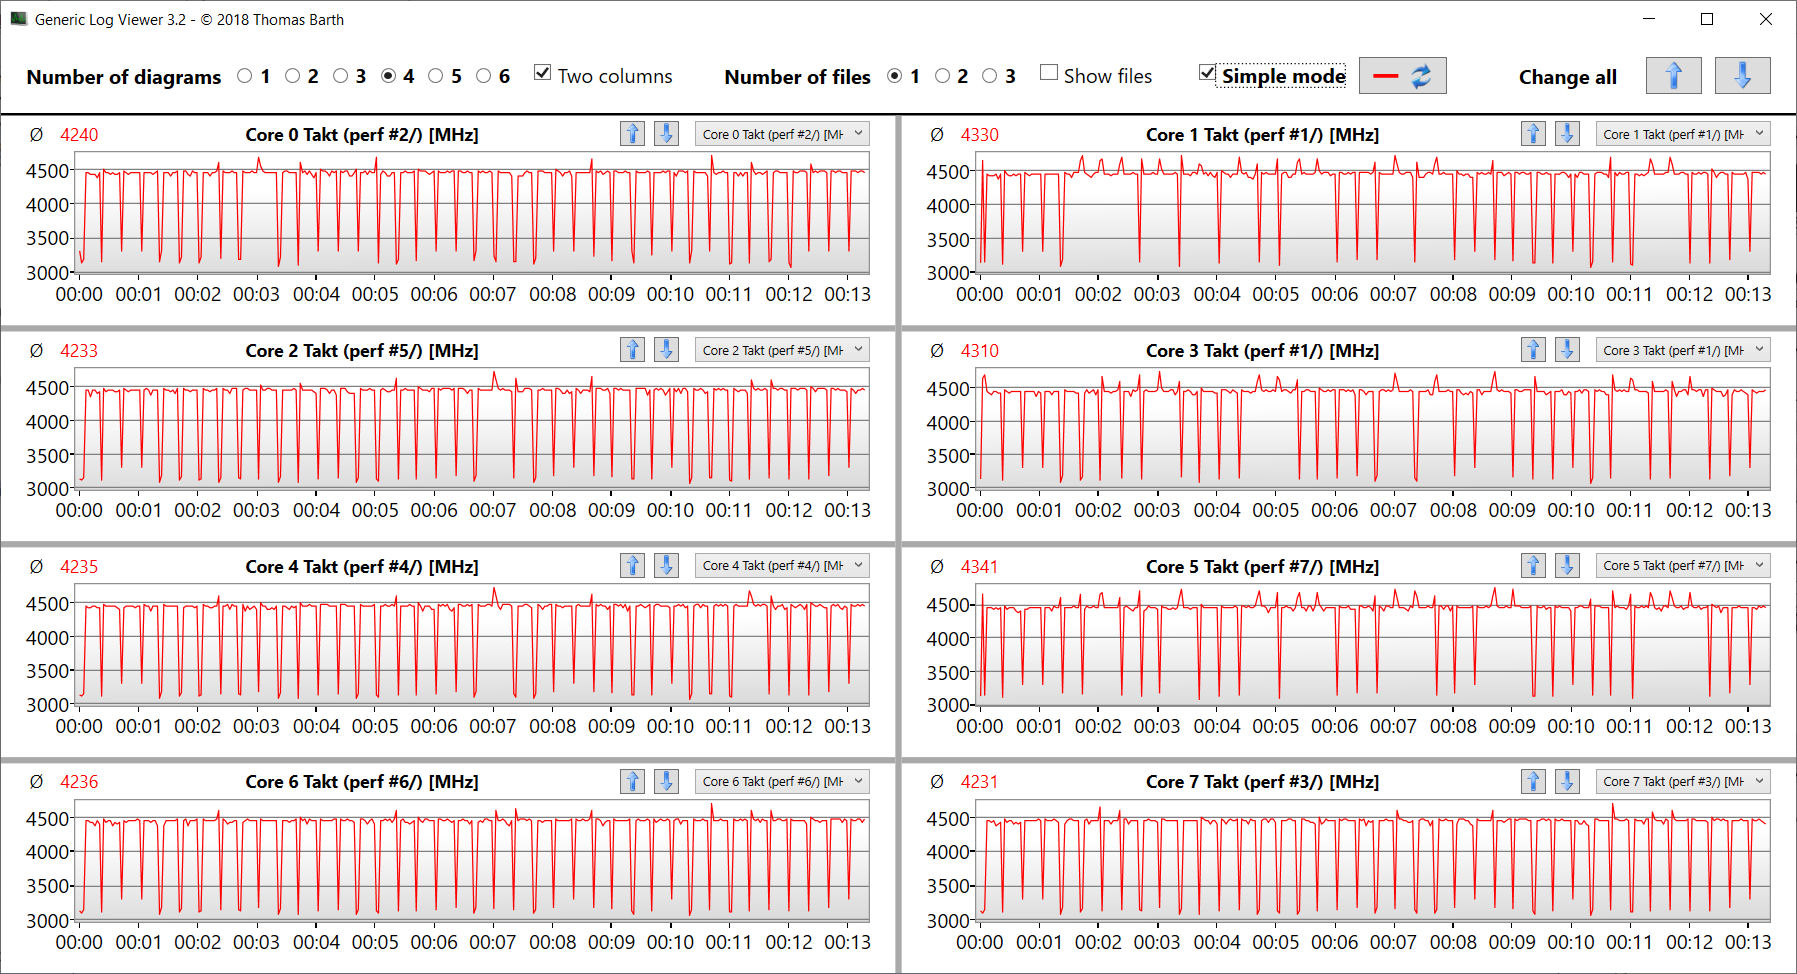
我们通过对Cinebench R15基准的多线程测试进行至少30分钟的持续循环,来评估CPU Turbo在主电源运行中是否被持续使用。Turbo的使用水平很高。通过使用 "Turbo "性能配置文件,可以将时钟速度稍微提高。
Cinebench R15 Multi Constant Load Test
| CPU Performance rating - Percent | |
| Average of class Gaming | |
| MSI GE76 Raider | |
| Gigabyte Aero 16 YE5 | |
| Medion Erazer Beast X30 | |
| Asus ROG Zephyrus Duo 16 GX650RX | |
| Asus ROG Zephyrus Duo 16 GX650RX | |
| Asus ROG Zephyrus Duo 16 GX650RX | |
| Apple MacBook Pro 16 2021 M1 Max -5! | |
| Average AMD Ryzen 9 6900HX | |
| Razer Blade 15 Advanced Model Early 2022 | |
| Cinebench R23 | |
| Multi Core | |
| Average of class Gaming (10488 - 40970, n=110, last 2 years) | |
| Medion Erazer Beast X30 | |
| MSI GE76 Raider | |
| Gigabyte Aero 16 YE5 | |
| Asus ROG Zephyrus Duo 16 GX650RX (Turbo) | |
| Asus ROG Zephyrus Duo 16 GX650RX | |
| Asus ROG Zephyrus Duo 16 GX650RX (Leise) | |
| Average AMD Ryzen 9 6900HX (9709 - 15100, n=19) | |
| Apple MacBook Pro 16 2021 M1 Max | |
| Razer Blade 15 Advanced Model Early 2022 | |
| Single Core | |
| Average of class Gaming (1166 - 2356, n=110, last 2 years) | |
| Gigabyte Aero 16 YE5 | |
| MSI GE76 Raider | |
| Razer Blade 15 Advanced Model Early 2022 | |
| Medion Erazer Beast X30 | |
| Asus ROG Zephyrus Duo 16 GX650RX (Leise) | |
| Asus ROG Zephyrus Duo 16 GX650RX (Turbo) | |
| Asus ROG Zephyrus Duo 16 GX650RX | |
| Average AMD Ryzen 9 6900HX (1516 - 1616, n=19) | |
| Apple MacBook Pro 16 2021 M1 Max | |
| Cinebench R20 | |
| CPU (Multi Core) | |
| Average of class Gaming (4029 - 16108, n=109, last 2 years) | |
| Medion Erazer Beast X30 | |
| Gigabyte Aero 16 YE5 | |
| MSI GE76 Raider | |
| Asus ROG Zephyrus Duo 16 GX650RX (Turbo) | |
| Asus ROG Zephyrus Duo 16 GX650RX | |
| Asus ROG Zephyrus Duo 16 GX650RX (Leise) | |
| Average AMD Ryzen 9 6900HX (3742 - 5813, n=19) | |
| Razer Blade 15 Advanced Model Early 2022 | |
| Apple MacBook Pro 16 2021 M1 Max | |
| CPU (Single Core) | |
| Average of class Gaming (442 - 895, n=109, last 2 years) | |
| MSI GE76 Raider | |
| Razer Blade 15 Advanced Model Early 2022 | |
| Gigabyte Aero 16 YE5 | |
| Asus ROG Zephyrus Duo 16 GX650RX (Turbo) | |
| Asus ROG Zephyrus Duo 16 GX650RX (Leise) | |
| Average AMD Ryzen 9 6900HX (595 - 631, n=19) | |
| Medion Erazer Beast X30 | |
| Asus ROG Zephyrus Duo 16 GX650RX | |
| Apple MacBook Pro 16 2021 M1 Max | |
| Cinebench R15 | |
| CPU Multi 64Bit | |
| Average of class Gaming (1578 - 6271, n=108, last 2 years) | |
| MSI GE76 Raider | |
| Medion Erazer Beast X30 | |
| Gigabyte Aero 16 YE5 | |
| Asus ROG Zephyrus Duo 16 GX650RX (Turbo) | |
| Asus ROG Zephyrus Duo 16 GX650RX | |
| Asus ROG Zephyrus Duo 16 GX650RX (Leise) | |
| Average AMD Ryzen 9 6900HX (1588 - 2411, n=19) | |
| Apple MacBook Pro 16 2021 M1 Max (Rosetta 2) | |
| Razer Blade 15 Advanced Model Early 2022 | |
| CPU Single 64Bit | |
| Average of class Gaming (188.8 - 343, n=109, last 2 years) | |
| Gigabyte Aero 16 YE5 | |
| MSI GE76 Raider | |
| Asus ROG Zephyrus Duo 16 GX650RX (Turbo) | |
| Average AMD Ryzen 9 6900HX (241 - 261, n=19) | |
| Asus ROG Zephyrus Duo 16 GX650RX | |
| Asus ROG Zephyrus Duo 16 GX650RX (Leise) | |
| Razer Blade 15 Advanced Model Early 2022 | |
| Medion Erazer Beast X30 | |
| Apple MacBook Pro 16 2021 M1 Max (Rosetta 2) | |
| Blender - v2.79 BMW27 CPU | |
| Razer Blade 15 Advanced Model Early 2022 | |
| Asus ROG Zephyrus Duo 16 GX650RX (Leise) | |
| Average AMD Ryzen 9 6900HX (212 - 357, n=21) | |
| Asus ROG Zephyrus Duo 16 GX650RX | |
| Asus ROG Zephyrus Duo 16 GX650RX (Turbo) | |
| Gigabyte Aero 16 YE5 | |
| Apple MacBook Pro 16 2021 M1 Max (Blender 3.0 beta for mac) | |
| MSI GE76 Raider | |
| Medion Erazer Beast X30 | |
| Average of class Gaming (80 - 330, n=107, last 2 years) | |
| 7-Zip 18.03 | |
| 7z b 4 | |
| Average of class Gaming (33491 - 148086, n=108, last 2 years) | |
| Medion Erazer Beast X30 | |
| MSI GE76 Raider | |
| Gigabyte Aero 16 YE5 | |
| Asus ROG Zephyrus Duo 16 GX650RX (Turbo) | |
| Asus ROG Zephyrus Duo 16 GX650RX | |
| Asus ROG Zephyrus Duo 16 GX650RX (Leise) | |
| Average AMD Ryzen 9 6900HX (49526 - 65336, n=20) | |
| Razer Blade 15 Advanced Model Early 2022 | |
| 7z b 4 -mmt1 | |
| Average of class Gaming (4199 - 7436, n=108, last 2 years) | |
| Gigabyte Aero 16 YE5 | |
| MSI GE76 Raider | |
| Asus ROG Zephyrus Duo 16 GX650RX (Turbo) | |
| Razer Blade 15 Advanced Model Early 2022 | |
| Asus ROG Zephyrus Duo 16 GX650RX (Leise) | |
| Average AMD Ryzen 9 6900HX (5090 - 6070, n=20) | |
| Asus ROG Zephyrus Duo 16 GX650RX | |
| Medion Erazer Beast X30 | |
| Geekbench 5.5 | |
| Multi-Core | |
| Average of class Gaming (6460 - 27010, n=108, last 2 years) | |
| Gigabyte Aero 16 YE5 | |
| MSI GE76 Raider | |
| Apple MacBook Pro 16 2021 M1 Max | |
| Medion Erazer Beast X30 | |
| Asus ROG Zephyrus Duo 16 GX650RX (Turbo) | |
| Asus ROG Zephyrus Duo 16 GX650RX | |
| Asus ROG Zephyrus Duo 16 GX650RX (Leise) | |
| Average AMD Ryzen 9 6900HX (8313 - 10490, n=21) | |
| Razer Blade 15 Advanced Model Early 2022 | |
| Single-Core | |
| Average of class Gaming (986 - 2474, n=108, last 2 years) | |
| MSI GE76 Raider | |
| Gigabyte Aero 16 YE5 | |
| Razer Blade 15 Advanced Model Early 2022 | |
| Apple MacBook Pro 16 2021 M1 Max | |
| Asus ROG Zephyrus Duo 16 GX650RX (Turbo) | |
| Medion Erazer Beast X30 | |
| Asus ROG Zephyrus Duo 16 GX650RX | |
| Average AMD Ryzen 9 6900HX (1523 - 1652, n=21) | |
| Asus ROG Zephyrus Duo 16 GX650RX (Leise) | |
| HWBOT x265 Benchmark v2.2 - 4k Preset | |
| Average of class Gaming (11.5 - 44.3, n=108, last 2 years) | |
| Medion Erazer Beast X30 | |
| MSI GE76 Raider | |
| Asus ROG Zephyrus Duo 16 GX650RX (Turbo) | |
| Gigabyte Aero 16 YE5 | |
| Asus ROG Zephyrus Duo 16 GX650RX | |
| Asus ROG Zephyrus Duo 16 GX650RX (Leise) | |
| Average AMD Ryzen 9 6900HX (12.6 - 18.7, n=20) | |
| Razer Blade 15 Advanced Model Early 2022 | |
| LibreOffice - 20 Documents To PDF | |
| Average AMD Ryzen 9 6900HX (44.8 - 81.7, n=20) | |
| Medion Erazer Beast X30 | |
| Average of class Gaming (19 - 88.8, n=108, last 2 years) | |
| Asus ROG Zephyrus Duo 16 GX650RX (Leise) | |
| Asus ROG Zephyrus Duo 16 GX650RX | |
| Asus ROG Zephyrus Duo 16 GX650RX (Turbo) | |
| Razer Blade 15 Advanced Model Early 2022 | |
| Gigabyte Aero 16 YE5 | |
| MSI GE76 Raider | |
| R Benchmark 2.5 - Overall mean | |
| Medion Erazer Beast X30 | |
| Average AMD Ryzen 9 6900HX (0.4627 - 0.4974, n=20) | |
| Asus ROG Zephyrus Duo 16 GX650RX (Leise) | |
| Asus ROG Zephyrus Duo 16 GX650RX | |
| Asus ROG Zephyrus Duo 16 GX650RX (Turbo) | |
| Razer Blade 15 Advanced Model Early 2022 | |
| Average of class Gaming (0.3439 - 0.759, n=109, last 2 years) | |
| MSI GE76 Raider | |
| Gigabyte Aero 16 YE5 | |
* ... smaller is better
| Performance rating - Percent | |
| Average of class Gaming | |
| Asus ROG Zephyrus Duo 16 GX650RX | |
| Asus ROG Zephyrus Duo 16 GX650RX | |
| Asus ROG Zephyrus Duo 16 GX650RX | |
| Average AMD Ryzen 9 6900HX | |
| MSI GE76 Raider | |
| Medion Erazer Beast X30 | |
| Gigabyte Aero 16 YE5 | |
| Razer Blade 15 Advanced Model Early 2022 | |
系统性能
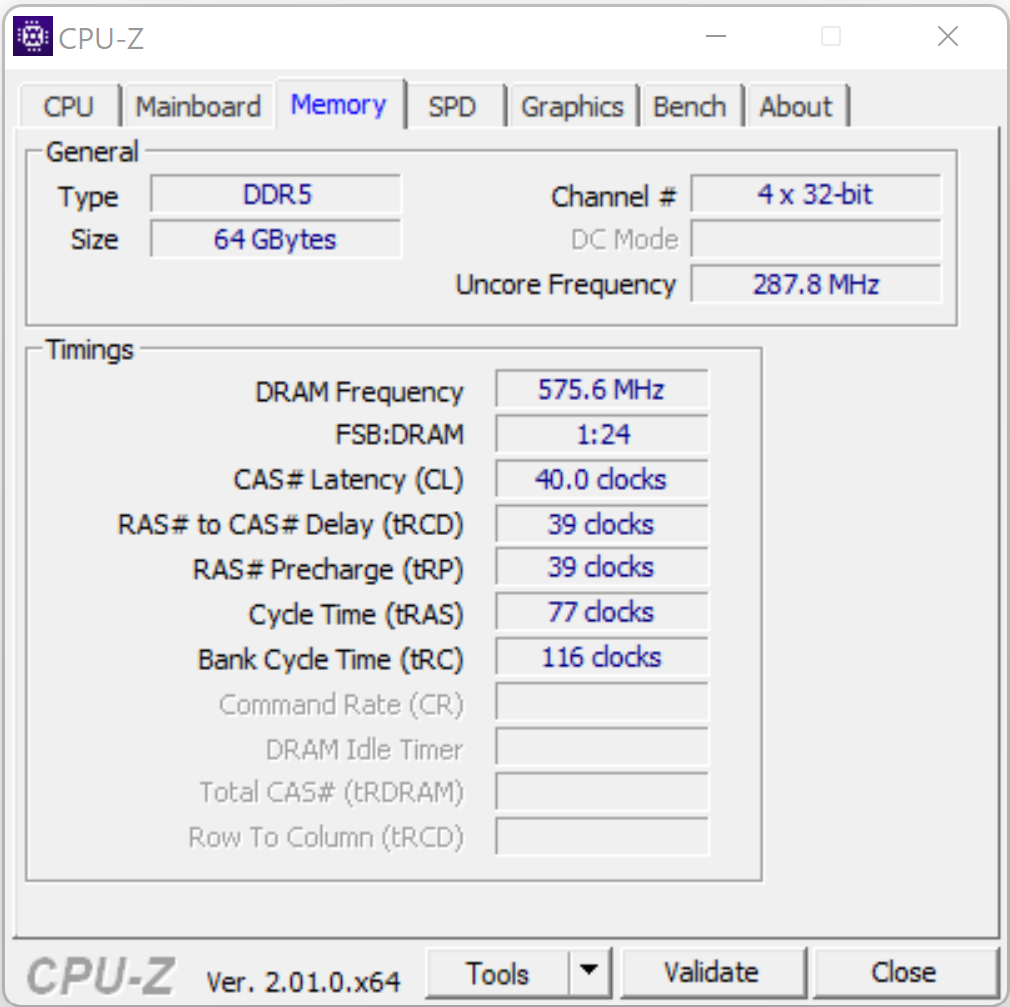
运行平稳的系统为未来几年的游戏、视频编辑和渲染提供了足够的性能。内置工作存储器的传输率仍然低于配备DDR5-4800存储的同类笔记本电脑的数值。伴随着这一点的是非常好的PC-Mark结果。
| PCMark 8 Home Score Accelerated v2 | 4418 points | |
| PCMark 8 Creative Score Accelerated v2 | 5798 points | |
| PCMark 8 Work Score Accelerated v2 | 4622 points | |
| PCMark 10 Score | 6351 points | |
Help | ||
CrossMark: Overall | Productivity | Creativity | Responsiveness
| PCMark 10 / Score | |
| Average of class Gaming (5828 - 11574, n=95, last 2 years) | |
| MSI GE76 Raider | |
| Gigabyte Aero 16 YE5 | |
| Razer Blade 15 Advanced Model Early 2022 | |
| Medion Erazer Beast X30 | |
| Asus ROG Zephyrus Duo 16 GX650RX | |
| PCMark 10 / Essentials | |
| Gigabyte Aero 16 YE5 | |
| MSI GE76 Raider | |
| Average of class Gaming (8810 - 12600, n=99, last 2 years) | |
| Razer Blade 15 Advanced Model Early 2022 | |
| Medion Erazer Beast X30 | |
| Asus ROG Zephyrus Duo 16 GX650RX | |
| PCMark 10 / Productivity | |
| Average of class Gaming (6845 - 21327, n=97, last 2 years) | |
| MSI GE76 Raider | |
| Gigabyte Aero 16 YE5 | |
| Razer Blade 15 Advanced Model Early 2022 | |
| Medion Erazer Beast X30 | |
| Asus ROG Zephyrus Duo 16 GX650RX | |
| PCMark 10 / Digital Content Creation | |
| Average of class Gaming (7602 - 19657, n=97, last 2 years) | |
| MSI GE76 Raider | |
| Gigabyte Aero 16 YE5 | |
| Medion Erazer Beast X30 | |
| Razer Blade 15 Advanced Model Early 2022 | |
| Asus ROG Zephyrus Duo 16 GX650RX | |
| CrossMark / Overall | |
| Gigabyte Aero 16 YE5 | |
| Average of class Gaming (1366 - 2409, n=96, last 2 years) | |
| Razer Blade 15 Advanced Model Early 2022 | |
| Medion Erazer Beast X30 | |
| Asus ROG Zephyrus Duo 16 GX650RX | |
| Apple MacBook Pro 16 2021 M1 Max | |
| CrossMark / Productivity | |
| Gigabyte Aero 16 YE5 | |
| Average of class Gaming (1386 - 2254, n=96, last 2 years) | |
| Razer Blade 15 Advanced Model Early 2022 | |
| Asus ROG Zephyrus Duo 16 GX650RX | |
| Medion Erazer Beast X30 | |
| Apple MacBook Pro 16 2021 M1 Max | |
| CrossMark / Creativity | |
| Average of class Gaming (1343 - 2729, n=96, last 2 years) | |
| Gigabyte Aero 16 YE5 | |
| Apple MacBook Pro 16 2021 M1 Max | |
| Medion Erazer Beast X30 | |
| Razer Blade 15 Advanced Model Early 2022 | |
| Asus ROG Zephyrus Duo 16 GX650RX | |
| CrossMark / Responsiveness | |
| Gigabyte Aero 16 YE5 | |
| Asus ROG Zephyrus Duo 16 GX650RX | |
| Average of class Gaming (1226 - 2334, n=96, last 2 years) | |
| Razer Blade 15 Advanced Model Early 2022 | |
| Medion Erazer Beast X30 | |
| Apple MacBook Pro 16 2021 M1 Max | |
| AIDA64 / Memory Copy | |
| Average of class Gaming (21750 - 129946, n=107, last 2 years) | |
| MSI GE76 Raider (v6.50.5800) | |
| Gigabyte Aero 16 YE5 (v6.50.5800) | |
| Razer Blade 15 Advanced Model Early 2022 (v6.50.5800) | |
| Medion Erazer Beast X30 (v6.50.5800) | |
| Asus ROG Zephyrus Duo 16 GX650RX | |
| Average AMD Ryzen 9 6900HX (47938 - 53345, n=20) | |
| AIDA64 / Memory Read | |
| Average of class Gaming (22956 - 118858, n=107, last 2 years) | |
| Medion Erazer Beast X30 (v6.50.5800) | |
| Gigabyte Aero 16 YE5 (v6.50.5800) | |
| MSI GE76 Raider (v6.50.5800) | |
| Razer Blade 15 Advanced Model Early 2022 (v6.50.5800) | |
| Asus ROG Zephyrus Duo 16 GX650RX (v6.50.5800) | |
| Average AMD Ryzen 9 6900HX (43892 - 53321, n=20) | |
| AIDA64 / Memory Write | |
| Average of class Gaming (22297 - 135096, n=107, last 2 years) | |
| Razer Blade 15 Advanced Model Early 2022 (v6.50.5800) | |
| Medion Erazer Beast X30 (v6.50.5800) | |
| MSI GE76 Raider (v6.50.5800) | |
| Gigabyte Aero 16 YE5 (v6.50.5800) | |
| Asus ROG Zephyrus Duo 16 GX650RX (v6.50.5800) | |
| Average AMD Ryzen 9 6900HX (51085 - 57202, n=20) | |
| AIDA64 / Memory Latency | |
| Average of class Gaming (75.3 - 259, n=107, last 2 years) | |
| Razer Blade 15 Advanced Model Early 2022 (v6.50.5800) | |
| MSI GE76 Raider (v6.50.5800) | |
| Asus ROG Zephyrus Duo 16 GX650RX (v6.50.5800) | |
| Gigabyte Aero 16 YE5 (v6.50.5800) | |
| Average AMD Ryzen 9 6900HX (80.7 - 120.6, n=20) | |
| Medion Erazer Beast X30 (v6.50.5800) | |
* ... smaller is better
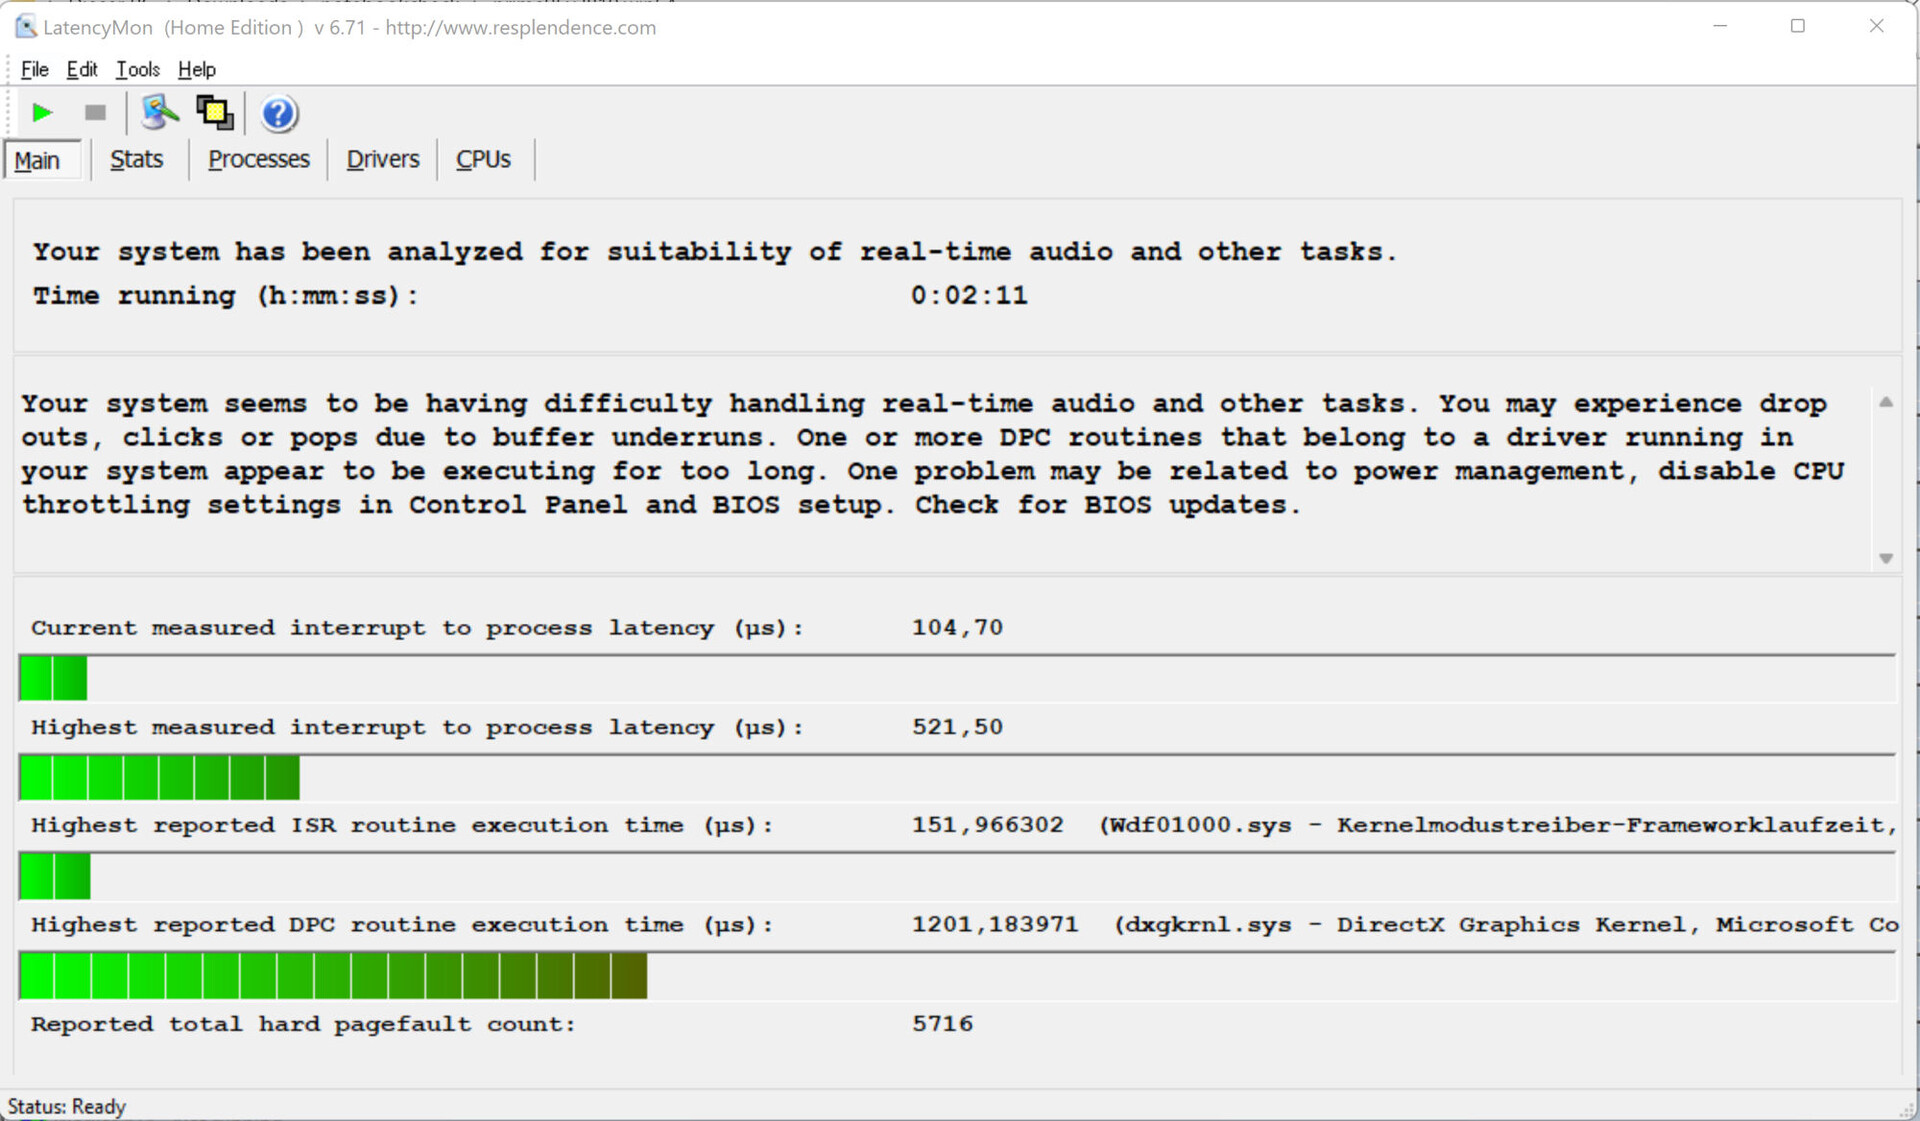
DPC延迟
标准化的延迟监测测试(网络冲浪、4k视频再现、Prime95高负荷)显示了DPC延迟的一些明显的延迟。该系统似乎并不适合实时视频和音频处理。然而,未来的软件更新可能会带来一些改进,甚至使情况变得更糟。

| DPC Latencies / LatencyMon - interrupt to process latency (max), Web, Youtube, Prime95 | |
| Razer Blade 15 Advanced Model Early 2022 | |
| MSI GE76 Raider | |
| Medion Erazer Beast X30 | |
| Gigabyte Aero 16 YE5 | |
| Asus ROG Zephyrus Duo 16 GX650RX | |
* ... smaller is better
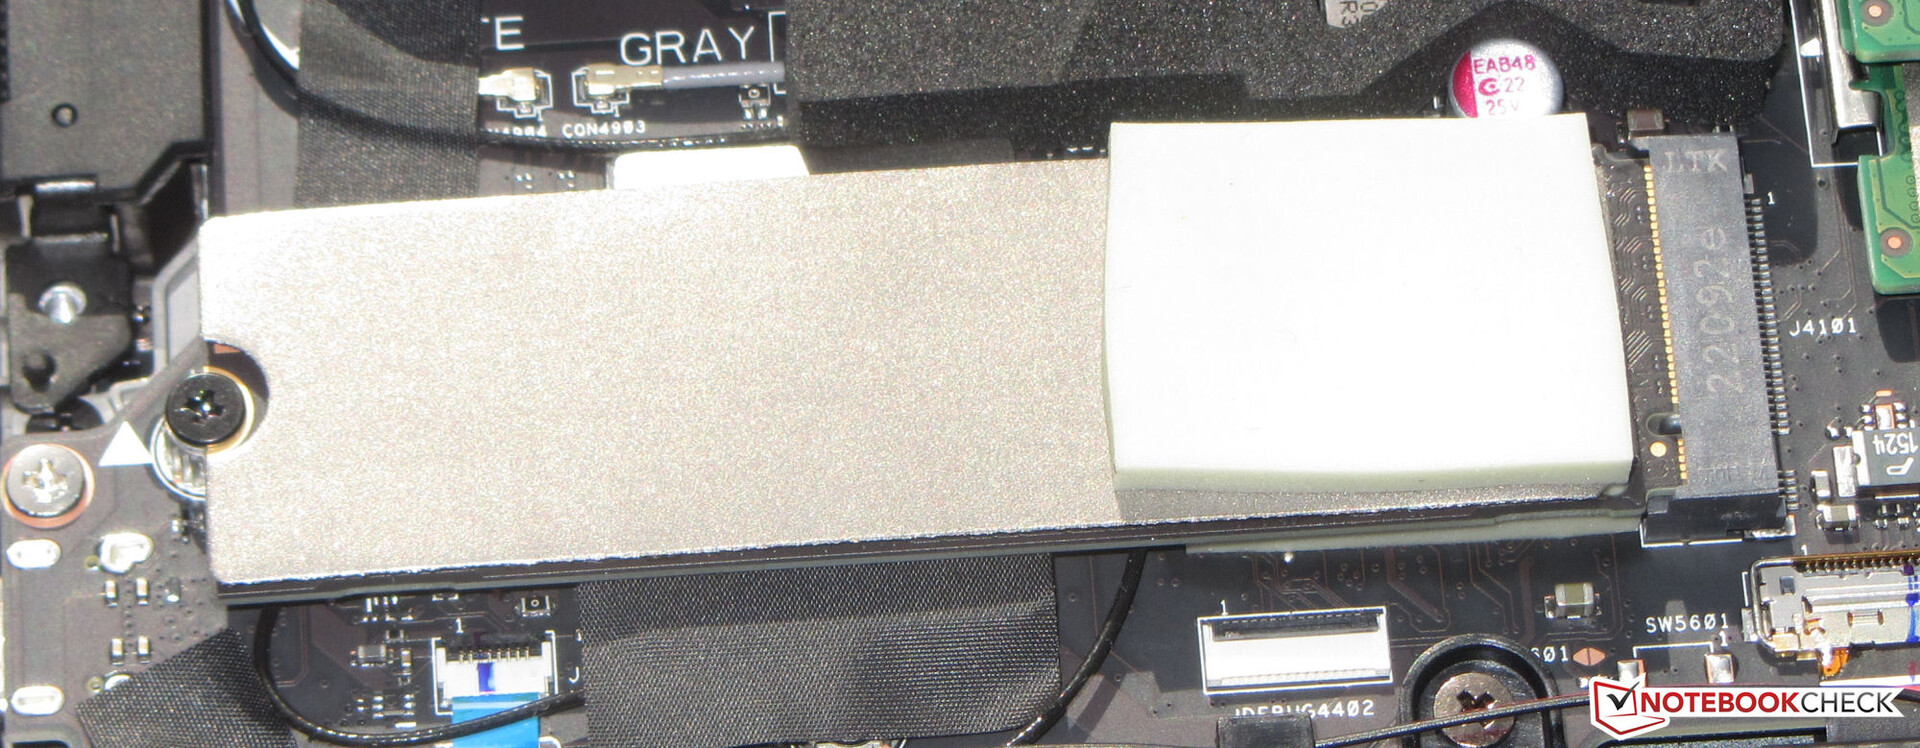
存储解决方案
两个存储容量为2TB的PCIe 4固态硬盘(M.2-2280)被组合在一个RAID 0阵列中,因此操作系统将这两个固态硬盘视为一个4TB的固态硬盘。所有需要存储的数据都分布在这两块SSD上。由此产生的高传输率和短加载时间是游戏的最佳选择。

| Drive Performance rating - Percent | |
| Gigabyte Aero 16 YE5 | |
| Asus ROG Zephyrus Duo 16 GX650RX | |
| MSI GE76 Raider | |
| Razer Blade 15 Advanced Model Early 2022 | |
| Medion Erazer Beast X30 | |
| Average of class Gaming | |
* ... smaller is better
Constant Performance Reading: DiskSpd Read Loop, Queue Depth 8
图形卡
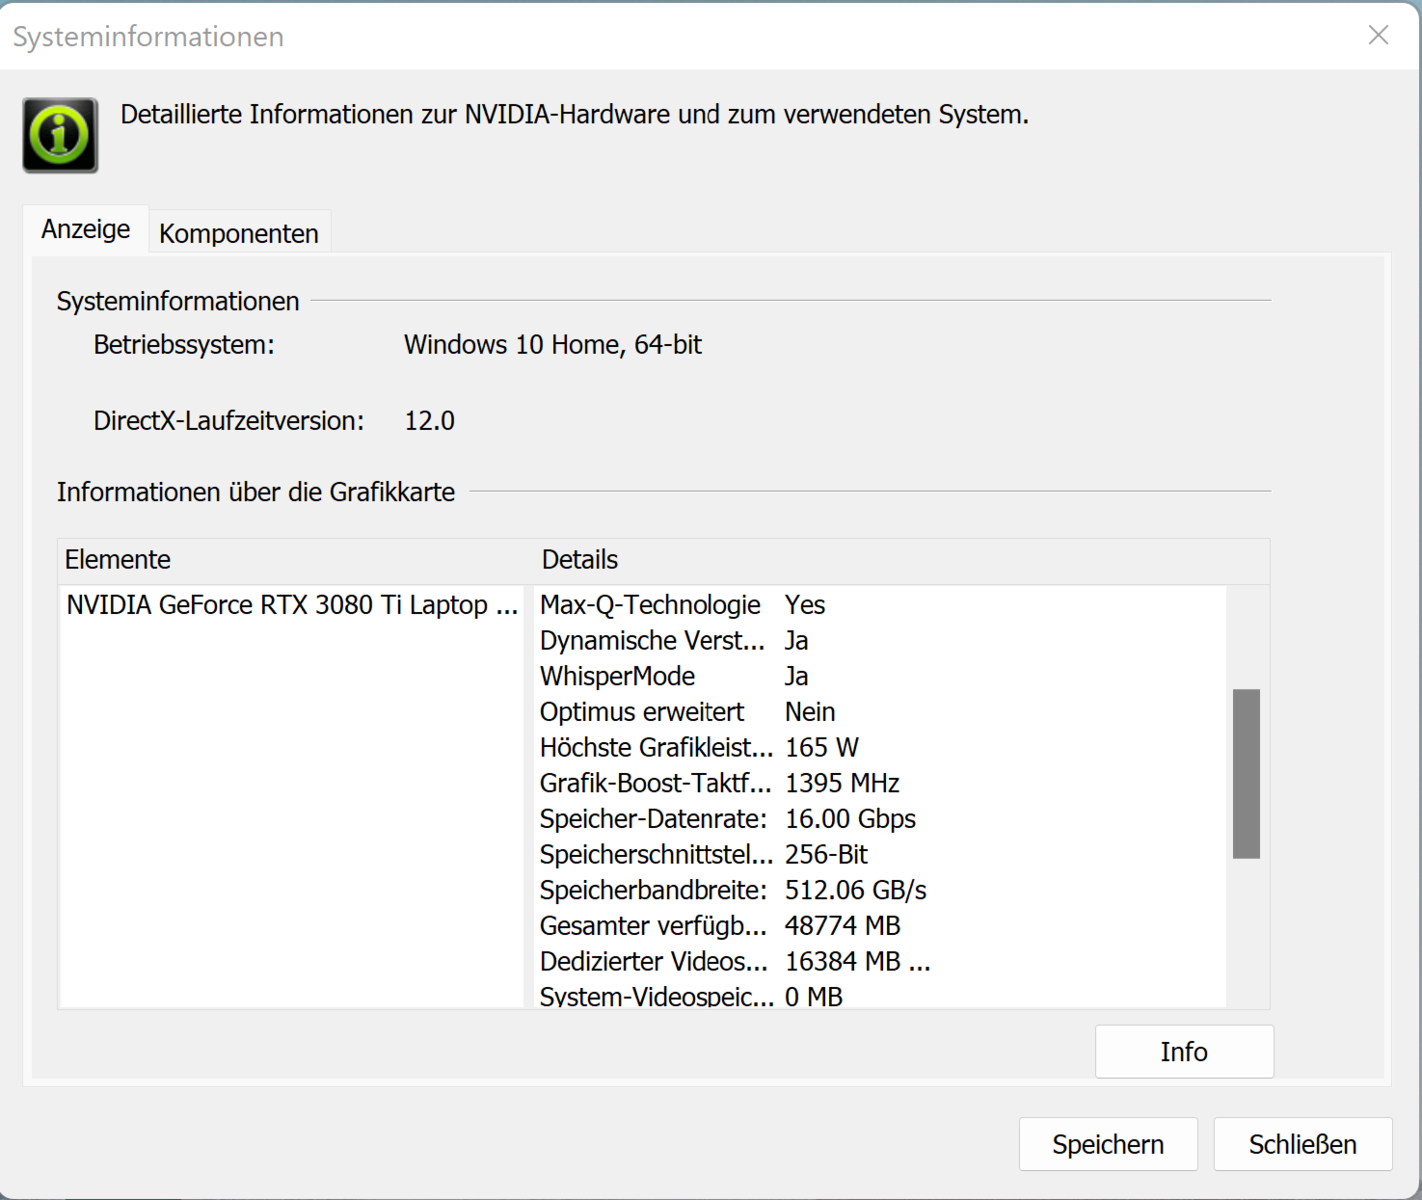
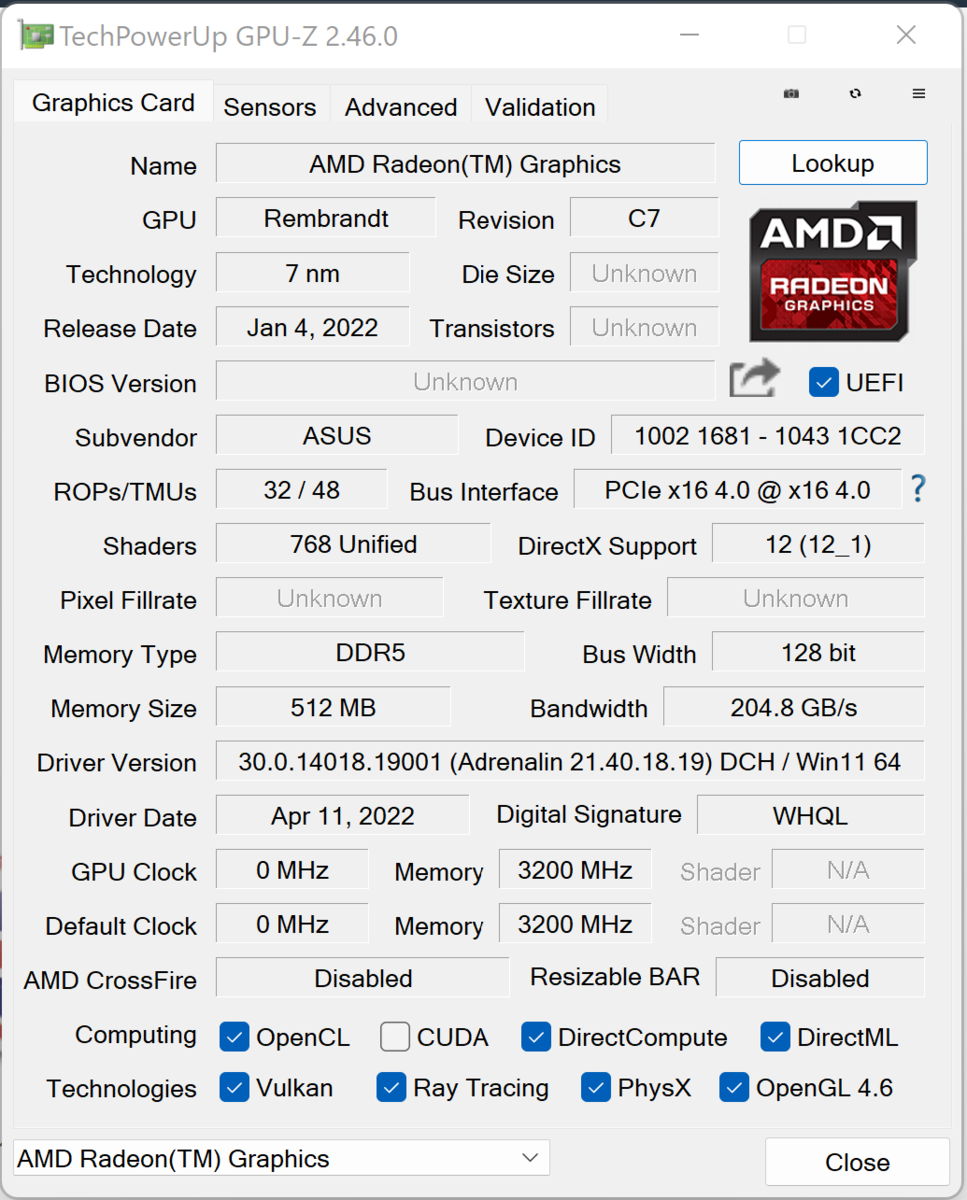
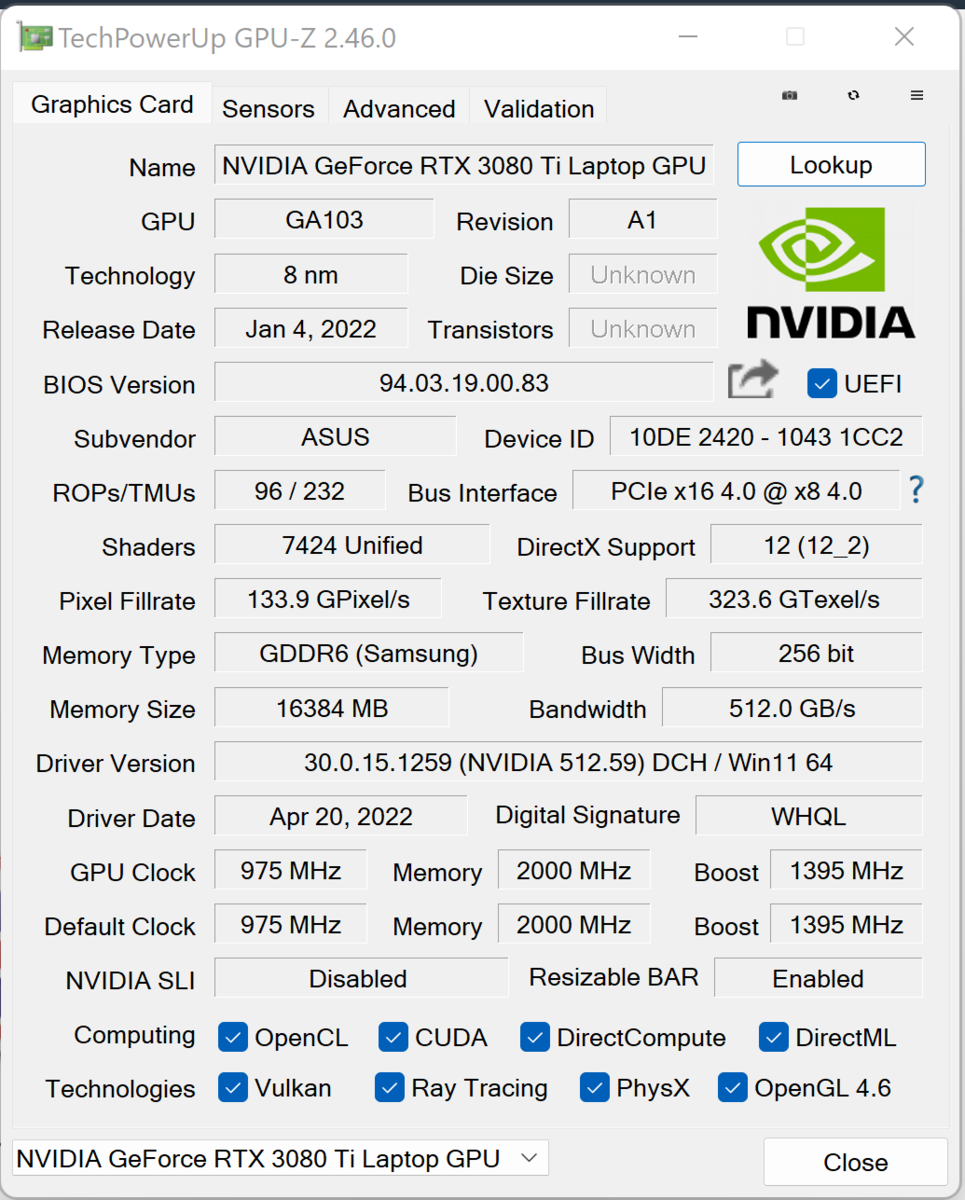
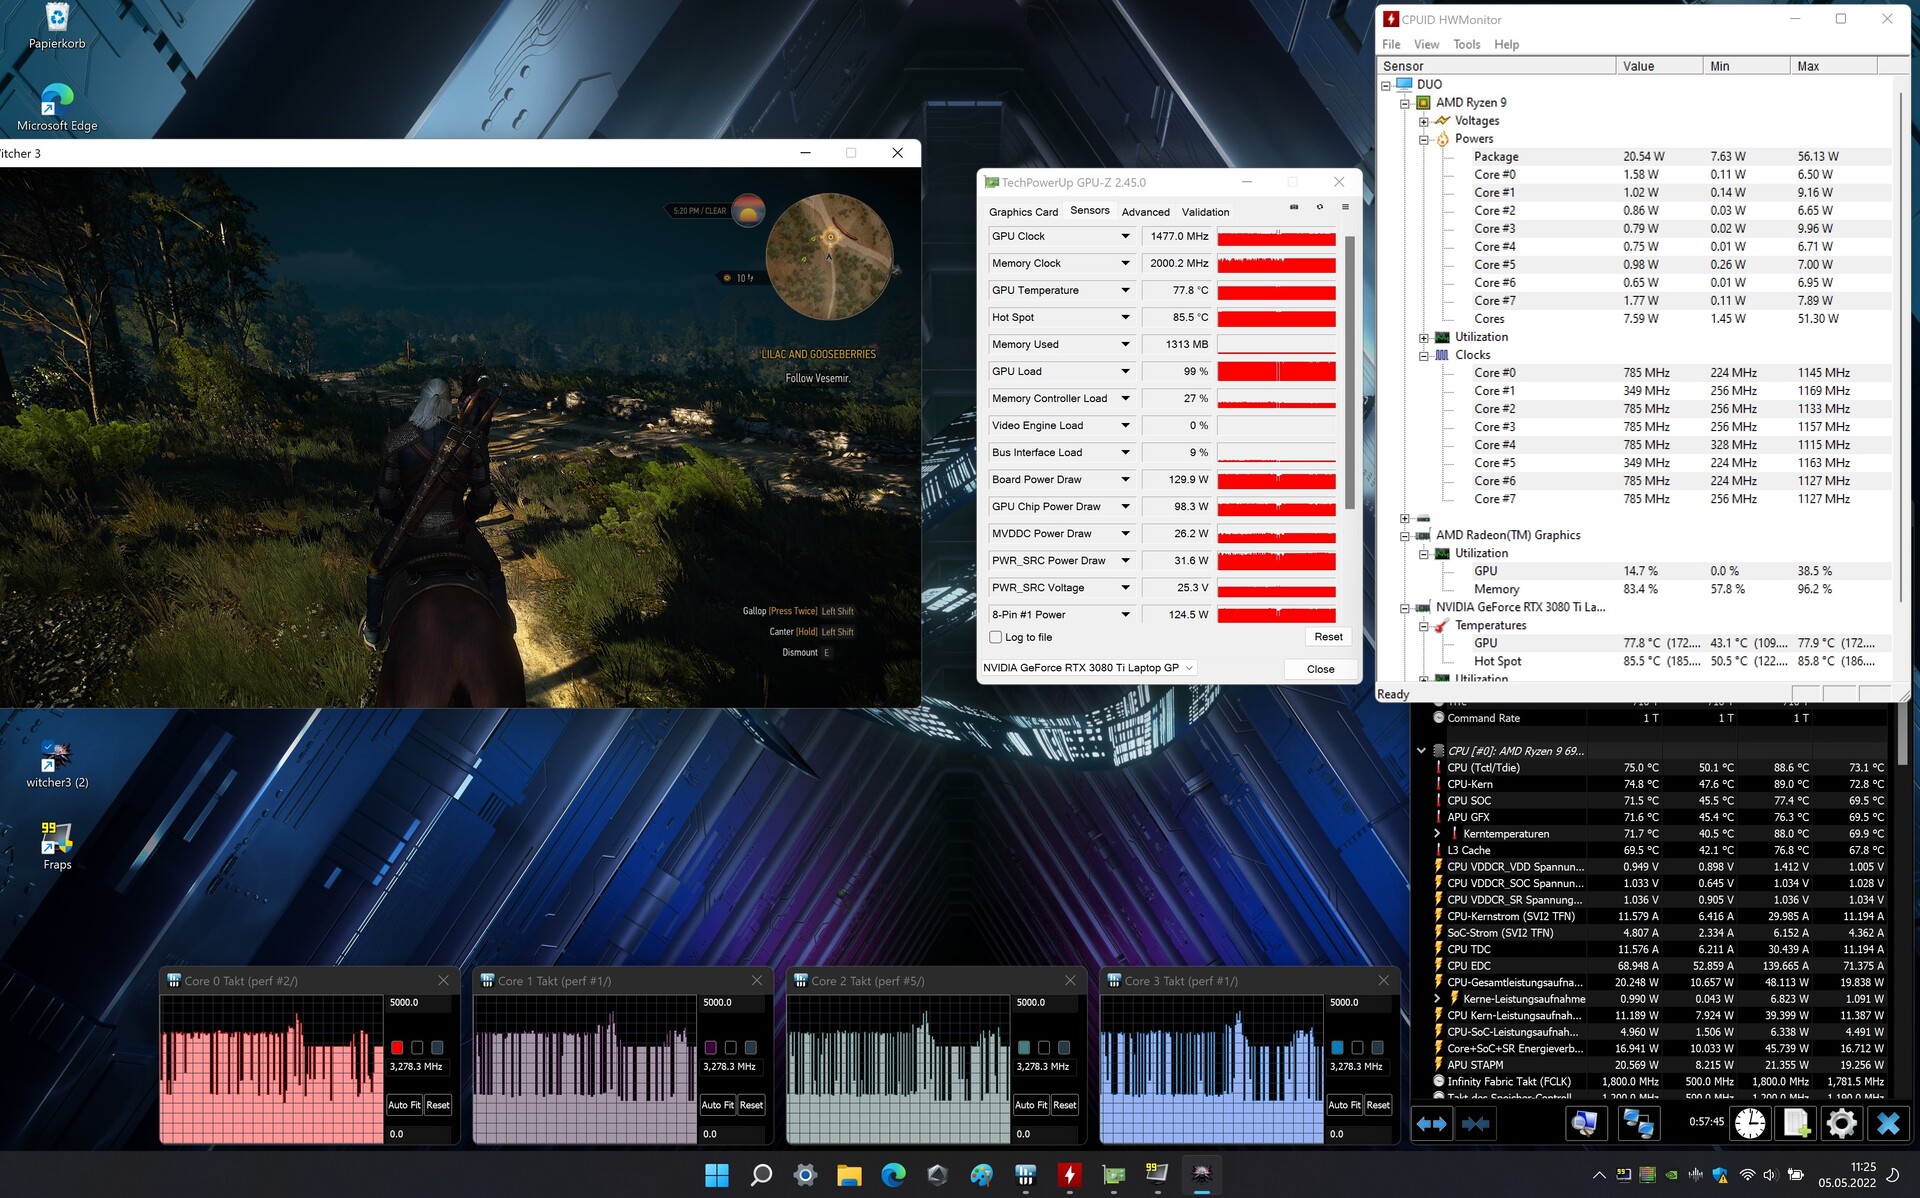
RTX 3000 GPU的实际性能取决于几个因素:冷却、存储设备,以及制造商在Nvidia定义的限制范围内配置的最大TGP。华硕允许 GeForce RTX 3080 Ti LaptopGPU的最大TGP为165瓦(140瓦+25瓦的动态提升)。该GPU能够使用快速的GDDR6图形存储(16,384 MB)。
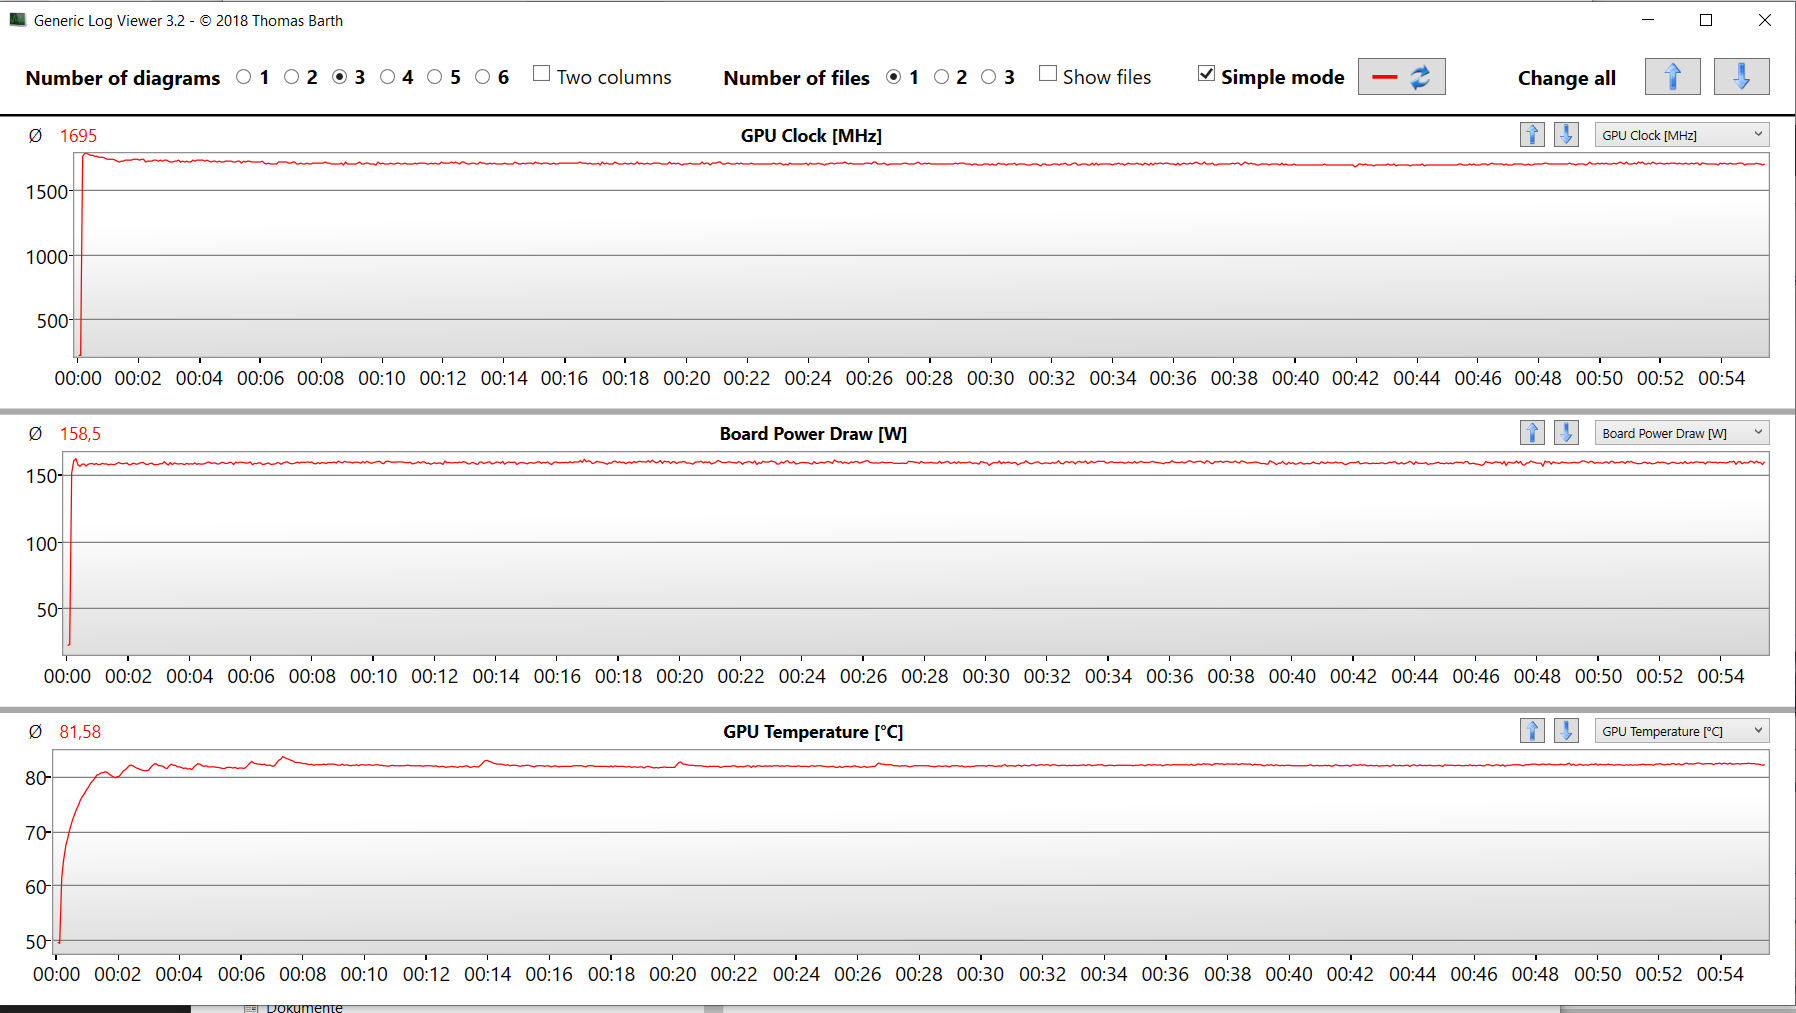
根据华硕的说法,动态提升(最大10瓦)只有在选择了 "Turbo "性能配置时才能使用,Witcher 3 测试证实了这一点。最大(25瓦)需要使用Armoury Crate软件("手动 "配置文件)来启用。基准结果的范围刚刚超过我们迄今为止确定的RTX 3080 Ti的平均水平。
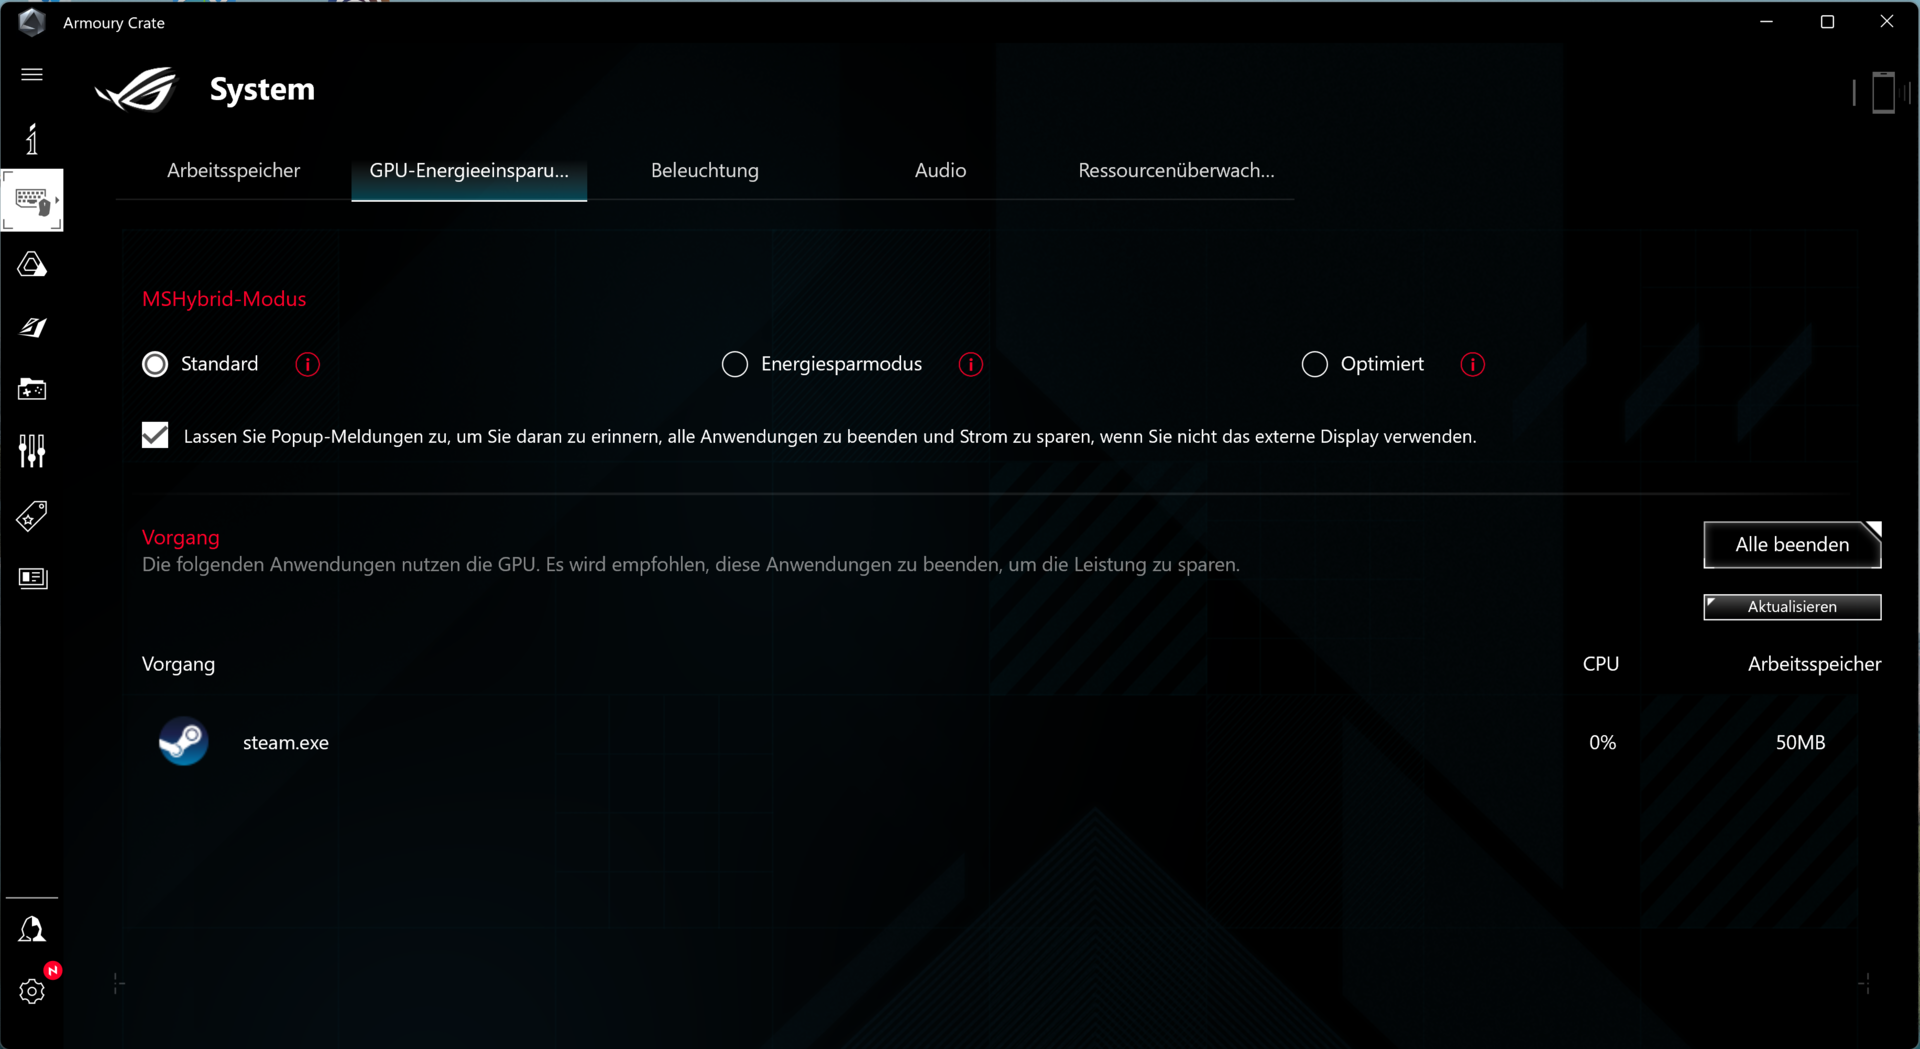
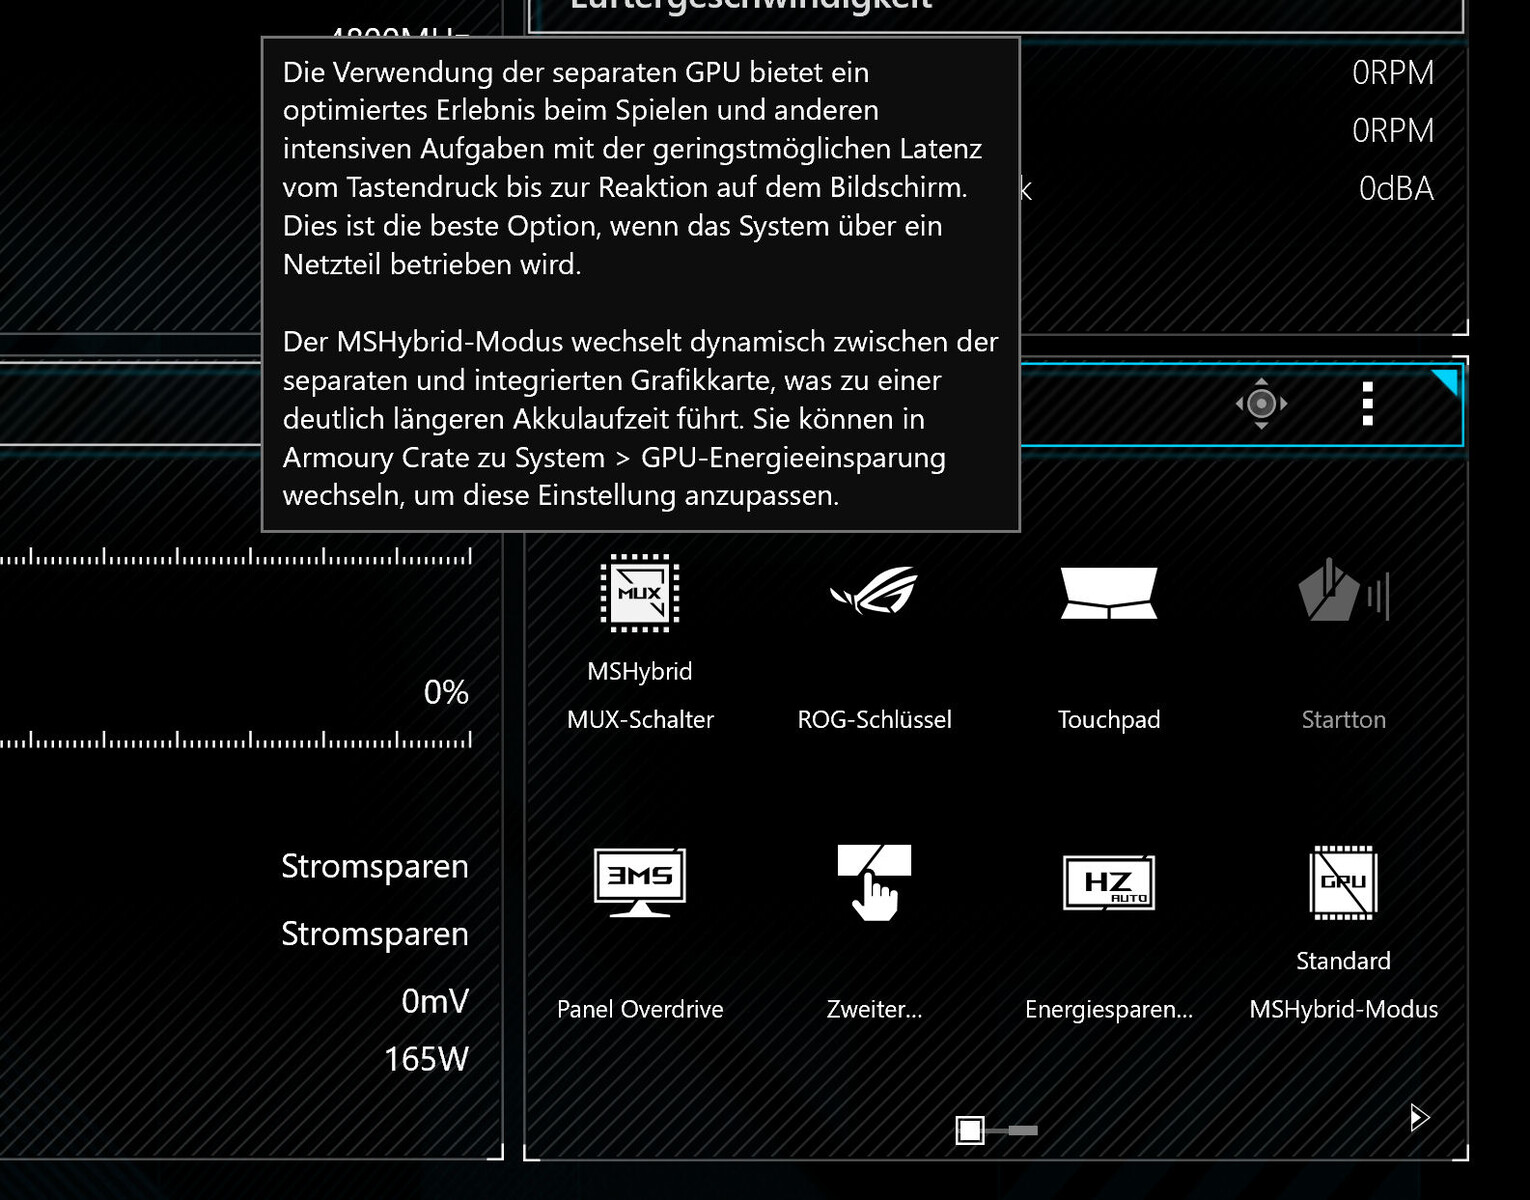
但这并不是终点。还有一个选项是通过GeForce GPU直接输出图像(Armoury Crate,MUX开关:独立的GPU)。结合手动将动态提升至25瓦,图形性能明显增加。

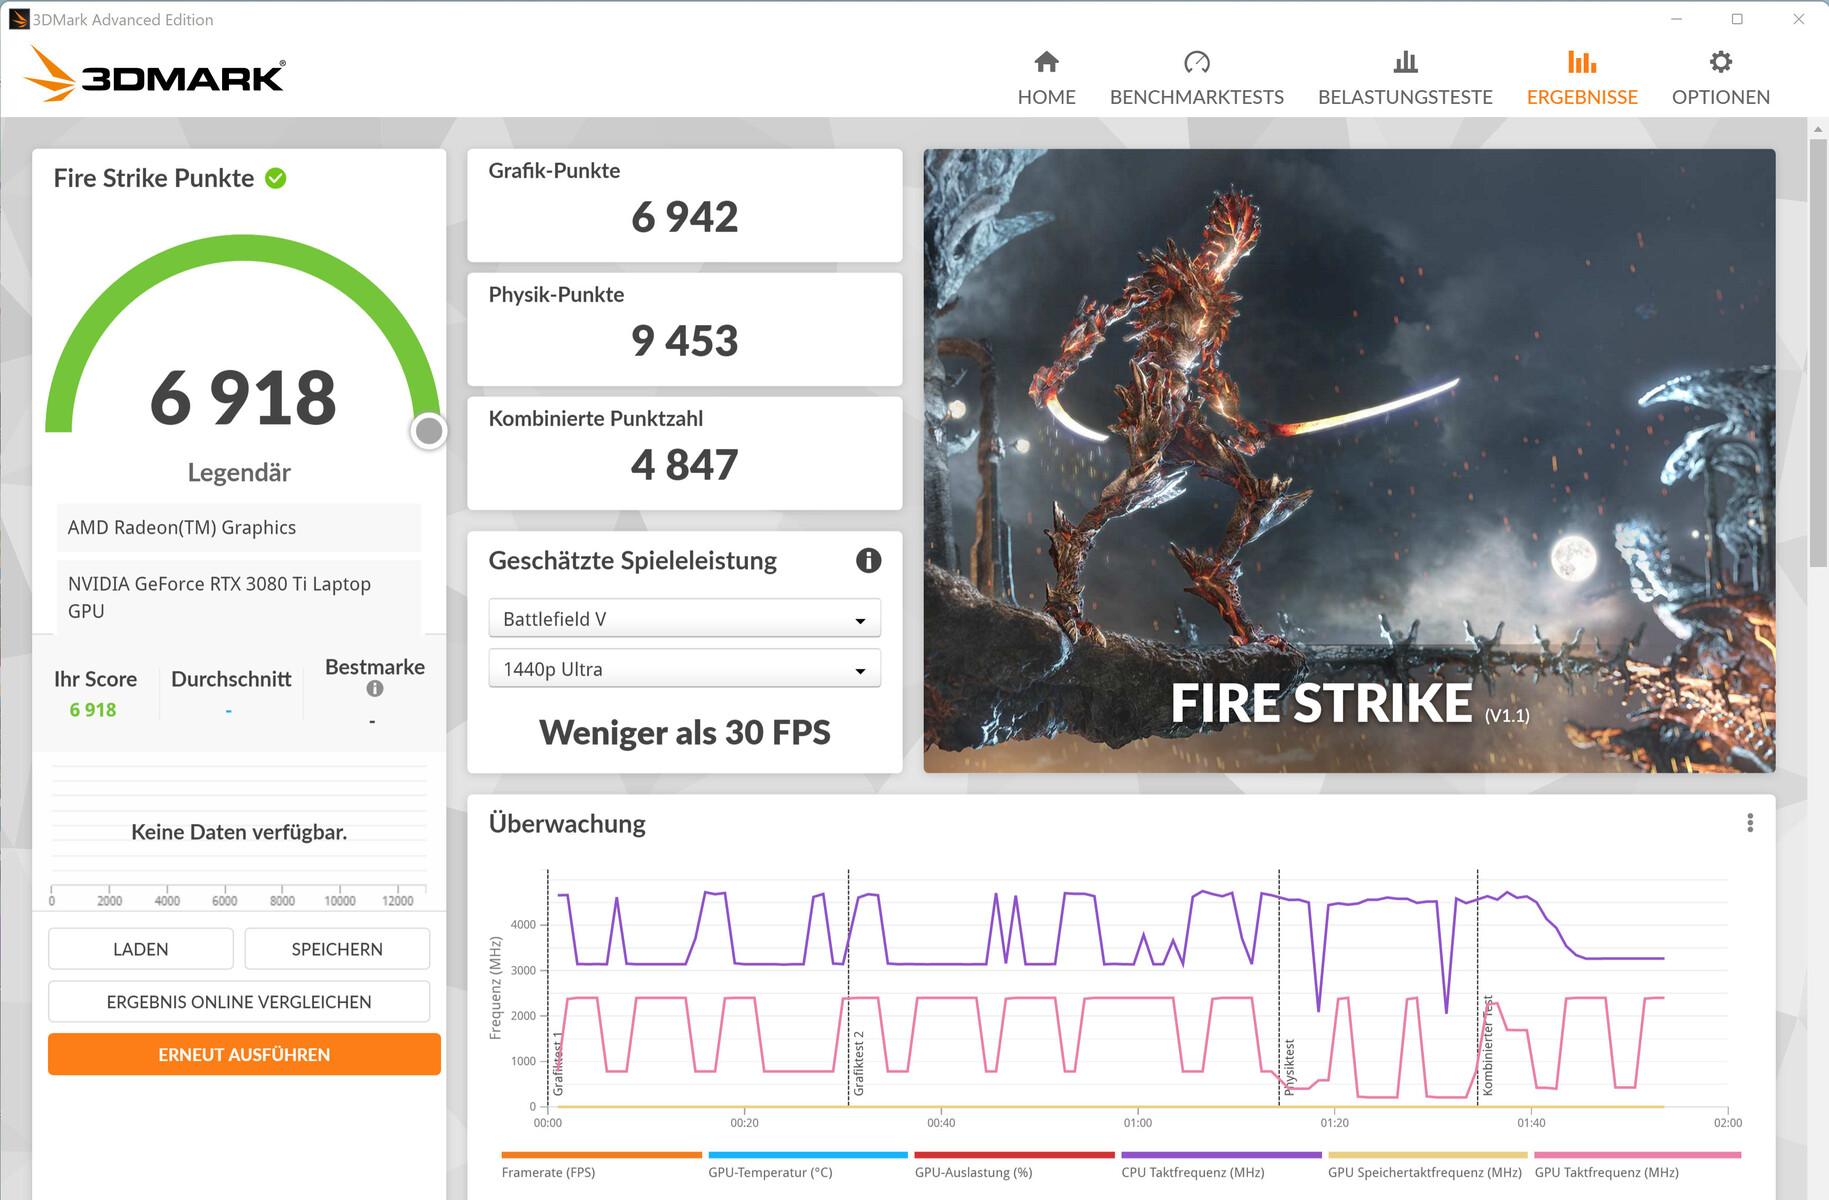
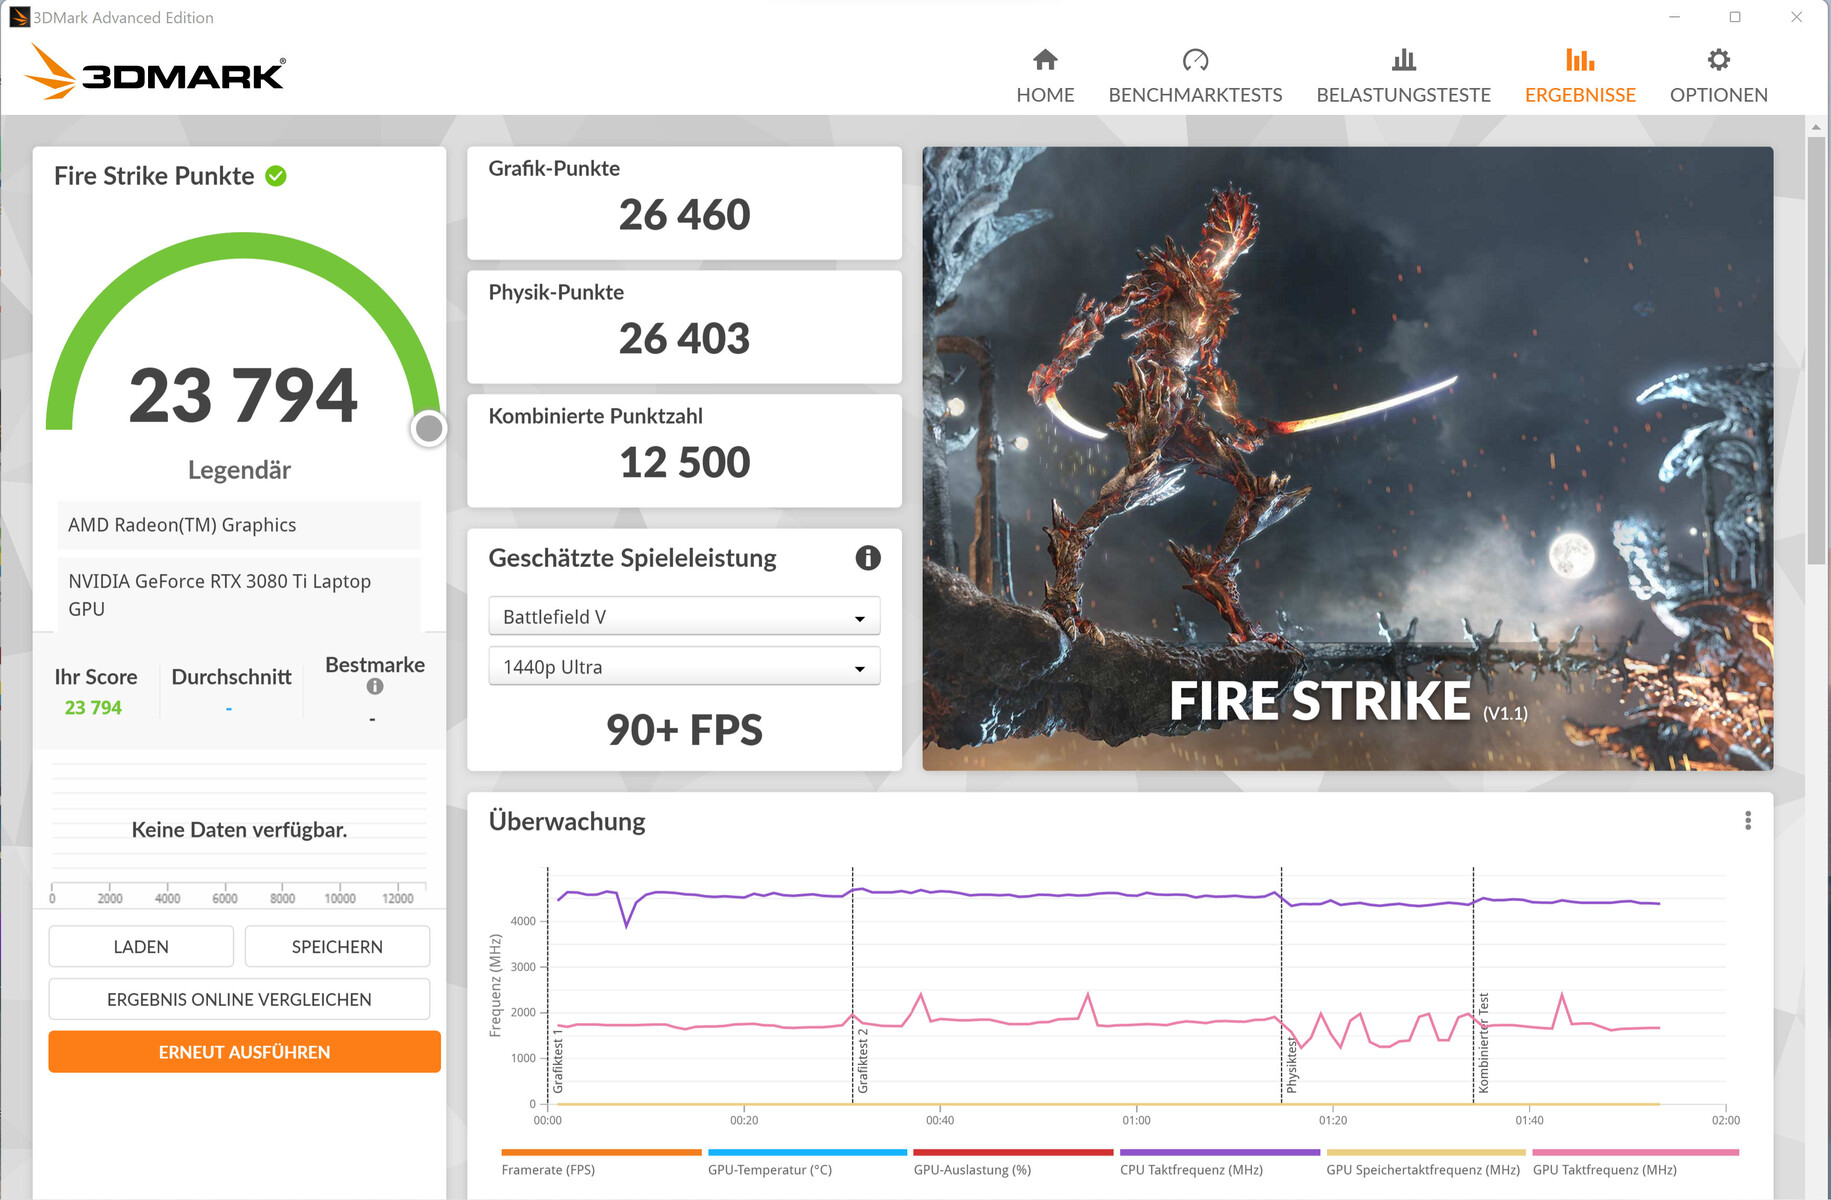
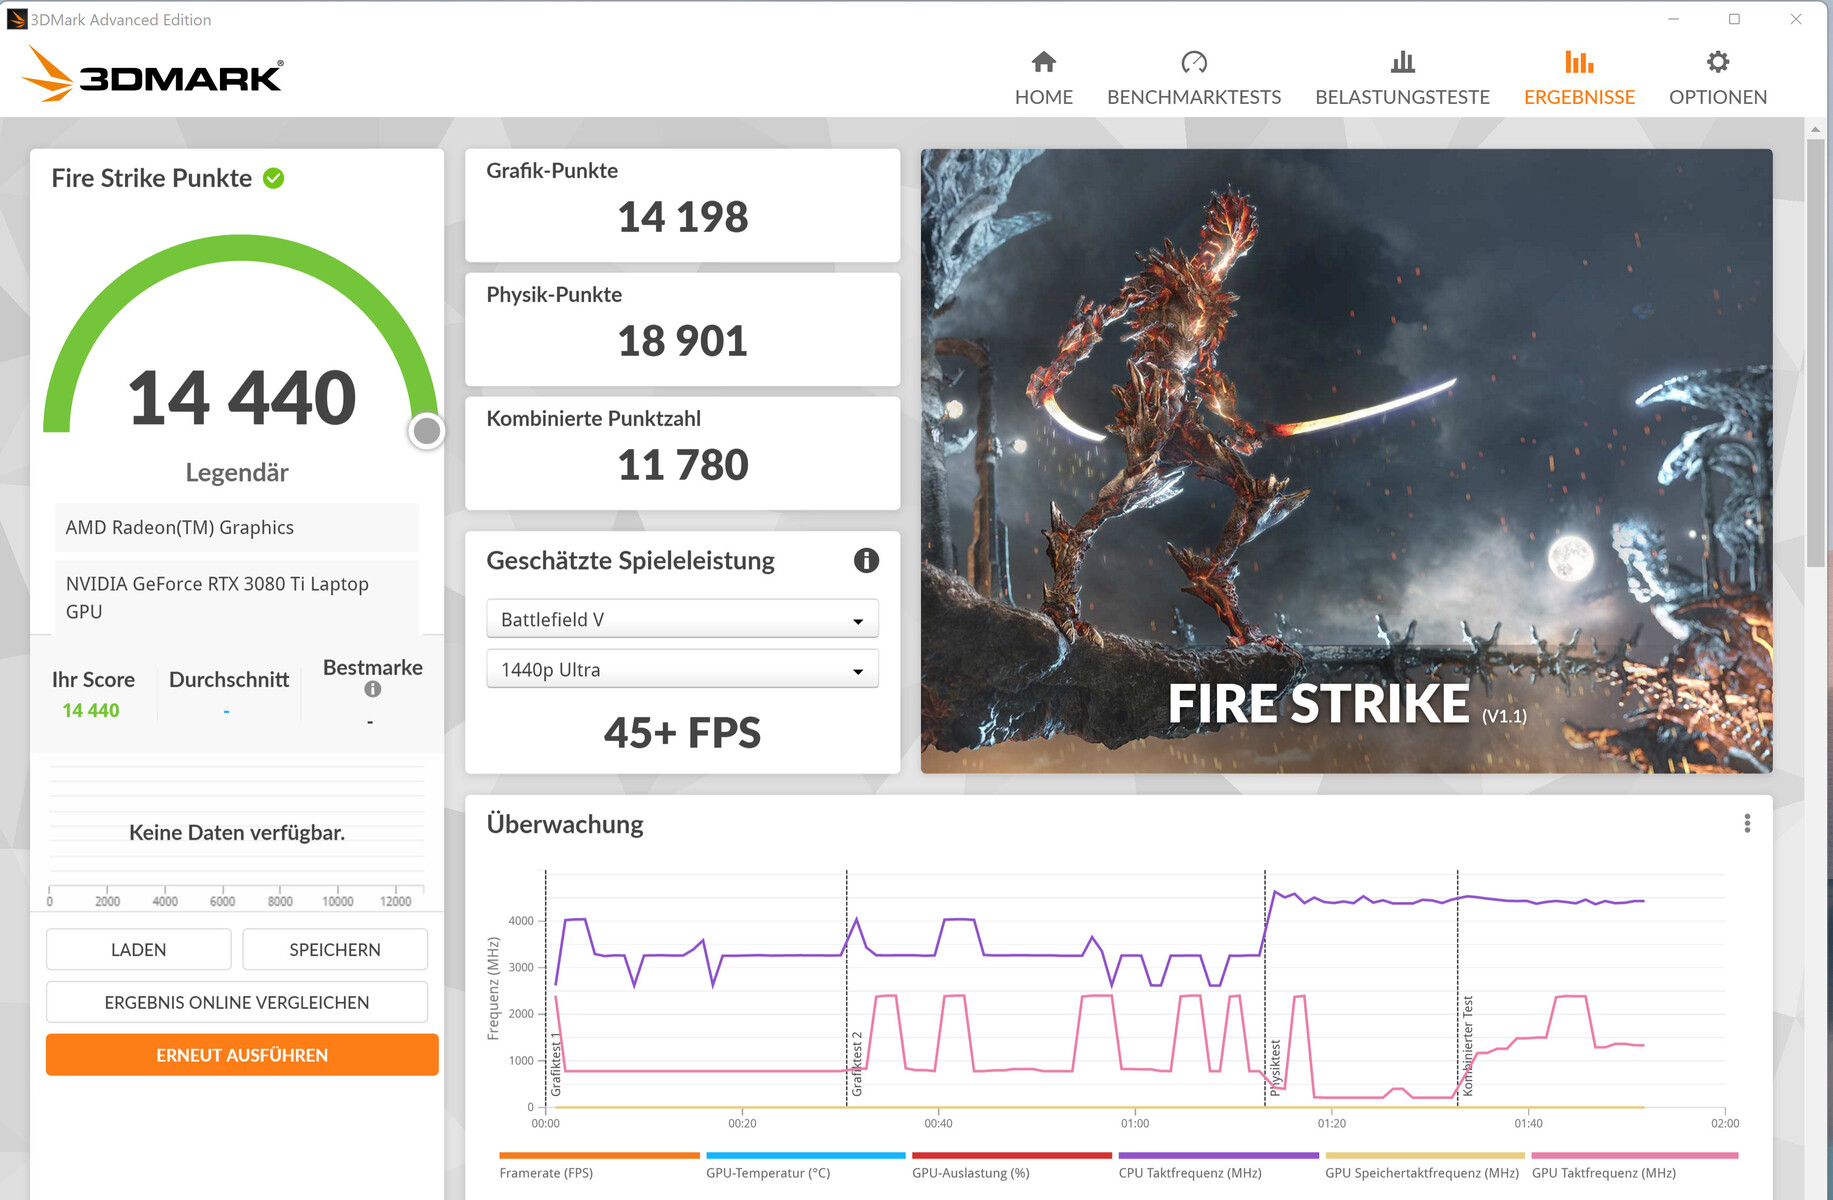
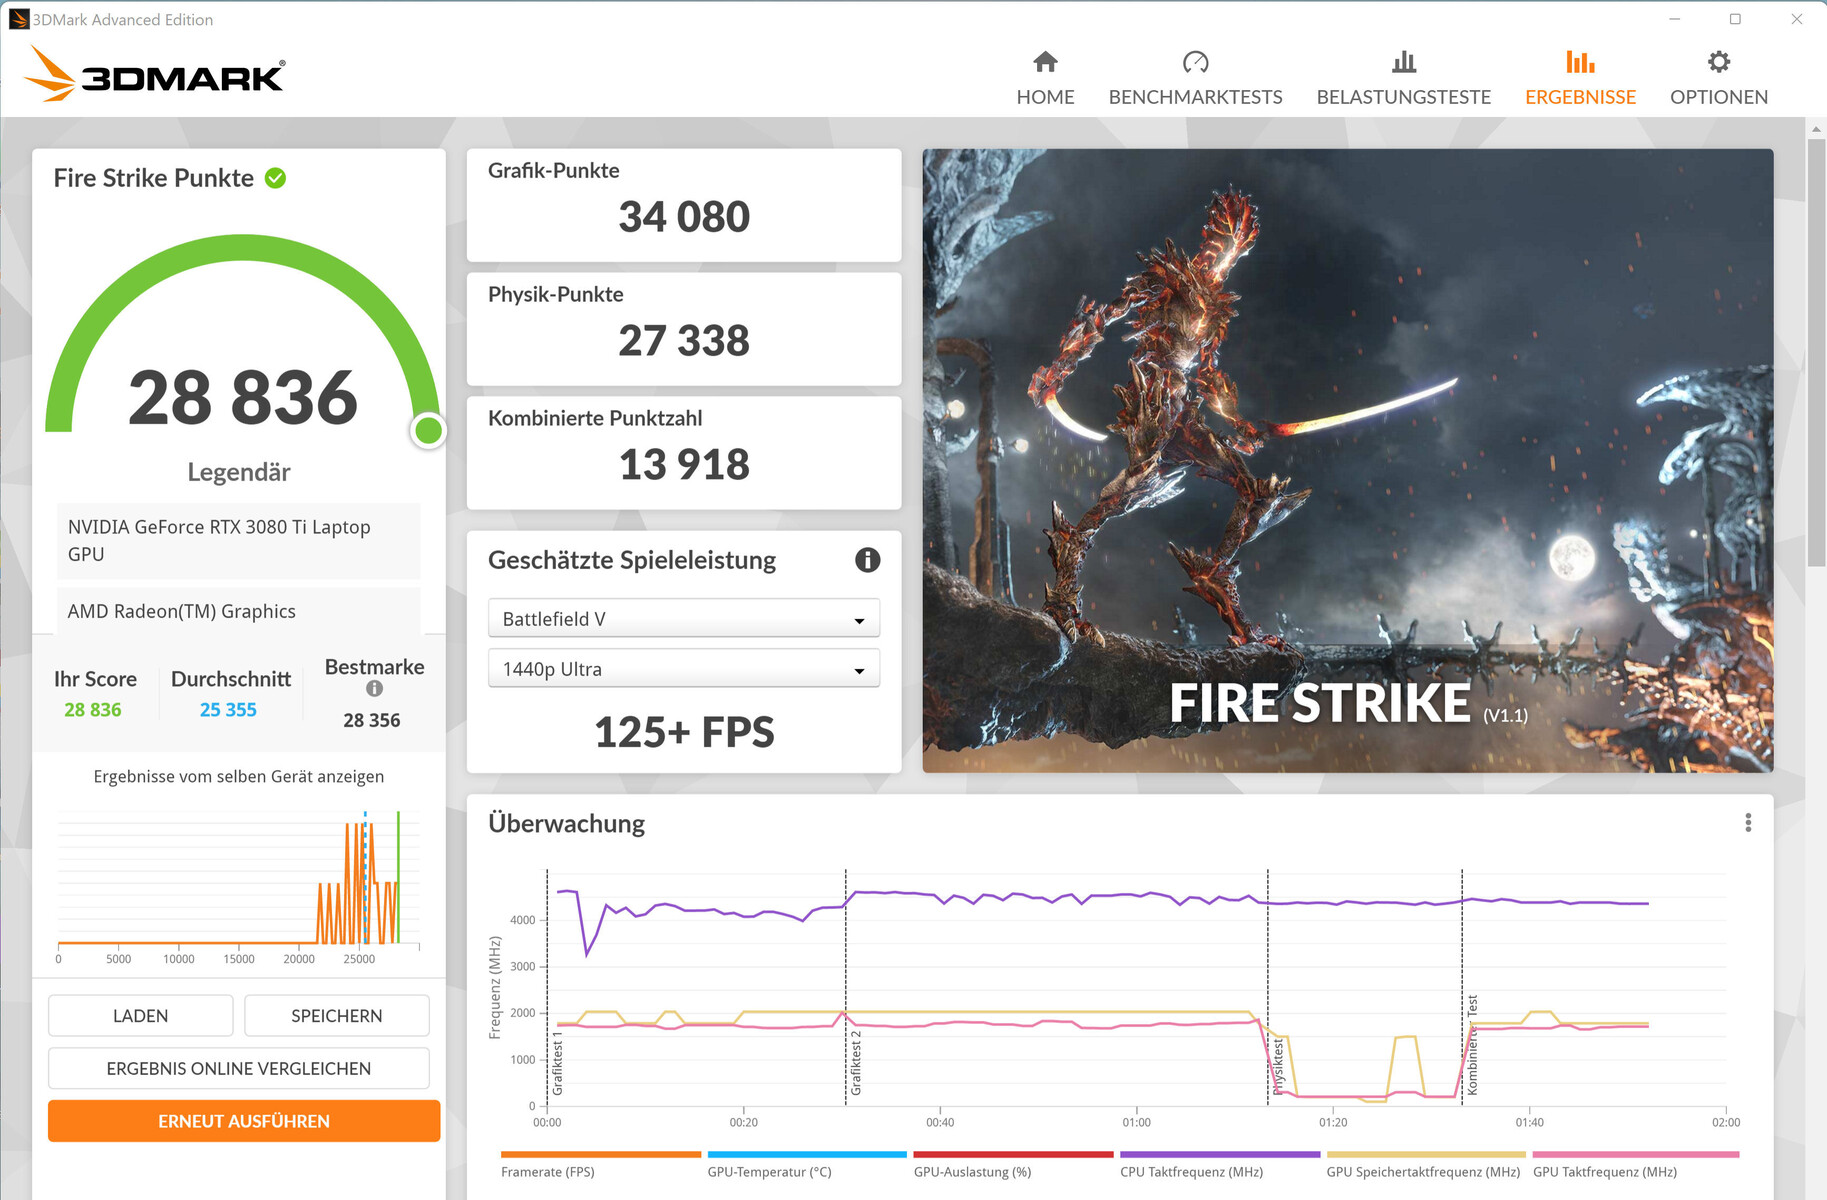
| 3DMark 11 Performance | 31771 points | |
| 3DMark Cloud Gate Standard Score | 47119 points | |
| 3DMark Fire Strike Score | 24278 points | |
Help | ||
| 3DMark Performance rating - Percent | |
| MSI GE76 Raider -25! | |
| Average NVIDIA GeForce RTX 3080 Ti Laptop GPU | |
| Asus ROG Zephyrus Duo 16 GX650RX -25! | |
| Asus ROG Zephyrus Duo 16 GX650RX -2! | |
| Average of class Gaming -2! | |
| Medion Erazer Beast X30 -25! | |
| Asus ROG Zephyrus Duo 16 GX650RX -25! | |
| Gigabyte Aero 16 YE5 -1! | |
| Razer Blade 15 Advanced Model Early 2022 -25! | |
| Asus ROG Zephyrus Duo 16 GX650RX -25! | |
| 3DMark 11 - 1280x720 Performance GPU | |
| Average of class Gaming (21841 - 80022, n=106, last 2 years) | |
| MSI GE76 Raider | |
| Asus ROG Zephyrus Duo 16 GX650RX (Turbo) | |
| Asus ROG Zephyrus Duo 16 GX650RX (sep. GPU, 25W) | |
| Medion Erazer Beast X30 | |
| Asus ROG Zephyrus Duo 16 GX650RX | |
| Average NVIDIA GeForce RTX 3080 Ti Laptop GPU (13920 - 45841, n=45) | |
| Gigabyte Aero 16 YE5 | |
| Razer Blade 15 Advanced Model Early 2022 | |
| Asus ROG Zephyrus Duo 16 GX650RX (Leise) | |
游戏性能
该硬件以FHD到QHD的分辨率和最大设置将当前所有的游戏流畅地带到屏幕上。使用3840 x 2400像素的全显示分辨率有时需要降低设置。帧率的范围在RTX 3080 Ti的平均值左右。通过GeForce GPU(MUX开关:独立的GPU)直接输出图像,结合动态提升至25瓦,导致帧率略有增加。
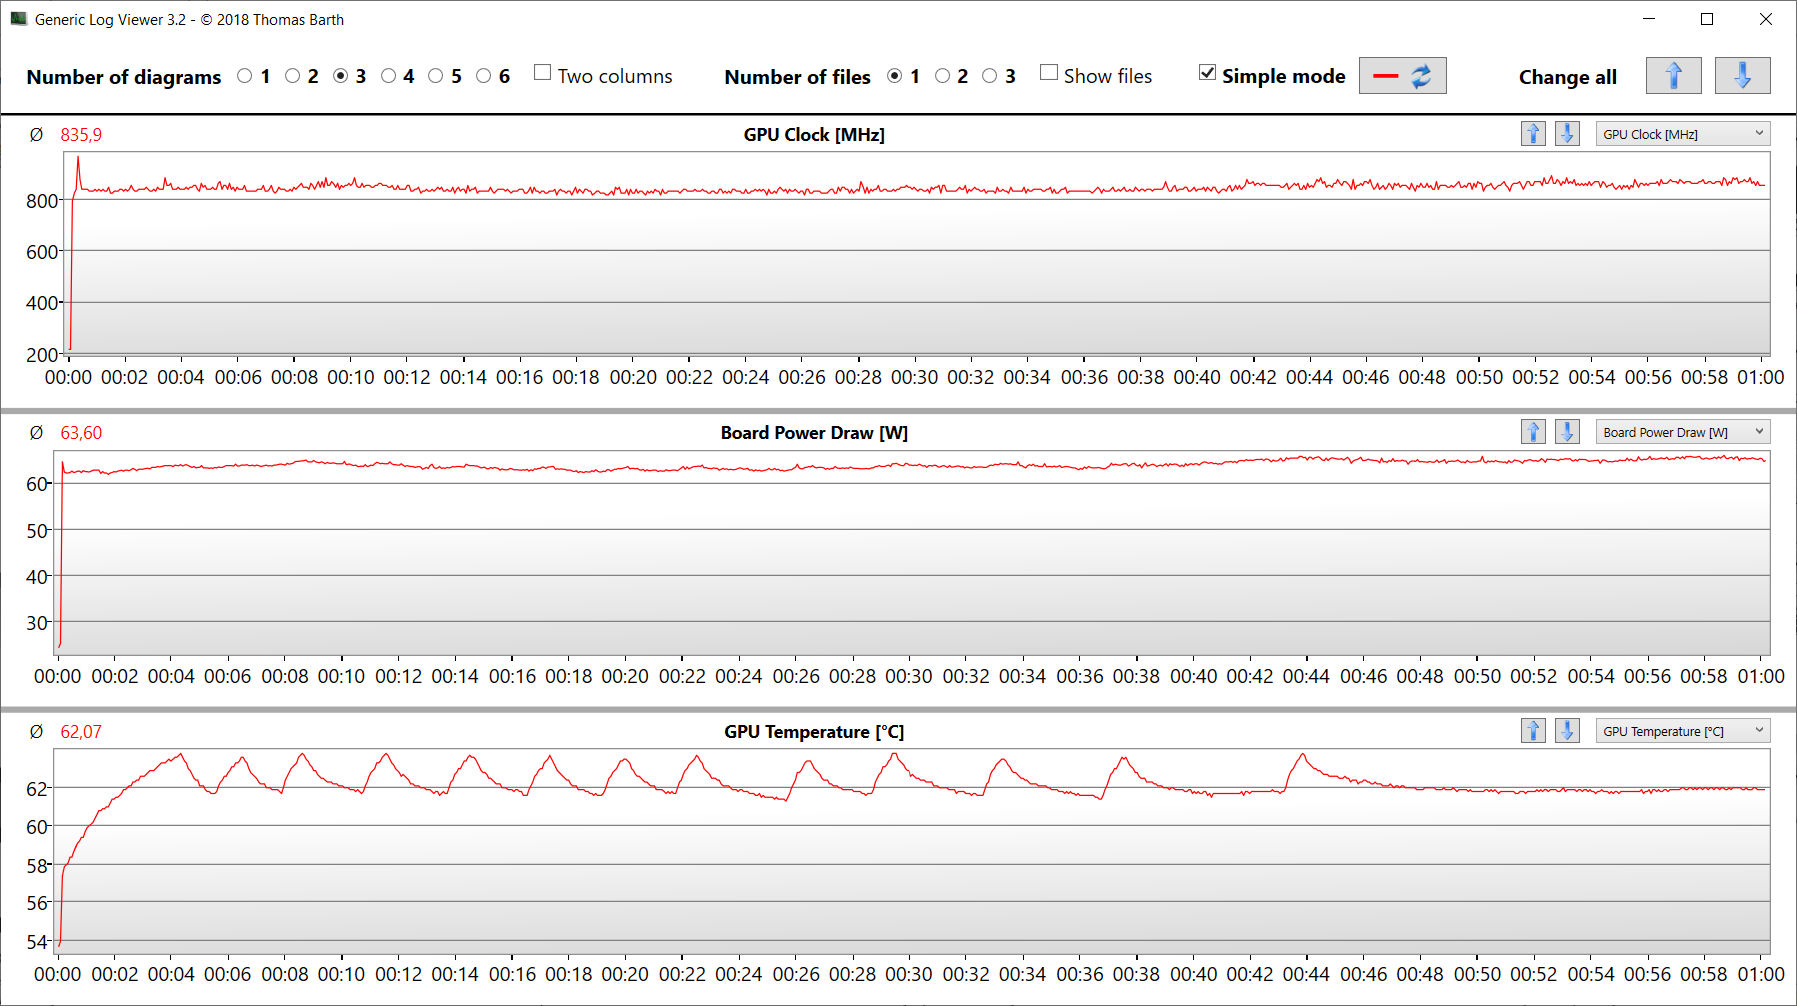
激活 "静音 "配置文件时的低帧率是由于GeForce GPU的 "耳语模式2.0",它应该尽可能地保持低噪音水平,同时帧率水平仍然足以应付游戏(至少30至60帧)。这意味着GPU不必在全功率下运行,从而产生更少的热量,使风扇保持更安静。
| The Witcher 3 | |
| 1920x1080 Ultra Graphics & Postprocessing (HBAO+) | |
| Average of class Gaming (95 - 240, n=8, last 2 years) | |
| MSI GE76 Raider | |
| Asus ROG Zephyrus Duo 16 GX650RX (sep. GPU, 25W) | |
| Asus ROG Zephyrus Duo 16 GX650RX (Turbo) | |
| Medion Erazer Beast X30 | |
| Average NVIDIA GeForce RTX 3080 Ti Laptop GPU (30 - 130.6, n=43) | |
| Asus ROG Zephyrus Duo 16 GX650RX | |
| Gigabyte Aero 16 YE5 | |
| Razer Blade 15 Advanced Model Early 2022 | |
| Asus ROG Zephyrus Duo 16 GX650RX (Leise) | |
| 3840x2160 Ultra Graphics & Postprocessing (HBAO+) | |
| Average of class Gaming (48.4 - 112.4, n=2, last 2 years) | |
| Average NVIDIA GeForce RTX 3080 Ti Laptop GPU (44.8 - 62.7, n=5) | |
| Asus ROG Zephyrus Duo 16 GX650RX | |
| Gigabyte Aero 16 YE5 | |
| Dota 2 Reborn | |
| 1920x1080 ultra (3/3) best looking | |
| Gigabyte Aero 16 YE5 | |
| MSI GE76 Raider | |
| Average of class Gaming (84.8 - 248, n=110, last 2 years) | |
| Medion Erazer Beast X30 | |
| Average NVIDIA GeForce RTX 3080 Ti Laptop GPU (29.9 - 170.5, n=45) | |
| Asus ROG Zephyrus Duo 16 GX650RX (sep. GPU, 25W) | |
| Asus ROG Zephyrus Duo 16 GX650RX (Turbo) | |
| Asus ROG Zephyrus Duo 16 GX650RX | |
| Razer Blade 15 Advanced Model Early 2022 | |
| Asus ROG Zephyrus Duo 16 GX650RX (Leise) | |
| 3840x2160 ultra (3/3) best looking | |
| Average of class Gaming (105.2 - 199.2, n=33, last 2 years) | |
| Average NVIDIA GeForce RTX 3080 Ti Laptop GPU (70.8 - 155.6, n=19) | |
| Gigabyte Aero 16 YE5 | |
| Asus ROG Zephyrus Duo 16 GX650RX (Leise) | |
| Asus ROG Zephyrus Duo 16 GX650RX (Turbo) | |
| Asus ROG Zephyrus Duo 16 GX650RX | |
| X-Plane 11.11 | |
| 3840x2160 high (fps_test=3) | |
| Average of class Gaming (60 - 124.1, n=33, last 2 years) | |
| Average NVIDIA GeForce RTX 3080 Ti Laptop GPU (32.9 - 109.5, n=20) | |
| Gigabyte Aero 16 YE5 | |
| Asus ROG Zephyrus Duo 16 GX650RX (Turbo) | |
| Asus ROG Zephyrus Duo 16 GX650RX | |
| Asus ROG Zephyrus Duo 16 GX650RX (Leise) | |
| 1920x1080 high (fps_test=3) | |
| MSI GE76 Raider | |
| Gigabyte Aero 16 YE5 | |
| Average NVIDIA GeForce RTX 3080 Ti Laptop GPU (32.6 - 127, n=45) | |
| Medion Erazer Beast X30 | |
| Average of class Gaming (52.1 - 143.5, n=113, last 2 years) | |
| Razer Blade 15 Advanced Model Early 2022 | |
| Asus ROG Zephyrus Duo 16 GX650RX (sep. GPU, 25W) | |
| Asus ROG Zephyrus Duo 16 GX650RX (Turbo) | |
| Asus ROG Zephyrus Duo 16 GX650RX | |
| Asus ROG Zephyrus Duo 16 GX650RX (Leise) | |
| Final Fantasy XV Benchmark | |
| 3840x2160 High Quality | |
| Average of class Gaming (45 - 111.8, n=34, last 2 years) | |
| Asus ROG Zephyrus Duo 16 GX650RX (1.3, sep. GPU, 25W) | |
| Asus ROG Zephyrus Duo 16 GX650RX (1.3, Turbo) | |
| Average NVIDIA GeForce RTX 3080 Ti Laptop GPU (35.1 - 61.2, n=18) | |
| Asus ROG Zephyrus Duo 16 GX650RX (1.3) | |
| Asus ROG Zephyrus Duo 16 GX650RX (1.3, Leise) | |
| Gigabyte Aero 16 YE5 (1.3) | |
| 1920x1080 High Quality | |
| Average of class Gaming (41 - 215, n=99, last 2 years) | |
| MSI GE76 Raider | |
| Asus ROG Zephyrus Duo 16 GX650RX (1.3, sep. GPU, 25W) | |
| Asus ROG Zephyrus Duo 16 GX650RX (1.3, Turbo) | |
| Average NVIDIA GeForce RTX 3080 Ti Laptop GPU (30.7 - 140.6, n=42) | |
| Asus ROG Zephyrus Duo 16 GX650RX (1.3) | |
| Razer Blade 15 Advanced Model Early 2022 (1.3) | |
| Medion Erazer Beast X30 (1.3) | |
| Gigabyte Aero 16 YE5 (1.3) | |
| GTA V | |
| 3840x2160 Highest AA:4xMSAA + FX AF:16x | |
| Average of class Gaming (40.5 - 116.7, n=25, last 2 years) | |
| Asus ROG Zephyrus Duo 16 GX650RX (Turbo) | |
| Asus ROG Zephyrus Duo 16 GX650RX | |
| Average NVIDIA GeForce RTX 3080 Ti Laptop GPU (37.7 - 67.2, n=14) | |
| Gigabyte Aero 16 YE5 | |
| 1920x1080 Highest AA:4xMSAA + FX AF:16x | |
| Average of class Gaming (48.3 - 186.9, n=98, last 2 years) | |
| MSI GE76 Raider | |
| Gigabyte Aero 16 YE5 | |
| Average NVIDIA GeForce RTX 3080 Ti Laptop GPU (30 - 139.2, n=42) | |
| Medion Erazer Beast X30 | |
| Asus ROG Zephyrus Duo 16 GX650RX (sep. GPU, 25W) | |
| Asus ROG Zephyrus Duo 16 GX650RX (Turbo) | |
| Asus ROG Zephyrus Duo 16 GX650RX | |
| Razer Blade 15 Advanced Model Early 2022 | |
| Asus ROG Zephyrus Duo 16 GX650RX (Leise) | |
| F1 2021 | |
| 3840x2160 Ultra High Preset + Raytracing AA:T AF:16x | |
| MSI GE76 Raider | |
| Asus ROG Zephyrus Duo 16 GX650RX (874931, sep. GPU, 25W) | |
| Asus ROG Zephyrus Duo 16 GX650RX (874931, Turbo) | |
| Average NVIDIA GeForce RTX 3080 Ti Laptop GPU (41.1 - 70.2, n=18) | |
| Asus ROG Zephyrus Duo 16 GX650RX (874931) | |
| Asus ROG Zephyrus Duo 16 GX650RX (874931, Leise) | |
| Gigabyte Aero 16 YE5 (852849) | |
| 1920x1080 Ultra High Preset + Raytracing AA:T AF:16x | |
| MSI GE76 Raider | |
| Asus ROG Zephyrus Duo 16 GX650RX (874931, sep. GPU, 25W) | |
| Asus ROG Zephyrus Duo 16 GX650RX (874931, Turbo) | |
| Asus ROG Zephyrus Duo 16 GX650RX (874931) | |
| Medion Erazer Beast X30 (874931) | |
| Average NVIDIA GeForce RTX 3080 Ti Laptop GPU (30.2 - 160.6, n=30) | |
| Gigabyte Aero 16 YE5 (852849) | |
| Asus ROG Zephyrus Duo 16 GX650RX (874931, Leise) | |
| Strange Brigade | |
| 3840x2160 ultra AA:ultra AF:16 | |
| Average of class Gaming (66.7 - 187.2, n=34, last 2 years) | |
| Asus ROG Zephyrus Duo 16 GX650RX (1.47.22.14 D3D12, Turbo) | |
| Average NVIDIA GeForce RTX 3080 Ti Laptop GPU (61.7 - 100.7, n=15) | |
| Asus ROG Zephyrus Duo 16 GX650RX (1.47.22.14 D3D12) | |
| Gigabyte Aero 16 YE5 (1.47.22.14 D3D12) | |
| 1920x1080 ultra AA:ultra AF:16 | |
| Average of class Gaming (76.3 - 456, n=89, last 2 years) | |
| MSI GE76 Raider (1.47.22.14 D3D12) | |
| Asus ROG Zephyrus Duo 16 GX650RX (1.47.22.14 D3D12, sep. GPU, 25W) | |
| Medion Erazer Beast X30 (1.47.22.14 D3D12) | |
| Asus ROG Zephyrus Duo 16 GX650RX (1.47.22.14 D3D12, Turbo) | |
| Average NVIDIA GeForce RTX 3080 Ti Laptop GPU (42.3 - 224, n=41) | |
| Asus ROG Zephyrus Duo 16 GX650RX (1.47.22.14 D3D12) | |
| Gigabyte Aero 16 YE5 (1.47.22.14 D3D12) | |
| Razer Blade 15 Advanced Model Early 2022 (1.47.22.14 D3D12) | |
| Asus ROG Zephyrus Duo 16 GX650RX (1.47.22.14 D3D12, Leise) | |
| Cyberpunk 2077 1.6 | |
| 1920x1080 Ray Tracing Ultra Preset (DLSS off) | |
| Gigabyte Aero 16 YE5 | |
| Average NVIDIA GeForce RTX 3080 Ti Laptop GPU (39.2 - 49.9, n=7) | |
| Asus ROG Zephyrus Duo 16 GX650RX | |
| 3840x2160 Ultra Preset | |
| Average NVIDIA GeForce RTX 3080 Ti Laptop GPU (19.6 - 32.4, n=6) | |
| Asus ROG Zephyrus Duo 16 GX650RX | |
| Gigabyte Aero 16 YE5 | |
| 1920x1080 Ultra Preset | |
| Asus ROG Zephyrus Duo 16 GX650RX | |
| Average NVIDIA GeForce RTX 3080 Ti Laptop GPU (54 - 144.1, n=16) | |
| Gigabyte Aero 16 YE5 | |
| Far Cry 6 | |
| 1920x1080 Ultra Graphics Quality + HD Textures AA:T | |
| Average of class Gaming (96.3 - 135.7, n=3, last 2 years) | |
| MSI GE76 Raider | |
| Average NVIDIA GeForce RTX 3080 Ti Laptop GPU (71.3 - 114, n=6) | |
| Asus ROG Zephyrus Duo 16 GX650RX | |
| Asus ROG Zephyrus Duo 16 GX650RX | |
| 3840x2160 Ultra Graphics Quality + HD Textures AA:T | |
| MSI GE76 Raider | |
| Average NVIDIA GeForce RTX 3080 Ti Laptop GPU (46.2 - 57, n=4) | |
| Asus ROG Zephyrus Duo 16 GX650RX | |
| Average of class Gaming (n=1last 2 years) | |
| 1920x1080 Ultra Graphics Quality + HD Textures + DXR AA:T | |
| Average of class Gaming (n=1last 2 years) | |
| Average NVIDIA GeForce RTX 3080 Ti Laptop GPU (91 - 92, n=3) | |
| MSI GE76 Raider | |
| Rainbow Six Extraction | |
| 1920x1080 Ultra Preset (with Fixed Resolution Quality) | |
| Asus ROG Zephyrus Duo 16 GX650RX | |
| Medion Erazer Beast X30 | |
| Average NVIDIA GeForce RTX 3080 Ti Laptop GPU (128 - 169, n=3) | |
| Gigabyte Aero 16 YE5 | |
| 3840x2160 Ultra Preset (with Fixed Resolution Quality) | |
| Asus ROG Zephyrus Duo 16 GX650RX | |
| Average NVIDIA GeForce RTX 3080 Ti Laptop GPU (44 - 57, n=2) | |
| Gigabyte Aero 16 YE5 | |
| Ghostwire Tokyo | |
| 1920x1080 Highest Settings | |
| Asus ROG Zephyrus Duo 16 GX650RX | |
| Average NVIDIA GeForce RTX 3080 Ti Laptop GPU (125 - 143.3, n=2) | |
| Medion Erazer Beast X30 | |
| 3840x2160 Highest Settings | |
| Asus ROG Zephyrus Duo 16 GX650RX | |
| Average NVIDIA GeForce RTX 3080 Ti Laptop GPU (n=1) | |
| 1920x1080 Highest Settings + Maximum Ray Tracing | |
| Medion Erazer Beast X30 | |
| Average NVIDIA GeForce RTX 3080 Ti Laptop GPU (66.1 - 68.3, n=2) | |
| Asus ROG Zephyrus Duo 16 GX650RX | |
| Tiny Tina's Wonderlands | |
| 1920x1080 Badass Preset (DX12) | |
| Average NVIDIA GeForce RTX 3080 Ti Laptop GPU (100.7 - 110.5, n=4) | |
| Asus ROG Zephyrus Duo 16 GX650RX | |
| Medion Erazer Beast X30 | |
| Average of class Gaming (55 - 159.4, n=5, last 2 years) | |
| 3840x2160 Badass Preset (DX12) | |
| Average of class Gaming (n=1last 2 years) | |
| Average NVIDIA GeForce RTX 3080 Ti Laptop GPU (40.1 - 43.9, n=2) | |
| Asus ROG Zephyrus Duo 16 GX650RX | |
| Guardians of the Galaxy | |
| 1920x1080 Ultra Preset | |
| MSI GE76 Raider | |
| Average NVIDIA GeForce RTX 3080 Ti Laptop GPU (112 - 155, n=3) | |
| Asus ROG Zephyrus Duo 16 GX650RX | |
| 3840x2160 Ultra Preset | |
| MSI GE76 Raider | |
| Average NVIDIA GeForce RTX 3080 Ti Laptop GPU (60 - 75, n=2) | |
| Asus ROG Zephyrus Duo 16 GX650RX | |
| 1920x1080 Ultra Preset + Ultra Ray-Tracing | |
| MSI GE76 Raider | |
| Average NVIDIA GeForce RTX 3080 Ti Laptop GPU (82 - 104, n=2) | |
| Asus ROG Zephyrus Duo 16 GX650RX | |
| Alan Wake Remastered | |
| 3840x2160 High Preset | |
| MSI GE76 Raider | |
| Average NVIDIA GeForce RTX 3080 Ti Laptop GPU (71.6 - 89, n=2) | |
| Asus ROG Zephyrus Duo 16 GX650RX | |
| 1920x1080 High Preset | |
| MSI GE76 Raider | |
| Average NVIDIA GeForce RTX 3080 Ti Laptop GPU (118.8 - 155, n=2) | |
| Asus ROG Zephyrus Duo 16 GX650RX | |
| Dying Light 2 | |
| 1920x1080 High Quality Raytracing | |
| Asus ROG Zephyrus Duo 16 GX650RX | |
| Average NVIDIA GeForce RTX 3080 Ti Laptop GPU (33.4 - 42.3, n=5) | |
| Gigabyte Aero 16 YE5 | |
| 3840x2160 High Quality | |
| Asus ROG Zephyrus Duo 16 GX650RX | |
| Average NVIDIA GeForce RTX 3080 Ti Laptop GPU (27.3 - 31, n=2) | |
| Gigabyte Aero 16 YE5 | |
| 1920x1080 High Quality | |
| Average NVIDIA GeForce RTX 3080 Ti Laptop GPU (69.2 - 88.4, n=5) | |
| Asus ROG Zephyrus Duo 16 GX650RX | |
| Gigabyte Aero 16 YE5 | |
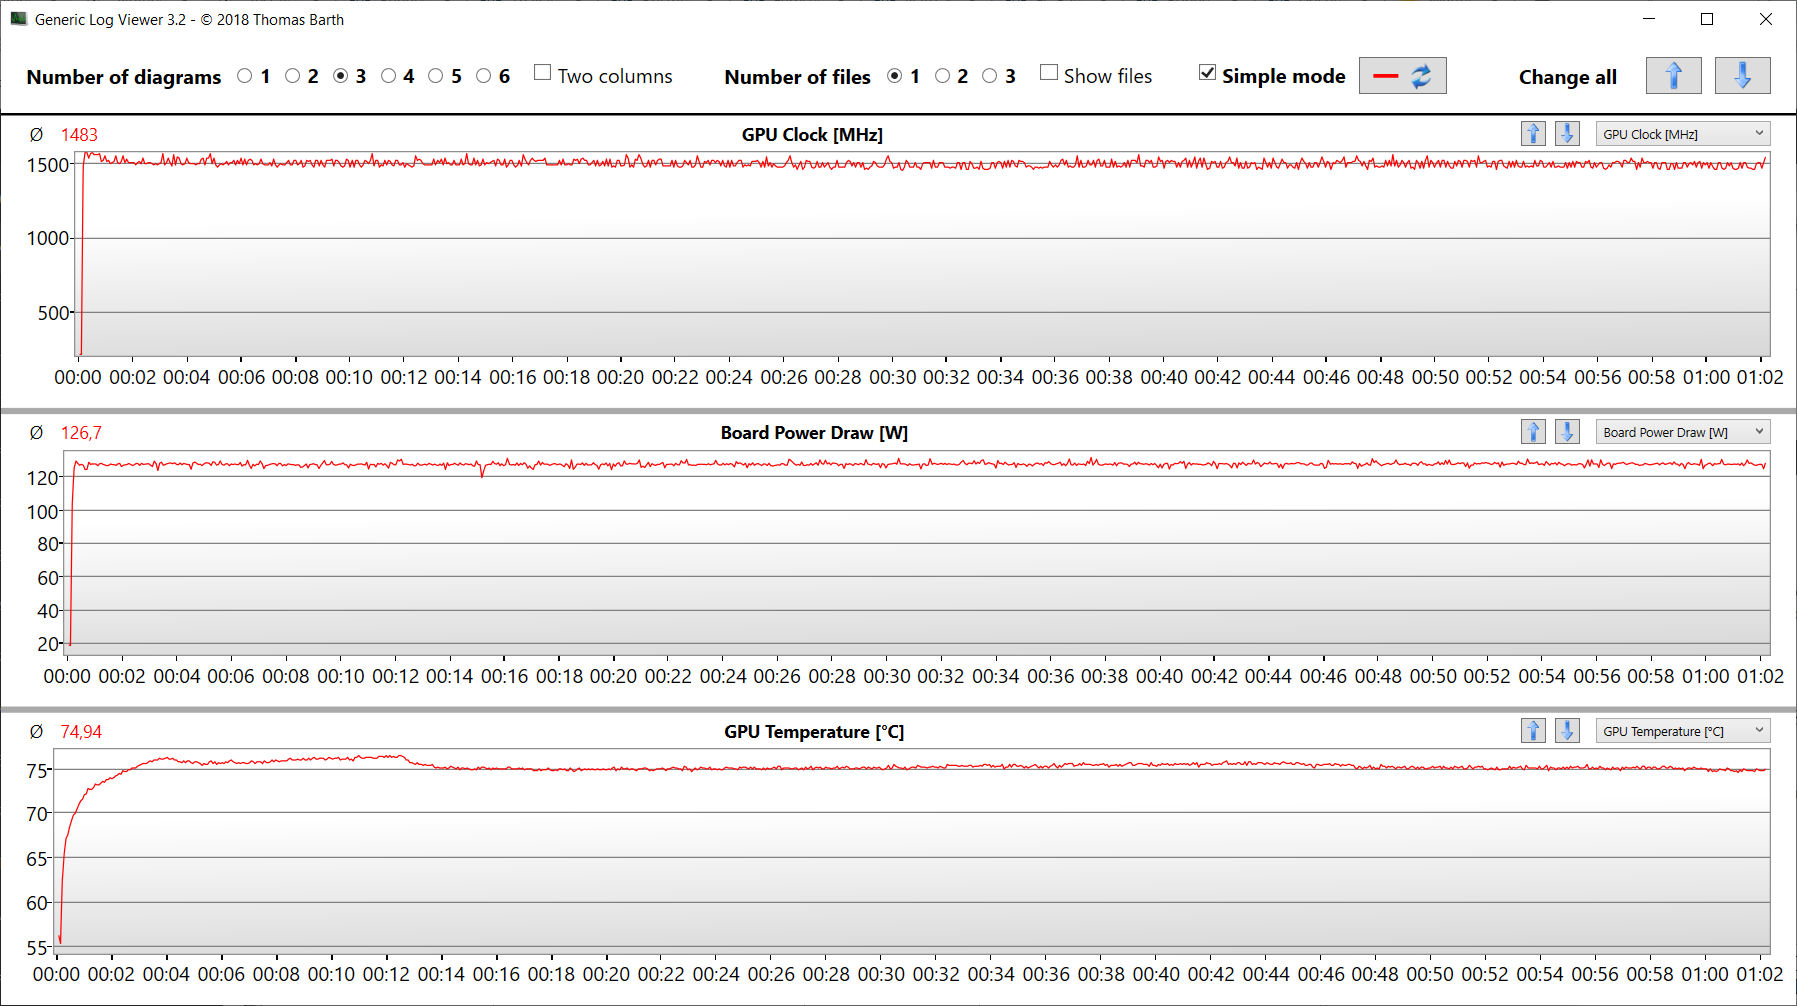
为了评估帧率是否在较长的时间内保持相当稳定,我们让游戏"TheWitcher 3"在全高清分辨率和最高质量设置下运行了约60分钟,没有移动游戏角色。我们没有注意到帧率的下降。
The Witcher 3 FPS Chart
| low | med. | high | ultra | QHD | 4K | |
|---|---|---|---|---|---|---|
| GTA V (2015) | 180.4 | 175.4 | 158.9 | 101.5 | 92.2 | 101.5 |
| The Witcher 3 (2015) | 345 | 298 | 197.9 | 111.1 | 80.5 | |
| Dota 2 Reborn (2015) | 133.8 | 122.2 | 114.8 | 111.3 | 89.2 | |
| Final Fantasy XV Benchmark (2018) | 177.8 | 138.7 | 108 | 84.6 | 51.4 | |
| X-Plane 11.11 (2018) | 112.9 | 95.1 | 78.2 | 66.1 | ||
| Far Cry 5 (2018) | 146 | 124 | 120 | 111 | 104 | 60 |
| Strange Brigade (2018) | 359 | 229 | 198.8 | 182.4 | 140.2 | 84.5 |
| F1 2021 (2021) | 330 | 275 | 225 | 130.2 | 102.5 | 60 |
| Alan Wake Remastered (2021) | 142.4 | 123.4 | 118.8 | 114.4 | 71.6 | |
| Far Cry 6 (2021) | 116.2 | 100.3 | 90.9 | 71.3 | 75.2 | 46.2 |
| Guardians of the Galaxy (2021) | 118 | 113 | 112 | 112 | 103 | 60 |
| Rainbow Six Extraction (2022) | 243 | 207 | 202 | 169 | 113 | 57 |
| Dying Light 2 (2022) | 106.9 | 88.4 | 77.6 | 55.8 | 31 | |
| Cyberpunk 2077 1.6 (2022) | 136.3 | 119.6 | 98.3 | 99.1 | 53.7 | 25.2 |
| Ghostwire Tokyo (2022) | 148.1 | 146.8 | 143.8 | 143.3 | 110.6 | 59.9 |
| Tiny Tina's Wonderlands (2022) | 192.7 | 167.3 | 128.9 | 104.3 | 73.5 | 40.1 |
排放--华硕ROG 16的噪音和热量发展可以接受
噪声排放
在日常办公和互联网任务的操作中,这两个风扇很轻松,只产生非常小的噪音。有时,它们甚至保持关闭状态。另一方面,在满负荷的情况下,它们会变得很吵,在压力测试中最大的噪音水平为50 dB(A),在Witcher 3 测试中为48 dB(A)。虽然可以通过选择 "静音 "配置文件来减少噪音的发展,但这是以计算性能为代价的。
Noise level
| Idle |
| 26 / 27 / 29 dB(A) |
| Load |
| 41 / 50 dB(A) |
 | ||
30 dB silent 40 dB(A) audible 50 dB(A) loud |
||
min: | ||
| Asus ROG Zephyrus Duo 16 GX650RX R9 6900HX, GeForce RTX 3080 Ti Laptop GPU | Apple MacBook Pro 16 2021 M1 Max M1 Max, M1 Max 32-Core GPU | Razer Blade 15 Advanced Model Early 2022 i7-12800H, GeForce RTX 3080 Ti Laptop GPU | MSI GE76 Raider i9-12900HK, GeForce RTX 3080 Ti Laptop GPU | Medion Erazer Beast X30 i9-12900HK, GeForce RTX 3080 Ti Laptop GPU | Gigabyte Aero 16 YE5 i9-12900HK, GeForce RTX 3080 Ti Laptop GPU | |
|---|---|---|---|---|---|---|
| Noise | 10% | 4% | -11% | -8% | -9% | |
| off / environment * (dB) | 26 | 24.2 7% | 26 -0% | 26 -0% | 26 -0% | 25 4% |
| Idle Minimum * (dB) | 26 | 24.2 7% | 26 -0% | 26 -0% | 27 -4% | 30 -15% |
| Idle Average * (dB) | 27 | 24.2 10% | 27 -0% | 27 -0% | 29 -7% | 32 -19% |
| Idle Maximum * (dB) | 29 | 24.2 17% | 29 -0% | 40 -38% | 34 -17% | 33 -14% |
| Load Average * (dB) | 41 | 42.9 -5% | 37 10% | 50 -22% | 48 -17% | 45 -10% |
| Witcher 3 ultra * (dB) | 48 | 39.5 18% | 44 8% | 53 -10% | 51 -6% | 50 -4% |
| Load Maximum * (dB) | 50 | 42.9 14% | 45 10% | 53 -6% | 53 -6% | 52 -4% |
* ... smaller is better
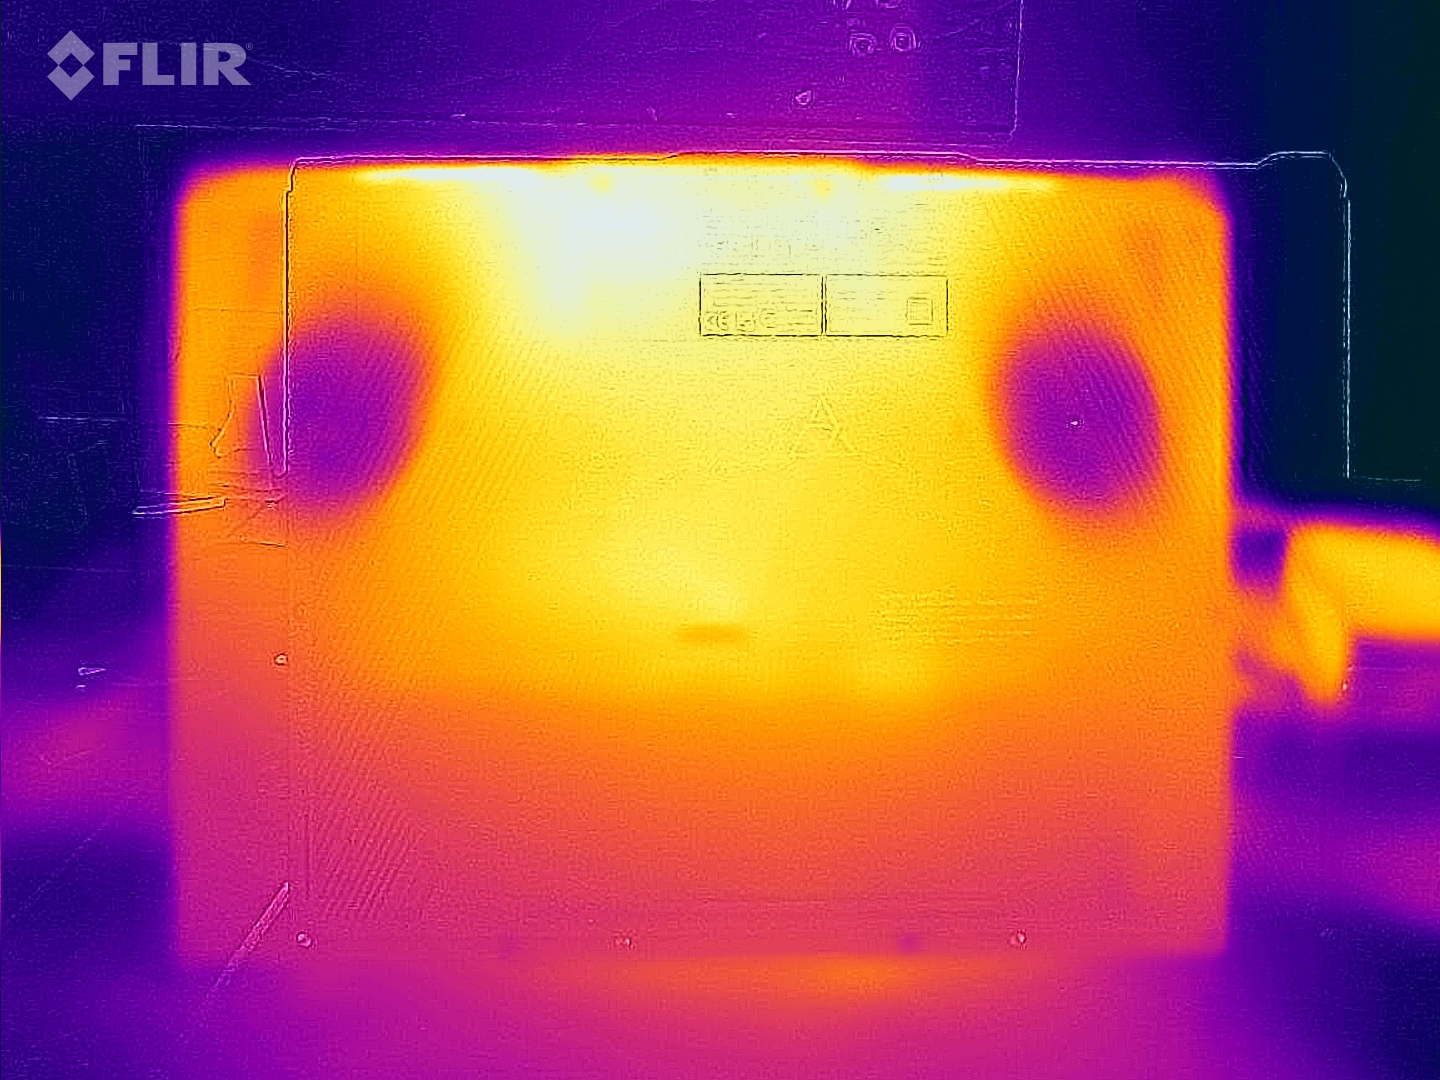
温度
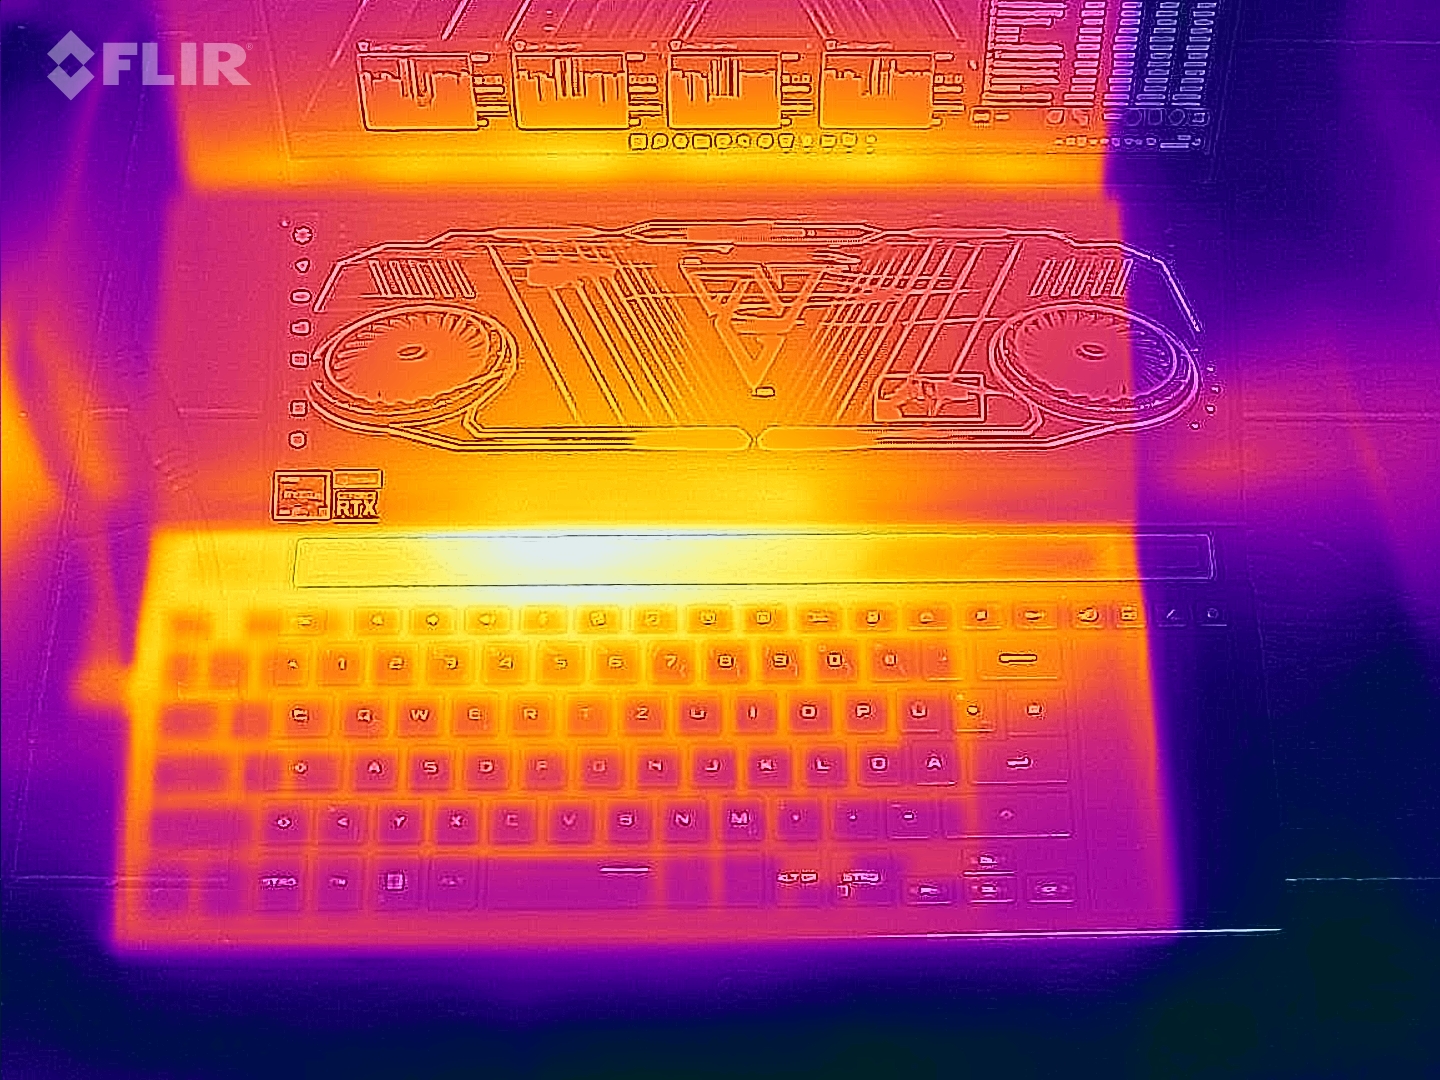
在日常操作中(办公室、互联网),机箱温度保持在绿色范围内。在负载情况下(压力测试,Witcher 3 测试),笔记本电脑升温而不会变得过热。CPU的温度范围在可接受的水平内。
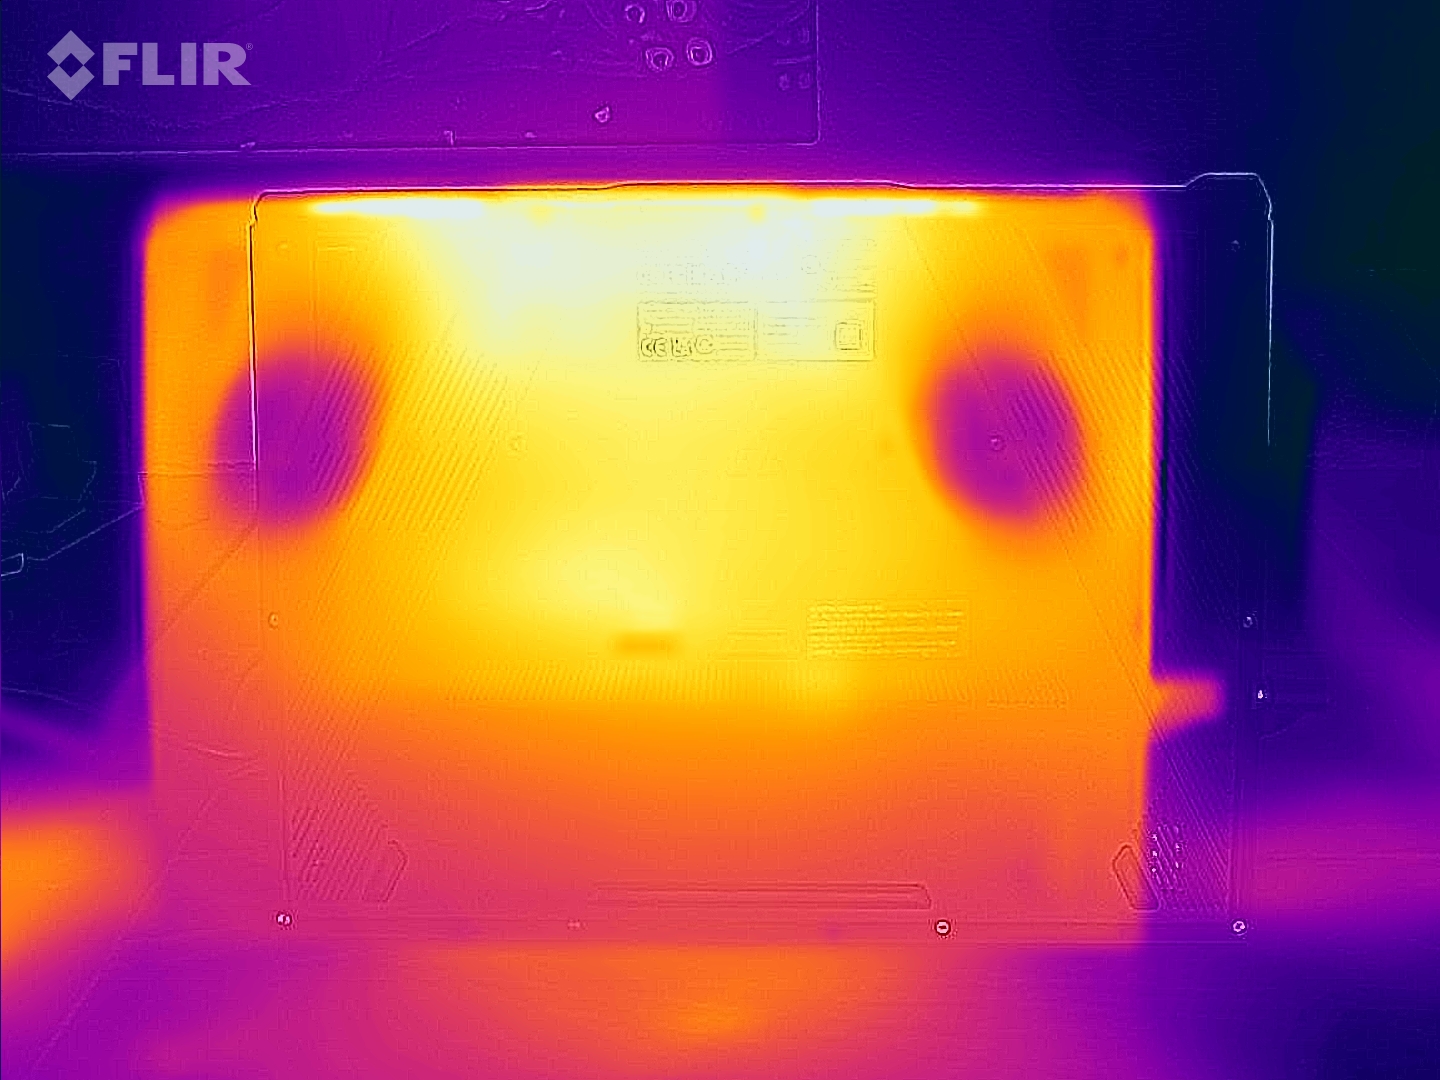
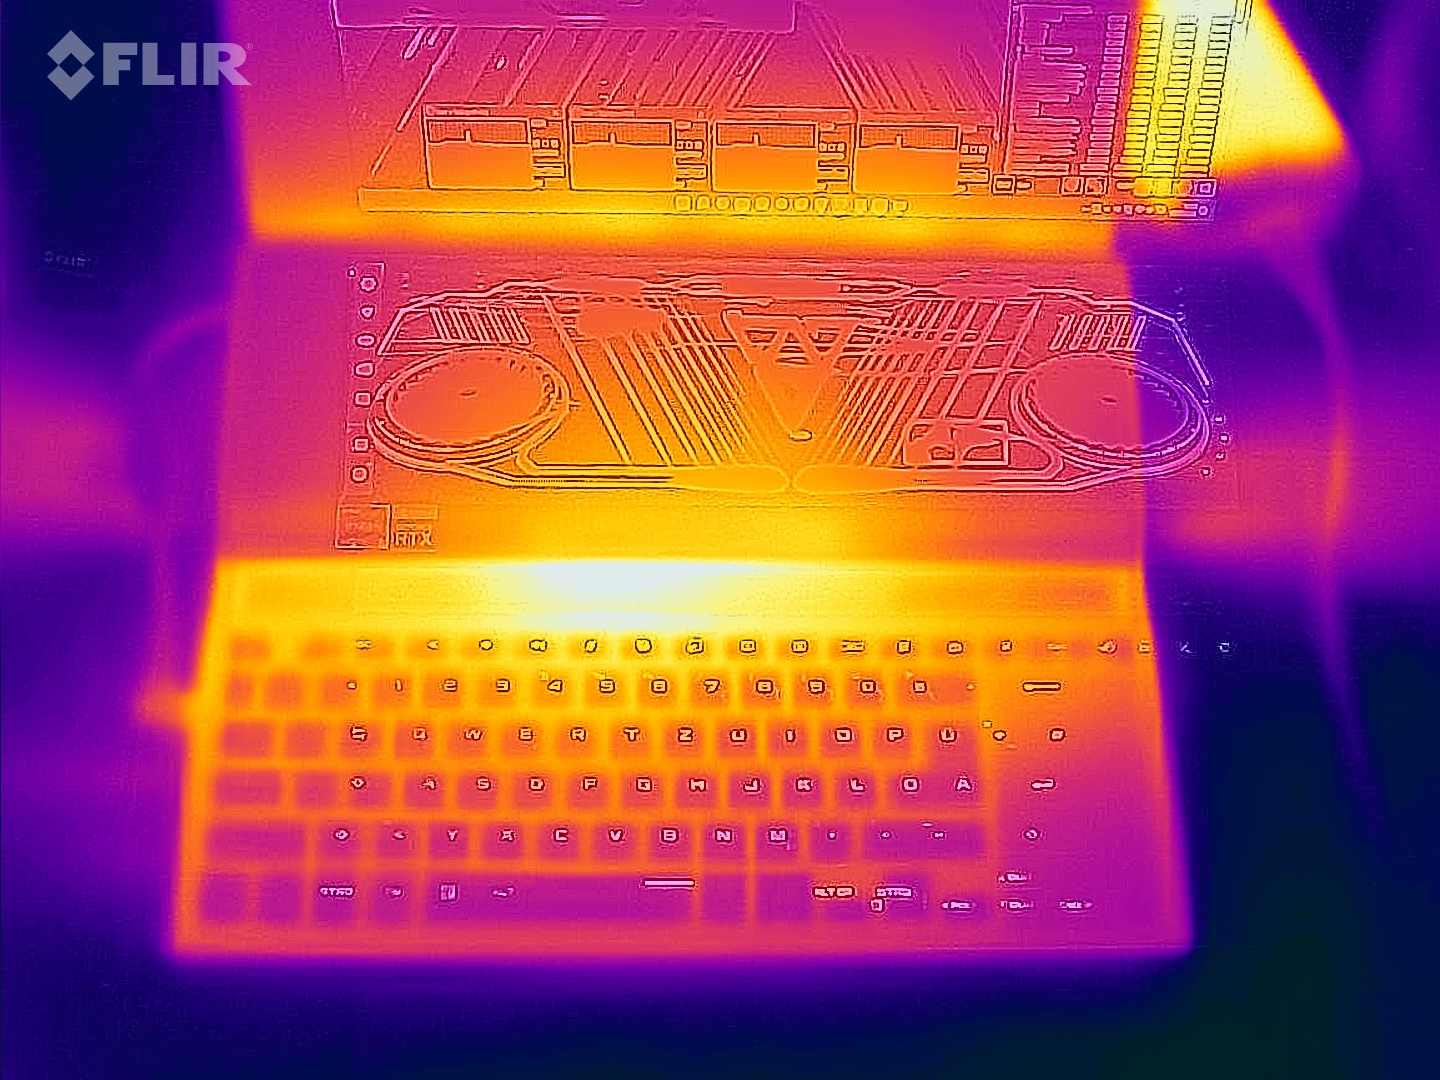
(±) The maximum temperature on the upper side is 45 °C / 113 F, compared to the average of 40.4 °C / 105 F, ranging from 21.2 to 68.8 °C for the class Gaming.
(-) The bottom heats up to a maximum of 50 °C / 122 F, compared to the average of 43.2 °C / 110 F
(+) In idle usage, the average temperature for the upper side is 29.8 °C / 86 F, compared to the device average of 33.9 °C / 93 F.
(-) Playing The Witcher 3, the average temperature for the upper side is 40.1 °C / 104 F, compared to the device average of 33.9 °C / 93 F.
(-) The palmrests and touchpad can get very hot to the touch with a maximum of 42 °C / 107.6 F.
(-) The average temperature of the palmrest area of similar devices was 28.8 °C / 83.8 F (-13.2 °C / -23.8 F).
| Asus ROG Zephyrus Duo 16 GX650RX AMD Ryzen 9 6900HX, NVIDIA GeForce RTX 3080 Ti Laptop GPU | Apple MacBook Pro 16 2021 M1 Max Apple M1 Max, Apple M1 Max 32-Core GPU | Razer Blade 15 Advanced Model Early 2022 Intel Core i7-12800H, NVIDIA GeForce RTX 3080 Ti Laptop GPU | MSI GE76 Raider Intel Core i9-12900HK, NVIDIA GeForce RTX 3080 Ti Laptop GPU | Medion Erazer Beast X30 Intel Core i9-12900HK, NVIDIA GeForce RTX 3080 Ti Laptop GPU | Gigabyte Aero 16 YE5 Intel Core i9-12900HK, NVIDIA GeForce RTX 3080 Ti Laptop GPU | |
|---|---|---|---|---|---|---|
| Heat | 20% | -12% | -1% | -13% | -5% | |
| Maximum Upper Side * (°C) | 45 | 42.3 6% | 53 -18% | 43 4% | 55 -22% | 49 -9% |
| Maximum Bottom * (°C) | 50 | 41.7 17% | 53 -6% | 47 6% | 62 -24% | 55 -10% |
| Idle Upper Side * (°C) | 33 | 23.9 28% | 36 -9% | 33 -0% | 32 3% | 33 -0% |
| Idle Bottom * (°C) | 33 | 23.9 28% | 38 -15% | 37 -12% | 36 -9% | 33 -0% |
* ... smaller is better
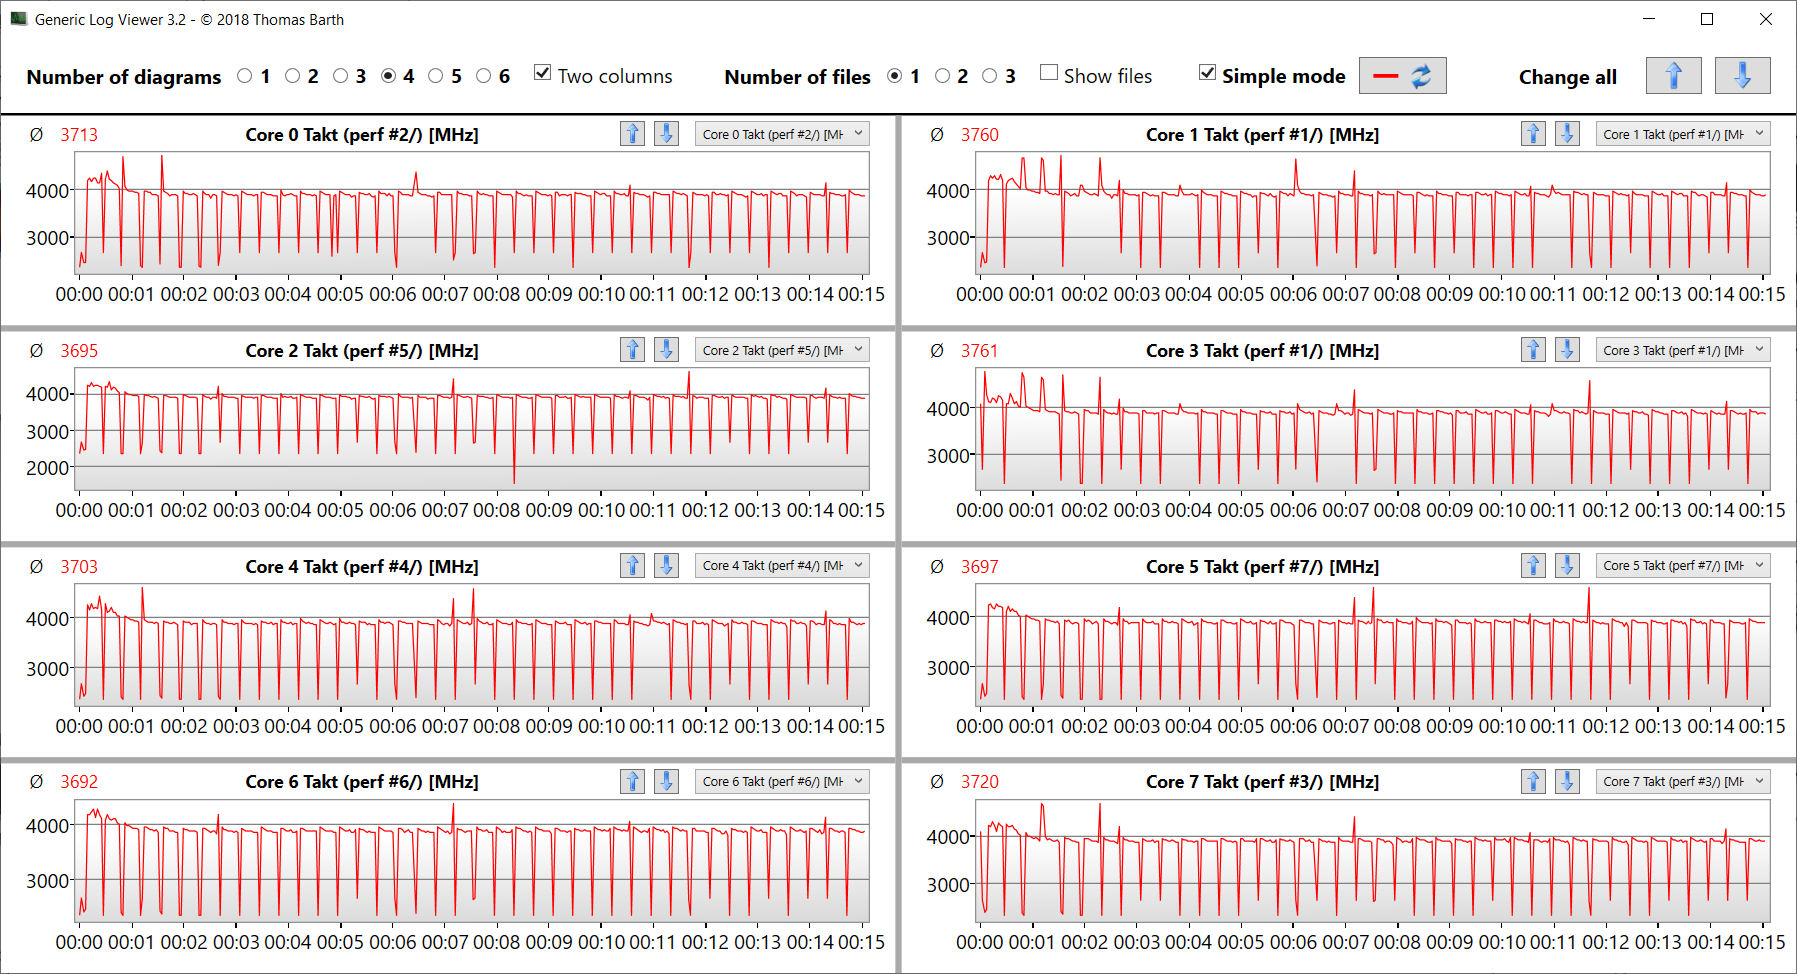
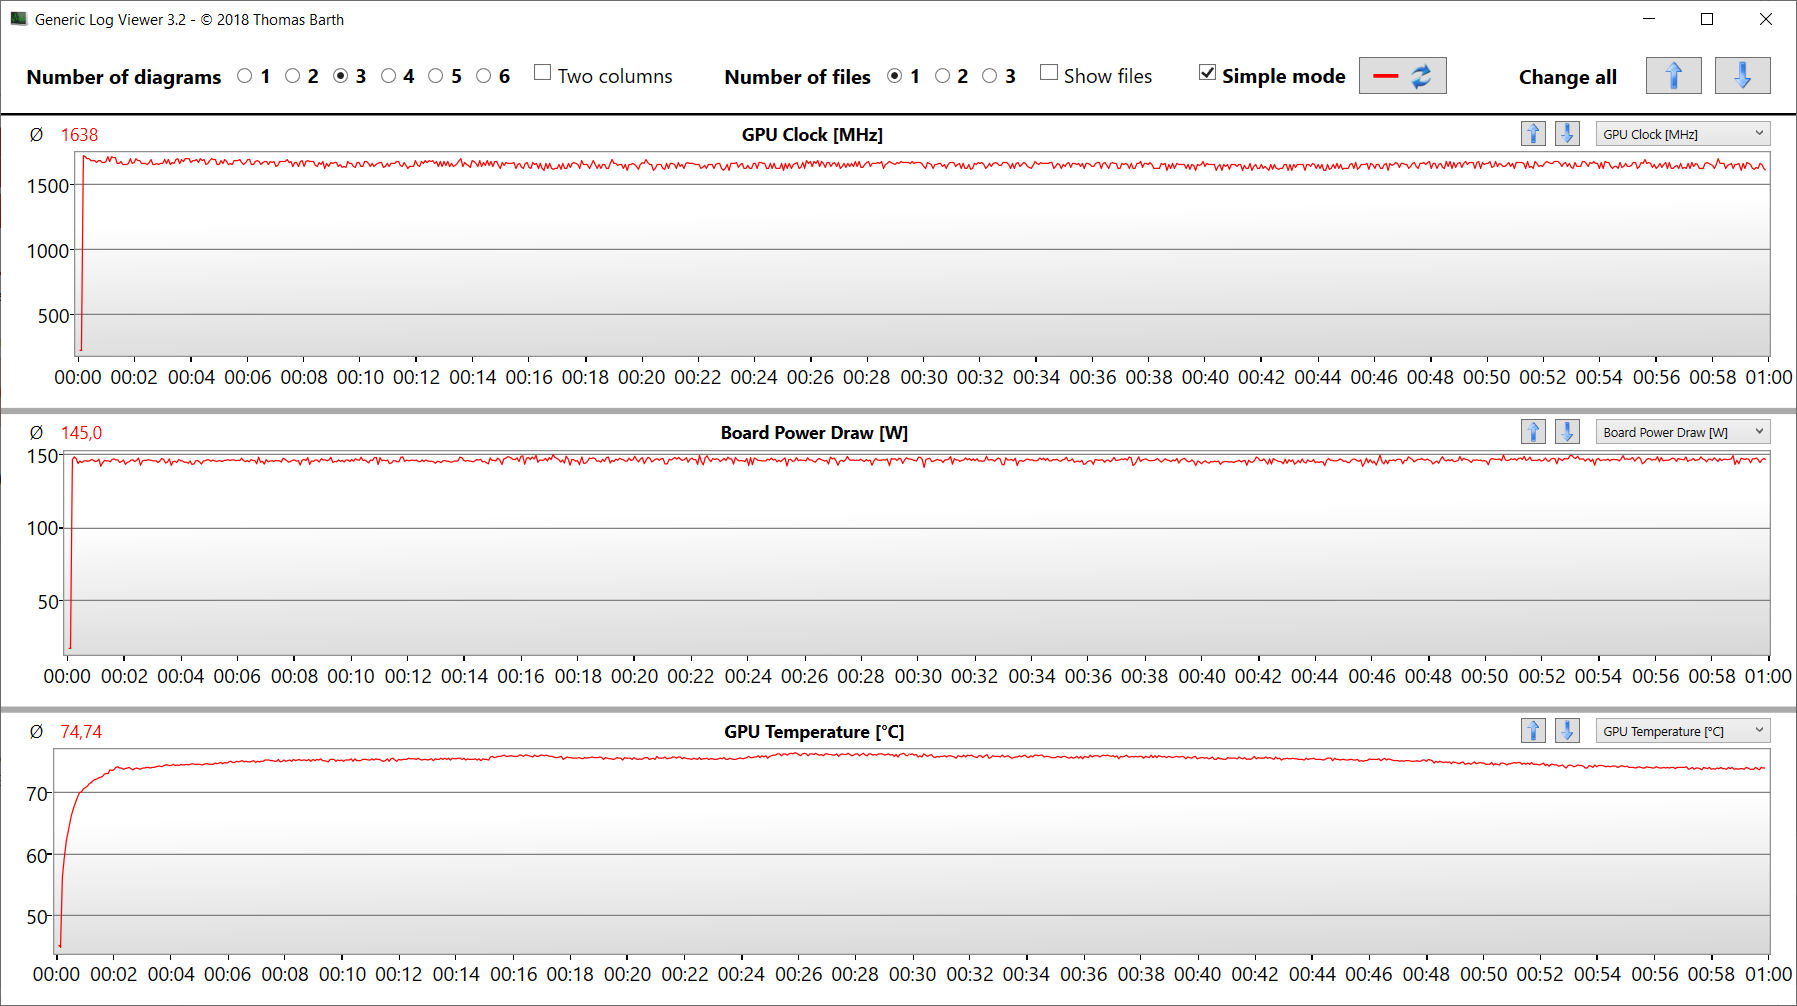
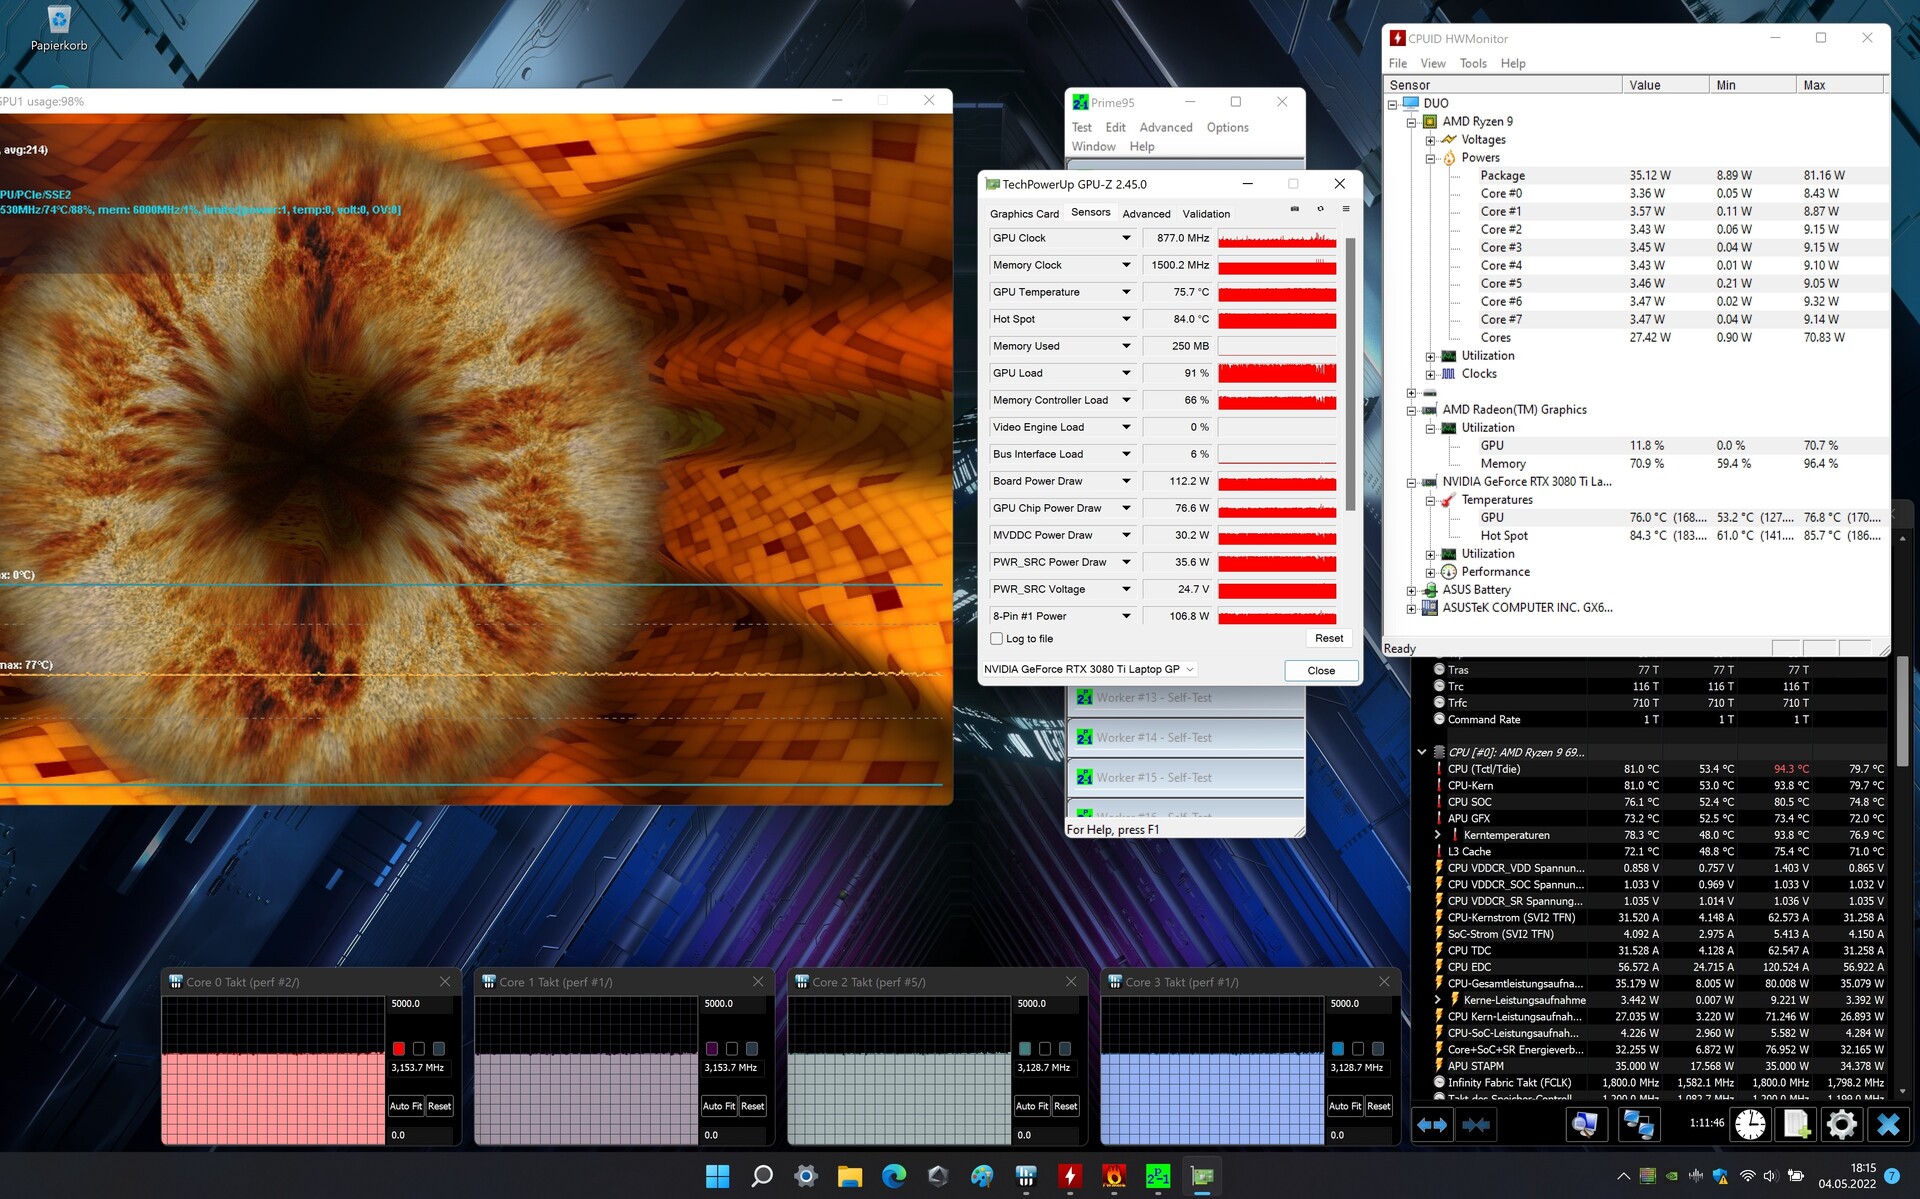
压力测试
在Prime95和Furmark运行至少一个小时的压力测试开始时,CPU(4至4.1 GHz)和GPU(1,000至1,600 MHz)以高时钟速度运行。继续下去,数值下降到3至3.1GHz(CPU)和850至900MHz(GPU)之间。压力测试代表了一种极端情况,我们用这个测试来评估系统在满负荷情况下是否保持稳定。
发言人
立体声扬声器产生了一个体面的声音,尽管它可以使用更多的低音。为了获得更好的声音体验,建议使用耳机或外部扬声器。
Asus ROG Zephyrus Duo 16 GX650RX audio analysis
(±) | speaker loudness is average but good (80 dB)
Bass 100 - 315 Hz
(±) | reduced bass - on average 8.9% lower than median
(±) | linearity of bass is average (12.4% delta to prev. frequency)
Mids 400 - 2000 Hz
(±) | higher mids - on average 6.8% higher than median
(+) | mids are linear (4.3% delta to prev. frequency)
Highs 2 - 16 kHz
(±) | reduced highs - on average 6% lower than median
(±) | linearity of highs is average (7.3% delta to prev. frequency)
Overall 100 - 16.000 Hz
(±) | linearity of overall sound is average (16.5% difference to median)
Compared to same class
» 42% of all tested devices in this class were better, 7% similar, 51% worse
» The best had a delta of 6%, average was 18%, worst was 132%
Compared to all devices tested
» 28% of all tested devices were better, 6% similar, 66% worse
» The best had a delta of 4%, average was 24%, worst was 134%
电源管理 - Zephyrus Duo提供良好的电池寿命
消耗功率
在空闲运行期间,GX650的功耗略高于大多数其他Windows竞争对手。然而,其他竞争对手都无法达到MacBook Pro 16的低值。 MacBook Pro 16.压力测试或Witcher-3测试导致Zephyrus的消耗量增加,最高达到256瓦或平均186.5瓦,这对这里使用的硬件来说是正常值。虽然在Witcher 3 测试期间功耗保持不变,但在压力测试过程中功耗略有下降。额定功率为280瓦,附带的电源尺寸足够大。
| Off / Standby | |
| Idle | |
| Load |
|
Key:
min: | |
| Asus ROG Zephyrus Duo 16 GX650RX R9 6900HX, GeForce RTX 3080 Ti Laptop GPU | Apple MacBook Pro 16 2021 M1 Max M1 Max, M1 Max 32-Core GPU | Razer Blade 15 Advanced Model Early 2022 i7-12800H, GeForce RTX 3080 Ti Laptop GPU | MSI GE76 Raider i9-12900HK, GeForce RTX 3080 Ti Laptop GPU | Medion Erazer Beast X30 i9-12900HK, GeForce RTX 3080 Ti Laptop GPU | Gigabyte Aero 16 YE5 i9-12900HK, GeForce RTX 3080 Ti Laptop GPU | Average of class Gaming | |
|---|---|---|---|---|---|---|---|
| Power Consumption | 42% | 16% | 4% | 9% | -15% | 14% | |
| Idle Minimum * (Watt) | 19 | 5.4 72% | 17 11% | 12 37% | 12 37% | 26 -37% | 13.1 ? 31% |
| Idle Average * (Watt) | 24 | 16.4 32% | 19 21% | 17 29% | 16 33% | 30 -25% | 18.8 ? 22% |
| Idle Maximum * (Watt) | 31 | 16.7 46% | 25 19% | 28 10% | 22 29% | 37 -19% | 24.4 ? 21% |
| Load Average * (Watt) | 104 | 94 10% | 108 -4% | 118 -13% | 118 -13% | 127 -22% | 108.6 ? -4% |
| Witcher 3 ultra * (Watt) | 186.5 | 104 44% | 150 20% | 252 -35% | 223 -20% | 176 6% | |
| Load Maximum * (Watt) | 256 | 135 47% | 179 30% | 272 -6% | 290 -13% | 236 8% | 254 ? 1% |
* ... smaller is better
Power Consumption The Witcher 3 / Stress Test
Power Consumption With External Monitor
电池寿命
在通过脚本加载网站的WLAN测试中,以及在持续循环运行短片《Big Buck Bunny》(H.264编码,FHD)的视频测试中,16英寸笔记本电脑分别持续了7:49小时和9:19小时。在这两项测试中,笔记本电脑的省电功能被停用,显示亮度被调整到大约150cd/m²。在运行视频测试时,通信模块也被关闭。
| Asus ROG Zephyrus Duo 16 GX650RX R9 6900HX, GeForce RTX 3080 Ti Laptop GPU, 90 Wh | Apple MacBook Pro 16 2021 M1 Max M1 Max, M1 Max 32-Core GPU, 99.6 Wh | Razer Blade 15 Advanced Model Early 2022 i7-12800H, GeForce RTX 3080 Ti Laptop GPU, 80 Wh | MSI GE76 Raider i9-12900HK, GeForce RTX 3080 Ti Laptop GPU, 99.99 Wh | Medion Erazer Beast X30 i9-12900HK, GeForce RTX 3080 Ti Laptop GPU, 91.2 Wh | Gigabyte Aero 16 YE5 i9-12900HK, GeForce RTX 3080 Ti Laptop GPU, 99 Wh | Average of class Gaming | |
|---|---|---|---|---|---|---|---|
| Battery runtime | 61% | -2% | -35% | 11% | -2% | -1% | |
| Reader / Idle (h) | 12.5 | 8.1 -35% | 7.7 -38% | 8.9 -29% | 8.71 ? -30% | ||
| H.264 (h) | 9.3 | 17 83% | 5.9 -37% | 6.4 -31% | 7.5 -19% | 8.28 ? -11% | |
| WiFi v1.3 (h) | 7.8 | 14.9 91% | 4.9 -37% | 5.1 -35% | 5.7 -27% | 6.4 -18% | 6.96 ? -11% |
| Load (h) | 1 | 1.1 10% | 2 100% | 2.4 140% | 1.6 60% | 1.47 ? 47% |
Pros
Cons
结论 - 一款针对创意领域的强大笔记本电脑
华硕将Zephyrus主要宣传为游戏笔记本,但该笔记本的概念也是针对内容创作者的。视频和图像处理、渲染,当然还有游戏是核心学科。4k游戏在高至最大设置下是可能的。
虽然Screenpad Plus应该在某些应用场景中提供一定的附加价值,但它也增加了笔记本电脑的重量、购买价格和尺寸。
ARyzen 9-6900HXAPU和 GeForce RTX 3080-Ti LaptopGPU提供必要的计算性能,而且这两个组件都以恒定的高时钟速度运行。两个PCIe 4固态硬盘(RAID 0)确保了短的加载时间,并提供了大量的存储空间(4TB)。整个包由64GB的工作内存来完善。
负载下的噪音和热量发展范围是该类笔记本电脑的通常水平。然而,在日常操作中,笔记本电脑仍然非常安静。16:10格式的良好的16英寸显示屏具有出色的色彩再现能力(潘通认证),完全覆盖DCI-P3色彩空间。
尽管计算性能很高,但你不必忍受短暂的电池寿命。一次电池充电(90Wh)可维持近8小时的无线网络运行时间。另一个积极因素是能够使用通用的USB-C充电器(最小45瓦)为电池充电,因为左边的USB-C第二代端口也支持Power Delivery。这意味着你不一定要带着高大上的280瓦的电源。
Zephyrus的另一个选择是 技嘉Aero 16,它提供了更高的CPU性能和一个Thunderbolt 4端口。其缺点是电池寿命较差,显示屏反光,发热量较大。如果你需要一个强大的计算性能和尽可能长的电池寿命,你很难绕过 Apple MacBook Pro 16.另一方面,那时你既不能更换或扩展固态硬盘,也不能更换或扩展工作内存。此外,MacBook还使用反射式屏幕。
价格和可用性
虽然ROG Zephyrus Duo 16 GX650RX已经在华硕的美国网站上上市了在本次测试时,其他在线商店,如CDW ($4097)和B&H Photo ($4000)显示它还没有存货。
Asus ROG Zephyrus Duo 16 GX650RX
- 05/23/2022 v7 (old)
Sascha Mölck
Price comparison

