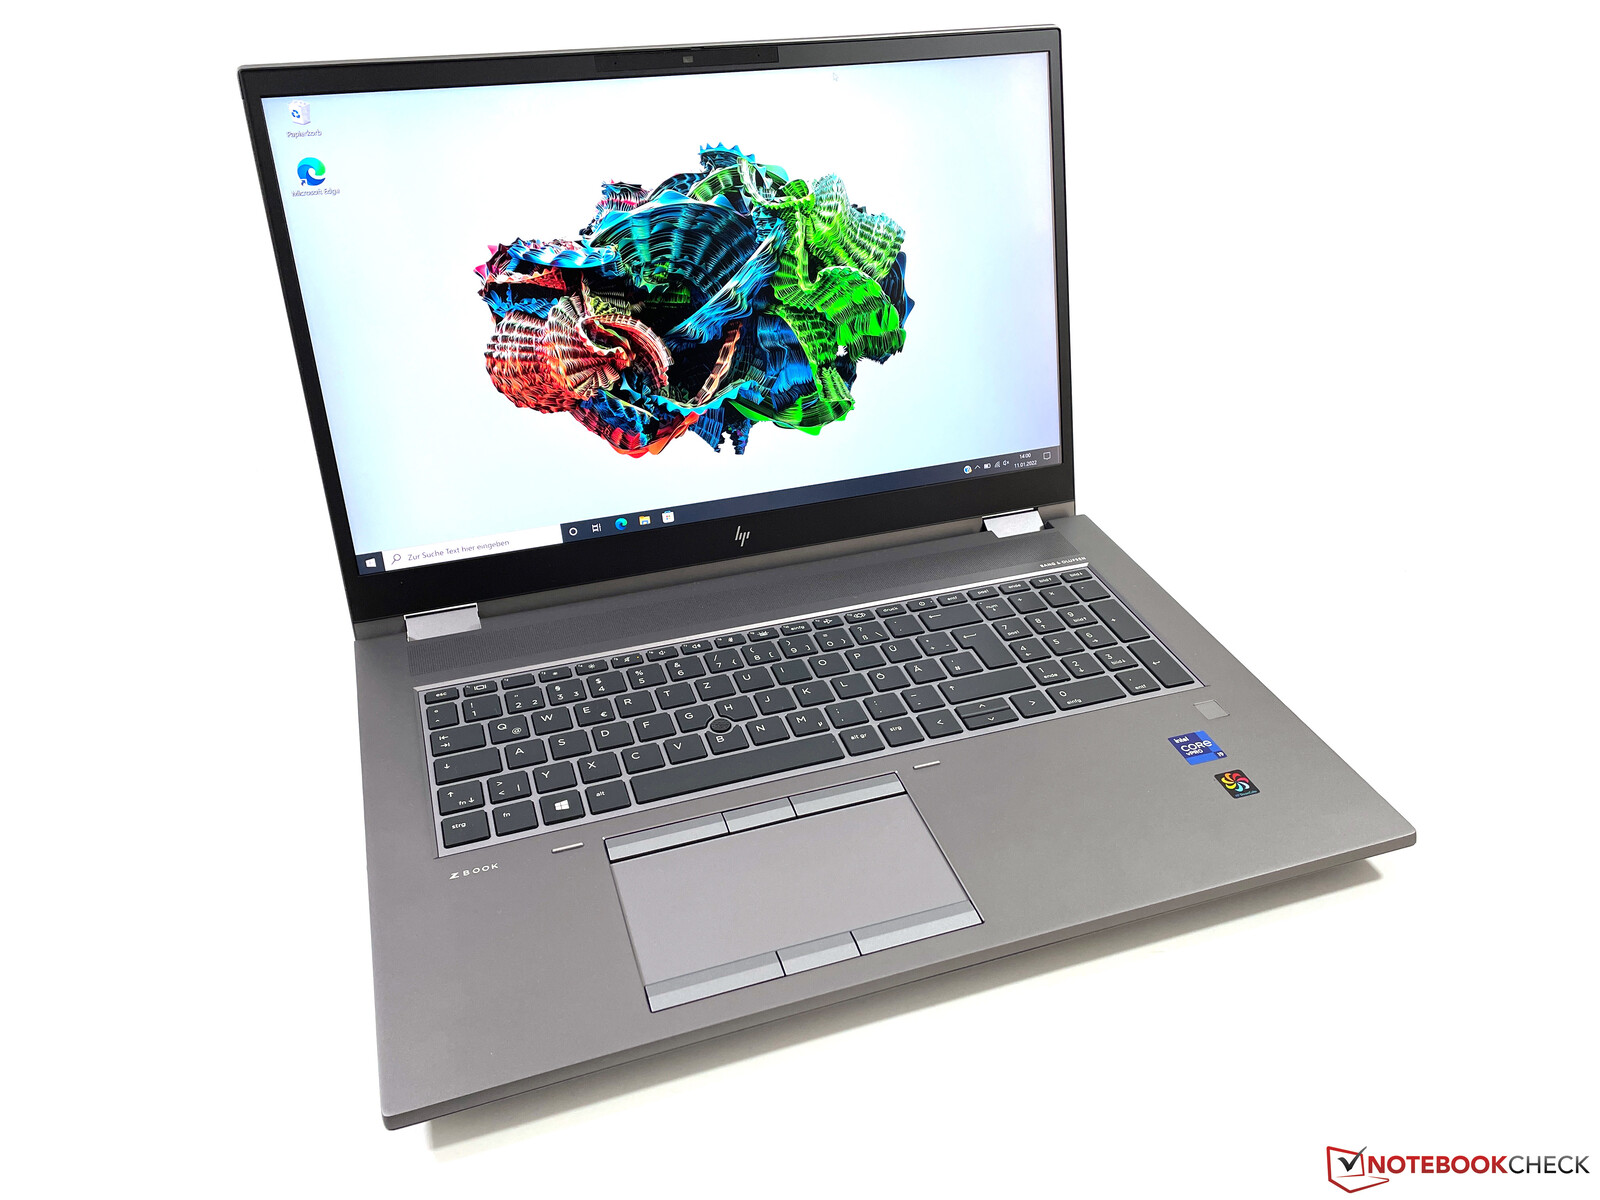
惠普ZBook Fury 17 G8评测--配备4K梦幻色彩显示屏的移动工作站
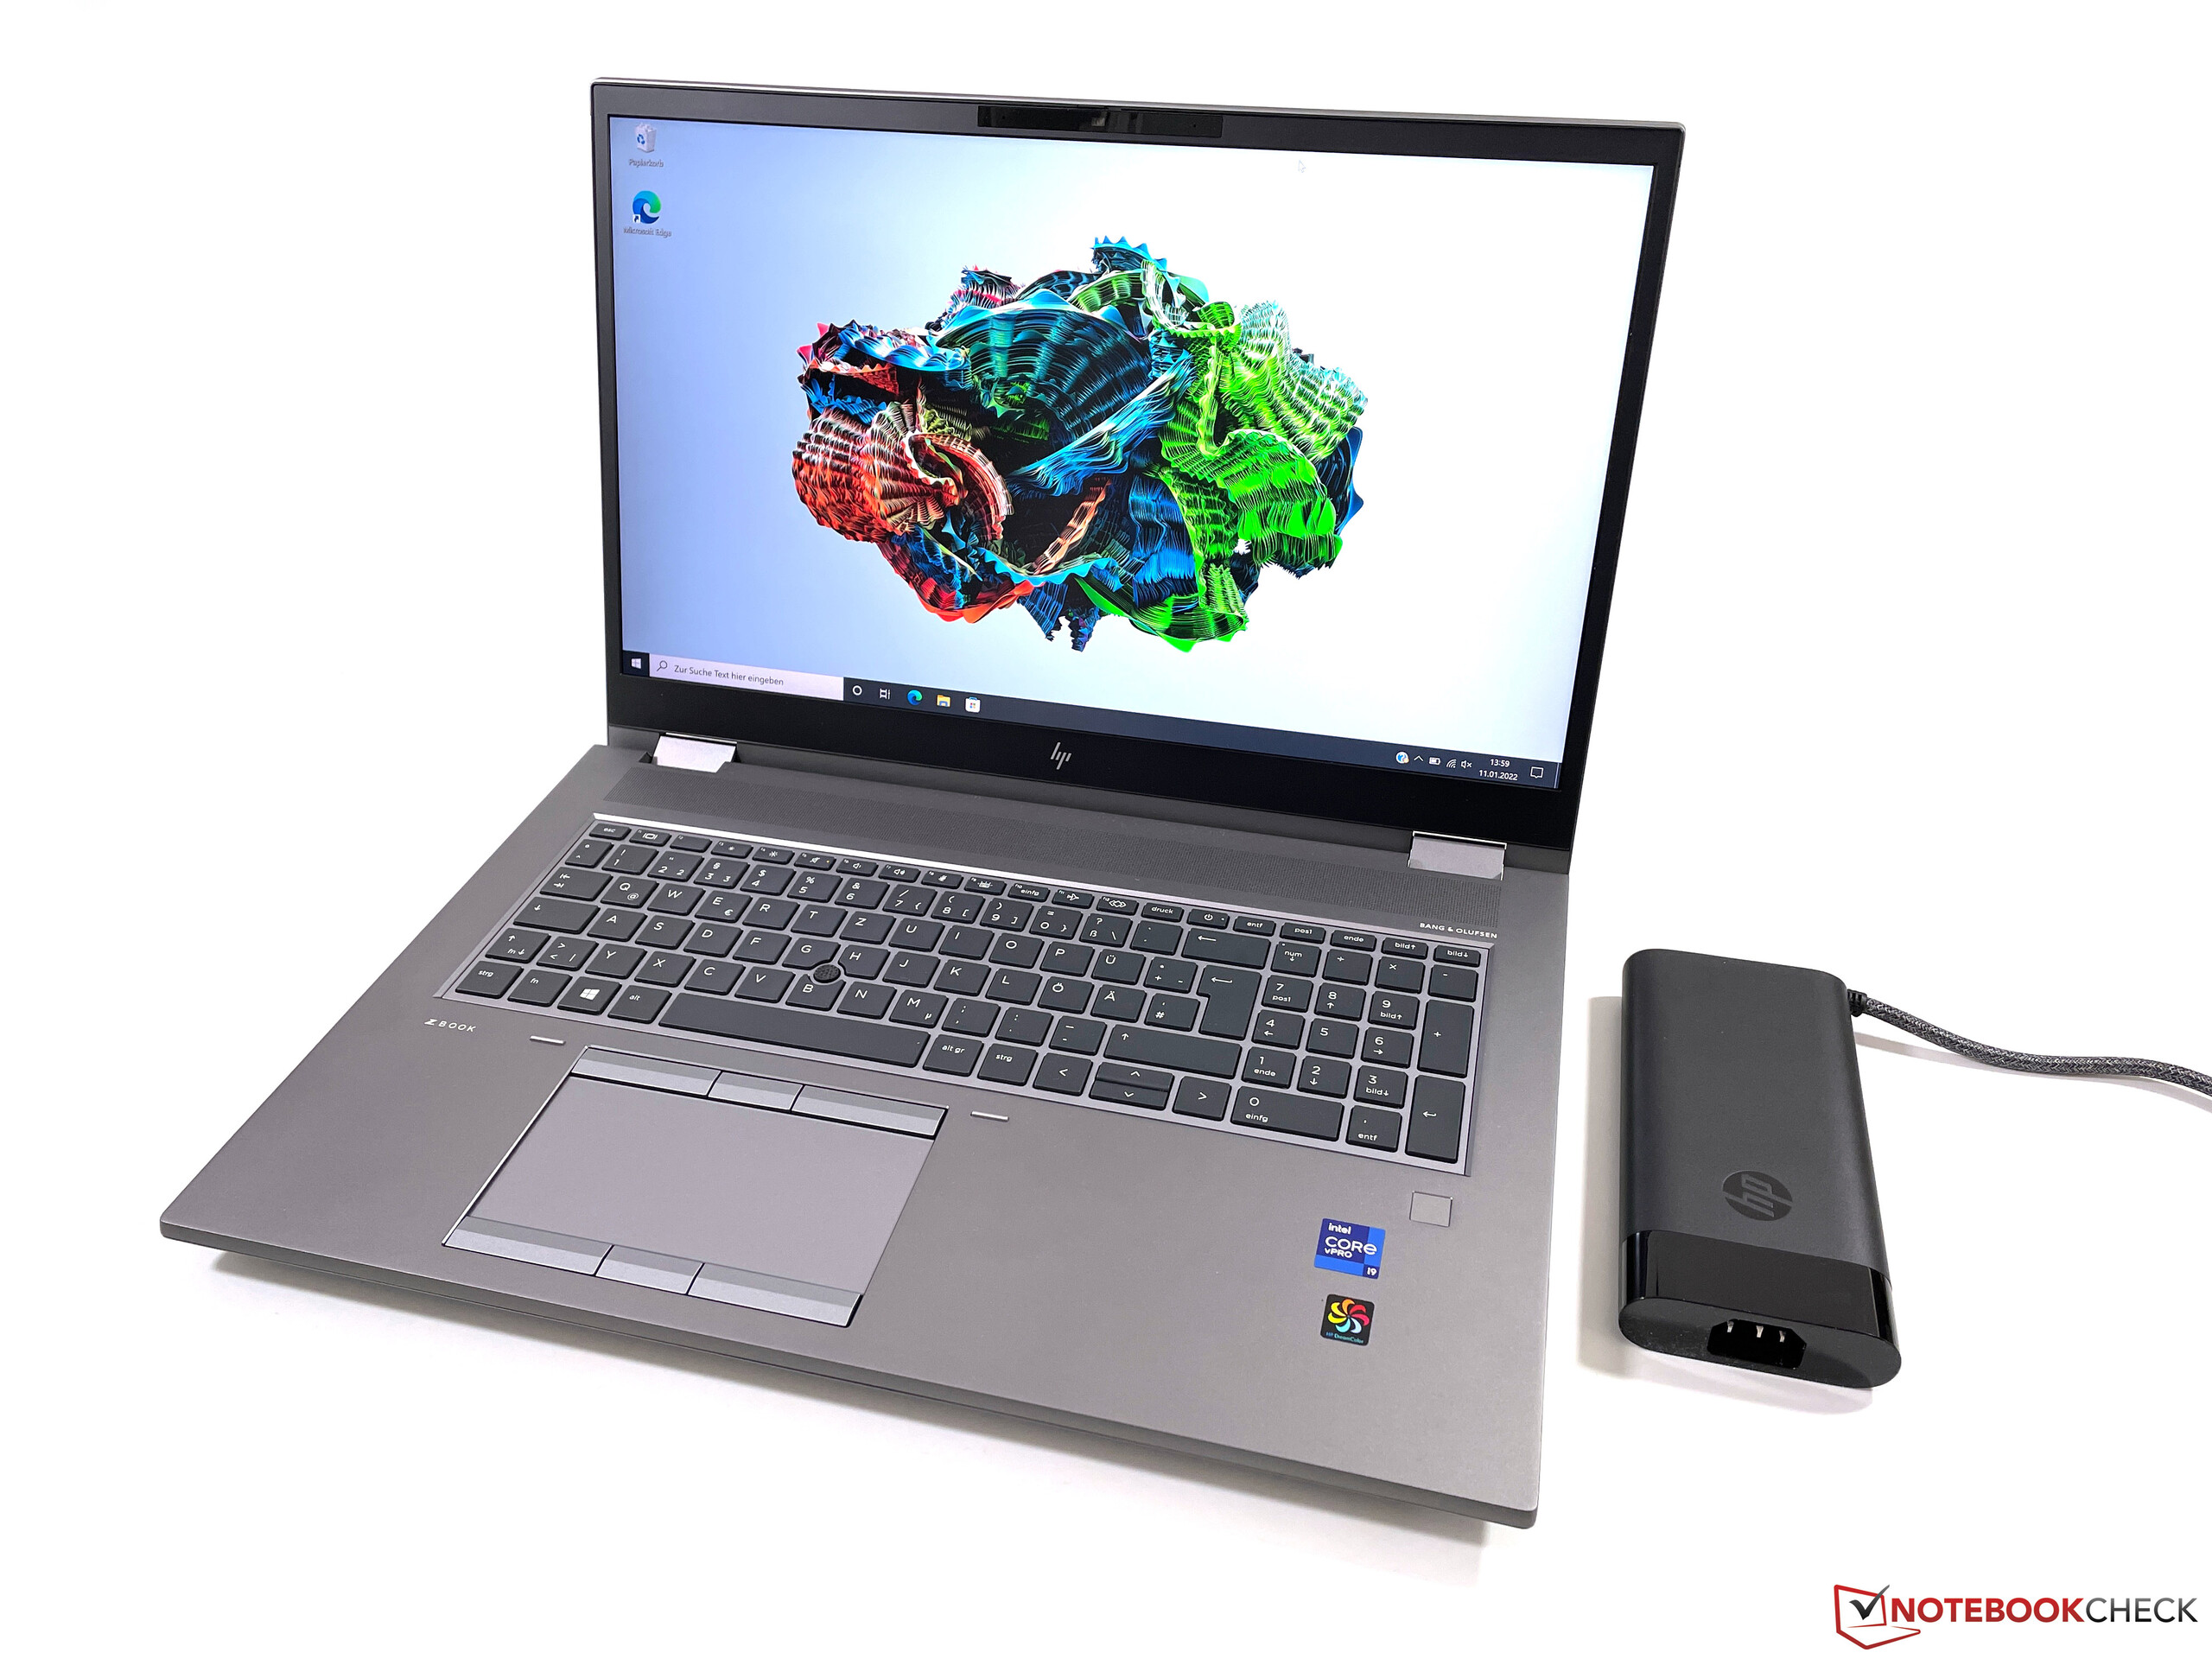
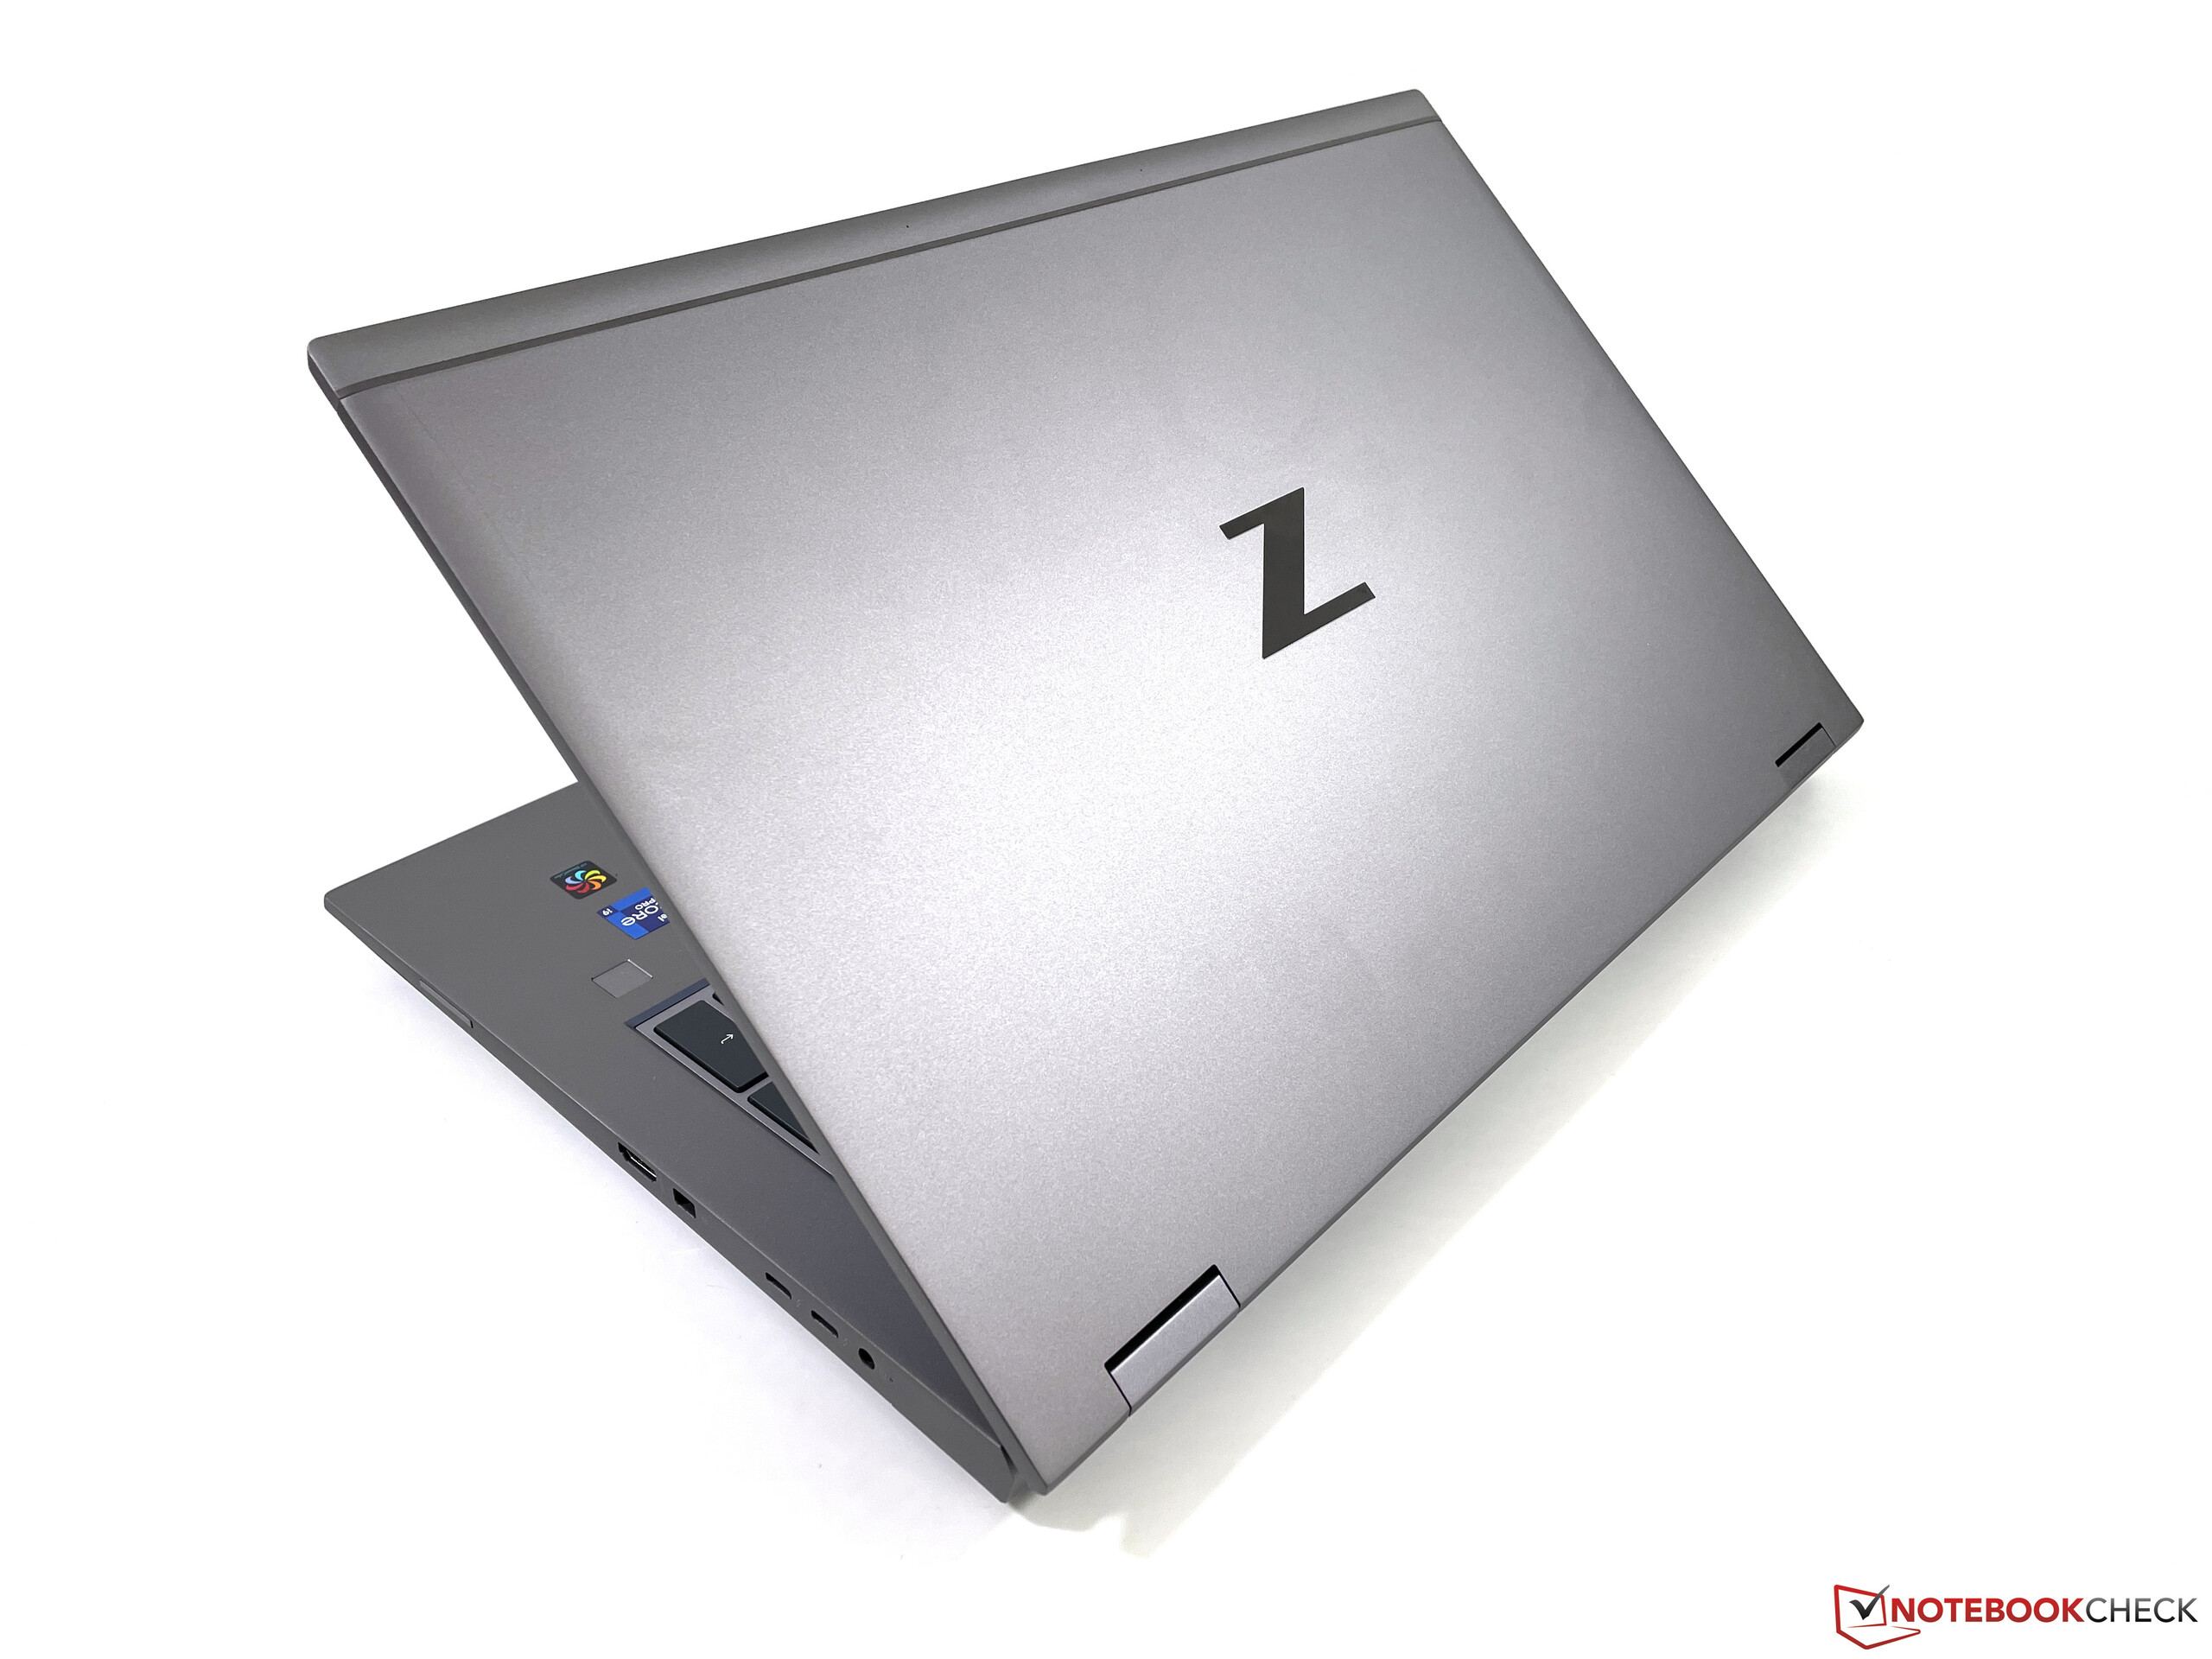
惠普ZBook Fury 17 G8是一款经典的移动工作站,注重性能、端口种类以及维护选项等方面。这些产品类别并不遵循当前设备越来越轻薄的趋势,这意味着你必须做出妥协。你还可以通过广泛的CPU/GPU组合选择来很好地定制配置,满足你的要求。
我们的审查单位是一个相当强大的单位,配备了酷睿i9处理器和Nvidia RTX A3000 GPU(以前被称为Quadro),但还有更强大的GPU可供选择(一直到RTX A5000).你还会得到32GB内存、1TB NVMe SSD以及4K梦幻色彩显示屏,这使ZBook Fury 17 G8的价格上升到3800欧元左右。
潜在的竞争对手比较
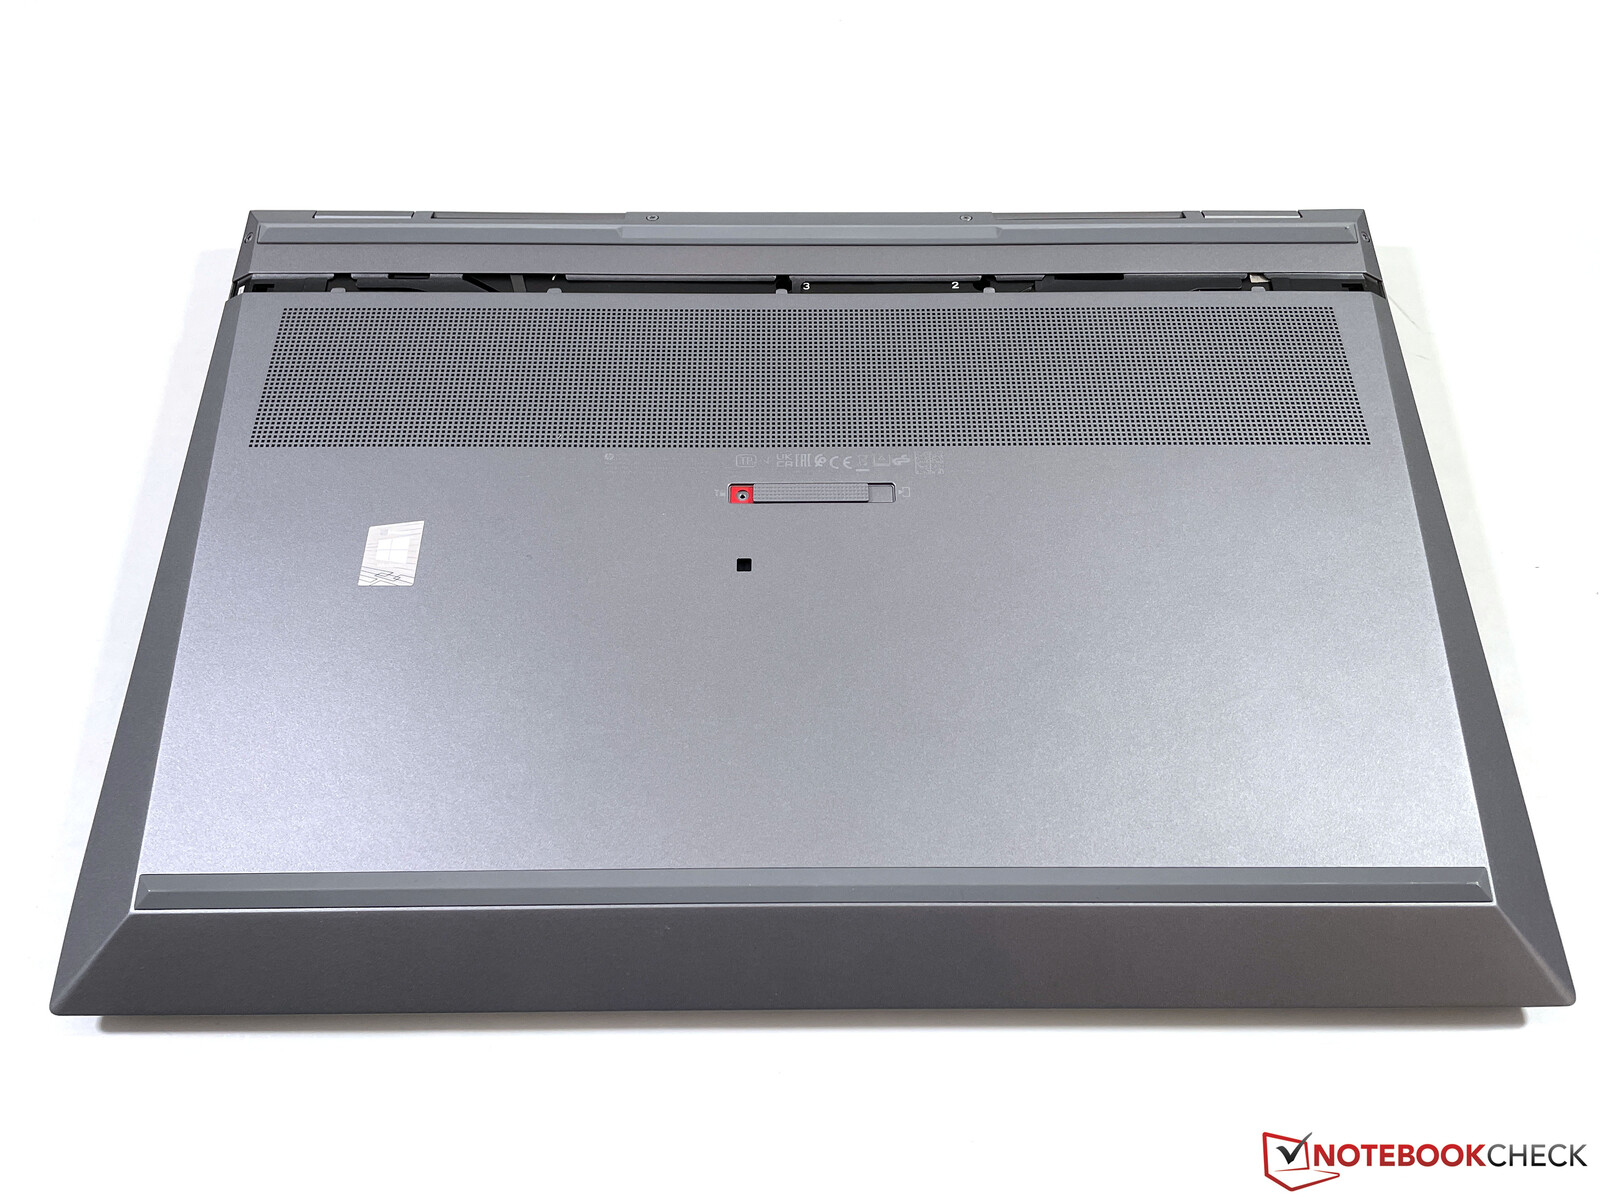
案例 - 存在异常质量问题的ZBook
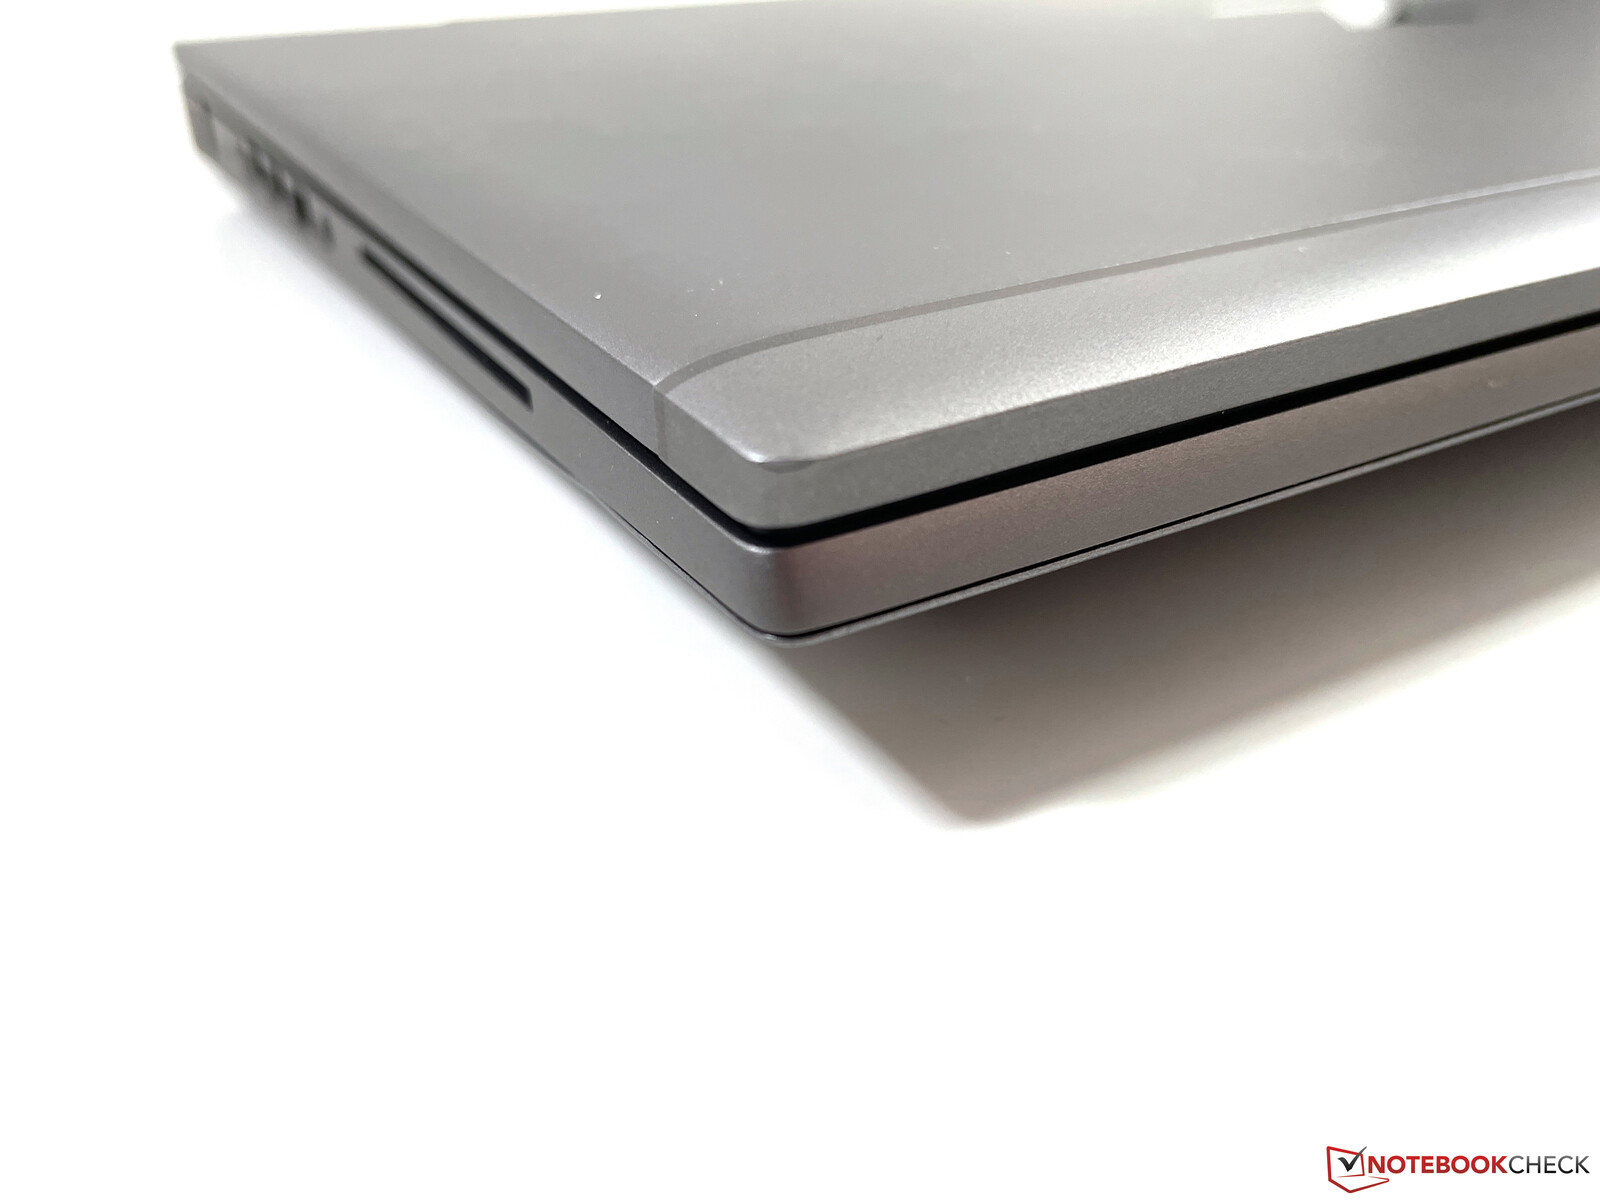
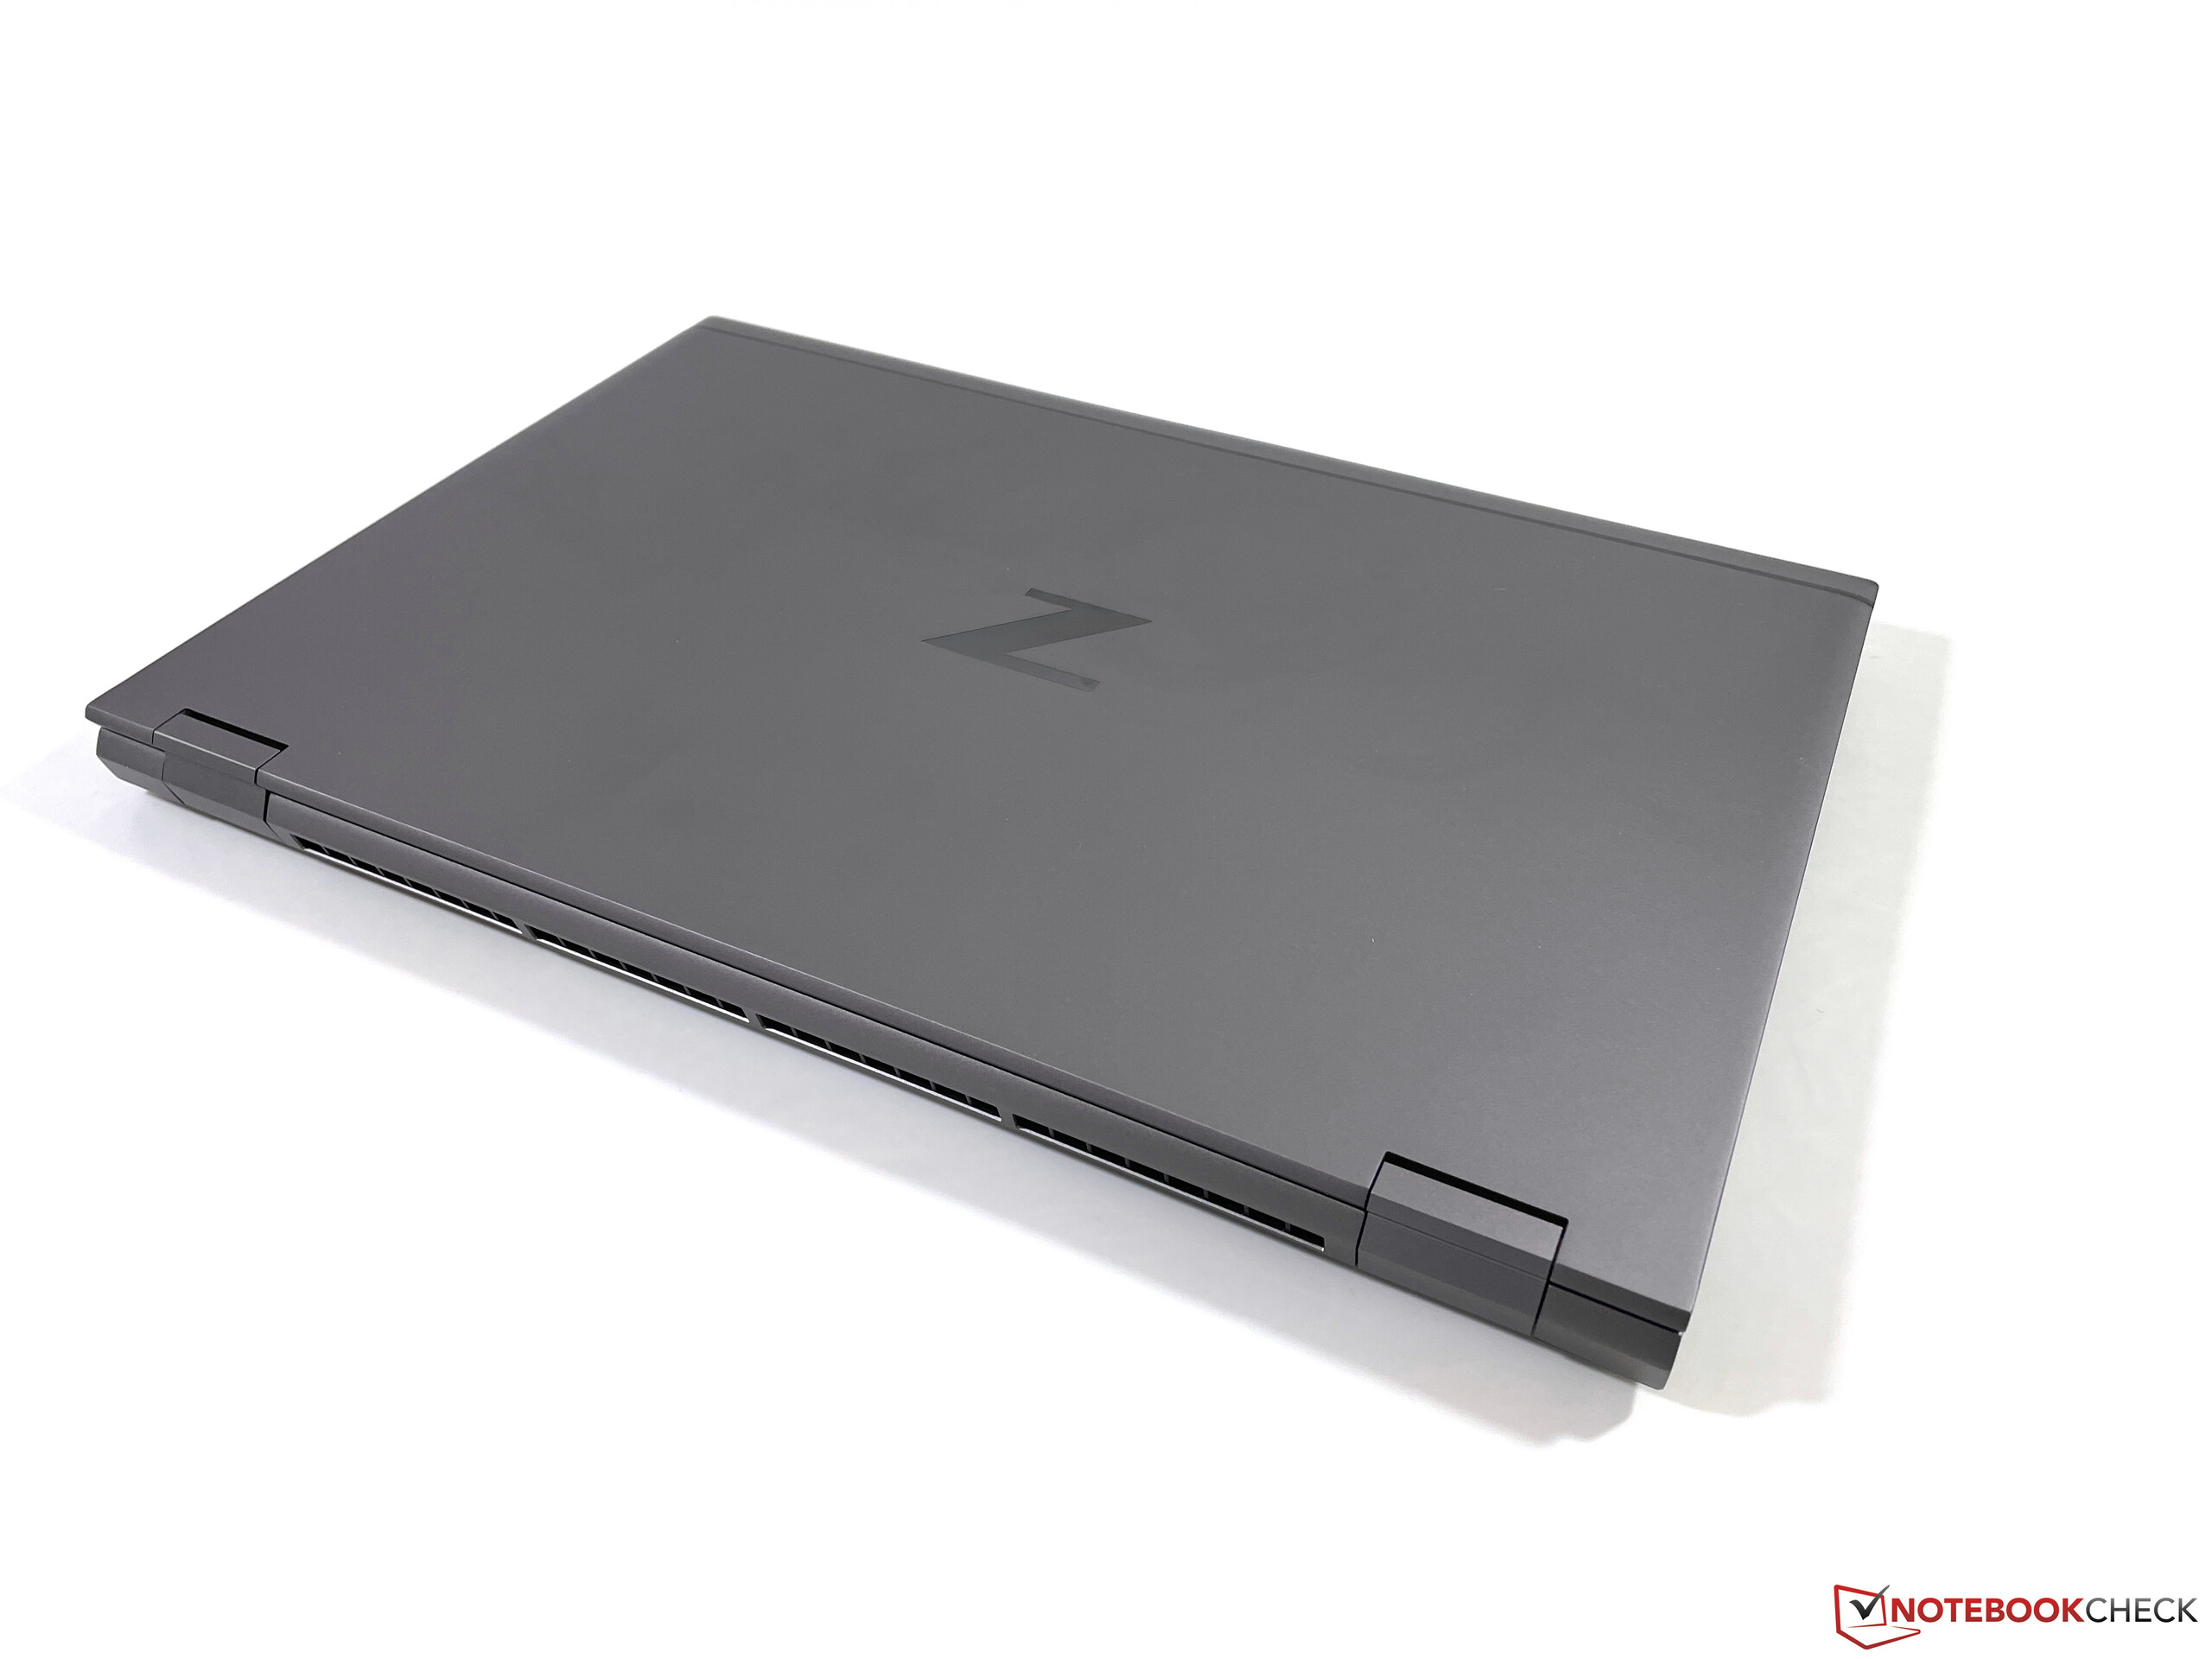
我们已经熟悉了前辈的机箱设计ZBook Fury 17 G7而深灰色的机箱在专业环境中效果不错。机箱以及盖子的稳定性都很好,整体质量也很高,但我们注意到底板的安装问题。它只由一个杠杆和一个中央螺丝固定,所以非常容易拆卸,但面板与机箱的其他部分并不完全对齐,有明显的差异。这与高额的零售价格其实并不相符,而且影响了视觉效果。虽然卸下面板很容易,但我们更希望有一个更坚固的解决方案,有更多的螺丝。
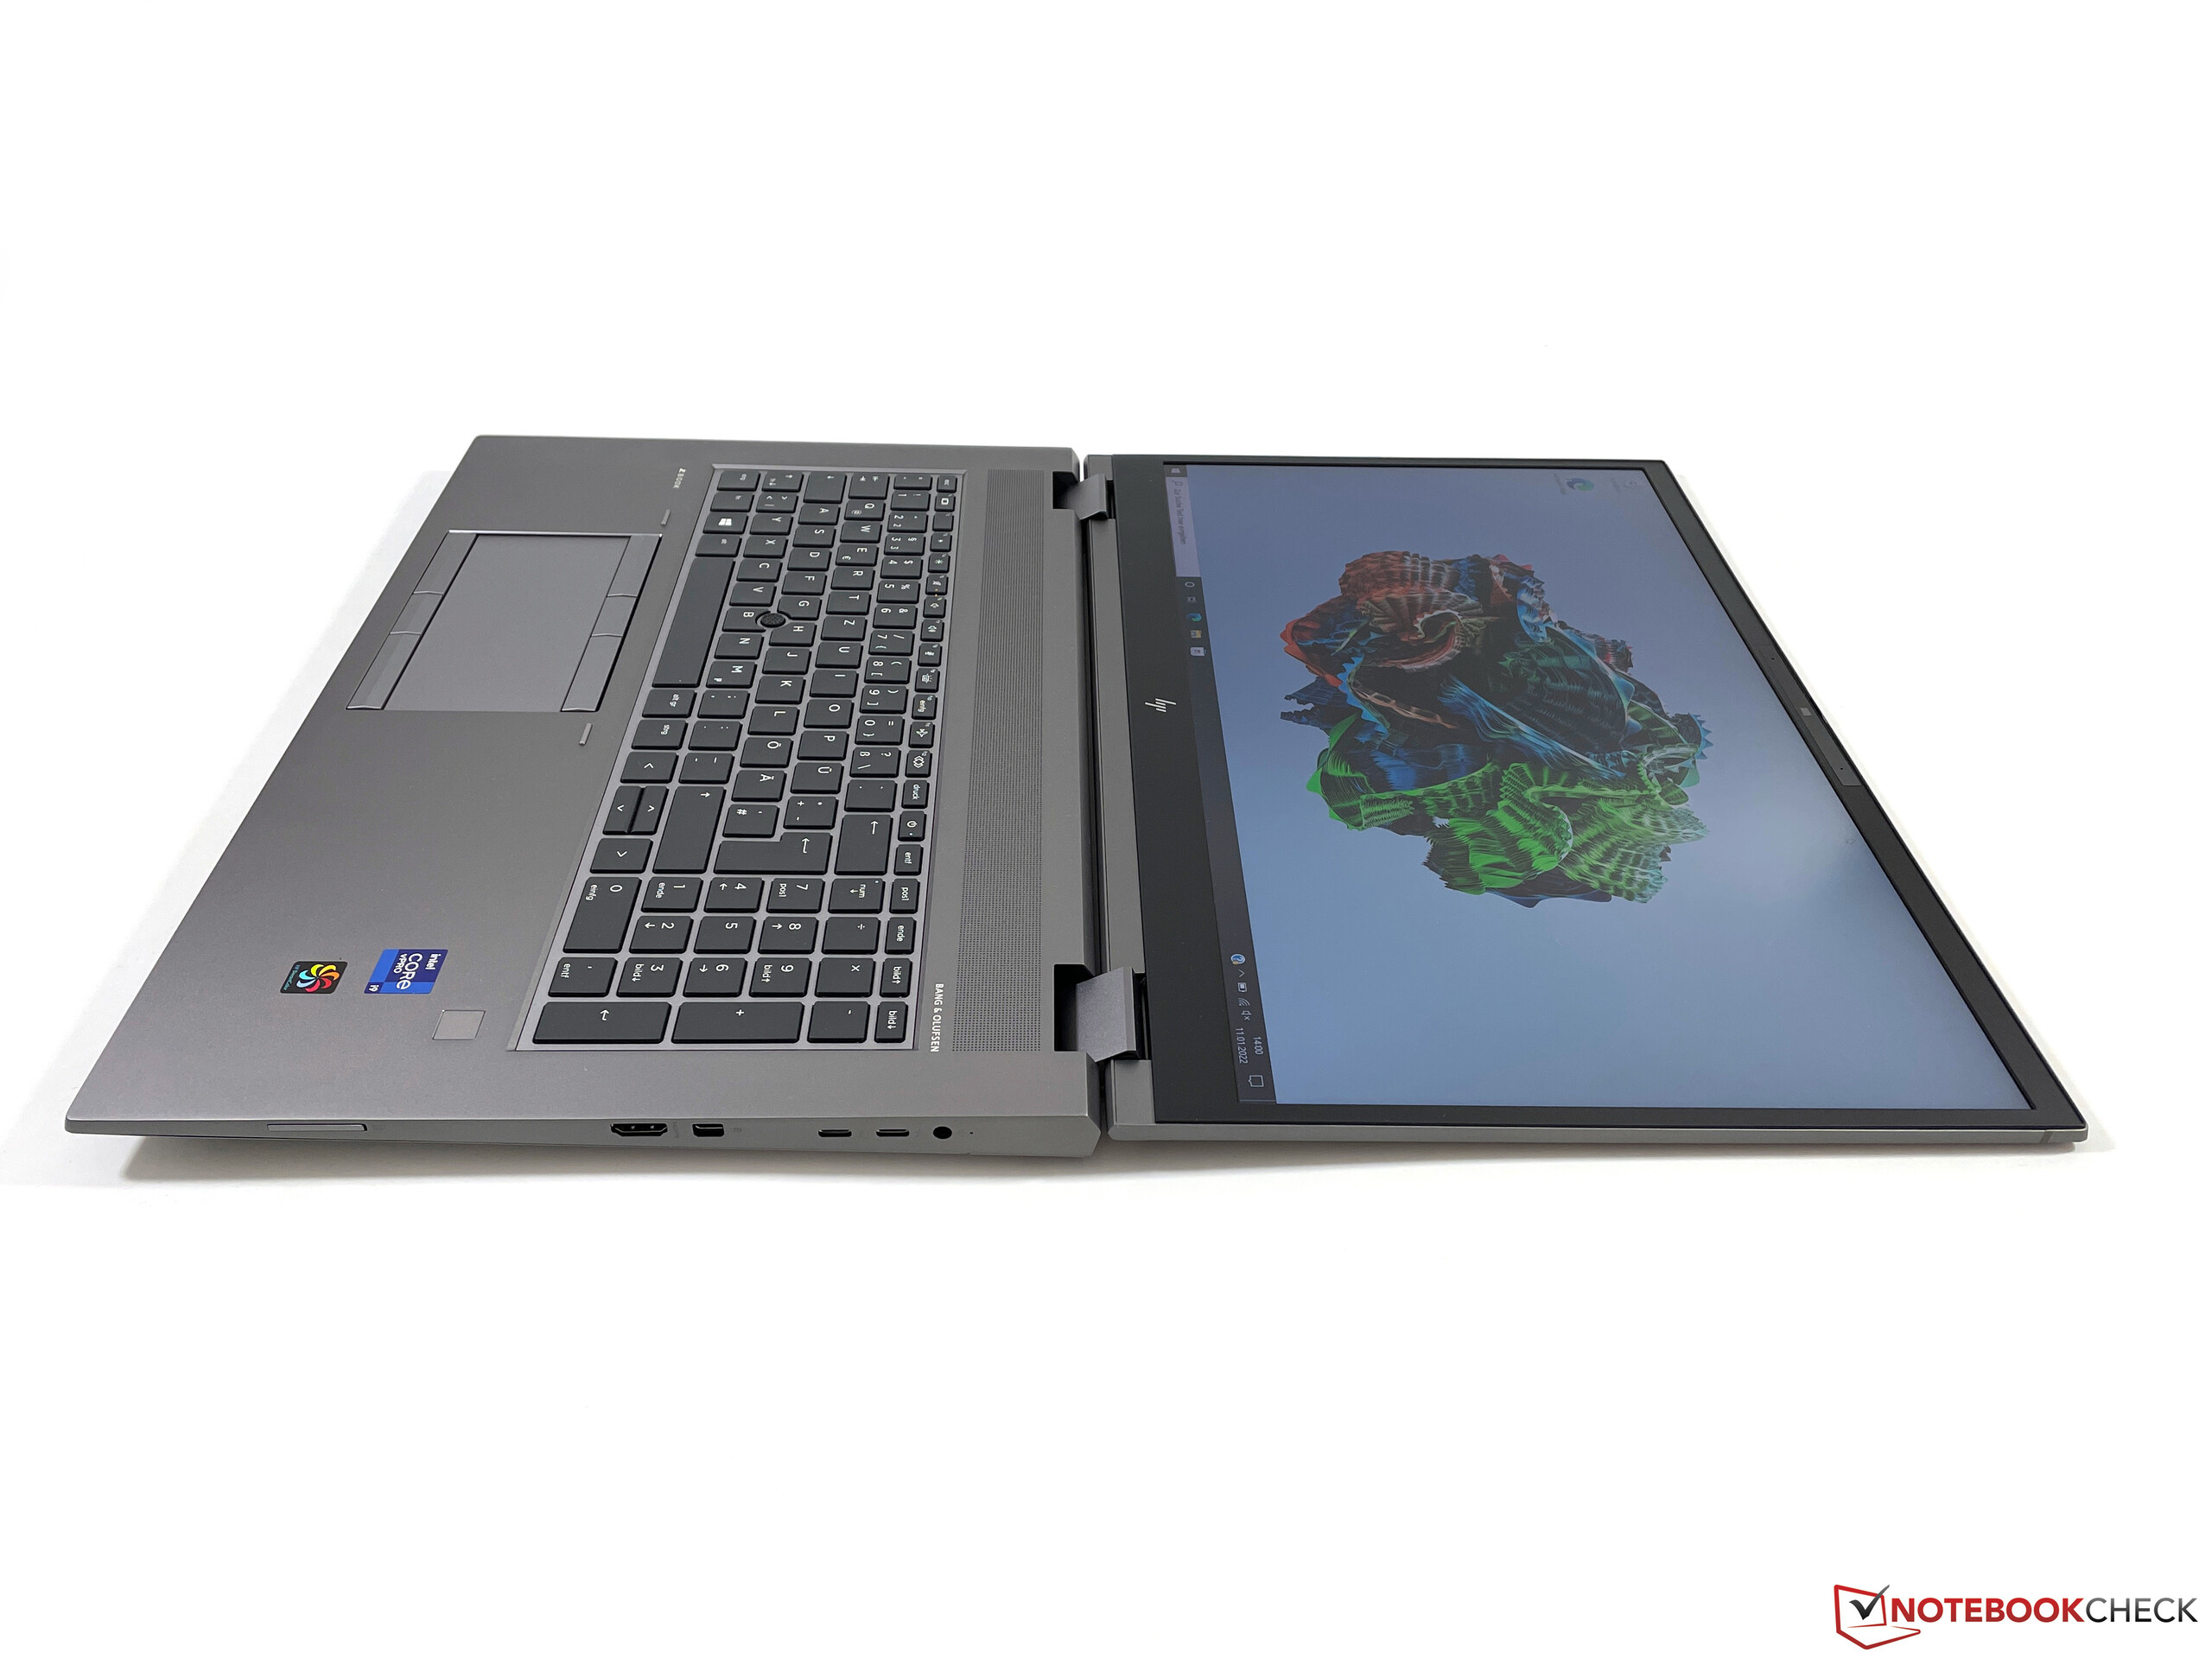
惠普仍然使用16:9的面板,边框相当宽,尤其是在屏幕下方。虽然许多现代的15和16英寸的笔记本电脑正在回到16:10的面板,但现在似乎就是没有合适的17.3英寸面板。只有联想ThinkPad P17更为笨重,但其他所有的对比设备都比ZBook更为紧凑。
尺寸比较
连接性 - Thunderbolt 4,但SD卡读卡器速度慢
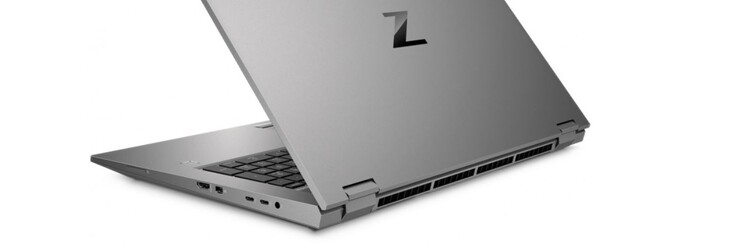
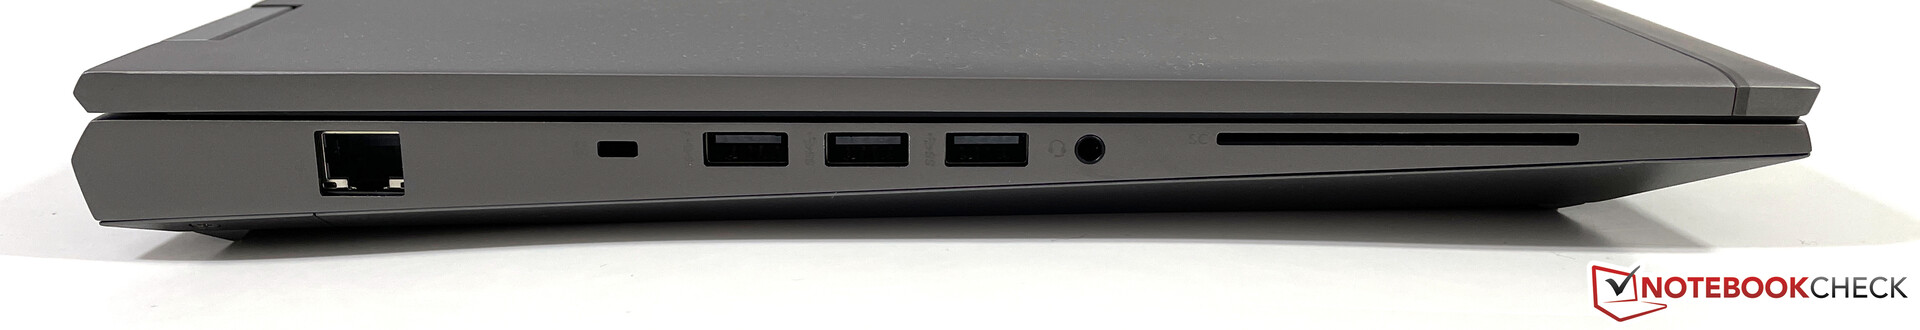
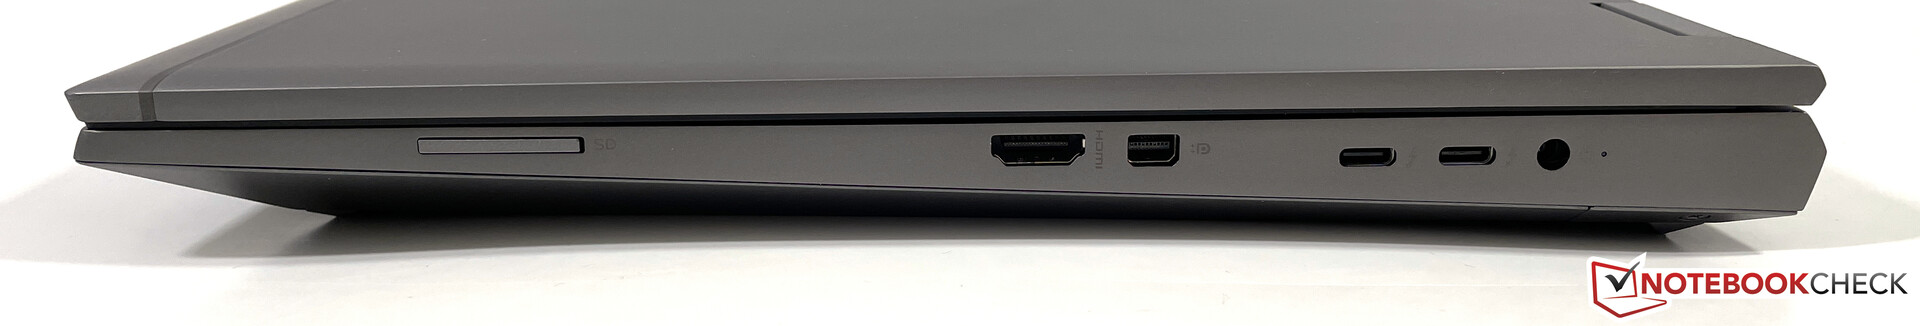
你可以得到所有重要的端口,包括Thunderbolt/USB-C、常规USB-A端口、以太网、HDMI和Mini-DisplayPort。ZBook总共可以驱动四个屏幕。后面的空间被风扇的排气口占据,所以所有的端口都分布在两边。
SD卡阅读器
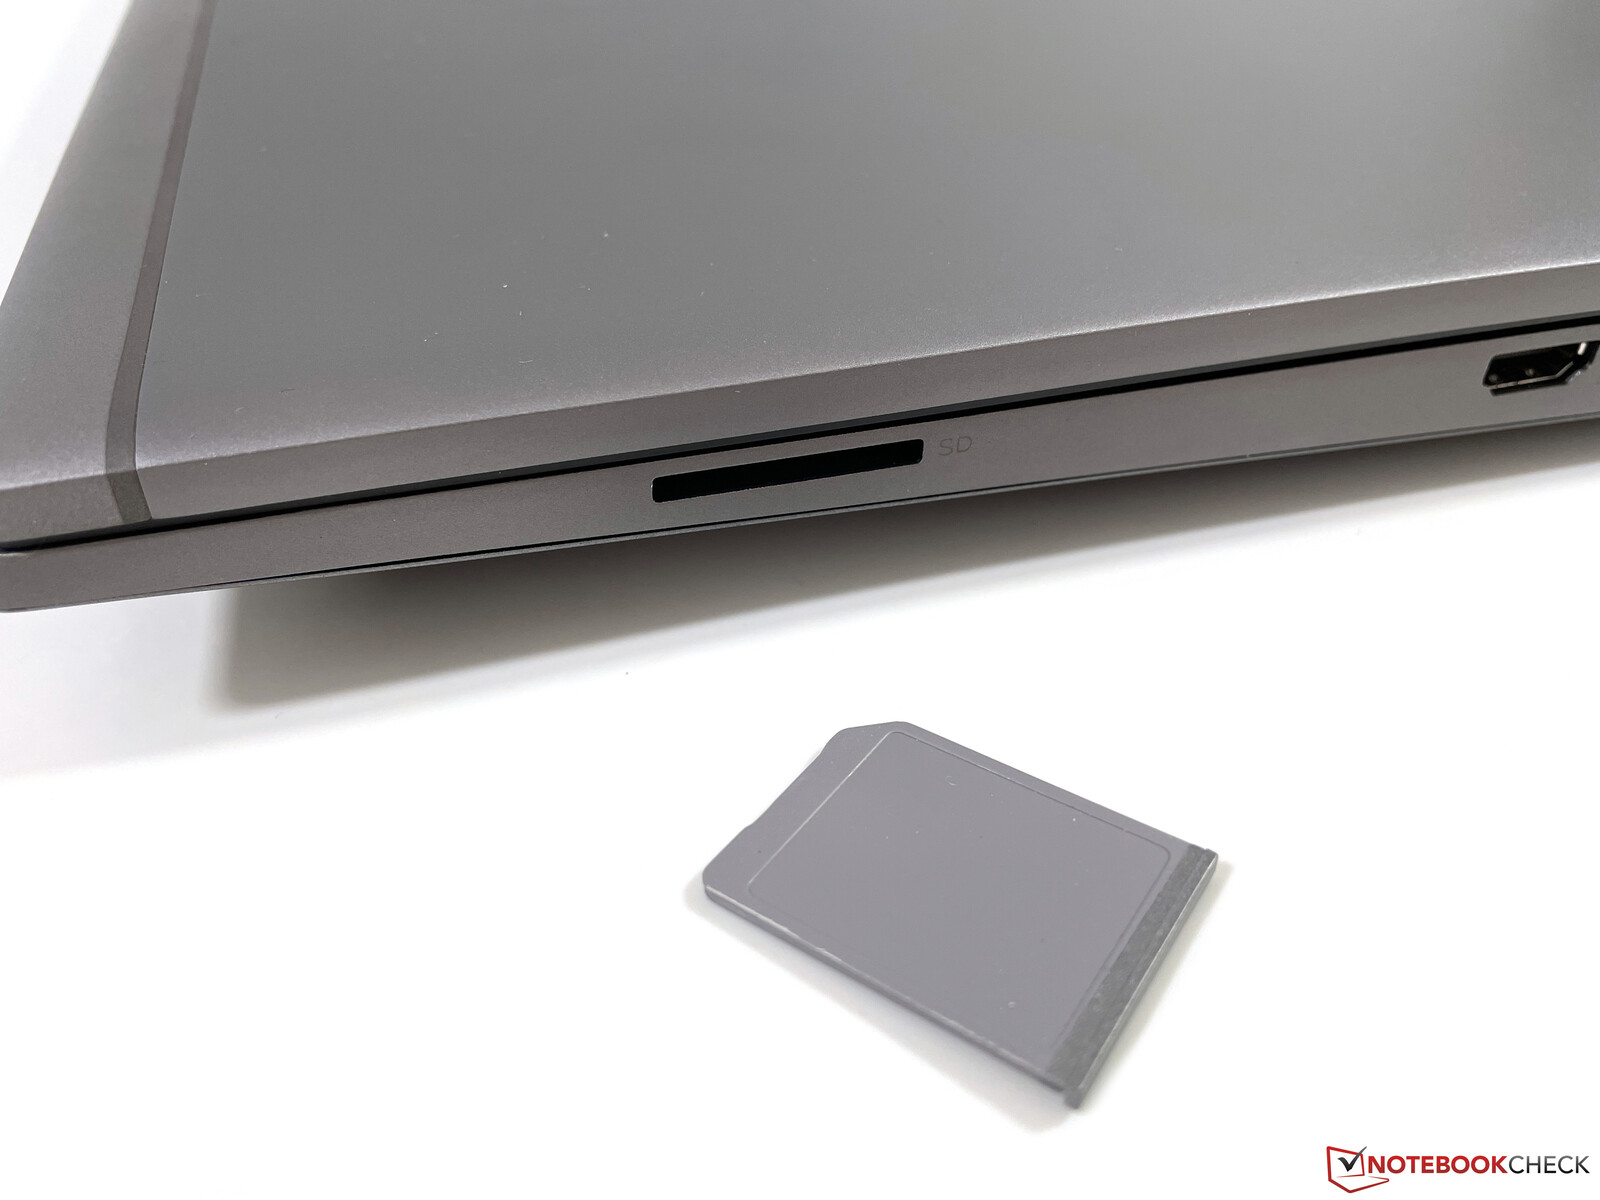
惠普仍然在右侧使用全尺寸的SD卡读卡器,而且SD卡完全插入。与之相比 之前的型号,但性能要低得多,我们在基准测试中只能达到90MB/s,而ZBook Fury 17 G7仍能达到170MB/s。除了我们目前的参考卡(Angelbird AV Pro V60),我们还检查了我们以前的东芝的卡,以排除任何兼容性问题,但结果几乎相同。
| SD Card Reader | |
| average JPG Copy Test (av. of 3 runs) | |
| Lenovo ThinkPad P17 G2-20YU0025G (Toshiba Exceria Pro SDXC 64 GB UHS-II) | |
| HP ZBook Fury 17 G7 119W5EA (AV Pro 60) | |
| Average of class Workstation (49.6 - 681, n=14, last 2 years) | |
| MSI WE76 11UM-456 (AV Pro V60) | |
| HP ZBook Fury 17 G8-4A6A9EA (Angelbird AV Pro V60) | |
| Asus ProArt StudioBook 16 W7600H5A-2BL2 (AV Pro SD microSD 128 GB V60) | |
| maximum AS SSD Seq Read Test (1GB) | |
| Average of class Workstation (87.6 - 1455, n=14, last 2 years) | |
| Lenovo ThinkPad P17 G2-20YU0025G (Toshiba Exceria Pro SDXC 64 GB UHS-II) | |
| HP ZBook Fury 17 G7 119W5EA (AV Pro 60) | |
| MSI WE76 11UM-456 (AV Pro V60) | |
| HP ZBook Fury 17 G8-4A6A9EA (Angelbird AV Pro V60) | |
| Asus ProArt StudioBook 16 W7600H5A-2BL2 (AV Pro SD microSD 128 GB V60) | |
沟通
除了千兆以太网端口,你还可以得到一个来自英特尔的Wi-Fi 6模块,以及添加WWAN模块(4G/LTE)的可能性,因为所有必要的天线都已经包括在内。然而,惠普没有使用最新的标准,已经有了更现代的Wi-Fi 6E模块,而且在2022年有一个5G调制解调器也不错。Wi-Fi模块的性能仍然非常好,我们能够测量到超过1Gbps的传输速率。在与Netgear的Wi-Fi 6路由器或AVM FritzBox 7490(Wi-Fi 5)结合使用时,我们没有遇到任何稳定性问题。
网络摄像头
ZBook Fury 17 G8仍然使用720p网络摄像头。它完成了自己的工作,但即使在体面的照明条件下,图片质量也不理想。


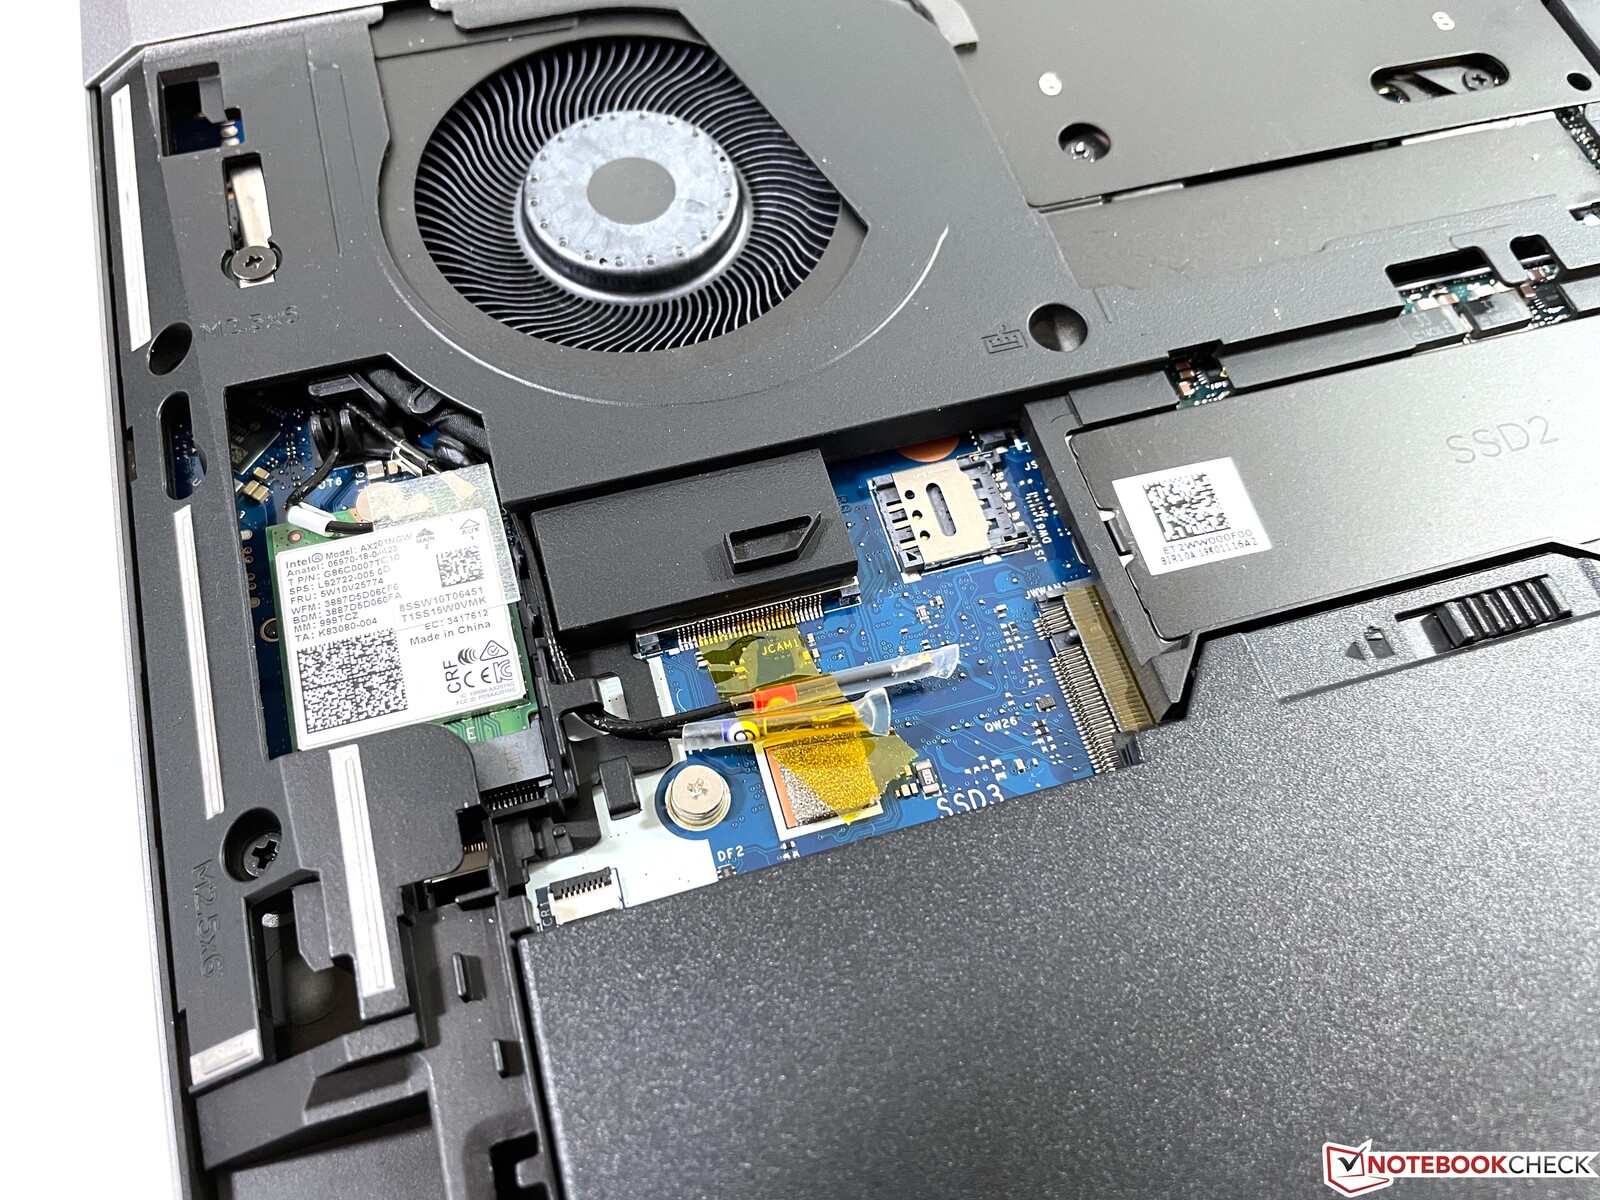
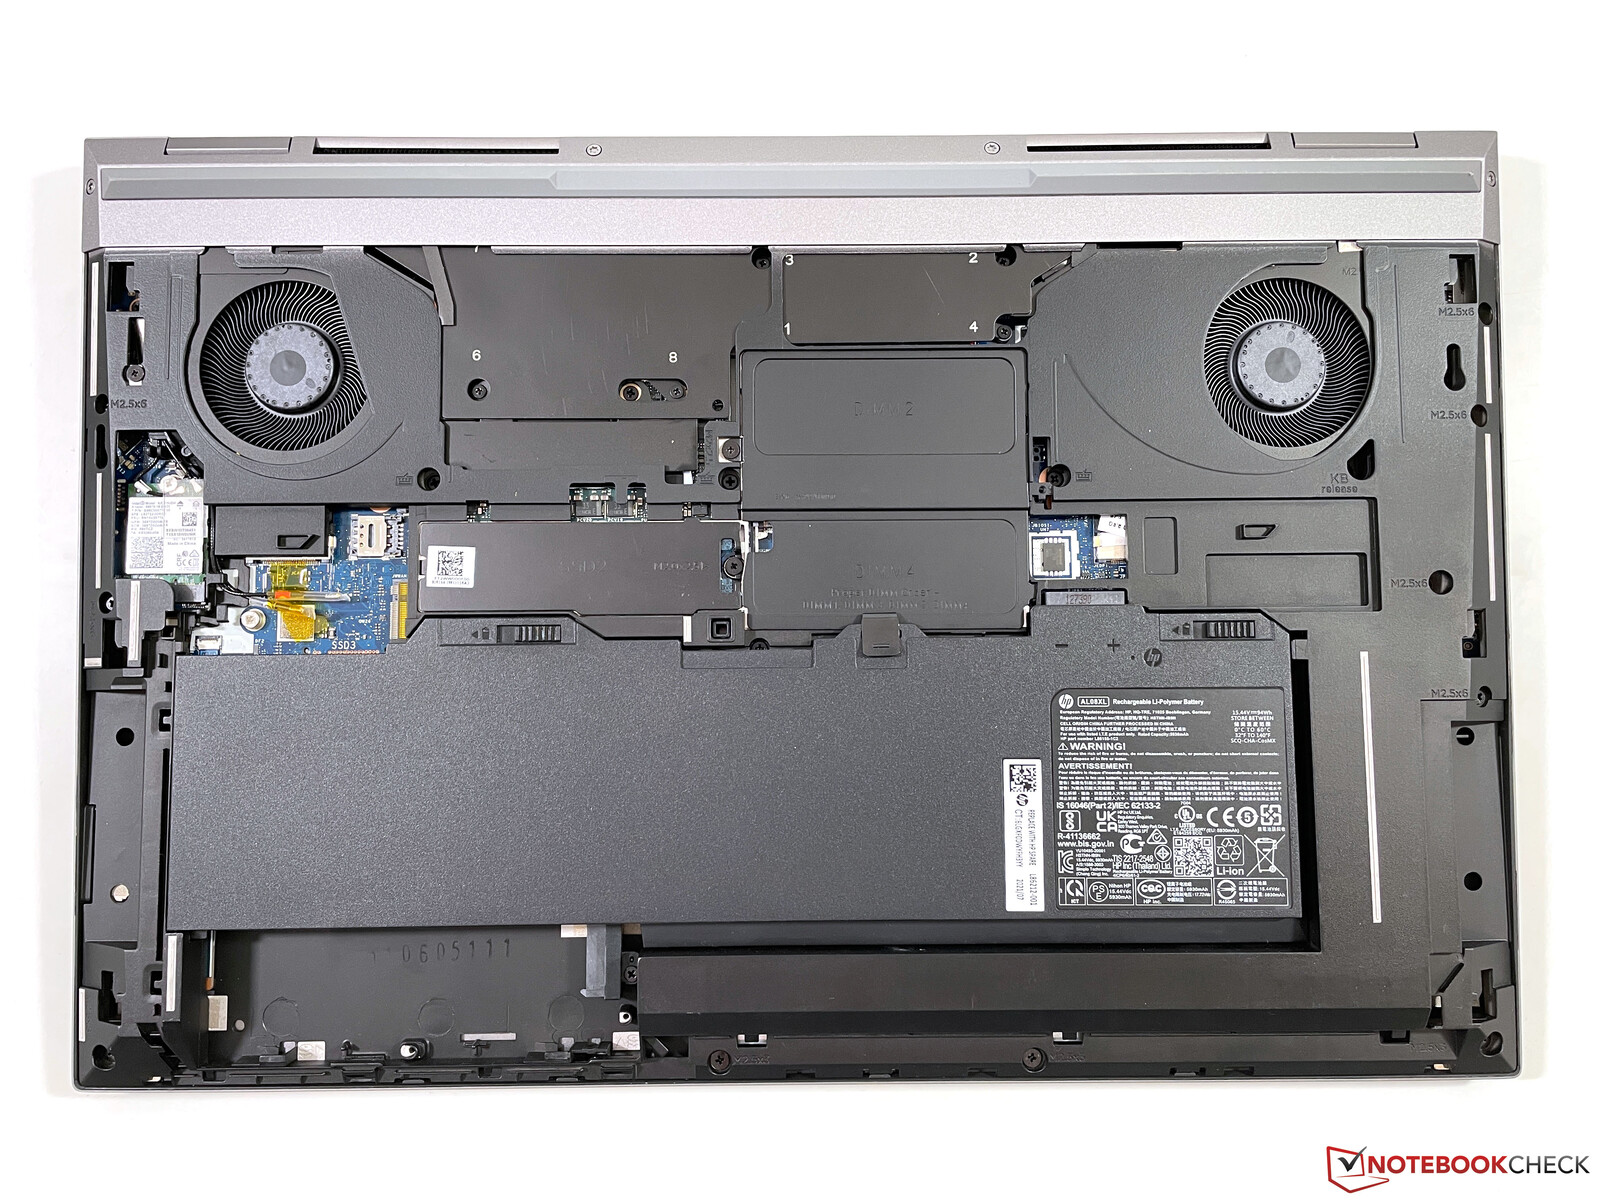
维护
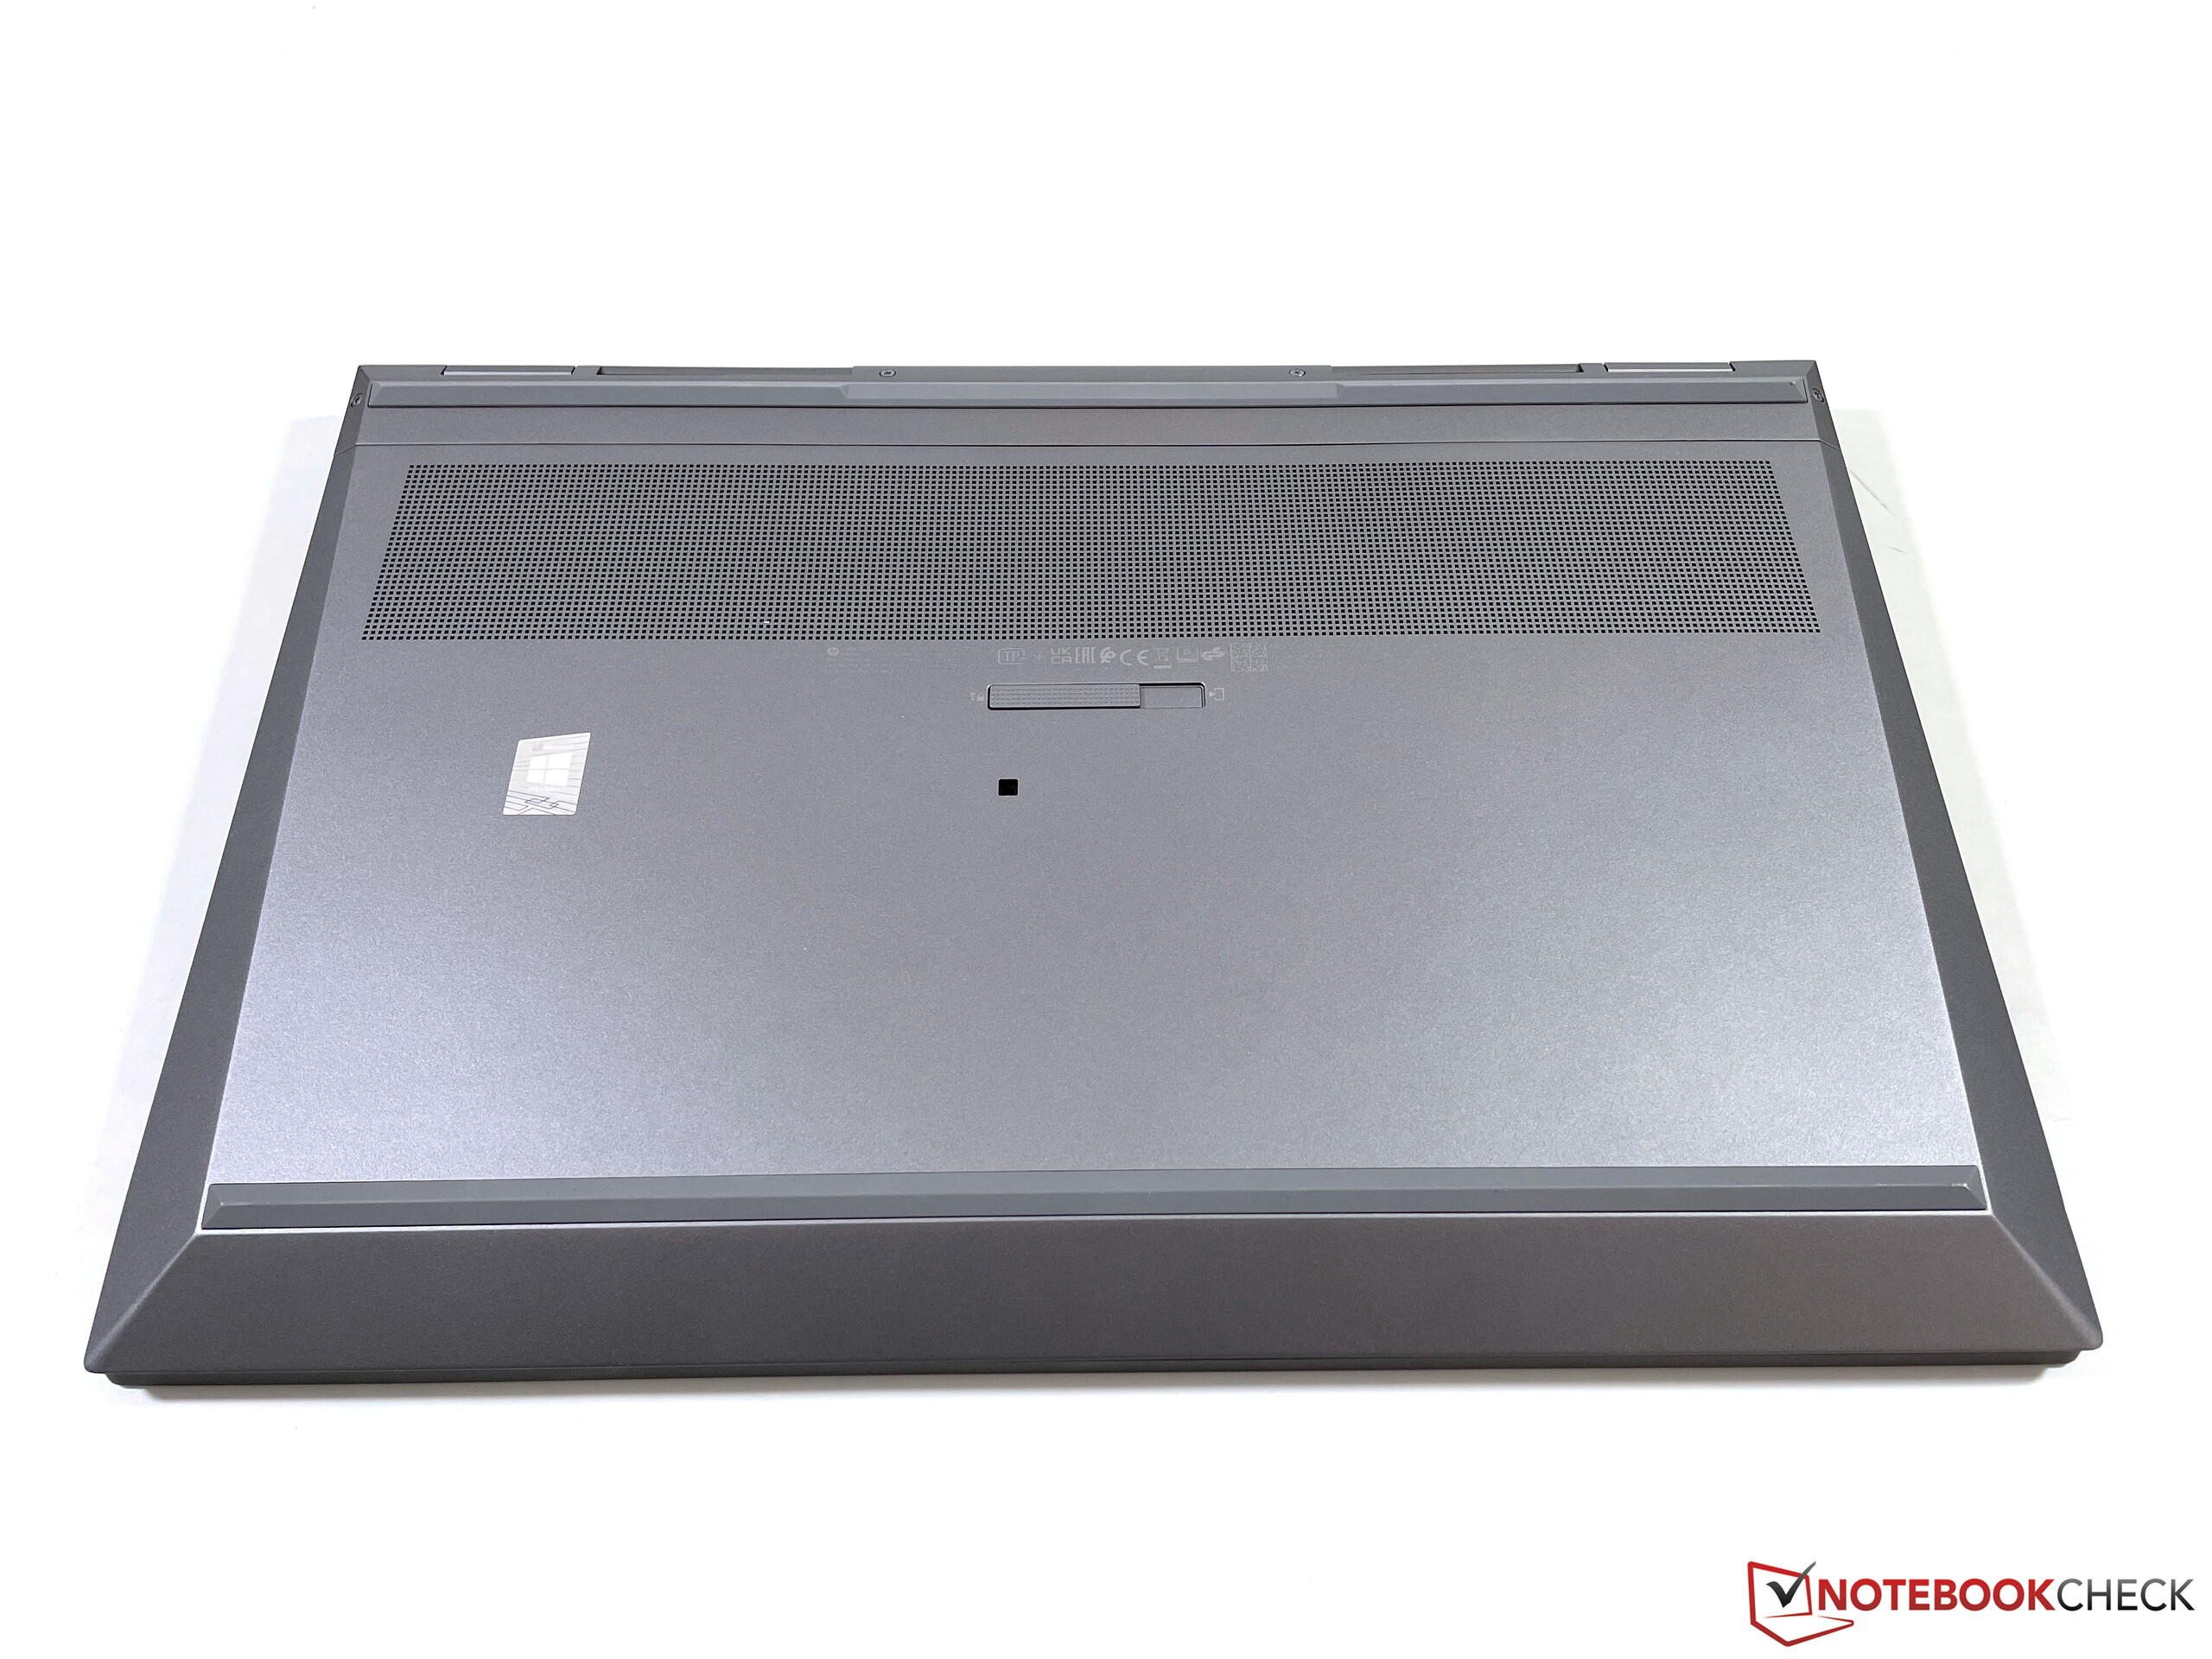
如前所述,拆除底板非常容易。你只需取下固定杠杆的中央螺丝,然后就可以直接取下它。然而,一旦进入内部,你会发现许多额外的盖子,所以进入实际组件毕竟需要更多的修整。四个内存插槽中的两个也位于键盘下方。在电池下面还有空间放置一个2.5英寸的驱动器,必要的安装工具也在盒子里。
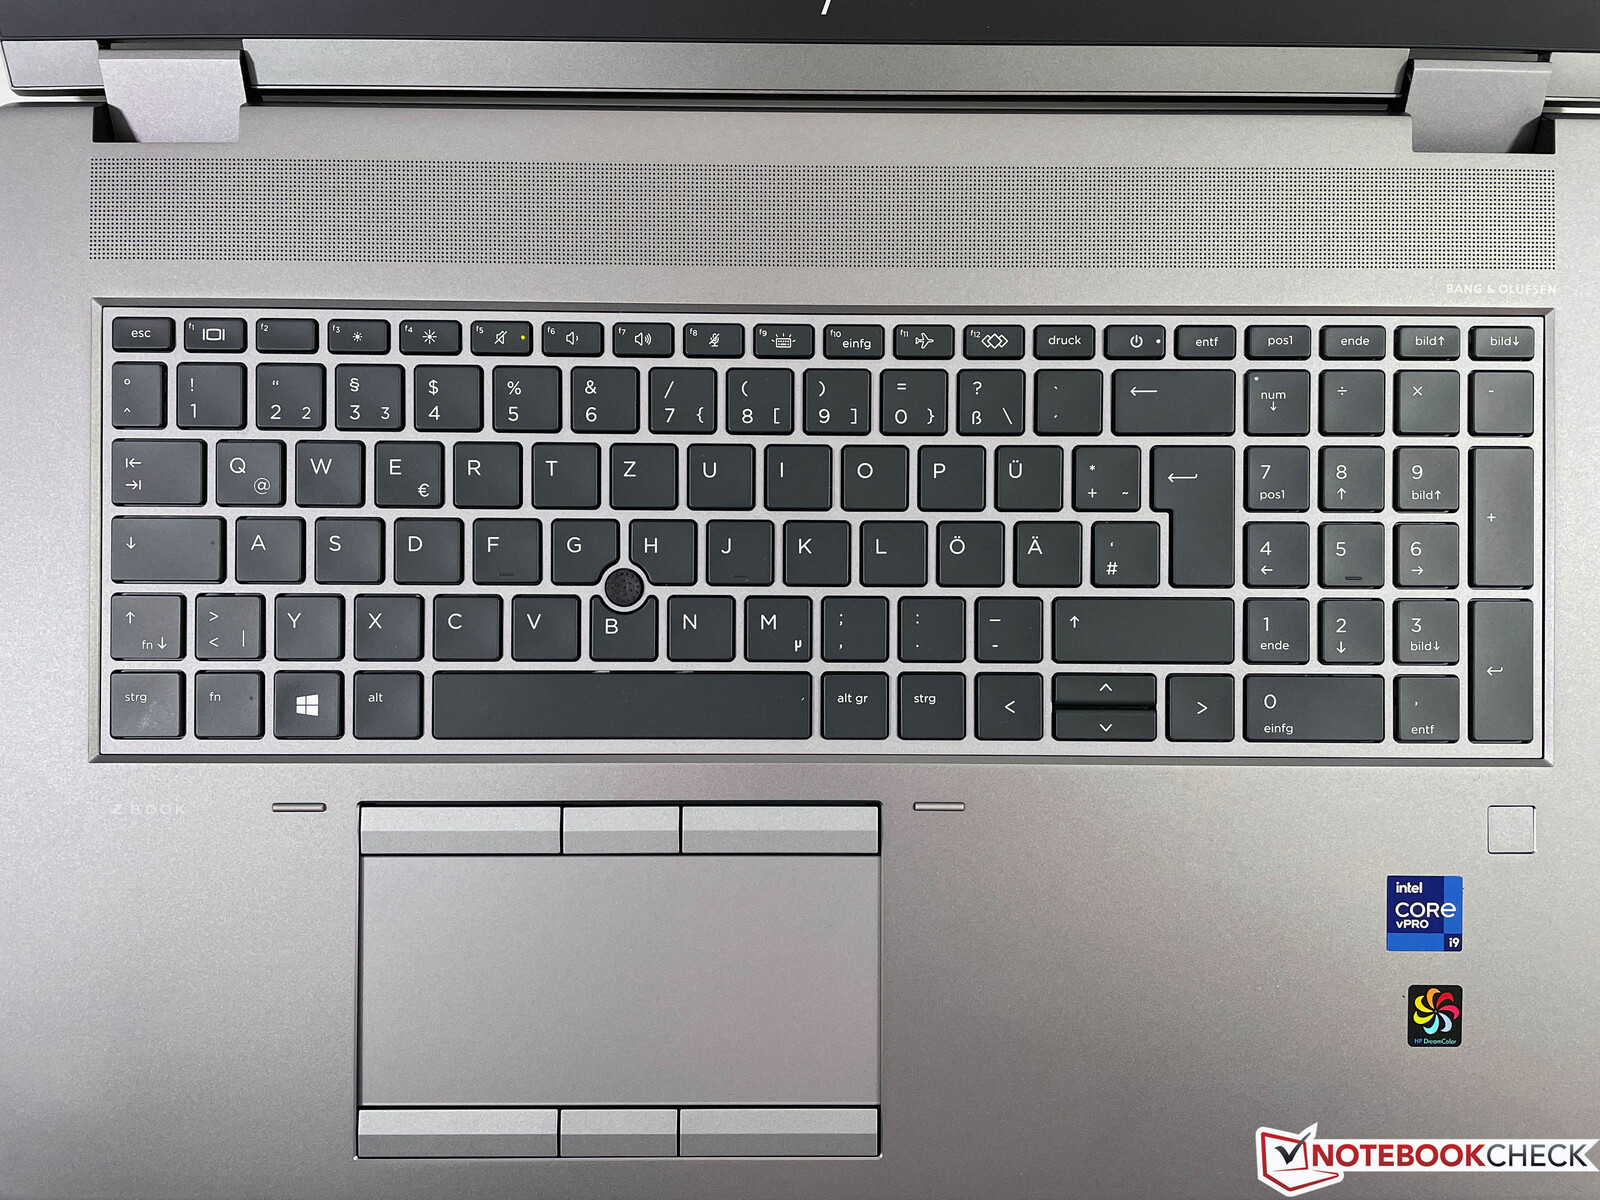
输入设备 - 移动工作站仍然使用PointStick
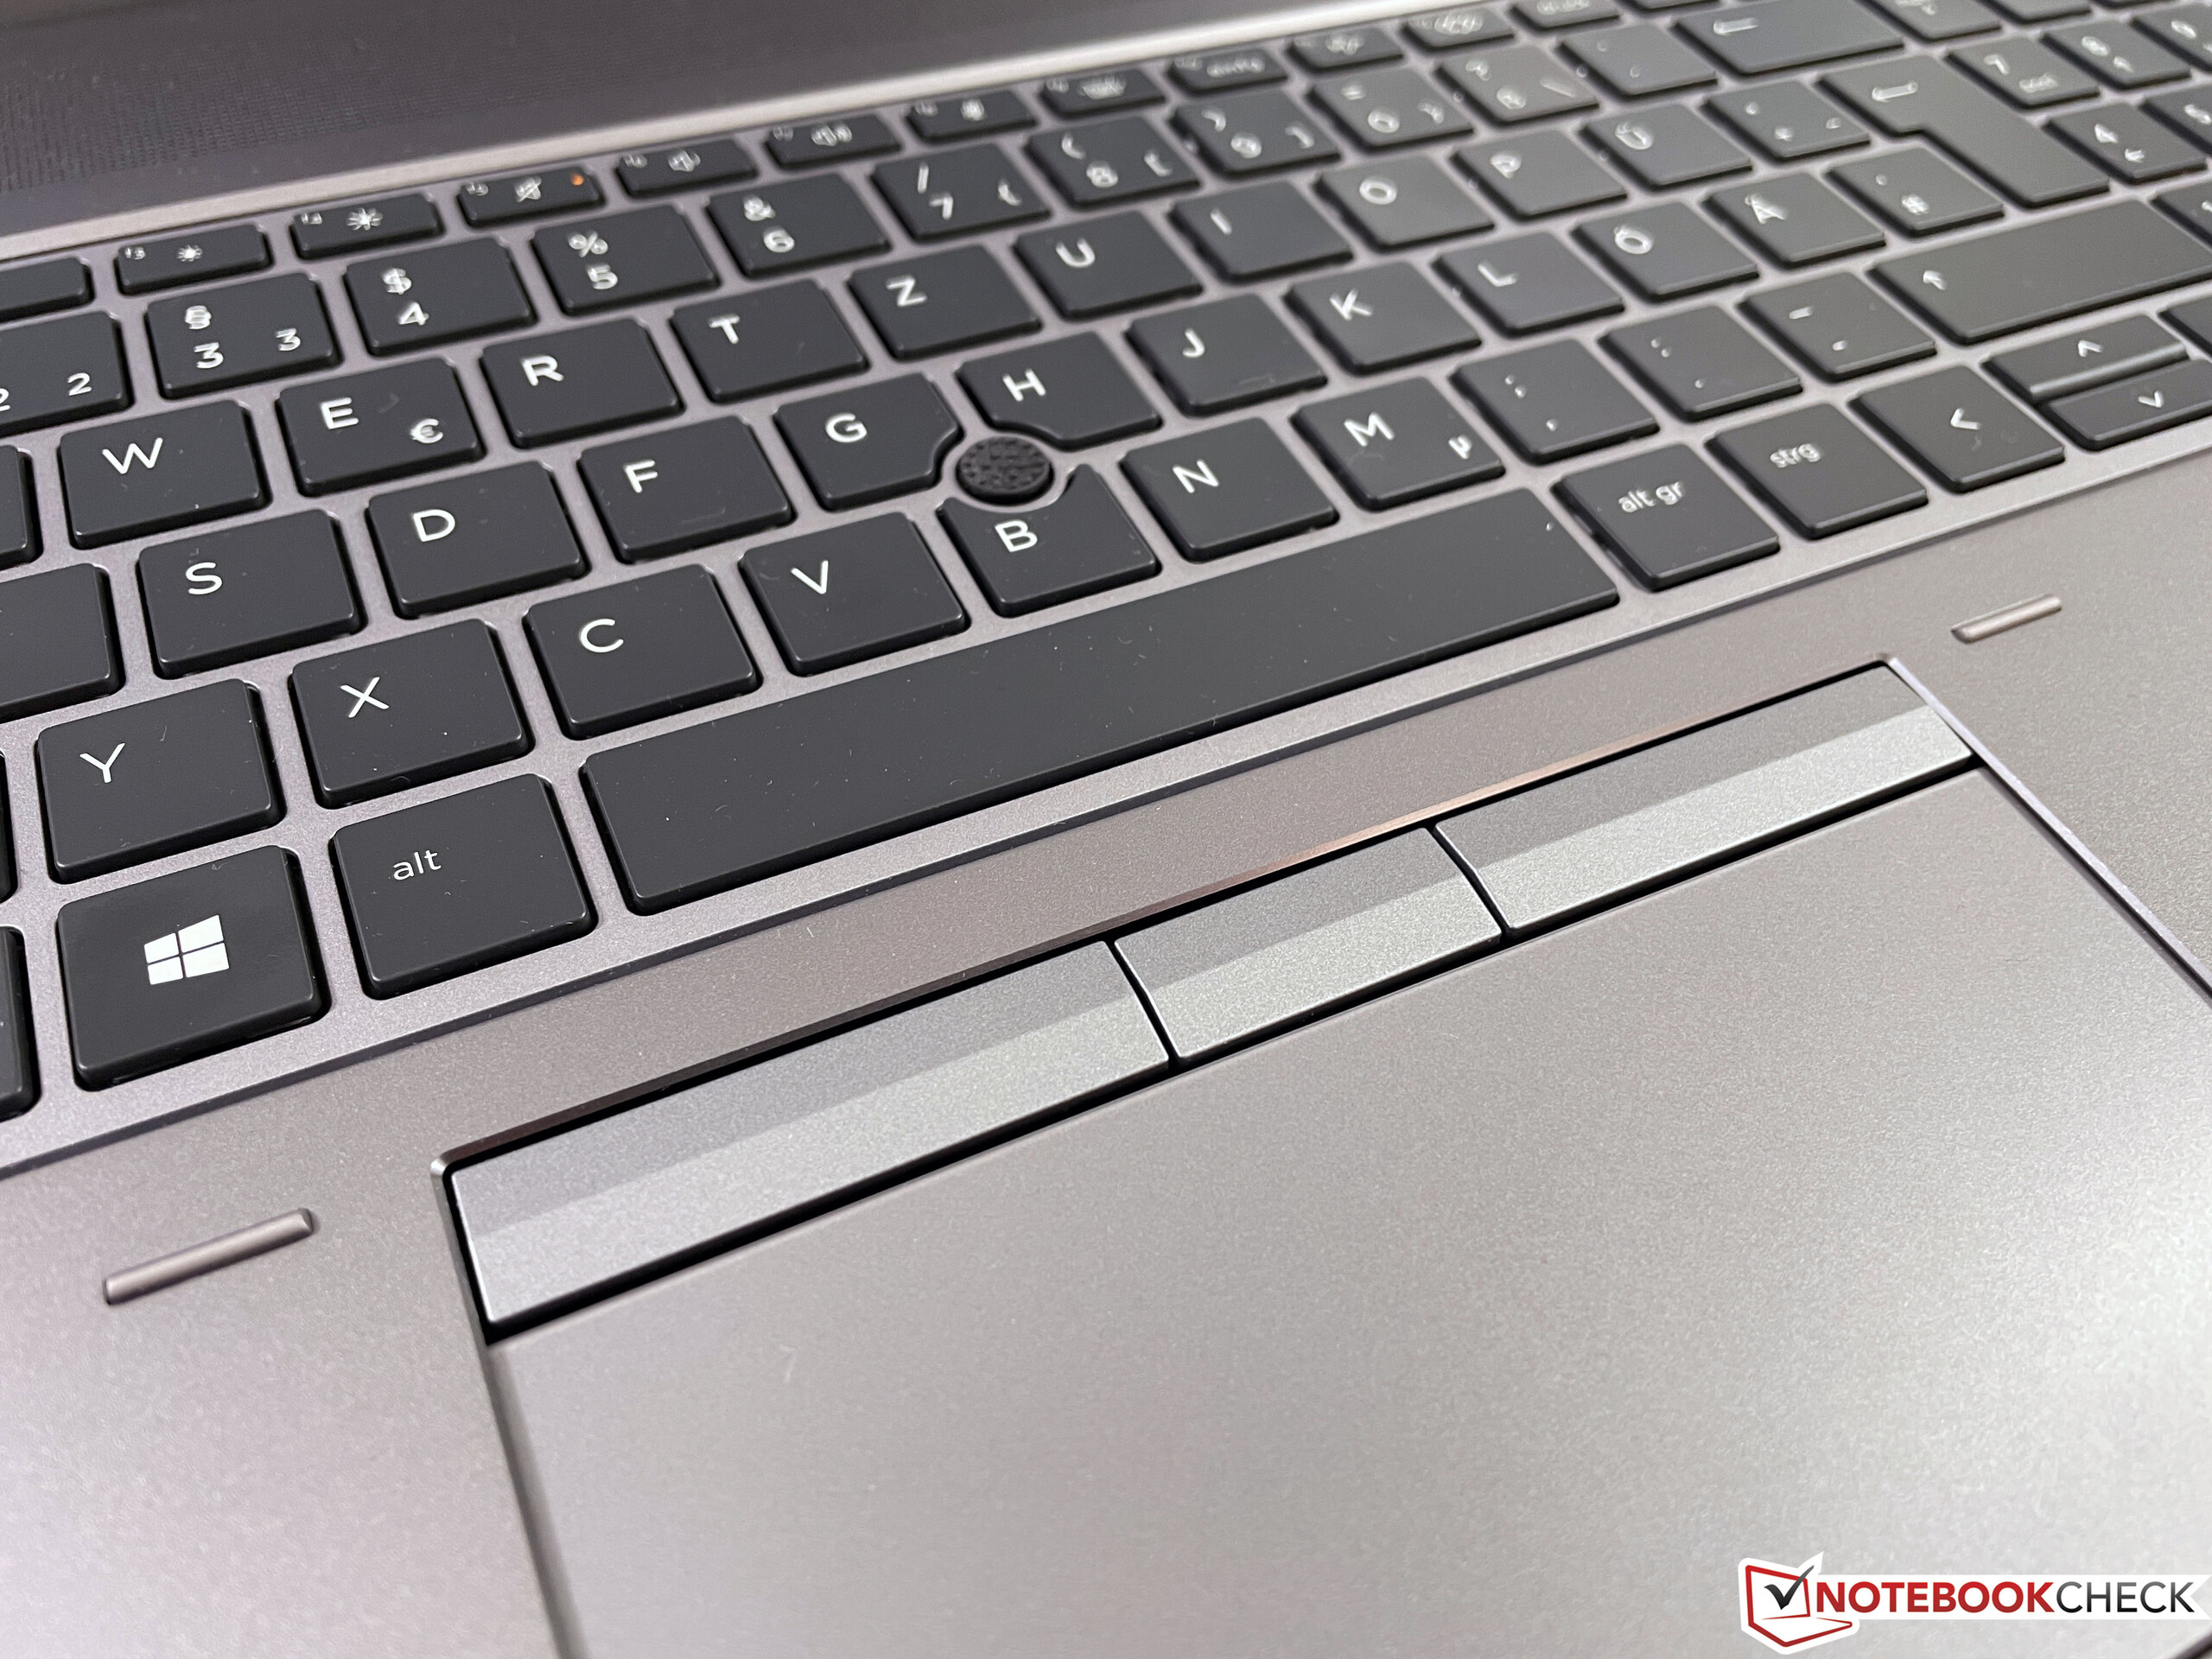
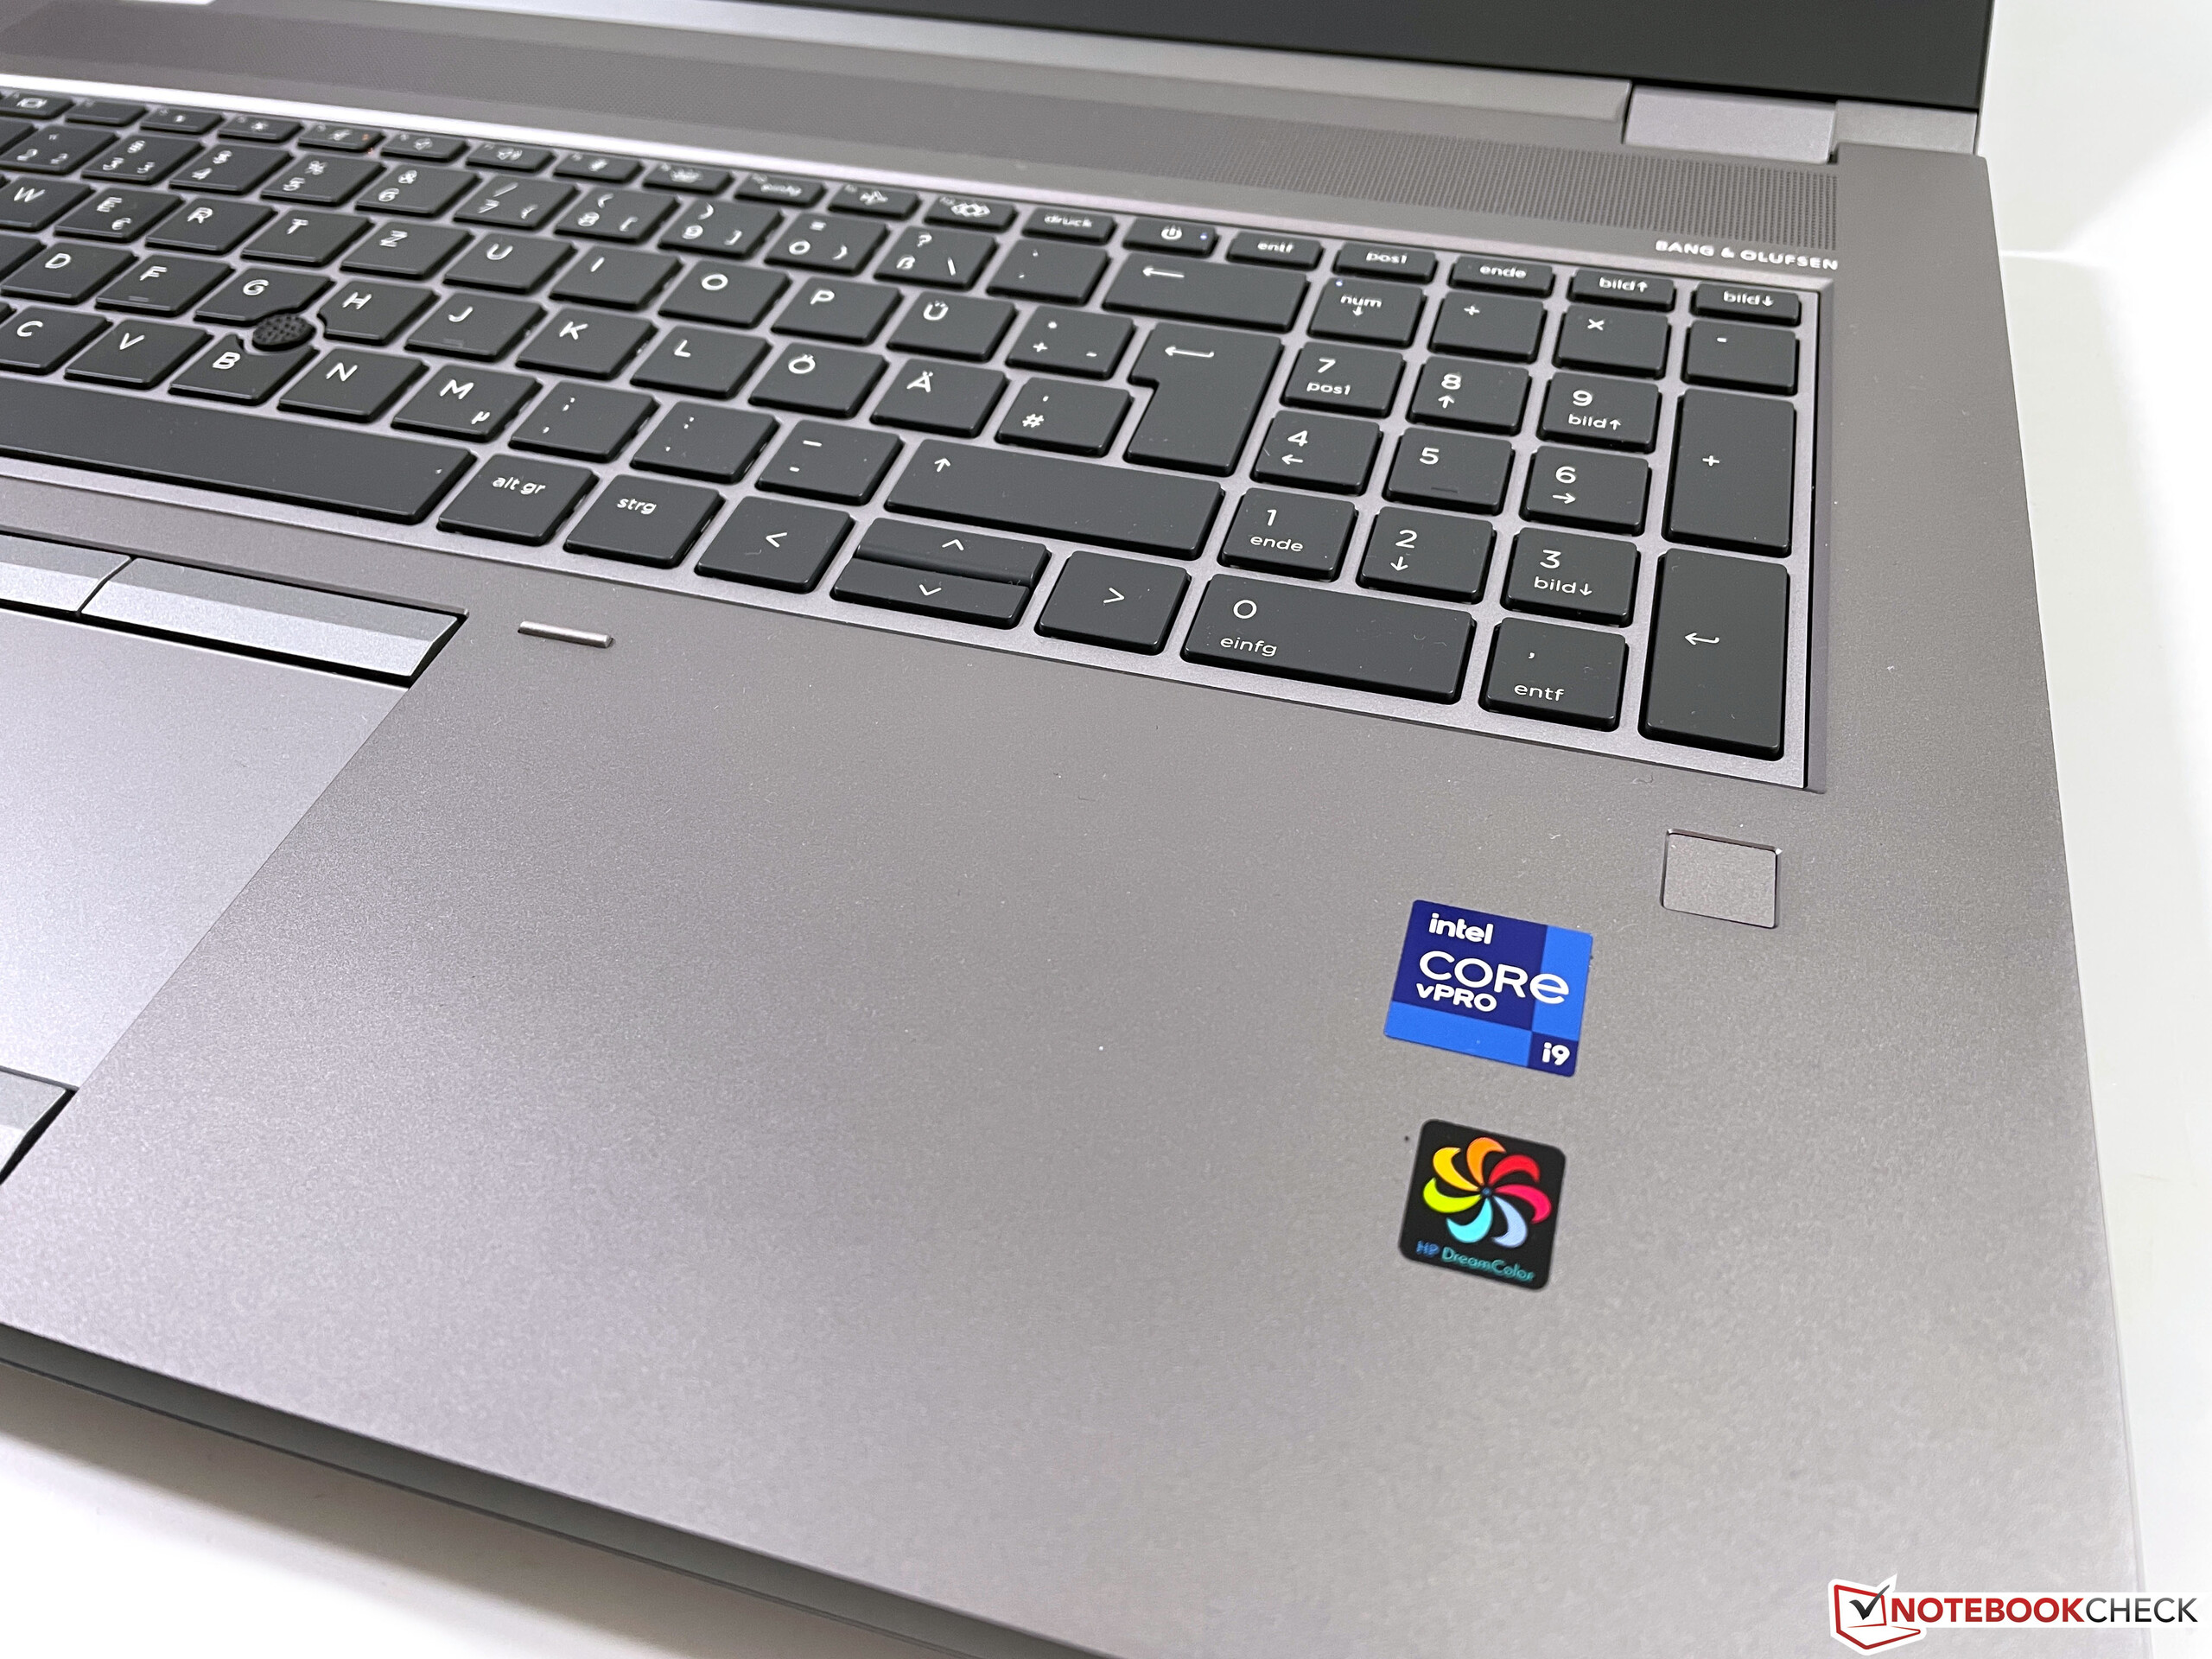
输入设备与之前的型号相比没有变化。 以前的型号.黑色的键盘非常结实(不弯曲),并以非常清晰的压力点以及足够的行程而令人信服。除了ThinkPad工作站(如ThinkPad P17 G2),惠普当然也提供市场上最好的移动键盘之一。除了全尺寸的小键盘外,你还能得到两级白色照明,而且键盘还能防泼水。我们认为,方向键的垂直尺寸较小是该键盘唯一真正的缺点,你必须习惯它。
与EliteBook系列相反,惠普在ZBook上除了触摸板,还配备了PointStick。这两种输入方法都有自己的一套专用鼠标按钮,而且都能很好地工作。
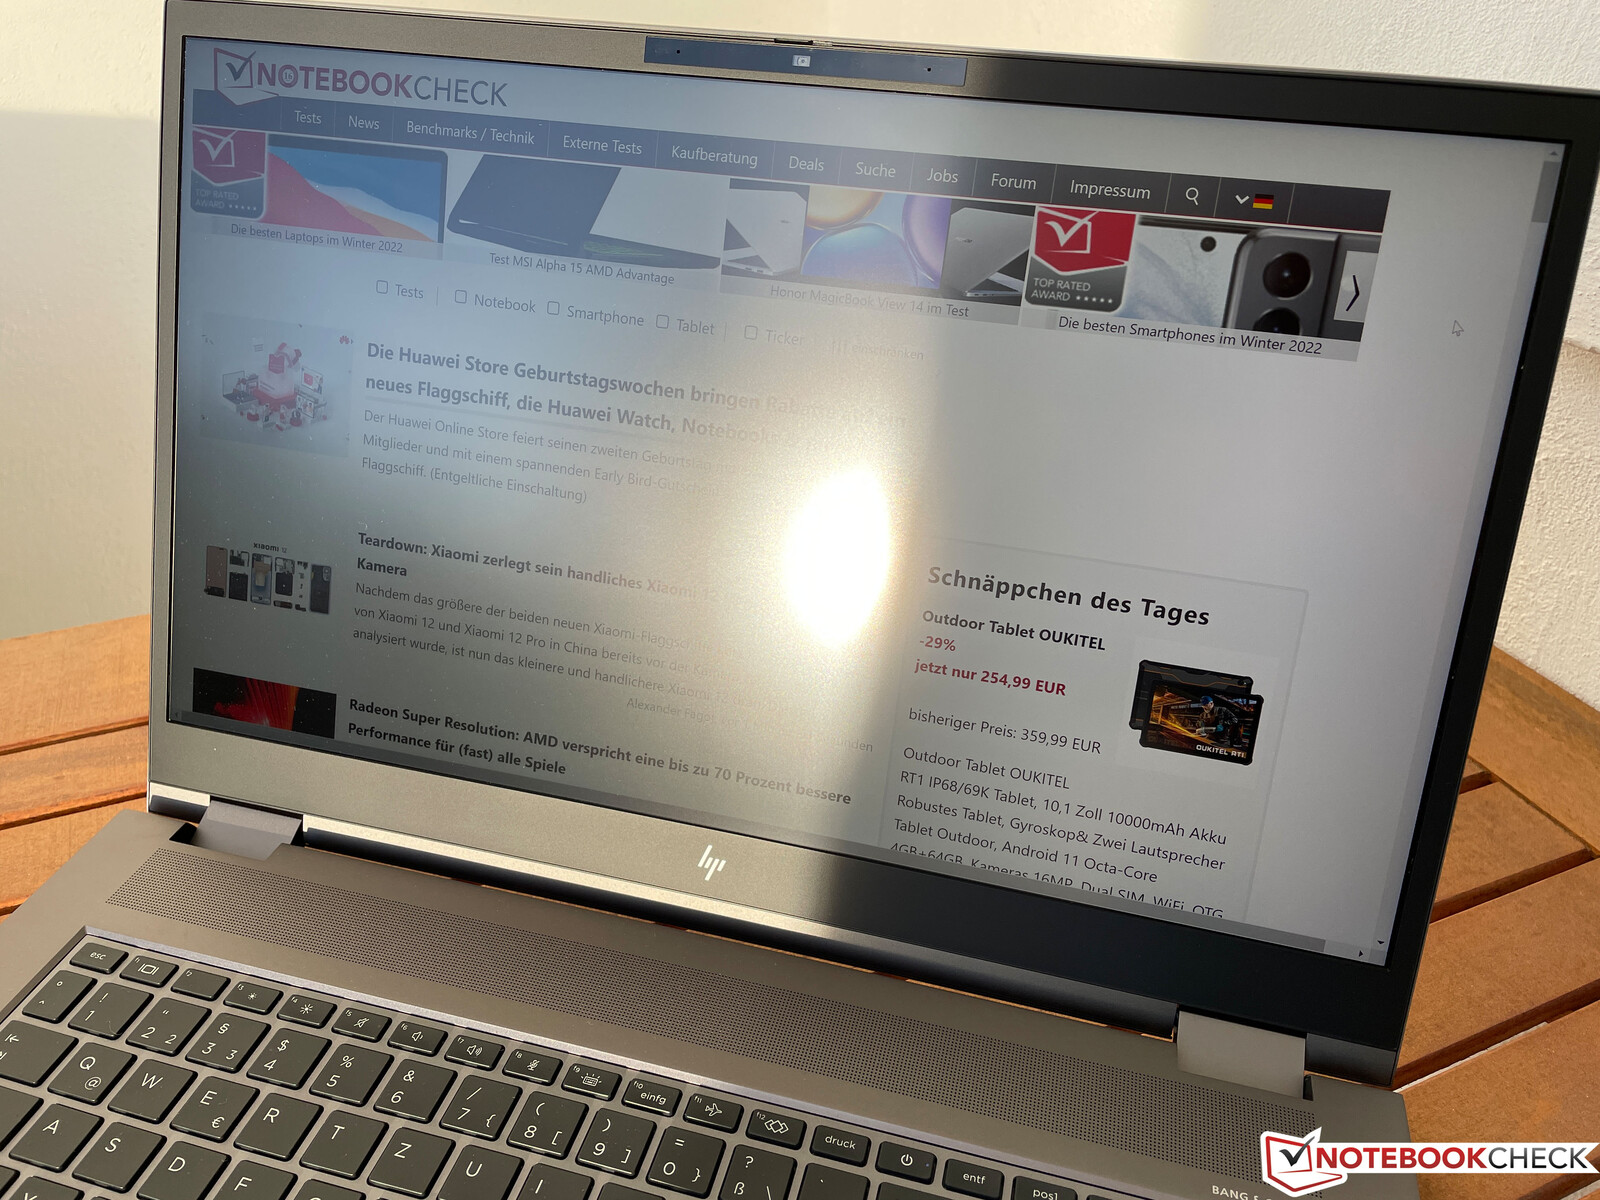
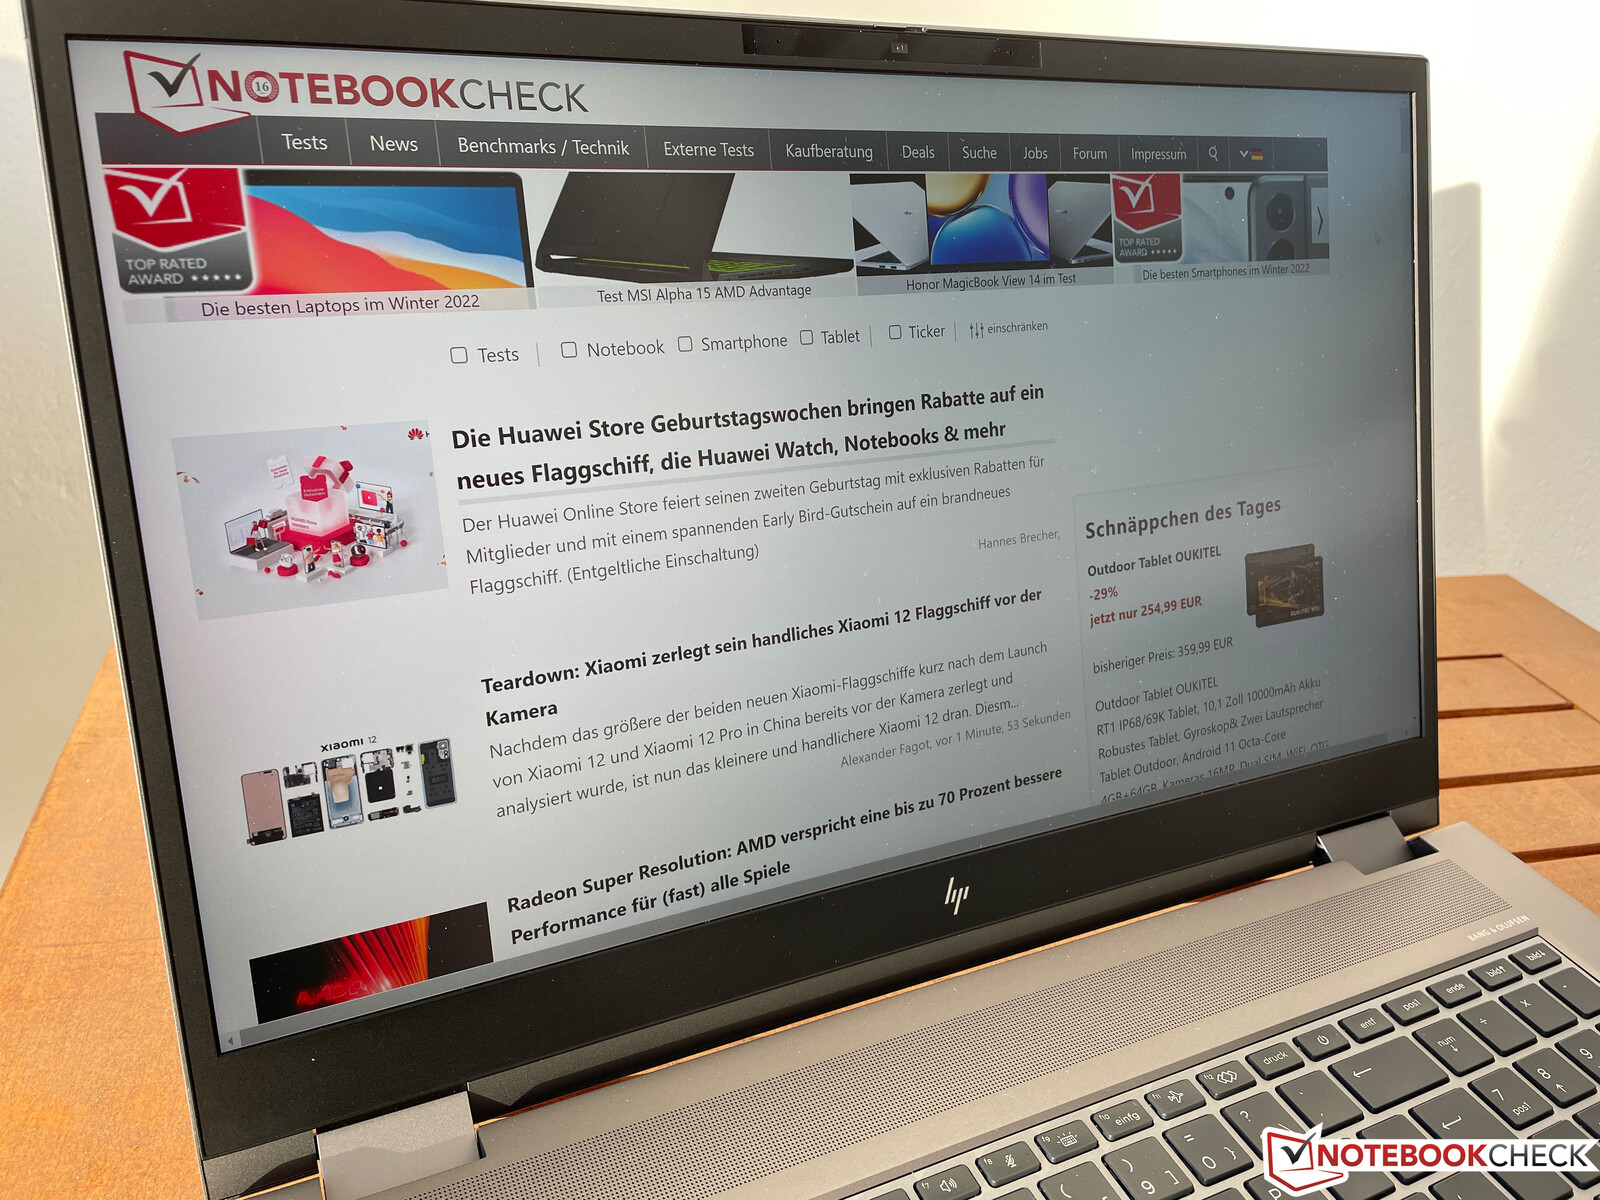
显示 - 梦幻色彩现在具有DCI-P3功能
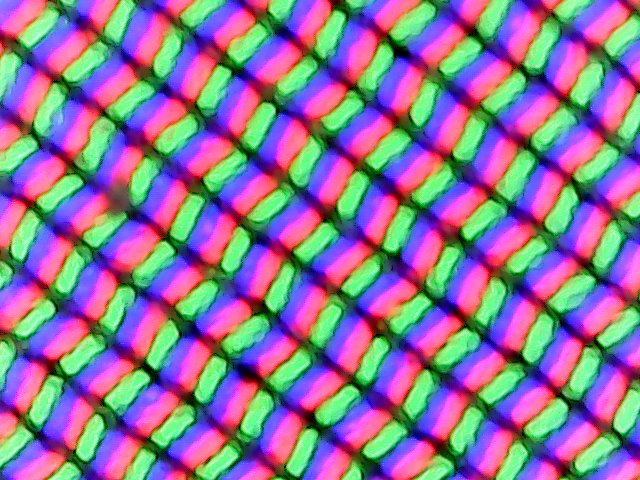
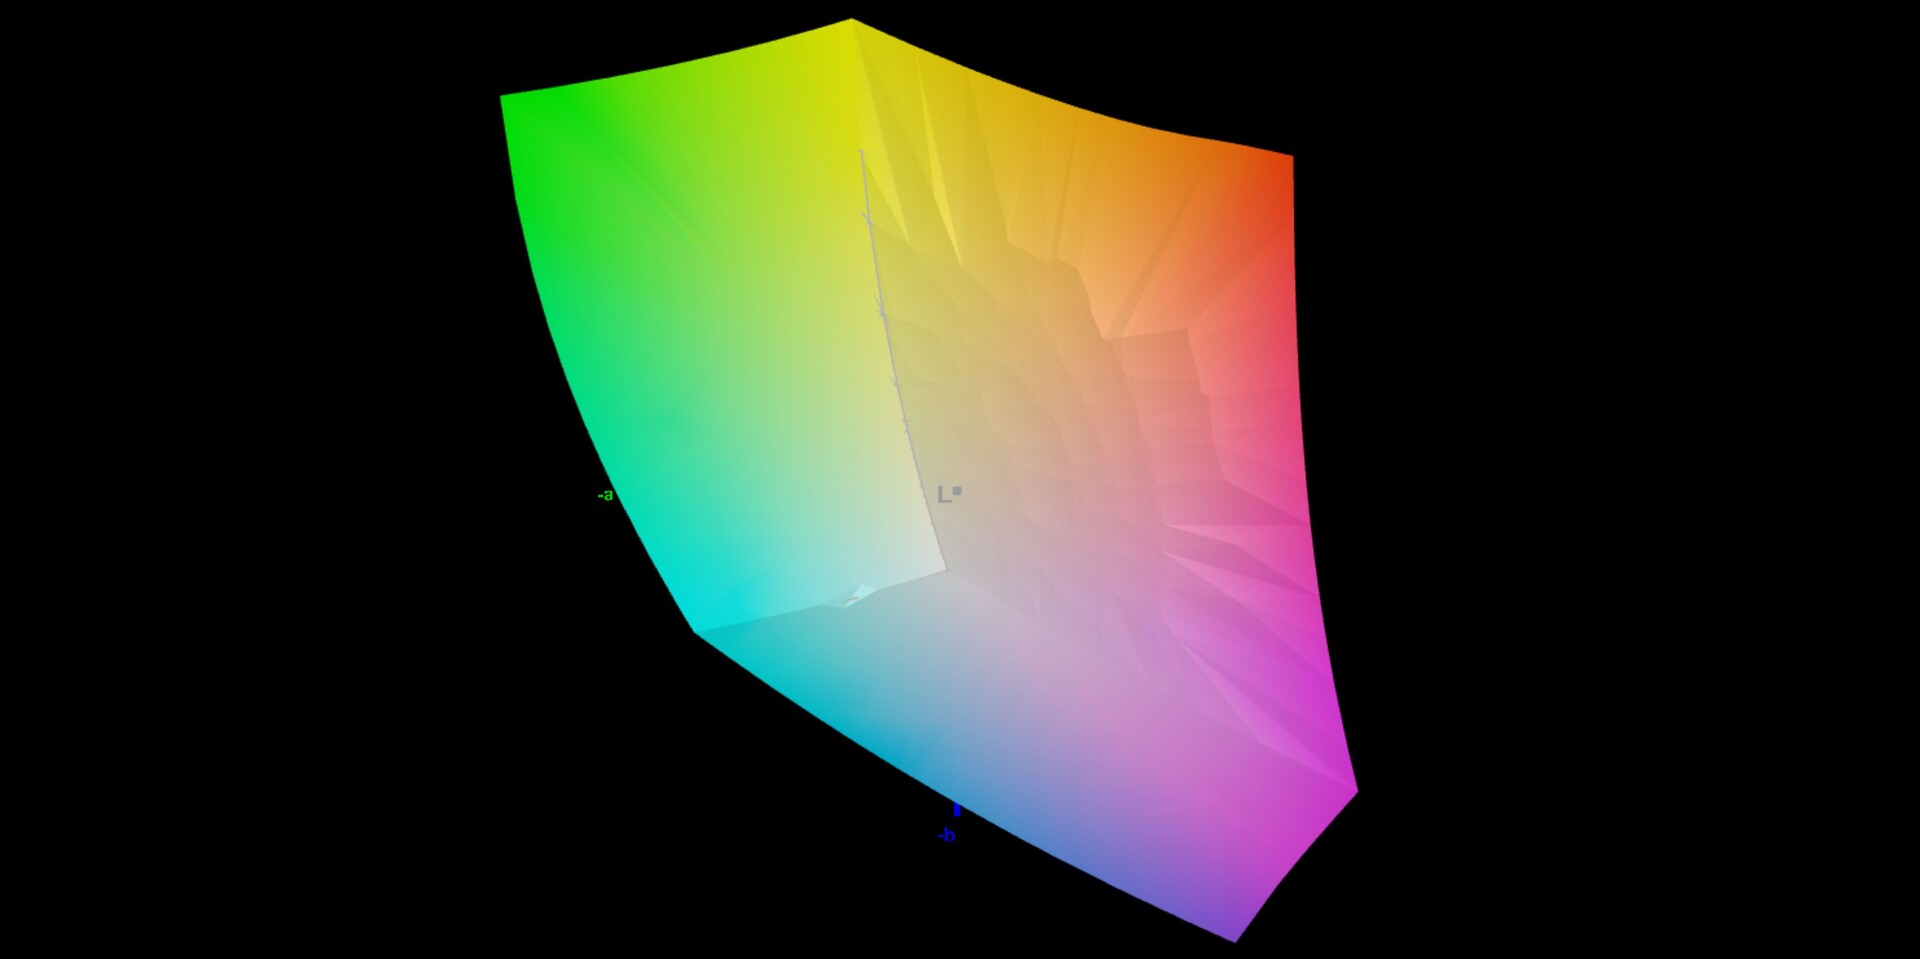
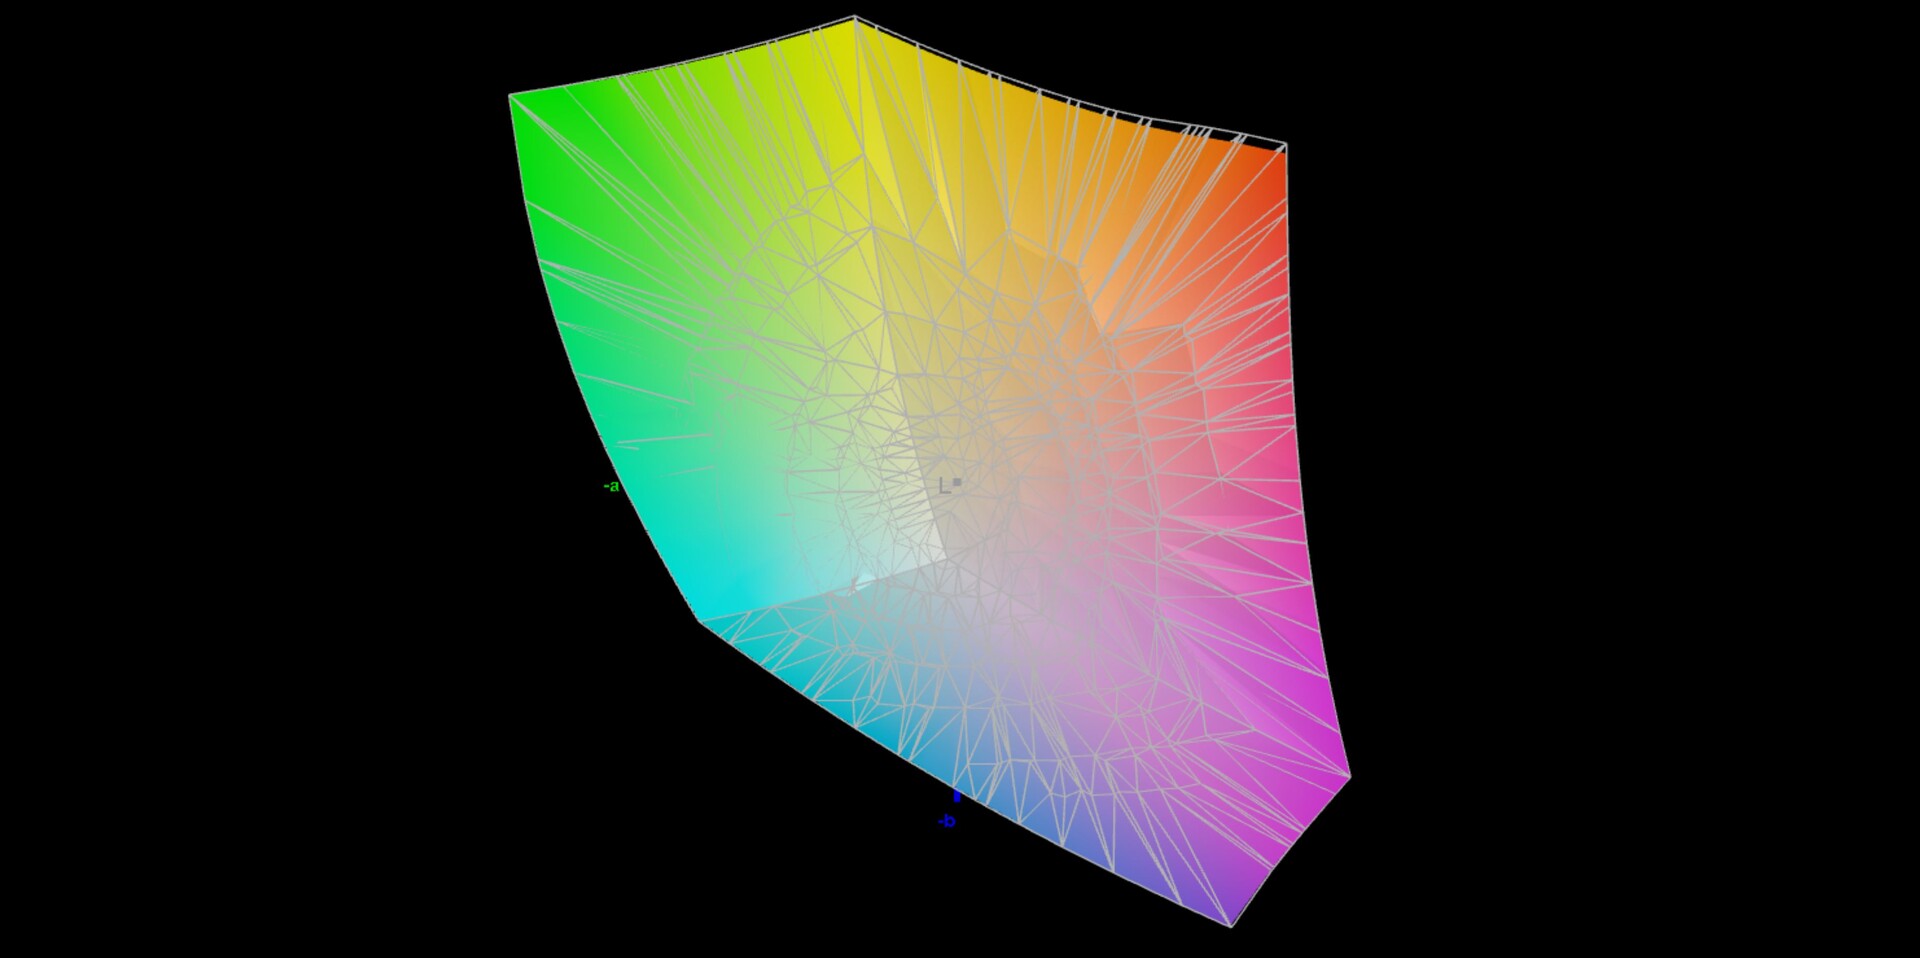
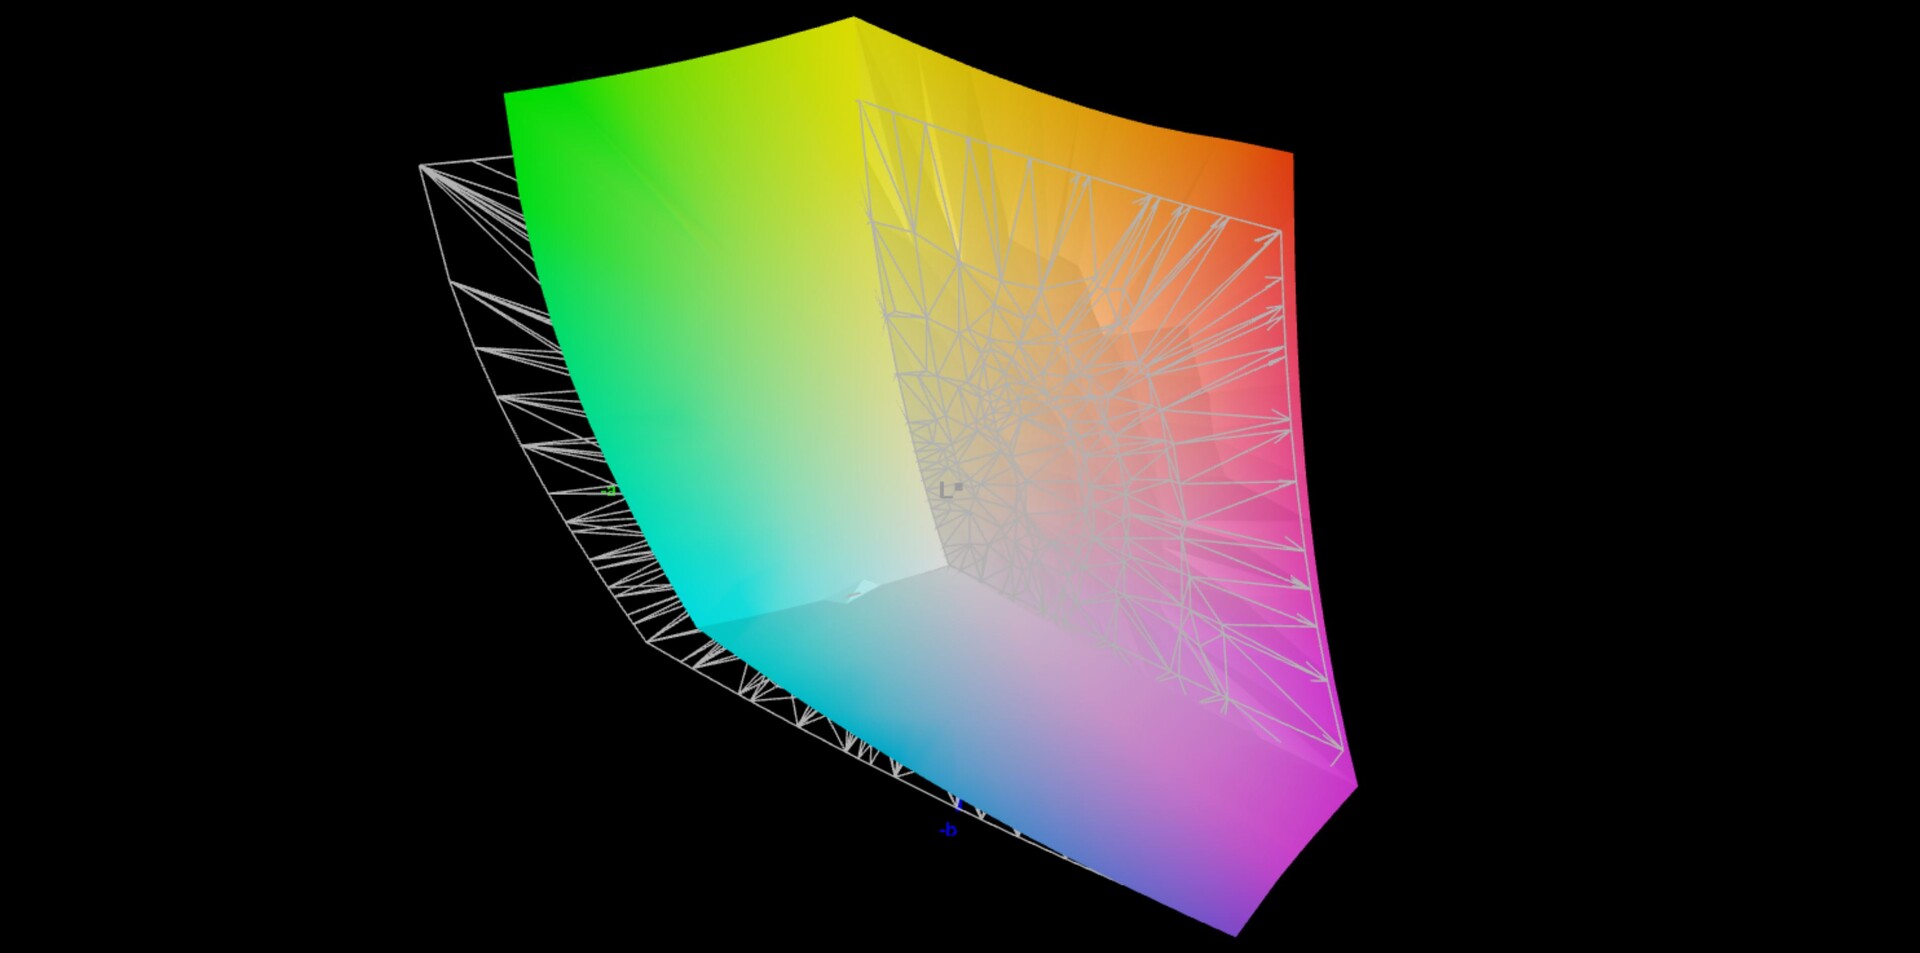
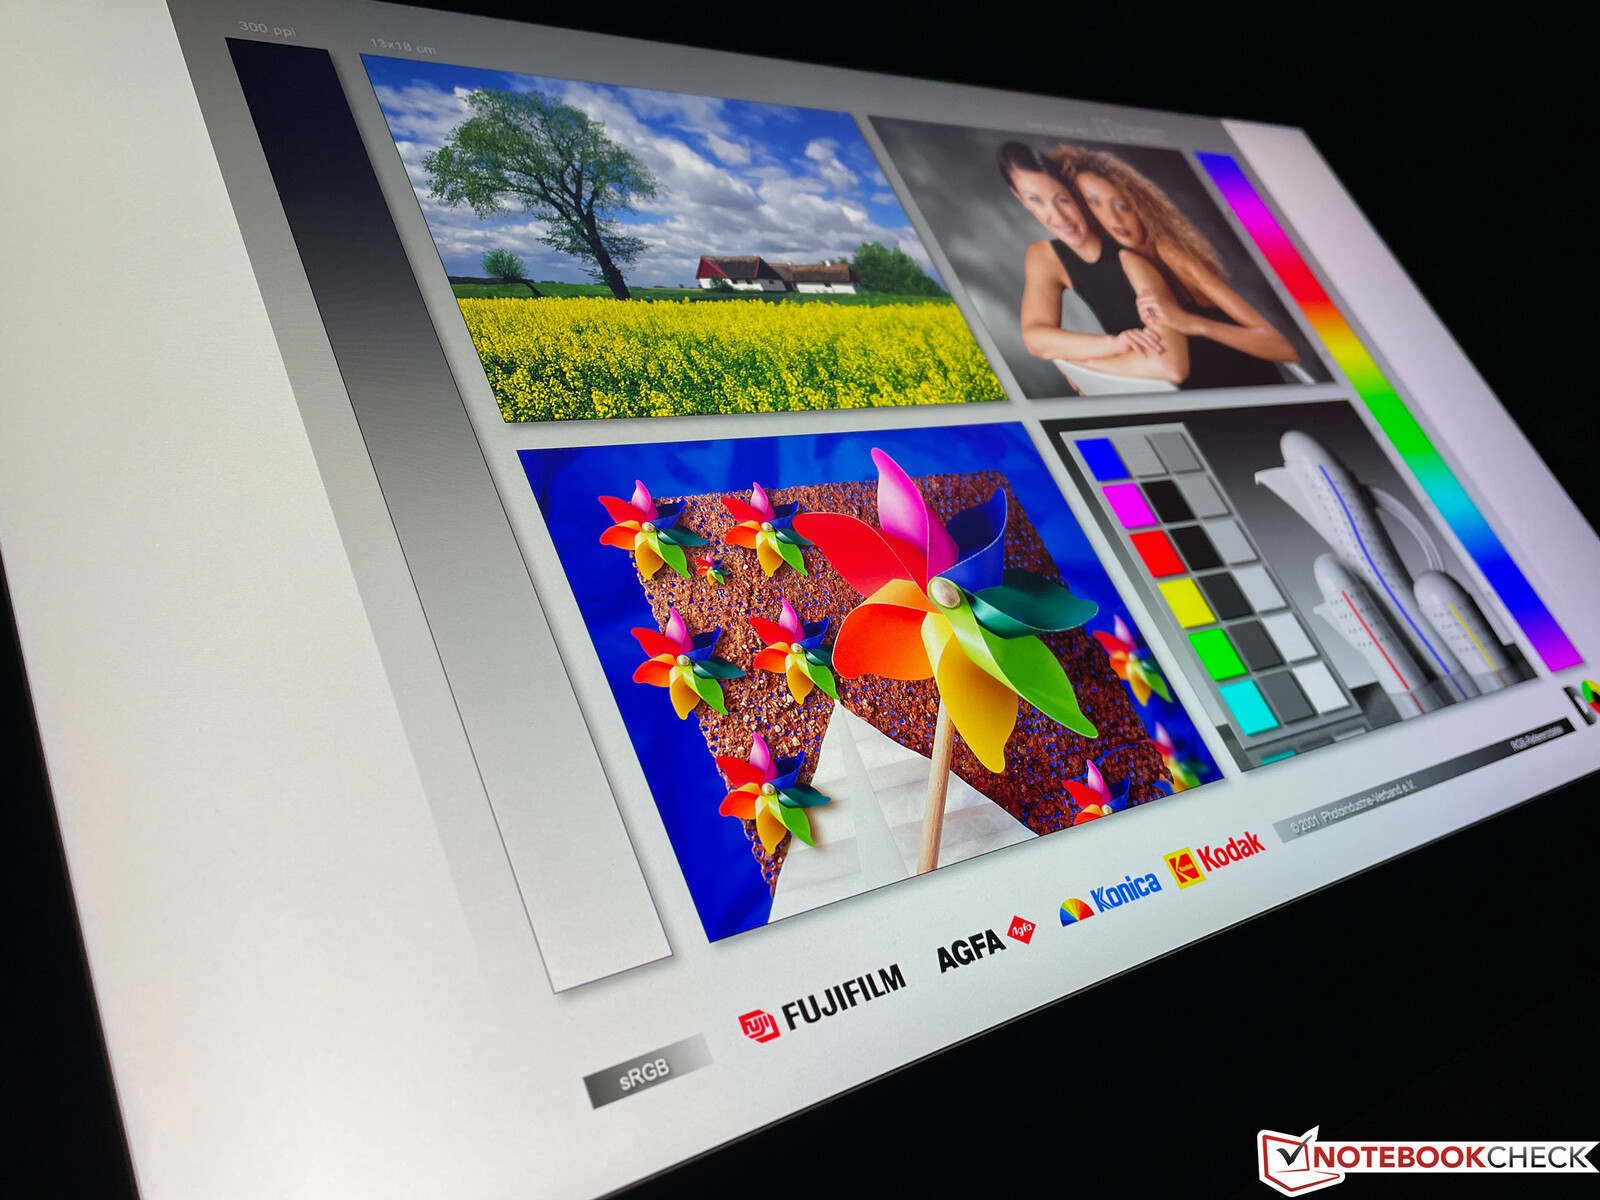
我们的评测单元配备了哑光4K DreamColor显示屏,它的长宽比仍然是16:9。与以前迭代的DreamColor显示屏相比,其中涵盖了AdobeRGB色彩空间。新版本 "只 "针对较小的DCI-P3色彩空间,就像Apple MacBook Pro机型。主观的画面印象仍然很好,只是明亮的表面显得有些颗粒感。
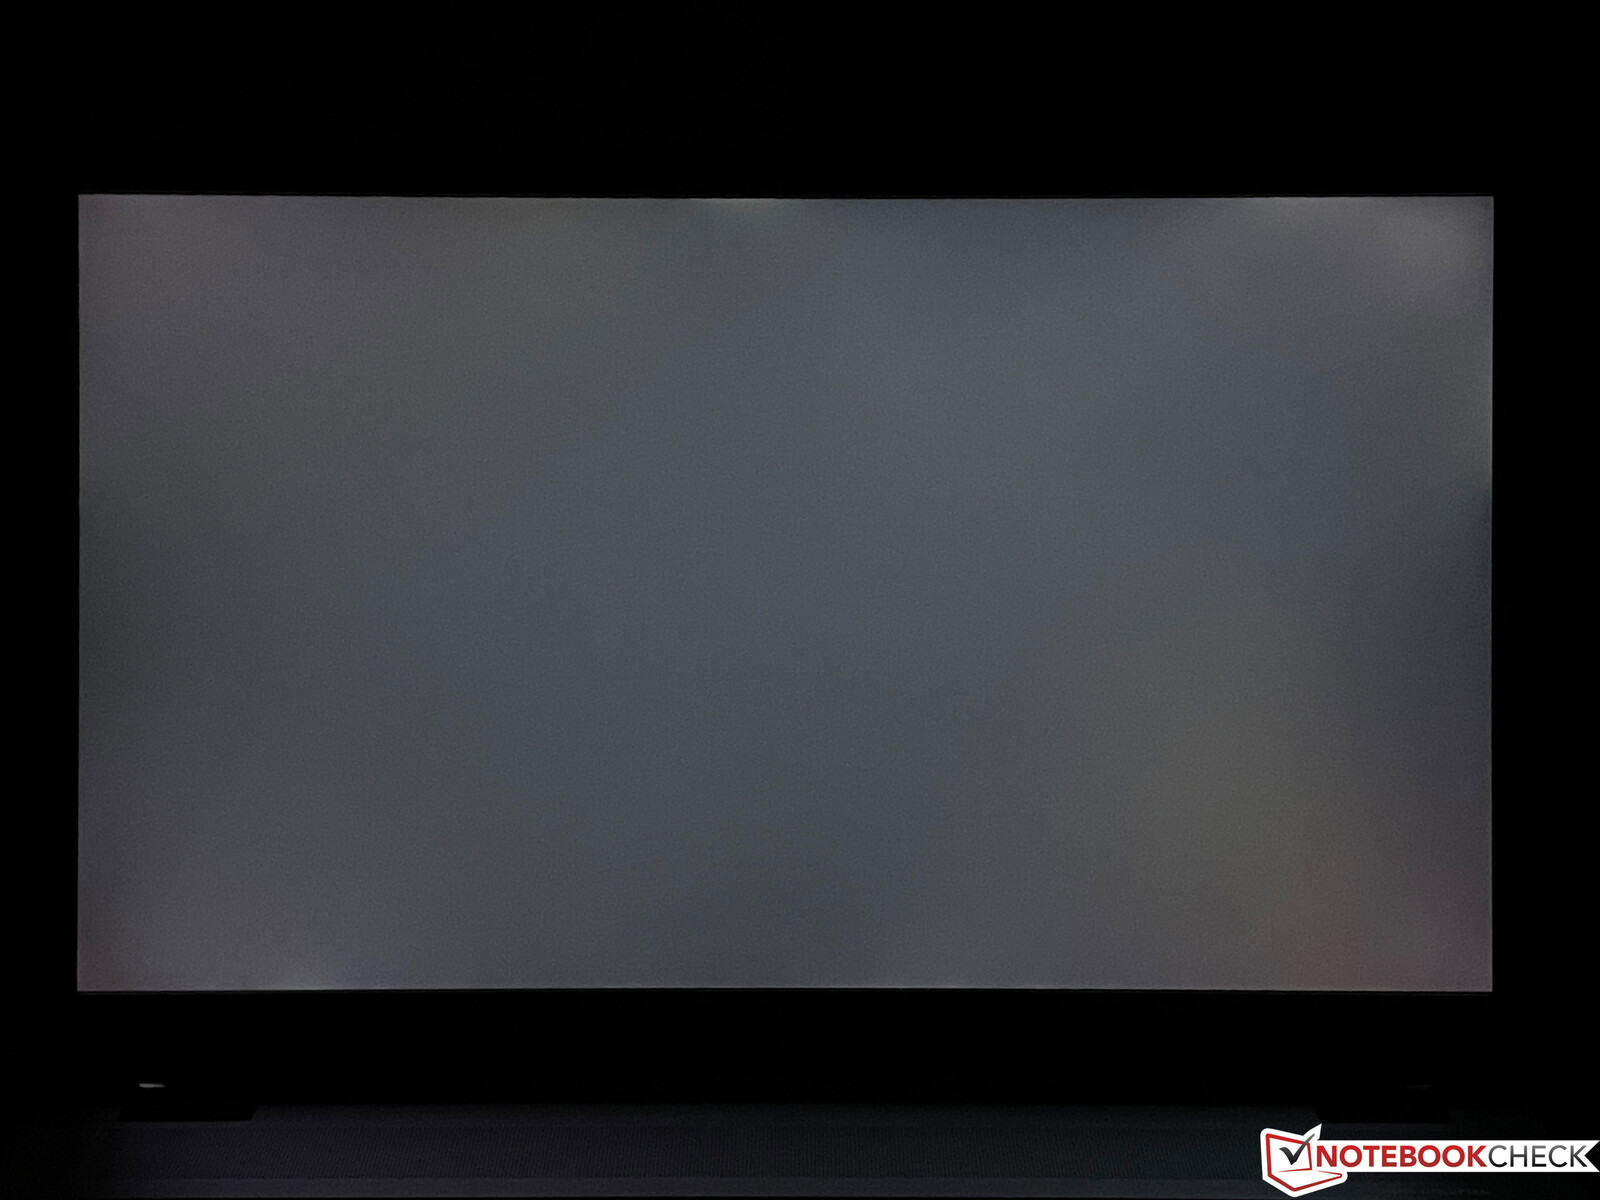
惠普宣传的平均亮度为550cd/m²,我们在测量后可以确认这个数值。考虑到高亮度,黑值也很体面,为0.33cd/m²,这导致了超过1700:1的非常高的对比度。即使在黑暗的背景上达到最大亮度,你也只能看到边缘有轻微的背光渗漏,但在实践中它们是没有问题的。没有PWM,只是响应时间相当慢,这导致了明显的重影。
| |||||||||||||||||||||||||
Brightness Distribution: 88 %
Center on Battery: 569 cd/m²
Contrast: 1721:1 (Black: 0.33 cd/m²)
ΔE ColorChecker Calman: 1 | ∀{0.5-29.43 Ø4.71}
calibrated: 0.5
ΔE Greyscale Calman: 1.7 | ∀{0.09-98 Ø4.96}
86.8% AdobeRGB 1998 (Argyll 3D)
100% sRGB (Argyll 3D)
99.1% Display P3 (Argyll 3D)
Gamma: 2.18
CCT: 6461 K
| HP ZBook Fury 17 G8-4A6A9EA AUOCD8C, IPS, 3840x2160, 17.3" | Lenovo ThinkPad P17 G2-20YU0025G LP173WF4-SPF7, IPS LED, 1920x1080, 17.3" | MSI WE76 11UM-456 B173ZAN03.3, IPS, 3840x2160, 17.3" | Asus ProArt StudioBook 16 W7600H5A-2BL2 ATNA60YV02-0, OLED, 3840x2400, 16" | HP ZBook Fury 17 G7 119W5EA AUOCD8C, , 3840x2160, 17.3" | Apple MacBook Pro 16 2021 M1 Max Mini-LED, 3456x2234, 16.2" | |
|---|---|---|---|---|---|---|
| Display | -23% | -2% | 5% | 0% | ||
| Display P3 Coverage (%) | 99.1 | 67.9 -31% | 82.1 -17% | 99.9 1% | 99.3 0% | |
| sRGB Coverage (%) | 100 | 87.3 -13% | 99.3 -1% | 100 0% | 99.9 0% | |
| AdobeRGB 1998 Coverage (%) | 86.8 | 63.9 -26% | 96 11% | 98.6 14% | 86.9 0% | |
| Response Times | 29% | 67% | 95% | -16% | ||
| Response Time Grey 50% / Grey 80% * (ms) | 67.6 ? | 39.2 ? 42% | 17.6 ? 74% | 2 ? 97% | 56 ? 17% | |
| Response Time Black / White * (ms) | 26.8 ? | 22.4 ? 16% | 10.8 ? 60% | 2 ? 93% | 40 ? -49% | |
| PWM Frequency (Hz) | 240 ? | |||||
| Screen | -189% | -36% | -104% | -33% | 170% | |
| Brightness middle (cd/m²) | 568 | 361 -36% | 419 -26% | 353 -38% | 573 1% | 507 -11% |
| Brightness (cd/m²) | 564 | 334 -41% | 416 -26% | 360 -36% | 586 4% | 494 -12% |
| Brightness Distribution (%) | 88 | 87 -1% | 93 6% | 96 9% | 91 3% | 96 9% |
| Black Level * (cd/m²) | 0.33 | 0.35 -6% | 0.34 -3% | 0.38 -15% | 0.02 94% | |
| Contrast (:1) | 1721 | 1031 -40% | 1232 -28% | 1508 -12% | 25350 1373% | |
| Colorchecker dE 2000 * | 1 | 5.4 -440% | 1.5 -50% | 2.45 -145% | 1.9 -90% | 1.4 -40% |
| Colorchecker dE 2000 max. * | 2.4 | 9.9 -313% | 4.7 -96% | 3.75 -56% | 4.2 -75% | 2.8 -17% |
| Colorchecker dE 2000 calibrated * | 0.5 | 3.2 -540% | 0.9 -80% | 2.77 -454% | 0.7 -40% | |
| Greyscale dE 2000 * | 1.7 | 6.5 -282% | 2 -18% | 1.88 -11% | 2.9 -71% | 2.3 -35% |
| Gamma | 2.18 101% | 2.23 99% | 2.17 101% | 2.31 95% | 2.1 105% | 2.27 97% |
| CCT | 6461 101% | 7351 88% | 6629 98% | 6441 101% | 6217 105% | 6792 96% |
| Color Space (Percent of AdobeRGB 1998) (%) | 77.6 | |||||
| Color Space (Percent of sRGB) (%) | 100 | |||||
| Total Average (Program / Settings) | -61% /
-122% | 10% /
-14% | -1% /
-44% | -16% /
-23% | 170% /
170% |
* ... smaller is better
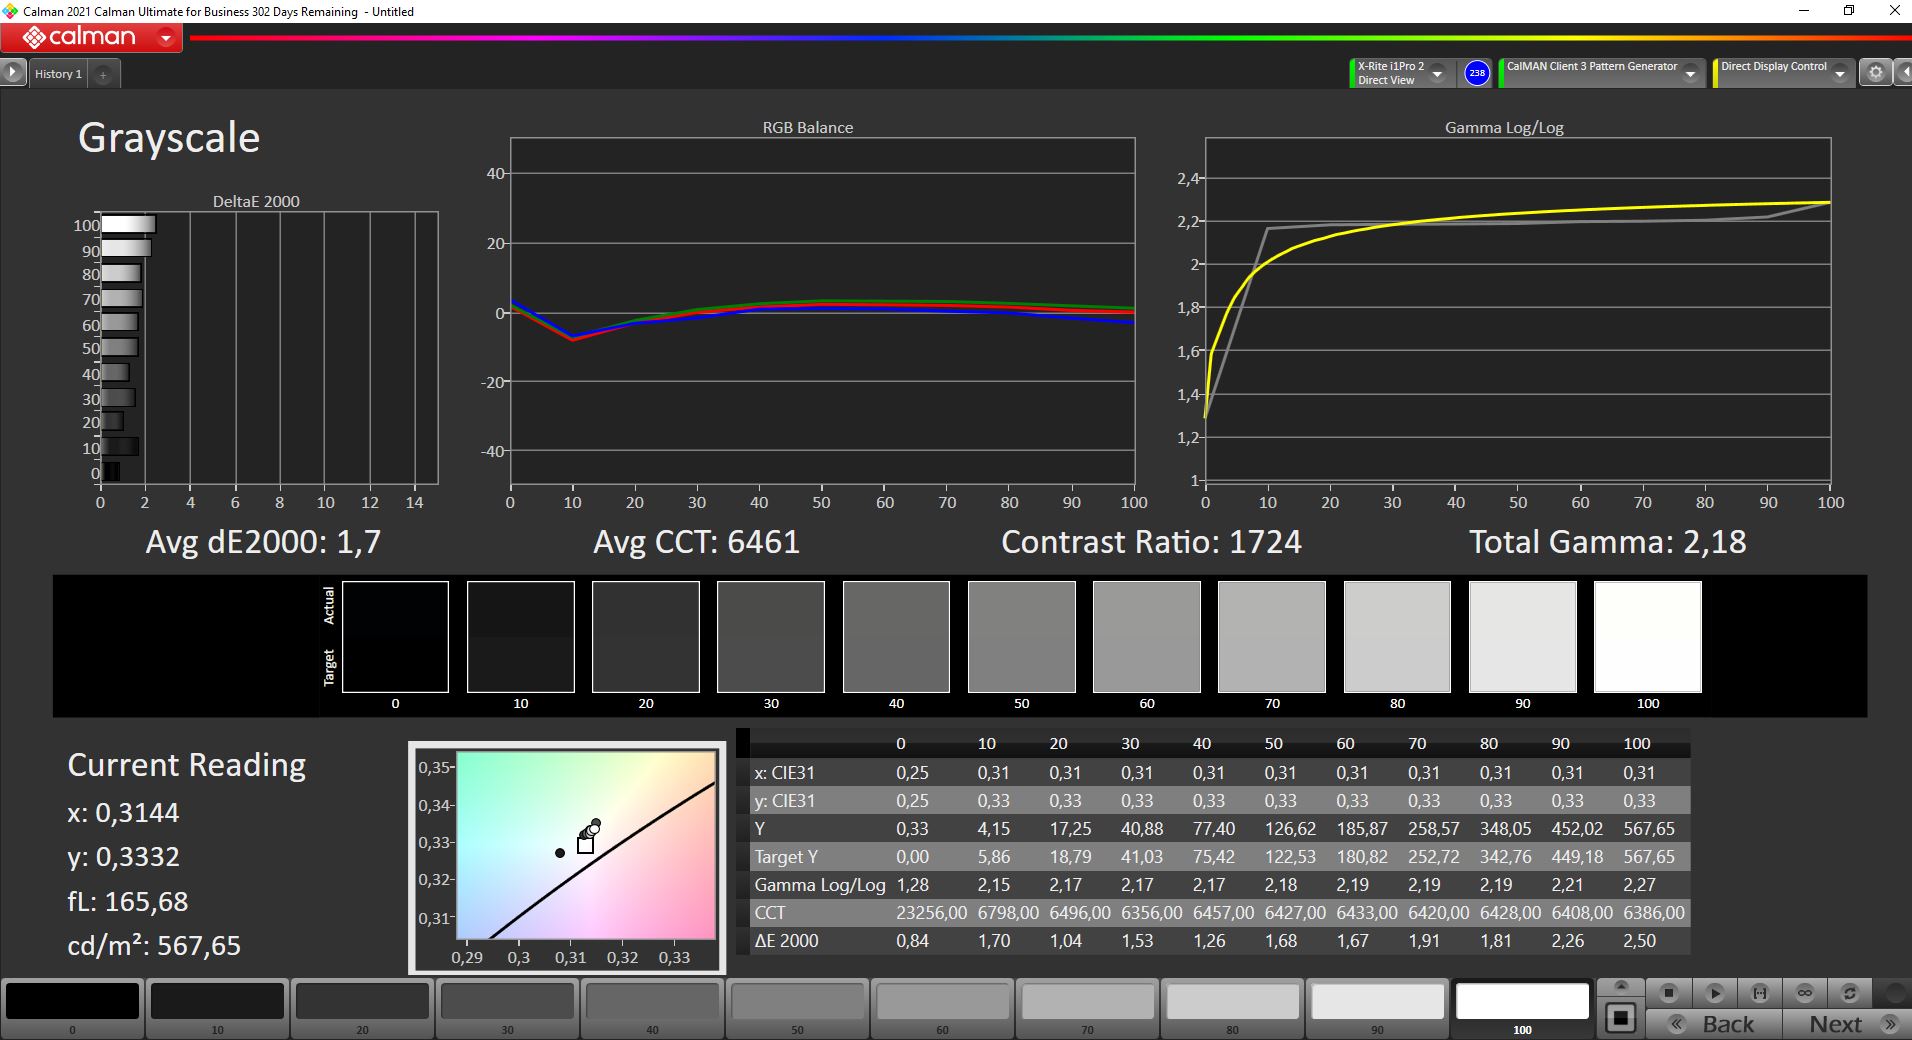
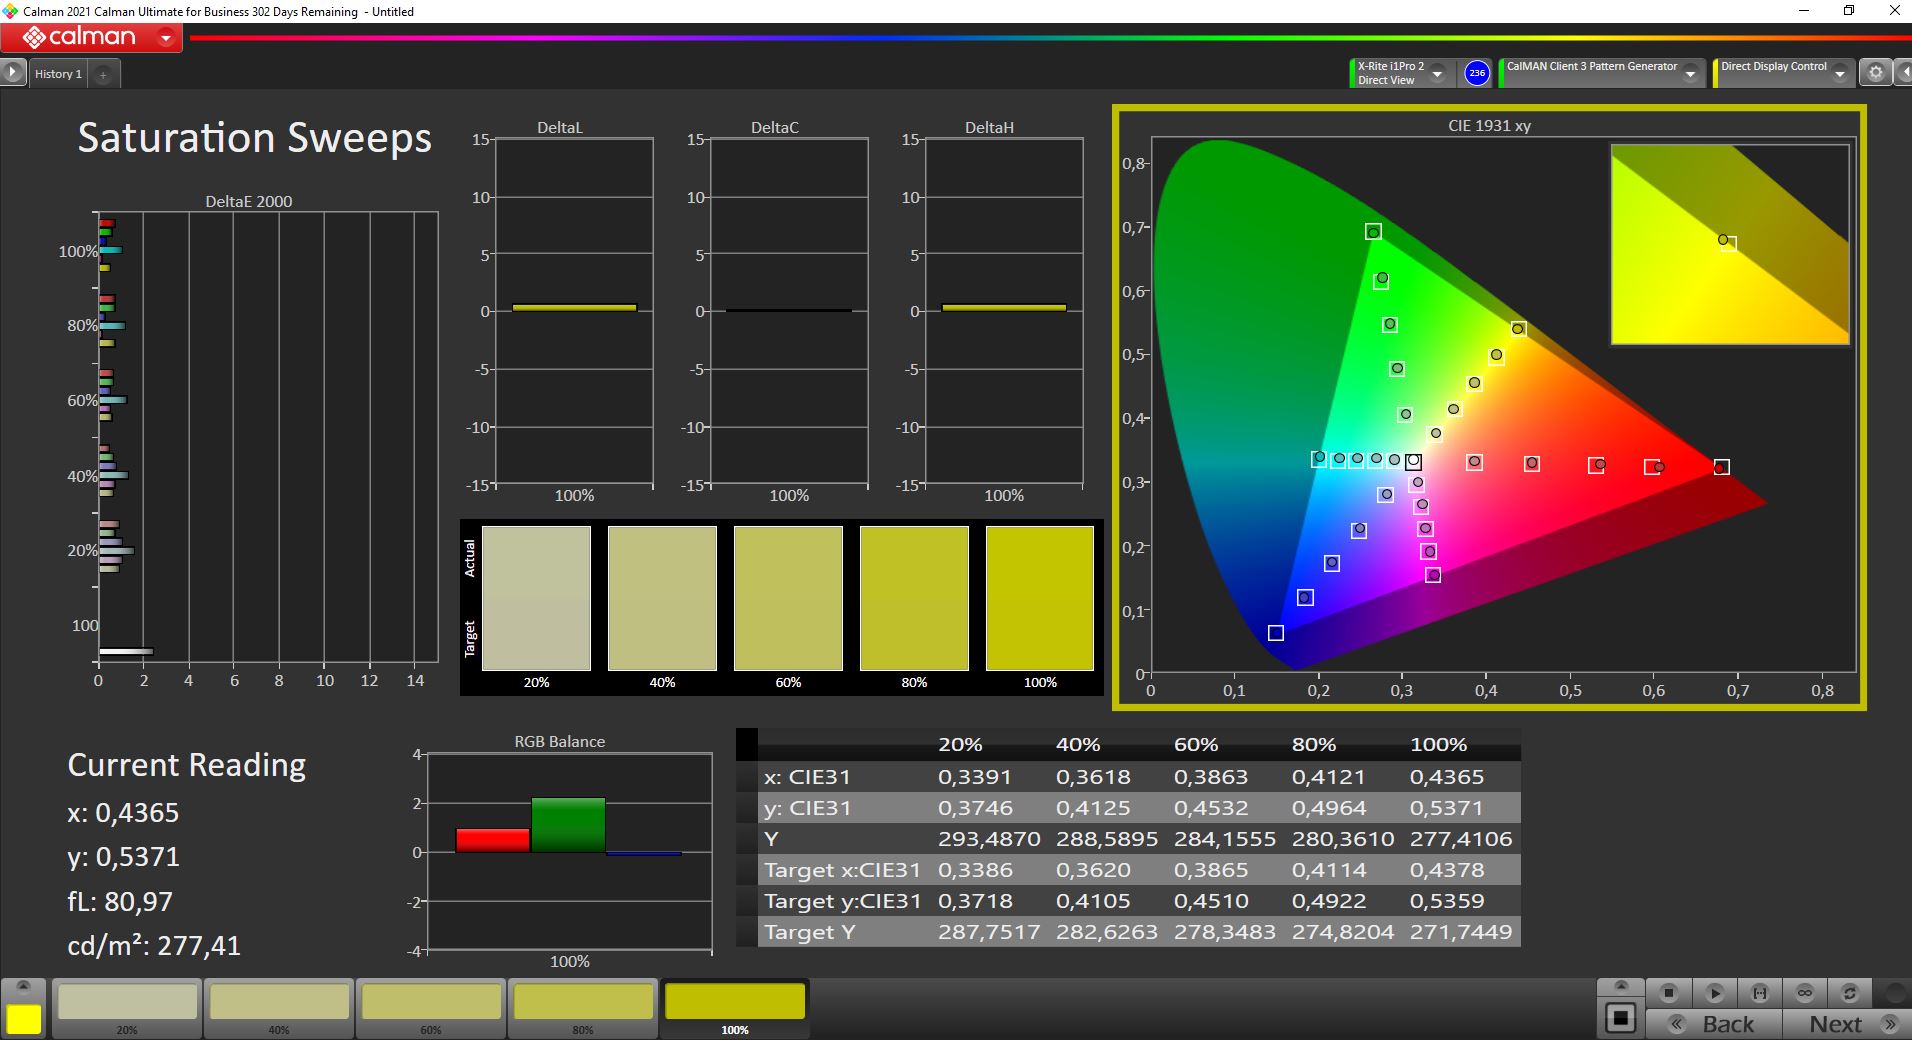
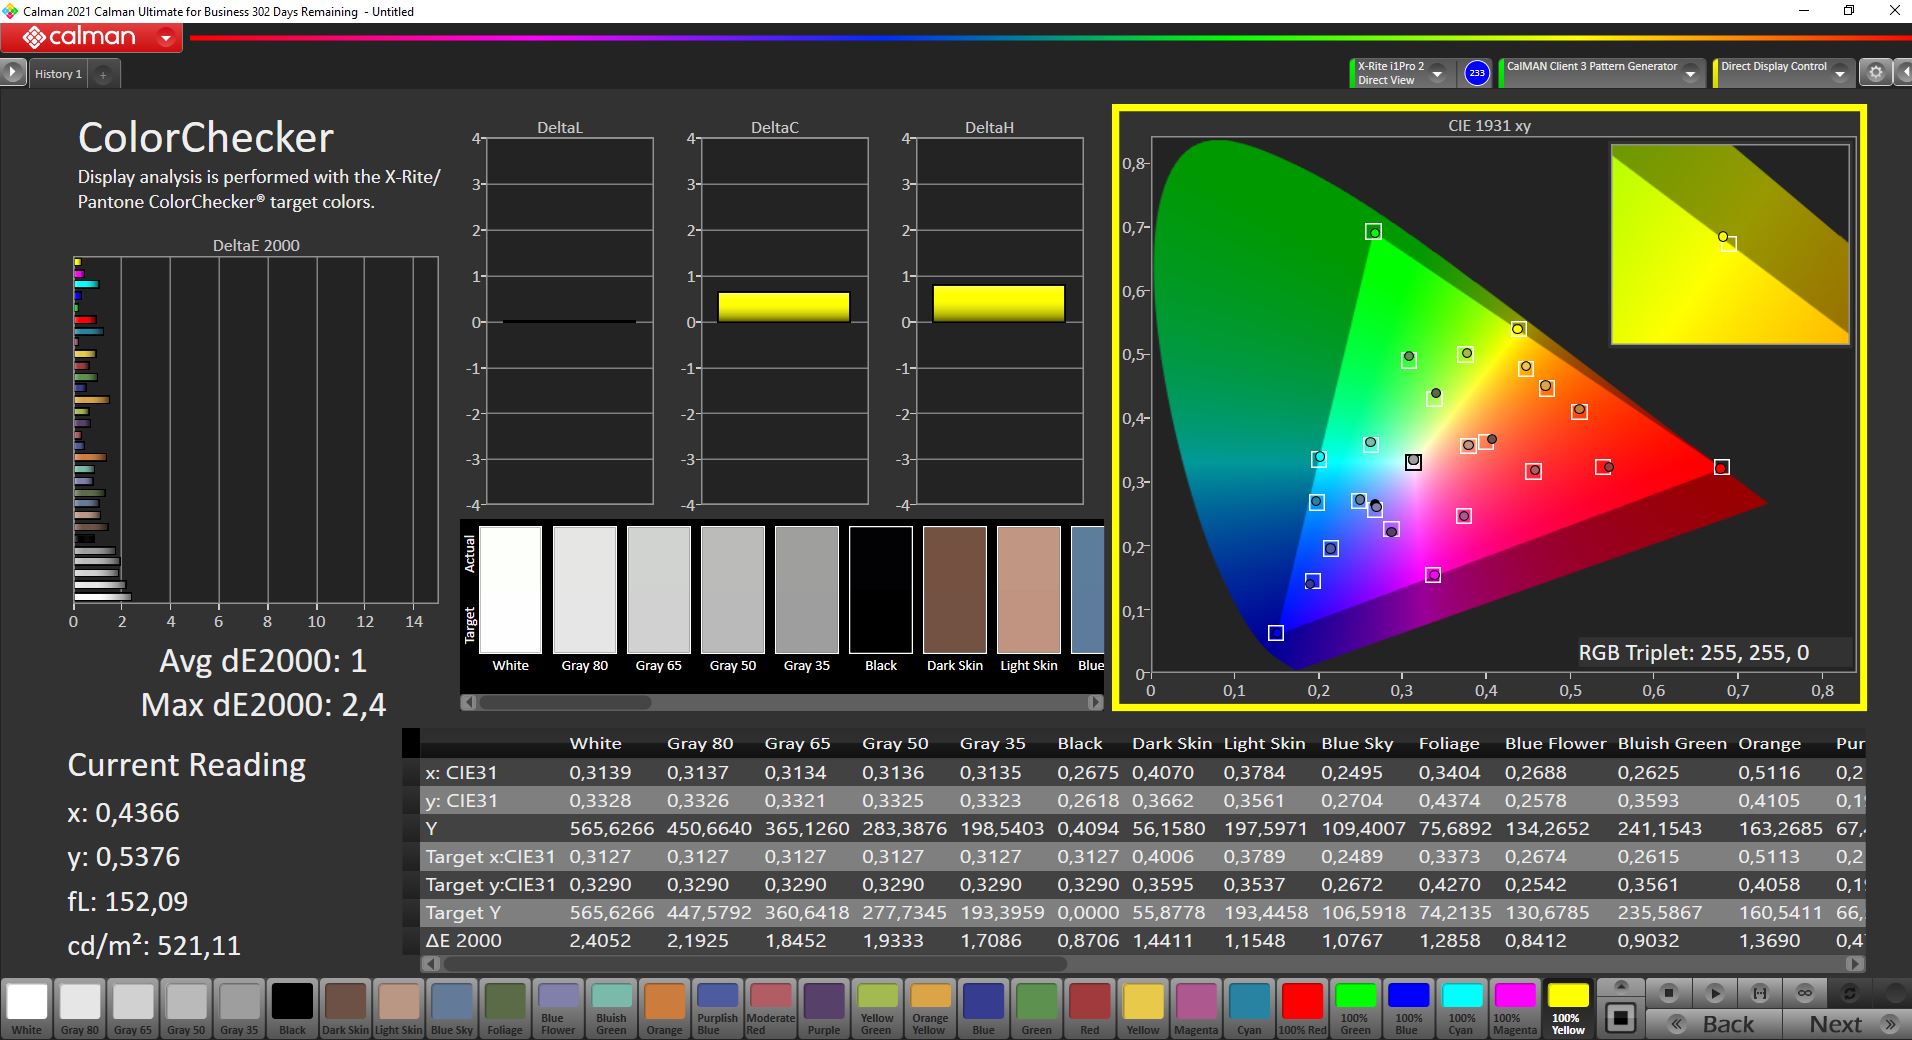


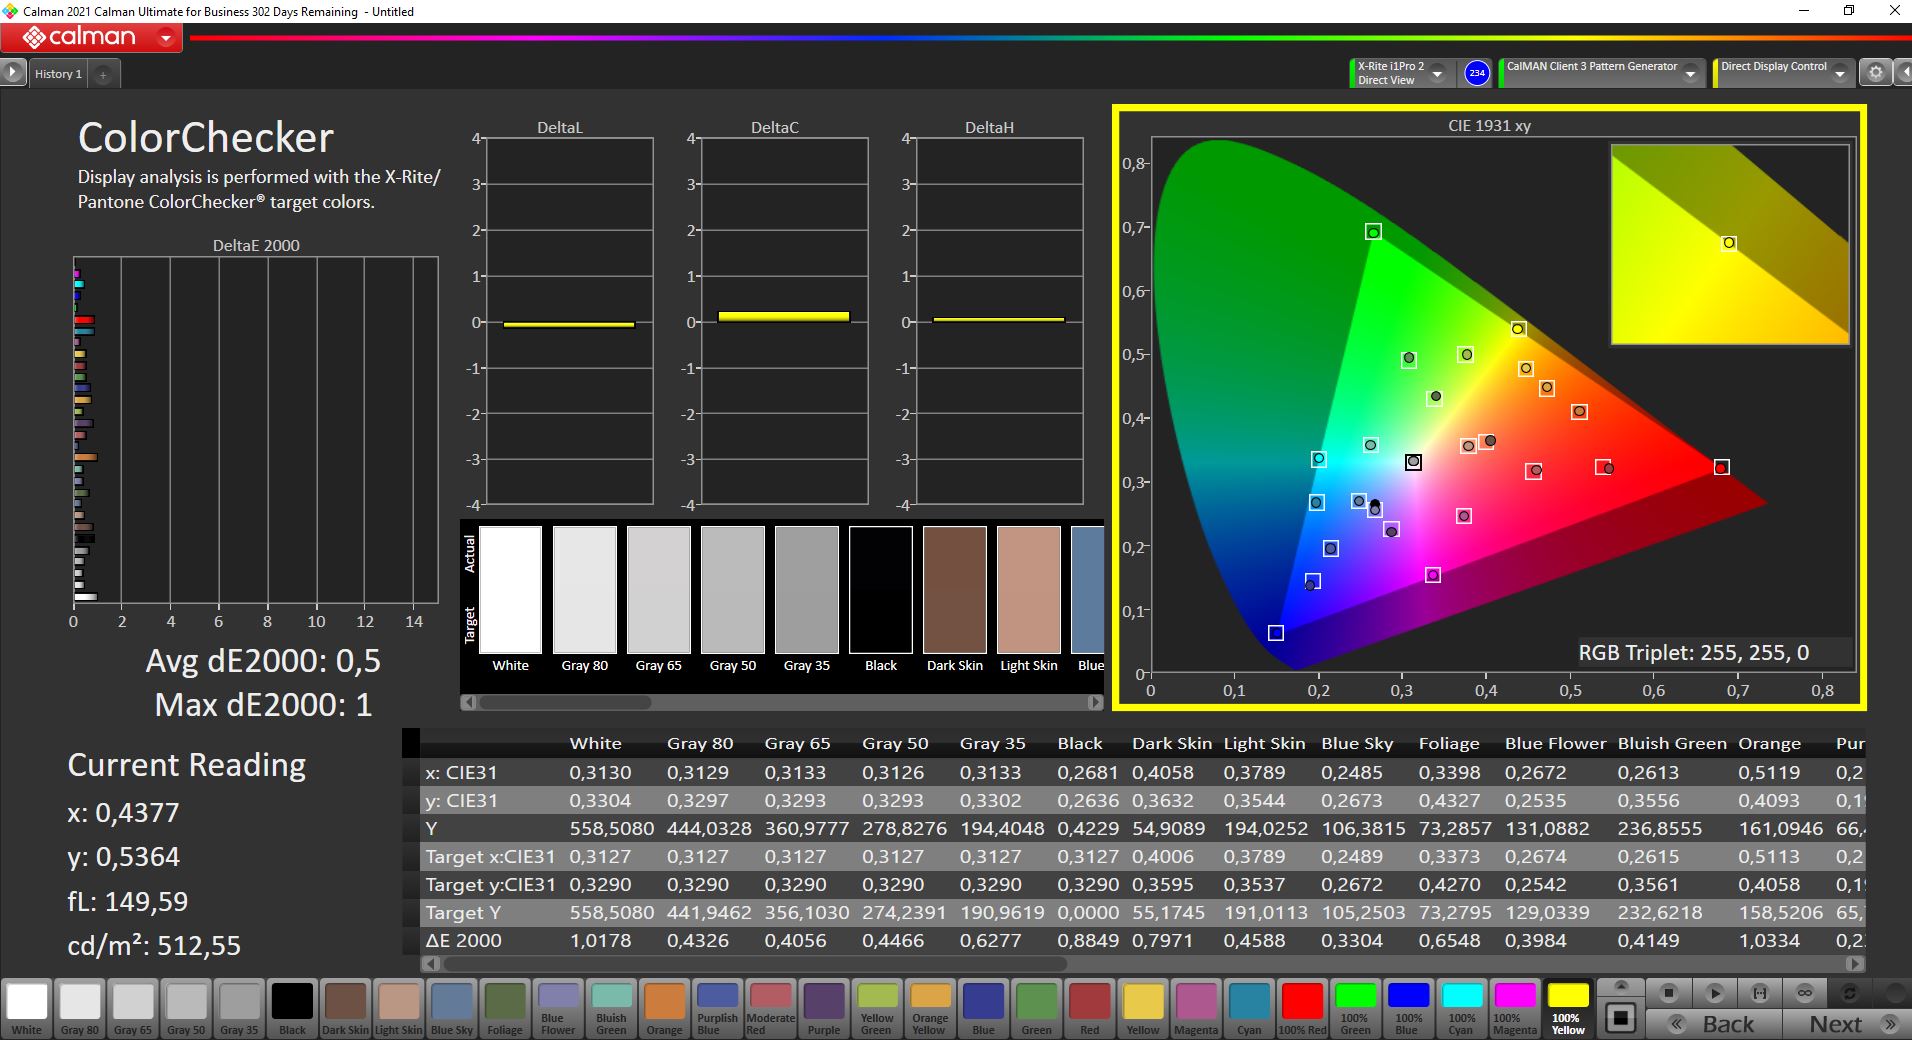
与以前配备可选DreamColor显示屏的ZBooks相比,另一个不同之处是不再有预装DreamColor软件,这意味着你不能再切换色彩空间。我们用专业的CalMAN软件和X-Rite i1 Pro 2分光光度计分析了该面板。与P3基准相比,灰度和颜色的偏差已经很低了,用户实际上没有必要进行校准。我们自己的校准(配置文件可在上面的方框中免费下载)确实进一步减少了偏差,但差别不大。根据我们的测量,P3色彩空间的覆盖率为99.1%。
Display Response Times
| ↔ Response Time Black to White | ||
|---|---|---|
| 26.8 ms ... rise ↗ and fall ↘ combined | ↗ 9.2 ms rise | 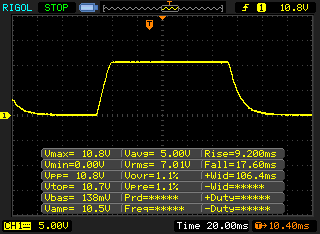 |
| ↘ 17.6 ms fall | ||
| The screen shows relatively slow response rates in our tests and may be too slow for gamers. In comparison, all tested devices range from 0.1 (minimum) to 240 (maximum) ms. » 67 % of all devices are better. This means that the measured response time is worse than the average of all tested devices (19.8 ms). | ||
| ↔ Response Time 50% Grey to 80% Grey | ||
| 67.6 ms ... rise ↗ and fall ↘ combined | ↗ 31.6 ms rise | 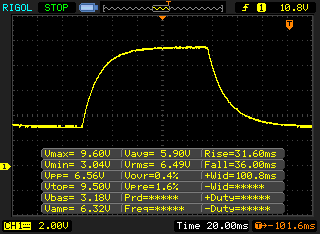 |
| ↘ 36 ms fall | ||
| The screen shows slow response rates in our tests and will be unsatisfactory for gamers. In comparison, all tested devices range from 0.165 (minimum) to 636 (maximum) ms. » 98 % of all devices are better. This means that the measured response time is worse than the average of all tested devices (31 ms). | ||
Screen Flickering / PWM (Pulse-Width Modulation)
| Screen flickering / PWM not detected | 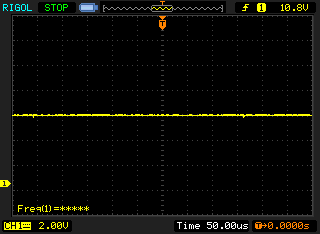 | ||
In comparison: 52 % of all tested devices do not use PWM to dim the display. If PWM was detected, an average of 7751 (minimum: 5 - maximum: 343500) Hz was measured. | |||
这个大的17英寸设备当然不是最机动的装置,但哑光和明亮的显示屏在户外效果很好。IPS面板的视角稳定性也没有受到批评。
性能 - 配备Core i9和RTX A3000的ZBook
测试设置
惠普没有实施任何自定义电源配置文件或额外的性能设置,只使用常规的Windows电源设置。
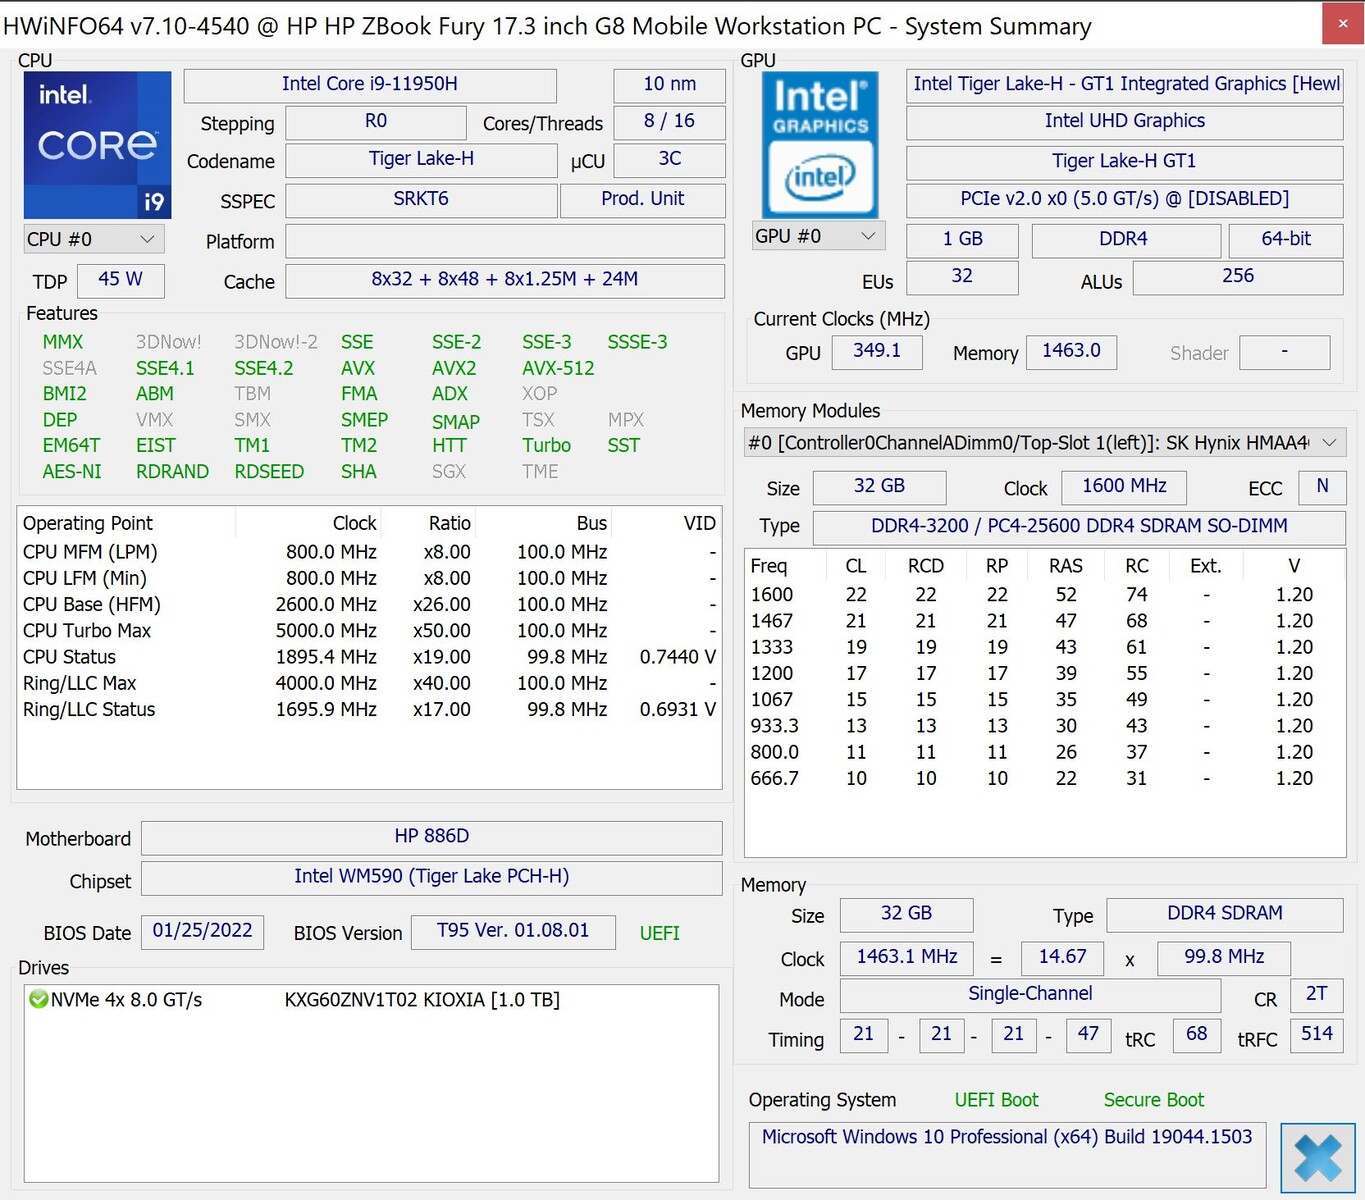
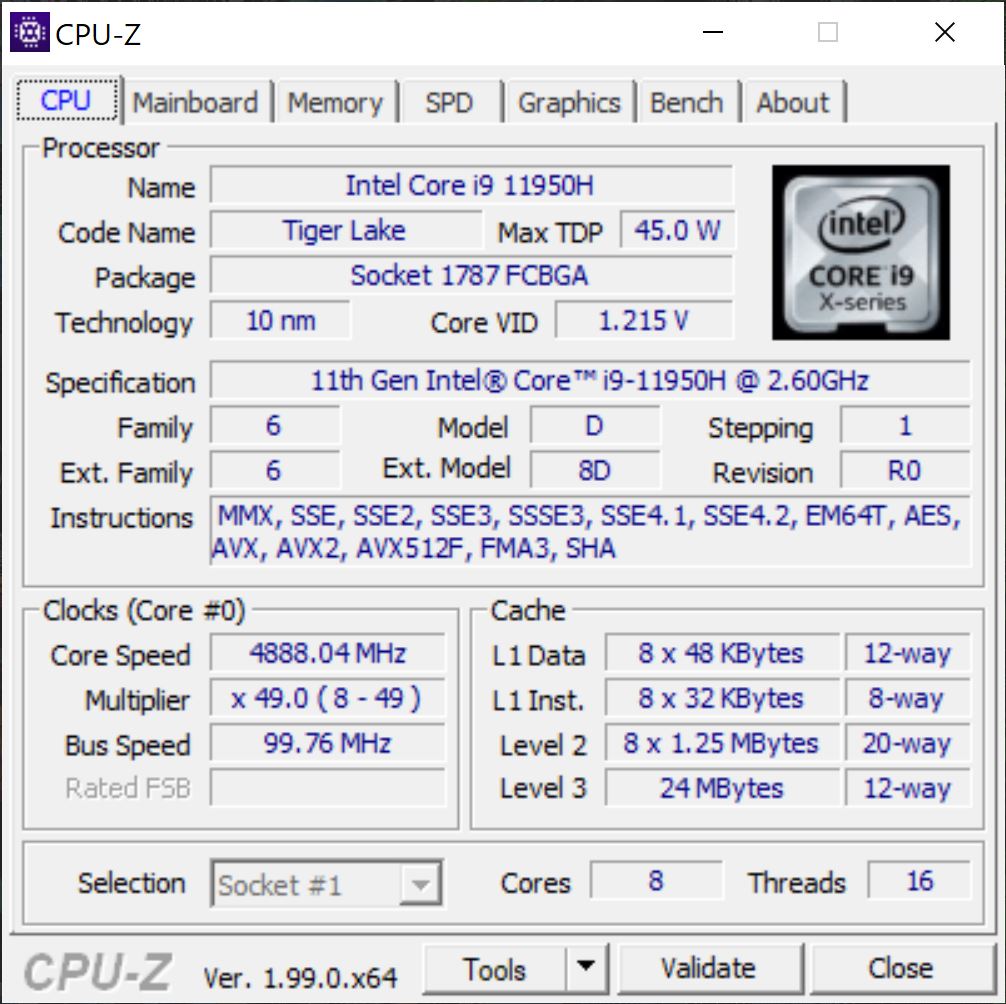
处理器 - Core i9-11950H
我们的测试装置配备了酷睿i9-11950H,这是商务版的酷睿i9-11980HK.没有解锁的倍频,但作为回报,该芯片支持vPro。8个核心可以达到5GHz(或在所有核心同时受力时达到4.5GHz),因此这是最快的移动Tiger Lake 芯片之一。CPU可以在短暂的时间内消耗超过100瓦特,而在持续的工作负荷下,其消耗量约为70瓦特,这些都是很好的数值。
这意味着ZBook的CPU性能与工作站竞争产品相当,但英特尔全新的Alder Lake处理器使用的内核多得多,将在下一代机型中提供巨大的多核性能优势。AMDs目前的移动处理器在可比的TDP设置下也能提供更多性能。
在电池供电的情况下,功耗被限制在65瓦,这导致在多核场景下的性能赤字约为15%。更多的CPU基准测试可在我们的 技术部分.
Cinebench R15 Multi Loop
Cinebench R23: Multi Core | Single Core
Cinebench R20: CPU (Multi Core) | CPU (Single Core)
Cinebench R15: CPU Multi 64Bit | CPU Single 64Bit
Blender: v2.79 BMW27 CPU
7-Zip 18.03: 7z b 4 | 7z b 4 -mmt1
Geekbench 5.5: Multi-Core | Single-Core
HWBOT x265 Benchmark v2.2: 4k Preset
LibreOffice : 20 Documents To PDF
R Benchmark 2.5: Overall mean
| CPU Performance rating | |
| Average of class Workstation | |
| MSI WE76 11UM-456 -1! | |
| Apple MacBook Pro 16 2021 M1 Max -5! | |
| HP ZBook Fury 17 G8-4A6A9EA | |
| Average Intel Core i9-11950H | |
| Asus ProArt StudioBook 16 W7600H5A-2BL2 | |
| Lenovo ThinkPad P17 G2-20YU0025G | |
| HP ZBook Fury 17 G7 119W5EA | |
| Cinebench R23 / Multi Core | |
| Average of class Workstation (14621 - 38520, n=23, last 2 years) | |
| MSI WE76 11UM-456 | |
| HP ZBook Fury 17 G8-4A6A9EA | |
| Lenovo ThinkPad P17 G2-20YU0025G | |
| Average Intel Core i9-11950H (12048 - 13113, n=4) | |
| Apple MacBook Pro 16 2021 M1 Max | |
| Asus ProArt StudioBook 16 W7600H5A-2BL2 | |
| HP ZBook Fury 17 G7 119W5EA | |
| Cinebench R23 / Single Core | |
| Average of class Workstation (1712 - 2228, n=23, last 2 years) | |
| HP ZBook Fury 17 G8-4A6A9EA | |
| MSI WE76 11UM-456 | |
| Average Intel Core i9-11950H (1569 - 1633, n=4) | |
| Apple MacBook Pro 16 2021 M1 Max | |
| Lenovo ThinkPad P17 G2-20YU0025G | |
| Asus ProArt StudioBook 16 W7600H5A-2BL2 | |
| HP ZBook Fury 17 G7 119W5EA | |
| Cinebench R20 / CPU (Multi Core) | |
| Average of class Workstation (5760 - 15043, n=23, last 2 years) | |
| Lenovo ThinkPad P17 G2-20YU0025G | |
| HP ZBook Fury 17 G8-4A6A9EA | |
| Average Intel Core i9-11950H (4471 - 5000, n=4) | |
| MSI WE76 11UM-456 | |
| Asus ProArt StudioBook 16 W7600H5A-2BL2 | |
| HP ZBook Fury 17 G7 119W5EA | |
| Apple MacBook Pro 16 2021 M1 Max | |
| Cinebench R20 / CPU (Single Core) | |
| Average of class Workstation (671 - 857, n=23, last 2 years) | |
| HP ZBook Fury 17 G8-4A6A9EA | |
| MSI WE76 11UM-456 | |
| Average Intel Core i9-11950H (610 - 632, n=4) | |
| Lenovo ThinkPad P17 G2-20YU0025G | |
| Asus ProArt StudioBook 16 W7600H5A-2BL2 | |
| HP ZBook Fury 17 G7 119W5EA | |
| Apple MacBook Pro 16 2021 M1 Max | |
| Cinebench R15 / CPU Multi 64Bit | |
| Average of class Workstation (2489 - 5810, n=23, last 2 years) | |
| MSI WE76 11UM-456 | |
| Lenovo ThinkPad P17 G2-20YU0025G | |
| HP ZBook Fury 17 G8-4A6A9EA | |
| Average Intel Core i9-11950H (1827 - 2130, n=5) | |
| Asus ProArt StudioBook 16 W7600H5A-2BL2 | |
| Apple MacBook Pro 16 2021 M1 Max | |
| HP ZBook Fury 17 G7 119W5EA | |
| Cinebench R15 / CPU Single 64Bit | |
| Average of class Workstation (191.4 - 328, n=23, last 2 years) | |
| HP ZBook Fury 17 G8-4A6A9EA | |
| MSI WE76 11UM-456 | |
| Average Intel Core i9-11950H (236 - 249, n=4) | |
| Lenovo ThinkPad P17 G2-20YU0025G | |
| Asus ProArt StudioBook 16 W7600H5A-2BL2 | |
| HP ZBook Fury 17 G7 119W5EA | |
| Apple MacBook Pro 16 2021 M1 Max | |
| Blender / v2.79 BMW27 CPU | |
| HP ZBook Fury 17 G7 119W5EA | |
| Asus ProArt StudioBook 16 W7600H5A-2BL2 | |
| Average Intel Core i9-11950H (244 - 261, n=3) | |
| Lenovo ThinkPad P17 G2-20YU0025G | |
| HP ZBook Fury 17 G8-4A6A9EA | |
| Apple MacBook Pro 16 2021 M1 Max | |
| Average of class Workstation (91 - 222, n=23, last 2 years) | |
| 7-Zip 18.03 / 7z b 4 | |
| Average of class Workstation (60489 - 116969, n=23, last 2 years) | |
| MSI WE76 11UM-456 | |
| HP ZBook Fury 17 G8-4A6A9EA | |
| Average Intel Core i9-11950H (50050 - 51402, n=3) | |
| Lenovo ThinkPad P17 G2-20YU0025G | |
| Asus ProArt StudioBook 16 W7600H5A-2BL2 | |
| HP ZBook Fury 17 G7 119W5EA | |
| 7-Zip 18.03 / 7z b 4 -mmt1 | |
| Average of class Workstation (5126 - 6960, n=23, last 2 years) | |
| HP ZBook Fury 17 G8-4A6A9EA | |
| Average Intel Core i9-11950H (5755 - 5919, n=3) | |
| MSI WE76 11UM-456 | |
| HP ZBook Fury 17 G7 119W5EA | |
| Lenovo ThinkPad P17 G2-20YU0025G | |
| Asus ProArt StudioBook 16 W7600H5A-2BL2 | |
| Geekbench 5.5 / Multi-Core | |
| Average of class Workstation (11542 - 25554, n=23, last 2 years) | |
| Apple MacBook Pro 16 2021 M1 Max | |
| MSI WE76 11UM-456 | |
| Asus ProArt StudioBook 16 W7600H5A-2BL2 | |
| HP ZBook Fury 17 G8-4A6A9EA | |
| Lenovo ThinkPad P17 G2-20YU0025G | |
| Average Intel Core i9-11950H (7286 - 8152, n=3) | |
| HP ZBook Fury 17 G7 119W5EA | |
| Geekbench 5.5 / Single-Core | |
| Average of class Workstation (1783 - 2183, n=23, last 2 years) | |
| Apple MacBook Pro 16 2021 M1 Max | |
| MSI WE76 11UM-456 | |
| Average Intel Core i9-11950H (1623 - 1702, n=3) | |
| HP ZBook Fury 17 G8-4A6A9EA | |
| Lenovo ThinkPad P17 G2-20YU0025G | |
| Asus ProArt StudioBook 16 W7600H5A-2BL2 | |
| HP ZBook Fury 17 G7 119W5EA | |
| HWBOT x265 Benchmark v2.2 / 4k Preset | |
| Average of class Workstation (17.8 - 40.5, n=23, last 2 years) | |
| MSI WE76 11UM-456 | |
| Lenovo ThinkPad P17 G2-20YU0025G | |
| HP ZBook Fury 17 G8-4A6A9EA | |
| Average Intel Core i9-11950H (13.8 - 14.5, n=4) | |
| Asus ProArt StudioBook 16 W7600H5A-2BL2 | |
| HP ZBook Fury 17 G7 119W5EA | |
| LibreOffice / 20 Documents To PDF | |
| HP ZBook Fury 17 G7 119W5EA | |
| HP ZBook Fury 17 G8-4A6A9EA | |
| Lenovo ThinkPad P17 G2-20YU0025G | |
| Average Intel Core i9-11950H (38.6 - 53.2, n=4) | |
| Average of class Workstation (37.1 - 74.7, n=23, last 2 years) | |
| MSI WE76 11UM-456 | |
| Asus ProArt StudioBook 16 W7600H5A-2BL2 | |
| R Benchmark 2.5 / Overall mean | |
| HP ZBook Fury 17 G7 119W5EA | |
| Asus ProArt StudioBook 16 W7600H5A-2BL2 | |
| Lenovo ThinkPad P17 G2-20YU0025G | |
| MSI WE76 11UM-456 | |
| Average Intel Core i9-11950H (0.521 - 0.551, n=4) | |
| HP ZBook Fury 17 G8-4A6A9EA | |
| Average of class Workstation (0.3825 - 0.603, n=23, last 2 years) | |
* ... smaller is better
AIDA64: FP32 Ray-Trace | FPU Julia | CPU SHA3 | CPU Queen | FPU SinJulia | FPU Mandel | CPU AES | CPU ZLib | FP64 Ray-Trace | CPU PhotoWorxx
| Performance rating | |
| Average of class Workstation | |
| MSI WE76 11UM-456 | |
| Average Intel Core i9-11950H | |
| HP ZBook Fury 17 G8-4A6A9EA | |
| HP ZBook Fury 17 G7 119W5EA | |
| Lenovo ThinkPad P17 G2-20YU0025G -9! | |
| Asus ProArt StudioBook 16 W7600H5A-2BL2 -9! | |
| AIDA64 / FP32 Ray-Trace | |
| Average of class Workstation (16730 - 61611, n=23, last 2 years) | |
| MSI WE76 11UM-456 | |
| HP ZBook Fury 17 G8-4A6A9EA | |
| Average Intel Core i9-11950H (14407 - 15655, n=4) | |
| HP ZBook Fury 17 G7 119W5EA | |
| AIDA64 / FPU Julia | |
| Average of class Workstation (89597 - 186971, n=23, last 2 years) | |
| MSI WE76 11UM-456 | |
| HP ZBook Fury 17 G8-4A6A9EA | |
| Average Intel Core i9-11950H (60286 - 63537, n=4) | |
| HP ZBook Fury 17 G7 119W5EA | |
| AIDA64 / CPU SHA3 | |
| Average of class Workstation (4178 - 8975, n=23, last 2 years) | |
| MSI WE76 11UM-456 | |
| HP ZBook Fury 17 G8-4A6A9EA | |
| Average Intel Core i9-11950H (4003 - 4254, n=4) | |
| HP ZBook Fury 17 G7 119W5EA | |
| AIDA64 / CPU Queen | |
| Average of class Workstation (60778 - 144411, n=23, last 2 years) | |
| MSI WE76 11UM-456 | |
| HP ZBook Fury 17 G8-4A6A9EA | |
| Average Intel Core i9-11950H (97840 - 98772, n=4) | |
| HP ZBook Fury 17 G7 119W5EA | |
| AIDA64 / FPU SinJulia | |
| Average of class Workstation (8165 - 29343, n=23, last 2 years) | |
| MSI WE76 11UM-456 | |
| HP ZBook Fury 17 G8-4A6A9EA | |
| Average Intel Core i9-11950H (9828 - 10462, n=4) | |
| HP ZBook Fury 17 G7 119W5EA | |
| AIDA64 / FPU Mandel | |
| Average of class Workstation (44497 - 98153, n=23, last 2 years) | |
| MSI WE76 11UM-456 | |
| HP ZBook Fury 17 G8-4A6A9EA | |
| Average Intel Core i9-11950H (35735 - 38450, n=4) | |
| HP ZBook Fury 17 G7 119W5EA | |
| AIDA64 / CPU AES | |
| Average of class Workstation (73133 - 187841, n=23, last 2 years) | |
| Average Intel Core i9-11950H (83095 - 147249, n=4) | |
| MSI WE76 11UM-456 | |
| HP ZBook Fury 17 G8-4A6A9EA | |
| HP ZBook Fury 17 G7 119W5EA | |
| AIDA64 / CPU ZLib | |
| Average of class Workstation (929 - 2148, n=23, last 2 years) | |
| MSI WE76 11UM-456 | |
| HP ZBook Fury 17 G8-4A6A9EA | |
| Average Intel Core i9-11950H (756 - 820, n=4) | |
| HP ZBook Fury 17 G7 119W5EA | |
| Lenovo ThinkPad P17 G2-20YU0025G | |
| Asus ProArt StudioBook 16 W7600H5A-2BL2 | |
| Asus ProArt StudioBook 16 W7600H5A-2BL2 | |
| AIDA64 / FP64 Ray-Trace | |
| Average of class Workstation (8545 - 32891, n=23, last 2 years) | |
| MSI WE76 11UM-456 | |
| HP ZBook Fury 17 G8-4A6A9EA | |
| Average Intel Core i9-11950H (7871 - 8549, n=4) | |
| HP ZBook Fury 17 G7 119W5EA | |
| AIDA64 / CPU PhotoWorxx | |
| Average of class Workstation (37151 - 93684, n=23, last 2 years) | |
| MSI WE76 11UM-456 | |
| Average Intel Core i9-11950H (12933 - 26370, n=4) | |
| HP ZBook Fury 17 G8-4A6A9EA | |
| HP ZBook Fury 17 G7 119W5EA | |
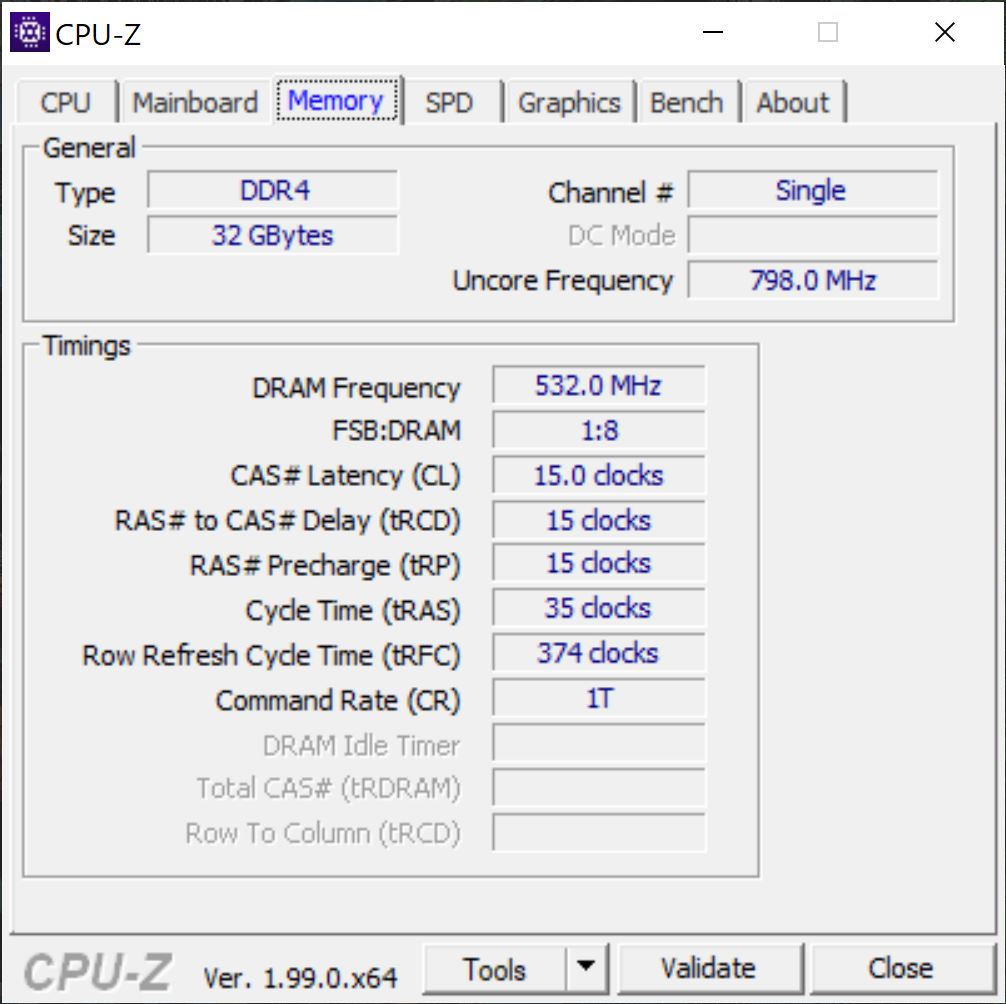
系统性能
ZBook Fury 17 G8的主观性能印象,正如预期的那样,非常好,这也被基准测试结果所证实。然而,我们对我们的设备只有一个32GB模块的单通道内存配置有点惊讶。总共有四个插槽,所以对于大多数用户来说,使用两个16GB模块的双通道配置会是更好的解决方案。
CrossMark: Overall | Productivity | Creativity | Responsiveness
| PCMark 10 / Score | |
| Average of class Workstation (6563 - 10409, n=19, last 2 years) | |
| MSI WE76 11UM-456 | |
| Asus ProArt StudioBook 16 W7600H5A-2BL2 | |
| Lenovo ThinkPad P17 G2-20YU0025G | |
| HP ZBook Fury 17 G8-4A6A9EA | |
| Average Intel Core i9-11950H, NVIDIA RTX A3000 Laptop GPU (n=1) | |
| HP ZBook Fury 17 G7 119W5EA | |
| PCMark 10 / Essentials | |
| Average of class Workstation (9622 - 11157, n=19, last 2 years) | |
| Asus ProArt StudioBook 16 W7600H5A-2BL2 | |
| Lenovo ThinkPad P17 G2-20YU0025G | |
| MSI WE76 11UM-456 | |
| HP ZBook Fury 17 G8-4A6A9EA | |
| Average Intel Core i9-11950H, NVIDIA RTX A3000 Laptop GPU (n=1) | |
| HP ZBook Fury 17 G7 119W5EA | |
| PCMark 10 / Productivity | |
| Average of class Workstation (8789 - 20616, n=19, last 2 years) | |
| MSI WE76 11UM-456 | |
| Asus ProArt StudioBook 16 W7600H5A-2BL2 | |
| Lenovo ThinkPad P17 G2-20YU0025G | |
| HP ZBook Fury 17 G8-4A6A9EA | |
| Average Intel Core i9-11950H, NVIDIA RTX A3000 Laptop GPU (n=1) | |
| HP ZBook Fury 17 G7 119W5EA | |
| PCMark 10 / Digital Content Creation | |
| Average of class Workstation (8108 - 15631, n=19, last 2 years) | |
| MSI WE76 11UM-456 | |
| Asus ProArt StudioBook 16 W7600H5A-2BL2 | |
| HP ZBook Fury 17 G8-4A6A9EA | |
| Average Intel Core i9-11950H, NVIDIA RTX A3000 Laptop GPU (n=1) | |
| Lenovo ThinkPad P17 G2-20YU0025G | |
| HP ZBook Fury 17 G7 119W5EA | |
| CrossMark / Overall | |
| Average of class Workstation (1307 - 2267, n=22, last 2 years) | |
| MSI WE76 11UM-456 | |
| Apple MacBook Pro 16 2021 M1 Max | |
| HP ZBook Fury 17 G8-4A6A9EA | |
| Average Intel Core i9-11950H, NVIDIA RTX A3000 Laptop GPU (n=1) | |
| CrossMark / Productivity | |
| Average of class Workstation (1130 - 2122, n=22, last 2 years) | |
| MSI WE76 11UM-456 | |
| HP ZBook Fury 17 G8-4A6A9EA | |
| Average Intel Core i9-11950H, NVIDIA RTX A3000 Laptop GPU (n=1) | |
| Apple MacBook Pro 16 2021 M1 Max | |
| CrossMark / Creativity | |
| Average of class Workstation (1657 - 2725, n=22, last 2 years) | |
| Apple MacBook Pro 16 2021 M1 Max | |
| MSI WE76 11UM-456 | |
| HP ZBook Fury 17 G8-4A6A9EA | |
| Average Intel Core i9-11950H, NVIDIA RTX A3000 Laptop GPU (n=1) | |
| CrossMark / Responsiveness | |
| Average of class Workstation (993 - 2096, n=22, last 2 years) | |
| MSI WE76 11UM-456 | |
| HP ZBook Fury 17 G8-4A6A9EA | |
| Average Intel Core i9-11950H, NVIDIA RTX A3000 Laptop GPU (n=1) | |
| Apple MacBook Pro 16 2021 M1 Max | |
| PCMark 10 Score | 6212 points | |
Help | ||
| AIDA64 / Memory Copy | |
| Average of class Workstation (56003 - 164795, n=23, last 2 years) | |
| MSI WE76 11UM-456 | |
| Average Intel Core i9-11950H (25952 - 48565, n=4) | |
| HP ZBook Fury 17 G8-4A6A9EA | |
| HP ZBook Fury 17 G7 119W5EA | |
| AIDA64 / Memory Read | |
| Average of class Workstation (55795 - 121563, n=23, last 2 years) | |
| MSI WE76 11UM-456 | |
| Average Intel Core i9-11950H (26064 - 47921, n=4) | |
| HP ZBook Fury 17 G8-4A6A9EA | |
| HP ZBook Fury 17 G7 119W5EA | |
| AIDA64 / Memory Write | |
| Average of class Workstation (55663 - 214520, n=23, last 2 years) | |
| MSI WE76 11UM-456 | |
| Average Intel Core i9-11950H (22302 - 46818, n=4) | |
| HP ZBook Fury 17 G8-4A6A9EA | |
| HP ZBook Fury 17 G7 119W5EA | |
| AIDA64 / Memory Latency | |
| Average of class Workstation (84.5 - 165.2, n=23, last 2 years) | |
| MSI WE76 11UM-456 | |
| Average Intel Core i9-11950H (82.6 - 88.6, n=4) | |
| HP ZBook Fury 17 G8-4A6A9EA | |
| HP ZBook Fury 17 G7 119W5EA | |
| Lenovo ThinkPad P17 G2-20YU0025G | |
| Asus ProArt StudioBook 16 W7600H5A-2BL2 | |
| Asus ProArt StudioBook 16 W7600H5A-2BL2 | |
* ... smaller is better
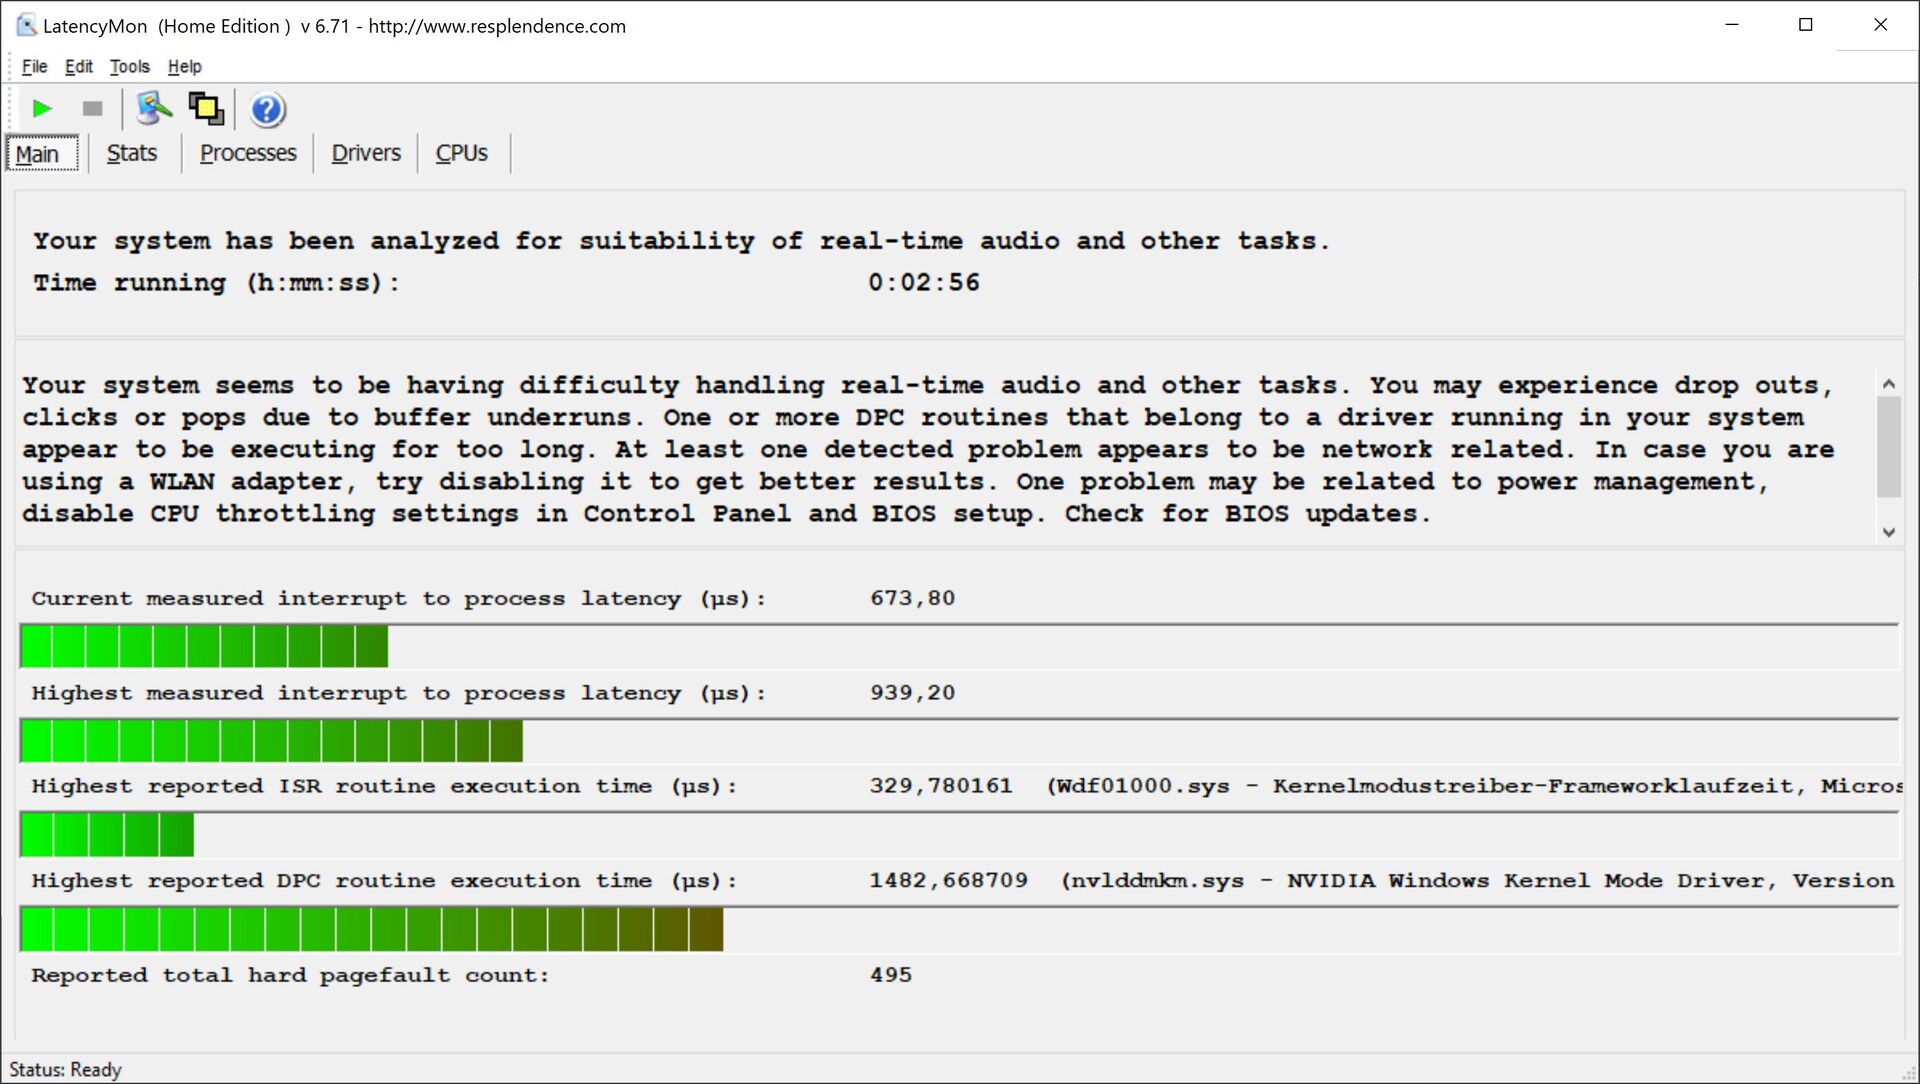
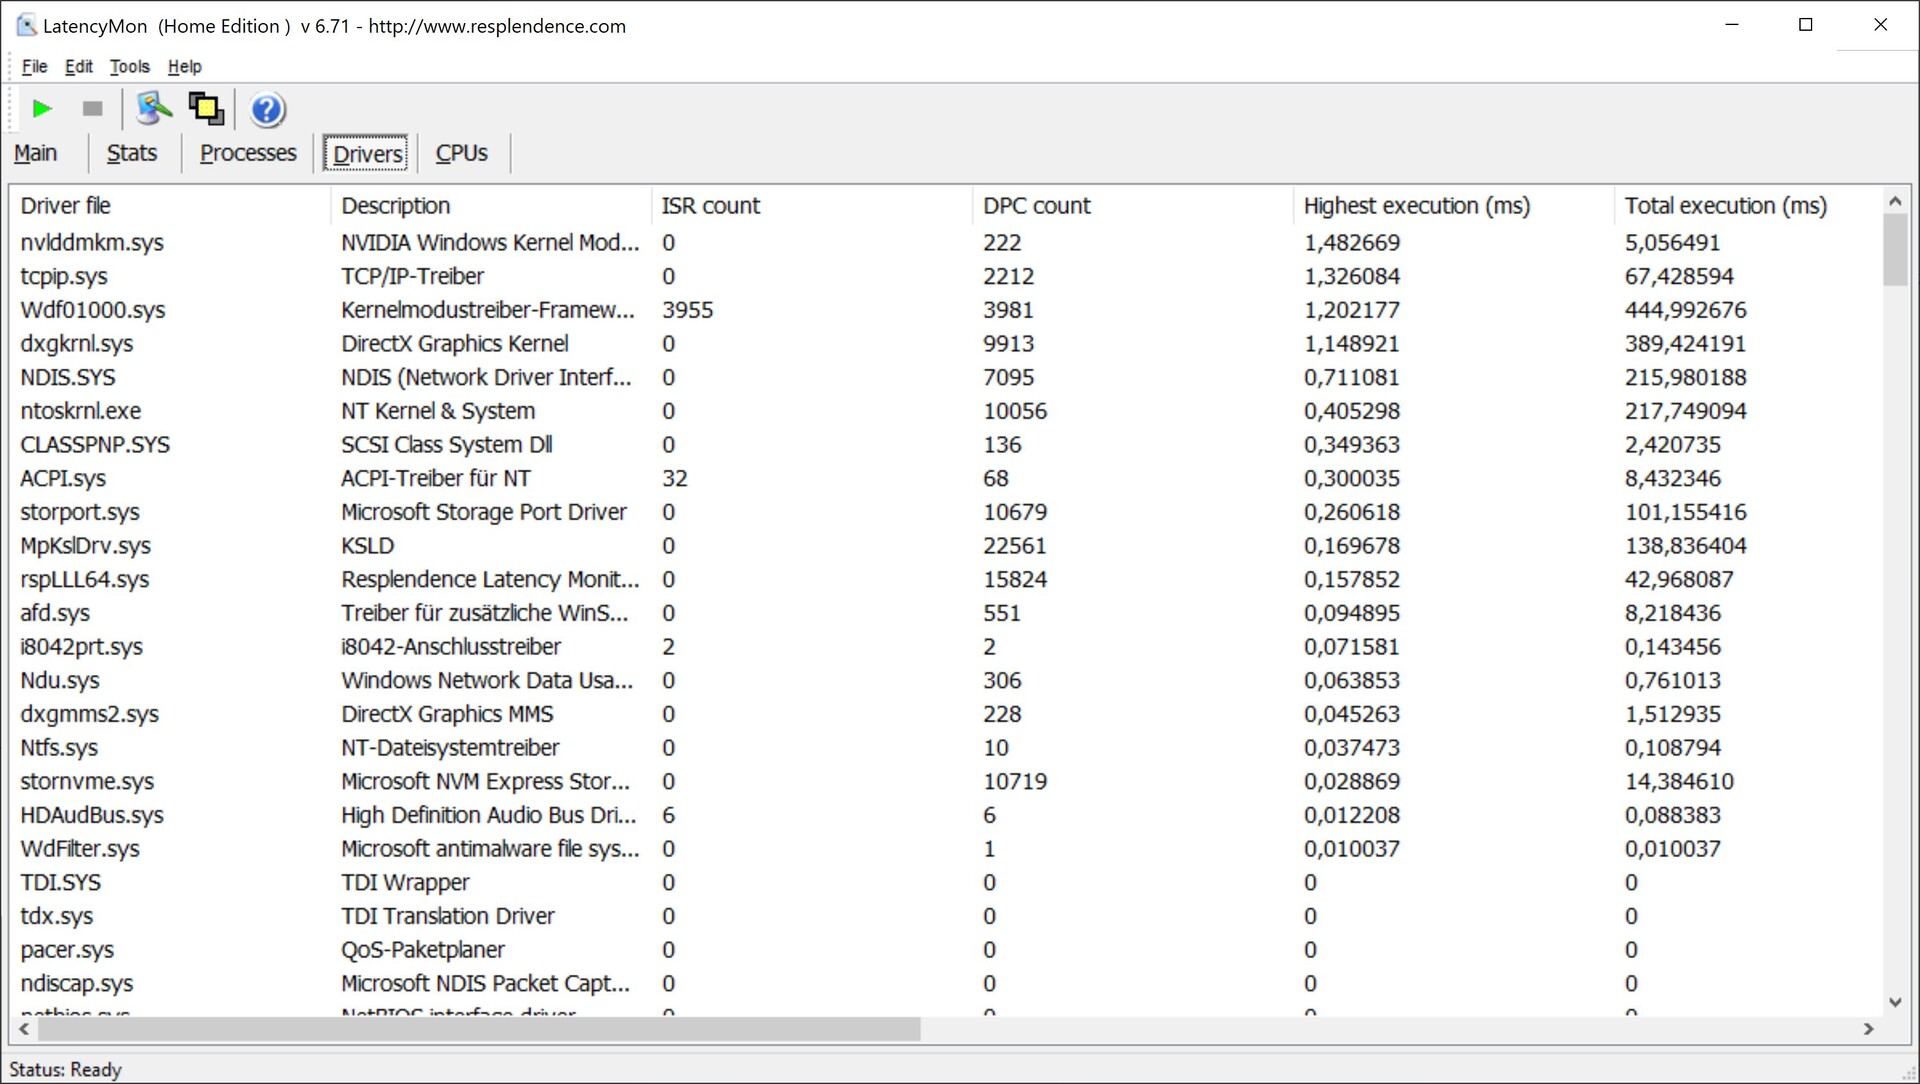
DPC延时
我们的标准化延迟测试显示,目前的BIOS版本的延迟略有增加,因此并不完全适合于实时音频应用。
| DPC Latencies / LatencyMon - interrupt to process latency (max), Web, Youtube, Prime95 | |
| Lenovo ThinkPad P17 G2-20YU0025G | |
| HP ZBook Fury 17 G7 119W5EA | |
| Asus ProArt StudioBook 16 W7600H5A-2BL2 | |
| MSI WE76 11UM-456 | |
| HP ZBook Fury 17 G8-4A6A9EA | |
* ... smaller is better
存储设备
两个M.2-2280插槽不支持最新的PCIe 4.0标准,但东芝的1TB固态硬盘(初始设置后用户可获得885GB)尽管采用了PCIe 3.0接口,但仍能管理超过3GB/s的高传输率。不过,许多竞争对手在这方面还是比较出色的。用于2.5英寸驱动器(SATA)的额外插槽显得相当过时,但惠普至少提供了必要的安装套件。更多的SSD基准测试可在 这里.

* ... smaller is better
Disk Throttling: DiskSpd Read Loop, Queue Depth 8
GPU性能
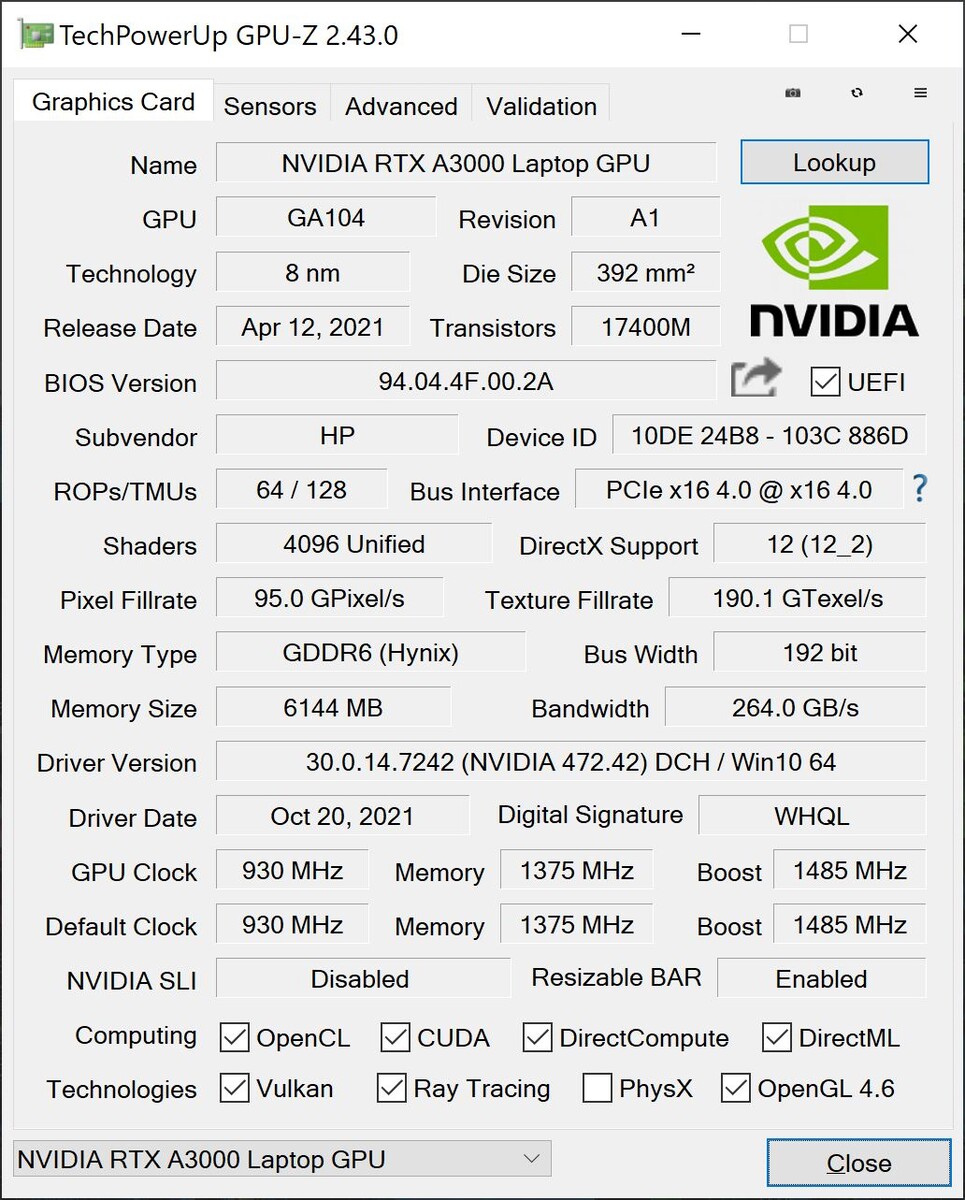
Nvidia的RTX A3000是一款专业的上层主流移动显卡,其性能与消费版相当GeForce RTX 3060.由于有特殊的驱动程序,在一些应用程序中的性能可以高得多,这也得到了SPECviewperf基准测试结果的支持。由于TGP为80W,这是GPU的一个较慢的版本(在前几代中它会带有Max-Q的称号),考虑到笨重的机箱,这有点令人失望。可选的RTX A4000的最大功率消耗RTX A4000和RTX A5000由于200W电源适配器的限制,GPU也应设置为80W。
从性能上看,RTX A3000基本与旧的Quadro RTX 4000 Max-Q在前辈ZBook Fury 17 G7在大多数基准测试中,略低于我们数据库中的RTX A3000的平均得分。这里肯定有改进的余地,但在持续的工作负荷下,性能至少是稳定的;苛刻的3DMarkTime Spy 压力测试也很容易通过。
TGP在电池供电的情况下被限制在55瓦,这导致了大约25%的性能赤字(5000分对6580分@Time Spy Graphics)。更多的GPU基准测试被列在 这里.
| 3DMark 11 Performance | 20760 points | |
| 3DMark Cloud Gate Standard Score | 24449 points | |
| 3DMark Fire Strike Score | 15711 points | |
| 3DMark Time Spy Score | 6490 points | |
Help | ||
游戏性能
Nvidia的专业GPU也很适合游戏,RTX A3000的性能甚至常常足以满足原生4K分辨率的要求,只有像《赛博朋克2077》这样要求非常高的游戏才需要减少细节和/或分辨率。在较长的游戏过程中,性能是稳定的,但在电池电量上再次出现了小的不足;Witcher 3 Ultra在电池上的结果是43帧,而在主电源上是61帧。请参阅我们的 技术部分了解更多的游戏基准测试。
Witcher 3 FPS Diagram
| low | med. | high | ultra | QHD | 4K | |
|---|---|---|---|---|---|---|
| GTA V (2015) | 163 | 150 | 101 | 64.3 | 53.5 | 49.2 |
| The Witcher 3 (2015) | 263 | 176 | 112 | 61.1 | 45 | |
| Dota 2 Reborn (2015) | 156 | 131 | 119 | 108 | 77.1 | |
| Final Fantasy XV Benchmark (2018) | 130 | 86.7 | 67 | 50.7 | 28.8 | |
| X-Plane 11.11 (2018) | 103 | 82.1 | 66.7 | 40.5 | ||
| Far Cry 5 (2018) | 113 | 84 | 81 | 77 | 62 | 36 |
| Strange Brigade (2018) | 324 | 164 | 134 | 118 | 87 | 51 |
| Cyberpunk 2077 1.0 (2020) | 78 | 64 | 52 | 45 | 28 | 14 |
| F1 2021 (2021) | 202 | 131 | 114 | 75 | 56.7 | 26.9 |
排放 - ZBook保持凉爽
系统噪音
在日常工作中,ZBook Fury 17 G8通常是一个非常安静的伙伴,在更具挑战性的工作负荷中,由于没有高亢的噪音,风扇的杂音仍然可以忍受,大约为40 dB(A)。我们在最大负荷下测得高达47 dB(A),这是非常可听的,但我们没有注意到任何其他电子噪音,例如线圈啸叫。
Noise level
| Idle |
| 24.5 / 24.5 / 26.8 dB(A) |
| Load |
| 41.8 / 47.1 dB(A) |
 | ||
30 dB silent 40 dB(A) audible 50 dB(A) loud |
||
min: | ||
| HP ZBook Fury 17 G8-4A6A9EA RTX A3000 Laptop GPU, i9-11950H, Toshiba XG6 KXG60ZNV1T02 | Lenovo ThinkPad P17 G2-20YU0025G RTX A2000 Laptop GPU, i7-11800H, Kioxia XG7 KXG7AZNV512G | MSI WE76 11UM-456 RTX A5000 Laptop GPU, i9-11980HK, Samsung PM9A1 MZVL22T0HBLB | Asus ProArt StudioBook 16 W7600H5A-2BL2 RTX A5000 Laptop GPU, W-11955M, 2x Micron 2300 2TB MTFDHBA2T0TDV (RAID 0) | HP ZBook Fury 17 G7 119W5EA Quadro RTX 4000 Max-Q, i9-10885H, WDC PC SN730 SDBPNTY-1T00 | Apple MacBook Pro 16 2021 M1 Max M1 Max 32-Core GPU, M1 Max, Apple SSD AP2048R | |
|---|---|---|---|---|---|---|
| Noise | 1% | -2% | -1% | -3% | 4% | |
| off / environment * (dB) | 24.5 | 26.4 -8% | 24.7 -1% | 26 -6% | 24.4 -0% | 24.2 1% |
| Idle Minimum * (dB) | 24.5 | 26.4 -8% | 24.7 -1% | 26 -6% | 24.4 -0% | 24.2 1% |
| Idle Average * (dB) | 24.5 | 26.4 -8% | 24.7 -1% | 26 -6% | 26.6 -9% | 24.2 1% |
| Idle Maximum * (dB) | 26.8 | 26.4 1% | 27.5 -3% | 26.5 1% | 29 -8% | 24.2 10% |
| Load Average * (dB) | 41.8 | 38.1 9% | 43.7 -5% | 42 -0% | 40.2 4% | 42.9 -3% |
| Witcher 3 ultra * (dB) | 44.9 | 38.1 15% | 46.6 -4% | 48 -7% | 39.5 12% | |
| Load Maximum * (dB) | 47.1 | 45 4% | 47.7 -1% | 43 9% | 48 -2% | 42.9 9% |
* ... smaller is better
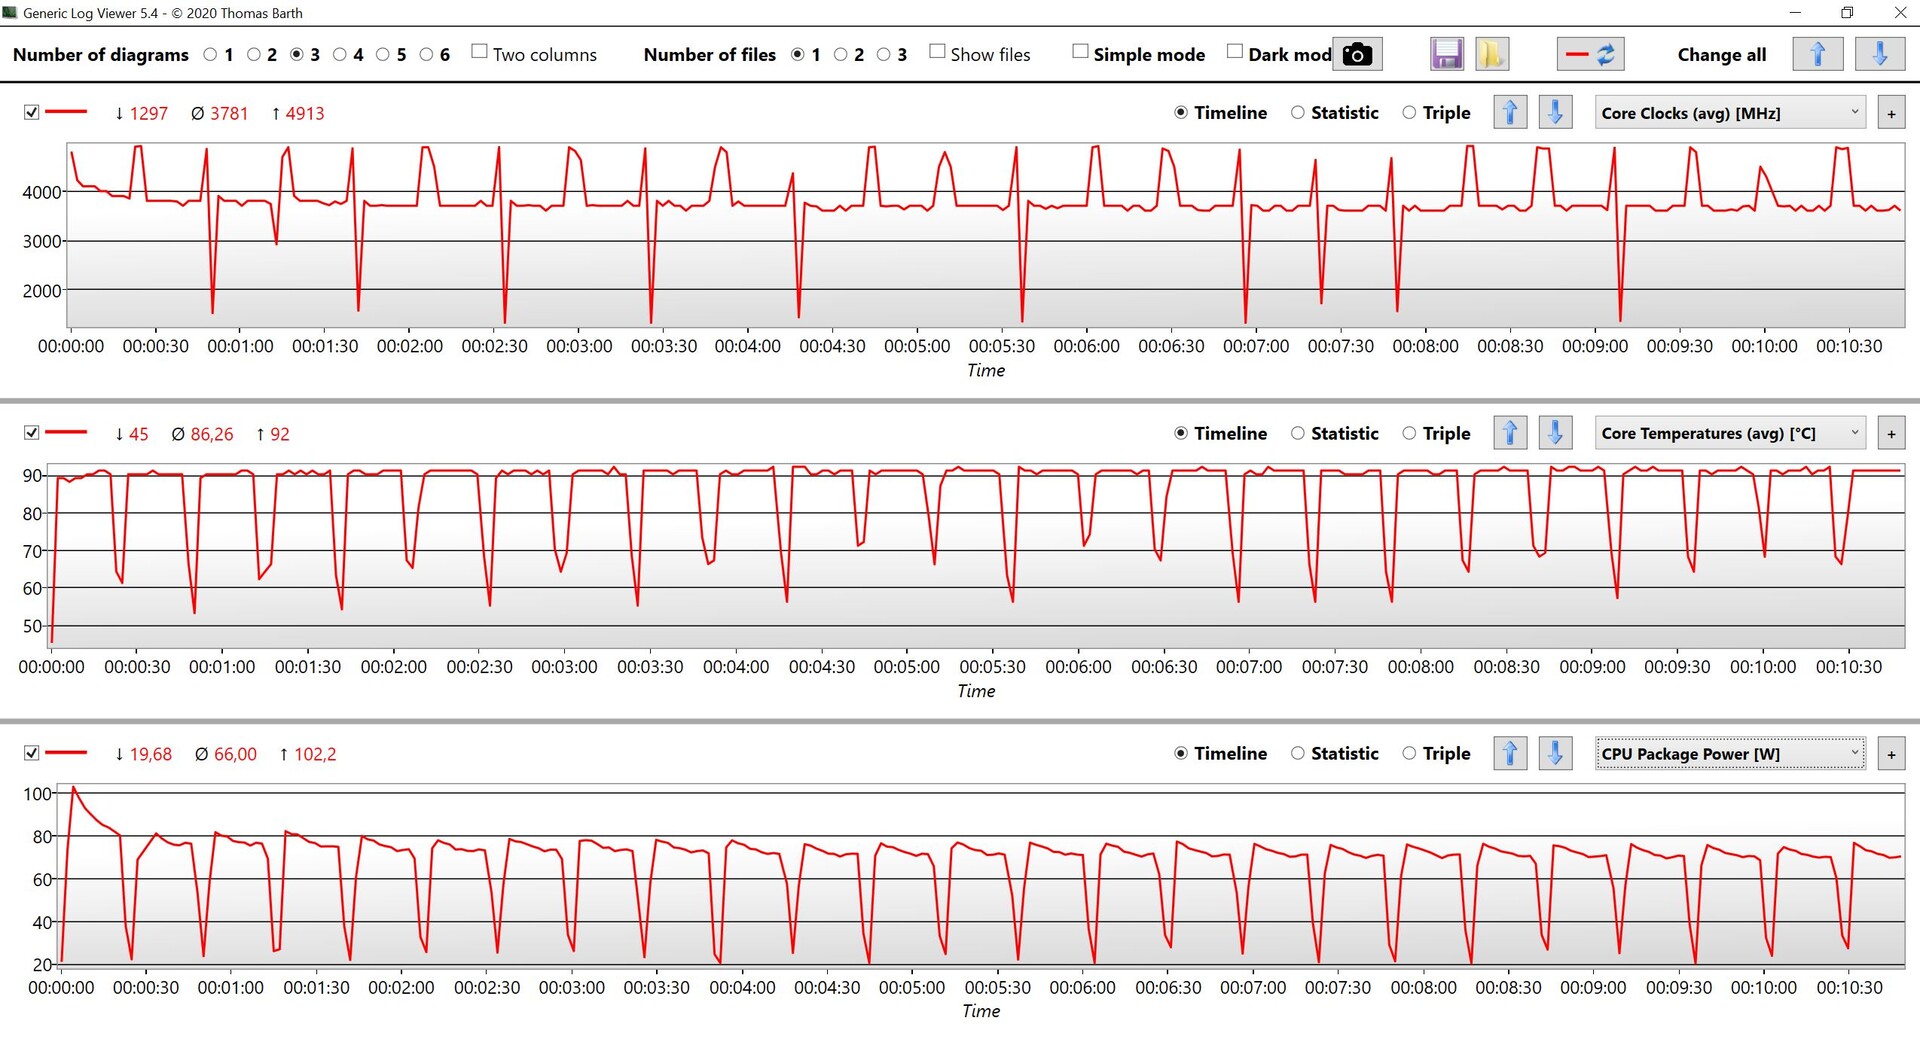
温度
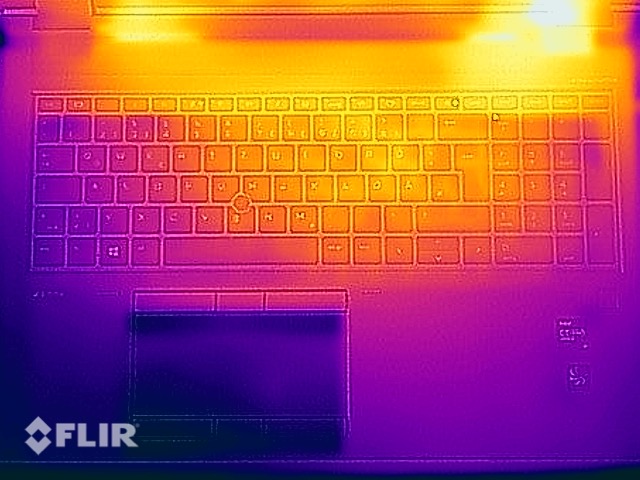
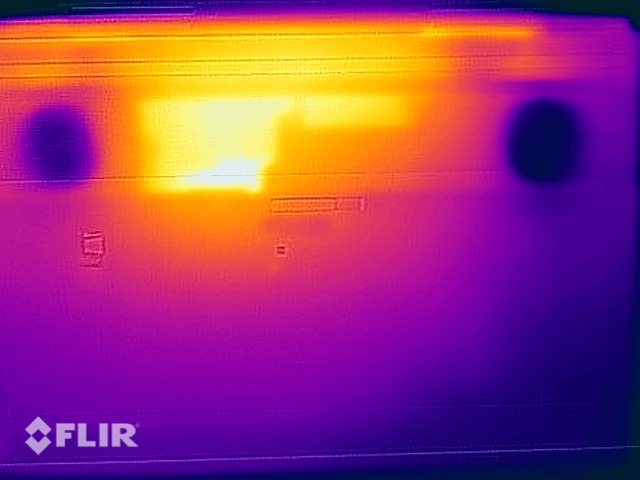
表面温度完全不挑剔,甚至在我们的压力测试中,我们只能在机箱底部的几个地方测到略高于50℃的温度。基本单元的顶部,包括键盘台面,要冷得多,没有划过40℃的大关,所以完全没有限制。在轻度工作负荷下,该装置根本没有真正升温。
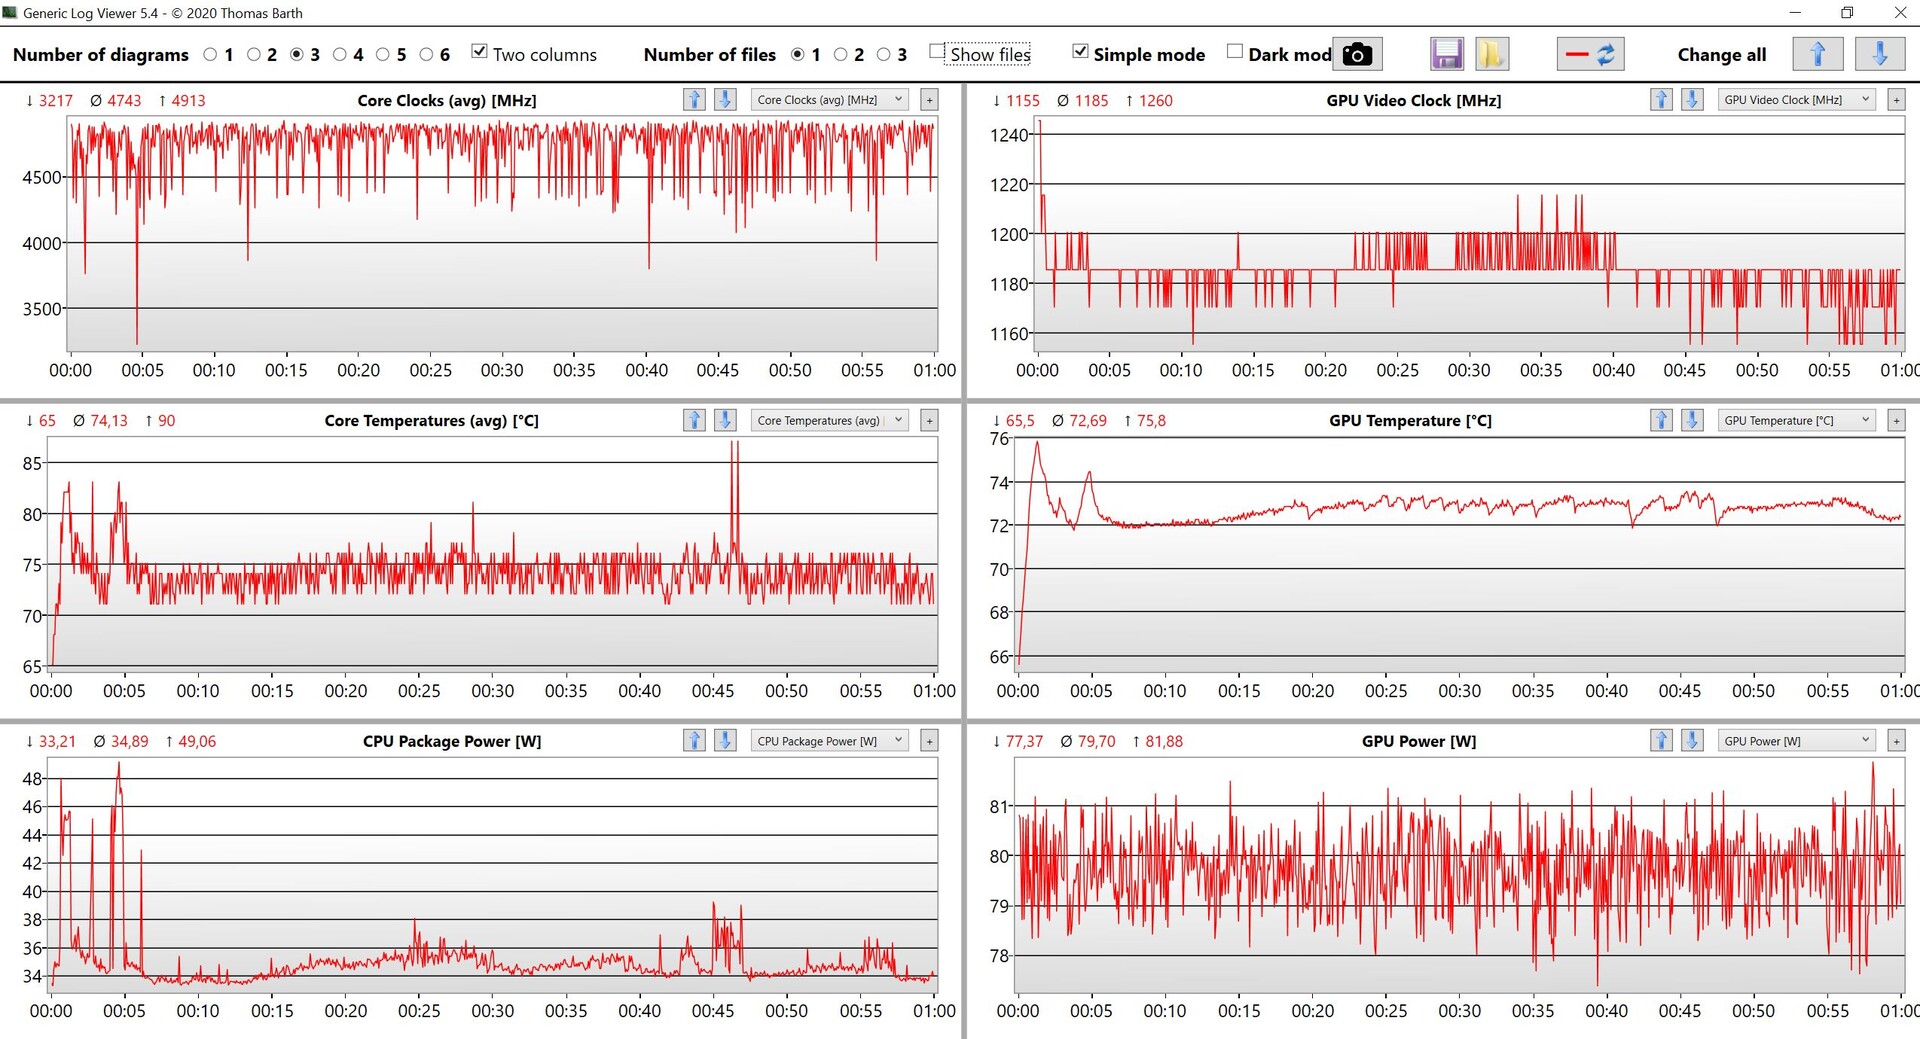
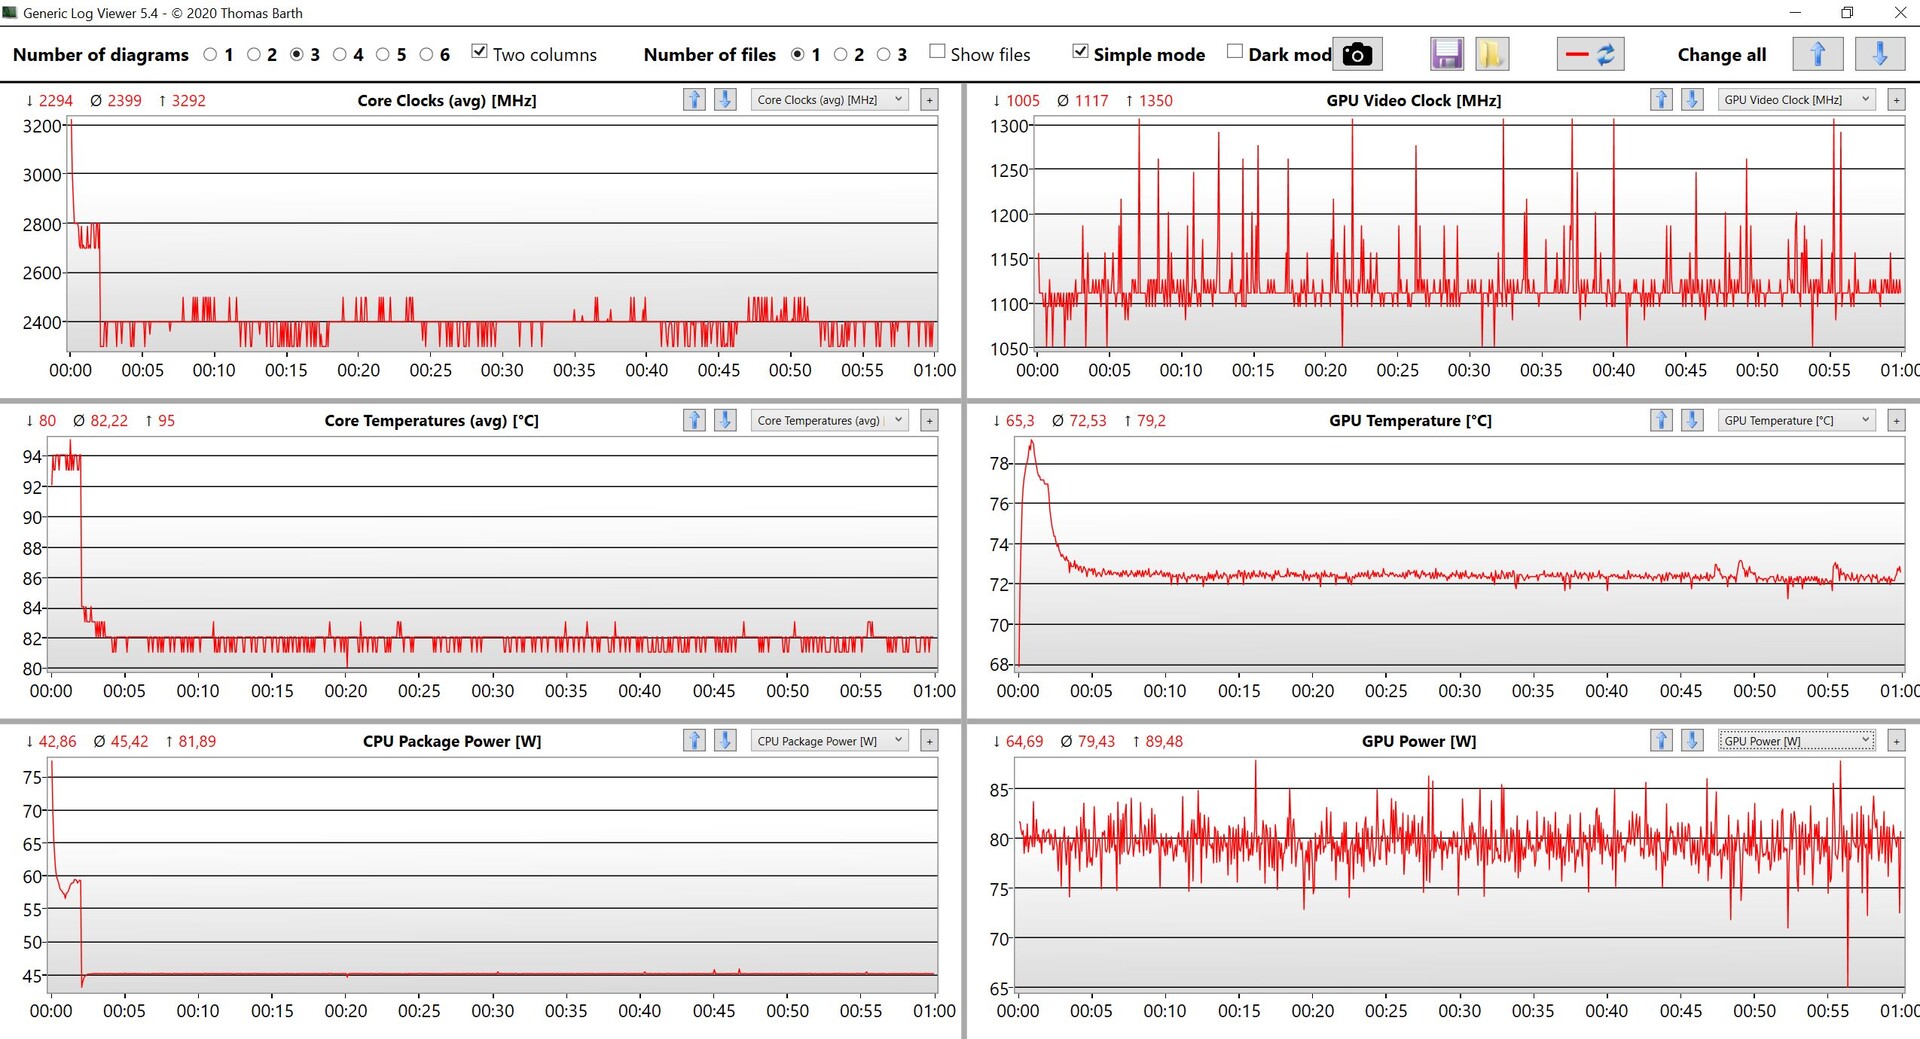
在压力测试中,性能并不令人失望,但这应该是一个大型移动工作站的预期。几分钟后,处理器的性能被限制在标称的45瓦特,而专用显卡可以保持80瓦特。因此,在压力测试之后,并没有立即出现性能不足的情况。
(±) The maximum temperature on the upper side is 41.9 °C / 107 F, compared to the average of 38.2 °C / 101 F, ranging from 22.2 to 69.8 °C for the class Workstation.
(-) The bottom heats up to a maximum of 52.9 °C / 127 F, compared to the average of 41.1 °C / 106 F
(+) In idle usage, the average temperature for the upper side is 26.6 °C / 80 F, compared to the device average of 32 °C / 90 F.
(±) Playing The Witcher 3, the average temperature for the upper side is 34.6 °C / 94 F, compared to the device average of 32 °C / 90 F.
(+) The palmrests and touchpad are cooler than skin temperature with a maximum of 28.6 °C / 83.5 F and are therefore cool to the touch.
(±) The average temperature of the palmrest area of similar devices was 27.8 °C / 82 F (-0.8 °C / -1.5 F).
| HP ZBook Fury 17 G8-4A6A9EA Intel Core i9-11950H, NVIDIA RTX A3000 Laptop GPU | Lenovo ThinkPad P17 G2-20YU0025G Intel Core i7-11800H, NVIDIA RTX A2000 Laptop GPU | MSI WE76 11UM-456 Intel Core i9-11980HK, NVIDIA RTX A5000 Laptop GPU | Asus ProArt StudioBook 16 W7600H5A-2BL2 Intel Xeon W-11955M, NVIDIA RTX A5000 Laptop GPU | HP ZBook Fury 17 G7 119W5EA Intel Core i9-10885H, NVIDIA Quadro RTX 4000 Max-Q | Apple MacBook Pro 16 2021 M1 Max Apple M1 Max, Apple M1 Max 32-Core GPU | |
|---|---|---|---|---|---|---|
| Heat | 1% | -7% | -9% | 6% | 14% | |
| Maximum Upper Side * (°C) | 41.9 | 49.6 -18% | 48.4 -16% | 45.7 -9% | 46.1 -10% | 42.3 -1% |
| Maximum Bottom * (°C) | 52.9 | 52.1 2% | 56.2 -6% | 48.3 9% | 57.6 -9% | 41.7 21% |
| Idle Upper Side * (°C) | 28.2 | 26 8% | 28.6 -1% | 35.3 -25% | 23.4 17% | 23.9 15% |
| Idle Bottom * (°C) | 30.7 | 27.6 10% | 31.8 -4% | 34.4 -12% | 23.4 24% | 23.9 22% |
* ... smaller is better
发言人
ZBook的立体声扬声器提供良好的音质;它们有足够的音量和丰富的内容。它的音频性能无法与MacBook Pro 16,但集成模块绝不是坏事。麦克风在我们的审查中也留下了良好的印象,语音记录非常清晰,没有重大失真。
HP ZBook Fury 17 G8-4A6A9EA audio analysis
(±) | speaker loudness is average but good (81.1 dB)
Bass 100 - 315 Hz
(±) | reduced bass - on average 9.5% lower than median
(±) | linearity of bass is average (7.8% delta to prev. frequency)
Mids 400 - 2000 Hz
(+) | balanced mids - only 4.6% away from median
(+) | mids are linear (4.9% delta to prev. frequency)
Highs 2 - 16 kHz
(+) | balanced highs - only 4% away from median
(+) | highs are linear (3.9% delta to prev. frequency)
Overall 100 - 16.000 Hz
(+) | overall sound is linear (13.7% difference to median)
Compared to same class
» 28% of all tested devices in this class were better, 3% similar, 70% worse
» The best had a delta of 7%, average was 17%, worst was 35%
Compared to all devices tested
» 15% of all tested devices were better, 4% similar, 81% worse
» The best had a delta of 4%, average was 23%, worst was 134%
Lenovo ThinkPad P17 G2-20YU0025G audio analysis
(±) | speaker loudness is average but good (76.6 dB)
Bass 100 - 315 Hz
(±) | reduced bass - on average 14.5% lower than median
(±) | linearity of bass is average (9.6% delta to prev. frequency)
Mids 400 - 2000 Hz
(±) | higher mids - on average 6.9% higher than median
(±) | linearity of mids is average (7.7% delta to prev. frequency)
Highs 2 - 16 kHz
(+) | balanced highs - only 2.6% away from median
(+) | highs are linear (6.6% delta to prev. frequency)
Overall 100 - 16.000 Hz
(±) | linearity of overall sound is average (20.1% difference to median)
Compared to same class
» 71% of all tested devices in this class were better, 6% similar, 23% worse
» The best had a delta of 7%, average was 17%, worst was 35%
Compared to all devices tested
» 52% of all tested devices were better, 8% similar, 40% worse
» The best had a delta of 4%, average was 23%, worst was 134%
Apple MacBook Pro 16 2021 M1 Pro audio analysis
(+) | speakers can play relatively loud (84.7 dB)
Bass 100 - 315 Hz
(+) | good bass - only 3.8% away from median
(+) | bass is linear (5.2% delta to prev. frequency)
Mids 400 - 2000 Hz
(+) | balanced mids - only 1.3% away from median
(+) | mids are linear (2.1% delta to prev. frequency)
Highs 2 - 16 kHz
(+) | balanced highs - only 1.9% away from median
(+) | highs are linear (2.7% delta to prev. frequency)
Overall 100 - 16.000 Hz
(+) | overall sound is linear (4.6% difference to median)
Compared to same class
» 0% of all tested devices in this class were better, 0% similar, 100% worse
» The best had a delta of 5%, average was 17%, worst was 45%
Compared to all devices tested
» 0% of all tested devices were better, 0% similar, 100% worse
» The best had a delta of 4%, average was 23%, worst was 134%
能量管理 - 体面的耐力
消耗功率
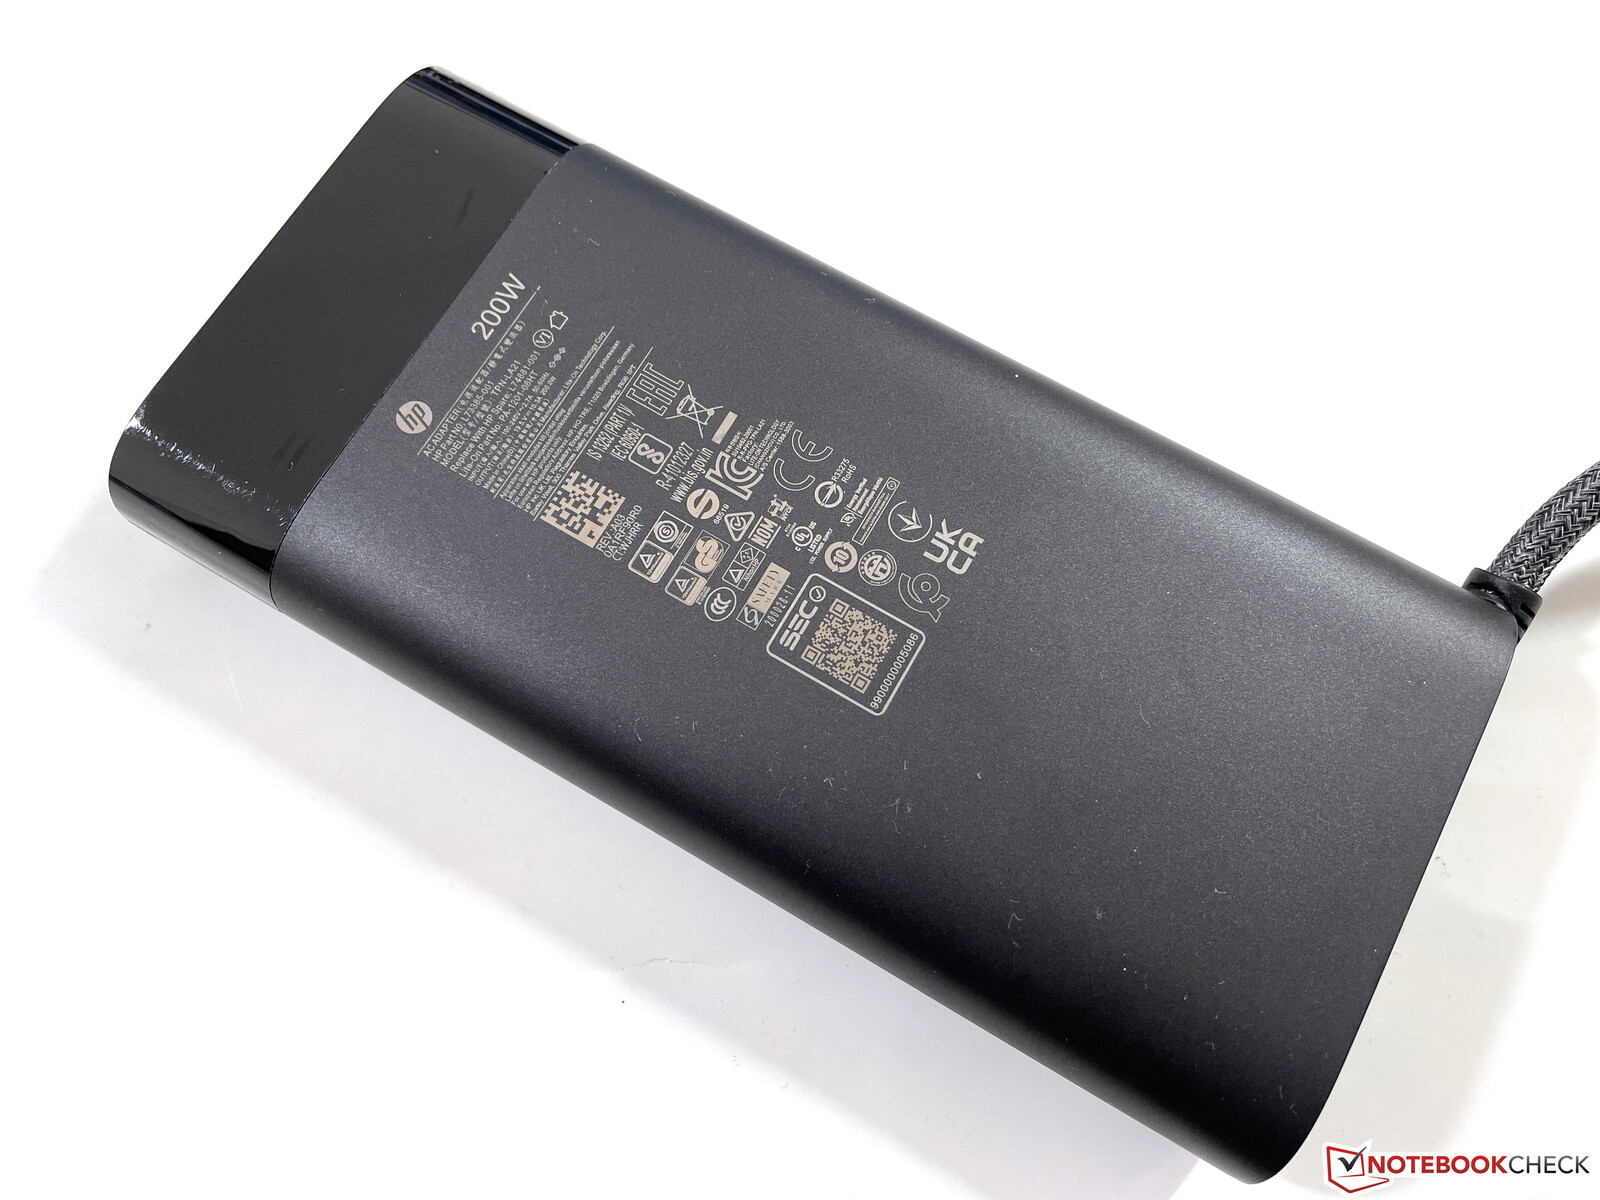
功耗与前一型号大致相当。 以前的型号.我们可以测量到在负载下略高于200瓦,所以该设备受到电源适配器的限制。我们对这种限制有点惊讶,强大的移动工作站过去都是用230W的单元发货的。根据官方的规格表,200W的模块是最强大的版本。
在压力测试中,消耗量将在160W左右趋于平稳,所以这不是什么大问题,但惠普可以使用更强大的GPU型号(具有更高的TGP值),并配备更强大的PSU。
| Off / Standby | |
| Idle | |
| Load |
|
Key:
min: | |
| HP ZBook Fury 17 G8-4A6A9EA i9-11950H, RTX A3000 Laptop GPU, Toshiba XG6 KXG60ZNV1T02, IPS, 3840x2160, 17.3" | Lenovo ThinkPad P17 G2-20YU0025G i7-11800H, RTX A2000 Laptop GPU, Kioxia XG7 KXG7AZNV512G, IPS LED, 1920x1080, 17.3" | MSI WE76 11UM-456 i9-11980HK, RTX A5000 Laptop GPU, Samsung PM9A1 MZVL22T0HBLB, IPS, 3840x2160, 17.3" | Asus ProArt StudioBook 16 W7600H5A-2BL2 W-11955M, RTX A5000 Laptop GPU, 2x Micron 2300 2TB MTFDHBA2T0TDV (RAID 0), OLED, 3840x2400, 16" | HP ZBook Fury 17 G7 119W5EA i9-10885H, Quadro RTX 4000 Max-Q, WDC PC SN730 SDBPNTY-1T00, , 3840x2160, 17.3" | Apple MacBook Pro 16 2021 M1 Max M1 Max, M1 Max 32-Core GPU, Apple SSD AP2048R, Mini-LED, 3456x2234, 16.2" | Average NVIDIA RTX A3000 Laptop GPU | Average of class Workstation | |
|---|---|---|---|---|---|---|---|---|
| Power Consumption | 21% | -28% | -12% | 4% | 20% | 6% | 5% | |
| Idle Minimum * (Watt) | 7.6 | 6.1 20% | 10.5 -38% | 12.4 -63% | 5.8 24% | 5.4 29% | 8.23 ? -8% | 9.11 ? -20% |
| Idle Average * (Watt) | 16.7 | 10.9 35% | 18.6 -11% | 16.5 1% | 14.8 11% | 16.4 2% | 14.6 ? 13% | 13.8 ? 17% |
| Idle Maximum * (Watt) | 17.5 | 12.3 30% | 20 -14% | 25 -43% | 17 3% | 16.7 5% | 15.3 ? 13% | 17.9 ? -2% |
| Load Average * (Watt) | 117 | 106.3 9% | 132.4 -13% | 132 -13% | 120.4 -3% | 94 20% | 109.3 ? 7% | 96 ? 18% |
| Witcher 3 ultra * (Watt) | 150 | 124 17% | 232 -55% | 132 12% | 168.4 -12% | 104 31% | ||
| Load Maximum * (Watt) | 202 | 168.9 16% | 281.6 -39% | 134 34% | 199.8 1% | 135 33% | 196.5 ? 3% | 180.3 ? 11% |
* ... smaller is better
Energieaufnahme Witcher 3 / Stresstest
Power Consumption external screen
电池运行时间
尽管采用了4K面板,但94Wh电池的运行时间还算不错。在150尼特的调整亮度下(在我们的测试单元中为44%),我们的视频测试运行了8.5小时,Wi-Fi测试运行了7.5小时。当我们以最大显示亮度重复测试时,Wi-Fi运行时间下降到5小时多一点。
当你真正给设备施加压力时,电池在大约2小时后就空了,当设备打开时,充满电需要113分钟。大约35分钟后,50%的容量就会被重新充电。
| HP ZBook Fury 17 G8-4A6A9EA i9-11950H, RTX A3000 Laptop GPU, 94 Wh | Lenovo ThinkPad P17 G2-20YU0025G i7-11800H, RTX A2000 Laptop GPU, 94 Wh | MSI WE76 11UM-456 i9-11980HK, RTX A5000 Laptop GPU, 99.9 Wh | Asus ProArt StudioBook 16 W7600H5A-2BL2 W-11955M, RTX A5000 Laptop GPU, 90 Wh | HP ZBook Fury 17 G7 119W5EA i9-10885H, Quadro RTX 4000 Max-Q, 94 Wh | Apple MacBook Pro 16 2021 M1 Max M1 Max, M1 Max 32-Core GPU, 99.6 Wh | Average of class Workstation | |
|---|---|---|---|---|---|---|---|
| Battery runtime | 5% | -23% | -56% | 3% | 52% | 2% | |
| H.264 (h) | 8.5 | 9.5 12% | 6.9 -19% | 1.8 -79% | 10.3 21% | 17 100% | 10.1 ? 19% |
| WiFi v1.3 (h) | 7.4 | 9.8 32% | 6.3 -15% | 5 -32% | 7.6 3% | 14.9 101% | 8.55 ? 16% |
| Load (h) | 2 | 1.4 -30% | 1.3 -35% | 1.7 -15% | 1.1 -45% | 1.441 ? -28% | |
| Witcher 3 ultra (h) | 1.6 |
Pros
Cons
结论 - ZBook Fury 17需要更新
ZBook Fury 17 G8在某些方面显得略为过时。你得到了现代的CPU和GPU,但2.5英寸的硬盘插槽在今天是相当罕见的。你也没有得到最新的通信模块(没有Wi-Fi 6E,没有5G),仍然有一个720p的网络摄像头,以及包括宽边框的16:9长宽比。
我们也有点惊讶,组件没有提供更多的性能。如果你得到这样一个 "经典 "的移动工作站,并有一个相对较重和笨重的机箱,你通常希望有尽可能高的性能。然而,由于对200W电源适配器的限制,制造商不必要地限制了自己,冷却解决方案当然可以处理更多。性能至少是稳定的。如果你需要更多的CPU性能,我们建议你等待下一代,由于英特尔新的Alder Lake芯片具有更多的CPU核心,因此有望实现重大飞跃。
适当的性能利用率和适度的排放。ZBook Fury 17 G8是一个坚实的移动工作站,但惠普在GPU性能方面相当保守。考虑到笨重的机箱,可以有更强大的GPU版本。
目前的DreamColor版本仍然提供非常好的画质。他们不再覆盖AdobeRGB,而是 "只 "参考DCI-P3,类似于MacBook Pro型号的Apple 。如果你在工作中使用大量的HDR内容,你应该考虑目前的MacBooks因为它们由于采用了Mini-LED技术,峰值亮度高得多。
带有大型维护盖的想法是好的,但该机制不应影响质量印象,我们的测试装置就是这种情况。对于近4000欧元的价格,你应该能够期待完美的制造质量,甚至是缝隙。各个组件的额外盖子也影响了对组件的方便接触。
如果你不愿意在GPU性能方面做出妥协,你应该看一下微星WE76(155W TGP),而ThinkPad P17 G2在许多方面与ZBook非常相似,但在键盘质量方面仍有轻微优势。不过,从其他ThinkPad键盘的发展来看,这种情况可能很快会改变。
价格和可用性
你可以在HP的网站上定制ZBook Fury 17 G8。.与我们的测试设备类似的配置,售价为4942美元,发货日期为5月。
HP ZBook Fury 17 G8-4A6A9EA
- 02/16/2022 v7 (old)
Andreas Osthoff
Price comparison

