面向游戏玩家和内容创作者。联想Legion 5 Pro笔记本评测
去年,联想在Legion 5 Pro中提供了一个特别令人印象深刻和极其受欢迎的高端游戏笔记本电脑。我们已经测试了Nvidia的RTX 3070 Ti版本,所以我们认为我们现在应该仔细看看稍微便宜的120W RTX 3060版本。对于那些优先考虑性价比,并且满足于在QHD的最新游戏中以60FPS运行的游戏玩家,或者注重CPU性能的创作者,联想在这里把一个令人信服的组合放在一起。竞争者将包括其他RTX-3060笔记本电脑,以及具有可比性的英特尔i7或AMD Ryzen 7 CPU,例如最近测试的 HP Omen 16或者更昂贵的笔记本,如 Gigabyte Aero 16等。后者将很难在同等程度上开发其性能潜力。
潜在的竞争对手比较
Rating | Date | Model | Weight | Height | Size | Resolution | Price |
|---|---|---|---|---|---|---|---|
| 86.6 % v7 (old) | 07 / 2022 | Lenovo Legion 5 Pro 16IAH7H i7-12700H, GeForce RTX 3060 Laptop GPU | 2.6 kg | 27 mm | 16.00" | 2560x1600 | |
| 85.5 % v7 (old) | 05 / 2022 | HP Omen 16-b1090ng i7-12700H, GeForce RTX 3070 Ti Laptop GPU | 2.3 kg | 23 mm | 16.10" | 2560x1440 | |
| 86 % v7 (old) | 04 / 2022 | HP Omen 16-c0077ng R7 5800H, Radeon RX 6600M | 2.3 kg | 26 mm | 16.10" | 2560x1440 | |
| 84.7 % v7 (old) | 03 / 2022 | Gigabyte Aero 16 YE5 i9-12900HK, GeForce RTX 3080 Ti Laptop GPU | 2.3 kg | 22.4 mm | 16.00" | 3840x2400 | |
| 86.7 % v7 (old) | 03 / 2022 | Alienware x14 i7 RTX 3060 i7-12700H, GeForce RTX 3060 Laptop GPU | 1.8 kg | 14.5 mm | 14.00" | 1920x1080 | |
| 88 % v7 (old) | 03 / 2022 | Lenovo Legion 5 Pro 16 G7 i7 RTX 3070Ti i7-12700H, GeForce RTX 3070 Ti Laptop GPU | 2.6 kg | 26.6 mm | 16.00" | 2560x1600 |
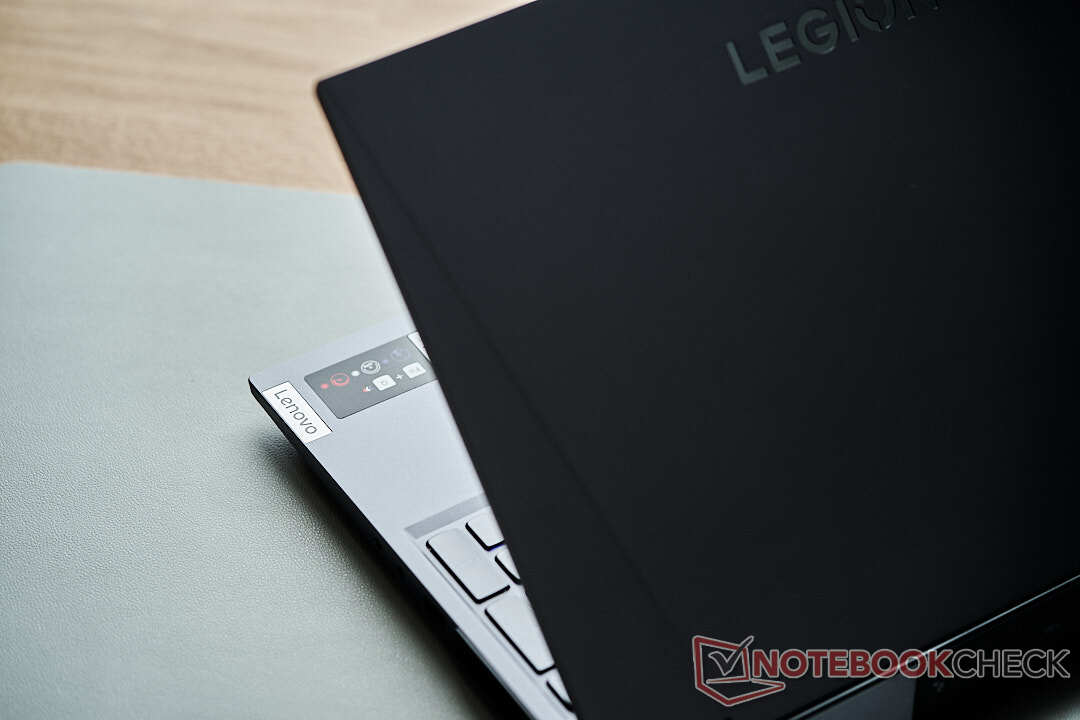
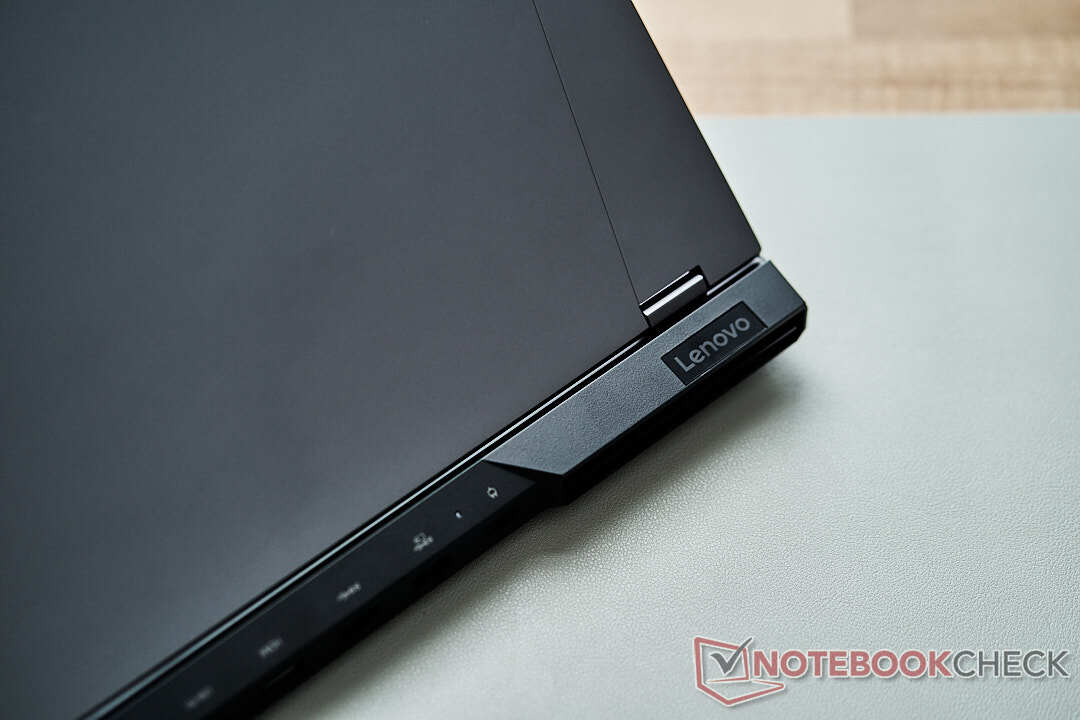
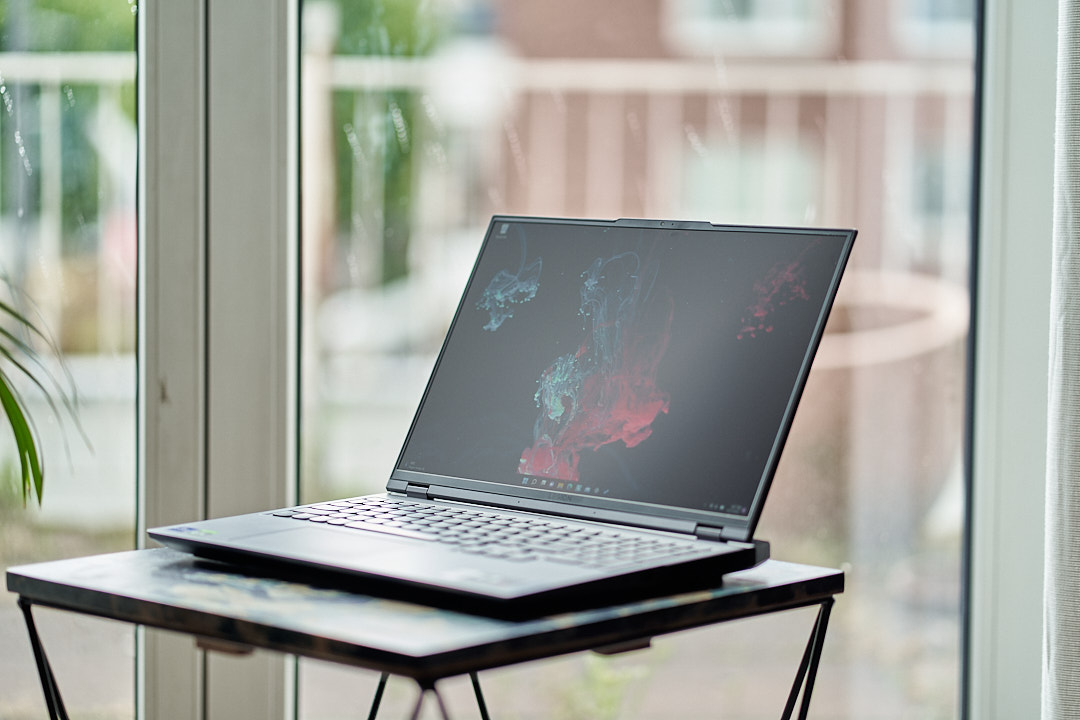
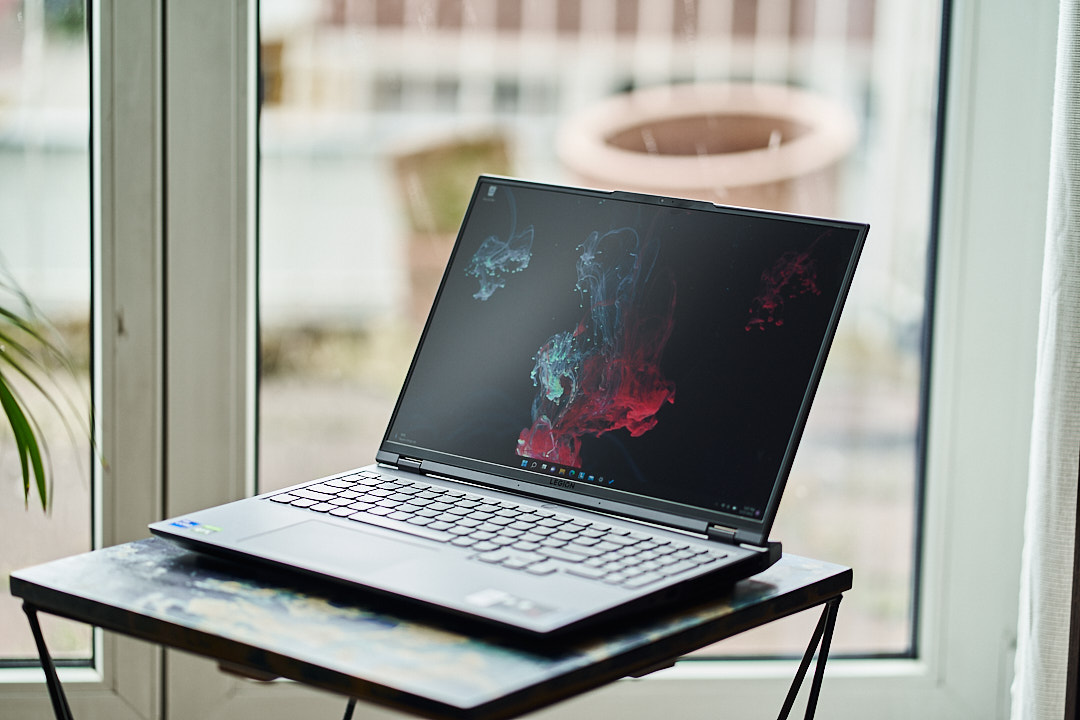
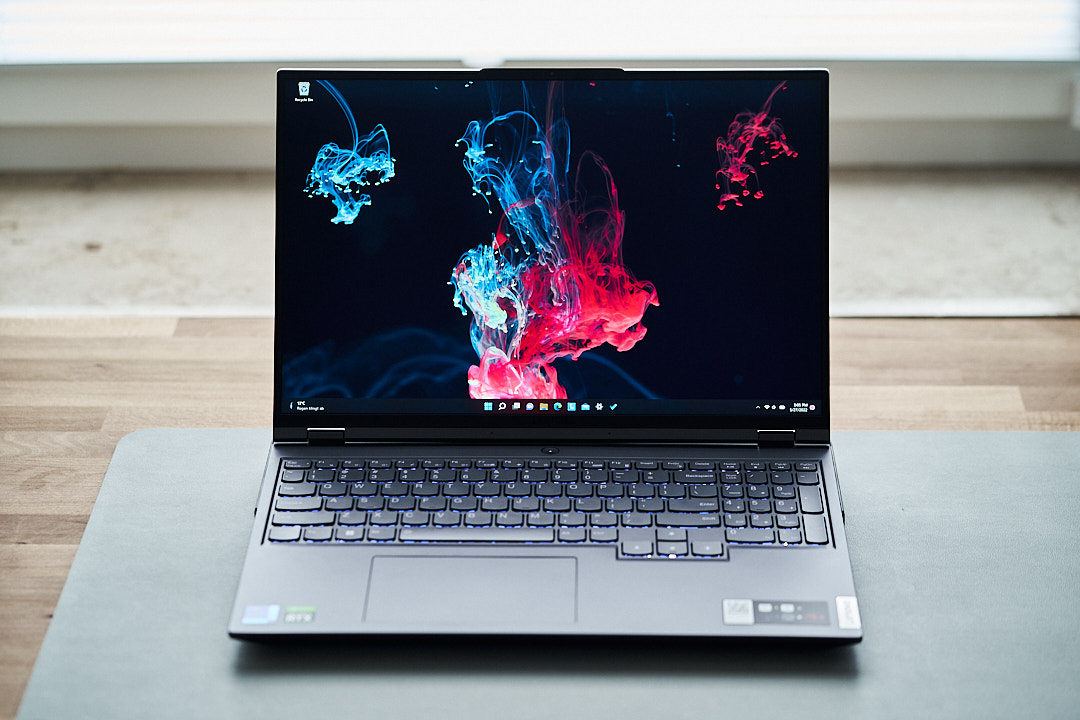
外壳 -Legion 5 Pro,有大量的金属材料
联想为Legion 5 Pro提供了一个坚实的金属外壳。它的做工完美无瑕,这台16英寸的游戏笔记本电脑散发着质量的气息,无论是随意还是故意的操作都不会导致表面弯曲或唤起任何不愉快的吱嘎声。即使是盖子,这通常是许多有竞争力的笔记本电脑的一个致命弱点,测试时也很牢固,使显示器僵硬地处于所需位置。
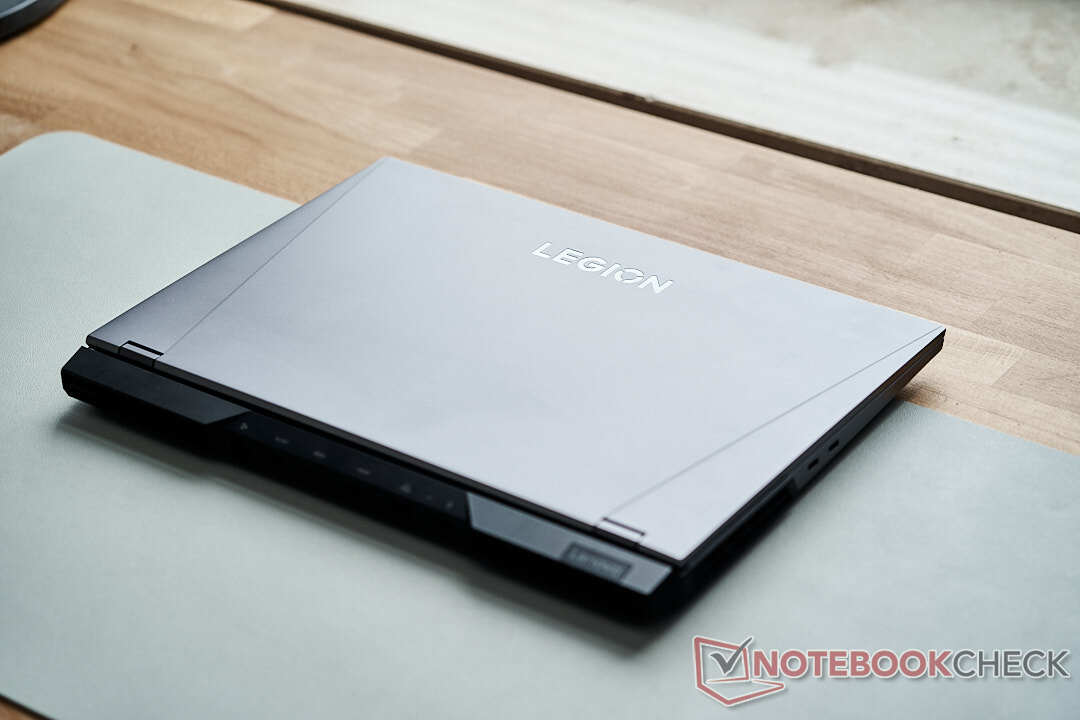
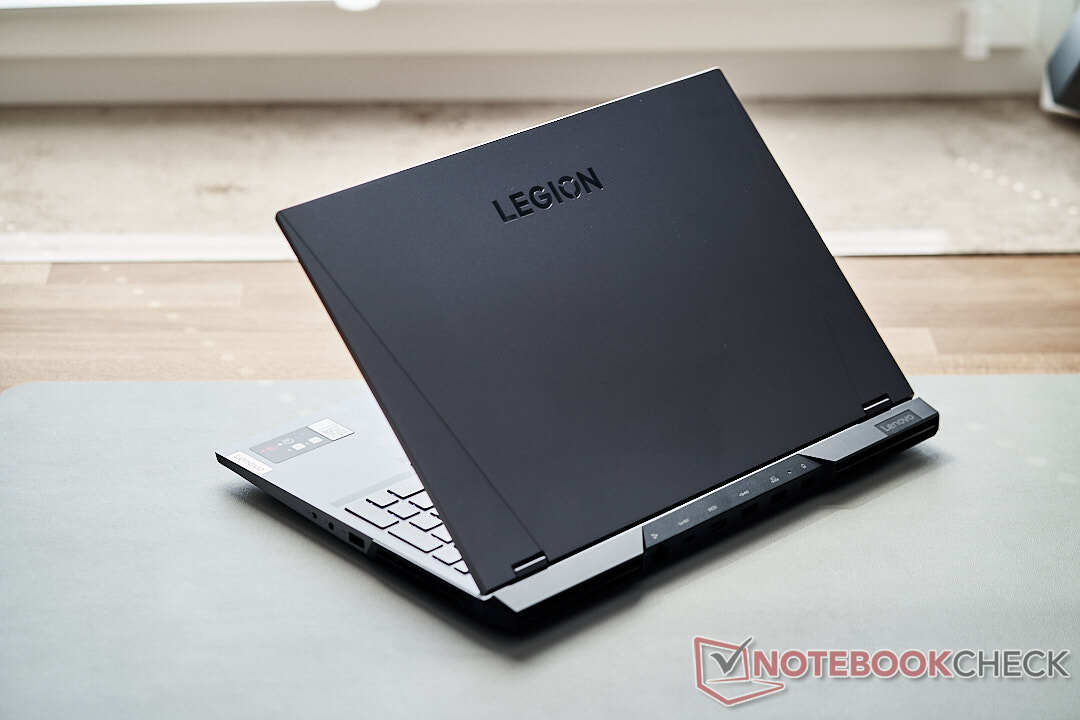
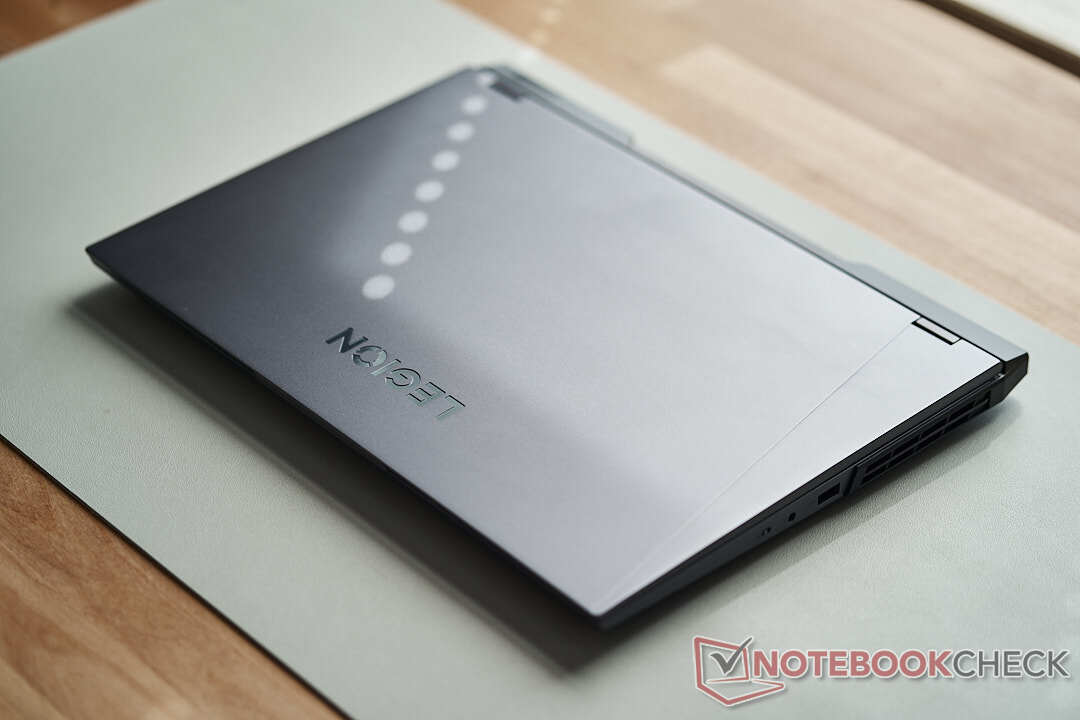
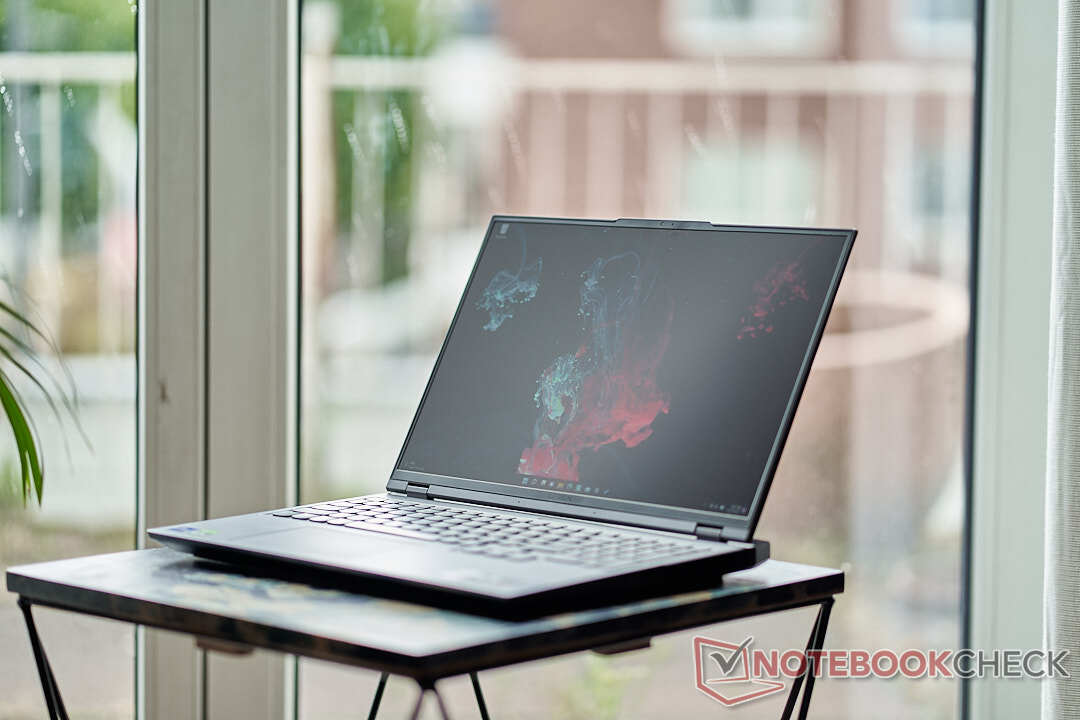
在重量方面,大量使用金属材料是很明显的。Legion ,是所有同类设备中最重的一个。冷却通风口就分布在设备的底部。联想违背了推出越来越薄、越来越小的设备的趋势,并明确地将重点放在这个强大的硬件展示的坚固性和冷却潜力上。
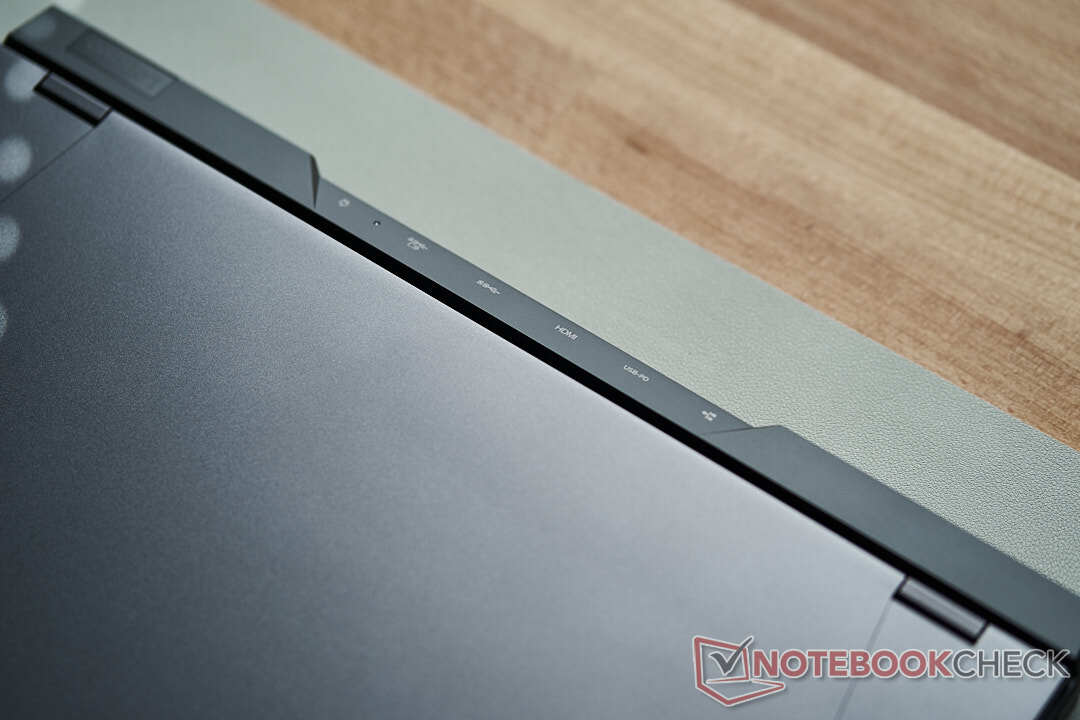
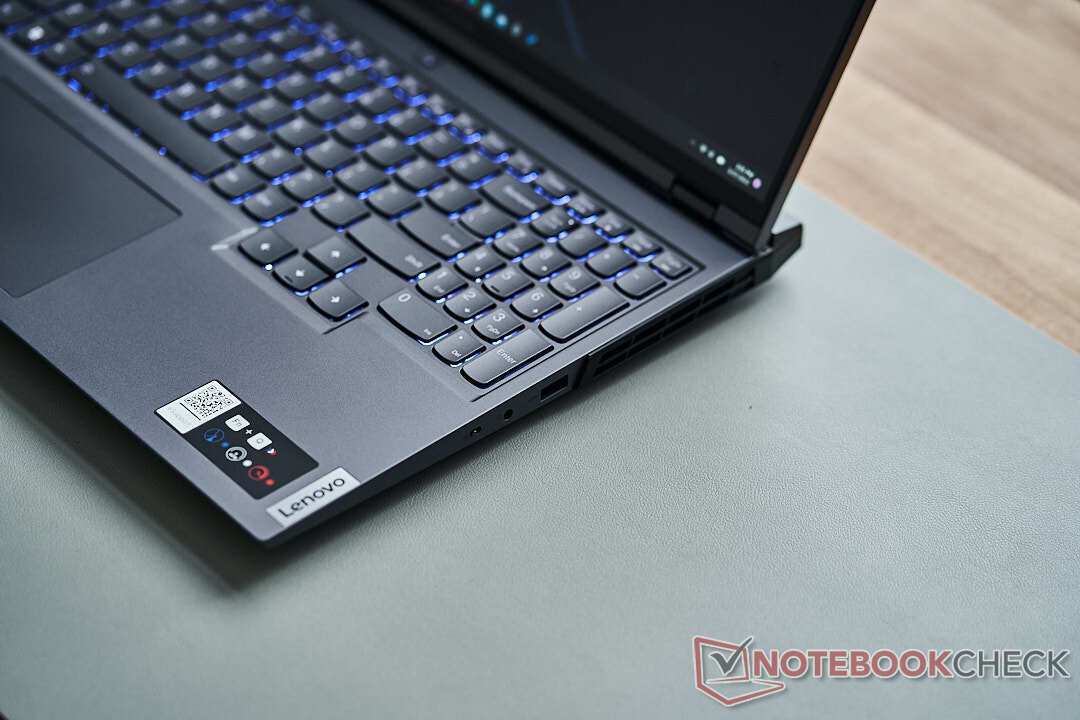
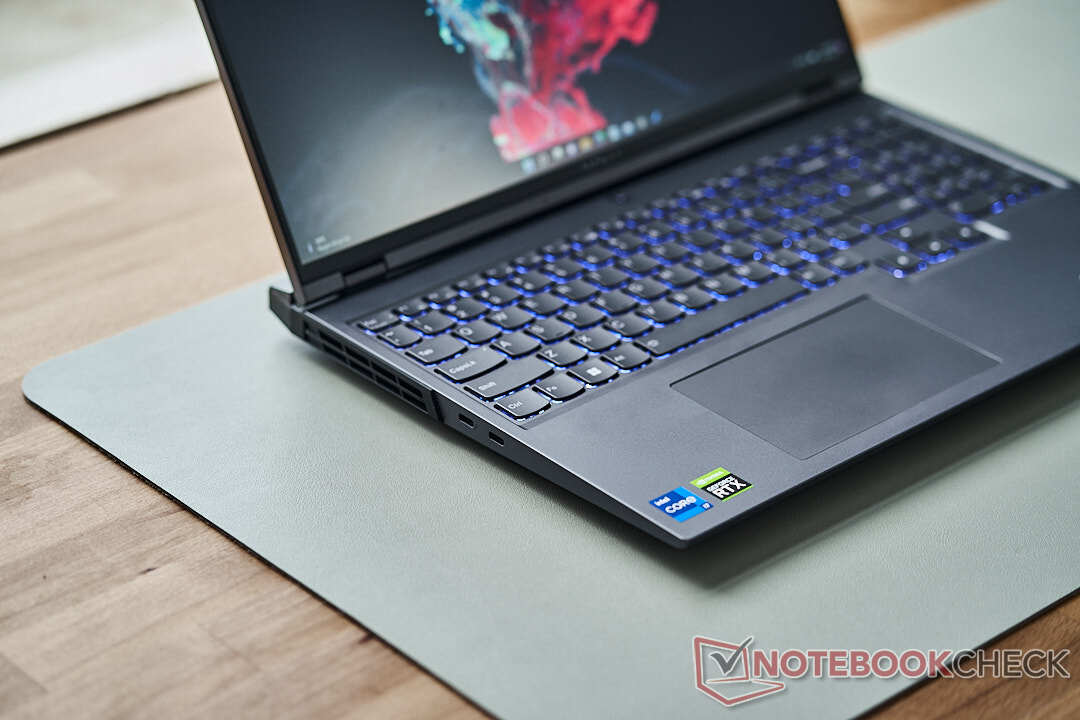
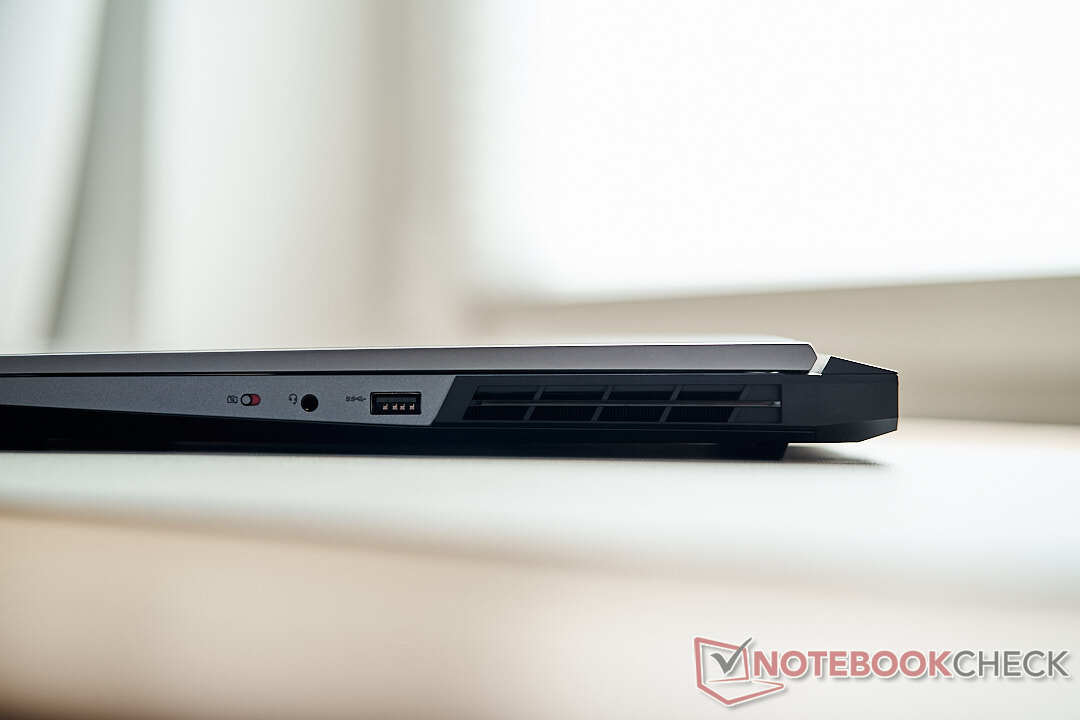
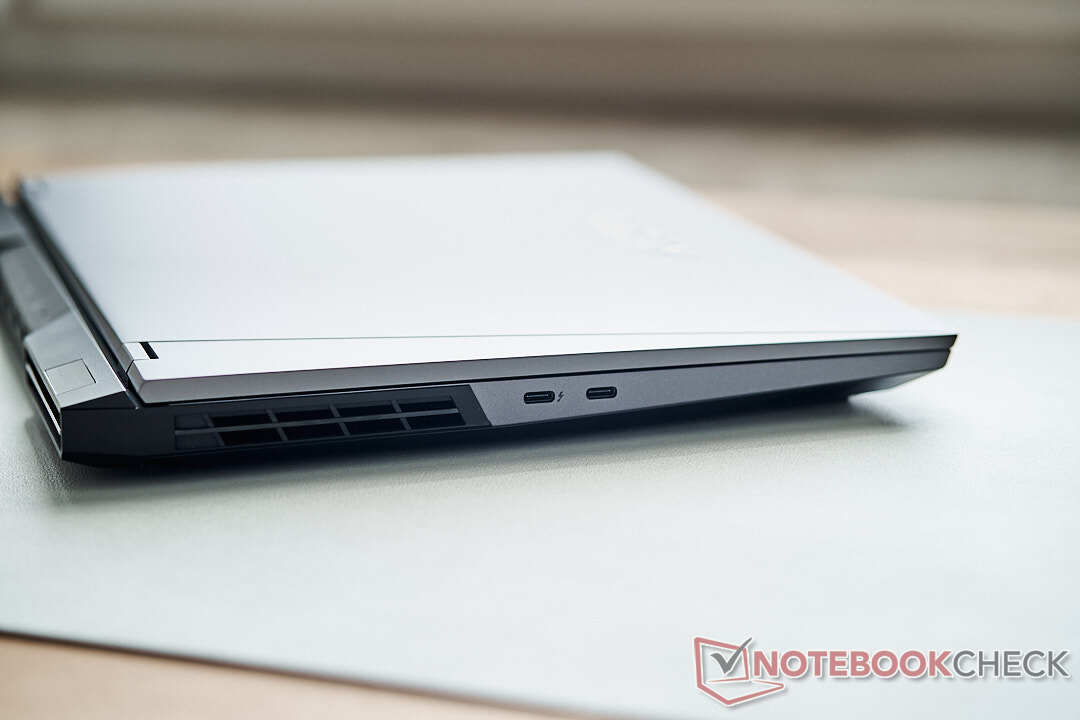
连接性--有雷电4和USB-C电力传输,一切都在那里。
联想在分布在机箱三面的端口和插槽的类型和数量方面也树立了一个好榜样。从人体工程学的角度来看,它有利于右手用户,在机箱的右侧只提供一个USB-A端口(USB 3.2 Gen 1)。这减少了使用鼠标时被显示器或网线缠住的风险。举例来说,这个端口是外围设备的无线加密狗的理想选择。
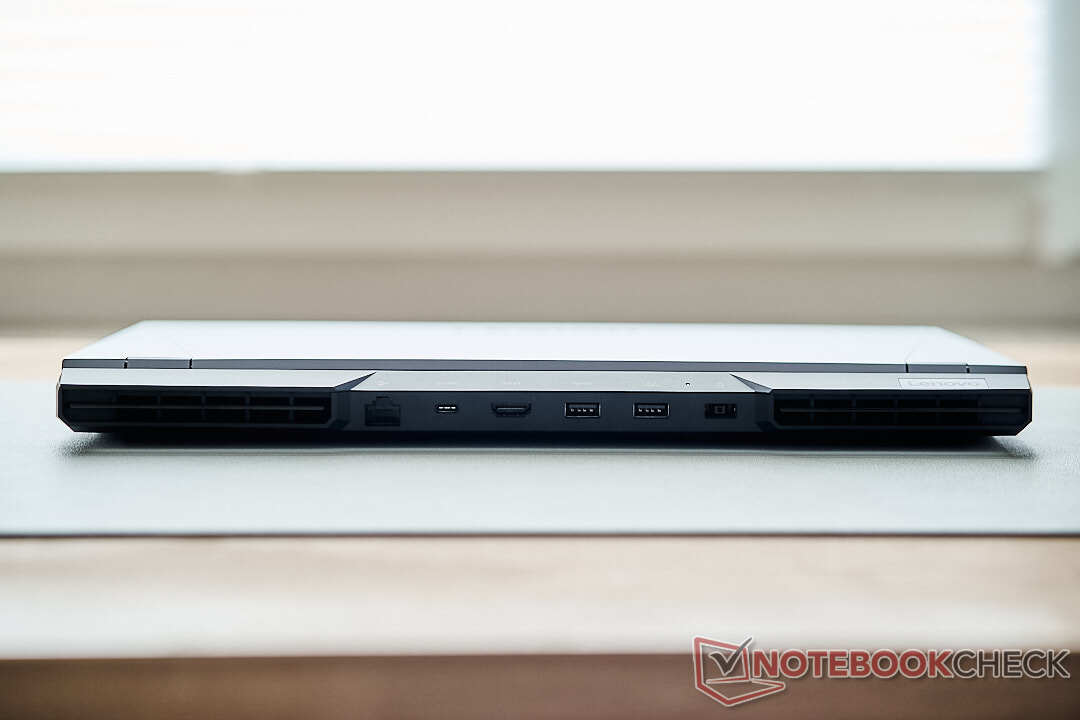
左边有两个最先进的USB-C端口,一个是Thunderbolt 4,另一个符合USB 3.2 Gen 2标准,完全支持20Gbit/s和Displayport 1.4。其余的端口可以在机箱背面找到,联想在这里充分地利用了可用空间。除了另外两个USB-A 3.2 Gen-1端口外,还有第三个USB-C端口,通过它,笔记本电脑还可以以高达135W的功率进行充电。电源插头插槽也在机箱背面。
鉴于端口和插槽的多样性和位置,Legion 5 Pro可以很容易地被部署为具有多个显示器和外围设备的桌面替代设备,而作为一个移动设备,它的装备可以满足任何情况。还有机会将电子狗的使用限制在DisplayPort适配器上。
沟通
Legion 5 Pro配备了极为流行的英特尔AX211 WLAN模块。由于板载了Wi-Fi 6E,它不仅提供了最新的Wi-Fi标准。该卡发挥了全部潜力,在同类设备中占据了首要位置。这不仅仅是数据传输速度令人印象深刻,而且在日常使用中,作为游戏笔记本也不会令人失望。凭借稳定而快速的传输速度,即使是大型游戏下载也不会有什么影响。一个千兆以太网端口可用于有线连接。在这里,我们更喜欢更快的2.5GbE端口,因为它已经被安装在许多竞争设备上。在相称的网络中或连接到NAS系统时,其速度优势是巨大的,而且会与硬件配置的其他部分很好地匹配。
| Networking | |
| iperf3 transmit AX12 | |
| Alienware x14 i7 RTX 3060 | |
| Average Intel Wi-Fi 6E AX211 (1003 - 1501, n=4) | |
| HP Omen 16-c0077ng | |
| iperf3 receive AX12 | |
| Average Intel Wi-Fi 6E AX211 (1178 - 1623, n=4) | |
| Alienware x14 i7 RTX 3060 | |
| HP Omen 16-c0077ng | |
| iperf3 receive AXE11000 6GHz | |
| Lenovo Legion 5 Pro 16IAH7H | |
| Average of class Gaming (975 - 1775, n=37, last 2 years) | |
| Average Intel Wi-Fi 6E AX211 (700 - 1857, n=226) | |
| iperf3 transmit AXE11000 6GHz | |
| Lenovo Legion 5 Pro 16IAH7H | |
| Average of class Gaming (723 - 2355, n=38, last 2 years) | |
| Average Intel Wi-Fi 6E AX211 (385 - 1851, n=226) | |
网络摄像头
说到网络摄像头,联想提供了标准的票价;不幸的是, 没有比我们多年来习惯的游戏笔记本更好的。图像质量对于一个或另一个变焦电话来说无疑是可以接受的,但在这里我们希望看到在色彩表现、分辨率和动态范围方面的全面改进。

")
")
辅料
除了笔记本电脑本身之外,盒子里只有电源。这已被标准化为所有Legion 5 Pro的配置,所以我们的RTX-3060模型也得到了有点超大的300W电源。如果你打算带着Legion ,就应该考虑到电源的额外1公斤(约2.2磅)重量。
维护
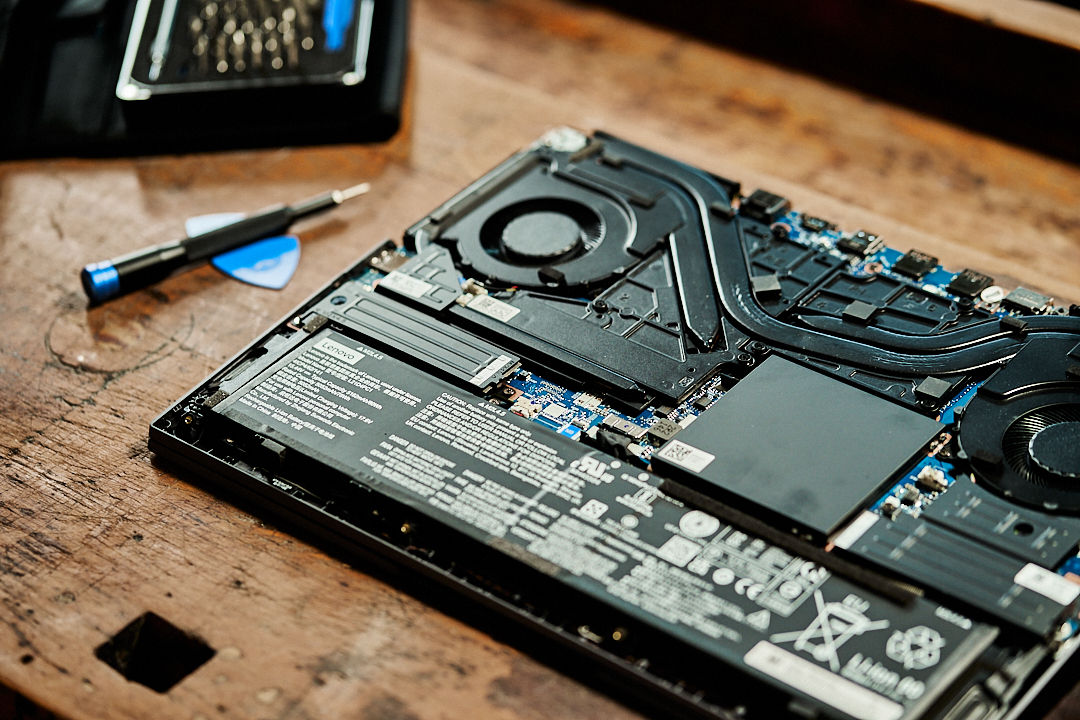
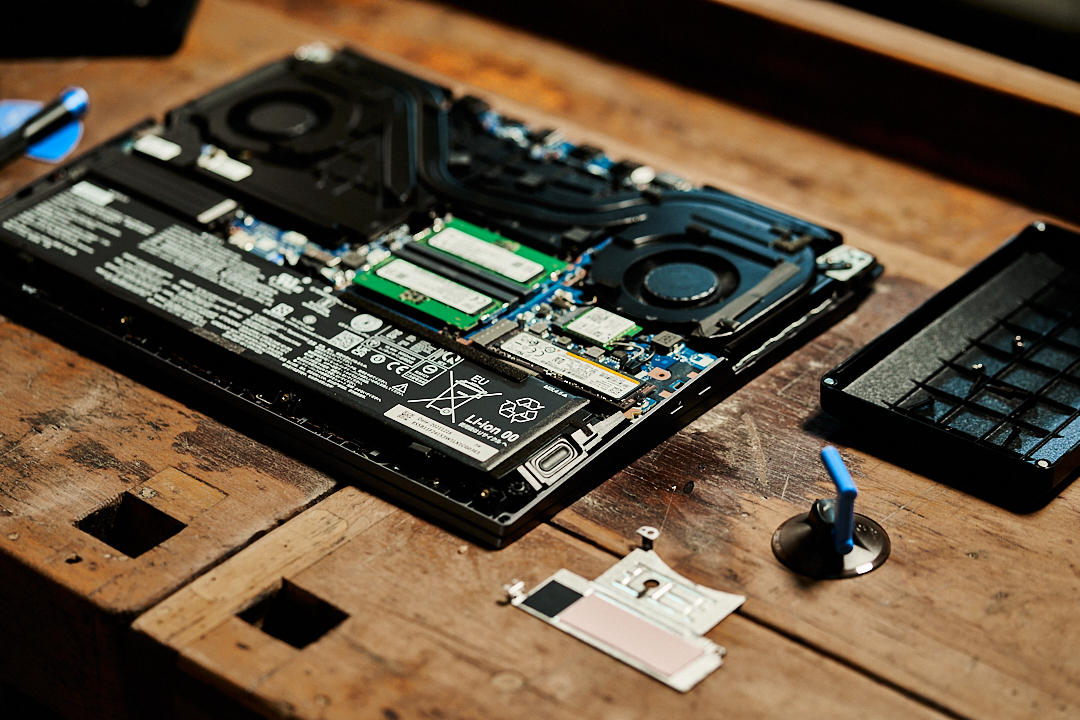
为了维修或升级,Legion ,需要松开十个飞利浦头的螺丝。联想使用三种不同的尺寸,所以你应该注意记住不同螺丝的归属。拆卸底板需要比我们想象中更多的努力。特别是底板后三分之一处的塑料元件被固定得非常紧。我们通过适当的辅助工具,逐步从板子的前部中心向后部推进。要松开塑料盖,可能最好使用来自iFixit(关联链接)的适当工具。.另外,也可以使用塑料信用卡,巧妙地施加力量,直到它们松开。
在机箱内部,我们可以期待一个整洁的画面,最重要的是对强大硬件的精心冷却解决方案的洞察。原则上,用户可以接触到两个M.2插槽和内存。为了冷却它们,巨大的散热器覆盖了快速驱动器,而内存则在一个塑料罩下。
担保
在德国,Legion 5 Pro联想的基本保修期为2年。
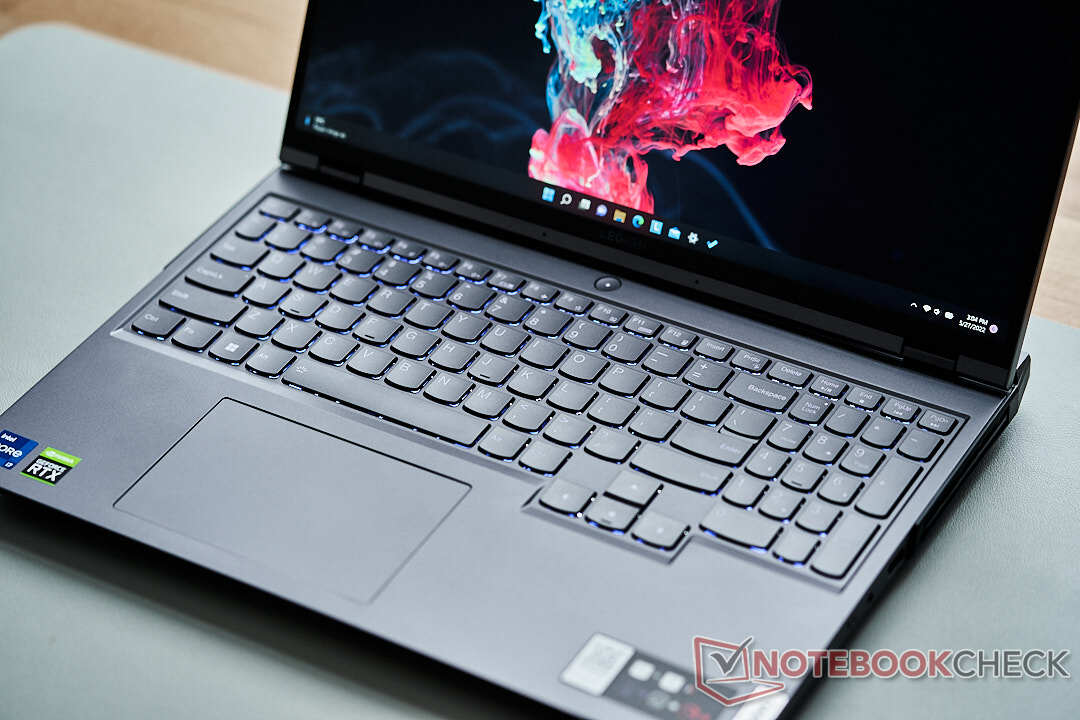
输入设备--为游戏玩家和内容创造者提供了引人注目的全面解决方案
键盘
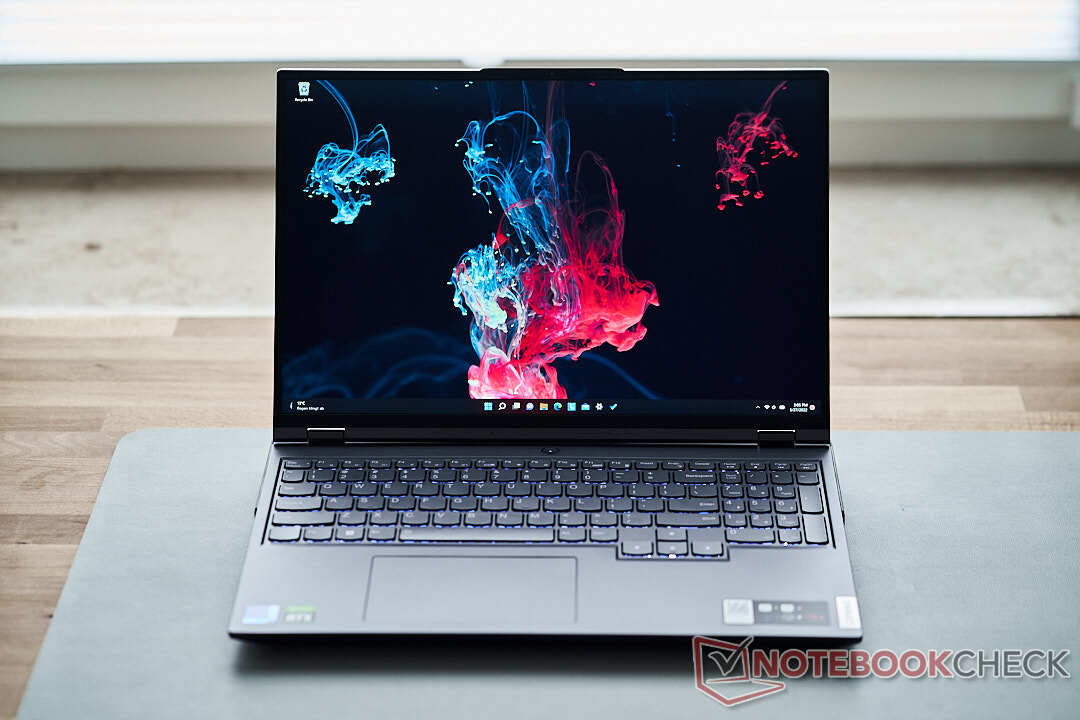
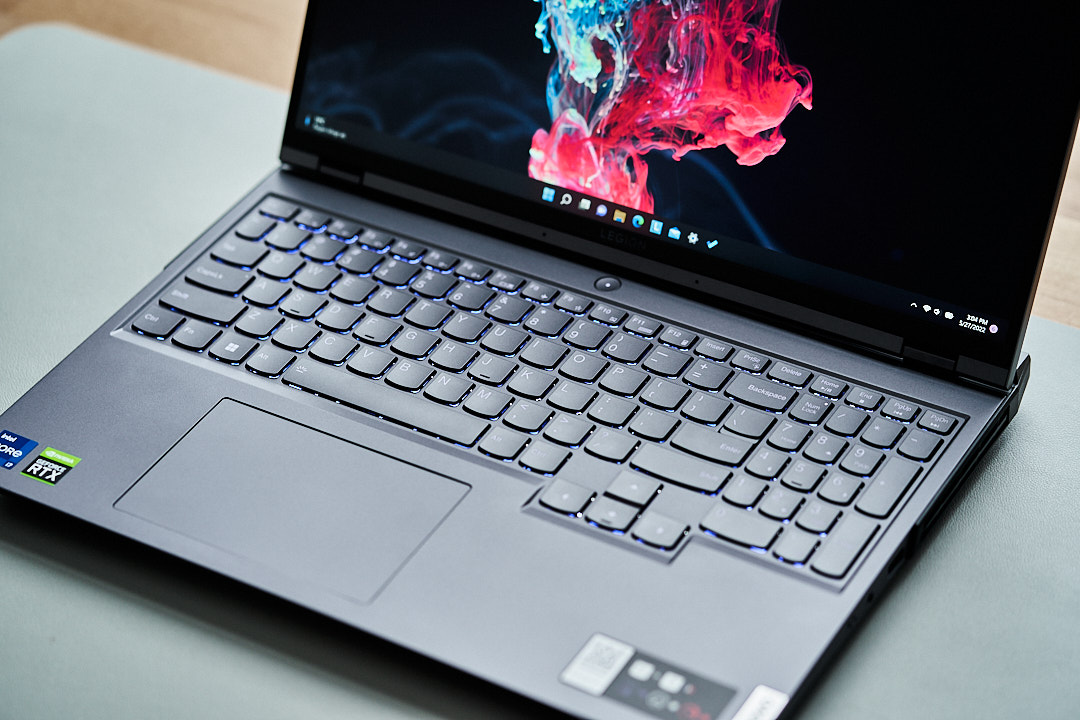
在这个16英寸的设备上,密集游戏环节的键盘性能是非常出色的。Chiclet键的形状和弧度有点不寻常,提供了一个可触及的压力点,令人愉快的阻力以及坚实的行程。RGB按键的背光可以在键盘上的四个区域进行调整,照明效果很好。从视觉上看,数字键盘上稍小的按键和普通尺寸的方向键并不像它们可能的那样清晰,但从纯粹的功能上看,没有理由抱怨。
触摸板
触摸板对于游戏笔记本来说足够大,可以在其表面平滑滑动。 滚动和点击时的触觉特性是高质量的。鼠标触摸板稍稍向左偏移,这有时会导致在过于随意地使用时向右点击而不是向左点击。由于165赫兹的高刷新率,使用Legion 似乎非常流畅和精确。尽管大多数游戏者会使用鼠标,但在Windows中导航或滚动网站时应该没有任何问题。
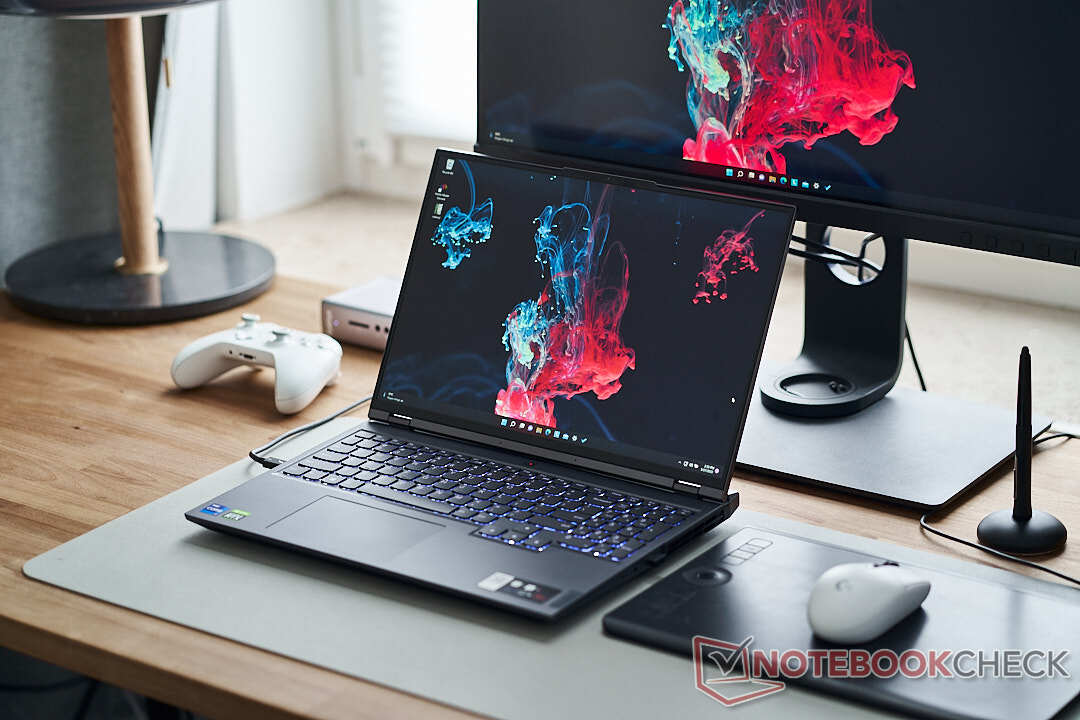
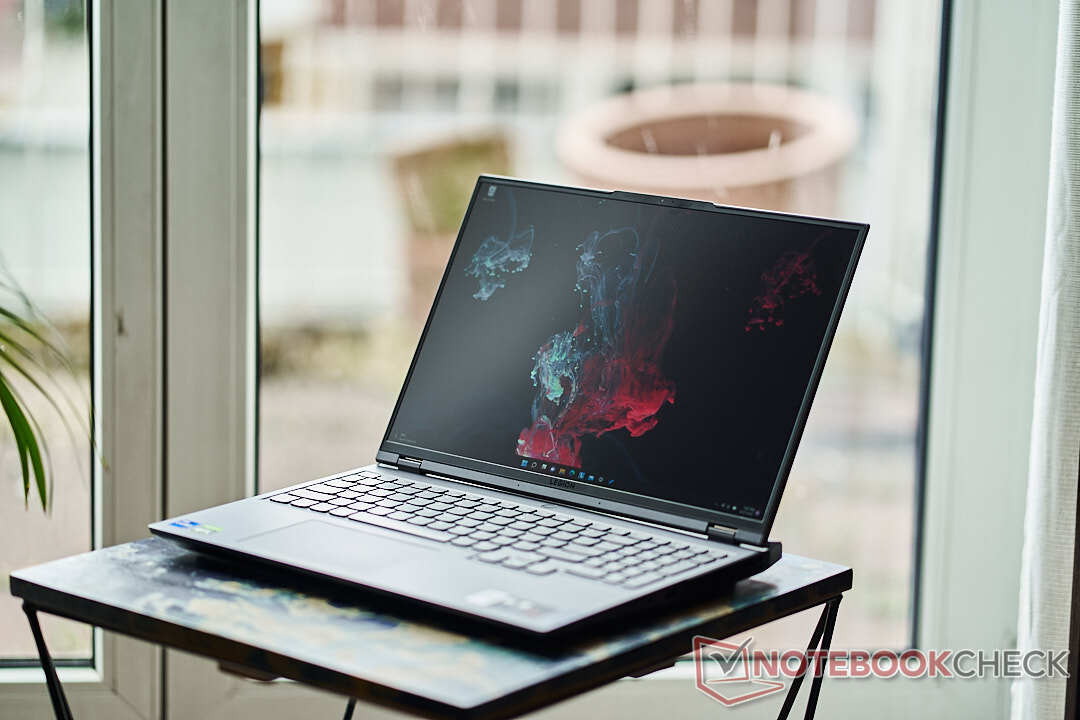
显示 - 快速的165赫兹满足G-Sync和WQHD分辨率

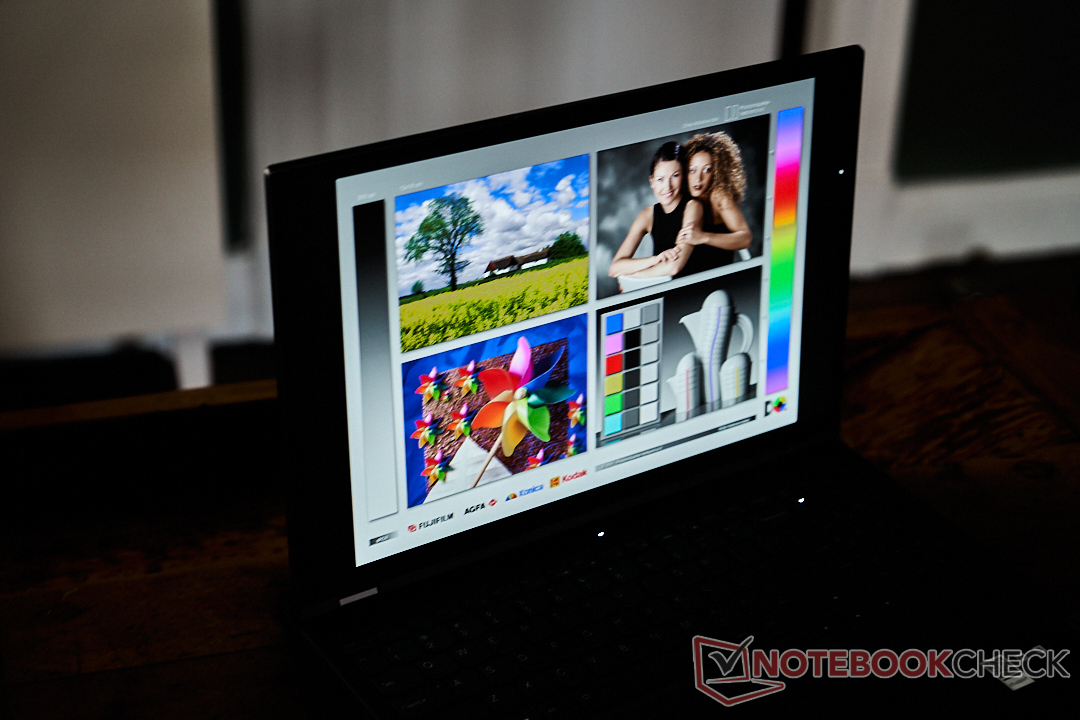
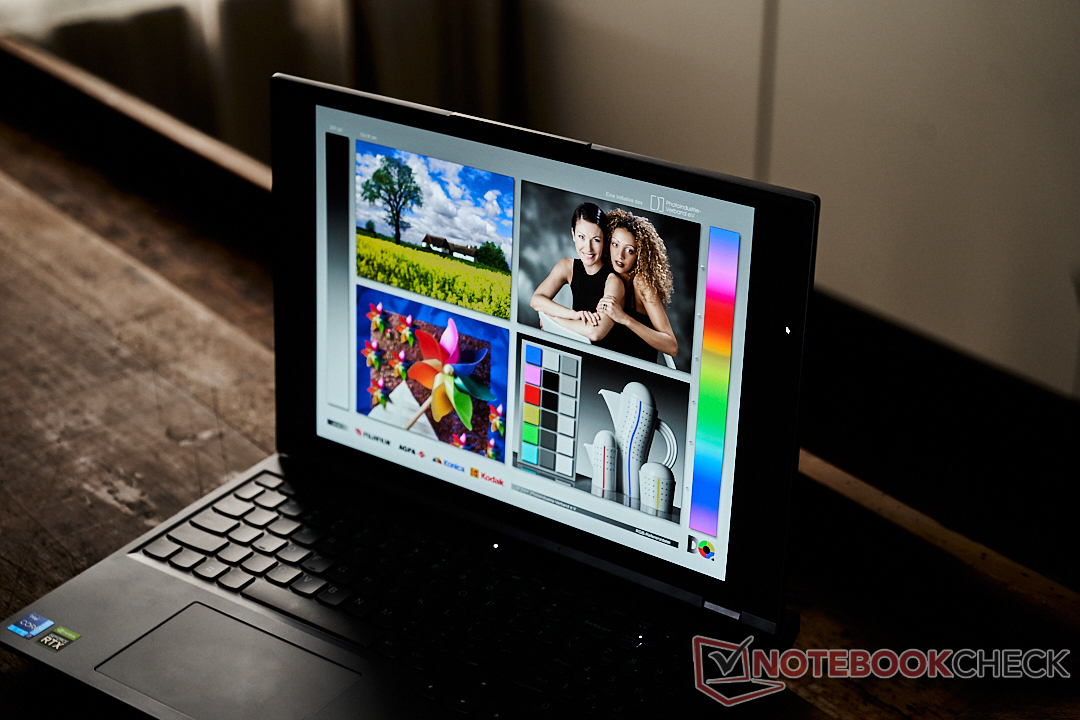
16英寸显示屏正在成为最新游戏笔记本的越来越多的标准,而Legion 版本就是一个很好的例子。这里为游戏玩家、内容编写者以及日常使用提供了相当多的东西。哑光显示屏提供典型的IPS对比度,几乎从任何角度都有很好的可读性。与竞争对手相比,联想的最大亮度水平是最高的,尽管显示亮度只有85%左右,但还可以更好。
16:10版本的QHD分辨率为2,560 x 1,600像素,在任何使用场景下都能提供清晰的图像,而磨砂显示屏和高亮度水平的结合甚至使户外使用成为可能。游戏玩家将欣赏165赫兹的高刷新率和令人愉快的快速响应时间。虽然这款显示器并没有对最近测试的360赫兹4毫秒的屏幕构成严重挑战 MSI Vector GP76的360赫兹4毫秒屏幕构成严重挑战,但它仍能满足快速射击者的需要。
| |||||||||||||||||||||||||
Brightness Distribution: 85 %
Contrast: 1144:1 (Black: 0.45 cd/m²)
ΔE ColorChecker Calman: 2.38 | ∀{0.5-29.43 Ø4.73}
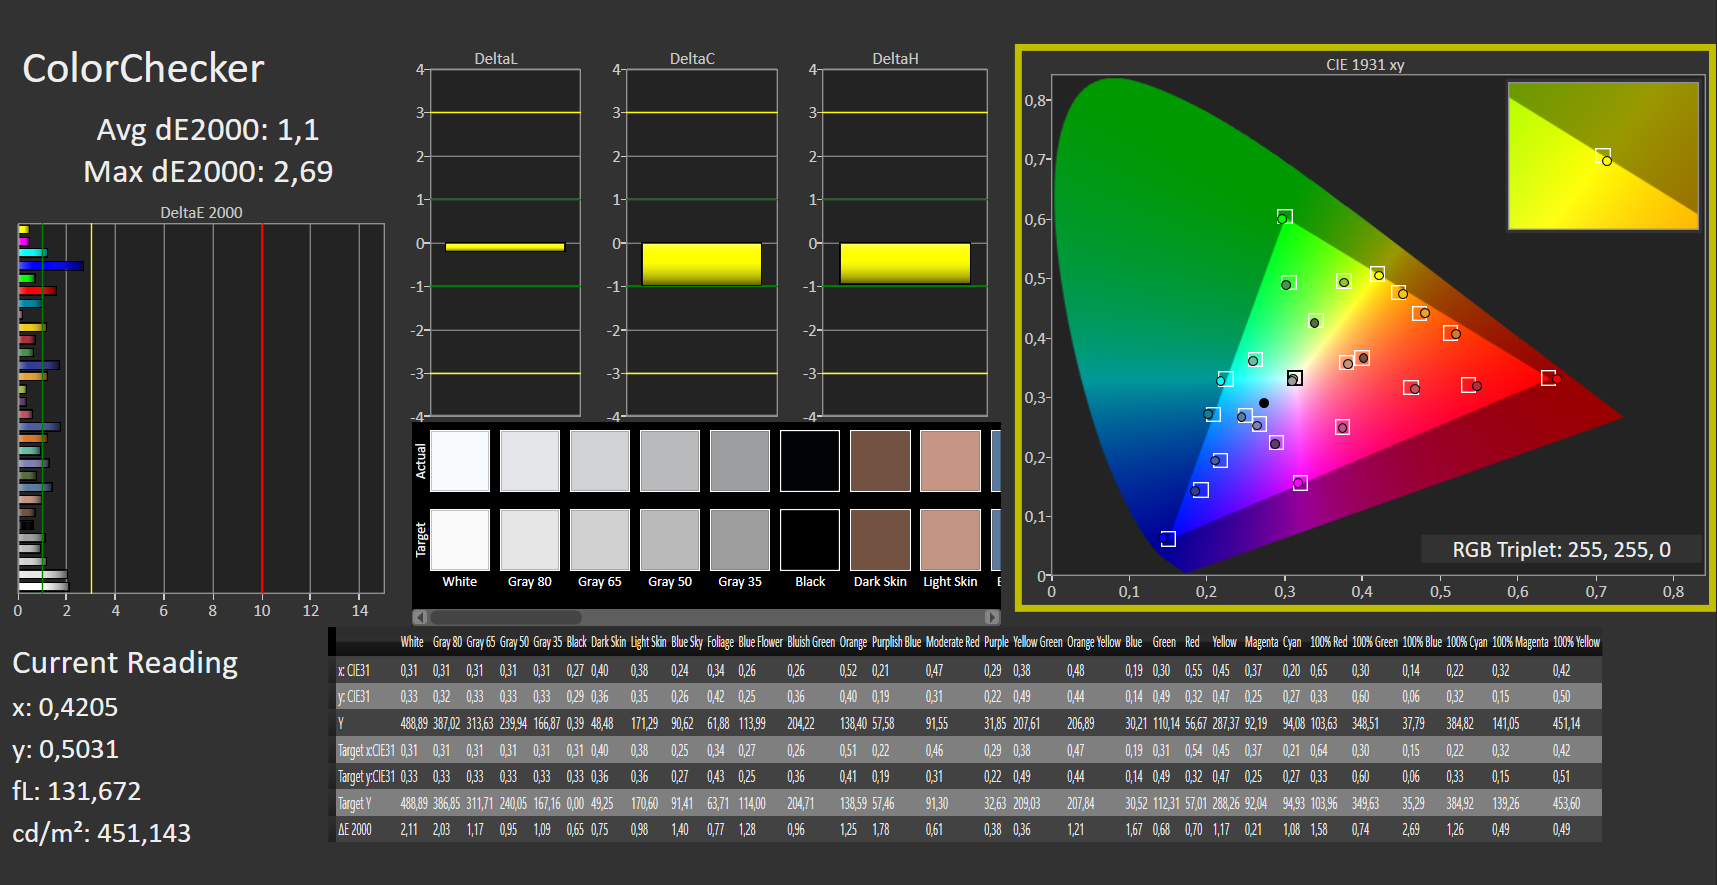
calibrated: 1.1
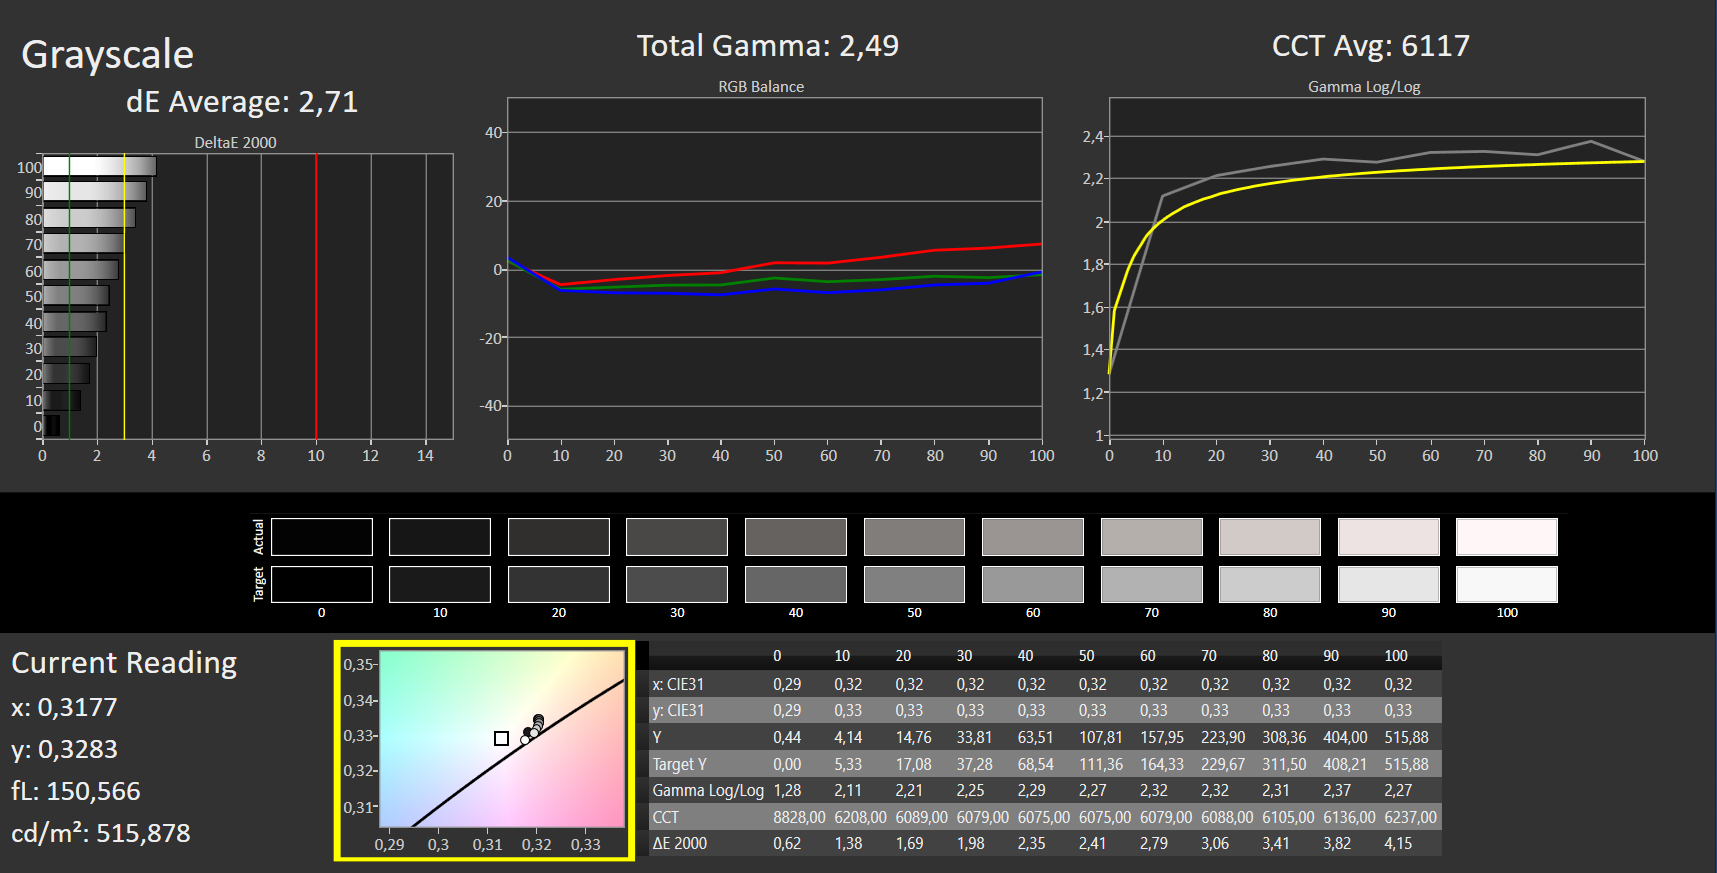
ΔE Greyscale Calman: 2.71 | ∀{0.09-98 Ø4.97}
70.45% AdobeRGB 1998 (Argyll 3D)
98.38% sRGB (Argyll 3D)
68.53% Display P3 (Argyll 3D)
Gamma: 2.49
CCT: 6117 K
| Lenovo Legion 5 Pro 16IAH7H BOE CCQ_NE160QDM_NY1, IPS, 2560x1600, 16" | HP Omen 16-b1090ng BOE09E5, IPS, 2560x1440, 16.1" | HP Omen 16-c0077ng BOE09E5, IPS, 2560x1440, 16.1" | Gigabyte Aero 16 YE5 Samsung SDC416B, AMOLED, 3840x2400, 16" | Alienware x14 i7 RTX 3060 SHP154D, IPS, 1920x1080, 14" | |
|---|---|---|---|---|---|
| Display | 3% | -0% | 24% | ||
| Display P3 Coverage (%) | 68.53 | 71 4% | 68.8 0% | 99.6 45% | |
| sRGB Coverage (%) | 98.38 | 97.9 0% | 96.9 -2% | 100 2% | |
| AdobeRGB 1998 Coverage (%) | 70.45 | 73.3 4% | 71.1 1% | 87.6 24% | |
| Response Times | -31% | -30% | 75% | 2% | |
| Response Time Grey 50% / Grey 80% * (ms) | 14 ? | 14.5 ? -4% | 13 ? 7% | 2.4 ? 83% | 9.6 ? 31% |
| Response Time Black / White * (ms) | 6 ? | 9.4 ? -57% | 10 ? -67% | 2 ? 67% | 7.6 ? -27% |
| PWM Frequency (Hz) | 60 ? | ||||
| Screen | -44% | -27% | 406% | -8% | |
| Brightness middle (cd/m²) | 515 | 335 -35% | 297 -42% | 368 -29% | 434 -16% |
| Brightness (cd/m²) | 475 | 319 -33% | 283 -40% | 368 -23% | 411 -13% |
| Brightness Distribution (%) | 85 | 90 6% | 91 7% | 93 9% | 89 5% |
| Black Level * (cd/m²) | 0.45 | 0.28 38% | 0.22 51% | 0.01 98% | 0.25 44% |
| Contrast (:1) | 1144 | 1196 5% | 1350 18% | 36800 3117% | 1736 52% |
| Colorchecker dE 2000 * | 2.38 | 4.38 -84% | 3.25 -37% | 2.33 2% | 3 -26% |
| Colorchecker dE 2000 max. * | 4.37 | 9.48 -117% | 6.33 -45% | 4.34 1% | 7.1 -62% |
| Colorchecker dE 2000 calibrated * | 1.1 | 1.33 -21% | 1.11 -1% | 0.7 36% | |
| Greyscale dE 2000 * | 2.71 | 7 -158% | 6.97 -157% | 0.8 70% | 5.1 -88% |
| Gamma | 2.49 88% | 2.103 105% | 2.3 96% | 2.119 104% | 2.19 100% |
| CCT | 6117 106% | 6244 104% | 6050 107% | 6569 99% | 6204 105% |
| Total Average (Program / Settings) | -24% /
-32% | -19% /
-22% | 241% /
340% | 6% /
1% |
* ... smaller is better
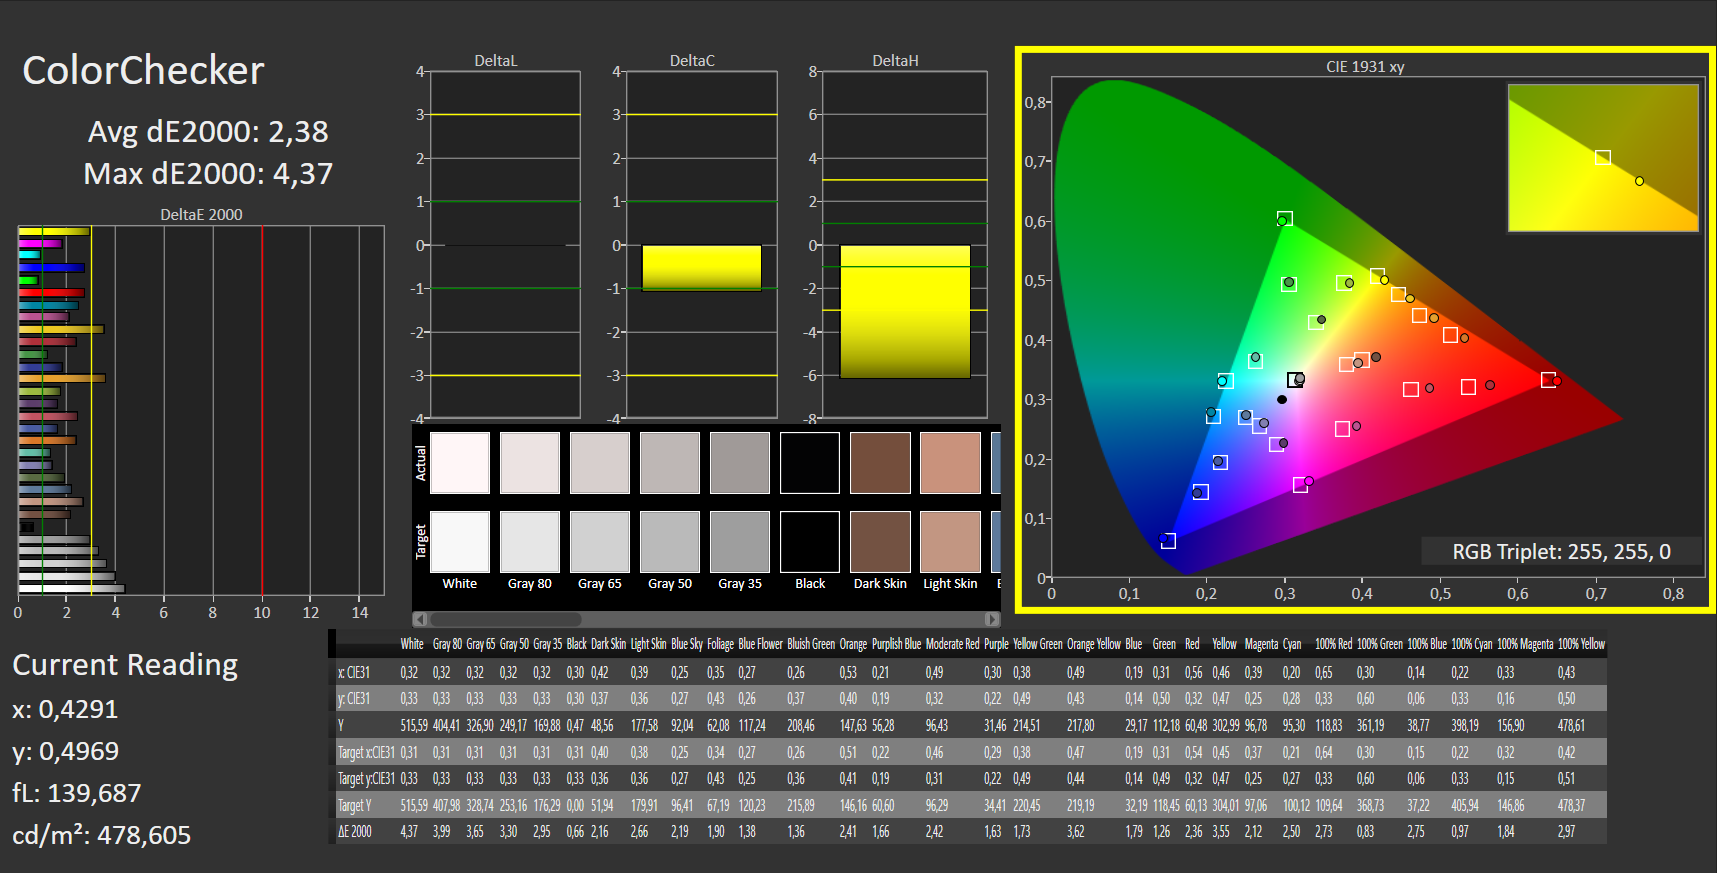
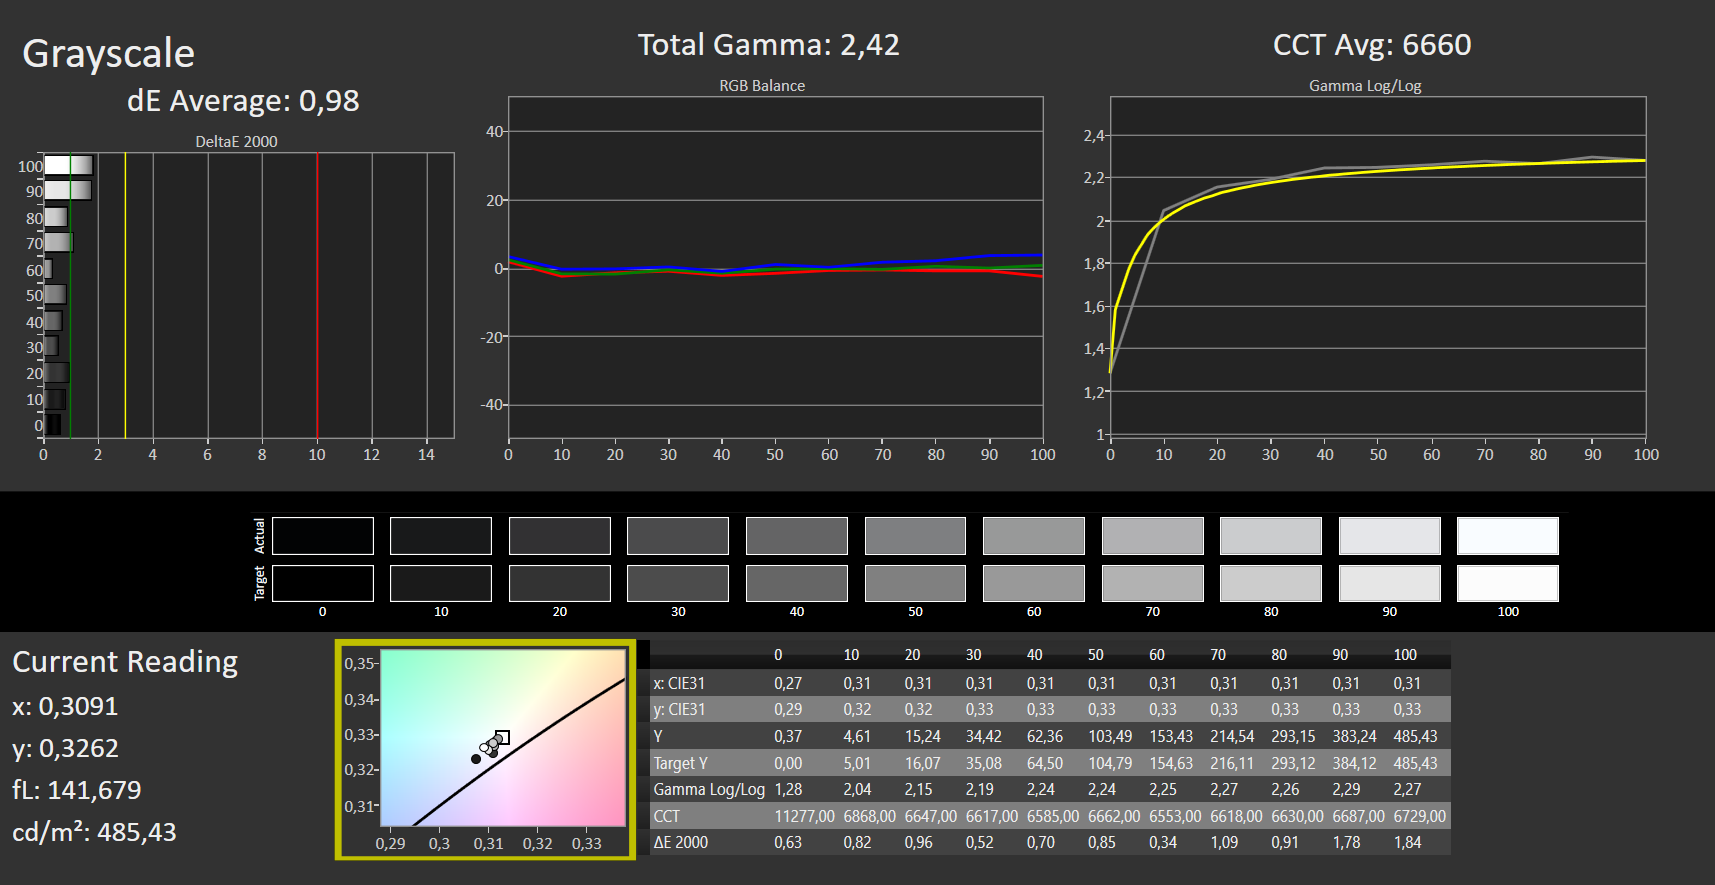
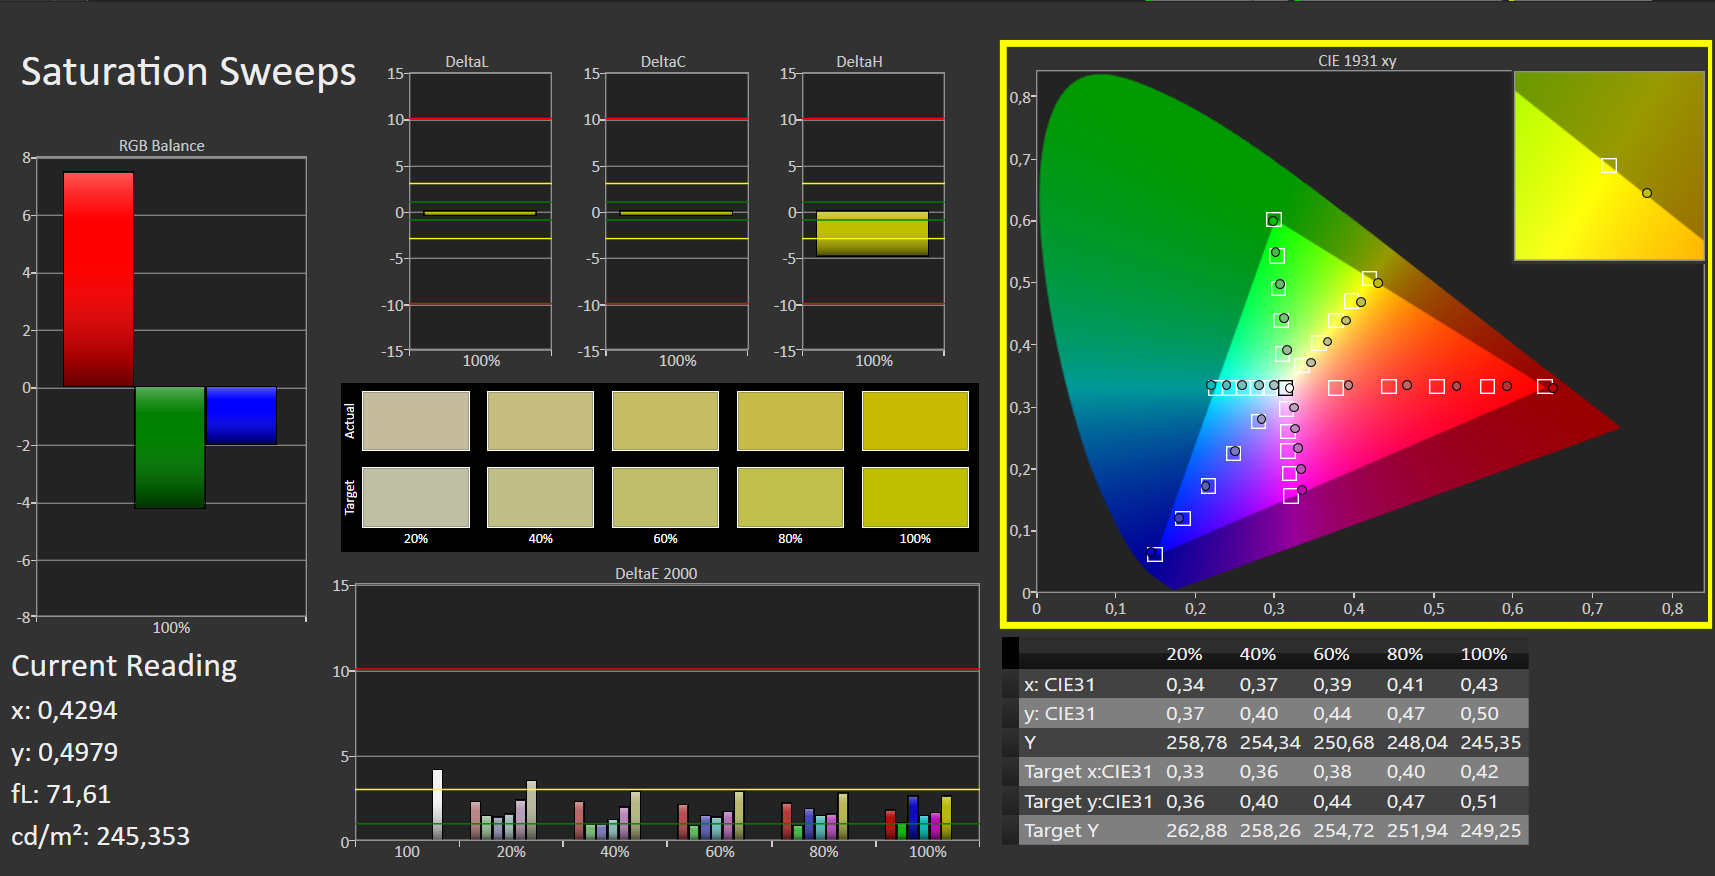
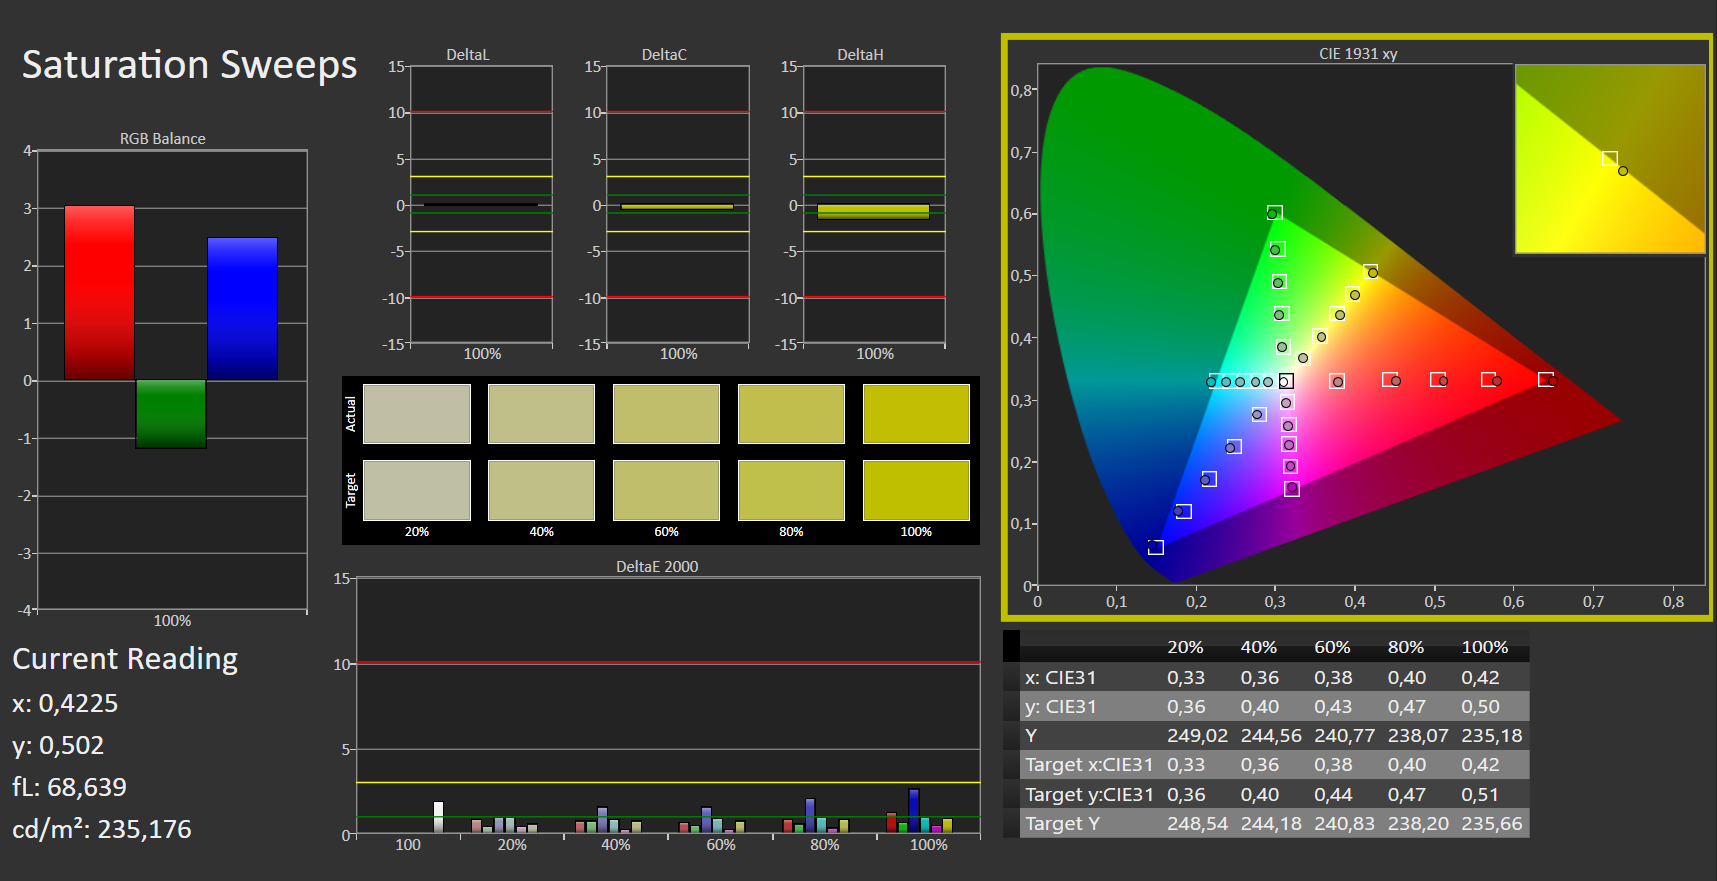
凭借常见色彩空间的坚实数值和良好的工厂校准,Legion 5 Pro的色彩再现无疑适合日常使用。由于平均色差约为2.5 DeltaE ex works,这台16英寸设备的色彩再现立即可以用于半专业的图像编辑,而专业人士可以通过一些手动校准从显示器中获得更多。
我们用专业设备进行校准,将DeltaE降低到1以下(配置文件可在上面下载),从而在sRGB的范围内提供出色的色彩再现。为了能够在专业和色彩关键的应用中不使用外部显示器,我们希望在AdobeRGB和DCI-P3色彩空间中能有更好的覆盖。在这方面,尤其是摄影师和图像编辑,有点不足。然而,对于那些主要为网络制作的摄像师来说,该显示器是绰绰有余的。
联想的X-Rite色彩应用程序允许它为经常使用的色彩空间提供几个额外的预设,这对日常创意内容工作有很大帮助。例如,sRGB模式可能对在线设计感兴趣,而使用Rec709配置文件的摄像师甚至可以在某种程度上放心地给视频材料着色。
Display Response Times
| ↔ Response Time Black to White | ||
|---|---|---|
| 6 ms ... rise ↗ and fall ↘ combined | ↗ 2 ms rise |  |
| ↘ 4 ms fall | ||
| The screen shows very fast response rates in our tests and should be very well suited for fast-paced gaming. In comparison, all tested devices range from 0.1 (minimum) to 240 (maximum) ms. » 18 % of all devices are better. This means that the measured response time is better than the average of all tested devices (19.9 ms). | ||
| ↔ Response Time 50% Grey to 80% Grey | ||
| 14 ms ... rise ↗ and fall ↘ combined | ↗ 6 ms rise |  |
| ↘ 8 ms fall | ||
| The screen shows good response rates in our tests, but may be too slow for competitive gamers. In comparison, all tested devices range from 0.165 (minimum) to 636 (maximum) ms. » 28 % of all devices are better. This means that the measured response time is better than the average of all tested devices (31.1 ms). | ||
Screen Flickering / PWM (Pulse-Width Modulation)
| Screen flickering / PWM not detected |  | ||
In comparison: 52 % of all tested devices do not use PWM to dim the display. If PWM was detected, an average of 7784 (minimum: 5 - maximum: 343500) Hz was measured. | |||
如前所述,超过500cd/m²的高亮度水平在户外也有帮助。仍应避免阳光直射,但这适用于所有笔记本电脑的大部分显示屏。哑光涂层当然可以防止你看到自己比屏幕内容更多。


性能 - 无限的i7-12700H与快速的RTX 3060相遇
虽然到目前为止,联想已经能够提供比大多数竞争对手更多的东西(大量的端口、出色的外壳和出色的显示屏),但其提供的性能几乎是无与伦比的。i7超越了它的竞争对手,尽管它有一部分配备了i9处理器。RTX 3060也提供了彻底令人印象深刻的性能。为了实现如此出色的系统性能,联想用16GB最先进的DDR5 4800内存和反应迅速的2TB RAID-0 NVME SSD阵列来支撑其核心组件。
测试条件
该设备附带的Vantage软件可能有些矫枉过正,但确实提供了三种不同的性能模式。我们所有的性能测试都是在电源模式下进行的,该模式名副其实,为i7提供了高达120W的峰值和100W的恒定功率。电源按钮上的彩色LED会发生变化,作为一个视觉指示器(红色:电源模式,白色:平衡,蓝色:静音)。静音模式也名副其实:在最初的120瓦峰值之后,处理器的功耗为65瓦,风扇的声音令人愉快地抑制。如果你不一定要追求最高的Cinebench分数,那么平衡模式也是CPU密集型计算的一个好选择。功耗约为85-90W,但与电源模式相比,风扇的噪音要小一些。
处理器
现在是2022年中期,i7-12700H已经成为一个熟悉的熟人。它已经成为快速内容创作者和游戏笔记本的英特尔标准。不同设备的性能差异很大,既取决于制造商的配置,也取决于特定设备的冷却管理。
i7是英特尔最新一代Alder Lake的主流动力,提供六个性能核心,支持超线程,时钟频率为2.4至4.7GHz。后台任务或多核支持由8个效率核心(1.8-3.5 GHz)提供,并完成14个核心提供总共20个线程。
联想允许CPU在Legion ,让16英寸笔记本在多核性能有要求的情况下,可以轻松达到领导者的顶端。一些笔记本提供的单核性能略高,配备i9的笔记本在此略微领先。然而,如今单核性能与很少的应用有关,这种性能优势在日常使用中几乎无法察觉。
Legion 5 Pro削减了一个优秀的数字,特别是在持续负载下。许多笔记本只能在著名的第一次或第二次Cinebench运行中保持其硬件性能,而Legion 5 Pro却能提供持续的性能,没有波动。无论是游戏还是创意内容的应用,都有足够的动力。
除了我们的标准化测试序列,我们还在我们的YouTube频道上使用这台笔记本电脑。我们用BlackMagics DaVinci Resolve 17对视频进行了剪辑、上色和输出。与常见的Adobe应用软件主要使用处理器不同,在这个编辑软件中,CPU和GPU被平等地使用。由于功能强大,我们的源材料(4k,BlackMagic RAW)处理起来没有任何问题,也没有掉帧。此外,在PhaseOnes Capture One和一流的Photoshop中进行的图像编辑也没有给我们带来任何问题。
Cinebench R15 Multi Loop
Cinebench R23: Multi Core | Single Core
Cinebench R20: CPU (Multi Core) | CPU (Single Core)
Cinebench R15: CPU Multi 64Bit | CPU Single 64Bit
Blender: v2.79 BMW27 CPU
7-Zip 18.03: 7z b 4 | 7z b 4 -mmt1
Geekbench 5.5: Multi-Core | Single-Core
HWBOT x265 Benchmark v2.2: 4k Preset
LibreOffice : 20 Documents To PDF
R Benchmark 2.5: Overall mean
| CPU Performance rating | |
| Average of class Gaming | |
| Gigabyte Aero 16 YE5 | |
| HP Omen 16-b1090ng | |
| Lenovo Legion 5 Pro 16IAH7H | |
| Alienware x14 i7 RTX 3060 | |
| Average Intel Core i7-12700H | |
| HP Omen 16-c0077ng -1! | |
| Cinebench R23 / Multi Core | |
| Average of class Gaming (10488 - 40970, n=110, last 2 years) | |
| Lenovo Legion 5 Pro 16IAH7H | |
| Gigabyte Aero 16 YE5 | |
| HP Omen 16-b1090ng | |
| Alienware x14 i7 RTX 3060 | |
| Average Intel Core i7-12700H (4032 - 19330, n=64) | |
| HP Omen 16-c0077ng | |
| Cinebench R23 / Single Core | |
| Average of class Gaming (1166 - 2356, n=110, last 2 years) | |
| Gigabyte Aero 16 YE5 | |
| HP Omen 16-b1090ng | |
| Alienware x14 i7 RTX 3060 | |
| Average Intel Core i7-12700H (778 - 1826, n=63) | |
| Lenovo Legion 5 Pro 16IAH7H | |
| HP Omen 16-c0077ng | |
| Cinebench R20 / CPU (Multi Core) | |
| Average of class Gaming (4029 - 16108, n=109, last 2 years) | |
| Lenovo Legion 5 Pro 16IAH7H | |
| Gigabyte Aero 16 YE5 | |
| Alienware x14 i7 RTX 3060 | |
| Average Intel Core i7-12700H (1576 - 7407, n=64) | |
| HP Omen 16-b1090ng | |
| HP Omen 16-c0077ng | |
| Cinebench R20 / CPU (Single Core) | |
| Average of class Gaming (442 - 895, n=109, last 2 years) | |
| HP Omen 16-b1090ng | |
| Gigabyte Aero 16 YE5 | |
| Alienware x14 i7 RTX 3060 | |
| Average Intel Core i7-12700H (300 - 704, n=64) | |
| Lenovo Legion 5 Pro 16IAH7H | |
| HP Omen 16-c0077ng | |
| Cinebench R15 / CPU Multi 64Bit | |
| Average of class Gaming (1578 - 6271, n=109, last 2 years) | |
| Lenovo Legion 5 Pro 16IAH7H | |
| HP Omen 16-b1090ng | |
| Gigabyte Aero 16 YE5 | |
| Alienware x14 i7 RTX 3060 | |
| Average Intel Core i7-12700H (1379 - 2916, n=70) | |
| HP Omen 16-c0077ng | |
| Cinebench R15 / CPU Single 64Bit | |
| Average of class Gaming (188.8 - 343, n=109, last 2 years) | |
| Gigabyte Aero 16 YE5 | |
| HP Omen 16-b1090ng | |
| Average Intel Core i7-12700H (113 - 263, n=65) | |
| Alienware x14 i7 RTX 3060 | |
| Lenovo Legion 5 Pro 16IAH7H | |
| HP Omen 16-c0077ng | |
| Blender / v2.79 BMW27 CPU | |
| HP Omen 16-c0077ng | |
| Average Intel Core i7-12700H (168 - 732, n=63) | |
| Alienware x14 i7 RTX 3060 | |
| Gigabyte Aero 16 YE5 | |
| HP Omen 16-b1090ng | |
| Lenovo Legion 5 Pro 16IAH7H | |
| Average of class Gaming (80 - 330, n=107, last 2 years) | |
| 7-Zip 18.03 / 7z b 4 | |
| Average of class Gaming (33491 - 148086, n=108, last 2 years) | |
| HP Omen 16-b1090ng | |
| Lenovo Legion 5 Pro 16IAH7H | |
| Gigabyte Aero 16 YE5 | |
| Alienware x14 i7 RTX 3060 | |
| Average Intel Core i7-12700H (22844 - 73067, n=63) | |
| 7-Zip 18.03 / 7z b 4 -mmt1 | |
| Average of class Gaming (4199 - 7436, n=108, last 2 years) | |
| Gigabyte Aero 16 YE5 | |
| HP Omen 16-b1090ng | |
| Average Intel Core i7-12700H (2743 - 5972, n=63) | |
| Alienware x14 i7 RTX 3060 | |
| Lenovo Legion 5 Pro 16IAH7H | |
| HP Omen 16-c0077ng | |
| Geekbench 5.5 / Multi-Core | |
| Average of class Gaming (6460 - 27010, n=108, last 2 years) | |
| Gigabyte Aero 16 YE5 | |
| HP Omen 16-b1090ng | |
| Alienware x14 i7 RTX 3060 | |
| Lenovo Legion 5 Pro 16IAH7H | |
| Average Intel Core i7-12700H (5144 - 13745, n=64) | |
| HP Omen 16-c0077ng | |
| Geekbench 5.5 / Single-Core | |
| Average of class Gaming (986 - 2474, n=108, last 2 years) | |
| Gigabyte Aero 16 YE5 | |
| HP Omen 16-b1090ng | |
| Alienware x14 i7 RTX 3060 | |
| Average Intel Core i7-12700H (803 - 1851, n=64) | |
| Lenovo Legion 5 Pro 16IAH7H | |
| HP Omen 16-c0077ng | |
| HWBOT x265 Benchmark v2.2 / 4k Preset | |
| Average of class Gaming (11.5 - 44.3, n=108, last 2 years) | |
| Lenovo Legion 5 Pro 16IAH7H | |
| HP Omen 16-b1090ng | |
| Gigabyte Aero 16 YE5 | |
| Alienware x14 i7 RTX 3060 | |
| Average Intel Core i7-12700H (4.67 - 21.8, n=64) | |
| HP Omen 16-c0077ng | |
| LibreOffice / 20 Documents To PDF | |
| HP Omen 16-c0077ng | |
| Average of class Gaming (19 - 88.8, n=108, last 2 years) | |
| Average Intel Core i7-12700H (34.2 - 95.3, n=63) | |
| HP Omen 16-b1090ng | |
| Lenovo Legion 5 Pro 16IAH7H | |
| Alienware x14 i7 RTX 3060 | |
| Gigabyte Aero 16 YE5 | |
| R Benchmark 2.5 / Overall mean | |
| HP Omen 16-c0077ng | |
| Lenovo Legion 5 Pro 16IAH7H | |
| Average Intel Core i7-12700H (0.4441 - 1.052, n=63) | |
| Alienware x14 i7 RTX 3060 | |
| HP Omen 16-b1090ng | |
| Average of class Gaming (0.3439 - 0.759, n=109, last 2 years) | |
| Gigabyte Aero 16 YE5 | |
* ... smaller is better
AIDA64: FP32 Ray-Trace | FPU Julia | CPU SHA3 | CPU Queen | FPU SinJulia | FPU Mandel | CPU AES | CPU ZLib | FP64 Ray-Trace | CPU PhotoWorxx
| Performance rating | |
| Average of class Gaming | |
| HP Omen 16-c0077ng | |
| Lenovo Legion 5 Pro 16IAH7H | |
| Alienware x14 i7 RTX 3060 | |
| Average Intel Core i7-12700H | |
| Gigabyte Aero 16 YE5 | |
| HP Omen 16-b1090ng | |
| AIDA64 / FP32 Ray-Trace | |
| Average of class Gaming (10227 - 85542, n=107, last 2 years) | |
| Lenovo Legion 5 Pro 16IAH7H | |
| Lenovo Legion 5 Pro 16IAH7H | |
| HP Omen 16-c0077ng | |
| Average Intel Core i7-12700H (2585 - 17957, n=64) | |
| Alienware x14 i7 RTX 3060 | |
| Gigabyte Aero 16 YE5 | |
| HP Omen 16-b1090ng | |
| AIDA64 / FPU Julia | |
| Average of class Gaming (51376 - 238426, n=107, last 2 years) | |
| HP Omen 16-c0077ng | |
| Lenovo Legion 5 Pro 16IAH7H | |
| Lenovo Legion 5 Pro 16IAH7H | |
| Average Intel Core i7-12700H (12439 - 90760, n=64) | |
| Alienware x14 i7 RTX 3060 | |
| Gigabyte Aero 16 YE5 | |
| HP Omen 16-b1090ng | |
| AIDA64 / CPU SHA3 | |
| Average of class Gaming (2180 - 9817, n=107, last 2 years) | |
| Lenovo Legion 5 Pro 16IAH7H | |
| Lenovo Legion 5 Pro 16IAH7H | |
| HP Omen 16-c0077ng | |
| Average Intel Core i7-12700H (833 - 4242, n=64) | |
| Gigabyte Aero 16 YE5 | |
| Alienware x14 i7 RTX 3060 | |
| HP Omen 16-b1090ng | |
| AIDA64 / CPU Queen | |
| Average of class Gaming (49785 - 173351, n=98, last 2 years) | |
| Gigabyte Aero 16 YE5 | |
| HP Omen 16-b1090ng | |
| Alienware x14 i7 RTX 3060 | |
| HP Omen 16-c0077ng | |
| Lenovo Legion 5 Pro 16IAH7H | |
| Average Intel Core i7-12700H (57923 - 103202, n=63) | |
| AIDA64 / FPU SinJulia | |
| Average of class Gaming (4424 - 33636, n=107, last 2 years) | |
| HP Omen 16-c0077ng | |
| Lenovo Legion 5 Pro 16IAH7H | |
| Lenovo Legion 5 Pro 16IAH7H | |
| Gigabyte Aero 16 YE5 | |
| Alienware x14 i7 RTX 3060 | |
| HP Omen 16-b1090ng | |
| Average Intel Core i7-12700H (3249 - 9939, n=64) | |
| AIDA64 / FPU Mandel | |
| Average of class Gaming (25115 - 128721, n=107, last 2 years) | |
| HP Omen 16-c0077ng | |
| Lenovo Legion 5 Pro 16IAH7H | |
| Lenovo Legion 5 Pro 16IAH7H | |
| Average Intel Core i7-12700H (7135 - 44760, n=64) | |
| Gigabyte Aero 16 YE5 | |
| Alienware x14 i7 RTX 3060 | |
| HP Omen 16-b1090ng | |
| AIDA64 / CPU AES | |
| Lenovo Legion 5 Pro 16IAH7H | |
| Lenovo Legion 5 Pro 16IAH7H | |
| HP Omen 16-c0077ng | |
| Average of class Gaming (39258 - 247074, n=107, last 2 years) | |
| Alienware x14 i7 RTX 3060 | |
| Gigabyte Aero 16 YE5 | |
| Average Intel Core i7-12700H (31839 - 144360, n=64) | |
| HP Omen 16-b1090ng | |
| AIDA64 / CPU ZLib | |
| Average of class Gaming (574 - 2531, n=107, last 2 years) | |
| Lenovo Legion 5 Pro 16IAH7H | |
| Lenovo Legion 5 Pro 16IAH7H | |
| Alienware x14 i7 RTX 3060 | |
| Gigabyte Aero 16 YE5 | |
| Average Intel Core i7-12700H (305 - 1171, n=64) | |
| HP Omen 16-b1090ng | |
| HP Omen 16-c0077ng | |
| AIDA64 / FP64 Ray-Trace | |
| Average of class Gaming (5509 - 45446, n=107, last 2 years) | |
| Lenovo Legion 5 Pro 16IAH7H | |
| Lenovo Legion 5 Pro 16IAH7H | |
| HP Omen 16-c0077ng | |
| Average Intel Core i7-12700H (1437 - 9692, n=64) | |
| Alienware x14 i7 RTX 3060 | |
| Gigabyte Aero 16 YE5 | |
| HP Omen 16-b1090ng | |
| AIDA64 / CPU PhotoWorxx | |
| Alienware x14 i7 RTX 3060 | |
| Average of class Gaming (12271 - 89891, n=107, last 2 years) | |
| HP Omen 16-b1090ng | |
| Gigabyte Aero 16 YE5 | |
| Lenovo Legion 5 Pro 16IAH7H | |
| Lenovo Legion 5 Pro 16IAH7H | |
| Average Intel Core i7-12700H (12863 - 52207, n=64) | |
| HP Omen 16-c0077ng | |
系统性能
这款顶级笔记本电脑的系统性能是无可辩驳的,尽管有 "小 "安培显卡,我们的测试配置相对于其他笔记本电脑来说是非常好的。正如我们的PC Mark结果和我们自己的观察所显示的那样,Legion 以闪电般的速度掌握了日常任务,没有什么能使它脱离其步伐。在Photoshop中编辑图片,跳转到视频编辑程序,并在YouTube上观看4K视频日志,都是很容易的事;即使打开大量的浏览器标签,仍有足够的容量。
CrossMark: Overall | Productivity | Creativity | Responsiveness
| PCMark 10 / Score | |
| Average of class Gaming (5828 - 11574, n=94, last 2 years) | |
| Gigabyte Aero 16 YE5 | |
| Lenovo Legion 5 Pro 16IAH7H | |
| HP Omen 16-b1090ng | |
| Average Intel Core i7-12700H, NVIDIA GeForce RTX 3060 Laptop GPU (5986 - 8156, n=12) | |
| Alienware x14 i7 RTX 3060 | |
| HP Omen 16-c0077ng | |
| PCMark 10 / Essentials | |
| Lenovo Legion 5 Pro 16IAH7H | |
| Gigabyte Aero 16 YE5 | |
| Average of class Gaming (8810 - 12600, n=98, last 2 years) | |
| Average Intel Core i7-12700H, NVIDIA GeForce RTX 3060 Laptop GPU (9289 - 12144, n=12) | |
| HP Omen 16-c0077ng | |
| Alienware x14 i7 RTX 3060 | |
| HP Omen 16-b1090ng | |
| PCMark 10 / Productivity | |
| Average of class Gaming (6845 - 18766, n=96, last 2 years) | |
| Gigabyte Aero 16 YE5 | |
| Alienware x14 i7 RTX 3060 | |
| HP Omen 16-b1090ng | |
| Lenovo Legion 5 Pro 16IAH7H | |
| HP Omen 16-c0077ng | |
| Average Intel Core i7-12700H, NVIDIA GeForce RTX 3060 Laptop GPU (6161 - 10362, n=12) | |
| PCMark 10 / Digital Content Creation | |
| Average of class Gaming (7602 - 19657, n=96, last 2 years) | |
| Gigabyte Aero 16 YE5 | |
| Lenovo Legion 5 Pro 16IAH7H | |
| HP Omen 16-b1090ng | |
| Average Intel Core i7-12700H, NVIDIA GeForce RTX 3060 Laptop GPU (8950 - 12554, n=12) | |
| HP Omen 16-c0077ng | |
| Alienware x14 i7 RTX 3060 | |
| CrossMark / Overall | |
| Gigabyte Aero 16 YE5 | |
| Average of class Gaming (1366 - 2409, n=96, last 2 years) | |
| Alienware x14 i7 RTX 3060 | |
| Average Intel Core i7-12700H, NVIDIA GeForce RTX 3060 Laptop GPU (1649 - 2017, n=11) | |
| Lenovo Legion 5 Pro 16IAH7H | |
| CrossMark / Productivity | |
| Gigabyte Aero 16 YE5 | |
| Average of class Gaming (1386 - 2254, n=96, last 2 years) | |
| Alienware x14 i7 RTX 3060 | |
| Average Intel Core i7-12700H, NVIDIA GeForce RTX 3060 Laptop GPU (1536 - 1958, n=11) | |
| Lenovo Legion 5 Pro 16IAH7H | |
| CrossMark / Creativity | |
| Average of class Gaming (1343 - 2729, n=96, last 2 years) | |
| Gigabyte Aero 16 YE5 | |
| Alienware x14 i7 RTX 3060 | |
| Average Intel Core i7-12700H, NVIDIA GeForce RTX 3060 Laptop GPU (1816 - 2084, n=11) | |
| Lenovo Legion 5 Pro 16IAH7H | |
| CrossMark / Responsiveness | |
| Gigabyte Aero 16 YE5 | |
| Alienware x14 i7 RTX 3060 | |
| Lenovo Legion 5 Pro 16IAH7H | |
| Average of class Gaming (1226 - 2334, n=96, last 2 years) | |
| Average Intel Core i7-12700H, NVIDIA GeForce RTX 3060 Laptop GPU (1210 - 2207, n=11) | |
| PCMark 10 Score | 7531 points | |
Help | ||
| AIDA64 / Memory Copy | |
| Alienware x14 i7 RTX 3060 | |
| Average of class Gaming (21750 - 129946, n=107, last 2 years) | |
| HP Omen 16-b1090ng | |
| Gigabyte Aero 16 YE5 | |
| Lenovo Legion 5 Pro 16IAH7H | |
| Lenovo Legion 5 Pro 16IAH7H | |
| Average Intel Core i7-12700H (25615 - 80511, n=64) | |
| HP Omen 16-c0077ng | |
| AIDA64 / Memory Read | |
| Alienware x14 i7 RTX 3060 | |
| Average of class Gaming (22956 - 118858, n=107, last 2 years) | |
| HP Omen 16-b1090ng | |
| Gigabyte Aero 16 YE5 | |
| Lenovo Legion 5 Pro 16IAH7H | |
| Lenovo Legion 5 Pro 16IAH7H | |
| Average Intel Core i7-12700H (25586 - 79442, n=64) | |
| HP Omen 16-c0077ng | |
| AIDA64 / Memory Write | |
| Average of class Gaming (22297 - 135096, n=107, last 2 years) | |
| HP Omen 16-b1090ng | |
| Alienware x14 i7 RTX 3060 | |
| Gigabyte Aero 16 YE5 | |
| Lenovo Legion 5 Pro 16IAH7H | |
| Lenovo Legion 5 Pro 16IAH7H | |
| Average Intel Core i7-12700H (23679 - 88660, n=64) | |
| HP Omen 16-c0077ng | |
| AIDA64 / Memory Latency | |
| Lenovo Legion 5 Pro 16IAH7H | |
| Lenovo Legion 5 Pro 16IAH7H | |
| Alienware x14 i7 RTX 3060 | |
| Average of class Gaming (75.3 - 259, n=107, last 2 years) | |
| HP Omen 16-b1090ng | |
| Gigabyte Aero 16 YE5 | |
| HP Omen 16-c0077ng | |
| Average Intel Core i7-12700H (76.2 - 133.9, n=62) | |
* ... smaller is better
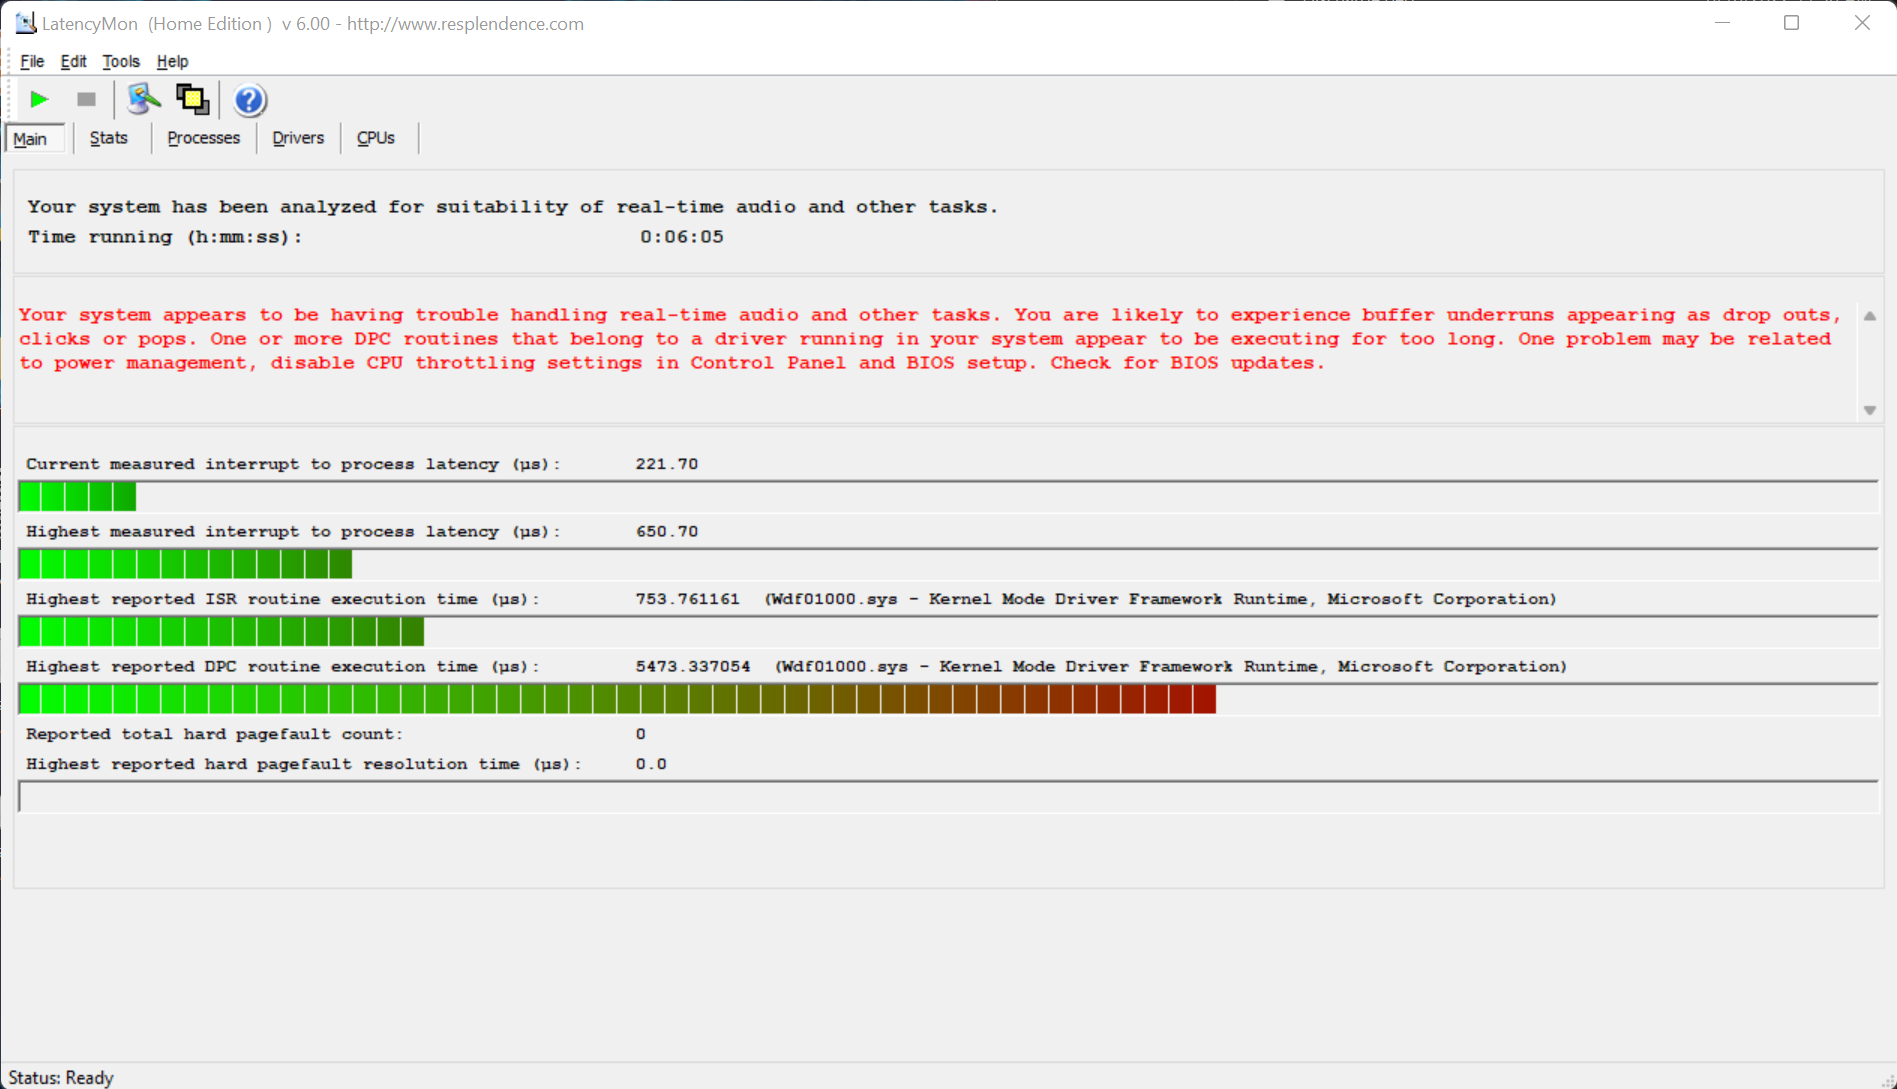
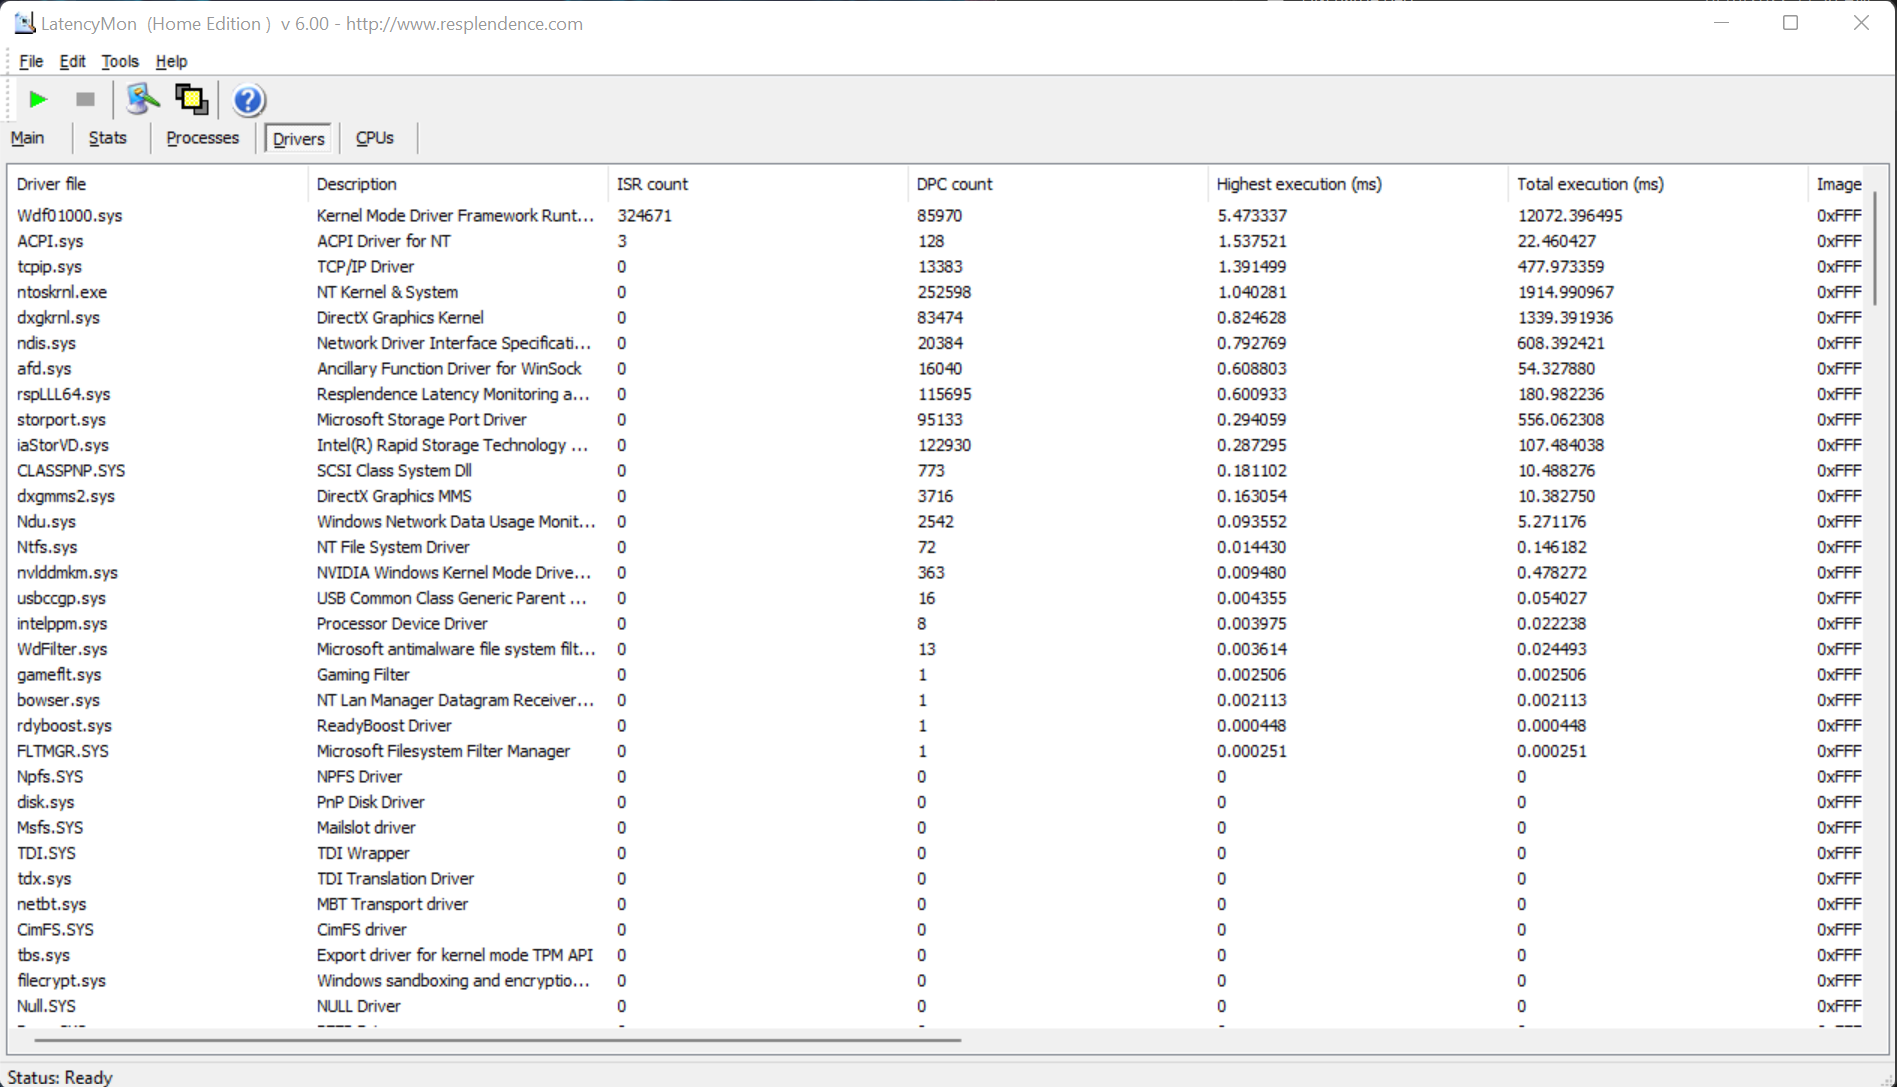
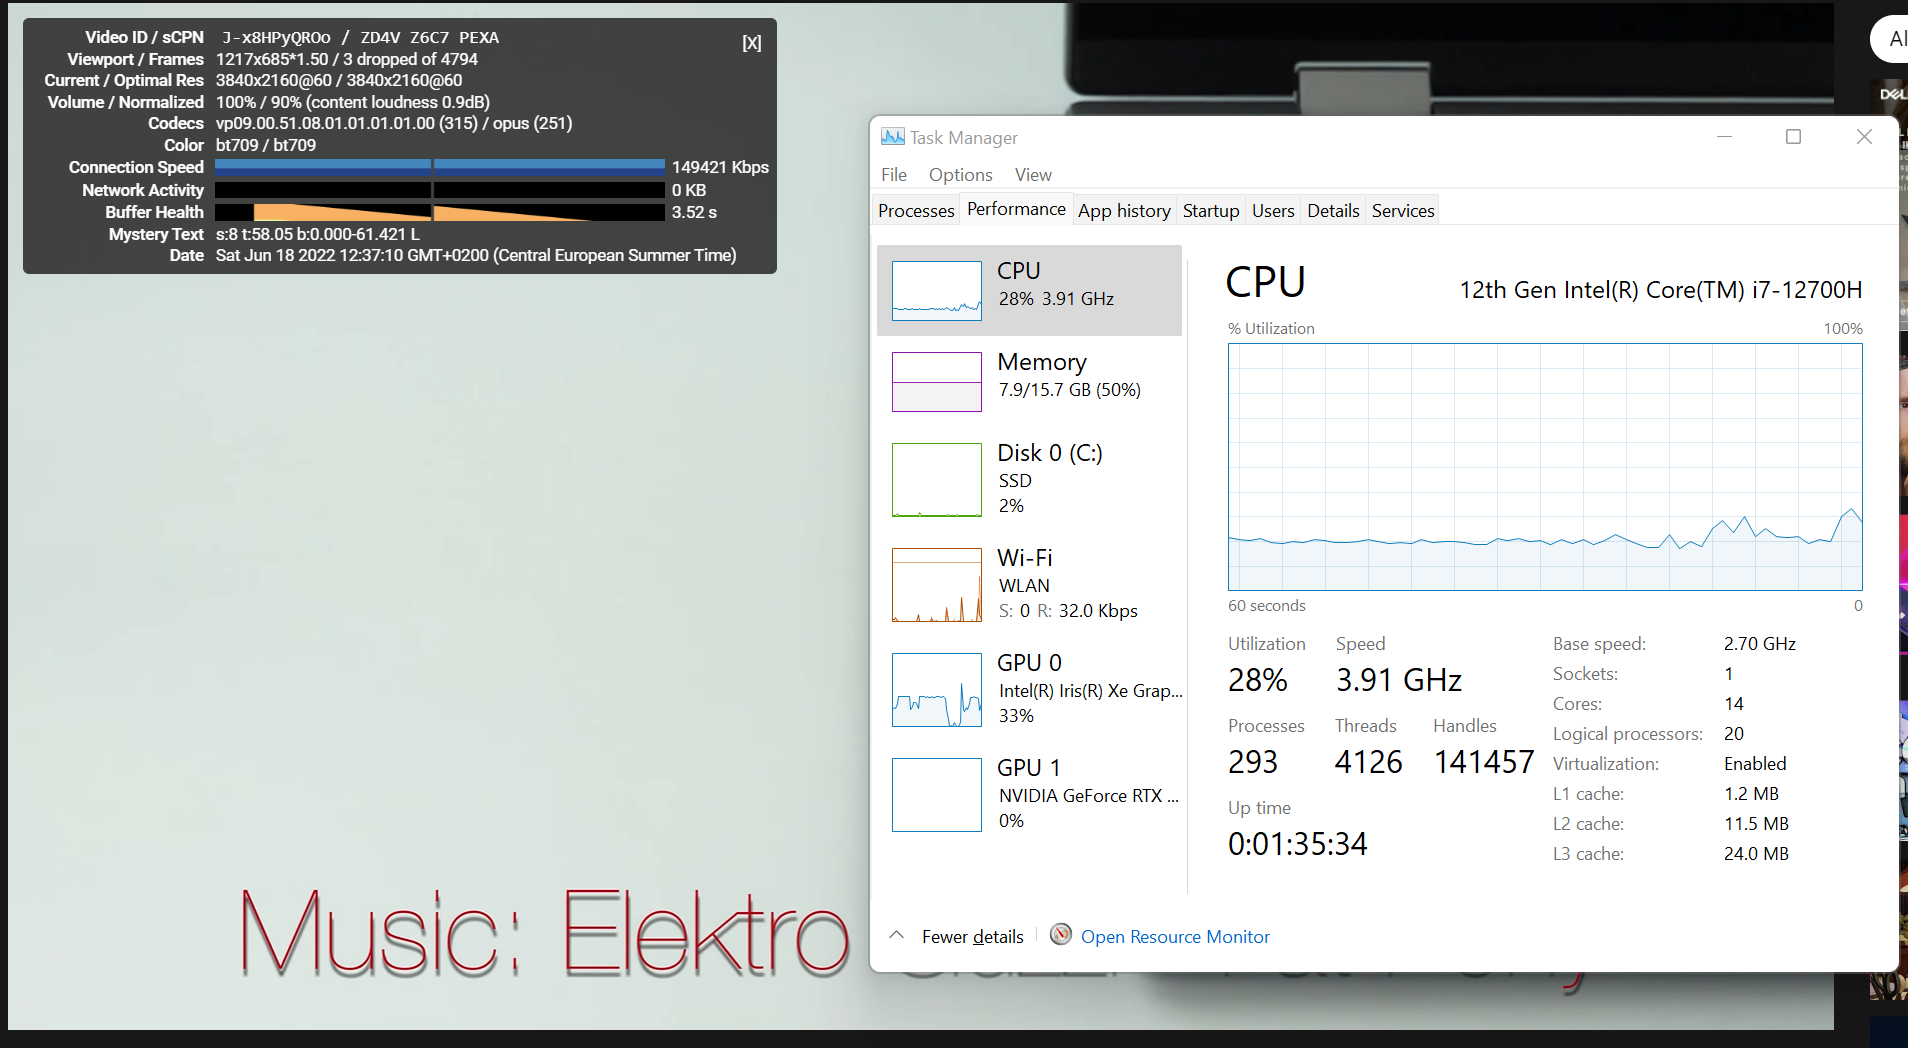
DPC延时
我们的评测设备的LatencyMon测试结果在某种程度上比竞争对手的要好得多,但当涉及到实时音频编辑时,Legion 不是首选的设备。然而,考虑到它本质上是一台游戏笔记本电脑,并考虑到我们的YouTube视频只掉了一小部分帧,LatencyMon的结果可能是可以接受的。然而,在4K视频播放过程中,CPU/GPU的负载确实相当高,我们希望看到系统资源的部署更有效一些。
| DPC Latencies / LatencyMon - interrupt to process latency (max), Web, Youtube, Prime95 | |
| HP Omen 16-c0077ng | |
| Alienware x14 i7 RTX 3060 | |
| HP Omen 16-b1090ng | |
| Lenovo Legion 5 Pro 16IAH7H | |
| Gigabyte Aero 16 YE5 | |
* ... smaller is better
存储设备
最新的PCI-E第4代NVME固态硬盘实际上已经非常快了,以至于它们在日常使用中的性能差异几乎不起作用,几乎感觉不到。尽管如此,联想还是决定在Legion 5i Pro的RAID-0阵列中加入两块最快的指数。
虽然这些固态硬盘中的每一个都有很好的单独得分,并在我们的性能表上名列前茅,但它们在双阵列中的读写率几乎翻了一番。约12GB的峰值测量值在纸面上听起来非常令人印象深刻,但可能没有多少应用会受益于这种突破性的速度。当然,这绝不是一种抱怨,因为有2TB的总存储空间可用于游戏、图片或高分辨率视频数据。特别是在日常工作中,不得不使用各种外部硬盘的烦扰变得可以避免。固态硬盘的耐力测试确实在较长时间后出现了反复下降的情况。这可能是温度过高的表现,在固态硬盘持续高负荷下会出现这种情况。

* ... smaller is better
Disk Throttling: DiskSpd Read Loop, Queue Depth 8
GPU性能
与CPU一样,建模工具已不足以可靠地评估显卡的性能。Nvidia在功耗方面给制造商留下了很大的余地,因此,有时很难预测图形芯片在现代笔记本电脑中的表现。联想在这里再次树立了一个好榜样。中端RTX 3060在Legion 5中连续使用120瓦,最大功率约为140瓦。见我们的评论,这里)的速度约为20%,而技嘉Aero 16中的3080 Ti,例如,仅领先几个百分点。与具有相同GPU的笔记本电脑相比,较小的安培卡也表现良好。配备RTX 3060的Legion 5 Pro比该类别的平均水平高出14%,甚至比Alienware x14的3060还要高出20%。
| 3DMark 11 Performance | 27368 points | |
| 3DMark Cloud Gate Standard Score | 55891 points | |
| 3DMark Fire Strike Score | 20491 points | |
| 3DMark Fire Strike Extreme Score | 10399 points | |
| 3DMark Time Spy Score | 9640 points | |
| 3DMark Steel Nomad Score | 1882 points | |
| 3DMark Steel Nomad Light Score | 8440 points | |
Help | ||
游戏性能
撇开合成基准不谈,在游戏方面,特别好的印象一直存在。性能非常好,在目前几乎所有的游戏中都能在高细节中实现60FPS左右。如果QHD显示器的原生刷新率用完了,分辨率应该降低到全高清,甚至可能是高清。
| The Witcher 3 - 1920x1080 Ultra Graphics & Postprocessing (HBAO+) | |
| Average of class Gaming (95 - 240, n=8, last 2 years) | |
| Lenovo Legion 5 Pro 16 G7 i7 RTX 3070Ti | |
| HP Omen 16-b1090ng | |
| Gigabyte Aero 16 YE5 | |
| Lenovo Legion 5 Pro 16IAH7H | |
| HP Omen 16-c0077ng | |
| Average NVIDIA GeForce RTX 3060 Laptop GPU (58.2 - 91.5, n=48) | |
| Alienware x14 i7 RTX 3060 | |
| Alienware x14 i7 RTX 3060 | |
| F1 2021 - 1920x1080 Ultra High Preset + Raytracing AA:T AF:16x | |
| Lenovo Legion 5 Pro 16 G7 i7 RTX 3070Ti | |
| Lenovo Legion 5 Pro 16IAH7H | |
| Gigabyte Aero 16 YE5 | |
| Alienware x14 i7 RTX 3060 | |
| Average NVIDIA GeForce RTX 3060 Laptop GPU (67 - 112.8, n=9) | |
| Far Cry 6 - 1920x1080 Ultra Graphics Quality + HD Textures AA:T | |
| Average of class Gaming (96.3 - 135.7, n=3, last 2 years) | |
| Lenovo Legion 5 Pro 16IAH7H | |
| Average NVIDIA GeForce RTX 3060 Laptop GPU (59.8 - 94.3, n=6) | |
| Tiny Tina's Wonderlands | |
| 1920x1080 High Preset (DX12) | |
| Average of class Gaming (72.1 - 203, n=5, last 2 years) | |
| HP Omen 16-b1090ng | |
| Lenovo Legion 5 Pro 16IAH7H | |
| Average NVIDIA GeForce RTX 3060 Laptop GPU (94.8 - 102.7, n=2) | |
| 1920x1080 Badass Preset (DX12) | |
| Average of class Gaming (55 - 159.4, n=5, last 2 years) | |
| HP Omen 16-b1090ng | |
| Lenovo Legion 5 Pro 16IAH7H | |
| Average NVIDIA GeForce RTX 3060 Laptop GPU (72.3 - 80.5, n=3) | |
RTX 3060也能保持稳定的性能,正如我们的基准测试,特别是我们的 Witcher 3测试显示。在30分钟的测试中,刷新率只在开始时下降了几帧,然后可以永久保持,没有进一步下降。
为了在内部显示器上获得最大性能,联想为Legion 5 Pro配备了一个MUX开关和高级优化器,以绕过GPU。使用联想的Vantage软件,还可以用开关对GPU进行超频。在我们的测试中,这是很明显的,核心时钟速度平均高出50-100兆赫。
Witcher 3 FPS-Diagram
| low | med. | high | ultra | QHD DLSS | QHD FSR | QHD | 4K DLSS | 4K FSR | 4K | |
|---|---|---|---|---|---|---|---|---|---|---|
| GTA V (2015) | 185.4 | 181.3 | 161.8 | 107.8 | 83.1 | |||||
| The Witcher 3 (2015) | 389 | 276.8 | 184.6 | 88.2 | ||||||
| Dota 2 Reborn (2015) | 172.1 | 159.4 | 148.9 | 142.8 | ||||||
| Civilization 6 (2016) | 349 | 149 | 131 | |||||||
| Final Fantasy XV Benchmark (2018) | 199.2 | 117.8 | 87.2 | 63.8 | ||||||
| X-Plane 11.11 (2018) | 150.4 | 138 | 105.6 | |||||||
| World of Tanks enCore (2018) | 121.1 | |||||||||
| Far Cry 5 (2018) | 165 | 135 | 128 | 120 | 90 | |||||
| Strange Brigade (2018) | 393 | 235 | 186.6 | 160.7 | ||||||
| Apex Legends (2019) | 164.7 | 163.9 | 135.1 | 92.4 | 73.5 | 48.6 | ||||
| Borderlands 3 (2019) | 72.1 | 51.3 | ||||||||
| Gears Tactics (2020) | 109 | 73.3 | ||||||||
| Valorant (2020) | 189.4 | 304 | ||||||||
| Assassin´s Creed Valhalla (2020) | 152 | 106 | 85 | 62 | 53 | |||||
| F1 2021 (2021) | 360 | 287 | 227 | 112.8 | ||||||
| Far Cry 6 (2021) | 148.1 | 119.8 | 104.1 | 94.3 | 70.3 | |||||
| Cyberpunk 2077 1.6 (2022) | 61.9 | 38.6 | ||||||||
| Tiny Tina's Wonderlands (2022) | 180.27 | 147.17 | 102.73 | 80.51 | 56.25 | |||||
| F1 22 (2022) | 184.2 | 171.6 | 141.2 | 50.4 | 31.4 | |||||
| FIFA 23 (2022) | 116.9 | 118.2 | 111.9 | 88.9 | 62.8 | |||||
| A Plague Tale Requiem (2022) | 40.5 | 28.8 | ||||||||
| Uncharted Legacy of Thieves Collection (2022) | 57 | 34.3 | ||||||||
| Call of Duty Modern Warfare 2 2022 (2022) | 76 | 54 | ||||||||
| Spider-Man Miles Morales (2022) | 75.8 | 63.8 | ||||||||
| Starfield (2023) | 40.1 | 35.3 | 28.6 | 18.8 | ||||||
| Baldur's Gate 3 (2023) | 90.6 | 60.6 | ||||||||
| Cyberpunk 2077 (2023) | 107.6 | 85.8 | 73.3 | 63.6 | 46 | 38.2 | 22.2 | 17 | ||
| Counter-Strike 2 (2023) | 122.9 | 82.2 | 49.2 | |||||||
| EA Sports FC 24 (2023) | 125.6 | 101 | 58.2 | |||||||
| Total War Pharaoh (2023) | 97.3 | 69.3 | 36.5 | |||||||
| The Finals (2023) | 120.9 | 75.4 | 35 | |||||||
| Helldivers 2 (2024) | 73.9 | 37.9 | 27.6 | |||||||
| Horizon Forbidden West (2024) | 33.3 | 26.7 | 12.1 | |||||||
| Senua's Saga Hellblade 2 (2024) | 23.9 | 17.7 | 9.25 | |||||||
| F1 24 (2024) | 130.9 | 106.2 | 66.3 | 31 | 31.3 | 29.4 | 19.8 | 15.3 | 14 | 9.08 |
| Black Myth: Wukong (2024) | 41 | 32 | 18 | 15 | ||||||
| Star Wars Outlaws (2024) | 29.8 | 27.8 | 23.7 | 19.2 | 25.2 | 17.8 | ||||
| Space Marine 2 (2024) | 61.9 | 56.9 | 43 | 22.5 | ||||||
| Final Fantasy XVI (2024) | 49.7 | 43.8 | 40.9 | |||||||
| EA Sports FC 25 (2024) | 73.6 | 58 | 32.3 | |||||||
| Stalker 2 (2024) | 54.7 | 16.1 | 11.6 | 13.9 | 4 | |||||
| Marvel Rivals (2024) | 81 | 64 | 57 | 34 | 21 | |||||
| Kingdom Come Deliverance 2 (2025) | 60.4 | 44.2 | 43.6 | 31.6 | ||||||
| Monster Hunter Wilds (2025) | 59.6 | 49.3 | 27 | 25.5 | 18.8 | |||||
| Civilization 7 (2025) | 110.3 | 103.2 | 70.8 | 46.5 | 30.6 | |||||
| The Elder Scrolls IV Oblivion Remastered (2025) | 69 | 58.9 | 49.4 | 19.7 | 11.9 | |||||
| Doom: The Dark Ages (2025) | 62.5 | 58.1 | 50.4 | 49.9 | 40.9 | 44.8 | 31.6 | 12.7 | 10.3 | 10.4 |
| F1 25 (2025) | 186.8 | 165.1 | 126.5 | 10.4 | 10.7 | 6 | 4.54 | 1.697 | ||
| Borderlands 4 (2025) | 39.1 | 30.7 | 23.2 | 13.8 | ||||||
| Battlefield 6 (2025) | 94.1 | 82.3 | 67.9 | 45.2 | 41.1 | 26.9 | ||||
| The Outer Worlds 2 (2025) | 86.1 | 64.3 | 47.1 | 23.4 | 14.6 | |||||
| ARC Raiders (2025) | 143.8 | 90.5 | 70 | 37.5 | 27.2 | |||||
| Anno 117: Pax Romana (2025) | 80 | 59.2 | 44.6 | 24.3 | 24.9 | 17.2 | ||||
| Call of Duty Black Ops 7 (2025) | 122 | 111 | 83 | 27 | 15 | 3 | ||||
| Resident Evil Requiem (2026) | 86.1 | 60.6 | 57 | |||||||
| Death Stranding 2 (2026) | 67 | 57.2 | 51.8 | 38.8 | 42 | 26 | ||||
| Crimson Desert (2026) | 84.9 | 52 | 48.8 | 41.7 | 35 | 31.9 | ||||
| Pragmata (2026) | 58.2 | 53.8 | 39.5 | 25.2 | 19.1 | |||||
| War Thunder (2026) | 245 | 261 | 240 | 62.3 | 37.7 | 19.6 | ||||
| Forza Horizon 6 (2026) | 79 | 47 | 21 | 19 | 14 | |||||
| 007 First Light (2026) | 53.9 | 51.1 | 44.7 | 41.6 | 35.5 | 13.2 |
排放--典型的游戏者
系统噪音
尽管联想为CPU和GPU的功耗提供了非常慷慨的补贴,但与竞争对手相比,Legion 5在噪音测试中表现得并不突出。尽管风扇在简单的活动中也会运行,但我们并不觉得这很烦人。由于风扇没有脉动,并以缓慢的速度增加来登记它们的部署,而且没有恼人的干扰频率,所以你也可以在不戴耳机的情况下剪切视频或编辑图像。只要CPU和显卡的运行功率达到120W,由此产生的废热就必须从机箱内排出。当这种情况发生时,风扇就会启动,但即使在更高的速度下也会保持其不引人注目的特性。
然而,在启动时,你应该保持你的耳机或耳麦处于待机状态,这适用于2022年的几乎所有游戏笔记本电脑,即使硬件没有像Legion 5 Pro那样被有效利用。
Noise level
| Idle |
| 28.7 / 32 / 32 dB(A) |
| Load |
| 45.2 / 54.4 dB(A) |
 | ||
30 dB silent 40 dB(A) audible 50 dB(A) loud |
||
min: | ||
| Lenovo Legion 5 Pro 16IAH7H GeForce RTX 3060 Laptop GPU, i7-12700H, 2x Samsung PM9A1 MZVL21T0HCLR (RAID 0) | HP Omen 16-b1090ng GeForce RTX 3070 Ti Laptop GPU, i7-12700H, WDC PC SN810 1TB | HP Omen 16-c0077ng Radeon RX 6600M, R7 5800H, Samsung PM981a MZVLB1T0HBLR | Gigabyte Aero 16 YE5 GeForce RTX 3080 Ti Laptop GPU, i9-12900HK, Phison ESR01TBMFCT | Alienware x14 i7 RTX 3060 GeForce RTX 3060 Laptop GPU, i7-12700H, WDC PC SN810 1TB | |
|---|---|---|---|---|---|
| Noise | -4% | -3% | -1% | 10% | |
| off / environment * (dB) | 24.6 | 26 -6% | 25 -2% | 25 -2% | 24.7 -0% |
| Idle Minimum * (dB) | 28.7 | 30 -5% | 25 13% | 30 -5% | 24.7 14% |
| Idle Average * (dB) | 32 | 31 3% | 31.2 2% | 32 -0% | 24.7 23% |
| Idle Maximum * (dB) | 32 | 33 -3% | 33.8 -6% | 33 -3% | 30.9 3% |
| Load Average * (dB) | 45.2 | 49 -8% | 55.4 -23% | 45 -0% | 40 12% |
| Load Maximum * (dB) | 54.4 | 57 -5% | 56 -3% | 52 4% | 51.5 5% |
| Witcher 3 ultra * (dB) | 53 | 50 | 51.5 |
* ... smaller is better
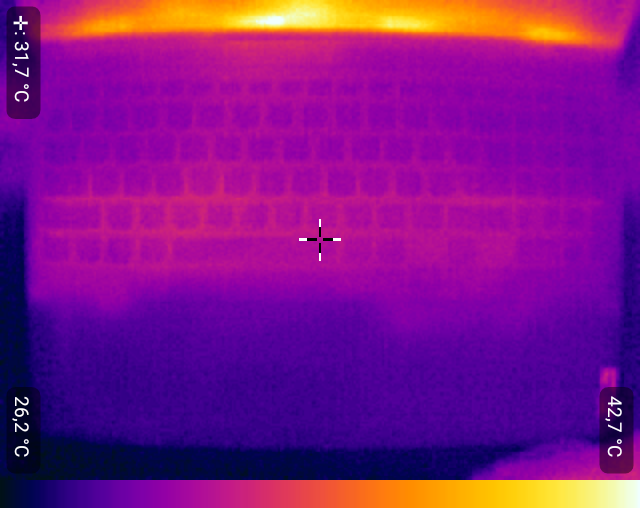
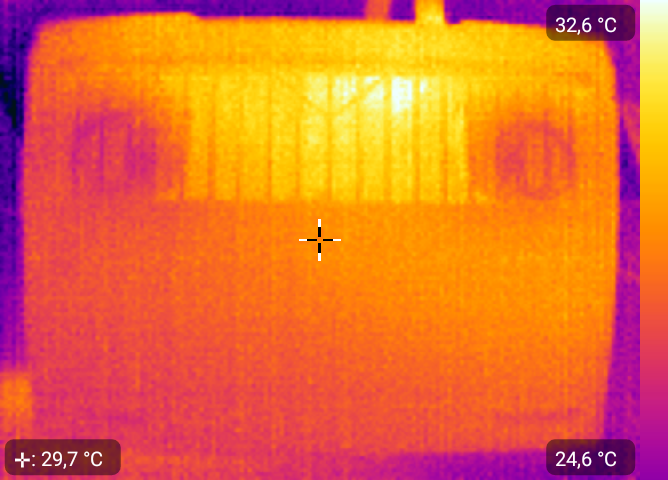
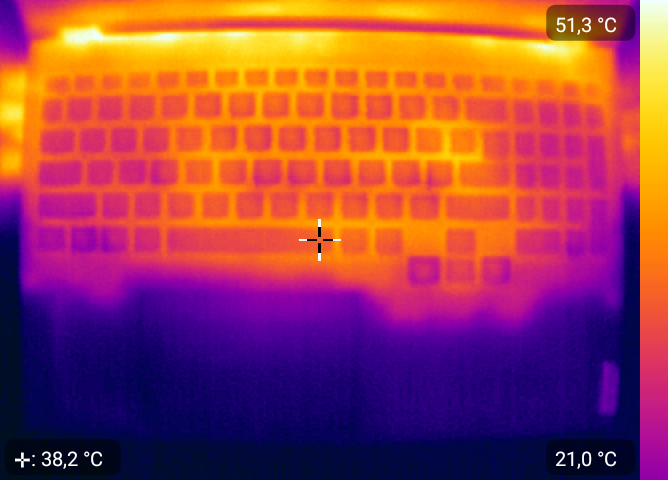
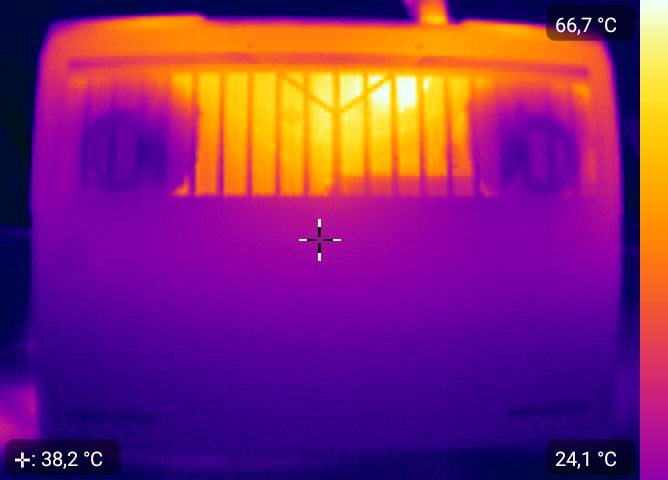
温度
这款16英寸设备的顶部金属表面在负载下会适度发热。它在显示屏附近也会变得非常热,但在我们的测试中,键盘和腕托都没有令人不快的温度。在笔记本电脑的底部和背面的冷却元件附近,它可以变得相当热。我们只能说,Legion ,在游戏时宁愿趴在桌子上。
(-) The maximum temperature on the upper side is 45.8 °C / 114 F, compared to the average of 40.4 °C / 105 F, ranging from 21.2 to 68.8 °C for the class Gaming.
(-) The bottom heats up to a maximum of 66.3 °C / 151 F, compared to the average of 43.2 °C / 110 F
(+) In idle usage, the average temperature for the upper side is 27.8 °C / 82 F, compared to the device average of 33.9 °C / 93 F.
(+) The palmrests and touchpad are cooler than skin temperature with a maximum of 29 °C / 84.2 F and are therefore cool to the touch.
(±) The average temperature of the palmrest area of similar devices was 28.8 °C / 83.8 F (-0.2 °C / -0.4 F).
| Lenovo Legion 5 Pro 16IAH7H Intel Core i7-12700H, NVIDIA GeForce RTX 3060 Laptop GPU | HP Omen 16-b1090ng Intel Core i7-12700H, NVIDIA GeForce RTX 3070 Ti Laptop GPU | HP Omen 16-c0077ng AMD Ryzen 7 5800H, AMD Radeon RX 6600M | Gigabyte Aero 16 YE5 Intel Core i9-12900HK, NVIDIA GeForce RTX 3080 Ti Laptop GPU | Alienware x14 i7 RTX 3060 Intel Core i7-12700H, NVIDIA GeForce RTX 3060 Laptop GPU | |
|---|---|---|---|---|---|
| Heat | 12% | 9% | -2% | 11% | |
| Maximum Upper Side * (°C) | 45.8 | 41 10% | 40.6 11% | 49 -7% | 51.3 -12% |
| Maximum Bottom * (°C) | 66.3 | 62 6% | 36 46% | 55 17% | 44.4 33% |
| Idle Upper Side * (°C) | 30.4 | 25 18% | 31.3 -3% | 33 -9% | 27.2 11% |
| Idle Bottom * (°C) | 30.4 | 26 14% | 36 -18% | 33 -9% | 26.6 12% |
* ... smaller is better
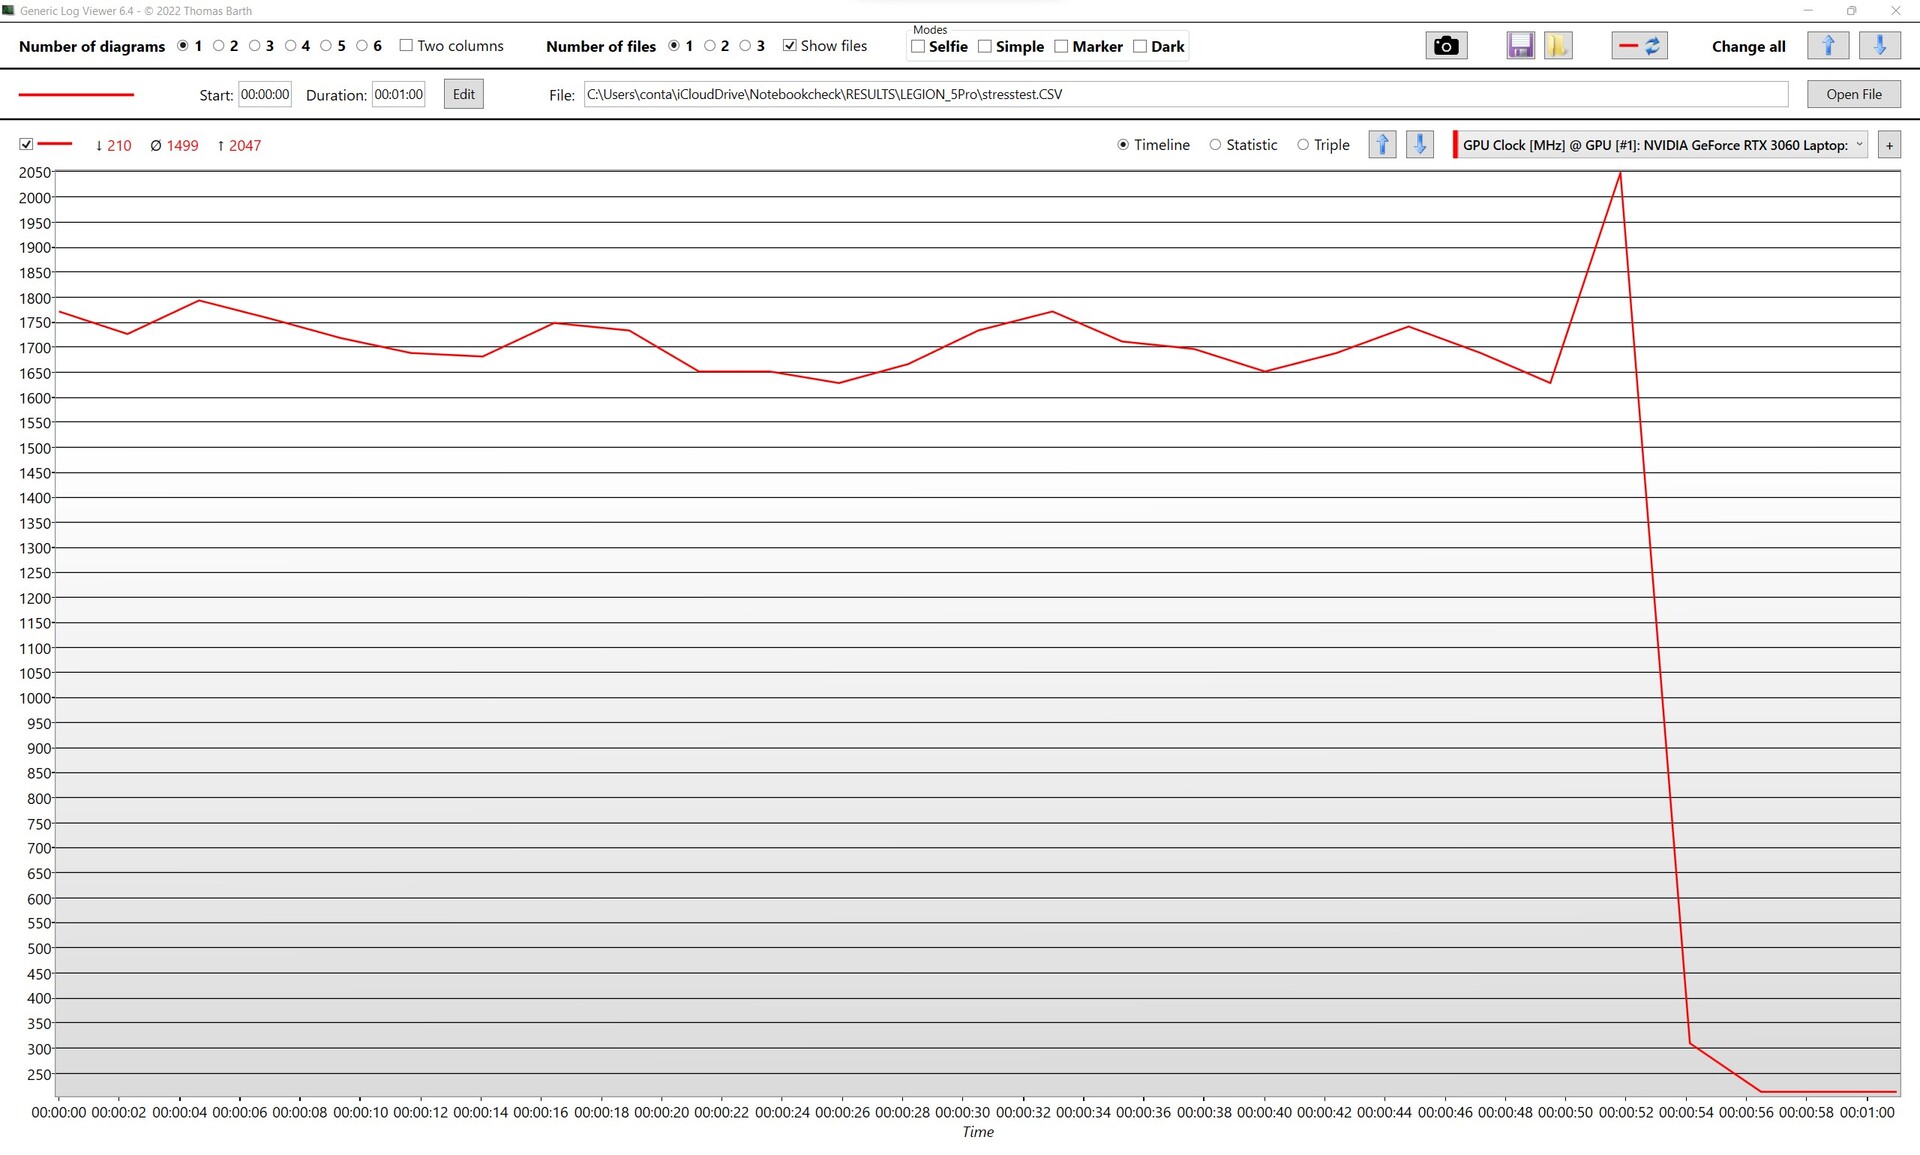
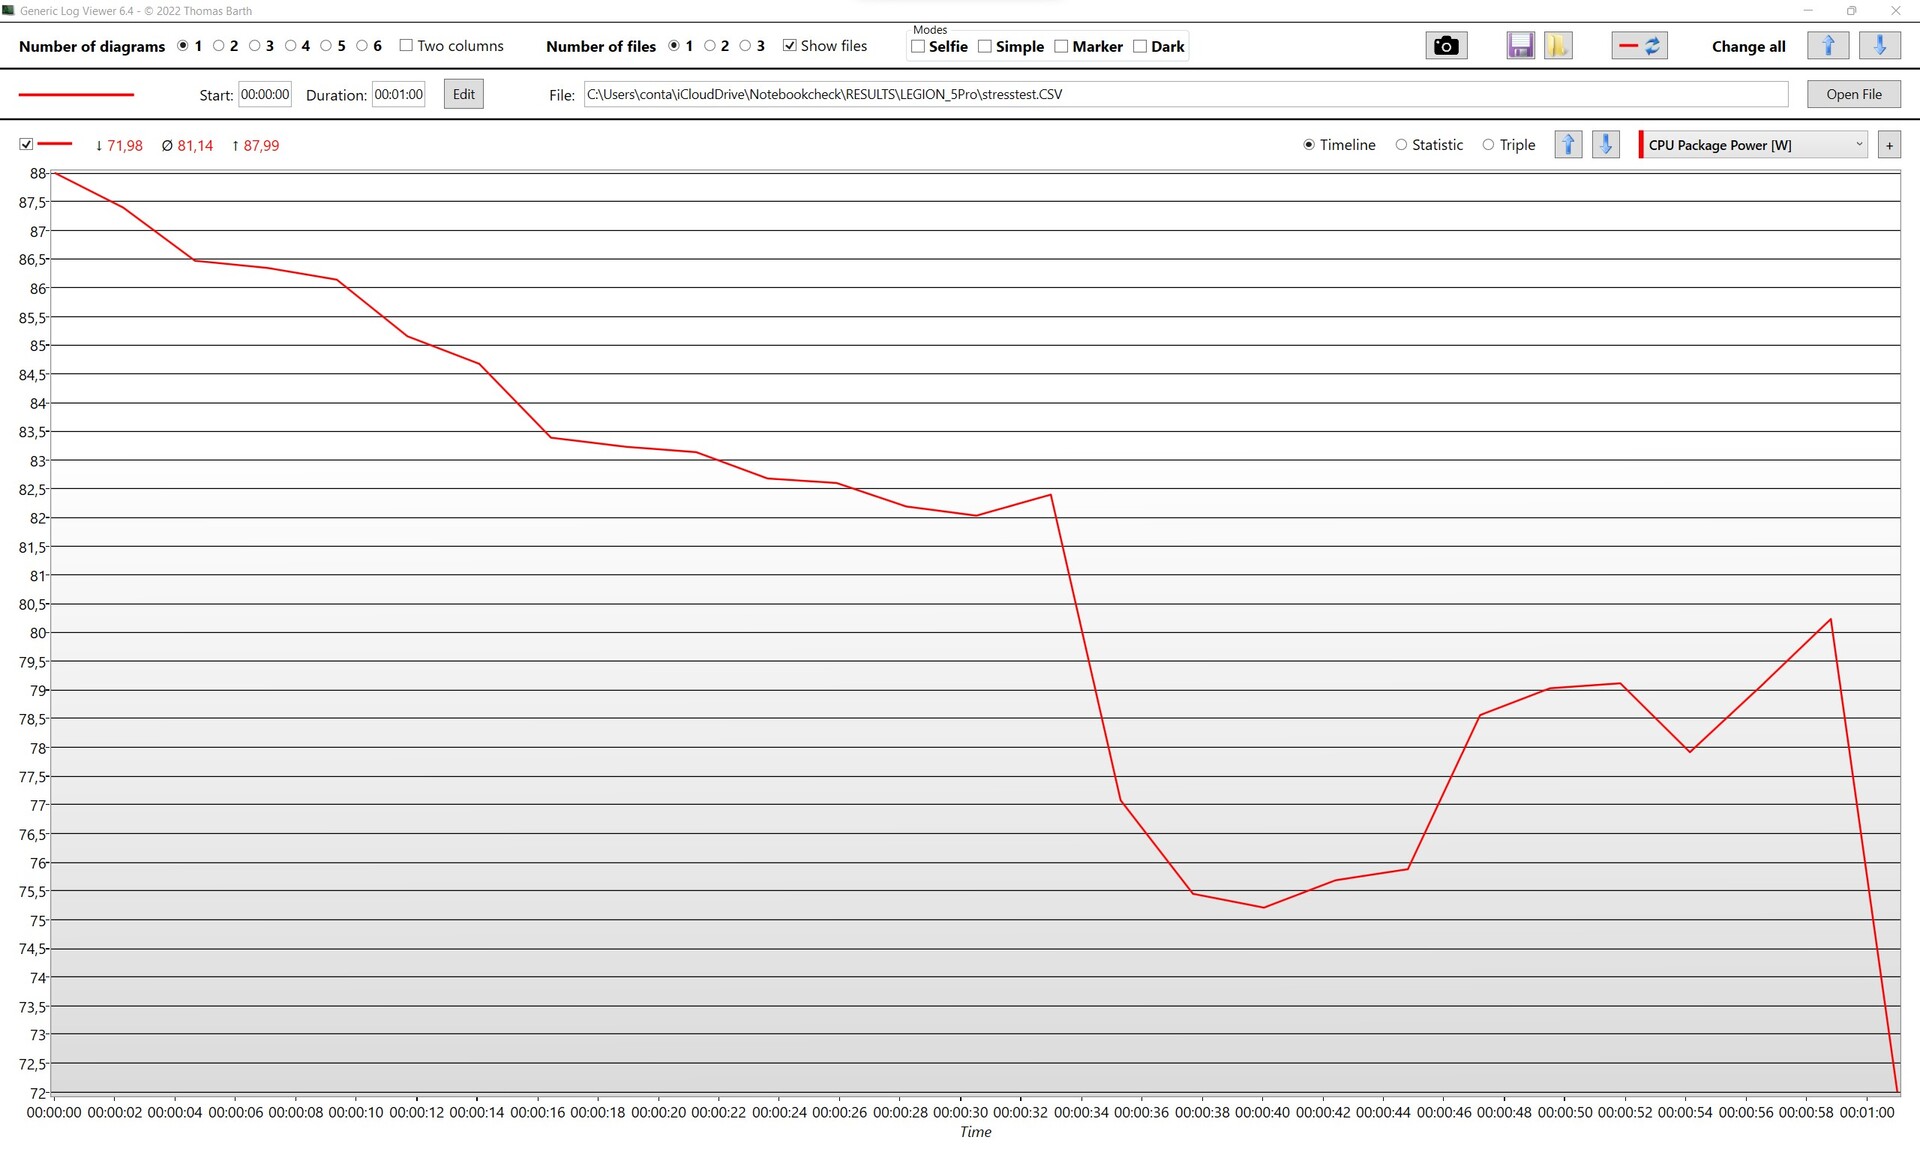
| CPU时钟(GHz) | GPU时钟(MHz) | durchschnittlich.CPU-温度 (°C) | durchschnittliche GPU-温度 (°C) | |
| 系统空闲 | 3.910 | 210 | 46 | 48 |
| Prime95压力 | 3.352 | 210 | 91 | 61 |
| Prime95 + FurMark 应力 | 2.773 | 1.568 | 93 | 86 |
| Witcher 3 应力 | 3.800 | 1.810 | 79 | 86 |
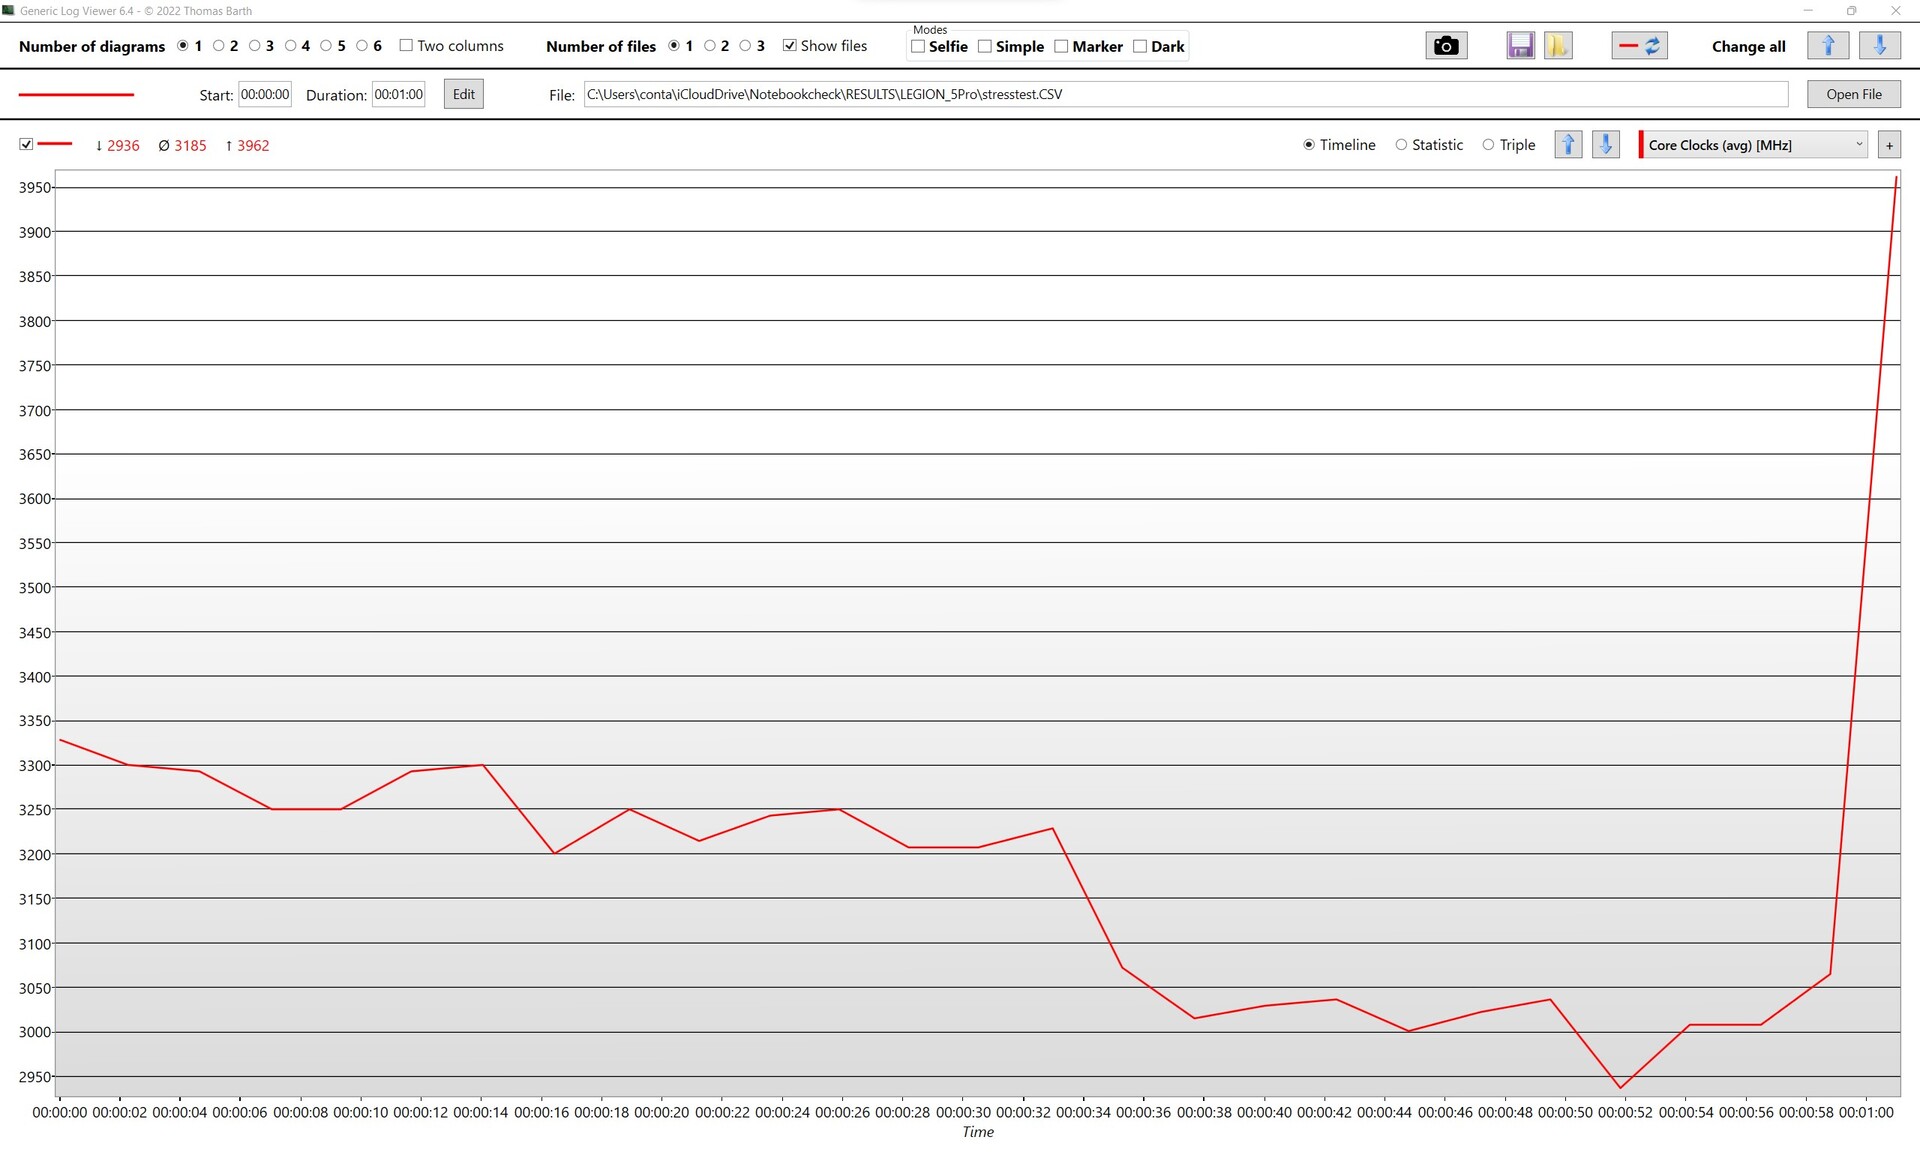
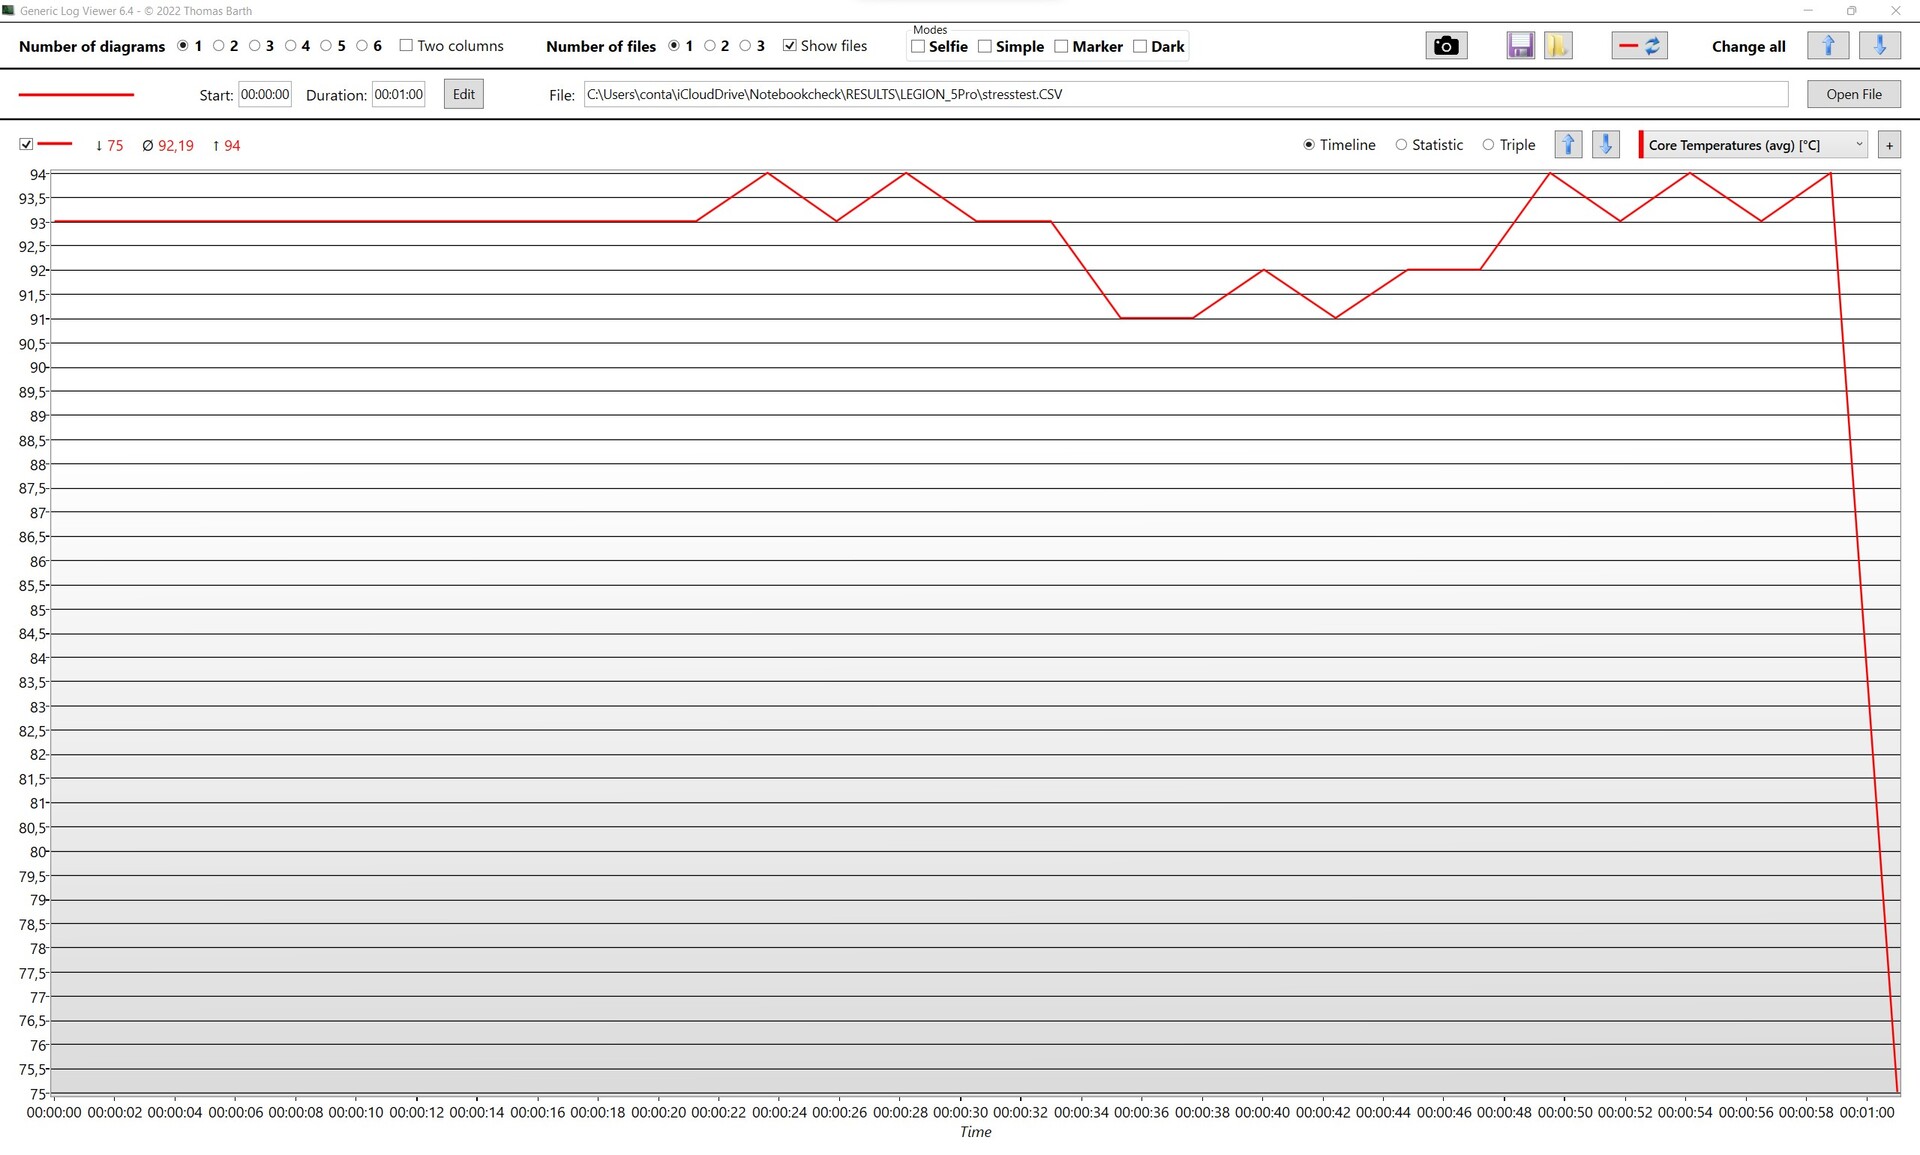
压力测试
在我们使用Prime 95和FurMark的一小时压力测试中,我们想探索极端情况下的热量和/或功耗问题。Legion 5 Pro甚至没有在正常使用模式下通常不会发生的人为场景中折服。虽然温度很高,但它们都在英特尔和英伟达的规格范围内,而且时钟速率仍然可以接受。i7和RTX 3060都没有低于它们的基本时钟频率,而且在正常游戏中,处理器和显卡的时钟频率始终保持较高。
发言人
集成的扬声器为奇特的YouTube视频或甚至为电影之夜做了更恰当的工作。其质量确实相当出色,但不幸的是,这不是笔记本电脑的典型特征。这是我们希望看到几乎所有制造商都能多关注的地方。
在Legion 5中,中频和高音完全令人满意,并能提供清晰的声音,而对于较大的房间或人群来说,音量可能需要稍高一些。不幸的是,我们几乎完全错过了低音,但这对于笔记本电脑来说一点也不稀奇。与其他产品类别相比,这款16英寸的设备只提供标准配置。但对于一台游戏笔记本来说,可能游戏者大部分时间都是带着耳机使用的,在我们看来这是可以接受的。
Lenovo Legion 5 Pro 16IAH7H audio analysis
(±) | speaker loudness is average but good (72.7 dB)
Bass 100 - 315 Hz
(-) | nearly no bass - on average 21.7% lower than median
(±) | linearity of bass is average (12.8% delta to prev. frequency)
Mids 400 - 2000 Hz
(±) | higher mids - on average 5% higher than median
(+) | mids are linear (3.4% delta to prev. frequency)
Highs 2 - 16 kHz
(+) | balanced highs - only 1.7% away from median
(+) | highs are linear (4.1% delta to prev. frequency)
Overall 100 - 16.000 Hz
(±) | linearity of overall sound is average (18% difference to median)
Compared to same class
» 55% of all tested devices in this class were better, 9% similar, 36% worse
» The best had a delta of 6%, average was 18%, worst was 132%
Compared to all devices tested
» 38% of all tested devices were better, 8% similar, 54% worse
» The best had a delta of 4%, average was 24%, worst was 134%
HP Omen 16-b1090ng audio analysis
(+) | speakers can play relatively loud (83 dB)
Bass 100 - 315 Hz
(-) | nearly no bass - on average 24.4% lower than median
(±) | linearity of bass is average (13.8% delta to prev. frequency)
Mids 400 - 2000 Hz
(+) | balanced mids - only 1.9% away from median
(+) | mids are linear (2.8% delta to prev. frequency)
Highs 2 - 16 kHz
(+) | balanced highs - only 2.2% away from median
(+) | highs are linear (3.8% delta to prev. frequency)
Overall 100 - 16.000 Hz
(±) | linearity of overall sound is average (15.1% difference to median)
Compared to same class
» 32% of all tested devices in this class were better, 6% similar, 62% worse
» The best had a delta of 6%, average was 18%, worst was 132%
Compared to all devices tested
» 21% of all tested devices were better, 4% similar, 75% worse
» The best had a delta of 4%, average was 24%, worst was 134%
能源管理 - 高功率水平需要大量的能源
消耗功率
安装的硬件的高功率目标在耗电方面是很明显的。即使在空闲状态下,Legion ,与竞争对手相比,有时消耗的能量也超过了两倍。在负载情况下,事实证明,300W的大型电源有点过大,但肯定没有超过规定。Legion 无疑在功耗方面处于领先地位,其最大功耗为240W,但从交付的性能来看,这绝对是可以接受的。
| Off / Standby | |
| Idle | |
| Load |
|
Key:
min: | |
| Lenovo Legion 5 Pro 16IAH7H i7-12700H, GeForce RTX 3060 Laptop GPU, 2x Samsung PM9A1 MZVL21T0HCLR (RAID 0), IPS, 2560x1600, 16" | HP Omen 16-b1090ng i7-12700H, GeForce RTX 3070 Ti Laptop GPU, WDC PC SN810 1TB, IPS, 2560x1440, 16.1" | HP Omen 16-c0077ng R7 5800H, Radeon RX 6600M, Samsung PM981a MZVLB1T0HBLR, IPS, 2560x1440, 16.1" | Gigabyte Aero 16 YE5 i9-12900HK, GeForce RTX 3080 Ti Laptop GPU, Phison ESR01TBMFCT, AMOLED, 3840x2400, 16" | Alienware x14 i7 RTX 3060 i7-12700H, GeForce RTX 3060 Laptop GPU, WDC PC SN810 1TB, IPS, 1920x1080, 14" | Apple MacBook Pro 16 2021 M1 Pro M1 Pro, M1 Pro 16-Core GPU, Apple SSD AP1024R, Mini-LED, 3456x2234, 16.2" | Average NVIDIA GeForce RTX 3060 Laptop GPU | Average of class Gaming | |
|---|---|---|---|---|---|---|---|---|
| Power Consumption | 42% | 29% | 5% | 54% | 63% | 41% | 30% | |
| Idle Minimum * (Watt) | 22.8 | 4 82% | 12 47% | 26 -14% | 7.9 65% | 5 78% | 10.4 ? 54% | 13.2 ? 42% |
| Idle Average * (Watt) | 26.5 | 10 62% | 12.8 52% | 30 -13% | 11.1 58% | 15.1 43% | 14.5 ? 45% | 18.9 ? 29% |
| Idle Maximum * (Watt) | 41 | 19 54% | 18.5 55% | 37 10% | 11.8 71% | 15.5 62% | 21.4 ? 48% | 24.3 ? 41% |
| Load Average * (Watt) | 191 | 114 40% | 190 1% | 127 34% | 107.4 44% | 54 72% | 109.3 ? 43% | 108.3 ? 43% |
| Witcher 3 ultra * (Watt) | 194.7 | 183.2 6% | 194 -0% | 176 10% | 111 43% | |||
| Load Maximum * (Watt) | 238 | 221 7% | 200 16% | 236 1% | 140.4 41% | 90 62% | 206 ? 13% | 254 ? -7% |
* ... smaller is better
Witcher 3 power consumption / Stress test
Power consumption external monitor
电池寿命
我们的测试显示了在不插入墙面插座的情况下,高能量需求的阴影面。在这里,竞争者把Legion ,因为灰尘。在我们的网络冲浪测试中,联想在150尼特的固定屏幕亮度下,成功运行了3.5小时,并没有赢得耐力奖。负载下30分钟的运行时间也没有竞争力。大约2个小时的游戏时间给Legion 一些安慰的分数。但在这里,我们也认为需要在可能的日常使用背景下考虑这些结果。你可能不会买这么强大的游戏笔记本来在咖啡馆里写一整天的电子邮件,或者在露营时主持一个系列马拉松。
| Lenovo Legion 5 Pro 16IAH7H i7-12700H, GeForce RTX 3060 Laptop GPU, 80 Wh | HP Omen 16-b1090ng i7-12700H, GeForce RTX 3070 Ti Laptop GPU, 83 Wh | HP Omen 16-c0077ng R7 5800H, Radeon RX 6600M, 70 Wh | Gigabyte Aero 16 YE5 i9-12900HK, GeForce RTX 3080 Ti Laptop GPU, 99 Wh | Alienware x14 i7 RTX 3060 i7-12700H, GeForce RTX 3060 Laptop GPU, 80 Wh | Average of class Gaming | |
|---|---|---|---|---|---|---|
| Battery runtime | 137% | 36% | 109% | 62% | 114% | |
| H.264 (h) | 4.1 | 7 71% | 7.5 83% | 9.4 129% | 8.26 ? 101% | |
| WiFi v1.3 (h) | 3.6 | 5.6 56% | 6.1 69% | 6.4 78% | 8.9 147% | 7.04 ? 96% |
| Witcher 3 ultra (h) | 2.1 | 1.4 -33% | 0.8 -62% | |||
| Load (h) | 0.6 | 1.9 217% | 1.6 167% | 0.8 33% | 1.47 ? 145% | |
| Reader / Idle (h) | 10.1 | 8.9 | 8.71 ? |
Pros
Cons
结论 - 一个均衡的软件包,展示了CPU和GPU的真正能力。
在去年交付了作为市场上最受欢迎的游戏笔记本之一的Legion 5 Pro之后,联想今年又做了很多正确的事情。这款机箱显然是针对游戏市场的,但醒目的标识已被有品位地淡化,从而为这款16英寸设备提供了作为性能工作主力的便利通道。
游戏玩家和图像编辑/摄像师都会对巨大的各种连接选项感到高兴。看到联想抵制放弃必要的端口和插槽而选择更薄的外壳的趋势,令人耳目一新。16英寸16:10的QHD显示屏也没有提供批评的理由。对于游戏来说,它是无可指责的,而且不仅仅是被RTX 3060激发出来的。虽然我们希望为专业图像编辑或摄影师提供更多的AdobeRGB覆盖,但视频编辑也会在这里得到他们的钱。包含的X-Rite软件可以提供整套的sRGB和Rec.709配置文件--这是一个巨大的收获。
Legion 5 Pro最突出的特点是其性能。所安装的组件被巧妙地部署,并提供了一个展示其能力的机会。这适用于异常强大的i7-12700H以及高端RTX 3060。很难想象一个人可能需要更多的东西,因此,它在未来几年内都是证明。
我们花了相当大的努力才想出任何实质性的缺陷,即使我们做到了,它们在游戏笔记本电脑的背景下也是可以忽略不计的(即电池寿命);或者它们以某种方式促进了其他的优势。Legion 5 Pro可能比它的竞争对手略大、更重、更笨重,但这正是为有效的冷却系统和大量的连接铺平道路的原因。如果你真的在追求更轻的东西,你可能想看一下惠普Omen 16(YouTube评论)。它的CPU性能与Legion ,但使用RTX 3070 Ti,你会得到明显更好的GPU性能和更薄的外壳。如果你的日常生活与实际工作有较大关系,你可能想看看技嘉Aero 16。虽然i9的高价几乎不值得(在我们的Cinebench R23测试中,它甚至被Legion 5 Pro上的i7击败),但RTX 3080 Ti和伟大的OLED面板对于视频和照片编辑来说是很好的选择。
价格和可用性
1TB固态硬盘单元的价格约为1800欧元(1825美元),联想Legion 5 Pro是一个几乎完美的全能型产品,适用于各种应用,并且可以自信地以RTX 3060来解决竞争对手的3070 Ti附加费。
Lenovo Legion 5 Pro 16IAH7H
- 07/25/2022 v7 (old)
Alexander Wätzel
Price comparison

