评语 - 办公室的最低配置
作为一款入门级办公笔记本电脑,微星 Venture 16 涵盖了该类笔记本电脑的大部分基本功能,包括易于维护、集成数字键盘以及灰色、无攻击性的设计。它相对较厚的机身让酷睿-H 处理器的运行温度比一般笔记本电脑更低,而许多其他经济型商务笔记本电脑可能会采用速度较慢的酷睿-U 或酷睿-V 处理器。替代产品如 戴尔 16 Plus或 联想 ThinkPad E16 G3与微星相比,它们的重量更轻,显示屏选项更多,但它们的 CPU 也更慢。
另一方面,即使从办公的角度来看,Venture 16 的几个方面也会让人感到失望。相对较重的重量、糟糕的 720p 网络摄像头、对老式桶装交流适配器的依赖以及缺少多个 USB-C 端口,可能会让那些希望提高移动生产力的旅行者望而却步。此外,基本 IPS 显示屏的色彩不适合大多数图形编辑工作,因此我们建议考虑售价高出 200 美元左右的 OLED 面板。
Pros
Cons
价格和供应情况
微星 16 AI 配有 Core Ultra 7 255H、1200p IPS 触摸屏、32 GB 内存和 512 GB 固态硬盘,亚马逊售价为 1030 美元。类似配置的 OLED 机型在Best Buy 上的售价为 1200 美元。.
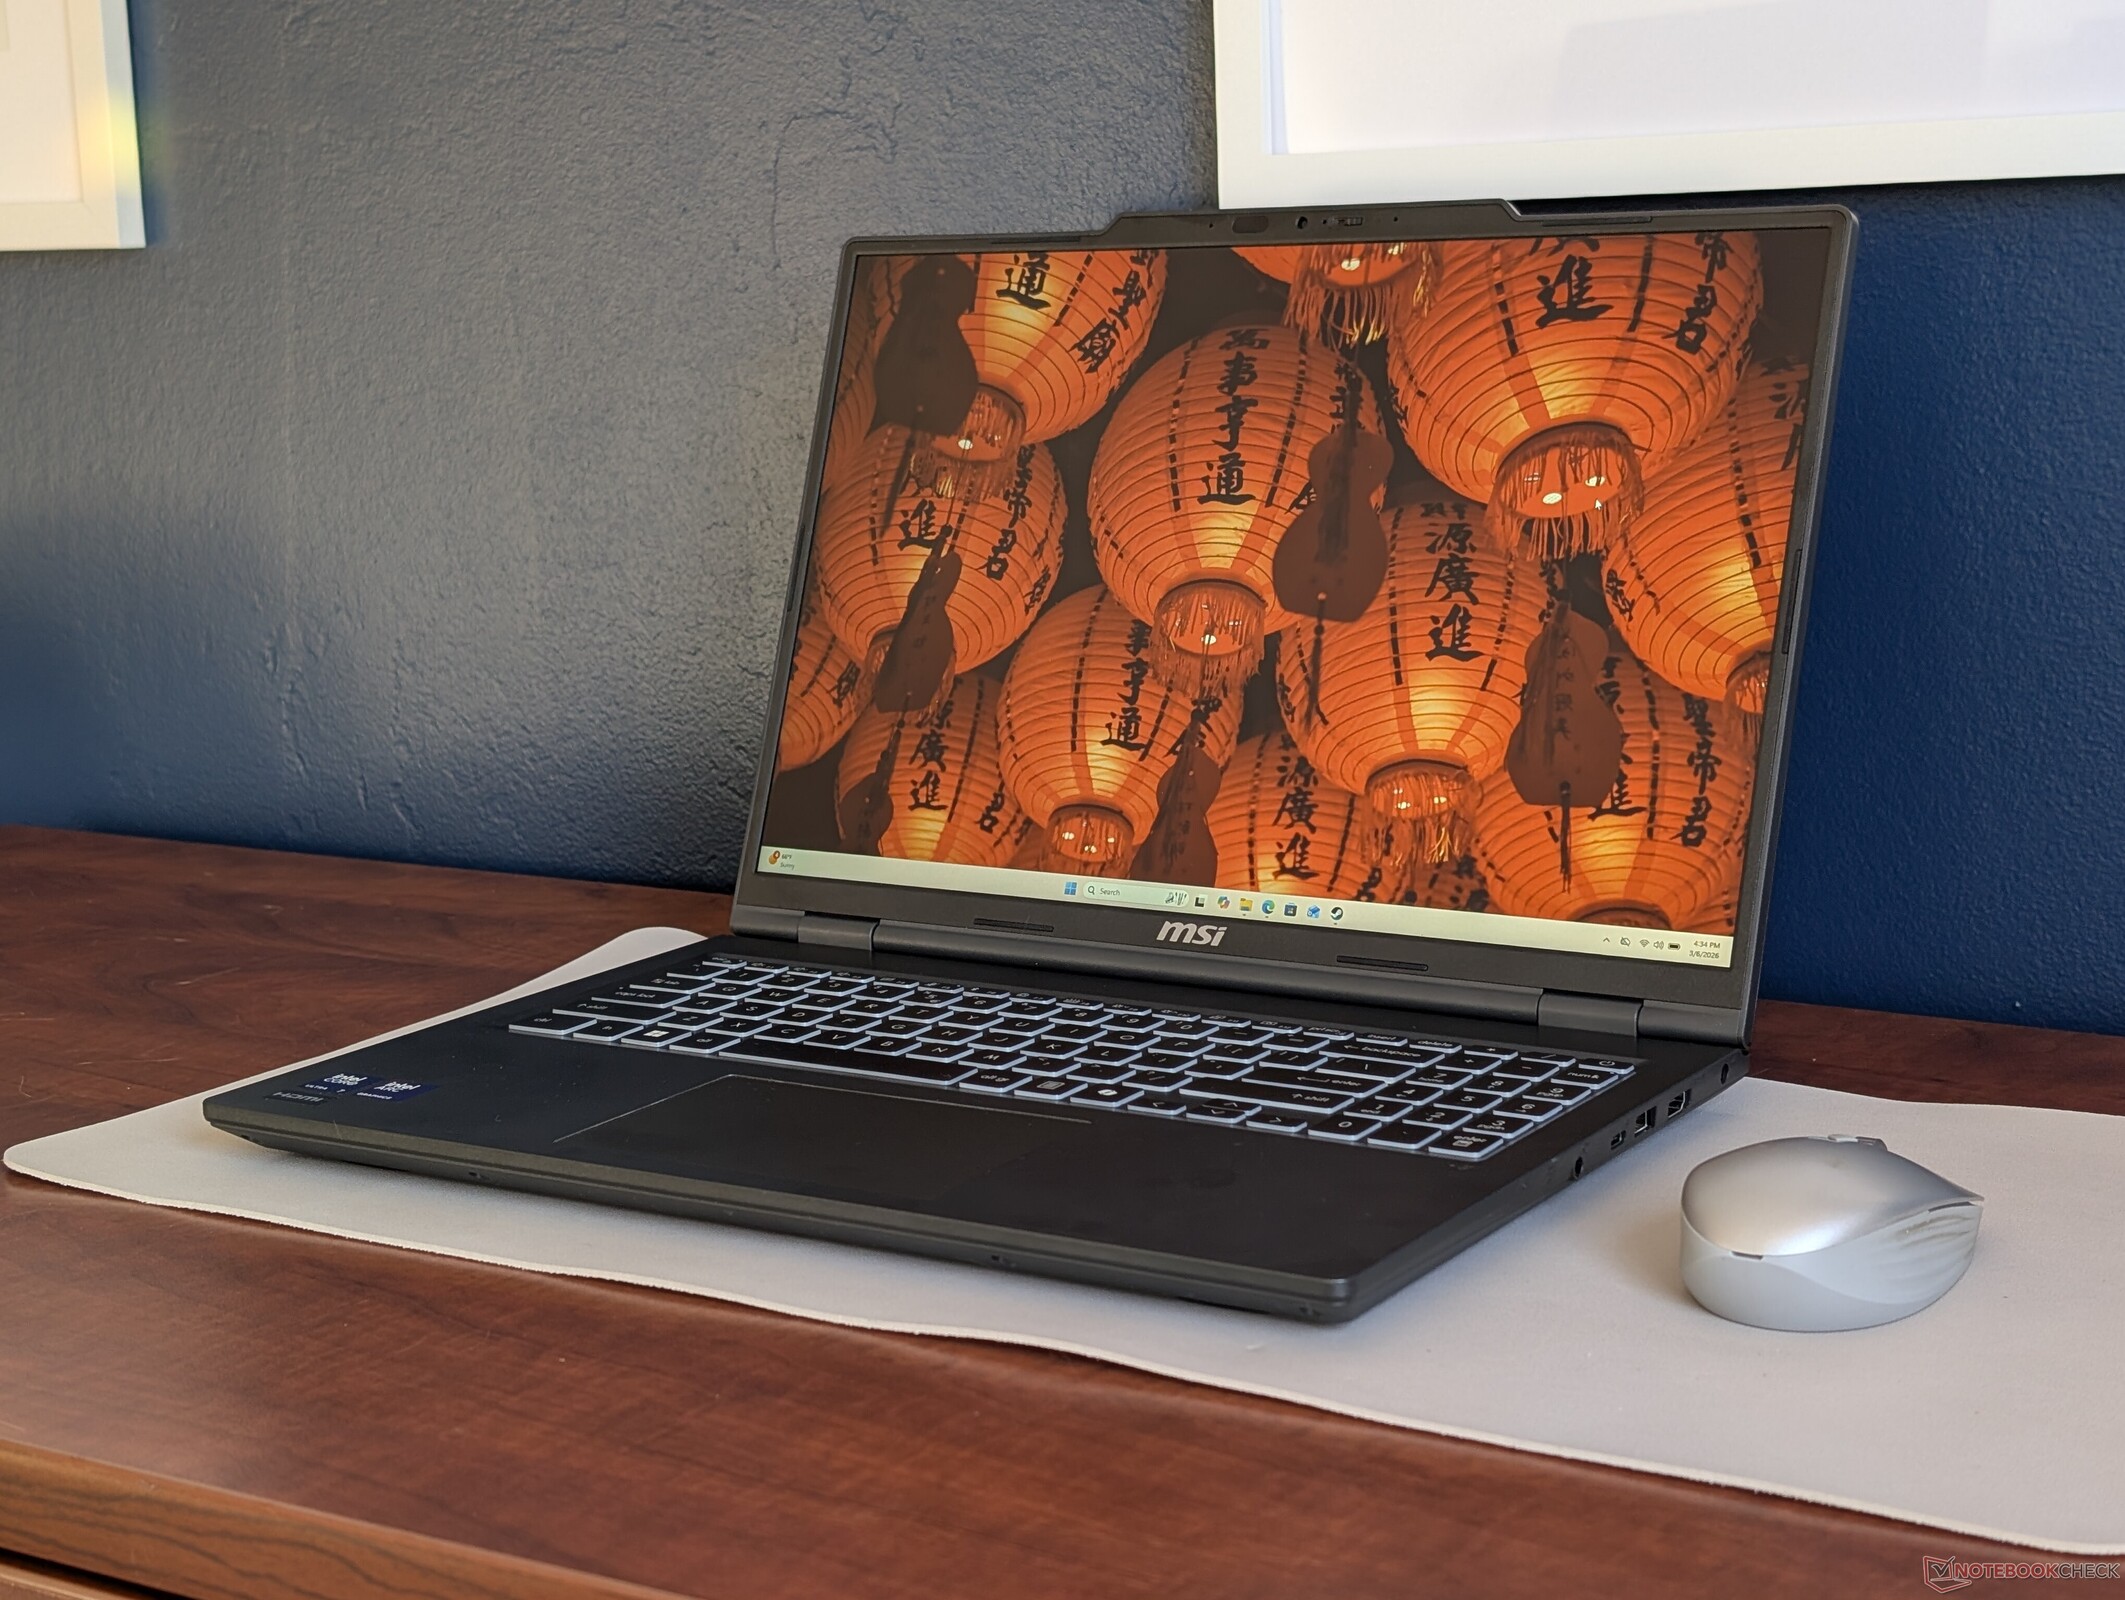
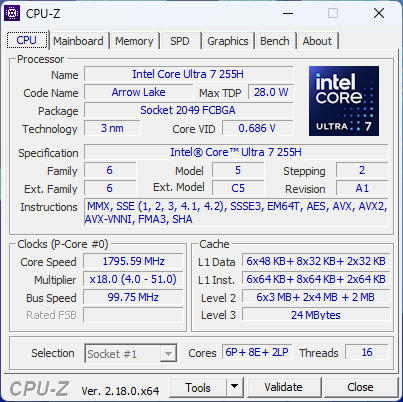
Venture 16 是微星的入门级办公笔记本电脑,旨在补充高端的 Prestige 系列。我们的测试机配备了 Arrow Lake-H Core Ultra 7 255H CPU 和 1200p IPS 触摸屏,零售价约为 900 美元,而更高端的配置可能会配备 Core Ultra 9 285H 和 1280p OLED 显示屏。
Venture 16 的替代产品包括戴尔 Inspiron 系列、惠普 ProBook 或Pavilion 系列或联想 ThinkPad E 系列等其他经济型办公笔记本电脑。
更多微星评论:
规格
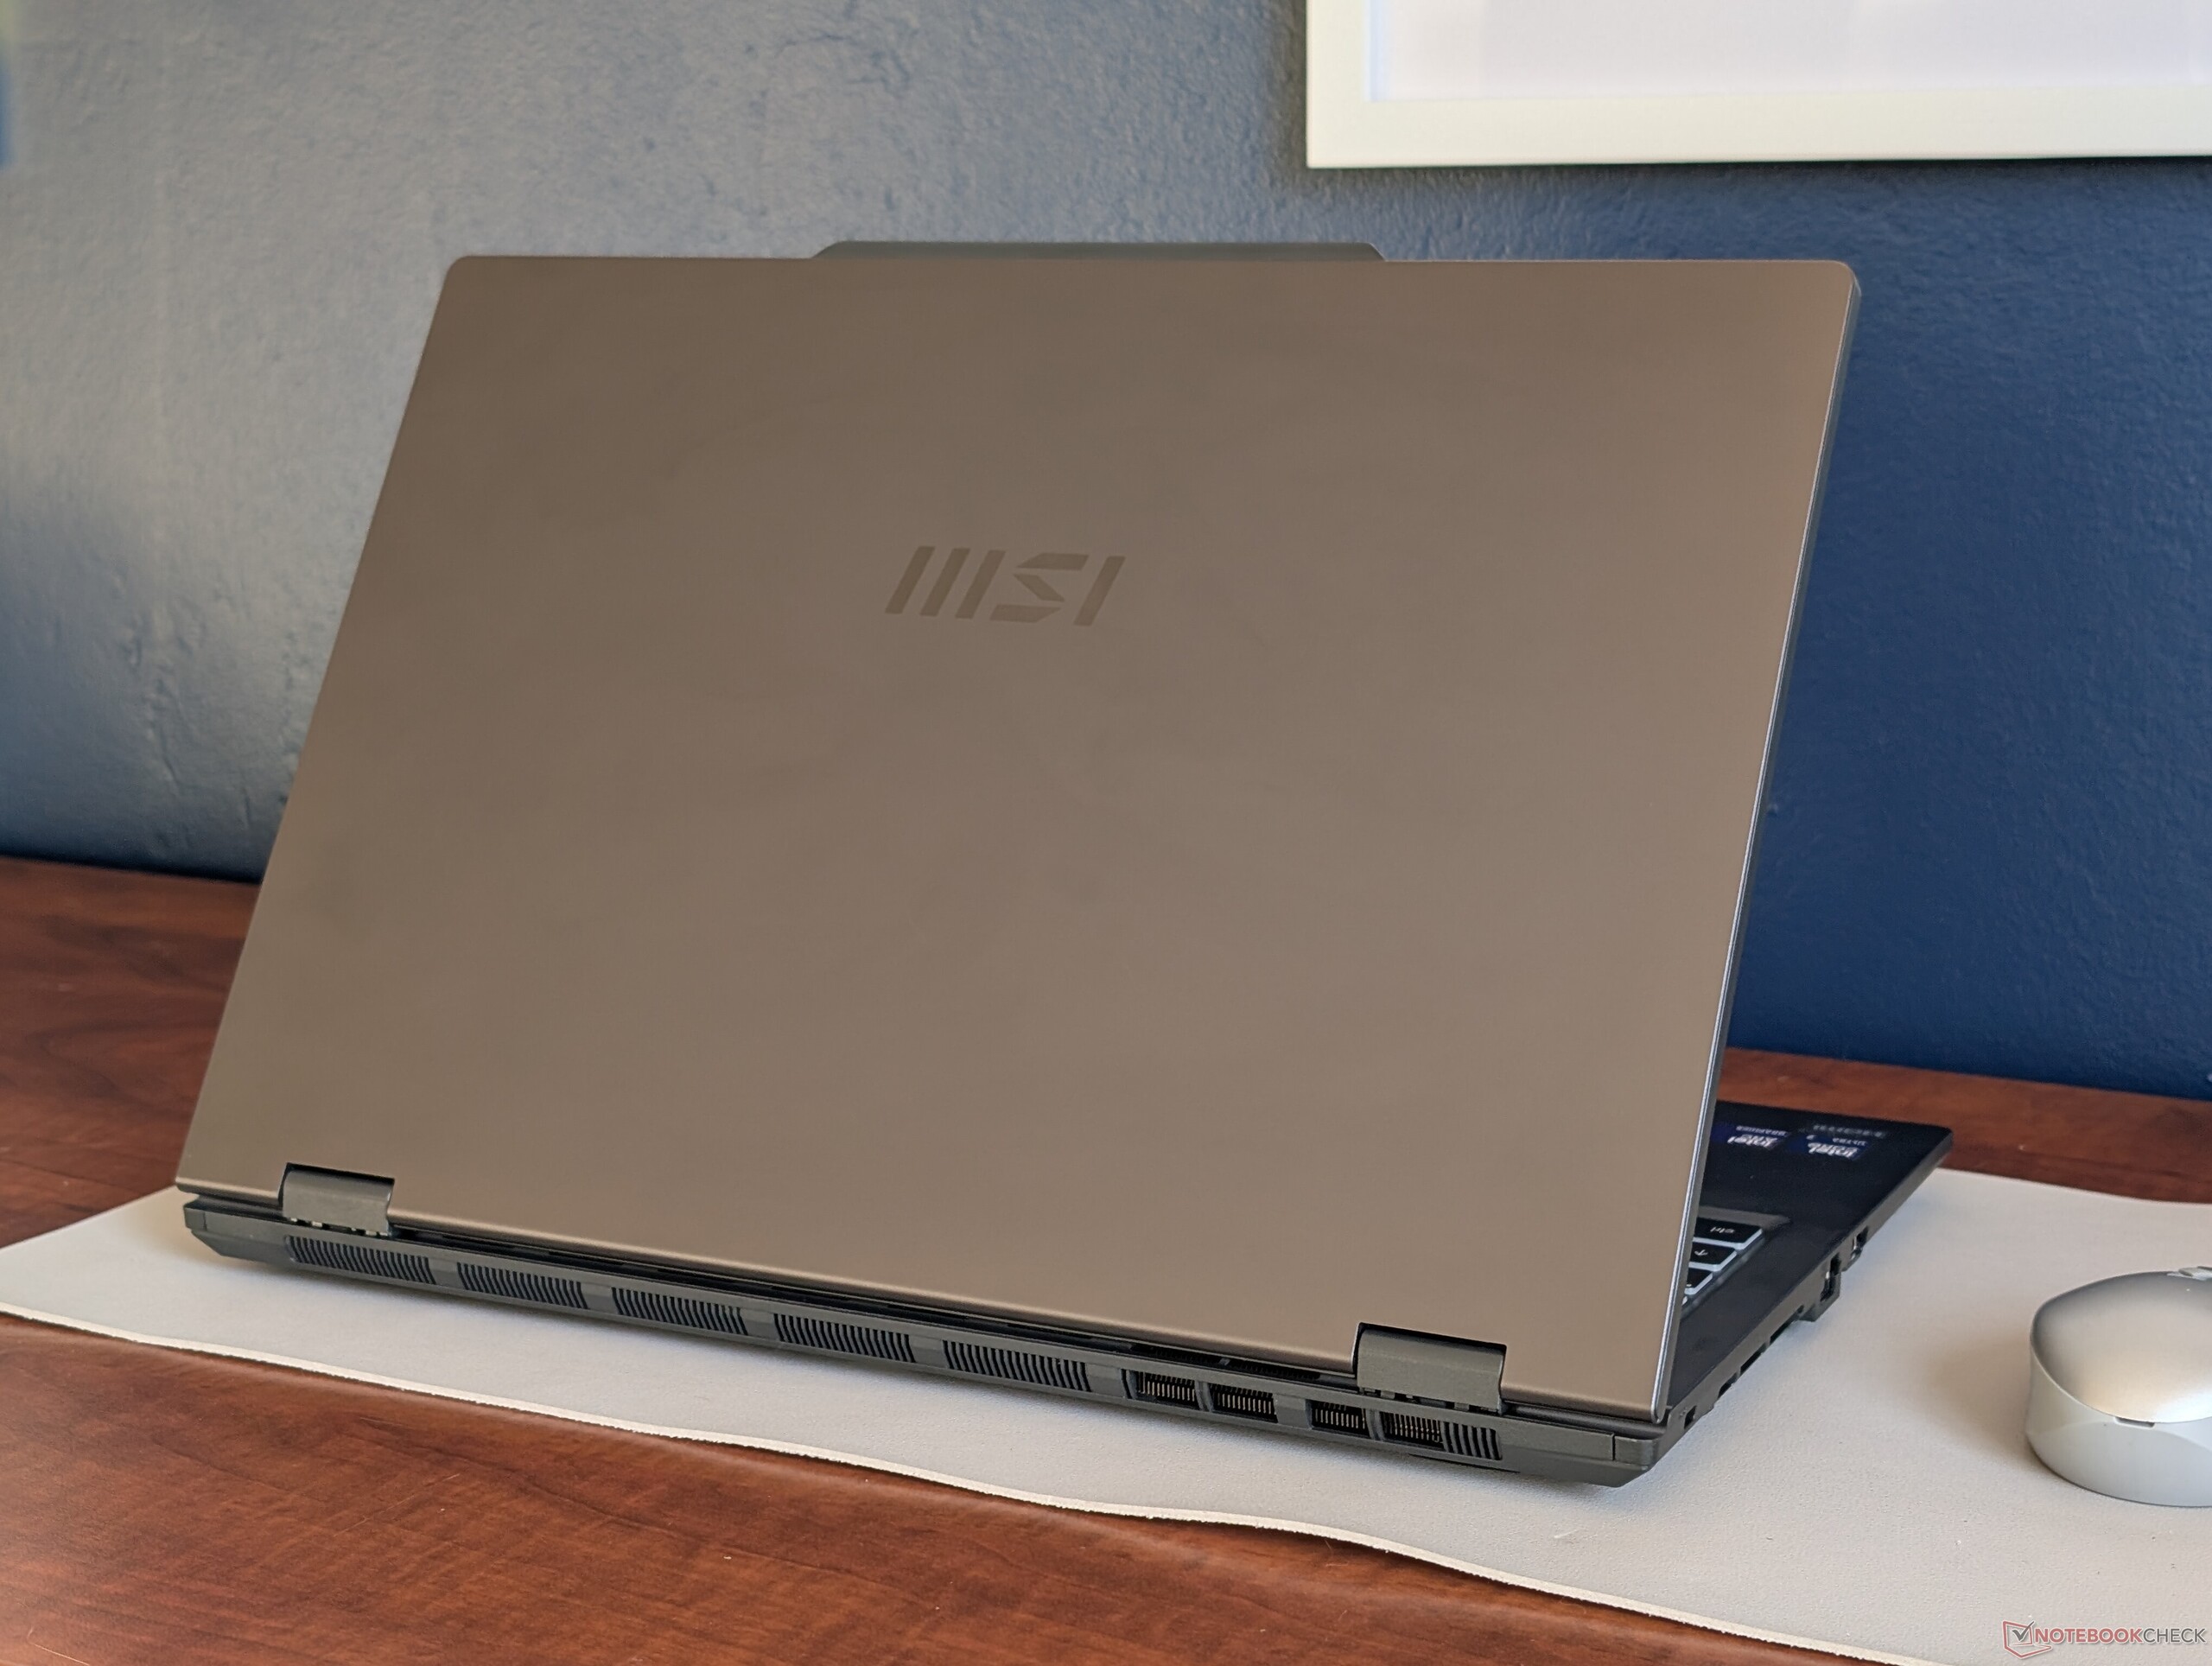
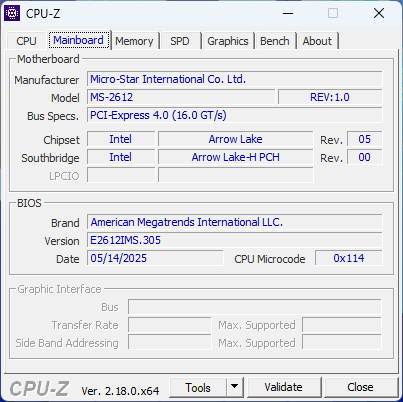
案例
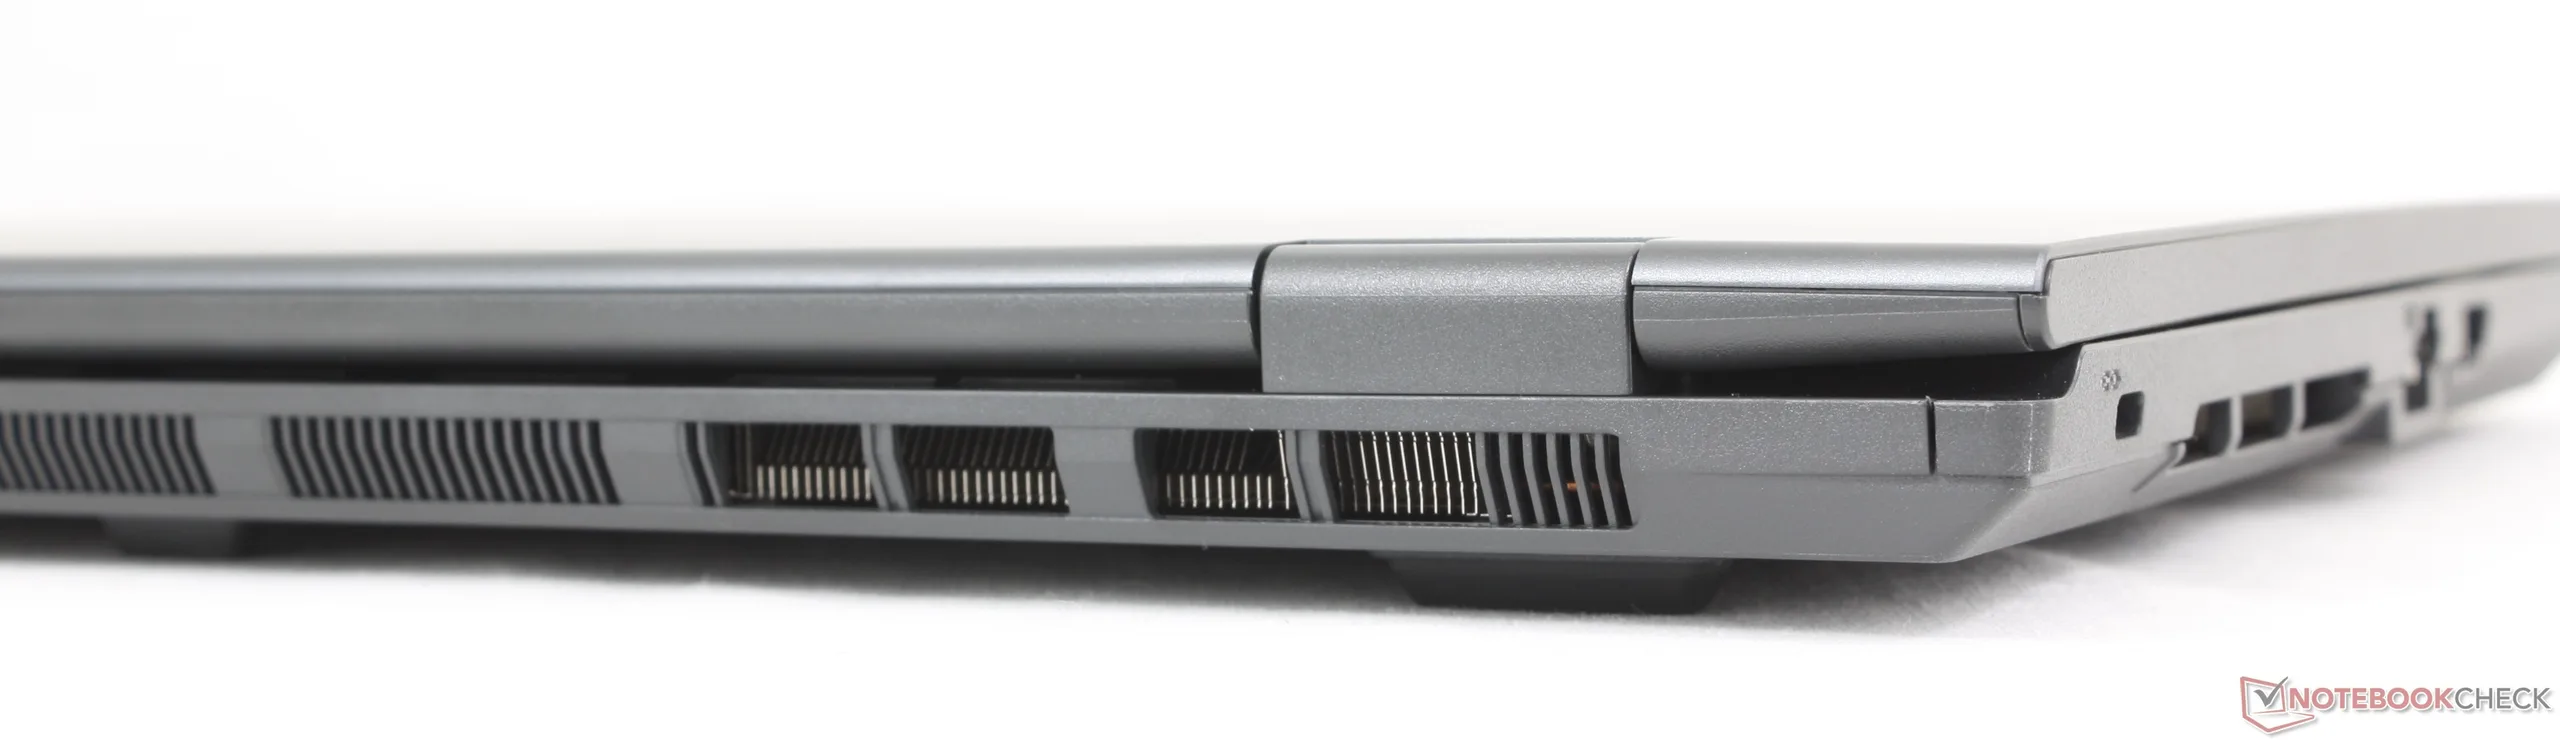
机身主要采用光滑的哑光塑料,具有良好的刚性,以降低成本。有趣的是,该系统比许多其他 16 英寸笔记本电脑更重、更厚,但由于边框更窄,占地面积更小。
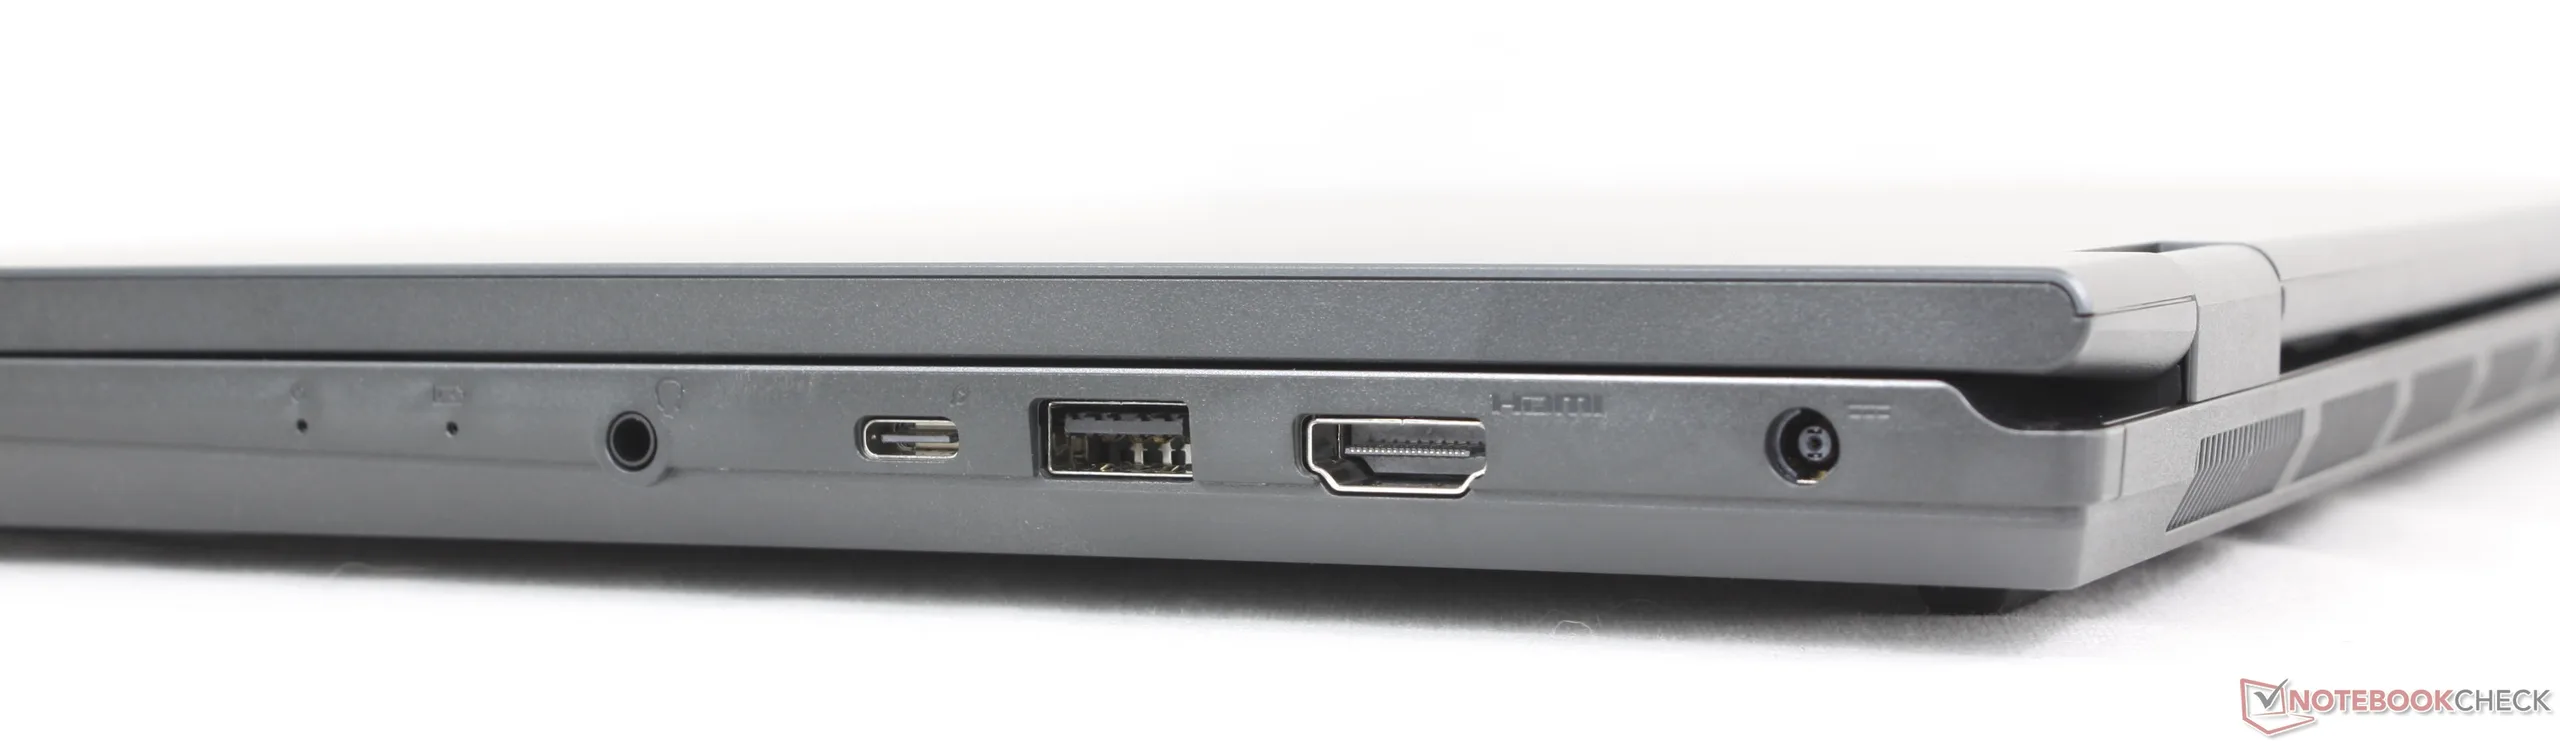
连接性
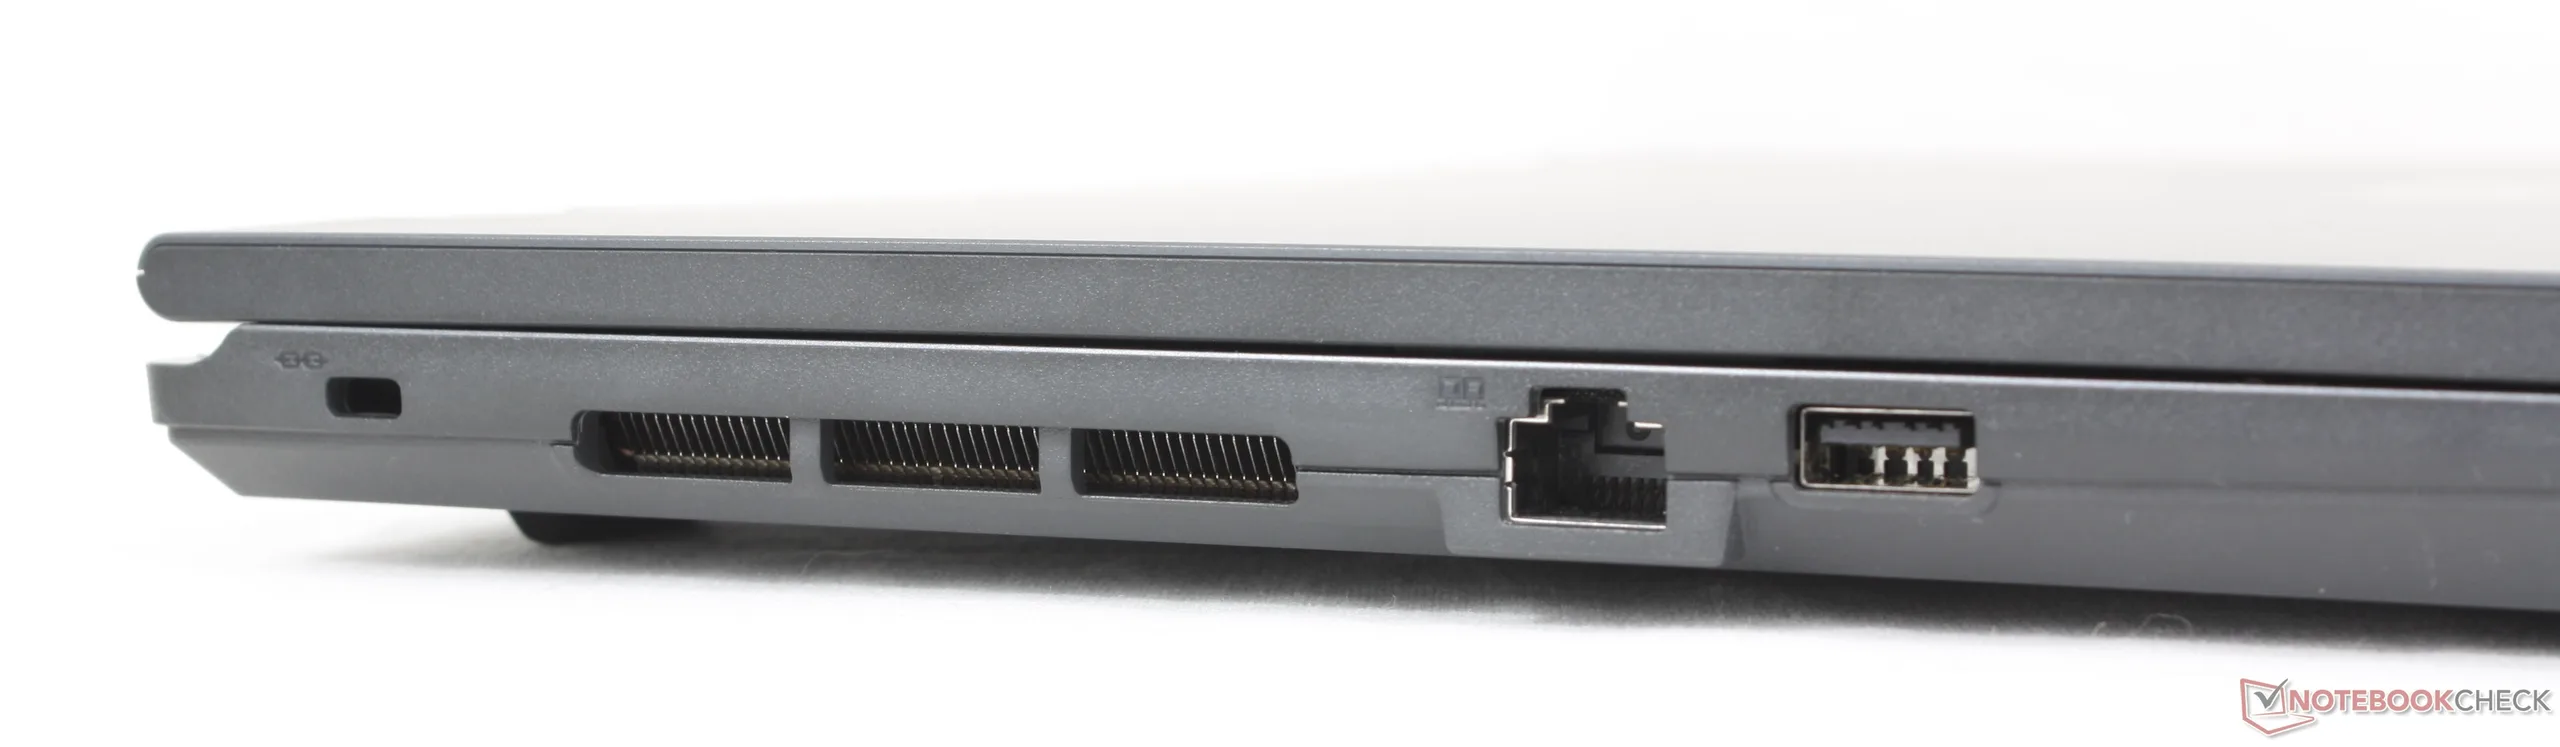
考虑到 16 英寸的大尺寸,端口选项可能会更好。例如,只有一个 USB-C 端口,而大多数其他笔记本电脑都有两个,包括 戴尔 16 Plus.
交流
| Networking | |
| iperf3 transmit AXE11000 | |
| Lenovo IdeaPad Slim 5 16AKP10 | |
| Dell 16 Plus 2-in-1 | |
| MSI Prestige 16 B1MG-001US | |
| HP Pavilion 16-ag0057ng | |
| Asus V16 V3607V | |
| MSI Venture 16 AI A2HMTG | |
| iperf3 receive AXE11000 | |
| Lenovo IdeaPad Slim 5 16AKP10 | |
| MSI Prestige 16 B1MG-001US | |
| Dell 16 Plus 2-in-1 | |
| HP Pavilion 16-ag0057ng | |
| Asus V16 V3607V | |
| MSI Venture 16 AI A2HMTG | |
| iperf3 transmit AXE11000 6GHz | |
| Dell 16 Plus 2-in-1 | |
| MSI Prestige 16 B1MG-001US | |
| MSI Venture 16 AI A2HMTG | |
| iperf3 receive AXE11000 6GHz | |
| Dell 16 Plus 2-in-1 | |
| MSI Venture 16 AI A2HMTG | |
| MSI Prestige 16 B1MG-001US | |
网络摄像头


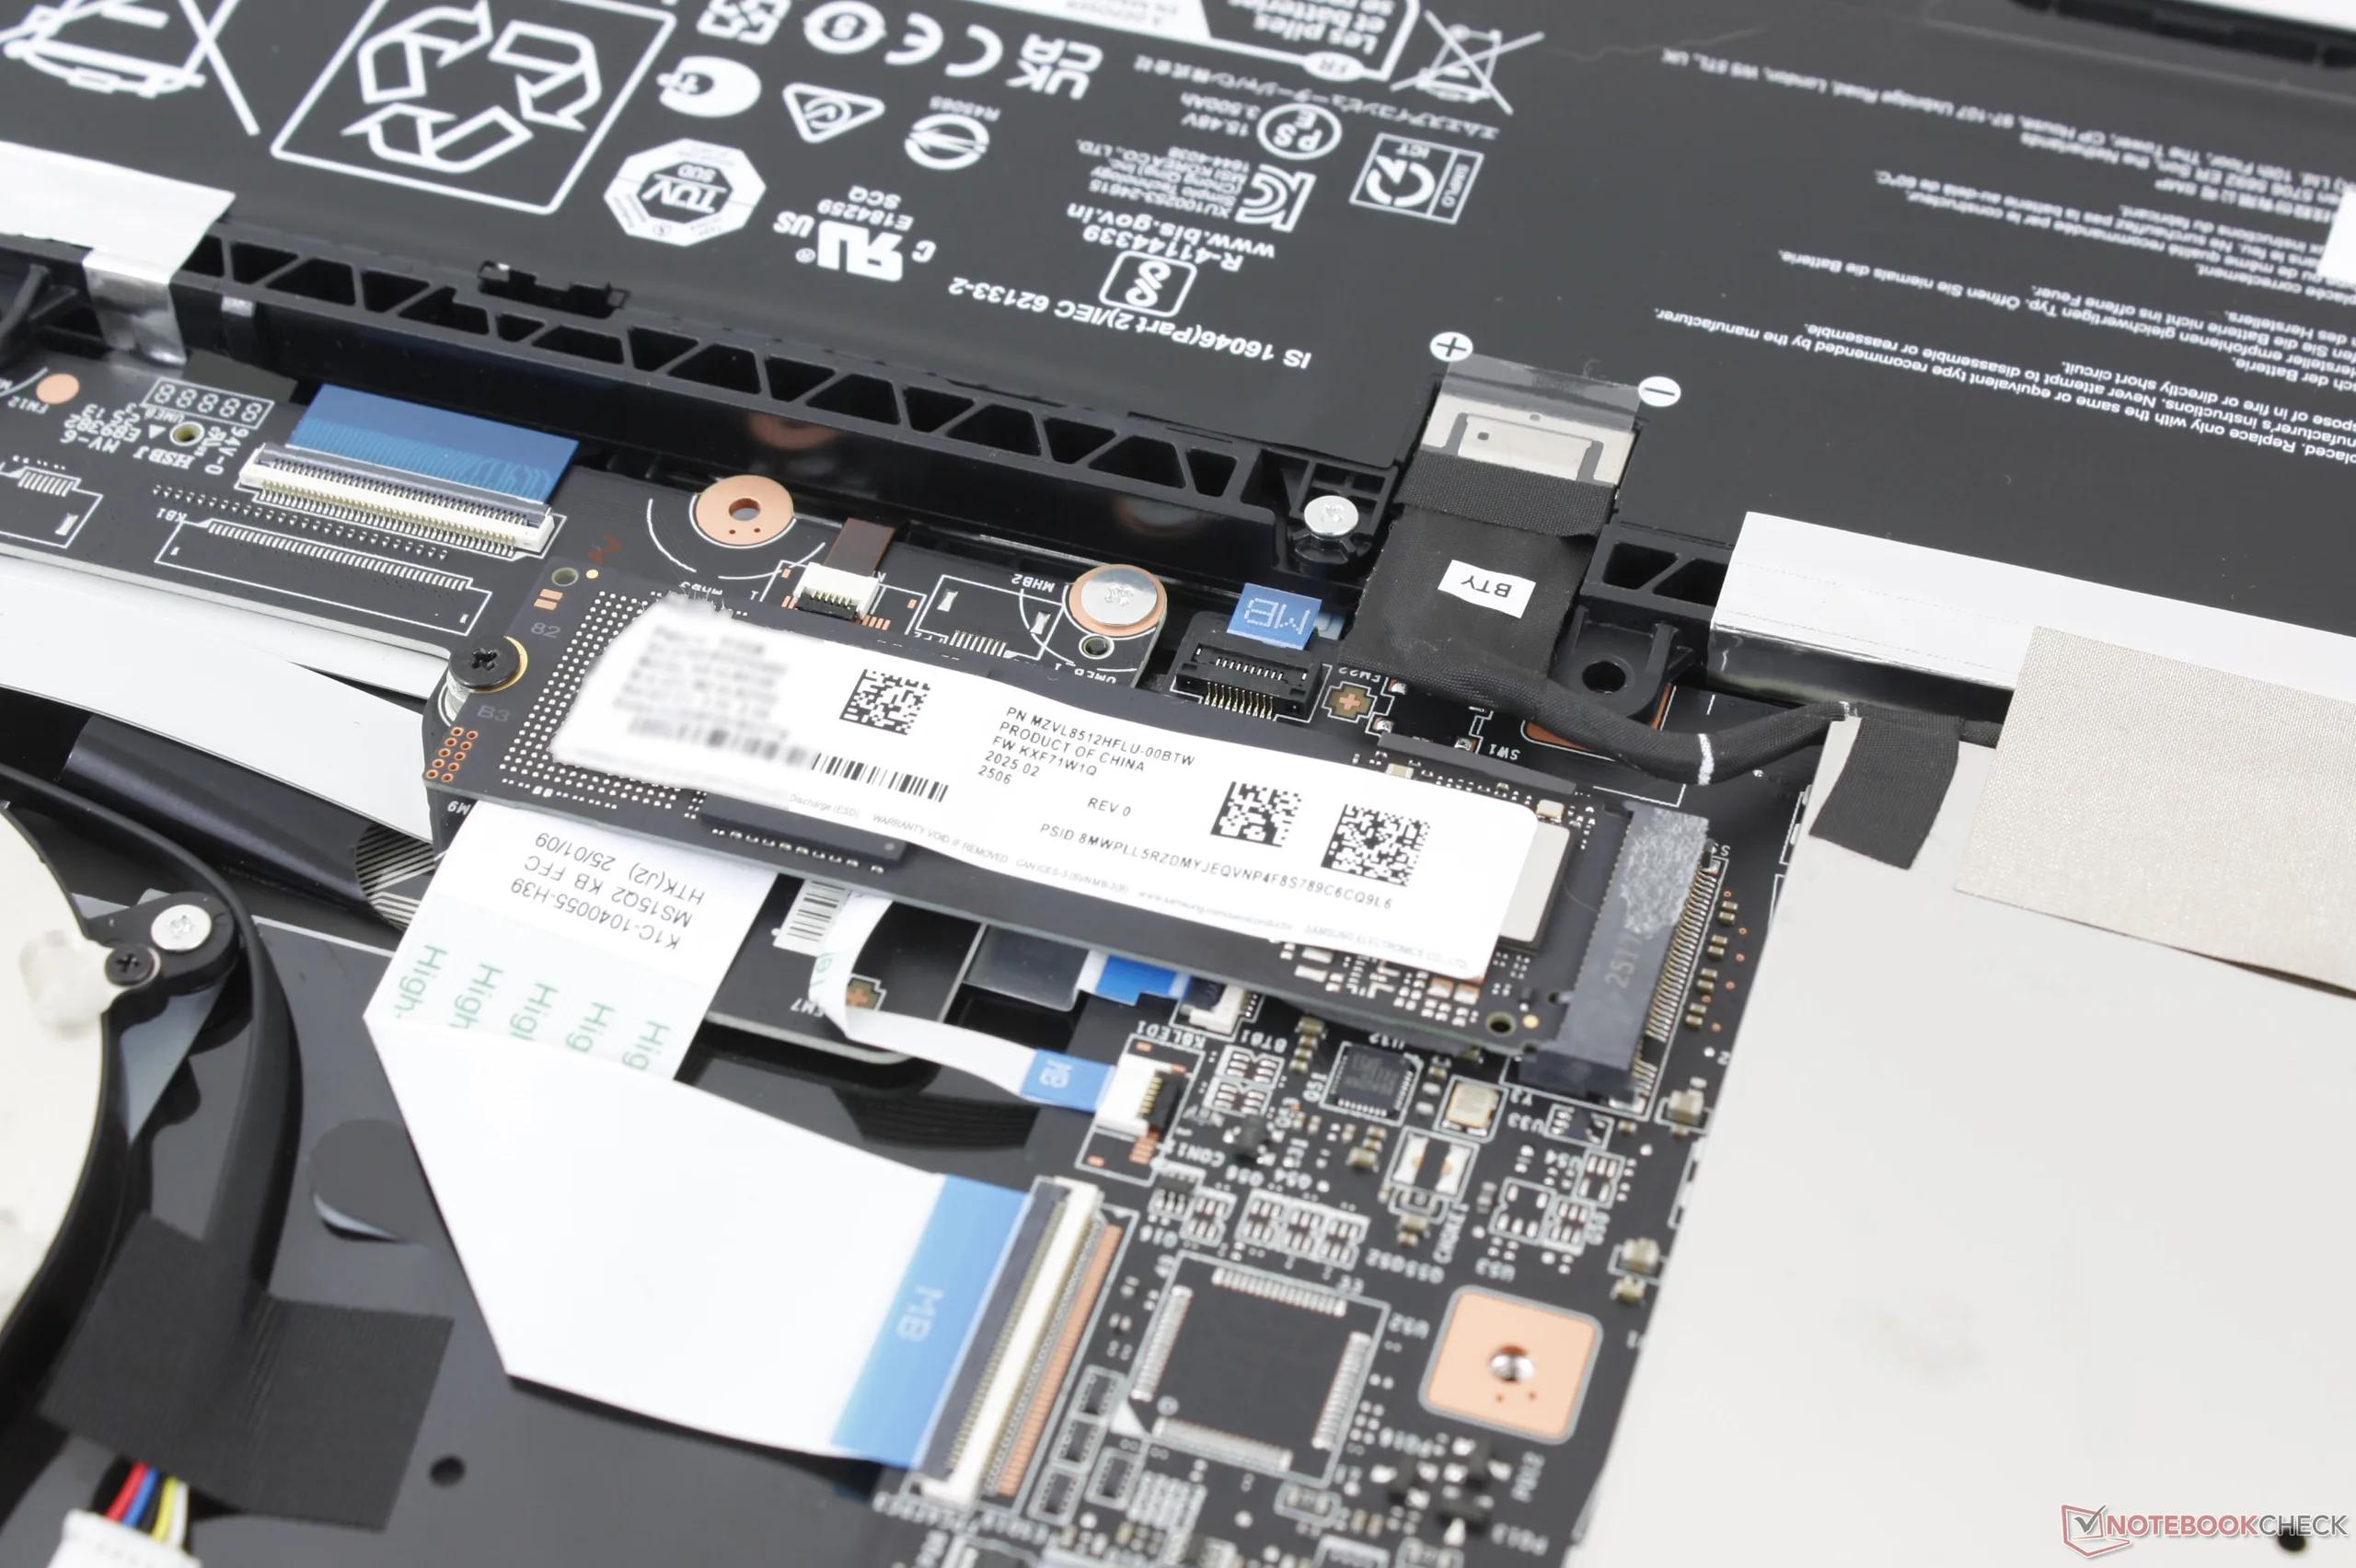
维护
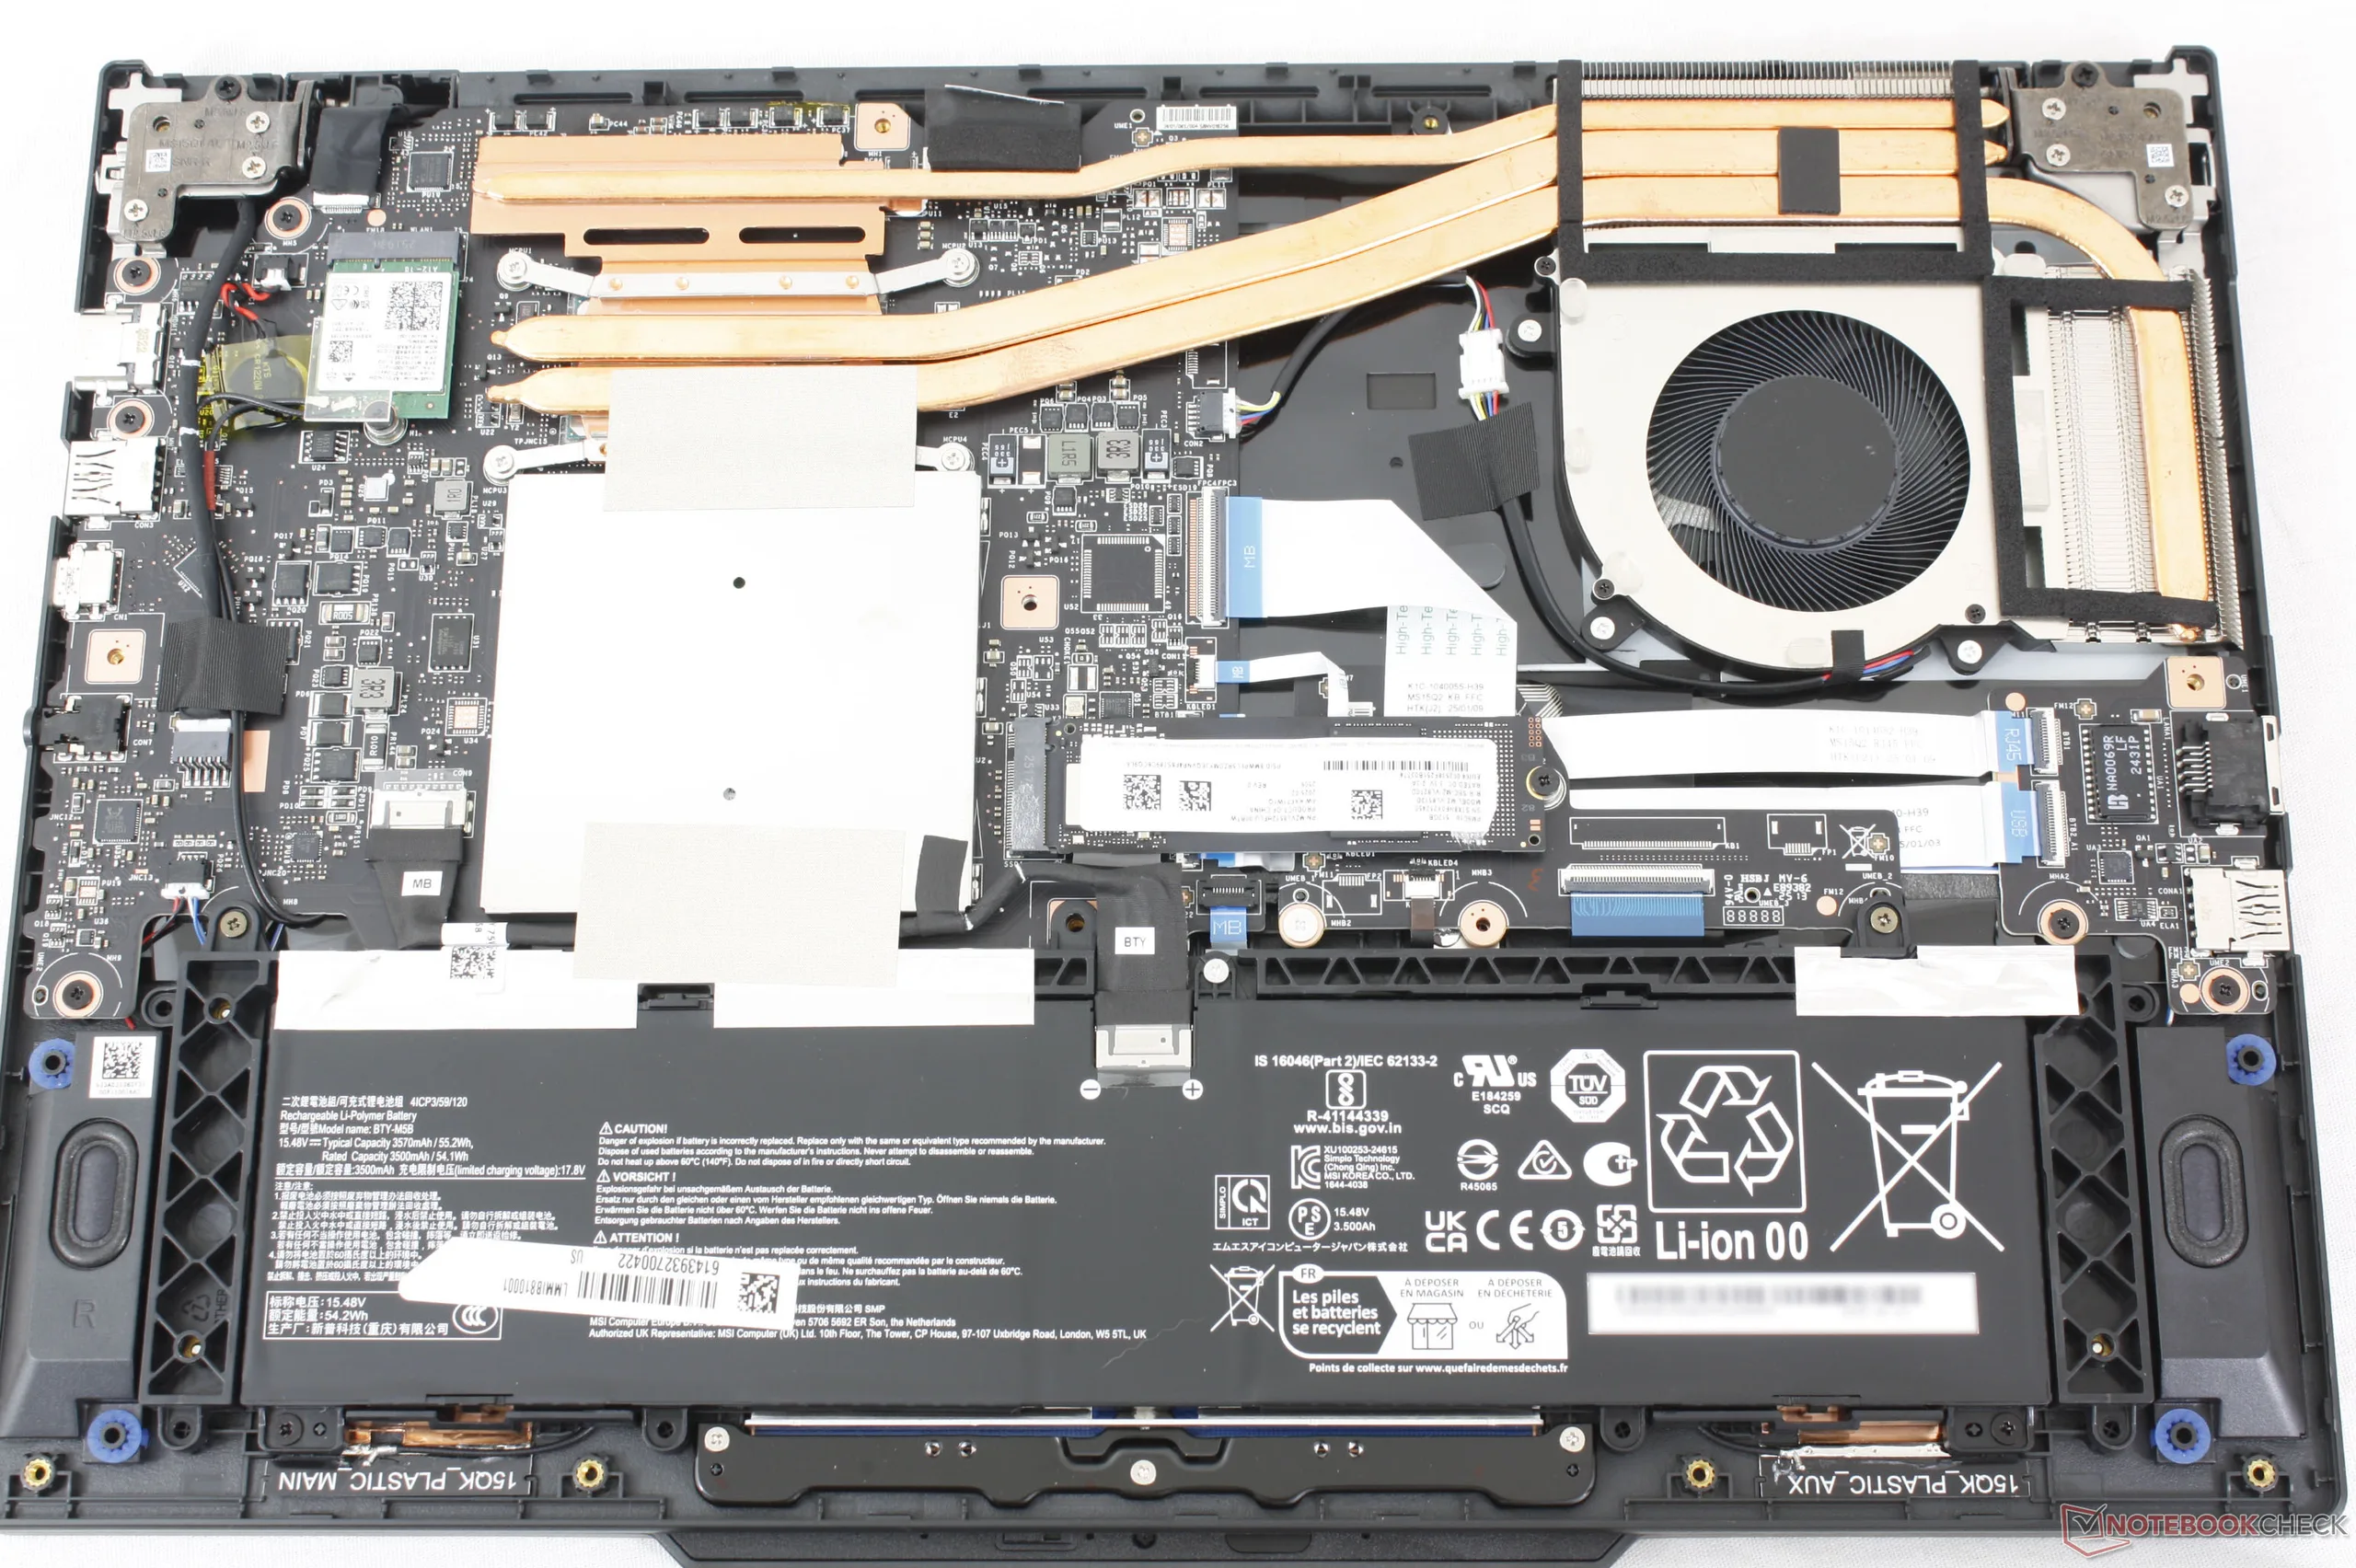
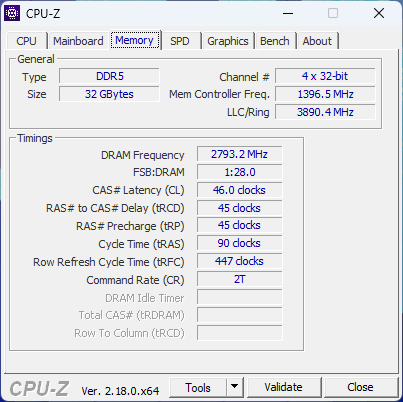
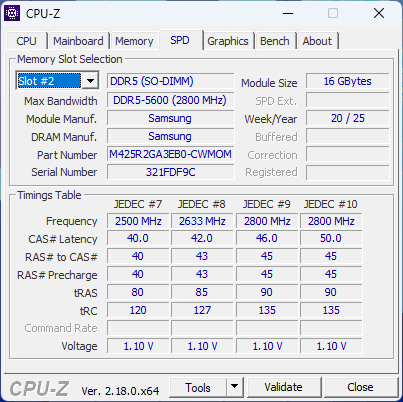
只需一把飞利浦螺丝刀,就能轻松拆下底部面板。内存可通过两个 DDR5 SODIMM 插槽升级,但只支持单个 M.2 2280 固态硬盘。
可持续性
虽然微星没有明确列出制造过程中使用的任何可回收材料,但该公司认可能源之星和 FSC 认证。笔记本电脑和交流适配器的包装采用塑料包装。
配件和保修
包装盒内除了交流适配器和文件外,没有其他附件。如果在美国购买,制造商通常提供一年有限保修。
输入设备
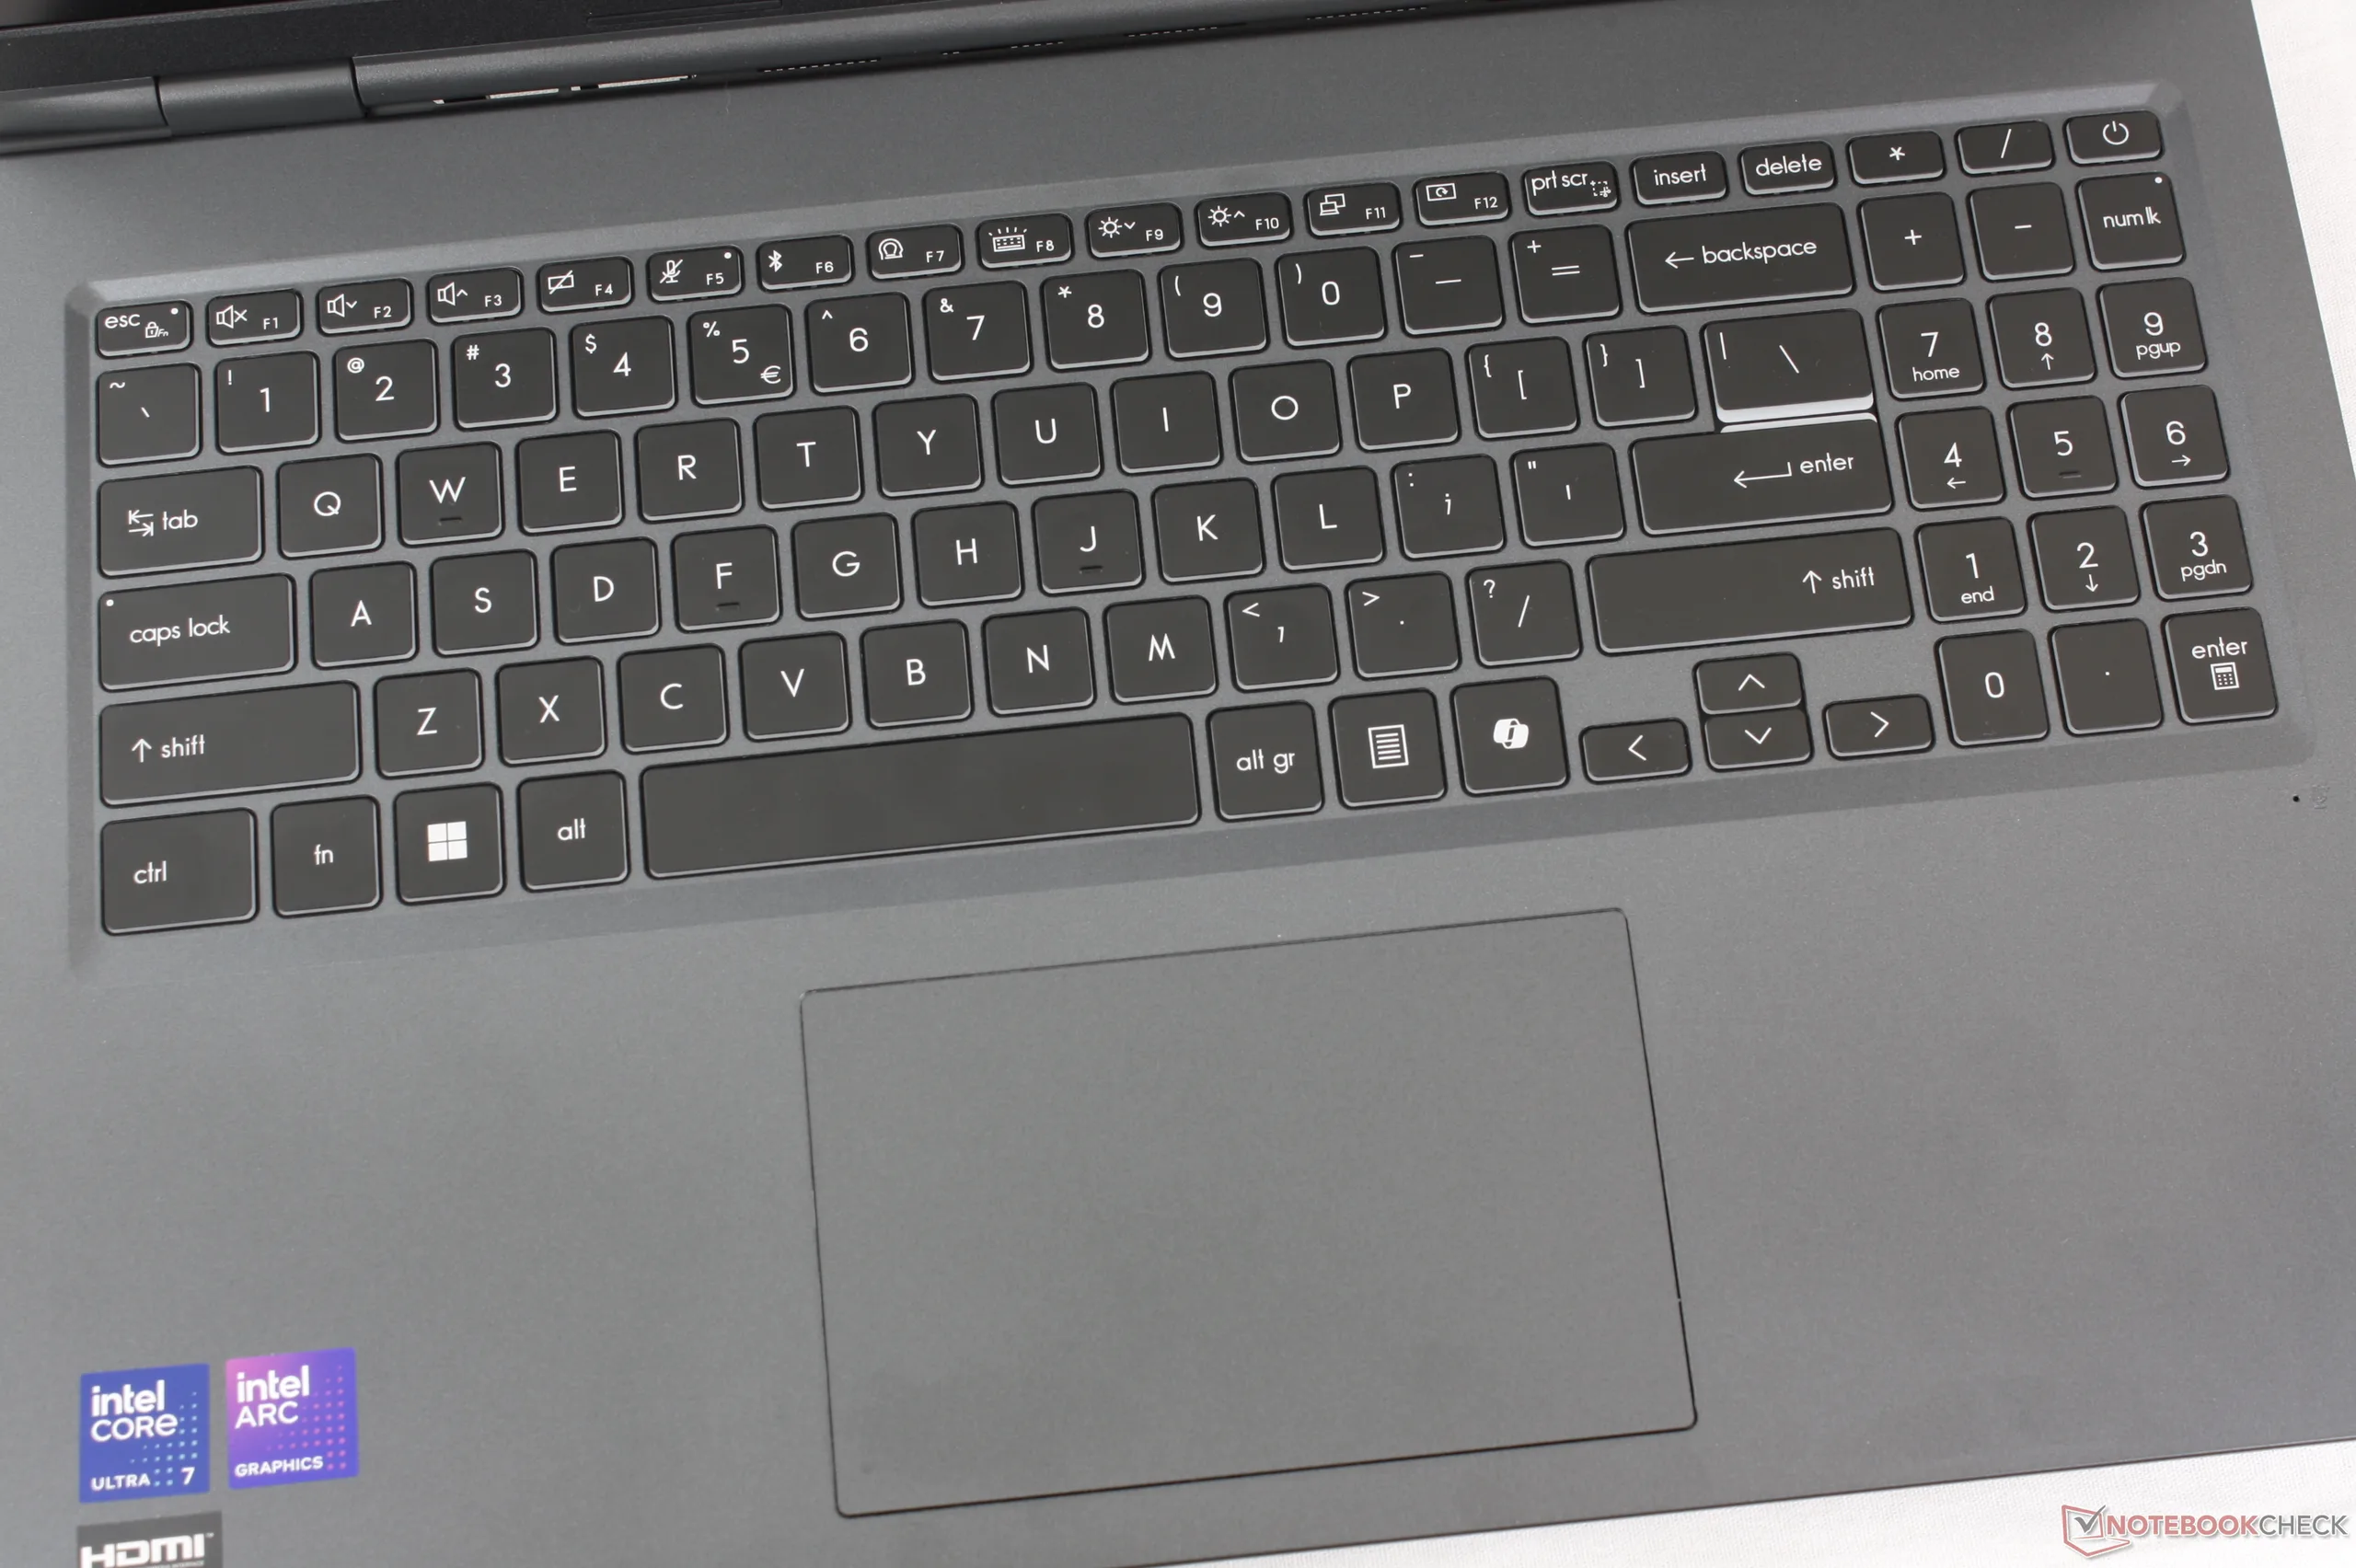
打字体验几乎与 威望 16Venture 16 采用了类似的键帽和组件。与传统的 ThinkPad 键盘相比,Venture 16 键盘的反馈相对较轻,敲击声较小,键程较浅。
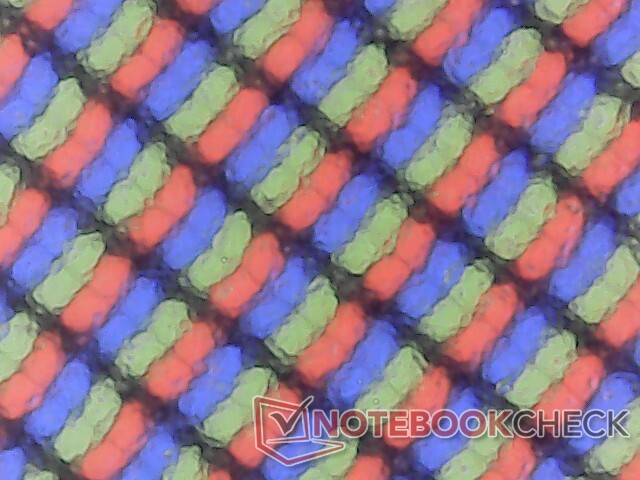
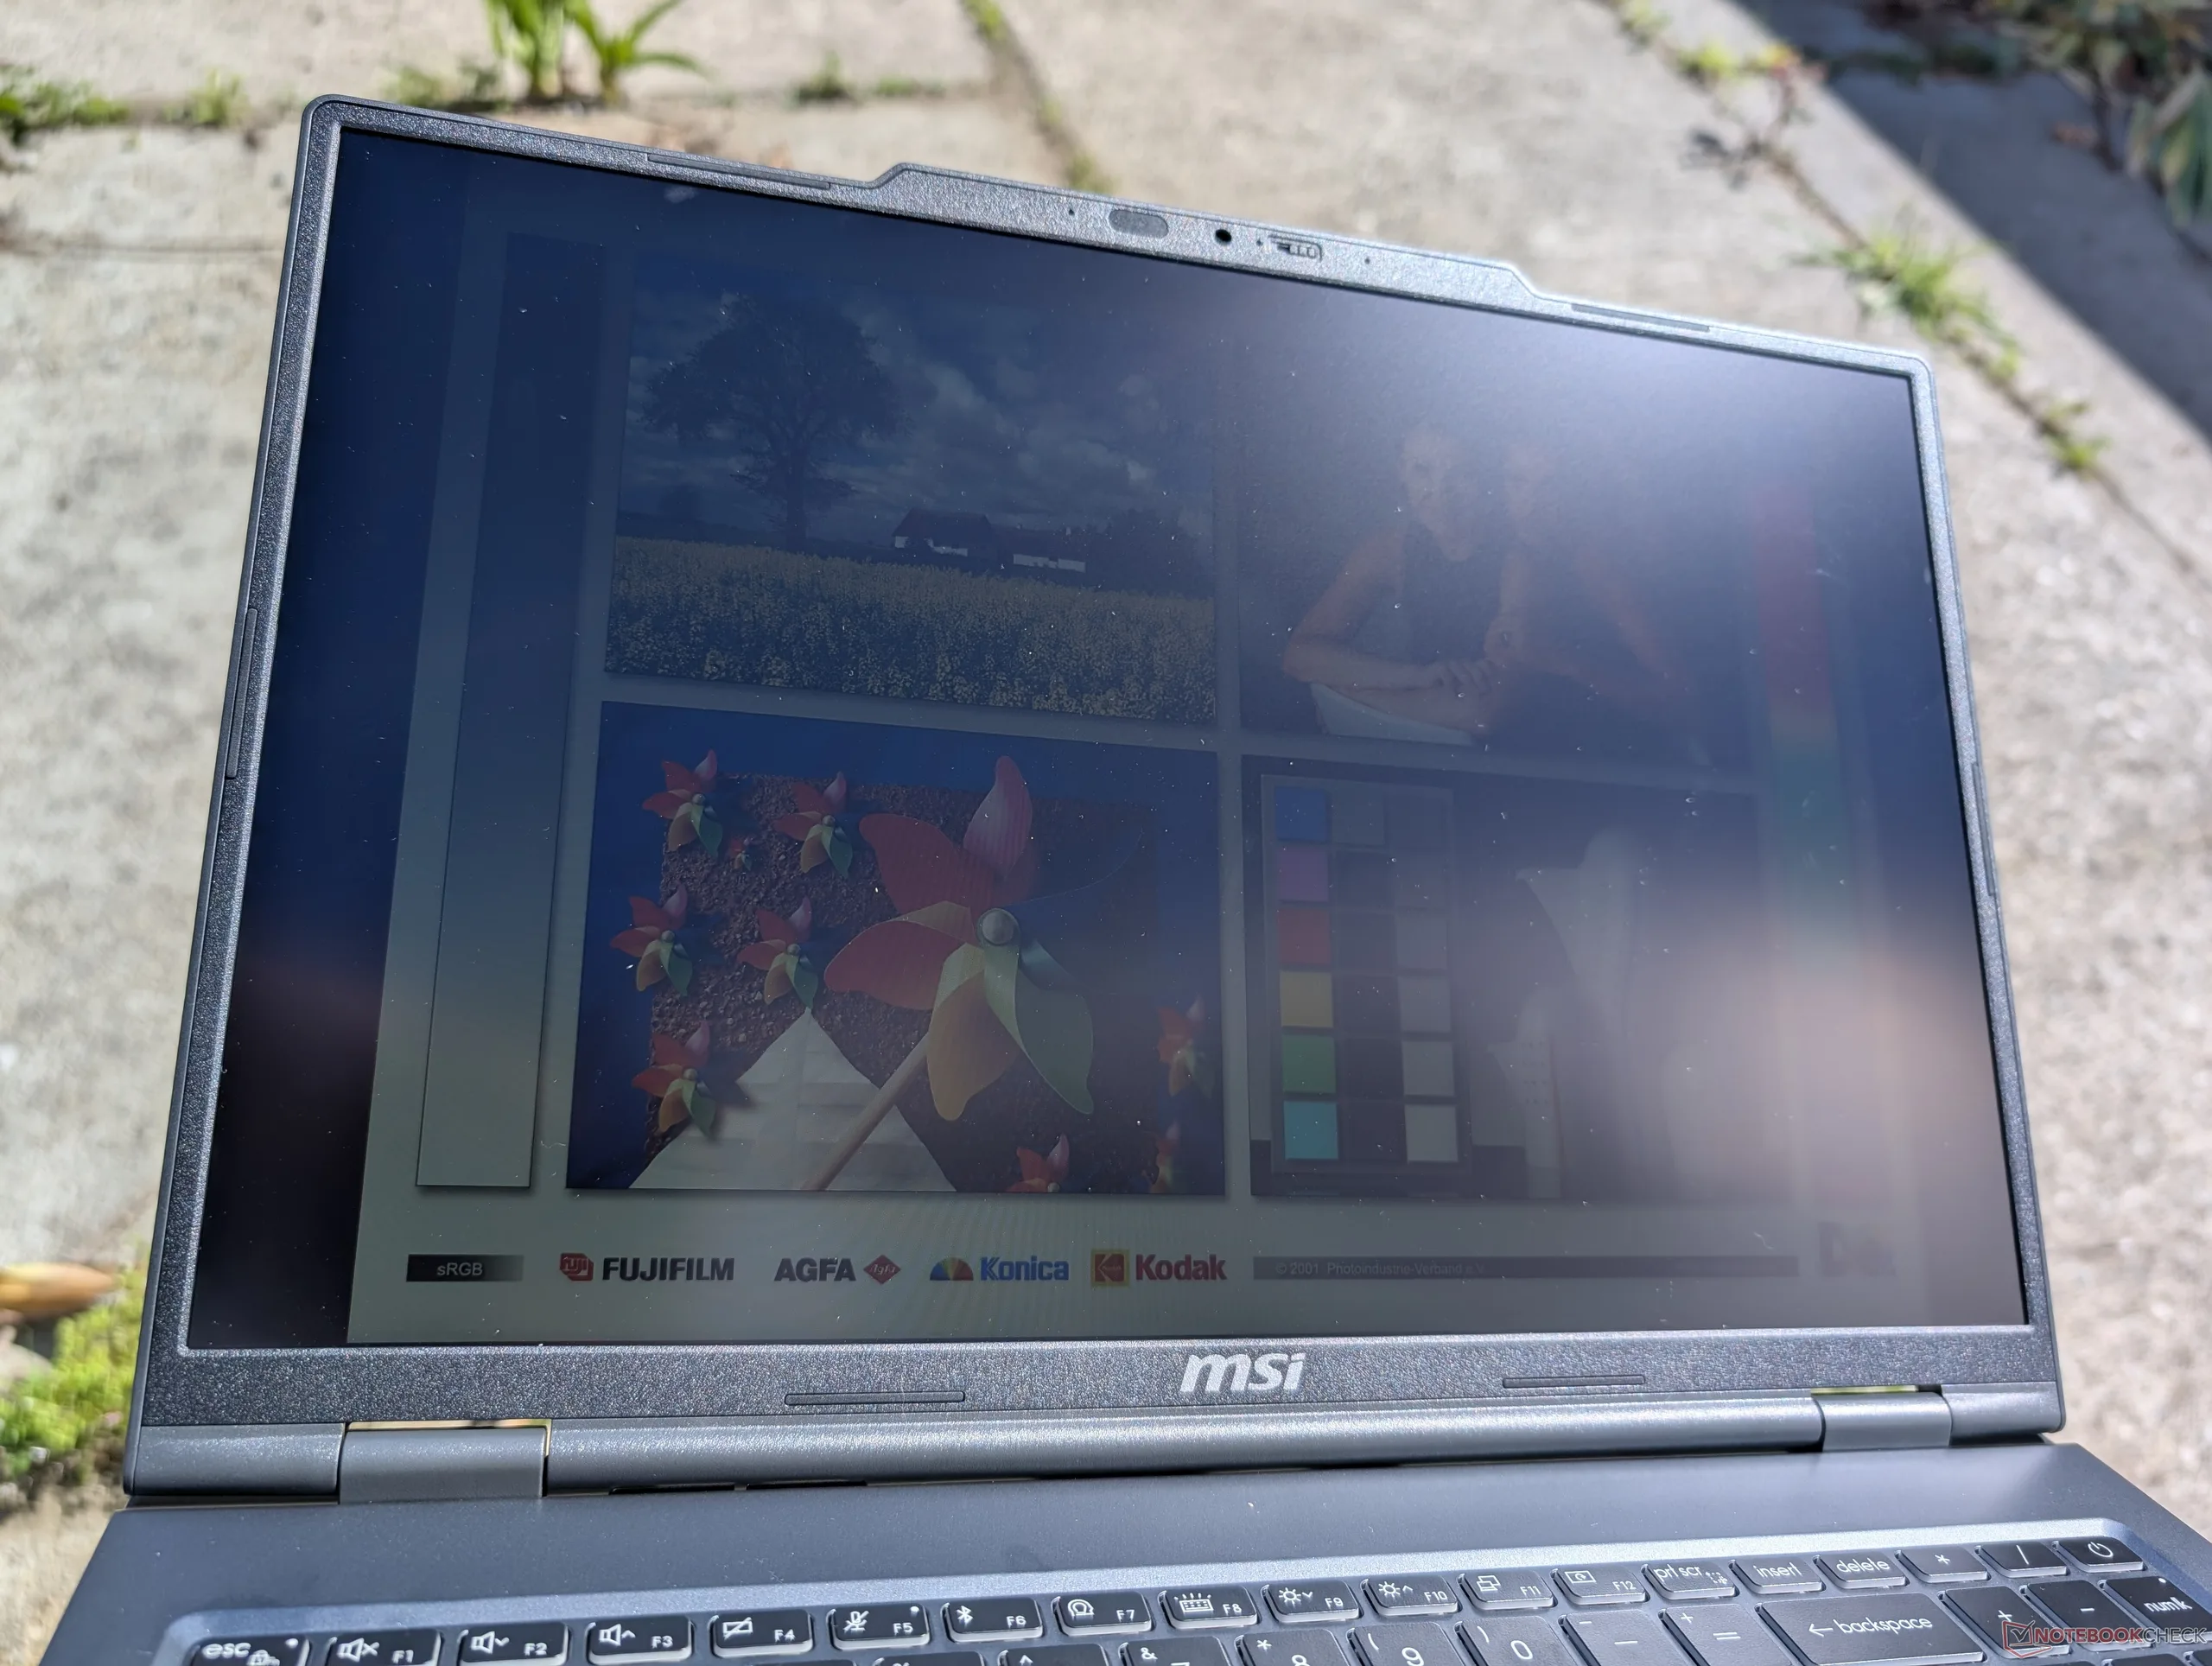
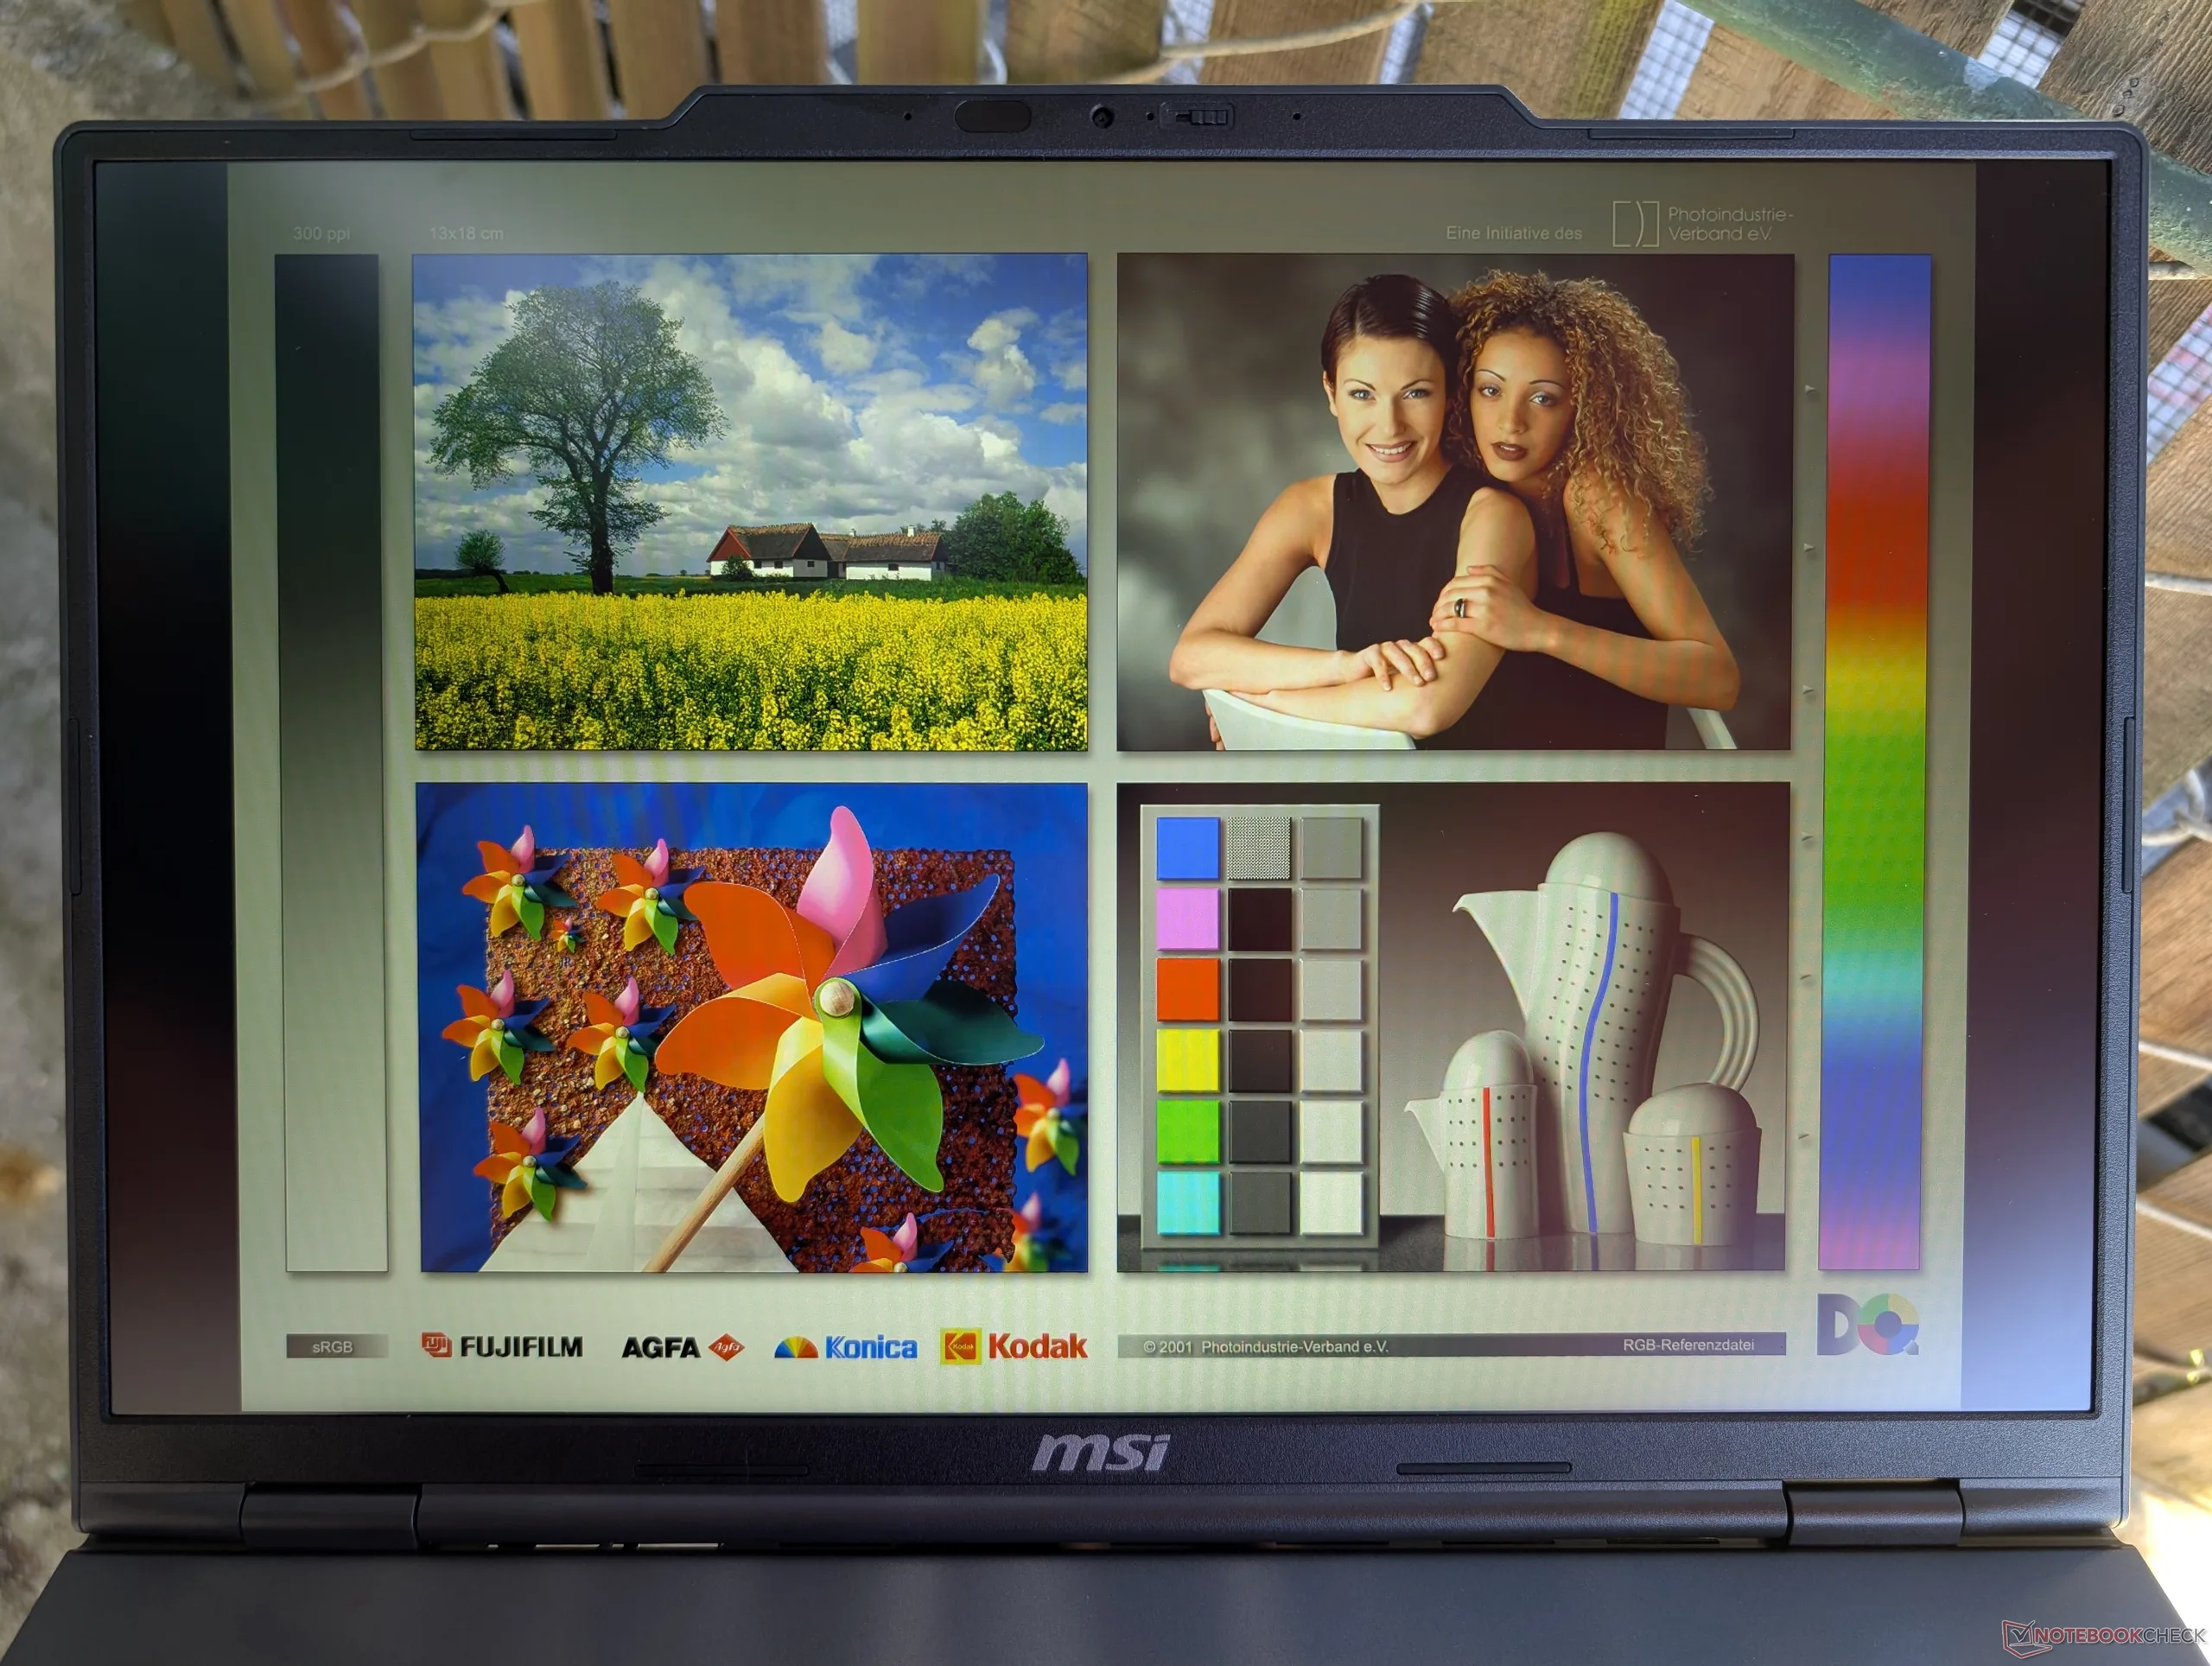
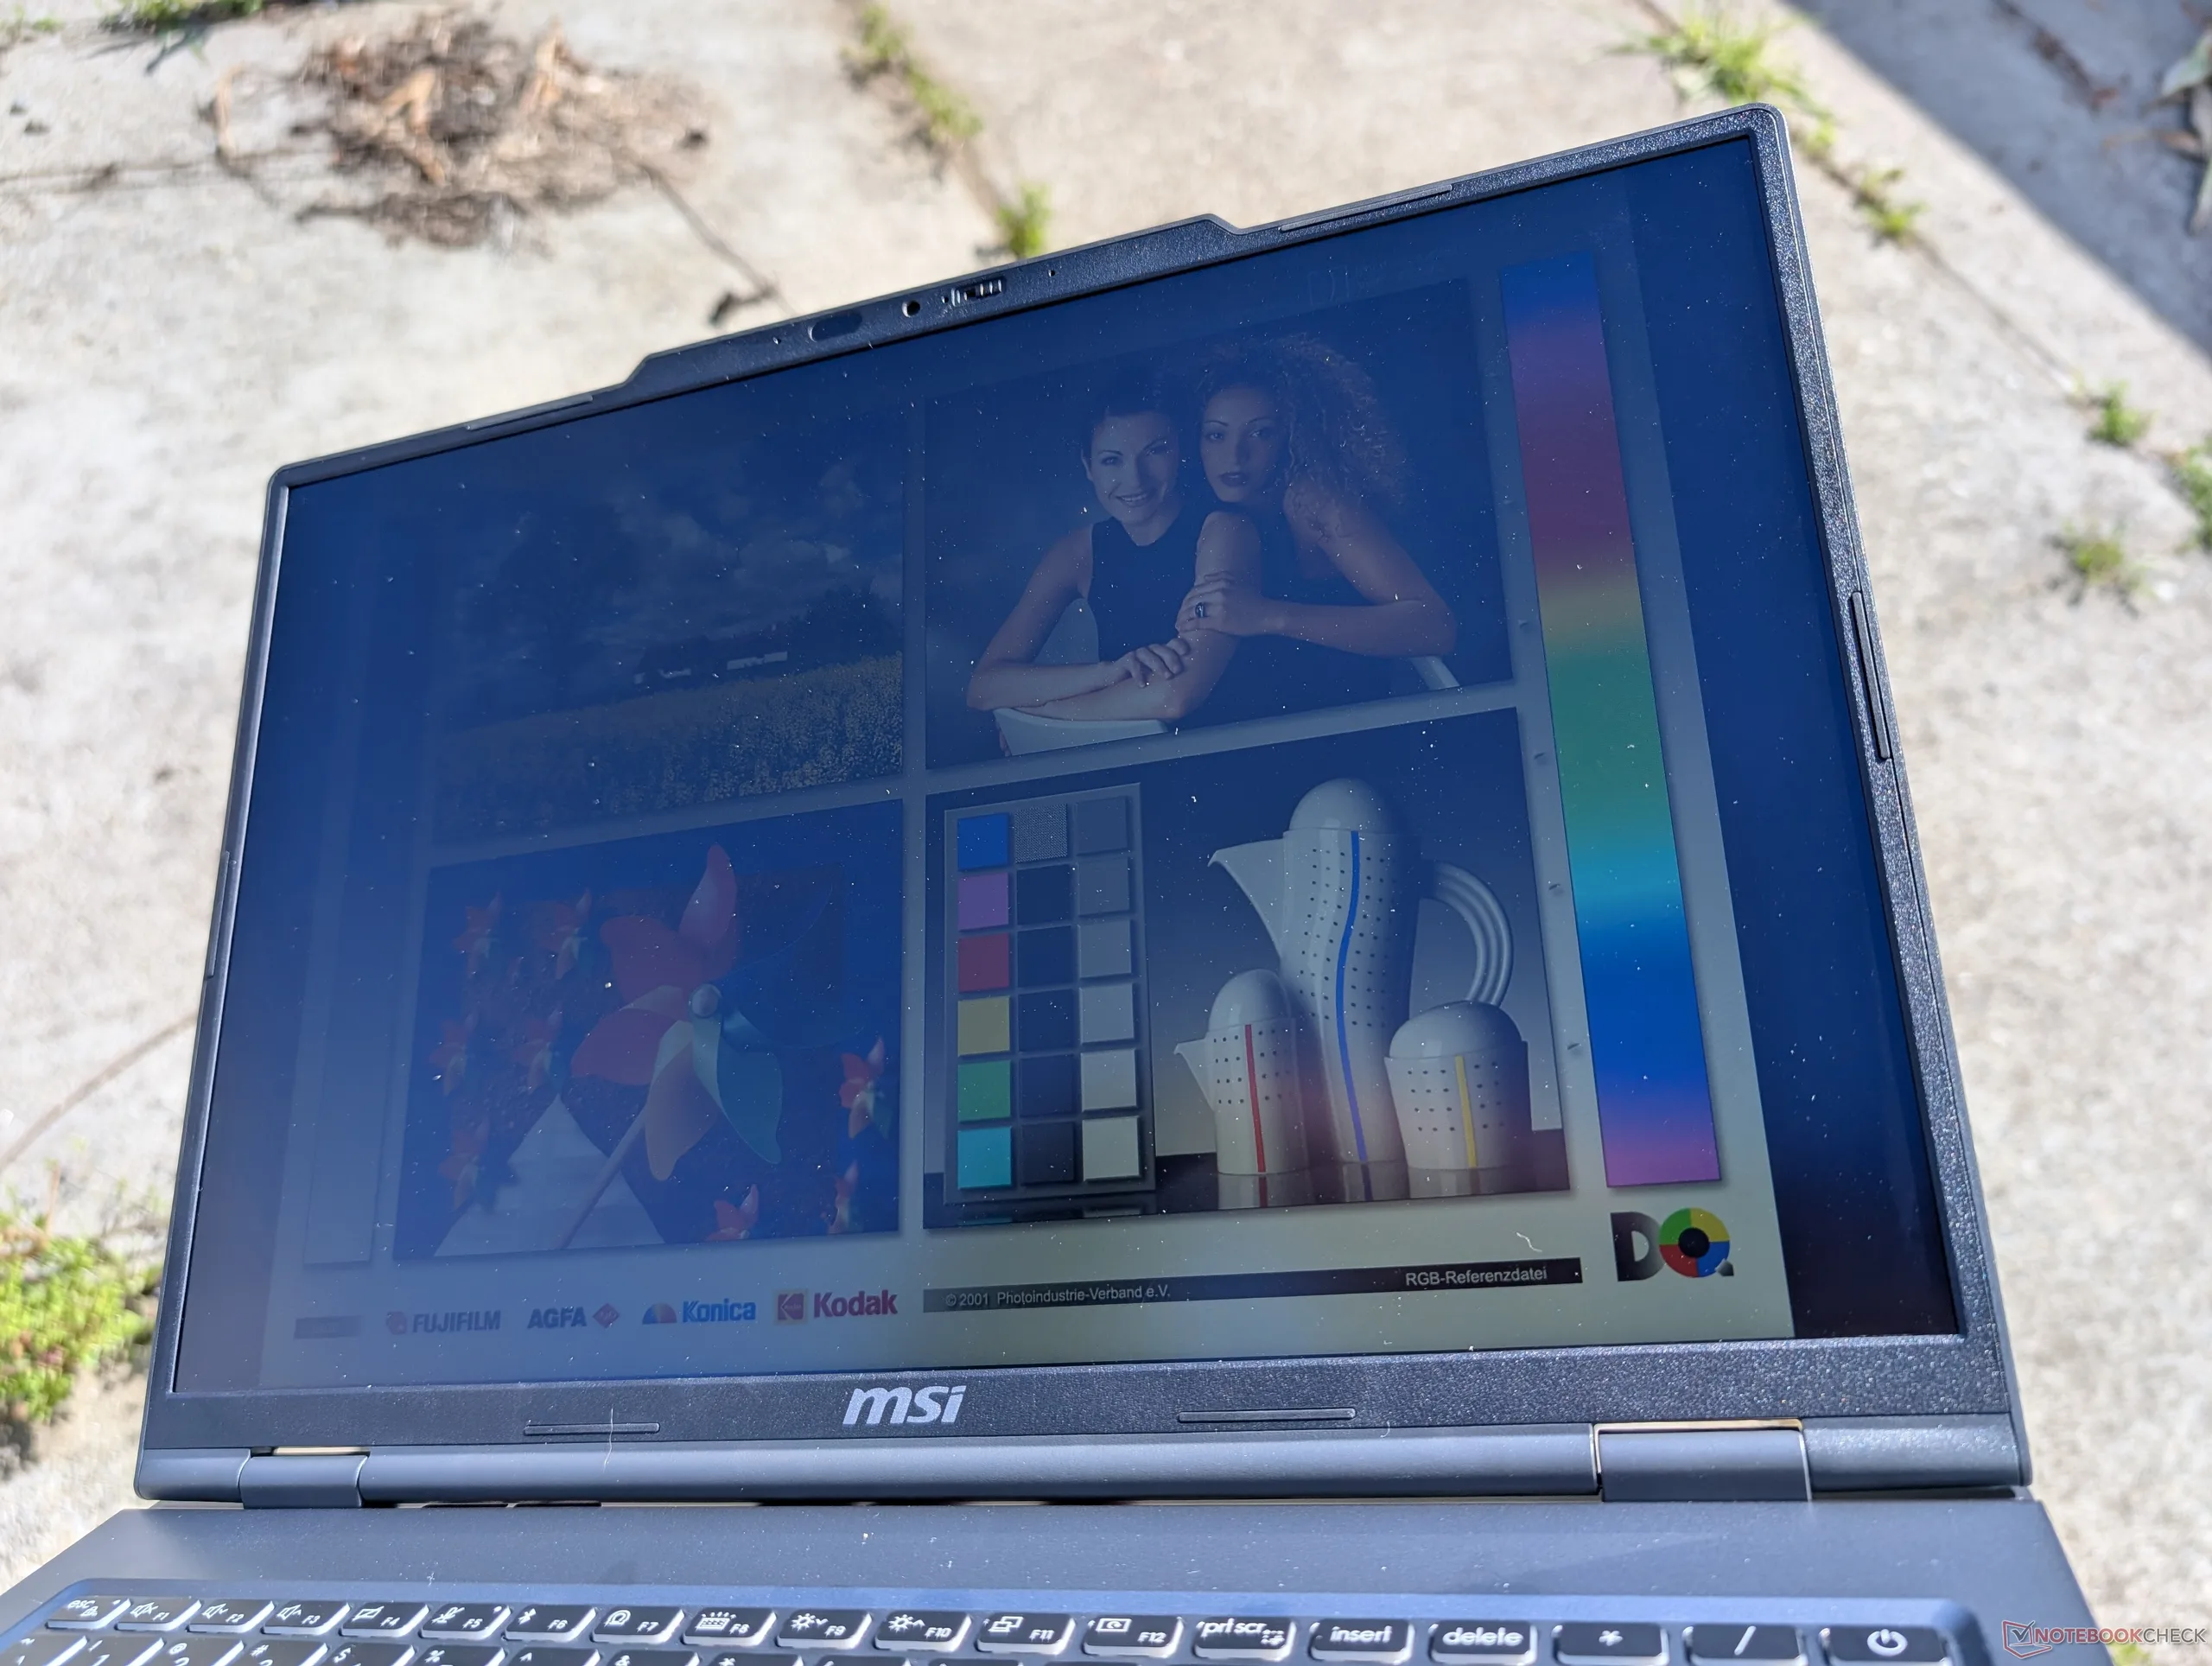
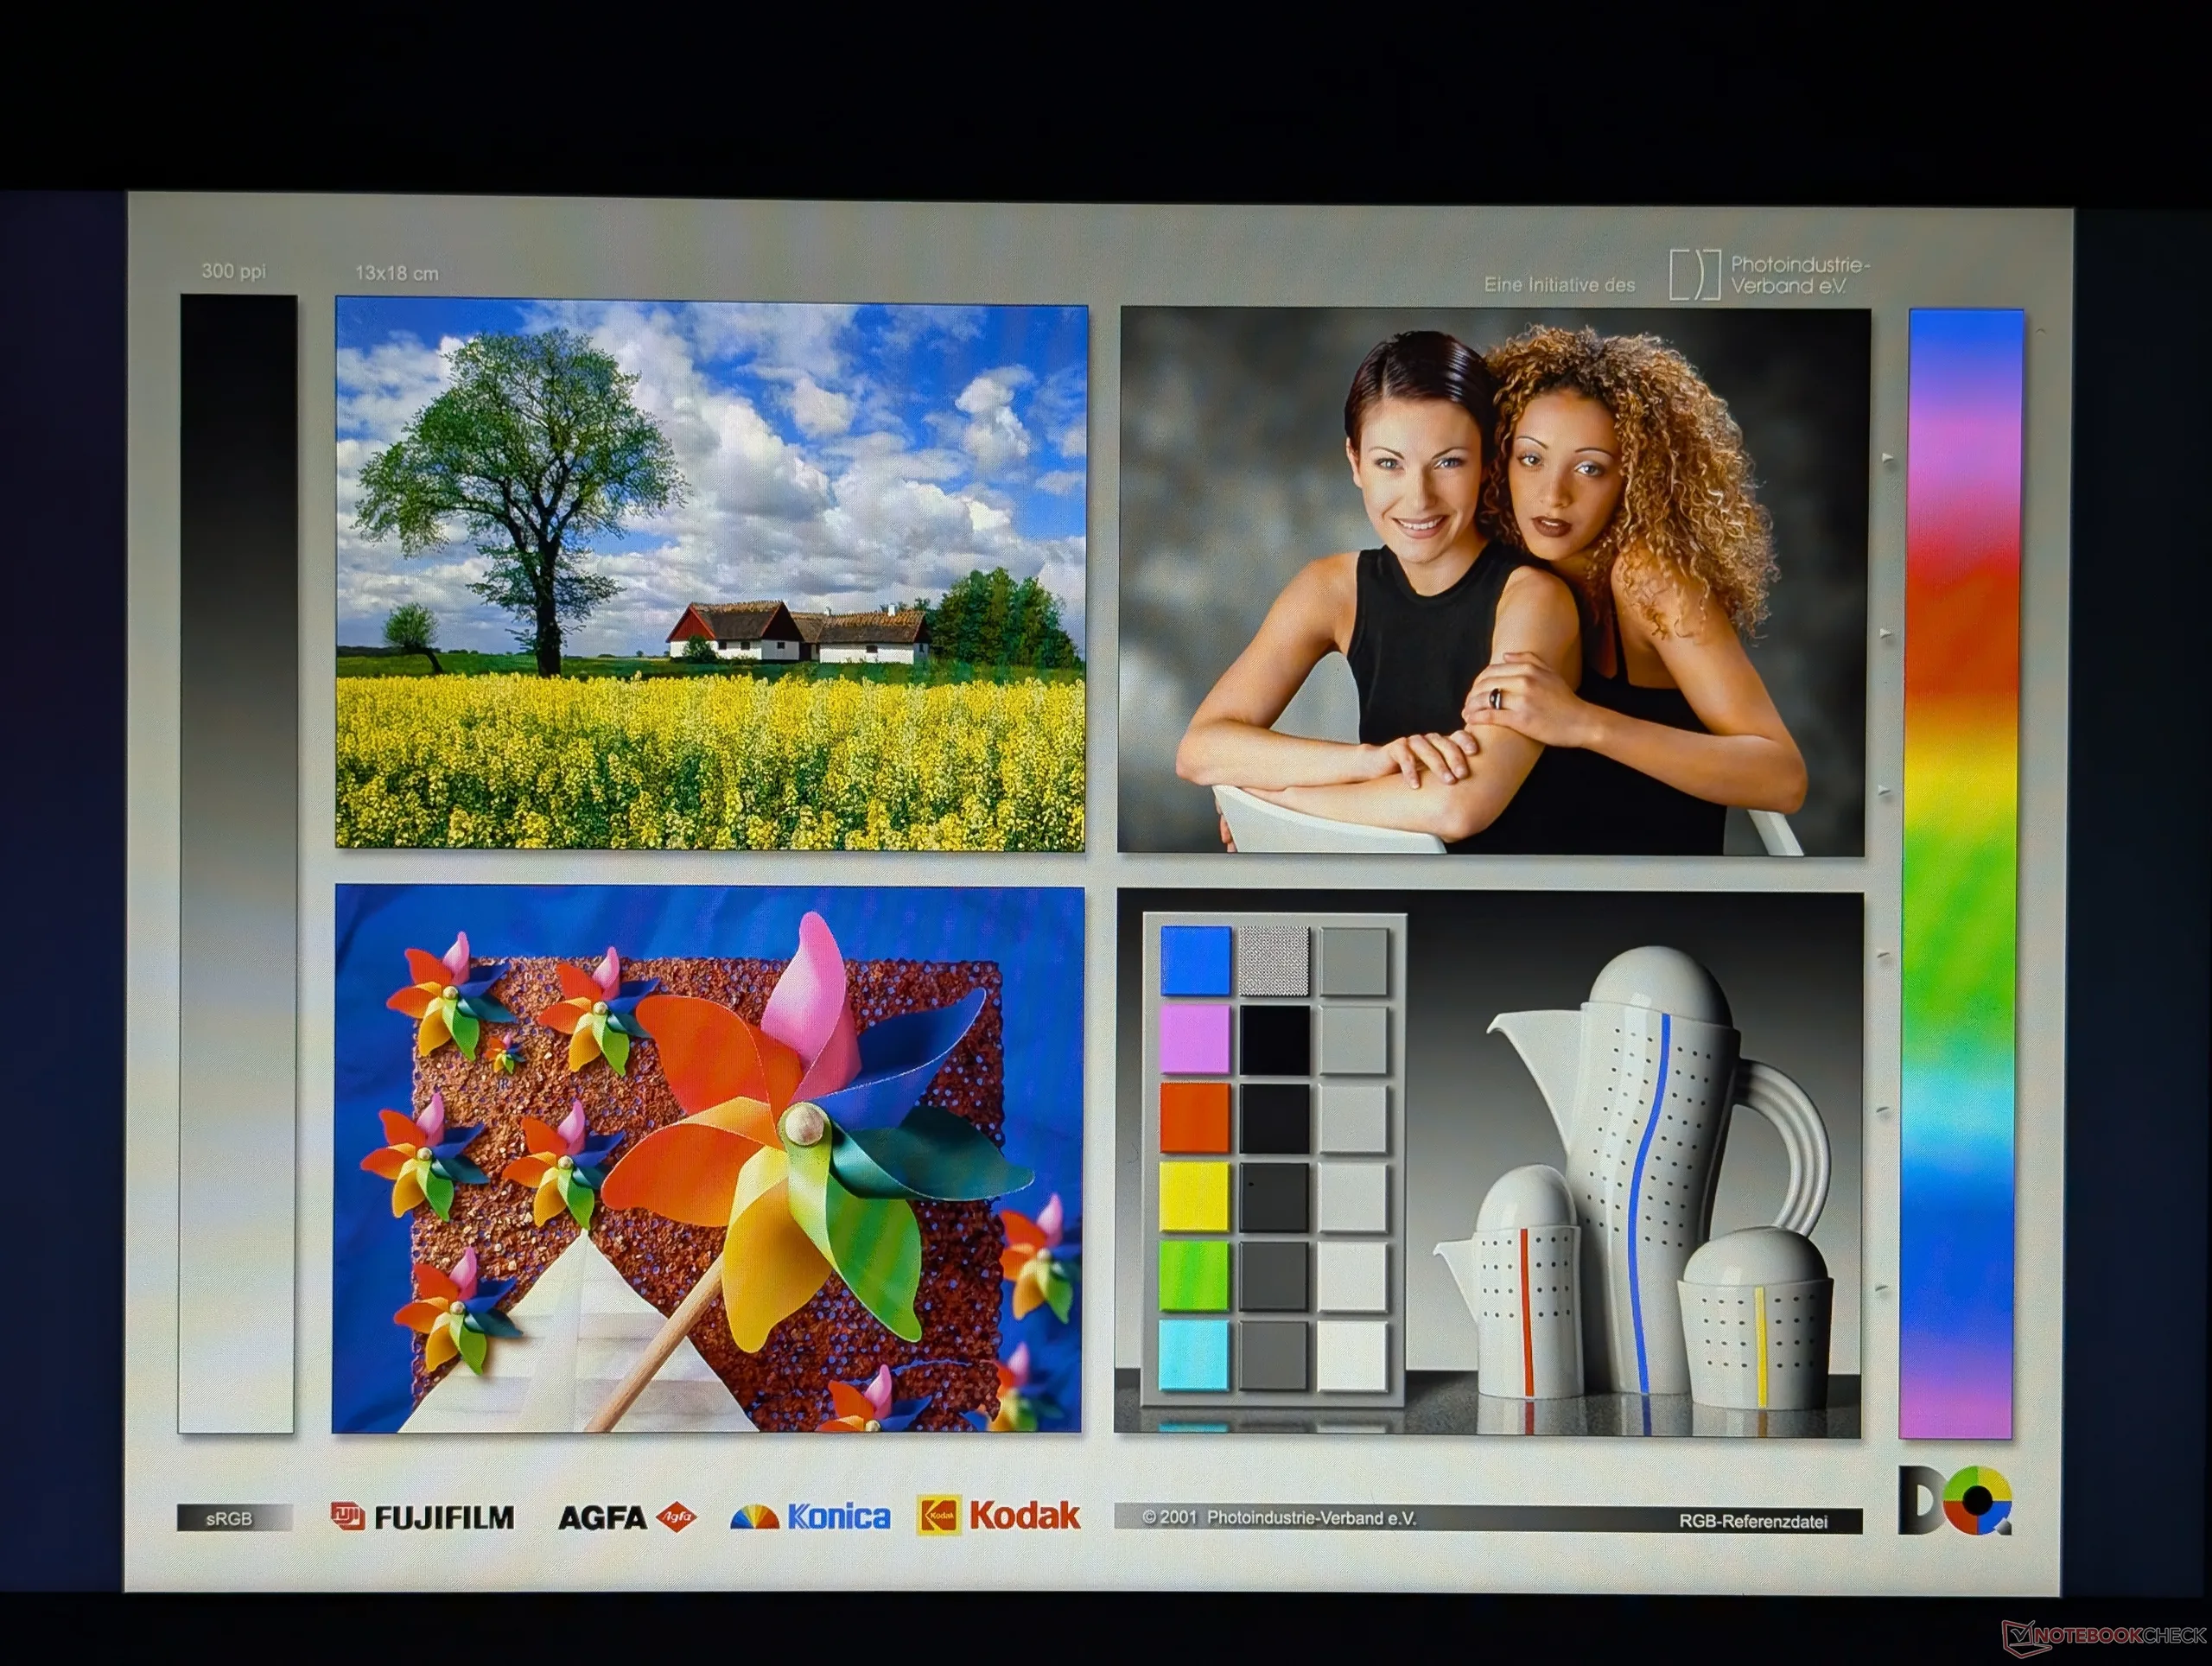
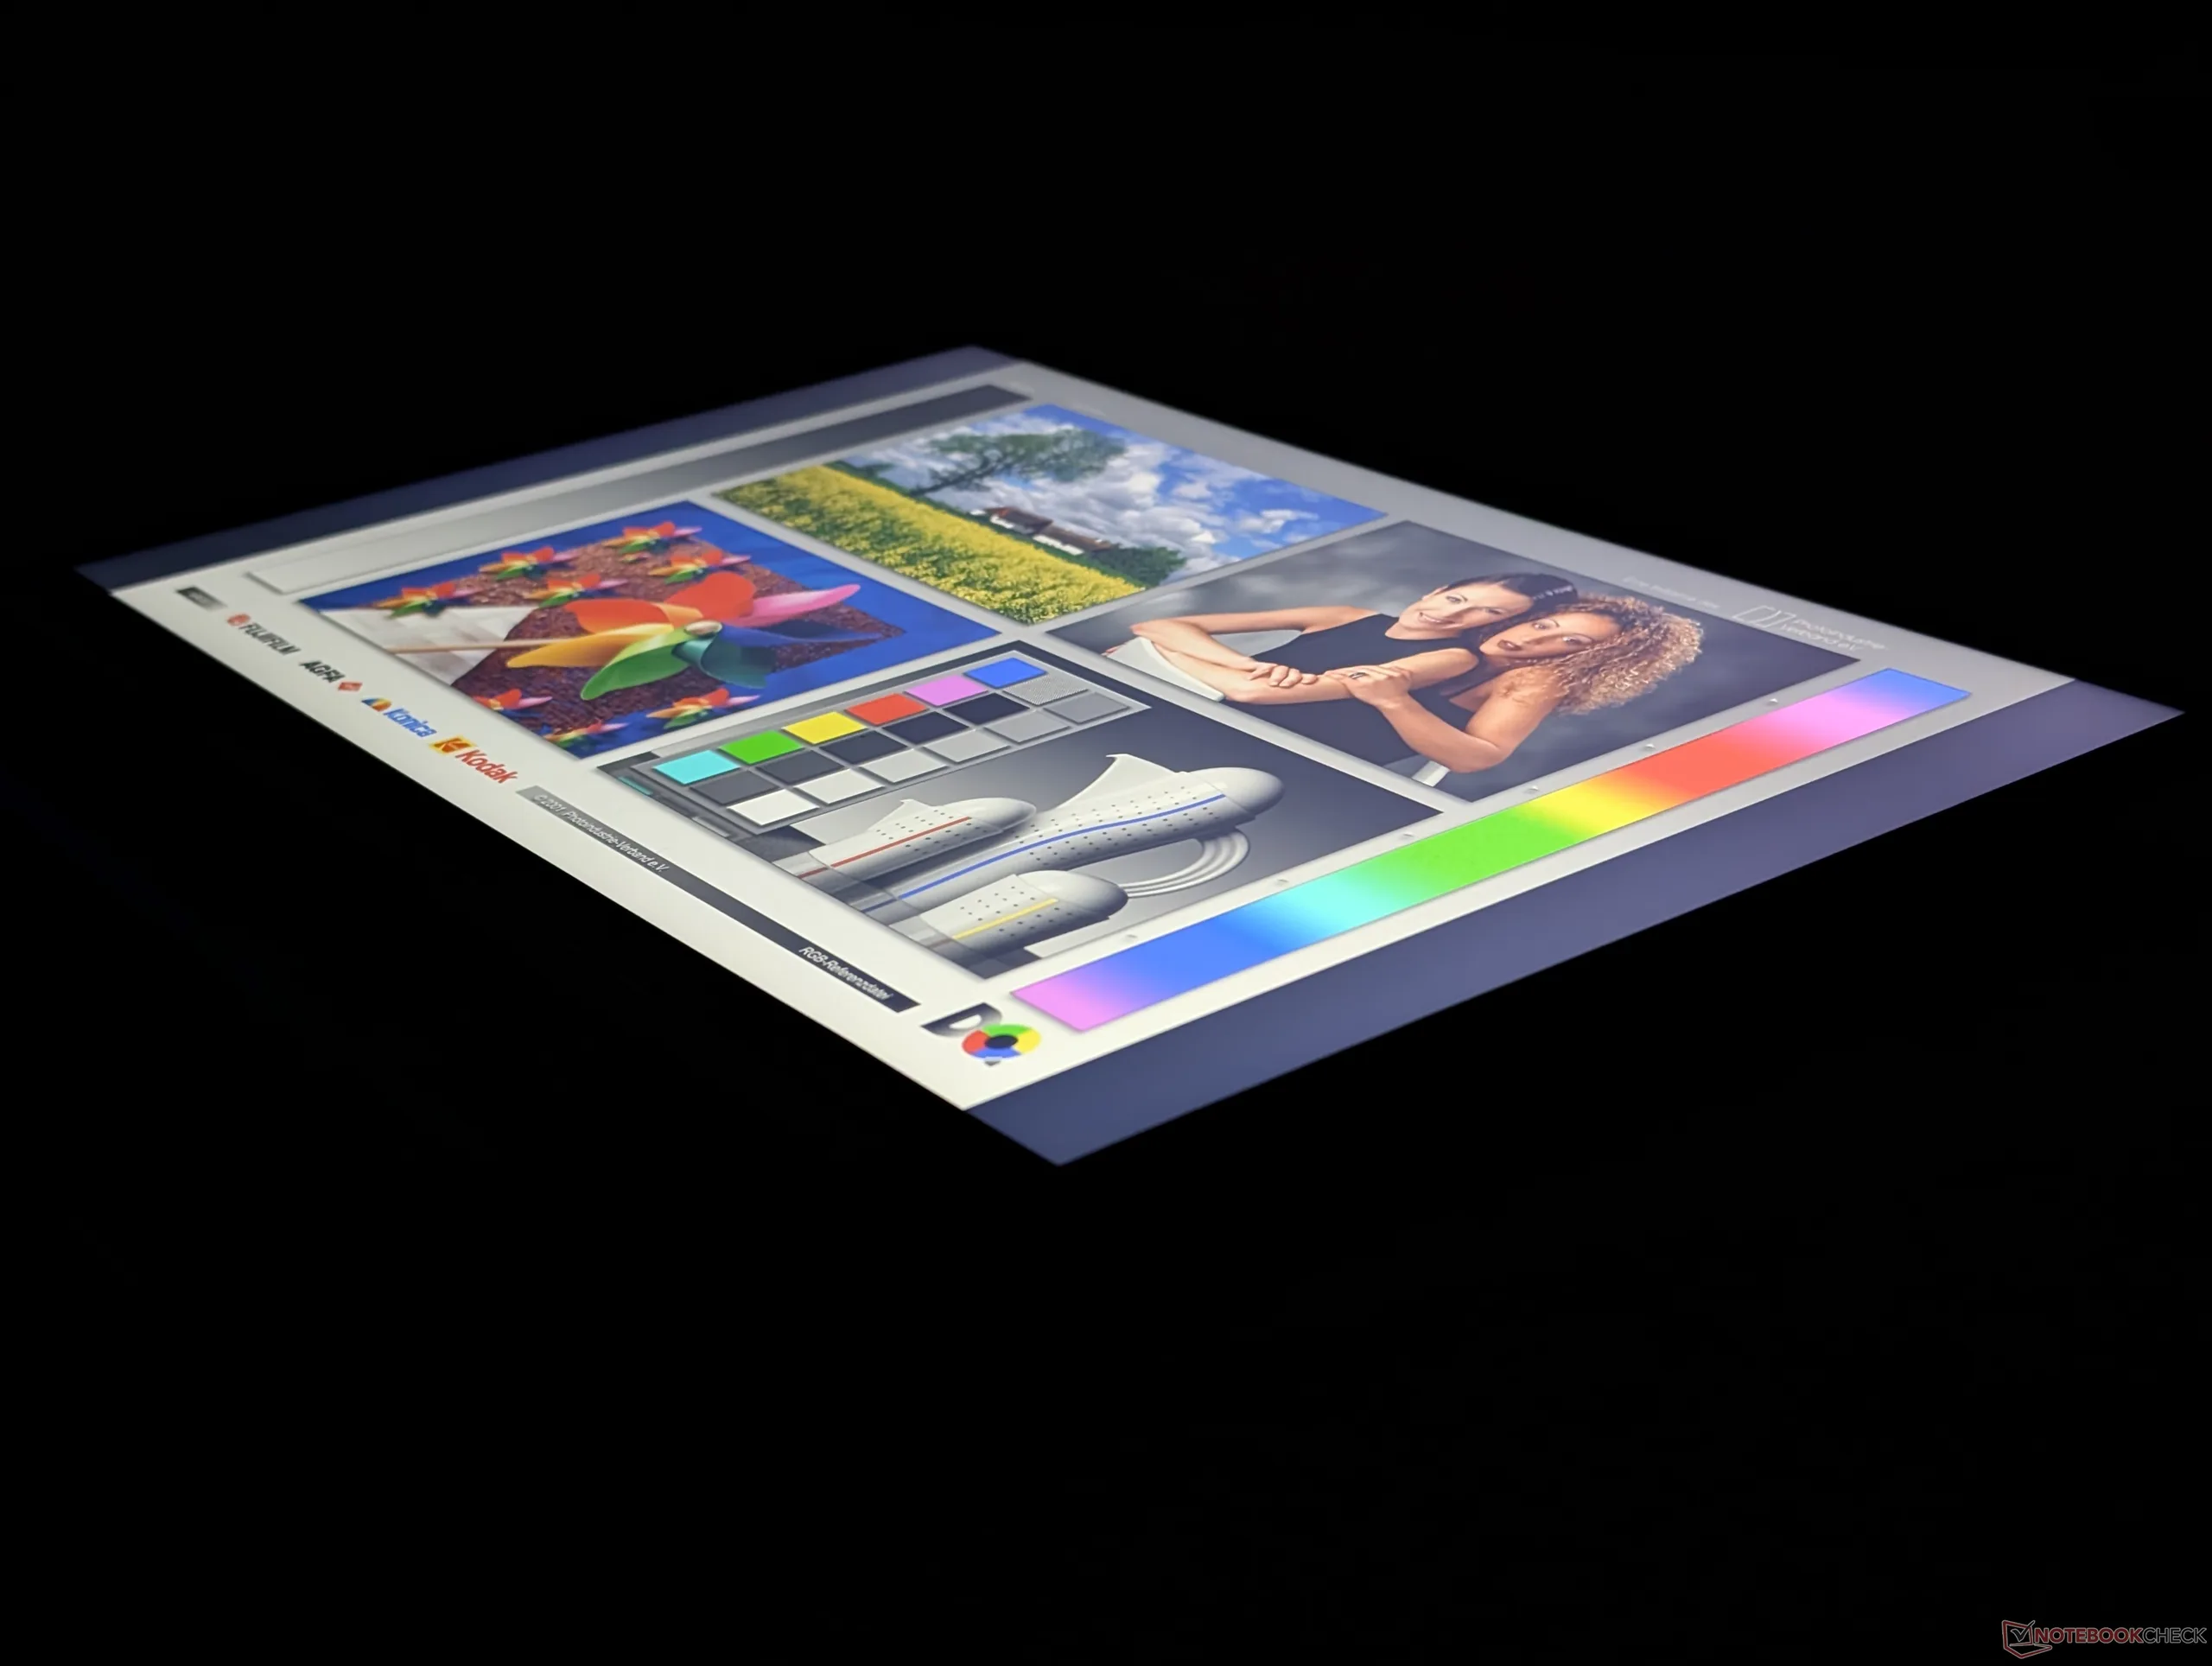
显示屏
有以下两种显示选项:
- 1920 x 1200、IPS、60% sRGB、60 Hz、触摸屏
- 2048 x 1280,OLED,100% DCI-P3,120 Hz,非触摸屏
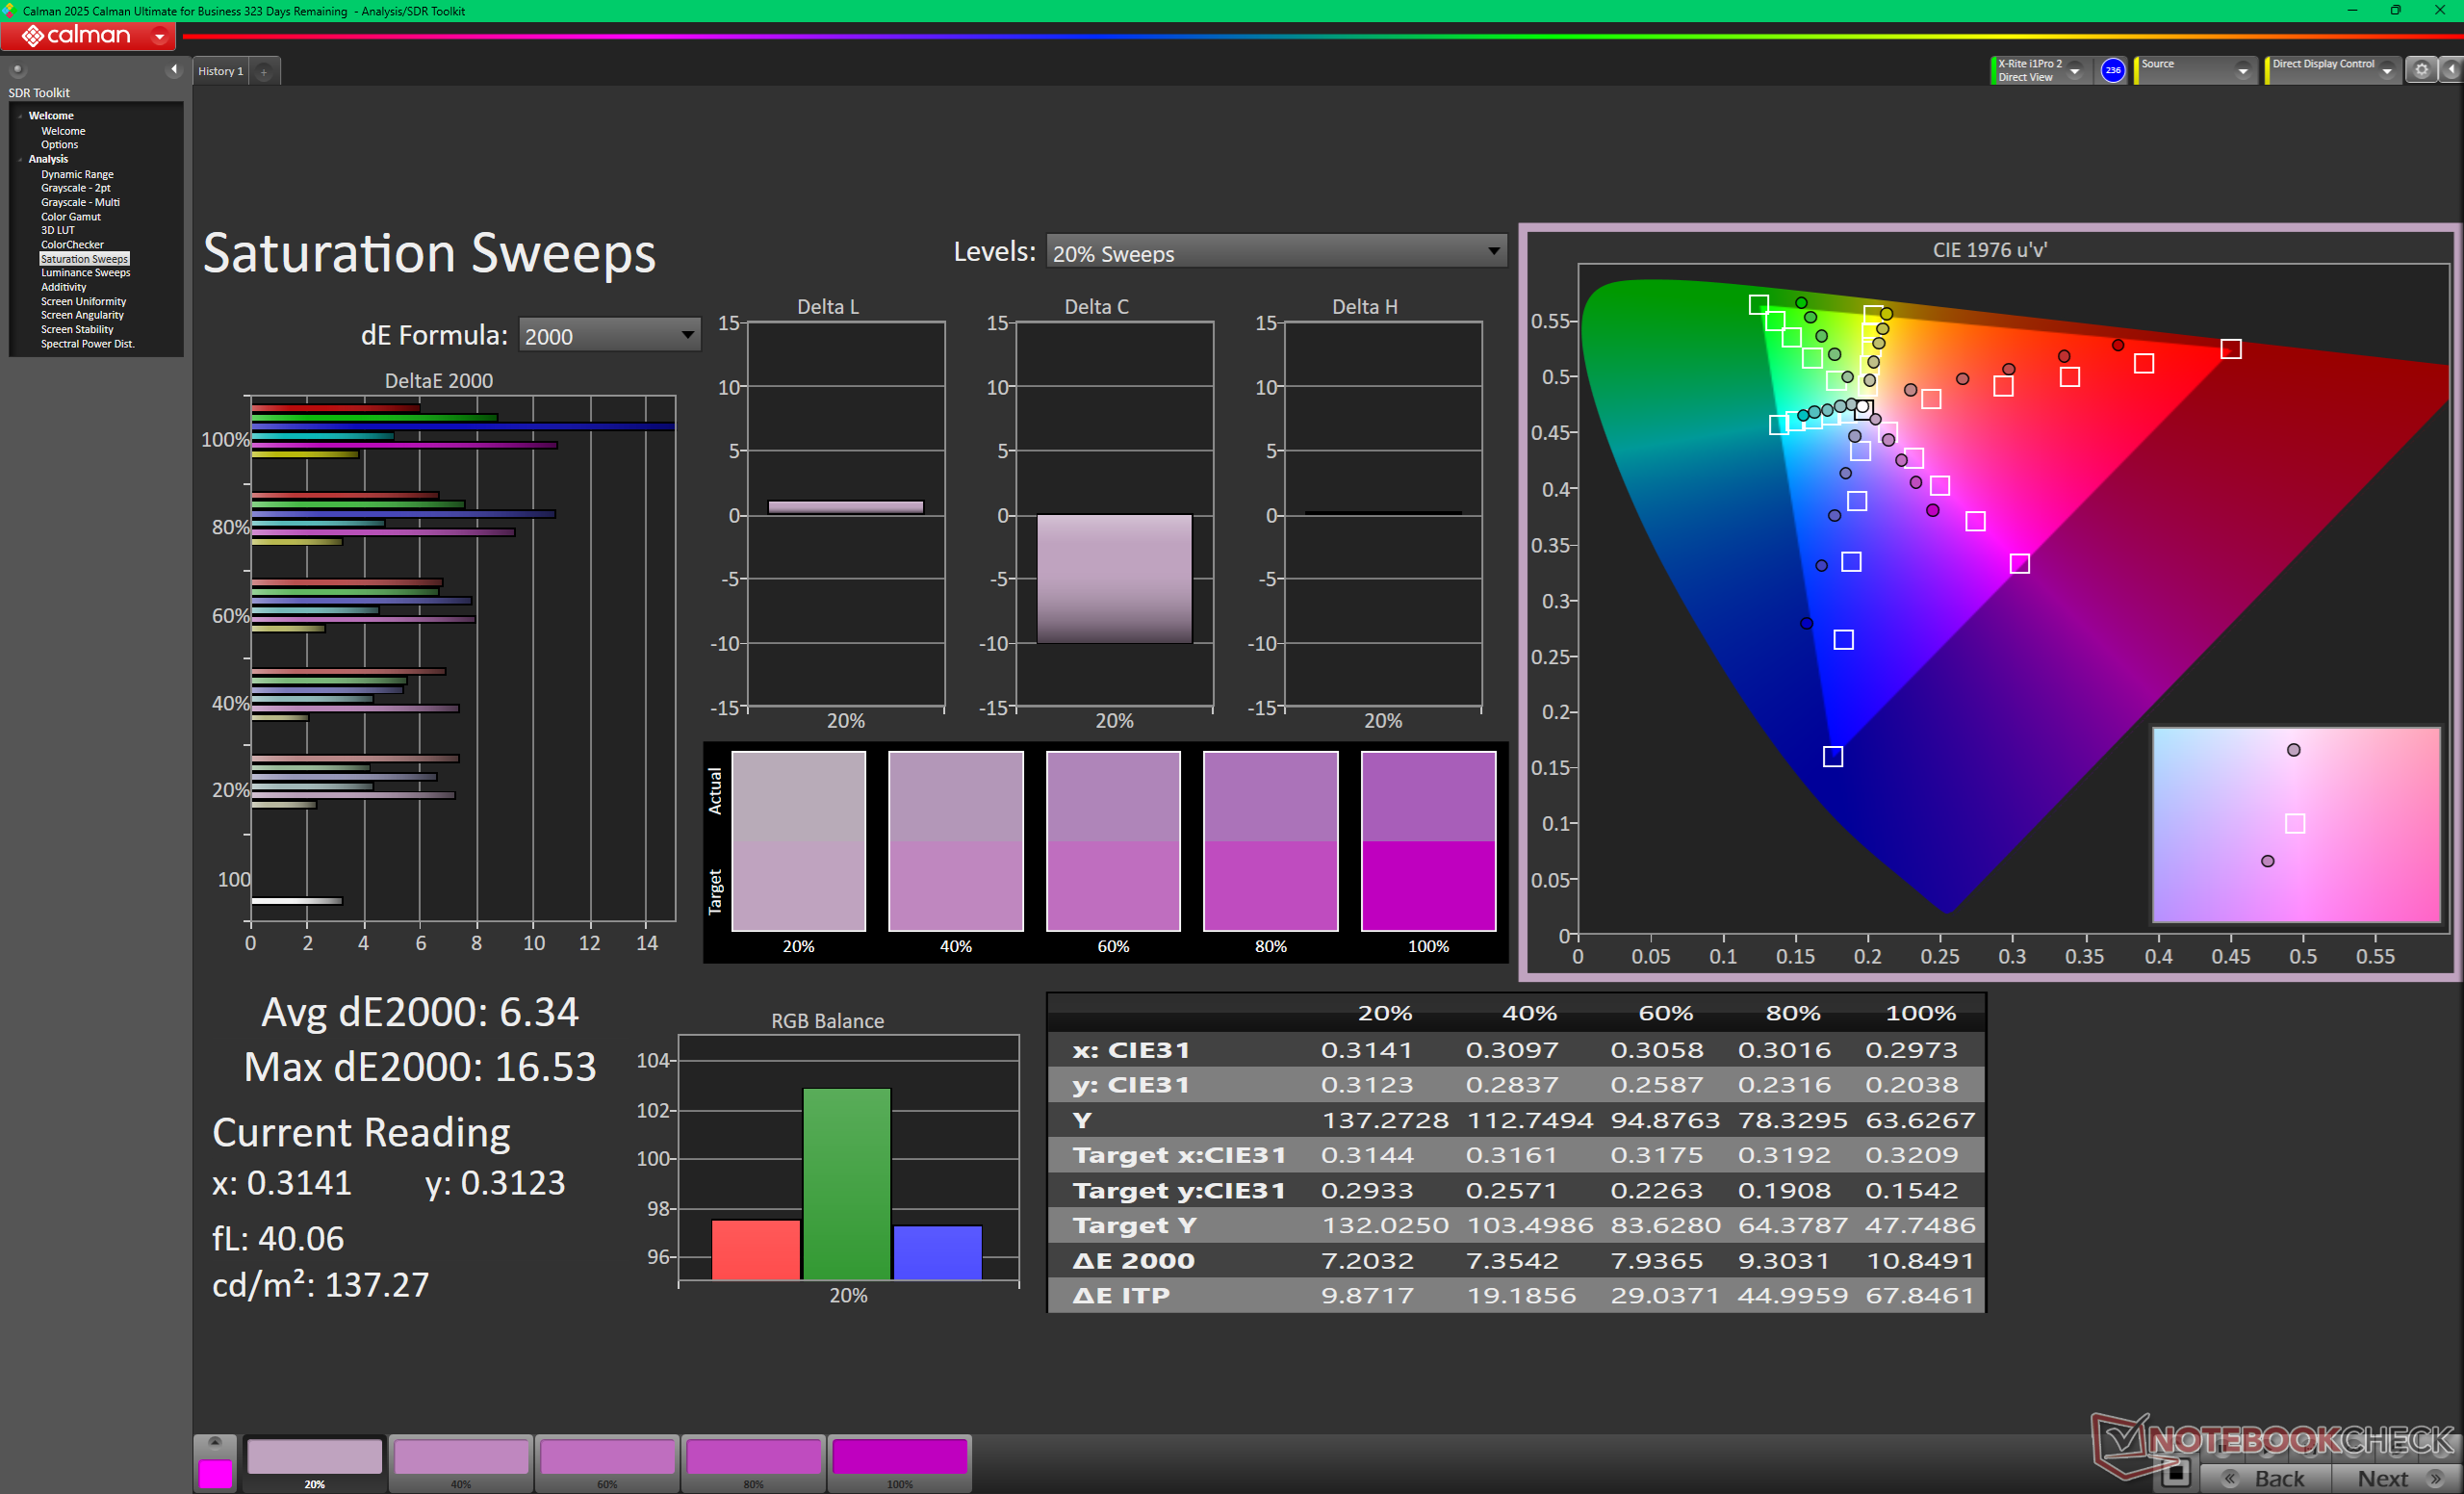
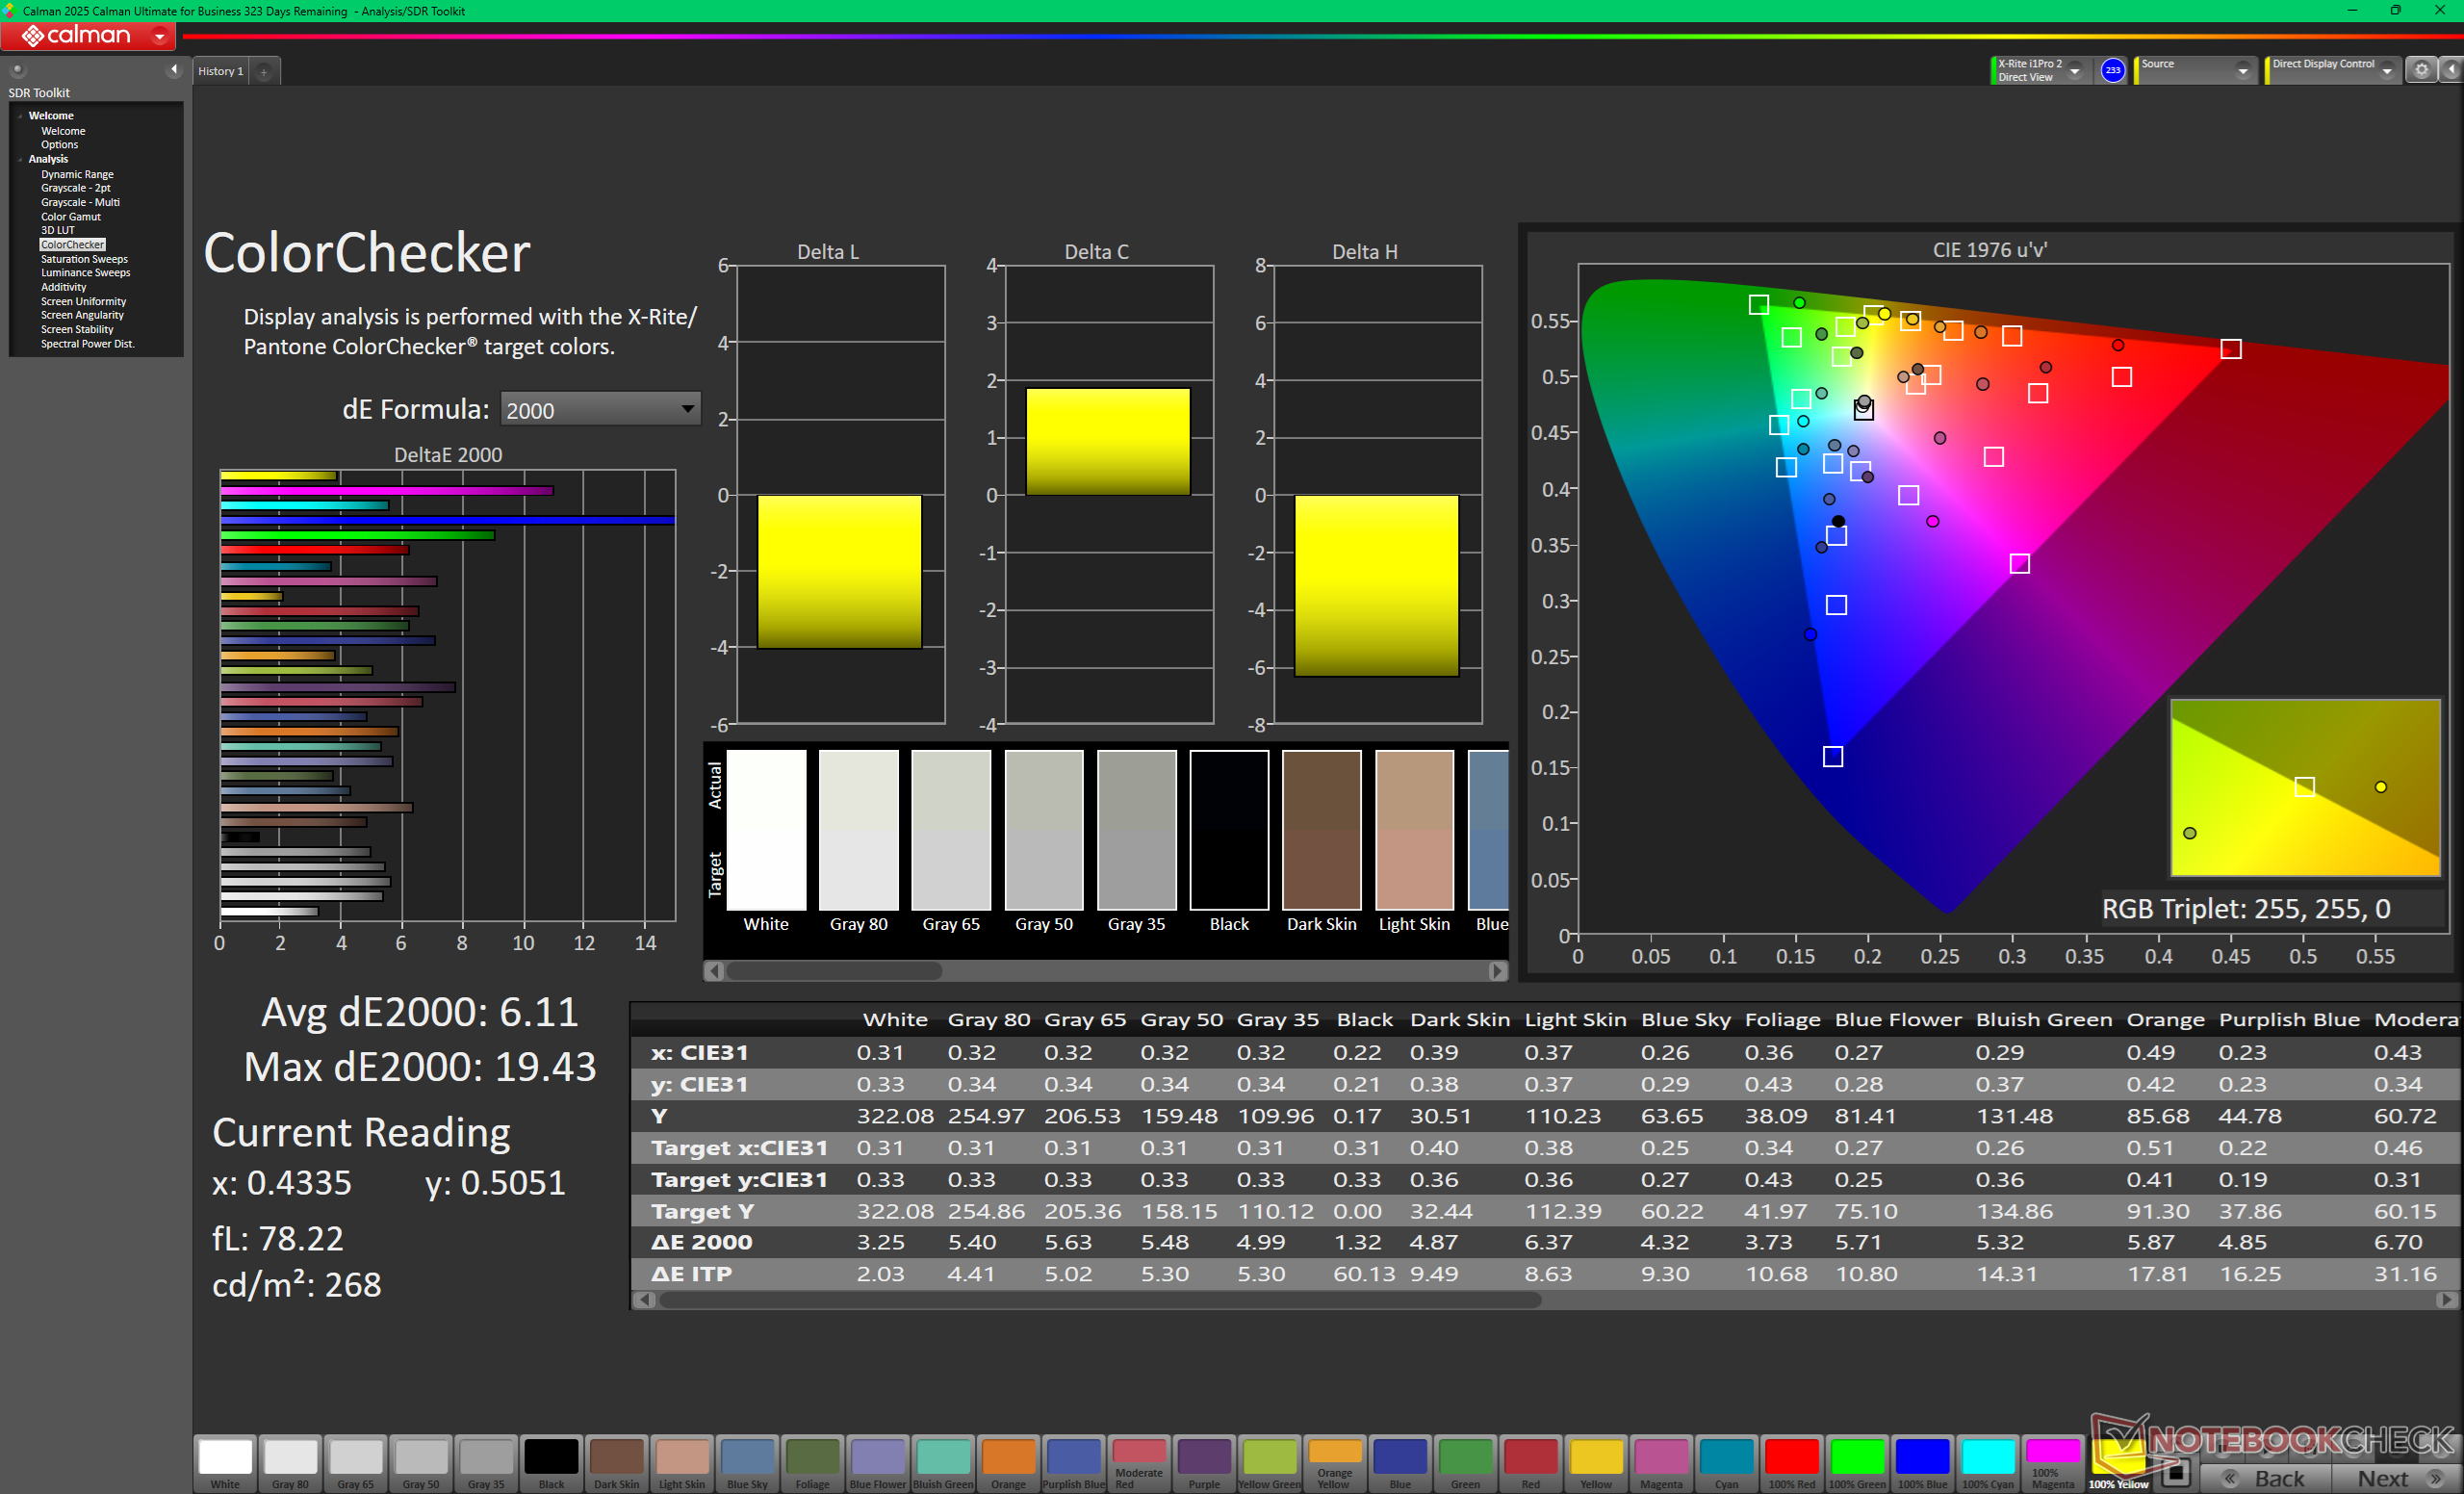
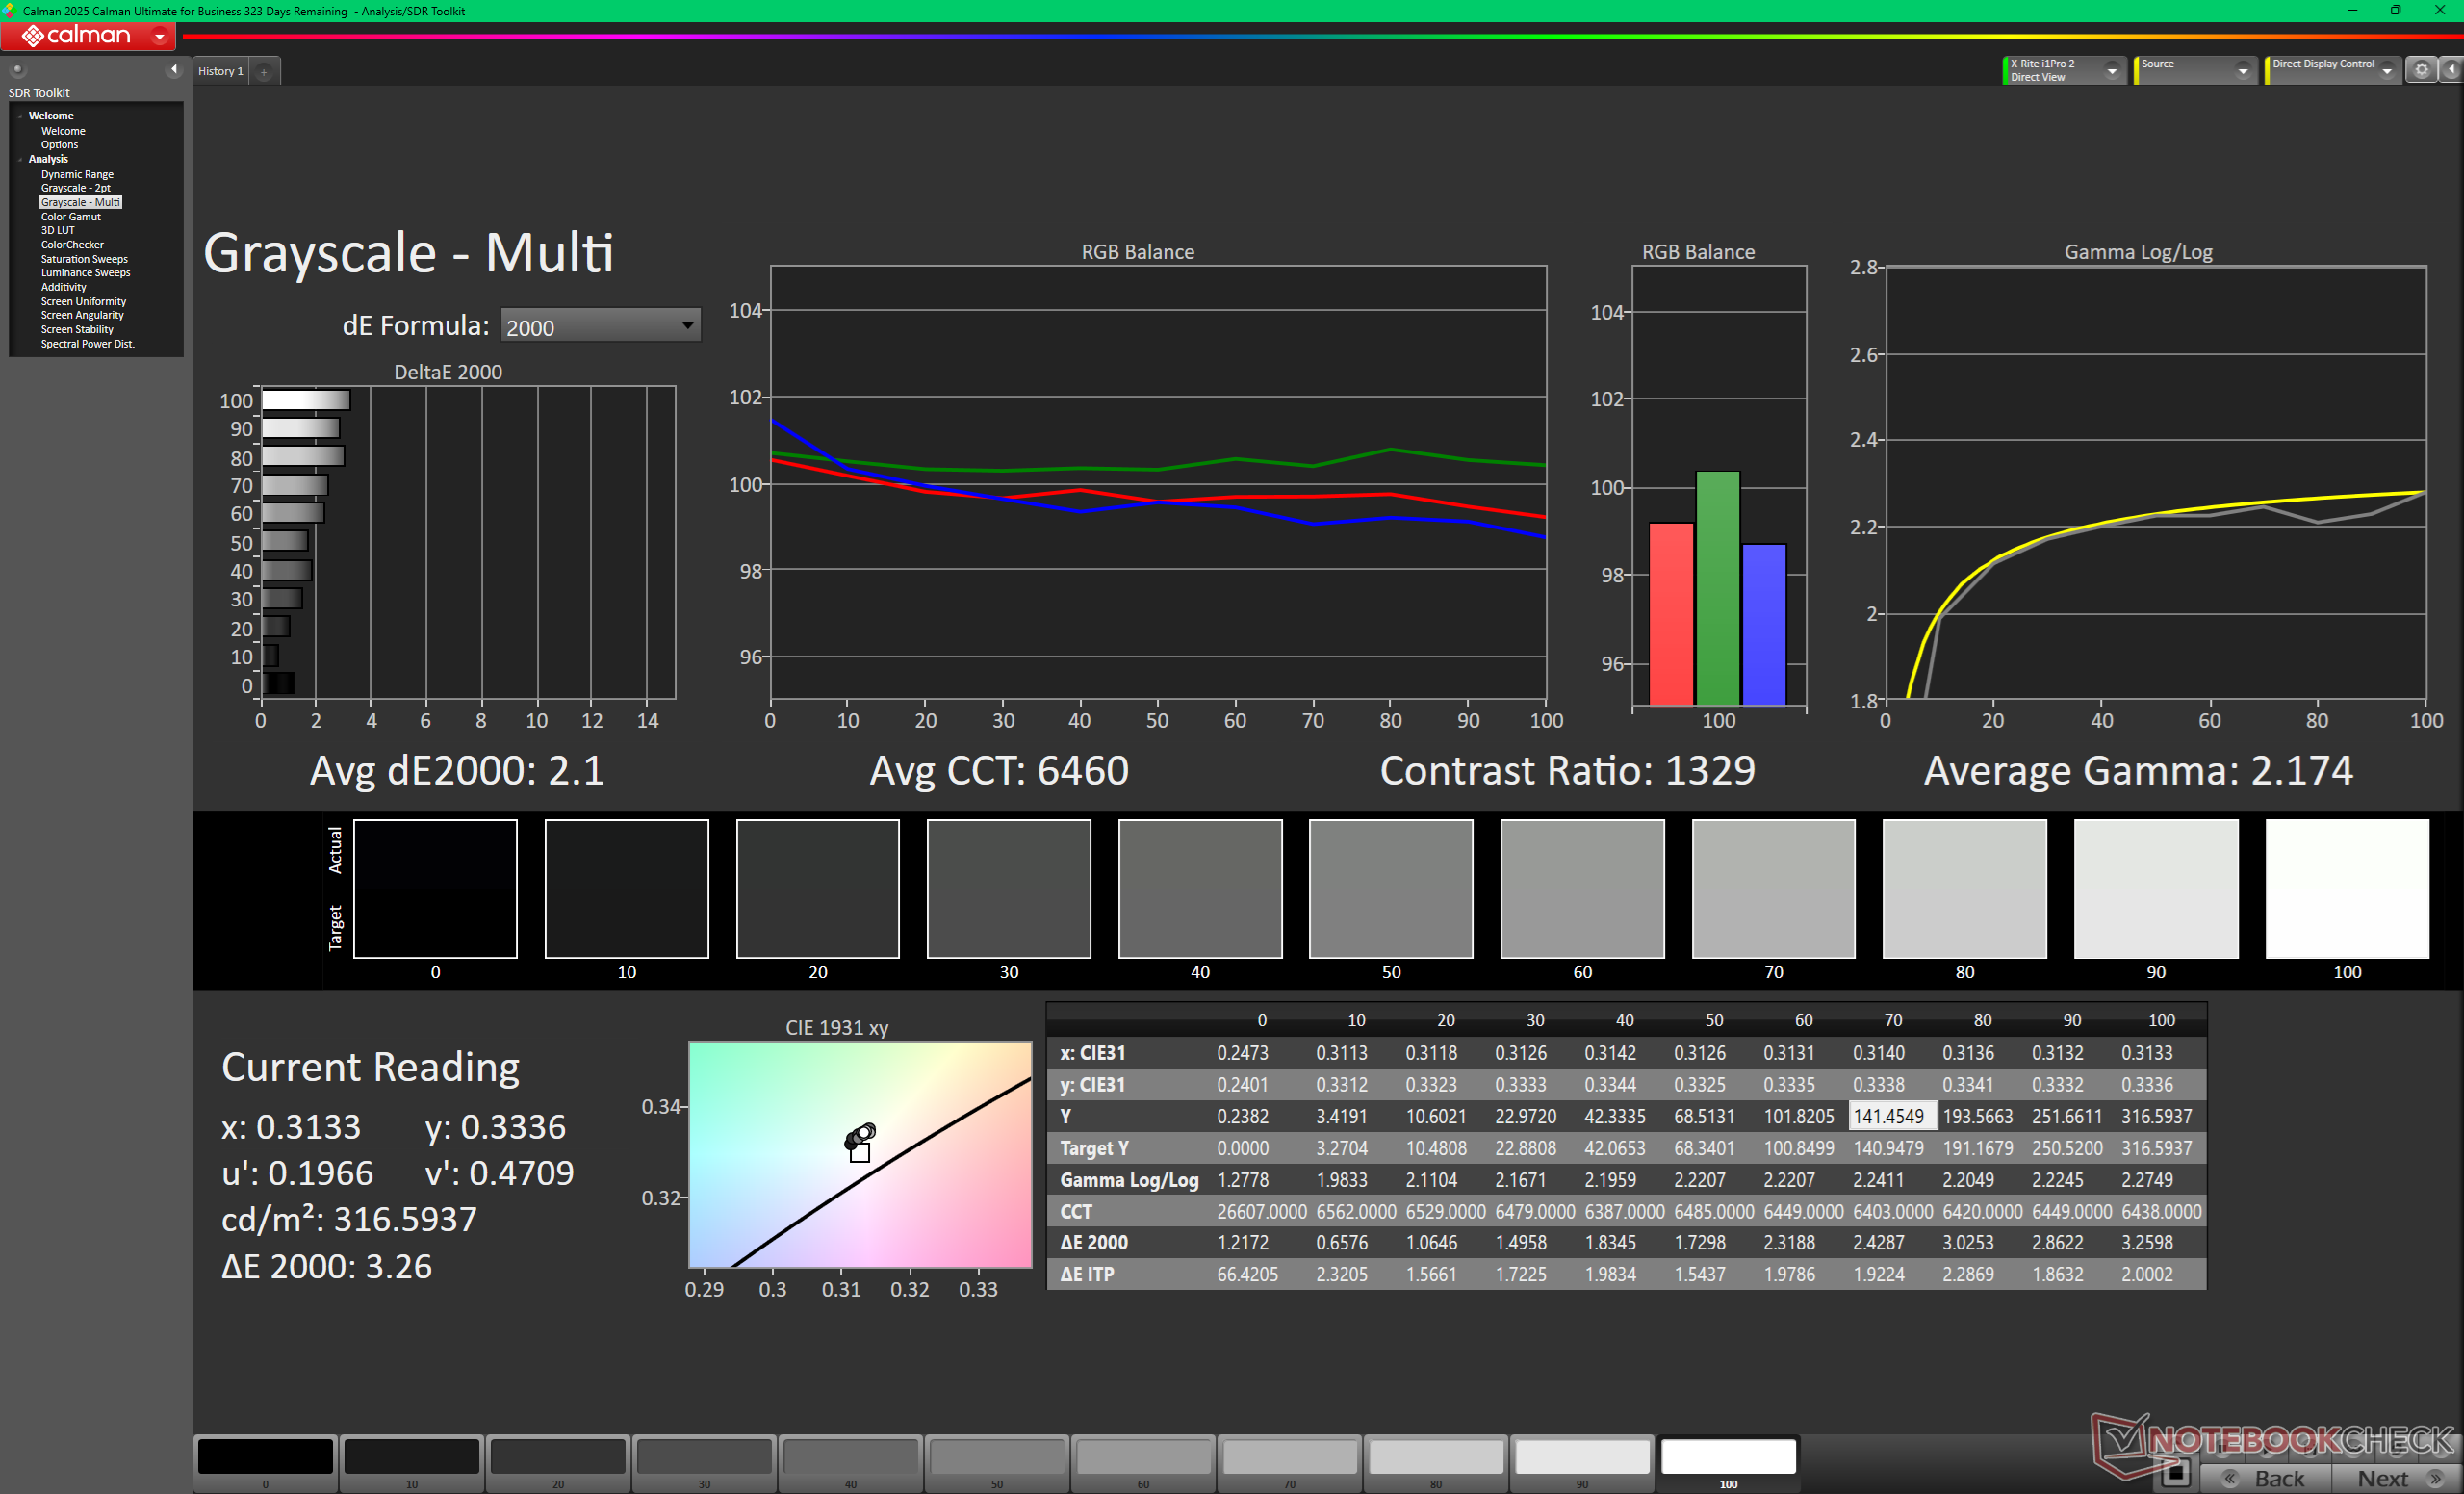
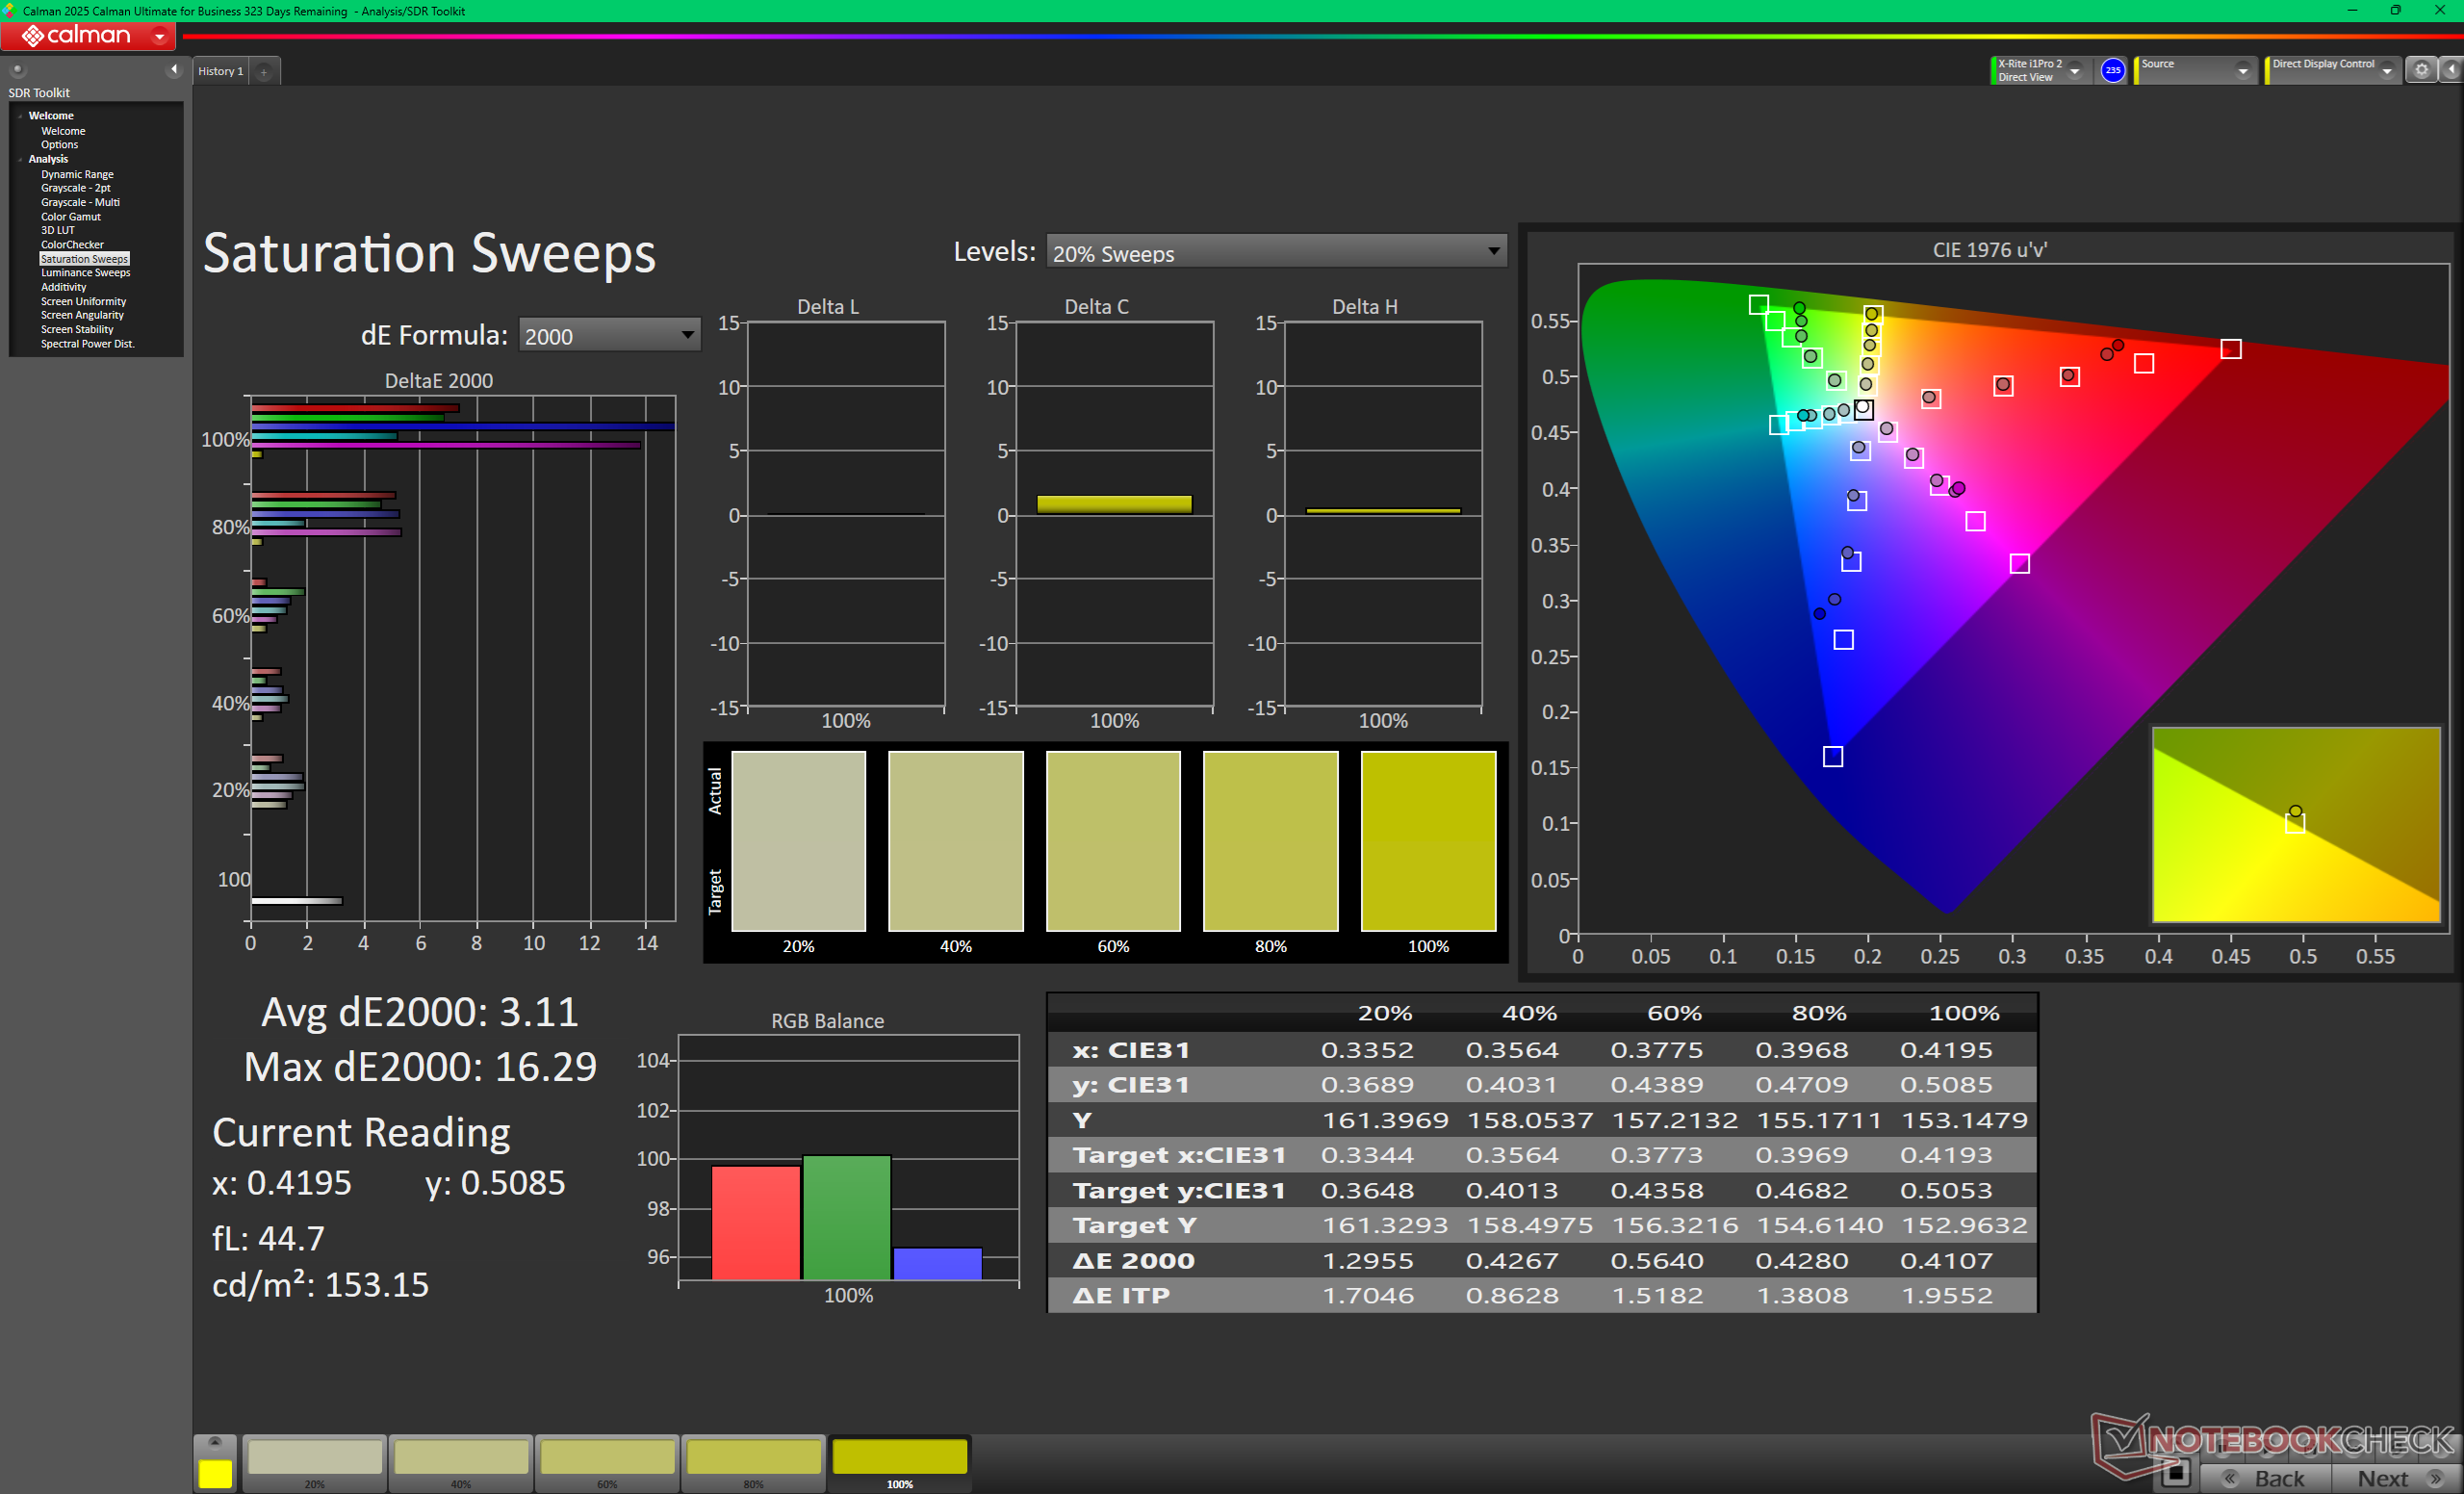
基本选项缺乏 sRGB 覆盖范围,刷新率也仅限于 60 Hz,而 OLED 选项的刷新率要高得多。此外,IPS 面板的对比度也相当不错,超过 1500:1。

| |||||||||||||||||||||||||
Brightness Distribution: 91 %
Center on Battery: 321.7 cd/m²
Contrast: 1787:1 (Black: 0.18 cd/m²)
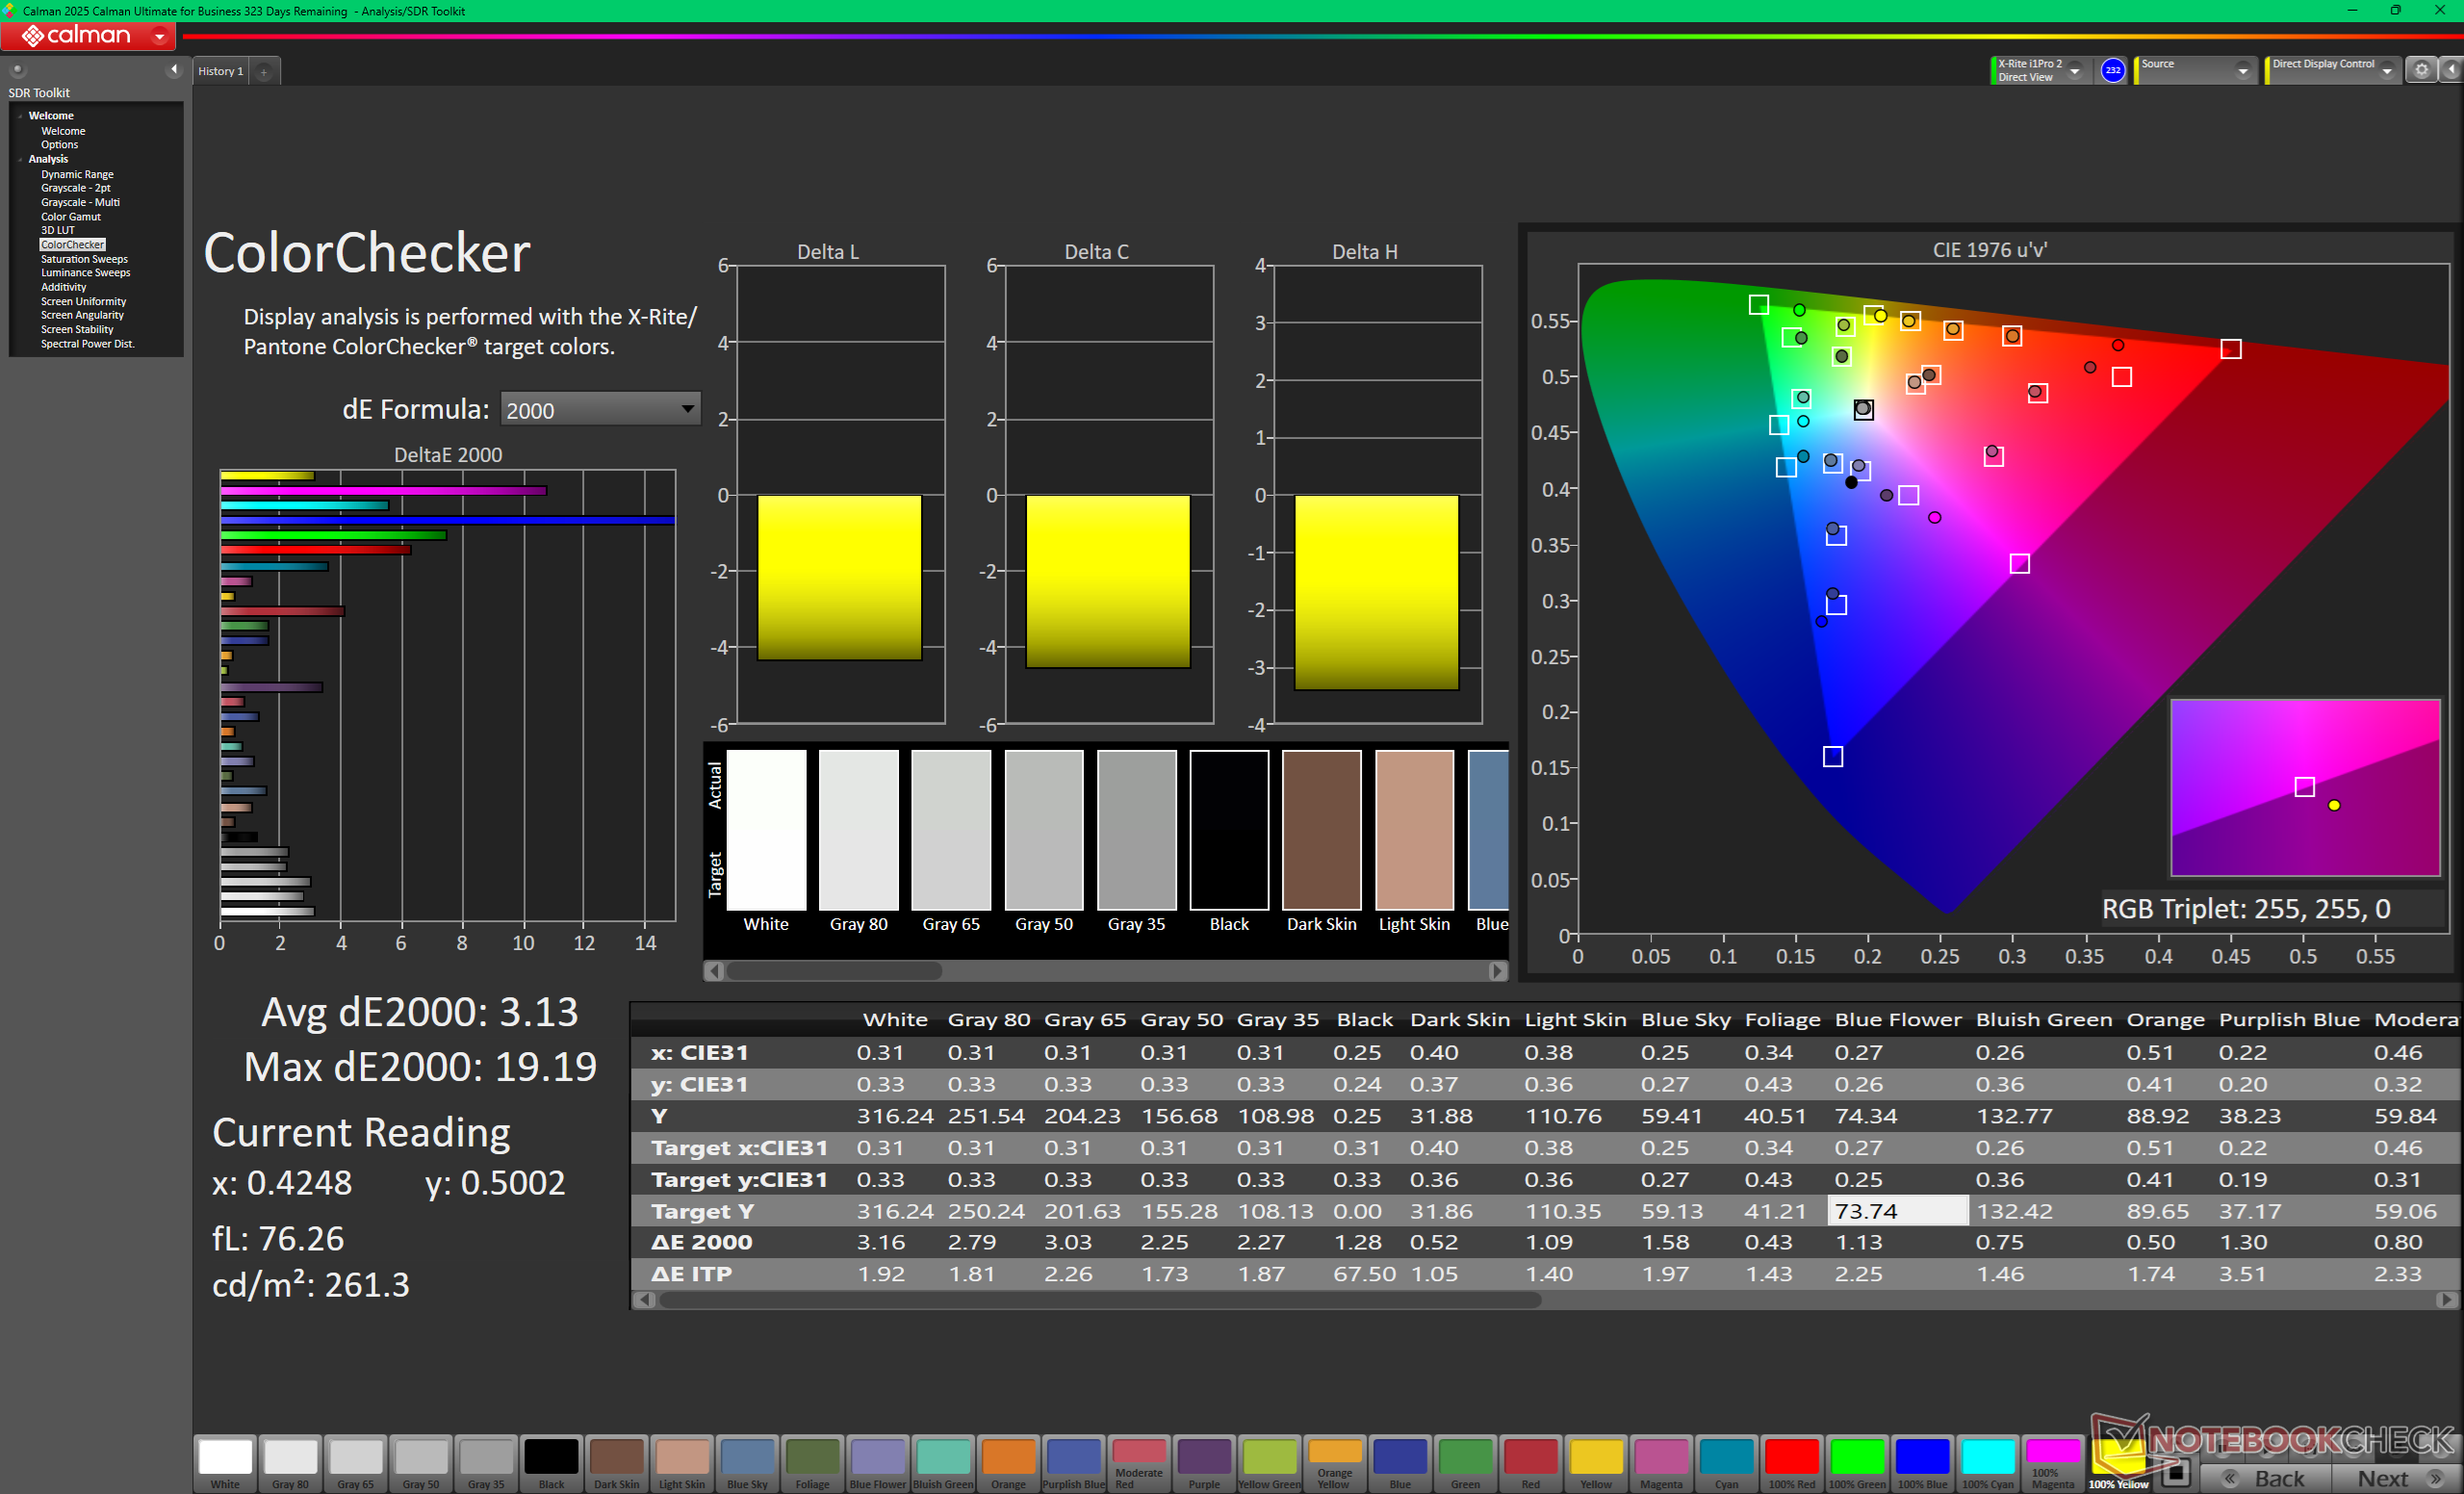
ΔE ColorChecker Calman: 6.11 | ∀{0.5-29.43 Ø4.72}
calibrated: 3.13
ΔE Greyscale Calman: 3.9 | ∀{0.09-98 Ø4.97}
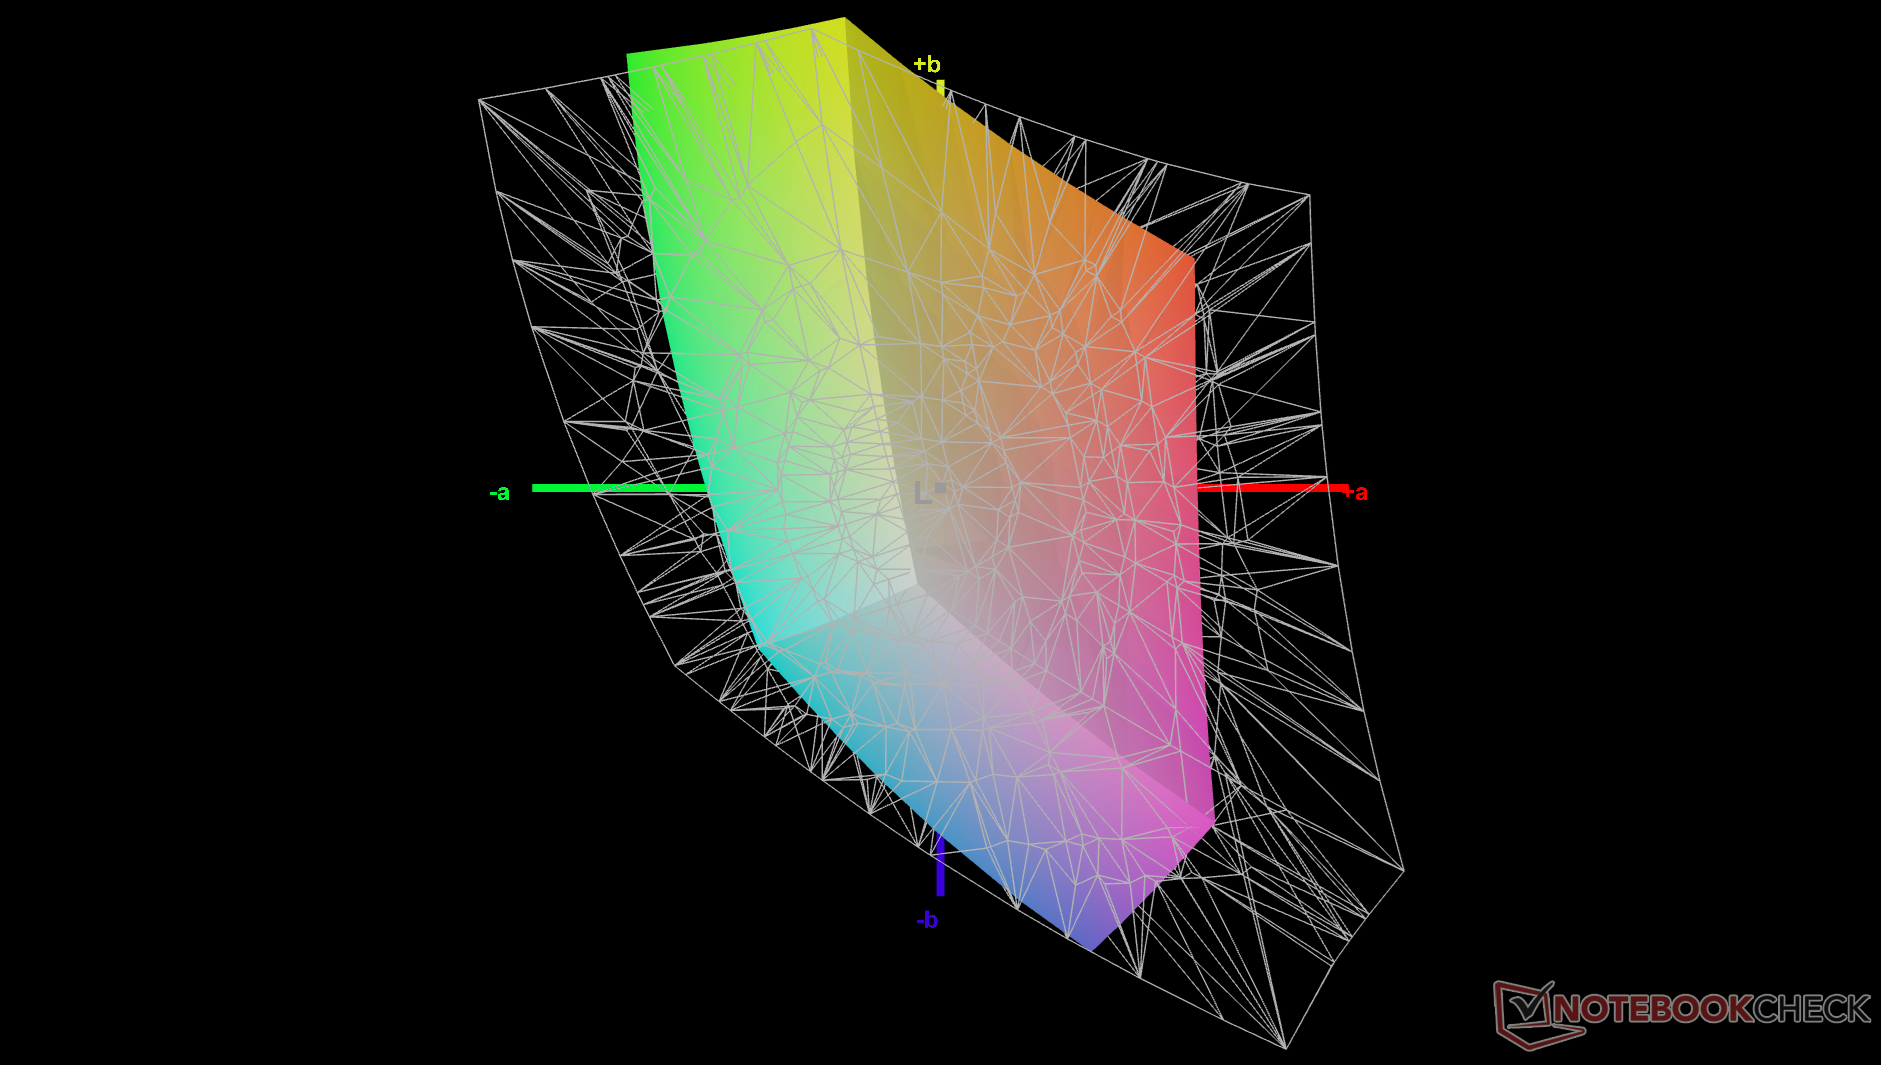
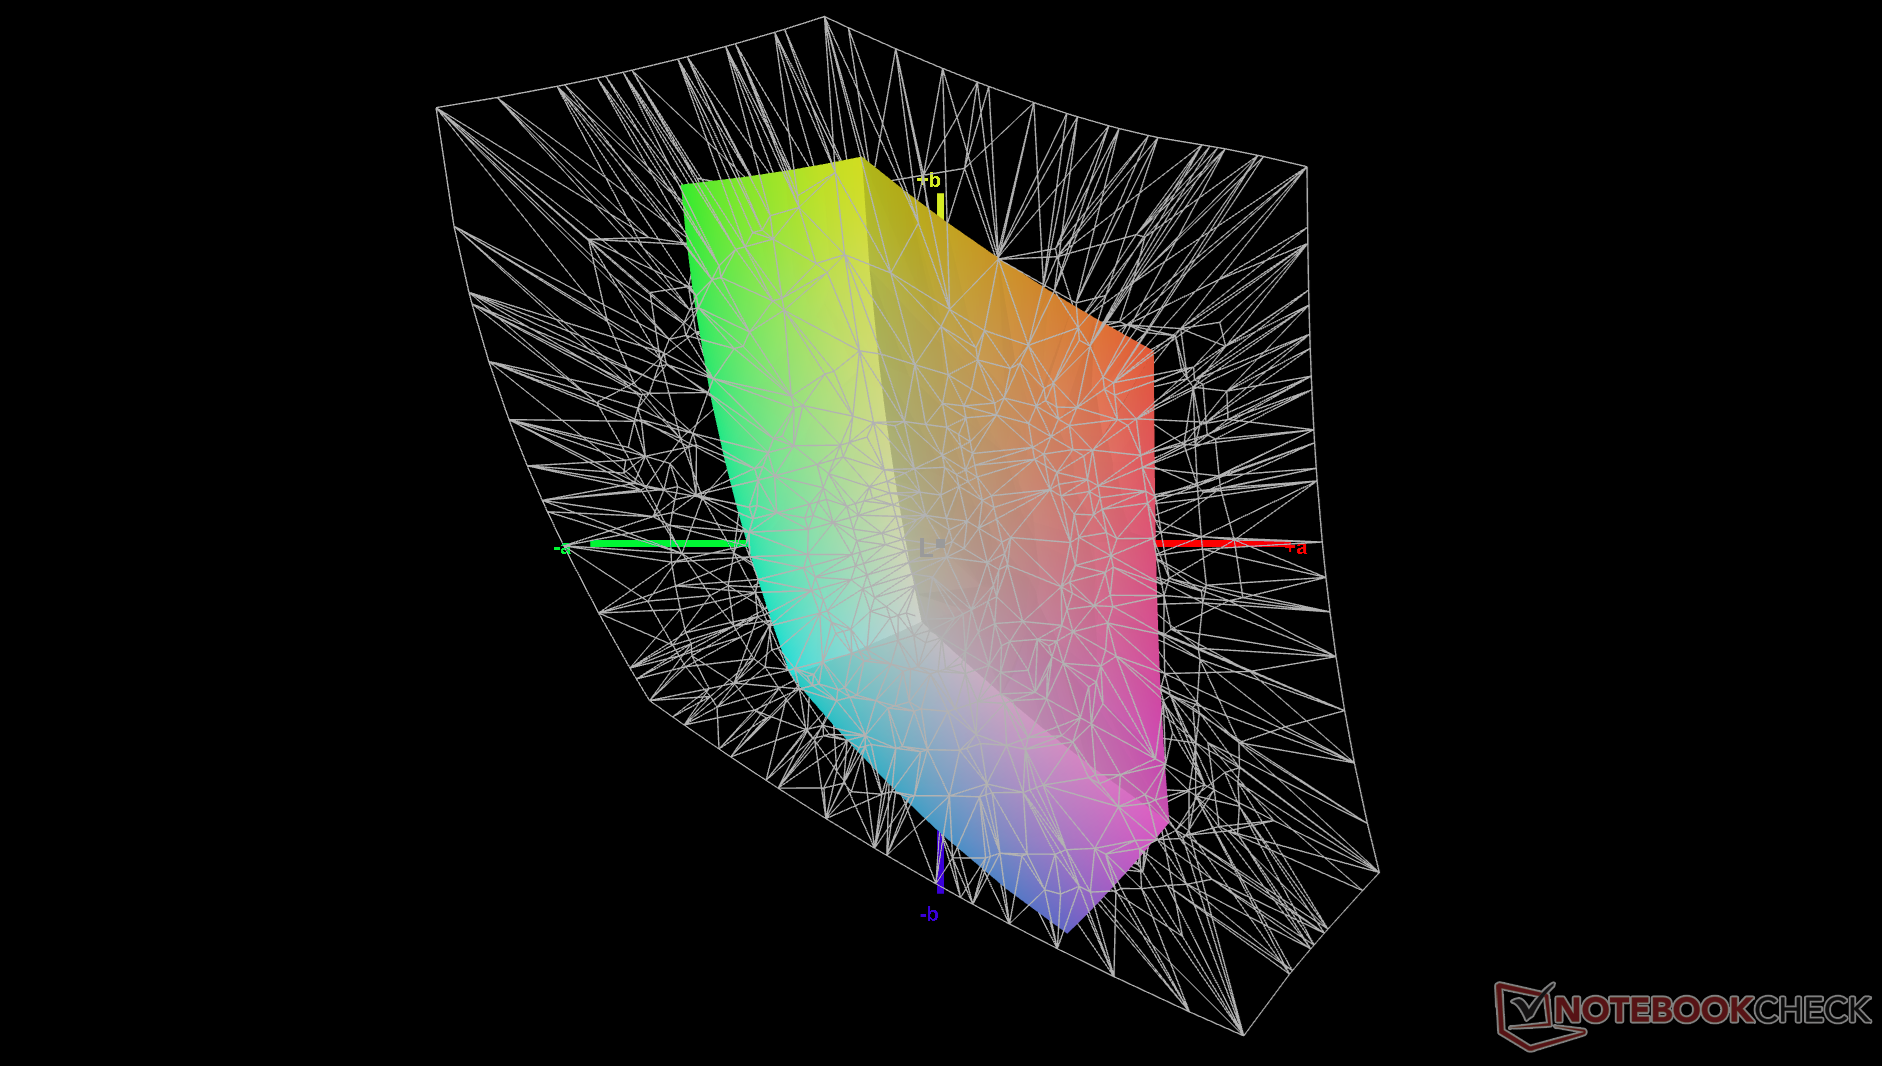
40.7% AdobeRGB 1998 (Argyll 3D)
57.4% sRGB (Argyll 3D)
39.4% Display P3 (Argyll 3D)
Gamma: 2.22
CCT: 6250 K
| MSI Venture 16 AI A2HMTG BOE0D3E, IPS, 1920x1200, 16", 60 Hz | MSI Prestige 16 B1MG-001US AU Optronics B160QAN03.R, IPS, 2560x1600, 16", 60 Hz | Dell 16 Plus 2-in-1 AU Optronics B160QAT, Mini-LED, 2560x1600, 16", 90 Hz | Asus V16 V3607V MNG007QX2-2, IPS, 1920x1200, 16", 144 Hz | HP Pavilion 16-ag0057ng CMN1640, IPS, 1920x1200, 16", 60 Hz | Lenovo IdeaPad Slim 5 16AKP10 Lenovo LEN160WUM, IPS, 1920x1200, 16", 60 Hz | |
|---|---|---|---|---|---|---|
| Display | 109% | 119% | 4% | 7% | -1% | |
| Display P3 Coverage (%) | 39.4 | 96.7 145% | 99.5 153% | 40.9 4% | 41.6 6% | 39.1 -1% |
| sRGB Coverage (%) | 57.4 | 99.8 74% | 100 74% | 59.7 4% | 62.4 9% | 57.6 0% |
| AdobeRGB 1998 Coverage (%) | 40.7 | 84.6 108% | 94.2 131% | 42.2 4% | 43 6% | 40.4 -1% |
| Response Times | -85% | -148% | 13% | -14% | -16% | |
| Response Time Grey 50% / Grey 80% * (ms) | 26.7 ? | 49.4 ? -85% | 48.8 ? -83% | 22.9 ? 14% | 30.7 ? -15% | 31.9 ? -19% |
| Response Time Black / White * (ms) | 18.4 ? | 33.9 ? -84% | 57.6 ? -213% | 16.1 ? 12% | 20.8 ? -13% | 20.6 ? -12% |
| PWM Frequency (Hz) | 2807 ? | |||||
| PWM Amplitude * (%) | 50 | |||||
| Screen | 18% | 49% | -27% | 0% | -13% | |
| Brightness middle (cd/m²) | 321.7 | 473.6 47% | 432.1 34% | 313.3 -3% | 324 1% | 349 8% |
| Brightness (cd/m²) | 306 | 456 49% | 426 39% | 298 -3% | 295 -4% | 332 8% |
| Brightness Distribution (%) | 91 | 87 -4% | 97 7% | 88 -3% | 88 -3% | 91 0% |
| Black Level * (cd/m²) | 0.18 | 0.19 -6% | 0.5 -178% | 0.2 -11% | 0.33 -83% | |
| Contrast (:1) | 1787 | 2493 40% | 627 -65% | 1620 -9% | 1058 -41% | |
| Colorchecker dE 2000 * | 6.11 | 5.9 3% | 1.95 68% | 6.09 -0% | 5.13 16% | 5.57 9% |
| Colorchecker dE 2000 max. * | 19.43 | 9.37 52% | 3.87 80% | 19.31 1% | 16.11 17% | 19.96 -3% |
| Colorchecker dE 2000 calibrated * | 3.13 | 0.89 72% | 1.16 63% | 2.63 16% | 2.99 4% | 4.52 -44% |
| Greyscale dE 2000 * | 3.9 | 7.3 -87% | 2 49% | 4.1 -5% | 4.24 -9% | 2.7 31% |
| Gamma | 2.22 99% | 1.9 116% | 2.3 96% | 2.18 101% | 2.3 96% | 2.129 103% |
| CCT | 6250 104% | 7260 90% | 6222 104% | 6031 108% | 7318 89% | 6656 98% |
| Total Average (Program / Settings) | 14% /
23% | 7% /
34% | -3% /
-14% | -2% /
-0% | -10% /
-11% |
* ... smaller is better
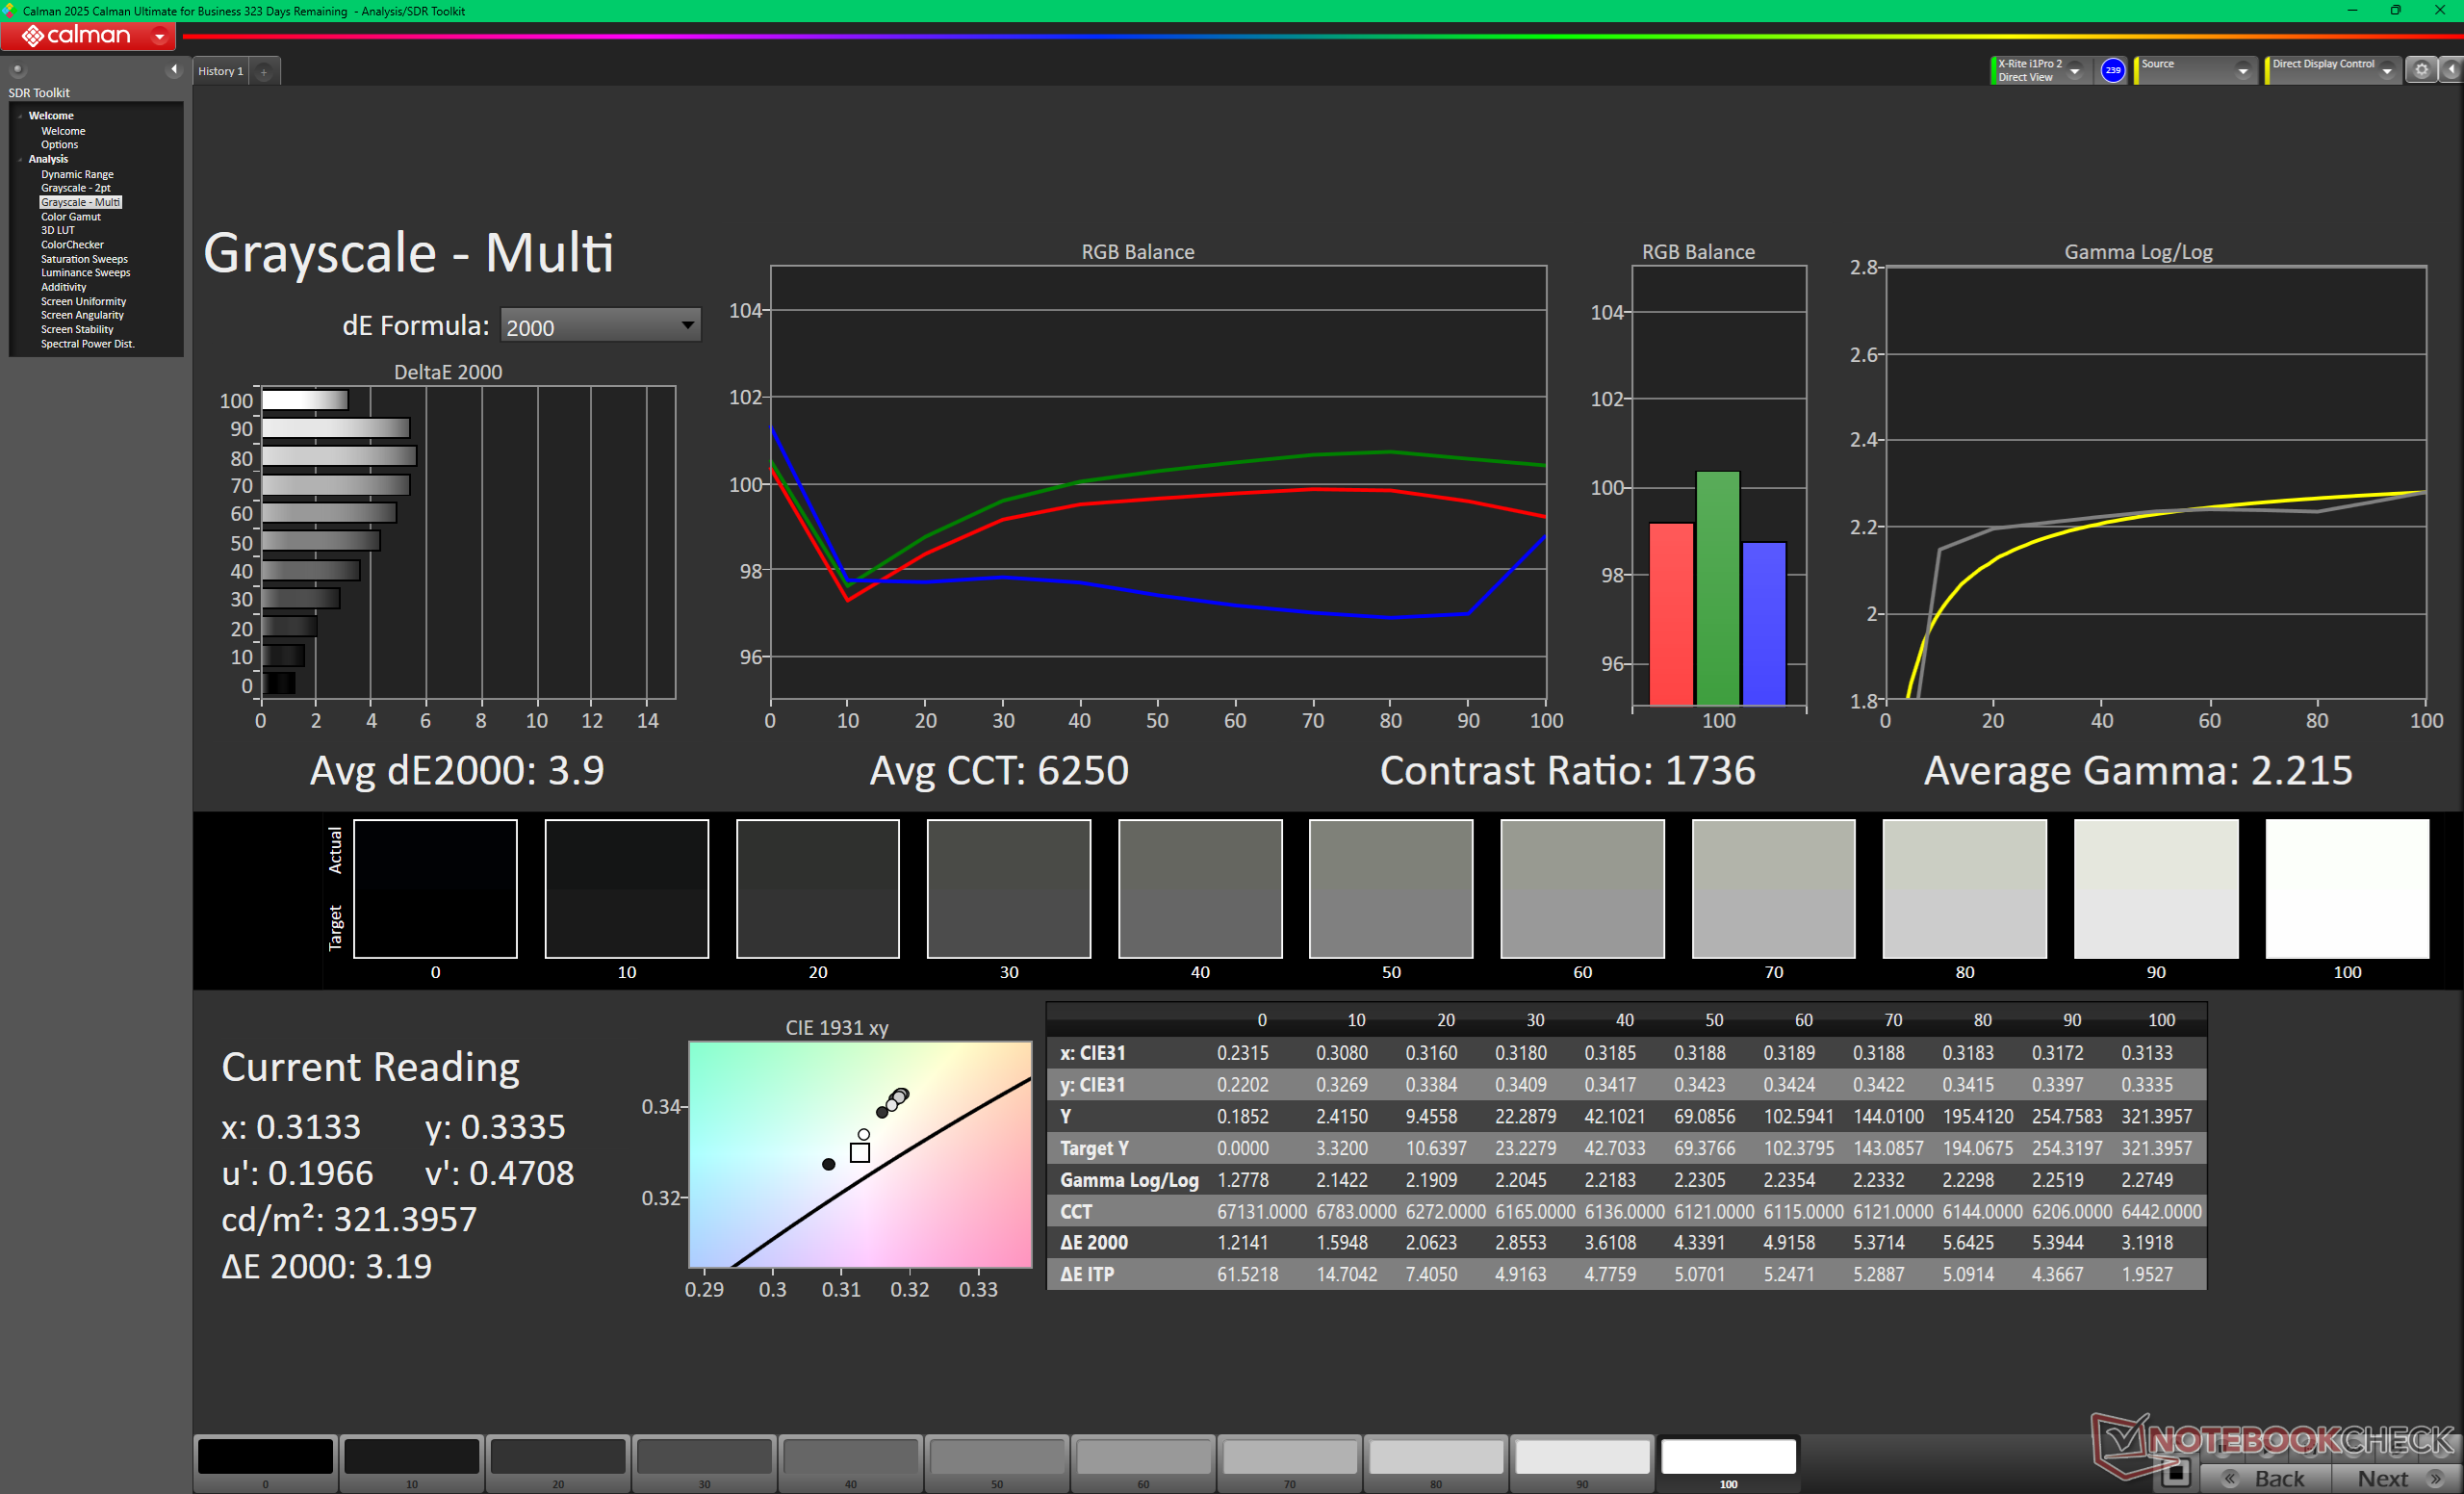
显示屏没有经过校准,这对于一款经济型产品来说是意料之中的。尽管平均灰度 deltaE 相对较低,仅为 3.9,但 6250K 的色温尤其偏暖。正如下面的 CalMAN 屏幕截图所示,尽管由于 sRGB 覆盖范围有限,我们自己校准面板并不能完全解决这些问题。我们的校准 ICM 配置文件可在上面免费下载。
Display Response Times
| ↔ Response Time Black to White | ||
|---|---|---|
| 18.4 ms ... rise ↗ and fall ↘ combined | ↗ 9.9 ms rise | 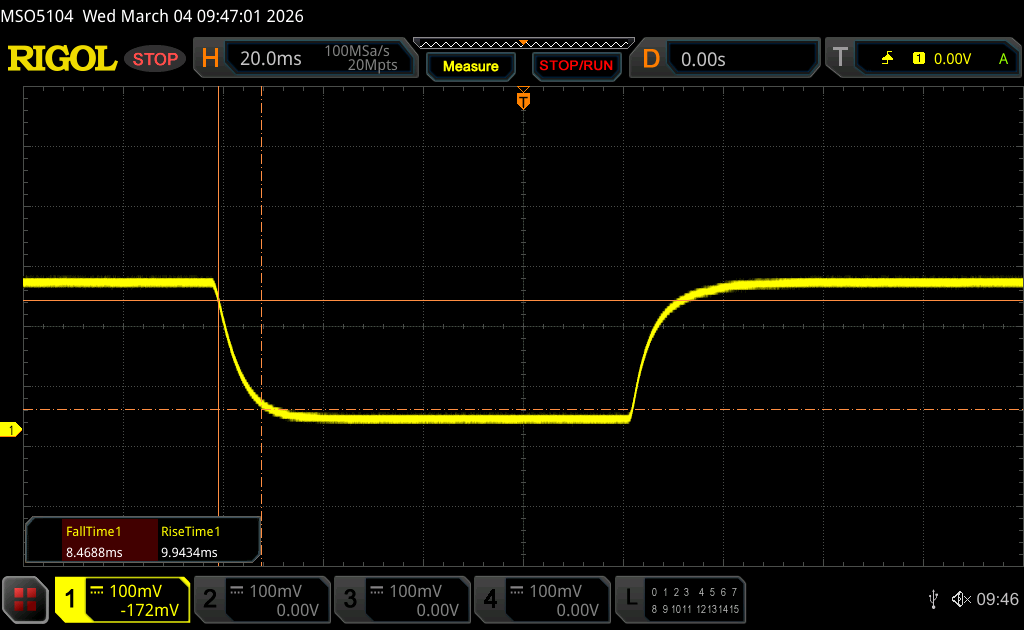 |
| ↘ 8.5 ms fall | ||
| The screen shows good response rates in our tests, but may be too slow for competitive gamers. In comparison, all tested devices range from 0.1 (minimum) to 240 (maximum) ms. » 41 % of all devices are better. This means that the measured response time is similar to the average of all tested devices (19.8 ms). | ||
| ↔ Response Time 50% Grey to 80% Grey | ||
| 26.7 ms ... rise ↗ and fall ↘ combined | ↗ 12.9 ms rise | 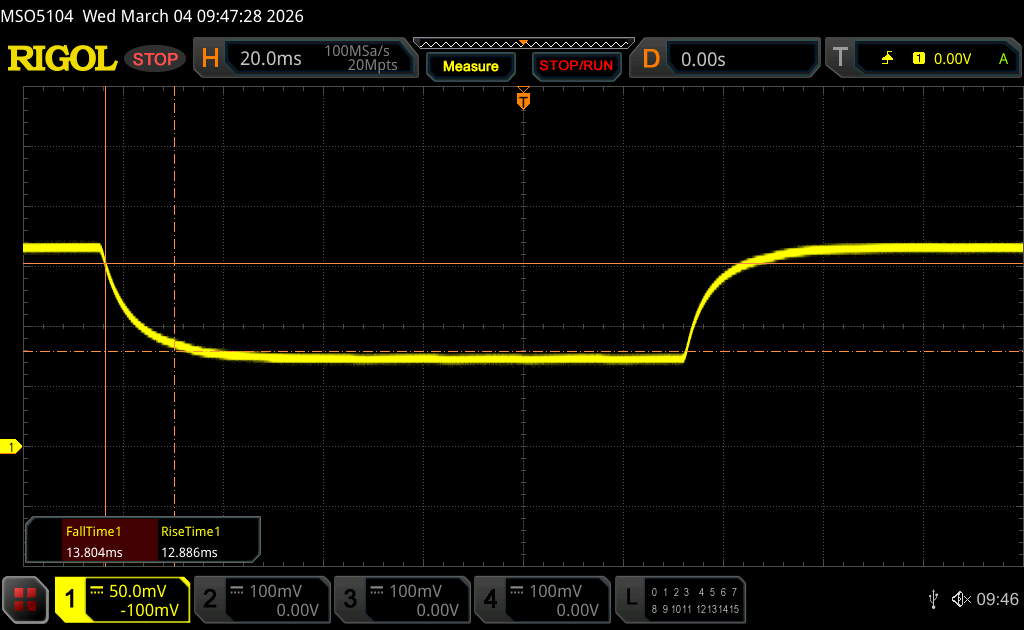 |
| ↘ 13.8 ms fall | ||
| The screen shows relatively slow response rates in our tests and may be too slow for gamers. In comparison, all tested devices range from 0.165 (minimum) to 636 (maximum) ms. » 37 % of all devices are better. This means that the measured response time is better than the average of all tested devices (31 ms). | ||
Screen Flickering / PWM (Pulse-Width Modulation)
| Screen flickering / PWM not detected | 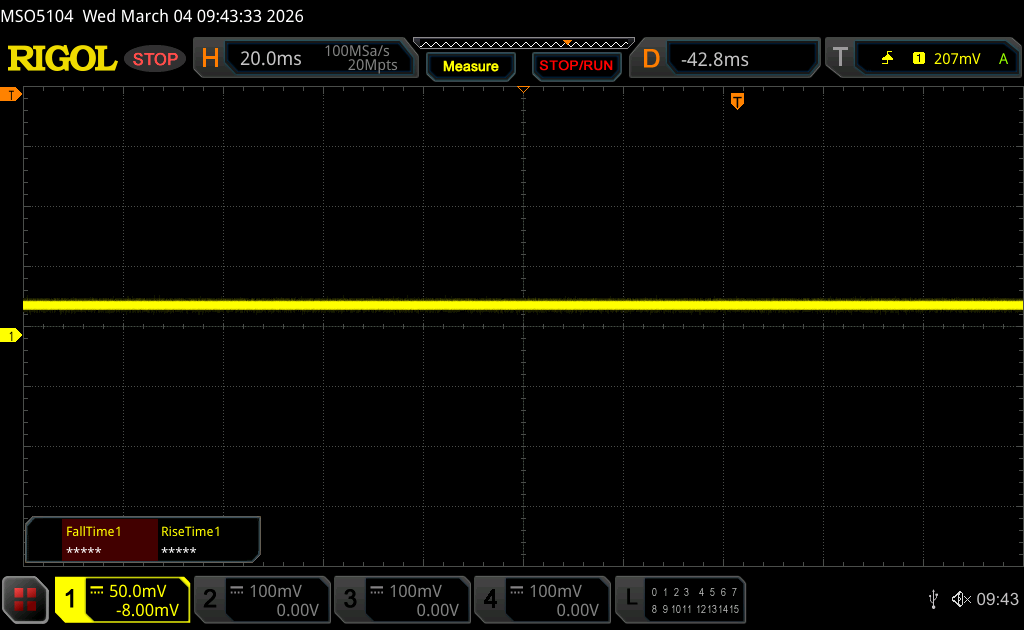 | ||
In comparison: 52 % of all tested devices do not use PWM to dim the display. If PWM was detected, an average of 7747 (minimum: 5 - maximum: 343500) Hz was measured. | |||
性能
测试条件
在运行以下基准测试之前,我们将 Windows 和 MSI Center 都设置为性能模式。
处理器
我们的 Core Ultra 7 255H比 Core Ultra 7 155HPrestige 16 的多线程性能比 Core Ultra 7 155H 快约 15%至 20%,同比提升幅度较大。不过,与其他采用相同 Core Ultra 7 255H 处理器的笔记本电脑相比,微星的性能略微落后几个百分点。
升级到 酷睿至尊 9 285H配置有望将多线程性能提高 15% 至 25%,如下图所示。
Cinebench R15 多回路运行
Cinebench R23: Multi Core | Single Core
Cinebench R20: CPU (Multi Core) | CPU (Single Core)
Cinebench R15: CPU Multi 64Bit | CPU Single 64Bit
Blender: v2.79 BMW27 CPU
7-Zip 18.03: 7z b 4 | 7z b 4 -mmt1
Geekbench 6.7: Multi-Core | Single-Core
Geekbench 5.5: Multi-Core | Single-Core
HWBOT x265 Benchmark v2.2: 4k Preset
LibreOffice : 20 Documents To PDF
R Benchmark 2.5: Overall mean
* ... smaller is better
AIDA64: FP32 Ray-Trace | FPU Julia | CPU SHA3 | CPU Queen | FPU SinJulia | FPU Mandel | CPU AES | CPU ZLib | FP64 Ray-Trace | CPU PhotoWorxx | CPU CheckMate
| Performance rating | |
| MSI Venture 16 AI A2HMTG -1! | |
| Average Intel Core Ultra 7 255H | |
| MSI Prestige 16 B1MG-001US -1! | |
| HP Pavilion 16-ag0057ng -1! | |
| Asus V16 V3607V -1! | |
| Dell 16 Plus 2-in-1 -1! | |
| Lenovo IdeaPad Slim 5 16AKP10 -1! | |
| AIDA64 / FP32 Ray-Trace | |
| Average Intel Core Ultra 7 255H (13863 - 24741, n=17) | |
| MSI Venture 16 AI A2HMTG (v8.20.8100) | |
| HP Pavilion 16-ag0057ng (v6.92.6600) | |
| MSI Prestige 16 B1MG-001US (v6.92.6600) | |
| Asus V16 V3607V (v6.92.6600) | |
| Lenovo IdeaPad Slim 5 16AKP10 (v6.92.6600) | |
| Dell 16 Plus 2-in-1 (v6.92.6600) | |
| AIDA64 / FPU Julia | |
| MSI Venture 16 AI A2HMTG (v8.20.8100) | |
| Average Intel Core Ultra 7 255H (71030 - 119222, n=17) | |
| MSI Prestige 16 B1MG-001US (v6.92.6600) | |
| HP Pavilion 16-ag0057ng (v6.92.6600) | |
| Asus V16 V3607V (v6.92.6600) | |
| Dell 16 Plus 2-in-1 (v6.92.6600) | |
| Lenovo IdeaPad Slim 5 16AKP10 (v6.92.6600) | |
| AIDA64 / CPU SHA3 | |
| Average Intel Core Ultra 7 255H (3408 - 5548, n=17) | |
| MSI Venture 16 AI A2HMTG (v8.20.8100) | |
| MSI Prestige 16 B1MG-001US (v6.92.6600) | |
| HP Pavilion 16-ag0057ng (v6.92.6600) | |
| Asus V16 V3607V (v6.92.6600) | |
| Dell 16 Plus 2-in-1 (v6.92.6600) | |
| Lenovo IdeaPad Slim 5 16AKP10 (v6.92.6600) | |
| AIDA64 / CPU Queen | |
| MSI Prestige 16 B1MG-001US (v6.92.6600) | |
| Asus V16 V3607V (v6.92.6600) | |
| HP Pavilion 16-ag0057ng (v6.92.6600) | |
| Average Intel Core Ultra 7 255H (59098 - 68460, n=16) | |
| Dell 16 Plus 2-in-1 (v6.92.6600) | |
| Lenovo IdeaPad Slim 5 16AKP10 (v6.92.6600) | |
| AIDA64 / FPU SinJulia | |
| MSI Prestige 16 B1MG-001US (v6.92.6600) | |
| HP Pavilion 16-ag0057ng (v6.92.6600) | |
| Asus V16 V3607V (v6.92.6600) | |
| MSI Venture 16 AI A2HMTG (v8.20.8100) | |
| Average Intel Core Ultra 7 255H (6716 - 9006, n=17) | |
| Lenovo IdeaPad Slim 5 16AKP10 (v6.92.6600) | |
| Dell 16 Plus 2-in-1 (v6.92.6600) | |
| AIDA64 / FPU Mandel | |
| MSI Venture 16 AI A2HMTG (v8.20.8100) | |
| Average Intel Core Ultra 7 255H (37031 - 63347, n=17) | |
| MSI Prestige 16 B1MG-001US (v6.92.6600) | |
| HP Pavilion 16-ag0057ng (v6.92.6600) | |
| Asus V16 V3607V (v6.92.6600) | |
| Dell 16 Plus 2-in-1 (v6.92.6600) | |
| Lenovo IdeaPad Slim 5 16AKP10 (v6.92.6600) | |
| AIDA64 / CPU AES | |
| MSI Prestige 16 B1MG-001US (v6.92.6600) | |
| Average Intel Core Ultra 7 255H (58402 - 83568, n=17) | |
| MSI Venture 16 AI A2HMTG (v8.20.8100) | |
| Asus V16 V3607V (v6.92.6600) | |
| HP Pavilion 16-ag0057ng (v6.92.6600) | |
| Dell 16 Plus 2-in-1 (v6.92.6600) | |
| Lenovo IdeaPad Slim 5 16AKP10 (v6.92.6600) | |
| AIDA64 / CPU ZLib | |
| Average Intel Core Ultra 7 255H (822 - 1316, n=17) | |
| MSI Prestige 16 B1MG-001US (v6.92.6600) | |
| MSI Venture 16 AI A2HMTG (v8.20.8100) | |
| Asus V16 V3607V (v6.92.6600) | |
| HP Pavilion 16-ag0057ng (v6.92.6600) | |
| Dell 16 Plus 2-in-1 (v6.92.6600) | |
| Lenovo IdeaPad Slim 5 16AKP10 (v6.92.6600) | |
| AIDA64 / FP64 Ray-Trace | |
| Average Intel Core Ultra 7 255H (7384 - 13231, n=17) | |
| MSI Venture 16 AI A2HMTG (v8.20.8100) | |
| HP Pavilion 16-ag0057ng (v6.92.6600) | |
| MSI Prestige 16 B1MG-001US (v6.92.6600) | |
| Asus V16 V3607V (v6.92.6600) | |
| Lenovo IdeaPad Slim 5 16AKP10 (v6.92.6600) | |
| Dell 16 Plus 2-in-1 (v6.92.6600) | |
| AIDA64 / CPU PhotoWorxx | |
| Average Intel Core Ultra 7 255H (23836 - 65787, n=17) | |
| Dell 16 Plus 2-in-1 (v6.92.6600) | |
| MSI Venture 16 AI A2HMTG (v8.20.8100) | |
| MSI Prestige 16 B1MG-001US (v6.92.6600) | |
| Lenovo IdeaPad Slim 5 16AKP10 (v6.92.6600) | |
| HP Pavilion 16-ag0057ng (v6.92.6600) | |
| Asus V16 V3607V (v6.92.6600) | |
| AIDA64 / CPU CheckMate | |
| MSI Venture 16 AI A2HMTG (v8.20.8100) | |
| Average Intel Core Ultra 7 255H (n=1) | |
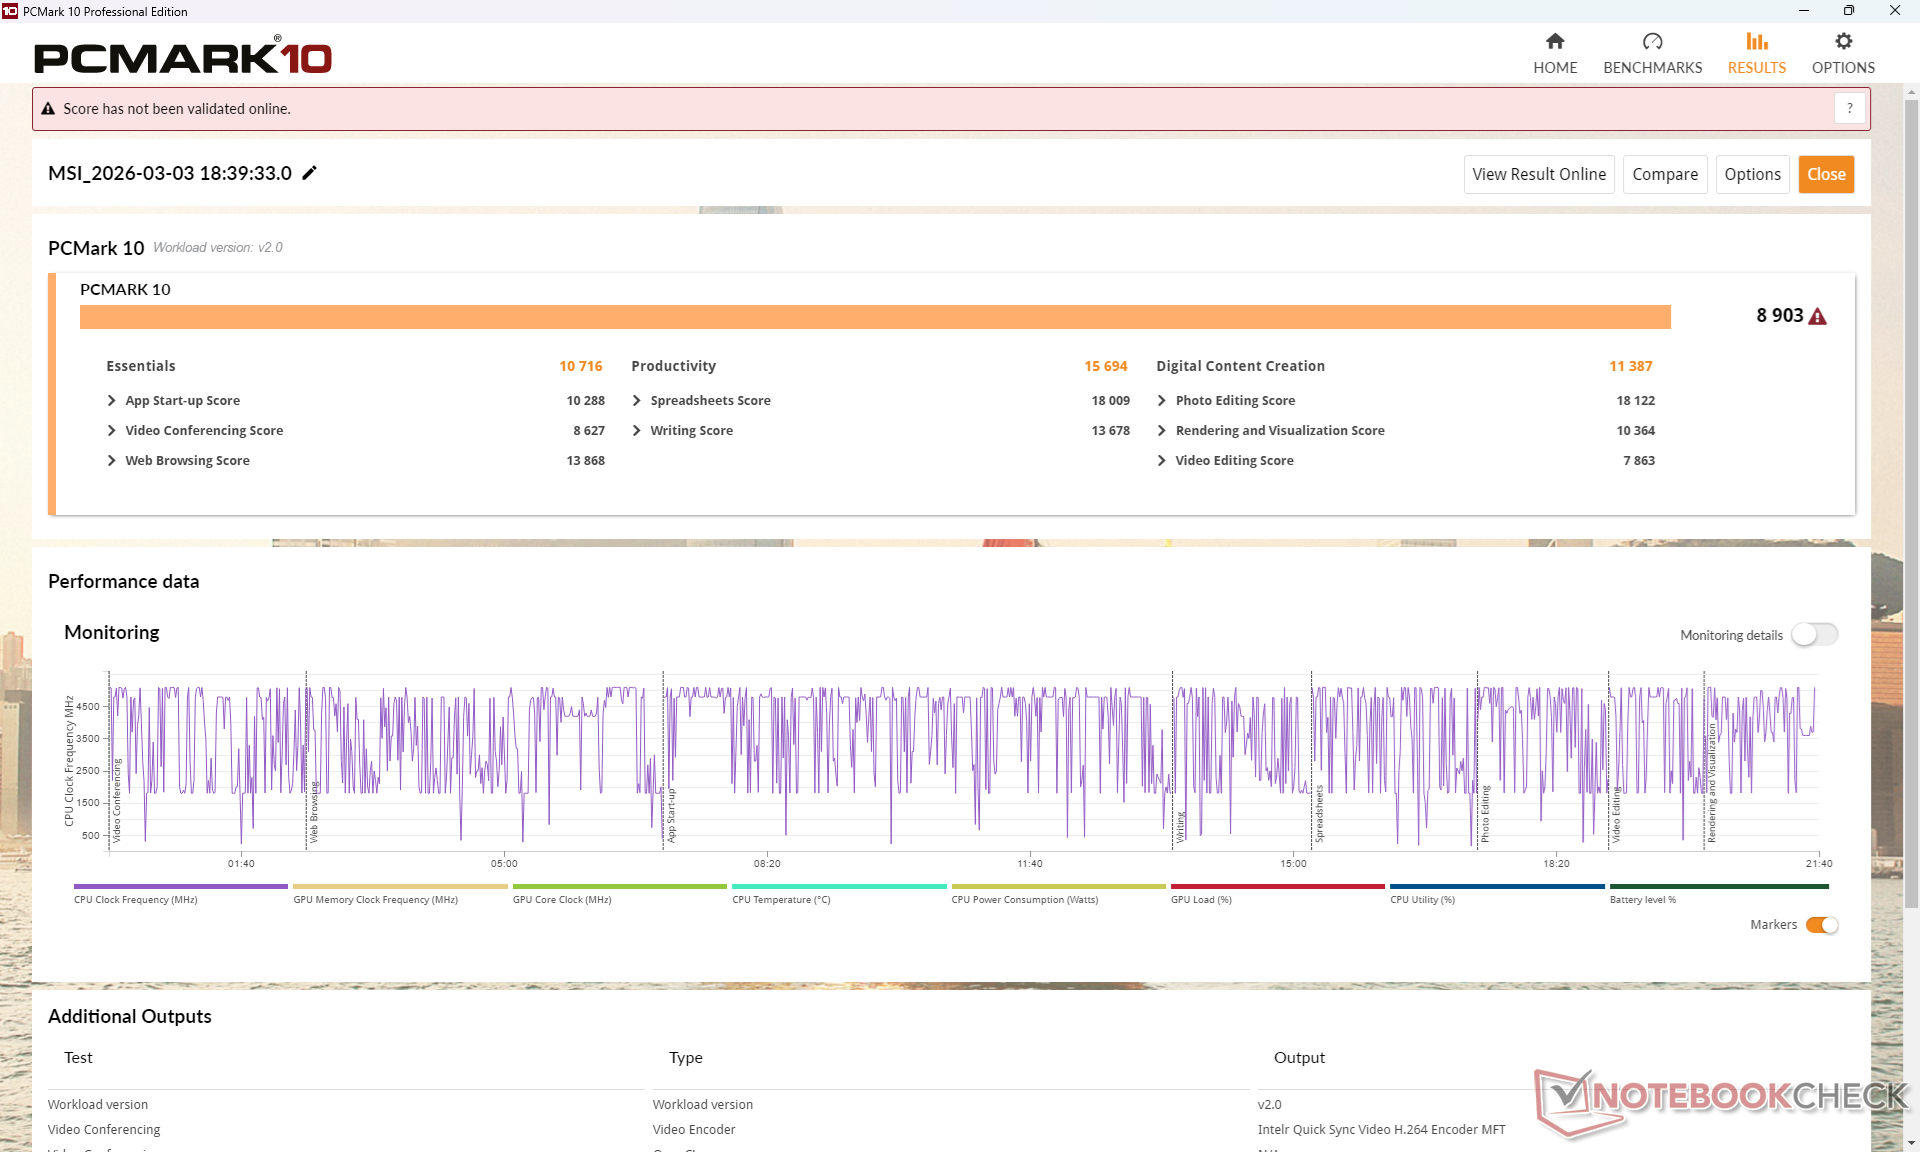
系统性能
PCMark 10 分数远高于平均水平,这是因为即使在更新和多次重新测试后,"生产力 "分数仍异常之高。这个结果几乎可以肯定是一个错误,因此下面的比较分数应该谨慎对待。
PCMark 10: Score | Essentials | Productivity | Digital Content Creation
CrossMark: Overall | Productivity | Creativity | Responsiveness
WebXPRT 3: Overall
WebXPRT 4: Overall
Mozilla Kraken 1.1: Total
Geekbench AI: Single Precision GPU 1.7 | Half Precision GPU 1.7 | Quantized GPU 1.7
| Performance rating | |
| MSI Venture 16 AI A2HMTG | |
| Average Intel Core Ultra 7 255H, Intel Arc Graphics 140T | |
| Dell 16 Plus 2-in-1 | |
| MSI Prestige 16 B1MG-001US -3! | |
| Asus V16 V3607V -4! | |
| HP Pavilion 16-ag0057ng -7! | |
| Lenovo IdeaPad Slim 5 16AKP10 -4! | |
| PCMark 10 / Score | |
| MSI Venture 16 AI A2HMTG | |
| Average Intel Core Ultra 7 255H, Intel Arc Graphics 140T (6878 - 9156, n=13) | |
| MSI Prestige 16 B1MG-001US | |
| Dell 16 Plus 2-in-1 | |
| Asus V16 V3607V | |
| HP Pavilion 16-ag0057ng | |
| Lenovo IdeaPad Slim 5 16AKP10 | |
| PCMark 10 / Essentials | |
| MSI Prestige 16 B1MG-001US | |
| Average Intel Core Ultra 7 255H, Intel Arc Graphics 140T (10637 - 11556, n=13) | |
| MSI Venture 16 AI A2HMTG | |
| Dell 16 Plus 2-in-1 | |
| HP Pavilion 16-ag0057ng | |
| Asus V16 V3607V | |
| Lenovo IdeaPad Slim 5 16AKP10 | |
| PCMark 10 / Productivity | |
| MSI Venture 16 AI A2HMTG | |
| Average Intel Core Ultra 7 255H, Intel Arc Graphics 140T (7598 - 15694, n=13) | |
| Asus V16 V3607V | |
| Lenovo IdeaPad Slim 5 16AKP10 | |
| HP Pavilion 16-ag0057ng | |
| MSI Prestige 16 B1MG-001US | |
| Dell 16 Plus 2-in-1 | |
| PCMark 10 / Digital Content Creation | |
| Average Intel Core Ultra 7 255H, Intel Arc Graphics 140T (10461 - 12552, n=13) | |
| MSI Venture 16 AI A2HMTG | |
| MSI Prestige 16 B1MG-001US | |
| Dell 16 Plus 2-in-1 | |
| Asus V16 V3607V | |
| HP Pavilion 16-ag0057ng | |
| Lenovo IdeaPad Slim 5 16AKP10 | |
| CrossMark / Overall | |
| MSI Venture 16 AI A2HMTG | |
| Average Intel Core Ultra 7 255H, Intel Arc Graphics 140T (1610 - 2018, n=13) | |
| Asus V16 V3607V | |
| MSI Prestige 16 B1MG-001US | |
| Dell 16 Plus 2-in-1 | |
| Lenovo IdeaPad Slim 5 16AKP10 | |
| CrossMark / Productivity | |
| MSI Venture 16 AI A2HMTG | |
| Average Intel Core Ultra 7 255H, Intel Arc Graphics 140T (1566 - 1908, n=13) | |
| Asus V16 V3607V | |
| MSI Prestige 16 B1MG-001US | |
| Dell 16 Plus 2-in-1 | |
| Lenovo IdeaPad Slim 5 16AKP10 | |
| CrossMark / Creativity | |
| MSI Venture 16 AI A2HMTG | |
| Average Intel Core Ultra 7 255H, Intel Arc Graphics 140T (1827 - 2396, n=13) | |
| Asus V16 V3607V | |
| MSI Prestige 16 B1MG-001US | |
| Dell 16 Plus 2-in-1 | |
| Lenovo IdeaPad Slim 5 16AKP10 | |
| CrossMark / Responsiveness | |
| MSI Prestige 16 B1MG-001US | |
| Asus V16 V3607V | |
| Average Intel Core Ultra 7 255H, Intel Arc Graphics 140T (1194 - 1781, n=13) | |
| MSI Venture 16 AI A2HMTG | |
| Dell 16 Plus 2-in-1 | |
| Lenovo IdeaPad Slim 5 16AKP10 | |
| WebXPRT 3 / Overall | |
| MSI Venture 16 AI A2HMTG | |
| Average Intel Core Ultra 7 255H, Intel Arc Graphics 140T (273 - 327, n=13) | |
| MSI Prestige 16 B1MG-001US | |
| Dell 16 Plus 2-in-1 | |
| HP Pavilion 16-ag0057ng | |
| HP Pavilion 16-ag0057ng | |
| Lenovo IdeaPad Slim 5 16AKP10 | |
| WebXPRT 4 / Overall | |
| MSI Venture 16 AI A2HMTG | |
| Average Intel Core Ultra 7 255H, Intel Arc Graphics 140T (247 - 317, n=13) | |
| Dell 16 Plus 2-in-1 | |
| Asus V16 V3607V | |
| MSI Prestige 16 B1MG-001US | |
| HP Pavilion 16-ag0057ng | |
| HP Pavilion 16-ag0057ng | |
| Mozilla Kraken 1.1 / Total | |
| Lenovo IdeaPad Slim 5 16AKP10 | |
| HP Pavilion 16-ag0057ng | |
| HP Pavilion 16-ag0057ng | |
| MSI Prestige 16 B1MG-001US | |
| Asus V16 V3607V | |
| Dell 16 Plus 2-in-1 | |
| MSI Venture 16 AI A2HMTG | |
| Average Intel Core Ultra 7 255H, Intel Arc Graphics 140T (427 - 510, n=13) | |
| Geekbench AI / Single Precision GPU 1.7 | |
| Dell 16 Plus 2-in-1 | |
| Average Intel Core Ultra 7 255H, Intel Arc Graphics 140T (6840 - 8478, n=7) | |
| MSI Venture 16 AI A2HMTG | |
| Geekbench AI / Half Precision GPU 1.7 | |
| Dell 16 Plus 2-in-1 | |
| Average Intel Core Ultra 7 255H, Intel Arc Graphics 140T (8108 - 12393, n=7) | |
| MSI Venture 16 AI A2HMTG | |
| Geekbench AI / Quantized GPU 1.7 | |
| Dell 16 Plus 2-in-1 | |
| Average Intel Core Ultra 7 255H, Intel Arc Graphics 140T (4705 - 5621, n=7) | |
| MSI Venture 16 AI A2HMTG | |
* ... smaller is better
| PCMark 10 Score | 8903 points | |
Help | ||
| AIDA64 / Memory Copy | |
| Dell 16 Plus 2-in-1 | |
| Average Intel Core Ultra 7 255H (39188 - 110930, n=17) | |
| MSI Prestige 16 B1MG-001US | |
| HP Pavilion 16-ag0057ng | |
| MSI Venture 16 AI A2HMTG | |
| Lenovo IdeaPad Slim 5 16AKP10 | |
| Asus V16 V3607V | |
| AIDA64 / Memory Read | |
| Dell 16 Plus 2-in-1 | |
| MSI Venture 16 AI A2HMTG | |
| Average Intel Core Ultra 7 255H (43703 - 90552, n=17) | |
| MSI Prestige 16 B1MG-001US | |
| Lenovo IdeaPad Slim 5 16AKP10 | |
| HP Pavilion 16-ag0057ng | |
| Asus V16 V3607V | |
| AIDA64 / Memory Write | |
| Dell 16 Plus 2-in-1 | |
| HP Pavilion 16-ag0057ng | |
| Lenovo IdeaPad Slim 5 16AKP10 | |
| MSI Venture 16 AI A2HMTG | |
| MSI Prestige 16 B1MG-001US | |
| Average Intel Core Ultra 7 255H (36438 - 87199, n=17) | |
| Asus V16 V3607V | |
| AIDA64 / Memory Latency | |
| MSI Prestige 16 B1MG-001US | |
| Average Intel Core Ultra 7 255H (107.6 - 147.2, n=17) | |
| HP Pavilion 16-ag0057ng | |
| MSI Venture 16 AI A2HMTG | |
| Dell 16 Plus 2-in-1 | |
| Asus V16 V3607V | |
| Lenovo IdeaPad Slim 5 16AKP10 | |
* ... smaller is better
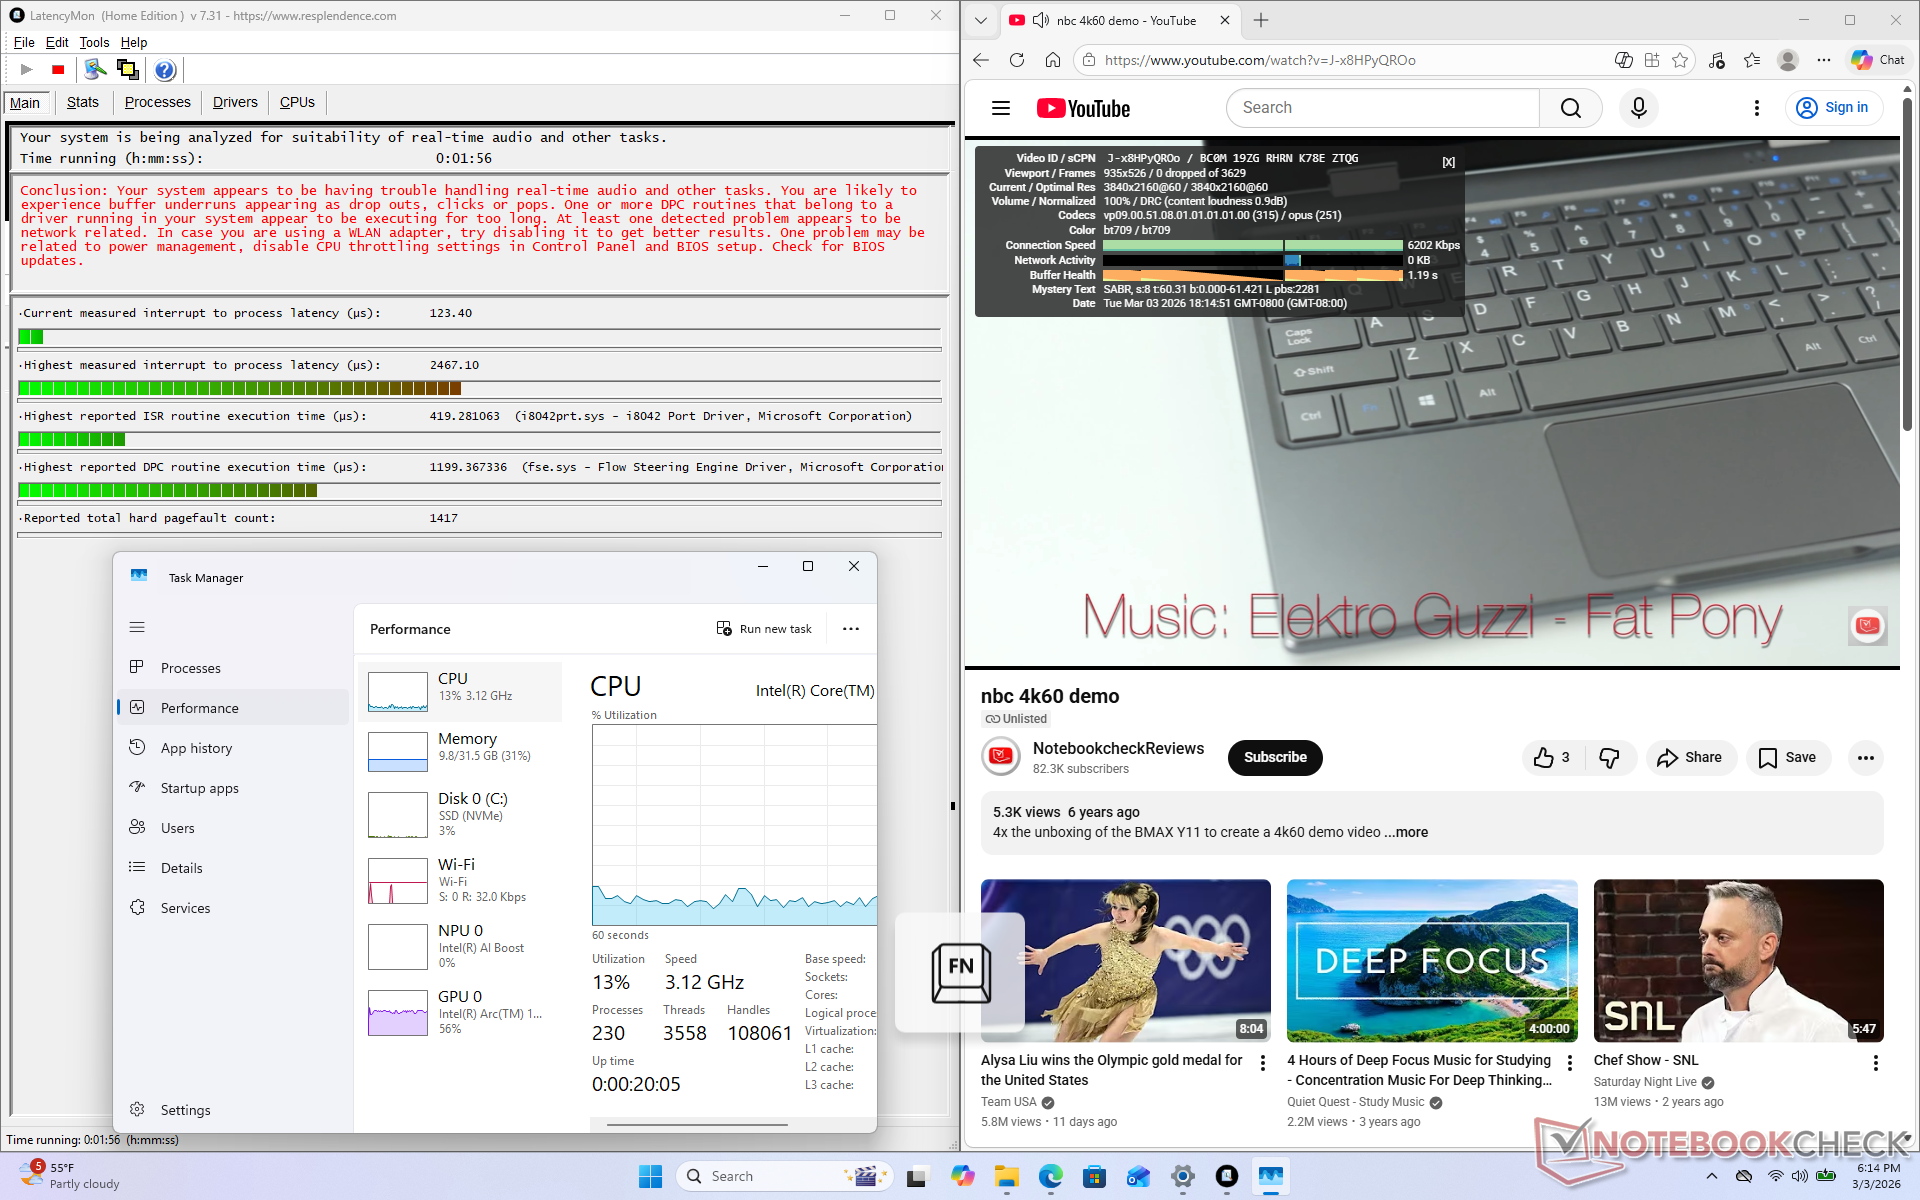
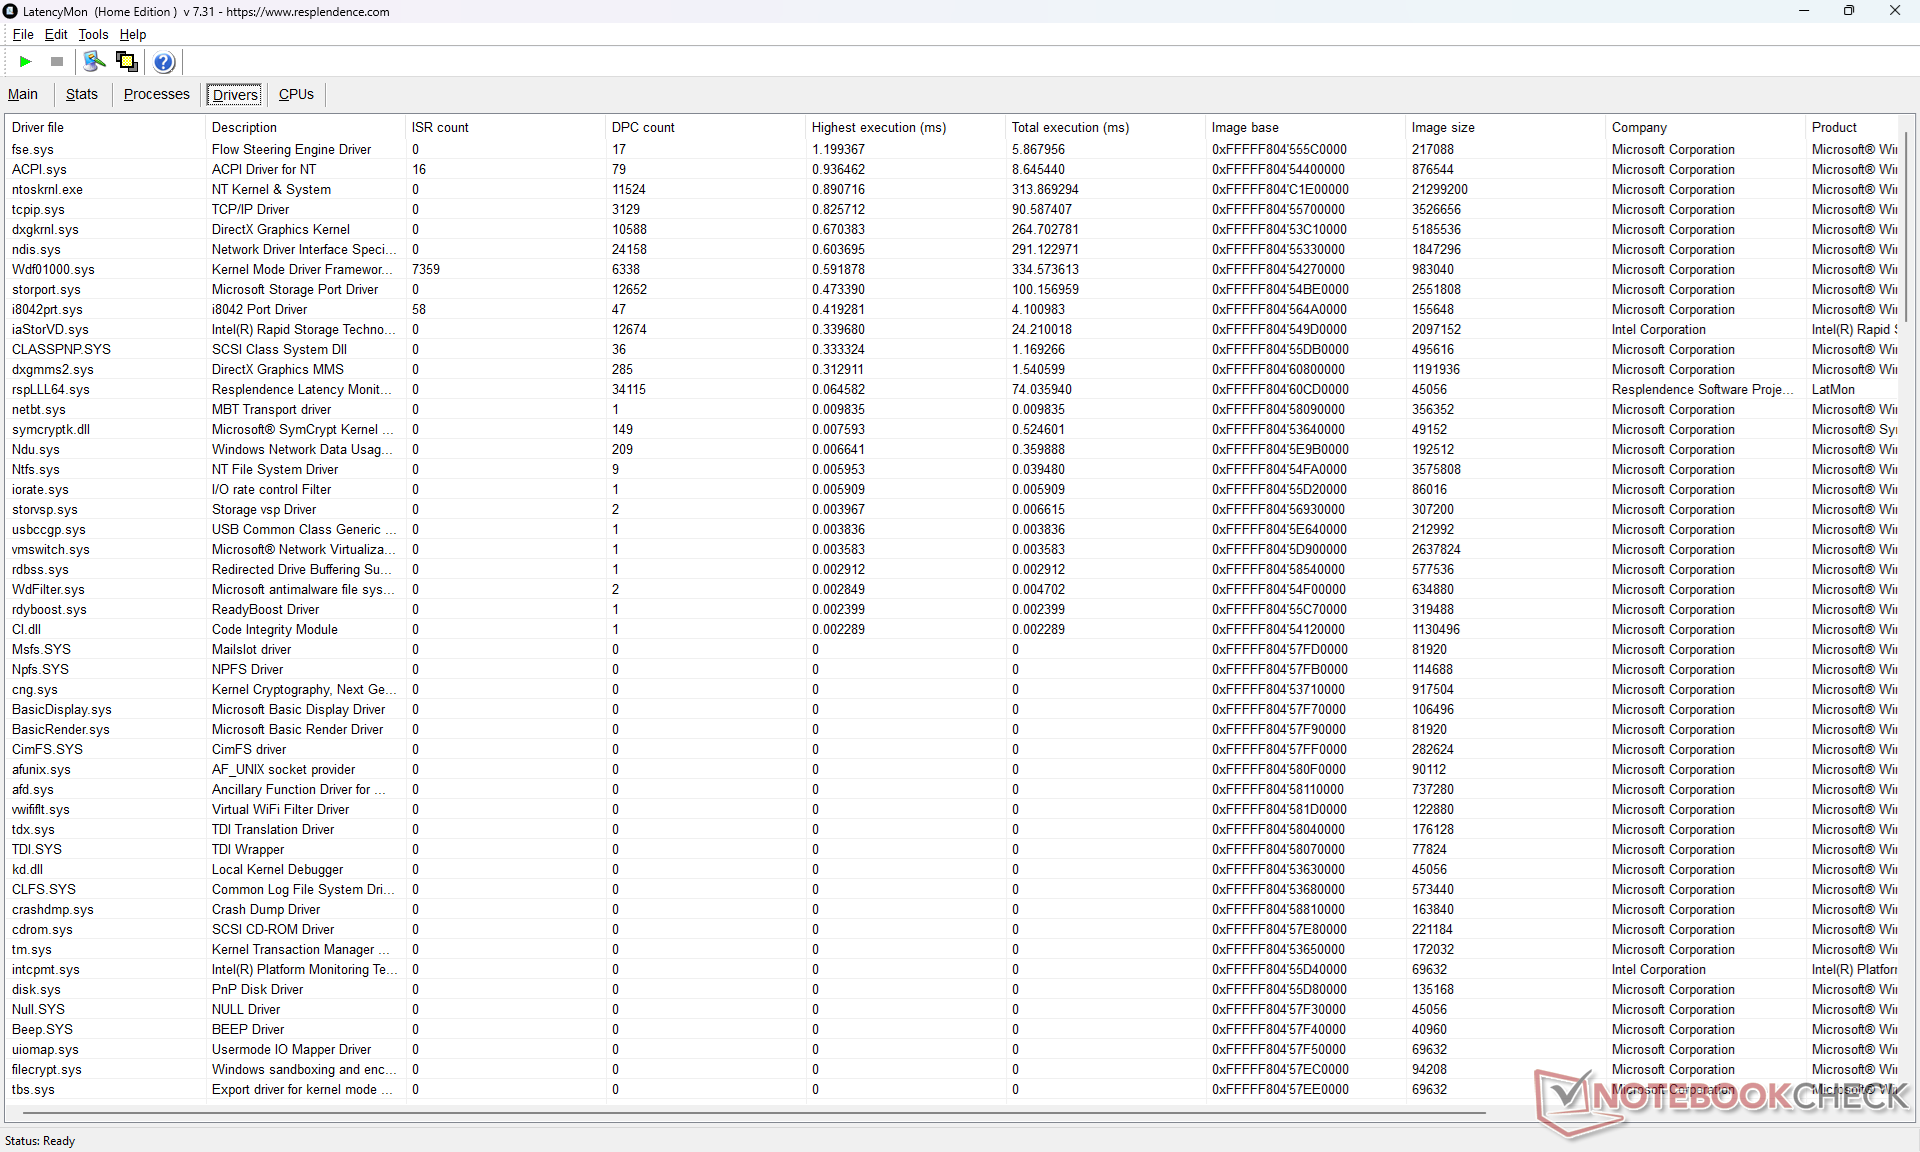
DPC 延迟
LatencyMon 显示了轻微的 DPC 问题,但在播放 4K60 视频时没有出现掉帧现象。
| DPC Latencies / LatencyMon - interrupt to process latency (max), Web, Youtube, Prime95 | |
| Lenovo IdeaPad Slim 5 16AKP10 | |
| Asus V16 V3607V | |
| MSI Venture 16 AI A2HMTG | |
| Dell 16 Plus 2-in-1 | |
| HP Pavilion 16-ag0057ng | |
| MSI Prestige 16 B1MG-001US | |
* ... smaller is better
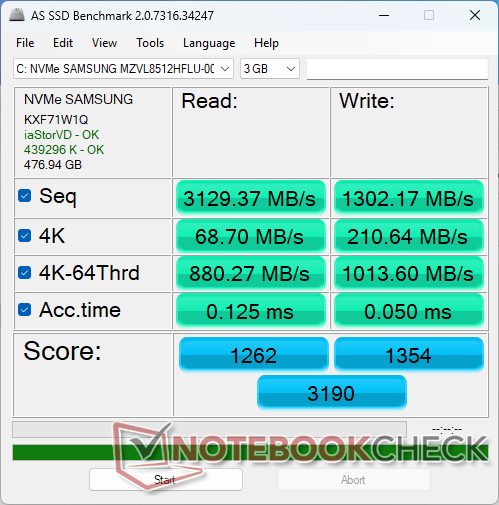
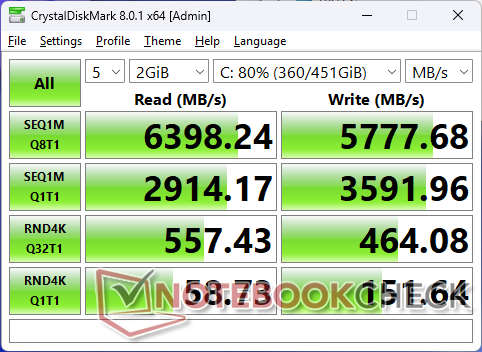
存储设备
三星 三星 MZVL8512HFLUPCIe4 x4 NVMe 固态硬盘即使没有专用散热器,也能维持高达 7000 MB/s 的传输速率。

| Drive Performance rating - Percent | |
| MSI Prestige 16 B1MG-001US | |
| Asus V16 V3607V | |
| MSI Venture 16 AI A2HMTG | |
| HP Pavilion 16-ag0057ng | |
| Lenovo IdeaPad Slim 5 16AKP10 | |
| Dell 16 Plus 2-in-1 | |
* ... smaller is better
磁盘节流DiskSpd 读取循环,队列深度 8
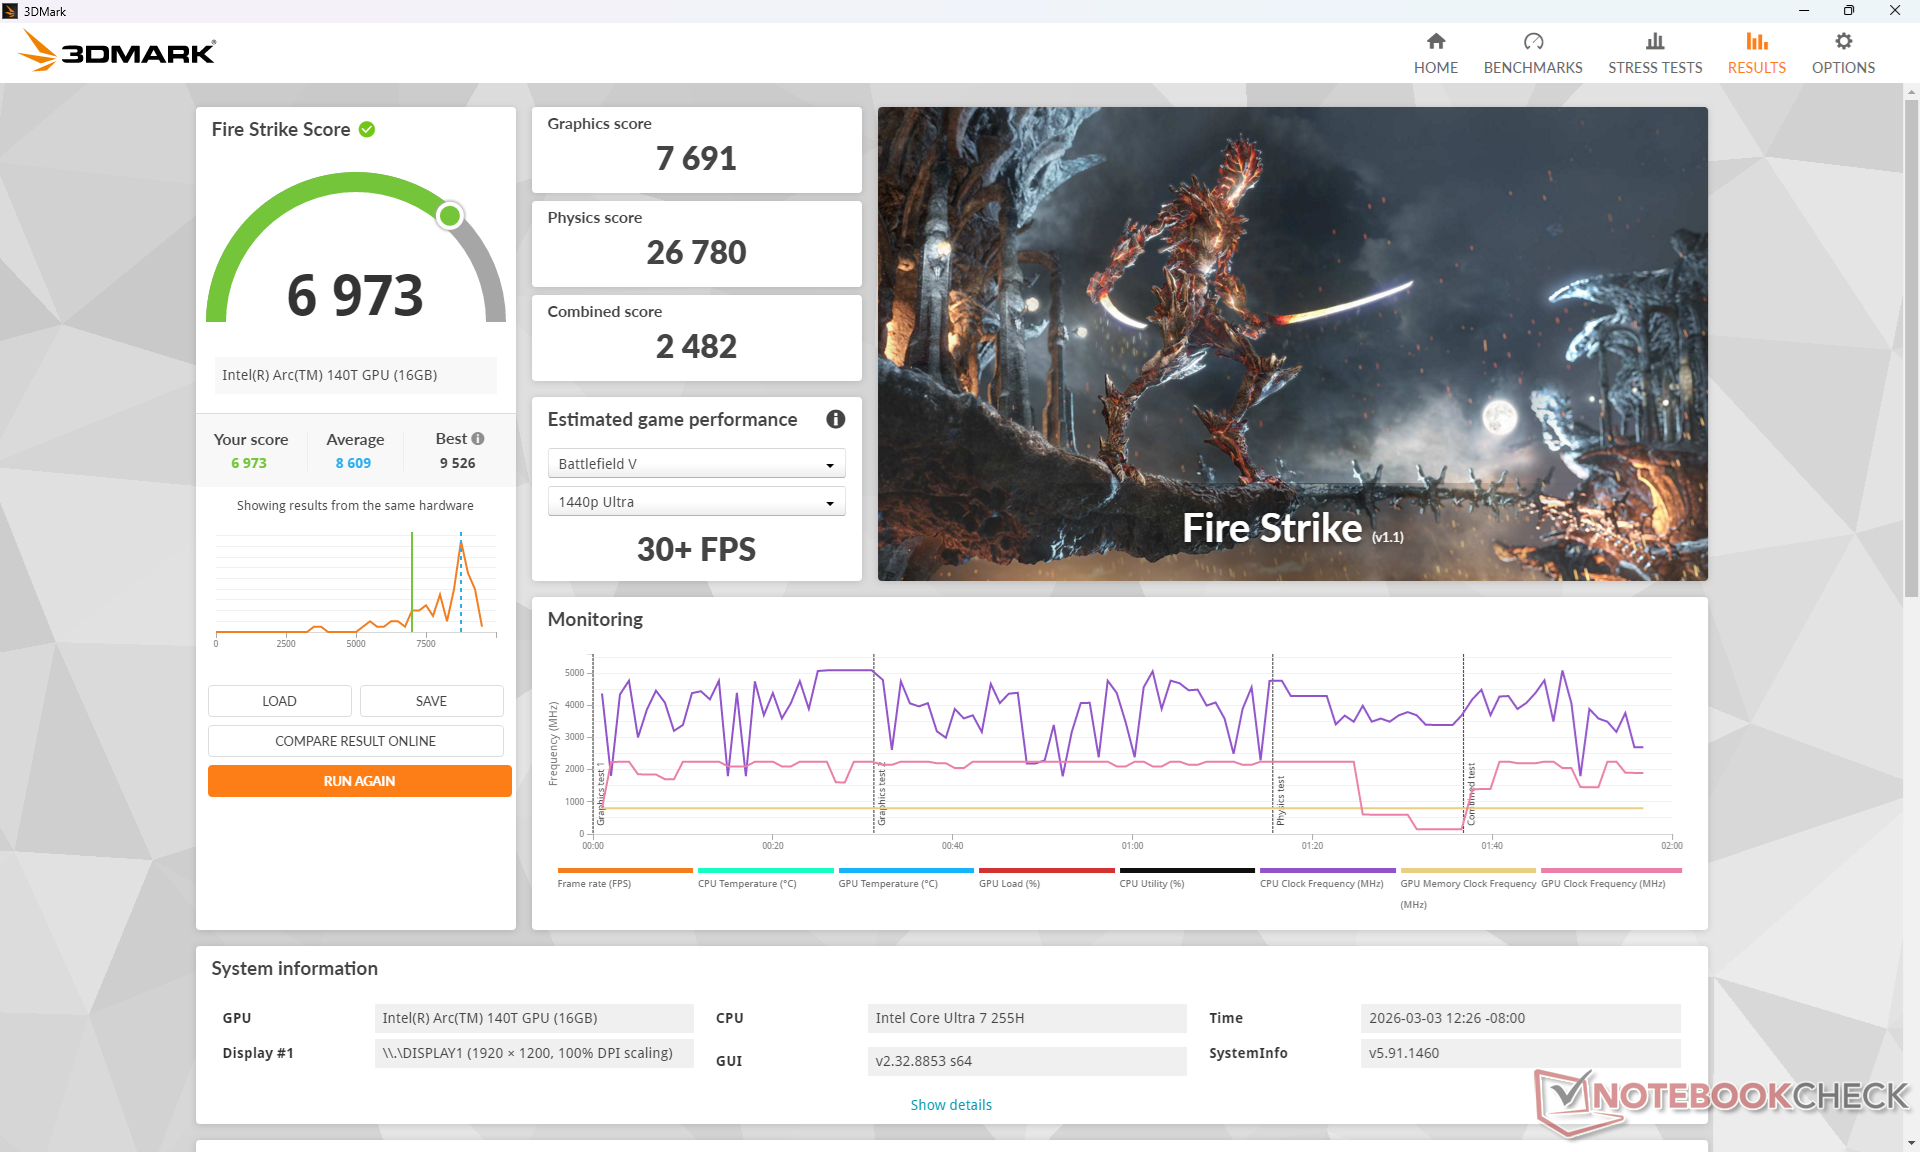
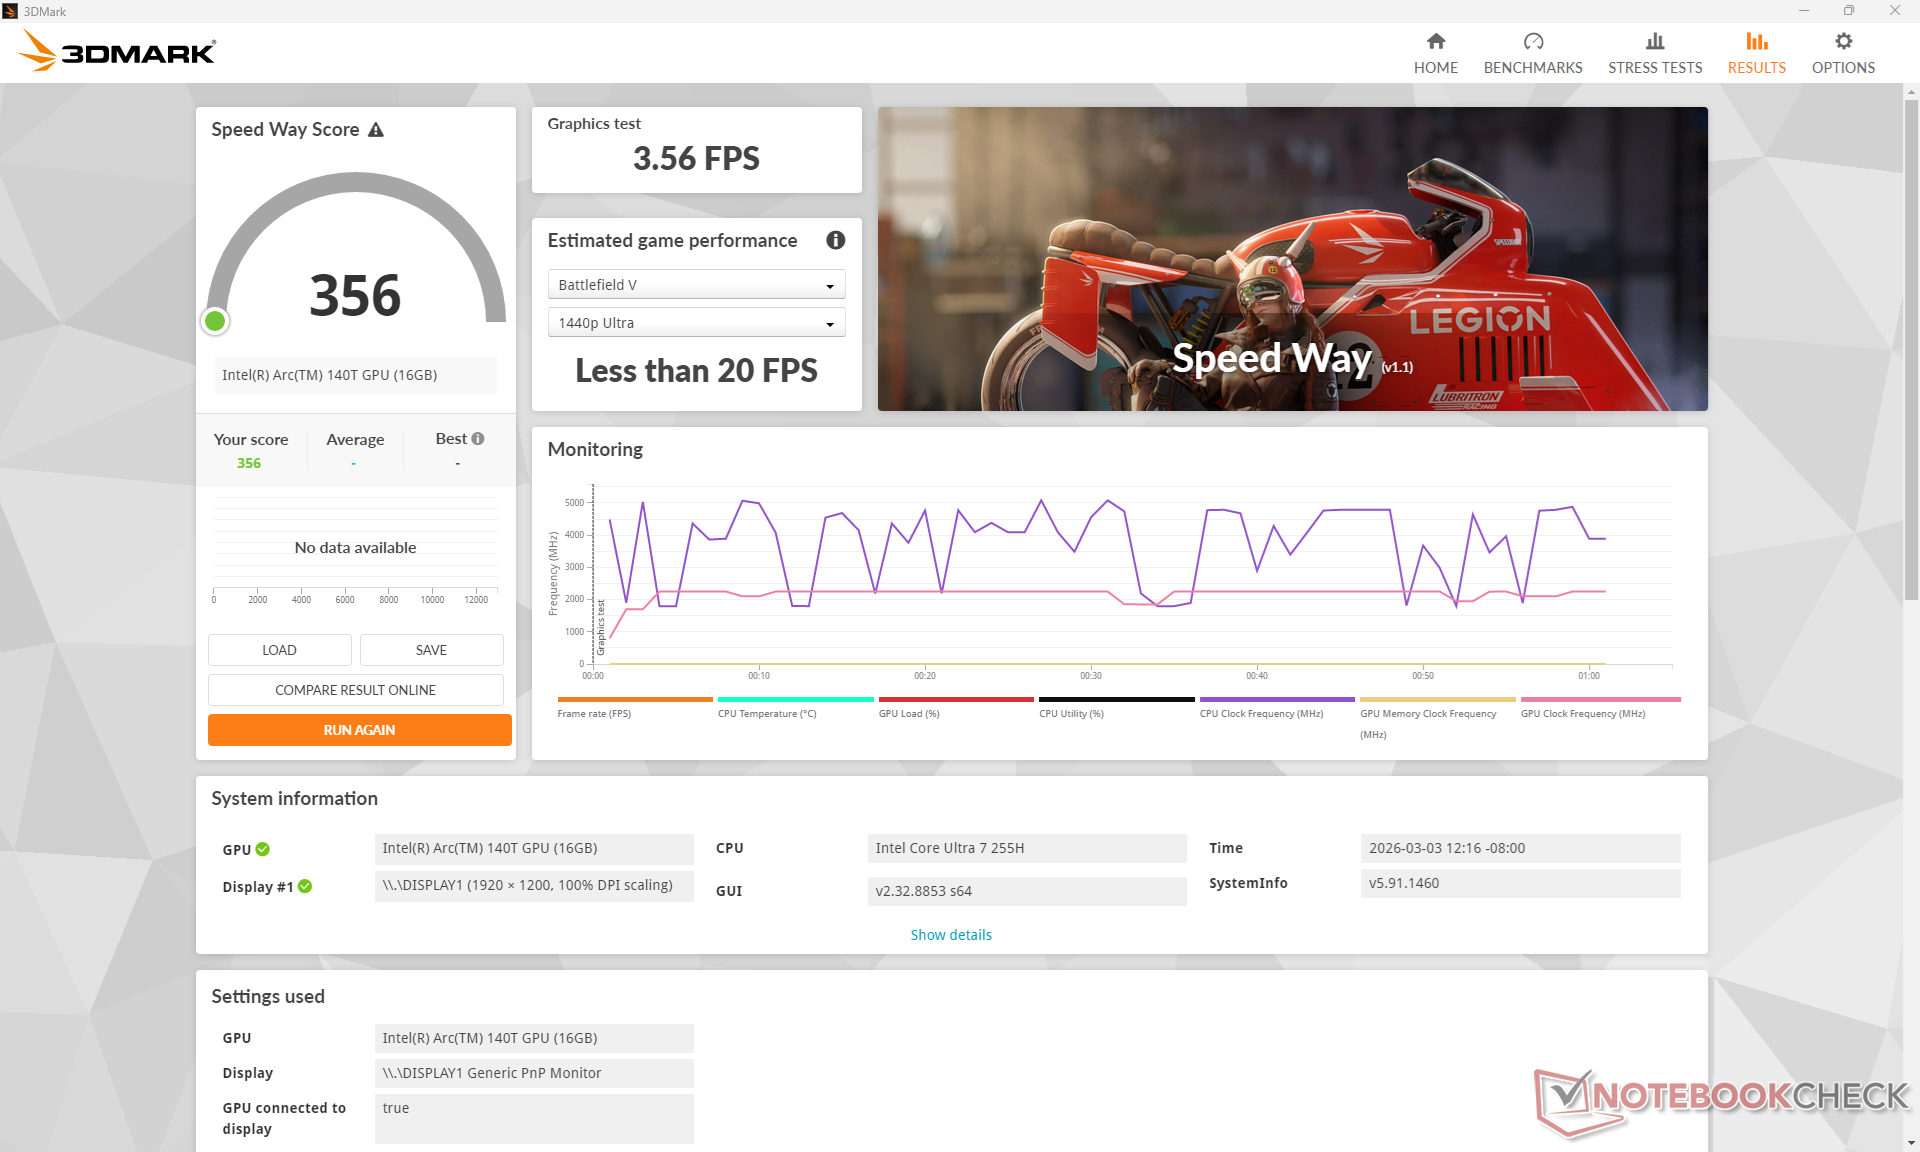
图形处理器性能
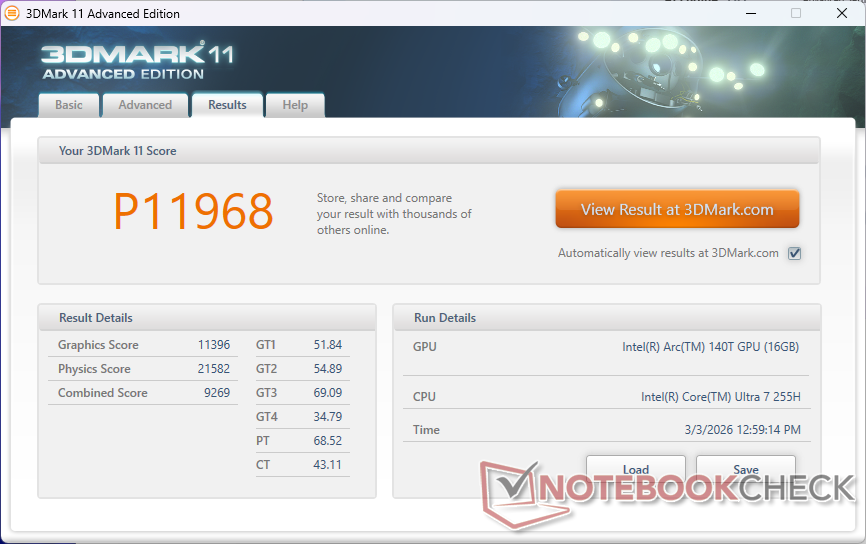
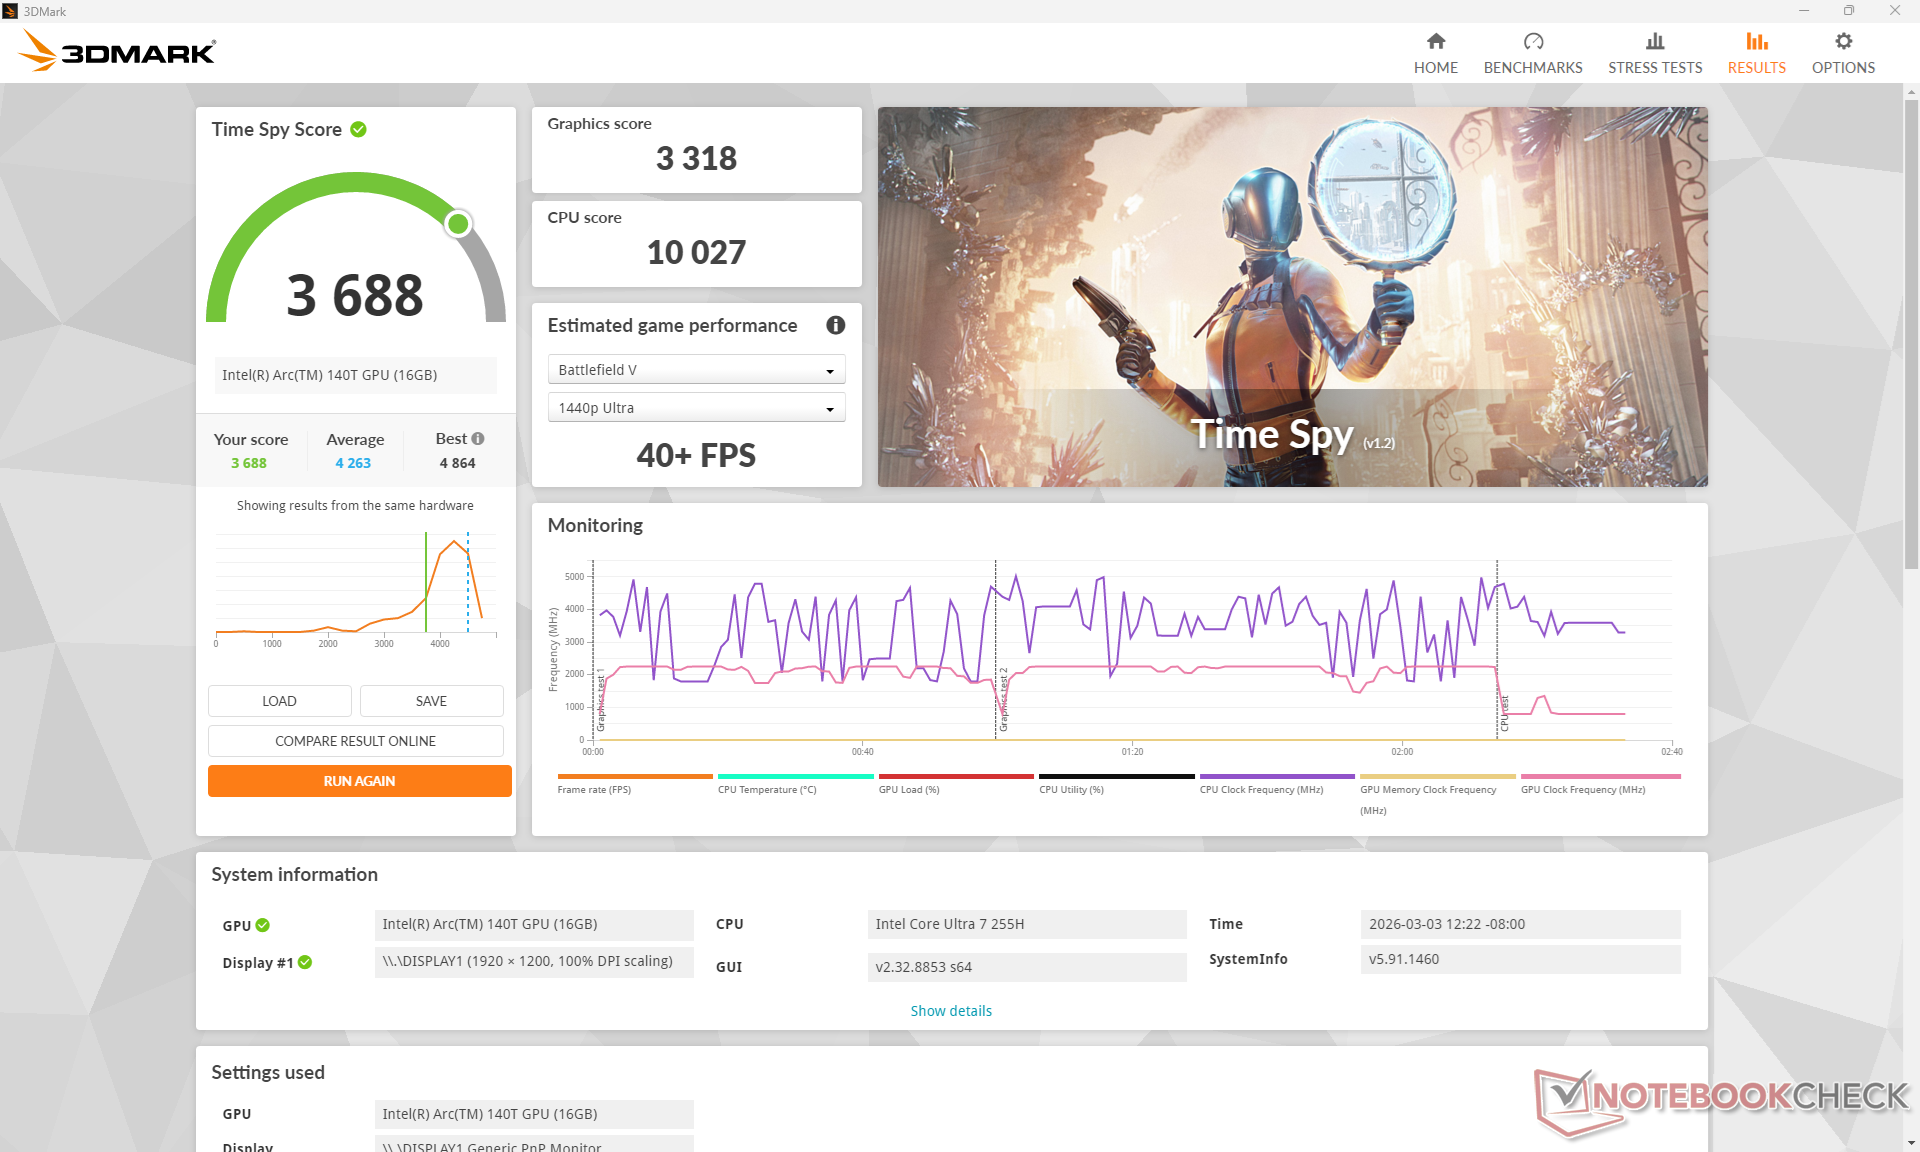
| 3DMark 11 Performance | 11968 points | |
| 3DMark Cloud Gate Standard Score | 35142 points | |
| 3DMark Fire Strike Score | 6973 points | |
| 3DMark Time Spy Score | 3688 points | |
Help | ||
| Blender | |
| v3.3 Classroom OPTIX/RTX | |
| Asus V16 V3607V | |
| v3.3 Classroom CUDA | |
| Asus V16 V3607V | |
| v3.3 Classroom CPU | |
| Lenovo IdeaPad Slim 5 16AKP10 | |
| Dell 16 Plus 2-in-1 | |
| HP Pavilion 16-ag0057ng | |
| Dynabook Tecra A60 A65-M | |
| Asus V16 V3607V | |
| MSI Prestige 16 B1MG-001US | |
| Asus ExpertBook B5 B5605CCA | |
| Average Intel Arc Graphics 140T (254 - 492, n=20) | |
| Acer Swift Go 16 AI SFG16-61-R5Y5 | |
| Acer Swift Go 16 AI SFG16-61-R5Y5 | |
| MSI Venture 16 AI A2HMTG | |
| Asus ZenBook S16 UM5606GA | |
| v3.3 Classroom oneAPI/Intel | |
| Average Intel Arc Graphics 140T (147 - 396, n=6) | |
| Dell 16 Plus 2-in-1 | |
| MSI Venture 16 AI A2HMTG | |
| v4.3 Barbershop CPU | |
| Dell 16 Plus 2-in-1 | |
| Asus V16 V3607V | |
| Dynabook Tecra A60 A65-M | |
| Acer Swift Go 16 AI SFG16-61-R5Y5 | |
| Average Intel Arc Graphics 140T (1349 - 1839, n=9) | |
| MSI Venture 16 AI A2HMTG | |
| v4.3 Barbershop oneAPI | |
| Dell 16 Plus 2-in-1 | |
| Average Intel Arc Graphics 140T (533 - 1037, n=5) | |
| MSI Venture 16 AI A2HMTG | |
| v4.3 Barbershop HIP | |
| Acer Swift Go 16 AI SFG16-61-R5Y5 | |
| v4.3 Barbershop OPTIX | |
| Asus V16 V3607V | |
* ... smaller is better
| Performance rating - Percent | |
| Asus V16 V3607V | |
| Dell 16 Plus 2-in-1 -1! | |
| MSI Prestige 16 B1MG-001US -1! | |
| MSI Venture 16 AI A2HMTG | |
| HP Pavilion 16-ag0057ng | |
| Lenovo IdeaPad Slim 5 16AKP10 | |
| Cyberpunk 2077 - 1920x1080 Ultra Preset (FSR off) | |
| Asus V16 V3607V | |
| Dell 16 Plus 2-in-1 | |
| MSI Venture 16 AI A2HMTG | |
| MSI Prestige 16 B1MG-001US | |
| HP Pavilion 16-ag0057ng | |
| Lenovo IdeaPad Slim 5 16AKP10 | |
| Baldur's Gate 3 - 1920x1080 Ultra Preset AA:T | |
| Asus V16 V3607V | |
| Dell 16 Plus 2-in-1 | |
| MSI Venture 16 AI A2HMTG | |
| MSI Prestige 16 B1MG-001US | |
| HP Pavilion 16-ag0057ng | |
| Lenovo IdeaPad Slim 5 16AKP10 | |
| GTA V - 1920x1080 Highest AA:4xMSAA + FX AF:16x | |
| Asus V16 V3607V | |
| MSI Venture 16 AI A2HMTG | |
| HP Pavilion 16-ag0057ng | |
| Lenovo IdeaPad Slim 5 16AKP10 | |
| Final Fantasy XV Benchmark - 1920x1080 High Quality | |
| Asus V16 V3607V | |
| Dell 16 Plus 2-in-1 | |
| MSI Venture 16 AI A2HMTG | |
| MSI Prestige 16 B1MG-001US | |
| HP Pavilion 16-ag0057ng | |
| Lenovo IdeaPad Slim 5 16AKP10 | |
| Strange Brigade - 1920x1080 ultra AA:ultra AF:16 | |
| Asus V16 V3607V | |
| Dell 16 Plus 2-in-1 | |
| MSI Venture 16 AI A2HMTG | |
| MSI Prestige 16 B1MG-001US | |
| HP Pavilion 16-ag0057ng | |
| Lenovo IdeaPad Slim 5 16AKP10 | |
| Dota 2 Reborn - 1920x1080 ultra (3/3) best looking | |
| Asus V16 V3607V | |
| Dell 16 Plus 2-in-1 | |
| MSI Venture 16 AI A2HMTG | |
| MSI Prestige 16 B1MG-001US | |
| HP Pavilion 16-ag0057ng | |
| Lenovo IdeaPad Slim 5 16AKP10 | |
| X-Plane 11.11 - 1920x1080 high (fps_test=3) | |
| Asus V16 V3607V | |
| MSI Venture 16 AI A2HMTG | |
| MSI Prestige 16 B1MG-001US | |
| Dell 16 Plus 2-in-1 | |
| Lenovo IdeaPad Slim 5 16AKP10 | |
| HP Pavilion 16-ag0057ng | |
| F1 24 | |
| 1920x1080 Low Preset AA:T AF:16x | |
| Dell 16 Plus 2-in-1 | |
| Asus ZenBook S16 UM5606GA | |
| Average Intel Arc Graphics 140T (53.5 - 93.4, n=15) | |
| MSI Venture 16 AI A2HMTG | |
| Asus ExpertBook B5 B5605CCA | |
| Dynabook Tecra A60 A65-M | |
| 1920x1080 Medium Preset AA:T AF:16x | |
| Dell 16 Plus 2-in-1 | |
| Asus ZenBook S16 UM5606GA | |
| Average Intel Arc Graphics 140T (47.4 - 85.7, n=15) | |
| MSI Venture 16 AI A2HMTG | |
| Asus ExpertBook B5 B5605CCA | |
| Dynabook Tecra A60 A65-M | |
| 1920x1080 High Preset AA:T AF:16x | |
| Dell 16 Plus 2-in-1 | |
| Asus ZenBook S16 UM5606GA | |
| Average Intel Arc Graphics 140T (37.5 - 64.9, n=14) | |
| MSI Venture 16 AI A2HMTG | |
| Asus ExpertBook B5 B5605CCA | |
| 1920x1080 Ultra High Preset AA:T AF:16x | |
| Dell 16 Plus 2-in-1 | |
| Average Intel Arc Graphics 140T (15.7 - 20.8, n=12) | |
| MSI Venture 16 AI A2HMTG | |
| Asus ZenBook S16 UM5606GA | |
赛博朋克 2077》超 FPS 图表
| low | med. | high | ultra | |
|---|---|---|---|---|
| GTA V (2015) | 167.9 | 155 | 41.1 | 16.7 |
| Dota 2 Reborn (2015) | 103.6 | 86.5 | 79.4 | 75.8 |
| Final Fantasy XV Benchmark (2018) | 68 | 39.2 | 26 | |
| X-Plane 11.11 (2018) | 55.8 | 44.6 | 39.7 | |
| Strange Brigade (2018) | 167.5 | 70.6 | 60.2 | 50.1 |
| Baldur's Gate 3 (2023) | 36.7 | 31 | 26.5 | 26.1 |
| Cyberpunk 2077 (2023) | 36.2 | 29.6 | 25.5 | 23 |
| F1 24 (2024) | 76.1 | 69.9 | 48 | 15.7 |
排放量
系统噪音
在运行浏览等日常负载时,风扇噪音往往徘徊在 27 分贝(A)左右,但在运行游戏等较高负载时,噪音会达到 45 分贝(A)。不幸的是,风扇的声音很高,因此任何脉动都会非常明显。
Noise level
| Idle |
| 23.1 / 23.1 / 24.1 dB(A) |
| Load |
| 45.2 / 44.7 dB(A) |
 | ||
30 dB silent 40 dB(A) audible 50 dB(A) loud |
||
min: | ||
| MSI Venture 16 AI A2HMTG Ultra 7 255H, Arc 140T | MSI Prestige 16 B1MG-001US Ultra 7 155H, Arc 8-Core | Dell 16 Plus 2-in-1 Core Ultra 7 258V, Arc 140V | Asus V16 V3607V Core 7 240H, GeForce RTX 3050 6GB Laptop GPU | HP Pavilion 16-ag0057ng R5 8540U, Radeon 740M | Lenovo IdeaPad Slim 5 16AKP10 Ryzen AI 5 330, Radeon 820M | |
|---|---|---|---|---|---|---|
| Noise | -6% | 2% | -4% | 1% | -3% | |
| off / environment * (dB) | 22.9 | 24.5 -7% | 23.2 -1% | 23.3 -2% | 24 -5% | 24 -5% |
| Idle Minimum * (dB) | 23.1 | 24.5 -6% | 23 -0% | 23.5 -2% | 24 -4% | 24 -4% |
| Idle Average * (dB) | 23.1 | 26.3 -14% | 23 -0% | 23.7 -3% | 25 -8% | 25 -8% |
| Idle Maximum * (dB) | 24.1 | 26.3 -9% | 24.7 -2% | 23.7 2% | 26 -8% | 26 -8% |
| Load Average * (dB) | 45.2 | 36.5 19% | 32.5 28% | 48 -6% | 38 16% | 43 5% |
| Cyberpunk 2077 ultra * (dB) | 39.4 | 42.6 -8% | 40.5 -3% | 37 6% | 42 -7% | |
| Load Maximum * (dB) | 44.7 | 52.9 -18% | 45.6 -2% | 51 -14% | 39 13% | 43 4% |
| Witcher 3 ultra * (dB) | 46.3 |
* ... smaller is better
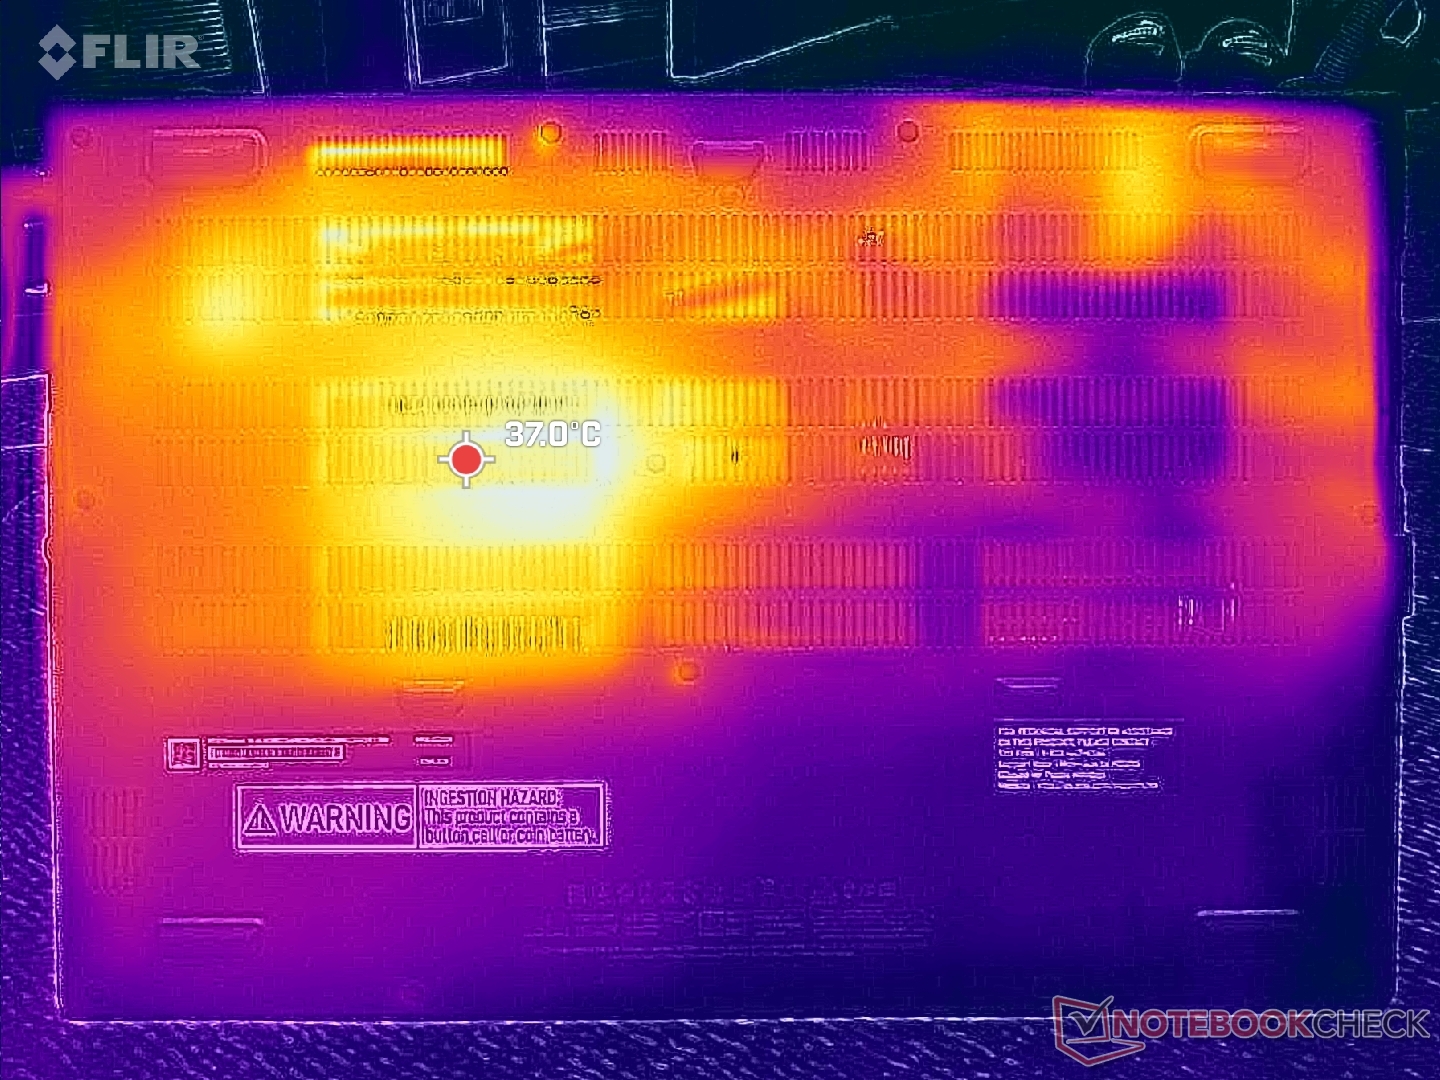
温度
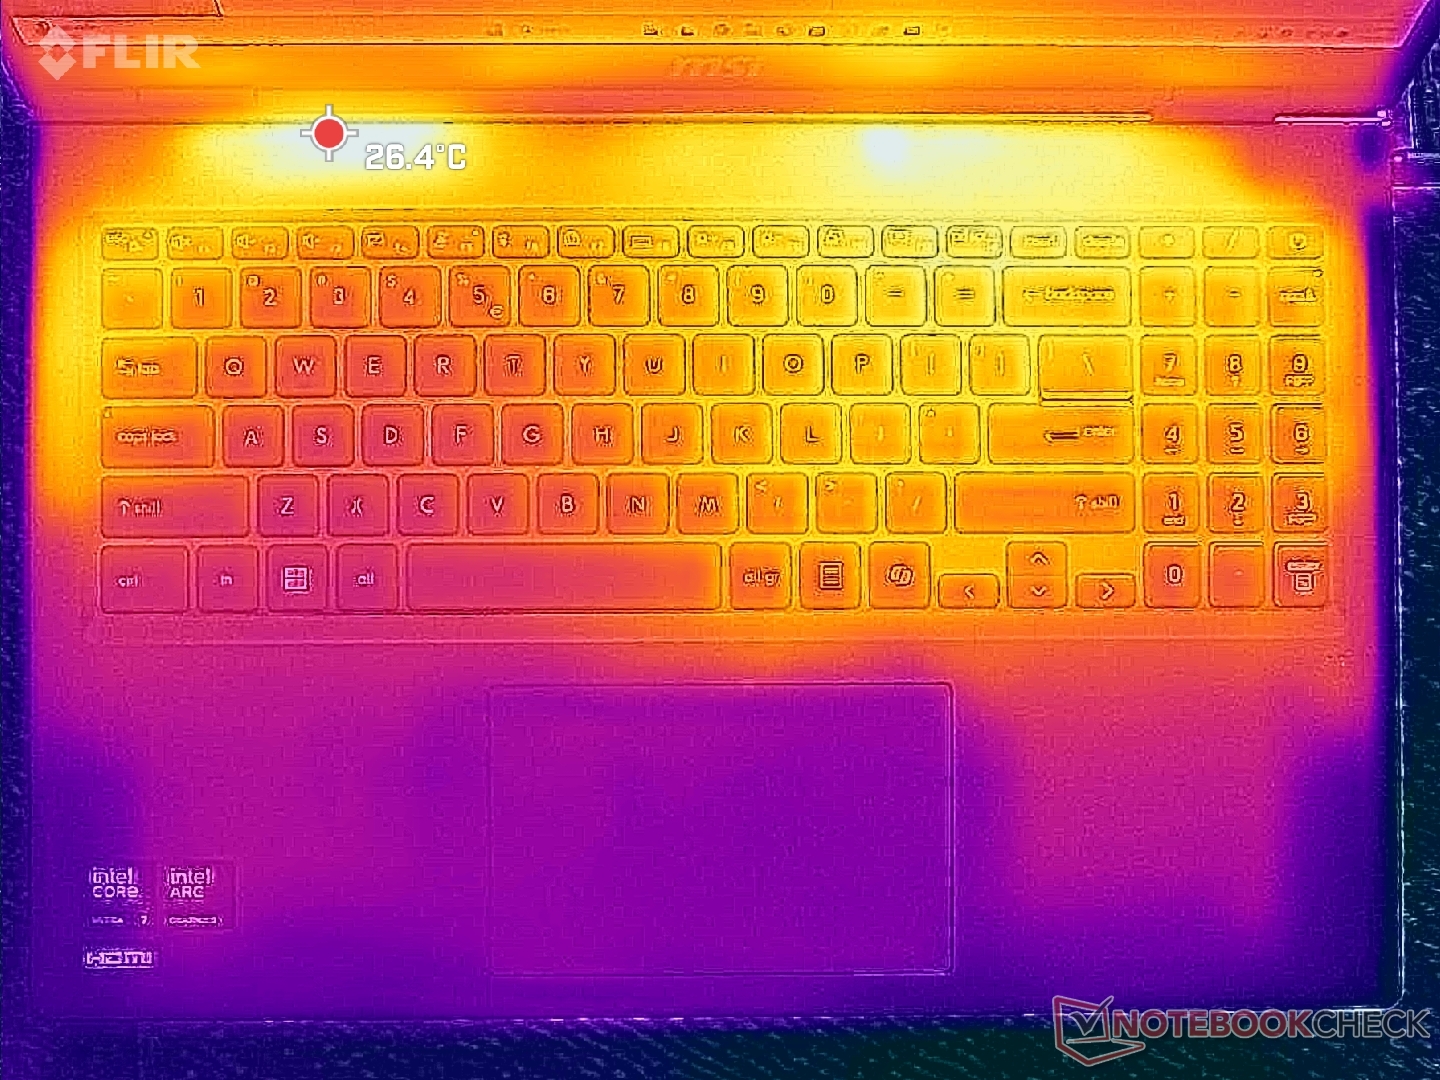
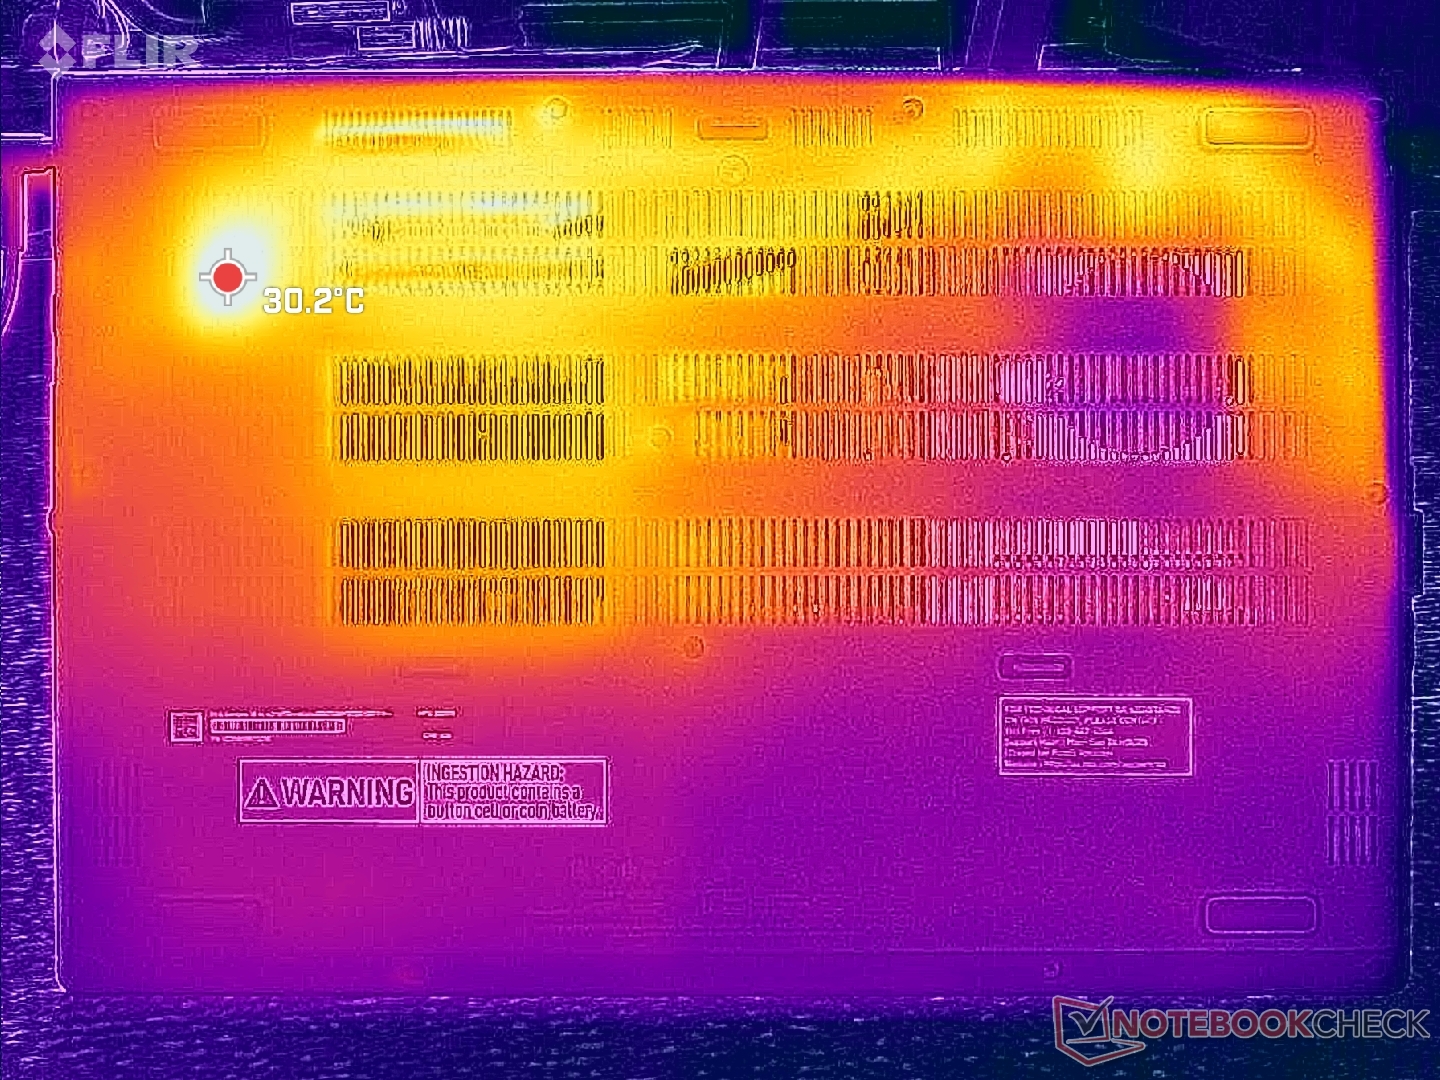
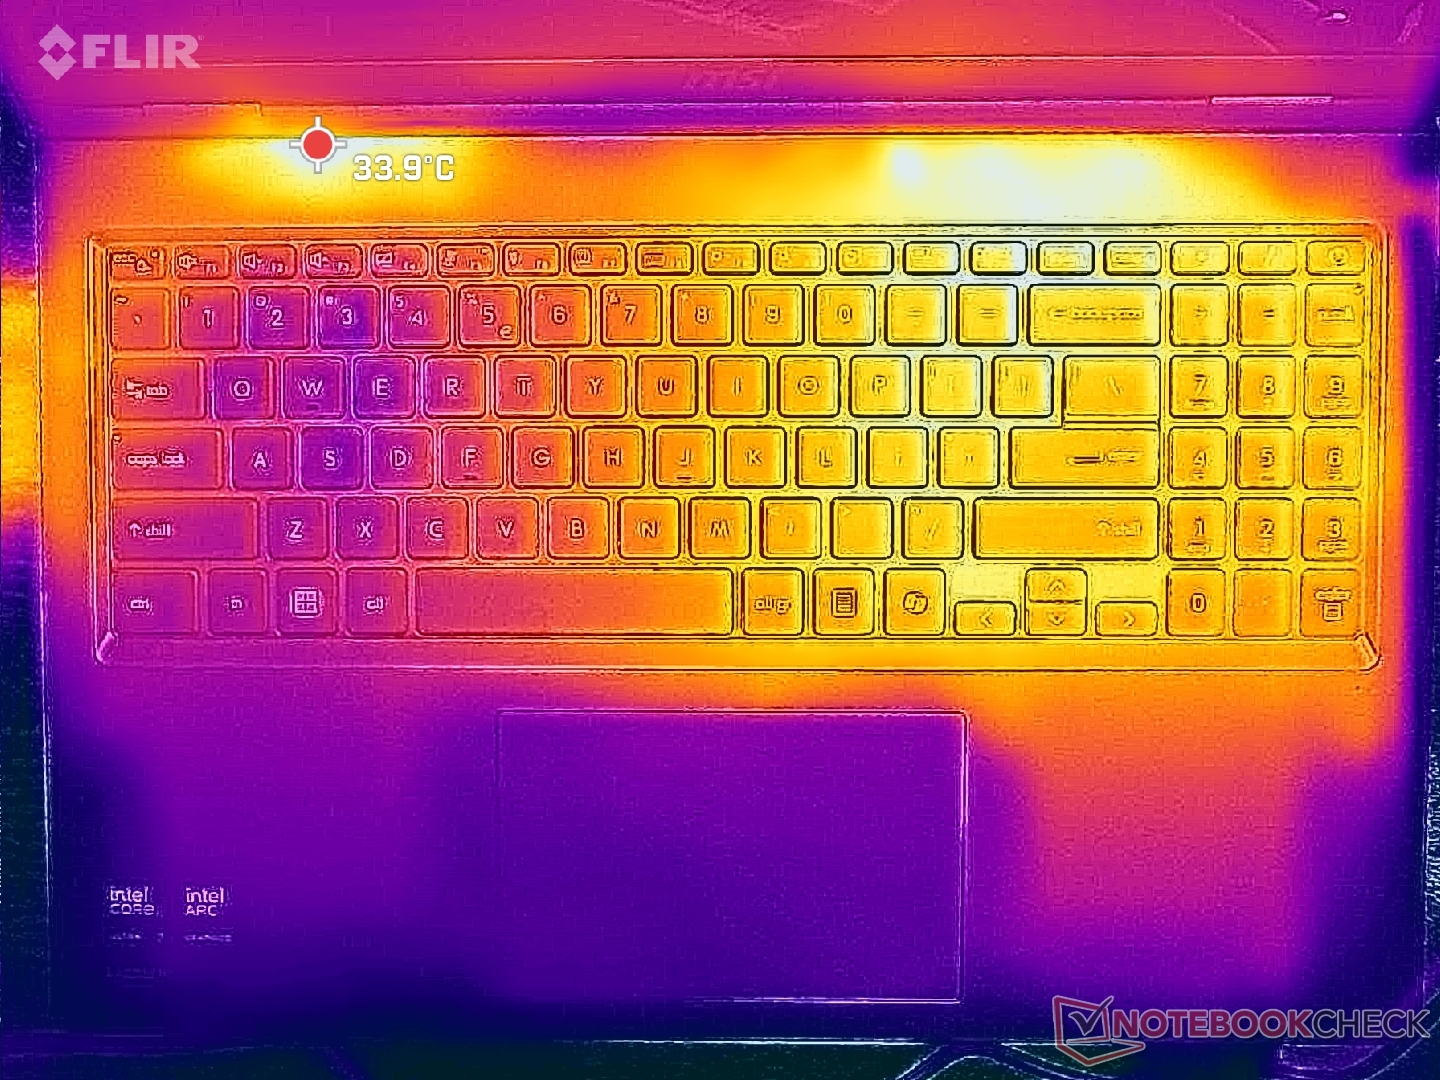
系统右半部分的地表温度比左半部分高。即便如此,由于剖面相对较厚,热点温度仅为 35 C 至 37 C。
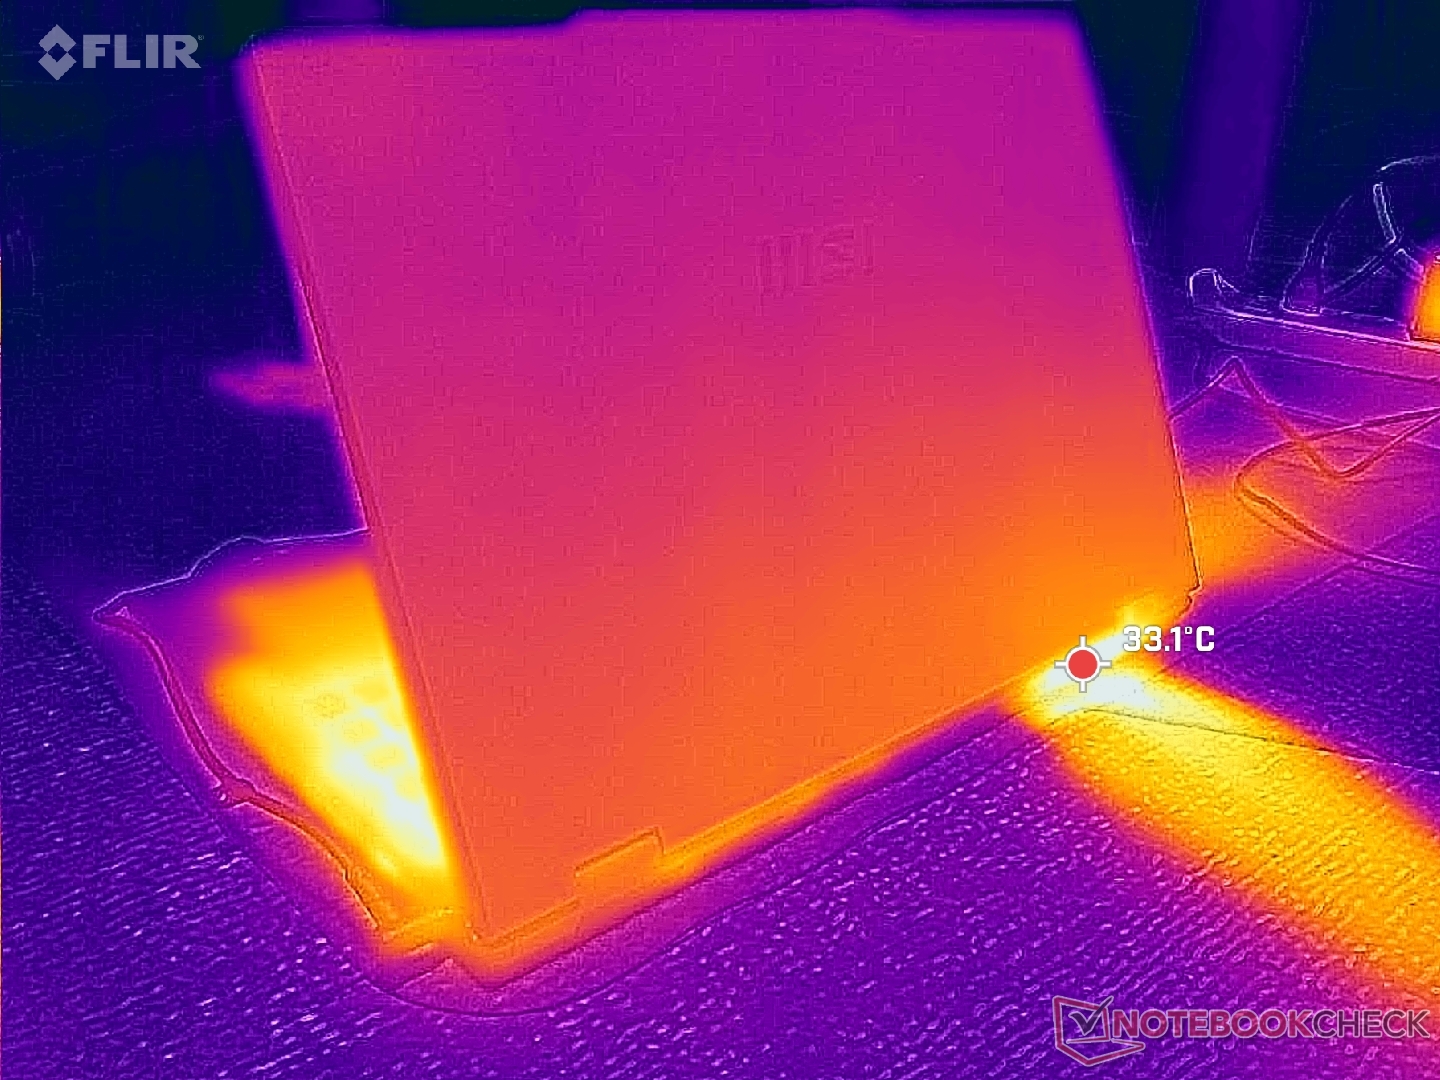
(+) The maximum temperature on the upper side is 35 °C / 95 F, compared to the average of 34.3 °C / 94 F, ranging from 21.2 to 62.5 °C for the class Office.
(+) The bottom heats up to a maximum of 37.4 °C / 99 F, compared to the average of 36.8 °C / 98 F
(+) In idle usage, the average temperature for the upper side is 26.8 °C / 80 F, compared to the device average of 29.5 °C / 85 F.
(+) The palmrests and touchpad are cooler than skin temperature with a maximum of 30.6 °C / 87.1 F and are therefore cool to the touch.
(-) The average temperature of the palmrest area of similar devices was 27.5 °C / 81.5 F (-3.1 °C / -5.6 F).
| MSI Venture 16 AI A2HMTG Ultra 7 255H, Arc 140T | MSI Prestige 16 B1MG-001US Ultra 7 155H, Arc 8-Core | Dell 16 Plus 2-in-1 Core Ultra 7 258V, Arc 140V | Asus V16 V3607V Core 7 240H, GeForce RTX 3050 6GB Laptop GPU | HP Pavilion 16-ag0057ng R5 8540U, Radeon 740M | Lenovo IdeaPad Slim 5 16AKP10 Ryzen AI 5 330, Radeon 820M | |
|---|---|---|---|---|---|---|
| Heat | -5% | -10% | 2% | -2% | 8% | |
| Maximum Upper Side * (°C) | 35 | 48.8 -39% | 44 -26% | 41.2 -18% | 42 -20% | 35 -0% |
| Maximum Bottom * (°C) | 37.4 | 47.6 -27% | 39.4 -5% | 34.4 8% | 44 -18% | 37 1% |
| Idle Upper Side * (°C) | 30.2 | 24.2 20% | 31.8 -5% | 28.8 5% | 26 14% | 26 14% |
| Idle Bottom * (°C) | 33 | 23.6 28% | 34.2 -4% | 29 12% | 28 15% | 27 18% |
* ... smaller is better
压力测试
当启动 Prime95 压力时,CPU 将稳定在 2.7 GHz、71 C 和 44 W。与配备类似酷睿 H 系列 CPU 的 Prestige 16 的 80 摄氏度相比,即使在压力下,核心温度也保持在 70 摄氏度左右。
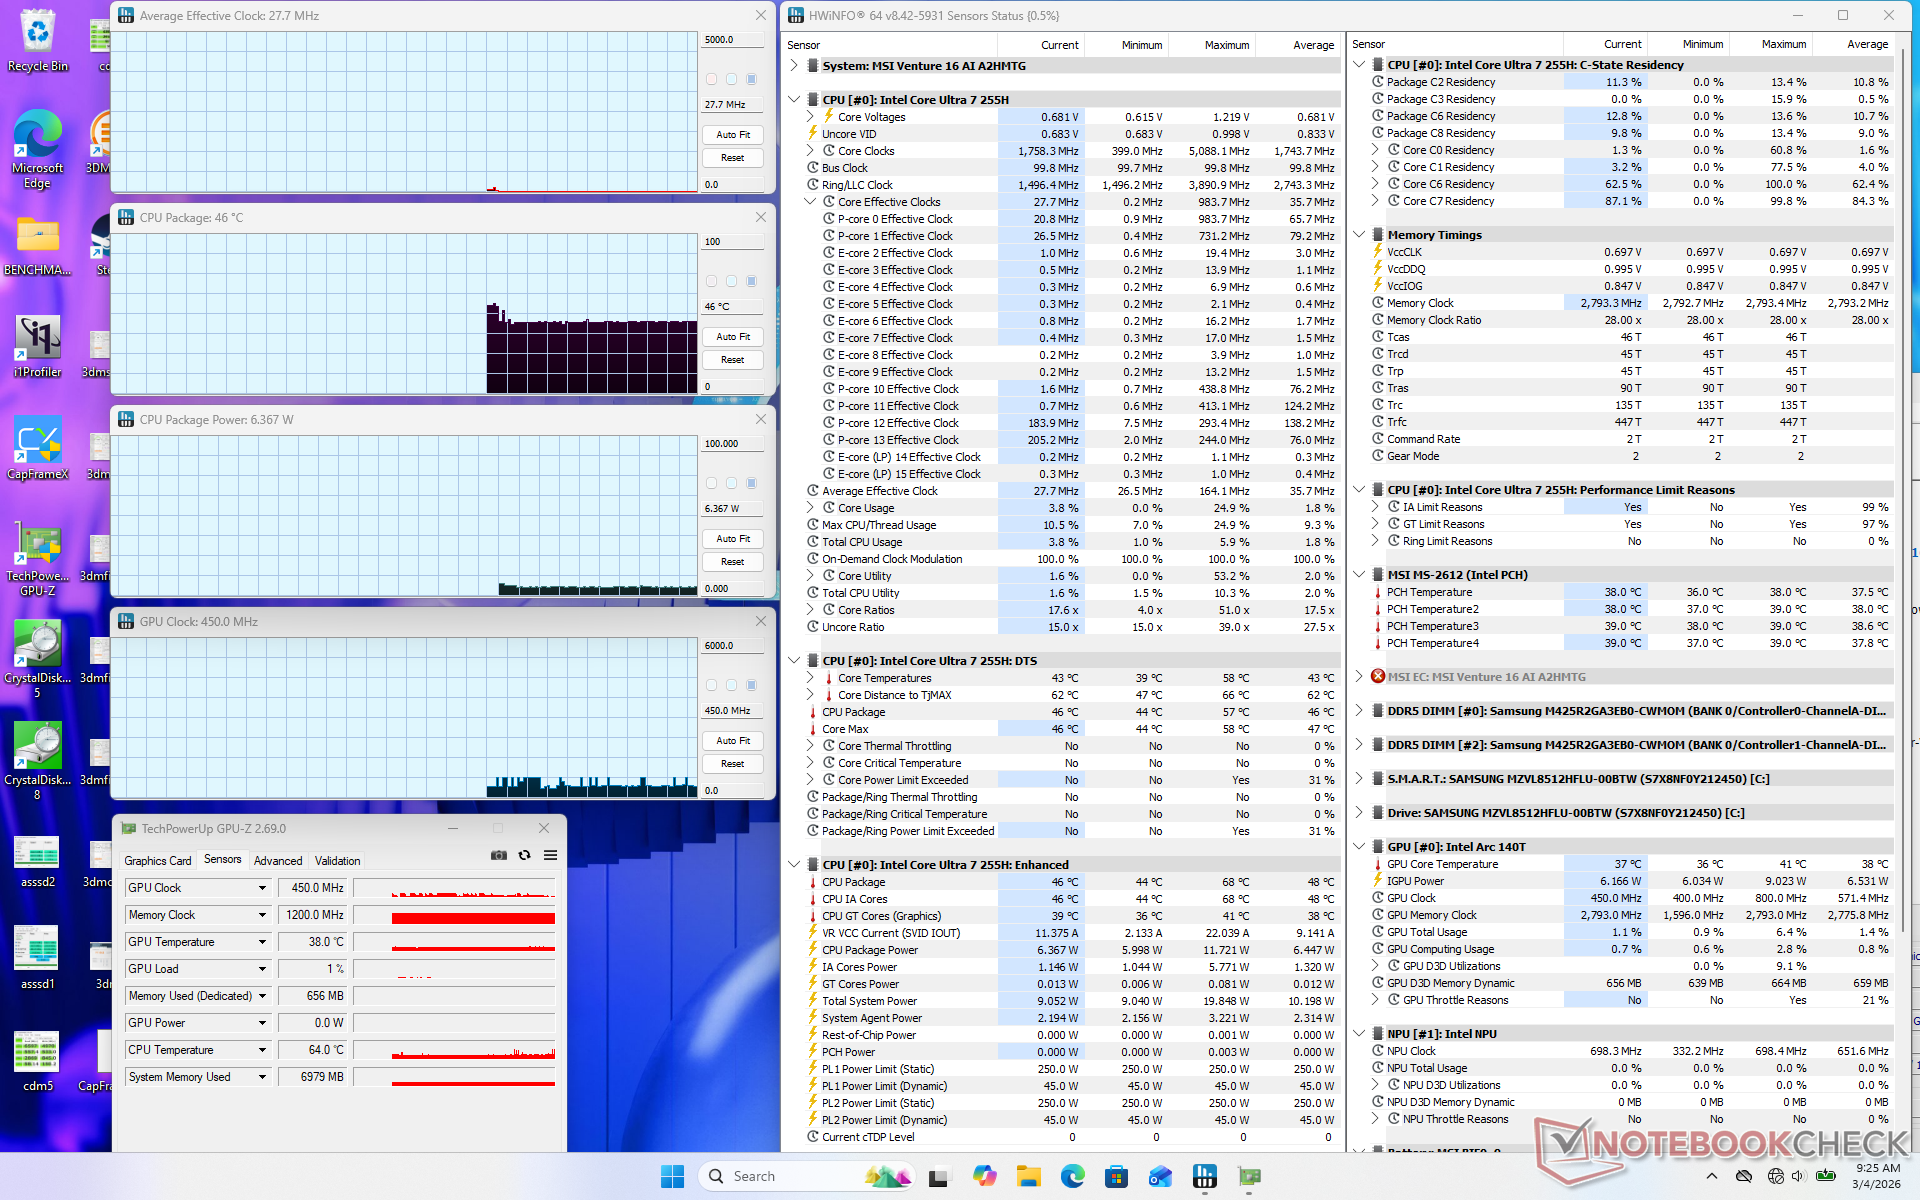
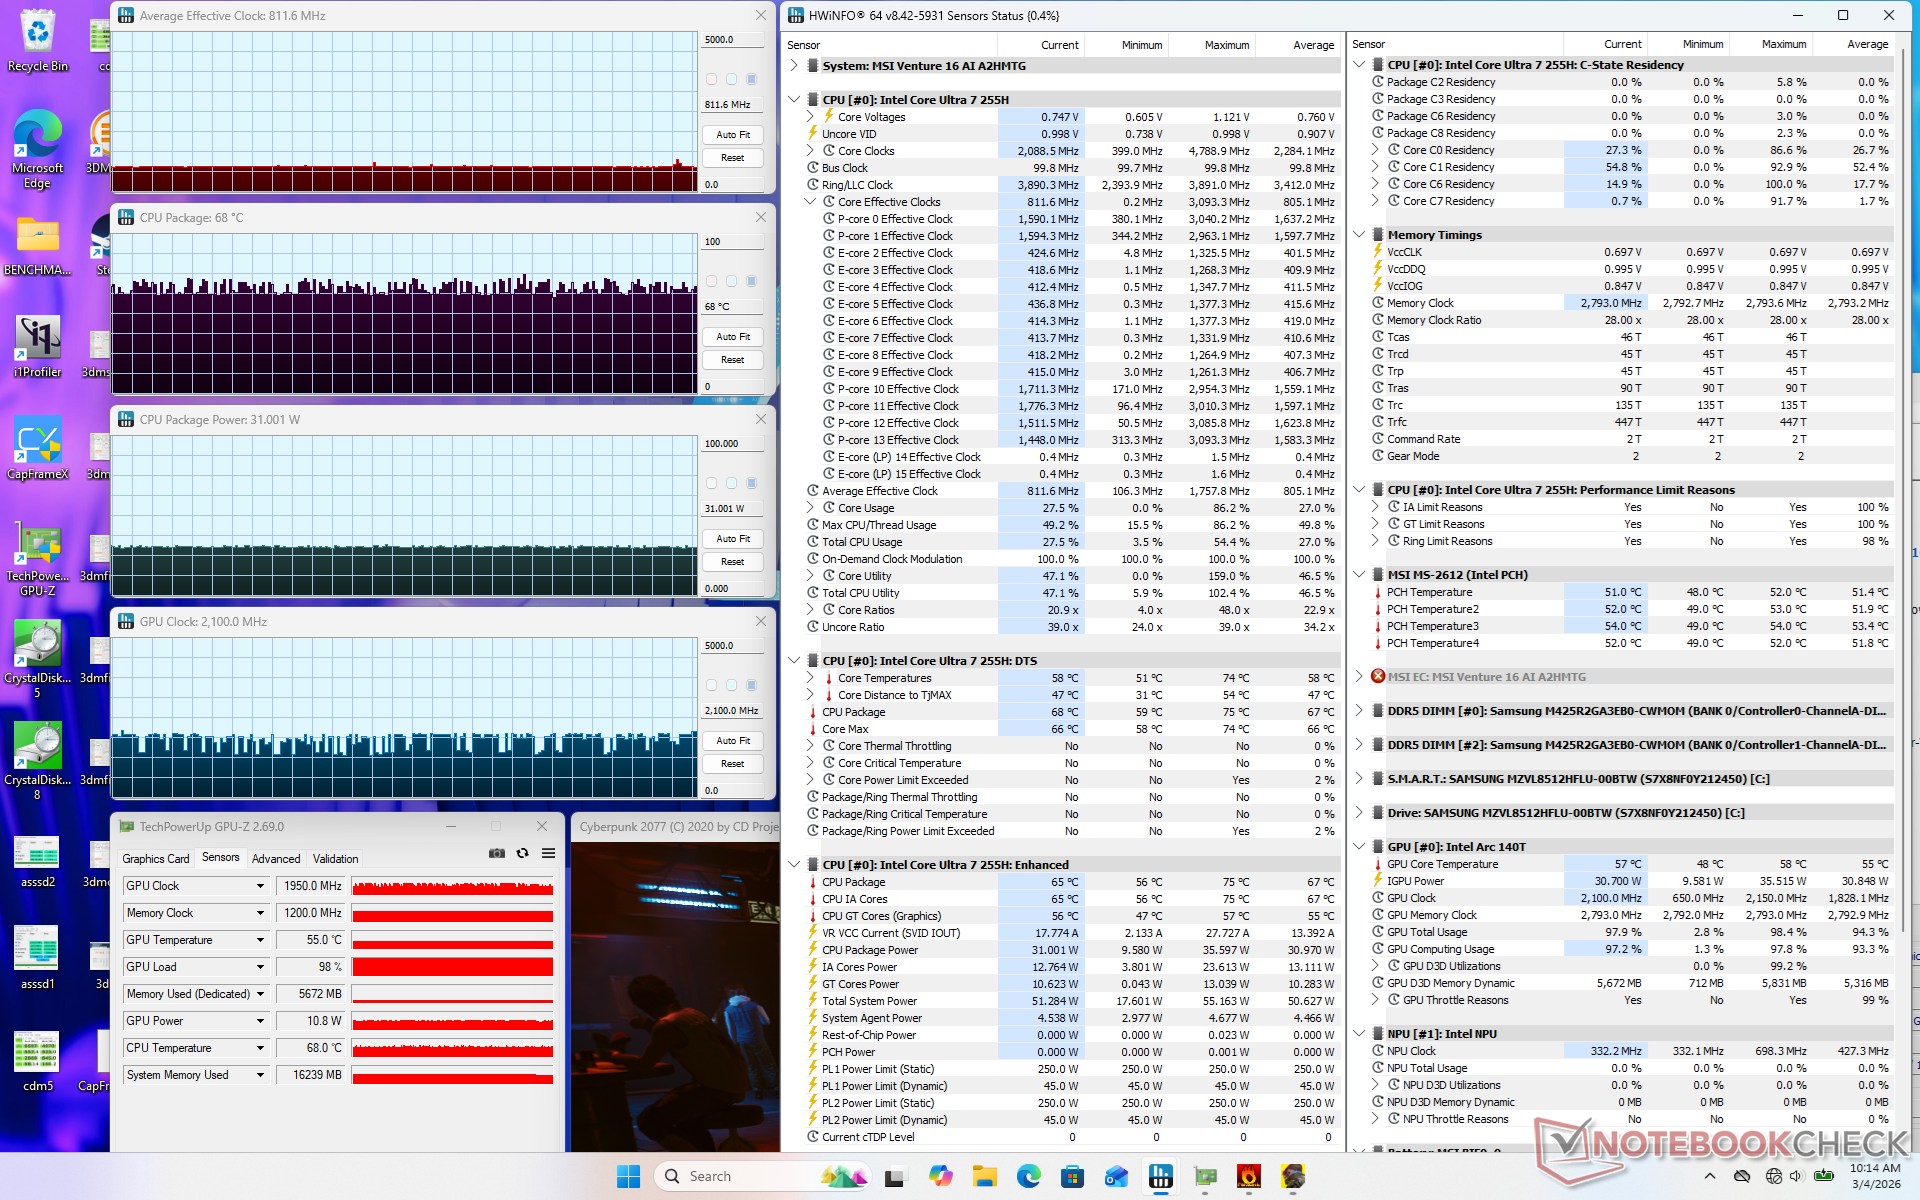
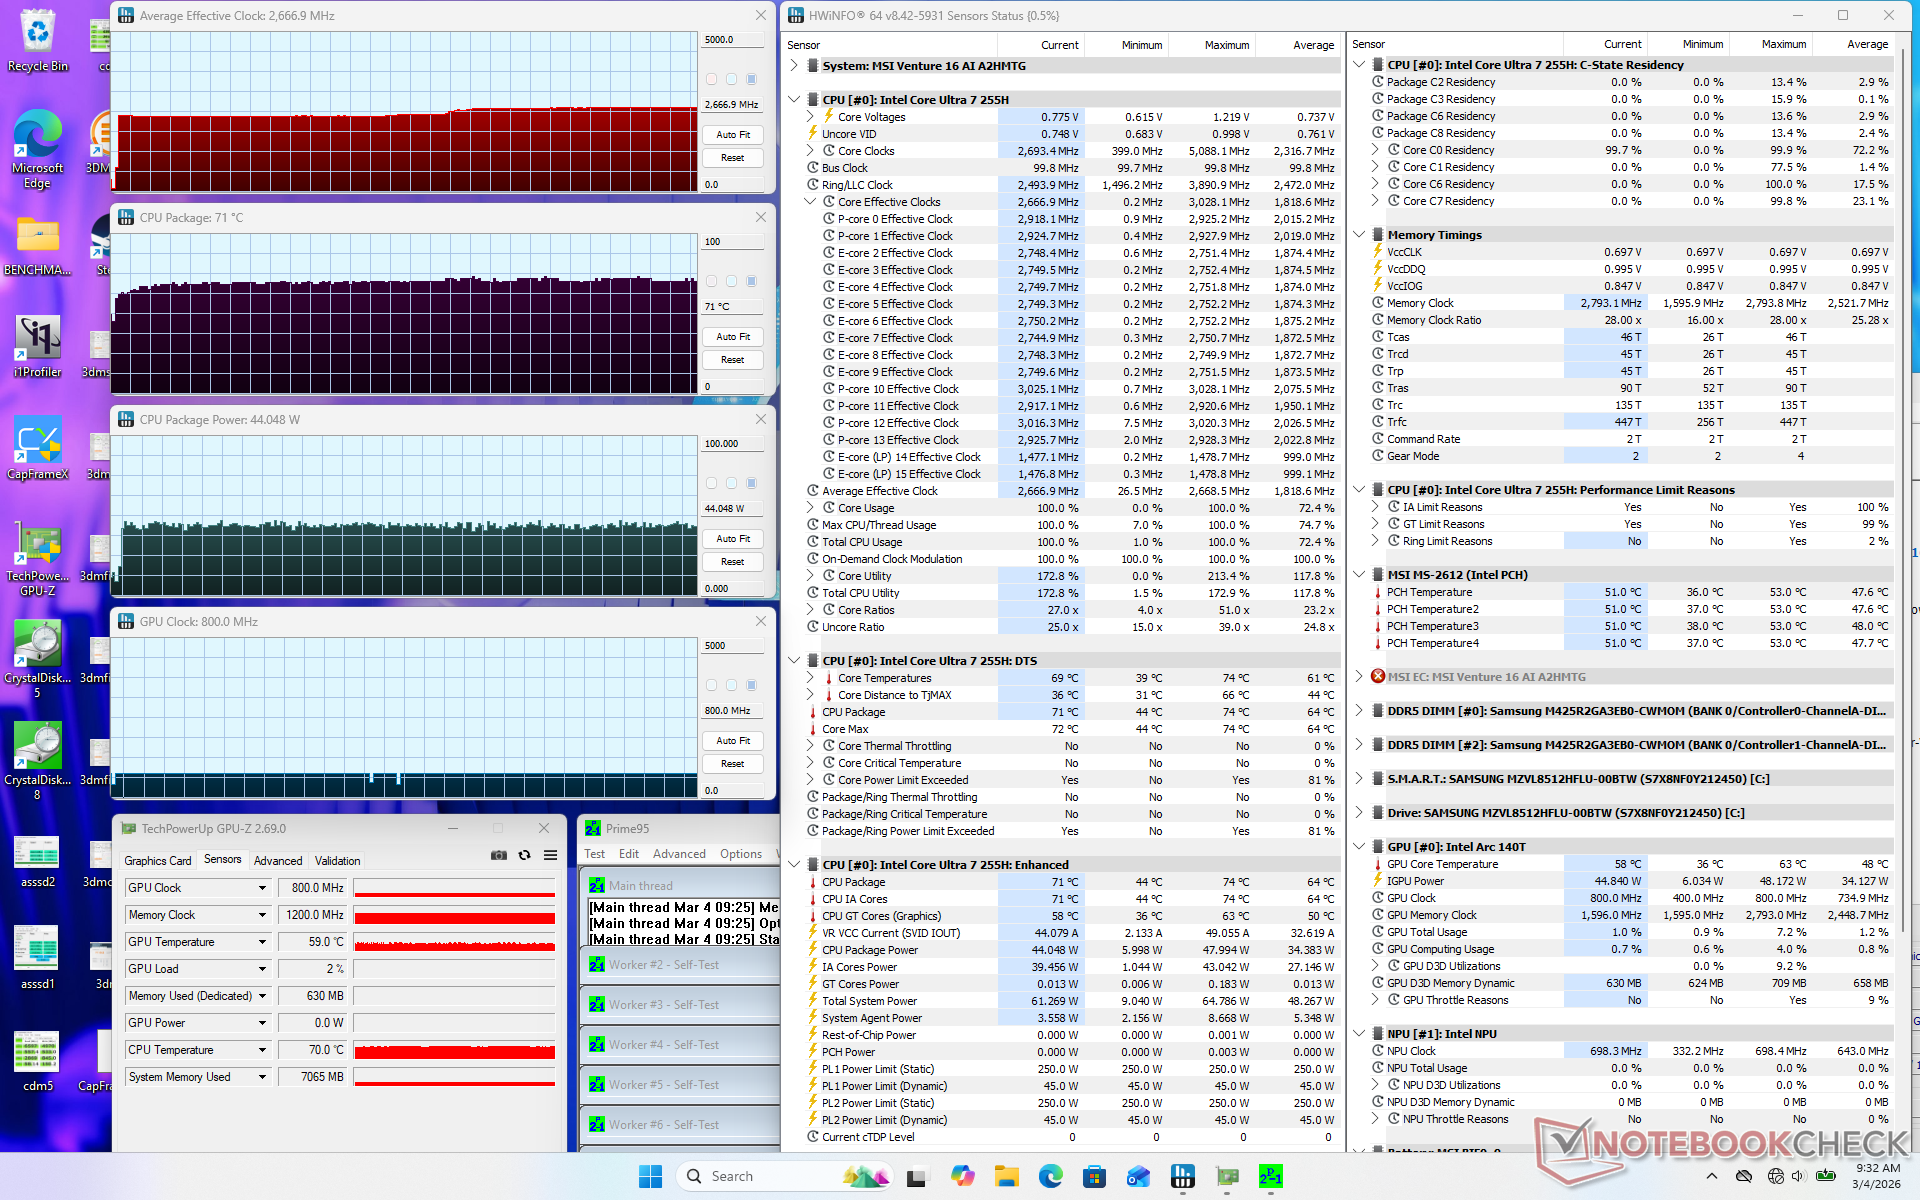
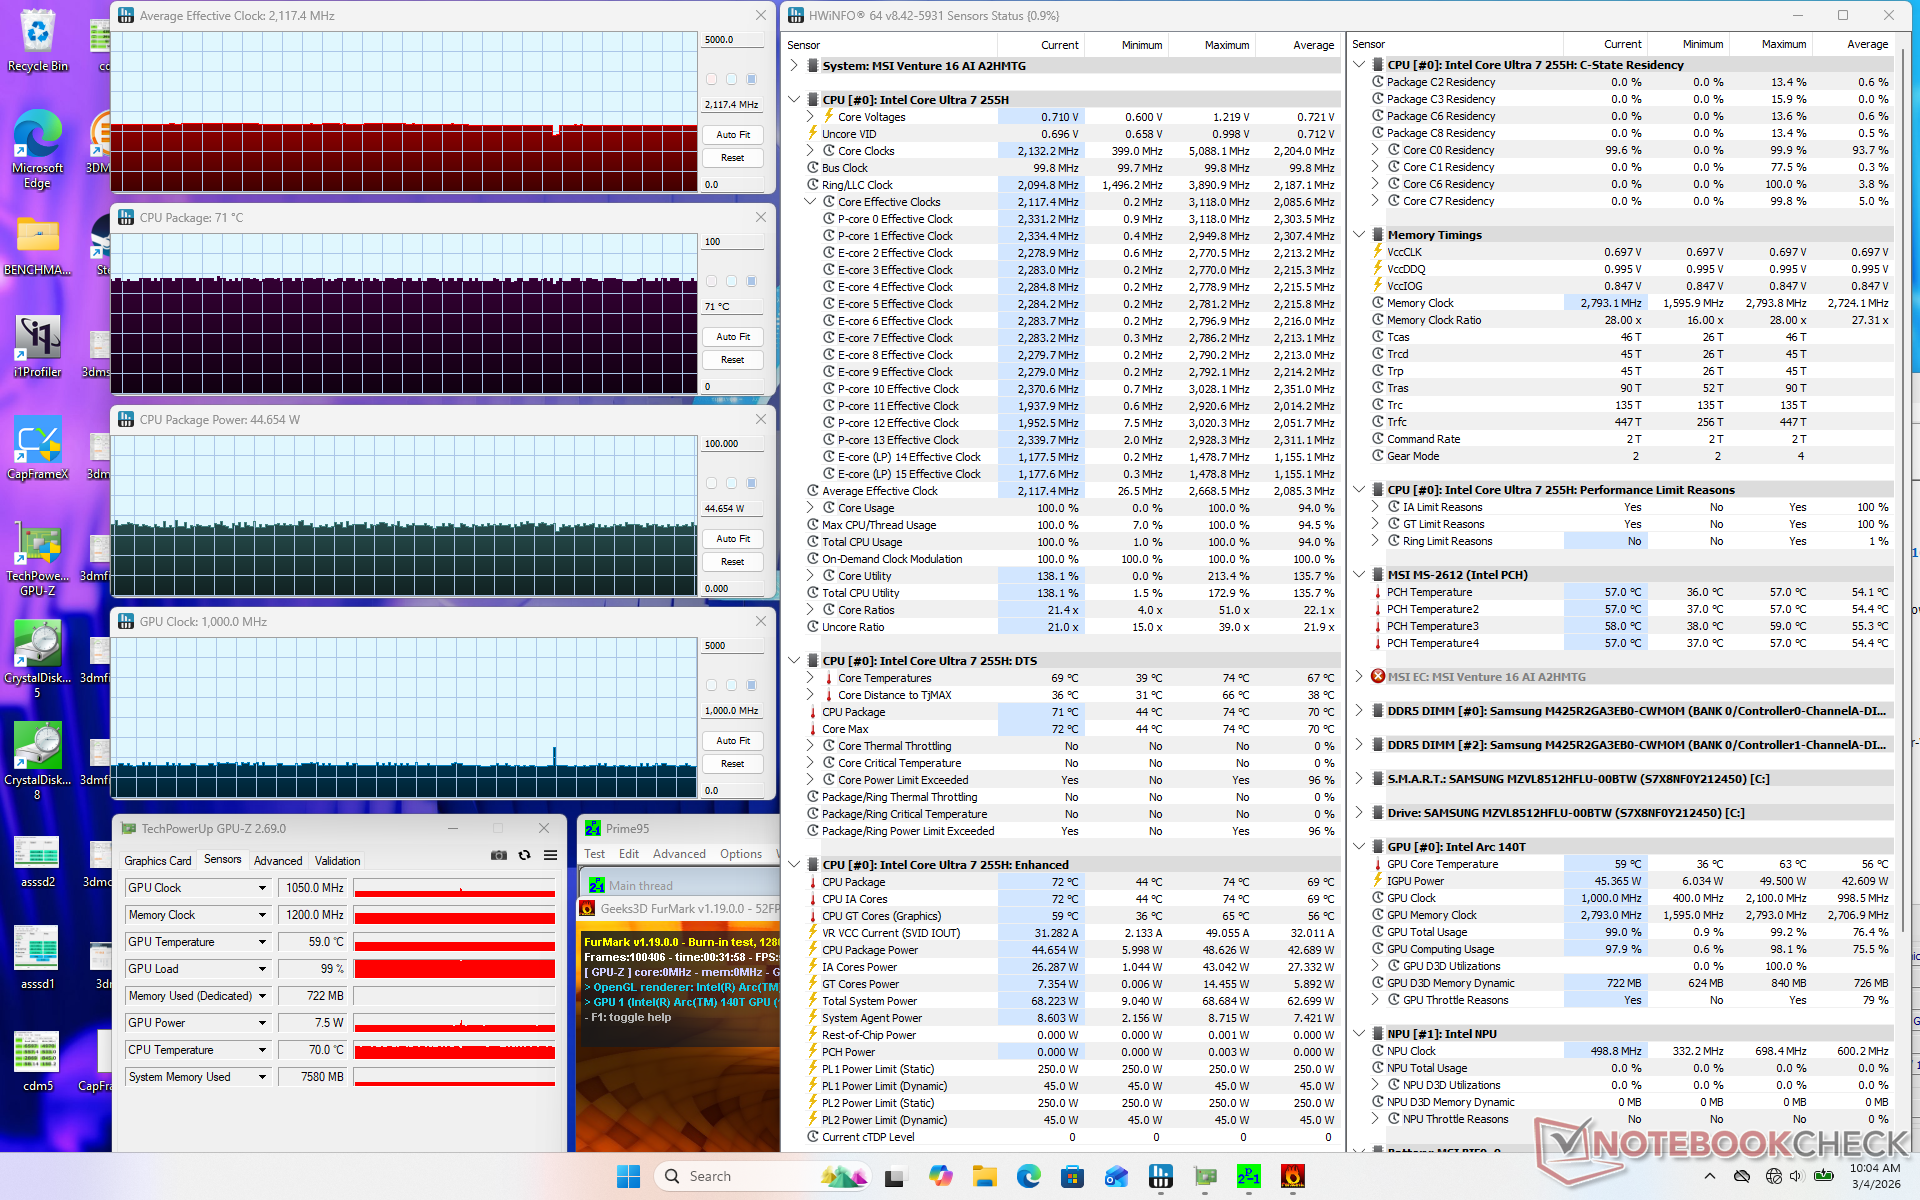
| CPU 平均时钟 (GHz) | GPU 时钟 (MHz) | CPU 平均温度 (°C) | |
| 系统闲置 | -- | -- | 46 |
| Prime95 压力 | 2.7 | -- | 71 |
| Prime95 + FurMark Stress | 2.1 | 1000 | 71 |
| 赛博朋克 2077》压力 | 0.8 | 1400 - 2100 | 68 |
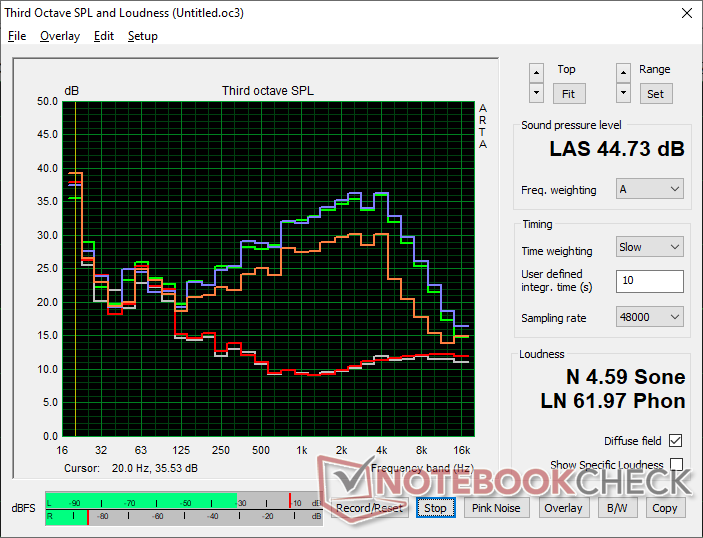
发言人
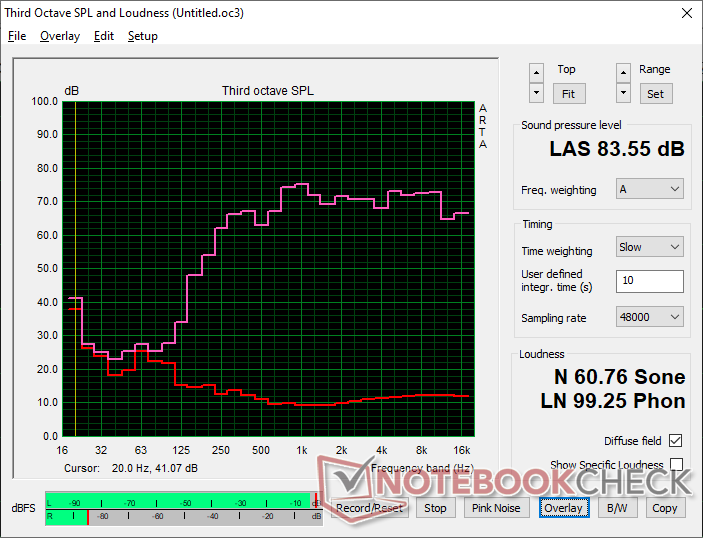
MSI Venture 16 AI A2HMTG audio analysis
(+) | speakers can play relatively loud (83.6 dB)
Bass 100 - 315 Hz
(-) | nearly no bass - on average 19.3% lower than median
(±) | linearity of bass is average (12.2% delta to prev. frequency)
Mids 400 - 2000 Hz
(+) | balanced mids - only 3.6% away from median
(+) | mids are linear (5.8% delta to prev. frequency)
Highs 2 - 16 kHz
(+) | balanced highs - only 3.5% away from median
(+) | highs are linear (2.8% delta to prev. frequency)
Overall 100 - 16.000 Hz
(+) | overall sound is linear (14% difference to median)
Compared to same class
» 9% of all tested devices in this class were better, 4% similar, 87% worse
» The best had a delta of 7%, average was 21%, worst was 53%
Compared to all devices tested
» 16% of all tested devices were better, 4% similar, 80% worse
» The best had a delta of 4%, average was 23%, worst was 134%
Apple MacBook Pro 16 2021 M1 Pro audio analysis
(+) | speakers can play relatively loud (84.7 dB)
Bass 100 - 315 Hz
(+) | good bass - only 3.8% away from median
(+) | bass is linear (5.2% delta to prev. frequency)
Mids 400 - 2000 Hz
(+) | balanced mids - only 1.3% away from median
(+) | mids are linear (2.1% delta to prev. frequency)
Highs 2 - 16 kHz
(+) | balanced highs - only 1.9% away from median
(+) | highs are linear (2.7% delta to prev. frequency)
Overall 100 - 16.000 Hz
(+) | overall sound is linear (4.6% difference to median)
Compared to same class
» 0% of all tested devices in this class were better, 0% similar, 100% worse
» The best had a delta of 5%, average was 17%, worst was 45%
Compared to all devices tested
» 0% of all tested devices were better, 0% similar, 100% worse
» The best had a delta of 4%, average was 23%, worst was 134%
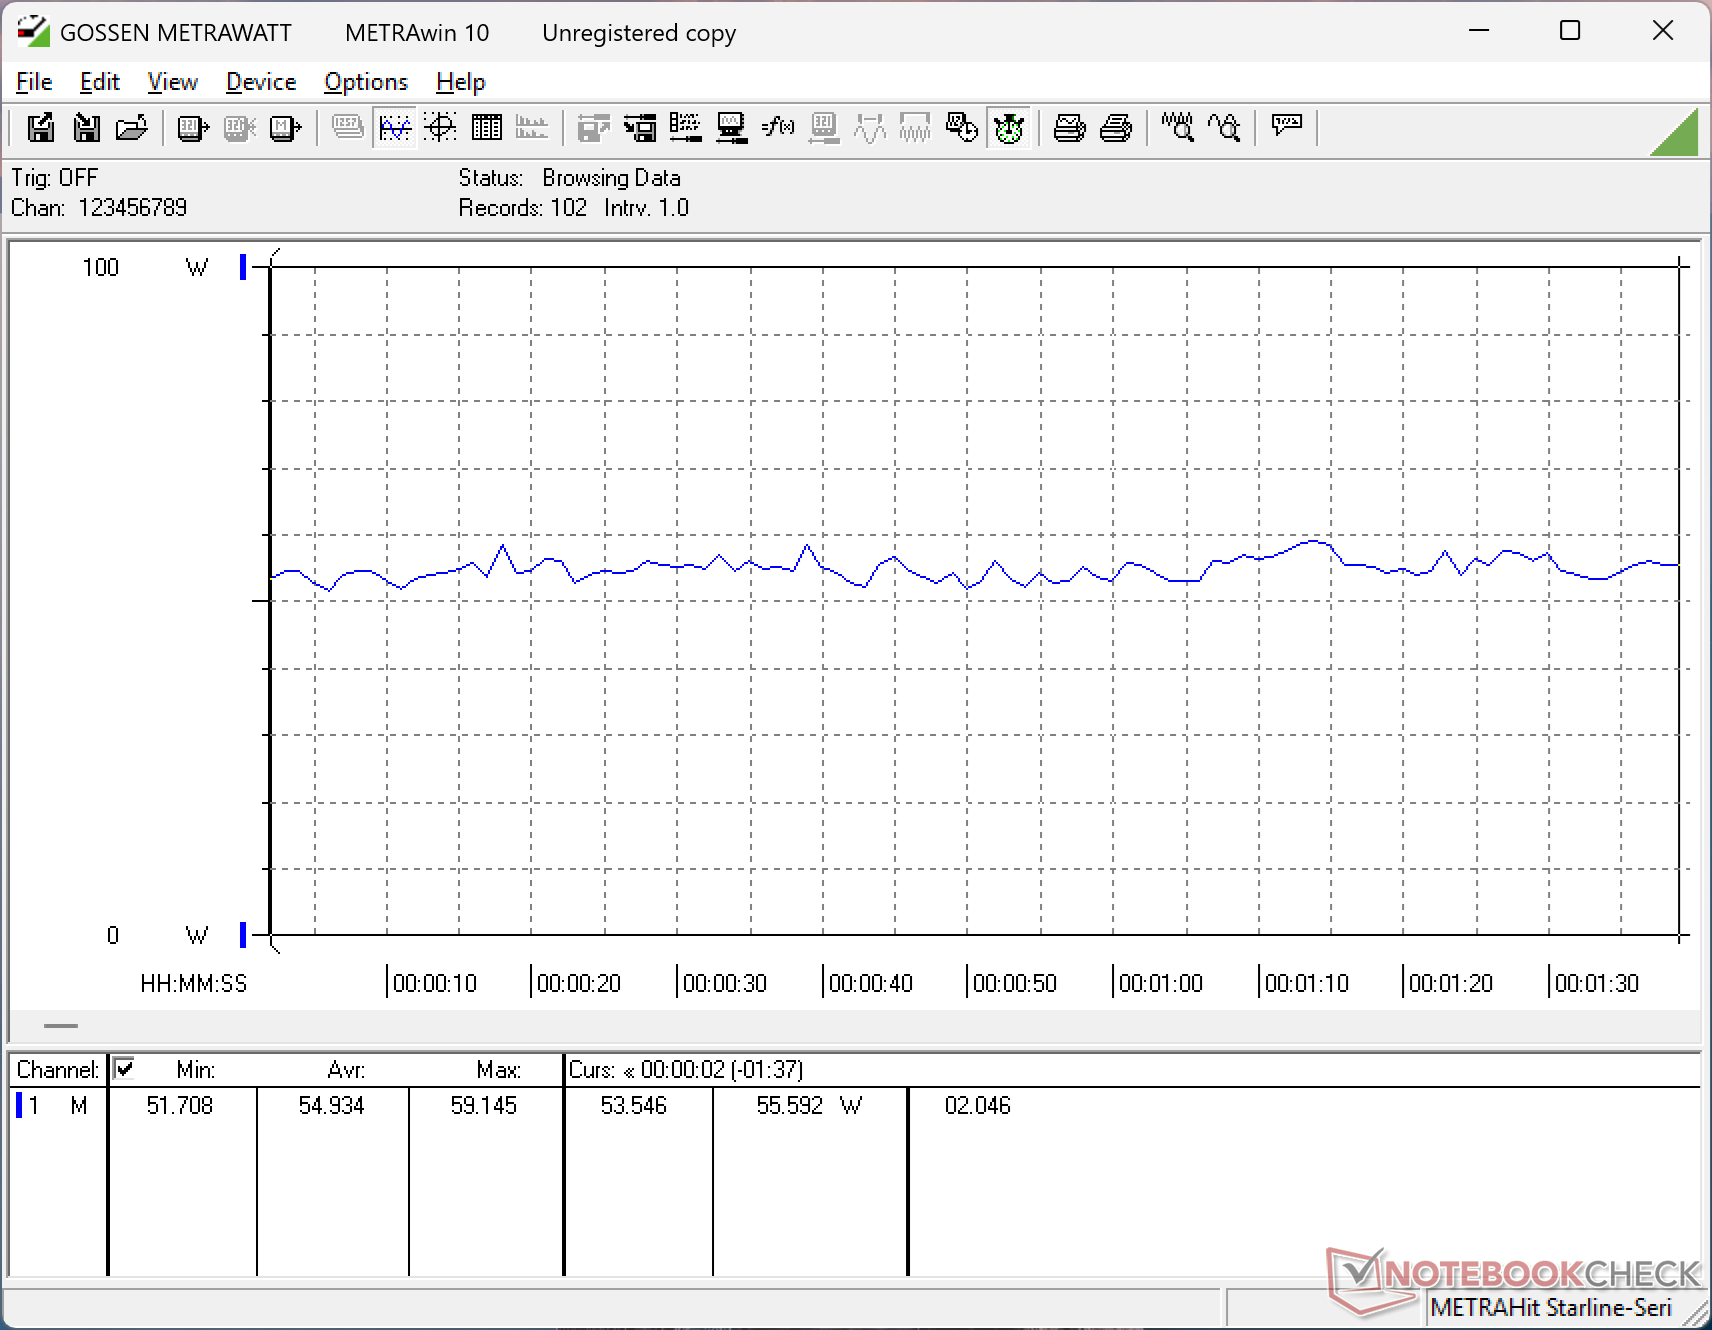
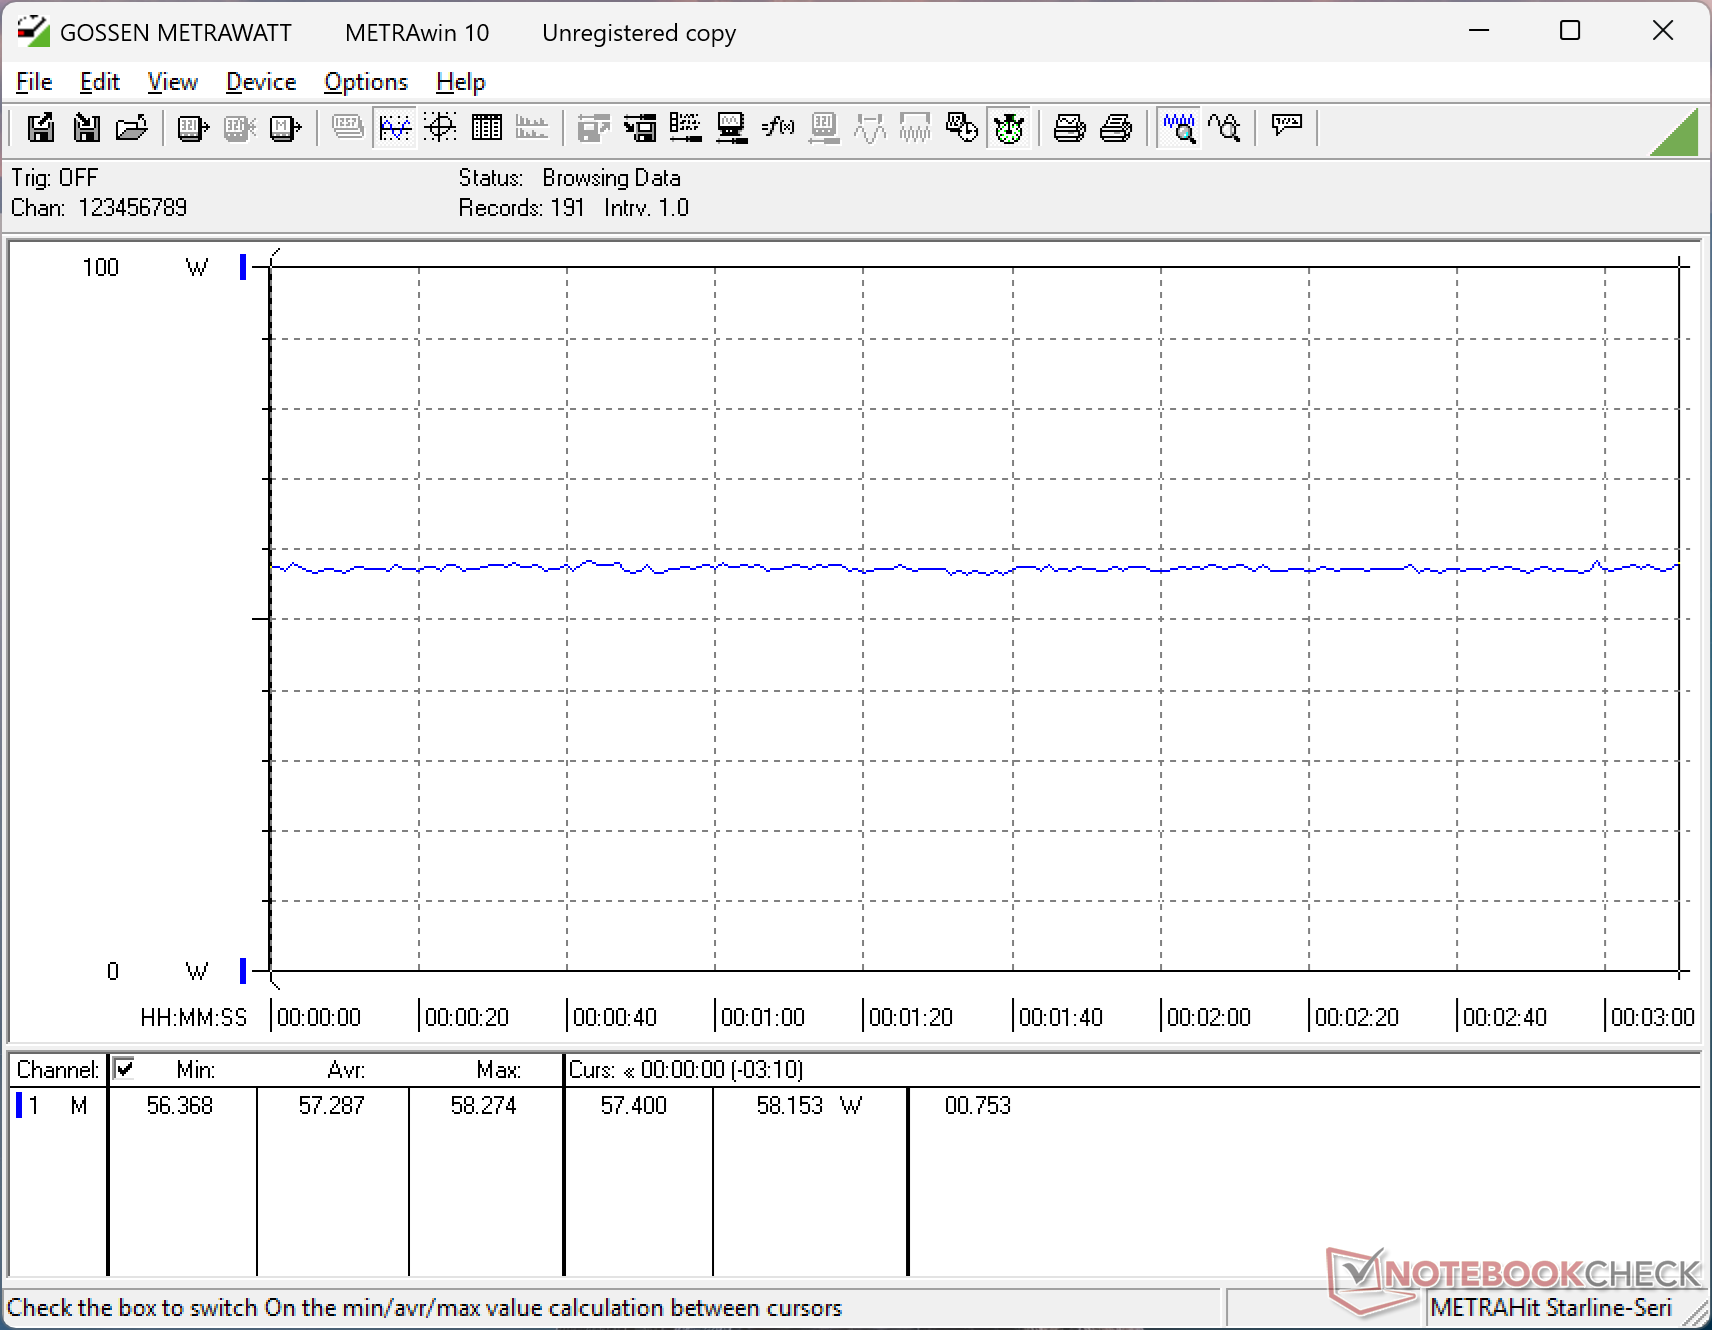
能源管理
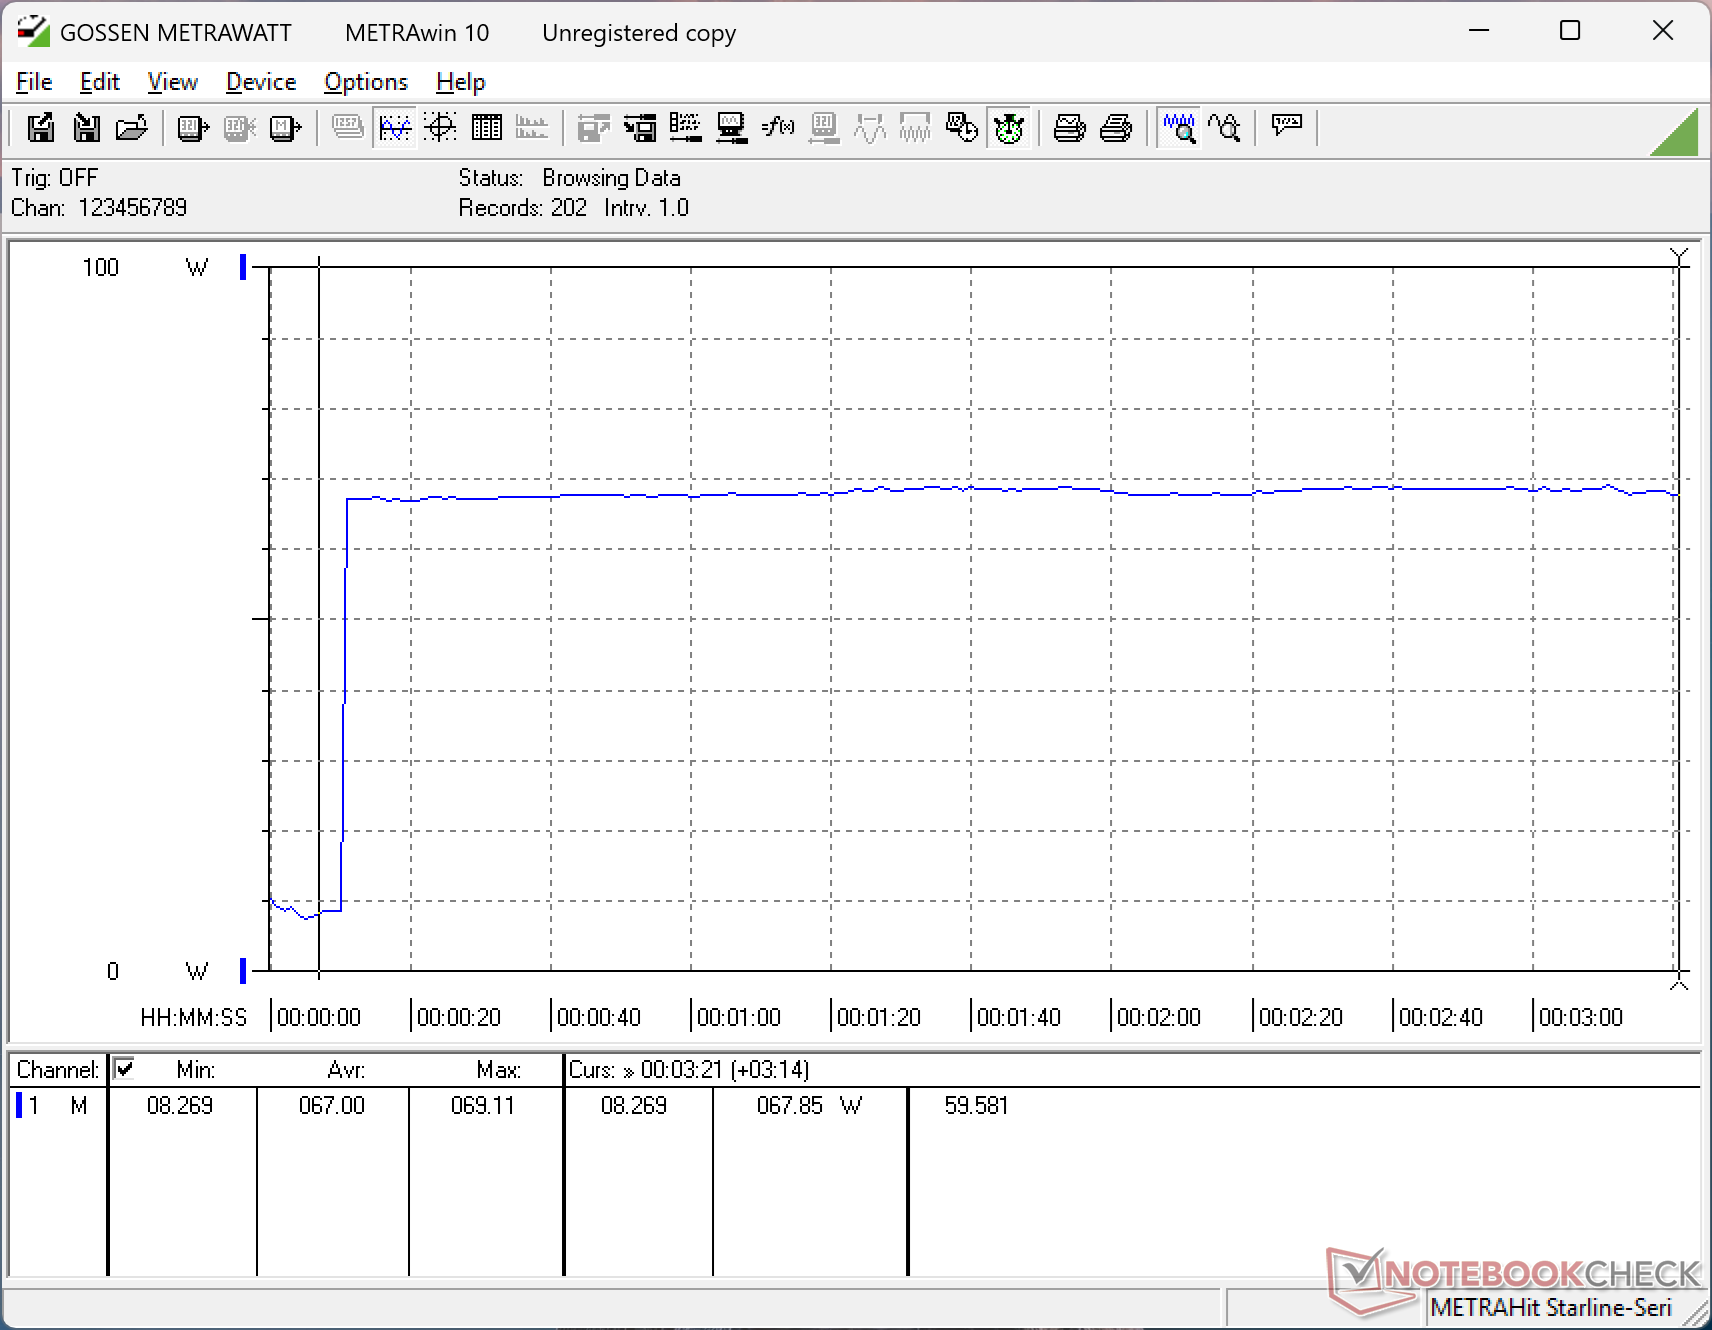
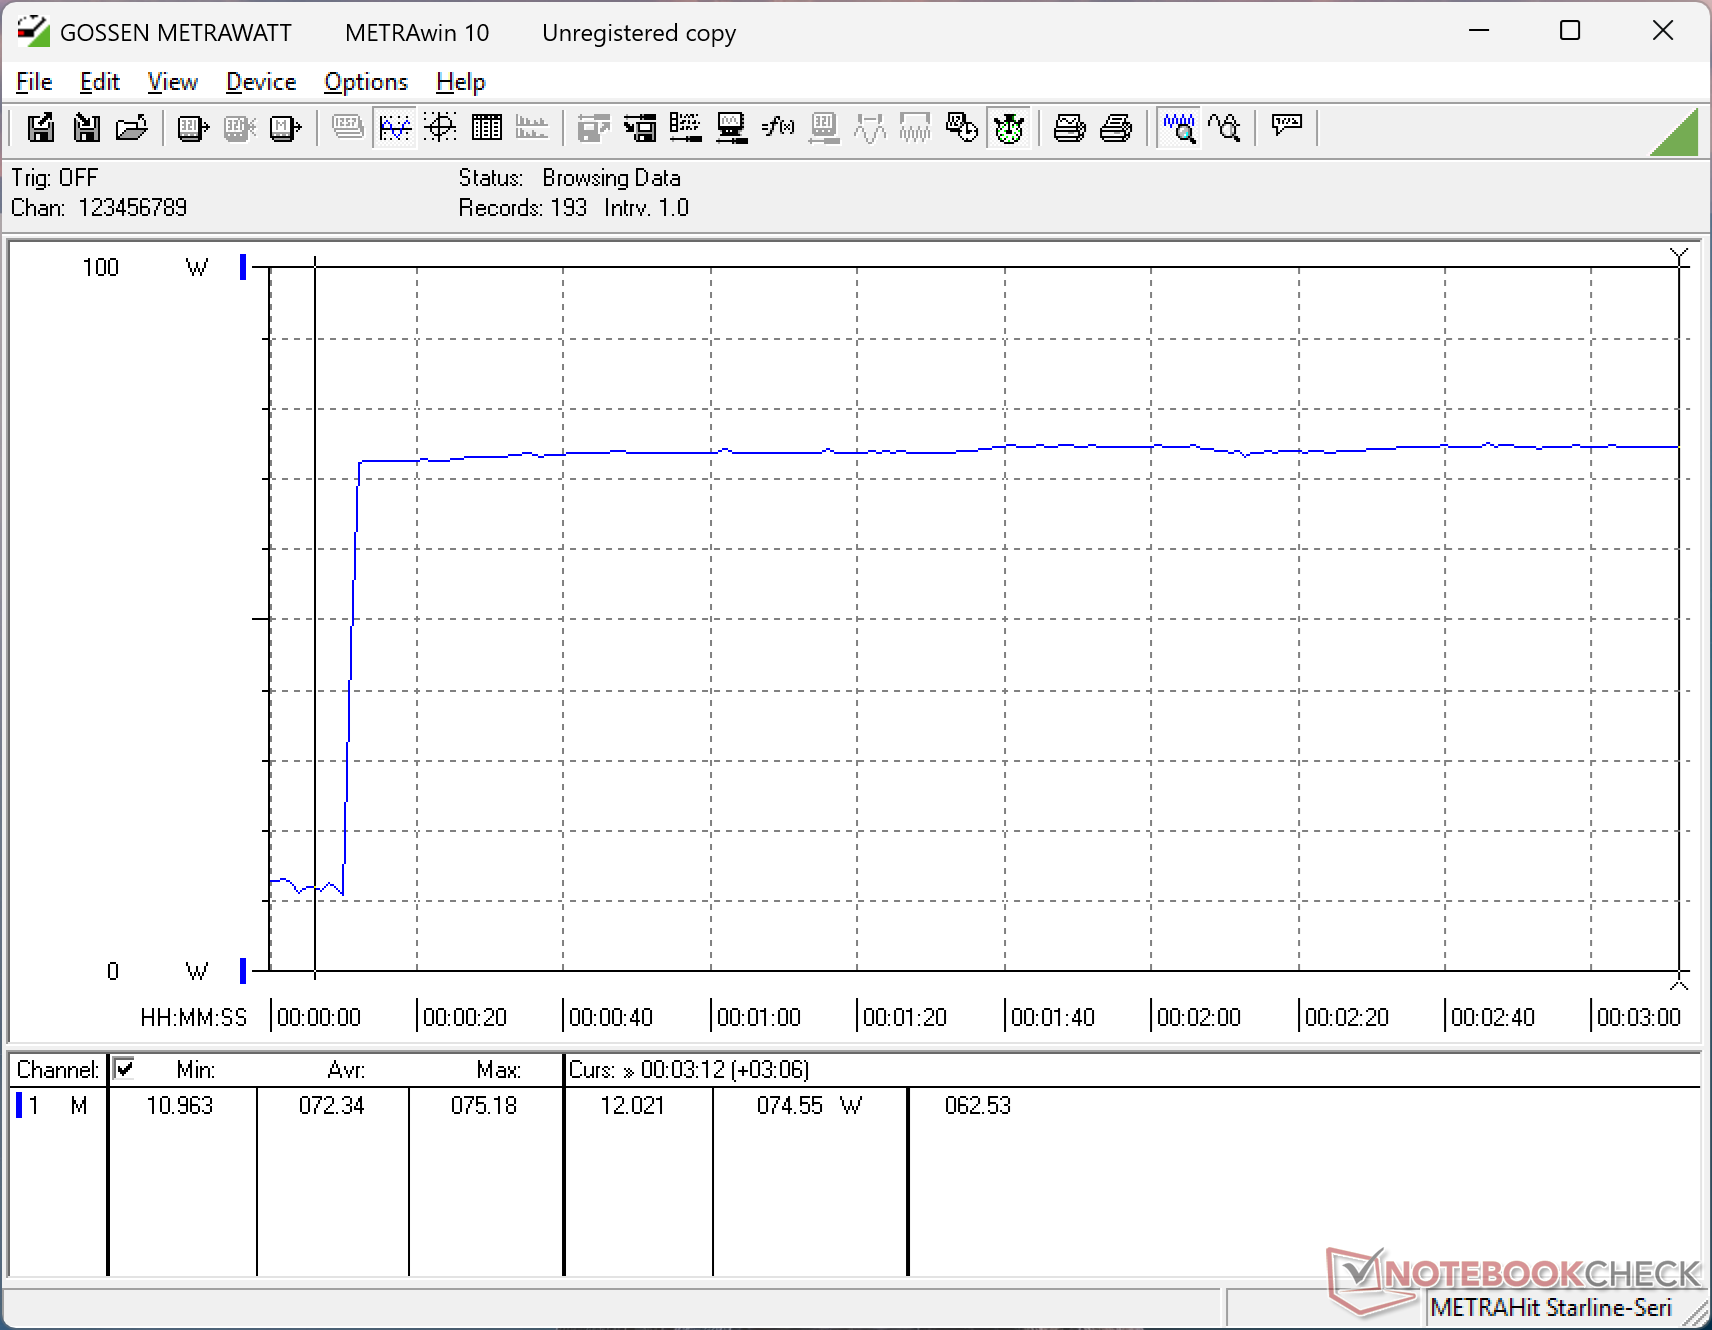
耗电量
总体功耗普遍高于许多其他经济型 16 英寸笔记本电脑,这主要是由于采用了速度更快的酷睿-H 系列 CPU。例如,运行 Prime95 需要近 70 W 的功耗,而采用 Lunar Lake-V 处理器的戴尔 16 Plus 仅需 40 W。 戴尔 16 Plus.
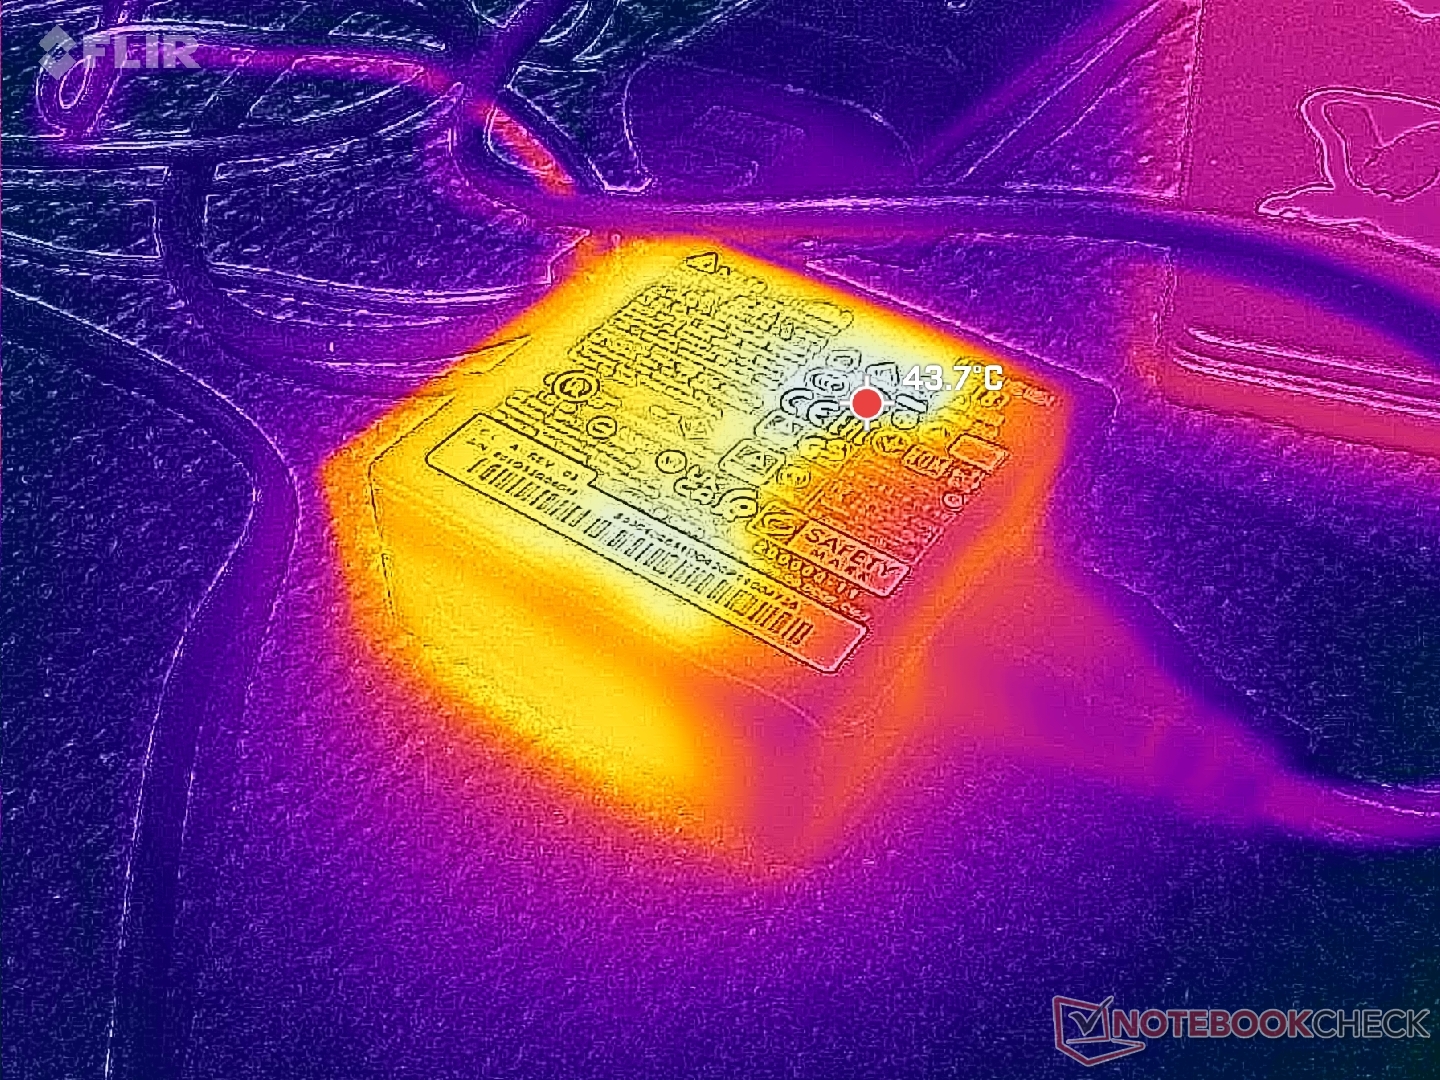
90 W AC 适配器非常小巧,仅约 7.5 x 7.5 x 2.8 厘米。不过,令人失望的是,该机型使用的是桶装交流充电器,而不是通用 USB-C。
| Off / Standby | |
| Idle | |
| Load |
|
Key:
min: | |
| MSI Venture 16 AI A2HMTG Ultra 7 255H, Arc 140T, , IPS, 1920x1200, 16" | MSI Prestige 16 B1MG-001US Ultra 7 155H, Arc 8-Core, Samsung PM9A1 MZVL22T0HBLB, IPS, 2560x1600, 16" | Dell 16 Plus 2-in-1 Core Ultra 7 258V, Arc 140V, Samsung BM9C1 1024GB, Mini-LED, 2560x1600, 16" | Asus V16 V3607V Core 7 240H, GeForce RTX 3050 6GB Laptop GPU, Samsung PM9C1 MZVL8512HELU, IPS, 1920x1200, 16" | HP Pavilion 16-ag0057ng R5 8540U, Radeon 740M, SK hynix BC901 HFS001TEJ4X164N, IPS, 1920x1200, 16" | Lenovo IdeaPad Slim 5 16AKP10 Ryzen AI 5 330, Radeon 820M, Western Digital PC SN5000S SDEPMSJ-512G, IPS, 1920x1200, 16" | |
|---|---|---|---|---|---|---|
| Power Consumption | -10% | -4% | -32% | 33% | 22% | |
| Idle Minimum * (Watt) | 5.9 | 3 49% | 7 -19% | 2.1 64% | 4 32% | 5.2 12% |
| Idle Average * (Watt) | 9 | 9.5 -6% | 13.2 -47% | 7.2 20% | 5 44% | 6 33% |
| Idle Maximum * (Watt) | 9.7 | 12 -24% | 13.4 -38% | 10.7 -10% | 6 38% | 7.7 21% |
| Load Average * (Watt) | 54.9 | 68.3 -24% | 43.9 20% | 99.4 -81% | 40 27% | 44 20% |
| Cyberpunk 2077 ultra * (Watt) | 57.3 | 44.9 22% | 92.1 -61% | 43 25% | 43 25% | |
| Cyberpunk 2077 ultra external monitor * (Watt) | 54.2 | 40.7 25% | 88.7 -64% | 39.1 28% | 40.4 25% | |
| Load Maximum * (Watt) | 72.3 | 104.8 -45% | 67.8 6% | 137.8 -91% | 46 36% | 58 20% |
| Witcher 3 ultra * (Watt) | 59.8 |
* ... smaller is better
功耗 赛博朋克/压力测试
外部显示器功耗
电池寿命
相对较小的 55 Wh 电池容量可提供约 7 小时的无线局域网运行时间。
| MSI Venture 16 AI A2HMTG Ultra 7 255H, Arc 140T, 55.2 Wh | MSI Prestige 16 B1MG-001US Ultra 7 155H, Arc 8-Core, 99.9 Wh | Dell 16 Plus 2-in-1 Core Ultra 7 258V, Arc 140V, 64 Wh | Asus V16 V3607V Core 7 240H, GeForce RTX 3050 6GB Laptop GPU, 63 Wh | HP Pavilion 16-ag0057ng R5 8540U, Radeon 740M, 59 Wh | Lenovo IdeaPad Slim 5 16AKP10 Ryzen AI 5 330, Radeon 820M, 60 Wh | |
|---|---|---|---|---|---|---|
| Battery runtime | 161% | 27% | 29% | 63% | 50% | |
| WiFi v1.3 (h) | 7 | 18.3 161% | 8.9 27% | 9 29% | 11.4 63% | 10.5 50% |
| Reader / Idle (h) | 25.1 | |||||
| Load (h) | 2.8 |
笔记本检查评级
Venture 16 AI 是微星最基本的产品之一,具有良好的可维护性,但功能有限,尤其是在基本配置方面。
MSI Venture 16 AI A2HMTG
- 03/06/2026 v8
Allen Ngo
 Total Sustainability Score:
 潜在竞争对手比较
Image | Model / Review | Price | Weight | Height | Display |
|---|---|---|---|---|---|
1. 80.7%  | MSI Venture 16 AI A2HMTG Intel Core Ultra 7 255H ⎘ Intel Arc Graphics 140T ⎘ 32 GB Memory | Amazon: List Price: 1000 USD | 2.1 kg | 23.15 mm | 16.00" 1920x1200 142 PPI IPS |
2. 88.1% v7 (old)  | MSI Prestige 16 B1MG-001US Intel Core Ultra 7 155H ⎘ Intel Arc 8-Core iGPU ⎘ 32 GB Memory, 2048 GB SSD | Amazon: 1. $43.99 AC Adapter Charger Compatibl... 2. $130.00 16.0 inch WQXGA 2560(RGB)*16... 3. $140.00 Replacement Screen 16.0 inch... List Price: 1300 USD | 1.6 kg | 19.1 mm | 16.00" 2560x1600 189 PPI IPS |
3. 83.5%  | Dell 16 Plus 2-in-1 Intel Core Ultra 7 258V ⎘ Intel Arc Graphics 140V ⎘ 32 GB Memory, 1024 GB SSD | Amazon: $1,149.99 List Price: 1500 USD | 2 kg | 16.99 mm | 16.00" 2560x1600 189 PPI Mini-LED |
4. 78.5%  | Asus V16 V3607V Intel Core 7 240H ⎘ NVIDIA GeForce RTX 3050 6GB Laptop GPU ⎘ 16 GB Memory, 512 GB SSD | Amazon: 1. $49.99 180W 150W 20V 9A Charger for... 2. $125.98 KrystalPix Replacement LCD f... 3. $125.98 KrystalPix Replacement LCD f... List Price: 900 USD | 2 kg | 22 mm | 16.00" 1920x1200 142 PPI IPS |
5. 77.3%  | HP Pavilion 16-ag0057ng AMD Ryzen 5 8540U ⎘ AMD Radeon 740M ⎘ 16 GB Memory, 1024 GB SSD | Amazon: List Price: 730 EUR | 1.7 kg | 18.6 mm | 16.00" 1920x1200 142 PPI IPS |
6. 80.8%  | Lenovo IdeaPad Slim 5 16AKP10 AMD Ryzen AI 5 330 ⎘ AMD Radeon 820M ⎘ 16 GB Memory, 512 GB SSD | Amazon: List Price: 700 EUR | 1.9 kg | 18.4 mm | 16.00" 1920x1200 142 PPI IPS |
Transparency
The selection of devices to be reviewed is made by our editorial team. The test sample was provided to the author as a loan by the manufacturer or retailer for the purpose of this review. The lender had no influence on this review, nor did the manufacturer receive a copy of this review before publication. There was no obligation to publish this review. As an independent media company, Notebookcheck is not subjected to the authority of manufacturers, retailers or publishers.
This is how Notebookcheck is testing
Every year, Notebookcheck independently reviews hundreds of laptops and smartphones using standardized procedures to ensure that all results are comparable. We have continuously developed our test methods for around 20 years and set industry standards in the process. In our test labs, high-quality measuring equipment is utilized by experienced technicians and editors. These tests involve a multi-stage validation process. Our complex rating system is based on hundreds of well-founded measurements and benchmarks, which maintains objectivity. Further information on our test methods can be found here.

