结论 - 比以前更瘦更轻
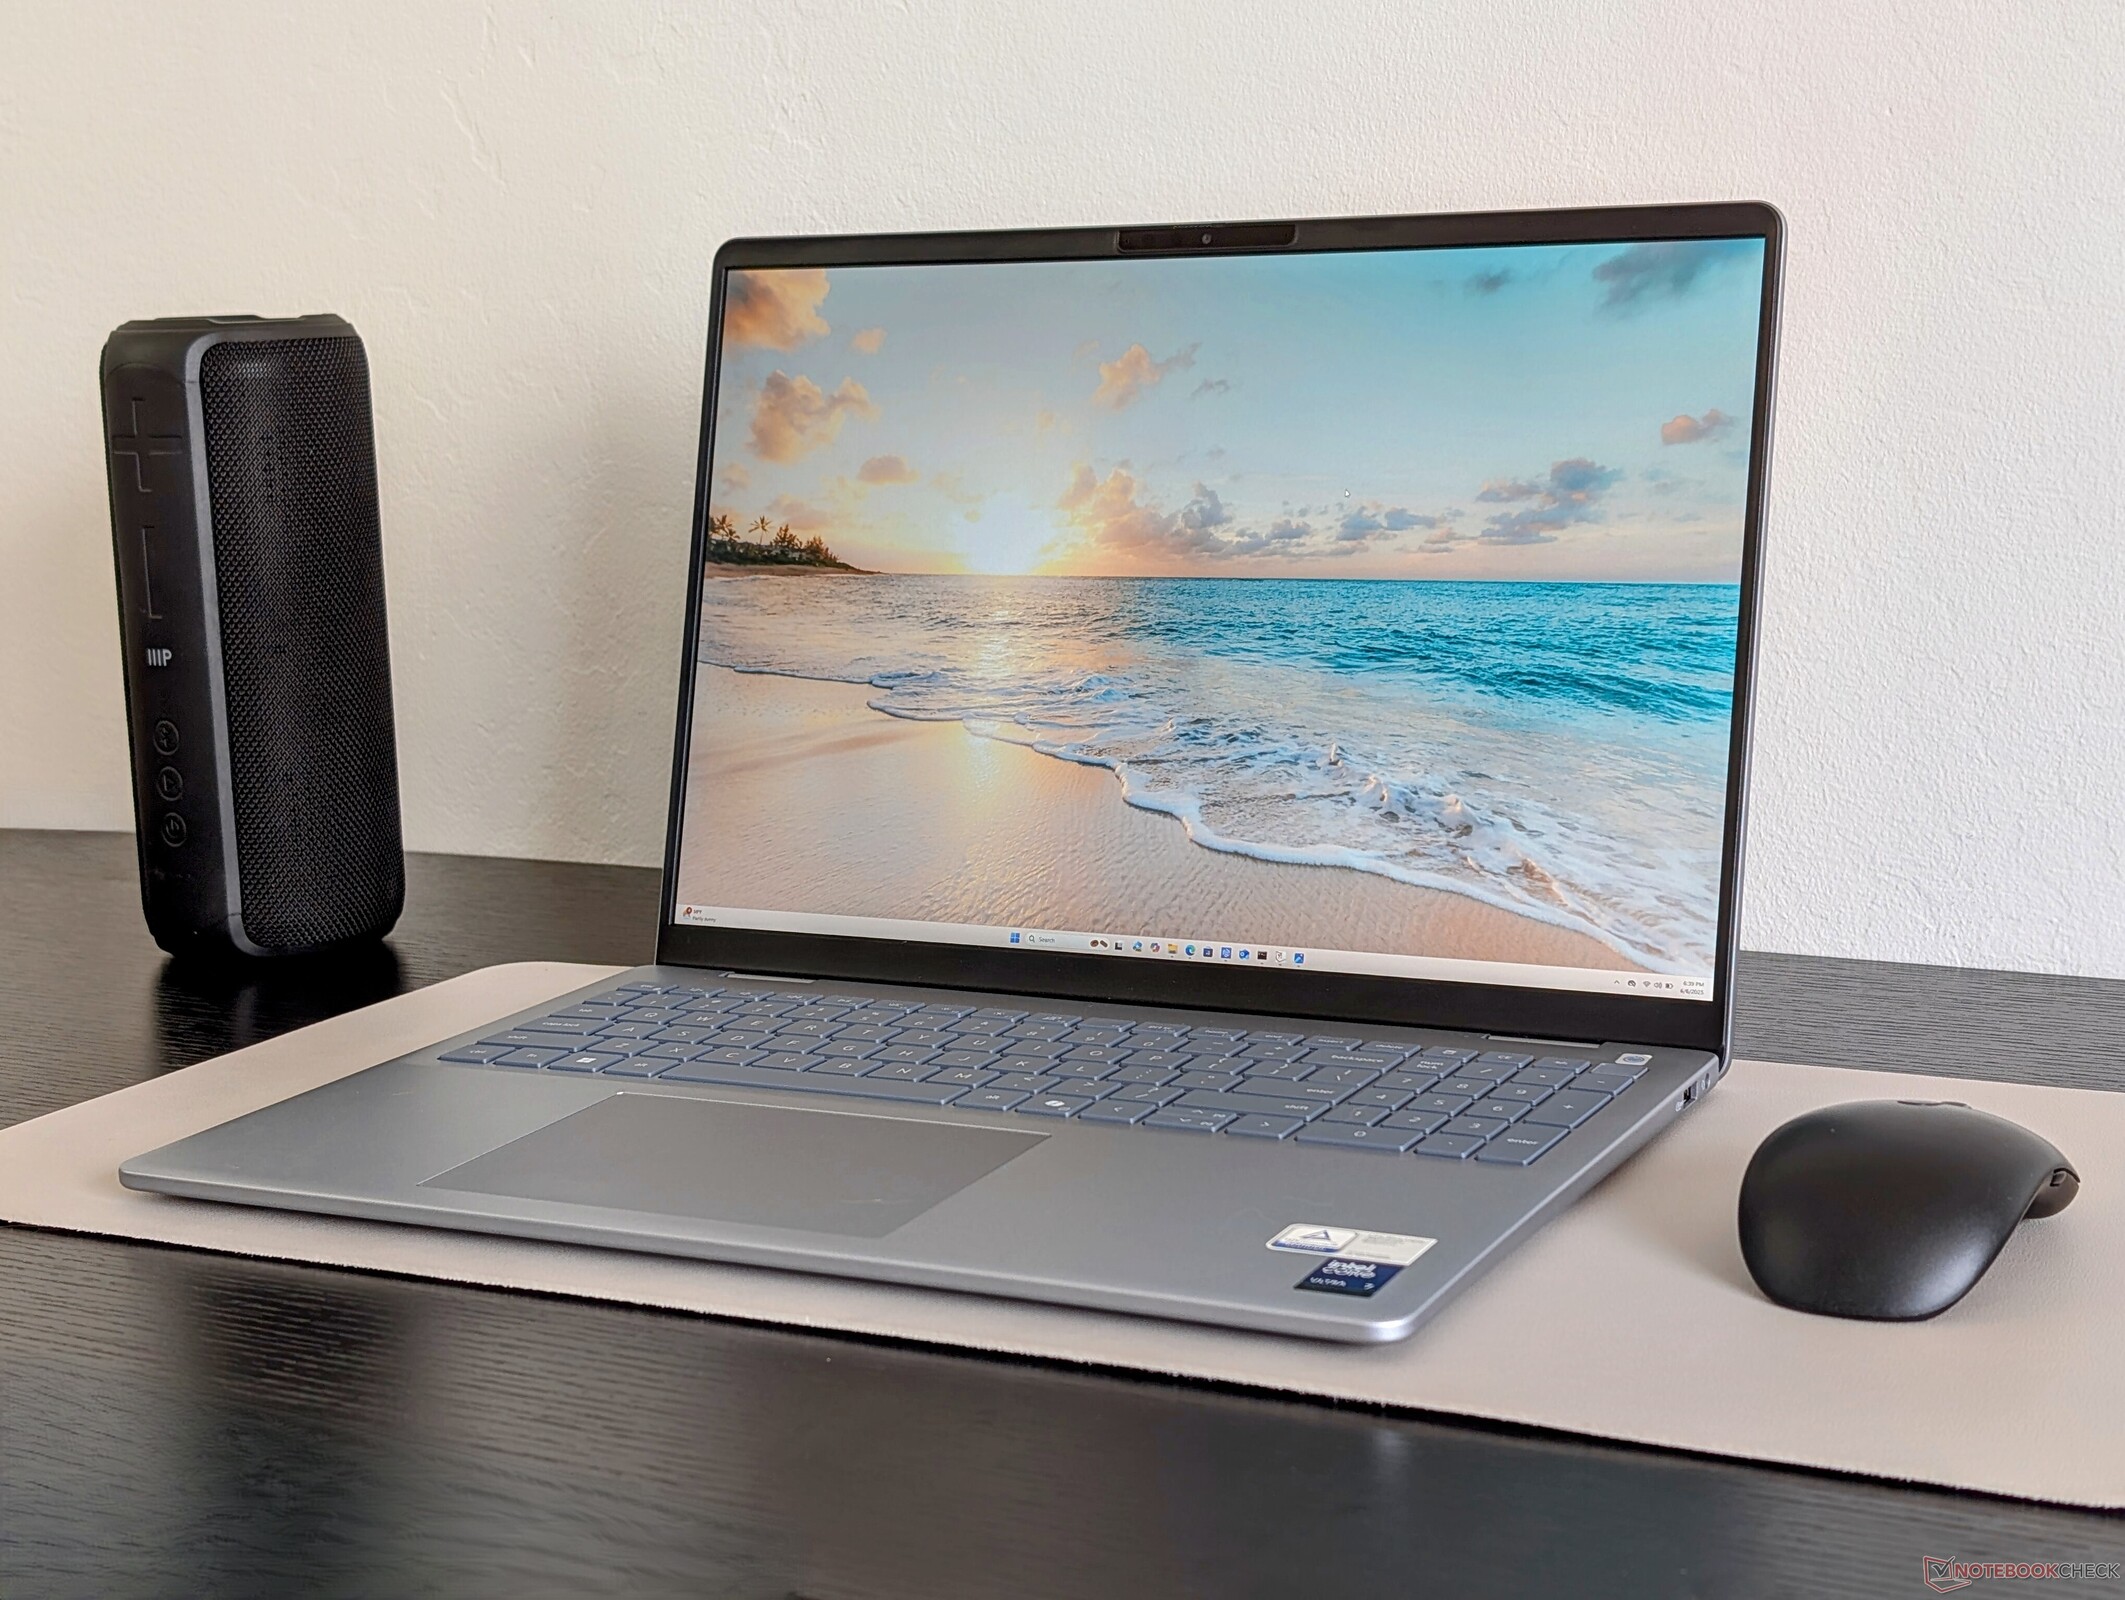
虽然它看起来很像其前代产品 Inspiron 16 Plus 7640戴尔 16 Plus 的 CPU 从酷睿 Ultra-H 升级到了最新的 Lunar Lake 酷睿 Ultra-V,这让它变得与众不同。这样一来,戴尔 Inspiron 16 Plus 变得更精巧、更轻便、更持久,应该更适合普通多媒体用户使用。我们还很欣赏它标配的 1600p120 IPS 显示屏,这意味着没有面板或色彩不佳的 "低端 "选择。
戴尔 16 Plus 的主要缺点是性能不足,无法满足要求更高的应用。旧款 Inspiron 16 Plus 7640或 Inspiron 16 7640 2-in-1配备了 Core-H 或独立 GPU 选项,性能比戴尔 16 Plus 快得多。它们还能以大致相同的价格提供相同甚至更好的观看体验。不需要额外马力的用户会发现,戴尔 16 Plus 更适合旅行和偶尔进行编辑时使用。否则,功能更强大的 戴尔 Premium 系列系列。
Pros
Cons
戴尔 16 Plus 取代了上一代 Inspiron 16 Plus 系列。虽然名称和处理器选项可能大不相同,但其物理特性仍大量借鉴了去年的 Inspiron 16 Plus 7640或 Inspiron 16 7640 2-in-1正如我们的评测所示。
我们的测试机属于中等配置,配备酷睿至尊 7 256V 和 1600p120 IPS 显示屏,起价为 1150 美元。更高端的配置包括酷睿至尊 7 258V 或酷睿至尊 9 288V,内存和存储空间翻倍,售价 1650 美元,其他显示屏选项包括 1200p IPS 或 1600p Mini-LED 显示屏。
该领域的竞争对手包括其他中端多媒体 16 英寸笔记本电脑,如 联想 IdeaPad Pro 5 16, 惠普Pavilion Plus 16或 华硕 Vivobook 16.
更多戴尔评论:
规格
案例
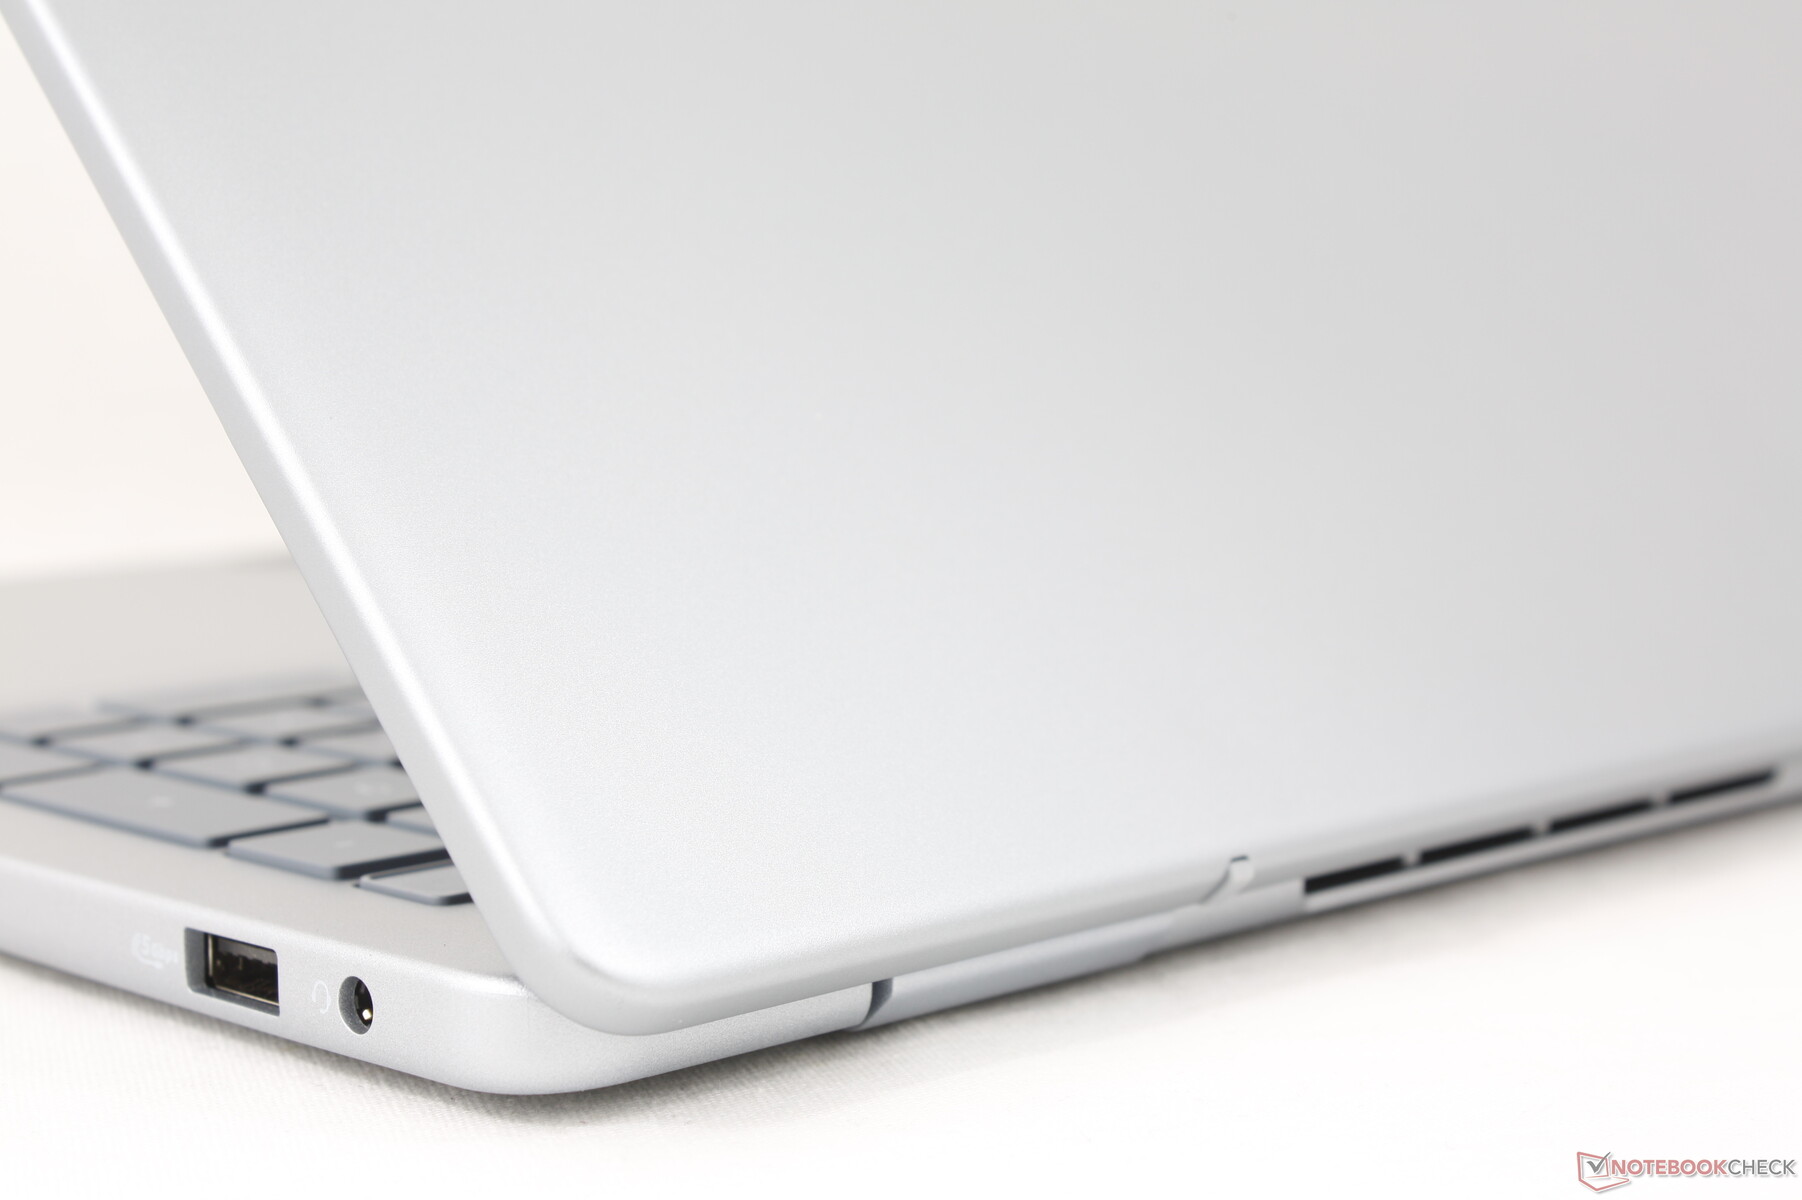
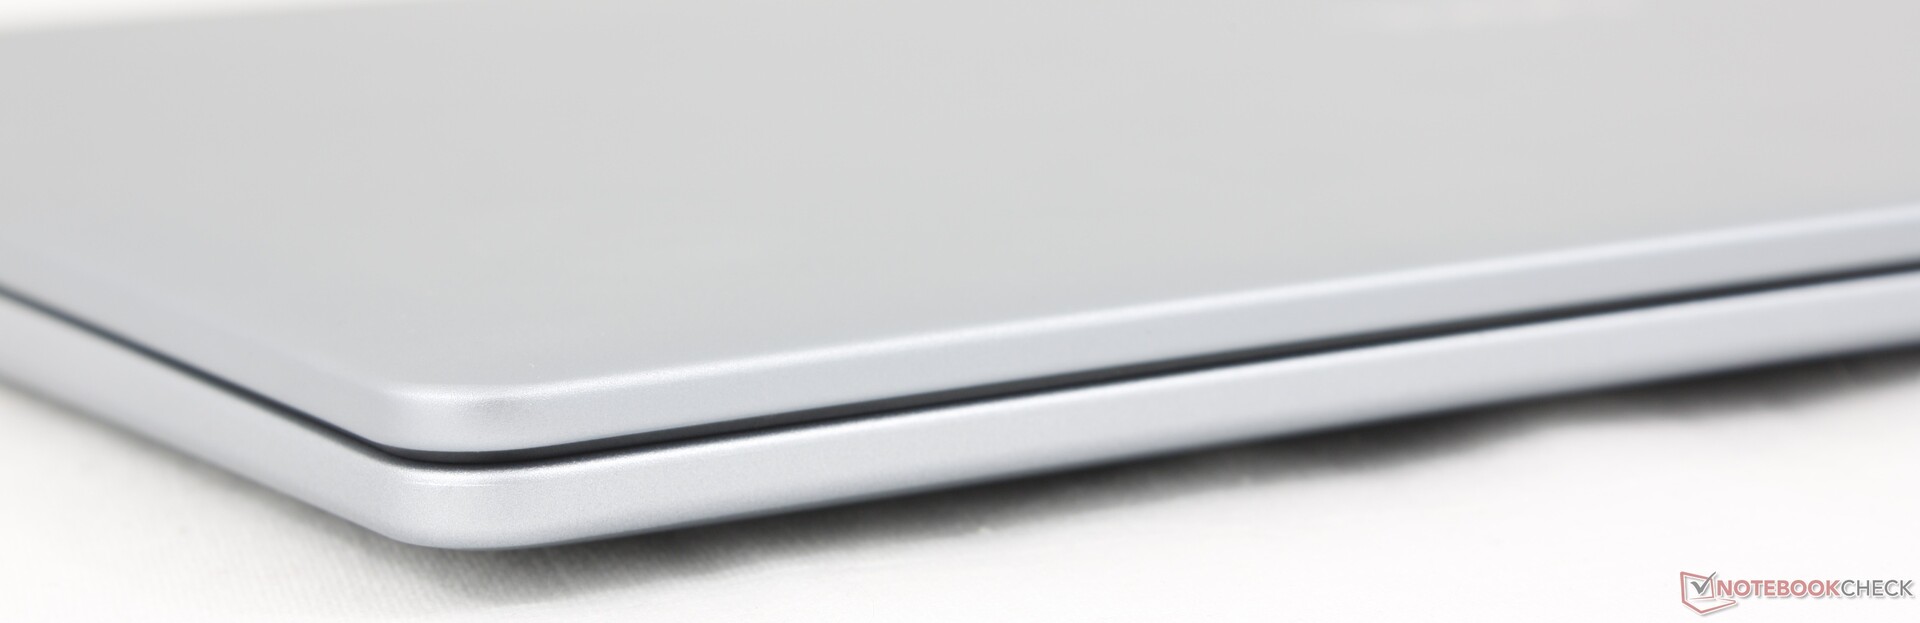
对于使用过 Inspiron 机型的人来说,光滑的哑光银色机身看起来和感觉都很熟悉。材料和设计与上一代产品基本相同,给人的第一印象也很相似。与价格更高的其他产品(如 XPS 16或 联想 Yoga Pro 9 16但在其他方面与惠普Pavilion Plus 16 或华硕 Vivobook 16 不相上下。
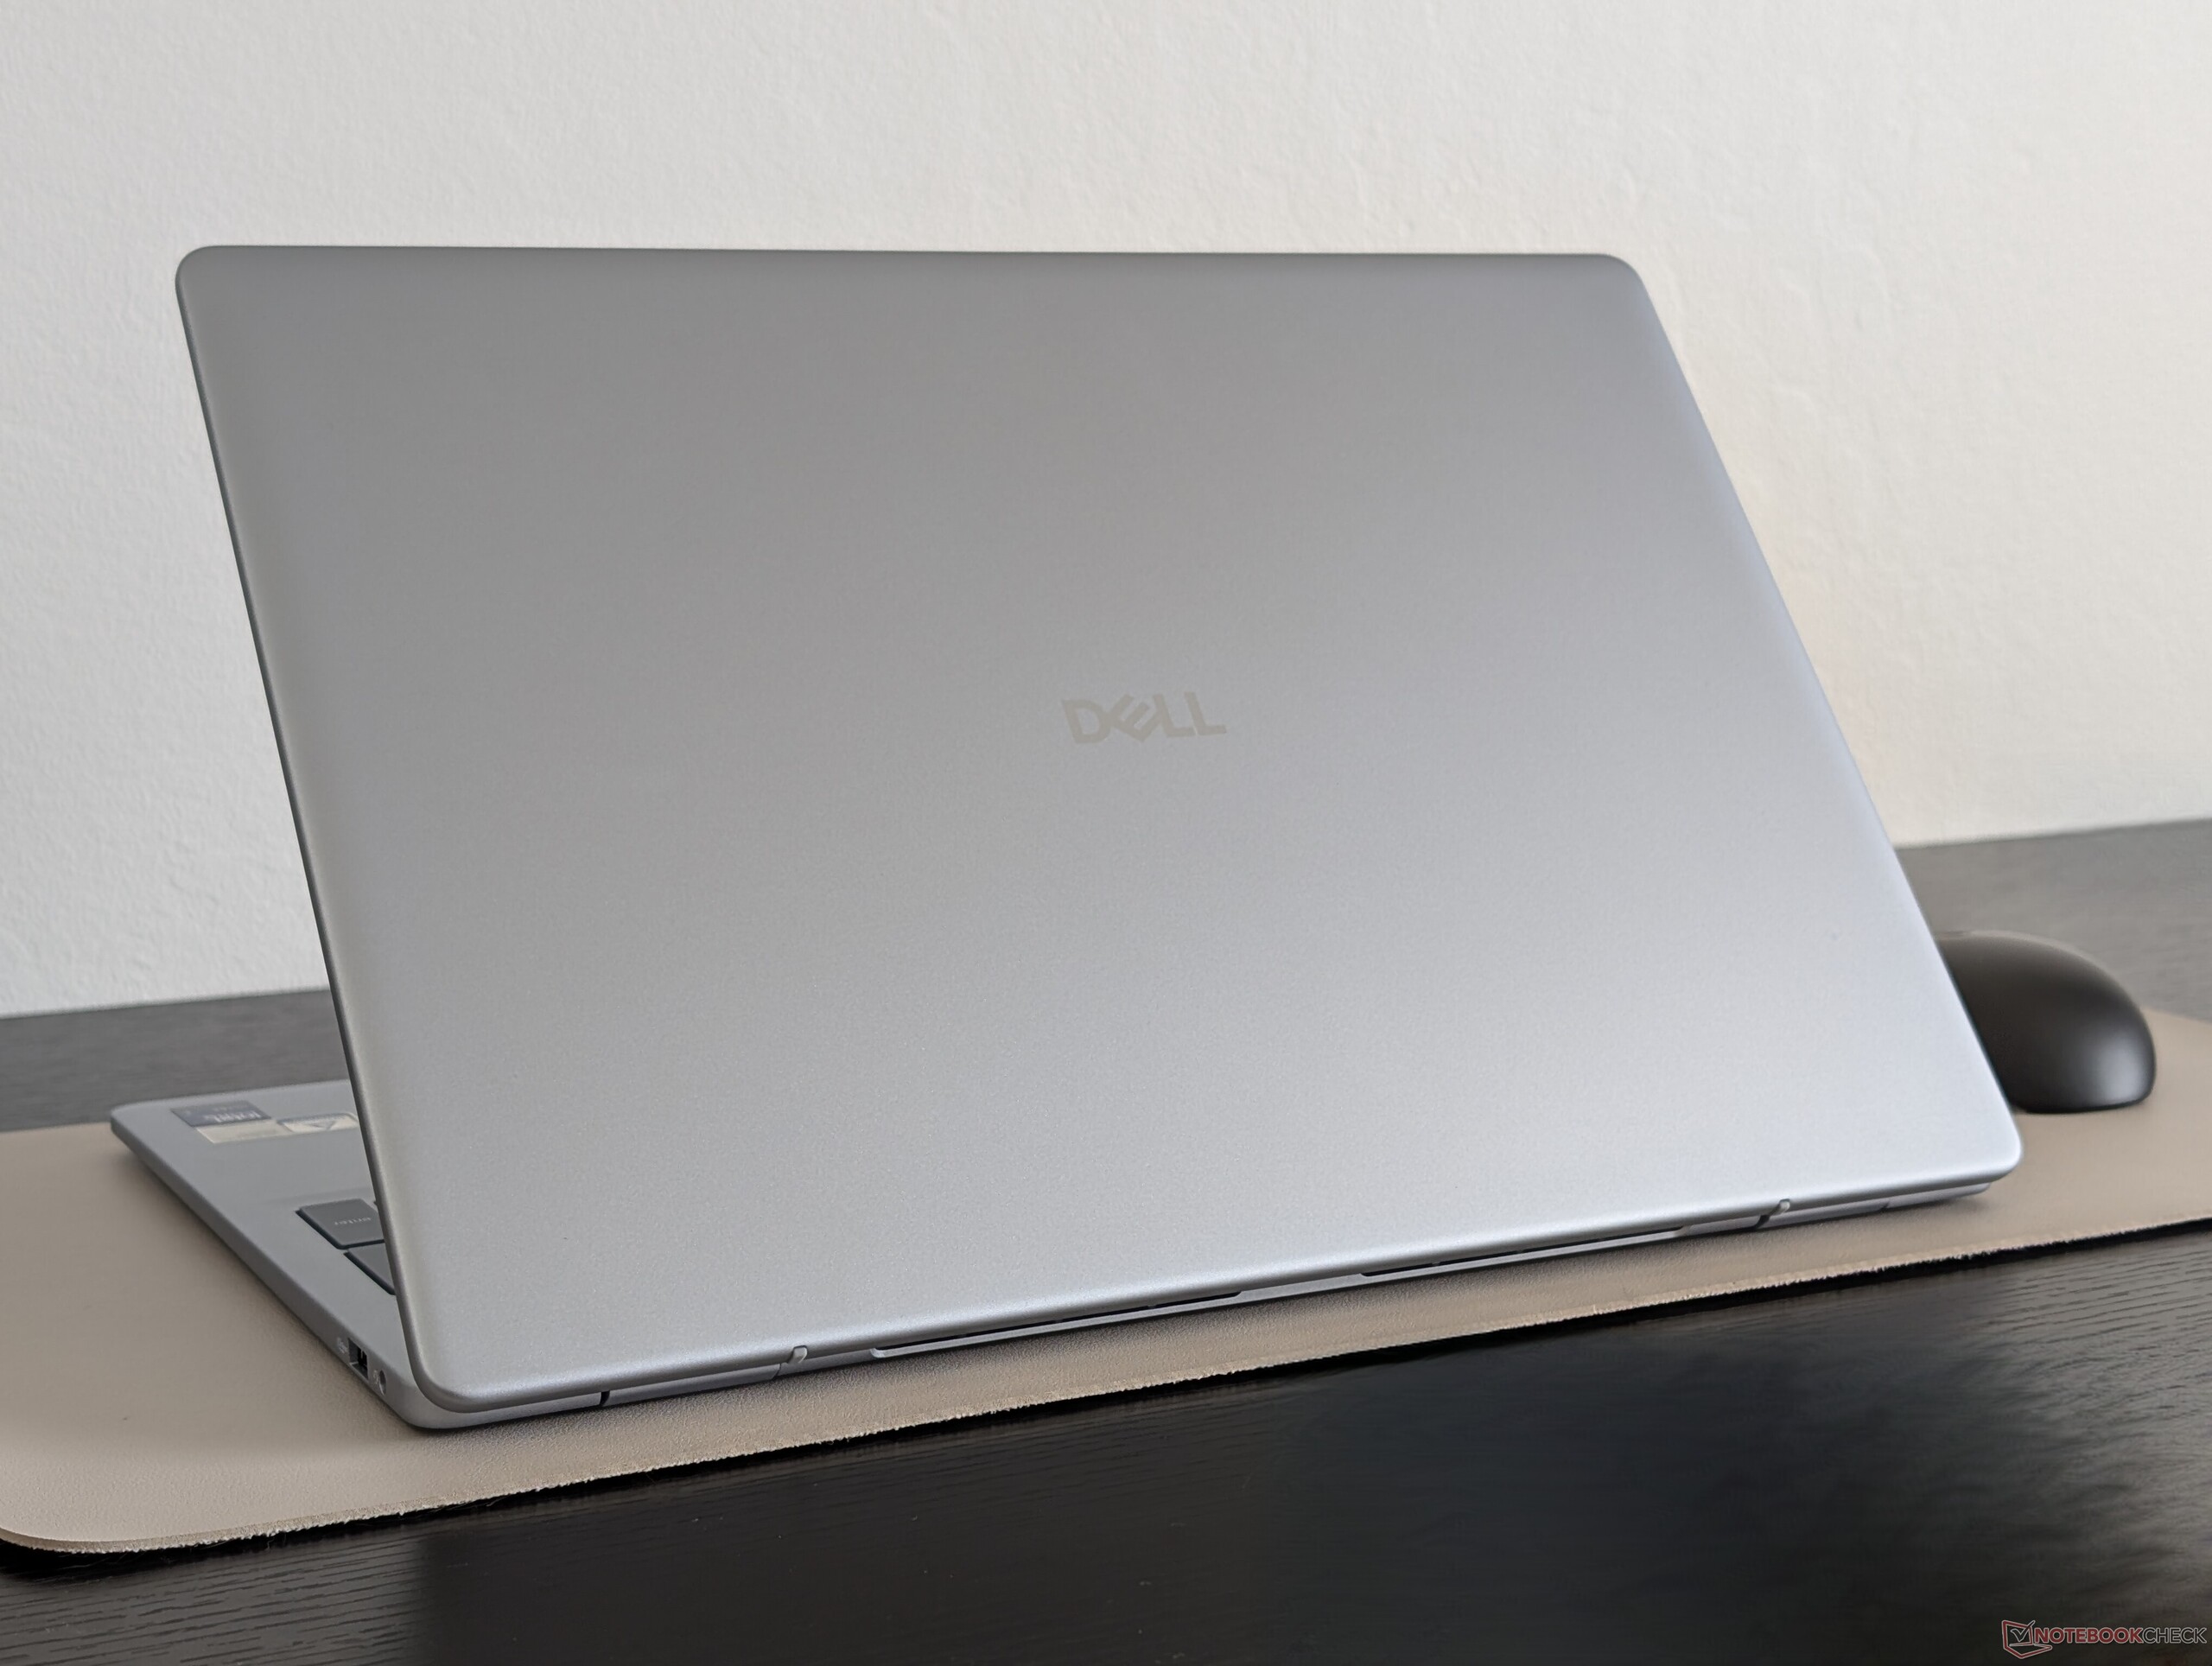
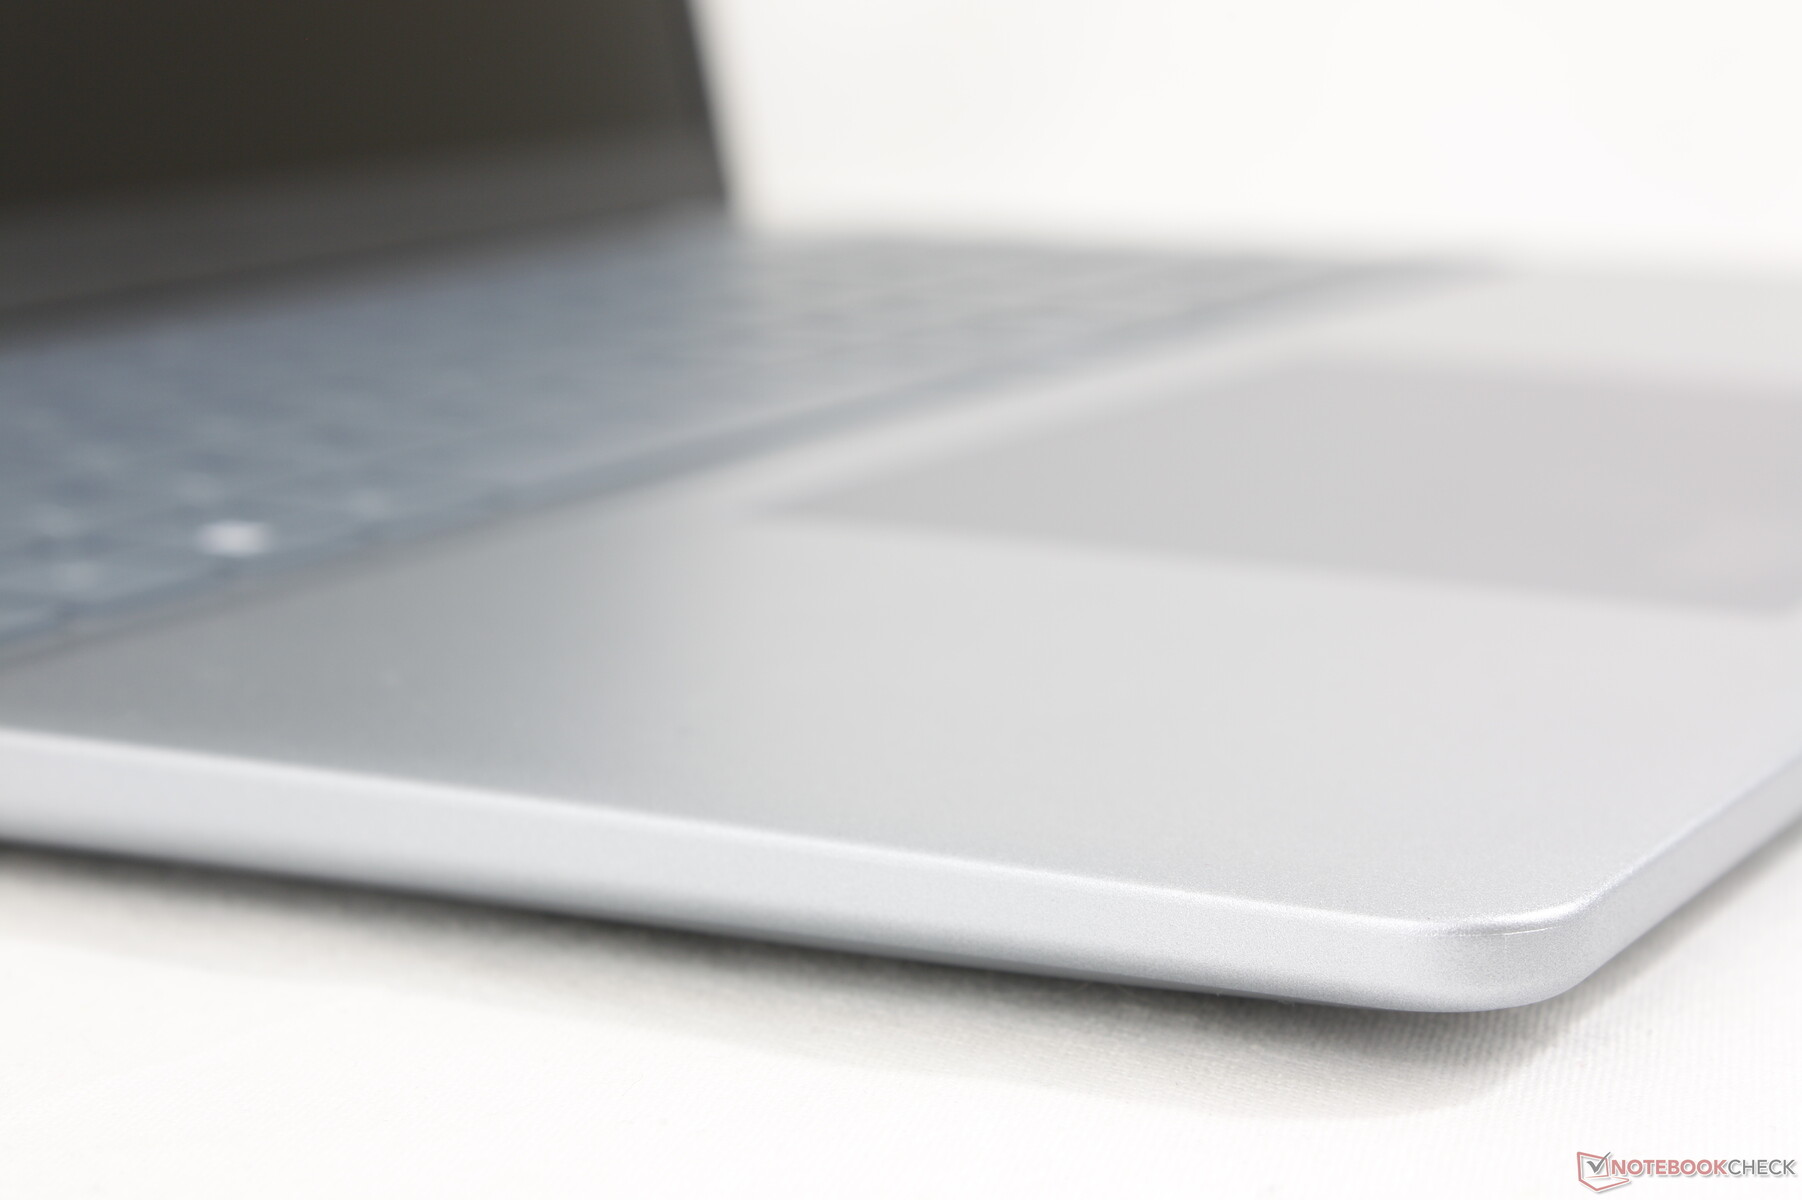
尺寸与即将上市的 Inspiron 16 Plus 7640 几乎是 1:1,甚至还要略薄一些。它们之间最大的区别在于重量,新款机型轻了约 400 克,这主要是因为没有独立 GPU 选项。
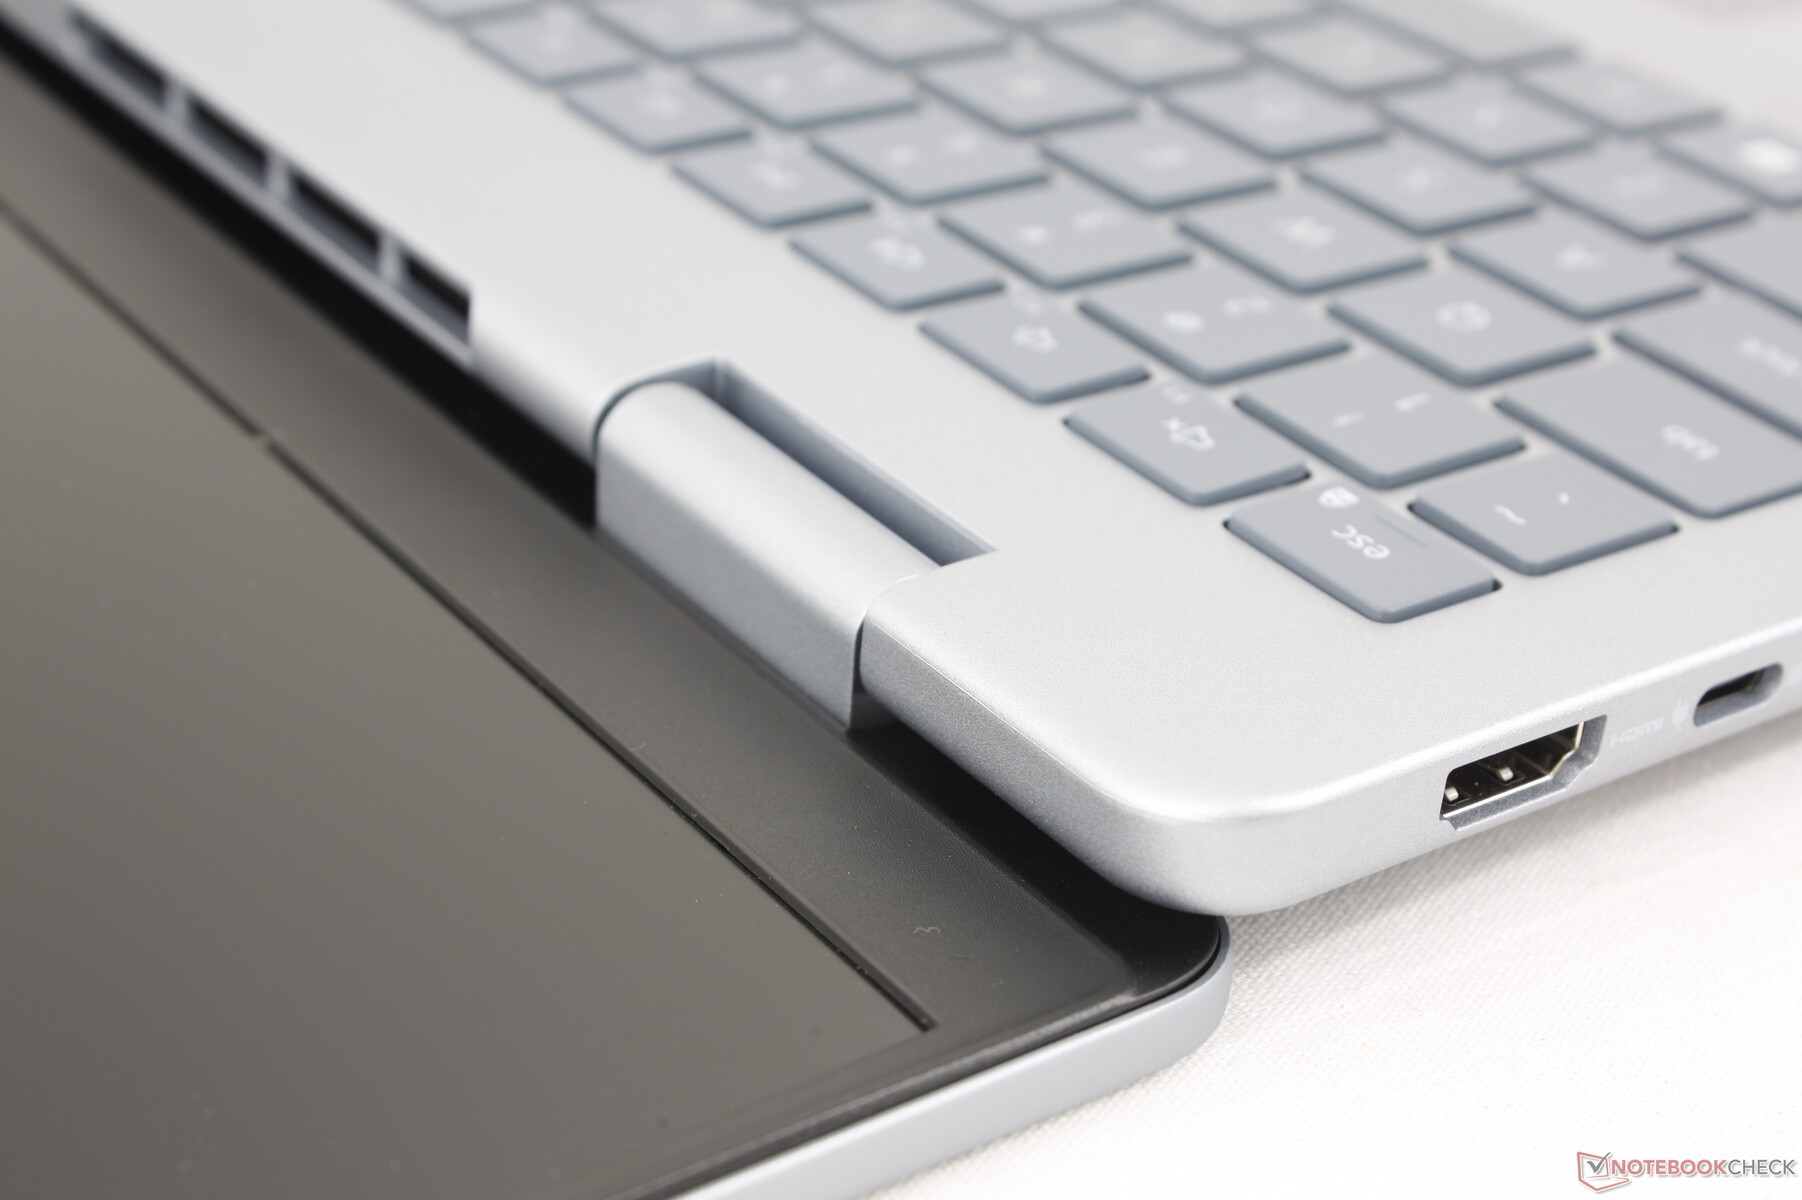
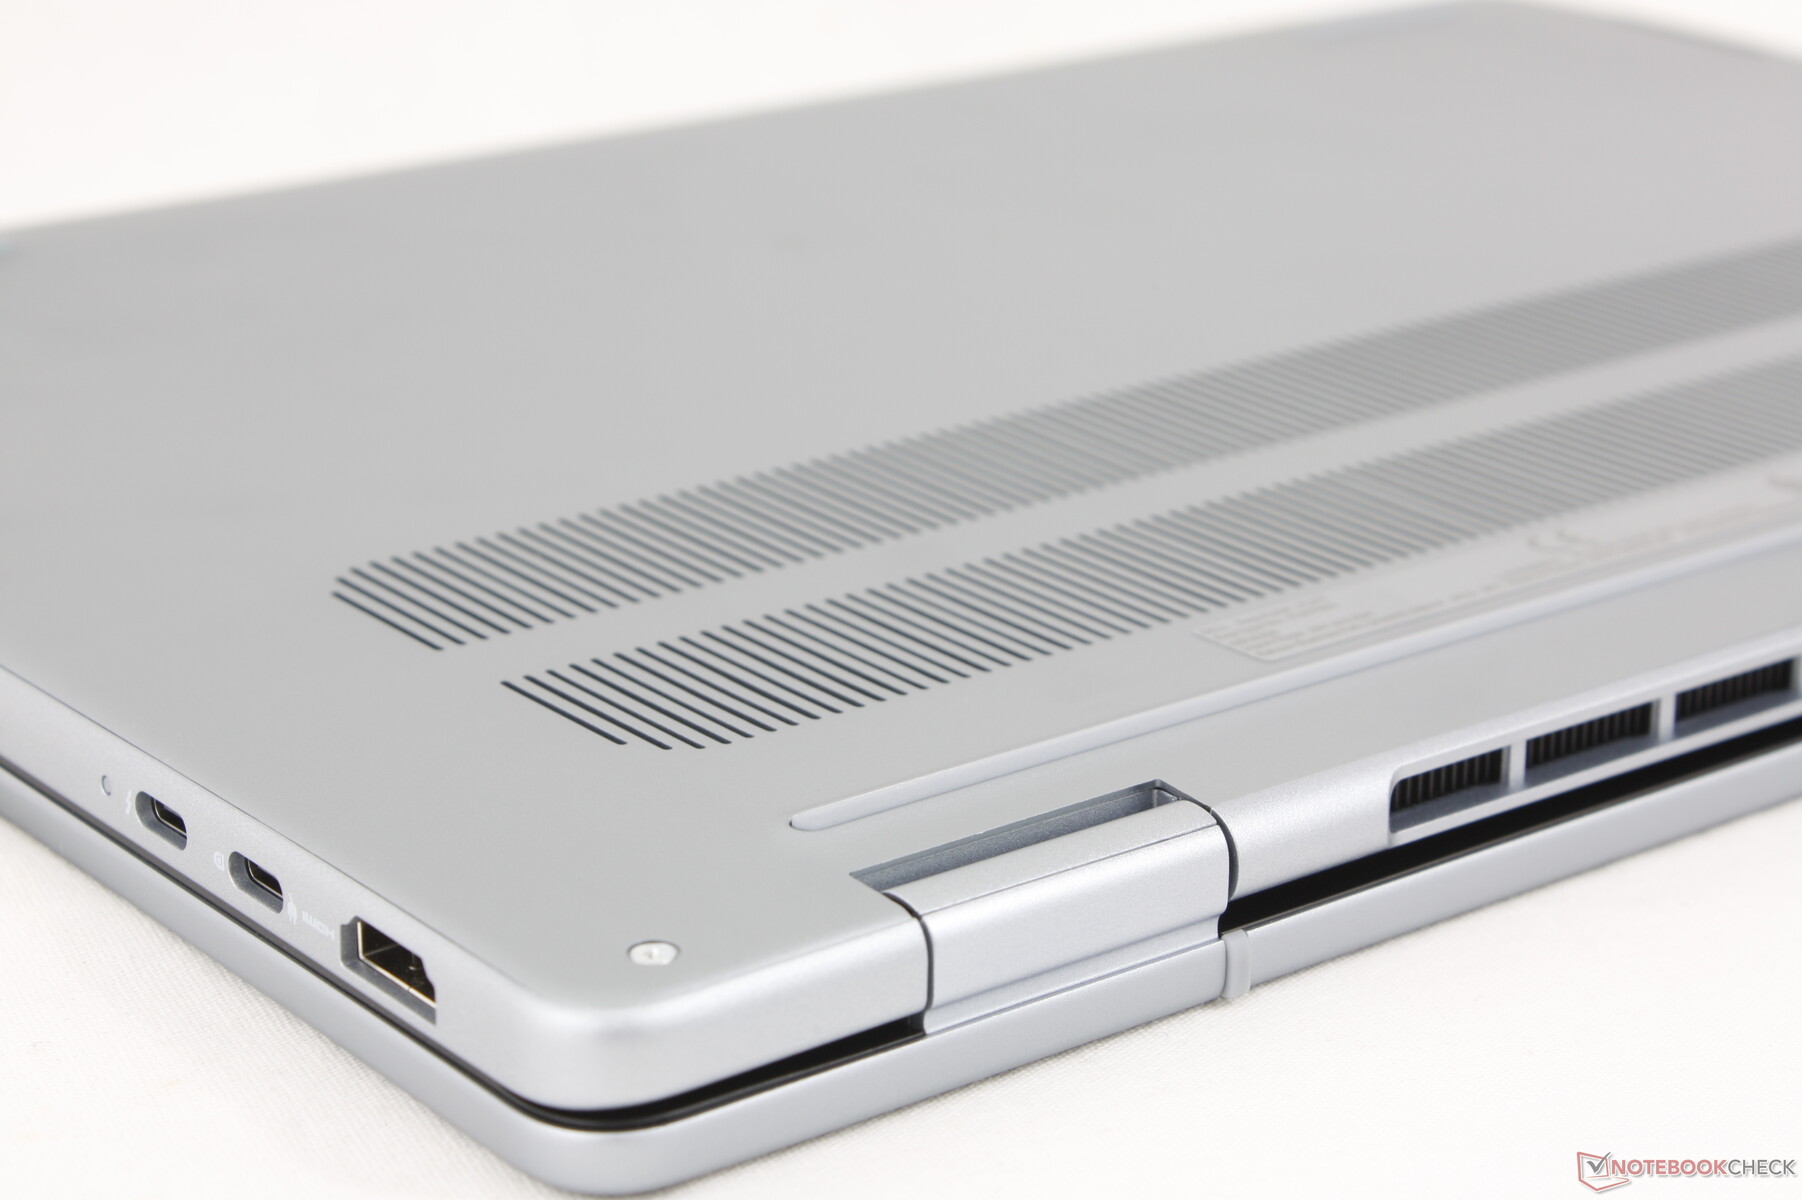
连接性
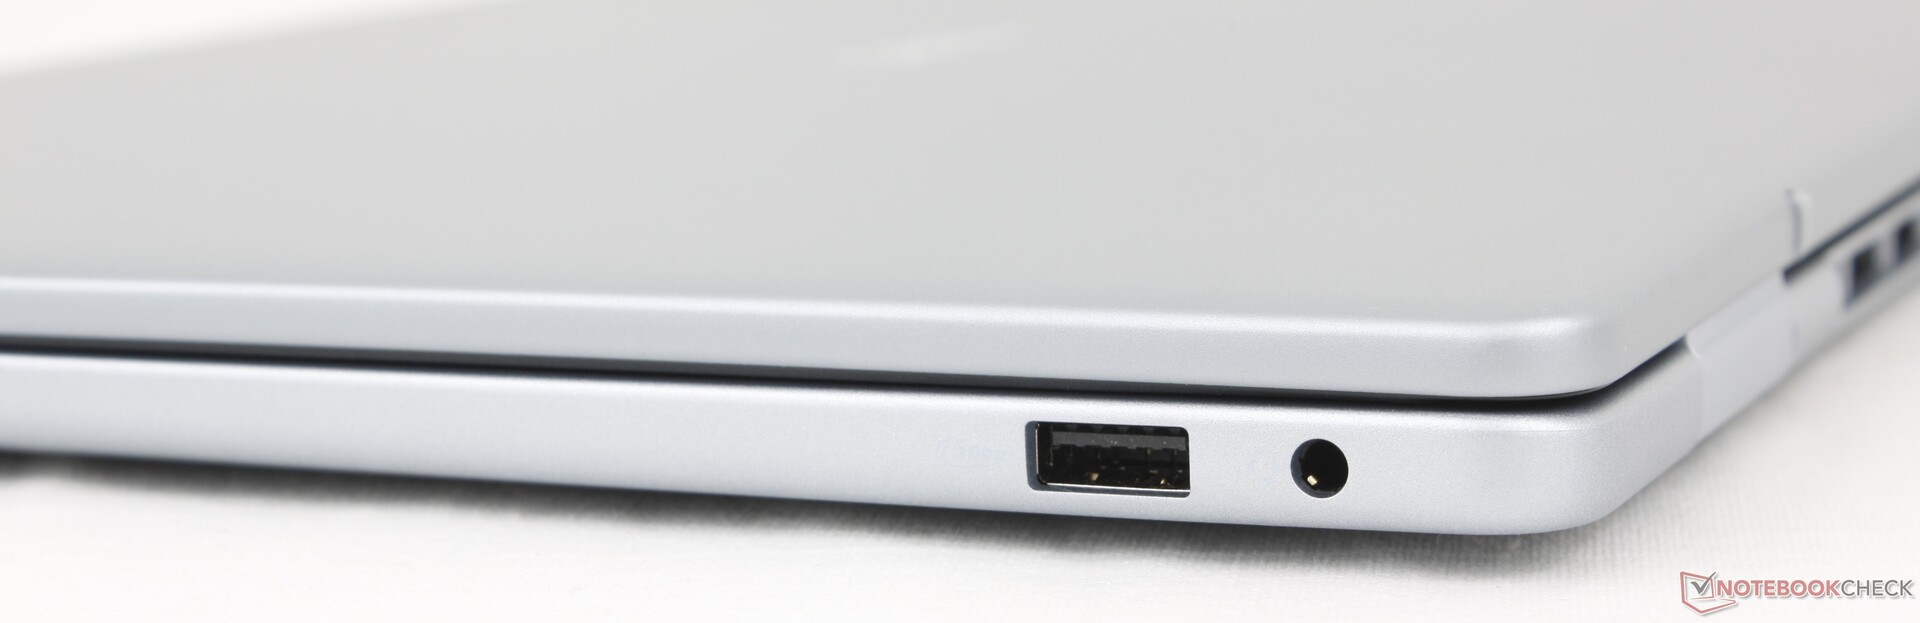
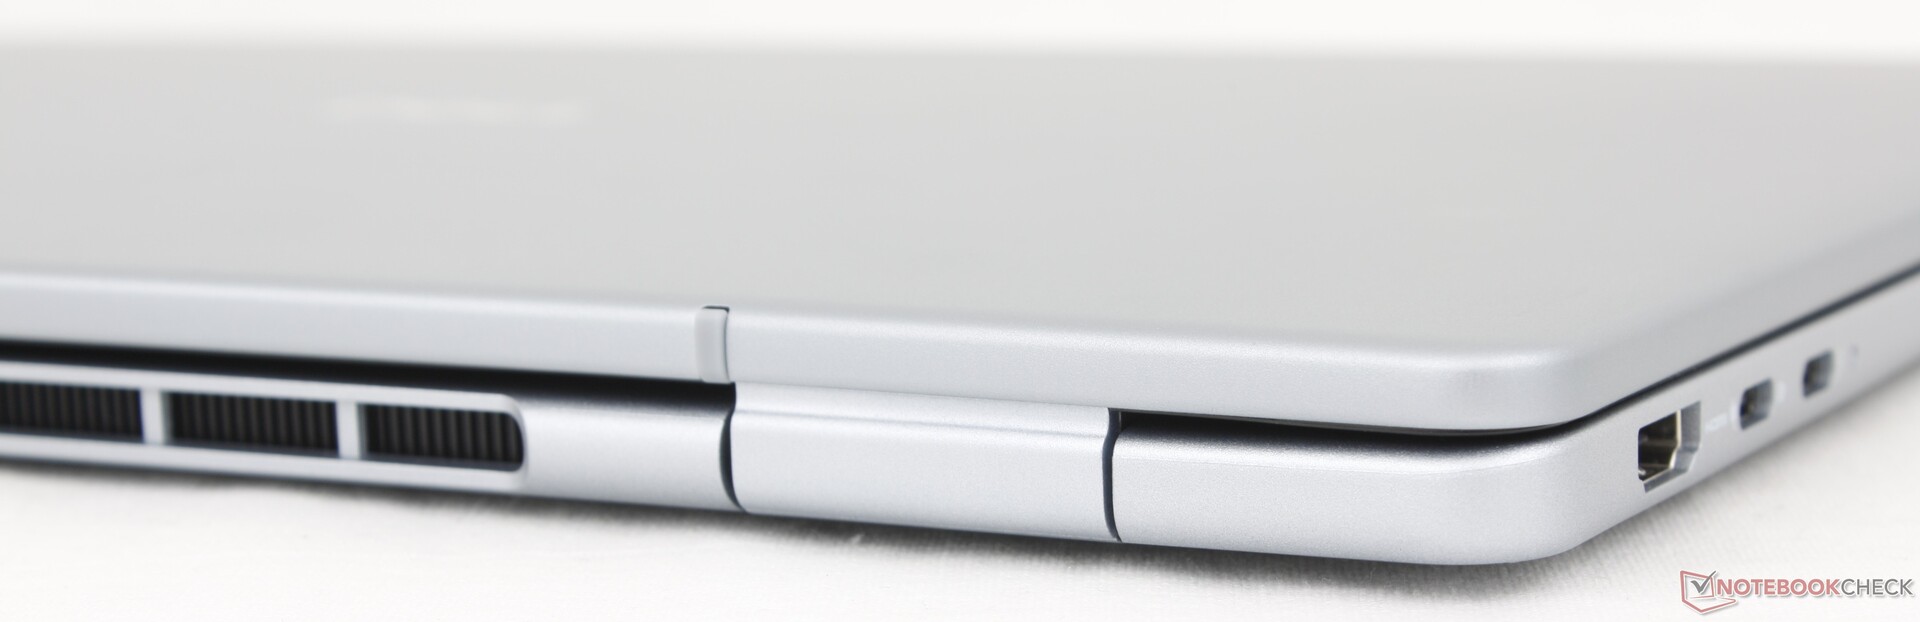
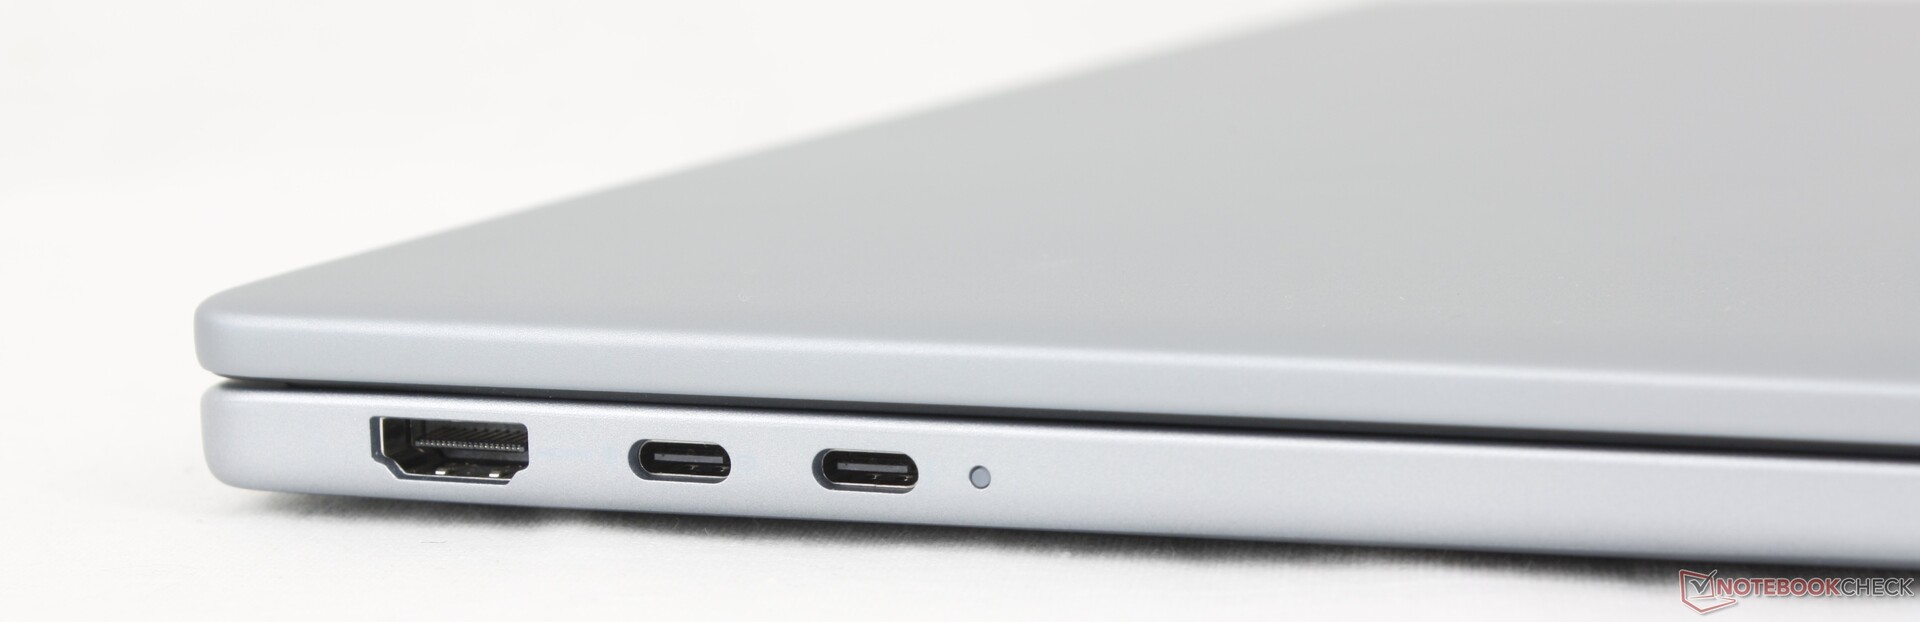
与去年的 Inspiron 16 Plus 7640 或 7640 2-in-1 相比,端口数量有所减少。戴尔 16 Plus 取消了 SD 读卡器和一个 USB-A 端口,改用第二个 USB-C 端口。需要注意的是,两个 USB-C 端口中只有一个兼容 Thunderbolt 4 和 DisplayPort 2.1。
交流
英特尔 BE201 标配 Wi-Fi 7 和蓝牙 5.4 连接功能。
| Networking | |
| iperf3 transmit AXE11000 | |
| Lenovo ThinkBook 16 G7+ AMD | |
| HP Pavilion Plus 16-ab0456tx | |
| Dell 16 Plus | |
| Asus Vivobook 16 M1606K | |
| Dell Inspiron 16 Plus 7640 | |
| iperf3 receive AXE11000 | |
| Lenovo ThinkBook 16 G7+ AMD | |
| HP Pavilion Plus 16-ab0456tx | |
| Dell 16 Plus | |
| Dell Inspiron 16 Plus 7640 | |
| Asus Vivobook 16 M1606K | |
| iperf3 transmit AXE11000 6GHz | |
| HP Pavilion Plus 16-ab0456tx | |
| Dell 16 Plus | |
| Acer Swift 16 AI SF16-51T-932H, Ultra 9 288V | |
| Dell Inspiron 16 Plus 7640 | |
| iperf3 receive AXE11000 6GHz | |
| Acer Swift 16 AI SF16-51T-932H, Ultra 9 288V | |
| HP Pavilion Plus 16-ab0456tx | |
| Dell 16 Plus | |
| Dell Inspiron 16 Plus 7640 | |
网络摄像头
标配 200 万像素网络摄像头,带有红外和物理隐私快门。


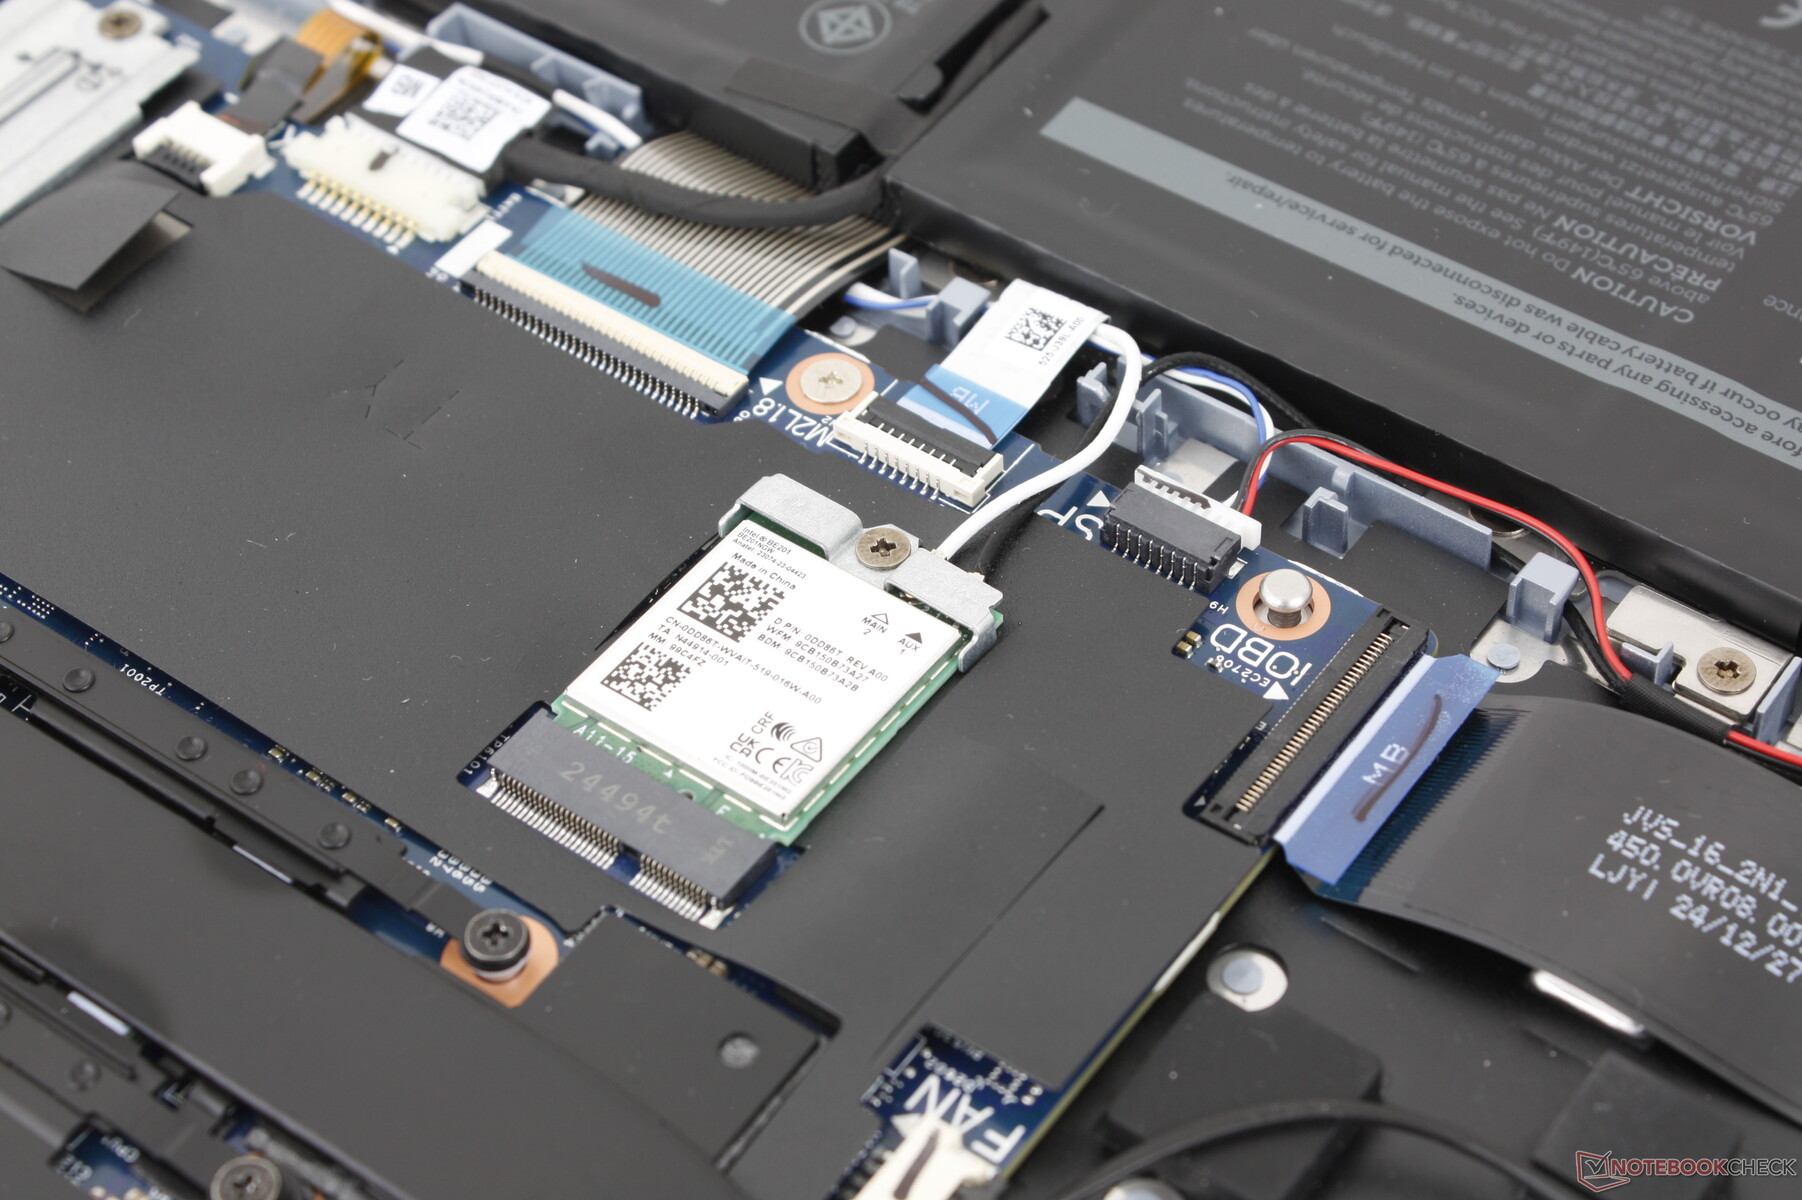
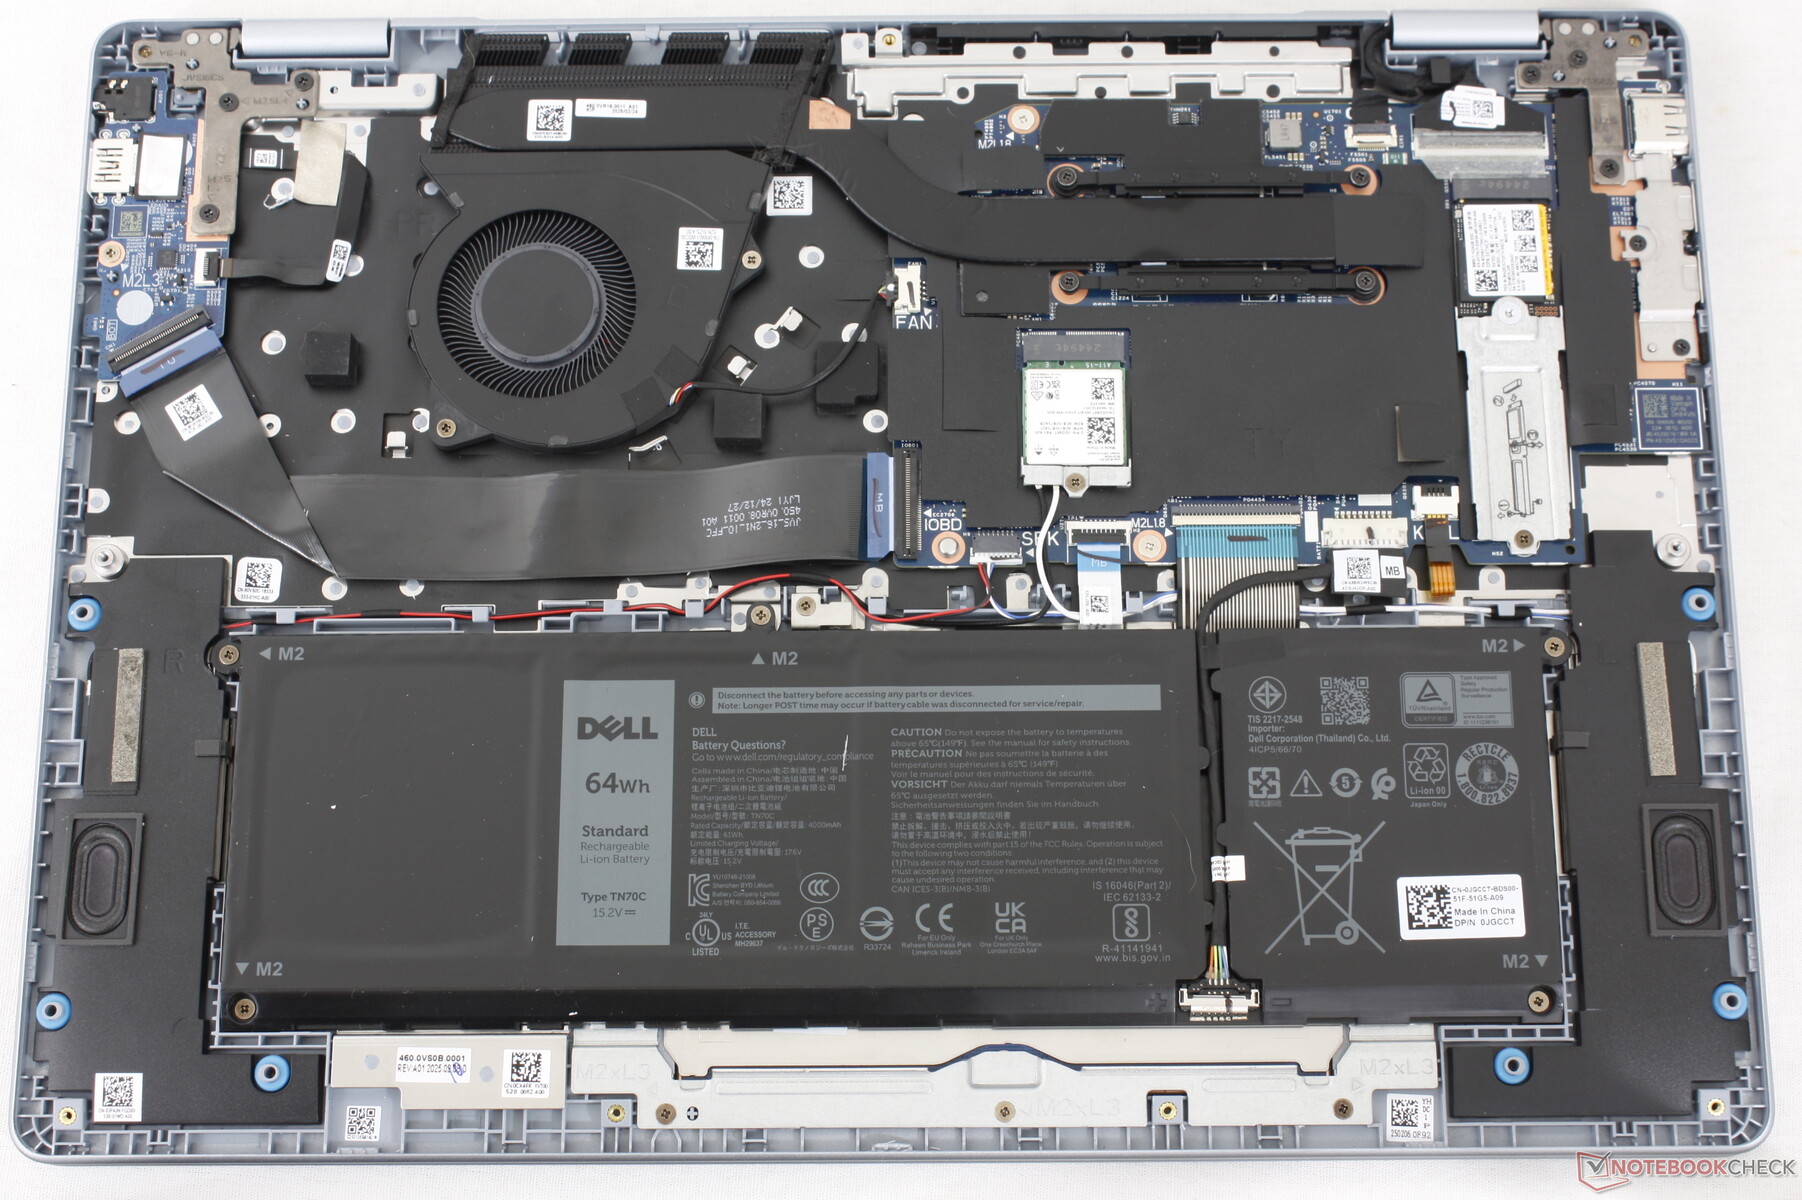
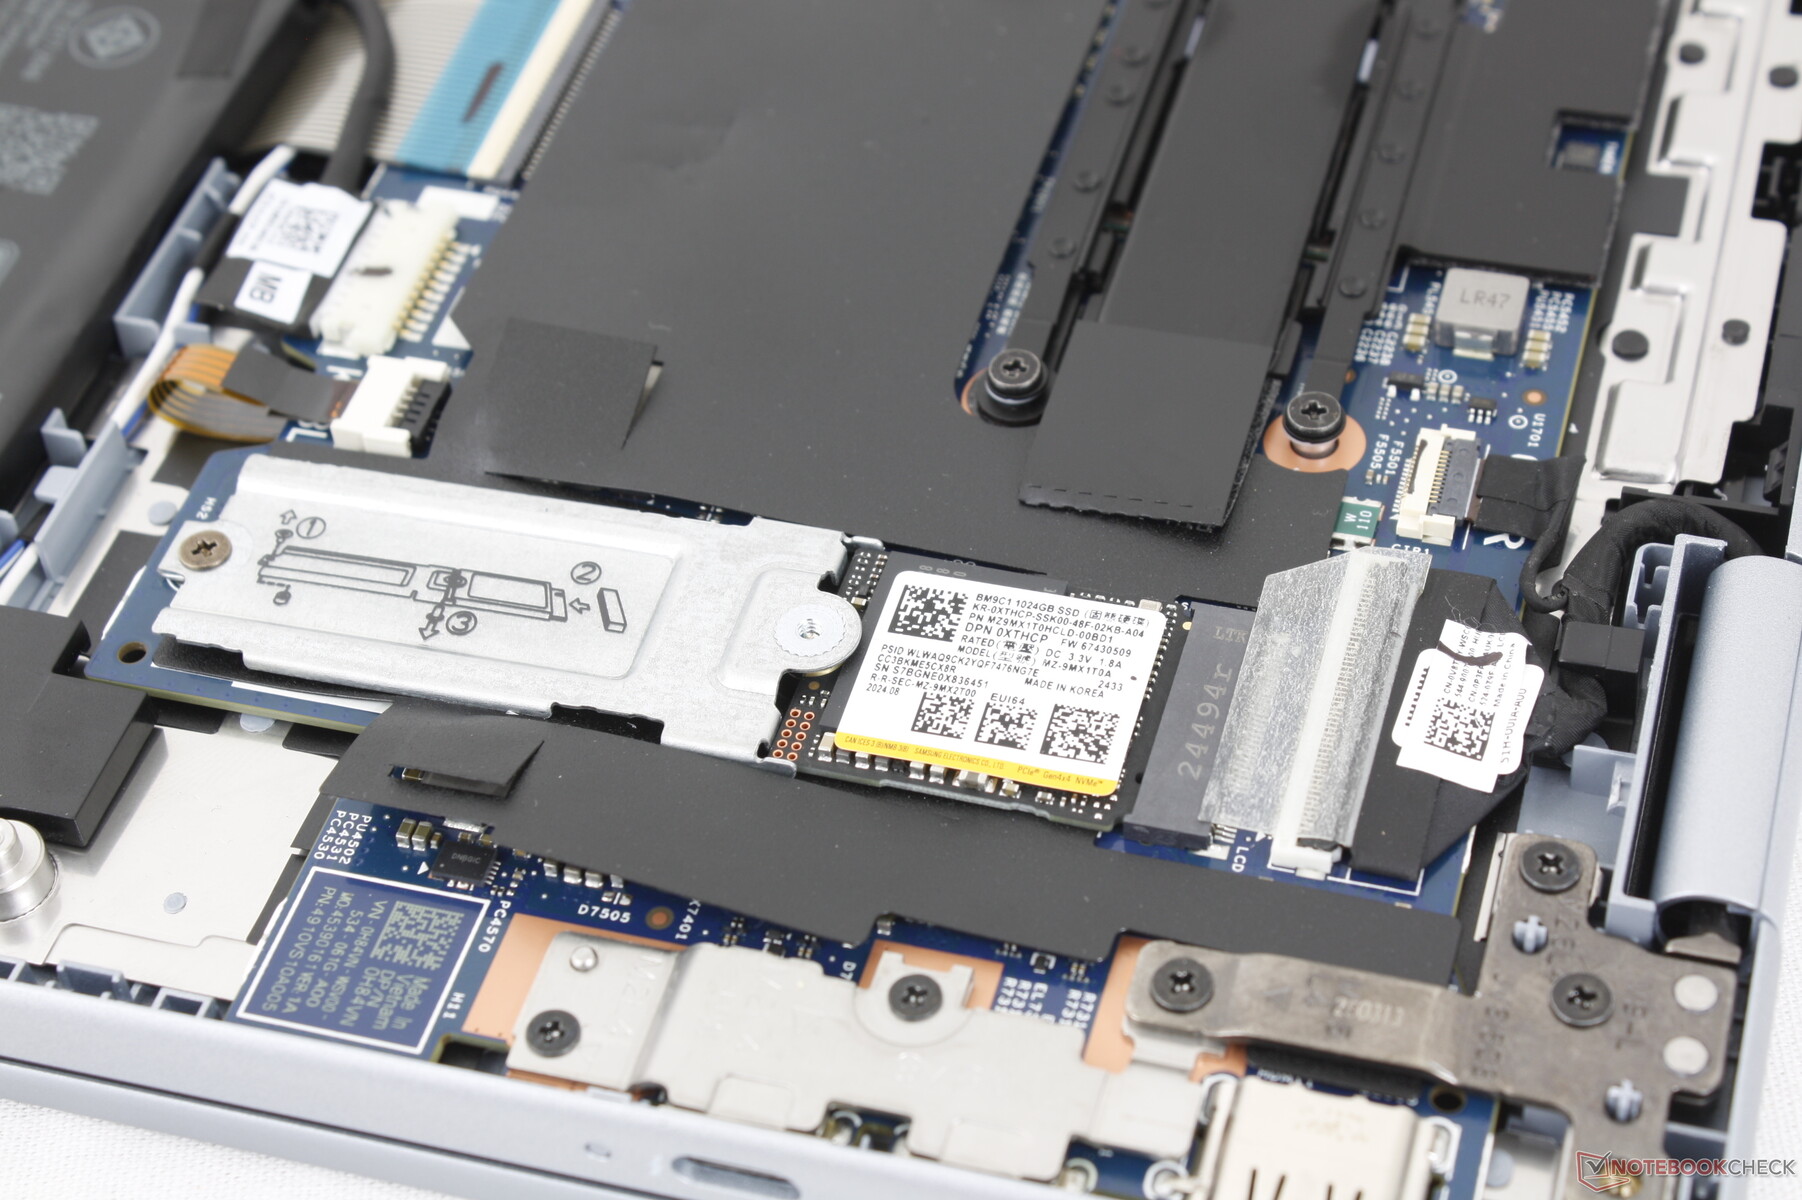
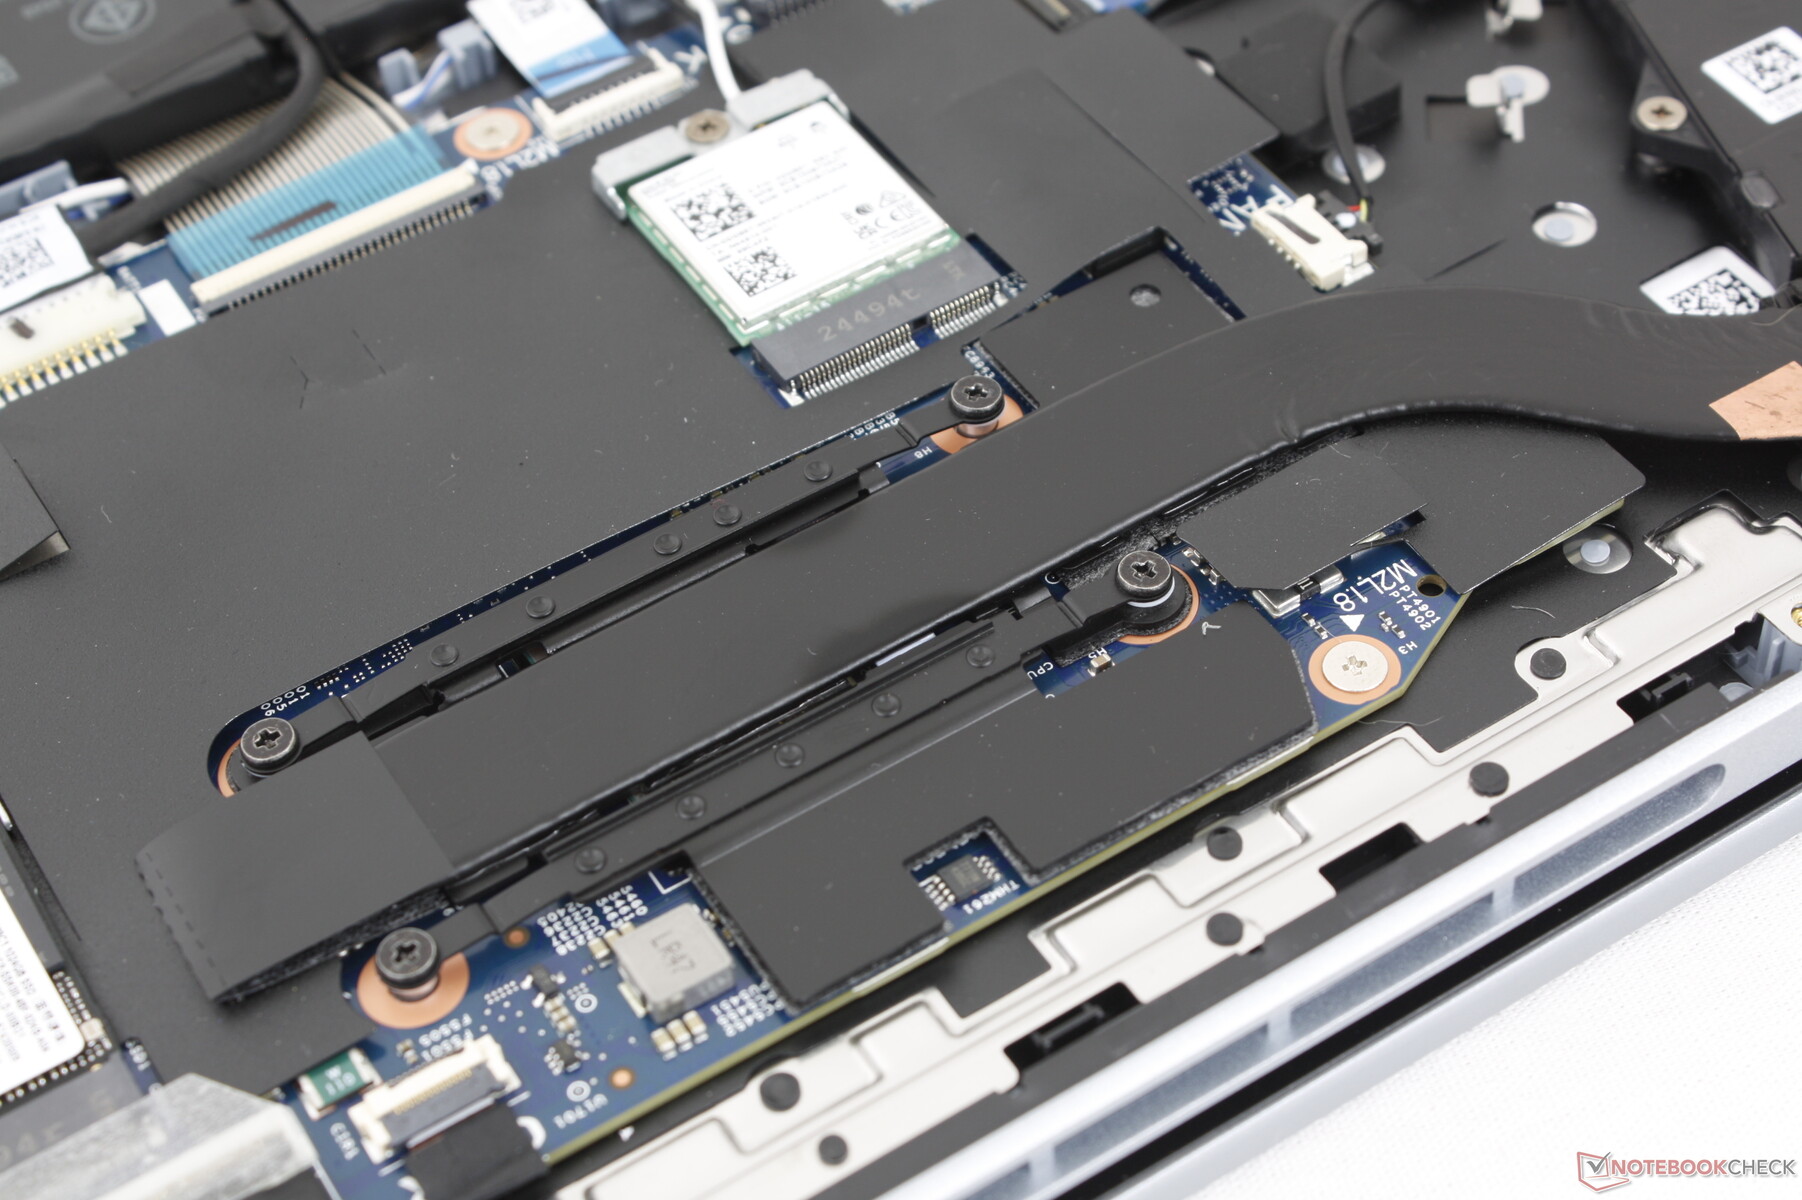
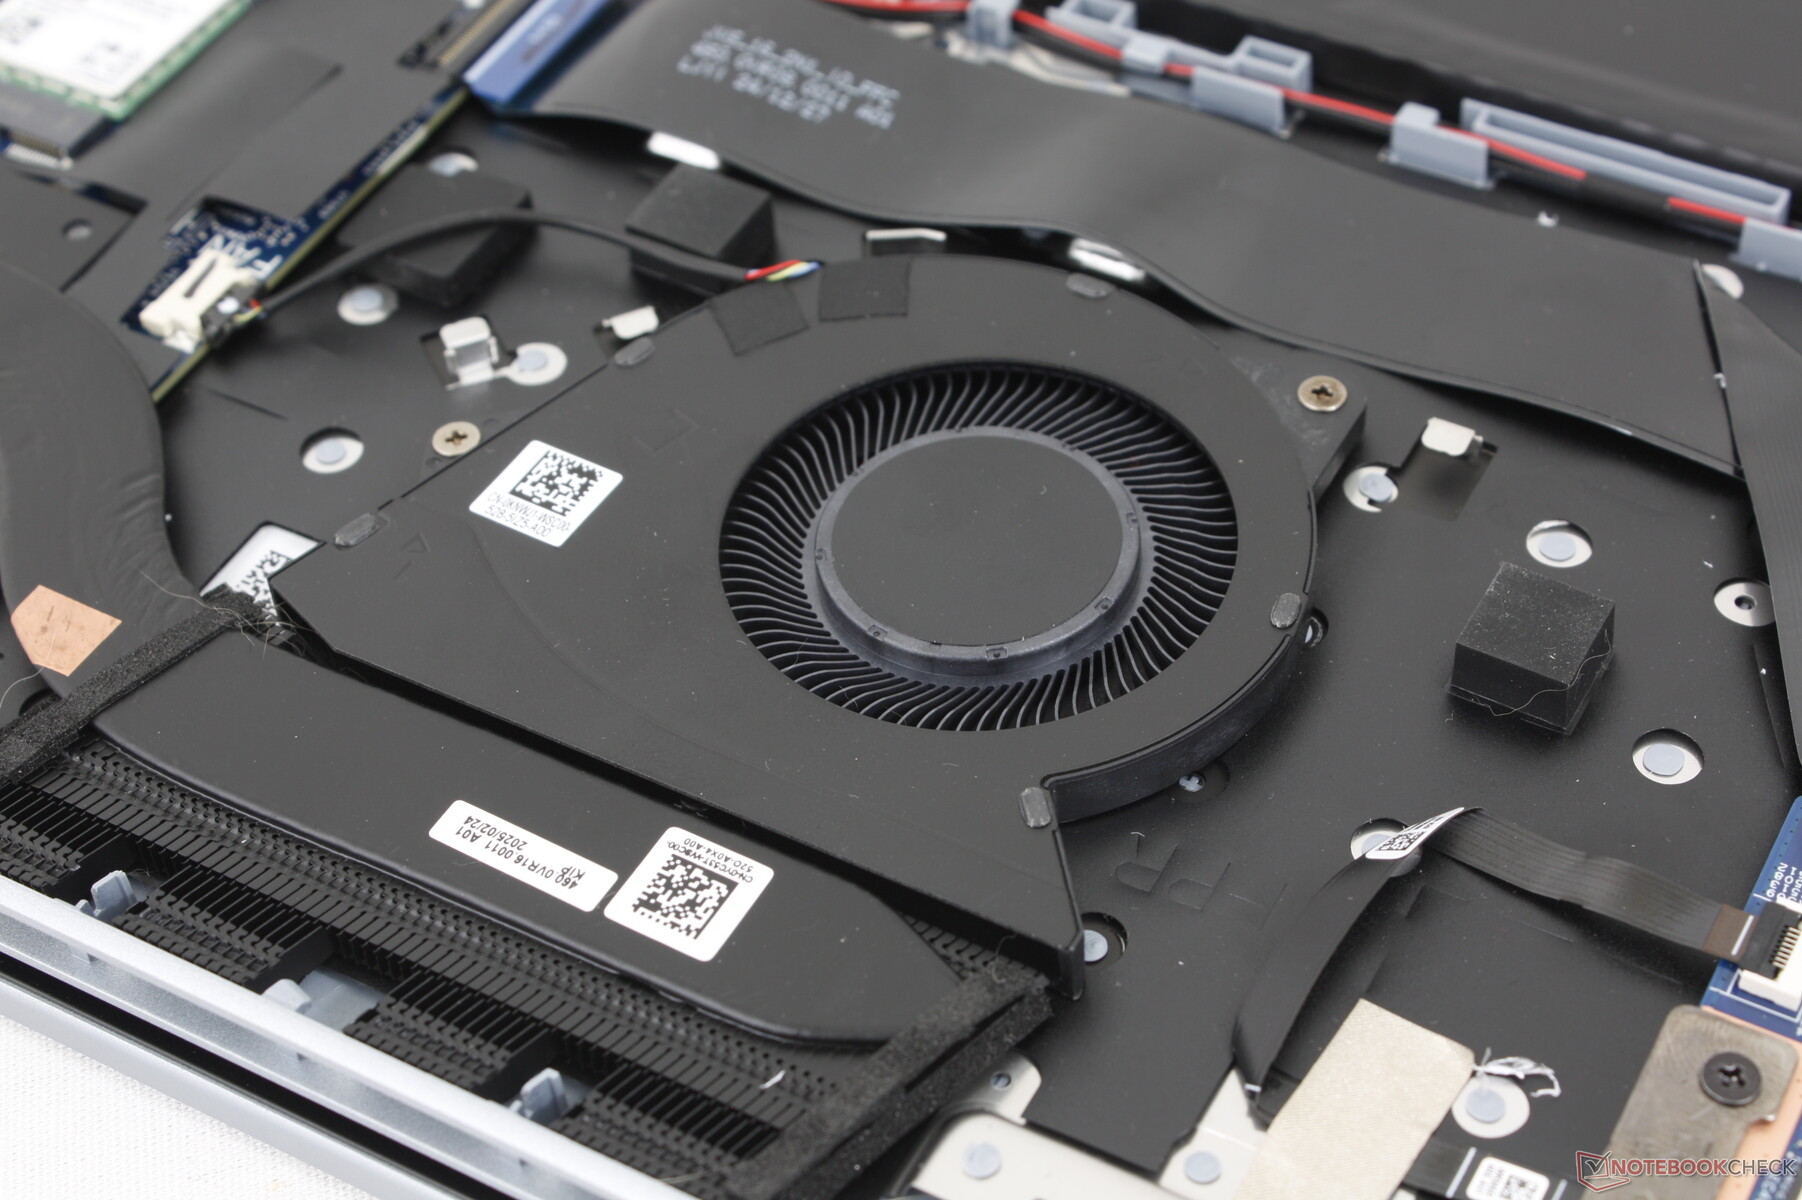
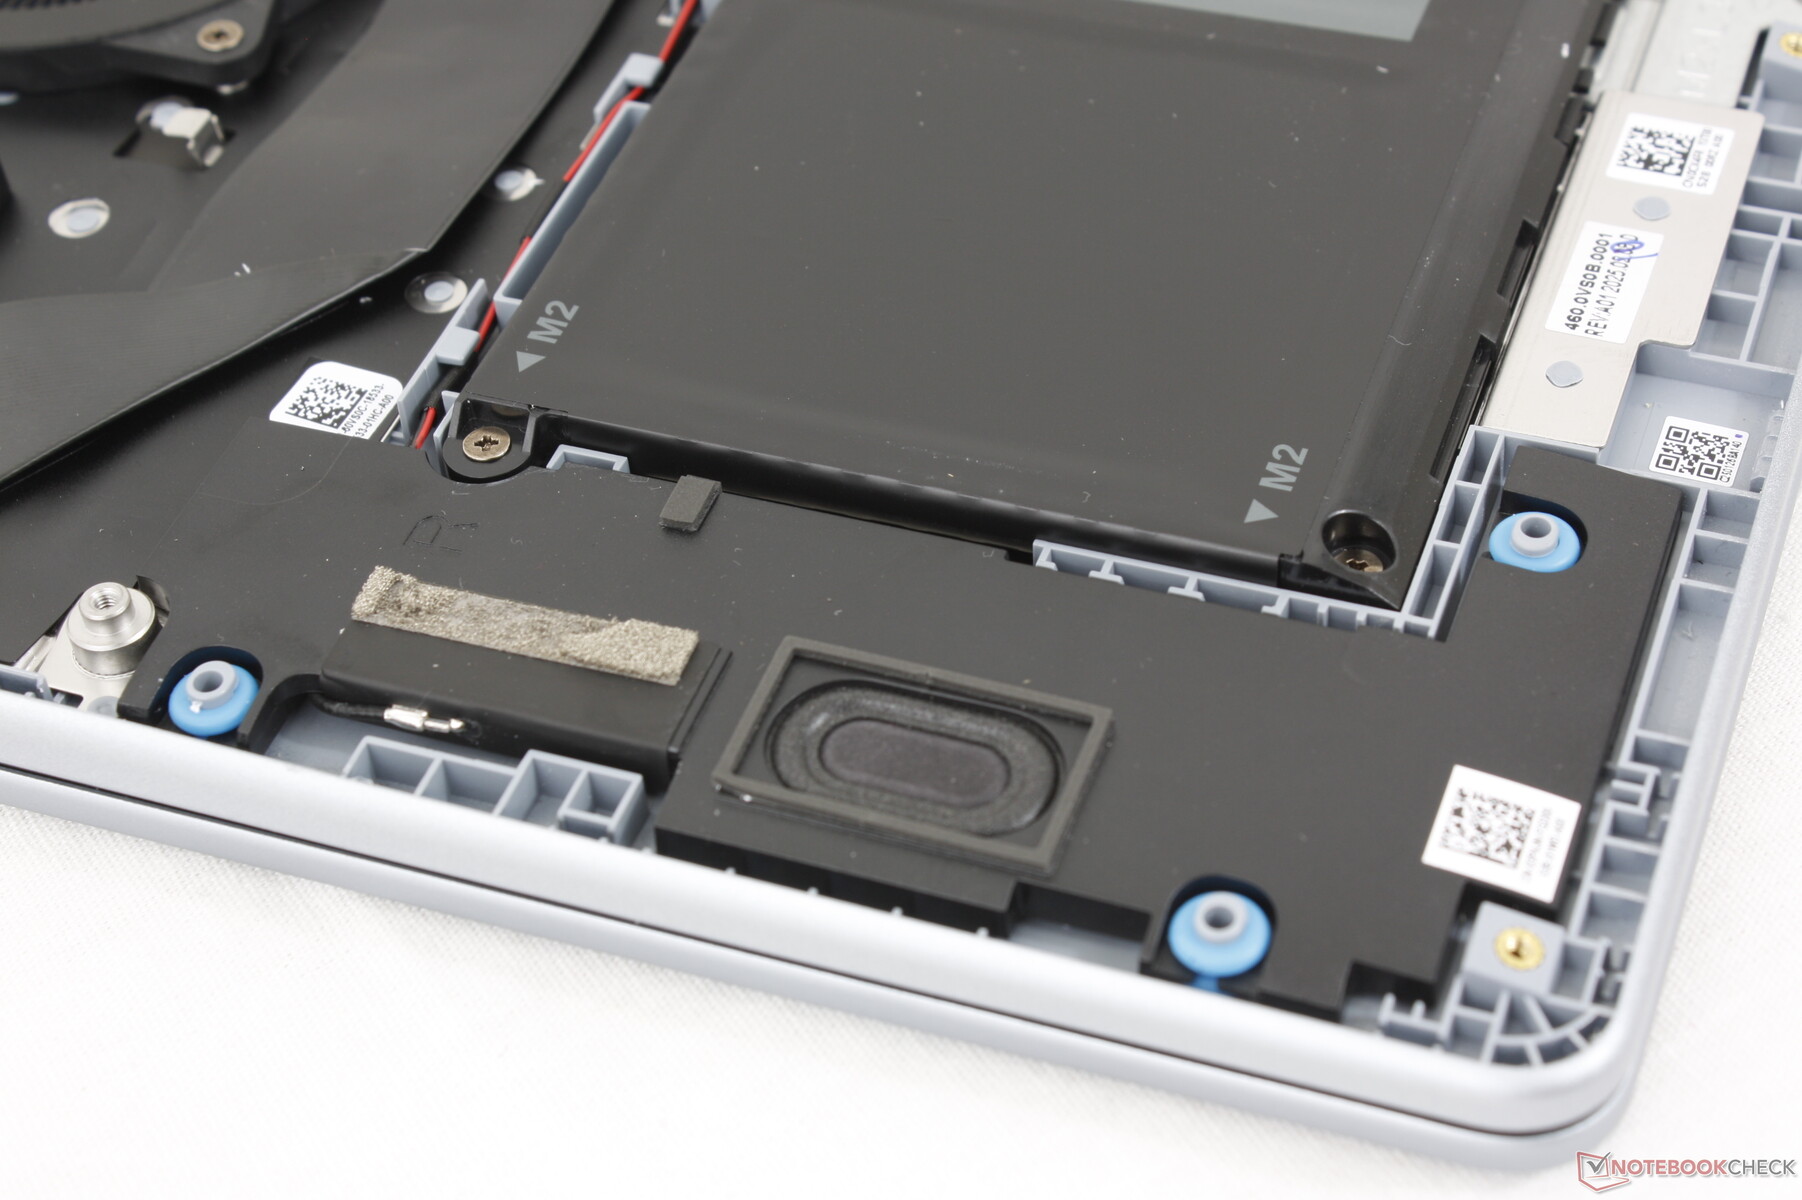
维护
底部由 8 颗十字螺丝固定,可直接进行维修。不过,由于面板边缘与底座的连接比其他大多数笔记本电脑更紧密,因此强烈建议小心操作并使用锋利的刃具。进入机身内部后,用户看不到可拆卸的 SODIMM 模块,只有一个 M.2 2280 存储插槽。
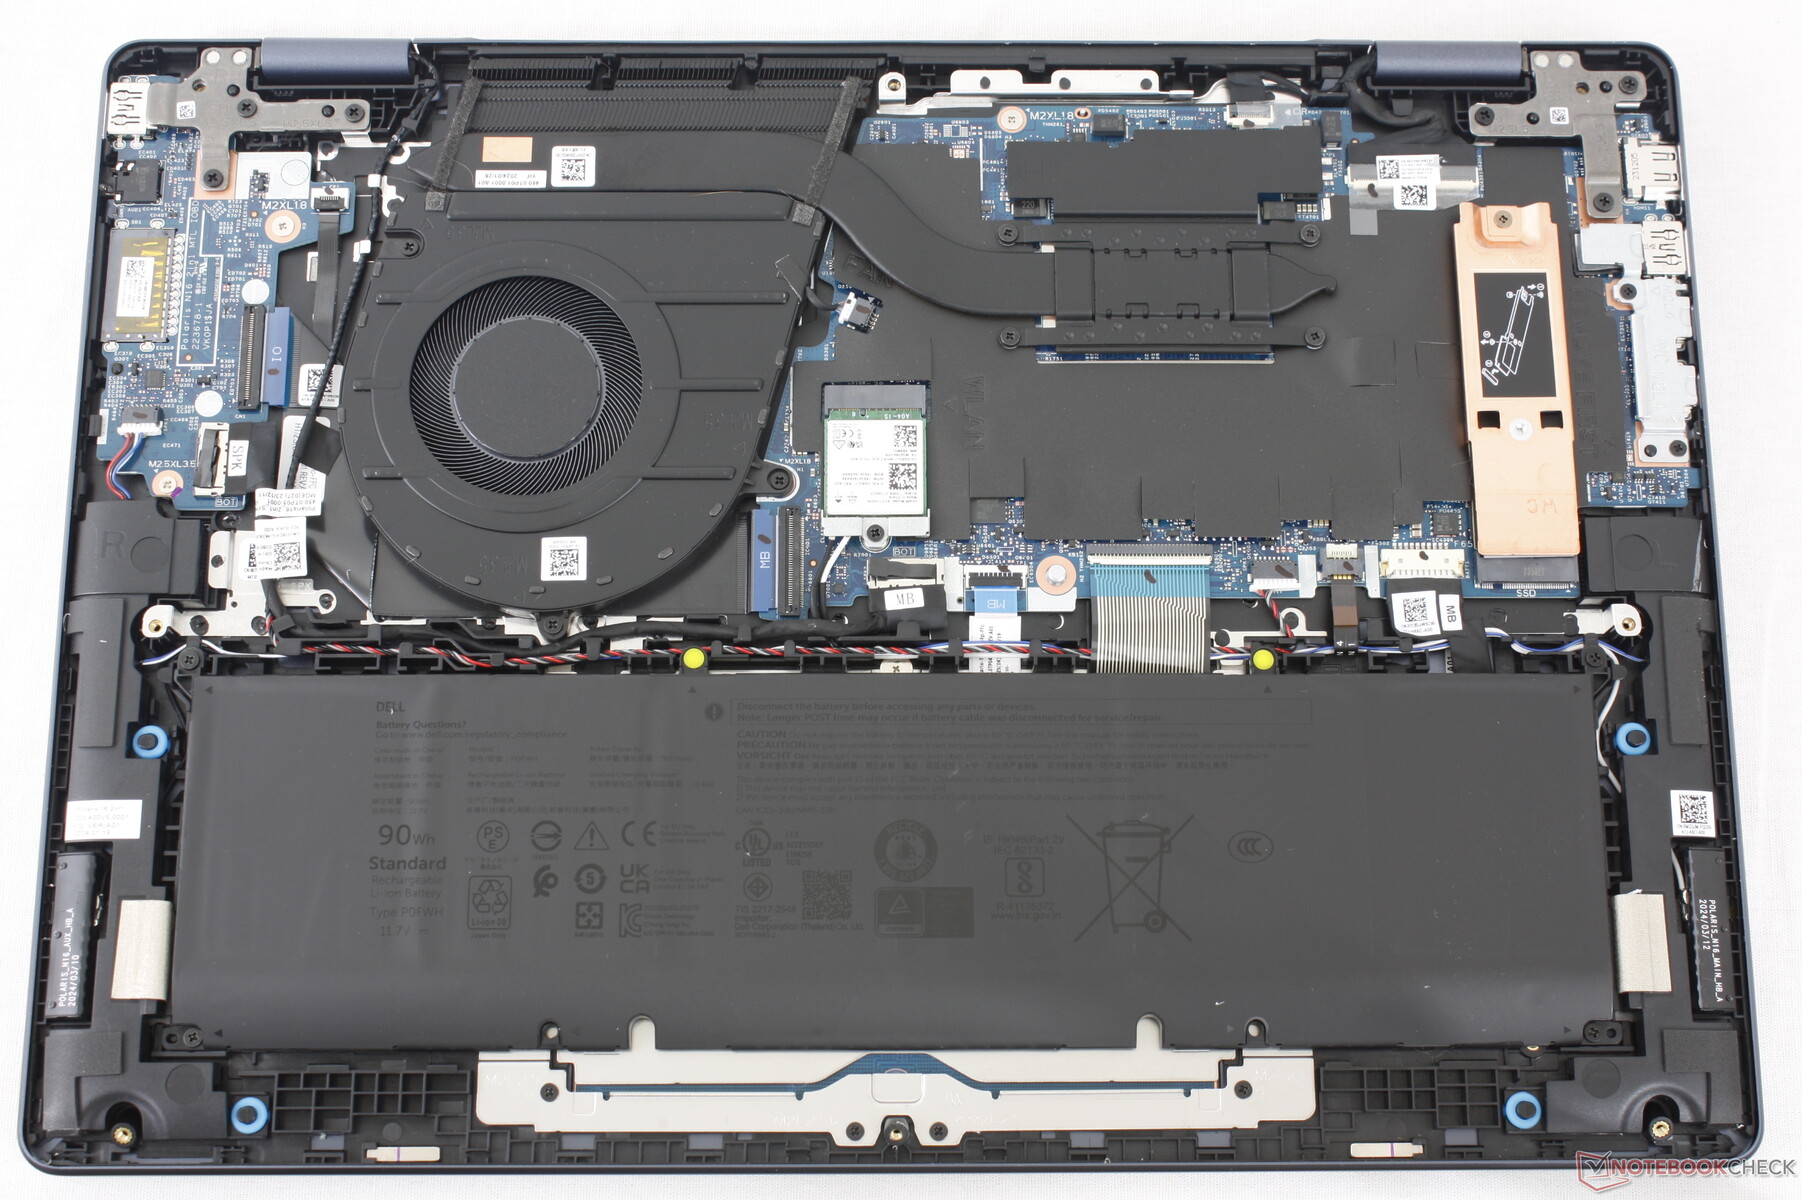
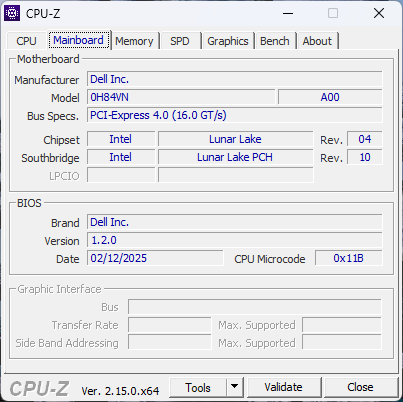
如下图所示,戴尔 16 Plus 与 Inspiron 16 Plus 7640 二合一笔记本共享许多内部功能。
可持续性
该模型在制造过程中使用了可回收的铝、钢和海洋塑料,而包装则完全可以回收利用。
配件和保修
包装盒内除了交流适配器和文件外,没有其他附件。如果在美国购买,制造商通常提供一年有限保修。
输入设备
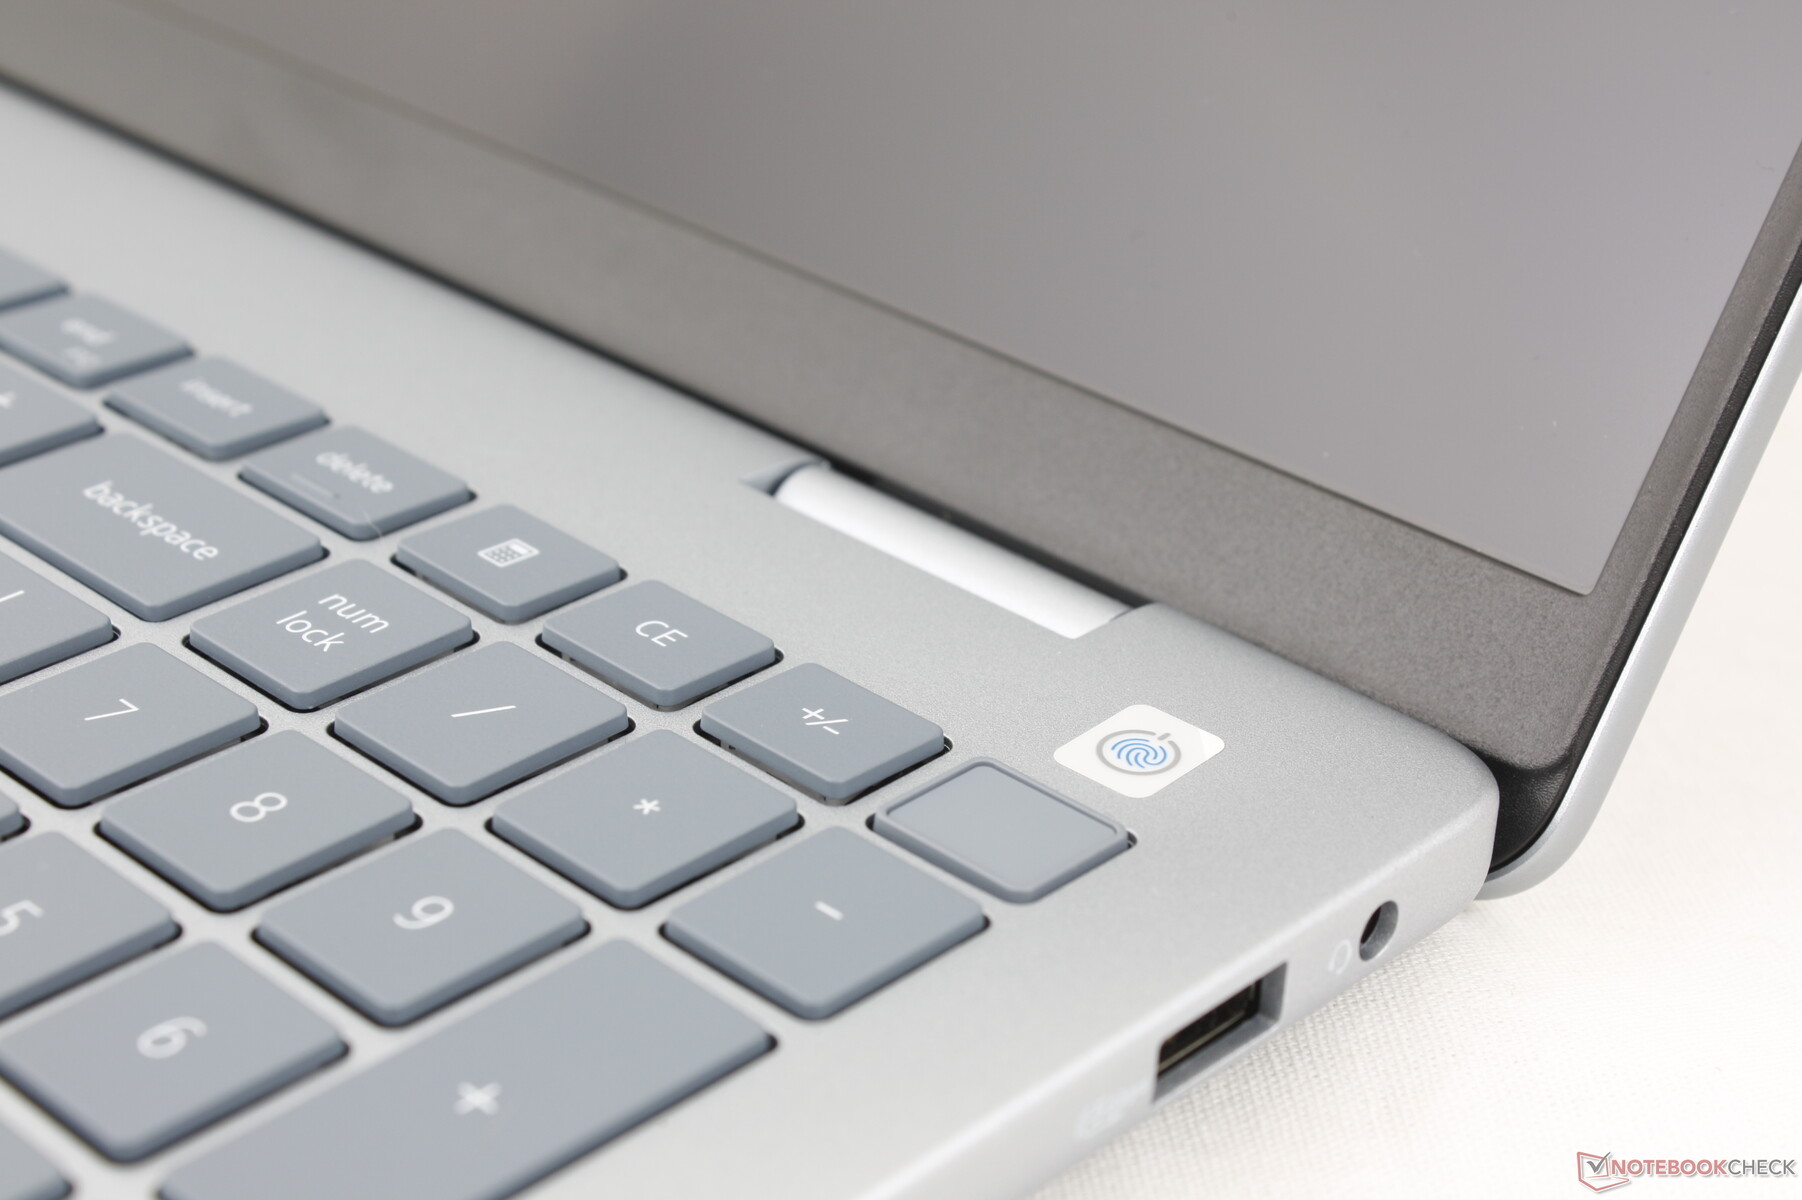
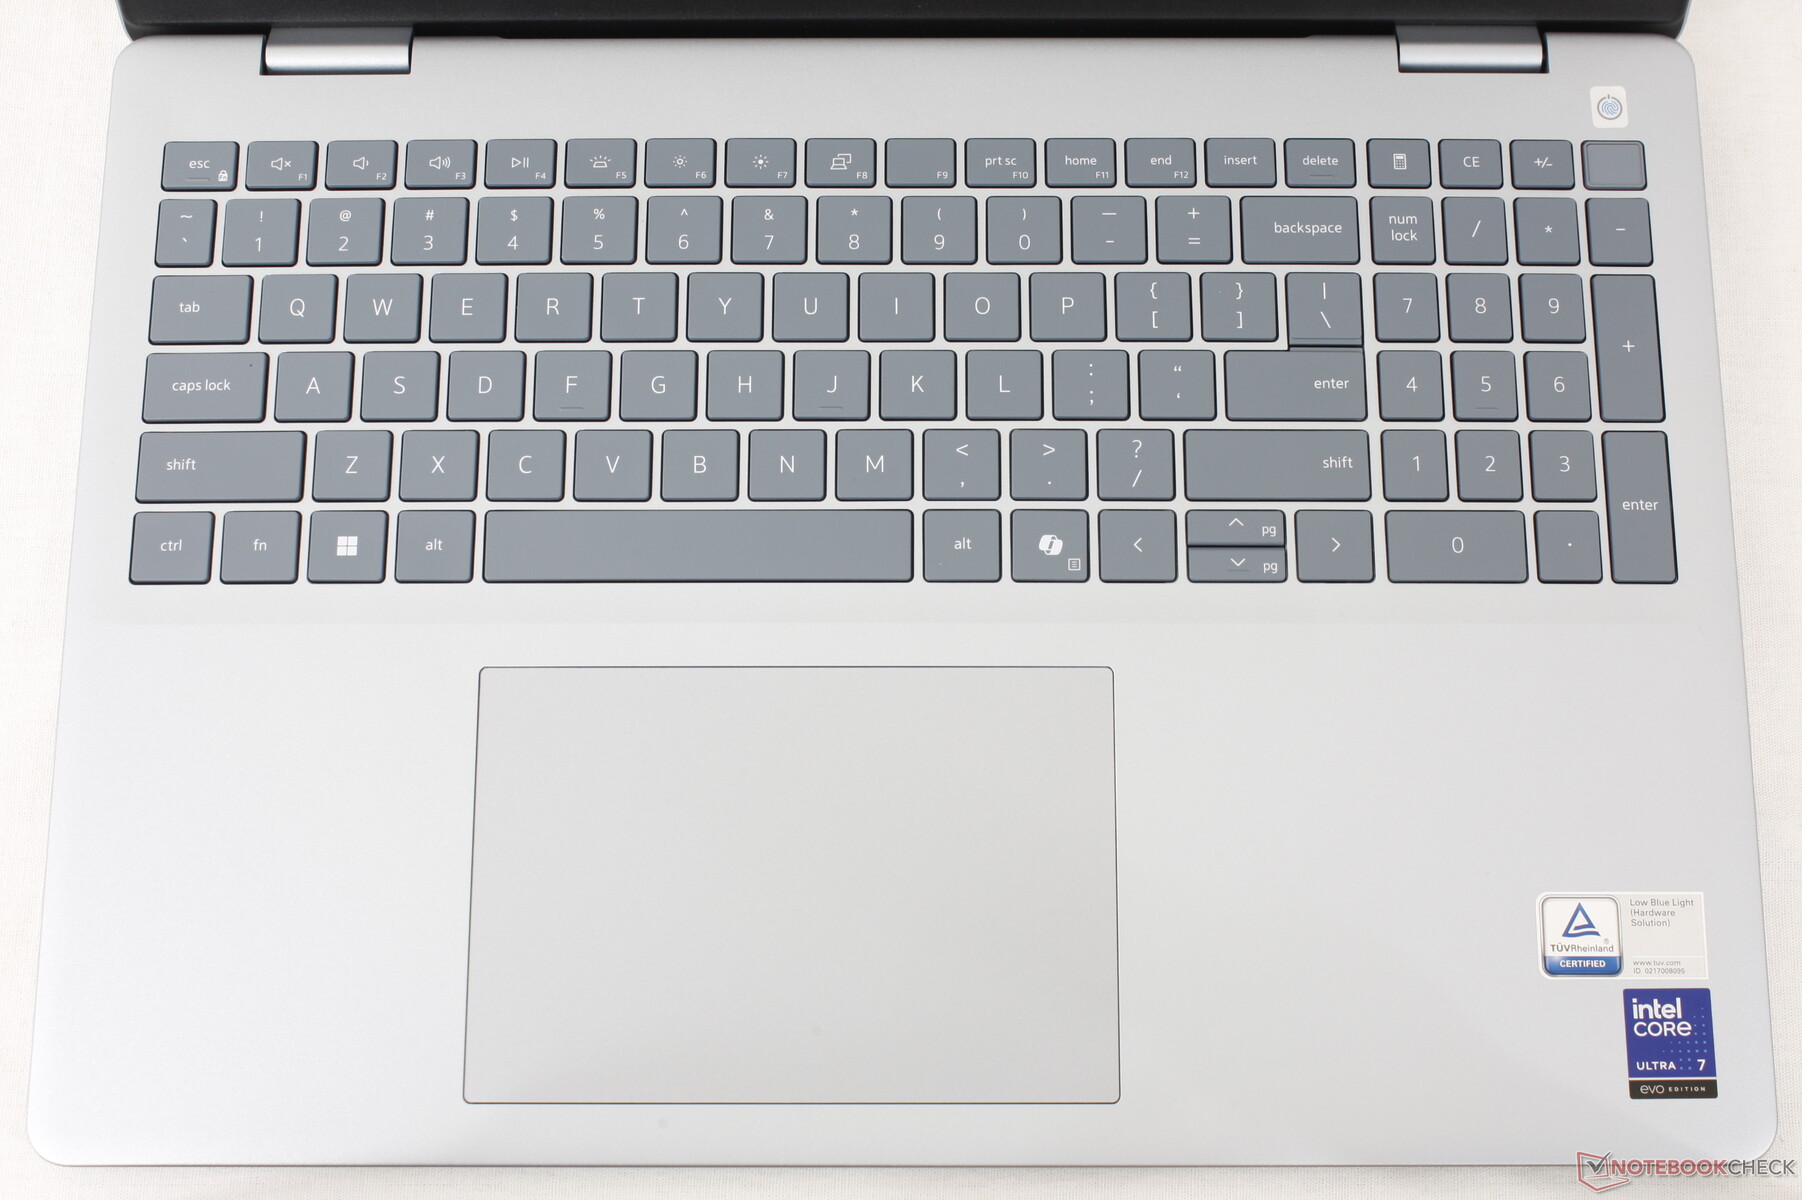
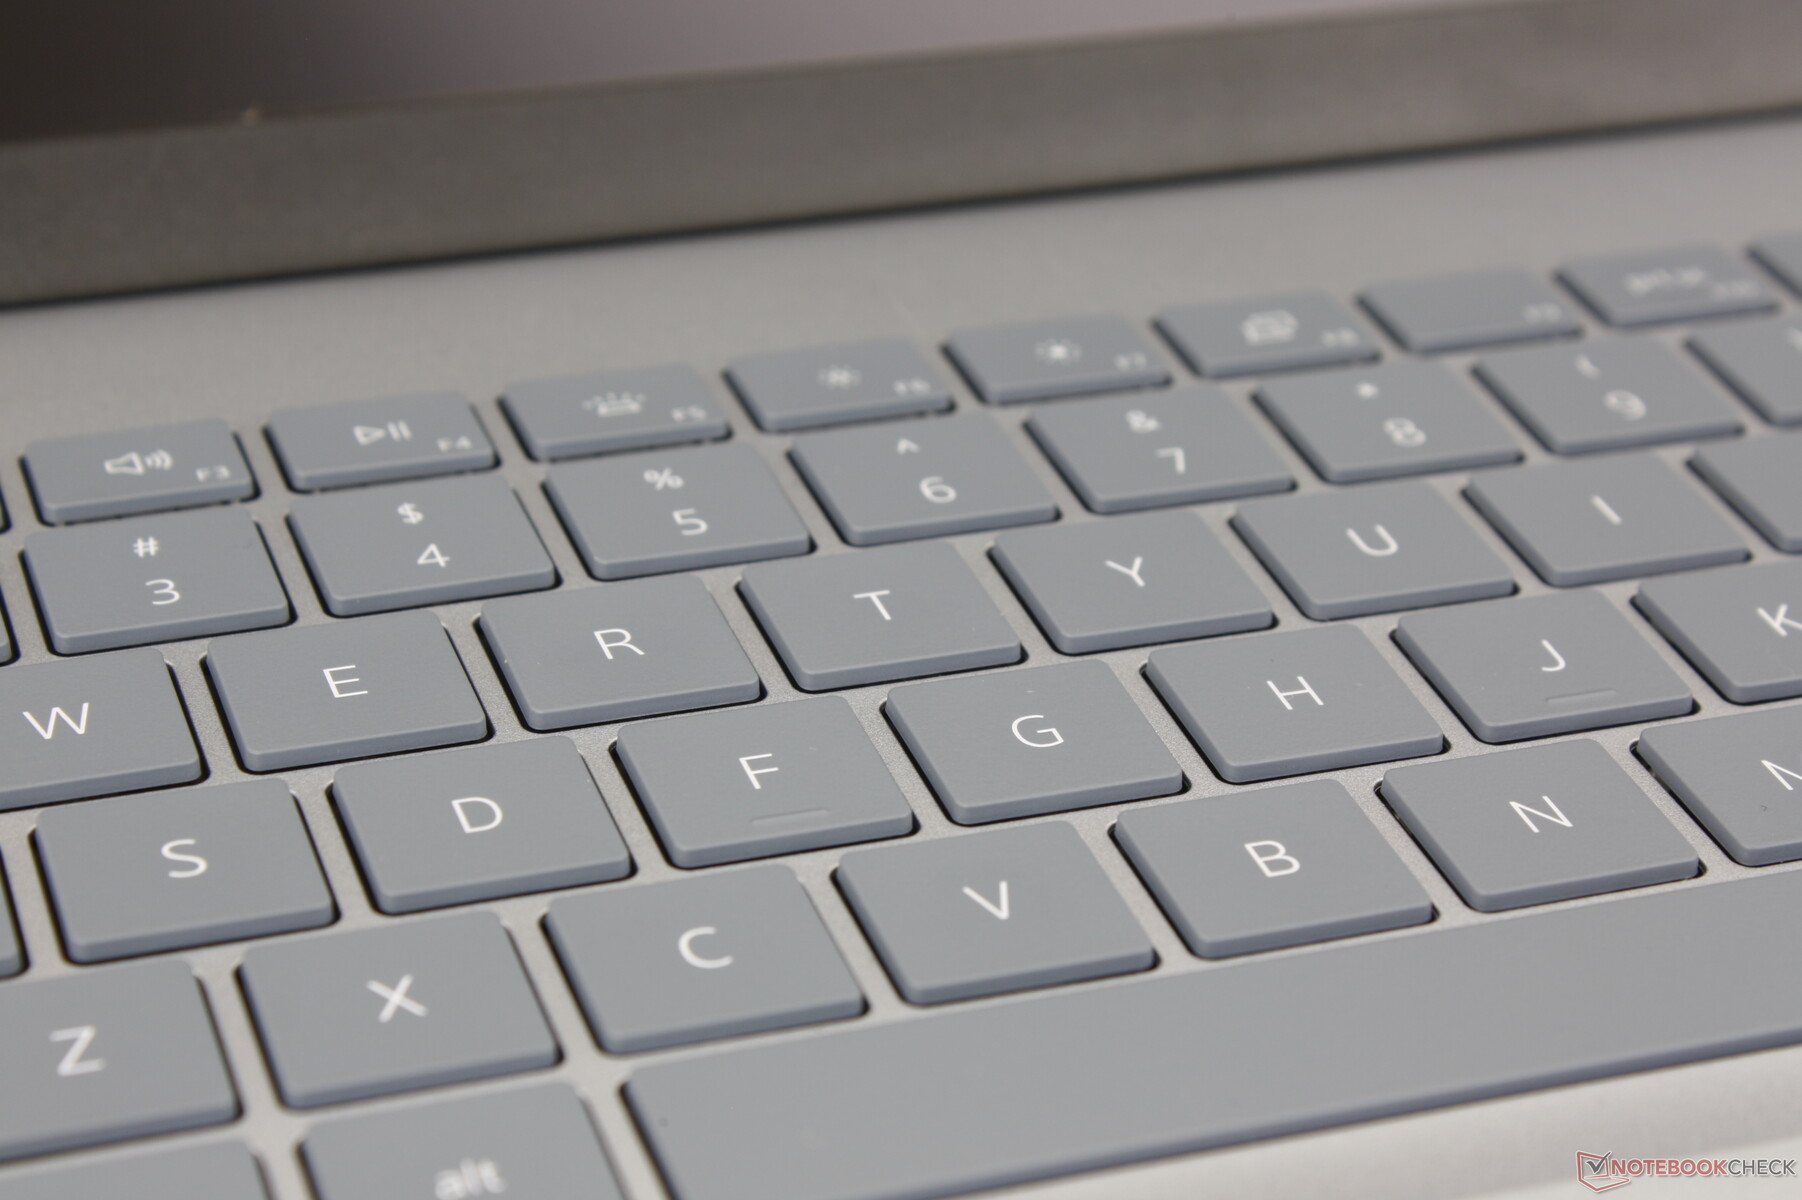
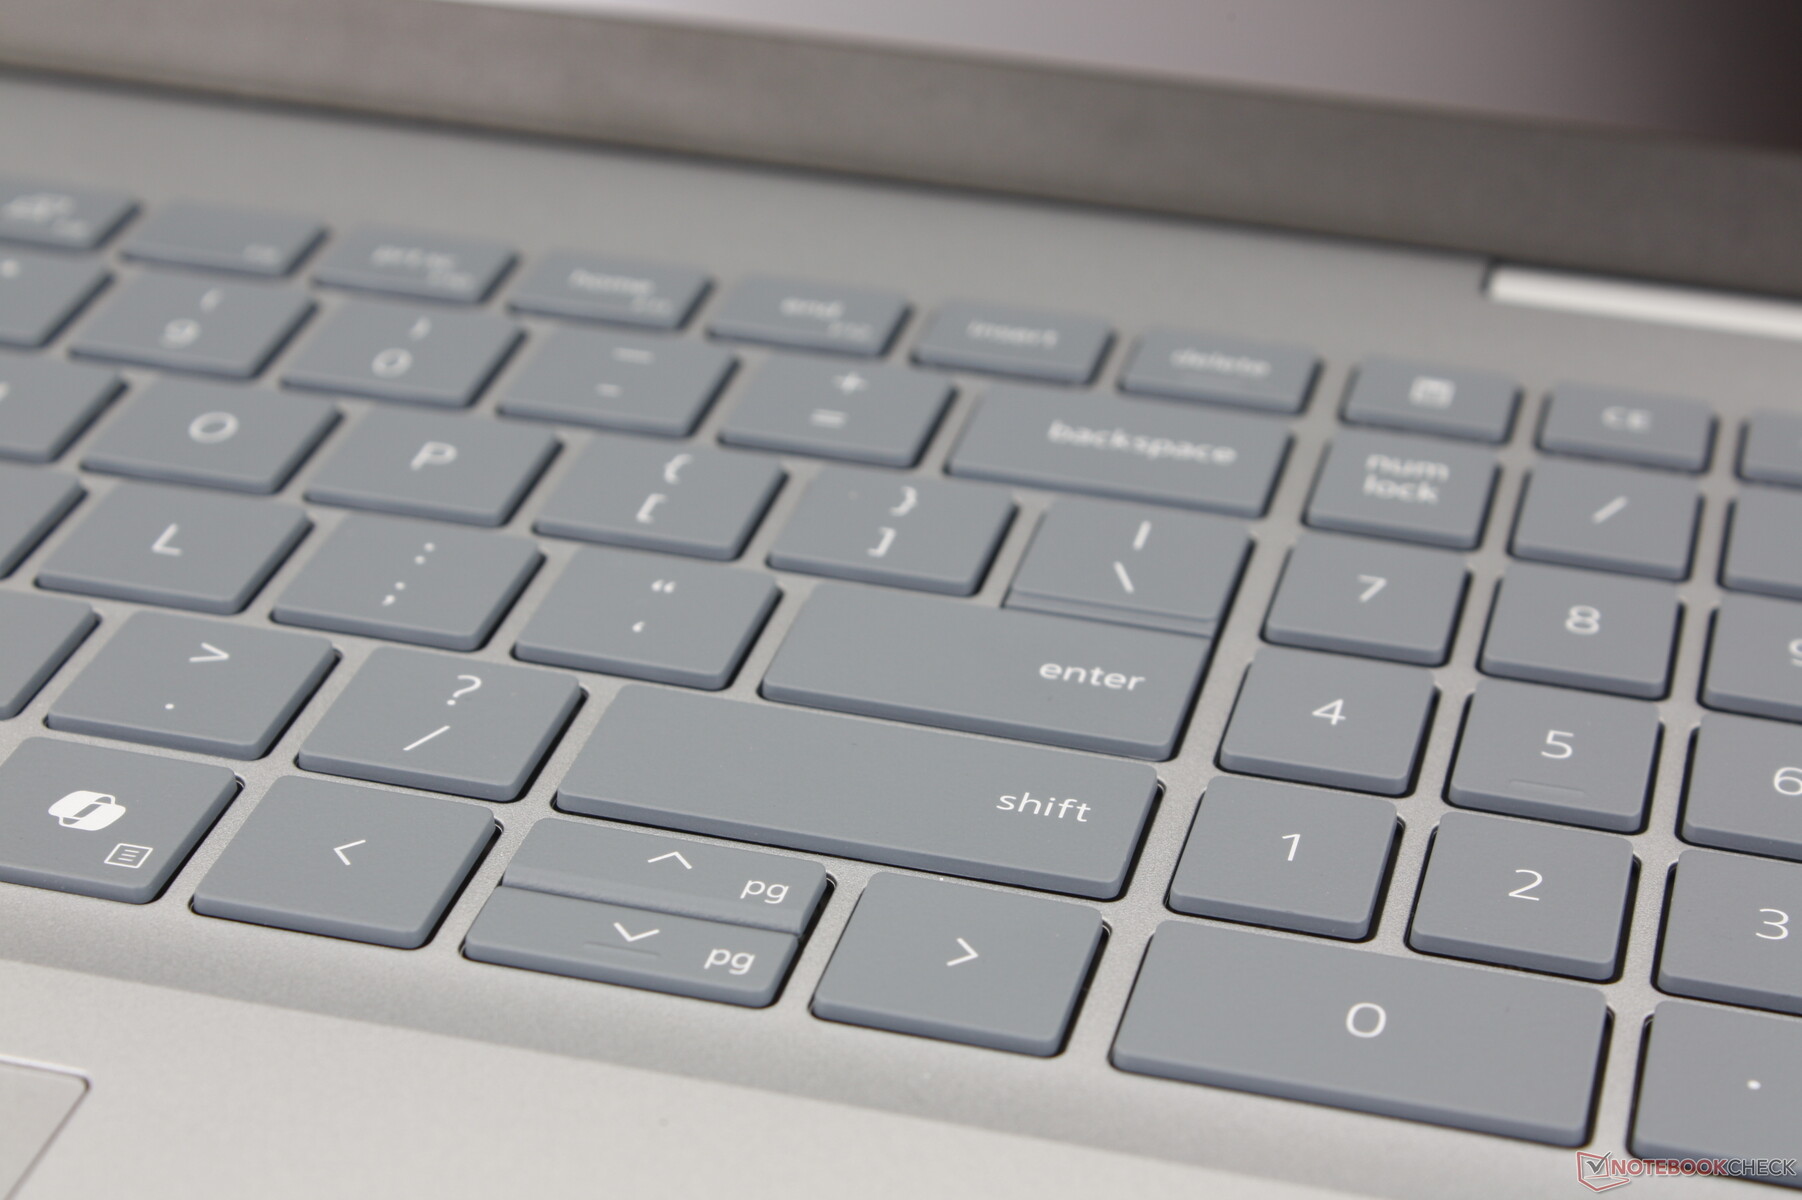
键盘
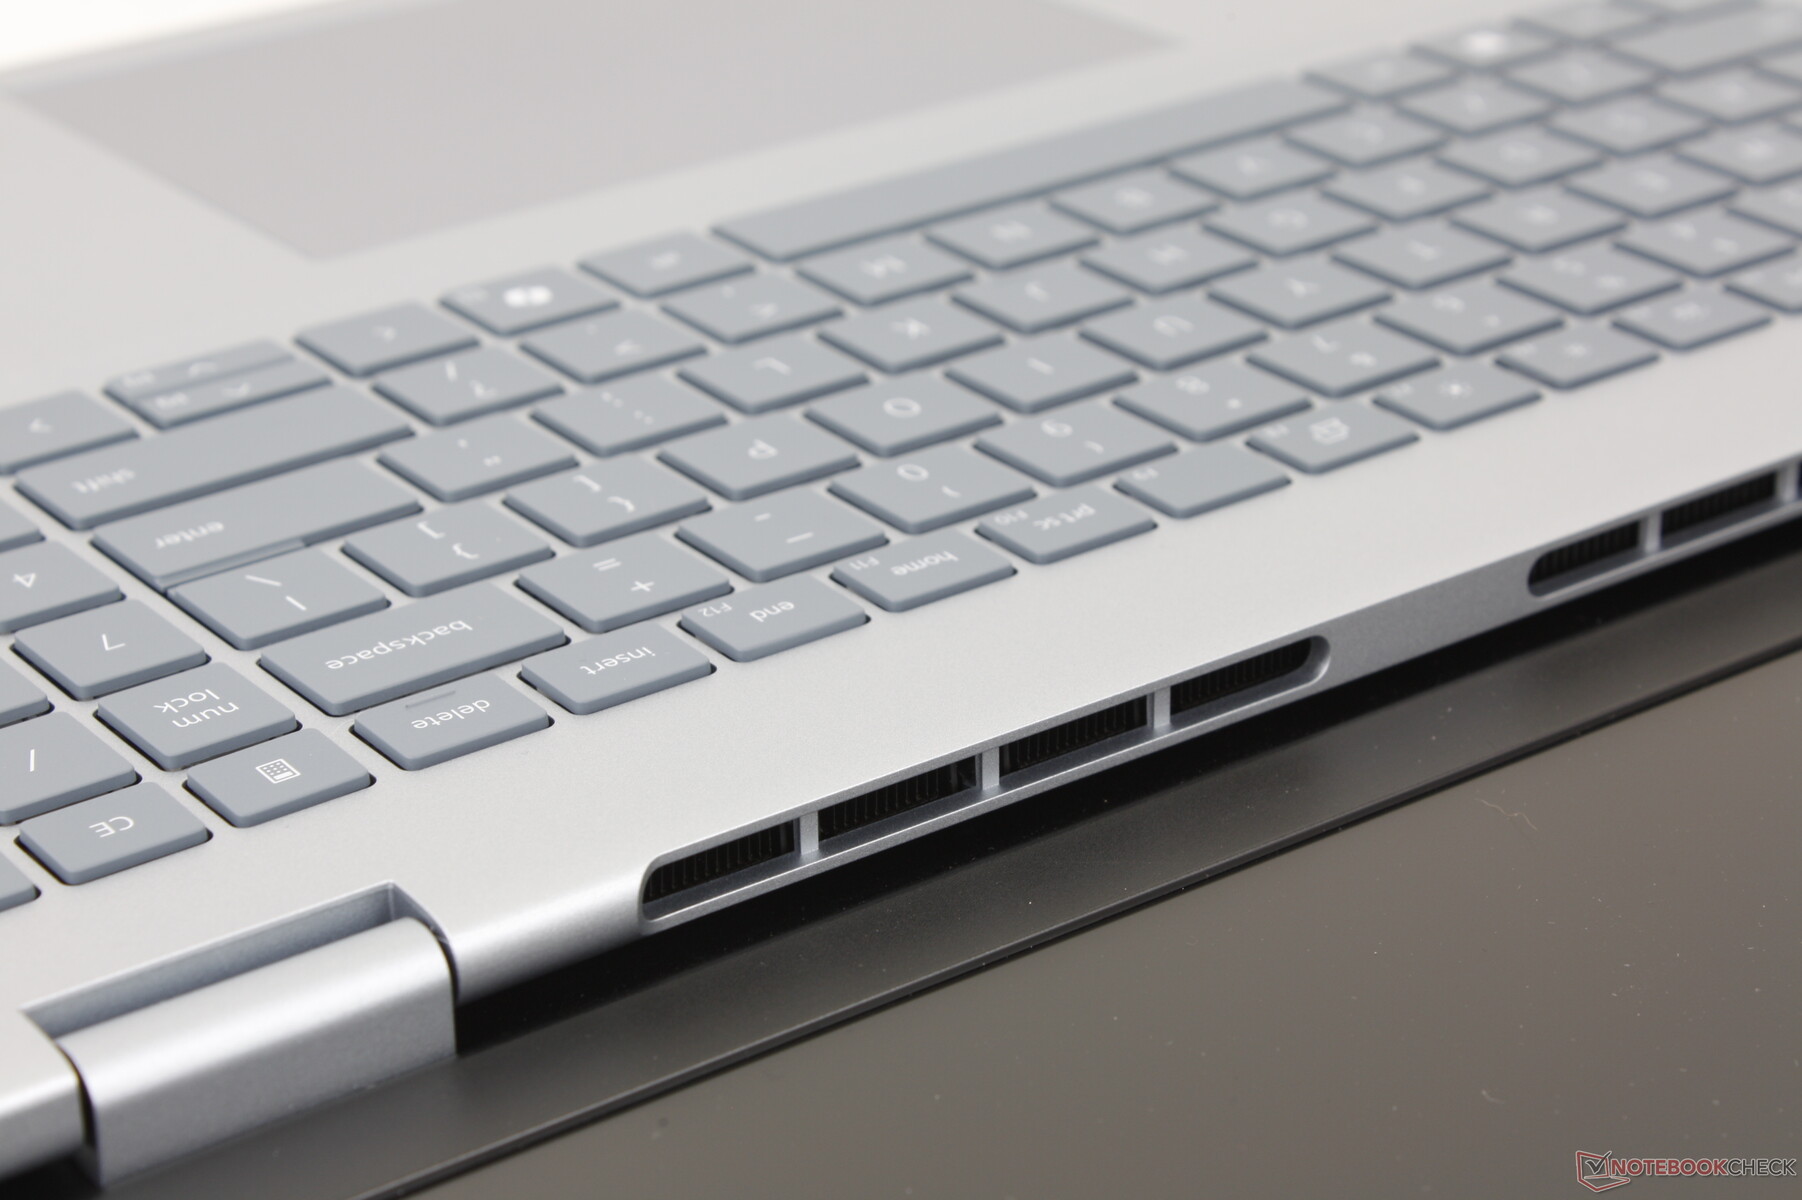
戴尔 16 Plus 引入了集成数字键盘,而 Inspiron 16 Plus 7640 系列则没有这项功能。在其他方面,输入体验与老一代 Inspiron 机型相似,好坏不一。按键反馈偏软,但空格键的声音和咔嗒声还算不错。
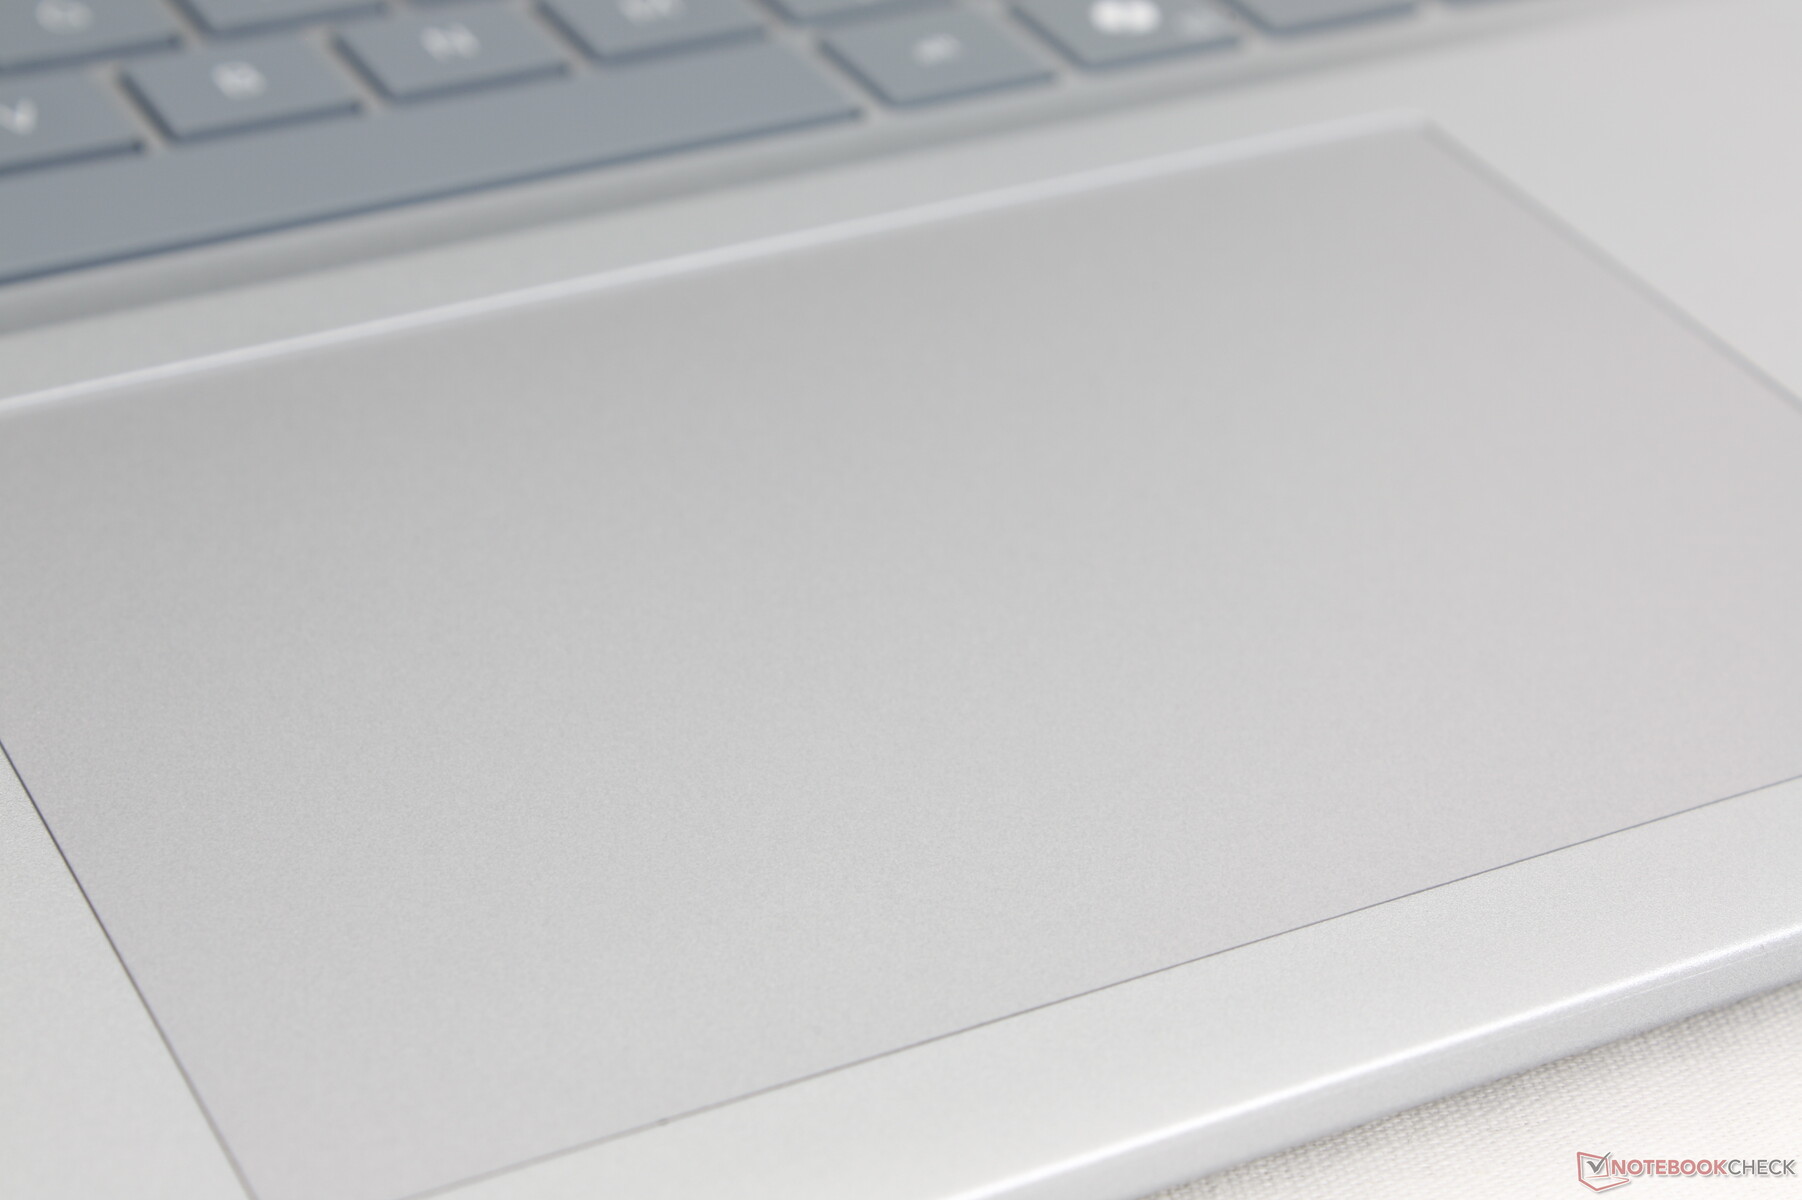
触摸板
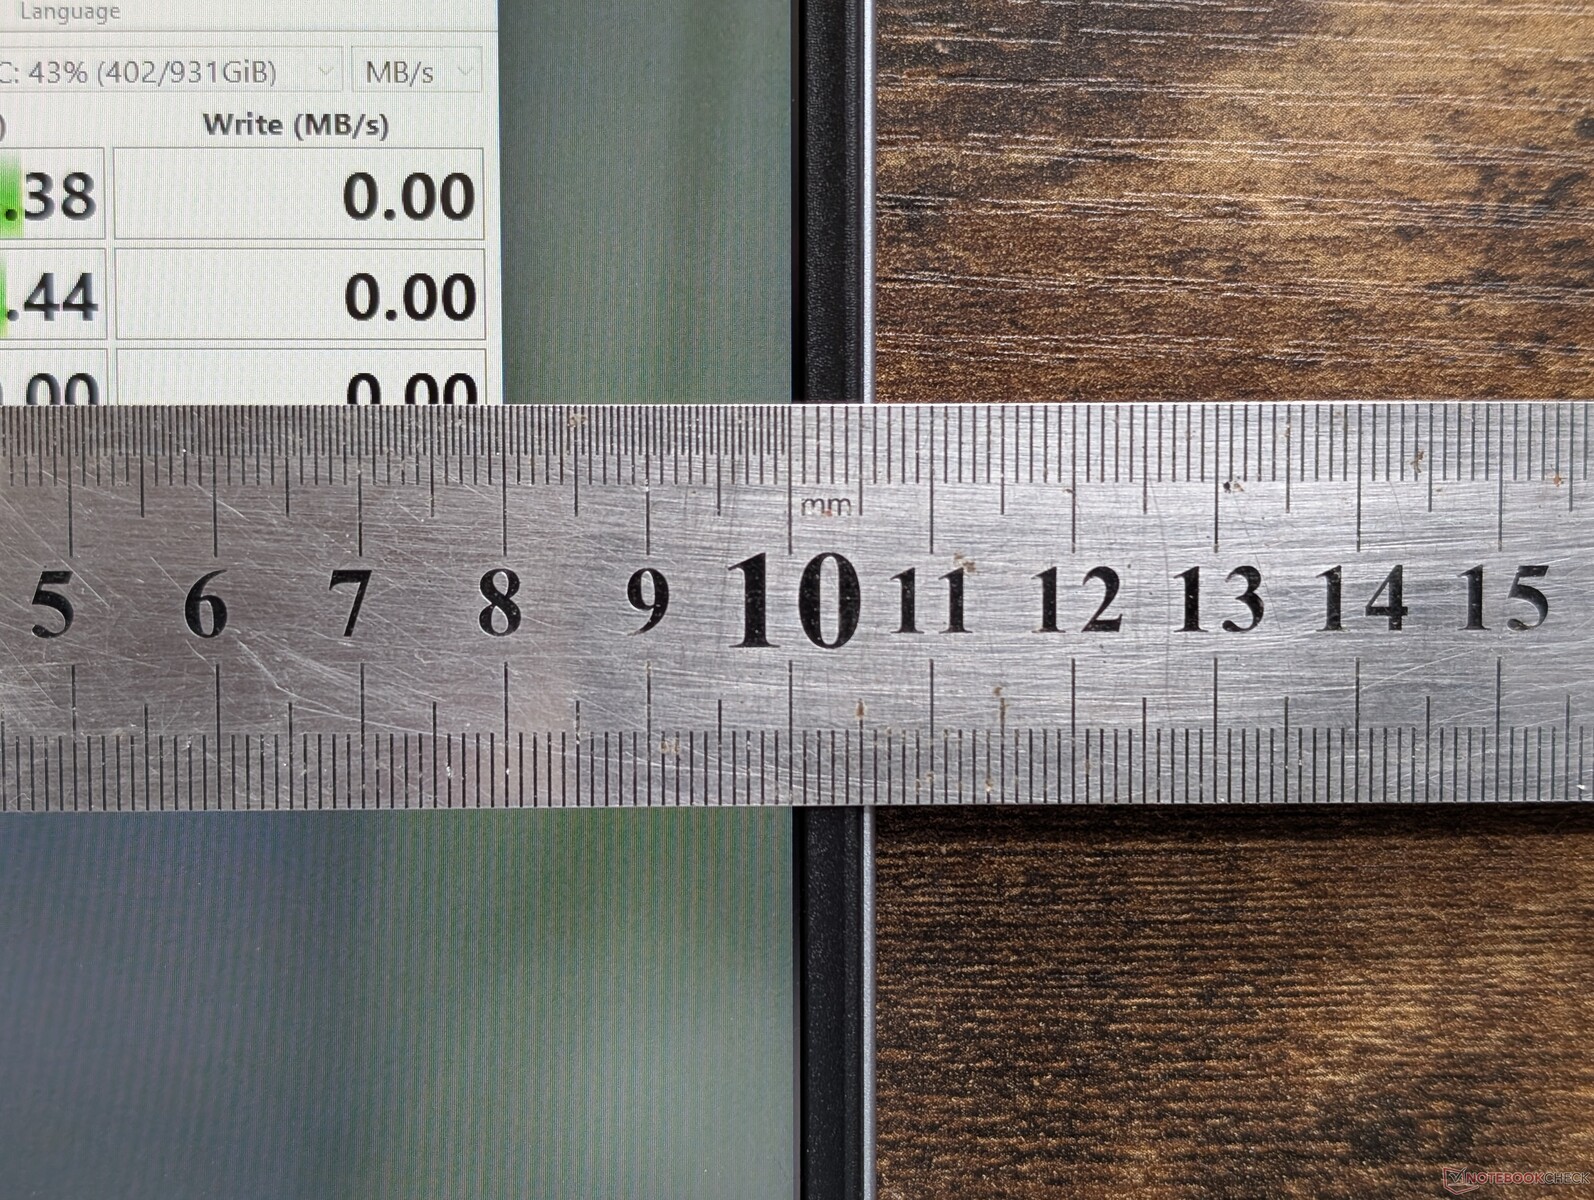
虽然键盘的功能有所扩展,但点击板的尺寸(13.3 x 9 厘米)仍与 Inspiron 16 Plus 7640 二合一笔记本相同。它既大又宽敞,可以进行舒适的光标控制和多点触控输入,但在其表面点击需要比其他大多数笔记本电脑更大的力量。
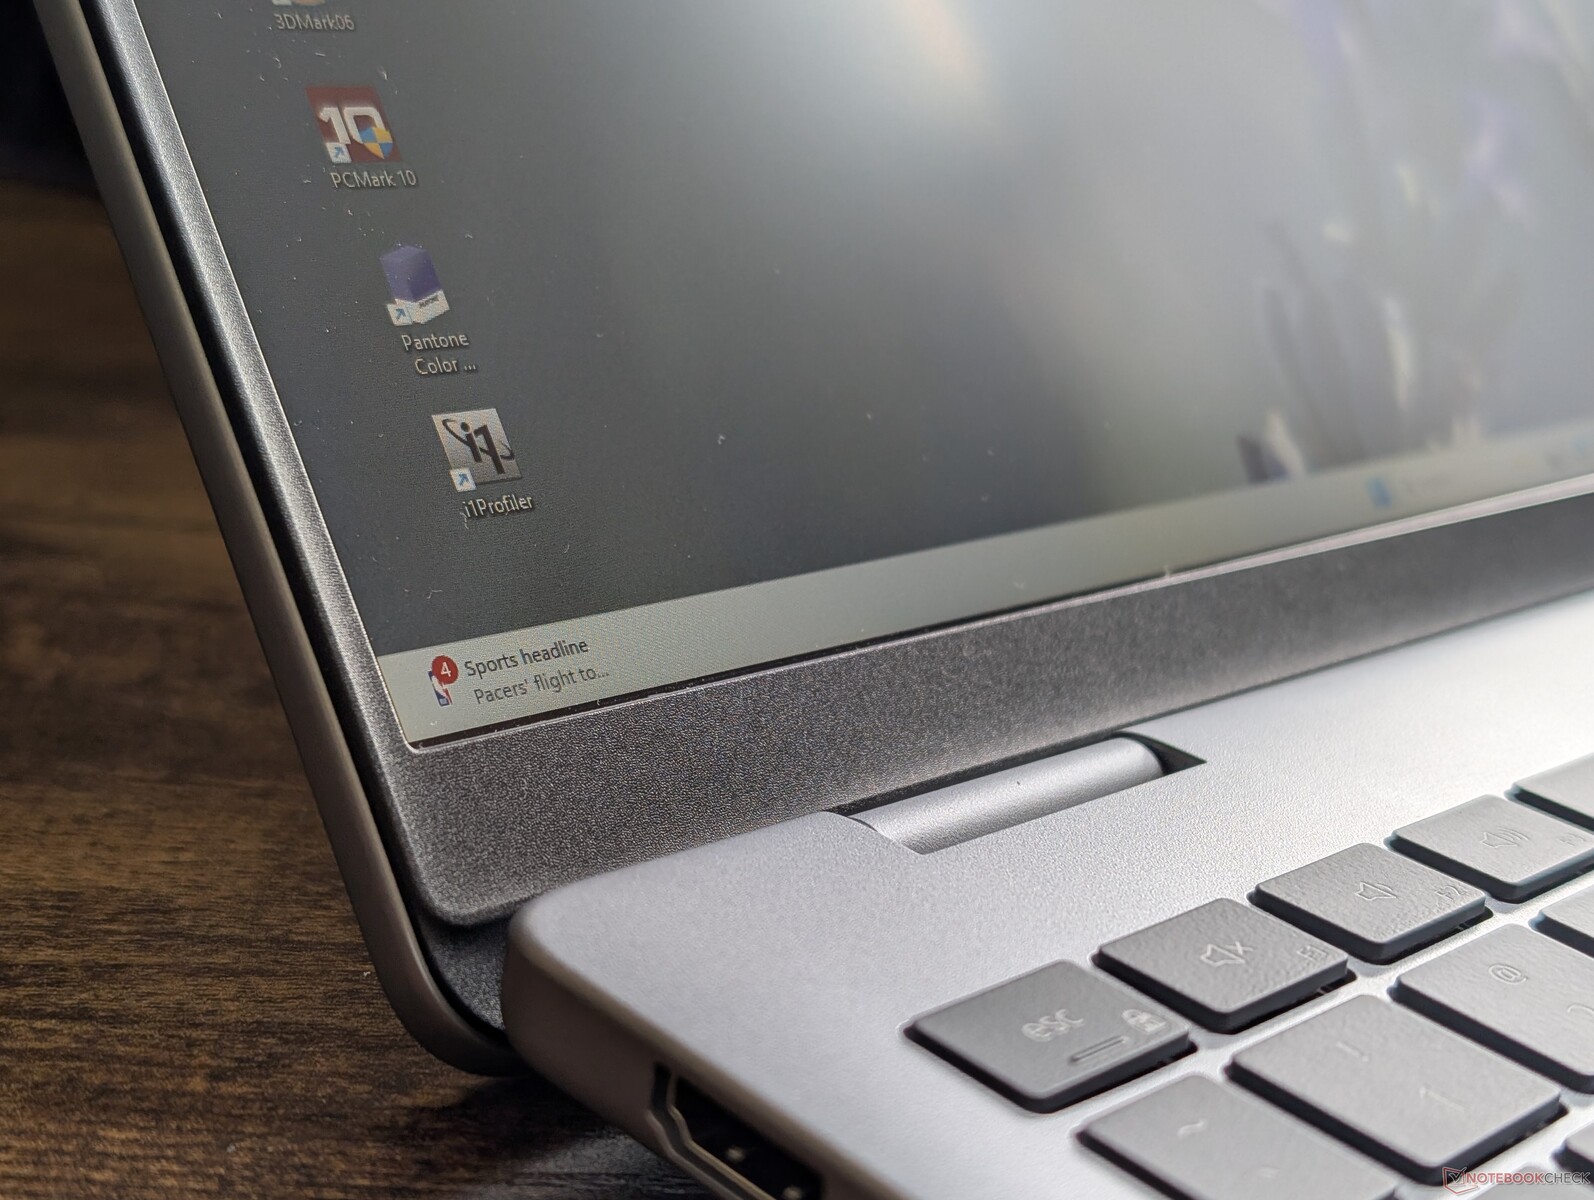
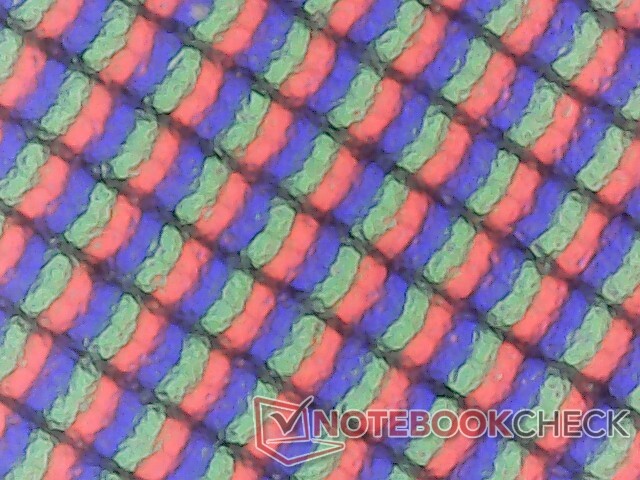
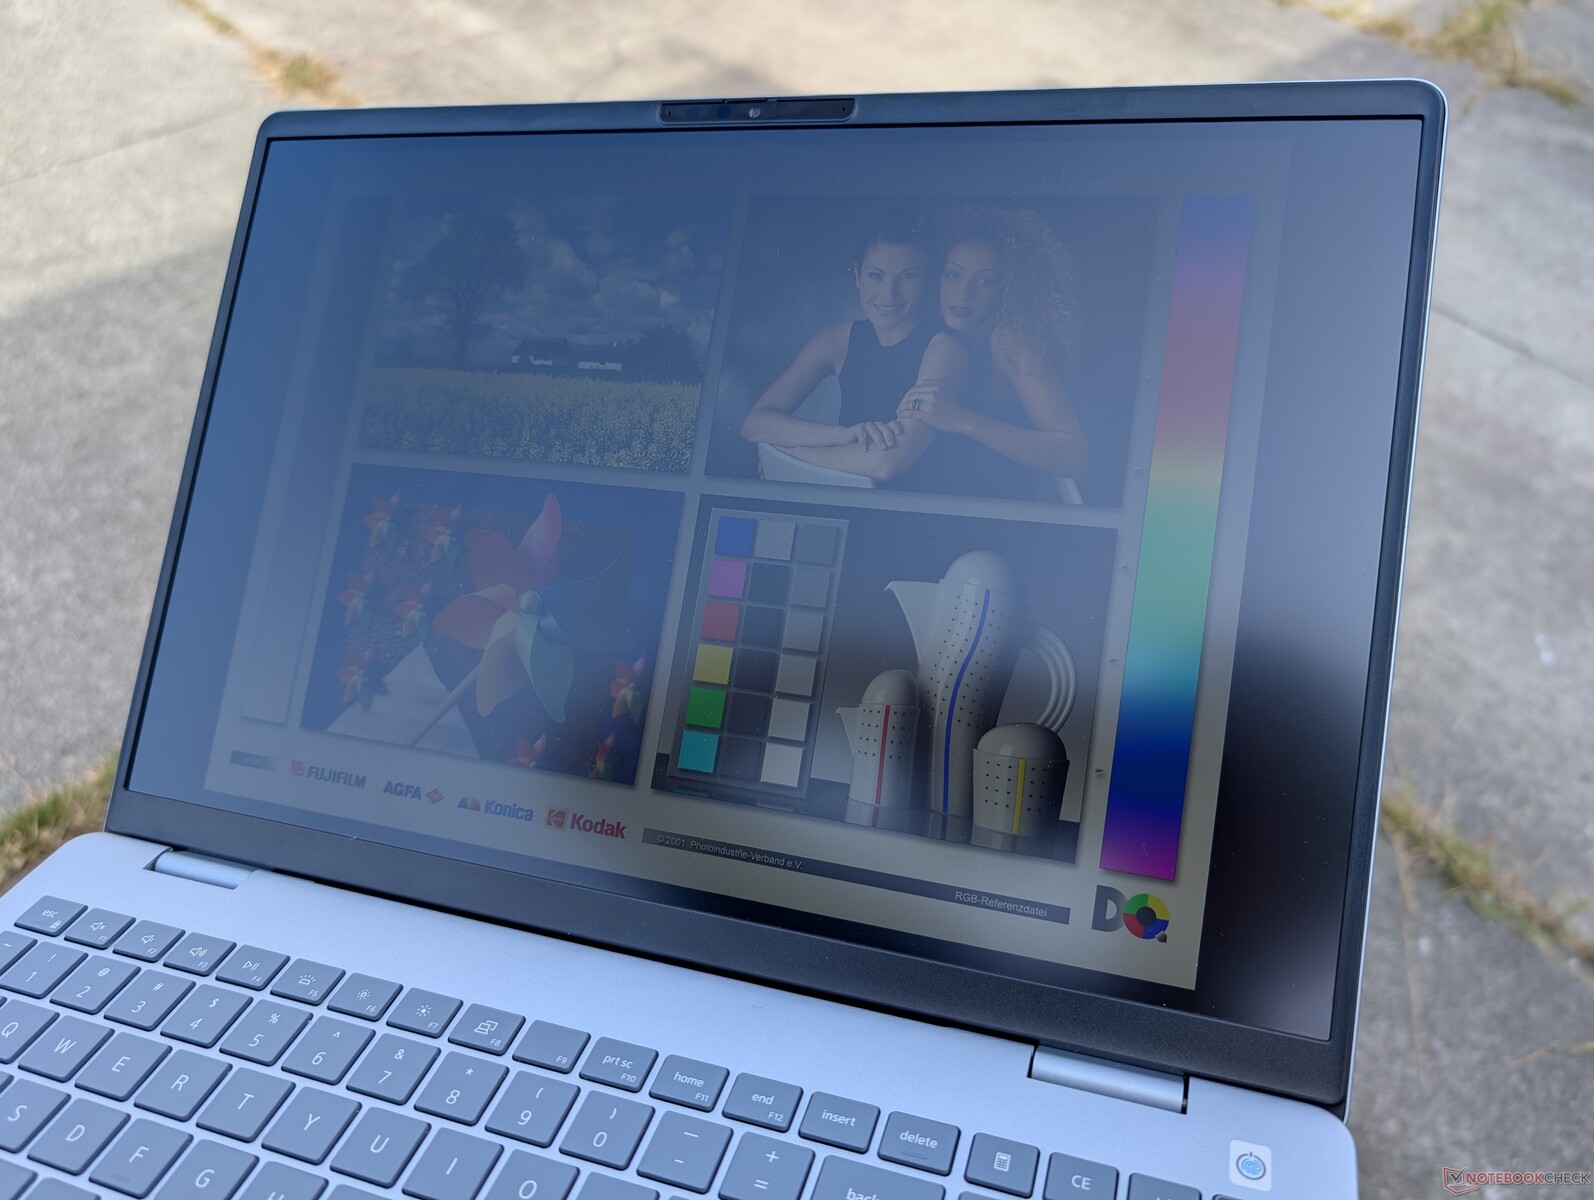
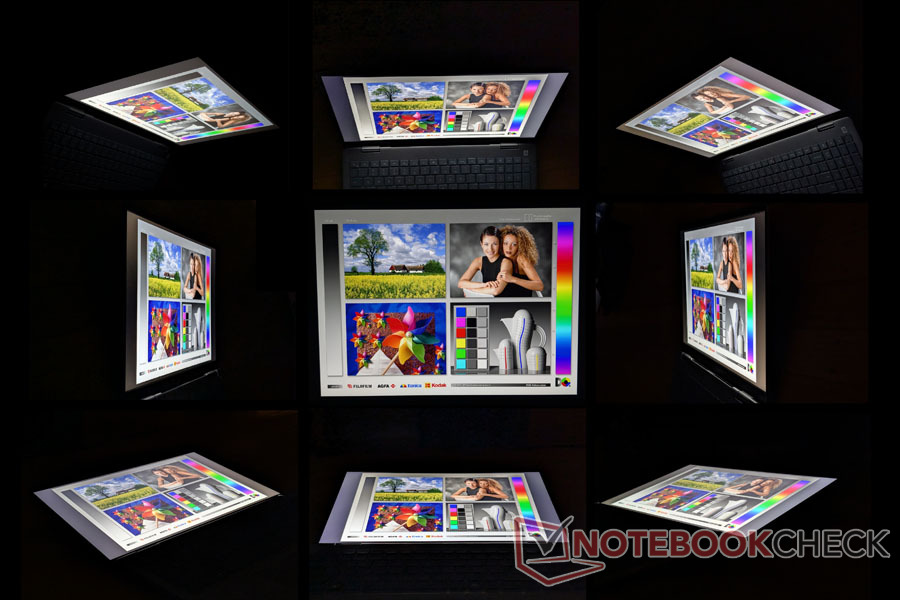
显示屏 - 120 Hz 和全 sRGB 色彩
戴尔 16 Plus 采用与 Inspiron 16 Plus 7640 相同的友达光电 B160QAN IPS 面板。 Inspiron 16 Plus 7640两者的观看体验基本相同。即便如此,我们还是希望看到亮度和 HDR 支持方面的改进。
90 Hz mini-LED 配置很可能与去年的 Inspiron 16 7640 2 合 1 上的面板相同。
| |||||||||||||||||||||||||
Brightness Distribution: 88 %
Center on Battery: 335.6 cd/m²
Contrast: 1525:1 (Black: 0.22 cd/m²)
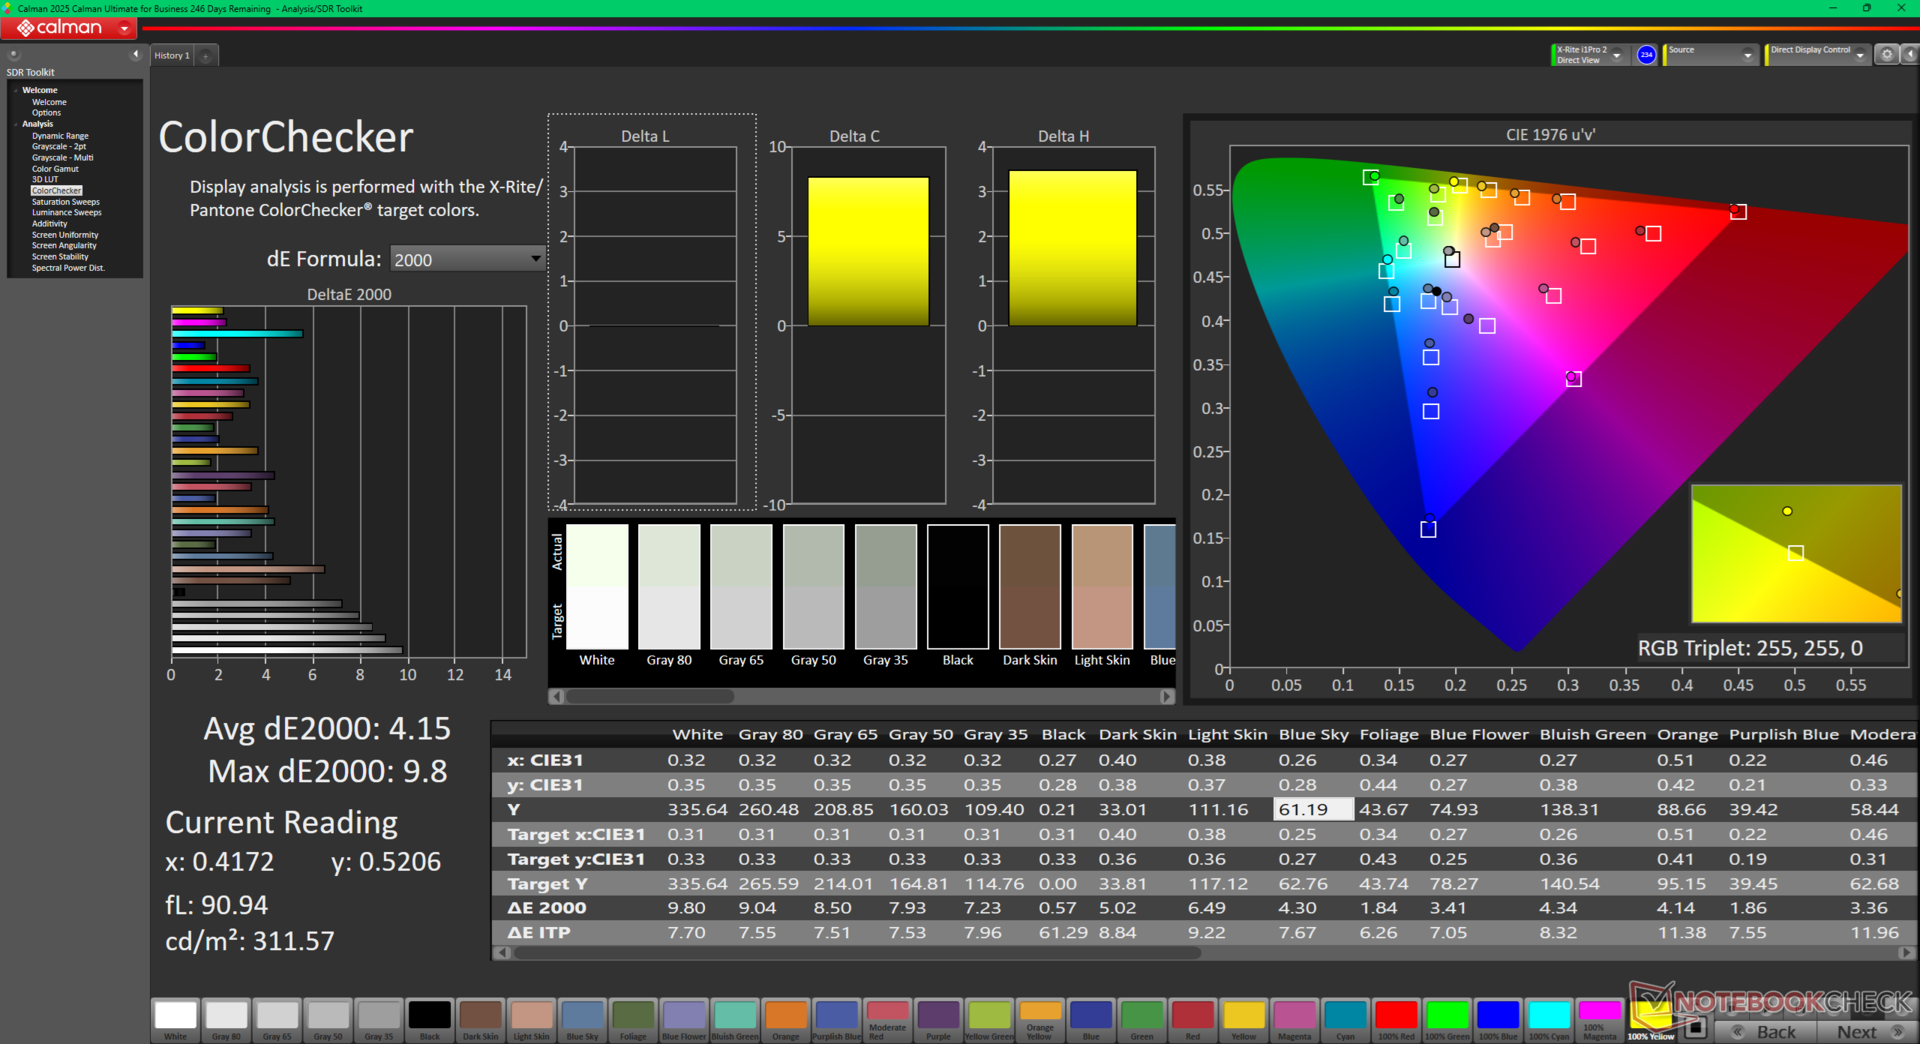
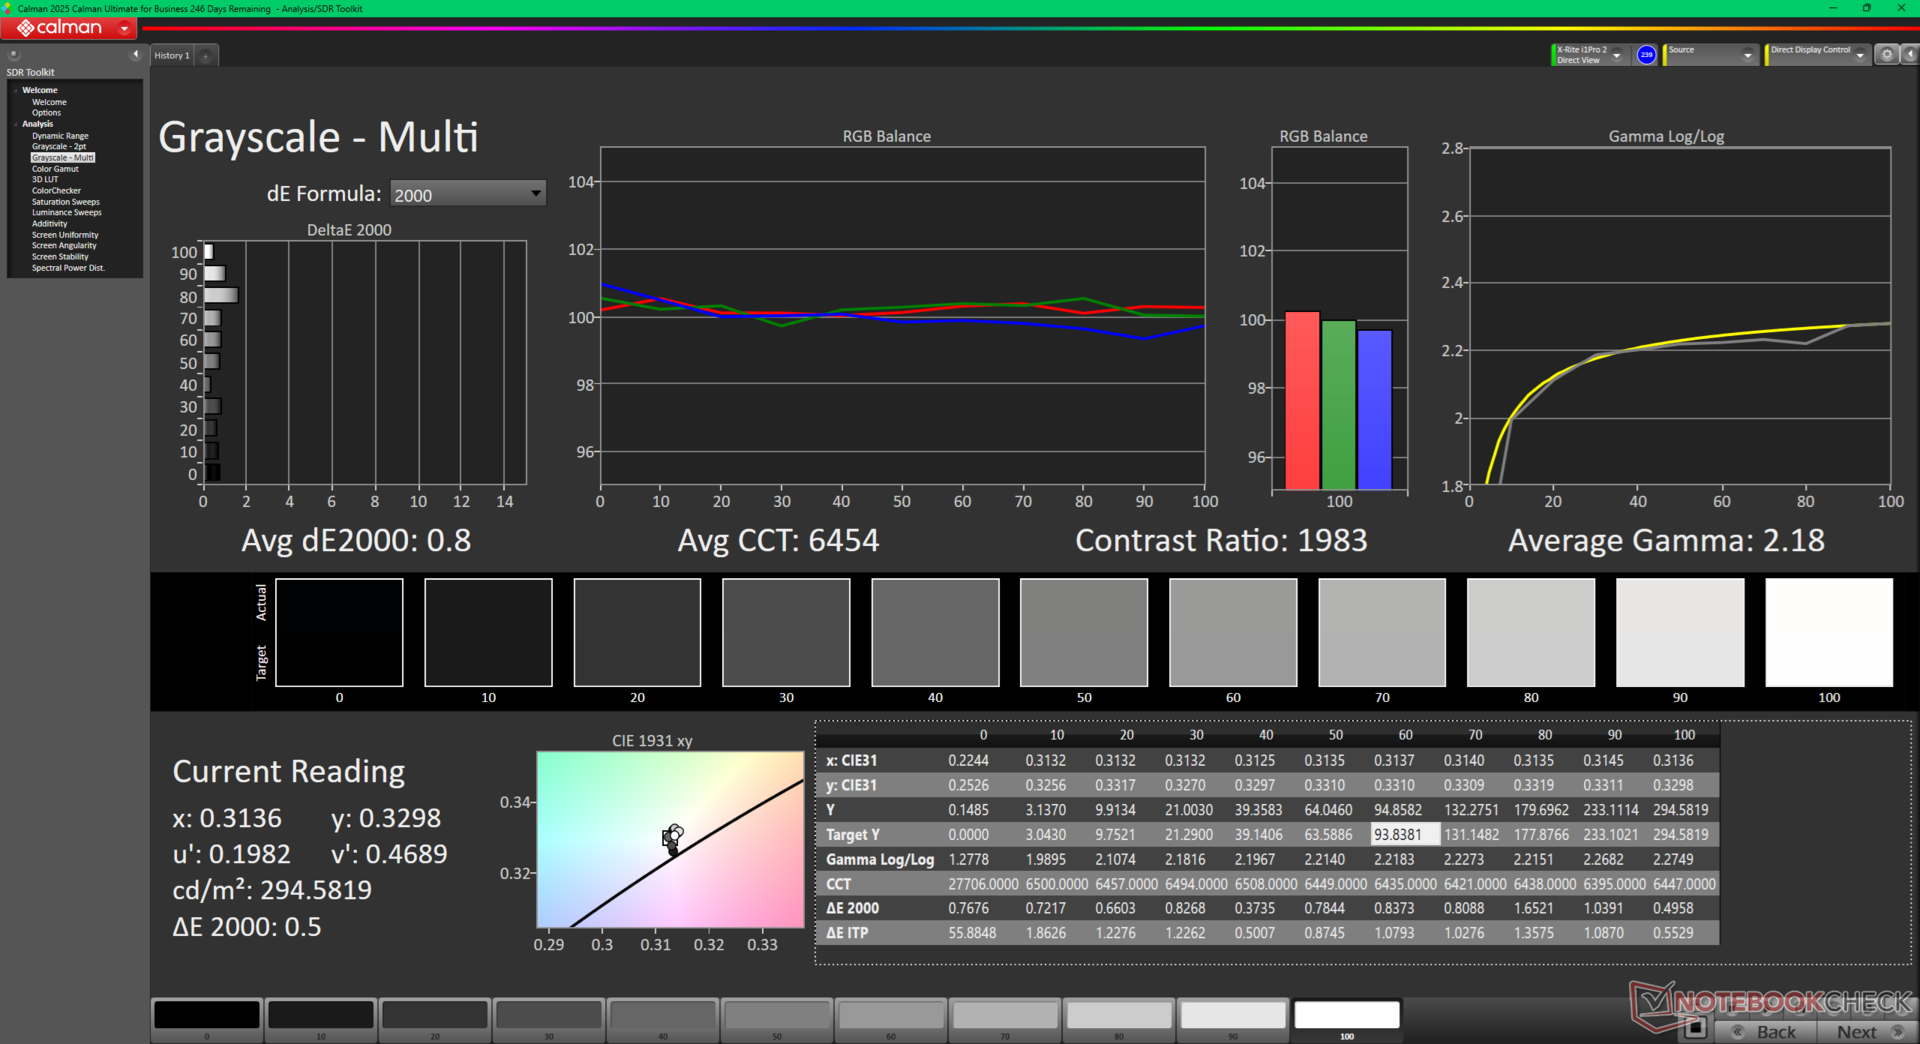
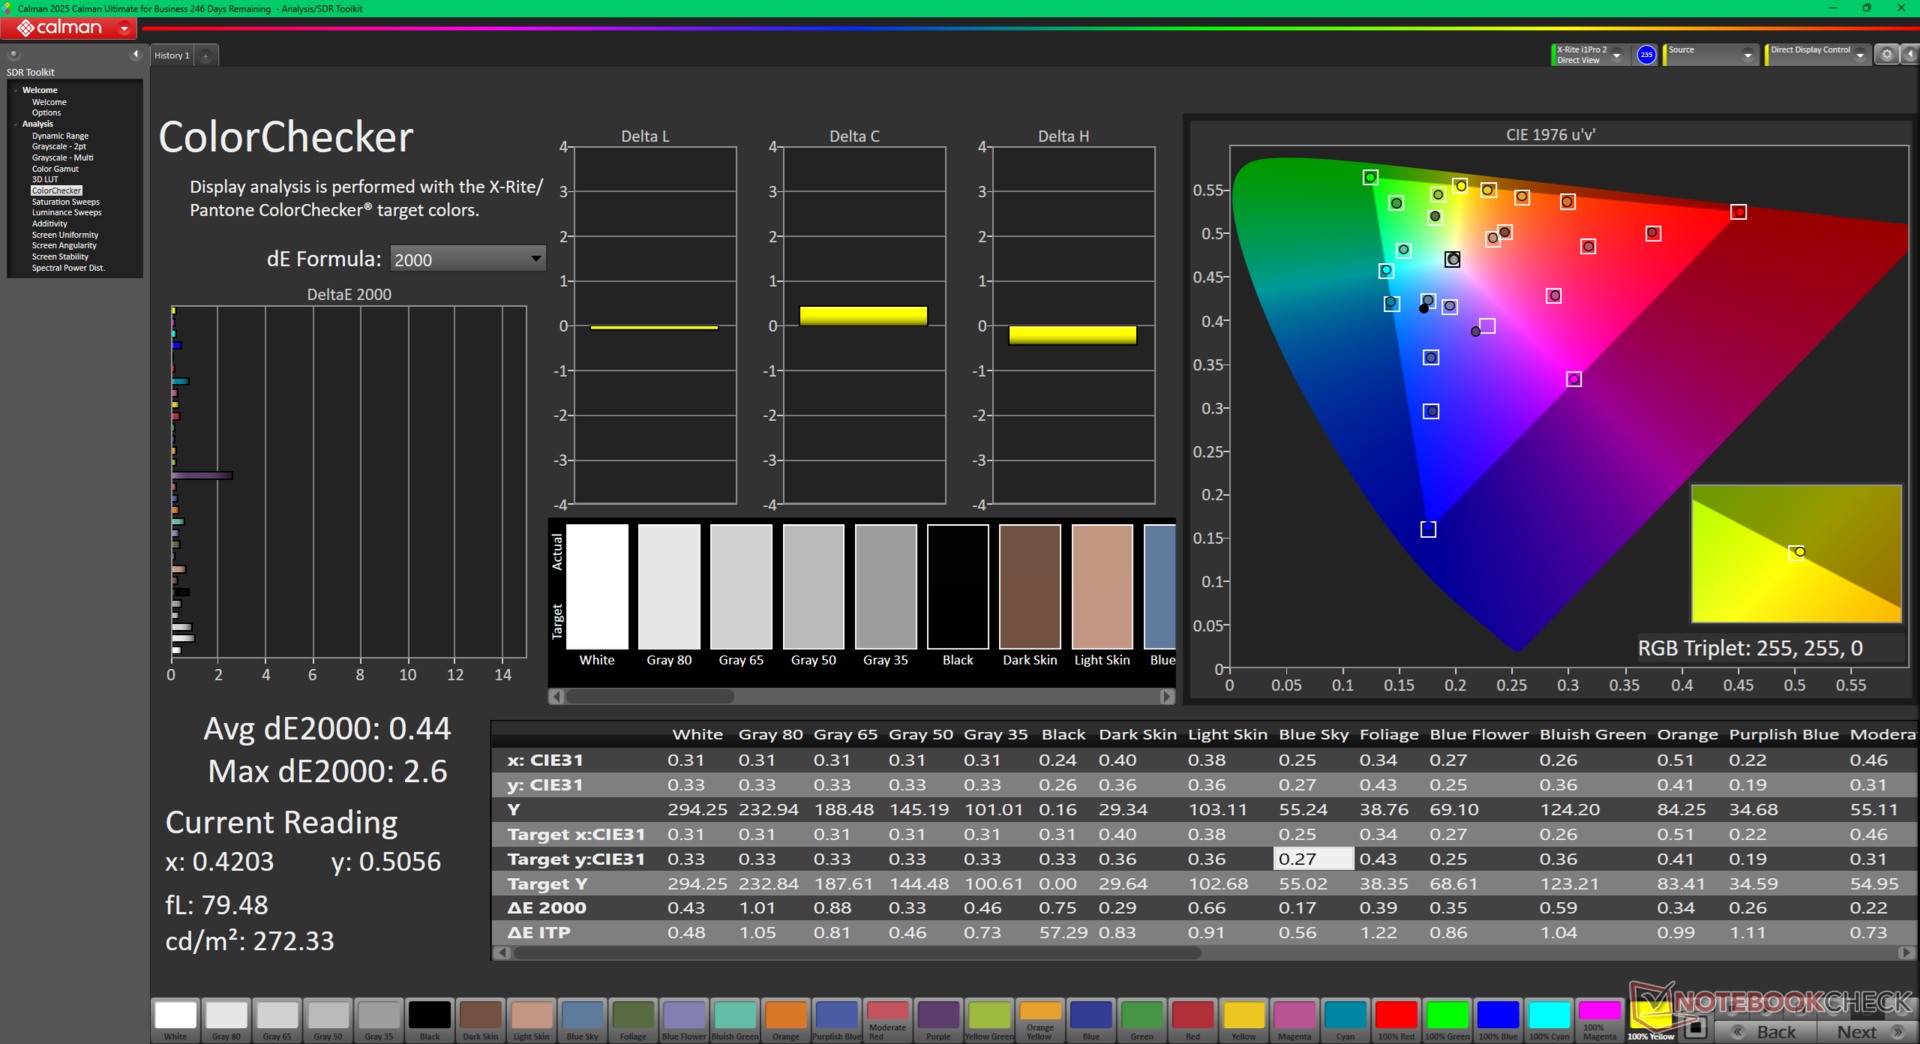
ΔE ColorChecker Calman: 4.15 | ∀{0.5-29.43 Ø4.71}
calibrated: 0.44
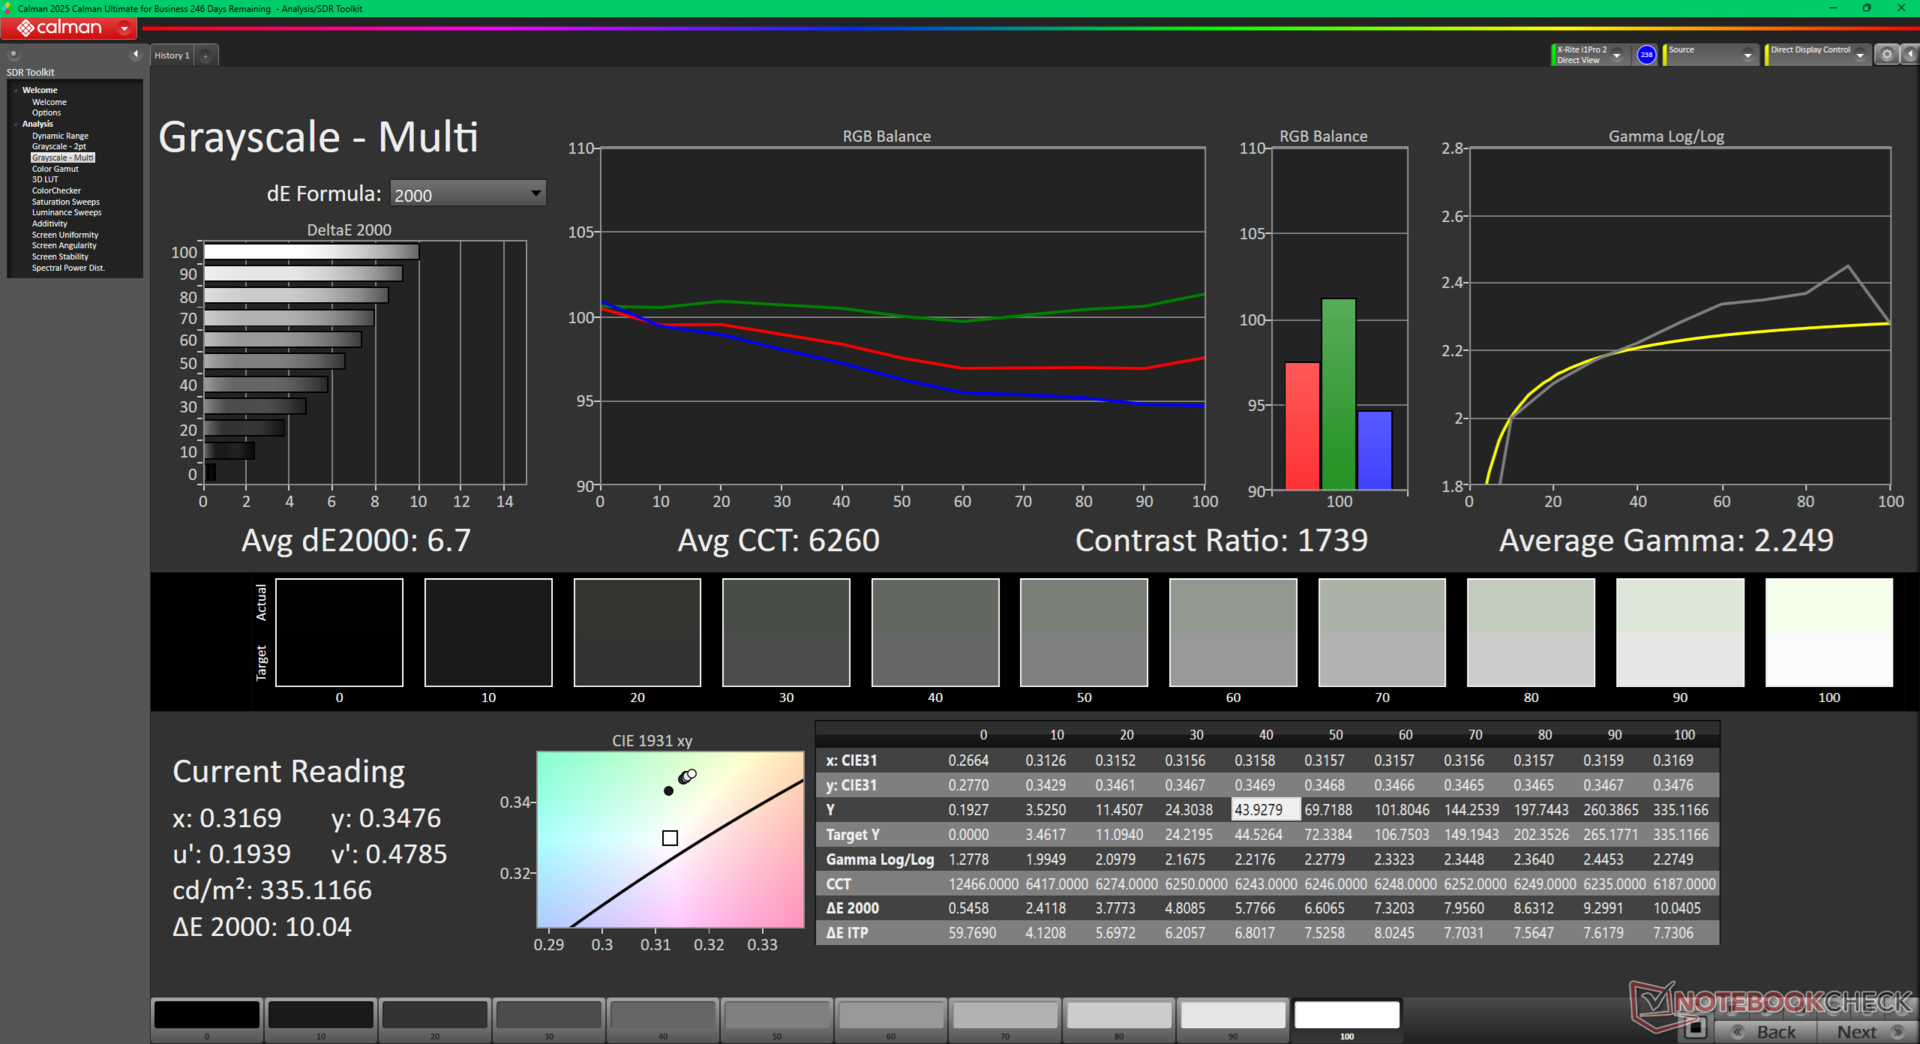
ΔE Greyscale Calman: 6.7 | ∀{0.09-98 Ø4.96}
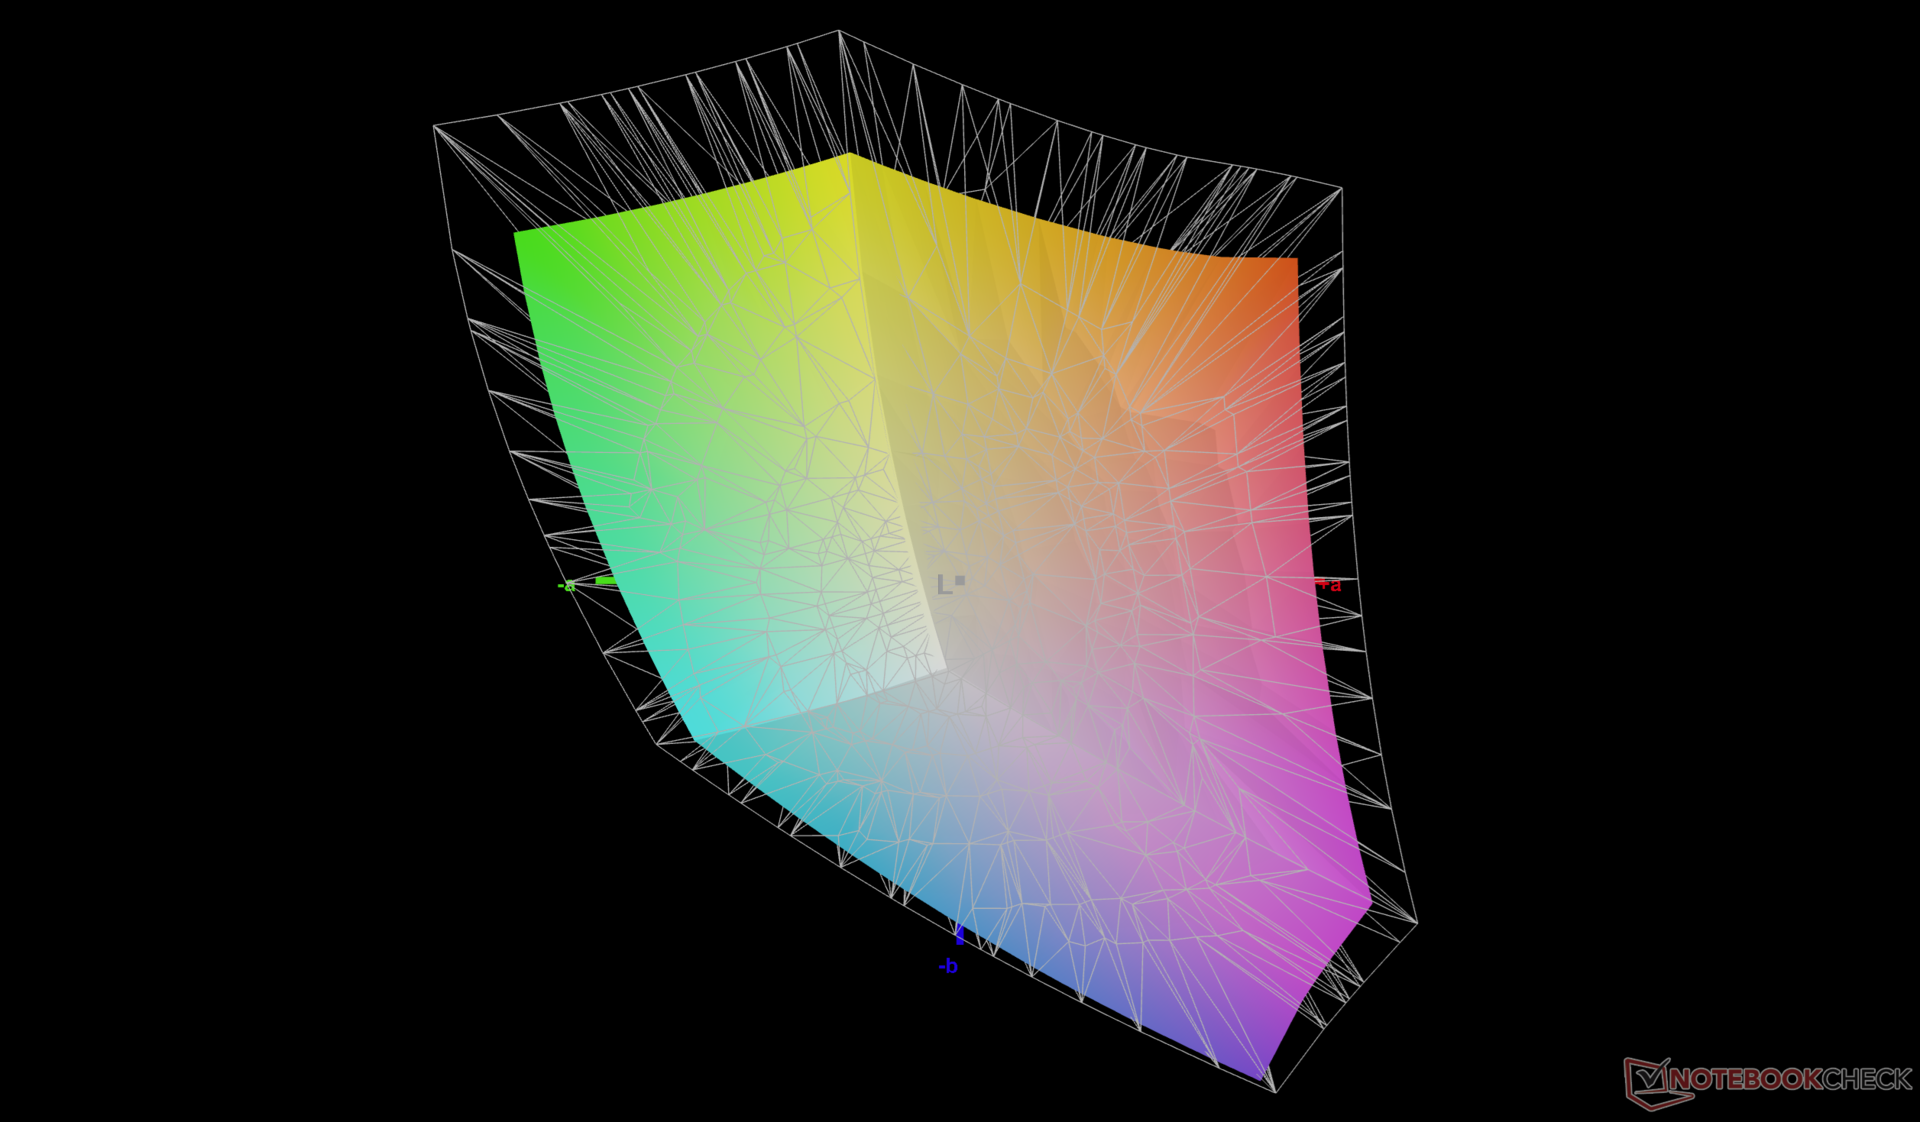
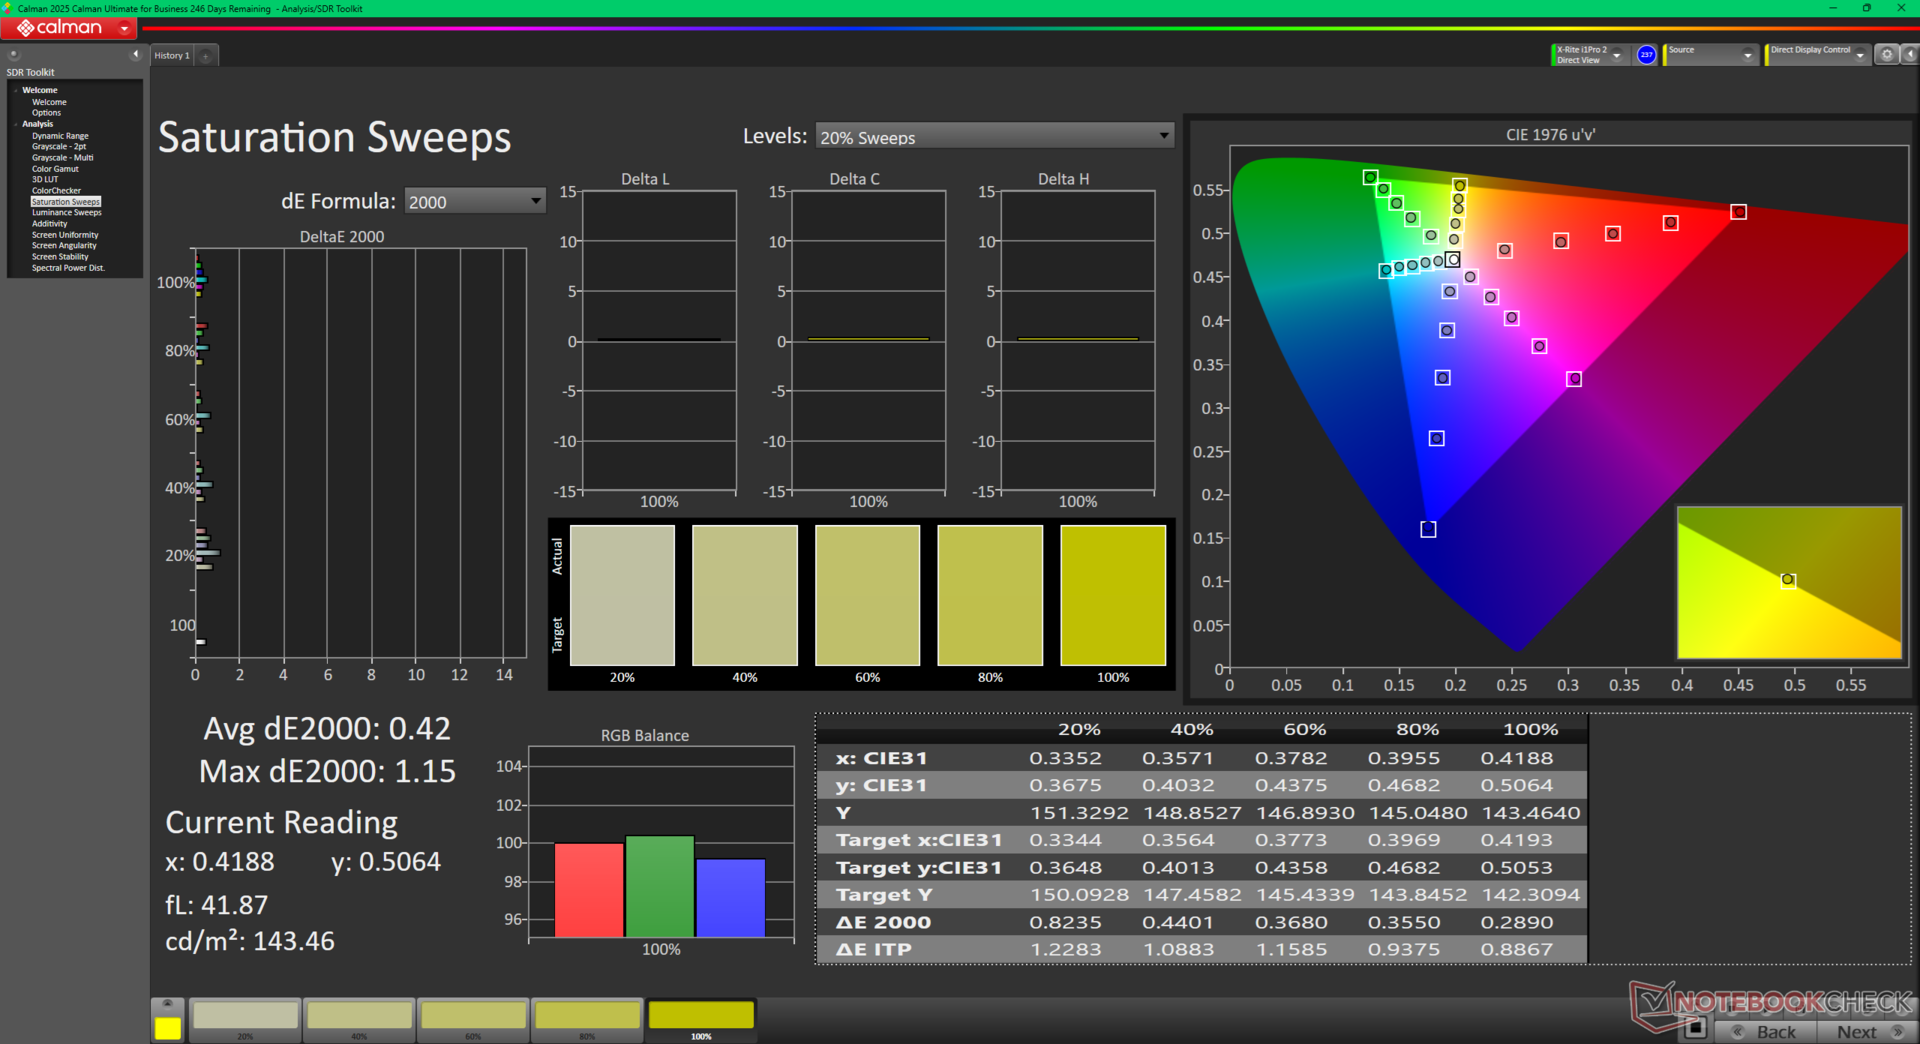
78.4% AdobeRGB 1998 (Argyll 3D)
99.8% sRGB (Argyll 3D)
76.6% Display P3 (Argyll 3D)
Gamma: 2.25
CCT: 6260 K
| Dell 16 Plus AU Optronics B160QAN, IPS, 2560x1600, 16", 120 Hz | Dell Inspiron 16 Plus 7640 AU Optronics B160QAN, IPS, 2560x1600, 16", 120 Hz | Acer Swift 16 AI SF16-51T-932H, Ultra 9 288V SDC41B6, OLED, 2880x1800, 16", 120 Hz | Lenovo ThinkBook 16 G7+ AMD LEN160-3.2K, IPS, 3200x2000, 16", 165 Hz | HP Pavilion Plus 16-ab0456tx AU Optronics AUOFDA4, IPS, 2560x1600, 16", 120 Hz | Asus Vivobook 16 M1606K B160UAN04.3 (AUOA5AB), IPS, 1920x1200, 16", 60 Hz | |
|---|---|---|---|---|---|---|
| Display | -1% | 17% | 12% | -2% | -50% | |
| Display P3 Coverage (%) | 76.6 | 76 -1% | 99.9 30% | 96.3 26% | 74.6 -3% | 36.8 -52% |
| sRGB Coverage (%) | 99.8 | 99.8 0% | 100 0% | 100 0% | 99 -1% | 55.3 -45% |
| AdobeRGB 1998 Coverage (%) | 78.4 | 76.7 -2% | 94.6 21% | 86.9 11% | 76.5 -2% | 38 -52% |
| Response Times | 24% | 54% | 66% | 72% | -1% | |
| Response Time Grey 50% / Grey 80% * (ms) | 32.8 ? | 25.6 ? 22% | 4.8 ? 85% | 13.9 ? 58% | 9.06 ? 72% | 36 ? -10% |
| Response Time Black / White * (ms) | 23.4 ? | 17.6 ? 25% | 18 ? 23% | 6.3 ? 73% | 6.7 ? 71% | 21.4 ? 9% |
| PWM Frequency (Hz) | 481 | |||||
| PWM Amplitude * (%) | 39 | |||||
| Screen | 0% | 195% | 16% | -23% | -128% | |
| Brightness middle (cd/m²) | 335.6 | 314.7 -6% | 425 27% | 422 26% | 403 20% | 326 -3% |
| Brightness (cd/m²) | 308 | 291 -6% | 421 37% | 403 31% | 394 28% | 303 -2% |
| Brightness Distribution (%) | 88 | 89 1% | 98 11% | 93 6% | 90 2% | 89 1% |
| Black Level * (cd/m²) | 0.22 | 0.28 -27% | 0.0219 90% | 0.3 -36% | 0.34 -55% | 0.24 -9% |
| Contrast (:1) | 1525 | 1124 -26% | 19406 1173% | 1407 -8% | 1185 -22% | 1358 -11% |
| Colorchecker dE 2000 * | 4.15 | 1.62 61% | 1.73 58% | 1.7 59% | 3.13 25% | 6.48 -56% |
| Colorchecker dE 2000 max. * | 9.8 | 2.94 70% | 3.82 61% | 3.4 65% | 6.14 37% | 19.42 -98% |
| Colorchecker dE 2000 calibrated * | 0.44 | 1.08 -145% | 0.7 -59% | 1.65 -275% | 4.92 -1018% | |
| Greyscale dE 2000 * | 6.7 | 1.3 81% | 0.09 99% | 2.4 64% | 4.5 33% | 3.85 43% |
| Gamma | 2.25 98% | 2.26 97% | 2.346 94% | 2.19 100% | 2.18 101% | 2.79 79% |
| CCT | 6260 104% | 6385 102% | 6432 101% | 6989 93% | 6261 104% | 6739 96% |
| Total Average (Program / Settings) | 8% /
3% | 89% /
132% | 31% /
23% | 16% /
-5% | -60% /
-93% |
* ... smaller is better
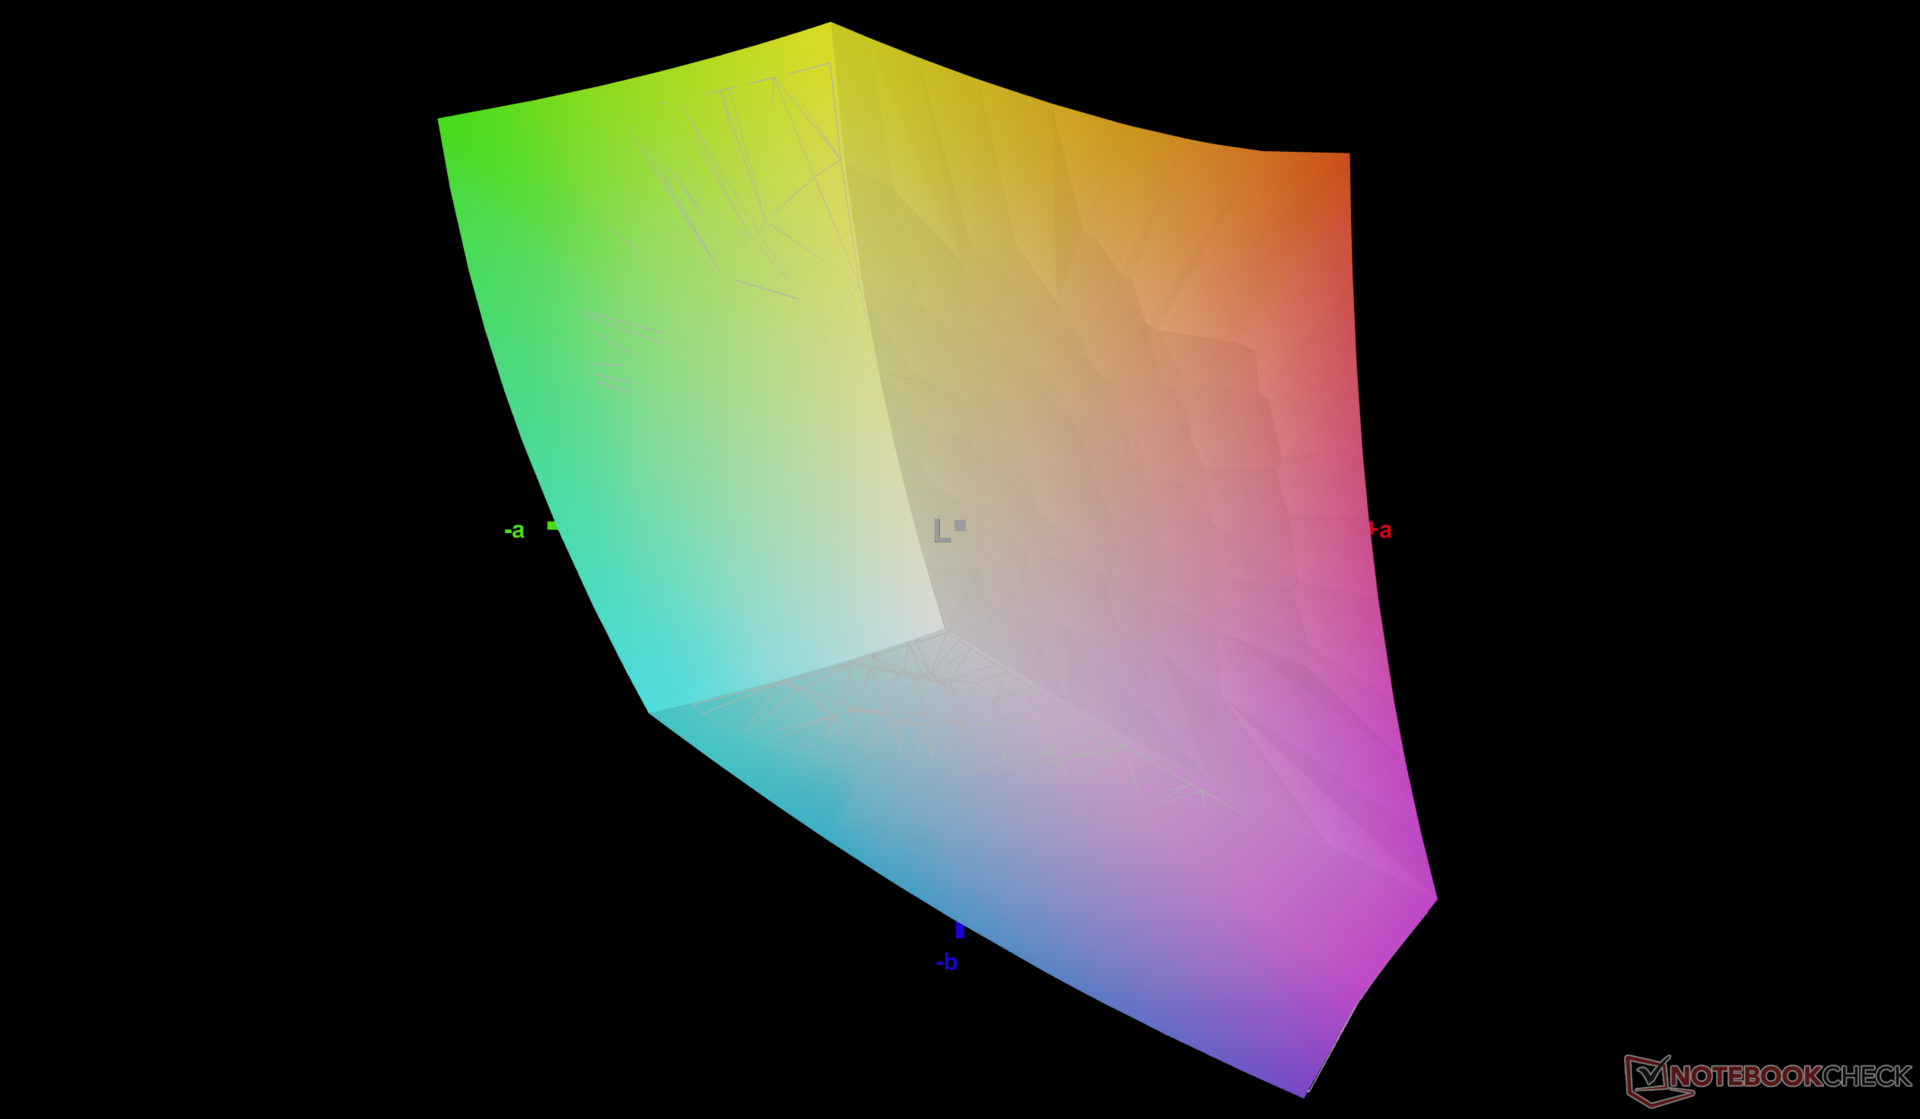
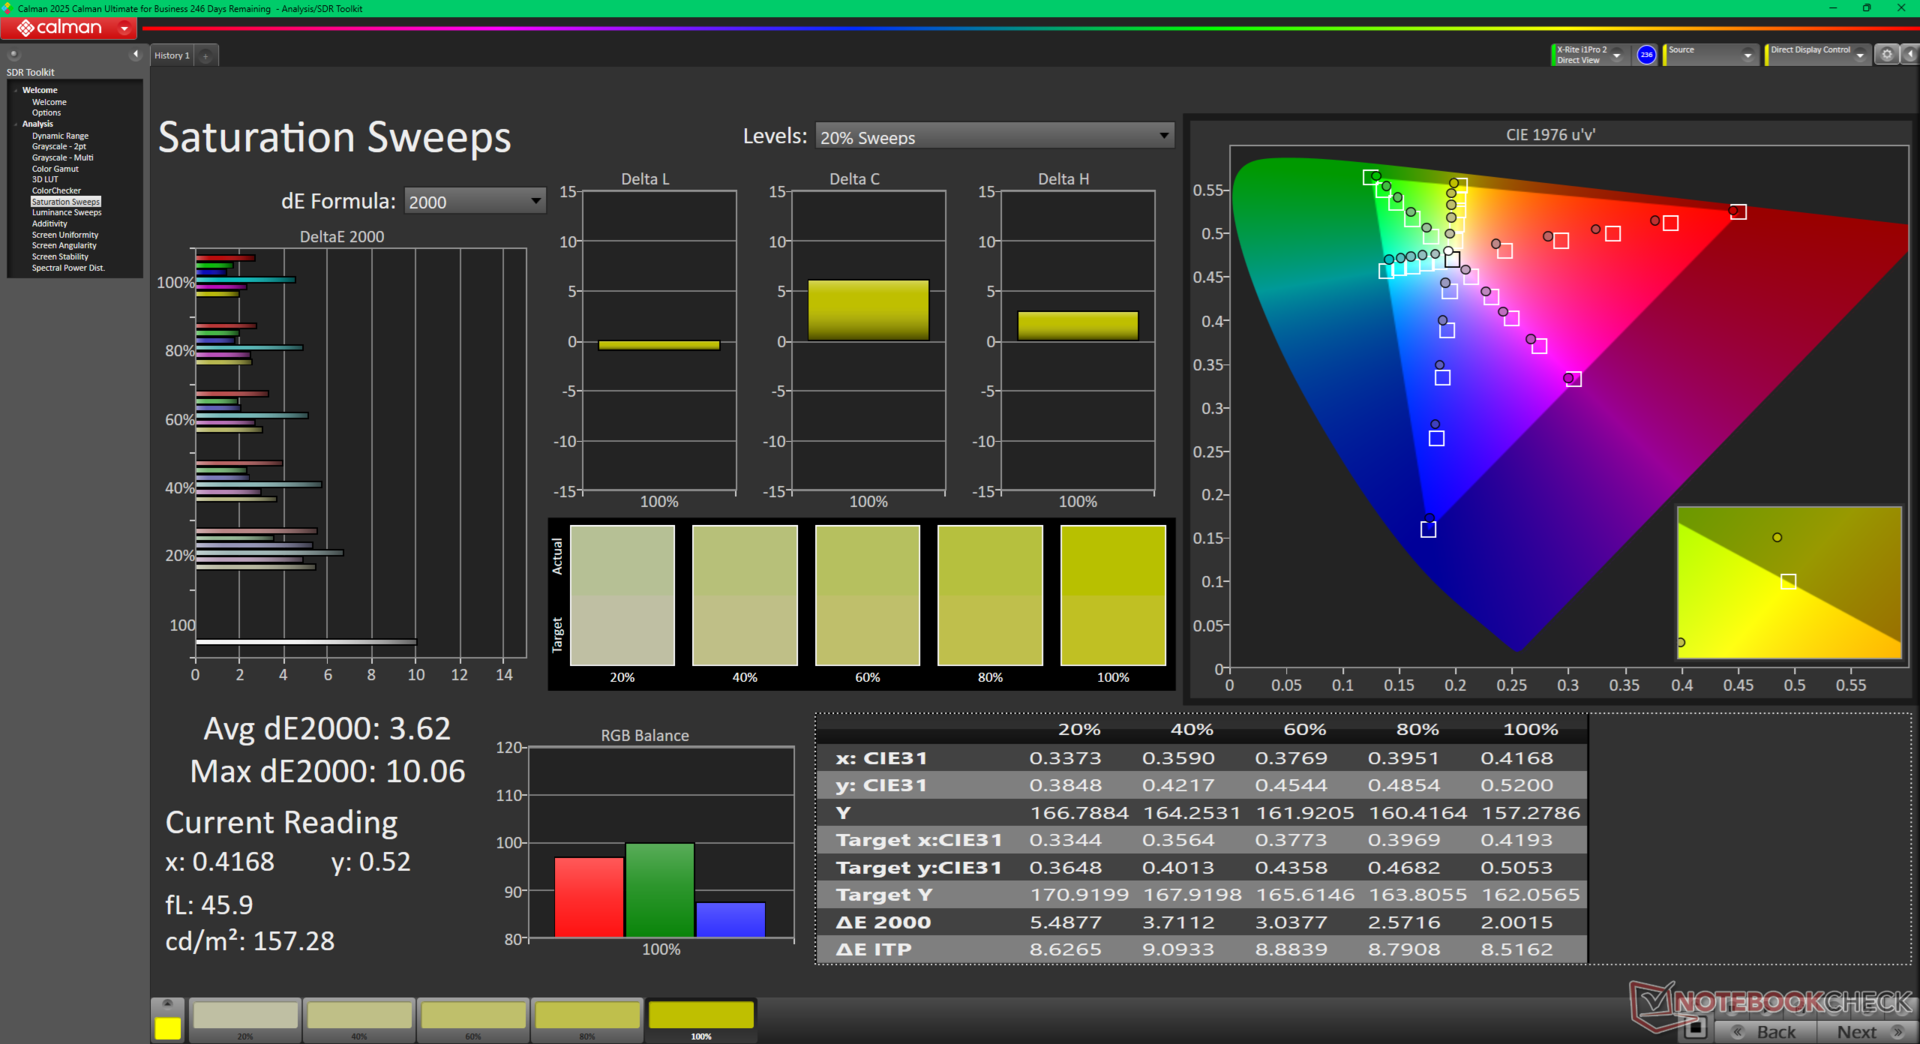
显示屏开箱后校准效果不佳,这在大多数经济型至中档消费笔记本电脑上很常见。使用 X-Rite 色差计自行校准显示屏可大大提高平均灰度和色彩 deltaE 值,分别从 6.7 和 4.15 降至 0.8 和 0.44,从而更好地利用全部 sRGB 覆盖范围。我们的校准 ICM 配置文件可在上面免费下载。
Display Response Times
| ↔ Response Time Black to White | ||
|---|---|---|
| 23.4 ms ... rise ↗ and fall ↘ combined | ↗ 11.6 ms rise | 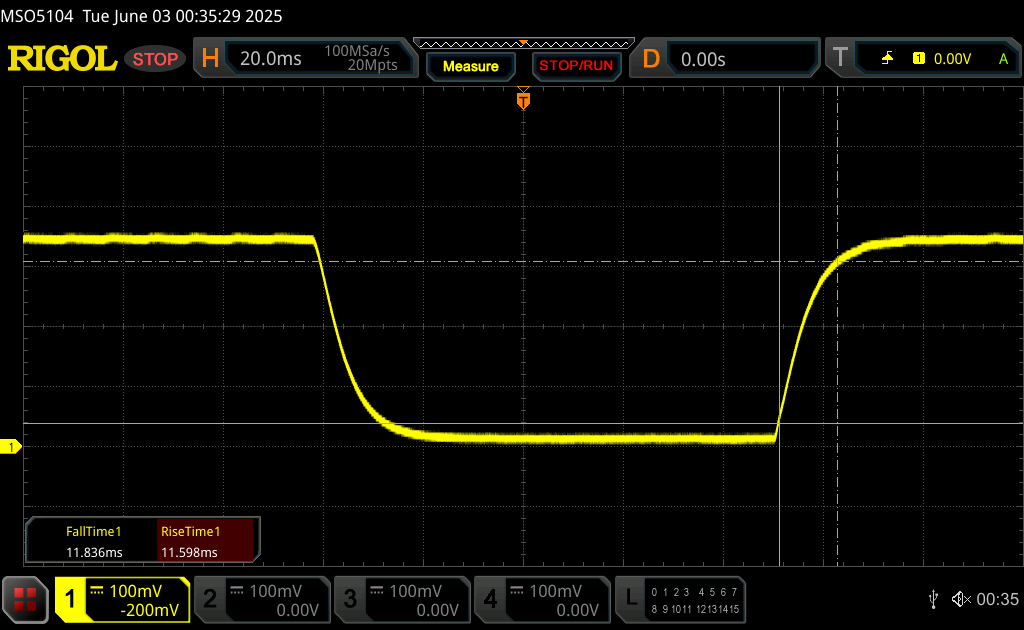 |
| ↘ 11.8 ms fall | ||
| The screen shows good response rates in our tests, but may be too slow for competitive gamers. In comparison, all tested devices range from 0.1 (minimum) to 240 (maximum) ms. » 54 % of all devices are better. This means that the measured response time is worse than the average of all tested devices (19.8 ms). | ||
| ↔ Response Time 50% Grey to 80% Grey | ||
| 32.8 ms ... rise ↗ and fall ↘ combined | ↗ 16.1 ms rise | 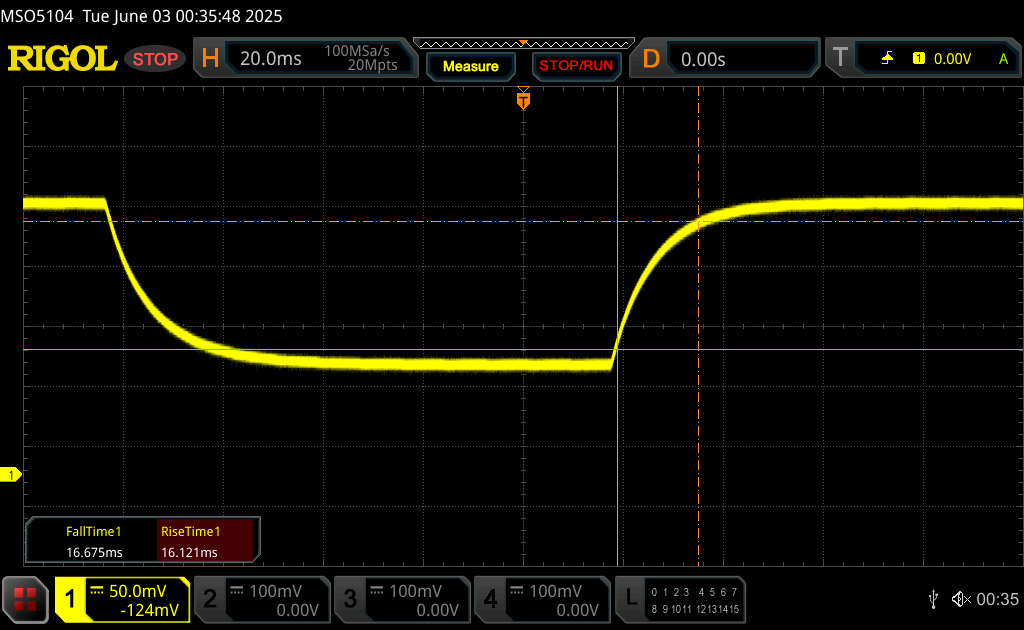 |
| ↘ 16.7 ms fall | ||
| The screen shows slow response rates in our tests and will be unsatisfactory for gamers. In comparison, all tested devices range from 0.165 (minimum) to 636 (maximum) ms. » 45 % of all devices are better. This means that the measured response time is similar to the average of all tested devices (31 ms). | ||
Screen Flickering / PWM (Pulse-Width Modulation)
| Screen flickering / PWM not detected | 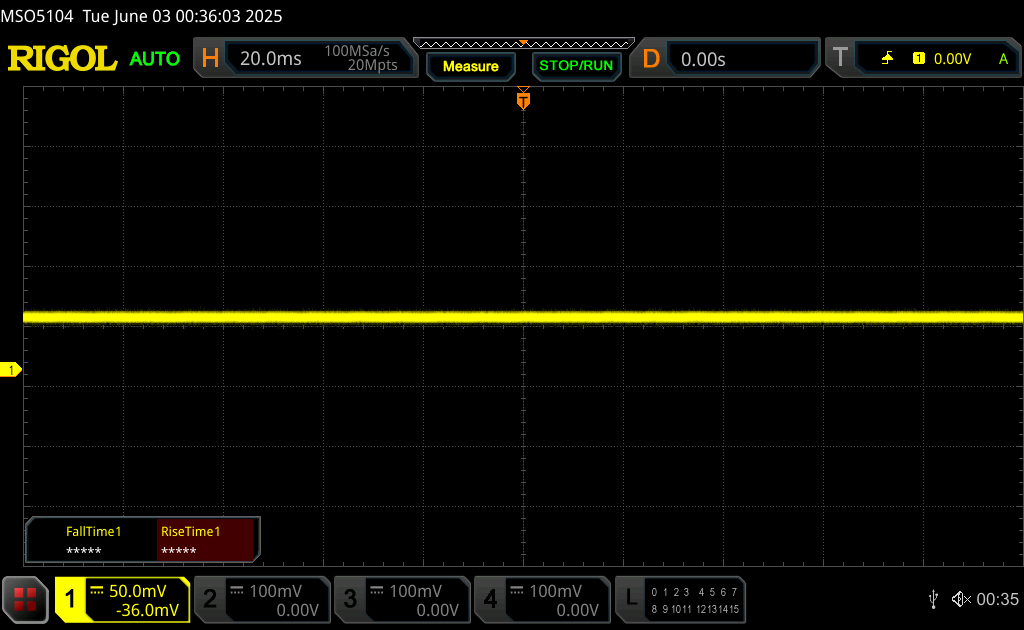 | ||
In comparison: 52 % of all tested devices do not use PWM to dim the display. If PWM was detected, an average of 7757 (minimum: 5 - maximum: 343500) Hz was measured. | |||
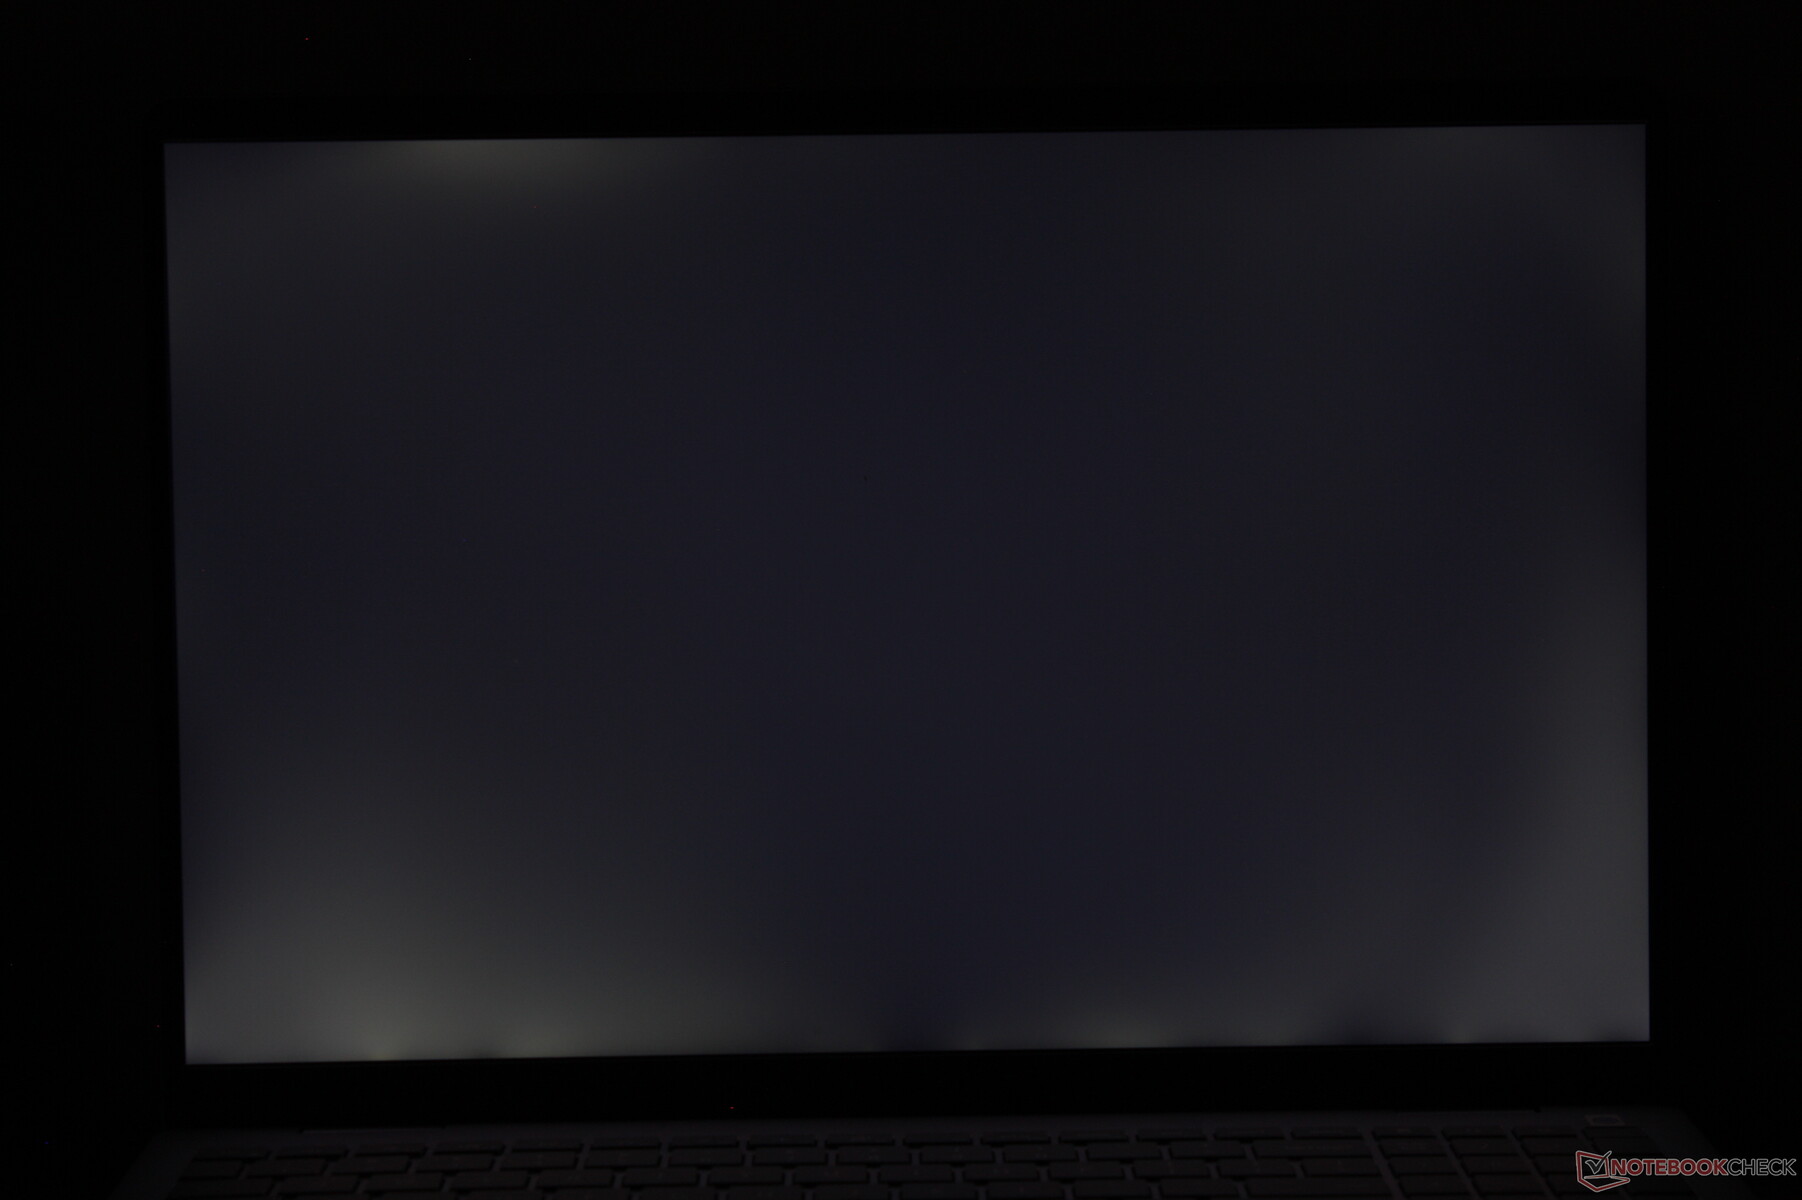
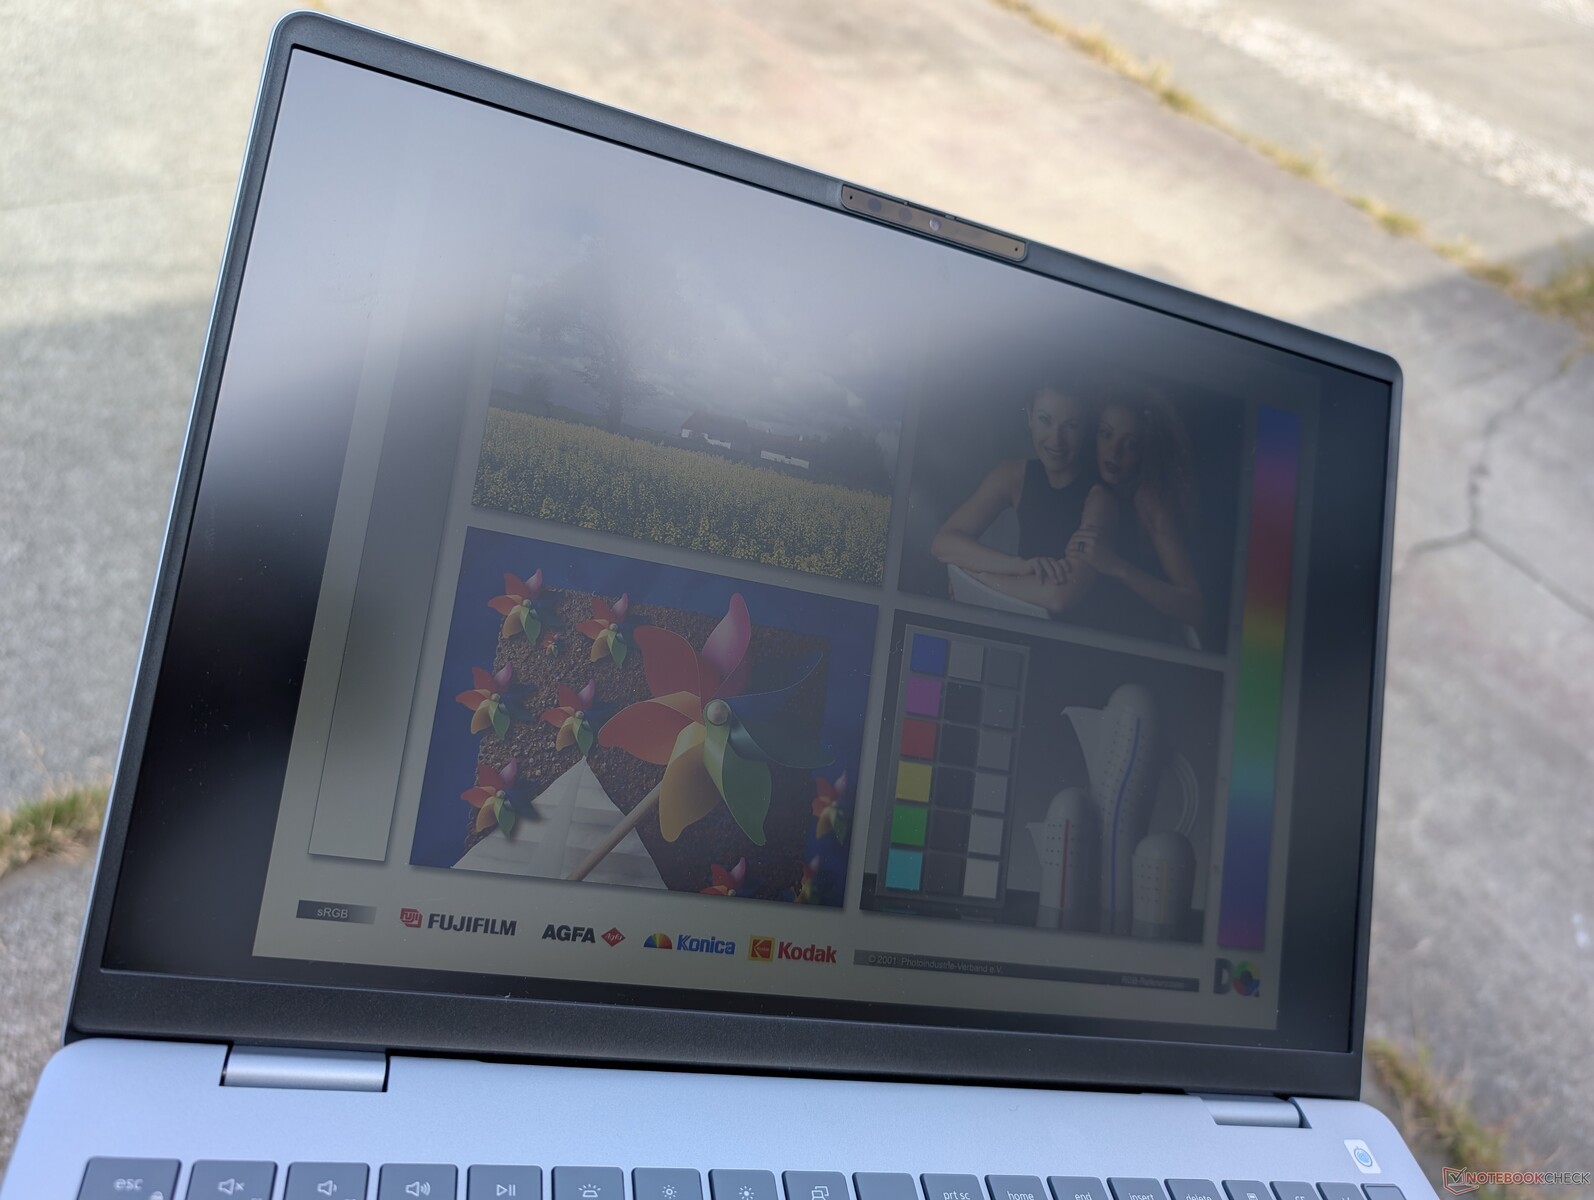
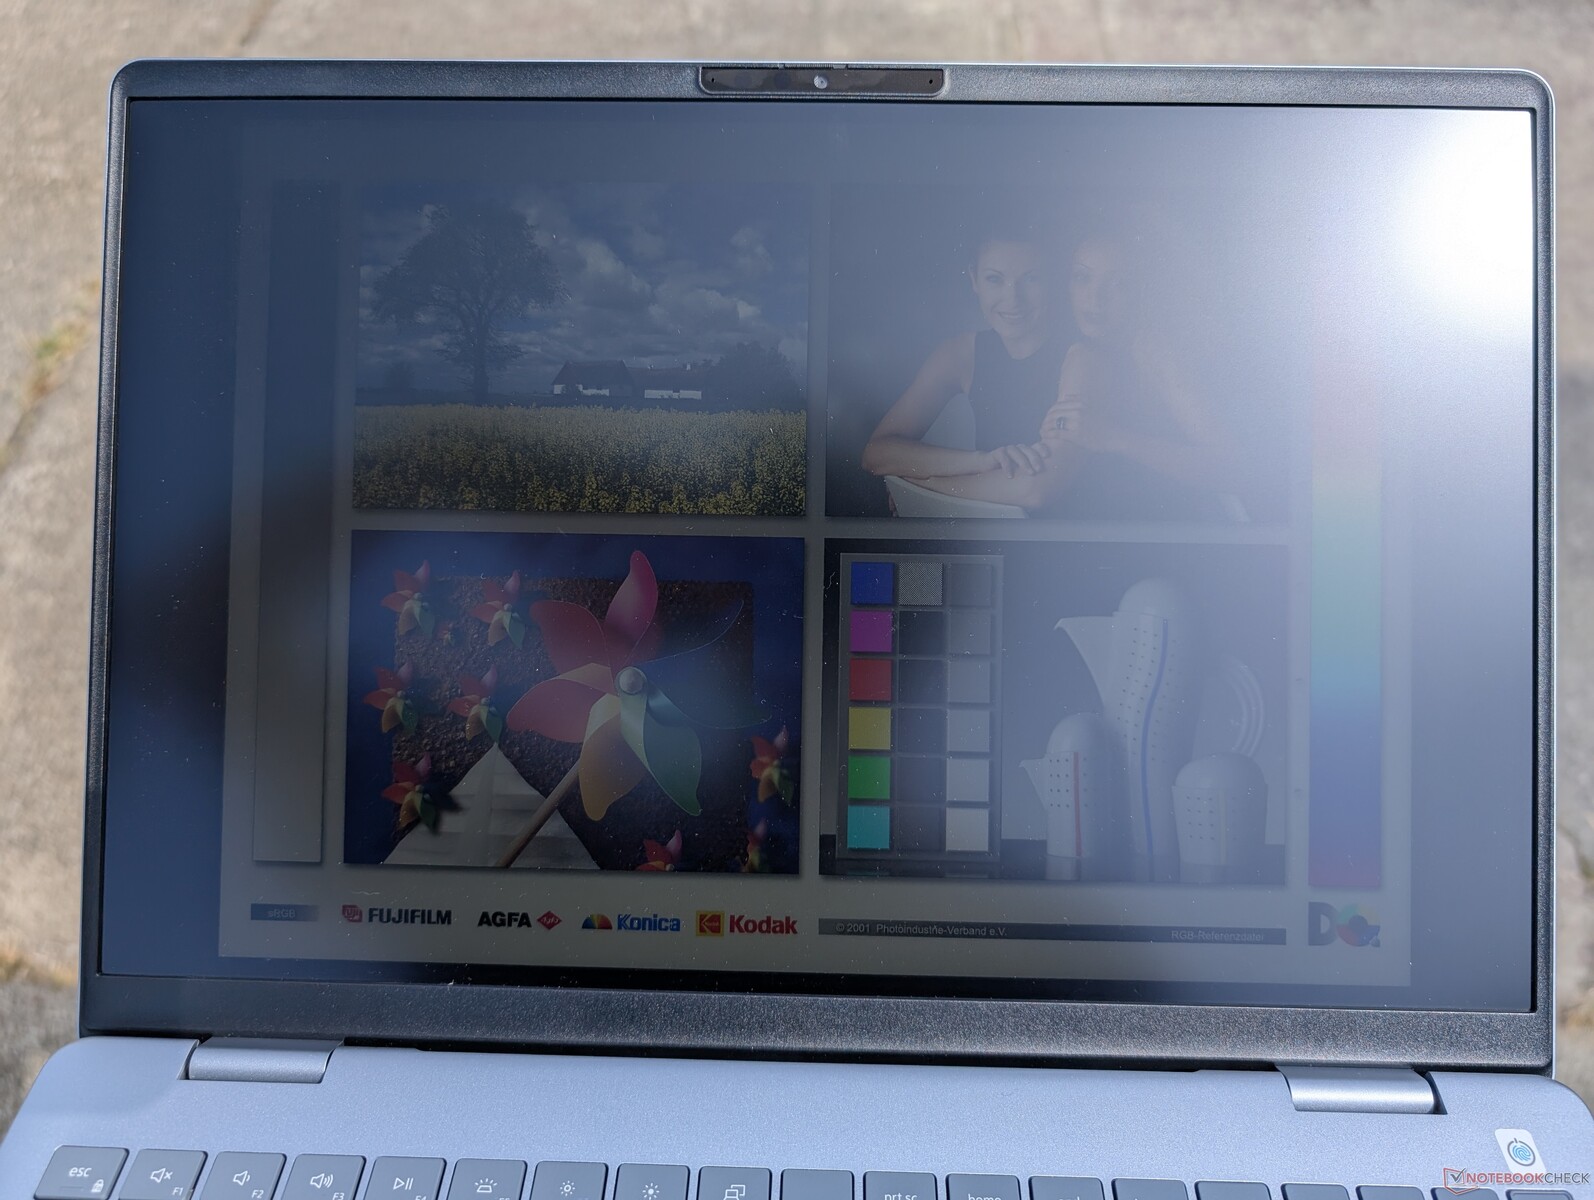
由于显示屏亮度不够,无法克服眩光,因此室外能见度较低。
性能 - 通过更快的集成显卡提高效率
测试条件
在运行下面的基准测试之前,我们将戴尔优化大师设置为性能模式。戴尔电源配置文件与默认的 Windows 电源配置文件相关联,更改一个配置文件将与另一个配置文件同步。
处理器
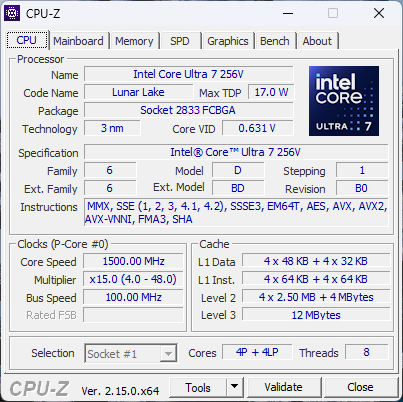
酷睿 Ultra 7 256V 酷睿至尊 7 256V在保持上一代处理器原始性能水平的同时,还注重提高效率酷睿至尊 7 155U.包括 Inspiron 16 7640 2-in-1 在内的采用酷睿 H 处理器的旧机型速度仍然明显更快。升级到 酷睿至尊 9 288V根据我们使用宏碁 Swift 16 AI 的经验,升级到酷睿 Ultra 9 288V 配置预计最多只能带来不到 10% 的微小提升。 宏碁 Swift 16 AI.
如下图所示,在运行 CineBench R15 xT 循环测试时,我们发现性能的持续性下降了 20%。
Cinebench R15 Multi Loop
Cinebench R23: Multi Core | Single Core
Cinebench R20: CPU (Multi Core) | CPU (Single Core)
Cinebench R15: CPU Multi 64Bit | CPU Single 64Bit
Blender: v2.79 BMW27 CPU
7-Zip 18.03: 7z b 4 | 7z b 4 -mmt1
Geekbench 6.7: Multi-Core | Single-Core
Geekbench 5.5: Multi-Core | Single-Core
HWBOT x265 Benchmark v2.2: 4k Preset
LibreOffice : 20 Documents To PDF
R Benchmark 2.5: Overall mean
* ... smaller is better
AIDA64: FP32 Ray-Trace | FPU Julia | CPU SHA3 | CPU Queen | FPU SinJulia | FPU Mandel | CPU AES | CPU ZLib | FP64 Ray-Trace | CPU PhotoWorxx
| Performance rating | |
| Lenovo ThinkBook 16 G7+ AMD | |
| Asus Vivobook 16 M1606K | |
| HP Pavilion Plus 16-ab0456tx | |
| Dell Inspiron 16 Plus 7640 | |
| Acer Swift 16 AI SF16-51T-932H, Ultra 9 288V | |
| Average Intel Core Ultra 7 256V | |
| Dell 16 Plus | |
| AIDA64 / FP32 Ray-Trace | |
| Lenovo ThinkBook 16 G7+ AMD | |
| Asus Vivobook 16 M1606K | |
| HP Pavilion Plus 16-ab0456tx | |
| Dell Inspiron 16 Plus 7640 | |
| Acer Swift 16 AI SF16-51T-932H, Ultra 9 288V | |
| Average Intel Core Ultra 7 256V (10524 - 12898, n=7) | |
| Dell 16 Plus | |
| AIDA64 / FPU Julia | |
| Lenovo ThinkBook 16 G7+ AMD | |
| Asus Vivobook 16 M1606K | |
| HP Pavilion Plus 16-ab0456tx | |
| Dell Inspiron 16 Plus 7640 | |
| Acer Swift 16 AI SF16-51T-932H, Ultra 9 288V | |
| Average Intel Core Ultra 7 256V (52443 - 62522, n=7) | |
| Dell 16 Plus | |
| AIDA64 / CPU SHA3 | |
| Lenovo ThinkBook 16 G7+ AMD | |
| Asus Vivobook 16 M1606K | |
| HP Pavilion Plus 16-ab0456tx | |
| Dell Inspiron 16 Plus 7640 | |
| Acer Swift 16 AI SF16-51T-932H, Ultra 9 288V | |
| Average Intel Core Ultra 7 256V (2364 - 2915, n=7) | |
| Dell 16 Plus | |
| AIDA64 / CPU Queen | |
| HP Pavilion Plus 16-ab0456tx | |
| Dell Inspiron 16 Plus 7640 | |
| Lenovo ThinkBook 16 G7+ AMD | |
| Asus Vivobook 16 M1606K | |
| Acer Swift 16 AI SF16-51T-932H, Ultra 9 288V | |
| Average Intel Core Ultra 7 256V (49622 - 49794, n=6) | |
| Dell 16 Plus | |
| AIDA64 / FPU SinJulia | |
| Lenovo ThinkBook 16 G7+ AMD | |
| Asus Vivobook 16 M1606K | |
| Dell Inspiron 16 Plus 7640 | |
| HP Pavilion Plus 16-ab0456tx | |
| Average Intel Core Ultra 7 256V (4401 - 4434, n=7) | |
| Acer Swift 16 AI SF16-51T-932H, Ultra 9 288V | |
| Dell 16 Plus | |
| AIDA64 / FPU Mandel | |
| Lenovo ThinkBook 16 G7+ AMD | |
| Asus Vivobook 16 M1606K | |
| HP Pavilion Plus 16-ab0456tx | |
| Dell Inspiron 16 Plus 7640 | |
| Acer Swift 16 AI SF16-51T-932H, Ultra 9 288V | |
| Average Intel Core Ultra 7 256V (27382 - 33019, n=7) | |
| Dell 16 Plus | |
| AIDA64 / CPU AES | |
| Lenovo ThinkBook 16 G7+ AMD | |
| Dell Inspiron 16 Plus 7640 | |
| HP Pavilion Plus 16-ab0456tx | |
| Asus Vivobook 16 M1606K | |
| Average Intel Core Ultra 7 256V (38495 - 75938, n=7) | |
| Acer Swift 16 AI SF16-51T-932H, Ultra 9 288V | |
| Dell 16 Plus | |
| AIDA64 / CPU ZLib | |
| Lenovo ThinkBook 16 G7+ AMD | |
| Dell Inspiron 16 Plus 7640 | |
| Asus Vivobook 16 M1606K | |
| HP Pavilion Plus 16-ab0456tx | |
| Average Intel Core Ultra 7 256V (536 - 632, n=7) | |
| Acer Swift 16 AI SF16-51T-932H, Ultra 9 288V | |
| Dell 16 Plus | |
| AIDA64 / FP64 Ray-Trace | |
| Lenovo ThinkBook 16 G7+ AMD | |
| Asus Vivobook 16 M1606K | |
| HP Pavilion Plus 16-ab0456tx | |
| Dell Inspiron 16 Plus 7640 | |
| Acer Swift 16 AI SF16-51T-932H, Ultra 9 288V | |
| Average Intel Core Ultra 7 256V (5655 - 6878, n=7) | |
| Dell 16 Plus | |
| AIDA64 / CPU PhotoWorxx | |
| Acer Swift 16 AI SF16-51T-932H, Ultra 9 288V | |
| Average Intel Core Ultra 7 256V (49906 - 57060, n=7) | |
| Dell 16 Plus | |
| Lenovo ThinkBook 16 G7+ AMD | |
| HP Pavilion Plus 16-ab0456tx | |
| Dell Inspiron 16 Plus 7640 | |
| Asus Vivobook 16 M1606K | |
压力测试
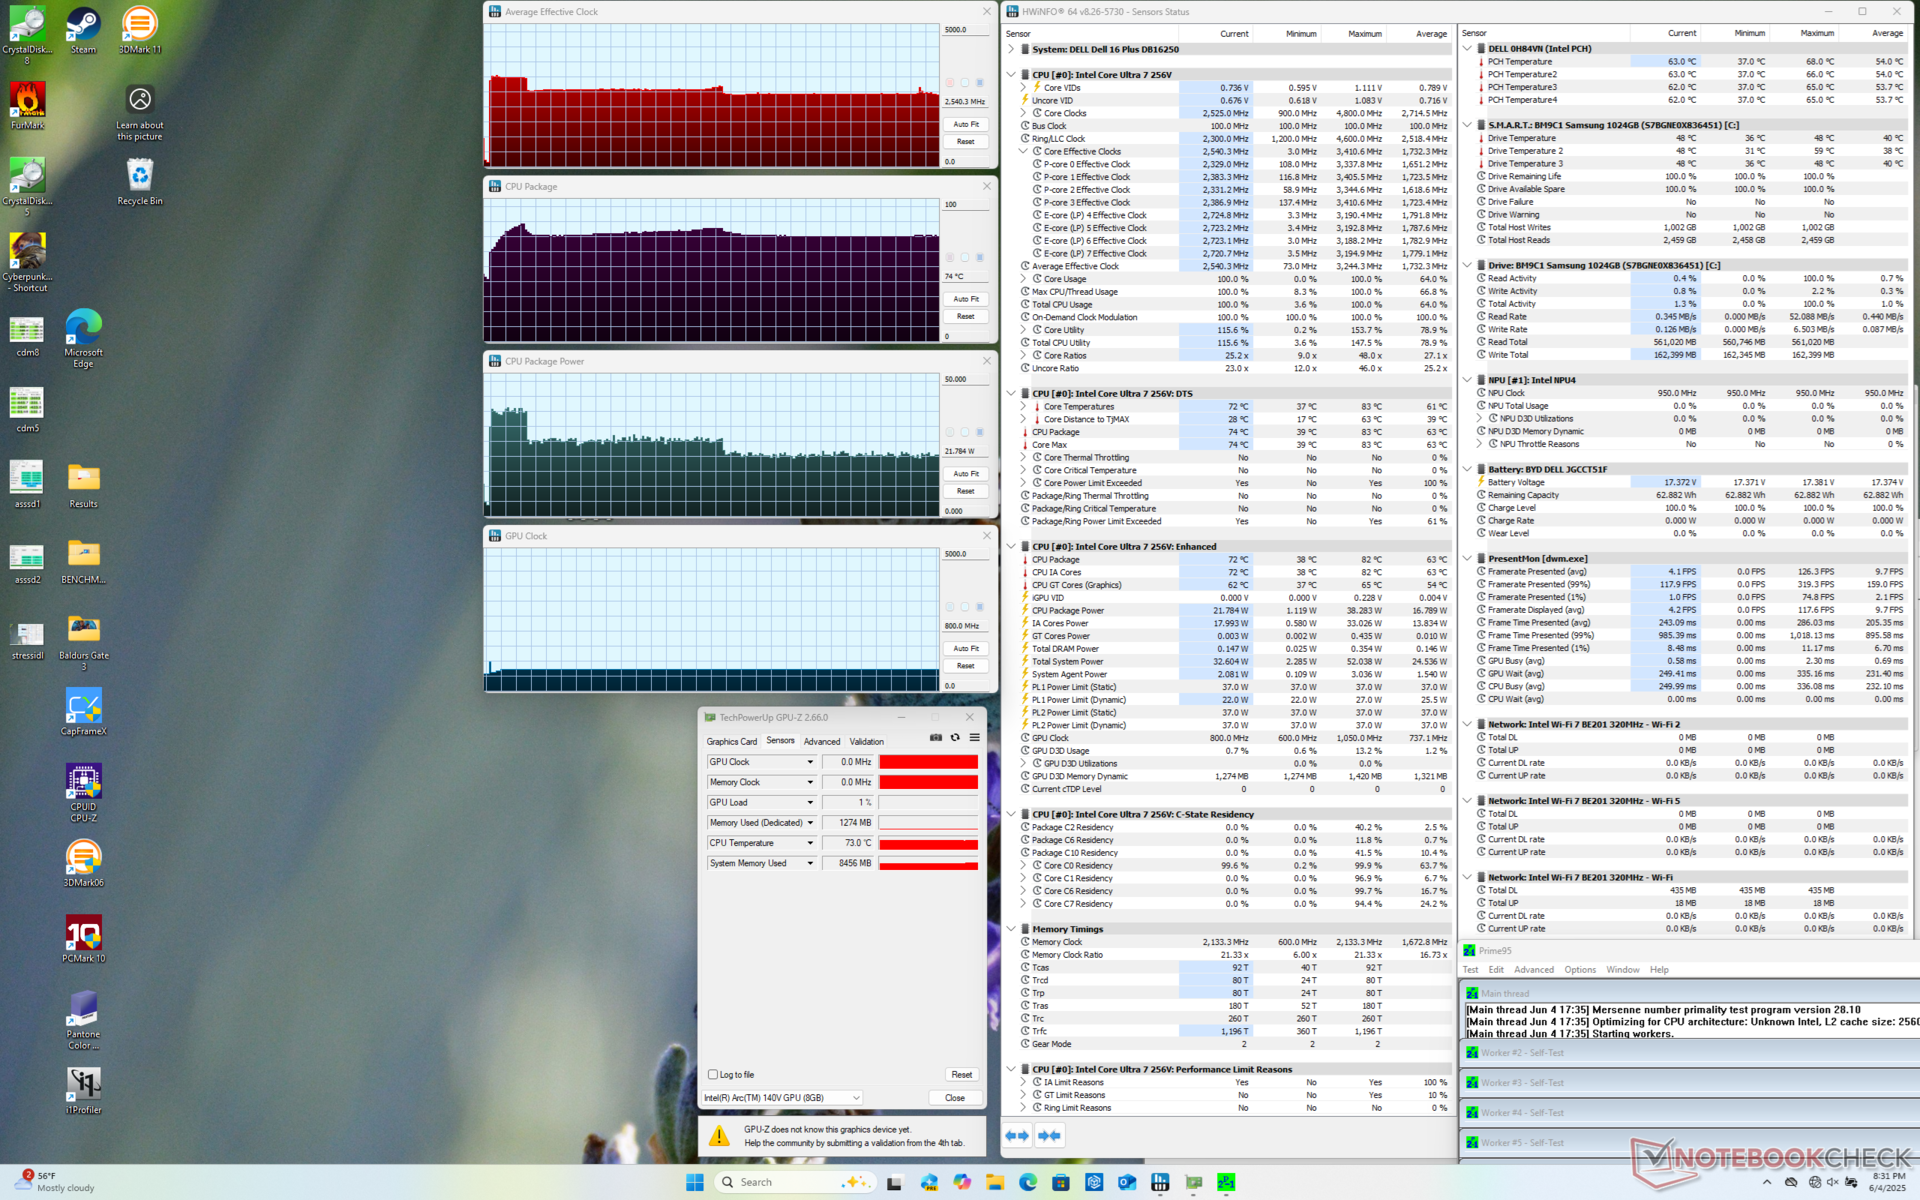
在运行 Prime95 压力测试时,CPU 会在达到 83 摄氏度之前提升到 3.2 GHz 和 38 W,并持续约 20 秒。如上所述,这也反映在我们的 CineBench R15 xT 循环测试中。
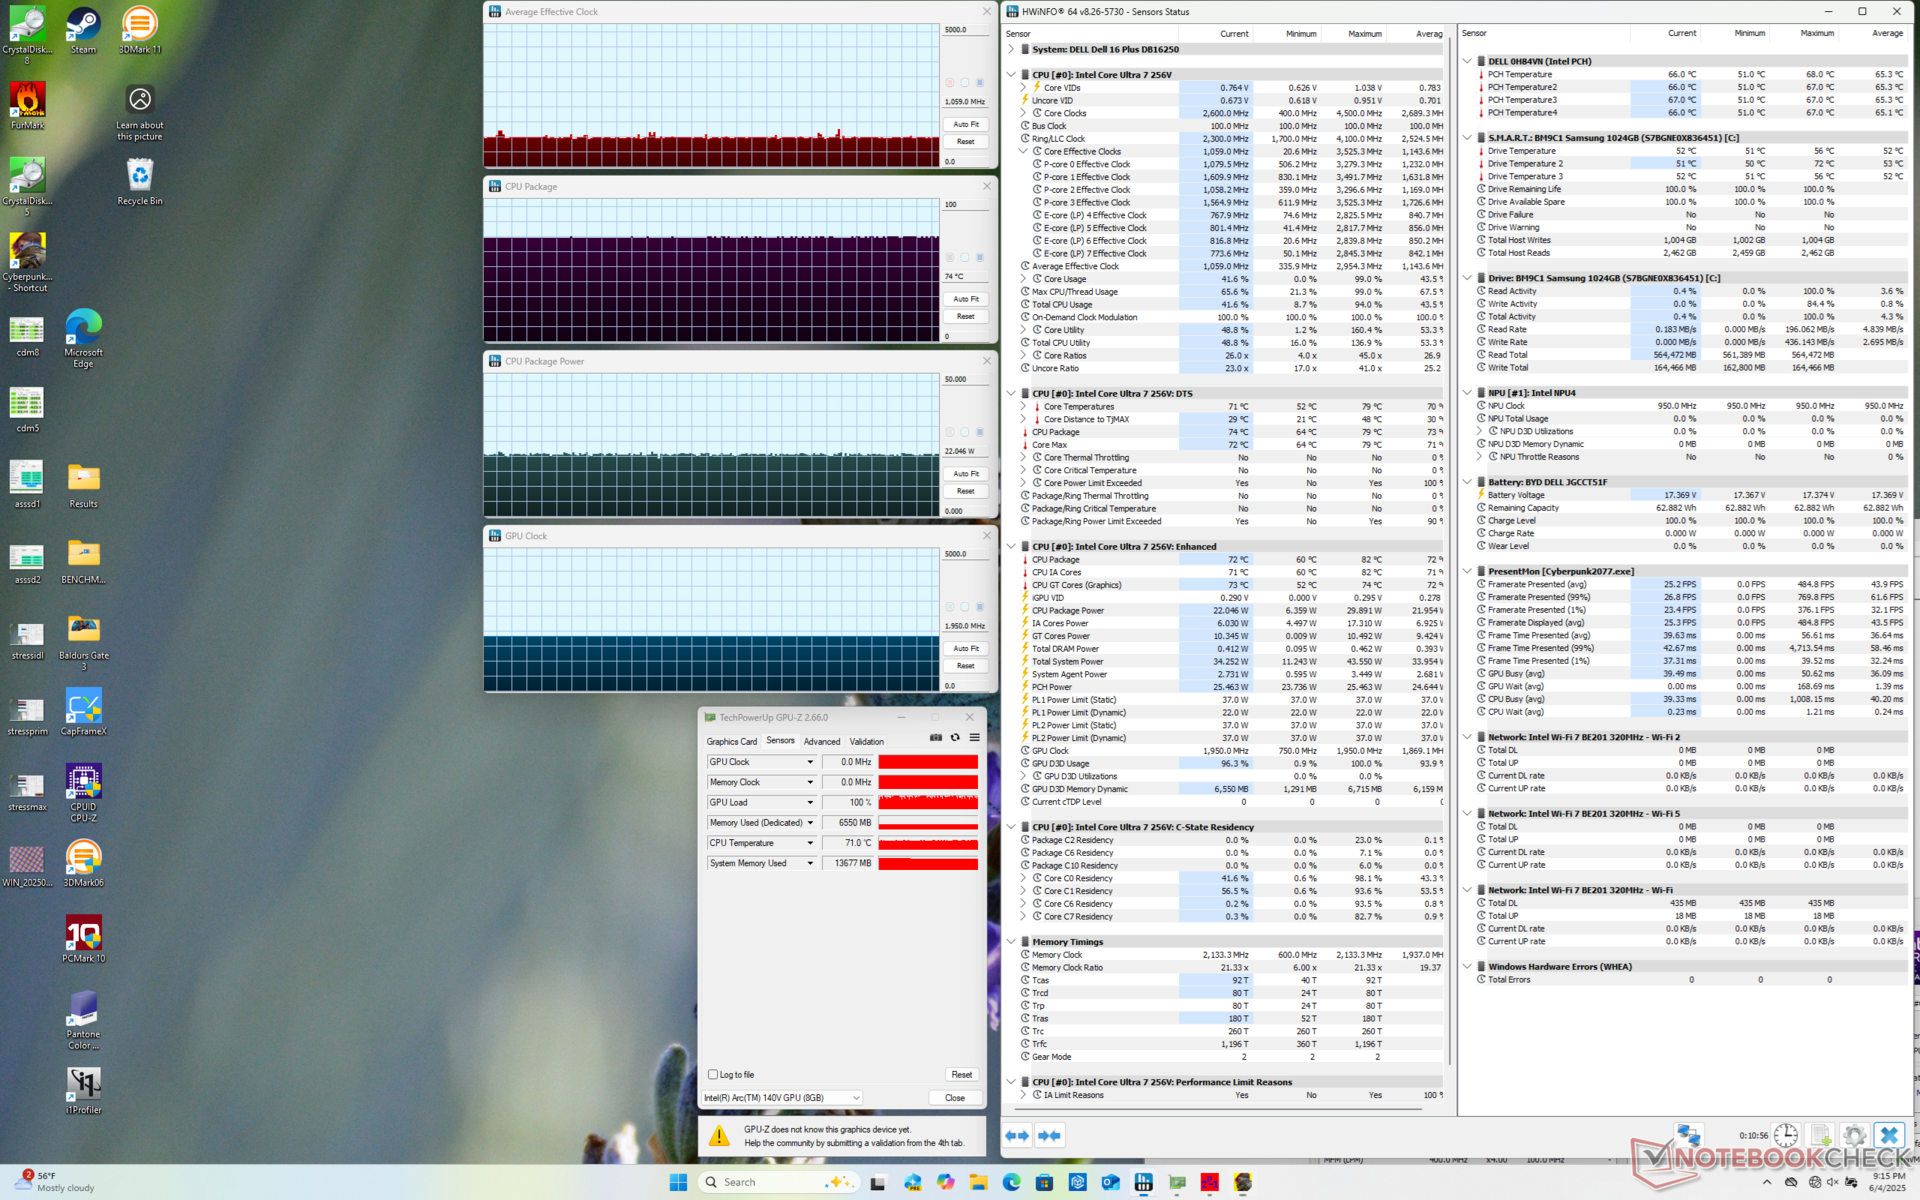
在运行《赛博朋克 2077》(Cyberpunk 2077)以体现典型的游戏压力时,处理器的最高温度再次达到 74 C,明显低于我们在 Inspiron 16 7640 2 合 1 上观察到的温度。 Inspiron 16 7640 2 合 1.
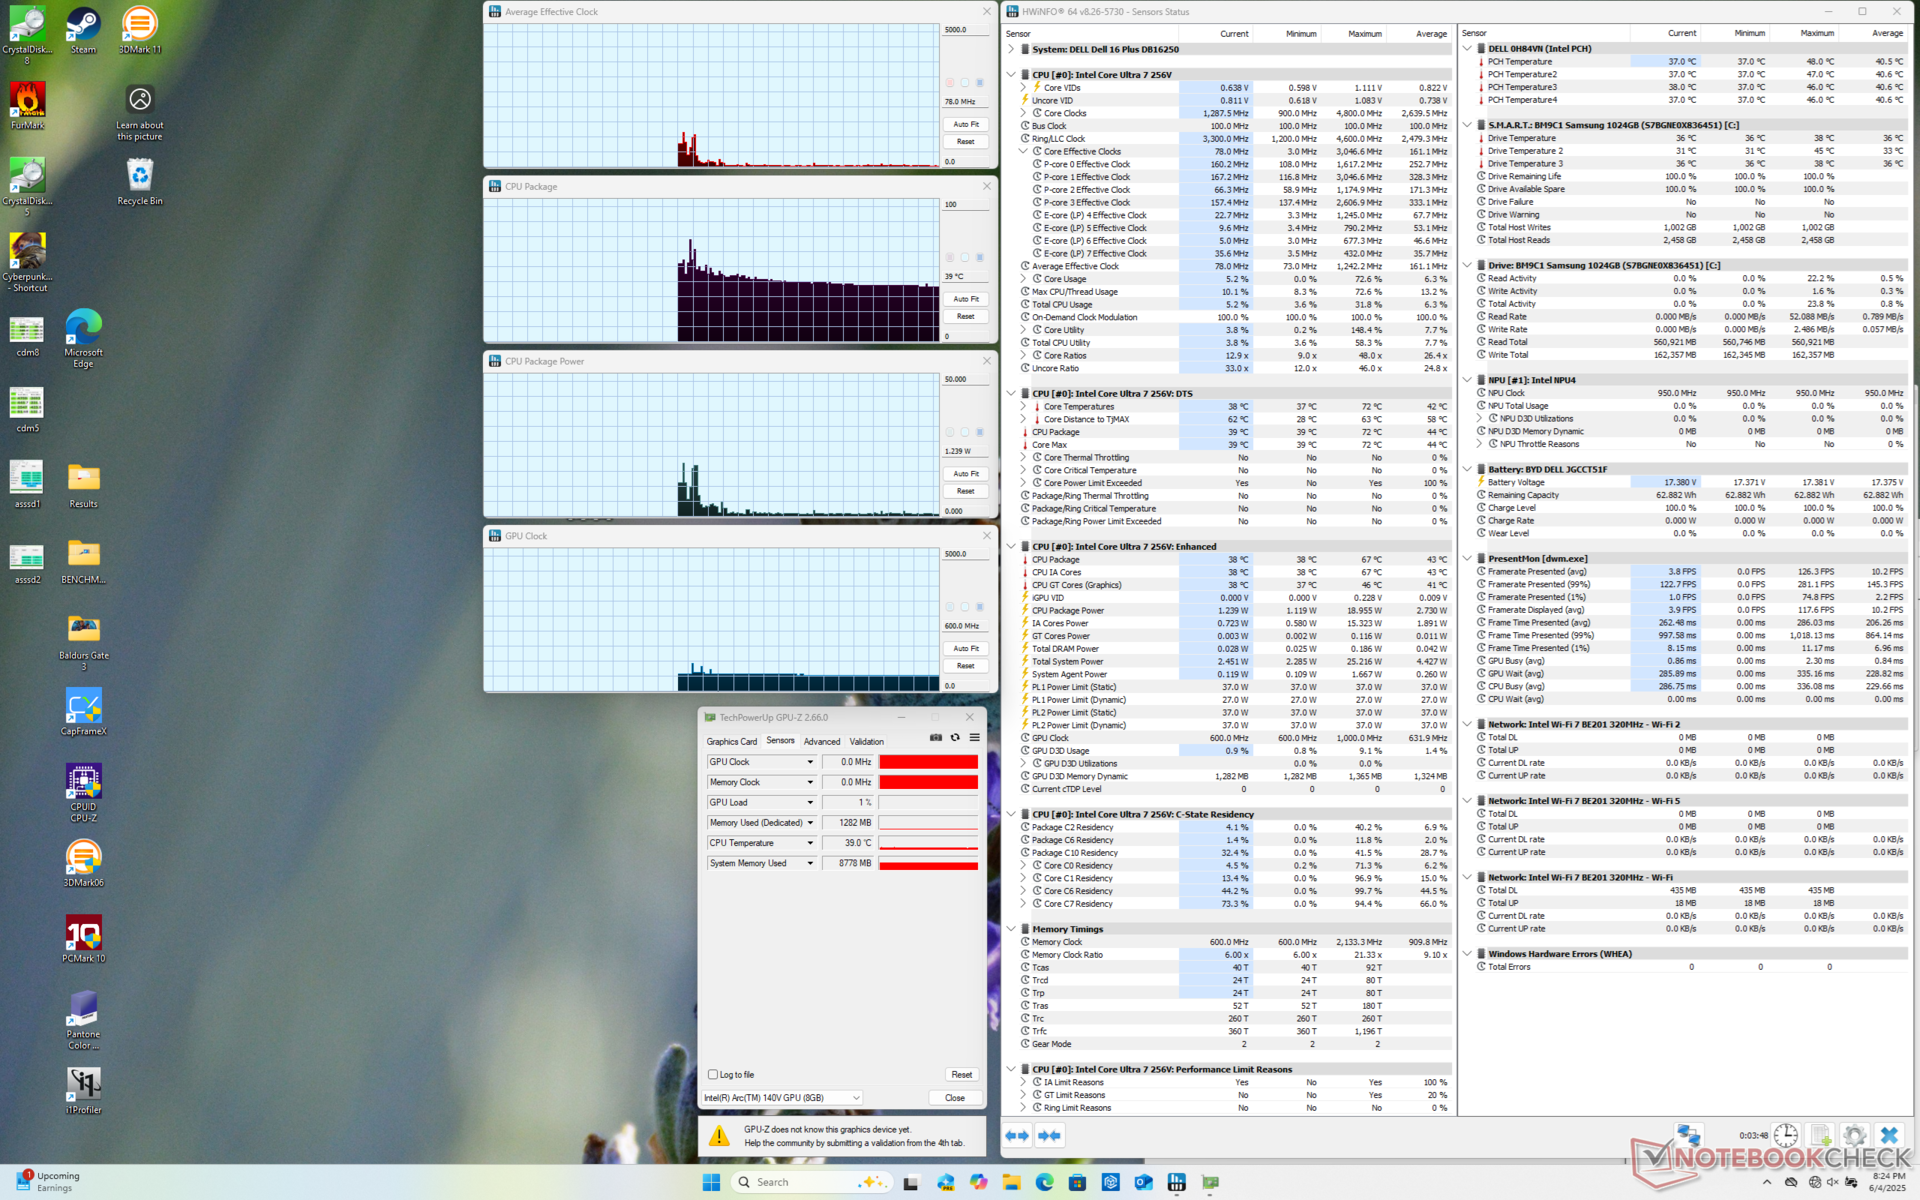
| CPU 平均时钟 (GHz) | GPU 时钟 (MHz) | CPU 平均温度 (°C) | |
| 系统闲置 | -- | -- | 39 |
| Prime95 压力 | 2.5 | -- | 74 |
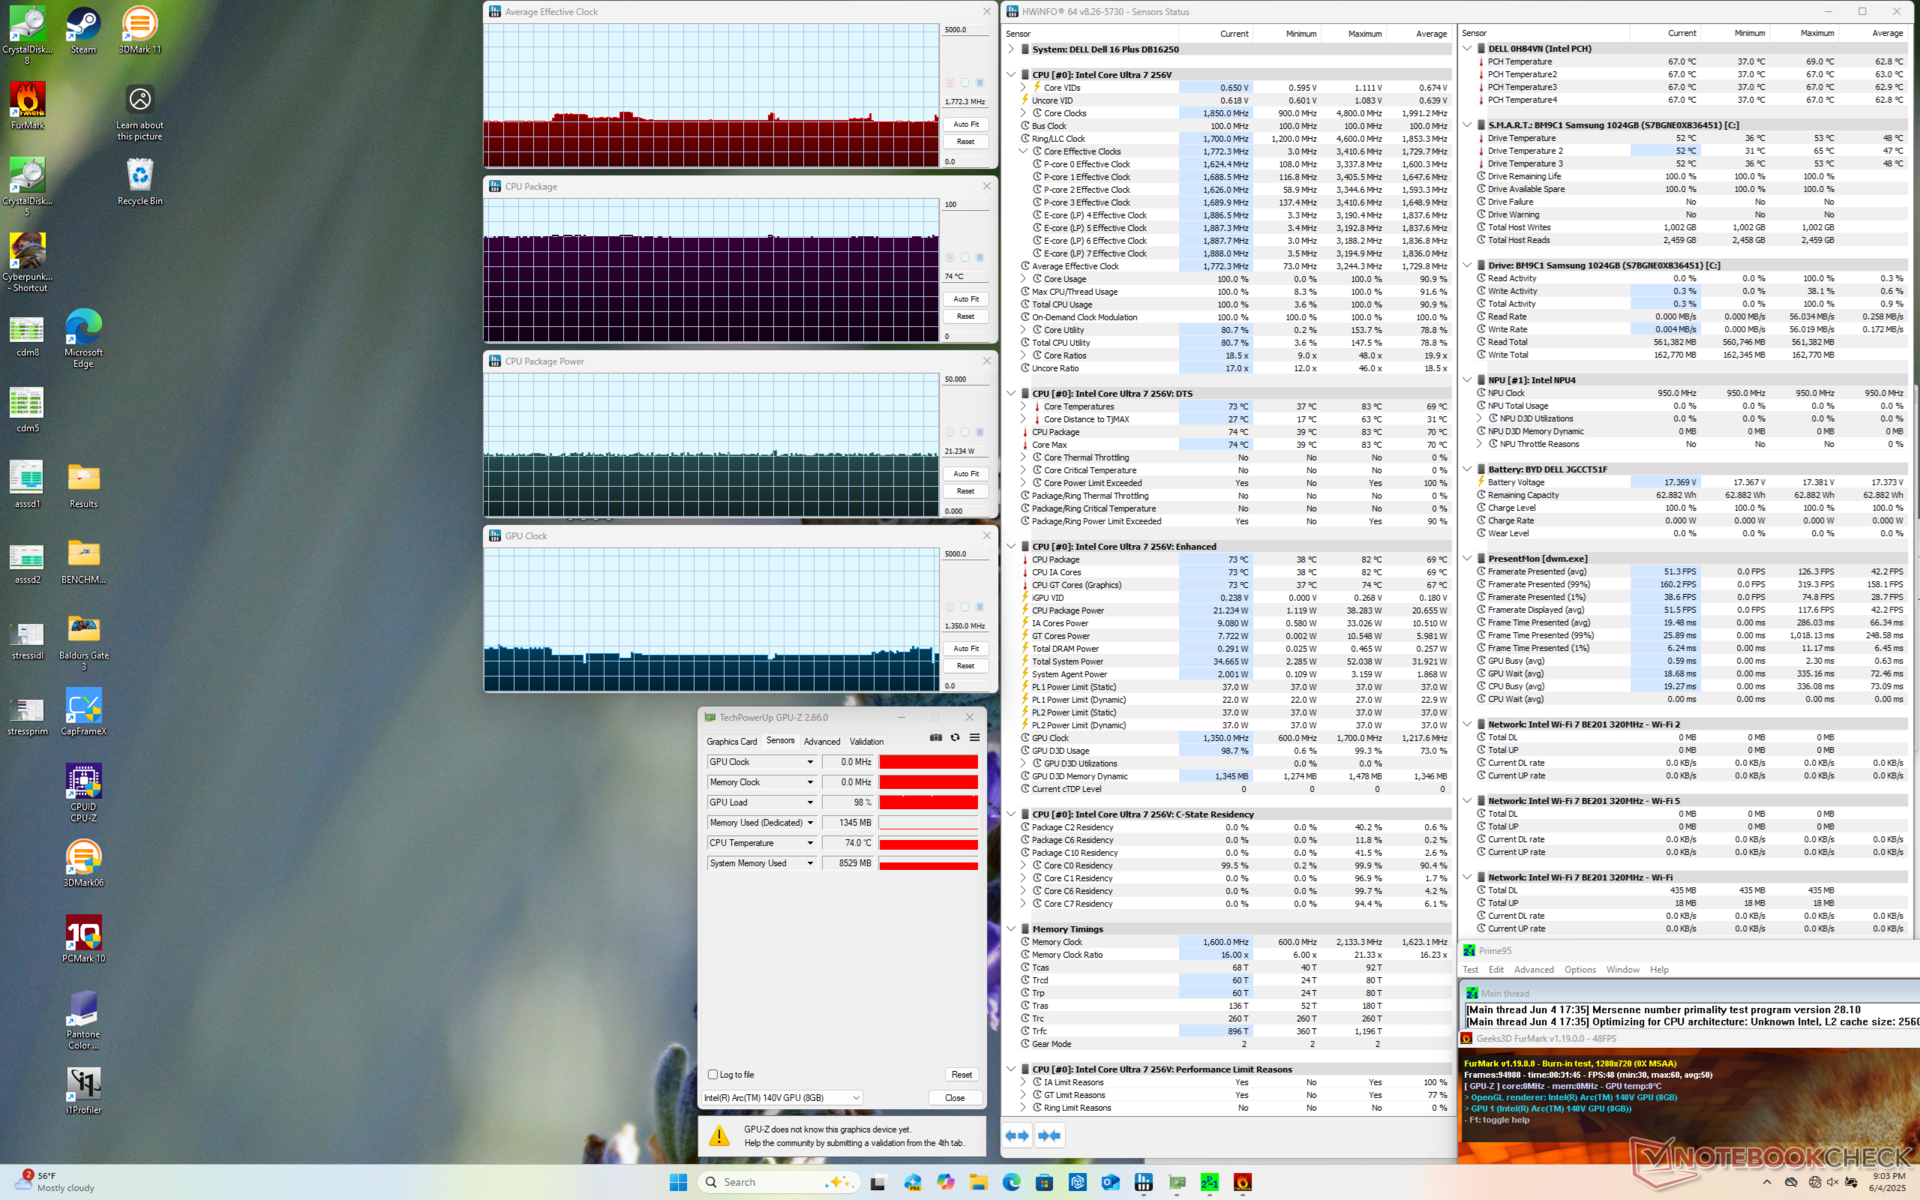
| Prime95 + FurMark Stress | 1.7 | 1350 | 74 |
| 赛博朋克 2077》压力 | 1.0 | 1950 | 74 |
系统性能
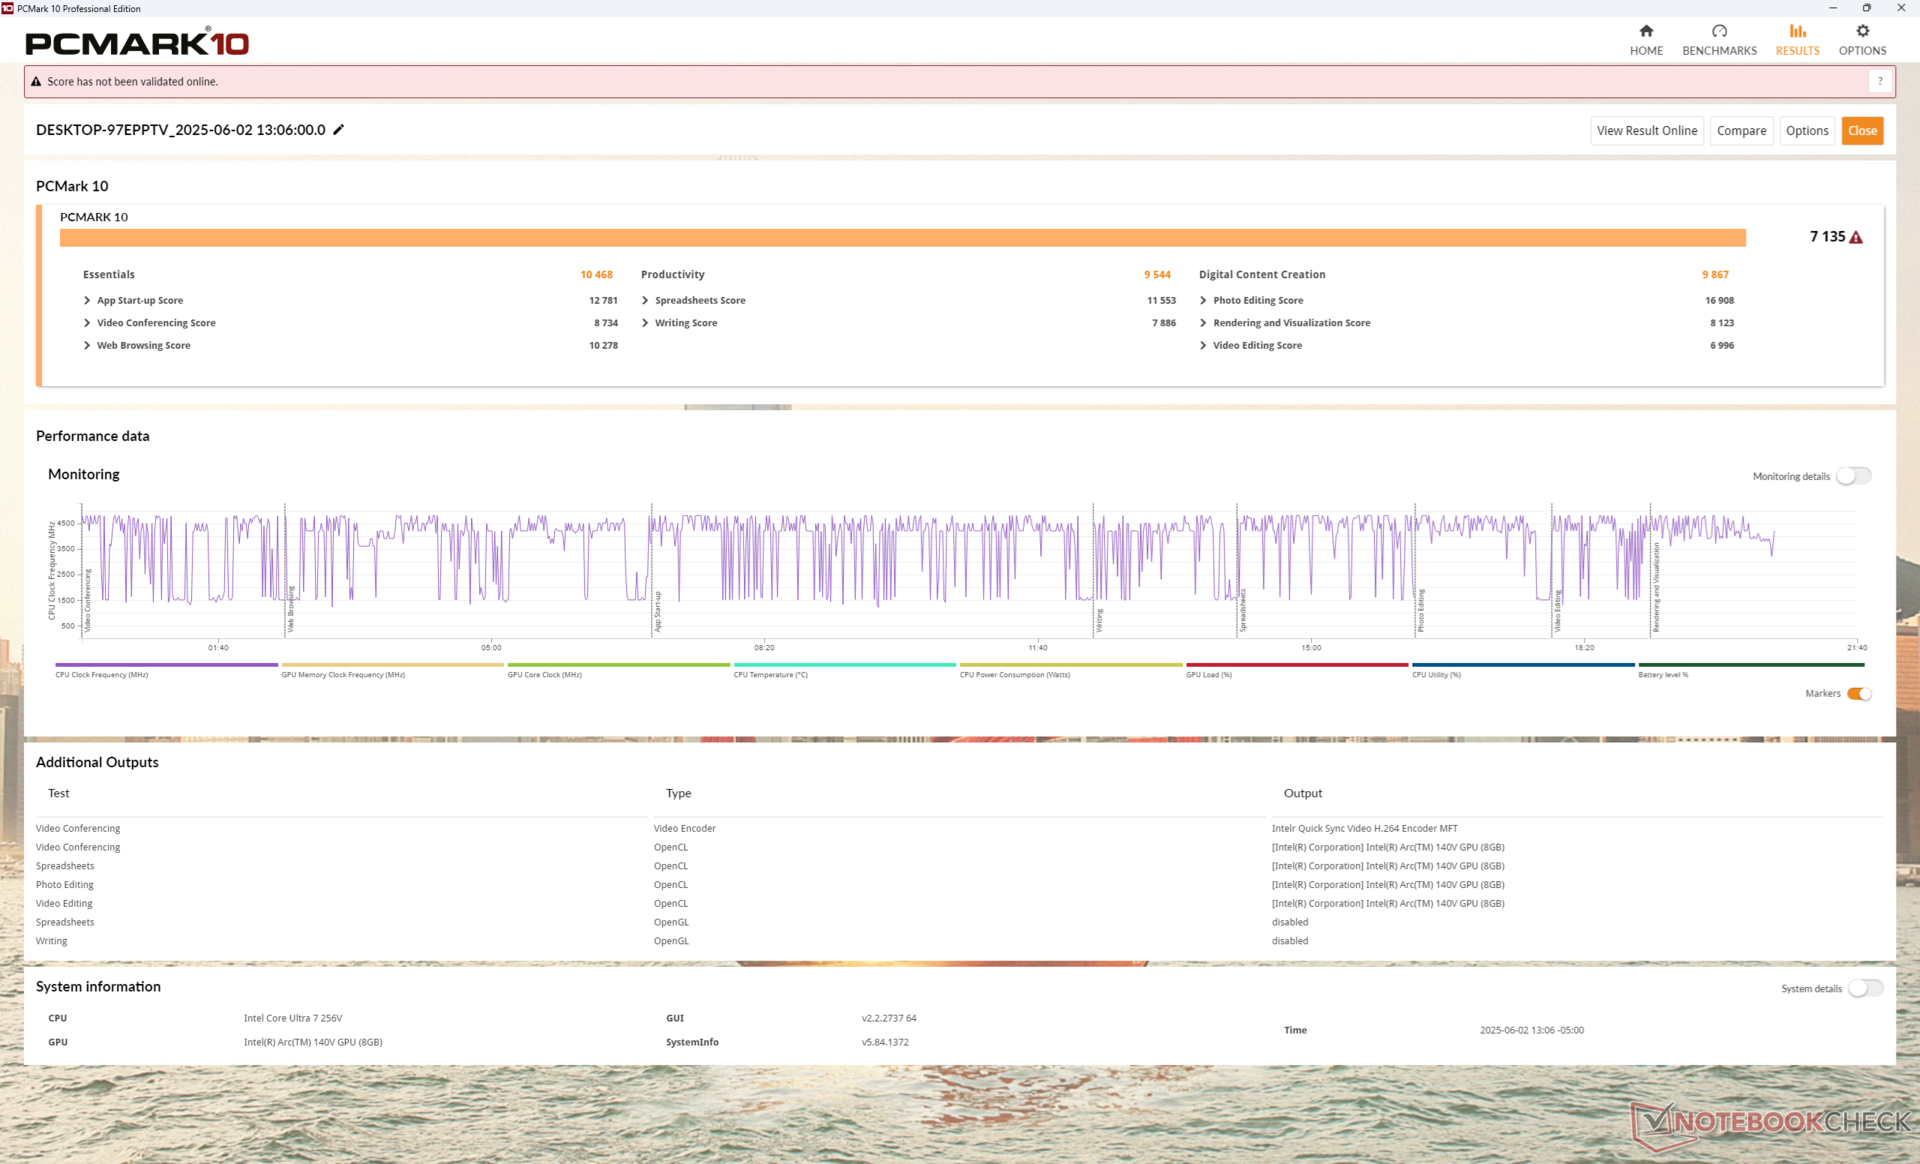
华硕 Vivobook 16 M1606K 的 PCMark 分数可与同类 16 英寸笔记本电脑媲美,甚至包括那些配备更快 H 系列 CPU 的笔记本电脑,如 华硕 Vivobook 16 M1606K.由于采用了 Lunar Lake 的封装设计,内存性能也非常出色。
PCMark 10: Score | Essentials | Productivity | Digital Content Creation
CrossMark: Overall | Productivity | Creativity | Responsiveness
WebXPRT 3: Overall
WebXPRT 4: Overall
Mozilla Kraken 1.1: Total
| Performance rating | |
| Lenovo ThinkBook 16 G7+ AMD | |
| Acer Swift 16 AI SF16-51T-932H, Ultra 9 288V | |
| Dell 16 Plus | |
| Average Intel Core Ultra 7 256V, Intel Arc Graphics 140V | |
| Asus Vivobook 16 M1606K | |
| HP Pavilion Plus 16-ab0456tx | |
| Dell Inspiron 16 Plus 7640 | |
| PCMark 10 / Score | |
| Lenovo ThinkBook 16 G7+ AMD | |
| Acer Swift 16 AI SF16-51T-932H, Ultra 9 288V | |
| Dell 16 Plus | |
| Average Intel Core Ultra 7 256V, Intel Arc Graphics 140V (6677 - 7702, n=7) | |
| Dell Inspiron 16 Plus 7640 | |
| Asus Vivobook 16 M1606K | |
| HP Pavilion Plus 16-ab0456tx | |
| PCMark 10 / Essentials | |
| Asus Vivobook 16 M1606K | |
| Lenovo ThinkBook 16 G7+ AMD | |
| Acer Swift 16 AI SF16-51T-932H, Ultra 9 288V | |
| Dell 16 Plus | |
| Dell Inspiron 16 Plus 7640 | |
| Average Intel Core Ultra 7 256V, Intel Arc Graphics 140V (9627 - 11365, n=7) | |
| HP Pavilion Plus 16-ab0456tx | |
| PCMark 10 / Productivity | |
| Lenovo ThinkBook 16 G7+ AMD | |
| Asus Vivobook 16 M1606K | |
| Average Intel Core Ultra 7 256V, Intel Arc Graphics 140V (8161 - 12672, n=7) | |
| Dell 16 Plus | |
| Acer Swift 16 AI SF16-51T-932H, Ultra 9 288V | |
| HP Pavilion Plus 16-ab0456tx | |
| Dell Inspiron 16 Plus 7640 | |
| PCMark 10 / Digital Content Creation | |
| Dell Inspiron 16 Plus 7640 | |
| Lenovo ThinkBook 16 G7+ AMD | |
| Acer Swift 16 AI SF16-51T-932H, Ultra 9 288V | |
| Dell 16 Plus | |
| Average Intel Core Ultra 7 256V, Intel Arc Graphics 140V (9481 - 10126, n=7) | |
| Asus Vivobook 16 M1606K | |
| HP Pavilion Plus 16-ab0456tx | |
| CrossMark / Overall | |
| HP Pavilion Plus 16-ab0456tx | |
| Lenovo ThinkBook 16 G7+ AMD | |
| Acer Swift 16 AI SF16-51T-932H, Ultra 9 288V | |
| Asus Vivobook 16 M1606K | |
| Average Intel Core Ultra 7 256V, Intel Arc Graphics 140V (1636 - 1736, n=7) | |
| Dell Inspiron 16 Plus 7640 | |
| Dell 16 Plus | |
| CrossMark / Productivity | |
| Acer Swift 16 AI SF16-51T-932H, Ultra 9 288V | |
| HP Pavilion Plus 16-ab0456tx | |
| Average Intel Core Ultra 7 256V, Intel Arc Graphics 140V (1563 - 1682, n=7) | |
| Asus Vivobook 16 M1606K | |
| Dell 16 Plus | |
| Lenovo ThinkBook 16 G7+ AMD | |
| Dell Inspiron 16 Plus 7640 | |
| CrossMark / Creativity | |
| Lenovo ThinkBook 16 G7+ AMD | |
| HP Pavilion Plus 16-ab0456tx | |
| Acer Swift 16 AI SF16-51T-932H, Ultra 9 288V | |
| Dell Inspiron 16 Plus 7640 | |
| Average Intel Core Ultra 7 256V, Intel Arc Graphics 140V (1862 - 1962, n=7) | |
| Dell 16 Plus | |
| Asus Vivobook 16 M1606K | |
| CrossMark / Responsiveness | |
| HP Pavilion Plus 16-ab0456tx | |
| Asus Vivobook 16 M1606K | |
| Lenovo ThinkBook 16 G7+ AMD | |
| Dell Inspiron 16 Plus 7640 | |
| Acer Swift 16 AI SF16-51T-932H, Ultra 9 288V | |
| Average Intel Core Ultra 7 256V, Intel Arc Graphics 140V (1215 - 1371, n=7) | |
| Dell 16 Plus | |
| WebXPRT 3 / Overall | |
| Lenovo ThinkBook 16 G7+ AMD | |
| Dell 16 Plus | |
| Acer Swift 16 AI SF16-51T-932H, Ultra 9 288V | |
| Average Intel Core Ultra 7 256V, Intel Arc Graphics 140V (243 - 310, n=7) | |
| Asus Vivobook 16 M1606K | |
| Dell Inspiron 16 Plus 7640 | |
| HP Pavilion Plus 16-ab0456tx | |
| WebXPRT 4 / Overall | |
| Average Intel Core Ultra 7 256V, Intel Arc Graphics 140V (282 - 286, n=7) | |
| Dell 16 Plus | |
| Acer Swift 16 AI SF16-51T-932H, Ultra 9 288V | |
| HP Pavilion Plus 16-ab0456tx | |
| Dell Inspiron 16 Plus 7640 | |
| Lenovo ThinkBook 16 G7+ AMD | |
| Asus Vivobook 16 M1606K | |
| Mozilla Kraken 1.1 / Total | |
| Dell Inspiron 16 Plus 7640 | |
| HP Pavilion Plus 16-ab0456tx | |
| Average Intel Core Ultra 7 256V, Intel Arc Graphics 140V (470 - 480, n=7) | |
| Dell 16 Plus | |
| Acer Swift 16 AI SF16-51T-932H, Ultra 9 288V | |
| Asus Vivobook 16 M1606K | |
| Lenovo ThinkBook 16 G7+ AMD | |
* ... smaller is better
| PCMark 10 Score | 7135 points | |
Help | ||
| AIDA64 / Memory Copy | |
| Acer Swift 16 AI SF16-51T-932H, Ultra 9 288V | |
| Average Intel Core Ultra 7 256V (99227 - 104459, n=7) | |
| Dell 16 Plus | |
| Lenovo ThinkBook 16 G7+ AMD | |
| HP Pavilion Plus 16-ab0456tx | |
| Dell Inspiron 16 Plus 7640 | |
| Asus Vivobook 16 M1606K | |
| AIDA64 / Memory Read | |
| Lenovo ThinkBook 16 G7+ AMD | |
| Dell 16 Plus | |
| Average Intel Core Ultra 7 256V (86352 - 89848, n=7) | |
| Acer Swift 16 AI SF16-51T-932H, Ultra 9 288V | |
| Dell Inspiron 16 Plus 7640 | |
| HP Pavilion Plus 16-ab0456tx | |
| Asus Vivobook 16 M1606K | |
| AIDA64 / Memory Write | |
| Dell 16 Plus | |
| Average Intel Core Ultra 7 256V (108692 - 117933, n=7) | |
| Acer Swift 16 AI SF16-51T-932H, Ultra 9 288V | |
| Lenovo ThinkBook 16 G7+ AMD | |
| HP Pavilion Plus 16-ab0456tx | |
| Dell Inspiron 16 Plus 7640 | |
| Asus Vivobook 16 M1606K | |
| AIDA64 / Memory Latency | |
| Dell Inspiron 16 Plus 7640 | |
| Lenovo ThinkBook 16 G7+ AMD | |
| Dell 16 Plus | |
| Average Intel Core Ultra 7 256V (96.1 - 99.6, n=7) | |
| Acer Swift 16 AI SF16-51T-932H, Ultra 9 288V | |
| HP Pavilion Plus 16-ab0456tx | |
| Asus Vivobook 16 M1606K | |
* ... smaller is better
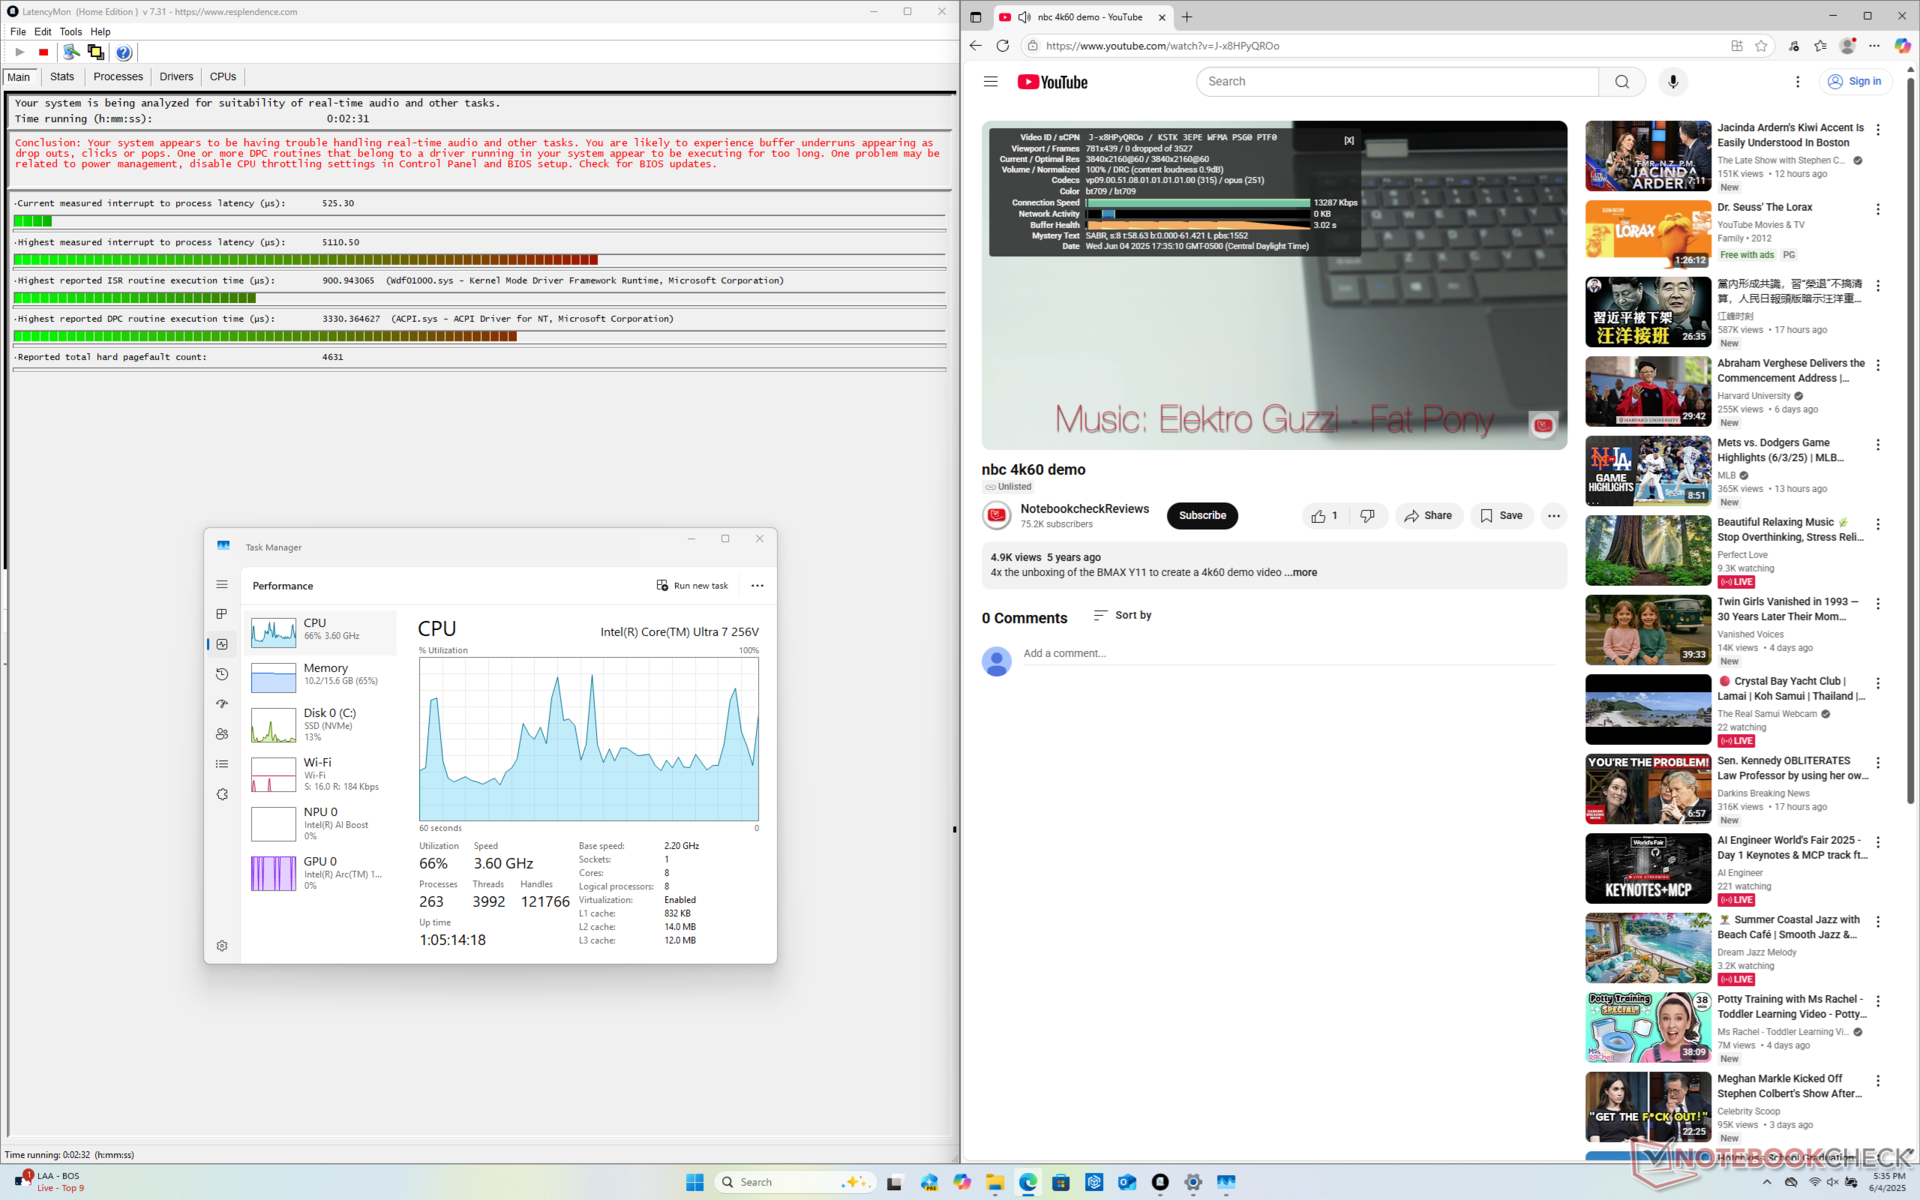
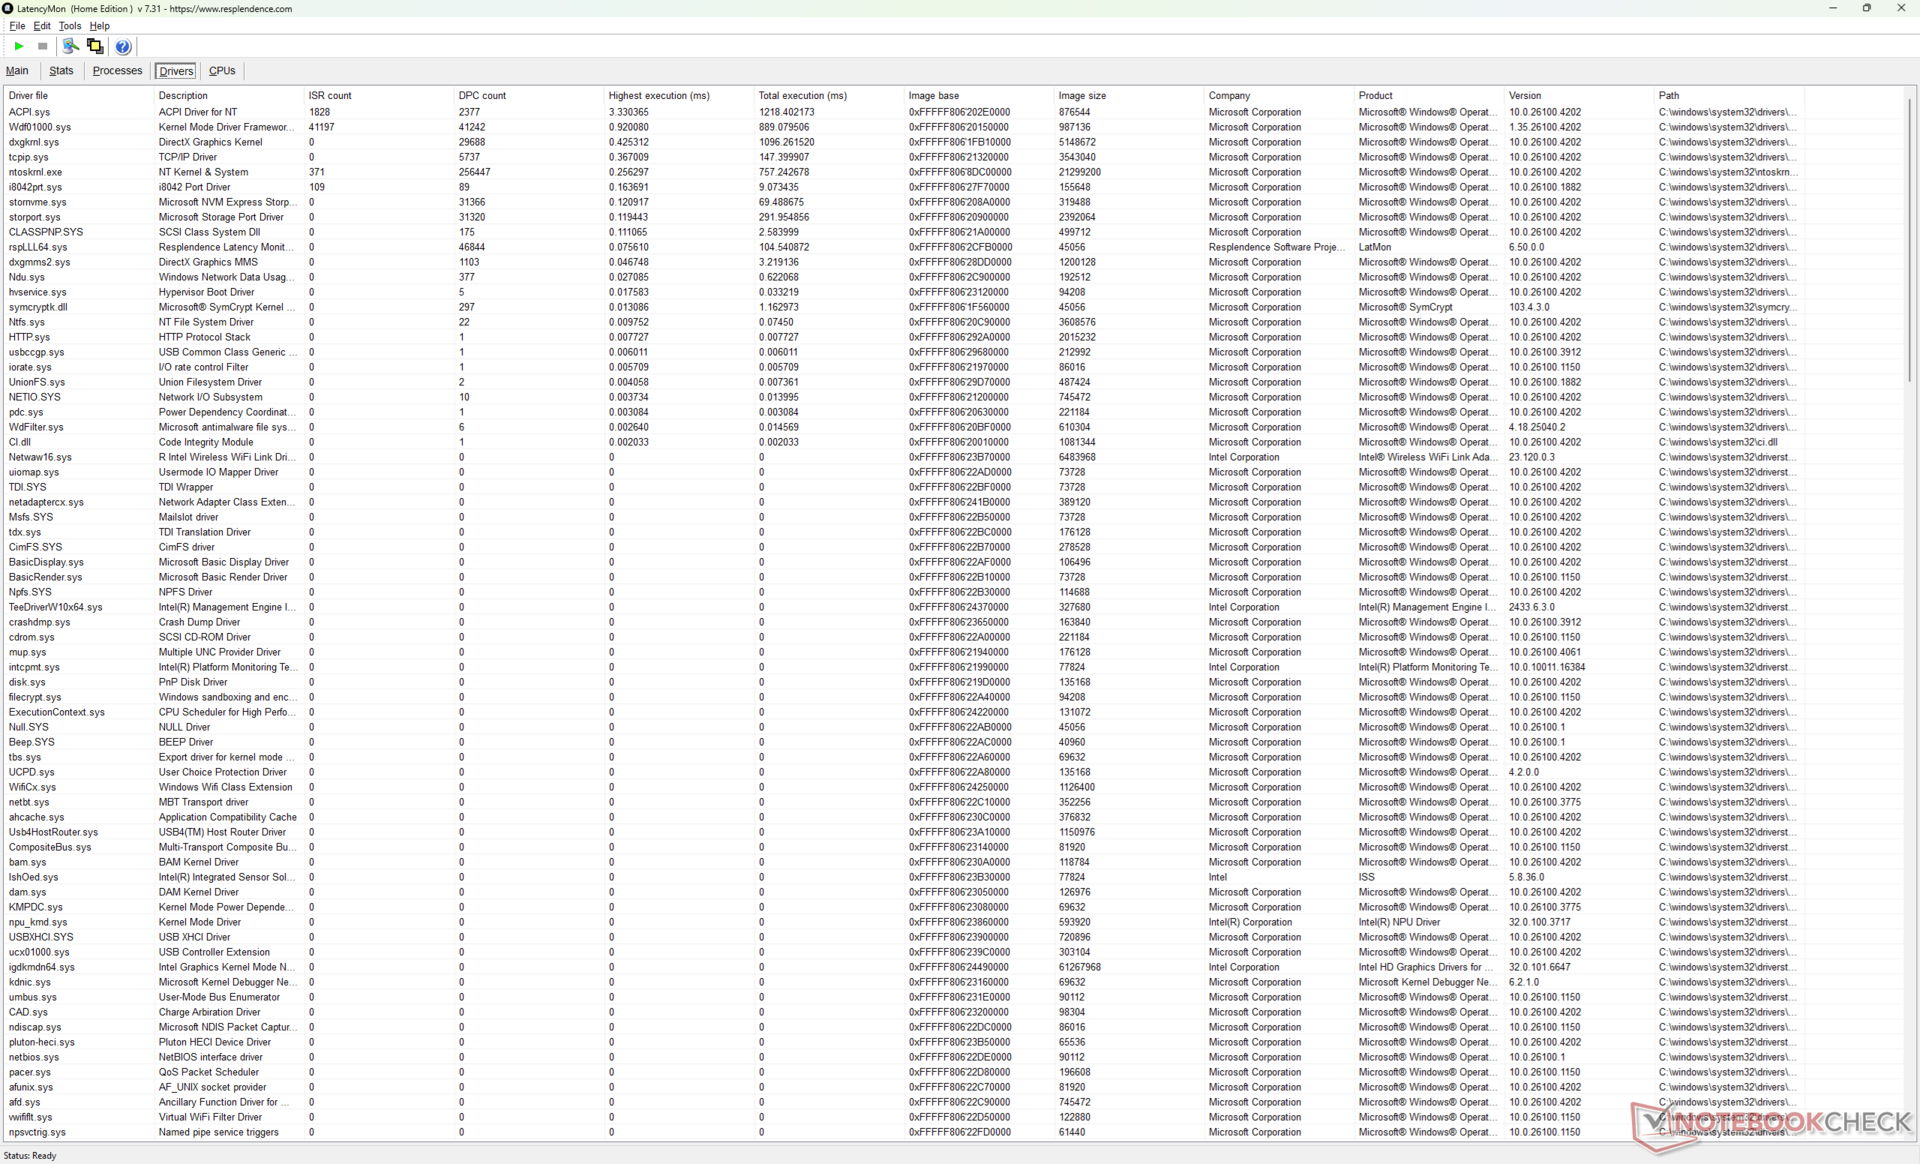
DPC 延迟
在打开我们主页的多个浏览器标签页时,LatencyMon 显示了 DPC 问题。奇怪的是,在播放 4K60 视频时,GPU 的活动会在 0% 和 100% 之间循环,而在大多数其他 Lunar Lake 笔记本电脑上,GPU 的活动会稳定在 40% 左右。除此之外,没有任何掉帧记录,可获得流畅的 4K60 流媒体体验。
| DPC Latencies / LatencyMon - interrupt to process latency (max), Web, Youtube, Prime95 | |
| HP Pavilion Plus 16-ab0456tx | |
| Dell 16 Plus | |
| Acer Swift 16 AI SF16-51T-932H, Ultra 9 288V | |
| Lenovo ThinkBook 16 G7+ AMD | |
| Asus Vivobook 16 M1606K | |
| Dell Inspiron 16 Plus 7640 | |
* ... smaller is better
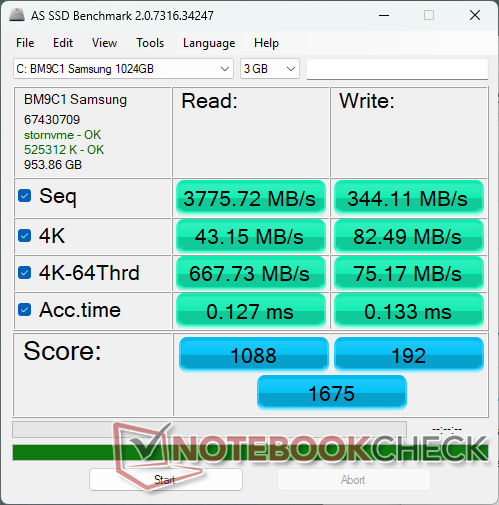
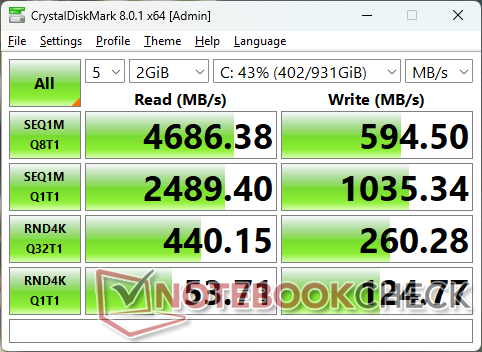
存储设备
三星 三星 BM9C1 不如去年 Inspiron 16 7640 2 合 1 上的美光 2550。传输速率并不稳定,在 3600 MB/s 和 4900 MB/s 之间波动,在 DiskSpd 循环测试中甚至低至 2200 MB/s。

| Drive Performance rating - Percent | |
| HP Pavilion Plus 16-ab0456tx | |
| Asus Vivobook 16 M1606K | |
| Lenovo ThinkBook 16 G7+ AMD | |
| Dell Inspiron 16 Plus 7640 | |
| Acer Swift 16 AI SF16-51T-932H, Ultra 9 288V | |
| Dell 16 Plus | |
* ... smaller is better
Disk Throttling: DiskSpd Read Loop, Queue Depth 8
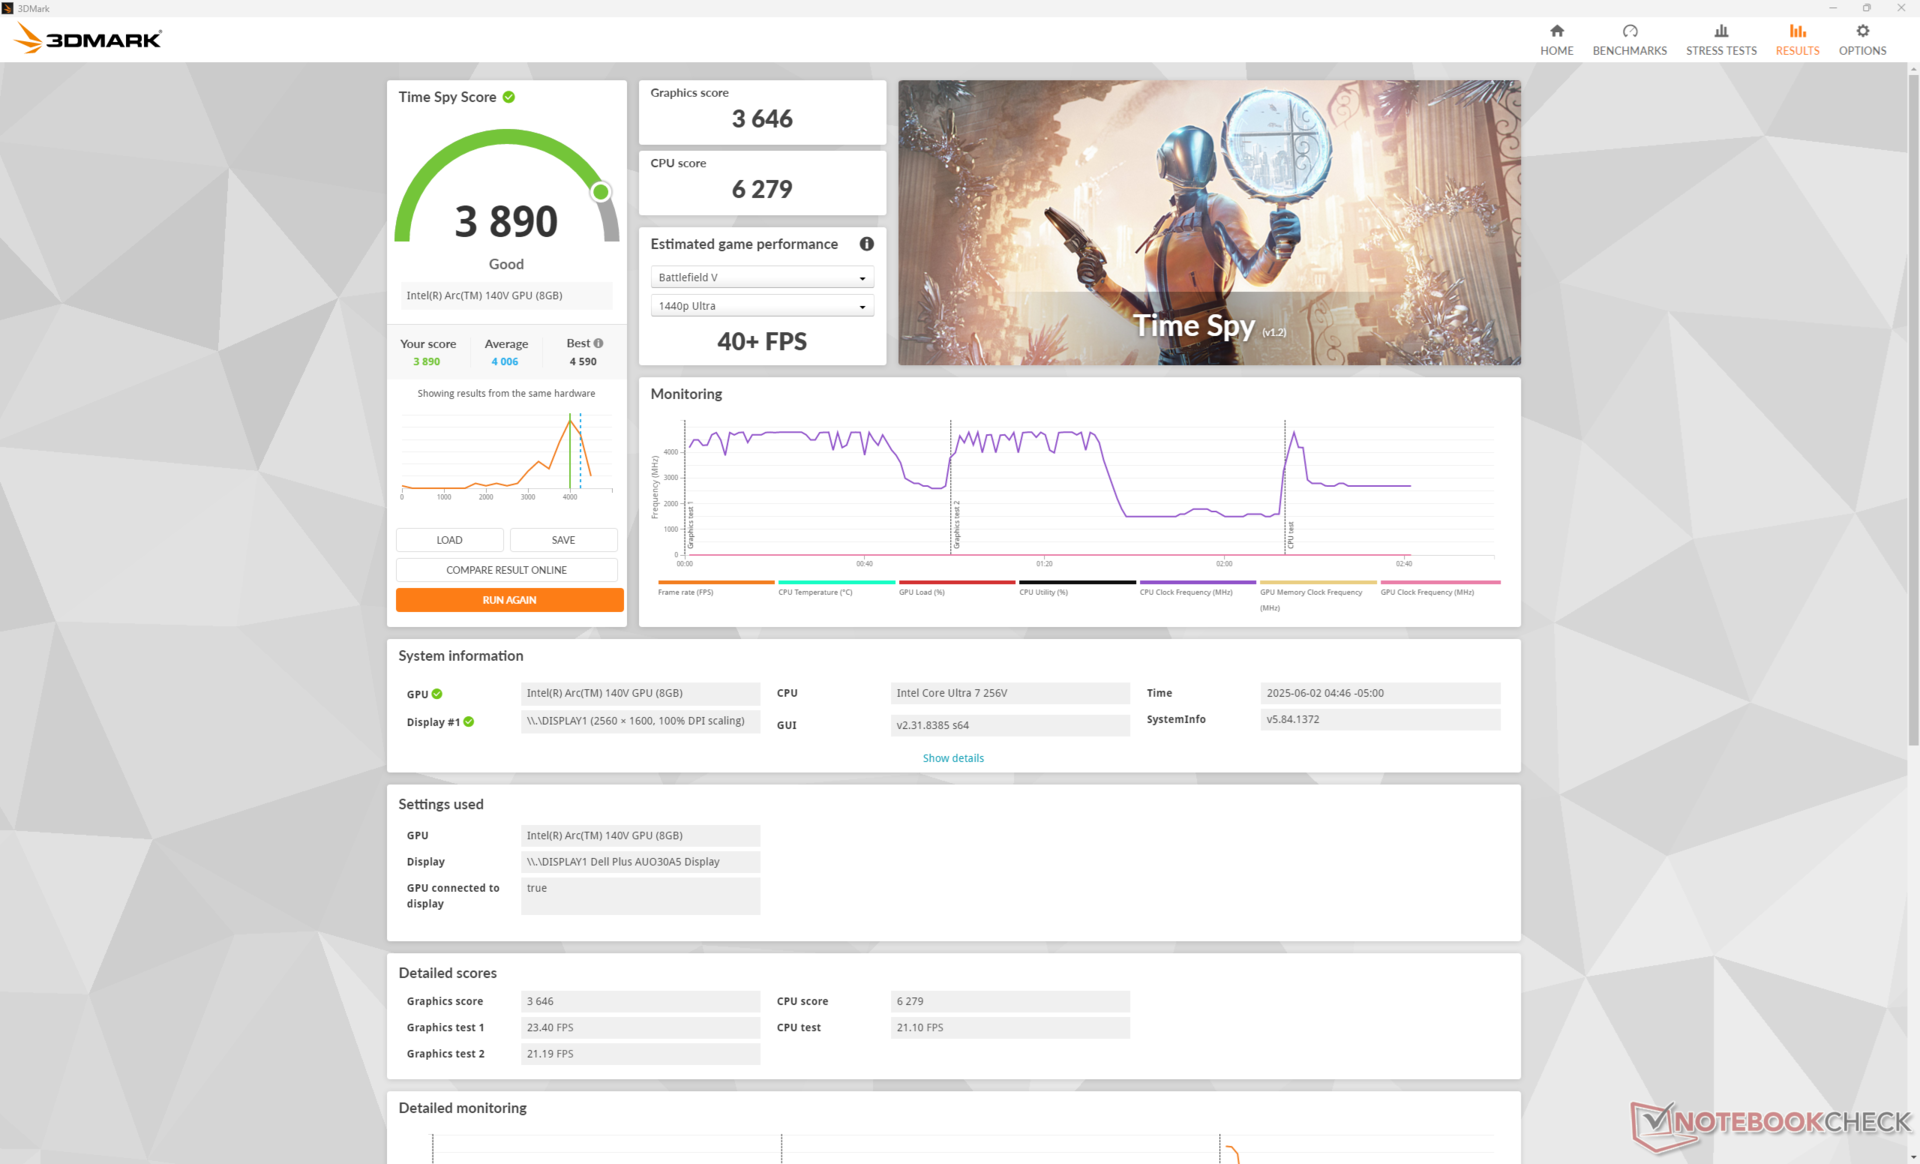
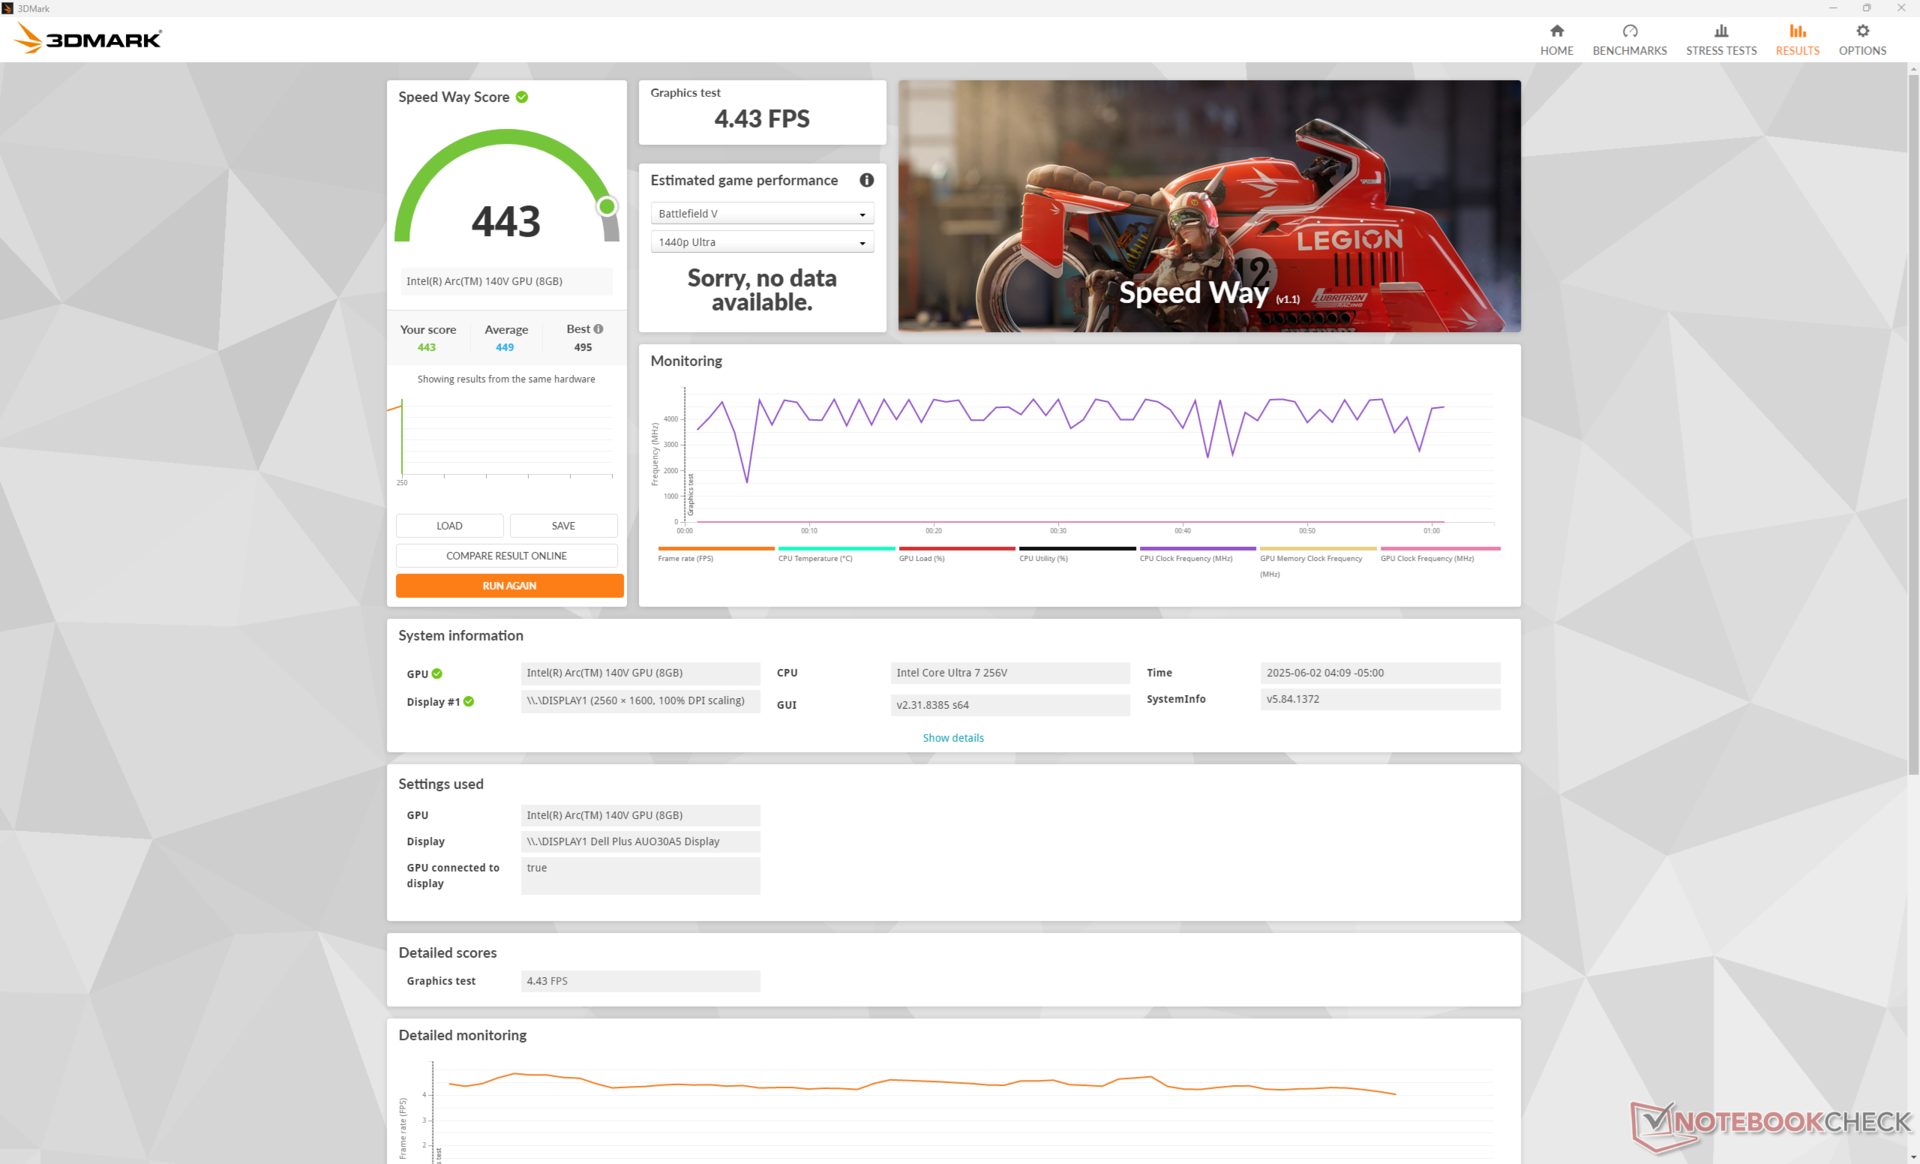
图形处理器性能
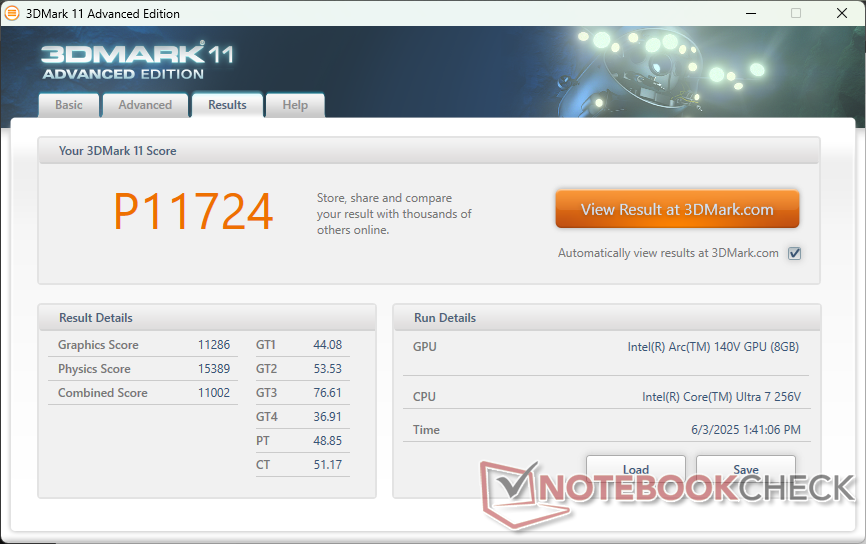

| 3DMark 11 Performance | 11724 points | |
| 3DMark Fire Strike Score | 8470 points | |
| 3DMark Time Spy Score | 3890 points | |
Help | ||
* ... smaller is better
游戏性能
包括《博德之门 3》在内的大多数游戏都能在原生 1080p 和低设置下良好运行。不过,像《赛博朋克 2077》这样要求较高的游戏可能需要降至 720p 才能获得更流畅的体验。
| F1 24 | |
| 1920x1080 Low Preset AA:T AF:16x | |
| Average Intel Arc Graphics 140V (54 - 99, n=25) | |
| Dell 16 Plus | |
| Lenovo ThinkPad T16 Gen 3 21MN005XGE | |
| 1920x1080 Medium Preset AA:T AF:16x | |
| Average Intel Arc Graphics 140V (49.2 - 88.2, n=24) | |
| Dell 16 Plus | |
| Lenovo ThinkPad T16 Gen 3 21MN005XGE | |
| 1920x1080 High Preset AA:T AF:16x | |
| Average Intel Arc Graphics 140V (34.4 - 66.4, n=27) | |
| Dell 16 Plus | |
| LG Gram Pro 16Z90TS-G.AU89G | |
| Lenovo ThinkPad T16 Gen 3 21MN005XGE | |
| 1920x1080 Ultra High Preset AA:T AF:16x | |
| Dell 16 Plus | |
| Average Intel Arc Graphics 140V (14.6 - 22, n=25) | |
| Lenovo ThinkPad T16 Gen 3 21MN005XGE | |
Cyberpunk 2077 ultra FPS Chart
| low | med. | high | ultra | |
|---|---|---|---|---|
| Dota 2 Reborn (2015) | 98.3 | 70.3 | 71.1 | 71.9 |
| Final Fantasy XV Benchmark (2018) | 80.5 | 45.7 | 33.3 | |
| X-Plane 11.11 (2018) | 51.2 | 39.7 | 35.7 | |
| Strange Brigade (2018) | 205 | 81 | 68 | 56.9 |
| Baldur's Gate 3 (2023) | 38.1 | 31 | 27.7 | 27 |
| Cyberpunk 2077 (2023) | 44.2 | 35.2 | 24.7 | 24.1 |
| F1 24 (2024) | 75.3 | 70.7 | 55.3 | 18.8 |
排放量
系统噪音
内部风扇对负载的响应通常比较迟缓,这意味着在启动或运行要求较高的应用程序时,风扇转速会缓慢上升。这是件好事,因为在大量使用时,风扇噪音需要更长的时间才能变得更加明显。不过,一段时间后,系统会达到与宏碁 Swift 16 AI 或华硕 Vivobook 16 等大多数其他 16 英寸多媒体笔记本电脑类似的最高水平。
Noise level
| Idle |
| 23.5 / 23.5 / 23.5 dB(A) |
| Load |
| 31.9 / 46.9 dB(A) |
 | ||
30 dB silent 40 dB(A) audible 50 dB(A) loud |
||
min: | ||
| Dell 16 Plus Arc 140V, Core Ultra 7 256V, Samsung BM9C1 1024GB | Dell Inspiron 16 Plus 7640 GeForce RTX 4060 Laptop GPU, Ultra 7 155H, SK hynix BC901 HFS001TEJ4X164N | Acer Swift 16 AI SF16-51T-932H, Ultra 9 288V Arc 140V, Core Ultra 9 288V, Western Digital PC SN5000S SDEQNSJ-1T00 | Lenovo ThinkBook 16 G7+ AMD Radeon 880M, Ryzen AI 9 365, Samsung PM9C1a MZAL81T0HDLB | HP Pavilion Plus 16-ab0456tx GeForce RTX 3050 6GB Laptop GPU, i7-13700H, WDC PC SN810 1TB | Asus Vivobook 16 M1606K Radeon 860M, Ryzen AI 7 350, Micron 2500 1TB MTFDKBA1T0QGN | |
|---|---|---|---|---|---|---|
| Noise | -2% | -6% | -2% | -0% | 2% | |
| off / environment * (dB) | 23.4 | 23.8 -2% | 25.8 -10% | 24.5 -5% | 22.22 5% | 23 2% |
| Idle Minimum * (dB) | 23.5 | 24.2 -3% | 25.8 -10% | 24.5 -4% | 22.22 5% | 23 2% |
| Idle Average * (dB) | 23.5 | 24.2 -3% | 25.8 -10% | 24.5 -4% | 22.22 5% | 23 2% |
| Idle Maximum * (dB) | 23.5 | 24.2 -3% | 26.7 -14% | 25.9 -10% | 22.22 5% | 24.67 -5% |
| Load Average * (dB) | 31.9 | 28.9 9% | 36.2 -13% | 42.03 -32% | 31.72 1% | |
| Cyberpunk 2077 ultra * (dB) | 42.6 | 44.4 -4% | 40.1 6% | 41.53 3% | ||
| Load Maximum * (dB) | 46.9 | 51 -9% | 41.1 12% | 40.1 14% | 42.1 10% | 42.51 9% |
| Witcher 3 ultra * (dB) | 51 | 42.1 |
* ... smaller is better
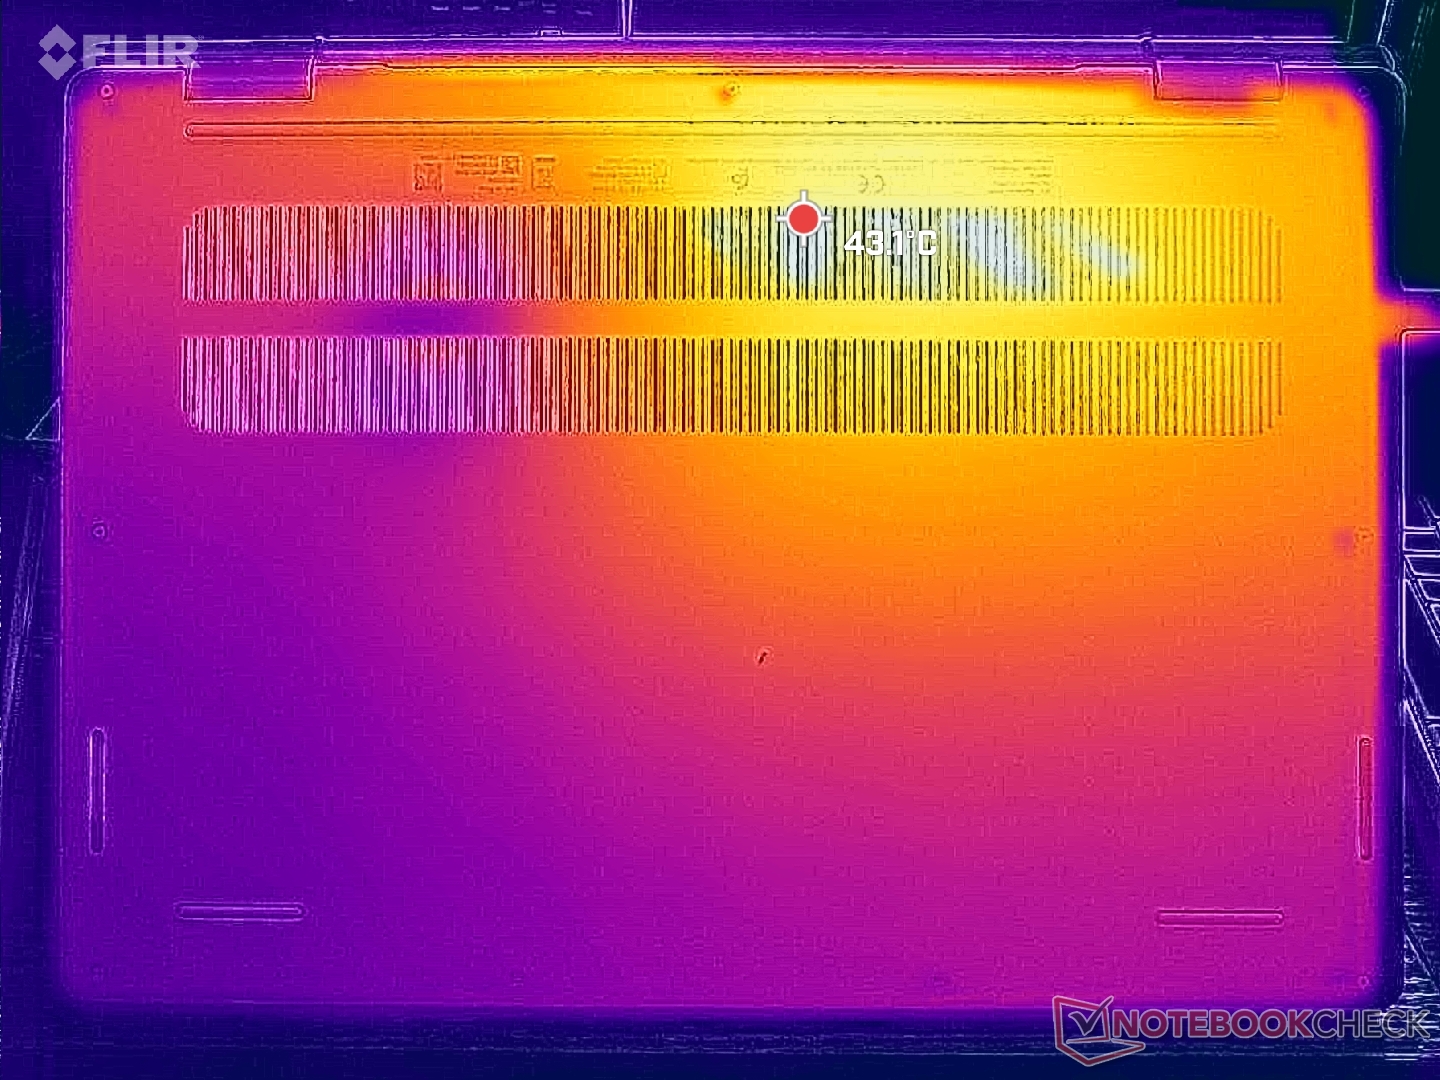
温度
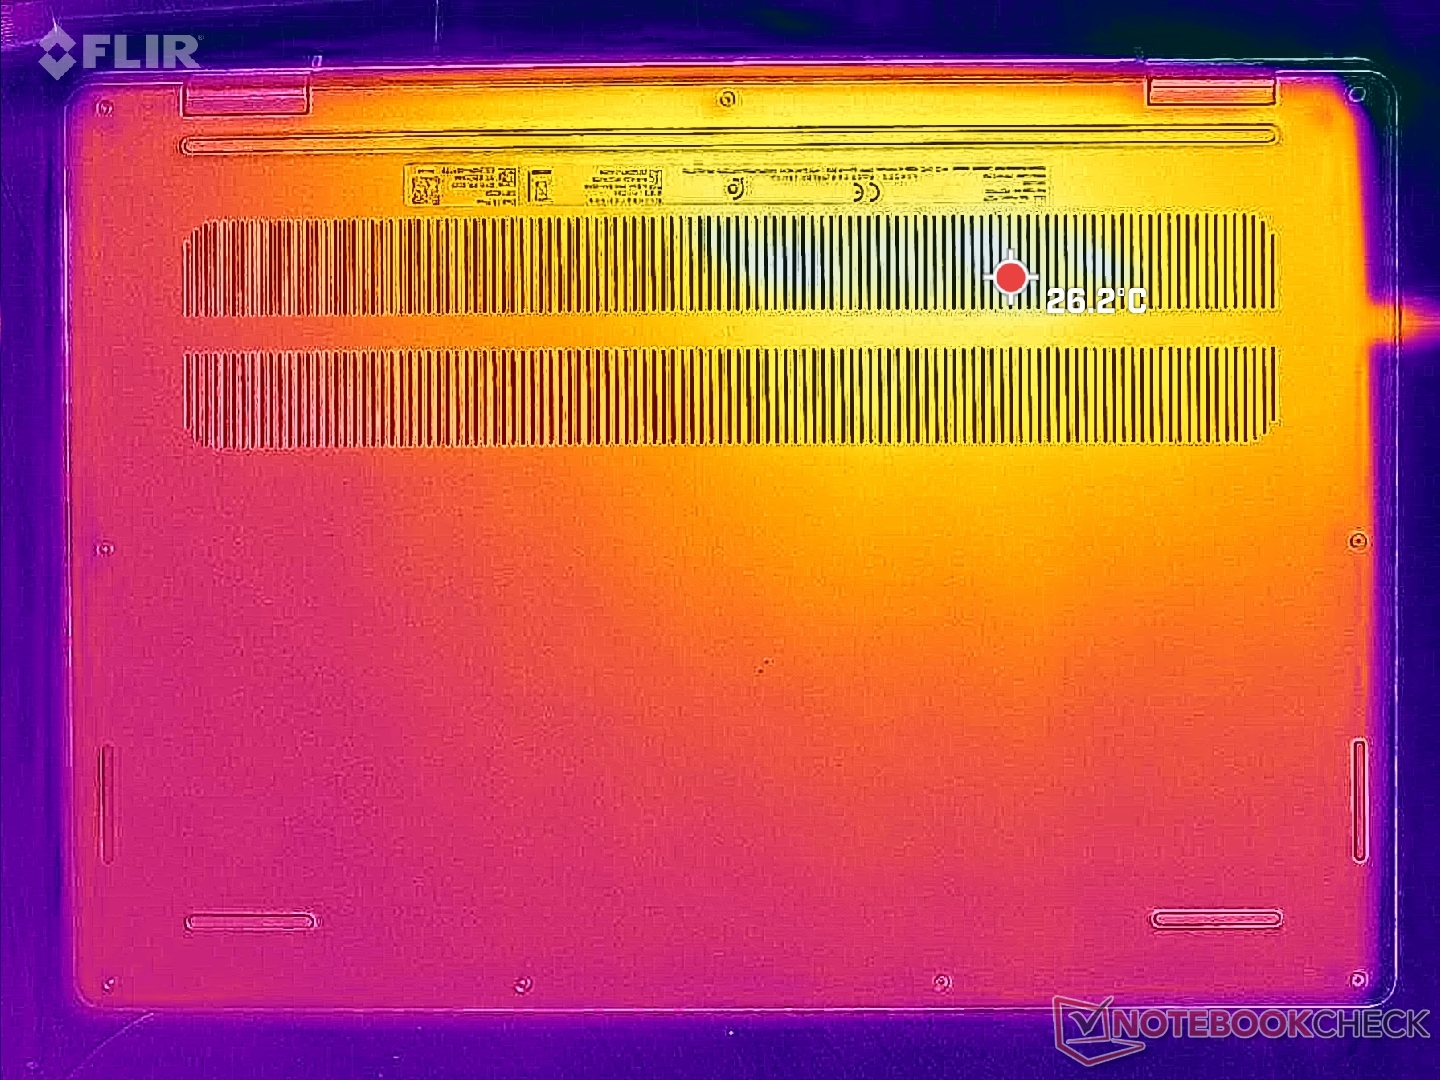
与即将发布的 Inspiron 16 7640 系列相比,表面温度明显降低,这主要是由于处理器的变化。热点最高温度为 40 摄氏度,而不是较高的 40 摄氏度。
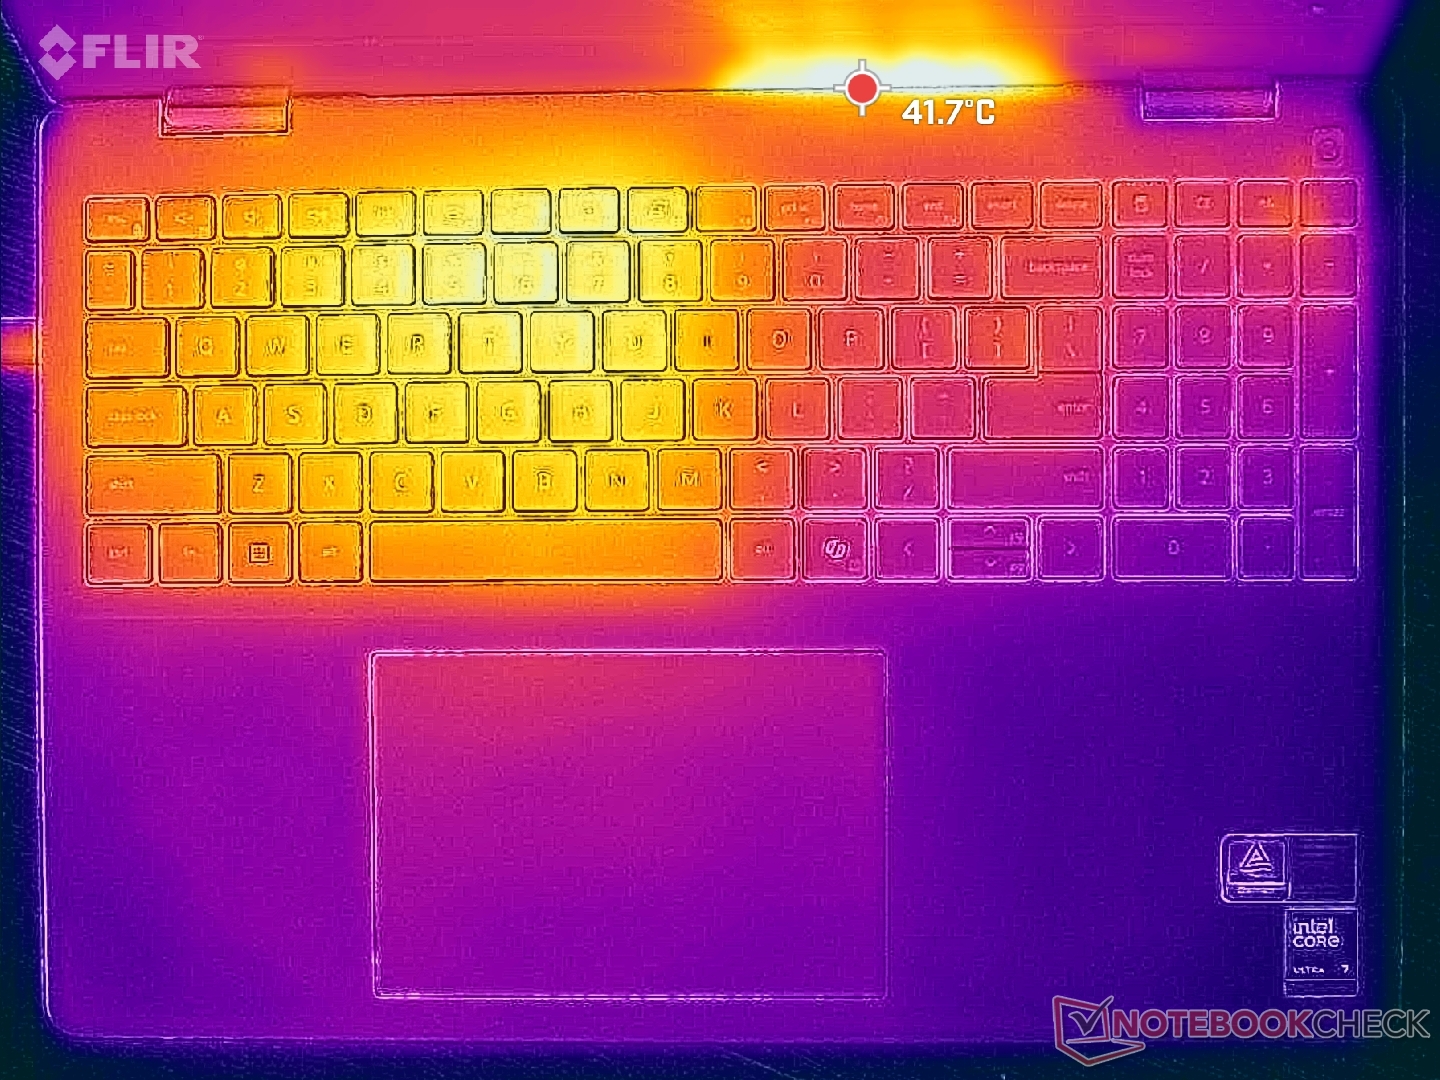
该系统显然不是为游戏玩家设计的,因为 WASD 区域的温度会比键盘其他区域高得多,如下图所示。
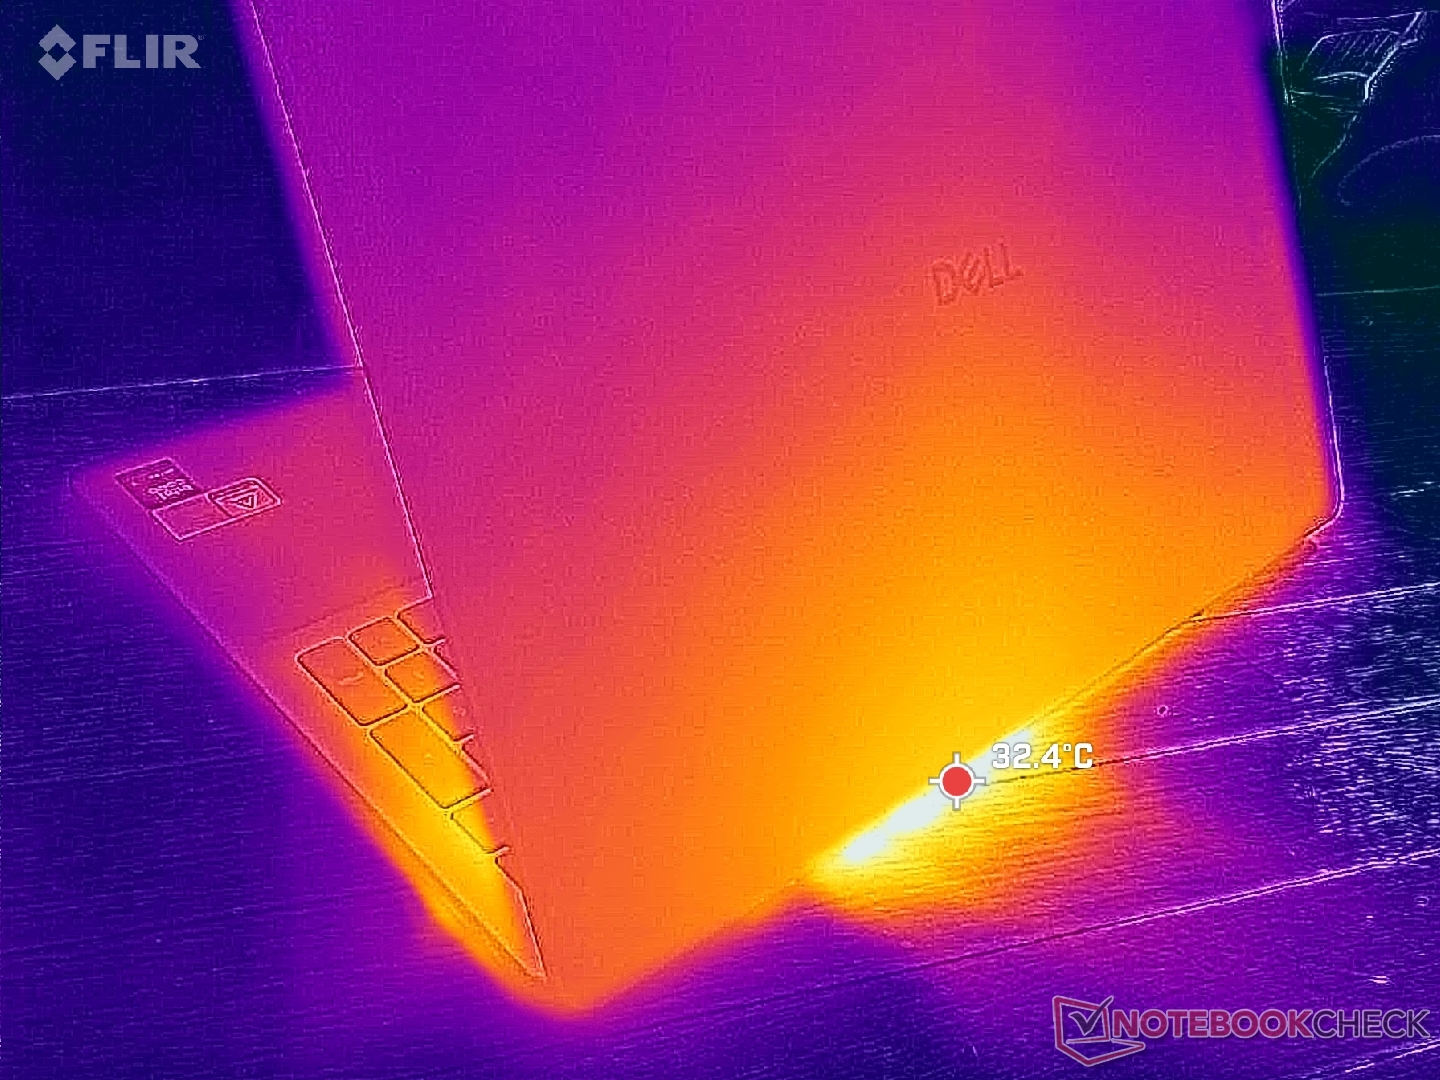
(±) The maximum temperature on the upper side is 40.6 °C / 105 F, compared to the average of 36.8 °C / 98 F, ranging from 21 to 71 °C for the class Multimedia.
(±) The bottom heats up to a maximum of 40 °C / 104 F, compared to the average of 39.1 °C / 102 F
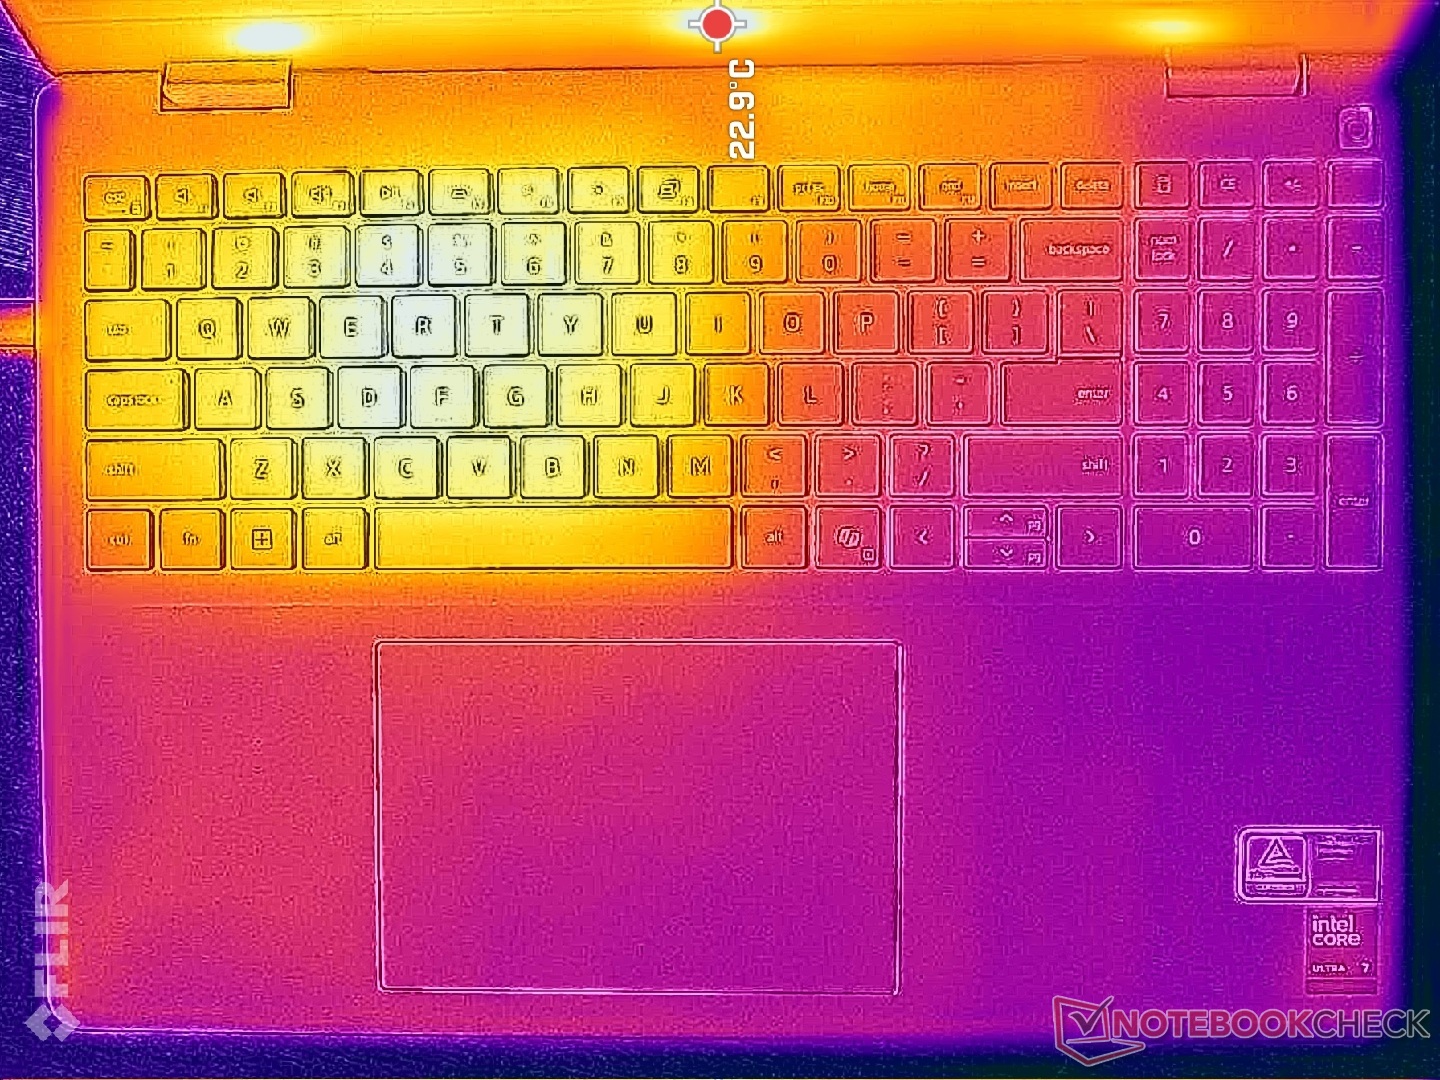
(+) In idle usage, the average temperature for the upper side is 27.2 °C / 81 F, compared to the device average of 31.3 °C / 88 F.
(+) The palmrests and touchpad are cooler than skin temperature with a maximum of 25.8 °C / 78.4 F and are therefore cool to the touch.
(+) The average temperature of the palmrest area of similar devices was 28.7 °C / 83.7 F (+2.9 °C / 5.3 F).
| Dell 16 Plus Intel Core Ultra 7 256V, Intel Arc Graphics 140V | Dell Inspiron 16 Plus 7640 Intel Core Ultra 7 155H, NVIDIA GeForce RTX 4060 Laptop GPU | Acer Swift 16 AI SF16-51T-932H, Ultra 9 288V Intel Core Ultra 9 288V, Intel Arc Graphics 140V | Lenovo ThinkBook 16 G7+ AMD AMD Ryzen AI 9 365, AMD Radeon 880M | HP Pavilion Plus 16-ab0456tx Intel Core i7-13700H, NVIDIA GeForce RTX 3050 6GB Laptop GPU | Asus Vivobook 16 M1606K AMD Ryzen AI 7 350, AMD Radeon 860M | |
|---|---|---|---|---|---|---|
| Heat | -9% | 7% | 9% | -24% | 0% | |
| Maximum Upper Side * (°C) | 40.6 | 43.4 -7% | 37.9 7% | 38.2 6% | 49.6 -22% | 48 -18% |
| Maximum Bottom * (°C) | 40 | 41.6 -4% | 31.5 21% | 37.9 5% | 45.8 -15% | 51 -27% |
| Idle Upper Side * (°C) | 29.2 | 32.8 -12% | 28.3 3% | 25.4 13% | 39.2 -34% | 22 25% |
| Idle Bottom * (°C) | 28.6 | 32.4 -13% | 29.7 -4% | 25.7 10% | 35.4 -24% | 23 20% |
* ... smaller is better
发言人
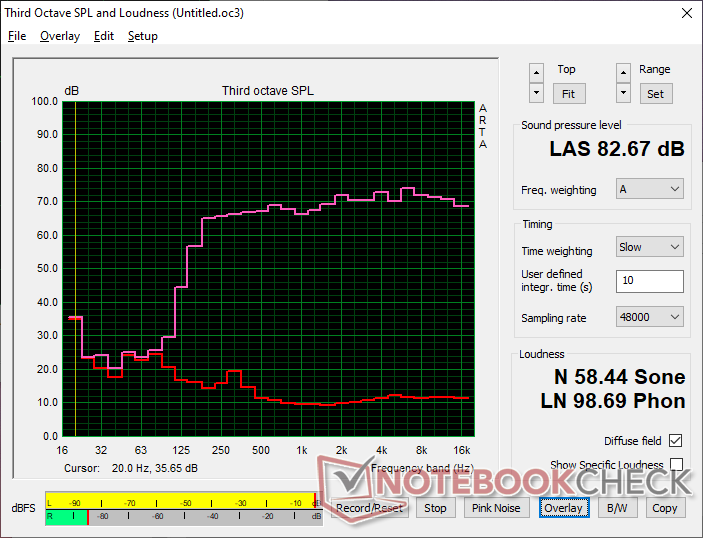
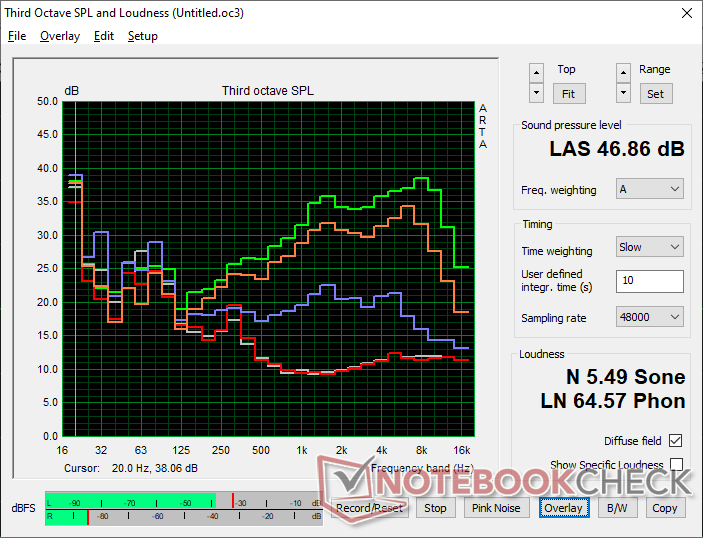
Dell 16 Plus audio analysis
(+) | speakers can play relatively loud (82.7 dB)
Bass 100 - 315 Hz
(±) | reduced bass - on average 14.1% lower than median
(±) | linearity of bass is average (11.8% delta to prev. frequency)
Mids 400 - 2000 Hz
(+) | balanced mids - only 1.6% away from median
(+) | mids are linear (2.4% delta to prev. frequency)
Highs 2 - 16 kHz
(+) | balanced highs - only 2.9% away from median
(+) | highs are linear (3.3% delta to prev. frequency)
Overall 100 - 16.000 Hz
(+) | overall sound is linear (10% difference to median)
Compared to same class
» 13% of all tested devices in this class were better, 2% similar, 84% worse
» The best had a delta of 5%, average was 17%, worst was 45%
Compared to all devices tested
» 4% of all tested devices were better, 1% similar, 94% worse
» The best had a delta of 4%, average was 23%, worst was 134%
Apple MacBook Pro 16 2021 M1 Pro audio analysis
(+) | speakers can play relatively loud (84.7 dB)
Bass 100 - 315 Hz
(+) | good bass - only 3.8% away from median
(+) | bass is linear (5.2% delta to prev. frequency)
Mids 400 - 2000 Hz
(+) | balanced mids - only 1.3% away from median
(+) | mids are linear (2.1% delta to prev. frequency)
Highs 2 - 16 kHz
(+) | balanced highs - only 1.9% away from median
(+) | highs are linear (2.7% delta to prev. frequency)
Overall 100 - 16.000 Hz
(+) | overall sound is linear (4.6% difference to median)
Compared to same class
» 0% of all tested devices in this class were better, 0% similar, 100% worse
» The best had a delta of 5%, average was 17%, worst was 45%
Compared to all devices tested
» 0% of all tested devices were better, 0% similar, 100% worse
» The best had a delta of 4%, average was 23%, worst was 134%
能源管理
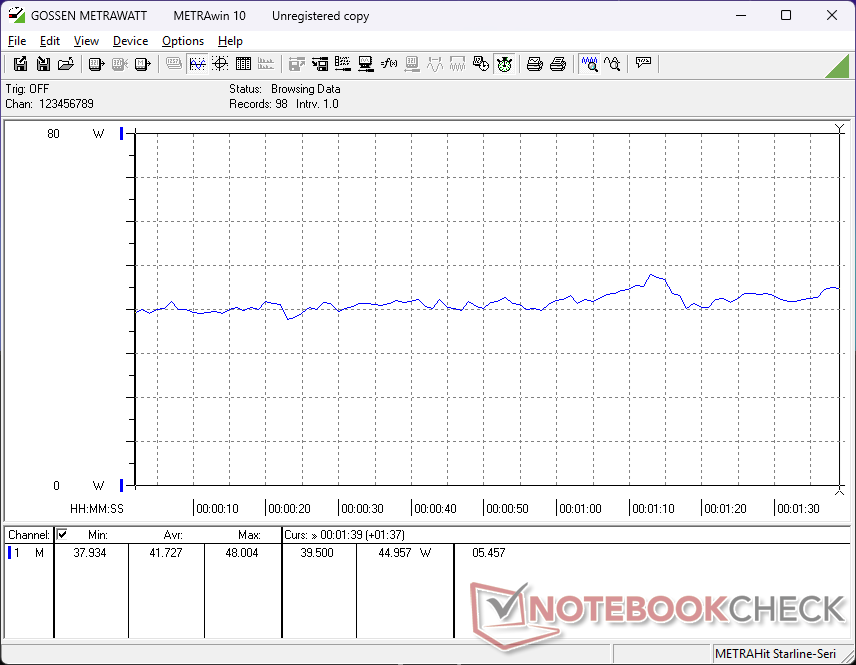
功耗 - 提高每瓦性能
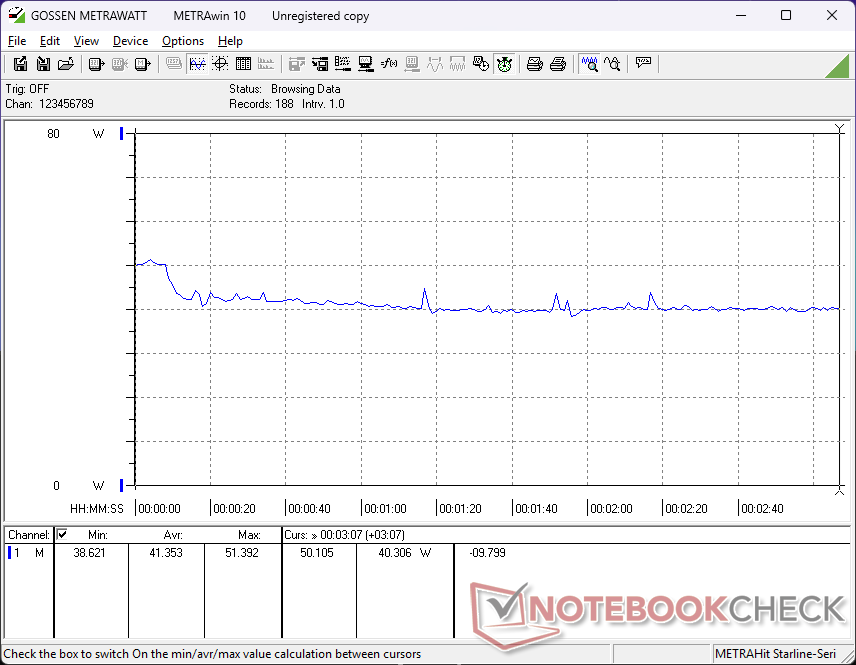
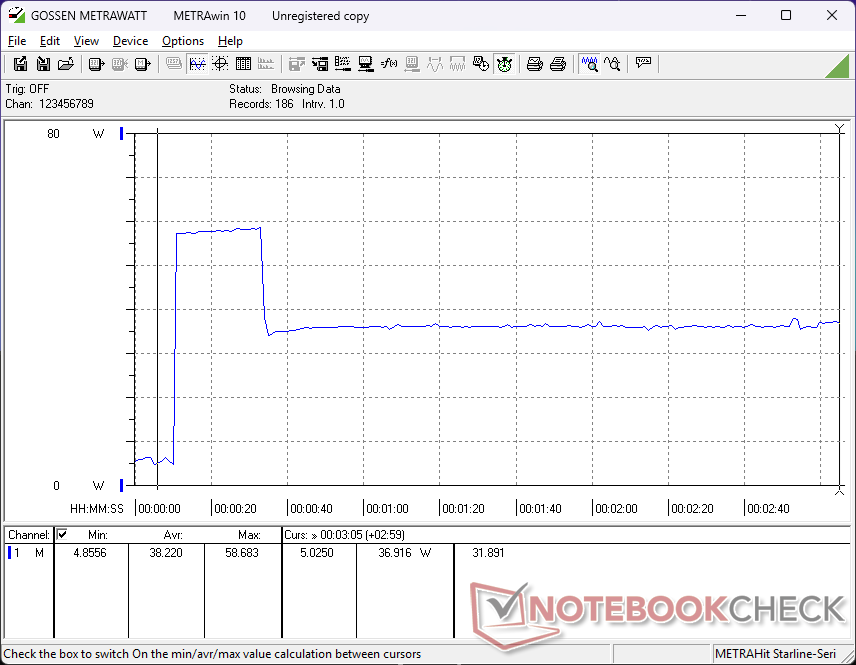
由于没有采用 H 系列 CPU、独立 GPU 或 OLED 选项,因此对于一款 16 英寸笔记本电脑来说,总功耗相当低,而所有这些都比我们的 V 系列 CPU、集成 GPU 和 IPS 面板要求更高。最值得注意的是,在运行《赛博朋克 2077》时,该系统的功耗仅为 41 W,而 Inspiron 16 7640 2 合 1 的功耗为 67 W,尽管我们的戴尔 16 Plus 运行游戏的速度要快大约 25%。
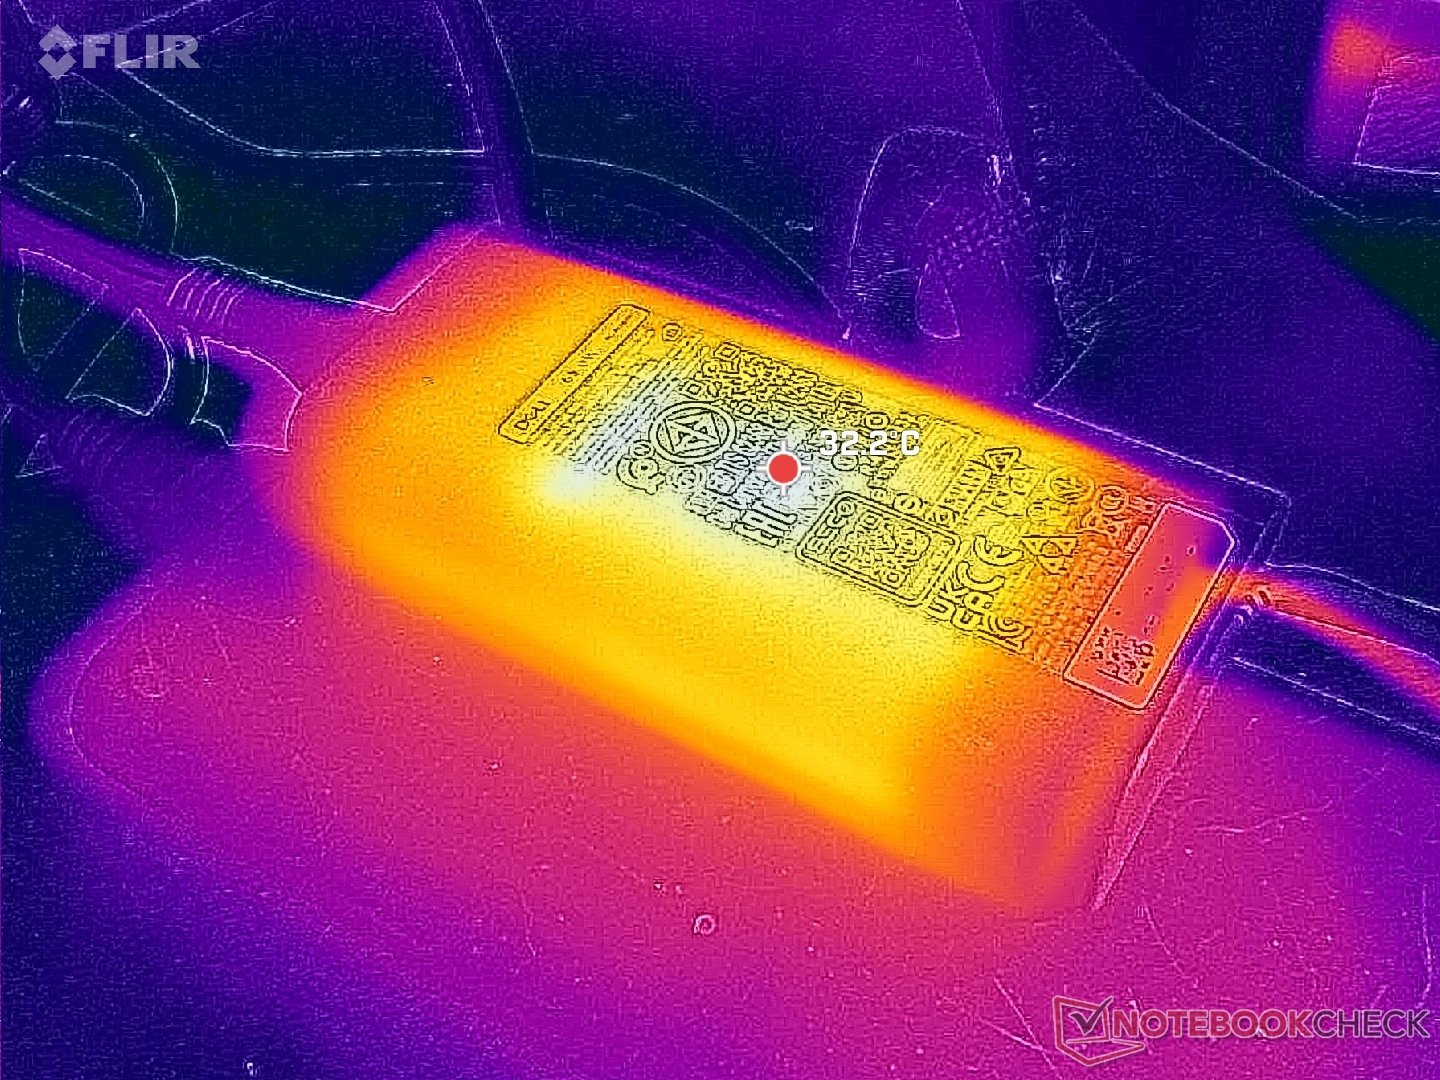
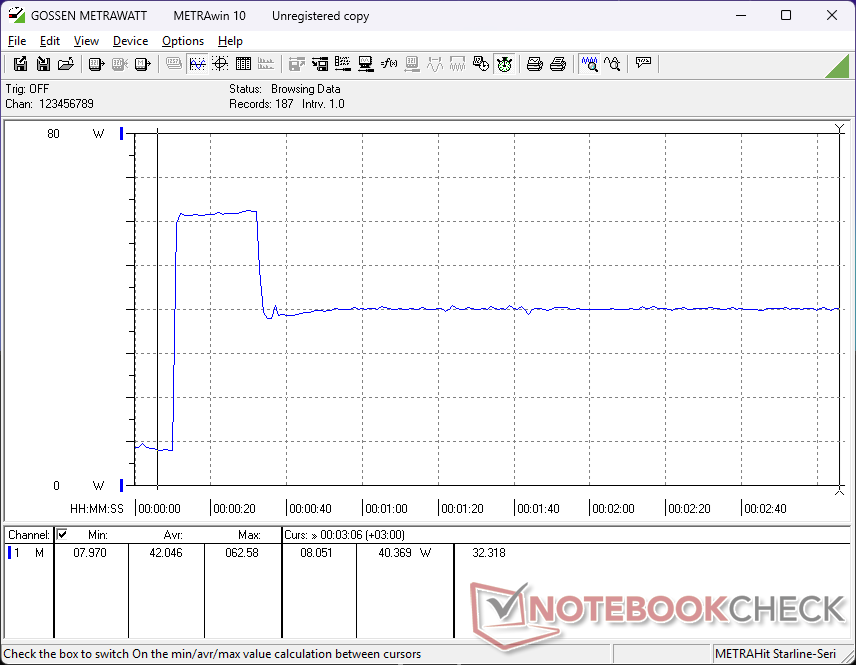
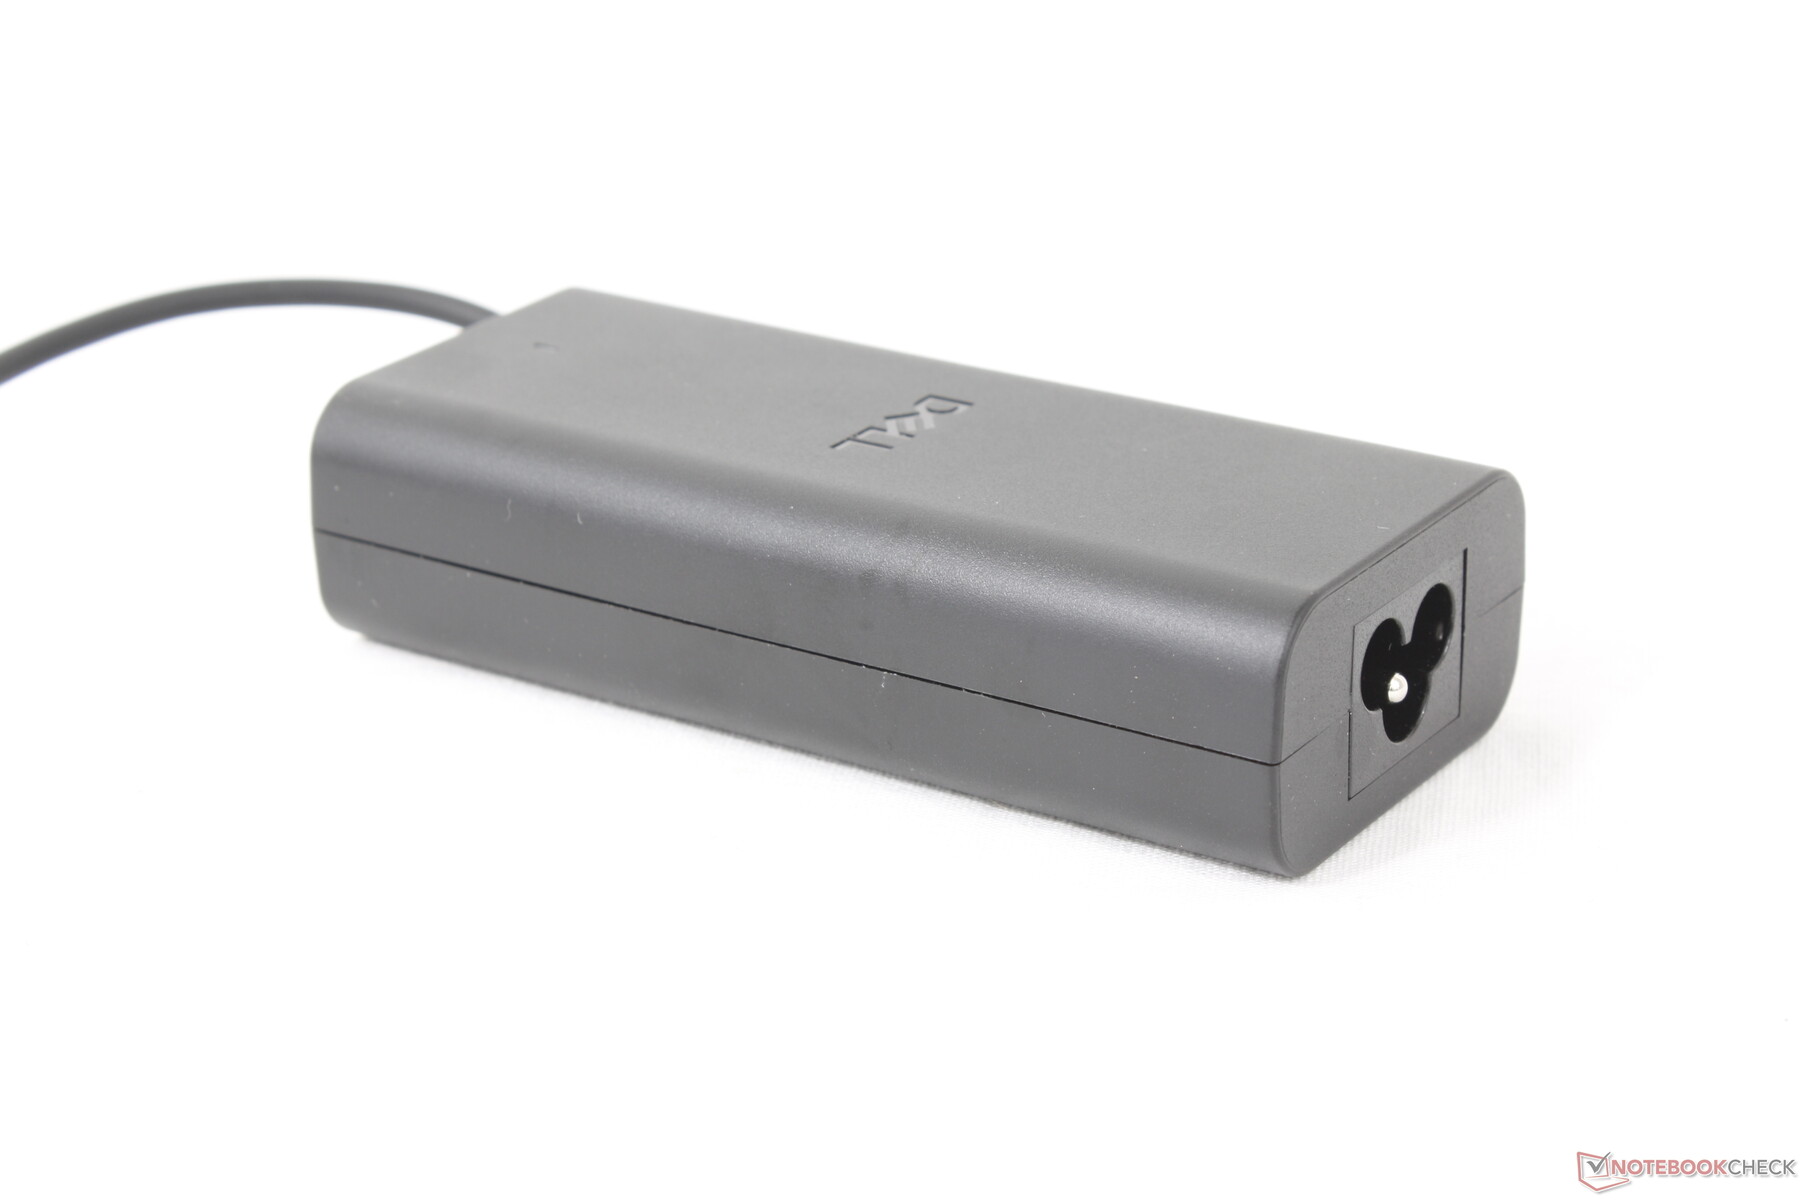
我们使用中小型(约 11.2 x 5 x 2.8 厘米)65 W USB-C 交流适配器记录的临时最大功耗为 62 W。
| Off / Standby | |
| Idle | |
| Load |
|
Key:
min: | |
| Dell 16 Plus Core Ultra 7 256V, Arc 140V, Samsung BM9C1 1024GB, IPS, 2560x1600, 16" | Dell Inspiron 16 Plus 7640 Ultra 7 155H, GeForce RTX 4060 Laptop GPU, SK hynix BC901 HFS001TEJ4X164N, IPS, 2560x1600, 16" | Acer Swift 16 AI SF16-51T-932H, Ultra 9 288V Core Ultra 9 288V, Arc 140V, Western Digital PC SN5000S SDEQNSJ-1T00, OLED, 2880x1800, 16" | Lenovo ThinkBook 16 G7+ AMD Ryzen AI 9 365, Radeon 880M, Samsung PM9C1a MZAL81T0HDLB, IPS, 3200x2000, 16" | HP Pavilion Plus 16-ab0456tx i7-13700H, GeForce RTX 3050 6GB Laptop GPU, WDC PC SN810 1TB, IPS, 2560x1600, 16" | Asus Vivobook 16 M1606K Ryzen AI 7 350, Radeon 860M, Micron 2500 1TB MTFDKBA1T0QGN, IPS, 1920x1200, 16" | |
|---|---|---|---|---|---|---|
| Power Consumption | -64% | -22% | -93% | -60% | -36% | |
| Idle Minimum * (Watt) | 3.4 | 4.2 -24% | 5.7 -68% | 6.4 -88% | 3.3 3% | 4.7 -38% |
| Idle Average * (Watt) | 6.9 | 6.9 -0% | 7.4 -7% | 14.1 -104% | 7.3 -6% | 8.2 -19% |
| Idle Maximum * (Watt) | 7.4 | 15.2 -105% | 7.9 -7% | 14.3 -93% | 14.24 -92% | 9 -22% |
| Load Average * (Watt) | 41.7 | 70.4 -69% | 83.4 -100% | 91.7 -120% | 59 -41% | |
| Cyberpunk 2077 ultra external monitor * (Watt) | 38 | 77.5 -104% | 58 -53% | |||
| Cyberpunk 2077 ultra * (Watt) | 41.4 | 49.8 -20% | 79.8 -93% | 65 -57% | ||
| Load Maximum * (Watt) | 62 | 137.4 -122% | 65.41 -6% | 102.9 -66% | 115.8 -87% | 74 -19% |
| Witcher 3 ultra * (Watt) | 115.9 | 96.2 |
* ... smaller is better
Power Consumption Cyberpunk / Stress Test
Power Consumption external Monitor
电池寿命
对于这样一款搭载 Lunar Lake 处理器的笔记本电脑来说,运行时间非常长,这也在意料之中。尽管戴尔 16 Plus 的电池组比 Inspiron 16 Plus 7640 小 30%,但其 WLAN 电池续航时间略高于 14 小时,甚至比 Inspiron 16 Plus 7640 更长。
| Dell 16 Plus Core Ultra 7 256V, Arc 140V, 64 Wh | Dell Inspiron 16 Plus 7640 Ultra 7 155H, GeForce RTX 4060 Laptop GPU, 90 Wh | Acer Swift 16 AI SF16-51T-932H, Ultra 9 288V Core Ultra 9 288V, Arc 140V, 70 Wh | Lenovo ThinkBook 16 G7+ AMD Ryzen AI 9 365, Radeon 880M, 85 Wh | HP Pavilion Plus 16-ab0456tx i7-13700H, GeForce RTX 3050 6GB Laptop GPU, 68 Wh | Asus Vivobook 16 M1606K Ryzen AI 7 350, Radeon 860M, 42 Wh | |
|---|---|---|---|---|---|---|
| Battery runtime | -6% | -6% | -23% | -26% | -52% | |
| WiFi v1.3 (h) | 14.1 | 13.3 -6% | 13.2 -6% | 10.8 -23% | 10.4 -26% | 6.8 -52% |
| H.264 (h) | 13.9 | 12 | 6.8 | |||
| Load (h) | 1.1 |
笔记本检查评级
Dell 16 Plus
- 06/06/2025 v8
Allen Ngo
 Total Sustainability Score:
 Potential Competitors in Comparison
Image | Model / Review | Price | Weight | Height | Display |
|---|---|---|---|---|---|
1. 81.8%  | Dell 16 Plus Intel Core Ultra 7 256V ⎘ Intel Arc Graphics 140V ⎘ 16 GB Memory, 1024 GB SSD | Amazon: List Price: 1150 USD | 1.8 kg | 16.99 mm | 16.00" 2560x1600 189 PPI IPS |
2. 83.4%  | Dell Inspiron 16 Plus 7640 Intel Core Ultra 7 155H ⎘ NVIDIA GeForce RTX 4060 Laptop GPU ⎘ 16 GB Memory, 1024 GB SSD | Amazon: List Price: 1300 USD | 2.2 kg | 19.9 mm | 16.00" 2560x1600 189 PPI IPS |
3. 85.3%  | Acer Swift 16 AI SF16-51T-932H, Ultra 9 288V Intel Core Ultra 9 288V ⎘ Intel Arc Graphics 140V ⎘ 32 GB Memory, 1024 GB SSD | Amazon: | 1.5 kg | 15.95 mm | 16.00" 2880x1800 212 PPI OLED |
4. 86.6%  | Lenovo ThinkBook 16 G7+ AMD AMD Ryzen AI 9 365 ⎘ AMD Radeon 880M ⎘ 32 GB Memory, 1024 GB SSD | Amazon: 1. $1,199.99 Lenovo ThinkBook 16 G7 Busin... 2. $999.95 Lenovo ThinkBook 16 G7 Busin... 3. $1,199.95 Lenovo ThinkBook 16 G7 Busin... List Price: 1399€ | 1.9 kg | 16.9 mm | 16.00" 3200x2000 236 PPI IPS |
5. 88.7% v7 (old)  | HP Pavilion Plus 16-ab0456tx Intel Core i7-13700H ⎘ NVIDIA GeForce RTX 3050 6GB Laptop GPU ⎘ 16 GB Memory, 1024 GB SSD | Amazon: 1. $799.99 HP Pavilion Plus 16 inch Lap... 2. $34.00 Laptop Right Fan for HP Pavi... 3. $439.99 HP Pavilion | 15.6" HD Displ... List Price: 1350 USD | 1.9 kg | 19.9 mm | 16.00" 2560x1600 189 PPI IPS |
6. 77.6%  | Asus Vivobook 16 M1606K AMD Ryzen AI 7 350 ⎘ AMD Radeon 860M ⎘ 16 GB Memory, 1024 GB SSD | Amazon: 1. $129.00 Replacement Screen 16.0" for... 2. $123.00 16.0" WUXGA 1920(RGB)*1200 f... 3. $689.00 ASUS Vivobook 16 Laptop, 16�... | 1.9 kg | 19.9 mm | 16.00" 1920x1200 142 PPI IPS |
Transparency
The selection of devices to be reviewed is made by our editorial team. The test sample was provided to the author as a loan by the manufacturer or retailer for the purpose of this review. The lender had no influence on this review, nor did the manufacturer receive a copy of this review before publication. There was no obligation to publish this review. As an independent media company, Notebookcheck is not subjected to the authority of manufacturers, retailers or publishers.
This is how Notebookcheck is testing
Every year, Notebookcheck independently reviews hundreds of laptops and smartphones using standardized procedures to ensure that all results are comparable. We have continuously developed our test methods for around 20 years and set industry standards in the process. In our test labs, high-quality measuring equipment is utilized by experienced technicians and editors. These tests involve a multi-stage validation process. Our complex rating system is based on hundreds of well-founded measurements and benchmarks, which maintains objectivity. Further information on our test methods can be found here.

