Ready or Not》评测:笔记本电脑和台式机基准测试

测试系统

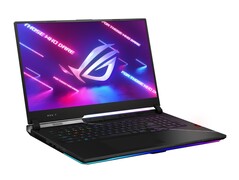
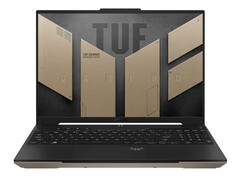
我们目前使用这些设备进行游戏基准测试。点击单张照片可进入相应制造商的网站。有关设备规格的更多详情,请参阅文章末尾。
技术
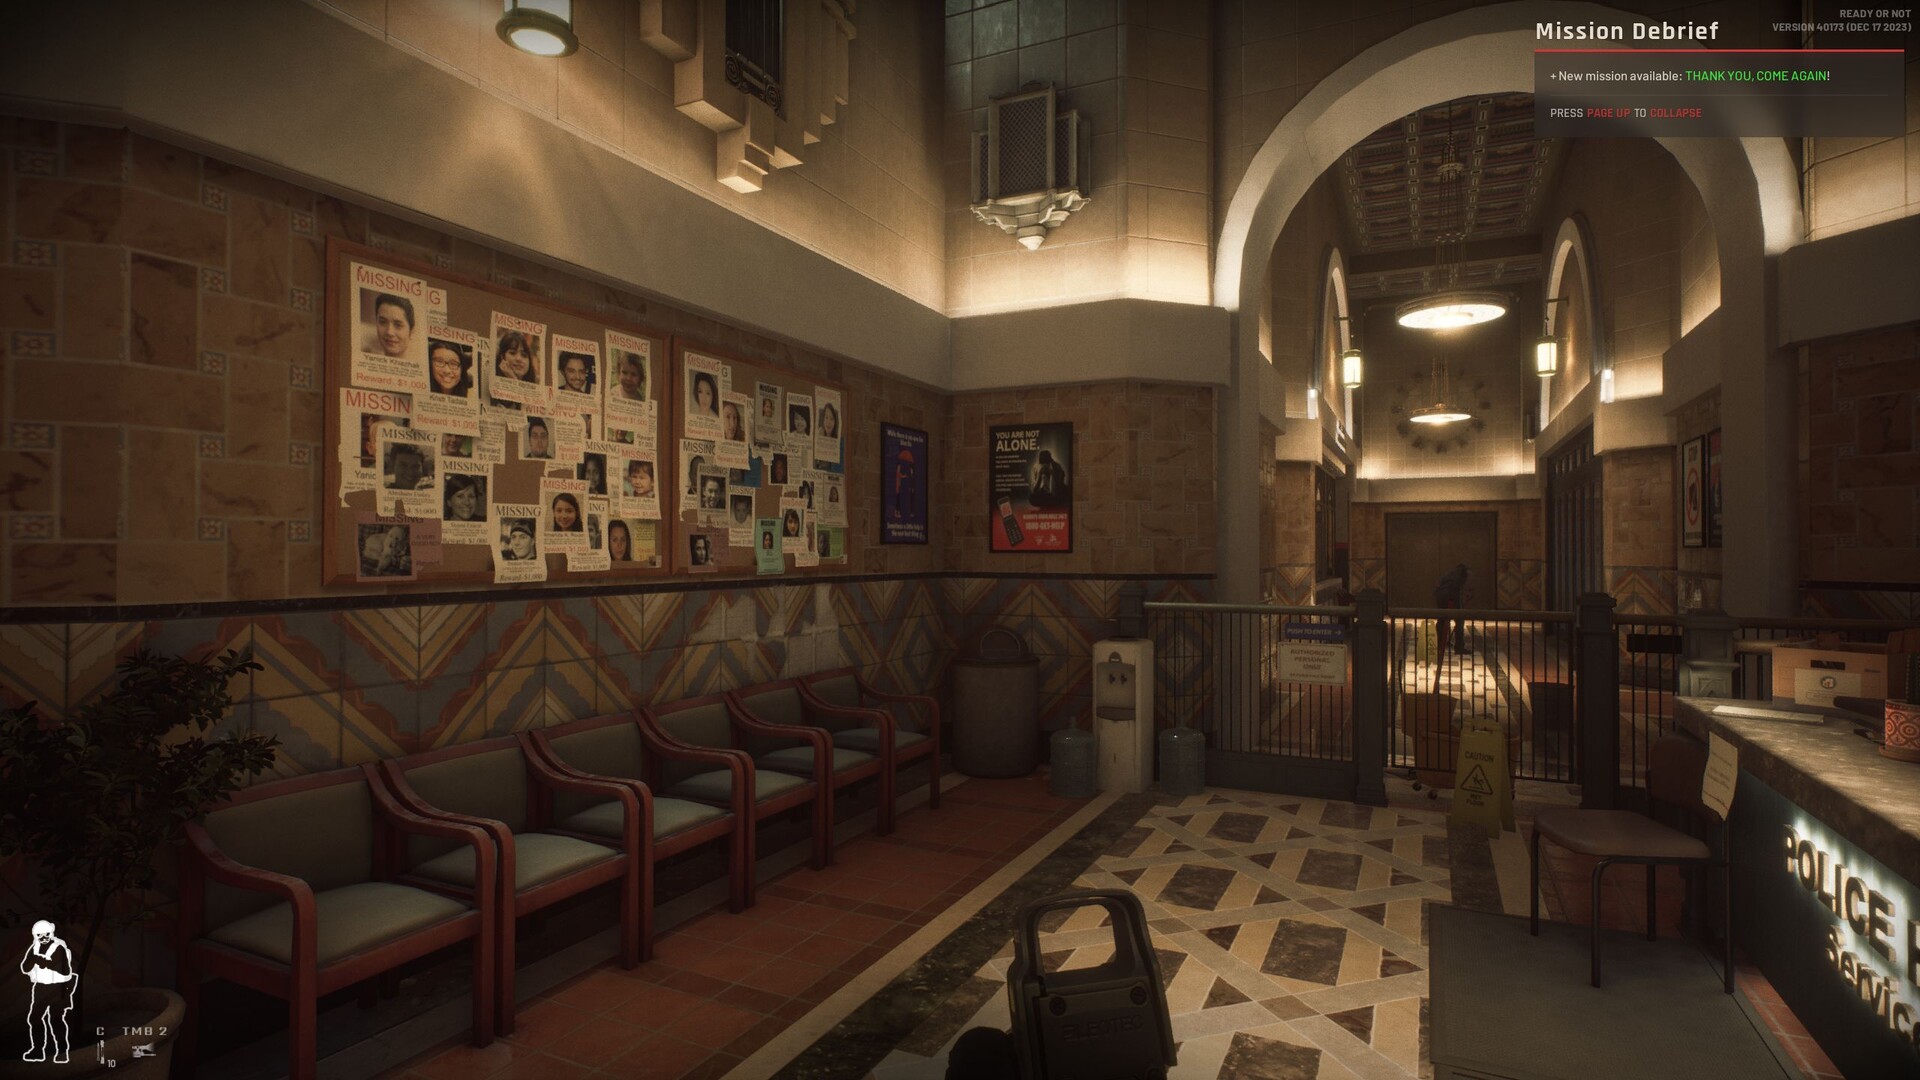
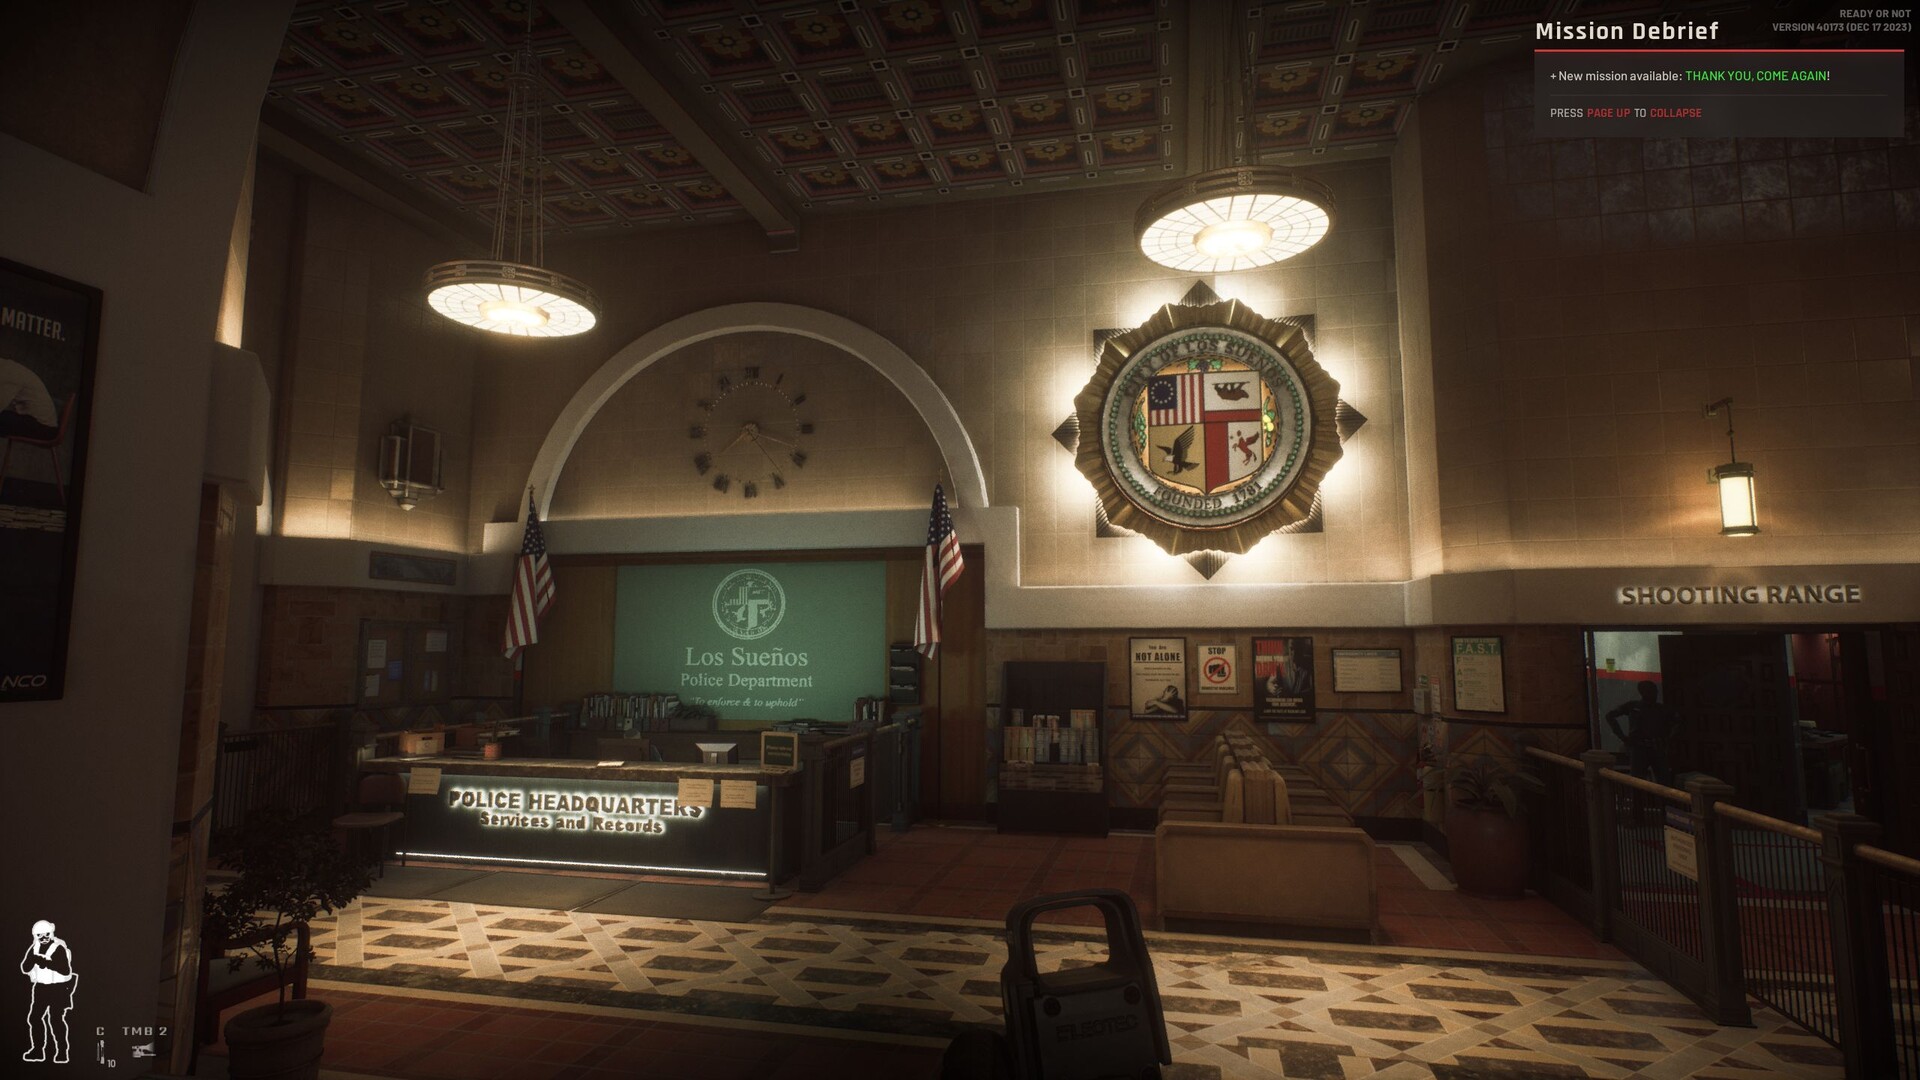
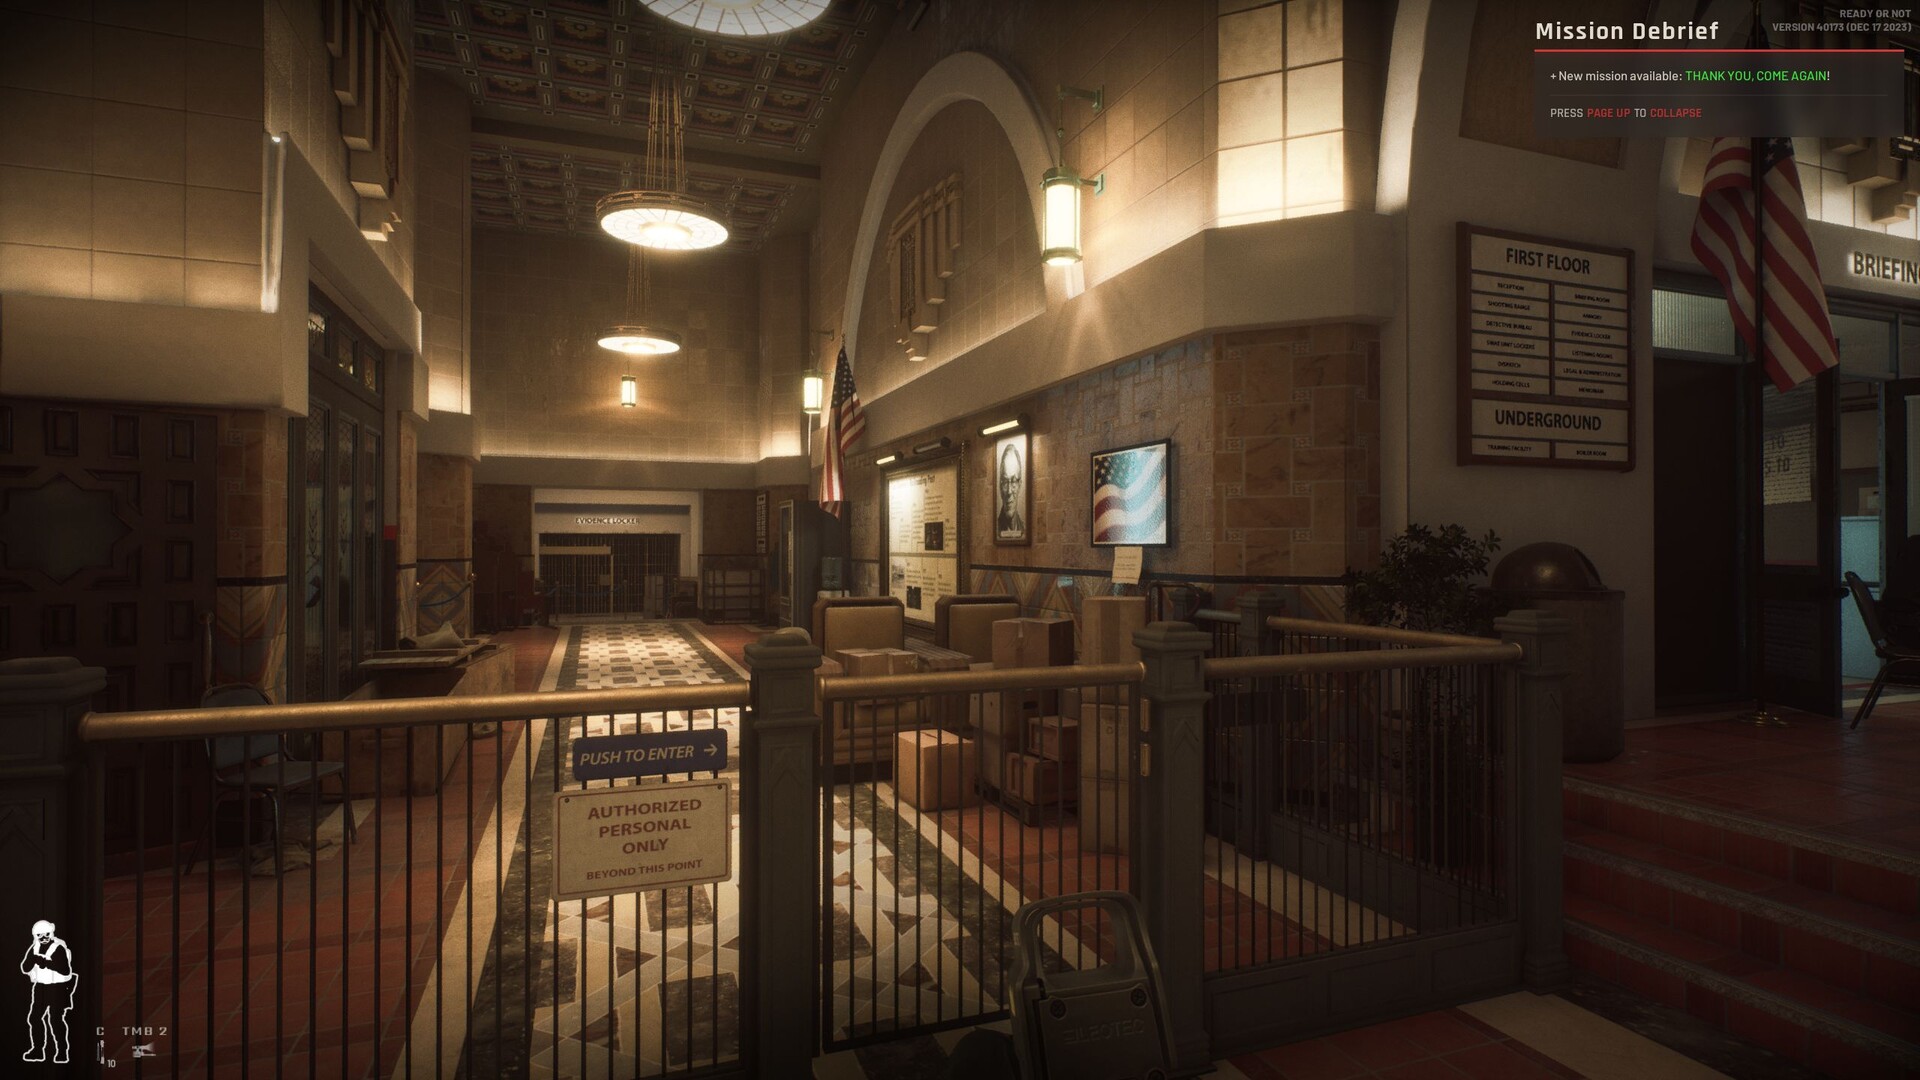
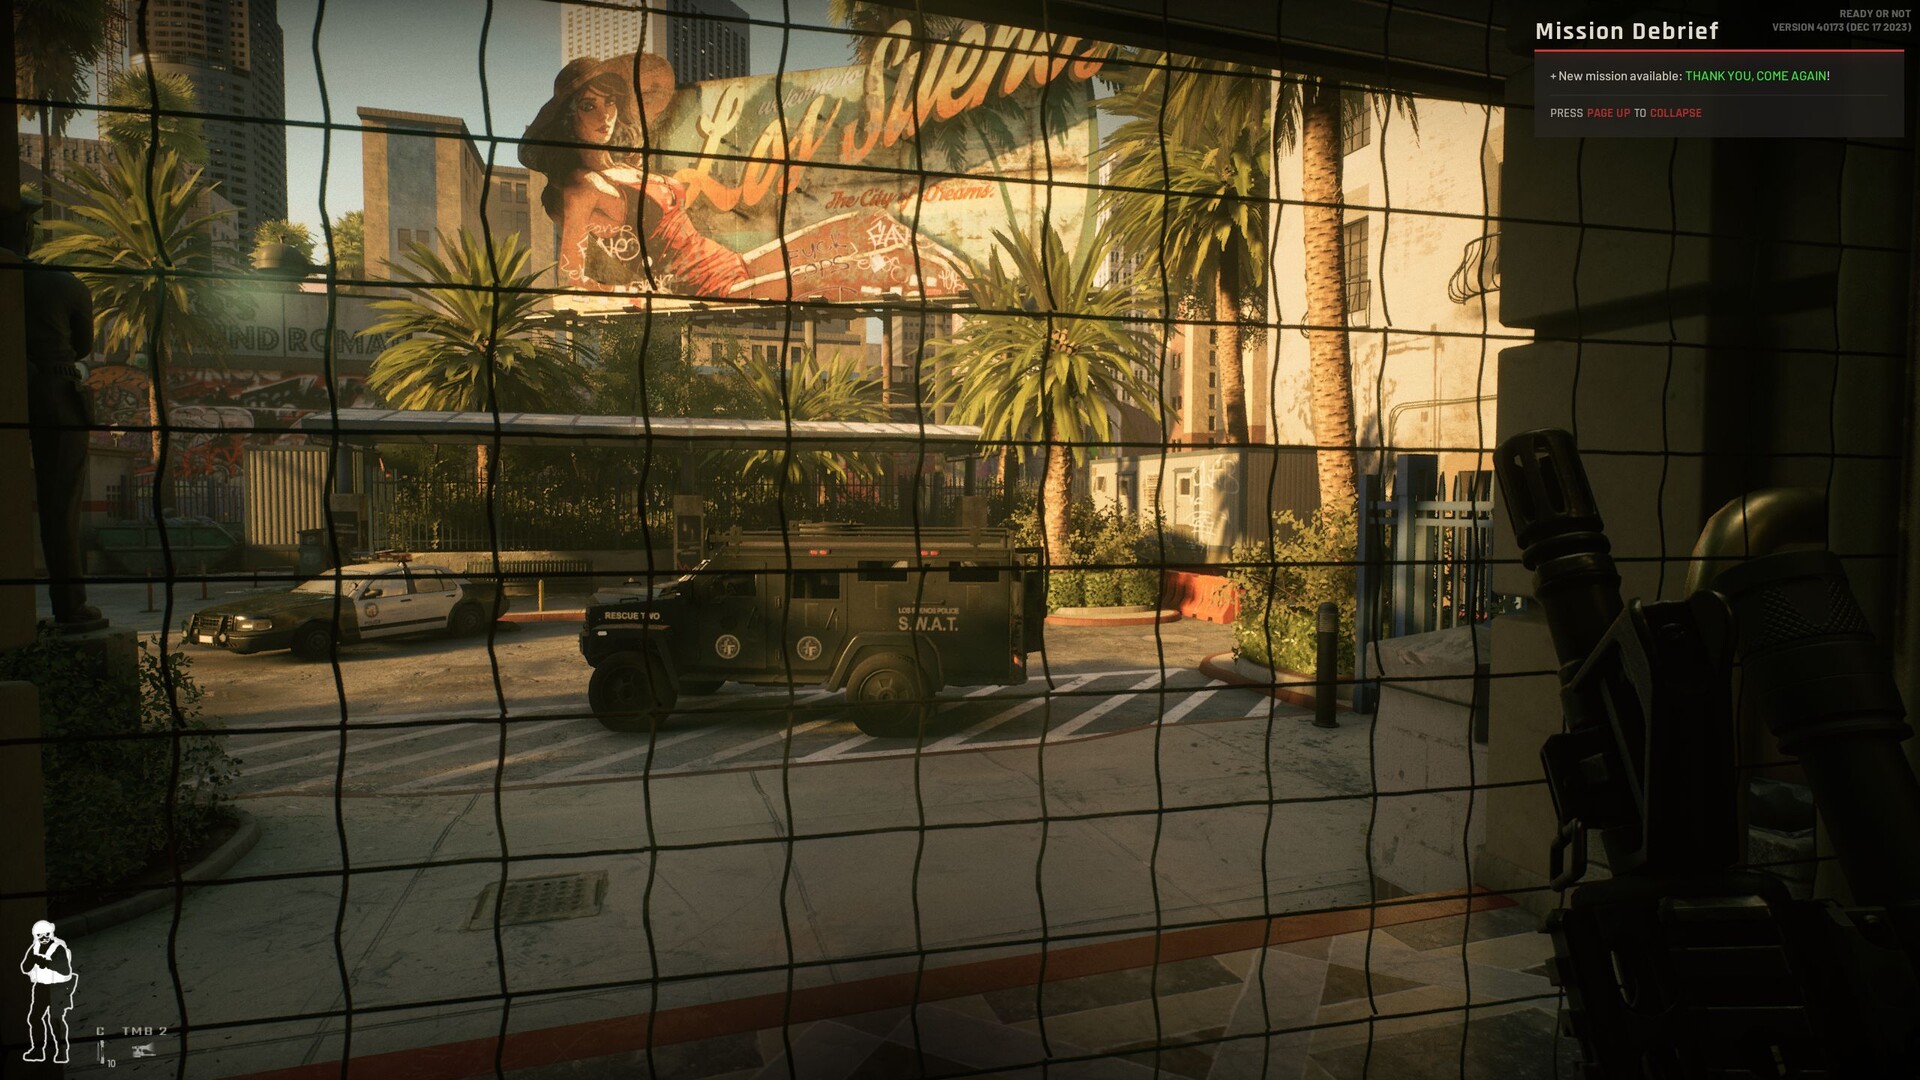
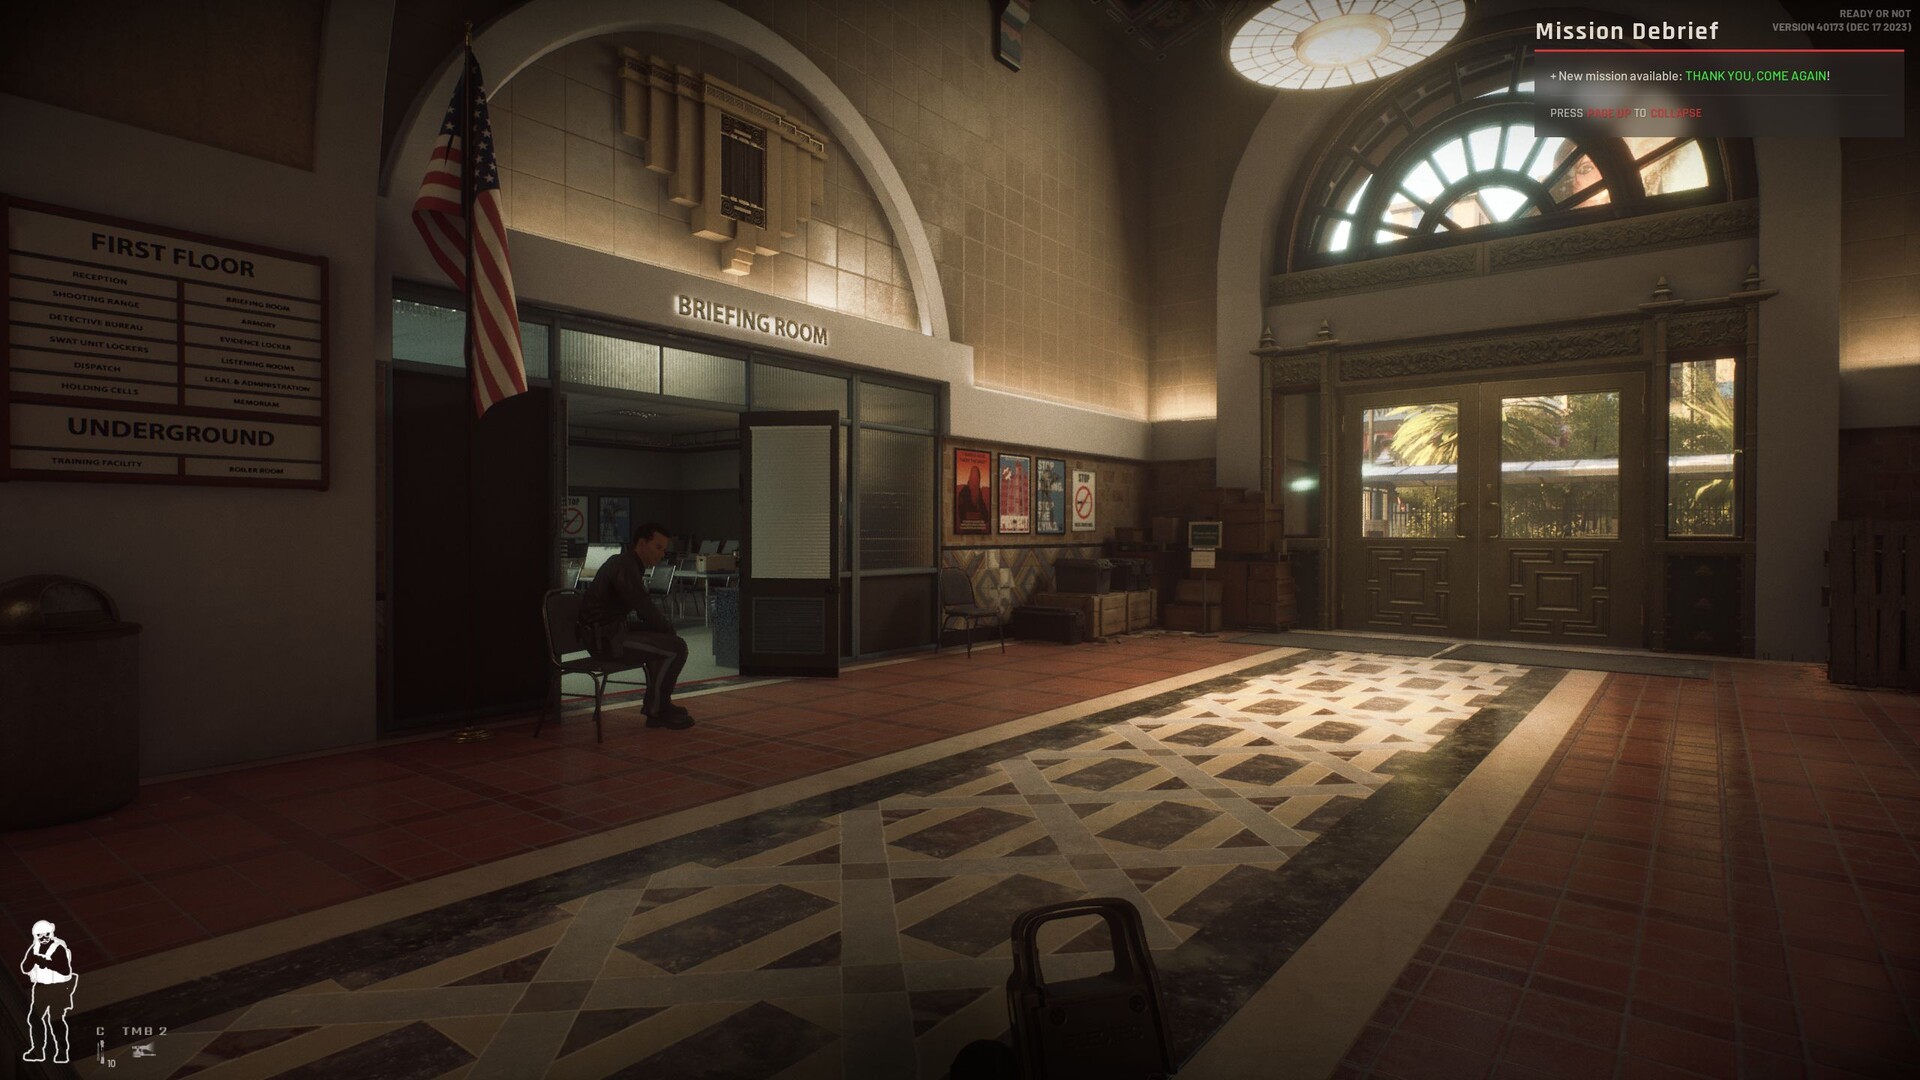
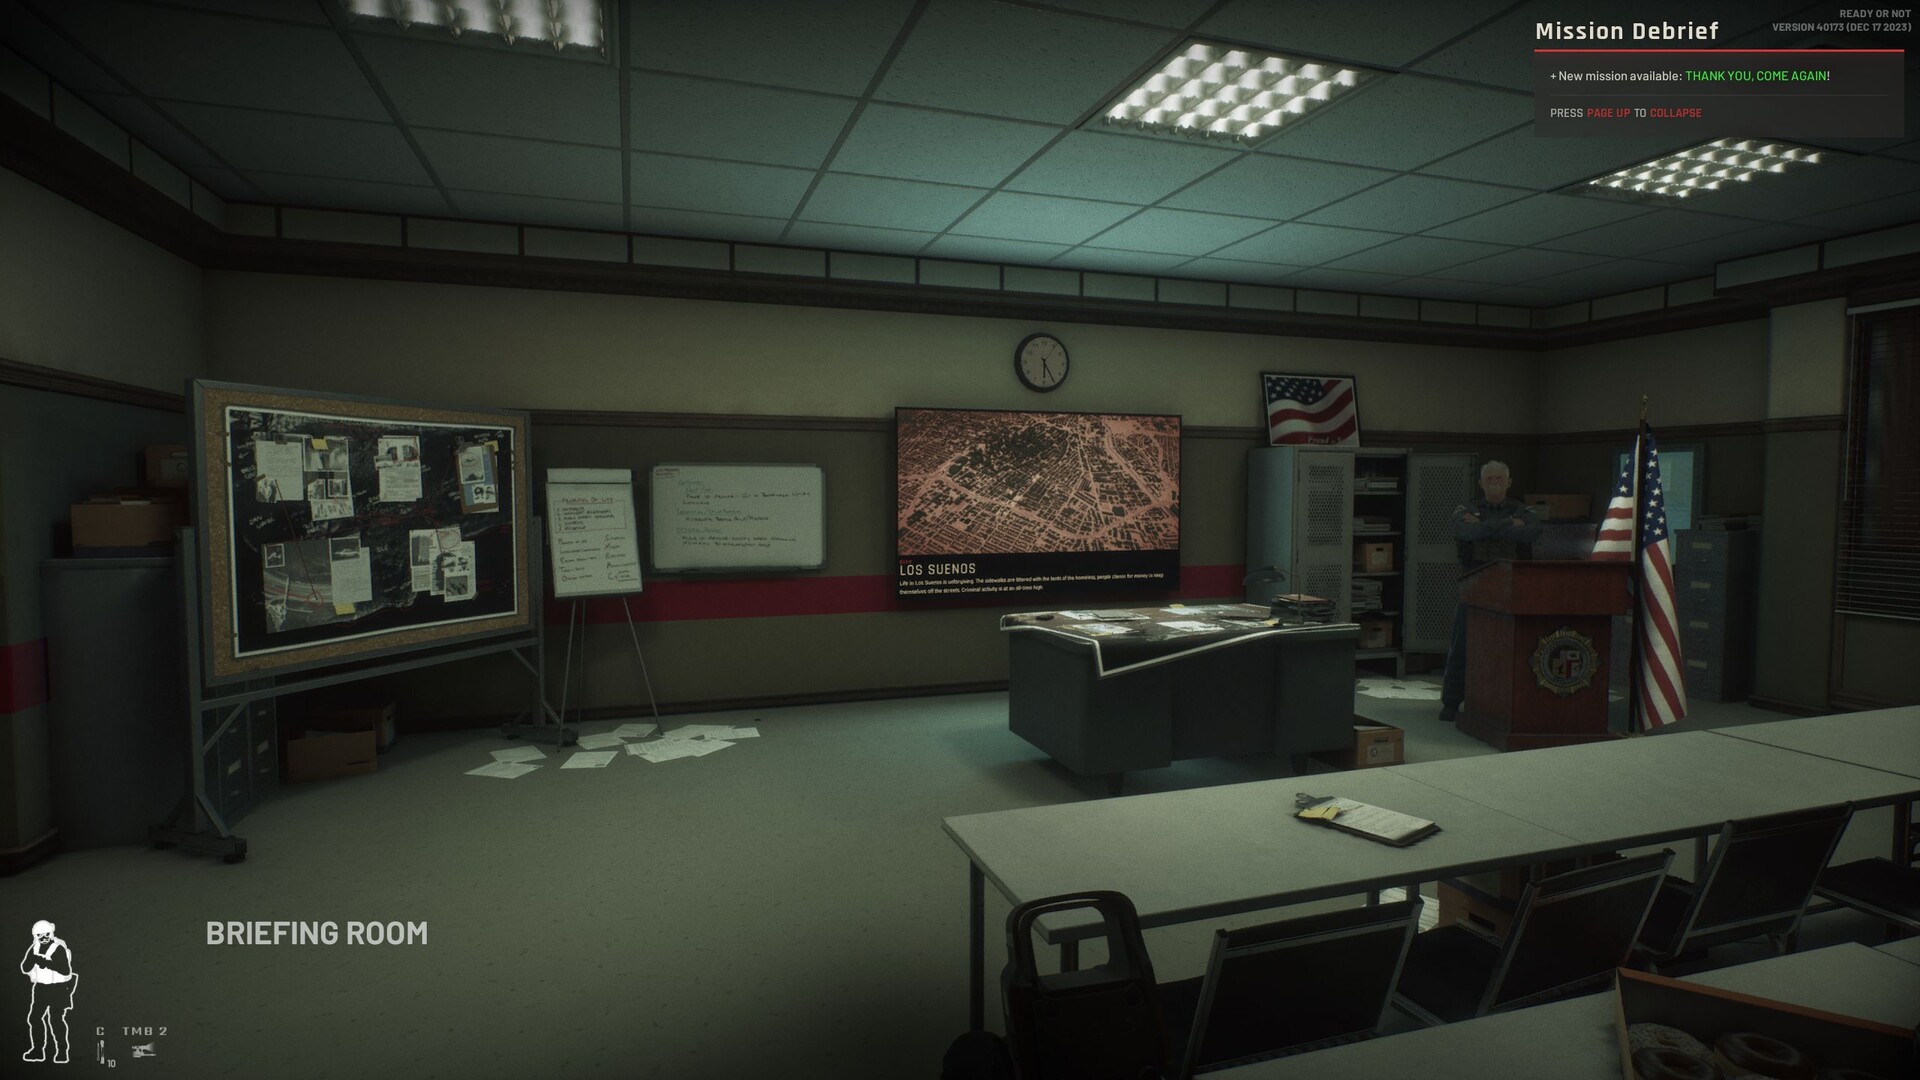
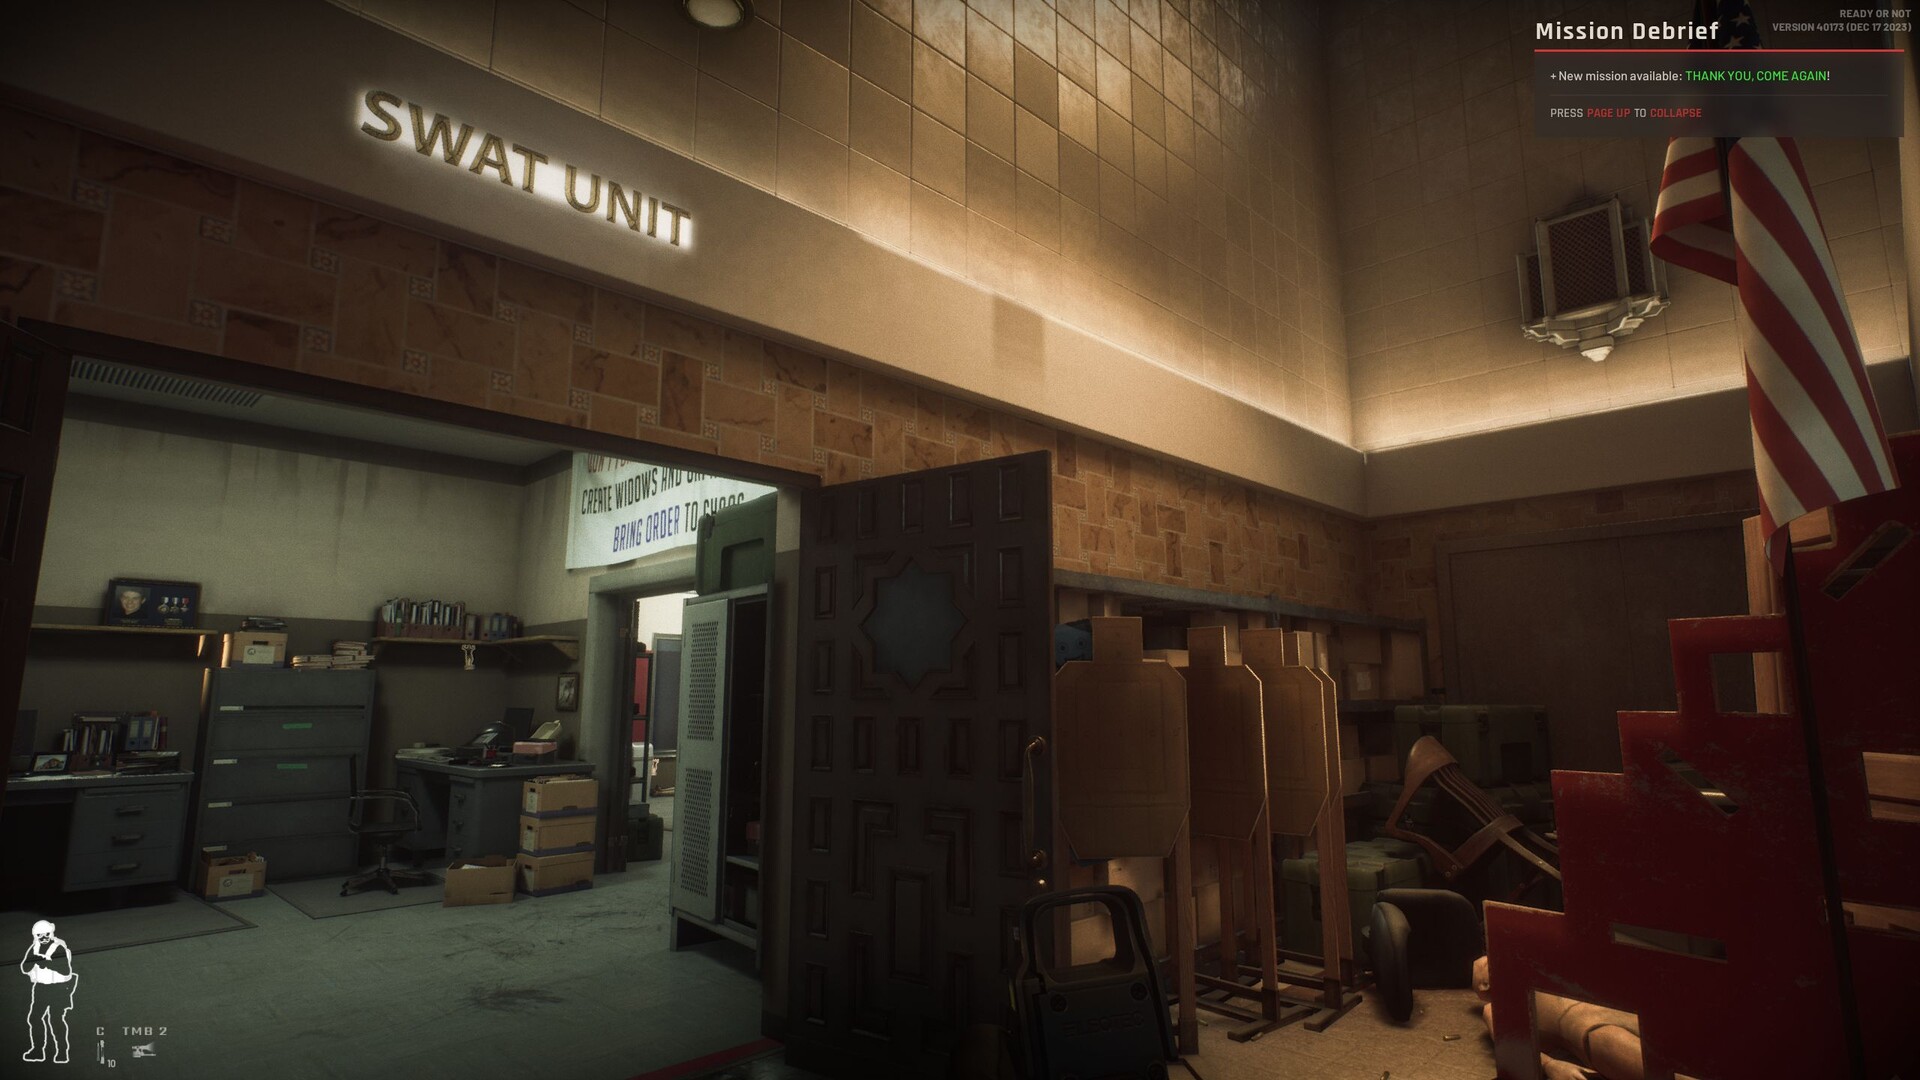
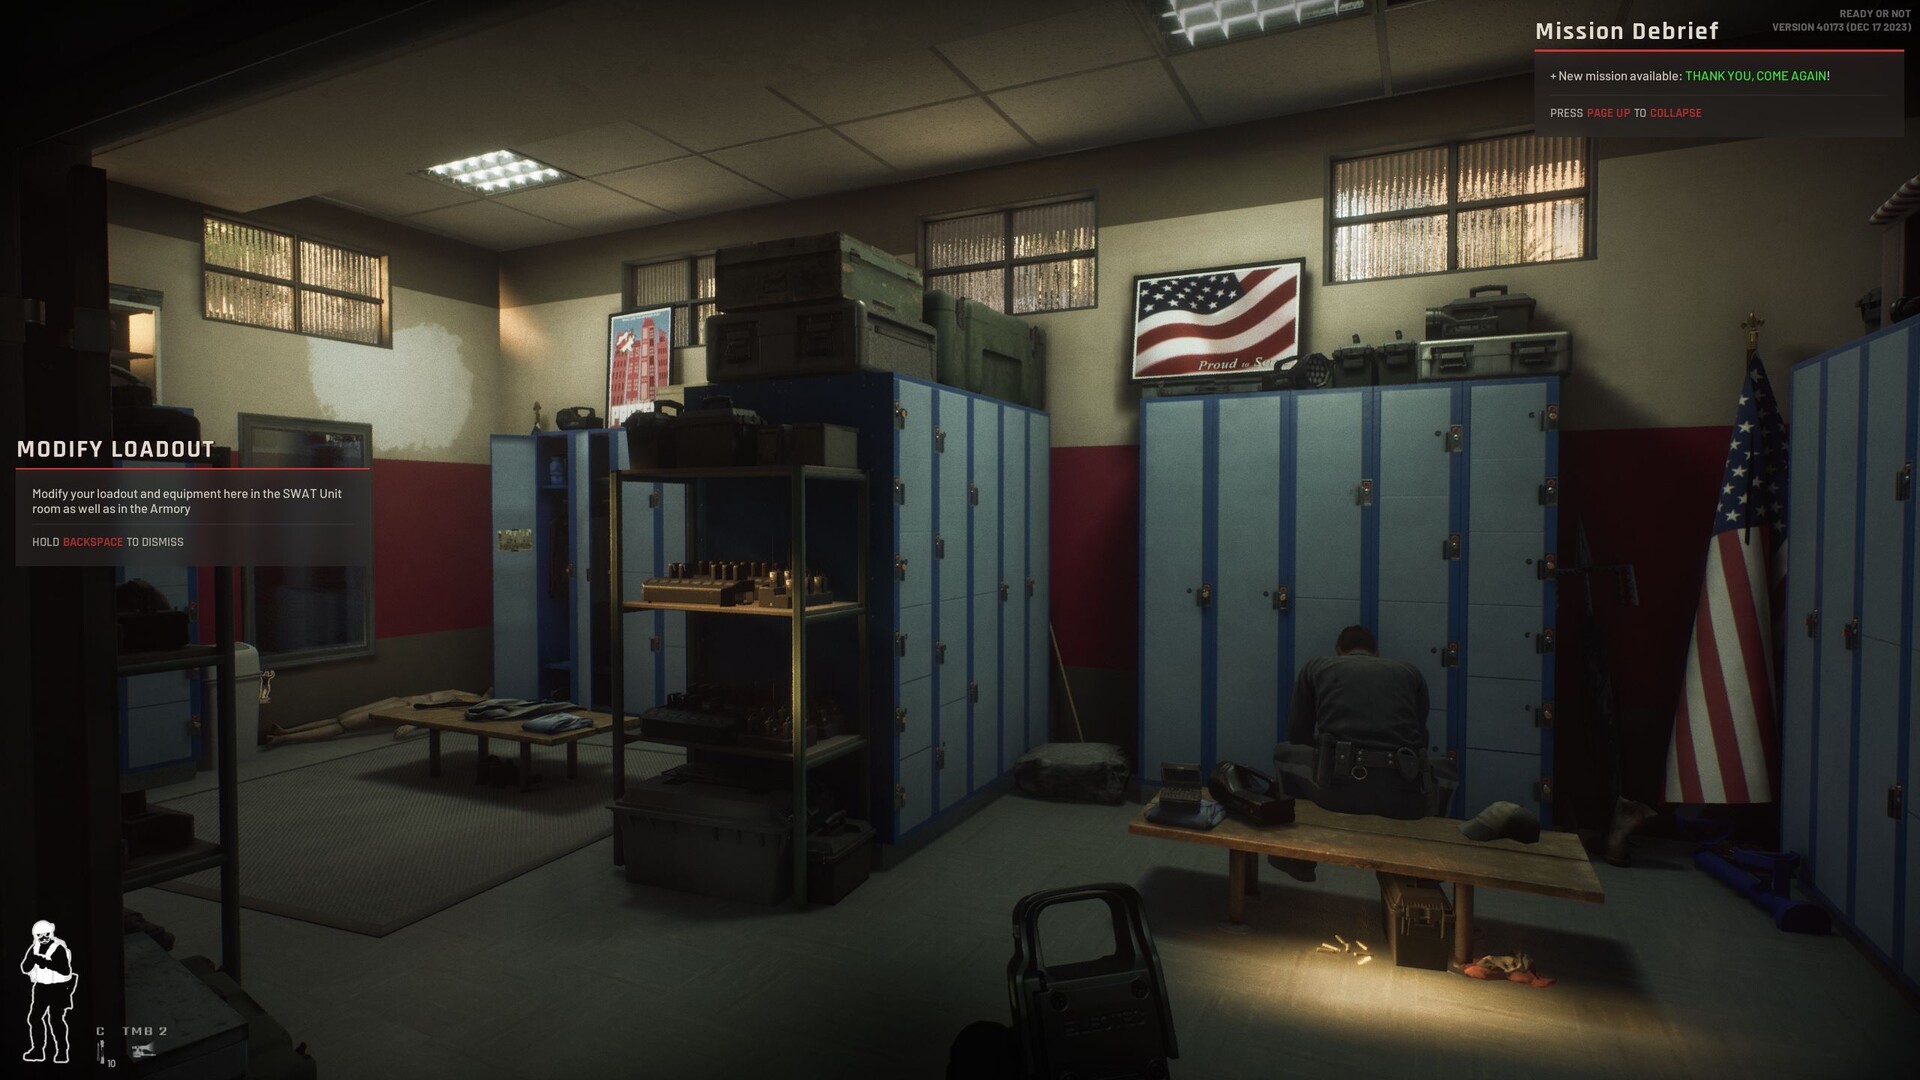
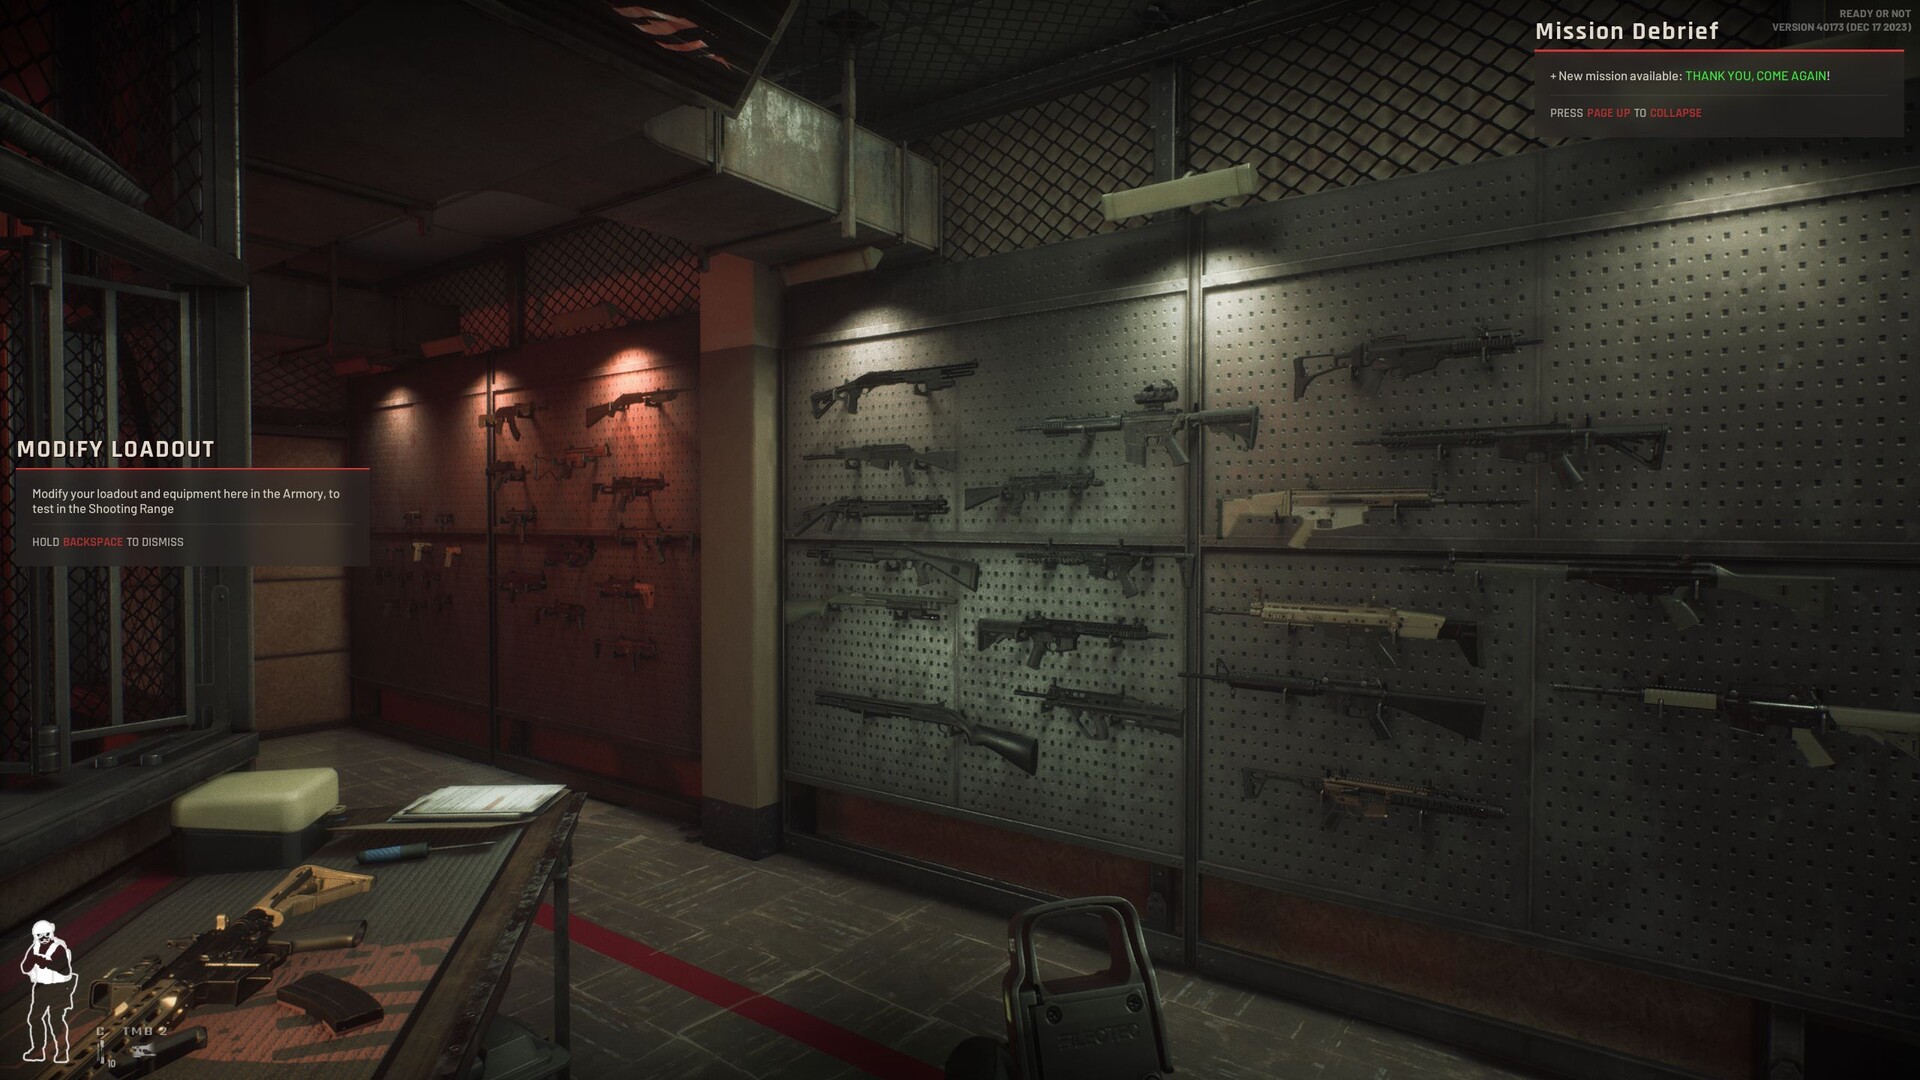
如前所述,《Ready or Not》基于流行的虚幻引擎。虽然它 "只 "使用了 UE4 而不是较新的 UE5,但这款游戏仍拥有良好甚至非常出色的视觉效果。正如您在我们的截图中看到的那样,游戏具有清晰的纹理、迷人的光照和较高的物体密度。尽管团队规模相对较小,但每个关卡的制作都充满了爱与关注。
不过,有时纹理需要一段时间才能正常加载(尤其是在较弱的设备上),这可能会让人有点烦。开发人员还可以改进有时出现的掉帧(尤其是刚加载完时)以及游戏总体上较差的最低 FPS 速率。此外,游戏的控制(碰撞检测等)也常常显得相当笨拙。即使是战术射击游戏,你也不得不喜欢它相当迟缓的移动速度。另一方面,这款游戏拥有一流的(武器)音效,一些大型工作室可以将其作为范例。
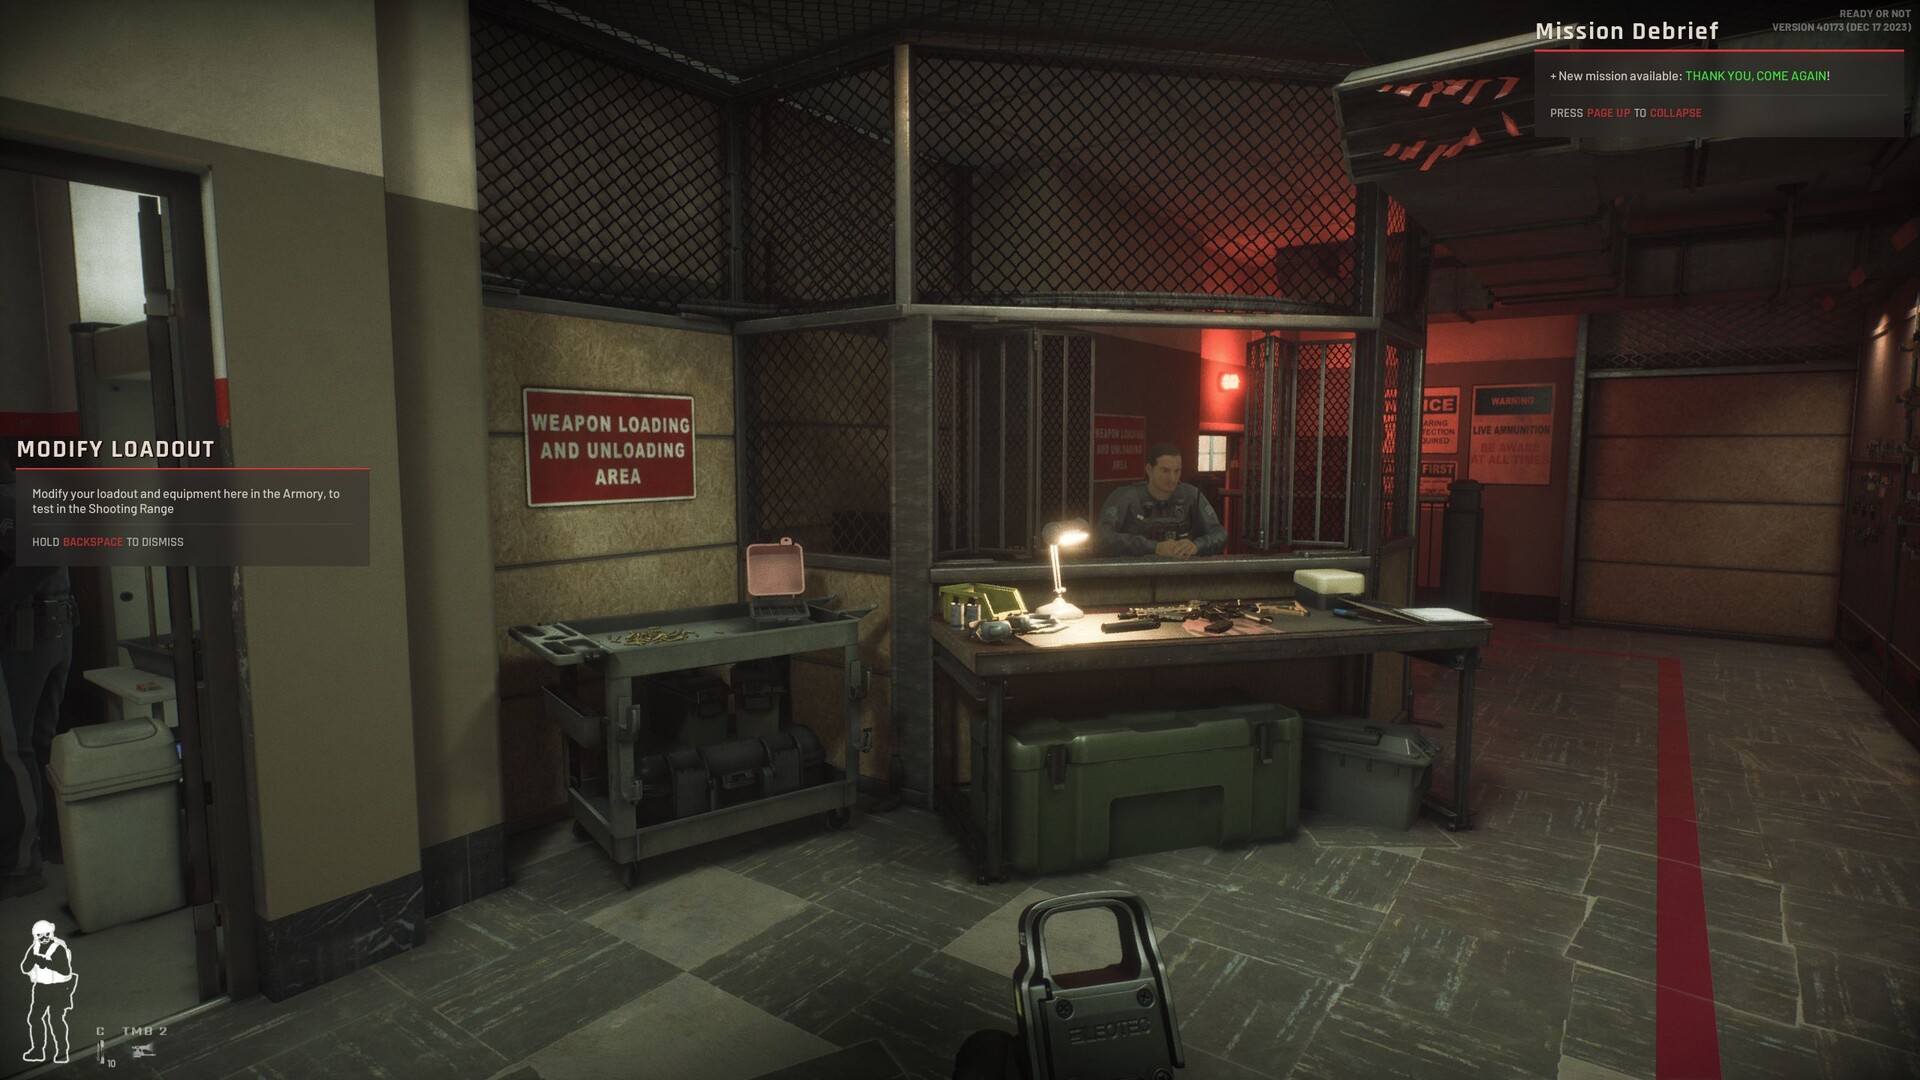
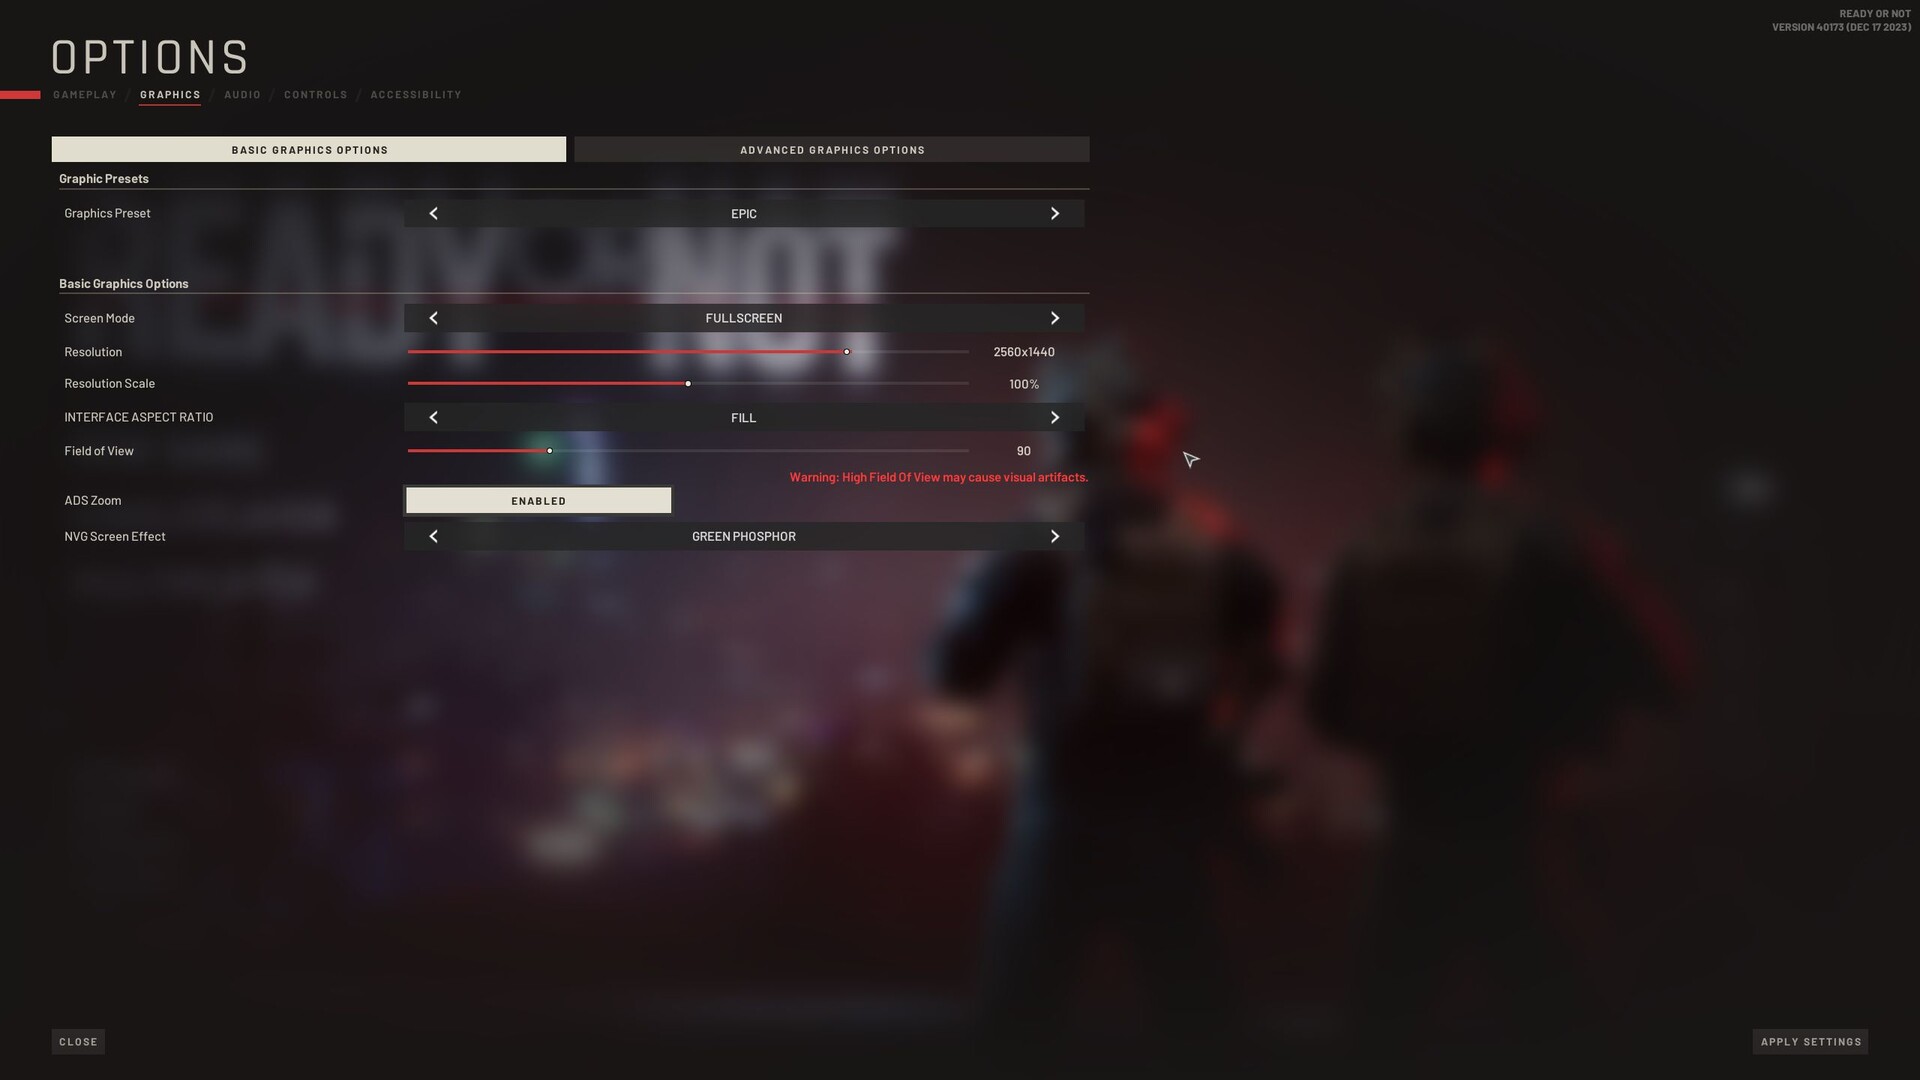
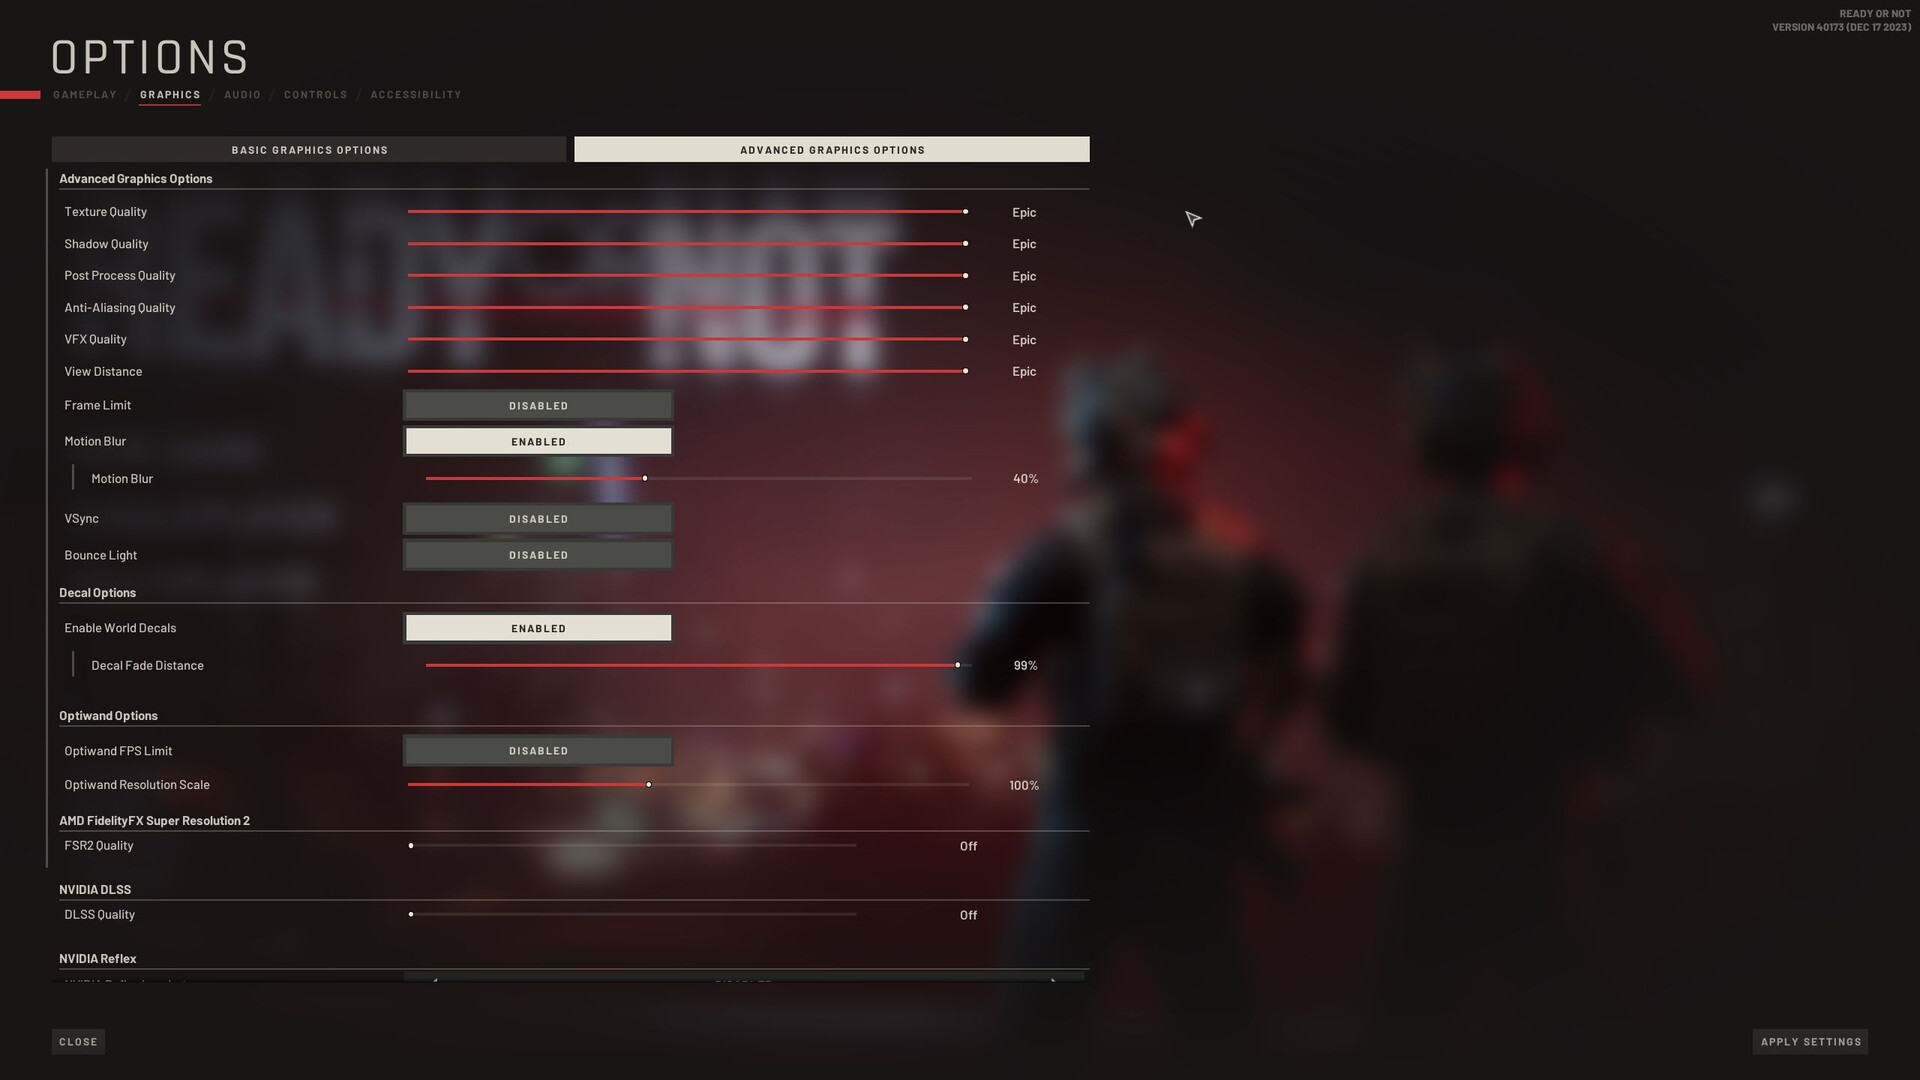
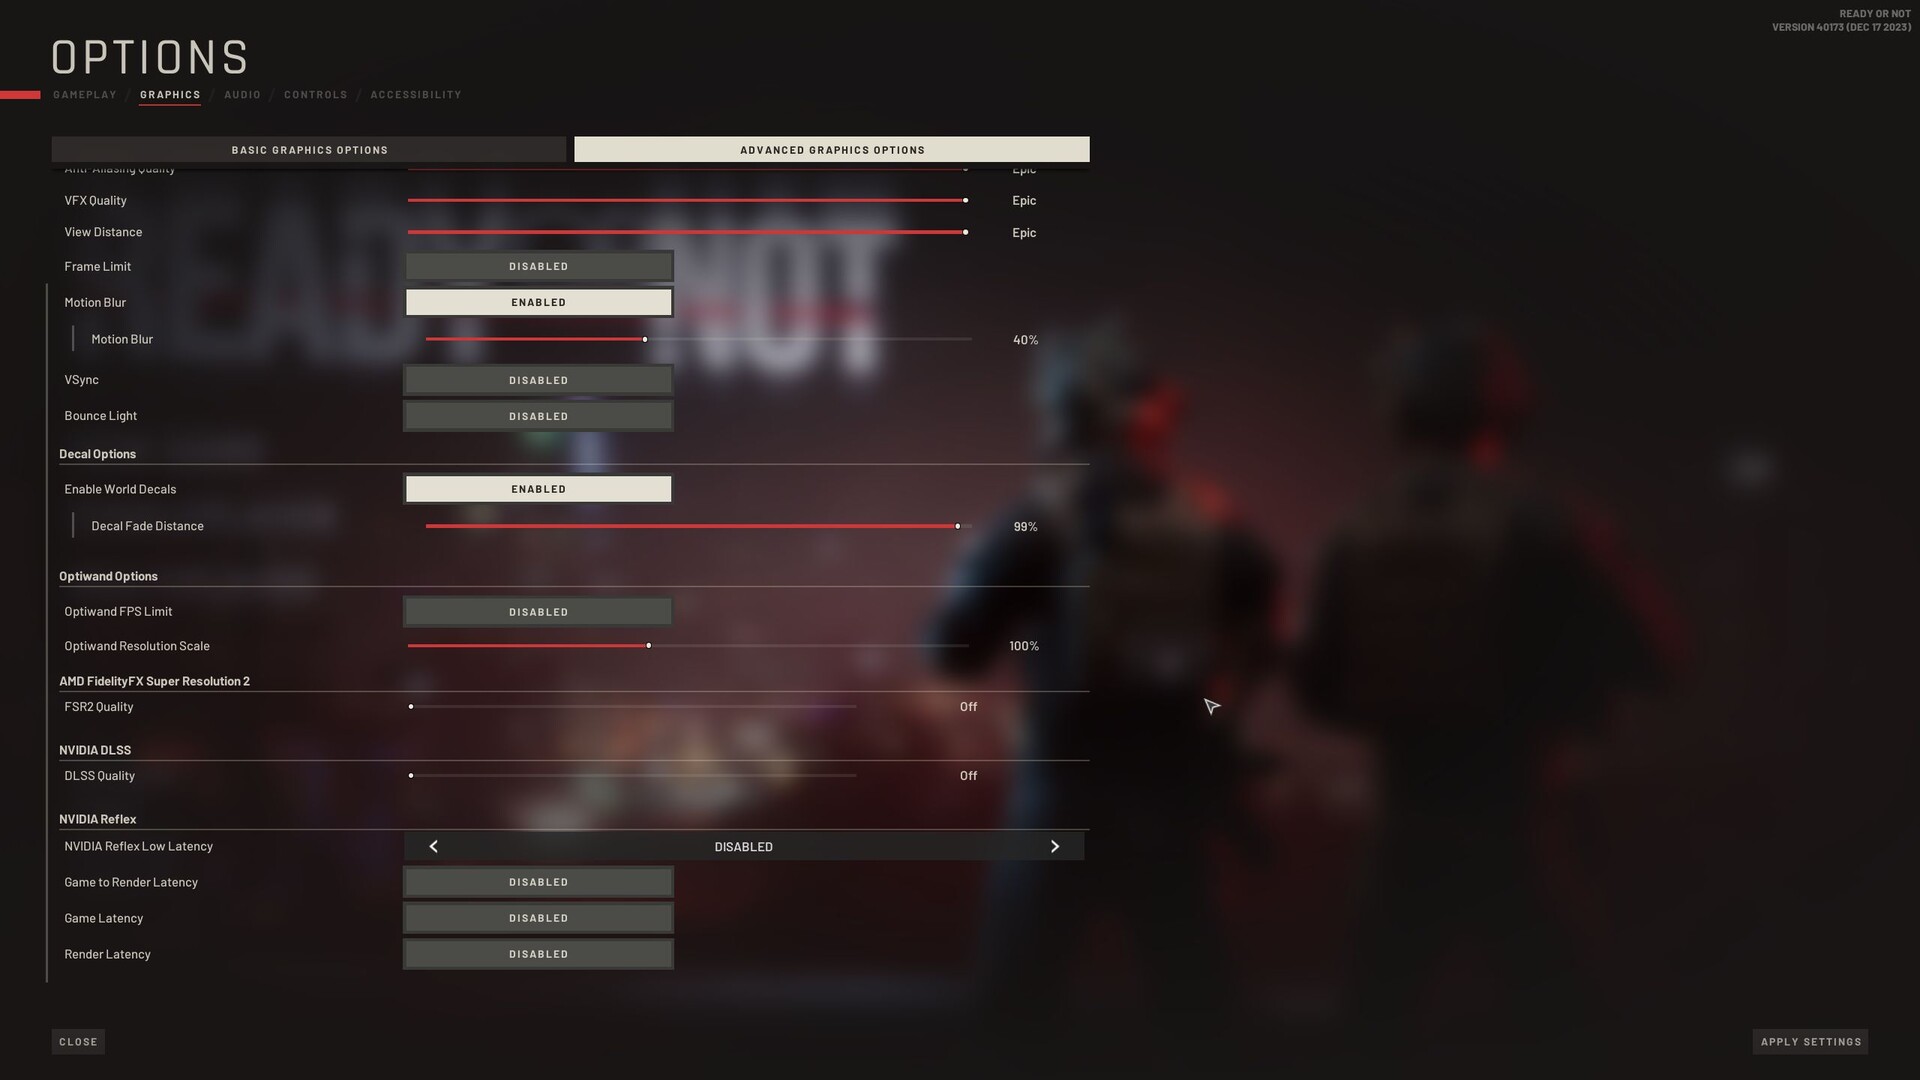
图形选项既漂亮又丰富。虽然基本选项卡仍然易于管理,而且相对来说不够美观(见截图),但高级选项卡中有近 20 个设置选项。升级爱好者可以期待 FSR 和 DLSS 的出现。另一个不错的功能是,无需重启游戏即可应用更改,而且还有一些方便的预设。启动游戏时,你还可以选择 DirectX 11 或 DirectX 12(我们的基准测试是在 DX12 模式下进行的)。
基准
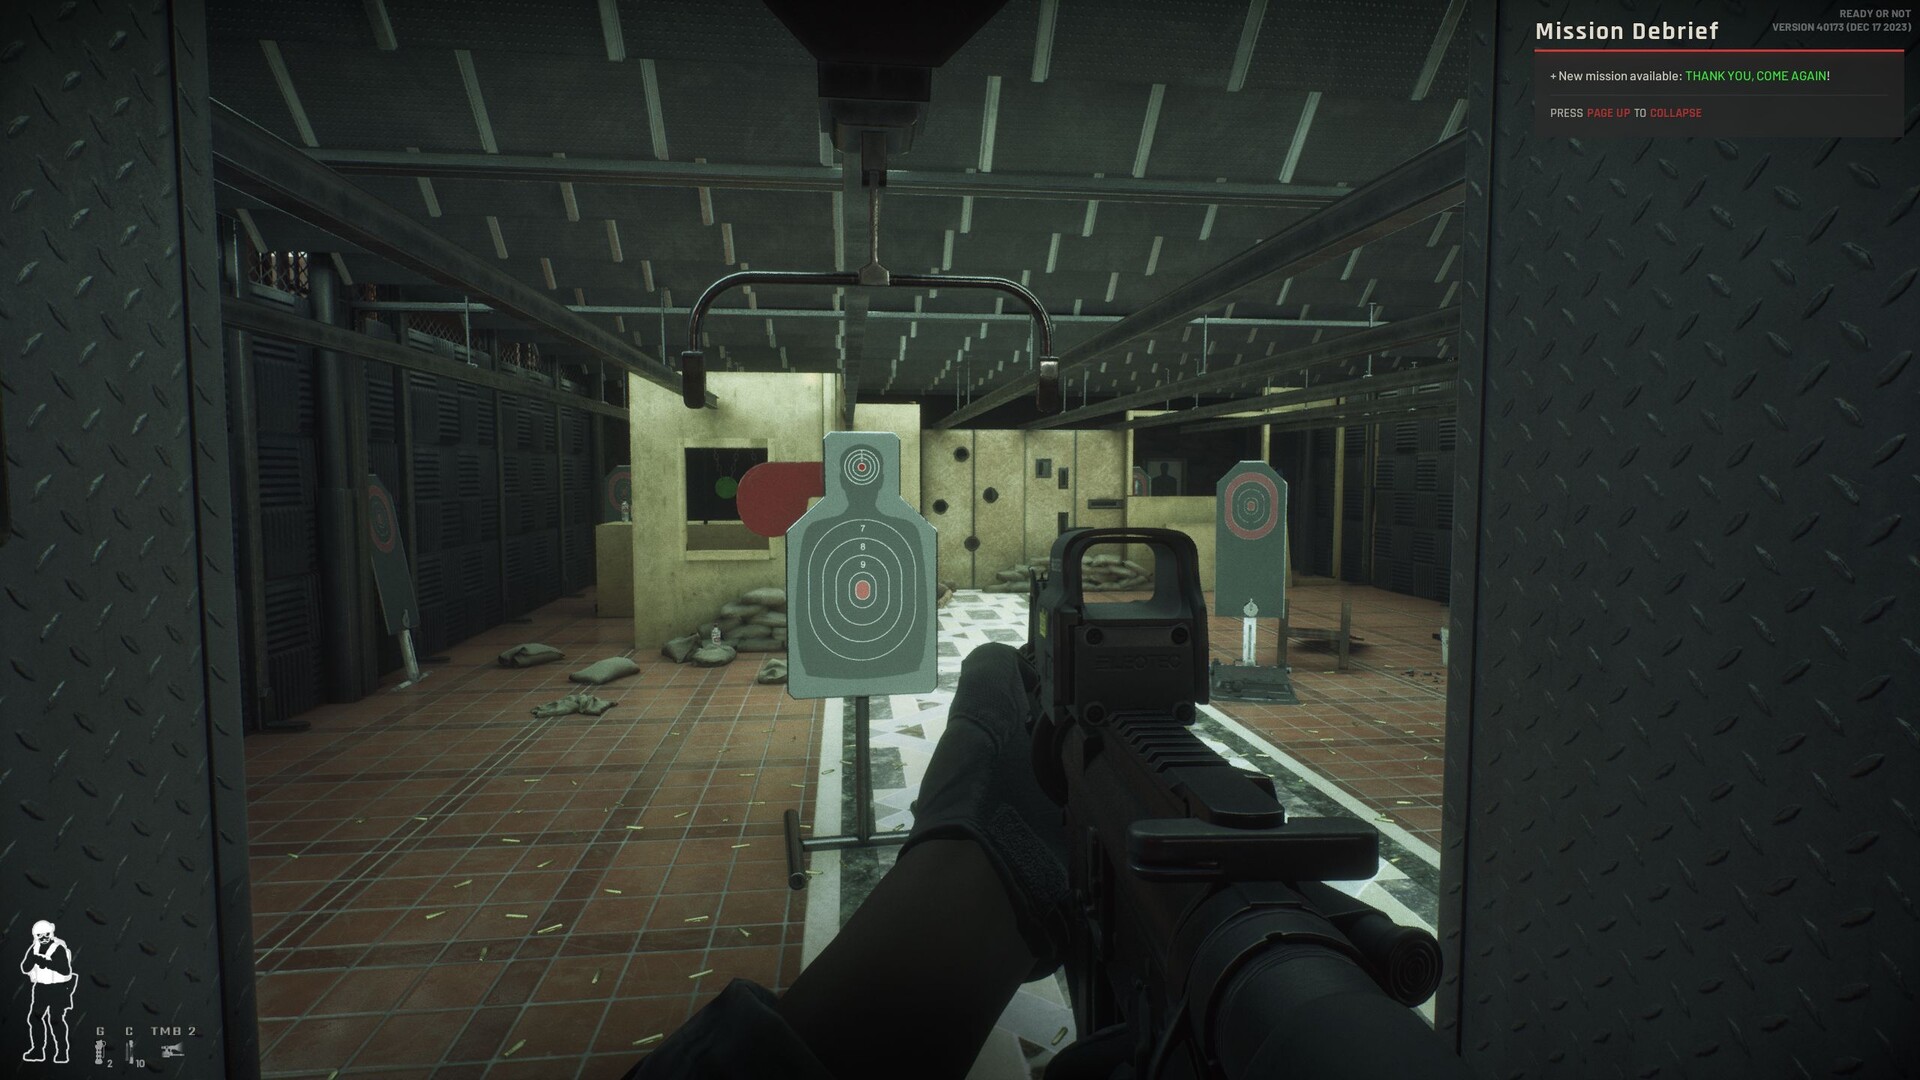
我们使用单人菜单的练习模式作为基准序列。如下视频所示,我们沿着固定路线跑了不到 30 秒,并使用 CapFrameX 工具记录了帧率。由于这是一款第一人称游戏,我们建议至少达到 40 FPS,尽管游戏的节奏很悠闲。
成果
全高清(1,920 x 1,080)
事实证明,虚幻引擎的要求并不高,从我们最近对 决赛.在 1,920 x 1,080 像素和高细节的组合下,即使是一台 Radeon 780M也能突破 40 FPS 大关,尽管最低 FPS 速率并不高。目前的中端 GPU 如 GeForce RTX 4050等目前的中端 GPU 在史诗级预设下也没有大问题--除了之前提到的掉帧问题。
| Ready or Not | |
| 1920x1080 Low Preset 1920x1080 Medium Preset 1920x1080 High Preset 1920x1080 Epic Preset | |
| NVIDIA GeForce RTX 4080, i9-13900K | |
| AMD Radeon RX 7900 XT, i9-13900K | |
| NVIDIA GeForce RTX 4090 Laptop GPU, i9-13900H | |
| NVIDIA GeForce RTX 4080 Laptop GPU, i9-13950HX | |
| NVIDIA GeForce RTX 3080 Ti Laptop GPU, i9-12900H | |
| NVIDIA GeForce RTX 4070 Laptop GPU, i9-13900HX | |
| NVIDIA GeForce RTX 4060 Laptop GPU, R9 7940HS | |
| NVIDIA GeForce RTX 4050 Laptop GPU, i7-13700H | |
| AMD Radeon RX 7600S, R9 7940HS | |
| AMD Radeon 780M, R9 7940HS | |
QHD (2,560 x 1,440)
对于 QHD 来说,中档机型也足够了。从 Radeon RX 7600S以上,以 2,560 x 1,440 像素和最高设置运行游戏时,平均 FPS 可超过 60。
| Ready or Not | |
| 2560x1440 Epic Preset | |
| NVIDIA GeForce RTX 4080, i9-13900K | |
| AMD Radeon RX 7900 XT, i9-13900K | |
| NVIDIA GeForce RTX 4090 Laptop GPU, i9-13900H | |
| NVIDIA GeForce RTX 4080 Laptop GPU, i9-13950HX | |
| NVIDIA GeForce RTX 3080 Ti Laptop GPU, i9-12900H | |
| NVIDIA GeForce RTX 4070 Laptop GPU, i9-13900HX | |
| NVIDIA GeForce RTX 4060 Laptop GPU, R9 7940HS | |
| AMD Radeon RX 7600S, R9 7940HS | |
| NVIDIA GeForce RTX 4050 Laptop GPU, i7-13700H | |
超高清(3,840 x 2,160)
只有 4K 才能将小麦从谷壳中分离出来。使用史诗级预设时,您可能无法避免需要高端组件。从 GeForce RTX 4070以上的设备都能带来可接受的性能。激活 DLSS(质量)后,情况看起来会轻松一些。理论上,RTX 4050 已经可以提供足够的性能。
| Ready or Not | |
| 3840x2160 Epic Preset 3840x2160 Epic Preset + Quality DLSS | |
| NVIDIA GeForce RTX 4080, i9-13900K | |
| AMD Radeon RX 7900 XT, i9-13900K | |
| NVIDIA GeForce RTX 4090 Laptop GPU, i9-13900H | |
| NVIDIA GeForce RTX 4080 Laptop GPU, i9-13950HX | |
| NVIDIA GeForce RTX 3080 Ti Laptop GPU, i9-12900H | |
| NVIDIA GeForce RTX 4070 Laptop GPU, i9-13900HX | |
| NVIDIA GeForce RTX 4060 Laptop GPU, R9 7940HS | |
| AMD Radeon RX 7600S, R9 7940HS | |
| NVIDIA GeForce RTX 4050 Laptop GPU, i7-13700H | |
Overview
Test system details
| 笔记本电脑 | 显卡 | 处理器 | 内存 |
|---|---|---|---|
| 华硕 ROG Zephyrus M16 | NvidiaGeForce RTX 4090 @150 W TGP (16 GB GDDR6X) | Intel Core i9-13900H | 2 x 16 GB DDR5 |
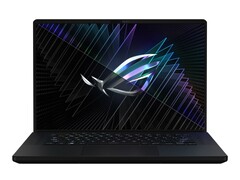
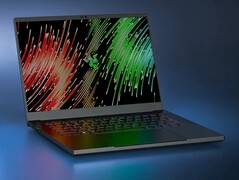
| Razer Blade 16 Mid 23 | NvidiaGeForce RTX 4080 @175 W TGP (12 GB GDDR6X) | Intel Core i9-13950HX | 2 x 16 GB DDR5 |
| XMG Pro 15 E23 | NvidiaGeForce RTX 4070 @140 W TGP (8 GB GDDR6) | Intel Core i9-13900HX | 2 x 16 GB DDR5 |
| Razer Blade 14 Mid 23 | NvidiaGeForce RTX 4060 @140 W TGP (8 GB GDDR6) | AMD Ryzen 9 7940HS | 2 x 8 GB DDR5 |
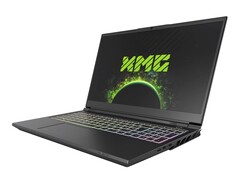
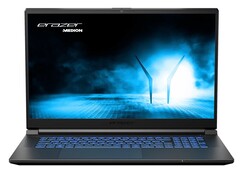
| Medion Erazer Scout E20 | NvidiaGeForce RTX 4050 @100 W TGP (6 GB GDDR6) | Intel Core i7-13700H | 2 x 8 GB DDR5 |
| 华硕 ROG Strix Scar 17 | NvidiaGeForce RTX 3080 Ti @150 W TGP (16 GB GDDR6) | Intel Core i9-12900H | 2 x 16 GB DDR5 |
| 华硕 TUF Gaming Advantage A16 | AMD Radeon RX 7600S (8 GB GDDR6) & AMD Radeon 780M | AMD Ryzen 9 7940HS | 2 x 8 GB DDR5 |
| 塔式电脑 | 显卡 | 处理器 | 内存 |
|---|---|---|---|
| 华硕 ROG Strix Z790-F | NvidiaGeForce RTX 4080 (16 GB GDDR6X) AMD Radeon RX 7900 XT (20 GB GDDR6) |
Intel Core i9-13900K | 2 x 24 GB DDR5 G.Skill |
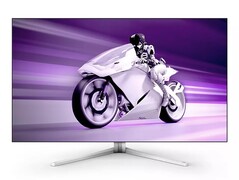
| 4K 显示器 | 操作系统 | Nvidia 驱动程序 | AMD 驱动程序 |
|---|---|---|---|
| Philips Evnia 42M2N8900 | Windows 11 | ForceWare 546.33 | Adrenalin 23.12.1 |

