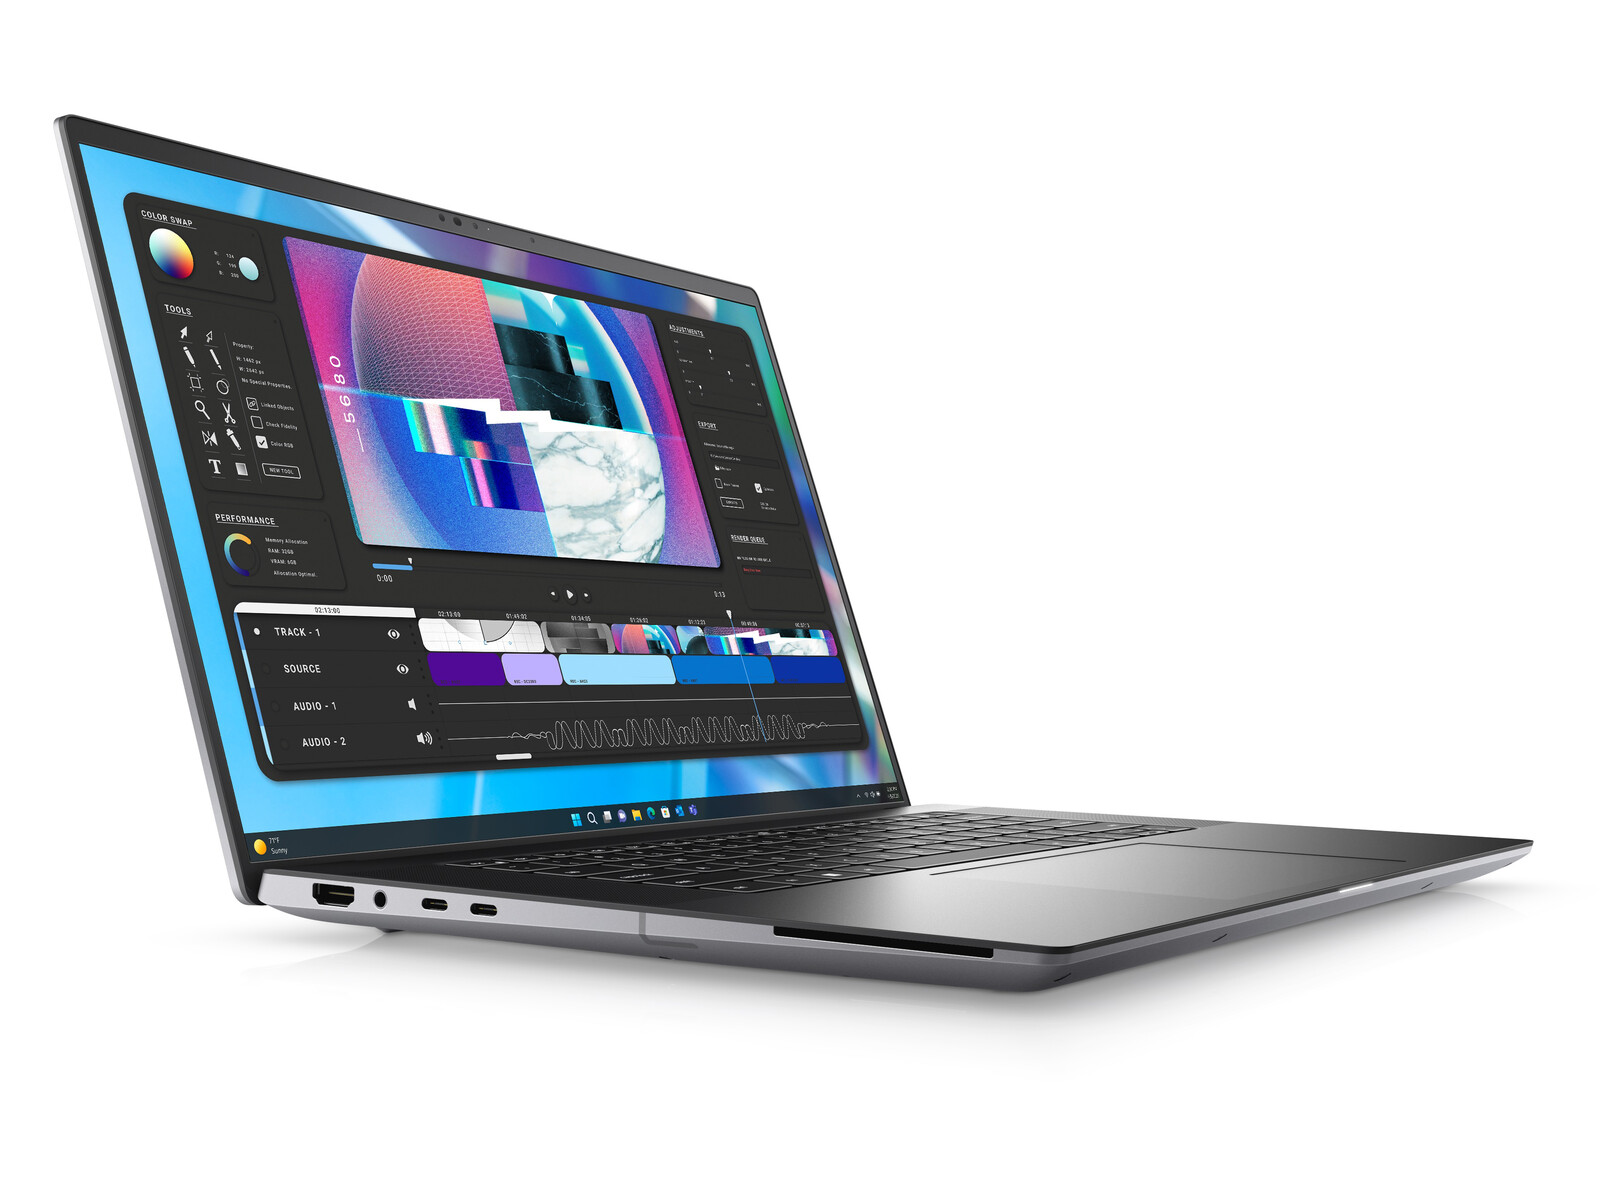
戴尔Precision 5680 评测:阿达-拉芙蕾丝在工作站中独占鳌头

Precision 5680 是Precision 5000 系列中的第一款 16 英寸机型,是对现有 14 英寸 Precision 5470和 15 英寸 Precision 5560和 17 英寸 Precision 5750.这是一款高端移动工作站,比 7000 型号更薄、更轻。 Precision 7000 型尽管集成的辅助功能较少。
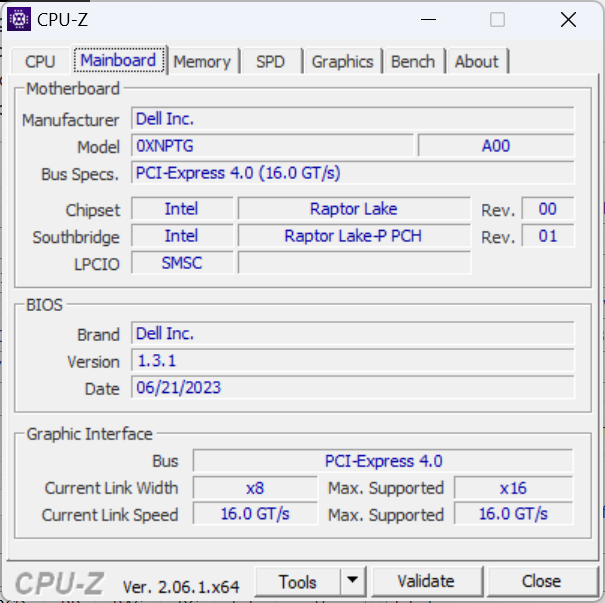
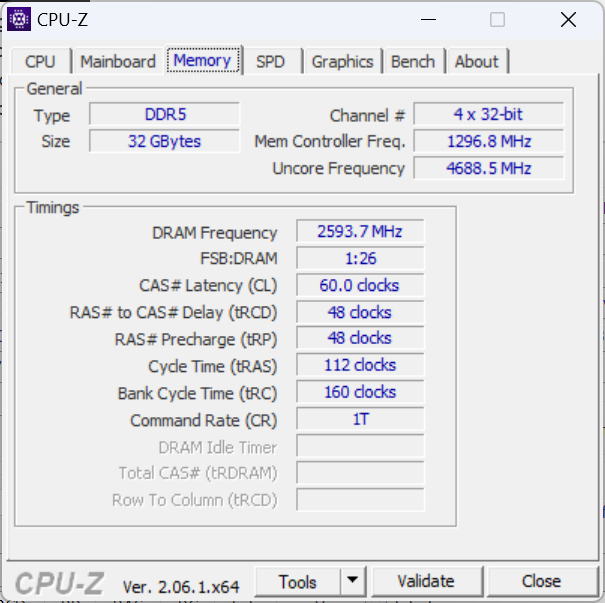
我们的测试机是高端配置,配备第 13 代 Raptor Lake-H Core i9-13900H CPU、75 W Nvidia RTX 5000 GPU 和 2400p OLED 触摸屏,售价约 6500 美元。配置较低的 SKU 有酷睿 i5-13600H、无独立 GPU 和 1200p IPS 显示屏,起价较低,约为 2490 美元。
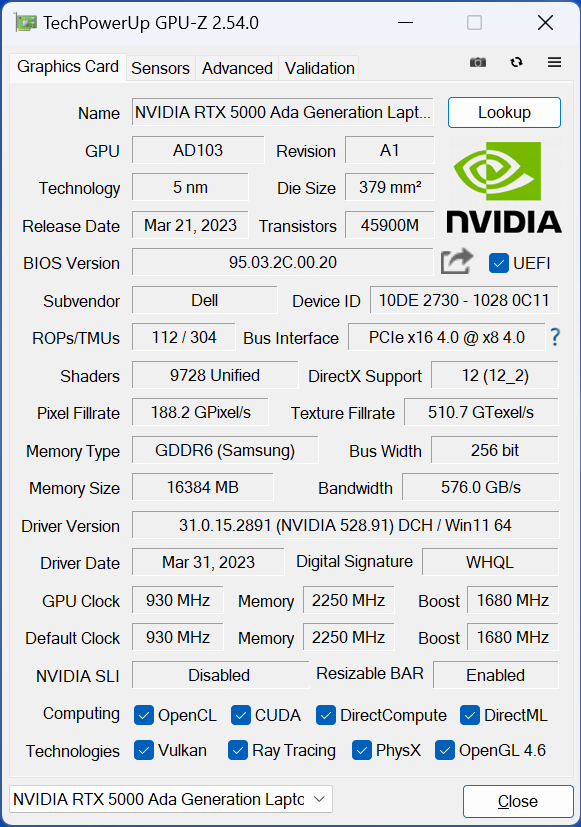
这也是首批配备 RTX 5000 Ada Lovelace 移动 GPU 的工作站之一。 Quadro RTX 5000或基于安培的 RTX A5000.
该领域的竞争对手包括其他 16 英寸工作站,如惠普 ZBook Fury 16 G9,联想 ThinkPad P16 G1,微星CreatorPro Z16P或 华硕 ProArt StudioBook 16 系列.
更多戴尔评测:
潜在的竞争对手比较
Rating | Date | Model | Weight | Height | Size | Resolution | Price |
|---|---|---|---|---|---|---|---|
| 89 % v7 (old) | 08 / 2023 | Dell Precision 5000 5680 i9-13900H, RTX 5000 Ada Generation Laptop | 2.3 kg | 22.17 mm | 16.00" | 3840x2400 | |
| 89.1 % v7 (old) | 12 / 2022 | Dell Precision 7000 7670 Performance i9-12950HX, RTX A5500 Laptop GPU | 2.8 kg | 25.95 mm | 16.00" | 3840x2400 | |
| 91 % v7 (old) | 06 / 2023 | HP ZBook Fury 16 G9 i9-12950HX, RTX A5500 Laptop GPU | 2.6 kg | 28.5 mm | 16.00" | 3840x2400 | |
| 91 % v7 (old) | 02 / 2023 | Lenovo ThinkPad P16 G1 RTX A5500 i9-12950HX, RTX A5500 Laptop GPU | 3 kg | 30.23 mm | 16.00" | 3840x2400 | |
| 84.3 % v7 (old) | 11 / 2022 | MSI CreatorPro Z16P B12UKST i7-12700H, RTX A3000 Laptop GPU | 2.4 kg | 19 mm | 16.00" | 2560x1600 | |
| 89.6 % v7 (old) | 01 / 2023 | Asus ExpertBook B6 Flip B6602FC2 i9-12950HX, RTX A2000 Laptop GPU | 2.8 kg | 27.2 mm | 16.00" | 2560x1600 |
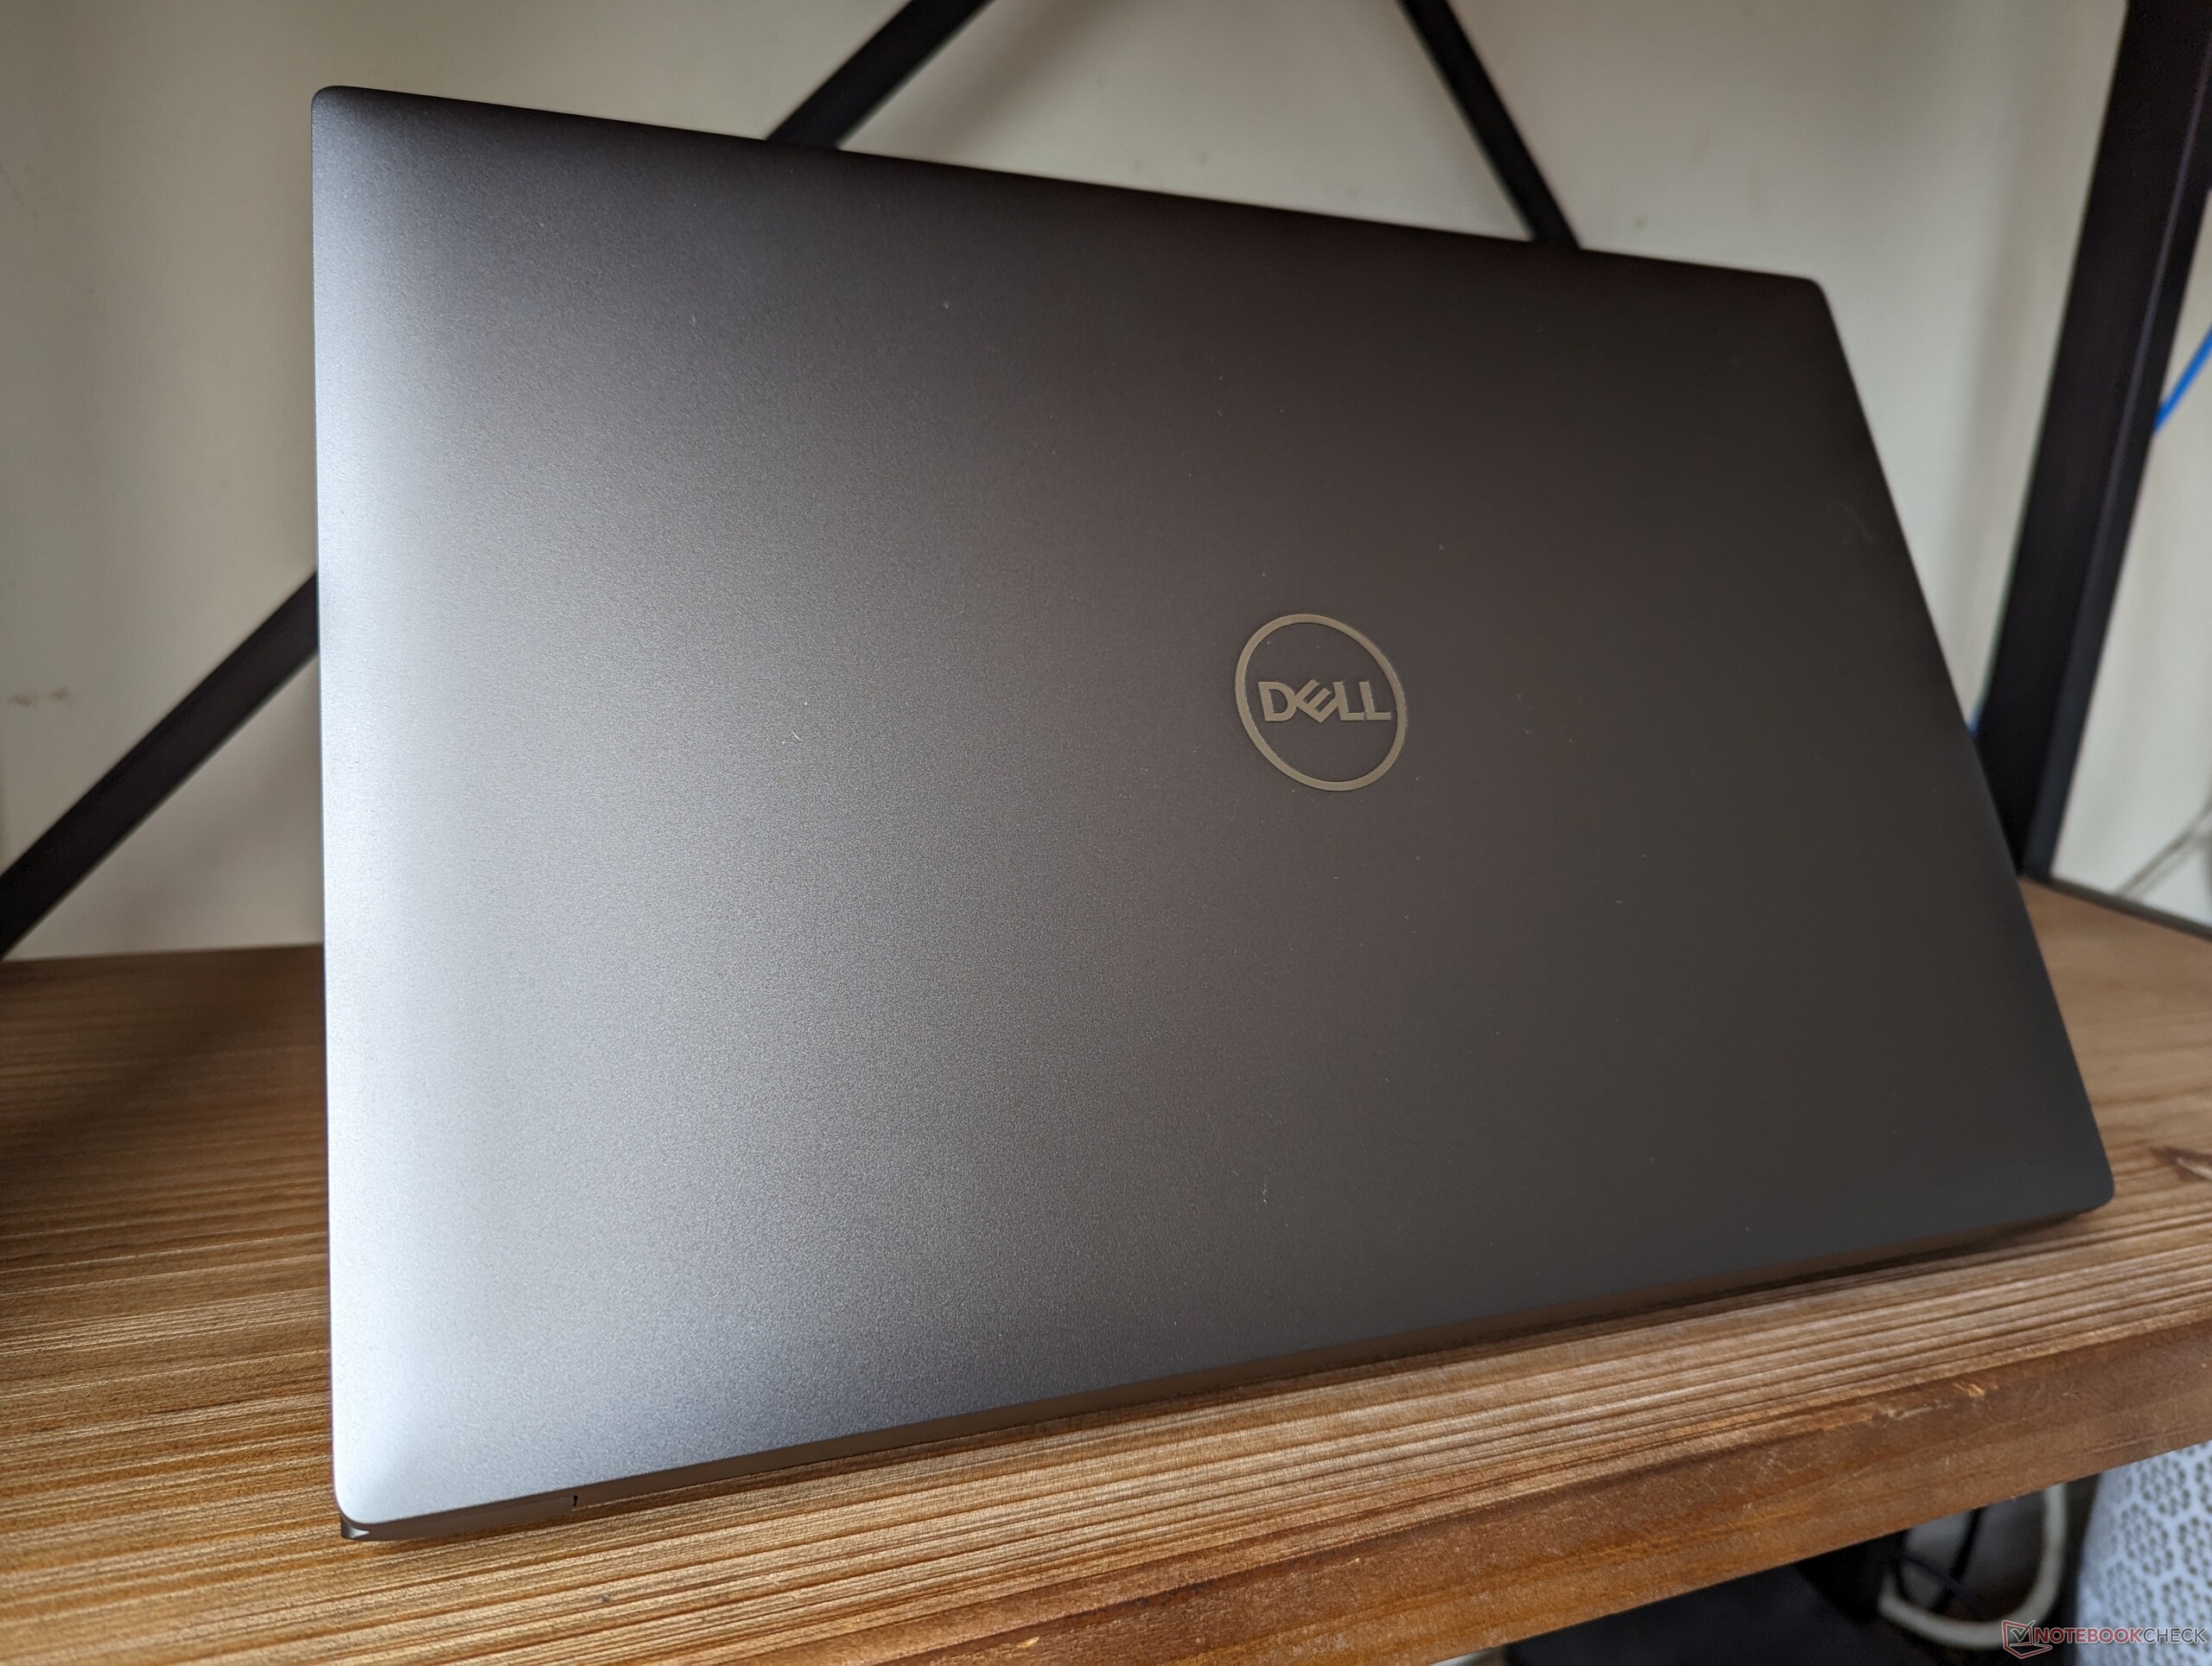
外壳 - XPS Roots
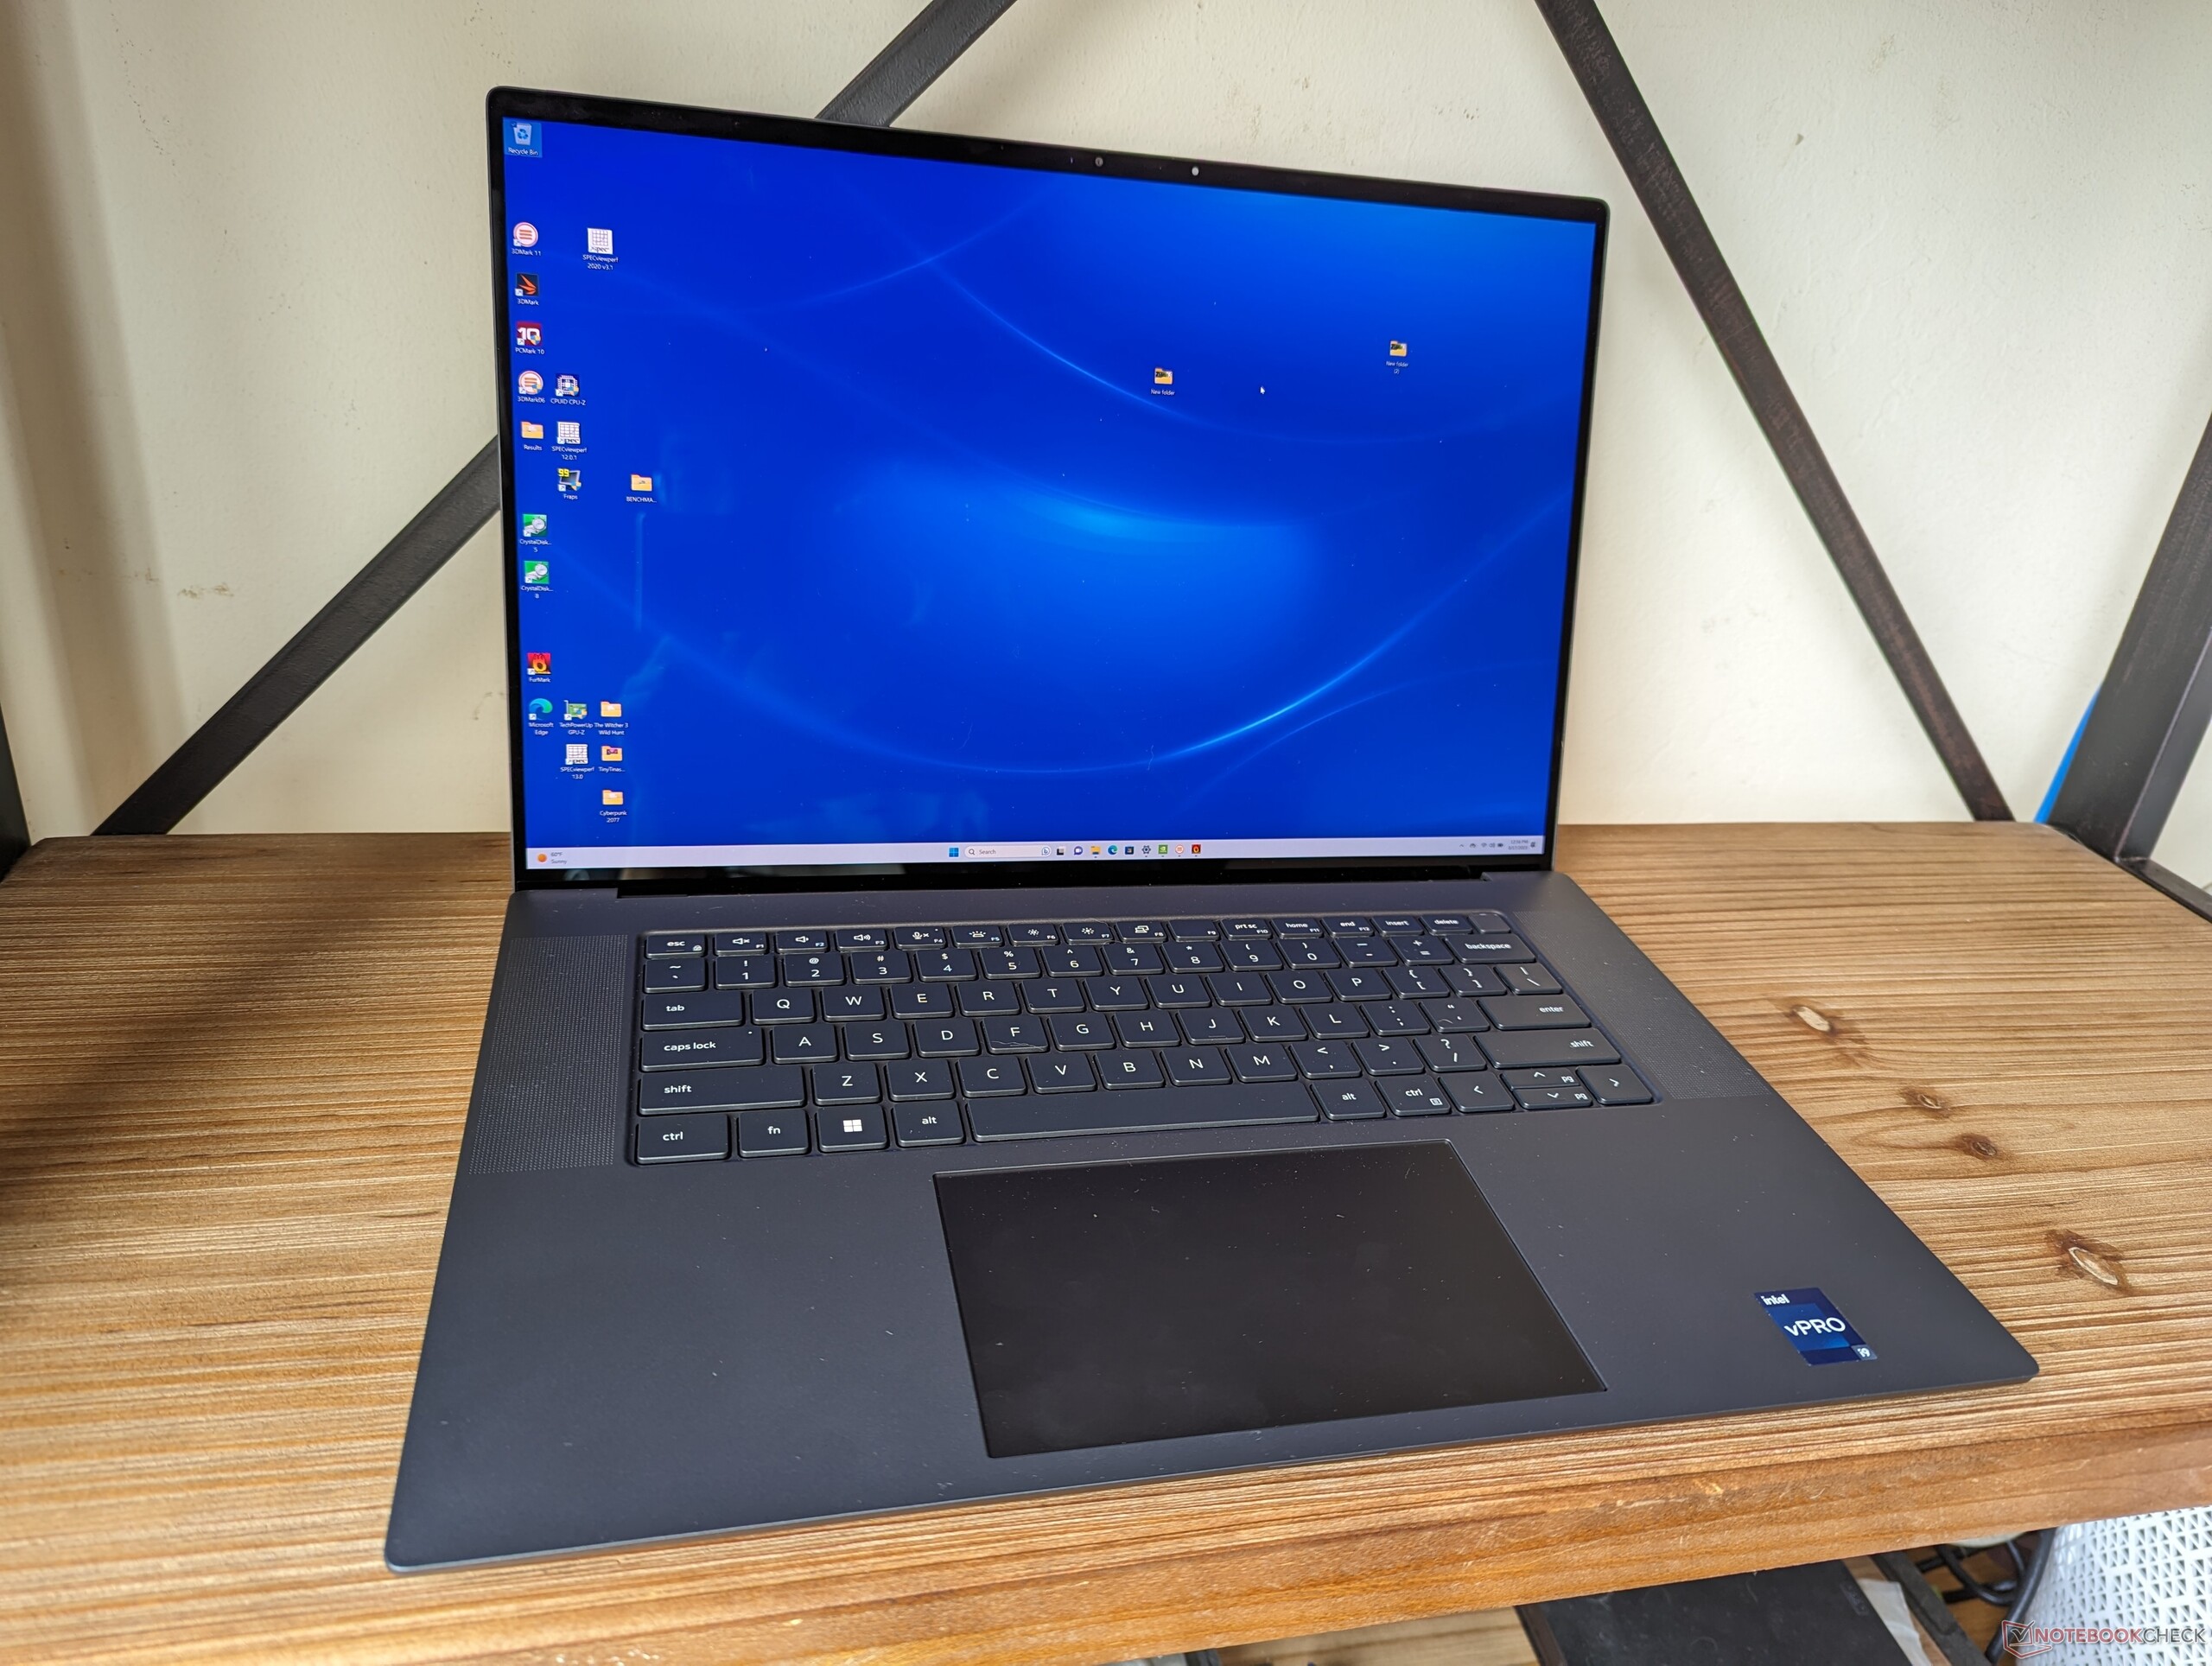
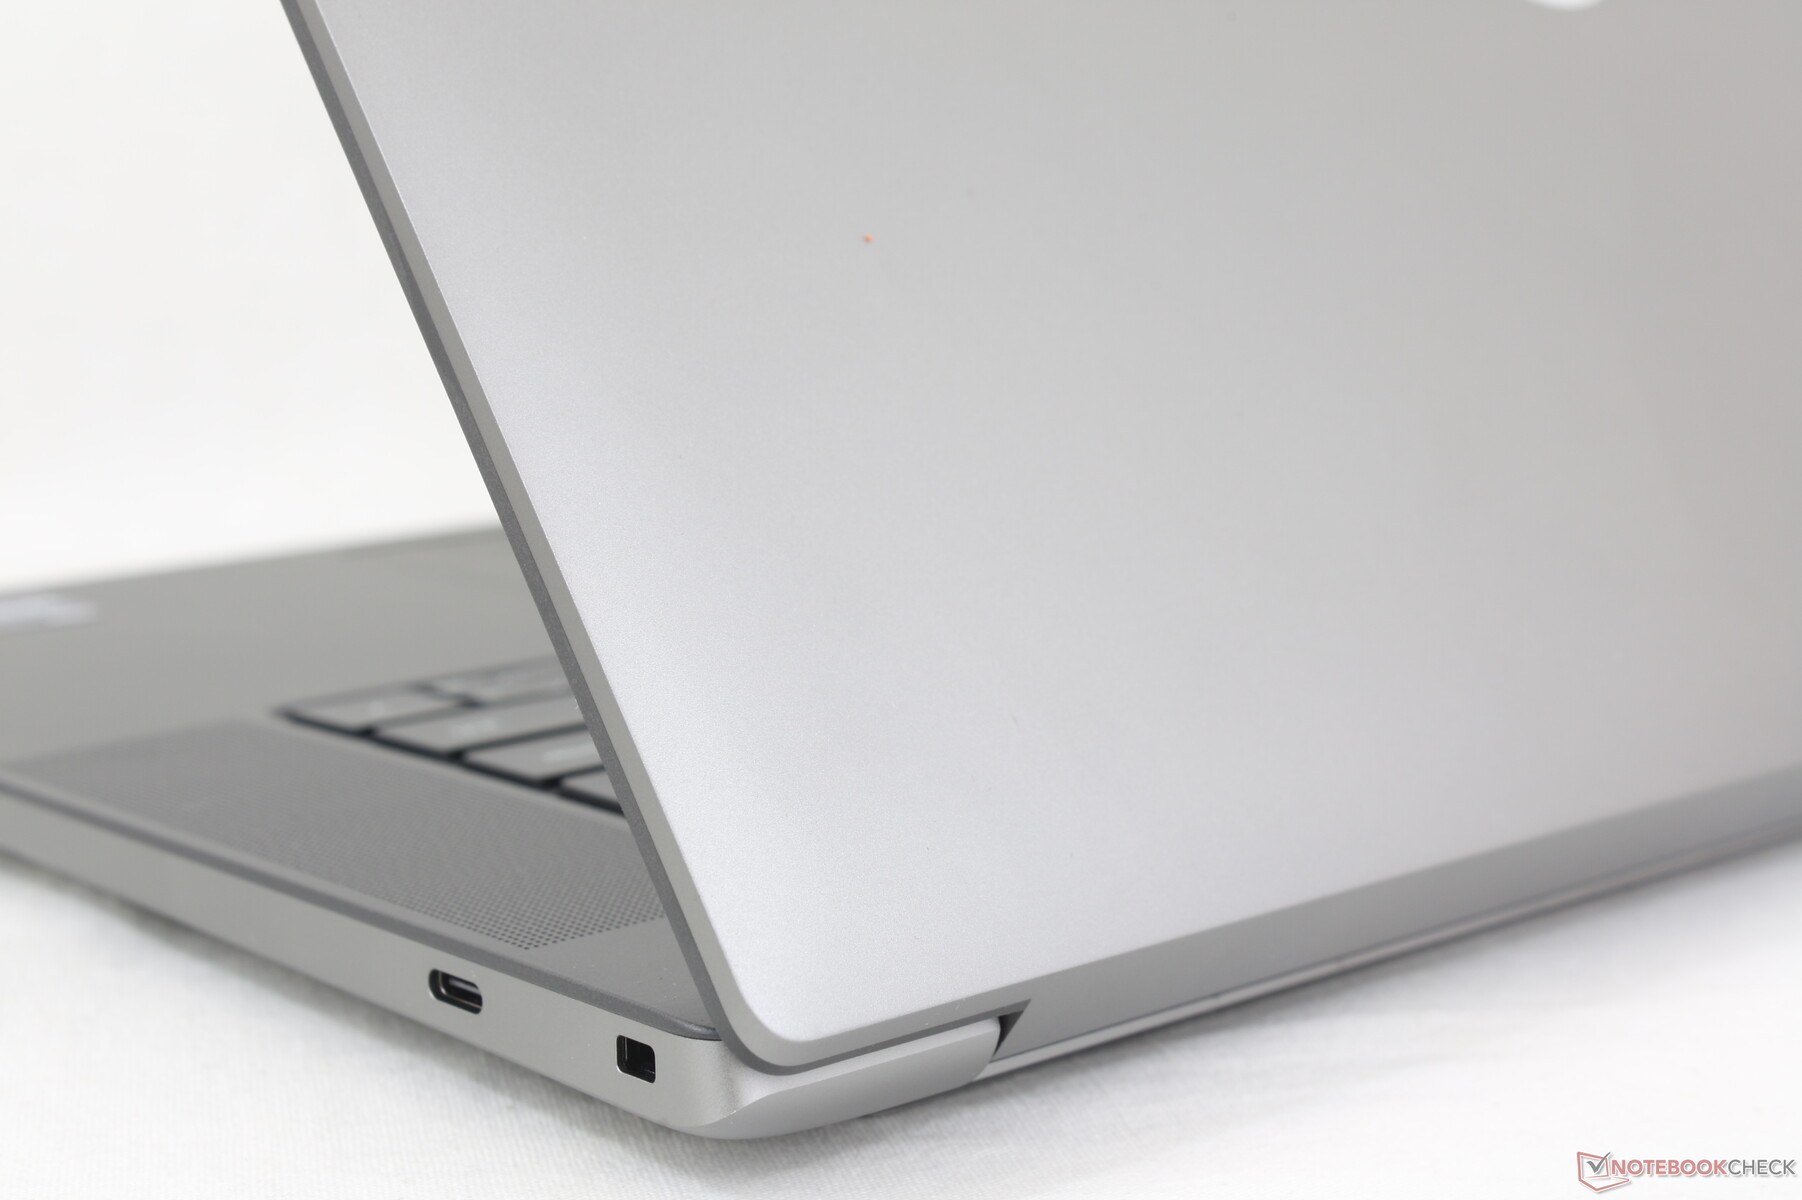
Precision 5680 的设计灵感显而易见,因为它本质上是 15 英寸 XPS 15和 17 英寸 XPS 17.如果你以前使用过 XPS 机型,那么Precision 5680 应该会让你感觉很熟悉。它似乎是假想的 "XPS 16 "的前身,如果在不久的将来看到这样一款机型采用基于Precision 5680 的机箱,我们也不会感到惊讶。
与 ZBook Fury 16 G9 或CreatorPro Z16P这些产品也主要由金属合金组成,给人留下了深刻的第一印象。
Precision 5680 仅重 2.3 千克,是目前最轻的 16 英寸工作站之一。CreatorPro Z16P 和惠普 ZBook Fury 16 G9例如,CreatorPro Z16P 和惠普 ZBook Fury 16 G9 分别重约 100 克和 300 克,而且占地面积也比戴尔大。考虑到其性能,Precision 5680 的便携性令人惊讶。
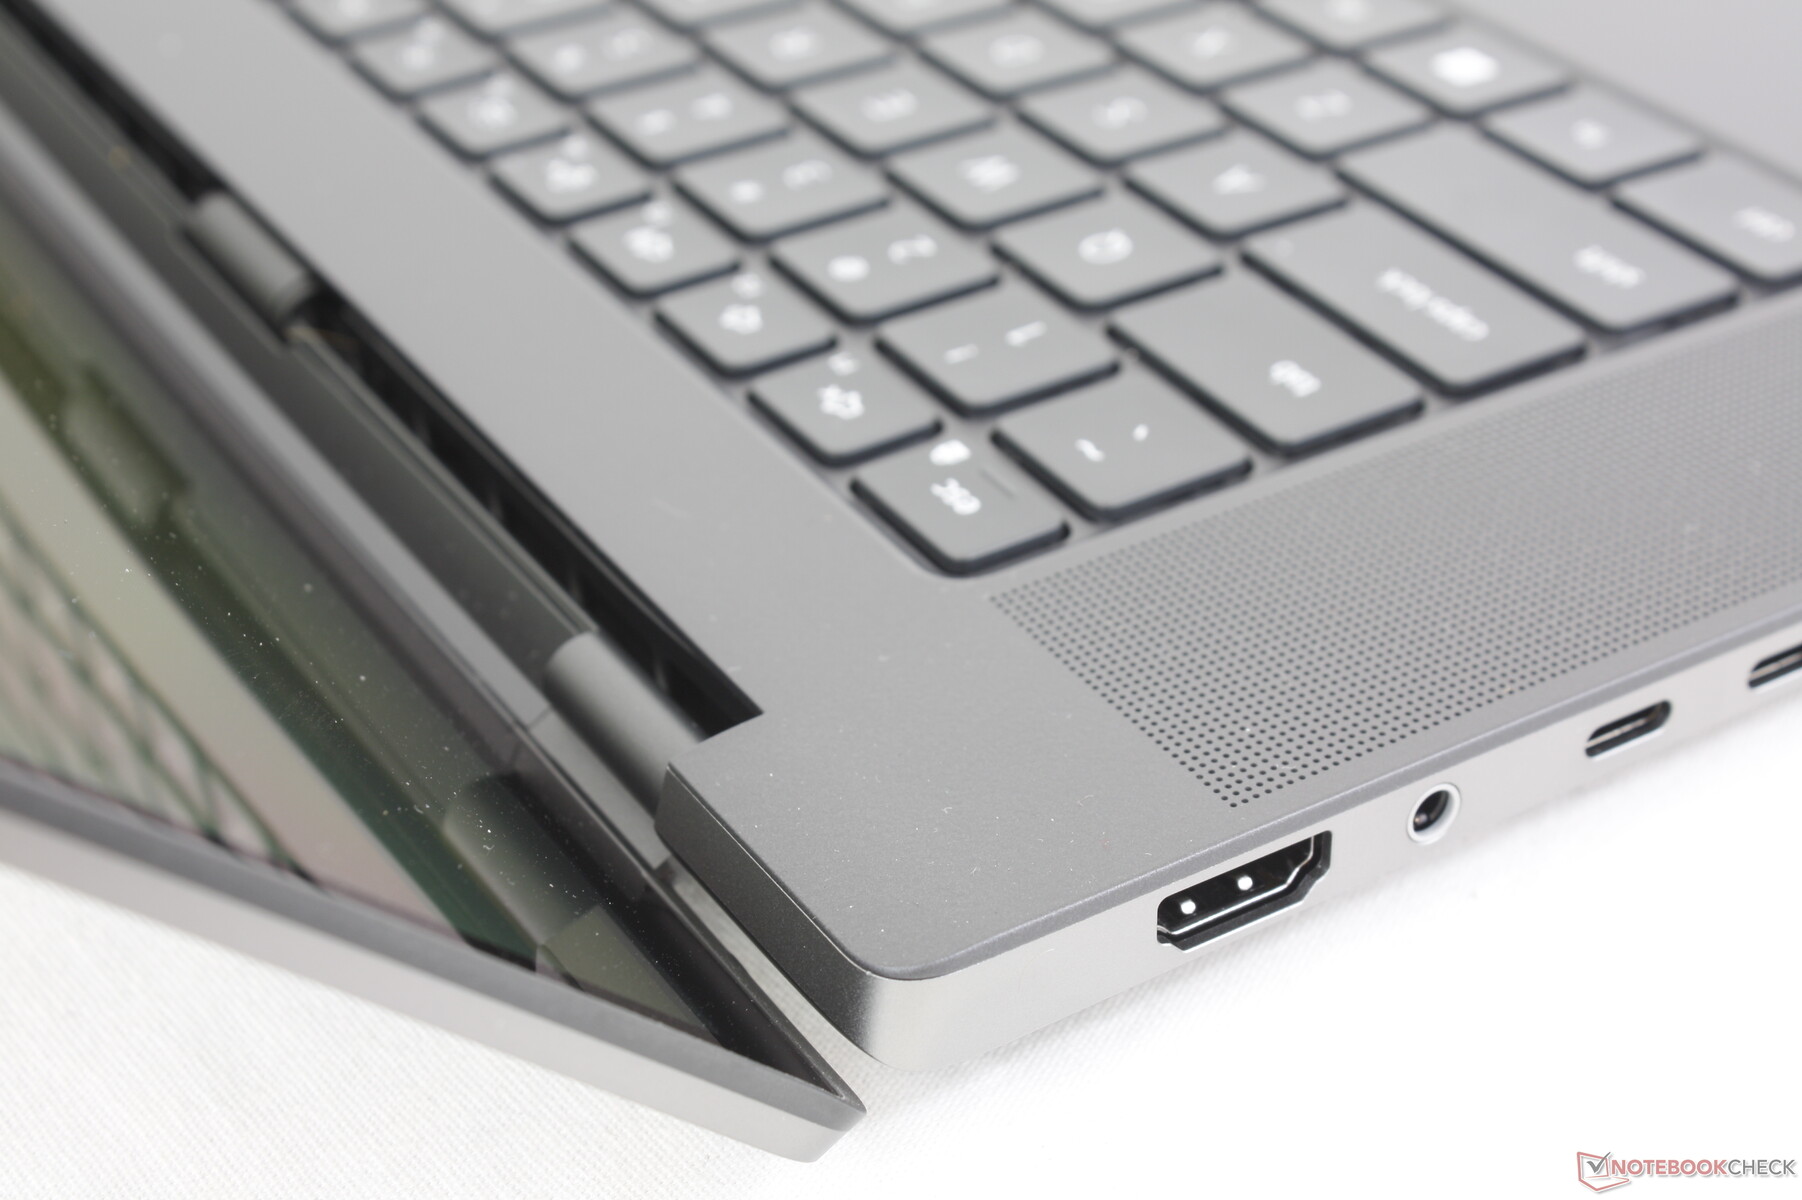
连接性--对于工作站来说不算多
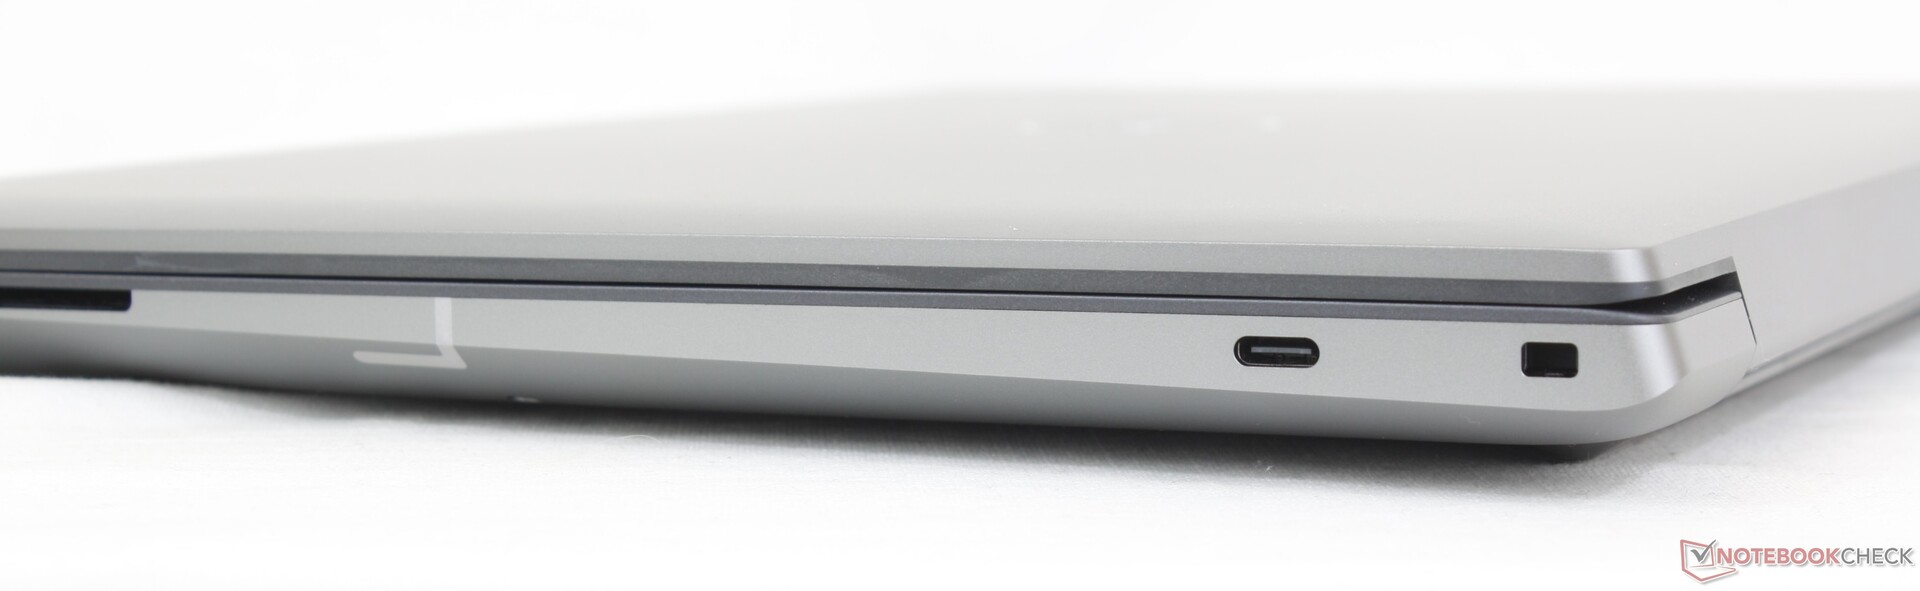
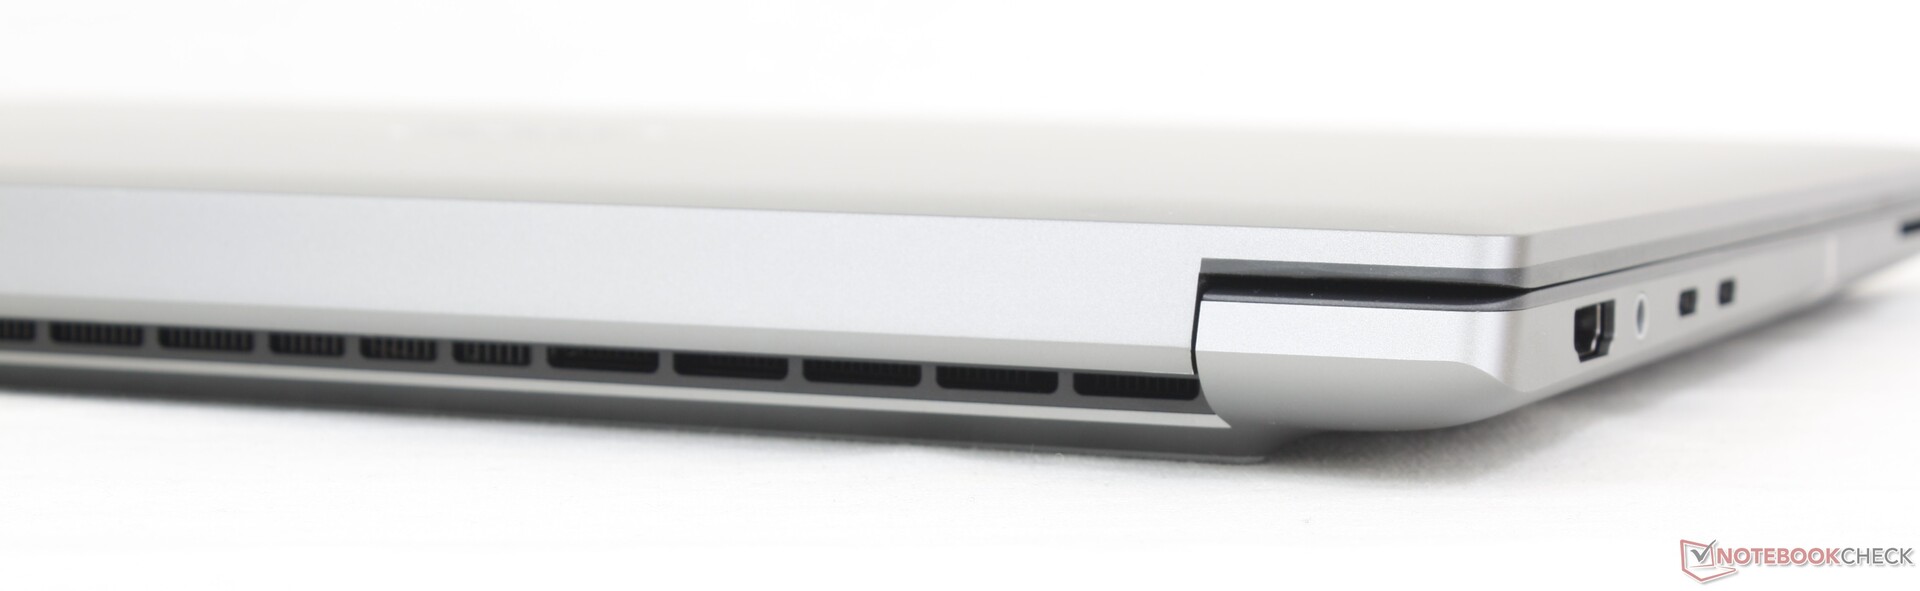
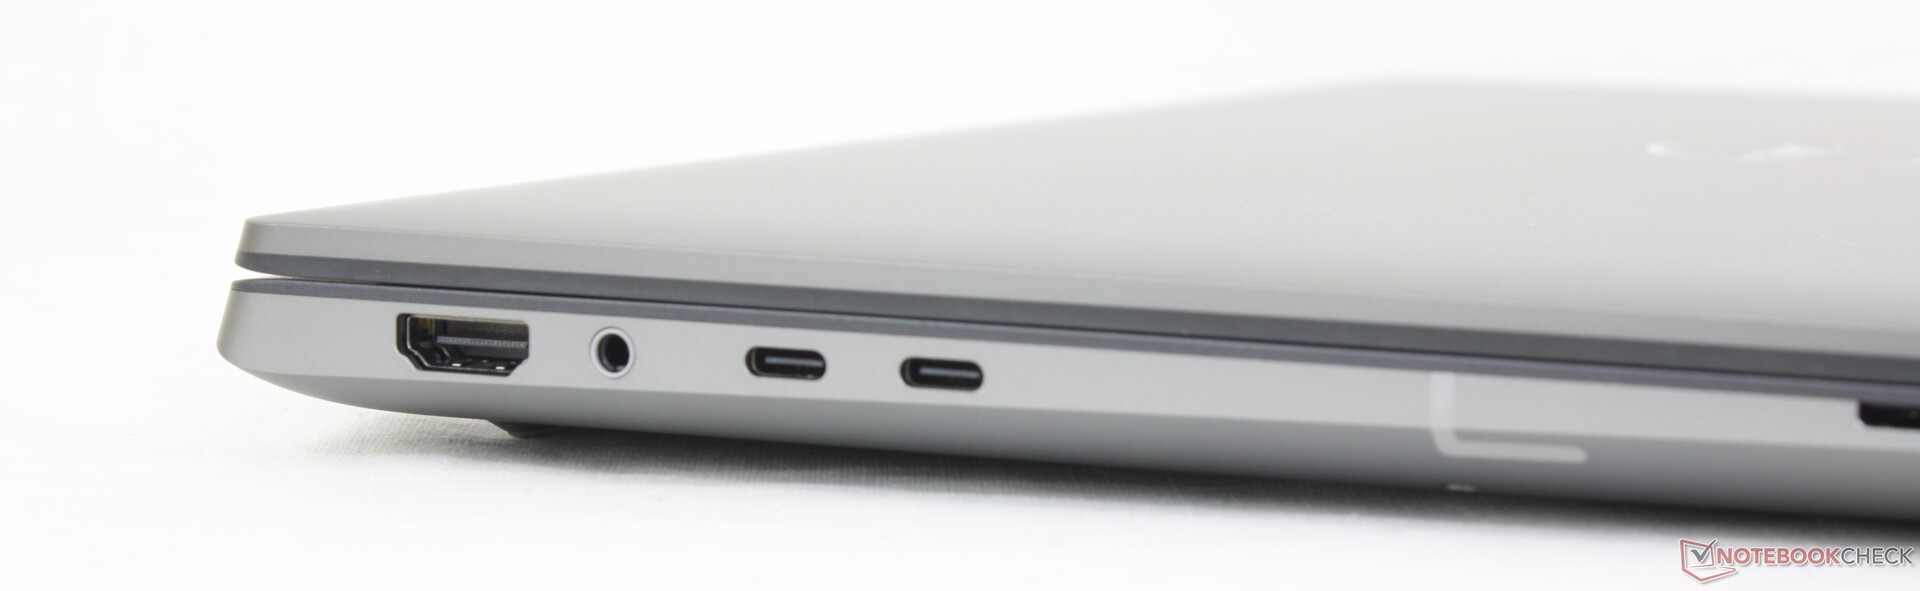
无论好坏,端口选项都是前瞻性的。好的方面是每个端口在适配器和外设方面都具有很强的通用性,但也有不好的地方,那就是没有全尺寸 USB 或 RJ-45 等主要端口。ThinkPad P1 G4 或 专家本 B6 Flip 等替代产品都提供了比戴尔更多的端口。因此,在使用Precision 5680 时,请准备好使用适配器或扩展坞。
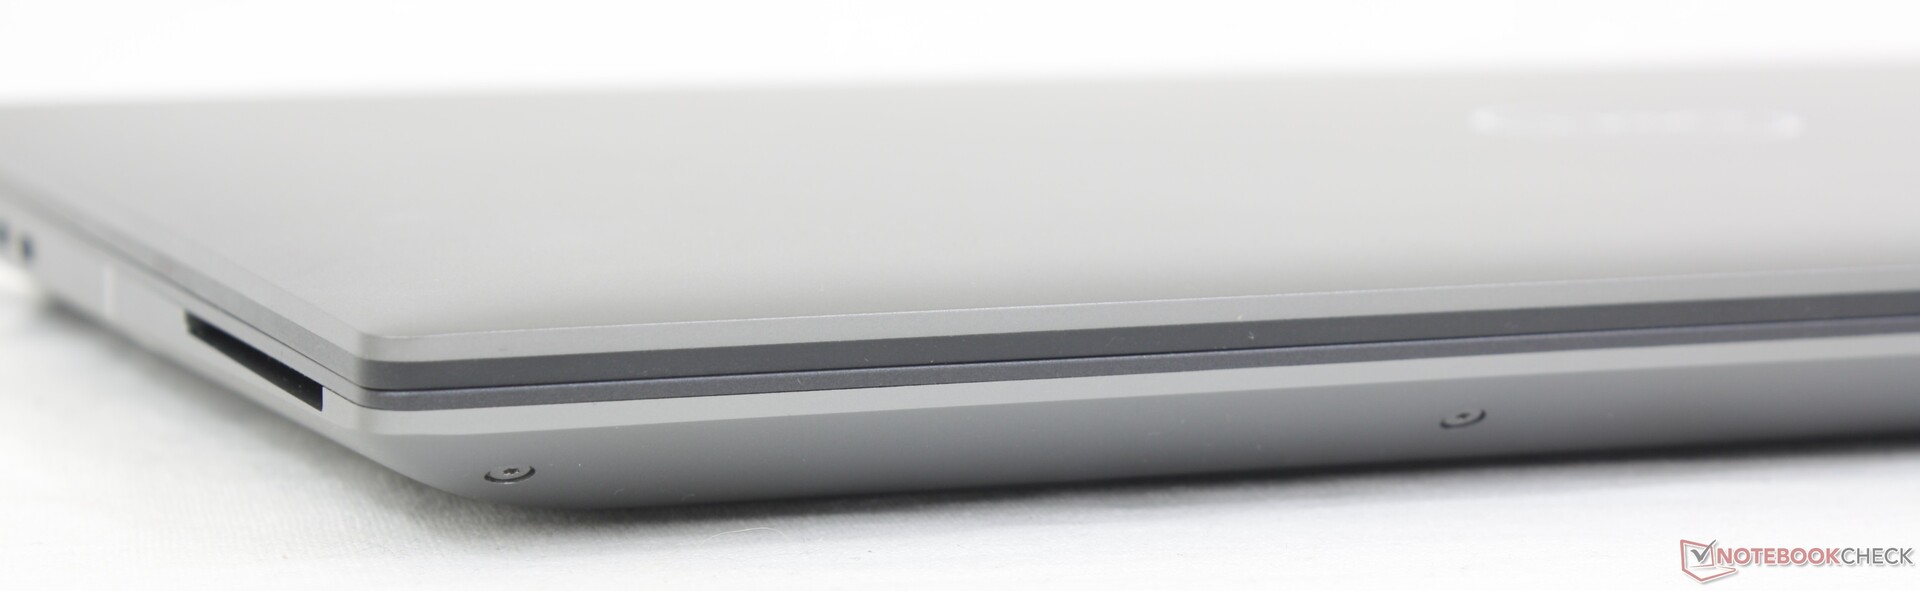
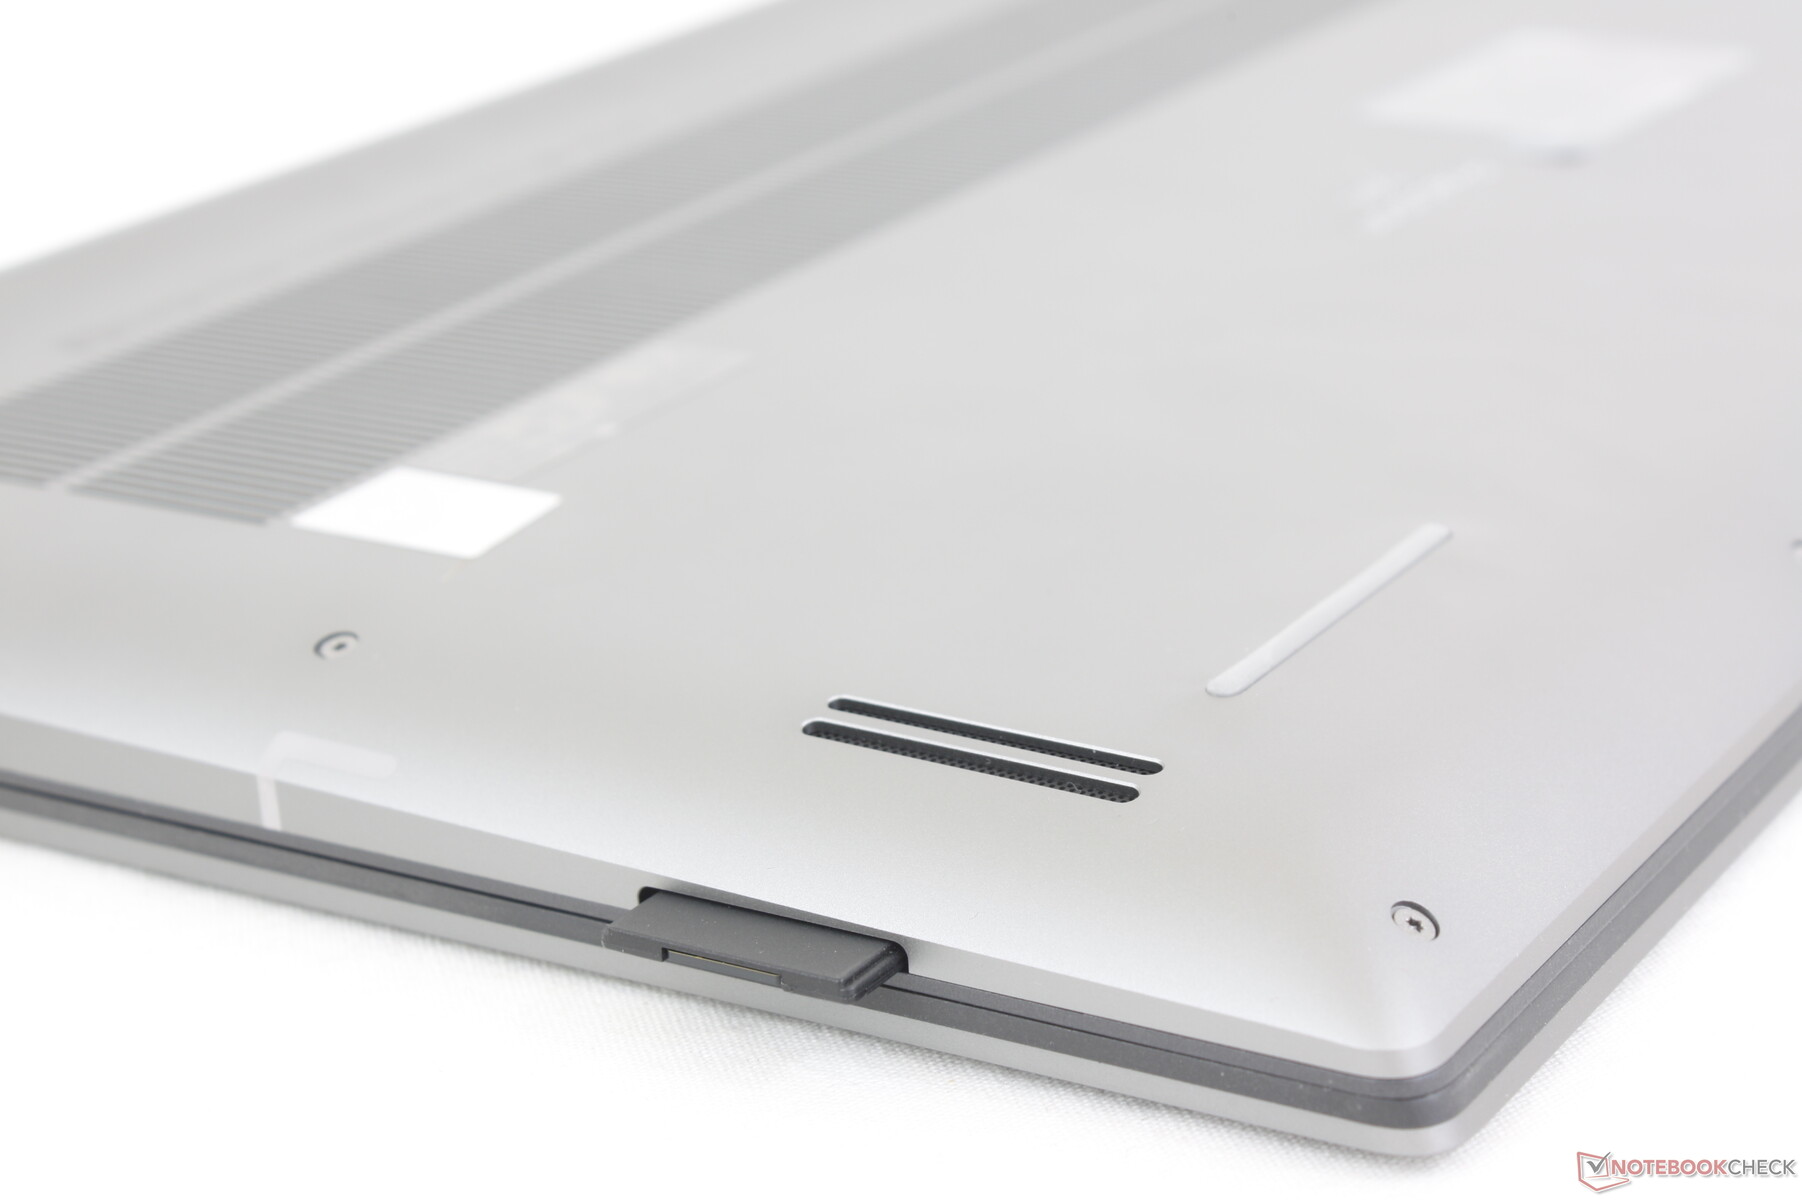
SD 读卡器
XPS 和Precision 机型拥有最快的集成 SD 卡读卡器,我们的Precision 5680 也是如此。读取速度比 ZBook Fury 16 G9 或 ThinkPad P16 G1 快 2 倍以上,因此从我们的 UHS-II 测试卡向台式机传输 1 GB 的数据只需 5 至 6 秒。
| SD Card Reader | |
| average JPG Copy Test (av. of 3 runs) | |
| Dell Precision 5000 5680 (Toshiba Exceria Pro SDXC 64 GB UHS-II) | |
| Dell Precision 7000 7670 Performance (Toshiba Exceria Pro SDXC 64 GB UHS-II) | |
| MSI CreatorPro Z16P B12UKST (AV Pro V60) | |
| HP ZBook Fury 16 G9 (PNY EliteX-PRO60) | |
| Lenovo ThinkPad P16 G1 RTX A5500 (Toshiba Exceria Pro SDXC 64 GB UHS-II) | |
| maximum AS SSD Seq Read Test (1GB) | |
| Dell Precision 7000 7670 Performance (Toshiba Exceria Pro SDXC 64 GB UHS-II) | |
| Dell Precision 5000 5680 (Toshiba Exceria Pro SDXC 64 GB UHS-II) | |
| HP ZBook Fury 16 G9 (PNY EliteX-PRO60) | |
| MSI CreatorPro Z16P B12UKST (AV Pro V60) | |
| Lenovo ThinkPad P16 G1 RTX A5500 (Toshiba Exceria Pro SDXC 64 GB UHS-II) | |
交流
英特尔 AX211 标配 Wi-Fi 6E 和蓝牙 5.3 连接。与华硕 AXE11000 6GHz 网络配对后,传输速率非常稳定。
遗憾的是,与竞争对手 ZBook Fury 16 G9 不同,它不支持广域网选项。
网络摄像头
戴尔将网络摄像头从Precision 5550 上的 100 万像素提升到了Precision 5680 上的 200 万像素。即便如此,令人恼火的是仍然没有集成隐私快门。


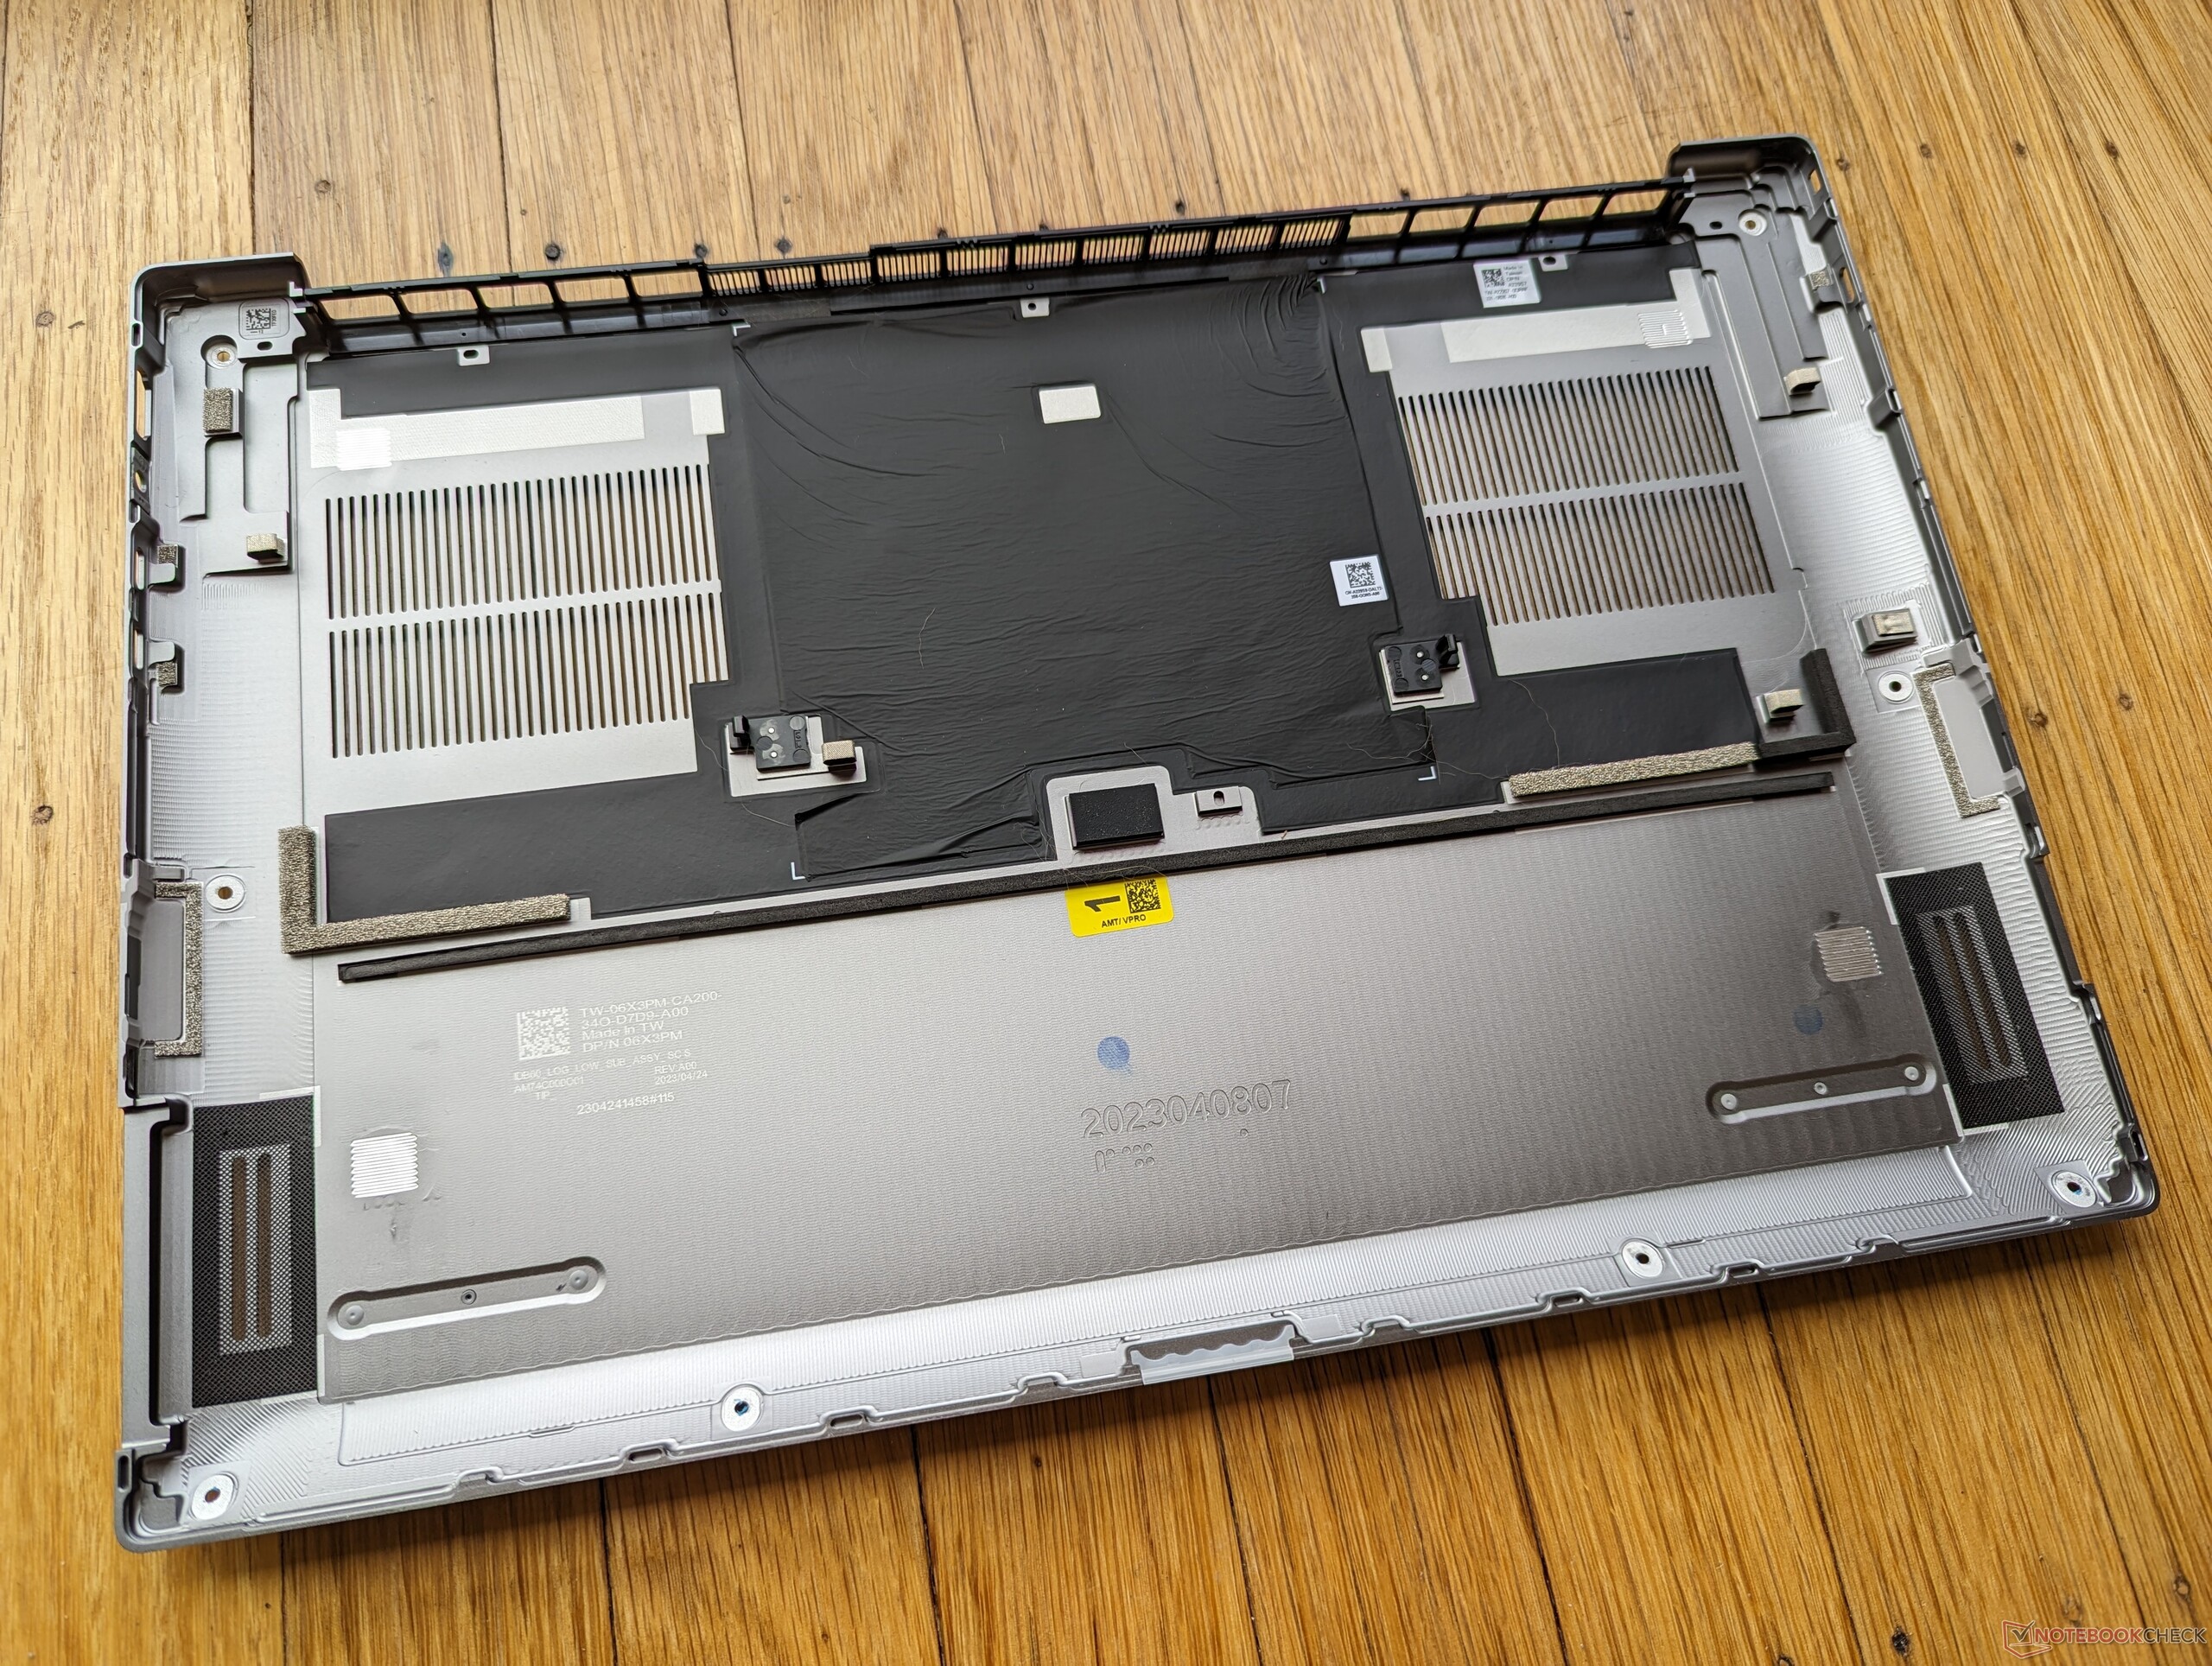
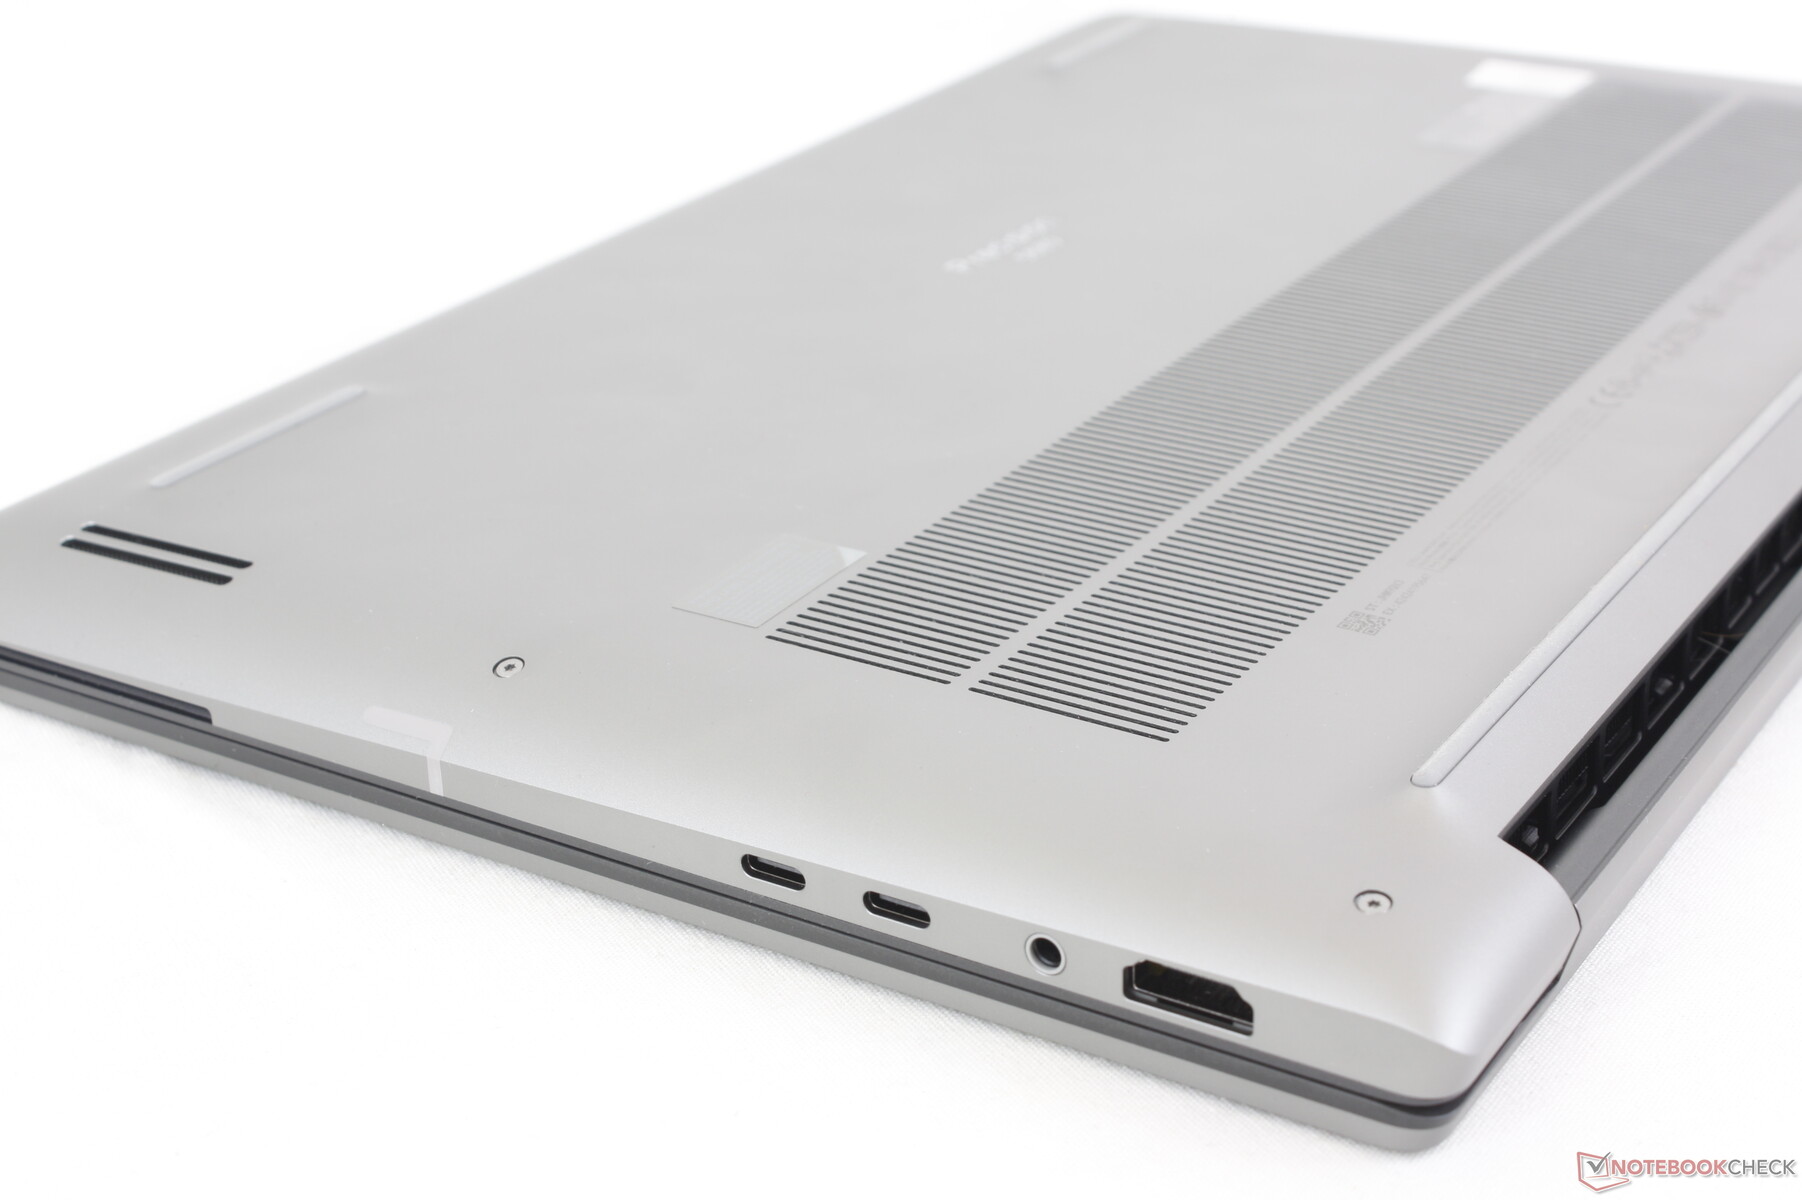
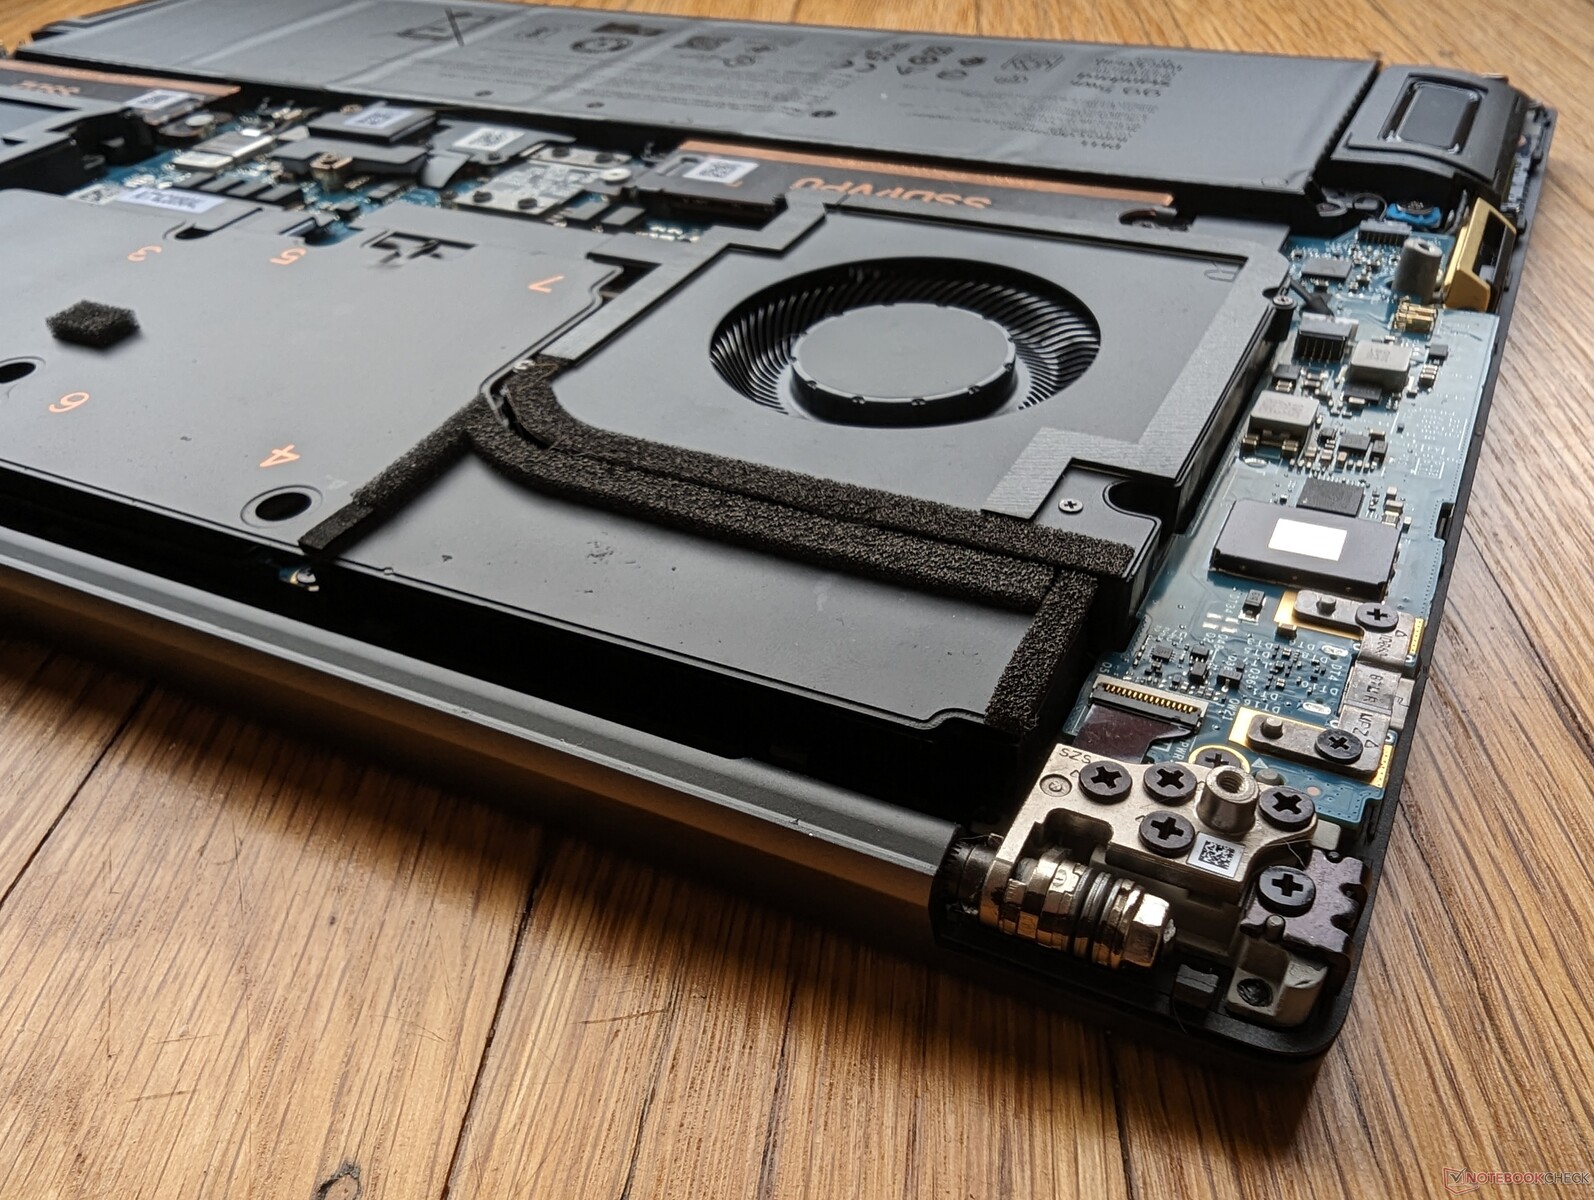
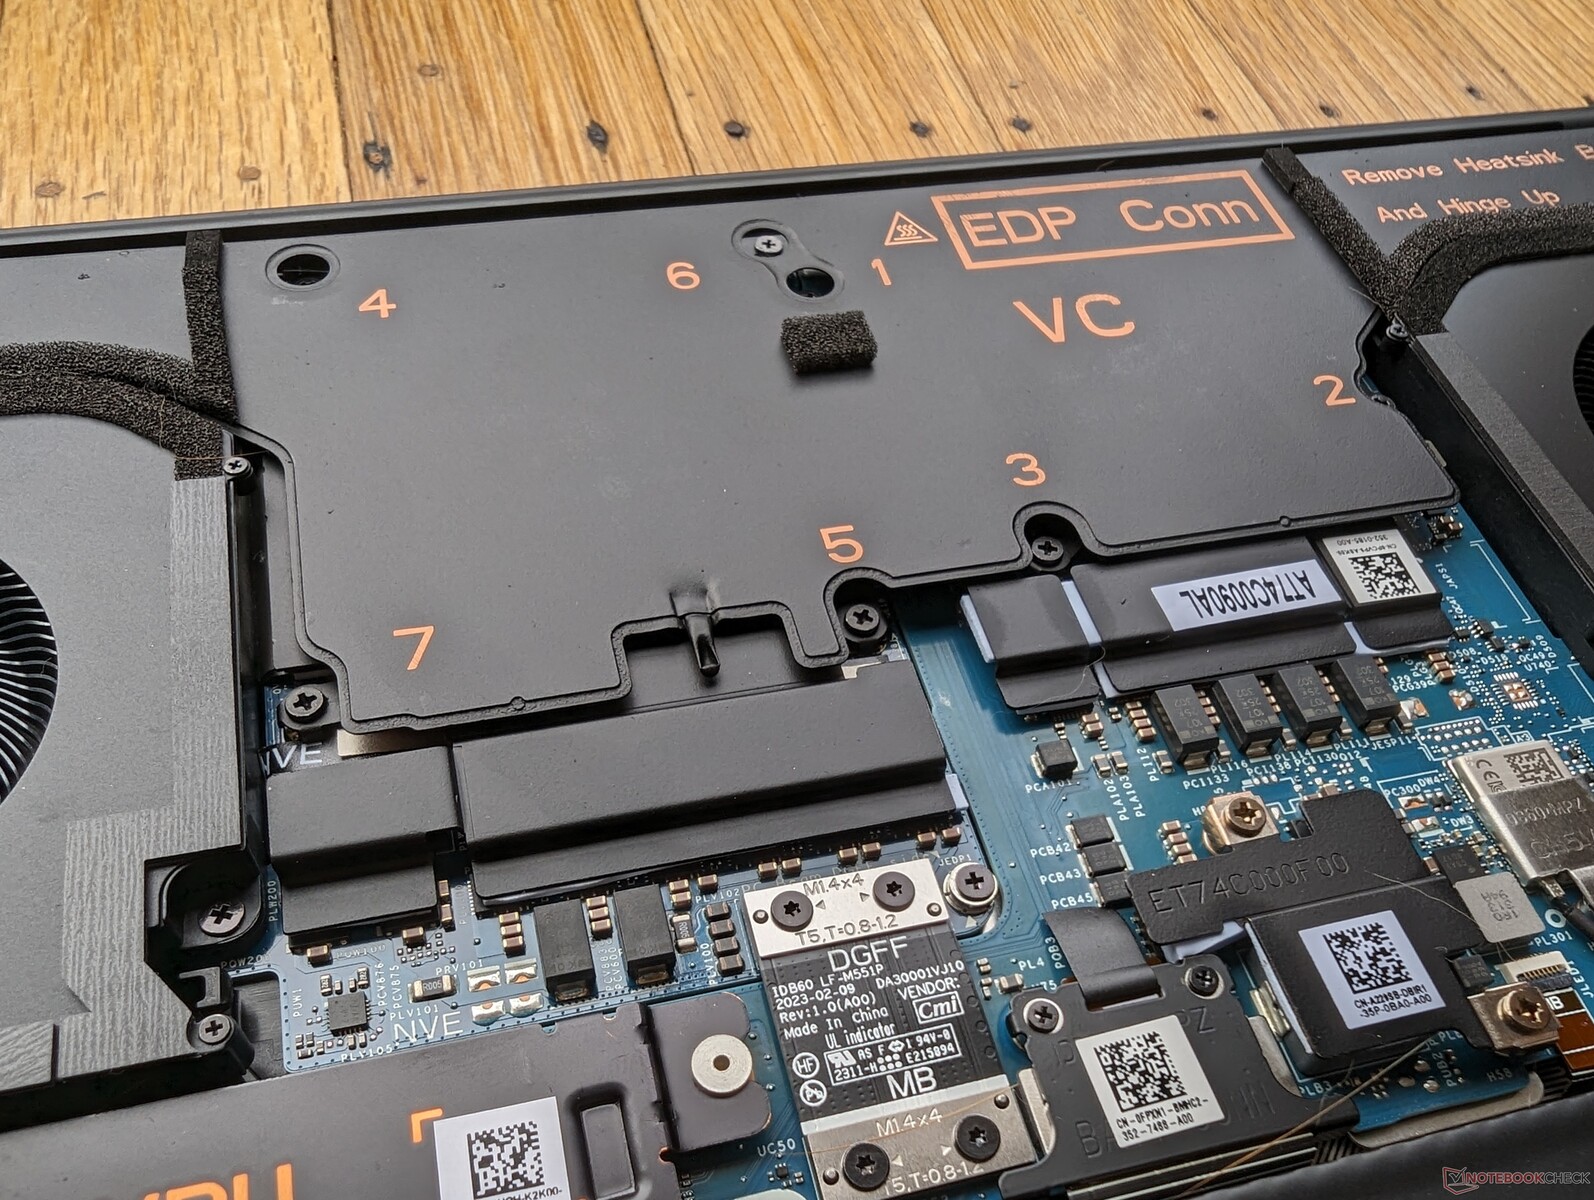
维护
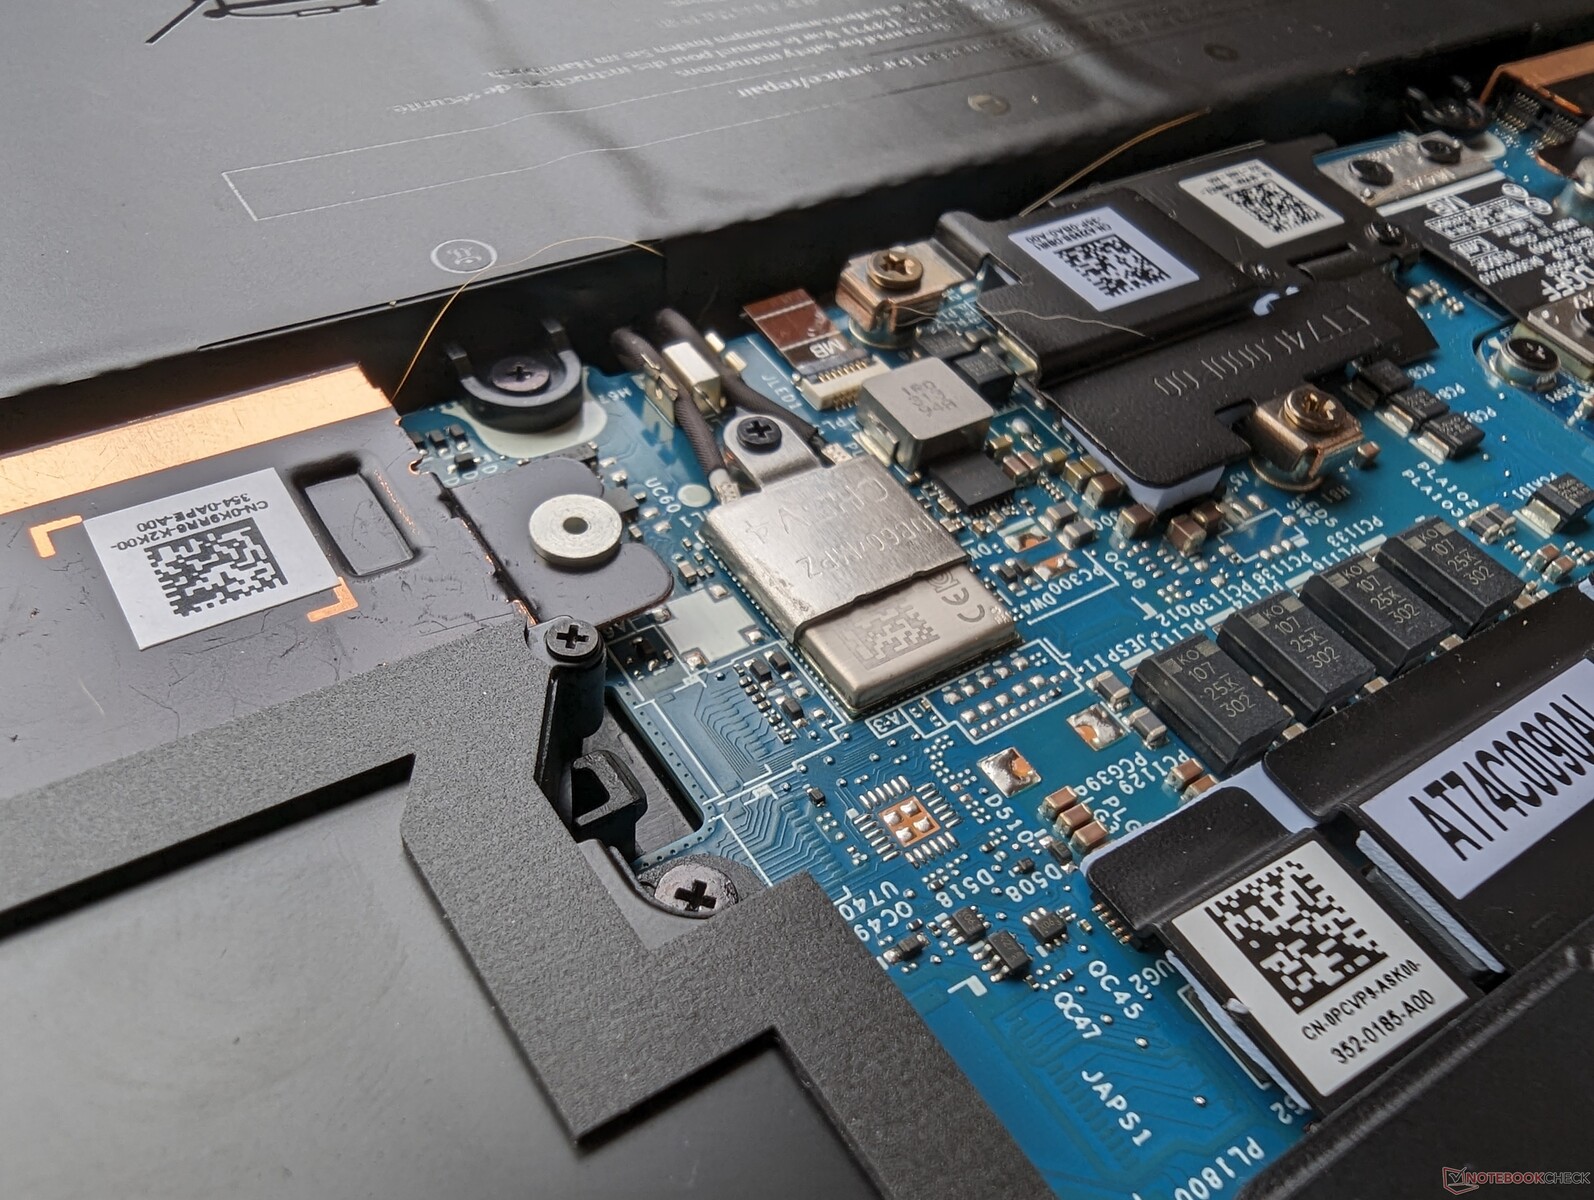
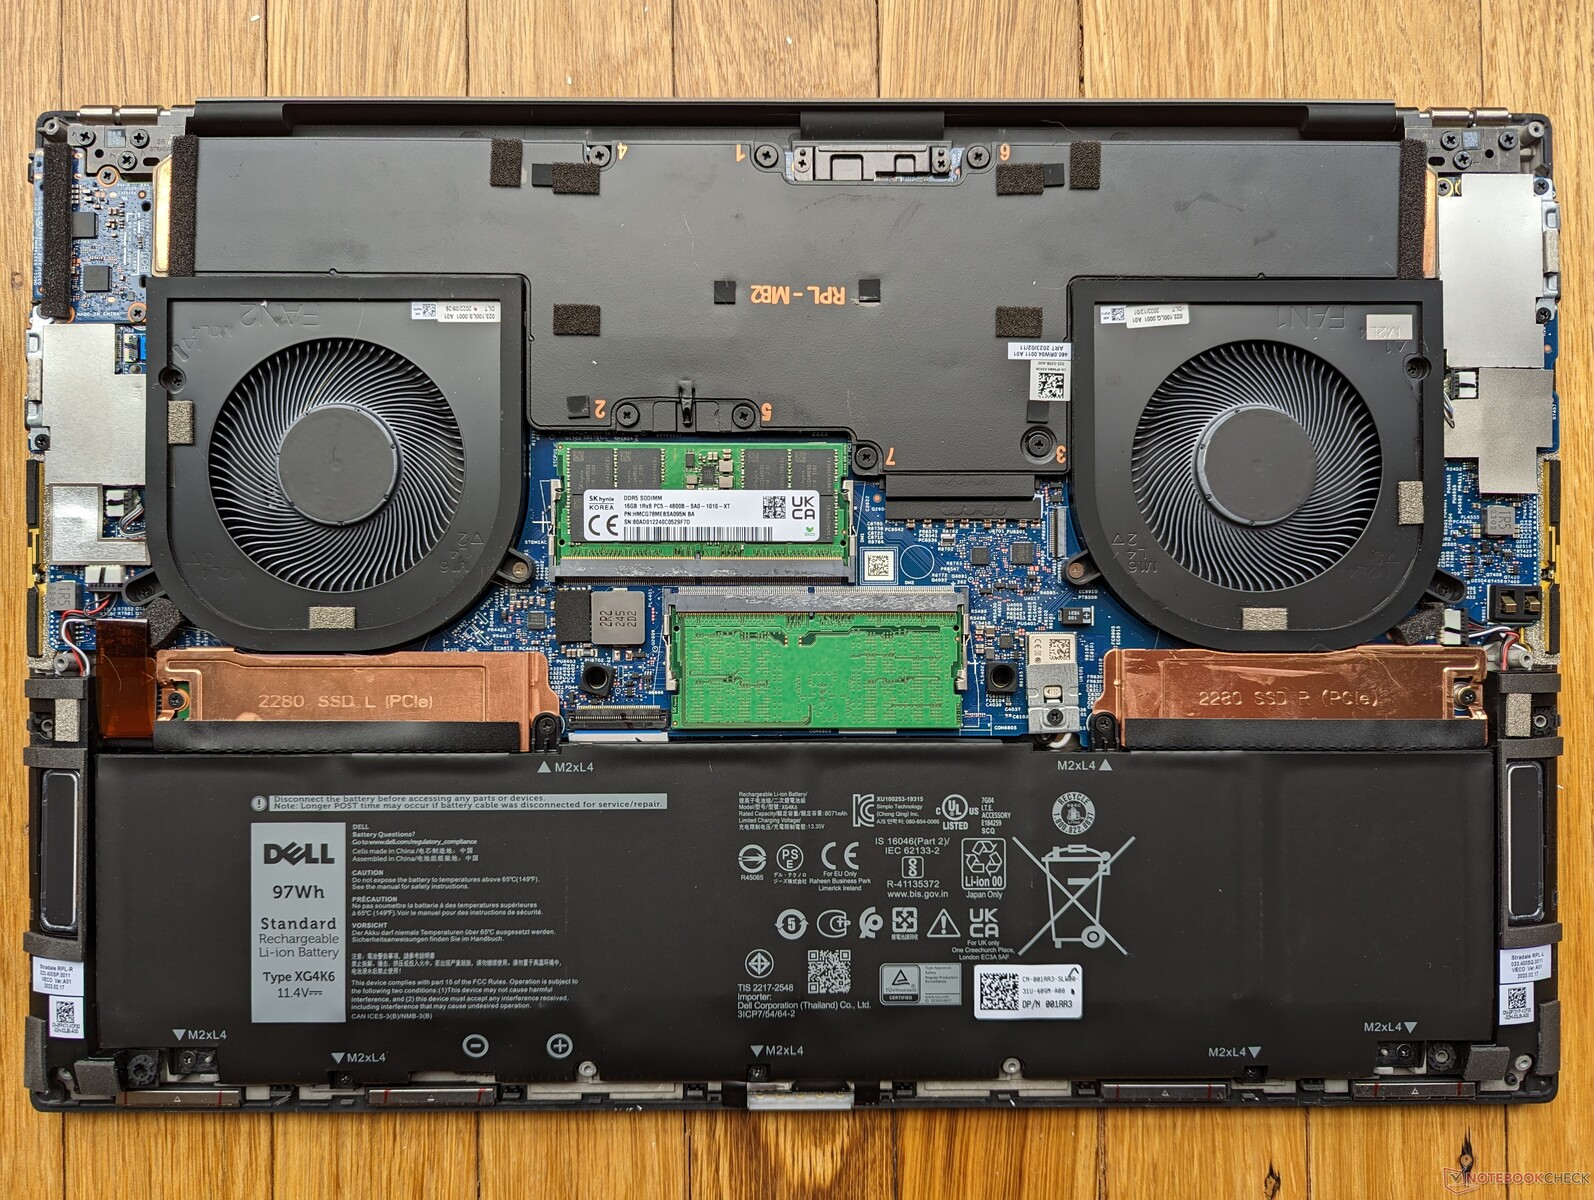
底部面板的拆卸比想象的要困难一些,因为金属板的边缘既锋利又紧锁,与 XPS 15 或 XPS 17 上的情况类似。维修系统时,建议使用 Torx 螺钉和平边。
WLAN 模块和内存模块都是焊接的,这与其他大多数同屏幕尺寸的工作站不同。高度集成的模块和有限的端口选项很可能是设计时尚和重量相对较轻的缺点。
配件和保修
零售包装盒包括一个小型 USB-C 转 USB-A 适配器,以弥补系统没有全尺寸 USB 端口的缺陷。
如果在美国购买,可享受基本的三年有限制造商保修和现场维修服务。
输入设备 - 与 XPS 略有不同
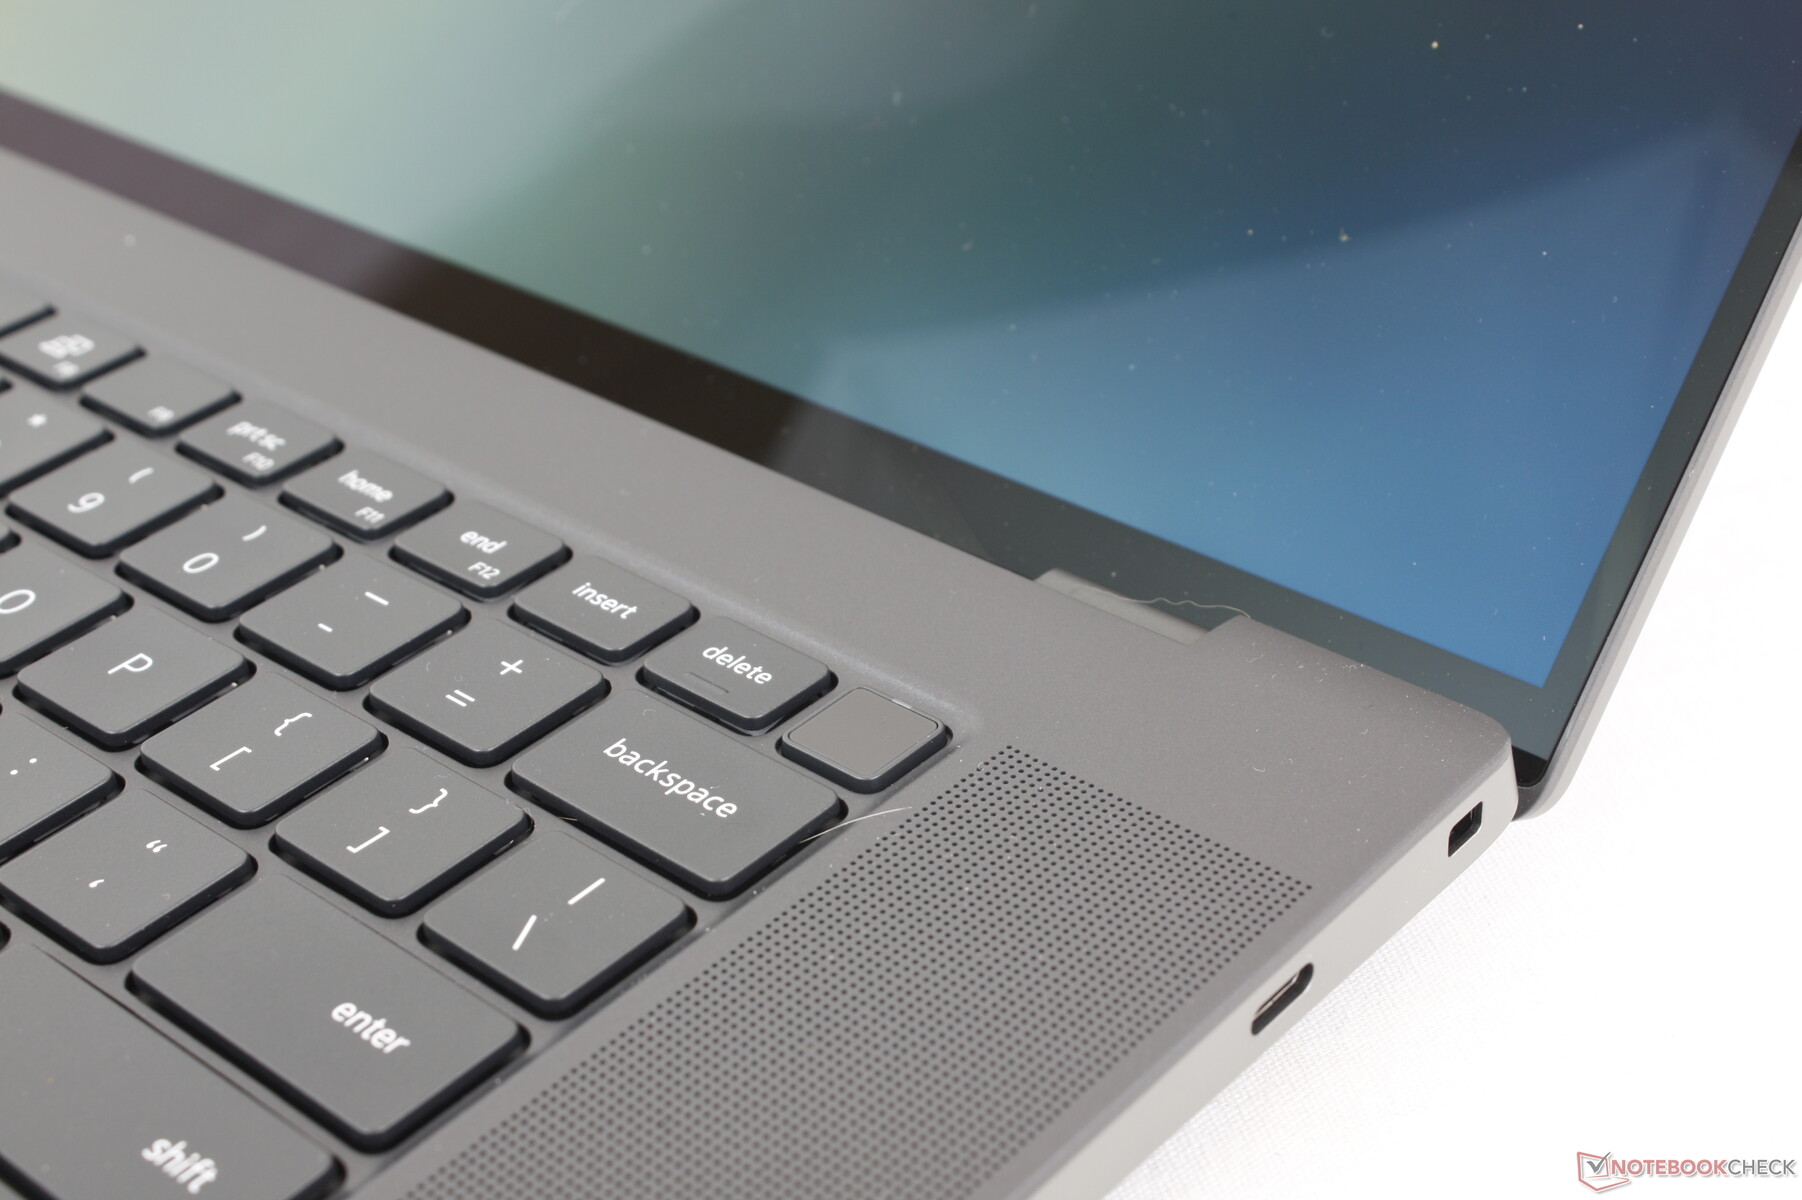
键盘
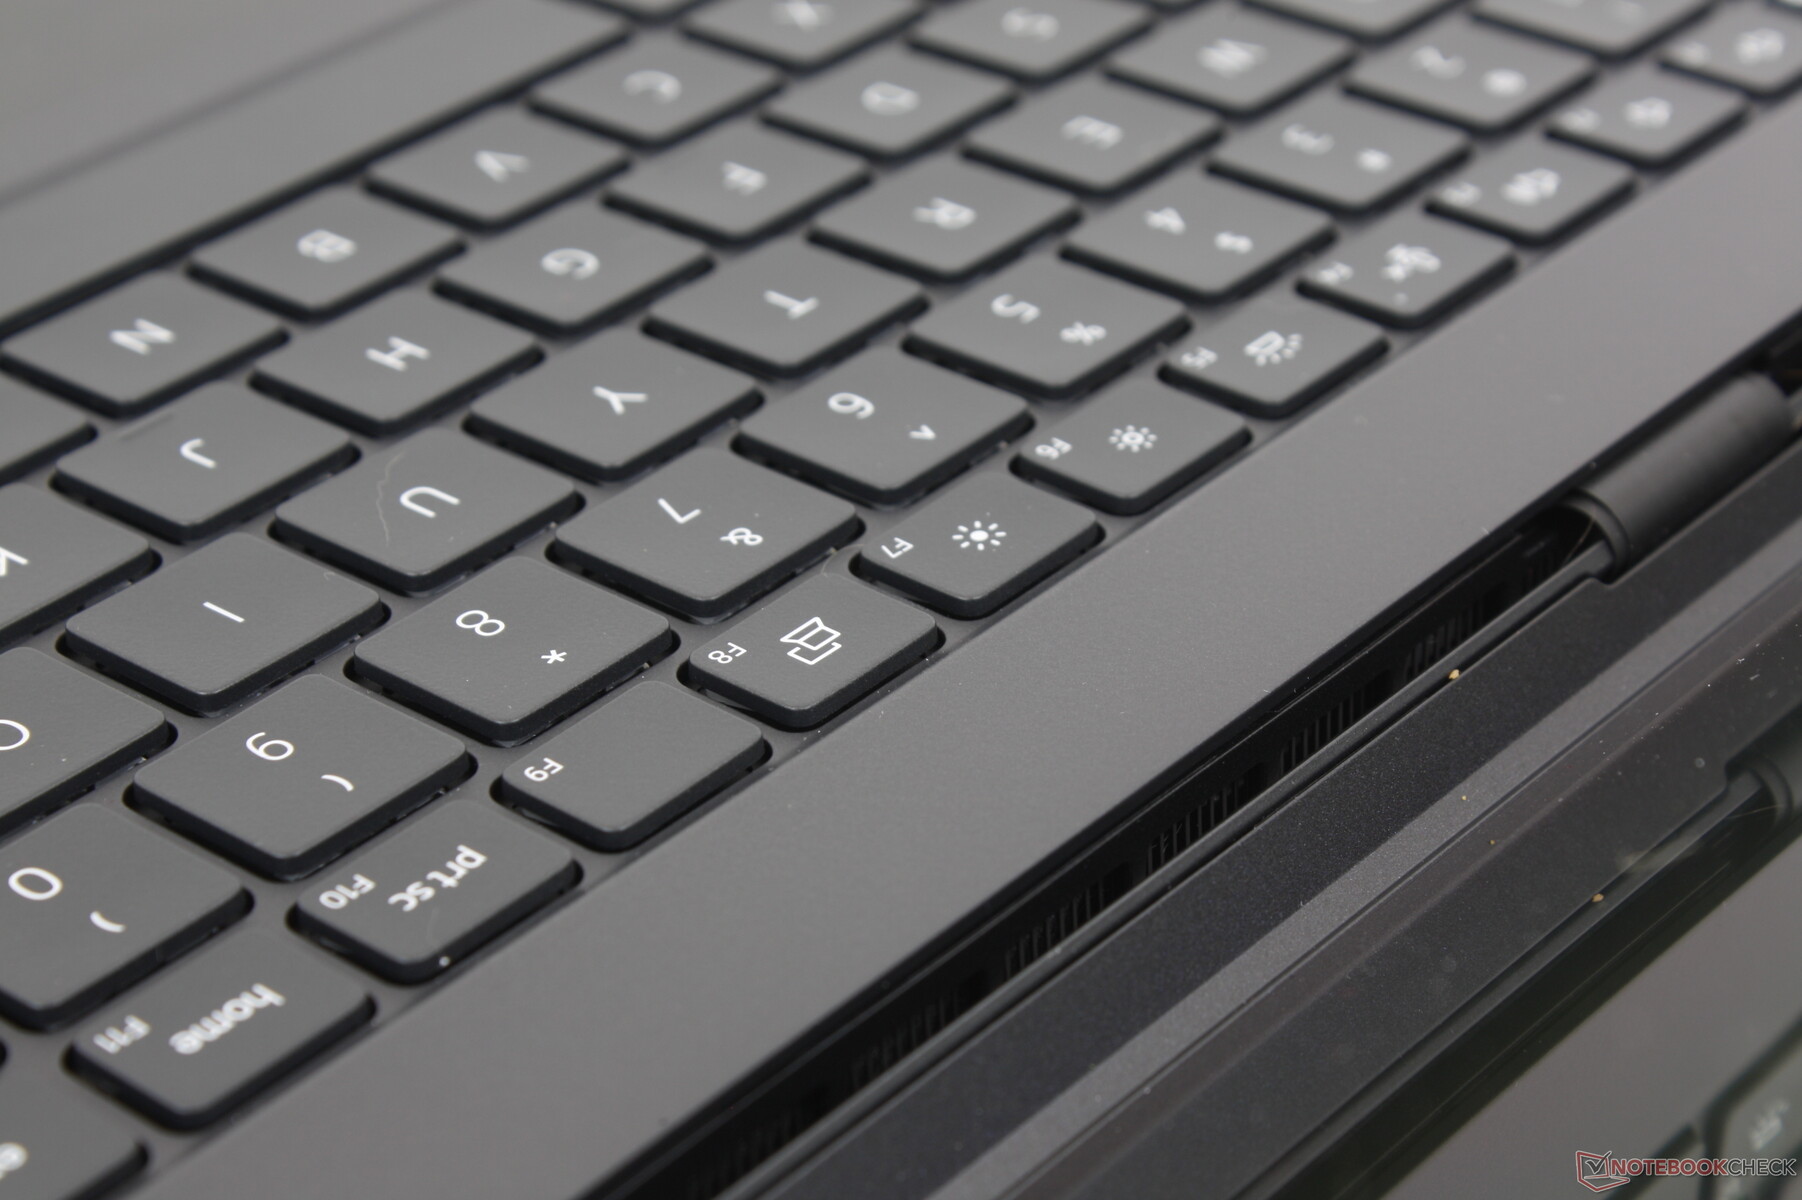
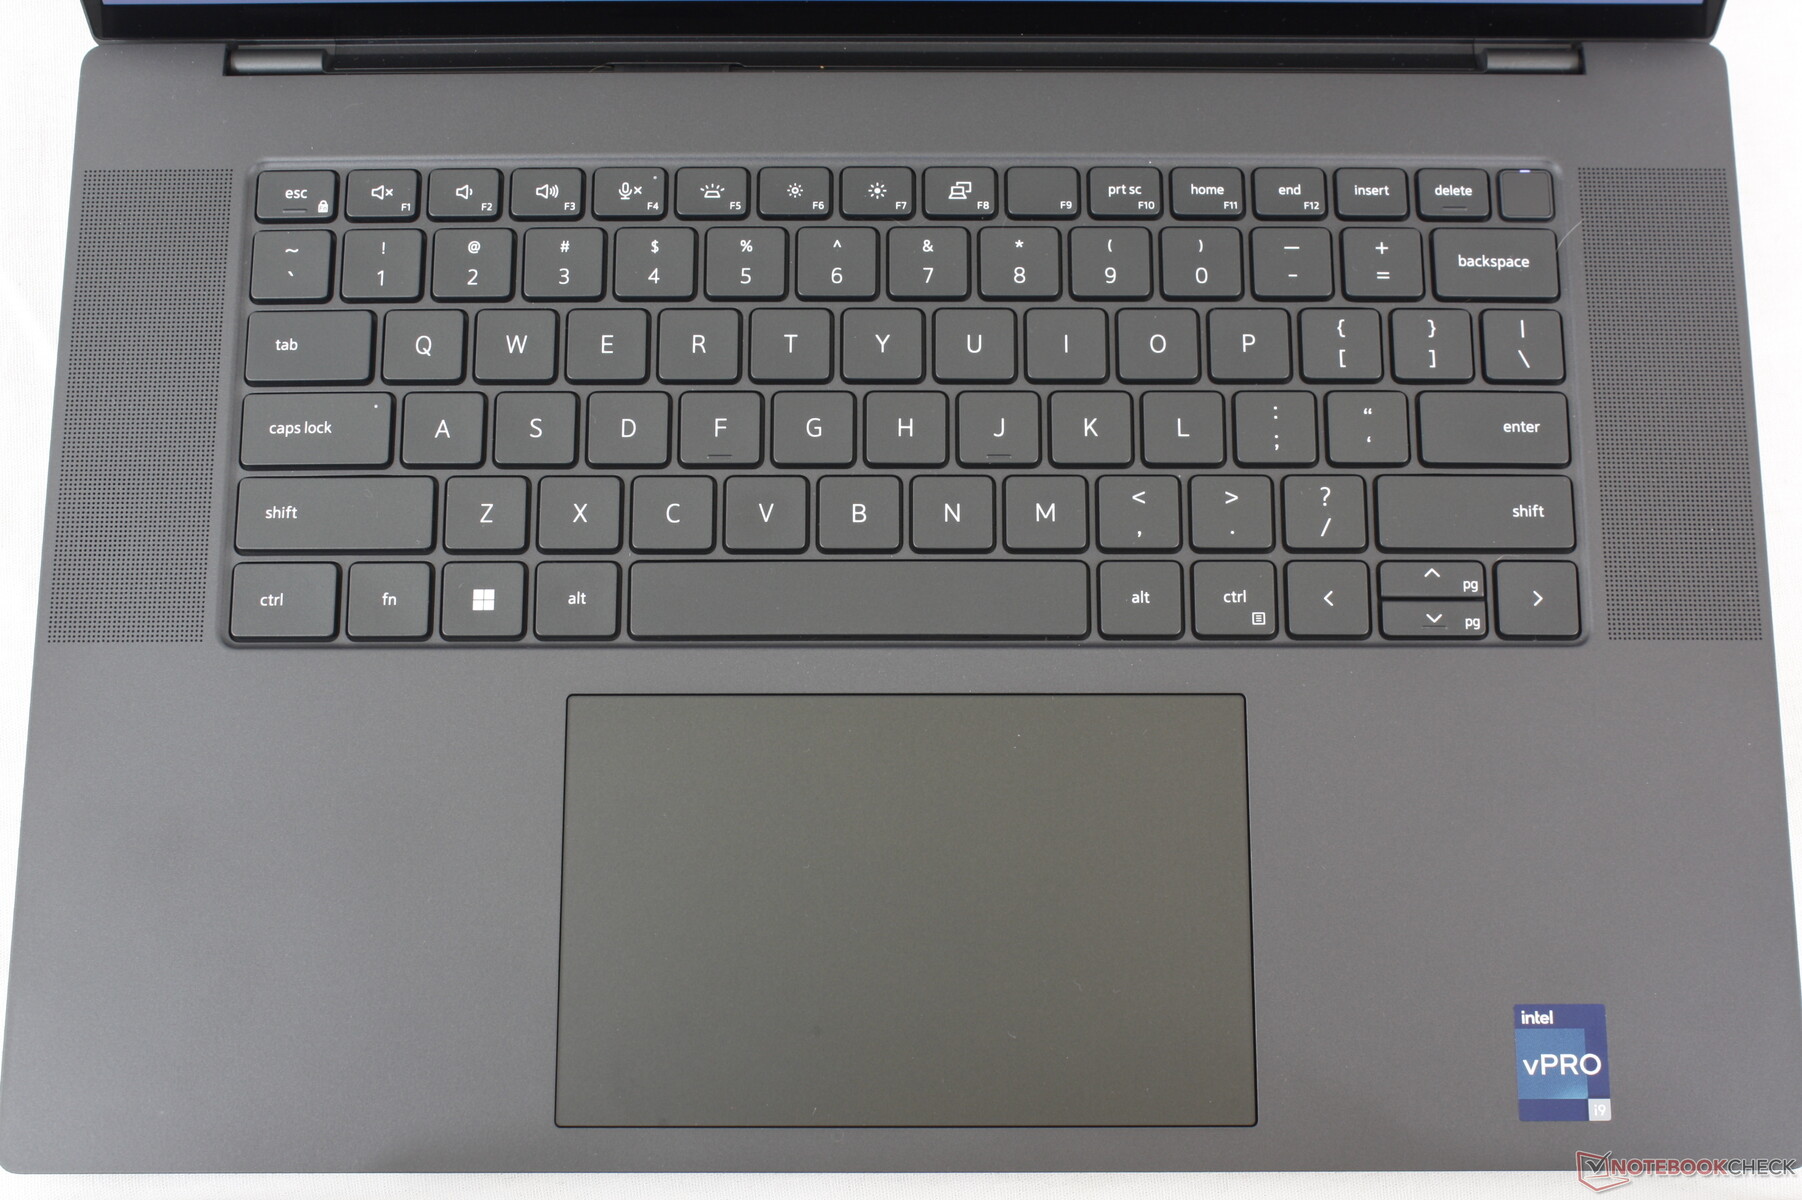
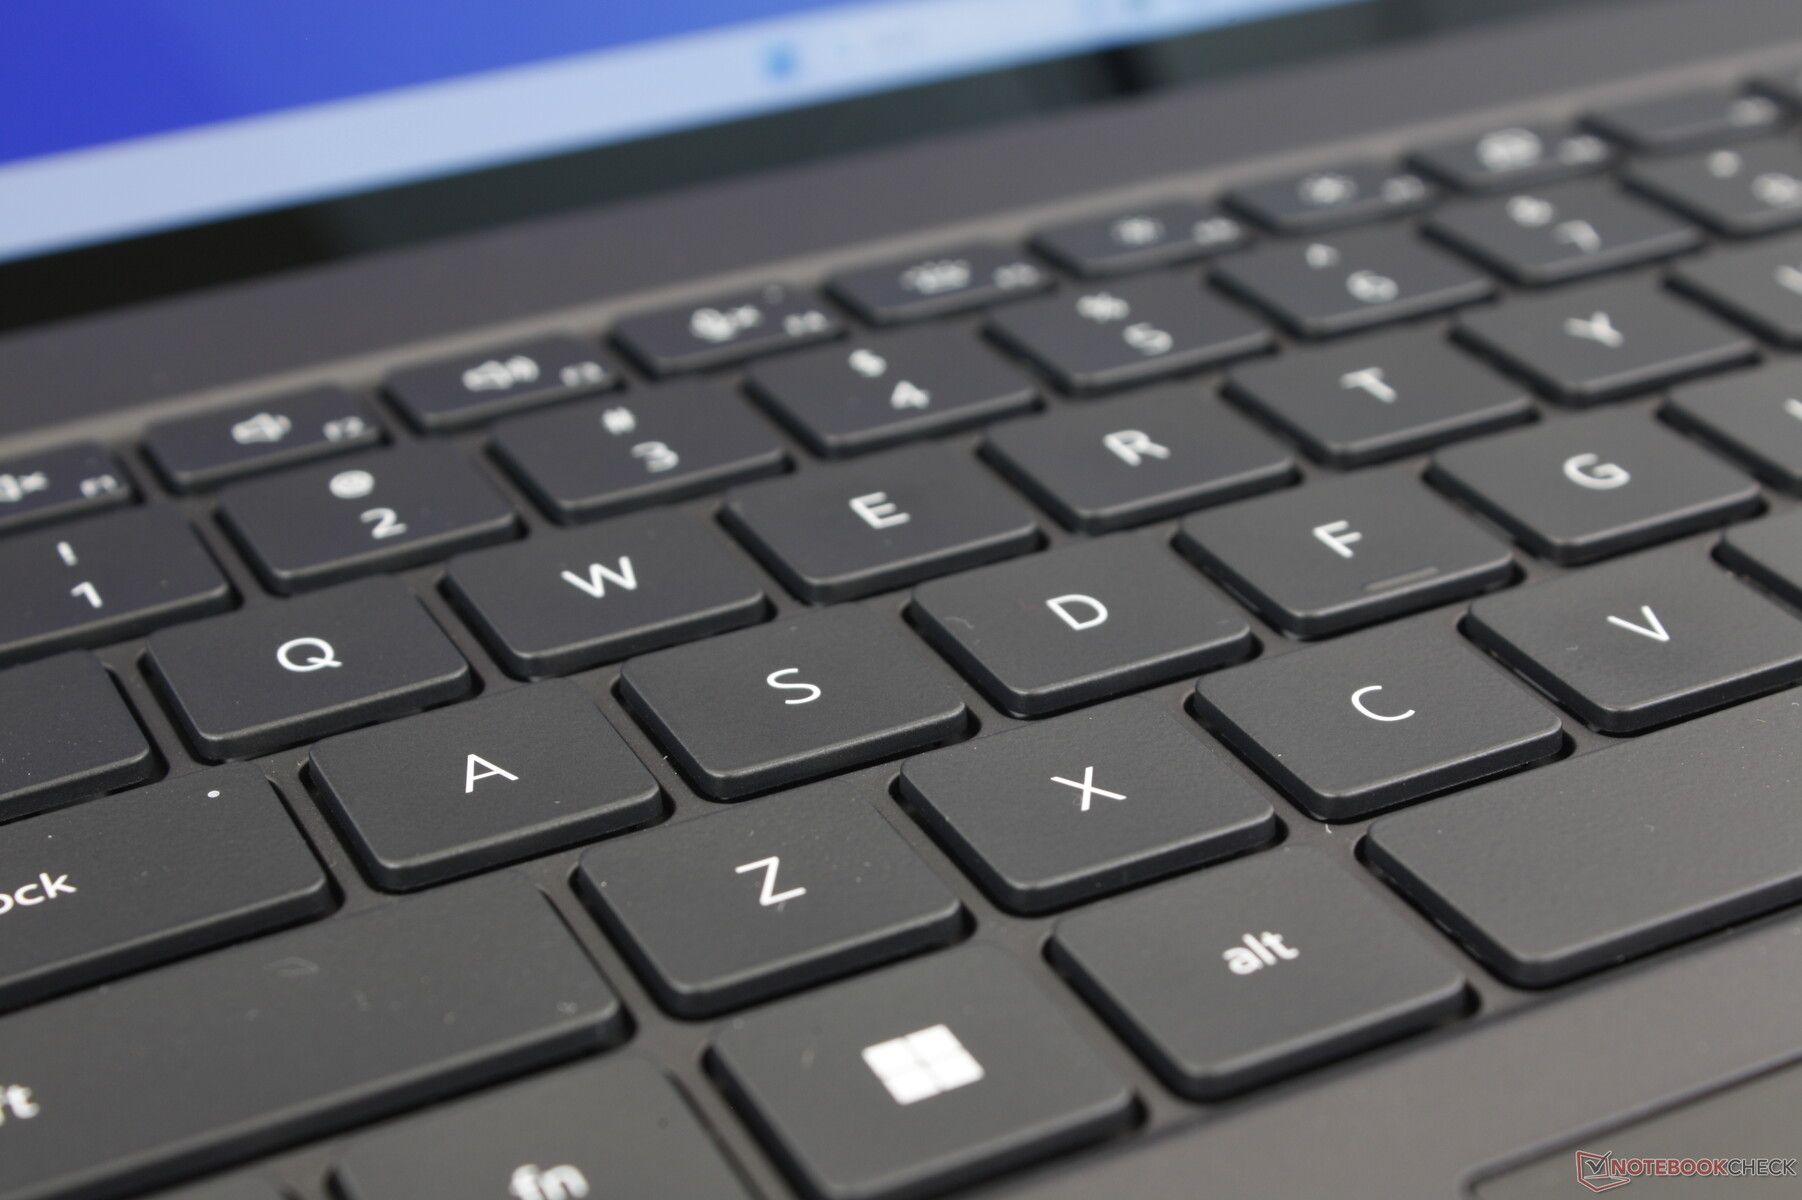
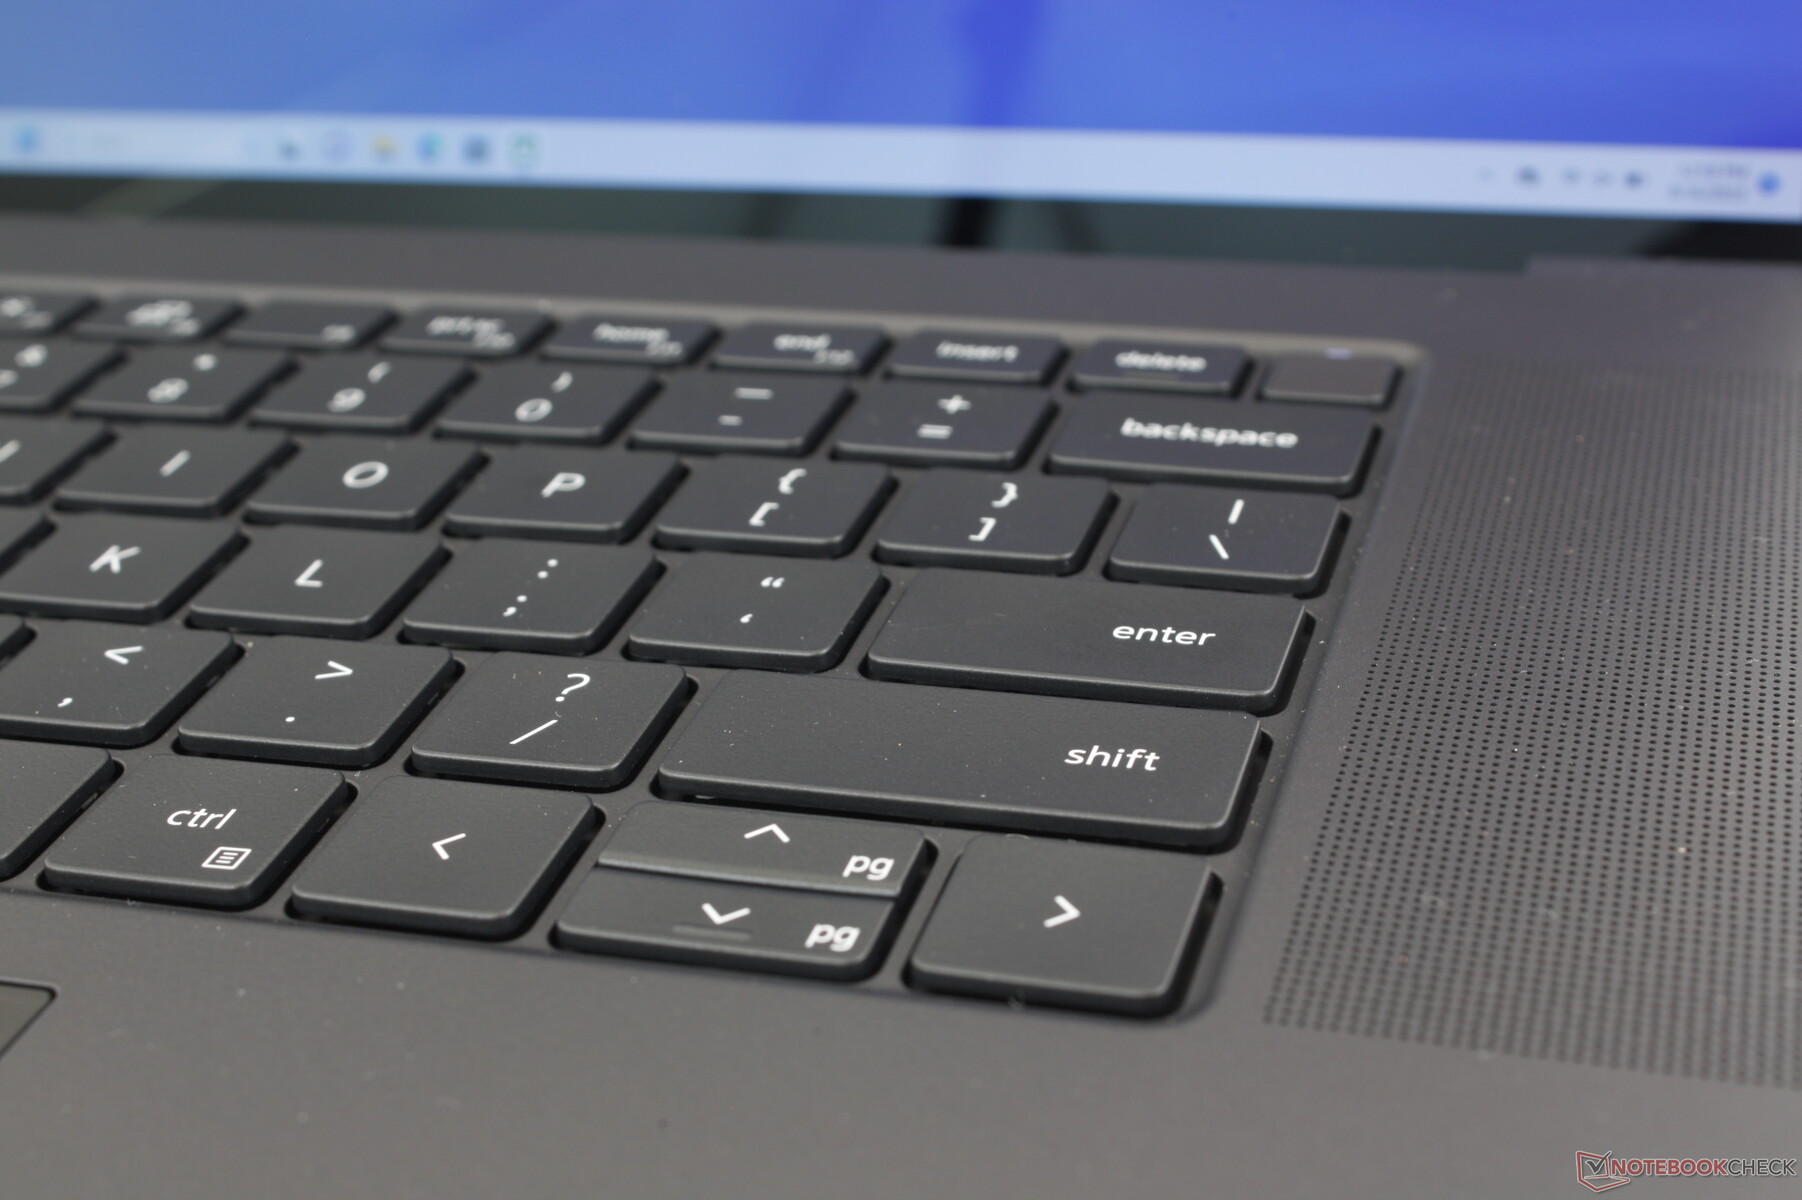
键盘乍一看可能与 XPS 15 或Precision 5550 上的键盘相同,但有几个重要的变化。首先,最上面一排的功能键现在变大了,因为一些 XPS 15 用户抱怨它们太窄了。其次,边缘的几个按键现在稍短了一些,包括退格键、回车键、Shift 键、Tab 键、Ctrl 键和 Shift 键。除此之外,输入体验保持不变,给人一种熟悉的 XPS 感觉。
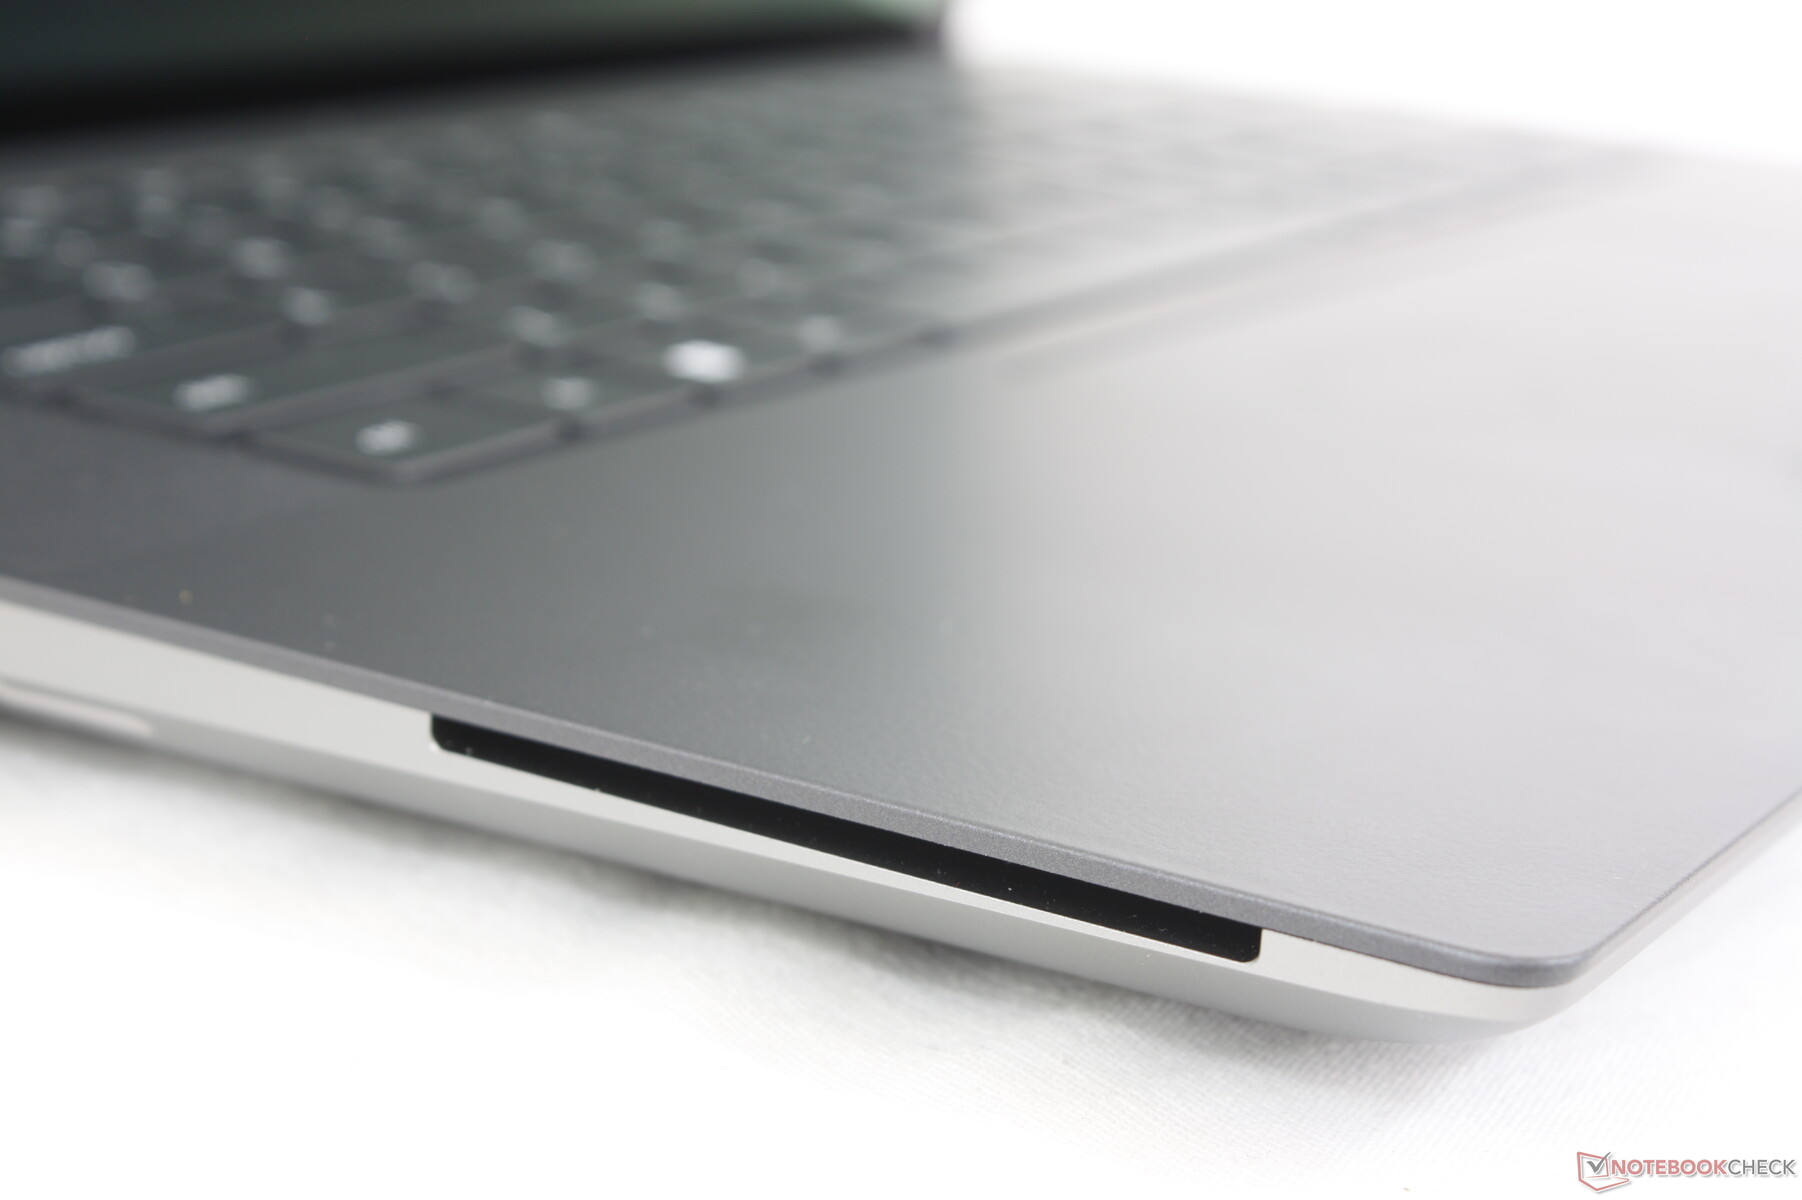
触摸板
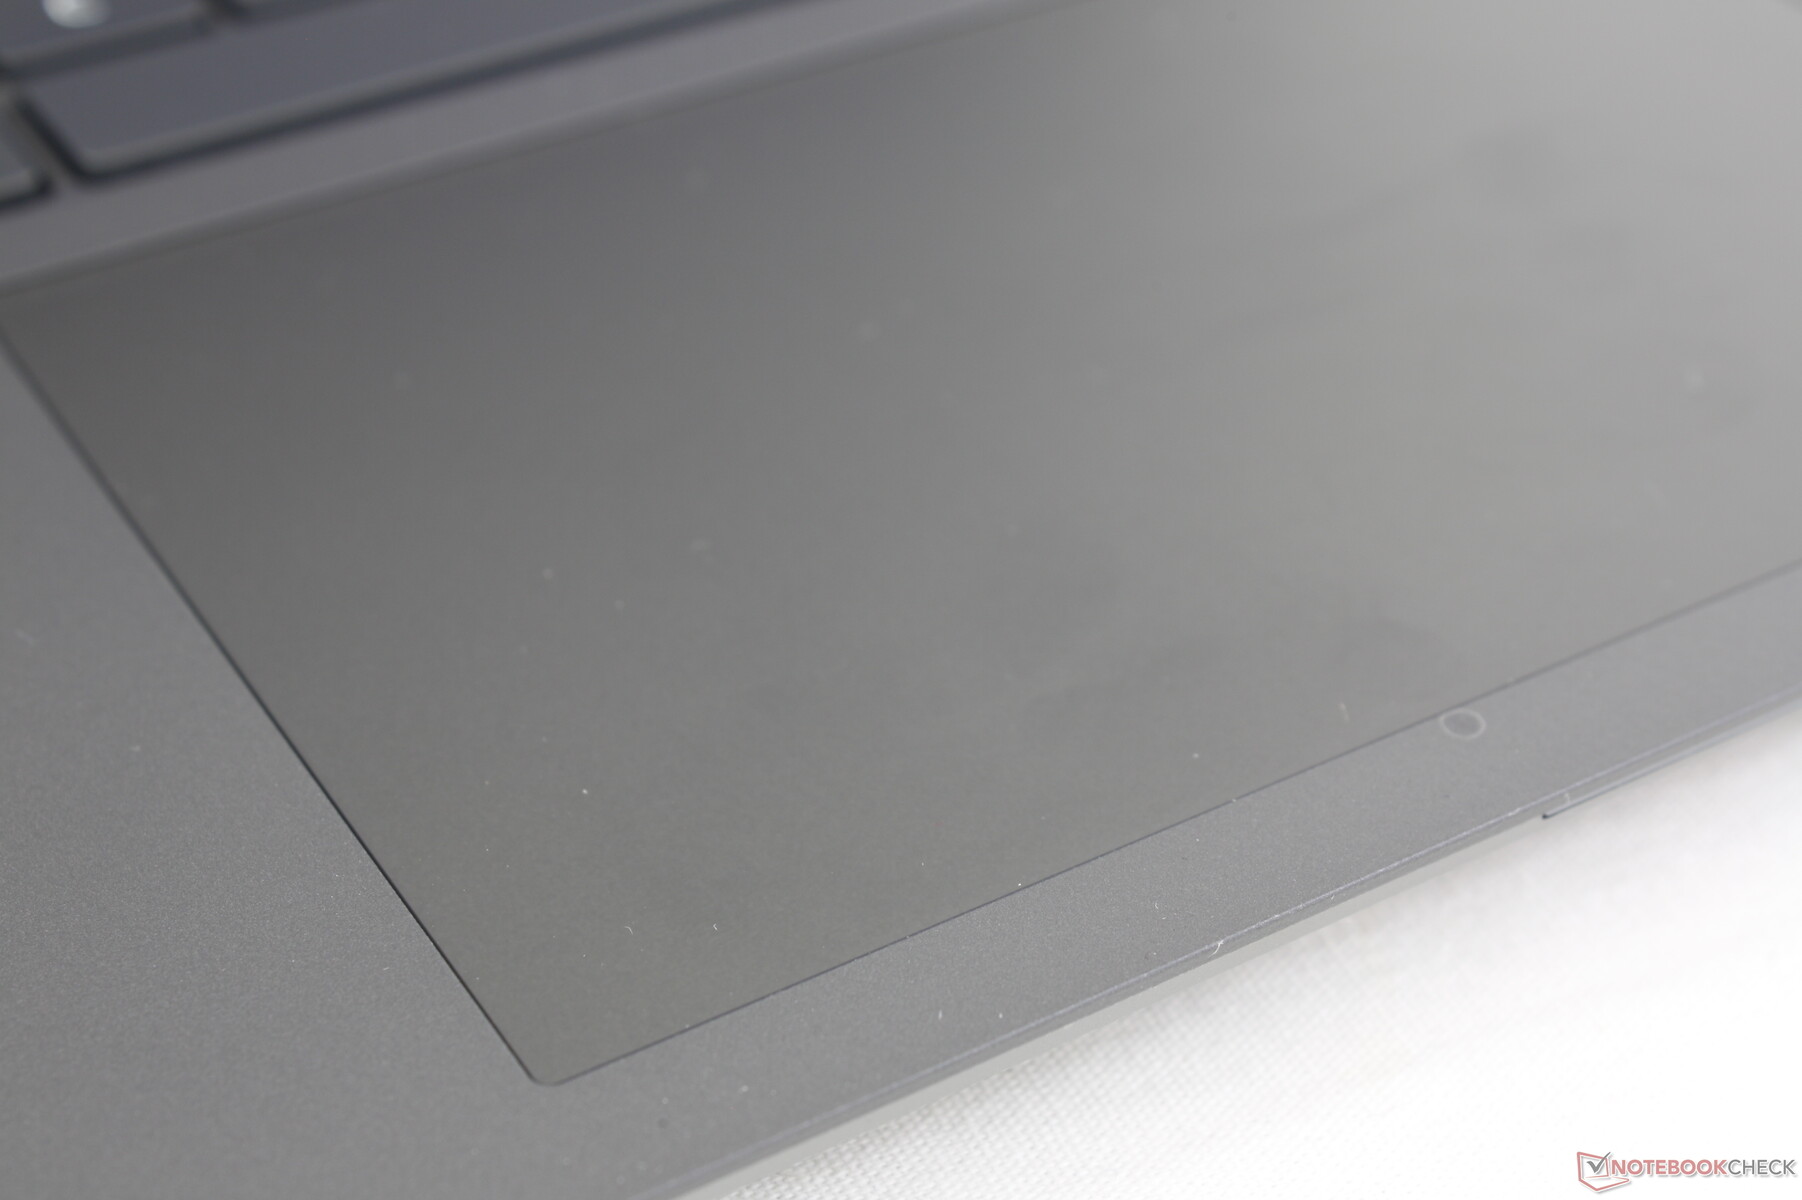
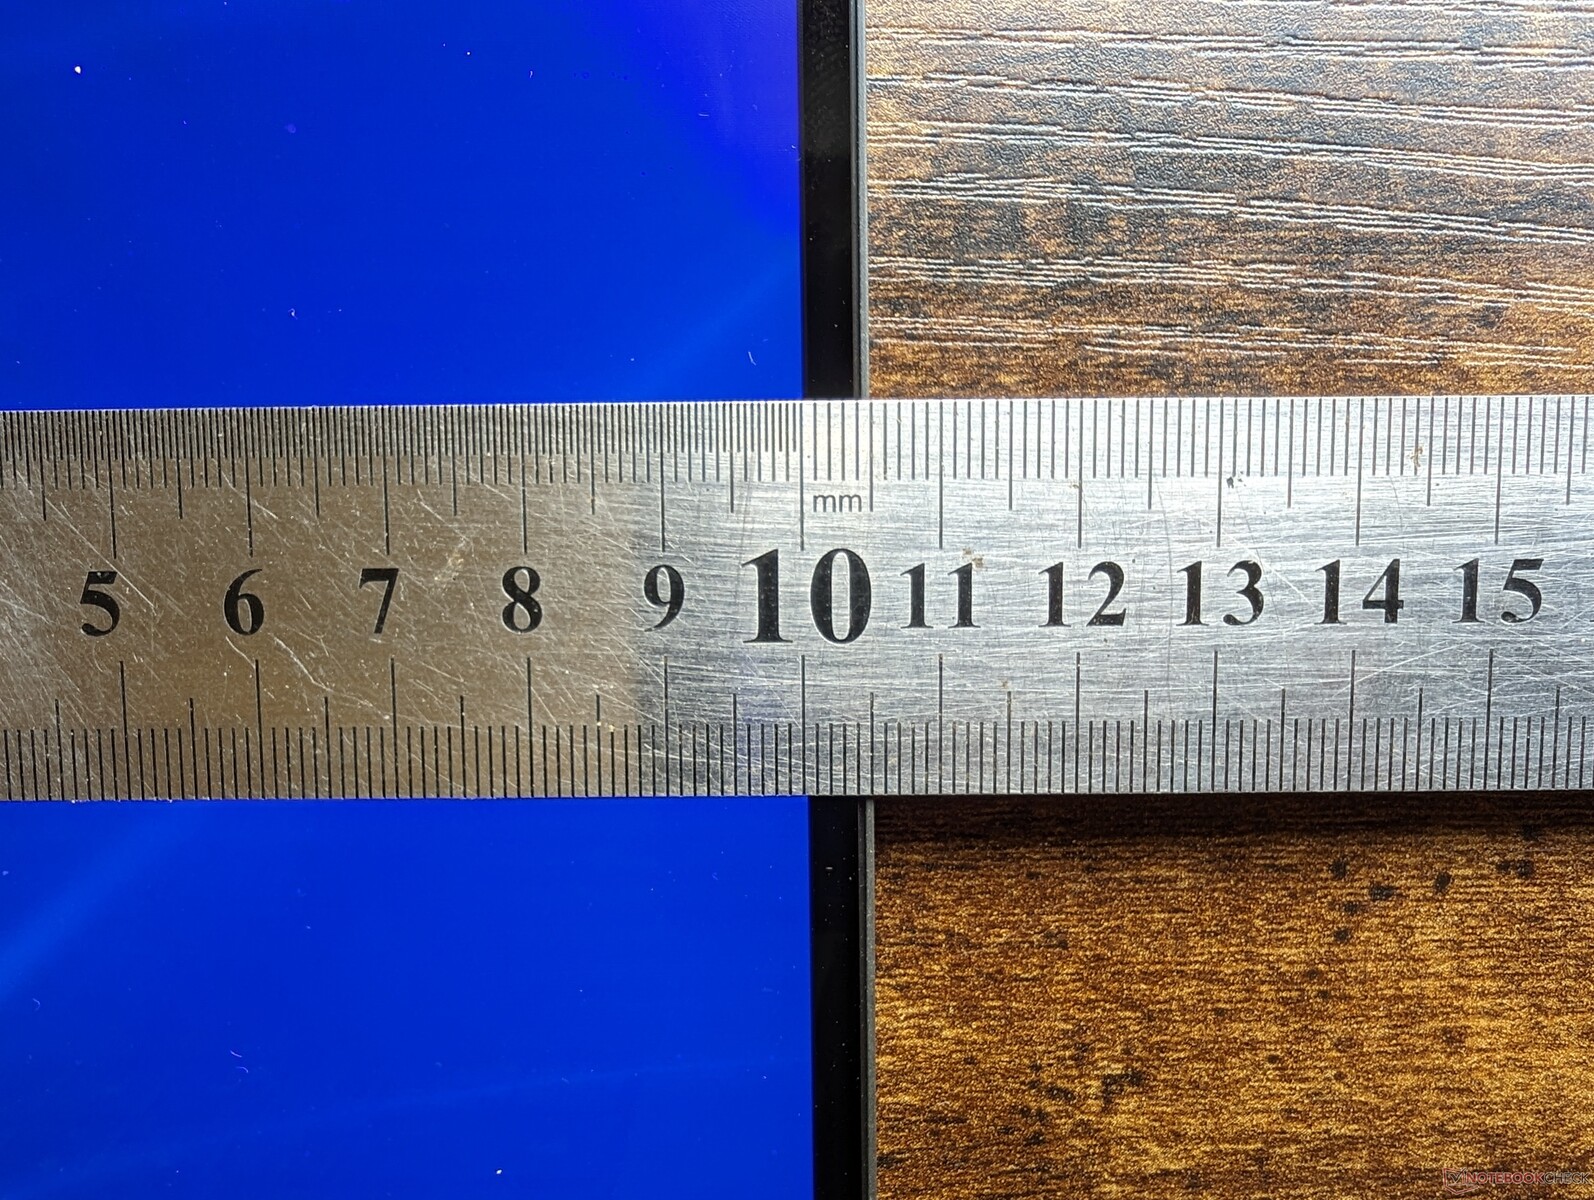
尽管我们的屏幕尺寸更大,但点击板实际上比 15 英寸Precision 5550 的点击板更小(13.7 x 8.5 厘米对 15.1 x 9 厘米)。即便如此,它仍然给人一种宽敞的感觉,滑动性能流畅可靠,与 XPS 15 上的感觉非常相似。
遗憾的是,点击触觉点击板时的反馈几乎不存在。事实上,几乎没有任何移动或声音反馈。强烈建议使用鼠标进行更精确的拖放操作。
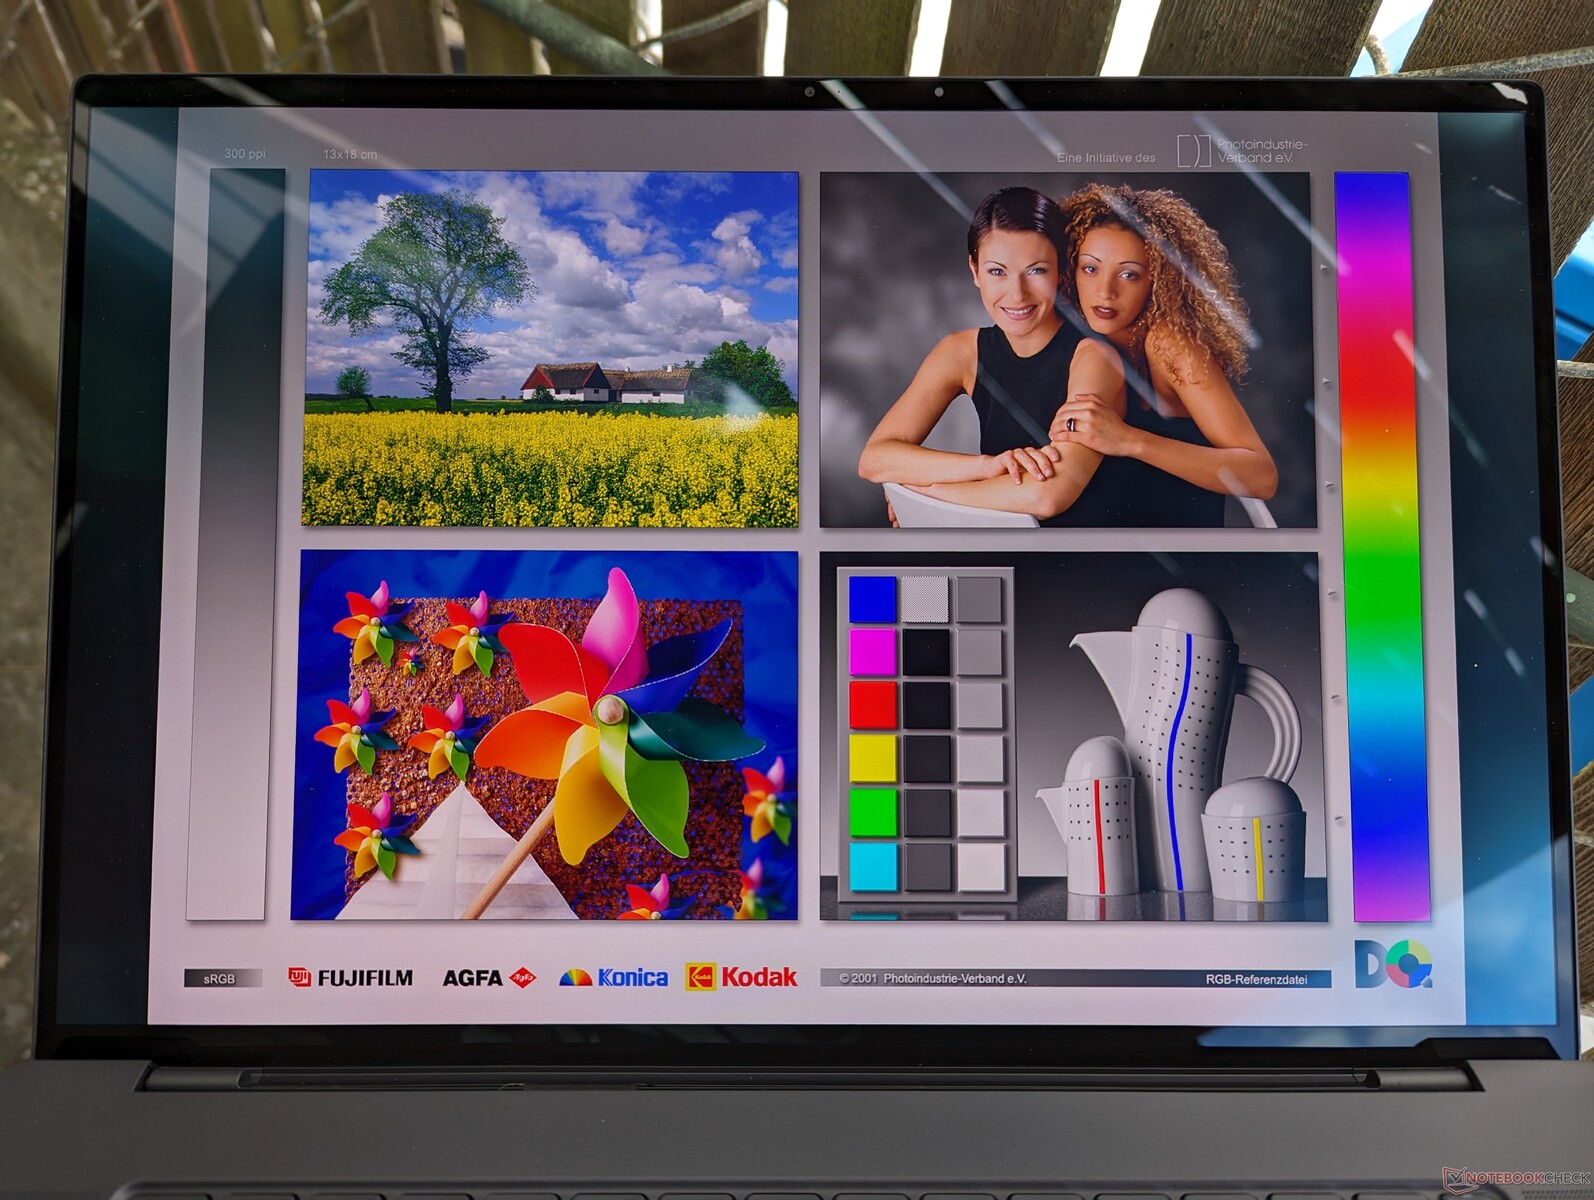
显示屏
戴尔的 16 英寸Precision 5680 和 16 英寸 7670 均采用了相同的三星 160YV03 OLED 面板。 Precision 7670.因此,正如下面的对比表所示,这两款产品在响应时间、全 DCI-P3 色彩和亮度水平方面都具有相同的视觉体验。希望在不久的将来,我们能看到一些刷新率更高的产品。
| |||||||||||||||||||||||||
Brightness Distribution: 98 %
Center on Battery: 345.7 cd/m²
Contrast: ∞:1 (Black: 0 cd/m²)
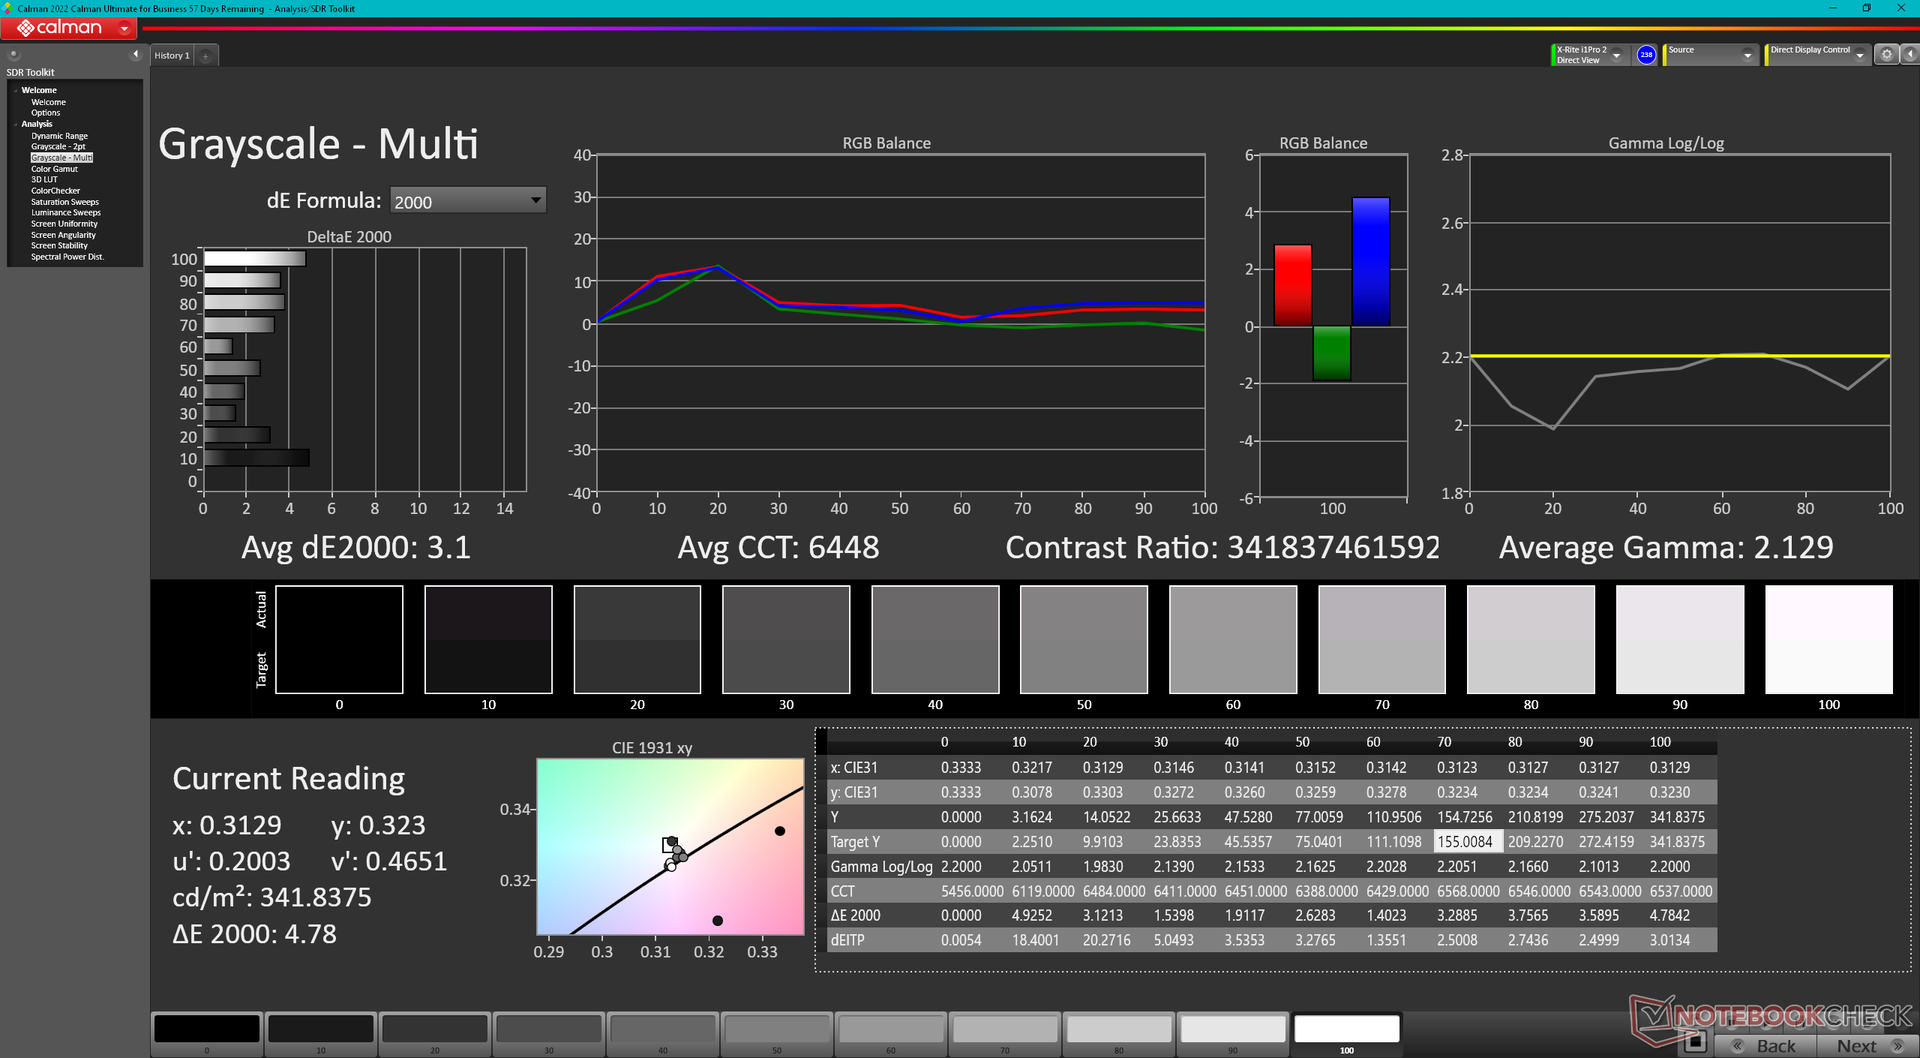
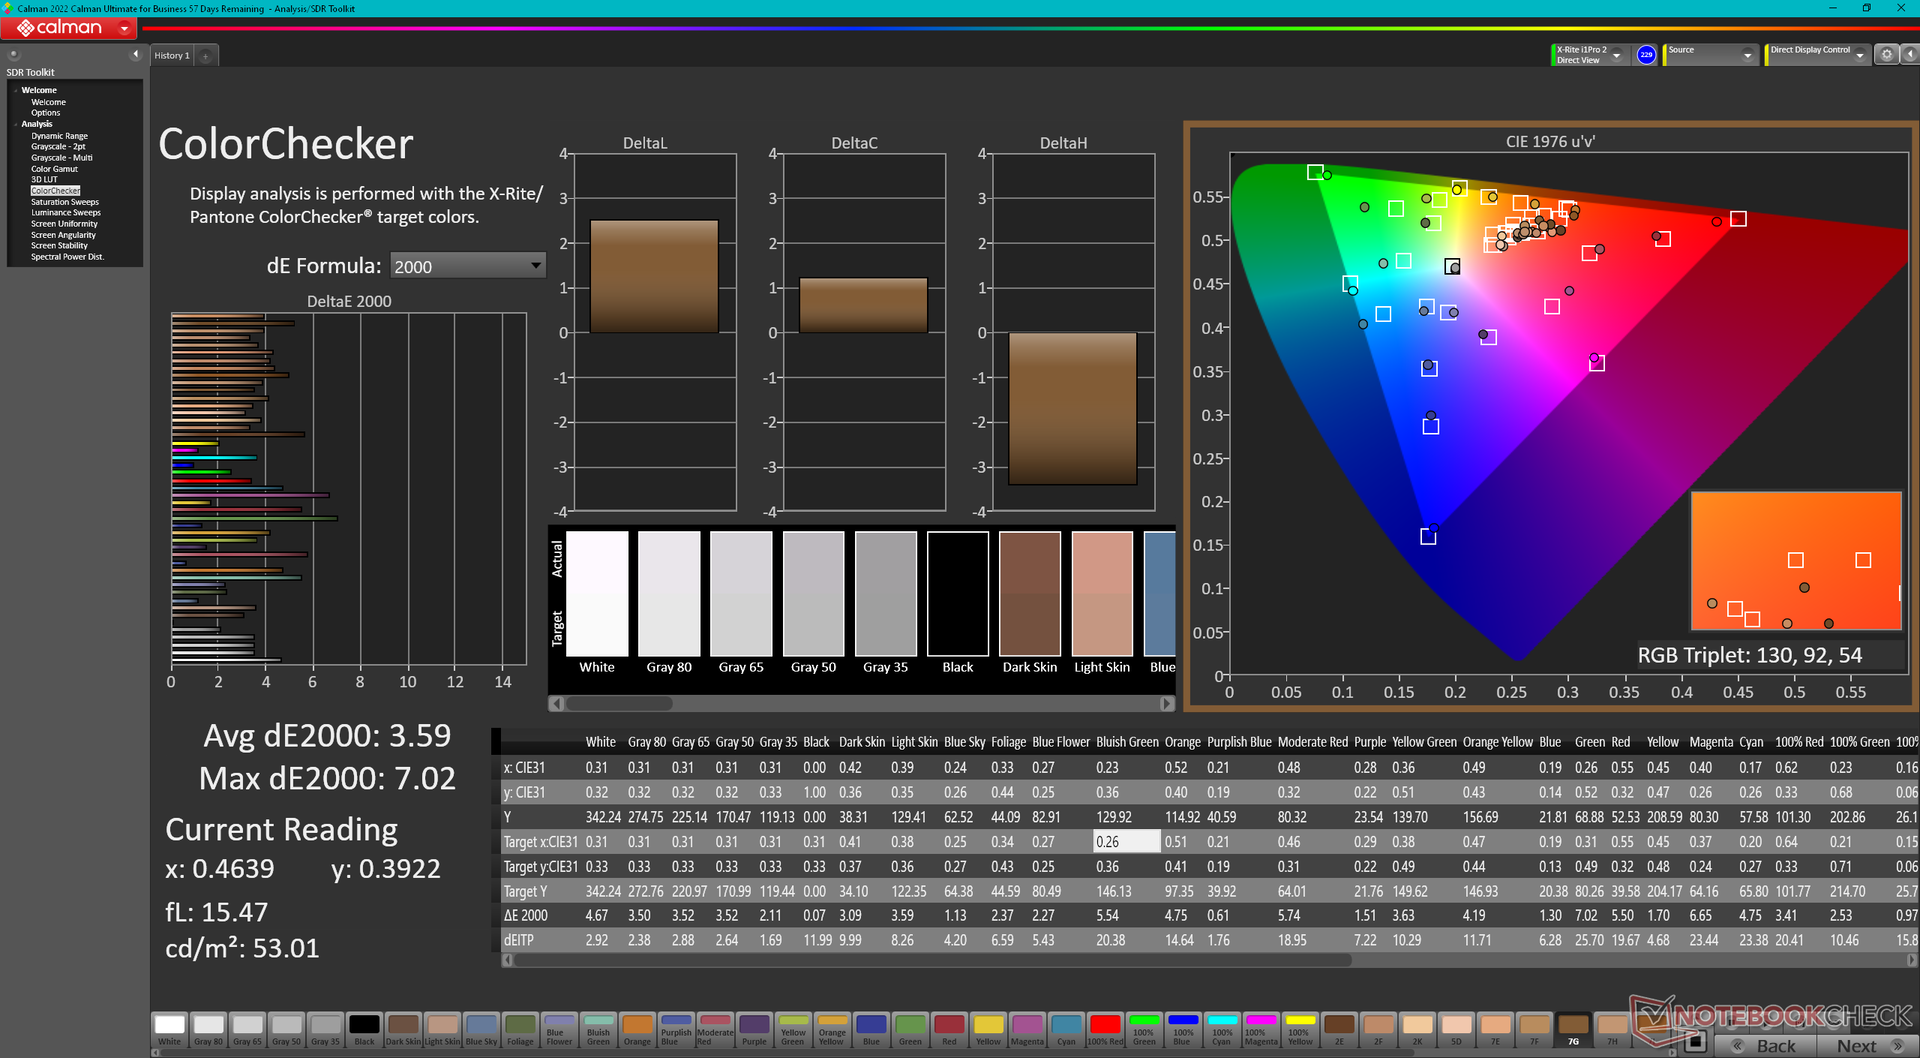
ΔE ColorChecker Calman: 3.59 | ∀{0.5-29.43 Ø4.71}
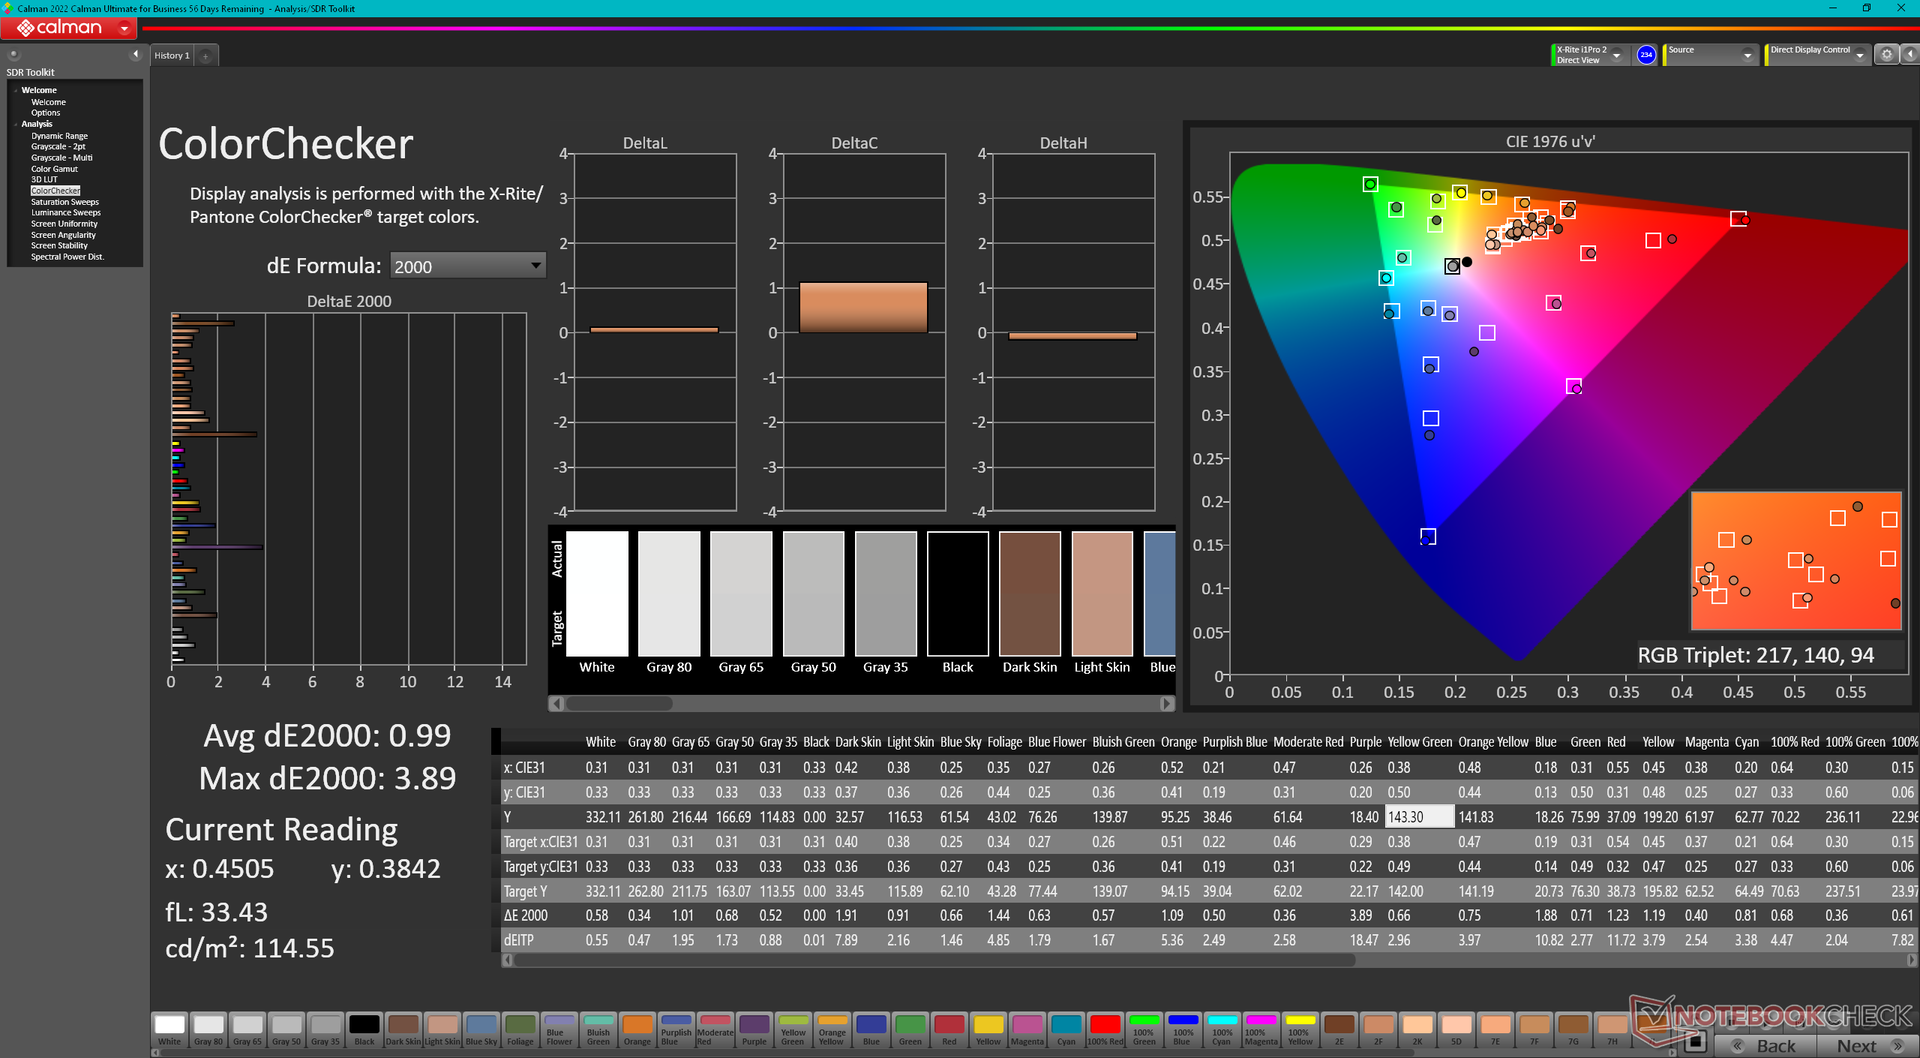
calibrated: 0.99
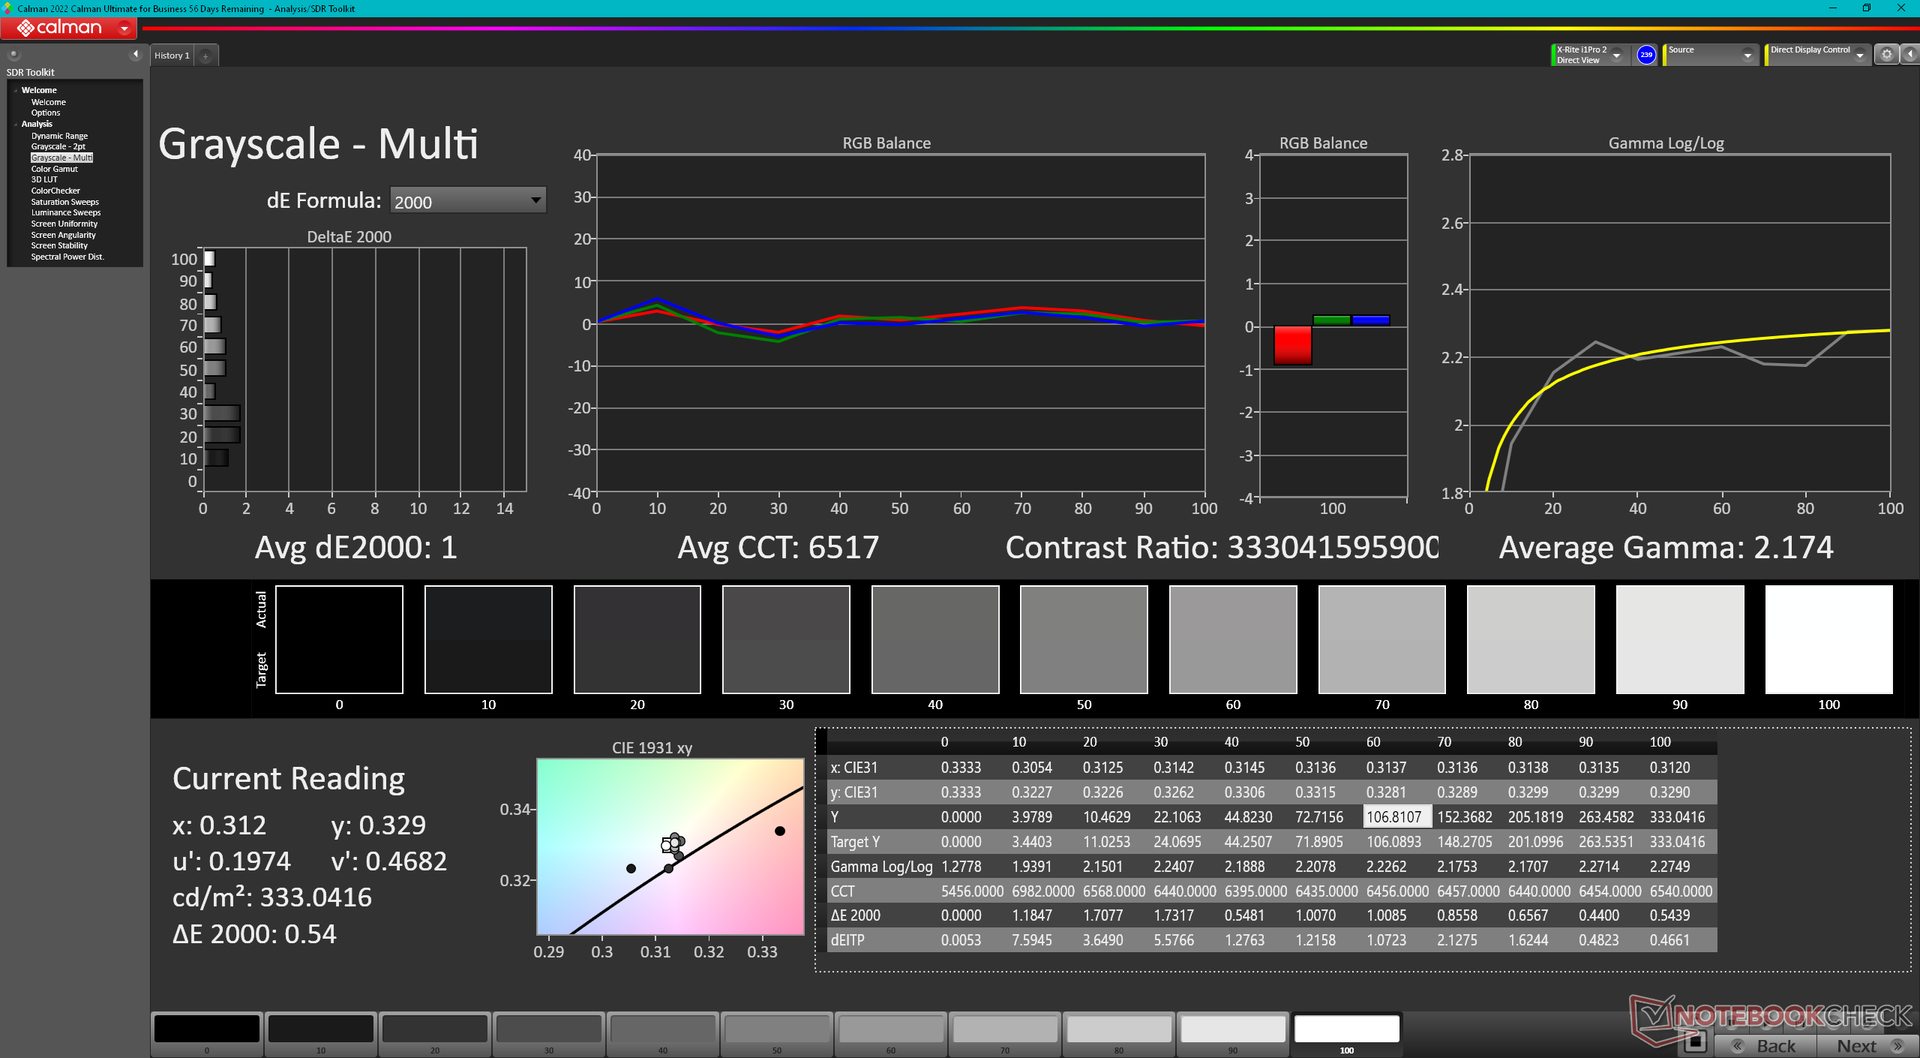
ΔE Greyscale Calman: 3.1 | ∀{0.09-98 Ø4.96}
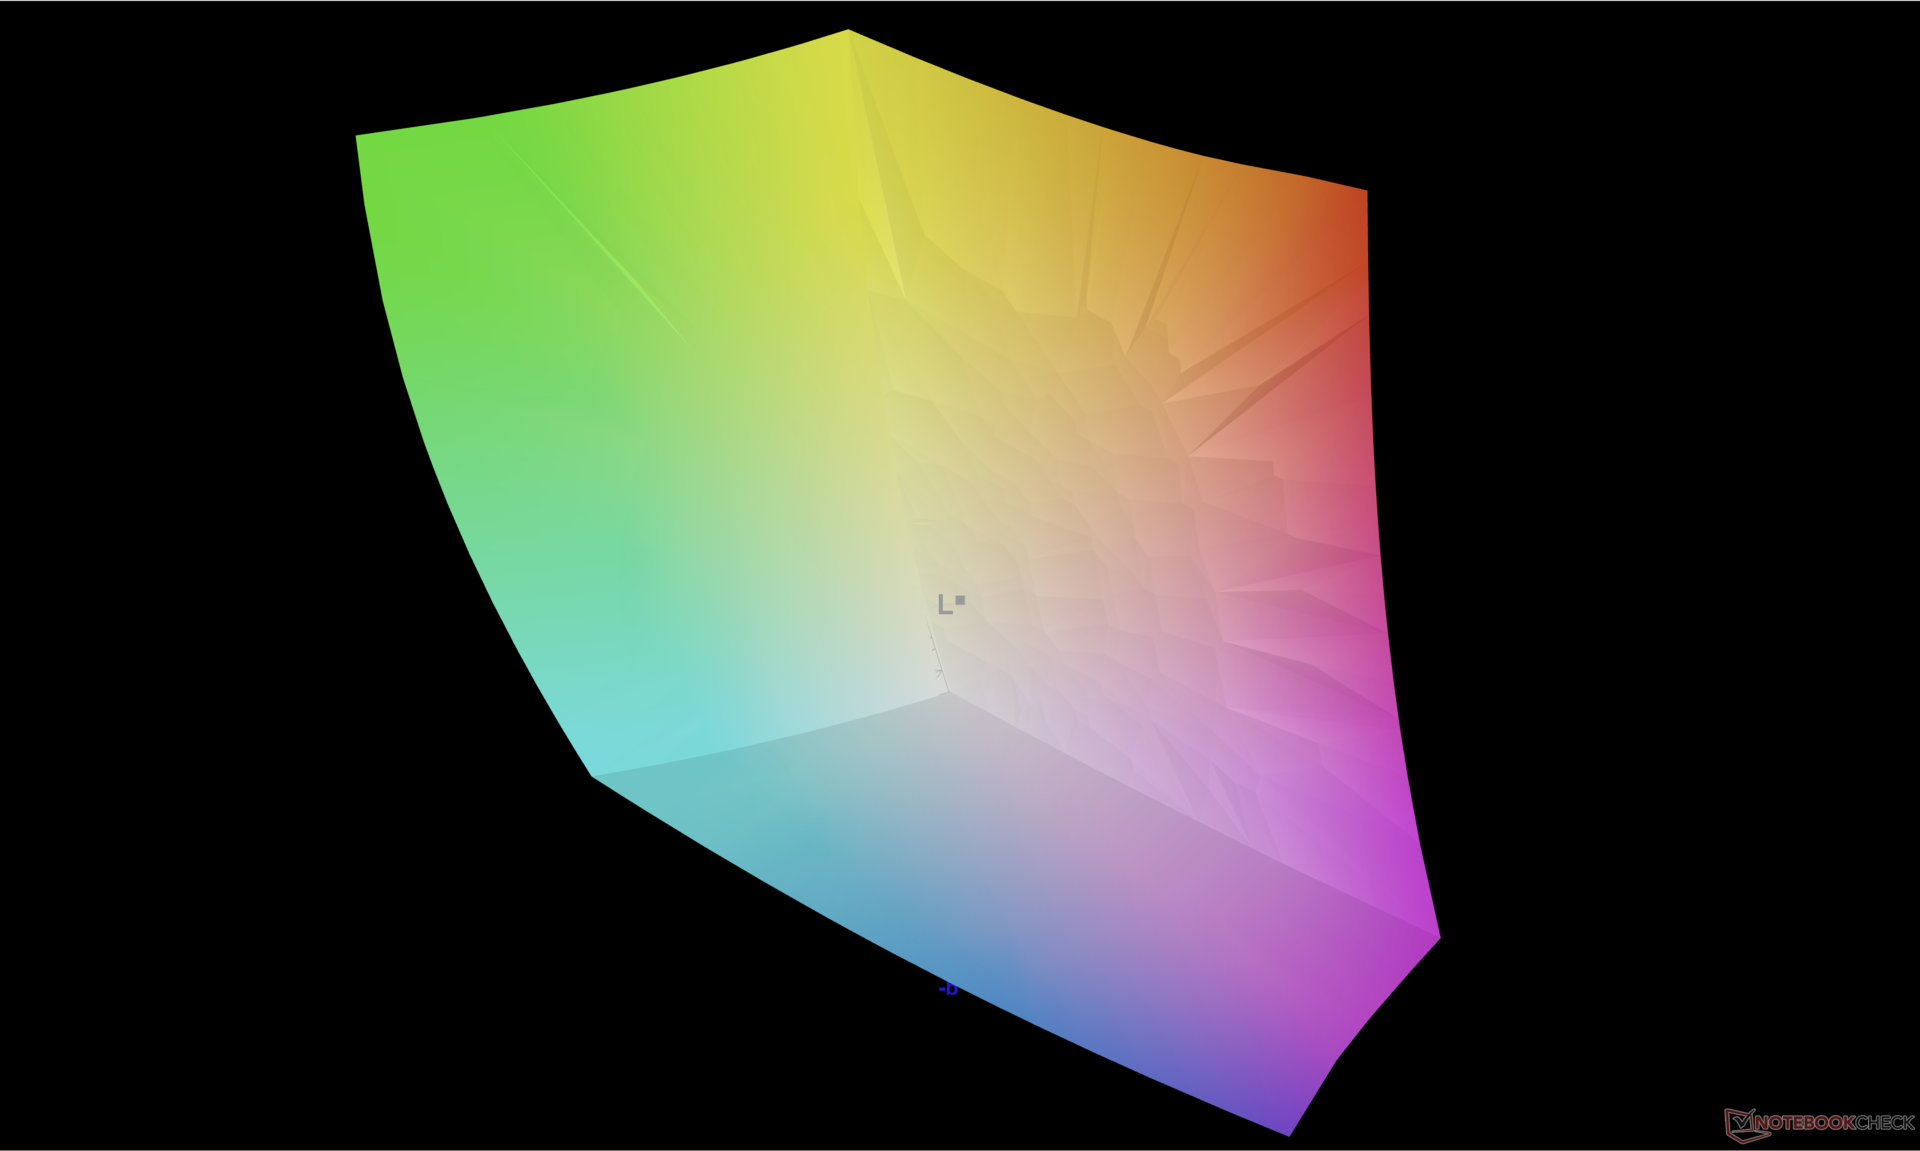
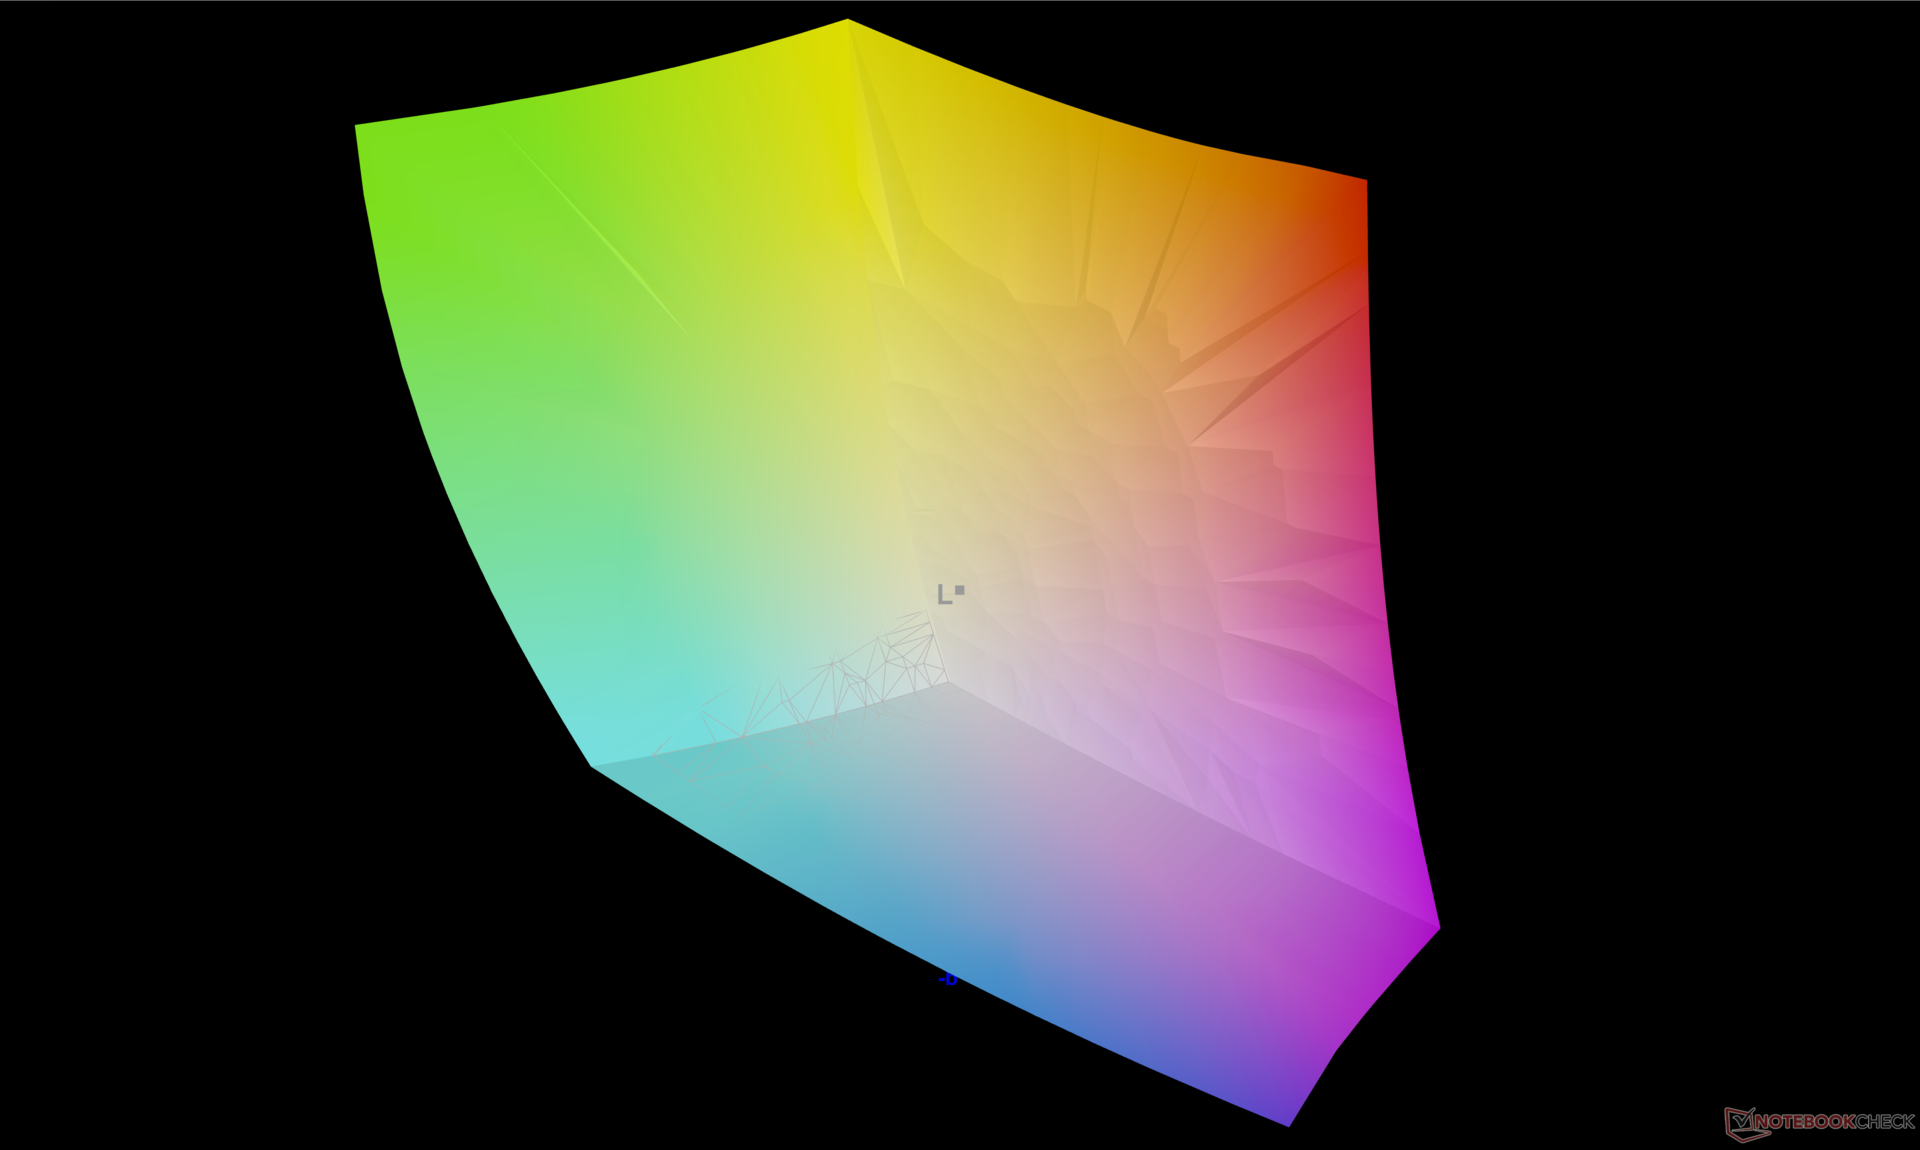
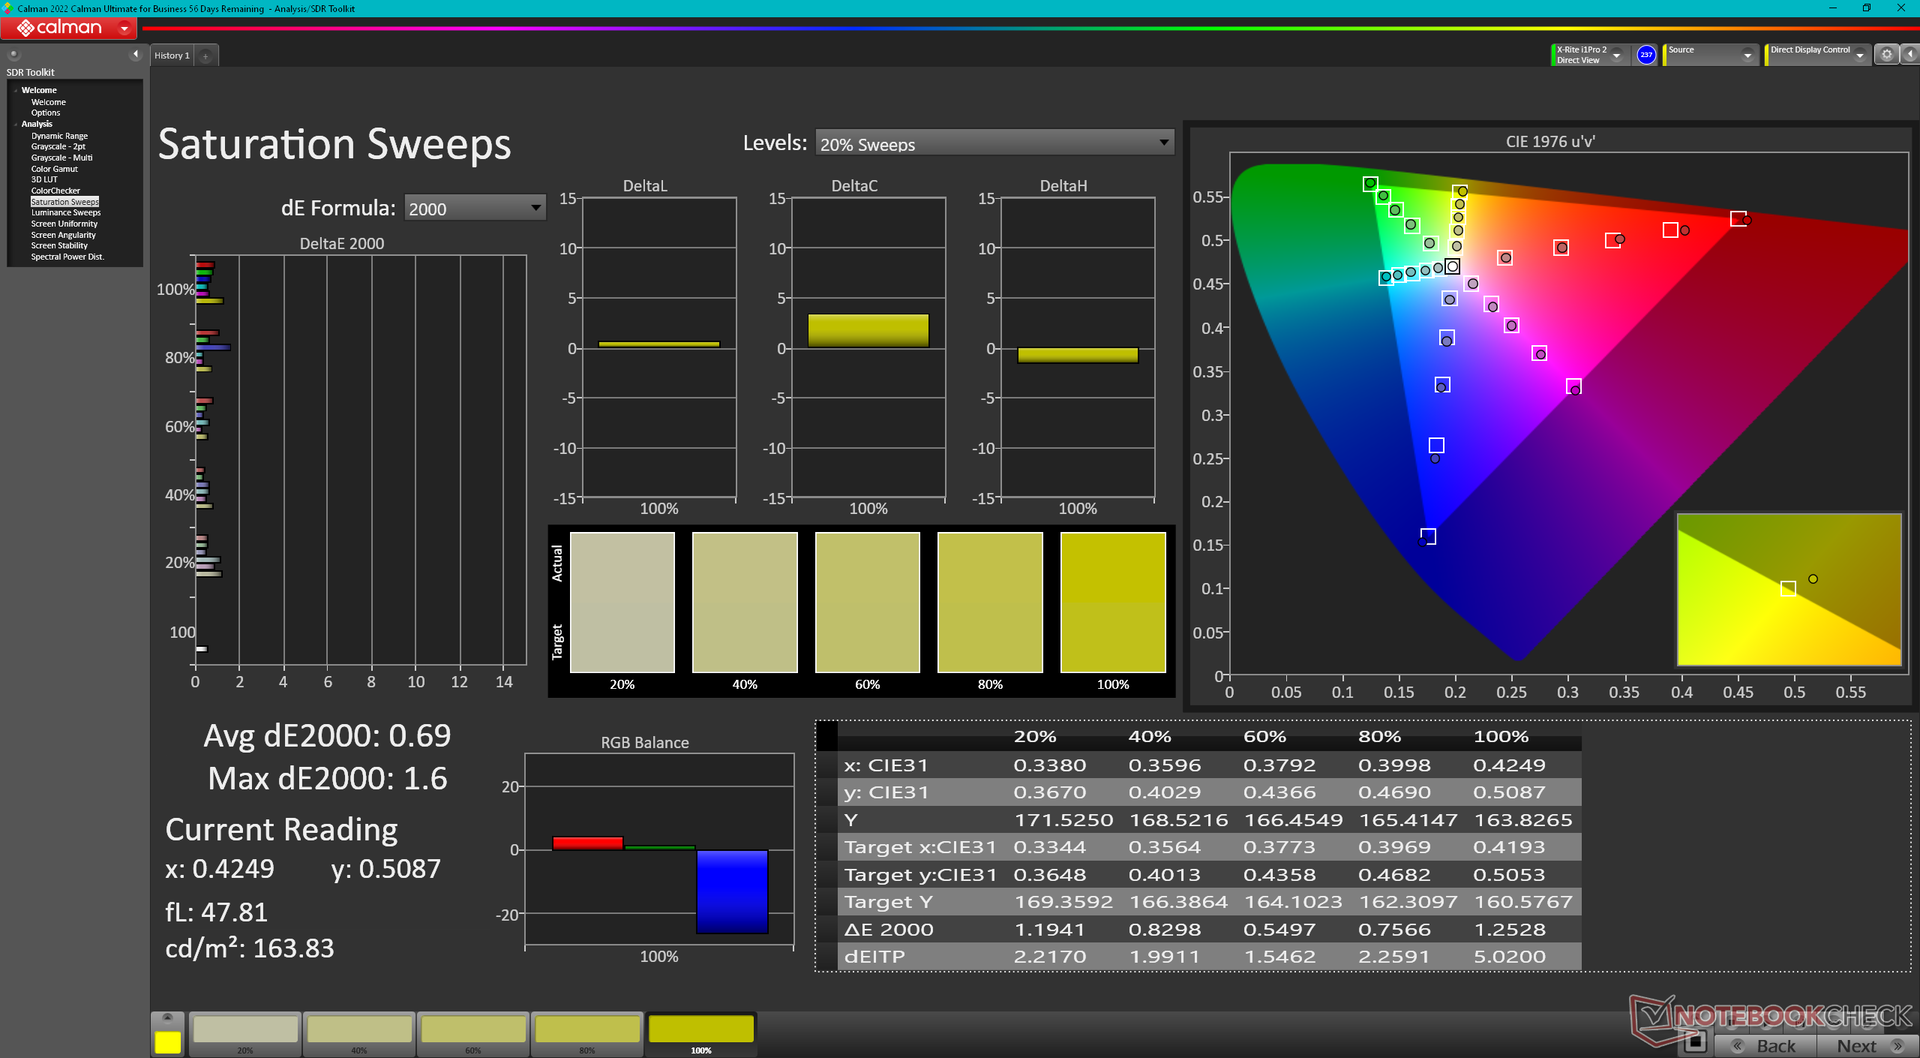
97.5% AdobeRGB 1998 (Argyll 3D)
100% sRGB (Argyll 3D)
99.9% Display P3 (Argyll 3D)
Gamma: 2.13
CCT: 6448 K
| Dell Precision 5000 5680 Samsung 160YV03, OLED, 3840x2400, 16" | Dell Precision 7000 7670 Performance Samsung 160YV03, OLED, 3840x2400, 16" | HP ZBook Fury 16 G9 BOE0A52, IPS, 3840x2400, 16" | Lenovo ThinkPad P16 G1 RTX A5500 LP160UQ1-SPB1, IPS, 3840x2400, 16" | MSI CreatorPro Z16P B12UKST B160QAN02.N, IPS, 2560x1600, 16" | Asus ExpertBook B6 Flip B6602FC2 AU Optronics Model: AUOE495, IPS, 2560x1600, 16" | |
|---|---|---|---|---|---|---|
| Display | 0% | -5% | -7% | -4% | -5% | |
| Display P3 Coverage (%) | 99.9 | 99.9 0% | 97.4 -3% | 82.9 -17% | 97.6 -2% | 97.9 -2% |
| sRGB Coverage (%) | 100 | 100 0% | 99.9 0% | 98.9 -1% | 99.9 0% | 99.89 0% |
| AdobeRGB 1998 Coverage (%) | 97.5 | 98.1 1% | 86.3 -11% | 95.9 -2% | 87.4 -10% | 85.52 -12% |
| Response Times | -9% | -551% | -2297% | -490% | -1452% | |
| Response Time Grey 50% / Grey 80% * (ms) | 1.68 ? | 1.84 ? -10% | 13.7 ? -715% | 45.6 ? -2614% | 12.8 ? -662% | 36 ? -2043% |
| Response Time Black / White * (ms) | 1.77 ? | 1.92 ? -8% | 8.6 ? -386% | 36.8 ? -1979% | 7.4 ? -318% | 17 ? -860% |
| PWM Frequency (Hz) | 60 ? | 59.52 ? | ||||
| Screen | -5% | -33% | 33% | 30% | -6% | |
| Brightness middle (cd/m²) | 345.7 | 325.2 -6% | 530.5 53% | 601.9 74% | 407 18% | 440 27% |
| Brightness (cd/m²) | 349 | 328 -6% | 476 36% | 569 63% | 388 11% | 418 20% |
| Brightness Distribution (%) | 98 | 97 -1% | 83 -15% | 77 -21% | 88 -10% | 82 -16% |
| Black Level * (cd/m²) | 0.57 | 0.47 | 0.36 | 0.3 | ||
| Colorchecker dE 2000 * | 3.59 | 4.59 -28% | 2.26 37% | 2.45 32% | 1.3 64% | 2.81 22% |
| Colorchecker dE 2000 max. * | 7.02 | 7.65 -9% | 4.46 36% | 2.5 64% | 4.62 34% | |
| Colorchecker dE 2000 calibrated * | 0.99 | 4.73 -378% | 0.7 29% | 2.99 -202% | ||
| Greyscale dE 2000 * | 3.1 | 2.5 19% | 1 68% | 2.6 16% | 2.1 32% | 0.91 71% |
| Gamma | 2.13 103% | 2.1 105% | 2.28 96% | 2.3 96% | 2.26 97% | 2.2 100% |
| CCT | 6448 101% | 6541 99% | 6543 99% | 6805 96% | 6437 101% | 6600 98% |
| Contrast (:1) | 931 | 1281 | 1131 | 1467 | ||
| Total Average (Program / Settings) | -5% /
-4% | -196% /
-119% | -757% /
-401% | -155% /
-65% | -488% /
-247% |
* ... smaller is better
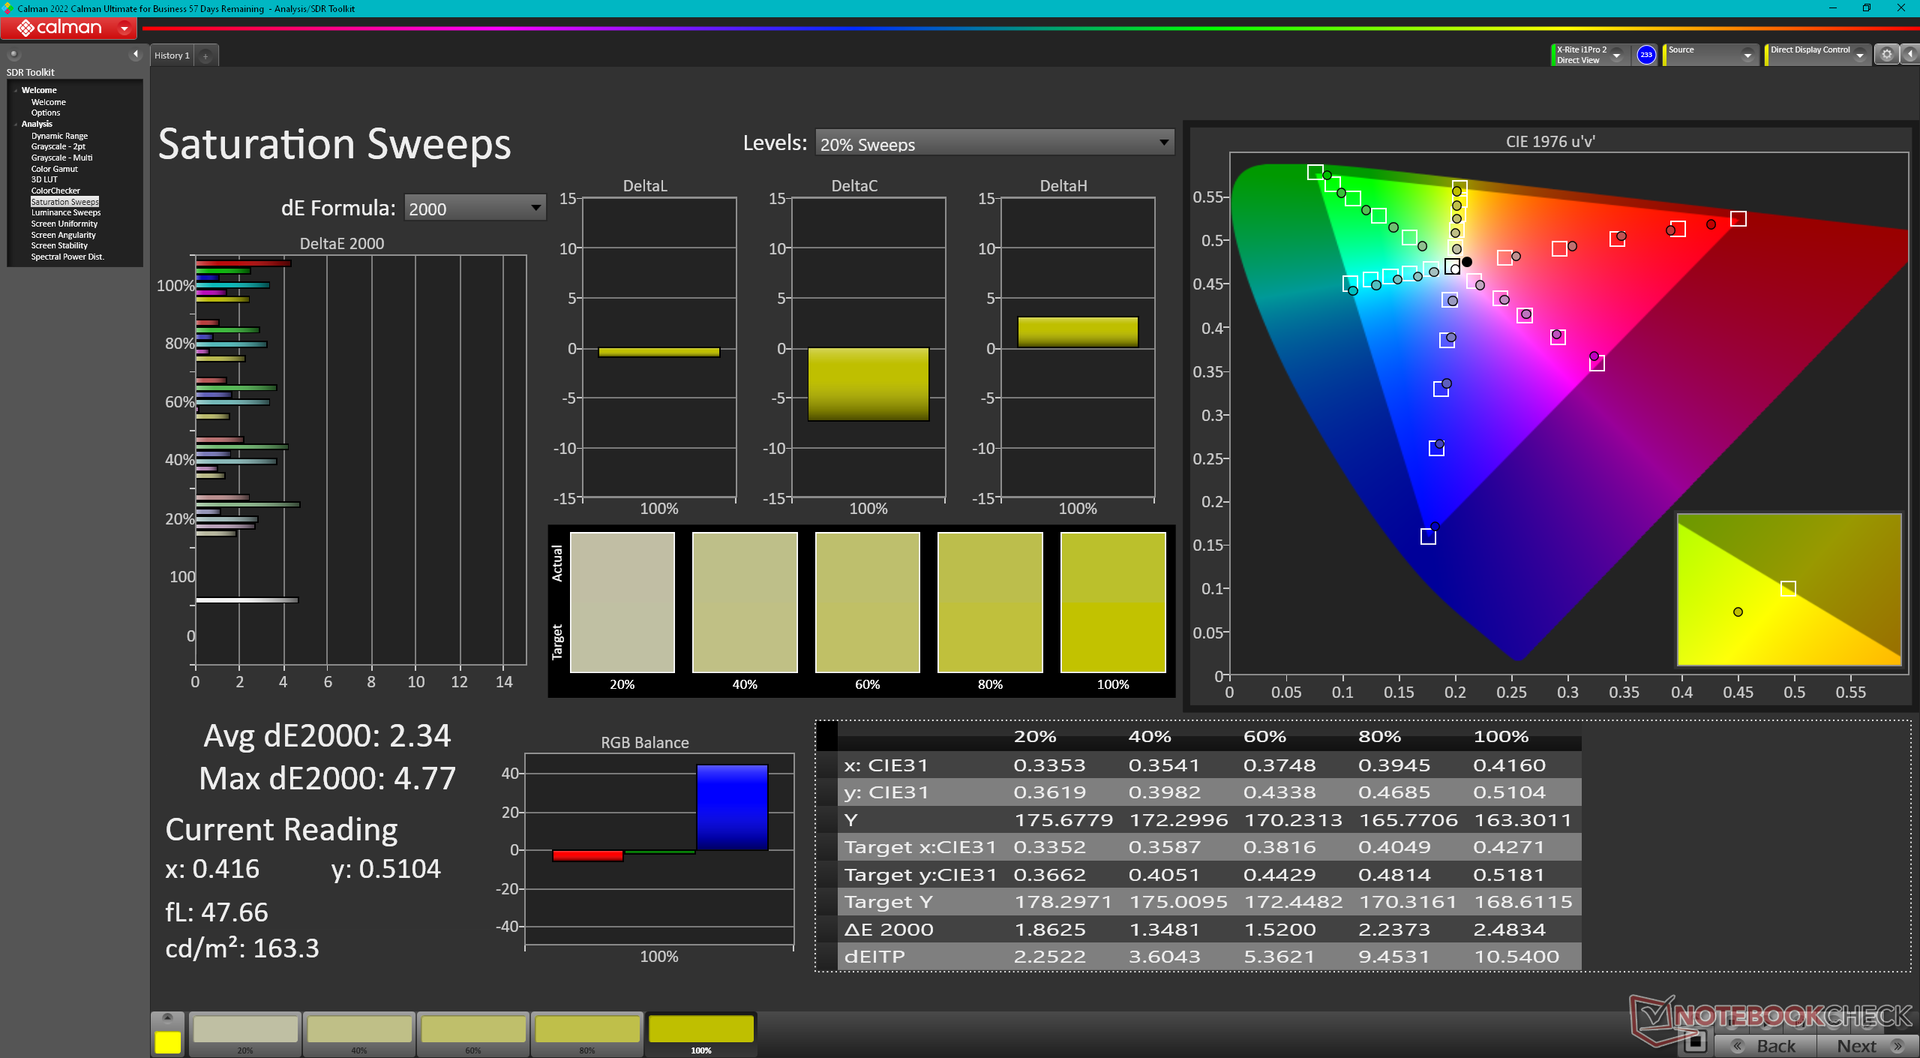
显示器的校准效果不错,平均 deltaE 值在 3 到 4 之间。我们的校准 ICM 配置文件可在上面免费下载。
Display Response Times
| ↔ Response Time Black to White | ||
|---|---|---|
| 1.77 ms ... rise ↗ and fall ↘ combined | ↗ 0.8 ms rise | 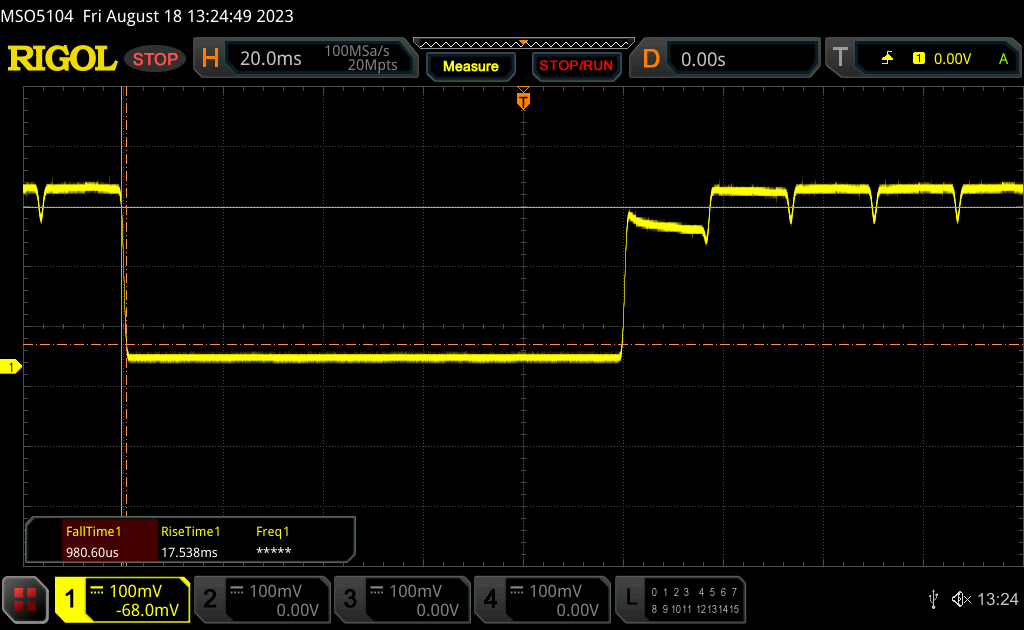 |
| ↘ 0.97 ms fall | ||
| The screen shows very fast response rates in our tests and should be very well suited for fast-paced gaming. In comparison, all tested devices range from 0.1 (minimum) to 240 (maximum) ms. » 10 % of all devices are better. This means that the measured response time is better than the average of all tested devices (19.8 ms). | ||
| ↔ Response Time 50% Grey to 80% Grey | ||
| 1.68 ms ... rise ↗ and fall ↘ combined | ↗ 0.97 ms rise | 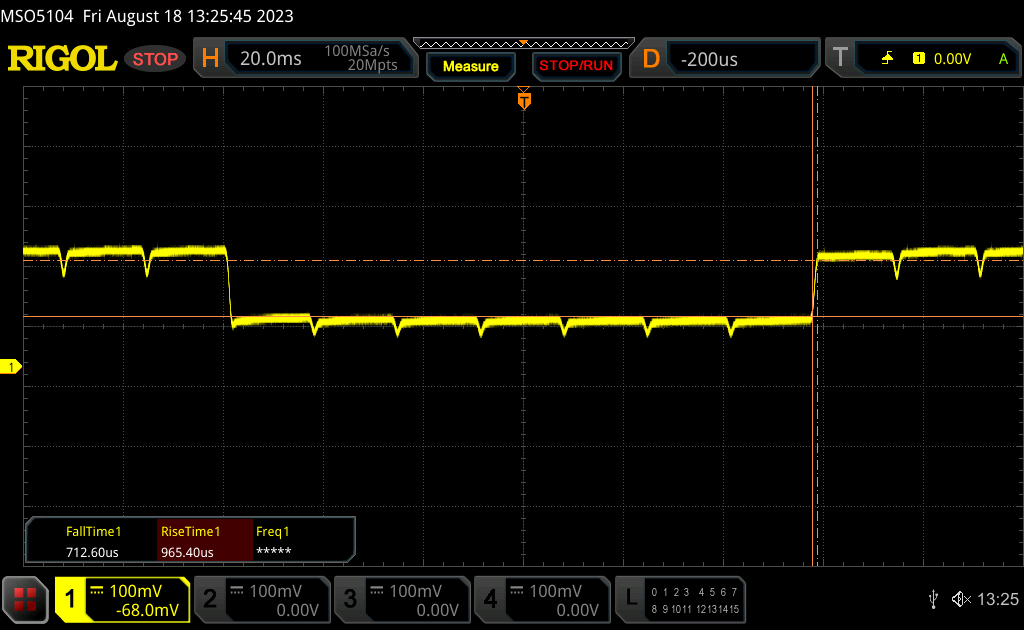 |
| ↘ 0.71 ms fall | ||
| The screen shows very fast response rates in our tests and should be very well suited for fast-paced gaming. In comparison, all tested devices range from 0.165 (minimum) to 636 (maximum) ms. » 9 % of all devices are better. This means that the measured response time is better than the average of all tested devices (31 ms). | ||
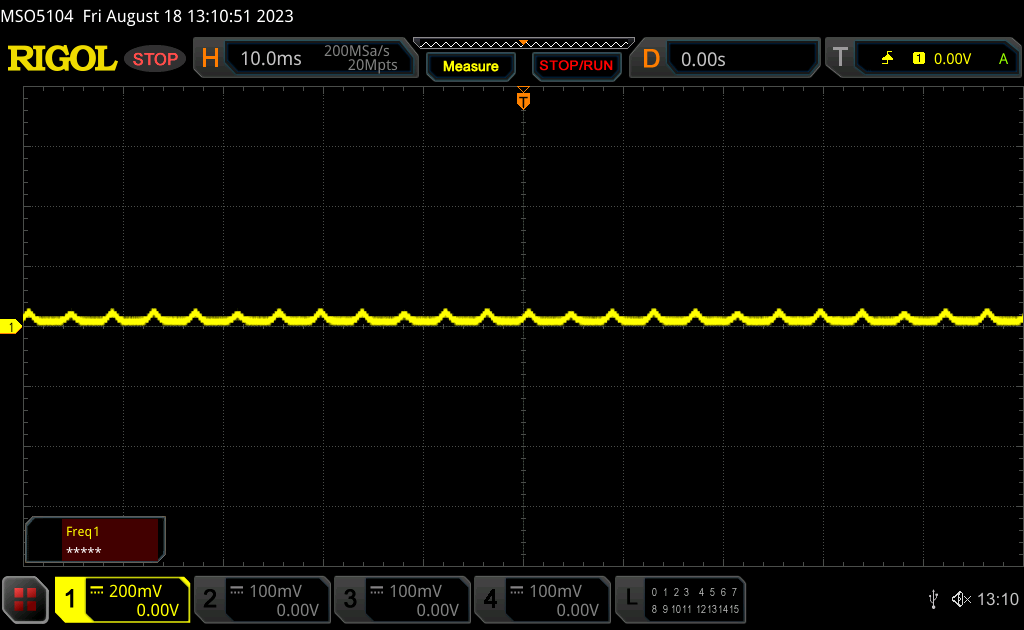
Screen Flickering / PWM (Pulse-Width Modulation)
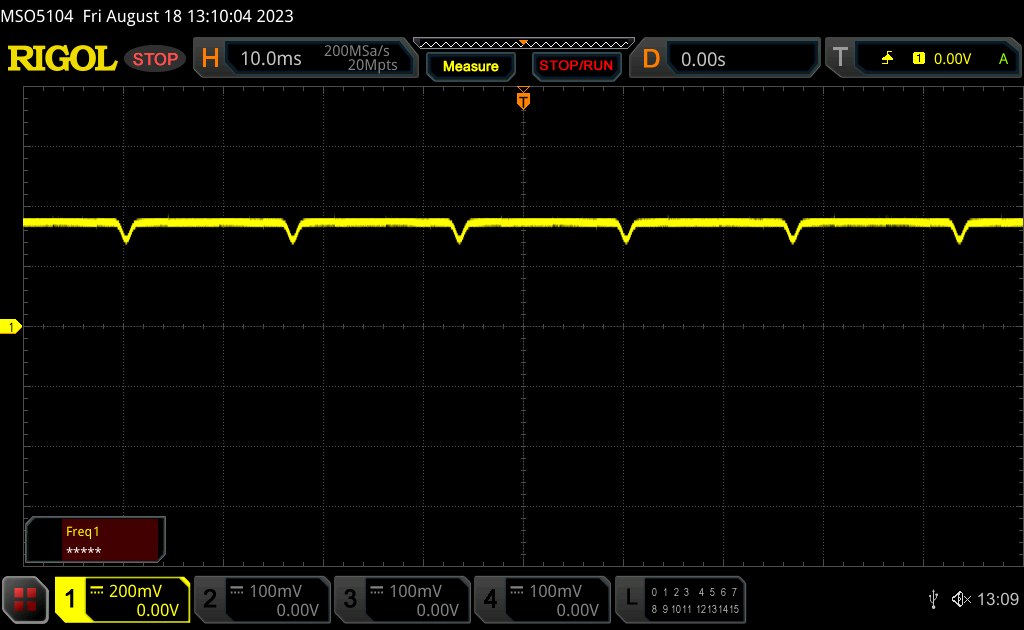
| Screen flickering / PWM detected | 60 Hz | ≤ 100 % brightness setting | 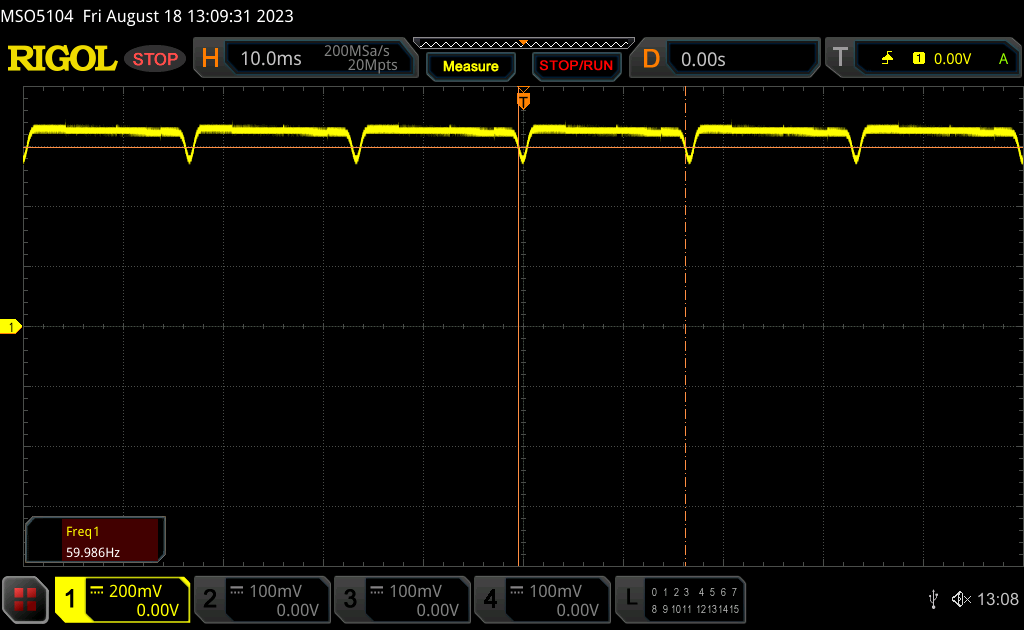 |
The display backlight flickers at 60 Hz (worst case, e.g., utilizing PWM) Flickering detected at a brightness setting of 100 % and below. There should be no flickering or PWM above this brightness setting. The frequency of 60 Hz is very low, so the flickering may cause eyestrain and headaches after extended use. In comparison: 52 % of all tested devices do not use PWM to dim the display. If PWM was detected, an average of 7754 (minimum: 5 - maximum: 343500) Hz was measured. | |||
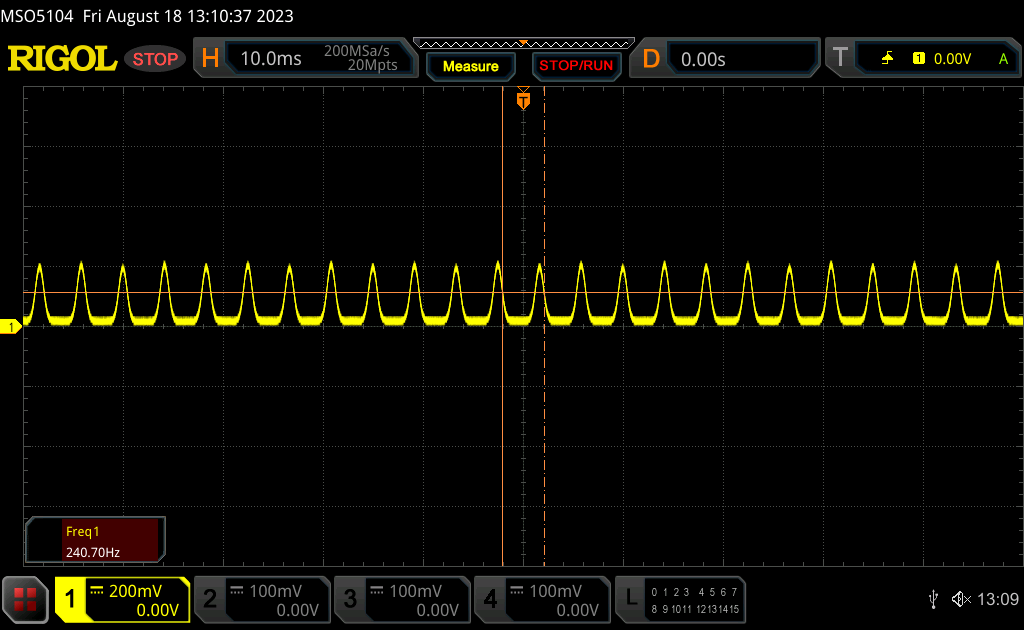
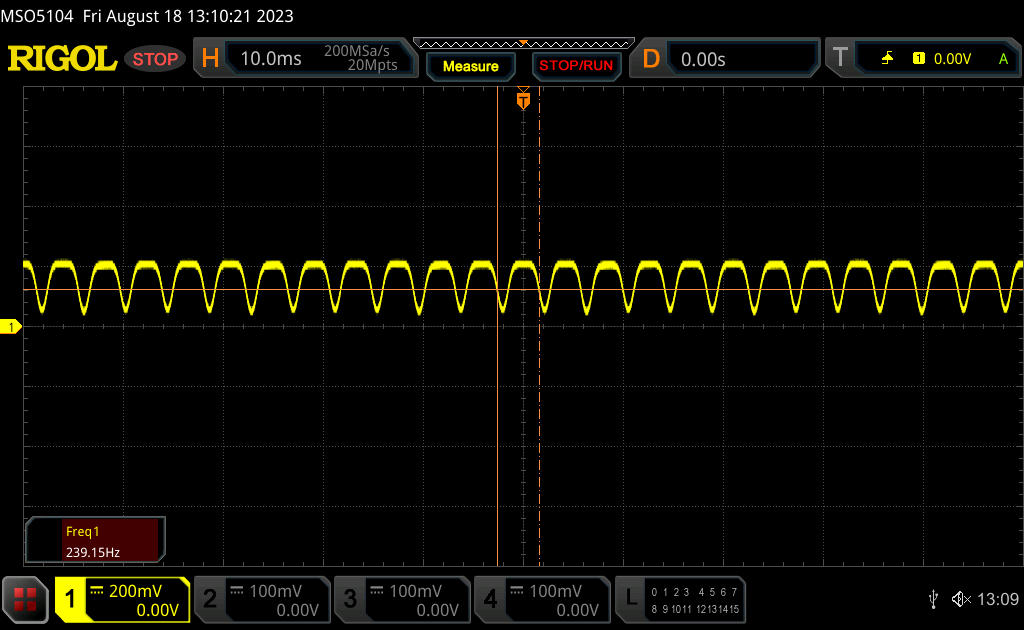
与智能手机和其他配备 OLED 面板的笔记本电脑类似,在所有亮度水平上都会出现闪烁现象。亮度从 0 到 54% 时,频率稳定在 239 赫兹,亮度从 55% 到 100% 时,频率稳定在 60 赫兹。
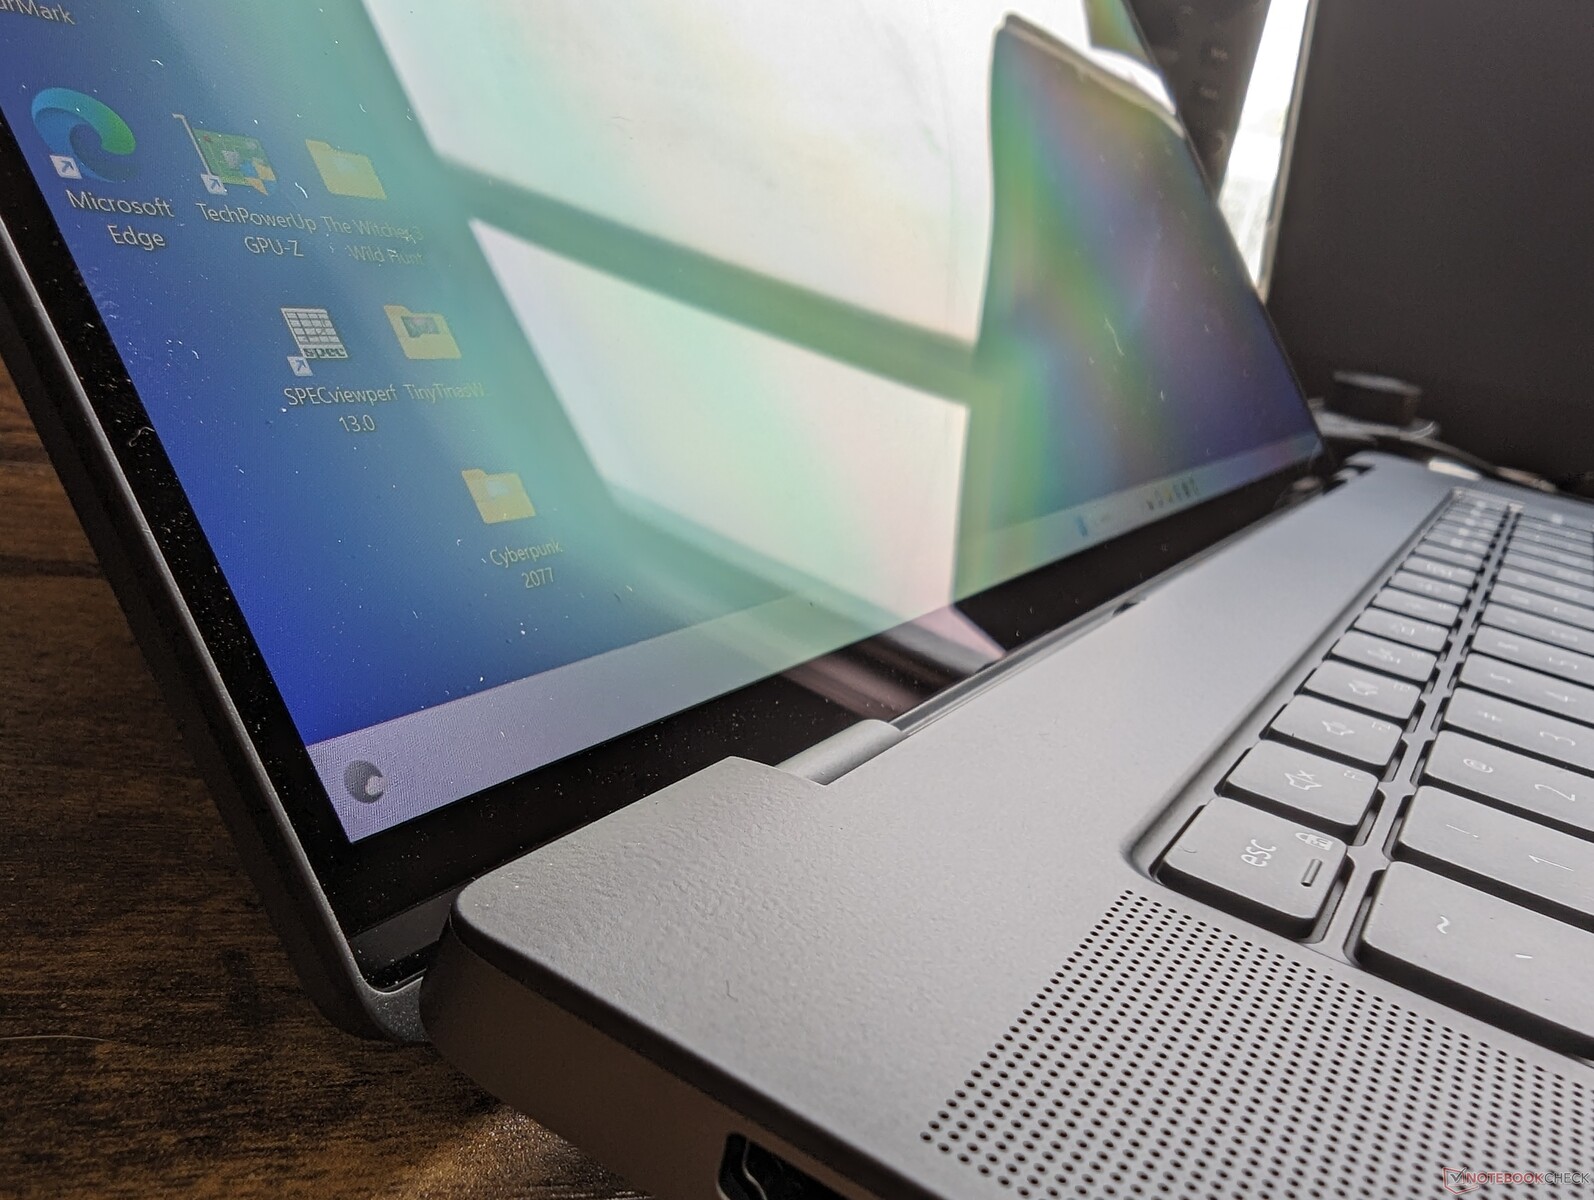
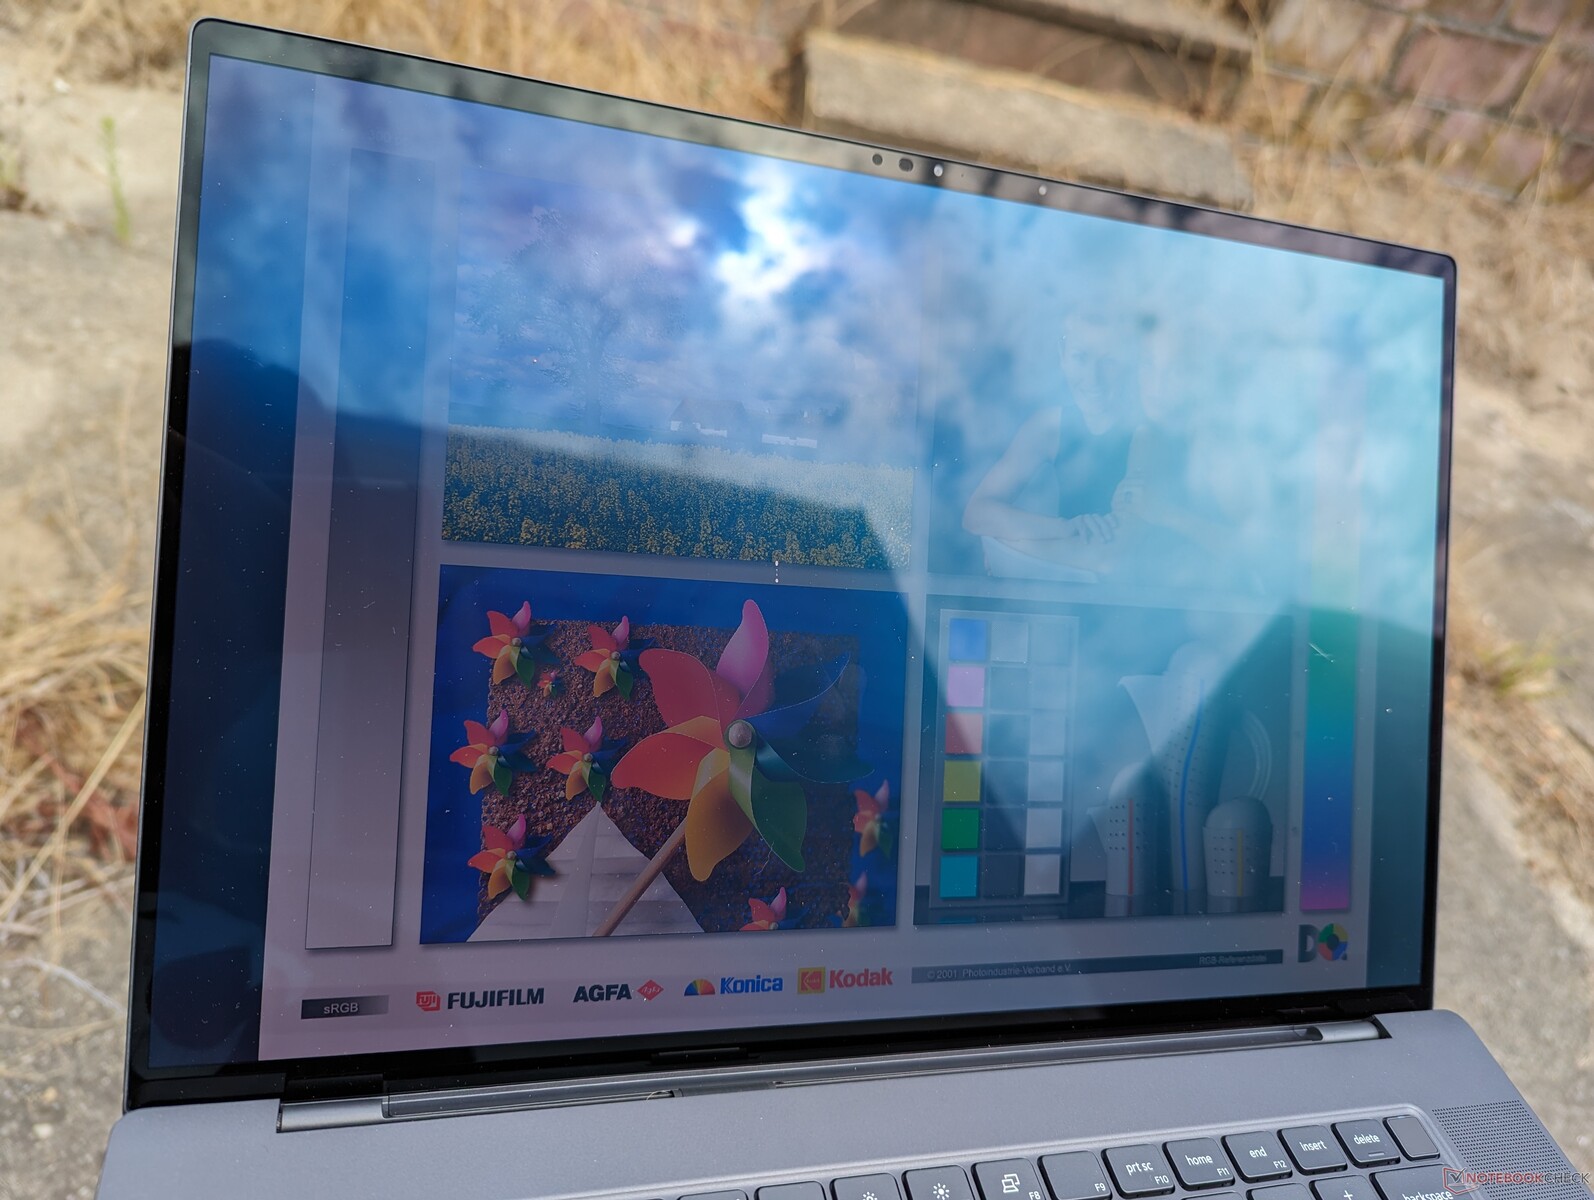
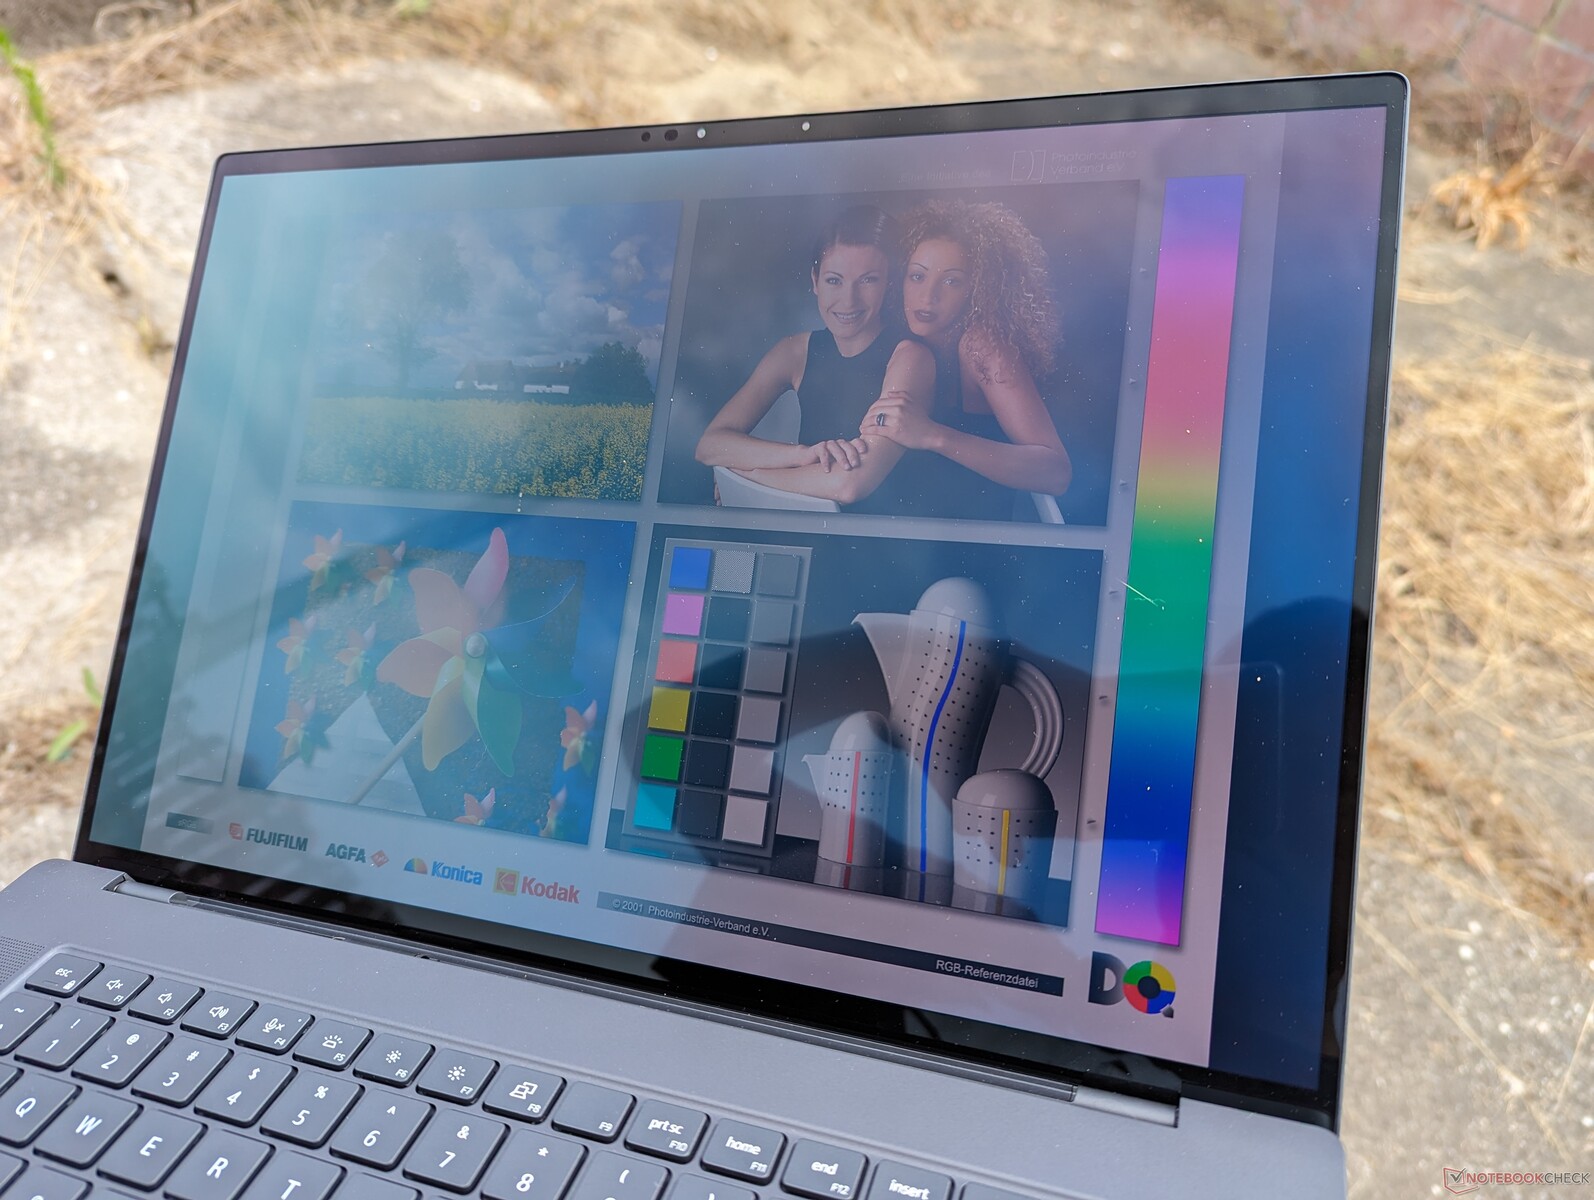
由于 350 尼特光面 OLED 触摸屏的亮度远不及 ZBook Fury 16 G9 或 ThinkPad P16 G1 的 IPS 显示屏,因此户外能见度充其量只能算一般。 ThinkPad P16 G1接近 500 至 600 尼特。
性能 - 英特尔第 13 代 Raptor Lake-H
测试条件
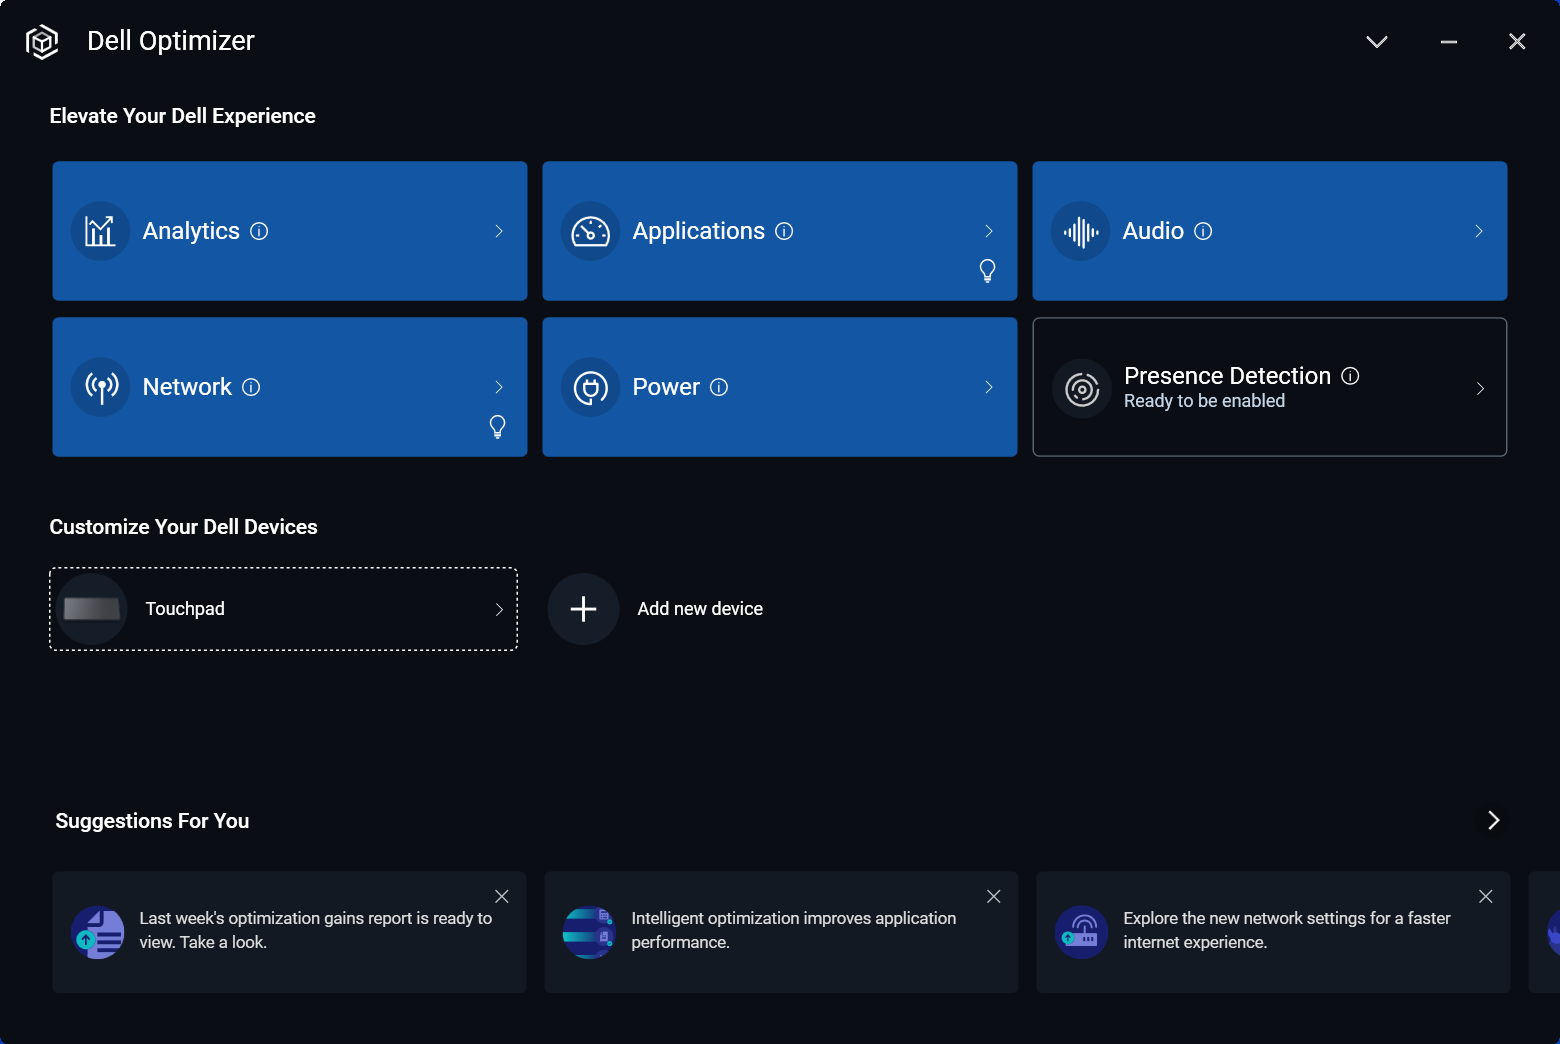
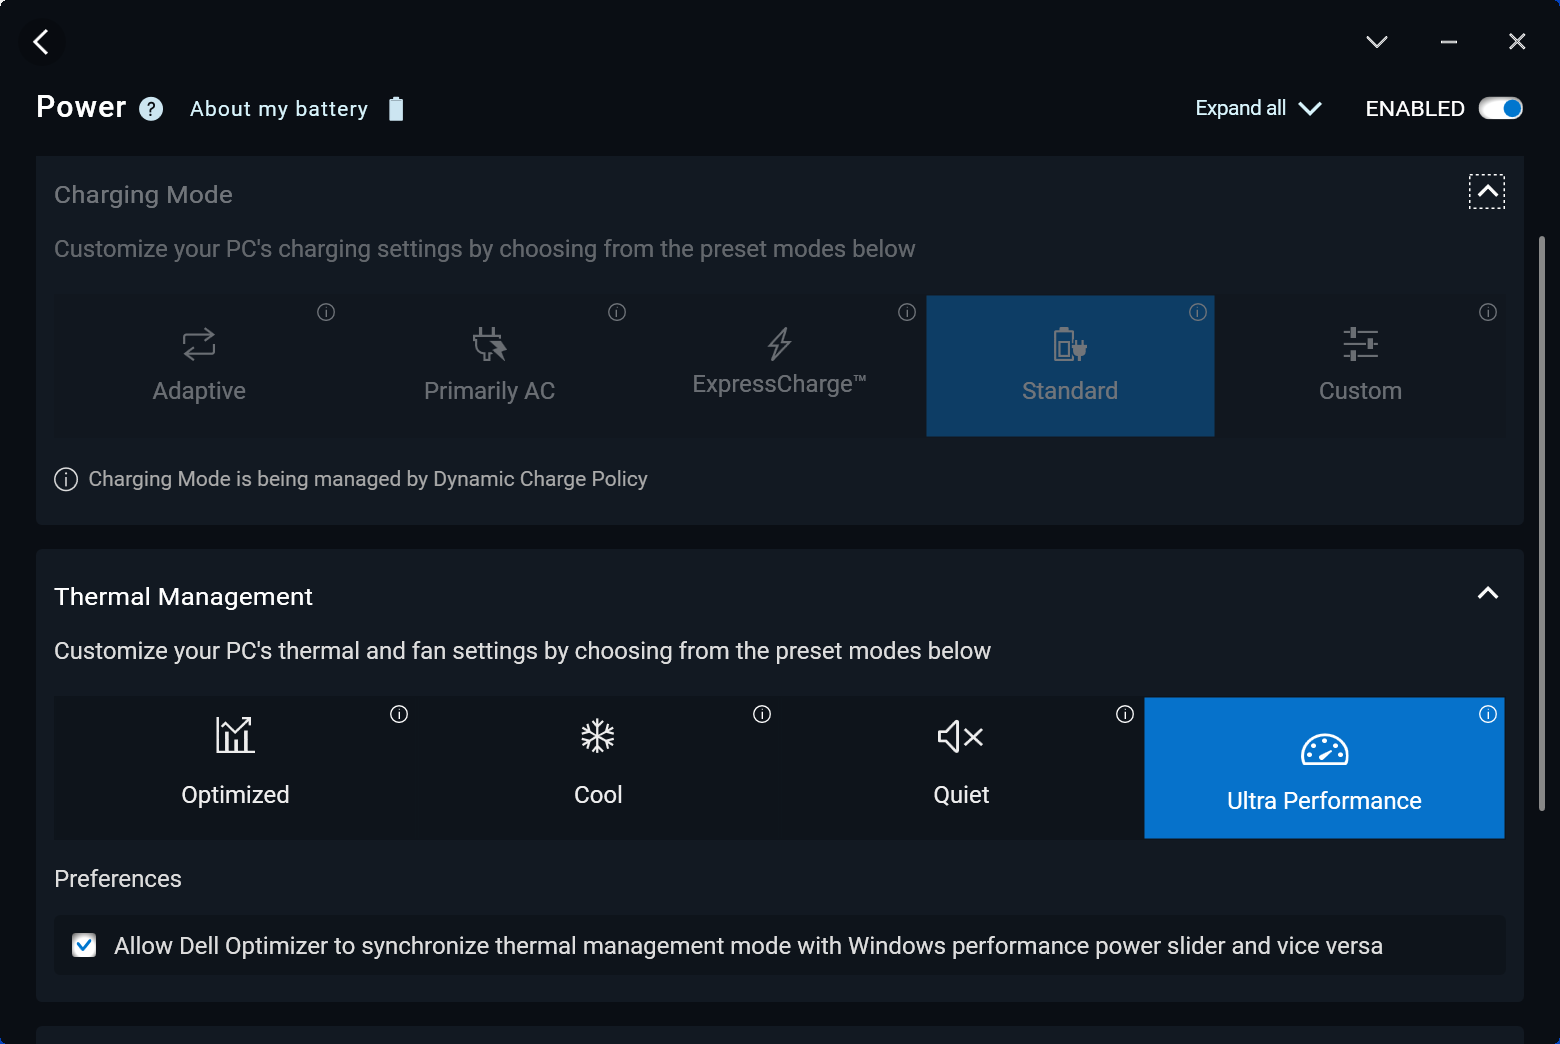
在运行以下基准测试之前,我们通过戴尔优化器软件将设备设置为超性能模式。Optimizer 电源配置文件可以方便地与 Windows 电源配置文件同步,这与大多数其他制造商的专用电源配置文件不同。
不支持高级 Optimus 或 Optimus 2.0。不过,阿达-拉芙蕾丝工作站 GPU 新增了 ECC VRAM 模式,可通过 Nvidia 控制面板打开或关闭。切换该功能时需要重新启动。
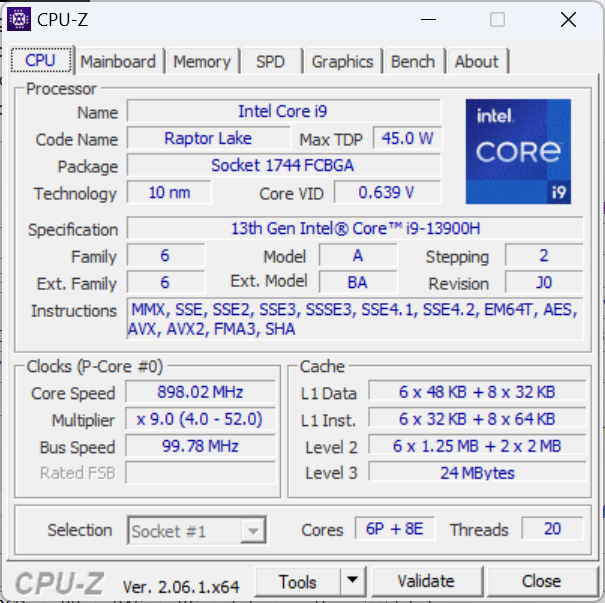
处理器
第 13 代 酷睿 i9-13900H令人失望的是,它与去年的第 12 代 酷睿 i9-12900H.例如,其性能与华硕 ProArt StudioBook 16的性能基本相同,只是在单线程操作方面略微提升了 5% 至 10%。可惜的是,Precision 5680 没有提供 酷睿 i9-13900HX这将会比任何 Alder Lake-H 移动处理器的性能提升更为显著。
请注意,Precision 5680 系列也没有至强或 W 级处理器可供选择,这意味着它不支持 ECC 内存。
降级到 酷睿 i7-13700H从 i9-13900H 降级到酷睿 i7-13700H,多线程性能预计会降低约 20%。申克 Vision 16 Pro.
Cinebench R15 Multi Loop
Cinebench R23: Multi Core | Single Core
Cinebench R20: CPU (Multi Core) | CPU (Single Core)
Cinebench R15: CPU Multi 64Bit | CPU Single 64Bit
Blender: v2.79 BMW27 CPU
7-Zip 18.03: 7z b 4 | 7z b 4 -mmt1
Geekbench 5.5: Multi-Core | Single-Core
HWBOT x265 Benchmark v2.2: 4k Preset
LibreOffice : 20 Documents To PDF
R Benchmark 2.5: Overall mean
* ... smaller is better
AIDA64: FP32 Ray-Trace | FPU Julia | CPU SHA3 | CPU Queen | FPU SinJulia | FPU Mandel | CPU AES | CPU ZLib | FP64 Ray-Trace | CPU PhotoWorxx
| Performance rating | |
| Lenovo ThinkPad P16 G1 RTX A5500 | |
| HP ZBook Fury 16 G9 | |
| Dell Precision 5000 5680 | |
| MSI CreatorPro Z16P B12UKST | |
| Asus ExpertBook B6 Flip B6602FC2 | |
| Average Intel Core i9-13900H | |
| Dell Precision 7000 7670 Performance | |
| AIDA64 / FP32 Ray-Trace | |
| Lenovo ThinkPad P16 G1 RTX A5500 | |
| HP ZBook Fury 16 G9 | |
| Asus ExpertBook B6 Flip B6602FC2 | |
| Dell Precision 5000 5680 | |
| Dell Precision 7000 7670 Performance | |
| Average Intel Core i9-13900H (6788 - 19557, n=25) | |
| MSI CreatorPro Z16P B12UKST | |
| AIDA64 / FPU Julia | |
| HP ZBook Fury 16 G9 | |
| Lenovo ThinkPad P16 G1 RTX A5500 | |
| Asus ExpertBook B6 Flip B6602FC2 | |
| Dell Precision 5000 5680 | |
| Dell Precision 7000 7670 Performance | |
| Average Intel Core i9-13900H (22551 - 95579, n=25) | |
| MSI CreatorPro Z16P B12UKST | |
| AIDA64 / CPU SHA3 | |
| Lenovo ThinkPad P16 G1 RTX A5500 | |
| HP ZBook Fury 16 G9 | |
| MSI CreatorPro Z16P B12UKST | |
| Average Intel Core i9-13900H (2491 - 4270, n=25) | |
| Dell Precision 5000 5680 | |
| Asus ExpertBook B6 Flip B6602FC2 | |
| Dell Precision 7000 7670 Performance | |
| AIDA64 / CPU Queen | |
| Dell Precision 5000 5680 | |
| Average Intel Core i9-13900H (65121 - 120936, n=25) | |
| Lenovo ThinkPad P16 G1 RTX A5500 | |
| Dell Precision 7000 7670 Performance | |
| Asus ExpertBook B6 Flip B6602FC2 | |
| HP ZBook Fury 16 G9 | |
| MSI CreatorPro Z16P B12UKST | |
| AIDA64 / FPU SinJulia | |
| Lenovo ThinkPad P16 G1 RTX A5500 | |
| HP ZBook Fury 16 G9 | |
| Asus ExpertBook B6 Flip B6602FC2 | |
| Dell Precision 7000 7670 Performance | |
| Dell Precision 5000 5680 | |
| Average Intel Core i9-13900H (6108 - 11631, n=25) | |
| MSI CreatorPro Z16P B12UKST | |
| AIDA64 / FPU Mandel | |
| HP ZBook Fury 16 G9 | |
| Lenovo ThinkPad P16 G1 RTX A5500 | |
| Asus ExpertBook B6 Flip B6602FC2 | |
| Dell Precision 5000 5680 | |
| Average Intel Core i9-13900H (11283 - 48474, n=25) | |
| Dell Precision 7000 7670 Performance | |
| MSI CreatorPro Z16P B12UKST | |
| AIDA64 / CPU AES | |
| MSI CreatorPro Z16P B12UKST | |
| HP ZBook Fury 16 G9 | |
| Lenovo ThinkPad P16 G1 RTX A5500 | |
| Average Intel Core i9-13900H (3691 - 149377, n=25) | |
| Asus ExpertBook B6 Flip B6602FC2 | |
| Dell Precision 7000 7670 Performance | |
| Dell Precision 5000 5680 | |
| AIDA64 / CPU ZLib | |
| Lenovo ThinkPad P16 G1 RTX A5500 | |
| HP ZBook Fury 16 G9 | |
| Average Intel Core i9-13900H (789 - 1254, n=25) | |
| Asus ExpertBook B6 Flip B6602FC2 | |
| MSI CreatorPro Z16P B12UKST | |
| Dell Precision 5000 5680 | |
| Dell Precision 7000 7670 Performance | |
| AIDA64 / FP64 Ray-Trace | |
| Lenovo ThinkPad P16 G1 RTX A5500 | |
| HP ZBook Fury 16 G9 | |
| Asus ExpertBook B6 Flip B6602FC2 | |
| Dell Precision 5000 5680 | |
| Dell Precision 7000 7670 Performance | |
| Average Intel Core i9-13900H (3655 - 10716, n=25) | |
| MSI CreatorPro Z16P B12UKST | |
| AIDA64 / CPU PhotoWorxx | |
| Dell Precision 5000 5680 | |
| MSI CreatorPro Z16P B12UKST | |
| Dell Precision 7000 7670 Performance | |
| Lenovo ThinkPad P16 G1 RTX A5500 | |
| Average Intel Core i9-13900H (10871 - 50488, n=25) | |
| HP ZBook Fury 16 G9 | |
| Asus ExpertBook B6 Flip B6602FC2 | |
系统性能
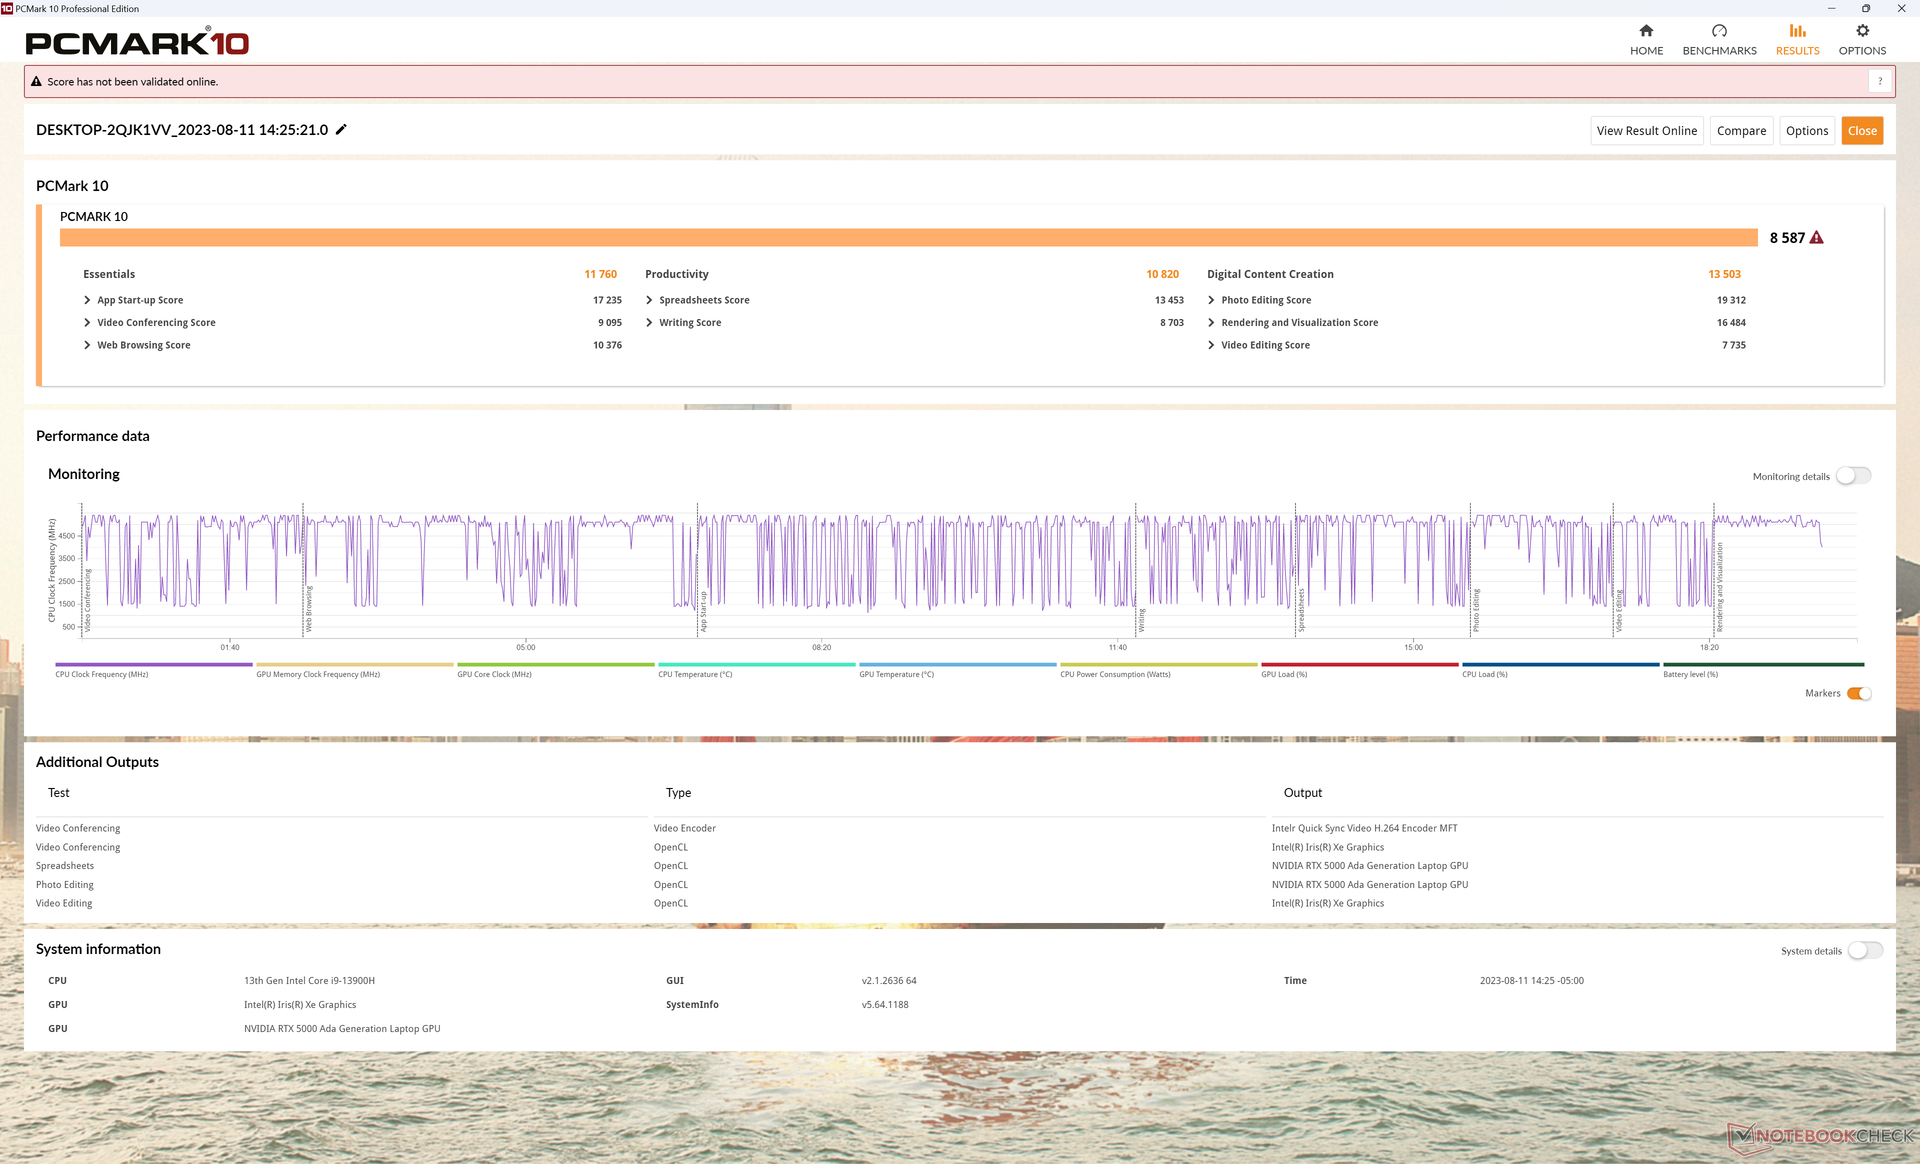
PCMark 分数比大多数其他工作站都要高,甚至高出惠普 ZBook Fury 16 G9 或 7670 等一些强大的工作站。Precision 7670 性能.这要归功于我们的 RAID 0 固态硬盘配置和 RTX 5000 GPU,而大多数其他工作站运行的是单固态硬盘和老一代 GPU。
CrossMark: Overall | Productivity | Creativity | Responsiveness
| PCMark 10 / Score | |
| Dell Precision 5000 5680 | |
| Average Intel Core i9-13900H, NVIDIA RTX 5000 Ada Generation Laptop (n=1) | |
| Asus ExpertBook B6 Flip B6602FC2 | |
| Lenovo ThinkPad P16 G1 RTX A5500 | |
| MSI CreatorPro Z16P B12UKST | |
| HP ZBook Fury 16 G9 | |
| Dell Precision 7000 7670 Performance | |
| PCMark 10 / Essentials | |
| Dell Precision 5000 5680 | |
| Average Intel Core i9-13900H, NVIDIA RTX 5000 Ada Generation Laptop (n=1) | |
| Dell Precision 7000 7670 Performance | |
| HP ZBook Fury 16 G9 | |
| Lenovo ThinkPad P16 G1 RTX A5500 | |
| Asus ExpertBook B6 Flip B6602FC2 | |
| MSI CreatorPro Z16P B12UKST | |
| PCMark 10 / Productivity | |
| Dell Precision 5000 5680 | |
| Average Intel Core i9-13900H, NVIDIA RTX 5000 Ada Generation Laptop (n=1) | |
| Asus ExpertBook B6 Flip B6602FC2 | |
| Lenovo ThinkPad P16 G1 RTX A5500 | |
| MSI CreatorPro Z16P B12UKST | |
| HP ZBook Fury 16 G9 | |
| Dell Precision 7000 7670 Performance | |
| PCMark 10 / Digital Content Creation | |
| Dell Precision 5000 5680 | |
| Average Intel Core i9-13900H, NVIDIA RTX 5000 Ada Generation Laptop (n=1) | |
| Lenovo ThinkPad P16 G1 RTX A5500 | |
| MSI CreatorPro Z16P B12UKST | |
| Dell Precision 7000 7670 Performance | |
| HP ZBook Fury 16 G9 | |
| Asus ExpertBook B6 Flip B6602FC2 | |
| CrossMark / Overall | |
| Asus ExpertBook B6 Flip B6602FC2 | |
| MSI CreatorPro Z16P B12UKST | |
| Dell Precision 5000 5680 | |
| Average Intel Core i9-13900H, NVIDIA RTX 5000 Ada Generation Laptop (n=1) | |
| HP ZBook Fury 16 G9 | |
| Lenovo ThinkPad P16 G1 RTX A5500 | |
| Dell Precision 7000 7670 Performance | |
| CrossMark / Productivity | |
| Asus ExpertBook B6 Flip B6602FC2 | |
| MSI CreatorPro Z16P B12UKST | |
| Dell Precision 5000 5680 | |
| Average Intel Core i9-13900H, NVIDIA RTX 5000 Ada Generation Laptop (n=1) | |
| HP ZBook Fury 16 G9 | |
| Lenovo ThinkPad P16 G1 RTX A5500 | |
| Dell Precision 7000 7670 Performance | |
| CrossMark / Creativity | |
| Lenovo ThinkPad P16 G1 RTX A5500 | |
| Dell Precision 5000 5680 | |
| Average Intel Core i9-13900H, NVIDIA RTX 5000 Ada Generation Laptop (n=1) | |
| Asus ExpertBook B6 Flip B6602FC2 | |
| HP ZBook Fury 16 G9 | |
| MSI CreatorPro Z16P B12UKST | |
| Dell Precision 7000 7670 Performance | |
| CrossMark / Responsiveness | |
| MSI CreatorPro Z16P B12UKST | |
| Asus ExpertBook B6 Flip B6602FC2 | |
| HP ZBook Fury 16 G9 | |
| Dell Precision 5000 5680 | |
| Average Intel Core i9-13900H, NVIDIA RTX 5000 Ada Generation Laptop (n=1) | |
| Dell Precision 7000 7670 Performance | |
| Lenovo ThinkPad P16 G1 RTX A5500 | |
| PCMark 10 Score | 8587 points | |
Help | ||
| AIDA64 / Memory Copy | |
| Dell Precision 5000 5680 | |
| Dell Precision 7000 7670 Performance | |
| Lenovo ThinkPad P16 G1 RTX A5500 | |
| MSI CreatorPro Z16P B12UKST | |
| Average Intel Core i9-13900H (37448 - 74486, n=25) | |
| HP ZBook Fury 16 G9 | |
| Asus ExpertBook B6 Flip B6602FC2 | |
| AIDA64 / Memory Read | |
| Dell Precision 7000 7670 Performance | |
| Dell Precision 5000 5680 | |
| MSI CreatorPro Z16P B12UKST | |
| Lenovo ThinkPad P16 G1 RTX A5500 | |
| Average Intel Core i9-13900H (41599 - 75433, n=25) | |
| Asus ExpertBook B6 Flip B6602FC2 | |
| HP ZBook Fury 16 G9 | |
| AIDA64 / Memory Write | |
| Dell Precision 5000 5680 | |
| MSI CreatorPro Z16P B12UKST | |
| Dell Precision 7000 7670 Performance | |
| Average Intel Core i9-13900H (36152 - 88505, n=25) | |
| Lenovo ThinkPad P16 G1 RTX A5500 | |
| Asus ExpertBook B6 Flip B6602FC2 | |
| HP ZBook Fury 16 G9 | |
| AIDA64 / Memory Latency | |
| MSI CreatorPro Z16P B12UKST | |
| Asus ExpertBook B6 Flip B6602FC2 | |
| Dell Precision 5000 5680 | |
| HP ZBook Fury 16 G9 | |
| Lenovo ThinkPad P16 G1 RTX A5500 | |
| Average Intel Core i9-13900H (75.8 - 102.3, n=25) | |
| Dell Precision 7000 7670 Performance | |
* ... smaller is better
DPC 延迟
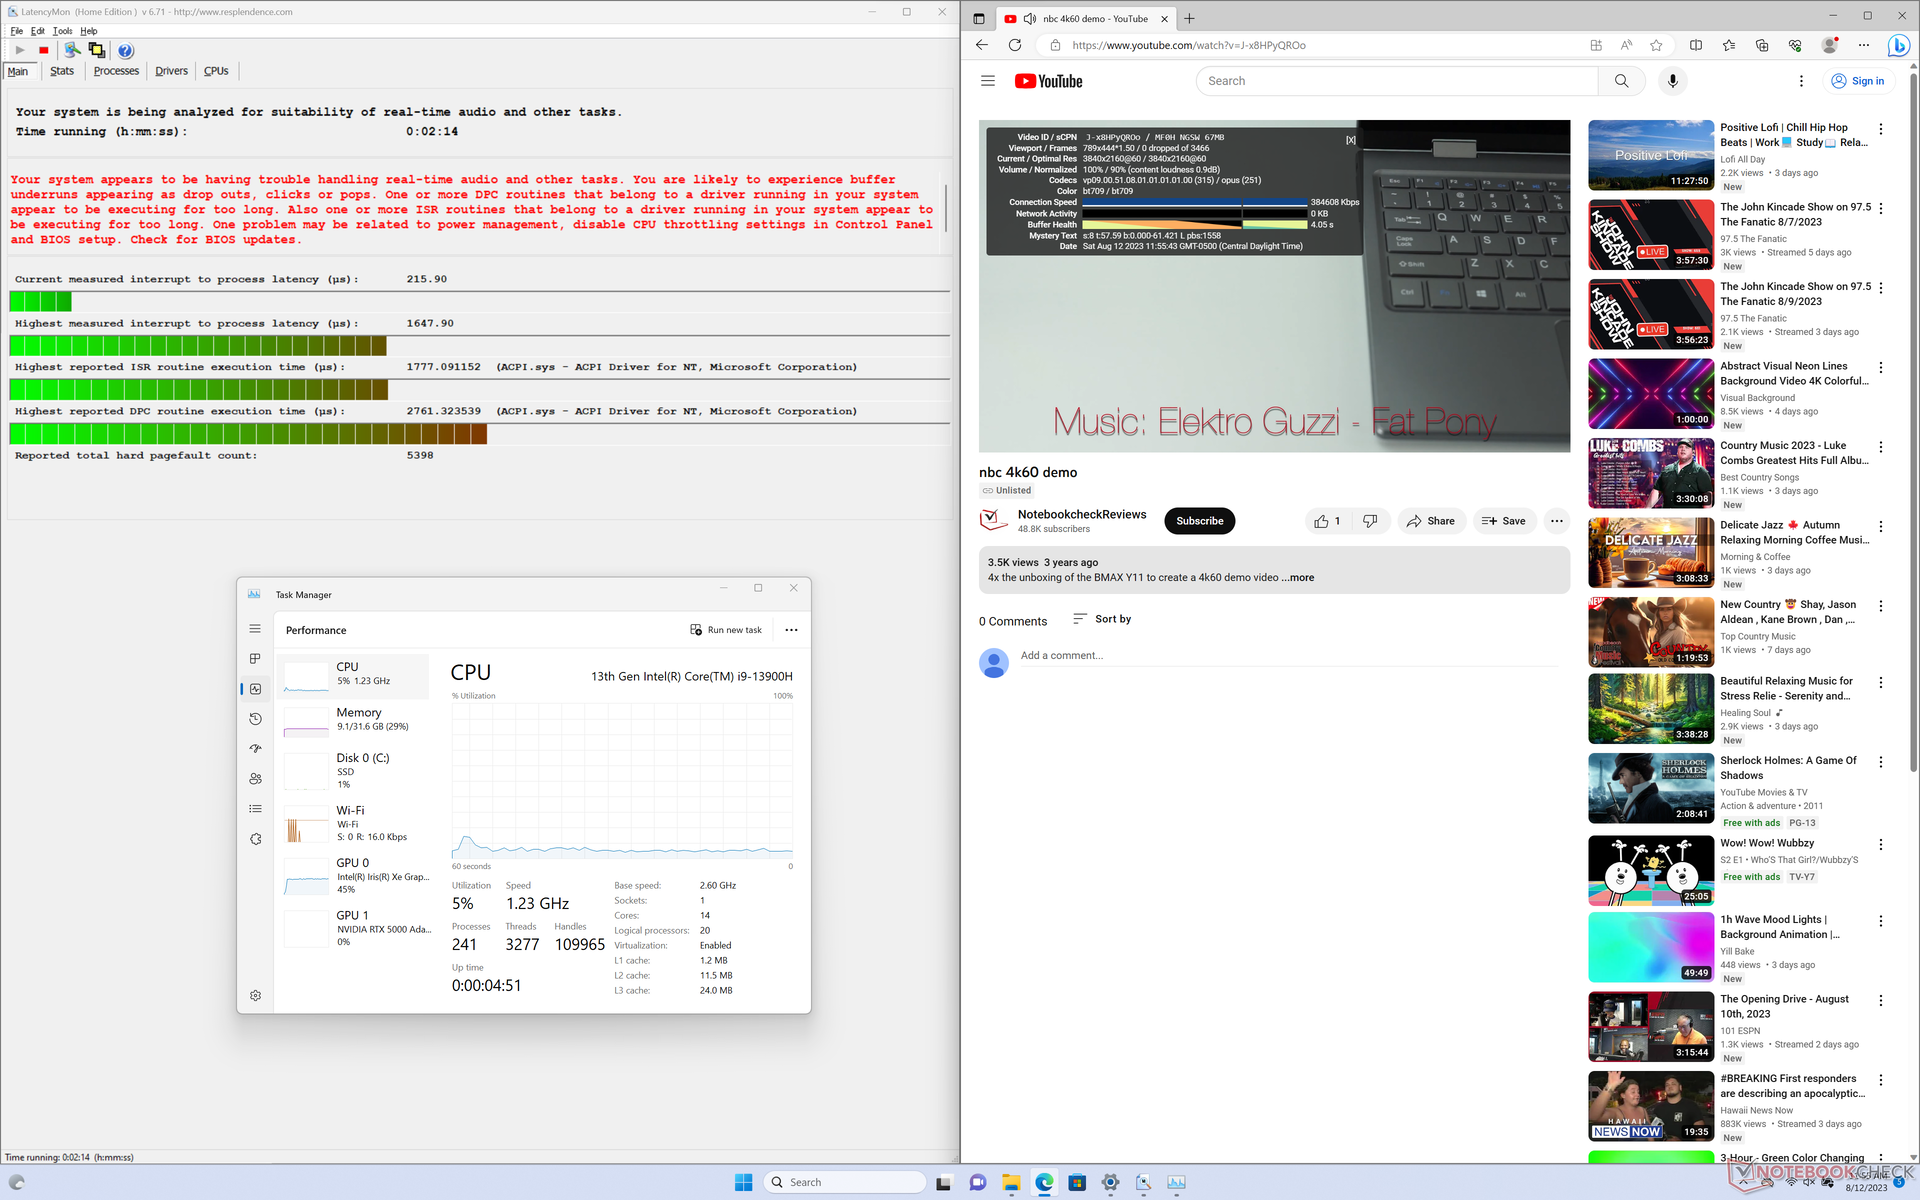
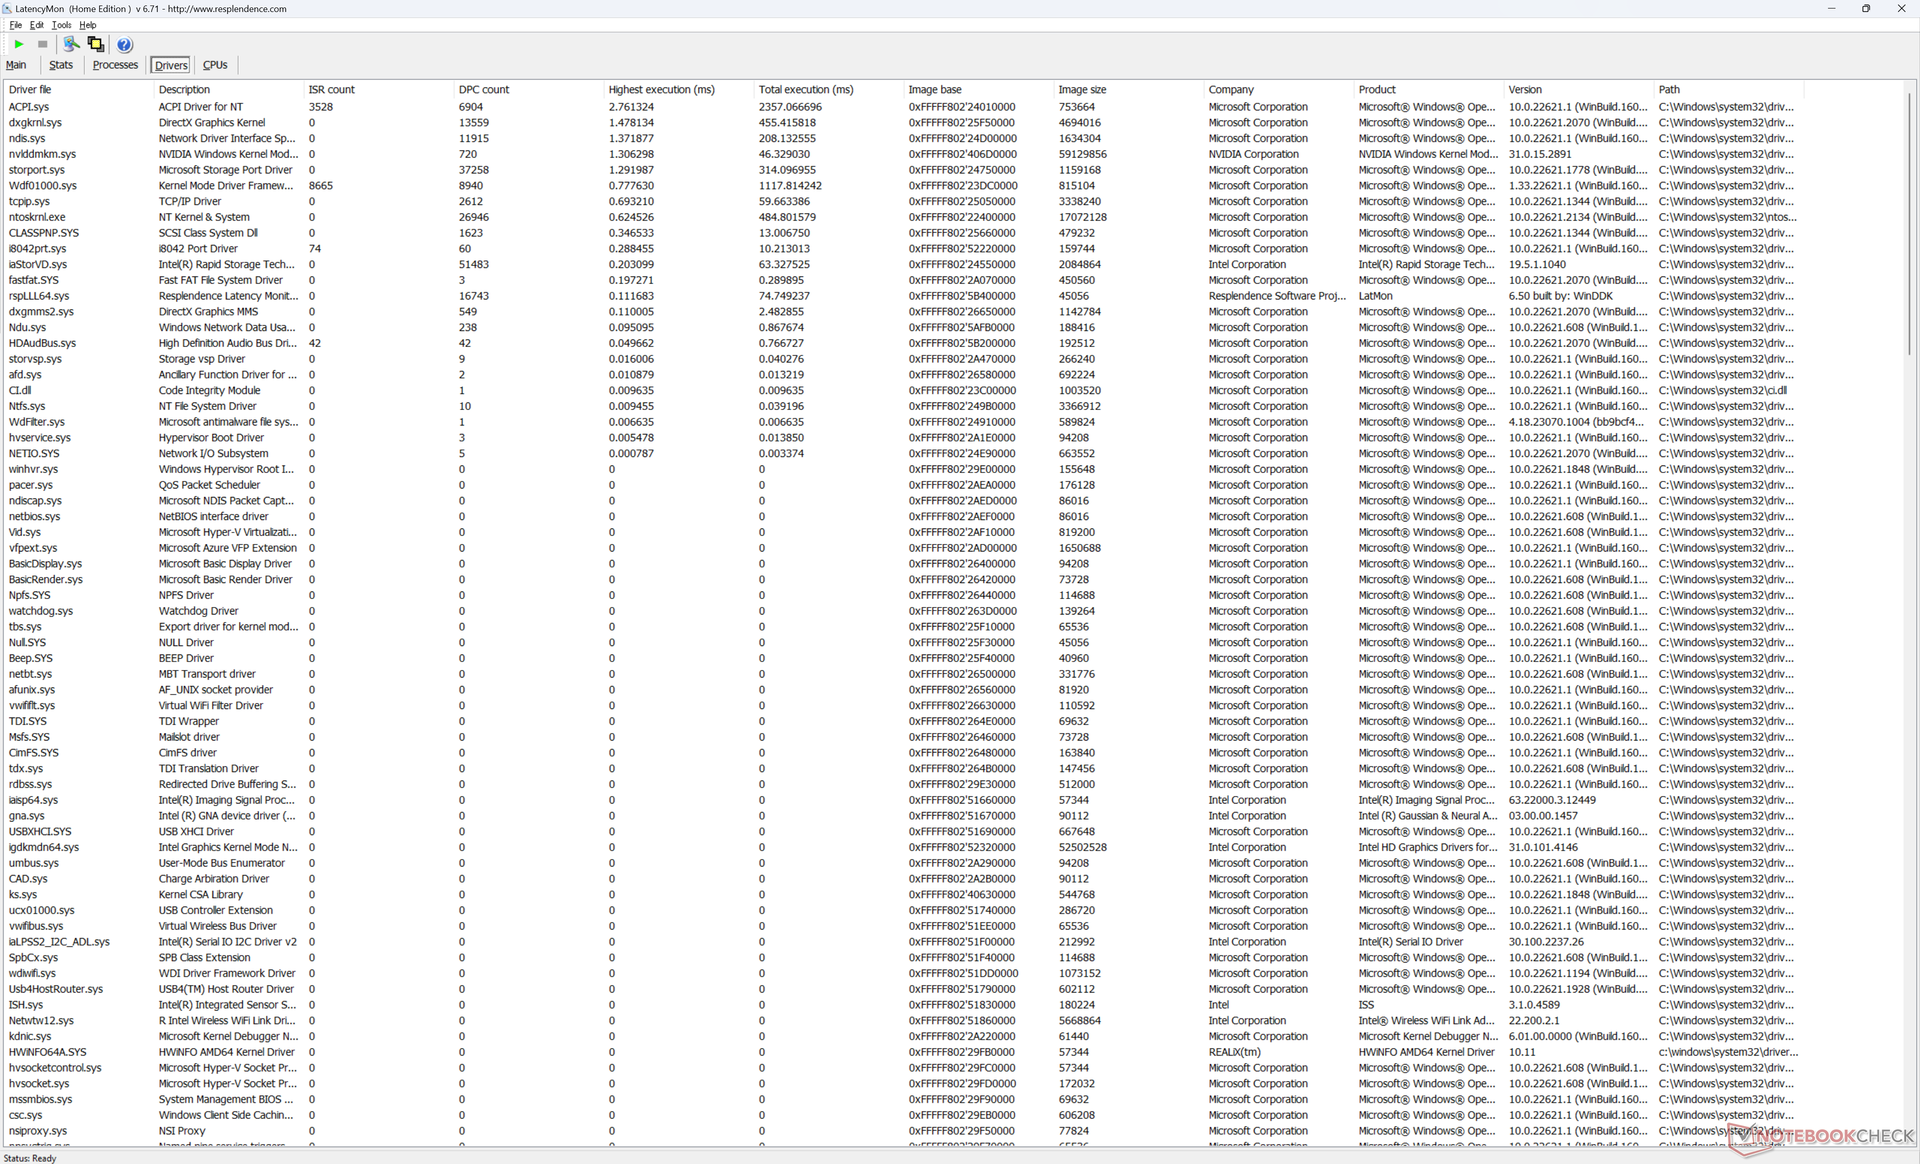
在打开主页的多个浏览器标签页时,LatencyMon 会显示轻微的 DPC 问题,这与我们在Precision 7670 上观察到的情况类似。在其他方面,以 60 FPS 播放 4K 视频也非常完美,没有掉帧记录。
| DPC Latencies / LatencyMon - interrupt to process latency (max), Web, Youtube, Prime95 | |
| HP ZBook Fury 16 G9 | |
| Asus ExpertBook B6 Flip B6602FC2 | |
| Dell Precision 7000 7670 Performance | |
| Dell Precision 5000 5680 | |
| Lenovo ThinkPad P16 G1 RTX A5500 | |
| MSI CreatorPro Z16P B12UKST | |
* ... smaller is better
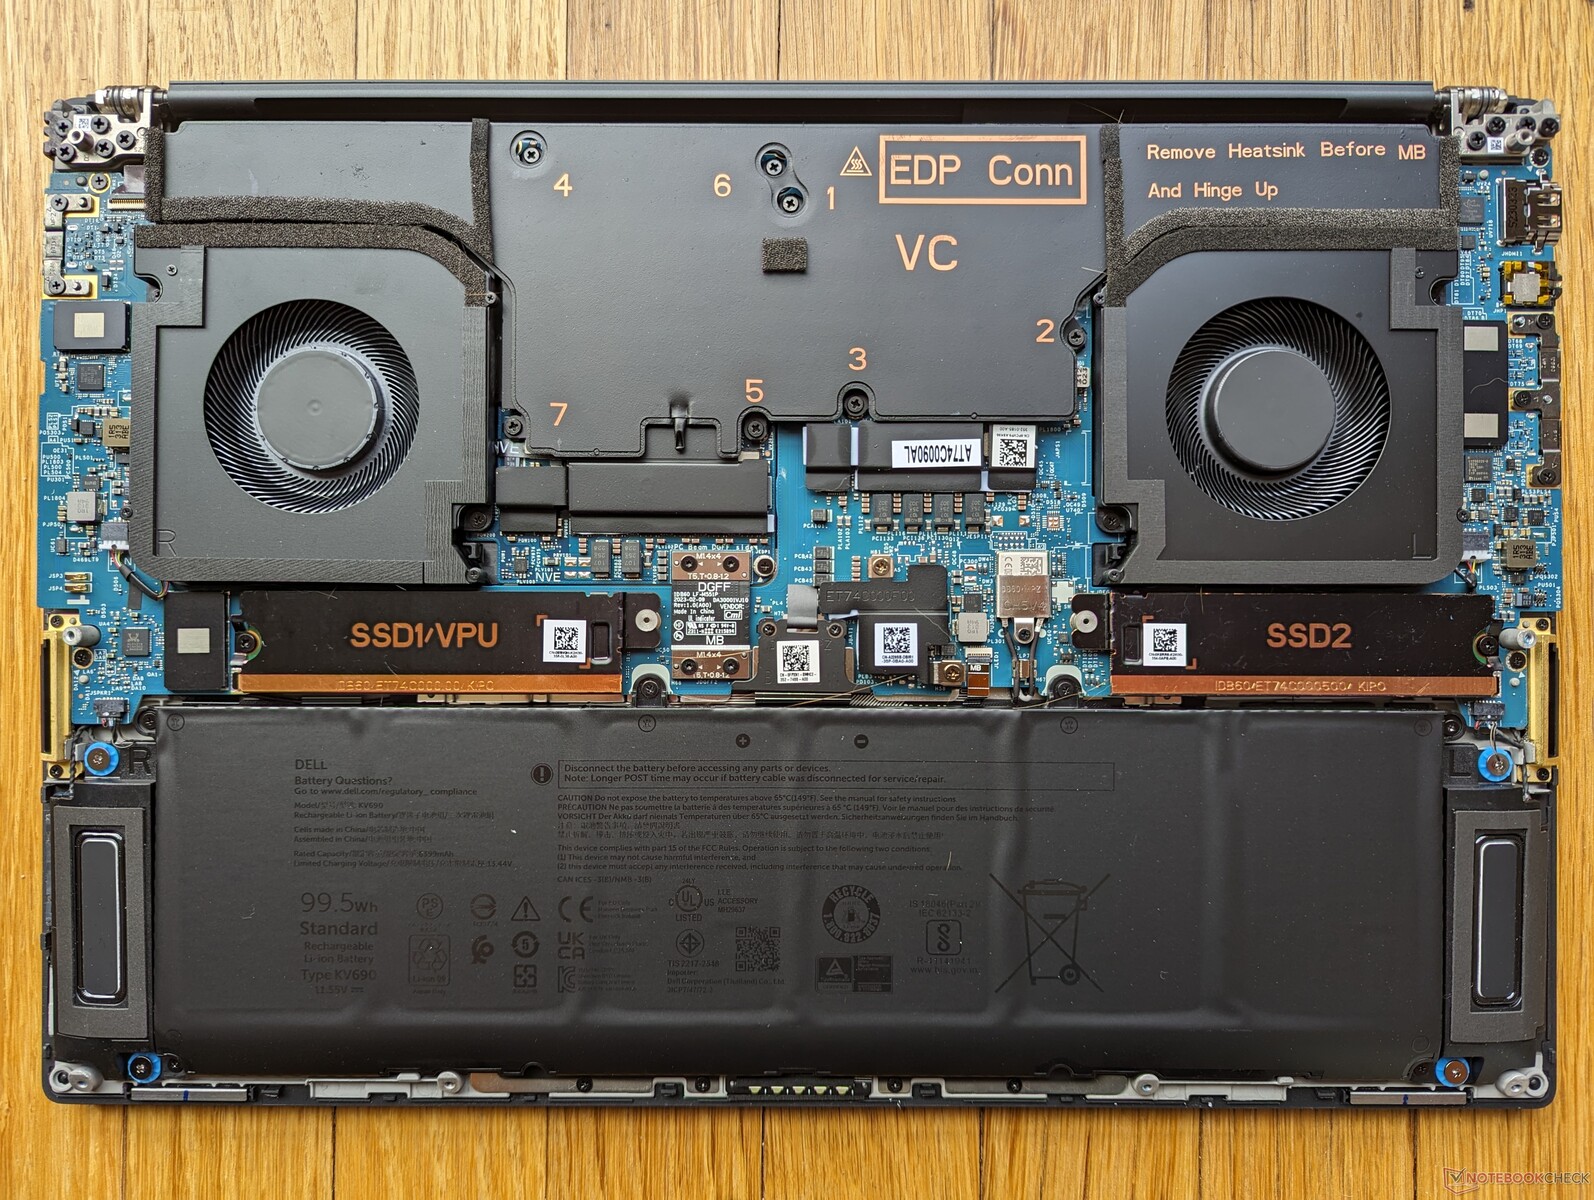
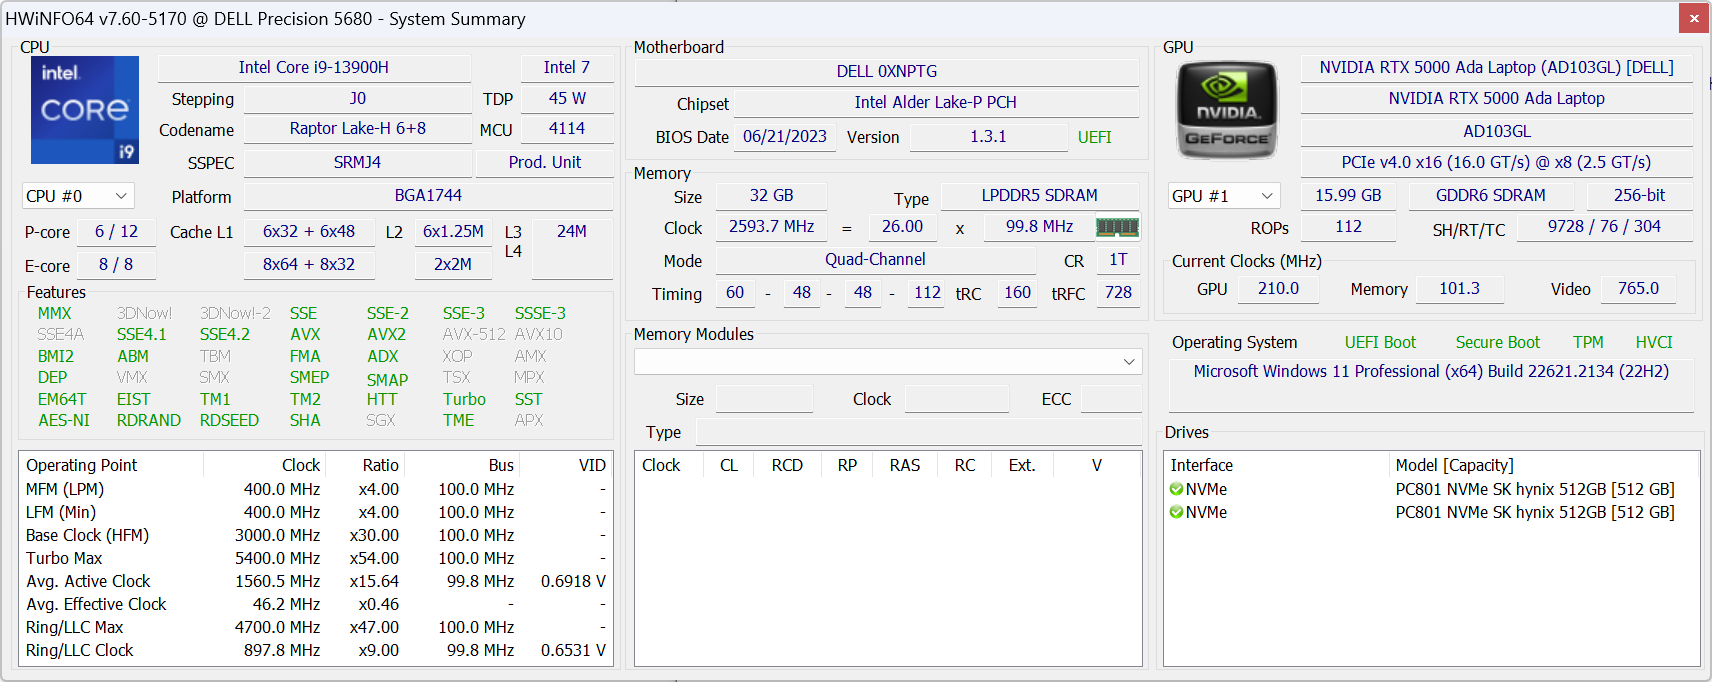
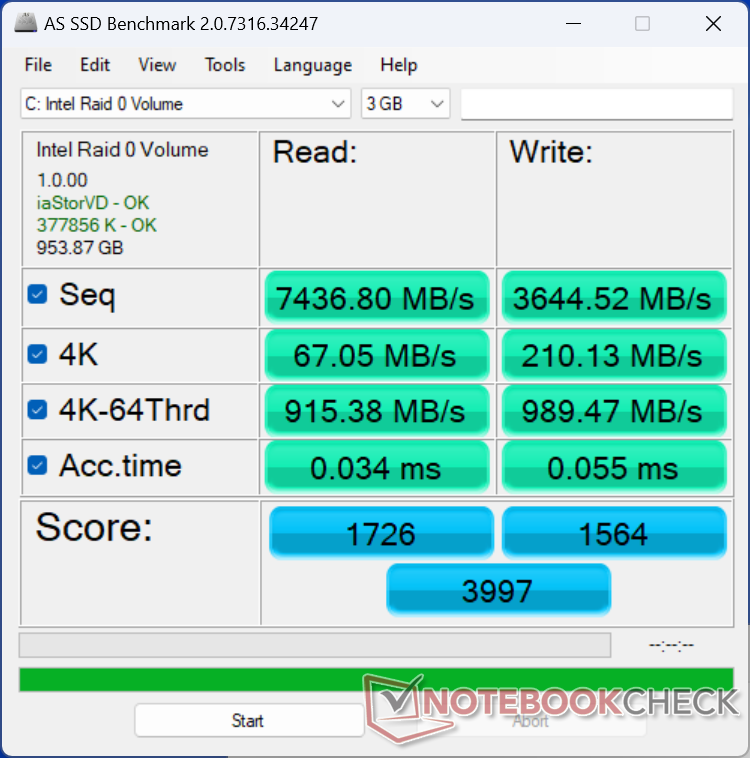
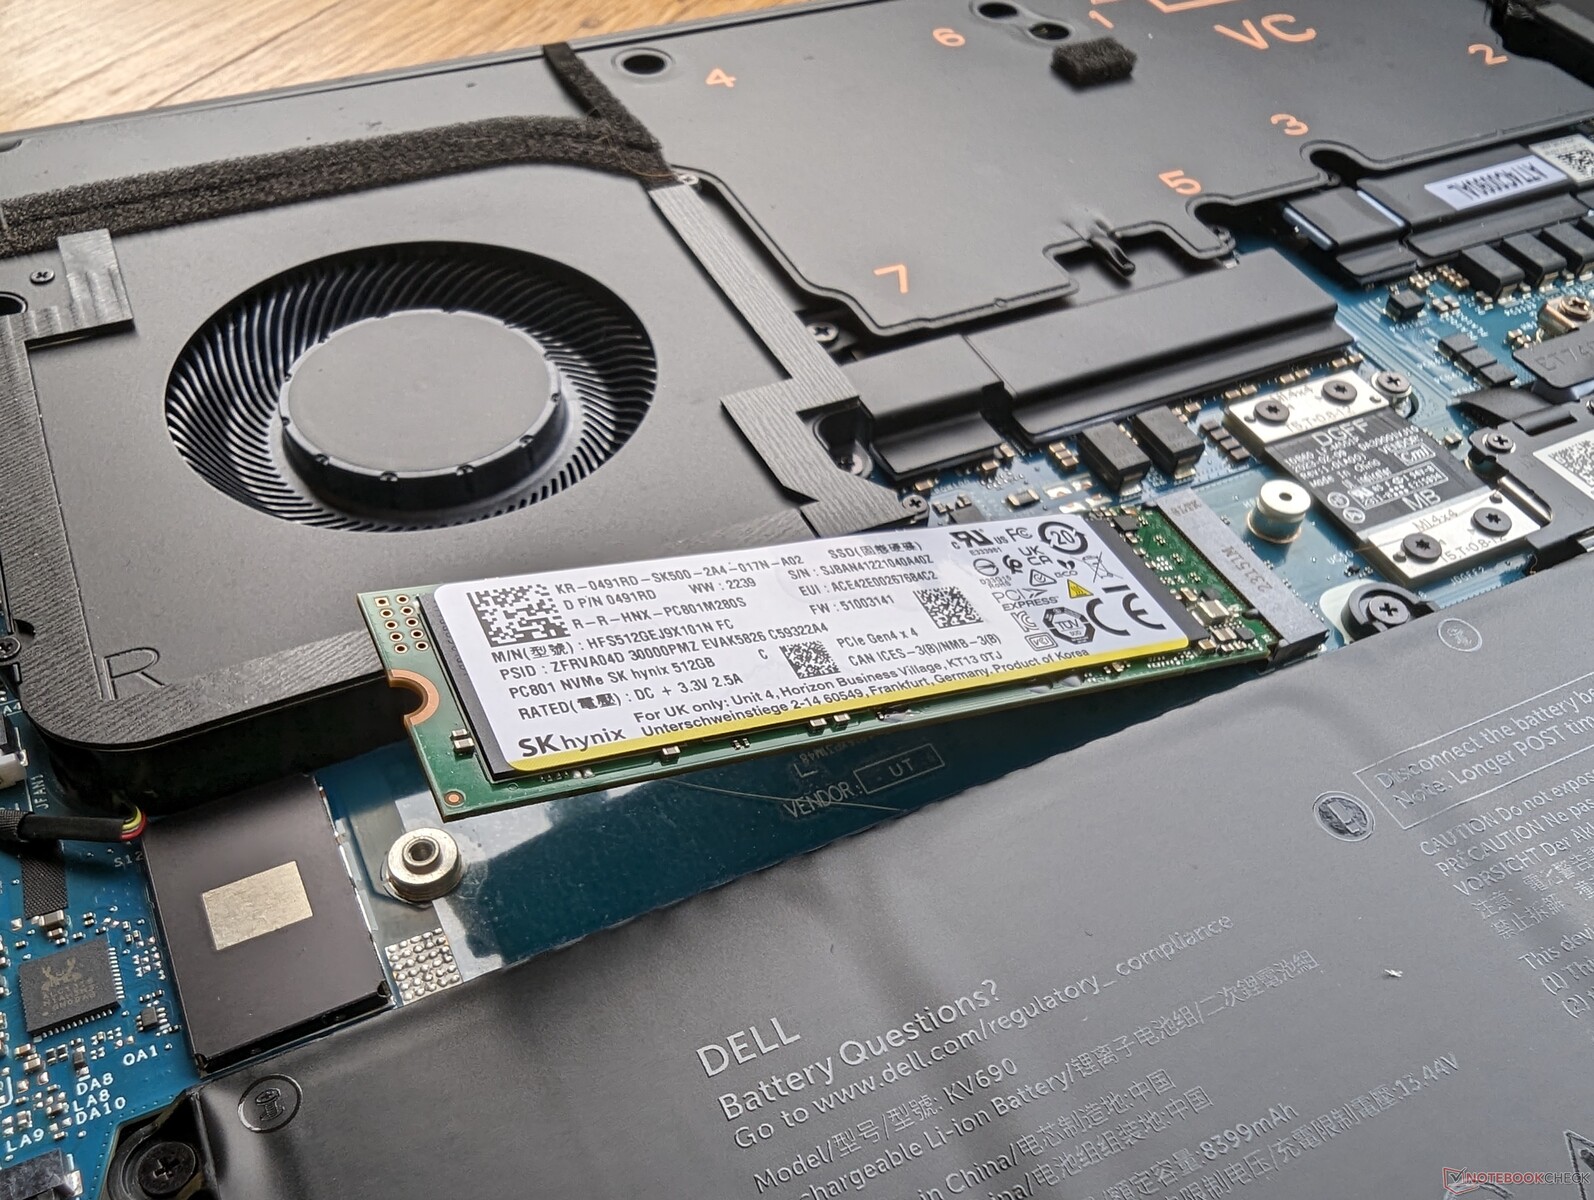
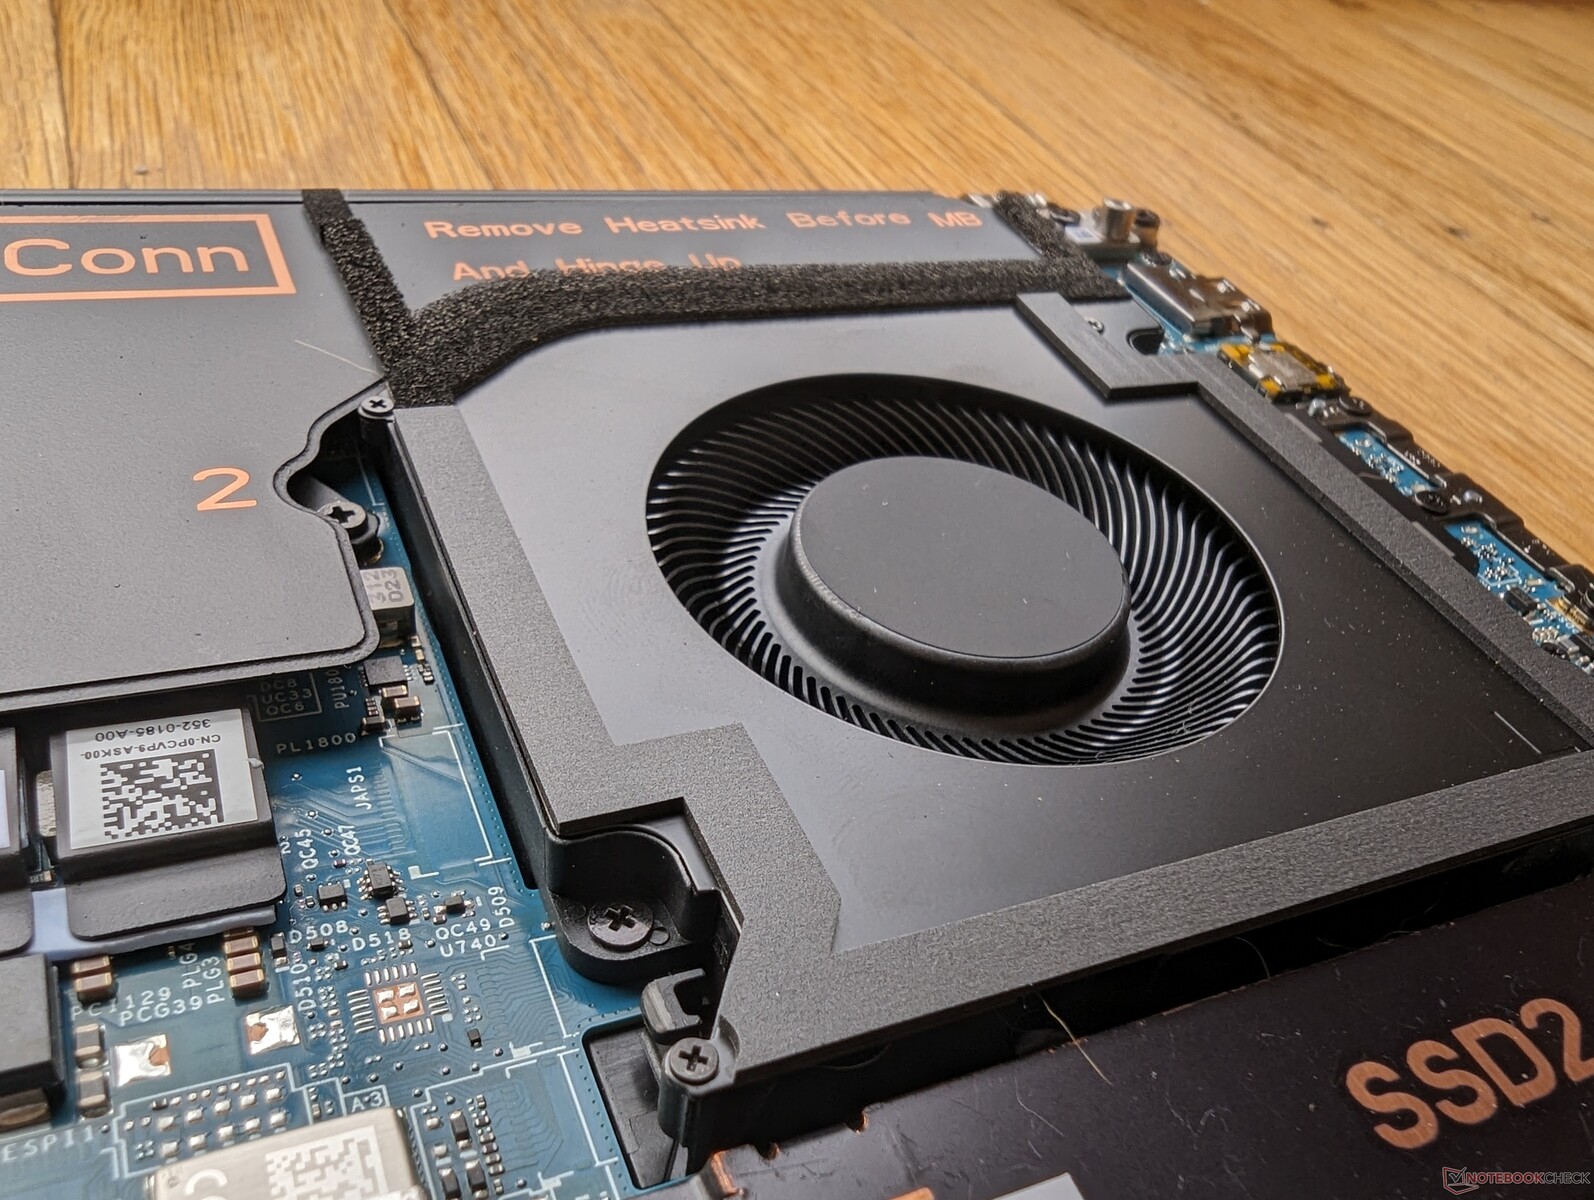
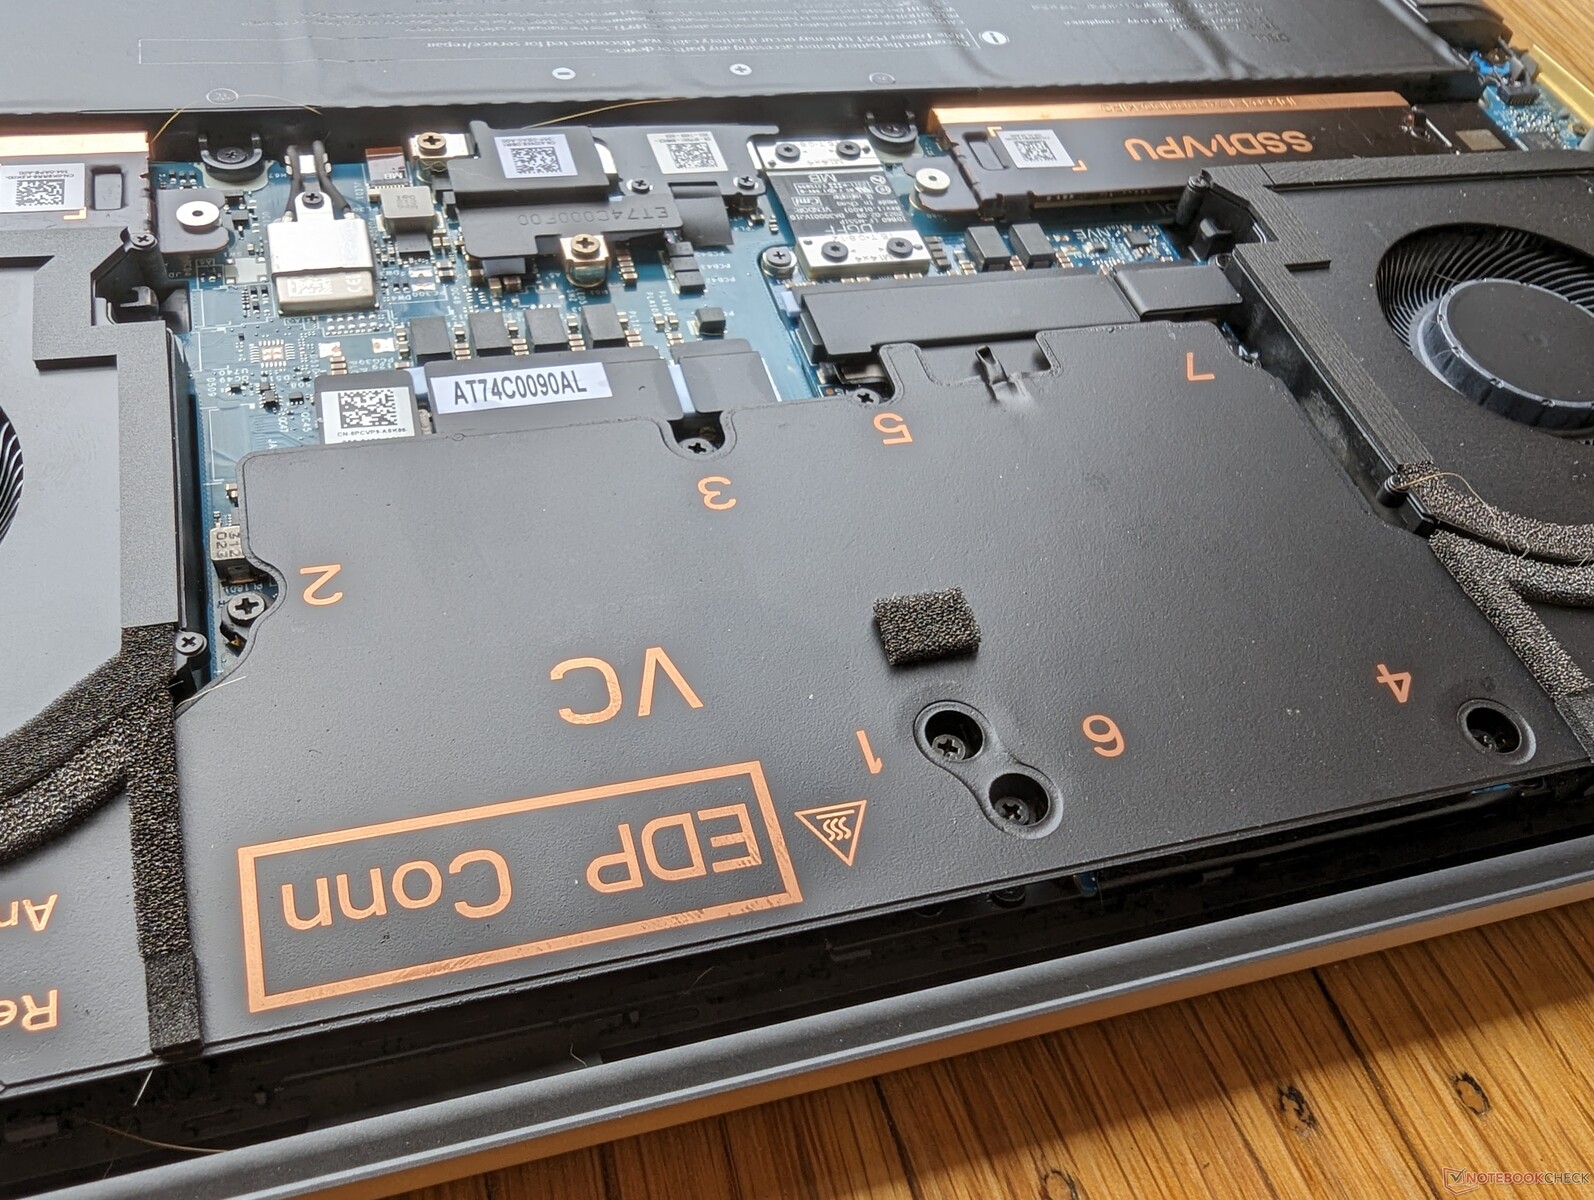
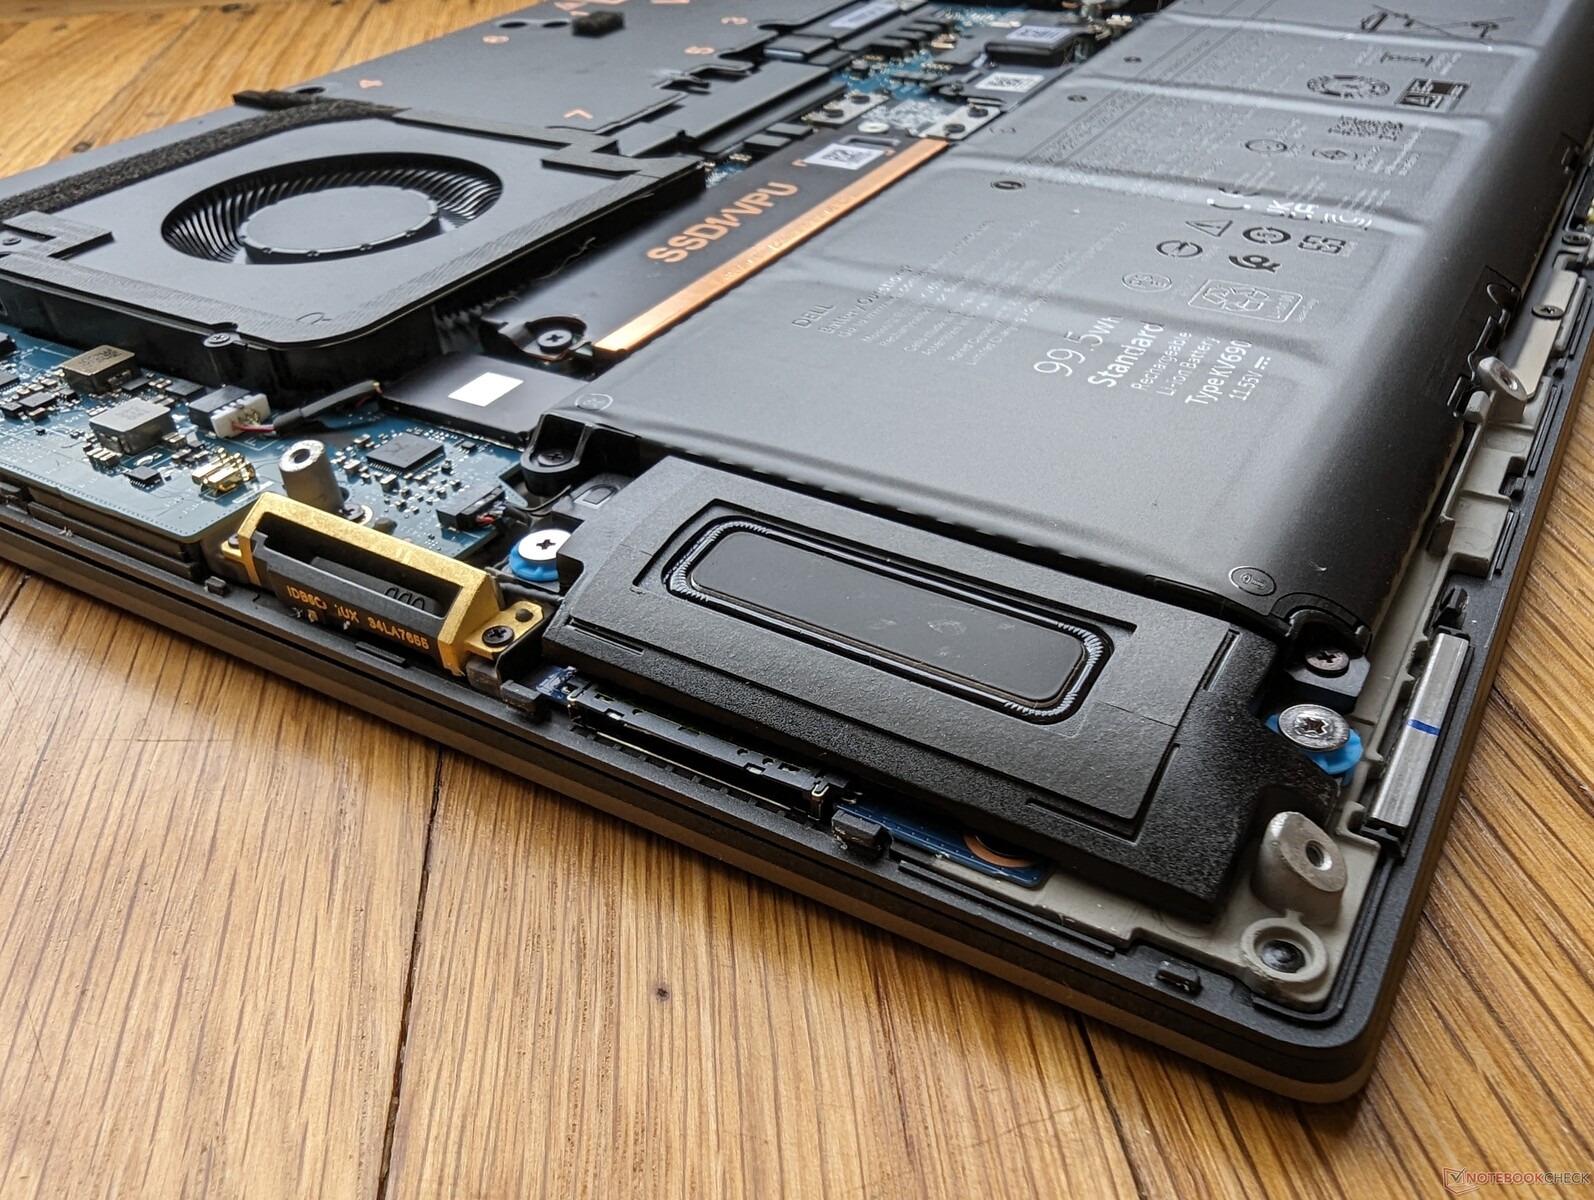
存储设备 - 多达两个 PCIe4 x4 NVMe 固态硬盘
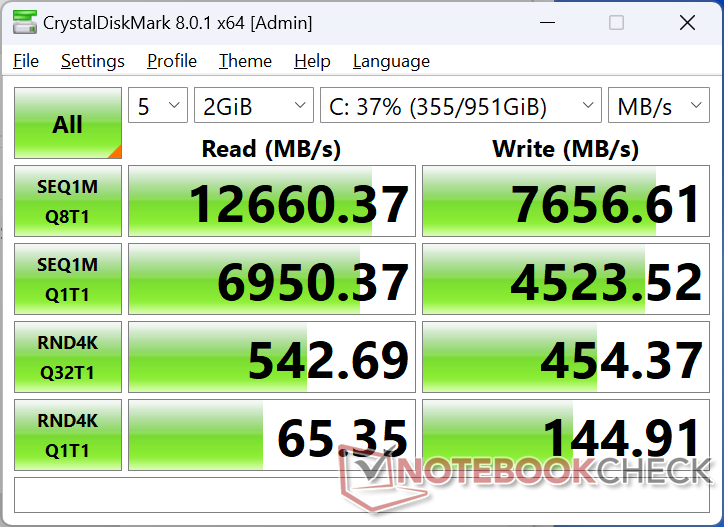
我们的测试设备配备了相同的 SK hynix PC801PCIe4 x4 NVMe 固态硬盘,RAID 0 配置与Precision 7670 系列相同。虽然 PCIe5 支持 某些游戏笔记本电脑虽然 PCIe5 支持(如某些游戏笔记本电脑中的 PCIe5 支持)是件好事,但鉴于 PCIe5 SSD 仍然非常稀少,目前这并不是一项重要功能。戴尔提供自加密固态硬盘选项,以提高安全性。
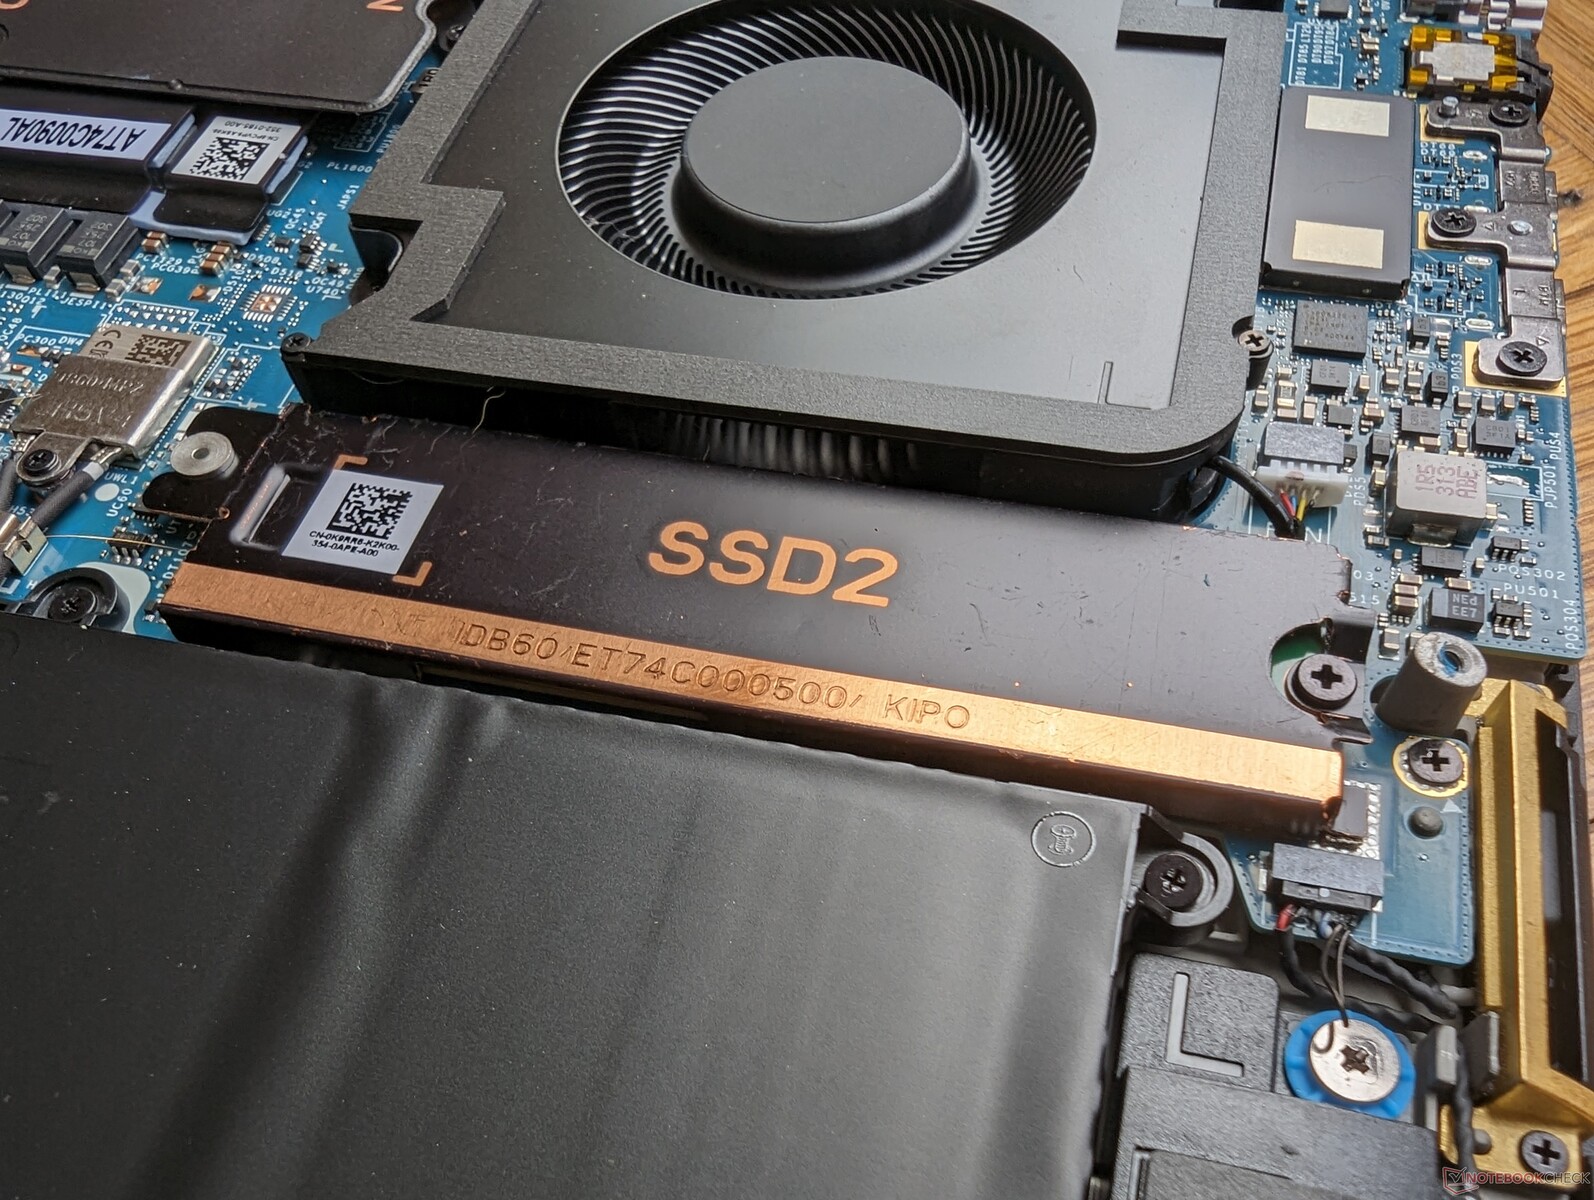
如下图所示,每个 M.2 固态硬盘插槽都配有一个铜质散热器,以帮助散热。我们设备中的每块硬盘都能长时间保持 5400 MB/s 的高传输速率,没有出现重大节流问题。

* ... smaller is better
Disk Throttling: DiskSpd Read Loop, Queue Depth 8
GPU 性能 - 70 W Nvidia Ada Lovelace
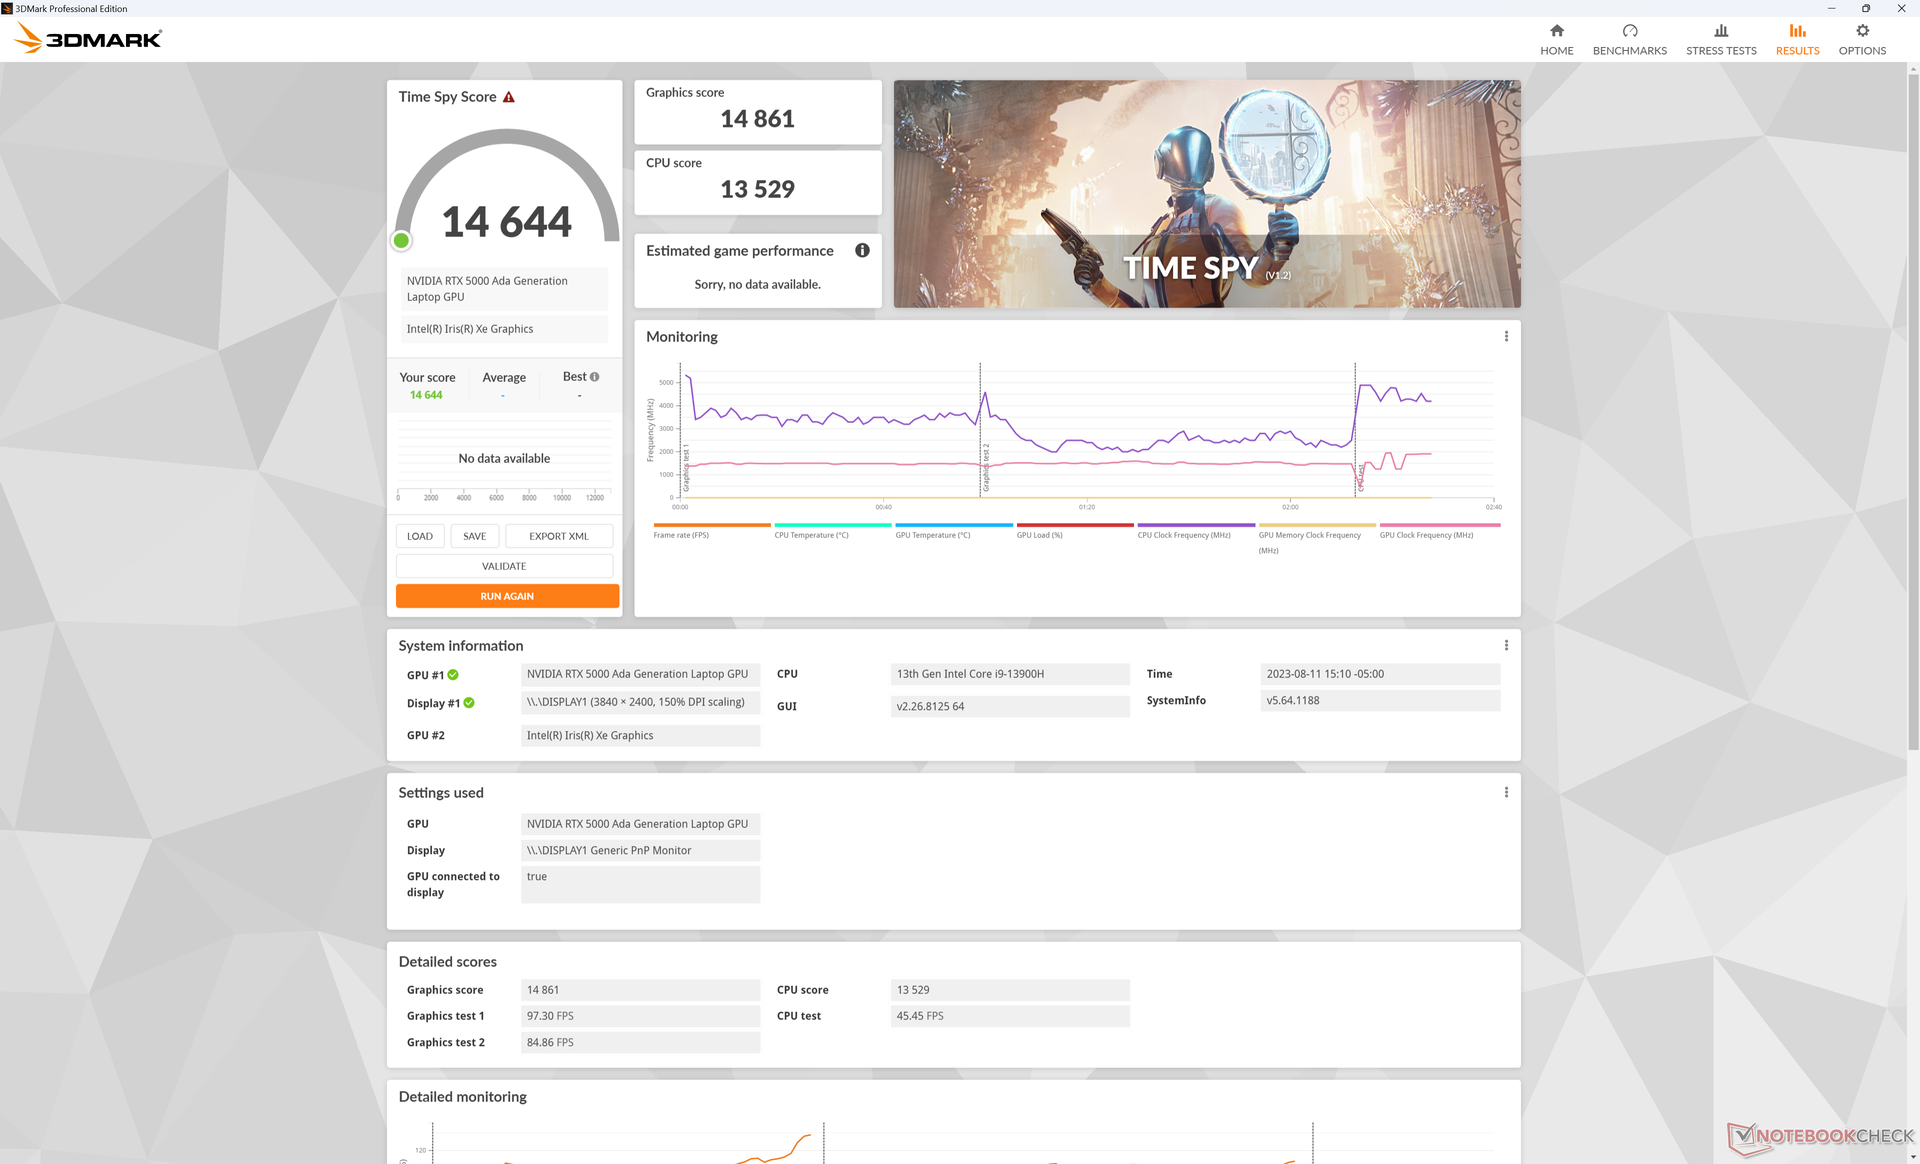
全新 RTX 5000 与去年的 RTX A5000和 A5500 特别是在 DX12 应用程序和 Blender CUDA 加速方面。Time Spy例如,在我们的Precision 上,RTX 5000 的得分比微星 WE76 高出 30% 至 40%。微星 WE76或联想 ThinkPad P16 G1 的得分高出 30% 至 40%。这些优势还体现在大多数 Specviewperf 子测试中。
启用 ECC VRAM 模式似乎不会影响内存时钟频率,但根据 GPU-Z,最大可用 VRAM 将从 16384 MB 减少到 15360 MB。
请注意,如下Fire Strike 结果所示,从 "性能 "模式切换到 "平衡 "模式不会对 GPU 性能产生重大影响。相反,CPU 性能会受到明显影响。
| 电源配置文件 | 物理得分 | 图形得分 | 综合得分 |
| 电池电量 | 20938 (-31%) | 27514 (-10%) | 8910 (-31%) |
| 平衡模式 | 24828 (-18%) | 30588 (-0%) | 11365 (-12%) |
| 绩效模式 | 30237 | 30422 | 12907 |
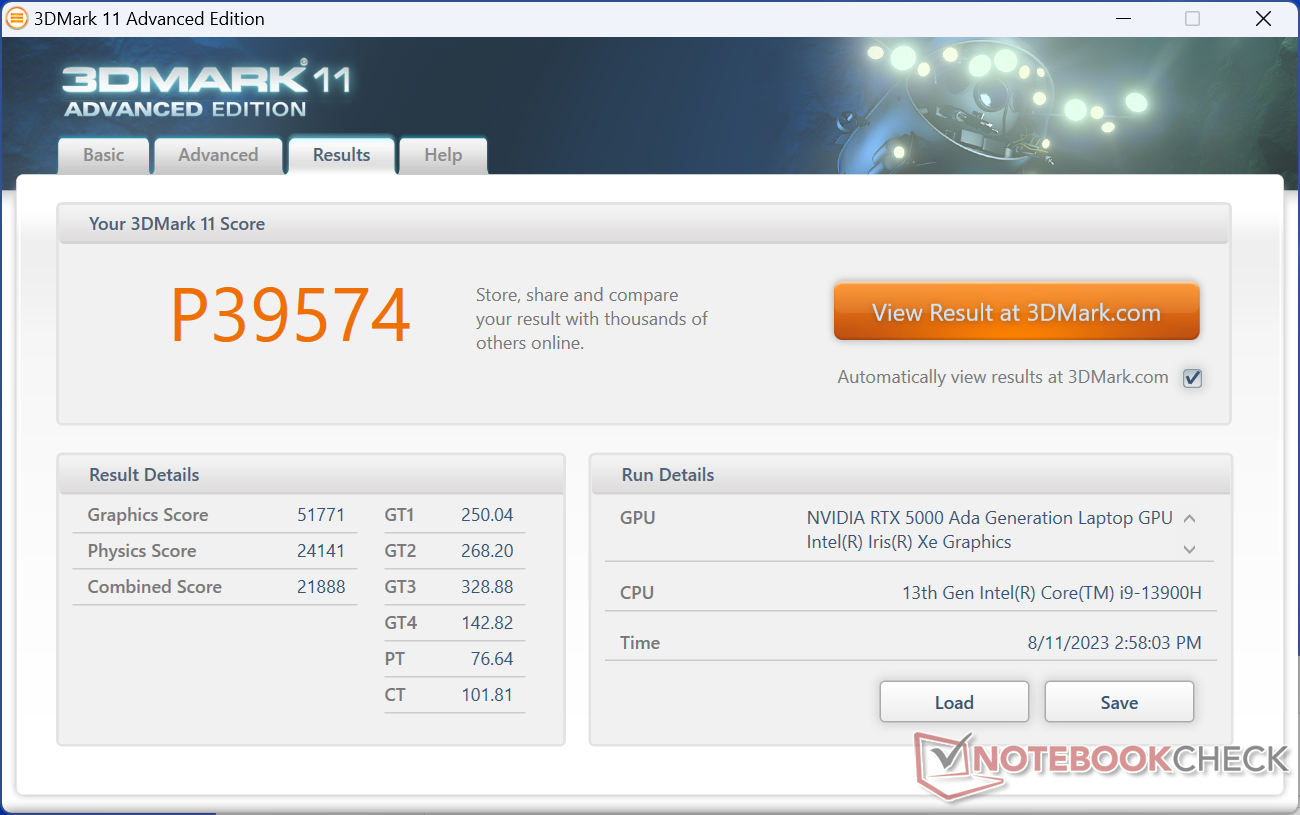
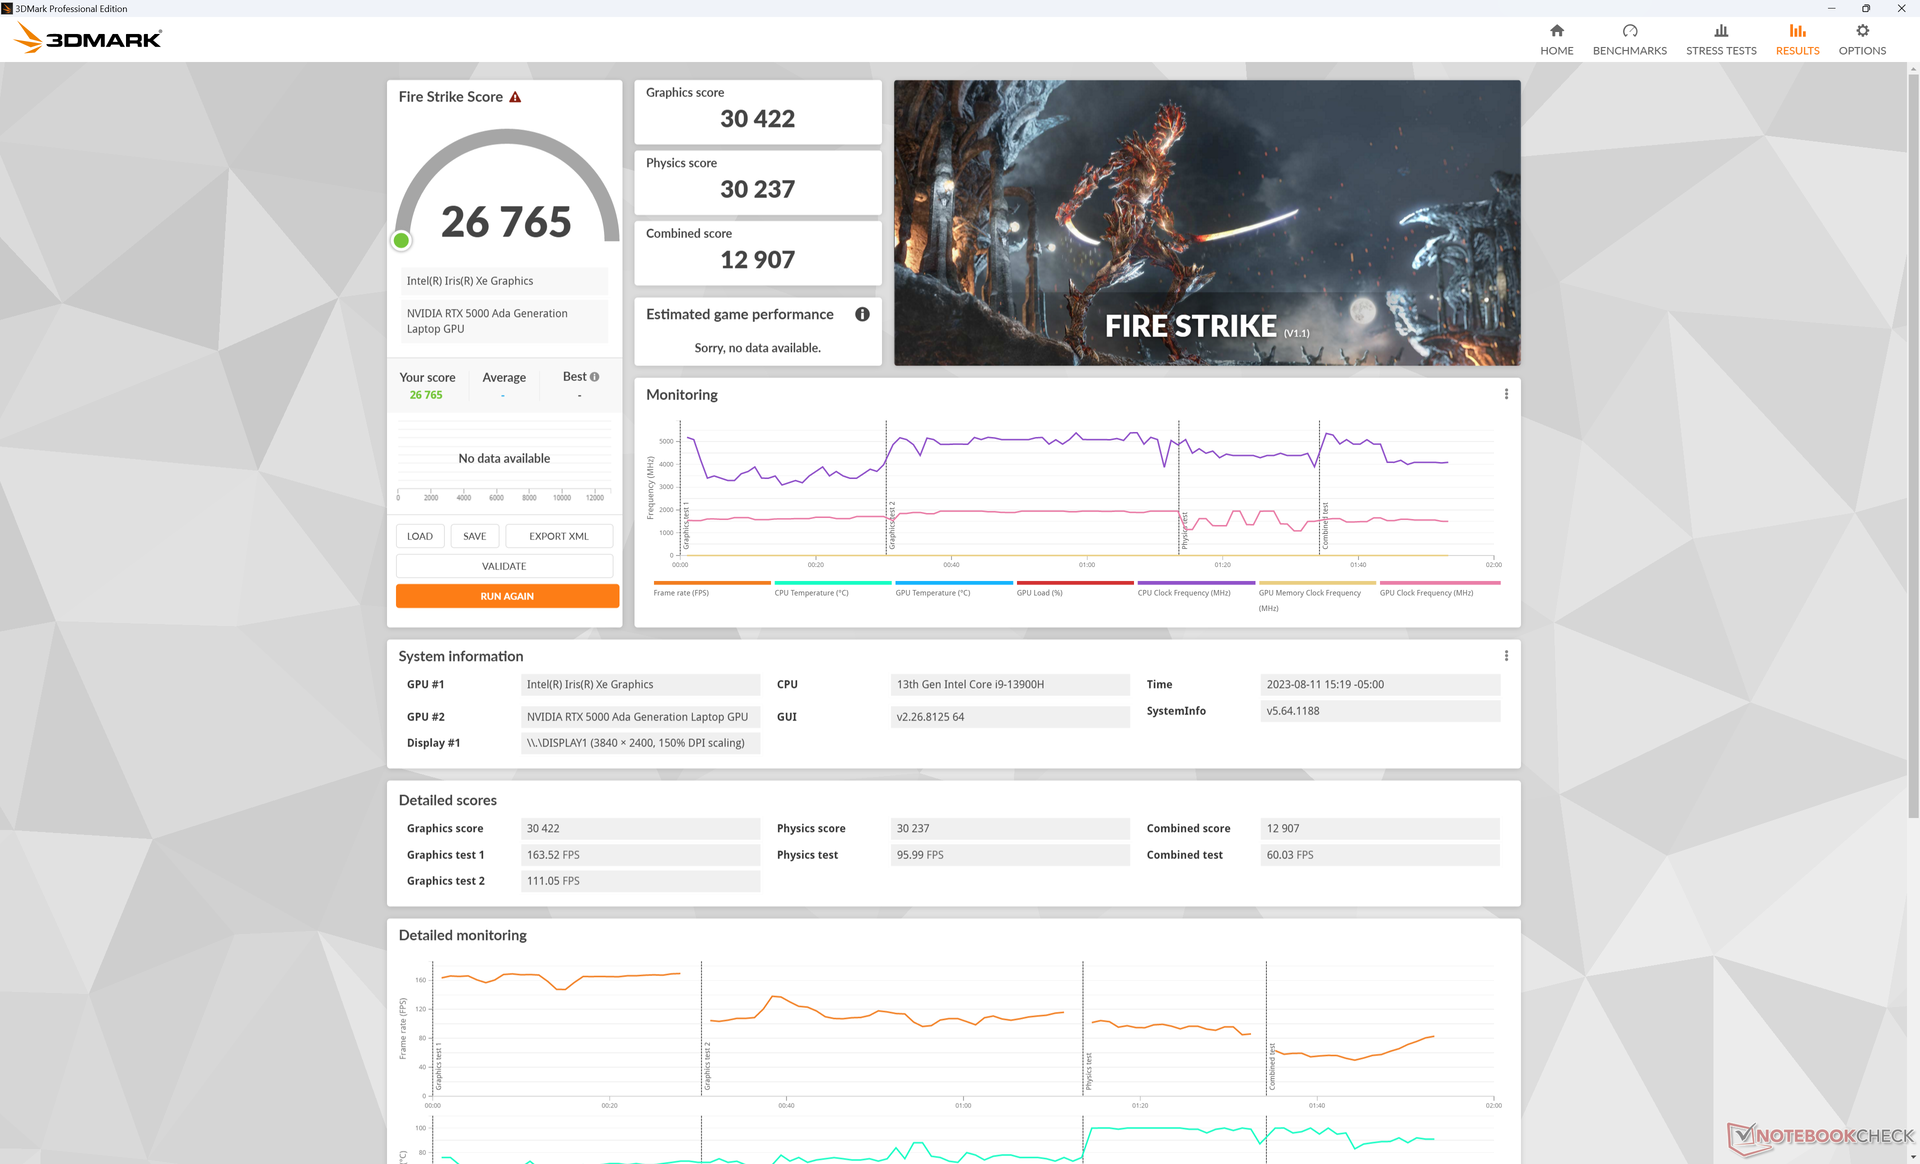
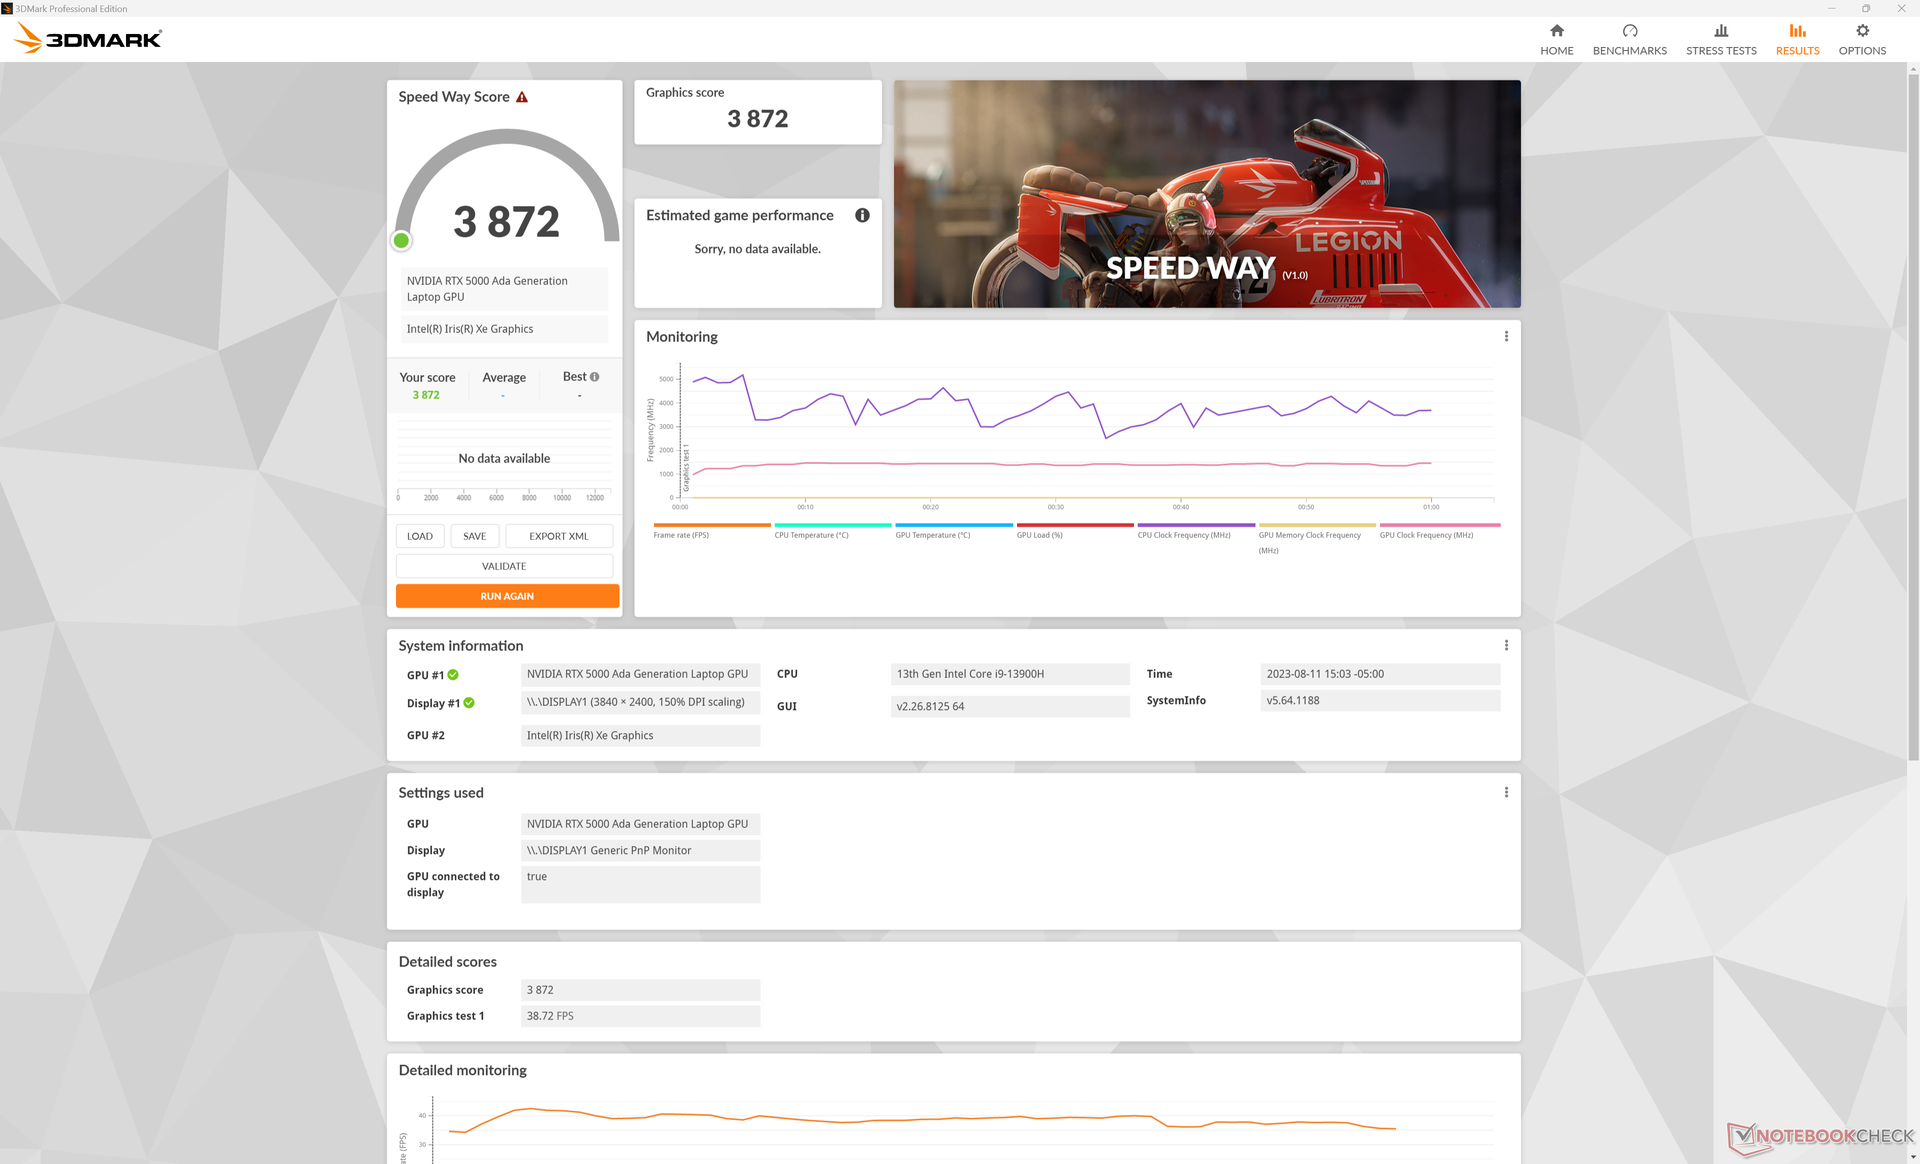
| 3DMark 11 Performance | 39574 points | |
| 3DMark Fire Strike Score | 26765 points | |
| 3DMark Time Spy Score | 14644 points | |
Help | ||
* ... smaller is better
游戏性能
Precision 5680 虽然不是一款游戏笔记本电脑,但仍然完全能够玩到最新的高要求游戏,而且在测试过程中没有出现任何兼容性问题。整体游戏性能介于移动GeForce RTX 4060 和 移动 RTX 4070之间。 HP Omen Transcend 16.
Witcher 3 FPS Chart
| low | med. | high | ultra | QHD | 4K | |
|---|---|---|---|---|---|---|
| GTA V (2015) | 185.4 | 179.7 | 175.3 | 117.1 | 106.6 | 108 |
| The Witcher 3 (2015) | 412.7 | 329.6 | 256 | 137 | 97 | |
| Dota 2 Reborn (2015) | 178 | 161.7 | 154 | 144 | 142.5 | |
| Final Fantasy XV Benchmark (2018) | 196.3 | 165.6 | 127.4 | 100.8 | 60.4 | |
| X-Plane 11.11 (2018) | 155.3 | 133 | 102.4 | 86.2 | ||
| Far Cry 5 (2018) | 145 | 132 | 129 | 132 | 114 | 70 |
| Cyberpunk 2077 1.6 (2022) | 124.9 | 122.7 | 107.7 | 100 | 66.2 | 32.2 |
| Tiny Tina's Wonderlands (2022) | 220 | 202.3 | 152.6 | 125 | 90.1 | 50.9 |
| F1 22 (2022) | 232 | 218 | 202 | 84.5 | 56.1 | 28.8 |
| Returnal (2023) | 98 | 94 | 90 | 81 | 60 | 34 |
排放 - 大部分时间保持安静
系统噪音
噪音水平与Precision 5550尽管我们的Precision 5680 配备了速度更快的 GPU。在运行网页浏览器等要求不高的负载时,风扇噪音往往徘徊在 20 分贝(A)的中高水平,而要求较高的负载则会产生 51 分贝(A)的稳定噪音。
有趣的是,平衡模式下的最大风扇噪音水平与性能模式下相同。
Noise level
| Idle |
| 23 / 23 / 23 dB(A) |
| Load |
| 37.2 / 51 dB(A) |
 | ||
30 dB silent 40 dB(A) audible 50 dB(A) loud |
||
min: | ||
| Dell Precision 5000 5680 RTX 5000 Ada Generation Laptop, i9-13900H, 2x SK hynix PC801 HFS512GEJ9X101N RAID 0 | Dell Precision 7000 7670 Performance RTX A5500 Laptop GPU, i9-12950HX | HP ZBook Fury 16 G9 RTX A5500 Laptop GPU, i9-12950HX, Micron 3400 1TB MTFDKBA1T0TFH | Lenovo ThinkPad P16 G1 RTX A5500 RTX A5500 Laptop GPU, i9-12950HX, WDC PC SN810 2TB | MSI CreatorPro Z16P B12UKST RTX A3000 Laptop GPU, i7-12700H, Samsung PM9A1 MZVL21T0HCLR | Asus ExpertBook B6 Flip B6602FC2 RTX A2000 Laptop GPU, i9-12950HX, Samsung PM9A1 MZVL21T0HCLR | |
|---|---|---|---|---|---|---|
| Noise | -11% | -2% | 3% | -8% | -30% | |
| off / environment * (dB) | 22.8 | 23.9 -5% | 22.6 1% | 23.1 -1% | 24.1 -6% | 26 -14% |
| Idle Minimum * (dB) | 23 | 24 -4% | 22.7 1% | 23.1 -0% | 27.1 -18% | 32.4 -41% |
| Idle Average * (dB) | 23 | 24 -4% | 22.7 1% | 23.1 -0% | 27.1 -18% | 32.4 -41% |
| Idle Maximum * (dB) | 23 | 38 -65% | 28.8 -25% | 23.1 -0% | 27.1 -18% | 32.4 -41% |
| Load Average * (dB) | 37.2 | 46.3 -24% | 36.2 3% | 28.9 22% | 42.9 -15% | 51.9 -40% |
| Witcher 3 ultra * (dB) | 51 | 41.9 18% | 49.5 3% | 51.6 -1% | 44 14% | |
| Load Maximum * (dB) | 51 | 47.9 6% | 49.3 3% | 51.4 -1% | 47 8% | 52.1 -2% |
* ... smaller is better
温度
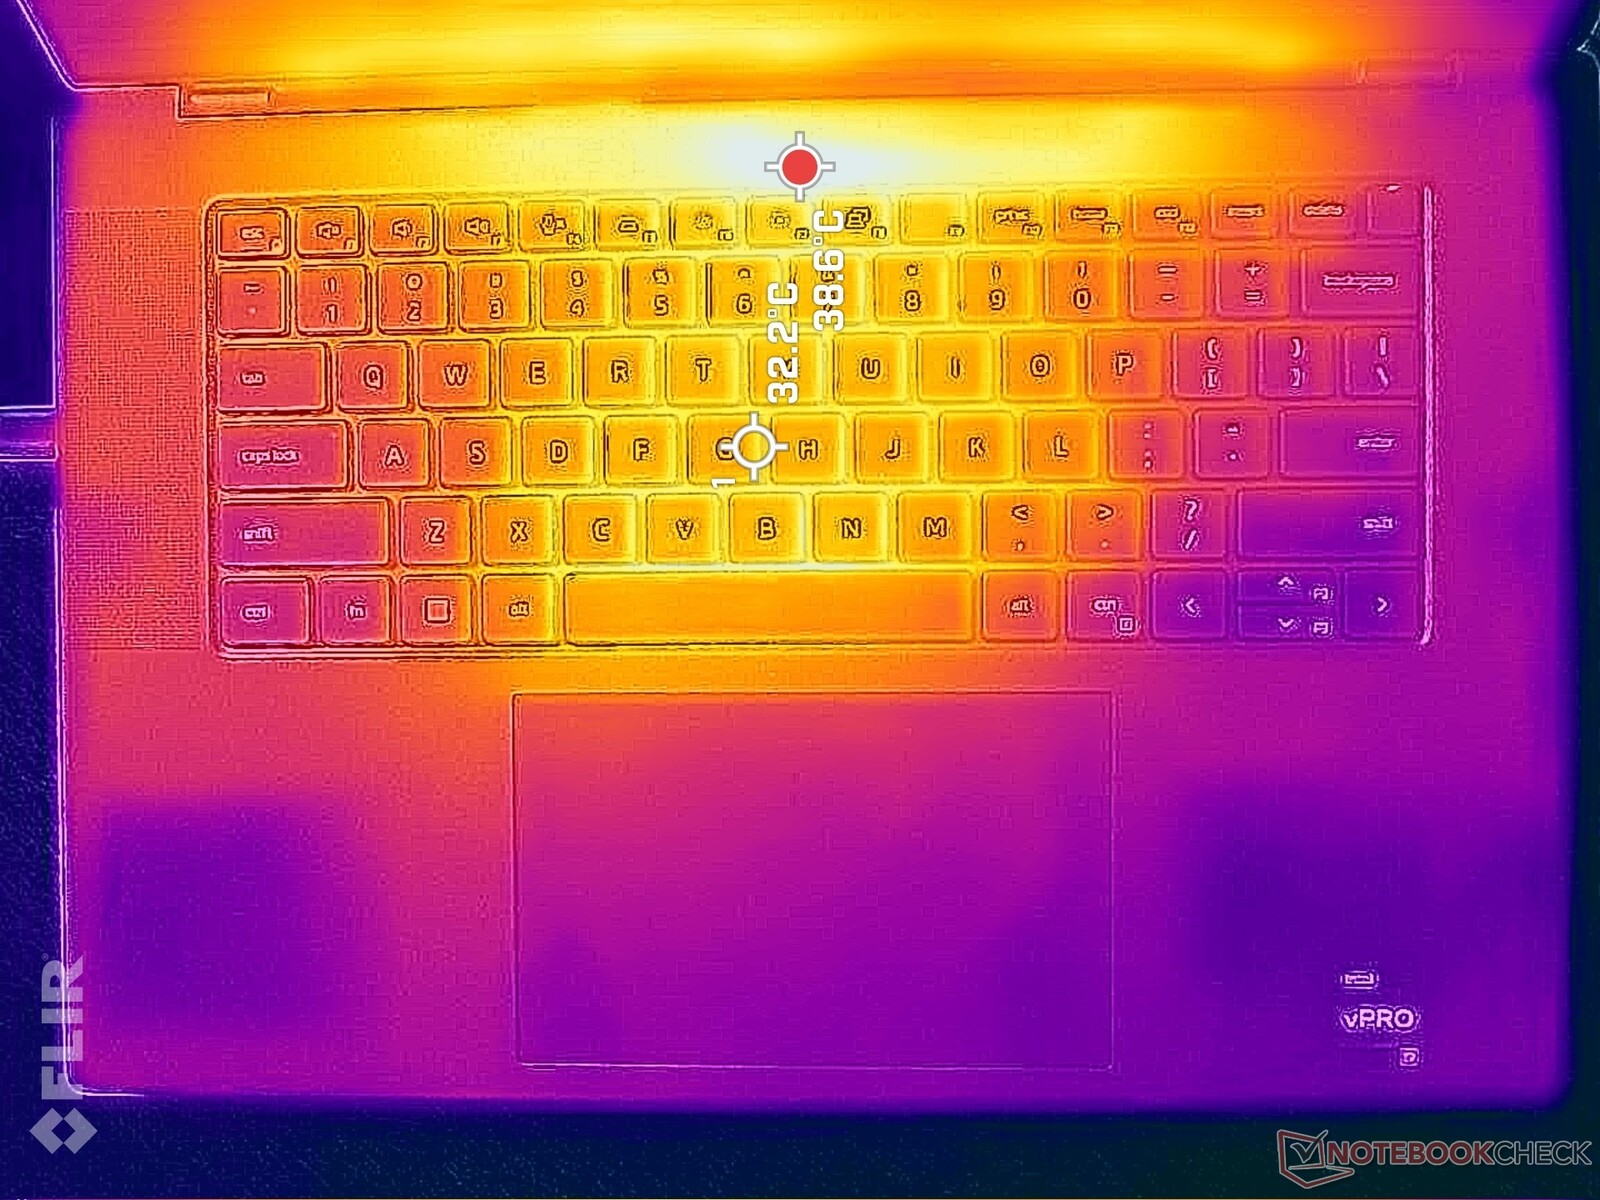
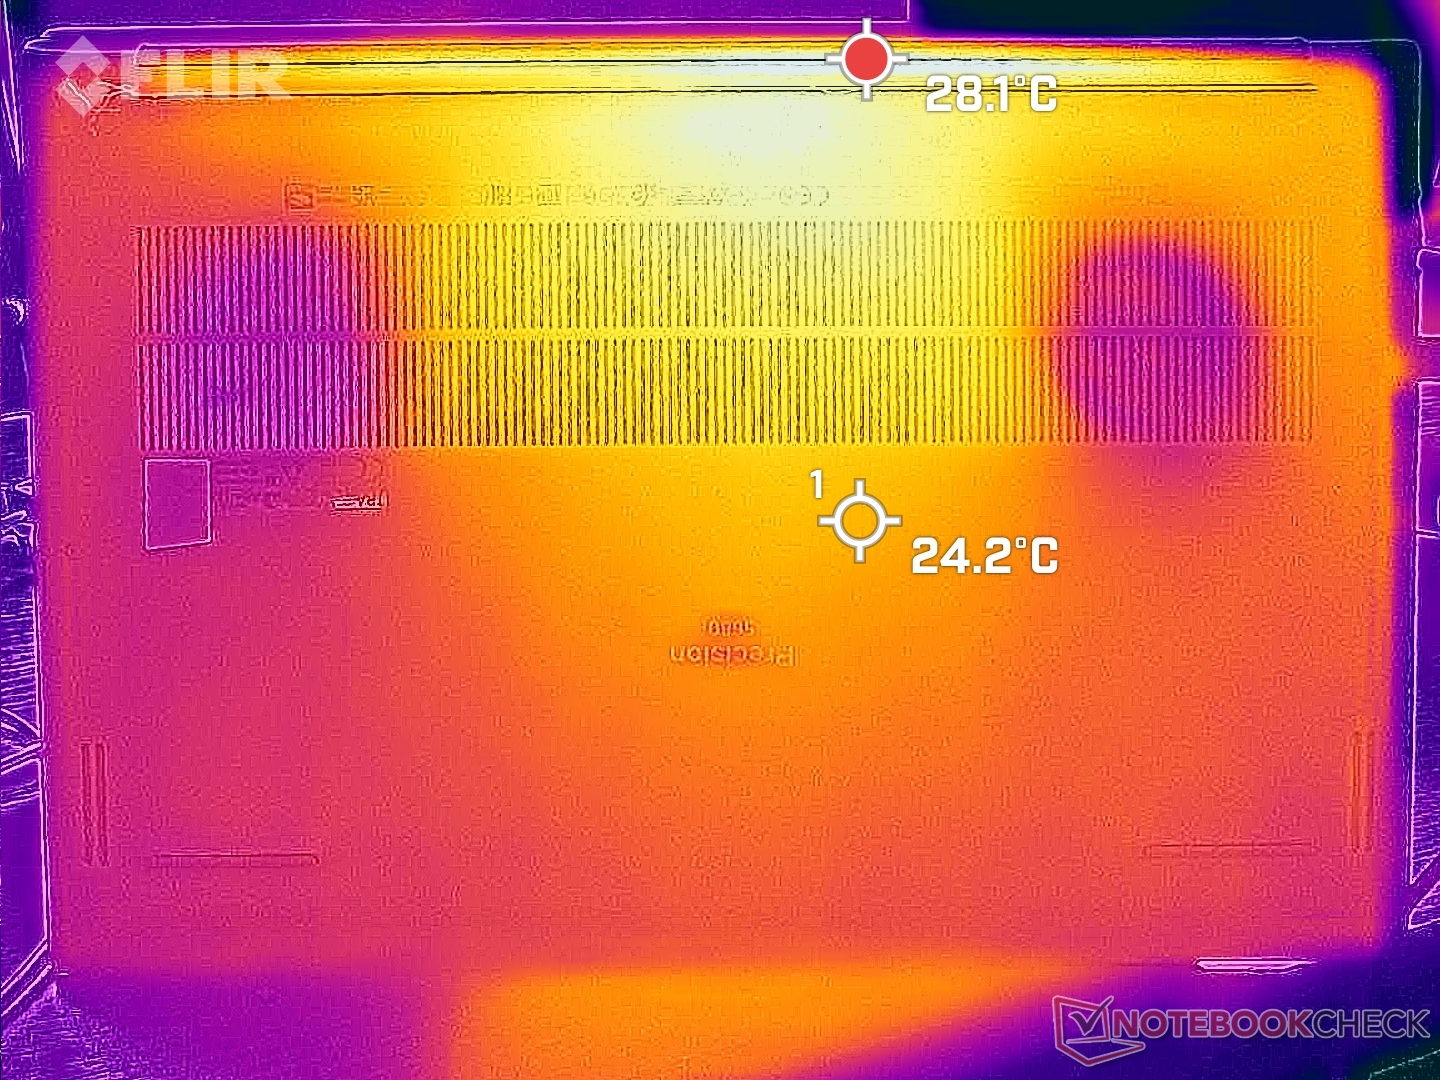
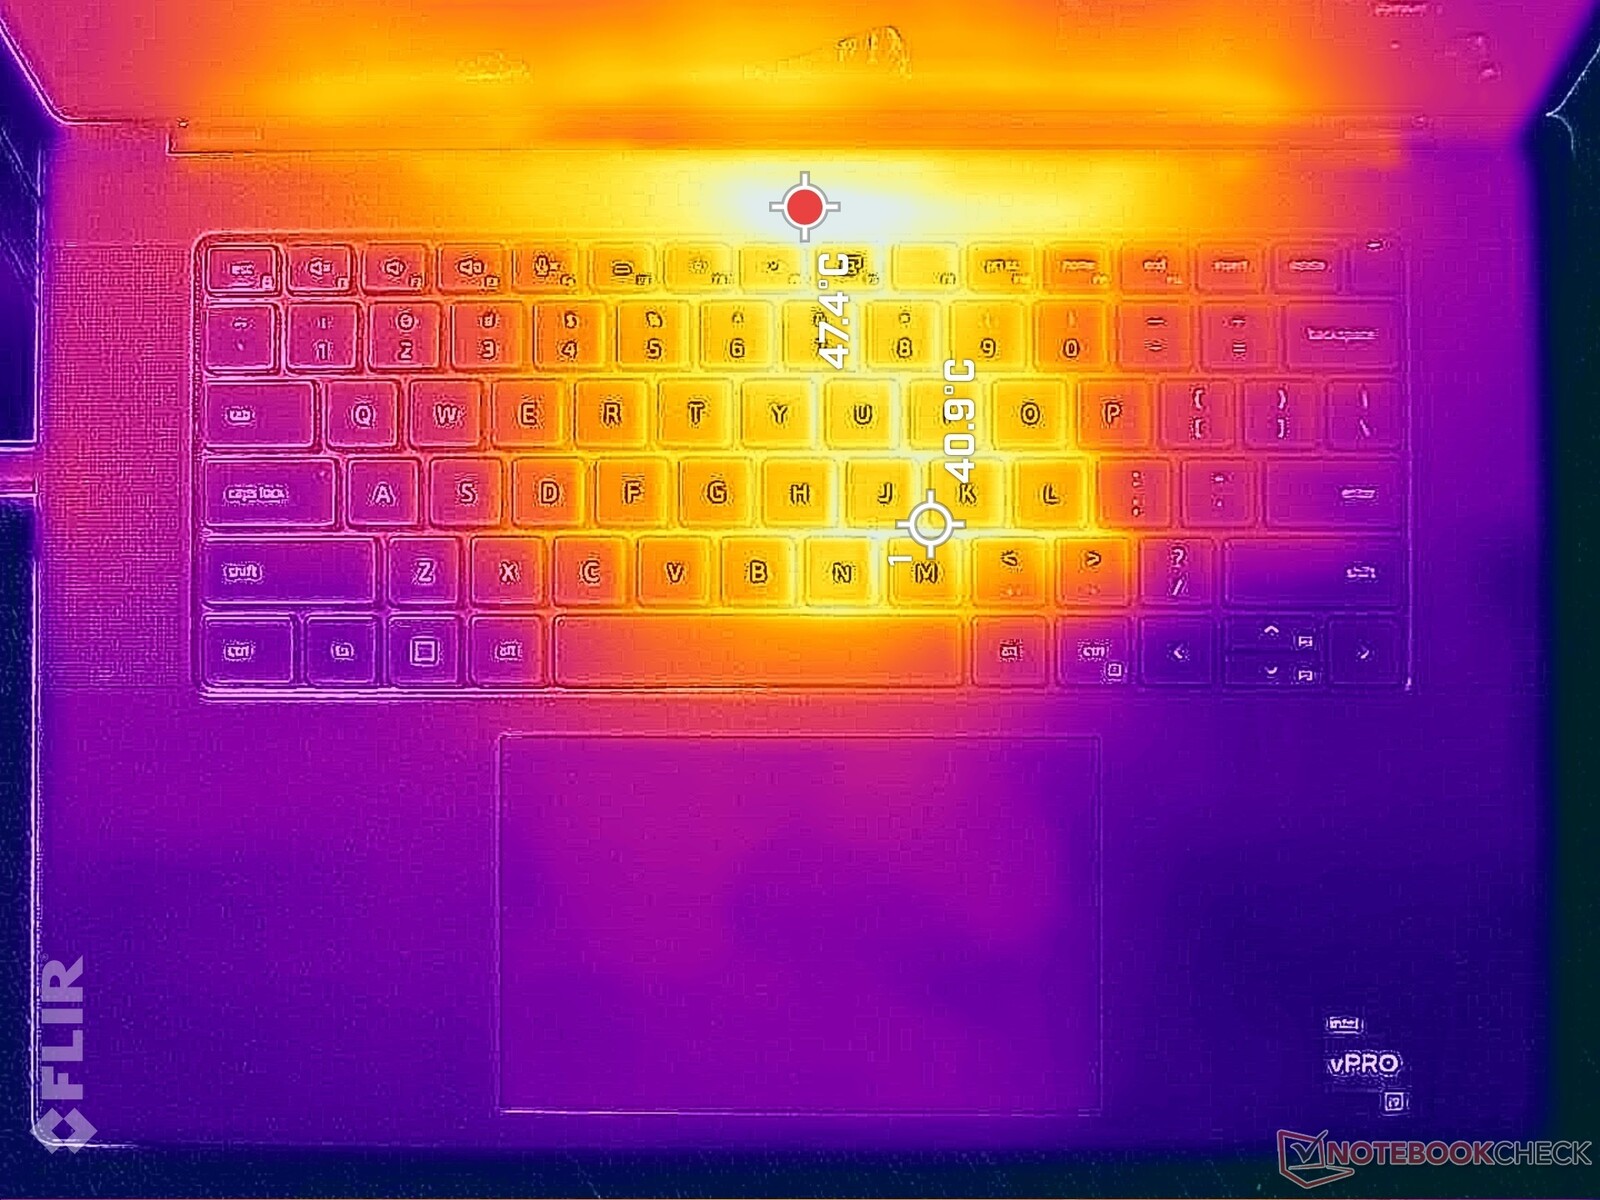
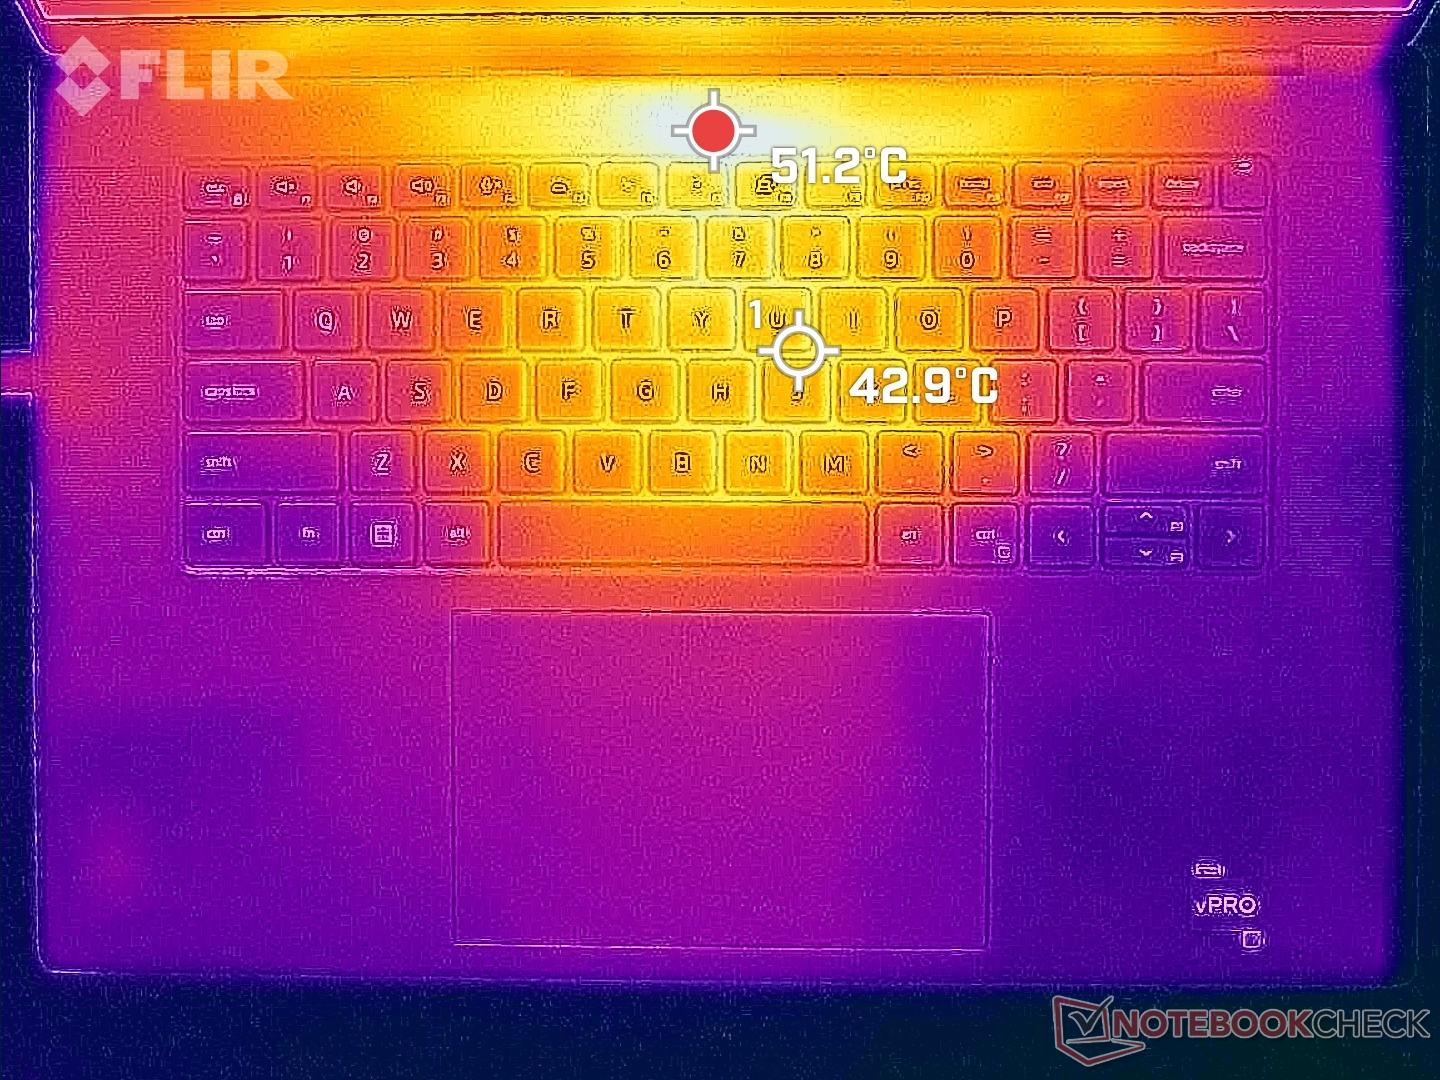
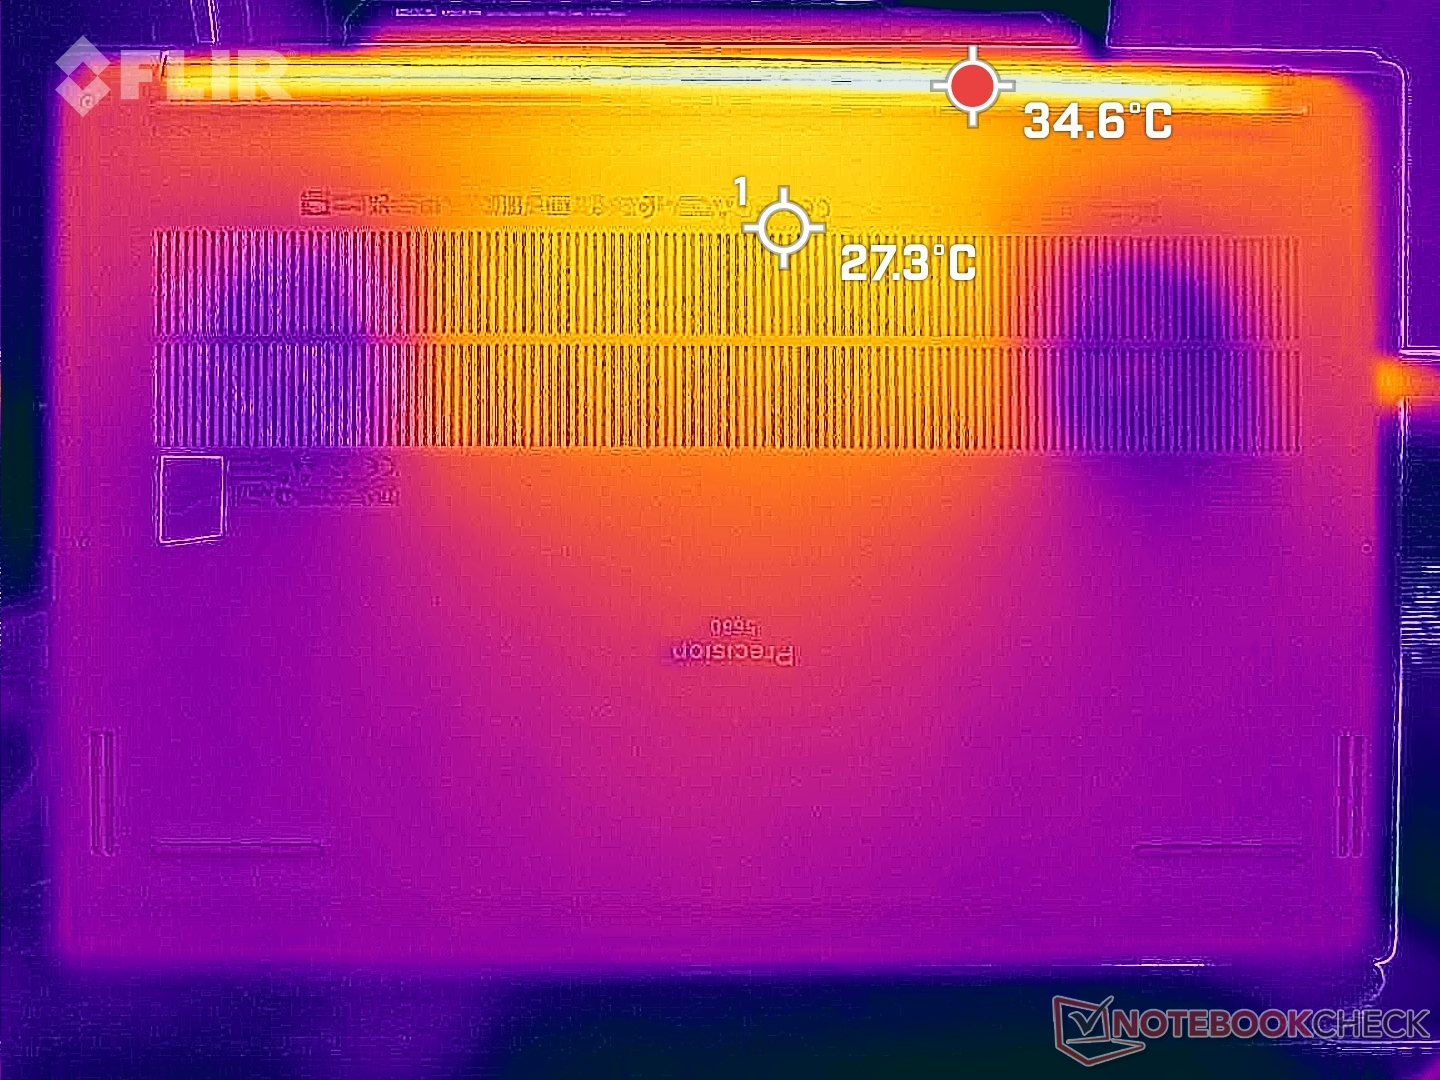
由于风扇在需要时才会空转,因此空转时的表面温度比预期的要高。顶面和底面的热点温度分别高达 37 摄氏度和 32 摄氏度,而在底面则低于 30 摄氏度。B6 Flip.
当运行要求较高的负载时,键盘中心的温度可达 50 摄氏度以上,而底面几乎不会升温,部分原因是采用了戈尔绝缘体。手指和手掌只是不经常接触键盘中心,因此热热点一般不会影响舒适度。
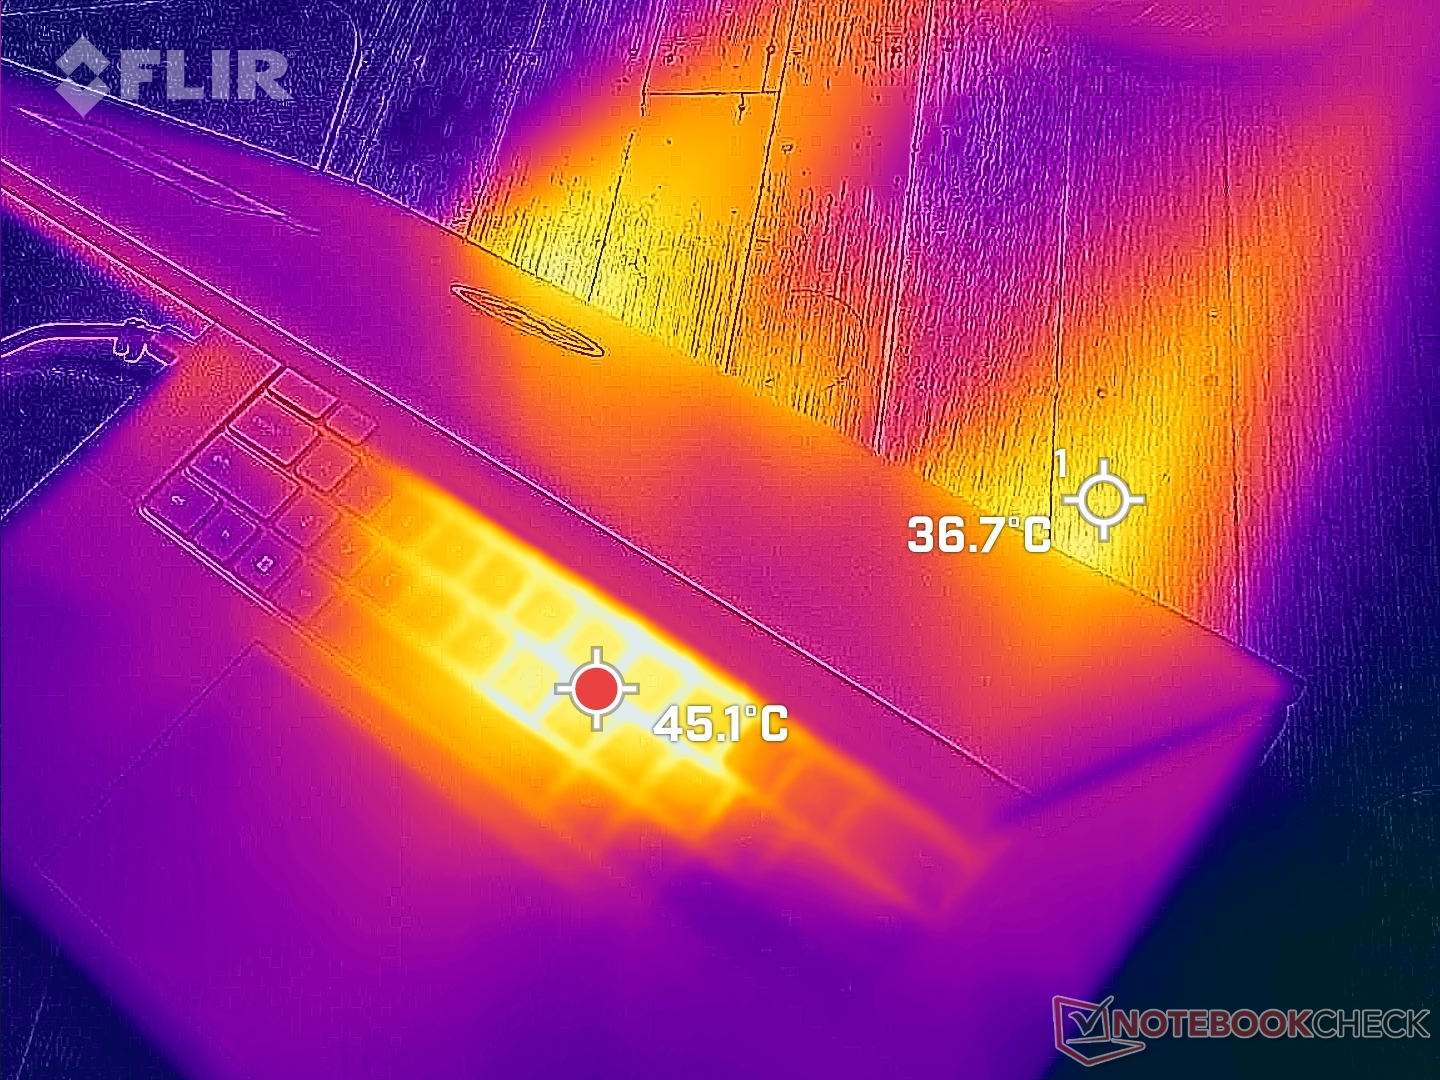
(-) The maximum temperature on the upper side is 50.2 °C / 122 F, compared to the average of 38.2 °C / 101 F, ranging from 22.2 to 69.8 °C for the class Workstation.
(+) The bottom heats up to a maximum of 32 °C / 90 F, compared to the average of 41.1 °C / 106 F
(+) In idle usage, the average temperature for the upper side is 30.1 °C / 86 F, compared to the device average of 32 °C / 90 F.
(±) Playing The Witcher 3, the average temperature for the upper side is 34.6 °C / 94 F, compared to the device average of 32 °C / 90 F.
(+) The palmrests and touchpad are cooler than skin temperature with a maximum of 27.6 °C / 81.7 F and are therefore cool to the touch.
(±) The average temperature of the palmrest area of similar devices was 27.8 °C / 82 F (+0.2 °C / 0.3 F).

| Dell Precision 5000 5680 Intel Core i9-13900H, NVIDIA RTX 5000 Ada Generation Laptop | Dell Precision 7000 7670 Performance Intel Core i9-12950HX, NVIDIA RTX A5500 Laptop GPU | HP ZBook Fury 16 G9 Intel Core i9-12950HX, NVIDIA RTX A5500 Laptop GPU | Lenovo ThinkPad P16 G1 RTX A5500 Intel Core i9-12950HX, NVIDIA RTX A5500 Laptop GPU | MSI CreatorPro Z16P B12UKST Intel Core i7-12700H, NVIDIA RTX A3000 Laptop GPU | Asus ExpertBook B6 Flip B6602FC2 Intel Core i9-12950HX, NVIDIA RTX A2000 Laptop GPU | |
|---|---|---|---|---|---|---|
| Heat | -12% | -3% | -13% | -19% | -8% | |
| Maximum Upper Side * (°C) | 50.2 | 53 -6% | 43.2 14% | 44.8 11% | 56.3 -12% | 48.4 4% |
| Maximum Bottom * (°C) | 32 | 43.2 -35% | 50.4 -58% | 49.8 -56% | 68.3 -113% | 52.3 -63% |
| Idle Upper Side * (°C) | 37.4 | 36.8 2% | 28.6 24% | 30.6 18% | 25.2 33% | 27.8 26% |
| Idle Bottom * (°C) | 31.2 | 33.8 -8% | 28.2 10% | 38.6 -24% | 25.9 17% | 30.3 3% |
* ... smaller is better
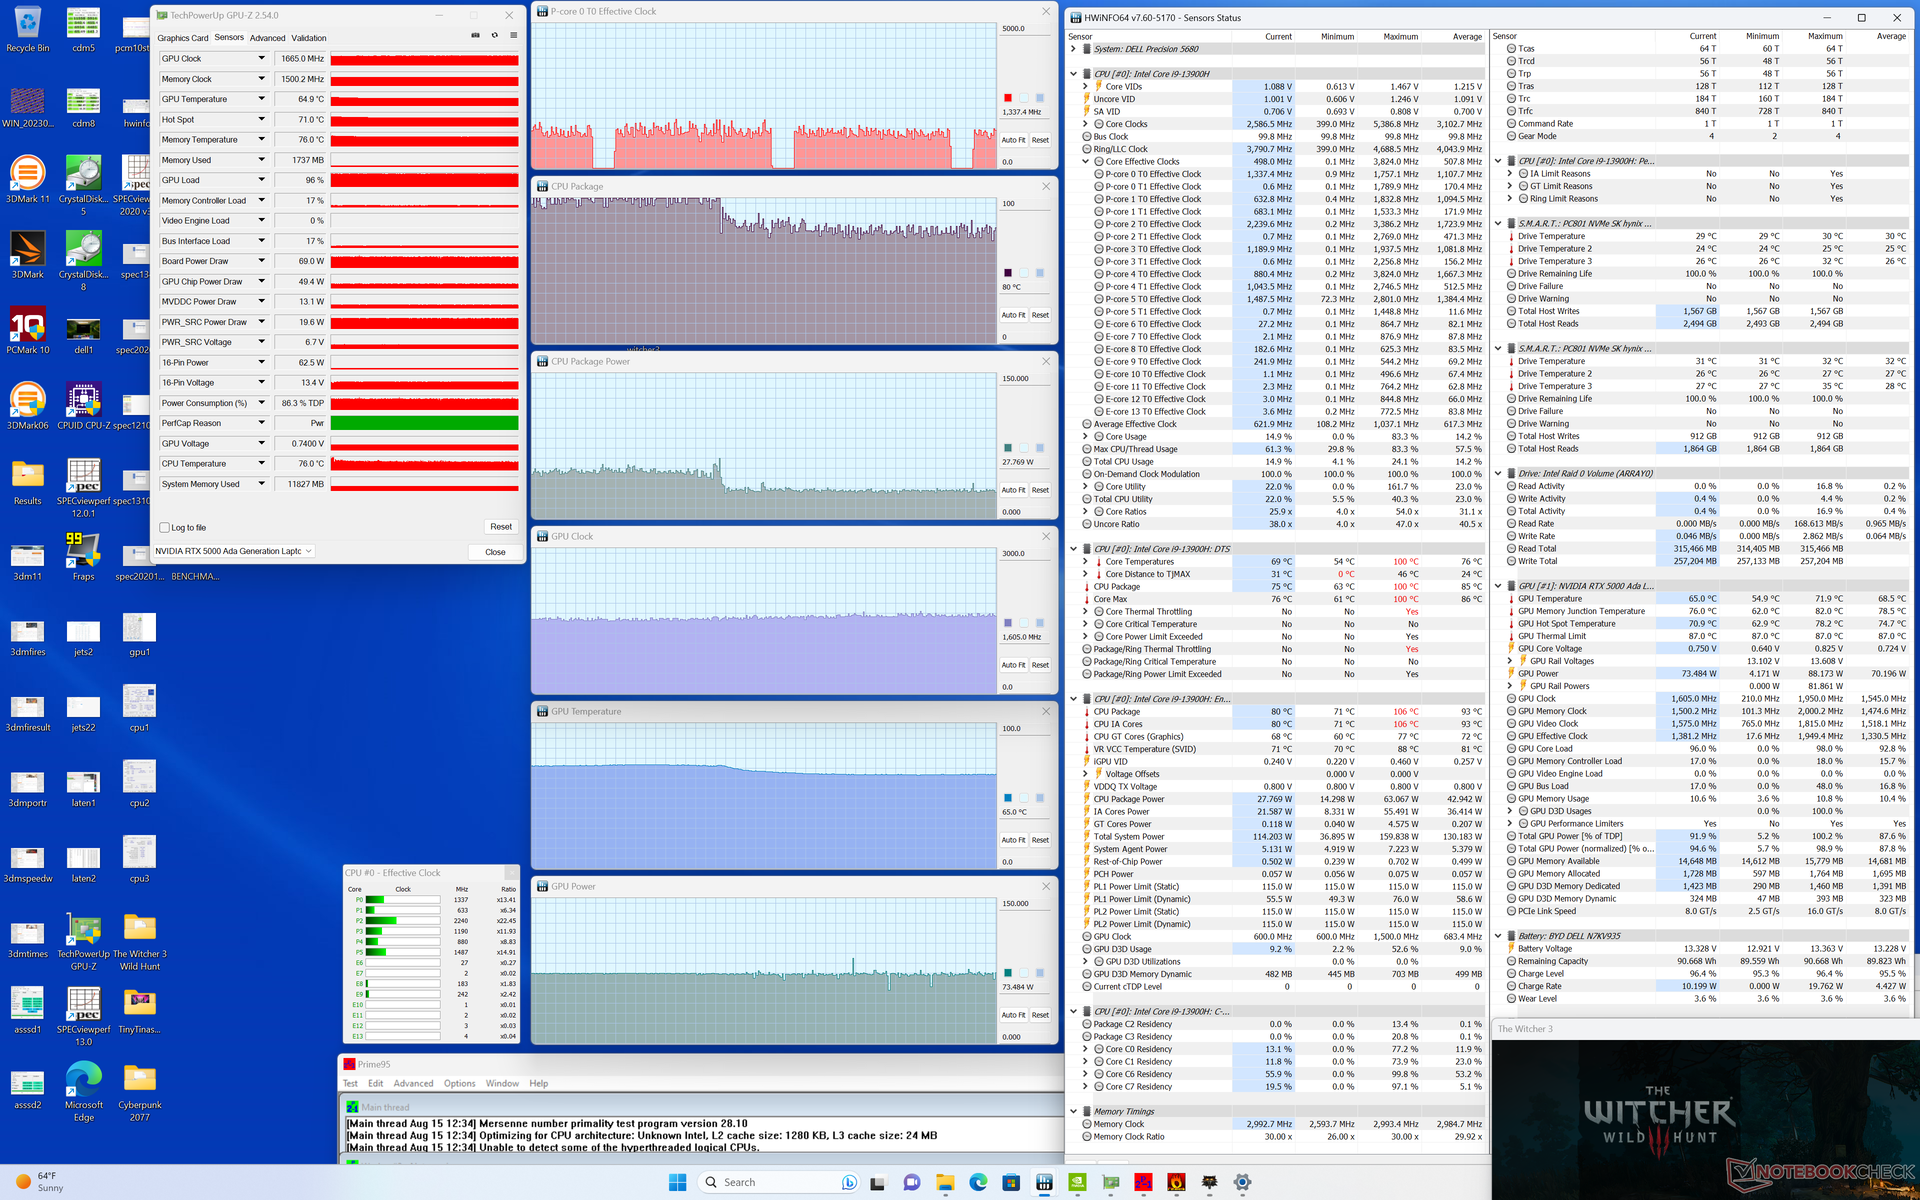
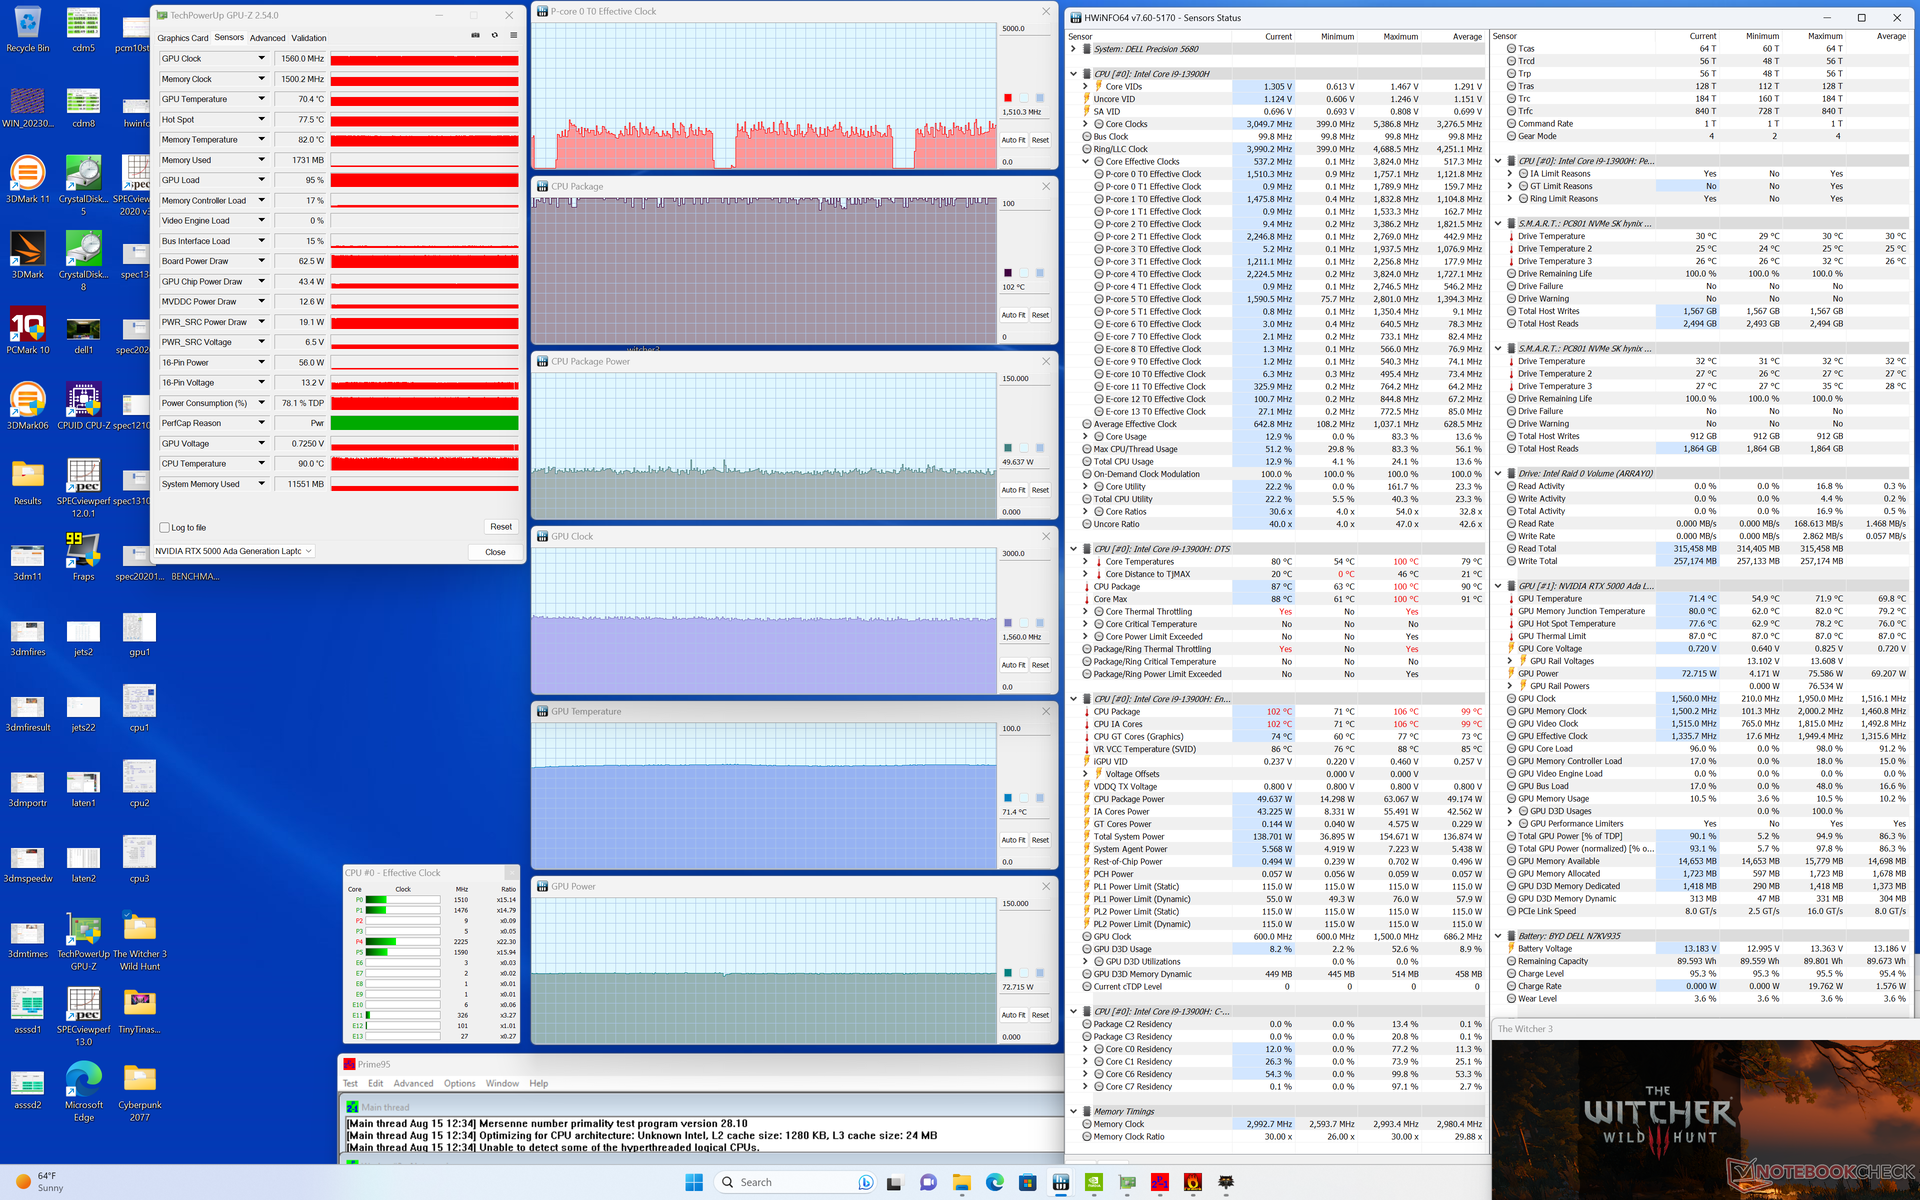
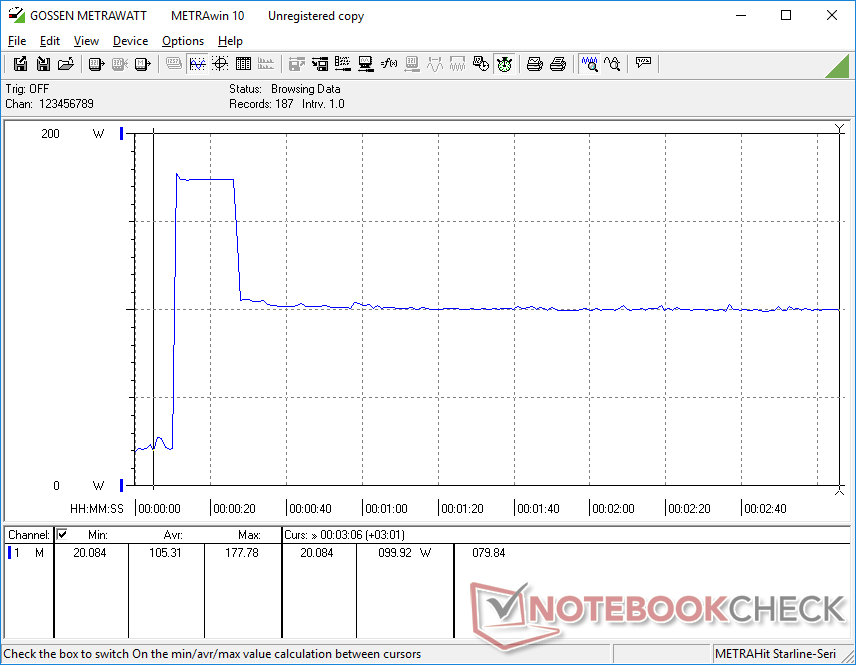
压力测试
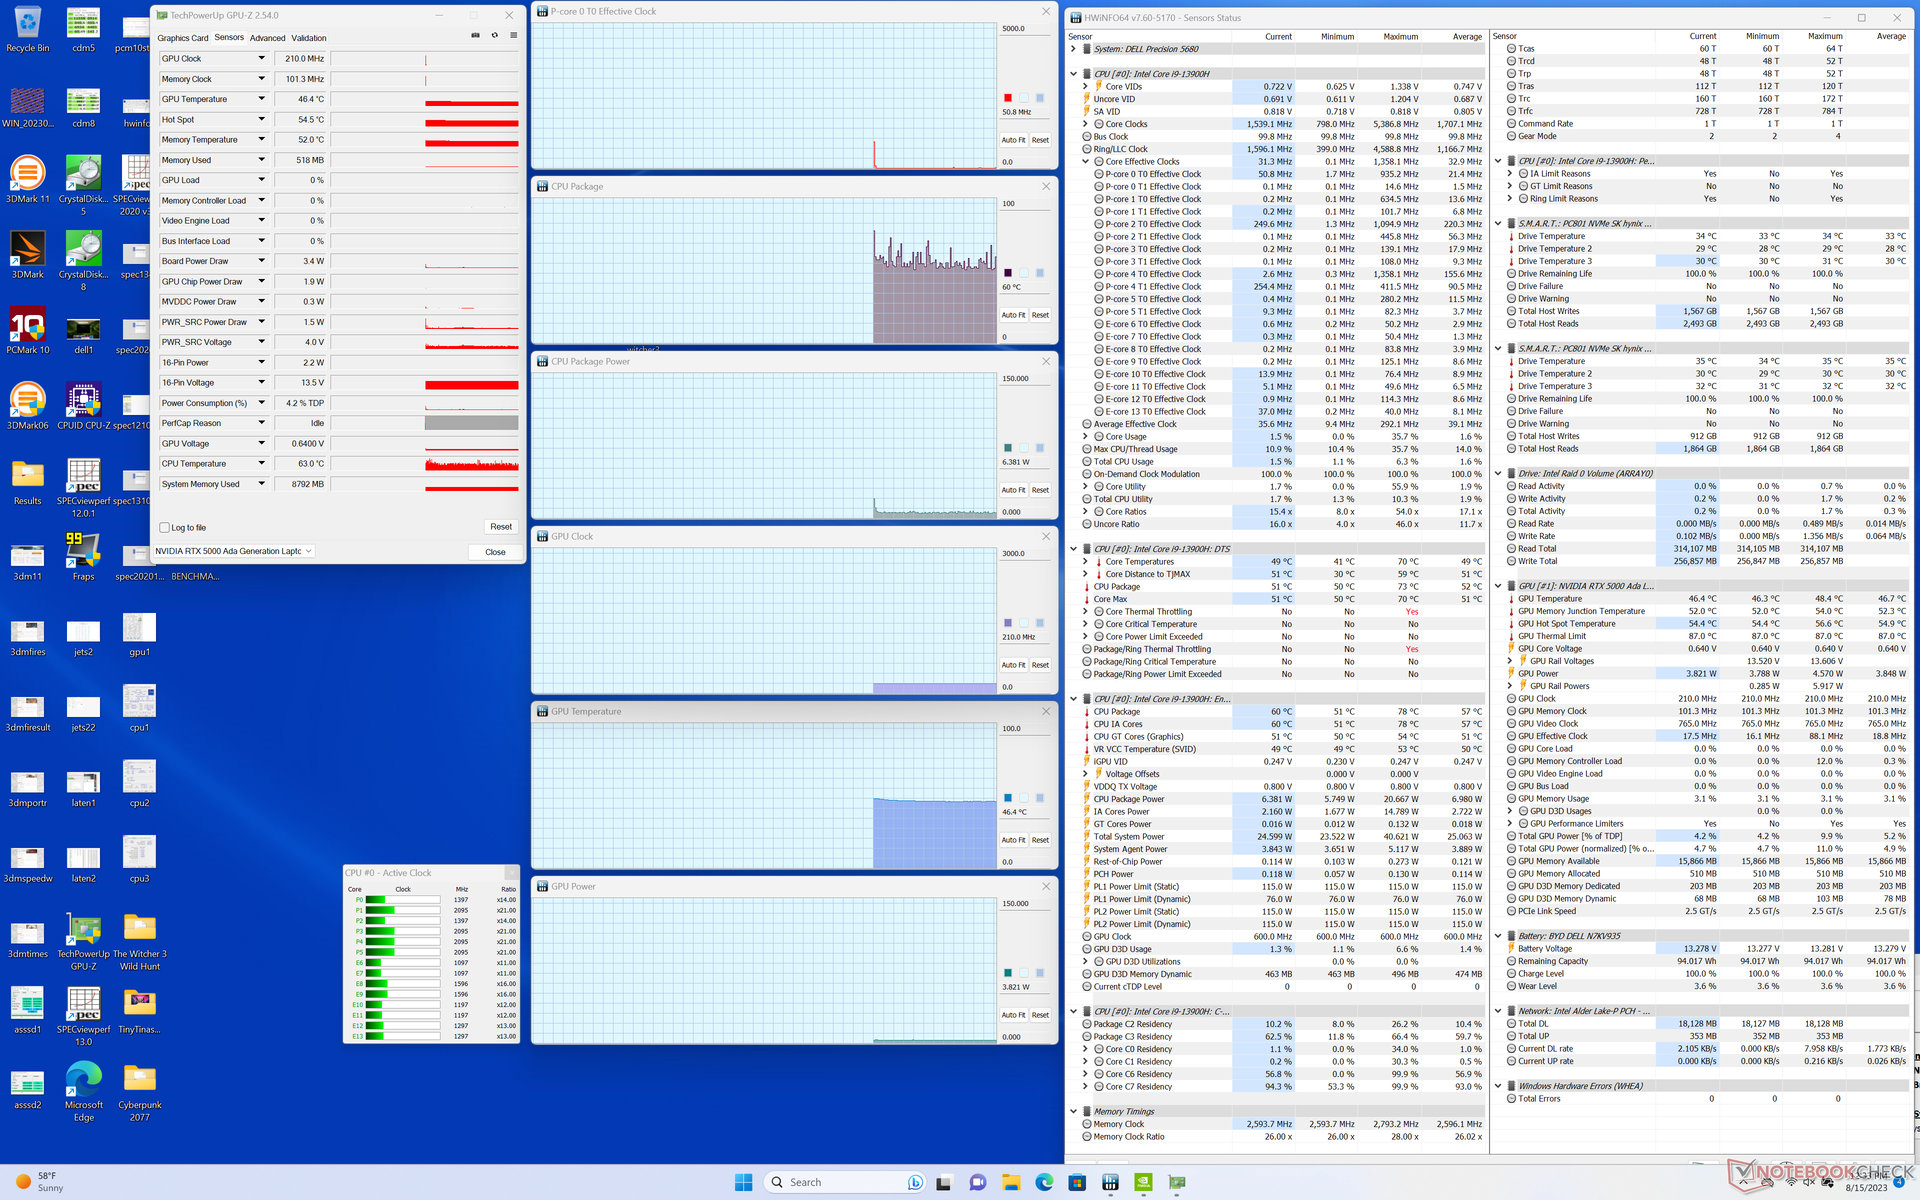
在运行 Prime95 压力测试时,CPU 会提升到 3.9 GHz、117 W 和 100 C,持续时间仅约 15 秒。此后,Turbo Boost 潜能会下降,然后稳定在 2.8 GHz 和 56 W 左右,核心温度为 75 C,更为合理。因此,即使设置为性能模式,最大 Turbo Boost 也无法在Precision 5680 上持续。
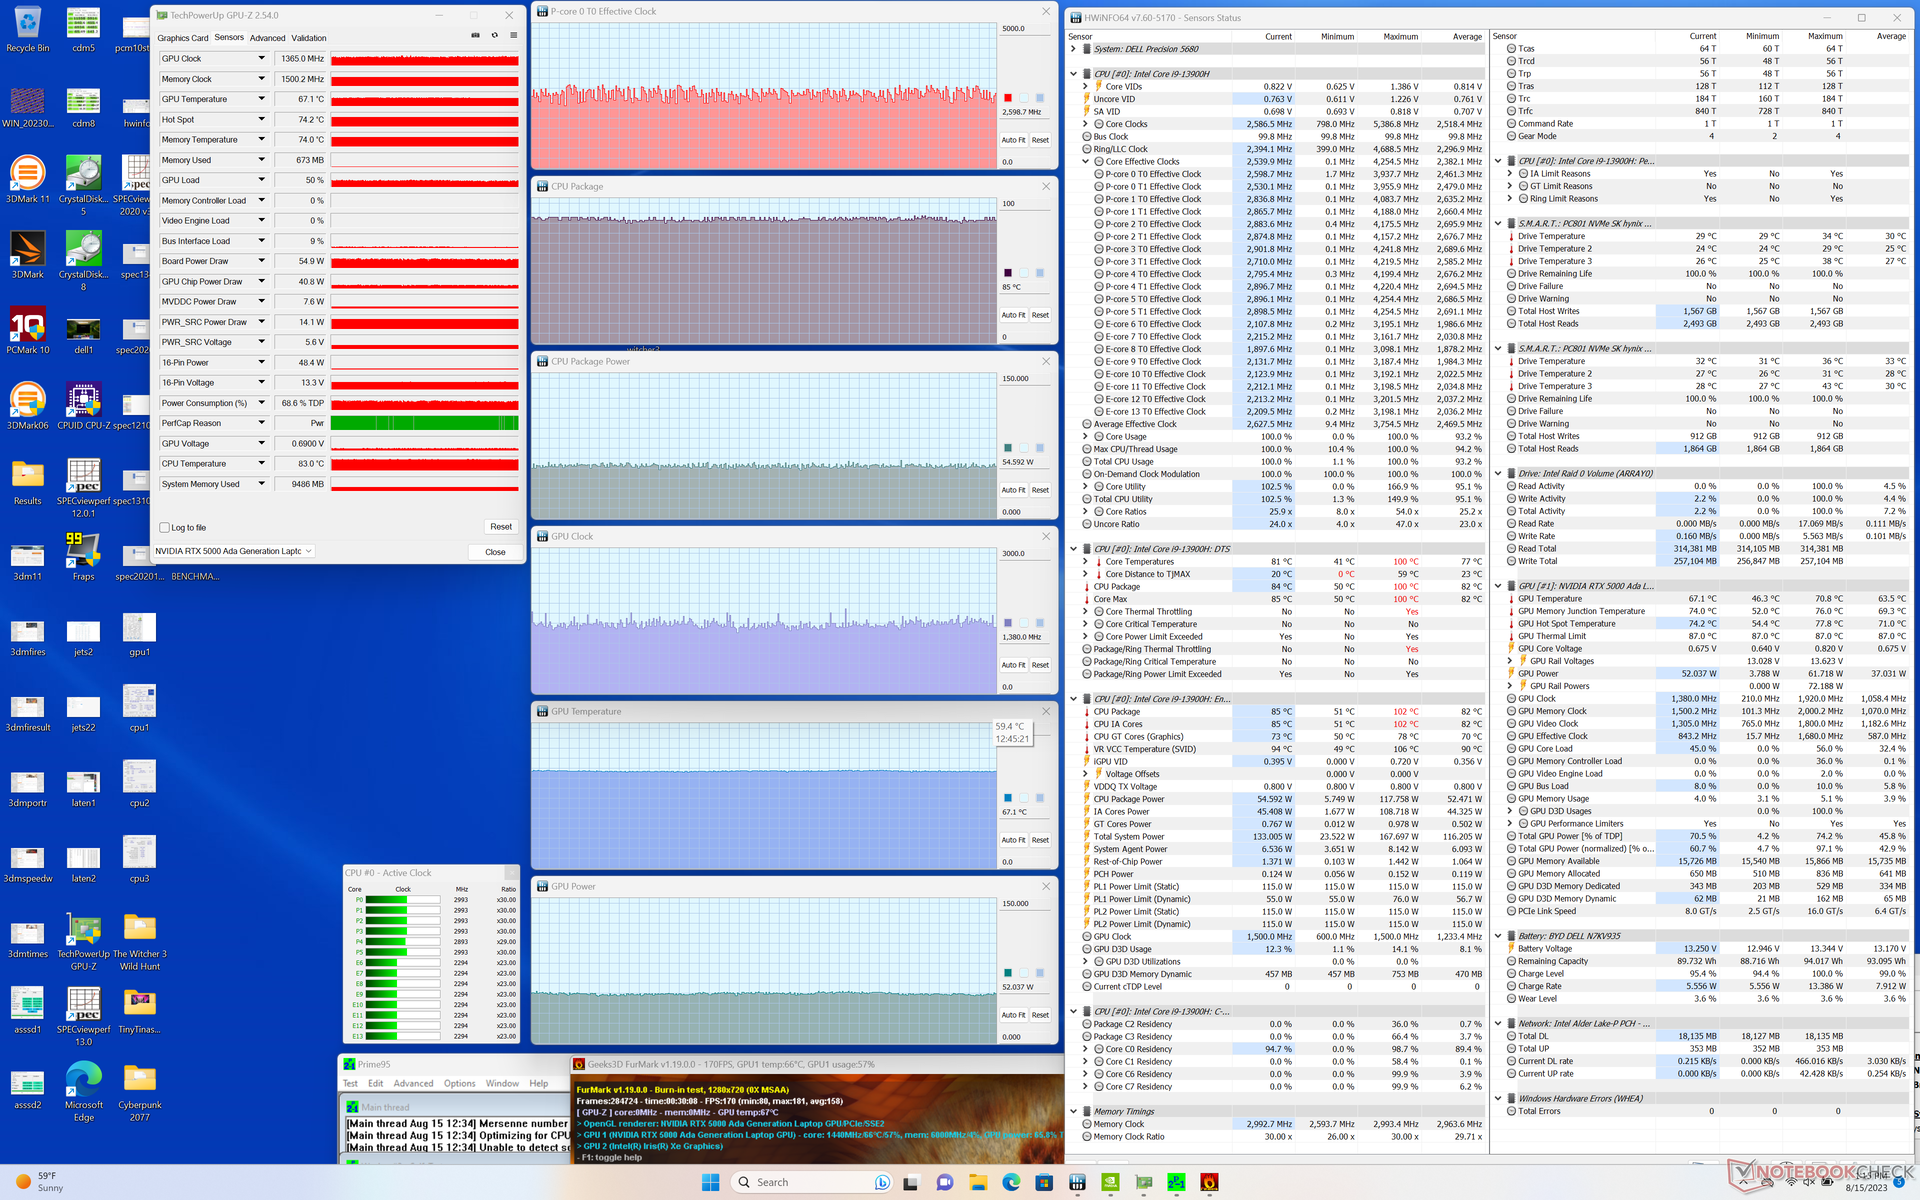
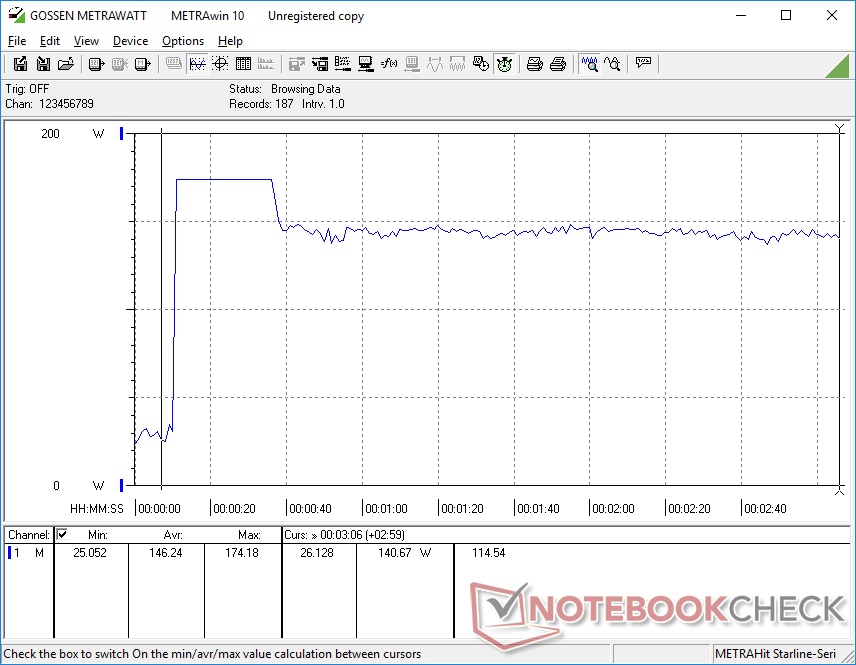
如上所述,在平衡模式而非性能模式下运行不会对 GPU 性能产生负面影响。在性能模式下运行时,GPU 时钟、温度和功耗 Witcher 3 分别稳定在 1560 MHz、72 C 和 63 W,而在平衡模式下为 1665 MHz、65 C 和 69 W。平衡模式和性能模式之间最大的区别似乎在于 CPU 温度,在性能模式下,CPU 温度可高达 100 摄氏度以上,以获得更高的 Turbo Boost 潜能,而在平衡模式下,CPU 温度仅为 80 摄氏度左右。
需要注意的是,尽管 Nvidia 控制面板显示的目标 TGP 为 95 W,但我们的 GPU 板最大功耗仅为 75 W。
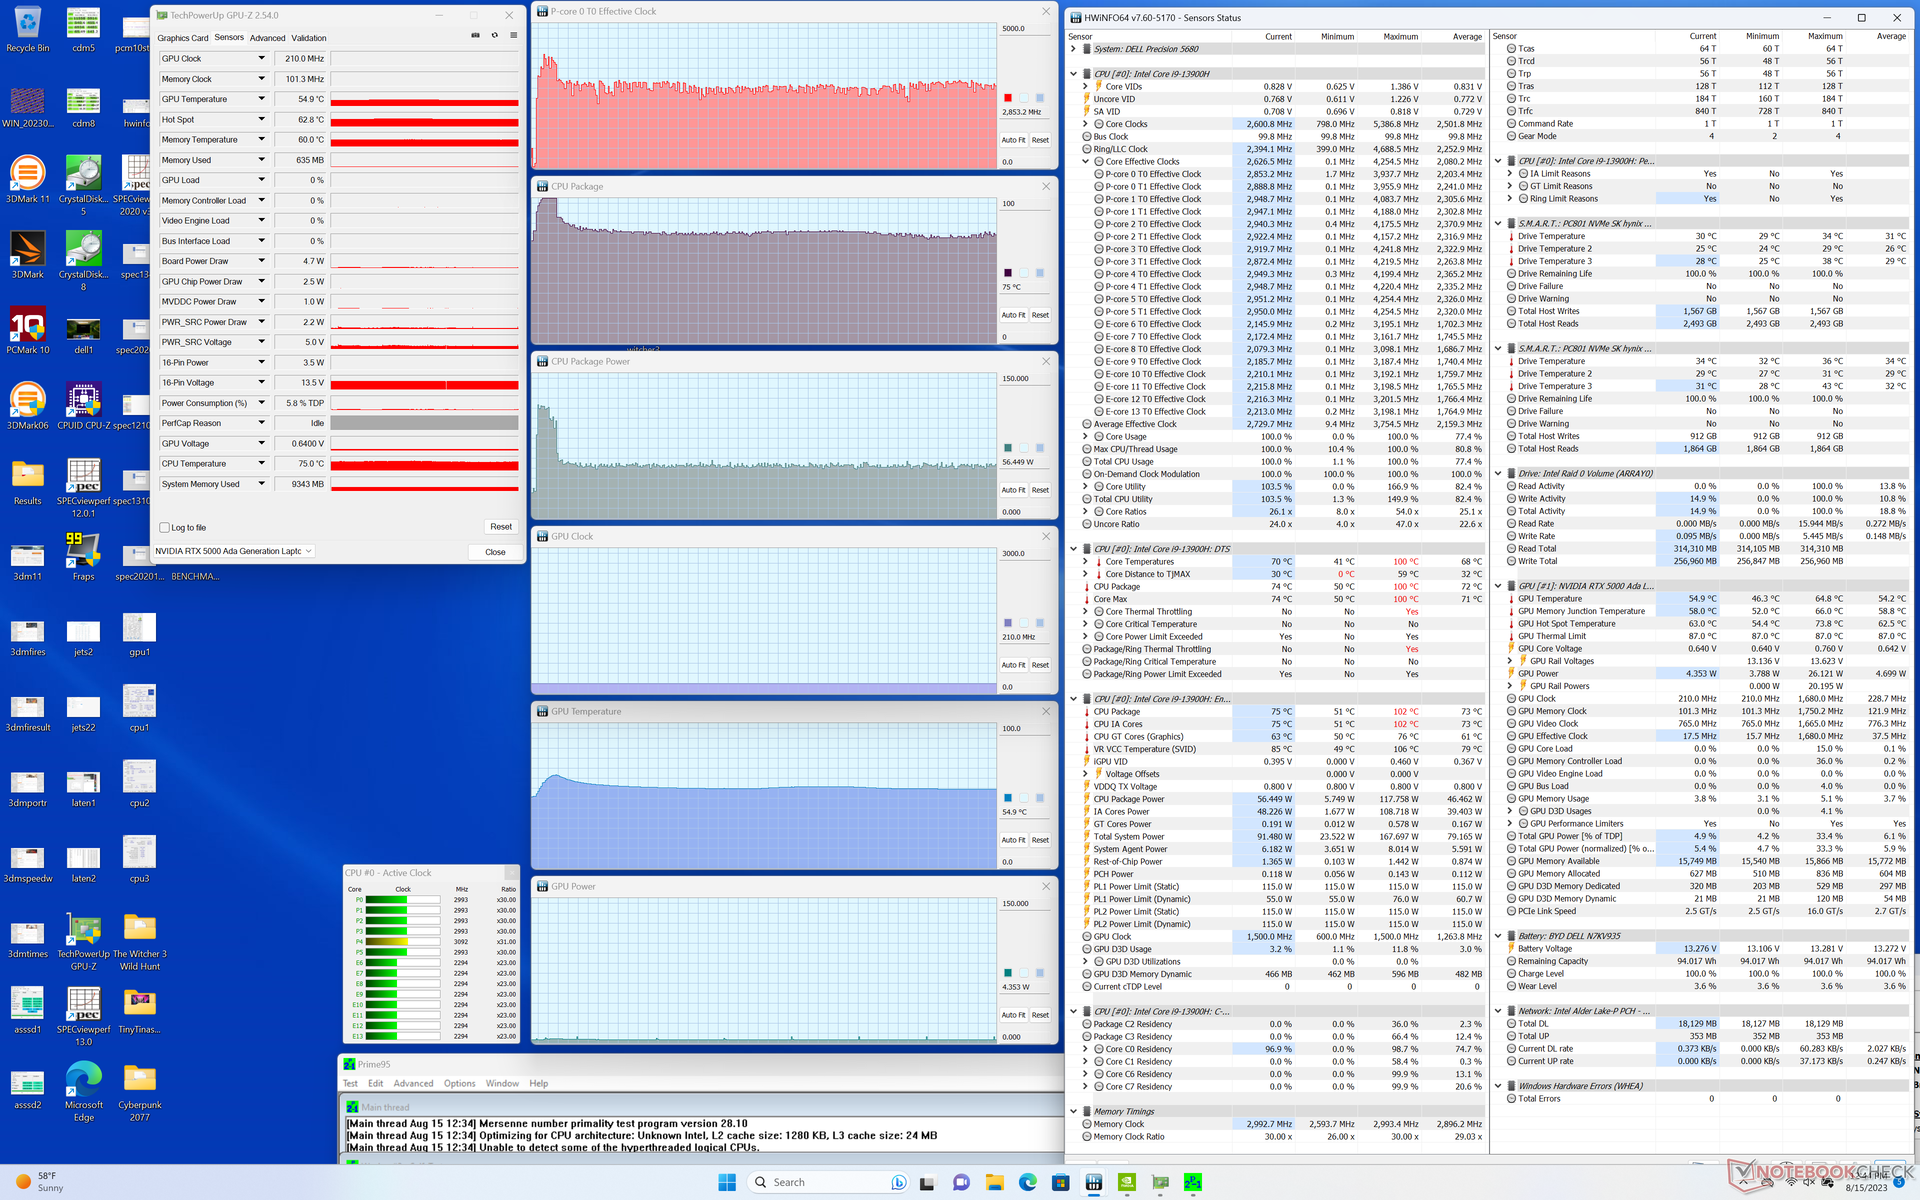
| CPU 时钟 (GHz) | GPU 时钟 (MHz) | CPU 平均温度 (°C) | GPU 平均温度(°C) | |
| 系统闲置 | -- | -- | 60 | 46 |
| Prime95 压力 | ~2.8 | -- | 75 | 55 |
| Prime95 + FurMark 压力 | ~2.6 | 1365 | 85 | 67 |
| Witcher 3 压力(性能模式) | ~1.5 | 1560 | 100 | 72 |
| Witcher 3 压力(平衡模式) | ~1.3 | 1665 | 80 | 65 |
发言人
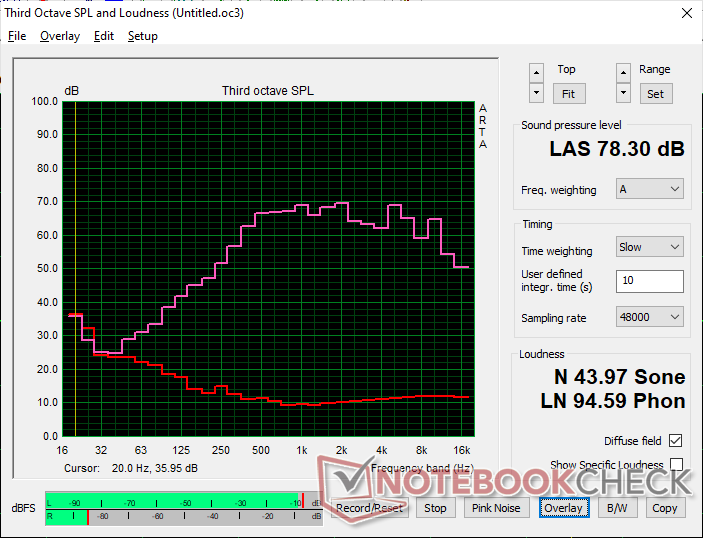
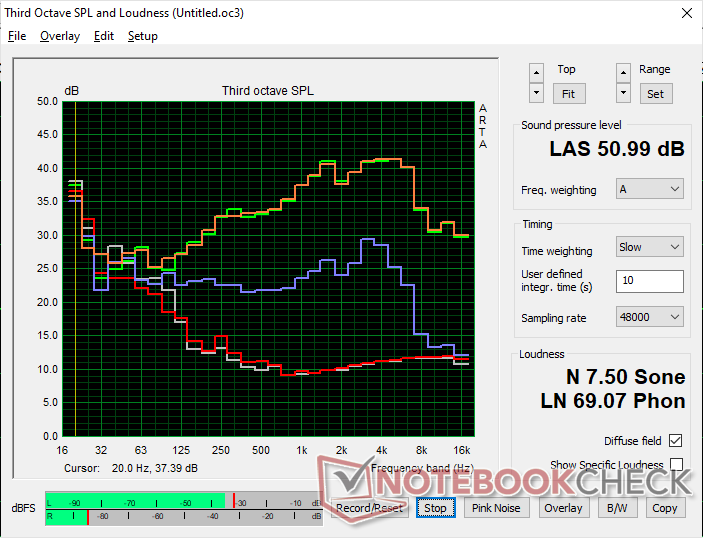
Dell Precision 5000 5680 audio analysis
(±) | speaker loudness is average but good (78.3 dB)
Bass 100 - 315 Hz
(-) | nearly no bass - on average 16.4% lower than median
(±) | linearity of bass is average (7.5% delta to prev. frequency)
Mids 400 - 2000 Hz
(+) | balanced mids - only 3.9% away from median
(+) | mids are linear (4.5% delta to prev. frequency)
Highs 2 - 16 kHz
(+) | balanced highs - only 2.2% away from median
(±) | linearity of highs is average (8.3% delta to prev. frequency)
Overall 100 - 16.000 Hz
(±) | linearity of overall sound is average (15.5% difference to median)
Compared to same class
» 35% of all tested devices in this class were better, 10% similar, 55% worse
» The best had a delta of 7%, average was 17%, worst was 35%
Compared to all devices tested
» 23% of all tested devices were better, 4% similar, 73% worse
» The best had a delta of 4%, average was 23%, worst was 134%
Apple MacBook Pro 16 2021 M1 Pro audio analysis
(+) | speakers can play relatively loud (84.7 dB)
Bass 100 - 315 Hz
(+) | good bass - only 3.8% away from median
(+) | bass is linear (5.2% delta to prev. frequency)
Mids 400 - 2000 Hz
(+) | balanced mids - only 1.3% away from median
(+) | mids are linear (2.1% delta to prev. frequency)
Highs 2 - 16 kHz
(+) | balanced highs - only 1.9% away from median
(+) | highs are linear (2.7% delta to prev. frequency)
Overall 100 - 16.000 Hz
(+) | overall sound is linear (4.6% difference to median)
Compared to same class
» 0% of all tested devices in this class were better, 0% similar, 100% worse
» The best had a delta of 5%, average was 17%, worst was 45%
Compared to all devices tested
» 0% of all tested devices were better, 0% similar, 100% worse
» The best had a delta of 4%, average was 23%, worst was 134%
能源管理 - 艾达-拉芙蕾丝大放异彩
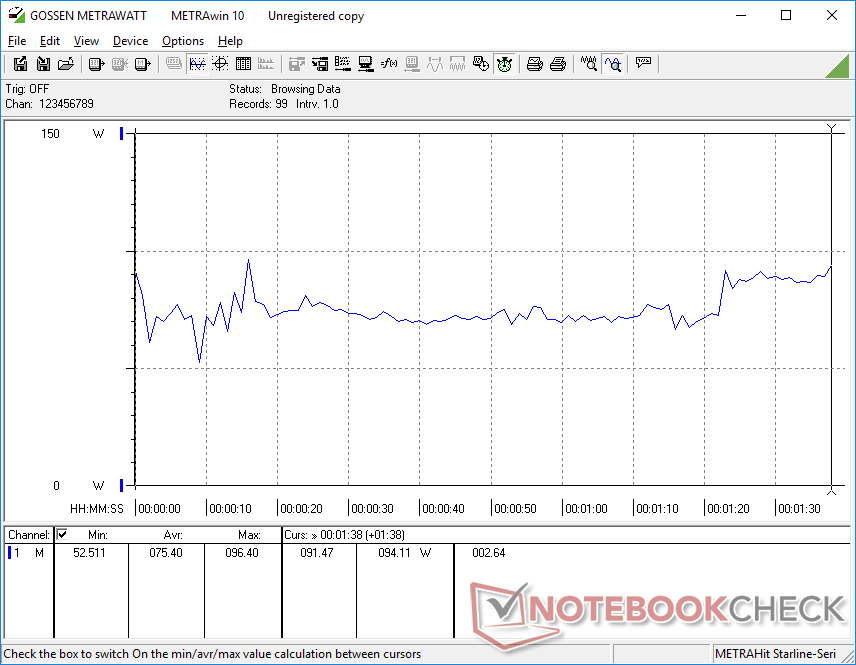
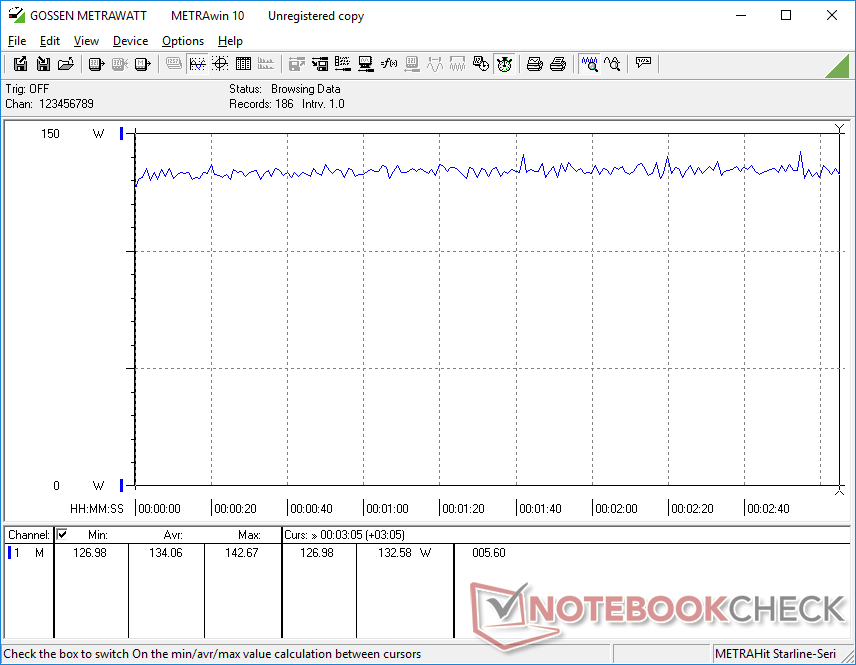
耗电量
由于我们的Precision 采用了新一代 Ada Lovelace GPU,因此每瓦性能大大领先于大多数其他工作站。运行 Witcher 3为例,我们系统的功耗仅为 134 瓦,而 7670 的功耗分别为 159 瓦和 189 瓦。 Precision 7670 性能和 HP ZBook Fury 16 G9 的功耗分别为 159 W 和 189 W,尽管如上所述,我们的 RTX 5000 GPU 性能要优于它们的 RTX A5500 GPU。
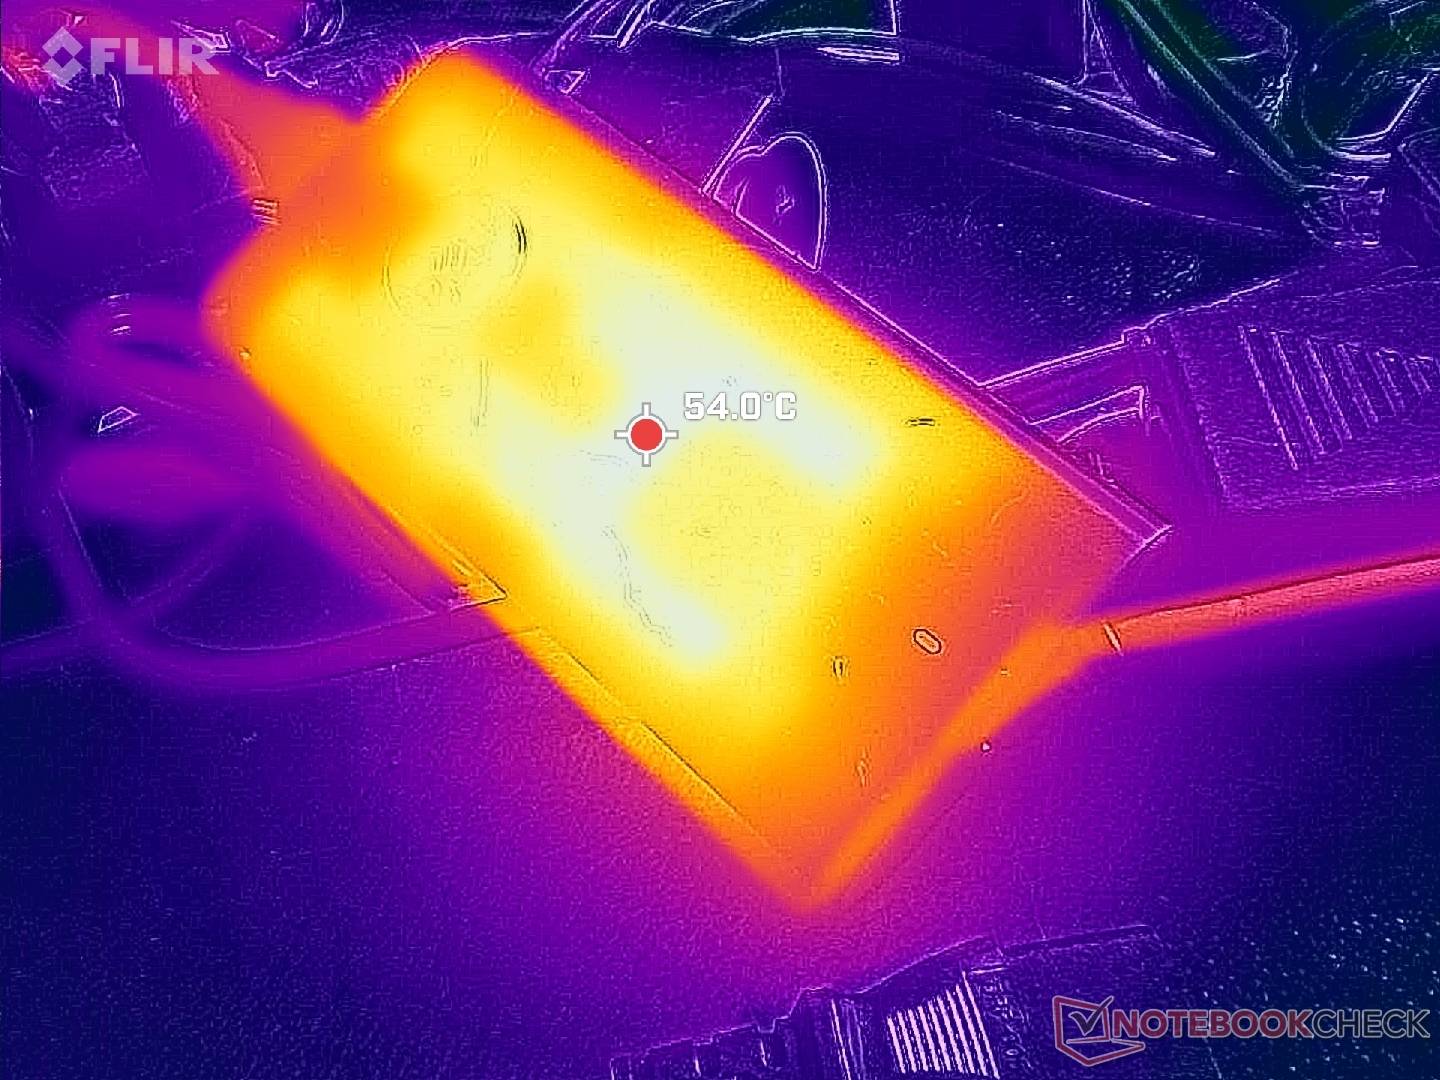
相对较小(约 13.5 x 6.5 x 2.2 厘米)的 165 W USB-C 交流适配器的高功率输出也值得一提。现有的大多数 USB-C 适配器功率最多只能达到 100 W 至 140 W,这使得我们的 165 W 适配器成为最通用的适配器之一。这款新适配器直接解决了 电池充电问题我们在旧版Precision 7000 型号上遇到的电池充电问题,该型号配备的是功率较小的 130 W USB-C 适配器。
| Off / Standby | |
| Idle | |
| Load |
|
Key:
min: | |
| Dell Precision 5000 5680 i9-13900H, RTX 5000 Ada Generation Laptop, 2x SK hynix PC801 HFS512GEJ9X101N RAID 0, OLED, 3840x2400, 16" | Dell Precision 7000 7670 Performance i9-12950HX, RTX A5500 Laptop GPU, , OLED, 3840x2400, 16" | HP ZBook Fury 16 G9 i9-12950HX, RTX A5500 Laptop GPU, Micron 3400 1TB MTFDKBA1T0TFH, IPS, 3840x2400, 16" | Lenovo ThinkPad P16 G1 RTX A5500 i9-12950HX, RTX A5500 Laptop GPU, WDC PC SN810 2TB, IPS, 3840x2400, 16" | MSI CreatorPro Z16P B12UKST i7-12700H, RTX A3000 Laptop GPU, Samsung PM9A1 MZVL21T0HCLR, IPS, 2560x1600, 16" | Asus ExpertBook B6 Flip B6602FC2 i9-12950HX, RTX A2000 Laptop GPU, Samsung PM9A1 MZVL21T0HCLR, IPS, 2560x1600, 16" | |
|---|---|---|---|---|---|---|
| Power Consumption | -99% | -86% | -53% | -18% | -35% | |
| Idle Minimum * (Watt) | 8 | 16.4 -105% | 19.5 -144% | 7.5 6% | 10.8 -35% | 10.5 -31% |
| Idle Average * (Watt) | 10.4 | 35.9 -245% | 29 -179% | 20.1 -93% | 16.3 -57% | 11.9 -14% |
| Idle Maximum * (Watt) | 30.5 | 47 -54% | 40.7 -33% | 40 -31% | 16.9 45% | 18 41% |
| Load Average * (Watt) | 75.4 | 147.1 -95% | 142.1 -88% | 137 -82% | 111.7 -48% | 182 -141% |
| Witcher 3 ultra * (Watt) | 134 | 158.8 -19% | 188.6 -41% | 208 -55% | 152.1 -14% | 177.5 -32% |
| Load Maximum * (Watt) | 175 | 311 -78% | 224.4 -28% | 285.9 -63% | 177.4 -1% | 229 -31% |
* ... smaller is better
Power Consumption Witcher 3 / Stresstest
Power Consumption external Monitor
电池寿命

考虑到高性能和苛刻的 4K OLED 面板,电池续航时间非常出色。在使用 iGPU 的平衡配置文件时,我们可以记录近 10 个小时的 WLAN 实际浏览时间,而联想 ThinkPad P16 G1 或微星 CreatorPro Z16P 等其他产品的实际浏览时间几乎只有它的一半。微星CreatorPro Z16P.
使用随附的 165 瓦交流适配器,从空电充至满电大约需要 2 个小时。我们的第三方 65 W USB-C 适配器也能为系统充电,尽管速度较慢。
| Dell Precision 5000 5680 i9-13900H, RTX 5000 Ada Generation Laptop, 98 Wh | Dell Precision 7000 7670 Performance i9-12950HX, RTX A5500 Laptop GPU, 93 Wh | HP ZBook Fury 16 G9 i9-12950HX, RTX A5500 Laptop GPU, 95 Wh | Lenovo ThinkPad P16 G1 RTX A5500 i9-12950HX, RTX A5500 Laptop GPU, 94 Wh | MSI CreatorPro Z16P B12UKST i7-12700H, RTX A3000 Laptop GPU, 90 Wh | Asus ExpertBook B6 Flip B6602FC2 i9-12950HX, RTX A2000 Laptop GPU, 90 Wh | |
|---|---|---|---|---|---|---|
| Battery runtime | -53% | -46% | -41% | -41% | -14% | |
| Reader / Idle (h) | 17.9 | 5.3 -70% | 12.5 -30% | |||
| WiFi v1.3 (h) | 9.9 | 4.7 -53% | 6 -39% | 5.8 -41% | 5.8 -41% | 8.7 -12% |
| Load (h) | 1.7 | 1.2 -29% | 1.7 0% | |||
| H.264 (h) | 5.8 |
Pros
Cons
结论:比看上去更强大
Precision 5680 是戴尔整个产品线中最精简、速度最快的移动工作站之一。便携式设计、165 W USB-C 适配器、出色的 4K OLED 显示屏和强大的 RTX 5000 GPU 都是该机型最突出的特点。特别是后者,由于采用了 Ada Lovelace 架构和极高的每瓦特性能,它在性能提升和电池续航时间方面比其他大多数工作站都更具优势。
Precision 5680 在不断增长的轻薄型工作站类别中提供了最高的每瓦性能。
铁杆工作站用户可能仍然喜欢更大更厚的机型,如 HP ZBook Fury 16或 Precision 7670Precision 5680 的超薄设计放弃了一些关键功能,如可扩展内存、广域网、ECC 内存和更多端口选项。其糟糕的点击板不如惠普或联想的触摸板精确。 联想 ThinkPad P16惠普或联想 ThinkPad P16 上的触摸板准确度差很多,而惠普或联想 ThinkPad P16 上的触摸板有真正的鼠标按钮,控制效果更好。
价格和供应情况
戴尔公司目前正在出货 Precision 5680,起价为 2490 美元,最高超过 6500 美元。
Dell Precision 5000 5680
- 08/18/2023 v7 (old)
Allen Ngo
Transparency
The selection of devices to be reviewed is made by our editorial team. The test sample was provided to the author as a loan by the manufacturer or retailer for the purpose of this review. The lender had no influence on this review, nor did the manufacturer receive a copy of this review before publication. There was no obligation to publish this review. As an independent media company, Notebookcheck is not subjected to the authority of manufacturers, retailers or publishers.
This is how Notebookcheck is testing
Every year, Notebookcheck independently reviews hundreds of laptops and smartphones using standardized procedures to ensure that all results are comparable. We have continuously developed our test methods for around 20 years and set industry standards in the process. In our test labs, high-quality measuring equipment is utilized by experienced technicians and editors. These tests involve a multi-stage validation process. Our complex rating system is based on hundreds of well-founded measurements and benchmarks, which maintains objectivity. Further information on our test methods can be found here.
Price comparison

