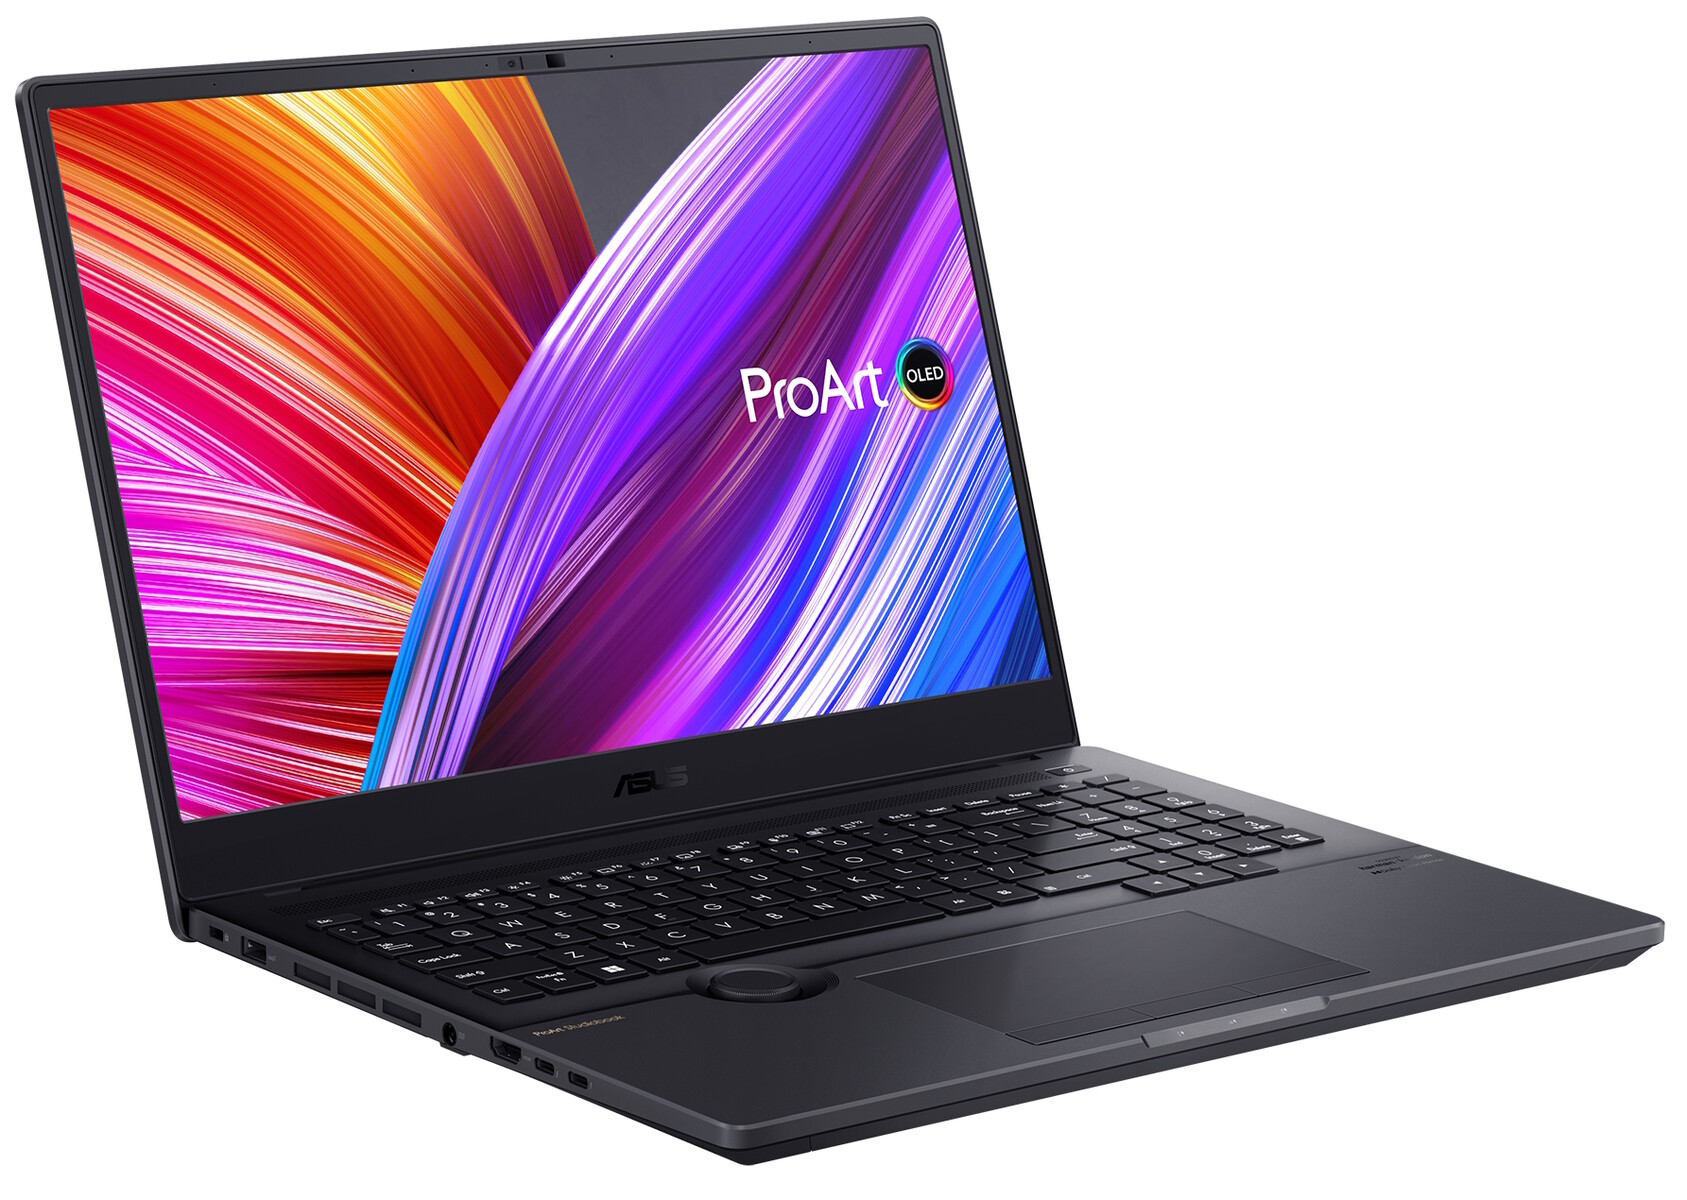
华硕ProArt StudioBook 16 H7600ZW评论。为内容创作者提供绝对的MacBook Pro替代品

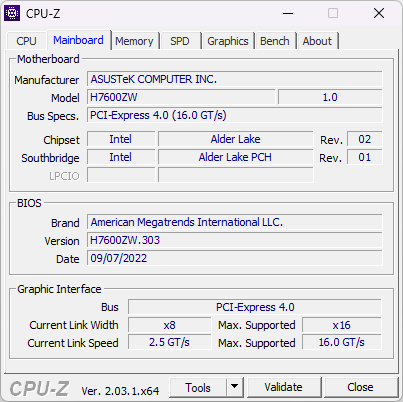
华硕ProArt系列的目标是那些需要顶级硬件以获得无阻碍的生产力的创意专业人士。ProArt StudioBook的目标是成为Windows方面的创意者的MacBook Pro替代品,并具有为移动中的创作者量身定做的独特功能。
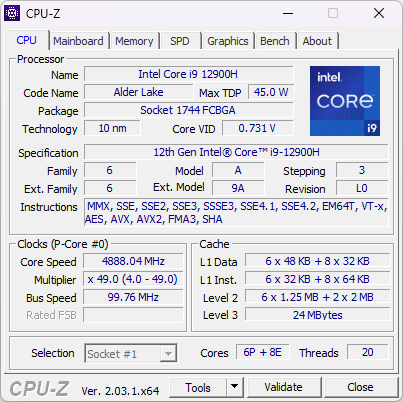
我们以前审查过 ProArt StudioBook 16 Pro W7600工作站笔记本电脑的特点是 英特尔至强W-11955M和一个 Nvidia RTX A5000 笔记本GPU.现在,我们有了ProArt StudioBook 16 H7600ZW,它具有一个 英特尔酷睿i9-12900H和一个 NvidiaGeForce RTX 3070 Ti 笔记本电脑GPU.
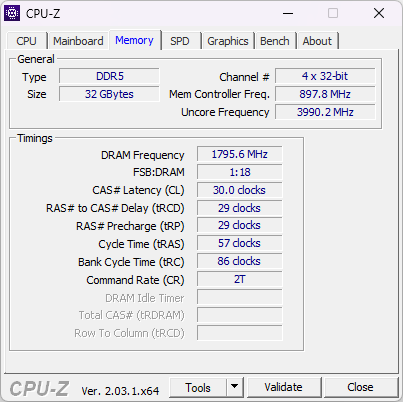
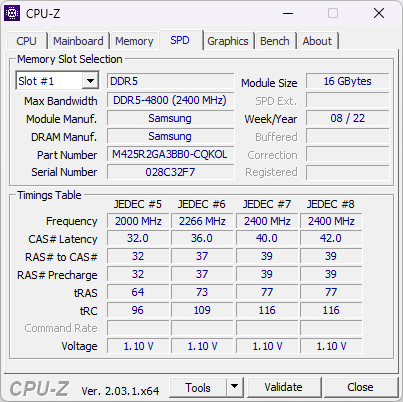
我们的测试样品还配备了32GB DDR5-4800内存,16英寸三星4K OLED面板和1TB PCIe存储。华硕目前对这一配置的定价从1,99,990元起,在美国从2,699.99美元起。
不幸的是,华硕在ProArt系列中完全跳过了Ryzen 6000或Ryzen 7000选项。目前唯一基于Ryzen的SKU是ProArt StudioBook 16 OLED H5600,配有 Ryzen 9 5900HX和 RTX 3070笔记本电脑GPU.对这一变体的审查将很快进行。
然而,华硕公布了ProArt StudioBook 16 3D OLED在2023年国际消费电子展上推出了英特尔第13代和3D OLED面板的升级版,我们希望在未来几周内对其进行审查。
在这篇评论中,我们对华硕ProArt StudioBook 16 H7600ZW进行了测试,看看这款笔记本电脑是否确实有潜力让你的创造力畅通无阻。
潜在的竞争对手比较
Rating | Date | Model | Weight | Height | Size | Resolution | Price |
|---|---|---|---|---|---|---|---|
| 89 % v7 (old) | 02 / 2023 | Asus ProArt StudioBook 16 H7600ZW i9-12900H, GeForce RTX 3070 Ti Laptop GPU | 2.4 kg | 19.9 mm | 16.00" | 3840x2400 | |
| 83.8 % v7 (old) | 09 / 2022 | MSI Creator Z17 A12UGST-054 i9-12900H, GeForce RTX 3070 Ti Laptop GPU | 2.5 kg | 19 mm | 17.00" | 2560x1600 | |
| 83.7 % v7 (old) | 06 / 2022 | MSI Creator Z16P B12UHST i9-12900H, GeForce RTX 3080 Ti Laptop GPU | 2.4 kg | 20.4 mm | 16.00" | 2560x1600 | |
| 86.3 % v7 (old) | 06 / 2022 | Asus ROG Strix Scar 15 G533ZW-LN106WS i9-12900H, GeForce RTX 3070 Ti Laptop GPU | 2.3 kg | 27.2 mm | 15.60" | 2560x1440 | |
| 88.4 % v7 (old) | 12 / 2022 | Asus ZenBook Pro 16X OLED UX7602ZM-ME115W i9-12900H, GeForce RTX 3060 Laptop GPU | 2.4 kg | 19.5 mm | 16.00" | 3840x2400 | |
| 84.7 % v7 (old) | 03 / 2022 | Gigabyte Aero 16 YE5 i9-12900HK, GeForce RTX 3080 Ti Laptop GPU | 2.3 kg | 22.4 mm | 16.00" | 3840x2400 | |
| 87.9 % v7 (old) | 10 / 2022 | Lenovo ThinkBook 16p G3 ARH R9 6900HX, GeForce RTX 3060 Laptop GPU | 2.1 kg | 19.5 mm | 16.00" | 2560x1600 | |
| 88.2 % v7 (old) | 05 / 2022 | Asus ROG Zephyrus Duo 16 GX650RX R9 6900HX, GeForce RTX 3080 Ti Laptop GPU | 2.6 kg | 20.5 mm | 16.00" | 3840x2400 | |
| 93.2 % v7 (old) | 11 / 2021 | Apple MacBook Pro 16 2021 M1 Pro M1 Pro, M1 Pro 16-Core GPU | 2.2 kg | 16.8 mm | 16.20" | 3456x2234 | |
| 92.1 % v7 (old) | 04 / 2022 | Apple MacBook Pro 14 2021 M1 Max 24-Core GPU M1 Max, M1 Max 24-Core GPU | 1.6 kg | 15.5 mm | 14.20" | 3024x1964 |
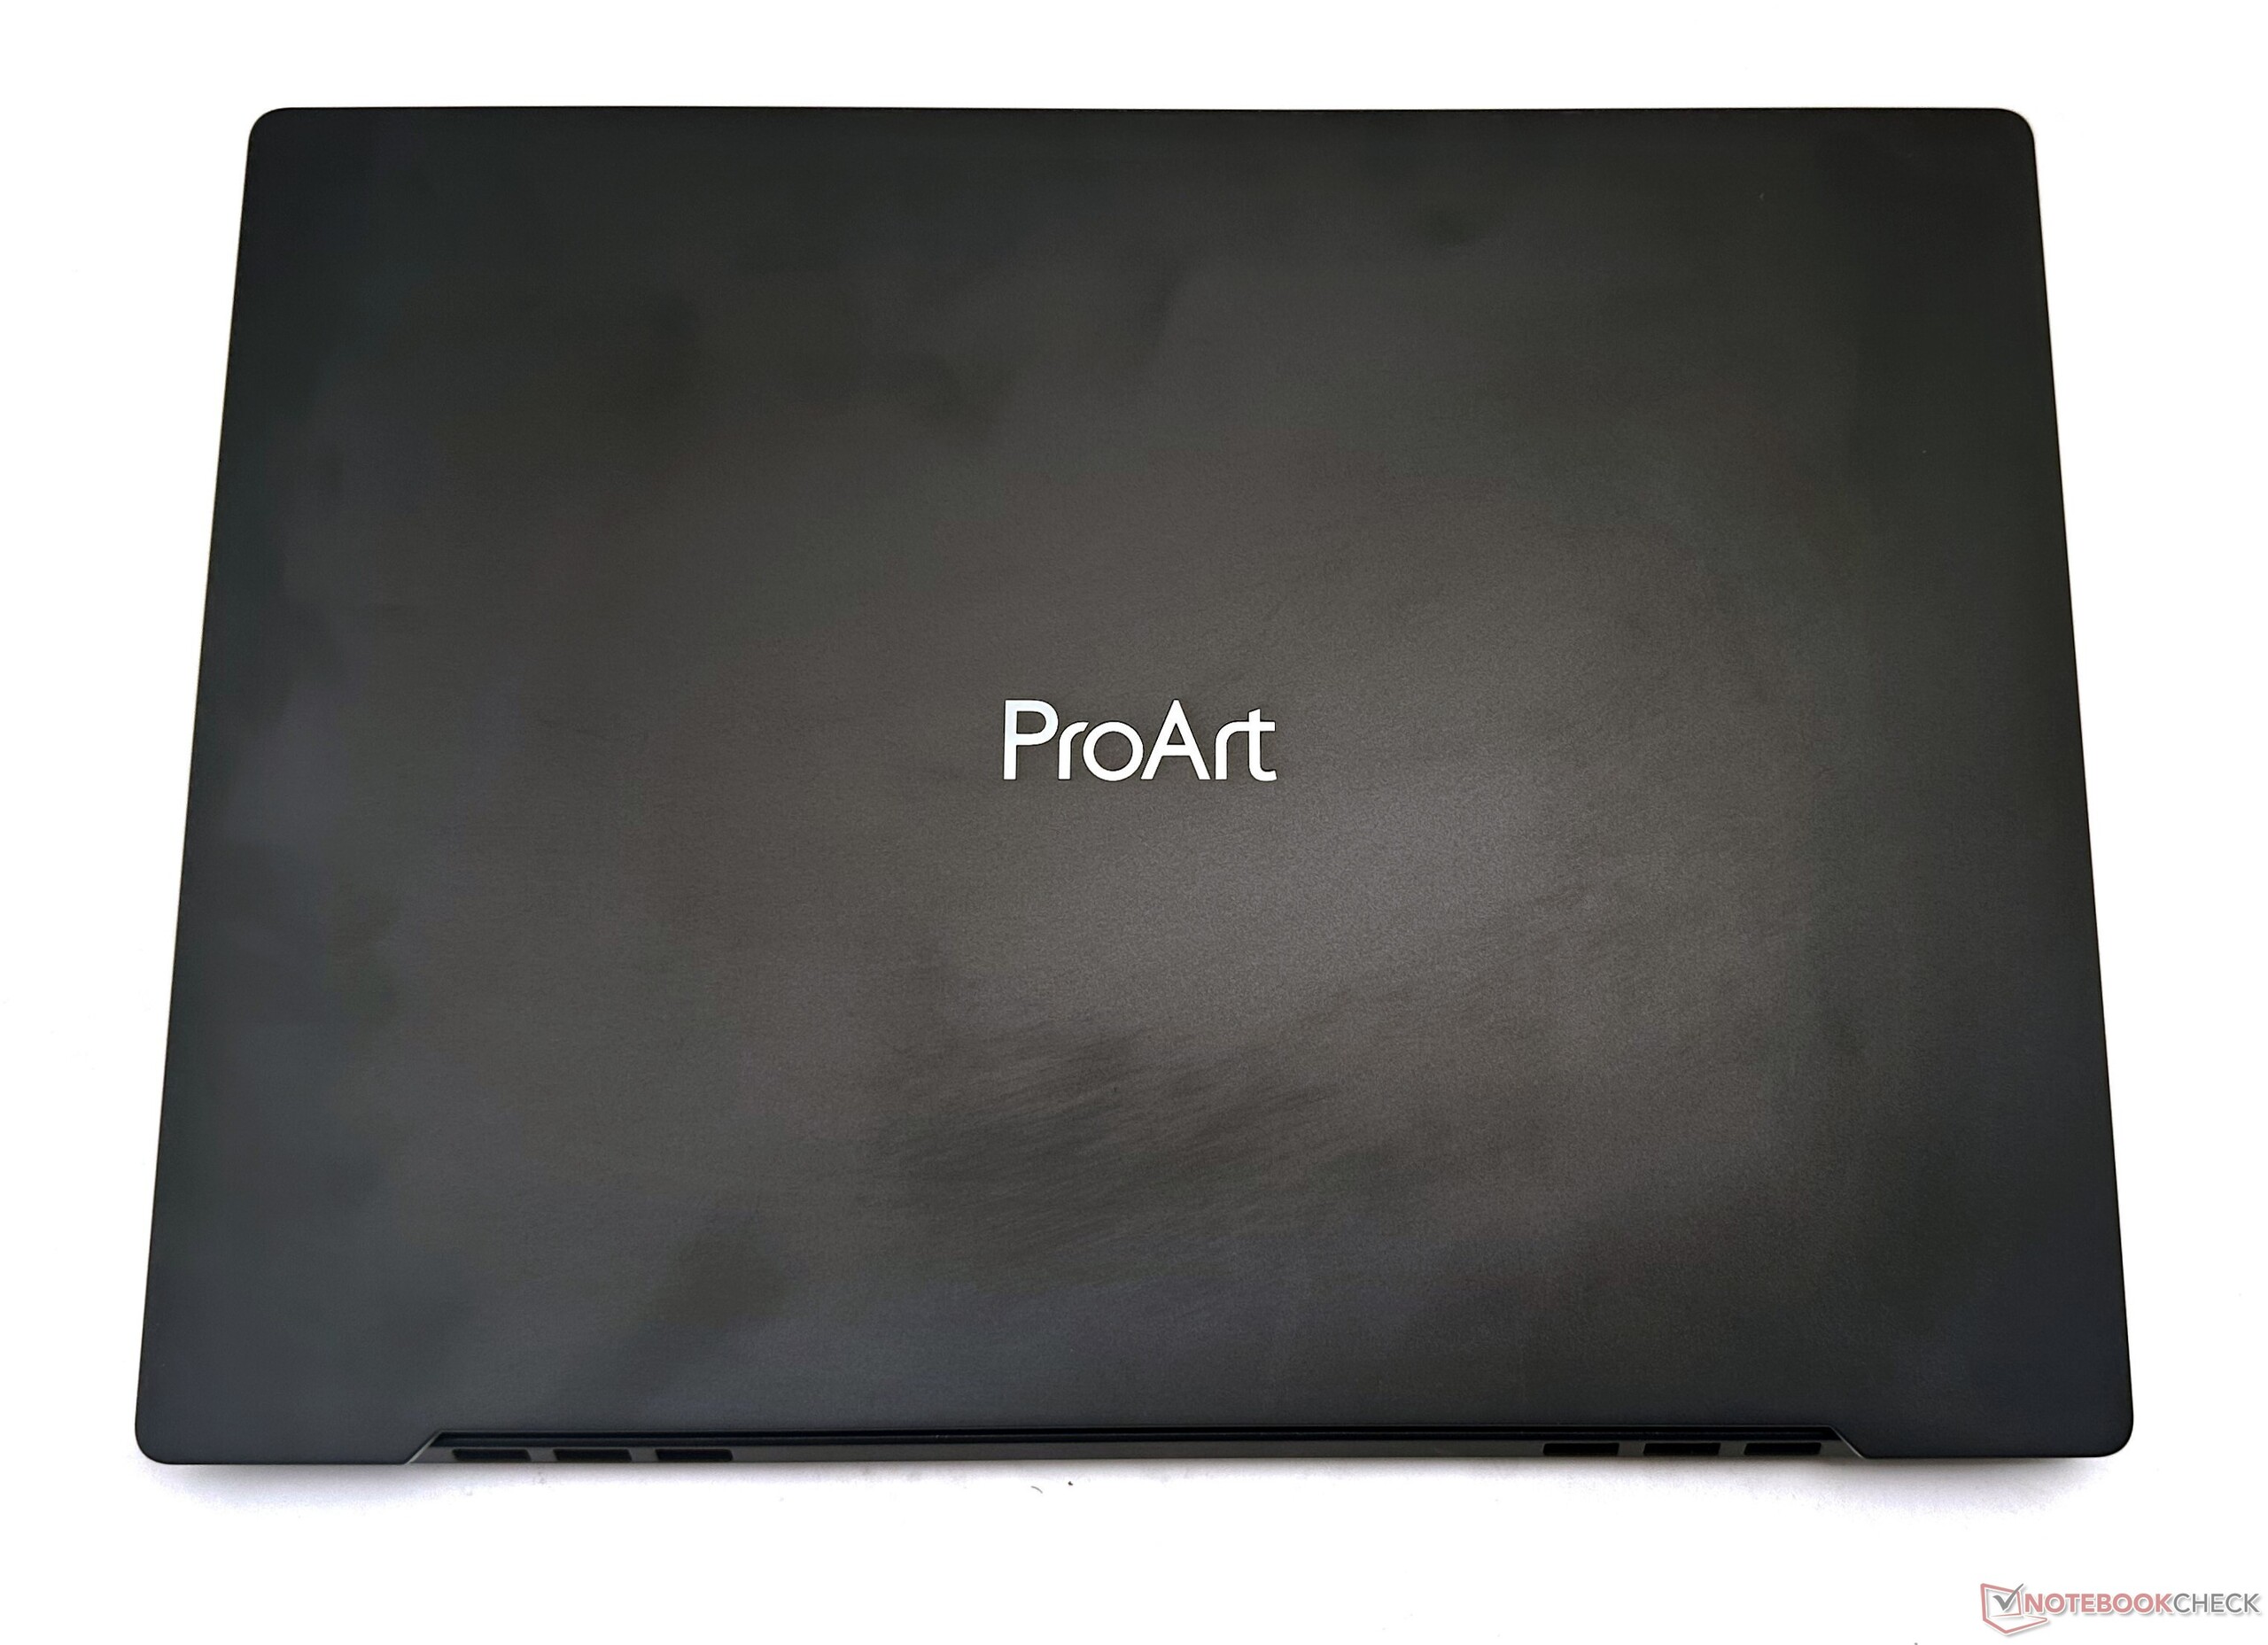
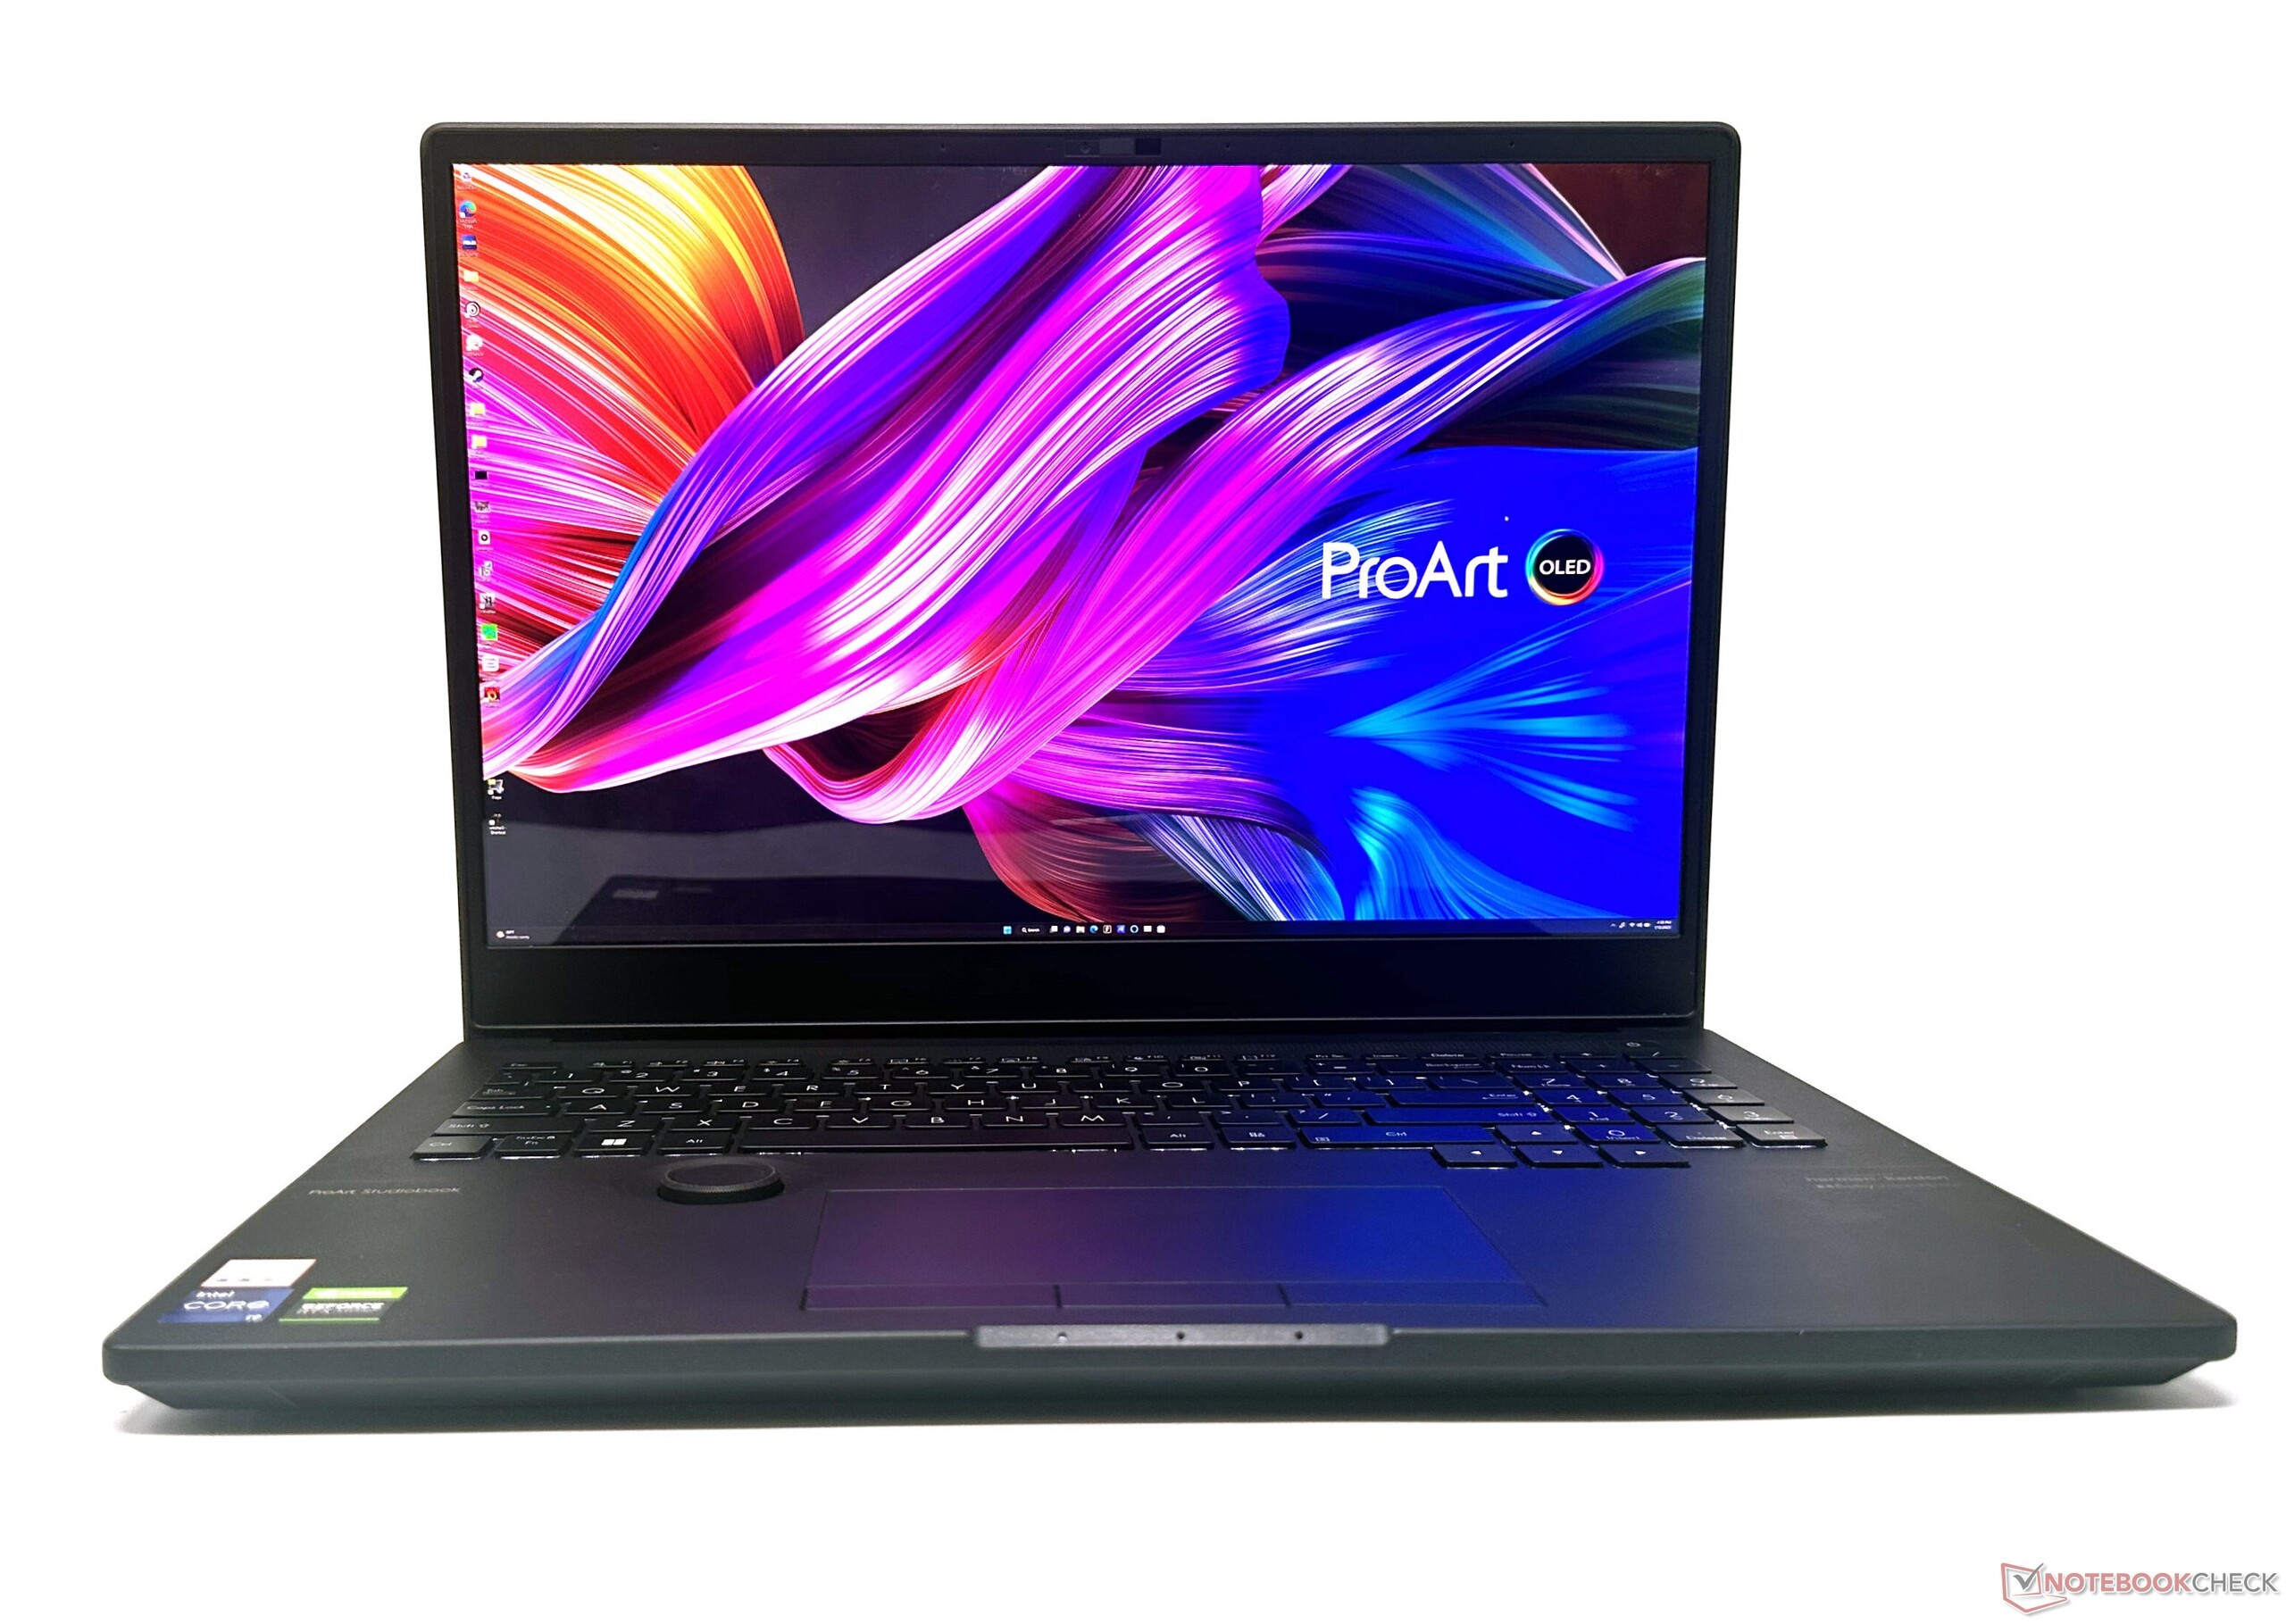
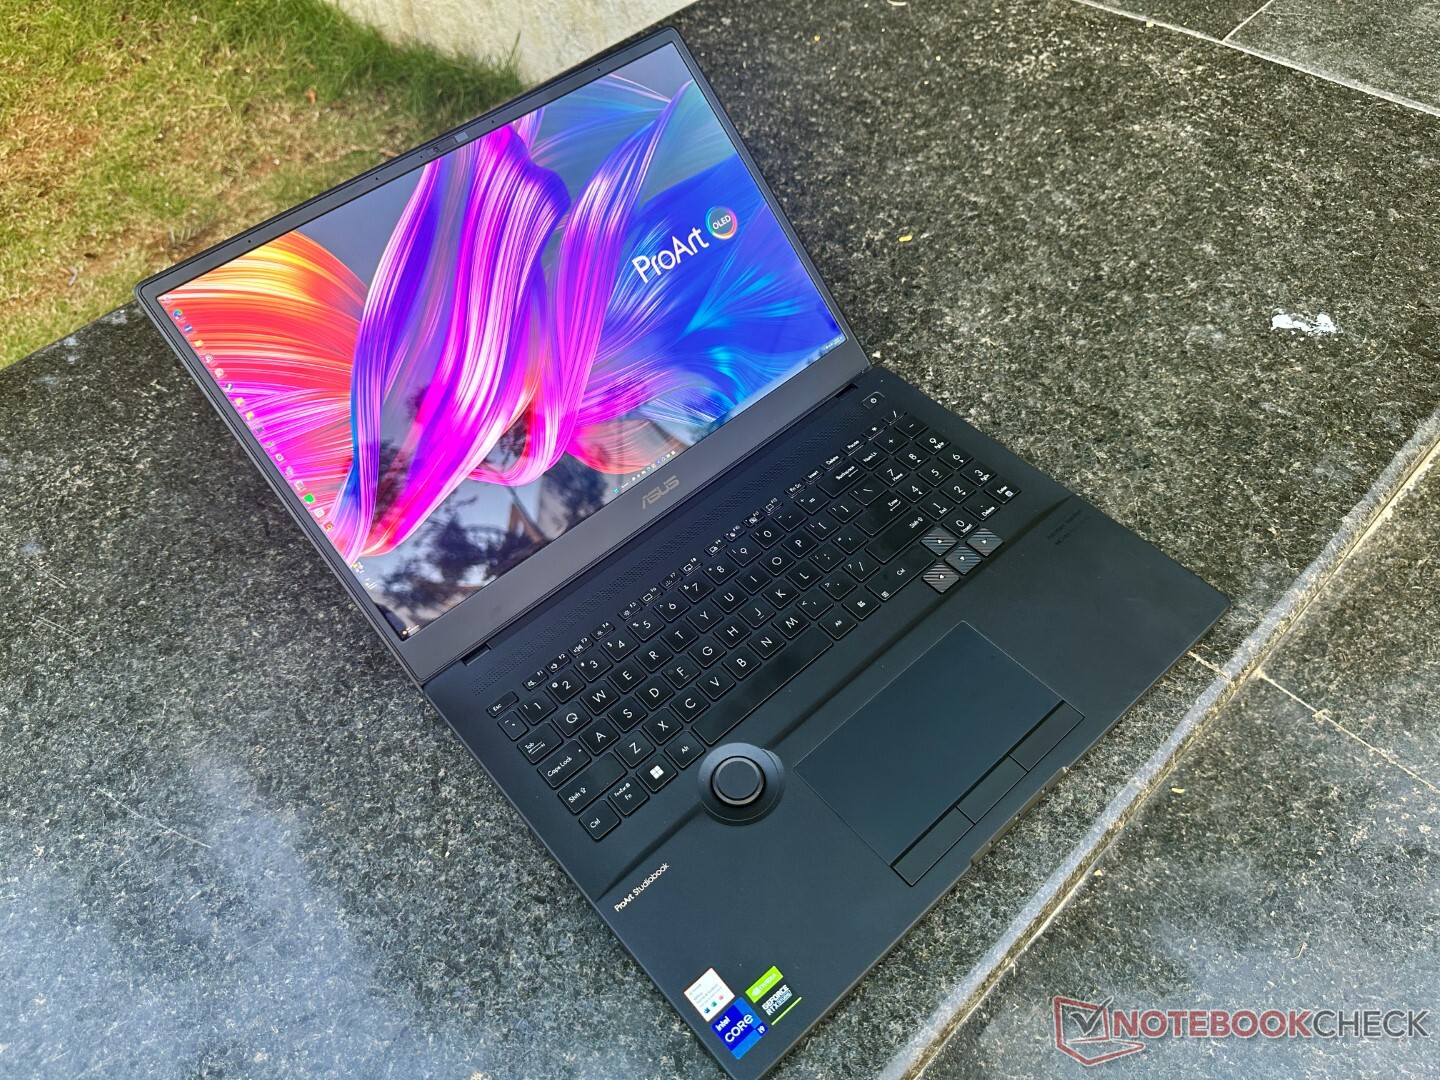
外壳。充满信心的铝合金
机箱和触觉与ProArt StudioBook 16 Pro W7600完全相同。这台笔记本电脑相当重,有2.4公斤,但在0.78英寸的超薄16英寸机身上的重量分布相等,确实让人对日常操作充满信心。
特别是,我们喜欢凸起的设计,它允许更舒适的打字体验和无阻碍的空气流通。没有尖锐的边缘,我们也没有体验到任何肆意的显示屏晃动。盖子也相当耐扭。盖子可以用一个手指打开到150°,没有任何稳定性问题。
键盘甲板的顶部有进气孔。键盘板本身结构良好,没有可察觉的弯曲。底部有三个状态指示灯,分别是电源、电池和SSD活动。
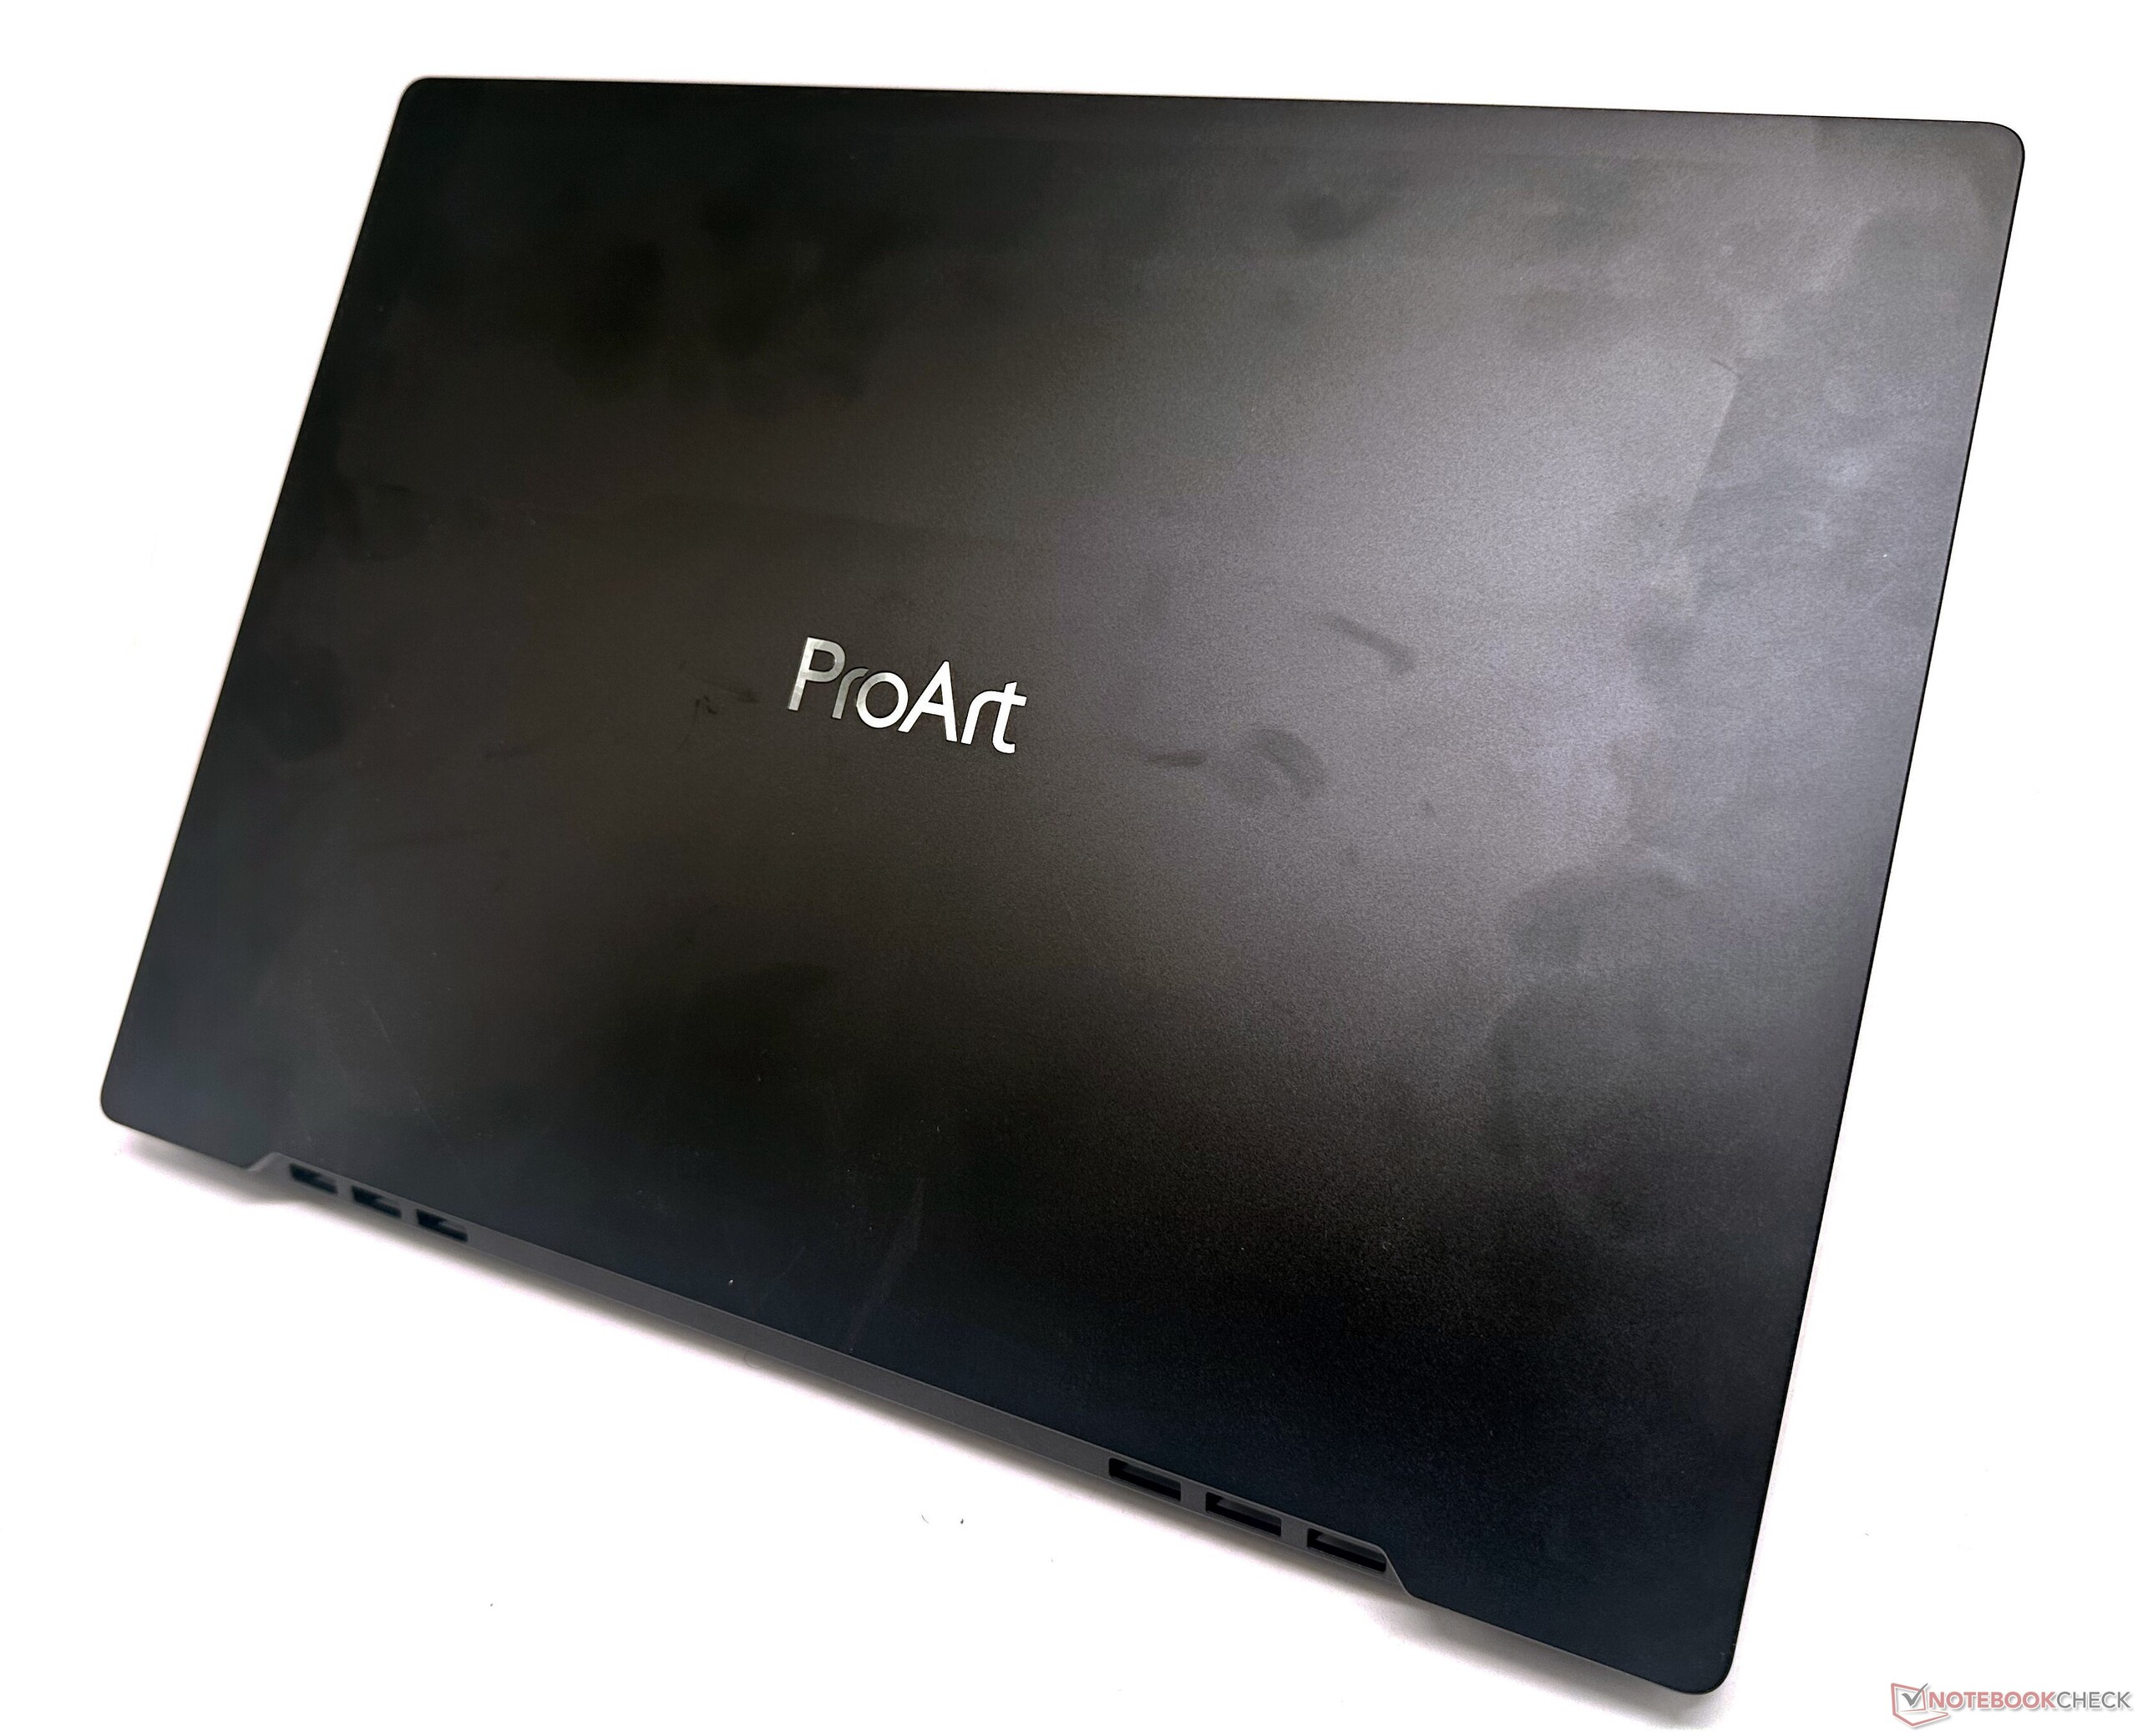
华硕声称,矿物黑配色的磨砂盖子具有 "高科技防指纹纳米涂层"。虽然指纹可能不明显,但盖子对污垢没有免疫力,也不防油。
ProArt StudioBook 16还符合MIL-STD-810H的耐用性标准,可以轻松承受在户外工作的变化无常。
总的来说,华硕ProArt StudioBook 16可能不完全是MacBook Pro的感觉,但铝合金结构绝对是优质的,简约的,而且与要价很吻合。
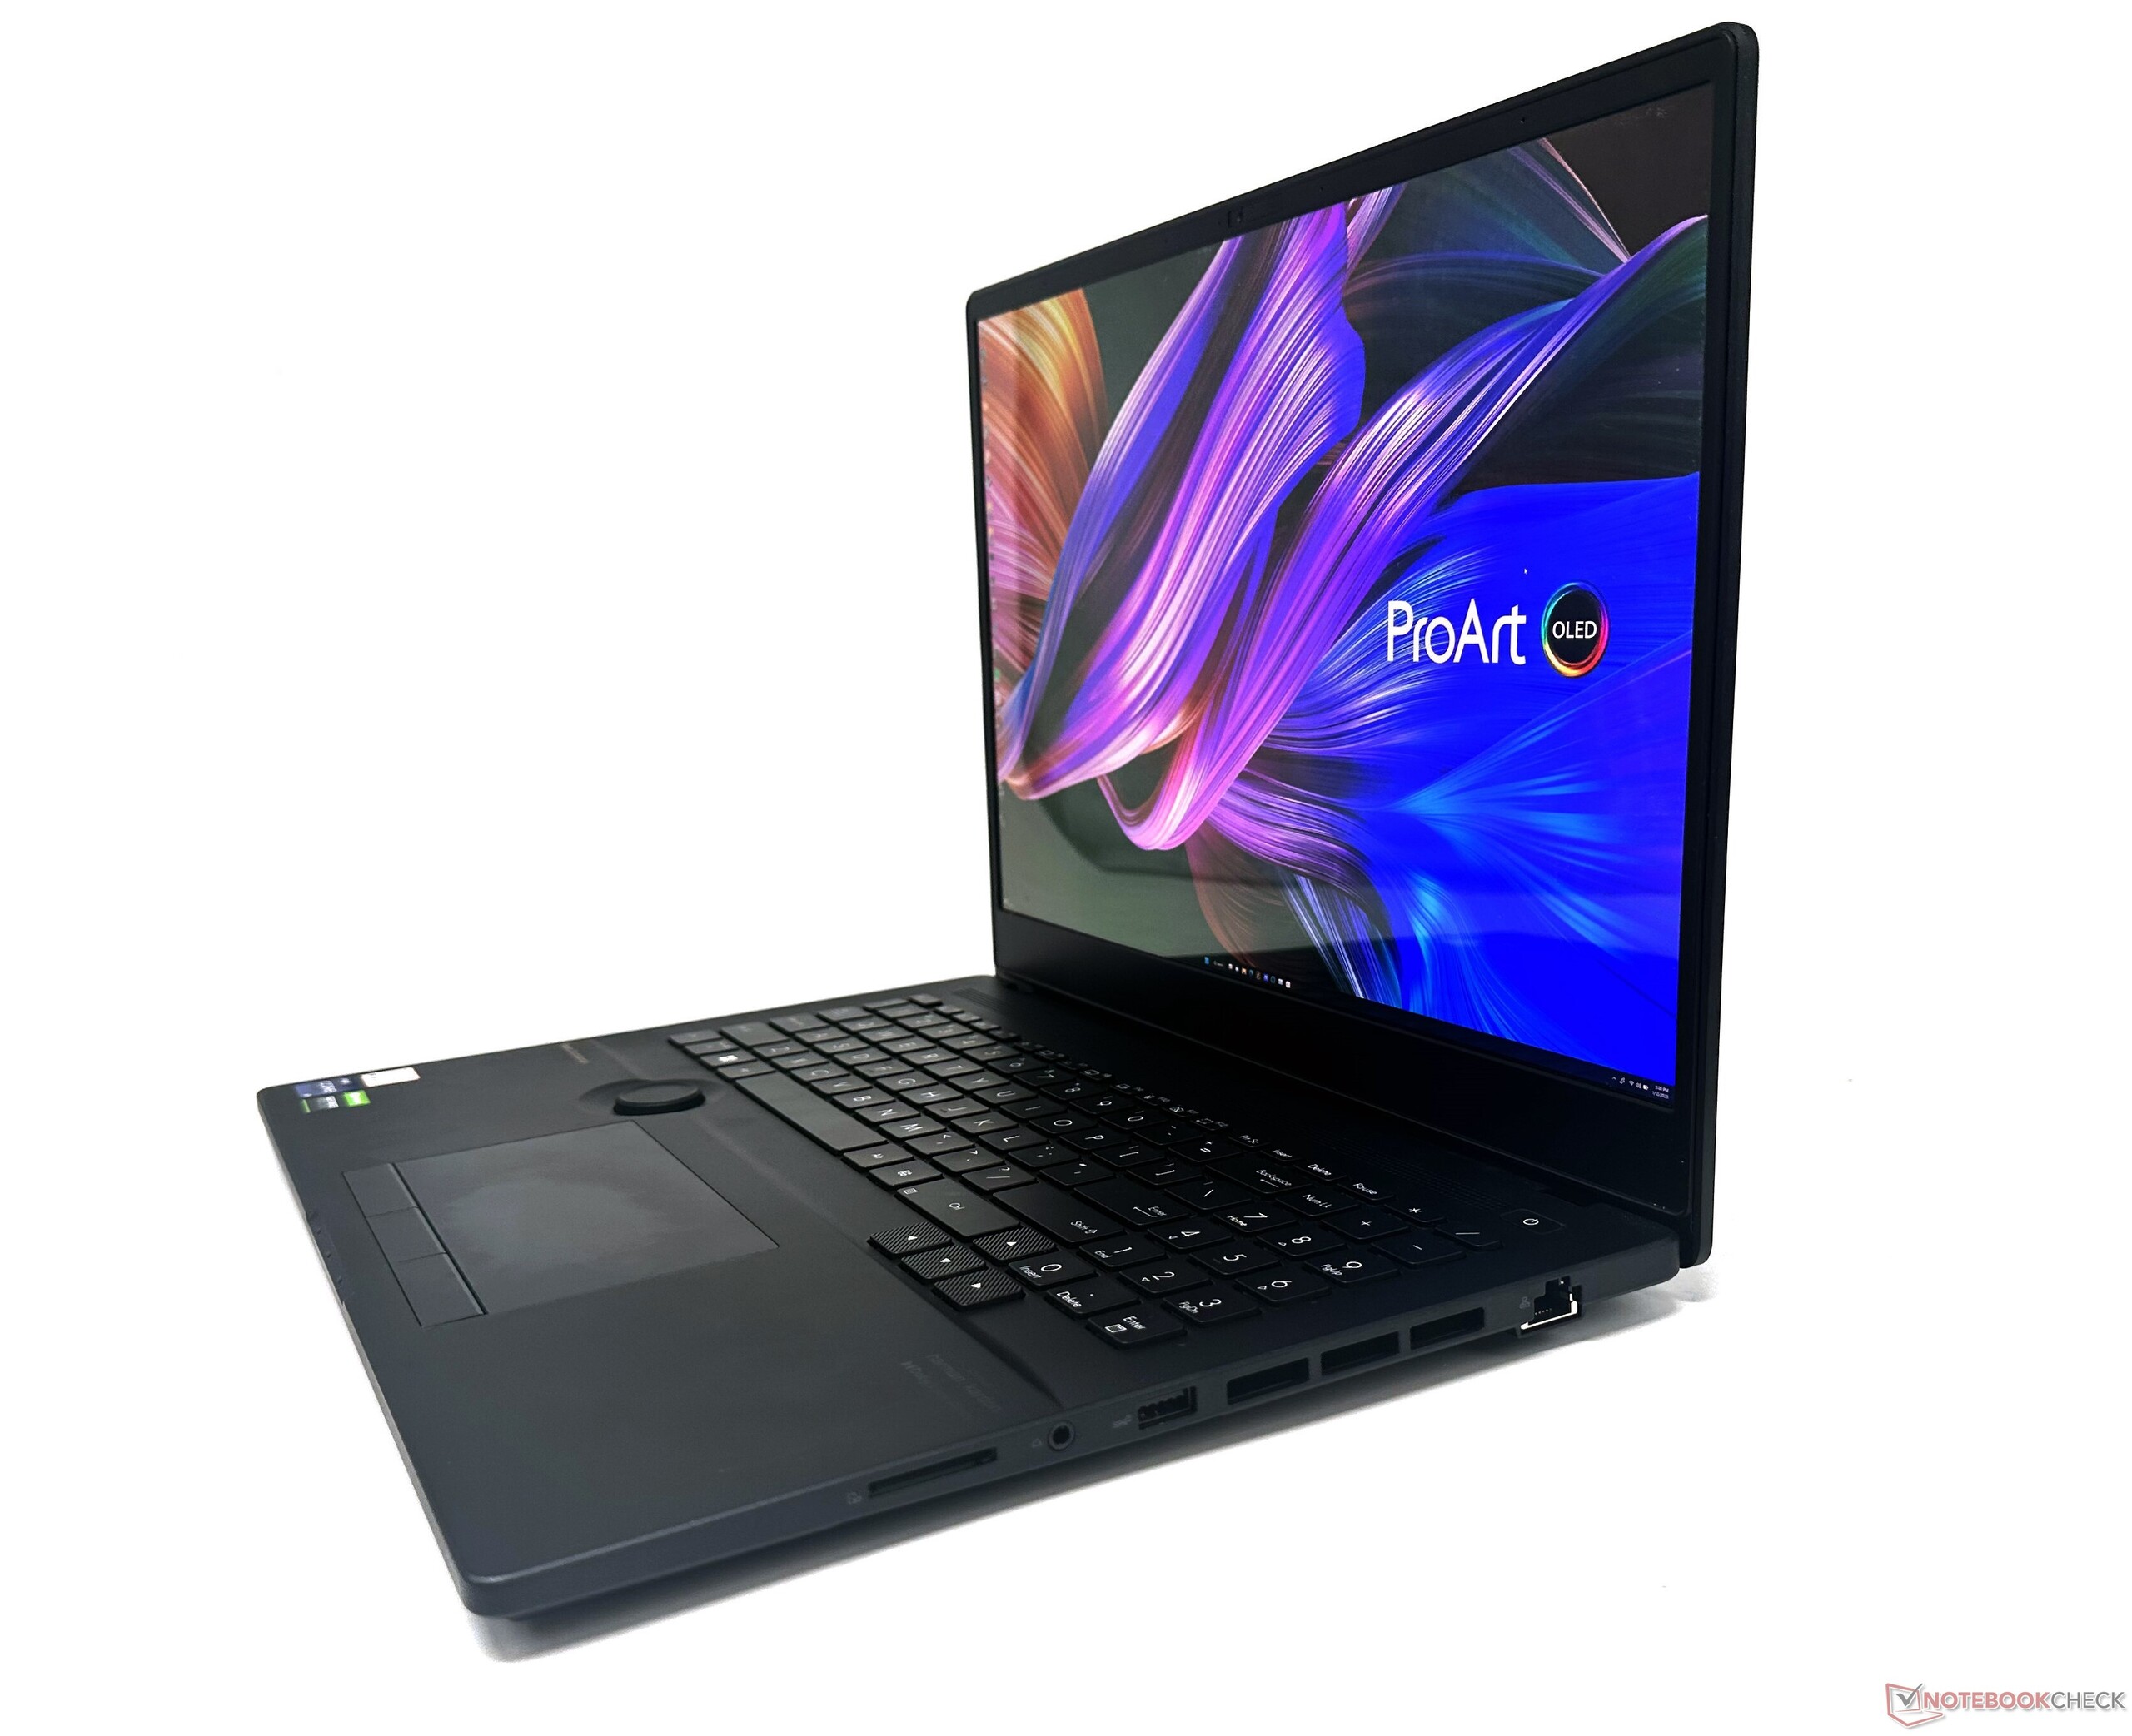
连接性。缓慢、不稳定的Wi-Fi 6E吞吐量
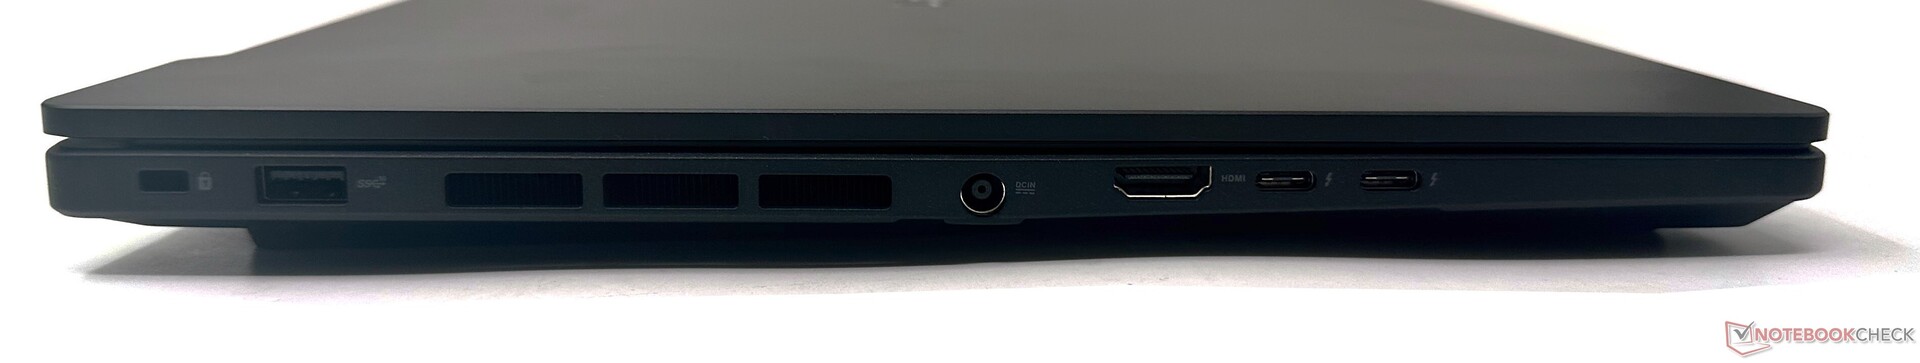
华硕ProArt StudioBook 16的端口选择还不错,但不是很广泛。华硕完全放弃了USB 2.0端口。相反,你有两个USB 3.2 Gen2 Type-A端口,一个在两边。
由于是英特尔平台,几个Thunderbolt 4端口也可以在左边使用。还有一个HDMI 2.1输出和一个2.5Gb的LAN端口。
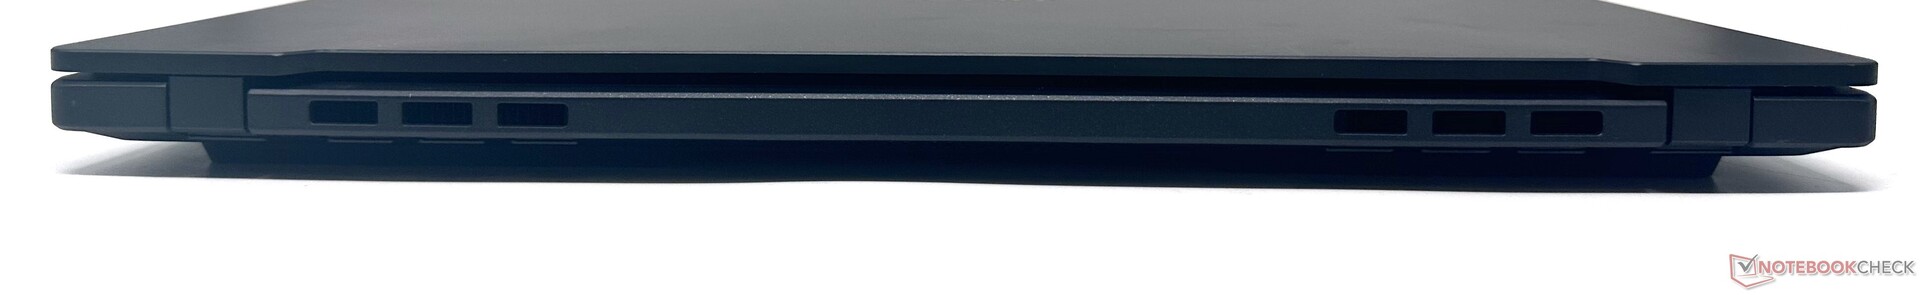
后面没有提供连接。由于这是一款以创造者为中心的笔记本电脑,把雷电4端口放在后面而不是把它们都挤在机箱的左侧可能更合理。这将有助于避免在主要工作区因底座和其他此类配件而产生的杂乱。
尽管如此,我们在连接多个外围设备时没有发现任何特别的障碍。
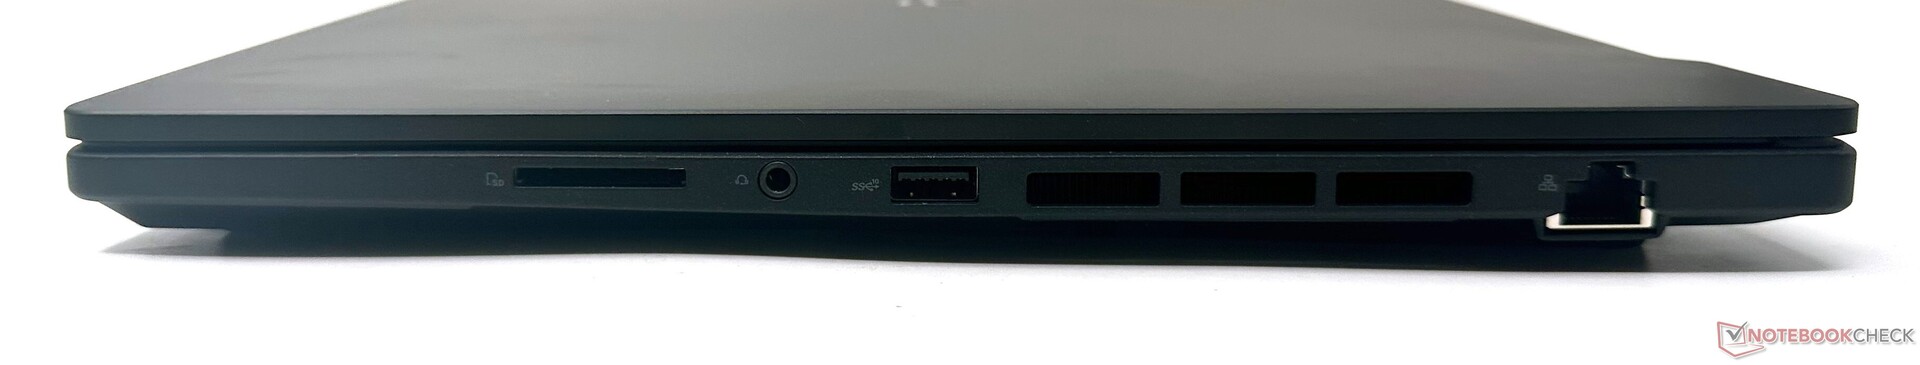
SD卡阅读器
华硕为ProArt StudoBook 16配备了一个SD Express 7.0读卡器。该读卡器提供了体面的传输速度,接近同类产品的平均水平,并类似于在 联想ThinkBook 16p第三代和 华硕ZenBook Pro 16X OLED.
然而,这并不是我们所见过的最快的SD卡性能--这要归功于 ROG Zephyrus Duo 16和 2021Apple MacBook Pro 16.
| SD Card Reader | |
| average JPG Copy Test (av. of 3 runs) | |
| Asus ROG Zephyrus Duo 16 GX650RX (AV PRO microSD 128 GB V60) | |
| Average of class Multimedia (23 - 531, n=37, last 2 years) | |
| Apple MacBook Pro 16 2021 M1 Pro (Angelbird AV Pro V60) | |
| MSI Creator Z17 A12UGST-054 (AV Pro SD microSD 128 GB V60) | |
| MSI Creator Z16P B12UHST (AV PRO microSD 128 GB V60) | |
| Lenovo ThinkBook 16p G3 ARH (AV PRO microSD 128 GB V60) | |
| Asus ProArt StudioBook 16 H7600ZW (AV PRO microSD 128 GB V60) | |
| Asus ZenBook Pro 16X OLED UX7602ZM-ME115W (AV Pro SD microSD 128 GB V60) | |
| maximum AS SSD Seq Read Test (1GB) | |
| Average of class Multimedia (37.3 - 1455, n=36, last 2 years) | |
| Asus ROG Zephyrus Duo 16 GX650RX (AV PRO microSD 128 GB V60) | |
| Lenovo ThinkBook 16p G3 ARH (AV PRO microSD 128 GB V60) | |
| Asus ProArt StudioBook 16 H7600ZW (AV PRO microSD 128 GB V60) | |
| Asus ZenBook Pro 16X OLED UX7602ZM-ME115W (AV Pro SD microSD 128 GB V60) | |
| MSI Creator Z17 A12UGST-054 (AV Pro SD microSD 128 GB V60) | |
沟通
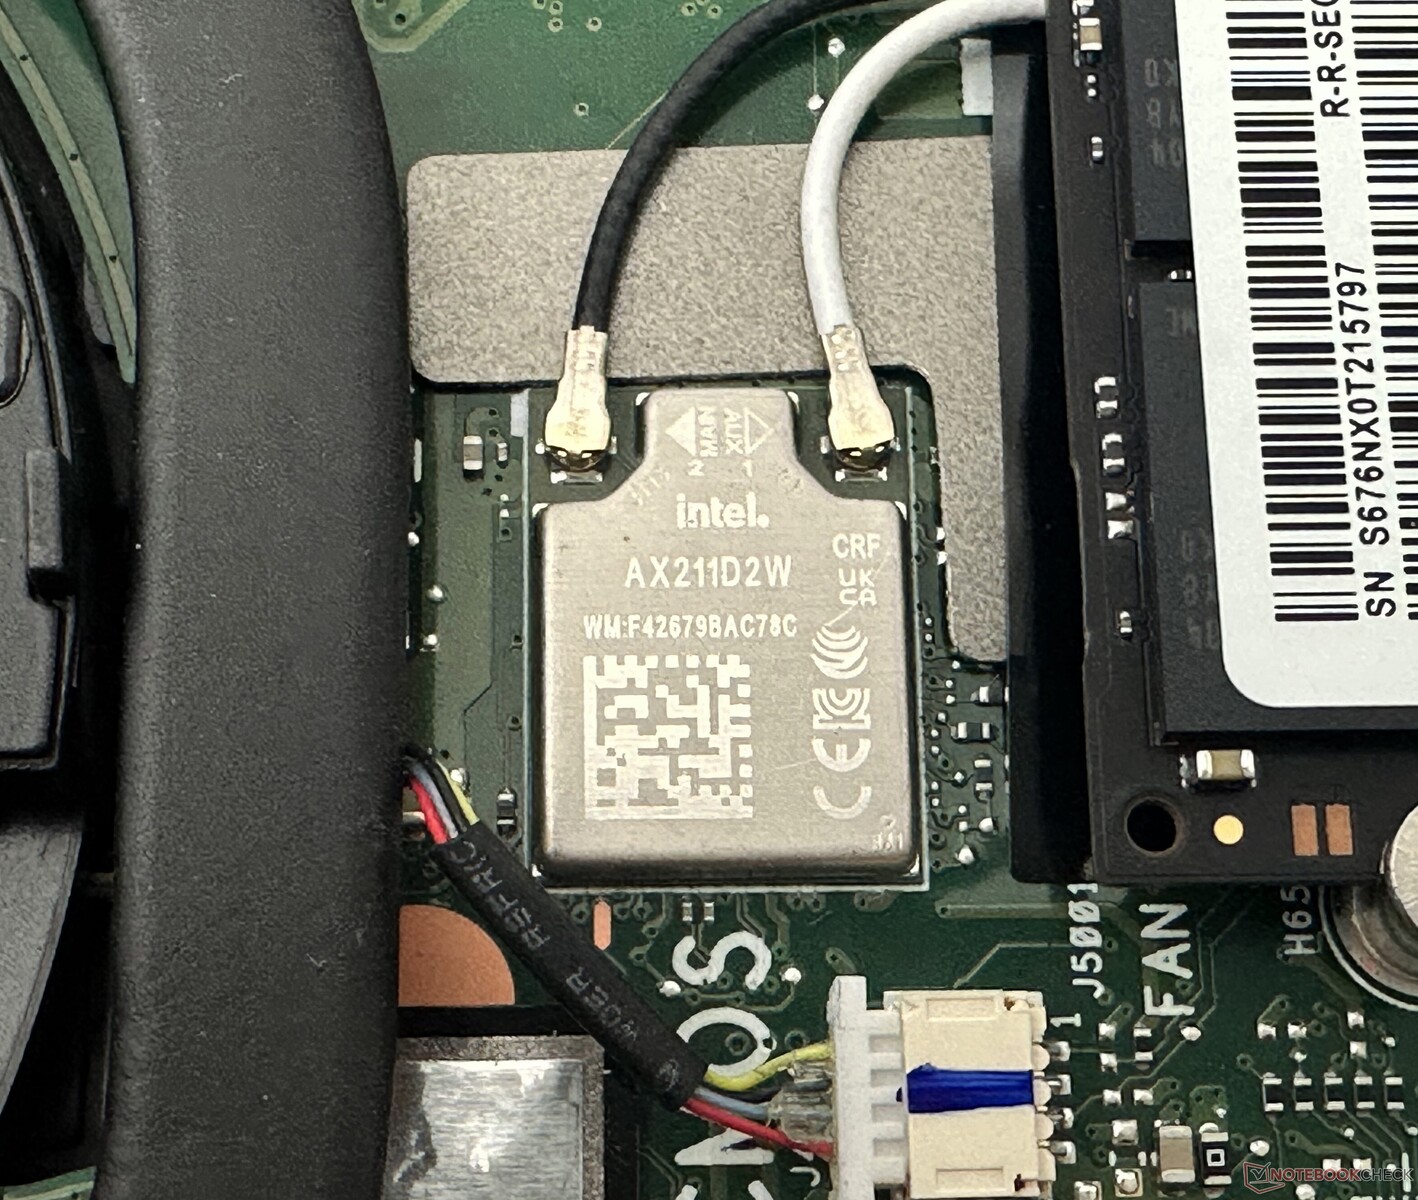
ProArt StudioBook 16采用了英特尔Wi-Fi 6E AX211 WLAN卡,不幸的是它被焊接在主板上。我们用我们的参考华硕ROG Rapture GT-AXE11000路由器测试了5GHz和6GHz频段的Wi-Fi性能,距离笔记本电脑1米,没有其他连接设备或外部干扰。
笔记本电脑在5GHz频谱中显示出体面的传输速率,总体上与竞争对手持平。 然而,6GHz频段表现相当差,特别是在传输测试中,有很多不稳定因素。我们发现,即使经过多次重复,情况也是如此。
网络摄像头
ProArt StudioBook 16缺少一个高质量的网络摄像头。内置的720p摄像头的图像质量没有什么可写的。
照片显示出较大的颜色偏差,缺乏清晰度和细节,尽管只要有足够的环境光线,他们就可以为一两个奇怪的视频电话服务。它可以通过F11键的快捷方式关闭网络摄像头。
华硕可以很容易地提供一个1080p的模块来代替这个价格。


安全问题
ProArt StudioBook 16为网络摄像头配备了一个物理快门,并为基于Windows Hello的登录提供了一个红外摄像头。没有指纹识别器,但有TPM 2.0芯片和Kensington锁插槽。
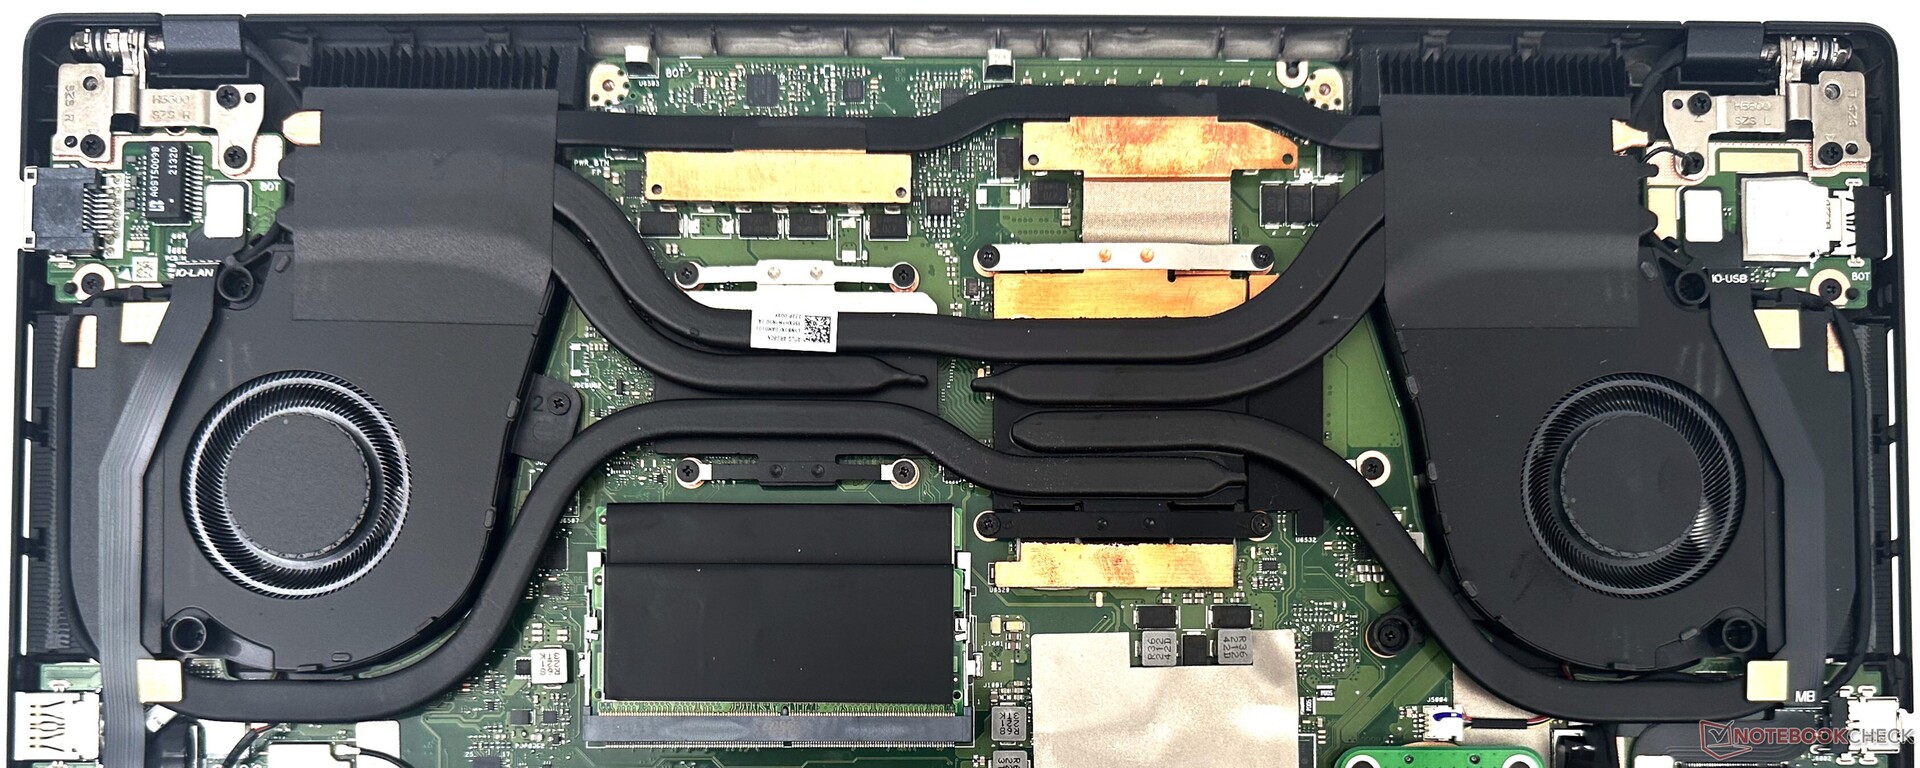
维护
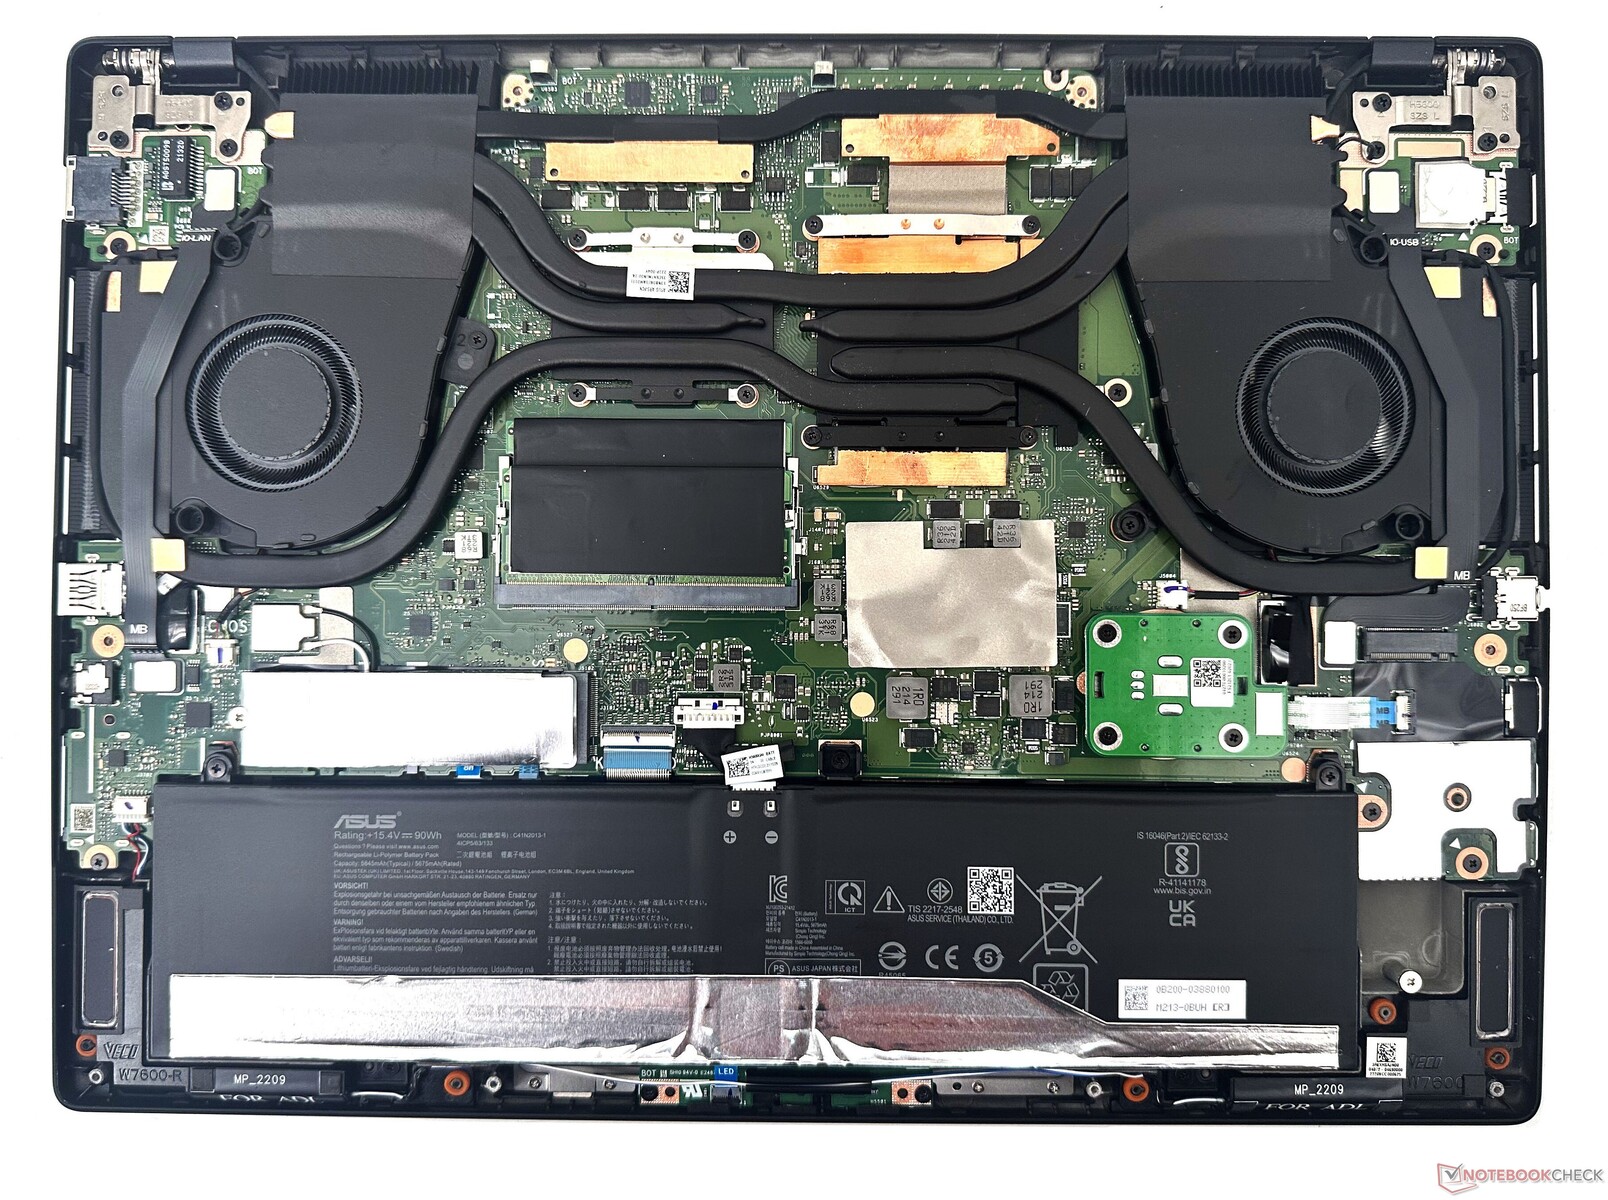
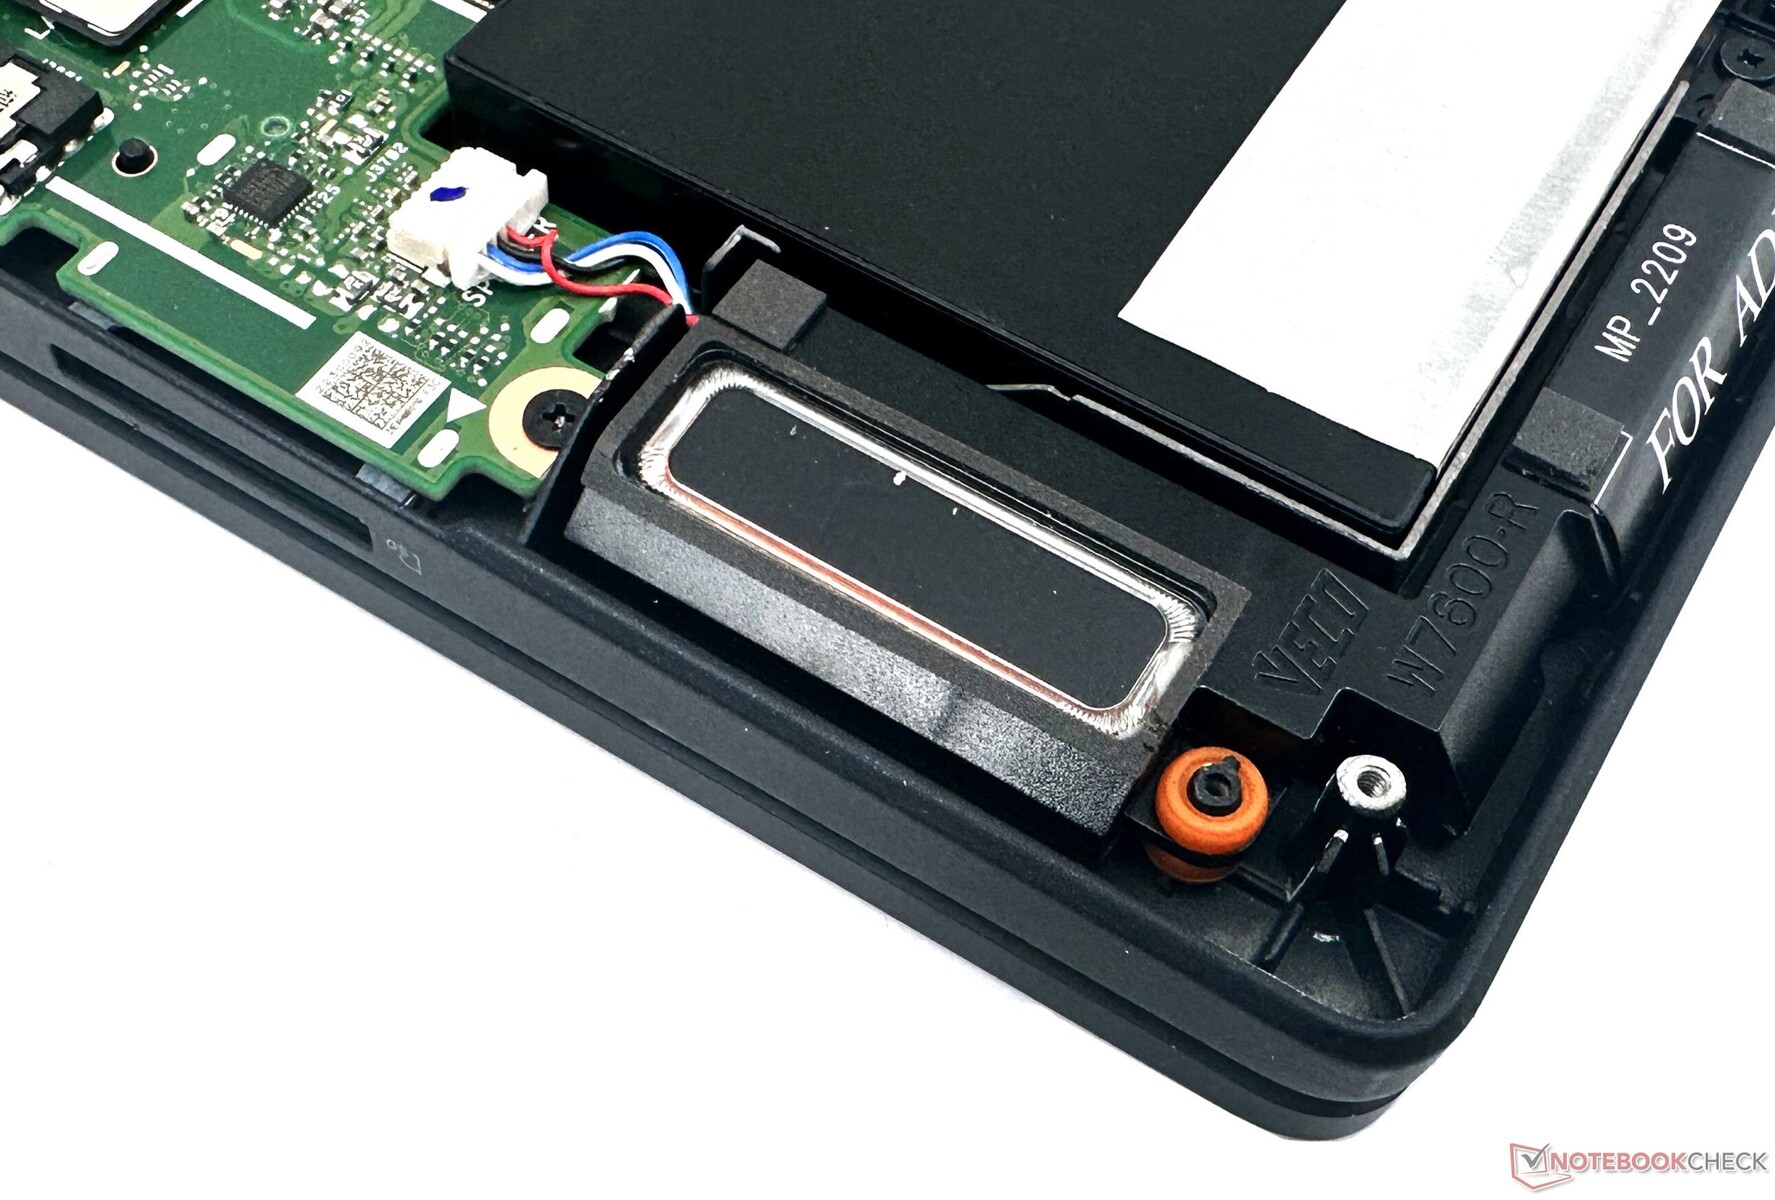
ProArt StudioBook 16具有良好的可维修性。要进入内部,需要卸下背板上的13颗奇怪的Torx T5螺丝。宽敞的机箱为各种部件之间提供了良好的分隔。
内存和NVMe固态硬盘可以被换掉或升级,而Wi-Fi卡是焊接的。如果有必要,电池可以被拧开。我们还看到一个单独的PCB,用于华硕拨号。
配件和保修
盒子里有240瓦的电源适配器和通常的文书工作。此外,华硕还提供了一个为移动中的创作者设计的功利性背包。
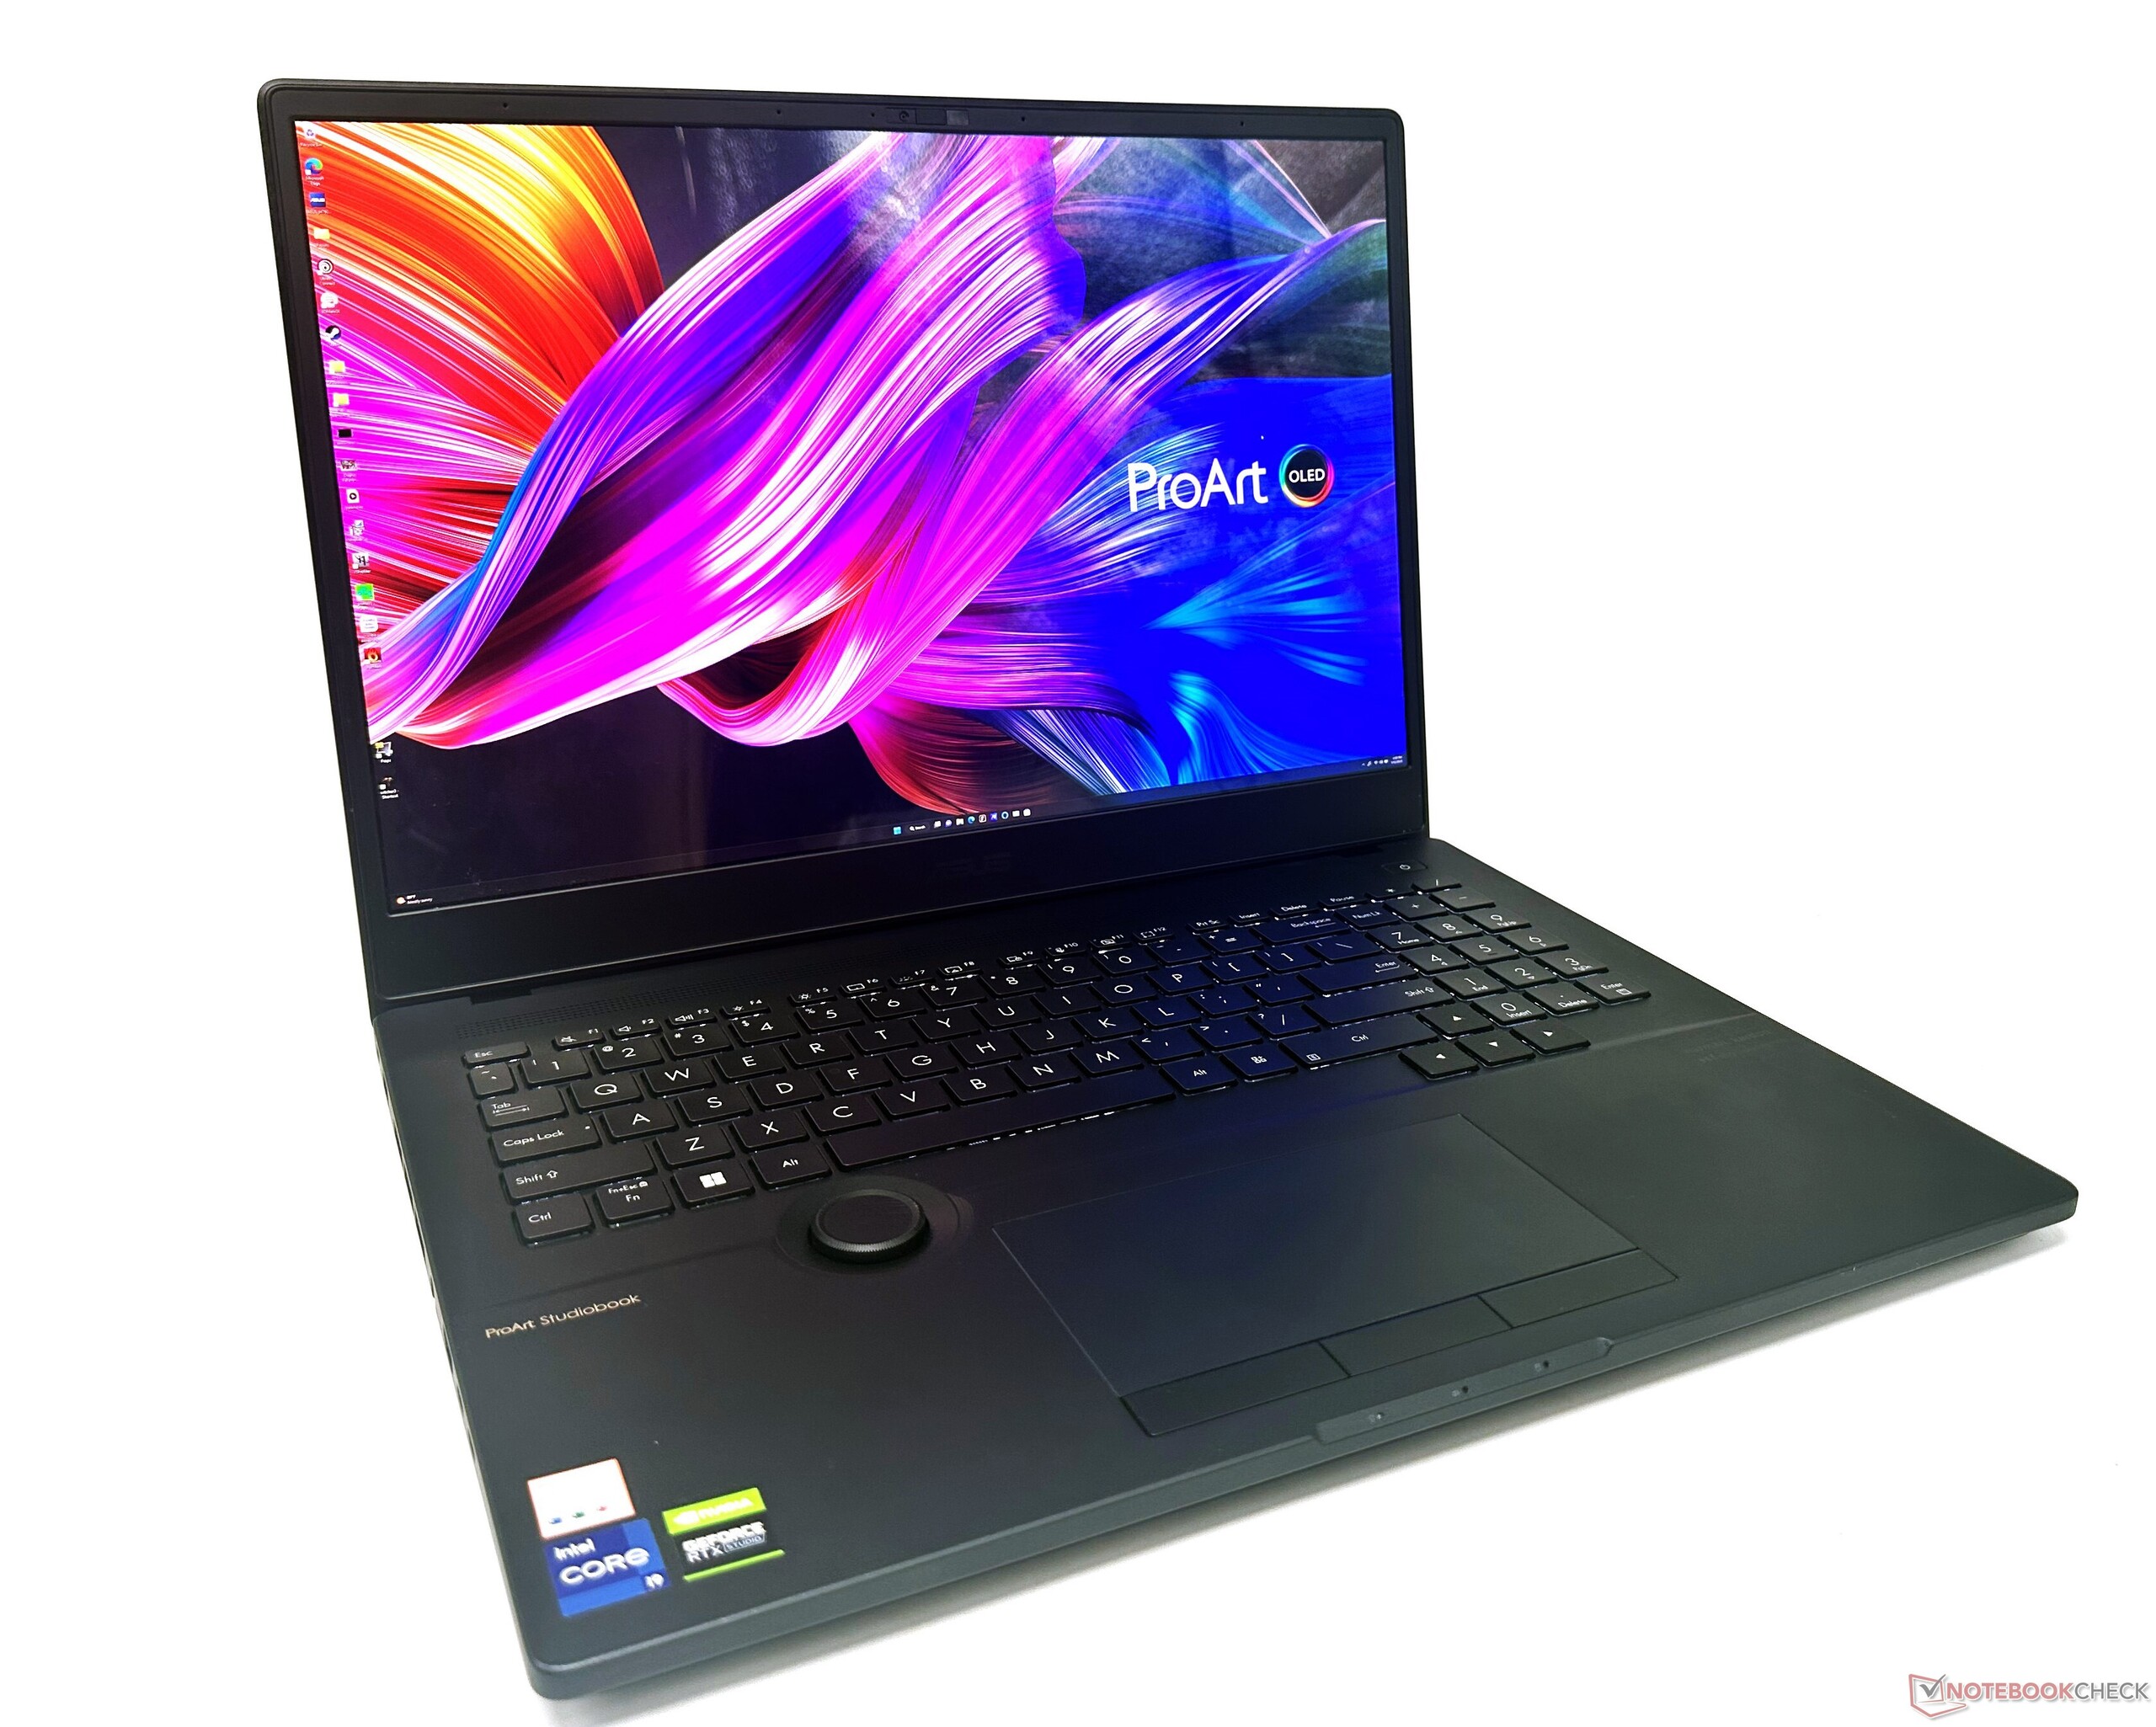
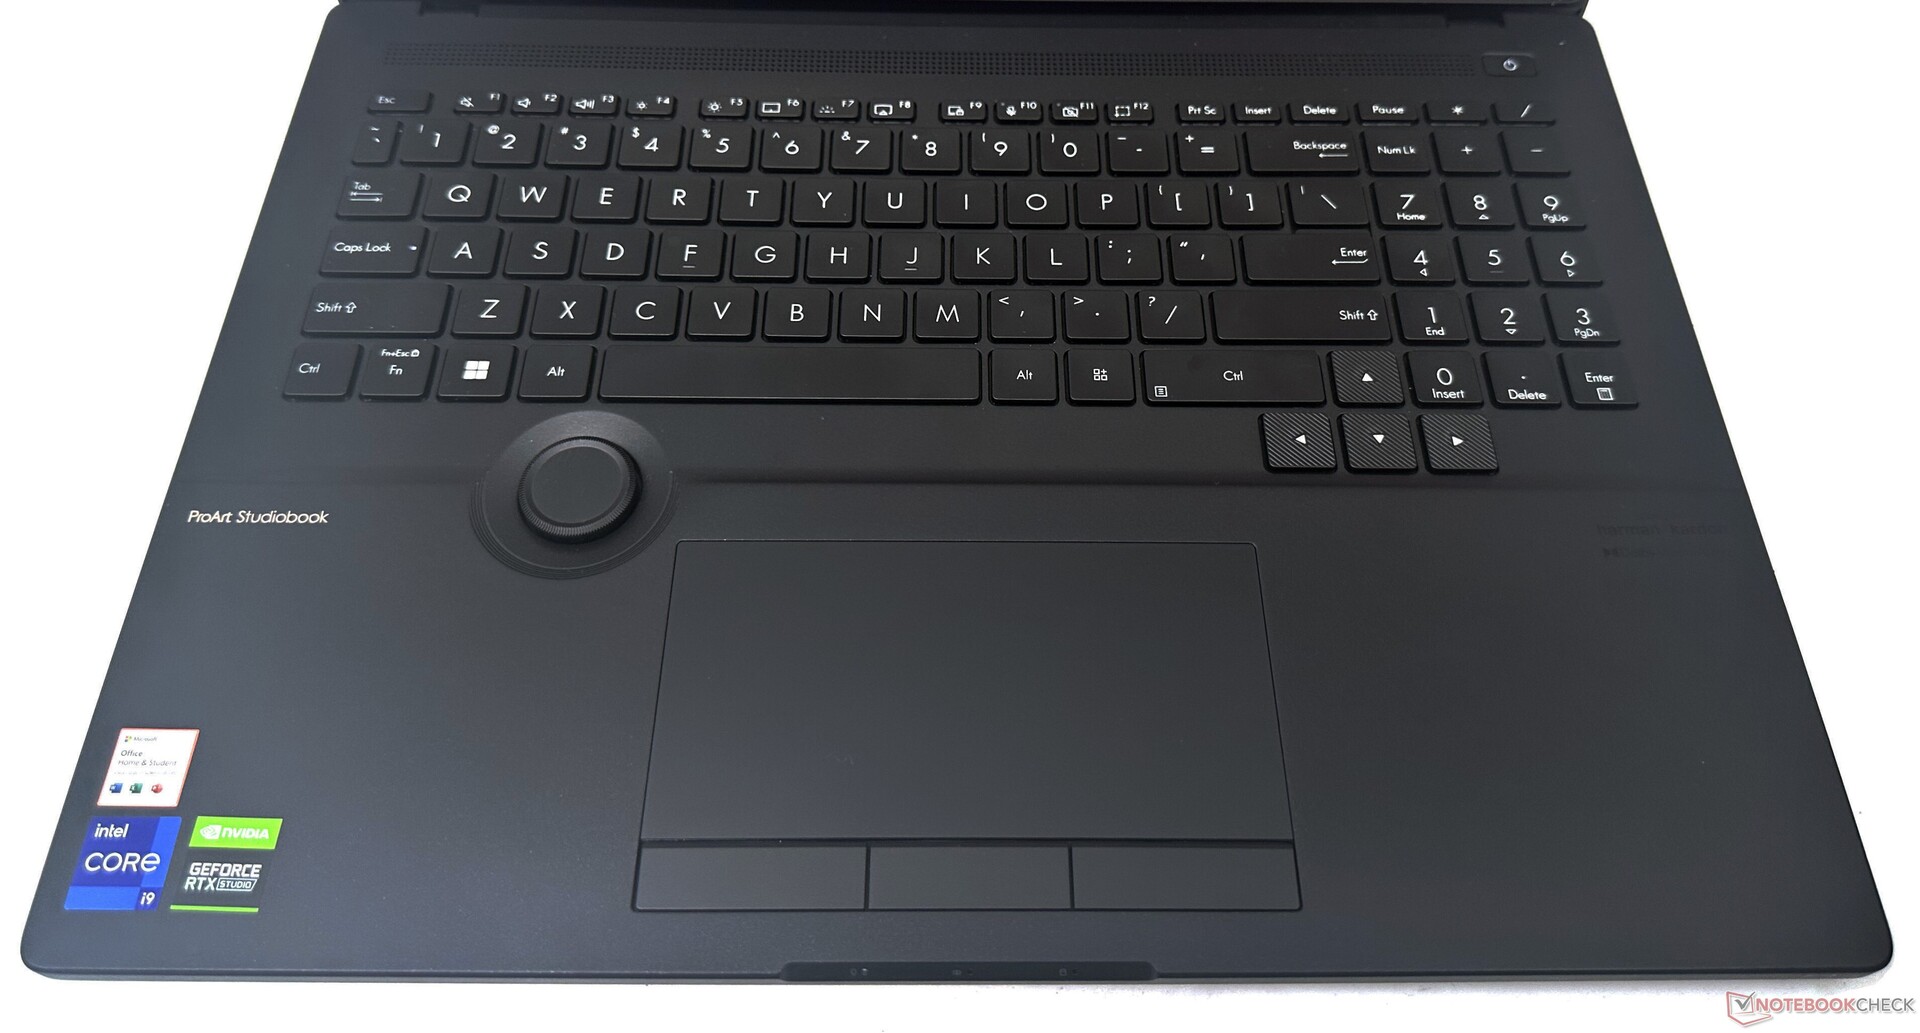
输入设备。触摸板有自己的想法
键盘
全尺寸的背光Chiclet键盘感觉很宽敞,有适当大小的方向键。1.4毫米的移动距离使打字相当舒适,触觉反馈很好,咔哒声很低。最上面一排提供了常用功能的快捷键,包括调整三段式背光。
华硕表盘
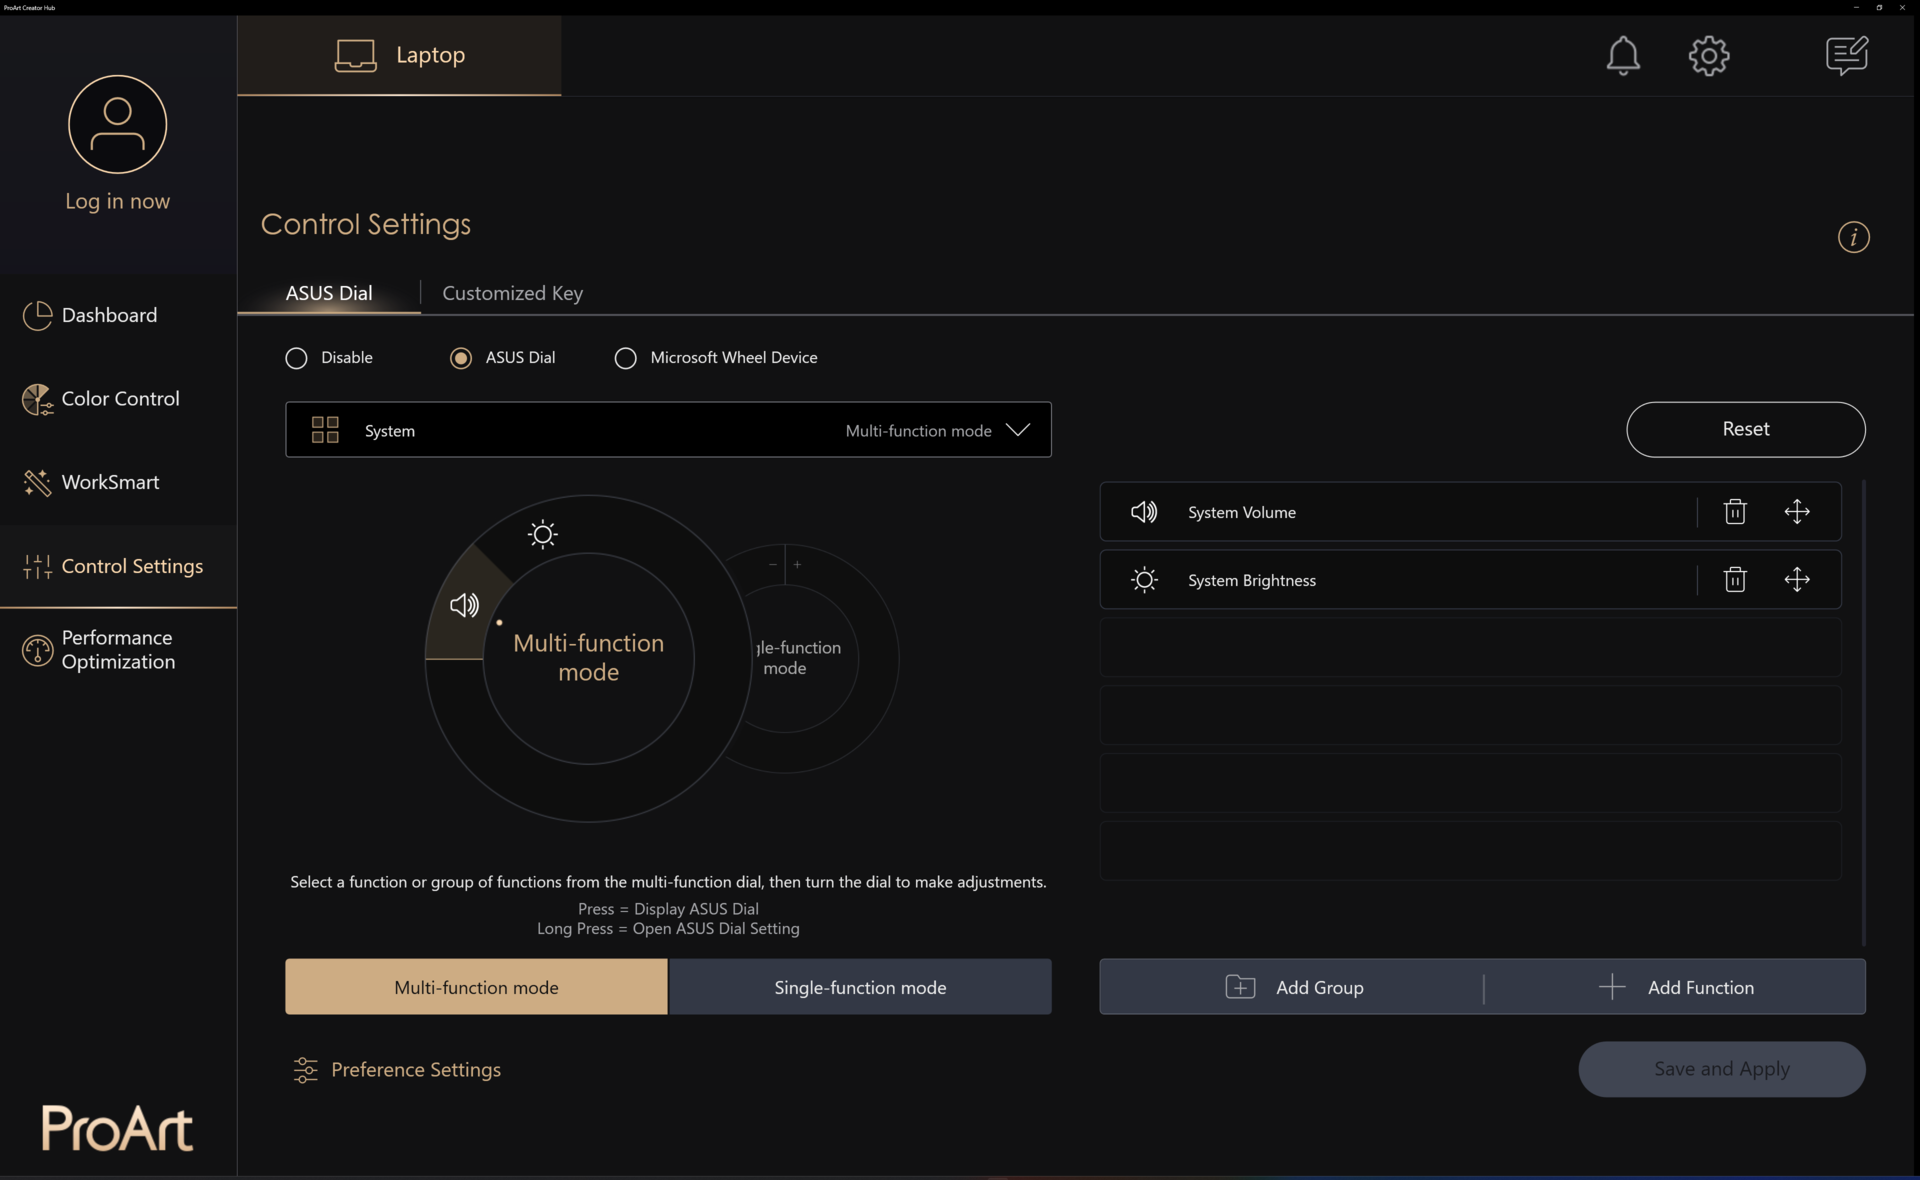
华硕表盘是ProArt StudioBook系列的突出特点。Dial为创作者提供了使用其应用程序的模拟感觉。
目前,华硕提供了与Adobe程序的兼容性,如Photoshop、Illustrator、Lightroom Classic、Premiere Pro和After Effects,对更多的应用程序的支持正在进行中。
Dial还可以使用常见的Windows功能,如亮度和音量调节。Dial的其他功能可以从ProArt Creator Hub内添加。
在实践中,华硕拨号盘是相当直观的,但可能需要一些时间来习惯用肌肉记忆来访问功能。拨号盘并不妨碍打字或使用触摸板。
触摸板
ProArt StudioBook 16采用了优质的玻璃触摸板,与WindowsPrecision 手势完全兼容。华硕在触摸板的底部提供了三个物理按钮,这在现在是很罕见的,但在创意应用中可以用来平移或旋转场景中的对象。
触摸板本身没有点击功能,尽管左键点击仍以轻触方式登记。然而,我们评测单位的触摸板似乎过于敏感。这常常导致触摸板错误地将点击识别为拖动和保持手势。在控制面板中改变鼠标灵敏度也没有什么帮助。
在正常使用中,经常有一个以上的手指点击触摸板,这是很自然的。这马上就会触发一个拖动和保持的手势,使UI导航变得有些不直观。物理按钮提供了一个有点模糊但令人满意的点击。
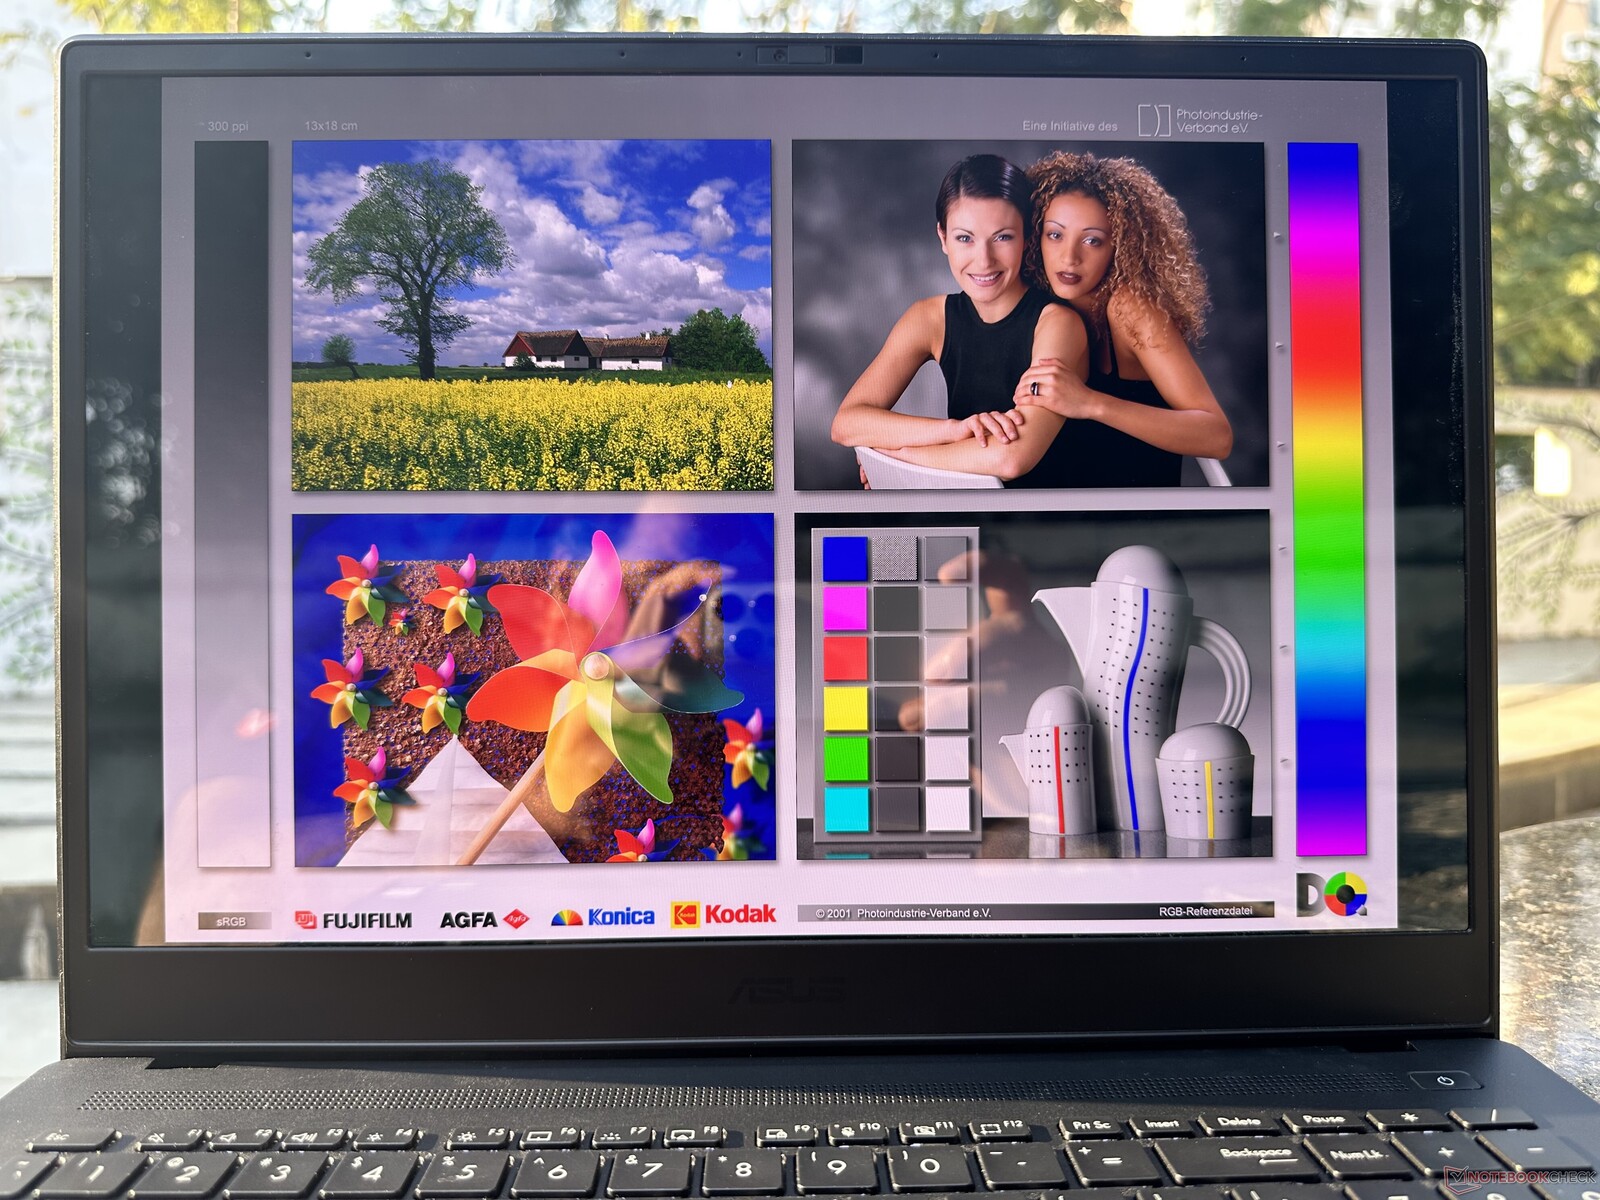
显示屏。60赫兹杜比视界OELD面板,带PWM功能
ProArt StudioBook 16配备了来自三星的16英寸16:10 4K(3840 x 2400)OLED面板。华硕只用了一个60赫兹的面板,但在其他方面进行了弥补,我们将在下面看到。
子像素排列表明,S-Stripe RGB矩阵的整体密度为283PPI。由于这是一个OLED面板,所以没有观察到背光渗漏。


由于是OLED面板,三星ATNA60YV02提供了均匀的98%的亮度分布和基本上无限的对比度。我们测量了378尼特的平均SDR亮度水平。
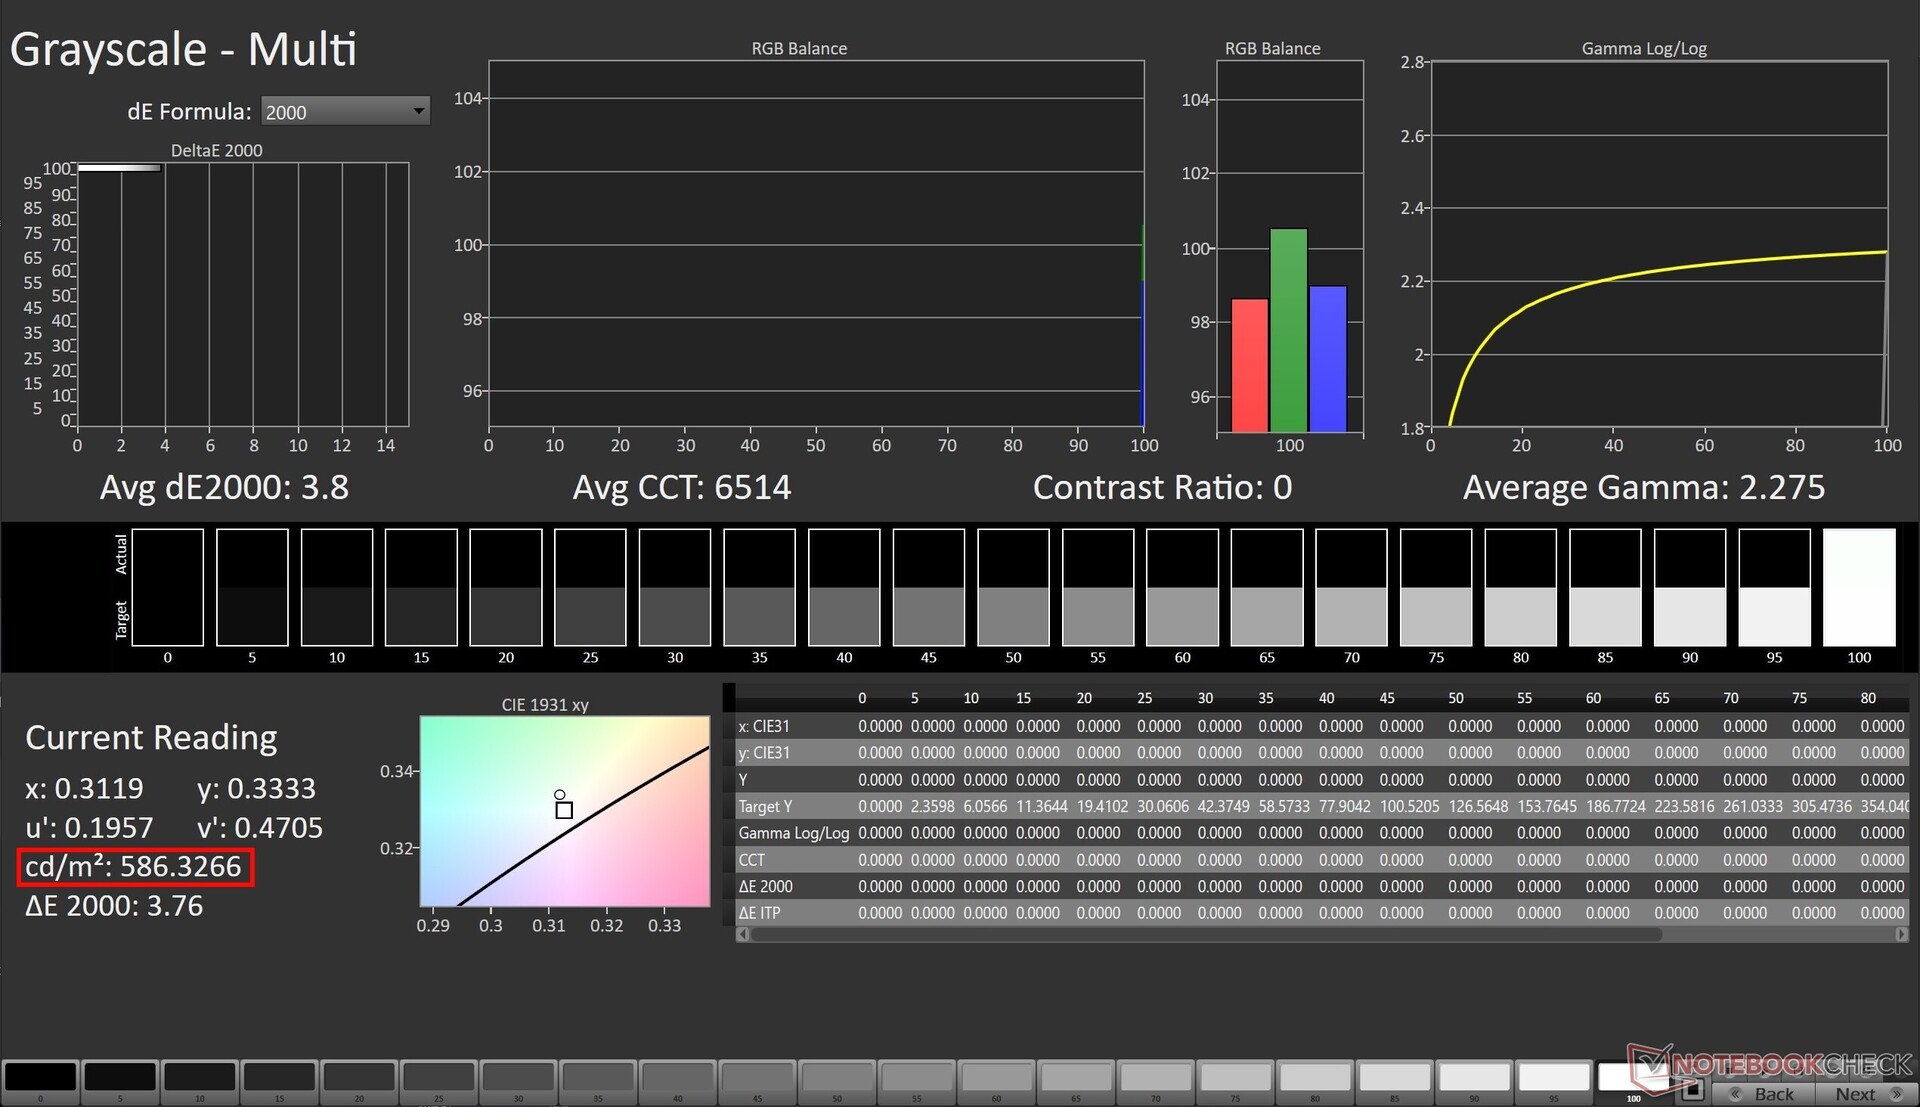
据华硕称,ProArt StudioBook 16的OLED面板通过了VESA DisplayHDR True Black 600认证。支持Dolby Vision HDR。
在我们的测试中,我们在HDR模式下记录了586尼特的峰值亮度,白色图像为100%。
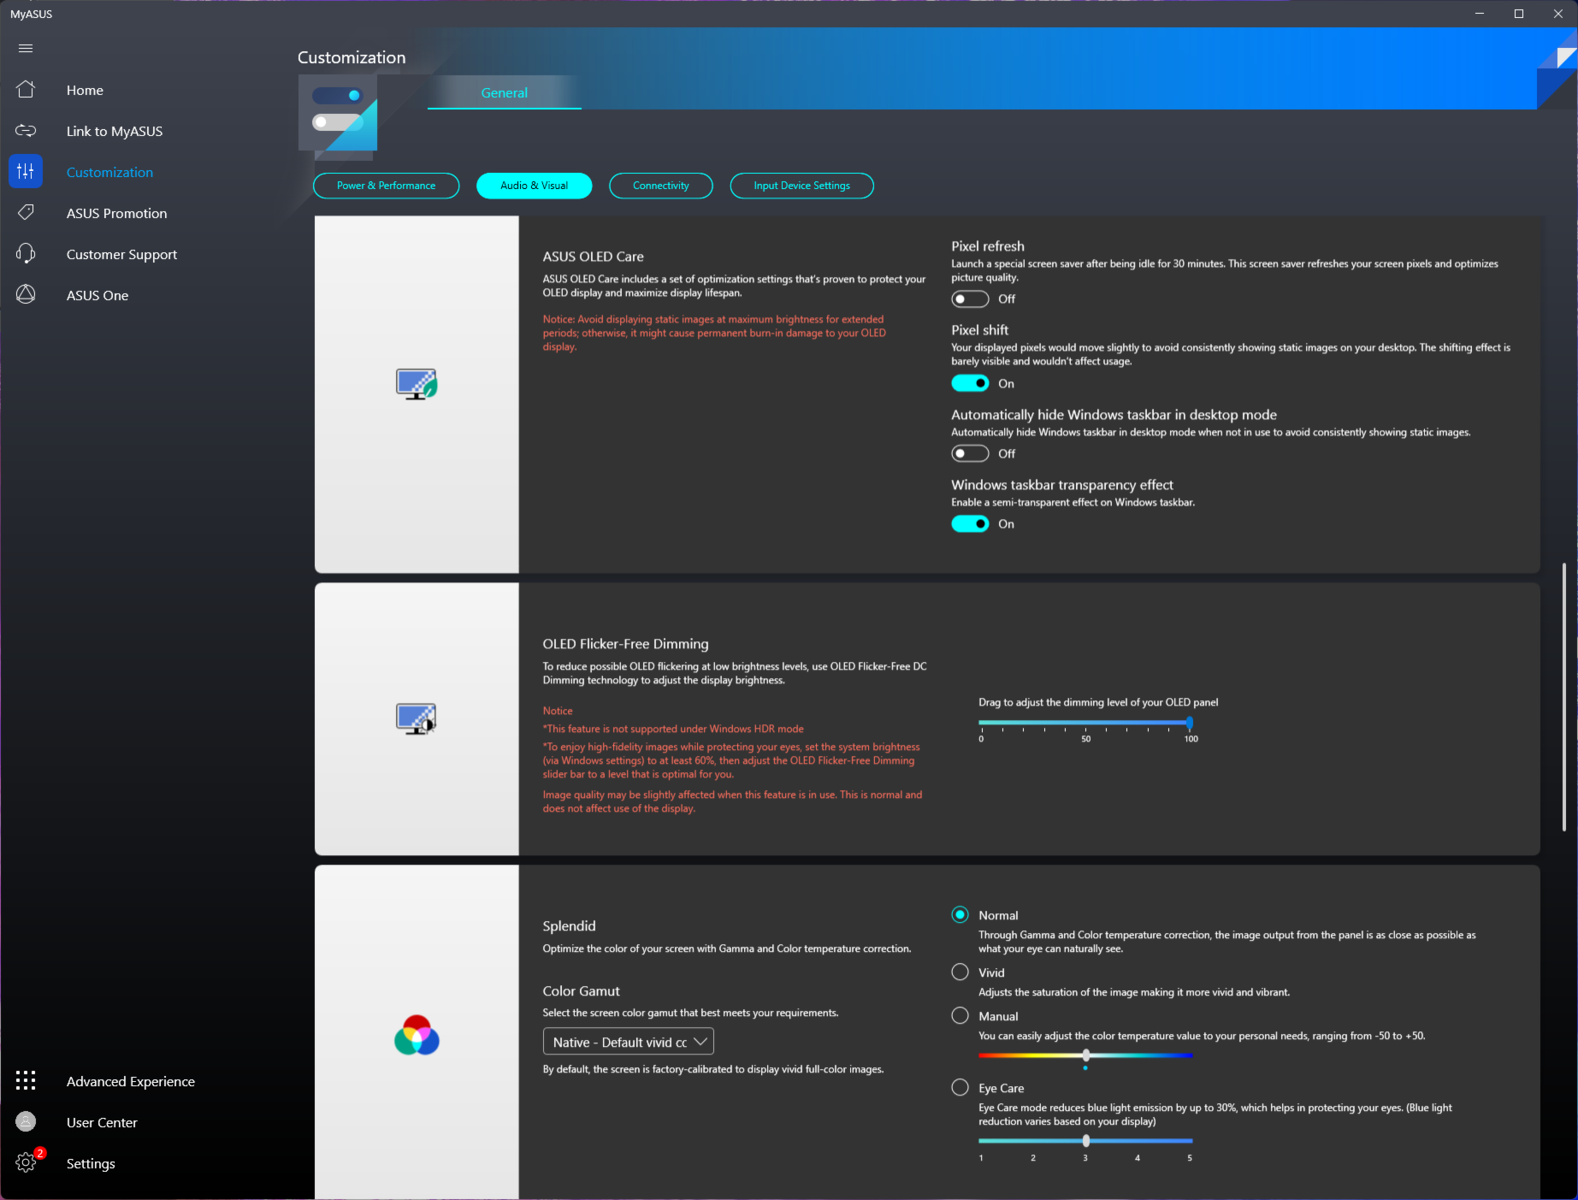
MyAsus应用程序提供了设置像素刷新和像素移动设置的选项,以保护OLED不被烧毁。用户还可以调整要使用的直流调光的程度。
你还可以通过Splendid在各种颜色配置文件中进行选择。我们在正常设置下进行了显示器校准。
| |||||||||||||||||||||||||
Brightness Distribution: 98 %
Center on Battery: 369 cd/m²
Contrast: ∞:1 (Black: 0 cd/m²)
ΔE ColorChecker Calman: 2.97 | ∀{0.5-29.43 Ø4.71}
calibrated: 2.15
ΔE Greyscale Calman: 2.9 | ∀{0.09-98 Ø4.96}
96.5% AdobeRGB 1998 (Argyll 3D)
100% sRGB (Argyll 3D)
99.6% Display P3 (Argyll 3D)
Gamma: 2.13
CCT: 6636 K
| Asus ProArt StudioBook 16 H7600ZW Samsung ATNA60YV02, OLED, 3840x2400, 16" | MSI Creator Z16P B12UHST AUOD298, IPS True Pixel (~100% DCI-P3), 2560x1600, 16" | Asus ROG Strix Scar 15 G533ZW-LN106WS BOE CQ NE156QHM-NZ2, IPS-level, 2560x1440, 15.6" | Asus ZenBook Pro 16X OLED UX7602ZM-ME115W Samsung SDC415D, OLED, 3840x2400, 16" | Asus ROG Zephyrus Duo 16 GX650RX BOE NE160QAM-NX1, IPS-Level, 3840x2400, 16" | Apple MacBook Pro 16 2021 M1 Pro Liquid Retina XDR, Mini-LED, 3456x2234, 16.2" | |
|---|---|---|---|---|---|---|
| Display | -4% | -5% | -3% | -4% | -3% | |
| Display P3 Coverage (%) | 99.6 | 97.6 -2% | 96.2 -3% | 99.84 0% | 98 -2% | 99.1 -1% |
| sRGB Coverage (%) | 100 | 99.9 0% | 99.9 0% | 99.99 0% | 99.9 0% | 100 0% |
| AdobeRGB 1998 Coverage (%) | 96.5 | 86.8 -10% | 84.5 -12% | 88.9 -8% | 86.3 -11% | 88 -9% |
| Response Times | -321% | -165% | 32% | -372% | -1488% | |
| Response Time Grey 50% / Grey 80% * (ms) | 1.6 ? | 12.9 ? -706% | 7.86 ? -391% 4.21 ? -163% | 2 ? -25% | 14.6 ? -813% | 42.8 ? -2575% |
| Response Time Black / White * (ms) | 18.32 ? | 6.4 ? 65% | 7.5 ? 59% | 2 ? 89% | 5.6 ? 69% | 91.6 ? -400% |
| PWM Frequency (Hz) | 60 ? | 59 ? | 14880 | |||
| Screen | 12% | -14% | 6% | -10% | 30% | |
| Brightness middle (cd/m²) | 370 | 428 16% | 346 -6% | 346 -6% | 459 24% | 514 39% |
| Brightness (cd/m²) | 374 | 394 5% | 329 -12% | 354 -5% | 434 16% | 497 33% |
| Brightness Distribution (%) | 98 | 86 -12% | 91 -7% | 96 -2% | 88 -10% | 95 -3% |
| Black Level * (cd/m²) | 0.42 | 0.59 | 0.44 | 0.02 | ||
| Colorchecker dE 2000 * | 2.97 | 1.67 44% | 3.06 -3% | 2.28 23% | 2.97 -0% | 1.4 53% |
| Colorchecker dE 2000 max. * | 4.38 | 5.71 -30% | 5.81 -33% | 4.94 -13% | 8.13 -86% | 2.8 36% |
| Colorchecker dE 2000 calibrated * | 2.15 | 0.71 67% | 2.57 -20% | 2.16 -0% | 1.03 52% | |
| Greyscale dE 2000 * | 2.9 | 3.1 -7% | 1.64 43% | 4.9 -69% | 2.3 21% | |
| Gamma | 2.13 103% | 2.195 100% | 2.12 104% | 2.37 93% | 2.235 98% | 2.27 97% |
| CCT | 6636 98% | 6498 100% | 7021 93% | 6384 102% | 6775 96% | 6792 96% |
| Contrast (:1) | 1019 | 586 | 1043 | 25700 | ||
| Total Average (Program / Settings) | -104% /
-48% | -61% /
-49% | 12% /
8% | -129% /
-69% | -487% /
-255% |
* ... smaller is better
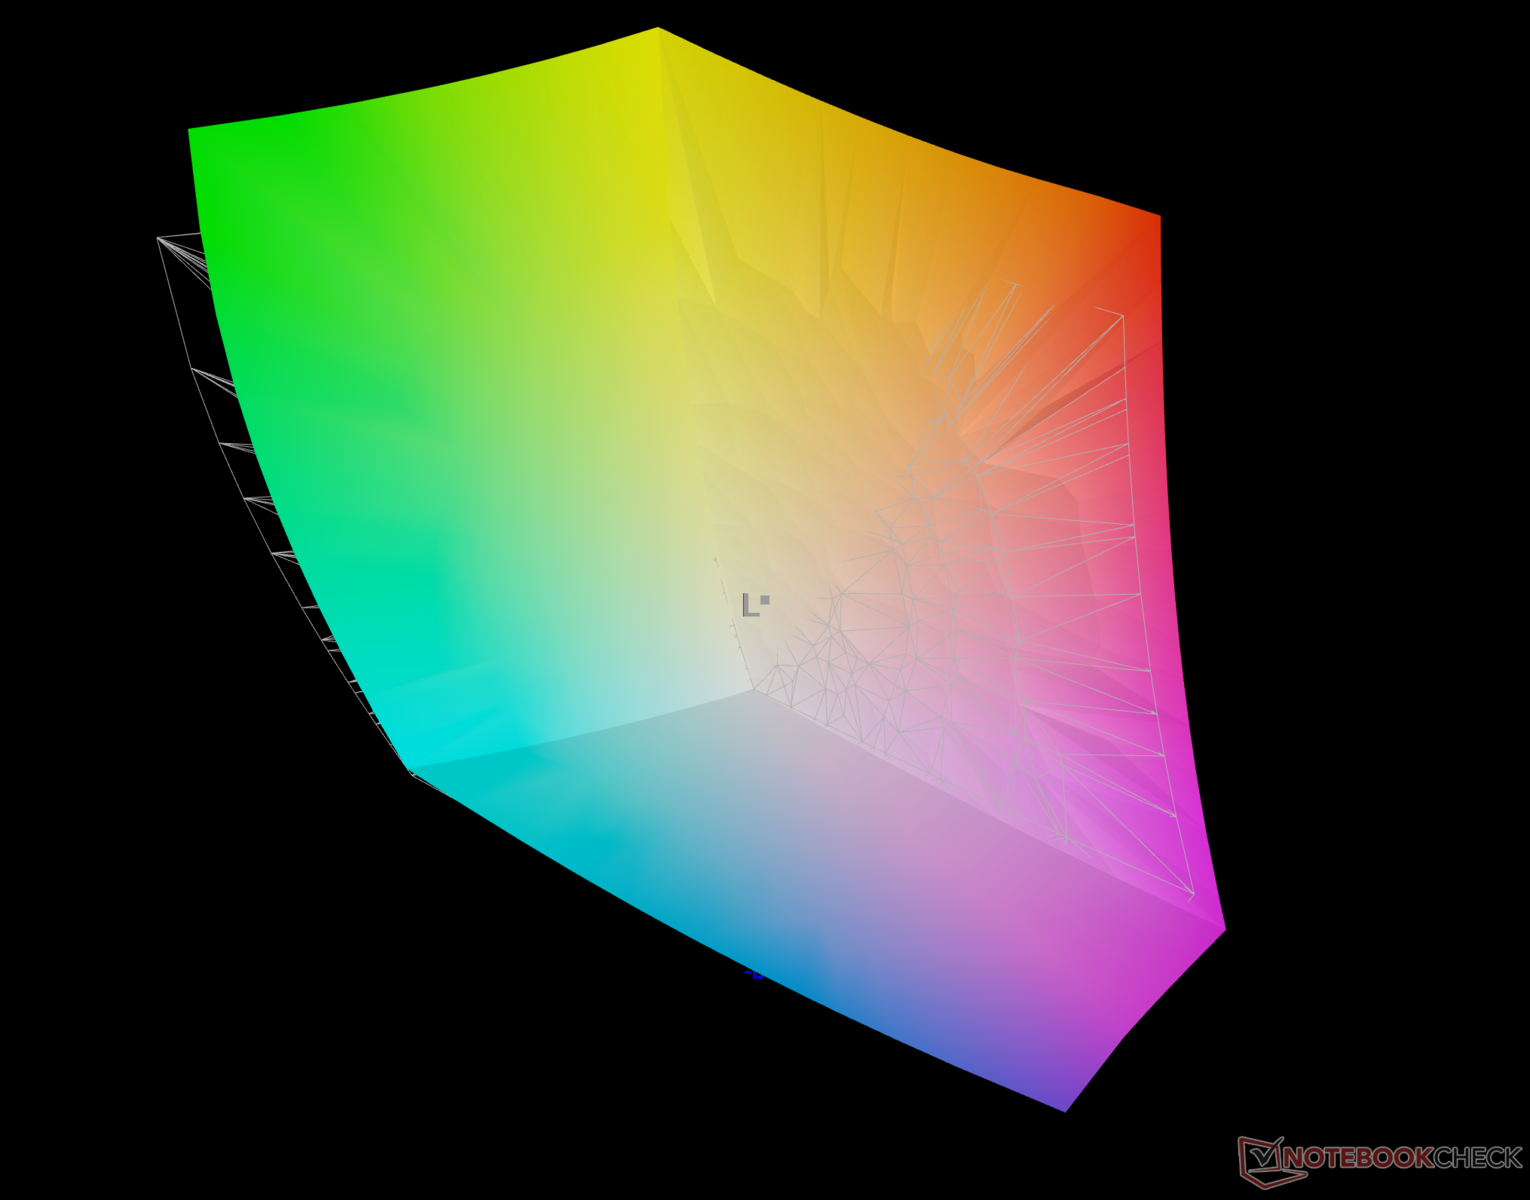
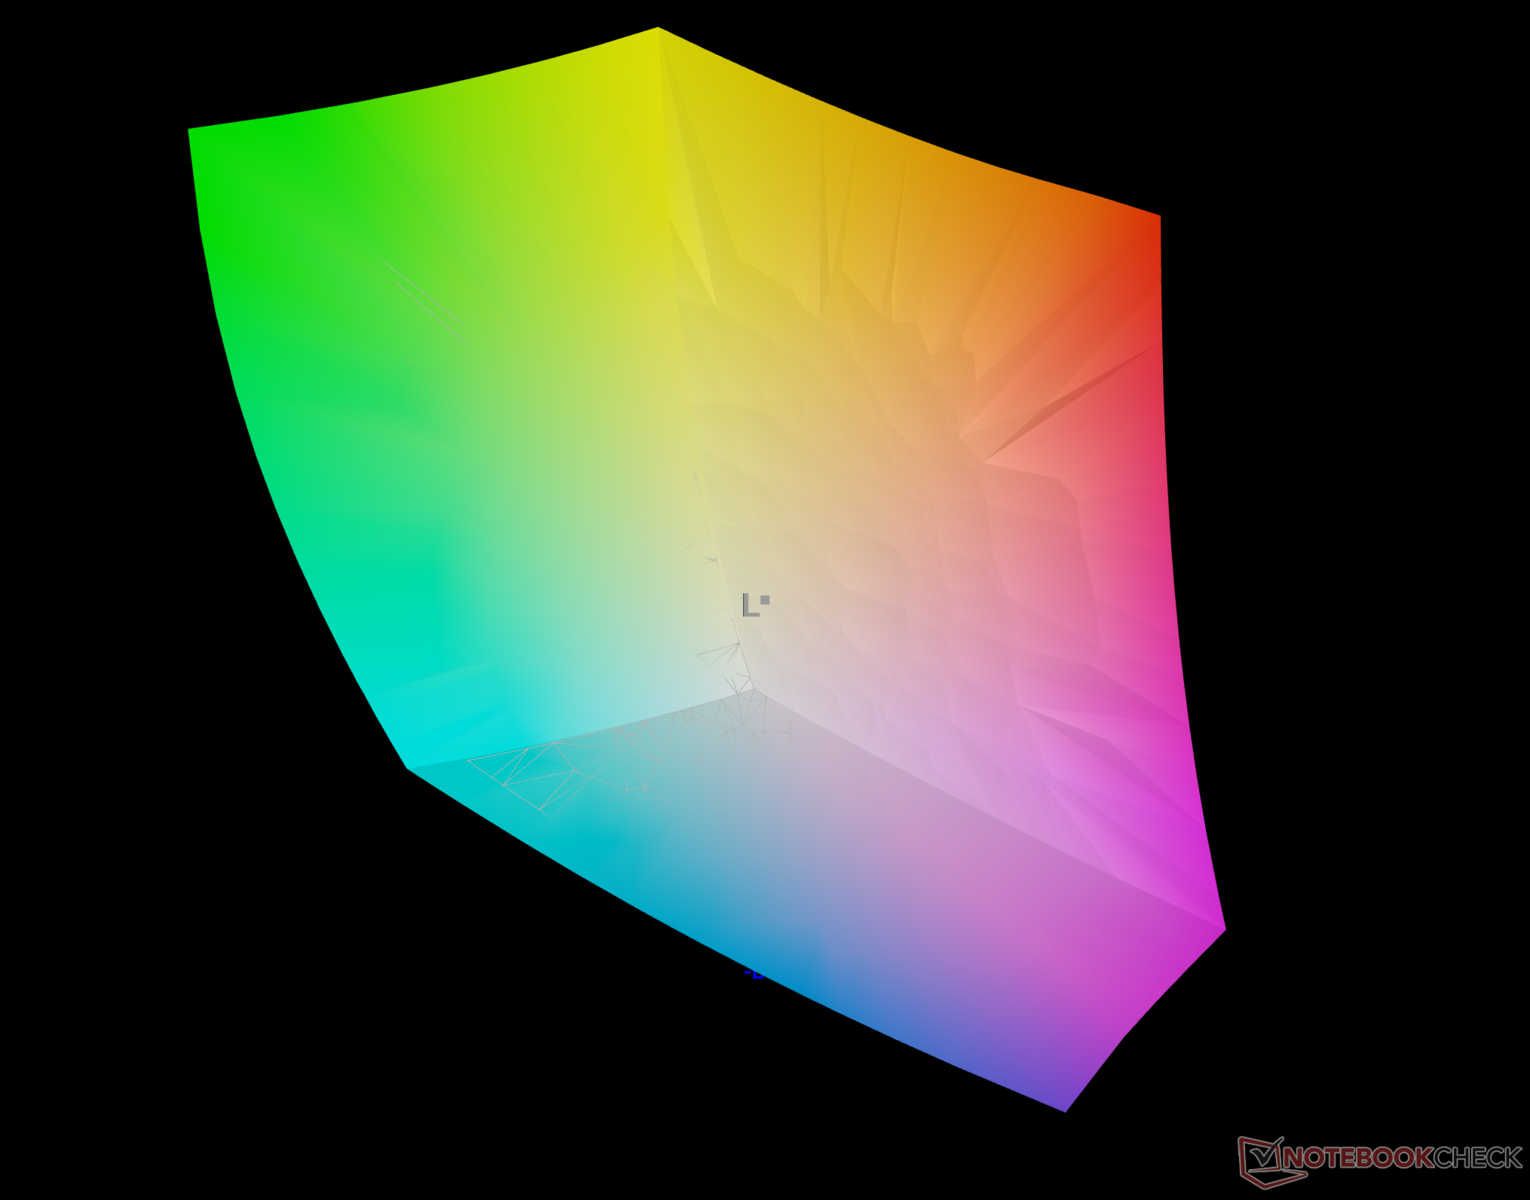
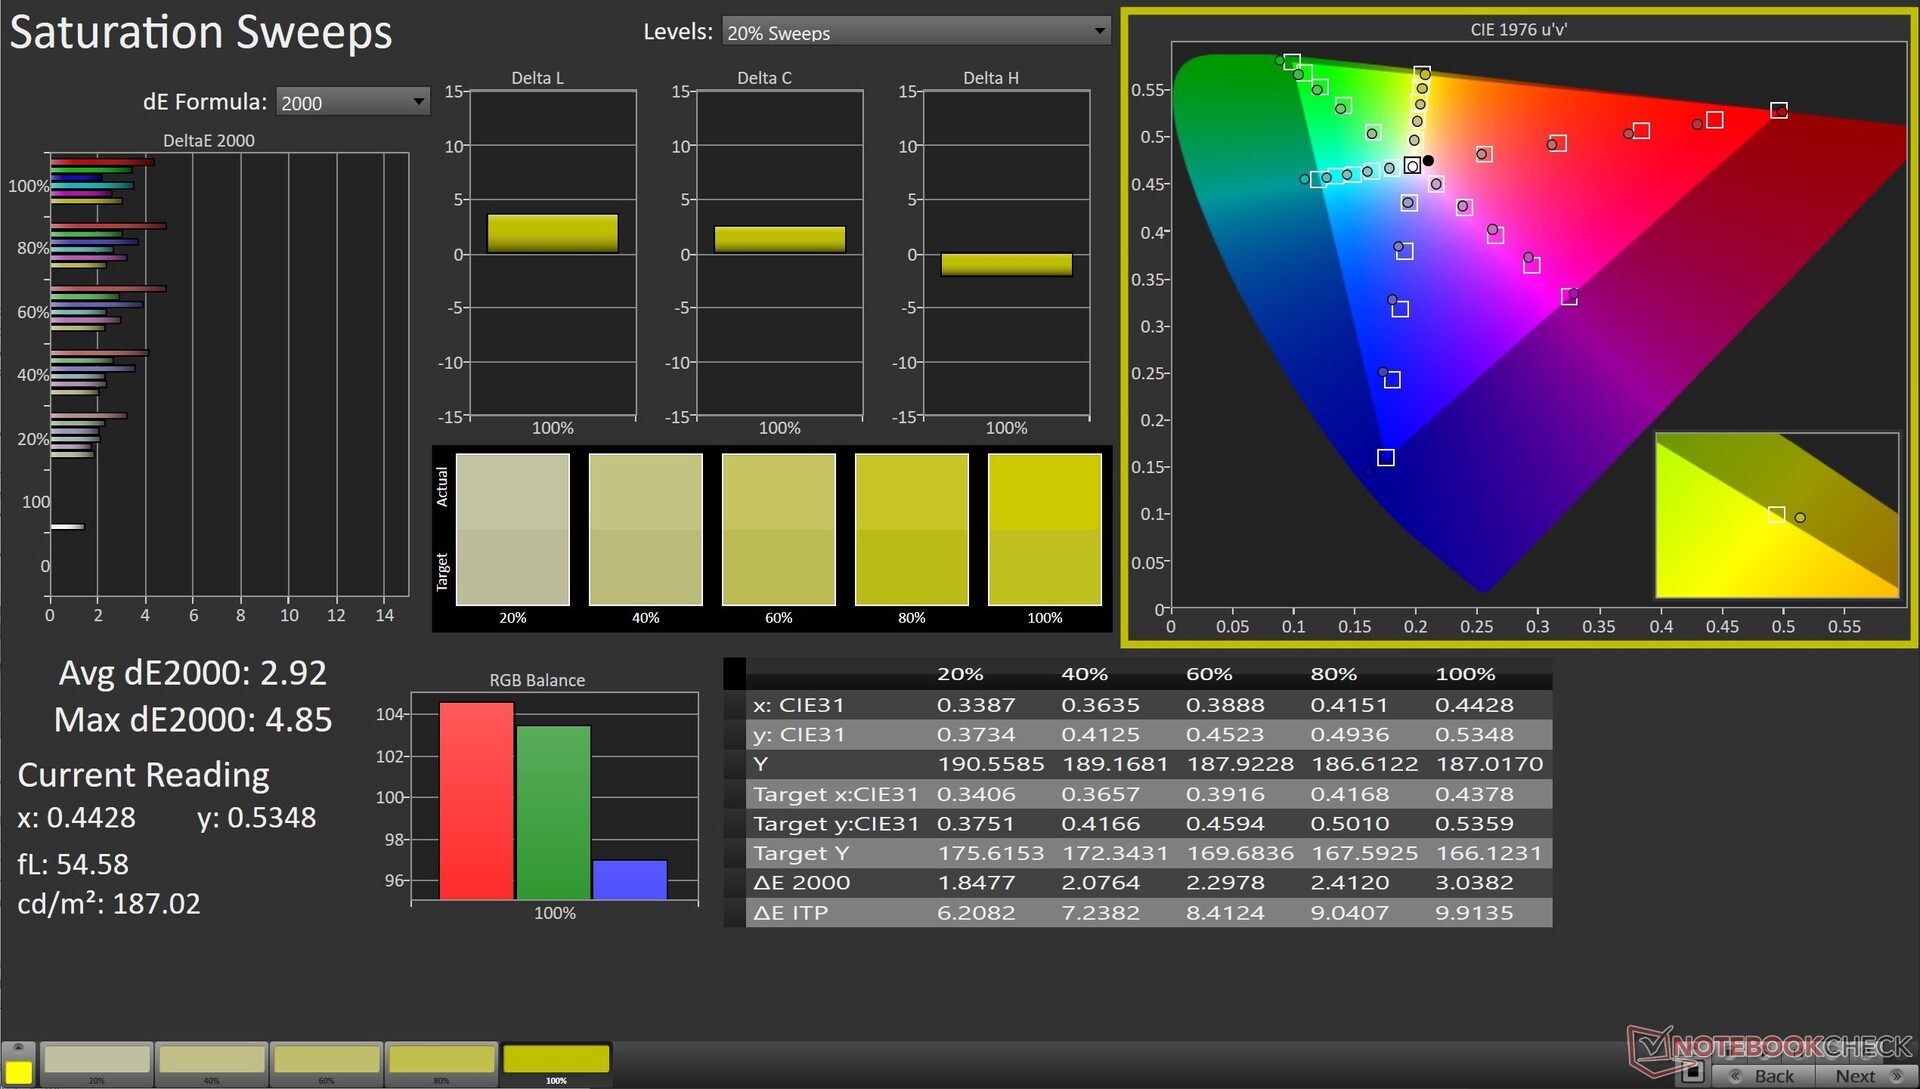
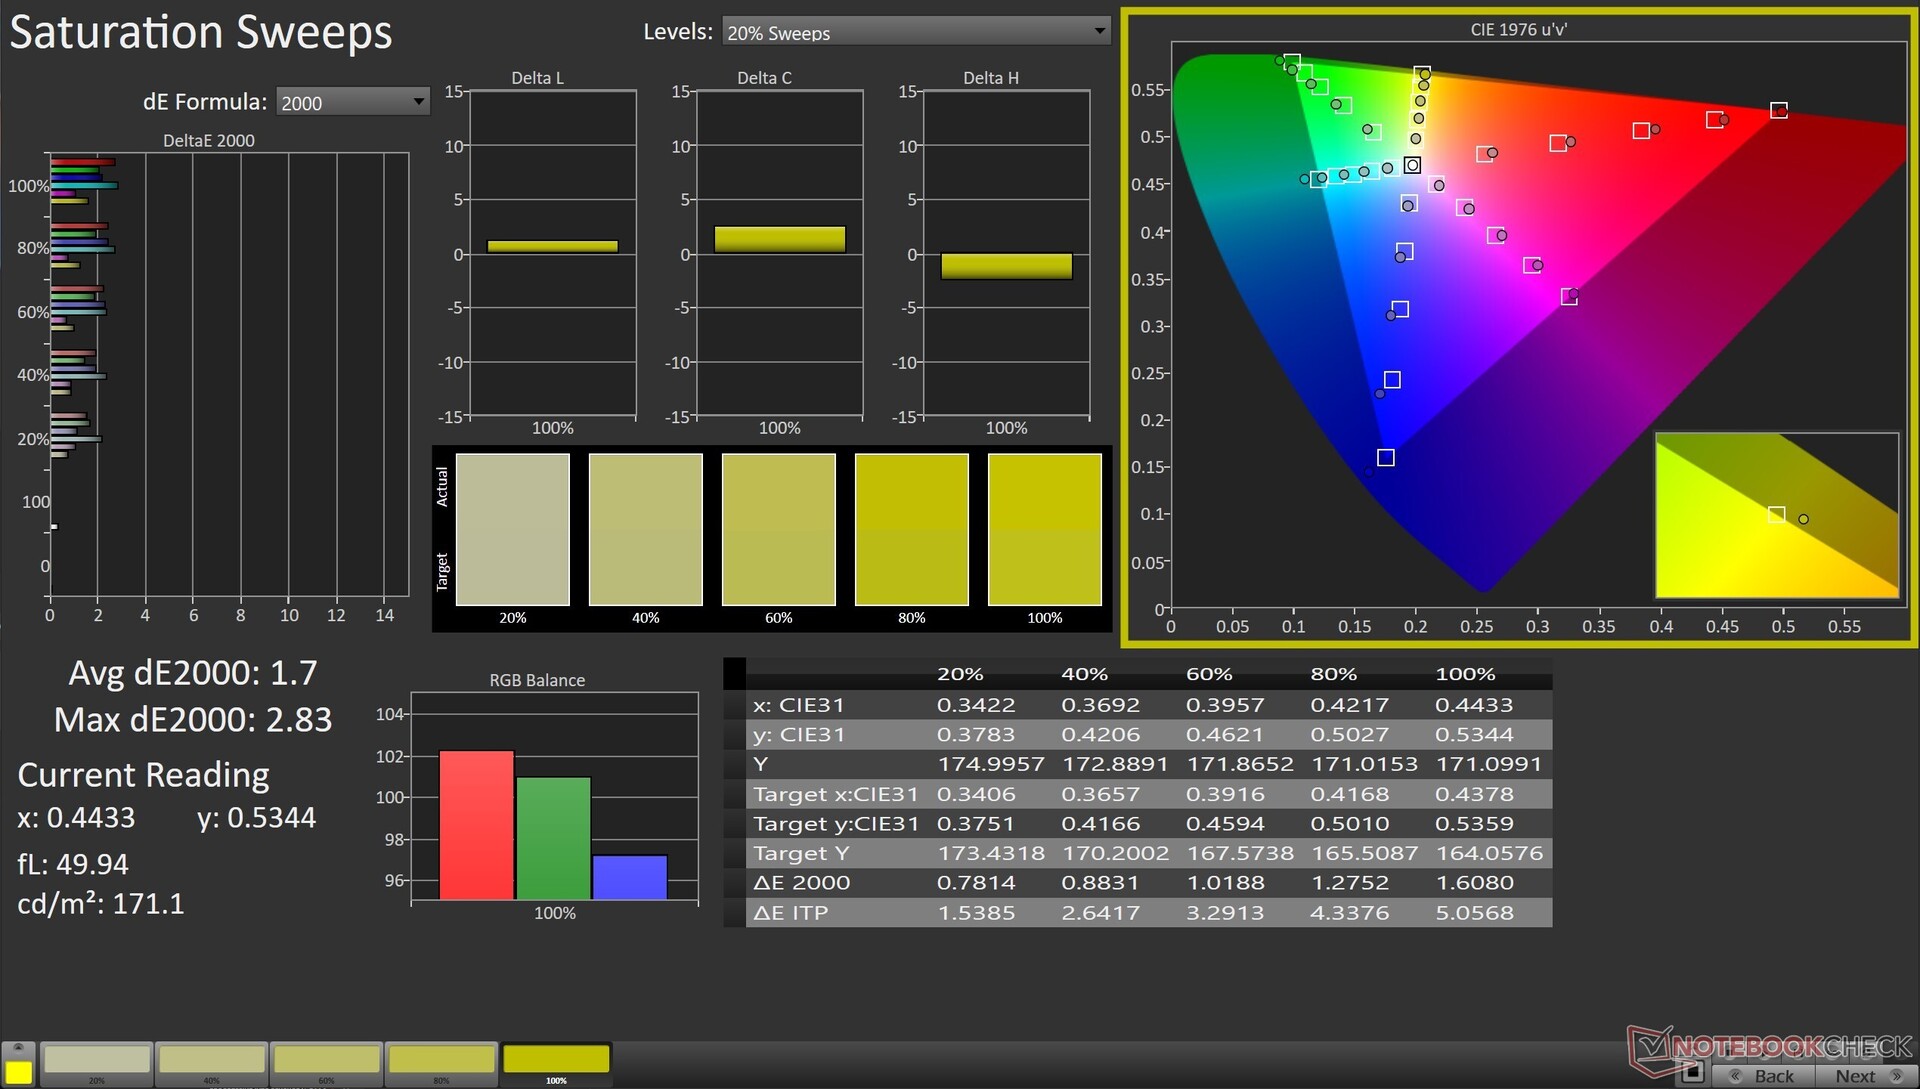
华硕宣传三星OLED面板的DCI-P3色域覆盖率为100%,而我们的测量结果显示,该面板确实能够完全覆盖sRGB和Display P3色彩空间。
Adobe RGB的覆盖率也非常好,达到96.5%,这使得ProArt StudioBook 16在内容创作和多媒体消费方面都非常出色。

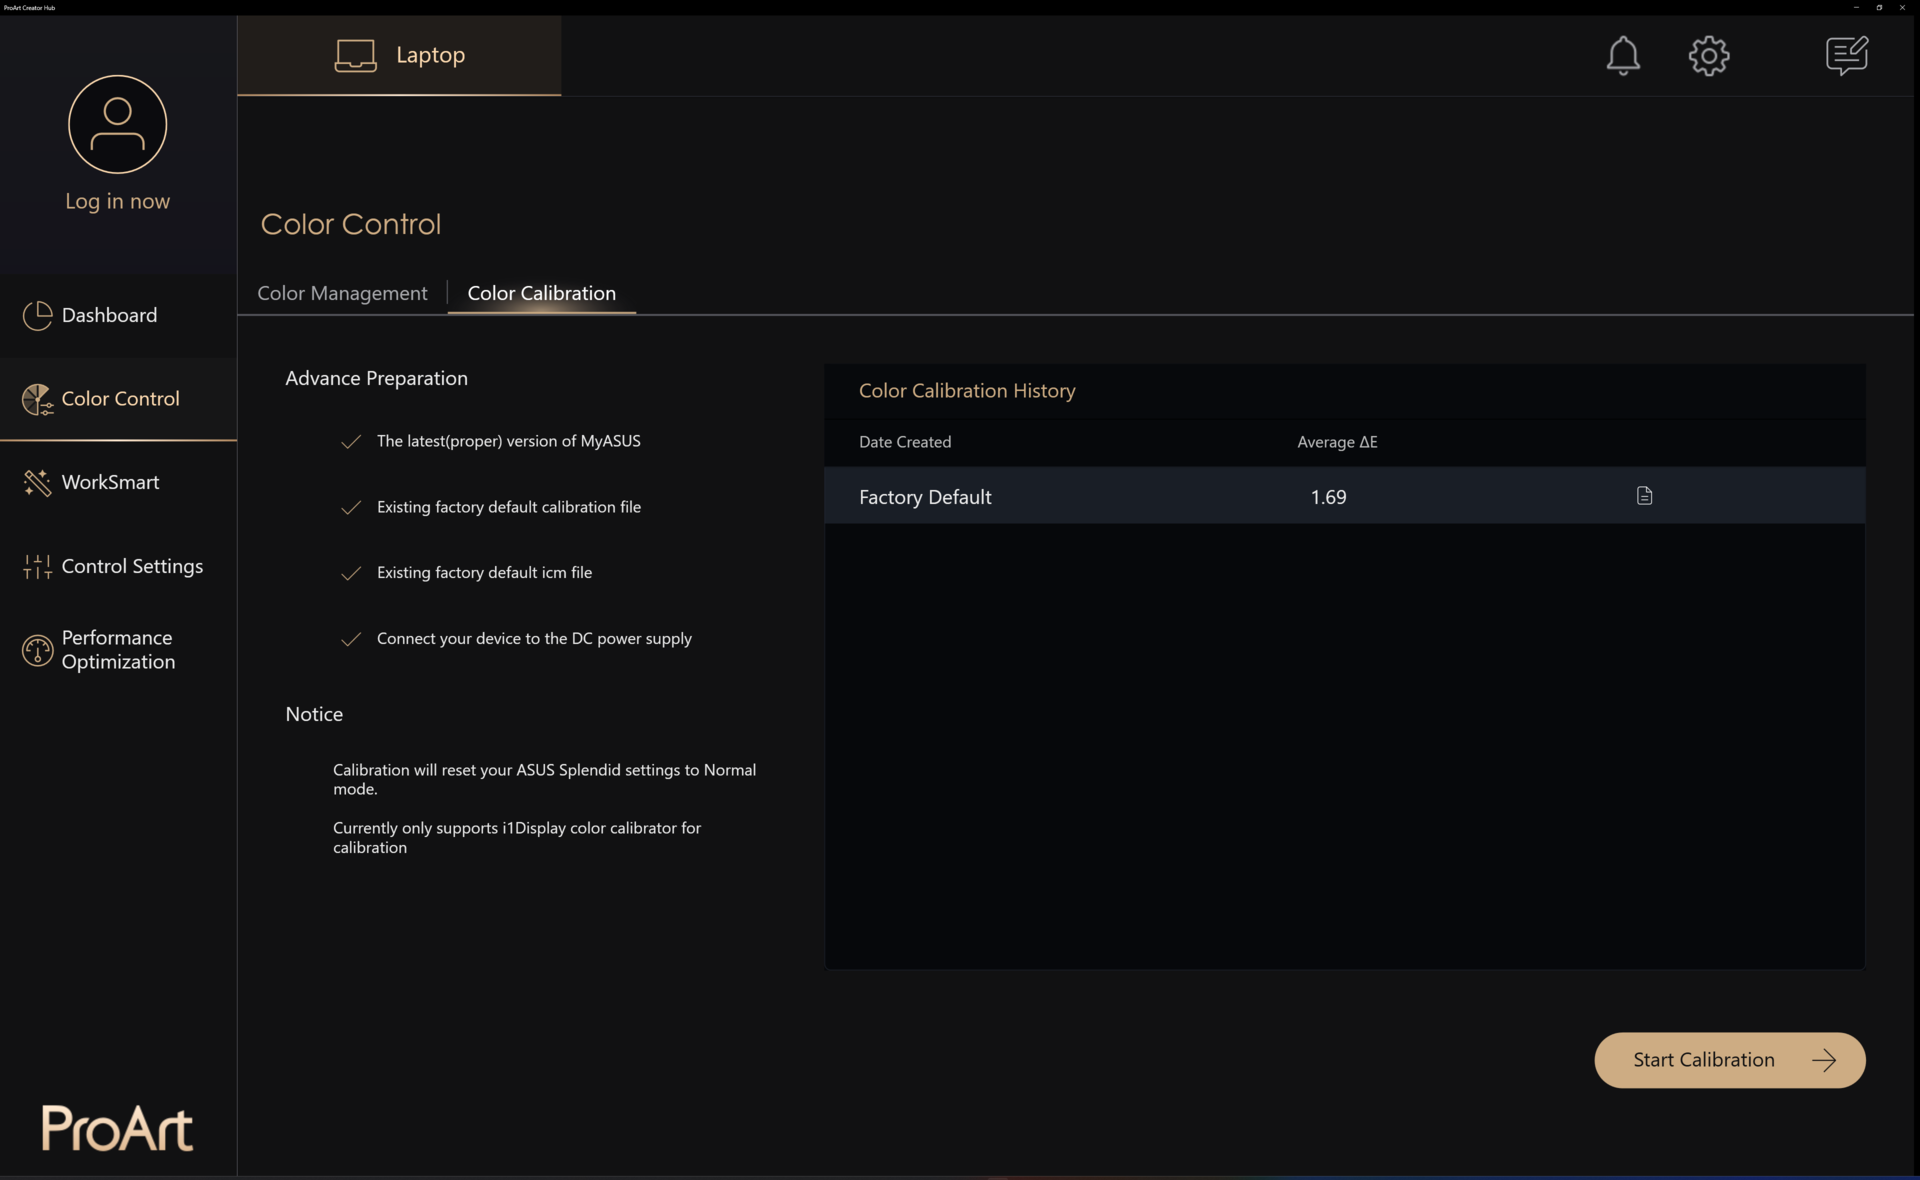
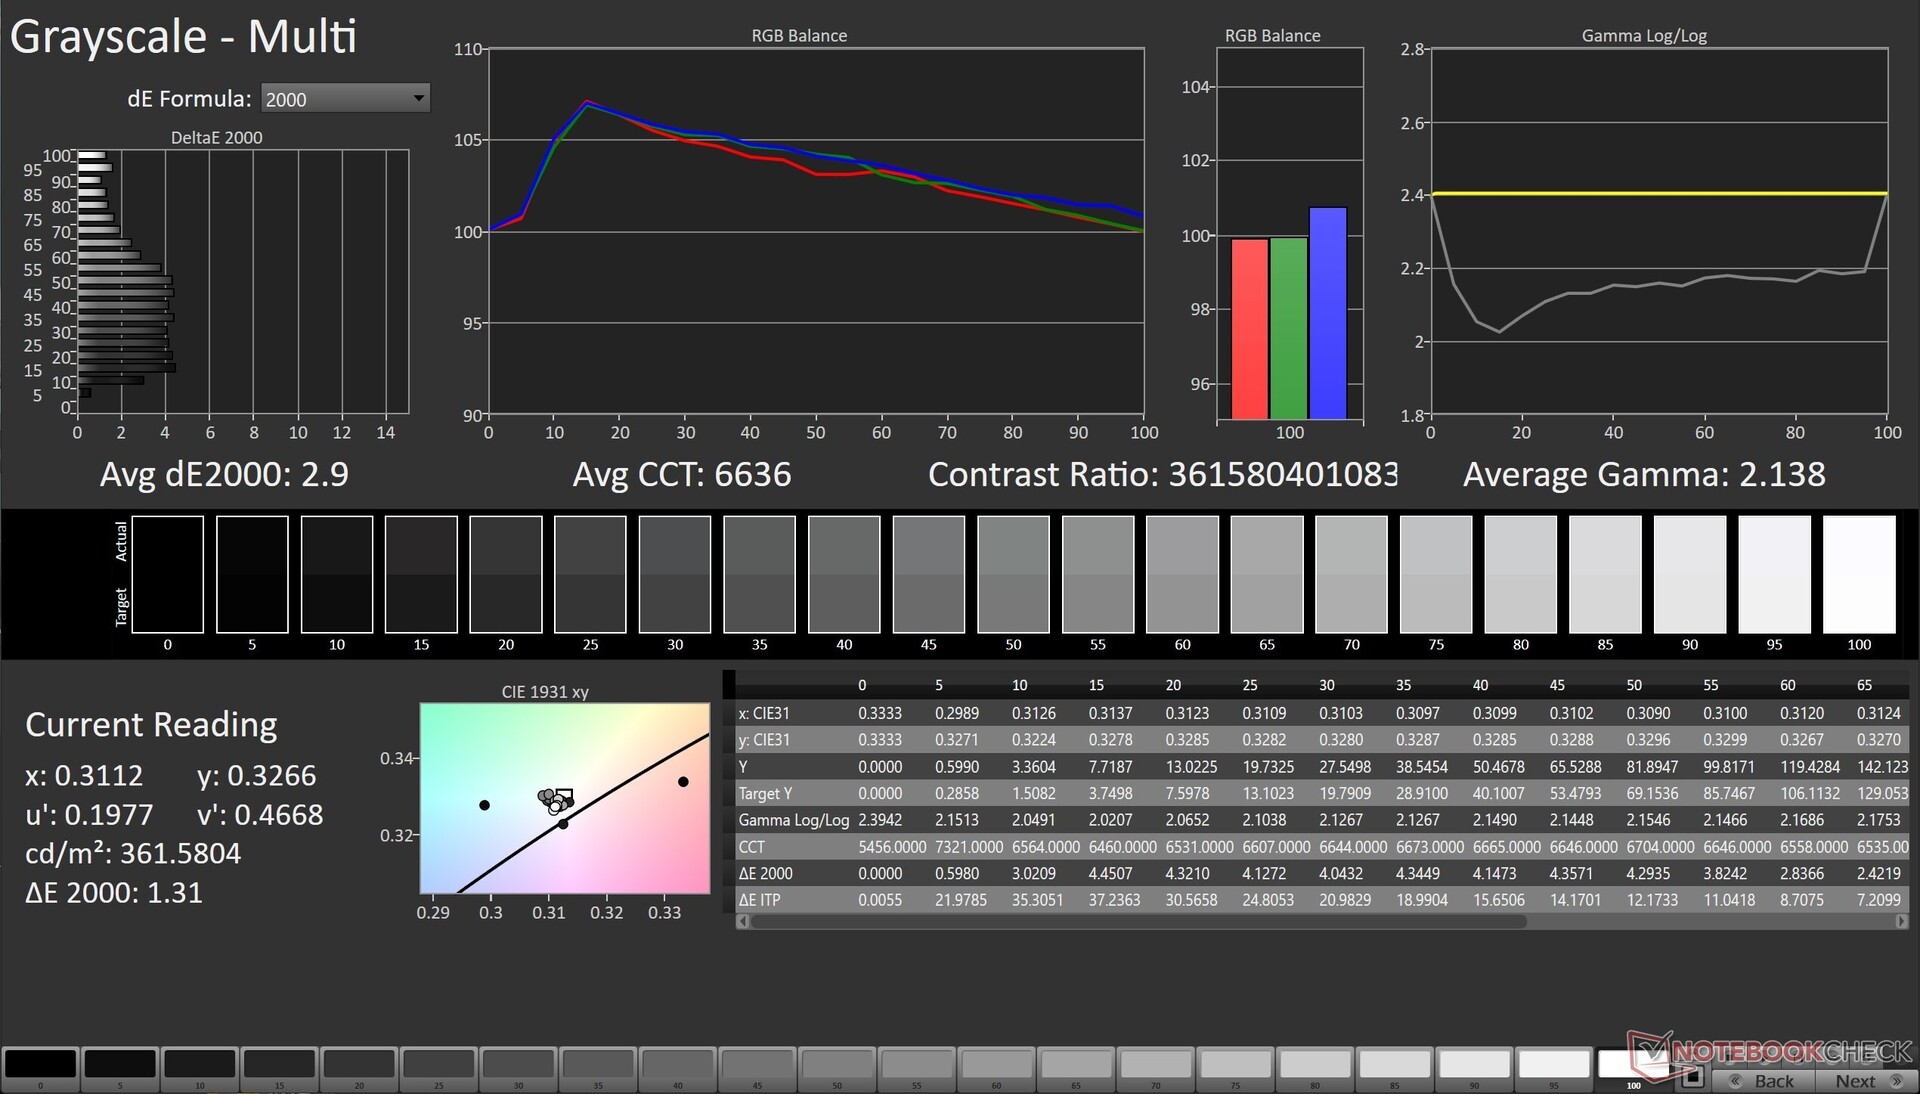
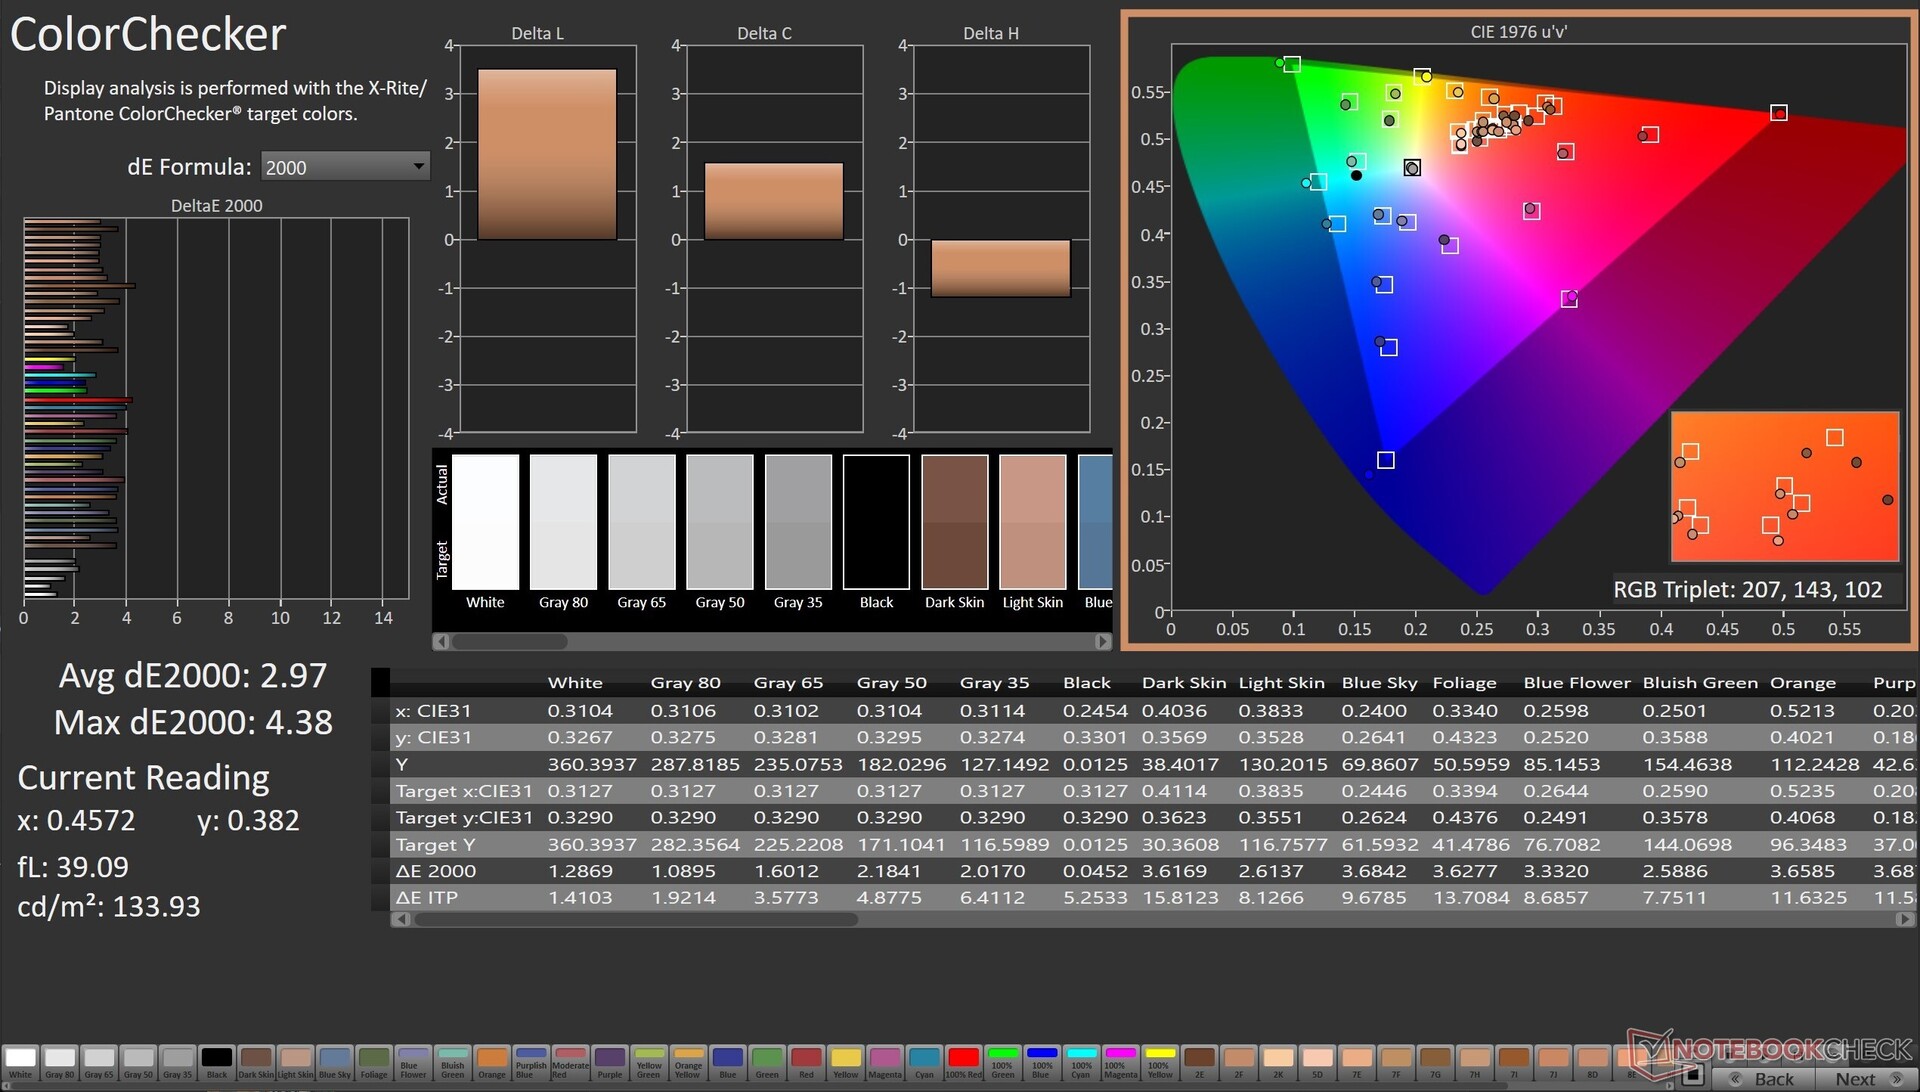
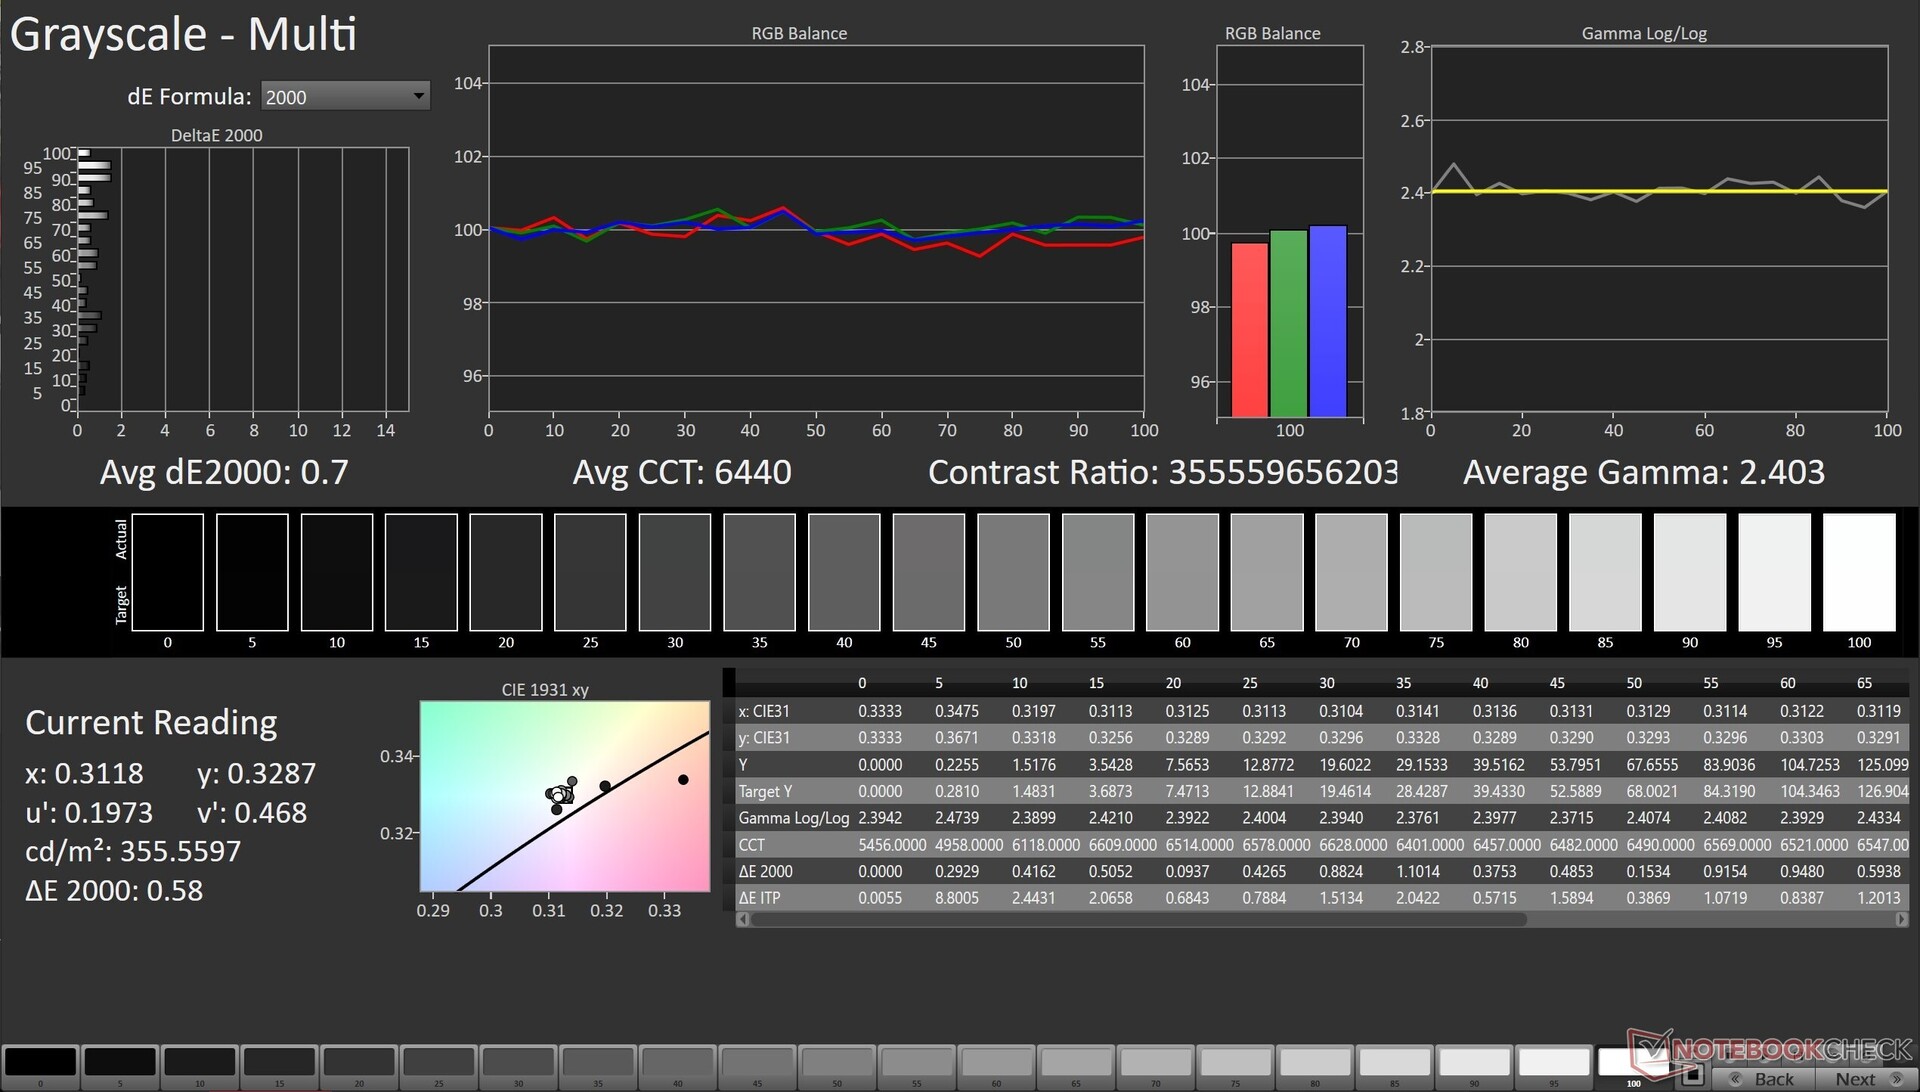
经过PANTONE验证的显示器应该提供1.6的平均Delta E,开箱即用。然而,我们在灰度和ColorChecker的正常色彩配置文件中测得的Delta Es为2.9和2.97。
华硕还提供了一种方法,可以在ProArt Creator Hub应用程序中用兼容的分光光度计进行显示器校准。
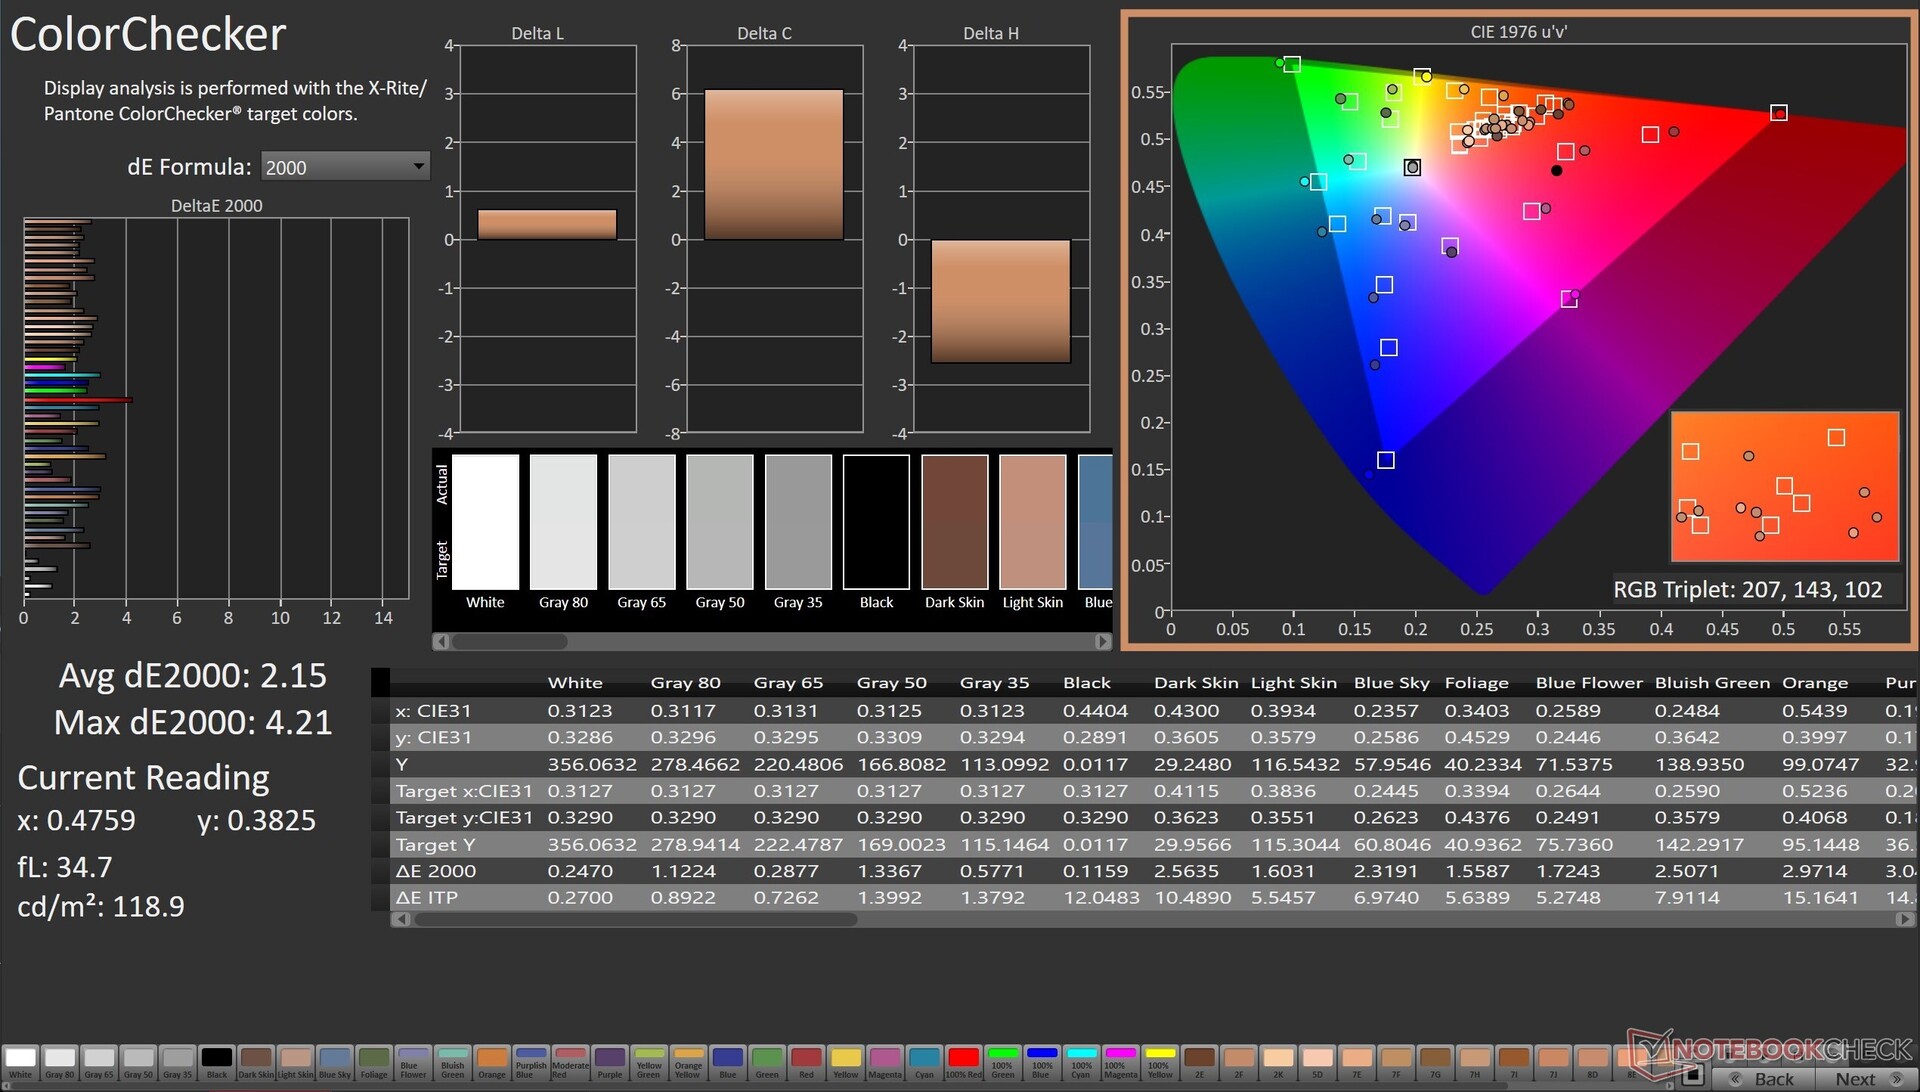
使用X-rite i1Basic Pro 3分光光度计和Portrait Displays公司的Calman Ultimate色彩校准软件在DCI-P3中进一步校准显示器,结果灰度Delta E明显改善,仅为0.7。
ColorChecker Delta E在校准后略微提高到2.15。从视觉上看,除了100%的红色和蓝色阴影,大多数颜色在校准后都显示出了准确性的提高。
校准后的ICC文件可以从上面的链接下载。
Display Response Times
| ↔ Response Time Black to White | ||
|---|---|---|
| 18.32 ms ... rise ↗ and fall ↘ combined | ↗ 17.39 ms rise | 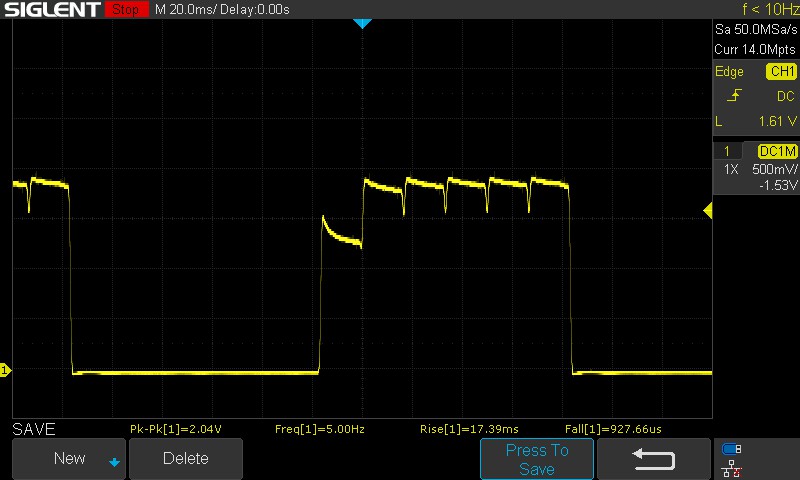 |
| ↘ 0.93 ms fall | ||
| The screen shows good response rates in our tests, but may be too slow for competitive gamers. In comparison, all tested devices range from 0.1 (minimum) to 240 (maximum) ms. » 41 % of all devices are better. This means that the measured response time is similar to the average of all tested devices (19.8 ms). | ||
| ↔ Response Time 50% Grey to 80% Grey | ||
| 1.6 ms ... rise ↗ and fall ↘ combined | ↗ 0.82 ms rise |  |
| ↘ 0.78 ms fall | ||
| The screen shows very fast response rates in our tests and should be very well suited for fast-paced gaming. In comparison, all tested devices range from 0.165 (minimum) to 636 (maximum) ms. » 8 % of all devices are better. This means that the measured response time is better than the average of all tested devices (31 ms). | ||
OLED面板提供了一个出色的50%灰色到80%灰色的响应时间,即1.6毫秒。然而,100%黑色到100%白色的转换需要18.32毫秒。这对于游戏来说应该还是可以的,对于笔记本电脑的预期使用情况来说绝对不是问题。
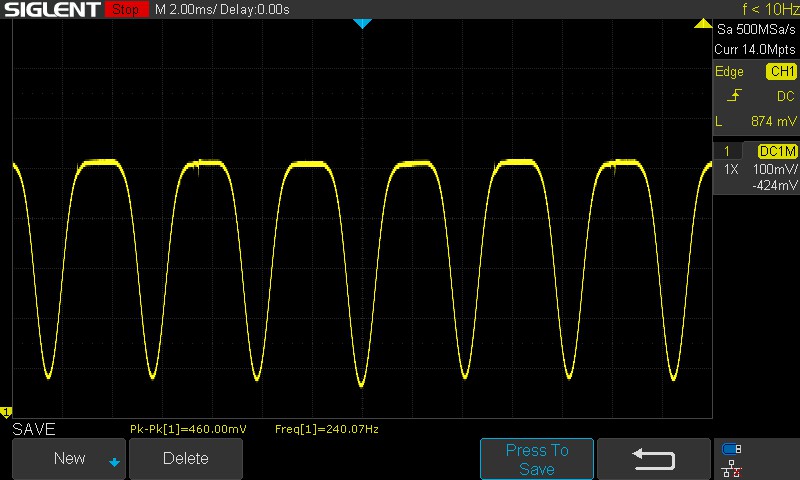
Screen Flickering / PWM (Pulse-Width Modulation)
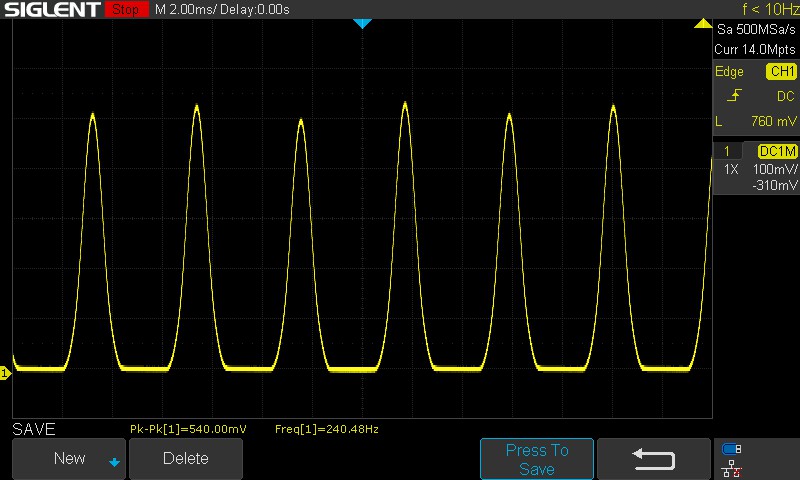
| Screen flickering / PWM detected | 60 Hz | ≤ 100 % brightness setting | 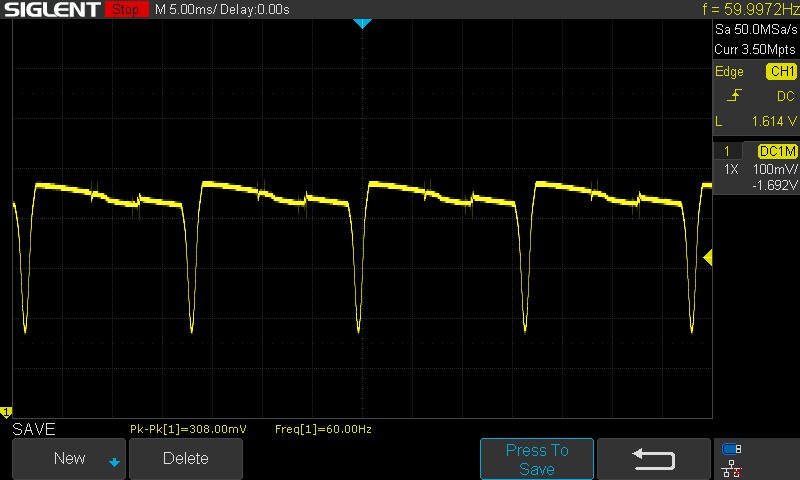 |
The display backlight flickers at 60 Hz (worst case, e.g., utilizing PWM) Flickering detected at a brightness setting of 100 % and below. There should be no flickering or PWM above this brightness setting. The frequency of 60 Hz is very low, so the flickering may cause eyestrain and headaches after extended use. In comparison: 52 % of all tested devices do not use PWM to dim the display. If PWM was detected, an average of 7754 (minimum: 5 - maximum: 343500) Hz was measured. | |||
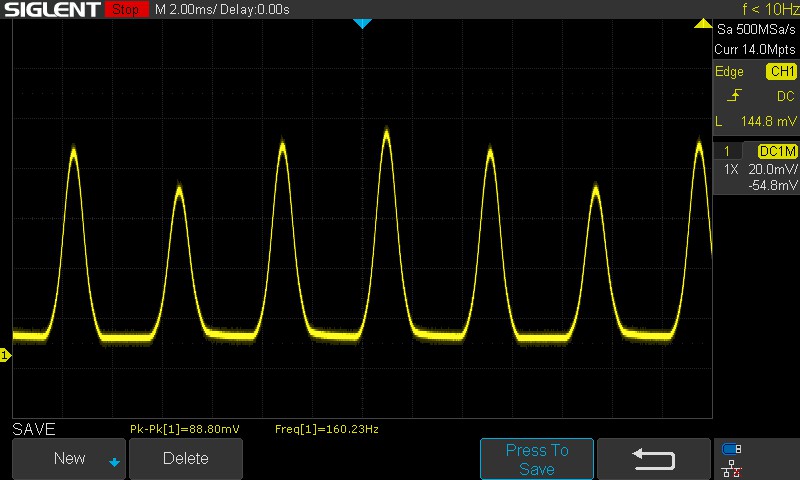
华硕使用直流调光来调整背光强度。60赫兹的直流调光在亮度水平高于51%至100%时出现。低于50%时,面板使用PWM,以240赫兹的频率闪烁。当Windows亮度滑块被设置为0%时,这将减少到160赫兹。
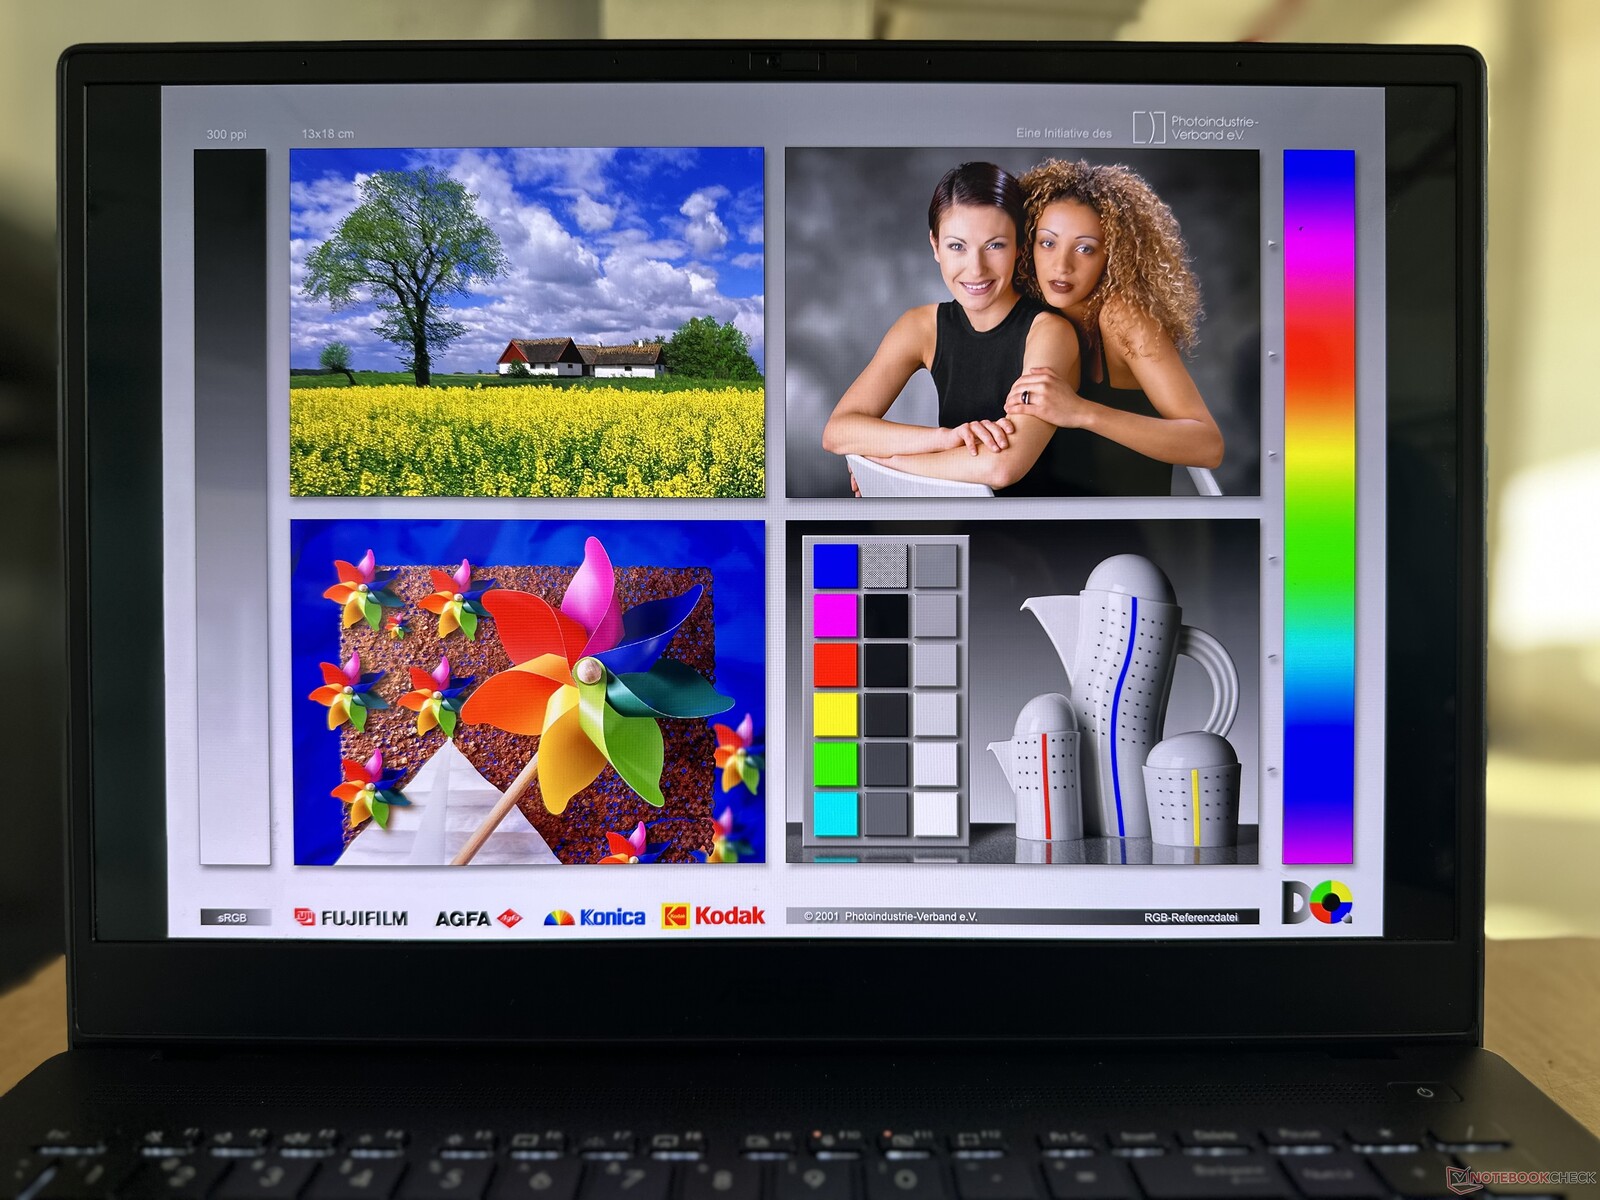
明亮的屏幕确保了在阳光下的良好能见度。除了在极端情况下亮度损失很小外,视角相对稳定。

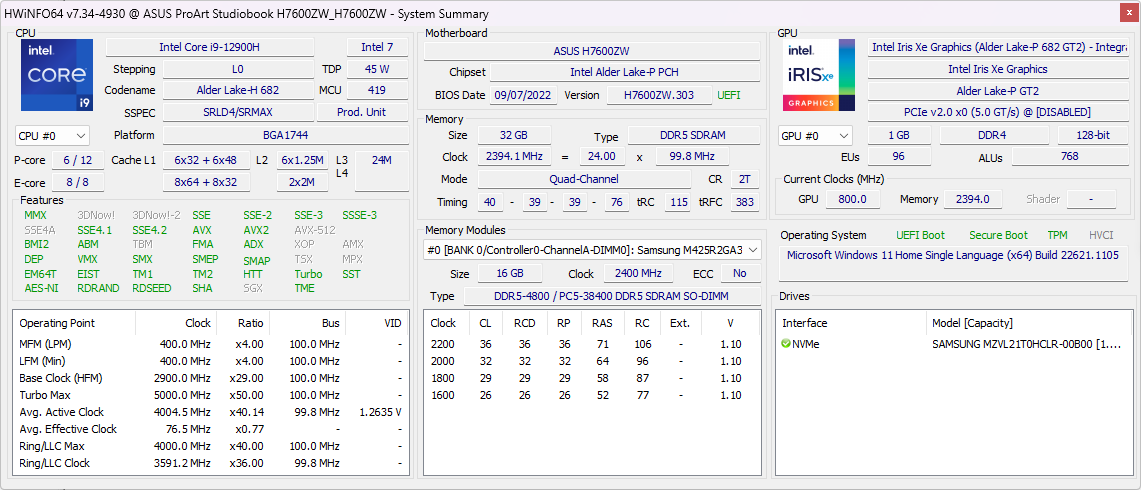
性能。毫无保留的Core i9-12900H和RTX 3070 Ti组合
我们的华硕ProArt StudioBook 16搭载了 英特尔酷睿i9-12900H处理器和一个115W NvidiaGeForce RTX 3070 Ti笔记本GPU.买家还可以选择具有以下特点的SKU 酷睿i7-12700H和一个 GeForce RTX 3060或 RTX 3080 Ti笔记本GPU以及可升级的DDR5-4800内存选项,最高可达64GB。
测试条件
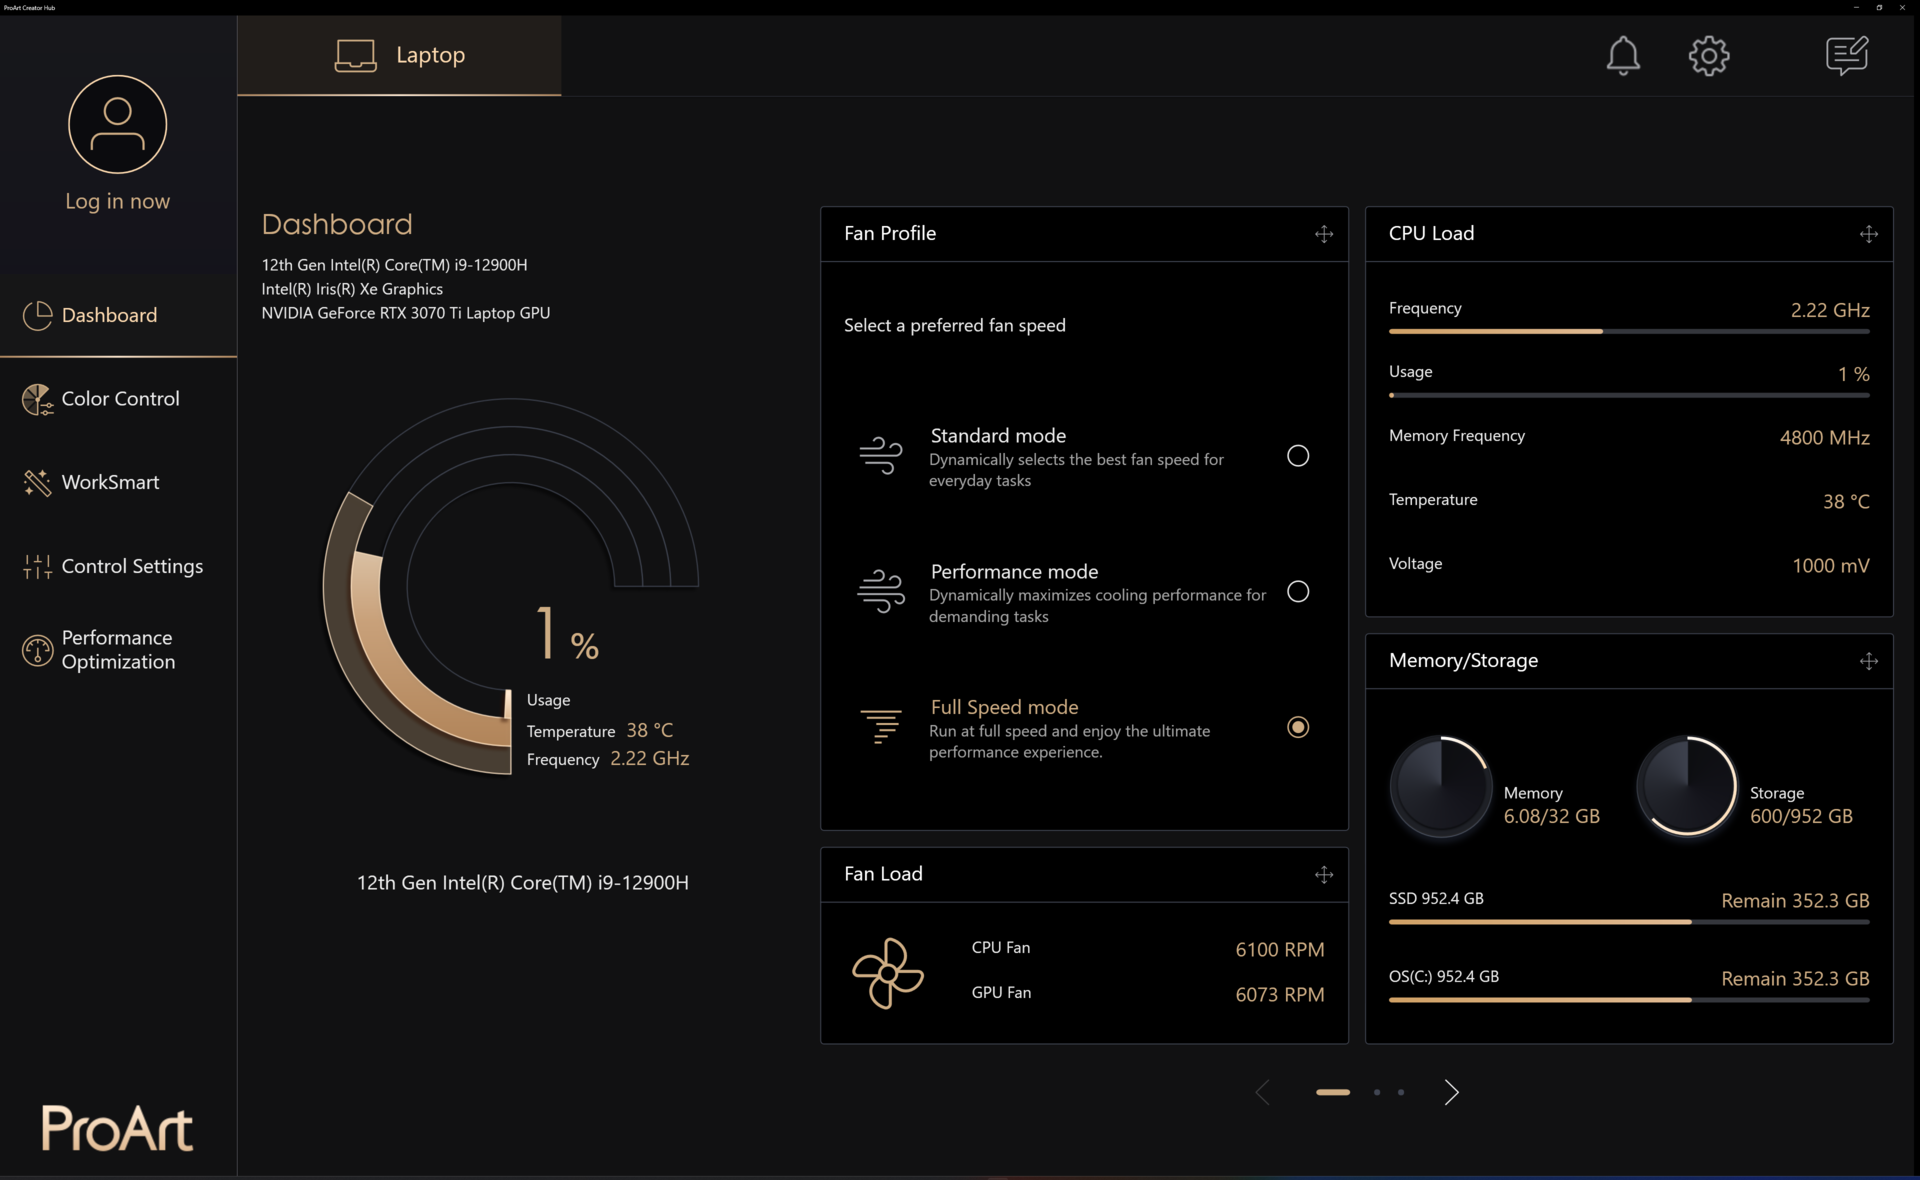
设备设置分布在ProArt Creator Hub和MyAsus应用程序之间,这对于那些刚接触ProArt系列的人来说,最初可能会有点混乱。
ProArt Creator Hub允许你在三种可用的性能模式之间进行选择,这将影响Core i9-12900H的TDP,如下表所示。
我们在所有的测试中都使用了全速性能模式,除了电池运行时间测试,这是在标准模式下进行的。
| 性能模式 | PL1(PBP)/ Tau | PL2(MTP)/ Tau |
|---|---|---|
| 标准 | 60 W / 56 s | 115 W / 2.44 ms |
| 性能 | 110 W / 56 s | 115 W / 2.44 ms |
| 全速 | 110 W / 56 s | 115 W / 2.44 ms |
处理器
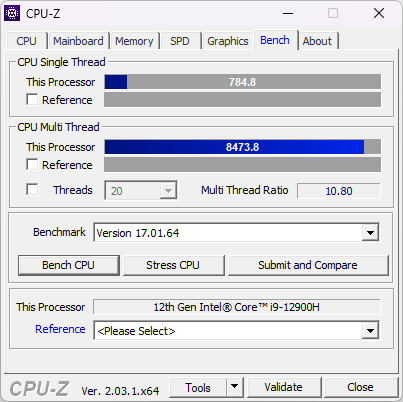
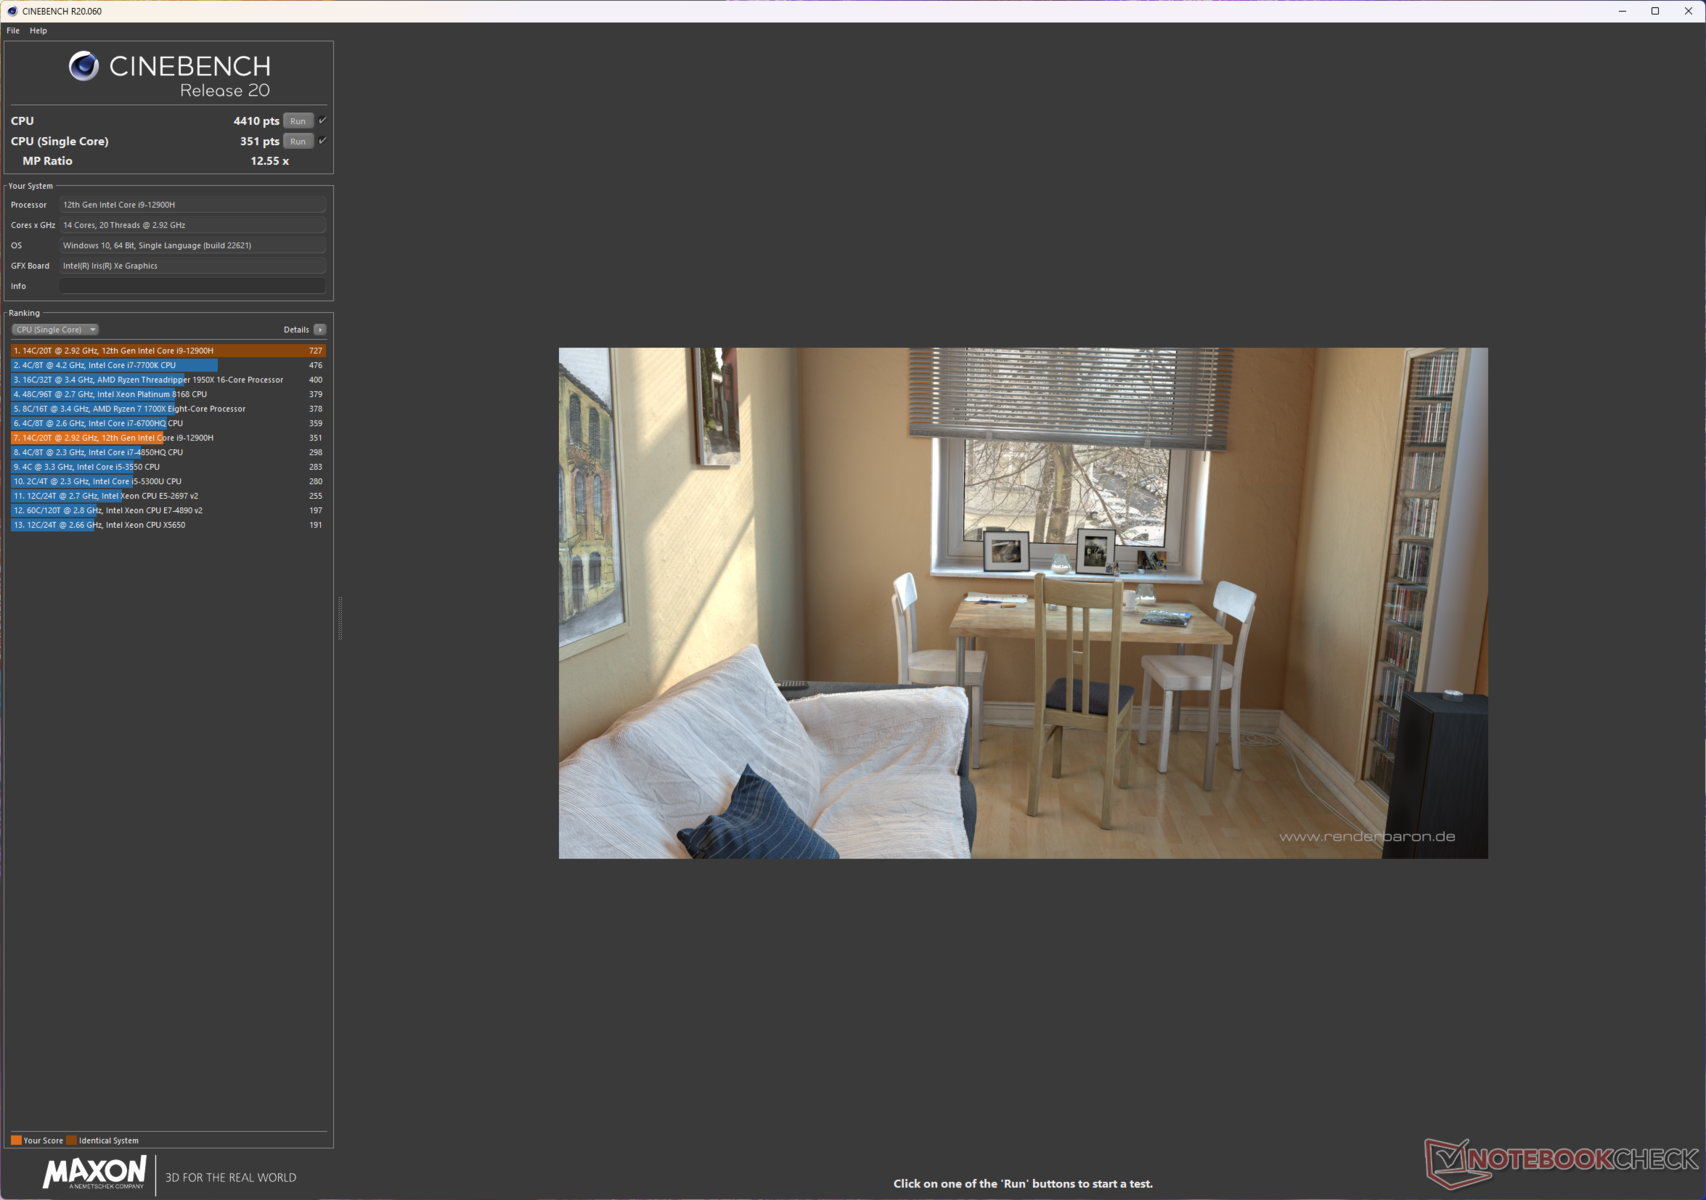
英特尔Alder Lake-H酷睿i9-12900H具有14个核心和20个线程,提升到5GHz。华硕的冷却实现似乎相当强大,我们的Cinebench R15多核循环测试没有显示出可感知的节流迹象,就是证明。
ProArt StudioBook 16在整体CPU性能方面处于领先地位,尽管与采用相同处理器的竞争对手相比,它的领先优势不大。也就是说,由于115W PL2,单核性能受到了很小的打击,与微星造物主Z16P相比,单核性能受到了很大的影响。 微星创造者Z16P的160W。 华硕ROG Strix Scar 15的135W,和 微星创造者Z17的120W。
相较于 Apple M1 Pro和 M1 Max相比,ProArt StudioBook 16中的Core i9-12900H在Cinebench R23中的单核速度快22%,多核速度快55%。
Cinebench R15 Multi Loop
Cinebench R23: Multi Core | Single Core
Cinebench R20: CPU (Multi Core) | CPU (Single Core)
Cinebench R15: CPU Multi 64Bit | CPU Single 64Bit
Blender: v2.79 BMW27 CPU
7-Zip 18.03: 7z b 4 | 7z b 4 -mmt1
Geekbench 5.5: Multi-Core | Single-Core
HWBOT x265 Benchmark v2.2: 4k Preset
LibreOffice : 20 Documents To PDF
R Benchmark 2.5: Overall mean
| CPU Performance rating | |
| Asus ProArt StudioBook 16 H7600ZW | |
| Asus ROG Strix Scar 15 G533ZW-LN106WS | |
| MSI Creator Z16P B12UHST | |
| Gigabyte Aero 16 YE5 | |
| Asus ZenBook Pro 16X OLED UX7602ZM-ME115W | |
| MSI Creator Z17 A12UGST-054 | |
| Average of class Multimedia | |
| Average Intel Core i9-12900H | |
| Asus ROG Zephyrus Duo 16 GX650RX | |
| Apple MacBook Pro 16 2021 M1 Pro -5! | |
| Apple MacBook Pro 14 2021 M1 Max 24-Core GPU -5! | |
| Lenovo ThinkBook 16p G3 ARH | |
| Cinebench R20 / CPU (Multi Core) | |
| Asus ProArt StudioBook 16 H7600ZW | |
| Asus ROG Strix Scar 15 G533ZW-LN106WS | |
| MSI Creator Z16P B12UHST | |
| Gigabyte Aero 16 YE5 | |
| Average of class Multimedia (1887 - 12912, n=57, last 2 years) | |
| MSI Creator Z17 A12UGST-054 | |
| Asus ZenBook Pro 16X OLED UX7602ZM-ME115W | |
| Average Intel Core i9-12900H (2681 - 7471, n=28) | |
| Asus ROG Zephyrus Duo 16 GX650RX | |
| Lenovo ThinkBook 16p G3 ARH | |
| Apple MacBook Pro 14 2021 M1 Max 24-Core GPU | |
| Apple MacBook Pro 16 2021 M1 Pro | |
| Cinebench R20 / CPU (Single Core) | |
| MSI Creator Z16P B12UHST | |
| Asus ProArt StudioBook 16 H7600ZW | |
| Average of class Multimedia (425 - 853, n=57, last 2 years) | |
| Asus ROG Strix Scar 15 G533ZW-LN106WS | |
| MSI Creator Z17 A12UGST-054 | |
| Average Intel Core i9-12900H (624 - 738, n=28) | |
| Gigabyte Aero 16 YE5 | |
| Asus ZenBook Pro 16X OLED UX7602ZM-ME115W | |
| Lenovo ThinkBook 16p G3 ARH | |
| Asus ROG Zephyrus Duo 16 GX650RX | |
| Apple MacBook Pro 14 2021 M1 Max 24-Core GPU | |
| Apple MacBook Pro 16 2021 M1 Pro | |
| Cinebench R15 / CPU Multi 64Bit | |
| Asus ROG Strix Scar 15 G533ZW-LN106WS | |
| Asus ProArt StudioBook 16 H7600ZW | |
| MSI Creator Z16P B12UHST | |
| Gigabyte Aero 16 YE5 | |
| Asus ZenBook Pro 16X OLED UX7602ZM-ME115W | |
| MSI Creator Z17 A12UGST-054 | |
| Average of class Multimedia (856 - 5224, n=61, last 2 years) | |
| Average Intel Core i9-12900H (1395 - 3077, n=28) | |
| Asus ROG Zephyrus Duo 16 GX650RX | |
| Lenovo ThinkBook 16p G3 ARH | |
| Apple MacBook Pro 16 2021 M1 Pro | |
| Apple MacBook Pro 14 2021 M1 Max 24-Core GPU | |
| 7-Zip 18.03 / 7z b 4 | |
| Asus ProArt StudioBook 16 H7600ZW | |
| MSI Creator Z16P B12UHST | |
| Asus ZenBook Pro 16X OLED UX7602ZM-ME115W | |
| Gigabyte Aero 16 YE5 | |
| Asus ROG Strix Scar 15 G533ZW-LN106WS | |
| Asus ROG Zephyrus Duo 16 GX650RX | |
| MSI Creator Z17 A12UGST-054 | |
| Average Intel Core i9-12900H (34684 - 76677, n=28) | |
| Average of class Multimedia (26062 - 130368, n=55, last 2 years) | |
| Lenovo ThinkBook 16p G3 ARH | |
| 7-Zip 18.03 / 7z b 4 -mmt1 | |
| Asus ProArt StudioBook 16 H7600ZW | |
| Gigabyte Aero 16 YE5 | |
| MSI Creator Z16P B12UHST | |
| Average of class Multimedia (3666 - 7545, n=56, last 2 years) | |
| Asus ROG Strix Scar 15 G533ZW-LN106WS | |
| MSI Creator Z17 A12UGST-054 | |
| Average Intel Core i9-12900H (5302 - 6289, n=28) | |
| Asus ZenBook Pro 16X OLED UX7602ZM-ME115W | |
| Asus ROG Zephyrus Duo 16 GX650RX | |
| Lenovo ThinkBook 16p G3 ARH | |
| HWBOT x265 Benchmark v2.2 / 4k Preset | |
| Asus ProArt StudioBook 16 H7600ZW | |
| Asus ROG Strix Scar 15 G533ZW-LN106WS | |
| Asus ZenBook Pro 16X OLED UX7602ZM-ME115W | |
| MSI Creator Z16P B12UHST | |
| Average of class Multimedia (5.26 - 36.1, n=56, last 2 years) | |
| Gigabyte Aero 16 YE5 | |
| Asus ROG Zephyrus Duo 16 GX650RX | |
| MSI Creator Z17 A12UGST-054 | |
| Average Intel Core i9-12900H (8.05 - 22.5, n=28) | |
| Lenovo ThinkBook 16p G3 ARH | |
| LibreOffice / 20 Documents To PDF | |
| Lenovo ThinkBook 16p G3 ARH | |
| Average of class Multimedia (23.9 - 146.7, n=57, last 2 years) | |
| Asus ROG Zephyrus Duo 16 GX650RX | |
| Asus ProArt StudioBook 16 H7600ZW | |
| Average Intel Core i9-12900H (36.8 - 59.8, n=28) | |
| MSI Creator Z17 A12UGST-054 | |
| Asus ZenBook Pro 16X OLED UX7602ZM-ME115W | |
| Asus ROG Strix Scar 15 G533ZW-LN106WS | |
| Gigabyte Aero 16 YE5 | |
| MSI Creator Z16P B12UHST | |
| R Benchmark 2.5 / Overall mean | |
| Lenovo ThinkBook 16p G3 ARH | |
| Asus ROG Zephyrus Duo 16 GX650RX | |
| Average of class Multimedia (0.3604 - 0.947, n=56, last 2 years) | |
| Average Intel Core i9-12900H (0.4218 - 0.506, n=28) | |
| MSI Creator Z17 A12UGST-054 | |
| Asus ZenBook Pro 16X OLED UX7602ZM-ME115W | |
| Asus ProArt StudioBook 16 H7600ZW | |
| MSI Creator Z16P B12UHST | |
| Asus ROG Strix Scar 15 G533ZW-LN106WS | |
| Gigabyte Aero 16 YE5 | |
* ... smaller is better
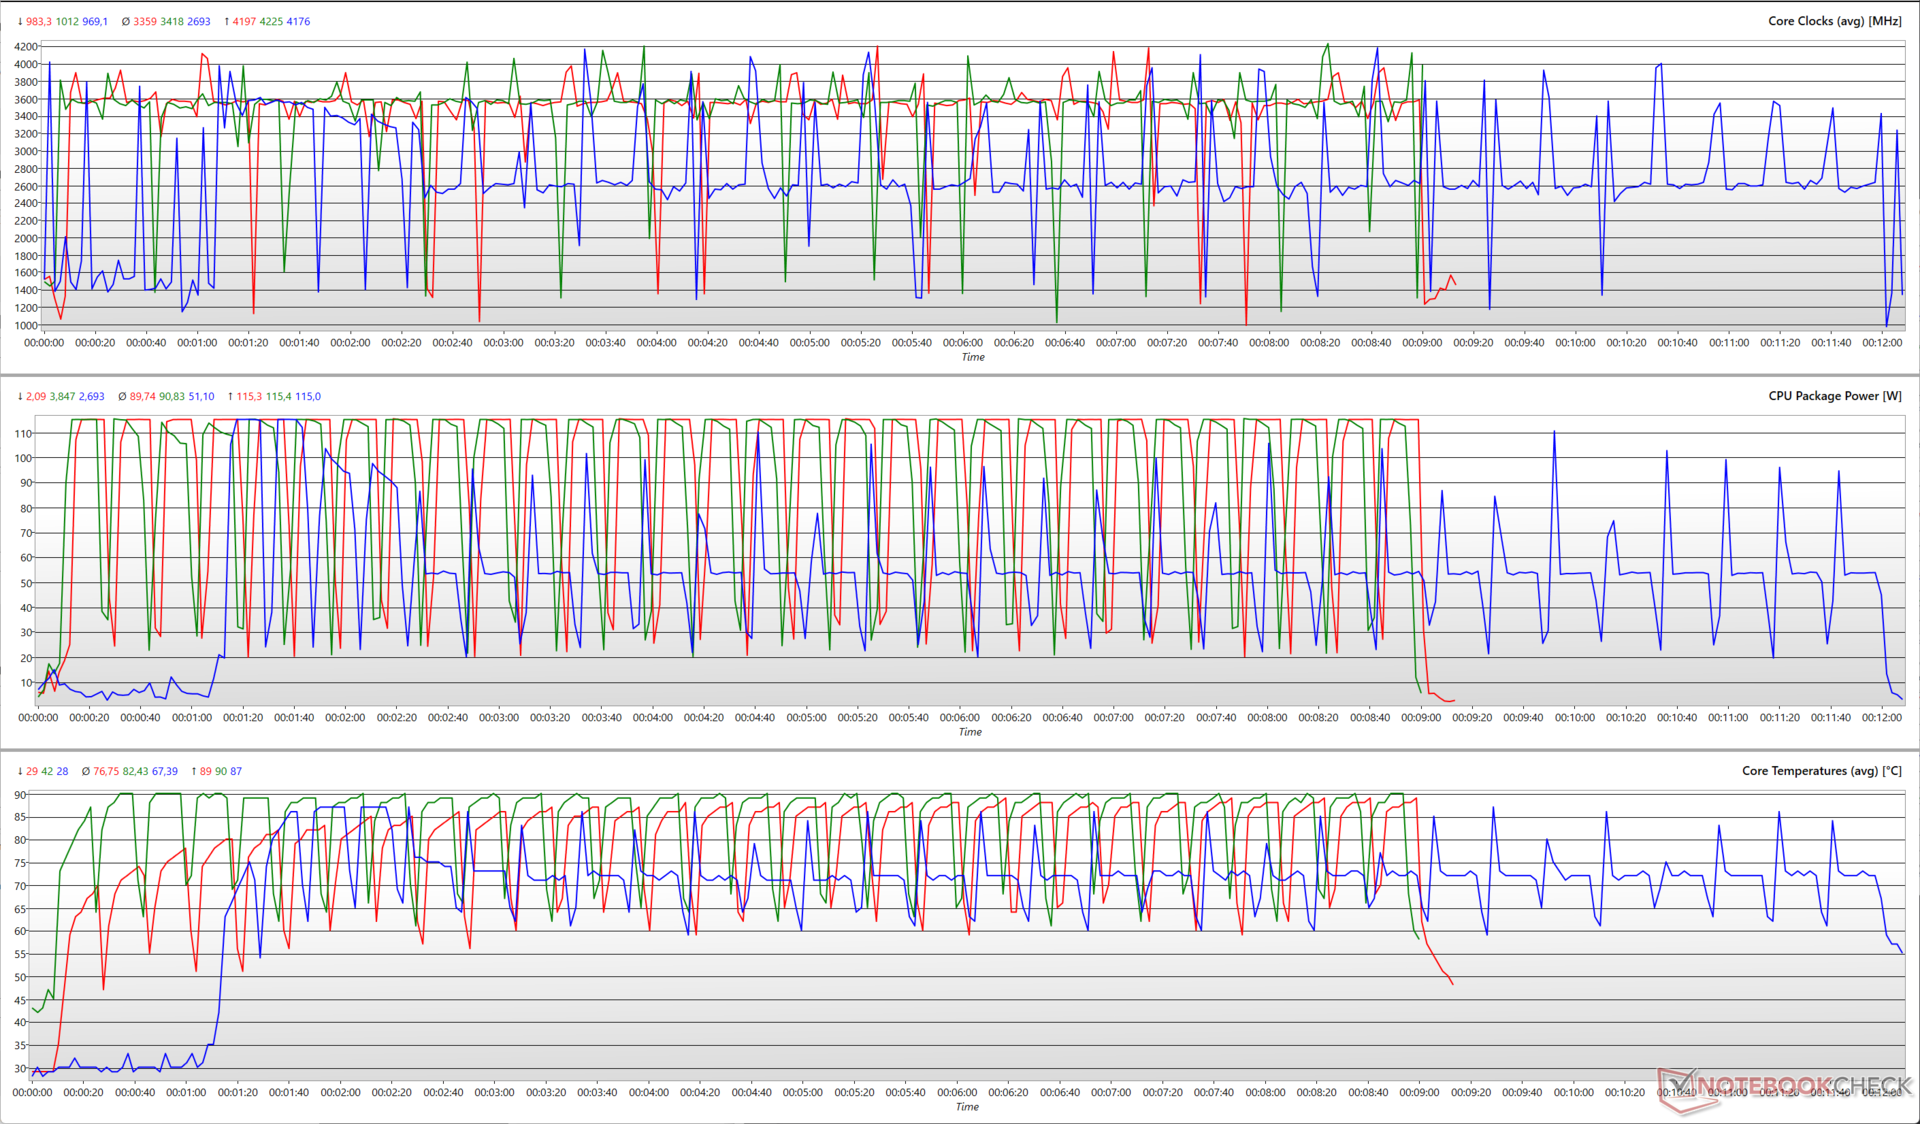
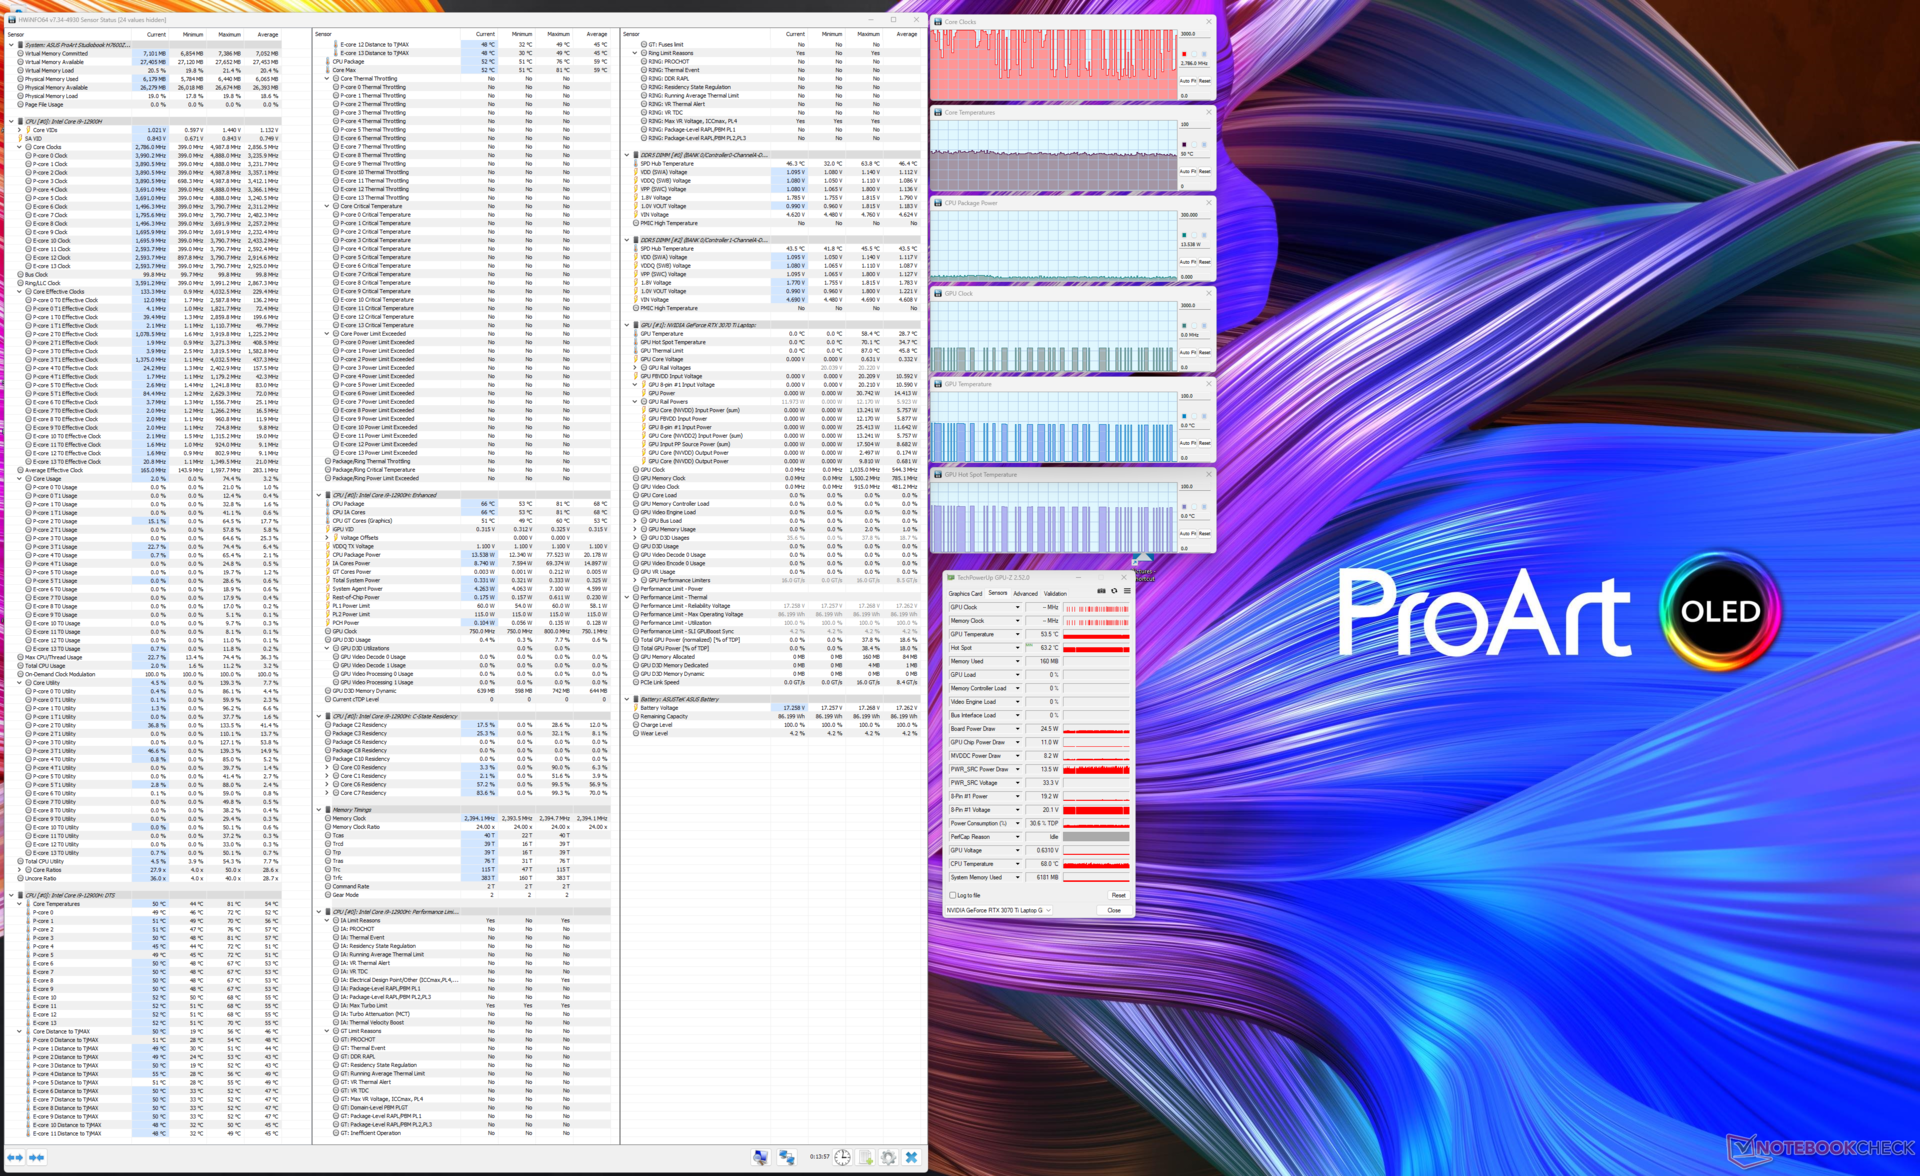
下图说明了在Cinebench R15多核循环测试中各种CPU参数的变化。我们看到,所有三种性能模式都能够达到最大的时钟、功率和温度限制。
然而,标准模式的平均封装功率较低,为51瓦,而其他两种模式为90瓦。这导致了较低的平均内核时钟(约2.7GHz)和较低的内核温度(徘徊在67℃左右)。
性能模式和全速模式在功率限制方面大致相同,但后者即使在空闲状态下也会以最大速度持续旋转风扇。因此,与性能模式相比,全速模式下的平均核心温度要低约6℃。
然而,性能在电池供电的情况下会受到影响。在电池上运行时,Cinebench R20的单核分数下降52%,多核下降40%。
不像Apple ,无论是插电还是电池供电,MacBook Pros的性能都相当稳定,ProArt StudioBook 16,像所有现代x86设备一样,只有在连接到电源时才能完全发挥它的力量。
也就是说,电池上的性能下降应该仍然足以帮助你在移动中完成创造性工作。
总的来说,ProArt StudioBook 16提供了足够的CPU马力,可以在不出汗的情况下通过最苛刻的工作流程。
AIDA64: FP32 Ray-Trace | FPU Julia | CPU SHA3 | CPU Queen | FPU SinJulia | FPU Mandel | CPU AES | CPU ZLib | FP64 Ray-Trace | CPU PhotoWorxx
| Performance rating | |
| Asus ProArt StudioBook 16 H7600ZW | |
| Asus ROG Zephyrus Duo 16 GX650RX | |
| Average of class Multimedia | |
| Lenovo ThinkBook 16p G3 ARH | |
| Asus ZenBook Pro 16X OLED UX7602ZM-ME115W | |
| Asus ROG Strix Scar 15 G533ZW-LN106WS | |
| MSI Creator Z16P B12UHST | |
| Average Intel Core i9-12900H | |
| Gigabyte Aero 16 YE5 | |
| MSI Creator Z17 A12UGST-054 | |
| AIDA64 / FP32 Ray-Trace | |
| Asus ProArt StudioBook 16 H7600ZW | |
| Average of class Multimedia (2214 - 50388, n=53, last 2 years) | |
| Asus ROG Zephyrus Duo 16 GX650RX | |
| Lenovo ThinkBook 16p G3 ARH | |
| Asus ZenBook Pro 16X OLED UX7602ZM-ME115W | |
| Average Intel Core i9-12900H (4074 - 18289, n=29) | |
| Asus ROG Strix Scar 15 G533ZW-LN106WS | |
| MSI Creator Z16P B12UHST | |
| Gigabyte Aero 16 YE5 | |
| MSI Creator Z17 A12UGST-054 | |
| AIDA64 / FPU Julia | |
| Asus ROG Zephyrus Duo 16 GX650RX | |
| Lenovo ThinkBook 16p G3 ARH | |
| Asus ProArt StudioBook 16 H7600ZW | |
| Average of class Multimedia (12867 - 201874, n=54, last 2 years) | |
| Asus ZenBook Pro 16X OLED UX7602ZM-ME115W | |
| Average Intel Core i9-12900H (22307 - 93236, n=29) | |
| Asus ROG Strix Scar 15 G533ZW-LN106WS | |
| MSI Creator Z16P B12UHST | |
| Gigabyte Aero 16 YE5 | |
| MSI Creator Z17 A12UGST-054 | |
| AIDA64 / CPU SHA3 | |
| Asus ProArt StudioBook 16 H7600ZW | |
| Average of class Multimedia (626 - 8623, n=54, last 2 years) | |
| Asus ZenBook Pro 16X OLED UX7602ZM-ME115W | |
| Asus ROG Zephyrus Duo 16 GX650RX | |
| Asus ROG Strix Scar 15 G533ZW-LN106WS | |
| Lenovo ThinkBook 16p G3 ARH | |
| Average Intel Core i9-12900H (1378 - 4215, n=29) | |
| MSI Creator Z16P B12UHST | |
| Gigabyte Aero 16 YE5 | |
| MSI Creator Z17 A12UGST-054 | |
| AIDA64 / CPU Queen | |
| Asus ProArt StudioBook 16 H7600ZW | |
| Asus ZenBook Pro 16X OLED UX7602ZM-ME115W | |
| Gigabyte Aero 16 YE5 | |
| MSI Creator Z16P B12UHST | |
| MSI Creator Z17 A12UGST-054 | |
| Asus ROG Zephyrus Duo 16 GX650RX | |
| Asus ROG Strix Scar 15 G533ZW-LN106WS | |
| Lenovo ThinkBook 16p G3 ARH | |
| Average Intel Core i9-12900H (78172 - 111241, n=28) | |
| Average of class Multimedia (13483 - 181505, n=41, last 2 years) | |
| AIDA64 / FPU SinJulia | |
| Lenovo ThinkBook 16p G3 ARH | |
| Asus ROG Zephyrus Duo 16 GX650RX | |
| Asus ProArt StudioBook 16 H7600ZW | |
| Asus ROG Strix Scar 15 G533ZW-LN106WS | |
| MSI Creator Z16P B12UHST | |
| Asus ZenBook Pro 16X OLED UX7602ZM-ME115W | |
| Gigabyte Aero 16 YE5 | |
| MSI Creator Z17 A12UGST-054 | |
| Average Intel Core i9-12900H (5709 - 10410, n=29) | |
| Average of class Multimedia (886 - 28794, n=54, last 2 years) | |
| AIDA64 / FPU Mandel | |
| Asus ROG Zephyrus Duo 16 GX650RX | |
| Lenovo ThinkBook 16p G3 ARH | |
| Asus ProArt StudioBook 16 H7600ZW | |
| Average of class Multimedia (6395 - 105740, n=53, last 2 years) | |
| Asus ZenBook Pro 16X OLED UX7602ZM-ME115W | |
| Average Intel Core i9-12900H (11257 - 45581, n=29) | |
| Asus ROG Strix Scar 15 G533ZW-LN106WS | |
| MSI Creator Z16P B12UHST | |
| Gigabyte Aero 16 YE5 | |
| MSI Creator Z17 A12UGST-054 | |
| AIDA64 / CPU AES | |
| Asus ProArt StudioBook 16 H7600ZW | |
| Asus ROG Zephyrus Duo 16 GX650RX | |
| Asus ROG Strix Scar 15 G533ZW-LN106WS | |
| MSI Creator Z16P B12UHST | |
| Gigabyte Aero 16 YE5 | |
| MSI Creator Z17 A12UGST-054 | |
| Average Intel Core i9-12900H (31935 - 151546, n=29) | |
| Asus ZenBook Pro 16X OLED UX7602ZM-ME115W | |
| Average of class Multimedia (8171 - 126790, n=54, last 2 years) | |
| Lenovo ThinkBook 16p G3 ARH | |
| AIDA64 / CPU ZLib | |
| MSI Creator Z16P B12UHST | |
| Asus ROG Strix Scar 15 G533ZW-LN106WS | |
| Asus ProArt StudioBook 16 H7600ZW | |
| Asus ZenBook Pro 16X OLED UX7602ZM-ME115W | |
| Gigabyte Aero 16 YE5 | |
| Average of class Multimedia (143.8 - 2022, n=54, last 2 years) | |
| MSI Creator Z17 A12UGST-054 | |
| Average Intel Core i9-12900H (449 - 1193, n=29) | |
| Asus ROG Zephyrus Duo 16 GX650RX | |
| Lenovo ThinkBook 16p G3 ARH | |
| AIDA64 / FP64 Ray-Trace | |
| Asus ProArt StudioBook 16 H7600ZW | |
| Average of class Multimedia (1014 - 26875, n=54, last 2 years) | |
| Asus ROG Zephyrus Duo 16 GX650RX | |
| Lenovo ThinkBook 16p G3 ARH | |
| Asus ZenBook Pro 16X OLED UX7602ZM-ME115W | |
| Average Intel Core i9-12900H (2235 - 10511, n=29) | |
| Asus ROG Strix Scar 15 G533ZW-LN106WS | |
| MSI Creator Z16P B12UHST | |
| Gigabyte Aero 16 YE5 | |
| MSI Creator Z17 A12UGST-054 | |
| AIDA64 / CPU PhotoWorxx | |
| Average of class Multimedia (8187 - 88154, n=54, last 2 years) | |
| Asus ZenBook Pro 16X OLED UX7602ZM-ME115W | |
| Asus ProArt StudioBook 16 H7600ZW | |
| MSI Creator Z16P B12UHST | |
| Asus ROG Strix Scar 15 G533ZW-LN106WS | |
| MSI Creator Z17 A12UGST-054 | |
| Gigabyte Aero 16 YE5 | |
| Average Intel Core i9-12900H (20960 - 48269, n=30) | |
| Asus ROG Zephyrus Duo 16 GX650RX | |
| Lenovo ThinkBook 16p G3 ARH | |
查看我们专门的 英特尔酷睿i9-12900H页面了解更多信息和性能比较。
系统性能
ProArt StudioBook 16在日常系统性能和反应能力方面没有问题。PCMark 10的总体分数是在这个配置的预期线上。
与华硕ROG Strix Scar 15和微星Creator Z17相比,CrossMark出现了轻微的挫折,但StudioBook 16比M1 Max MacBook Pro 14快17%。 M1 Max MacBook Pro 14和22%的速度比 M1 Pro MacBook Pro 16.
然而,Affinity Photo 2看到Apple 芯片明显领先于Core i9-12900H。ProArt StudioBook 16在综合CPU测试中落后14%,在综合GPU测试中比基于M1 Max的MacBook Pro 14落后多达55%。
CrossMark: Overall | Productivity | Creativity | Responsiveness
Affinity Photo 2: Combined (Multi CPU) | Combined (Single / Multi GPU)
| PCMark 10 / Score | |
| MSI Creator Z16P B12UHST | |
| Asus ProArt StudioBook 16 H7600ZW | |
| Asus ROG Strix Scar 15 G533ZW-LN106WS | |
| Gigabyte Aero 16 YE5 | |
| Average of class Multimedia (4325 - 10386, n=52, last 2 years) | |
| Average Intel Core i9-12900H, NVIDIA GeForce RTX 3070 Ti Laptop GPU (7087 - 8072, n=6) | |
| Asus ZenBook Pro 16X OLED UX7602ZM-ME115W | |
| MSI Creator Z17 A12UGST-054 | |
| Lenovo ThinkBook 16p G3 ARH | |
| Asus ROG Zephyrus Duo 16 GX650RX | |
| PCMark 10 / Essentials | |
| Asus ProArt StudioBook 16 H7600ZW | |
| MSI Creator Z16P B12UHST | |
| Asus ZenBook Pro 16X OLED UX7602ZM-ME115W | |
| Gigabyte Aero 16 YE5 | |
| Average Intel Core i9-12900H, NVIDIA GeForce RTX 3070 Ti Laptop GPU (10266 - 11663, n=6) | |
| Asus ROG Strix Scar 15 G533ZW-LN106WS | |
| Average of class Multimedia (8025 - 11664, n=51, last 2 years) | |
| MSI Creator Z17 A12UGST-054 | |
| Lenovo ThinkBook 16p G3 ARH | |
| Asus ROG Zephyrus Duo 16 GX650RX | |
| PCMark 10 / Productivity | |
| Average of class Multimedia (7323 - 18233, n=51, last 2 years) | |
| MSI Creator Z16P B12UHST | |
| Asus ProArt StudioBook 16 H7600ZW | |
| Asus ROG Strix Scar 15 G533ZW-LN106WS | |
| Average Intel Core i9-12900H, NVIDIA GeForce RTX 3070 Ti Laptop GPU (9402 - 10742, n=6) | |
| Asus ZenBook Pro 16X OLED UX7602ZM-ME115W | |
| Gigabyte Aero 16 YE5 | |
| MSI Creator Z17 A12UGST-054 | |
| Lenovo ThinkBook 16p G3 ARH | |
| Asus ROG Zephyrus Duo 16 GX650RX | |
| PCMark 10 / Digital Content Creation | |
| Asus ROG Strix Scar 15 G533ZW-LN106WS | |
| Gigabyte Aero 16 YE5 | |
| MSI Creator Z16P B12UHST | |
| Asus ProArt StudioBook 16 H7600ZW | |
| Average Intel Core i9-12900H, NVIDIA GeForce RTX 3070 Ti Laptop GPU (10009 - 12541, n=6) | |
| Average of class Multimedia (3651 - 16240, n=51, last 2 years) | |
| Asus ZenBook Pro 16X OLED UX7602ZM-ME115W | |
| MSI Creator Z17 A12UGST-054 | |
| Asus ROG Zephyrus Duo 16 GX650RX | |
| Lenovo ThinkBook 16p G3 ARH | |
| CrossMark / Overall | |
| Gigabyte Aero 16 YE5 | |
| Asus ROG Strix Scar 15 G533ZW-LN106WS | |
| MSI Creator Z17 A12UGST-054 | |
| Asus ProArt StudioBook 16 H7600ZW | |
| Average of class Multimedia (866 - 2728, n=60, last 2 years) | |
| Average Intel Core i9-12900H, NVIDIA GeForce RTX 3070 Ti Laptop GPU (1664 - 2044, n=6) | |
| Asus ZenBook Pro 16X OLED UX7602ZM-ME115W | |
| Asus ROG Zephyrus Duo 16 GX650RX | |
| Apple MacBook Pro 14 2021 M1 Max 24-Core GPU | |
| Apple MacBook Pro 16 2021 M1 Pro | |
| Lenovo ThinkBook 16p G3 ARH | |
| CrossMark / Productivity | |
| Gigabyte Aero 16 YE5 | |
| Asus ROG Strix Scar 15 G533ZW-LN106WS | |
| MSI Creator Z17 A12UGST-054 | |
| Asus ProArt StudioBook 16 H7600ZW | |
| Average Intel Core i9-12900H, NVIDIA GeForce RTX 3070 Ti Laptop GPU (1591 - 1968, n=6) | |
| Average of class Multimedia (931 - 2489, n=60, last 2 years) | |
| Asus ROG Zephyrus Duo 16 GX650RX | |
| Asus ZenBook Pro 16X OLED UX7602ZM-ME115W | |
| Lenovo ThinkBook 16p G3 ARH | |
| Apple MacBook Pro 14 2021 M1 Max 24-Core GPU | |
| Apple MacBook Pro 16 2021 M1 Pro | |
| CrossMark / Creativity | |
| Gigabyte Aero 16 YE5 | |
| Apple MacBook Pro 14 2021 M1 Max 24-Core GPU | |
| Average of class Multimedia (907 - 3465, n=60, last 2 years) | |
| MSI Creator Z17 A12UGST-054 | |
| Asus ROG Strix Scar 15 G533ZW-LN106WS | |
| Asus ProArt StudioBook 16 H7600ZW | |
| Apple MacBook Pro 16 2021 M1 Pro | |
| Asus ZenBook Pro 16X OLED UX7602ZM-ME115W | |
| Average Intel Core i9-12900H, NVIDIA GeForce RTX 3070 Ti Laptop GPU (1797 - 2148, n=6) | |
| Asus ROG Zephyrus Duo 16 GX650RX | |
| Lenovo ThinkBook 16p G3 ARH | |
| CrossMark / Responsiveness | |
| Gigabyte Aero 16 YE5 | |
| Asus ROG Strix Scar 15 G533ZW-LN106WS | |
| MSI Creator Z17 A12UGST-054 | |
| Average Intel Core i9-12900H, NVIDIA GeForce RTX 3070 Ti Laptop GPU (1514 - 2069, n=6) | |
| Asus ROG Zephyrus Duo 16 GX650RX | |
| Asus ProArt StudioBook 16 H7600ZW | |
| Average of class Multimedia (605 - 2024, n=60, last 2 years) | |
| Asus ZenBook Pro 16X OLED UX7602ZM-ME115W | |
| Lenovo ThinkBook 16p G3 ARH | |
| Apple MacBook Pro 14 2021 M1 Max 24-Core GPU | |
| Apple MacBook Pro 16 2021 M1 Pro | |
| Affinity Photo 2 / Combined (Multi CPU) | |
| Apple MacBook Pro 16 2021 M1 Pro | |
| Apple MacBook Pro 14 2021 M1 Max 24-Core GPU | |
| Asus ProArt StudioBook 16 H7600ZW | |
| Average Intel Core i9-12900H, NVIDIA GeForce RTX 3070 Ti Laptop GPU (n=1) | |
| Affinity Photo 2 / Combined (Single / Multi GPU) | |
| Apple MacBook Pro 14 2021 M1 Max 24-Core GPU | |
| Apple MacBook Pro 16 2021 M1 Pro | |
| Asus ProArt StudioBook 16 H7600ZW | |
| Average Intel Core i9-12900H, NVIDIA GeForce RTX 3070 Ti Laptop GPU (n=1) | |
| PCMark 8 Home Score Accelerated v2 | 5440 points | |
| PCMark 8 Work Score Accelerated v2 | 5380 points | |
| PCMark 10 Score | 8072 points | |
Help | ||
| AIDA64 / Memory Copy | |
| Average of class Multimedia (11299 - 132135, n=54, last 2 years) | |
| Asus ZenBook Pro 16X OLED UX7602ZM-ME115W | |
| MSI Creator Z16P B12UHST | |
| Gigabyte Aero 16 YE5 | |
| Asus ProArt StudioBook 16 H7600ZW | |
| MSI Creator Z17 A12UGST-054 | |
| Asus ROG Strix Scar 15 G533ZW-LN106WS | |
| Average Intel Core i9-12900H (34438 - 74264, n=29) | |
| Asus ROG Zephyrus Duo 16 GX650RX | |
| Lenovo ThinkBook 16p G3 ARH | |
| AIDA64 / Memory Read | |
| Average of class Multimedia (11624 - 174586, n=54, last 2 years) | |
| Asus ZenBook Pro 16X OLED UX7602ZM-ME115W | |
| MSI Creator Z16P B12UHST | |
| Asus ProArt StudioBook 16 H7600ZW | |
| Gigabyte Aero 16 YE5 | |
| MSI Creator Z17 A12UGST-054 | |
| Asus ROG Strix Scar 15 G533ZW-LN106WS | |
| Average Intel Core i9-12900H (36365 - 74642, n=29) | |
| Asus ROG Zephyrus Duo 16 GX650RX | |
| Lenovo ThinkBook 16p G3 ARH | |
| AIDA64 / Memory Write | |
| Average of class Multimedia (11755 - 134998, n=54, last 2 years) | |
| Asus ROG Strix Scar 15 G533ZW-LN106WS | |
| MSI Creator Z16P B12UHST | |
| MSI Creator Z17 A12UGST-054 | |
| Asus ProArt StudioBook 16 H7600ZW | |
| Asus ZenBook Pro 16X OLED UX7602ZM-ME115W | |
| Gigabyte Aero 16 YE5 | |
| Average Intel Core i9-12900H (32276 - 67858, n=29) | |
| Asus ROG Zephyrus Duo 16 GX650RX | |
| Lenovo ThinkBook 16p G3 ARH | |
| AIDA64 / Memory Latency | |
| Average of class Multimedia (7 - 535, n=53, last 2 years) | |
| Lenovo ThinkBook 16p G3 ARH | |
| Asus ZenBook Pro 16X OLED UX7602ZM-ME115W | |
| Asus ROG Strix Scar 15 G533ZW-LN106WS | |
| MSI Creator Z16P B12UHST | |
| MSI Creator Z17 A12UGST-054 | |
| Asus ROG Zephyrus Duo 16 GX650RX | |
| Gigabyte Aero 16 YE5 | |
| Asus ProArt StudioBook 16 H7600ZW | |
| Average Intel Core i9-12900H (74.7 - 118.1, n=28) | |
* ... smaller is better
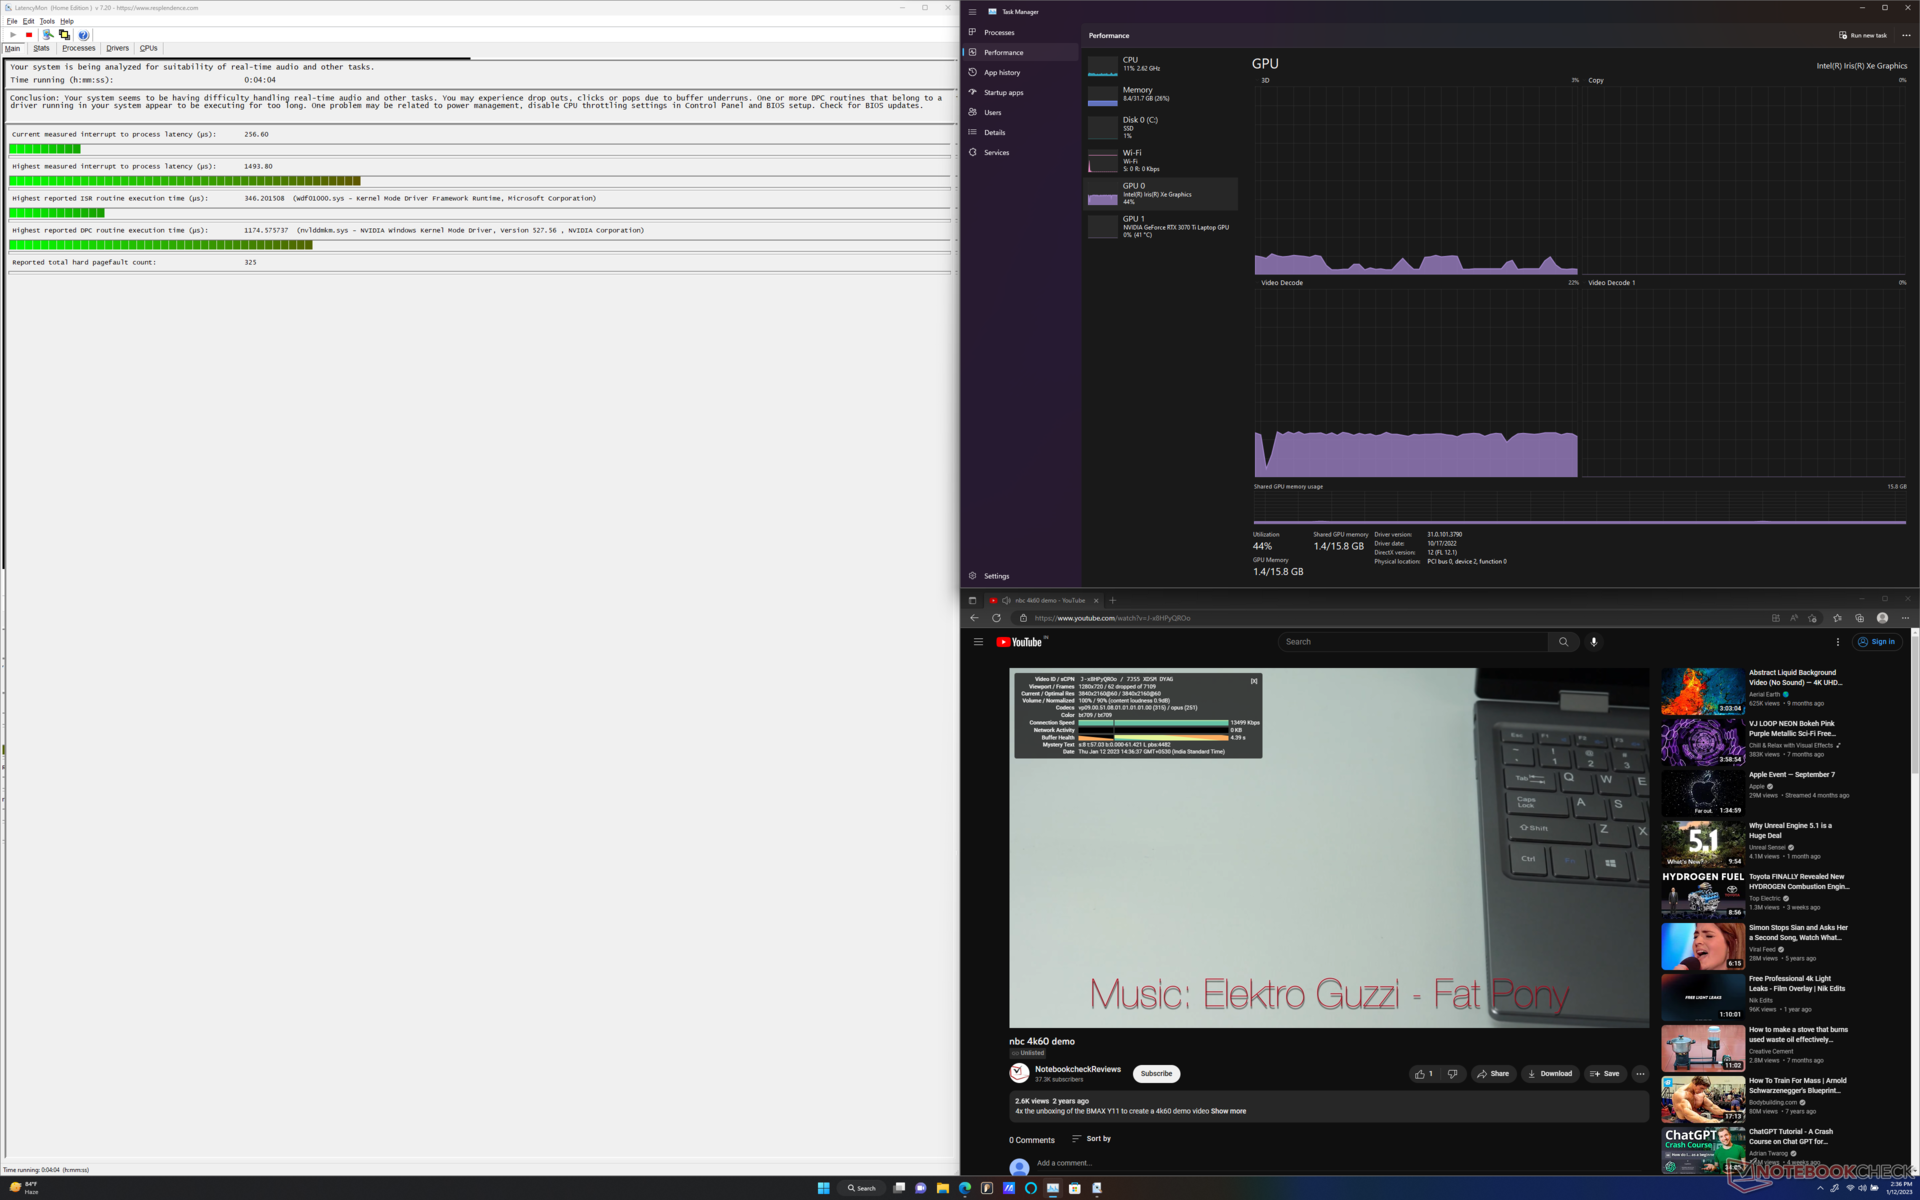
DPC延时
我们测量到最高的中断到处理的延迟是1493.8微秒,这对于一个以内容创作者为中心的笔记本电脑来说是偏高的。Nvidia内核模式的系统驱动似乎是延迟增加的原因。
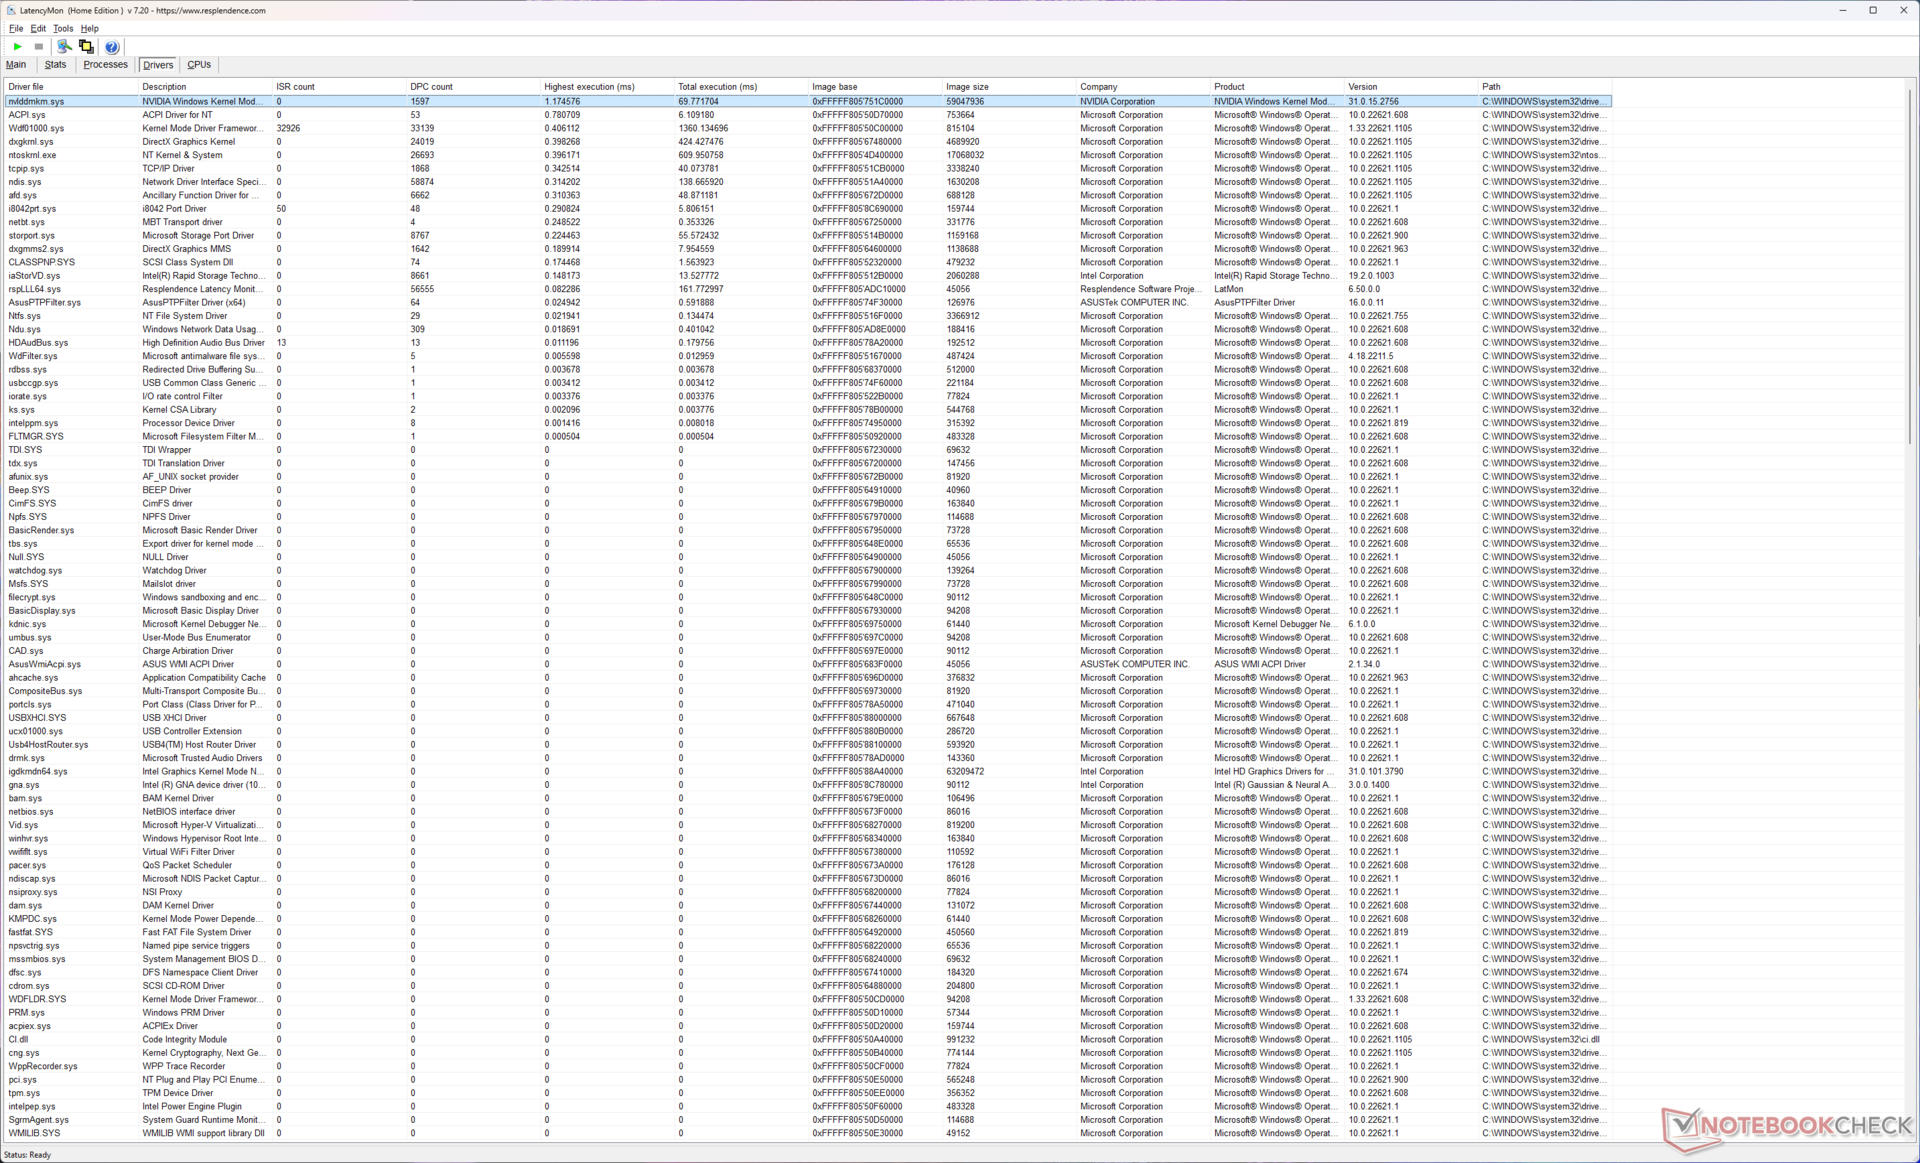
| DPC Latencies / LatencyMon - interrupt to process latency (max), Web, Youtube, Prime95 | |
| Lenovo ThinkBook 16p G3 ARH | |
| MSI Creator Z17 A12UGST-054 | |
| Asus ProArt StudioBook 16 H7600ZW | |
| Asus ROG Strix Scar 15 G533ZW-LN106WS | |
| MSI Creator Z16P B12UHST | |
| Gigabyte Aero 16 YE5 | |
| Asus ROG Zephyrus Duo 16 GX650RX | |
| Asus ZenBook Pro 16X OLED UX7602ZM-ME115W | |
* ... smaller is better
我们的 DPC延时排行页面提供了更多经过审查的设备之间的延迟比较。
存储设备
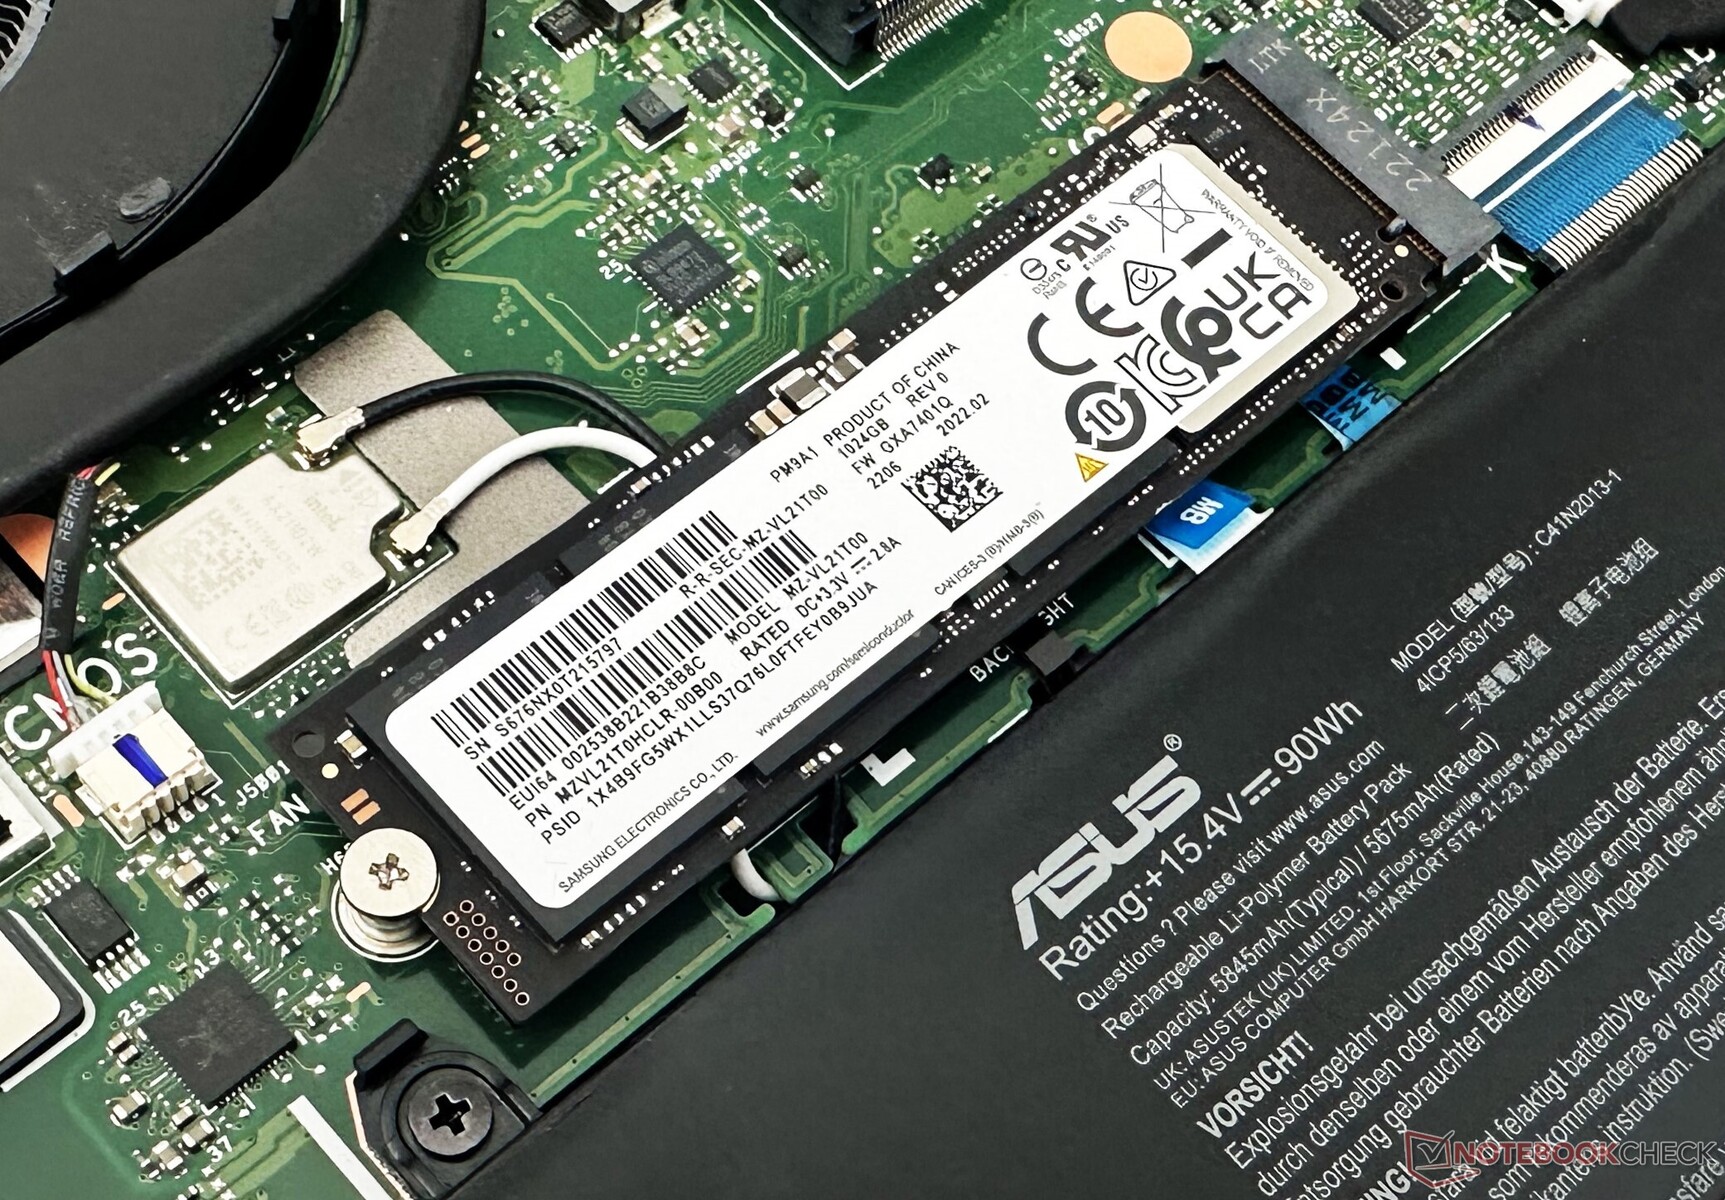
附带的三星PM9A1 1 TB NVMe SSD在整个磁盘基准中表现不错,但它落后于ROG Strix Scar 15和Creator Z16P中的2 TB表亲。它仍然比华硕ZenBook Pro 16X OLED中的相同驱动器快10%。
固态硬盘被包裹在铝制包装中,背板上也有散热垫。然而,在我们的DiskSpd读取循环测试中,该驱动器在队列深度为8时严重节流。
一个备用的M.2 2280插槽可用于添加另一个NVMe驱动器。然而,没有2.5英寸的驱动器插槽。

* ... smaller is better
Disk Throttling: DiskSpd Read Loop, Queue Depth 8
请参考我们的 SSD和HDD基准测试页面了解更多的存储比较。
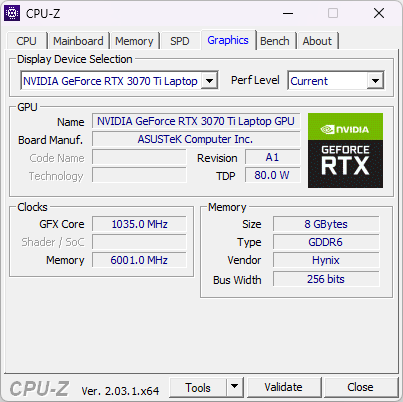
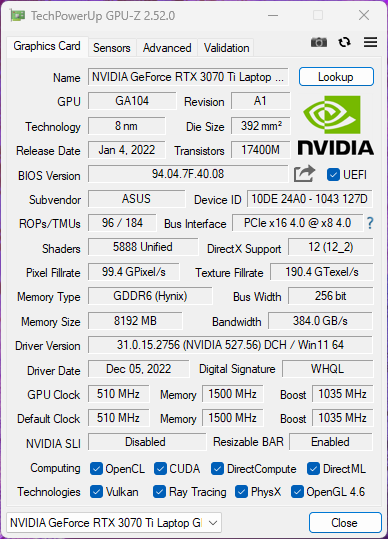
GPU性能
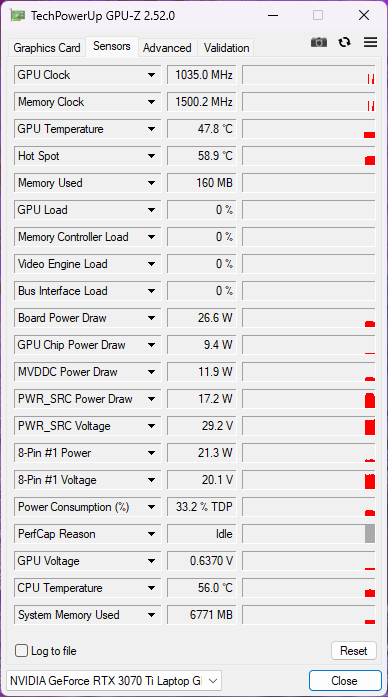
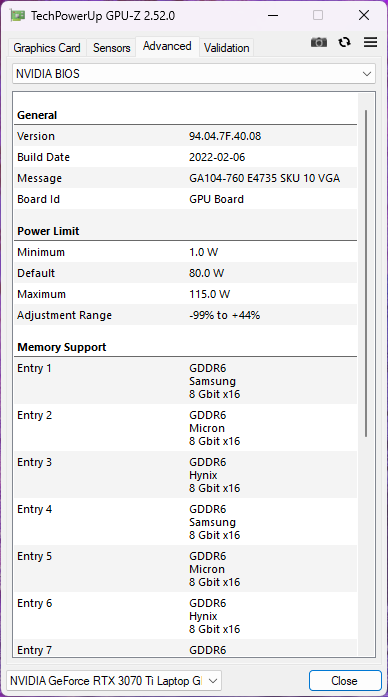
我们的ProArt StudioBook 16设备配备了一个115W的 NvidiaGeForce RTX 3070 Ti笔记本GPU与8GB GDDR6 VRAM。华硕没有指定该GPU的动态提升值。这款笔记本电脑默认使用Nvidia Studio驱动程序。
较低的TGP意味着ProArt StudioBook 16与使用150W RTX 3070 Ti的ROG Strix Scar 15相比,3DMark的整体性能要慢15%。然而,它仍然比105瓦的 RTX 3080 Ti笔记本GPU中的 Gigabyte Aero 16 YE5.
| 3DMark 11 Performance | 32806 points | |
| 3DMark Ice Storm Standard Score | 75692 points | |
| 3DMark Cloud Gate Standard Score | 49147 points | |
| 3DMark Fire Strike Score | 23989 points | |
| 3DMark Fire Strike Extreme Score | 12966 points | |
| 3DMark Time Spy Score | 10673 points | |
Help | ||
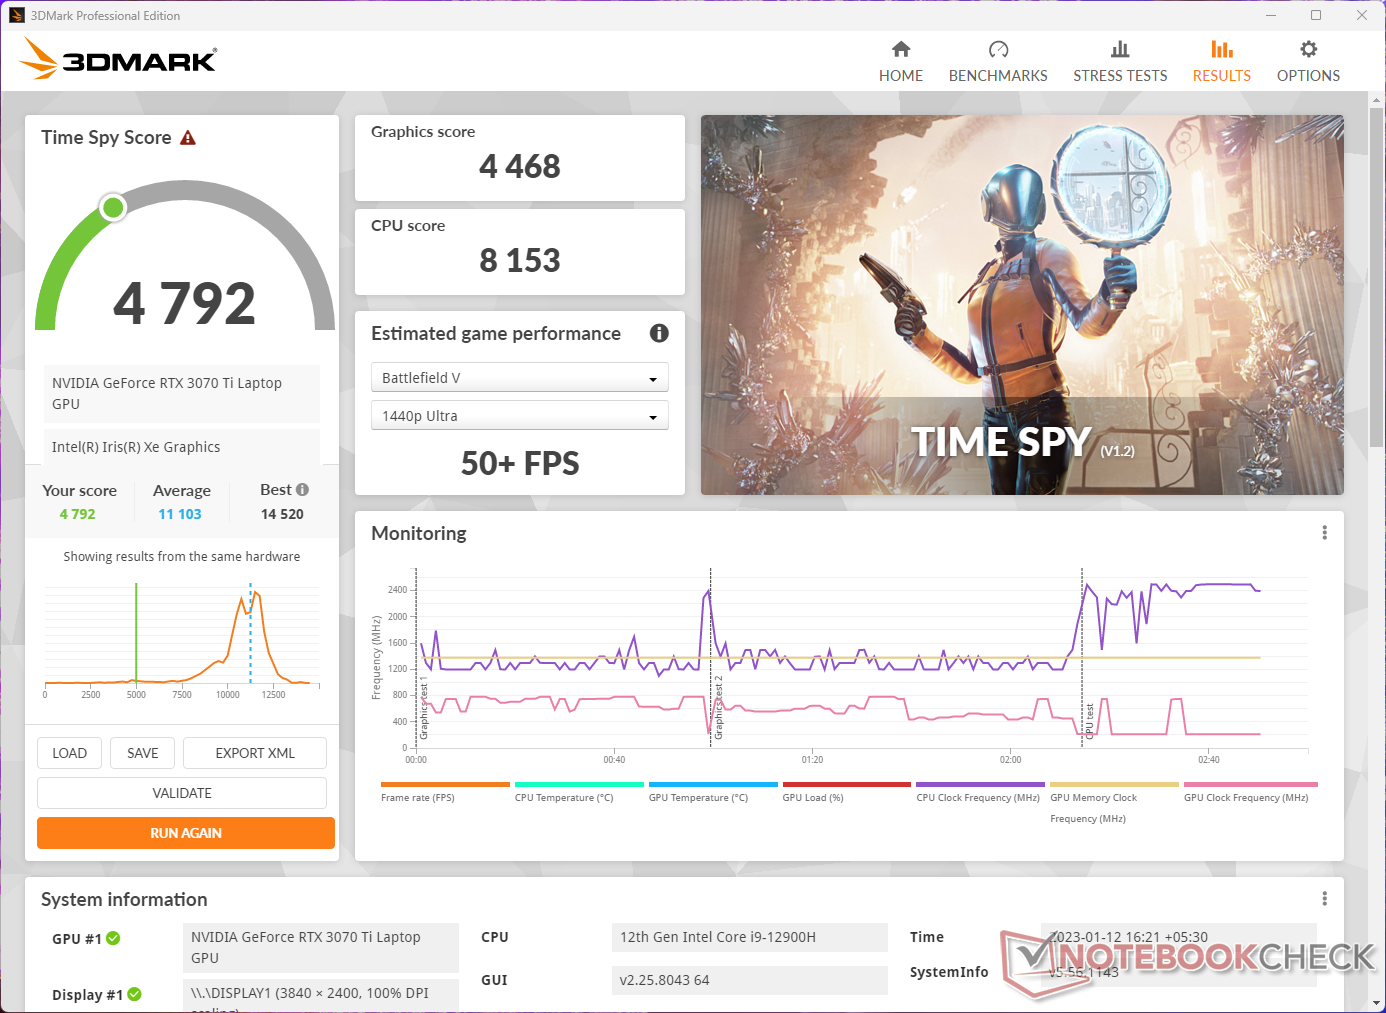
3DMarkTime Spy 分数在电池上下降了56%。根据该基准,在1440p的情况下,这应该仍能使50+fps的游戏发挥在 战地5.
与基于RTX 3060的笔记本电脑相比,StudioBook 16的RTX 3070 Ti在Blender测试中显示出明显的优势 - RTX 3060笔记本GPU在Blender Optix和CUDA测试中分别慢了23%和35%。
* ... smaller is better
游戏性能
华硕并没有将ProArt StudioBook 16作为游戏笔记本来销售,但所提供的硬件肯定能够以体面的帧率运行现代游戏。对于这种配置的设备来说,累积的游戏性能是预期的,但与微星Creator Z17相比,总体上还是快了约9%。
它甚至在比较中以可感知的幅度超越了一些搭载RTX 3080 Ti的笔记本电脑。然而,请注意,这种推论只在1080p下有效,因为游戏性能更受CPU的限制。
在更高的分辨率和光线追踪中,RTX 3080 Ti笔记本GPU的优势变得非常明显。然而,在大多数情况下,当涉及到光栅性能时,这两款GPU之间的差异仅在10%以内。
| The Witcher 3 | |
| 3840x2160 High Graphics & Postprocessing (Nvidia HairWorks Off) | |
| Asus ROG Zephyrus Duo 16 GX650RX | |
| Asus ROG Strix Scar 15 G533ZW-LN106WS | |
| Average NVIDIA GeForce RTX 3070 Ti Laptop GPU (73.2 - 78, n=2) | |
| Asus ProArt StudioBook 16 H7600ZW | |
| Average of class Multimedia (61 - 71, n=2, last 2 years) | |
| Gigabyte Aero 16 YE5 | |
| Asus ZenBook Pro 16X OLED UX7602ZM-ME115W | |
| 3840x2160 Ultra Graphics & Postprocessing (HBAO+) | |
| Asus ROG Zephyrus Duo 16 GX650RX | |
| Asus ROG Strix Scar 15 G533ZW-LN106WS | |
| Average NVIDIA GeForce RTX 3070 Ti Laptop GPU (48.4 - 52.3, n=2) | |
| Asus ProArt StudioBook 16 H7600ZW | |
| Gigabyte Aero 16 YE5 | |
Witcher 3 FPS图表
由于华硕出色的冷却效果,我们在用《Witcher 3 》 ,在1080p Ultra下进行压力测试时,没有看到可感知的帧数下降。
| low | med. | high | ultra | QHD | 4K | |
|---|---|---|---|---|---|---|
| GTA V (2015) | 187.2 | 186.4 | 181.9 | 122.2 | 97.6 | 92.1 |
| The Witcher 3 (2015) | 428 | 316 | 195.9 | 105.6 | 73.2 | |
| Dota 2 Reborn (2015) | 190.6 | 174.7 | 165.6 | 159.2 | 122.6 | |
| Final Fantasy XV Benchmark (2018) | 211 | 140.1 | 106.9 | 81.1 | 46.2 | |
| X-Plane 11.11 (2018) | 155 | 136.1 | 108.4 | 91.3 | ||
| Far Cry 5 (2018) | 182 | 154 | 145 | 137 | 104 | 57 |
| Strange Brigade (2018) | 460 | 257 | 209 | 183.8 | 136.9 | 74.4 |
| F1 2021 (2021) | 371 | 252 | 208 | 119.8 | 93.5 | 53.5 |
| Cyberpunk 2077 1.6 (2022) | 124.5 | 100.3 | 87.4 | 81.3 | 51 | 28.1 |
排放。标准剖面中的风扇噪音低于35 dB(A)
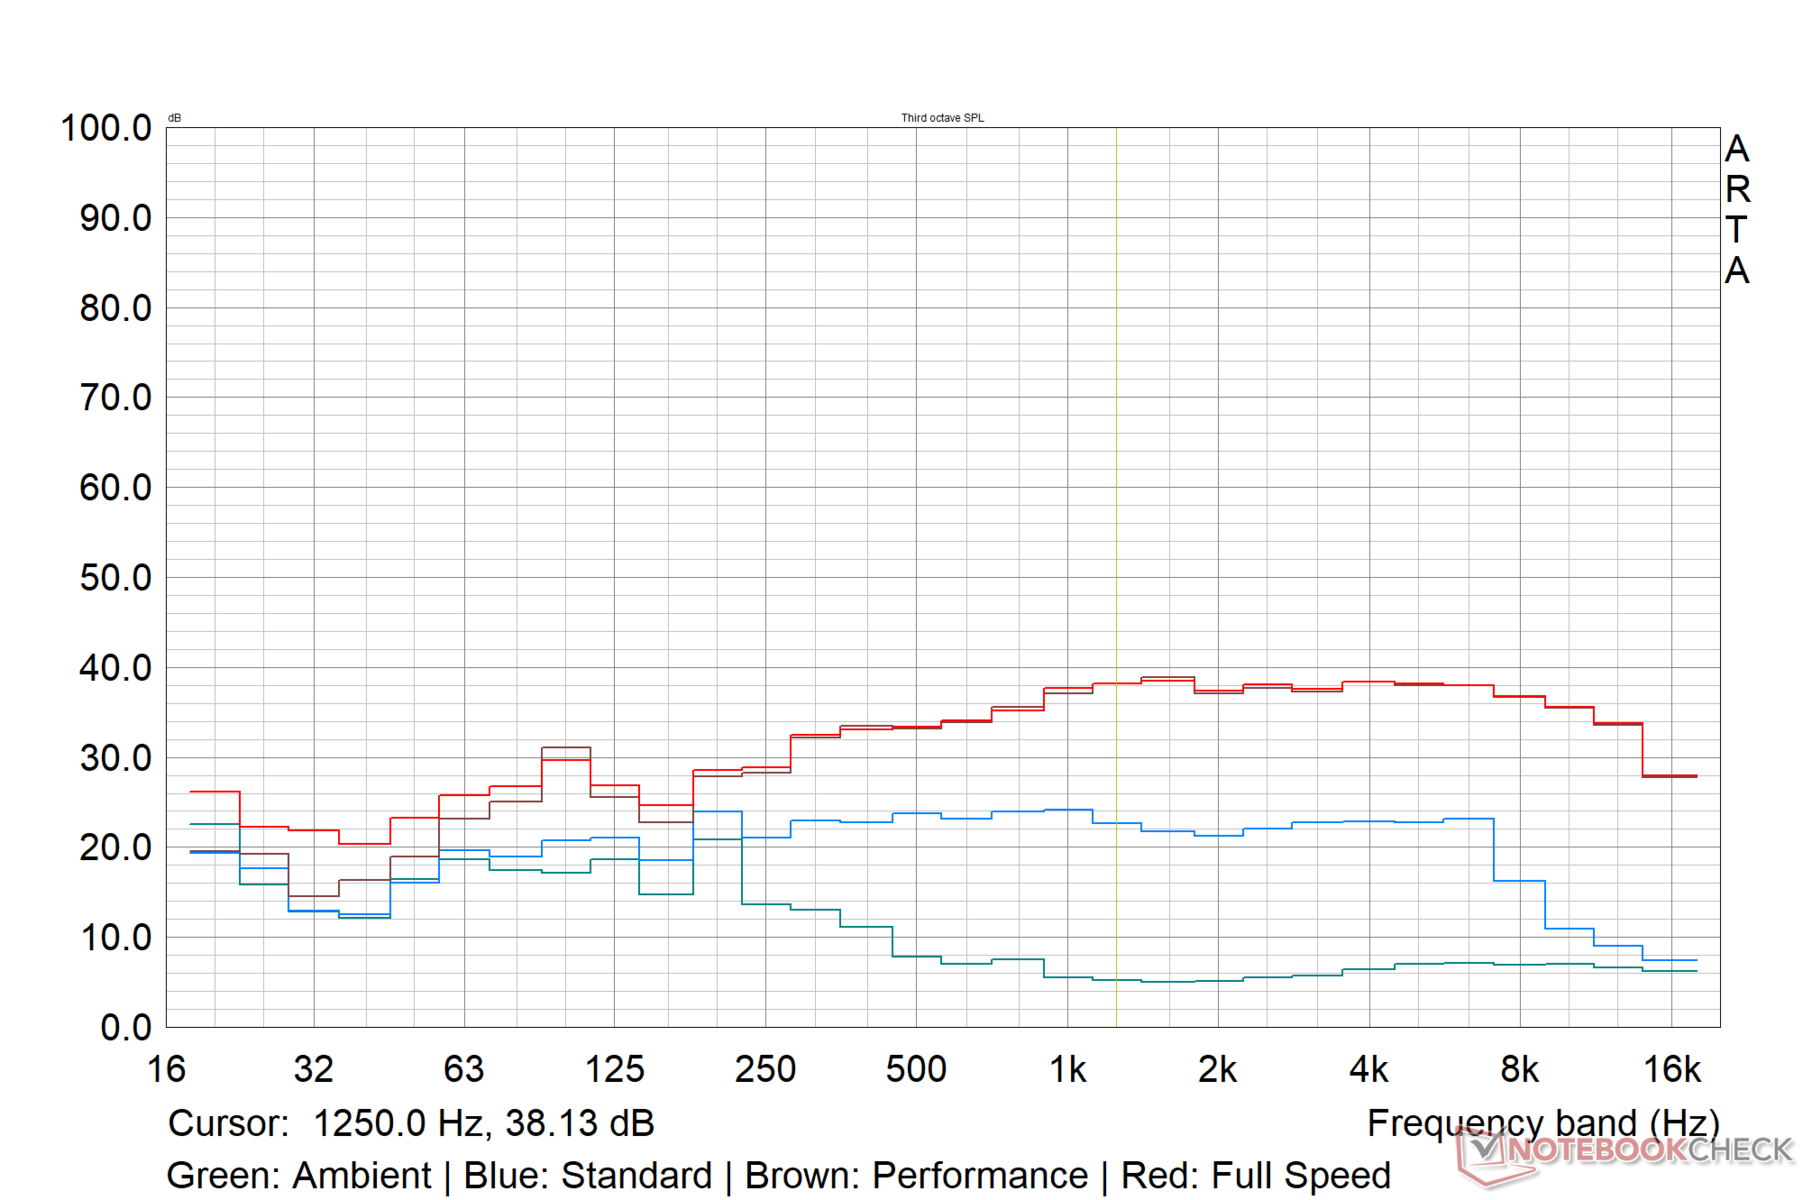
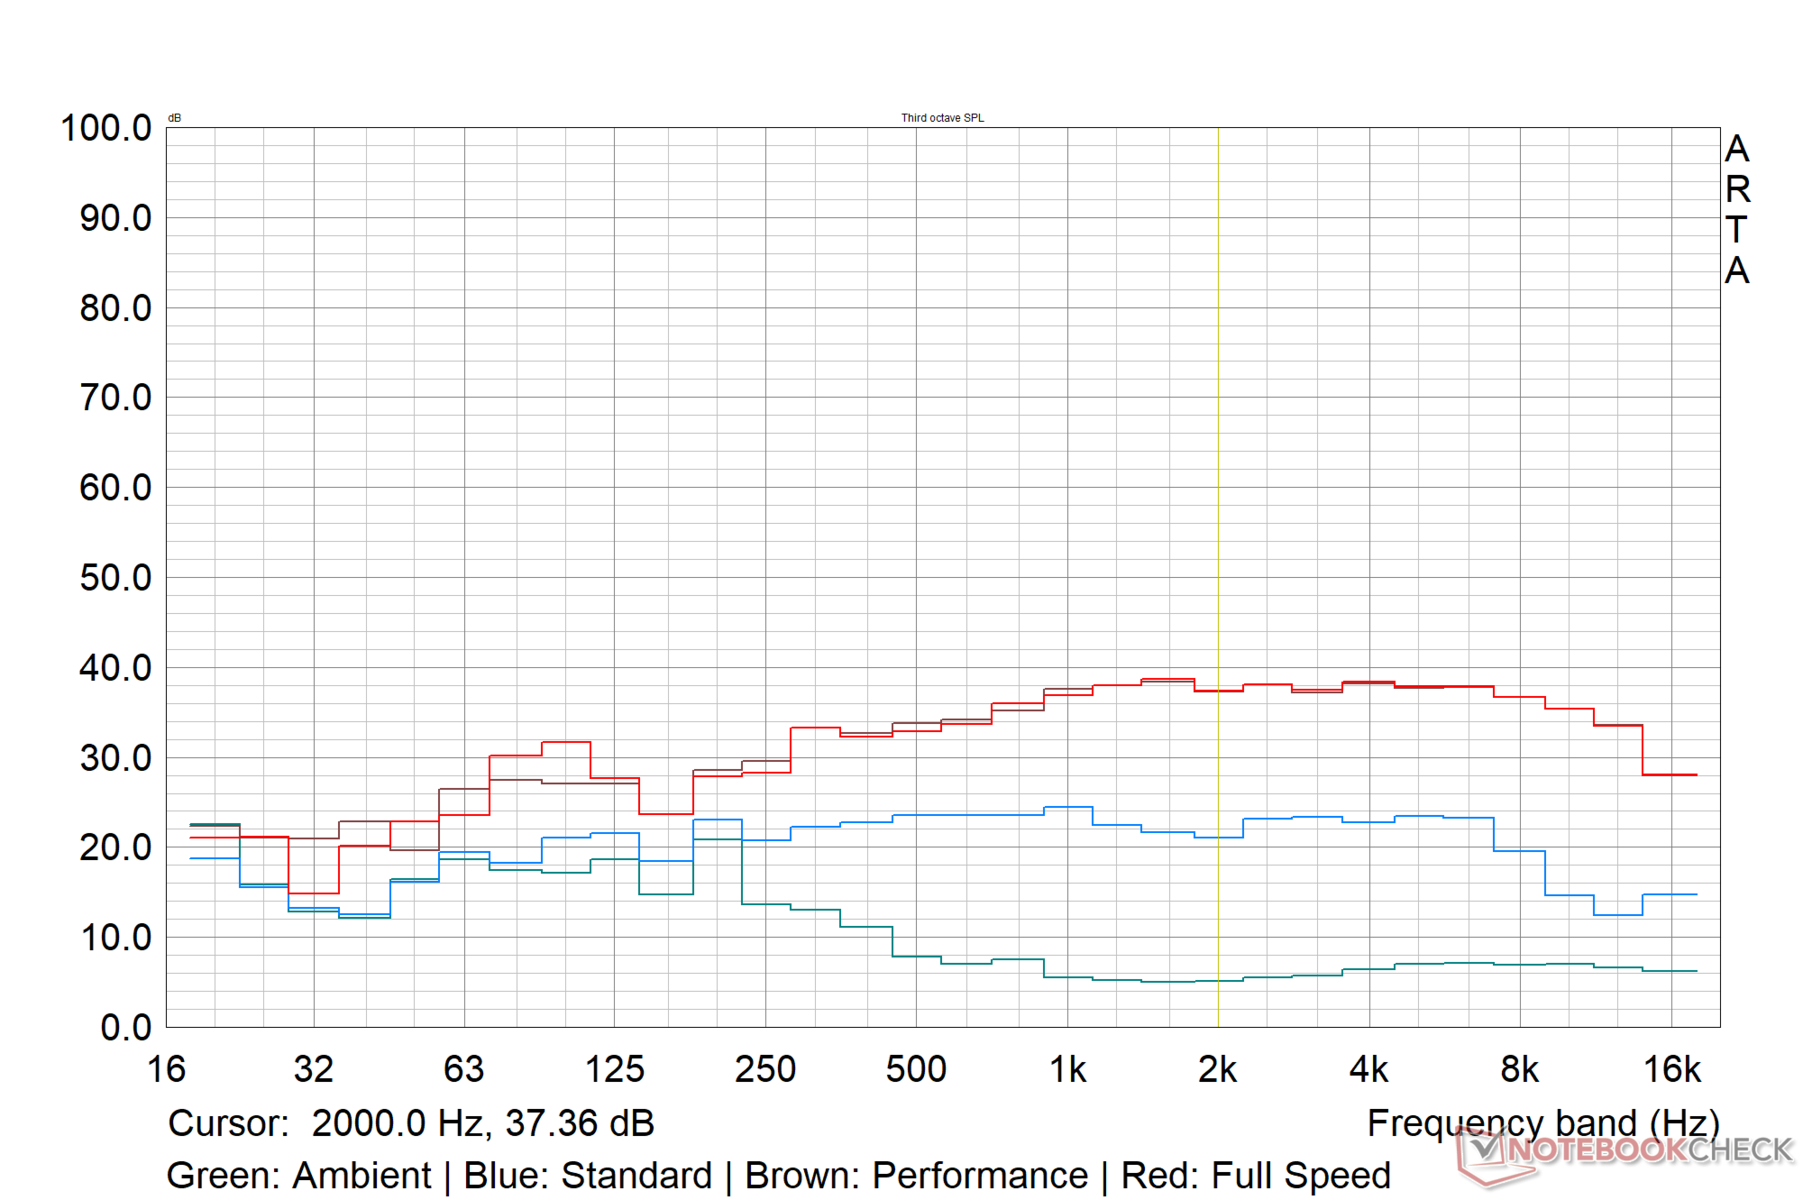
系统噪音
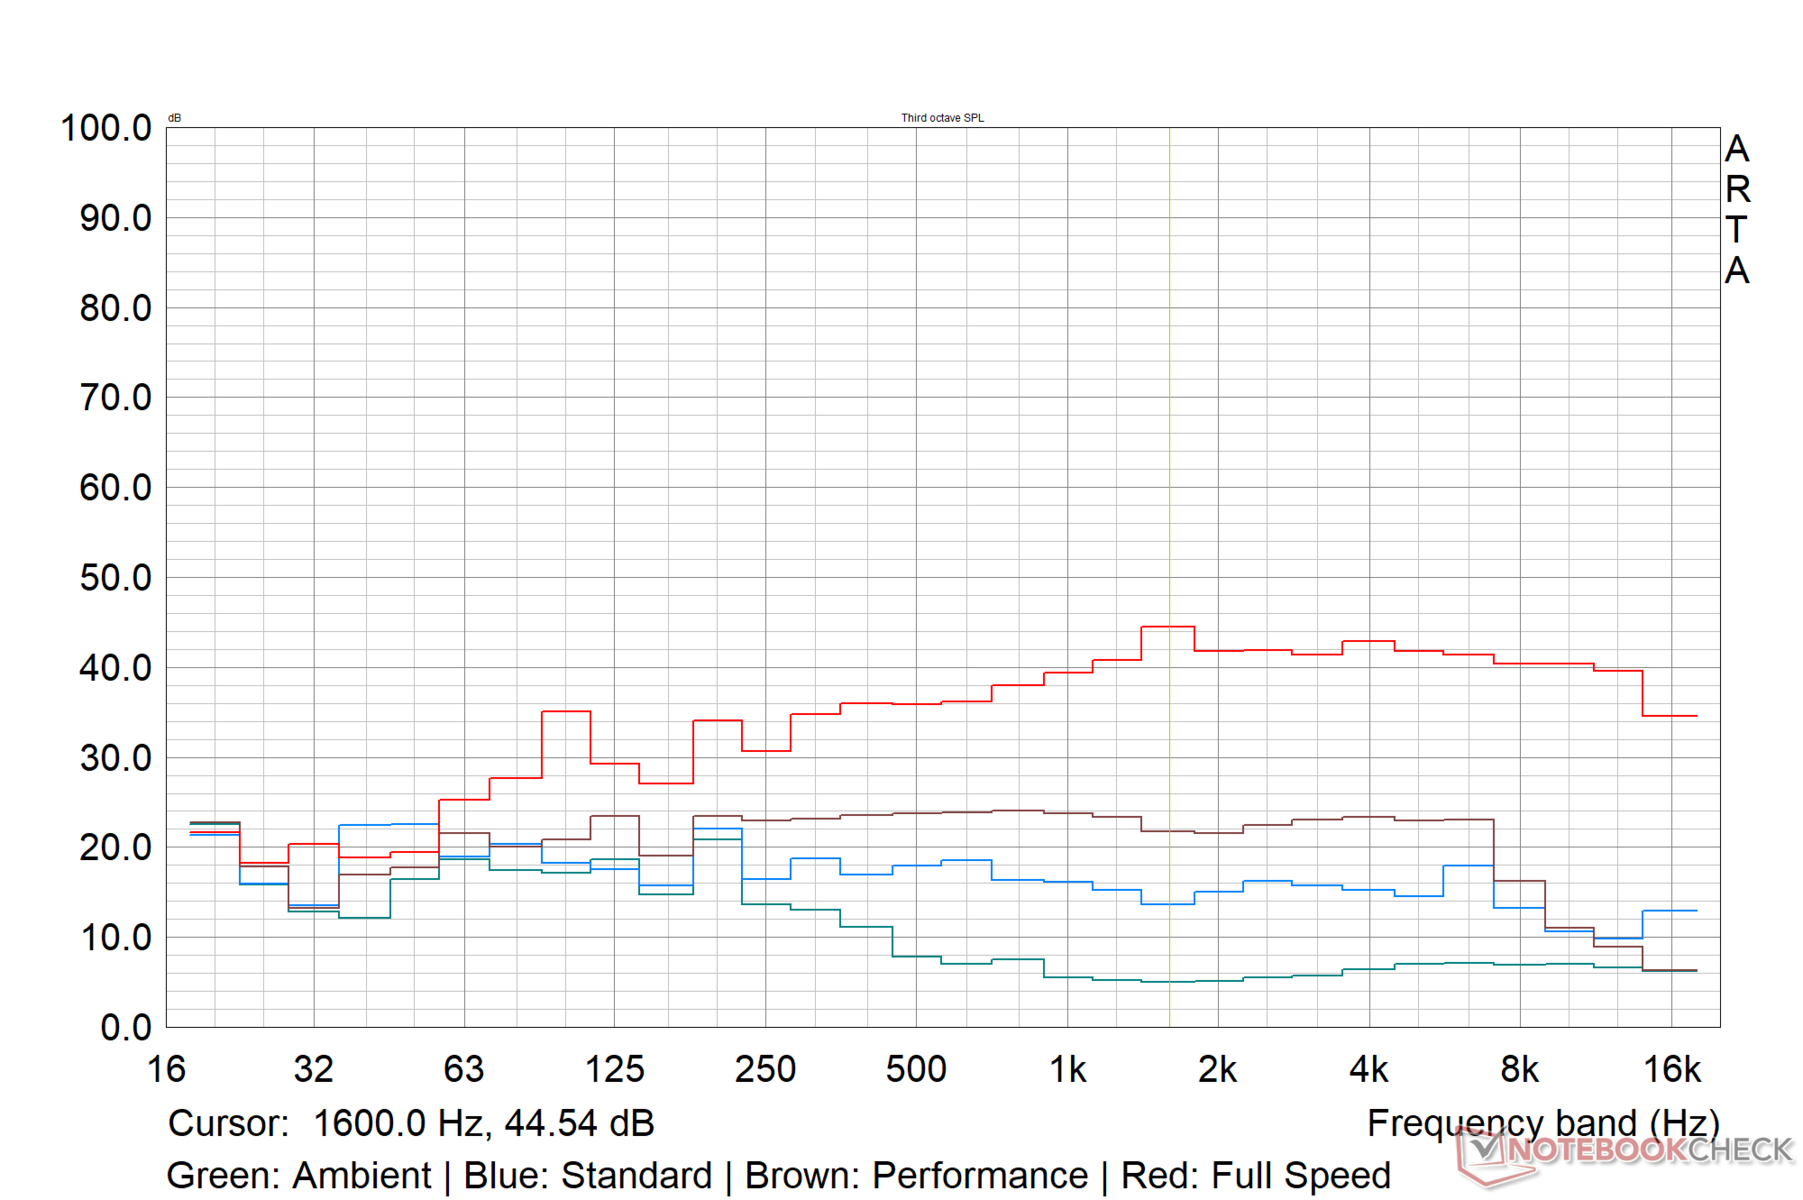
在全速设置下,即使在空闲状态下,风扇噪音声压级(SPL)也在50dB(A)和53dB(A)之间。因此,我们使用性能模式来对StudioBook 16的噪音水平进行更真实的评估。
我们记录了49分贝(A)的声压级,同时在1080p Ultra下运行TheWitcher 3,并在Prime95和FurMark的综合压力下。
华硕声称在标准模式下的噪音水平<40 dB(A),我们发现这是真的。在所有的测试条件下,标准模式的最大噪音水平保持在35dB(A)以下。
虽然标准模式一般可推荐用于非密集型使用,但你不会在此获得最高性能--我们观察到在此模式下,Cinebench R15多核得分下降了24%。
| 性能设置 | 空闲分贝(A) | 负载平均分贝(A) | 负载最大分贝(A) | Witcher 3 分贝(A) |
|---|---|---|---|---|
| 标准 | 19.54 | 27.84 | 34.31 | 34.60 |
| 性能 | 20.07 | 34.53 | 49.21 | 49.14 |
| 全速 | 53.26 | 53.24 | 49.32 | 49.20 |
Noise level
| Idle |
| 20.07 / 20.07 / 20.07 dB(A) |
| Load |
| 34.53 / 49.21 dB(A) |
 | ||
30 dB silent 40 dB(A) audible 50 dB(A) loud |
||
min: | ||
| Asus ProArt StudioBook 16 H7600ZW i9-12900H, GeForce RTX 3070 Ti Laptop GPU | MSI Creator Z17 A12UGST-054 i9-12900H, GeForce RTX 3070 Ti Laptop GPU | Asus ROG Strix Scar 15 G533ZW-LN106WS i9-12900H, GeForce RTX 3070 Ti Laptop GPU | Asus ROG Zephyrus Duo 16 GX650RX R9 6900HX, GeForce RTX 3080 Ti Laptop GPU | Apple MacBook Pro 14 2021 M1 Max 24-Core GPU M1 Max, M1 Max 24-Core GPU | |
|---|---|---|---|---|---|
| Noise | -41% | -58% | -23% | -9% | |
| off / environment * (dB) | 19.55 | 26 -33% | 26.86 -37% | 26 -33% | 24.8 -27% |
| Idle Minimum * (dB) | 20.07 | 31.8 -58% | 39.07 -95% | 26 -30% | 24.8 -24% |
| Idle Average * (dB) | 20.07 | 31.8 -58% | 39.07 -95% | 27 -35% | 24.8 -24% |
| Idle Maximum * (dB) | 20.07 | 31.8 -58% | 39.07 -95% | 29 -44% | 24.8 -24% |
| Load Average * (dB) | 34.53 | 53.9 -56% | 53.34 -54% | 41 -19% | 30.4 12% |
| Witcher 3 ultra * (dB) | 49.1 | 53.9 -10% | 56.6 -15% | 48 2% | 35.8 27% |
| Load Maximum * (dB) | 49.21 | 54.9 -12% | 56.6 -15% | 50 -2% | 49.5 -1% |
* ... smaller is better
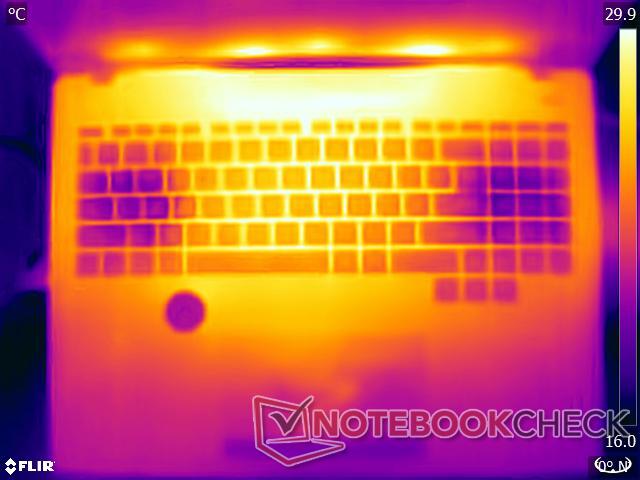
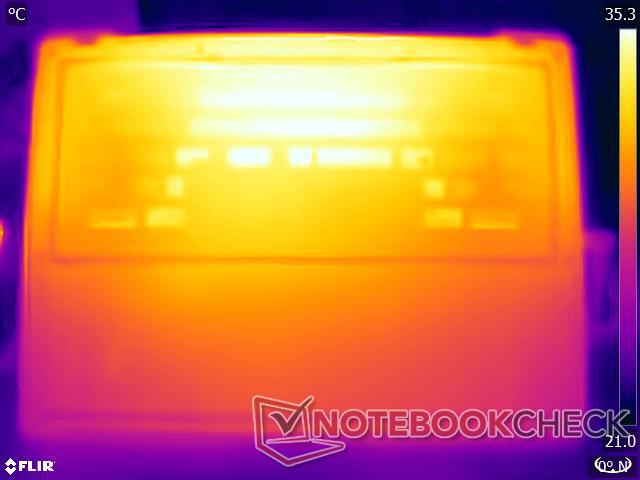
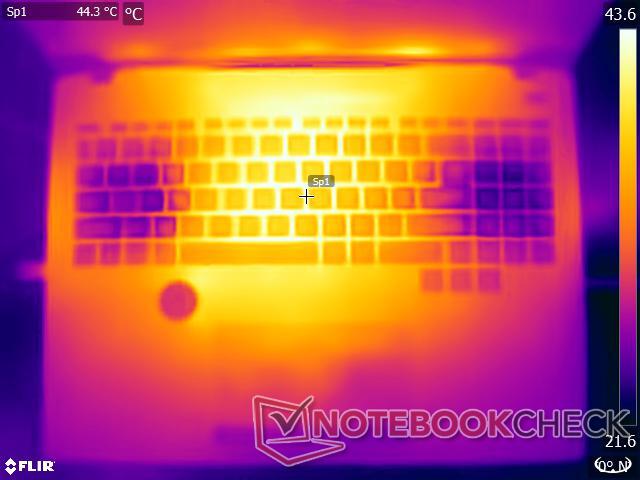
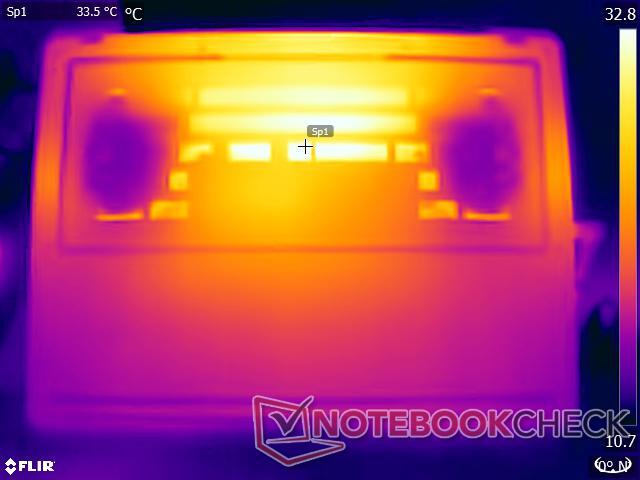
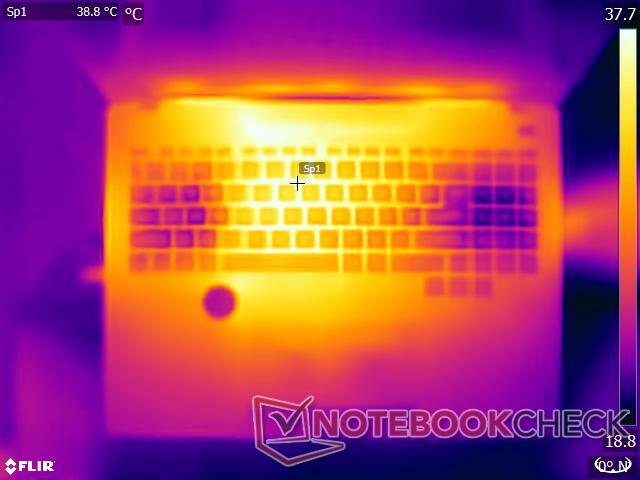
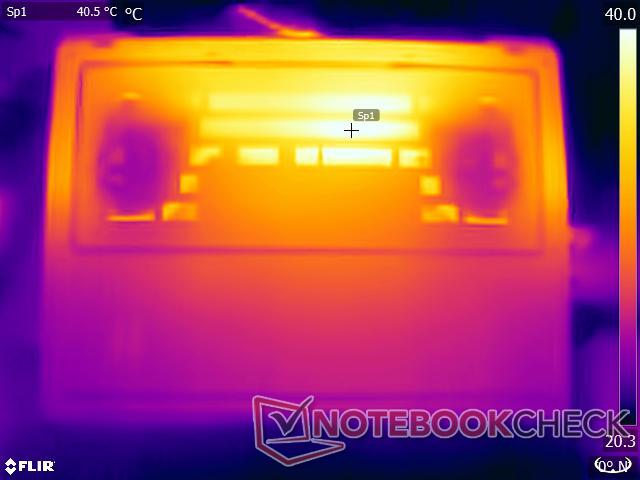
温度
由于风扇以最大速度持续运行,全速模式确保了负载下可容忍的表面温度。负载下较高的表面温度通常集中在机箱的顶部和左中部区域附近。
在Prime95和FurMark的综合负载下,顶部和底部的平均温度似乎在41℃左右。 Witcher 3在1080p Ultra下看到的平均表面温度相对较低,约为34℃。
触摸板和掌托区域在最大负荷下会变热,但在 Witcher 3的压力测试中则保持相对凉爽。
(±) The maximum temperature on the upper side is 41.6 °C / 107 F, compared to the average of 36.8 °C / 98 F, ranging from 21 to 71 °C for the class Multimedia.
(±) The bottom heats up to a maximum of 41.4 °C / 107 F, compared to the average of 39.1 °C / 102 F
(+) In idle usage, the average temperature for the upper side is 29.5 °C / 85 F, compared to the device average of 31.3 °C / 88 F.
(±) Playing The Witcher 3, the average temperature for the upper side is 34.2 °C / 94 F, compared to the device average of 31.3 °C / 88 F.
(+) The palmrests and touchpad are reaching skin temperature as a maximum (35.6 °C / 96.1 F) and are therefore not hot.
(-) The average temperature of the palmrest area of similar devices was 28.7 °C / 83.7 F (-6.9 °C / -12.4 F).
虽然我们的压力测试代表了极端情况,但为了个人安全,我们建议只在标准设置下运行非密集型工作负载时在腿上使用ProArt StudioBook 16。
| Asus ProArt StudioBook 16 H7600ZW Intel Core i9-12900H, NVIDIA GeForce RTX 3070 Ti Laptop GPU | MSI Creator Z17 A12UGST-054 Intel Core i9-12900H, NVIDIA GeForce RTX 3070 Ti Laptop GPU | Asus ROG Strix Scar 15 G533ZW-LN106WS Intel Core i9-12900H, NVIDIA GeForce RTX 3070 Ti Laptop GPU | Asus ROG Zephyrus Duo 16 GX650RX AMD Ryzen 9 6900HX, NVIDIA GeForce RTX 3080 Ti Laptop GPU | Apple MacBook Pro 14 2021 M1 Max 24-Core GPU Apple M1 Max, Apple M1 Max 24-Core GPU | |
|---|---|---|---|---|---|
| Heat | -28% | -19% | -12% | 5% | |
| Maximum Upper Side * (°C) | 41.6 | 63.9 -54% | 42.6 -2% | 45 -8% | 49.2 -18% |
| Maximum Bottom * (°C) | 41.4 | 68 -64% | 50.2 -21% | 50 -21% | 44.1 -7% |
| Idle Upper Side * (°C) | 31.8 | 28.3 11% | 36.2 -14% | 33 -4% | 23.5 26% |
| Idle Bottom * (°C) | 29.2 | 30.2 -3% | 40.2 -38% | 33 -13% | 23.6 19% |
* ... smaller is better
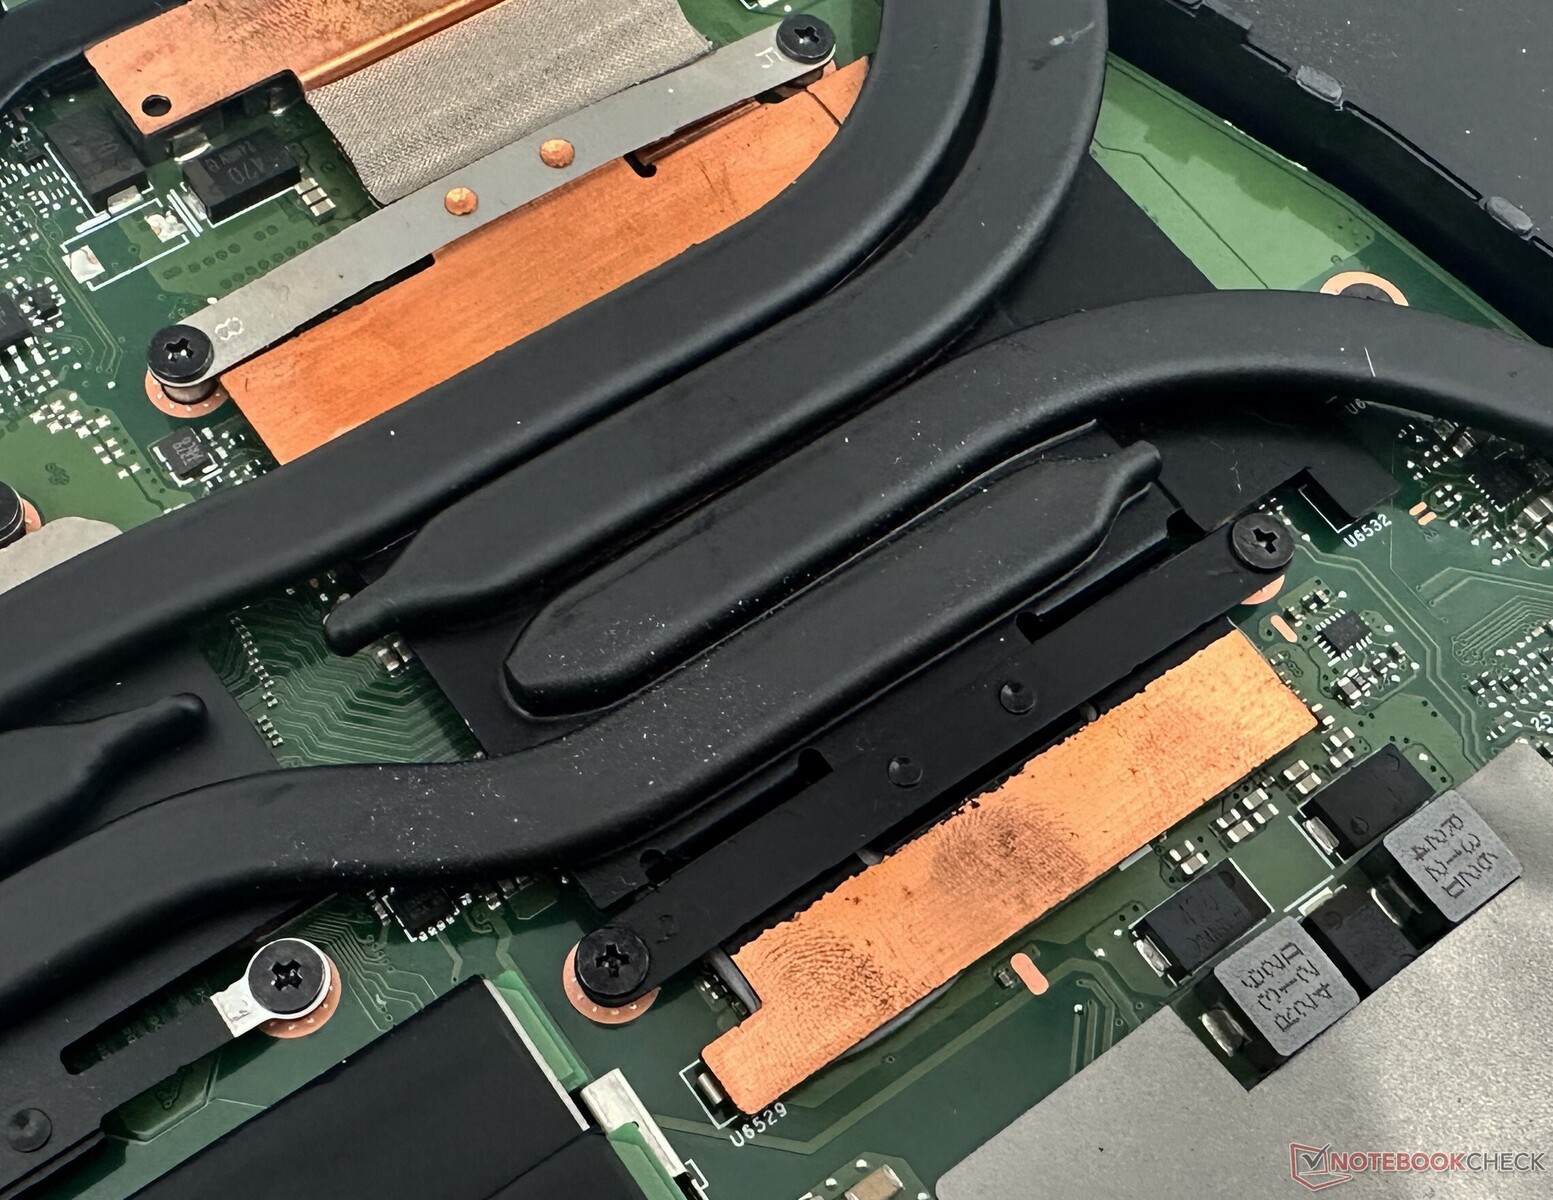
压力测试
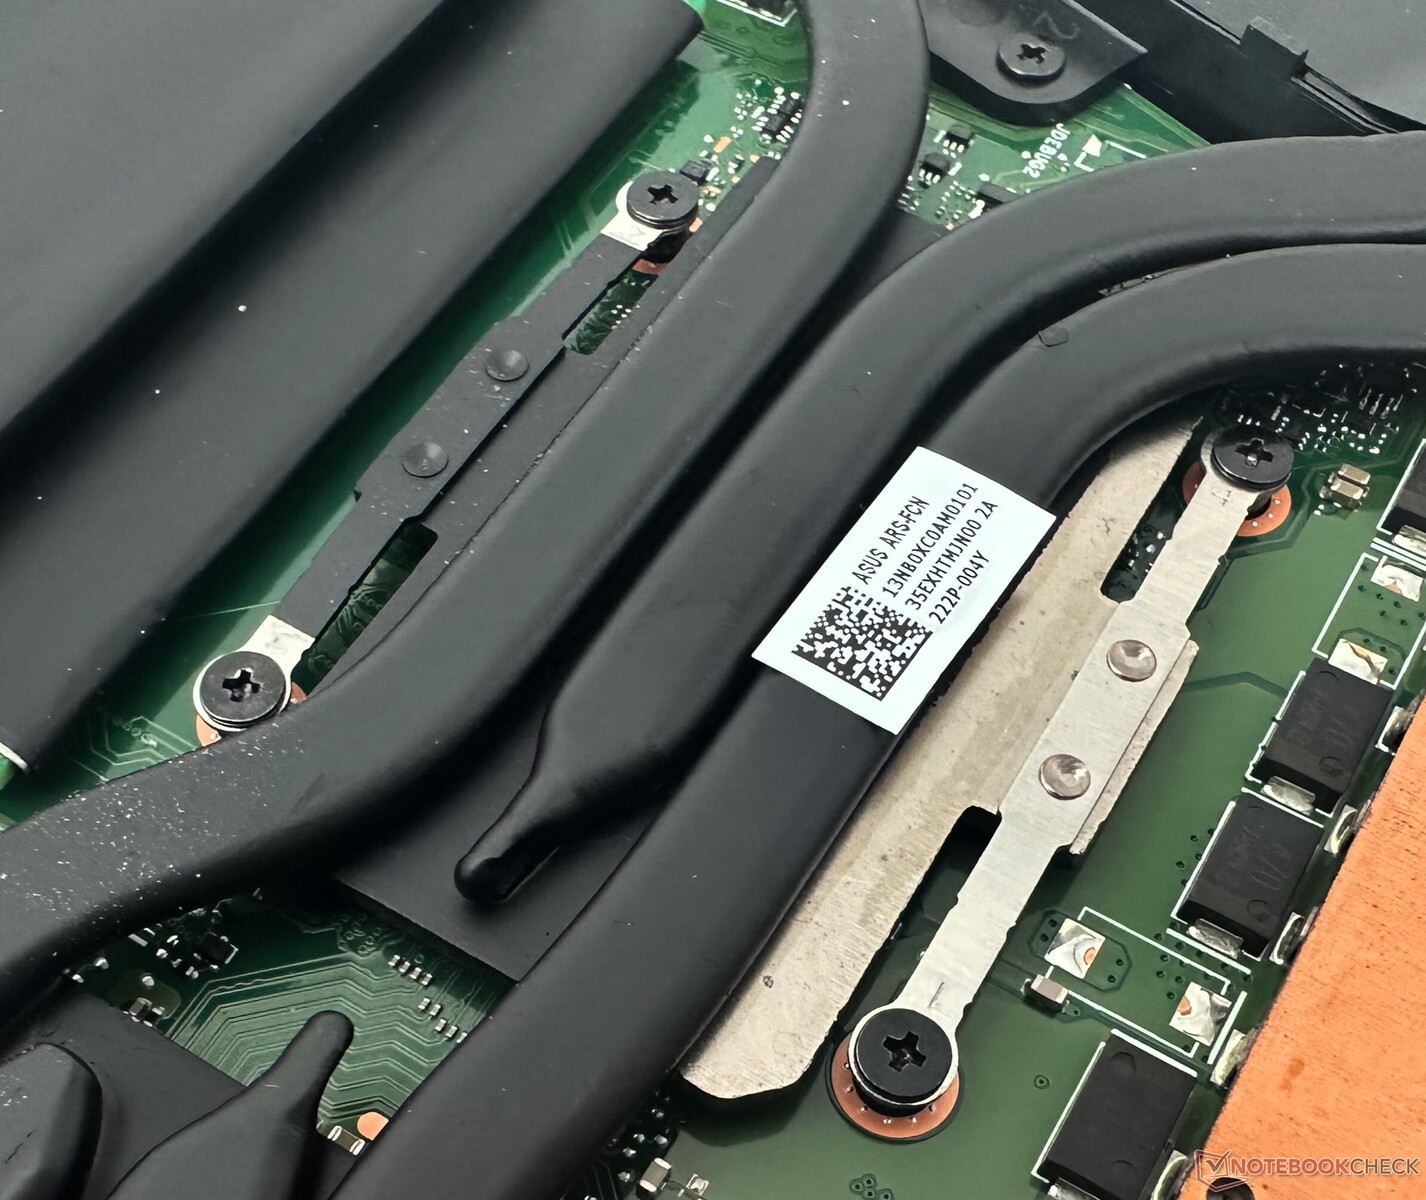
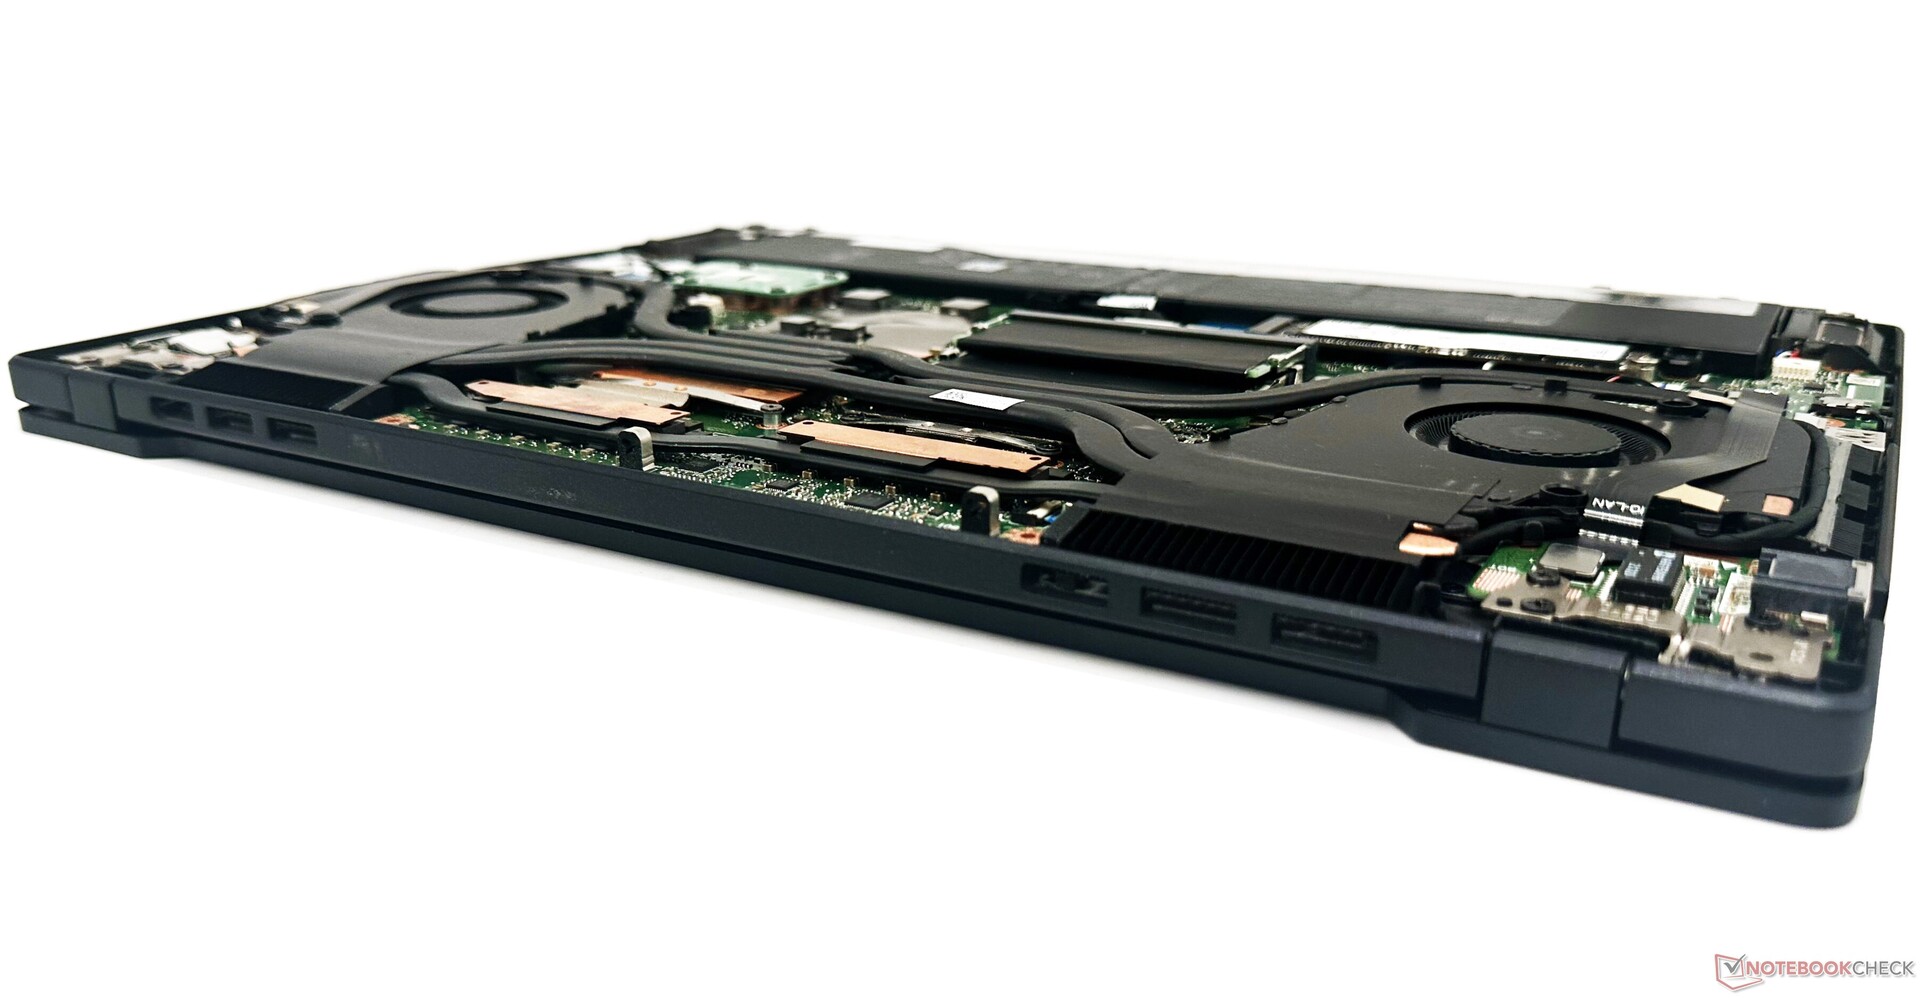
华硕使用双风扇、六热管冷却系统和一个液态金属接口的CPU,以保持ProArt StudioBook 16的运行温度。
运行Prime95原地大型FFT时,Core i9-12900H达到4.2GHz,核心温度达到91℃,封装功率达到115W。
在FurMark中,CPU的平均时钟下降到2.09 GHz,这为RTX 3070 Ti Laptop GPU提供了空间,使其峰值达到1,635 MHz。CPU和GPU都能够接近其115W的功率目标,尽管是暂时的。酷睿i9-12900H的平均封装功率被降低到52W,使RTX 3070 Ti的功耗达到91W。
Witcher 3,在1080p Ultra下呈现出一个更现实的压力条件。在这里,CPU的平均时钟在2.5GHz左右徘徊,但GPU能够持续执行提升时钟,同时在整个运行过程中以113W的TGP达到最大值。
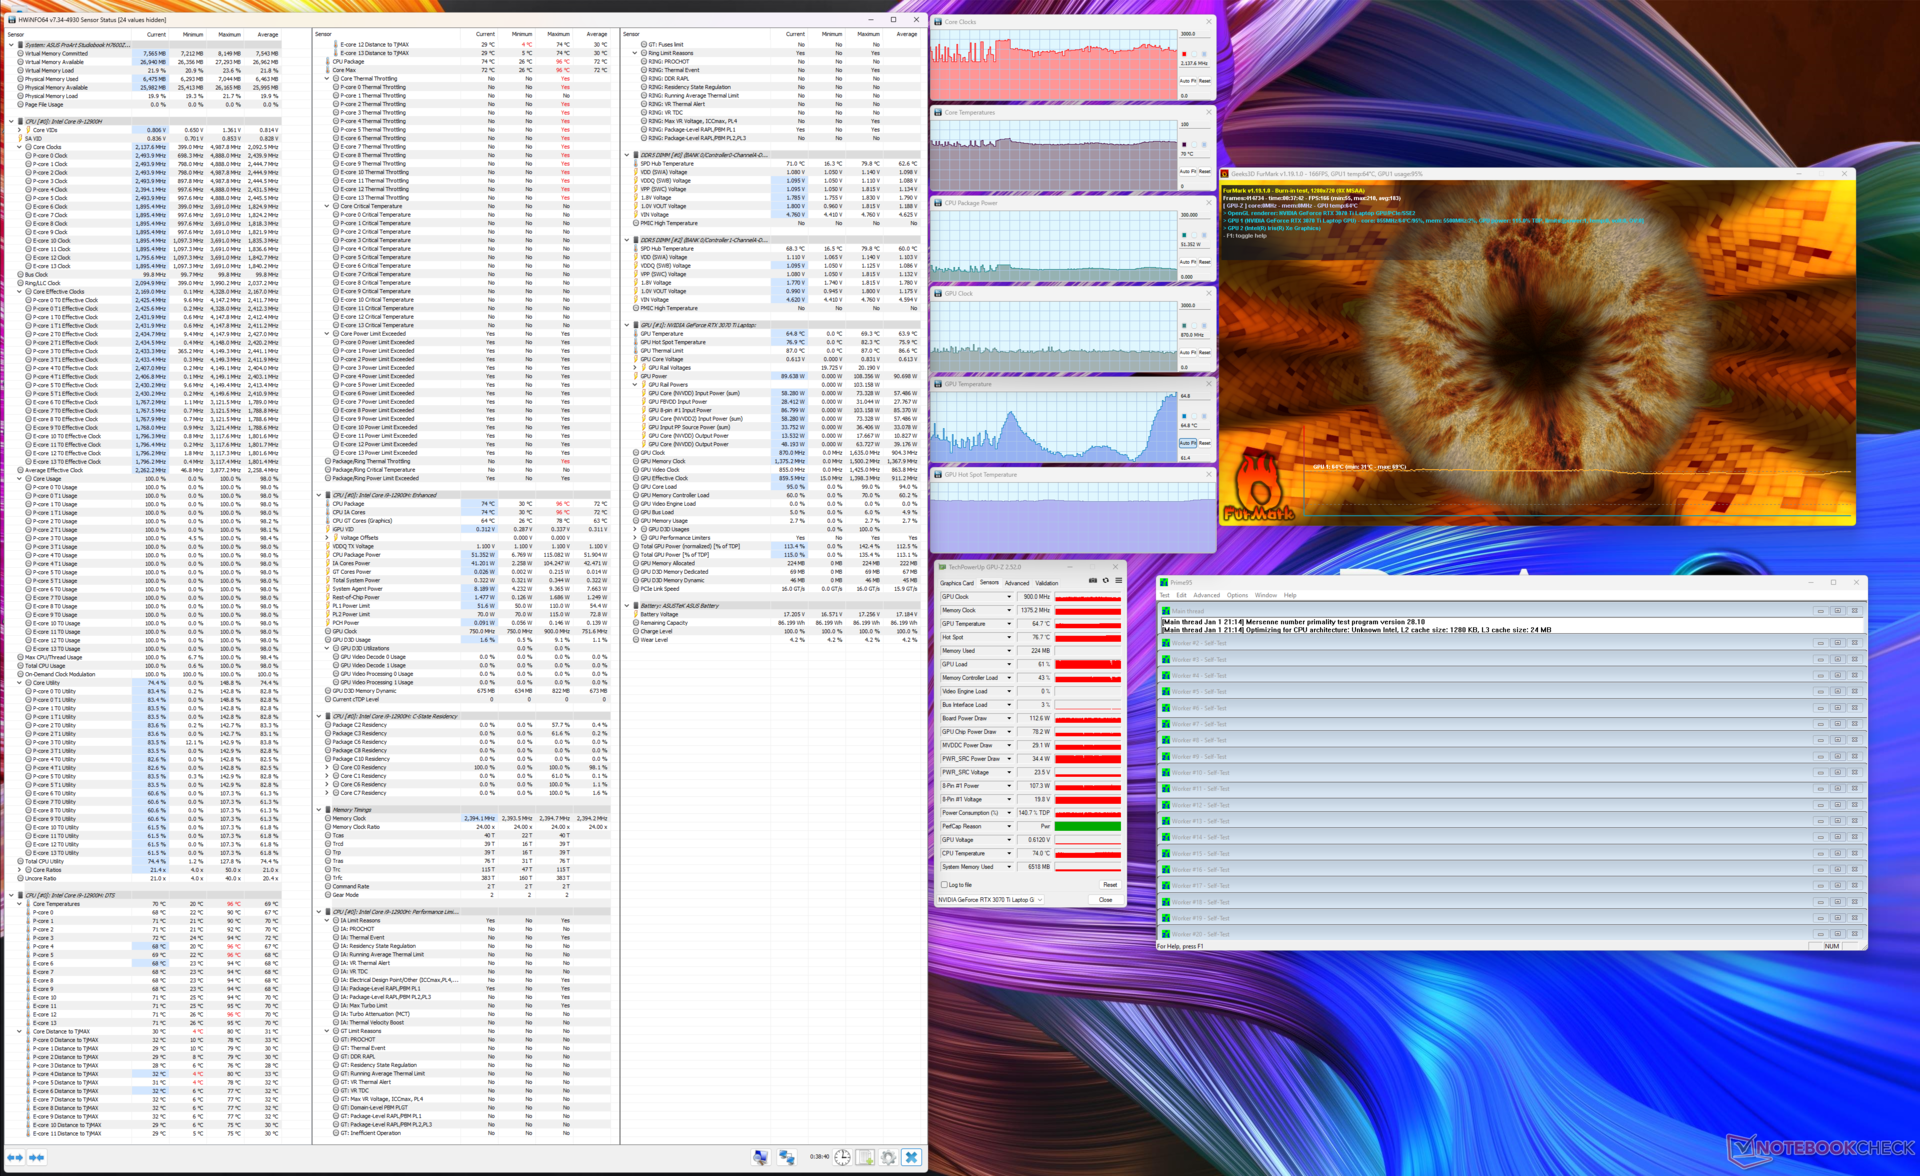
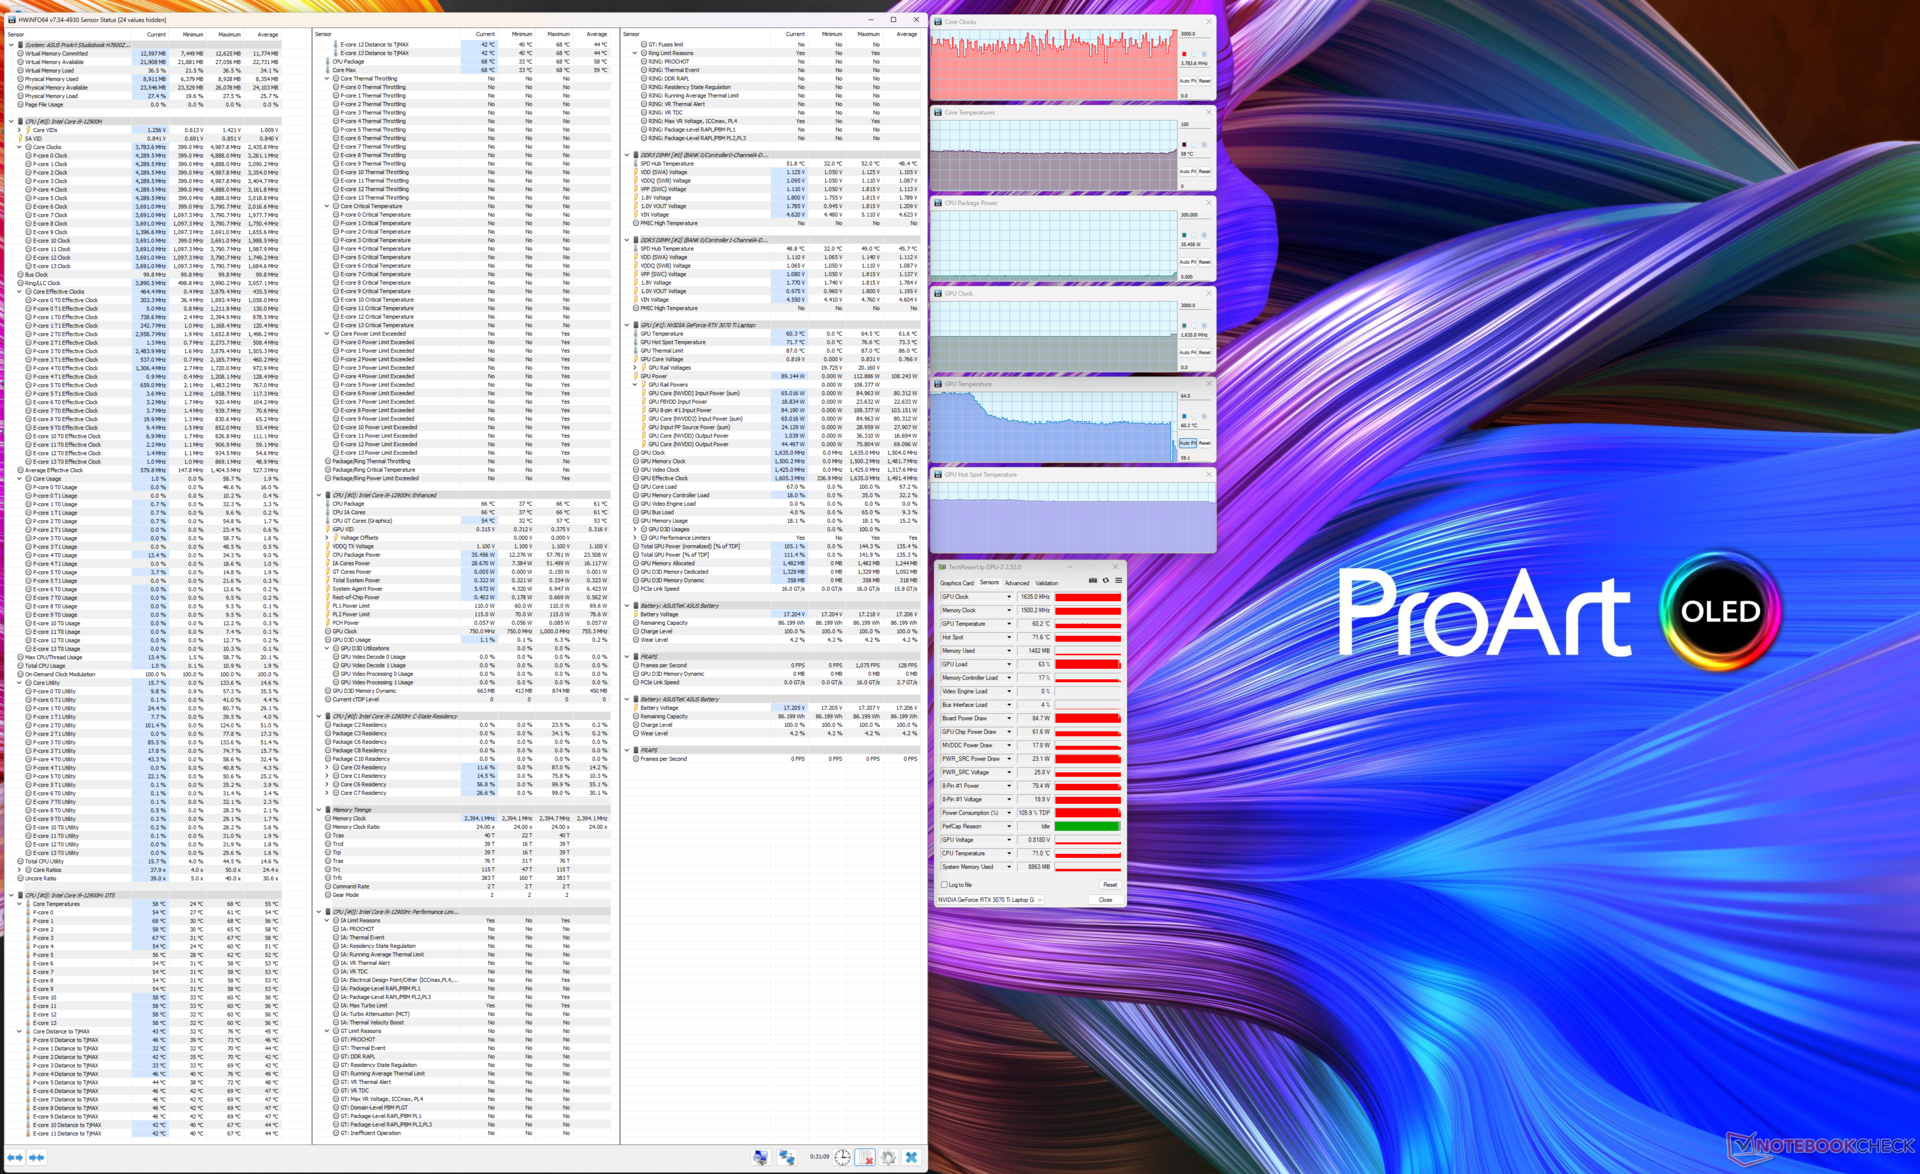
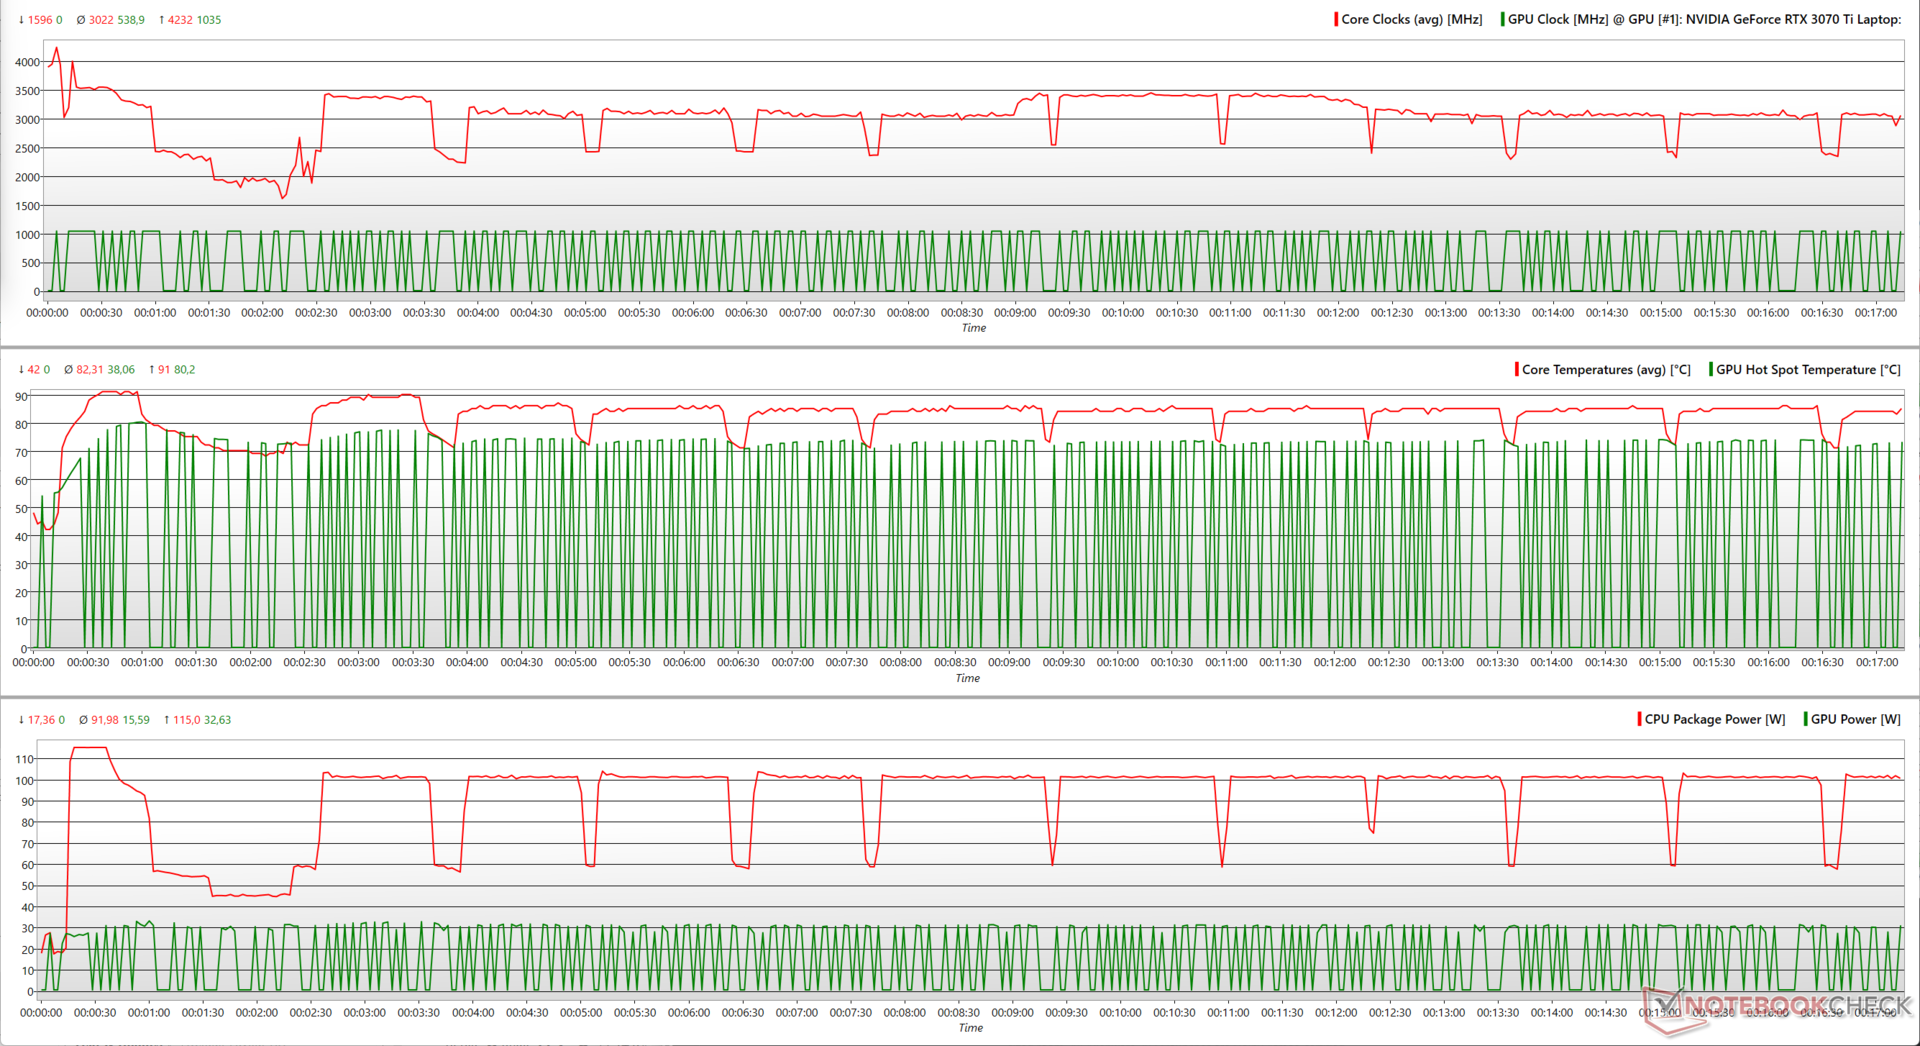
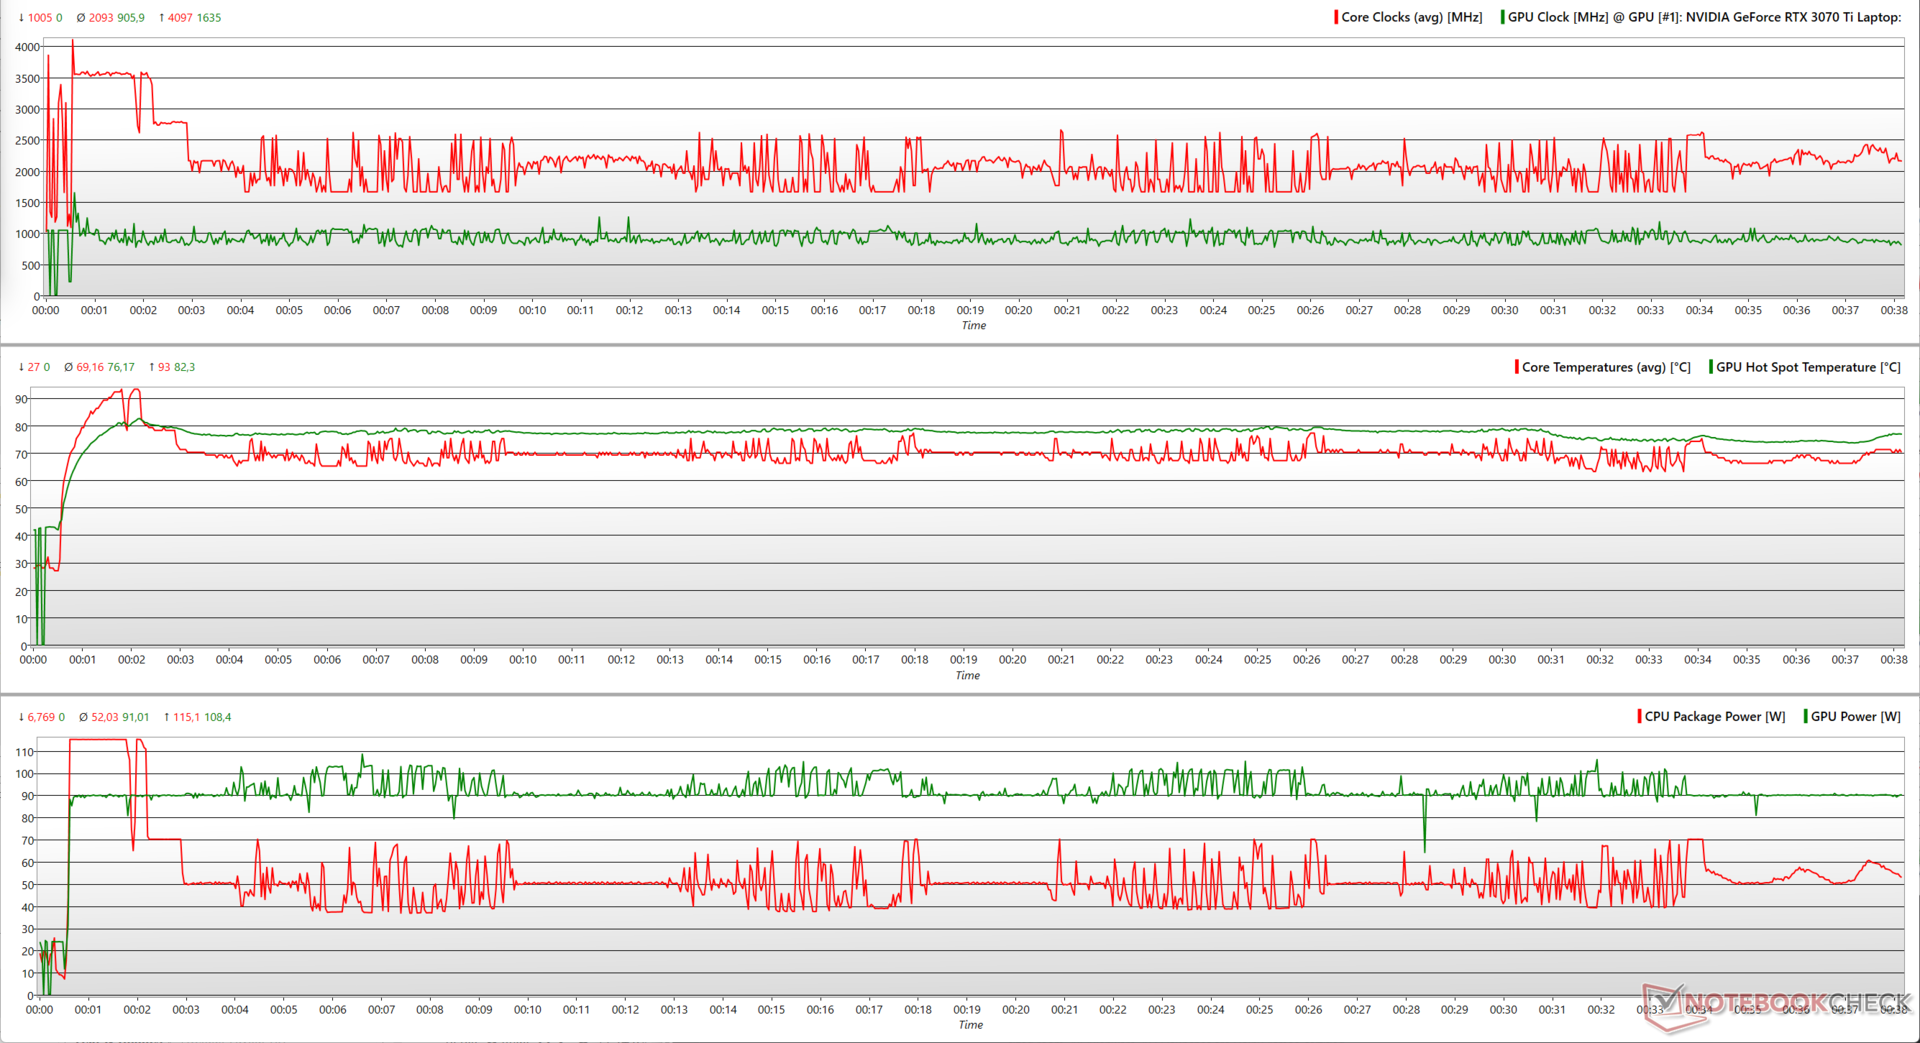
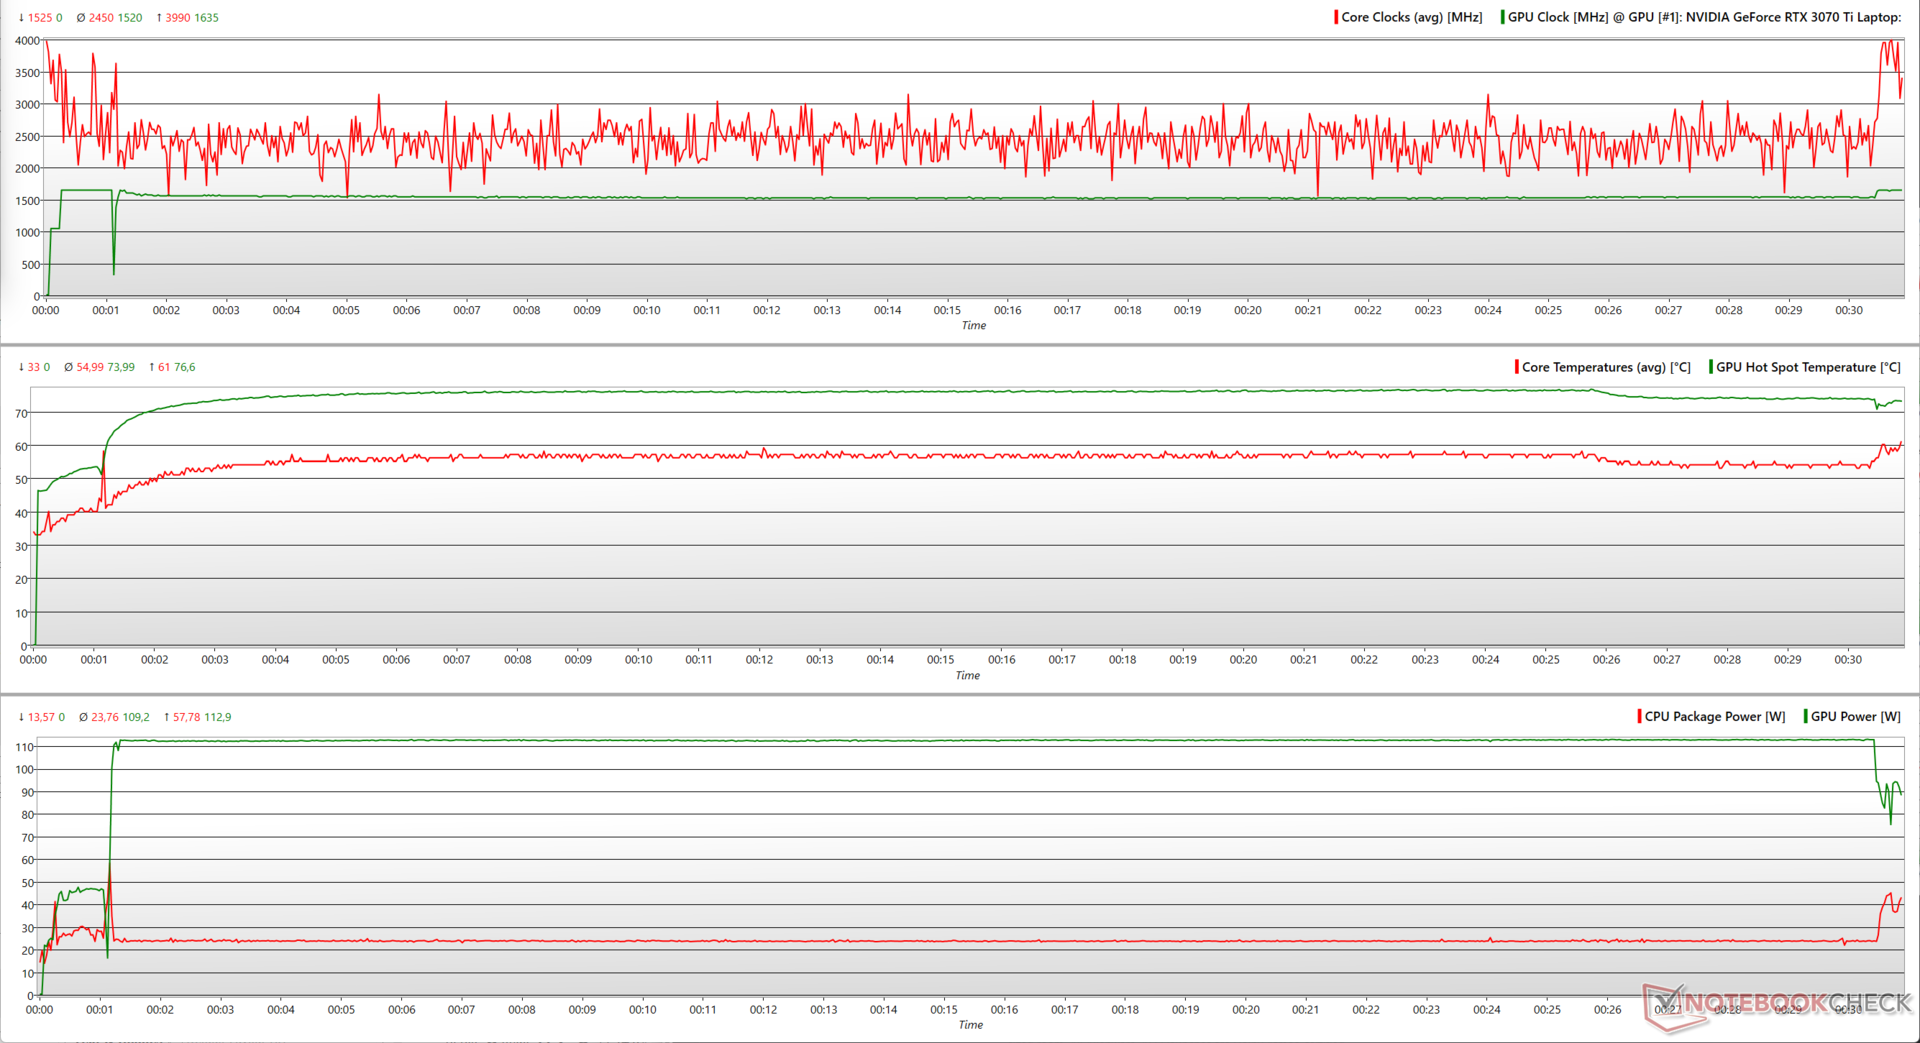
| 压力测试 | CPU时钟(GHz) | GPU时钟(MHz) | CPU平均温度(℃) | GPU平均温度(℃) |
| 系统空闲 | 2.79 | - | 54 | 28.7 |
| Prime95 | 3.03 | - | 82 | 30.9 |
| Prime95 + FurMark | 2.13 | 900 | 69 | 63.9 |
| TheWitcher 3 | 3.78 | 1,635 | 55 | 61.6 |
发言人
华硕为ProArt StudioBook 16配备了由智能放大器驱动的哈曼卡顿认证的板载立体声扬声器。音频子系统还支持Dolby Atmos和具有Hi-Res Audio认证的ESS Sabre DAC,用于驱动高阻抗耳机。
80.06 dB(A)的峰值响度对于一个普通大小的房间来说是足够的。我们观察到一个降低但仍然是线性的低音响应,以及良好的中音和高音。从主观上讲,板载的扬声器对于休闲聆听来说是不错的。
对于那些想要提高音频保真度的人来说,可以使用3.5毫米音频插孔和蓝牙5.0。
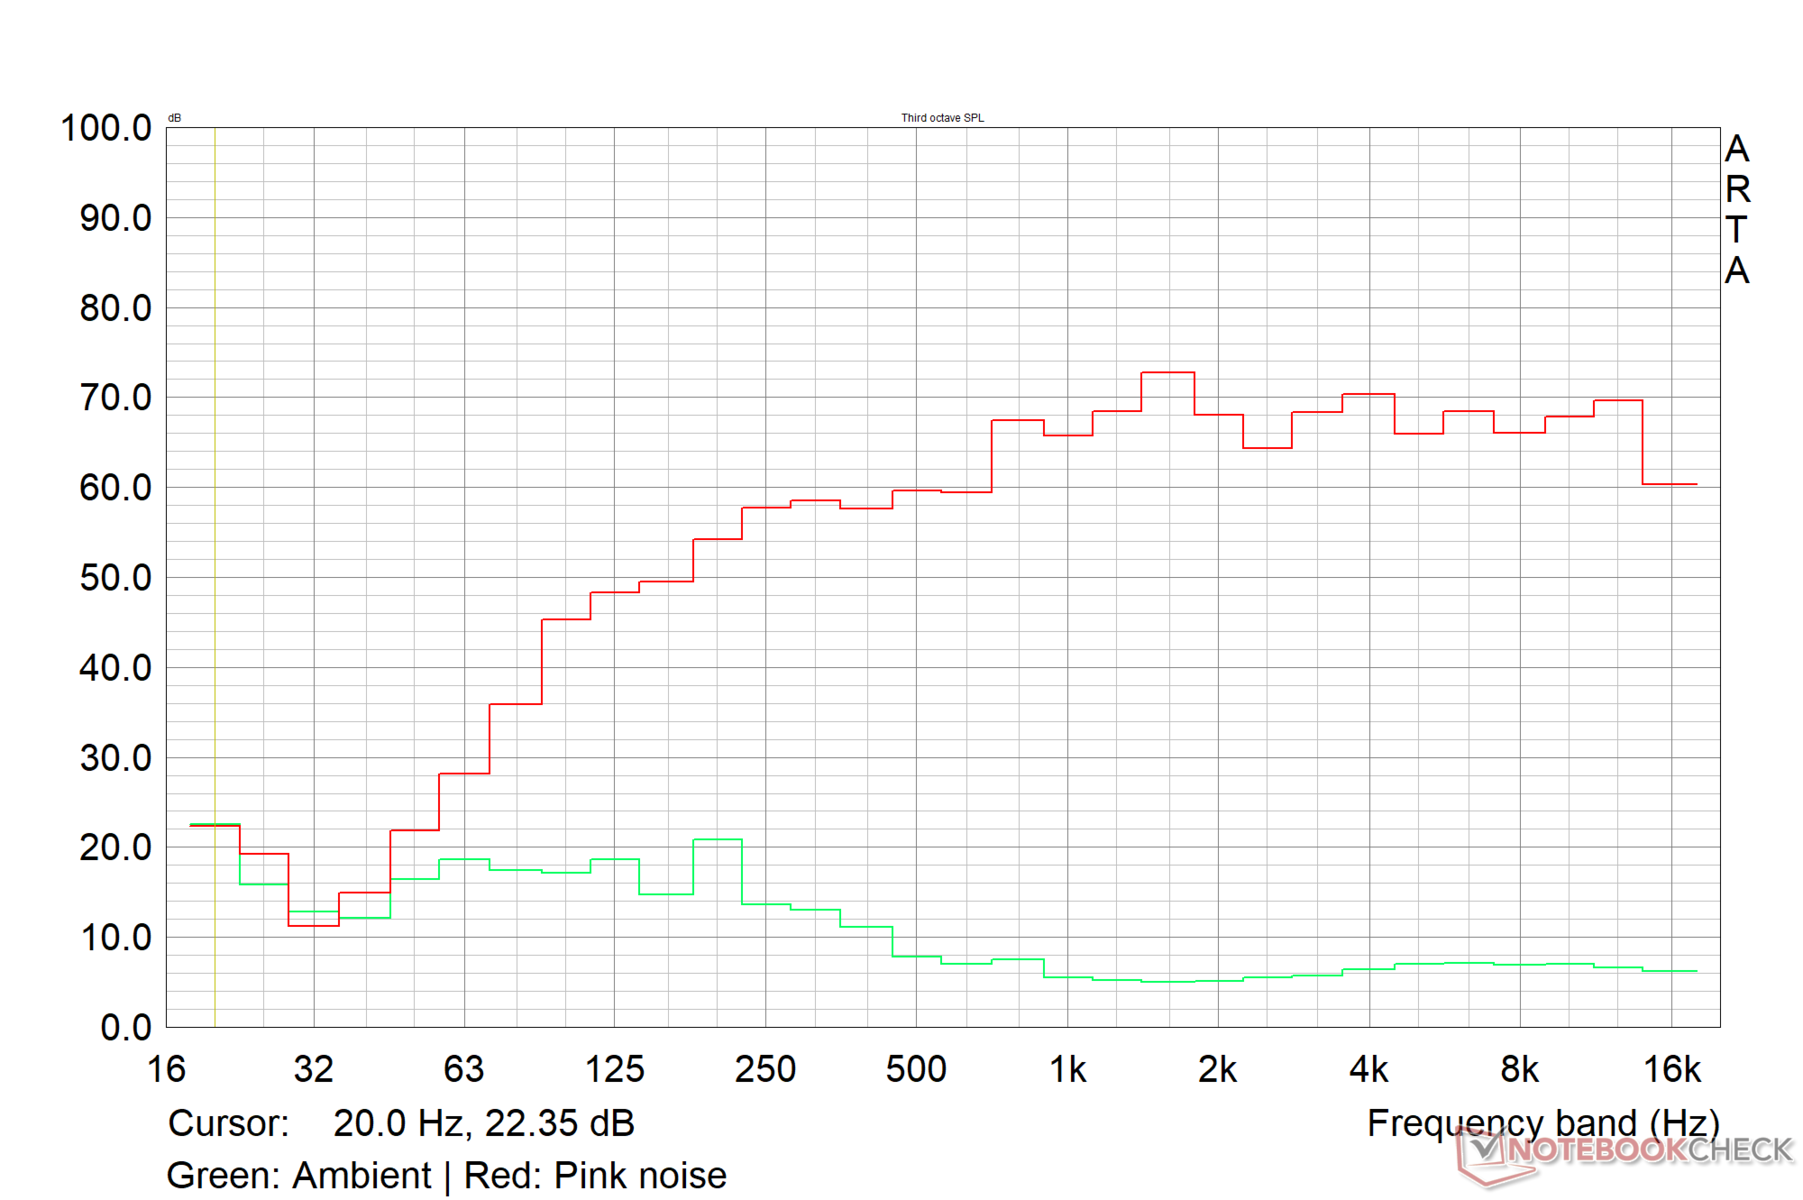
Asus ProArt StudioBook 16 H7600ZW audio analysis
(±) | speaker loudness is average but good (80.1 dB)
Bass 100 - 315 Hz
(±) | reduced bass - on average 13.5% lower than median
(+) | bass is linear (6.4% delta to prev. frequency)
Mids 400 - 2000 Hz
(+) | balanced mids - only 4.3% away from median
(+) | mids are linear (5.2% delta to prev. frequency)
Highs 2 - 16 kHz
(+) | balanced highs - only 2% away from median
(+) | highs are linear (5.1% delta to prev. frequency)
Overall 100 - 16.000 Hz
(+) | overall sound is linear (11.6% difference to median)
Compared to same class
» 19% of all tested devices in this class were better, 4% similar, 78% worse
» The best had a delta of 5%, average was 17%, worst was 45%
Compared to all devices tested
» 8% of all tested devices were better, 2% similar, 90% worse
» The best had a delta of 4%, average was 23%, worst was 134%
Apple MacBook Pro 16 2021 M1 Pro audio analysis
(+) | speakers can play relatively loud (84.7 dB)
Bass 100 - 315 Hz
(+) | good bass - only 3.8% away from median
(+) | bass is linear (5.2% delta to prev. frequency)
Mids 400 - 2000 Hz
(+) | balanced mids - only 1.3% away from median
(+) | mids are linear (2.1% delta to prev. frequency)
Highs 2 - 16 kHz
(+) | balanced highs - only 1.9% away from median
(+) | highs are linear (2.7% delta to prev. frequency)
Overall 100 - 16.000 Hz
(+) | overall sound is linear (4.6% difference to median)
Compared to same class
» 0% of all tested devices in this class were better, 0% similar, 100% worse
» The best had a delta of 5%, average was 17%, worst was 45%
Compared to all devices tested
» 0% of all tested devices were better, 0% similar, 100% worse
» The best had a delta of 4%, average was 23%, worst was 134%
能源管理。负载下最大功率为240W的电源
消耗功率
我们记录的最大功耗为241W,因此提供的240W适配器应该足以让ProArt StudioBook 16完成最苛刻的任务。墙上的耗电量让人想起我们之前在压力测试中看到的模式。
尽管如此,ProArt StudioBook 16并没有像微星Creator Z17那样遭受高闲置消耗。ROG Strix Scar 15在怠速时更经济,但在负载下的消耗比StudioBook 16高。
不足为奇的是 Apple MacBook Pro 14带M1 Max的MacBook Pro 14是这次比较中最节俭的能源消耗者。
| Off / Standby | |
| Idle | |
| Load |
|
Key:
min: | |
| Asus ProArt StudioBook 16 H7600ZW i9-12900H, GeForce RTX 3070 Ti Laptop GPU, OLED, 3840x2400, 16" | MSI Creator Z17 A12UGST-054 i9-12900H, GeForce RTX 3070 Ti Laptop GPU, IPS, 2560x1600, 17" | Asus ROG Strix Scar 15 G533ZW-LN106WS i9-12900H, GeForce RTX 3070 Ti Laptop GPU, IPS-level, 2560x1440, 15.6" | Lenovo ThinkBook 16p G3 ARH R9 6900HX, GeForce RTX 3060 Laptop GPU, IPS, 2560x1600, 16" | Apple MacBook Pro 14 2021 M1 Max 24-Core GPU M1 Max, M1 Max 24-Core GPU, Mini-LED, 3024x1964, 14.2" | Average NVIDIA GeForce RTX 3070 Ti Laptop GPU | Average of class Multimedia | |
|---|---|---|---|---|---|---|---|
| Power Consumption | -70% | 9% | 16% | 52% | -10% | 48% | |
| Idle Minimum * (Watt) | 12.6 | 34.6 -175% | 7.56 40% | 10.3 18% | 3.2 75% | 14.2 ? -13% | 5.66 ? 55% |
| Idle Average * (Watt) | 17.41 | 43 -147% | 13.5 22% | 16 8% | 12.6 28% | 19.9 ? -14% | 10.2 ? 41% |
| Idle Maximum * (Watt) | 23.12 | 44.9 -94% | 16.87 27% | 24 -4% | 13 44% | 26.2 ? -13% | 12.5 ? 46% |
| Load Average * (Watt) | 117.5 | 145 -23% | 128.9 -10% | 85.4 27% | 57.9 51% | 125.8 ? -7% | 65.2 ? 45% |
| Witcher 3 ultra * (Watt) | 172.6 | 152.4 12% | 196.2 -14% | 132.2 23% | 76.3 56% | ||
| Load Maximum * (Watt) | 241.36 | 220 9% | 274.86 -14% | 181.9 25% | 97.7 60% | 248 ? -3% | 113.5 ? 53% |
* ... smaller is better
Power Consumption: The Witcher 3 / Stress test
Power Consumption: External monitor
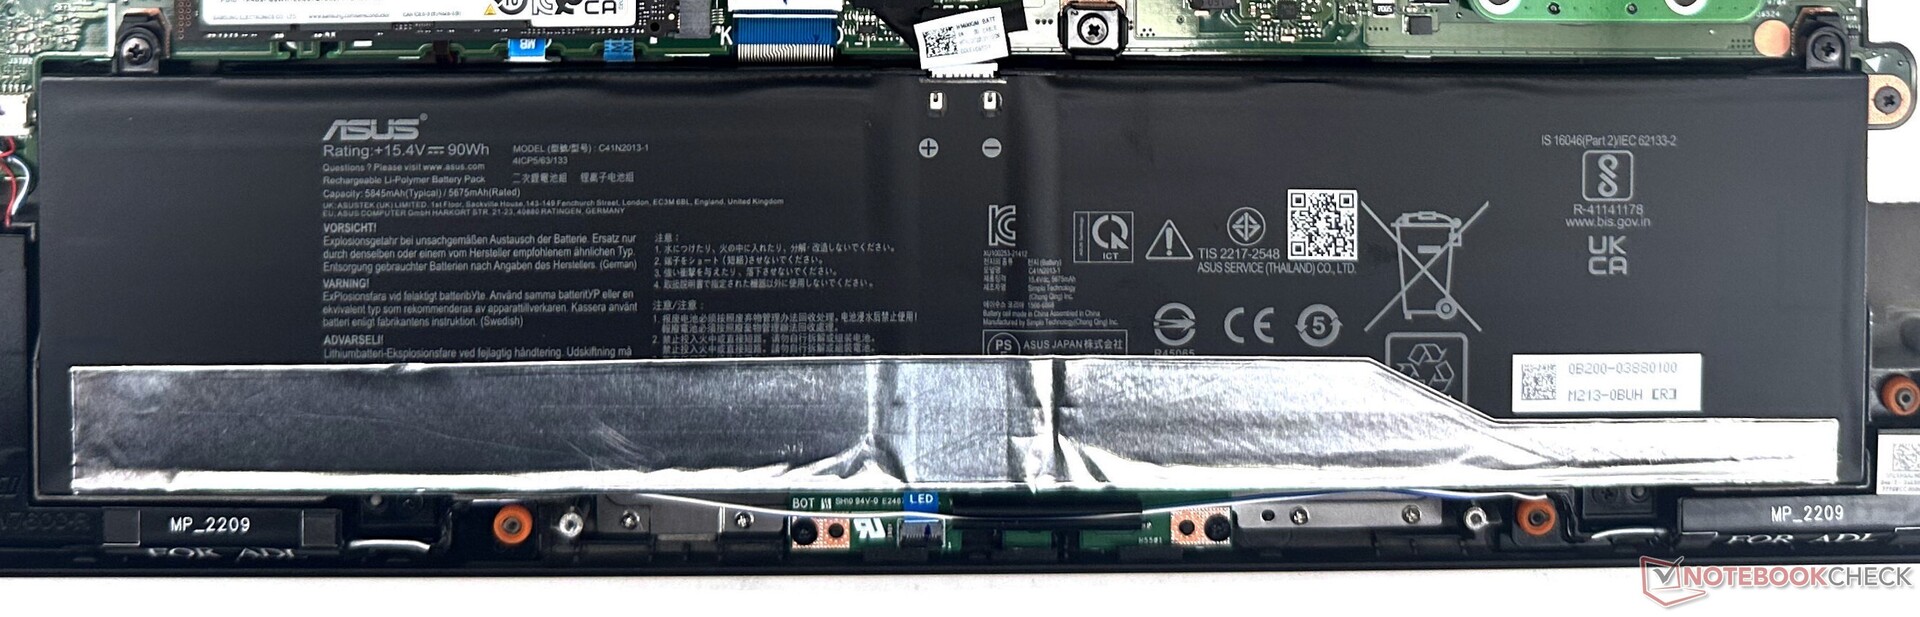
电池寿命
虽然ProArt StudioBook 16在电池运行时间方面无法与MacBook Pro相提并论,但90瓦时的锂离子电池组确保了在你不得不伸手去拿充电器之前,在路上有相当长的寿命。所有的电池测试都是在标准模式下进行的。
华硕宣传在视频播放时有10小时的电池运行时间,我们在150尼特的条件下进行H.264 1080p视频循环测试,离9:45大关只差一点。配备M1 Max的MacBook Pro 14在150尼特的屏幕亮度下,在我们的标准化Wi-Fi测试中提供了54%的运行时间。
如果需要,可以拧开并更换电池。
| Asus ProArt StudioBook 16 H7600ZW i9-12900H, GeForce RTX 3070 Ti Laptop GPU, 90 Wh | MSI Creator Z17 A12UGST-054 i9-12900H, GeForce RTX 3070 Ti Laptop GPU, 90 Wh | Asus ROG Strix Scar 15 G533ZW-LN106WS i9-12900H, GeForce RTX 3070 Ti Laptop GPU, 90 Wh | Lenovo ThinkBook 16p G3 ARH R9 6900HX, GeForce RTX 3060 Laptop GPU, 71 Wh | Apple MacBook Pro 14 2021 M1 Max 24-Core GPU M1 Max, M1 Max 24-Core GPU, 69.9 Wh | Average of class Multimedia | |
|---|---|---|---|---|---|---|
| Battery runtime | 25% | -2% | -13% | 40% | 75% | |
| H.264 (h) | 9.7 | 5.5 -43% | 8.5 -12% | 12.1 25% | 17.1 ? 76% | |
| WiFi v1.3 (h) | 7.5 | 5.5 -27% | 8.4 12% | 6.5 -13% | 11.6 55% | 12.2 ? 63% |
| Witcher 3 ultra (h) | 1.3 | 1.2 -8% | ||||
| Load (h) | 0.9 | 2.2 144% | 0.9 0% | 1.664 ? 85% |
Pros
Cons
评语:近乎完美的移动内容创作
华硕ProArt StudioBook 16试图从越来越多的以创作者为中心的笔记本电脑中脱颖而出,而且它成功地做到了这一点,令人信服。
ProArt StudioBook的设计是简约的,但散发着优雅的气息。机箱建造得很好,盖子可以用一根手指打开,显示屏的边框很薄,增加了沉浸感。
可定制的华硕表盘在支持的应用程序中非常方便,对于那些希望获得模拟式输入便利的人来说。
华硕在StudioBook 16中使用了高质量的三星OLED面板。它没有吹嘘高刷新率,但色彩准确性和接近100%的sRGB、Adobe RGB和Display P3色彩空间覆盖率将受到创作者的欢迎。该显示器在低亮度水平上受到PWM的影响,但在50%以上的亮度上使用直流调光,应该还是很容易看清的。
华硕ProArt StudioBook 16几乎提供了内容创作者对这个价格的笔记本电脑所期望的一切。凭借顶级性能的酷睿i9-12900H和RTX 3070 Ti笔记本GPU,加上明亮、生动的OLED面板和华硕表盘的便利性,ProArt StudioBook 16有可能使你远离MacBook Pro。
使用Core i9-12900H 和RTX 3070 Ti Laptop GPU 组合的性能并没有带来任何惊喜。事实上,它甚至超越了它的竞争对手,如MSI Creator Z17 和Ryzen 9 6900HX- poweredAsus ROG Zephyrus Duo 16 和Lenovo ThinkBook 16p G3 ,至少在CPU性能方面。
RTX 3070 Ti笔记本电脑的GPU对于QHD的游戏来说是很好的,对于为内容创作应用提供足够的能量来说应该是绰绰有余,特别是使用Nvidia Studio驱动程序。
华硕的目标显然是MacBook Pro 人群,在原始性能方面,ProArt StudioBook 16远远领先于来自库比蒂诺的竞争对手。也就是说,基于Apple 芯片的MacBooks在远离墙壁的性能和电池寿命方面确实具有架构优势。
此外,正如在Affinity Photo 2基准测试中所看到的,专门为Apple 硅片优化的应用程序可以显示出明显优于其x86版本的性能。
然而,华硕ProArt StudioBook 16并非没有一些缺点。Wi-Fi性能可以使用一些稳定性,在6GHz 6E频段增加吞吐量。考虑到其目标人群,SD卡的性能也可以大大改善。
三键触摸板是你能在Windows笔记本电脑上得到的最好的触摸板之一,但在开箱后的敏感度方面还需要很多微调。90WHr电池提供了高于平均水平的运行时间,但这只是在测试条件下。
综上所述,华硕ProArt StudioBook 16将外形和功能与同样良好的性能结合起来,如果价格没有问题的话,它绝对值得内容创作者考虑。
价格和可用性
测试的华硕ProArt StudioBook 16 H7600配置为酷睿i9-12900H和RTX 3070 Ti笔记本GPU,在印度亚马逊上售价为2,49,990(约3,015美元)。.
在美国,配备酷睿i7-12700H、RTX 3070 Ti笔记本GPU、16GB内存和2TB NVMe存储的ProArt StudioBook 16,在美国亚马逊上可以买到2,549美元。百思买的价格约为2,699.99美元。.
买家还可以选择ProArt StudioBook 16 SKU,其特点是 Nvidia RTX A3000 笔记本电脑GPU在美国亚马逊网站,价格为2,971美元。.
Asus ProArt StudioBook 16 H7600ZW
- 02/25/2023 v7 (old)
Vaidyanathan Subramaniam
Transparency
The selection of devices to be reviewed is made by our editorial team. The test sample was provided to the author as a loan by the manufacturer or retailer for the purpose of this review. The lender had no influence on this review, nor did the manufacturer receive a copy of this review before publication. There was no obligation to publish this review. As an independent media company, Notebookcheck is not subjected to the authority of manufacturers, retailers or publishers.
This is how Notebookcheck is testing
Every year, Notebookcheck independently reviews hundreds of laptops and smartphones using standardized procedures to ensure that all results are comparable. We have continuously developed our test methods for around 20 years and set industry standards in the process. In our test labs, high-quality measuring equipment is utilized by experienced technicians and editors. These tests involve a multi-stage validation process. Our complex rating system is based on hundreds of well-founded measurements and benchmarks, which maintains objectivity. Further information on our test methods can be found here.
Price comparison

