戴尔 Precision 5520 (E3-1505M, 超高清) 工作站简短评测


| SD Card Reader | |
| average JPG Copy Test (av. of 3 runs) | |
| Dell Precision 5520 UHD | |
| Dell Precision 3510 | |
| Dell Precision 7510 (4K IGZO) | |
| Lenovo ThinkPad P50 | |
| Fujitsu Celsius H760 | |
| maximum AS SSD Seq Read Test (1GB) | |
| Dell Precision 5520 UHD | |
| Dell Precision 3510 | |
| Lenovo ThinkPad P50 | |
| Fujitsu Celsius H760 | |
| Networking | |
| iperf3 transmit AX12 | |
| Dell Precision 5520 UHD | |
| iperf3 receive AX12 | |
| Dell Precision 5520 UHD | |
| |||||||||||||||||||||||||
Brightness Distribution: 90 %
Center on Battery: 372.4 cd/m²
Contrast: 776:1 (Black: 0.48 cd/m²)
ΔE ColorChecker Calman: 2.6 | ∀{0.5-29.43 Ø4.71}
ΔE Greyscale Calman: 3.7 | ∀{0.09-98 Ø4.96}
99% sRGB (Argyll 1.6.3 3D)
63% AdobeRGB 1998 (Argyll 1.6.3 3D)
68.9% AdobeRGB 1998 (Argyll 3D)
98.5% sRGB (Argyll 3D)
67.4% Display P3 (Argyll 3D)
Gamma: 2.14
CCT: 7096 K
| Dell Precision 5520 UHD SHP1476, IPS, 15.6", 3840x2160 | Dell Precision 5510 SHP143E, 7PHPT_LQ156D1, IGZO LED, 15.6", 3840x2160 | Fujitsu Celsius H760 LGD046F LP156WF6-SPP1, IPS LED, 15.6", 1920x1080 | Dell Precision 7510 (4K IGZO) Sharp LQ156D1, IGZO IPS, 15.6", 3840x2160 | Lenovo ThinkPad P50 LQ156D1JW05, IPS, 15.6", 3840x2160 | |
|---|---|---|---|---|---|
| Display | 26% | -11% | 24% | 23% | |
| Display P3 Coverage (%) | 67.4 | 88.4 31% | 63.9 -5% | 86.2 28% | 85.8 27% |
| sRGB Coverage (%) | 98.5 | 100 2% | 82.4 -16% | 99.7 1% | 98.6 0% |
| AdobeRGB 1998 Coverage (%) | 68.9 | 99.5 44% | 60.3 -12% | 99 44% | 98.2 43% |
| Response Times | 12% | 37% | 33% | 41% | |
| Response Time Grey 50% / Grey 80% * (ms) | 59.2 ? | 56.4 ? 5% | 38 ? 36% | 40.4 ? 32% | 39.2 ? 34% |
| Response Time Black / White * (ms) | 41.6 ? | 34 ? 18% | 26 ? 37% | 27.6 ? 34% | 22 ? 47% |
| PWM Frequency (Hz) | 198.4 ? | 217 | |||
| Screen | 0% | -10% | -1% | -23% | |
| Brightness middle (cd/m²) | 372.4 | 391 5% | 341 -8% | 279.2 -25% | 250 -33% |
| Brightness (cd/m²) | 368 | 361 -2% | 310 -16% | 271 -26% | 250 -32% |
| Brightness Distribution (%) | 90 | 87 -3% | 82 -9% | 83 -8% | 86 -4% |
| Black Level * (cd/m²) | 0.48 | 0.4 17% | 0.34 29% | 0.266 45% | 0.31 35% |
| Contrast (:1) | 776 | 978 26% | 1003 29% | 1050 35% | 806 4% |
| Colorchecker dE 2000 * | 2.6 | 4.85 -87% | 3.8 -46% | 4.14 -59% | 4.5 -73% |
| Colorchecker dE 2000 max. * | 5.6 | 10.8 -93% | 6.56 -17% | 9.3 -66% | |
| Greyscale dE 2000 * | 3.7 | 4.01 -8% | 2 46% | 3.26 12% | 7.2 -95% |
| Gamma | 2.14 103% | 2.18 101% | 2.17 101% | 2.19 100% | 2.31 95% |
| CCT | 7096 92% | 7340 89% | 6581 99% | 6375 102% | 6399 102% |
| Color Space (Percent of AdobeRGB 1998) (%) | 63 | 96 52% | 54 -14% | 85.68 36% | 85 35% |
| Color Space (Percent of sRGB) (%) | 99 | 100 1% | 82.2 -17% | 99.72 1% | 98.6 0% |
| Total Average (Program / Settings) | 13% /
7% | 5% /
-4% | 19% /
9% | 14% /
-5% |
* ... smaller is better
Display Response Times
| ↔ Response Time Black to White | ||
|---|---|---|
| 41.6 ms ... rise ↗ and fall ↘ combined | ↗ 26.8 ms rise | 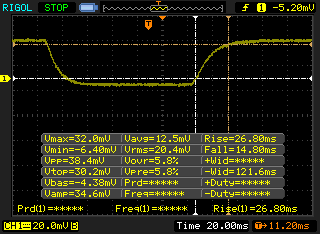 |
| ↘ 14.8 ms fall | ||
| The screen shows slow response rates in our tests and will be unsatisfactory for gamers. In comparison, all tested devices range from 0.1 (minimum) to 240 (maximum) ms. » 98 % of all devices are better. This means that the measured response time is worse than the average of all tested devices (19.8 ms). | ||
| ↔ Response Time 50% Grey to 80% Grey | ||
| 59.2 ms ... rise ↗ and fall ↘ combined | ↗ 27.6 ms rise | 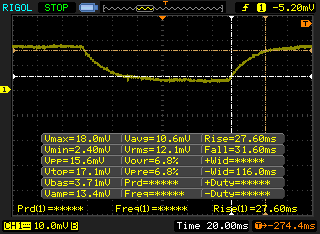 |
| ↘ 31.6 ms fall | ||
| The screen shows slow response rates in our tests and will be unsatisfactory for gamers. In comparison, all tested devices range from 0.165 (minimum) to 636 (maximum) ms. » 95 % of all devices are better. This means that the measured response time is worse than the average of all tested devices (31 ms). | ||
Screen Flickering / PWM (Pulse-Width Modulation)
| Screen flickering / PWM not detected | 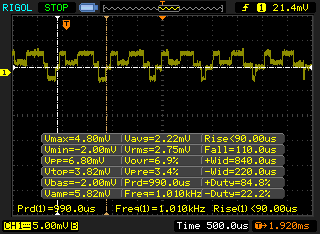 | ||
In comparison: 52 % of all tested devices do not use PWM to dim the display. If PWM was detected, an average of 7754 (minimum: 5 - maximum: 343500) Hz was measured. | |||
| Cinebench R15 | |
| CPU Single 64Bit | |
| Dell Precision 5520 UHD | |
| Dell Precision 7510 (4K IGZO) | |
| Fujitsu Celsius H760 | |
| Lenovo ThinkPad P50 | |
| Dell XPS 15 9560 (i7-7700HQ, UHD) | |
| Dell Precision 3510 | |
| Dell Precision 5510 | |
| CPU Multi 64Bit | |
| Dell Precision 7510 (4K IGZO) | |
| Dell XPS 15 9560 (i7-7700HQ, UHD) | |
| Dell Precision 5510 | |
| Lenovo ThinkPad P50 | |
| Fujitsu Celsius H760 | |
| Dell Precision 5520 UHD | |
| Dell Precision 3510 | |
| Cinebench R11.5 | |
| CPU Single 64Bit | |
| Dell Precision 5520 UHD | |
| Dell Precision 7510 (4K IGZO) | |
| Fujitsu Celsius H760 | |
| Lenovo ThinkPad P50 | |
| Dell XPS 15 9560 (i7-7700HQ, UHD) | |
| Dell Precision 3510 | |
| Dell Precision 5510 | |
| CPU Multi 64Bit | |
| Dell XPS 15 9560 (i7-7700HQ, UHD) | |
| Dell Precision 7510 (4K IGZO) | |
| Lenovo ThinkPad P50 | |
| Dell Precision 5510 | |
| Dell Precision 5520 UHD | |
| Fujitsu Celsius H760 | |
| Dell Precision 3510 | |
| wPrime 2.10 - 1024m | |
| Dell Precision 7510 (4K IGZO) | |
| Dell Precision 5520 UHD | |
| Dell Precision 5510 | |
| Dell XPS 15 9560 (i7-7700HQ, UHD) | |
* ... smaller is better
| PCMark 8 | |
| Home Score Accelerated v2 | |
| Dell Precision 3510 | |
| Fujitsu Celsius H760 | |
| Lenovo ThinkPad P50 | |
| Dell Precision 7510 (4K IGZO) | |
| Dell Precision 5510 | |
| Dell XPS 15 9560 (i7-7700HQ, UHD) | |
| Dell Precision 5520 UHD | |
| Work Score Accelerated v2 | |
| Fujitsu Celsius H760 | |
| Dell Precision 3510 | |
| Dell Precision 5510 | |
| Dell XPS 15 9560 (i7-7700HQ, UHD) | |
| Lenovo ThinkPad P50 | |
| Dell Precision 5520 UHD | |
| Dell Precision 7510 (4K IGZO) | |
| Creative Score Accelerated v2 | |
| Dell Precision 7510 (4K IGZO) | |
| Dell Precision 3510 | |
| Dell XPS 15 9560 (i7-7700HQ, UHD) | |
| Dell Precision 5520 UHD | |
| Dell Precision 5510 | |
| Fujitsu Celsius H760 | |
| Lenovo ThinkPad P50 | |
| PCMark 8 Home Score Accelerated v2 | 3504 points | |
| PCMark 8 Creative Score Accelerated v2 | 5086 points | |
| PCMark 8 Work Score Accelerated v2 | 4291 points | |
Help | ||
| Dell Precision 5520 UHD Samsung SM961 MZVKW512HMJP m.2 PCI-e | Dell Precision 7510 (4K IGZO) Samsung SSD SM951a 512GB M.2 PCIe 3.0 x4 NVMe (MZVKV512) | Lenovo ThinkPad P50 Samsung SM951 MZVPV256HDGL m.2 PCI-e | HP ZBook Studio G3 Samsung SM951 MZVPV512HDGL m.2 PCI-e | Dell XPS 15 9560 (i7-7700HQ, UHD) Lite-On CX2-8B512-Q11 | |
|---|---|---|---|---|---|
| CrystalDiskMark 3.0 | 11% | 28% | 22% | -7% | |
| Read Seq (MB/s) | 2253 | 1648 -27% | 1771 -21% | 1578 -30% | 1684 -25% |
| Write Seq (MB/s) | 1662 | 1575 -5% | 1304 -22% | 1557 -6% | 1106 -33% |
| Read 512 (MB/s) | 459.1 | 1155 152% | 1364 197% | 1234 169% | 977 113% |
| Write 512 (MB/s) | 1611 | 1561 -3% | 1291 -20% | 1391 -14% | 1119 -31% |
| Read 4k (MB/s) | 56.1 | 53 -6% | 60.2 7% | 59.9 7% | 45.14 -20% |
| Write 4k (MB/s) | 169.4 | 158.9 -6% | 256.7 52% | 225.6 33% | 134.1 -21% |
| Read 4k QD32 (MB/s) | 633 | 623 -2% | 953 51% | 946 49% | 509 -20% |
| Write 4k QD32 (MB/s) | 506 | 423 -16% | 389.6 -23% | 359 -29% | 398.1 -21% |

| 3DMark 11 | |
| 1280x720 Performance GPU | |
| Lenovo ThinkPad P50 | |
| Dell Precision 5520 UHD | |
| Dell Precision 7510 (4K IGZO) | |
| Dell Precision 5510 | |
| 1280x720 Performance Combined | |
| Dell Precision 5520 UHD | |
| Lenovo ThinkPad P50 | |
| Dell Precision 7510 (4K IGZO) | |
| Dell Precision 5510 | |
| 3DMark | |
| 1280x720 Cloud Gate Standard Graphics | |
| Dell XPS 15 9560 (i7-7700HQ, UHD) | |
| Fujitsu Celsius H760 | |
| Dell Precision 5520 UHD | |
| Dell Precision 7510 (4K IGZO) | |
| Lenovo ThinkPad P50 | |
| Dell Precision 5510 | |
| Dell Precision 3510 | |
| 1920x1080 Fire Strike Graphics | |
| Dell XPS 15 9560 (i7-7700HQ, UHD) | |
| Dell Precision 7510 (4K IGZO) | |
| Dell Precision 5520 UHD | |
| Lenovo ThinkPad P50 | |
| Fujitsu Celsius H760 | |
| Dell Precision 5510 | |
| Dell Precision 3510 | |
| 1920x1080 Ice Storm Extreme Graphics | |
| Dell XPS 15 9560 (i7-7700HQ, UHD) | |
| Dell Precision 5520 UHD | |
| 3DMark 06 Standard Score | 26109 points | |
| 3DMark 11 Performance | 5513 points | |
| 3DMark Ice Storm Standard Score | 57997 points | |
| 3DMark Cloud Gate Standard Score | 12632 points | |
| 3DMark Fire Strike Score | 3759 points | |
| 3DMark Fire Strike Extreme Score | 1919 points | |
Help | ||
| BioShock Infinite | |
| 1920x1080 Ultra Preset, DX11 (DDOF) (sort by value) | |
| Dell Precision 5520 UHD | |
| Dell Precision 7510 (4K IGZO) | |
| Dell Precision 3510 | |
| Lenovo ThinkPad P50 | |
| Dell XPS 15 9560 (i7-7700HQ, UHD) | |
| Dell Precision 5510 | |
| 1366x768 High Preset (sort by value) | |
| Dell Precision 5520 UHD | |
| Dell Precision 7510 (4K IGZO) | |
| Dell Precision 3510 | |
| Lenovo ThinkPad P50 | |
| Dell XPS 15 9560 (i7-7700HQ, UHD) | |
| Dell Precision 5510 | |
| 1366x768 Medium Preset (sort by value) | |
| Dell Precision 5520 UHD | |
| Dell Precision 7510 (4K IGZO) | |
| Dell Precision 3510 | |
| Lenovo ThinkPad P50 | |
| Dell Precision 5510 | |
| 1280x720 Very Low Preset (sort by value) | |
| Dell Precision 5520 UHD | |
| Dell Precision 7510 (4K IGZO) | |
| Dell Precision 3510 | |
| Lenovo ThinkPad P50 | |
| Dell Precision 5510 | |
| Doom | |
| 3840x2160 High Preset AA:FX (sort by value) | |
| Dell Precision 5520 UHD | |
| Dell XPS 15 9560 (i7-7700HQ, UHD) | |
| 1920x1080 Ultra Preset AA:SM (sort by value) | |
| Dell Precision 5520 UHD | |
| Dell XPS 15 9560 (i7-7700HQ, UHD) | |
| 1920x1080 High Preset AA:FX (sort by value) | |
| Dell Precision 5520 UHD | |
| Dell XPS 15 9560 (i7-7700HQ, UHD) | |
| 1366x768 Medium Preset (sort by value) | |
| Dell Precision 5520 UHD | |
| 1280x720 Low Preset (sort by value) | |
| Dell Precision 5520 UHD | |
| Batman: Arkham Knight | |
| 3840x2160 High / On (Interactive Smoke & Paper Debris Off) AA:SM AF:8x (sort by value) | |
| Dell Precision 5520 UHD | |
| Dell XPS 15 9560 (i7-7700HQ, UHD) | |
| 1920x1080 High / On AA:SM AF:16x (sort by value) | |
| Dell Precision 5520 UHD | |
| Dell XPS 15 9560 (i7-7700HQ, UHD) | |
| 1920x1080 High / On (Interactive Smoke & Paper Debris Off) AA:SM AF:8x (sort by value) | |
| Dell Precision 5520 UHD | |
| Dell XPS 15 9560 (i7-7700HQ, UHD) | |
| 1366x768 Normal / Off AF:4x (sort by value) | |
| Dell Precision 5520 UHD | |
| Dell XPS 15 9560 (i7-7700HQ, UHD) | |
| 1280x720 Low / Off AF:Trilinear (sort by value) | |
| Dell Precision 5520 UHD | |
| low | med. | high | ultra | 4K | |
|---|---|---|---|---|---|
| BioShock Infinite (2013) | 189 | 137 | 125 | 47 | |
| The Witcher 3 (2015) | 29 | ||||
| Batman: Arkham Knight (2015) | 74 | 63 | 35 | 29 | 11 |
| Doom (2016) | 79 | 66 | 37 | 34 | 12 |
Noise level
| Idle |
| 28.7 / 32.1 / 32.1 dB(A) |
| Load |
| 41.3 / 45.5 dB(A) |
 | ||
30 dB silent 40 dB(A) audible 50 dB(A) loud |
||
min: | ||
| Dell Precision 5520 UHD Quadro M1200, E3-1505M v6, Samsung SM961 MZVKW512HMJP m.2 PCI-e | Fujitsu Celsius H760 Quadro M2000M, E3-1505M v5, Samsung SM951 MZVPV512 m.2 PCI-e | Dell Precision 7510 (4K IGZO) Quadro M2000M, E3-1535M v5, Samsung SSD SM951a 512GB M.2 PCIe 3.0 x4 NVMe (MZVKV512) | Dell Precision 3510 FirePro W5130M, 6700HQ, Samsung SM951 MZVPV256HDGL m.2 PCI-e | Lenovo ThinkPad P50 Quadro M2000M, E3-1505M v5, Samsung SM951 MZVPV256HDGL m.2 PCI-e | Dell Precision 5510 Quadro M1000M, E3-1505M v5, SK hynix SC920 512 GB | |
|---|---|---|---|---|---|---|
| Noise | 1% | 2% | 2% | 2% | 1% | |
| off / environment * (dB) | 28.7 | 29 -1% | 28.2 2% | 30 -5% | 30 -5% | |
| Idle Minimum * (dB) | 28.7 | 29 -1% | 29.8 -4% | 30 -5% | 30 -5% | 30 -5% |
| Idle Average * (dB) | 32.1 | 29 10% | 29.8 7% | 30 7% | 30 7% | 30 7% |
| Idle Maximum * (dB) | 32.1 | 29 10% | 31.2 3% | 30 7% | 30 7% | 30 7% |
| Load Average * (dB) | 41.3 | 43.1 -4% | 37.2 10% | 38.1 8% | 42.1 -2% | 42.08 -2% |
| Witcher 3 ultra * (dB) | 45.5 | |||||
| Load Maximum * (dB) | 45.5 | 49.2 -8% | 49.4 -9% | 44.4 2% | 42.1 7% | 46.78 -3% |
* ... smaller is better
(-) The maximum temperature on the upper side is 51.6 °C / 125 F, compared to the average of 38.2 °C / 101 F, ranging from 22.2 to 69.8 °C for the class Workstation.
(±) The bottom heats up to a maximum of 43.6 °C / 110 F, compared to the average of 41.1 °C / 106 F
(+) In idle usage, the average temperature for the upper side is 25.3 °C / 78 F, compared to the device average of 32 °C / 90 F.
(±) Playing The Witcher 3, the average temperature for the upper side is 34.6 °C / 94 F, compared to the device average of 32 °C / 90 F.
(+) The palmrests and touchpad are cooler than skin temperature with a maximum of 28.4 °C / 83.1 F and are therefore cool to the touch.
(±) The average temperature of the palmrest area of similar devices was 27.8 °C / 82 F (-0.6 °C / -1.1 F).
Dell Precision 5520 UHD audio analysis
(±) | speaker loudness is average but good (79.6 dB)
Bass 100 - 315 Hz
(±) | reduced bass - on average 12.8% lower than median
(±) | linearity of bass is average (14.2% delta to prev. frequency)
Mids 400 - 2000 Hz
(+) | balanced mids - only 4% away from median
(±) | linearity of mids is average (9.9% delta to prev. frequency)
Highs 2 - 16 kHz
(+) | balanced highs - only 3.3% away from median
(±) | linearity of highs is average (12% delta to prev. frequency)
Overall 100 - 16.000 Hz
(±) | linearity of overall sound is average (16.7% difference to median)
Compared to same class
» 46% of all tested devices in this class were better, 9% similar, 45% worse
» The best had a delta of 7%, average was 17%, worst was 35%
Compared to all devices tested
» 29% of all tested devices were better, 7% similar, 64% worse
» The best had a delta of 4%, average was 23%, worst was 134%
Apple MacBook 12 (Early 2016) 1.1 GHz audio analysis
(+) | speakers can play relatively loud (83.6 dB)
Bass 100 - 315 Hz
(±) | reduced bass - on average 11.3% lower than median
(±) | linearity of bass is average (14.2% delta to prev. frequency)
Mids 400 - 2000 Hz
(+) | balanced mids - only 2.4% away from median
(+) | mids are linear (5.5% delta to prev. frequency)
Highs 2 - 16 kHz
(+) | balanced highs - only 2% away from median
(+) | highs are linear (4.5% delta to prev. frequency)
Overall 100 - 16.000 Hz
(+) | overall sound is linear (10.2% difference to median)
Compared to same class
» 7% of all tested devices in this class were better, 2% similar, 90% worse
» The best had a delta of 5%, average was 18%, worst was 53%
Compared to all devices tested
» 5% of all tested devices were better, 1% similar, 94% worse
» The best had a delta of 4%, average was 23%, worst was 134%
| Off / Standby | |
| Idle | |
| Load |
|
Key:
min: | |
| Dell Precision 5520 UHD E3-1505M v6, Quadro M1200, Samsung SM961 MZVKW512HMJP m.2 PCI-e, IPS, 3840x2160, 15.6" | Fujitsu Celsius H760 E3-1505M v5, Quadro M2000M, Samsung SM951 MZVPV512 m.2 PCI-e, IPS LED, 1920x1080, 15.6" | Dell Precision 7510 (4K IGZO) E3-1535M v5, Quadro M2000M, Samsung SSD SM951a 512GB M.2 PCIe 3.0 x4 NVMe (MZVKV512), IGZO IPS, 3840x2160, 15.6" | Dell Precision 3510 6700HQ, FirePro W5130M, Samsung SM951 MZVPV256HDGL m.2 PCI-e, TN LED, 1366x768, 15.6" | Lenovo ThinkPad P50 E3-1505M v5, Quadro M2000M, Samsung SM951 MZVPV256HDGL m.2 PCI-e, IPS, 3840x2160, 15.6" | Dell Precision 5510 E3-1505M v5, Quadro M1000M, SK hynix SC920 512 GB, IGZO LED, 3840x2160, 15.6" | |
|---|---|---|---|---|---|---|
| Power Consumption | 8% | -83% | 42% | -10% | -4% | |
| Idle Minimum * (Watt) | 8.9 | 7.7 13% | 23.9 -169% | 4.2 53% | 10.2 -15% | 8.6 3% |
| Idle Average * (Watt) | 13.6 | 11.8 13% | 28.9 -113% | 6.5 52% | 17.8 -31% | 16.2 -19% |
| Idle Maximum * (Watt) | 14.1 | 12.9 9% | 30 -113% | 7.1 50% | 18.3 -30% | 16.7 -18% |
| Load Average * (Watt) | 100.3 | 90.2 10% | 95.2 5% | 74.6 26% | 76.9 23% | 82.6 18% |
| Witcher 3 ultra * (Watt) | 100.2 | |||||
| Load Maximum * (Watt) | 126.3 | 130.8 -4% | 157.1 -24% | 92.2 27% | 123.5 2% | 131.8 -4% |
* ... smaller is better
| Dell Precision 5520 UHD E3-1505M v6, Quadro M1200, 97 Wh | Fujitsu Celsius H760 E3-1505M v5, Quadro M2000M, 72 Wh | Dell Precision 7510 (4K IGZO) E3-1535M v5, Quadro M2000M, 91 Wh | Dell Precision 3510 6700HQ, FirePro W5130M, 84 Wh | Lenovo ThinkPad P50 E3-1505M v5, Quadro M2000M, 90 Wh | Dell XPS 15 9560 (i7-7700HQ, UHD) i7-7700HQ, GeForce GTX 1050 Mobile, 97 Wh | Dell Precision 5510 E3-1505M v5, Quadro M1000M, 56 Wh | |
|---|---|---|---|---|---|---|---|
| Battery runtime | 30% | -16% | 96% | 16% | 52% | 18% | |
| Reader / Idle (h) | 12.1 | 9.3 -23% | 4.5 -63% | 19.5 61% | 9 -26% | 13.9 15% | 7.1 -41% |
| WiFi v1.3 (h) | 4.2 | 5.6 33% | 4 -5% | 9.9 136% | 4.8 14% | 7.2 71% | 4.8 14% |
| Load (h) | 1 | 1.8 80% | 1.2 20% | 1.9 90% | 1.6 60% | 1.7 70% | 1.8 80% |
| WiFi (h) | 5 |
Pros
Cons
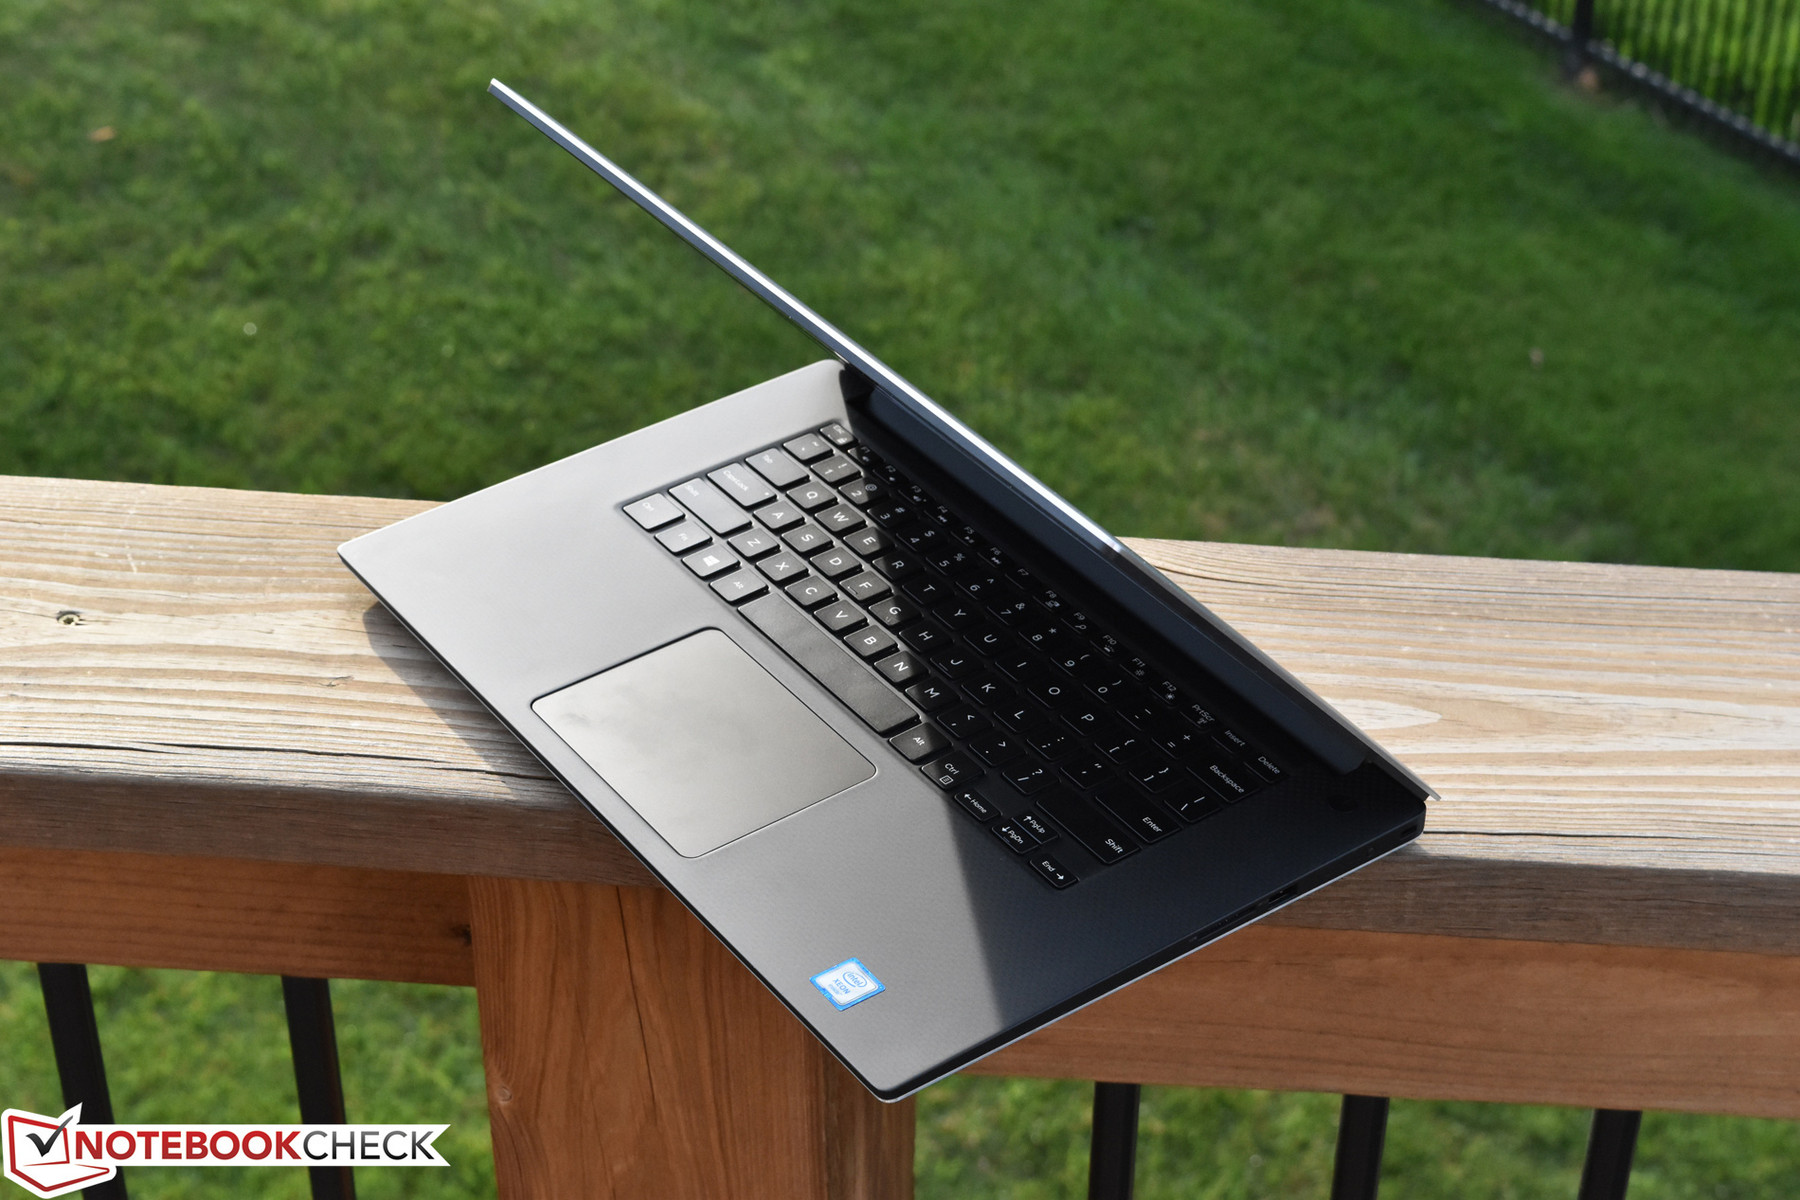
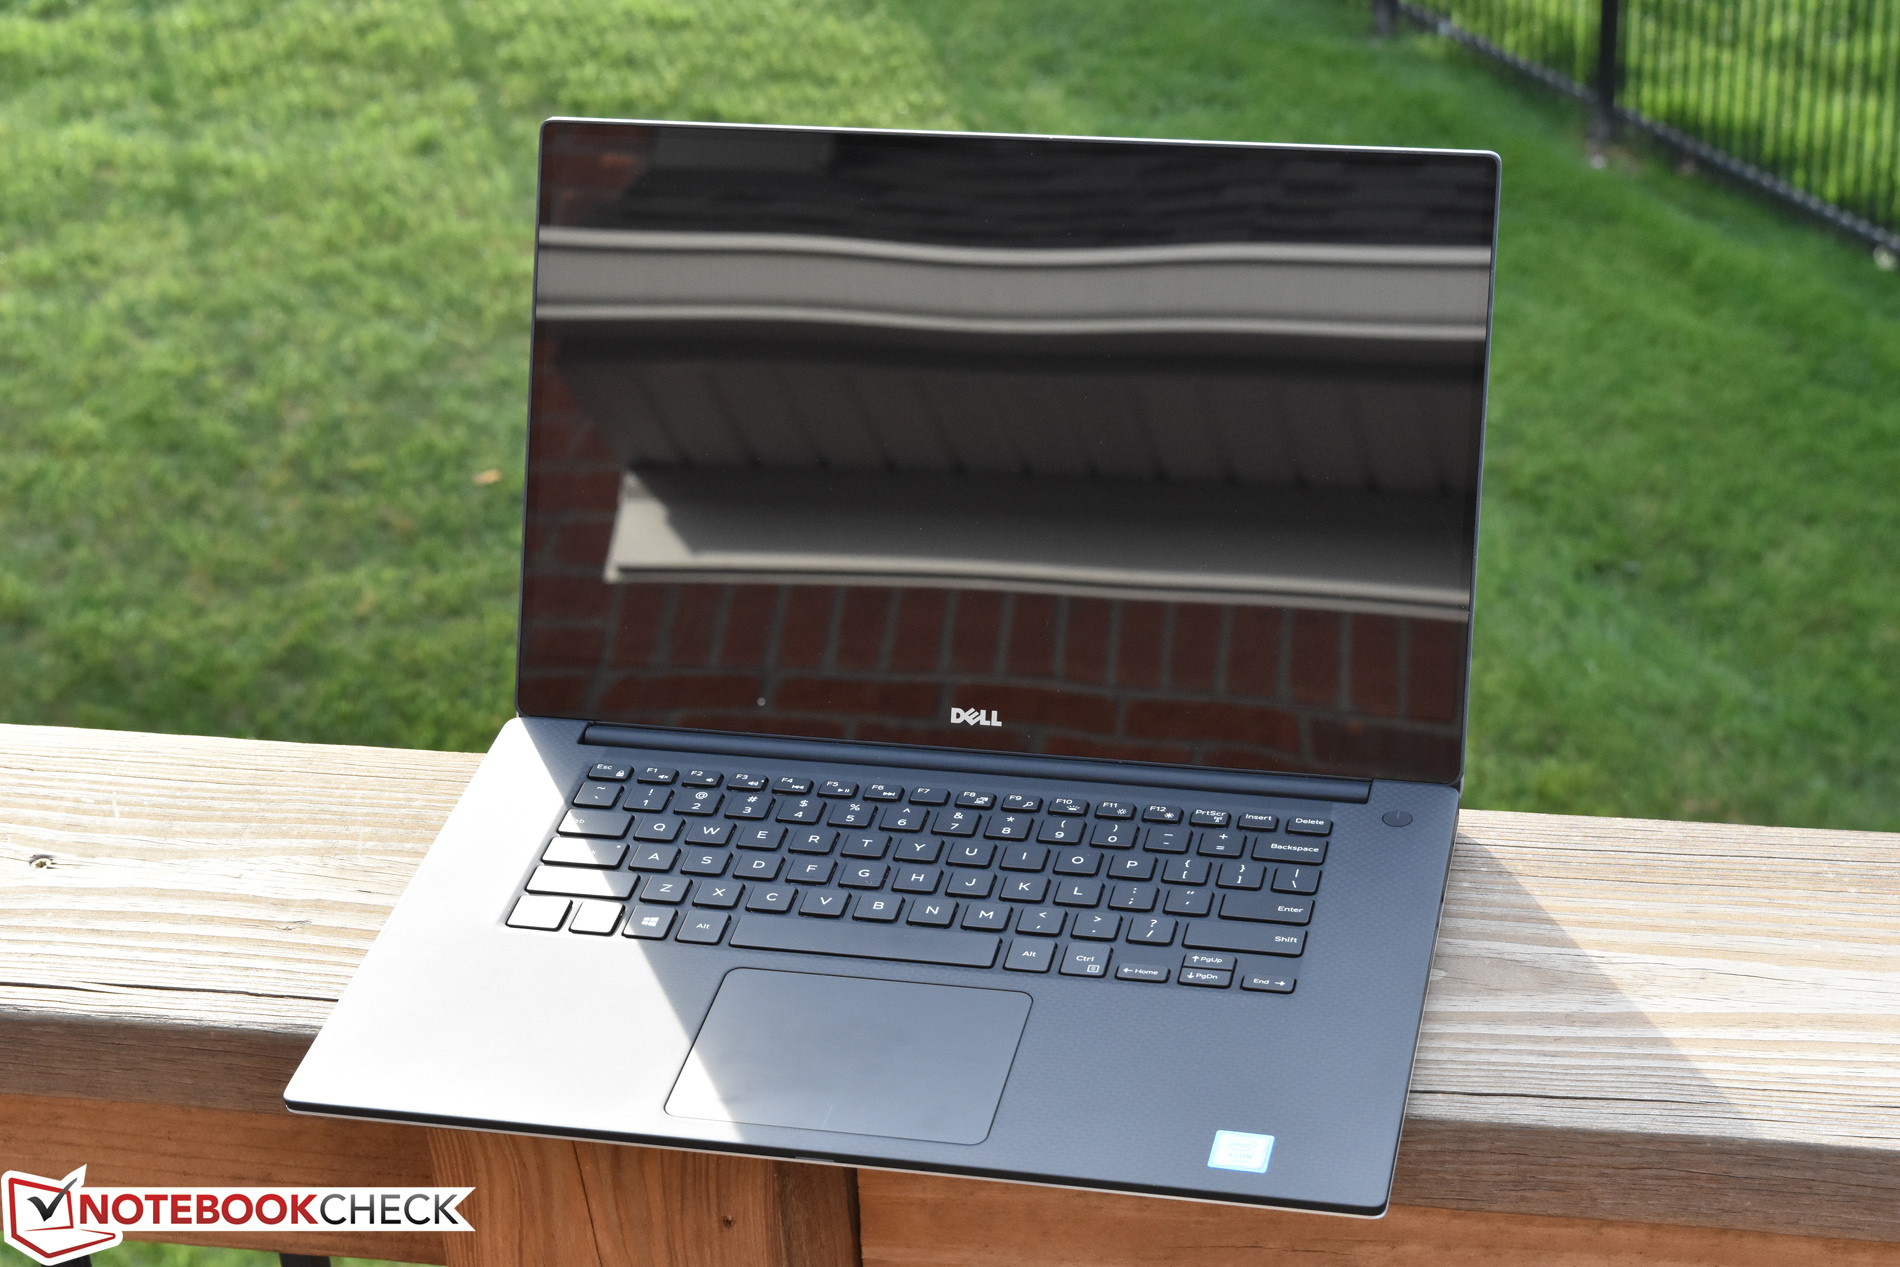
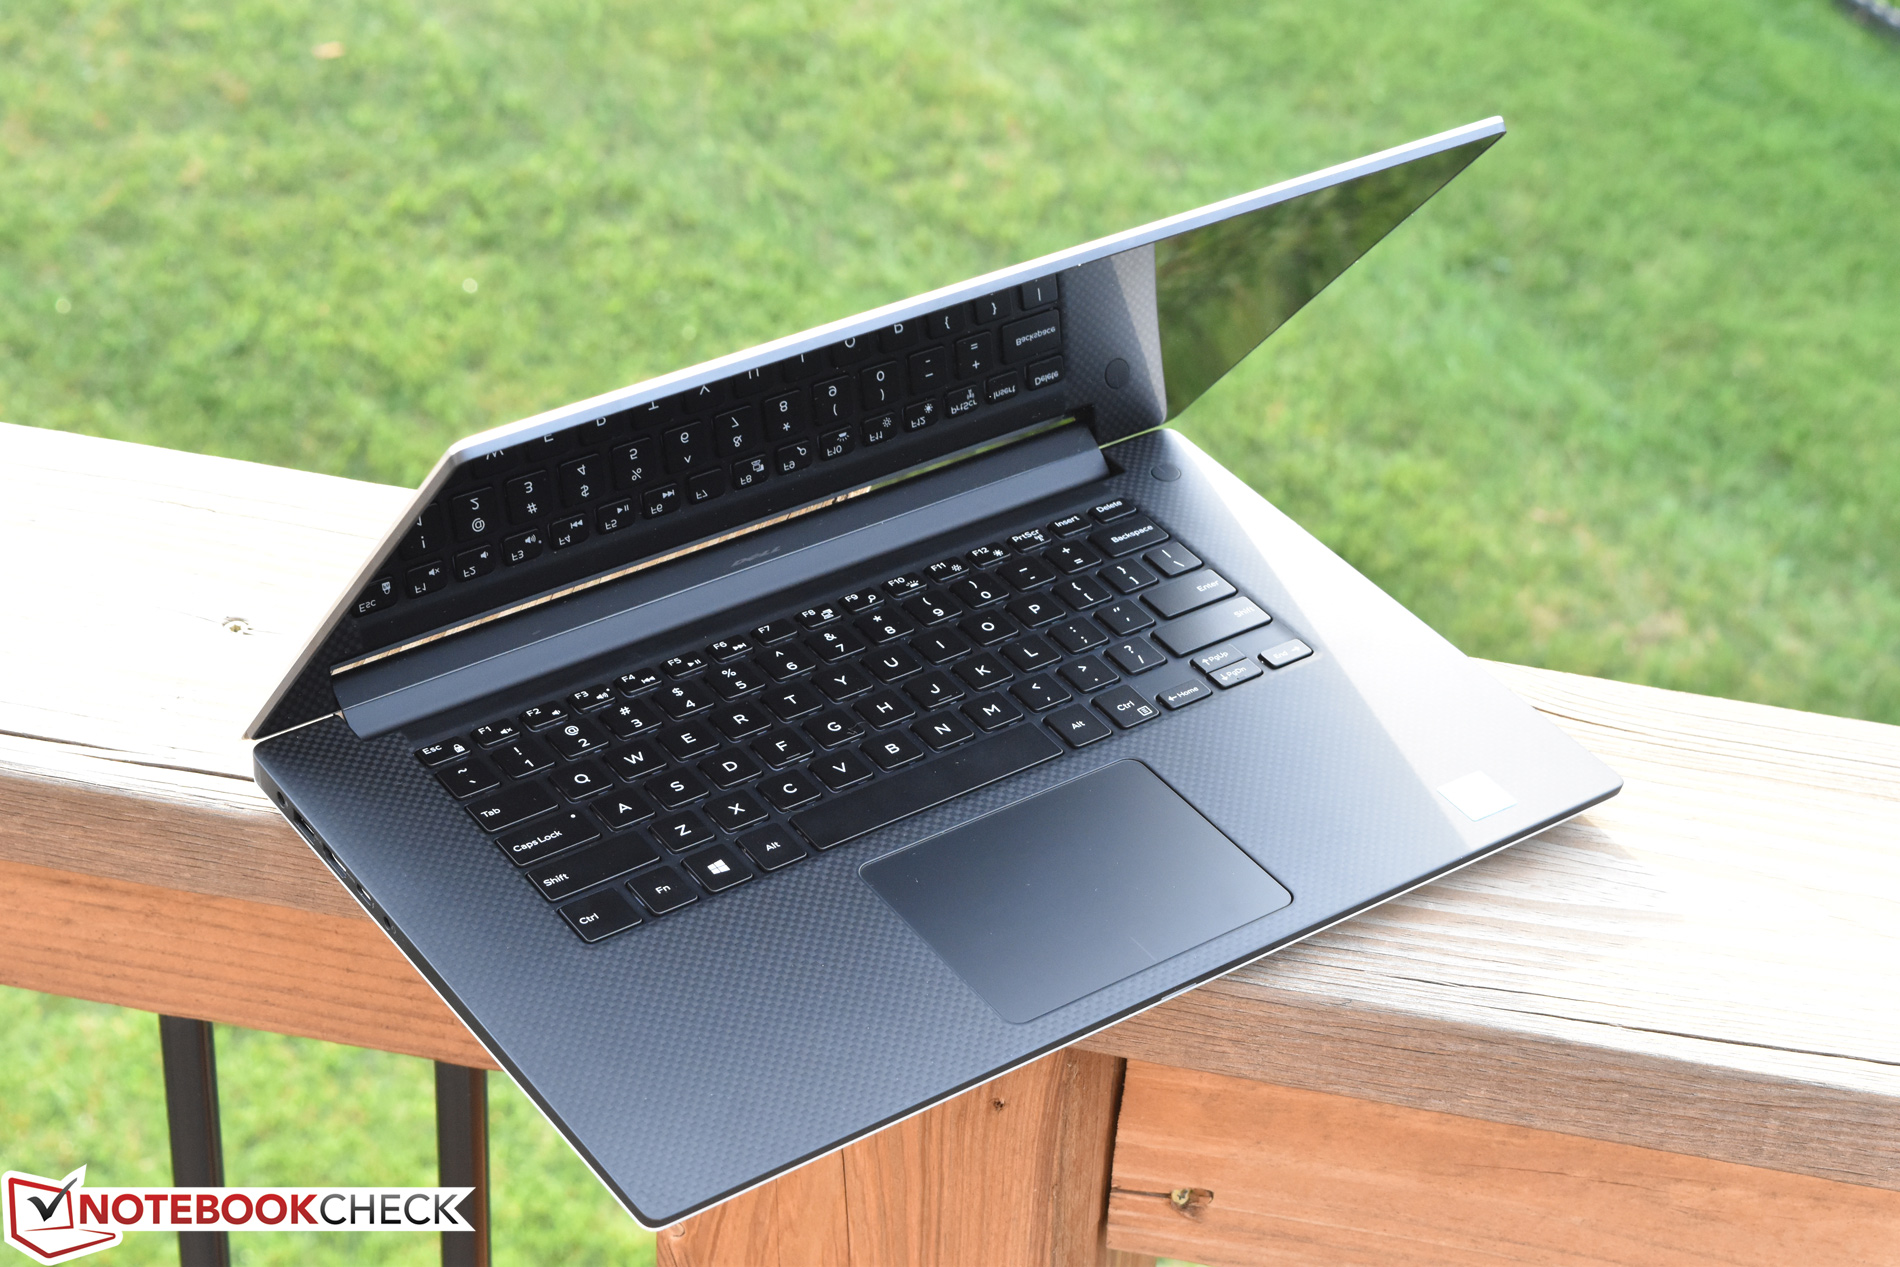
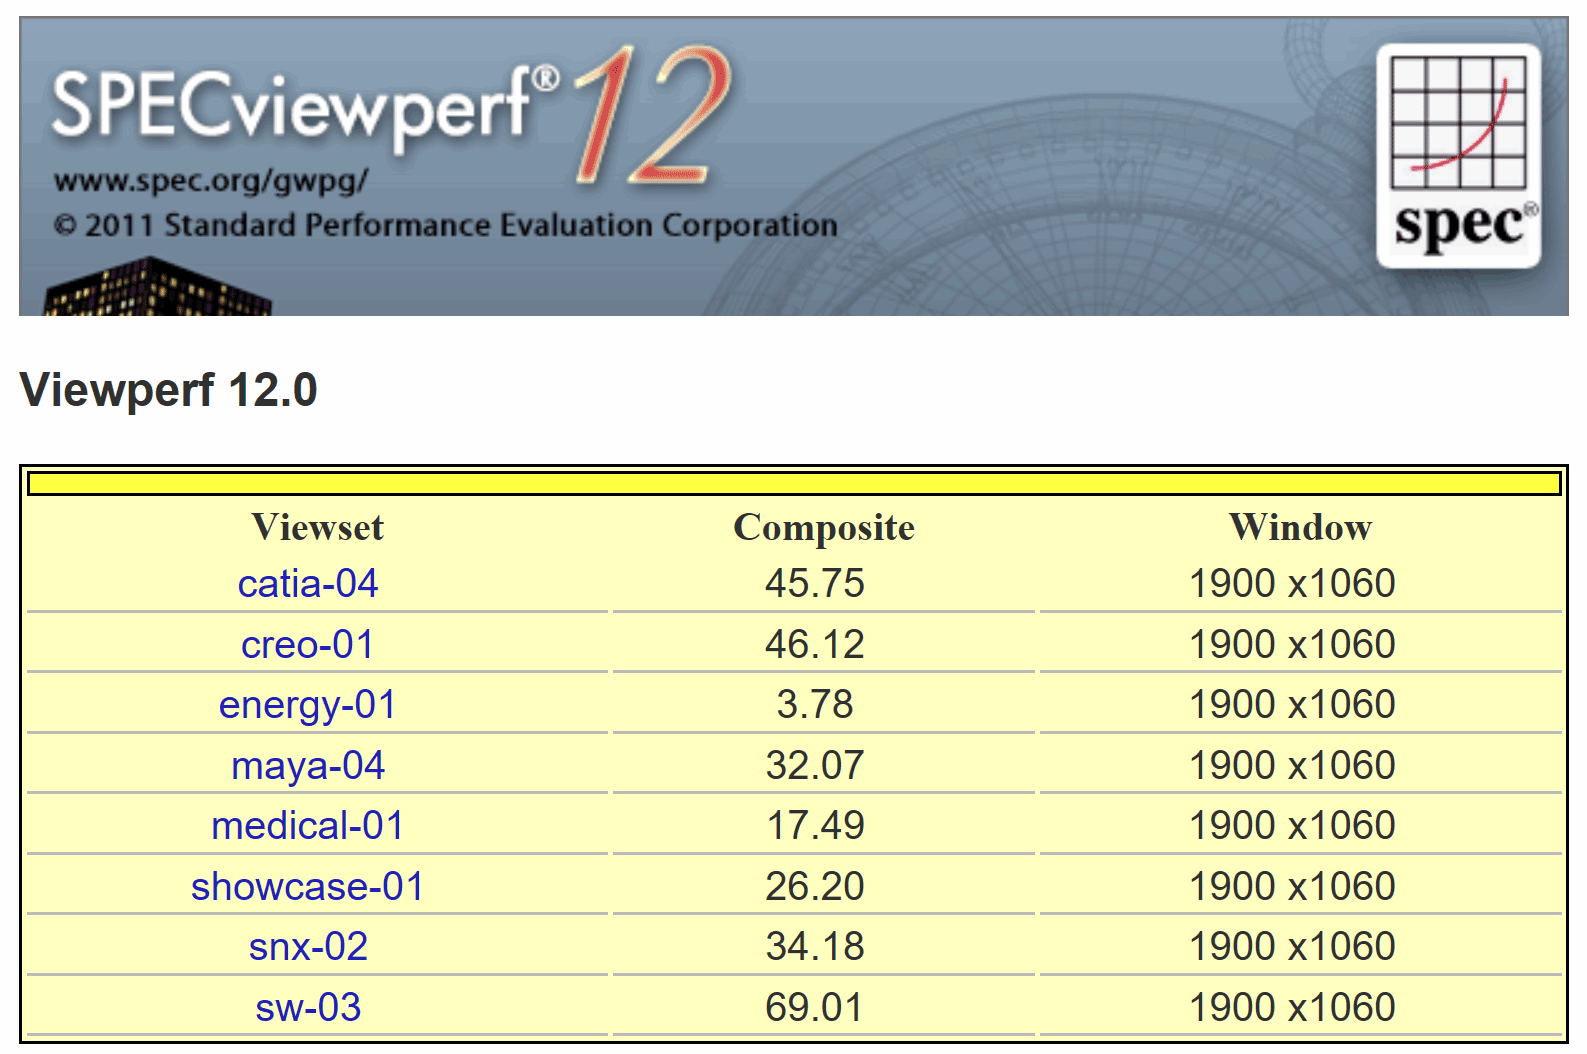
即使自从Precision 5510发布的一年后后,Dell Precision 55在基础设计方面没有太大变化,它仍然是最便携和最有吸引力的工作站之一。 向Kaby Lake的转变导致了复杂的结果,即使在现实的压力测试条件下,持续负载下处理器性能受到限制,使得该机器无法充分发挥其多核性能。但NVMe固态硬盘的升级和新NVIDIA Quadro M1200的采用,实实在在的提升了该工作站的性能:我们在SPECviewperf测试中全面记录了可观的结果,表现远高于5510。在Witcher 3压力测试下,显卡性能似乎相当稳定。
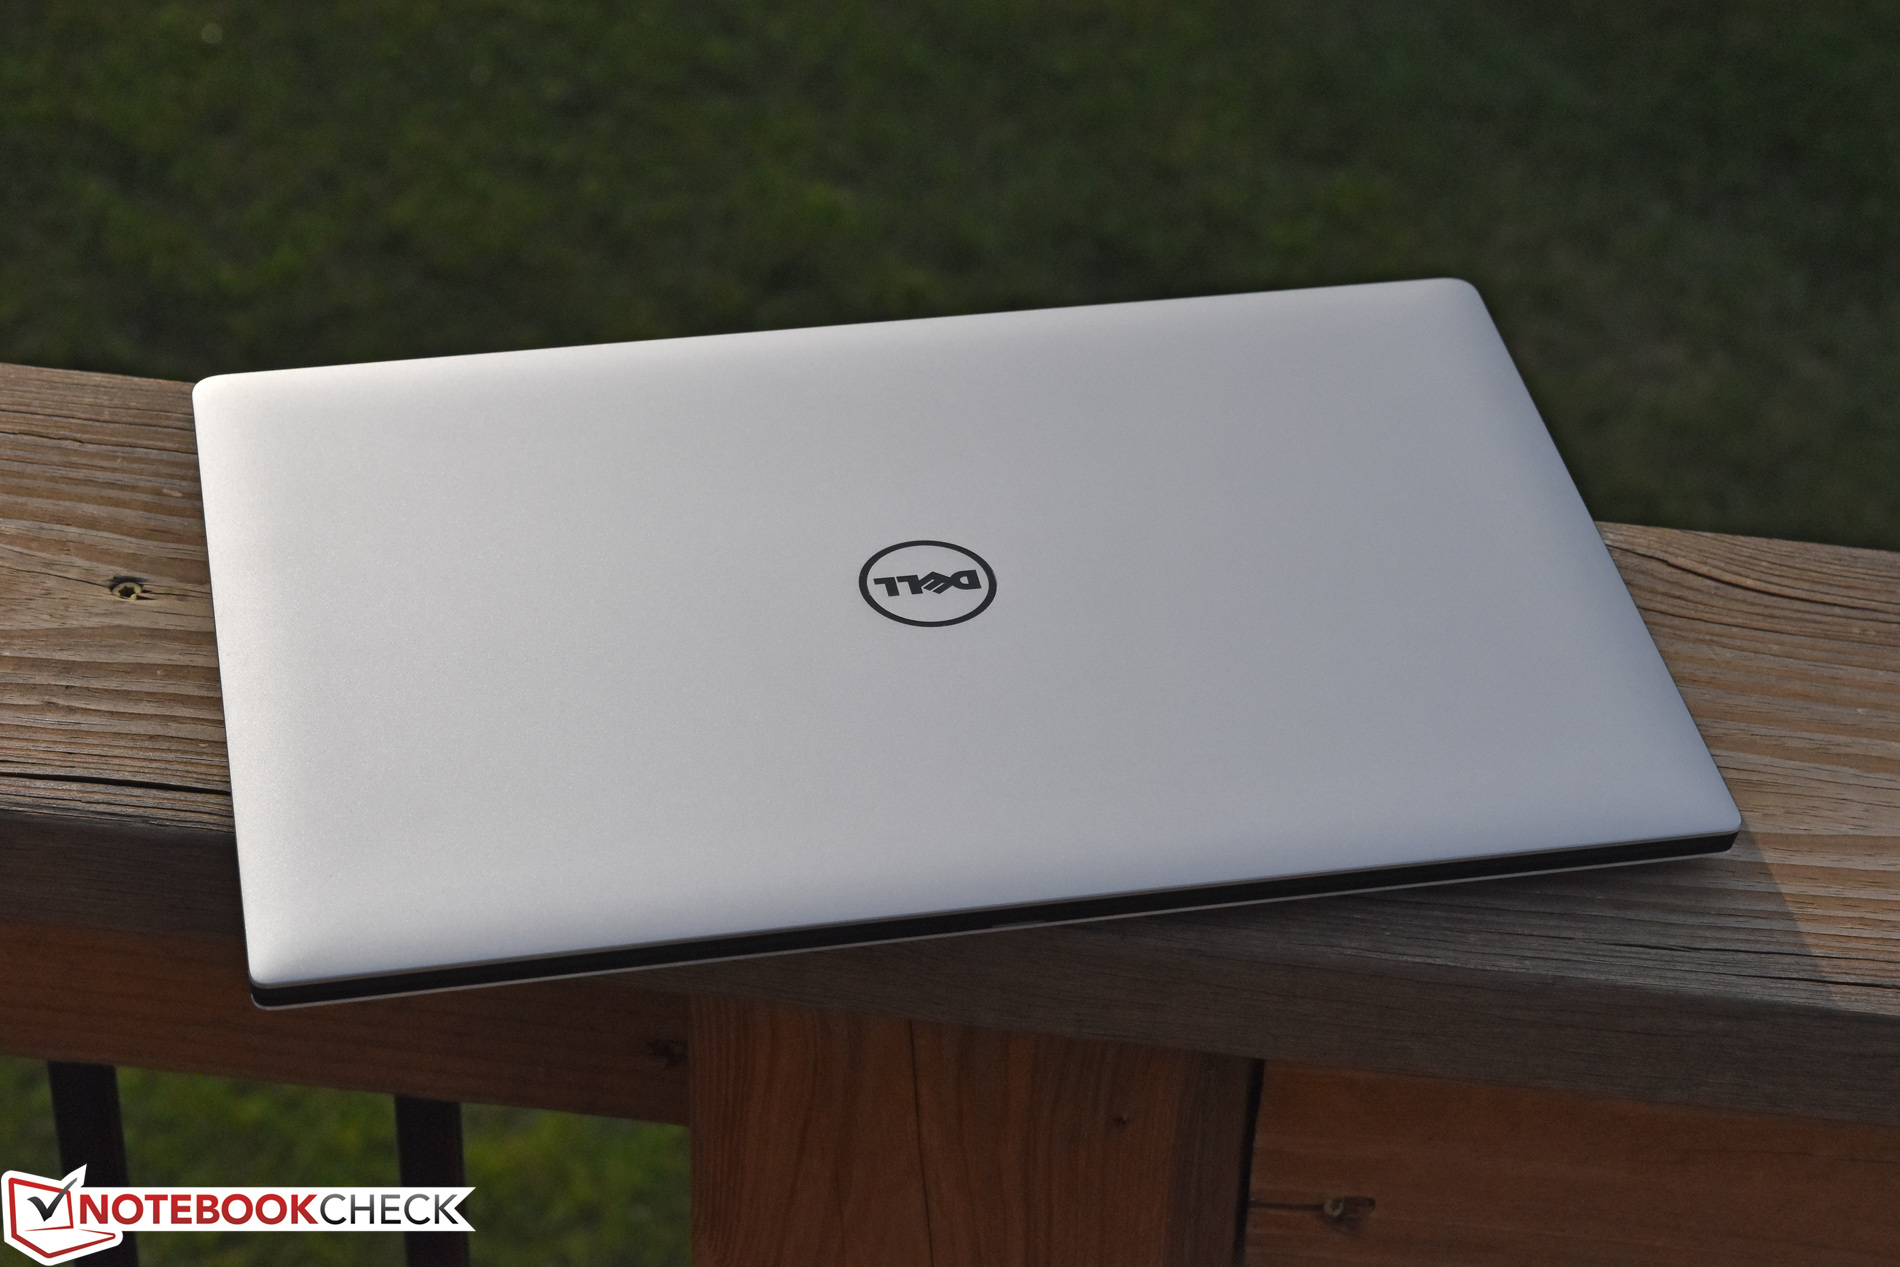
在处理这样一个大小的工作站时,难免会有牺牲一些优点;毕竟,5520的重量几乎超过了2公斤,与14英寸机器的尺寸接近。除了处理器限制外,高精密度使得在负载下容易发热,电池续航绝对没有什么亮点(我们在测试单元中采用的超高清屏幕)。因此,尽管混合超极本/工作站的梦想仍然未能实现,但对于那些可以获得良好的显卡/工作站性能而不是令人失望的多核处理器功能的人来说,Precision 5520是一个有吸引力的妥协选项:更好的便携性和更美的外观。
对于其他人来说,体型更大的工作站可能是唯一的答案——尽管总是有其他超轻量级(消费级)选项,如XPS 15和雷蛇 Blade。如果这些选项符合条件。 例如,虽然在我们的XPS 15的评测单元中,它的表现没有达到Precision那样的处理器功率,但在Cinebench循环测试中,时钟速率和性能很稳定,总体而言,持续性能更好。
在处理这样一个大小的工作站时,会有一些牺牲;对于那些性能足以满足的用户,Precision 5520是一个有吸引力的妥协选择,以换取更大的便携性和更美观的外观。
在未来的升级中,该机绝对有改进的空间,迪士尼是,Precision 5520仍是一个令人印象深刻的设备,具有坚实的专业极显卡性能。在2,867美元(标配)的价位下,它不是一笔小投资——但它也是(包括此时此刻)一个不错的选择。
注:本文是基于完整评测的缩减版本,阅读完整的英文评测,请点击这里。
Dell Precision 5520 UHD
- 04/28/2017 v6 (old)
Steve Schardein
Price comparison
