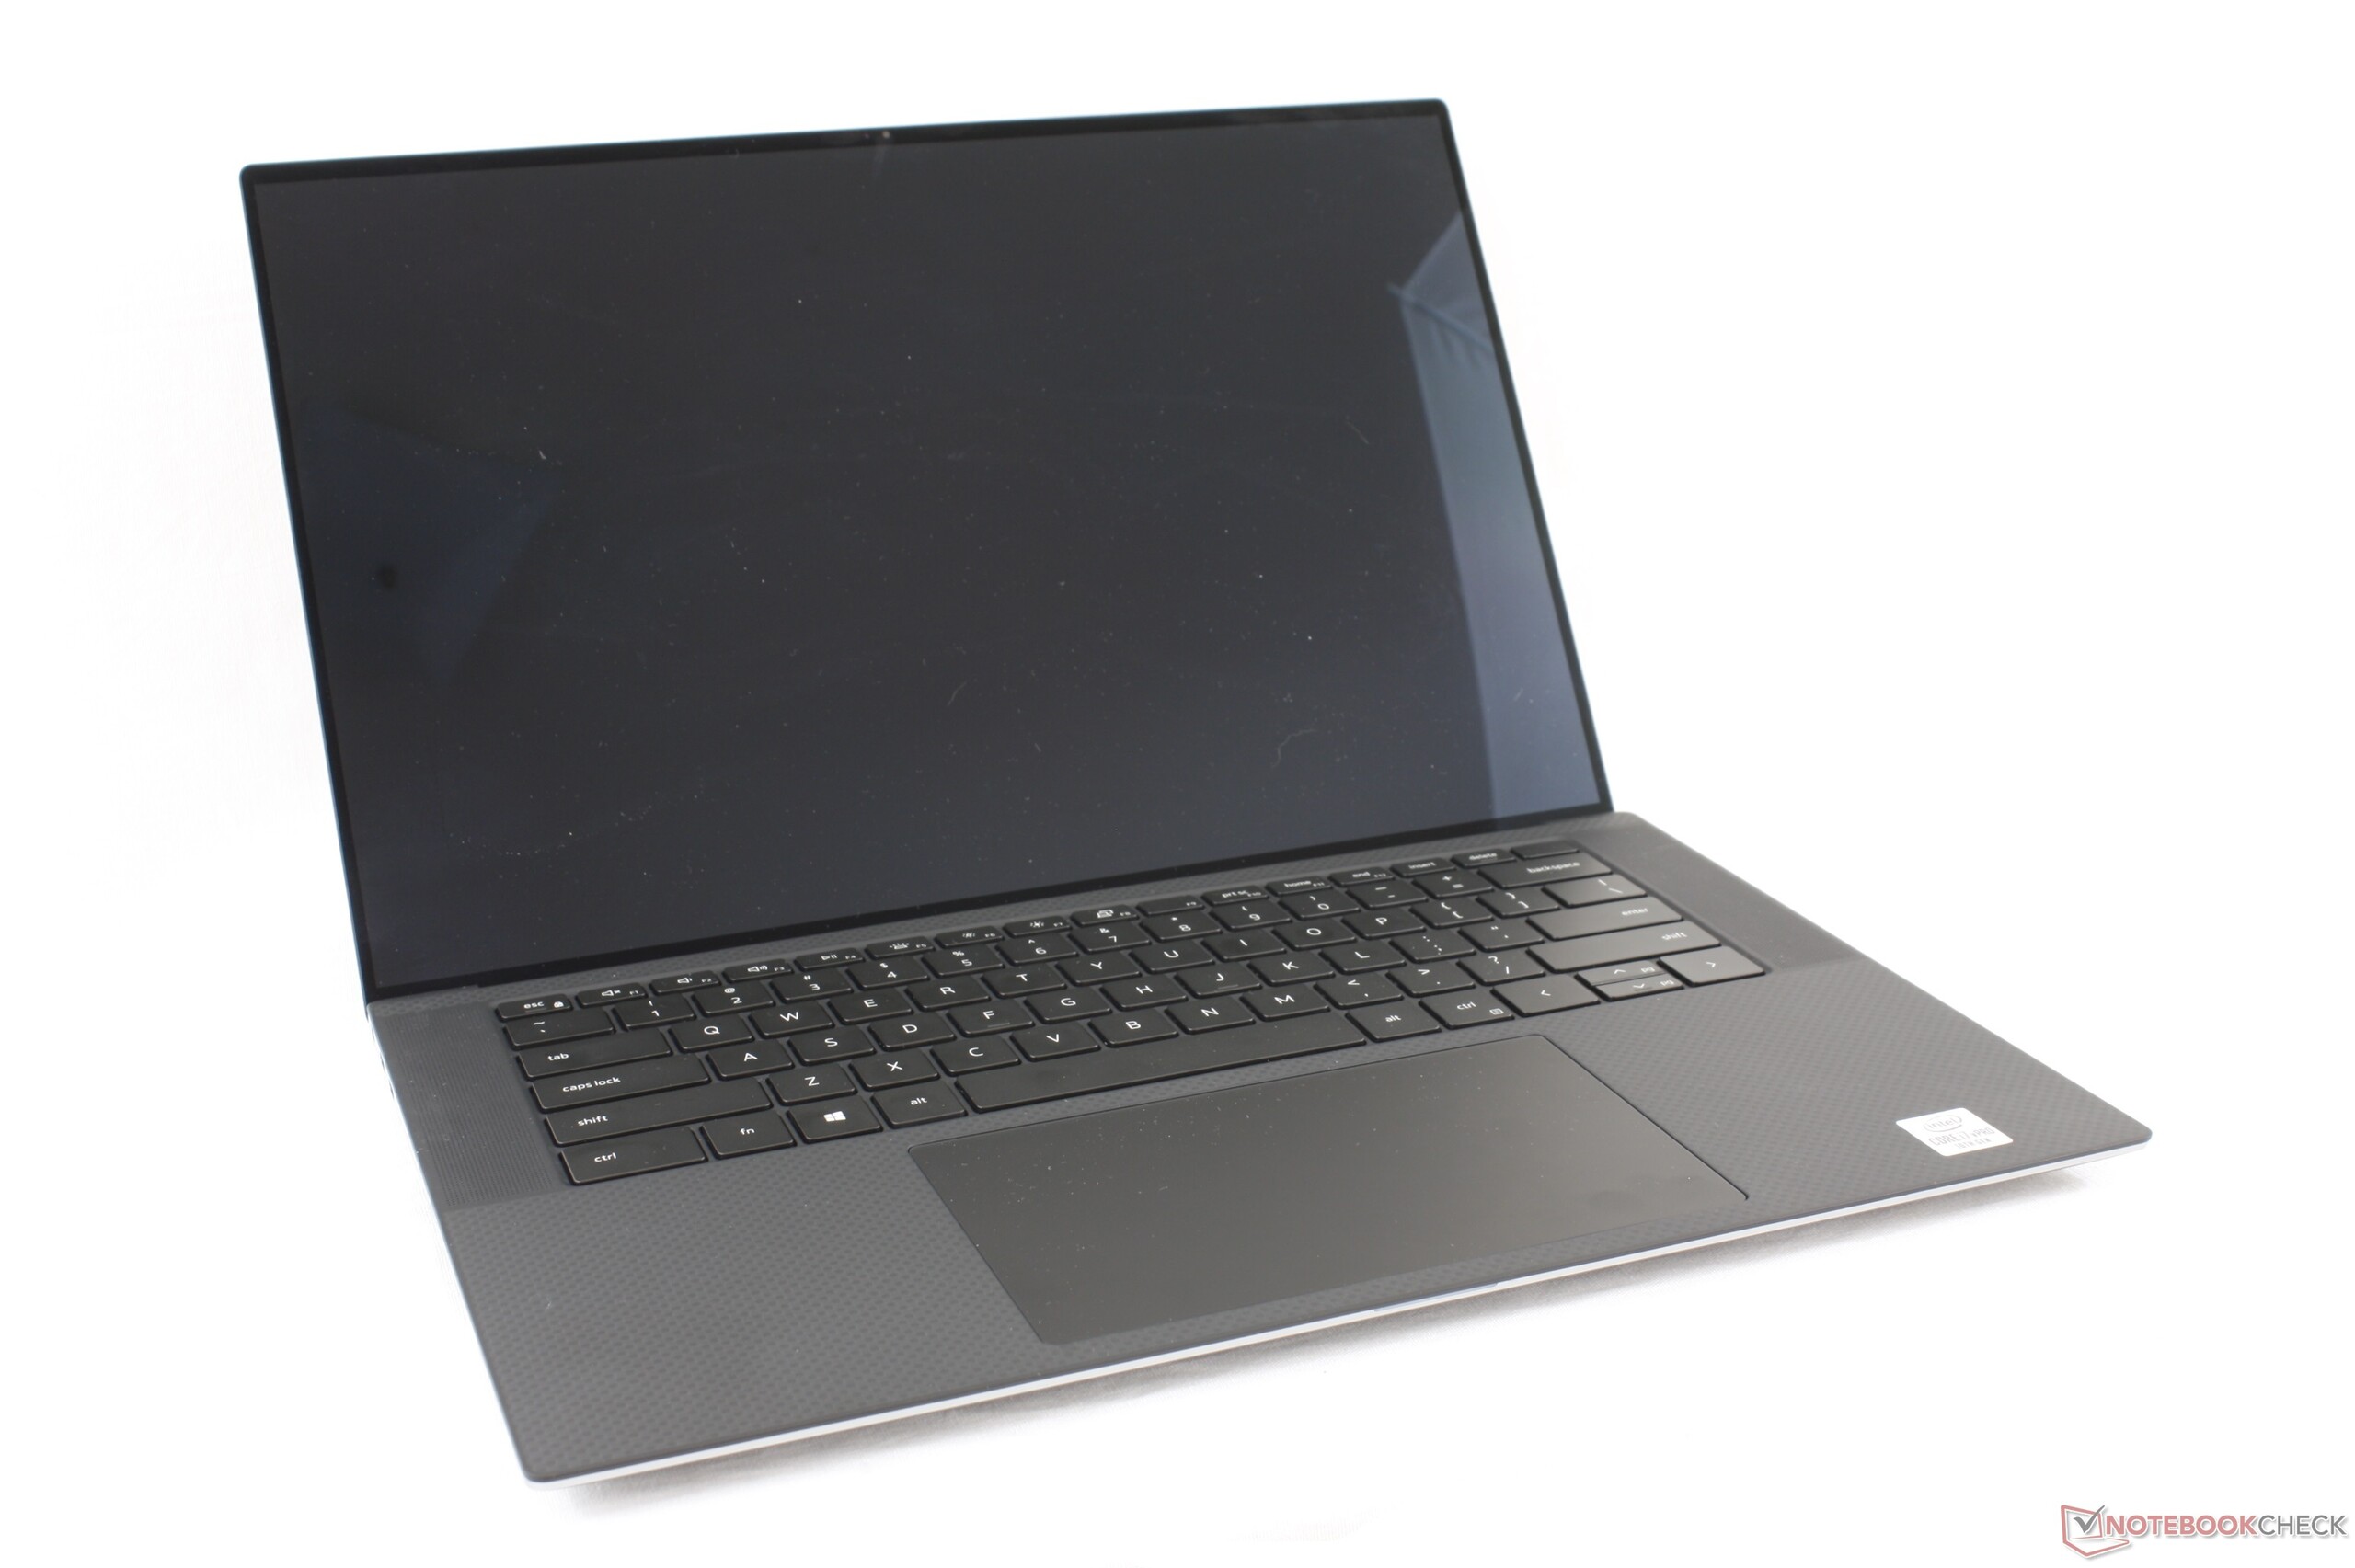
Dell Precision 5550工作站笔记本电脑评测:给专业人士的XPS 15
Rating | Date | Model | Weight | Height | Size | Resolution | Price |
|---|---|---|---|---|---|---|---|
| 86.3 % v7 (old) | 10 / 2020 | Dell Precision 5550 P91F i7-10875H, Quadro T2000 Max-Q | 2 kg | 18 mm | 15.60" | 3840x2400 | |
| 86.9 % v7 (old) | 03 / 2020 | Dell Precision 5540 i9-9980HK, Quadro T2000 Max-Q | 2 kg | 17 mm | 15.60" | 3840x2160 | |
| 87 % v7 (old) | 08 / 2020 | Razer Blade 15 Studio Edition 2020 i7-10875H, Quadro RTX 5000 Max-Q | 2.2 kg | 13.98 mm | 15.60" | 3840x2160 | |
| 82.1 % v7 (old) | 03 / 2020 | Acer ConceptD 3 Pro CN315-71P-73W1 i7-9750H, Quadro T1000 (Laptop) | 2.4 kg | 23.4 mm | 15.60" | 1920x1080 | |
| 89.8 % v7 (old) | 12 / 2019 | Lenovo ThinkPad P53-20QN000YGE i7-9850H, Quadro RTX 5000 Max-Q | 2.7 kg | 29.4 mm | 15.60" | 1920x1080 | |
| 76 % v7 (old) | MSI WP65 i7-9750H, Quadro P620 | 1.9 kg | 21.7 mm | 15.60" | 1920x1080 |
| SD Card Reader - average JPG Copy Test (av. of 3 runs) | |
| Dell Precision 5550 P91F (Toshiba Exceria Pro SDXC 64 GB UHS-II) | |
| Lenovo ThinkPad P53-20QN000YGE (Toshiba Exceria Pro SDXC 64 GB UHS-II) | |
| Dell Precision 5540 (Toshiba Exceria Pro SDXC 64 GB UHS-II) | |
| Razer Blade 15 Studio Edition (Toshiba Exceria Pro SDXC 64 GB UHS-II) | |


| |||||||||||||||||||||||||
Brightness Distribution: 85 %
Center on Battery: 469.8 cd/m²
Contrast: 1119:1 (Black: 0.42 cd/m²)
ΔE ColorChecker Calman: 5.16 | ∀{0.5-29.43 Ø4.71}
calibrated: 3.75
ΔE Greyscale Calman: 5.5 | ∀{0.09-98 Ø4.96}
100% sRGB (Argyll 1.6.3 3D)
89.2% AdobeRGB 1998 (Argyll 1.6.3 3D)
99.9% AdobeRGB 1998 (Argyll 3D)
100% sRGB (Argyll 3D)
89.9% Display P3 (Argyll 3D)
Gamma: 2
CCT: 6198 K
| Dell Precision 5550 P91F Sharp LQ156R1, IPS, 15.6", 3840x2400 | Dell Precision 5540 SDCA029, OLED, 15.6", 3840x2160 | Razer Blade 15 Studio Edition 2020 Samsung SDCA029, OLED, 15.6", 3840x2160 | Acer ConceptD 3 Pro CN315-71P-73W1 Chi Mei N156HCE-EN2, IPS, 15.6", 1920x1080 | Lenovo ThinkPad P53-20QN000YGE N156HCE-GN1, IPS, 15.6", 1920x1080 | MSI WP65 AU Optronics B156HAN02.1, IPS, 15.6", 1920x1080 | |
|---|---|---|---|---|---|---|
| Display | 3% | 3% | -1% | -24% | -52% | |
| Display P3 Coverage (%) | 89.9 | 99.9 11% | 99.9 11% | 97.9 9% | 63.2 -30% | 39.46 -56% |
| sRGB Coverage (%) | 100 | 100 0% | 100 0% | 99.9 0% | 92.9 -7% | 58.8 -41% |
| AdobeRGB 1998 Coverage (%) | 99.9 | 97.3 -3% | 97.3 -3% | 87.2 -13% | 64.3 -36% | 40.69 -59% |
| Response Times | 93% | 90% | 32% | 22% | 19% | |
| Response Time Grey 50% / Grey 80% * (ms) | 46 ? | 2.8 ? 94% | 4 ? 91% | 33 ? 28% | 38.4 ? 17% | 37.6 ? 18% |
| Response Time Black / White * (ms) | 34 ? | 3.2 ? 91% | 4 ? 88% | 22 ? 35% | 25.2 ? 26% | 27.6 ? 19% |
| PWM Frequency (Hz) | 240.9 ? | 26040 ? | ||||
| Screen | 14% | 171% | 14% | 20% | -25% | |
| Brightness middle (cd/m²) | 469.8 | 427 -9% | 380 -19% | 343 -27% | 510 9% | 267.4 -43% |
| Brightness (cd/m²) | 464 | 411 -11% | 388 -16% | 309 -33% | 468 1% | 259 -44% |
| Brightness Distribution (%) | 85 | 89 5% | 93 9% | 85 0% | 89 5% | 86 1% |
| Black Level * (cd/m²) | 0.42 | 0.018 96% | 0.22 48% | 0.36 14% | 0.37 12% | |
| Contrast (:1) | 1119 | 21111 1787% | 1559 39% | 1417 27% | 723 -35% | |
| Colorchecker dE 2000 * | 5.16 | 3.2 38% | 5.47 -6% | 3.73 28% | 2.3 55% | 4.21 18% |
| Colorchecker dE 2000 max. * | 9.33 | 8.4 10% | 8.19 12% | 6.51 30% | 5.5 41% | 21.1 -126% |
| Colorchecker dE 2000 calibrated * | 3.75 | 2.8 25% | 3.04 19% | 1.43 62% | 1.2 68% | 4.27 -14% |
| Greyscale dE 2000 * | 5.5 | 1.8 67% | 5.3 4% | 4.24 23% | 3.2 42% | 2.3 58% |
| Gamma | 2 110% | 2.15 102% | 2.15 102% | 2.2 100% | 2.34 94% | 2.2 100% |
| CCT | 6198 105% | 6176 105% | 6128 106% | 6329 103% | 7036 92% | 6578 99% |
| Color Space (Percent of AdobeRGB 1998) (%) | 89.2 | 86.8 -3% | 86 -4% | 78 -13% | 59.4 -33% | 37.2 -58% |
| Color Space (Percent of sRGB) (%) | 100 | 100 0% | 100 0% | 100 0% | 93.1 -7% | 58.5 -41% |
| Total Average (Program / Settings) | 37% /
23% | 88% /
129% | 15% /
14% | 6% /
12% | -19% /
-24% |
* ... smaller is better
Display Response Times
| ↔ Response Time Black to White | ||
|---|---|---|
| 34 ms ... rise ↗ and fall ↘ combined | ↗ 17.6 ms rise | 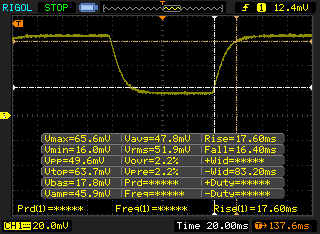 |
| ↘ 16.4 ms fall | ||
| The screen shows slow response rates in our tests and will be unsatisfactory for gamers. In comparison, all tested devices range from 0.1 (minimum) to 240 (maximum) ms. » 91 % of all devices are better. This means that the measured response time is worse than the average of all tested devices (19.8 ms). | ||
| ↔ Response Time 50% Grey to 80% Grey | ||
| 46 ms ... rise ↗ and fall ↘ combined | ↗ 24 ms rise | 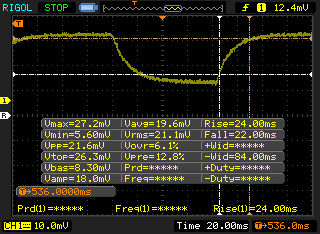 |
| ↘ 22 ms fall | ||
| The screen shows slow response rates in our tests and will be unsatisfactory for gamers. In comparison, all tested devices range from 0.165 (minimum) to 636 (maximum) ms. » 79 % of all devices are better. This means that the measured response time is worse than the average of all tested devices (30.9 ms). | ||
Screen Flickering / PWM (Pulse-Width Modulation)
| Screen flickering / PWM not detected |  | ||
In comparison: 52 % of all tested devices do not use PWM to dim the display. If PWM was detected, an average of 7741 (minimum: 5 - maximum: 343500) Hz was measured. | |||
Cinebench R15: CPU Multi 64Bit | CPU Single 64Bit
Blender: v2.79 BMW27 CPU
7-Zip 18.03: 7z b 4 -mmt1 | 7z b 4
Geekbench 5.5: Single-Core | Multi-Core
HWBOT x265 Benchmark v2.2: 4k Preset
LibreOffice : 20 Documents To PDF
R Benchmark 2.5: Overall mean
| Cinebench R20 / CPU (Multi Core) | |
| Eluktronics RP-15 | |
| Asus ROG Zephyrus Duo 15 GX550LXS | |
| Average Intel Core i7-10875H (1986 - 4176, n=32) | |
| Dell Precision 5550 P91F | |
| Apple MacBook Pro 15 2019 i9 Vega 16 | |
| MSI GS66 Stealth 10SE-045 | |
| Razer Blade 15 Studio Edition 2020 | |
| Schenker Work 15 | |
| Dell XPS 15 9500 Core i5 | |
| Razer Blade 15 Studio Edition | |
| Cinebench R20 / CPU (Single Core) | |
| Asus ROG Zephyrus Duo 15 GX550LXS | |
| Dell Precision 5550 P91F | |
| Eluktronics RP-15 | |
| Average Intel Core i7-10875H (430 - 524, n=32) | |
| Razer Blade 15 Studio Edition 2020 | |
| Apple MacBook Pro 15 2019 i9 Vega 16 | |
| MSI GS66 Stealth 10SE-045 | |
| Dell XPS 15 9500 Core i5 | |
| Razer Blade 15 Studio Edition | |
| Schenker Work 15 | |
| Cinebench R15 / CPU Multi 64Bit | |
| Eluktronics RP-15 | |
| Asus ROG Zephyrus Duo 15 GX550LXS | |
| Average Intel Core i7-10875H (1003 - 1833, n=38) | |
| Dell Precision 5550 P91F | |
| Dell Precision 5540 | |
| Apple MacBook Pro 15 2019 i9 Vega 16 | |
| Lenovo ThinkPad P53-20QN000YGE | |
| MSI GS66 Stealth 10SE-045 | |
| Razer Blade 15 Studio Edition 2020 | |
| Razer Blade 15 Studio Edition | |
| Schenker Work 15 | |
| Dell XPS 15 9500 Core i5 | |
| Cinebench R15 / CPU Single 64Bit | |
| Asus ROG Zephyrus Duo 15 GX550LXS | |
| Average Intel Core i7-10875H (190 - 220, n=37) | |
| Dell Precision 5550 P91F | |
| Lenovo ThinkPad P53-20QN000YGE | |
| Dell Precision 5540 | |
| Razer Blade 15 Studio Edition 2020 | |
| Eluktronics RP-15 | |
| MSI GS66 Stealth 10SE-045 | |
| Dell XPS 15 9500 Core i5 | |
| Apple MacBook Pro 15 2019 i9 Vega 16 | |
| Razer Blade 15 Studio Edition | |
| Schenker Work 15 | |
| Blender / v2.79 BMW27 CPU | |
| Dell XPS 15 9500 Core i5 | |
| Schenker Work 15 | |
| Schenker Work 15 | |
| Lenovo ThinkPad P53-20QN000YGE | |
| MSI GS66 Stealth 10SE-045 | |
| Razer Blade 15 Studio Edition 2020 | |
| Apple MacBook Pro 15 2019 i9 Vega 16 | |
| Dell Precision 5550 P91F | |
| Dell Precision 5540 | |
| Average Intel Core i7-10875H (259 - 535, n=30) | |
| Asus ROG Zephyrus Duo 15 GX550LXS | |
| Eluktronics RP-15 | |
| 7-Zip 18.03 / 7z b 4 -mmt1 | |
| Dell Precision 5550 P91F | |
| Asus ROG Zephyrus Duo 15 GX550LXS | |
| Average Intel Core i7-10875H (5071 - 5780, n=31) | |
| Razer Blade 15 Studio Edition 2020 | |
| Dell Precision 5540 | |
| Lenovo ThinkPad P53-20QN000YGE | |
| Dell XPS 15 9500 Core i5 | |
| MSI GS66 Stealth 10SE-045 | |
| Eluktronics RP-15 | |
| Schenker Work 15 | |
| Schenker Work 15 | |
| 7-Zip 18.03 / 7z b 4 | |
| Eluktronics RP-15 | |
| Asus ROG Zephyrus Duo 15 GX550LXS | |
| Average Intel Core i7-10875H (29844 - 49562, n=31) | |
| Dell Precision 5550 P91F | |
| Dell Precision 5540 | |
| Razer Blade 15 Studio Edition 2020 | |
| MSI GS66 Stealth 10SE-045 | |
| Lenovo ThinkPad P53-20QN000YGE | |
| Schenker Work 15 | |
| Schenker Work 15 | |
| Dell XPS 15 9500 Core i5 | |
| Geekbench 5.5 / Single-Core | |
| Asus ROG Zephyrus Duo 15 GX550LXS | |
| Dell Precision 5550 P91F | |
| Average Intel Core i7-10875H (1233 - 1371, n=29) | |
| Razer Blade 15 Studio Edition 2020 | |
| Eluktronics RP-15 | |
| MSI GS66 Stealth 10SE-045 | |
| Dell XPS 15 9500 Core i5 | |
| Geekbench 5.5 / Multi-Core | |
| Eluktronics RP-15 | |
| Asus ROG Zephyrus Duo 15 GX550LXS | |
| Dell Precision 5550 P91F | |
| Average Intel Core i7-10875H (5715 - 8620, n=29) | |
| Razer Blade 15 Studio Edition 2020 | |
| MSI GS66 Stealth 10SE-045 | |
| Dell XPS 15 9500 Core i5 | |
| HWBOT x265 Benchmark v2.2 / 4k Preset | |
| Eluktronics RP-15 | |
| Asus ROG Zephyrus Duo 15 GX550LXS | |
| Average Intel Core i7-10875H (7.27 - 14.1, n=27) | |
| Dell Precision 5540 | |
| Dell Precision 5550 P91F | |
| Razer Blade 15 Studio Edition 2020 | |
| MSI GS66 Stealth 10SE-045 | |
| Lenovo ThinkPad P53-20QN000YGE | |
| Schenker Work 15 | |
| Schenker Work 15 | |
| Dell XPS 15 9500 Core i5 | |
| LibreOffice / 20 Documents To PDF | |
| Dell XPS 15 9500 Core i5 | |
| Eluktronics RP-15 | |
| MSI GS66 Stealth 10SE-045 | |
| Asus ROG Zephyrus Duo 15 GX550LXS | |
| Average Intel Core i7-10875H (30.2 - 84.3, n=30) | |
| Razer Blade 15 Studio Edition 2020 | |
| Dell Precision 5550 P91F | |
| R Benchmark 2.5 / Overall mean | |
| Dell XPS 15 9500 Core i5 | |
| MSI GS66 Stealth 10SE-045 | |
| Dell Precision 5550 P91F | |
| Razer Blade 15 Studio Edition 2020 | |
| Asus ROG Zephyrus Duo 15 GX550LXS | |
| Average Intel Core i7-10875H (0.546 - 0.662, n=29) | |
| Eluktronics RP-15 | |
* ... smaller is better
| PCMark 8 | |
| Home Score Accelerated v2 | |
| MSI WP65 | |
| Acer ConceptD 3 Pro CN315-71P-73W1 | |
| Dell Precision 5550 P91F | |
| Dell Precision 5540 | |
| Razer Blade 15 Studio Edition 2020 | |
| Work Score Accelerated v2 | |
| Acer ConceptD 3 Pro CN315-71P-73W1 | |
| MSI WP65 | |
| Razer Blade 15 Studio Edition 2020 | |
| Dell Precision 5540 | |
| Dell Precision 5550 P91F | |
| PCMark 8 Home Score Accelerated v2 | 3729 points | |
| PCMark 8 Work Score Accelerated v2 | 4515 points | |
| PCMark 10 Score | 5442 points | |
Help | ||
| DPC Latencies / LatencyMon - interrupt to process latency (max), Web, Youtube, Prime95 | |
| Dell XPS 15 9500 Core i7 4K UHD | |
| Asus ROG Zephyrus Duo 15 GX550LXS | |
| Dell XPS 15 9500 Core i5 | |
| Acer ConceptD 3 Pro CN315-71P-73W1 | |
| Razer Blade 15 Studio Edition 2020 | |
| Eluktronics RP-15 | |
| Dell Precision 5550 P91F | |
* ... smaller is better
| Dell Precision 5550 P91F SK Hynix PC601A NVMe 1TB | Dell Precision 5540 SK hynix PC400 512 GB | Razer Blade 15 Studio Edition 2020 Samsung PM981a MZVLB1T0HBLR | Acer ConceptD 3 Pro CN315-71P-73W1 WDC PC SN720 SDAPNTW-512G | MSI WP65 Samsung SSD PM981 MZVLB512HAJQ | |
|---|---|---|---|---|---|
| AS SSD | -14% | 10% | 4% | 8% | |
| Seq Read (MB/s) | 2039 | 1743 -15% | 1982 -3% | 2973 46% | 1097 -46% |
| Seq Write (MB/s) | 1376 | 930 -32% | 2252 64% | 2429 77% | 1838 34% |
| 4K Read (MB/s) | 44.11 | 39.1 -11% | 47.13 7% | 24.7 -44% | 52.9 20% |
| 4K Write (MB/s) | 113.3 | 92.1 -19% | 88.2 -22% | 115.3 2% | 108.4 -4% |
| 4K-64 Read (MB/s) | 1094 | 956 -13% | 1481 35% | 1243 14% | 1509 38% |
| 4K-64 Write (MB/s) | 1630 | 863 -47% | 1842 13% | 835 -49% | 1695 4% |
| Access Time Read * (ms) | 0.059 | 0.074 -25% | 0.087 -47% | 0.067 -14% | |
| Access Time Write * (ms) | 0.99 | 0.053 95% | 0.04 96% | 0.034 97% | 0.103 90% |
| Score Read (Points) | 1342 | 1170 -13% | 1726 29% | 1565 17% | 1671 25% |
| Score Write (Points) | 1881 | 1048 -44% | 2155 15% | 1193 -37% | 1988 6% |
| Score Total (Points) | 3883 | 2781 -28% | 4781 23% | 3525 -9% | 4558 17% |
| Copy ISO MB/s (MB/s) | 2489 | 1982 -20% | 2136 -14% | 1800 -28% | |
| Copy Program MB/s (MB/s) | 682 | 501 -27% | 489.6 -28% | 569 -17% | |
| Copy Game MB/s (MB/s) | 1515 | 1140 -25% | 1163 -23% | 1409 -7% | |
| CrystalDiskMark 5.2 / 6 | -18% | 14% | -3% | 5% | |
| Write 4K (MB/s) | 122.6 | 98 -20% | 132.9 8% | 113.2 -8% | 126.9 4% |
| Read 4K (MB/s) | 42.4 | 41.25 -3% | 46.73 10% | 31.1 -27% | 44.91 6% |
| Write Seq (MB/s) | 2167 | 1295 -40% | 2214 2% | 2540 17% | 1944 -10% |
| Read Seq (MB/s) | 1747 | 1441 -18% | 2018 16% | 2005 15% | 1449 -17% |
| Write 4K Q32T1 (MB/s) | 388.8 | 429.2 10% | 478.9 23% | 331.4 -15% | 531 37% |
| Read 4K Q32T1 (MB/s) | 367.3 | 400.1 9% | 540 47% | 368.3 0% | 579 58% |
| Write Seq Q32T1 (MB/s) | 2629 | 1366 -48% | 2975 13% | 2535 -4% | 1970 -25% |
| Read Seq Q32T1 (MB/s) | 3460 | 2201 -36% | 3195 -8% | 3427 -1% | 2990 -14% |
| Total Average (Program / Settings) | -16% /
-16% | 12% /
11% | 1% /
1% | 7% /
7% |
* ... smaller is better

Disk Throttling: DiskSpd Read Loop, Queue Depth 8
| 3DMark | |
| 1280x720 Cloud Gate Standard Graphics | |
| Lenovo ThinkPad P53-20QN000YGE | |
| Razer Blade 15 Studio Edition 2020 | |
| Razer Blade 15 Studio Edition | |
| Eluktronics RP-15 | |
| Dell Precision 7540 | |
| Acer ConceptD 3 Pro CN315-71P-73W1 | |
| Apple MacBook Pro 15 2019 i9 Vega 16 | |
| Dell Precision 5540 | |
| Dell Precision 5550 P91F | |
| Dell XPS 15 9500 Core i7 4K UHD | |
| MSI WP65 | |
| Schenker Work 15 | |
| 1920x1080 Fire Strike Graphics | |
| Razer Blade 15 Studio Edition 2020 | |
| Razer Blade 15 Studio Edition | |
| Lenovo ThinkPad P53-20QN000YGE | |
| Eluktronics RP-15 | |
| Dell XPS 15 9500 Core i7 4K UHD | |
| Acer ConceptD 3 Pro CN315-71P-73W1 | |
| Dell Precision 5550 P91F | |
| Dell Precision 5540 | |
| Apple MacBook Pro 15 2019 i9 Vega 16 | |
| MSI WP65 | |
| Schenker Work 15 | |
| 2560x1440 Time Spy Graphics | |
| Razer Blade 15 Studio Edition 2020 | |
| Razer Blade 15 Studio Edition | |
| Lenovo ThinkPad P53-20QN000YGE | |
| Eluktronics RP-15 | |
| Dell Precision 7540 | |
| Dell XPS 15 9500 Core i7 4K UHD | |
| Acer ConceptD 3 Pro CN315-71P-73W1 | |
| Dell Precision 5550 P91F | |
| Dell Precision 5540 | |
| Apple MacBook Pro 15 2019 i9 Vega 16 | |
| MSI WP65 | |
| Schenker Work 15 | |
| 3DMark 11 | |
| 1280x720 Performance GPU | |
| Razer Blade 15 Studio Edition 2020 | |
| Razer Blade 15 Studio Edition | |
| Lenovo ThinkPad P53-20QN000YGE | |
| Eluktronics RP-15 | |
| Dell XPS 15 9500 Core i7 4K UHD | |
| Acer ConceptD 3 Pro CN315-71P-73W1 | |
| Dell Precision 5540 | |
| Dell Precision 5550 P91F | |
| Apple MacBook Pro 15 2019 i9 Vega 16 | |
| MSI WP65 | |
| Schenker Work 15 | |
| 1280x720 Performance Combined | |
| Eluktronics RP-15 | |
| Dell XPS 15 9500 Core i7 4K UHD | |
| Lenovo ThinkPad P53-20QN000YGE | |
| Razer Blade 15 Studio Edition 2020 | |
| Dell Precision 5550 P91F | |
| Razer Blade 15 Studio Edition | |
| Acer ConceptD 3 Pro CN315-71P-73W1 | |
| Dell Precision 5540 | |
| Apple MacBook Pro 15 2019 i9 Vega 16 | |
| MSI WP65 | |
| Schenker Work 15 | |
| 3DMark 11 Performance | 12119 points | |
| 3DMark Cloud Gate Standard Score | 21582 points | |
| 3DMark Fire Strike Score | 7767 points | |
| 3DMark Time Spy Score | 3348 points | |
Help | ||
| low | med. | high | ultra | QHD | 4K | |
|---|---|---|---|---|---|---|
| The Witcher 3 (2015) | 181 | 107.6 | 62.5 | 33.4 | ||
| Dota 2 Reborn (2015) | 153 | 140 | 130 | 118 | 47.9 | |
| Final Fantasy XV Benchmark (2018) | 91 | 48.5 | 36.8 | 25.7 | 13.7 | |
| X-Plane 11.11 (2018) | 91.9 | 76 | 64.8 | 47.2 | ||
| Shadow of the Tomb Raider (2018) | 101 | 56 | 48 | 42 | ||
| Assassin´s Creed Odyssey (2018) | 71 | 53 | 45 | 25 | ||
| Apex Legends (2019) | 144 | 86.4 | 72.7 | 64.9 | ||
| Far Cry New Dawn (2019) | 83 | 58 | 55 | 50 | ||
| Metro Exodus (2019) | 91.5 | 41.74 | 31.2 | 24.6 | ||
| Dirt Rally 2.0 (2019) | 271 | 86.1 | 69.9 | 40.3 | ||
| Total War: Three Kingdoms (2019) | 148.4 | 60.3 | 36.3 | 24.4 | ||
| Control (2019) | 120.2 | 40.4 | 28.3 | |||
| Borderlands 3 (2019) | 123.4 | 56 | 35.8 | 27.3 | ||
| GRID 2019 (2019) | 179 | 94.7 | 77.7 | 51 | ||
| Star Wars Jedi Fallen Order (2019) | 64.2 | 53.1 | 47 | |||
| Hunt Showdown (2020) | 141.3 | 50.3 | 44.5 | |||
| Doom Eternal (2020) | 147.4 | 85.5 | 58.1 | |||
| Gears Tactics (2020) | 263.3 | 77.5 | 47.6 | 35.1 | ||
| F1 2020 (2020) | 182 | 96 | 78 | 55 |
| Dell Precision 5550 P91F Quadro T2000 Max-Q, i7-10875H, SK Hynix PC601A NVMe 1TB | Dell Precision 5540 Quadro T2000 Max-Q, i9-9980HK, SK hynix PC400 512 GB | Razer Blade 15 Studio Edition 2020 Quadro RTX 5000 Max-Q, i7-10875H, Samsung PM981a MZVLB1T0HBLR | Acer ConceptD 3 Pro CN315-71P-73W1 Quadro T1000 (Laptop), i7-9750H, WDC PC SN720 SDAPNTW-512G | Lenovo ThinkPad P53-20QN000YGE Quadro RTX 5000 Max-Q, i7-9850H, Samsung PM981a MZVLB1T0HBLR | MSI WP65 Quadro P620, i7-9750H, Samsung SSD PM981 MZVLB512HAJQ | |
|---|---|---|---|---|---|---|
| Noise | 2% | -11% | -7% | 3% | -15% | |
| off / environment * (dB) | 26.2 | 28.6 -9% | 30.1 -15% | 31.2 -19% | 28.3 -8% | 28.7 -10% |
| Idle Minimum * (dB) | 26.2 | 28.6 -9% | 30.1 -15% | 31.2 -19% | 28.3 -8% | 33.4 -27% |
| Idle Average * (dB) | 26.2 | 28.6 -9% | 30.1 -15% | 31.2 -19% | 28.3 -8% | 33.5 -28% |
| Idle Maximum * (dB) | 26.2 | 28.6 -9% | 30.1 -15% | 31.5 -20% | 28.3 -8% | 33.5 -28% |
| Load Average * (dB) | 39.2 | 33.3 15% | 42.3 -8% | 38.4 2% | 29.8 24% | 37 6% |
| Witcher 3 ultra * (dB) | 39 | 34.7 11% | 48.2 -24% | 36.9 5% | 38.3 2% | 38.7 1% |
| Load Maximum * (dB) | 50.6 | 38 25% | 42.1 17% | 41.2 19% | 38.3 24% | 59.5 -18% |
* ... smaller is better
Noise level
| Idle |
| 26.2 / 26.2 / 26.2 dB(A) |
| Load |
| 39.2 / 50.6 dB(A) |
 | ||
30 dB silent 40 dB(A) audible 50 dB(A) loud |
||
min: | ||
(-) The maximum temperature on the upper side is 47 °C / 117 F, compared to the average of 38.2 °C / 101 F, ranging from 22.2 to 69.8 °C for the class Workstation.
(±) The bottom heats up to a maximum of 44 °C / 111 F, compared to the average of 41.1 °C / 106 F
(+) In idle usage, the average temperature for the upper side is 27.1 °C / 81 F, compared to the device average of 32 °C / 90 F.
(±) Playing The Witcher 3, the average temperature for the upper side is 35.4 °C / 96 F, compared to the device average of 32 °C / 90 F.
(+) The palmrests and touchpad are reaching skin temperature as a maximum (32.2 °C / 90 F) and are therefore not hot.
(-) The average temperature of the palmrest area of similar devices was 27.8 °C / 82 F (-4.4 °C / -8 F).
Dell Precision 5550 P91F audio analysis
(+) | speakers can play relatively loud (85 dB)
Bass 100 - 315 Hz
(±) | reduced bass - on average 5.7% lower than median
(±) | linearity of bass is average (7.7% delta to prev. frequency)
Mids 400 - 2000 Hz
(+) | balanced mids - only 2.9% away from median
(+) | mids are linear (4.2% delta to prev. frequency)
Highs 2 - 16 kHz
(+) | balanced highs - only 2.3% away from median
(+) | highs are linear (2.6% delta to prev. frequency)
Overall 100 - 16.000 Hz
(+) | overall sound is linear (6.7% difference to median)
Compared to same class
» 0% of all tested devices in this class were better, 1% similar, 99% worse
» The best had a delta of 7%, average was 17%, worst was 35%
Compared to all devices tested
» 1% of all tested devices were better, 0% similar, 99% worse
» The best had a delta of 4%, average was 23%, worst was 134%
Apple MacBook 12 (Early 2016) 1.1 GHz audio analysis
(+) | speakers can play relatively loud (83.6 dB)
Bass 100 - 315 Hz
(±) | reduced bass - on average 11.3% lower than median
(±) | linearity of bass is average (14.2% delta to prev. frequency)
Mids 400 - 2000 Hz
(+) | balanced mids - only 2.4% away from median
(+) | mids are linear (5.5% delta to prev. frequency)
Highs 2 - 16 kHz
(+) | balanced highs - only 2% away from median
(+) | highs are linear (4.5% delta to prev. frequency)
Overall 100 - 16.000 Hz
(+) | overall sound is linear (10.2% difference to median)
Compared to same class
» 7% of all tested devices in this class were better, 2% similar, 90% worse
» The best had a delta of 5%, average was 18%, worst was 53%
Compared to all devices tested
» 5% of all tested devices were better, 1% similar, 94% worse
» The best had a delta of 4%, average was 23%, worst was 134%
| Off / Standby | |
| Idle | |
| Load |
|
Key:
min: | |
| Dell Precision 5550 P91F i7-10875H, Quadro T2000 Max-Q, SK Hynix PC601A NVMe 1TB, IPS, 3840x2400, 15.6" | Dell Precision 5540 i9-9980HK, Quadro T2000 Max-Q, SK hynix PC400 512 GB, OLED, 3840x2160, 15.6" | Razer Blade 15 Studio Edition 2020 i7-10875H, Quadro RTX 5000 Max-Q, Samsung PM981a MZVLB1T0HBLR, OLED, 3840x2160, 15.6" | Acer ConceptD 3 Pro CN315-71P-73W1 i7-9750H, Quadro T1000 (Laptop), WDC PC SN720 SDAPNTW-512G, IPS, 1920x1080, 15.6" | Lenovo ThinkPad P53-20QN000YGE i7-9850H, Quadro RTX 5000 Max-Q, Samsung PM981a MZVLB1T0HBLR, IPS, 1920x1080, 15.6" | MSI WP65 i7-9750H, Quadro P620, Samsung SSD PM981 MZVLB512HAJQ, IPS, 1920x1080, 15.6" | |
|---|---|---|---|---|---|---|
| Power Consumption | -2% | -59% | 31% | -27% | -4% | |
| Idle Minimum * (Watt) | 5.6 | 7.4 -32% | 13.4 -139% | 2.9 48% | 7.9 -41% | 5.6 -0% |
| Idle Average * (Watt) | 11.2 | 12.1 -8% | 18 -61% | 5.5 51% | 11.8 -5% | 8.6 23% |
| Idle Maximum * (Watt) | 18.4 | 12.7 31% | 26.1 -42% | 10.6 42% | 14.9 19% | 30.7 -67% |
| Load Average * (Watt) | 114 | 98 14% | 115 -1% | 86 25% | 96 16% | 78 32% |
| Witcher 3 ultra * (Watt) | 76.7 | 89.9 -17% | 145 -89% | 83 -8% | 149 -94% | 63.5 17% |
| Load Maximum * (Watt) | 134.2 | 135.1 -1% | 165 -23% | 100.7 25% | 207.8 -55% | 170.2 -27% |
* ... smaller is better
| Dell Precision 5550 P91F i7-10875H, Quadro T2000 Max-Q, 86 Wh | Dell Precision 5540 i9-9980HK, Quadro T2000 Max-Q, 97 Wh | Razer Blade 15 Studio Edition 2020 i7-10875H, Quadro RTX 5000 Max-Q, 80 Wh | Acer ConceptD 3 Pro CN315-71P-73W1 i7-9750H, Quadro T1000 (Laptop), 58.7 Wh | Lenovo ThinkPad P53-20QN000YGE i7-9850H, Quadro RTX 5000 Max-Q, 90 Wh | MSI WP65 i7-9750H, Quadro P620, 51 Wh | |
|---|---|---|---|---|---|---|
| Battery runtime | -9% | -18% | -10% | 33% | -48% | |
| Reader / Idle (h) | 22.6 | 15 -34% | 8.8 -61% | 10.1 -55% | ||
| WiFi v1.3 (h) | 9 | 7.7 -14% | 5.7 -37% | 8.1 -10% | 11.1 23% | 6 -33% |
| Load (h) | 1.4 | 1.7 21% | 2 43% | 2 43% | 0.6 -57% |
Pros
Cons
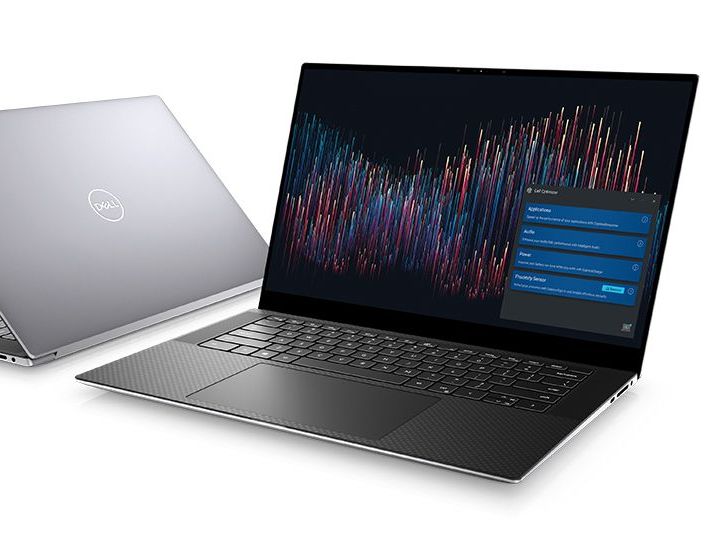
与大多数其他超轻薄工作站笔记本一样,Precision 5550应因其便携的机身,时尚的设计和令人印象深刻的触摸屏而备受瞩目,而不是其原始性能和端口选项。 这并不是说它的系统很弱,但是您不可避免地不得不牺牲一些高端图形选项来获得吸引人的超极本外观。
如果您不打算用于通勤,或者您可以接受大体积,那么比Precision 5550更大的Precision 7550将具有更多的拓展和更好的性能选择。该机器为旅行者和混合型工作需求者特别打造。 目的而不是作为台式机替代品,但是仍然一次要运行数小时的高负载。
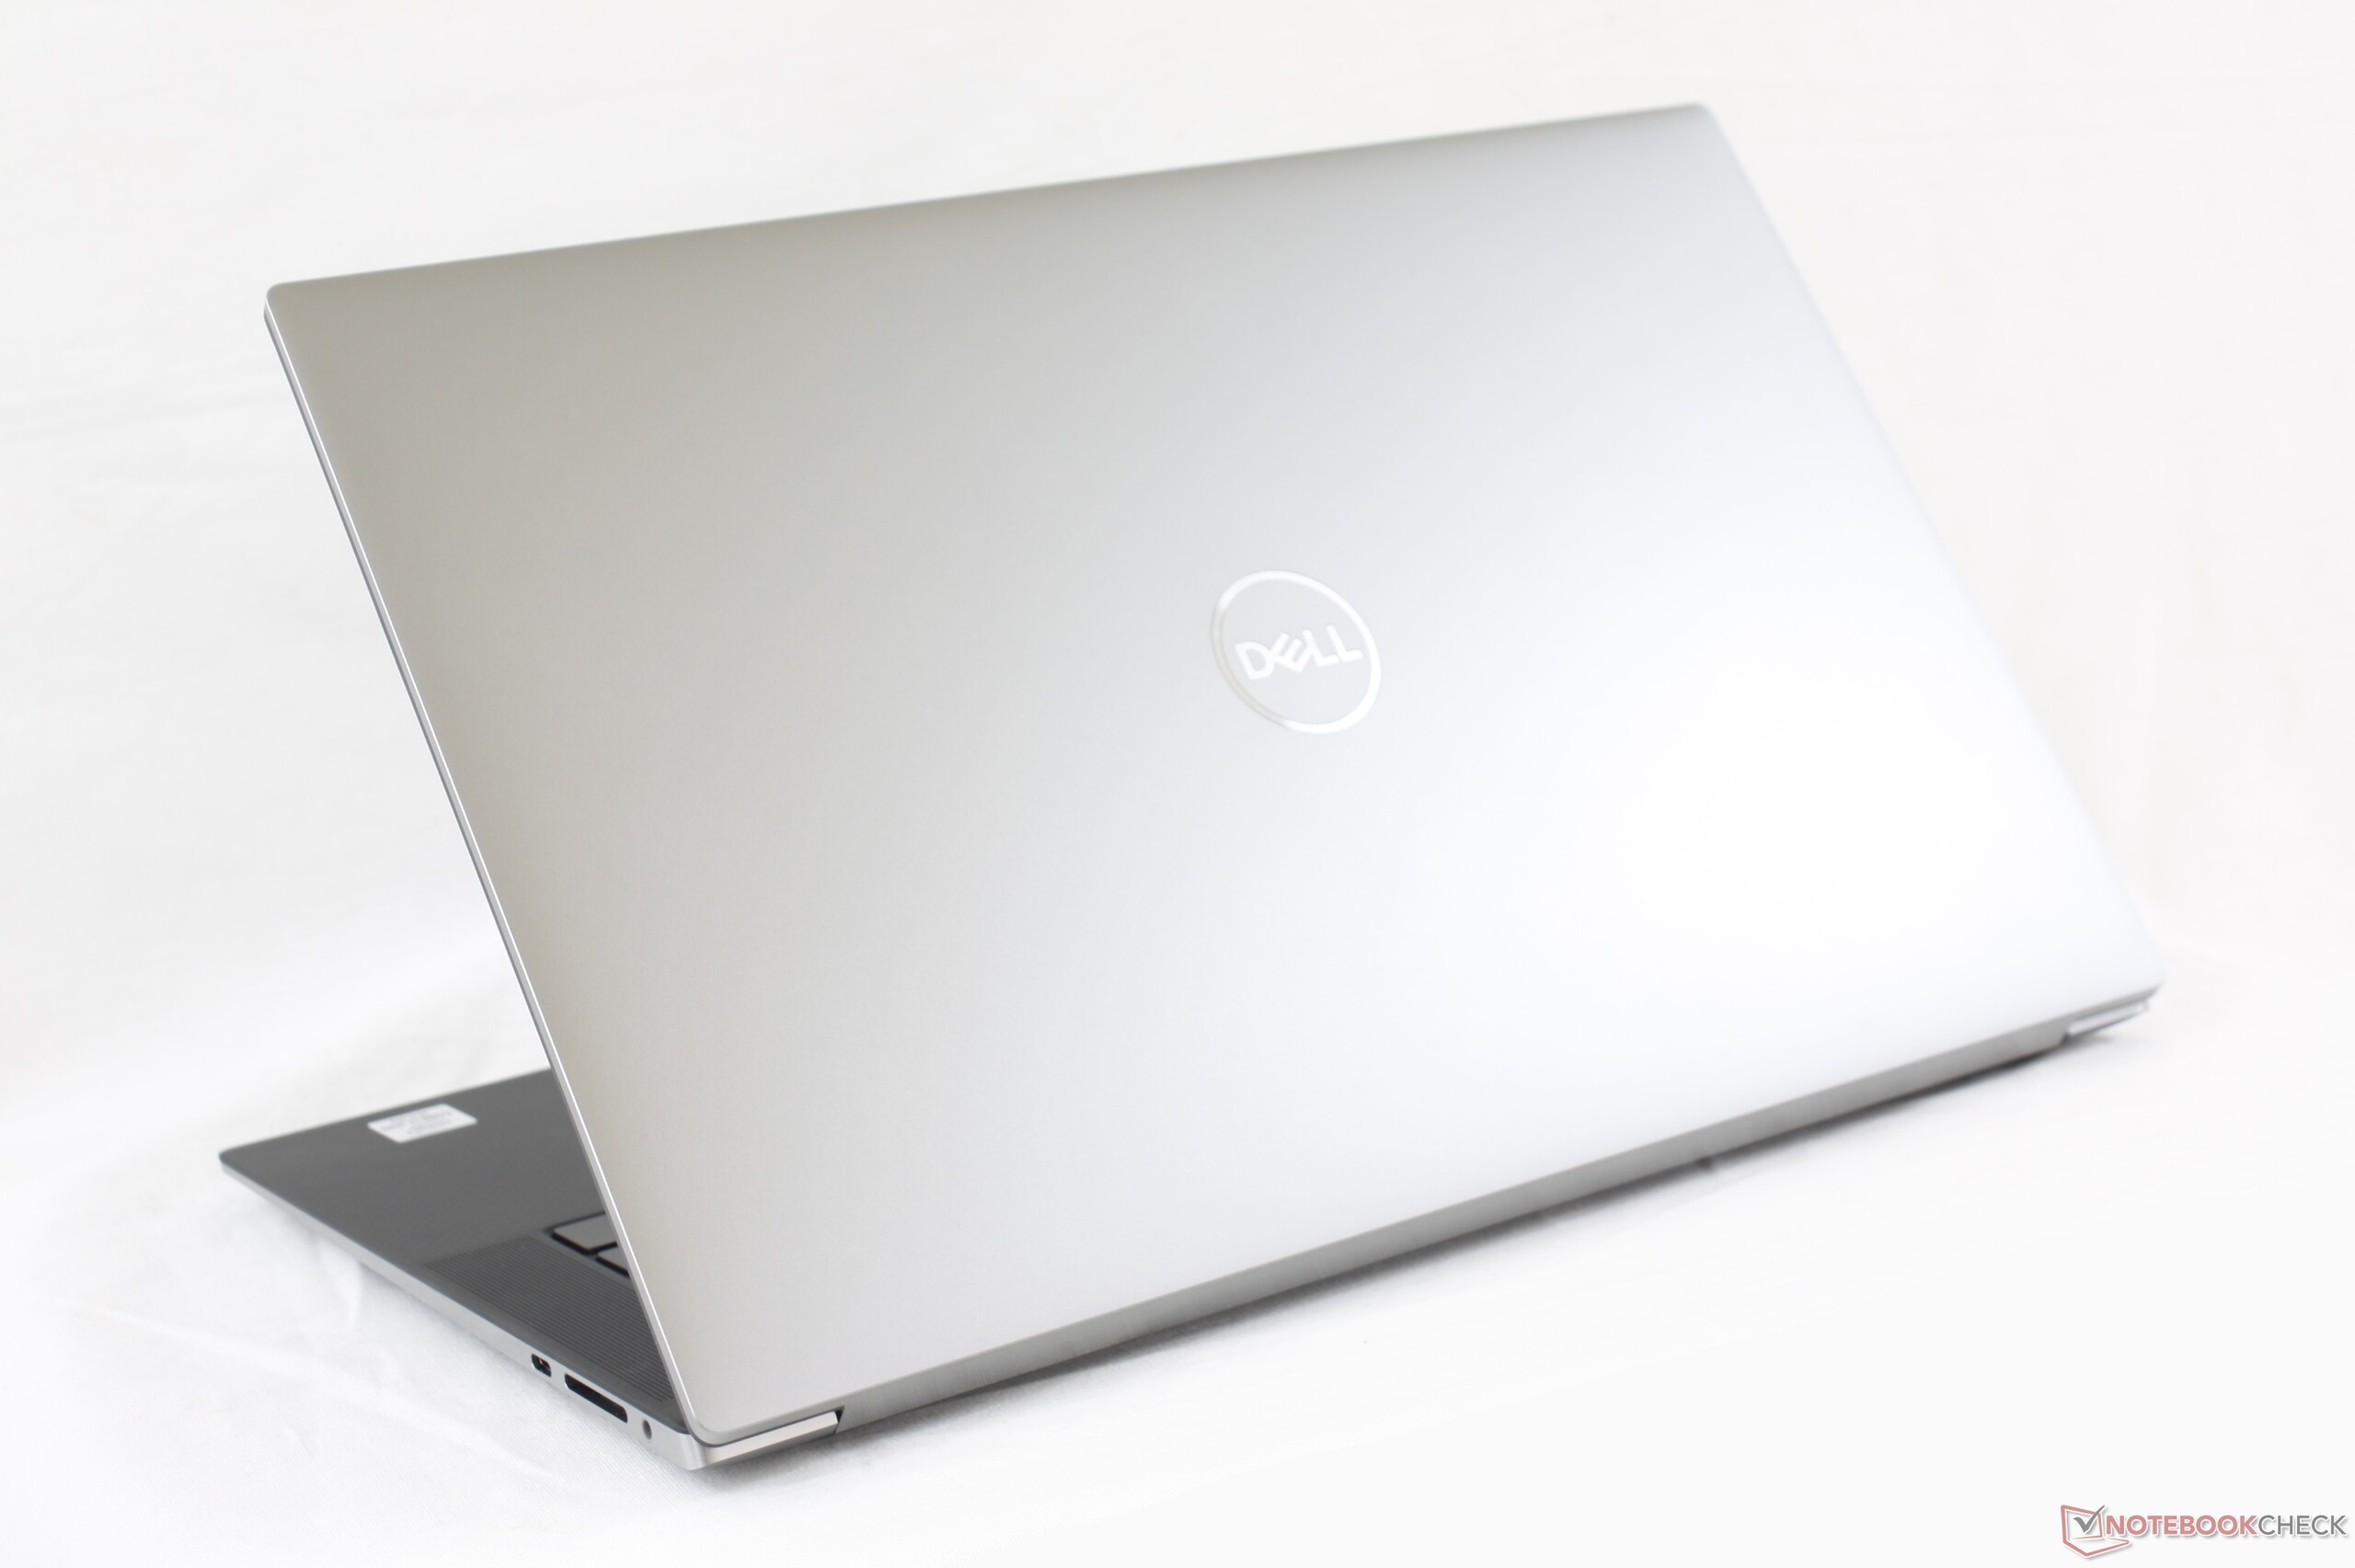
比当今市场上的大多数工作站更小,更薄,更轻。 Dell Precision 5550牺牲了更高的图形选项和端口种类,以实现出行友好的设计。
Dell Precision 5550 P91F
- 08/05/2020 v7 (old)
Allen Ngo
Price comparison

