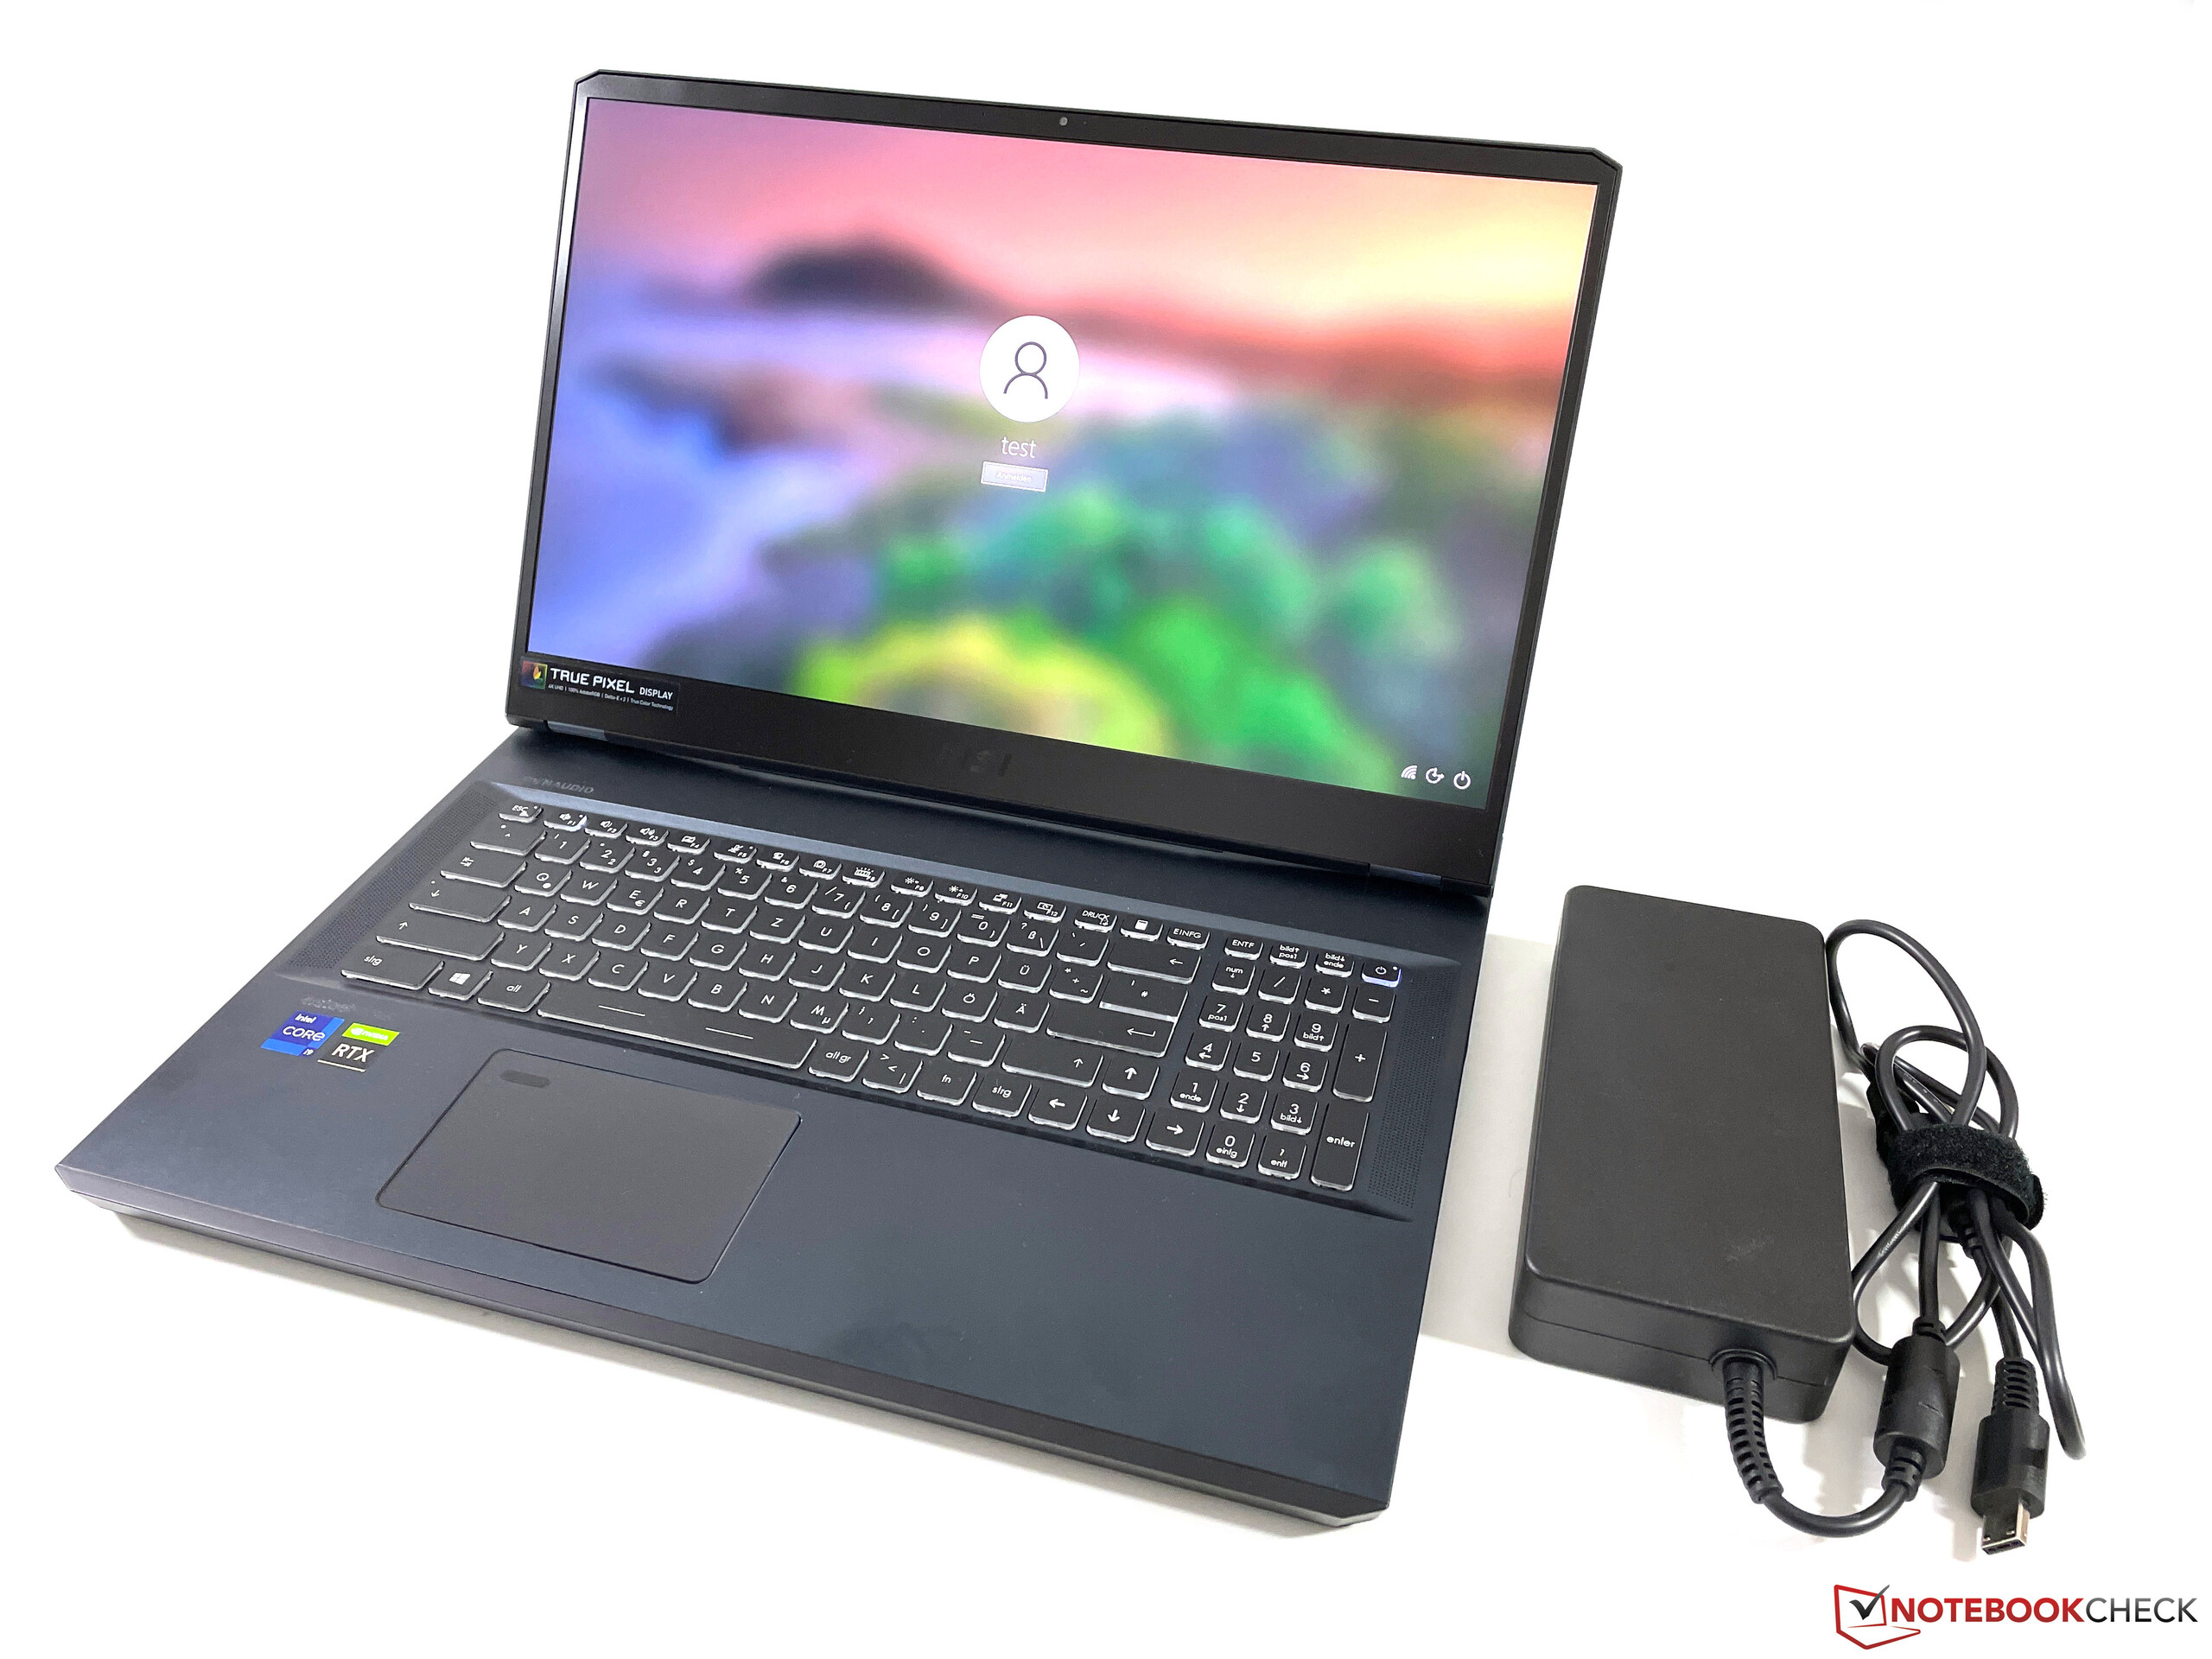
微星WE76的回顾。移动工作站追求最大性能

微星过去曾将其游戏笔记本稍作修改后作为移动工作站出售。由于游戏笔记本也是为高性能而设计的,此举是合理的。新的微星WE76是基于微星GE76,我们已经评测过。但WE76使用了Nvidia新的专业RTX A GPU,而不是消费者的GeForce 图形单元,也为专业软件提供了认证。
我们的评测单位是WE76 11UM-456高端型号,价格为4799欧元(约合人民币5,419元),配备的是 酷睿i9-11980HK处理器,专业的 RTX A5000 GPU,32GB内存,2TB PCIe 4.0固态硬盘,以及全AdobeRGB覆盖的哑光4K面板。还有另一种WE76 11UK-464型号,配备了 酷睿i7-11800H,以及RTX A3000和一个较小的1TB固态硬盘,售价为3099欧元(约合人民币3499元)。
Possible contenders in comparison
Rating | Date | Model | Weight | Height | Size | Resolution | Price |
|---|---|---|---|---|---|---|---|
| 88.6 % v7 (old) | 12 / 2021 | MSI WE76 11UM-456 i9-11980HK, RTX A5000 Laptop GPU | 2.9 kg | 25.9 mm | 17.30" | 3840x2160 | |
| 89.8 % v7 (old) | 11 / 2021 | Lenovo ThinkPad P1 G4-20Y4S0KS00 i7-11850H, GeForce RTX 3070 Laptop GPU | 2 kg | 17.7 mm | 16.00" | 3840x2400 | |
| 90.3 % v7 (old) | 10 / 2021 | HP ZBook Fury 15 G8 i9-11950H, RTX A5000 Laptop GPU | 2.5 kg | 25.9 mm | 15.60" | 3840x2160 | |
v (old) | 12 / 2021 | Asus ProArt StudioBook 16 W7600H5A-2BL2 W-11955M, RTX A5000 Laptop GPU | 2.4 kg | 21.4 mm | 16.00" | 3840x2400 | |
| 87.8 % v7 (old) | 10 / 2021 | Lenovo ThinkPad P17 G2-20YU0025G i7-11800H, RTX A2000 Laptop GPU | 3.6 kg | 28.38 mm | 17.30" | 1920x1080 | |
| 89.8 % v7 (old) | 09 / 2021 | HP ZBook Fury 17 G7 119W5EA i9-10885H, Quadro RTX 4000 Max-Q | 2.9 kg | 26.9 mm | 17.30" | 3840x2160 |
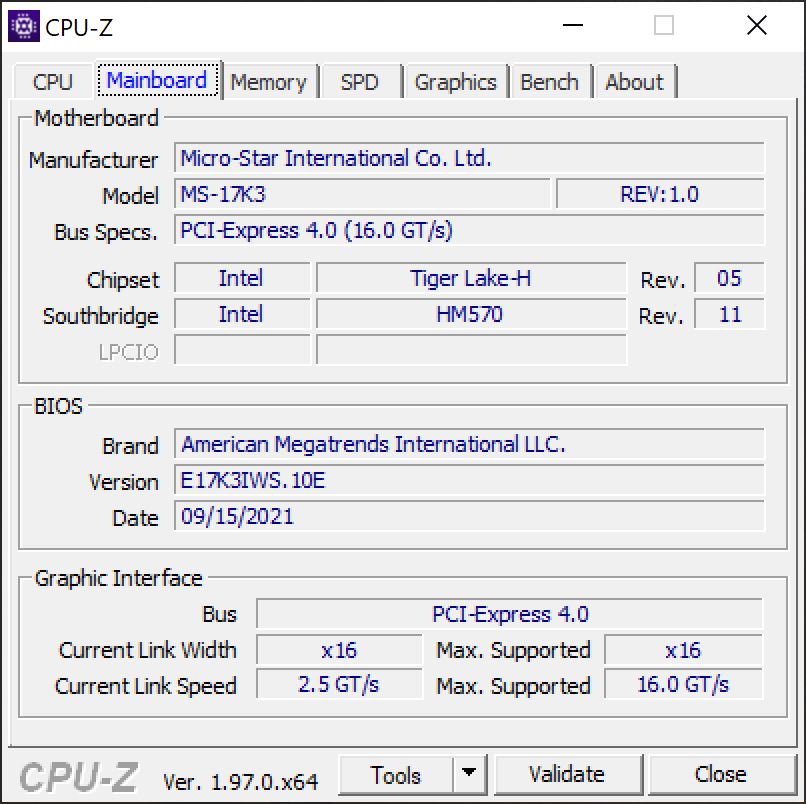
机箱 - 微星没有照明
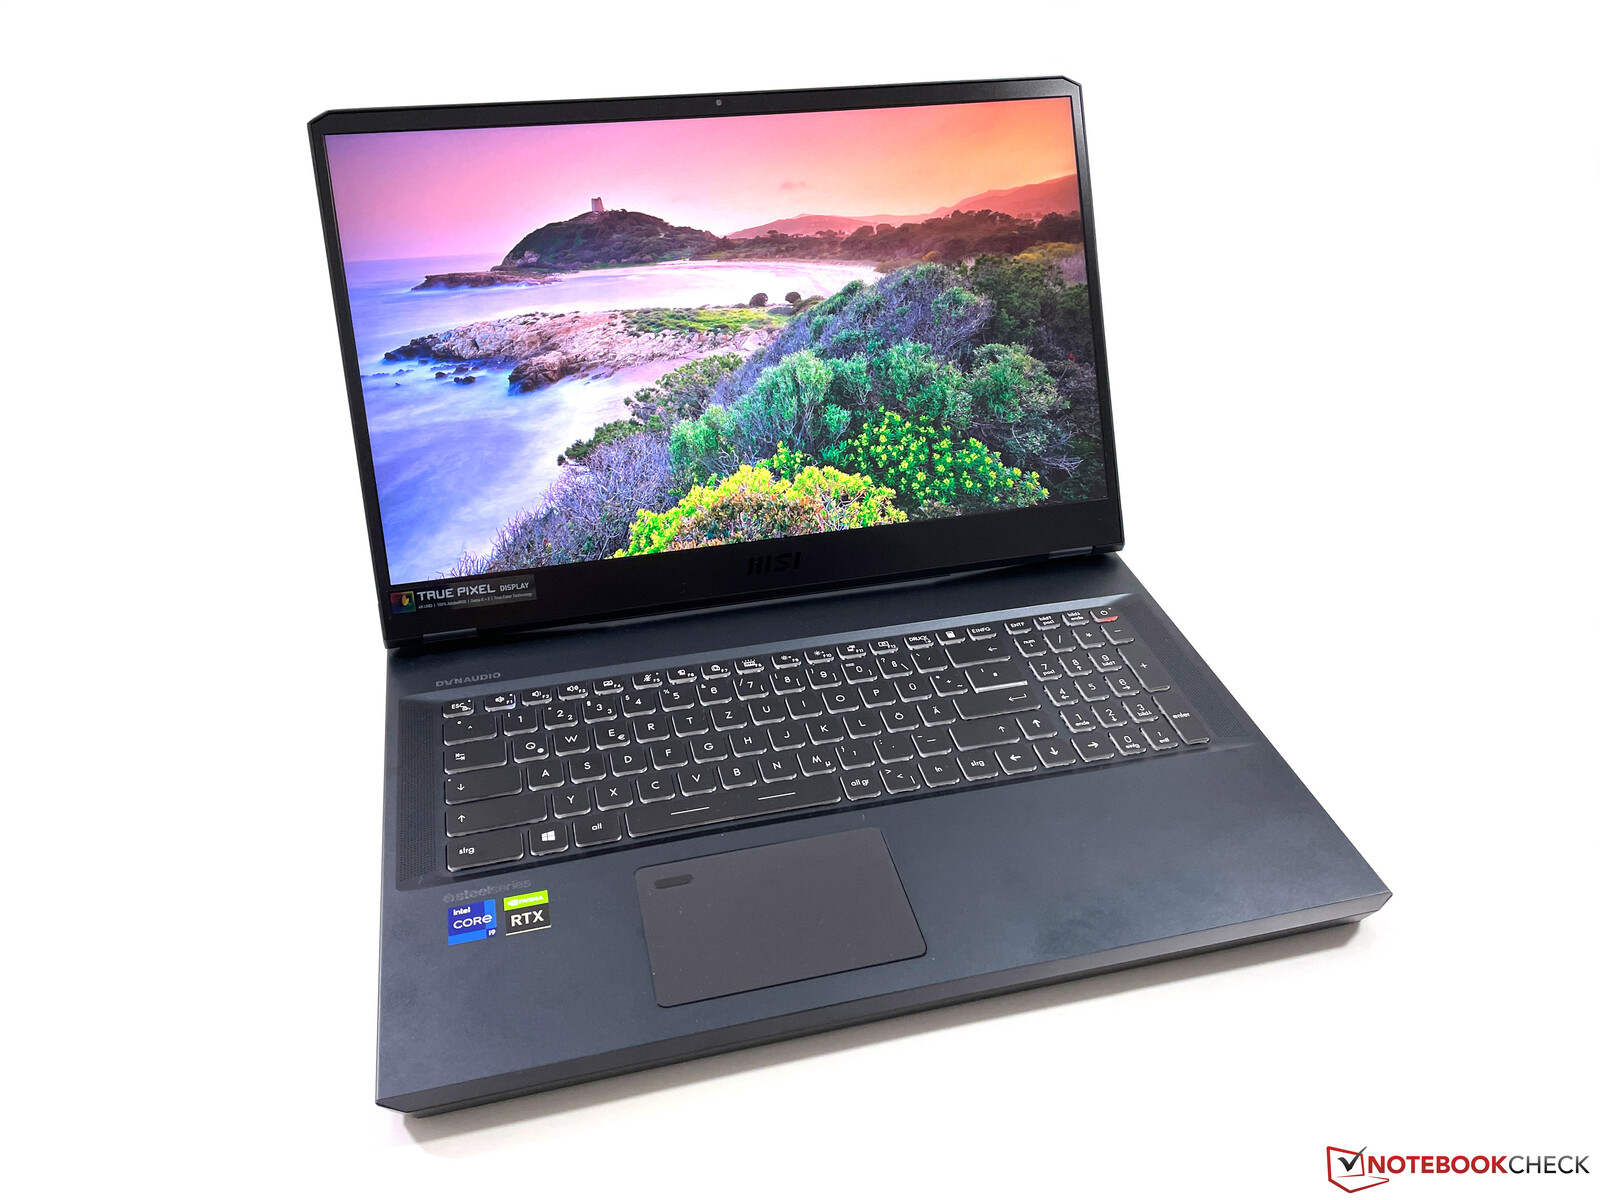
微星WE76的外壳与GE76游戏模型的外壳相同,但制造商省略了前缘的LED条。该设计让人联想到游戏机,但哑光的黑色和灰色表面使该移动工作站看起来相当谨慎,这也应该很适合办公环境。由于使用了16:9的显示屏(其他许多17英寸机型也是如此),显示屏下面的屏幕边框看起来非常宽,显示屏和机箱之间的比例也只有73%。
在稳定性和做工方面,我们的评测样品非常出色;尤其是底座单元对扭转的抵抗力非常强。盖子更灵活一些,但我们不能造成任何图像失真。铰链从根本上说也是适当调整的,尽管它们不能防止显示器在一定程度上摇摆。此外,这种铰链设计将最大开启角度限制在135度,不像其他一些竞争对手那样宽松。
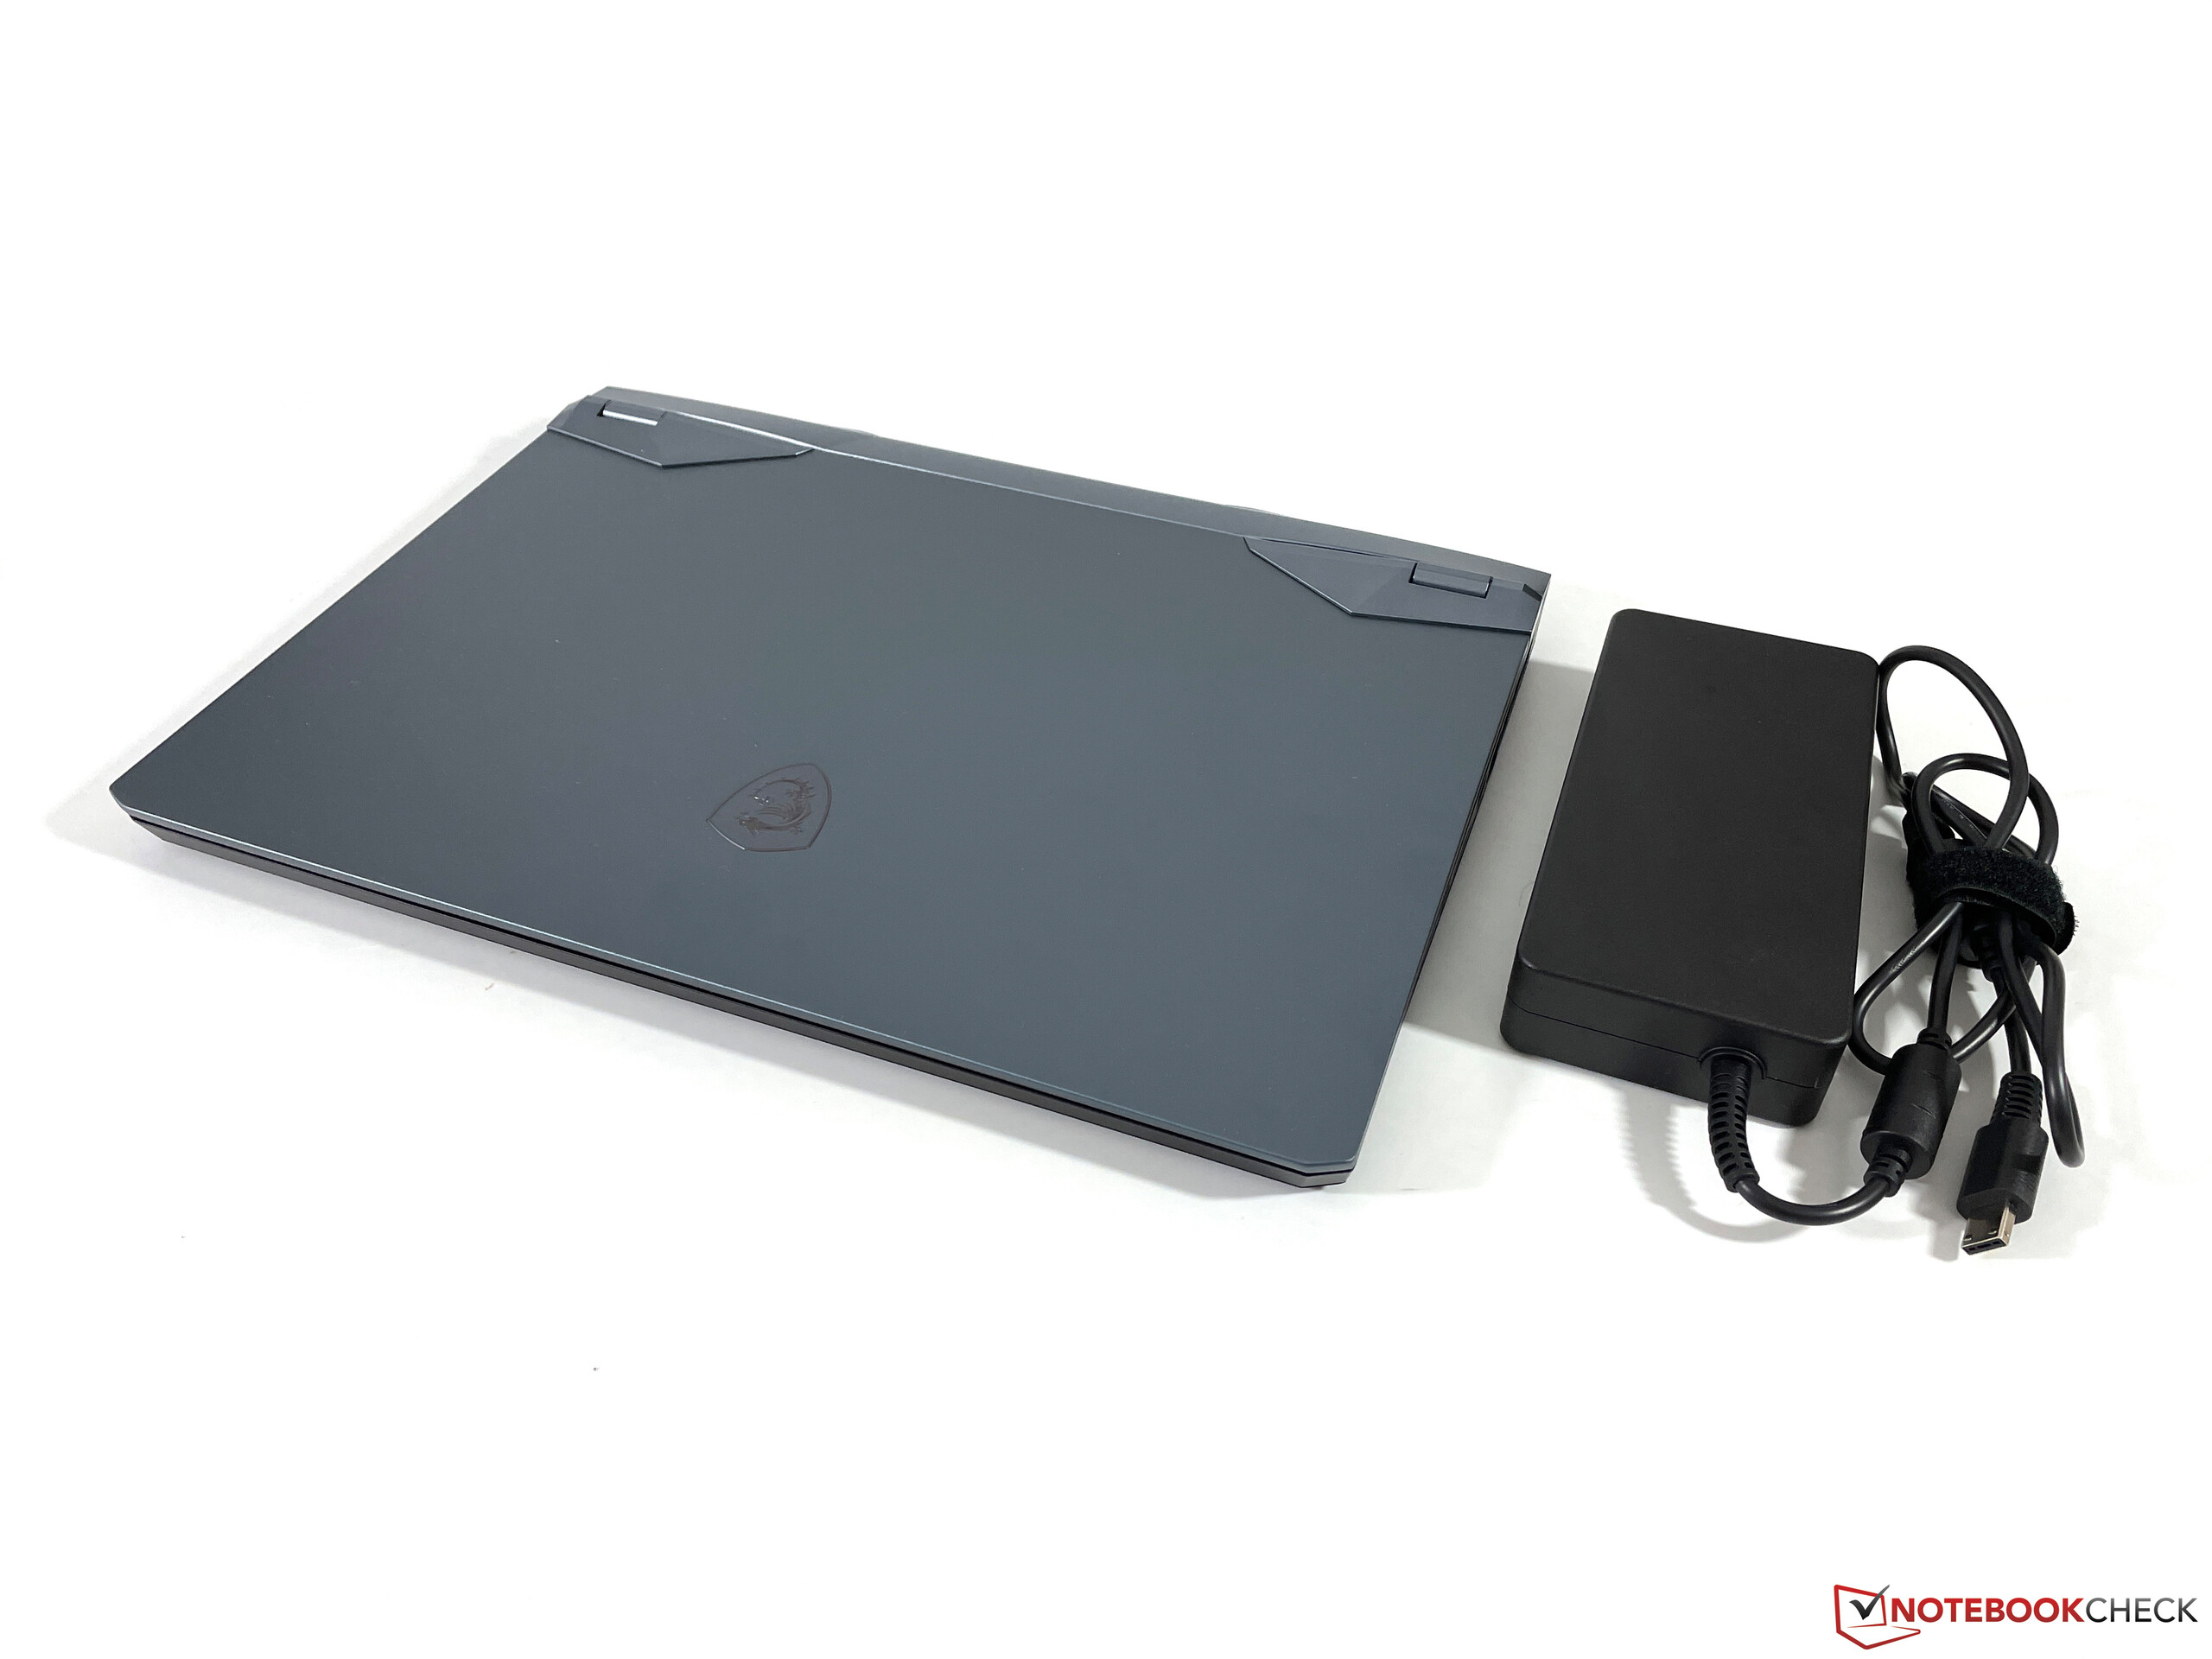
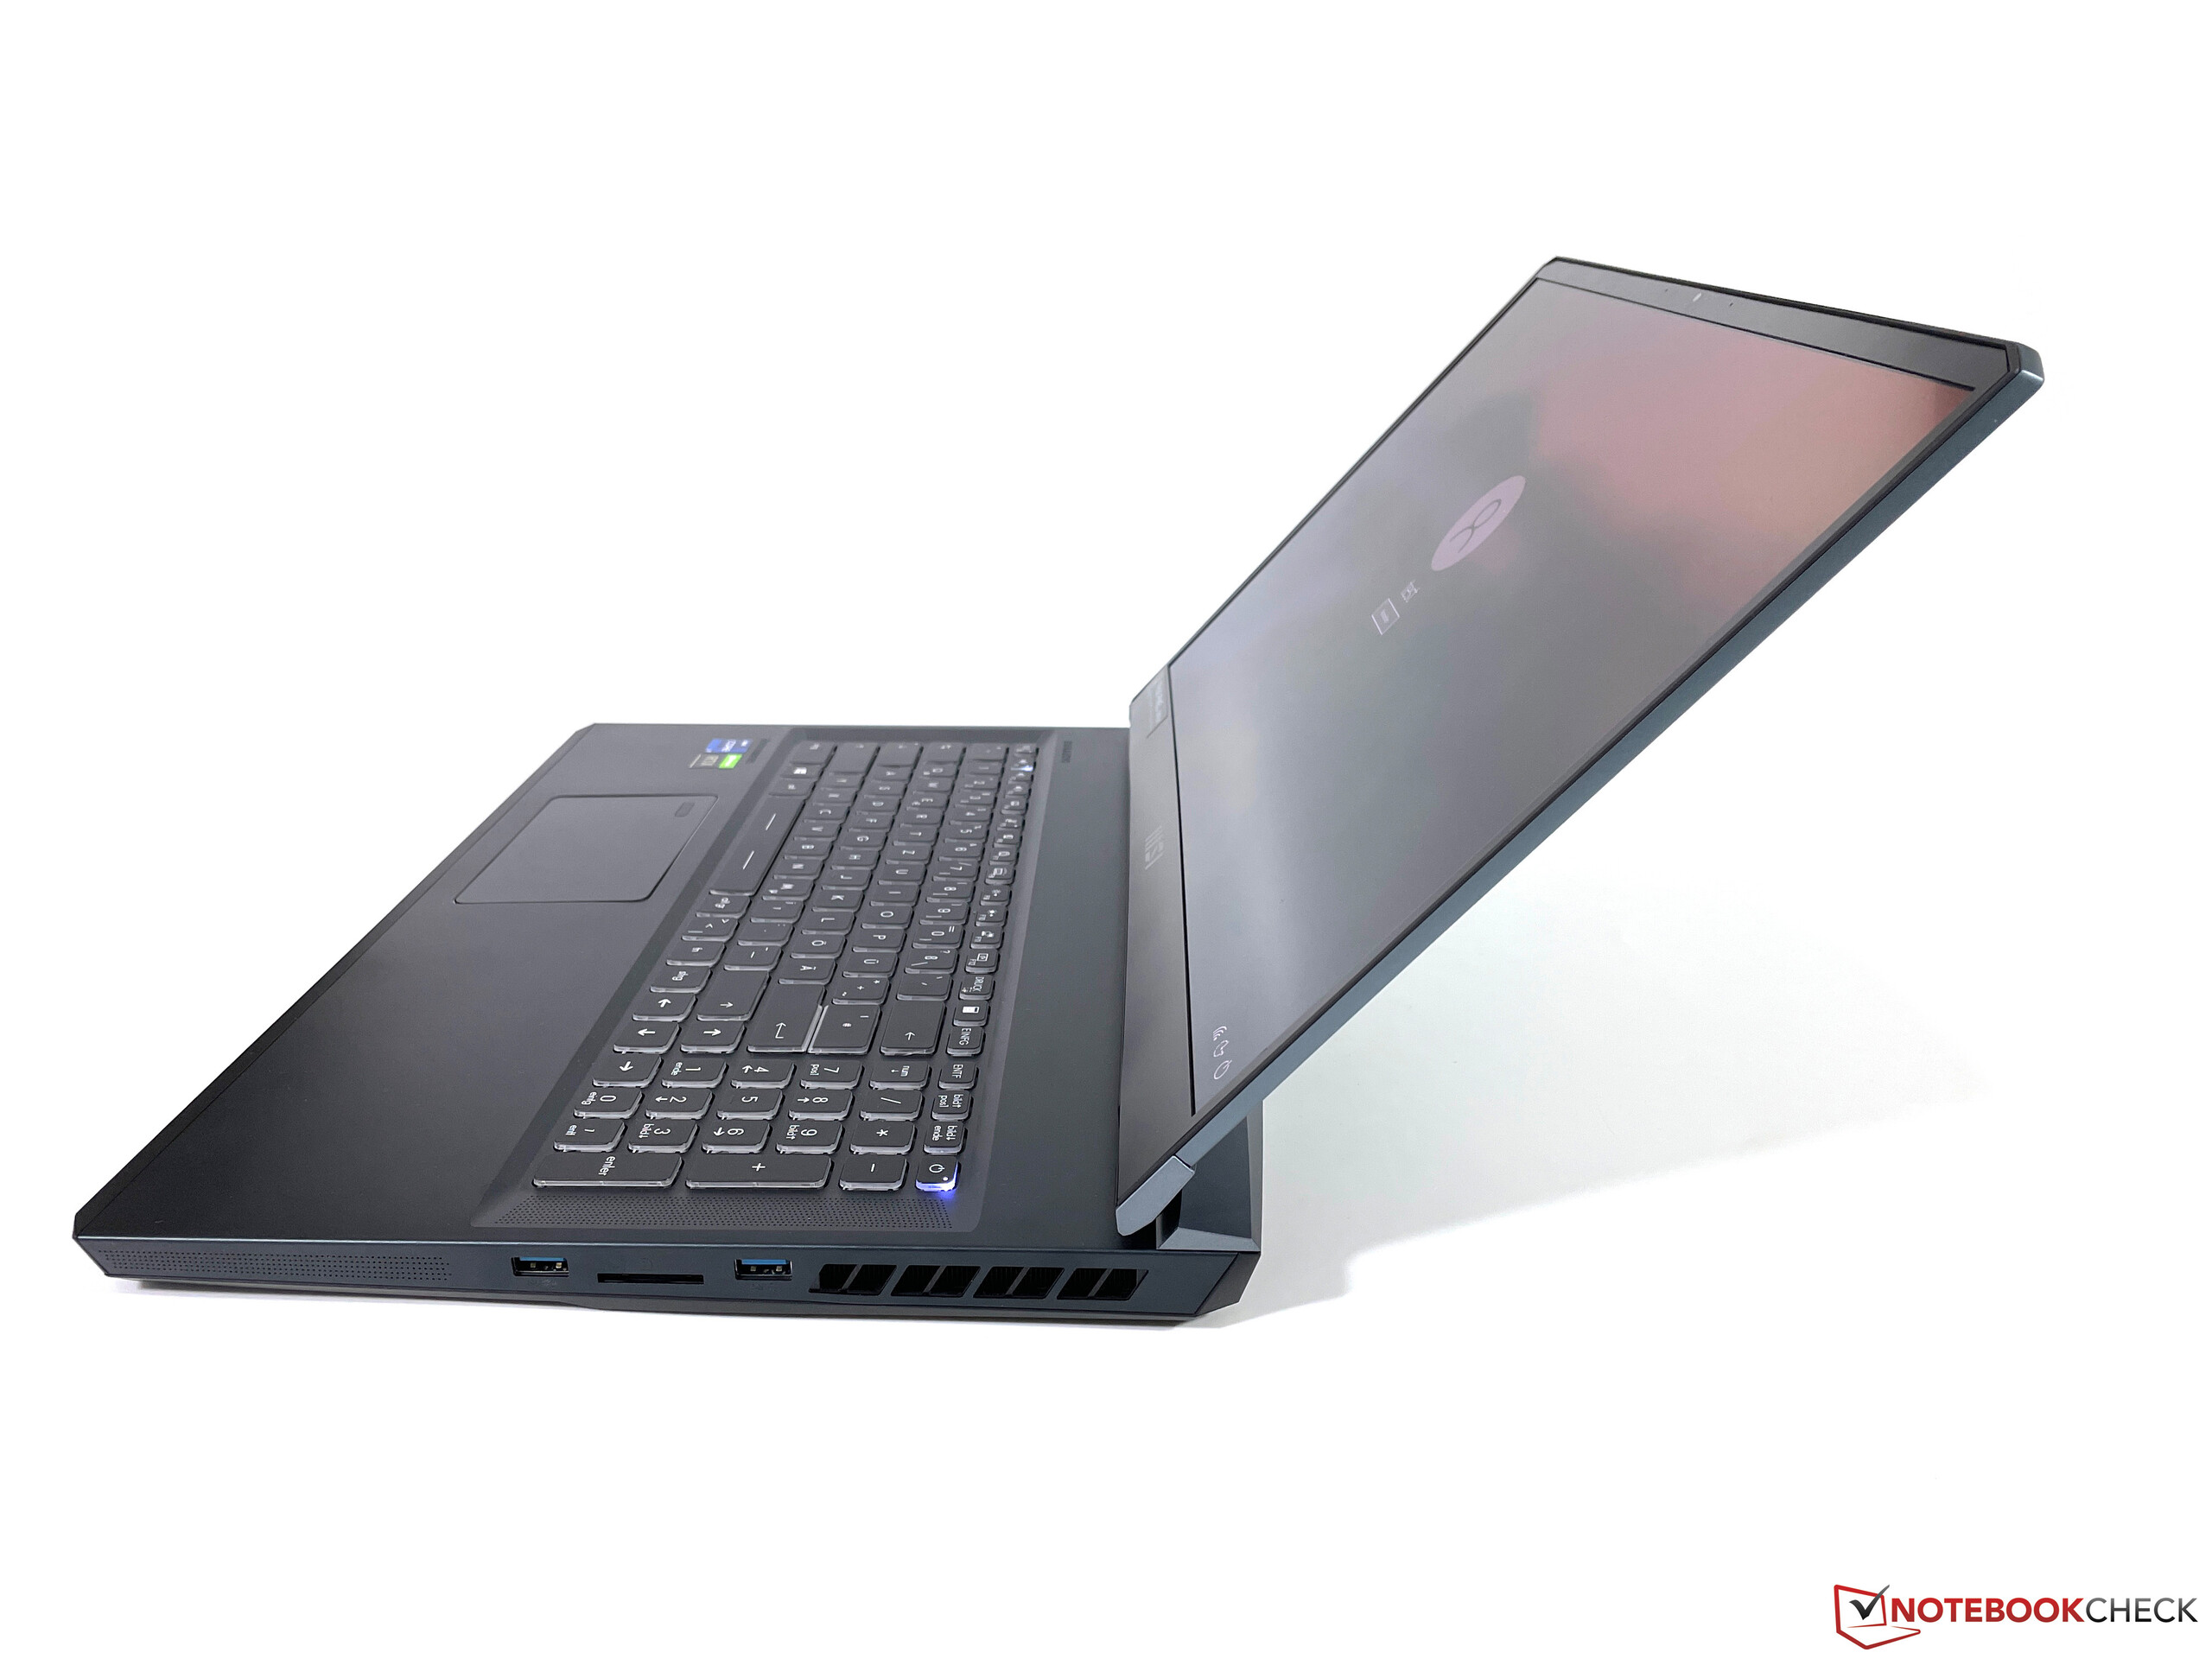
WE76是一个传统的移动工作站,重点是性能。因此,重点并不在于使设备尽可能的薄和细。尽管如此,与我们的两个17英寸的竞争对手,即ThinkPad P17,直接比较起来,差别还是相当小的。 ThinkPad P17和ZBook Fury 17.我们的测试设备重2,922克,但在运输笔记本电脑时,你必须为笨重的电源适配器再增加1,060克。
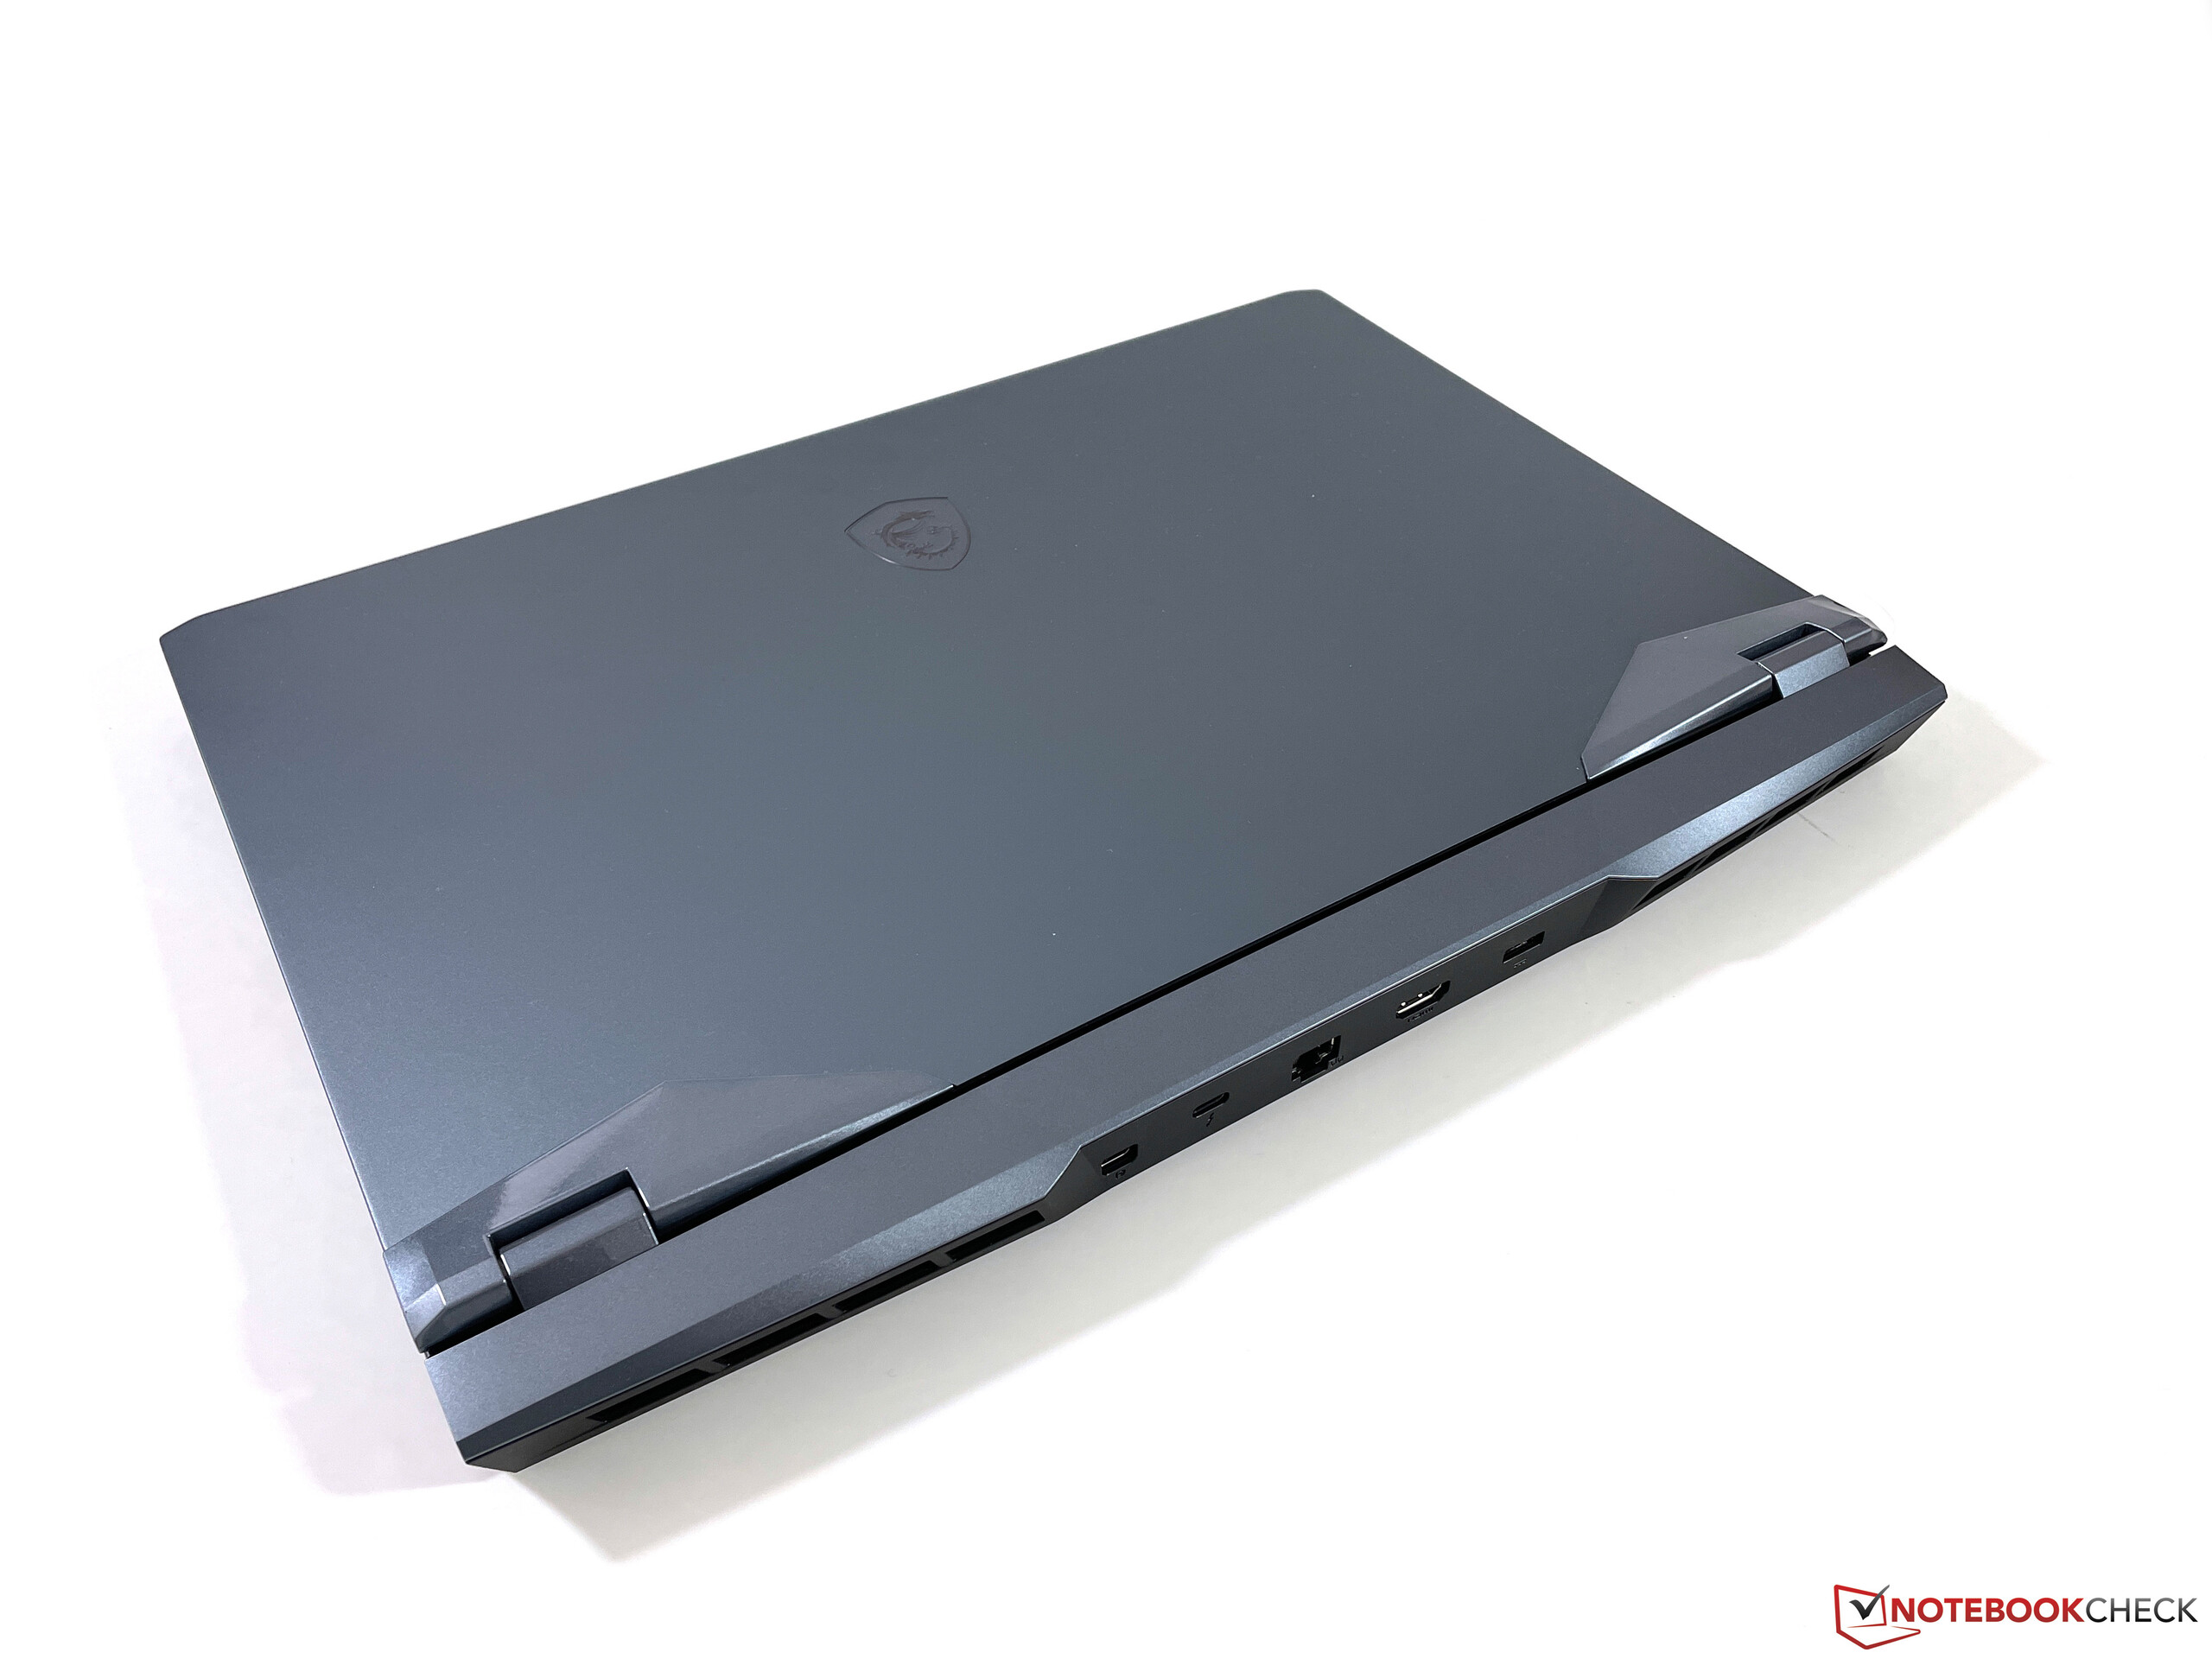
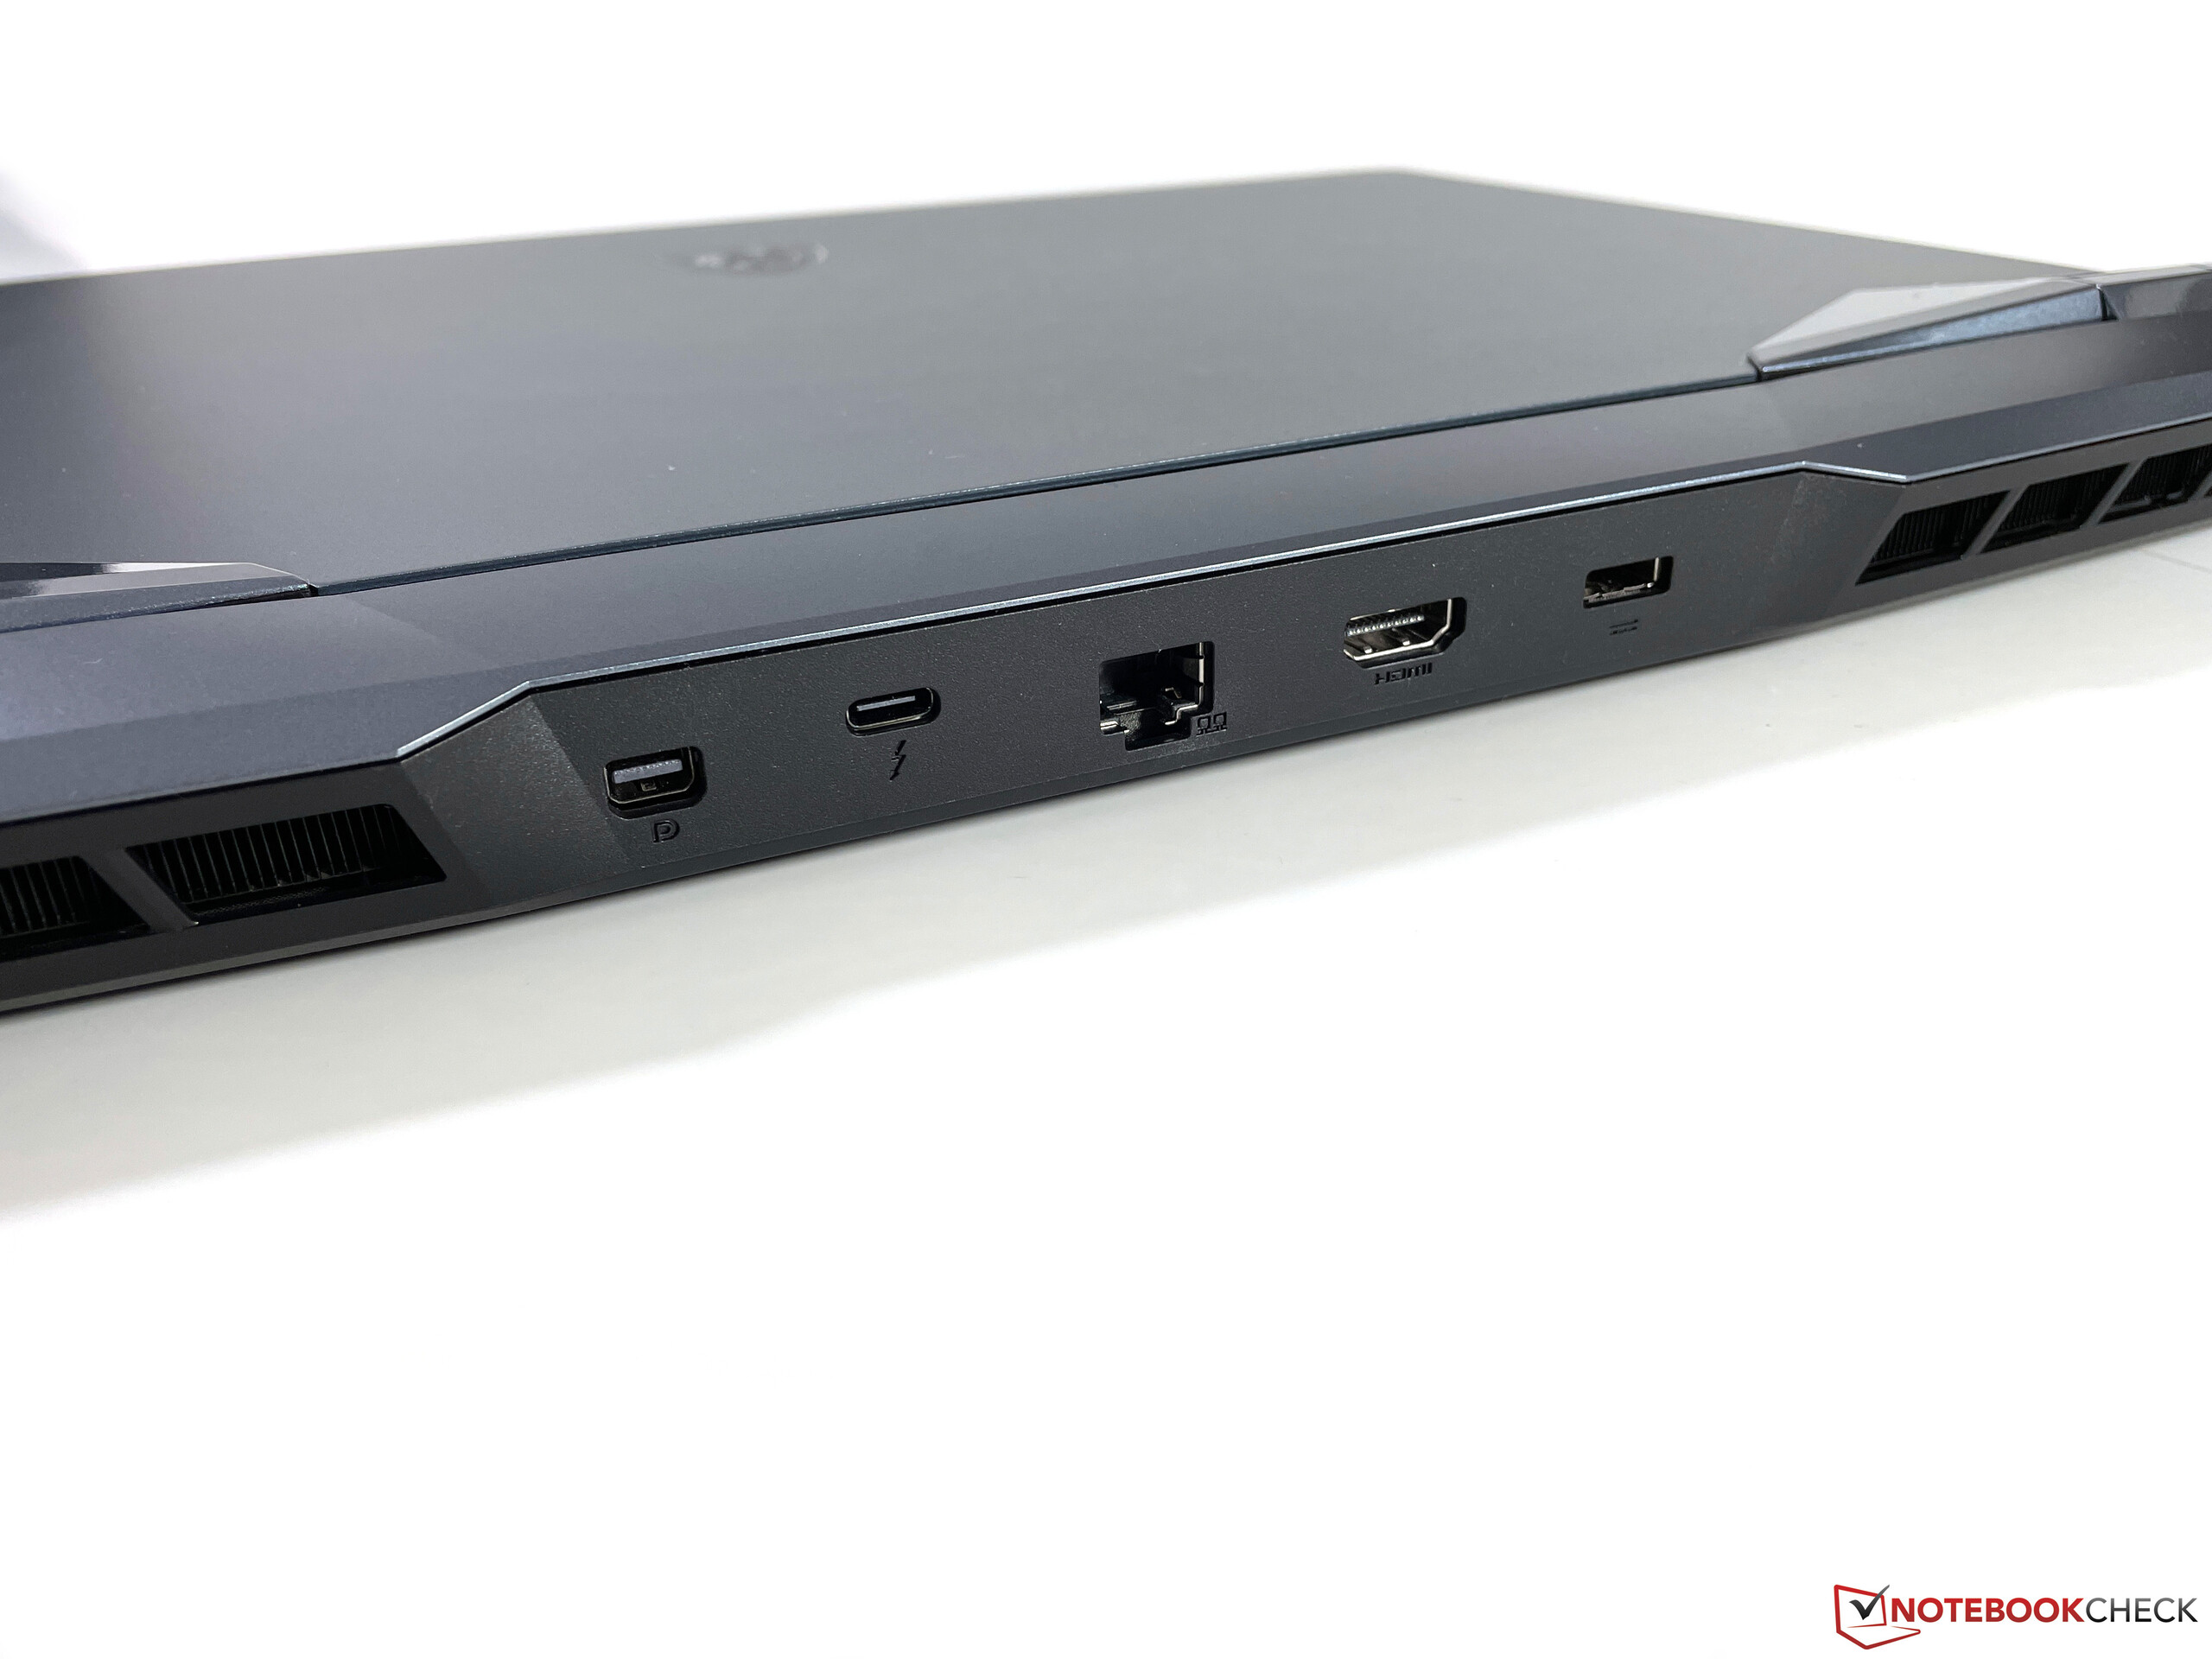
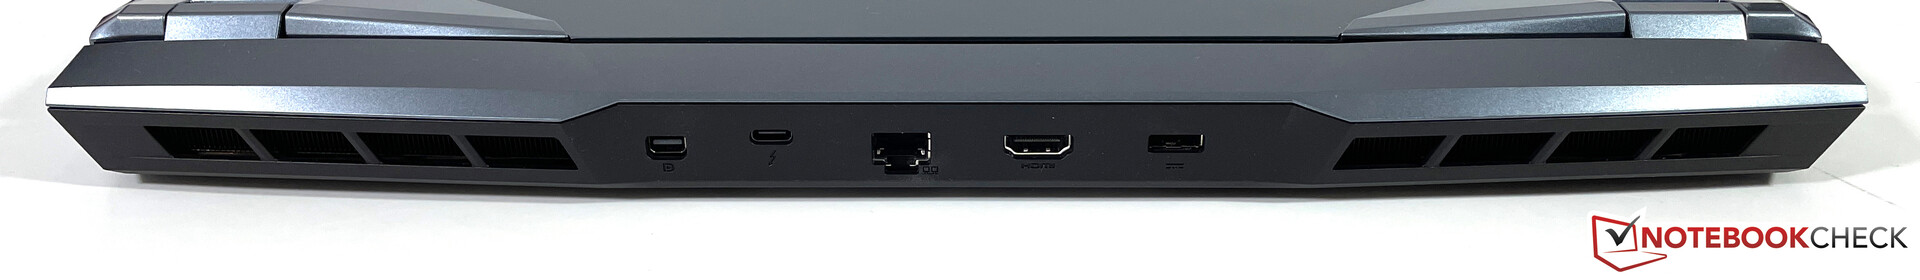
连接性 - WE76带有Thunderbolt 4/USB 4功能
说到端口,你会发现你心中所想的一切,包括足够的USB端口和现代的Thunderbolt 4接口。电源适配器、局域网和外部显示器(最多三个)的端口在背面,而USB端口以及读卡器被放置在侧面,以便快速访问。另一方面,可选的智能卡读卡器是不存在的。
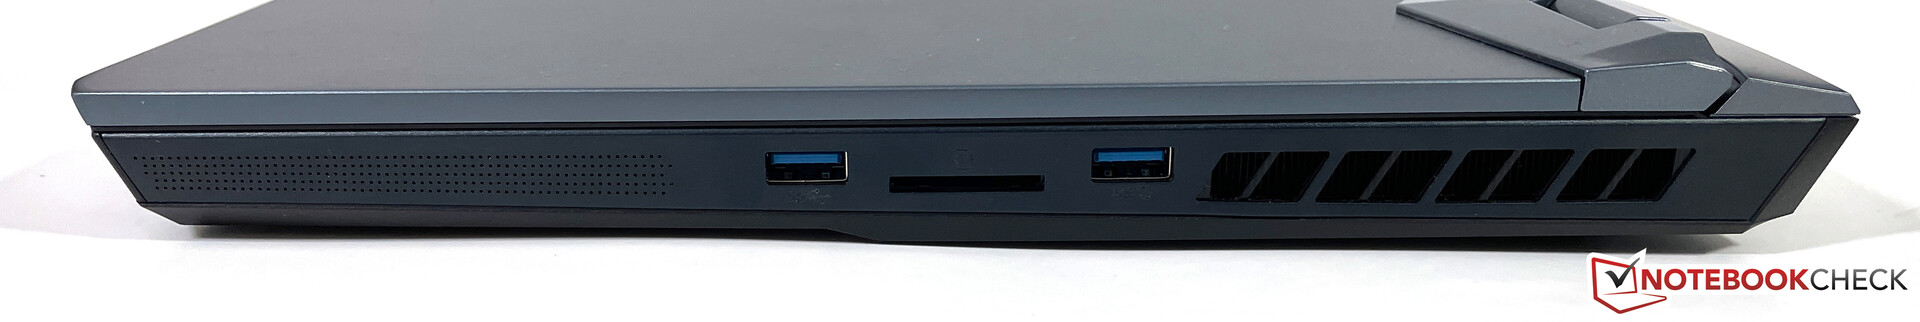
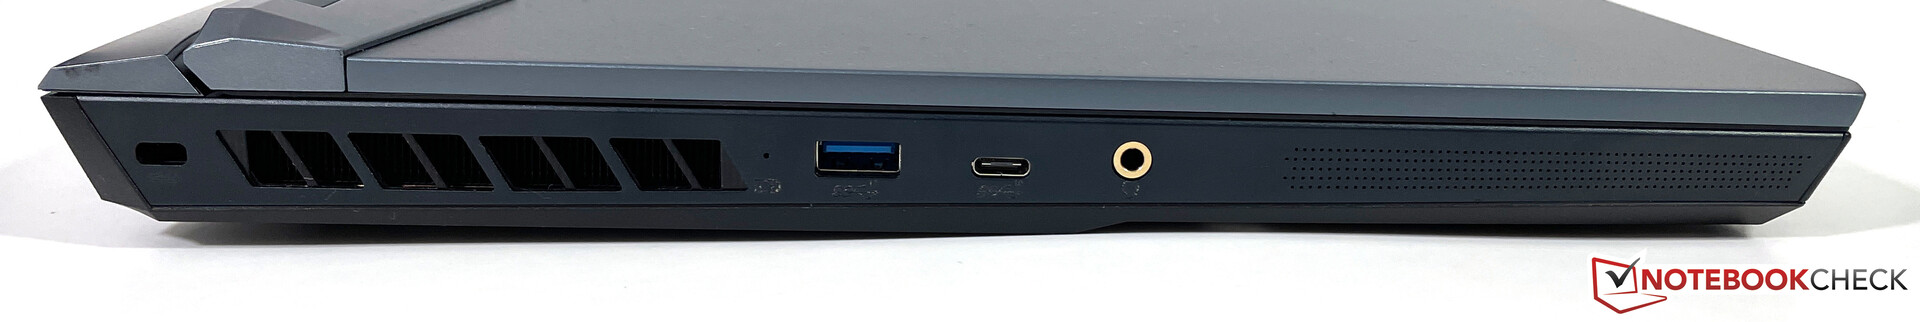
SD卡阅读器
右边的成熟的SD读卡器比旧的WE75中的读卡器要快。我们确定参考卡(Angelbird AV Pro V60)的传输速率为80-90 MB/s。这是可以接受的,但一些竞争对手提供的模块要快得多。一张插入的SD卡从机箱中突出4毫米。
| SD Card Reader | |
| average JPG Copy Test (av. of 3 runs) | |
| Lenovo ThinkPad P17 G2-20YU0025G (Toshiba Exceria Pro SDXC 64 GB UHS-II) | |
| HP ZBook Fury 17 G7 119W5EA (AV Pro 60) | |
| Average of class Workstation (49.6 - 681, n=14, last 2 years) | |
| MSI WE76 11UM-456 (AV Pro V60) | |
| HP ZBook Fury 15 G8 (AV Pro V60) | |
| Asus ProArt StudioBook 16 W7600H5A-2BL2 (AV Pro SD microSD 128 GB V60) | |
| MSI WE75 9TK (Toshiba Exceria Pro SDXC 64 GB UHS-II) | |
| maximum AS SSD Seq Read Test (1GB) | |
| Average of class Workstation (87.6 - 1455, n=14, last 2 years) | |
| Lenovo ThinkPad P17 G2-20YU0025G (Toshiba Exceria Pro SDXC 64 GB UHS-II) | |
| HP ZBook Fury 17 G7 119W5EA (AV Pro 60) | |
| MSI WE76 11UM-456 (AV Pro V60) | |
| HP ZBook Fury 15 G8 (AV Pro V60) | |
| Asus ProArt StudioBook 16 W7600H5A-2BL2 (AV Pro SD microSD 128 GB V60) | |
| MSI WE75 9TK (Toshiba Exceria Pro SDXC 64 GB UHS-II) | |
沟通
微星使用快速杀手AX1675x模块,支持现代Wi-Fi 6E标准以及蓝牙5.2。传输速率非常好,在我们与Netgear Nighthawk RAX120路由器的标准化Wi-Fi测试中处于比较领域的顶端。
网络摄像头
尽管显示屏上方的1080p网络摄像头提供了比通常的720p模块略高的分辨率,但图像质量仍然不是特别好。在我们的记录过程中,我们不得不处理相对较多的噪音,特别是。全高清视频可以用30FPS拍摄。


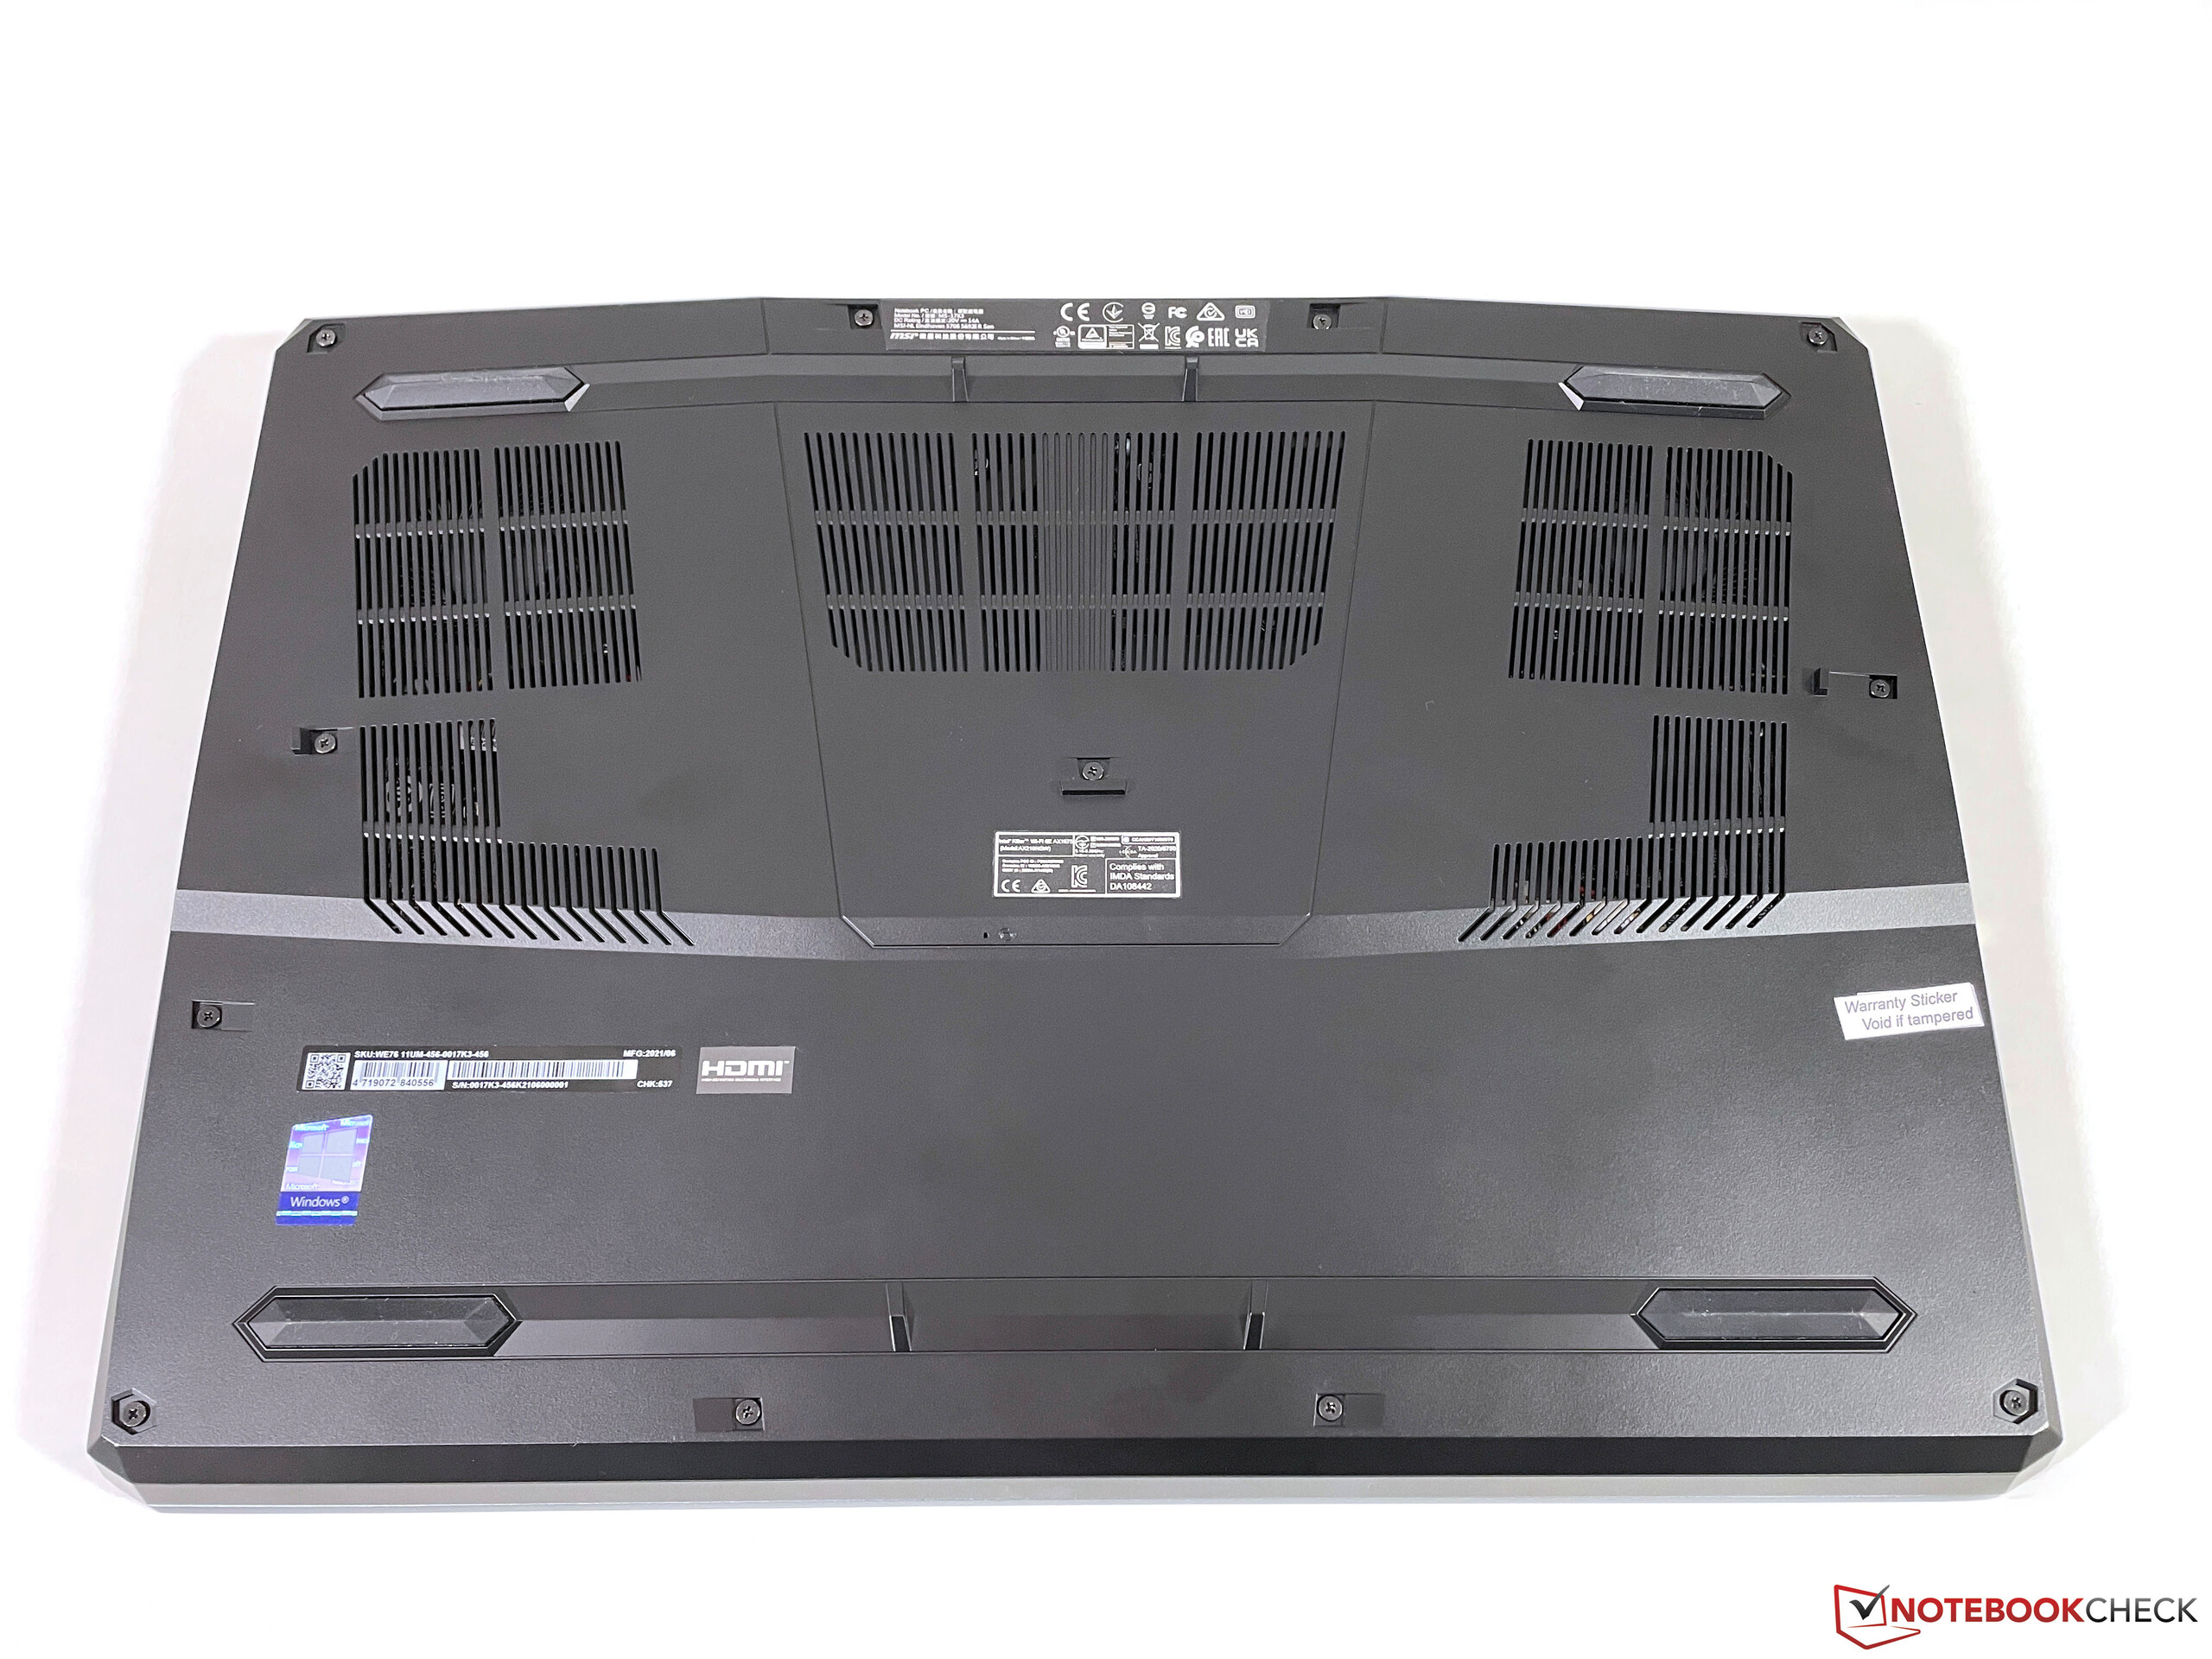
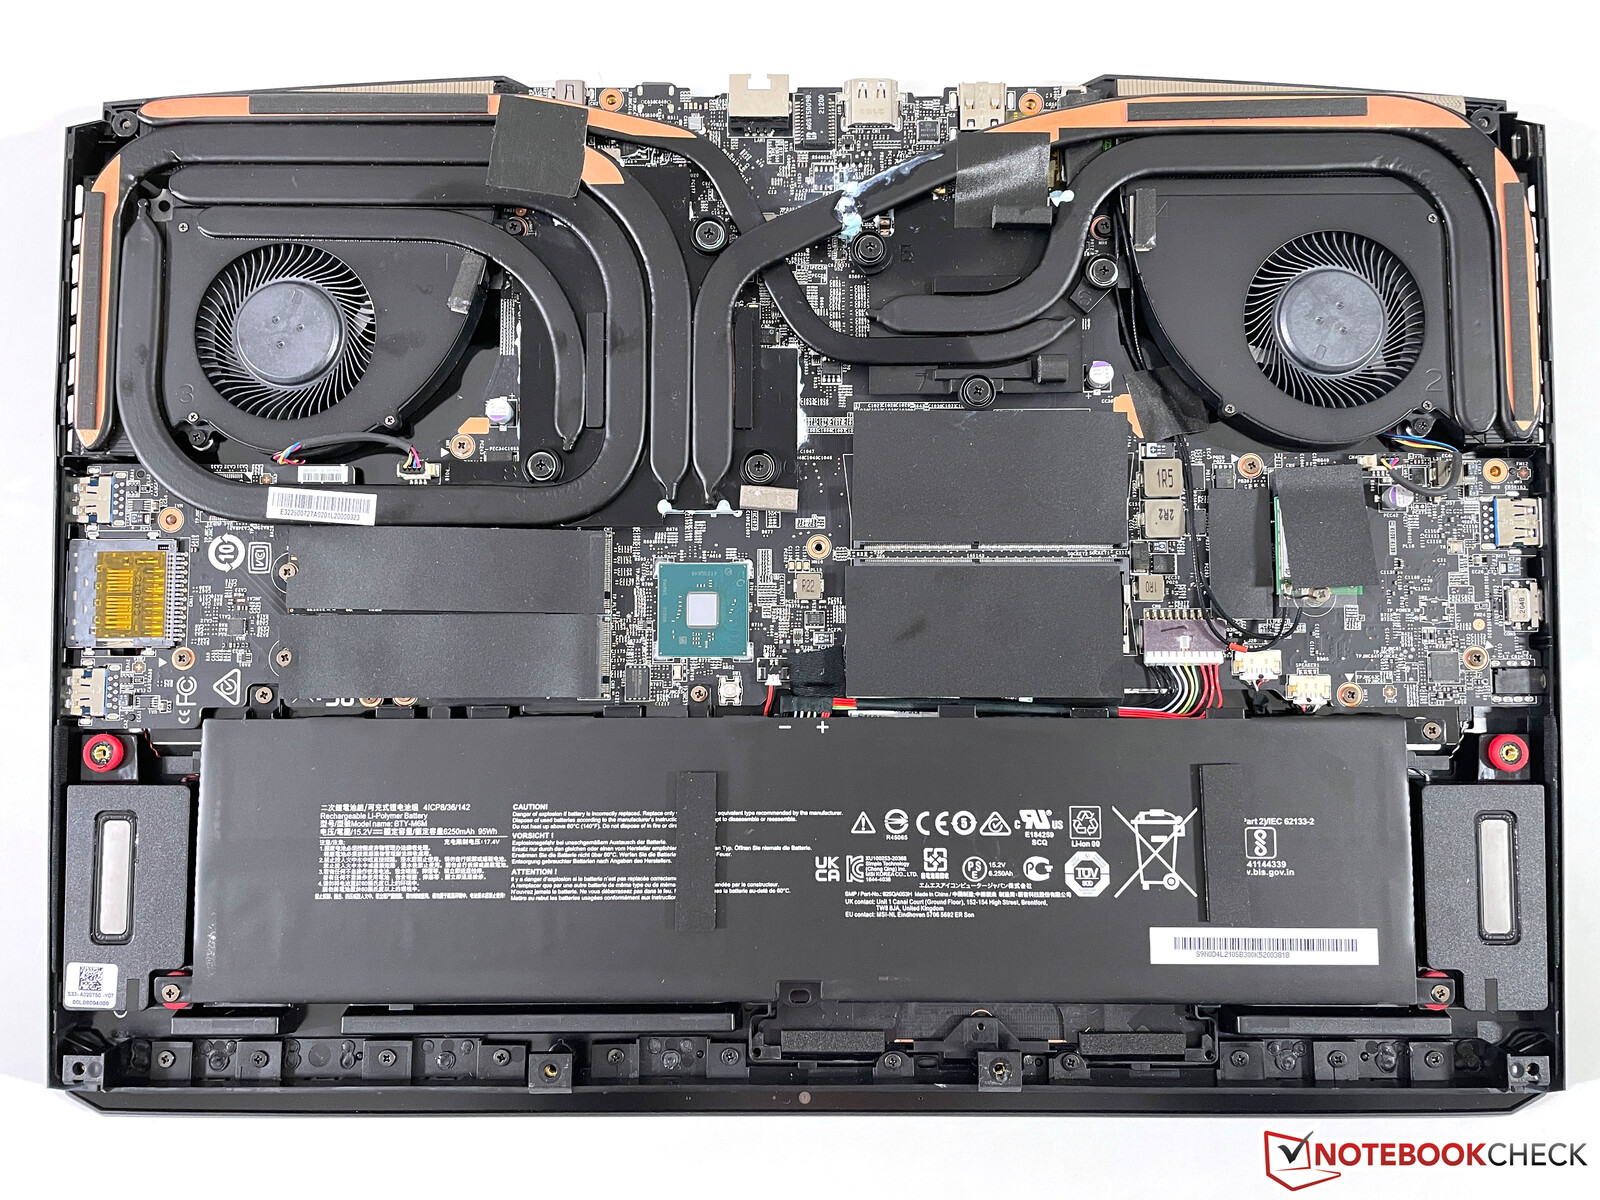
维护
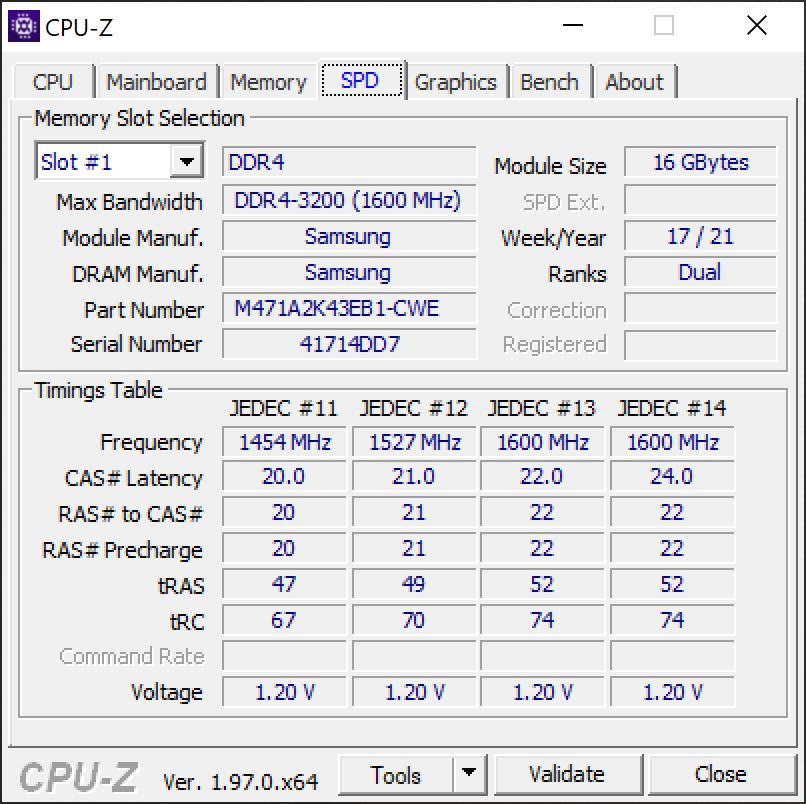
松开所有的十字螺丝后,整个底盖可以被卸下。除了两个SODIMM插槽,还有两个M.2-2280插槽可用(1个PCIe 4.0和1个PCIe 3.0)。Wi-Fi模块也可以被替换。
输入设备 - 带有数字键盘的SteelSeries
键盘
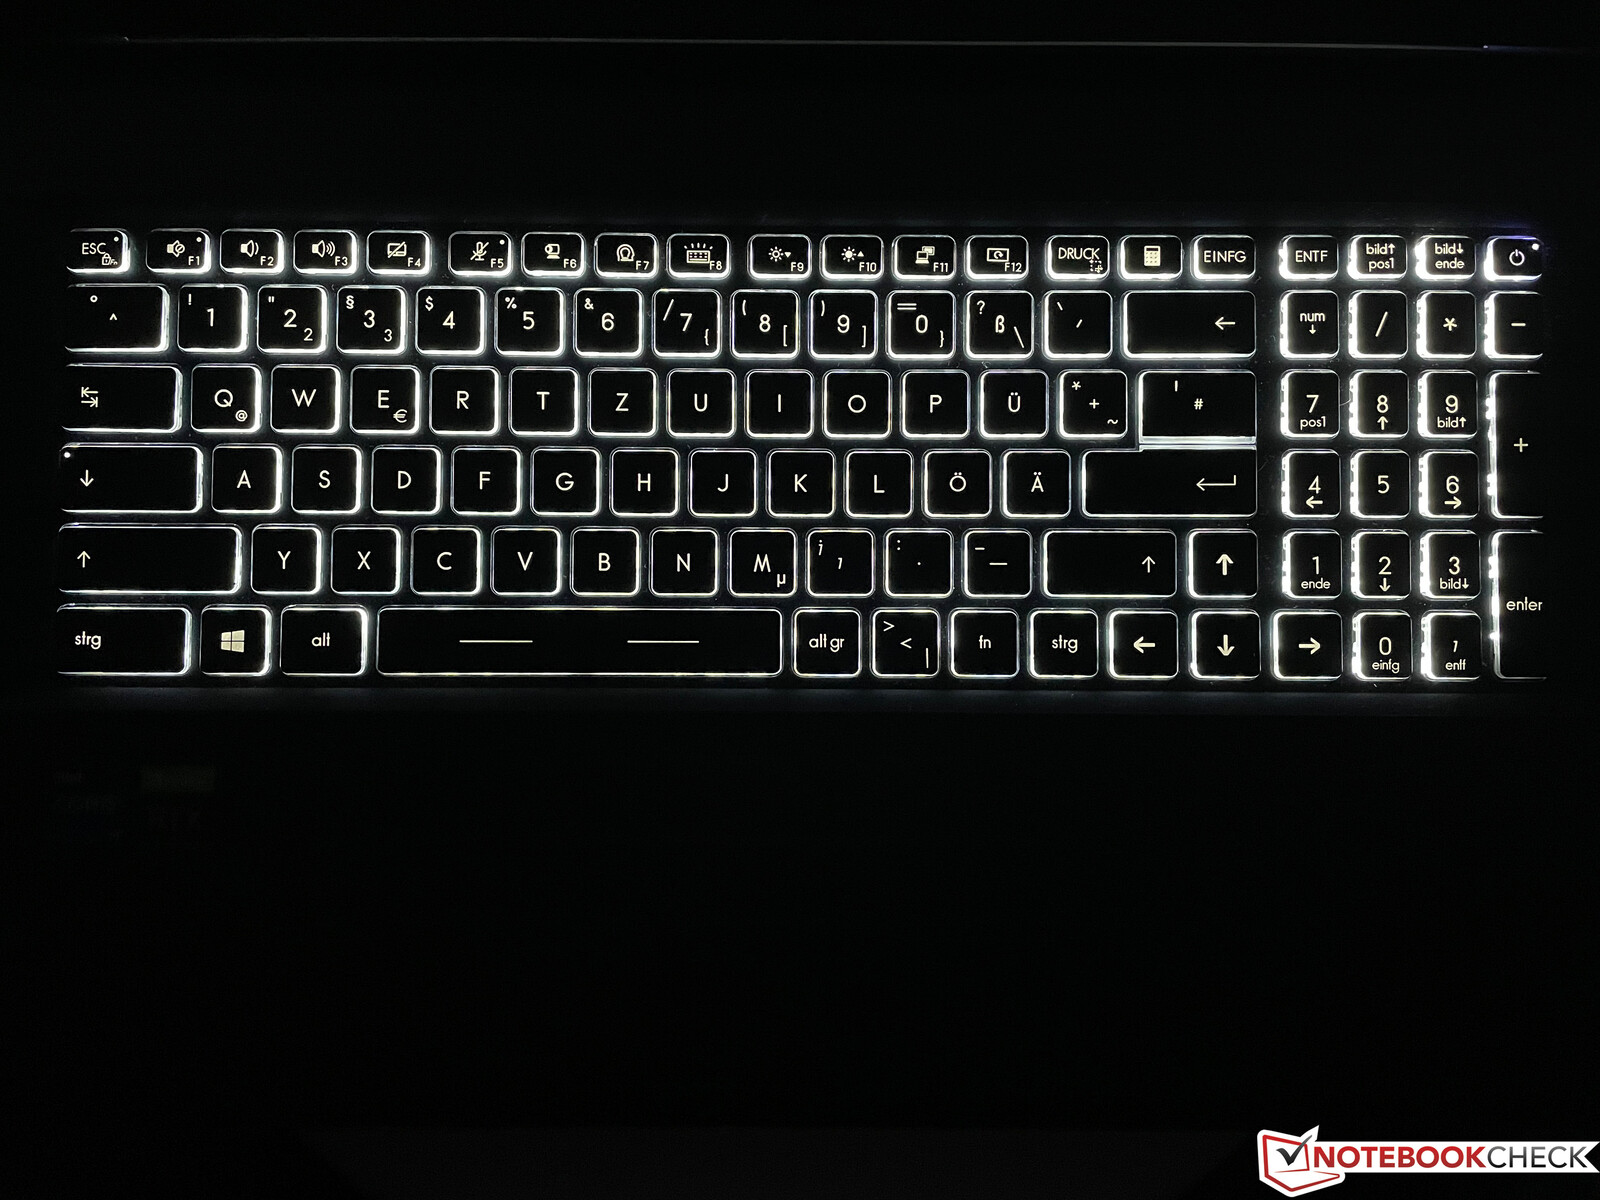
与它的游戏兄弟姐妹一样,WE76工作站的对应产品也有一个SteelSeries键盘。然而,彩色背光被省略了;相反,只有一个白色背光。键盘的键程相对较长,打字的感觉非常好,可以很容易地与现有工作站竞争者的最佳键盘竞争。此外,一个完整的数字键盘被整合在右侧。它的按键有点窄,但这在实践中并没有被证明是一个问题。
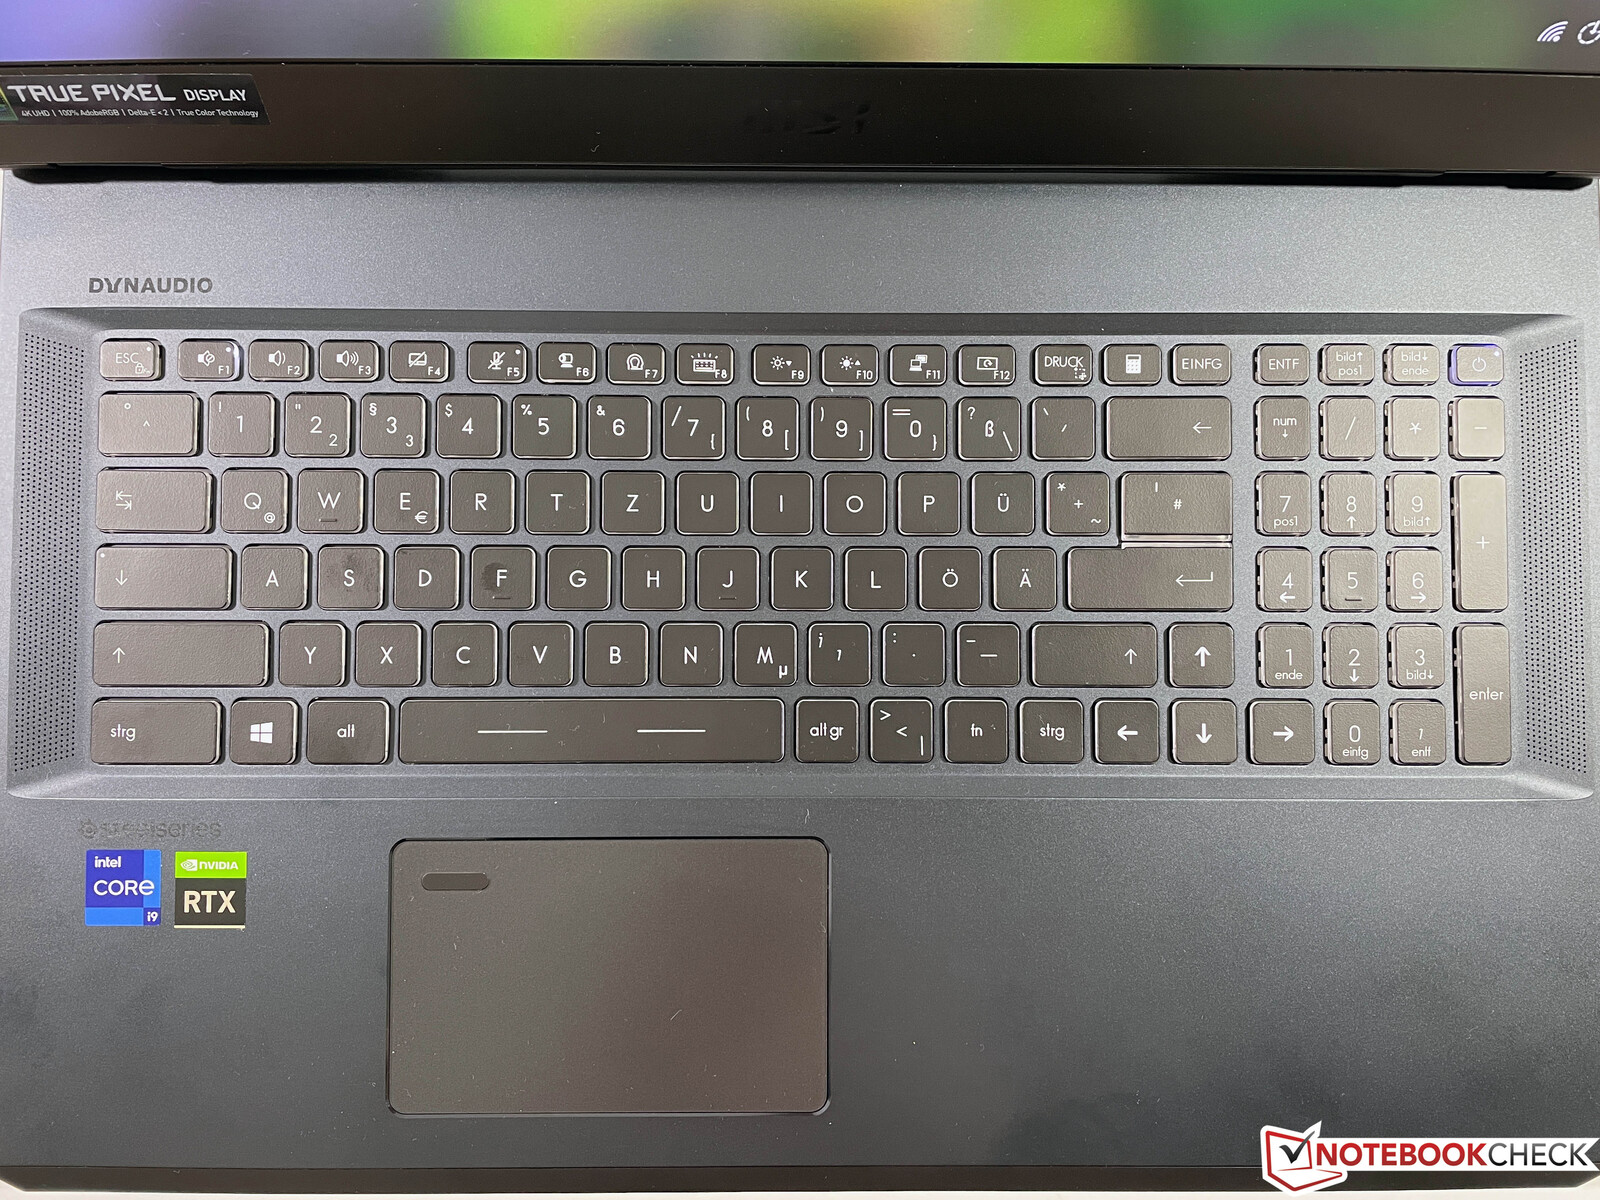
触摸板
ClickPad的尺寸为10.5 x 6.5厘米,按照今天的标准,它并不是特别大,但鼠标控制工作起来没有问题。光滑的表面提供了良好的滑行性能,位于左上角的内置刷卡指纹扫描仪也不碍事。不过,触摸板感觉有点乱,因为在你到达实际点击机制之前有一个轻微的间隙。这意味着下半部分可以被明显地压下而不触发点击。此外,实际的点击声太大,这让人感觉很廉价。
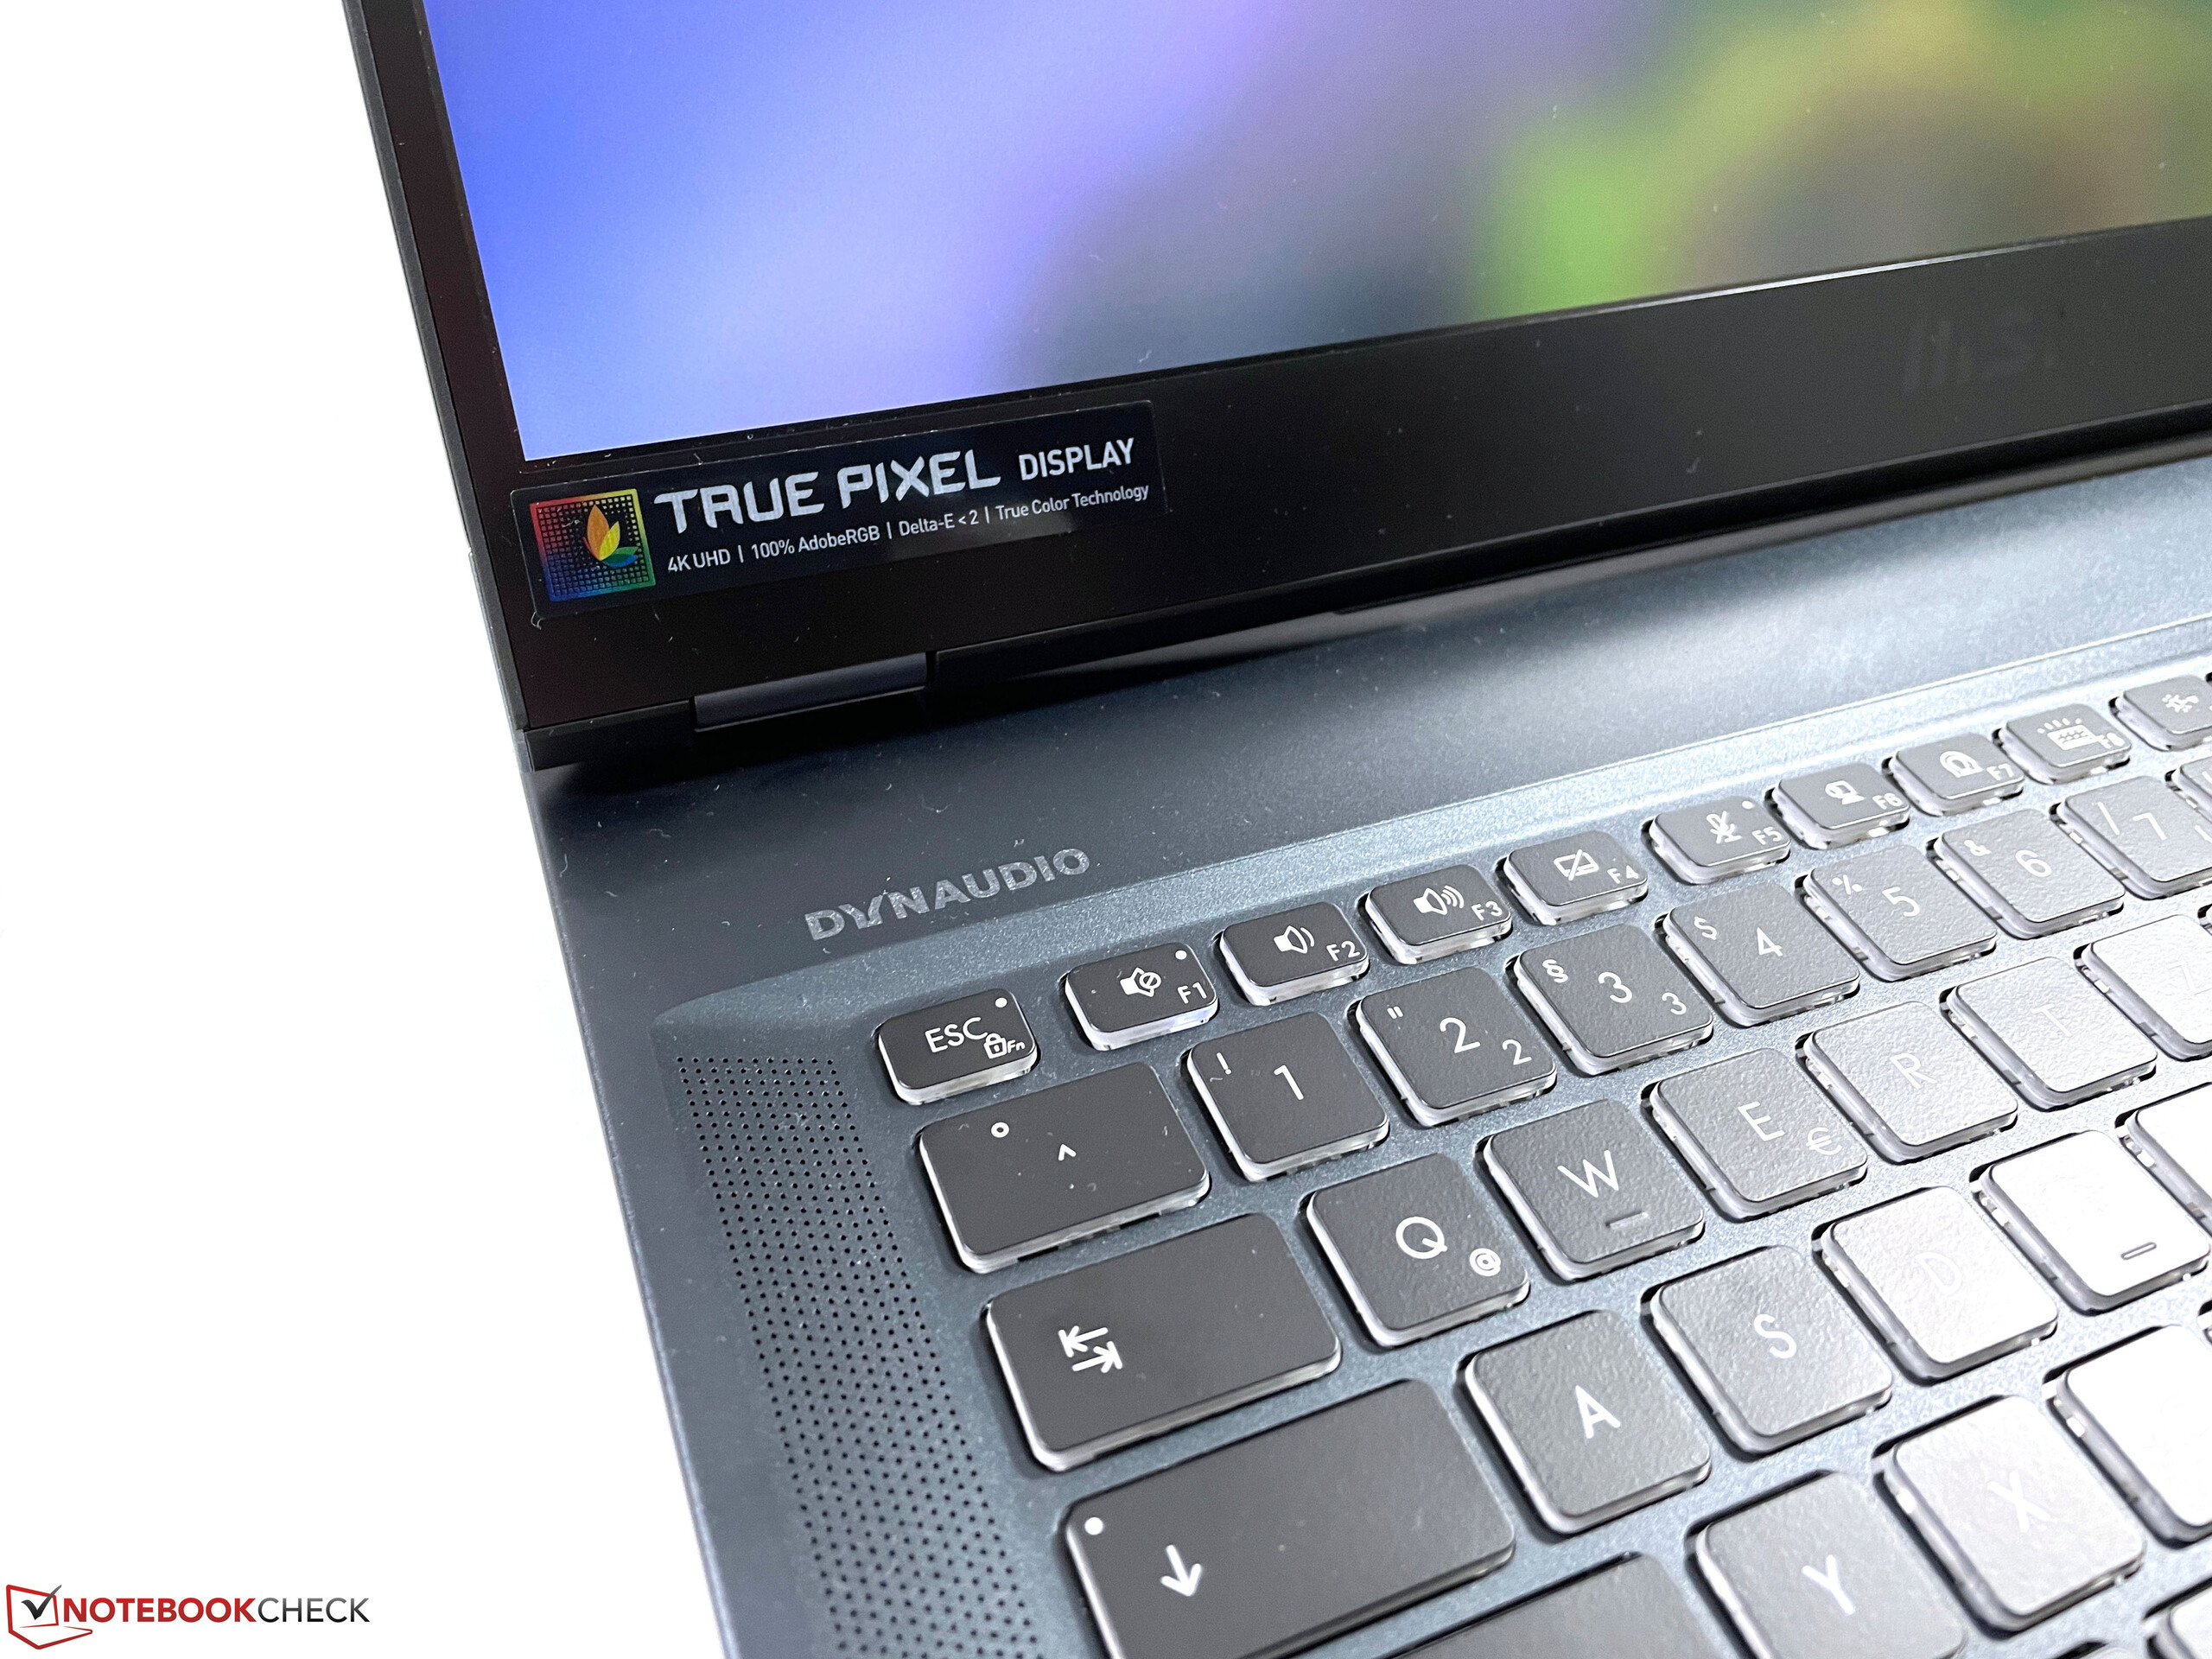
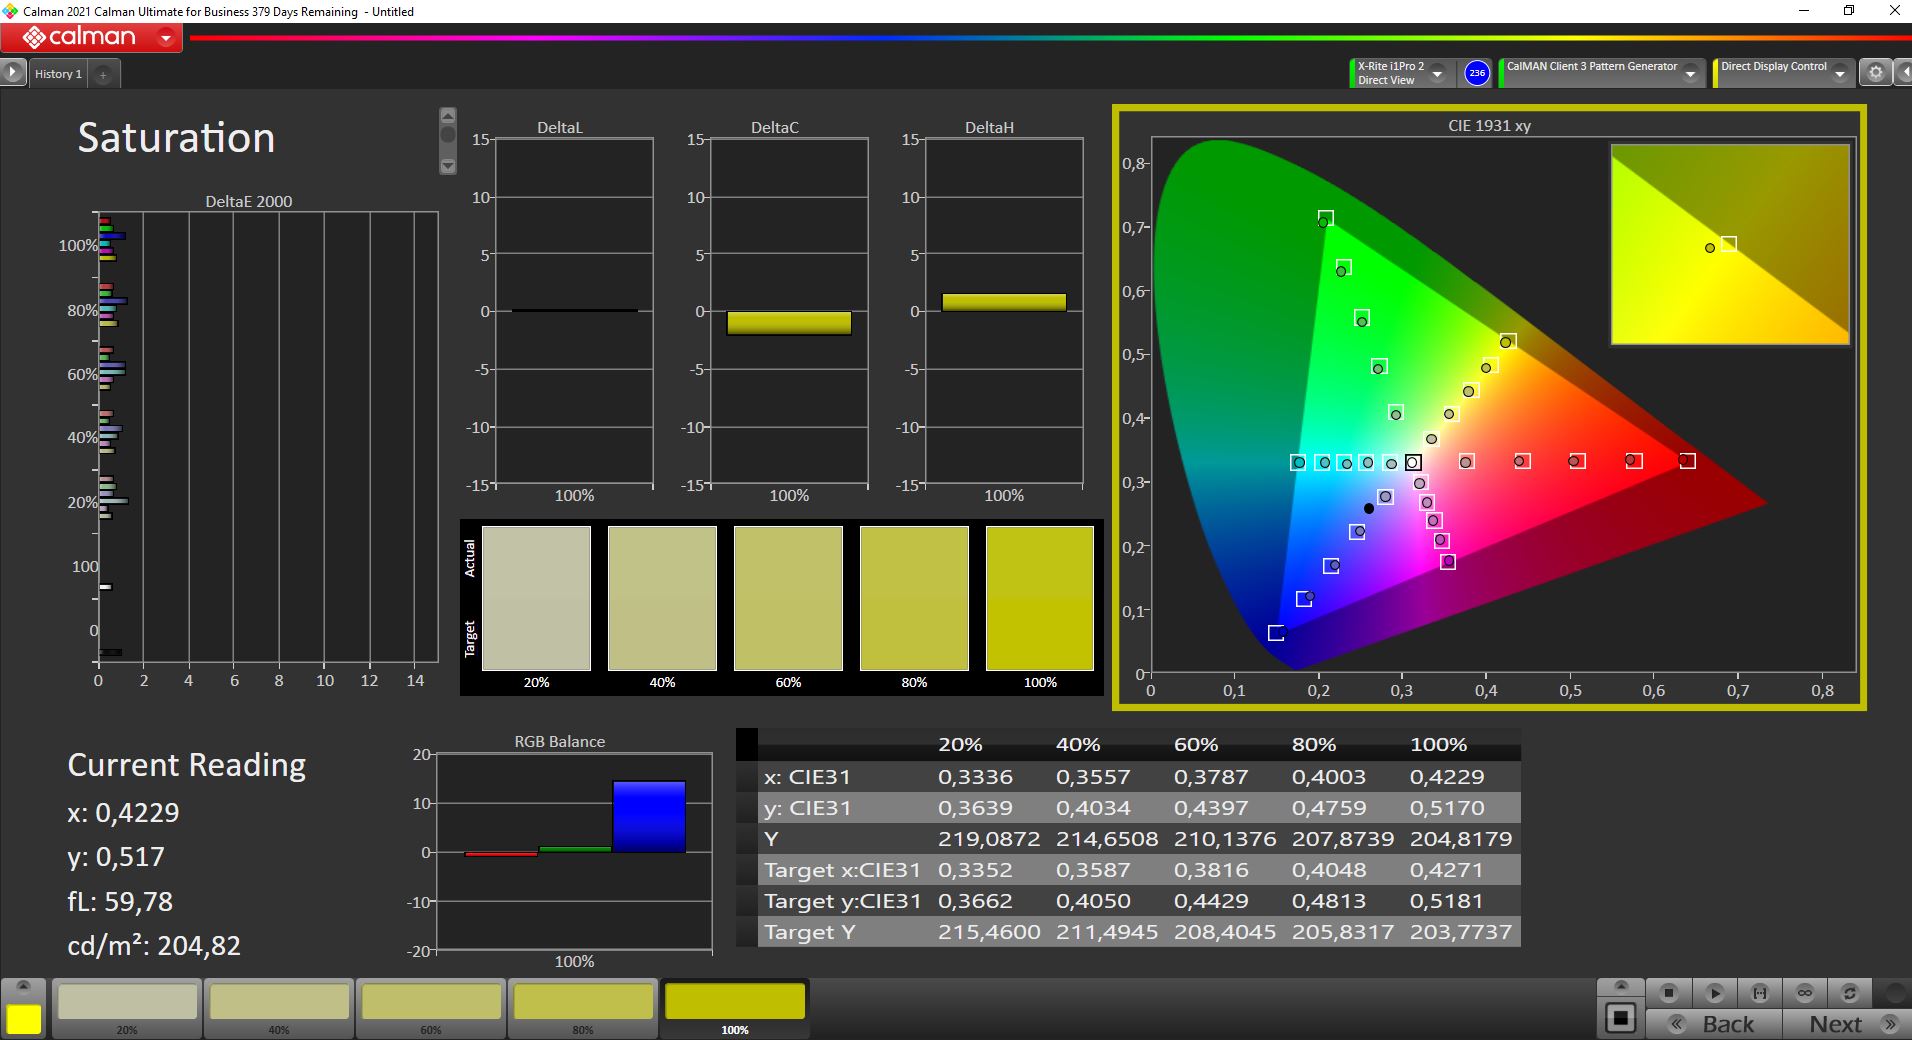
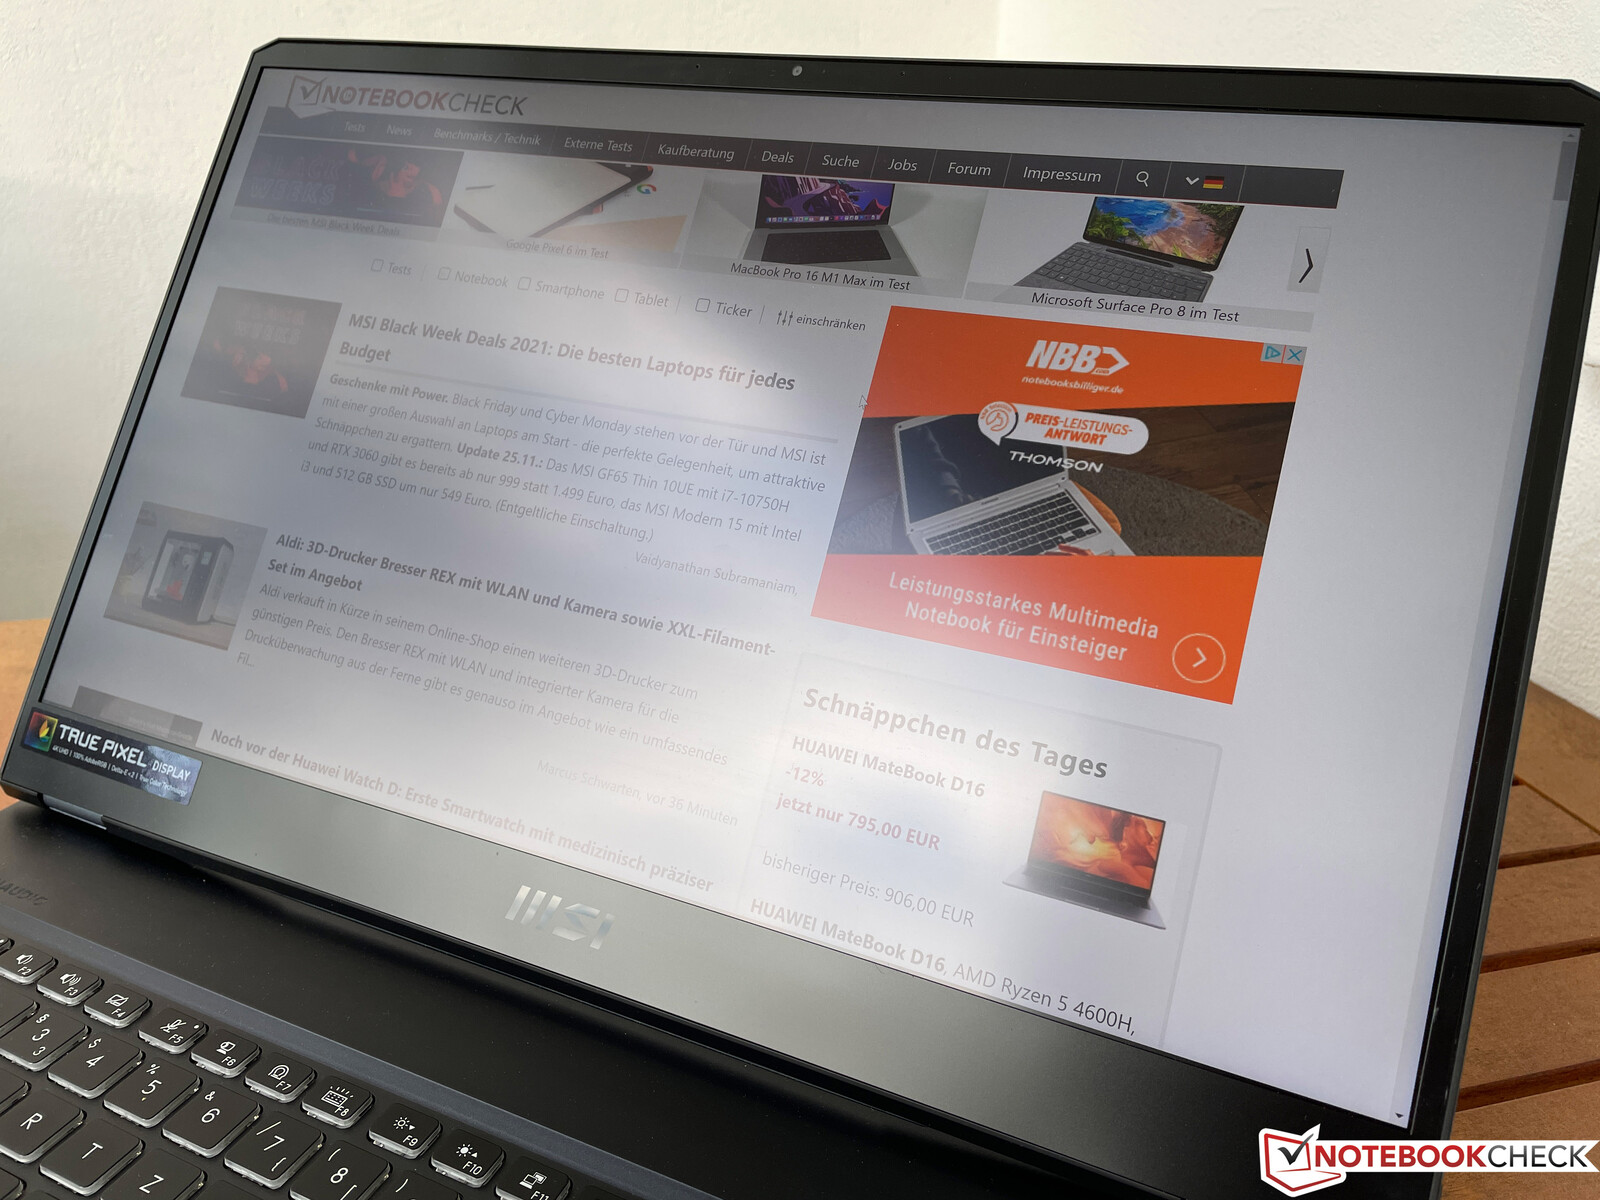
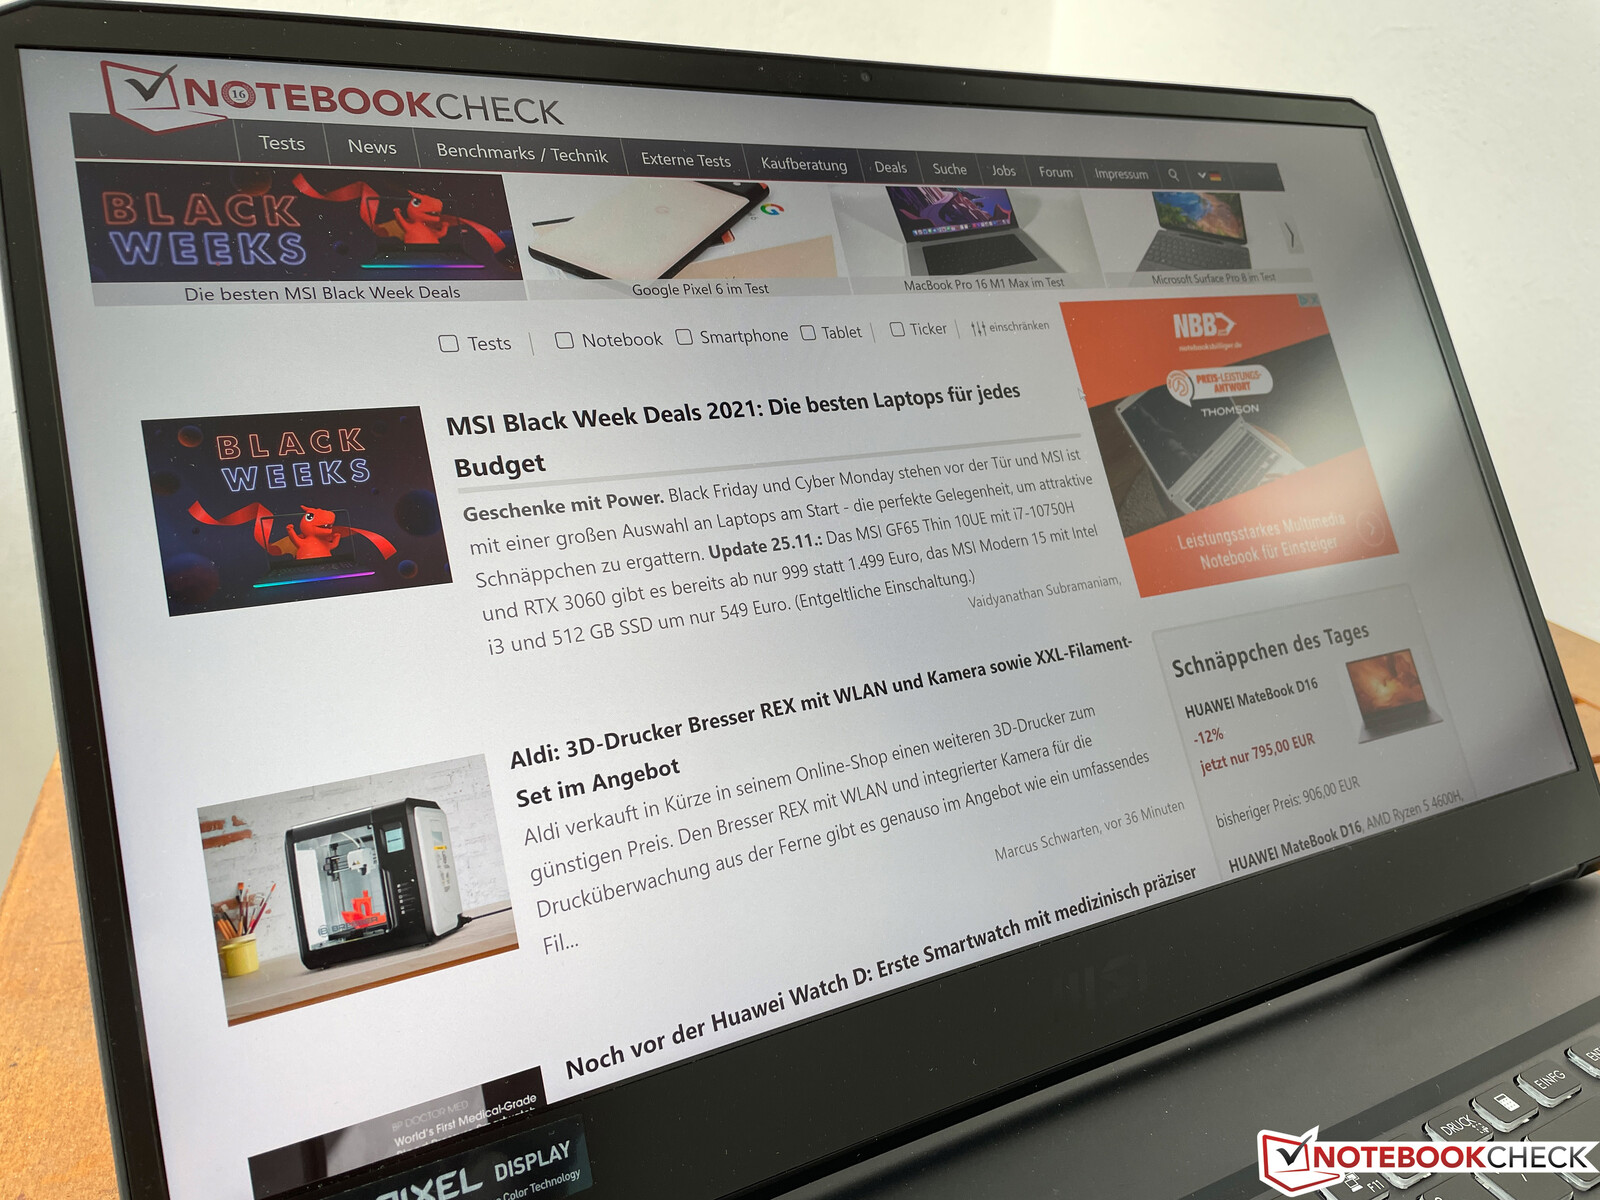
显示屏 - 带有AdobeRGB和120赫兹的哑光4K面板

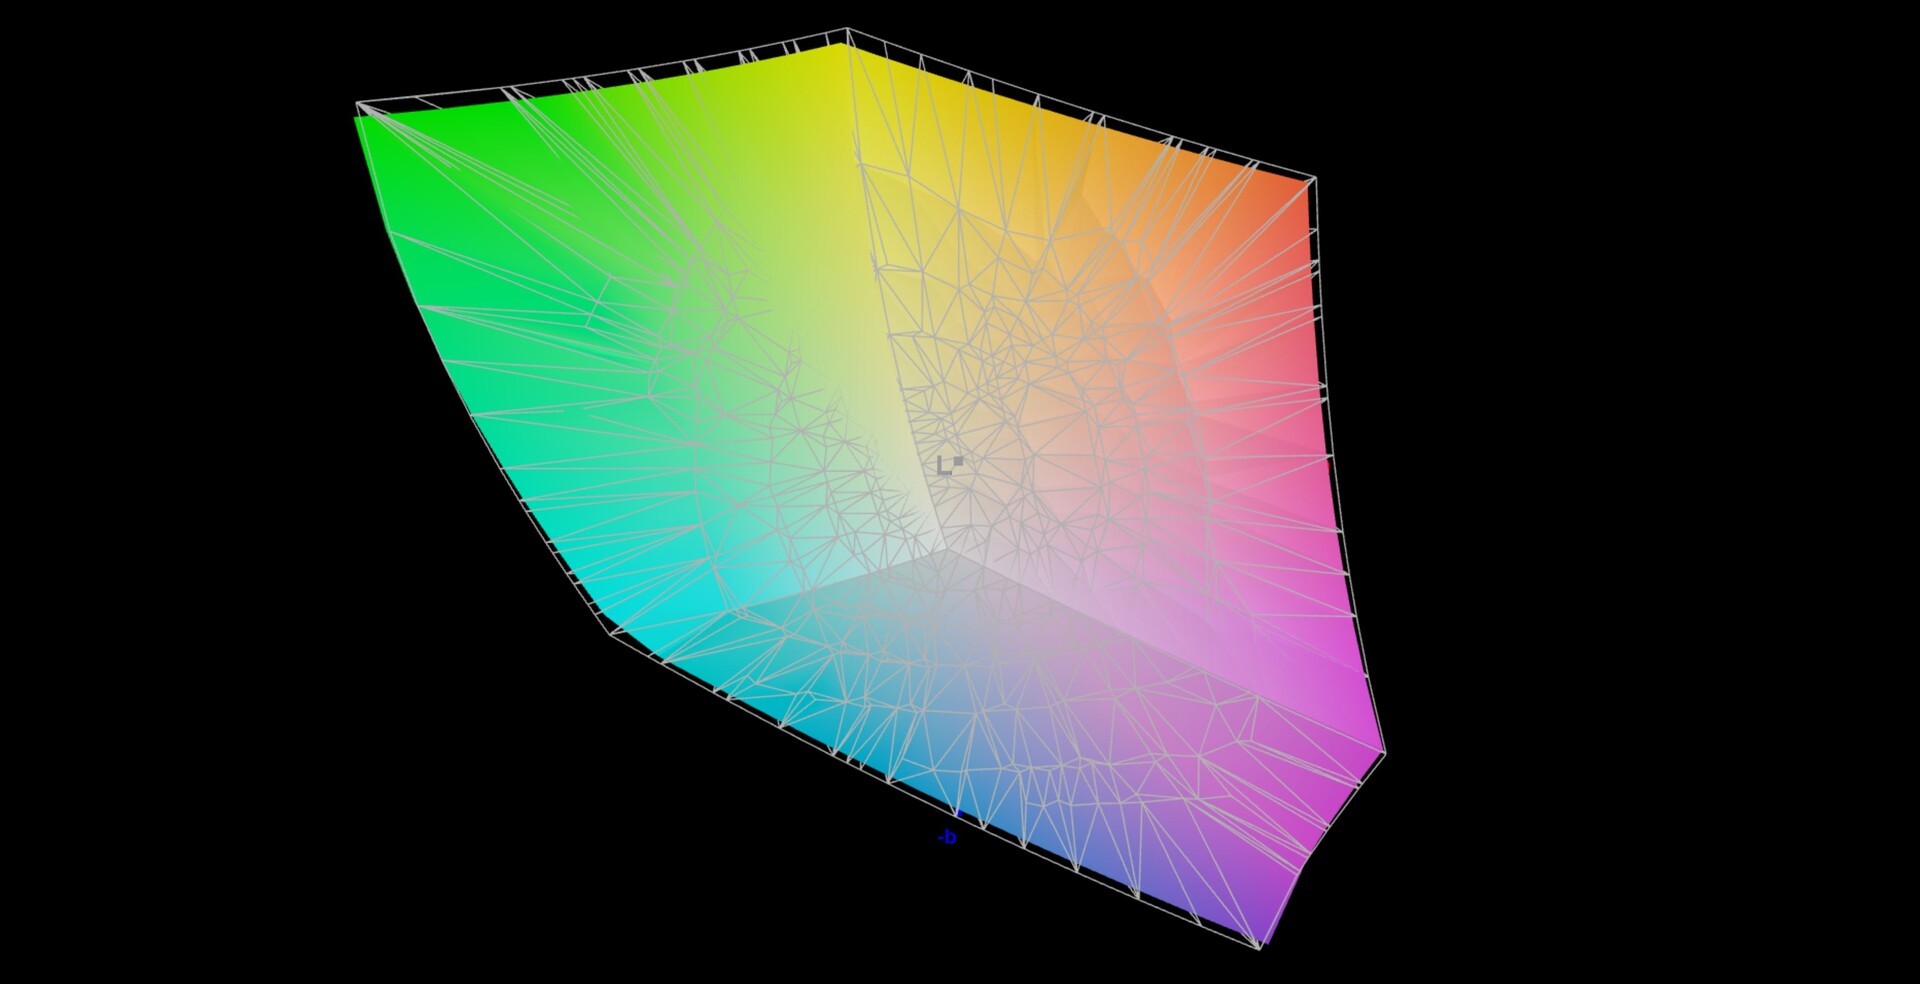
WE76独家配备了16:9长宽比的哑光4K面板。根据微星的说法,该显示器也完全覆盖了AdobeRGB色彩空间,120赫兹的刷新率确保了图像的流畅性,这也是默认启用的。微星在这里没有使用其游戏版本的更快的面板,不过这也是合理的。
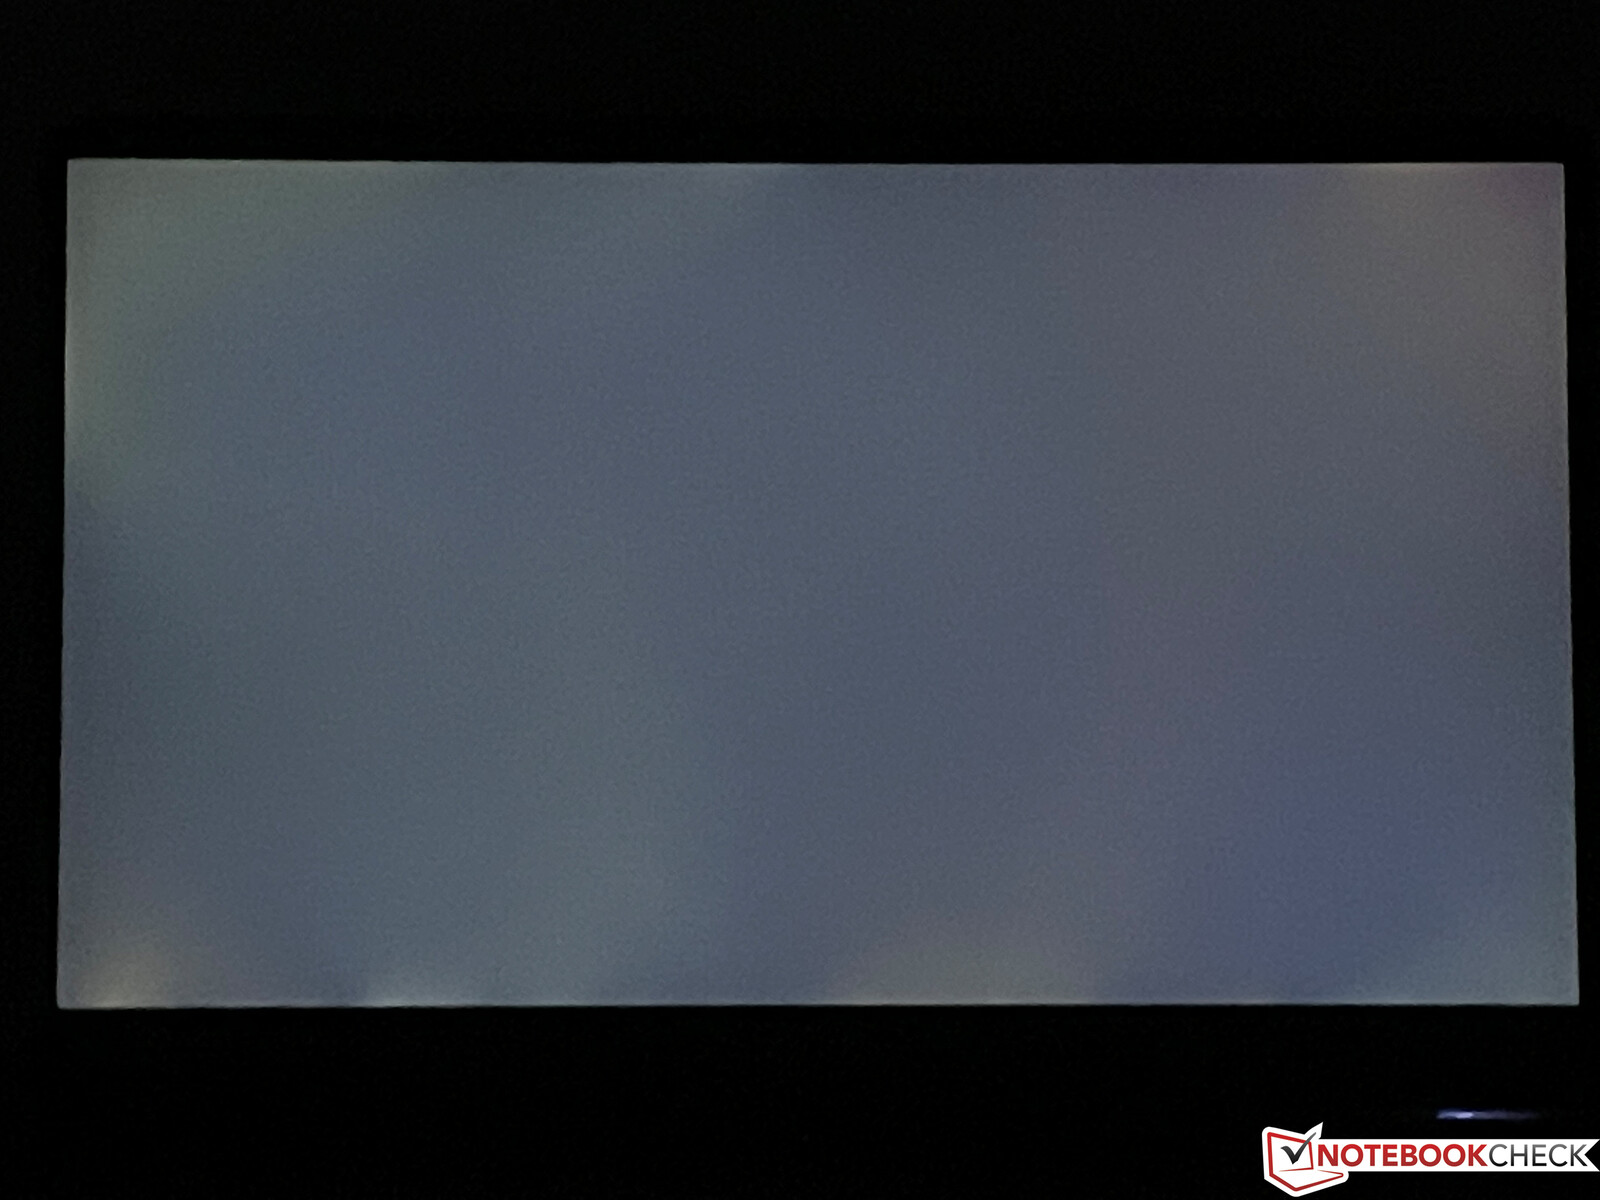
该面板的主观图像印象非常好。图片非常清晰,即使是明亮的区域也不会出现颗粒感。然而,与高质量的OLED或迷你LED面板相比,色彩并不十分鲜艳。平均亮度刚刚超过400cd/m²,对比度超过1,200:1。总的来说,比起老款的1080p显示屏,这是一个明显的改进。 微星WE75,但一些来自竞争对手的高分辨率面板提供了更好的成绩。
没有使用PWM,响应时间非常快,这意味着没有重影效应。在最大亮度下,当使用深色背景时,你可以注意到边缘有轻微的屏幕出血,但这在实践中并不明显。
| |||||||||||||||||||||||||
Brightness Distribution: 93 %
Center on Battery: 420 cd/m²
Contrast: 1232:1 (Black: 0.34 cd/m²)
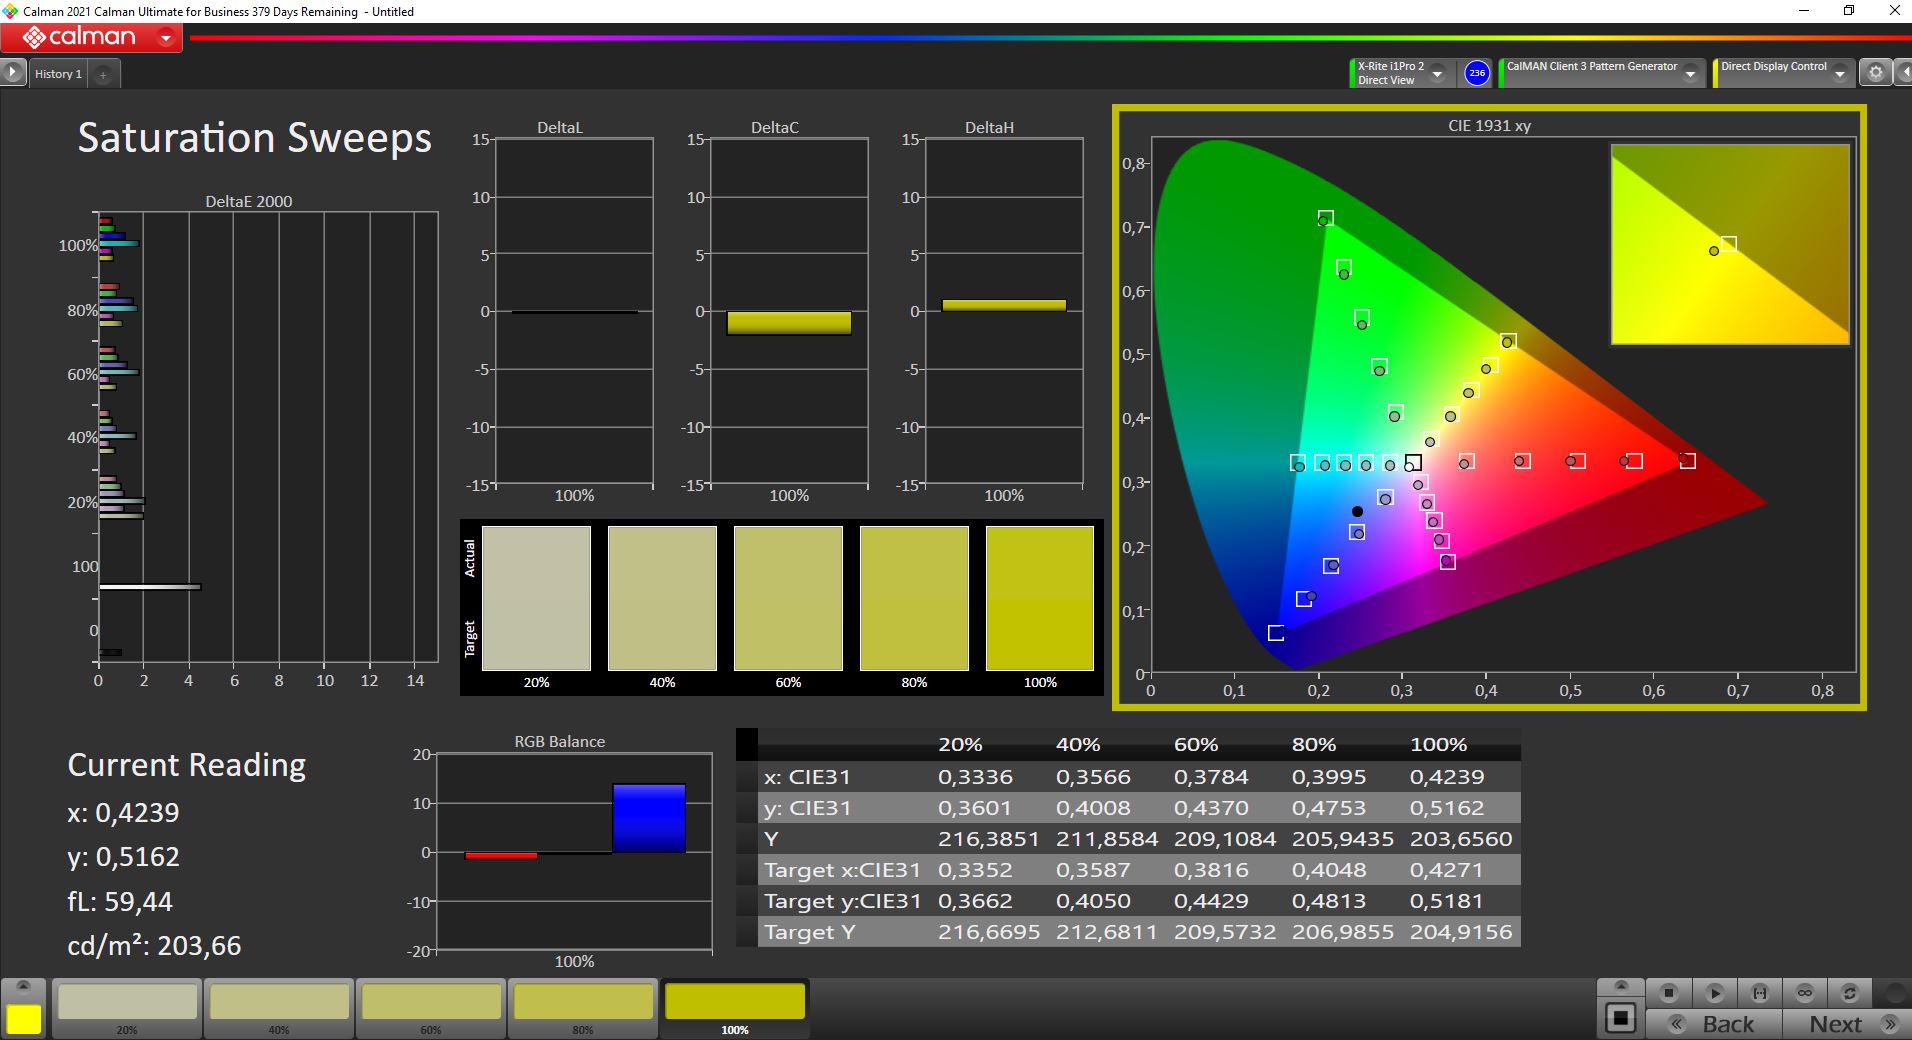
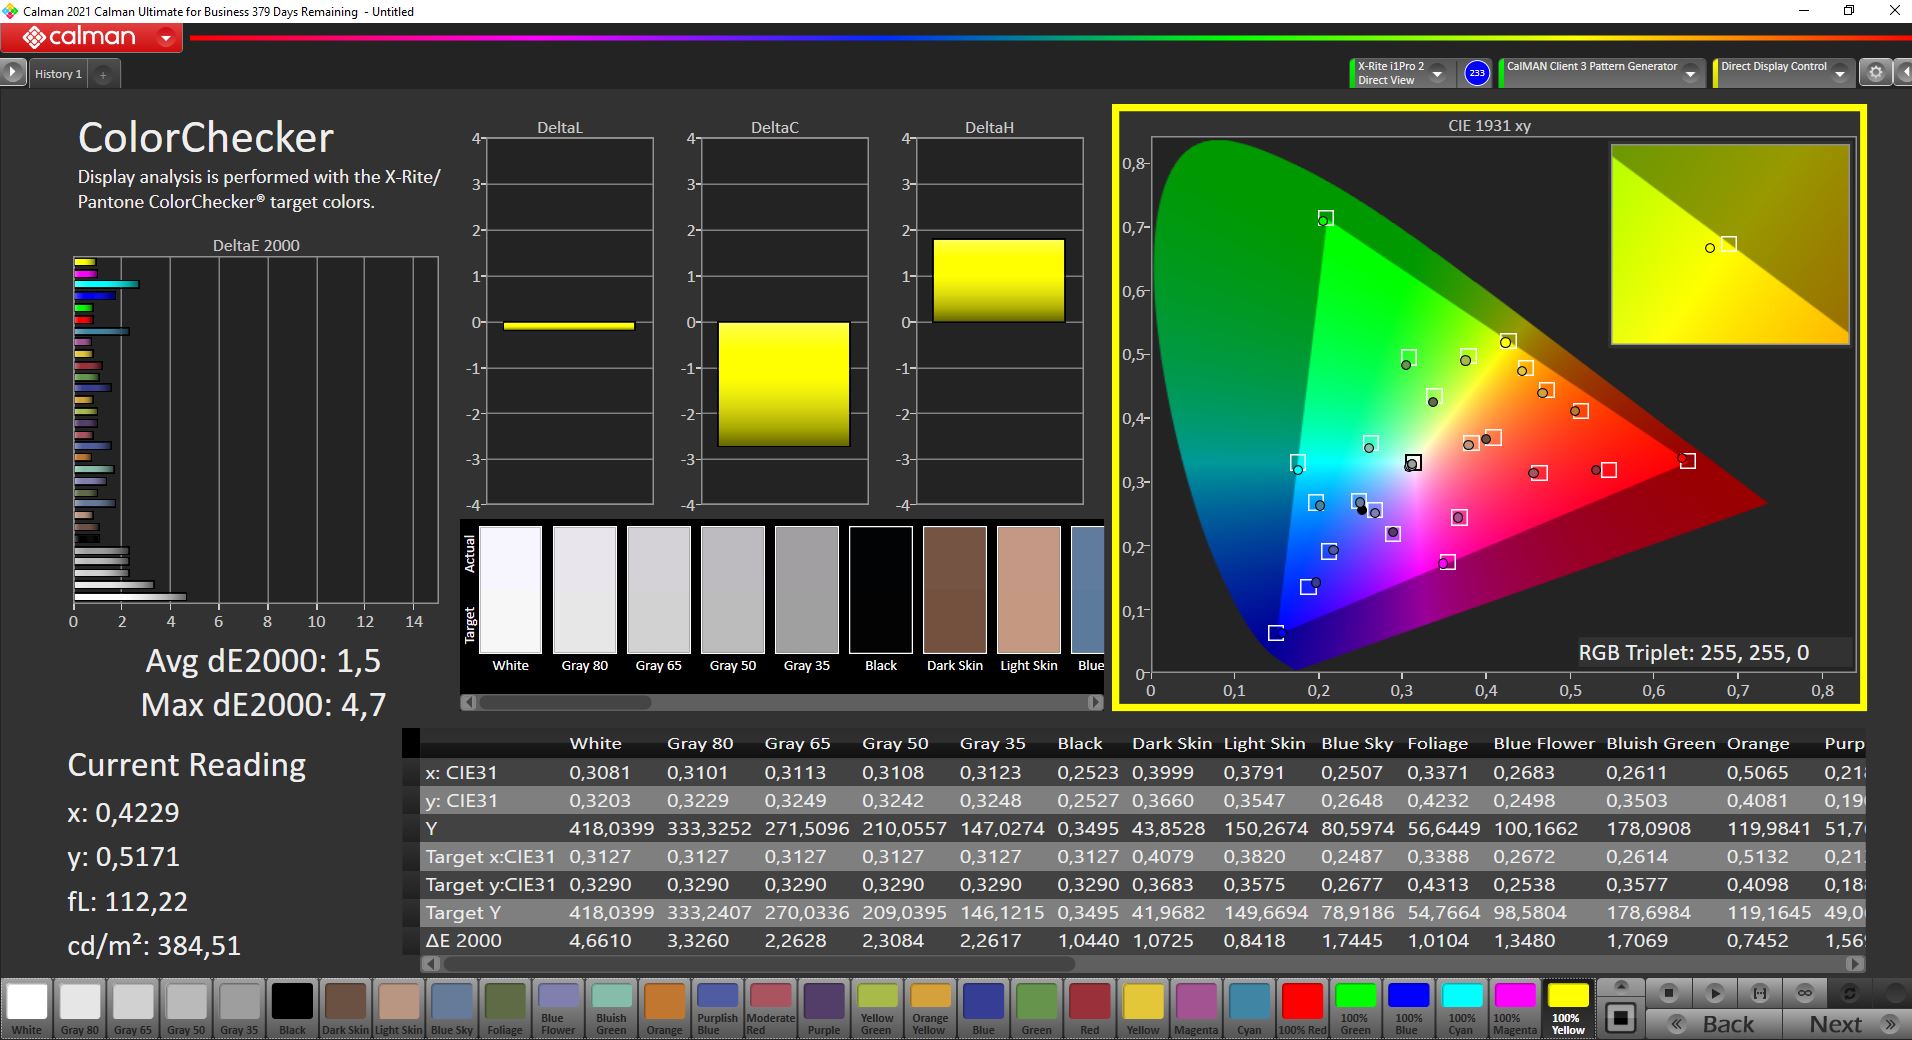
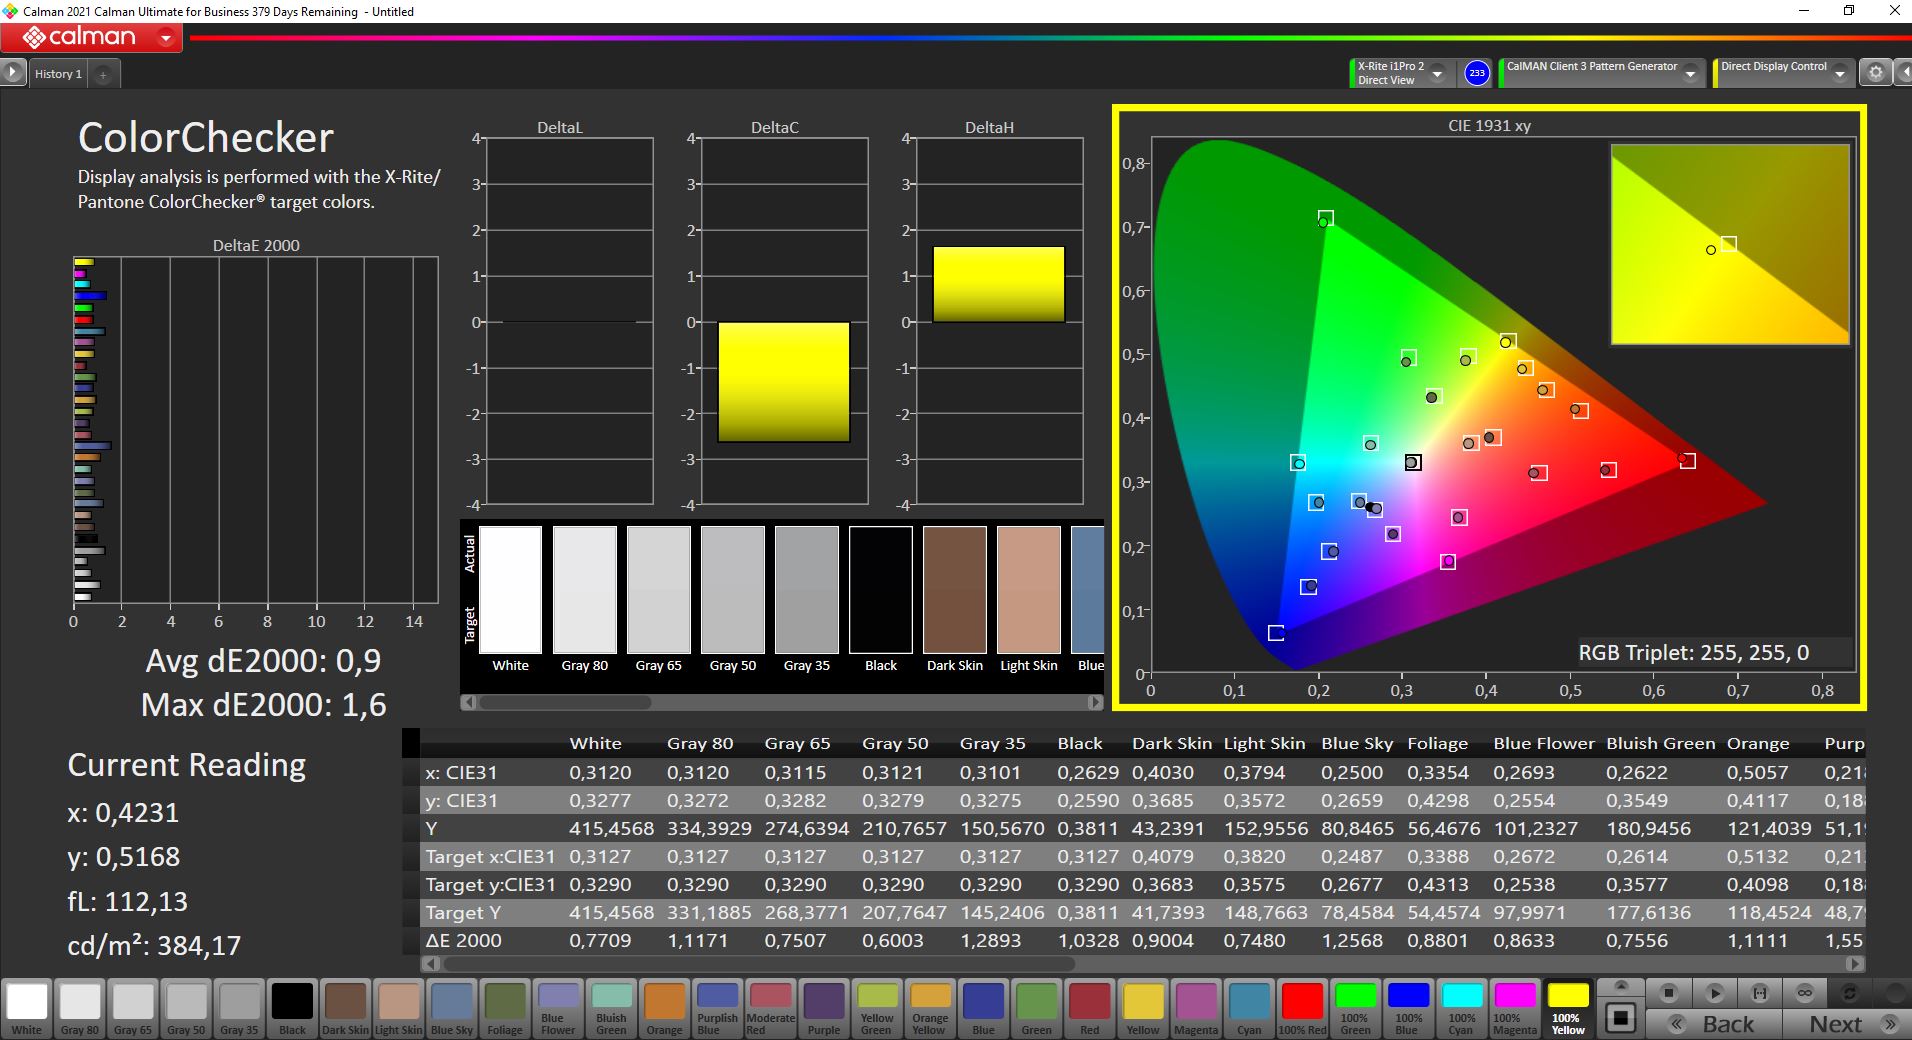
ΔE ColorChecker Calman: 1.5 | ∀{0.5-29.43 Ø4.72}
calibrated: 0.9
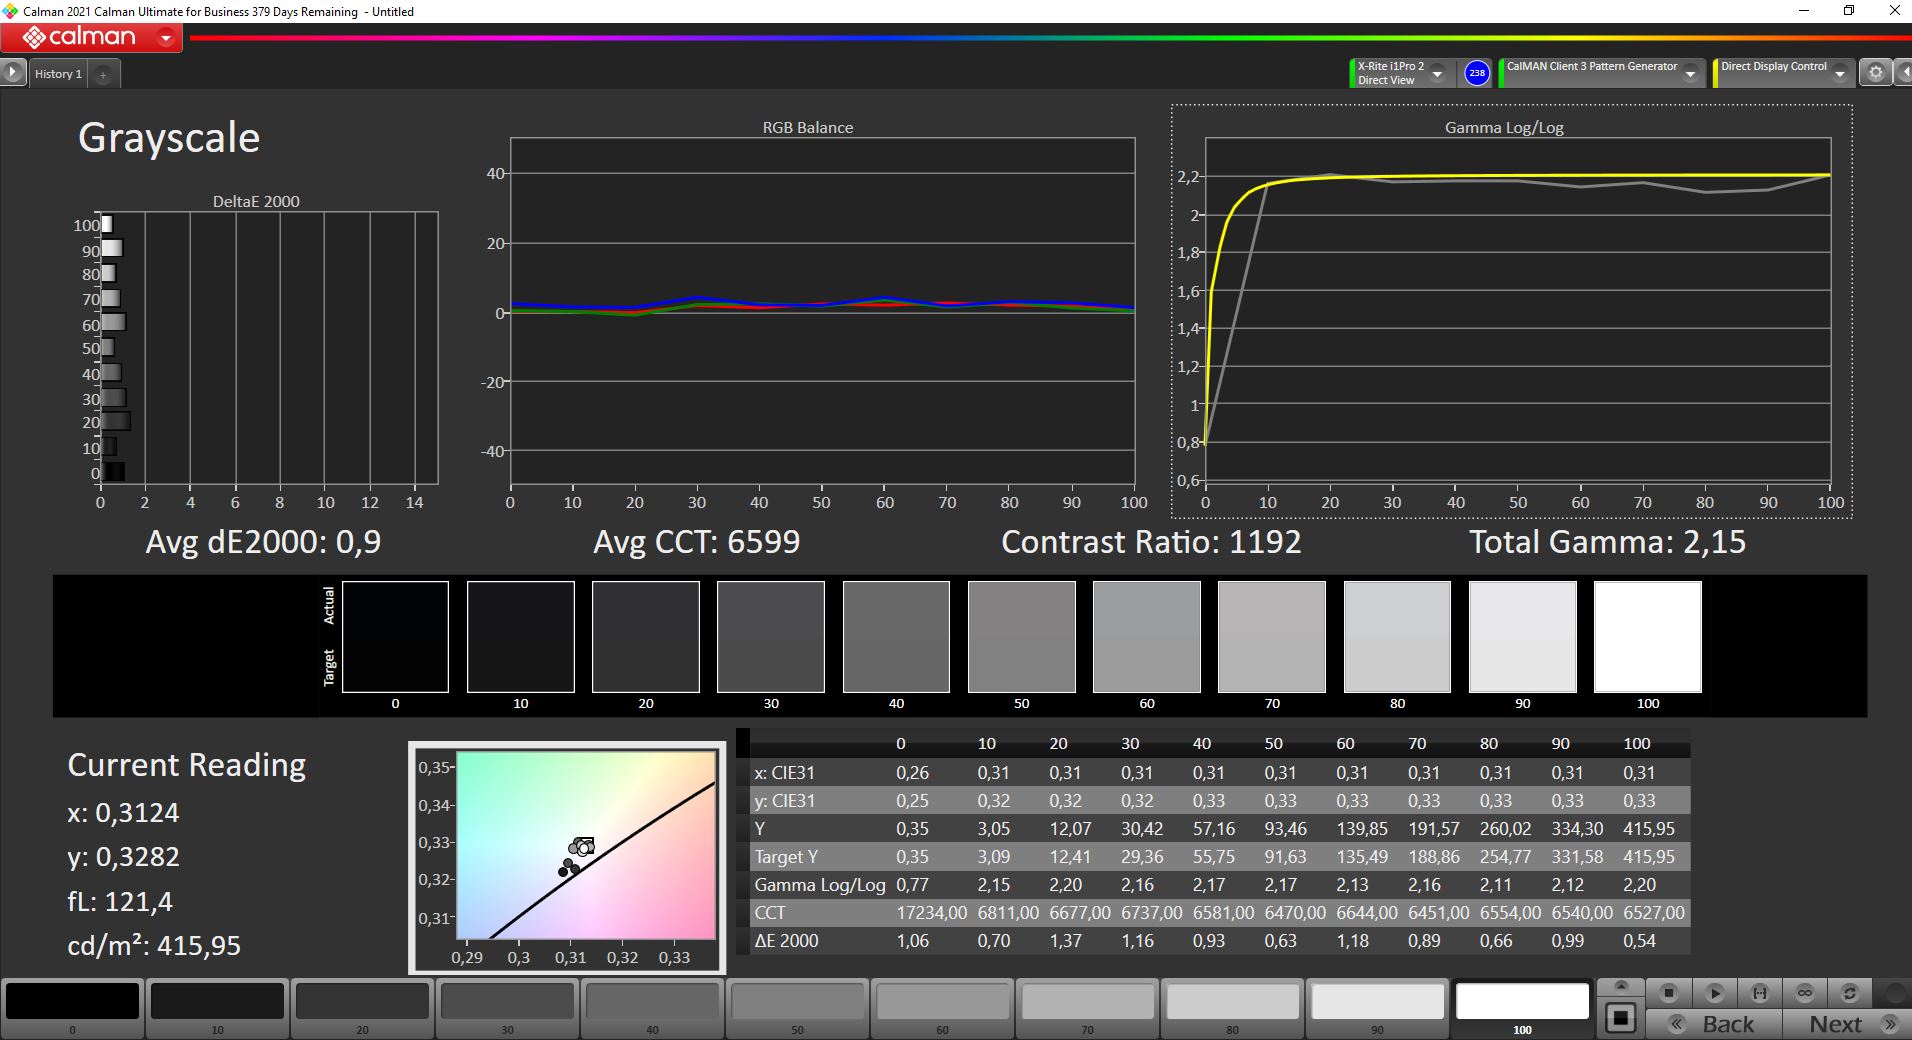
ΔE Greyscale Calman: 2 | ∀{0.09-98 Ø4.97}
96% AdobeRGB 1998 (Argyll 3D)
99.3% sRGB (Argyll 3D)
82.1% Display P3 (Argyll 3D)
Gamma: 2.17
CCT: 6629 K
| MSI WE76 11UM-456 B173ZAN03.3, IPS, 3840x2160, 17.3" | Lenovo ThinkPad P1 G4-20Y4S0KS00 LP160UQ1-SPB1, IPS LED, 3840x2400, 16" | HP ZBook Fury 15 G8 BOE0969, IPS, 3840x2160, 15.6" | Asus ProArt StudioBook 16 W7600H5A-2BL2 ATNA60YV02-0, OLED, 3840x2400, 16" | Lenovo ThinkPad P17 G2-20YU0025G LP173WF4-SPF7, IPS LED, 1920x1080, 17.3" | HP ZBook Fury 17 G7 119W5EA AUOCD8C, , 3840x2160, 17.3" | MSI WE75 9TK AU Optronics B173HAN04.2, IPS, 1920x1080, 17.3" | |
|---|---|---|---|---|---|---|---|
| Display | 2% | 3% | 9% | -21% | 4% | -22% | |
| Display P3 Coverage (%) | 82.1 | 85.7 4% | 95.9 17% | 99.9 22% | 67.9 -17% | 99.3 21% | 63.2 -23% |
| sRGB Coverage (%) | 99.3 | 99.4 0% | 100 1% | 100 1% | 87.3 -12% | 99.9 1% | 89.9 -9% |
| AdobeRGB 1998 Coverage (%) | 96 | 98.9 3% | 87.3 -9% | 98.6 3% | 63.9 -33% | 86.9 -9% | 64.3 -33% |
| Response Times | -202% | 7% | 85% | -115% | -244% | -132% | |
| Response Time Grey 50% / Grey 80% * (ms) | 17.6 ? | 55.2 ? -214% | 14.8 ? 16% | 2 ? 89% | 39.2 ? -123% | 56 ? -218% | 30.8 ? -75% |
| Response Time Black / White * (ms) | 10.8 ? | 31.2 ? -189% | 11 ? -2% | 2 ? 81% | 22.4 ? -107% | 40 ? -270% | 31.2 ? -189% |
| PWM Frequency (Hz) | 240 ? | ||||||
| Screen | 0% | -59% | -39% | -101% | 5% | -50% | |
| Brightness middle (cd/m²) | 419 | 630 50% | 626 49% | 353 -16% | 361 -14% | 573 37% | 287.3 -31% |
| Brightness (cd/m²) | 416 | 622 50% | 589 42% | 360 -13% | 334 -20% | 586 41% | 280 -33% |
| Brightness Distribution (%) | 93 | 90 -3% | 87 -6% | 96 3% | 87 -6% | 91 -2% | 89 -4% |
| Black Level * (cd/m²) | 0.34 | 0.41 -21% | 0.58 -71% | 0.35 -3% | 0.38 -12% | 0.26 24% | |
| Contrast (:1) | 1232 | 1537 25% | 1079 -12% | 1031 -16% | 1508 22% | 1105 -10% | |
| Colorchecker dE 2000 * | 1.5 | 2.2 -47% | 5.41 -261% | 2.45 -63% | 5.4 -260% | 1.9 -27% | 2.98 -99% |
| Colorchecker dE 2000 max. * | 4.7 | 5 -6% | 9.05 -93% | 3.75 20% | 9.9 -111% | 4.2 11% | 5.08 -8% |
| Colorchecker dE 2000 calibrated * | 0.9 | 1 -11% | 0.6 33% | 2.77 -208% | 3.2 -256% | 0.7 22% | 3.06 -240% |
| Greyscale dE 2000 * | 2 | 2.7 -35% | 6.2 -210% | 1.88 6% | 6.5 -225% | 2.9 -45% | 3 -50% |
| Gamma | 2.17 101% | 2.26 97% | 2.66 83% | 2.31 95% | 2.23 99% | 2.1 105% | 2.28 96% |
| CCT | 6629 98% | 6886 94% | 6101 107% | 6441 101% | 7351 88% | 6217 105% | 6993 93% |
| Color Space (Percent of AdobeRGB 1998) (%) | 77.6 | 58.1 | |||||
| Color Space (Percent of sRGB) (%) | 100 | 89.5 | |||||
| Total Average (Program / Settings) | -67% /
-28% | -16% /
-36% | 18% /
-6% | -79% /
-86% | -78% /
-31% | -68% /
-56% |
* ... smaller is better
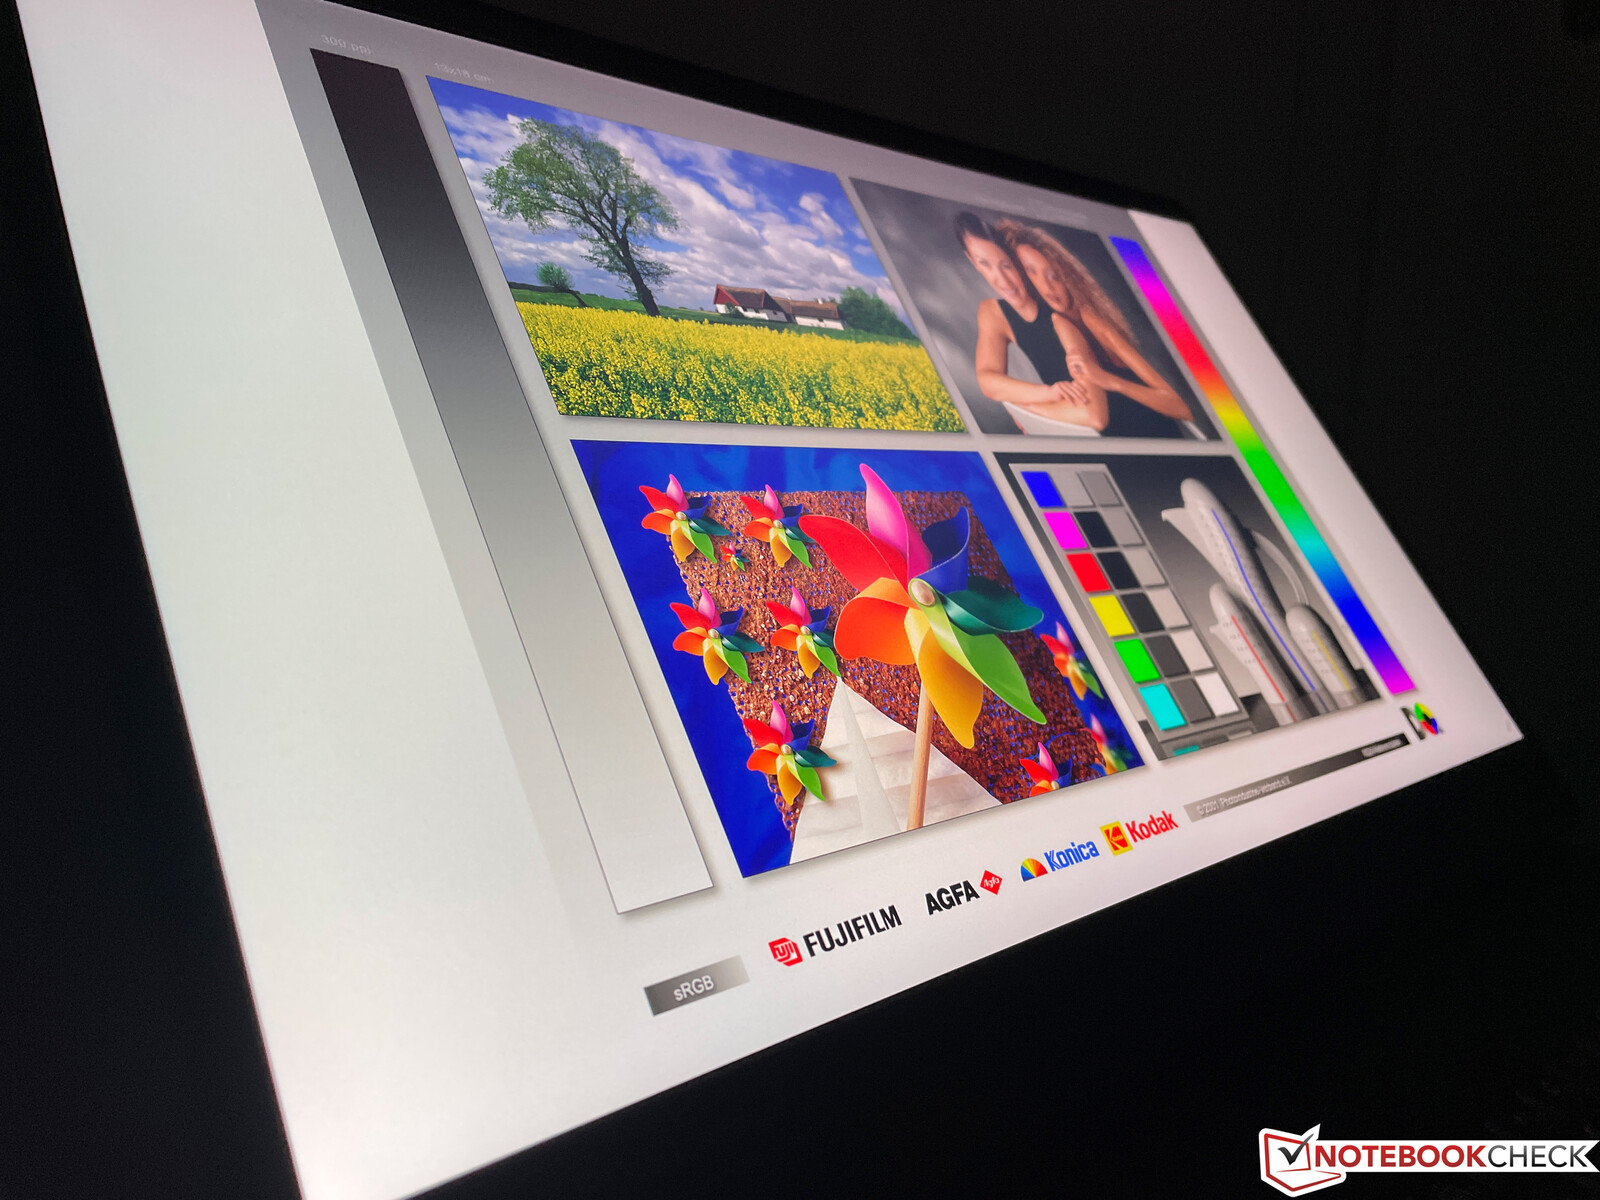
根据制造商的说法,这款4K显示器完全覆盖了AdobeRGB色彩空间;我们测得的比率为96%。微星已经安装了TrueColor软件,可以用来切换色彩空间。我们使用了默认的AdobeRGB模式。
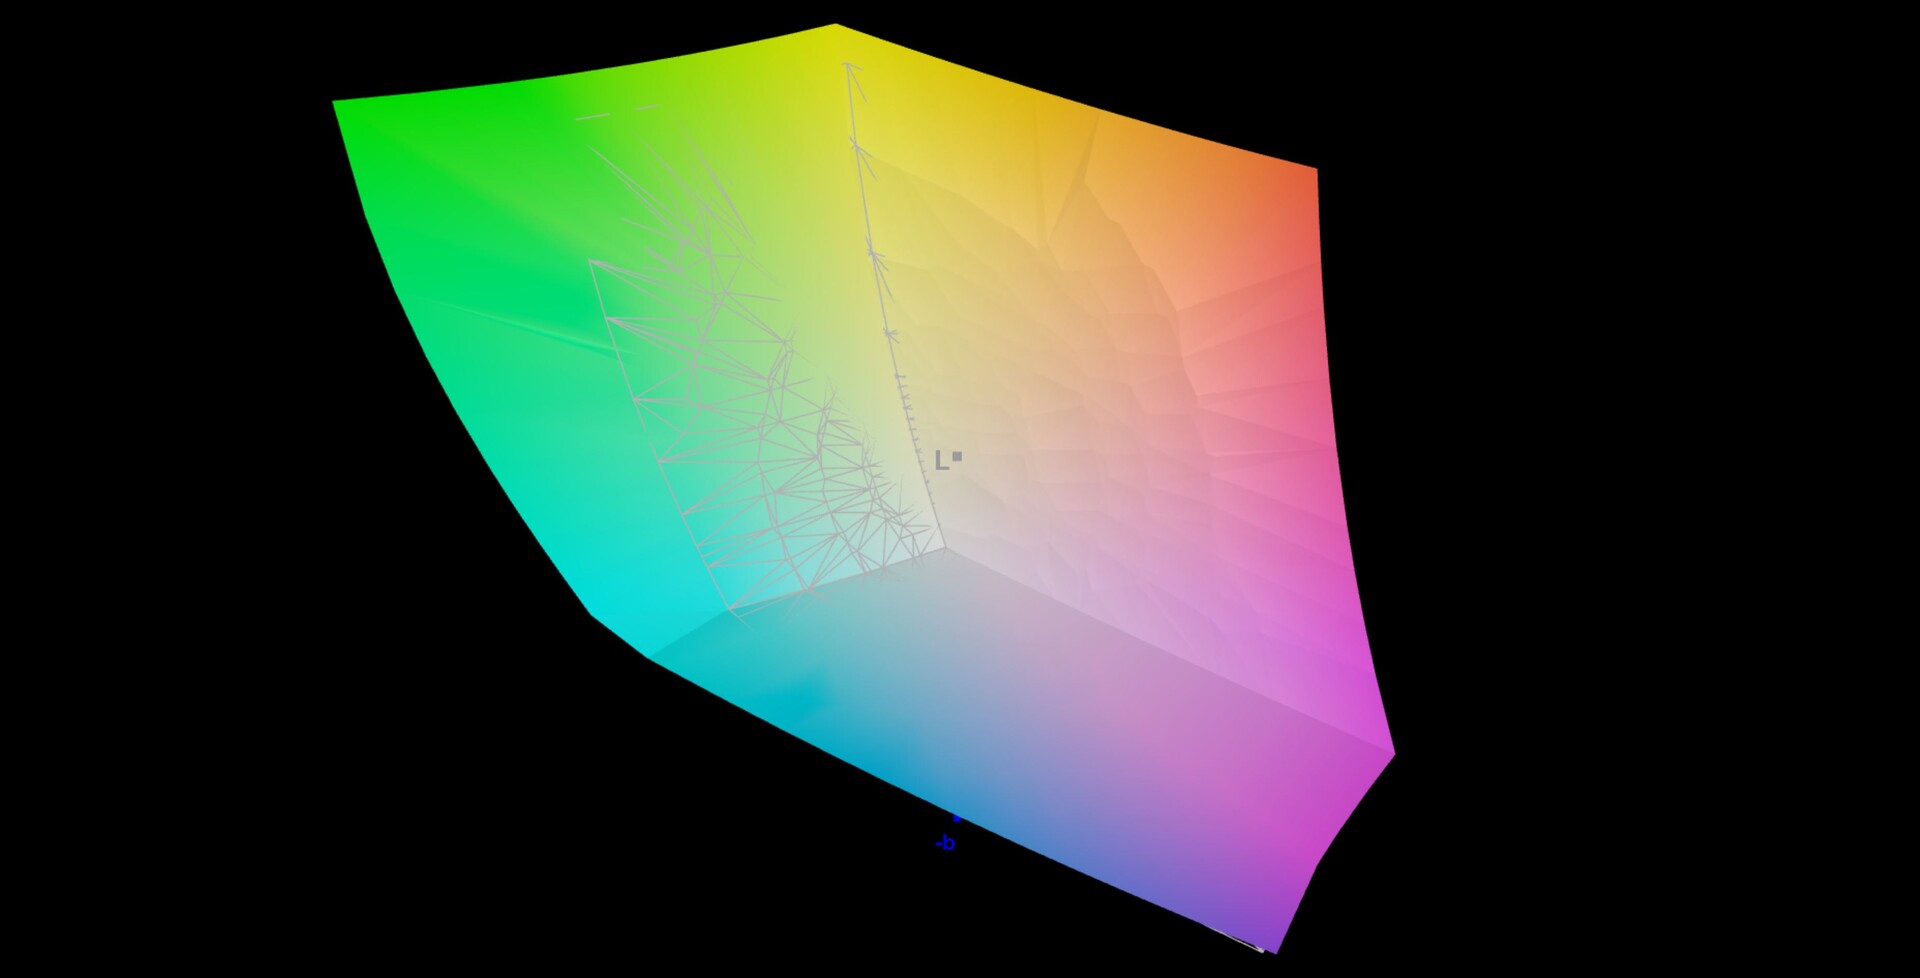
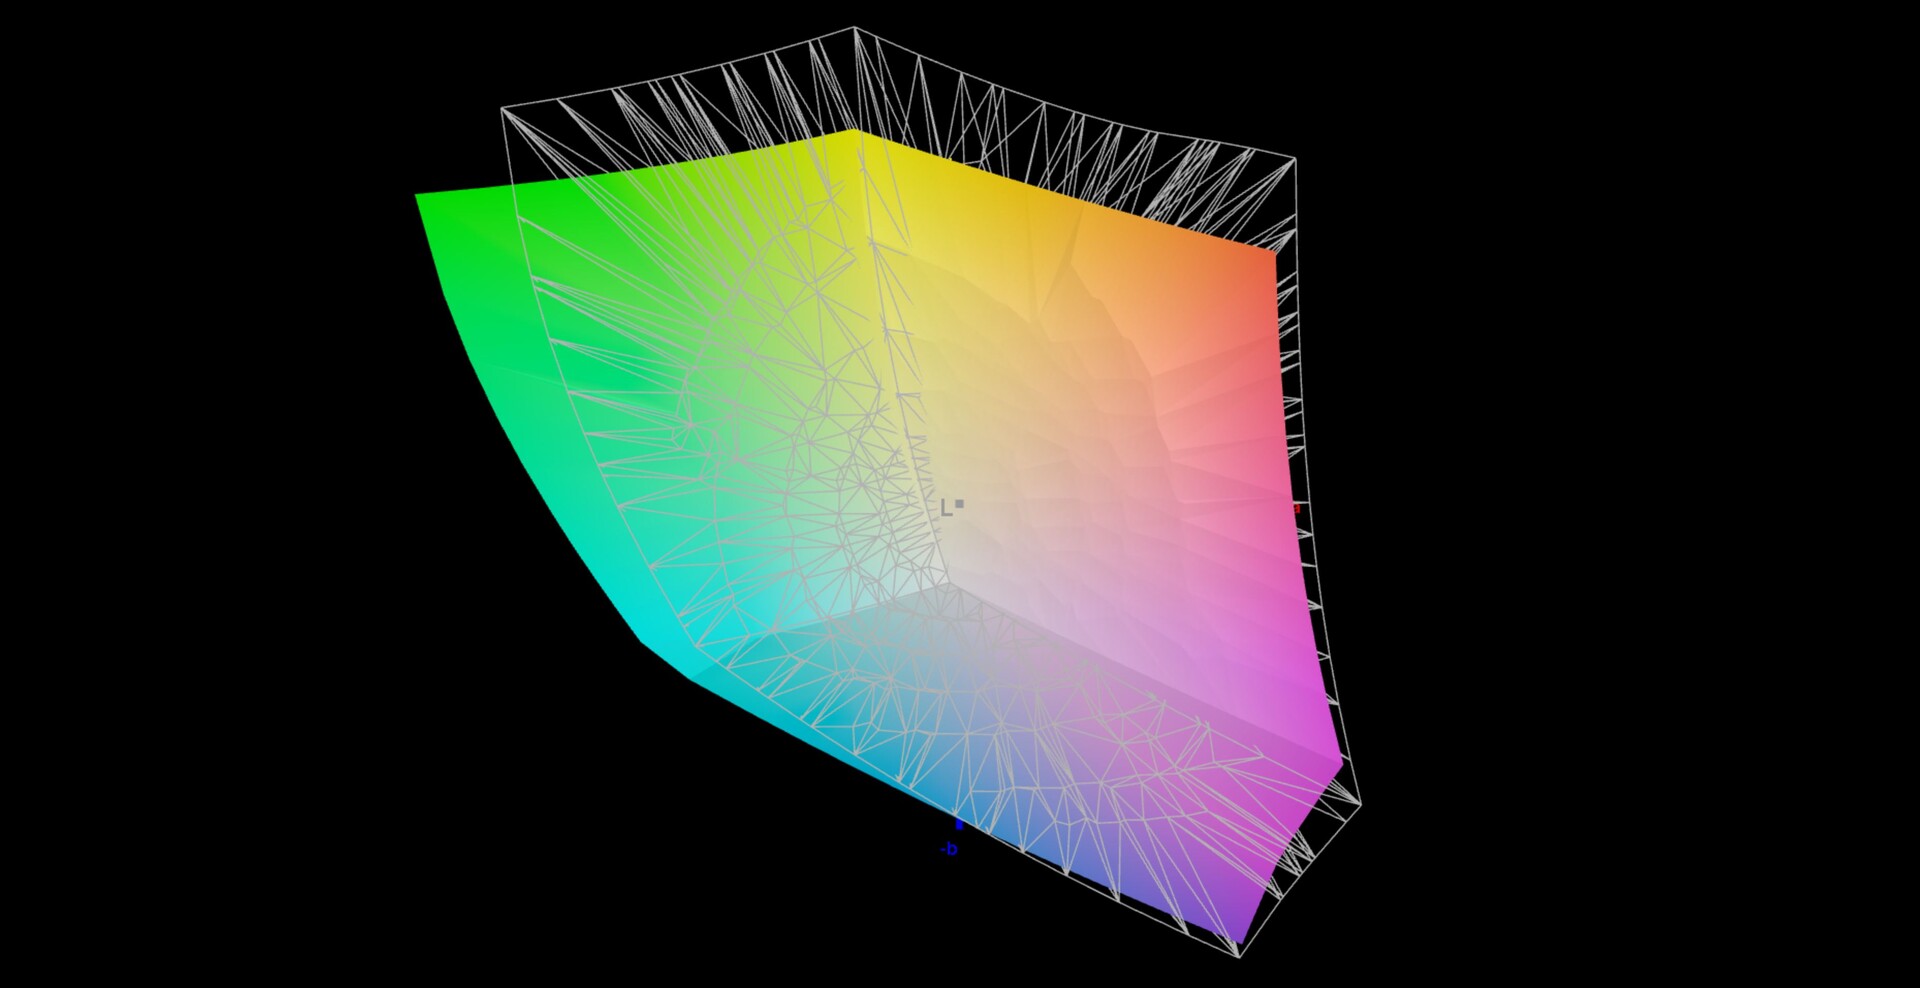
我们的分析(CalMAN和X-Rite i1 Pro 2)表明,即使开箱后,所有颜色都低于3的重要偏差。然而,我们仍然能够通过校准来改善灰度的再现(相应的配置文件可在上面下载)。因此,4K面板适合编辑图片/视频,没有任何问题,但不支持HDR内容。

Display Response Times
| ↔ Response Time Black to White | ||
|---|---|---|
| 10.8 ms ... rise ↗ and fall ↘ combined | ↗ 5.6 ms rise | 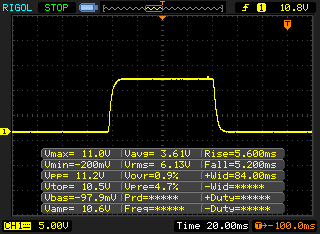 |
| ↘ 5.2 ms fall | ||
| The screen shows good response rates in our tests, but may be too slow for competitive gamers. In comparison, all tested devices range from 0.1 (minimum) to 240 (maximum) ms. » 29 % of all devices are better. This means that the measured response time is better than the average of all tested devices (19.8 ms). | ||
| ↔ Response Time 50% Grey to 80% Grey | ||
| 17.6 ms ... rise ↗ and fall ↘ combined | ↗ 8.4 ms rise | 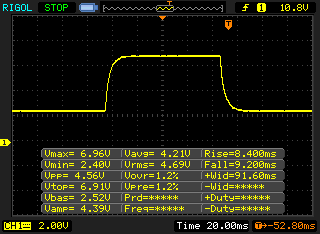 |
| ↘ 9.2 ms fall | ||
| The screen shows good response rates in our tests, but may be too slow for competitive gamers. In comparison, all tested devices range from 0.165 (minimum) to 636 (maximum) ms. » 32 % of all devices are better. This means that the measured response time is better than the average of all tested devices (31 ms). | ||
Screen Flickering / PWM (Pulse-Width Modulation)
| Screen flickering / PWM not detected |  | ||
In comparison: 52 % of all tested devices do not use PWM to dim the display. If PWM was detected, an average of 7769 (minimum: 5 - maximum: 343500) Hz was measured. | |||
WE76当然不是一个经常外出使用的设备,但面板的哑光表面在户外自然是有益的,至少在阴天使用它是非常舒适的。IPS显示屏的视角稳定性让人没有批评的余地。
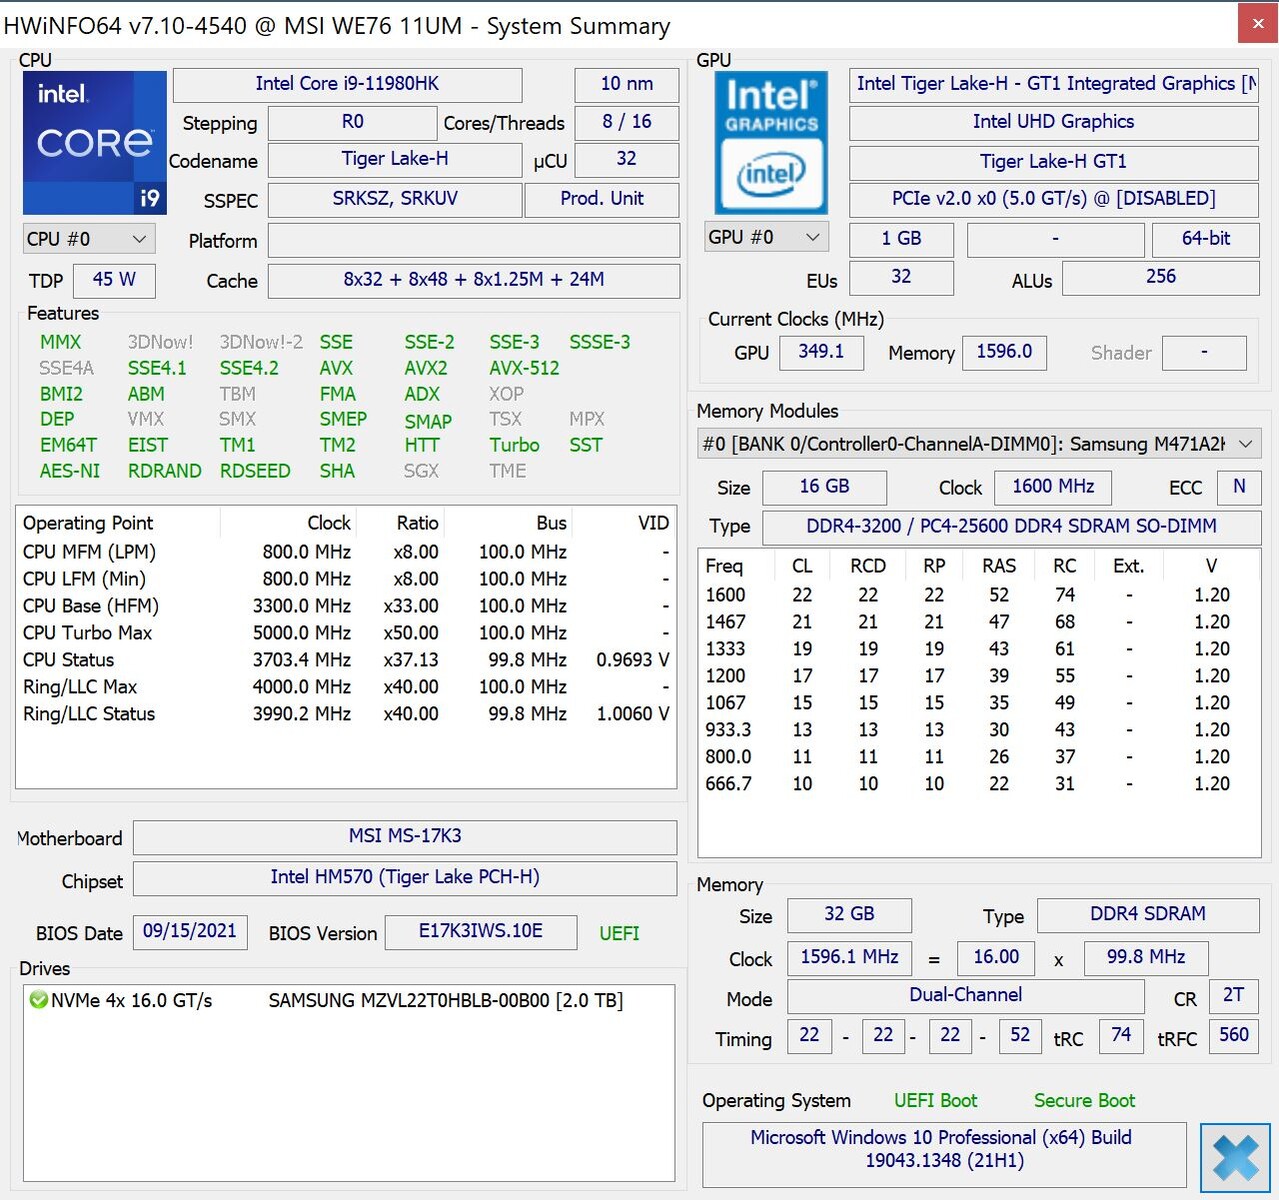
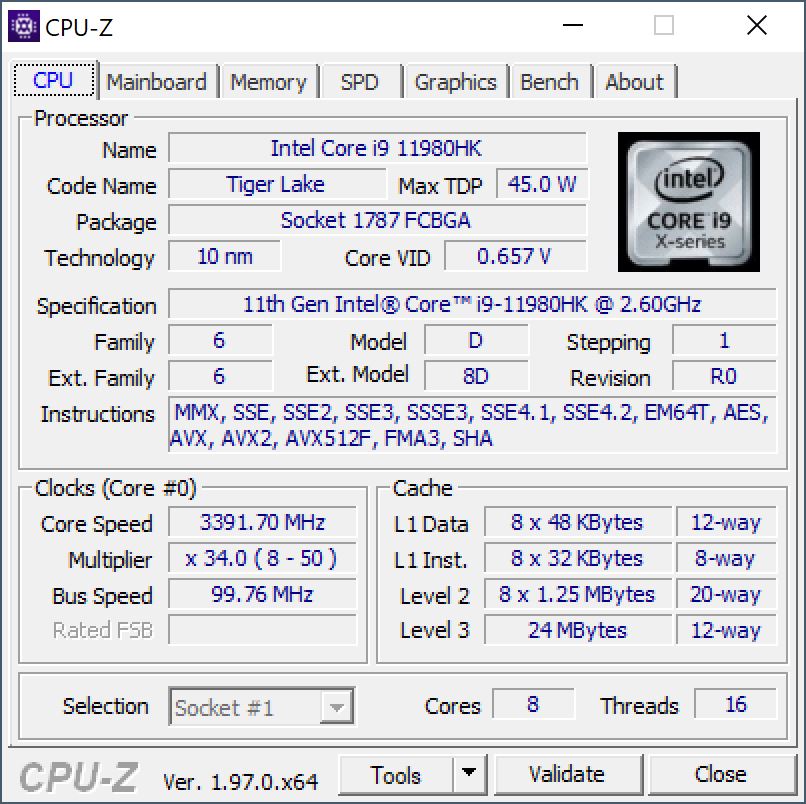
性能 - 配备酷睿i9和RTX A5000的WE76
测试条件
除了正常的Windows设置,微星还通过预装的MSI Center Pro提供了不同的性能设置。我们使用平衡预设进行了以下测试,但在某些方面,我们也会看一下其他性能模式的影响。高性能模式主要影响压力测试中的性能,也就是给CPU和GPU都施加压力。
处理器
微星选择了英特尔酷睿i9-11980HK处理器,这款处理器在我们的测试中表现非常好,而且经常能在比较领域中名列前茅。该处理器最大可消耗84瓦,但它很快就稳定在70瓦,后来又稳定在~62瓦。这也可以用一个普通的酷睿i7-11800H我们可以看到,在 ThinkPad P17第二代.然而,AMD的Ryzen 9 5900HX在相当的TDP配置下要快一些(在华硕ROG Zephyrus Duo 15的情况下,约为64瓦)。 华硕ROG Zephyrus Duo 15).
在电池供电的情况下,CPU的性能明显下降,因为TDP迅速下降到只有45瓦,然后是35瓦。因此,在使用所有核心时,你应该预期有大约30%-40%的亏损。进一步的比较可在我们的 CPU基准测试文章.
Cinebench R15 Multi endurance test
Cinebench R23: Multi Core | Single Core
Cinebench R20: CPU (Multi Core) | CPU (Single Core)
Cinebench R15: CPU Multi 64Bit | CPU Single 64Bit
Blender: v2.79 BMW27 CPU
7-Zip 18.03: 7z b 4 | 7z b 4 -mmt1
Geekbench 5.5: Multi-Core | Single-Core
HWBOT x265 Benchmark v2.2: 4k Preset
LibreOffice : 20 Documents To PDF
R Benchmark 2.5: Overall mean
| CPU Performance rating | |
| Average of class Workstation | |
| MSI WE76 11UM-456 -1! | |
| Lenovo ThinkPad P1 G4-20Y4S0KS00 | |
| Average Intel Core i9-11980HK | |
| Asus ProArt StudioBook 16 W7600H5A-2BL2 | |
| Lenovo ThinkPad P17 G2-20YU0025G | |
| HP ZBook Fury 15 G8 -2! | |
| MSI WE75 9TK -10! | |
| HP ZBook Fury 17 G7 119W5EA | |
| Cinebench R23 / Multi Core | |
| Average of class Workstation (14621 - 38520, n=24, last 2 years) | |
| MSI WE76 11UM-456 | |
| Lenovo ThinkPad P17 G2-20YU0025G | |
| HP ZBook Fury 15 G8 | |
| Lenovo ThinkPad P1 G4-20Y4S0KS00 | |
| Average Intel Core i9-11980HK (8459 - 13387, n=2) | |
| Asus ProArt StudioBook 16 W7600H5A-2BL2 | |
| HP ZBook Fury 17 G7 119W5EA | |
| Cinebench R23 / Single Core | |
| Average of class Workstation (1712 - 2228, n=24, last 2 years) | |
| MSI WE76 11UM-456 | |
| HP ZBook Fury 15 G8 | |
| Average Intel Core i9-11980HK (1505 - 1613, n=2) | |
| Lenovo ThinkPad P1 G4-20Y4S0KS00 | |
| Lenovo ThinkPad P17 G2-20YU0025G | |
| Asus ProArt StudioBook 16 W7600H5A-2BL2 | |
| HP ZBook Fury 17 G7 119W5EA | |
| Cinebench R20 / CPU (Multi Core) | |
| Average of class Workstation (5760 - 15043, n=24, last 2 years) | |
| Lenovo ThinkPad P17 G2-20YU0025G | |
| HP ZBook Fury 15 G8 | |
| Lenovo ThinkPad P1 G4-20Y4S0KS00 | |
| Average Intel Core i9-11980HK (3779 - 5256, n=8) | |
| MSI WE76 11UM-456 | |
| Asus ProArt StudioBook 16 W7600H5A-2BL2 | |
| HP ZBook Fury 17 G7 119W5EA | |
| MSI WE75 9TK | |
| Cinebench R20 / CPU (Single Core) | |
| Average of class Workstation (671 - 857, n=24, last 2 years) | |
| MSI WE76 11UM-456 | |
| HP ZBook Fury 15 G8 | |
| Lenovo ThinkPad P1 G4-20Y4S0KS00 | |
| Average Intel Core i9-11980HK (572 - 622, n=7) | |
| Lenovo ThinkPad P17 G2-20YU0025G | |
| Asus ProArt StudioBook 16 W7600H5A-2BL2 | |
| HP ZBook Fury 17 G7 119W5EA | |
| MSI WE75 9TK | |
| Cinebench R15 / CPU Multi 64Bit | |
| Average of class Workstation (2489 - 5810, n=24, last 2 years) | |
| MSI WE76 11UM-456 | |
| Lenovo ThinkPad P17 G2-20YU0025G | |
| Average Intel Core i9-11980HK (1696 - 2287, n=7) | |
| Lenovo ThinkPad P1 G4-20Y4S0KS00 | |
| Asus ProArt StudioBook 16 W7600H5A-2BL2 | |
| HP ZBook Fury 15 G8 | |
| HP ZBook Fury 17 G7 119W5EA | |
| MSI WE75 9TK | |
| Cinebench R15 / CPU Single 64Bit | |
| Average of class Workstation (191.4 - 328, n=24, last 2 years) | |
| MSI WE76 11UM-456 | |
| HP ZBook Fury 15 G8 | |
| Lenovo ThinkPad P1 G4-20Y4S0KS00 | |
| Lenovo ThinkPad P17 G2-20YU0025G | |
| Average Intel Core i9-11980HK (224 - 244, n=6) | |
| Asus ProArt StudioBook 16 W7600H5A-2BL2 | |
| HP ZBook Fury 17 G7 119W5EA | |
| MSI WE75 9TK | |
| Blender / v2.79 BMW27 CPU | |
| HP ZBook Fury 17 G7 119W5EA | |
| Asus ProArt StudioBook 16 W7600H5A-2BL2 | |
| HP ZBook Fury 15 G8 | |
| Lenovo ThinkPad P1 G4-20Y4S0KS00 | |
| Average Intel Core i9-11980HK (231 - 284, n=4) | |
| Lenovo ThinkPad P17 G2-20YU0025G | |
| Average of class Workstation (91 - 222, n=24, last 2 years) | |
| 7-Zip 18.03 / 7z b 4 | |
| Average of class Workstation (60489 - 116969, n=24, last 2 years) | |
| MSI WE76 11UM-456 | |
| Average Intel Core i9-11980HK (45226 - 56759, n=5) | |
| Lenovo ThinkPad P1 G4-20Y4S0KS00 | |
| HP ZBook Fury 15 G8 | |
| Lenovo ThinkPad P17 G2-20YU0025G | |
| Asus ProArt StudioBook 16 W7600H5A-2BL2 | |
| HP ZBook Fury 17 G7 119W5EA | |
| 7-Zip 18.03 / 7z b 4 -mmt1 | |
| Average of class Workstation (5126 - 6960, n=24, last 2 years) | |
| Lenovo ThinkPad P1 G4-20Y4S0KS00 | |
| HP ZBook Fury 15 G8 | |
| MSI WE76 11UM-456 | |
| Average Intel Core i9-11980HK (5428 - 5735, n=5) | |
| HP ZBook Fury 17 G7 119W5EA | |
| Lenovo ThinkPad P17 G2-20YU0025G | |
| Asus ProArt StudioBook 16 W7600H5A-2BL2 | |
| Geekbench 5.5 / Multi-Core | |
| Average of class Workstation (11542 - 25554, n=24, last 2 years) | |
| MSI WE76 11UM-456 | |
| Average Intel Core i9-11980HK (8786 - 10081, n=5) | |
| Lenovo ThinkPad P1 G4-20Y4S0KS00 | |
| Asus ProArt StudioBook 16 W7600H5A-2BL2 | |
| Lenovo ThinkPad P17 G2-20YU0025G | |
| HP ZBook Fury 17 G7 119W5EA | |
| Geekbench 5.5 / Single-Core | |
| Average of class Workstation (1783 - 2183, n=24, last 2 years) | |
| MSI WE76 11UM-456 | |
| Lenovo ThinkPad P1 G4-20Y4S0KS00 | |
| Average Intel Core i9-11980HK (1561 - 1679, n=5) | |
| Lenovo ThinkPad P17 G2-20YU0025G | |
| Asus ProArt StudioBook 16 W7600H5A-2BL2 | |
| HP ZBook Fury 17 G7 119W5EA | |
| HWBOT x265 Benchmark v2.2 / 4k Preset | |
| Average of class Workstation (17.8 - 40.5, n=24, last 2 years) | |
| MSI WE76 11UM-456 | |
| Average Intel Core i9-11980HK (13.1 - 16.3, n=5) | |
| Lenovo ThinkPad P17 G2-20YU0025G | |
| Lenovo ThinkPad P1 G4-20Y4S0KS00 | |
| HP ZBook Fury 15 G8 | |
| Asus ProArt StudioBook 16 W7600H5A-2BL2 | |
| HP ZBook Fury 17 G7 119W5EA | |
| LibreOffice / 20 Documents To PDF | |
| HP ZBook Fury 17 G7 119W5EA | |
| HP ZBook Fury 15 G8 | |
| Lenovo ThinkPad P17 G2-20YU0025G | |
| Average of class Workstation (37.1 - 74.7, n=24, last 2 years) | |
| MSI WE76 11UM-456 | |
| Lenovo ThinkPad P1 G4-20Y4S0KS00 | |
| Average Intel Core i9-11980HK (40.6 - 47.7, n=5) | |
| Asus ProArt StudioBook 16 W7600H5A-2BL2 | |
| R Benchmark 2.5 / Overall mean | |
| HP ZBook Fury 17 G7 119W5EA | |
| Asus ProArt StudioBook 16 W7600H5A-2BL2 | |
| Lenovo ThinkPad P17 G2-20YU0025G | |
| Average Intel Core i9-11980HK (0.545 - 0.565, n=5) | |
| MSI WE76 11UM-456 | |
| HP ZBook Fury 15 G8 | |
| Lenovo ThinkPad P1 G4-20Y4S0KS00 | |
| Average of class Workstation (0.3825 - 0.603, n=24, last 2 years) | |
* ... smaller is better
AIDA64: FP32 Ray-Trace | FPU Julia | CPU SHA3 | CPU Queen | FPU SinJulia | FPU Mandel | CPU AES | CPU ZLib | FP64 Ray-Trace | CPU PhotoWorxx
| Performance rating | |
| Average of class Workstation | |
| MSI WE76 11UM-456 | |
| Average Intel Core i9-11980HK | |
| HP ZBook Fury 15 G8 | |
| HP ZBook Fury 17 G7 119W5EA | |
| Lenovo ThinkPad P1 G4-20Y4S0KS00 -9! | |
| Asus ProArt StudioBook 16 W7600H5A-2BL2 -9! | |
| Lenovo ThinkPad P17 G2-20YU0025G -9! | |
| AIDA64 / FP32 Ray-Trace | |
| Average of class Workstation (15143 - 61611, n=24, last 2 years) | |
| MSI WE76 11UM-456 | |
| Average Intel Core i9-11980HK (14180 - 15661, n=2) | |
| HP ZBook Fury 15 G8 | |
| HP ZBook Fury 17 G7 119W5EA | |
| AIDA64 / FPU Julia | |
| Average of class Workstation (81575 - 186971, n=24, last 2 years) | |
| MSI WE76 11UM-456 | |
| Average Intel Core i9-11980HK (59177 - 64043, n=2) | |
| HP ZBook Fury 15 G8 | |
| HP ZBook Fury 17 G7 119W5EA | |
| AIDA64 / CPU SHA3 | |
| Average of class Workstation (3833 - 8975, n=24, last 2 years) | |
| MSI WE76 11UM-456 | |
| Average Intel Core i9-11980HK (3928 - 4220, n=2) | |
| HP ZBook Fury 15 G8 | |
| HP ZBook Fury 17 G7 119W5EA | |
| AIDA64 / CPU Queen | |
| Average of class Workstation (60778 - 144411, n=24, last 2 years) | |
| MSI WE76 11UM-456 | |
| Average Intel Core i9-11980HK (97901 - 98443, n=2) | |
| HP ZBook Fury 15 G8 | |
| HP ZBook Fury 17 G7 119W5EA | |
| AIDA64 / FPU SinJulia | |
| Average of class Workstation (8165 - 29343, n=24, last 2 years) | |
| MSI WE76 11UM-456 | |
| Average Intel Core i9-11980HK (10028 - 10494, n=2) | |
| HP ZBook Fury 17 G7 119W5EA | |
| HP ZBook Fury 15 G8 | |
| AIDA64 / FPU Mandel | |
| Average of class Workstation (40055 - 98153, n=24, last 2 years) | |
| MSI WE76 11UM-456 | |
| Average Intel Core i9-11980HK (35500 - 38635, n=2) | |
| HP ZBook Fury 15 G8 | |
| HP ZBook Fury 17 G7 119W5EA | |
| AIDA64 / CPU AES | |
| Average Intel Core i9-11980HK (90742 - 141352, n=2) | |
| Average of class Workstation (73133 - 187841, n=24, last 2 years) | |
| MSI WE76 11UM-456 | |
| HP ZBook Fury 15 G8 | |
| HP ZBook Fury 17 G7 119W5EA | |
| AIDA64 / CPU ZLib | |
| Average of class Workstation (929 - 2148, n=24, last 2 years) | |
| MSI WE76 11UM-456 | |
| HP ZBook Fury 15 G8 | |
| HP ZBook Fury 17 G7 119W5EA | |
| Average Intel Core i9-11980HK (769 - 839, n=5) | |
| Lenovo ThinkPad P17 G2-20YU0025G | |
| Asus ProArt StudioBook 16 W7600H5A-2BL2 | |
| Asus ProArt StudioBook 16 W7600H5A-2BL2 | |
| Lenovo ThinkPad P1 G4-20Y4S0KS00 | |
| AIDA64 / FP64 Ray-Trace | |
| Average of class Workstation (7813 - 32891, n=24, last 2 years) | |
| MSI WE76 11UM-456 | |
| Average Intel Core i9-11980HK (7662 - 8566, n=2) | |
| HP ZBook Fury 15 G8 | |
| HP ZBook Fury 17 G7 119W5EA | |
| AIDA64 / CPU PhotoWorxx | |
| Average of class Workstation (37151 - 93684, n=24, last 2 years) | |
| HP ZBook Fury 15 G8 | |
| MSI WE76 11UM-456 | |
| Average Intel Core i9-11980HK (23047 - 25908, n=2) | |
| HP ZBook Fury 17 G7 119W5EA | |
系统性能
正如预期的那样,一般的系统性能是非常高的。这可以从性能的主观印象以及基准测试结果中得到证实。在未来几年里,这里不会有任何瓶颈。
| PCMark 10 / Score | |
| Average of class Workstation (6563 - 10409, n=20, last 2 years) | |
| Lenovo ThinkPad P1 G4-20Y4S0KS00 | |
| MSI WE76 11UM-456 | |
| Average Intel Core i9-11980HK, NVIDIA RTX A5000 Laptop GPU (n=1) | |
| Asus ProArt StudioBook 16 W7600H5A-2BL2 | |
| HP ZBook Fury 15 G8 | |
| Lenovo ThinkPad P17 G2-20YU0025G | |
| MSI WE75 9TK | |
| HP ZBook Fury 17 G7 119W5EA | |
| PCMark 10 / Essentials | |
| Lenovo ThinkPad P1 G4-20Y4S0KS00 | |
| Average of class Workstation (9622 - 11157, n=20, last 2 years) | |
| Asus ProArt StudioBook 16 W7600H5A-2BL2 | |
| Lenovo ThinkPad P17 G2-20YU0025G | |
| HP ZBook Fury 15 G8 | |
| MSI WE75 9TK | |
| MSI WE76 11UM-456 | |
| Average Intel Core i9-11980HK, NVIDIA RTX A5000 Laptop GPU (n=1) | |
| HP ZBook Fury 17 G7 119W5EA | |
| PCMark 10 / Productivity | |
| Average of class Workstation (8789 - 20616, n=20, last 2 years) | |
| MSI WE76 11UM-456 | |
| Average Intel Core i9-11980HK, NVIDIA RTX A5000 Laptop GPU (n=1) | |
| Asus ProArt StudioBook 16 W7600H5A-2BL2 | |
| Lenovo ThinkPad P1 G4-20Y4S0KS00 | |
| HP ZBook Fury 15 G8 | |
| Lenovo ThinkPad P17 G2-20YU0025G | |
| MSI WE75 9TK | |
| HP ZBook Fury 17 G7 119W5EA | |
| PCMark 10 / Digital Content Creation | |
| Average of class Workstation (8108 - 15631, n=20, last 2 years) | |
| Lenovo ThinkPad P1 G4-20Y4S0KS00 | |
| MSI WE76 11UM-456 | |
| Average Intel Core i9-11980HK, NVIDIA RTX A5000 Laptop GPU (n=1) | |
| Asus ProArt StudioBook 16 W7600H5A-2BL2 | |
| HP ZBook Fury 15 G8 | |
| Lenovo ThinkPad P17 G2-20YU0025G | |
| HP ZBook Fury 17 G7 119W5EA | |
| MSI WE75 9TK | |
| PCMark 10 Score | 7023 points | |
Help | ||
| AIDA64 / Memory Copy | |
| Average of class Workstation (56003 - 164795, n=24, last 2 years) | |
| MSI WE76 11UM-456 | |
| Average Intel Core i9-11980HK (42653 - 47204, n=2) | |
| AIDA64 / Memory Read | |
| Average of class Workstation (55795 - 121563, n=24, last 2 years) | |
| Average Intel Core i9-11980HK (46298 - 47729, n=2) | |
| MSI WE76 11UM-456 | |
| AIDA64 / Memory Write | |
| Average of class Workstation (55663 - 214520, n=24, last 2 years) | |
| MSI WE76 11UM-456 | |
| Average Intel Core i9-11980HK (45456 - 45563, n=2) | |
| AIDA64 / Memory Latency | |
| Average of class Workstation (84.5 - 165.2, n=24, last 2 years) | |
| MSI WE76 11UM-456 | |
| Average Intel Core i9-11980HK (91.1 - 98.1, n=5) | |
* ... smaller is better
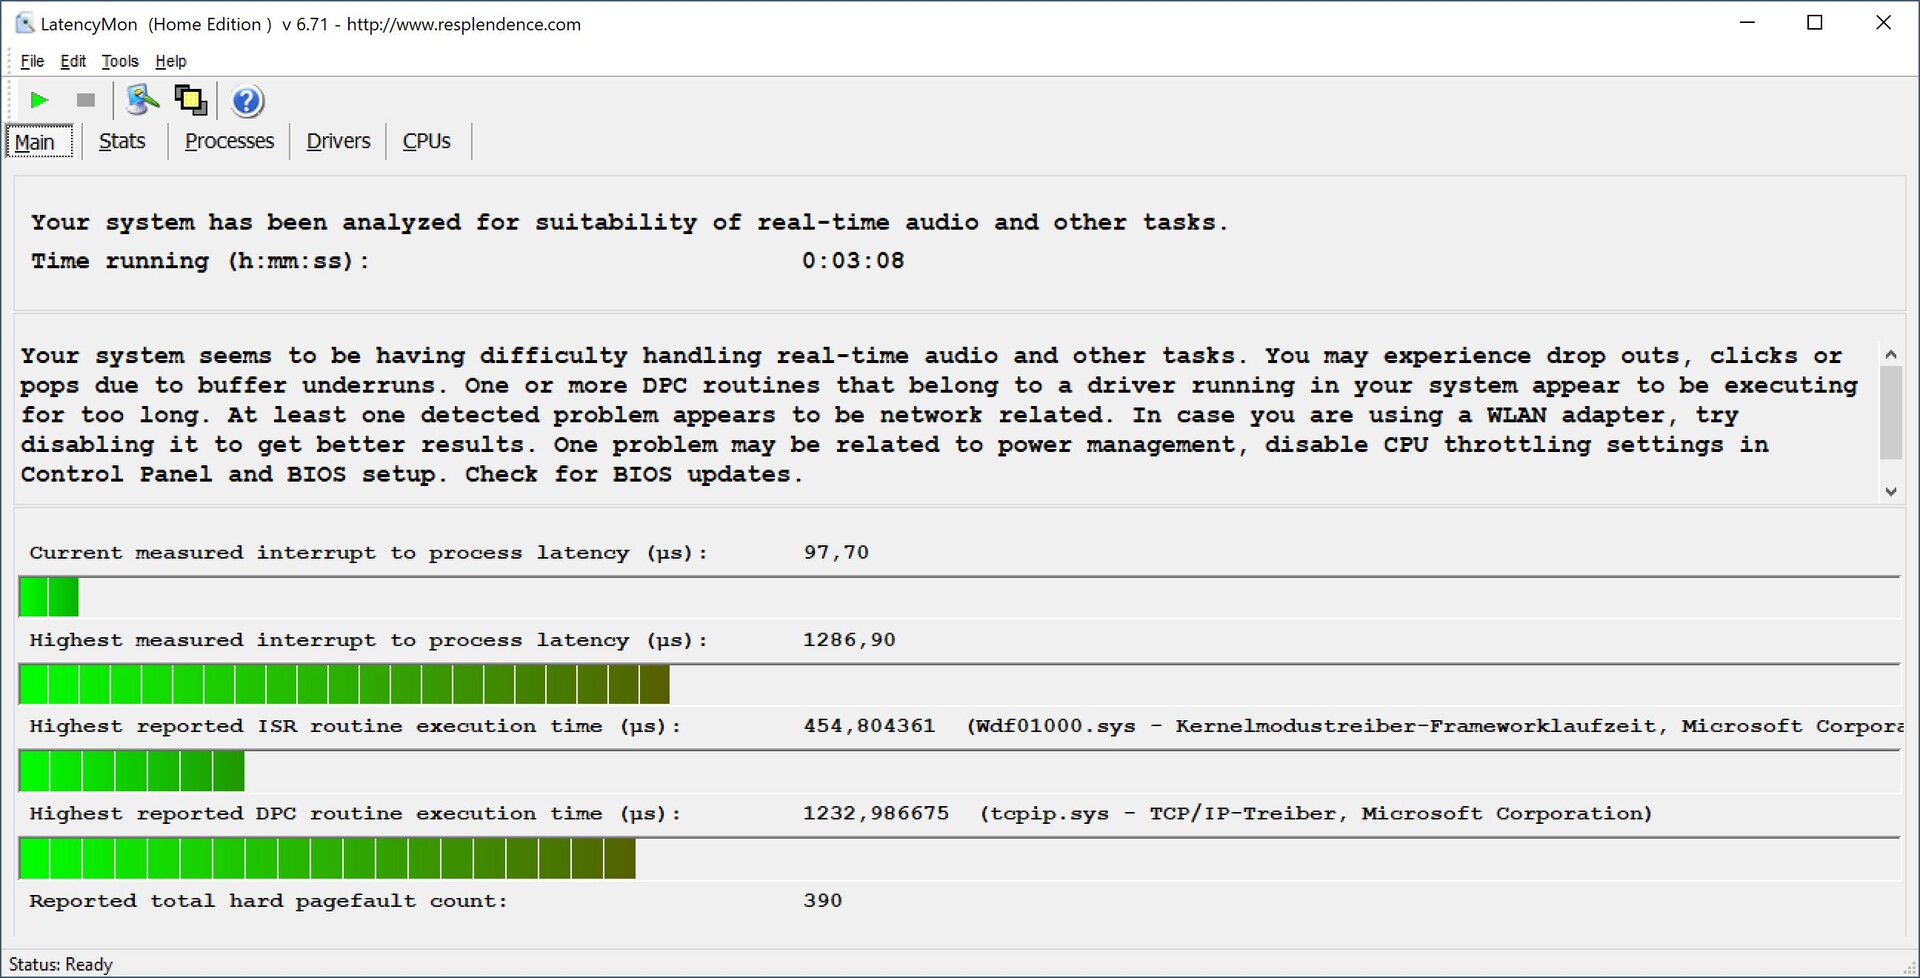
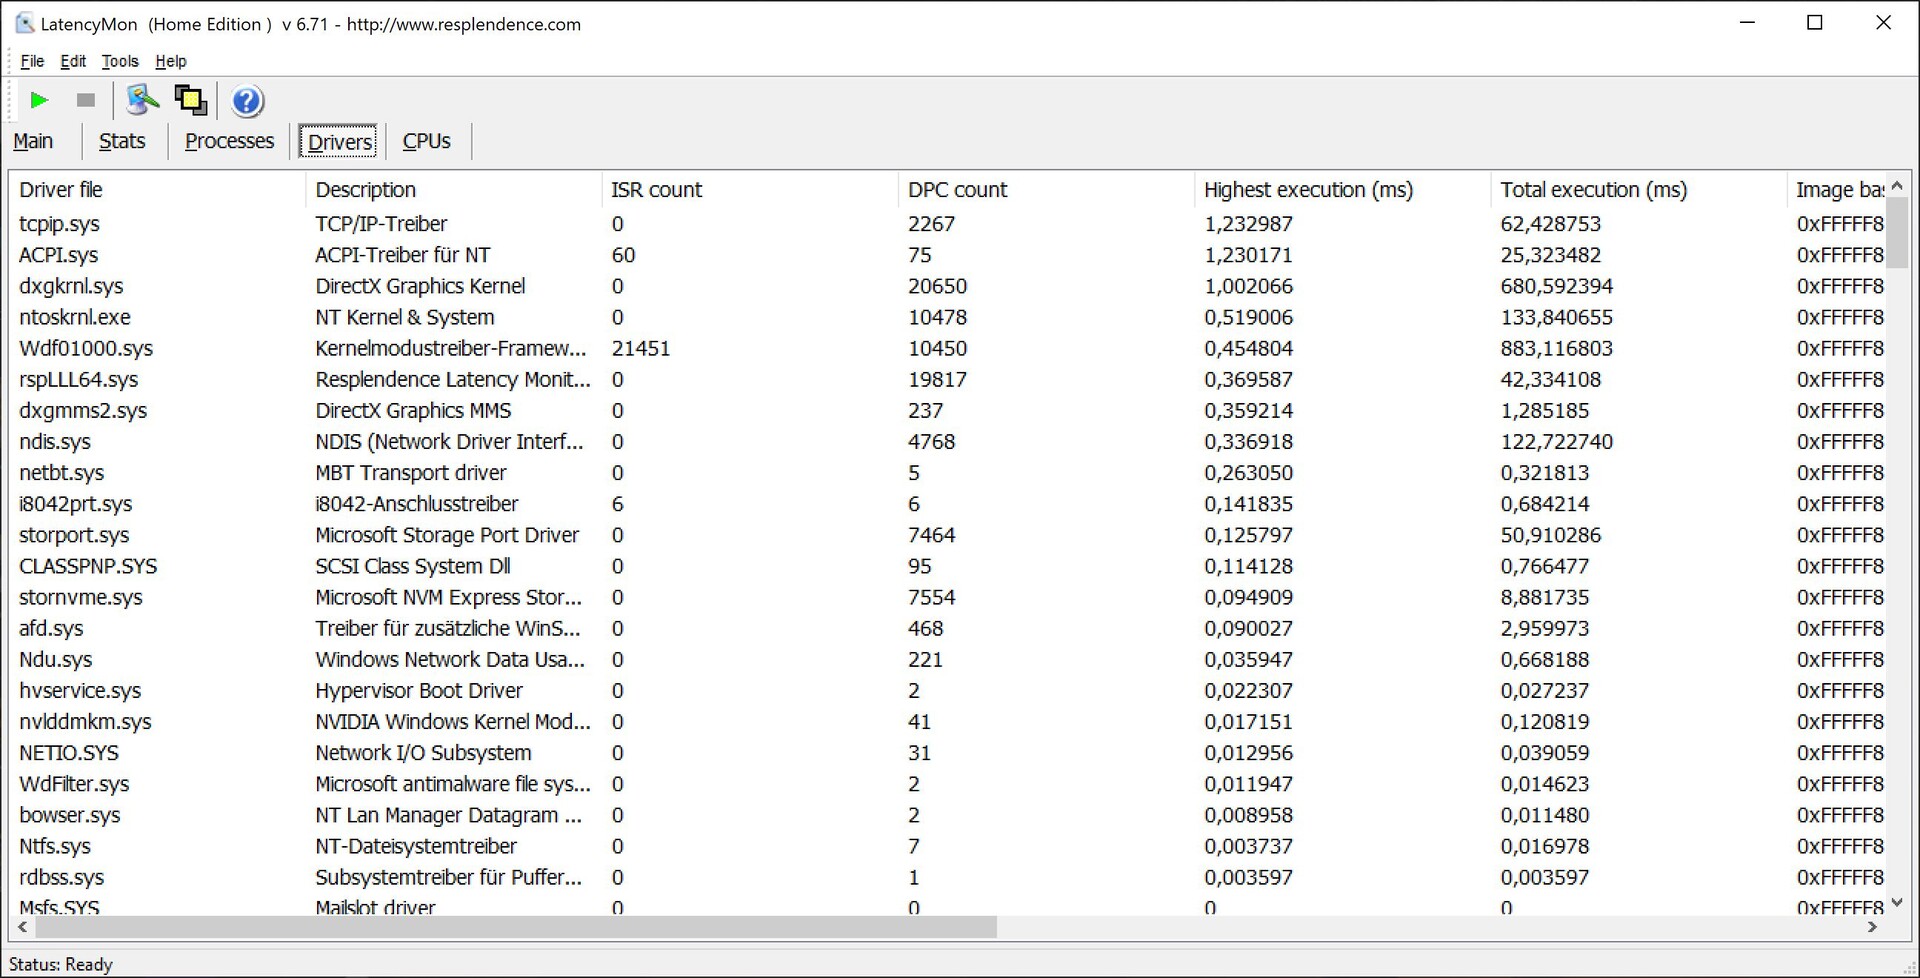
DPC延迟
我们对WE76的评测样本在当前BIOS版本的测试中显示出略微升高的延迟,而且在播放4K的YouTube视频时也有一些丢帧(跳帧)。这意味着该设备并不适合实时音频应用,但未来的更新有可能会改善这种情况。
| DPC Latencies / LatencyMon - interrupt to process latency (max), Web, Youtube, Prime95 | |
| Lenovo ThinkPad P17 G2-20YU0025G | |
| HP ZBook Fury 17 G7 119W5EA | |
| Asus ProArt StudioBook 16 W7600H5A-2BL2 | |
| MSI WE76 11UM-456 | |
| Lenovo ThinkPad P1 G4-20Y4S0KS00 | |
| HP ZBook Fury 15 G8 | |
* ... smaller is better
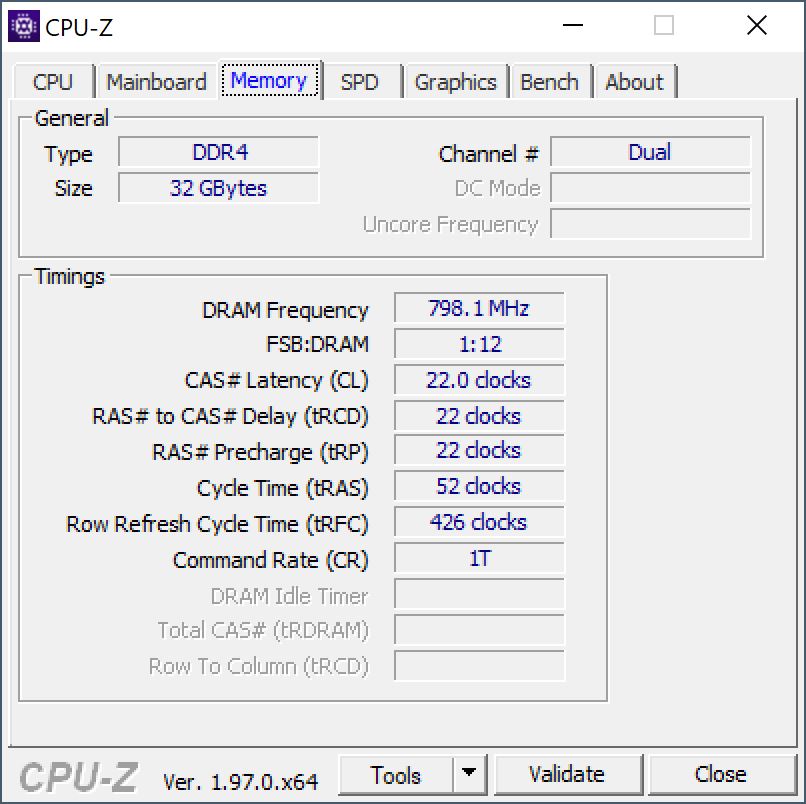
储存
我们的测试设备配备了一个三星PM9A1,存储容量为2TB,其中1.78TB在第一次启动后仍然可用。这是一个非常快的PCIe 4.0硬盘,WE76也可以适当地利用它,因为它在基准测试中以非常好的传输率给人留下深刻印象。此外,WE76提供了另一个M.2-2280插槽,以方便扩展存储,但第二个插槽 "只 "使用PCIe 3.0 x4接口。你可以找到更多的SSD基准测试 这里.

* ... smaller is better
Continuous load read: DiskSpd Read Loop, Queue Depth 8
图形卡
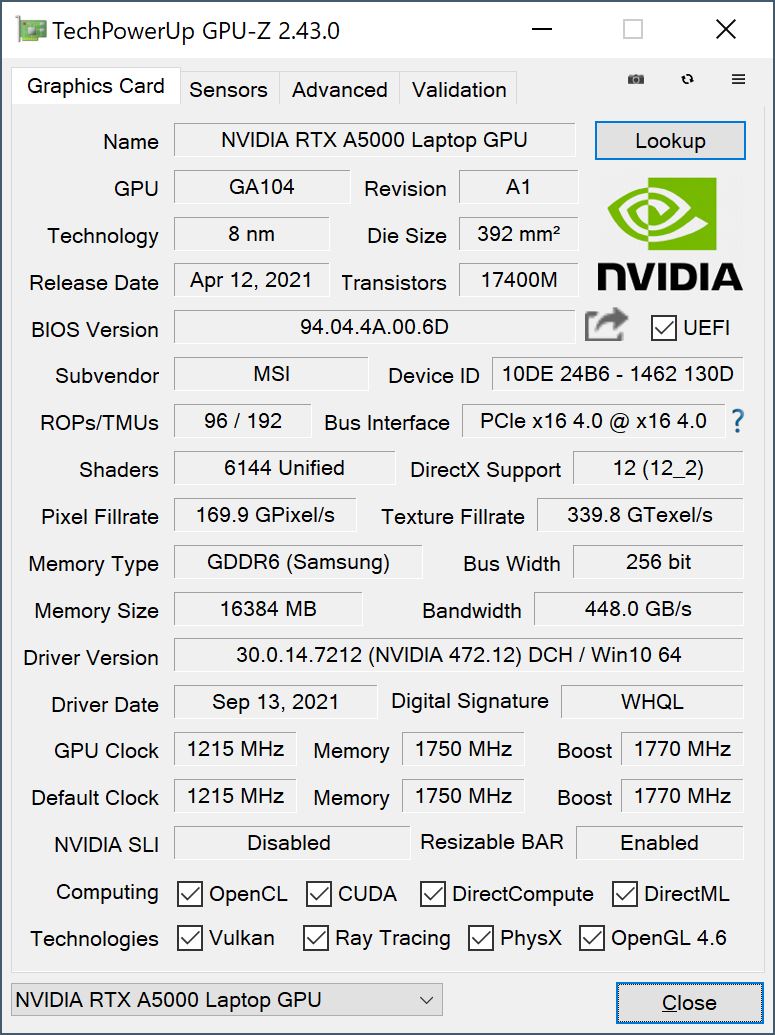
随着Nvidia RTX A5000(在此期间,Nvidia已经放弃了 "Quadro "的名称),微星已经安装了目前市场上最强大的专业移动GPU。凭借16GB内存和包括专业软件认证的专业驱动程序,WE76特别适合复杂的CAD/CAM应用或包括光线追踪的大型图形项目。最大TDP为155瓦(尽管我们有时甚至看到高达180瓦的峰值),该GPU显然是市场上最快的型号之一。支持Nvidia的Optimus图形切换解决方案,这意味着处理器的iGPU被用于简单任务。
我们也可以在基准测试中看到这一点,WE76设法使自己在竞争中处于领先地位。RTX A5000在 惠普ZBook Fury 15 G例如,根据基准测试,它的速度要慢10%-30%。可选的高性能模式并不直接影响GPU的性能,而且在两种模式下性能都很稳定。然而,在电池供电的情况下,功耗被限制在55瓦,这导致了约50%的性能损失。请参考我们的 GPU基准测试文章进行进一步比较。
| 3DMark Performance rating - Percent | |
| Average of class Workstation -1! | |
| Asus ProArt StudioBook 16 W7600H5A-2BL2 -10! | |
| MSI WE76 11UM-456 | |
| Average NVIDIA RTX A5000 Laptop GPU | |
| HP ZBook Fury 15 G8 | |
| MSI WE75 9TK -16! | |
| Lenovo ThinkPad P17 G2-20YU0025G -8! | |
| Lenovo ThinkPad P1 G4-20Y4S0KS00 | |
| HP ZBook Fury 17 G7 119W5EA | |
| 3DMark 11 Performance | 32211 points | |
| 3DMark Cloud Gate Standard Score | 35295 points | |
| 3DMark Fire Strike Score | 24155 points | |
| 3DMark Time Spy Score | 11185 points | |
Help | ||
游戏性能
WE76的游戏性能也很出色,我们在测试中没有遇到任何专业驱动程序的问题。即使在4K和最大细节的情况下,大多数游戏都可以流畅地进行。只有要求非常高的游戏,如《赛博朋克2077》,需要降低分辨率或细节,才能够顺利运行。游戏性能在电池电量上较低;以《Witcher 3》(超级设置)为例,性能从98FPS下降到67FPS。更多游戏基准测试可在 这里.
| The Witcher 3 | |
| 1920x1080 High Graphics & Postprocessing (Nvidia HairWorks Off) | |
| MSI WE76 11UM-456 | |
| Lenovo ThinkPad P1 G4-20Y4S0KS00 | |
| Average NVIDIA RTX A5000 Laptop GPU (124 - 179, n=3) | |
| HP ZBook Fury 15 G8 | |
| Asus ProArt StudioBook 16 W7600H5A-2BL2 | |
| Average of class Workstation (91 - 156.4, n=2, last 2 years) | |
| MSI WE75 9TK | |
| HP ZBook Fury 17 G7 119W5EA | |
| Lenovo ThinkPad P17 G2-20YU0025G | |
| 1920x1080 Ultra Graphics & Postprocessing (HBAO+) | |
| MSI WE76 11UM-456 | |
| Average NVIDIA RTX A5000 Laptop GPU (81.7 - 98.3, n=3) | |
| Asus ProArt StudioBook 16 W7600H5A-2BL2 | |
| Lenovo ThinkPad P1 G4-20Y4S0KS00 | |
| HP ZBook Fury 15 G8 | |
| Average of class Workstation (51 - 91.7, n=2, last 2 years) | |
| HP ZBook Fury 17 G7 119W5EA | |
| MSI WE75 9TK | |
| Lenovo ThinkPad P17 G2-20YU0025G | |
| Cyberpunk 2077 1.0 | |
| 1920x1080 Ultra Preset | |
| MSI WE76 11UM-456 | |
| Average NVIDIA RTX A5000 Laptop GPU (58.6 - 78, n=2) | |
| Asus ProArt StudioBook 16 W7600H5A-2BL2 | |
| 1920x1080 High Preset | |
| MSI WE76 11UM-456 | |
| Average NVIDIA RTX A5000 Laptop GPU (68.1 - 90, n=2) | |
| Asus ProArt StudioBook 16 W7600H5A-2BL2 | |
| F1 2021 | |
| 1920x1080 High Preset AA:T AF:16x | |
| MSI WE76 11UM-456 | |
| Asus ProArt StudioBook 16 W7600H5A-2BL2 | |
| Average NVIDIA RTX A5000 Laptop GPU (122 - 161, n=3) | |
| HP ZBook Fury 15 G8 | |
| Lenovo ThinkPad P17 G2-20YU0025G | |
| 1920x1080 Ultra High Preset + Raytracing AA:T AF:16x | |
| MSI WE76 11UM-456 | |
| Asus ProArt StudioBook 16 W7600H5A-2BL2 | |
| Average NVIDIA RTX A5000 Laptop GPU (85 - 109, n=3) | |
| HP ZBook Fury 15 G8 | |
| Lenovo ThinkPad P17 G2-20YU0025G | |
| Far Cry 6 | |
| 1920x1080 High Graphics Quality AA:T | |
| MSI WE76 11UM-456 | |
| Average NVIDIA RTX A5000 Laptop GPU (n=1) | |
| Average of class Workstation (n=1last 2 years) | |
| 1920x1080 Ultra Graphics Quality + HD Textures AA:T | |
| MSI WE76 11UM-456 | |
| Average NVIDIA RTX A5000 Laptop GPU (n=1) | |
The Witcher 3 FPS diagram
| low | med. | high | ultra | QHD | 4K | |
|---|---|---|---|---|---|---|
| GTA V (2015) | 181 | 175 | 161 | 94.6 | 84.3 | 92.5 |
| The Witcher 3 (2015) | 354 | 271 | 179 | 98.3 | 74 | |
| Final Fantasy XV Benchmark (2018) | 184 | 144 | 108 | 83.6 | 51.1 | |
| X-Plane 11.11 (2018) | 136 | 114 | 90.5 | 65.3 | ||
| Far Cry 5 (2018) | 121 | 113 | 103 | 92 | 50 | |
| Strange Brigade (2018) | 412 | 251 | 213 | 191 | 146 | 86.8 |
| Cyberpunk 2077 1.0 (2020) | 118 | 104 | 90 | 78 | 51 | 25 |
| F1 2021 (2021) | 257 | 187 | 161 | 109 | 88.2 | 53.6 |
| Far Cry 6 (2021) | 120 | 103 | 95 | 89 | 79 | 51 |
排放 - WE76具有强大的冷却功能
噪声排放
风扇控制绝对是WE76的弱点之一。即使在低负载情况下,风扇也会不时地响起,这就是为什么我们总是建议在日常工作中使用静音模式,因为那时风扇经常被关闭。如果你需要更多的性能(特别是在GPU方面),你仍然可以调整性能模式。然而,总的来说,微星的移动工作站在负载情况下要么不吵,要么只比竞争对手稍微吵一点,因为他们往往配备了较弱的组件。高性能模式下,风扇的最大噪音从不到48分贝增加到54分贝(A)左右,可以说是令人讨厌的噪音。通过CoolerBooster模式,你还可以激活最高的风扇速度,这将导致58.9分贝(A)。我们建议在游戏时检查静音模式下的性能,因为我们在TheWitcher 3 中只能测到38.6 dB(A),例如,这意味着你不必求助于耳机。不过,我们无法检测到任何其他电子噪音。
Noise level
| Idle |
| 24.7 / 24.7 / 27.5 dB(A) |
| Load |
| 43.7 / 47.7 dB(A) |
 | ||
30 dB silent 40 dB(A) audible 50 dB(A) loud |
||
min: | ||
| MSI WE76 11UM-456 RTX A5000 Laptop GPU, i9-11980HK, Samsung PM9A1 MZVL22T0HBLB | Lenovo ThinkPad P1 G4-20Y4S0KS00 GeForce RTX 3070 Laptop GPU, i7-11850H, Samsung PM9A1 MZVL21T0HCLR | HP ZBook Fury 15 G8 RTX A5000 Laptop GPU, i9-11950H, Samsung PM981a MZVLB1T0HBLR | Asus ProArt StudioBook 16 W7600H5A-2BL2 RTX A5000 Laptop GPU, W-11955M, 2x Micron 2300 2TB MTFDHBA2T0TDV (RAID 0) | Lenovo ThinkPad P17 G2-20YU0025G RTX A2000 Laptop GPU, i7-11800H, Kioxia XG7 KXG7AZNV512G | HP ZBook Fury 17 G7 119W5EA Quadro RTX 4000 Max-Q, i9-10885H, WDC PC SN730 SDBPNTY-1T00 | MSI WE75 9TK Quadro RTX 3000 (Laptop), i7-9750H, Samsung SSD PM981 MZVLB512HAJQ | |
|---|---|---|---|---|---|---|---|
| Noise | 3% | 6% | 1% | 3% | -1% | -7% | |
| off / environment * (dB) | 24.7 | 23.8 4% | 24.1 2% | 26 -5% | 26.4 -7% | 24.4 1% | 28.5 -15% |
| Idle Minimum * (dB) | 24.7 | 23.8 4% | 24.1 2% | 26 -5% | 26.4 -7% | 24.4 1% | 29 -17% |
| Idle Average * (dB) | 24.7 | 23.8 4% | 24.1 2% | 26 -5% | 26.4 -7% | 26.6 -8% | 29 -17% |
| Idle Maximum * (dB) | 27.5 | 28.3 -3% | 24.8 10% | 26.5 4% | 26.4 4% | 29 -5% | 31.5 -15% |
| Load Average * (dB) | 43.7 | 38.6 12% | 37.8 14% | 42 4% | 38.1 13% | 40.2 8% | 32 27% |
| Witcher 3 ultra * (dB) | 46.6 | 47.4 -2% | 44.2 5% | 38.1 18% | 48 -3% | 44.7 4% | |
| Load Maximum * (dB) | 47.7 | 47.4 1% | 44.2 7% | 43 10% | 45 6% | 48 -1% | 56.5 -18% |
* ... smaller is better
温度
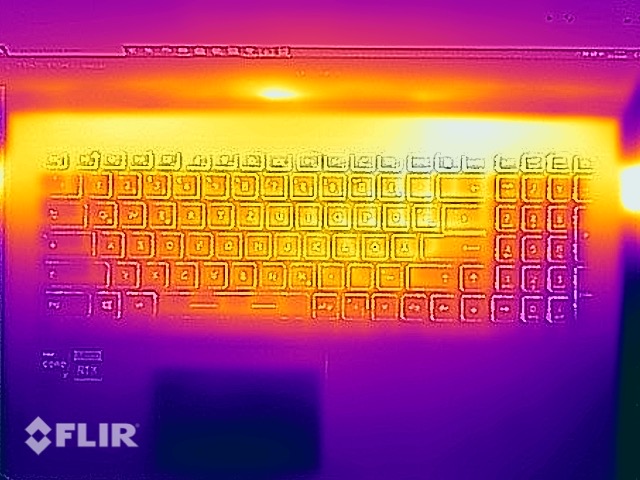
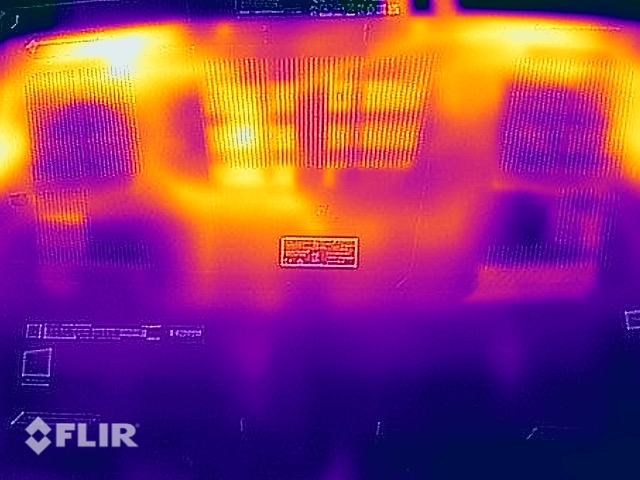
WE76没有任何温度问题,因为整个机箱在简单的任务中保持非常凉爽。虽然在底部的左后侧有一个区域在负载下,我们可以测量到超过55℃(约131°F),但我们不认为这是一个问题,因为你几乎不会在腿上使用这个移动工作站。键盘在高负荷下也会明显变热,但打字在这里不受影响。
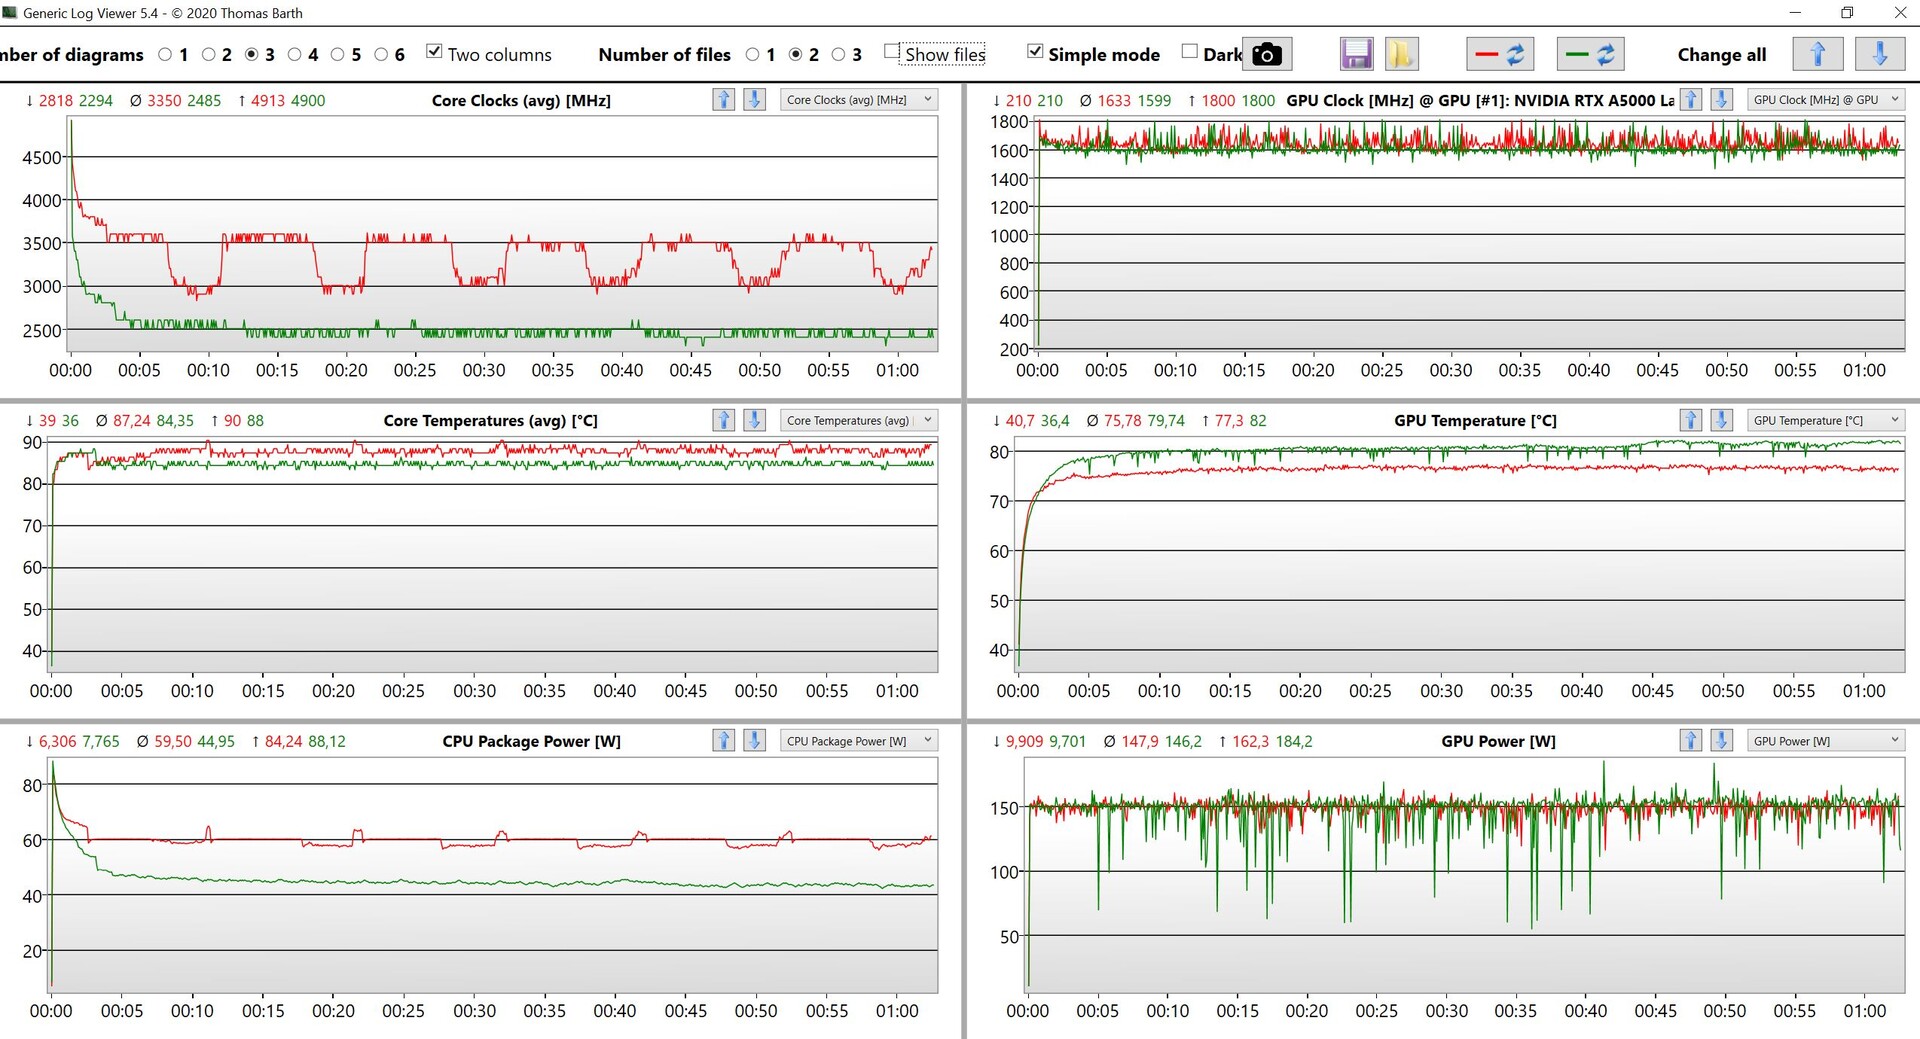
在压力测试中,你可以看到性能模式之间的差异,因为可选的高性能模式将CPU功耗从~42瓦增加到60瓦。不过,GPU的消耗量恒定在~150瓦,总体结果非常好。
(-) The maximum temperature on the upper side is 48.4 °C / 119 F, compared to the average of 38.2 °C / 101 F, ranging from 22.2 to 69.8 °C for the class Workstation.
(-) The bottom heats up to a maximum of 56.2 °C / 133 F, compared to the average of 41.1 °C / 106 F
(+) In idle usage, the average temperature for the upper side is 26 °C / 79 F, compared to the device average of 32 °C / 90 F.
(±) Playing The Witcher 3, the average temperature for the upper side is 37.6 °C / 100 F, compared to the device average of 32 °C / 90 F.
(+) The palmrests and touchpad are cooler than skin temperature with a maximum of 27.5 °C / 81.5 F and are therefore cool to the touch.
(±) The average temperature of the palmrest area of similar devices was 27.8 °C / 82 F (+0.3 °C / 0.5 F).
| MSI WE76 11UM-456 Intel Core i9-11980HK, NVIDIA RTX A5000 Laptop GPU | Lenovo ThinkPad P1 G4-20Y4S0KS00 Intel Core i7-11850H, NVIDIA GeForce RTX 3070 Laptop GPU | HP ZBook Fury 15 G8 Intel Core i9-11950H, NVIDIA RTX A5000 Laptop GPU | Asus ProArt StudioBook 16 W7600H5A-2BL2 Intel Xeon W-11955M, NVIDIA RTX A5000 Laptop GPU | Lenovo ThinkPad P17 G2-20YU0025G Intel Core i7-11800H, NVIDIA RTX A2000 Laptop GPU | HP ZBook Fury 17 G7 119W5EA Intel Core i9-10885H, NVIDIA Quadro RTX 4000 Max-Q | MSI WE75 9TK Intel Core i7-9750H, NVIDIA Quadro RTX 3000 (Laptop) | |
|---|---|---|---|---|---|---|---|
| Heat | 2% | 6% | -3% | 7% | 12% | 8% | |
| Maximum Upper Side * (°C) | 48.4 | 51 -5% | 45.6 6% | 45.7 6% | 49.6 -2% | 46.1 5% | 40.6 16% |
| Maximum Bottom * (°C) | 56.2 | 53.5 5% | 57.6 -2% | 48.3 14% | 52.1 7% | 57.6 -2% | 46 18% |
| Idle Upper Side * (°C) | 28.6 | 28.8 -1% | 26 9% | 35.3 -23% | 26 9% | 23.4 18% | 29.2 -2% |
| Idle Bottom * (°C) | 31.8 | 29.3 8% | 28.8 9% | 34.4 -8% | 27.6 13% | 23.4 26% | 32.4 -2% |
* ... smaller is better
发言人
微星公司安装了一个立体声音响系统,性能可以接受。然而,特别是当组件处于高负荷状态时,风扇噪音占主导地位(无论是否使用专业应用程序或游戏),因此,你不能很好地听到扬声器的声音。所以我们建议在这里使用耳机。
MSI WE76 11UM-456 audio analysis
(+) | speakers can play relatively loud (84.6 dB)
Bass 100 - 315 Hz
(±) | reduced bass - on average 14.7% lower than median
(±) | linearity of bass is average (7.8% delta to prev. frequency)
Mids 400 - 2000 Hz
(±) | higher mids - on average 5% higher than median
(+) | mids are linear (3.9% delta to prev. frequency)
Highs 2 - 16 kHz
(±) | higher highs - on average 5.6% higher than median
(±) | linearity of highs is average (9.1% delta to prev. frequency)
Overall 100 - 16.000 Hz
(±) | linearity of overall sound is average (16.3% difference to median)
Compared to same class
» 44% of all tested devices in this class were better, 9% similar, 47% worse
» The best had a delta of 7%, average was 17%, worst was 35%
Compared to all devices tested
» 27% of all tested devices were better, 6% similar, 68% worse
» The best had a delta of 4%, average was 24%, worst was 134%
HP ZBook Fury 17 G7 119W5EA audio analysis
(±) | speaker loudness is average but good (78.6 dB)
Bass 100 - 315 Hz
(±) | reduced bass - on average 7.9% lower than median
(±) | linearity of bass is average (11.1% delta to prev. frequency)
Mids 400 - 2000 Hz
(+) | balanced mids - only 2.8% away from median
(+) | mids are linear (3.9% delta to prev. frequency)
Highs 2 - 16 kHz
(+) | balanced highs - only 2.7% away from median
(+) | highs are linear (4.8% delta to prev. frequency)
Overall 100 - 16.000 Hz
(+) | overall sound is linear (10.9% difference to median)
Compared to same class
» 11% of all tested devices in this class were better, 4% similar, 85% worse
» The best had a delta of 7%, average was 17%, worst was 35%
Compared to all devices tested
» 6% of all tested devices were better, 2% similar, 92% worse
» The best had a delta of 4%, average was 24%, worst was 134%
Lenovo ThinkPad P17 G2-20YU0025G audio analysis
(±) | speaker loudness is average but good (76.6 dB)
Bass 100 - 315 Hz
(±) | reduced bass - on average 14.5% lower than median
(±) | linearity of bass is average (9.6% delta to prev. frequency)
Mids 400 - 2000 Hz
(±) | higher mids - on average 6.9% higher than median
(±) | linearity of mids is average (7.7% delta to prev. frequency)
Highs 2 - 16 kHz
(+) | balanced highs - only 2.6% away from median
(+) | highs are linear (6.6% delta to prev. frequency)
Overall 100 - 16.000 Hz
(±) | linearity of overall sound is average (20.1% difference to median)
Compared to same class
» 71% of all tested devices in this class were better, 6% similar, 23% worse
» The best had a delta of 7%, average was 17%, worst was 35%
Compared to all devices tested
» 52% of all tested devices were better, 8% similar, 40% worse
» The best had a delta of 4%, average was 24%, worst was 134%
能源管理--高耗能
能源消耗
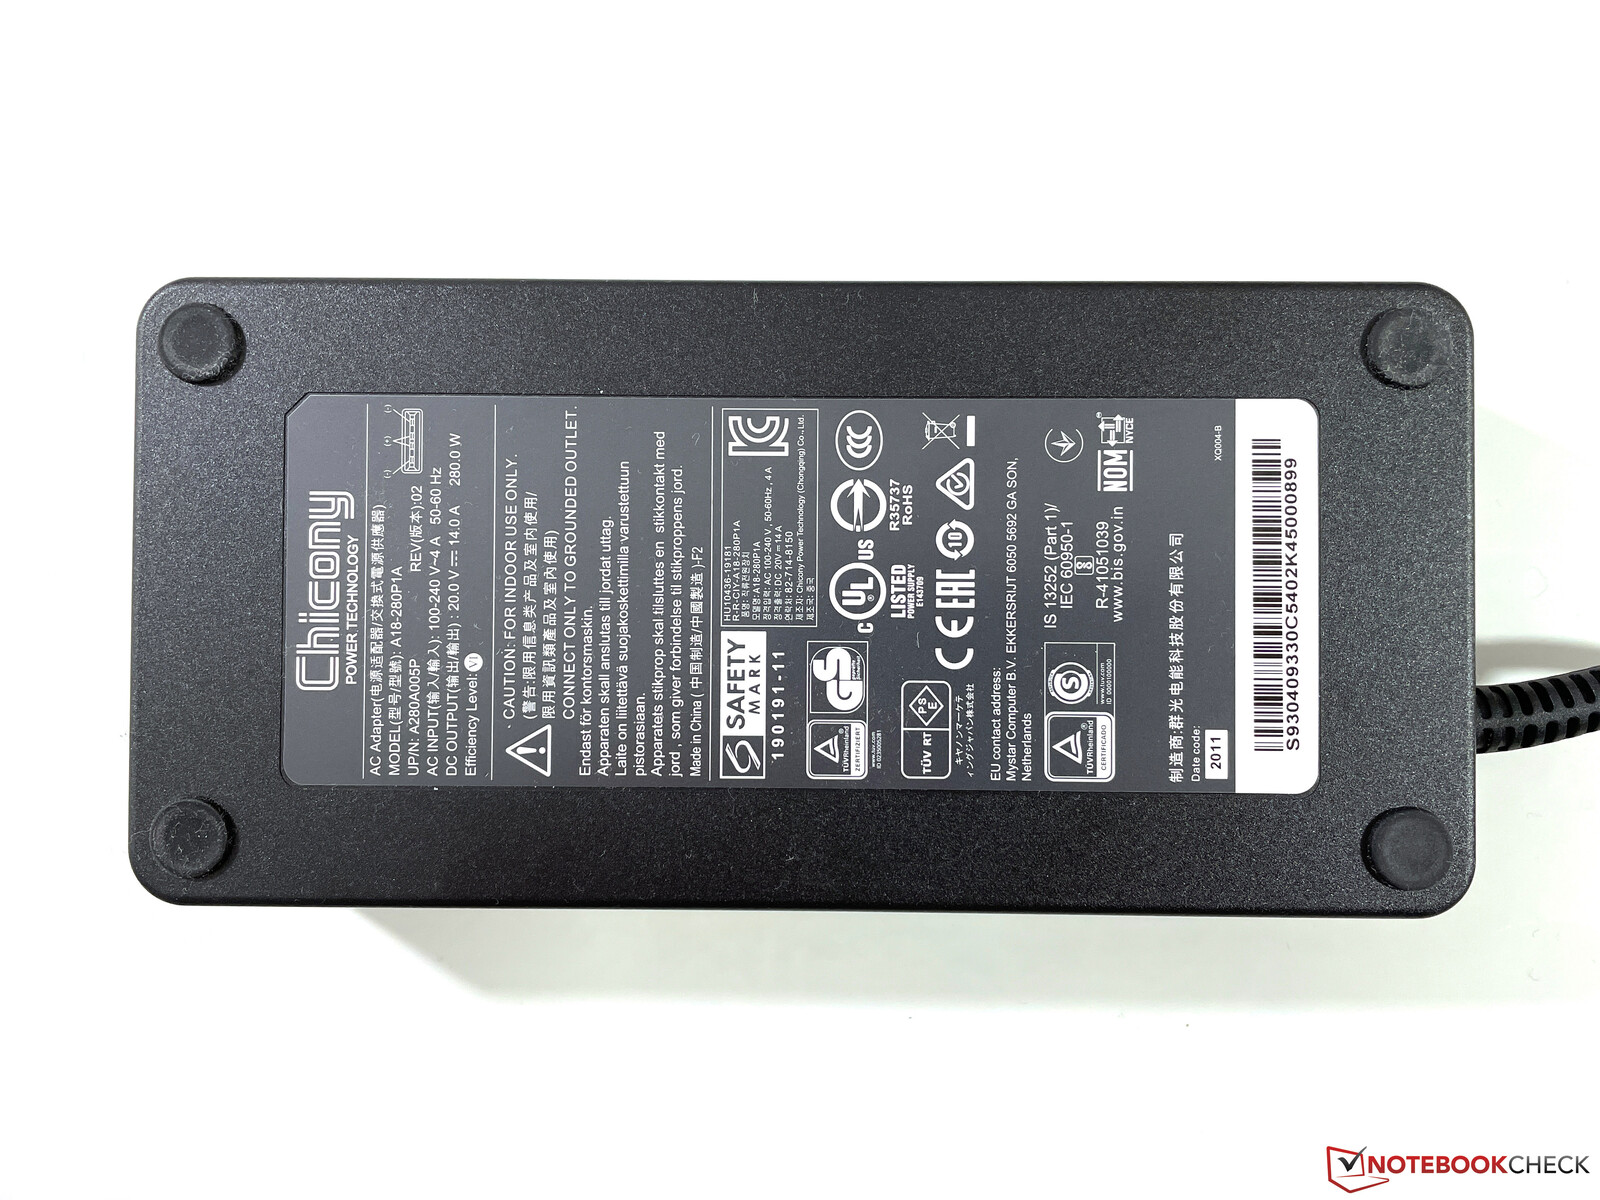
移动工作站需要大量的电力,这一点并不奇怪。由于自动图形切换,空闲率仍在限制范围内,最大为20瓦,但在负载下,最高达到281瓦,然后相当迅速地稳定在245瓦(高性能模式下约260瓦)。在游戏时,你可以期待大约230瓦的功率。这意味着附带的280瓦的电源适配器有足够的容量。
| Off / Standby | |
| Idle | |
| Load |
|
Key:
min: | |
| MSI WE76 11UM-456 i9-11980HK, RTX A5000 Laptop GPU, Samsung PM9A1 MZVL22T0HBLB, IPS, 3840x2160, 17.3" | Lenovo ThinkPad P1 G4-20Y4S0KS00 i7-11850H, GeForce RTX 3070 Laptop GPU, Samsung PM9A1 MZVL21T0HCLR, IPS LED, 3840x2400, 16" | HP ZBook Fury 15 G8 i9-11950H, RTX A5000 Laptop GPU, Samsung PM981a MZVLB1T0HBLR, IPS, 3840x2160, 15.6" | Asus ProArt StudioBook 16 W7600H5A-2BL2 W-11955M, RTX A5000 Laptop GPU, 2x Micron 2300 2TB MTFDHBA2T0TDV (RAID 0), OLED, 3840x2400, 16" | Lenovo ThinkPad P17 G2-20YU0025G i7-11800H, RTX A2000 Laptop GPU, Kioxia XG7 KXG7AZNV512G, IPS LED, 1920x1080, 17.3" | HP ZBook Fury 17 G7 119W5EA i9-10885H, Quadro RTX 4000 Max-Q, WDC PC SN730 SDBPNTY-1T00, , 3840x2160, 17.3" | MSI WE75 9TK i7-9750H, Quadro RTX 3000 (Laptop), Samsung SSD PM981 MZVLB512HAJQ, IPS, 1920x1080, 17.3" | Average NVIDIA RTX A5000 Laptop GPU | Average of class Workstation | |
|---|---|---|---|---|---|---|---|---|---|
| Power Consumption | 19% | 15% | 11% | 38% | 24% | 15% | 5% | 23% | |
| Idle Minimum * (Watt) | 10.5 | 8.1 23% | 8.3 21% | 12.4 -18% | 6.1 42% | 5.8 45% | 12.1 -15% | 10.4 ? 1% | 9.04 ? 14% |
| Idle Average * (Watt) | 18.6 | 20.2 -9% | 19.9 -7% | 16.5 11% | 10.9 41% | 14.8 20% | 18.4 1% | 18.3 ? 2% | 13.8 ? 26% |
| Idle Maximum * (Watt) | 20 | 21.9 -10% | 21.8 -9% | 25 -25% | 12.3 38% | 17 15% | 18.8 6% | 22.3 ? -12% | 17.7 ? 11% |
| Load Average * (Watt) | 132.4 | 88.2 33% | 110.9 16% | 132 -0% | 106.3 20% | 120.4 9% | 95.1 28% | 125.1 ? 6% | 96.2 ? 27% |
| Witcher 3 ultra * (Watt) | 232 | 149 36% | 165 29% | 132 43% | 124 47% | 168.4 27% | 135.5 42% | ||
| Load Maximum * (Watt) | 281.6 | 170.6 39% | 171.8 39% | 134 52% | 168.9 40% | 199.8 29% | 203.7 28% | 195.8 ? 30% | 178.5 ? 37% |
* ... smaller is better
Energy consumption during our The Witcher 3 test / stress test
Energy consumption with an external monitor
电池寿命
99.9Wh的电池是仍可在飞机上携带的最大容量。电池运行时间对性能和组件来说是合适的。在150cd/m²的Wi-Fi测试中,时间略高于6小时(或在全亮度下为4:30小时),在视频测试中略低于7小时,你绝对可以在不需要电源插座的情况下度过更长的会议。在负载情况下,略低于80分钟是可能的,但这只是可行的,因为性能大大降低。
| MSI WE76 11UM-456 i9-11980HK, RTX A5000 Laptop GPU, 99.9 Wh | Lenovo ThinkPad P1 G4-20Y4S0KS00 i7-11850H, GeForce RTX 3070 Laptop GPU, 90 Wh | HP ZBook Fury 15 G8 i9-11950H, RTX A5000 Laptop GPU, 94 Wh | Asus ProArt StudioBook 16 W7600H5A-2BL2 W-11955M, RTX A5000 Laptop GPU, 90 Wh | Lenovo ThinkPad P17 G2-20YU0025G i7-11800H, RTX A2000 Laptop GPU, 94 Wh | HP ZBook Fury 17 G7 119W5EA i9-10885H, Quadro RTX 4000 Max-Q, 94 Wh | MSI WE75 9TK i7-9750H, Quadro RTX 3000 (Laptop), 65 Wh | Average of class Workstation | |
|---|---|---|---|---|---|---|---|---|
| Battery runtime | 2% | -2% | -48% | 34% | 34% | -23% | 28% | |
| H.264 (h) | 6.9 | 7.2 4% | 1.8 -74% | 9.5 38% | 10.3 49% | 9.51 ? 38% | ||
| WiFi v1.3 (h) | 6.3 | 7 11% | 6.2 -2% | 5 -21% | 9.8 56% | 7.6 21% | 4.9 -22% | 8.52 ? 35% |
| Load (h) | 1.3 | 1.2 -8% | 1.4 8% | 1.7 31% | 1 -23% | 1.429 ? 10% | ||
| Witcher 3 ultra (h) | 1.6 | |||||||
| Reader / Idle (h) | 11 | 26.1 ? |
Pros
Cons
结论 - 微星提供了大量的性能
通过WE76,微星显然提供了一个传统的移动工作站,提供了大量的性能,并与戴尔Precision 7770、惠普ZBook Fury 17等型号直接竞争。 惠普ZBook Fury 17,以及 联想ThinkPad P17第二代.移动性在这些设备中只起到次要作用,而重点是性能,这正是微星工作站的优势所在。
事实上,制造商已经使用了一个游戏笔记本电脑(GE76)作为参考,对我们来说不是一个问题。大量的照明被省略了,也没有360赫兹的显示模式,考虑到目标群体,这根本不适合。相反,有一个哑光4K面板,色彩准确,几乎完全覆盖AdobeRGB,120赫兹,这也导致了在日常使用中明显更平滑的画面印象。此外,还有一个非常好的键盘,包括一个专用数字键盘。
特别是,专业的性能Nvidia RTX A5000(原Quadro)显卡的性能是完全引人注目的。处理器的性能也非常好,尽管这里不得不说,目前AMD的移动CPU更好,但它们还没有在工作站中实现(所有制造商都是如此)。
极快的显卡,较高的系统性能,哑光4K显示屏,以及出色的键盘。微星WE76是一款主要关注性能的移动工作站。
风扇的行为是为数不多的弱点之一,因为它们甚至在正常的日常使用中也经常启动,这使它们显得有些不稳定。这里推荐可选的静音模式,因为它能使设备更安静。然而,在负载下,最大的风扇音量是完全有竞争力的,不会过于响亮。
需要最大性能的用户不会在WE76上出错,而且微星在这里也比前述竞争者有优势。稍微小一点的16英寸机型(即 ThinkPad P1第四代或华硕ProArt StudioBook 16例如)诚然更紧凑、更机动,但它们提供的性能回报也更少。
价格和可用性
在撰写本文时,你可以在亚马逊上找到配备酷睿i9-11980HK、Quadro RTX A5000、64GB内存、1TB NVME SSD和Windows 10 Pro的微星WE76。起价约为4,300美元。
MSI WE76 11UM-456
- 12/06/2021 v7 (old)
Andreas Osthoff
Price comparison

