联想ThinkPad P1 G4笔记本电脑评论。BIOS更新提供更多的CPU性能
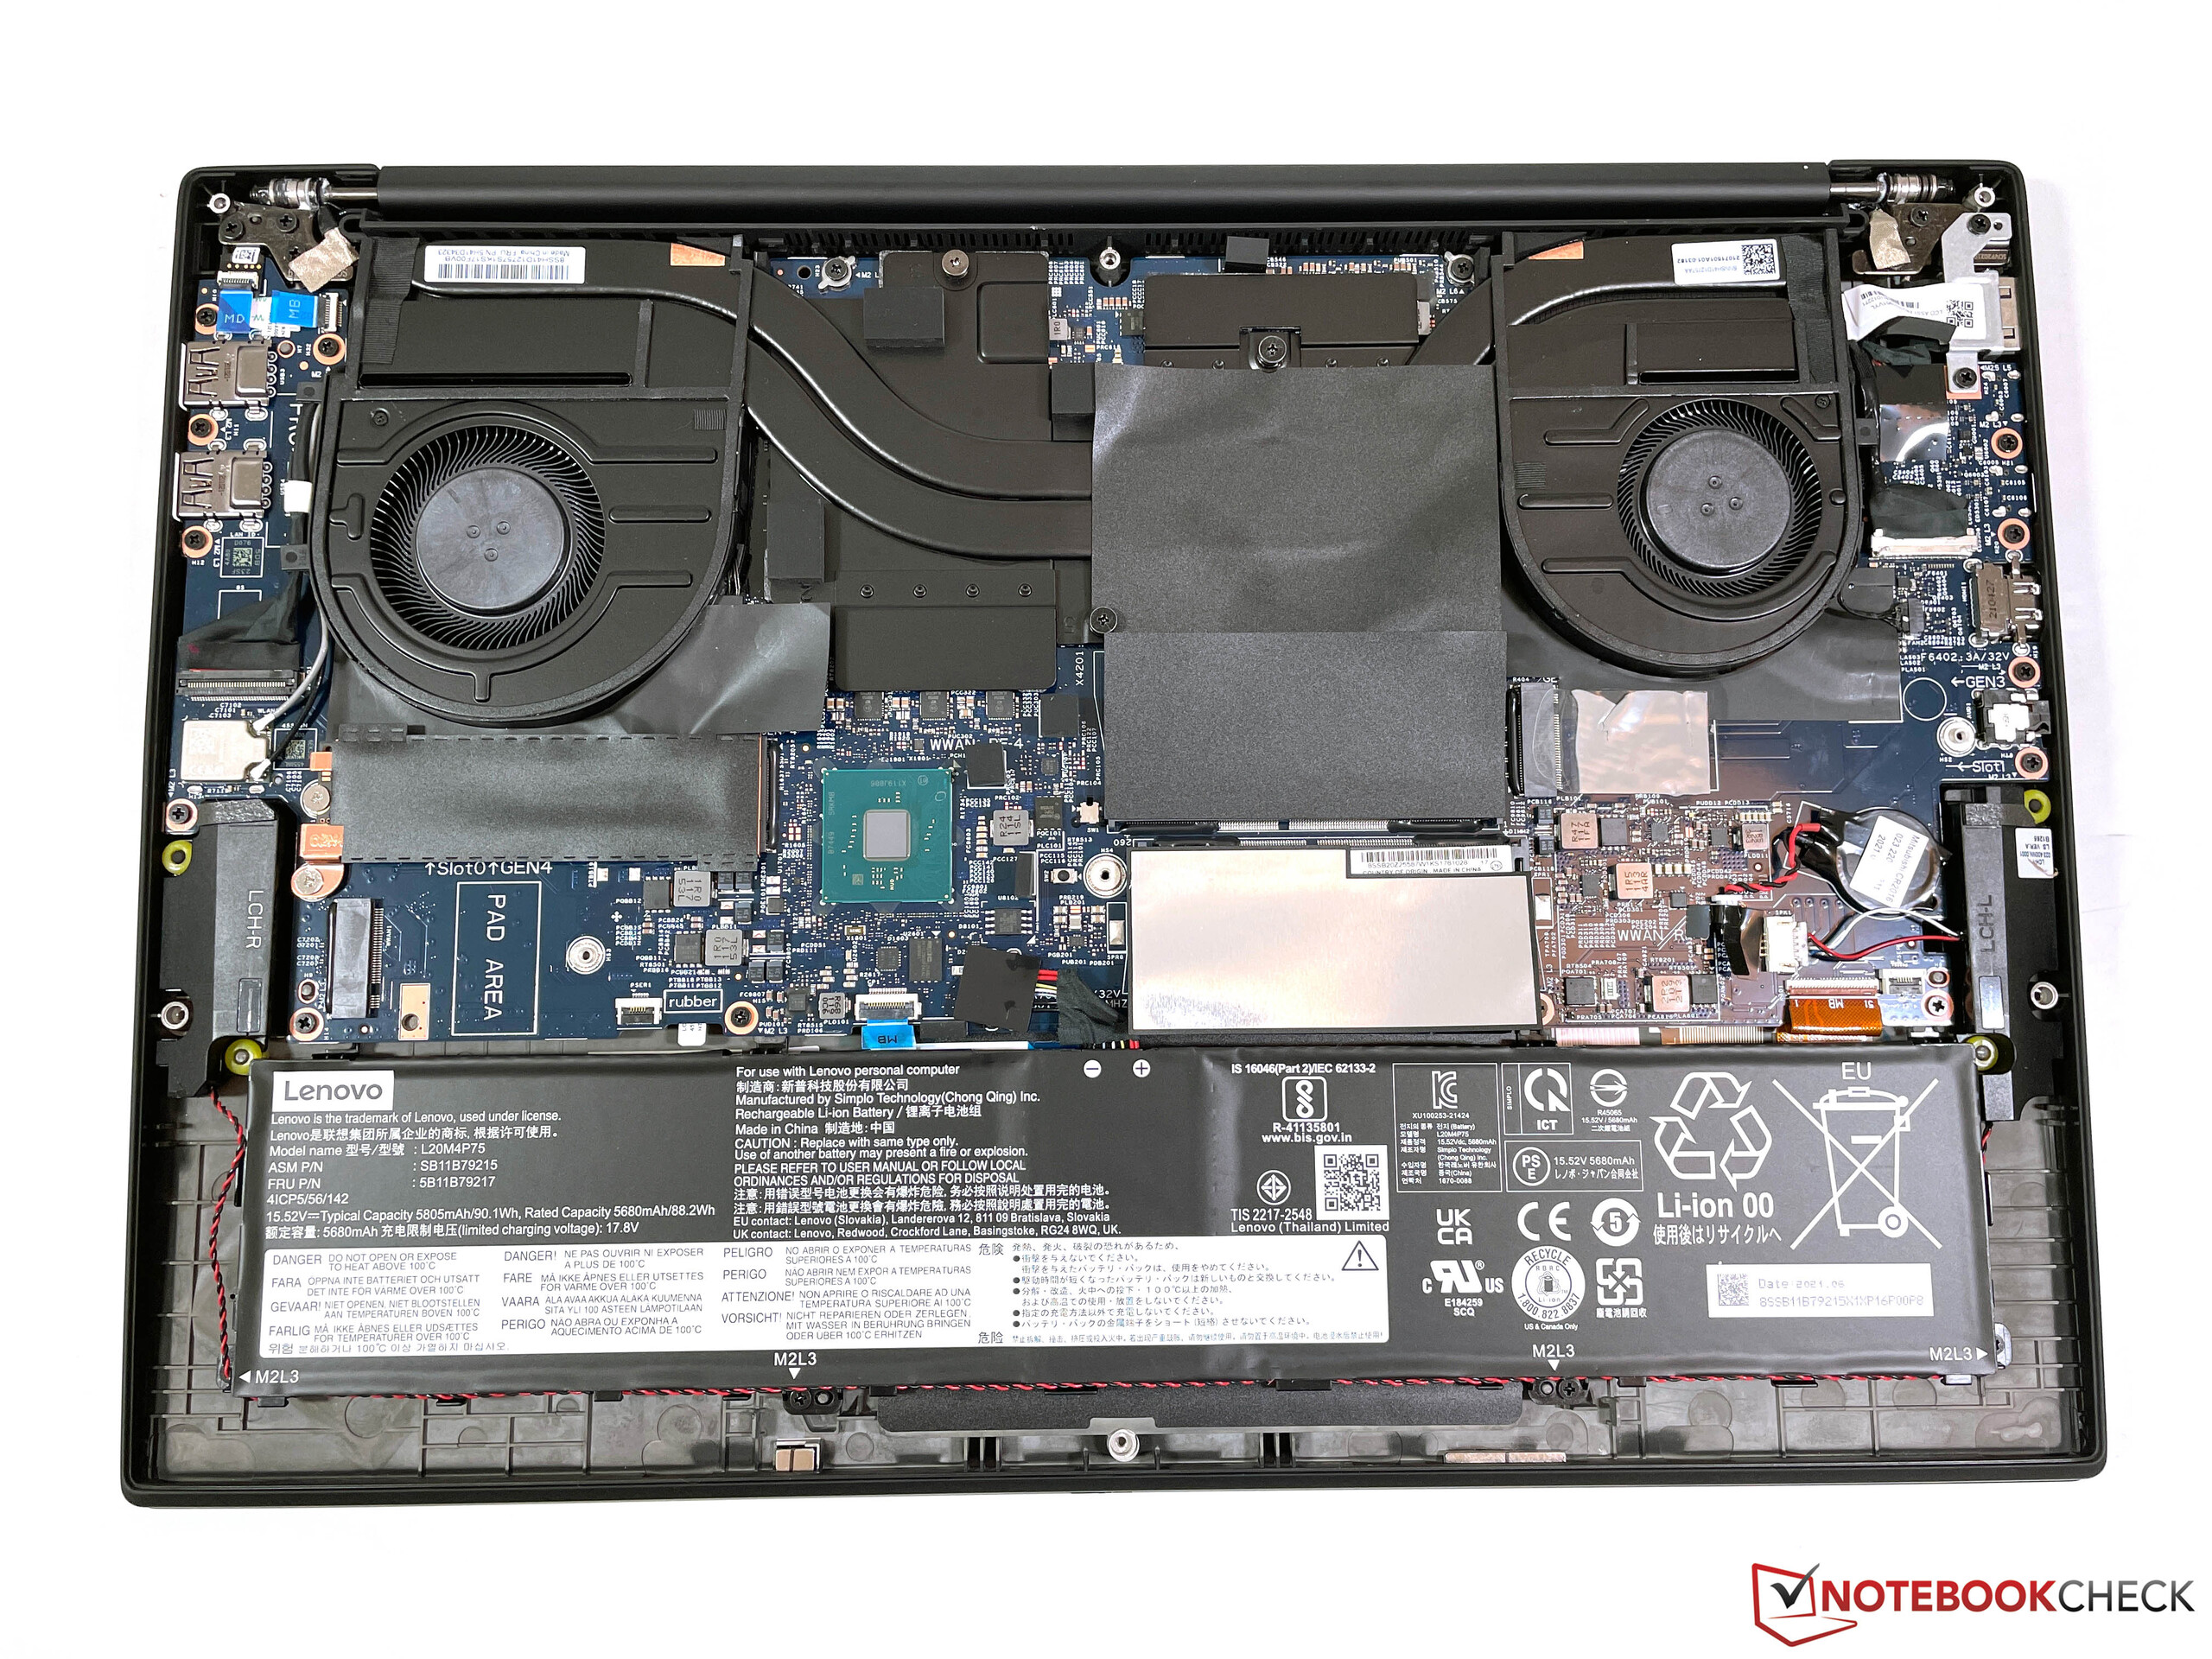
当前版本的ThinkPad P1 G4和结构相同的ThinkPad X1 Extreme G4有两种不同的冷却方案。配备更快的显卡的配置(从 RTX 3060或相应的RTX A3000)使用能力更强的蒸气室冷却。
在我们的 对ThinkPad P1 G4的第一次审查中中,我们对CPU的性能感到失望。现在我们在编辑部再次使用了同样的配置,我们想检查一下在使用最新的BIOS(1.13版)期间,CPU的性能是否有所提高。
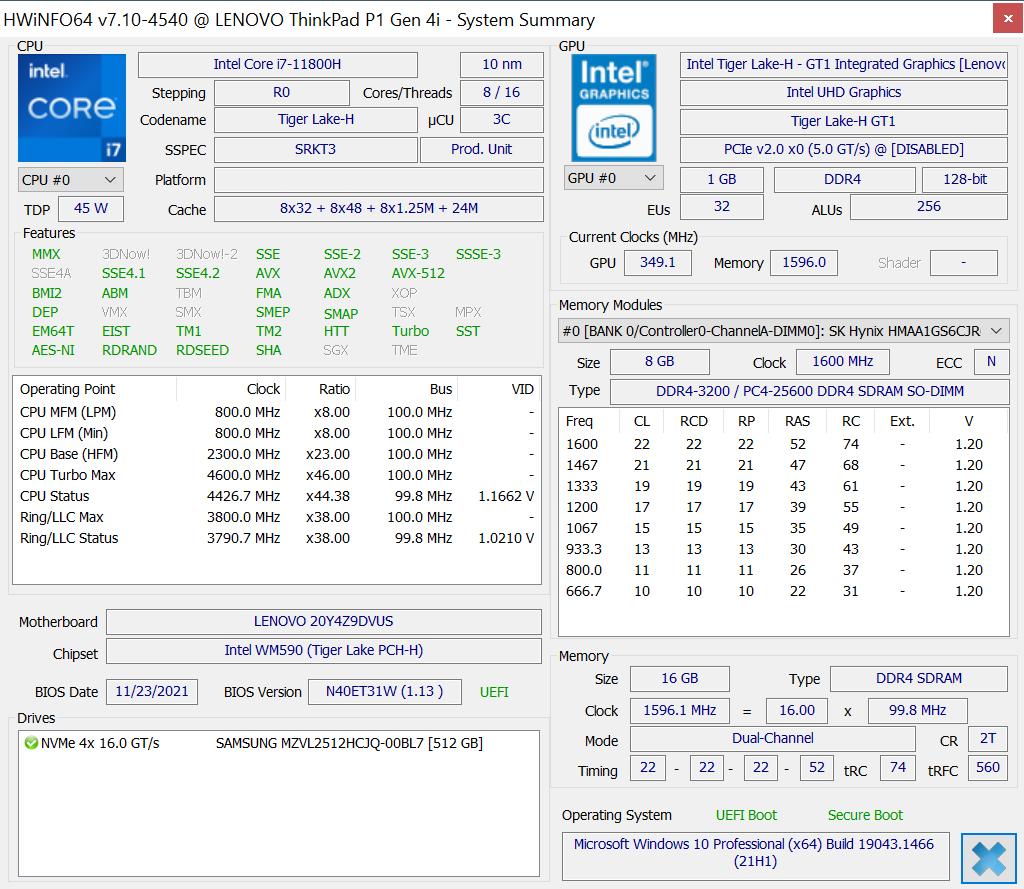
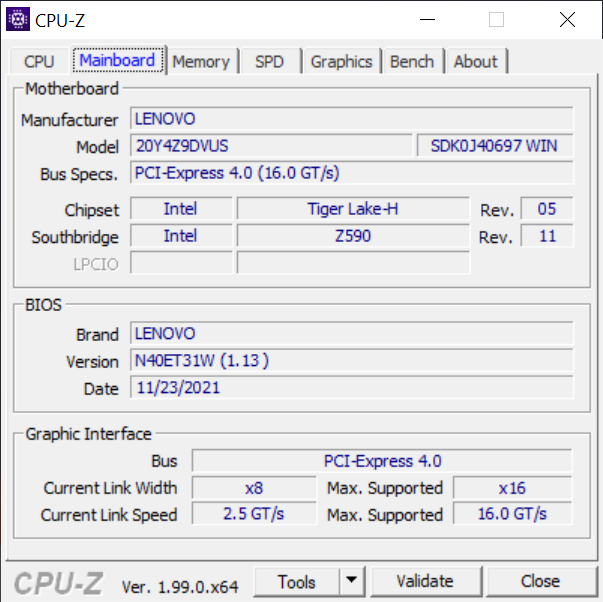
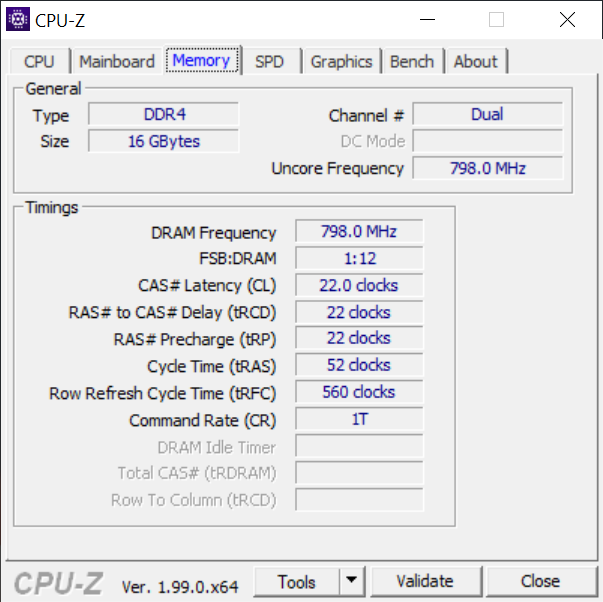
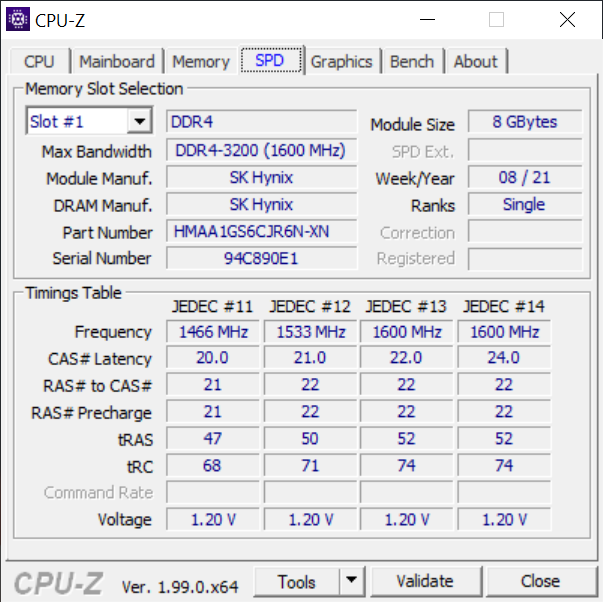
除了工作内存配置的变化(现在是双通道)之外,今天的测试设备的规格与ThinkPad P1 G4的第一个型号没有区别。因此,我们再次看到了一个组合,即英特尔酷睿i7-11800H和 Nvidia T1200.来自不同供应商的面板现在被用于WQHD屏幕,所以我们也看一下显示特性。然而,主要的重点是CPU的性能。
关于ThinkPad P1 G4和相同构造的ThinkPad X1 Extreme G4的进一步信息,我们请你参考我们以前的评论。
Possible competitors in comparison
Rating | Date | Model | Weight | Height | Size | Resolution | Price |
|---|---|---|---|---|---|---|---|
| 89.3 % v7 (old) | 02 / 2022 | Lenovo ThinkPad P1 G4-20Y4Z9DVUS i7-11800H, T1200 Laptop GPU | 1.8 kg | 17.7 mm | 16.00" | 2560x1600 | |
| 89.4 % v7 (old) | 10 / 2021 | Lenovo ThinkPad P1 G4-20Y30017GE i7-11800H, T1200 Laptop GPU | 1.8 kg | 17.7 mm | 16.00" | 2560x1600 | |
| 89.8 % v7 (old) | 11 / 2021 | Lenovo ThinkPad P1 G4-20Y4S0KS00 i7-11850H, GeForce RTX 3070 Laptop GPU | 2 kg | 17.7 mm | 16.00" | 3840x2400 | |
| 89 % v7 (old) | 11 / 2021 | Lenovo ThinkPad X1 Extreme G4-20Y5CTO1WW (3050 Ti) i7-11800H, GeForce RTX 3050 Ti Laptop GPU | 2 kg | 18.2 mm | 16.00" | 3840x2400 | |
| 88.3 % v7 (old) | 12 / 2021 | Lenovo ThinkPad X1 Extreme G4-20Y50040GE i9-11950H, GeForce RTX 3080 Laptop GPU | 1.9 kg | 18.2 mm | 16.00" | 3840x2400 |
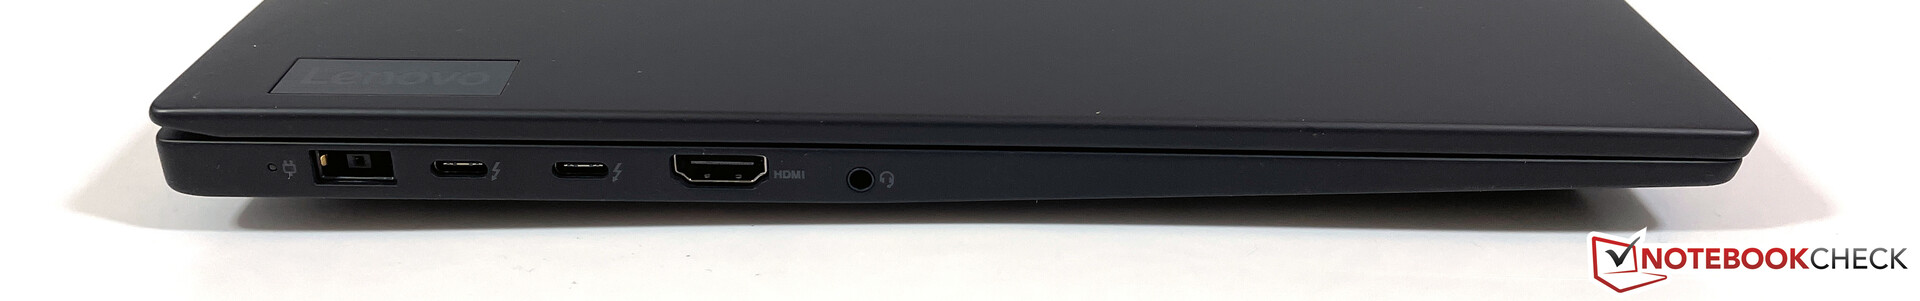
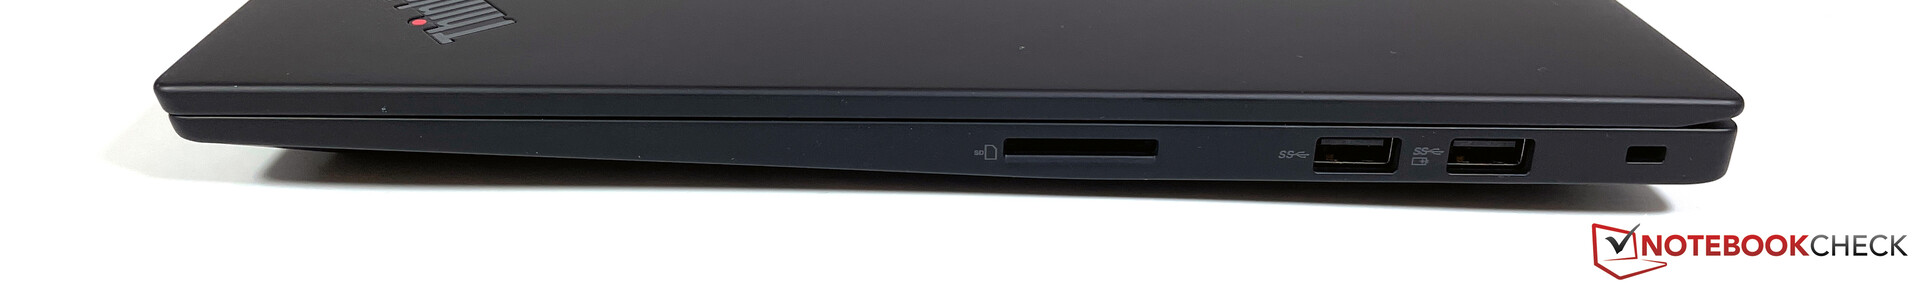
案例与设备
| SD Card Reader | |
| average JPG Copy Test (av. of 3 runs) | |
| Lenovo ThinkPad P1 G4-20Y4Z9DVUS (Angelbird AV Pro V60) | |
| Lenovo ThinkPad P1 G4-20Y30017GE (AV PRO V60) | |
| Lenovo ThinkPad X1 Extreme G4-20Y5CTO1WW (3050 Ti) (AV Pro V60) | |
| Average of class Workstation (49.6 - 681, n=14, last 2 years) | |
| maximum AS SSD Seq Read Test (1GB) | |
| Average of class Workstation (87.6 - 1455, n=14, last 2 years) | |
| Lenovo ThinkPad P1 G4-20Y30017GE (AV PRO V60) | |
| Lenovo ThinkPad P1 G4-20Y4Z9DVUS (Angelbird AV Pro V60) | |
| Lenovo ThinkPad X1 Extreme G4-20Y5CTO1WW (3050 Ti) (AV Pro V60) | |


显示屏。至少有两家供应商的WQHD面板
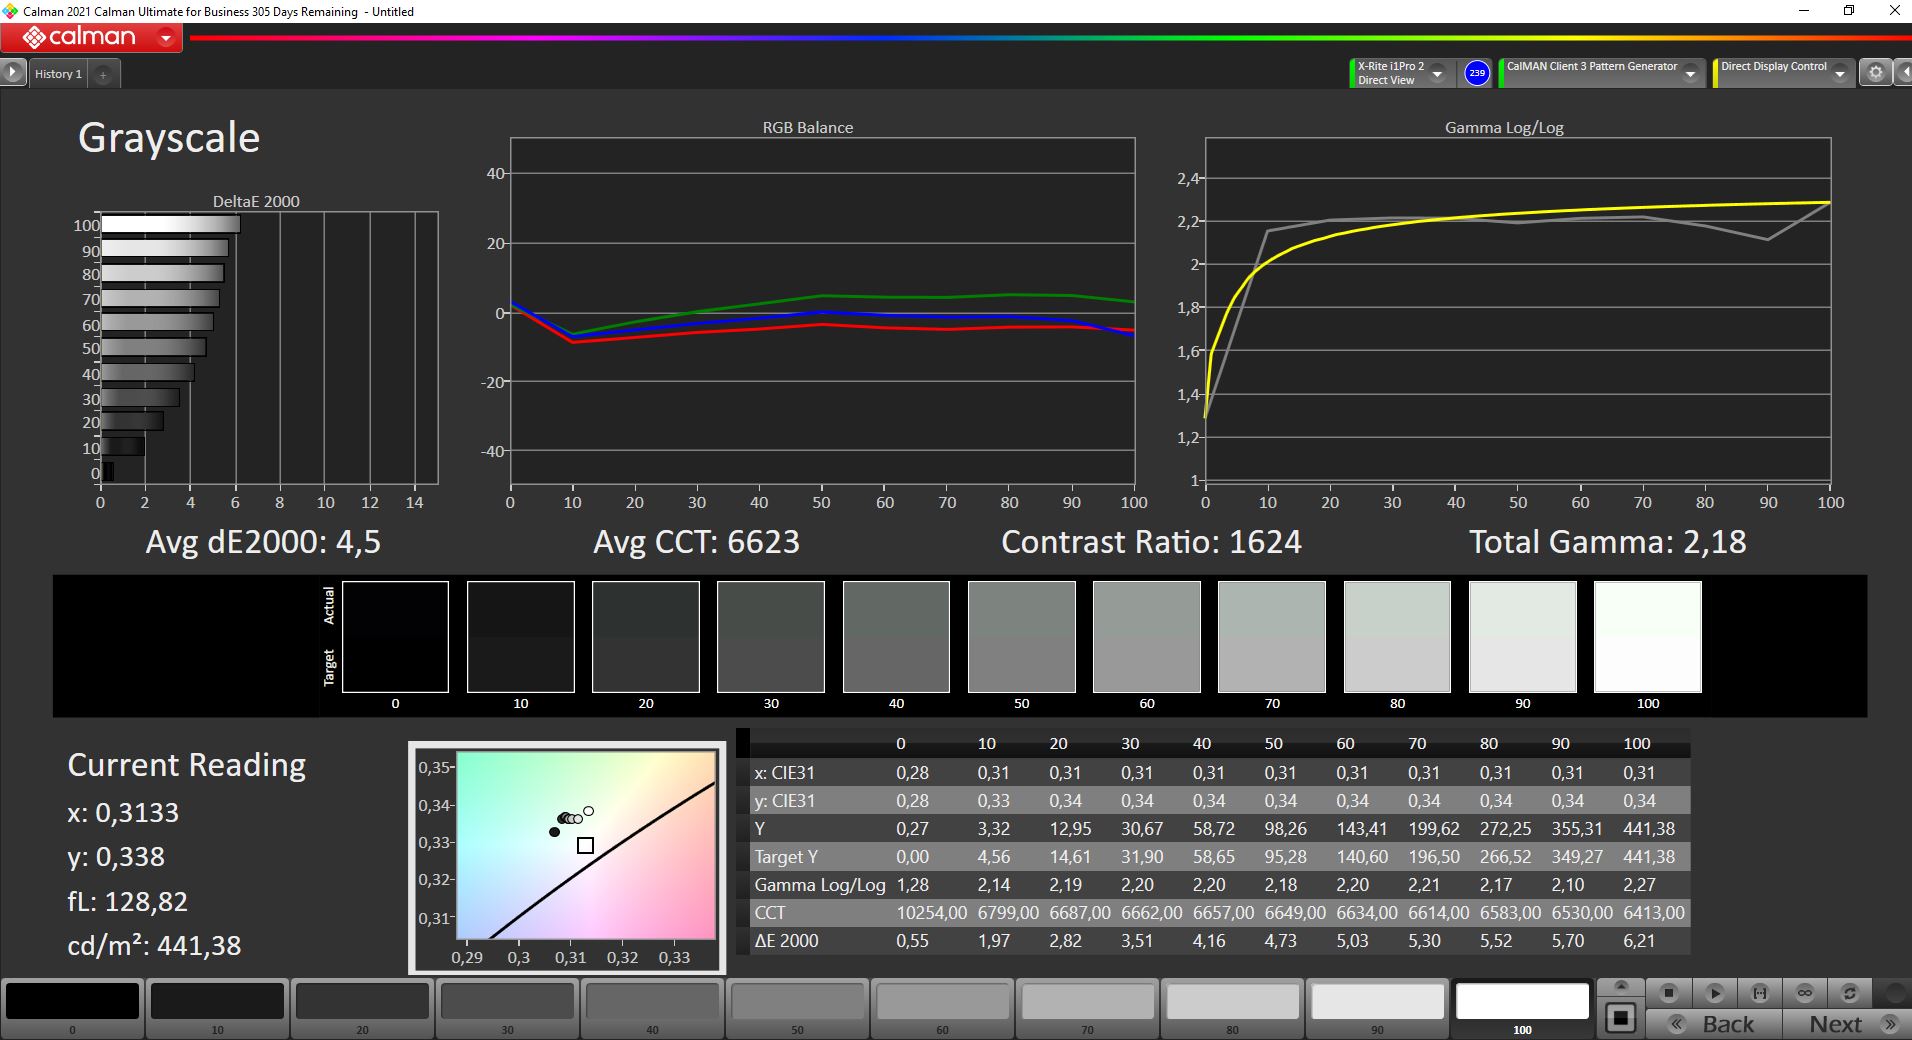
我们的ThinkPad P1 G4评测样本再次配备了标准的WQHD面板(2,560 x 1,600像素,16:10,哑光),但面板的ID,也就是供应商,有所不同。这块京东方的面板在测量中得分略高(略微更亮,对比度略高),但其数值基本相当。两块面板都提供了非常好的画质,没有PWM闪烁。响应时间很慢,但我们没有发现它们是有问题的。
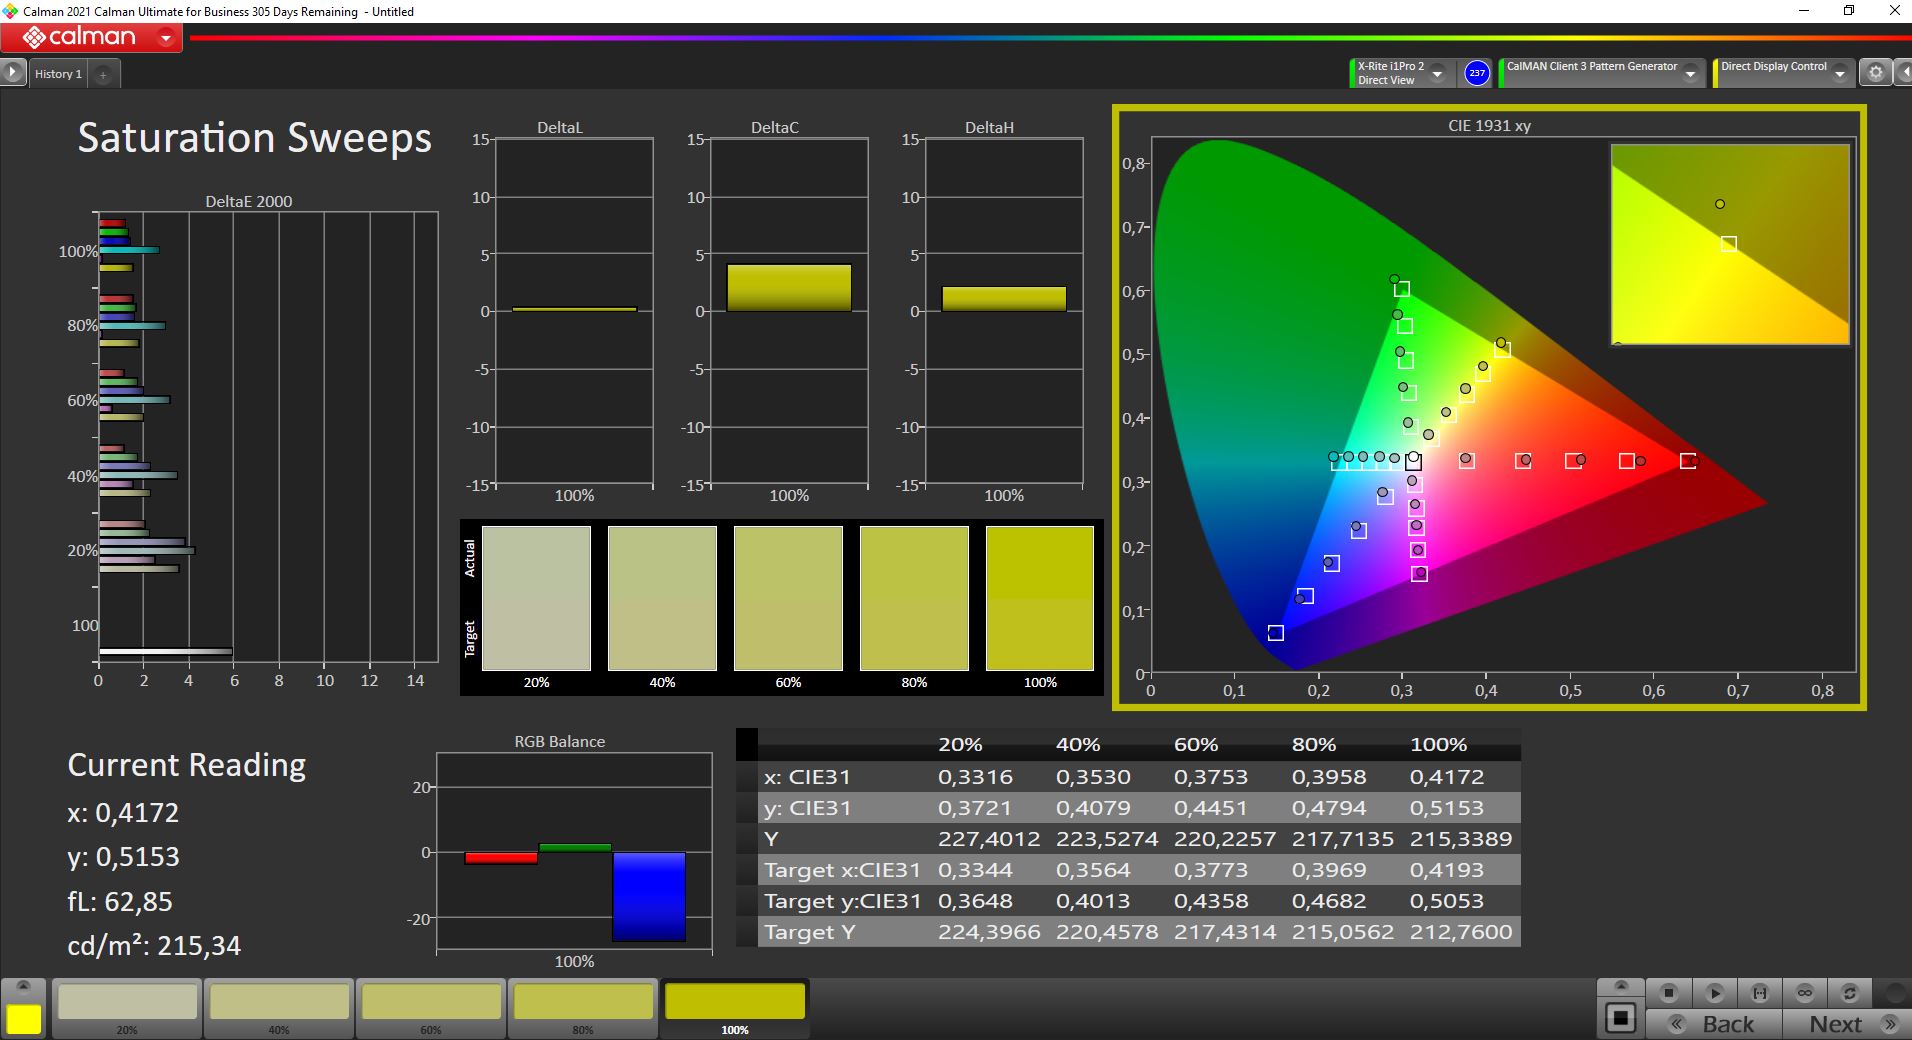
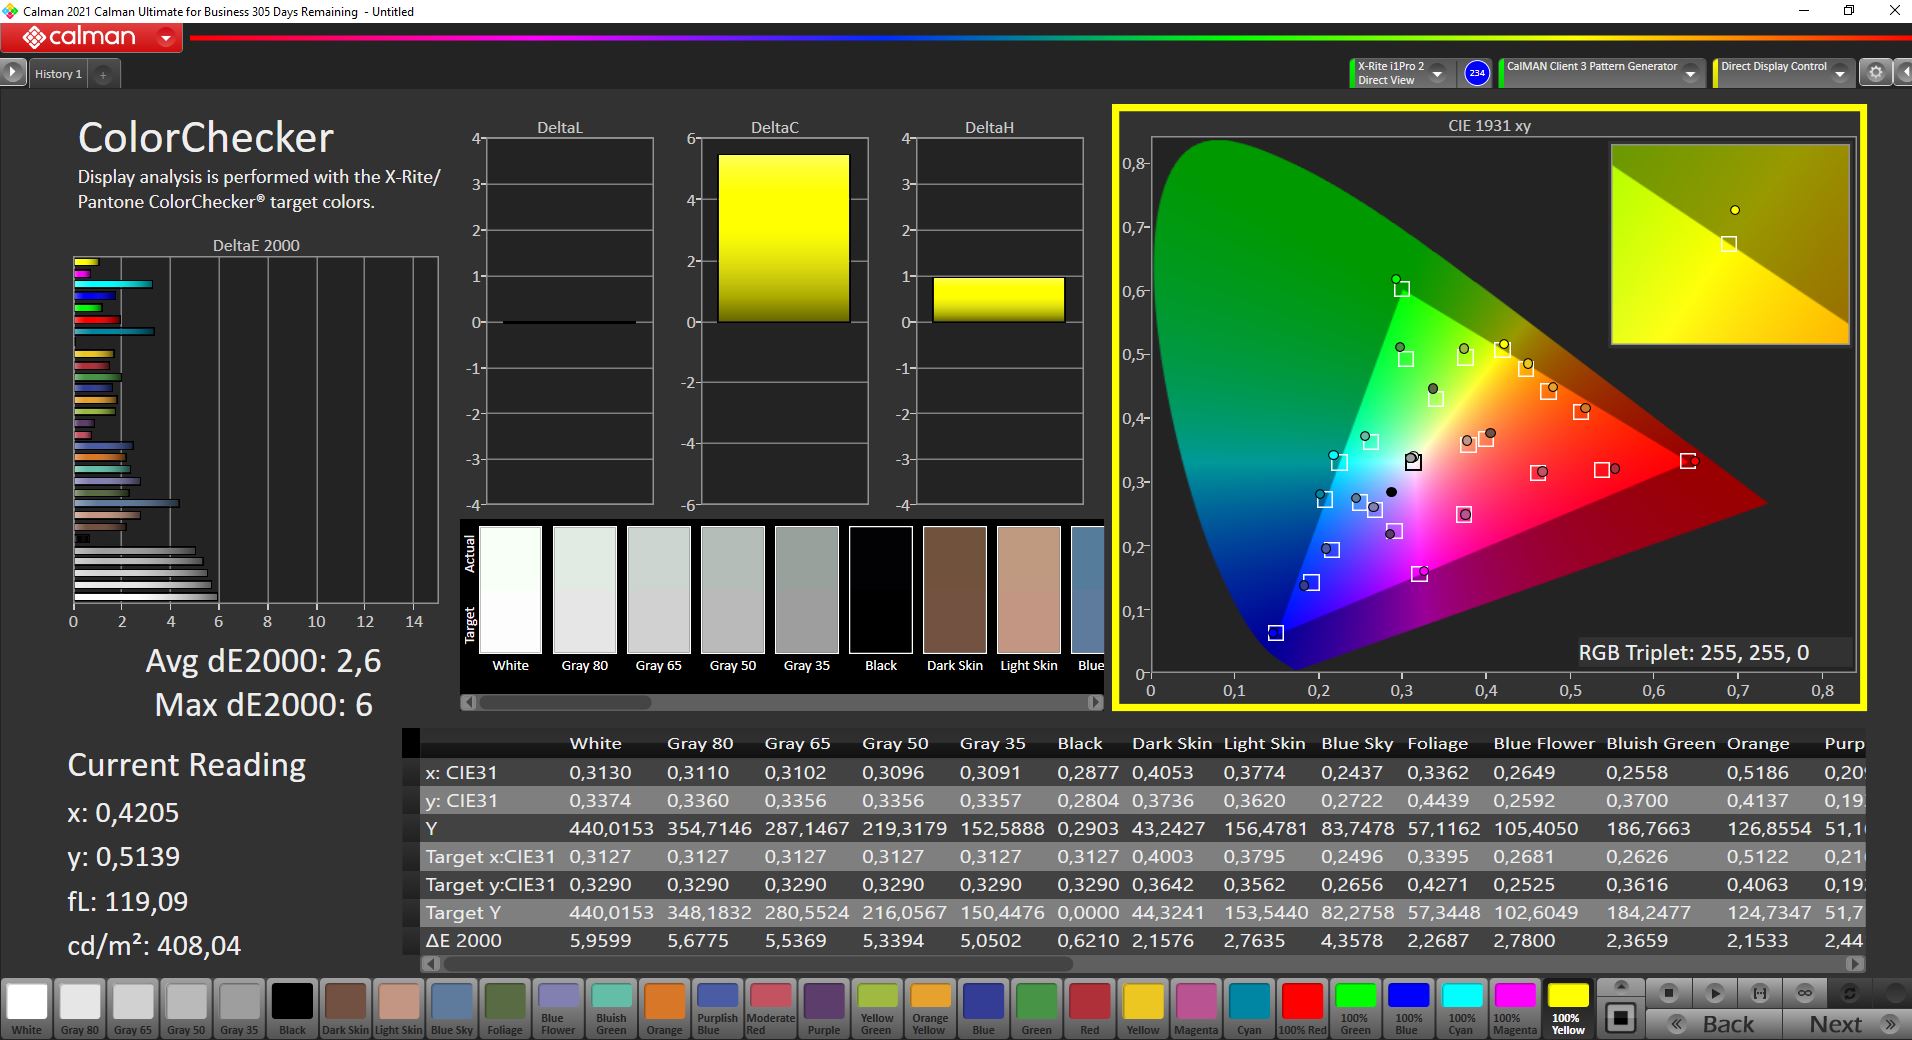
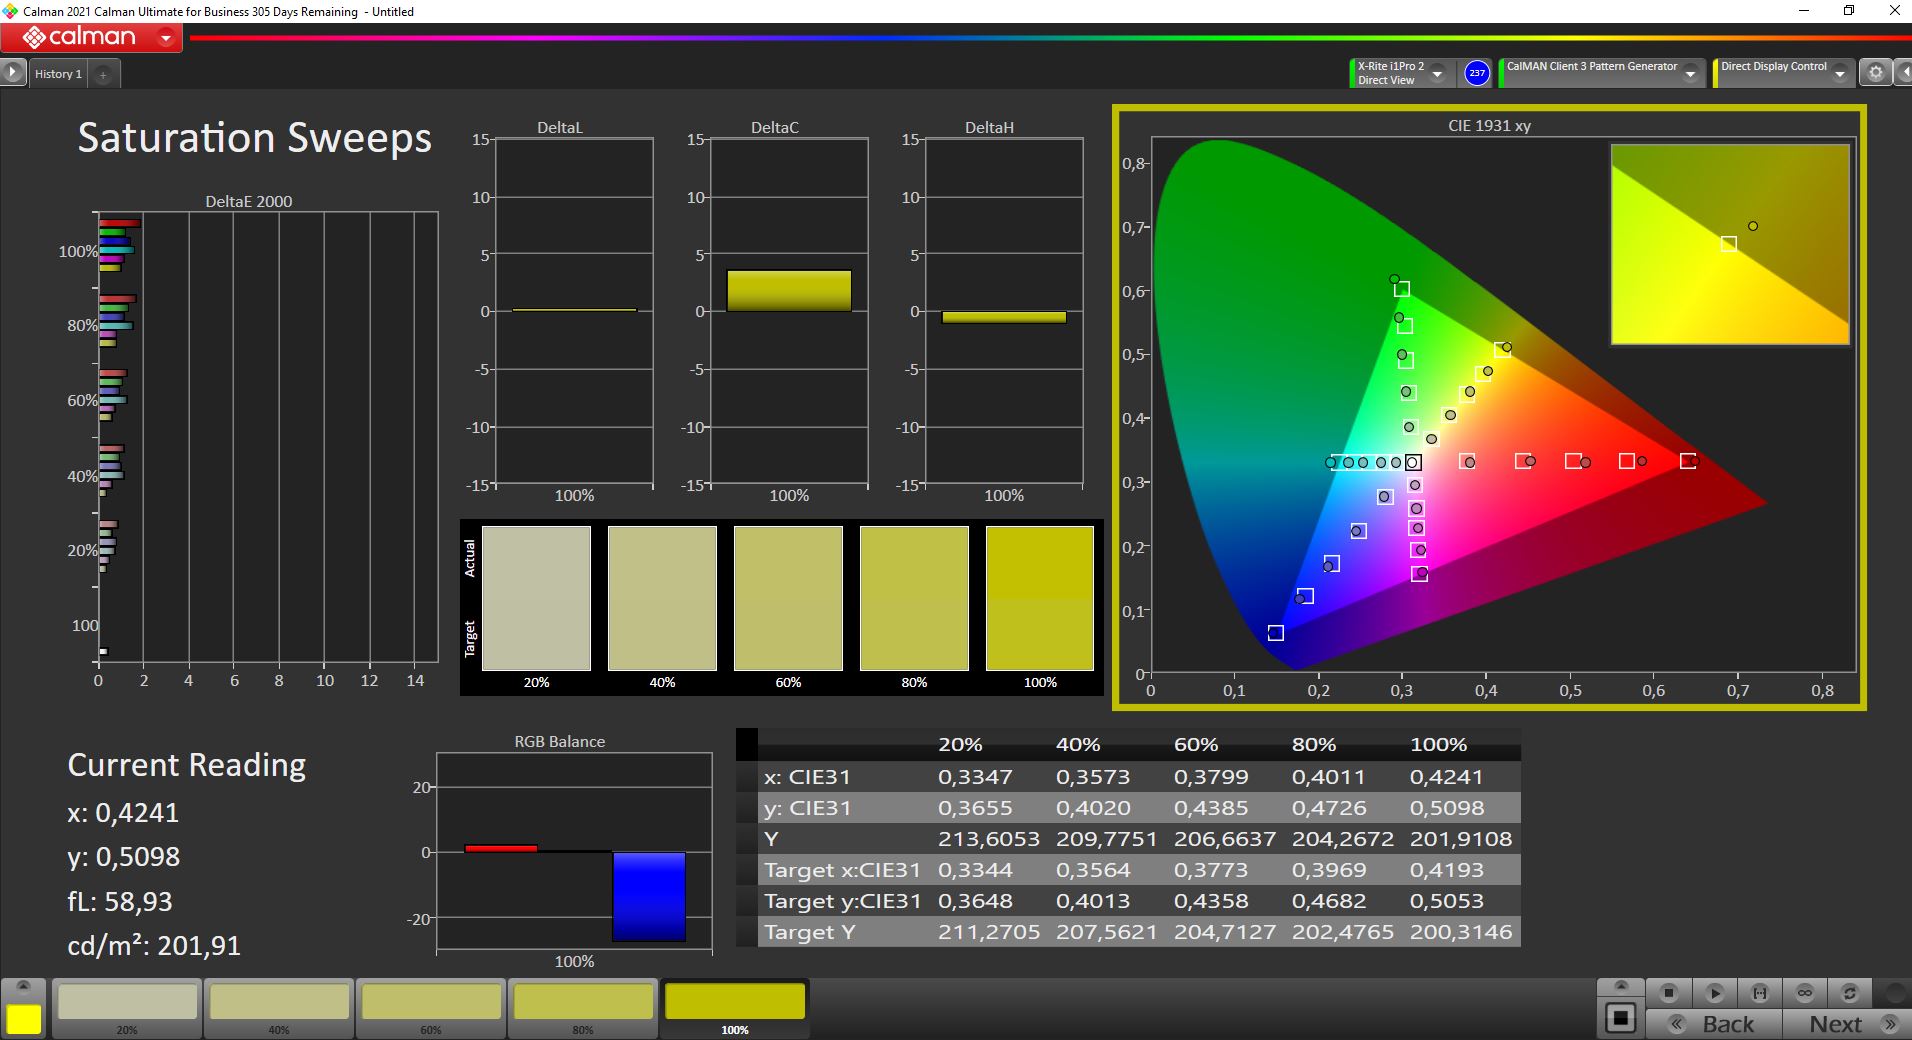
该面板完全覆盖了sRGB色彩空间,但为了获得最佳的显示质量,应该对屏幕进行校准(我们的校准配置文件可在下面的盒子中免费下载)。两个可选的4K显示器提供更大的色彩空间覆盖(AdobeRGB),但标准的WQHD面板对于正常使用来说是非常好的。
| |||||||||||||||||||||||||
Brightness Distribution: 90 %
Center on Battery: 443 cd/m²
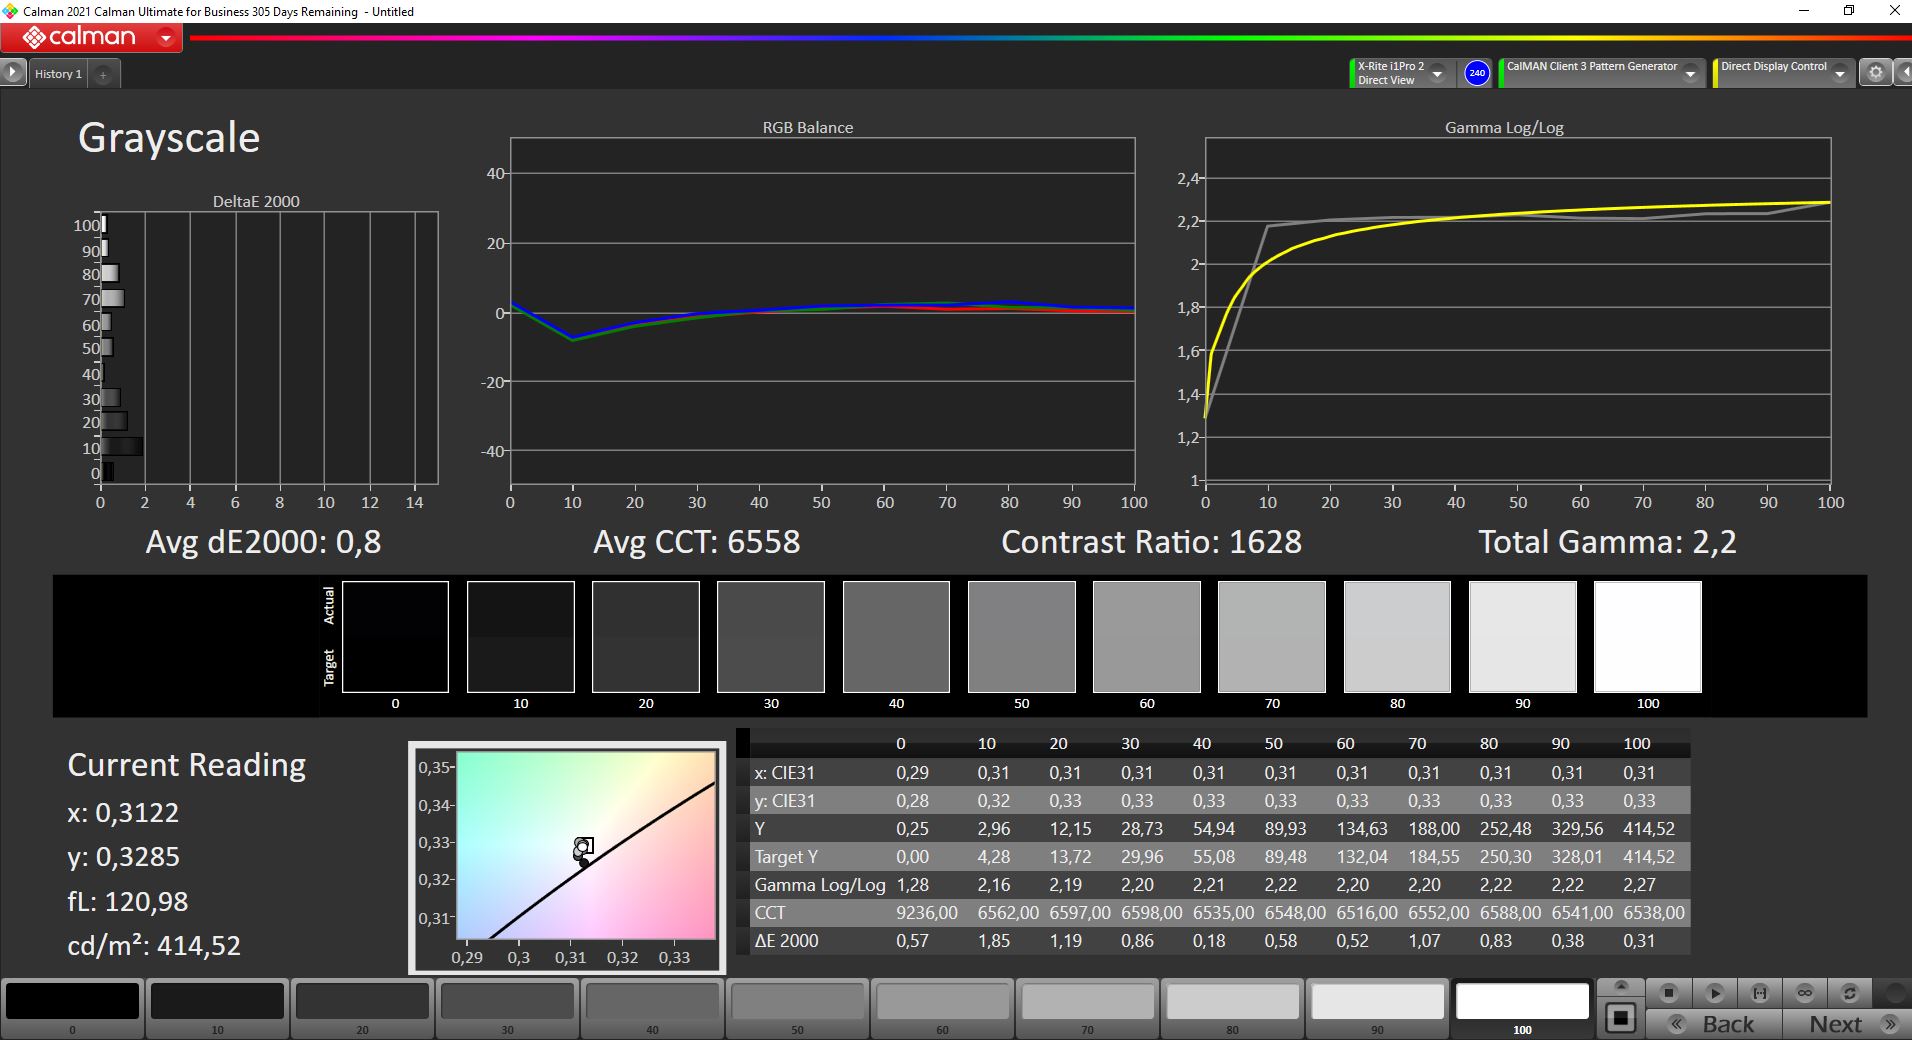
Contrast: 1633:1 (Black: 0.27 cd/m²)
ΔE ColorChecker Calman: 2.6 | ∀{0.5-29.43 Ø4.73}
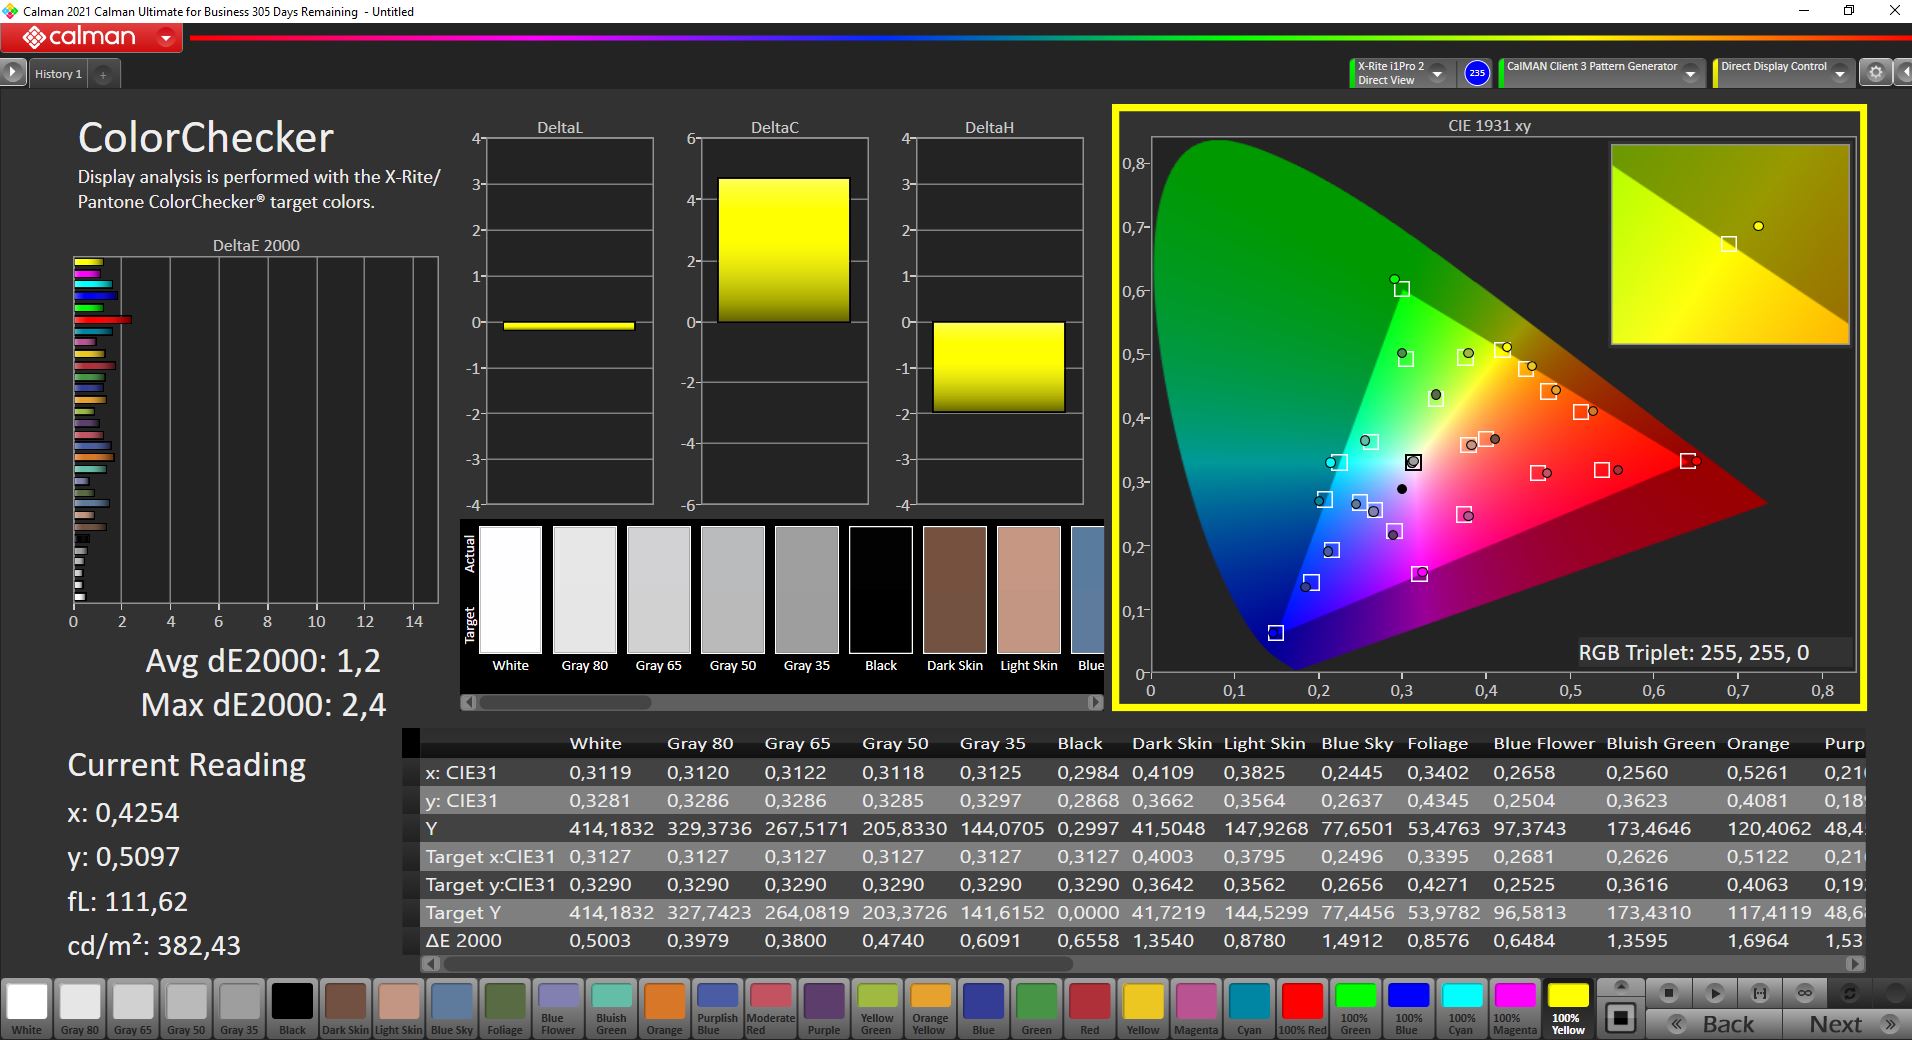
calibrated: 1.2
ΔE Greyscale Calman: 4.5 | ∀{0.09-98 Ø4.97}
74.7% AdobeRGB 1998 (Argyll 3D)
99.3% sRGB (Argyll 3D)
72.7% Display P3 (Argyll 3D)
Gamma: 2.18
CCT: 6623 K
| Lenovo ThinkPad P1 G4-20Y4Z9DVUS NE160QDM-N63, IPS, 2560x1600, 16" | Lenovo ThinkPad P1 G4-20Y30017GE B160QAN02.M, IPS, 2560x1600, 16" | Lenovo ThinkPad P1 G4-20Y4S0KS00 LP160UQ1-SPB1, IPS LED, 3840x2400, 16" | Lenovo ThinkPad X1 Extreme G4-20Y5CTO1WW (3050 Ti) LP160UQ1-SPB1, IPS LED, 3840x2400, 16" | |
|---|---|---|---|---|
| Display | 4% | 17% | 15% | |
| Display P3 Coverage (%) | 72.7 | 77.3 6% | 85.7 18% | 84.3 16% |
| sRGB Coverage (%) | 99.3 | 99.9 1% | 99.4 0% | 98.3 -1% |
| AdobeRGB 1998 Coverage (%) | 74.7 | 78.1 5% | 98.9 32% | 97.8 31% |
| Response Times | -14% | -43% | -75% | |
| Response Time Grey 50% / Grey 80% * (ms) | 40.8 | 40.8 ? -0% | 55.2 ? -35% | 60 ? -47% |
| Response Time Black / White * (ms) | 20.8 | 26.4 ? -27% | 31.2 ? -50% | 42 ? -102% |
| PWM Frequency (Hz) | ||||
| Screen | -2% | 14% | 7% | |
| Brightness middle (cd/m²) | 441 | 420 -5% | 630 43% | 639 45% |
| Brightness (cd/m²) | 420 | 401 -5% | 622 48% | 612 46% |
| Brightness Distribution (%) | 90 | 90 0% | 90 0% | 84 -7% |
| Black Level * (cd/m²) | 0.27 | 0.3 -11% | 0.41 -52% | 0.47 -74% |
| Contrast (:1) | 1633 | 1400 -14% | 1537 -6% | 1360 -17% |
| Colorchecker dE 2000 * | 2.6 | 2.5 4% | 2.2 15% | 2.2 15% |
| Colorchecker dE 2000 max. * | 6 | 4.9 18% | 5 17% | 5.3 12% |
| Colorchecker dE 2000 calibrated * | 1.2 | 1.6 -33% | 1 17% | 1.4 -17% |
| Greyscale dE 2000 * | 4.5 | 3.4 24% | 2.7 40% | 1.7 62% |
| Gamma | 2.18 101% | 2.24 98% | 2.26 97% | 2.31 95% |
| CCT | 6623 98% | 6479 100% | 6886 94% | 6390 102% |
| Total Average (Program / Settings) | -4% /
-3% | -4% /
6% | -18% /
-3% |
* ... smaller is better
Display Response Times
| ↔ Response Time Black to White | ||
|---|---|---|
| 20.8 ms ... rise ↗ and fall ↘ combined | ↗ ms rise | 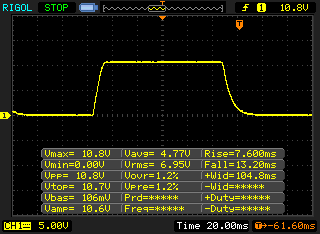 |
| ↘ ms fall | ||
| The screen shows good response rates in our tests, but may be too slow for competitive gamers. In comparison, all tested devices range from 0.1 (minimum) to 240 (maximum) ms. » 46 % of all devices are better. This means that the measured response time is similar to the average of all tested devices (19.9 ms). | ||
| ↔ Response Time 50% Grey to 80% Grey | ||
| 40.8 ms ... rise ↗ and fall ↘ combined | ↗ ms rise | 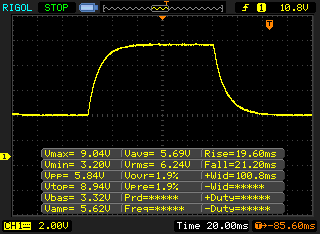 |
| ↘ ms fall | ||
| The screen shows slow response rates in our tests and will be unsatisfactory for gamers. In comparison, all tested devices range from 0.165 (minimum) to 636 (maximum) ms. » 64 % of all devices are better. This means that the measured response time is worse than the average of all tested devices (31.1 ms). | ||
Screen Flickering / PWM (Pulse-Width Modulation)
| Screen flickering / PWM not detected |  | ||
In comparison: 52 % of all tested devices do not use PWM to dim the display. If PWM was detected, an average of 7798 (minimum: 5 - maximum: 343500) Hz was measured. | |||
性能。ThinkPad P1 G4最终没有拉上手刹
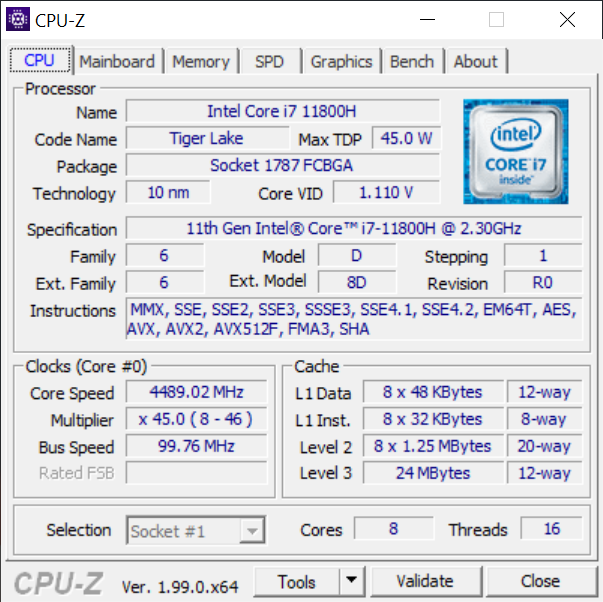
处理器。酷睿i7-11800H
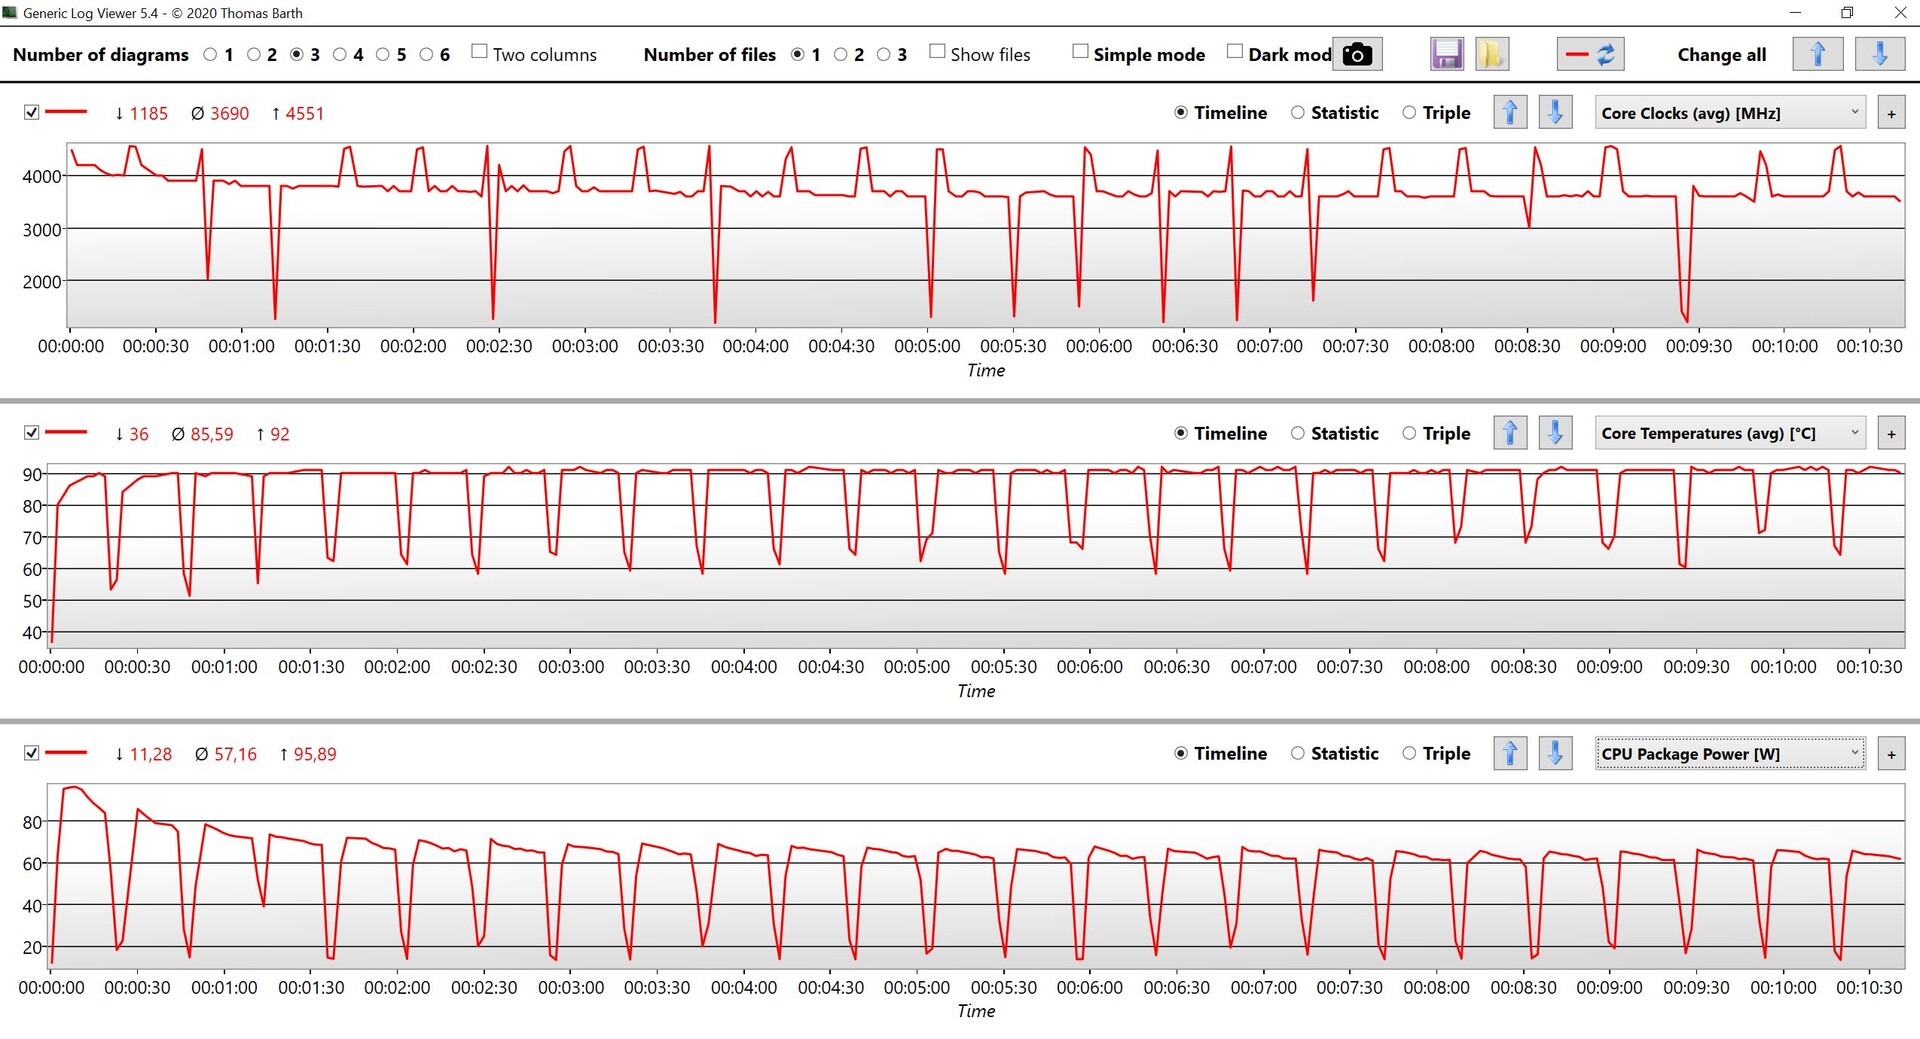
我们现在已经测试了ThinkPad P1 G4和X1 Extreme G4的几个版本,每一个新的BIOS版本的CPU性能都有提高。在我们的第一次测试中,我们感到很失望,因为CPU在短时间内就稳定在40W,因此明显比一般的Core i7-11800H 。然而,在最新的1.13版BIOS中,这些限制已经成为过去,Core i7-11800H的表现非常好。
现在的CPU性能与蒸汽室模型相当,与实际上更快的Core i9-11950H 。这表明,在单核测试中,可选的酷睿i9处理器只比酷睿i7-11800H提供了最小的性能优势。
在电池模式下,该处理器的功耗被限制在70瓦,这导致了约15%的小幅性能损失。更多的CPU基准测试可在我们的移动处理器比较部分。
Cinebench R15 Multi Dauertest
Cinebench R23: Multi Core | Single Core
Cinebench R20: CPU (Multi Core) | CPU (Single Core)
Cinebench R15: CPU Multi 64Bit | CPU Single 64Bit
Blender: v2.79 BMW27 CPU
7-Zip 18.03: 7z b 4 | 7z b 4 -mmt1
Geekbench 5.5: Multi-Core | Single-Core
HWBOT x265 Benchmark v2.2: 4k Preset
LibreOffice : 20 Documents To PDF
R Benchmark 2.5: Overall mean
| CPU Performance rating | |
| Average of class Workstation | |
| Lenovo ThinkPad P1 G4-20Y4S0KS00 | |
| Lenovo ThinkPad X1 Extreme G4-20Y50040GE -3! | |
| Lenovo ThinkPad X1 Extreme G4-20Y5CTO1WW (3050 Ti) | |
| Lenovo ThinkPad P1 G4-20Y4Z9DVUS | |
| Average Intel Core i7-11800H | |
| Lenovo ThinkPad P1 G4-20Y30017GE | |
| Cinebench R23 / Multi Core | |
| Average of class Workstation (14055 - 38520, n=25, last 2 years) | |
| Lenovo ThinkPad X1 Extreme G4-20Y5CTO1WW (3050 Ti) | |
| Lenovo ThinkPad P1 G4-20Y4Z9DVUS | |
| Lenovo ThinkPad X1 Extreme G4-20Y50040GE | |
| Lenovo ThinkPad P1 G4-20Y4S0KS00 | |
| Average Intel Core i7-11800H (6508 - 14088, n=48) | |
| Lenovo ThinkPad P1 G4-20Y30017GE | |
| Cinebench R23 / Single Core | |
| Average of class Workstation (1712 - 2228, n=25, last 2 years) | |
| Lenovo ThinkPad X1 Extreme G4-20Y50040GE | |
| Lenovo ThinkPad P1 G4-20Y4S0KS00 | |
| Lenovo ThinkPad X1 Extreme G4-20Y5CTO1WW (3050 Ti) | |
| Lenovo ThinkPad P1 G4-20Y4Z9DVUS | |
| Average Intel Core i7-11800H (1386 - 1522, n=45) | |
| Lenovo ThinkPad P1 G4-20Y30017GE | |
| Cinebench R20 / CPU (Multi Core) | |
| Average of class Workstation (5471 - 15043, n=25, last 2 years) | |
| Lenovo ThinkPad P1 G4-20Y4Z9DVUS | |
| Lenovo ThinkPad X1 Extreme G4-20Y5CTO1WW (3050 Ti) | |
| Lenovo ThinkPad P1 G4-20Y4S0KS00 | |
| Lenovo ThinkPad X1 Extreme G4-20Y50040GE | |
| Average Intel Core i7-11800H (2498 - 5408, n=50) | |
| Lenovo ThinkPad P1 G4-20Y30017GE | |
| Cinebench R20 / CPU (Single Core) | |
| Average of class Workstation (671 - 857, n=25, last 2 years) | |
| Lenovo ThinkPad X1 Extreme G4-20Y50040GE | |
| Lenovo ThinkPad P1 G4-20Y4S0KS00 | |
| Lenovo ThinkPad X1 Extreme G4-20Y5CTO1WW (3050 Ti) | |
| Lenovo ThinkPad P1 G4-20Y4Z9DVUS | |
| Average Intel Core i7-11800H (520 - 586, n=47) | |
| Lenovo ThinkPad P1 G4-20Y30017GE | |
| Cinebench R15 / CPU Multi 64Bit | |
| Average of class Workstation (2489 - 5810, n=25, last 2 years) | |
| Lenovo ThinkPad P1 G4-20Y4Z9DVUS | |
| Lenovo ThinkPad X1 Extreme G4-20Y50040GE | |
| Lenovo ThinkPad X1 Extreme G4-20Y50040GE | |
| Lenovo ThinkPad X1 Extreme G4-20Y5CTO1WW (3050 Ti) | |
| Lenovo ThinkPad P1 G4-20Y4S0KS00 | |
| Average Intel Core i7-11800H (1342 - 2173, n=50) | |
| Lenovo ThinkPad P1 G4-20Y30017GE | |
| Cinebench R15 / CPU Single 64Bit | |
| Average of class Workstation (191.4 - 328, n=25, last 2 years) | |
| Lenovo ThinkPad X1 Extreme G4-20Y50040GE | |
| Lenovo ThinkPad P1 G4-20Y4S0KS00 | |
| Lenovo ThinkPad P1 G4-20Y4Z9DVUS | |
| Lenovo ThinkPad X1 Extreme G4-20Y5CTO1WW (3050 Ti) | |
| Average Intel Core i7-11800H (201 - 231, n=46) | |
| Lenovo ThinkPad P1 G4-20Y30017GE | |
| Blender / v2.79 BMW27 CPU | |
| Lenovo ThinkPad P1 G4-20Y30017GE | |
| Average Intel Core i7-11800H (217 - 454, n=46) | |
| Lenovo ThinkPad P1 G4-20Y4S0KS00 | |
| Lenovo ThinkPad X1 Extreme G4-20Y5CTO1WW (3050 Ti) | |
| Lenovo ThinkPad P1 G4-20Y4Z9DVUS | |
| Average of class Workstation (91 - 261, n=25, last 2 years) | |
| 7-Zip 18.03 / 7z b 4 | |
| Average of class Workstation (54741 - 116969, n=25, last 2 years) | |
| Lenovo ThinkPad P1 G4-20Y4S0KS00 | |
| Lenovo ThinkPad P1 G4-20Y4Z9DVUS | |
| Lenovo ThinkPad X1 Extreme G4-20Y5CTO1WW (3050 Ti) | |
| Average Intel Core i7-11800H (33718 - 56758, n=46) | |
| Lenovo ThinkPad P1 G4-20Y30017GE | |
| 7-Zip 18.03 / 7z b 4 -mmt1 | |
| Average of class Workstation (5126 - 6960, n=25, last 2 years) | |
| Lenovo ThinkPad P1 G4-20Y4S0KS00 | |
| Lenovo ThinkPad X1 Extreme G4-20Y5CTO1WW (3050 Ti) | |
| Lenovo ThinkPad P1 G4-20Y4Z9DVUS | |
| Lenovo ThinkPad P1 G4-20Y30017GE | |
| Average Intel Core i7-11800H (5138 - 5732, n=46) | |
| Geekbench 5.5 / Multi-Core | |
| Average of class Workstation (11542 - 25554, n=25, last 2 years) | |
| Lenovo ThinkPad P1 G4-20Y4S0KS00 | |
| Average Intel Core i7-11800H (4655 - 9851, n=40) | |
| Lenovo ThinkPad P1 G4-20Y4Z9DVUS | |
| Lenovo ThinkPad X1 Extreme G4-20Y5CTO1WW (3050 Ti) | |
| Lenovo ThinkPad X1 Extreme G4-20Y50040GE | |
| Lenovo ThinkPad P1 G4-20Y30017GE | |
| Geekbench 5.5 / Single-Core | |
| Average of class Workstation (1781 - 2183, n=25, last 2 years) | |
| Lenovo ThinkPad P1 G4-20Y4S0KS00 | |
| Lenovo ThinkPad X1 Extreme G4-20Y50040GE | |
| Lenovo ThinkPad X1 Extreme G4-20Y5CTO1WW (3050 Ti) | |
| Lenovo ThinkPad P1 G4-20Y4Z9DVUS | |
| Average Intel Core i7-11800H (1429 - 1625, n=40) | |
| Lenovo ThinkPad P1 G4-20Y30017GE | |
| HWBOT x265 Benchmark v2.2 / 4k Preset | |
| Average of class Workstation (14.4 - 40.5, n=25, last 2 years) | |
| Lenovo ThinkPad P1 G4-20Y4S0KS00 | |
| Lenovo ThinkPad P1 G4-20Y4Z9DVUS | |
| Lenovo ThinkPad X1 Extreme G4-20Y50040GE | |
| Average Intel Core i7-11800H (7.38 - 17.4, n=46) | |
| Lenovo ThinkPad X1 Extreme G4-20Y5CTO1WW (3050 Ti) | |
| Lenovo ThinkPad P1 G4-20Y30017GE | |
| LibreOffice / 20 Documents To PDF | |
| Lenovo ThinkPad P1 G4-20Y4Z9DVUS | |
| Lenovo ThinkPad P1 G4-20Y30017GE | |
| Average of class Workstation (37.1 - 74.7, n=25, last 2 years) | |
| Average Intel Core i7-11800H (38.6 - 59.9, n=45) | |
| Lenovo ThinkPad P1 G4-20Y4S0KS00 | |
| Lenovo ThinkPad X1 Extreme G4-20Y5CTO1WW (3050 Ti) | |
| Lenovo ThinkPad X1 Extreme G4-20Y50040GE | |
| R Benchmark 2.5 / Overall mean | |
| Lenovo ThinkPad P1 G4-20Y30017GE | |
| Average Intel Core i7-11800H (0.548 - 0.615, n=46) | |
| Lenovo ThinkPad P1 G4-20Y4Z9DVUS | |
| Lenovo ThinkPad X1 Extreme G4-20Y5CTO1WW (3050 Ti) | |
| Lenovo ThinkPad X1 Extreme G4-20Y50040GE | |
| Lenovo ThinkPad P1 G4-20Y4S0KS00 | |
| Average of class Workstation (0.3825 - 0.603, n=25, last 2 years) | |
* ... smaller is better
AIDA64: FP32 Ray-Trace | FPU Julia | CPU SHA3 | CPU Queen | FPU SinJulia | FPU Mandel | CPU AES | CPU ZLib | FP64 Ray-Trace | CPU PhotoWorxx
| Performance rating | |
| Average of class Workstation | |
| Lenovo ThinkPad X1 Extreme G4-20Y50040GE | |
| Lenovo ThinkPad X1 Extreme G4-20Y5CTO1WW (3050 Ti) | |
| Lenovo ThinkPad P1 G4-20Y4Z9DVUS | |
| Average Intel Core i7-11800H | |
| Lenovo ThinkPad P1 G4-20Y30017GE -9! | |
| Lenovo ThinkPad P1 G4-20Y4S0KS00 -9! | |
| AIDA64 / FP32 Ray-Trace | |
| Average of class Workstation (10658 - 61611, n=25, last 2 years) | |
| Lenovo ThinkPad X1 Extreme G4-20Y50040GE | |
| Lenovo ThinkPad P1 G4-20Y4Z9DVUS | |
| Lenovo ThinkPad X1 Extreme G4-20Y5CTO1WW (3050 Ti) | |
| Average Intel Core i7-11800H (8772 - 15961, n=20) | |
| AIDA64 / FPU Julia | |
| Average of class Workstation (56664 - 186971, n=25, last 2 years) | |
| Lenovo ThinkPad P1 G4-20Y4Z9DVUS | |
| Lenovo ThinkPad X1 Extreme G4-20Y50040GE | |
| Lenovo ThinkPad X1 Extreme G4-20Y5CTO1WW (3050 Ti) | |
| Average Intel Core i7-11800H (39404 - 65636, n=20) | |
| AIDA64 / CPU SHA3 | |
| Average of class Workstation (2608 - 8975, n=25, last 2 years) | |
| Lenovo ThinkPad X1 Extreme G4-20Y50040GE | |
| Lenovo ThinkPad P1 G4-20Y4Z9DVUS | |
| Lenovo ThinkPad X1 Extreme G4-20Y5CTO1WW (3050 Ti) | |
| Average Intel Core i7-11800H (2599 - 4439, n=20) | |
| AIDA64 / CPU Queen | |
| Average of class Workstation (60778 - 144411, n=25, last 2 years) | |
| Lenovo ThinkPad X1 Extreme G4-20Y50040GE | |
| Lenovo ThinkPad X1 Extreme G4-20Y5CTO1WW (3050 Ti) | |
| Lenovo ThinkPad P1 G4-20Y4Z9DVUS | |
| Average Intel Core i7-11800H (85233 - 91941, n=20) | |
| AIDA64 / FPU SinJulia | |
| Average of class Workstation (8165 - 29343, n=25, last 2 years) | |
| Lenovo ThinkPad X1 Extreme G4-20Y50040GE | |
| Lenovo ThinkPad X1 Extreme G4-20Y5CTO1WW (3050 Ti) | |
| Lenovo ThinkPad P1 G4-20Y4Z9DVUS | |
| Average Intel Core i7-11800H (6420 - 9792, n=20) | |
| AIDA64 / FPU Mandel | |
| Average of class Workstation (27301 - 98153, n=25, last 2 years) | |
| Lenovo ThinkPad X1 Extreme G4-20Y50040GE | |
| Lenovo ThinkPad P1 G4-20Y4Z9DVUS | |
| Lenovo ThinkPad X1 Extreme G4-20Y5CTO1WW (3050 Ti) | |
| Average Intel Core i7-11800H (23365 - 39464, n=20) | |
| AIDA64 / CPU AES | |
| Lenovo ThinkPad X1 Extreme G4-20Y50040GE | |
| Lenovo ThinkPad X1 Extreme G4-20Y5CTO1WW (3050 Ti) | |
| Average Intel Core i7-11800H (74617 - 149388, n=20) | |
| Average of class Workstation (56077 - 187841, n=25, last 2 years) | |
| Lenovo ThinkPad P1 G4-20Y4Z9DVUS | |
| AIDA64 / CPU ZLib | |
| Average of class Workstation (742 - 2148, n=25, last 2 years) | |
| Lenovo ThinkPad X1 Extreme G4-20Y50040GE | |
| Lenovo ThinkPad P1 G4-20Y4Z9DVUS | |
| Lenovo ThinkPad X1 Extreme G4-20Y5CTO1WW (3050 Ti) | |
| Average Intel Core i7-11800H (461 - 830, n=43) | |
| Lenovo ThinkPad P1 G4-20Y30017GE | |
| Lenovo ThinkPad P1 G4-20Y4S0KS00 | |
| AIDA64 / FP64 Ray-Trace | |
| Average of class Workstation (5580 - 32891, n=25, last 2 years) | |
| Lenovo ThinkPad X1 Extreme G4-20Y50040GE | |
| Lenovo ThinkPad P1 G4-20Y4Z9DVUS | |
| Lenovo ThinkPad X1 Extreme G4-20Y5CTO1WW (3050 Ti) | |
| Average Intel Core i7-11800H (4545 - 8717, n=21) | |
| AIDA64 / CPU PhotoWorxx | |
| Average of class Workstation (37151 - 93684, n=25, last 2 years) | |
| Average Intel Core i7-11800H (11898 - 26757, n=21) | |
| Lenovo ThinkPad X1 Extreme G4-20Y5CTO1WW (3050 Ti) | |
| Lenovo ThinkPad P1 G4-20Y4Z9DVUS | |
| Lenovo ThinkPad X1 Extreme G4-20Y50040GE | |
CrossMark: Overall | Productivity | Creativity | Responsiveness
| PCMark 10 / Score | |
| Average of class Workstation (6436 - 10409, n=21, last 2 years) | |
| Lenovo ThinkPad P1 G4-20Y4S0KS00 | |
| Lenovo ThinkPad X1 Extreme G4-20Y50040GE | |
| Lenovo ThinkPad X1 Extreme G4-20Y5CTO1WW (3050 Ti) | |
| Lenovo ThinkPad P1 G4-20Y4Z9DVUS | |
| Average Intel Core i7-11800H, NVIDIA T1200 Laptop GPU (5889 - 6147, n=3) | |
| Lenovo ThinkPad P1 G4-20Y30017GE | |
| PCMark 10 / Essentials | |
| Lenovo ThinkPad P1 G4-20Y4S0KS00 | |
| Lenovo ThinkPad X1 Extreme G4-20Y5CTO1WW (3050 Ti) | |
| Lenovo ThinkPad X1 Extreme G4-20Y50040GE | |
| Average of class Workstation (9622 - 11157, n=21, last 2 years) | |
| Lenovo ThinkPad P1 G4-20Y4Z9DVUS | |
| Average Intel Core i7-11800H, NVIDIA T1200 Laptop GPU (9776 - 9956, n=3) | |
| Lenovo ThinkPad P1 G4-20Y30017GE | |
| PCMark 10 / Productivity | |
| Average of class Workstation (8789 - 20616, n=21, last 2 years) | |
| Lenovo ThinkPad P1 G4-20Y4S0KS00 | |
| Lenovo ThinkPad X1 Extreme G4-20Y50040GE | |
| Lenovo ThinkPad X1 Extreme G4-20Y5CTO1WW (3050 Ti) | |
| Lenovo ThinkPad P1 G4-20Y30017GE | |
| Average Intel Core i7-11800H, NVIDIA T1200 Laptop GPU (8276 - 8445, n=3) | |
| Lenovo ThinkPad P1 G4-20Y4Z9DVUS | |
| PCMark 10 / Digital Content Creation | |
| Average of class Workstation (7744 - 15631, n=21, last 2 years) | |
| Lenovo ThinkPad P1 G4-20Y4S0KS00 | |
| Lenovo ThinkPad X1 Extreme G4-20Y50040GE | |
| Lenovo ThinkPad X1 Extreme G4-20Y5CTO1WW (3050 Ti) | |
| Lenovo ThinkPad P1 G4-20Y4Z9DVUS | |
| Average Intel Core i7-11800H, NVIDIA T1200 Laptop GPU (6851 - 7581, n=3) | |
| Lenovo ThinkPad P1 G4-20Y30017GE | |
| CrossMark / Overall | |
| Average of class Workstation (1307 - 2267, n=24, last 2 years) | |
| Lenovo ThinkPad X1 Extreme G4-20Y50040GE | |
| Lenovo ThinkPad P1 G4-20Y4S0KS00 | |
| Lenovo ThinkPad P1 G4-20Y4Z9DVUS | |
| Average Intel Core i7-11800H, NVIDIA T1200 Laptop GPU (1367 - 1526, n=2) | |
| CrossMark / Productivity | |
| Average of class Workstation (1130 - 2122, n=24, last 2 years) | |
| Lenovo ThinkPad X1 Extreme G4-20Y50040GE | |
| Lenovo ThinkPad P1 G4-20Y4S0KS00 | |
| Lenovo ThinkPad P1 G4-20Y4Z9DVUS | |
| Average Intel Core i7-11800H, NVIDIA T1200 Laptop GPU (1389 - 1521, n=2) | |
| CrossMark / Creativity | |
| Average of class Workstation (1657 - 2725, n=24, last 2 years) | |
| Lenovo ThinkPad P1 G4-20Y4S0KS00 | |
| Lenovo ThinkPad X1 Extreme G4-20Y50040GE | |
| Lenovo ThinkPad P1 G4-20Y4Z9DVUS | |
| Average Intel Core i7-11800H, NVIDIA T1200 Laptop GPU (1430 - 1606, n=2) | |
| CrossMark / Responsiveness | |
| Average of class Workstation (993 - 2096, n=24, last 2 years) | |
| Lenovo ThinkPad X1 Extreme G4-20Y50040GE | |
| Lenovo ThinkPad P1 G4-20Y4S0KS00 | |
| Lenovo ThinkPad P1 G4-20Y4Z9DVUS | |
| Average Intel Core i7-11800H, NVIDIA T1200 Laptop GPU (1137 - 1323, n=2) | |
| PCMark 10 Score | 6147 points | |
Help | ||
| AIDA64 / Memory Copy | |
| Average of class Workstation (56003 - 164795, n=25, last 2 years) | |
| Average Intel Core i7-11800H (24508 - 48144, n=21) | |
| Lenovo ThinkPad P1 G4-20Y4Z9DVUS | |
| Lenovo ThinkPad X1 Extreme G4-20Y5CTO1WW (3050 Ti) | |
| Lenovo ThinkPad X1 Extreme G4-20Y50040GE | |
| AIDA64 / Memory Read | |
| Average of class Workstation (55795 - 121563, n=25, last 2 years) | |
| Average Intel Core i7-11800H (25882 - 50365, n=20) | |
| Lenovo ThinkPad X1 Extreme G4-20Y5CTO1WW (3050 Ti) | |
| Lenovo ThinkPad P1 G4-20Y4Z9DVUS | |
| Lenovo ThinkPad X1 Extreme G4-20Y50040GE | |
| AIDA64 / Memory Write | |
| Average of class Workstation (55663 - 214520, n=25, last 2 years) | |
| Average Intel Core i7-11800H (22240 - 46214, n=20) | |
| Lenovo ThinkPad X1 Extreme G4-20Y5CTO1WW (3050 Ti) | |
| Lenovo ThinkPad P1 G4-20Y4Z9DVUS | |
| Lenovo ThinkPad X1 Extreme G4-20Y50040GE | |
| AIDA64 / Memory Latency | |
| Average of class Workstation (84.5 - 165.2, n=25, last 2 years) | |
| Lenovo ThinkPad X1 Extreme G4-20Y50040GE | |
| Lenovo ThinkPad X1 Extreme G4-20Y5CTO1WW (3050 Ti) | |
| Lenovo ThinkPad P1 G4-20Y4Z9DVUS | |
| Average Intel Core i7-11800H (71.9 - 104.1, n=44) | |
| Lenovo ThinkPad P1 G4-20Y30017GE | |
| Lenovo ThinkPad P1 G4-20Y4S0KS00 | |
* ... smaller is better
DPC延迟
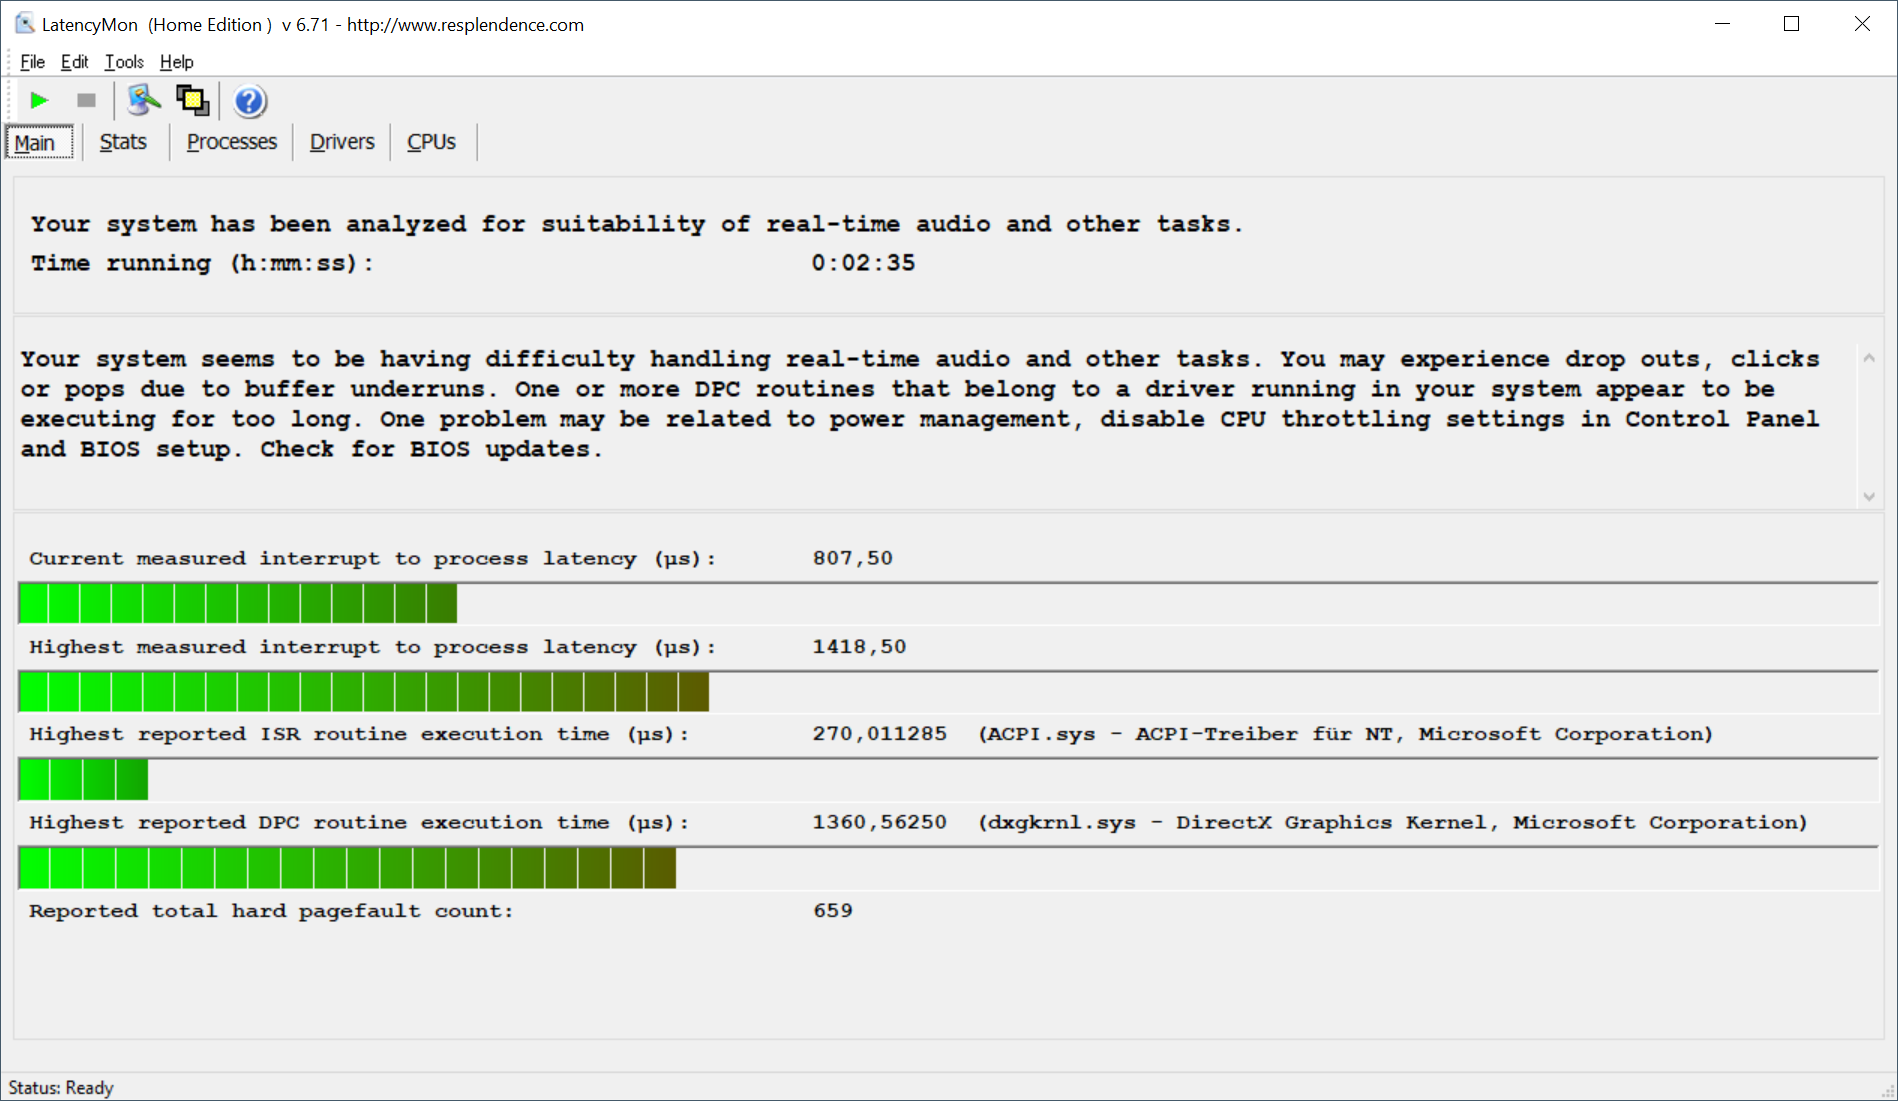
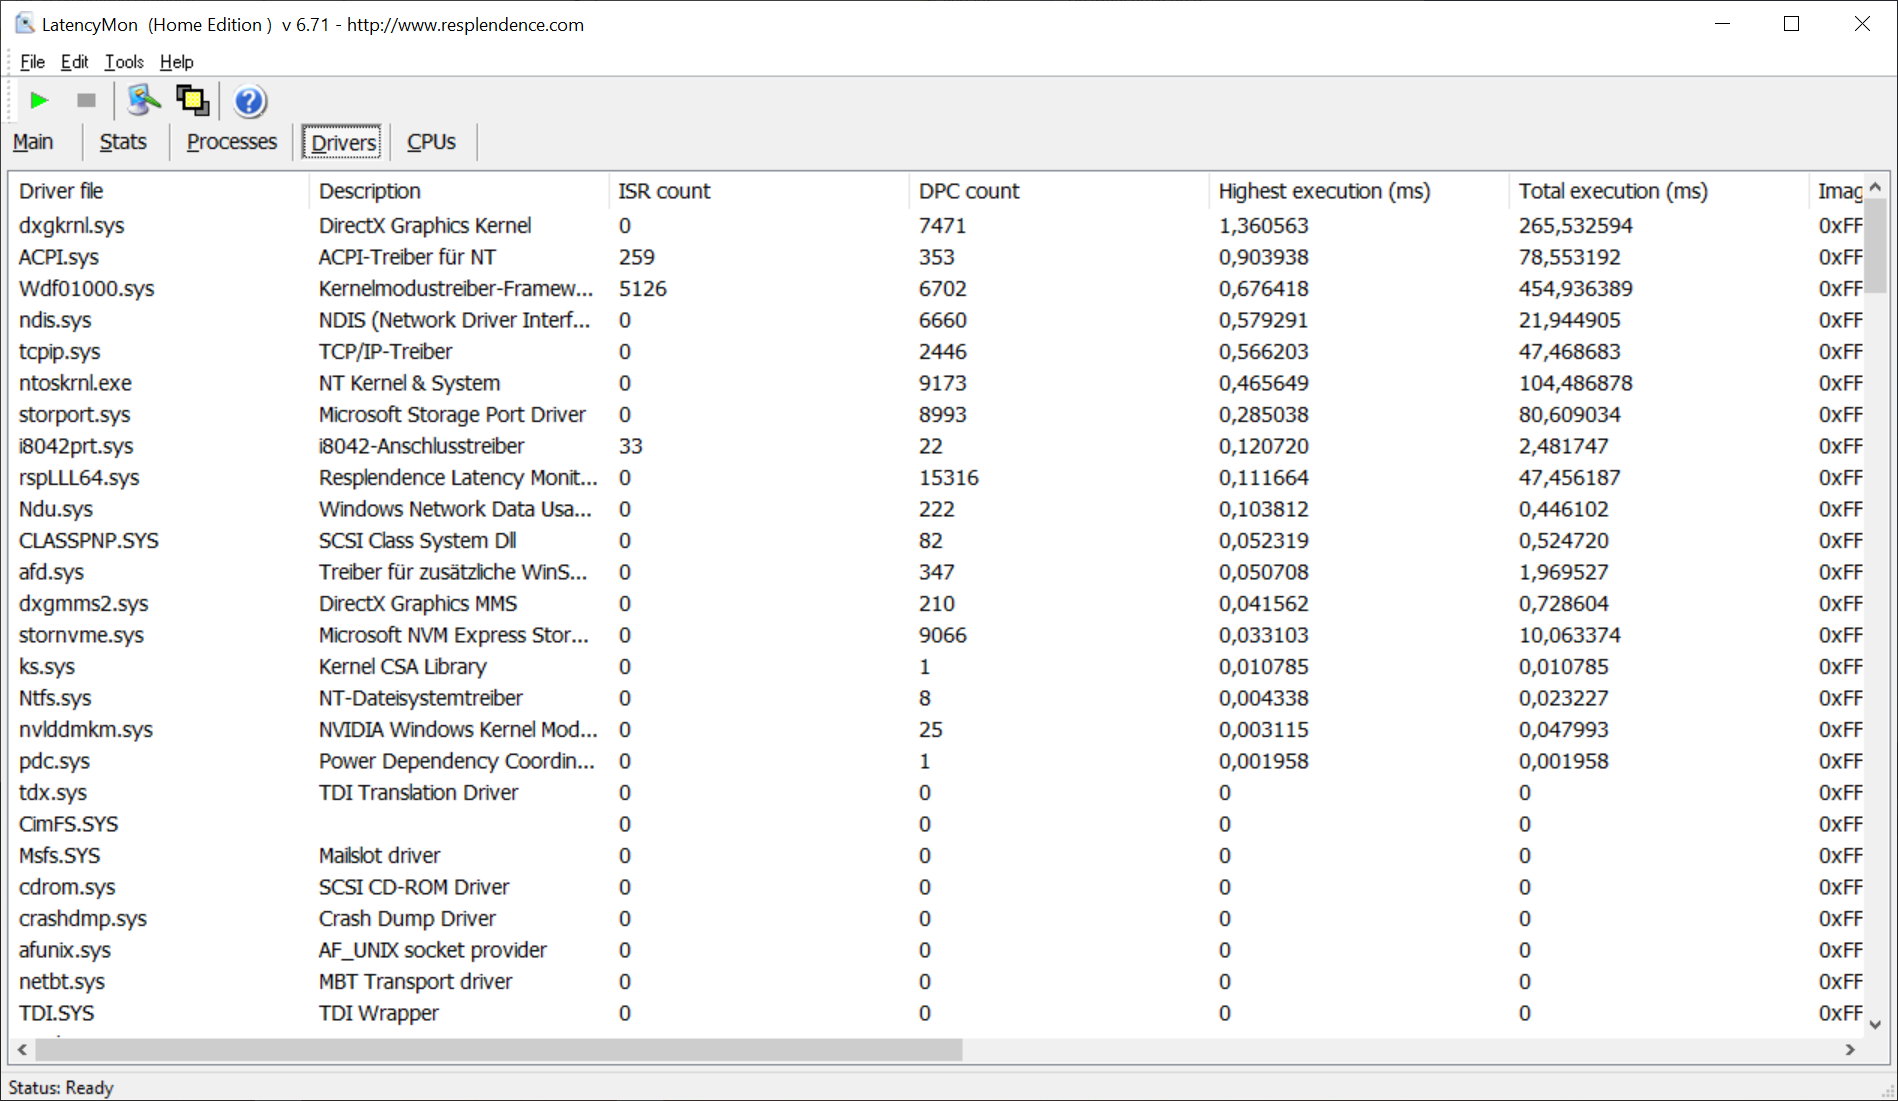
| DPC Latencies / LatencyMon - interrupt to process latency (max), Web, Youtube, Prime95 | |
| Lenovo ThinkPad P1 G4-20Y30017GE | |
| Lenovo ThinkPad X1 Extreme G4-20Y50040GE | |
| Lenovo ThinkPad P1 G4-20Y4Z9DVUS | |
| Lenovo ThinkPad X1 Extreme G4-20Y5CTO1WW (3050 Ti) | |
| Lenovo ThinkPad P1 G4-20Y4S0KS00 | |
* ... smaller is better

显卡。Nvidia T1200,60W
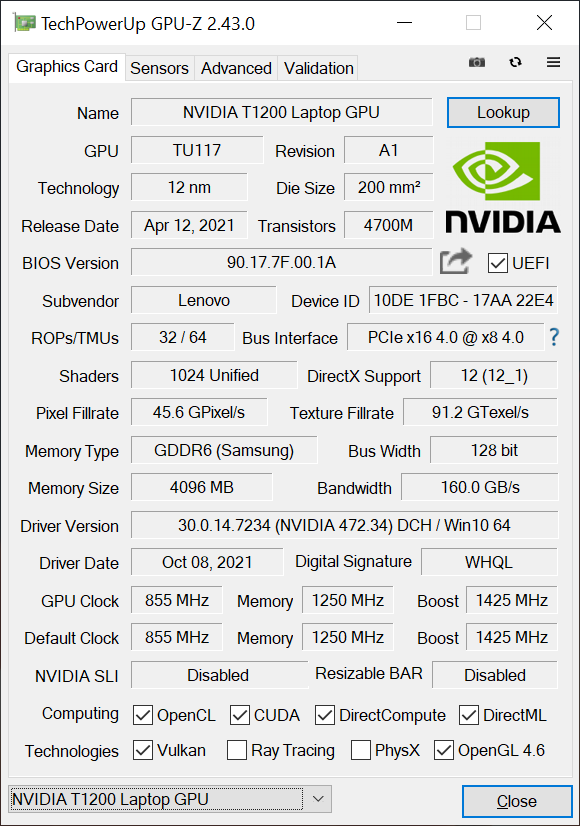
显卡的性能并没有因为BIOS的更新而改变。Nvidia的专业 T1200 GPU(基于消费级的TU117芯片)。 GeForce GTX 1650 Ti)仍然被允许消耗最大60W,在基准测试中的结果不出所料地与以前处于同一水平。在专业基准测试中,你仍然可以看到专业驱动程序的优势,因为即使是RTX 3070也可以在某些情况下被超越。
即使在较长的负载下,性能仍然稳定,苛刻的Time Spy 压力测试以99.2%的分数顺利通过。这也适用于我们对《Witcher 3》的游戏压力测试,其中性能保持完全稳定。在电池模式下,GPU被允许消耗最大35W,这就是为什么图形性能下降了约15%。
进一步的GPU基准测试可在这里.
| 3DMark 11 Performance | 14344 points | |
| 3DMark Fire Strike Score | 9310 points | |
| 3DMark Time Spy Score | 3937 points | |
Help | ||
The Witcher 3 FPS chart
| low | med. | high | ultra | QHD | |
|---|---|---|---|---|---|
| The Witcher 3 (2015) | 198 | 125 | 71 | 36.7 | |
| Dota 2 Reborn (2015) | 157 | 138 | 128 | 116 | |
| Final Fantasy XV Benchmark (2018) | 102 | 56.5 | 39 | 26.6 | |
| X-Plane 11.11 (2018) | 109 | 94 | 75.6 |
排放与能源
噪声排放
风扇的特性没有改变。两个风扇在负载下仍然迅速达到最大速度,这相当于~47dB(A)的噪音水平。在这个测试设备中,我们无法检测到任何令人不安的电子噪音或线圈啸叫。
| Lenovo ThinkPad P1 G4-20Y4Z9DVUS T1200 Laptop GPU, i7-11800H, Samsung PM9A1 MZVL2512HCJQ | Lenovo ThinkPad P1 G4-20Y30017GE T1200 Laptop GPU, i7-11800H, Samsung PM9A1 MZVL2512HCJQ | Lenovo ThinkPad P1 G4-20Y4S0KS00 GeForce RTX 3070 Laptop GPU, i7-11850H, Samsung PM9A1 MZVL21T0HCLR | Lenovo ThinkPad X1 Extreme G4-20Y5CTO1WW (3050 Ti) GeForce RTX 3050 Ti Laptop GPU, i7-11800H, Samsung PM9A1 MZVL21T0HCLR | Lenovo ThinkPad X1 Extreme G4-20Y50040GE GeForce RTX 3080 Laptop GPU, i9-11950H, Kioxia XG7 KXG7AZNV1T02 | |
|---|---|---|---|---|---|
| Noise | 0% | 2% | 1% | -2% | |
| off / environment * (dB) | 24.3 | 24.3 -0% | 23.8 2% | 23.52 3% | 24.7 -2% |
| Idle Minimum * (dB) | 24.3 | 24.3 -0% | 23.8 2% | 23.52 3% | 24.7 -2% |
| Idle Average * (dB) | 24.3 | 24.3 -0% | 23.8 2% | 23.52 3% | 24.7 -2% |
| Idle Maximum * (dB) | 26.6 | 26.6 -0% | 28.3 -6% | 23.52 12% | 28.1 -6% |
| Load Average * (dB) | 46.8 | 46.8 -0% | 38.6 18% | 42.9 8% | 42.5 9% |
| Witcher 3 ultra * (dB) | 46.8 | 46.8 -0% | 47.4 -1% | 52.5 -12% | 46.4 1% |
| Load Maximum * (dB) | 46.8 | 46.8 -0% | 47.4 -1% | 52.45 -12% | 52.1 -11% |
* ... smaller is better
温度
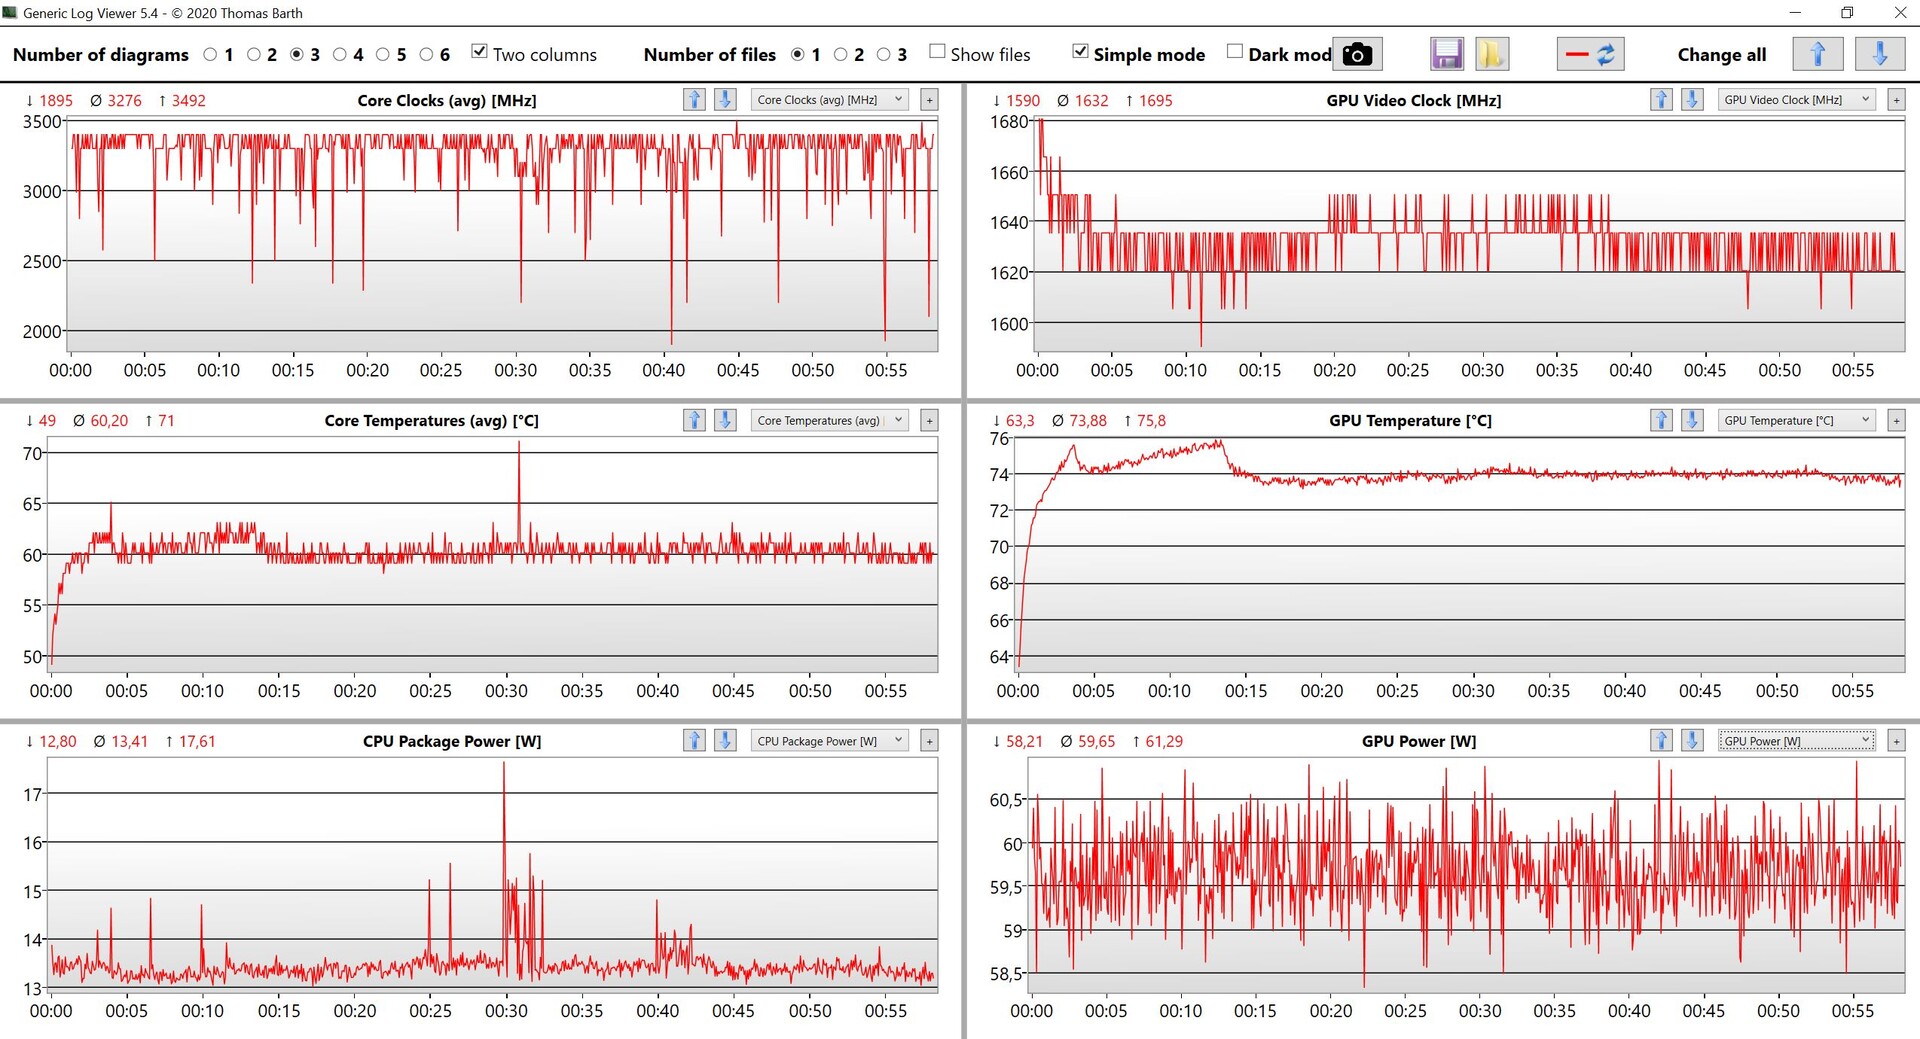
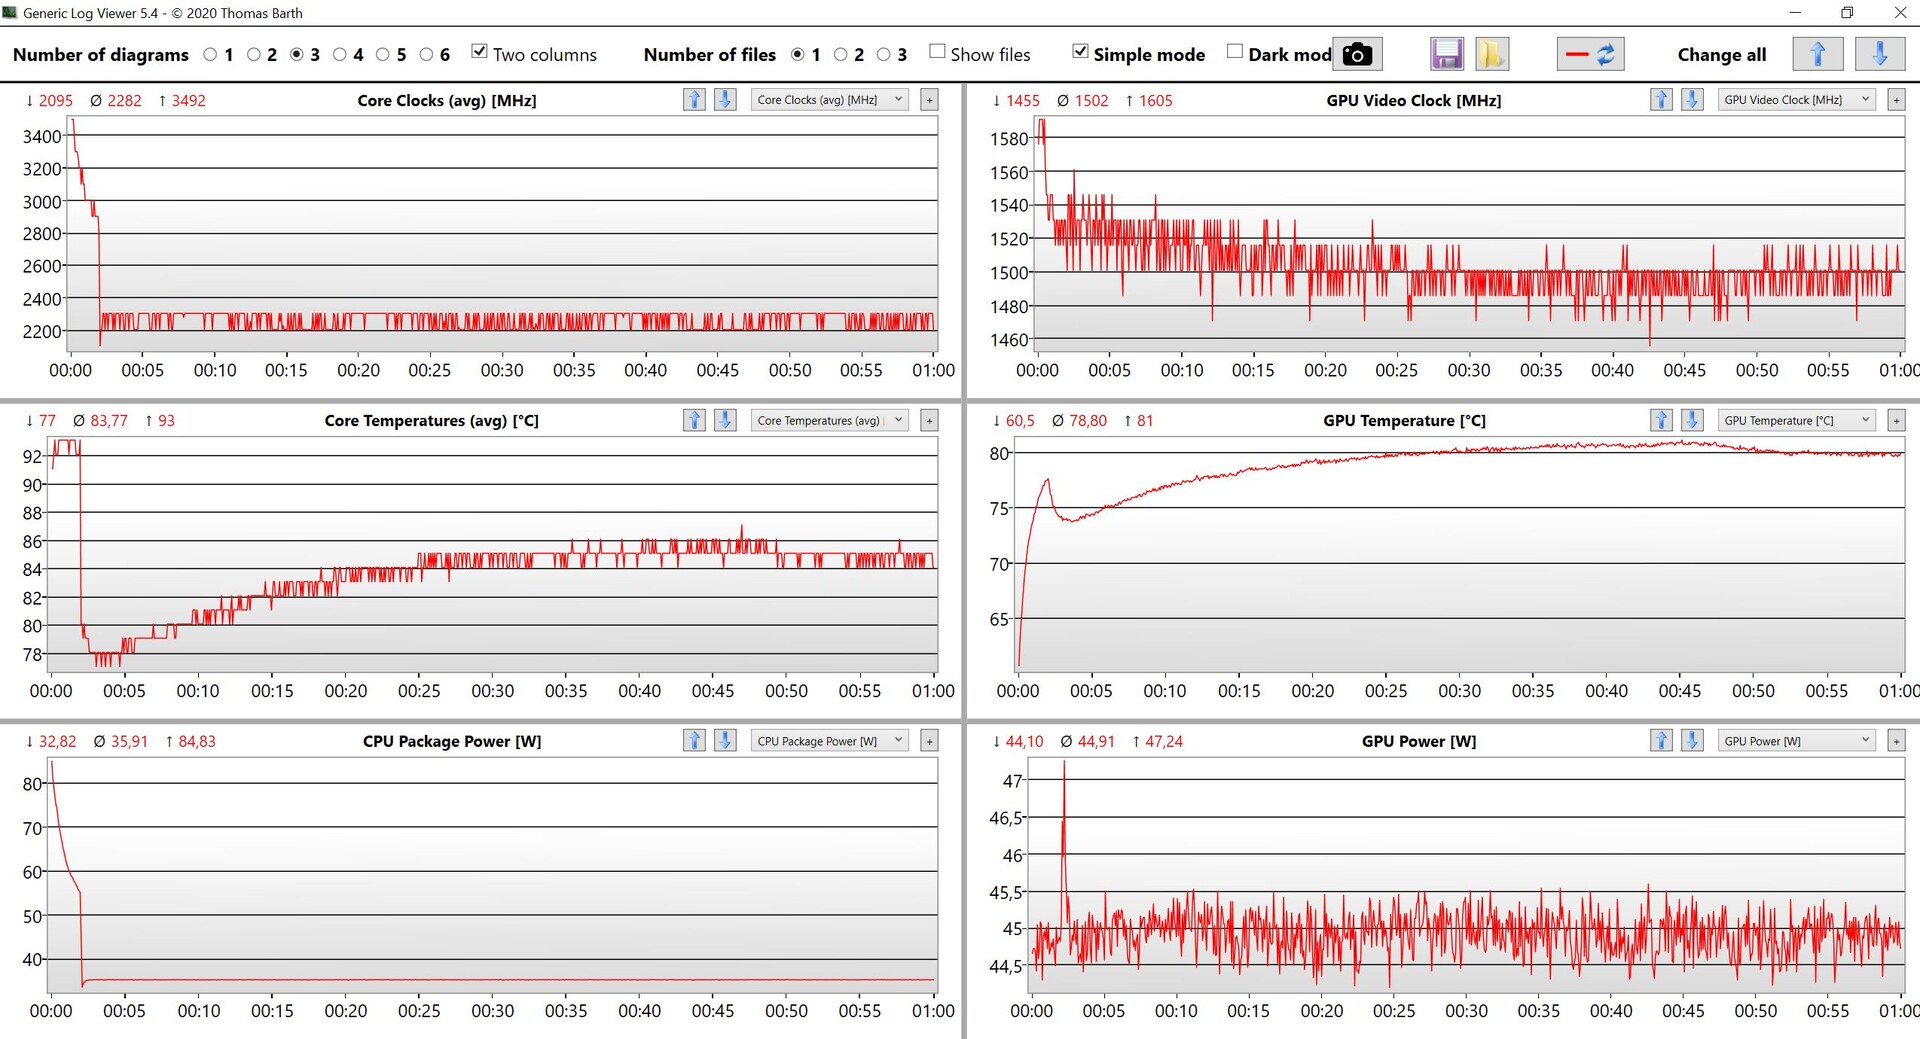
负载下的表面温度现在比以前略高,因为综合负载下组件的功耗发生了一些转变。在我们预览评测中的压力测试中,专用GPU显然是优先考虑的,它继续以60W的速度运行,这就是为什么处理器被节流到只有20W。随着最新的BIOS 1.13,这一比例现在已经转变,处理器在几分钟后稳定在35W,而Nvidia T1200现在运行在45W。
(-) The maximum temperature on the upper side is 49.9 °C / 122 F, compared to the average of 38.2 °C / 101 F, ranging from 22.2 to 69.8 °C for the class Workstation.
(-) The bottom heats up to a maximum of 56.7 °C / 134 F, compared to the average of 41.1 °C / 106 F
(+) In idle usage, the average temperature for the upper side is 24.9 °C / 77 F, compared to the device average of 32 °C / 90 F.
(+) The palmrests and touchpad are reaching skin temperature as a maximum (33.9 °C / 93 F) and are therefore not hot.
(-) The average temperature of the palmrest area of similar devices was 27.8 °C / 82 F (-6.1 °C / -11 F).
| Lenovo ThinkPad P1 G4-20Y4Z9DVUS Intel Core i7-11800H, NVIDIA T1200 Laptop GPU | Lenovo ThinkPad X1 Extreme G4-20Y5CTO1WW (3050 Ti) Intel Core i7-11800H, NVIDIA GeForce RTX 3050 Ti Laptop GPU | Lenovo ThinkPad X1 Extreme G4-20Y50040GE Intel Core i9-11950H, NVIDIA GeForce RTX 3080 Laptop GPU | Lenovo ThinkPad P1 G4-20Y30017GE Intel Core i7-11800H, NVIDIA T1200 Laptop GPU | Lenovo ThinkPad P1 G4-20Y4S0KS00 Intel Core i7-11850H, NVIDIA GeForce RTX 3070 Laptop GPU | |
|---|---|---|---|---|---|
| Heat | -4% | -5% | 2% | -5% | |
| Maximum Upper Side * (°C) | 49.9 | 49 2% | 51.4 -3% | 50.6 -1% | 51 -2% |
| Maximum Bottom * (°C) | 56.7 | 44.4 22% | 55.9 1% | 53.6 5% | 53.5 6% |
| Idle Upper Side * (°C) | 25.5 | 32.1 -26% | 27.2 -7% | 25 2% | 28.8 -13% |
| Idle Bottom * (°C) | 26.2 | 29.8 -14% | 28.8 -10% | 25.7 2% | 29.3 -12% |
* ... smaller is better
扬声器
Lenovo ThinkPad P1 G4-20Y4Z9DVUS audio analysis
(+) | speakers can play relatively loud (84.3 dB)
Bass 100 - 315 Hz
(±) | reduced bass - on average 12.2% lower than median
(±) | linearity of bass is average (9.8% delta to prev. frequency)
Mids 400 - 2000 Hz
(+) | balanced mids - only 3.4% away from median
(+) | mids are linear (3.4% delta to prev. frequency)
Highs 2 - 16 kHz
(+) | balanced highs - only 2.9% away from median
(+) | highs are linear (5% delta to prev. frequency)
Overall 100 - 16.000 Hz
(+) | overall sound is linear (11.8% difference to median)
Compared to same class
» 16% of all tested devices in this class were better, 3% similar, 81% worse
» The best had a delta of 7%, average was 17%, worst was 35%
Compared to all devices tested
» 8% of all tested devices were better, 3% similar, 89% worse
» The best had a delta of 4%, average was 24%, worst was 134%
能源消耗
现在,当CPU受到更大的压力时,负载下的功耗明显增加。在压力测试中,我们在测试开始时确定了170.8瓦的最大值,但是这个数值先是在122瓦停留了几分钟,然后是111瓦,这与处理器的TDP下降相一致。稍微偏北的待机消耗量为2W,仍然过高。
| Off / Standby | |
| Idle | |
| Load |
|
Key:
min: | |
Energieaufnahme Witcher 3 / Stresstest
Energieaufnahme mit externem Monitor
电池寿命
电池运行时间实际上与ThinkPad P1 G4的第一个评测单元完全相同。 的第一个评测单元几乎相同。.在150cd/m²的亮度下(在这种情况下相当于最大亮度的68%),我们的WLAN测试只运行了不到9小时,在最大亮度下只运行了6小时。因此,在耐用性方面,标准的WQHD面板显然仍然是比可选的4K面板更好的选择。
Pros
Cons
结论--ThinkPad P1 G4现在具有更强的CPU能力
现在,联想通过最新的BIOS版本明显改善了CPU的性能,无论你是选择传统冷却的配置还是选择更强的GPU和蒸汽室冷却的模型,都不再重要了。在综合负载下,两个版本的显卡性能相似,而采用传统冷却方式的处理器甚至有轻微的优势(压力测试中35瓦对30瓦)。
此外,我们的基准测试也清楚地表明,与标准的酷睿i7-11800H相比,可选的酷睿i9 CPU并没有提供任何额外的性能。在我们眼中,升级的唯一理由是可选芯片提供的vPro支持。
有了最新的BIOS 1.13,无论你选择传统冷却还是蒸汽室冷却的配置都不再重要,因为CPU的性能或多或少处于同一水平。
在这种情况下,联想依靠几个供应商提供的标准WQHD面板对客户来说不是一个大问题,因为这两种面板的性能非常接近,在实践中你不会发现有什么不同。因此,你不需要担心像一些旧的ThinkPad型号的面板抽奖。
价格和可用性
我们的测试设备立即在Campuspoint,售价2419欧元。.该零售商还可以进入联想的校园计划,可以让你以2279欧元的价格获得这个配置。.
Lenovo ThinkPad P1 G4-20Y4Z9DVUS
- 02/01/2022 v7 (old)
Andreas Osthoff
Price comparison
