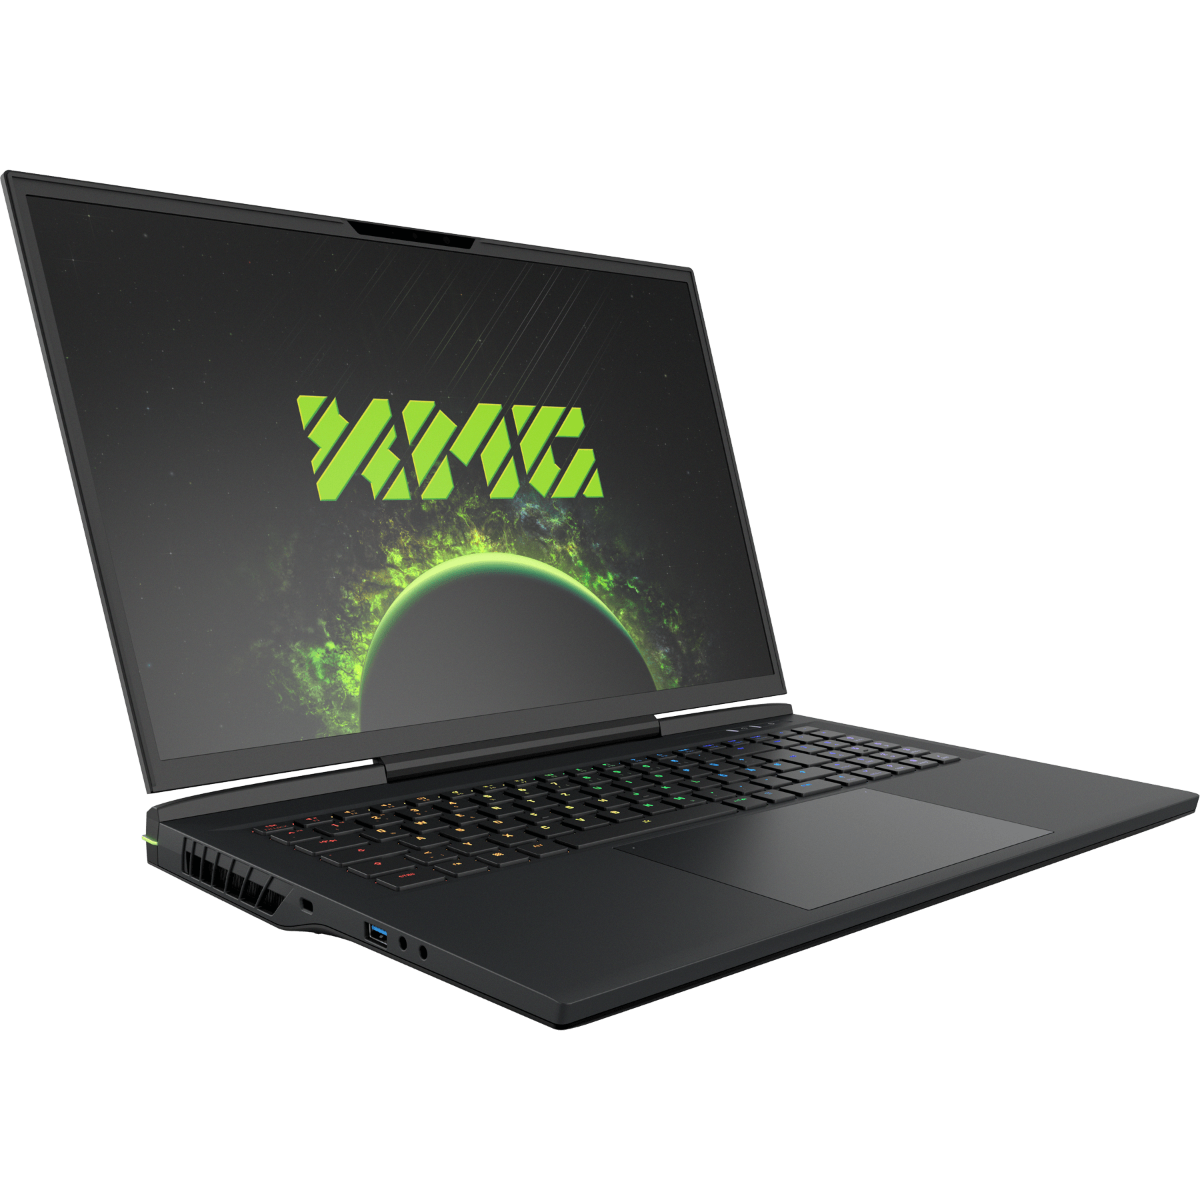
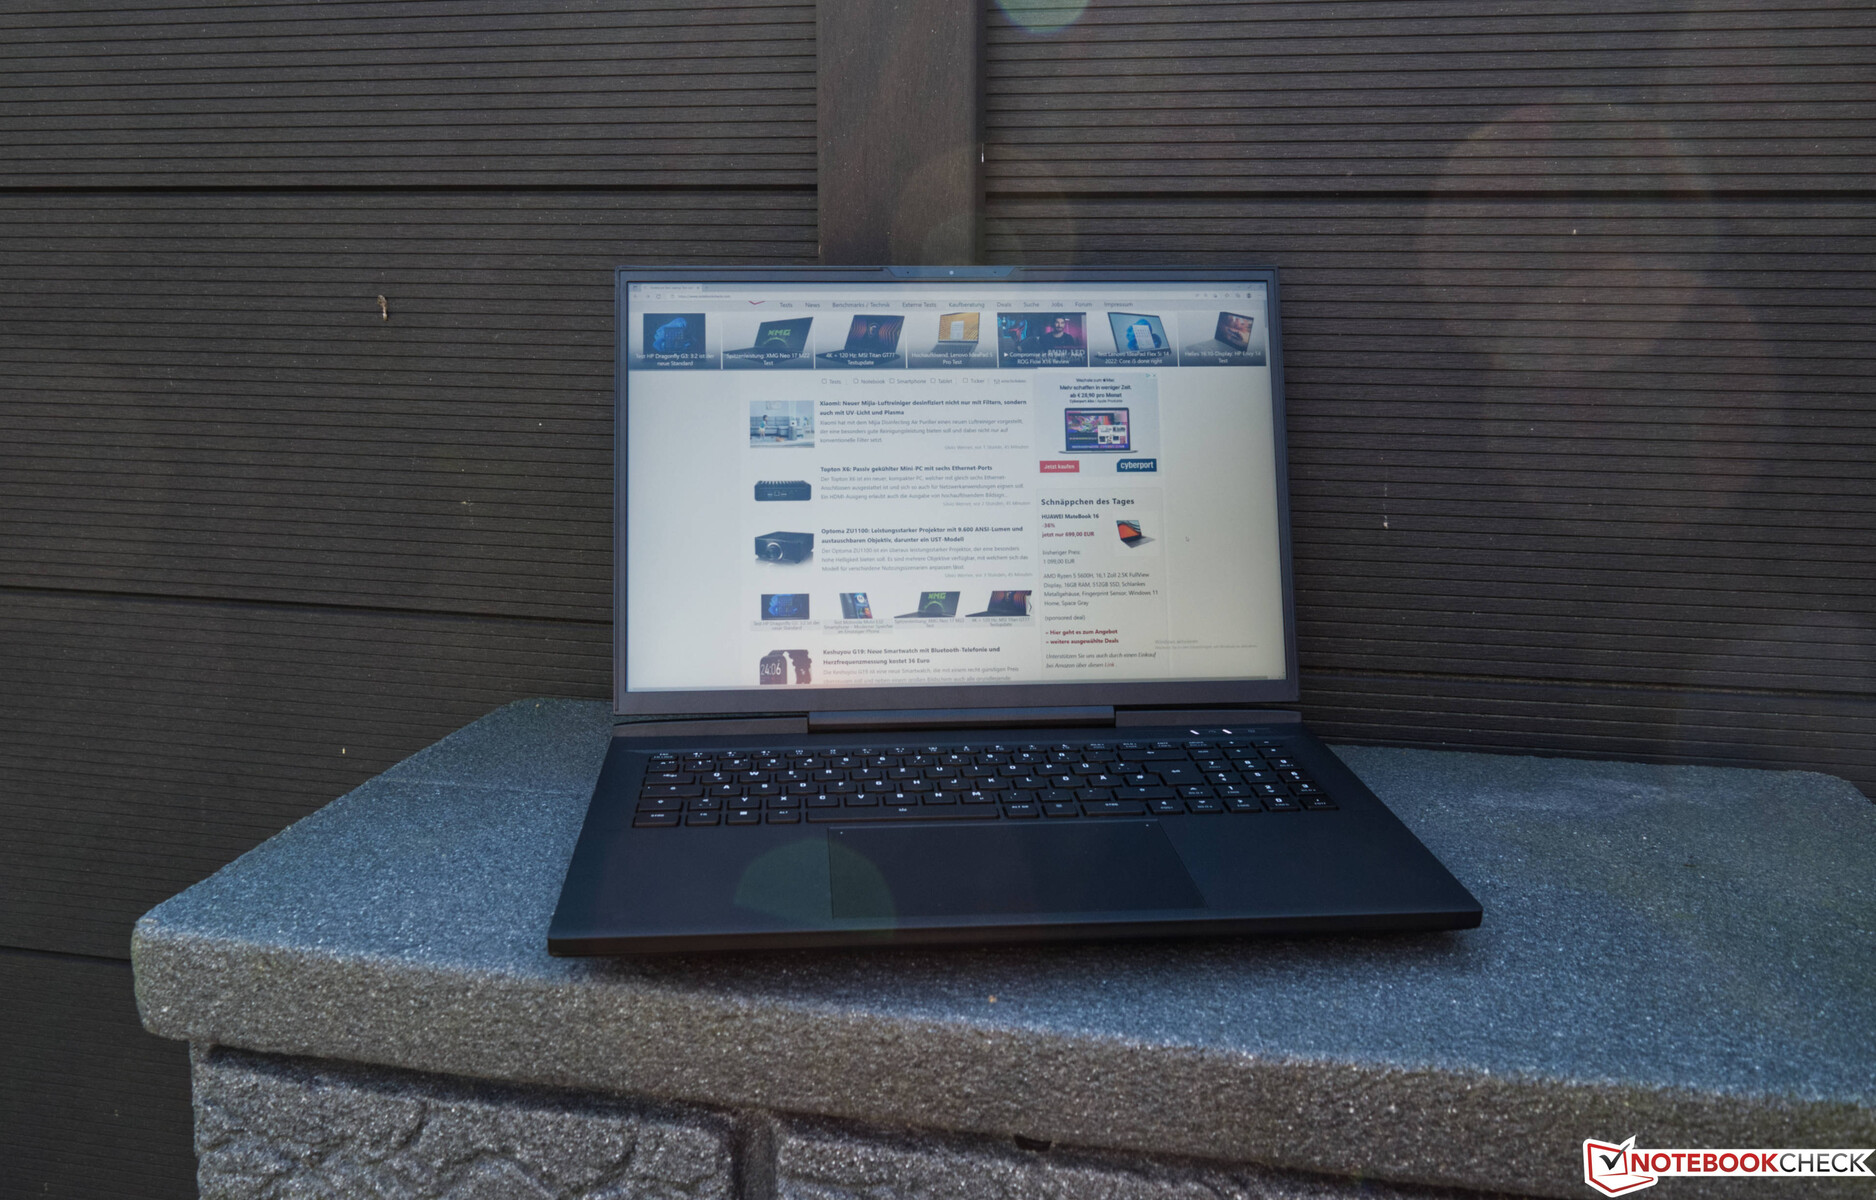
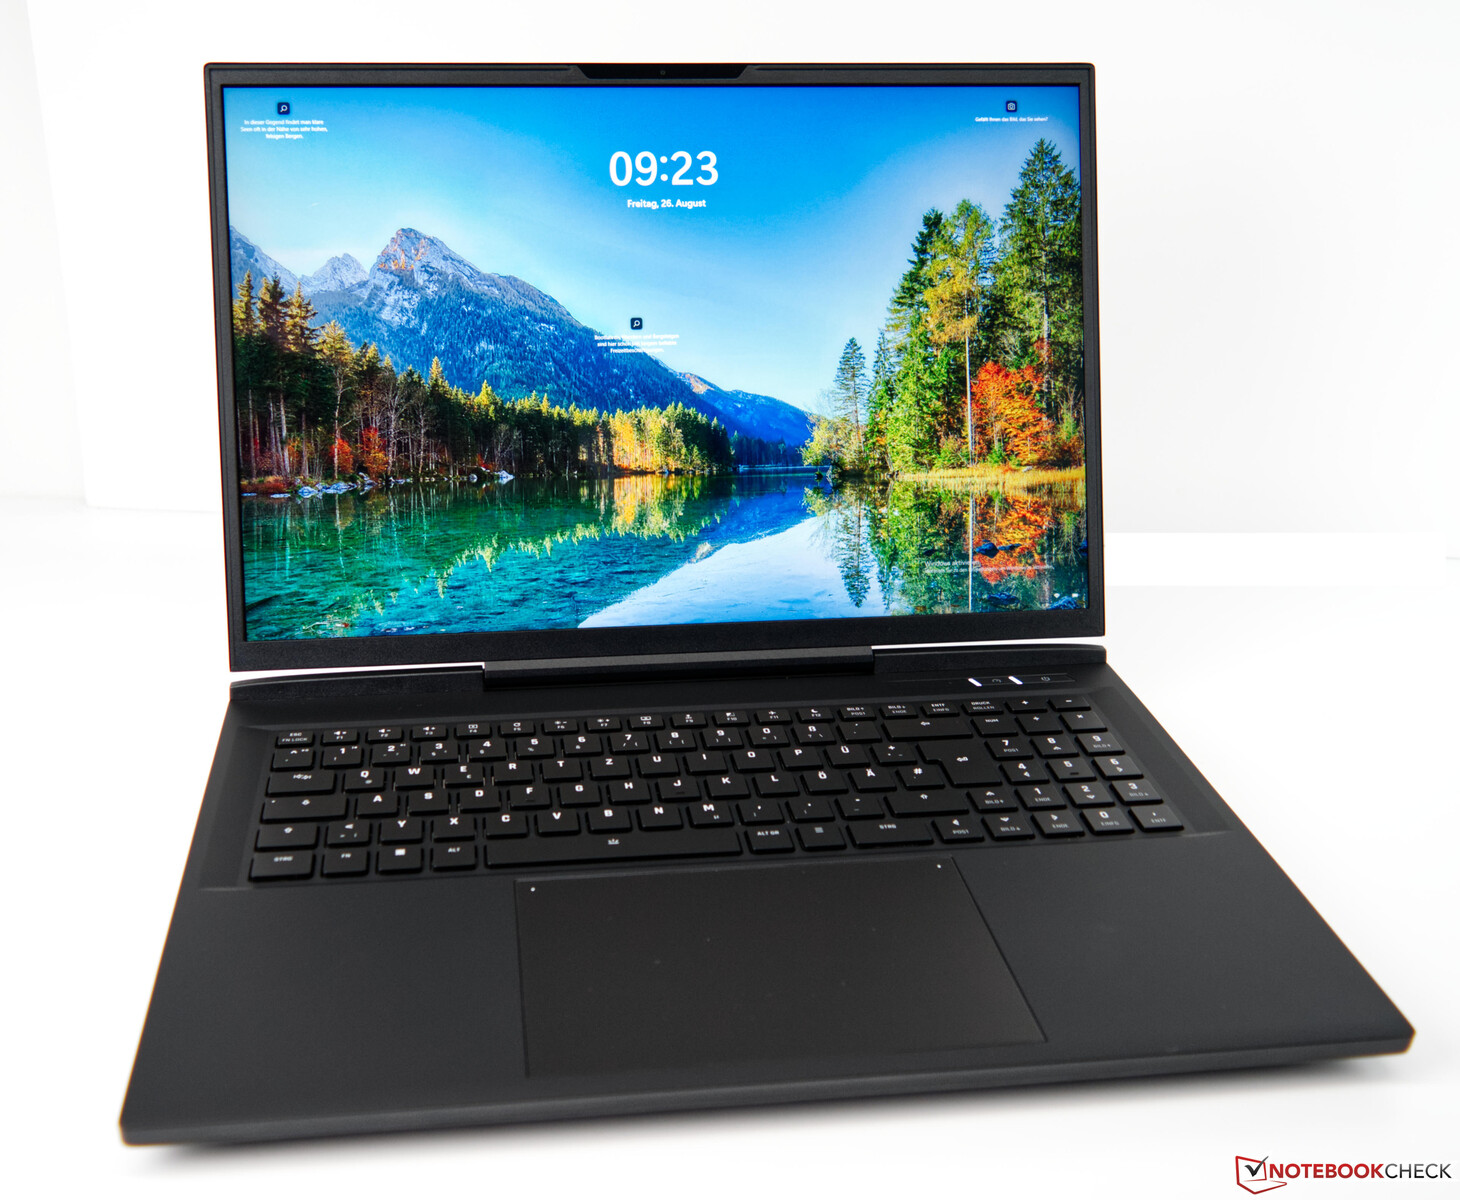
申克XMG Neo 17 M22的回顾。配备Cherry MX机械按键的高性能游戏笔记本
XMG是三个字母,表示Schenker的旗舰游戏笔记本电脑。最新的Schenker XMG Neo 17,顾名思义,是一款17英寸的笔记本电脑,也属于这个系列。许多人会高兴地发现,与许多其他游戏笔记本电脑不同,Schenker使用了16:10的显示屏,稍微适合以工作为重点的任务。为了确保适当的性能水平,制造商安装了AMD全新的 Ryzen 9 6900HX与一个 NvidiaGeForce RTX 3080 Ti Laptop GPU在现代机箱中。因此,它是目前绝对最快的型号之一。有了32GB的DDR5内存和1TB的固态硬盘,该系统是很全面的。然而,由于价格约为4200美元,我们配置的Schenker XMG Neo 17并不完全便宜。
熟悉Schenker的读者会知道该制造商通常提供多少种配置选项。这也适用于这个模型,基本模型开始时使用相同的CPU和一个 GeForce RTX 3070 Ti笔记本GPU价格约为2950美元。
为了进行比较,我们还包括具有类似规格的设备。下表显示了这些笔记本电脑的列表。
潜在的竞争对手比较
Rating | Date | Model | Weight | Height | Size | Resolution | Price |
|---|---|---|---|---|---|---|---|
| 87.6 % v7 (old) | 09 / 2022 | Schenker XMG Neo 17 M22 R9 6900HX, GeForce RTX 3080 Ti Laptop GPU | 2.8 kg | 27 mm | 17.00" | 2560x1600 | |
| 88.3 % v7 (old) | 08 / 2022 | MSI Titan GT77 12UHS i9-12900HX, GeForce RTX 3080 Ti Laptop GPU | 3.3 kg | 23 mm | 17.30" | 1920x1080 | |
| 89.9 % v7 (old) | 07 / 2022 | Razer Blade 17 Early 2022 i9-12900H, GeForce RTX 3080 Ti Laptop GPU | 2.8 kg | 19.9 mm | 17.30" | 3840x2160 | |
| 87.2 % v7 (old) | 06 / 2022 | Acer Predator Triton 500 SE PT516-52s-70KX i7-12700H, GeForce RTX 3080 Ti Laptop GPU | 2.3 kg | 19.9 mm | 16.00" | 2560x1600 | |
| 88.2 % v7 (old) | 05 / 2022 | Asus ROG Zephyrus Duo 16 GX650RX R9 6900HX, GeForce RTX 3080 Ti Laptop GPU | 2.6 kg | 20.5 mm | 16.00" | 3840x2400 | |
| 86.8 % v7 (old) | 07 / 2022 | MSI Raider GE77 HX 12UHS i9-12900HX, GeForce RTX 3080 Ti Laptop GPU | 3.1 kg | 25.9 mm | 17.30" | 3840x2160 |
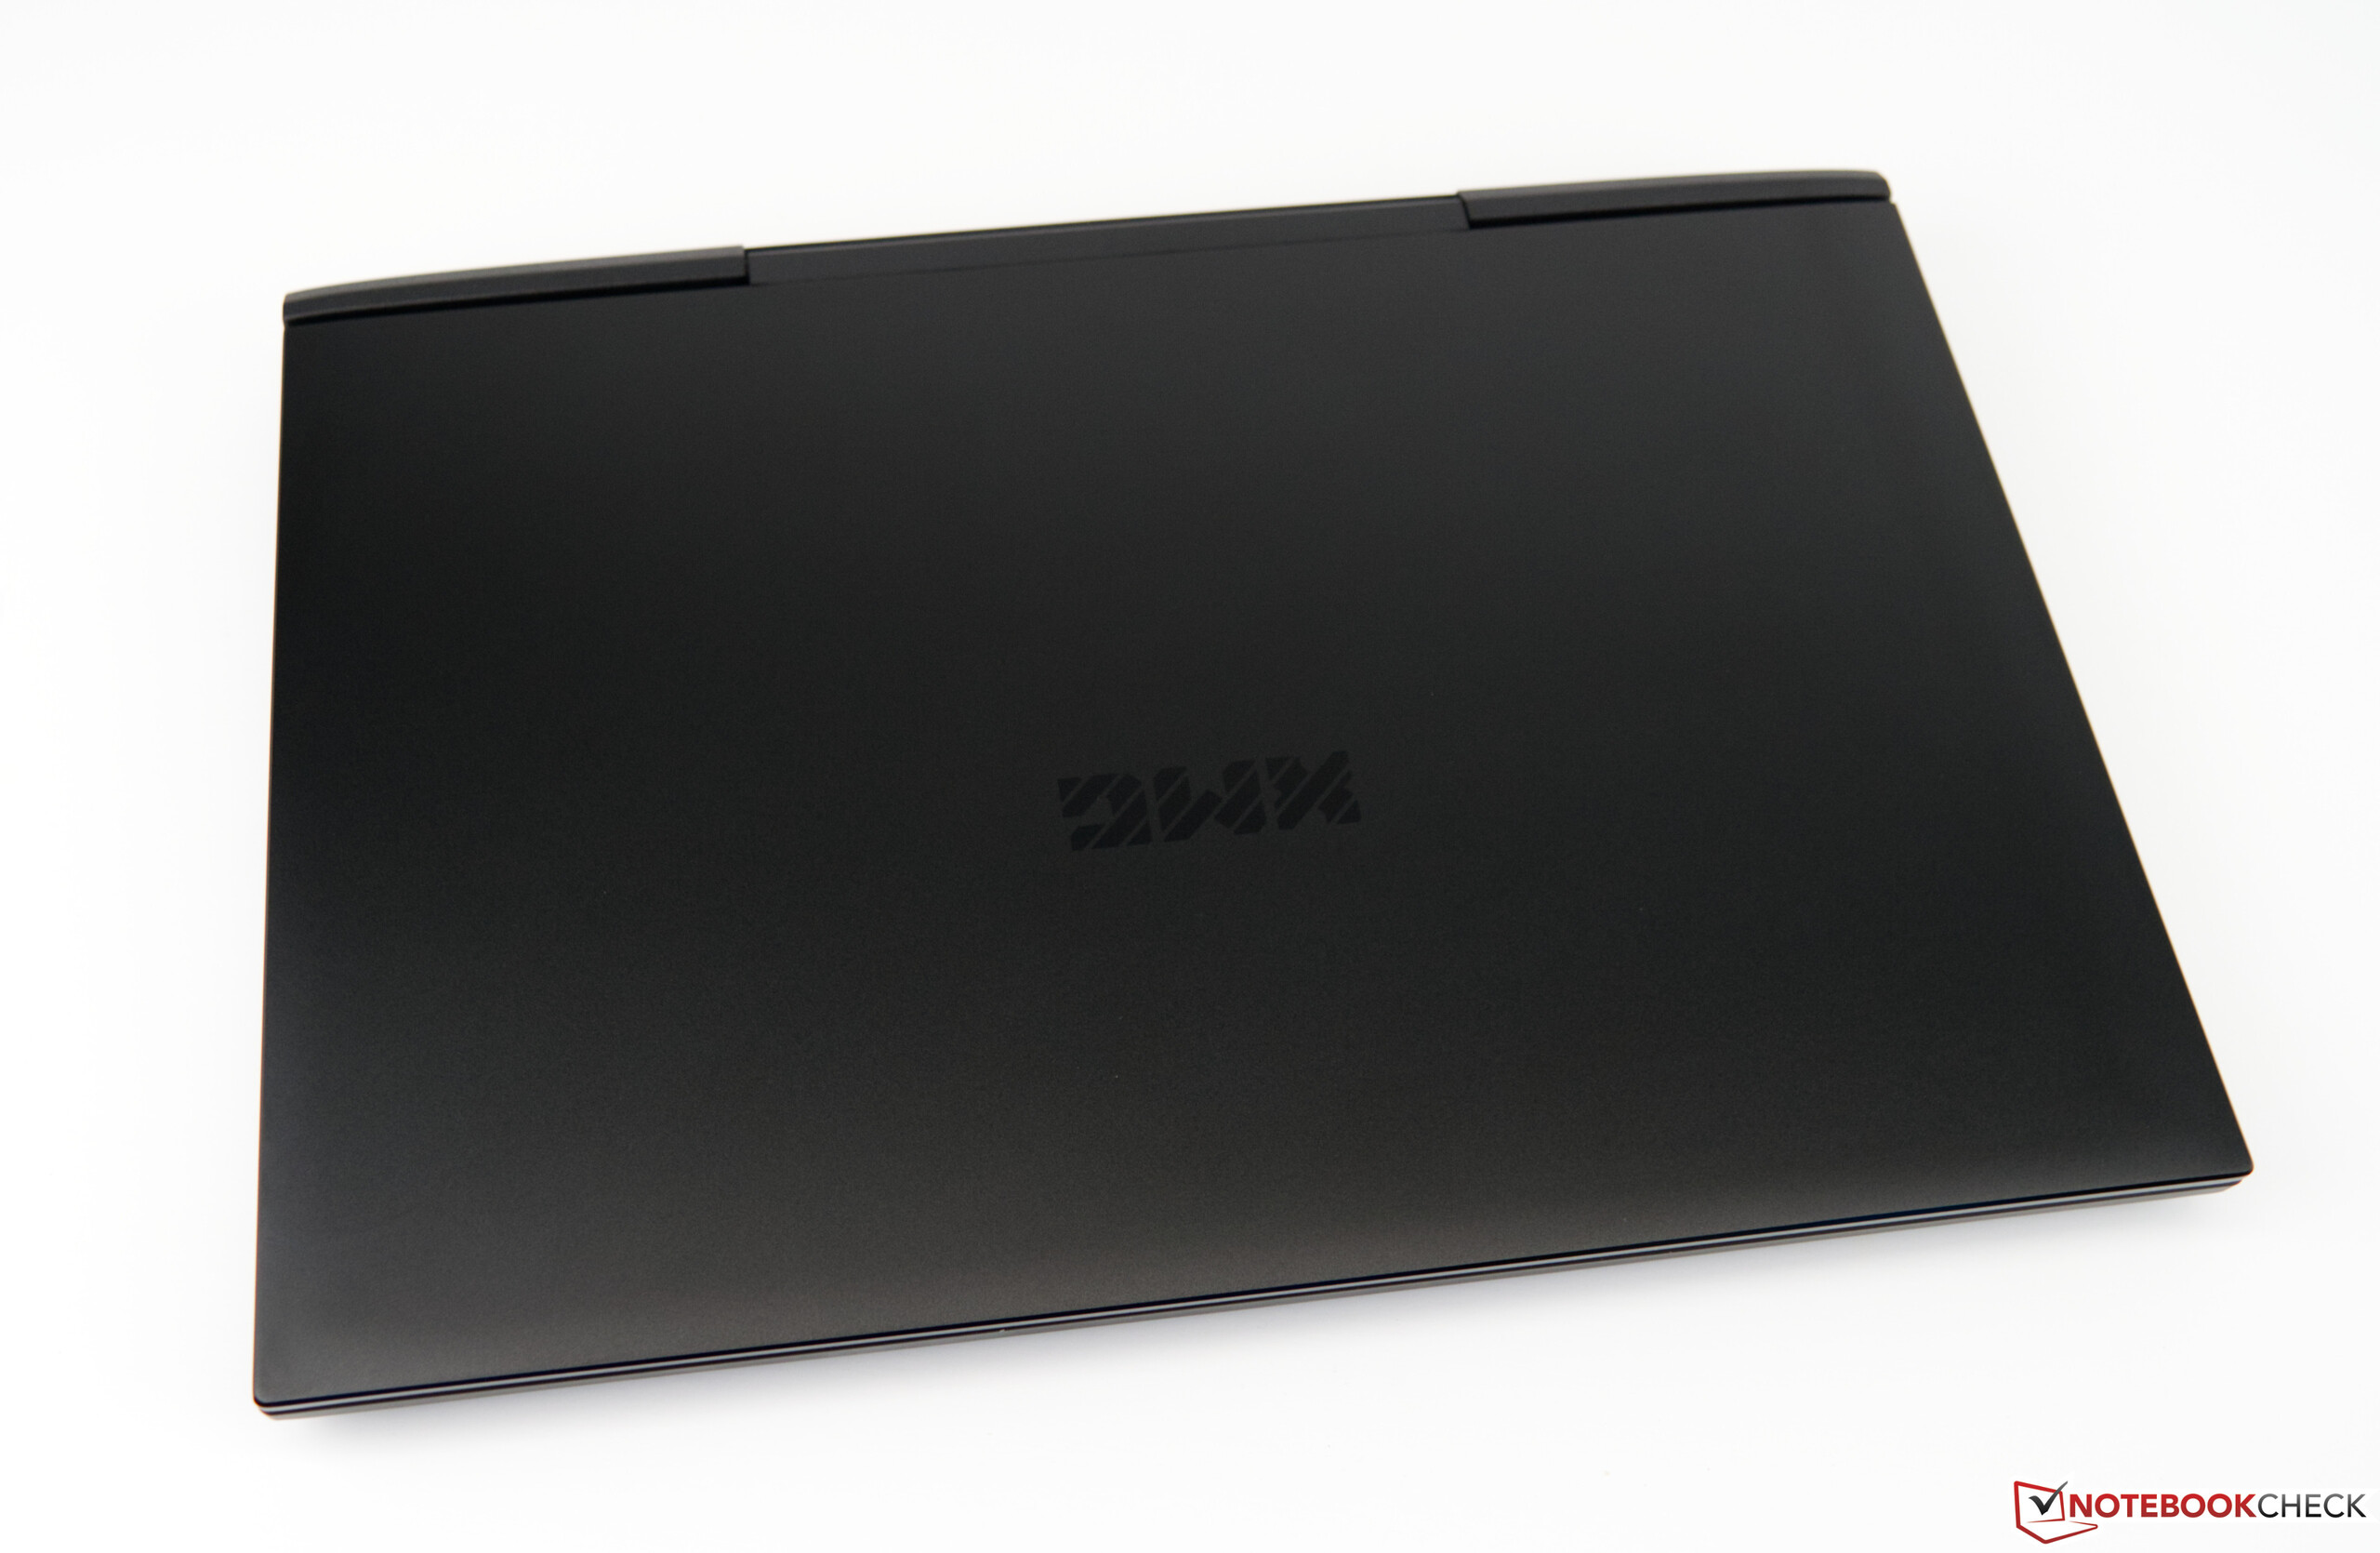
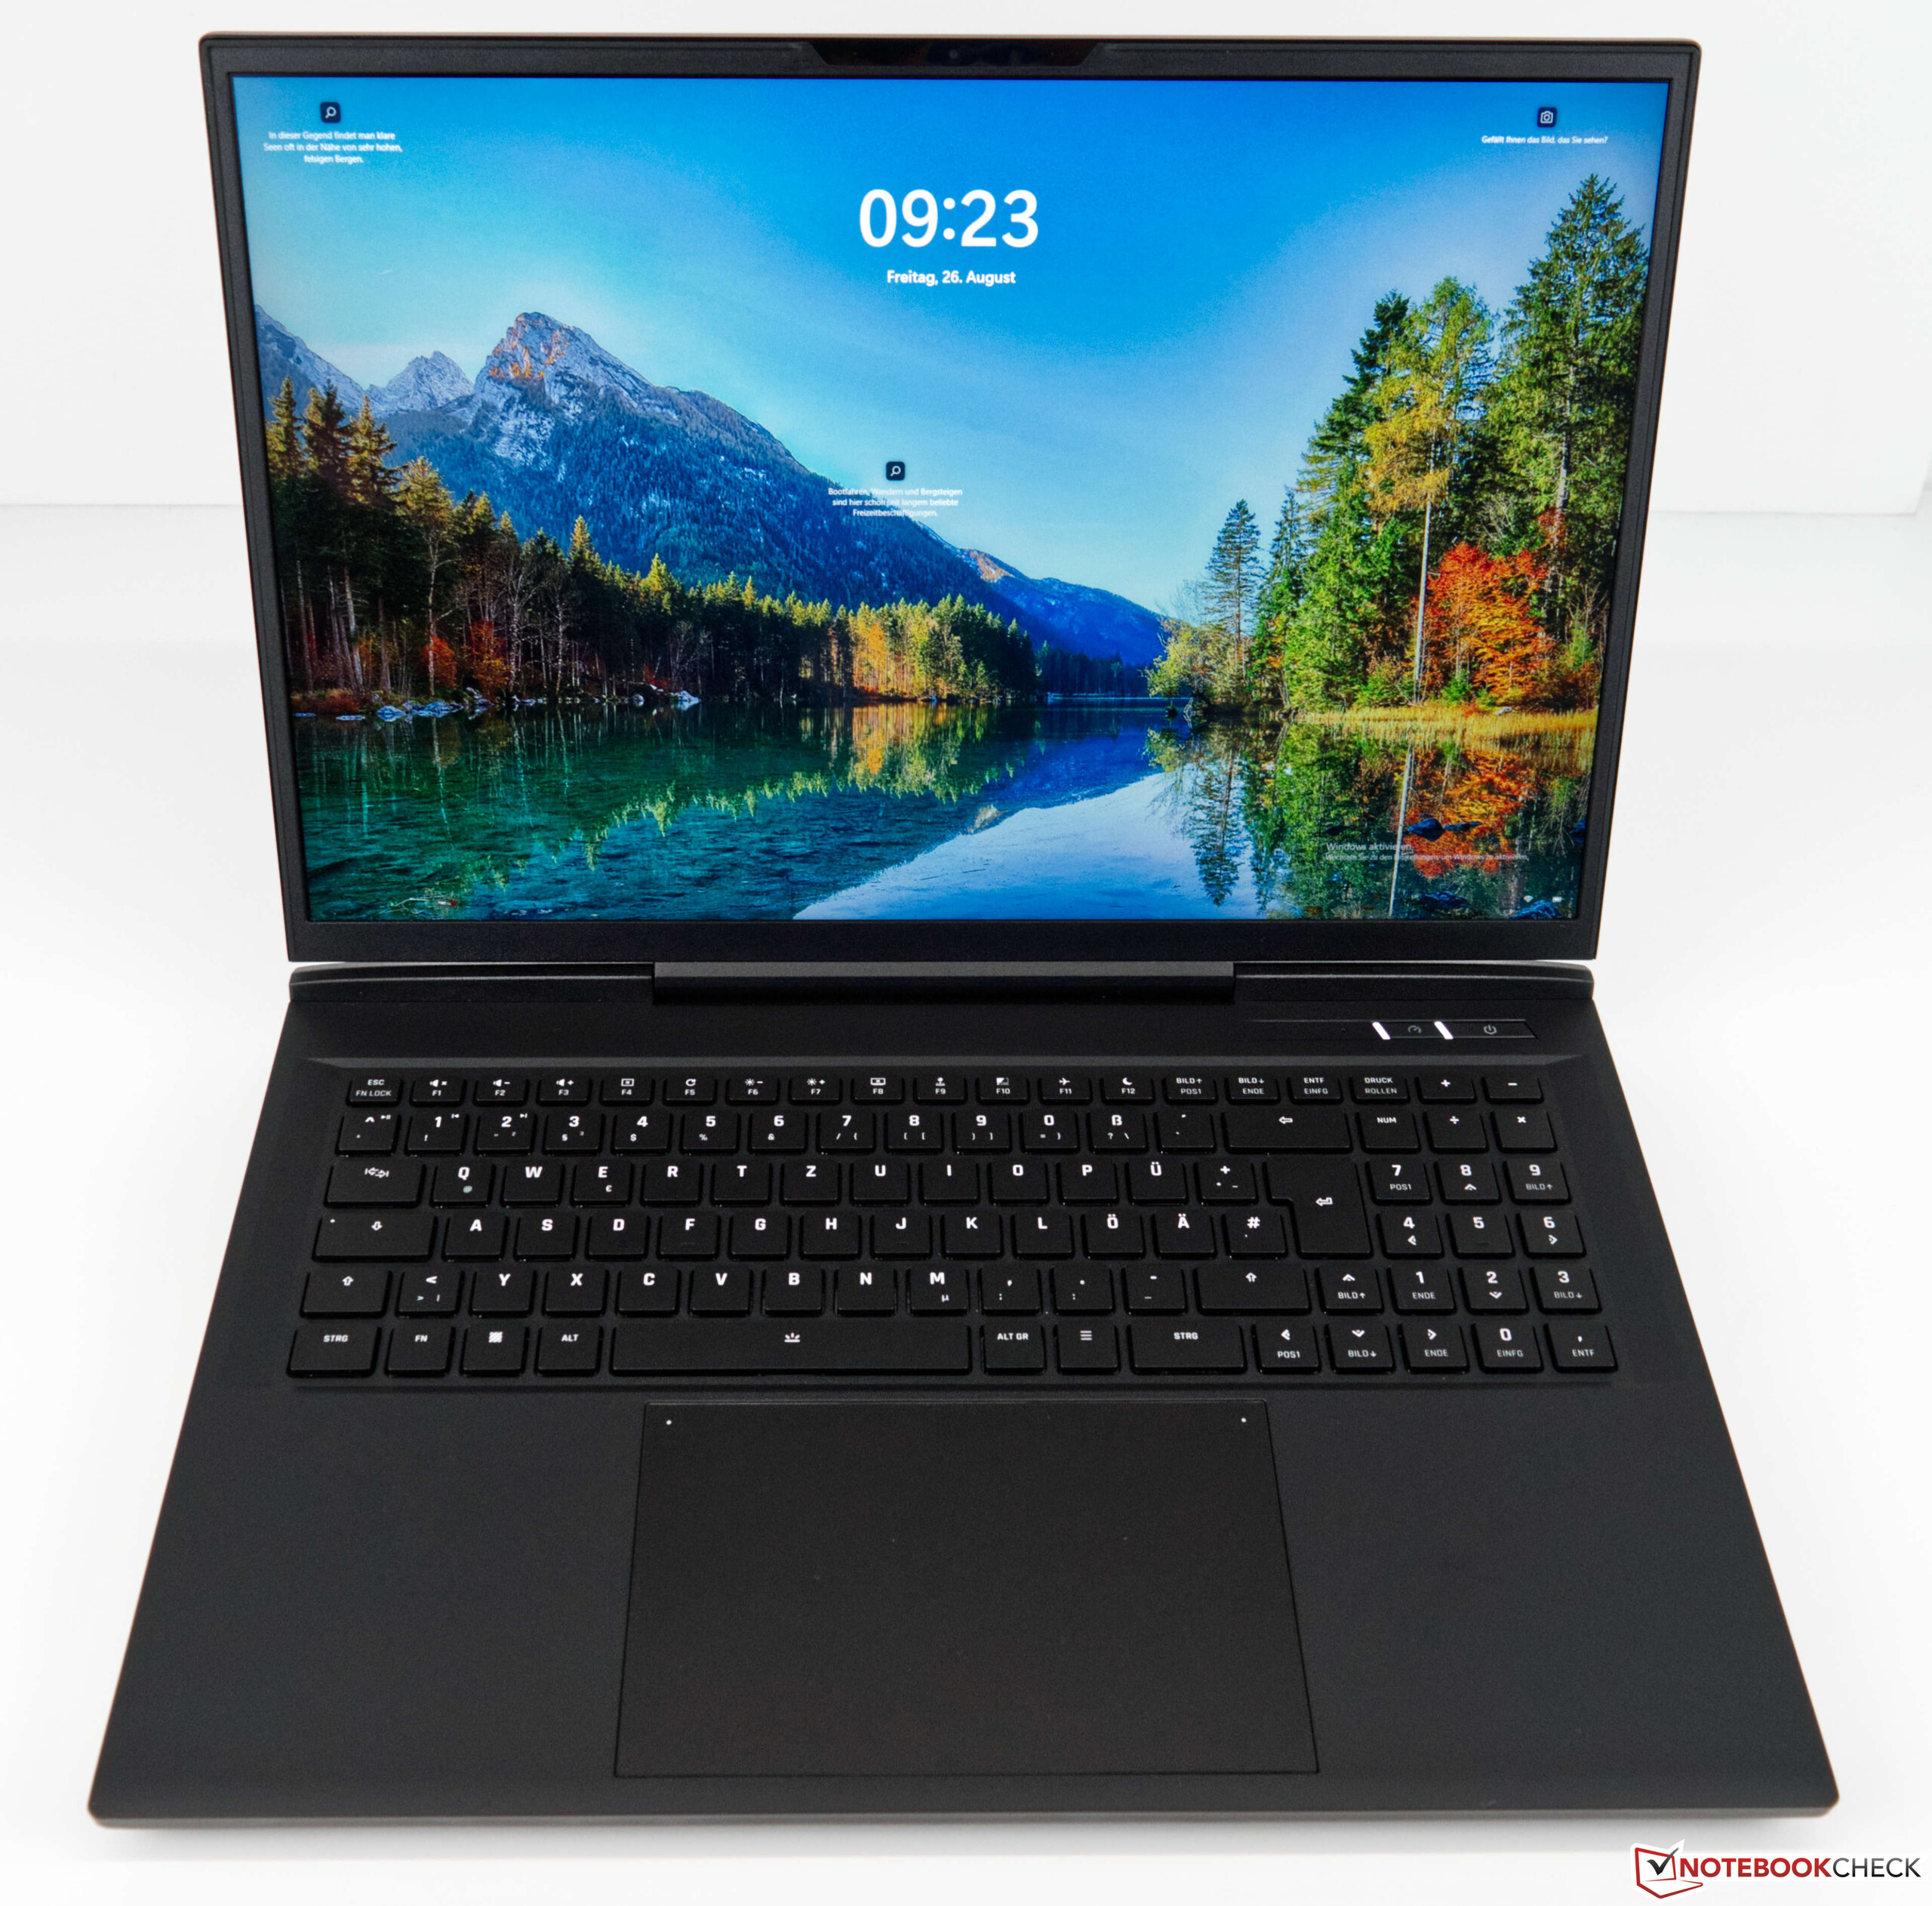
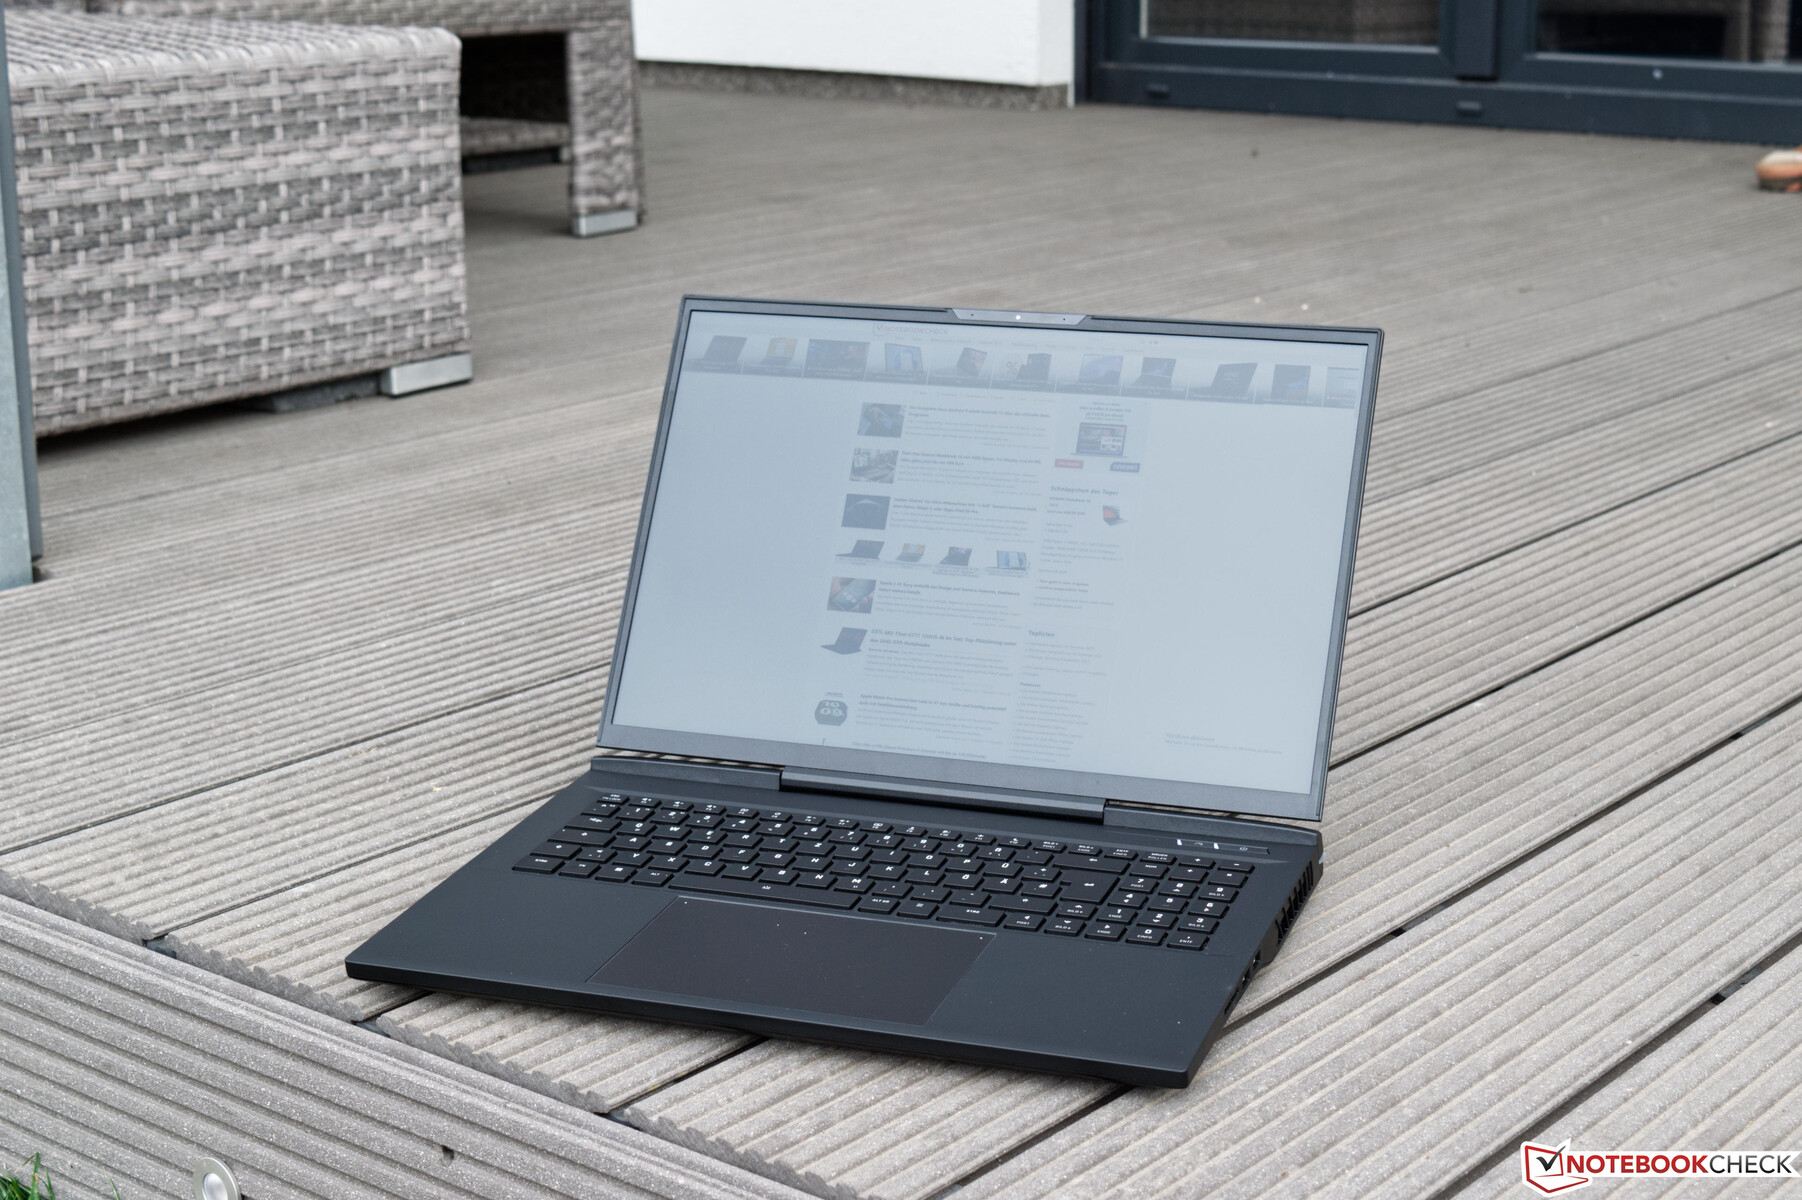
底盘 - 非常罗布斯基地
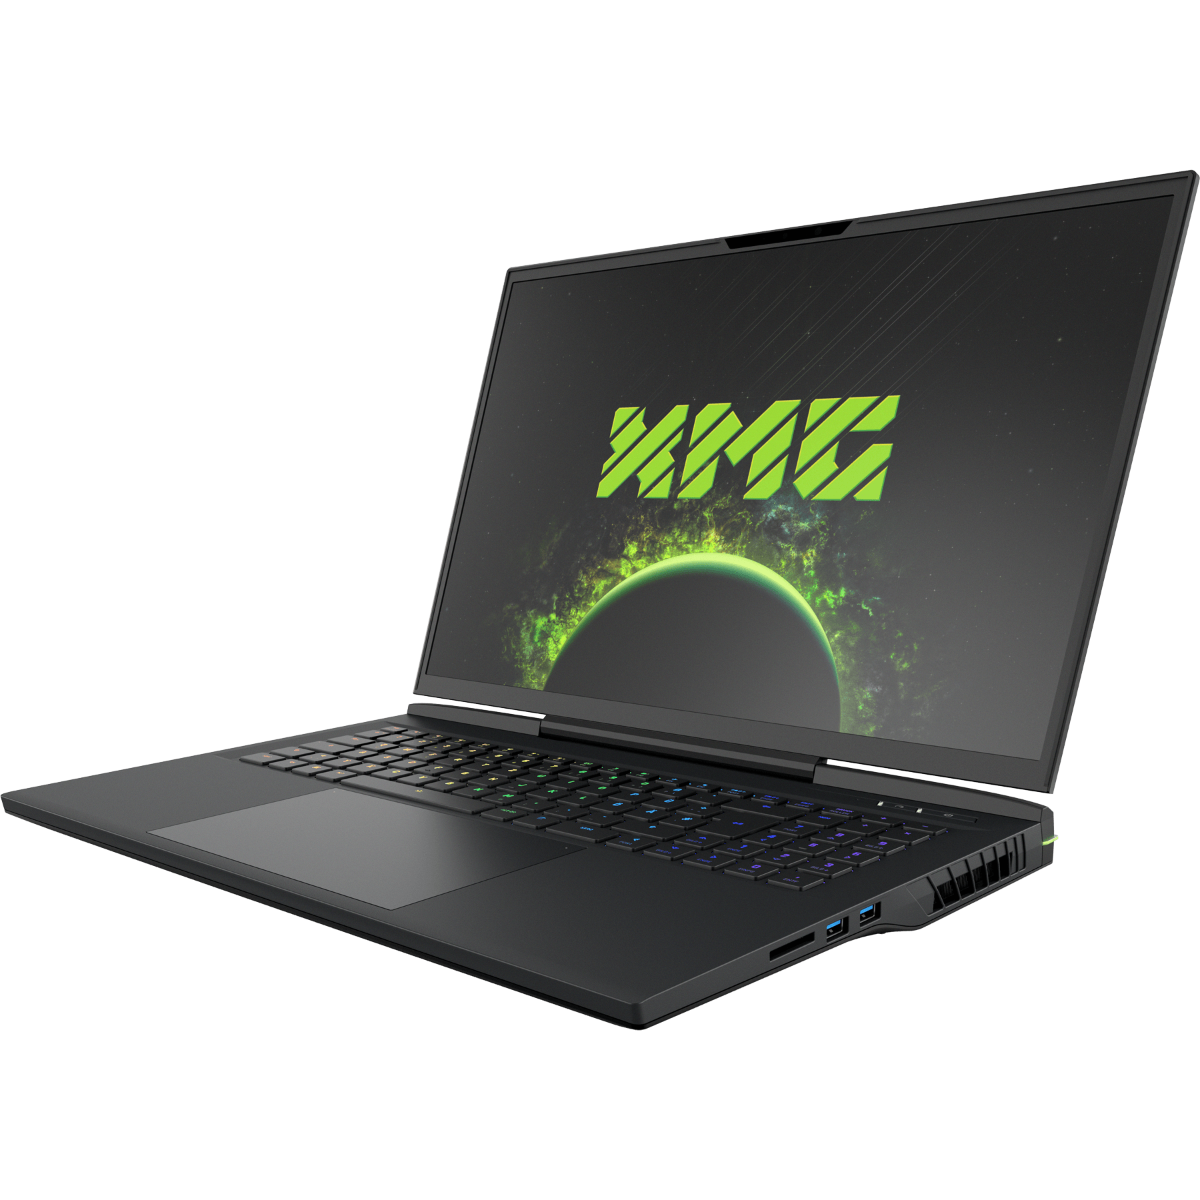
从视觉上看,Schenker XMG Neo 17很明显是一台Schenker游戏笔记本电脑。它显得很微妙,省略了华丽的RGB灯光。哑光金属表面提供了优质的美感,尽管在很短的时间内指纹就会在上面显现。塑料是显示器边框和基本单元的首选材料。后者涂有柔软的触摸层。值得庆幸的是,它对指纹的敏感度略低。尽管尺寸不大,但底座却相当坚硬。在压力下,Neo 17显示出它的坚固性,只有在大量压力下才会略微弯曲。盖子的情况也是如此。居中的铰链可以胜任这项工作,并能很好地防止过度的摇晃。


尺寸比较
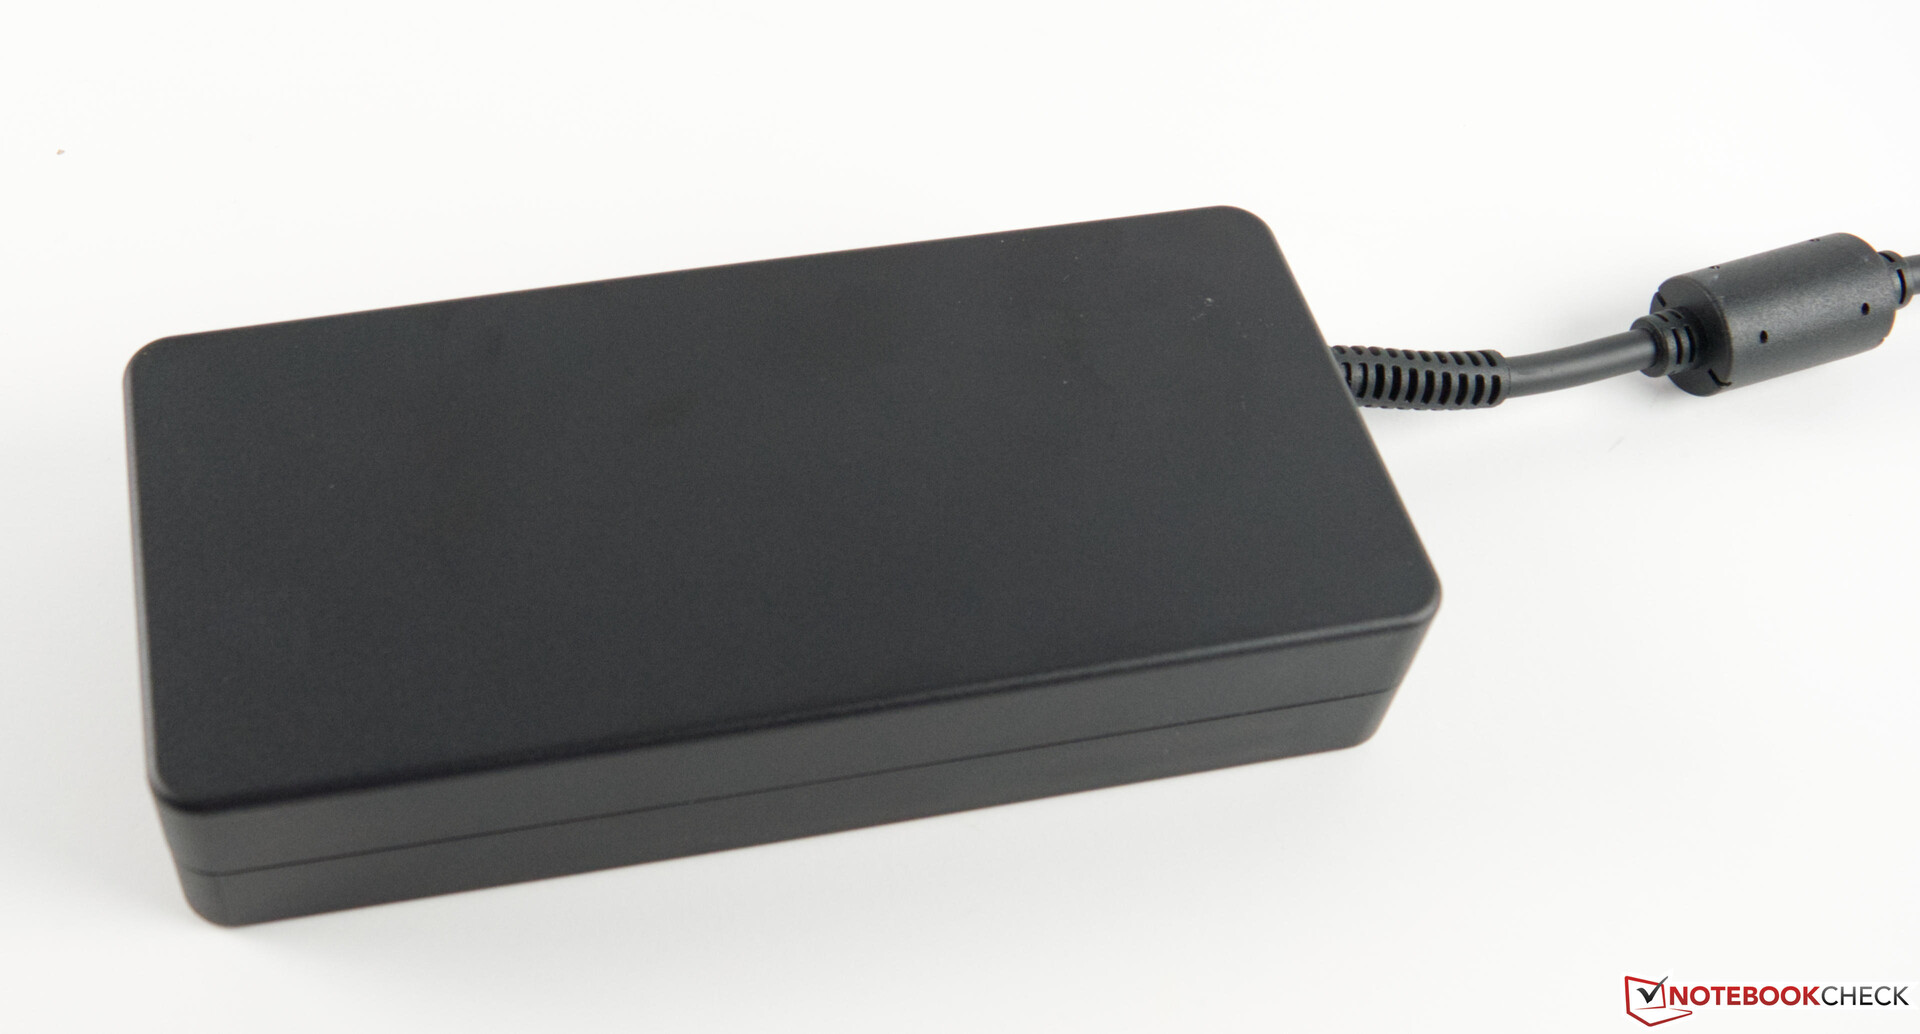
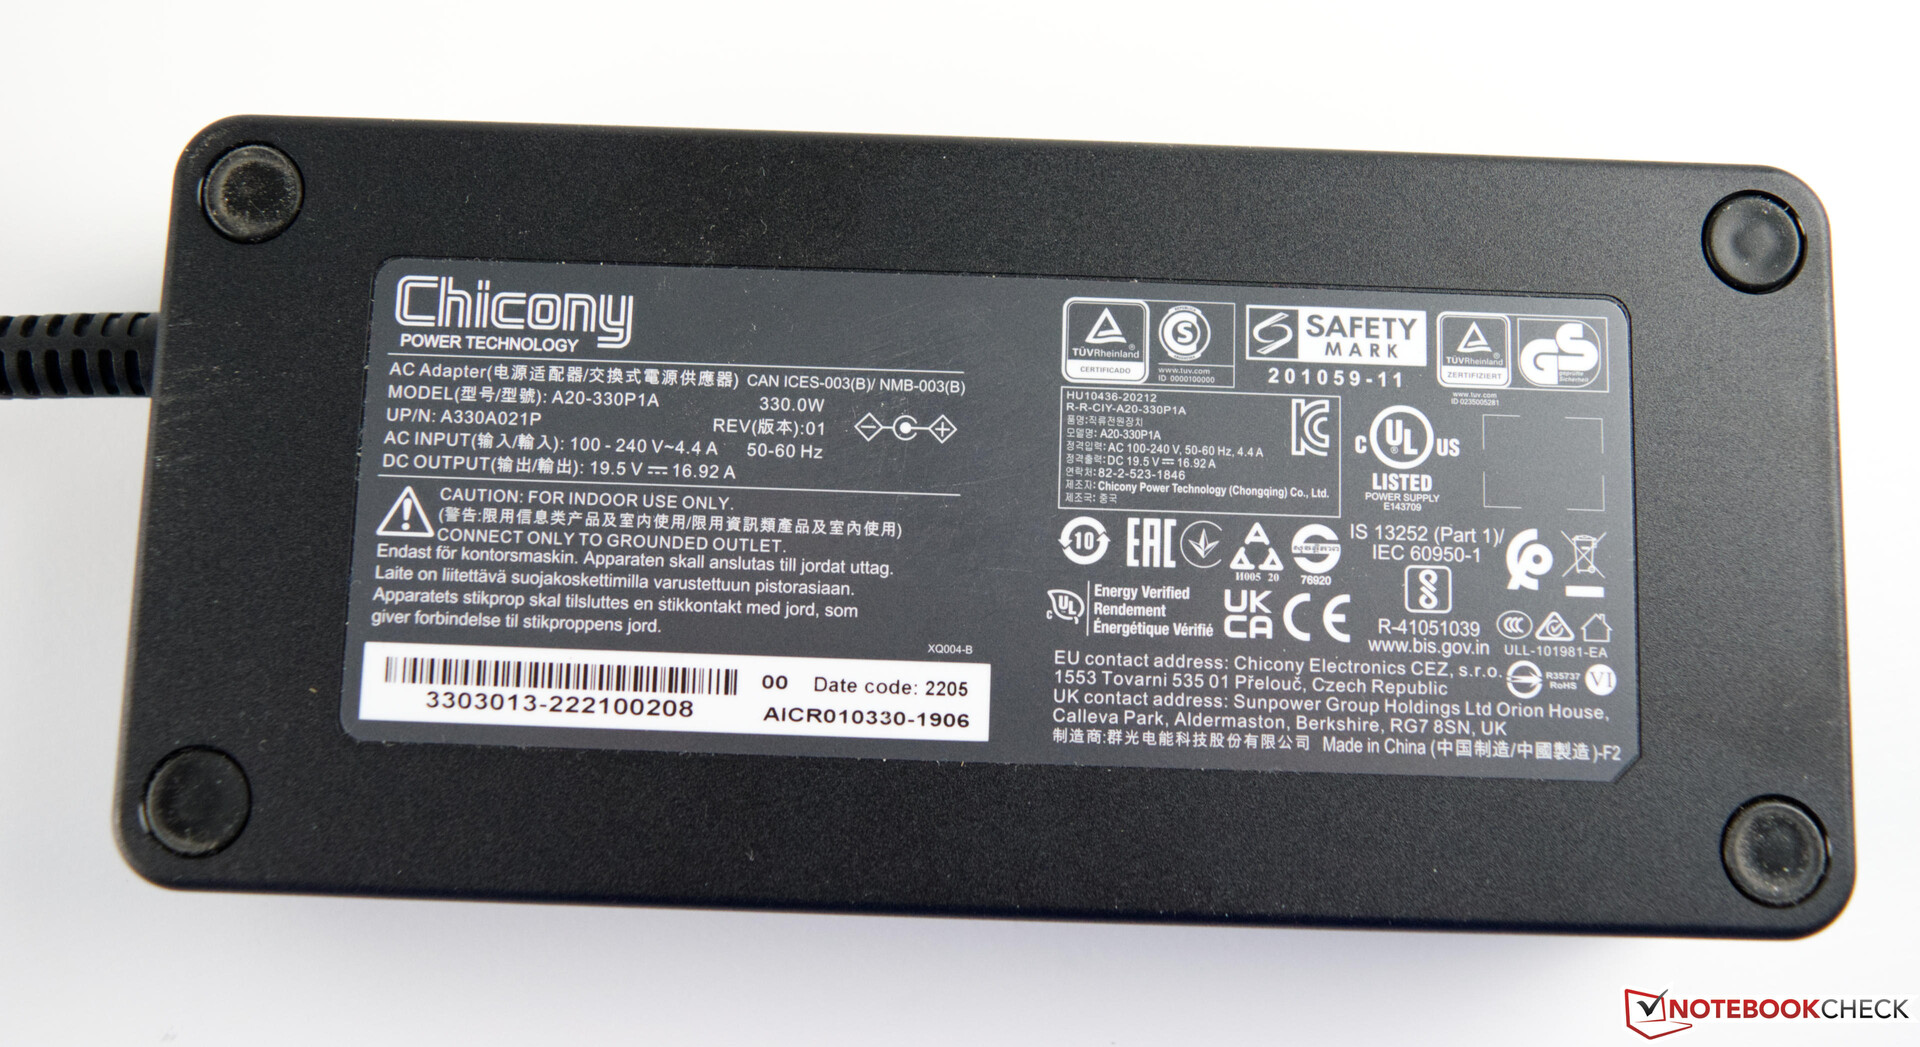
Schenker XMG Neo 17的重量为2.8公斤(6.17磅),在重量方面属于中等范围。强大的330瓦交流适配器几乎重达一公斤(980克/2.16磅)。
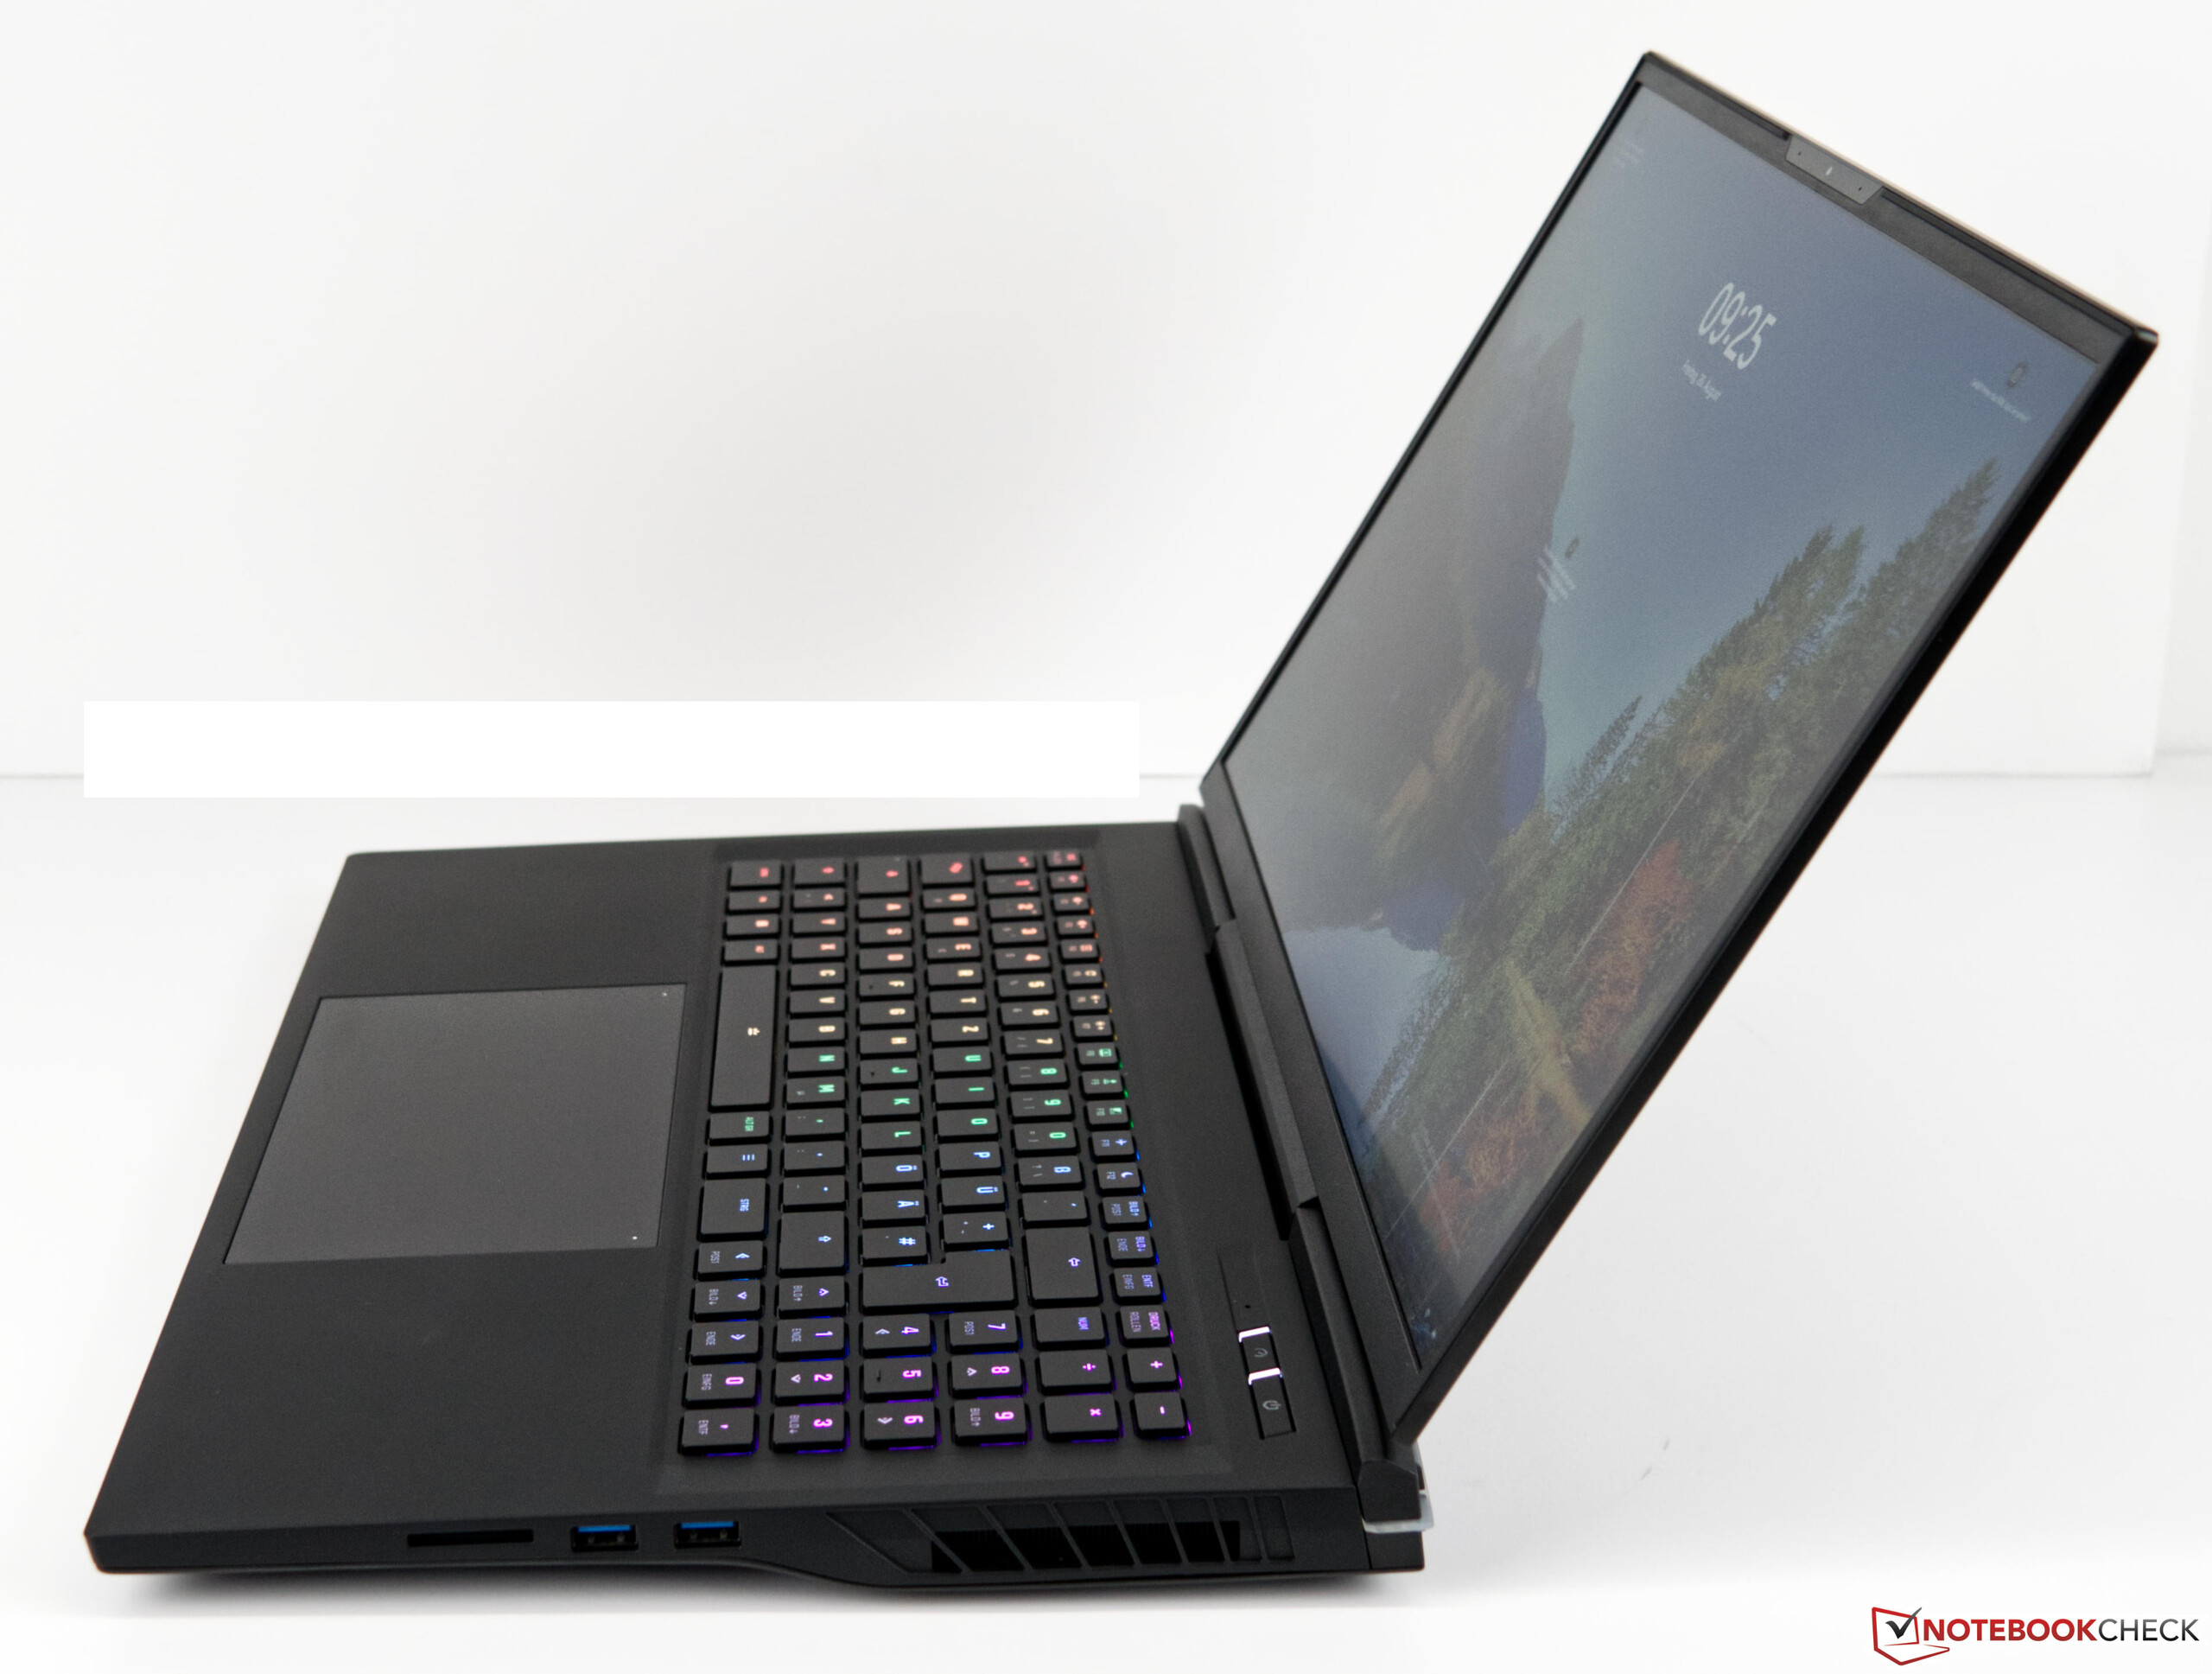
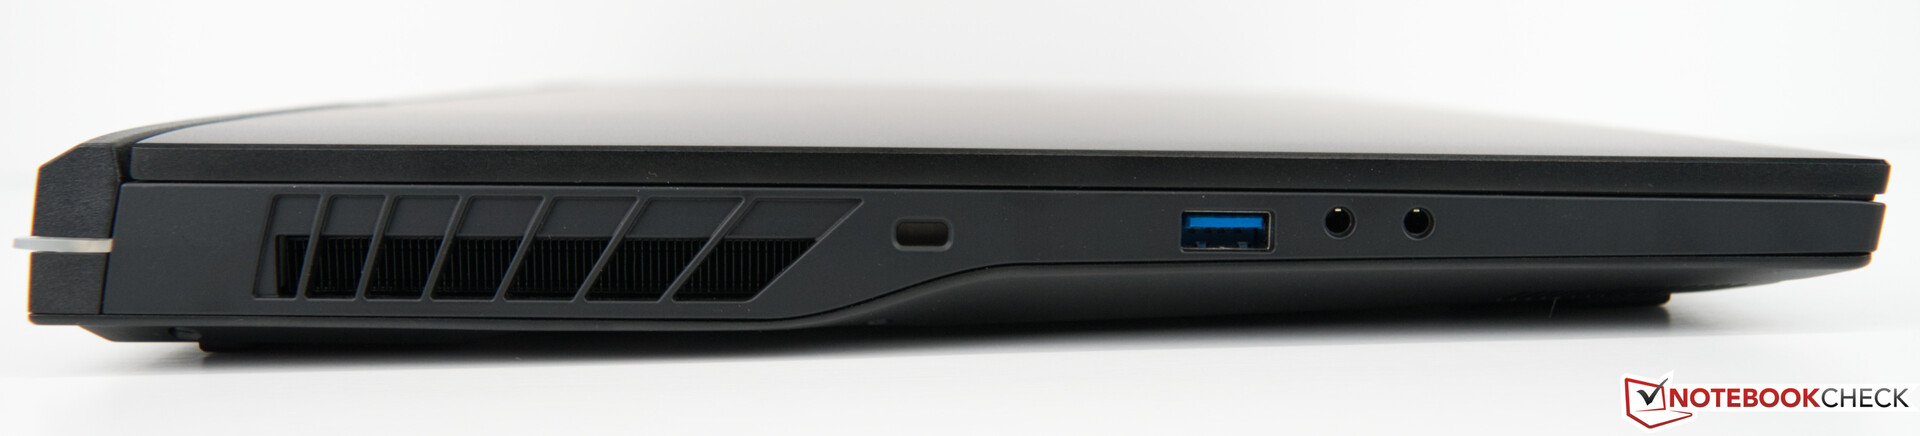
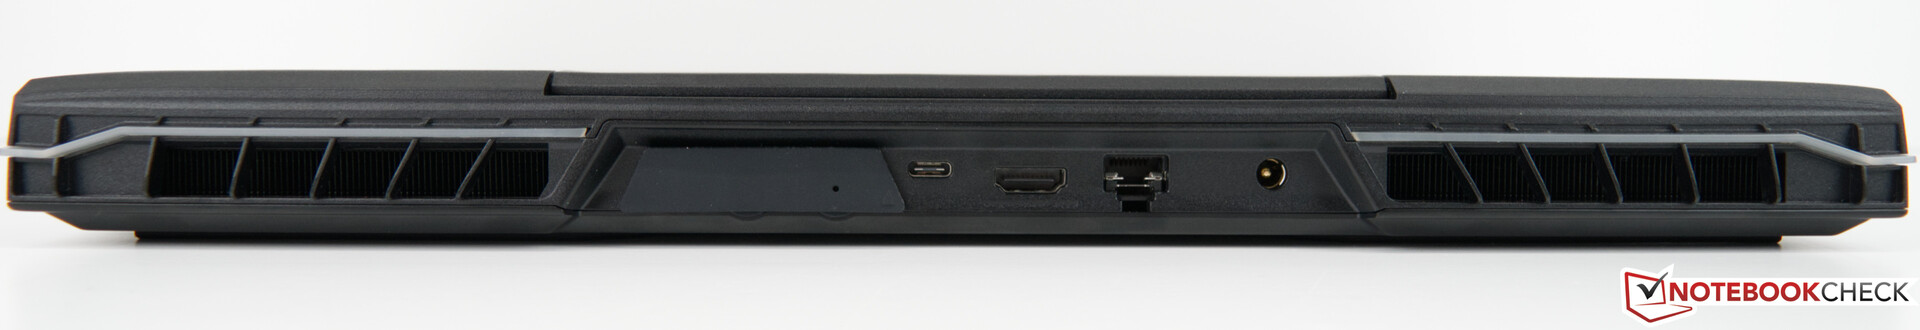
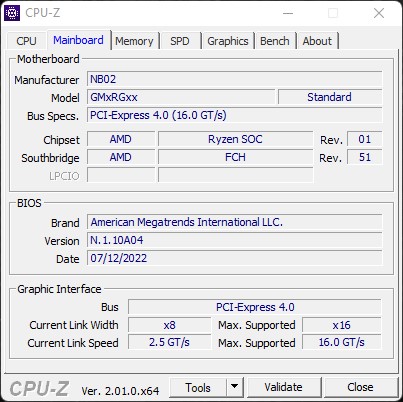
连接性 - 遗憾的是没有Thunderbolt 4
Schenker XMG Neo 17 M22提供了很好的各种外部接口。三个USB-A端口分布在两侧,可以舒适地进行日常使用。同时,使用频率较低的端口,如HDMI或LAN,则位于背面。交流电适配器也插在这里,因此在通电时不会干扰到外围设备。不幸的是,由于交流适配器的插头是有角度的,当电源线朝设备后面的右侧走时,使用相邻的端口需要更多的耐心。此外,桶形插头可以非常容易地插入,使其容易发生意外的拔插。
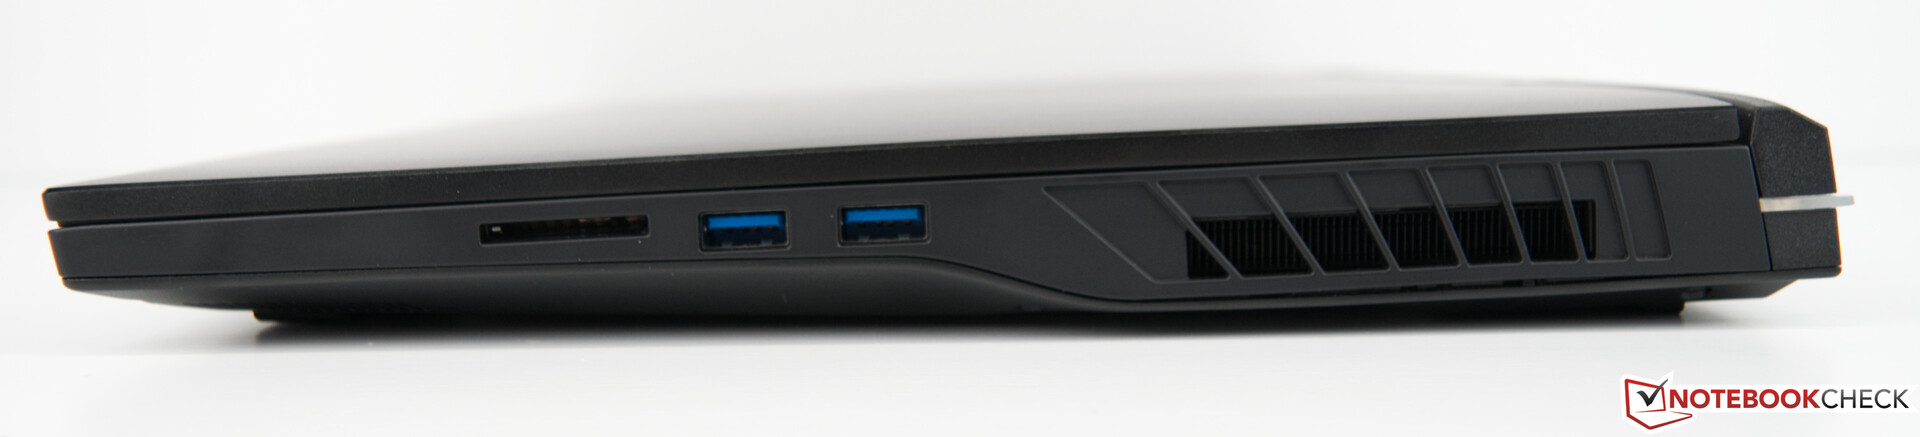
SD卡阅读器
Schenker XMG Neo 17 M22配备了一个支持USB-3速度的SD卡读卡器。在69MB/s的速度下,其性能还只是与同类设备相当。这两款 华硕ROG Zephyrus Duo和 Razer Blade 17展示了我们的参考卡(Angelbird AV Pro V60)在UHS-II标准下能够达到的速度。
| SD Card Reader - average JPG Copy Test (av. of 3 runs) | |
| Asus ROG Zephyrus Duo 16 GX650RX (AV PRO microSD 128 GB V60) | |
| Razer Blade 17 Early 2022 (AV PRO microSD 128 GB V60) | |
| Average of class Gaming (20.9 - 210, n=54, last 2 years) | |
| MSI Titan GT77 12UHS (AV PRO microSD 128 GB V60) | |
| Schenker XMG Neo 17 M22 (AV PRO microSD 128 GB V60) | |
| Acer Predator Triton 500 SE PT516-52s-70KX (AV PRO microSD 128 GB V60) | |
| MSI Raider GE77 HX 12UHS (AV PRO microSD 128 GB V60) | |
沟通
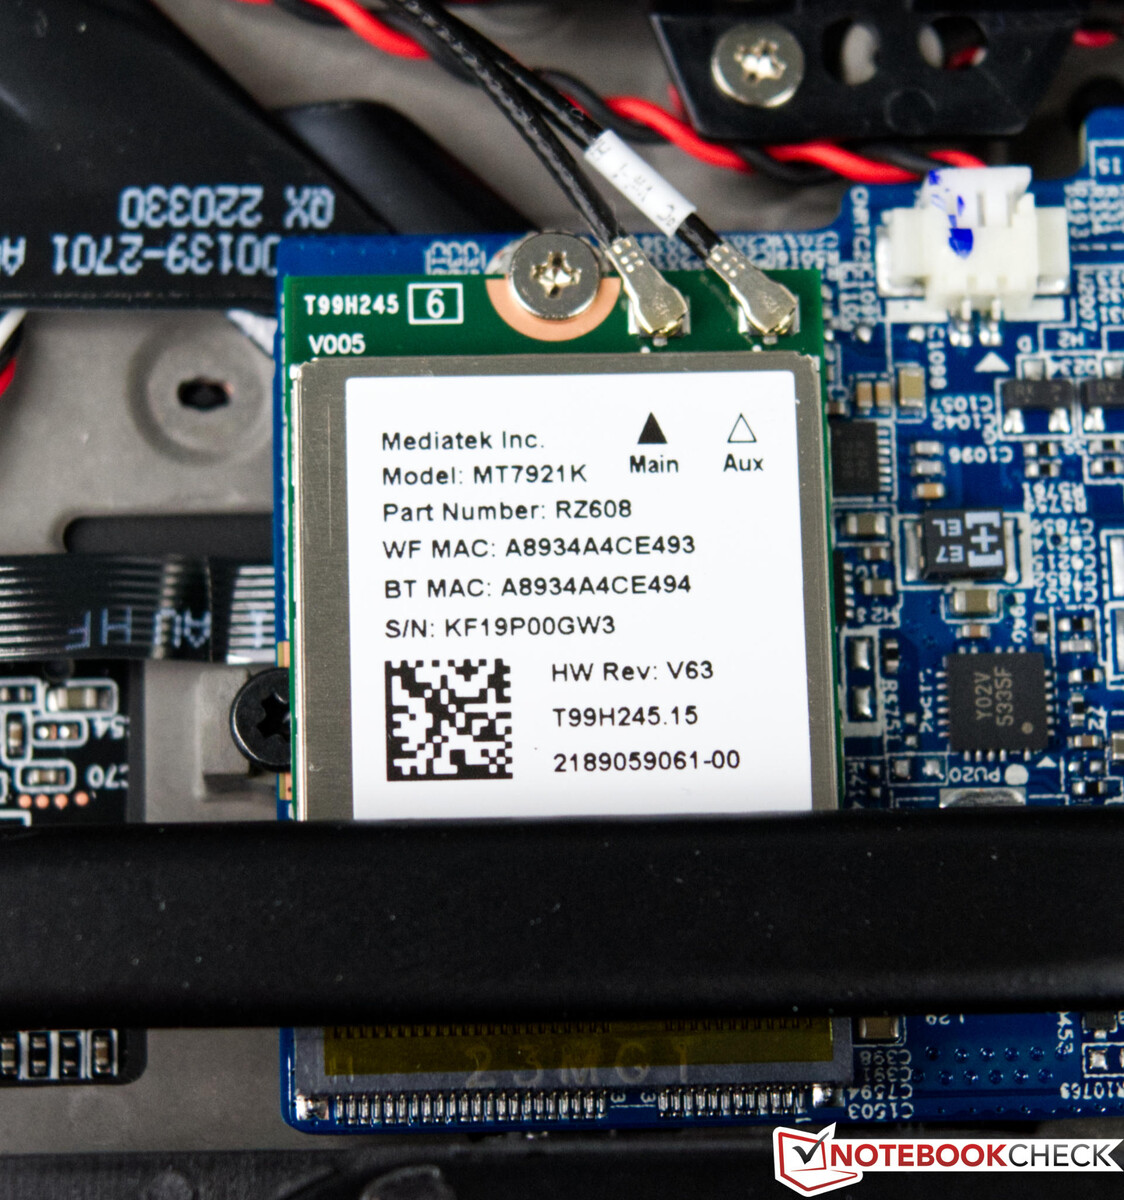
Schenker使用AMD RZ608作为我们设备中的Wi-Fi模块选择。在我们的测试中,该基本选项的性能无法超过其竞争对手。英特尔Wi-Fi 6 AX200和Rivet Networks Killer Wi-Fi 6 AX1650x可作为替代配置选项。我们还希望看到一个Wi-Fi 6E选项。有线网络可以达到2.5Gb/s,这是一个不错的选择。
网络摄像头
拥有良好网络摄像头的游戏笔记本电脑并不多。同样,Schenker XMG Neo 17的网络摄像头在色彩准确性和清晰度方面都有所欠缺,正如我们的图片所示。由于集成摄像头支持 "Windows Hello",它可以作为一种认证方法。


辅料
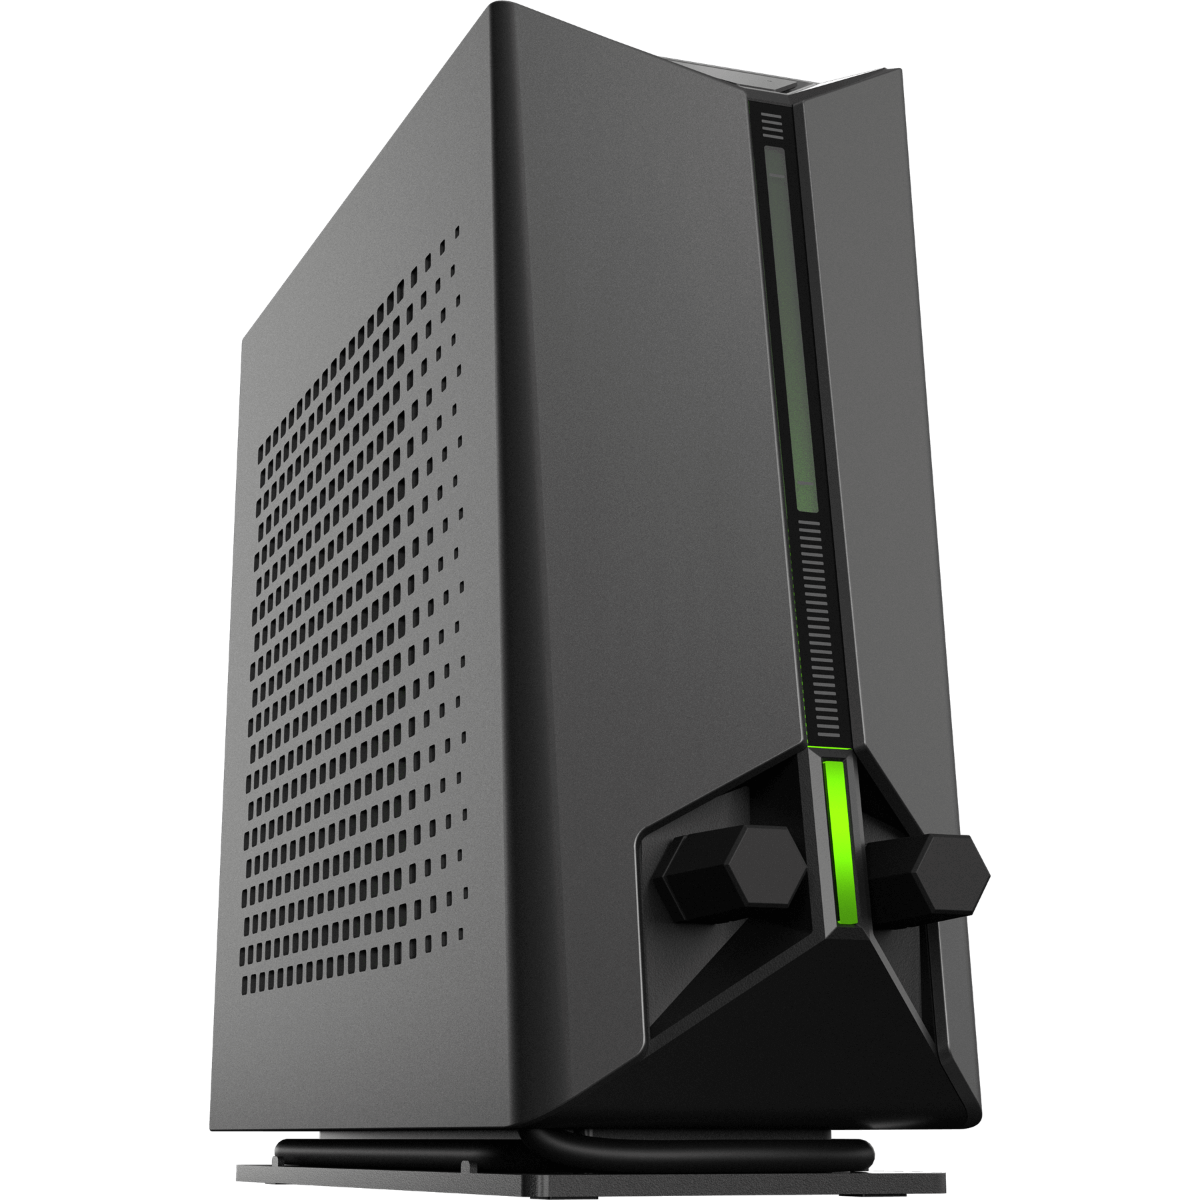
交付范围包括设备本身,一个330瓦的交流适配器,以及一个带有驱动程序的USB拇指驱动器。与Schenker Oasis一起,XMG Neo 17 M22提供一个可选的外部水冷解决方案。它可以在Schenker的网上商店单独购买,价格约为200美元。
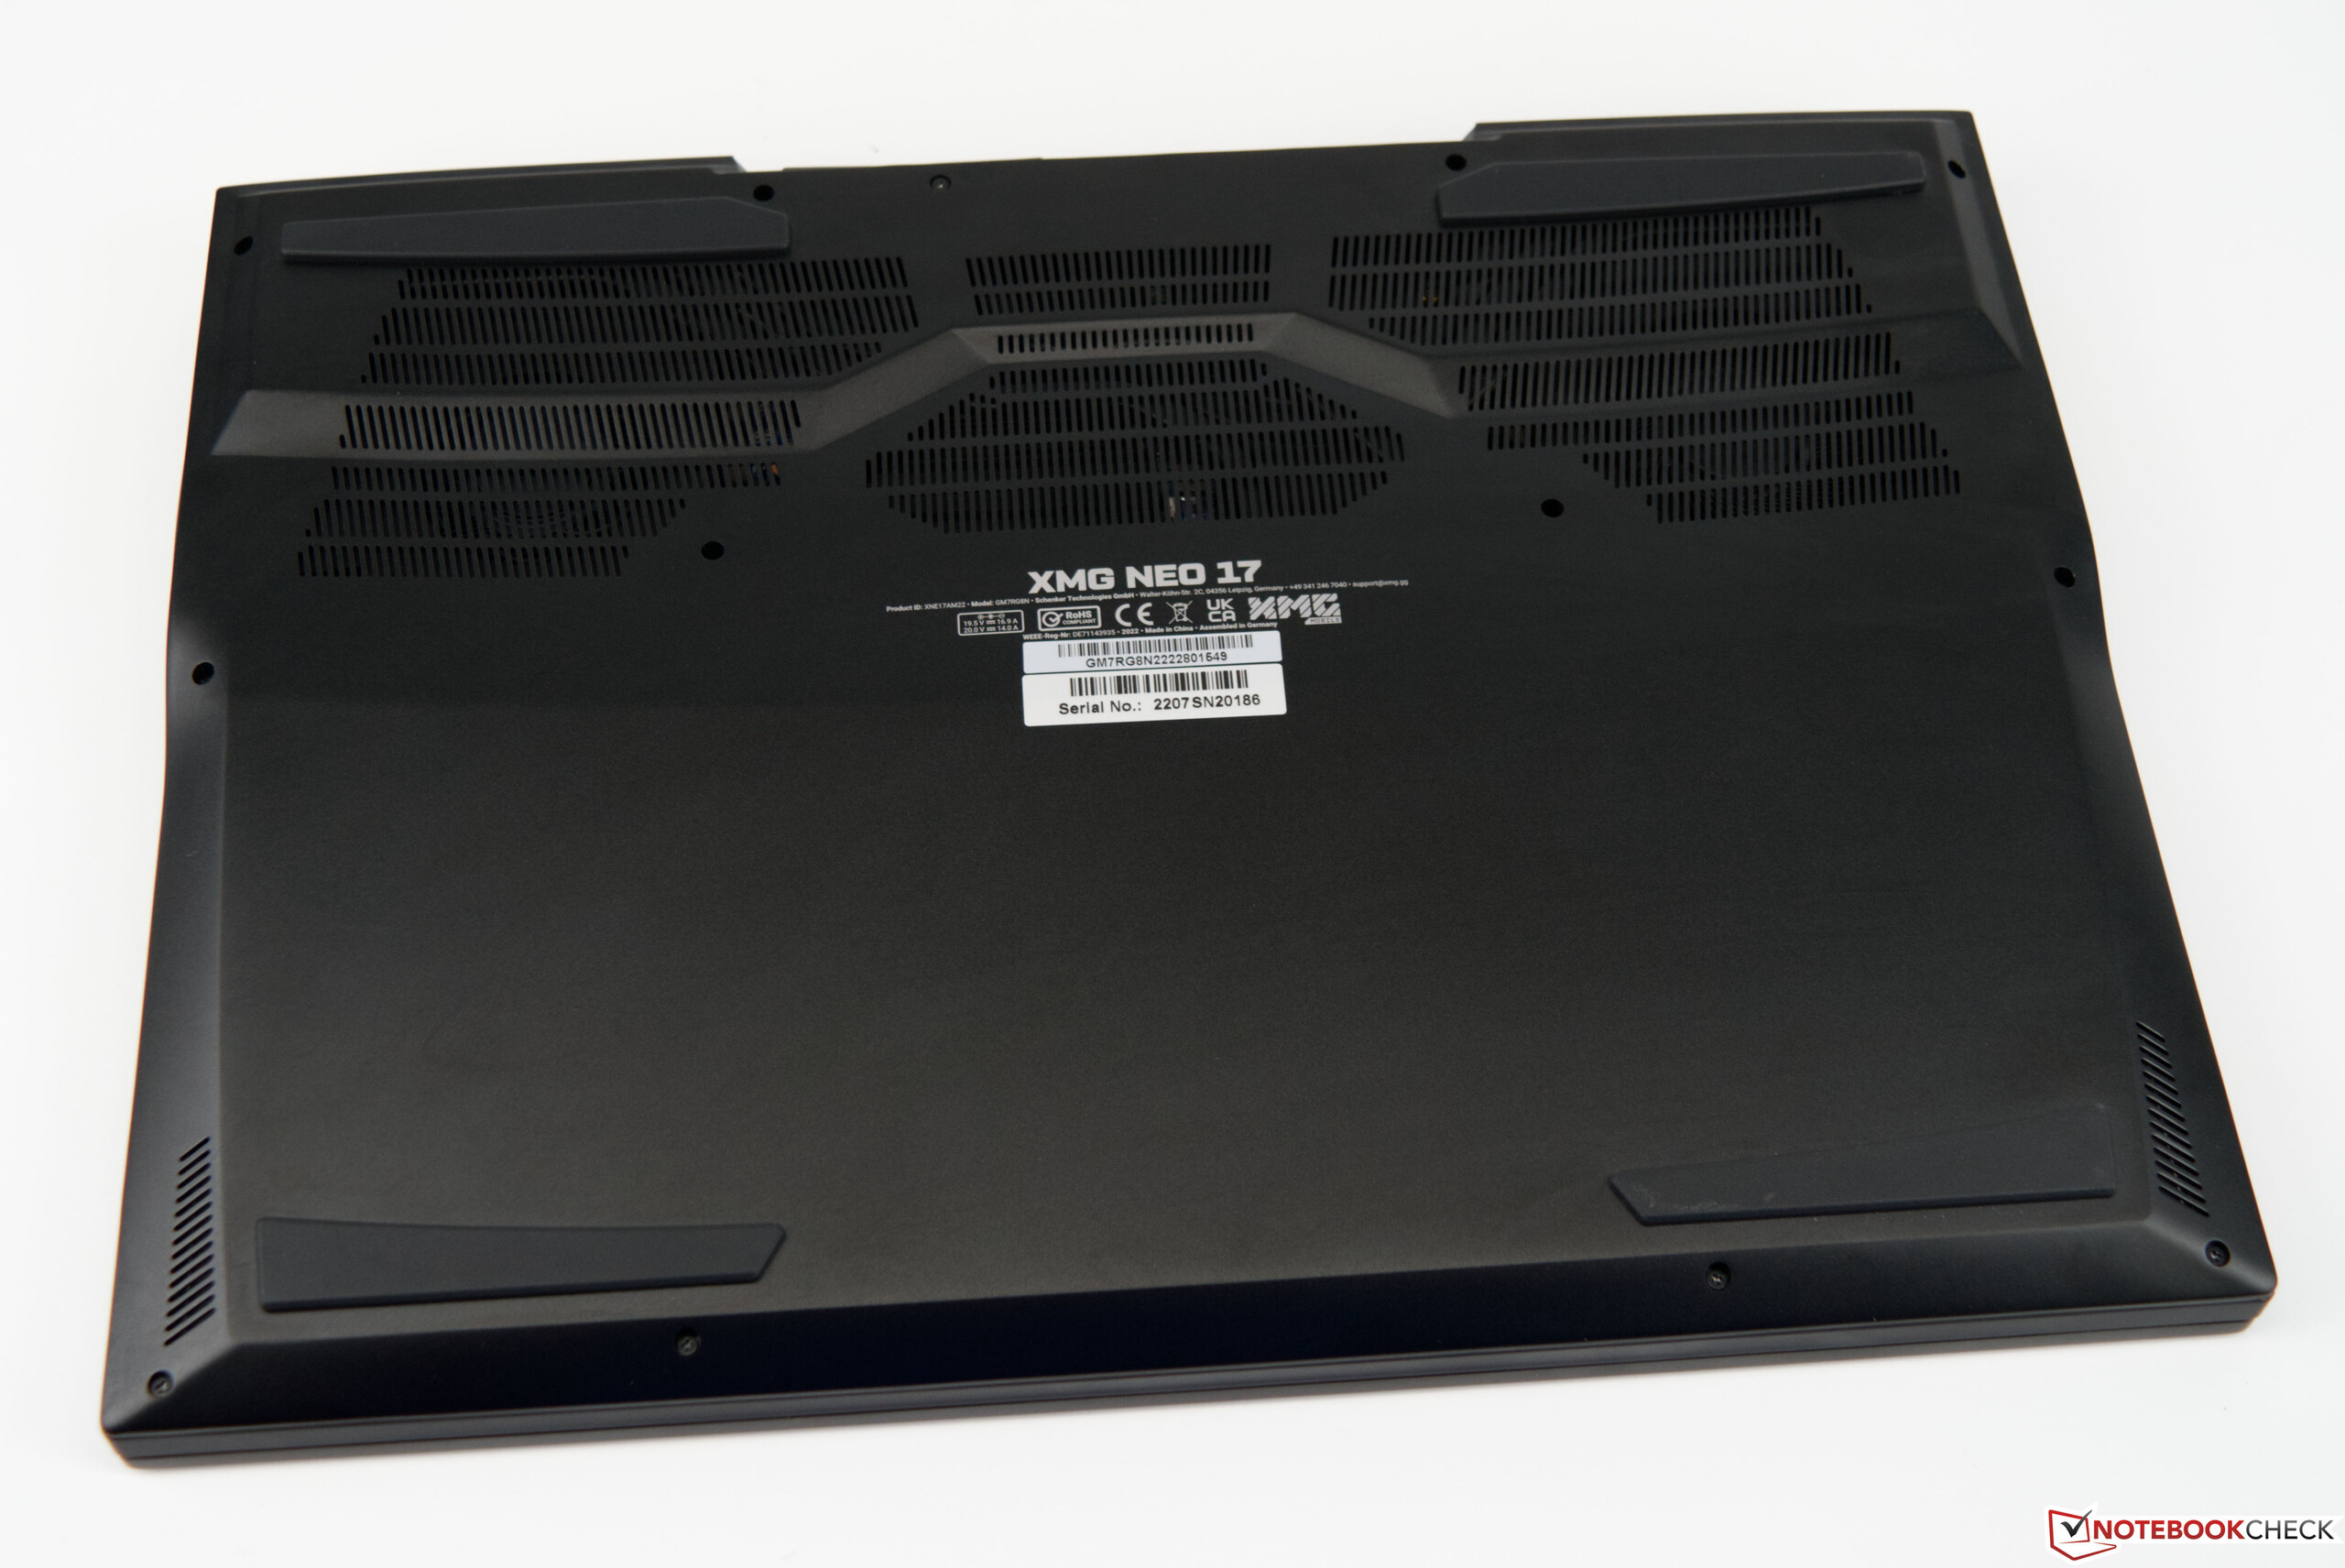
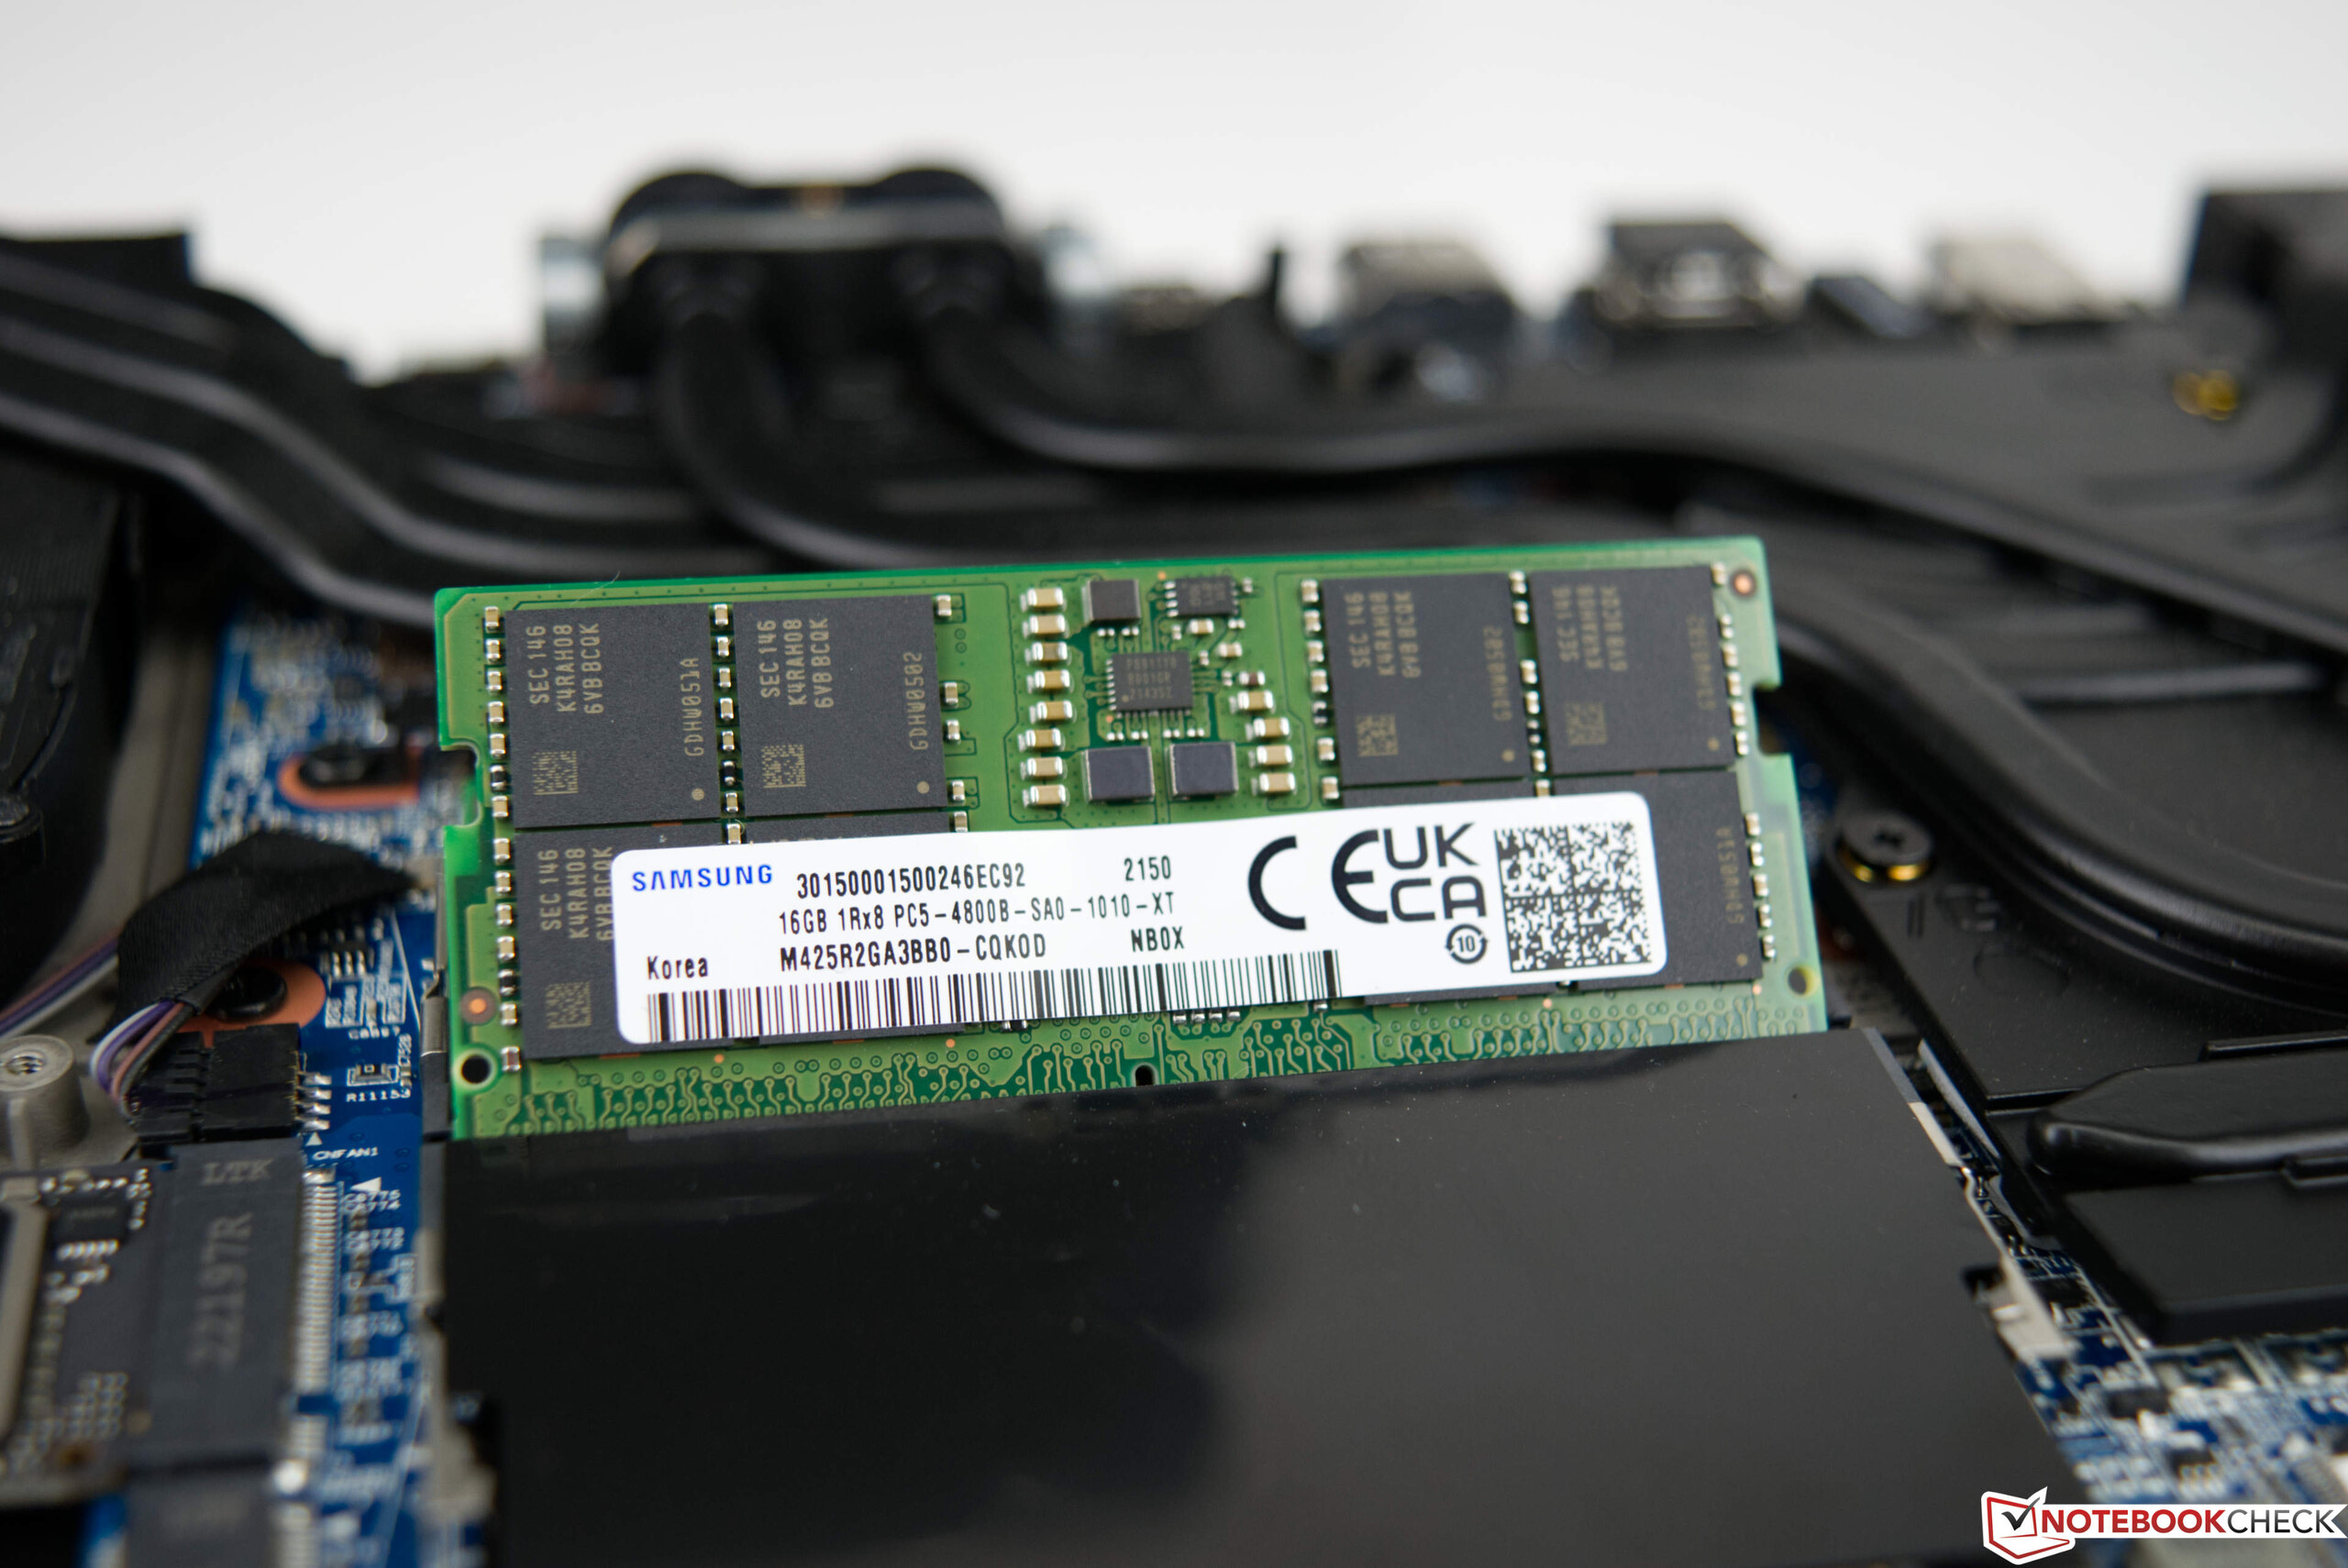
维护
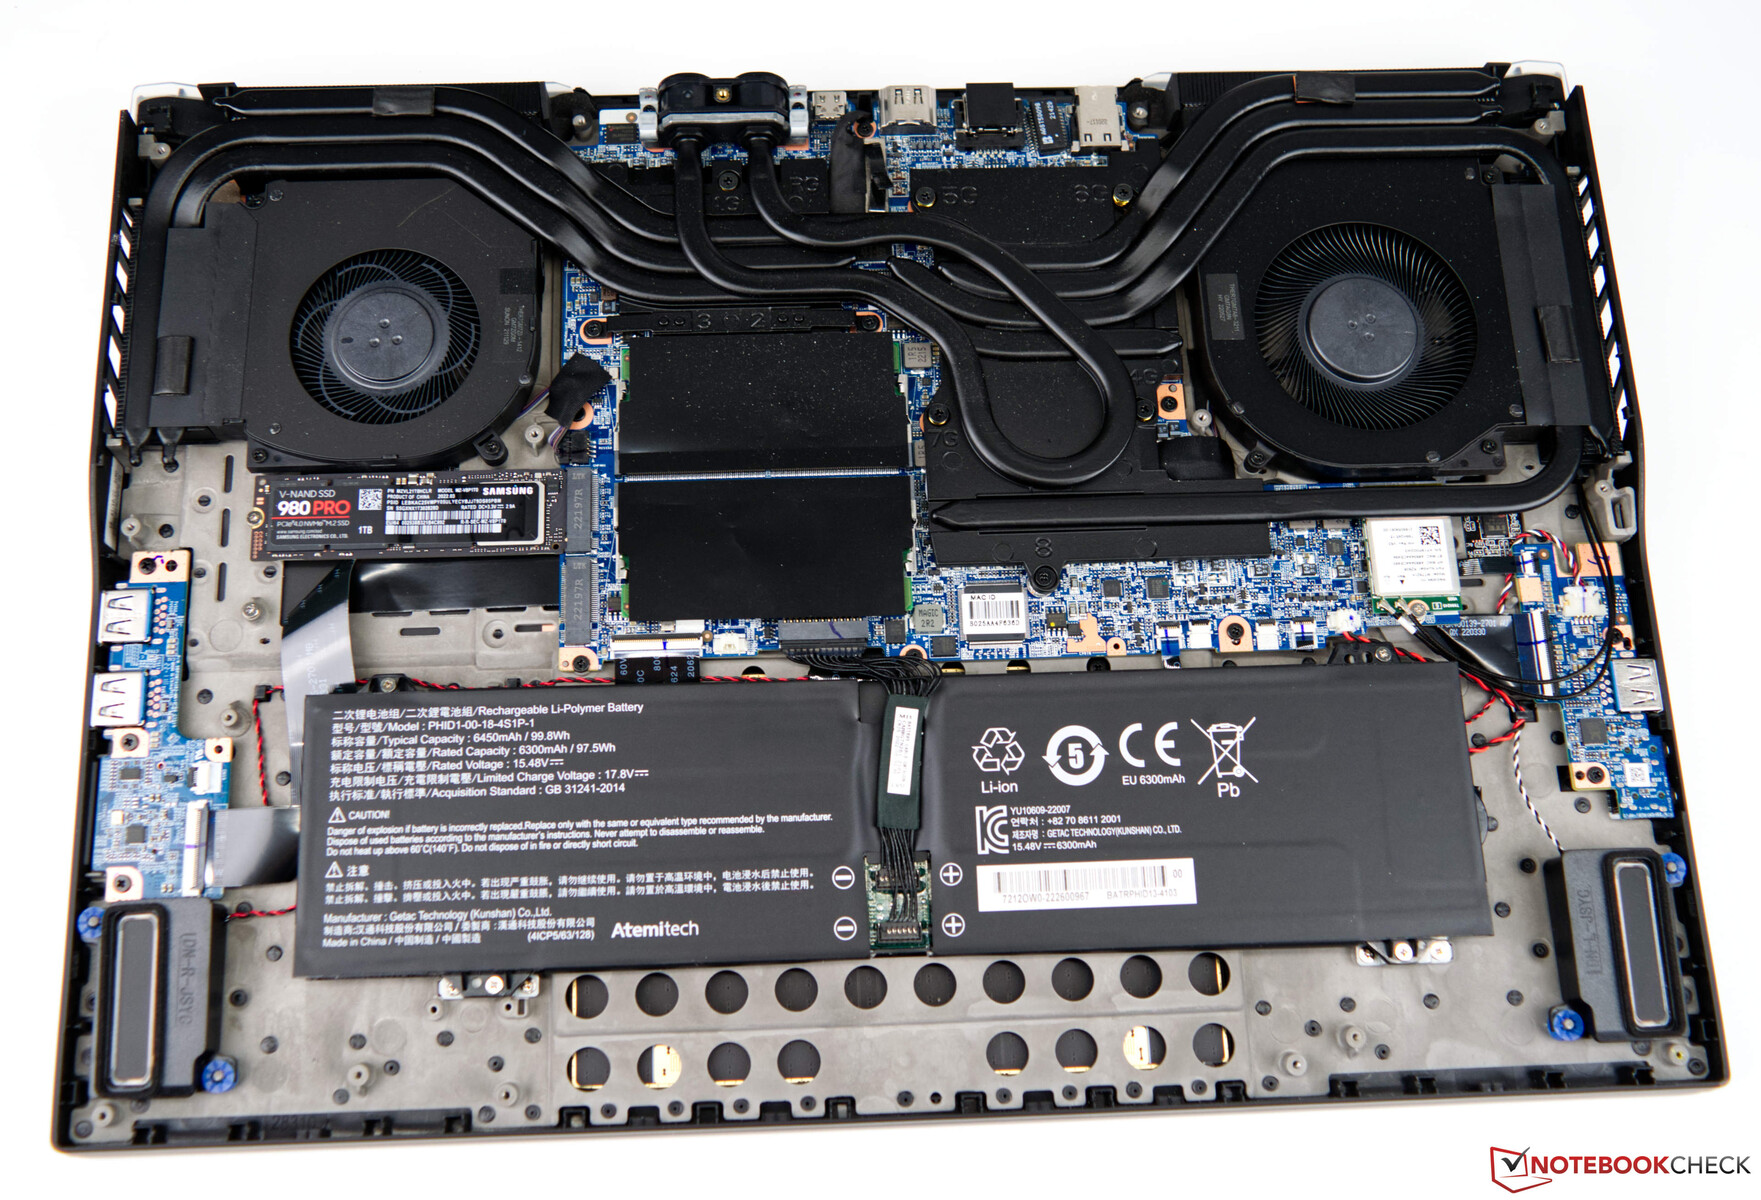
由于Schenker XMG Neo 17上没有维护舱口,无法快速进入内存和固态硬盘,因此更换这些部件有些困难。因此,底板必须被拆除,由于有许多塑料夹子进一步固定,这不是一项简单的任务。不管怎么说,底板可以从下面靠近通风口的地方用力一拉,就可以把它拆下来。
担保
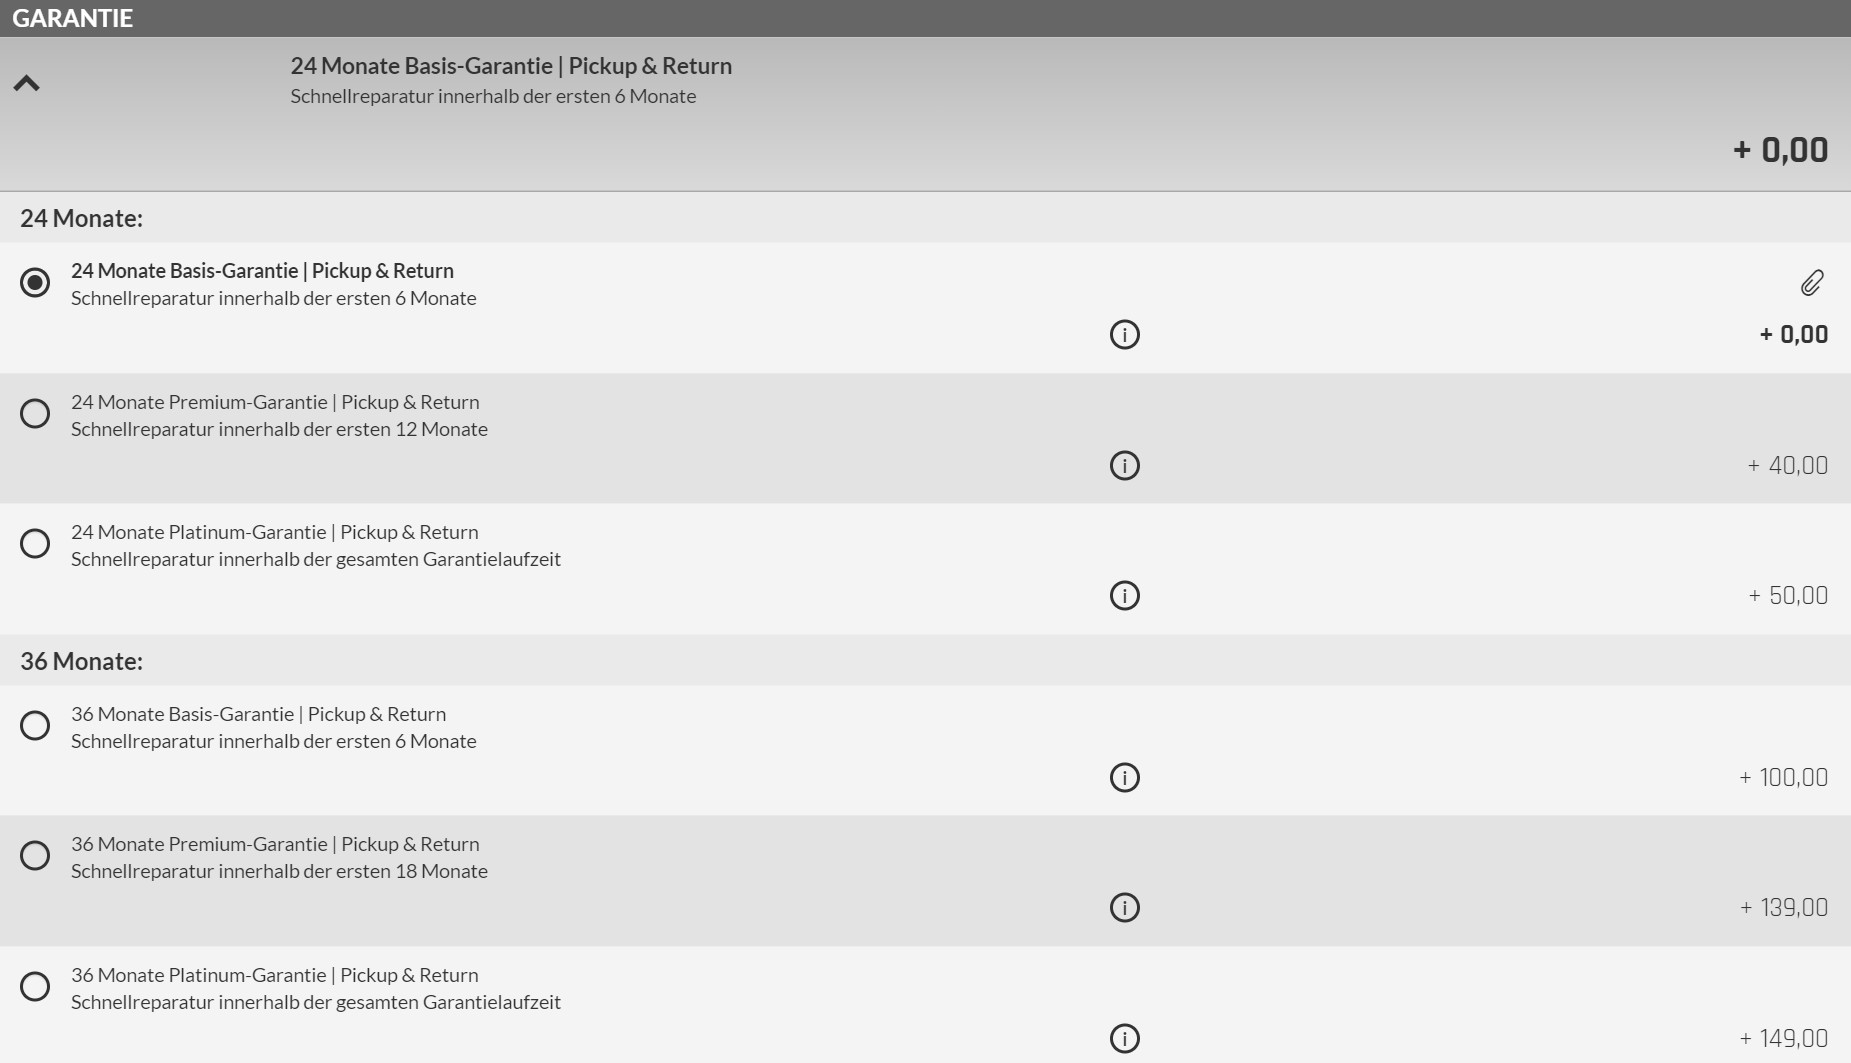
Schenker XMG Neo 17有24个月的基本保修期,包括6个月的快速维修,并提供提货和退货服务。在订购过程中,有各种其他选项。如果支付大约150美元的费用,保修期可以延长到36个月,包括整个期间的快速维修服务。
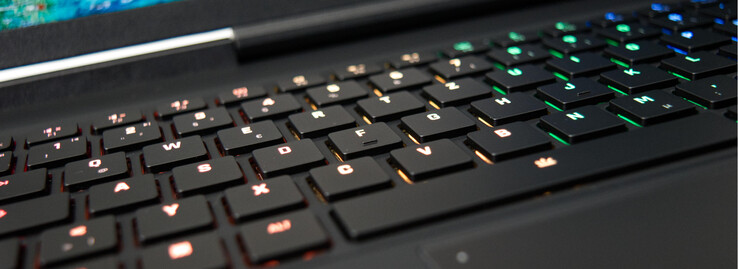
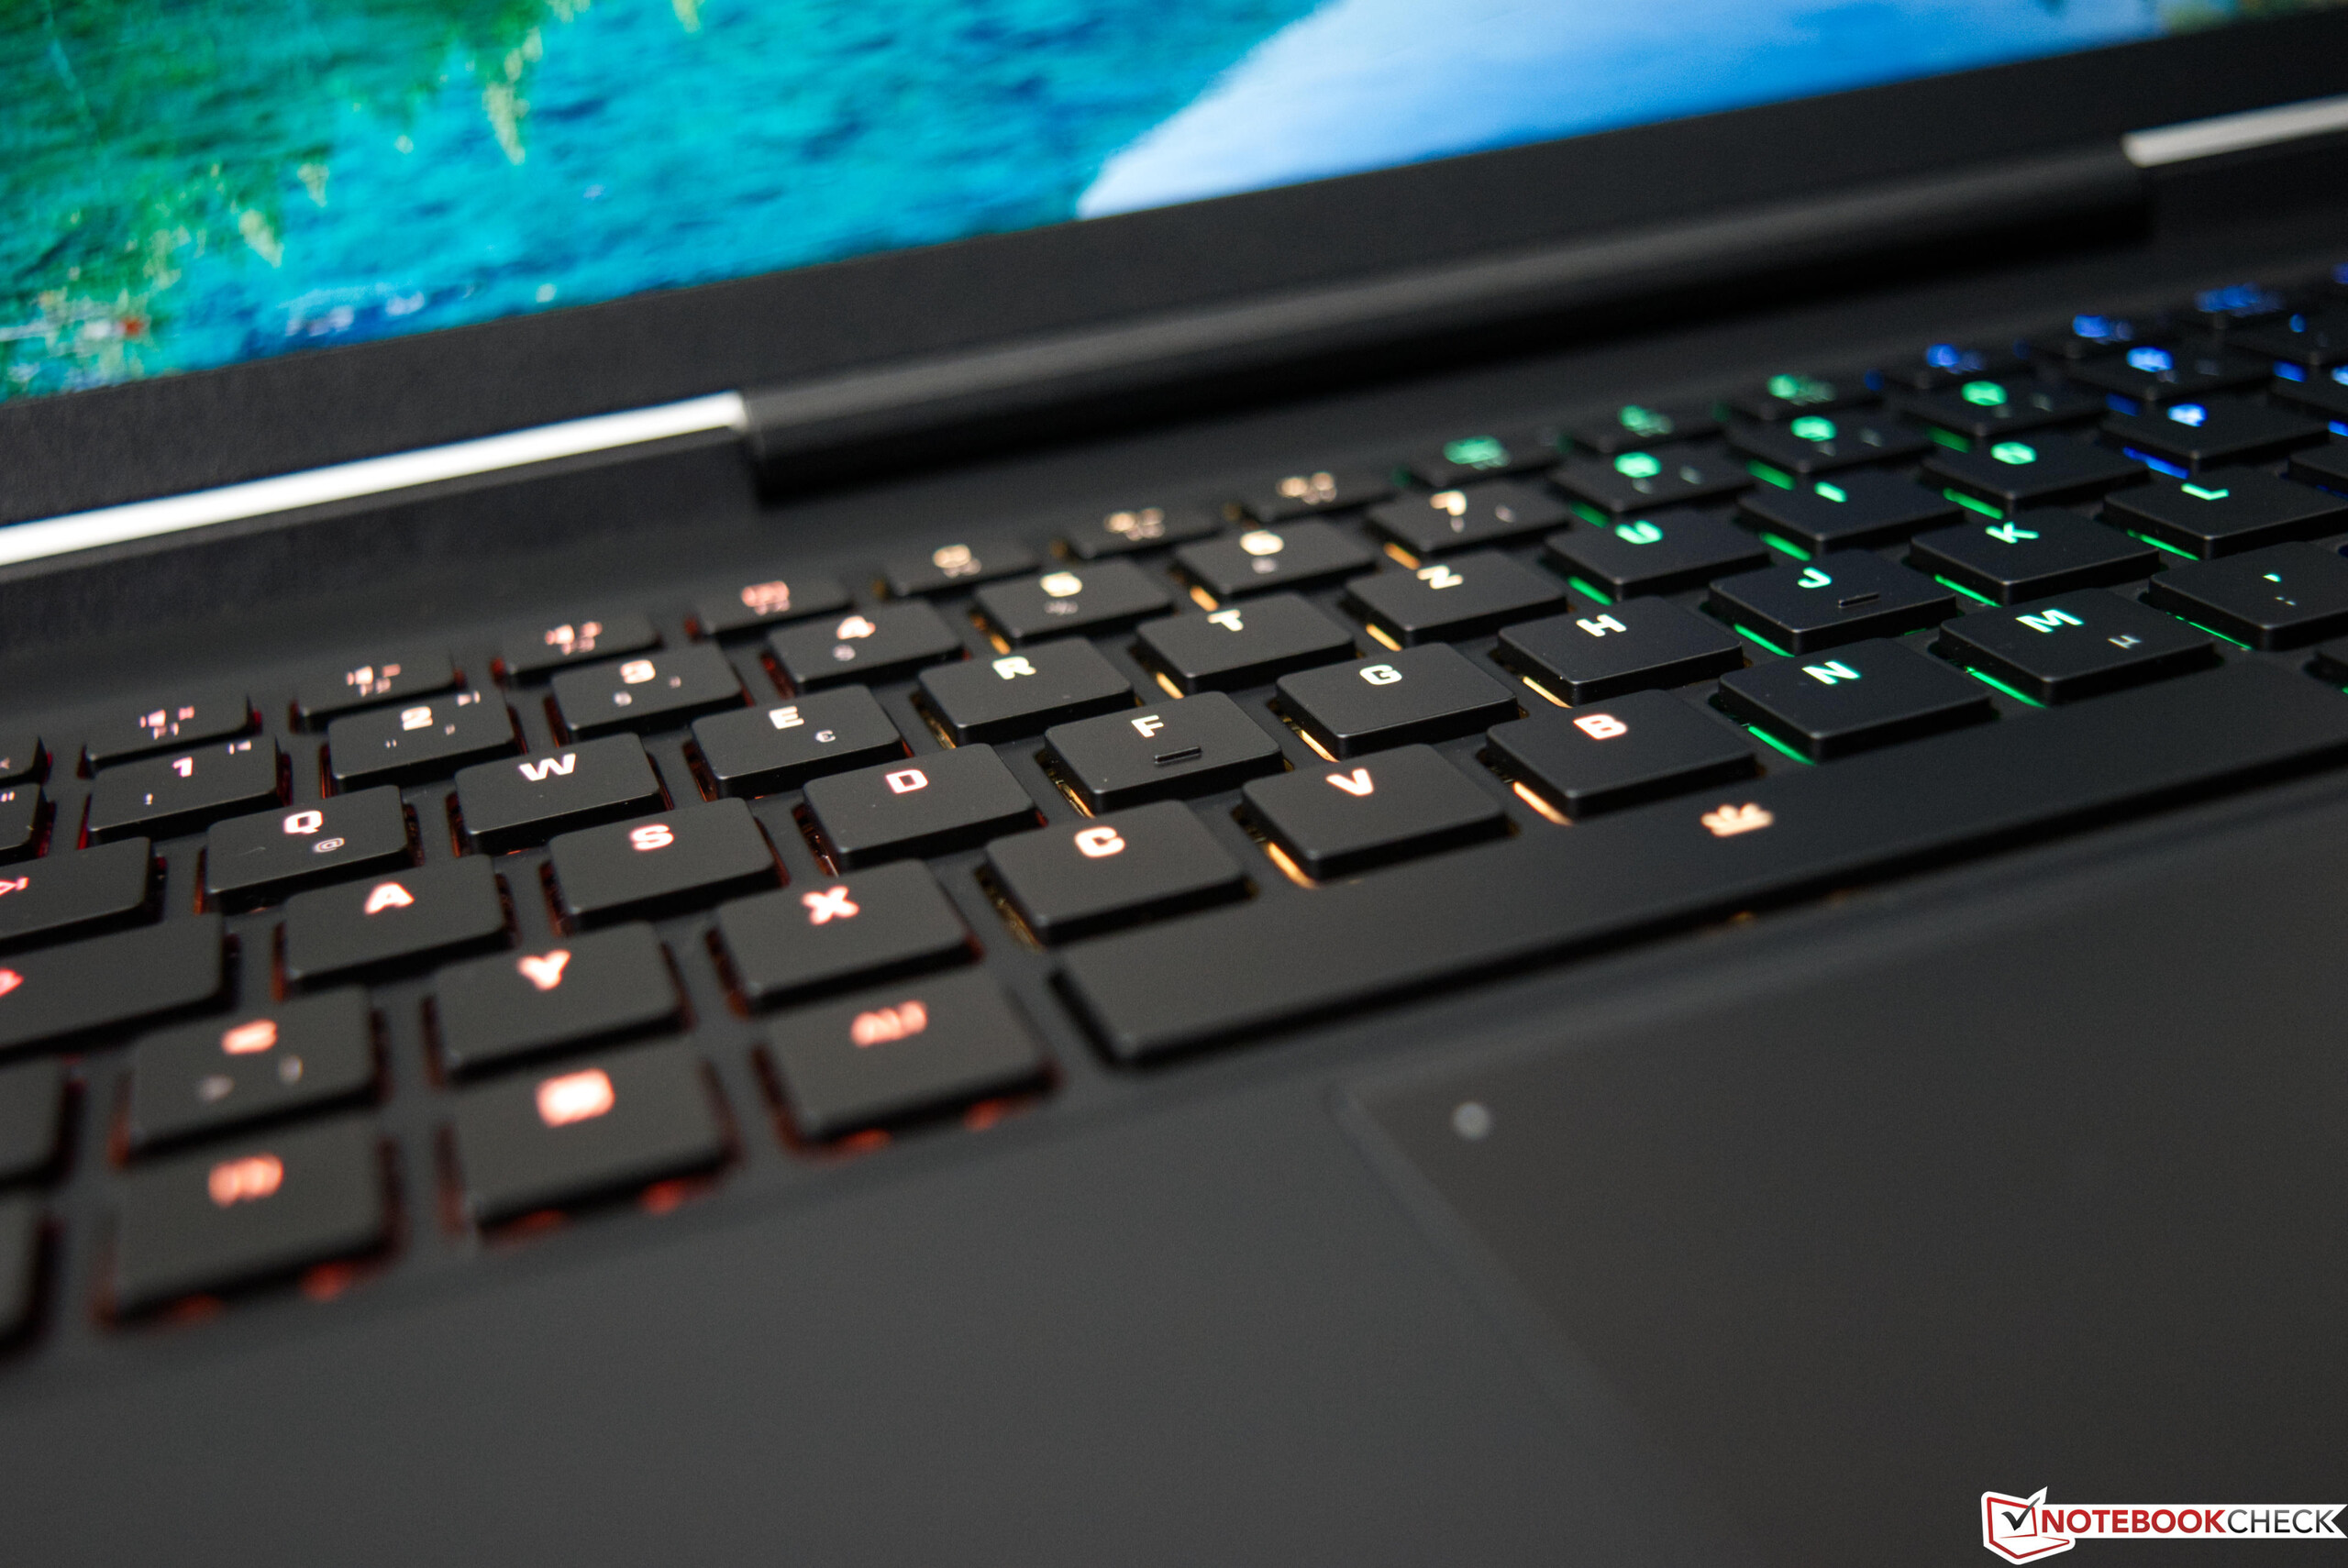
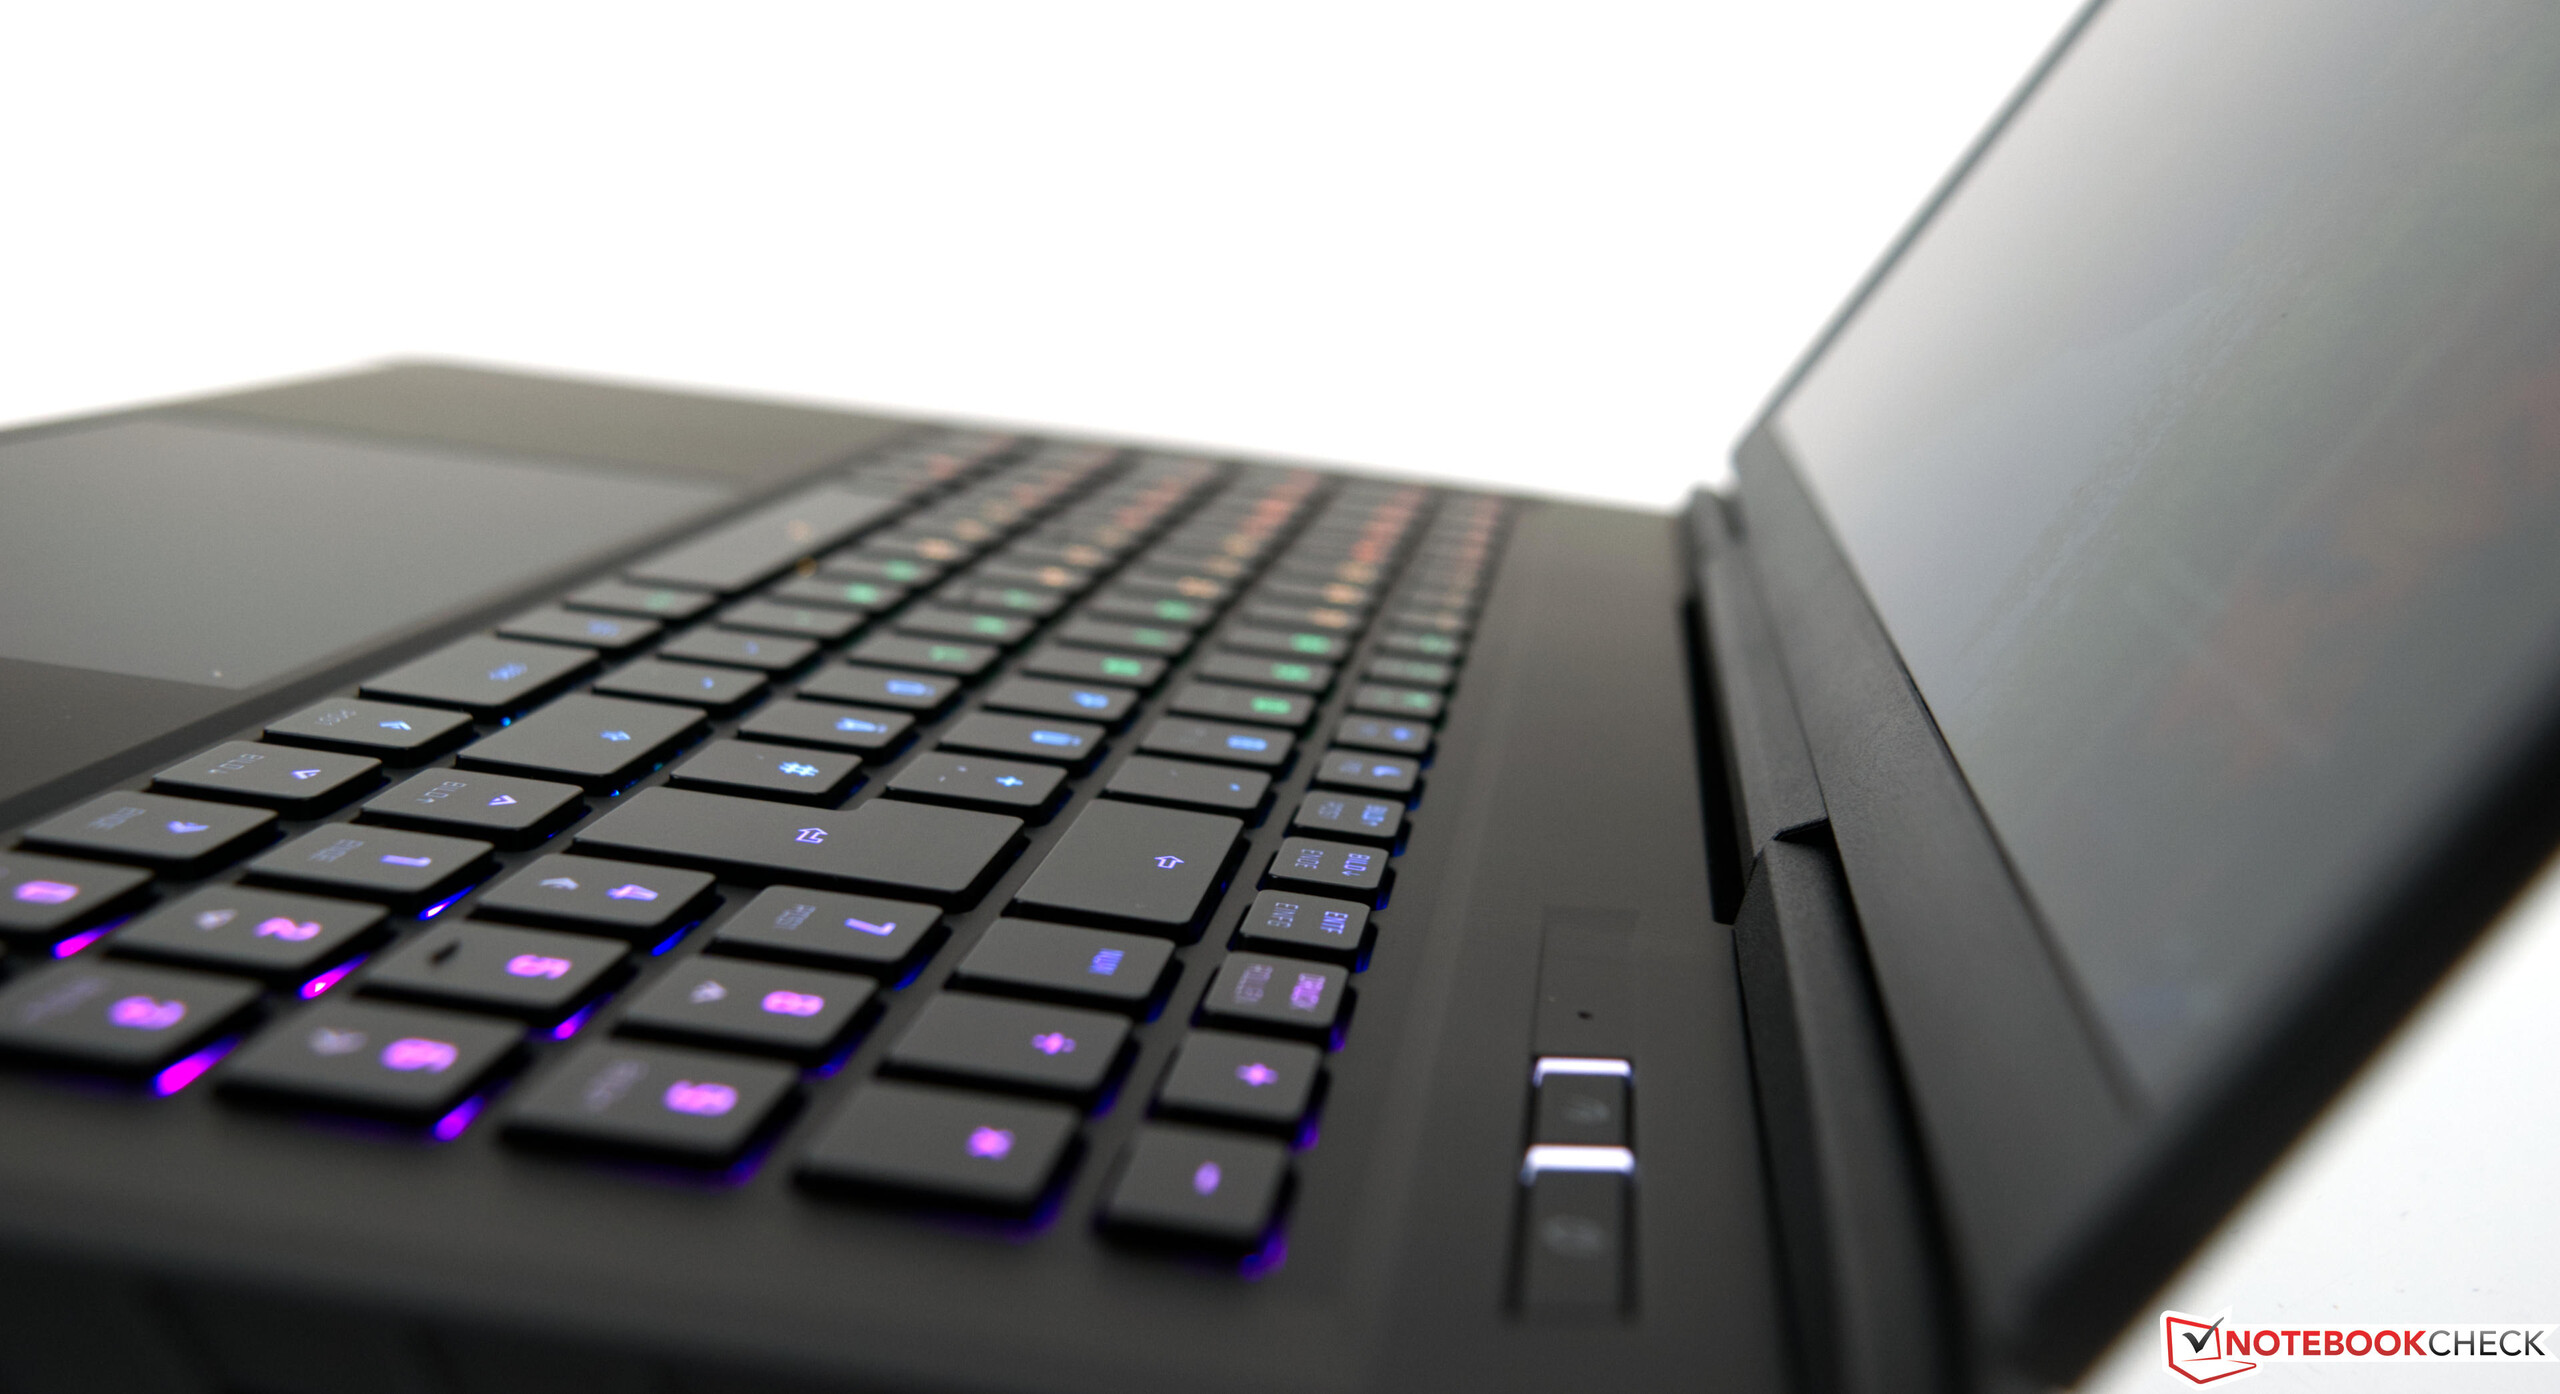
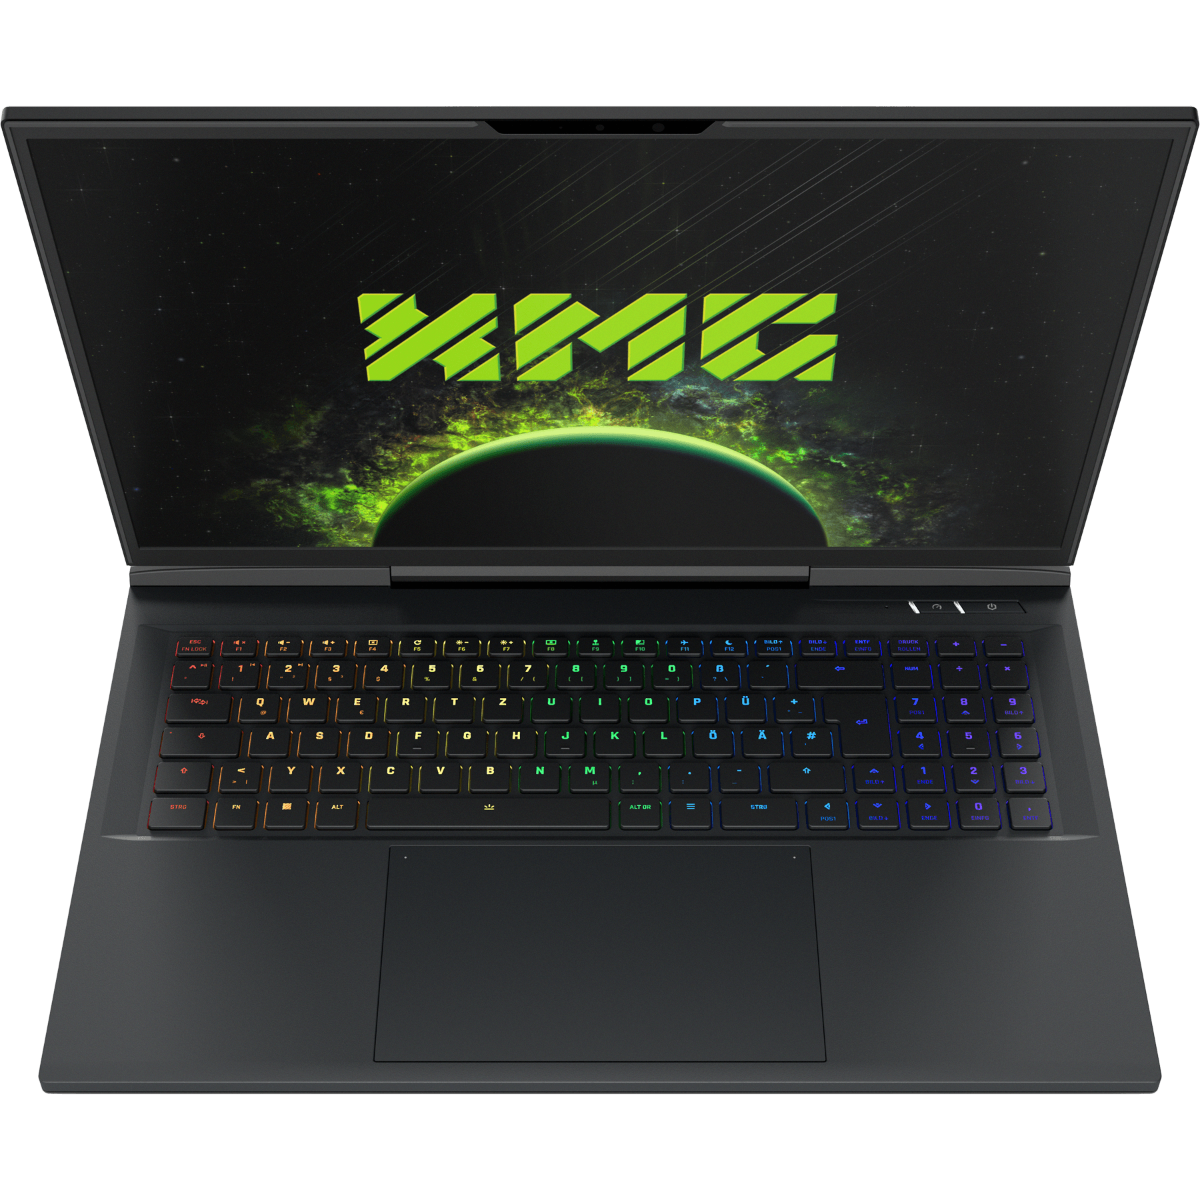
输入设备 - Cherry MX开关 - 但并非适用于所有的按键?
键盘
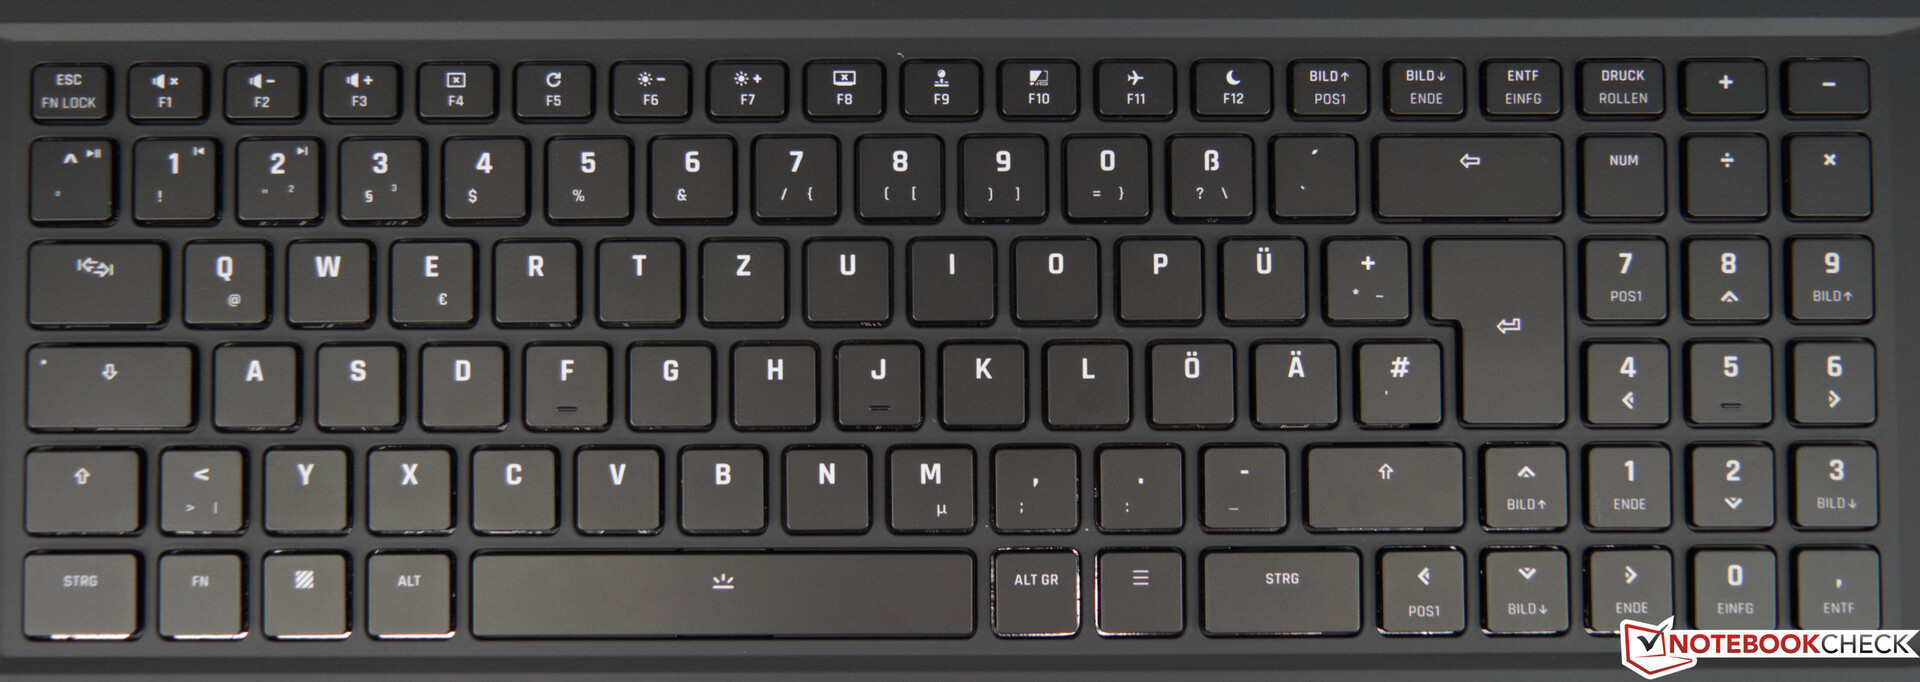
这款17英寸笔记本电脑拥有一个基于Cherry MX开关的机械键盘。它们以其坚固性和极长的寿命而闻名。它们提供了一个只有1.8毫米的浅行程和一个明显的启动点,以获得良好的整体反馈。由于按键没有被阻尼,所以在打字时没有海绵状的感觉。机械键盘很少能提供安静的按键声响。这对XMG Neo 17来说也是如此。用户应该确定自己对明显的点击声的偏好和容忍度。那些喜欢安静的键盘的人可能想去别的地方看看。
对于Schenker为什么不在所有的按键上使用Cherry MX开关,有一个合理的解释。由于空间限制,第一行的半高键不能使用机械开关。这就留下了小键盘,它也依赖于标准的橡胶圆顶开关。根据制造商的说法,做出这个决定是为了减轻重量和降低成本。从声学上看,传统的开关明显更安静,而且特有的橡胶圆顶键的按压感觉有些受阻,尽管这种行为在这种情况下并不太明显。
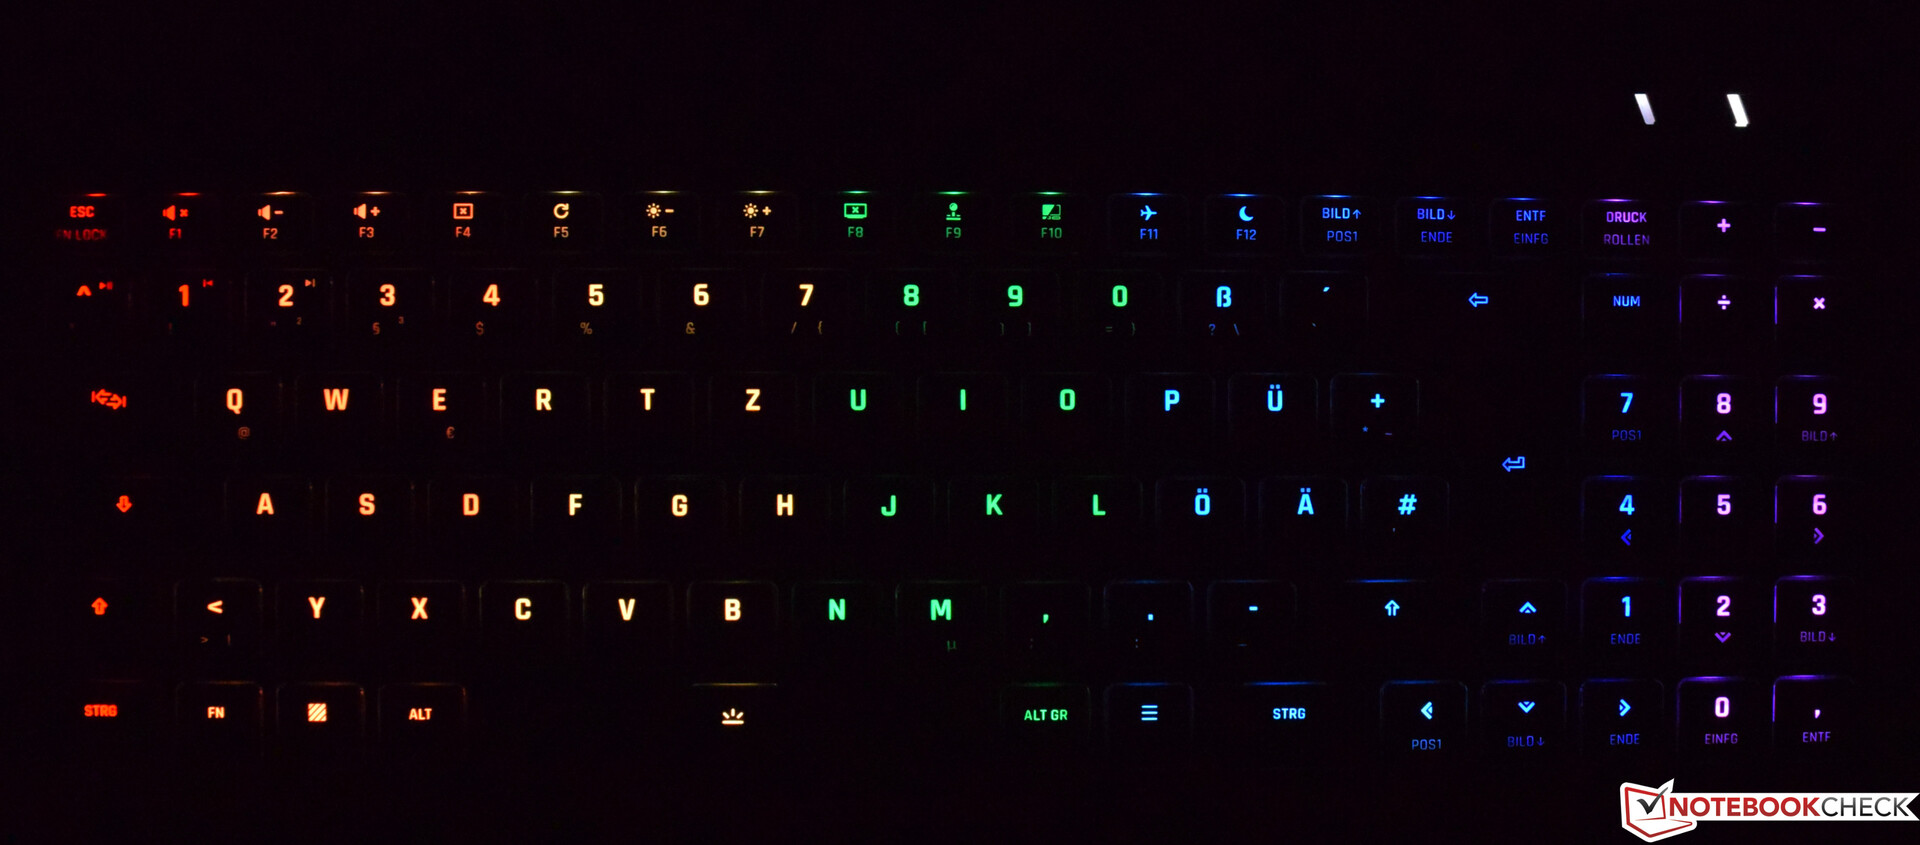
键盘的背光可以通过控制中心进行调整。用户能够在各种效果和整个调色板之间进行选择。
触摸板
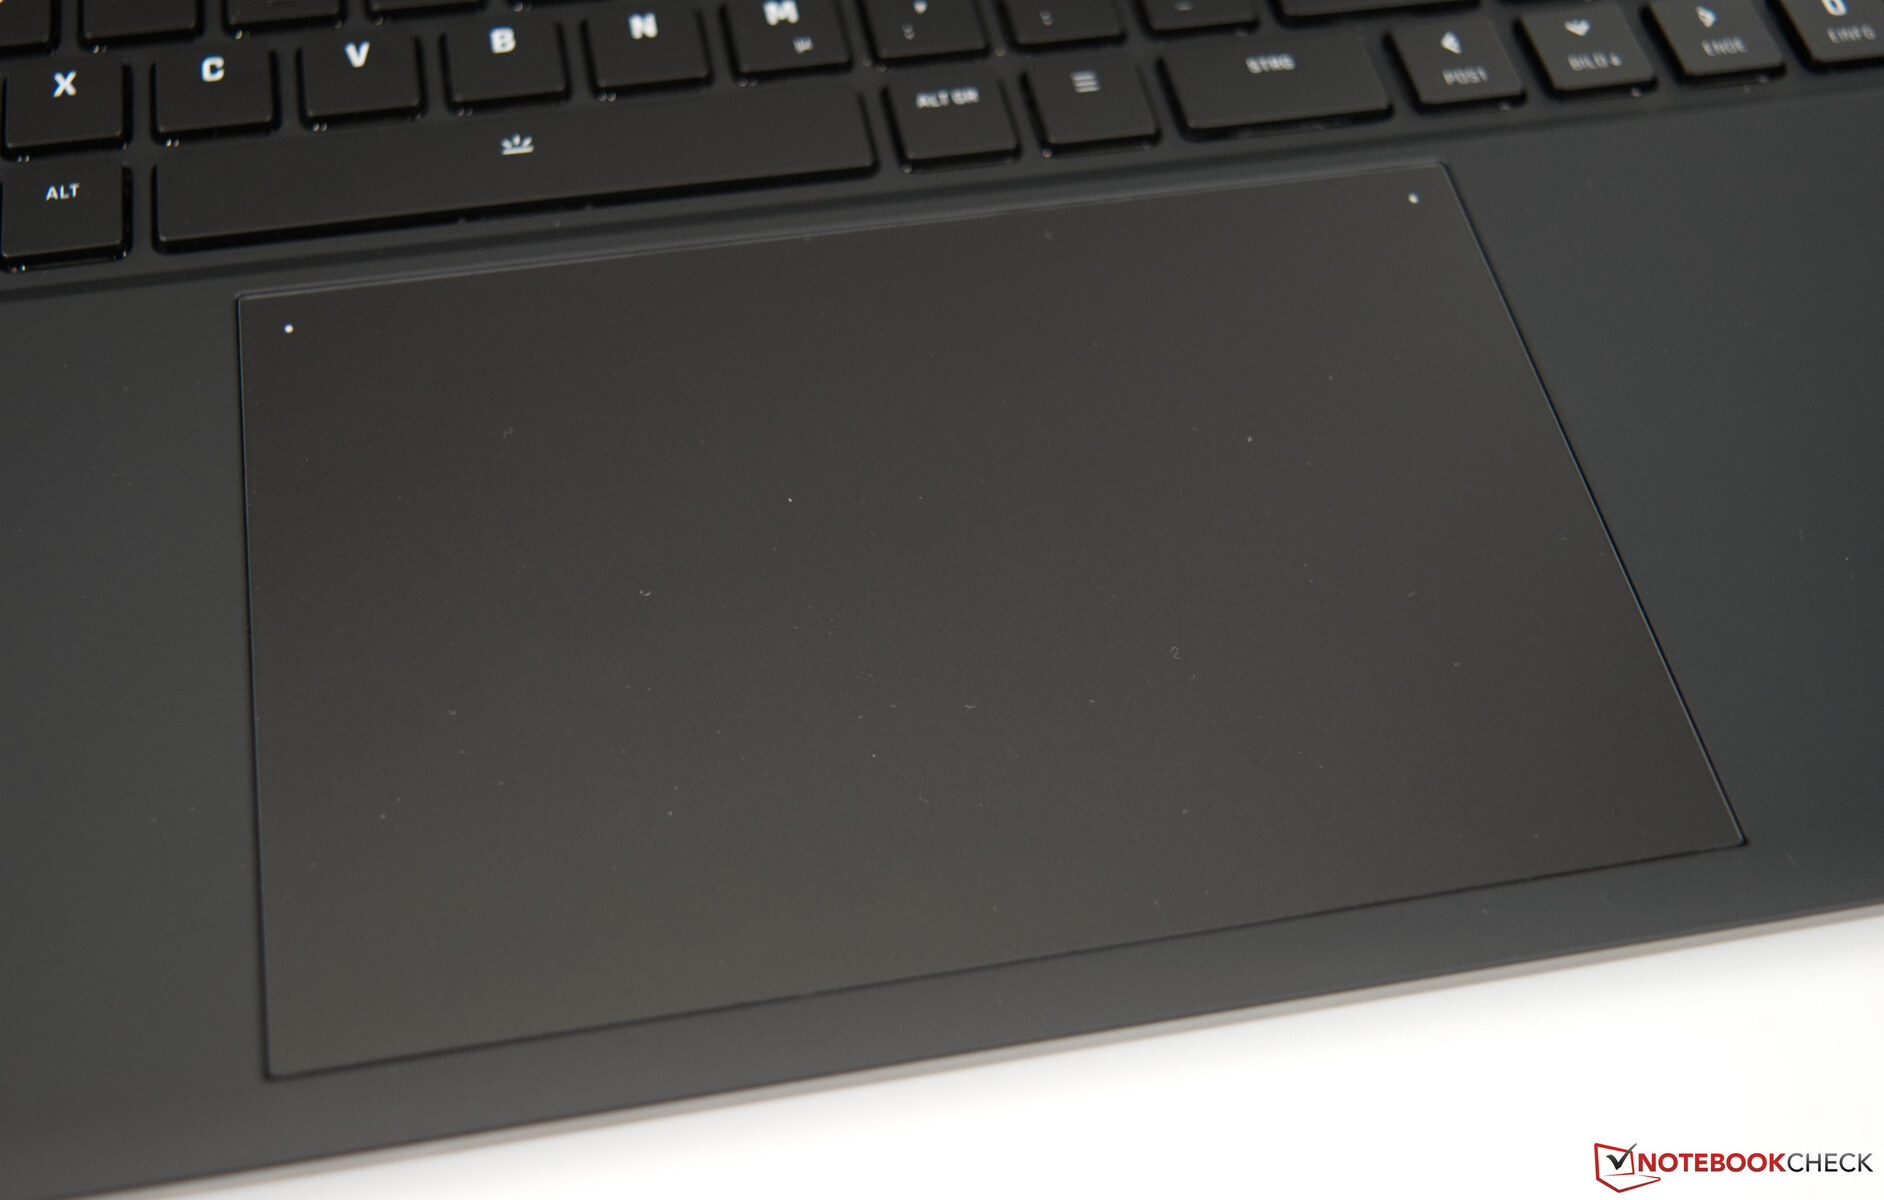
触摸板的尺寸为15.5 x 10厘米,非常大,对某些用户来说甚至可能太大。为了解决这个问题,输入面的右侧可以被禁用。在这种情况下,没有视觉或触觉线索显示触摸板的尽头。完全不需要点击板的用户也可以完全禁用它。这可以通过按两次左上角附近的白点来实现。玻璃表面经过轻微的磨砂处理,在手指出汗的情况下,用户体验会稍微舒适一些。我们在点击板靠近边缘的地方遇到了一个小问题,即点击板的反应能力。虽然这时它的反应会比较迟钝,但它的大尺寸大多可以弥补这一缺陷。键盘底部的两个按钮工作良好,提供相对安静的点击。
显示屏 - 240赫兹和16:10外形尺寸
Schenker XMG Neo 17上固定有17英寸240-Hz的IPS面板。16:10的外形尺寸比更常见的16:9的外形尺寸有一些优势,尤其是在生产力方面。
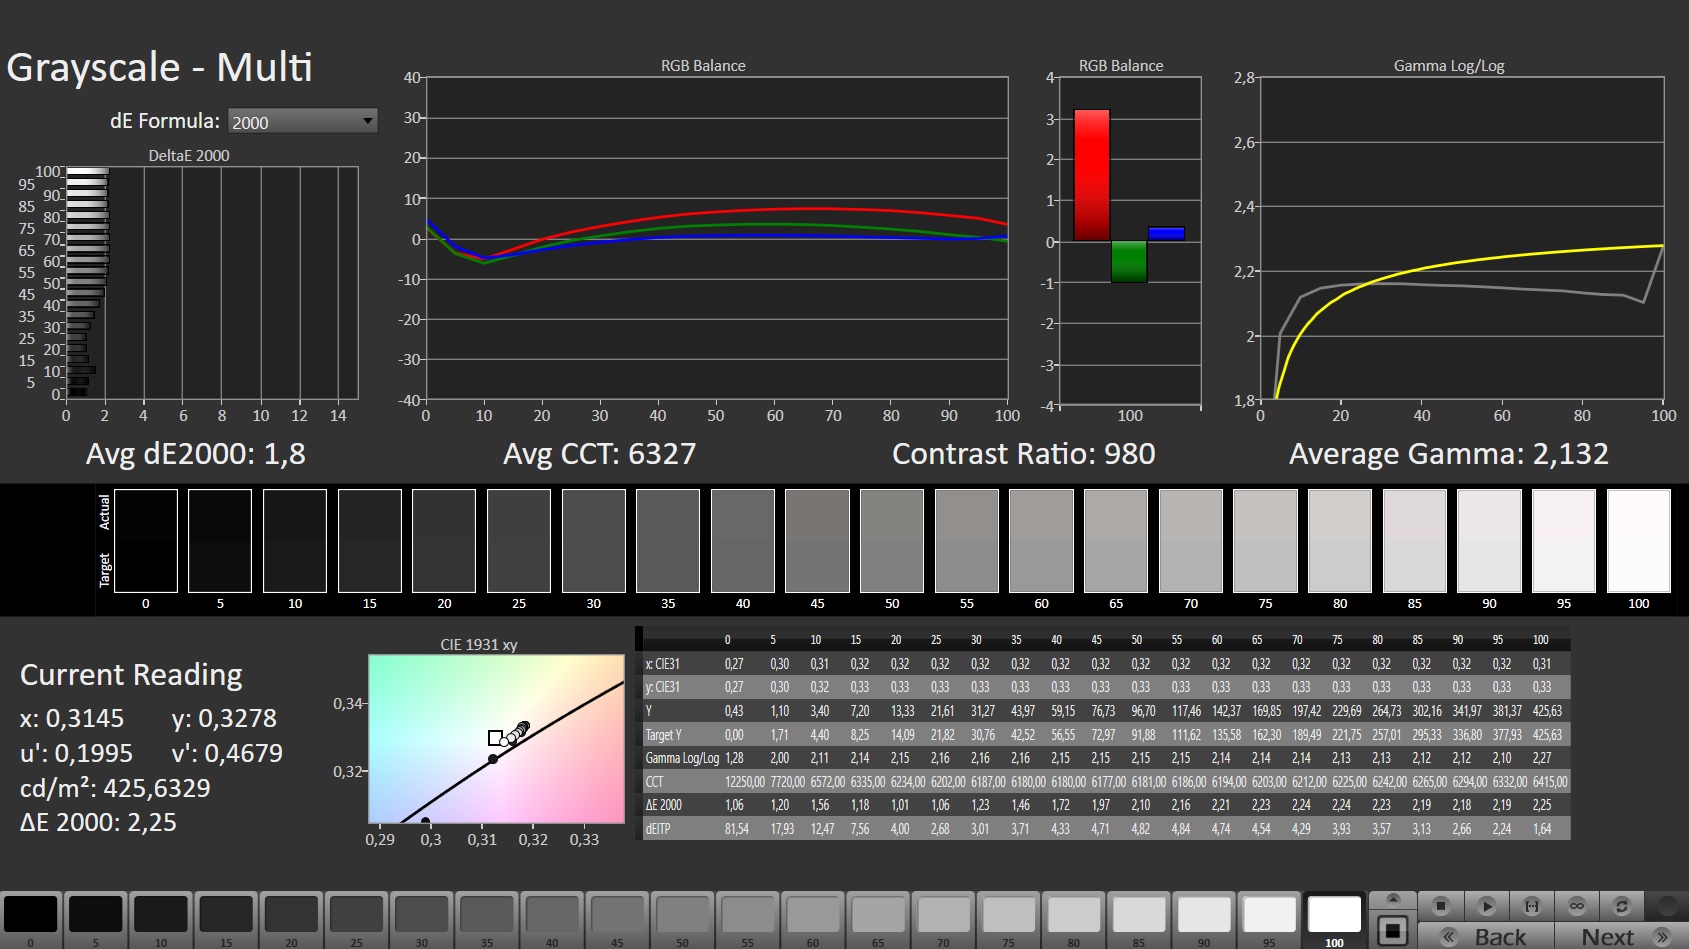
虽然根据我们的测量,该面板达到了399尼特的良好亮度水平,但一些竞争对手能够产生更好的结果。公平地说,我们的测量值稍微超过了XMG Neo 17的规格(数据表:380尼特)。对比度在一定程度上受到亮度和黑值的影响,导致比率仅为965:1。与MSI的两个竞争对手相比,这仍然是明显的好。
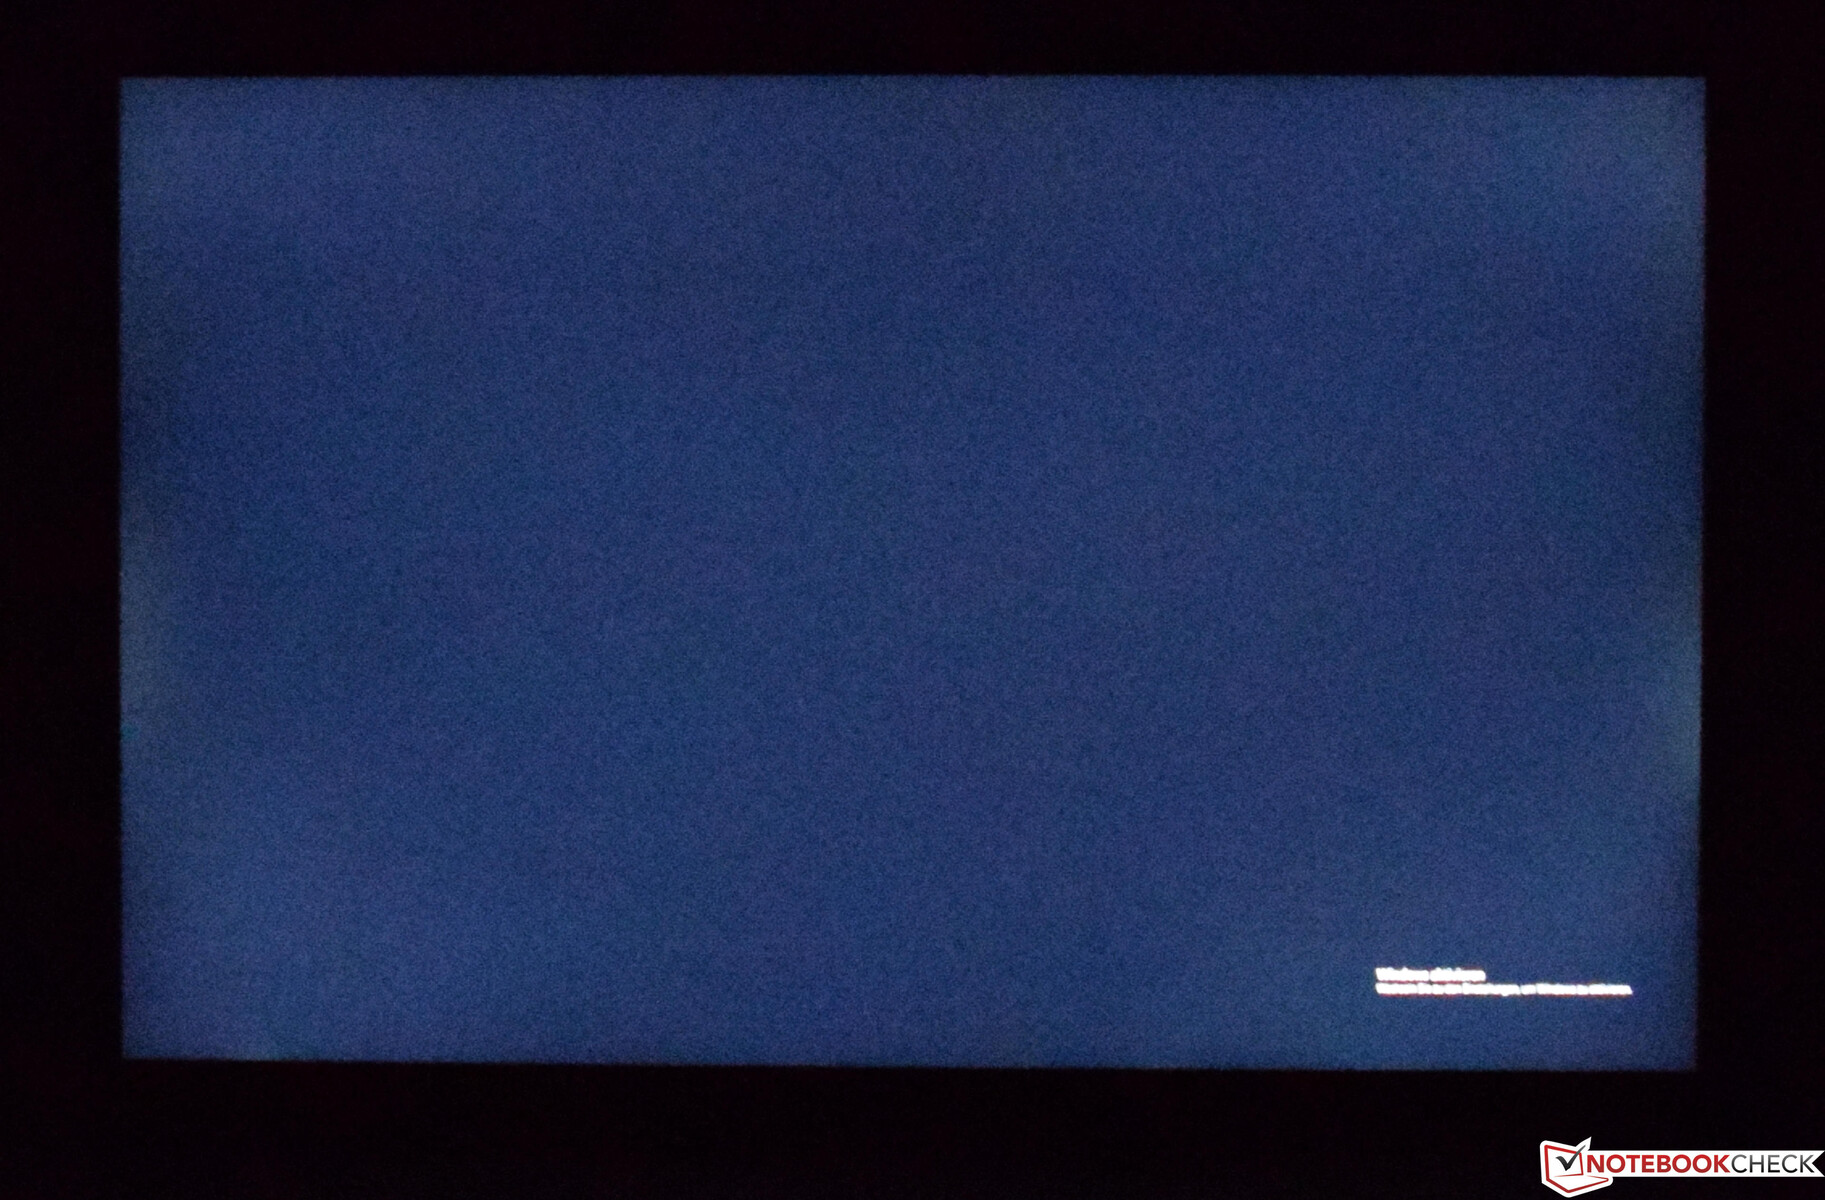
用户不太可能因为使用Schenker XMG Neo 17的PWM而出现眼睛疲劳。然而,有一些轻微的背光渗漏。不过,它只在靠近边缘的黑暗场景中变得明显。
| |||||||||||||||||||||||||
Brightness Distribution: 90 %
Center on Battery: 415 cd/m²
Contrast: 965:1 (Black: 0.43 cd/m²)
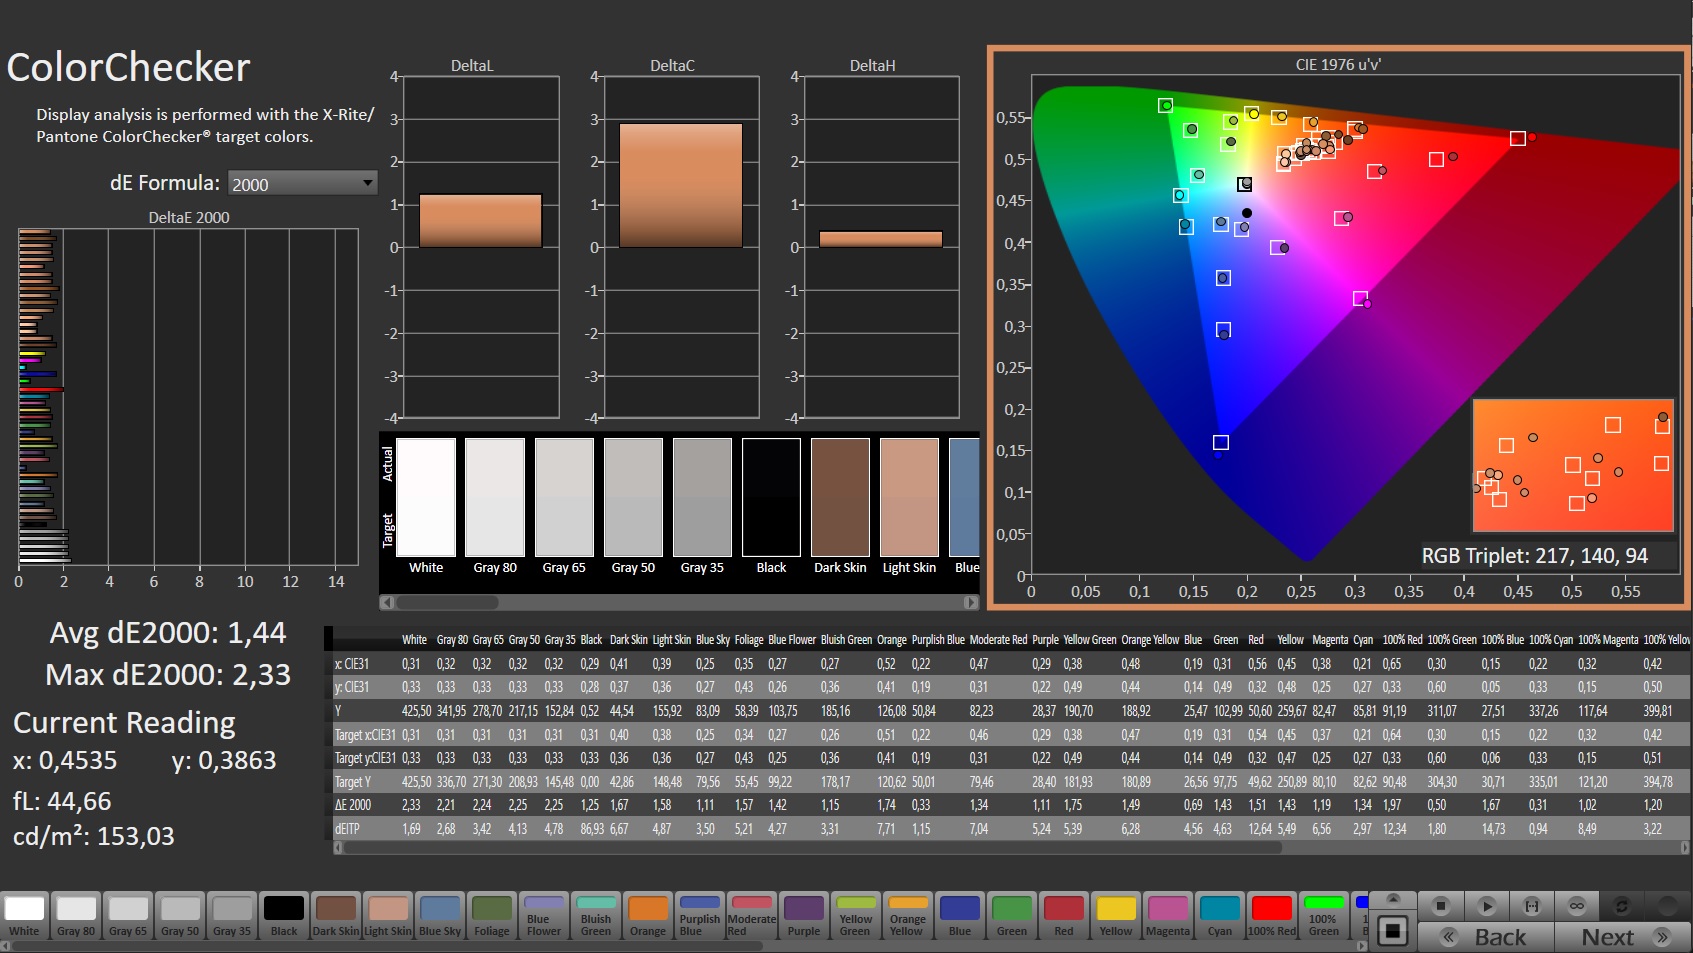
ΔE ColorChecker Calman: 1.44 | ∀{0.5-29.43 Ø4.71}
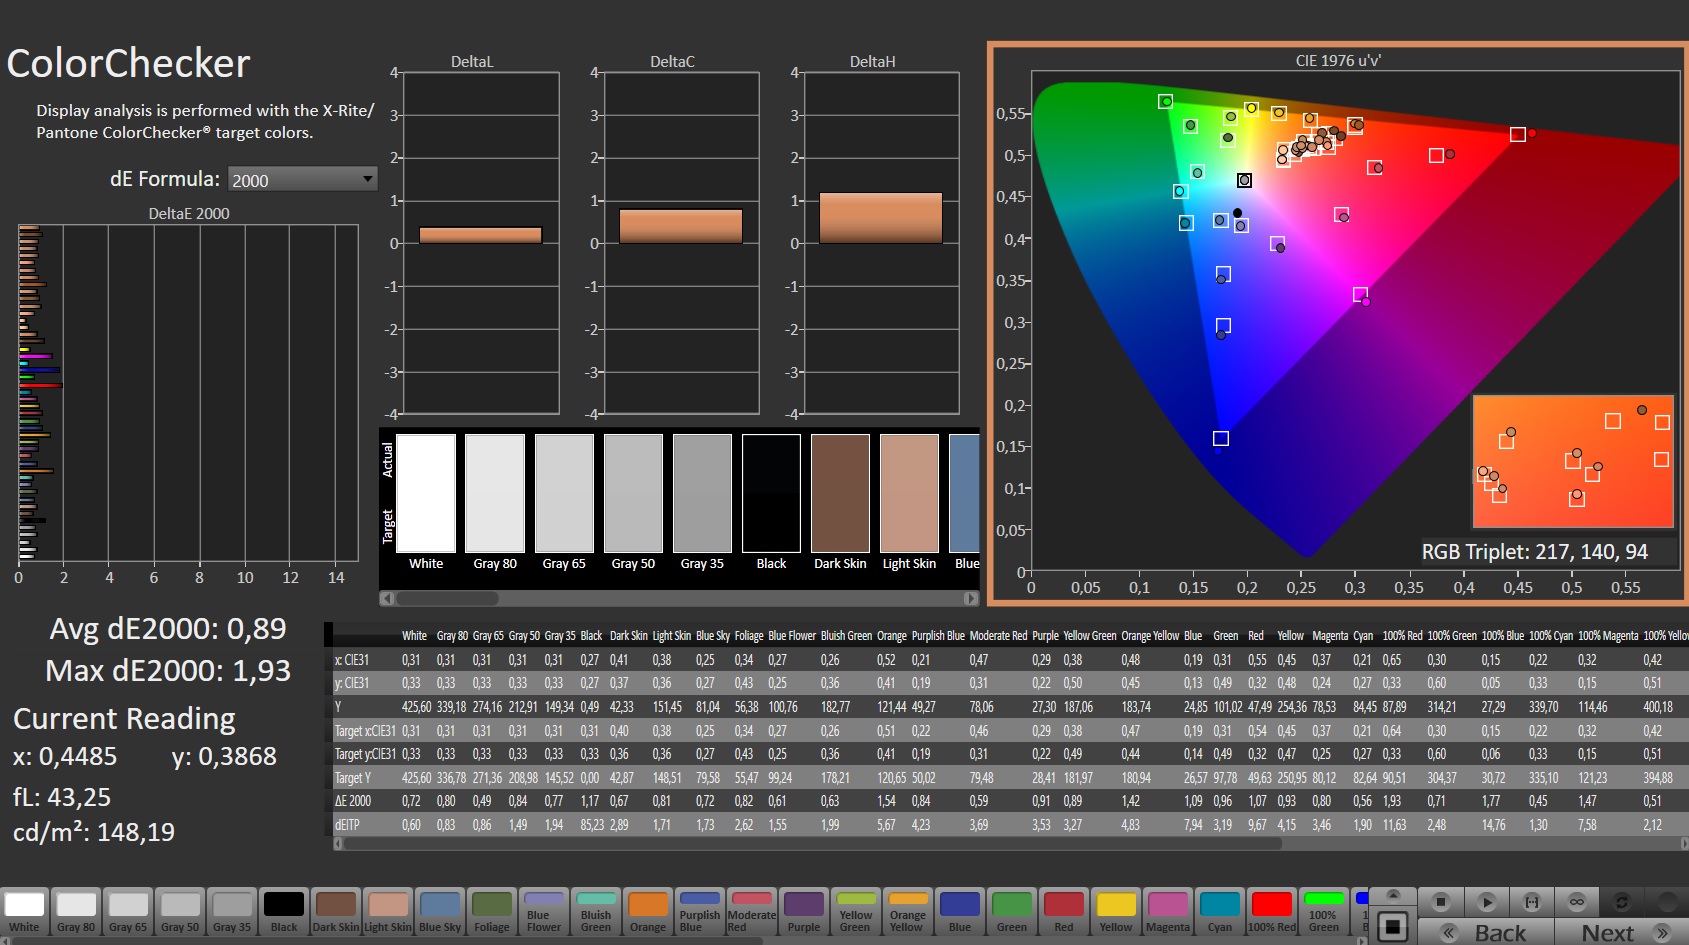
calibrated: 0.89
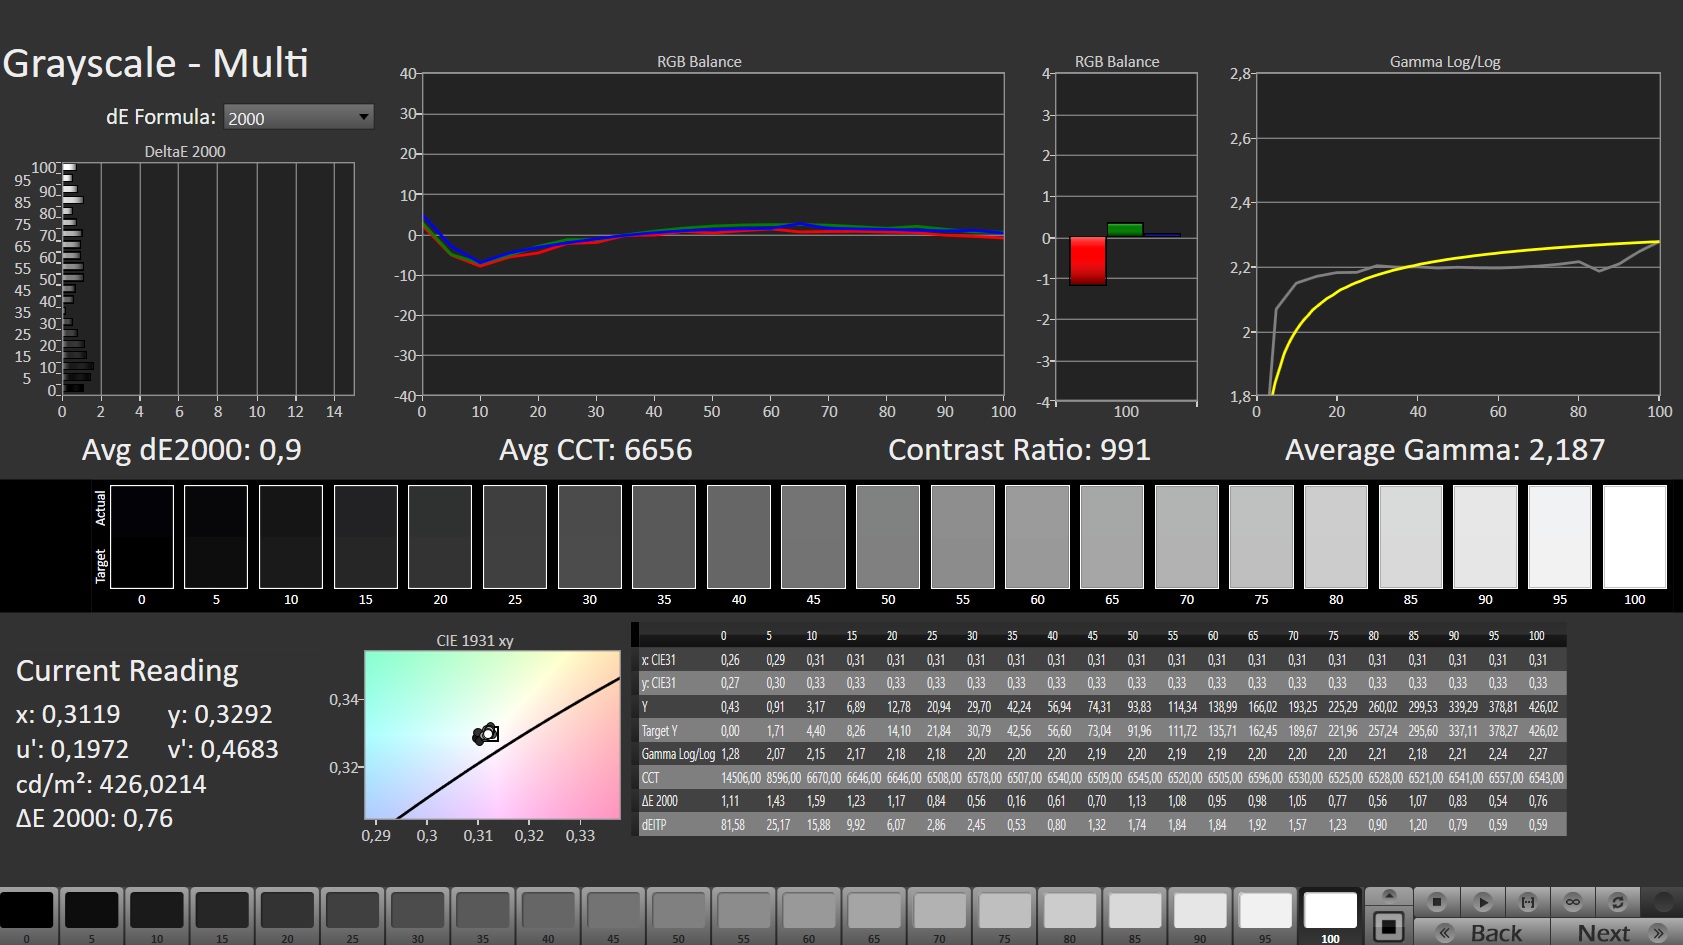
ΔE Greyscale Calman: 1.8 | ∀{0.09-98 Ø4.96}
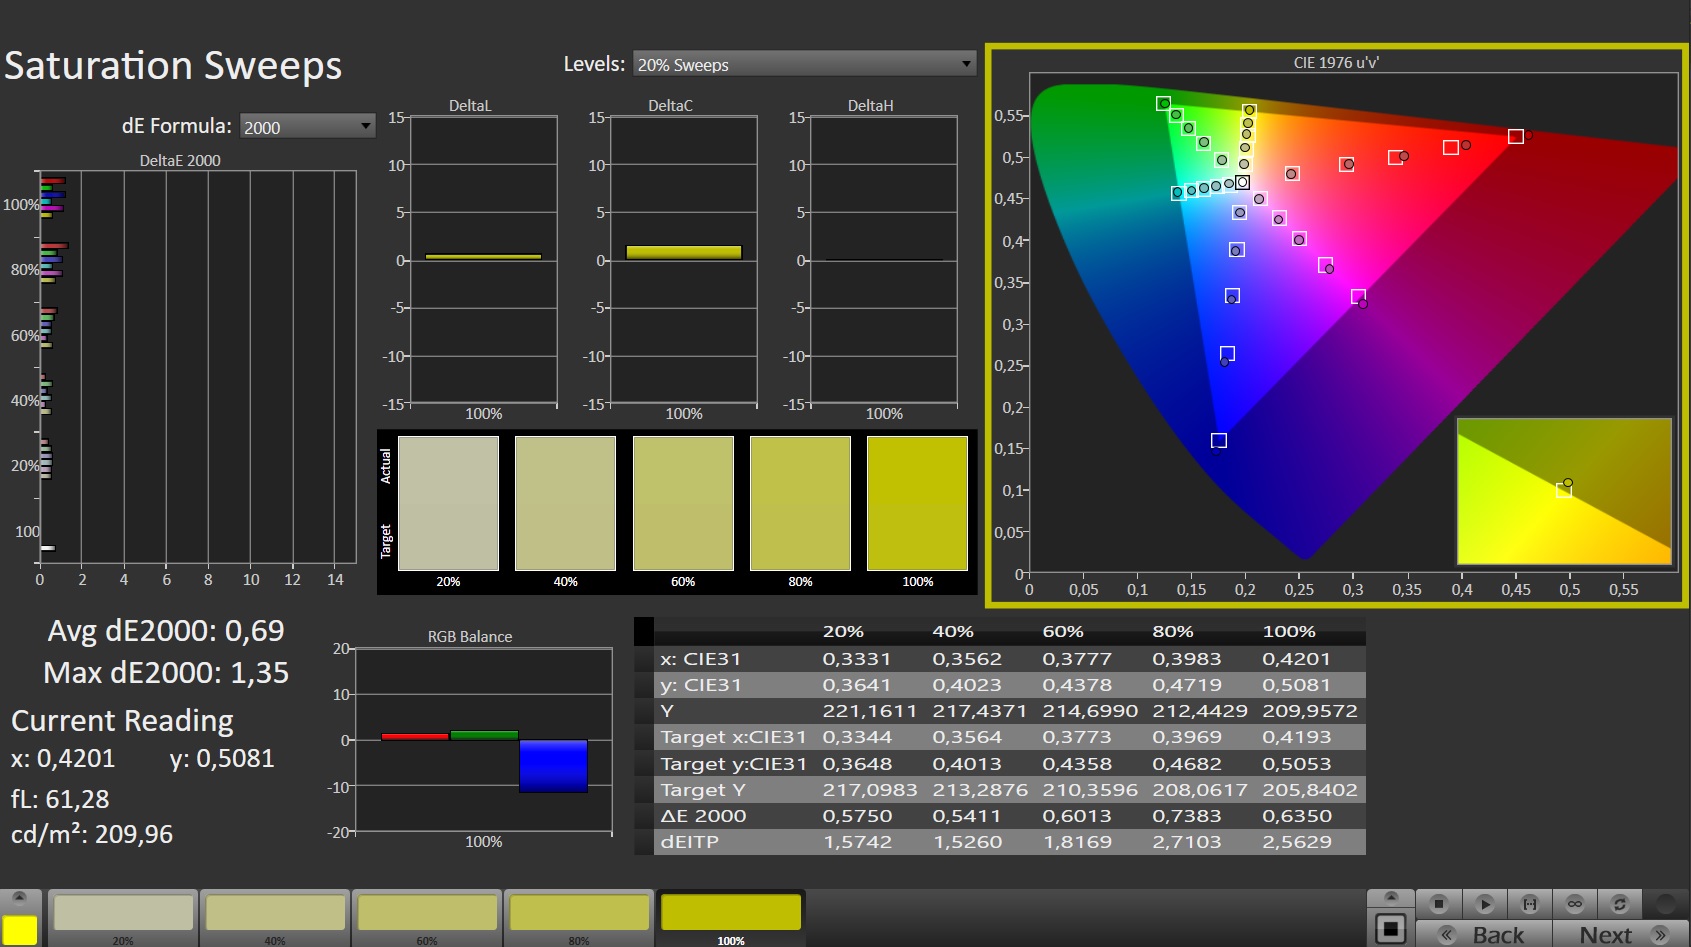
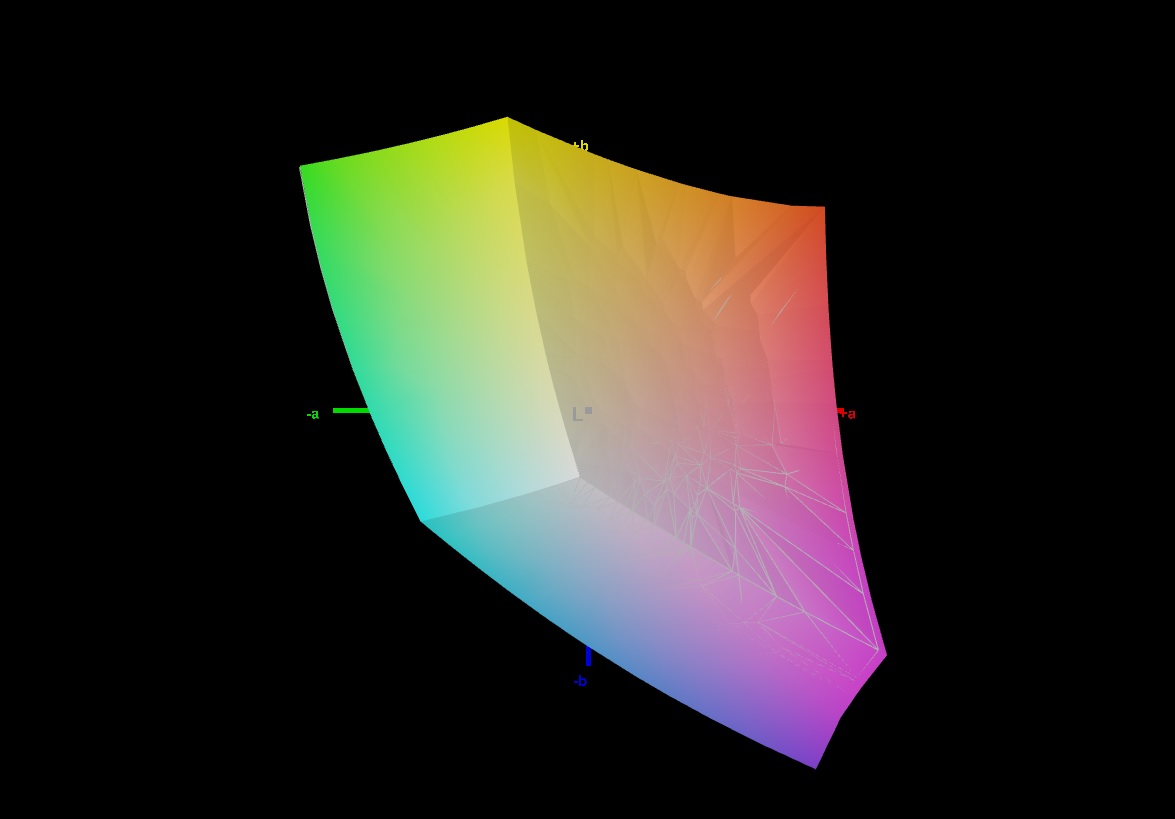
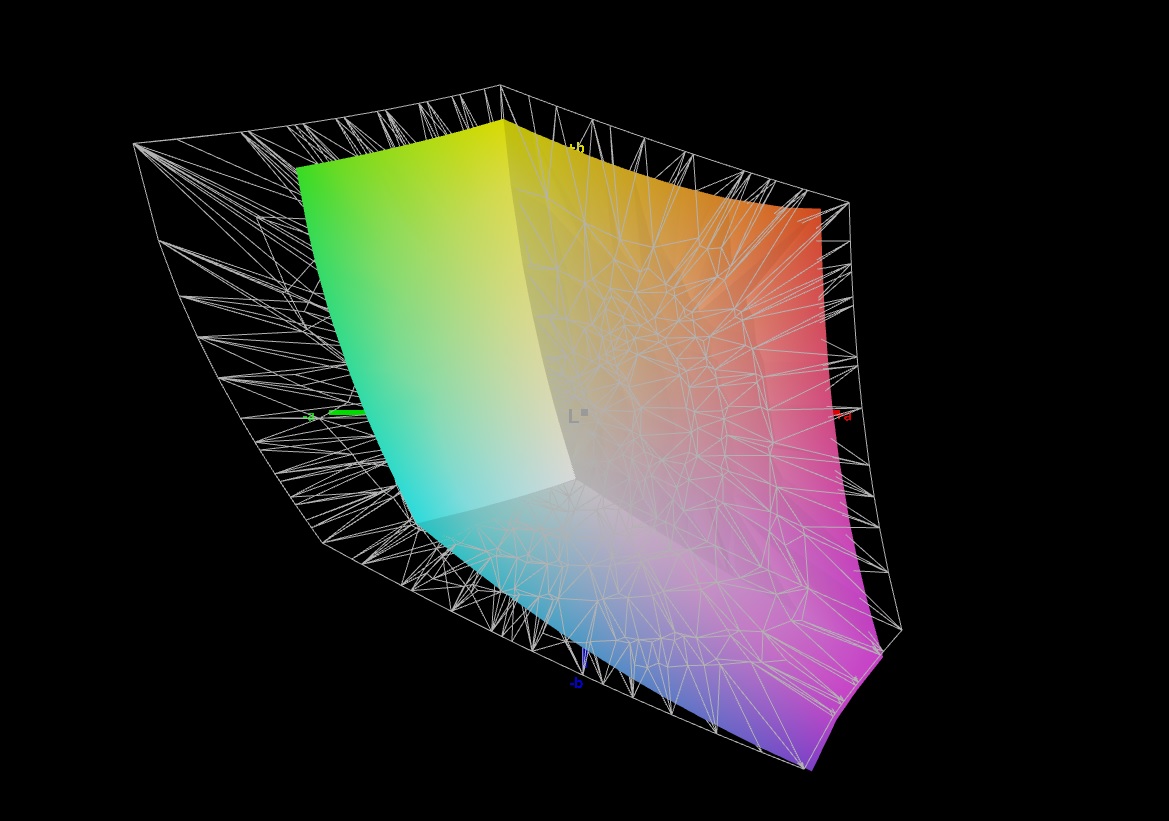
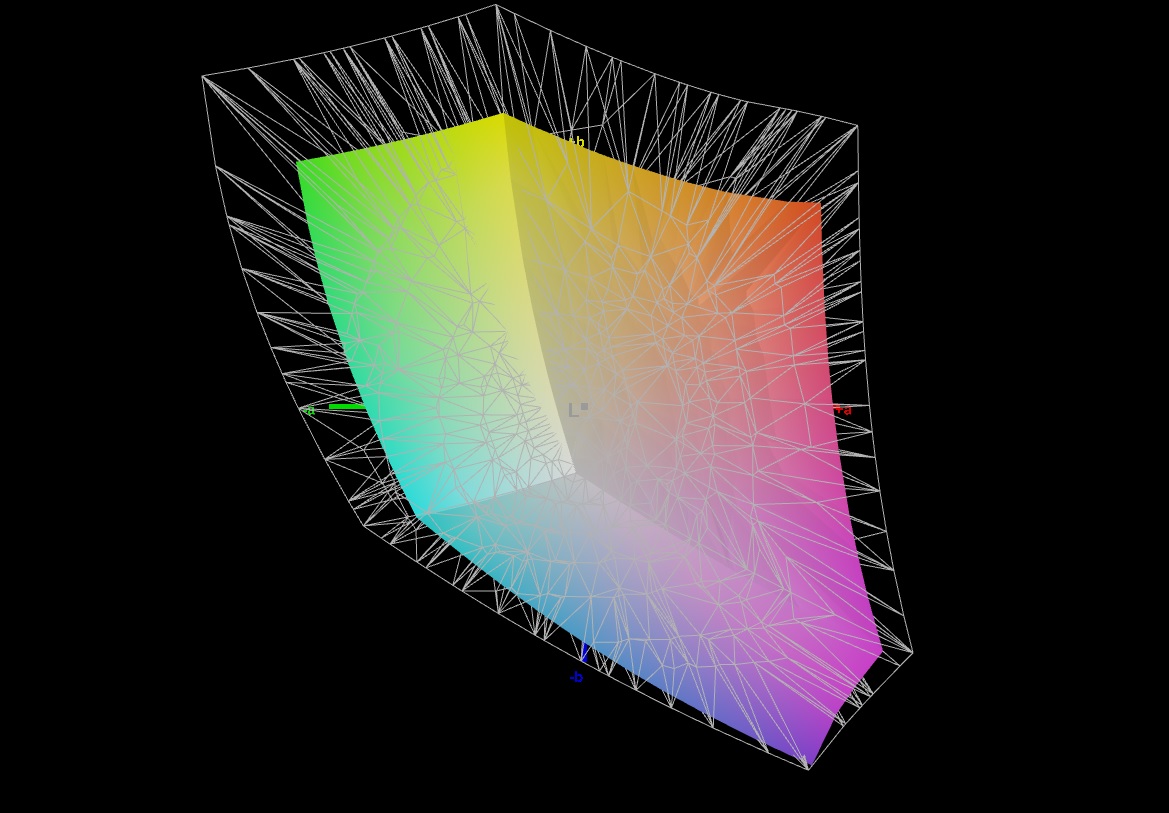
69.6% AdobeRGB 1998 (Argyll 3D)
99.8% sRGB (Argyll 3D)
69% Display P3 (Argyll 3D)
Gamma: 2.132
CCT: 6327 K
| Schenker XMG Neo 17 M22 BOE0A99, IPS, 2560x1600, 17" | MSI Titan GT77 12UHS Sharp SHP1544 LQ173M1JW08, IPS-Level, 1920x1080, 17.3" | Razer Blade 17 Early 2022 AU Optronics B173ZAN06.9, IPS, 3840x2160, 17.3" | Acer Predator Triton 500 SE PT516-52s-70KX NE160QDM-NZ2, IPS LED, 2560x1600, 16" | Asus ROG Zephyrus Duo 16 GX650RX BOE NE160QAM-NX1, IPS-Level, 3840x2400, 16" | MSI Raider GE77 HX 12UHS AU Optronics B173ZAN06.1, IPS, 3840x2160, 17.3" | |
|---|---|---|---|---|---|---|
| Display | 2% | 23% | 21% | 22% | 21% | |
| Display P3 Coverage (%) | 69 | 70.8 3% | 99.4 44% | 97.3 41% | 98 42% | 96.6 40% |
| sRGB Coverage (%) | 99.8 | 98.9 -1% | 100 0% | 100 0% | 99.9 0% | 99.8 0% |
| AdobeRGB 1998 Coverage (%) | 69.6 | 73 5% | 87.3 25% | 84.9 22% | 86.3 24% | 85.8 23% |
| Response Times | 43% | 20% | -17% | -14% | 27% | |
| Response Time Grey 50% / Grey 80% * (ms) | 10.8 ? | 3.03 ? 72% | 7.5 ? 31% | 13.8 ? -28% | 14.6 ? -35% | 5.8 ? 46% |
| Response Time Black / White * (ms) | 6.1 ? | 5.28 ? 13% | 5.6 ? 8% | 6.4 ? -5% | 5.6 ? 8% | 5.6 ? 8% |
| PWM Frequency (Hz) | ||||||
| Screen | -50% | 5% | -7% | -58% | -42% | |
| Brightness middle (cd/m²) | 415 | 280 -33% | 503 21% | 498 20% | 459 11% | 381 -8% |
| Brightness (cd/m²) | 399 | 275 -31% | 486 22% | 468 17% | 434 9% | 371 -7% |
| Brightness Distribution (%) | 90 | 79 -12% | 84 -7% | 80 -11% | 88 -2% | 84 -7% |
| Black Level * (cd/m²) | 0.43 | 0.4 7% | 0.44 -2% | 0.36 16% | 0.44 -2% | 0.52 -21% |
| Contrast (:1) | 965 | 700 -27% | 1143 18% | 1383 43% | 1043 8% | 733 -24% |
| Colorchecker dE 2000 * | 1.44 | 2.1 -46% | 1.08 25% | 1.77 -23% | 2.97 -106% | |
| Colorchecker dE 2000 max. * | 2.33 | 5.83 -150% | 4.54 -95% | 5.24 -125% | 8.13 -249% | |
| Colorchecker dE 2000 calibrated * | 0.89 | 1.58 -78% | 0.6 33% | 0.63 29% | 1.03 -16% | 2.53 -184% |
| Greyscale dE 2000 * | 1.8 | 3.3 -83% | 1.3 28% | 2.4 -33% | 4.9 -172% | |
| Gamma | 2.132 103% | 2.13 103% | 2.151 102% | 2.14 103% | 2.235 98% | |
| CCT | 6327 103% | 7060 92% | 6541 99% | 7046 92% | 6775 96% | |
| Total Average (Program / Settings) | -2% /
-26% | 16% /
11% | -1% /
-3% | -17% /
-34% | 2% /
-12% |
* ... smaller is better
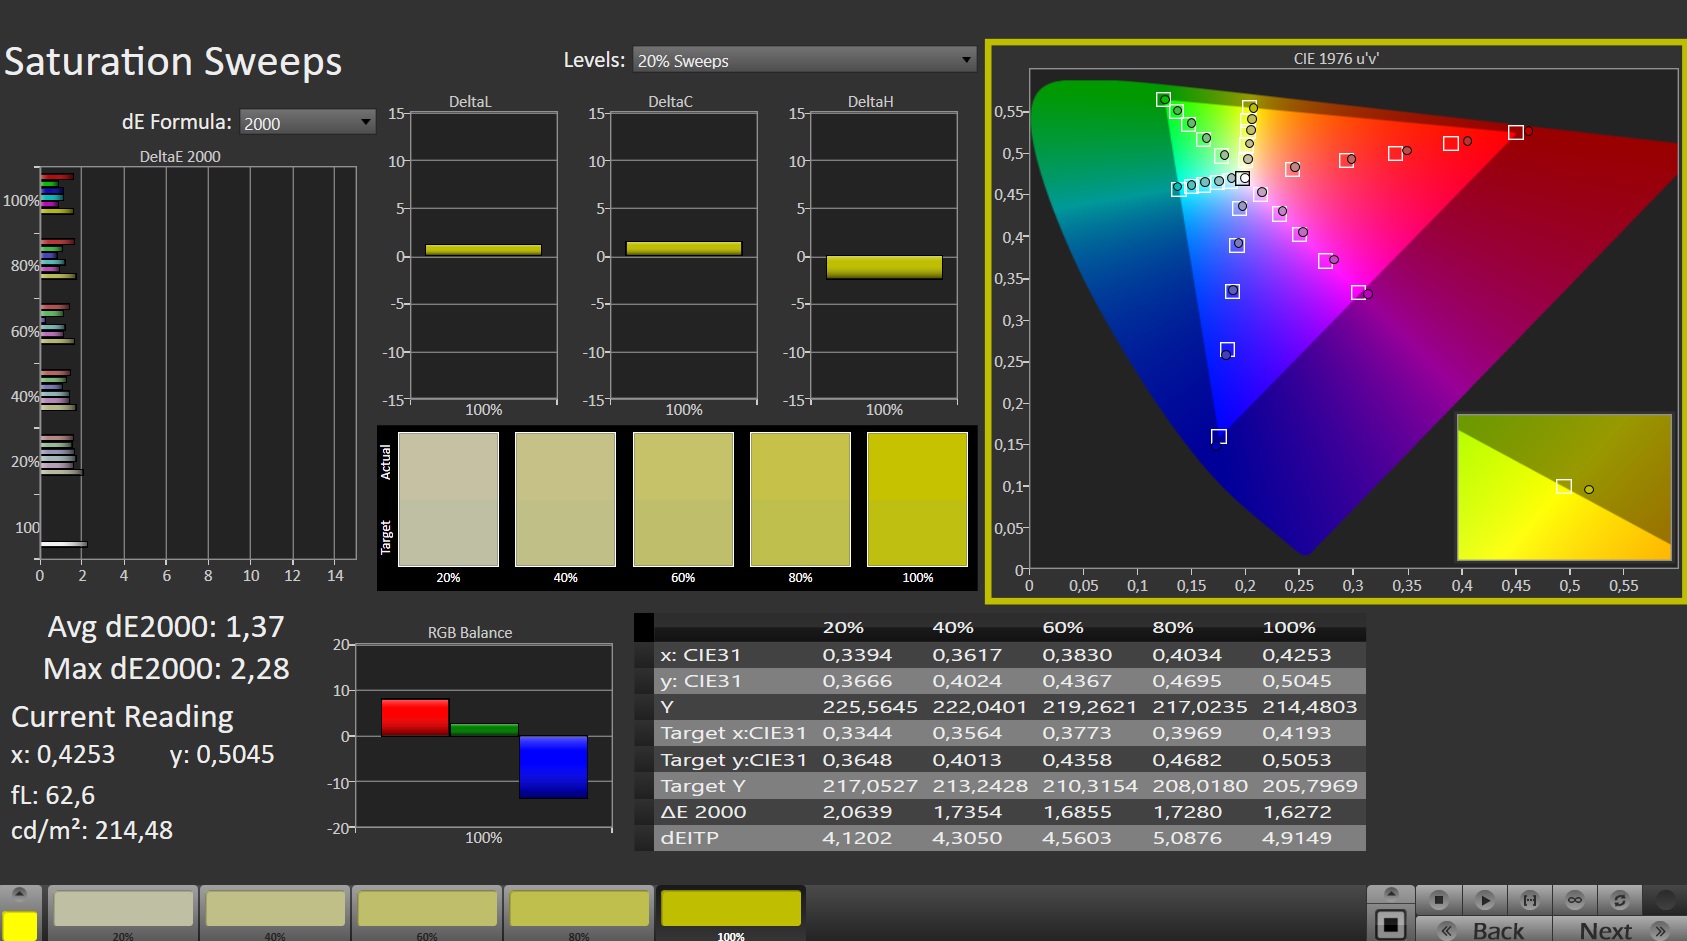
显示质量全面良好,我们没有观察到由于哑光显示层造成的颗粒感。此外,我们的测量结果表明,申克公司对Schenker Neo 17的显示屏进行了预校准。在出厂时,我们记录的灰度和彩色deltaE-2000值分别小于3,这是理想的范围。不管怎么说,我们能够通过手动校准显示器来进一步改善这些结果。Neo 17达到了宣传的99%的sRGB色彩空间覆盖率。然而,它只覆盖了69%的扩展色彩空间AdobeRGB和P3,使得它不适合用于非专业的照片和视频编辑。
Display Response Times
| ↔ Response Time Black to White | ||
|---|---|---|
| 6.1 ms ... rise ↗ and fall ↘ combined | ↗ 2.5 ms rise | 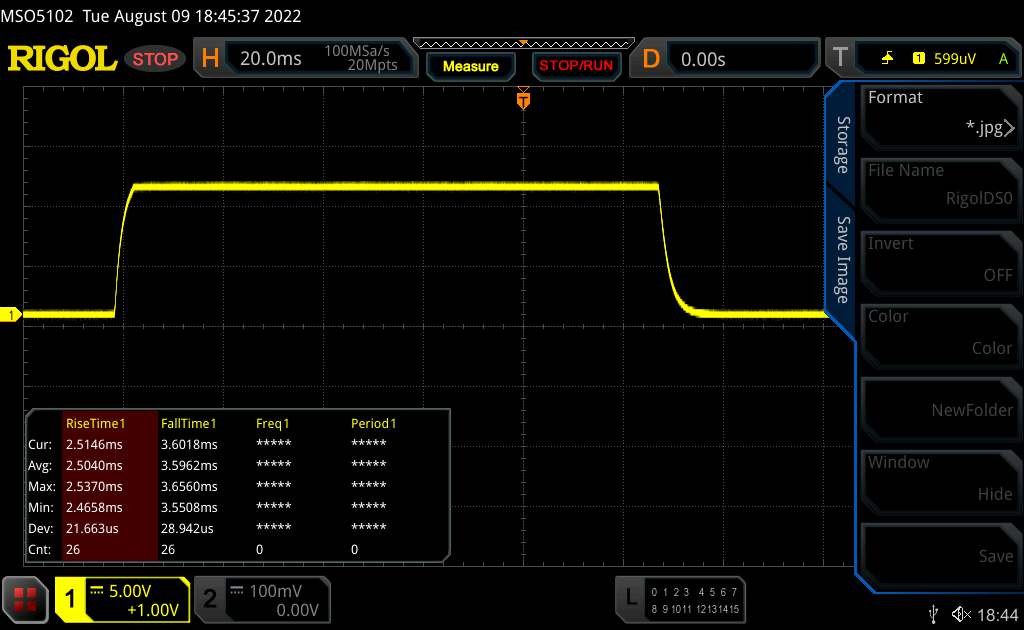 |
| ↘ 3.6 ms fall | ||
| The screen shows very fast response rates in our tests and should be very well suited for fast-paced gaming. In comparison, all tested devices range from 0.1 (minimum) to 240 (maximum) ms. » 20 % of all devices are better. This means that the measured response time is better than the average of all tested devices (19.8 ms). | ||
| ↔ Response Time 50% Grey to 80% Grey | ||
| 10.8 ms ... rise ↗ and fall ↘ combined | ↗ 5.1 ms rise | 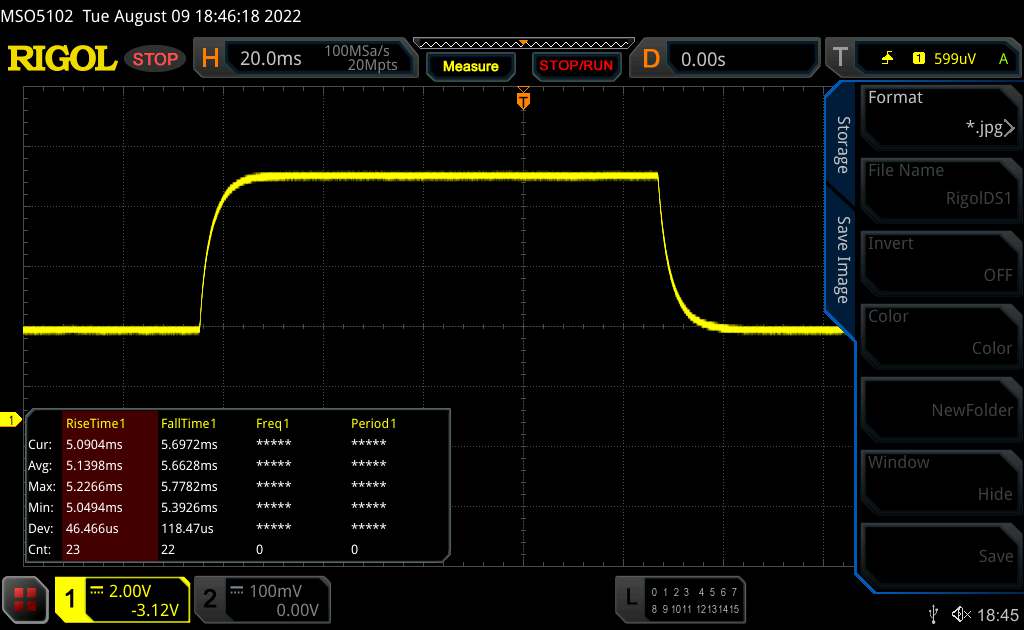 |
| ↘ 5.7 ms fall | ||
| The screen shows good response rates in our tests, but may be too slow for competitive gamers. In comparison, all tested devices range from 0.165 (minimum) to 636 (maximum) ms. » 25 % of all devices are better. This means that the measured response time is better than the average of all tested devices (31 ms). | ||
Screen Flickering / PWM (Pulse-Width Modulation)
| Screen flickering / PWM not detected | 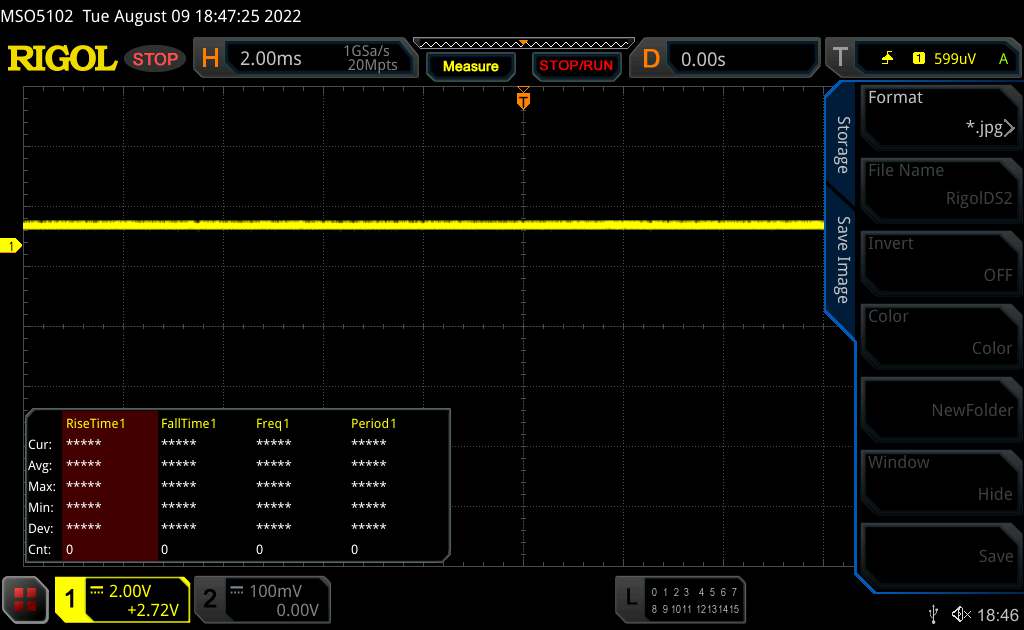 | ||
In comparison: 52 % of all tested devices do not use PWM to dim the display. If PWM was detected, an average of 7757 (minimum: 5 - maximum: 343500) Hz was measured. | |||
哑光显示涂层很适合户外使用。不管怎么说,在阴凉处的可读性是有限的。特别是,用户应避免在阳光直射下使用该屏幕。
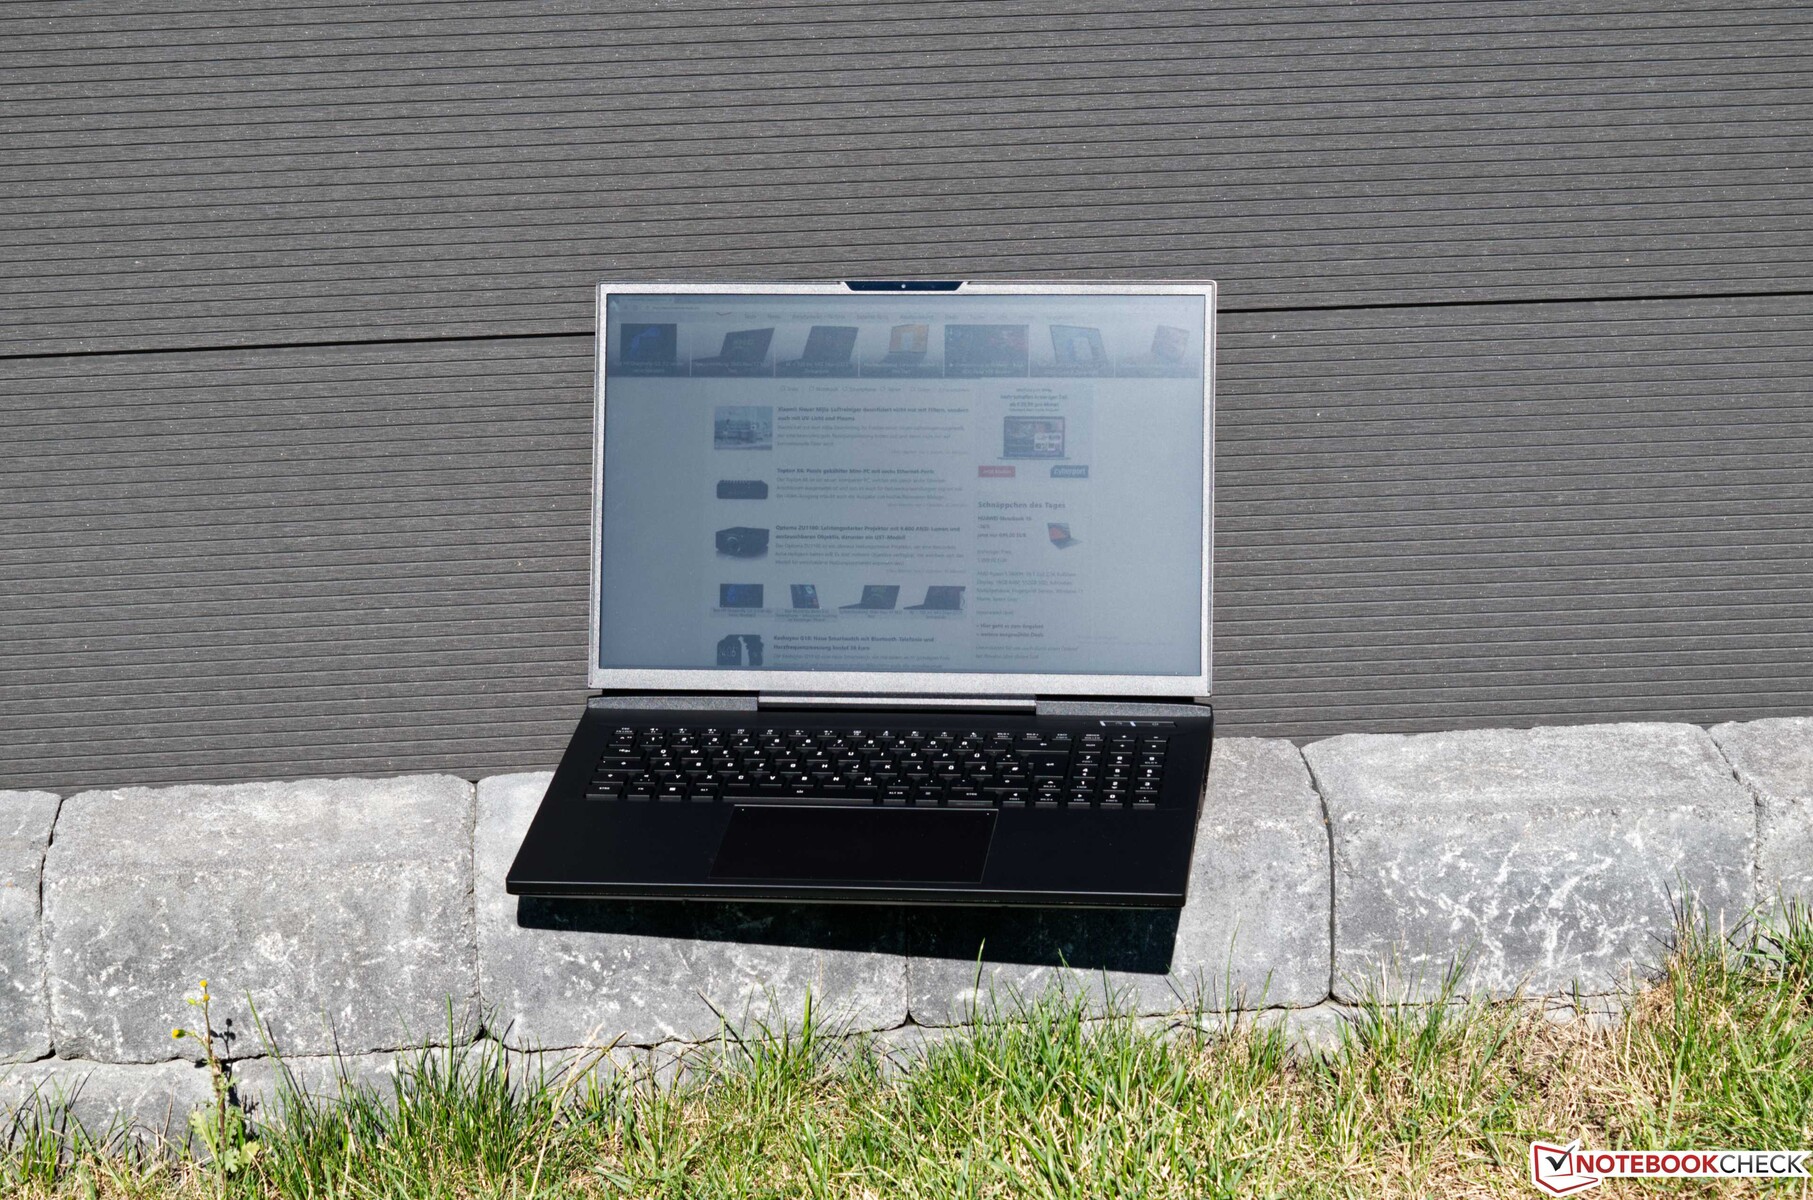
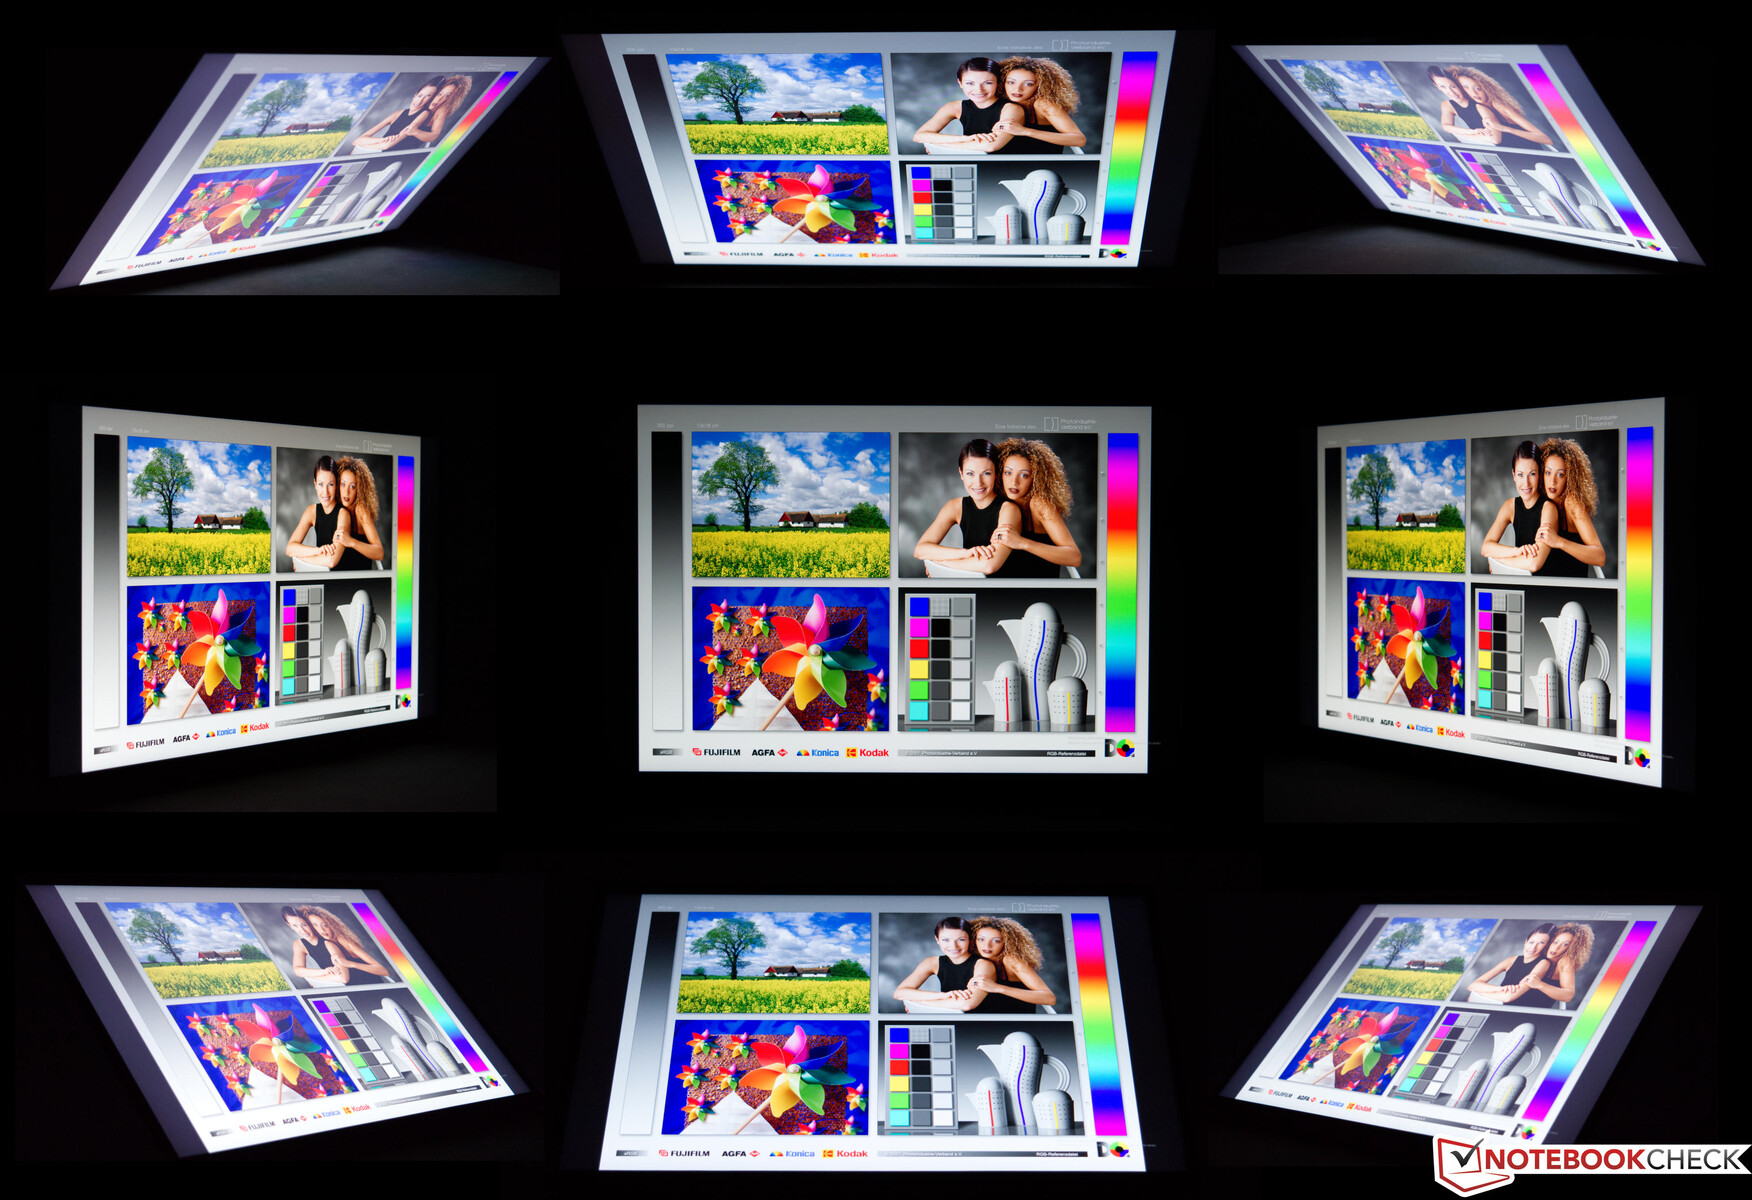
视角测试显示的结果是IPS面板的特点。只有四个角落的图像显示了轻微的颜色偏差,在正常使用中不会出现这种偏差。
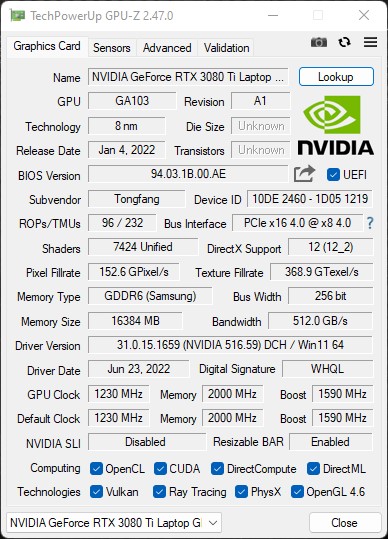
性能--AMD和Nvidia联合
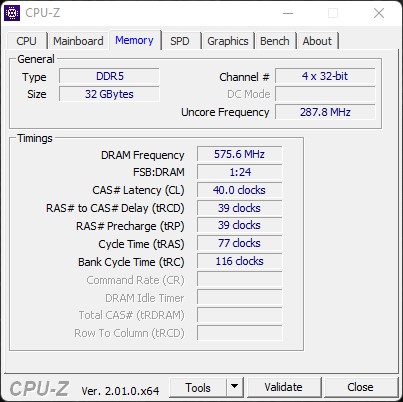
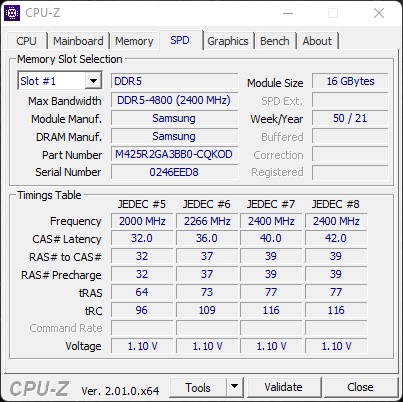
随着淘宝网和NvidiaGeForce RTX 3080 Ti笔记本GPU,我们的测试设备已经准备好在笔记本电脑的最大细节设置下进行最新的游戏。32GB的慷慨的系统内存配置为用户留下了足够的回旋余地,并支持新的DDR5标准。在典型的申克时尚中,用户可以根据自己的喜好调整配置,创建一个最佳系统。不过,CPU和17英寸面板是固定的。
测试条件
Schenker自己的控制中心包括预定义的风扇配置文件,这也会影响风扇的长期行为。为了获得最好的分数,我们在运行以下任何基准测试之前,将Schenker XMG Neo 17 M22设置为 "过度增压"。
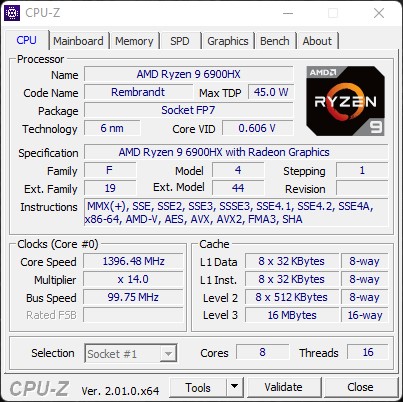
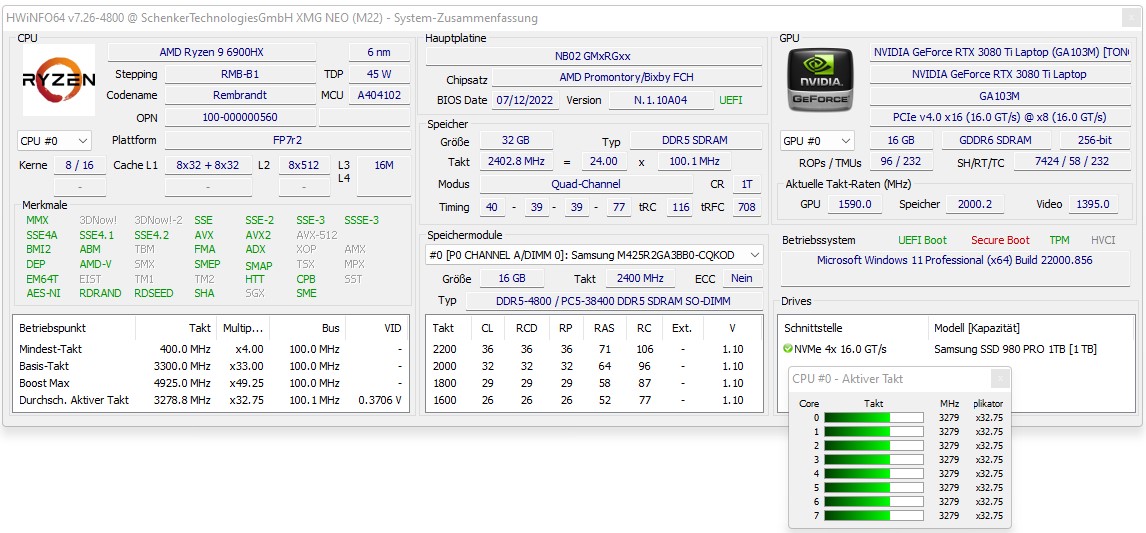
处理器
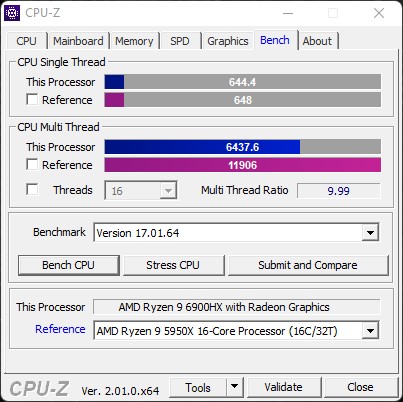
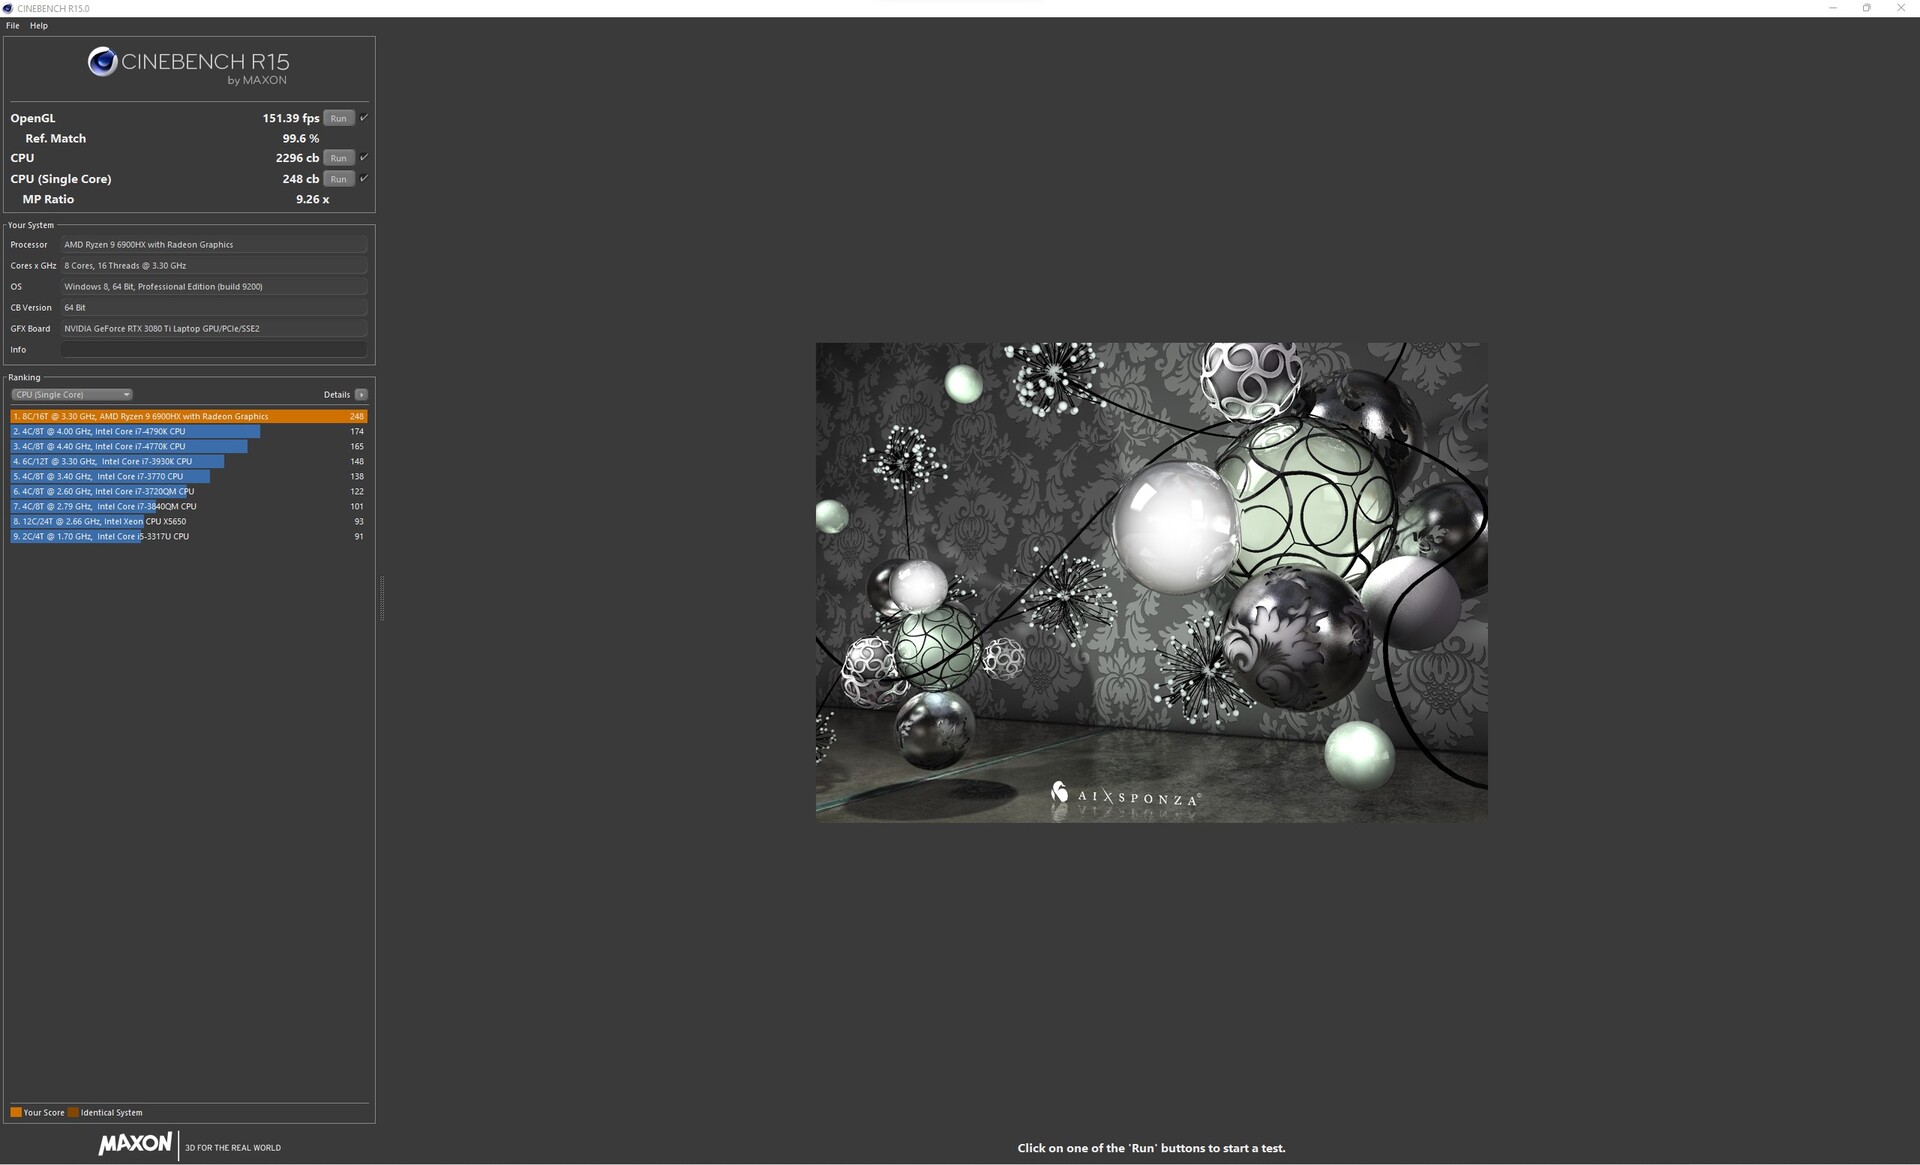
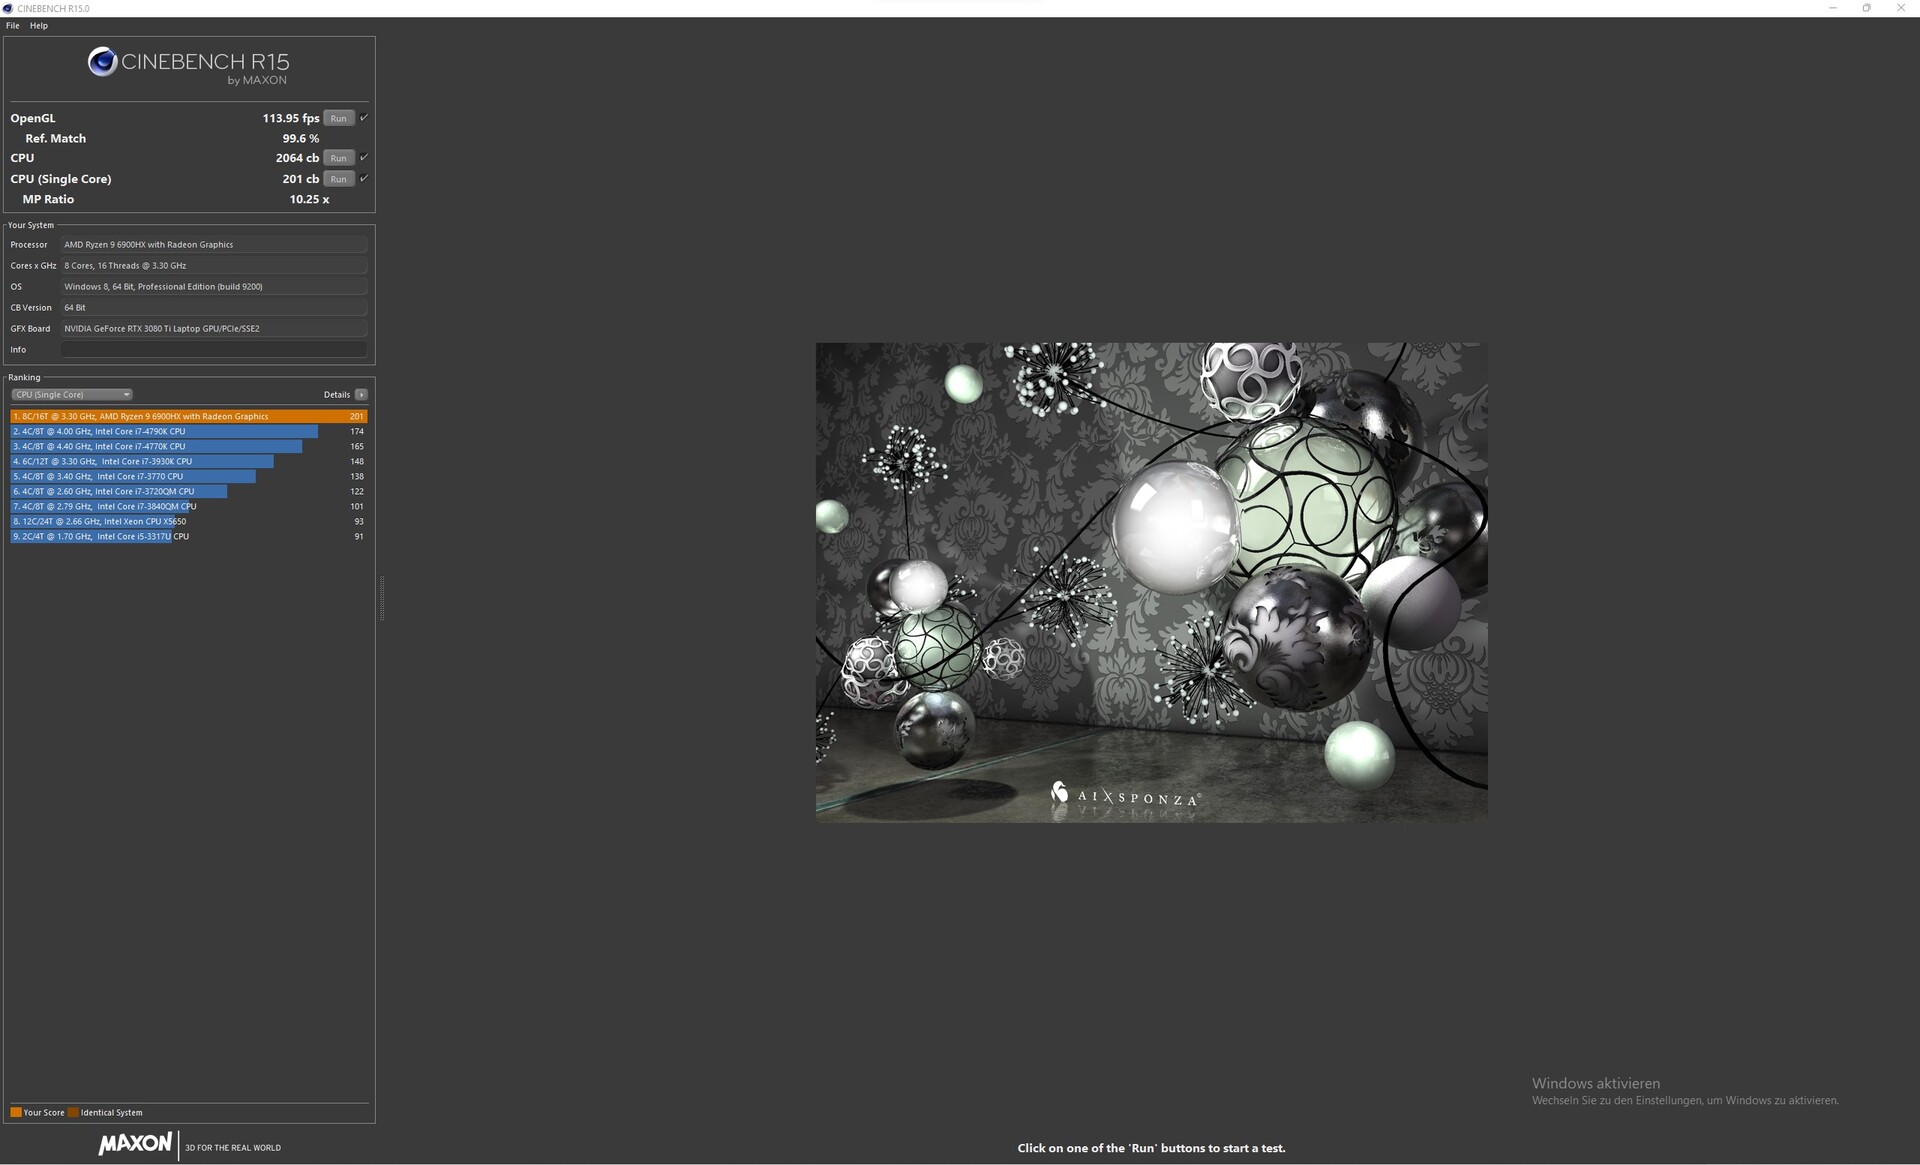
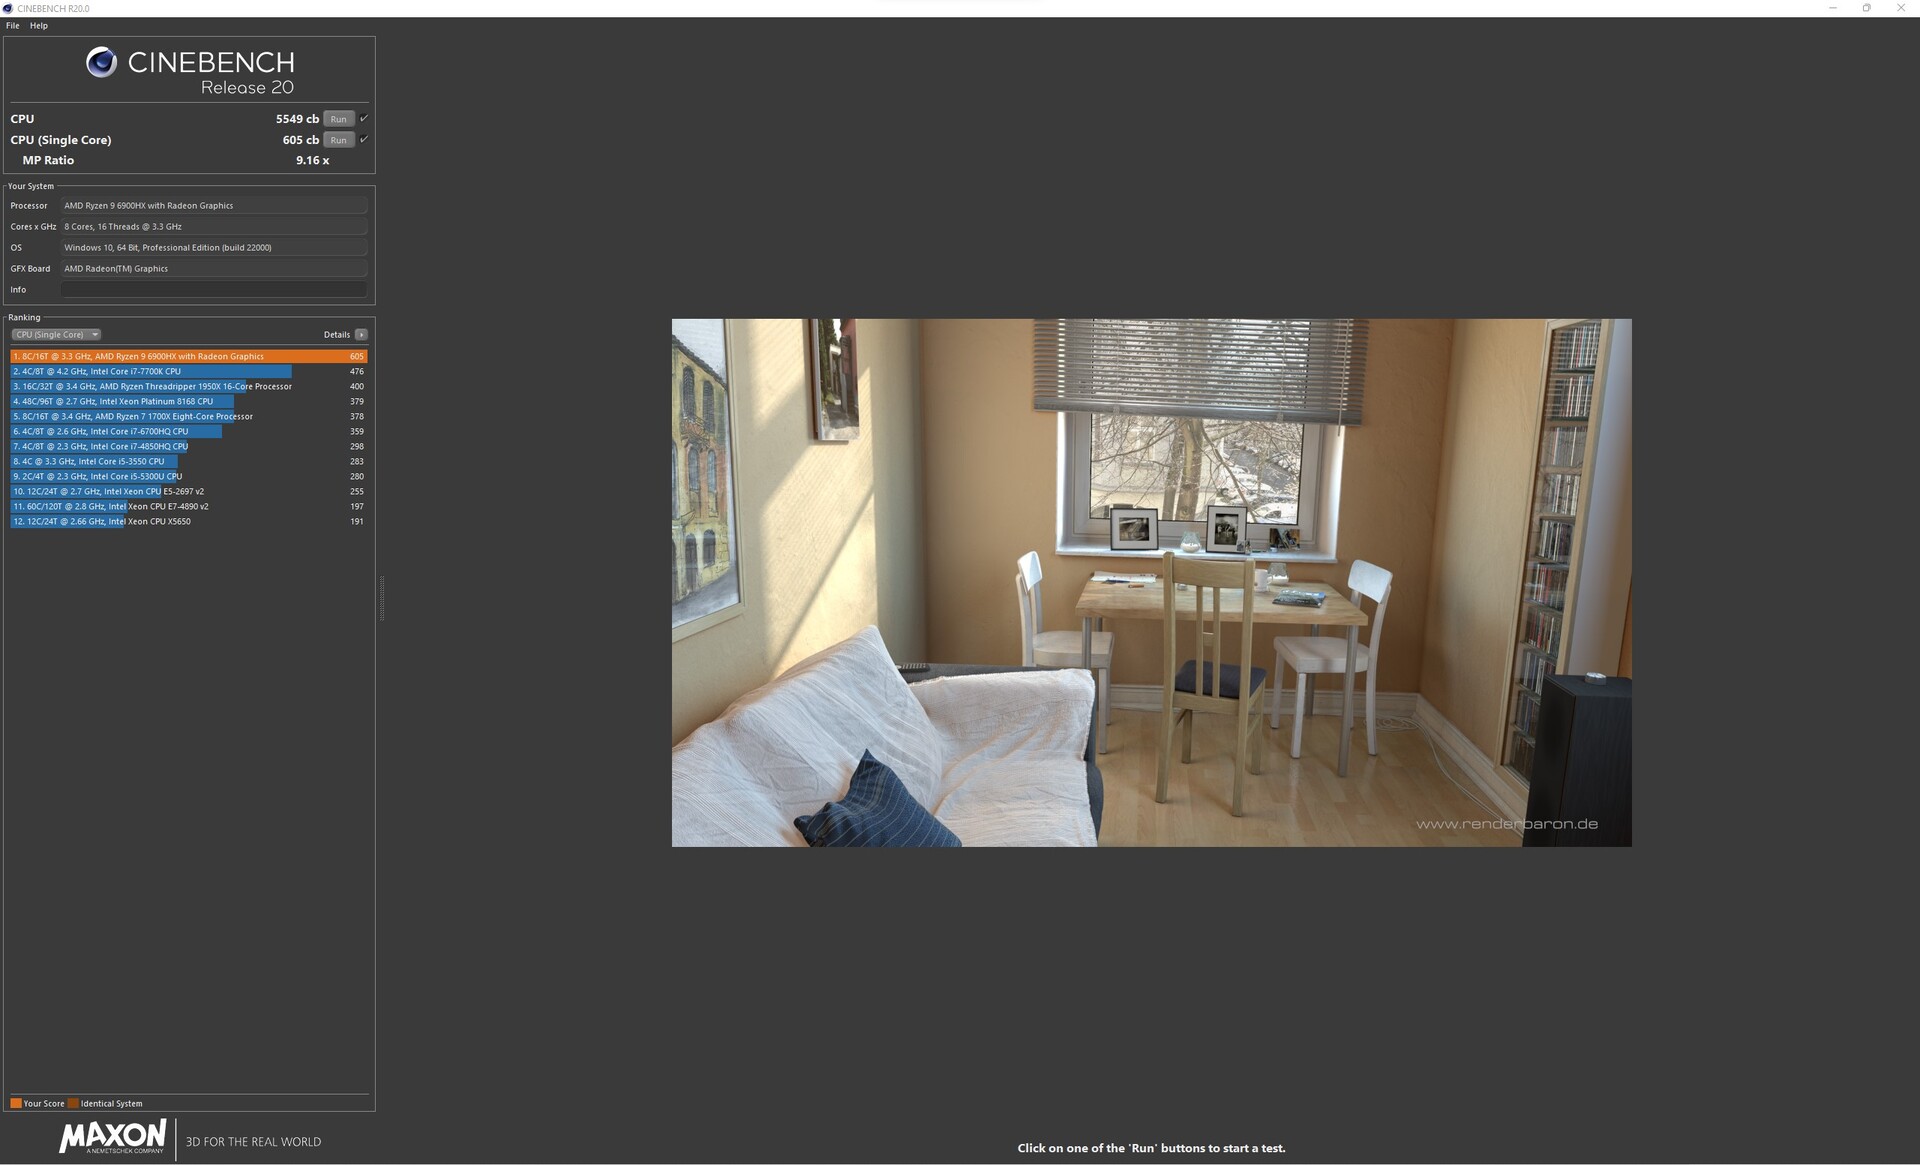
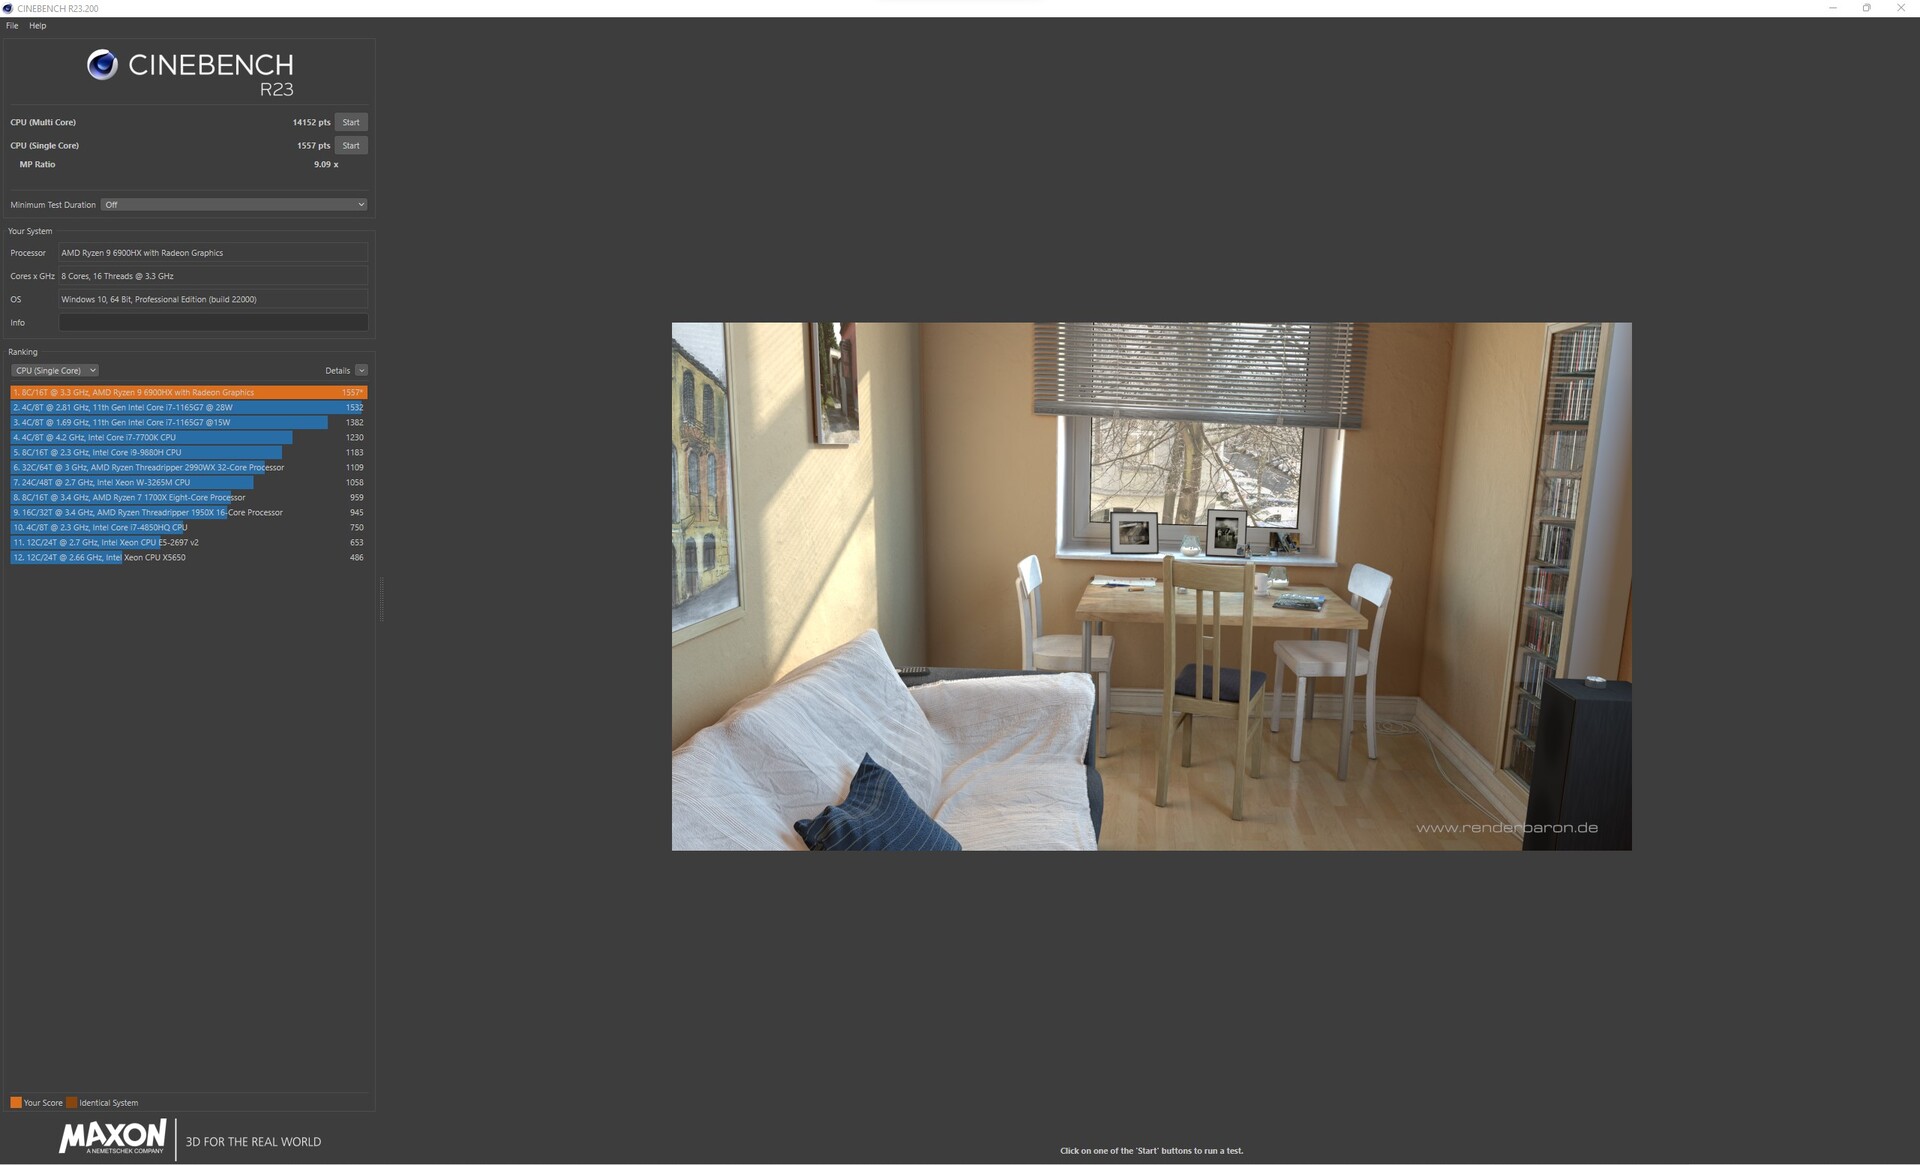
该 AMD Ryzen 9 6900HX是一个基于最新Zen-3架构的八核CPU。该SoC的时钟速度为3.3-4.9GHz提升,支持SMT,共有16个线程。然而,AMD Ryzen 9 6900HX面临着与英特尔第12代的激烈竞争,在直接比较中,英特尔第12代的速度会明显更快。
在我们的测试中,Schenker XMG Neo 17 M22的AMD Ryzen 9 6900HX能够保持稳定的性能水平。应该注意的是,在电池模式下,CPU性能下降了约10%。
更多基准测试可以在我们的 CPU比较表.
Cinebench R15 Multi Loop
Cinebench R23: Multi Core | Single Core
Cinebench R20: CPU (Multi Core) | CPU (Single Core)
Cinebench R15: CPU Multi 64Bit | CPU Single 64Bit
Blender: v2.79 BMW27 CPU
7-Zip 18.03: 7z b 4 | 7z b 4 -mmt1
Geekbench 5.5: Multi-Core | Single-Core
HWBOT x265 Benchmark v2.2: 4k Preset
LibreOffice : 20 Documents To PDF
R Benchmark 2.5: Overall mean
| CPU Performance rating | |
| Average of class Gaming | |
| MSI Titan GT77 12UHS | |
| MSI Raider GE77 HX 12UHS | |
| Acer Predator Triton 500 SE PT516-52s-70KX | |
| Asus ROG Zephyrus Duo 16 GX650RX | |
| Schenker XMG Neo 17 M22 | |
| Average AMD Ryzen 9 6900HX | |
| Razer Blade 17 Early 2022 | |
| Cinebench R23 / Multi Core | |
| Average of class Gaming (10488 - 42661, n=107, last 2 years) | |
| MSI Raider GE77 HX 12UHS | |
| MSI Titan GT77 12UHS | |
| Acer Predator Triton 500 SE PT516-52s-70KX | |
| Schenker XMG Neo 17 M22 | |
| Asus ROG Zephyrus Duo 16 GX650RX | |
| Average AMD Ryzen 9 6900HX (9709 - 15100, n=19) | |
| Razer Blade 17 Early 2022 | |
| Cinebench R23 / Single Core | |
| Average of class Gaming (1166 - 2415, n=107, last 2 years) | |
| MSI Titan GT77 12UHS | |
| Razer Blade 17 Early 2022 | |
| MSI Raider GE77 HX 12UHS | |
| Acer Predator Triton 500 SE PT516-52s-70KX | |
| Asus ROG Zephyrus Duo 16 GX650RX | |
| Average AMD Ryzen 9 6900HX (1516 - 1616, n=19) | |
| Schenker XMG Neo 17 M22 | |
| Cinebench R20 / CPU (Multi Core) | |
| Average of class Gaming (4029 - 16433, n=106, last 2 years) | |
| MSI Raider GE77 HX 12UHS | |
| MSI Titan GT77 12UHS | |
| Acer Predator Triton 500 SE PT516-52s-70KX | |
| Schenker XMG Neo 17 M22 | |
| Asus ROG Zephyrus Duo 16 GX650RX | |
| Average AMD Ryzen 9 6900HX (3742 - 5813, n=19) | |
| Razer Blade 17 Early 2022 | |
| Cinebench R20 / CPU (Single Core) | |
| Average of class Gaming (442 - 913, n=106, last 2 years) | |
| MSI Raider GE77 HX 12UHS | |
| MSI Titan GT77 12UHS | |
| Razer Blade 17 Early 2022 | |
| Acer Predator Triton 500 SE PT516-52s-70KX | |
| Average AMD Ryzen 9 6900HX (595 - 631, n=19) | |
| Schenker XMG Neo 17 M22 | |
| Asus ROG Zephyrus Duo 16 GX650RX | |
| Cinebench R15 / CPU Multi 64Bit | |
| Average of class Gaming (1578 - 6330, n=105, last 2 years) | |
| MSI Titan GT77 12UHS | |
| MSI Raider GE77 HX 12UHS | |
| Acer Predator Triton 500 SE PT516-52s-70KX | |
| Schenker XMG Neo 17 M22 | |
| Asus ROG Zephyrus Duo 16 GX650RX | |
| Average AMD Ryzen 9 6900HX (1588 - 2411, n=19) | |
| Razer Blade 17 Early 2022 | |
| Cinebench R15 / CPU Single 64Bit | |
| Average of class Gaming (188.8 - 350, n=106, last 2 years) | |
| MSI Raider GE77 HX 12UHS | |
| MSI Titan GT77 12UHS | |
| Razer Blade 17 Early 2022 | |
| Average AMD Ryzen 9 6900HX (241 - 261, n=19) | |
| Asus ROG Zephyrus Duo 16 GX650RX | |
| Schenker XMG Neo 17 M22 | |
| Acer Predator Triton 500 SE PT516-52s-70KX | |
| Blender / v2.79 BMW27 CPU | |
| Razer Blade 17 Early 2022 | |
| Average AMD Ryzen 9 6900HX (212 - 357, n=21) | |
| Asus ROG Zephyrus Duo 16 GX650RX | |
| Schenker XMG Neo 17 M22 | |
| Acer Predator Triton 500 SE PT516-52s-70KX | |
| MSI Raider GE77 HX 12UHS | |
| Average of class Gaming (79 - 330, n=104, last 2 years) | |
| MSI Titan GT77 12UHS | |
| 7-Zip 18.03 / 7z b 4 | |
| Average of class Gaming (33491 - 148086, n=105, last 2 years) | |
| MSI Raider GE77 HX 12UHS | |
| MSI Titan GT77 12UHS | |
| Acer Predator Triton 500 SE PT516-52s-70KX | |
| Asus ROG Zephyrus Duo 16 GX650RX | |
| Schenker XMG Neo 17 M22 | |
| Average AMD Ryzen 9 6900HX (49526 - 65336, n=20) | |
| Razer Blade 17 Early 2022 | |
| 7-Zip 18.03 / 7z b 4 -mmt1 | |
| Average of class Gaming (4199 - 7436, n=105, last 2 years) | |
| MSI Raider GE77 HX 12UHS | |
| MSI Titan GT77 12UHS | |
| Razer Blade 17 Early 2022 | |
| Schenker XMG Neo 17 M22 | |
| Average AMD Ryzen 9 6900HX (5090 - 6070, n=20) | |
| Asus ROG Zephyrus Duo 16 GX650RX | |
| Acer Predator Triton 500 SE PT516-52s-70KX | |
| Geekbench 5.5 / Multi-Core | |
| Average of class Gaming (6460 - 28263, n=105, last 2 years) | |
| MSI Raider GE77 HX 12UHS | |
| MSI Titan GT77 12UHS | |
| Acer Predator Triton 500 SE PT516-52s-70KX | |
| Asus ROG Zephyrus Duo 16 GX650RX | |
| Schenker XMG Neo 17 M22 | |
| Razer Blade 17 Early 2022 | |
| Average AMD Ryzen 9 6900HX (8313 - 10490, n=21) | |
| Geekbench 5.5 / Single-Core | |
| Average of class Gaming (986 - 2474, n=105, last 2 years) | |
| MSI Raider GE77 HX 12UHS | |
| MSI Titan GT77 12UHS | |
| Razer Blade 17 Early 2022 | |
| Acer Predator Triton 500 SE PT516-52s-70KX | |
| Asus ROG Zephyrus Duo 16 GX650RX | |
| Schenker XMG Neo 17 M22 | |
| Average AMD Ryzen 9 6900HX (1523 - 1652, n=21) | |
| HWBOT x265 Benchmark v2.2 / 4k Preset | |
| Average of class Gaming (11.5 - 44.4, n=105, last 2 years) | |
| MSI Raider GE77 HX 12UHS | |
| MSI Titan GT77 12UHS | |
| Acer Predator Triton 500 SE PT516-52s-70KX | |
| Asus ROG Zephyrus Duo 16 GX650RX | |
| Schenker XMG Neo 17 M22 | |
| Average AMD Ryzen 9 6900HX (12.6 - 18.7, n=20) | |
| Razer Blade 17 Early 2022 | |
| LibreOffice / 20 Documents To PDF | |
| Schenker XMG Neo 17 M22 | |
| Average AMD Ryzen 9 6900HX (44.8 - 81.7, n=20) | |
| Average of class Gaming (33.2 - 88.8, n=105, last 2 years) | |
| Asus ROG Zephyrus Duo 16 GX650RX | |
| MSI Raider GE77 HX 12UHS | |
| Acer Predator Triton 500 SE PT516-52s-70KX | |
| Razer Blade 17 Early 2022 | |
| MSI Titan GT77 12UHS | |
| R Benchmark 2.5 / Overall mean | |
| Average AMD Ryzen 9 6900HX (0.4627 - 0.4974, n=20) | |
| Schenker XMG Neo 17 M22 | |
| Asus ROG Zephyrus Duo 16 GX650RX | |
| Acer Predator Triton 500 SE PT516-52s-70KX | |
| Razer Blade 17 Early 2022 | |
| Average of class Gaming (0.3439 - 0.759, n=106, last 2 years) | |
| MSI Raider GE77 HX 12UHS | |
| MSI Titan GT77 12UHS | |
* ... smaller is better
AIDA64: FP32 Ray-Trace | FPU Julia | CPU SHA3 | CPU Queen | FPU SinJulia | FPU Mandel | CPU AES | CPU ZLib | FP64 Ray-Trace | CPU PhotoWorxx
| Performance rating | |
| Average of class Gaming | |
| MSI Raider GE77 HX 12UHS | |
| MSI Titan GT77 12UHS | |
| Asus ROG Zephyrus Duo 16 GX650RX | |
| Schenker XMG Neo 17 M22 | |
| Average AMD Ryzen 9 6900HX | |
| Acer Predator Triton 500 SE PT516-52s-70KX | |
| Razer Blade 17 Early 2022 | |
| AIDA64 / FP32 Ray-Trace | |
| Average of class Gaming (10227 - 85542, n=105, last 2 years) | |
| MSI Titan GT77 12UHS | |
| MSI Raider GE77 HX 12UHS | |
| Asus ROG Zephyrus Duo 16 GX650RX | |
| Schenker XMG Neo 17 M22 | |
| Average AMD Ryzen 9 6900HX (10950 - 17963, n=20) | |
| Acer Predator Triton 500 SE PT516-52s-70KX | |
| Razer Blade 17 Early 2022 | |
| AIDA64 / FPU Julia | |
| Average of class Gaming (51376 - 238426, n=105, last 2 years) | |
| MSI Raider GE77 HX 12UHS | |
| MSI Titan GT77 12UHS | |
| Asus ROG Zephyrus Duo 16 GX650RX | |
| Schenker XMG Neo 17 M22 | |
| Average AMD Ryzen 9 6900HX (71414 - 110797, n=20) | |
| Acer Predator Triton 500 SE PT516-52s-70KX | |
| Razer Blade 17 Early 2022 | |
| AIDA64 / CPU SHA3 | |
| Average of class Gaming (2180 - 10115, n=105, last 2 years) | |
| MSI Raider GE77 HX 12UHS | |
| MSI Titan GT77 12UHS | |
| Asus ROG Zephyrus Duo 16 GX650RX | |
| Schenker XMG Neo 17 M22 | |
| Acer Predator Triton 500 SE PT516-52s-70KX | |
| Average AMD Ryzen 9 6900HX (2471 - 3804, n=20) | |
| Razer Blade 17 Early 2022 | |
| AIDA64 / CPU Queen | |
| Average of class Gaming (49785 - 173351, n=90, last 2 years) | |
| Asus ROG Zephyrus Duo 16 GX650RX | |
| MSI Titan GT77 12UHS | |
| Schenker XMG Neo 17 M22 | |
| MSI Raider GE77 HX 12UHS | |
| Average AMD Ryzen 9 6900HX (84185 - 107544, n=20) | |
| Acer Predator Triton 500 SE PT516-52s-70KX | |
| Razer Blade 17 Early 2022 | |
| AIDA64 / FPU SinJulia | |
| Average of class Gaming (4424 - 33636, n=105, last 2 years) | |
| MSI Titan GT77 12UHS | |
| Asus ROG Zephyrus Duo 16 GX650RX | |
| MSI Raider GE77 HX 12UHS | |
| Schenker XMG Neo 17 M22 | |
| Average AMD Ryzen 9 6900HX (10970 - 13205, n=20) | |
| Acer Predator Triton 500 SE PT516-52s-70KX | |
| Razer Blade 17 Early 2022 | |
| AIDA64 / FPU Mandel | |
| Average of class Gaming (25115 - 128721, n=105, last 2 years) | |
| Asus ROG Zephyrus Duo 16 GX650RX | |
| Schenker XMG Neo 17 M22 | |
| Average AMD Ryzen 9 6900HX (39164 - 61370, n=20) | |
| MSI Titan GT77 12UHS | |
| MSI Raider GE77 HX 12UHS | |
| Acer Predator Triton 500 SE PT516-52s-70KX | |
| Razer Blade 17 Early 2022 | |
| AIDA64 / CPU AES | |
| MSI Raider GE77 HX 12UHS | |
| MSI Titan GT77 12UHS | |
| Asus ROG Zephyrus Duo 16 GX650RX | |
| Schenker XMG Neo 17 M22 | |
| Average AMD Ryzen 9 6900HX (54613 - 142360, n=20) | |
| Average of class Gaming (39258 - 247074, n=105, last 2 years) | |
| Acer Predator Triton 500 SE PT516-52s-70KX | |
| Razer Blade 17 Early 2022 | |
| AIDA64 / CPU ZLib | |
| Average of class Gaming (574 - 2531, n=105, last 2 years) | |
| MSI Raider GE77 HX 12UHS | |
| MSI Titan GT77 12UHS | |
| Acer Predator Triton 500 SE PT516-52s-70KX | |
| Asus ROG Zephyrus Duo 16 GX650RX | |
| Schenker XMG Neo 17 M22 | |
| Average AMD Ryzen 9 6900HX (578 - 911, n=20) | |
| Razer Blade 17 Early 2022 | |
| AIDA64 / FP64 Ray-Trace | |
| Average of class Gaming (5509 - 45446, n=105, last 2 years) | |
| MSI Titan GT77 12UHS | |
| MSI Raider GE77 HX 12UHS | |
| Asus ROG Zephyrus Duo 16 GX650RX | |
| Schenker XMG Neo 17 M22 | |
| Average AMD Ryzen 9 6900HX (5798 - 9540, n=20) | |
| Acer Predator Triton 500 SE PT516-52s-70KX | |
| Razer Blade 17 Early 2022 | |
| AIDA64 / CPU PhotoWorxx | |
| MSI Raider GE77 HX 12UHS | |
| Average of class Gaming (12271 - 89891, n=105, last 2 years) | |
| MSI Titan GT77 12UHS | |
| Razer Blade 17 Early 2022 | |
| Acer Predator Triton 500 SE PT516-52s-70KX | |
| Schenker XMG Neo 17 M22 | |
| Asus ROG Zephyrus Duo 16 GX650RX | |
| Average AMD Ryzen 9 6900HX (26873 - 30604, n=20) | |
系统性能
在系统性能基准测试中,Schenker XMG Neo 17 M22的结果与纯CPU基准测试的结果相似。性能水平仍然不错,与华硕ROG Zephyrus Duo相比,高出约10%。主观上,XMG Neo 17感觉非常快,在日常使用中几乎没有任何加载时间。
CrossMark: Overall | Productivity | Creativity | Responsiveness
| PCMark 10 / Score | |
| Average of class Gaming (5828 - 12414, n=93, last 2 years) | |
| MSI Titan GT77 12UHS | |
| Acer Predator Triton 500 SE PT516-52s-70KX | |
| Razer Blade 17 Early 2022 | |
| MSI Raider GE77 HX 12UHS | |
| Schenker XMG Neo 17 M22 | |
| Average AMD Ryzen 9 6900HX, NVIDIA GeForce RTX 3080 Ti Laptop GPU (6351 - 6966, n=2) | |
| Asus ROG Zephyrus Duo 16 GX650RX | |
| PCMark 10 / Essentials | |
| MSI Titan GT77 12UHS | |
| Acer Predator Triton 500 SE PT516-52s-70KX | |
| Average of class Gaming (8810 - 11935, n=97, last 2 years) | |
| Razer Blade 17 Early 2022 | |
| MSI Raider GE77 HX 12UHS | |
| Schenker XMG Neo 17 M22 | |
| Average AMD Ryzen 9 6900HX, NVIDIA GeForce RTX 3080 Ti Laptop GPU (9374 - 9740, n=2) | |
| Asus ROG Zephyrus Duo 16 GX650RX | |
| PCMark 10 / Productivity | |
| Average of class Gaming (6845 - 25323, n=95, last 2 years) | |
| MSI Titan GT77 12UHS | |
| MSI Raider GE77 HX 12UHS | |
| Acer Predator Triton 500 SE PT516-52s-70KX | |
| Schenker XMG Neo 17 M22 | |
| Razer Blade 17 Early 2022 | |
| Average AMD Ryzen 9 6900HX, NVIDIA GeForce RTX 3080 Ti Laptop GPU (7704 - 9564, n=2) | |
| Asus ROG Zephyrus Duo 16 GX650RX | |
| PCMark 10 / Digital Content Creation | |
| Average of class Gaming (7602 - 19954, n=95, last 2 years) | |
| MSI Titan GT77 12UHS | |
| Acer Predator Triton 500 SE PT516-52s-70KX | |
| Razer Blade 17 Early 2022 | |
| Schenker XMG Neo 17 M22 | |
| MSI Raider GE77 HX 12UHS | |
| Average AMD Ryzen 9 6900HX, NVIDIA GeForce RTX 3080 Ti Laptop GPU (9626 - 9848, n=2) | |
| Asus ROG Zephyrus Duo 16 GX650RX | |
| CrossMark / Overall | |
| MSI Raider GE77 HX 12UHS | |
| MSI Titan GT77 12UHS | |
| Average of class Gaming (1366 - 2409, n=94, last 2 years) | |
| Acer Predator Triton 500 SE PT516-52s-70KX | |
| Razer Blade 17 Early 2022 | |
| Asus ROG Zephyrus Duo 16 GX650RX | |
| Average AMD Ryzen 9 6900HX, NVIDIA GeForce RTX 3080 Ti Laptop GPU (1699 - 1711, n=2) | |
| Schenker XMG Neo 17 M22 | |
| CrossMark / Productivity | |
| MSI Raider GE77 HX 12UHS | |
| MSI Titan GT77 12UHS | |
| Average of class Gaming (1386 - 2254, n=94, last 2 years) | |
| Acer Predator Triton 500 SE PT516-52s-70KX | |
| Razer Blade 17 Early 2022 | |
| Asus ROG Zephyrus Duo 16 GX650RX | |
| Average AMD Ryzen 9 6900HX, NVIDIA GeForce RTX 3080 Ti Laptop GPU (1646 - 1698, n=2) | |
| Schenker XMG Neo 17 M22 | |
| CrossMark / Creativity | |
| MSI Raider GE77 HX 12UHS | |
| MSI Titan GT77 12UHS | |
| Average of class Gaming (1343 - 2786, n=94, last 2 years) | |
| Acer Predator Triton 500 SE PT516-52s-70KX | |
| Razer Blade 17 Early 2022 | |
| Schenker XMG Neo 17 M22 | |
| Average AMD Ryzen 9 6900HX, NVIDIA GeForce RTX 3080 Ti Laptop GPU (1724 - 1867, n=2) | |
| Asus ROG Zephyrus Duo 16 GX650RX | |
| CrossMark / Responsiveness | |
| MSI Raider GE77 HX 12UHS | |
| MSI Titan GT77 12UHS | |
| Acer Predator Triton 500 SE PT516-52s-70KX | |
| Asus ROG Zephyrus Duo 16 GX650RX | |
| Average of class Gaming (1226 - 2334, n=94, last 2 years) | |
| Razer Blade 17 Early 2022 | |
| Average AMD Ryzen 9 6900HX, NVIDIA GeForce RTX 3080 Ti Laptop GPU (1405 - 1715, n=2) | |
| Schenker XMG Neo 17 M22 | |
| PCMark 10 Score | 6966 points | |
Help | ||
| AIDA64 / Memory Copy | |
| Average of class Gaming (21750 - 129946, n=105, last 2 years) | |
| MSI Raider GE77 HX 12UHS | |
| MSI Titan GT77 12UHS | |
| Acer Predator Triton 500 SE PT516-52s-70KX | |
| Razer Blade 17 Early 2022 | |
| Asus ROG Zephyrus Duo 16 GX650RX | |
| Average AMD Ryzen 9 6900HX (47938 - 53345, n=20) | |
| Schenker XMG Neo 17 M22 | |
| AIDA64 / Memory Read | |
| Average of class Gaming (22956 - 118858, n=105, last 2 years) | |
| MSI Raider GE77 HX 12UHS | |
| Acer Predator Triton 500 SE PT516-52s-70KX | |
| Razer Blade 17 Early 2022 | |
| MSI Titan GT77 12UHS | |
| Asus ROG Zephyrus Duo 16 GX650RX | |
| Schenker XMG Neo 17 M22 | |
| Average AMD Ryzen 9 6900HX (43892 - 53321, n=20) | |
| AIDA64 / Memory Write | |
| Average of class Gaming (22297 - 135096, n=105, last 2 years) | |
| MSI Raider GE77 HX 12UHS | |
| MSI Titan GT77 12UHS | |
| Razer Blade 17 Early 2022 | |
| Asus ROG Zephyrus Duo 16 GX650RX | |
| Schenker XMG Neo 17 M22 | |
| Average AMD Ryzen 9 6900HX (51085 - 57202, n=20) | |
| Acer Predator Triton 500 SE PT516-52s-70KX | |
| AIDA64 / Memory Latency | |
| Acer Predator Triton 500 SE PT516-52s-70KX | |
| Average of class Gaming (75.3 - 259, n=105, last 2 years) | |
| Asus ROG Zephyrus Duo 16 GX650RX | |
| Schenker XMG Neo 17 M22 | |
| MSI Titan GT77 12UHS | |
| Average AMD Ryzen 9 6900HX (80.7 - 120.6, n=20) | |
| MSI Raider GE77 HX 12UHS | |
* ... smaller is better
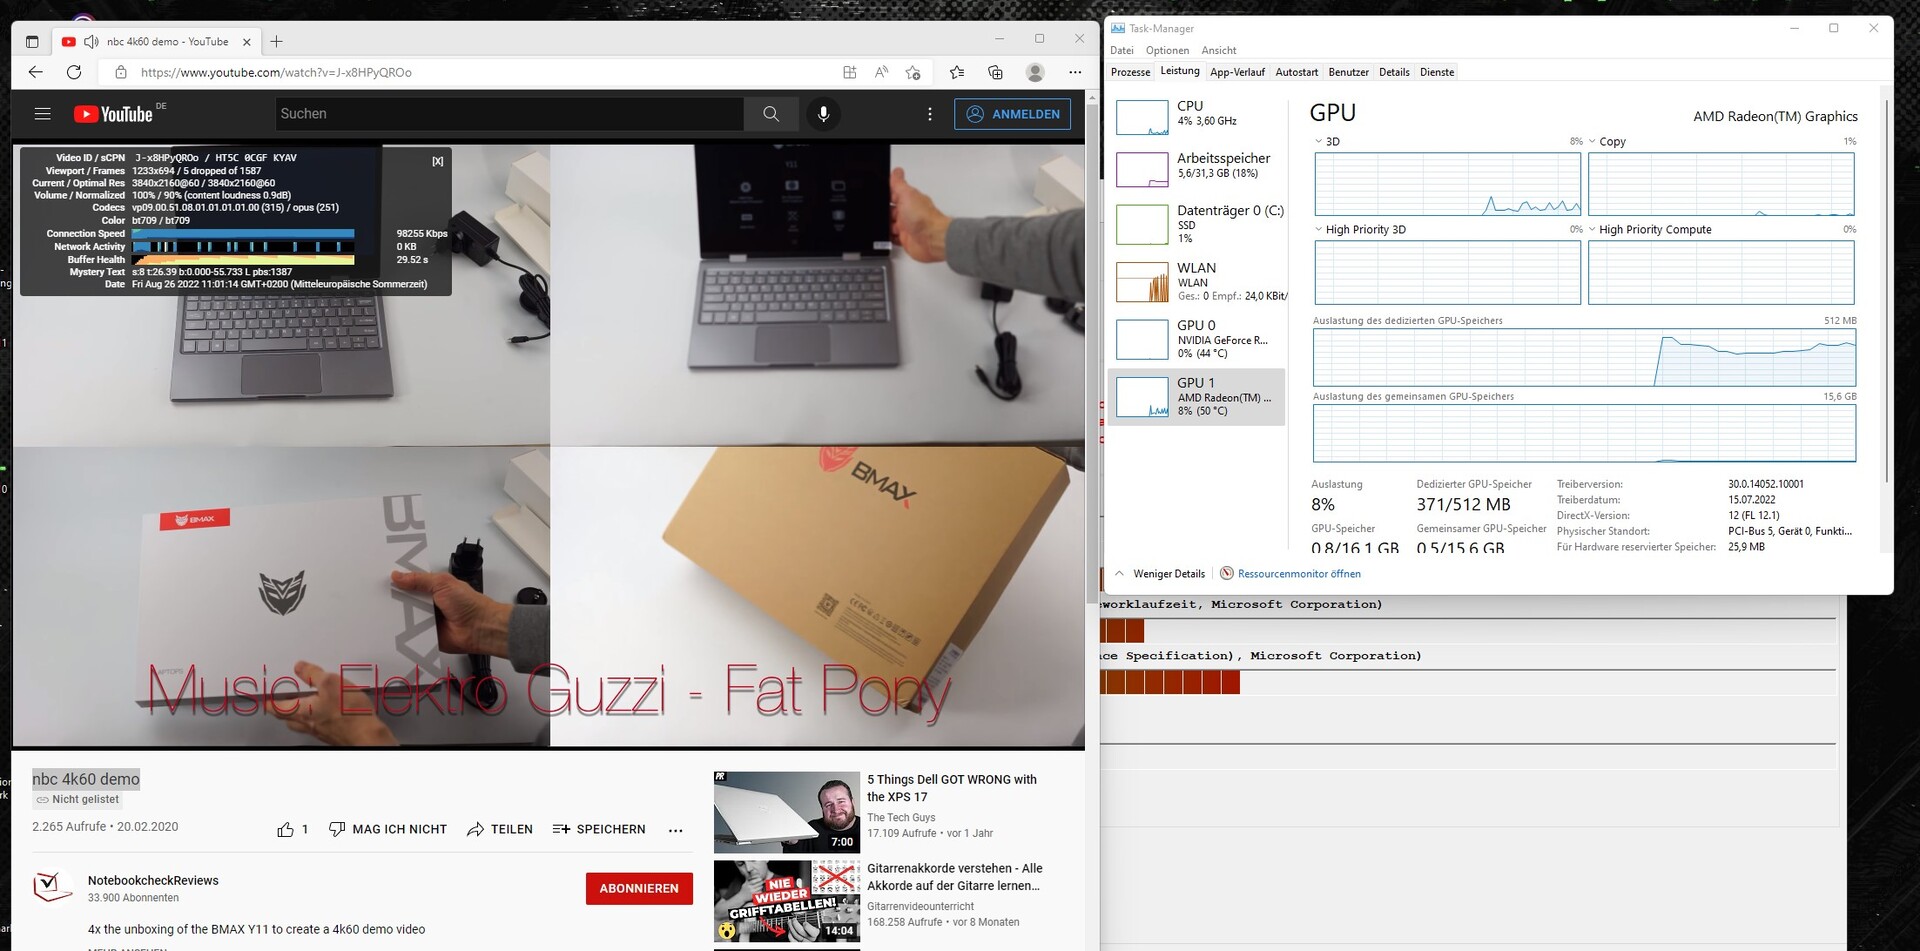
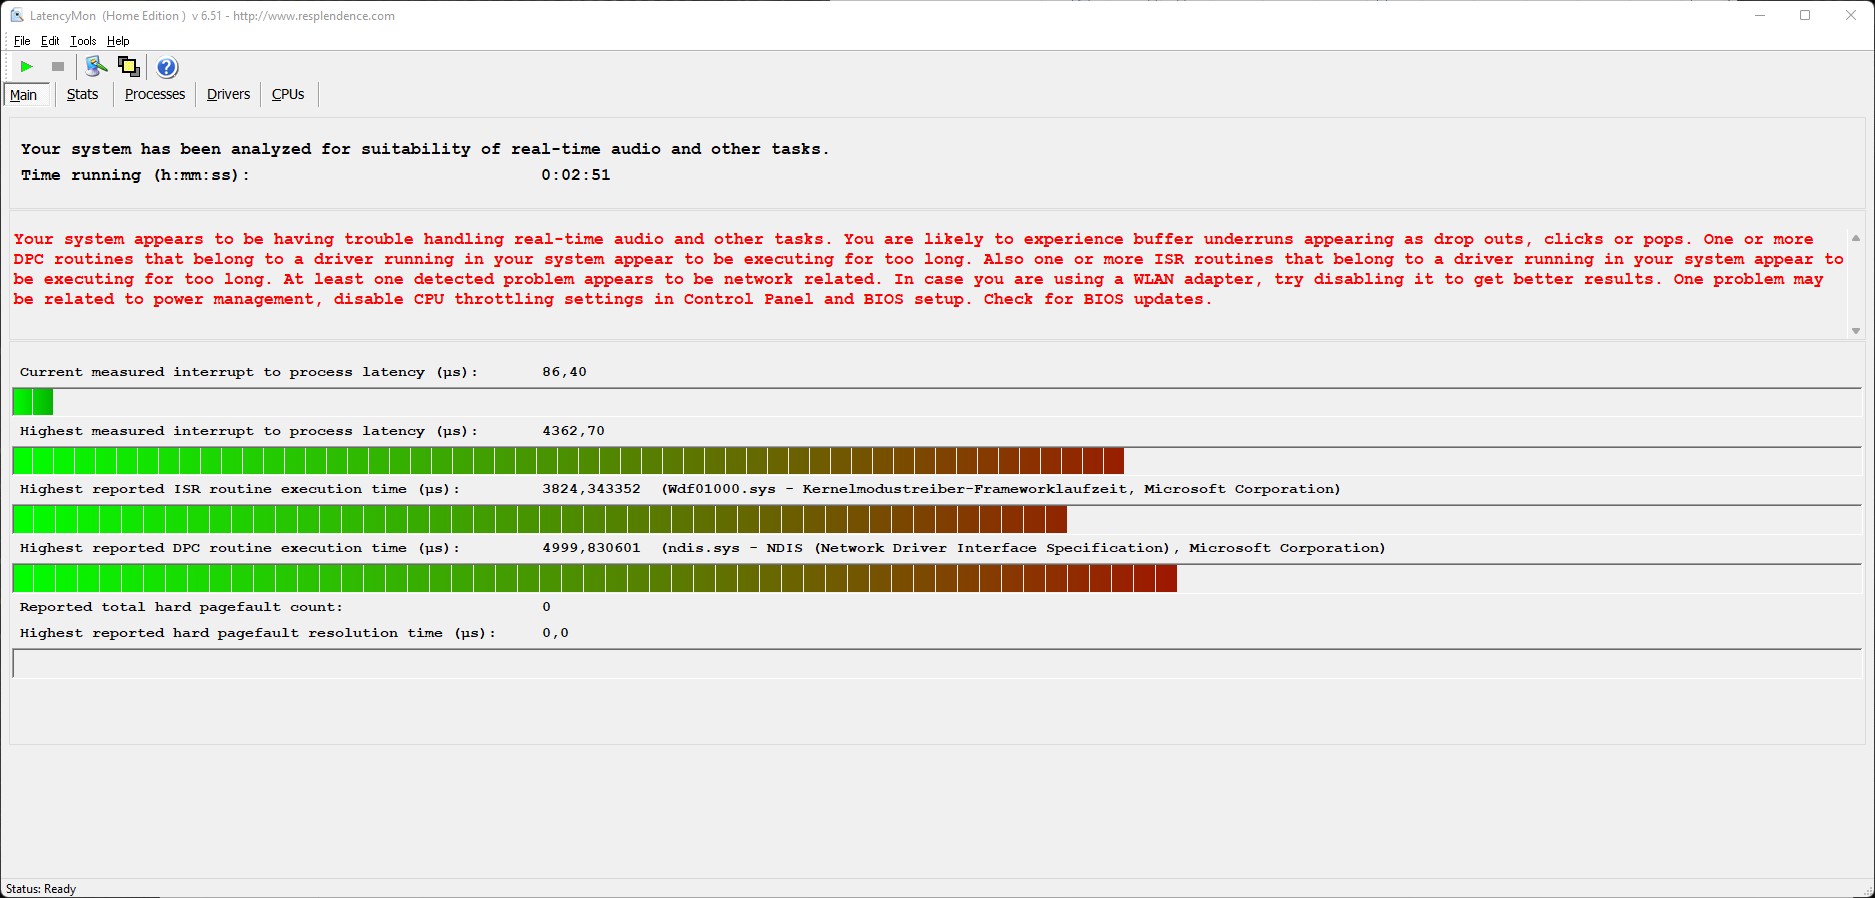
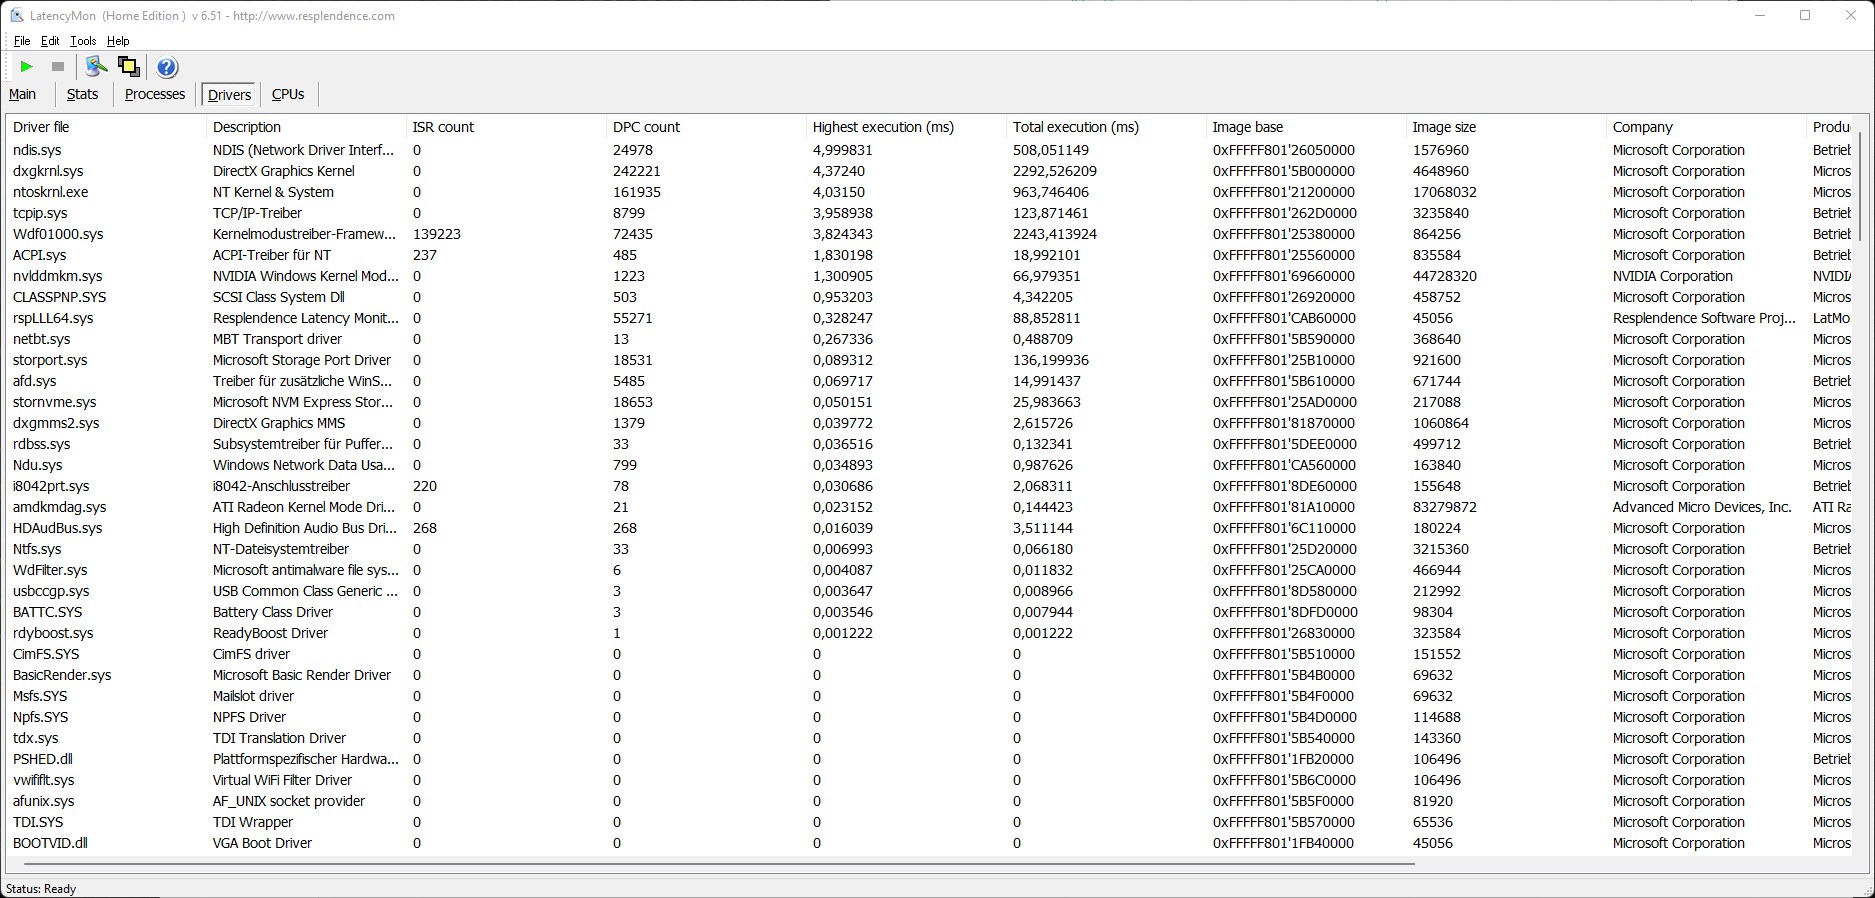
DPC延时
LatencyMon显示在Edge中打开多个浏览器标签后延迟增加。在播放4K YouTube视频和初始化Prime95之后,延迟略有增加。未来的驱动程序或BIOS优化可能会改善这个问题。播放我们的4K测试视频使用了大约10%的AMD Ryzen 9 6900HX的iGPU。
| DPC Latencies / LatencyMon - interrupt to process latency (max), Web, Youtube, Prime95 | |
| Schenker XMG Neo 17 M22 | |
| MSI Titan GT77 12UHS | |
| MSI Titan GT77 12UHS | |
| Acer Predator Triton 500 SE PT516-52s-70KX | |
| MSI Raider GE77 HX 12UHS | |
| Asus ROG Zephyrus Duo 16 GX650RX | |
| Razer Blade 17 Early 2022 | |
* ... smaller is better
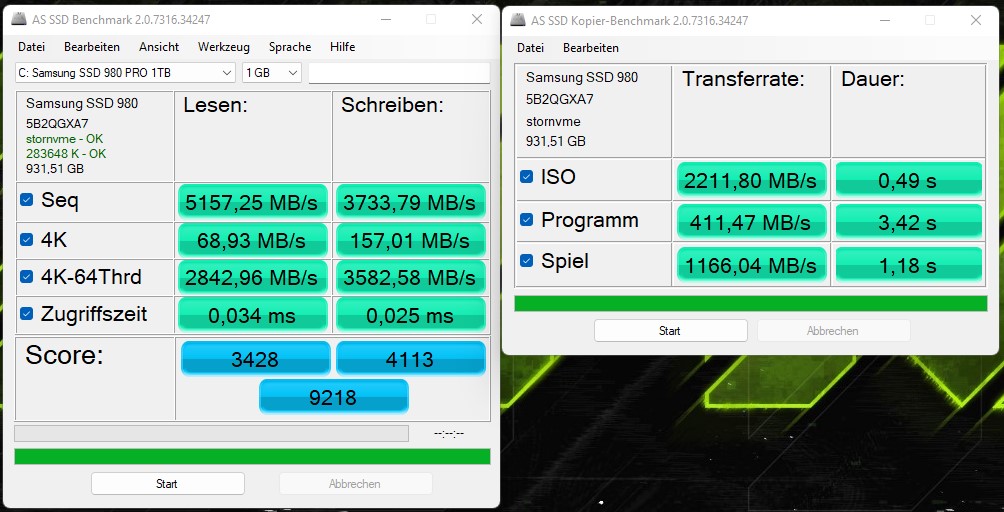
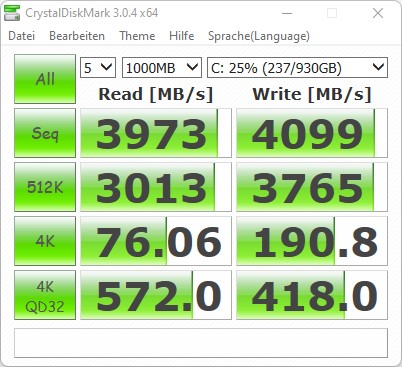
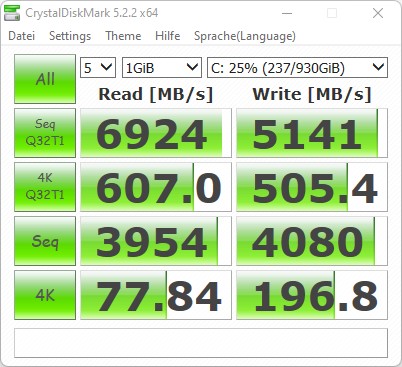
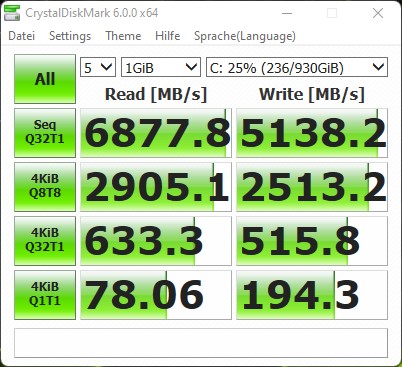
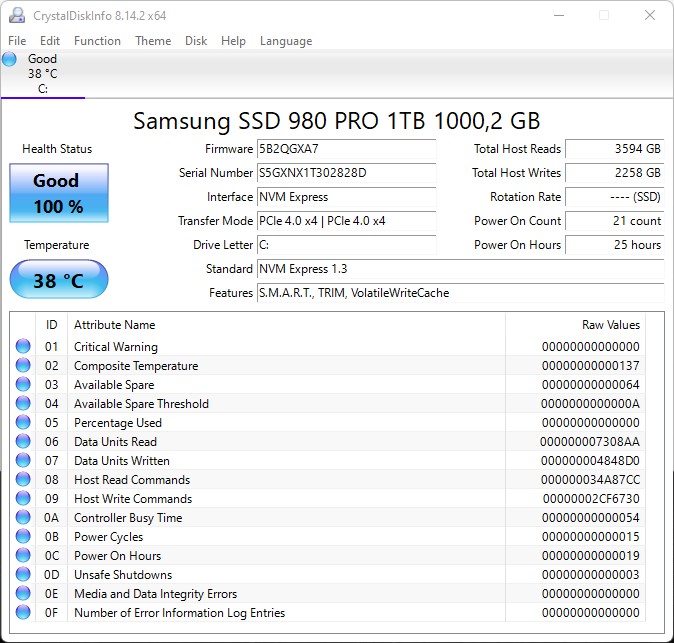
存储解决方案
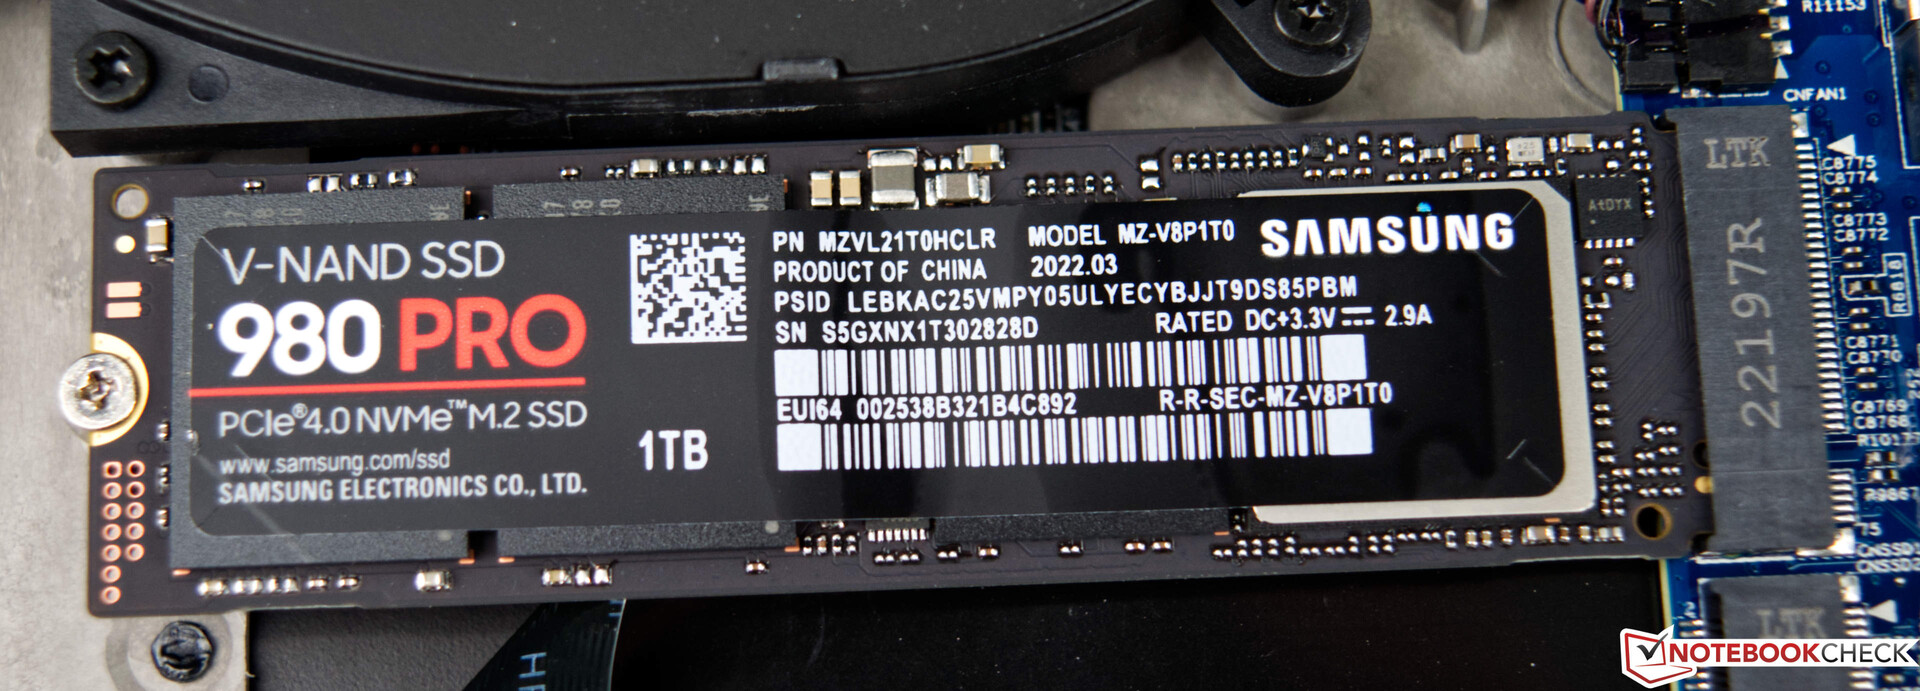
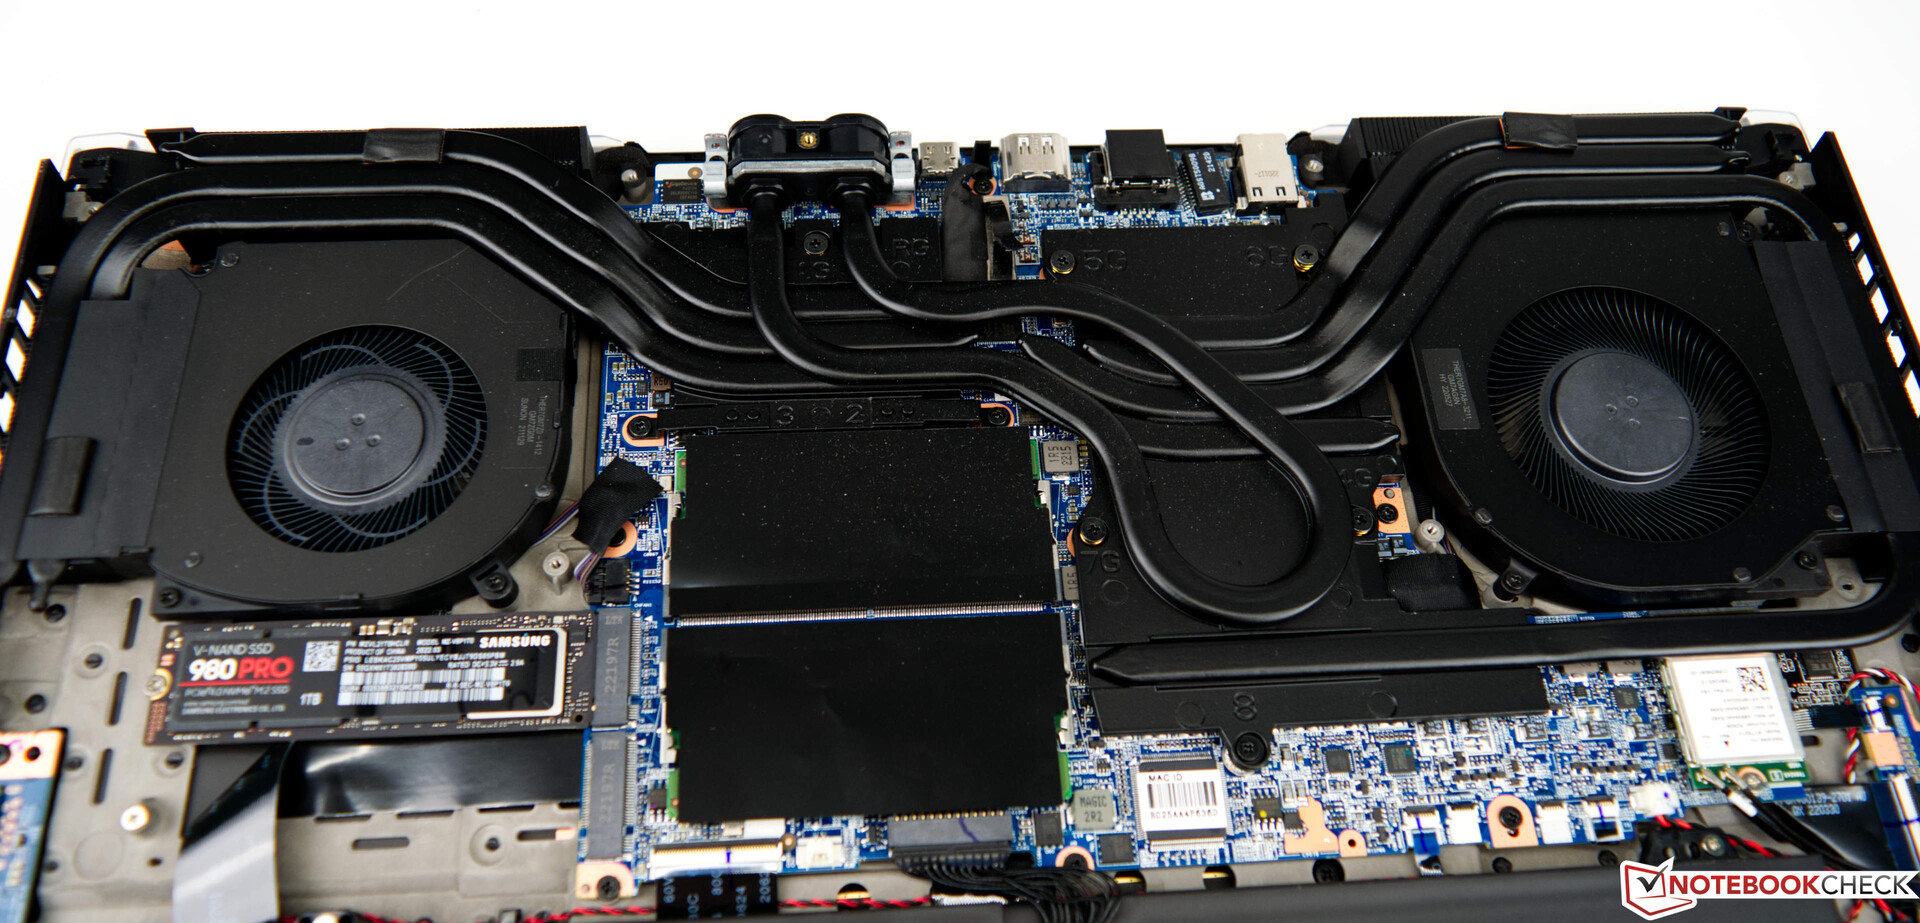
我们的测试样本配备的是三星980 Pro。然而,用户可以为XMG Neo 17选择希捷、Crucial和Corsair的型号。在订购时,用户将不得不在各种型号之间做出决定。虽然我们测试设备的固态硬盘为1TB,足够大,但我们建议不要选择较小的容量,以防止存储空间不断耗尽。在负载情况下,连续读取和写入性能非常好,使Schenker XMG Neo 17在这一类别中获得了良好的整体结果。
XMG Neo 17最多可以配备两个M.2固态硬盘。
更多的比较和基准可以在我们的 比较表.

* ... smaller is better
Disk Throttling: DiskSpd Read Loop, Queue Depth 8
GPU性能
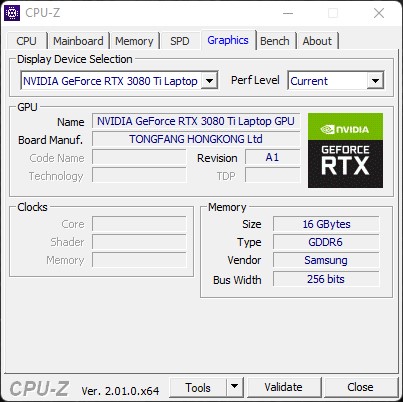
随着GeForce RTX 3080 Ti笔记本GPU,Nvidia最快的安培偏向作为显卡。有了16GB的VRAM,用户就不用担心了,GPU可以获得175瓦的最大功率预算。我们的模型表现得非常好,排在第二位的是 微星泰坦GT77.此外,4%的赤字小得可怜,尽管设备的CPU配置不同,但它们的表现非常相似。
| 3DMark 11 Performance | 33102 points | |
| 3DMark Fire Strike Score | 27946 points | |
| 3DMark Fire Strike Extreme Score | 15762 points | |
| 3DMark Time Spy Score | 12300 points | |
Help | ||
游戏性能
Schenker XMG Neo 17提供了一个杰出的游戏性能。简而言之,目前所有的游戏都能在原始分辨率和最大细节设置下顺利运行。帧率始终很高,由于有大的VRAM,用户在相当长的一段时间内不必担心升级问题。
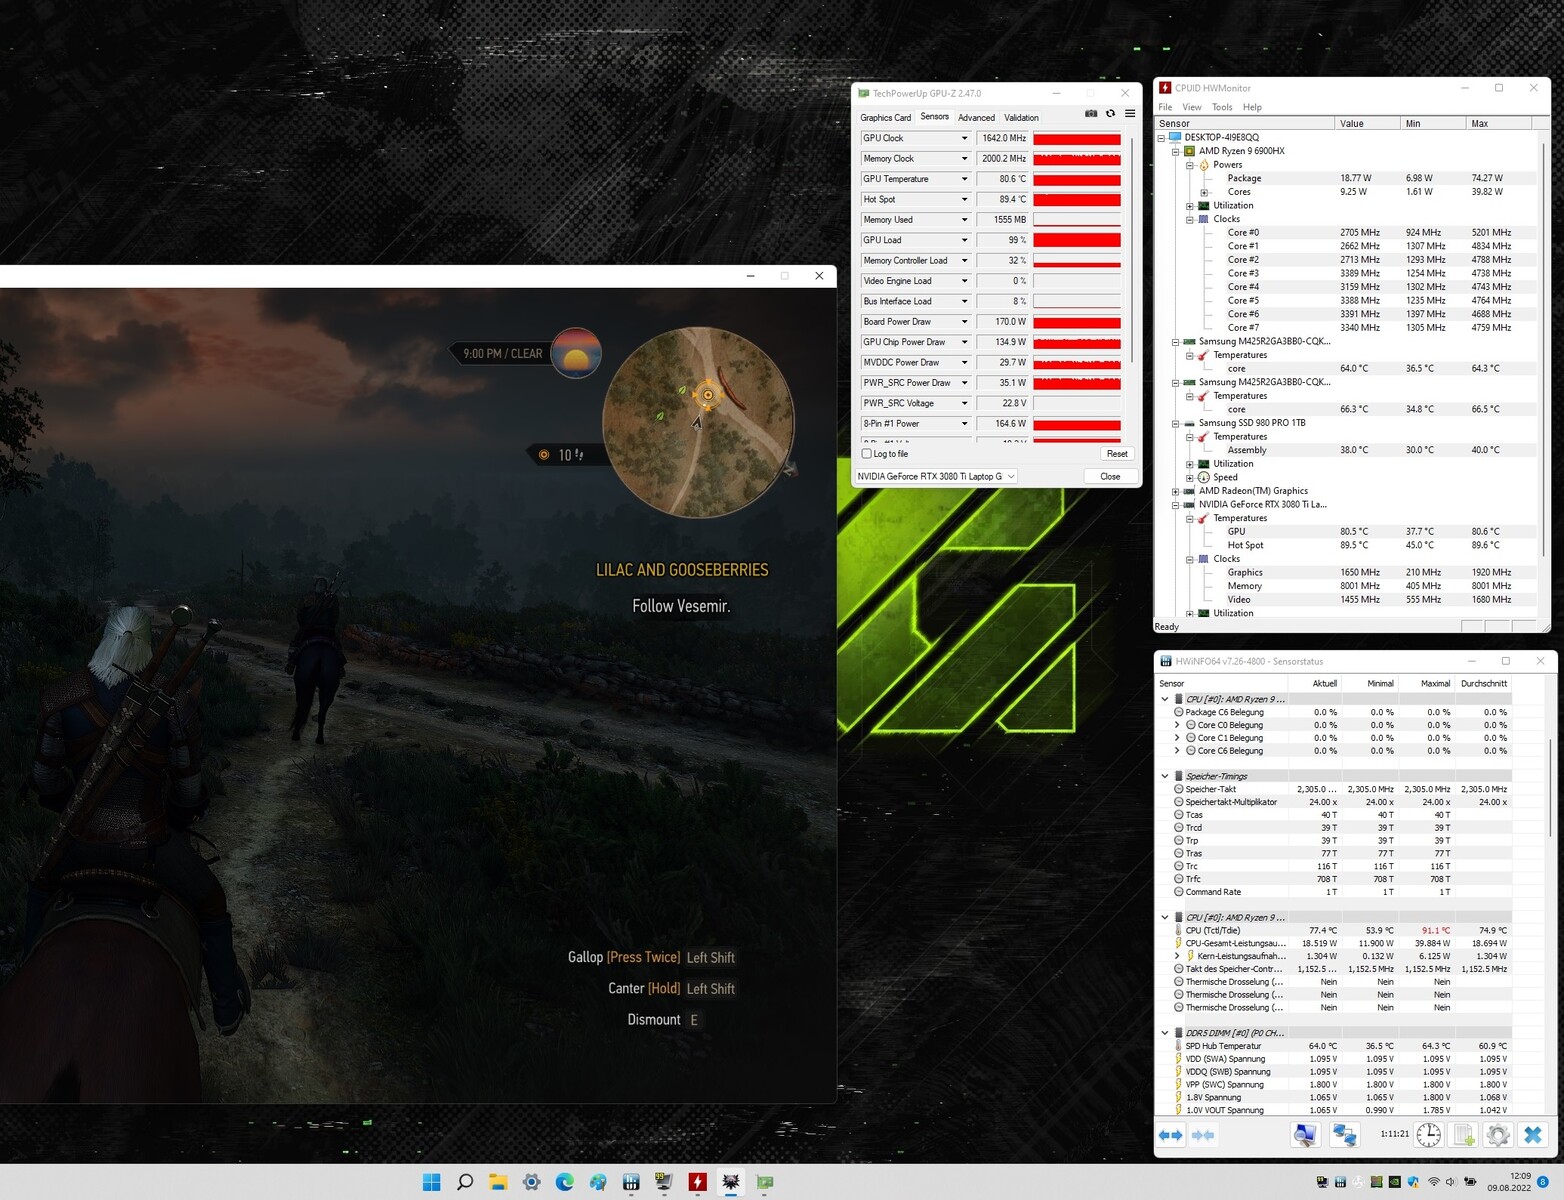
在我们的压力测试中,包括在Ultra预设下运行TheWitcher 3,该系统显示了稳定的性能。在测试期间或长时间游戏后,我们没有观察到帧率下降到无法播放的水平。
Witcher 3 FPS Graph
| low | med. | high | ultra | QHD | 4K | |
|---|---|---|---|---|---|---|
| GTA V (2015) | 181.2 | 176.1 | 163.8 | 101.8 | 101.1 | 121 |
| The Witcher 3 (2015) | 386 | 335 | 236 | 121 | 90.5 | |
| Dota 2 Reborn (2015) | 146.5 | 133.9 | 129.3 | 121.4 | 122.7 | |
| Final Fantasy XV Benchmark (2018) | 190.8 | 161.5 | 122.8 | 96.4 | 57.9 | |
| X-Plane 11.11 (2018) | 113.7 | 102 | 80.3 | 86.4 | ||
| Far Cry 5 (2018) | 142 | 125 | 118 | 113 | 110 | 70 |
| Strange Brigade (2018) | 205 | 277 | 229 | 201 | 154.4 | 95 |
| Shadow of the Tomb Raider (2018) | 175.2 | 152.9 | 152.6 | 156.5 | 123.9 | 72.4 |
| Far Cry New Dawn (2019) | 125 | 112 | 108 | 96 | 93 | 73 |
| Metro Exodus (2019) | 172.4 | 134.4 | 108.6 | 88.1 | 73.2 | 47.6 |
| Borderlands 3 (2019) | 123.6 | 106.4 | 99.8 | 90.7 | 78.2 | 46.1 |
| F1 2020 (2020) | 304 | 271 | 255 | 197.9 | 153.6 | 88.1 |
| F1 2021 (2021) | 354 | 314 | 269 | 148.5 | 114.2 | 65.3 |
| New World (2021) | 126.4 | 106.5 | 97 | 94.5 | 85.9 | 50.3 |
| Far Cry 6 (2021) | 118.6 | 104 | 95 | 99.4 | 86.6 | 54.2 |
| God of War (2022) | 129.9 | 127.9 | 111.1 | 78.9 | 64.7 | 46.5 |
| Tiny Tina's Wonderlands (2022) | 222 | 185.4 | 137.1 | 110.5 | 79.3 | 43.9 |
| F1 22 (2022) | 193 | 184 | 172 | 91 | 62 | 32 |
排放 - 负载下相对较响
系统噪音
在负载情况下,冷却解决方案有它自己的工作,导致最大的噪音水平高达54分贝(A)。由于其他设备在我们的比较中没有明显的噪音,Schenker XMG Neo 17的数值并不出奇。该系统可以连接到XMG Oasis,以获得更安静的噪音水平。然而,我们现在还无法证实这一点。
Noise level
| Idle |
| 26 / 29 / 40 dB(A) |
| Load |
| 47 / 54 dB(A) |
 | ||
30 dB silent 40 dB(A) audible 50 dB(A) loud |
||
min: | ||
| Schenker XMG Neo 17 M22 R9 6900HX, GeForce RTX 3080 Ti Laptop GPU | MSI Titan GT77 12UHS i9-12900HX, GeForce RTX 3080 Ti Laptop GPU | Razer Blade 17 Early 2022 i9-12900H, GeForce RTX 3080 Ti Laptop GPU | Acer Predator Triton 500 SE PT516-52s-70KX i7-12700H, GeForce RTX 3080 Ti Laptop GPU | Asus ROG Zephyrus Duo 16 GX650RX R9 6900HX, GeForce RTX 3080 Ti Laptop GPU | MSI Raider GE77 HX 12UHS i9-12900HX, GeForce RTX 3080 Ti Laptop GPU | |
|---|---|---|---|---|---|---|
| Noise | 10% | 4% | 0% | 9% | -7% | |
| off / environment * (dB) | 26 | 21.9 16% | 26 -0% | 26 -0% | 26 -0% | 26 -0% |
| Idle Minimum * (dB) | 26 | 24.53 6% | 26 -0% | 26 -0% | 26 -0% | 26 -0% |
| Idle Average * (dB) | 29 | 24.53 15% | 27 7% | 29 -0% | 27 7% | 34 -17% |
| Idle Maximum * (dB) | 40 | 24.53 39% | 32 20% | 34 15% | 29 27% | 46 -15% |
| Load Average * (dB) | 47 | 46.25 2% | 50 -6% | 50 -6% | 41 13% | 50 -6% |
| Witcher 3 ultra * (dB) | 52 | 56.86 -9% | 51 2% | 53 -2% | 48 8% | 55 -6% |
| Load Maximum * (dB) | 54 | 54.25 -0% | 51 6% | 56 -4% | 50 7% | 57 -6% |
* ... smaller is better
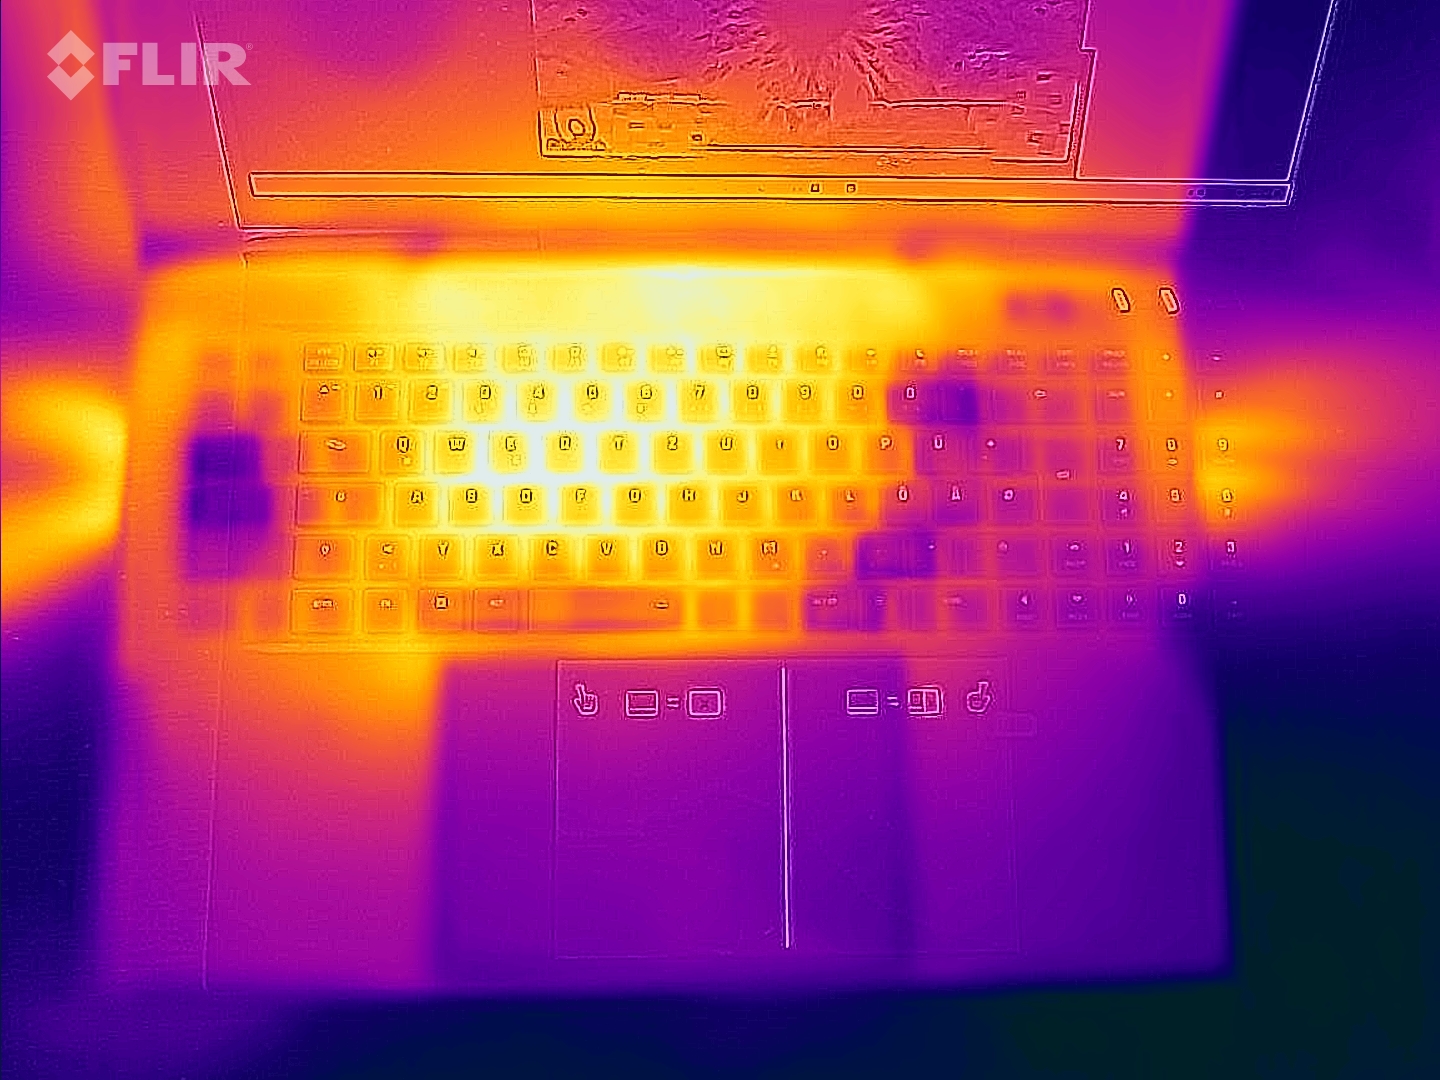
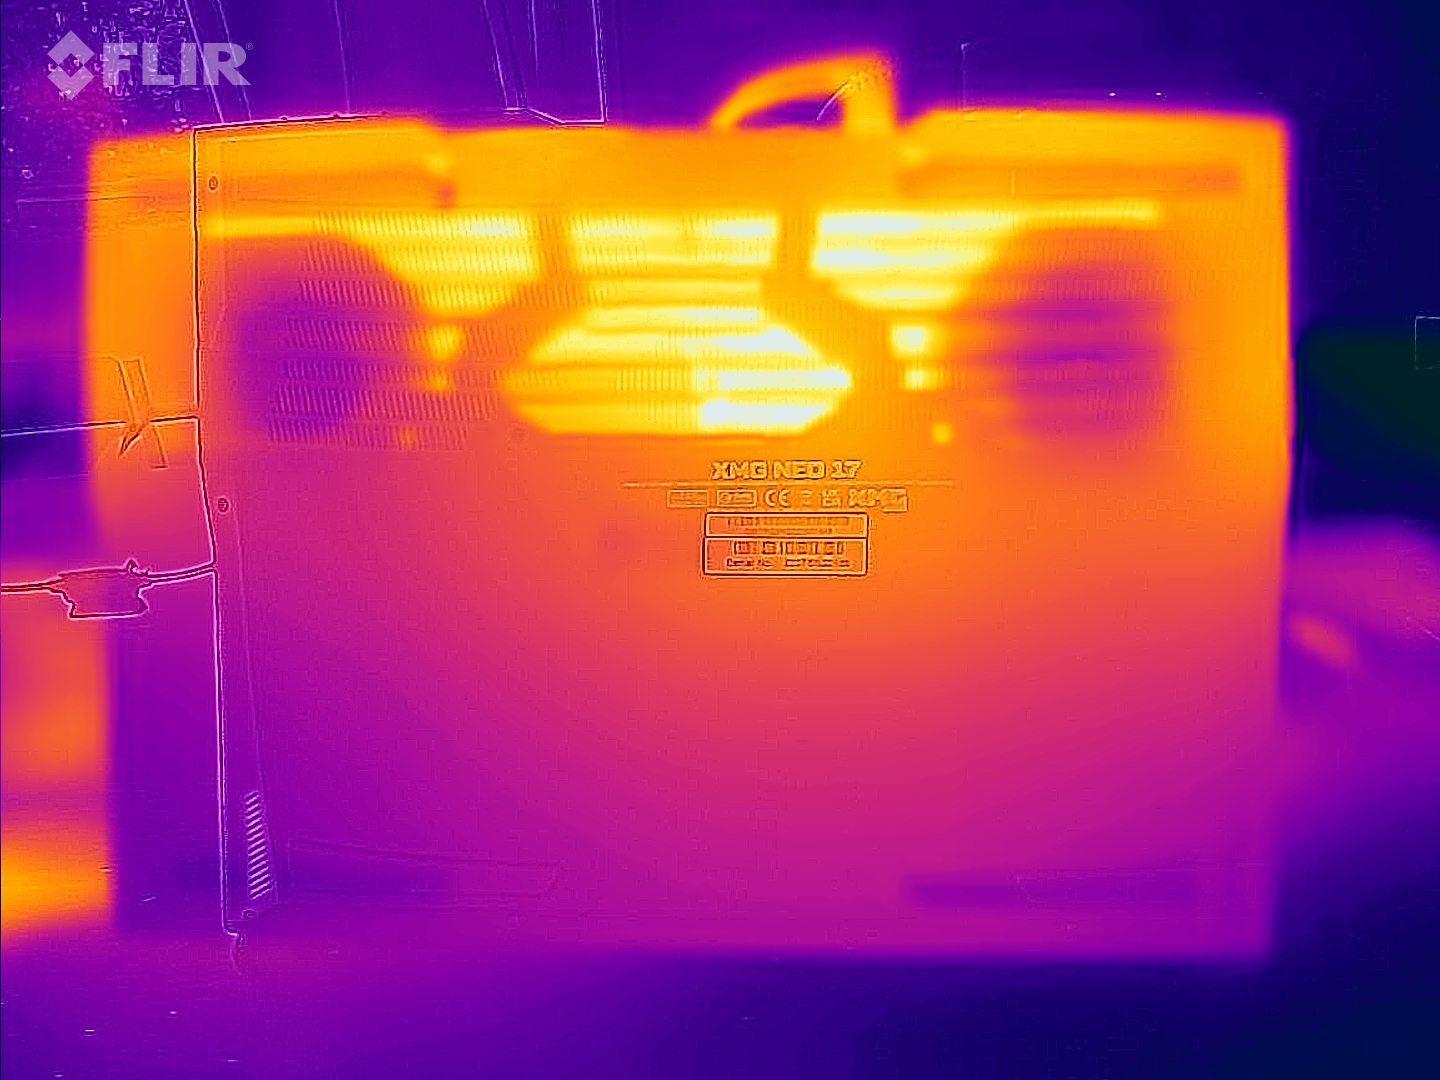
温度
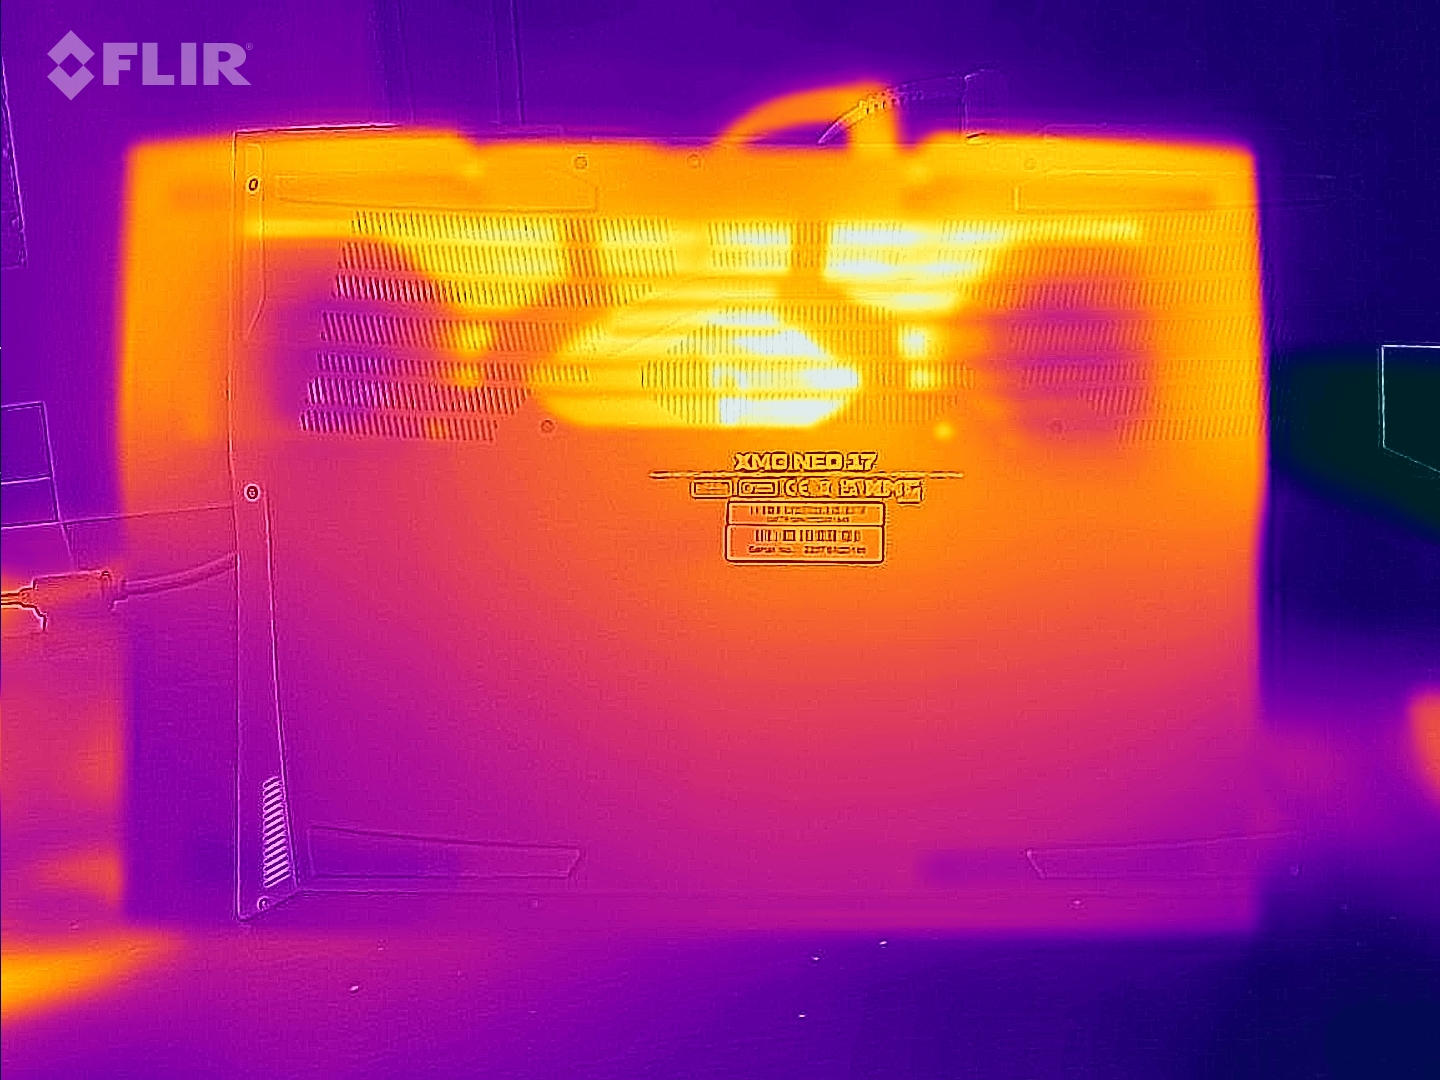
在高达52°C(125.6°F)的情况下,机箱的底部变得明显温暖。然而,在我们的比较中,其他设备也达到了类似的温度。由于我们在游戏时也测得了类似的温度,我们建议不要在腿上使用该系统。怠速时没有问题。然后,峰值温度分别下降到30℃(86℉)和33℃(91.4℉)。
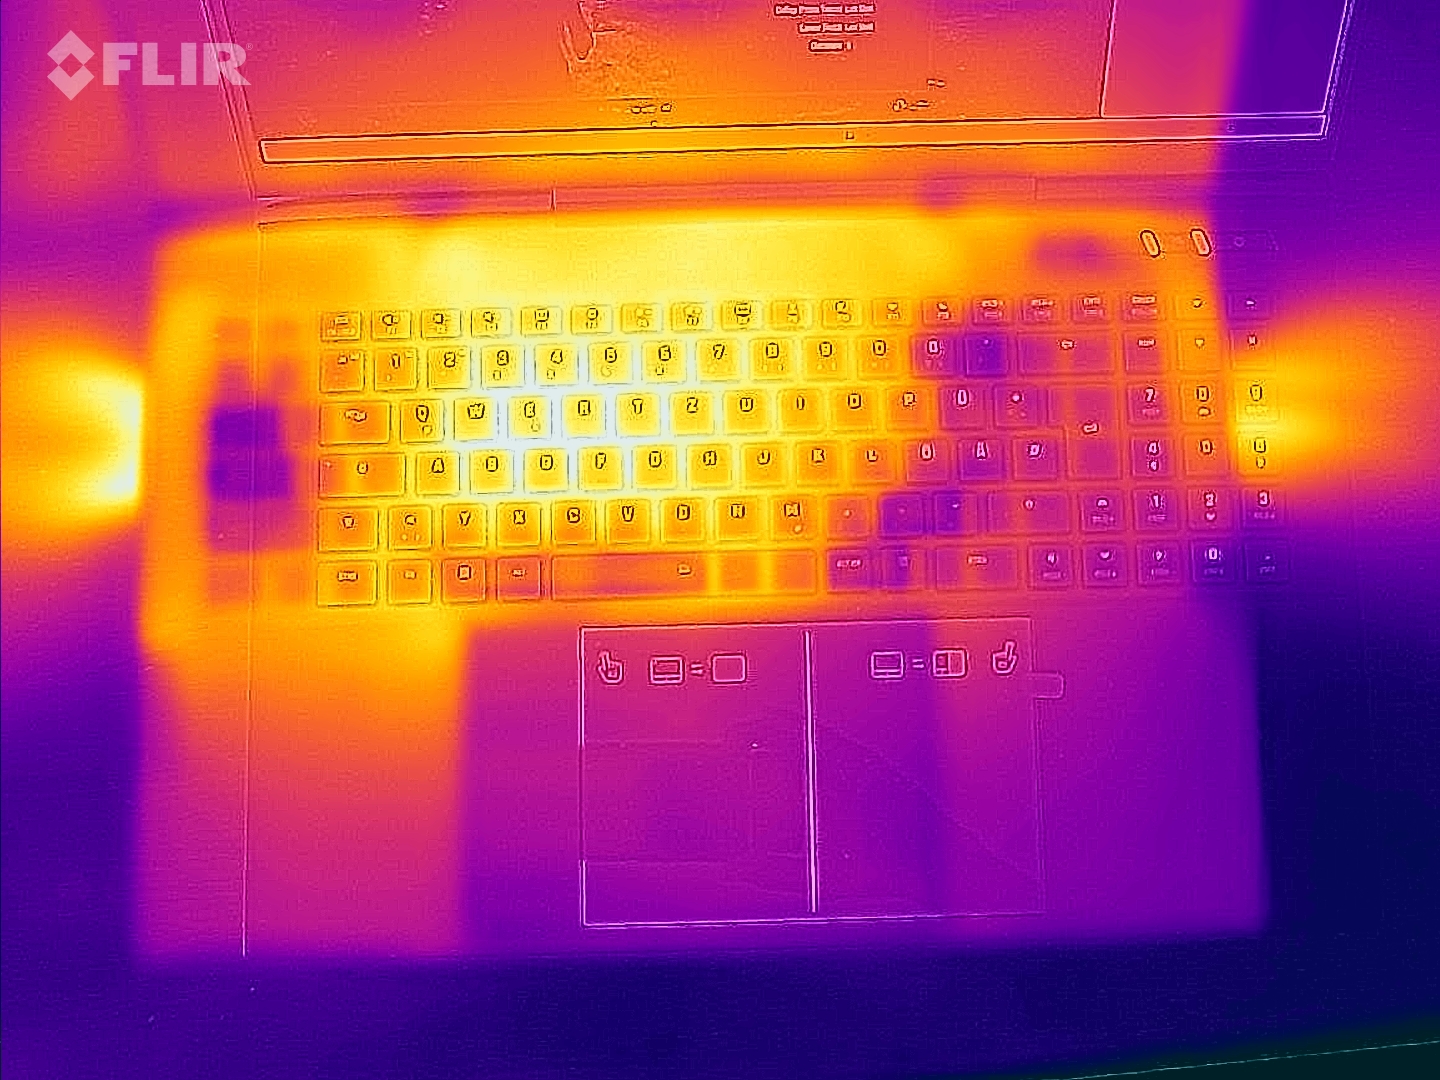
(-) The maximum temperature on the upper side is 49 °C / 120 F, compared to the average of 40.4 °C / 105 F, ranging from 21.2 to 68.8 °C for the class Gaming.
(-) The bottom heats up to a maximum of 52 °C / 126 F, compared to the average of 43.2 °C / 110 F
(+) In idle usage, the average temperature for the upper side is 29.7 °C / 85 F, compared to the device average of 33.9 °C / 93 F.
(-) Playing The Witcher 3, the average temperature for the upper side is 41.9 °C / 107 F, compared to the device average of 33.9 °C / 93 F.
(±) The palmrests and touchpad can get very hot to the touch with a maximum of 39 °C / 102.2 F.
(-) The average temperature of the palmrest area of similar devices was 28.8 °C / 83.8 F (-10.2 °C / -18.4 F).
| Schenker XMG Neo 17 M22 AMD Ryzen 9 6900HX, NVIDIA GeForce RTX 3080 Ti Laptop GPU | MSI Titan GT77 12UHS Intel Core i9-12900HX, NVIDIA GeForce RTX 3080 Ti Laptop GPU | Razer Blade 17 Early 2022 Intel Core i9-12900H, NVIDIA GeForce RTX 3080 Ti Laptop GPU | Acer Predator Triton 500 SE PT516-52s-70KX Intel Core i7-12700H, NVIDIA GeForce RTX 3080 Ti Laptop GPU | Asus ROG Zephyrus Duo 16 GX650RX AMD Ryzen 9 6900HX, NVIDIA GeForce RTX 3080 Ti Laptop GPU | MSI Raider GE77 HX 12UHS Intel Core i9-12900HX, NVIDIA GeForce RTX 3080 Ti Laptop GPU | |
|---|---|---|---|---|---|---|
| Heat | -4% | -11% | 3% | 1% | -19% | |
| Maximum Upper Side * (°C) | 49 | 40.8 17% | 50 -2% | 47 4% | 45 8% | 53 -8% |
| Maximum Bottom * (°C) | 52 | 52.4 -1% | 56 -8% | 49 6% | 50 4% | 58 -12% |
| Idle Upper Side * (°C) | 30 | 34.6 -15% | 36 -20% | 31 -3% | 33 -10% | 38 -27% |
| Idle Bottom * (°C) | 33 | 38.4 -16% | 38 -15% | 32 3% | 33 -0% | 43 -30% |
* ... smaller is better
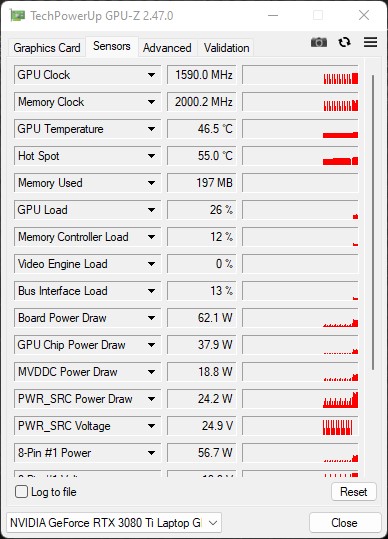
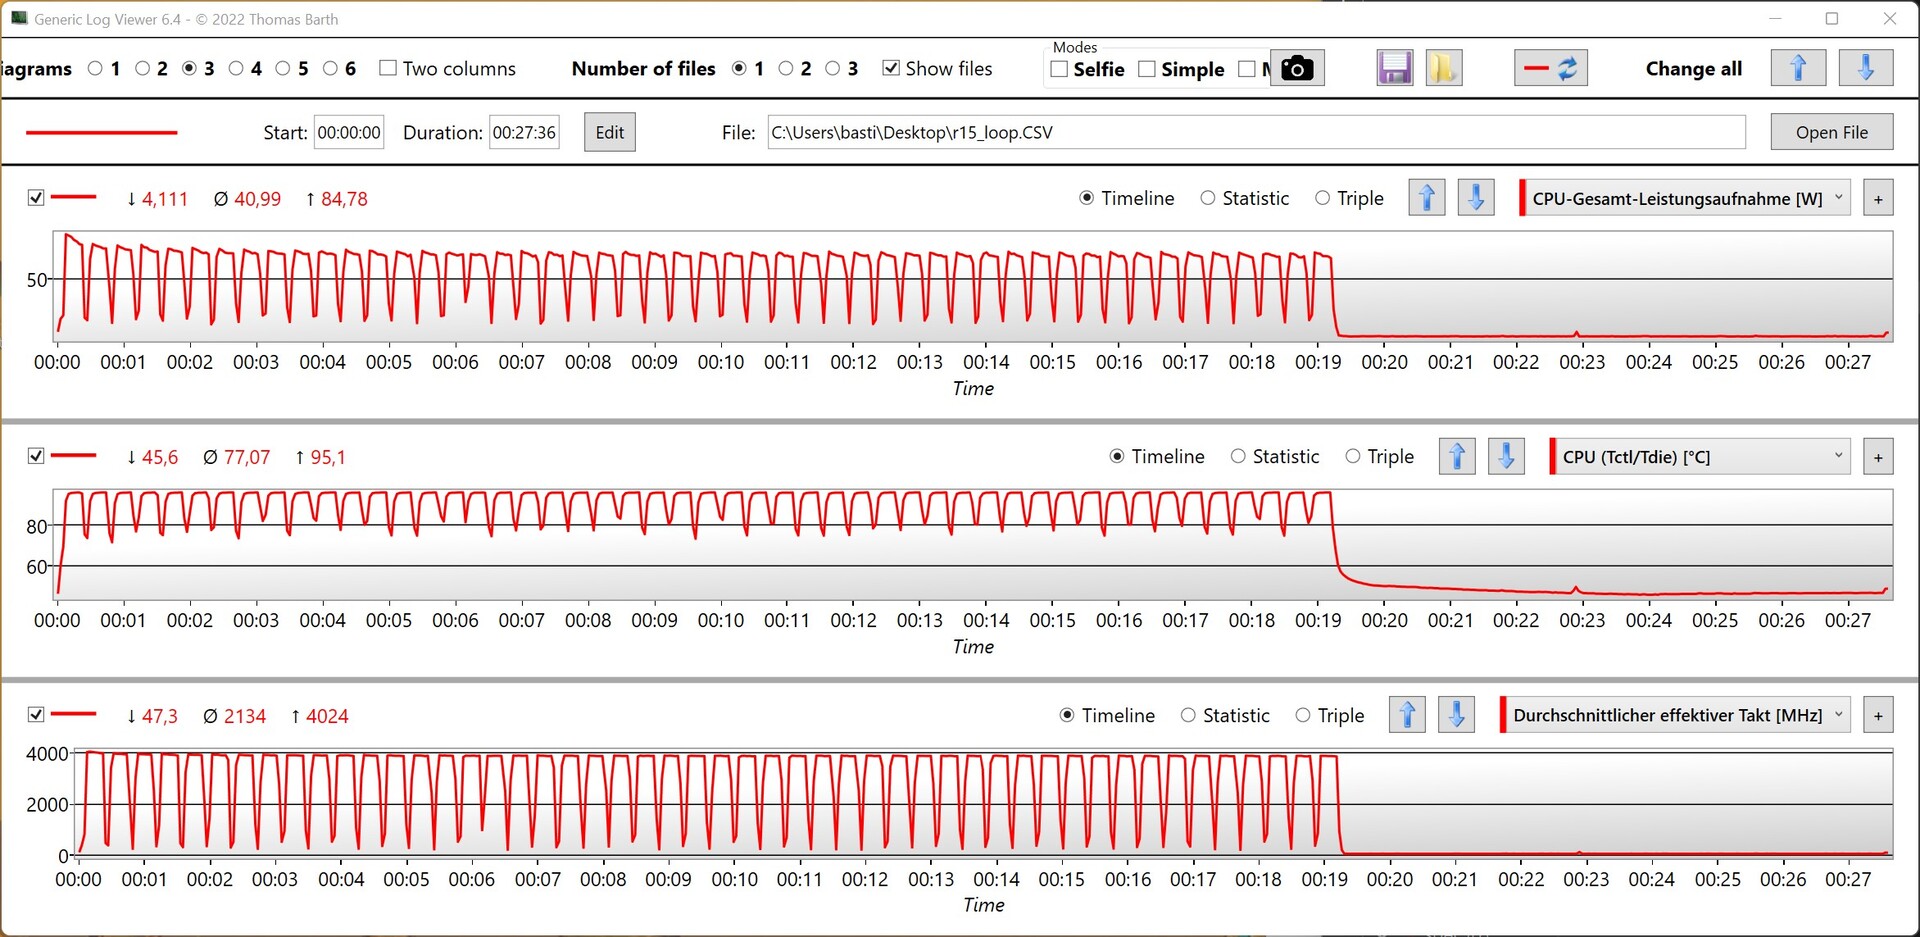
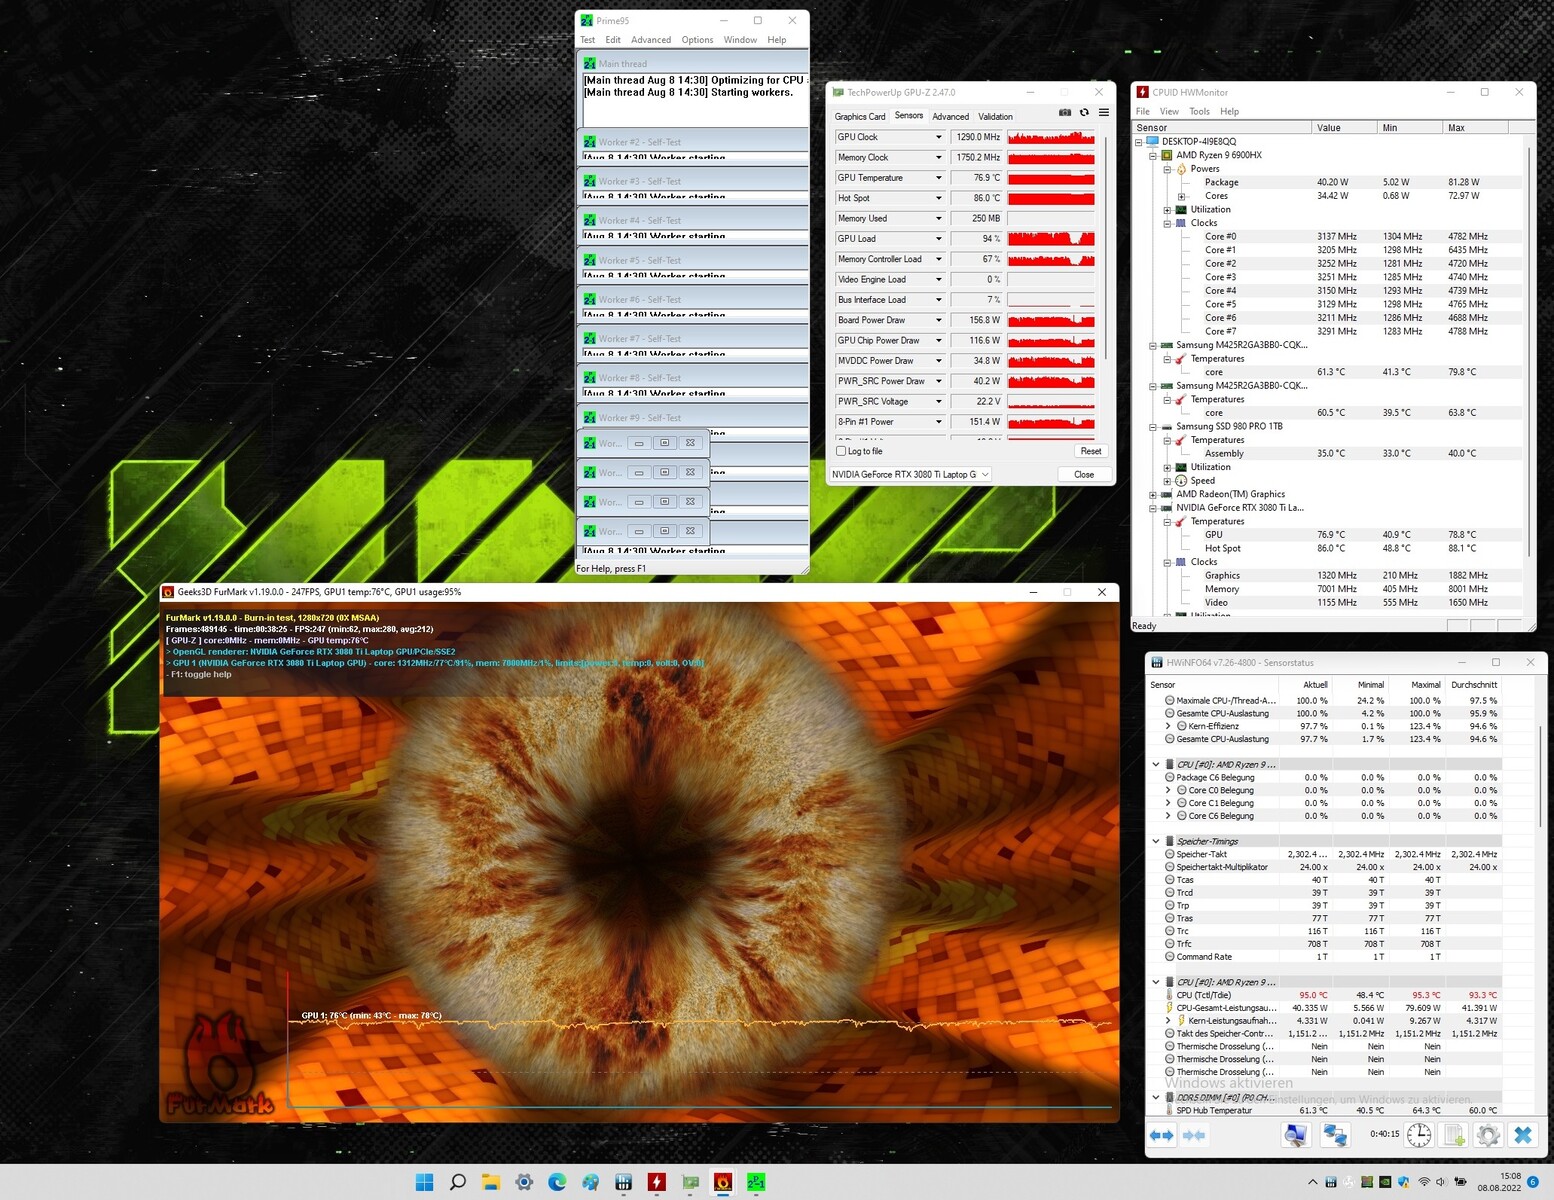
压力测试
Schenker对CPU和GPU的热量管理得相当好,尽管Ryzen 9 6900HX的峰值温度接近95℃(203°F),非常接近100℃(212°F)大关。尽管如此,该SoC的性能是一致的,没有任何重大的下滑。SoC达到了80瓦的峰值功耗,然后随着时间的推移下降并稳定在40瓦。GPU的温度看起来明显更好。尽管达到了高达170瓦的峰值消耗,但在我们的压力测试中,我们记录的最高温度只有77℃(170.6°F)。
发言人
掌托下方有两个下射式扬声器。不幸的是,它们在低音方面有所欠缺,而中音和高音则是声音中明显占主导地位的部分。对于游戏,用户可能会选择一个耳机。适当的型号可以通过3.5毫米耳机插孔或USB连接到笔记本电脑上。
Schenker XMG Neo 17 M22 audio analysis
(±) | speaker loudness is average but good (80 dB)
Bass 100 - 315 Hz
(-) | nearly no bass - on average 18.4% lower than median
(±) | linearity of bass is average (8.2% delta to prev. frequency)
Mids 400 - 2000 Hz
(+) | balanced mids - only 4.4% away from median
(±) | linearity of mids is average (7% delta to prev. frequency)
Highs 2 - 16 kHz
(+) | balanced highs - only 2.6% away from median
(+) | highs are linear (6.2% delta to prev. frequency)
Overall 100 - 16.000 Hz
(±) | linearity of overall sound is average (17.3% difference to median)
Compared to same class
» 47% of all tested devices in this class were better, 12% similar, 41% worse
» The best had a delta of 6%, average was 18%, worst was 132%
Compared to all devices tested
» 32% of all tested devices were better, 8% similar, 59% worse
» The best had a delta of 4%, average was 23%, worst was 134%
Asus ROG Zephyrus Duo 16 GX650RX audio analysis
(±) | speaker loudness is average but good (80 dB)
Bass 100 - 315 Hz
(±) | reduced bass - on average 8.9% lower than median
(±) | linearity of bass is average (12.4% delta to prev. frequency)
Mids 400 - 2000 Hz
(±) | higher mids - on average 6.8% higher than median
(+) | mids are linear (4.3% delta to prev. frequency)
Highs 2 - 16 kHz
(±) | reduced highs - on average 6% lower than median
(±) | linearity of highs is average (7.3% delta to prev. frequency)
Overall 100 - 16.000 Hz
(±) | linearity of overall sound is average (16.5% difference to median)
Compared to same class
» 42% of all tested devices in this class were better, 7% similar, 51% worse
» The best had a delta of 6%, average was 18%, worst was 132%
Compared to all devices tested
» 28% of all tested devices were better, 6% similar, 66% worse
» The best had a delta of 4%, average was 23%, worst was 134%
能源管理--良好的消耗值
能源消耗
在能源消耗方面,Schenker XMG Neo 17有一些惊喜,因为它在空闲和低负荷时非常高效。没有其他设备能够在这方面与我们的Schenker相提并论。在最大负荷下,该系统需要从AC适配器中获得高达306瓦的能量,由于电源砖的额定功率为330瓦,所以这不是一个问题。
| Off / Standby | |
| Idle | |
| Load |
|
Key:
min: | |
| Schenker XMG Neo 17 M22 R9 6900HX, GeForce RTX 3080 Ti Laptop GPU | MSI Titan GT77 12UHS i9-12900HX, GeForce RTX 3080 Ti Laptop GPU | Razer Blade 17 Early 2022 i9-12900H, GeForce RTX 3080 Ti Laptop GPU | Acer Predator Triton 500 SE PT516-52s-70KX i7-12700H, GeForce RTX 3080 Ti Laptop GPU | Asus ROG Zephyrus Duo 16 GX650RX R9 6900HX, GeForce RTX 3080 Ti Laptop GPU | MSI Raider GE77 HX 12UHS i9-12900HX, GeForce RTX 3080 Ti Laptop GPU | Average NVIDIA GeForce RTX 3080 Ti Laptop GPU | Average of class Gaming | |
|---|---|---|---|---|---|---|---|---|
| Power Consumption | -114% | -61% | -18% | -59% | -52% | -72% | -42% | |
| Idle Minimum * (Watt) | 7 | 30.21 -332% | 17 -143% | 7 -0% | 19 -171% | 13 -86% | 17.2 ? -146% | 13 ? -86% |
| Idle Average * (Watt) | 11 | 32.42 -195% | 23 -109% | 19 -73% | 24 -118% | 19 -73% | 23.3 ? -112% | 19 ? -73% |
| Idle Maximum * (Watt) | 17 | 33.7 -98% | 34 -100% | 28 -65% | 31 -82% | 29 -71% | 30.8 ? -81% | 24.6 ? -45% |
| Load Average * (Watt) | 92 | 125.09 -36% | 120 -30% | 114 -24% | 104 -13% | 143 -55% | 121.2 ? -32% | 110.7 ? -20% |
| Witcher 3 ultra * (Watt) | 221 | 256 -16% | 229 -4% | 159 28% | 186.5 16% | 247 -12% | ||
| Load Maximum * (Watt) | 306 | 321.88 -5% | 243 21% | 227 26% | 256 16% | 352 -15% | 276 ? 10% | 259 ? 15% |
* ... smaller is better
Consumption Witcher 3 / Stress Test
Consumption external Monitor
电池寿命
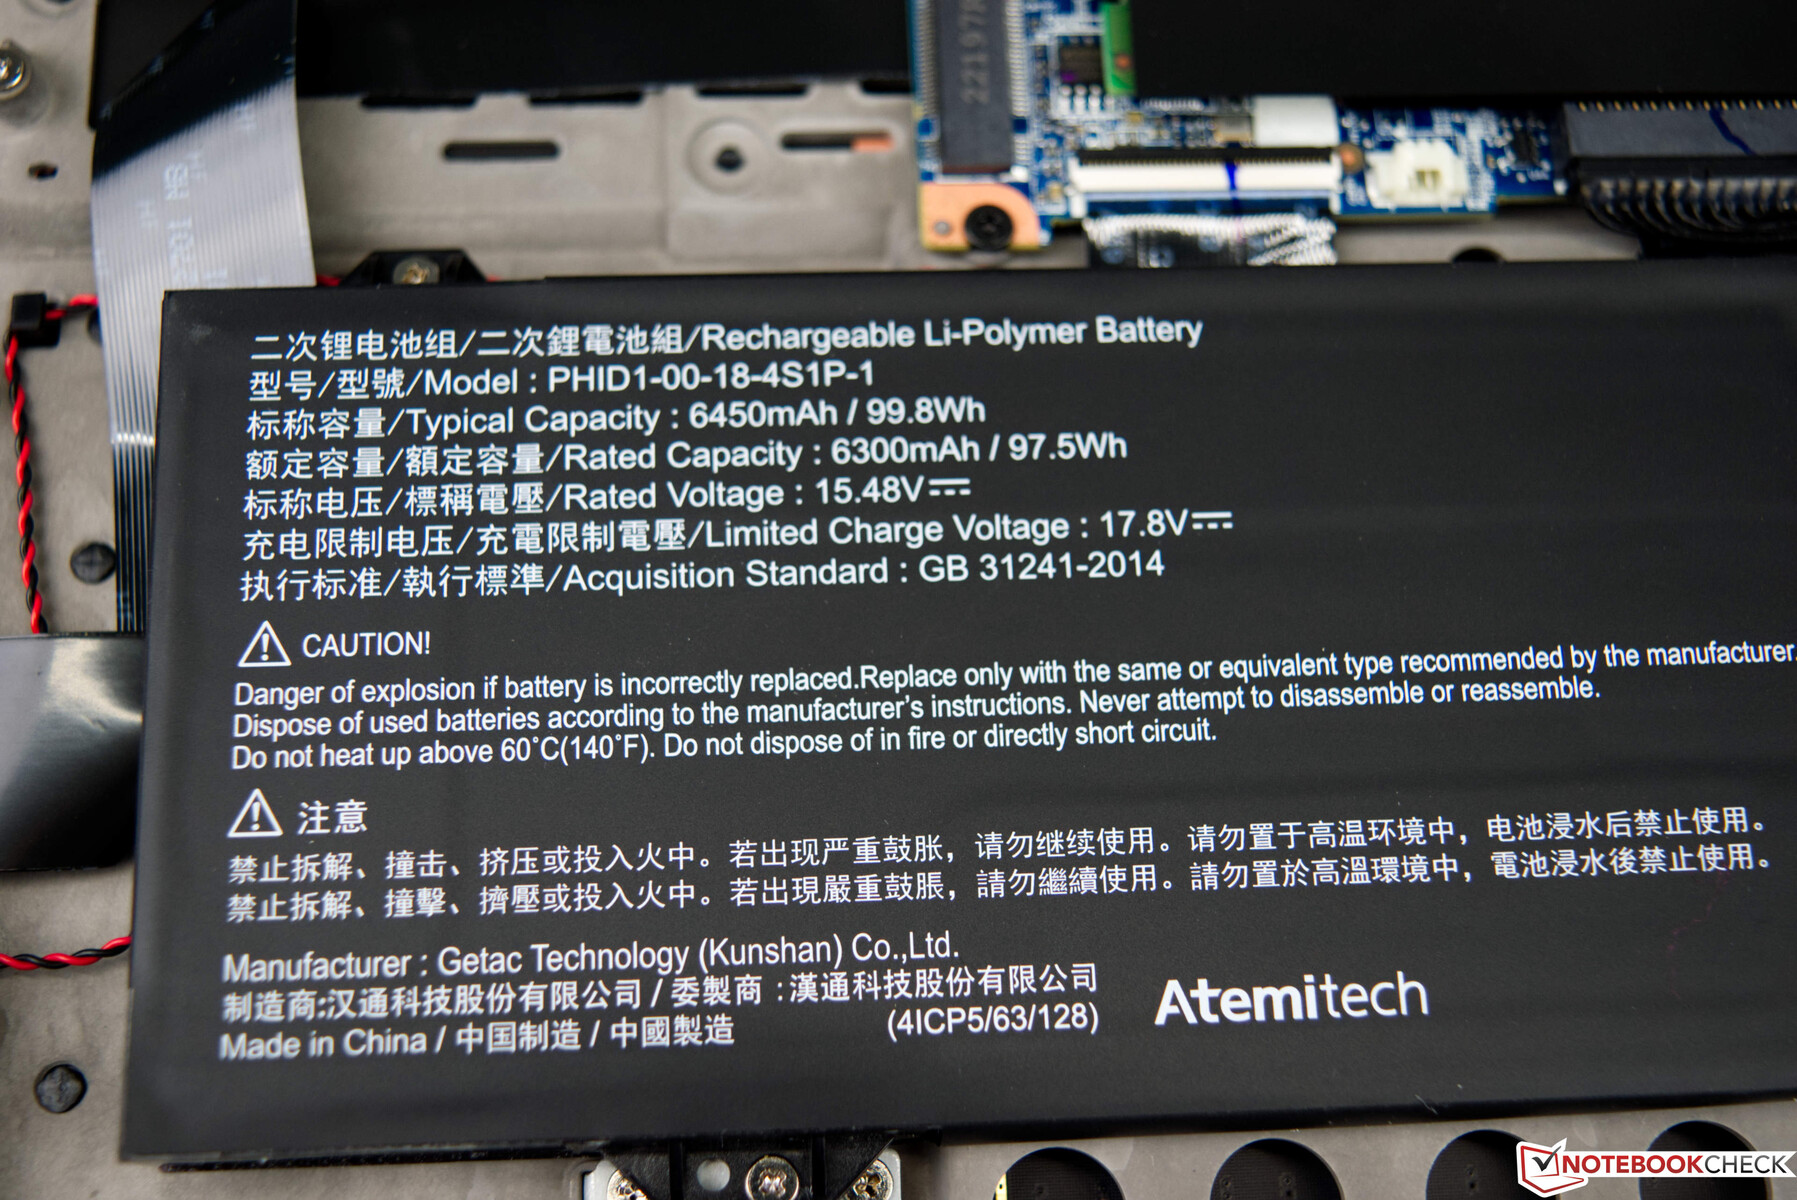
Schenker为XMG Neo 17配备了99瓦时的大电池,在我们的Wi-Fi测试中,它能够为我们的测试样本提供近9个小时的电力。特别是与它的竞争对手相比,这是一个很好的结果。视频播放的运行时间略低,该设备仅在6.5小时后就需要充电。给大电池完全充电的速度令人惊讶,仅需102分钟。
应该注意的是,在电池模式下,CPU和GPU的性能是有限的。然而,这种行为并不是Schenker XMG Neo 17所特有的,几乎在目前所有的游戏笔记本上都存在。

| Schenker XMG Neo 17 M22 R9 6900HX, GeForce RTX 3080 Ti Laptop GPU, 99 Wh | MSI Titan GT77 12UHS i9-12900HX, GeForce RTX 3080 Ti Laptop GPU, 99.9 Wh | Razer Blade 17 Early 2022 i9-12900H, GeForce RTX 3080 Ti Laptop GPU, 82 Wh | Acer Predator Triton 500 SE PT516-52s-70KX i7-12700H, GeForce RTX 3080 Ti Laptop GPU, 99.98 Wh | Asus ROG Zephyrus Duo 16 GX650RX R9 6900HX, GeForce RTX 3080 Ti Laptop GPU, 90 Wh | MSI Raider GE77 HX 12UHS i9-12900HX, GeForce RTX 3080 Ti Laptop GPU, 99.99 Wh | Average of class Gaming | |
|---|---|---|---|---|---|---|---|
| Battery runtime | -12% | -33% | 3% | -3% | -12% | -11% | |
| Reader / Idle (h) | 12 | 7.1 -41% | 12.5 4% | 9.8 -18% | 8.27 ? -31% | ||
| H.264 (h) | 6.6 | 7.2 9% | 4.8 -27% | 8.2 24% | 9.3 41% | 6.5 -2% | 8.32 ? 26% |
| WiFi v1.3 (h) | 9 | 6.9 -23% | 3.8 -58% | 5.7 -37% | 7.8 -13% | 5.4 -40% | 7.11 ? -21% |
| Load (h) | 1.8 | 1.4 -22% | 1.7 -6% | 2.2 22% | 1 -44% | 2 11% | 1.502 ? -17% |
| Witcher 3 ultra (h) | 1.5 |
Pros
Cons
结论 - 带有可选水冷的快速游戏笔记本
坚固而光滑的外壳,在日常使用中几乎没有任何性能,以及Nvidia最快的笔记本电脑GPU,再加上液体冷却设备的可能性,使Schenker XMG Neo 17成为一个引人注目的纸上报价。制造商几乎没有任何妥协,并允许硬件释放其全部潜力,这在很大程度上导致了出色的基准测试结果。
我们的Neo 17中的AMD Ryzen 9 6900HX表现良好,并能在长时间内保持其性能。NvidiaGeForce RTX 3080 Ti也是如此。这些是我们在没有选配XMG Oasis的情况下的观察结果,因为集成冷却解决方案已经促进了稳定的性能。对于喜欢更安静的系统的用户,可选的水冷器可能值得考虑。我们很高兴看到具有16:10外形尺寸的显示器。它唯一的缺点是AdobeRGB和P3色彩空间覆盖面有点窄,对于专业的照片和视频编辑来说,这还不够好。也就是说,如果你把XMG Neo 17作为游戏笔记本使用,这就不是一个问题。
Schenker XMG Neo 17是一款快速的游戏笔记本,不必人为地控制其性能。得益于可选的XMG Oasis配件,该笔记本甚至支持液体冷却。
总的来说,Schenker XMG Neo 17是一款坚实的游戏笔记本,在性能方面提供了很多。我们也没有发现什么大的缺点。Neo 17在电池寿命方面也做得很好。如果我们要批评什么,那就是键盘,它配备的小键盘不幸没有使用Cherry MX开关。此外,倾斜的交流电适配器插头是不理想的,因为一个直的插头不会不必要地阻碍附近的端口。在Wi-Fi性能方面,还有改进的余地。至少,用户可以在配置过程中选择一个更现代/更快速的Wi-Fi模块。说到这里--后者具有申克公司的特点,而且组织良好。该设备可以根据自己的喜好进行定制,而且选择范围很广。除了基本单元外,CPU和显示器都是固定的,不能改变。
Schenker XMG Neo 17有很多竞争对手。如前所述,一些由英特尔Alder Lake驱动的笔记本电脑可以提供更快的性能。微星Titan GT77 12UHS就是这样一个例子,尽管它(甚至)比我们配置的Neo 17更贵,价格约为4200美元。
价格和可用性
Schenker XMG Neo 17可直接从制造商的网上商店购买。有许多不同的配置选项。基本型号的价格约为2950美元,而我们的配置售价约为4200美元。
Schenker XMG Neo 17 M22
- 08/31/2022 v7 (old)
Sebastian Bade
Price comparison

