笔记本电脑评测:Alienware x15 R2。超极本般的飞碟采用酷睿i9-12900H和140W的RTX 3080 Ti,让人眼前一亮
戴尔已经有一段时间没有更换过 替换了Alienware m15系列的x15。x15系列基本上采用了与m15的Legend机箱相同的设计语言,但现在更加纤薄。今年,我们有 Alienware x15 R2和 Alienware x17 R2争夺你辛苦挣来的蛋糕。
我们之前曾对 谈到了Alienware x15 R1和Alienware x17 R2,所以现在是时候看看Alienware x15 R2了,看看今年的Alder Lake-H更新为我们带来了什么。
今年的Alienware x15 R2或多或少是上一代x15 R1的翻版。然而,我们看到一些急需的内部改进,包括升级到英特尔第12代Alder Lake-H,Nvidia RTX 30 Ti图形,杜比视界显示器,以及更多。
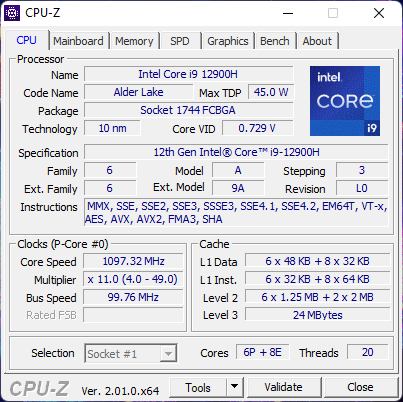
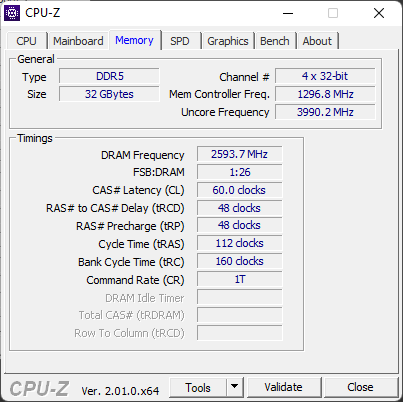
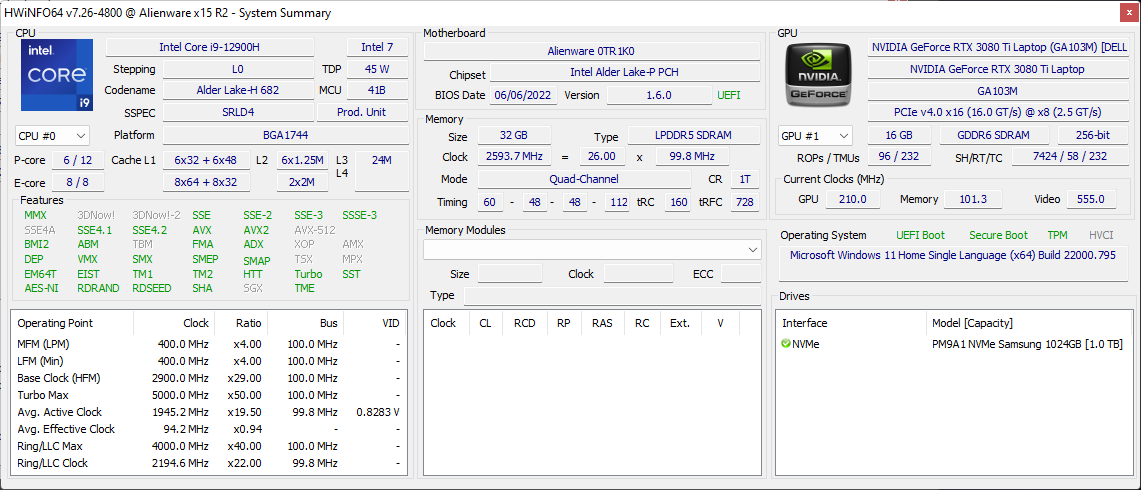
我们测试的Alienware x15 R2配备了一个 英特尔酷睿i9-12900H, NvidiaGeForce RTX 3080 Ti 笔记本GPU, 1080p 360 Hz显示屏,32GB LPDDR5-4800内存,以及1TB三星PM9A1 NVMe SSD。如果通过戴尔印度公司在线订购,这个配置将让你花费3,68,190英镑(约4,500美元或4,583欧元)。.
在这篇评论中,我们将Alienware x15 R2进行了测试,看看新的升级是否为这个价格带来了良好的体验。
潜在的竞争对手比较
Rating | Date | Model | Weight | Height | Size | Resolution | Price |
|---|---|---|---|---|---|---|---|
| 87.7 % v7 (old) | 10 / 2022 | Alienware x15 R2 P111F i9-12900H, GeForce RTX 3080 Ti Laptop GPU | 2.4 kg | 15.9 mm | 15.60" | 1920x1080 | |
| 86.3 % v7 (old) | 06 / 2022 | Asus ROG Strix Scar 15 G533ZW-LN106WS i9-12900H, GeForce RTX 3070 Ti Laptop GPU | 2.3 kg | 27.2 mm | 15.60" | 2560x1440 | |
| 88.2 % v7 (old) | 05 / 2022 | Asus ROG Zephyrus Duo 16 GX650RX R9 6900HX, GeForce RTX 3080 Ti Laptop GPU | 2.6 kg | 20.5 mm | 16.00" | 3840x2400 | |
| 87.4 % v7 (old) | 06 / 2022 | MSI Raider GE66 12UHS i9-12900HK, GeForce RTX 3080 Ti Laptop GPU | 2.4 kg | 23.4 mm | 15.60" | 3840x2160 | |
| 88.3 % v7 (old) | 08 / 2022 | MSI Titan GT77 12UHS i9-12900HX, GeForce RTX 3080 Ti Laptop GPU | 3.3 kg | 23 mm | 17.30" | 1920x1080 | |
| 86.9 % v7 (old) | 03 / 2022 | MSI Vector GP66 12UGS i9-12900H, GeForce RTX 3070 Ti Laptop GPU | 2.3 kg | 23.4 mm | 15.60" | 1920x1080 | |
| 88.3 % v7 (old) | 05 / 2022 | Razer Blade 15 Advanced Model Early 2022 i7-12800H, GeForce RTX 3080 Ti Laptop GPU | 2.1 kg | 16.99 mm | 15.60" | 1920x1080 |
机箱:近乎超极本机箱中的每寸Alienware
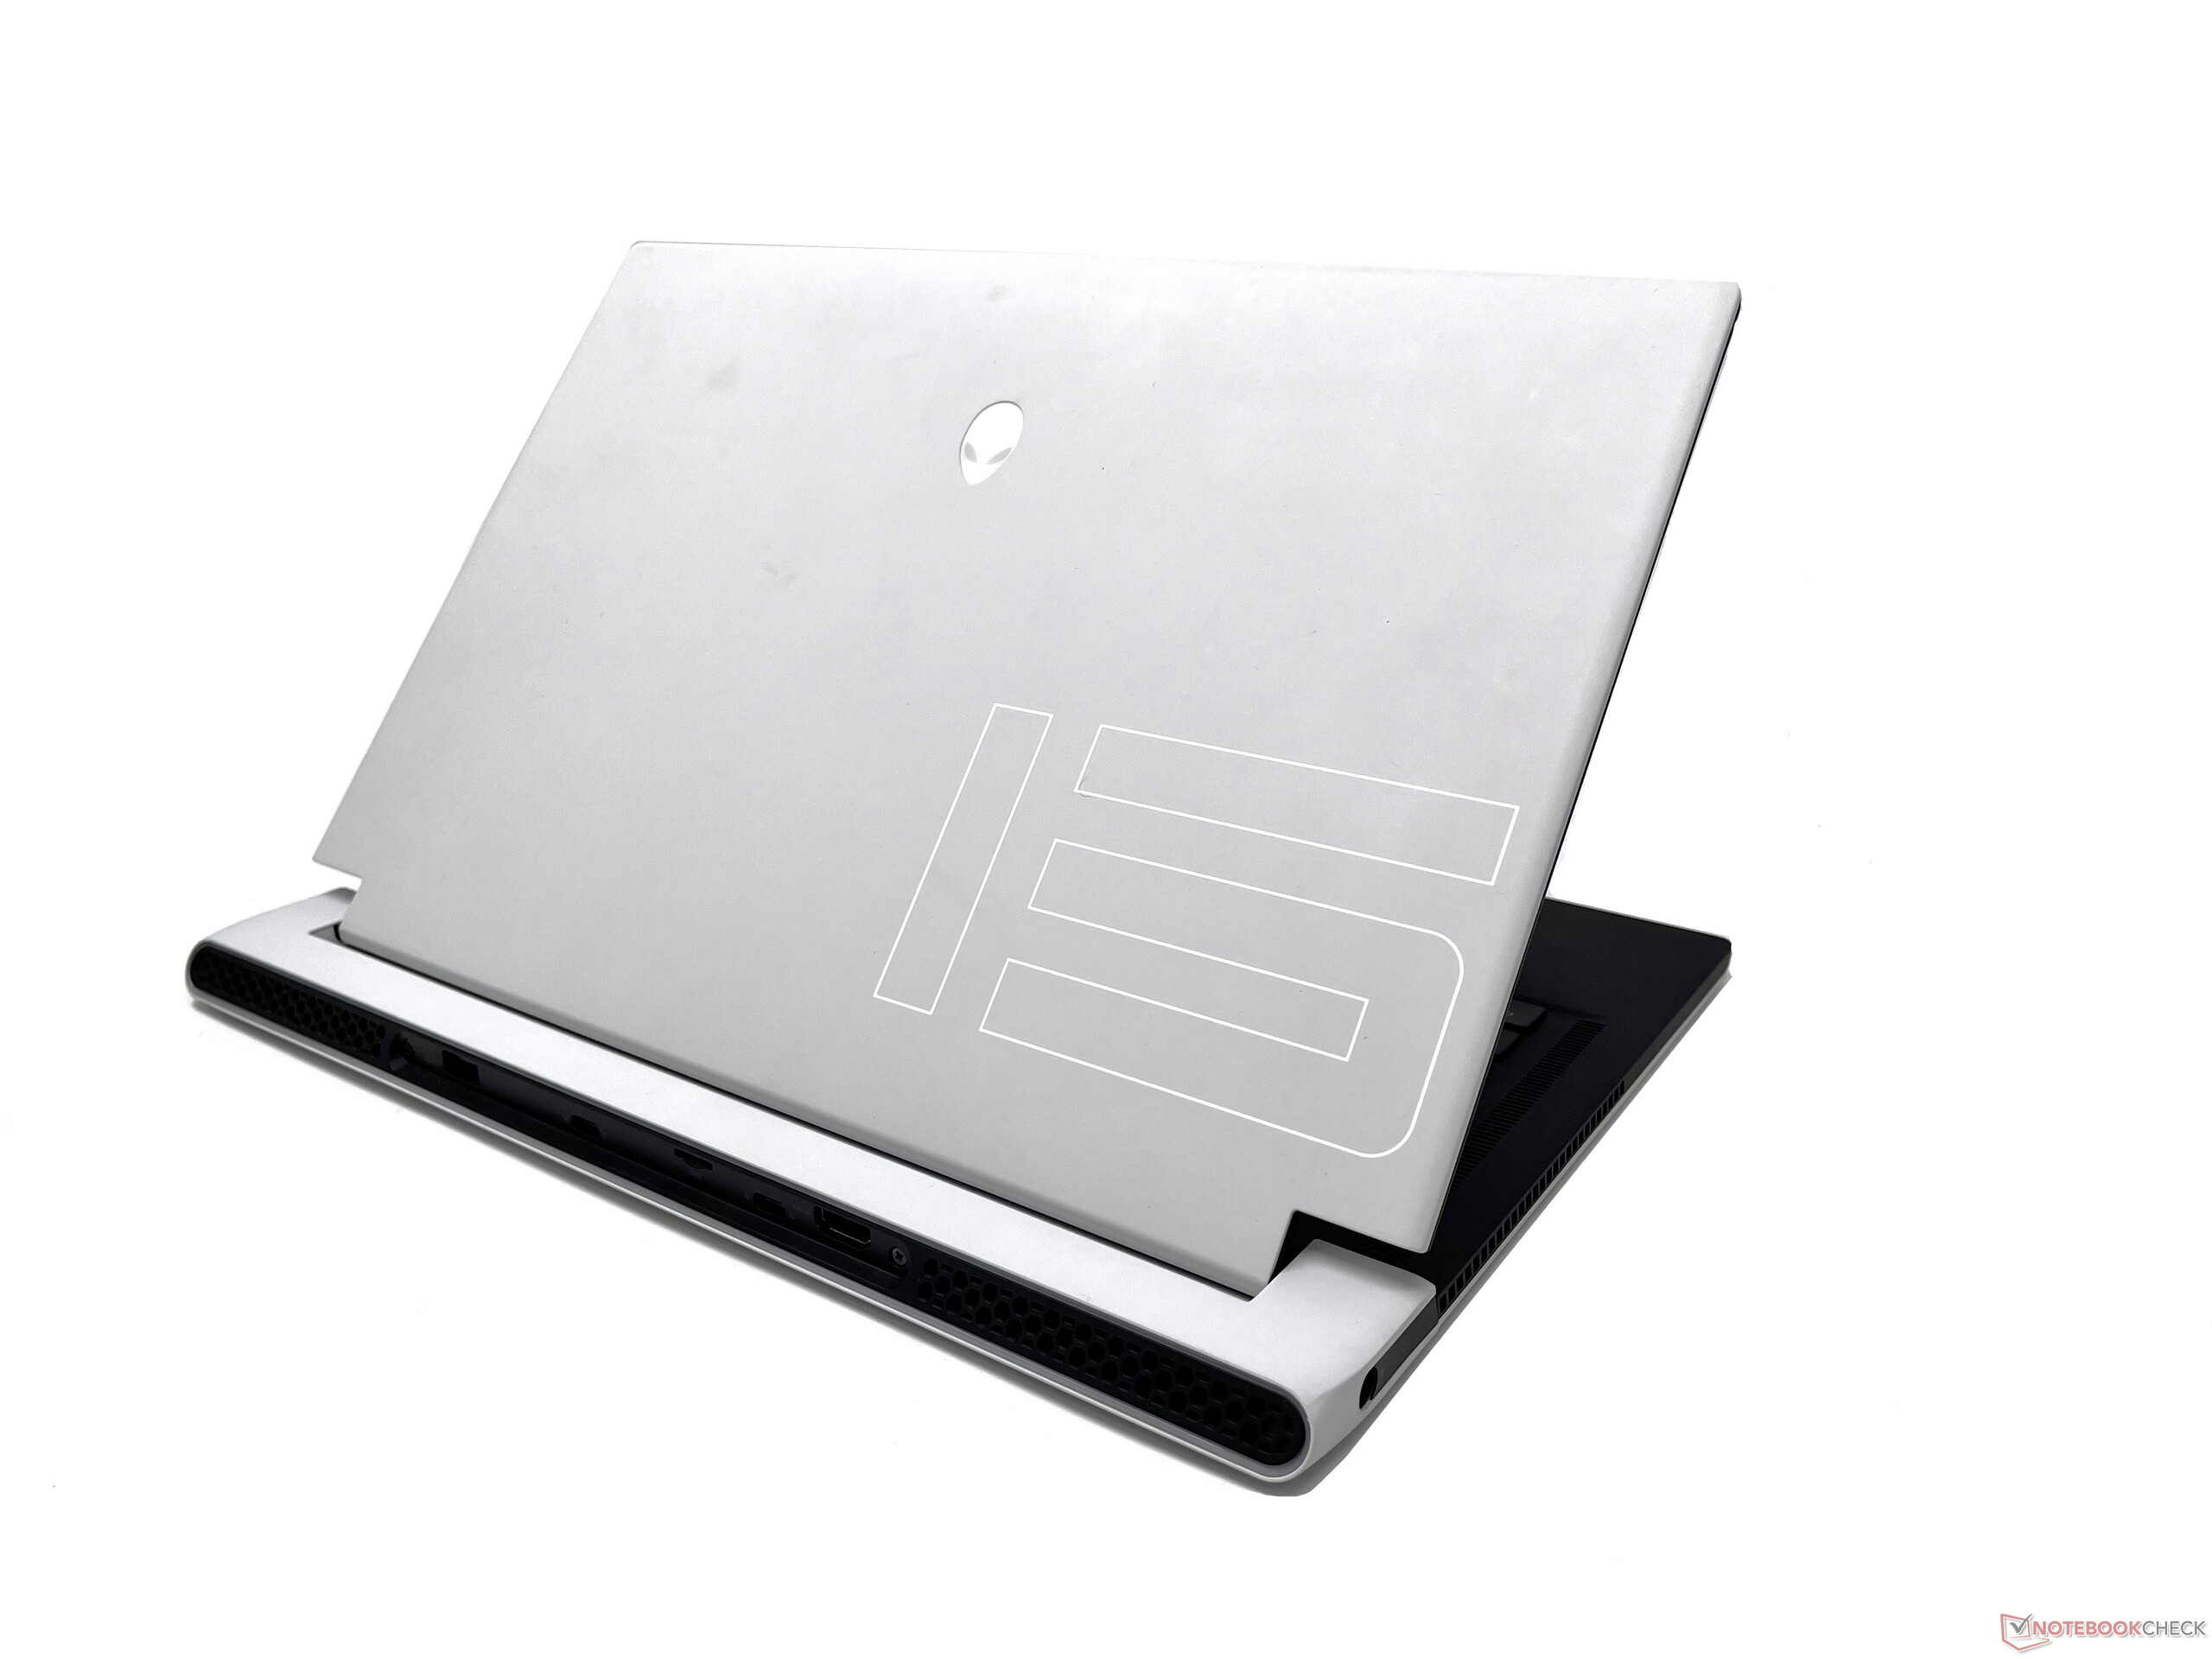
传奇2.0机箱与x15 R1基本没有变化,同样引人注目。就所提供的硬件而言,x15 R2看起来相当苗条,Alienware已经成功地将经典和游戏美学结合起来。
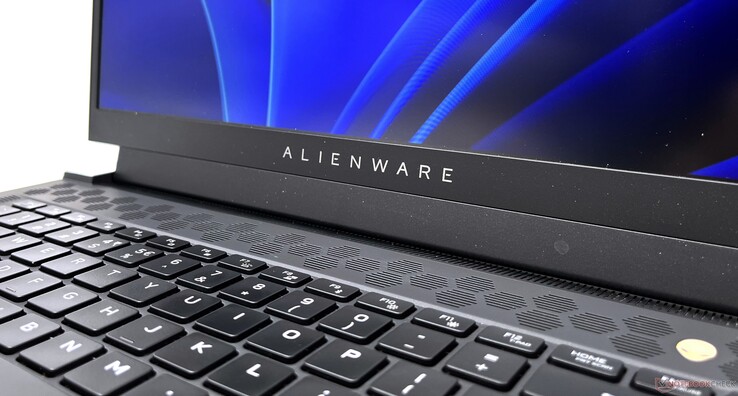
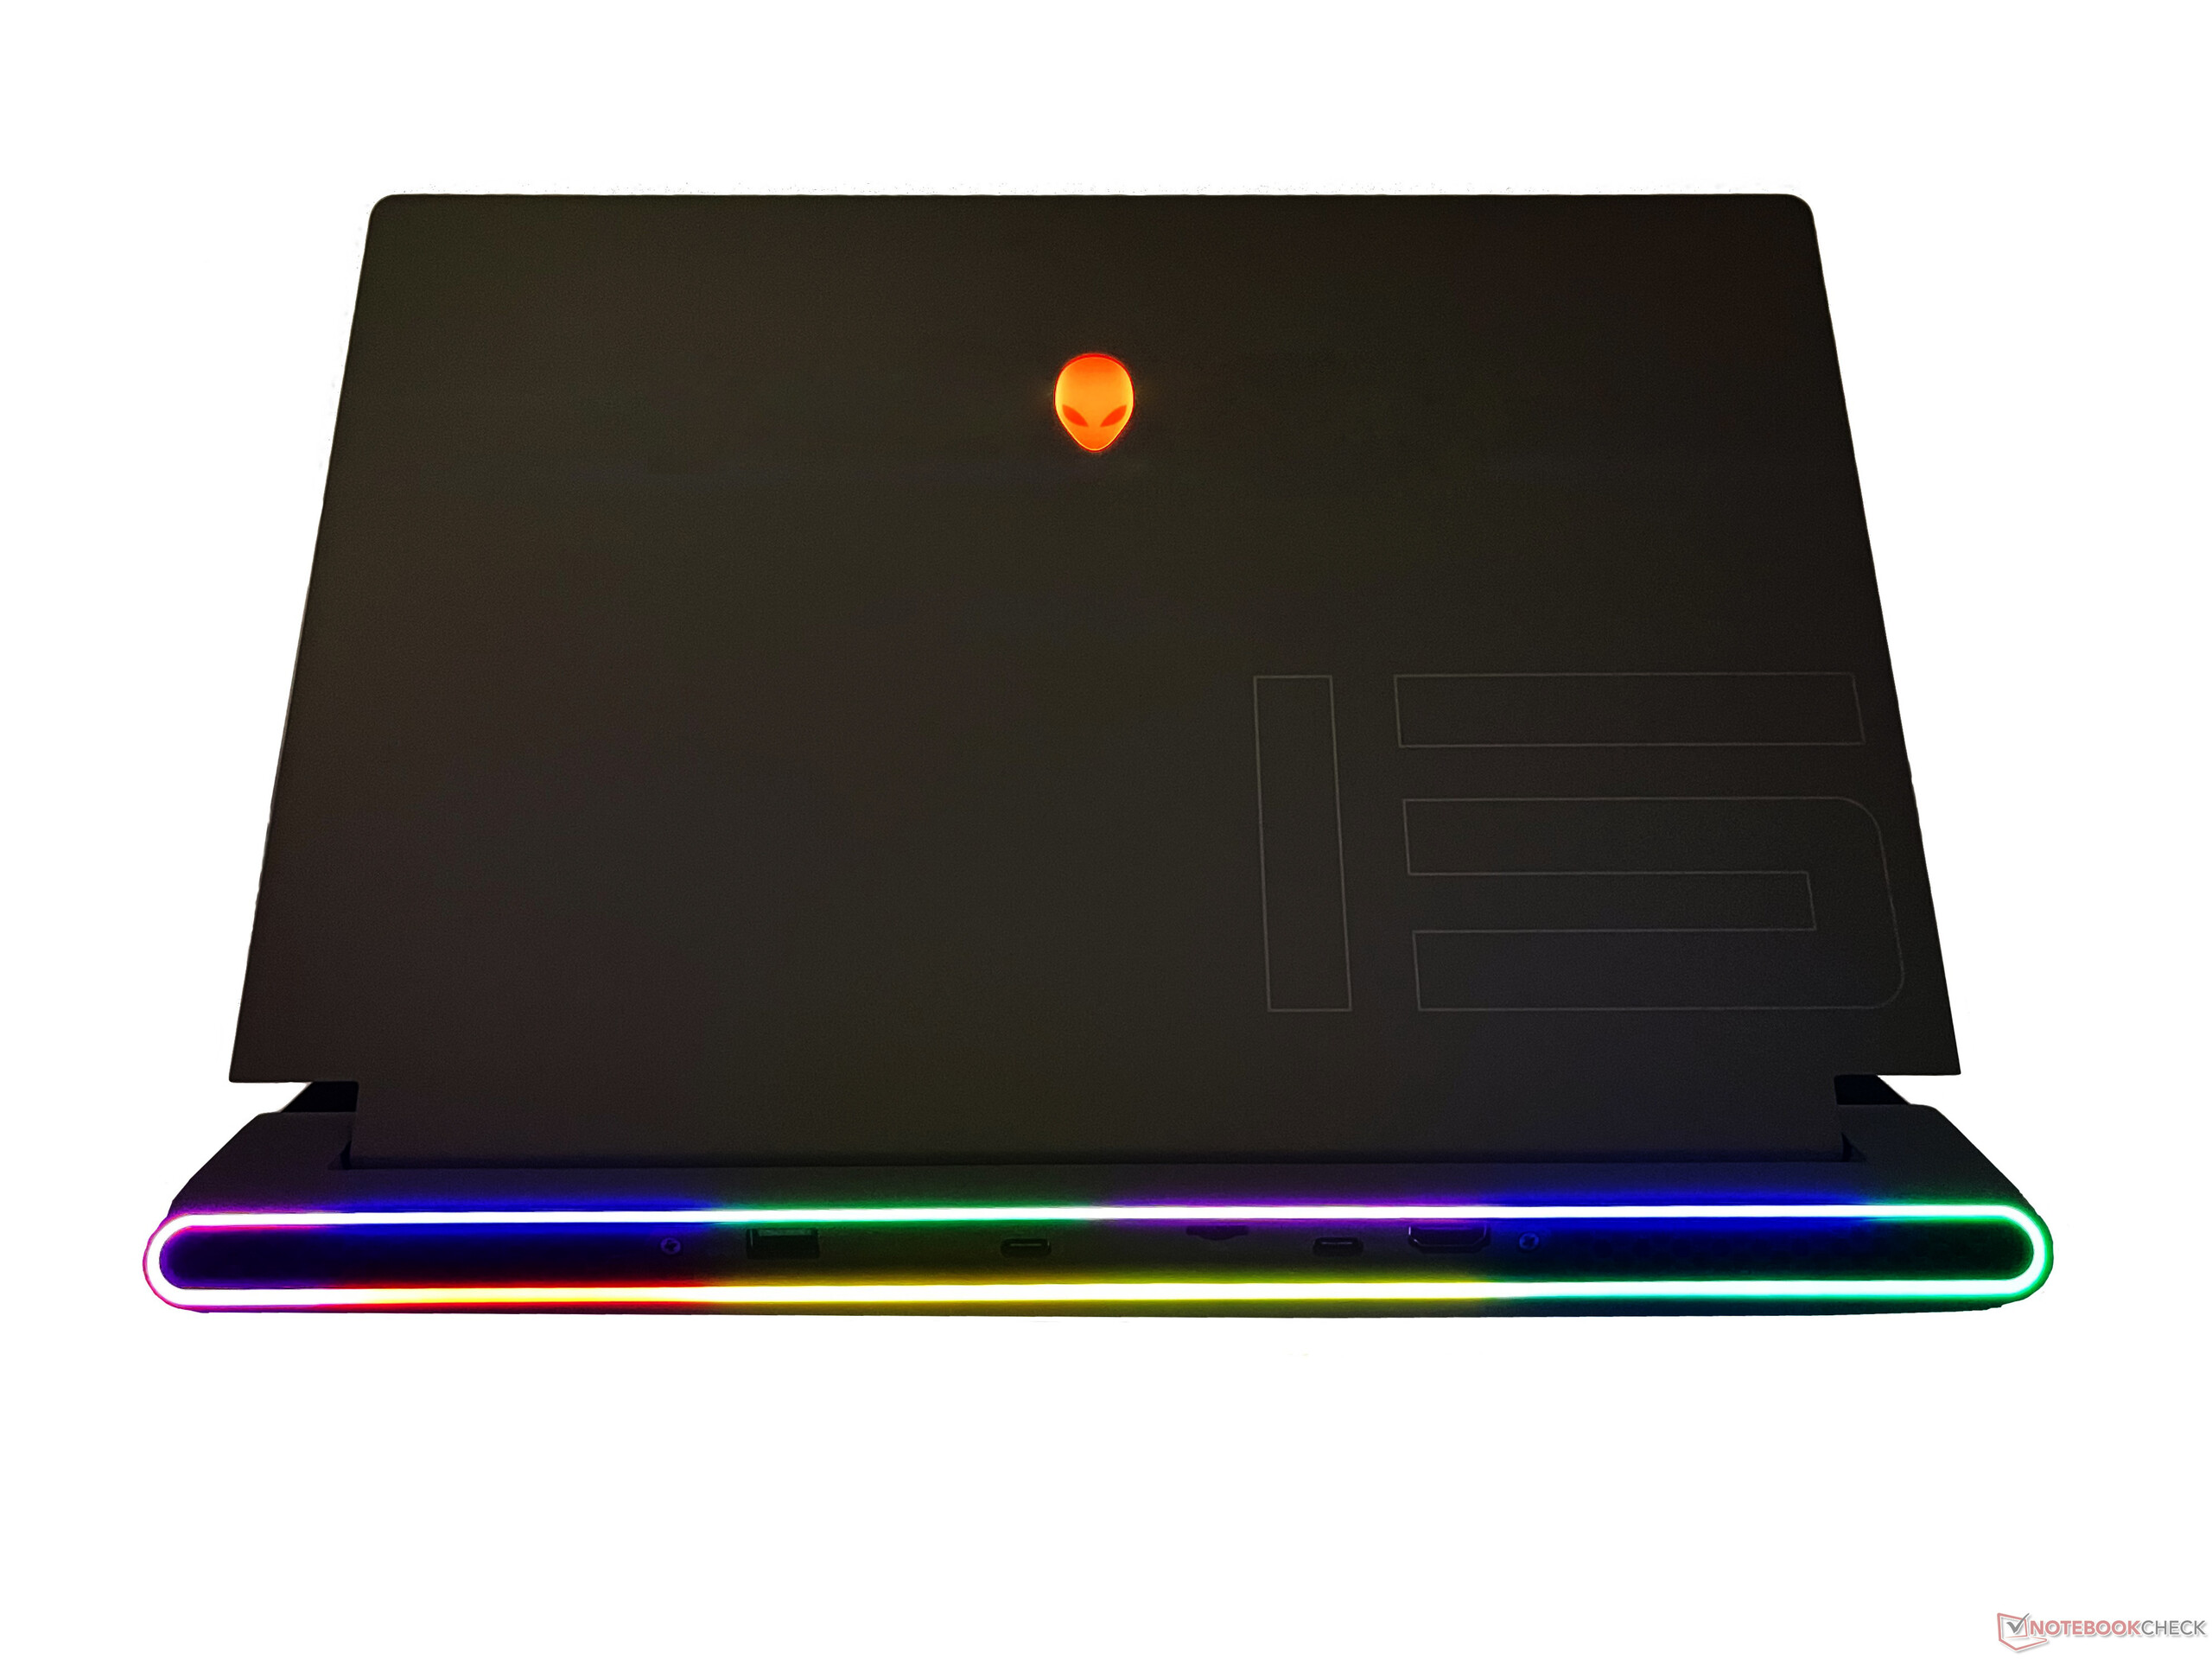
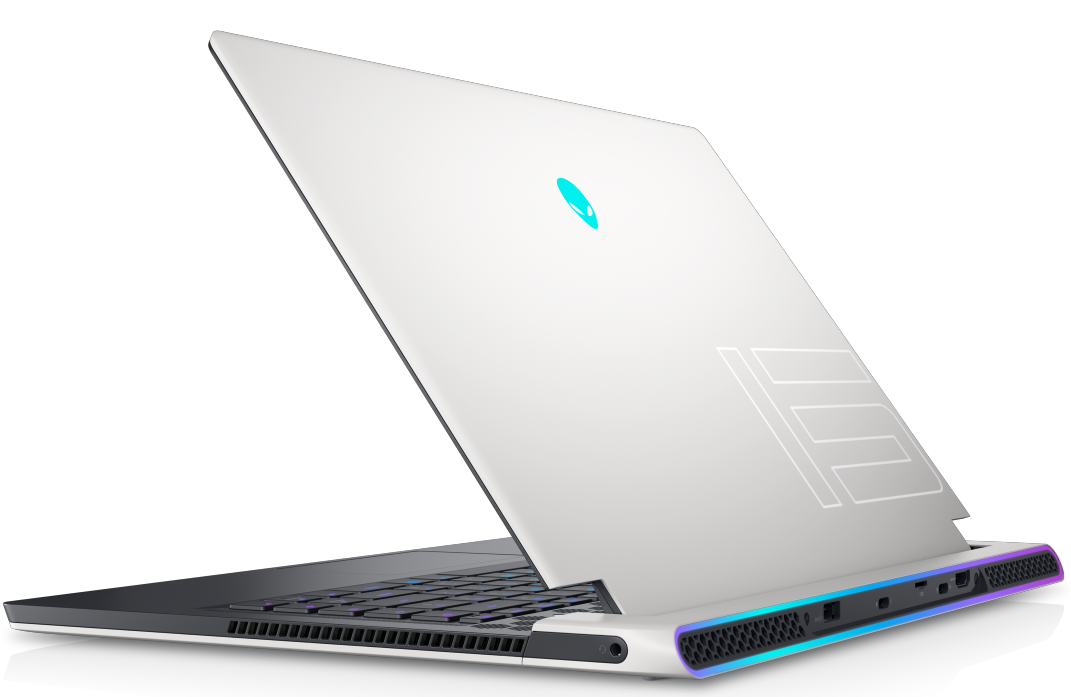
白色机箱和黑色键盘甲板的双色涂装看起来很吸引人,而且触感光滑。盖子背面的标志性外星头像和电源按钮在原始的RGB中发光,由90个微型LED组成的后场RGB灯也是如此,所有这些都可以在Alienware指挥中心中完全自定义或关闭。
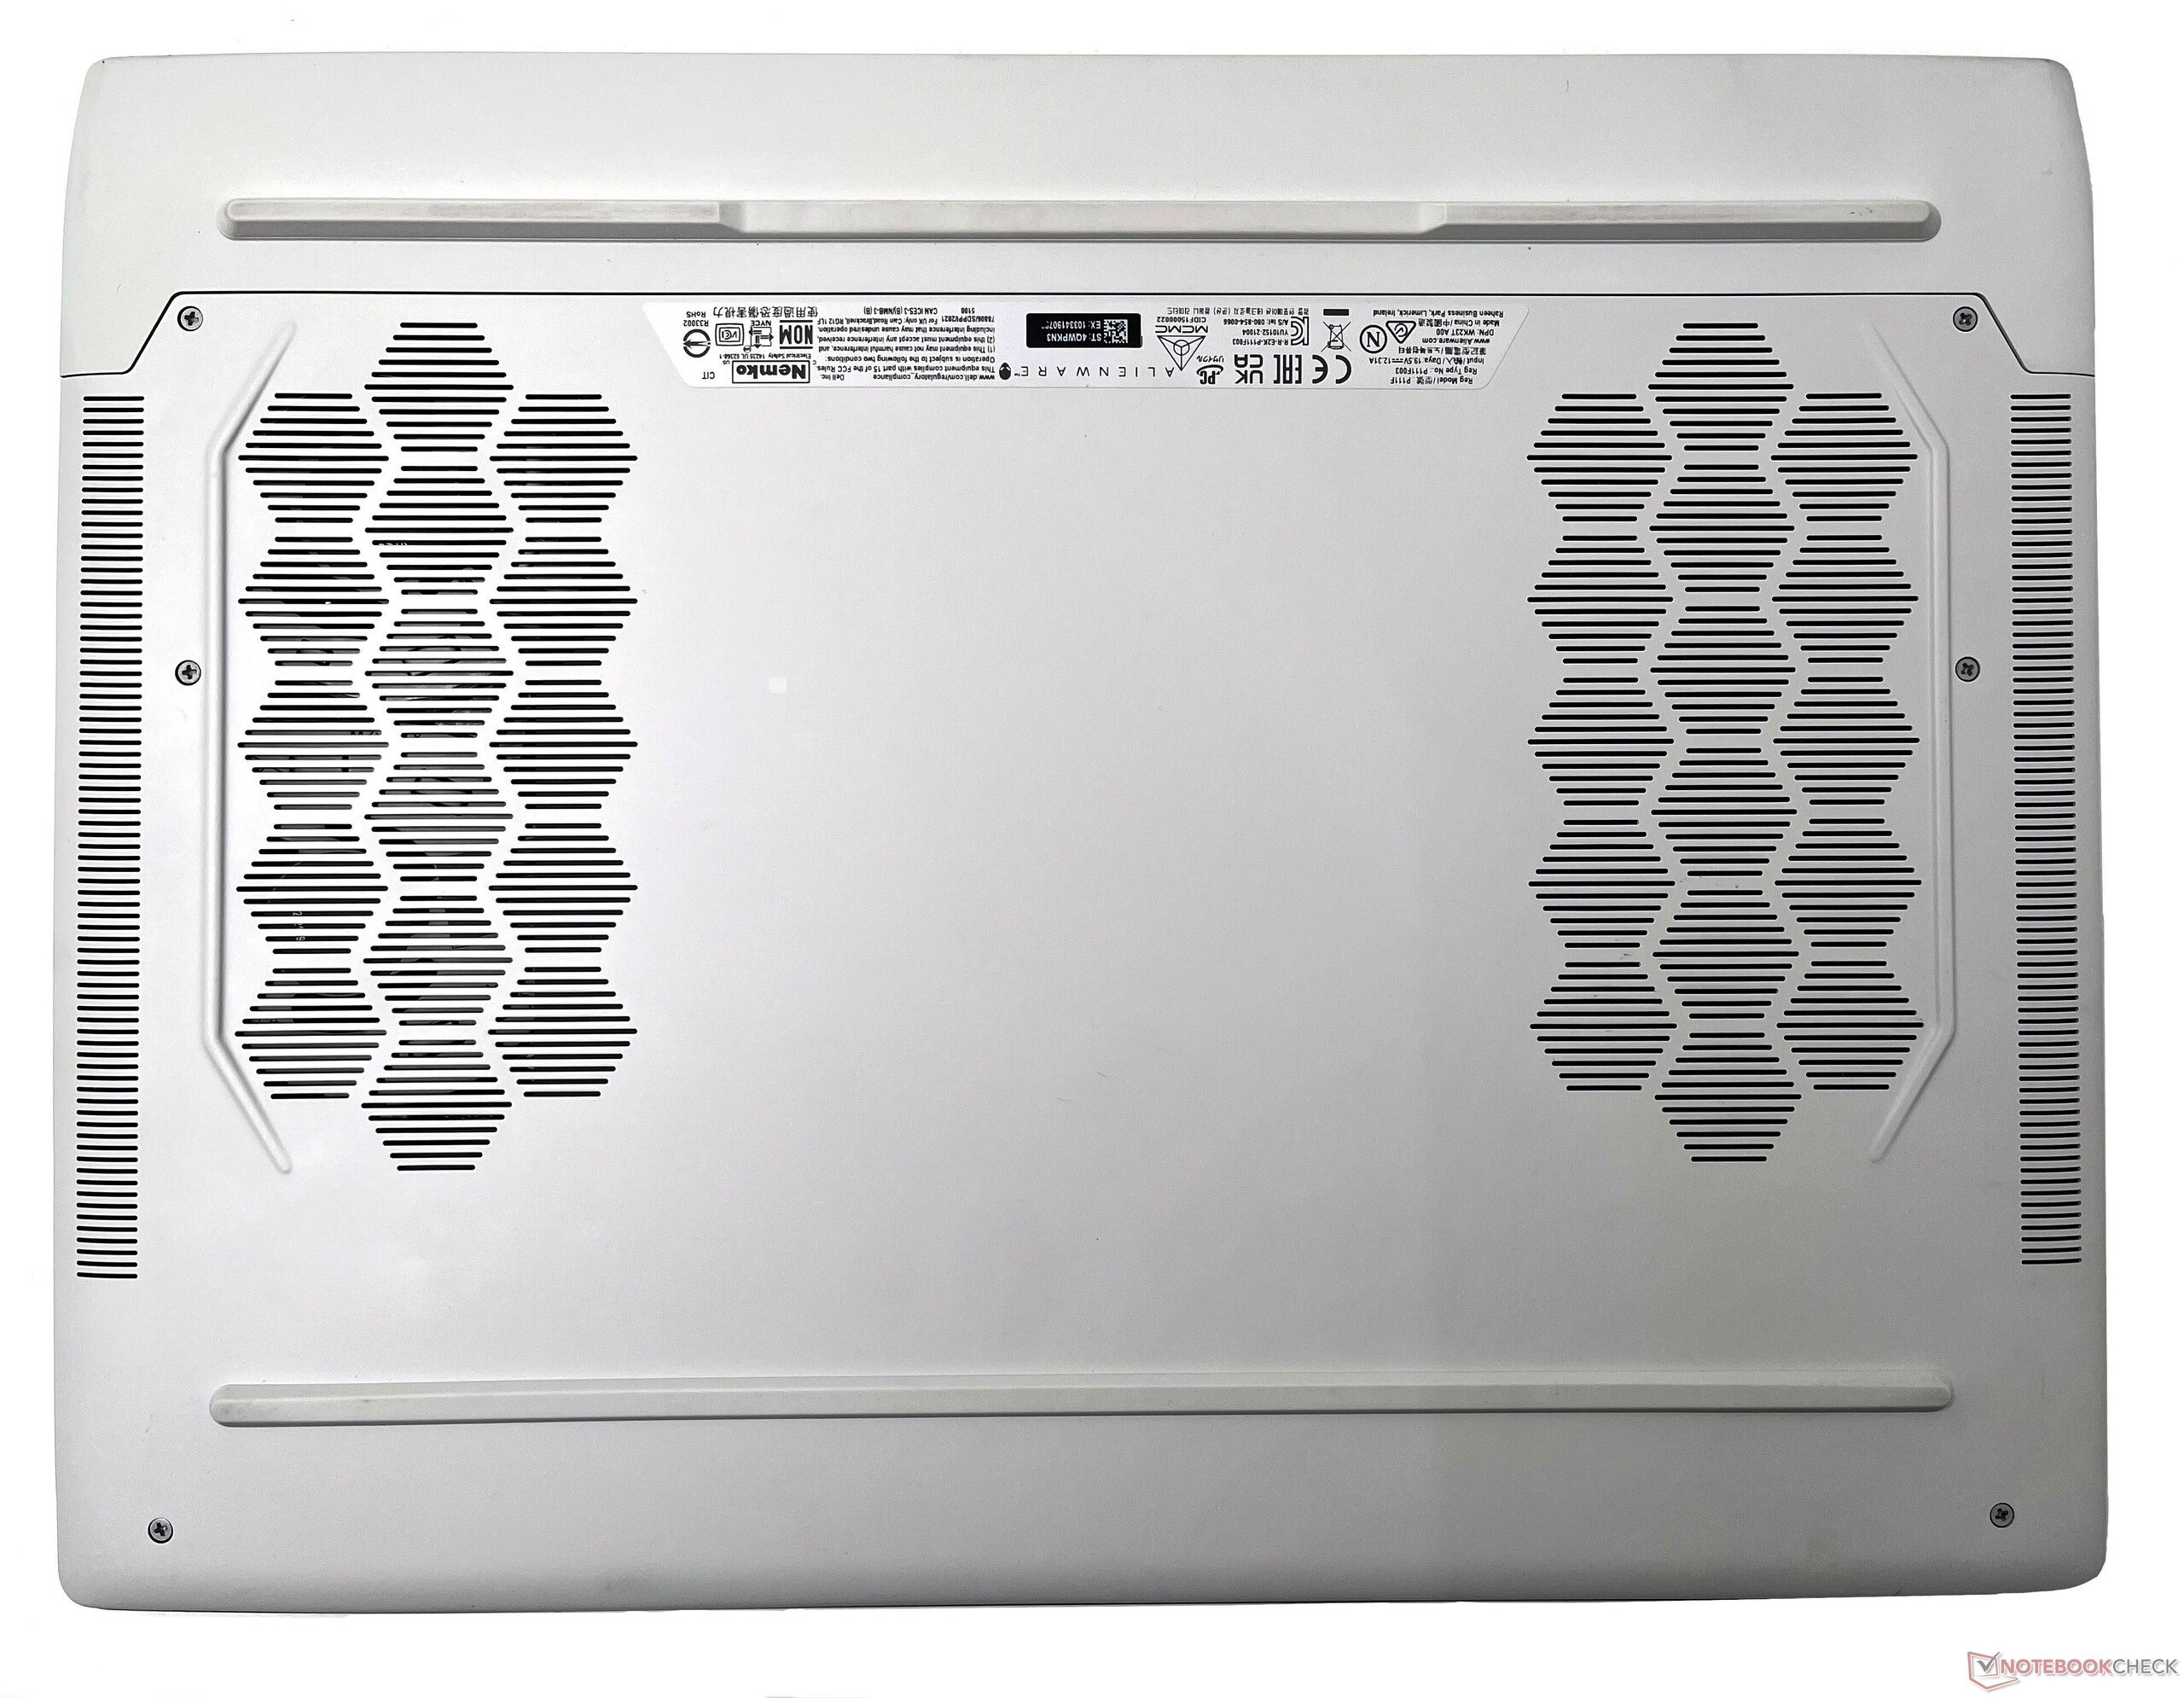
后面的通风口采用了蜂窝状的图案,增加了一点时尚感。底部面板也是塑料结构,并有图案的进气孔。
虽然键盘板的结构主要是塑料的,但它给人的感觉相当高级和统一,没有任何尖锐的边缘或肆意的弯曲--这是前几代Alienwares出了名的。 有一些弯曲,但只有在故意施加压力时才会观察到。显示屏的盖子是由镁合金制成的,具有很强的硬度,上面刻有数字 "15"。
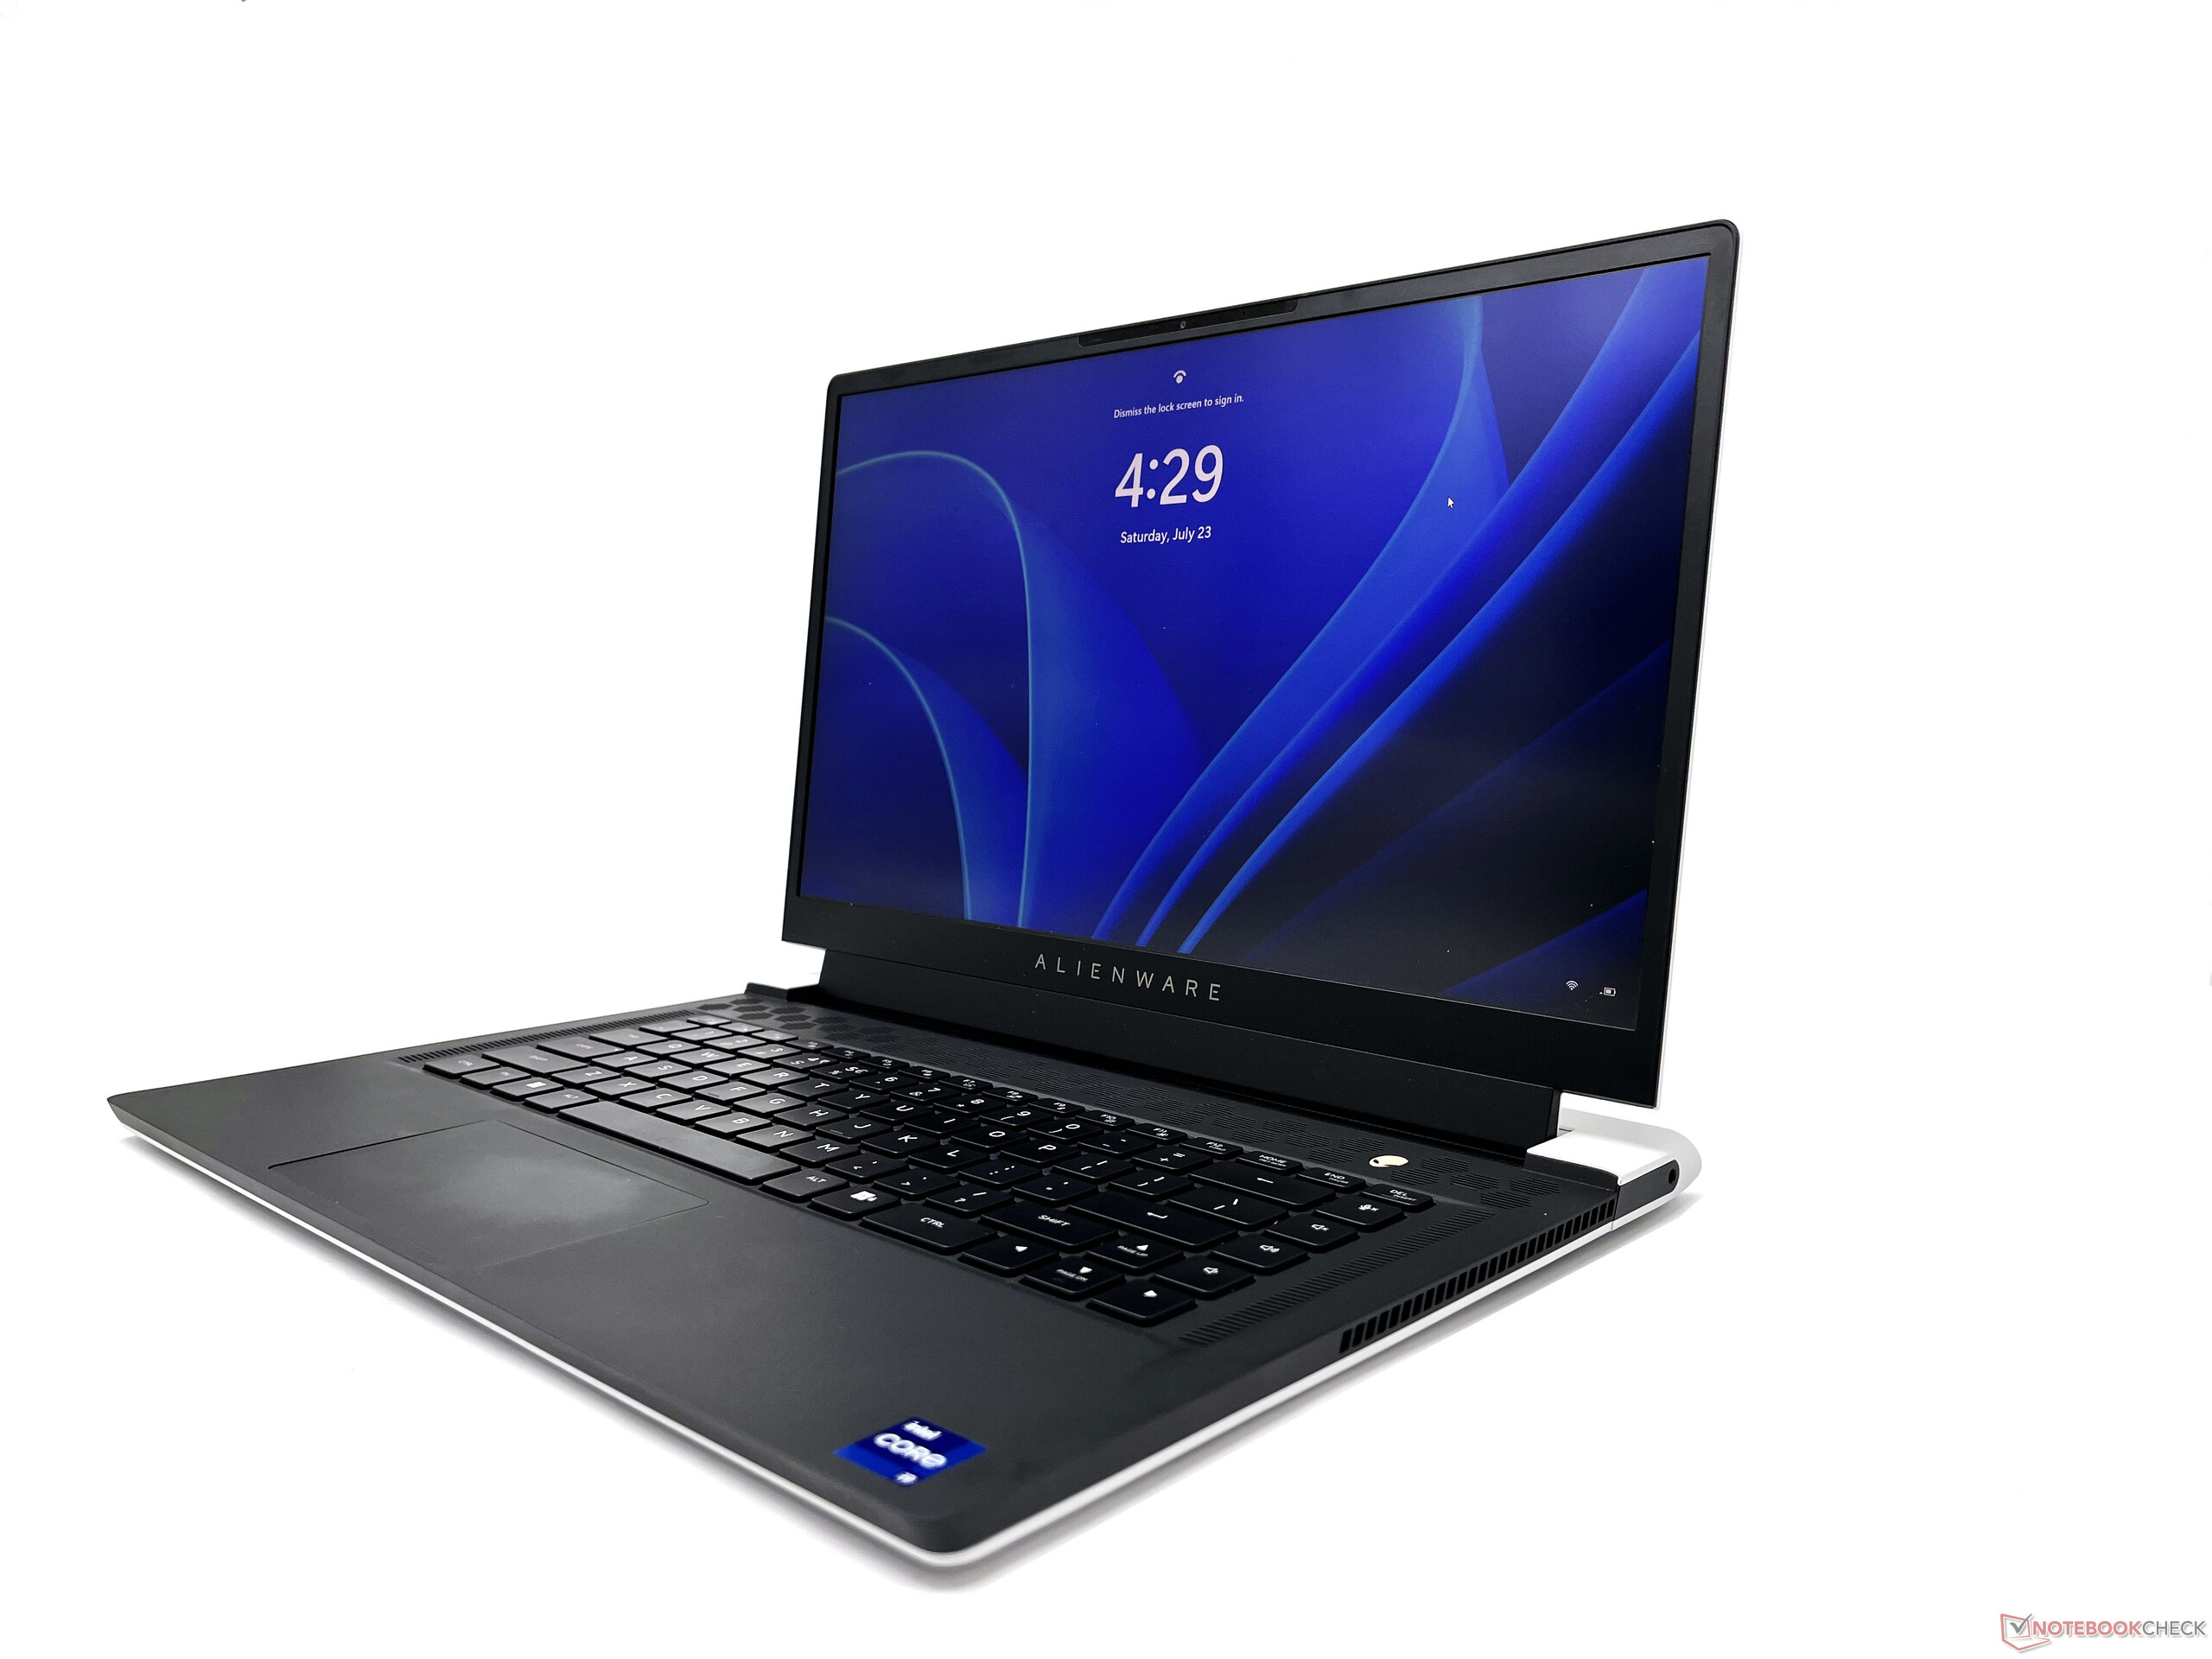
总的来说,Alienware x15 R2第一眼就给人以巨大的感觉,它具有超极本的外形,同时保留了Alienware的特色。
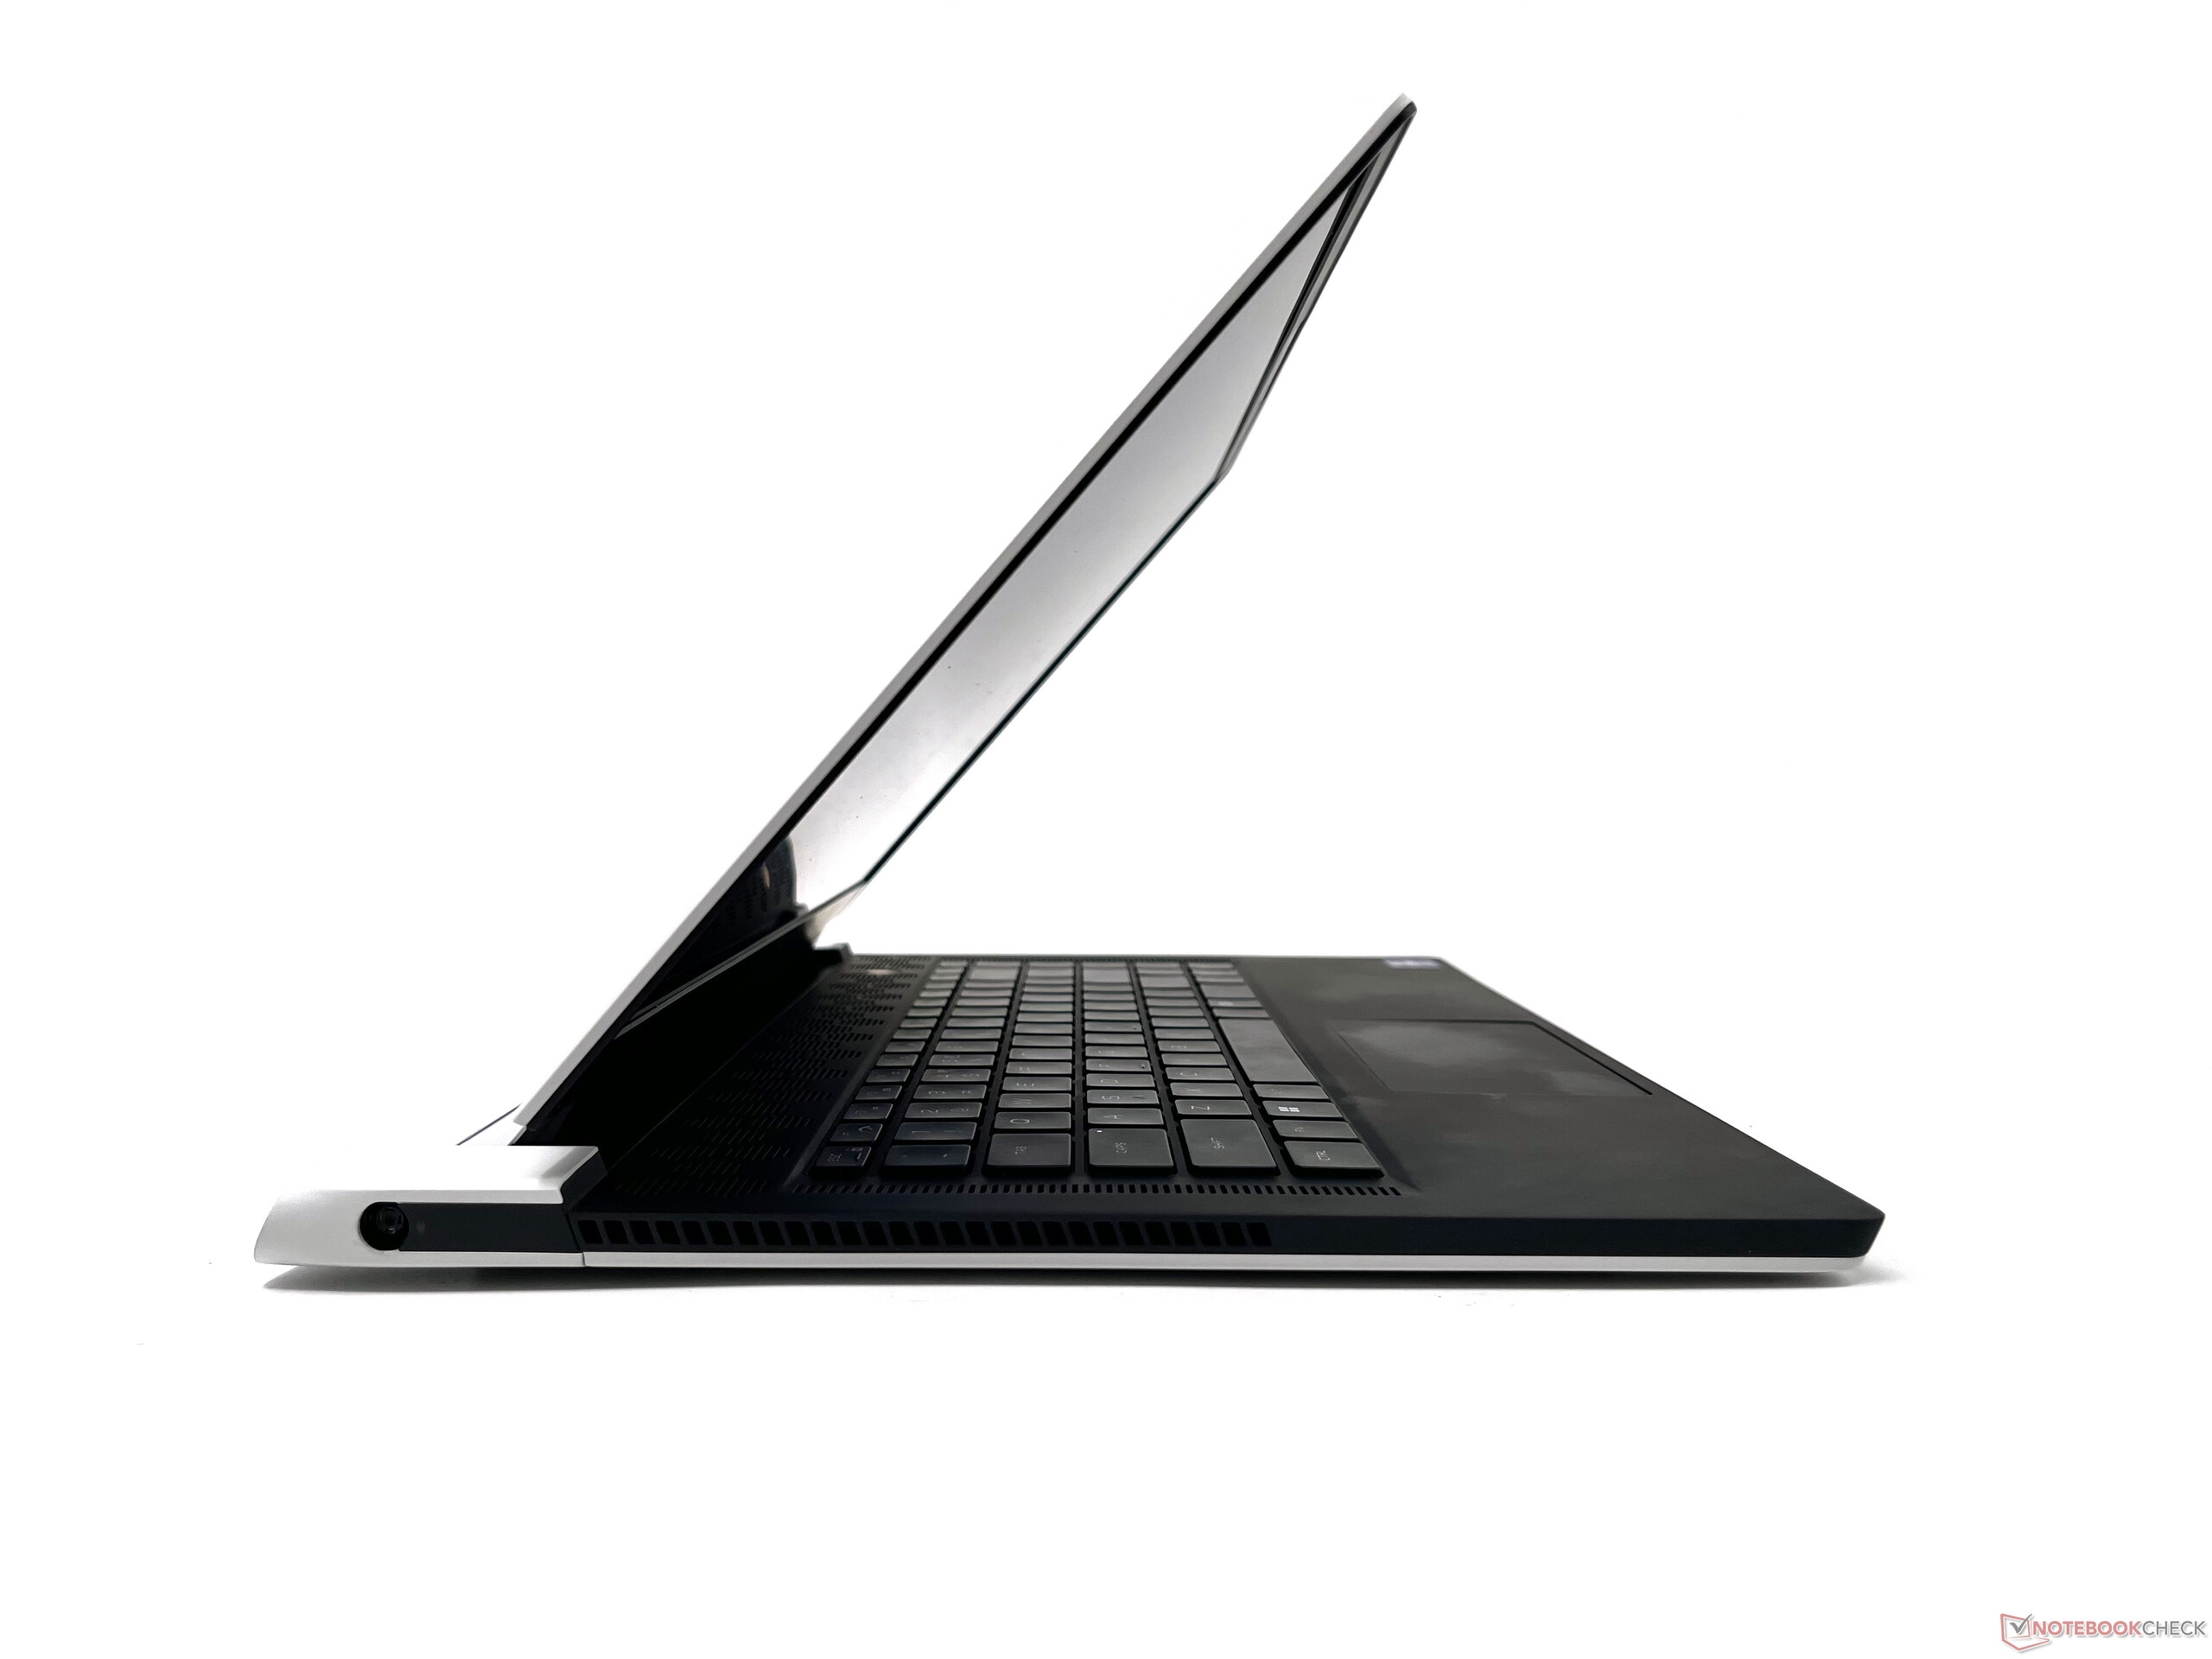
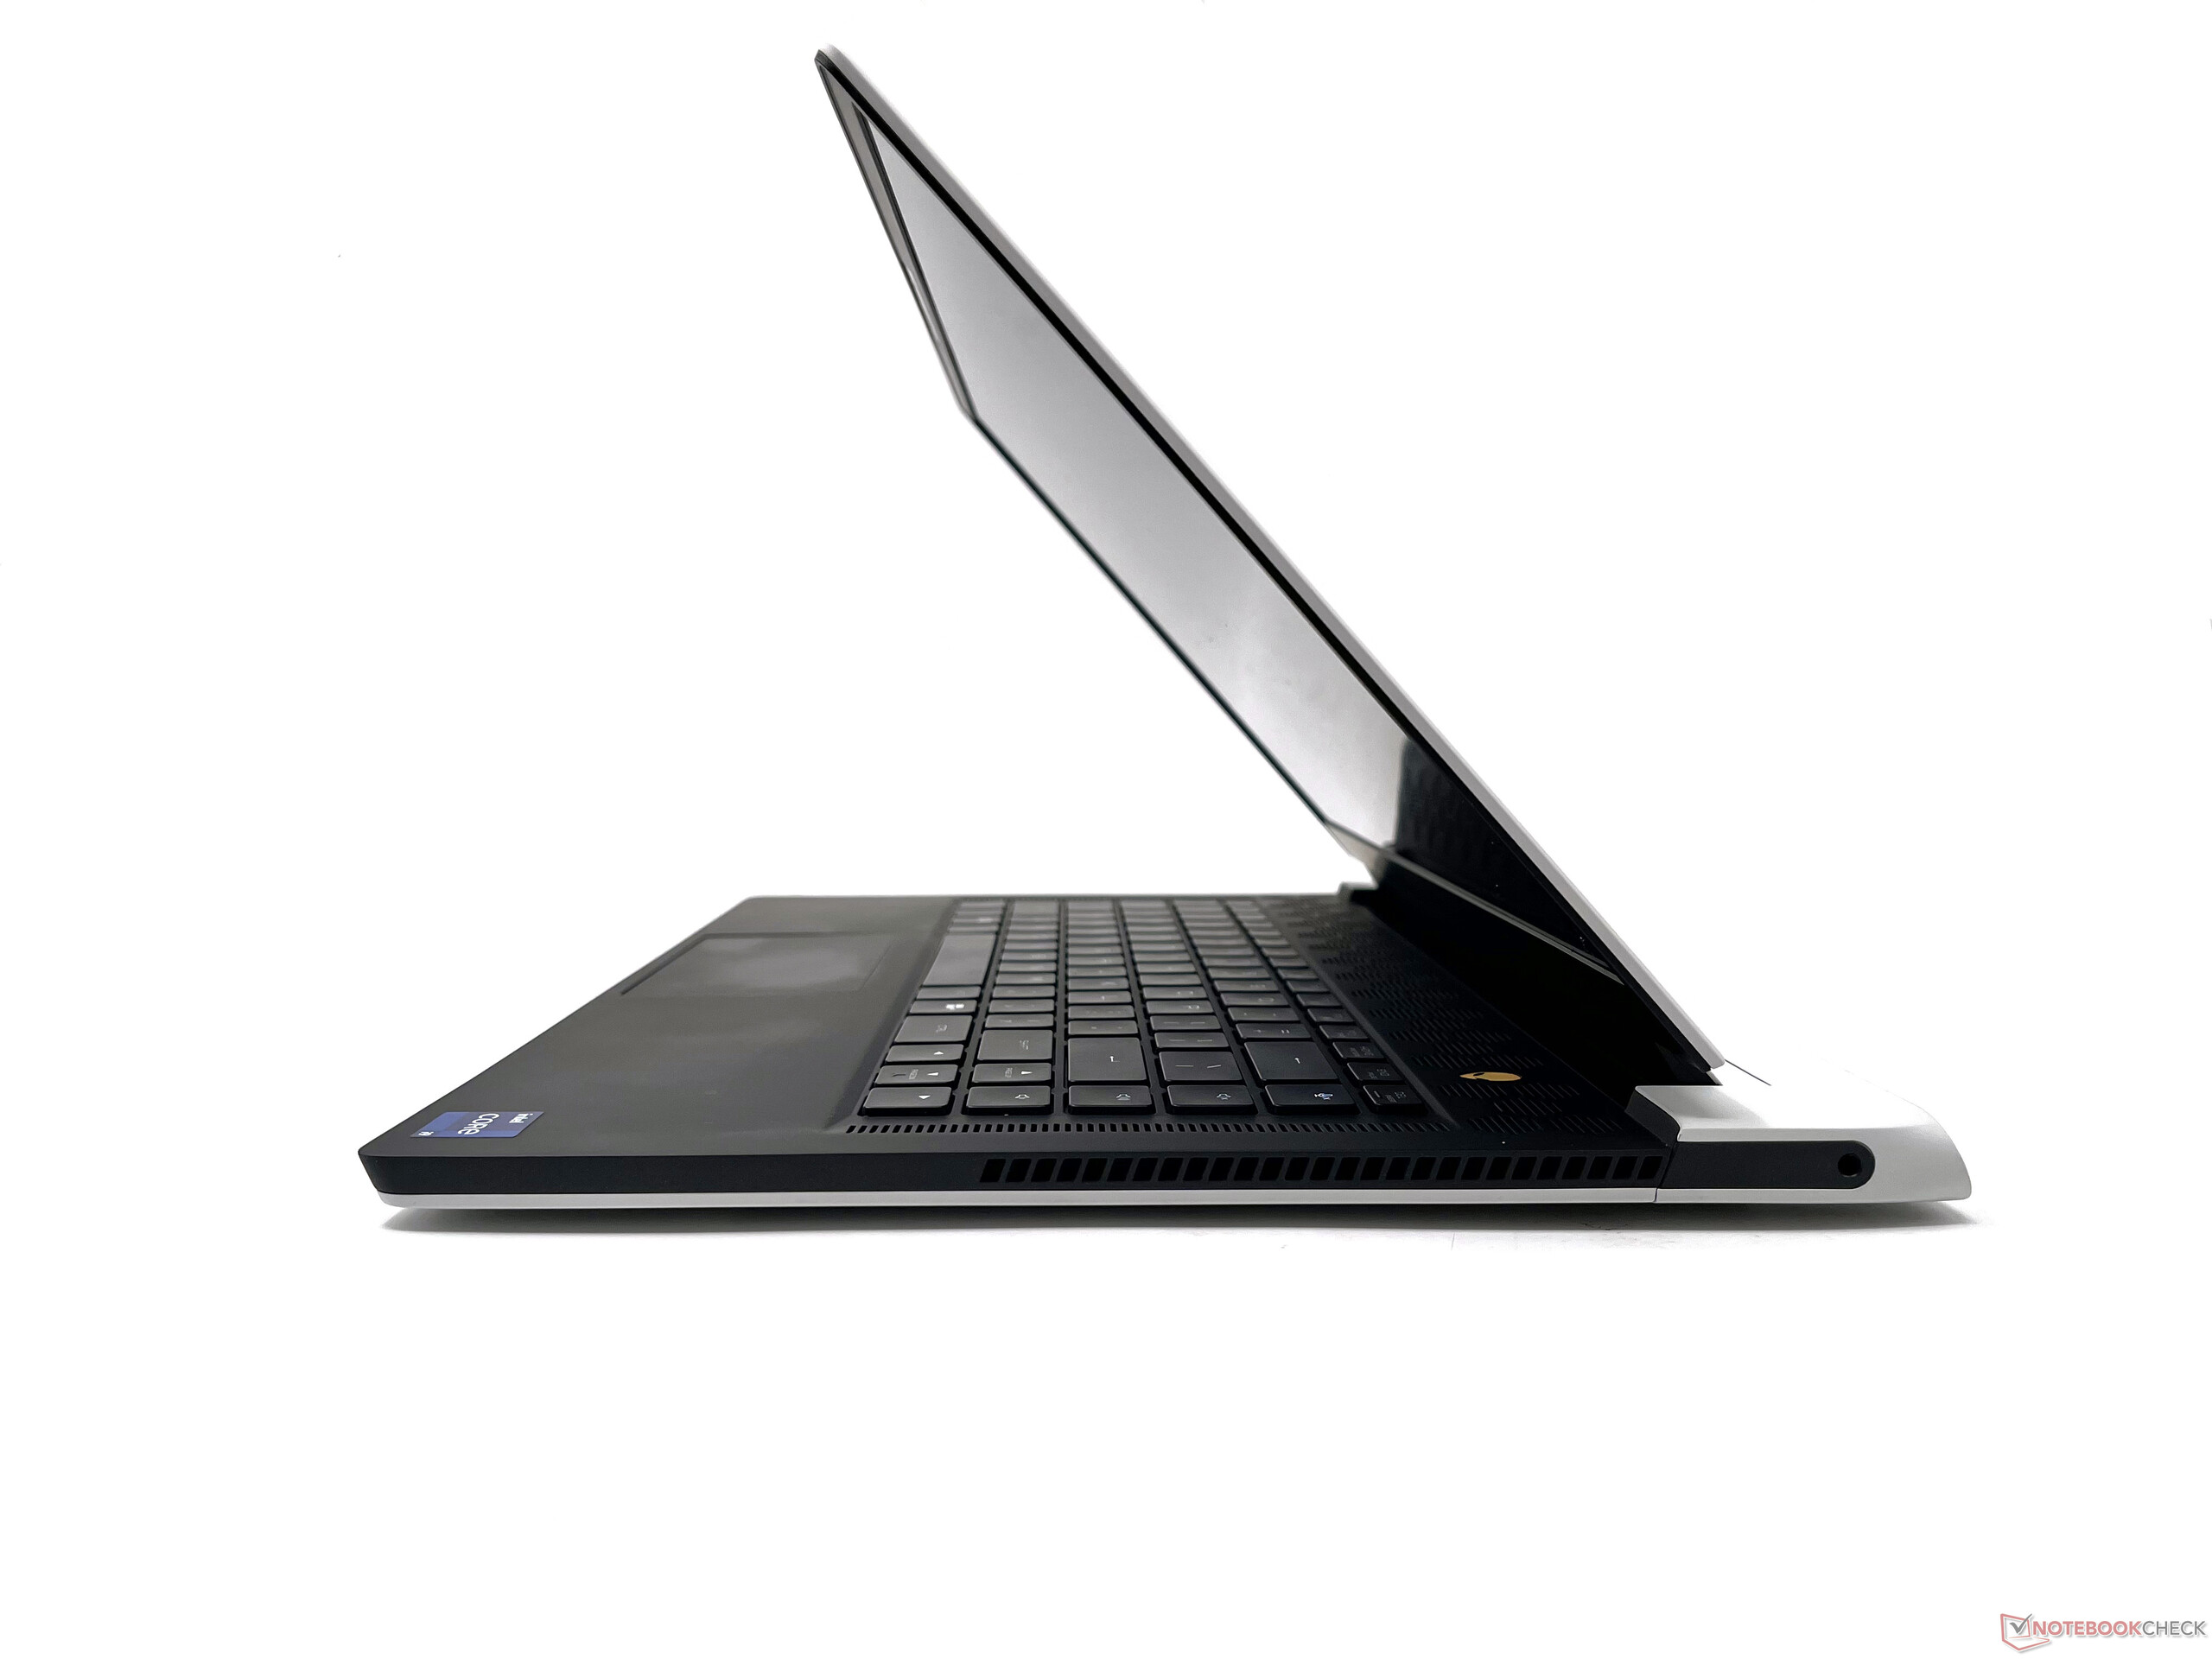
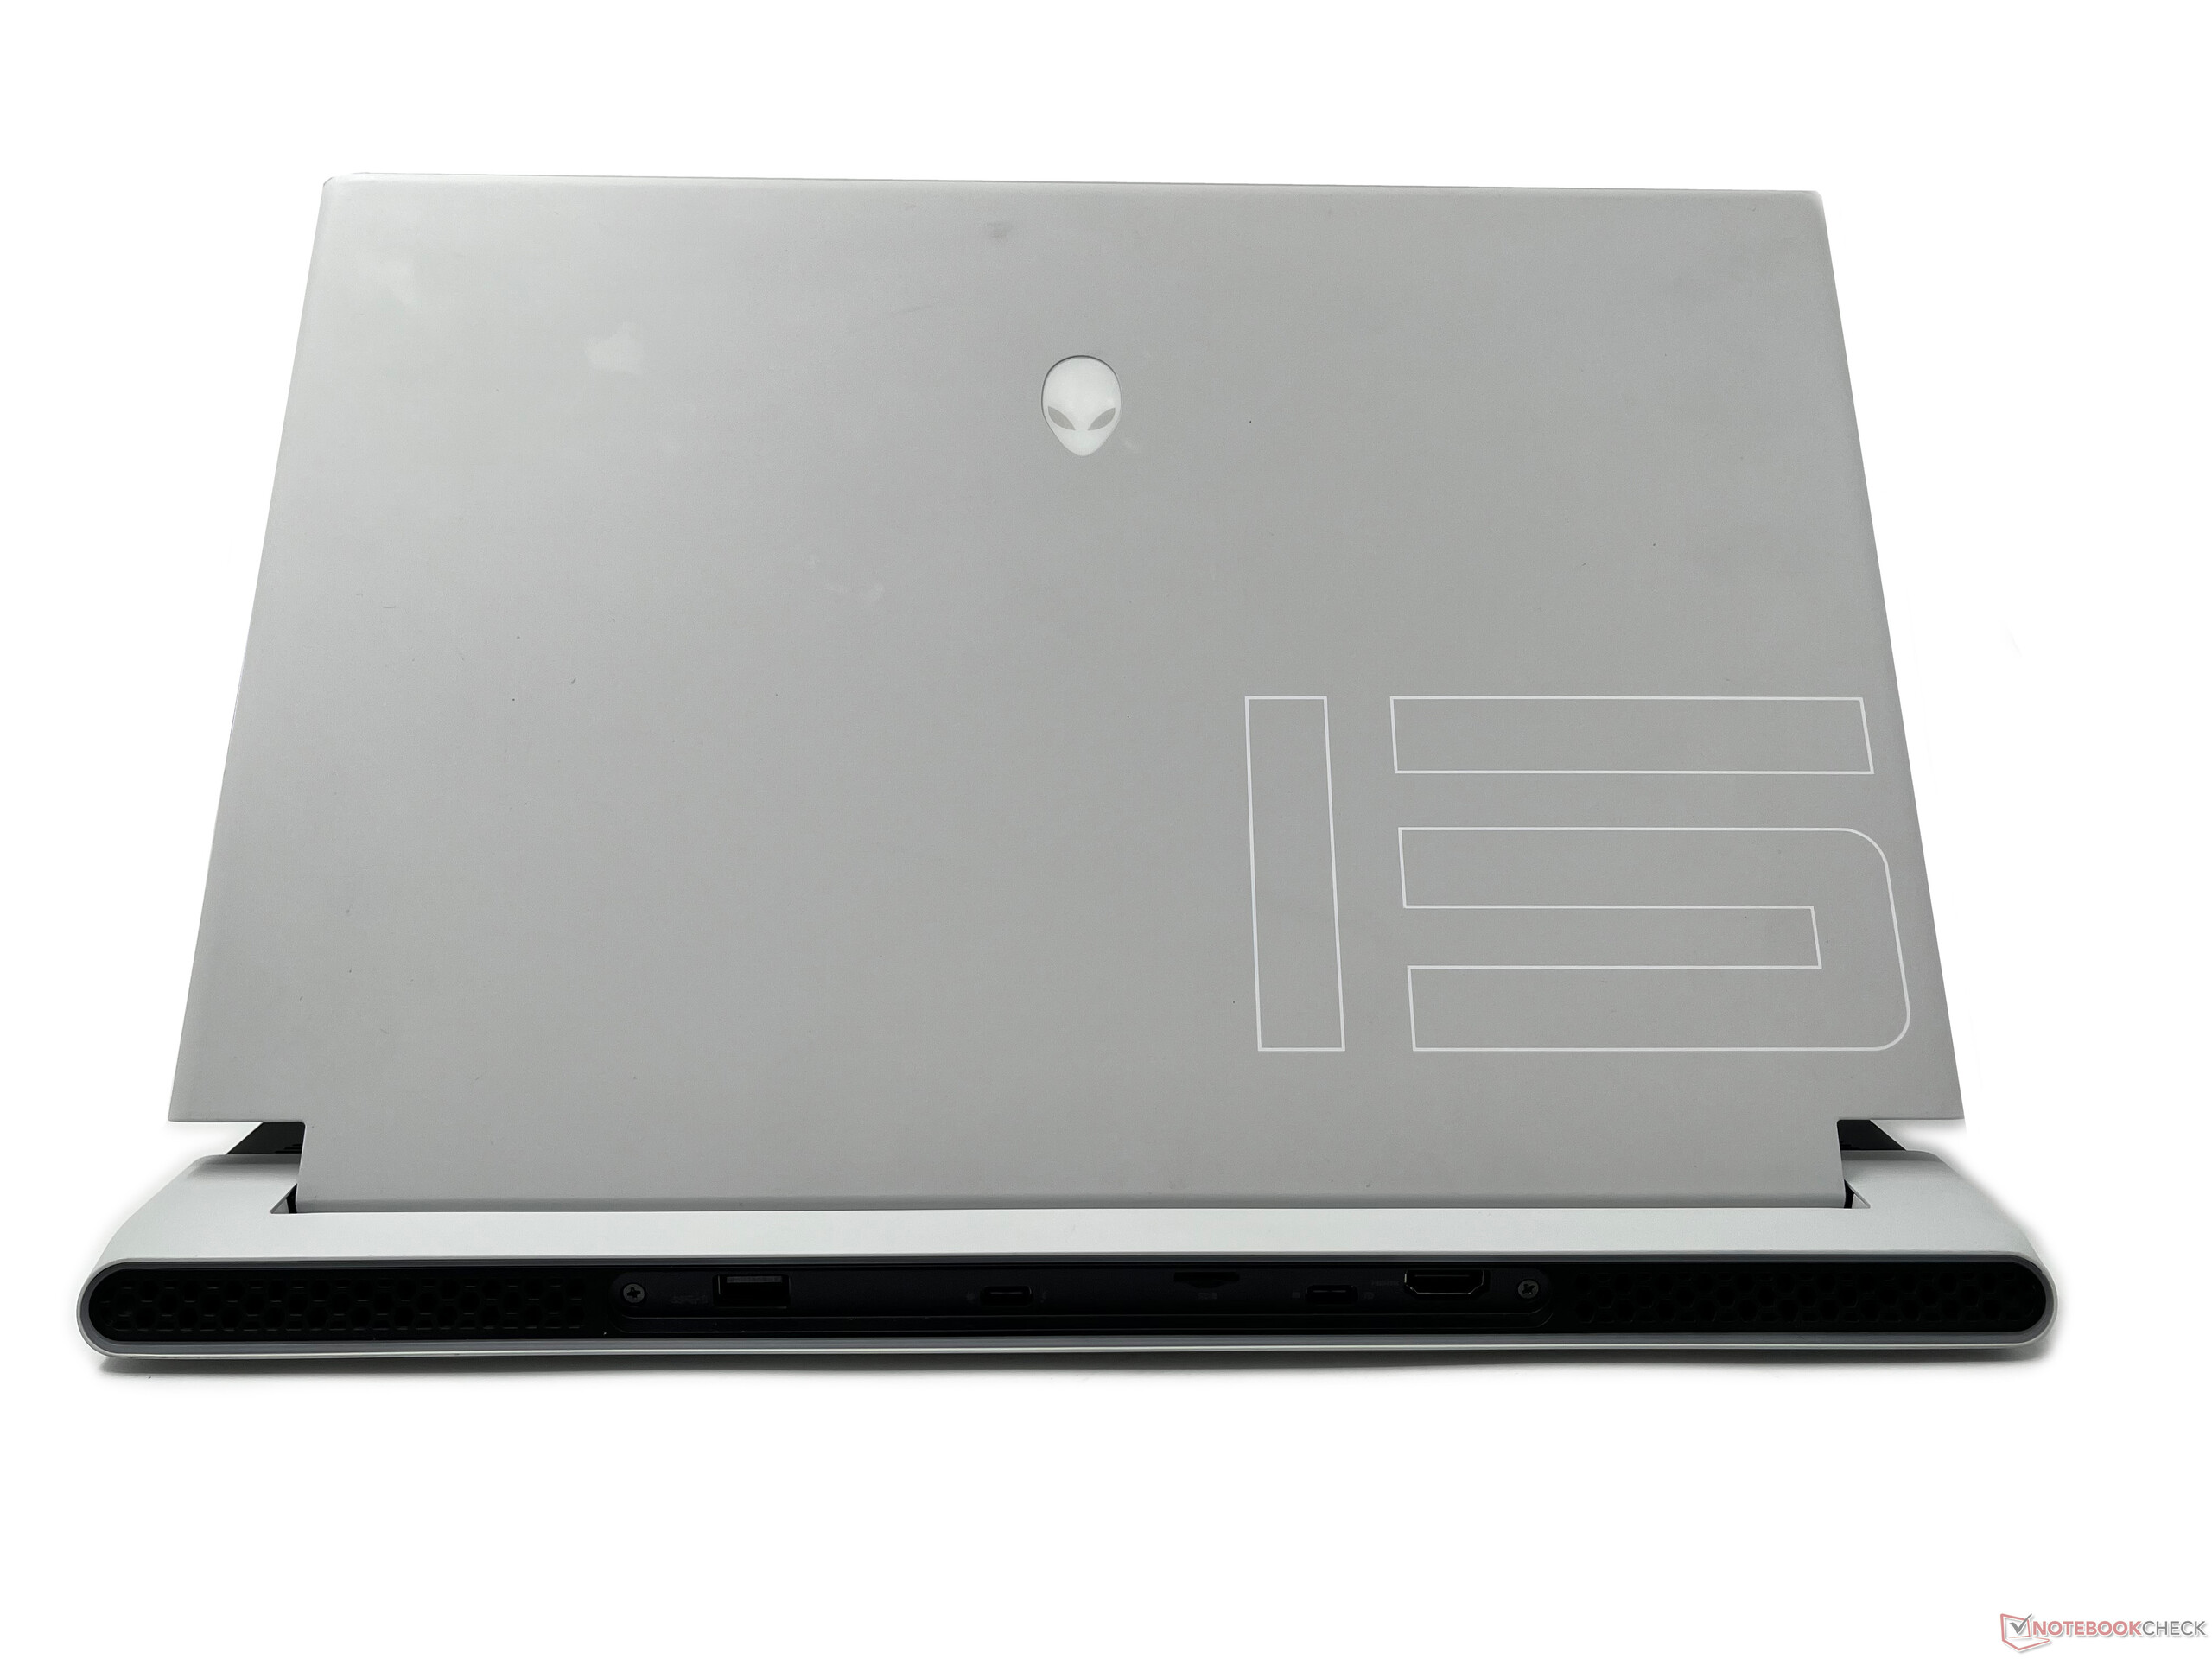
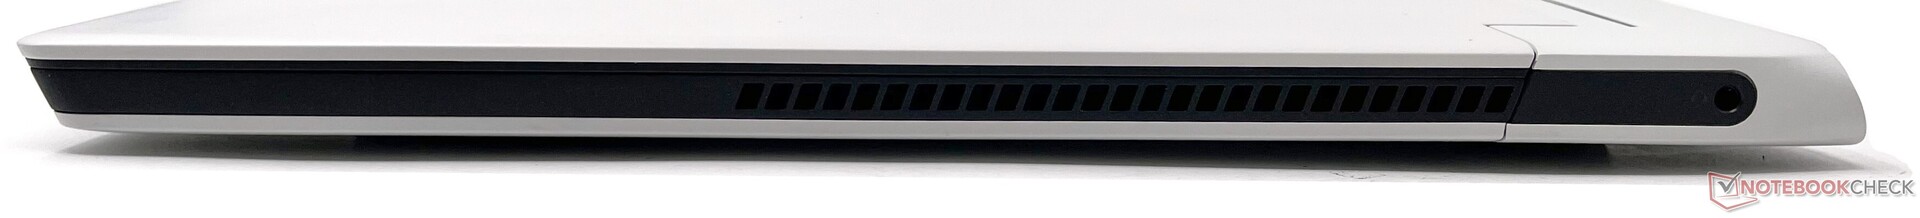
连接性。所有端口都在船尾一侧
Alienware x15 R2的端口安排与我们在x15 R1上看到的类似。
在左边,我们有一个电源适配器端口,而右边只有3.5毫米的组合音频插孔。音频插孔被放在离后方较远的地方,如果你的有线耳机使用较短的电缆,这可能会令人不快。
后面有一个带PowerShare的USB 3.2 Gen 1 Type-A端口,一个USB 3.2 Gen 2 Type-C端口,以及一个Thunderbolt 4端口。USB Type-C和Thunderbolt 4端口支持Power Delivery。一个microSD读卡器和一个HDMI 2.1输出端口完成了端口的选择。没有Kensington锁插槽和RJ-45插孔。然而,戴尔在盒子里捆绑了一个USB Type-C到RJ-45的加密狗,提供2.5GbE网络连接。
在连接多个外设时,端口的位置没有构成任何障碍。也就是说,所有主要端口都被单边放置在后部,这可能会使访问它们变得有点麻烦,特别是如果你经常交换外围设备的话。


SD卡阅读器
在我们的测试中,microSD读卡器的表现令人钦佩。性能似乎比我们之前看到的x15 R1慢了一点,但它是在同一联盟中的 华硕ROG Zephyrus Duo 16和 Razer Blade 15 Advanced.
| SD Card Reader | |
| average JPG Copy Test (av. of 3 runs) | |
| Alienware x15 RTX 3070 P111F (AV Pro V60) | |
| Razer Blade 15 Advanced Model Early 2022 (AV PRO microSD 128 GB V60) | |
| Asus ROG Zephyrus Duo 16 GX650RX (AV PRO microSD 128 GB V60) | |
| Alienware x15 R2 P111F (AV PRO microSD 128 GB V60) | |
| Average of class Gaming (20.9 - 210, n=54, last 2 years) | |
| MSI Raider GE66 12UHS (AV PRO microSD 128 GB V60) | |
| MSI Titan GT77 12UHS (AV PRO microSD 128 GB V60) | |
| maximum AS SSD Seq Read Test (1GB) | |
| Alienware x15 RTX 3070 P111F (AV Pro V60) | |
| Alienware x15 R2 P111F (AV PRO microSD 128 GB V60) | |
| Asus ROG Zephyrus Duo 16 GX650RX (AV PRO microSD 128 GB V60) | |
| Average of class Gaming (25.5 - 261, n=51, last 2 years) | |
| MSI Titan GT77 12UHS (AV PRO microSD 128 GB V60) | |
沟通
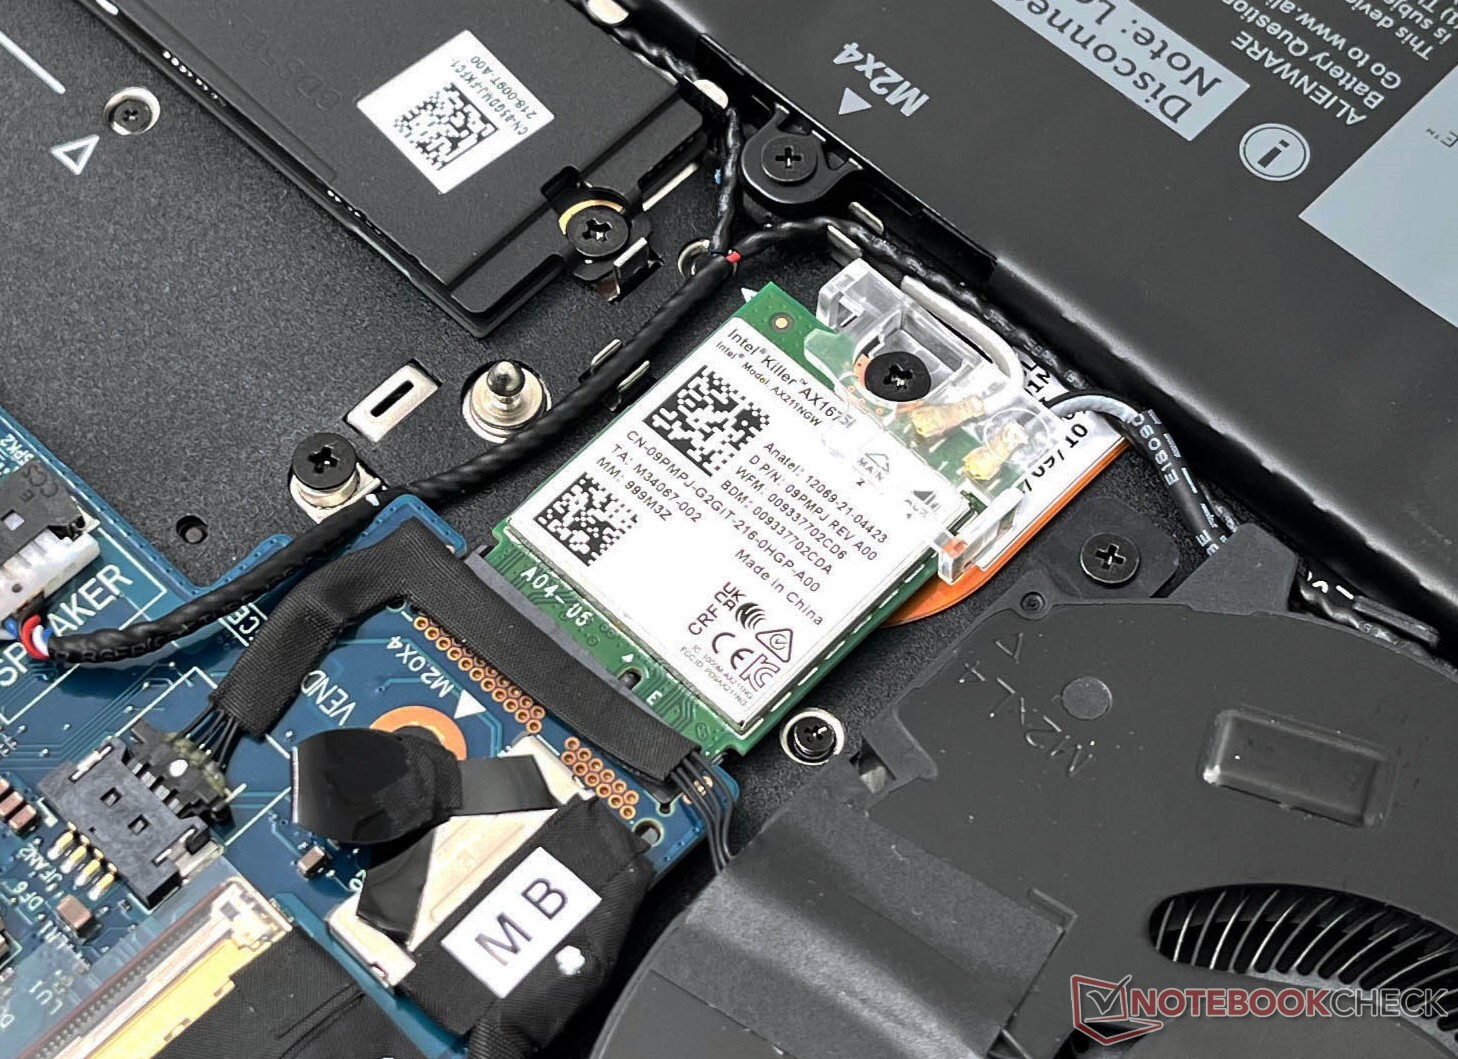
x15 R2配备了一个Killer Wi-Fi 6E AX1675i WLAN卡。性能还不错,但我们在其他笔记本电脑上看到这块卡的吞吐量更快。我们确实在5GHz的传输测试中观察到一些下降,但在与我们的参考华硕ROG Rapture GT-AXE11000路由器的测试中,连接总体上相当稳定。
在切换到6GHz频段时,我们没有注意到任何明显的好处,除了平均接收速度稍高和峰值吞吐量值较高。
网络摄像头
在FHD网络摄像头的时代,戴尔在Alienware x15 R2中加入了一个微不足道的720p摄像头。该网络摄像头对于偶尔的视频通话来说是可以使用的。颜色显示出很大的偏差,黑暗区域变成了相当大的噪音。即使在充足的环境照明条件下,图像的清晰度和细节也不理想。没有提供物理网络摄像头快门。


安全问题
x15 R2有一个集成的红外摄像头,支持基于Windows Hello的生物识别认证。没有指纹识别器可用。
红外相机很容易注册,而且反应相当灵敏。还有一个TPM 2.0模块。
辅料
除了240瓦的电源适配器和通常的文书工作,戴尔还在盒子里捆绑了一个USB Type-C到RJ-45 2.5Gb以太网加密狗。
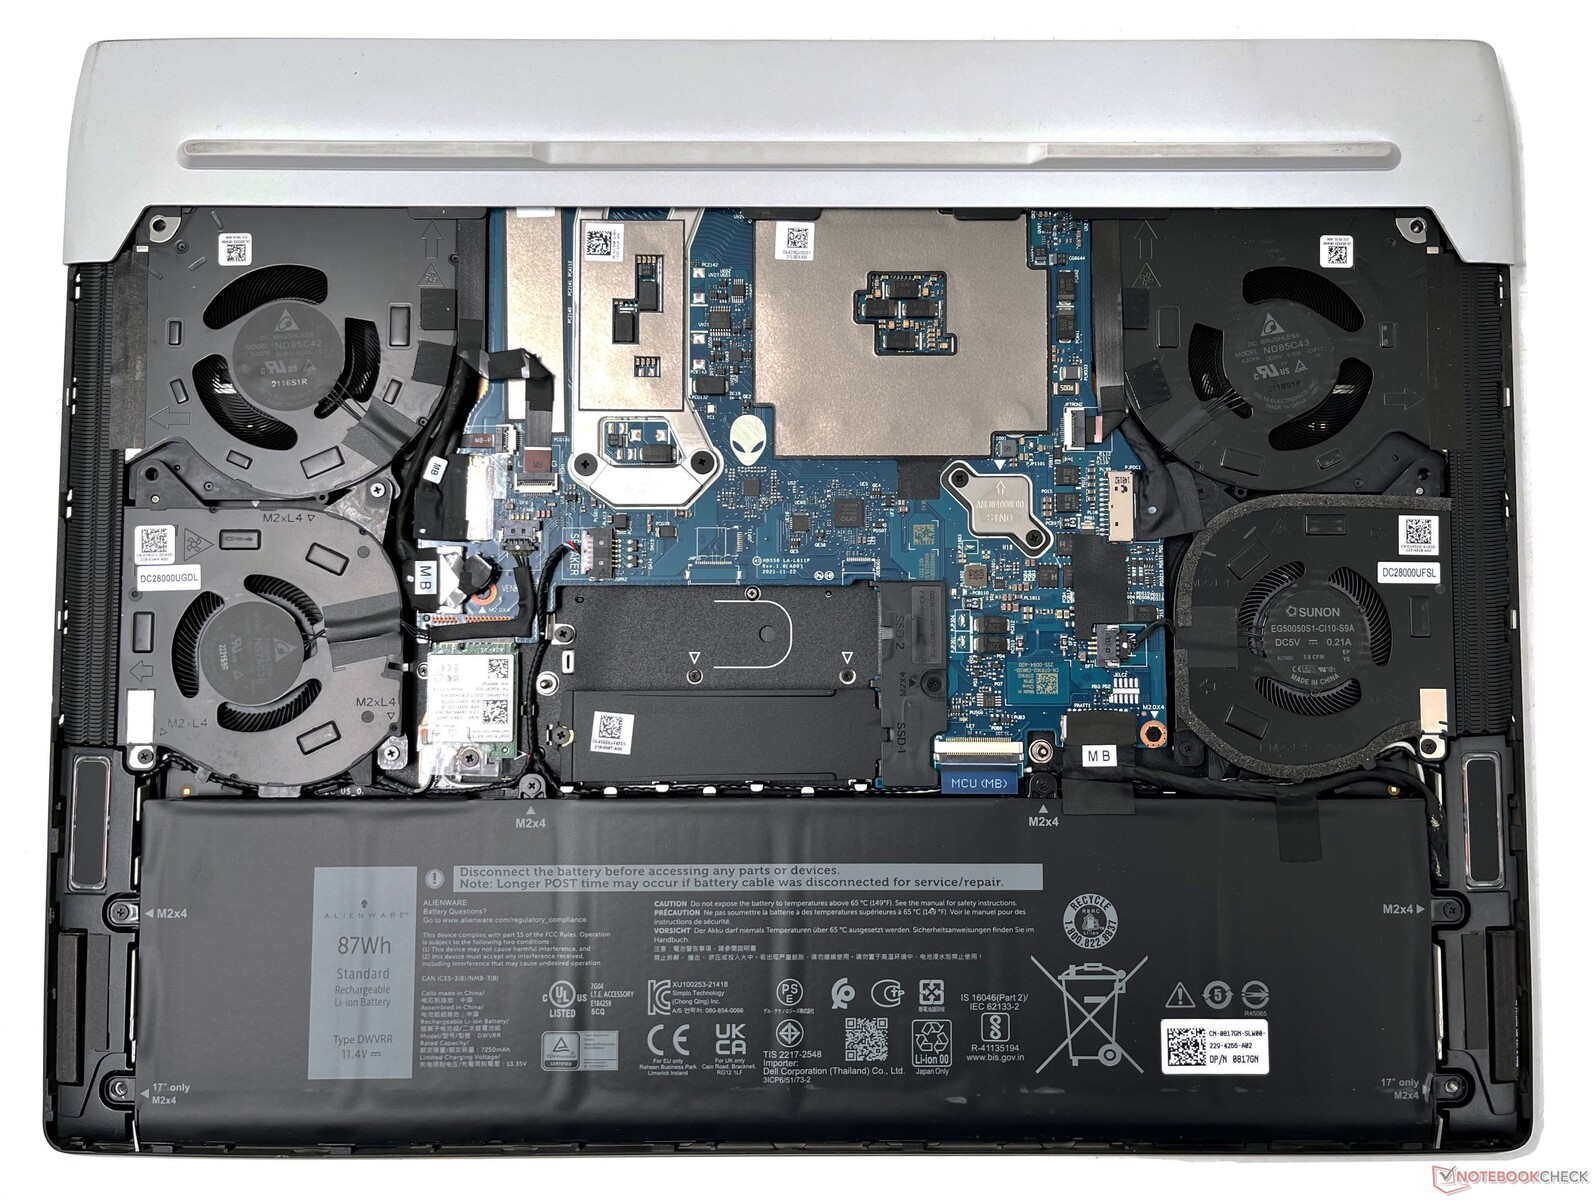
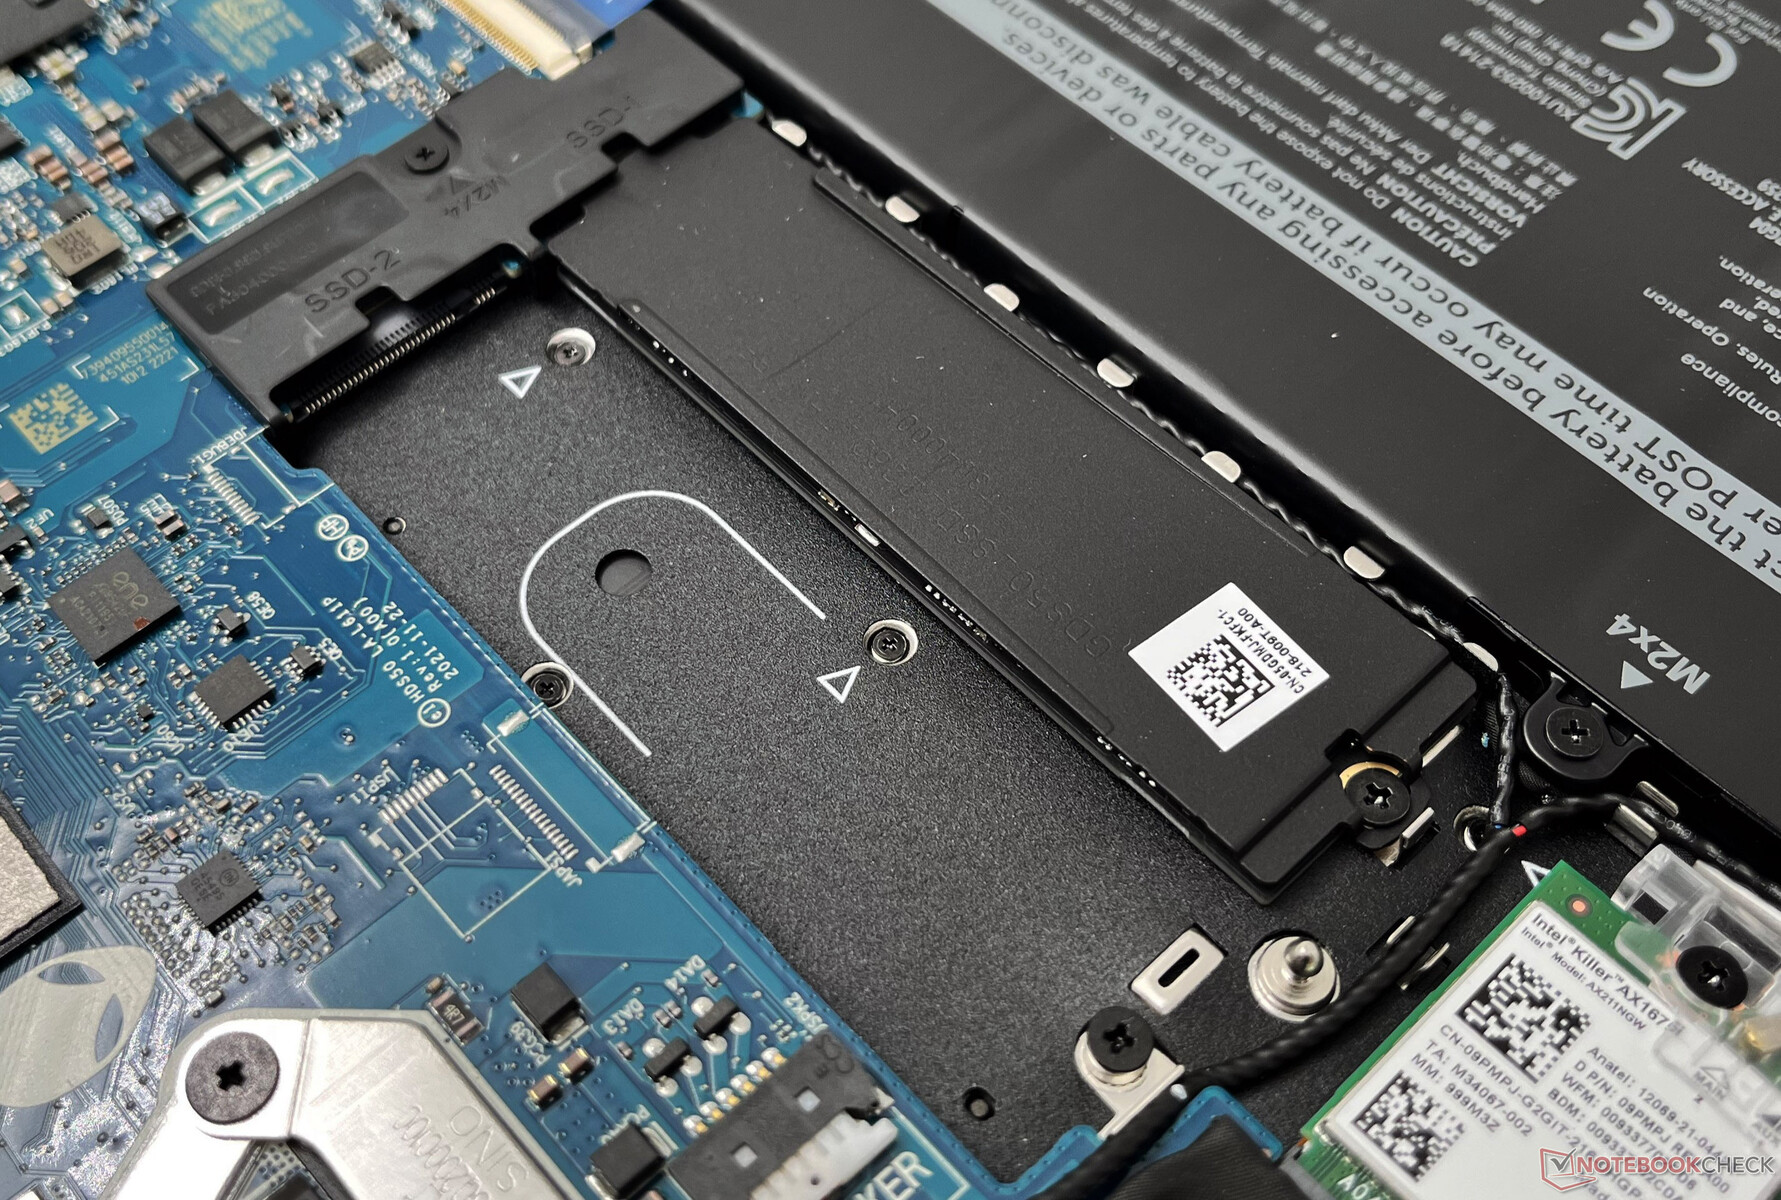
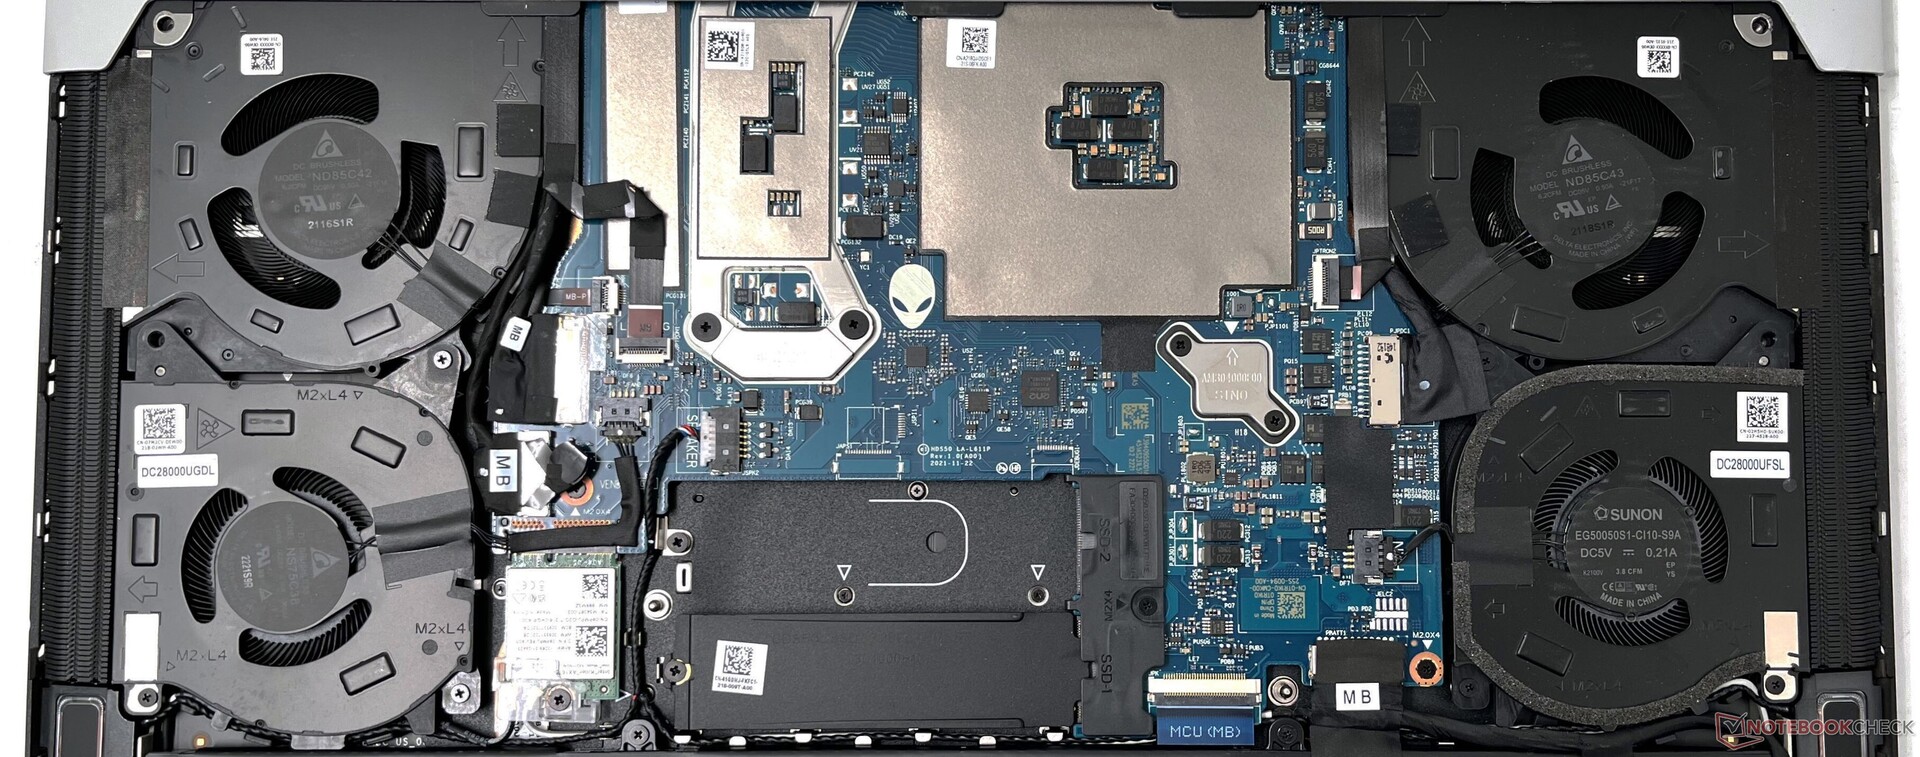
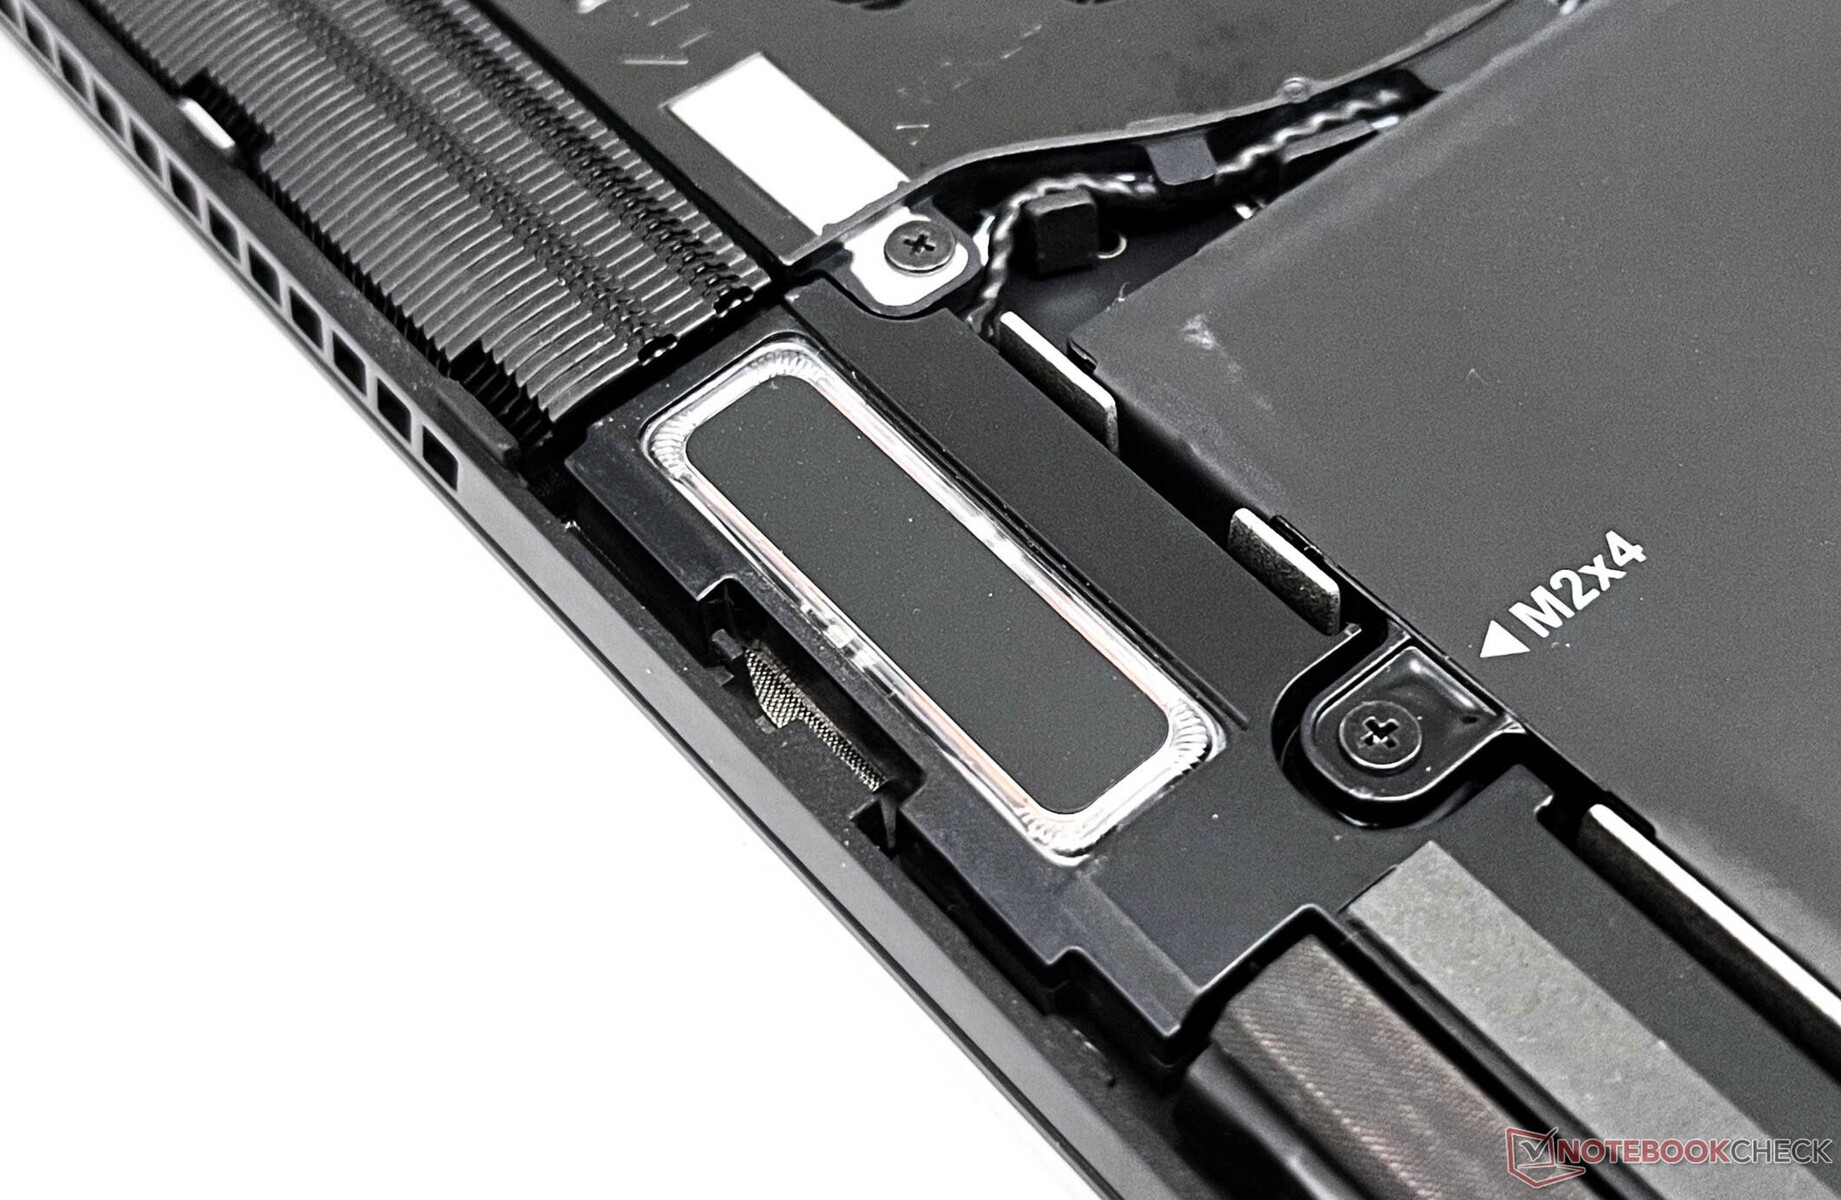
维护
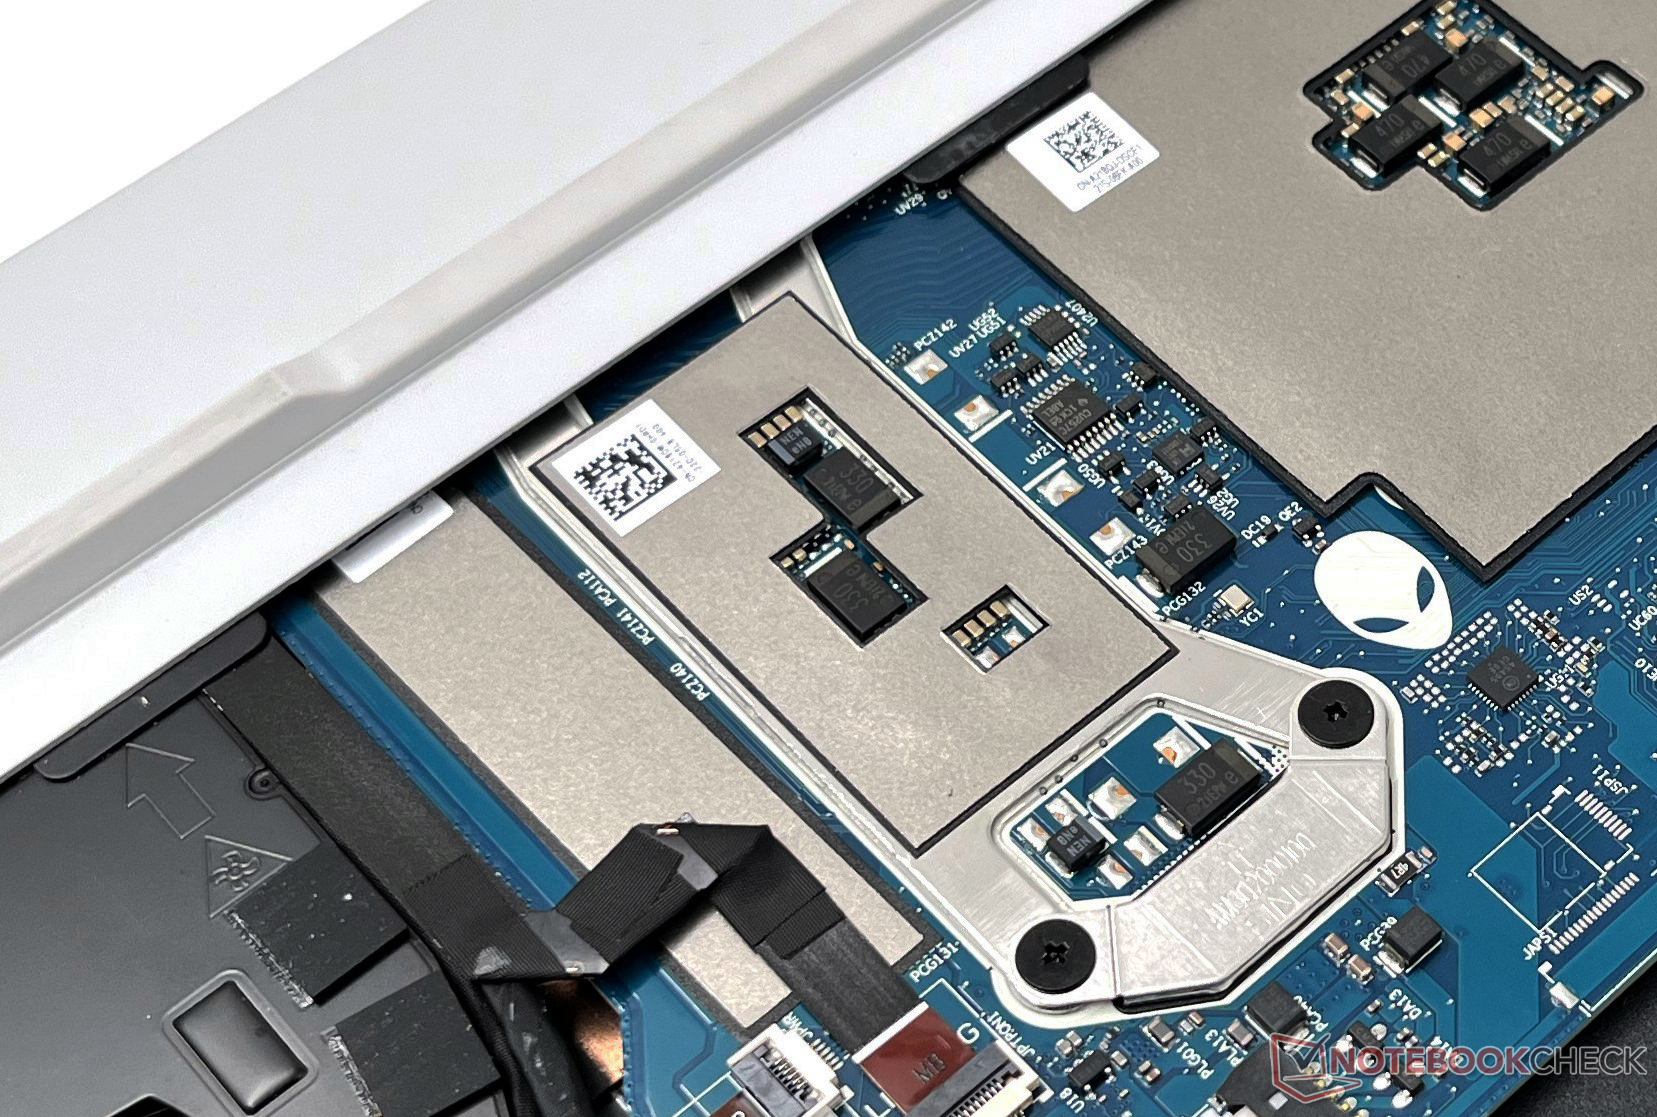
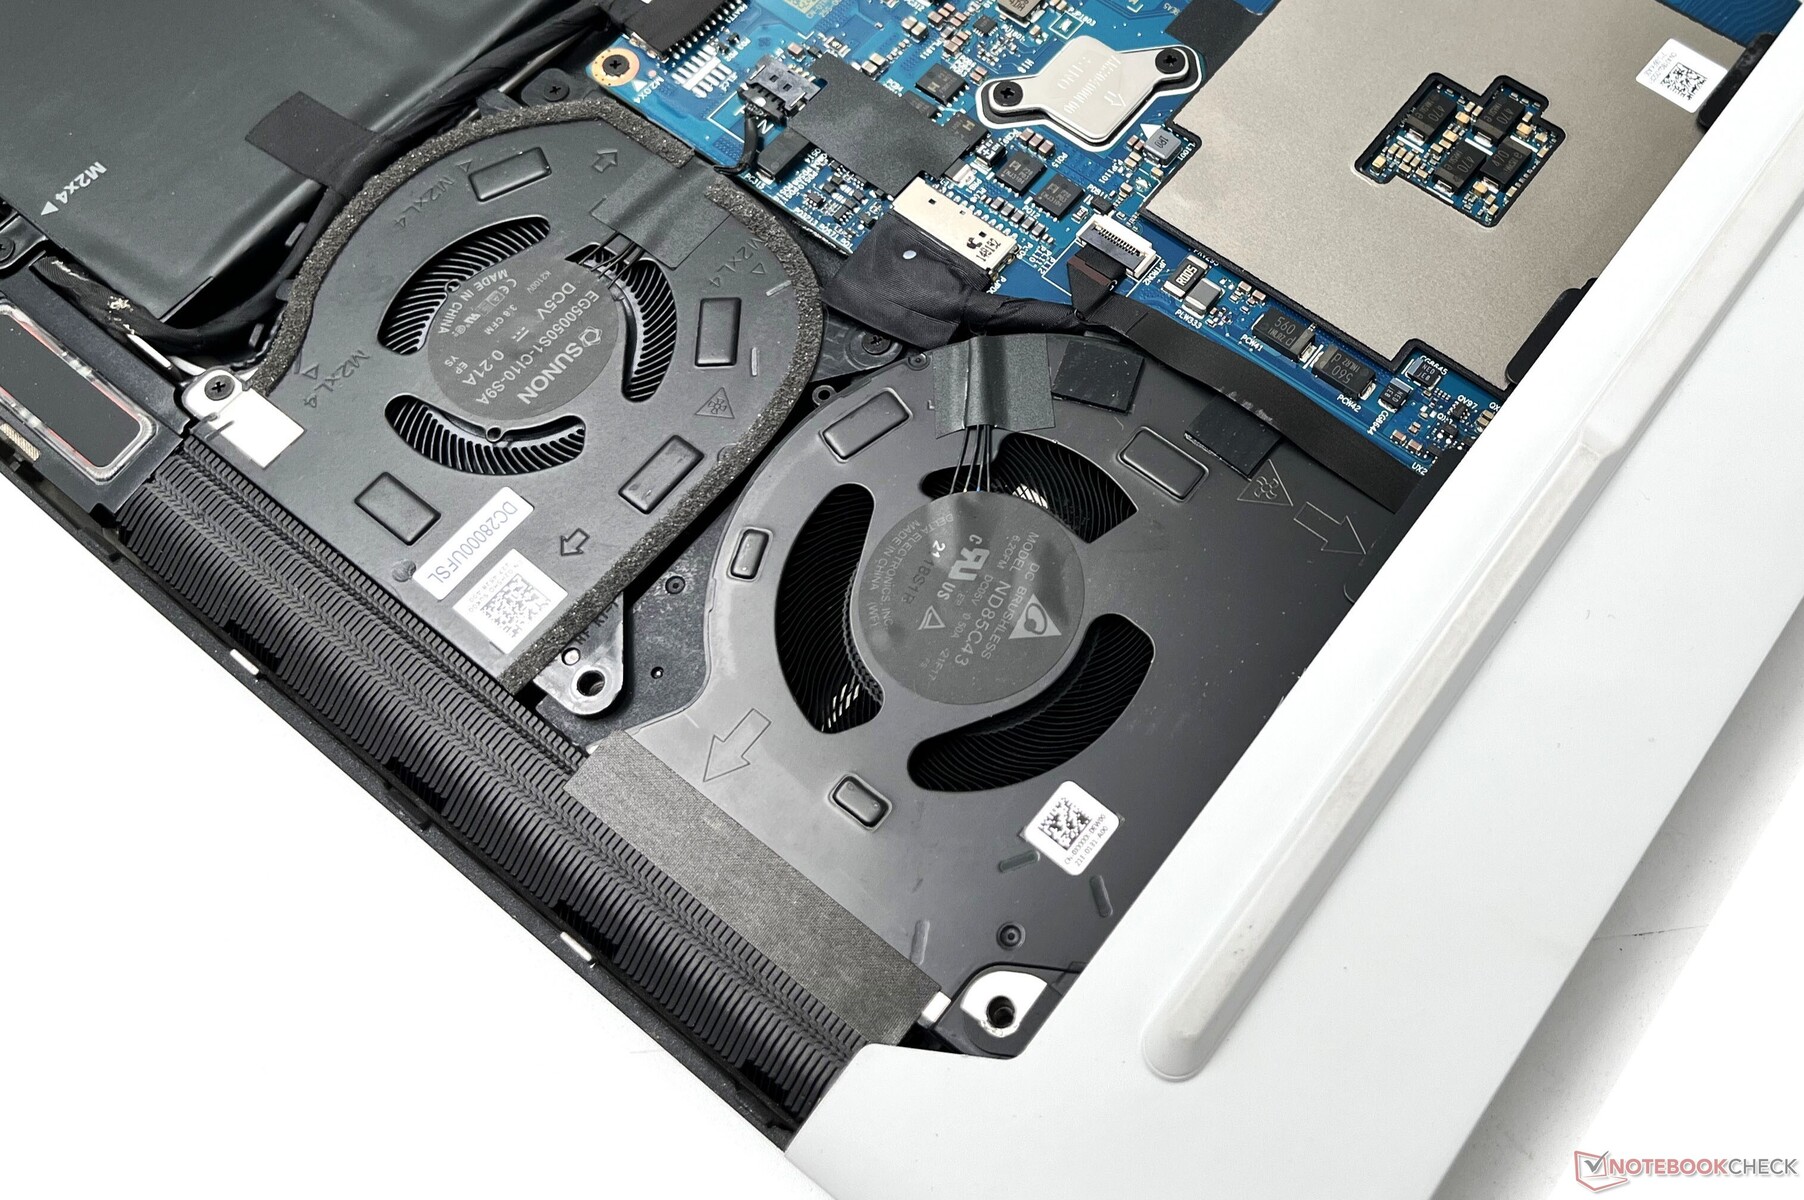
只需卸下底板上的六颗飞利浦螺钉,就可以接触到内部零件。要从机箱上完全撬开底板,确实需要一些努力。没有提供维护舱口。
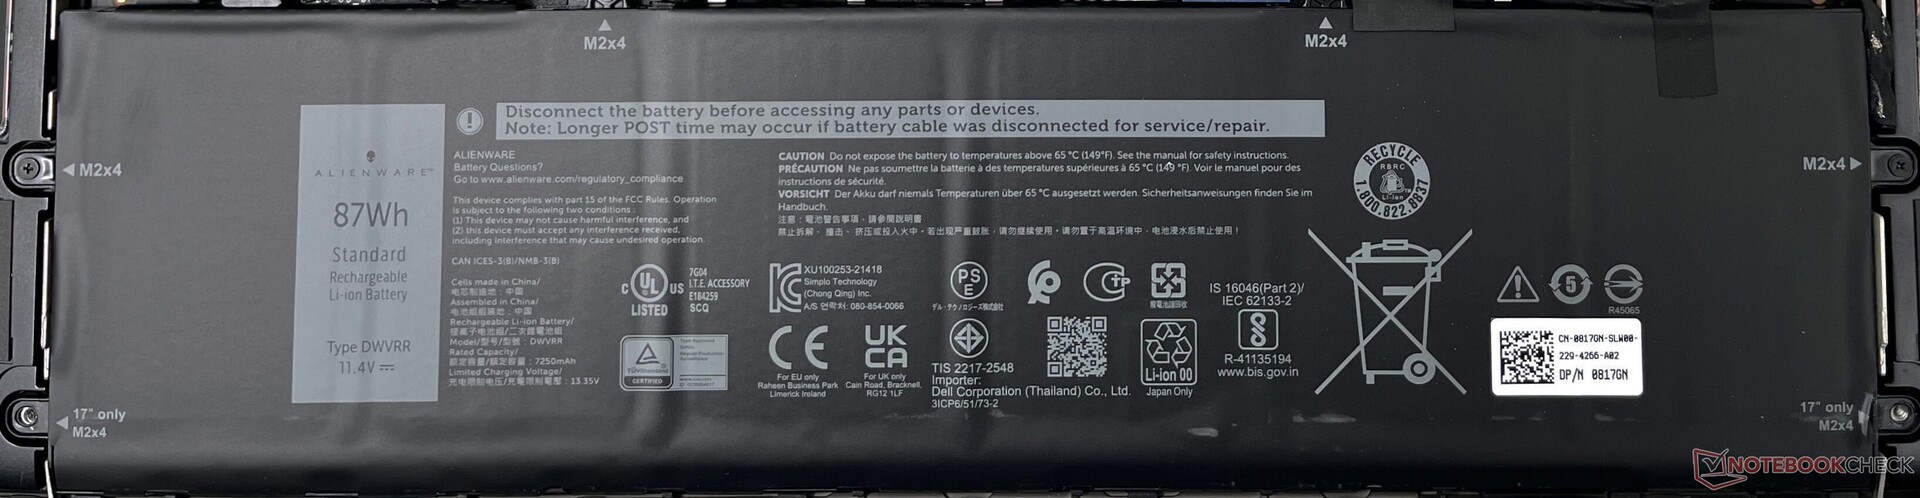
内部布局与去年相比没有变化,这也意味着你不得不再一次忍受焊接的内存。NVMe固态硬盘、杀手Wi-Fi卡和87WHr电池可以在需要时更换。
担保
Alienware x15 R2标配了戴尔为期一年的高级支持服务和现场服务设施。在Dell.com结账时可以增加额外的保修和支持选项。
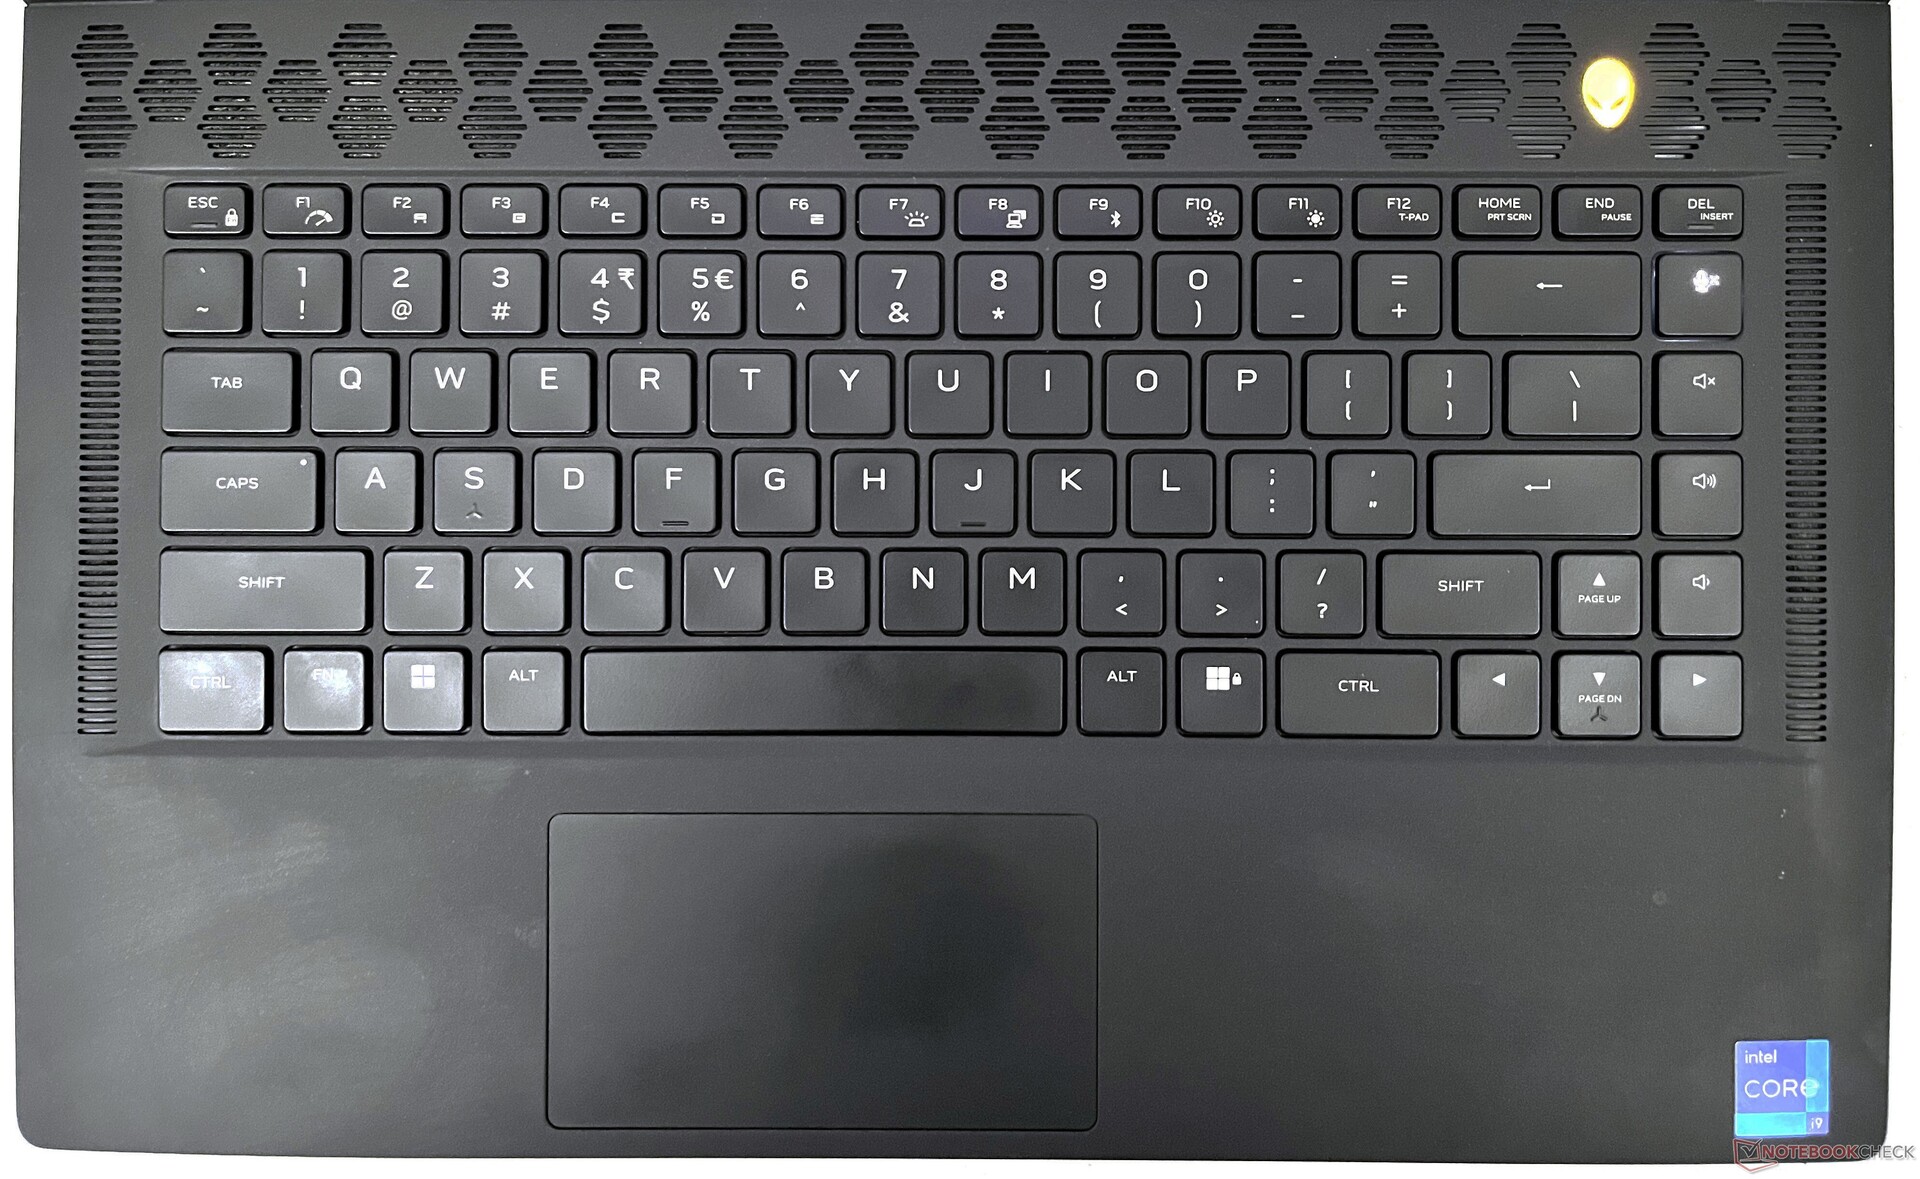
输入设备。副键保持不亮
键盘
键盘与x15 R1相比没有变化。戴尔采用了Alienware X系列薄型键盘,键程为1.5毫米,N键翻转,并采用了防鬼怪技术。由于机身较薄,所以没有机械键。
由于触觉反馈良好,在x15 R2的键盘上打字通常是一种愉快的体验。全尺寸的方向键也是从x15 R1延续下来的,是一个受欢迎的补充。然而,功能键上的次要符号继续保持不亮,这使得在黑暗中使用它们很不舒服。
触摸板
10.5厘米×6厘米的触摸板与竞争对手相比感觉有点小,但提供了流畅的滑行体验。支持WindowsPrecision 手势。点击有时确实需要一些努力,也可以从一些额外的反馈中受益。
与x15 R1不同,x15 R2的触摸板颜色方案与键盘甲板的其他部分相匹配,但仍然是一个指纹和污垢磁铁。
显示屏。360赫兹G-Sync面板,带杜比视界,无PWM
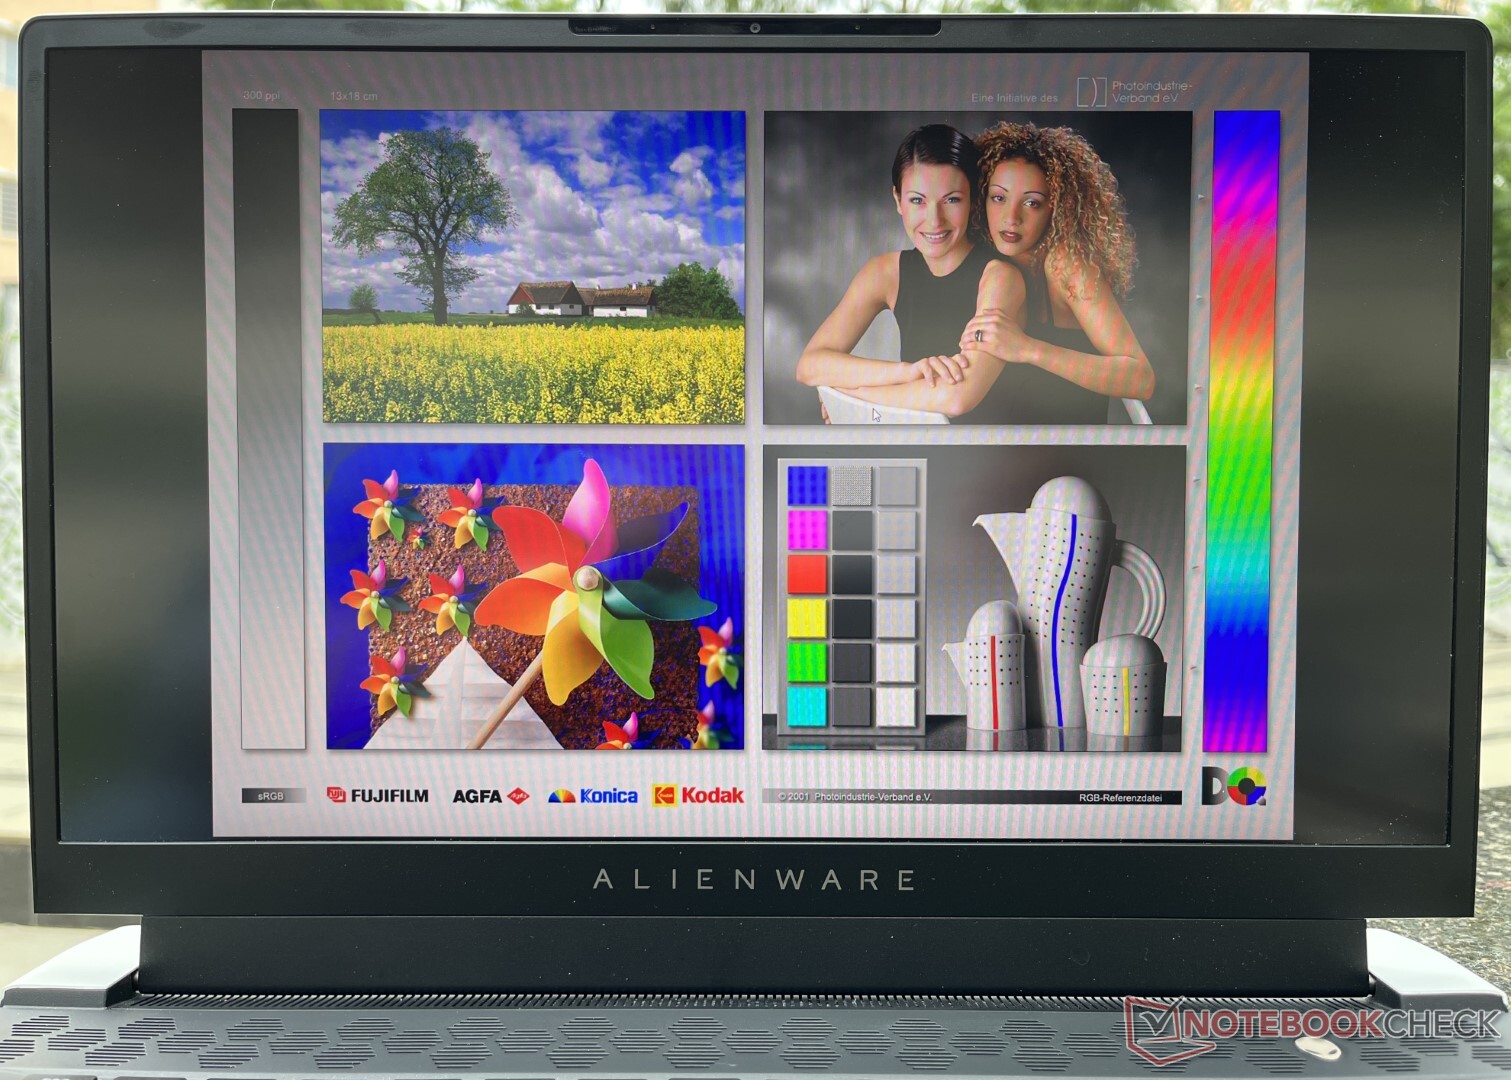
我们的Alienware x15 R2配备了一个1080p 360 Hz的面板。这是一个Nvidia G-Sync面板,支持Dolby Vision HDR。用户还可以为x15 R2配置支持G-Sync和Dolby Vision的FHD 165 Hz和QHD 240 Hz面板选项。
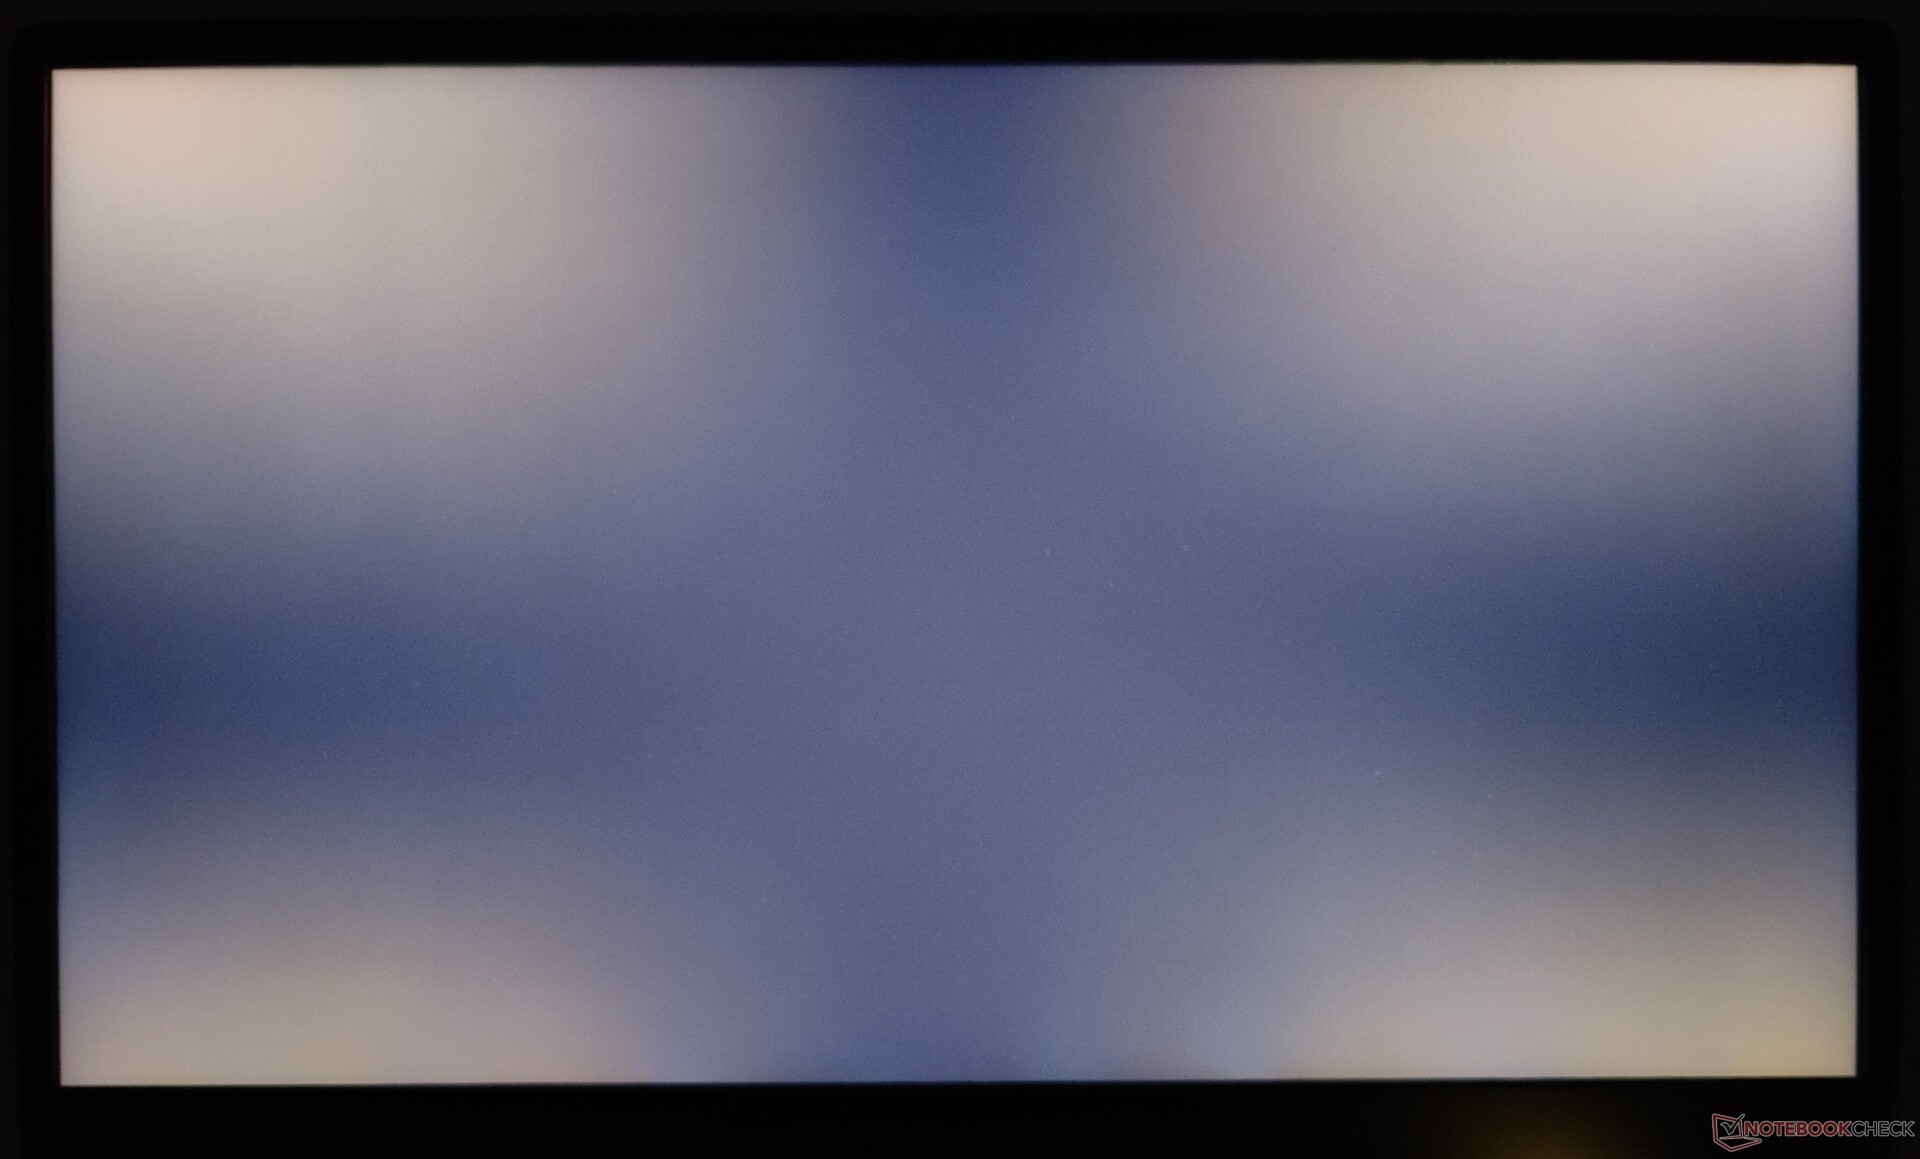
1080p分辨率导致更大的像素尺寸,整体密度为141PPI。我们观察到,在长时间曝光下,所有四个角落都有明显的背光渗漏。
x15 R2的显示特性类似于我们之前在2020年看到的情况 Alienware m15 R3所见,后者也采用了相同的面板。亮度分布为82%,还算不错,1033:1的实测对比度提供了良好的主观观看体验。

| |||||||||||||||||||||||||
Brightness Distribution: 82 %
Center on Battery: 341 cd/m²
Contrast: 1033:1 (Black: 0.33 cd/m²)
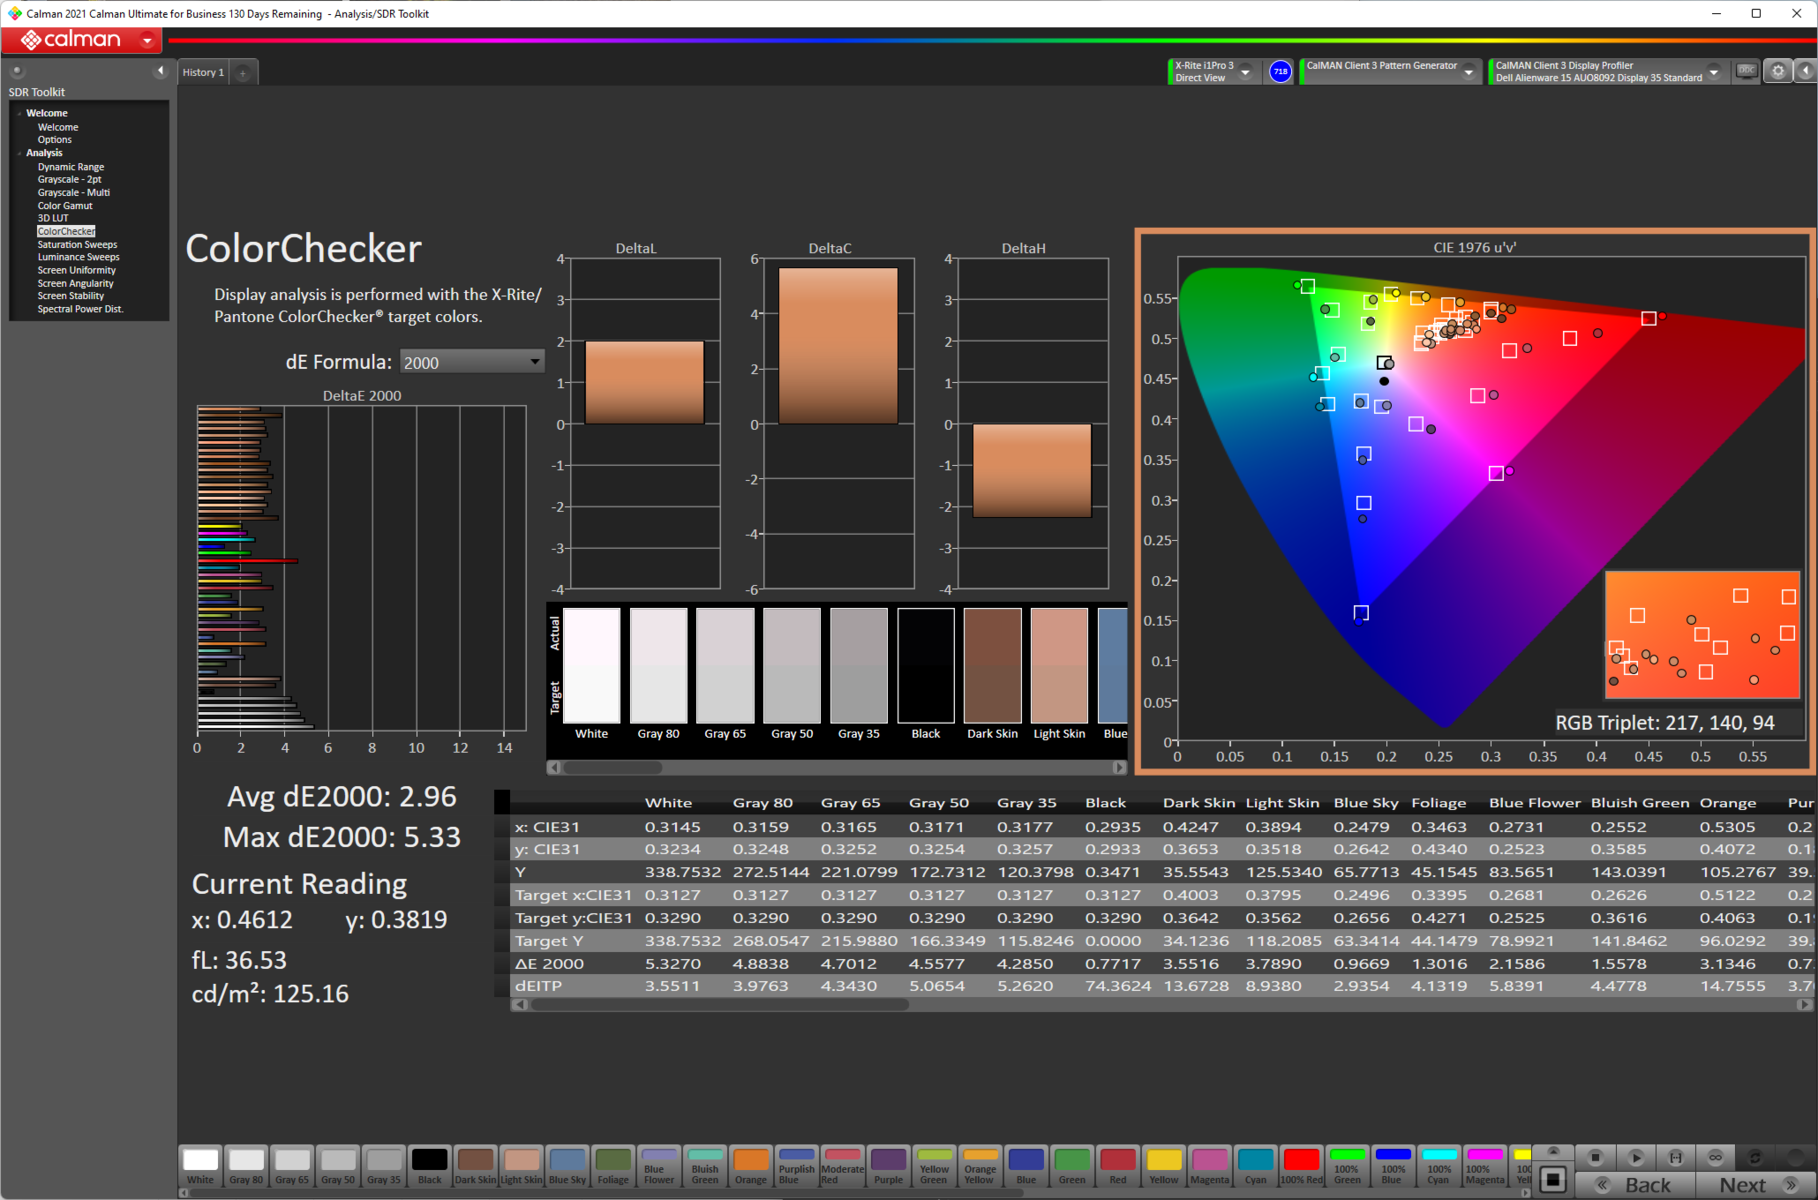
ΔE ColorChecker Calman: 2.96 | ∀{0.5-29.43 Ø4.71}
calibrated: 1.46
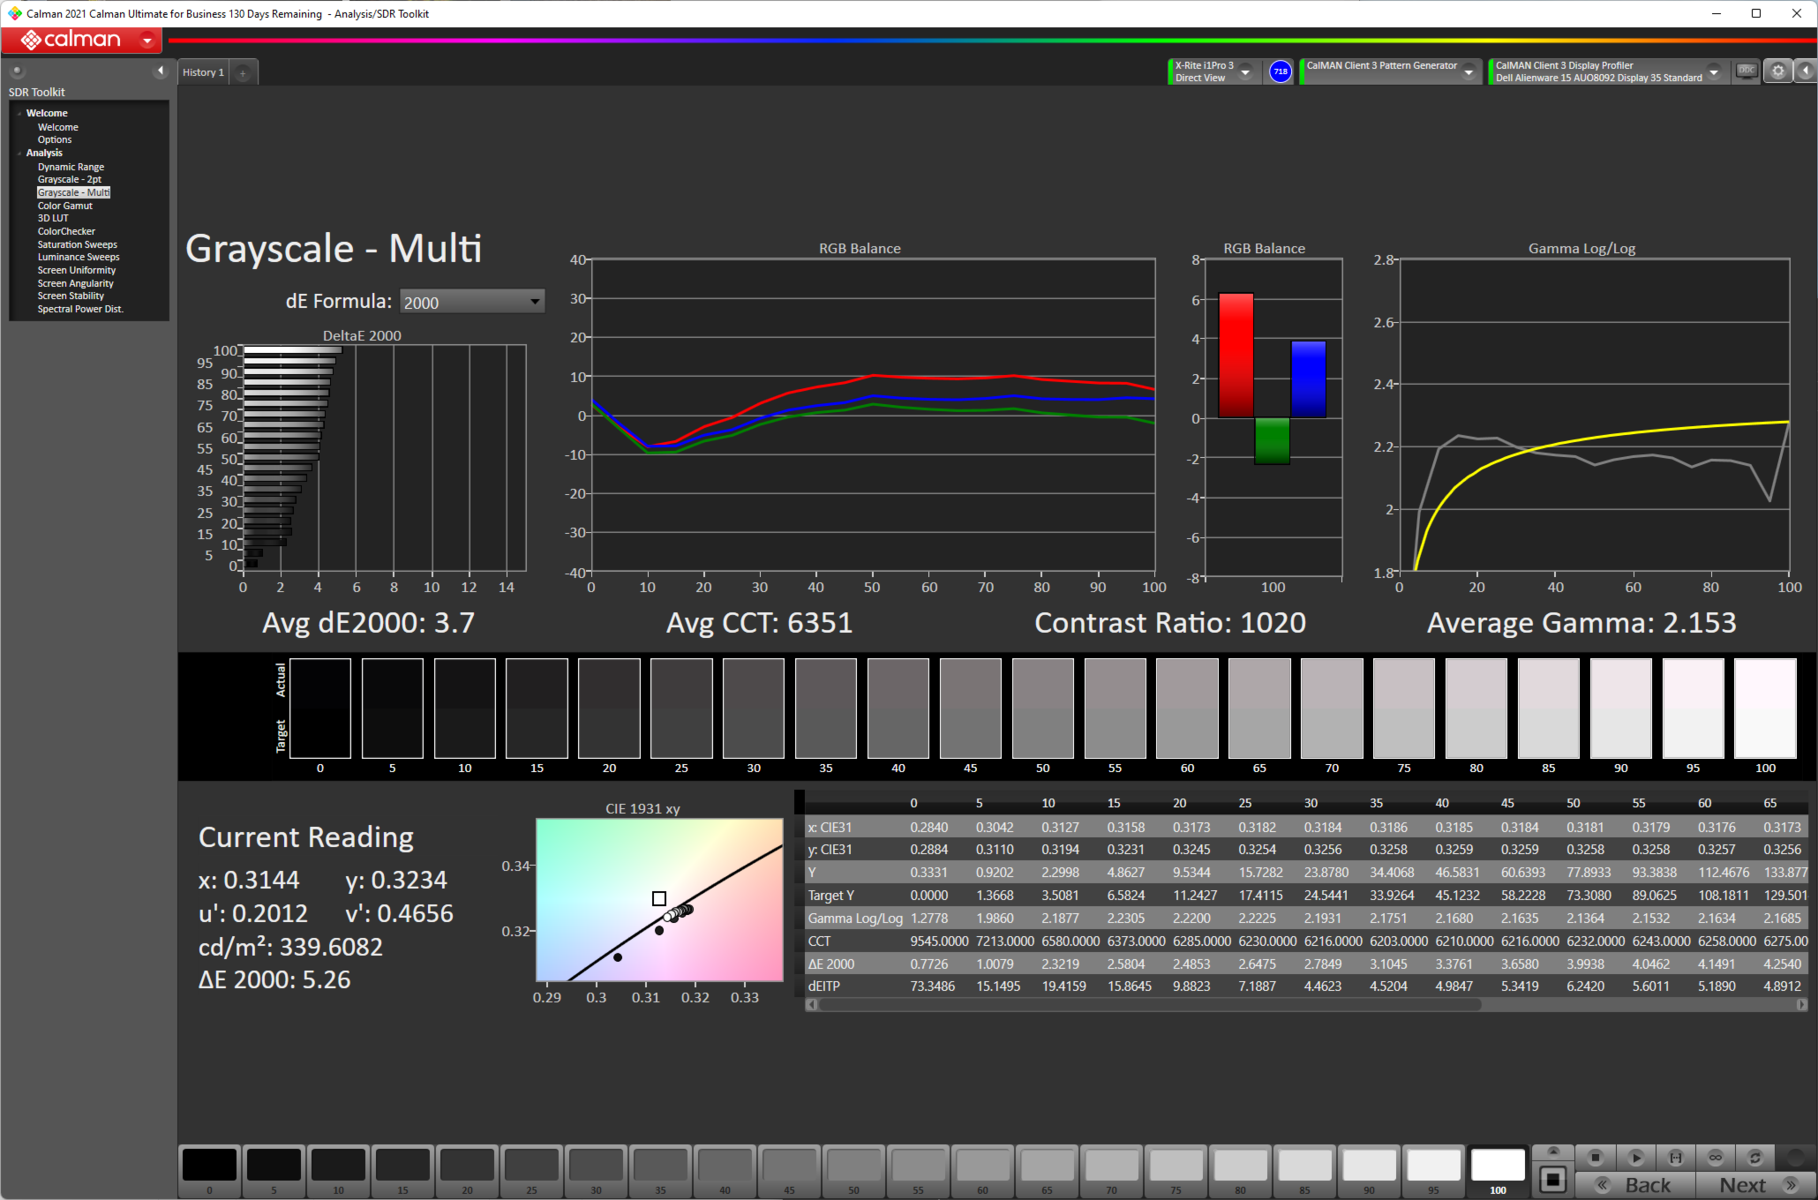
ΔE Greyscale Calman: 3.7 | ∀{0.09-98 Ø4.96}
75.7% AdobeRGB 1998 (Argyll 3D)
100% sRGB (Argyll 3D)
74.7% Display P3 (Argyll 3D)
Gamma: 2.15
CCT: 6351 K
| Alienware x15 R2 P111F AU Optronics B156HAN (AUO8092), IPS, 1920x1080, 15.6" | Alienware x15 RTX 3070 P111F LG Philips 156QHG, IPS, 2560x1440, 15.6" | Asus ROG Strix Scar 15 G533ZW-LN106WS BOE CQ NE156QHM-NZ2, IPS-level, 2560x1440, 15.6" | MSI Titan GT77 12UHS Sharp SHP1544 LQ173M1JW08, IPS-Level, 1920x1080, 17.3" | MSI Vector GP66 12UGS BOE NE156FHM-NZ3, IPS, 1920x1080, 15.6" | Razer Blade 15 Advanced Model Early 2022 TL156VDXP02-0, IPS, 1920x1080, 15.6" | |
|---|---|---|---|---|---|---|
| Display | 16% | 14% | -3% | -4% | -13% | |
| Display P3 Coverage (%) | 74.7 | 97.8 31% | 96.2 29% | 70.8 -5% | 70.1 -6% | 65.3 -13% |
| sRGB Coverage (%) | 100 | 99.9 0% | 99.9 0% | 98.9 -1% | 99.5 0% | 85.1 -15% |
| AdobeRGB 1998 Coverage (%) | 75.7 | 84.5 12% | 73 -4% | 72.1 -5% | 67.4 -11% | |
| Response Times | -429% | -232% | -64% | -209% | -168% | |
| Response Time Grey 50% / Grey 80% * (ms) | 1.47 ? | 12 ? -716% | 7.86 ? -435% 4.21 ? -186% | 3.03 ? -106% | 5.8 ? -295% | 4.3 ? -193% |
| Response Time Black / White * (ms) | 4.32 ? | 10.4 ? -141% | 7.5 ? -74% | 5.28 ? -22% | 9.6 ? -122% | 10.5 ? -143% |
| PWM Frequency (Hz) | ||||||
| Screen | -4% | -24% | -7% | 4% | 30% | |
| Brightness middle (cd/m²) | 341 | 409.5 20% | 346 1% | 280 -18% | 353.1 4% | 330 -3% |
| Brightness (cd/m²) | 316 | 390 23% | 329 4% | 275 -13% | 325 3% | 315 0% |
| Brightness Distribution (%) | 82 | 88 7% | 91 11% | 79 -4% | 85 4% | 89 9% |
| Black Level * (cd/m²) | 0.33 | 0.47 -42% | 0.59 -79% | 0.4 -21% | 0.38 -15% | 0.24 27% |
| Contrast (:1) | 1033 | 871 -16% | 586 -43% | 700 -32% | 929 -10% | 1375 33% |
| Colorchecker dE 2000 * | 2.96 | 3.48 -18% | 3.06 -3% | 2.1 29% | 2.24 24% | 1.47 50% |
| Colorchecker dE 2000 max. * | 5.33 | 6.31 -18% | 5.81 -9% | 5.83 -9% | 5 6% | 2.73 49% |
| Colorchecker dE 2000 calibrated * | 1.46 | 0.89 39% | 2.57 -76% | 1.58 -8% | 1.02 30% | 0.63 57% |
| Greyscale dE 2000 * | 3.7 | 5 -35% | 3.3 11% | 4 -8% | 1.8 51% | |
| Gamma | 2.15 102% | 2.16 102% | 2.12 104% | 2.13 103% | 2.24 98% | 2.282 96% |
| CCT | 6351 102% | 6591 99% | 7021 93% | 7060 92% | 6864 95% | 6499 100% |
| Total Average (Program / Settings) | -139% /
-67% | -81% /
-61% | -25% /
-15% | -70% /
-28% | -50% /
-7% |
* ... smaller is better
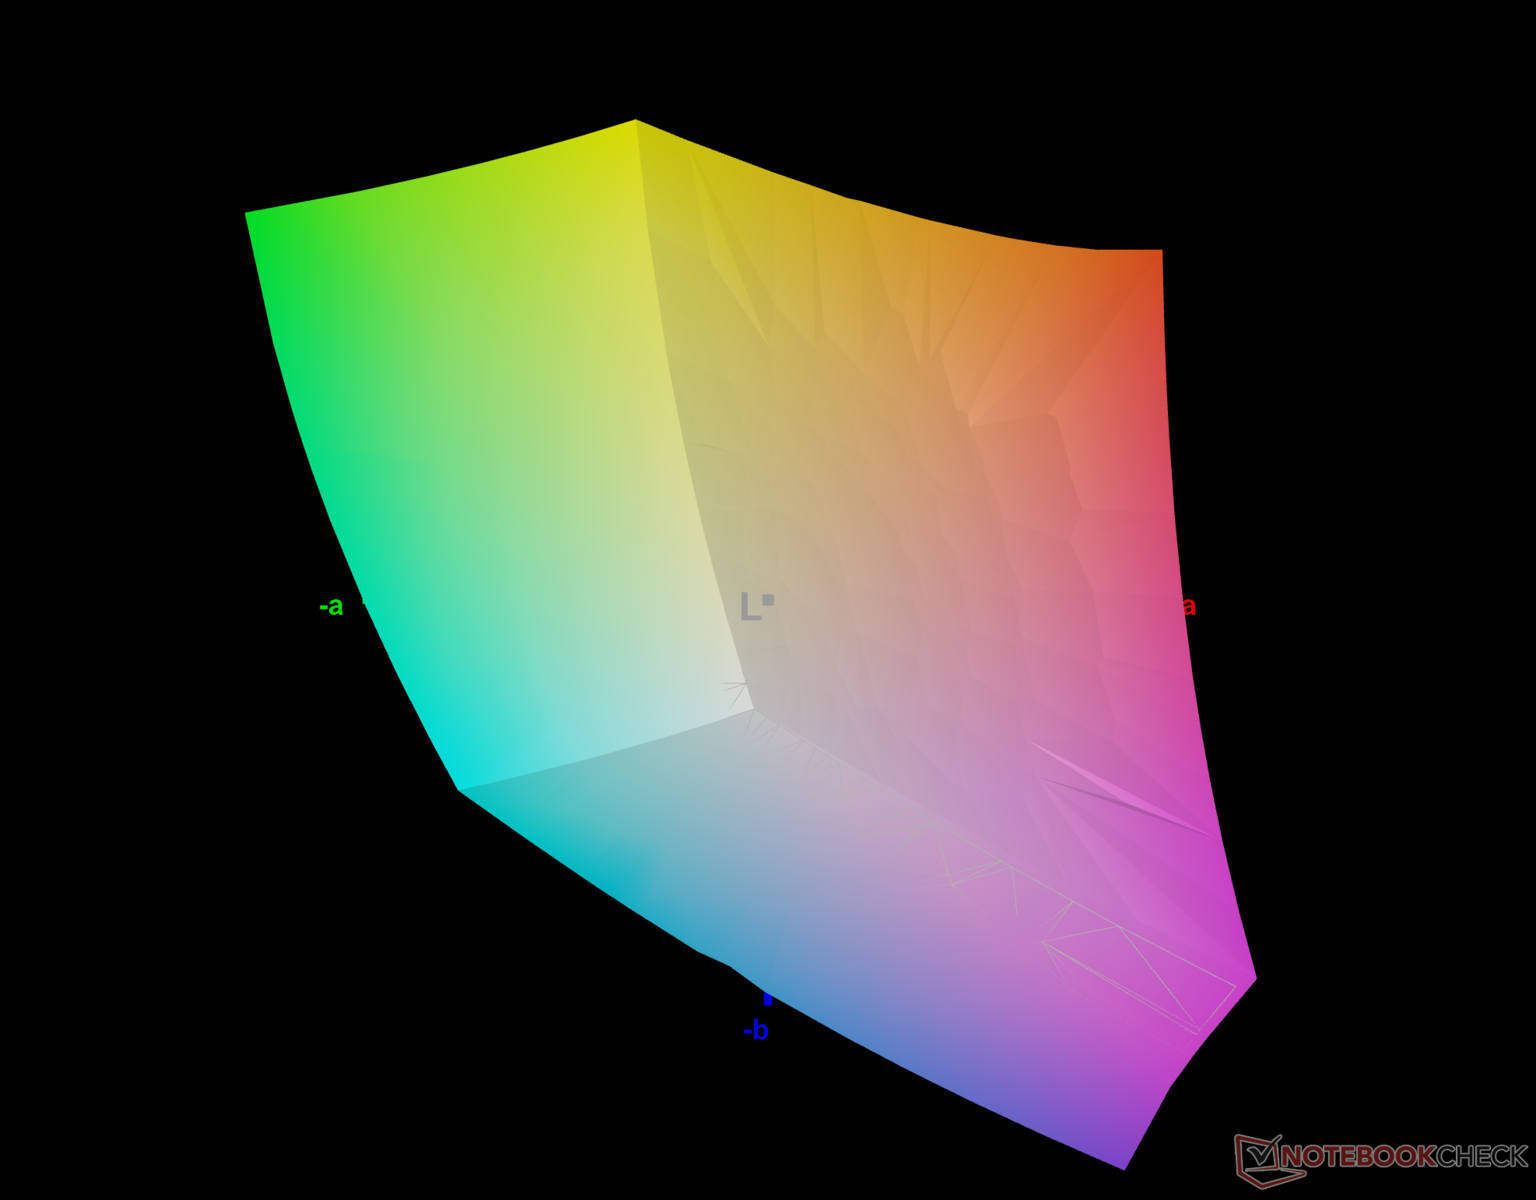
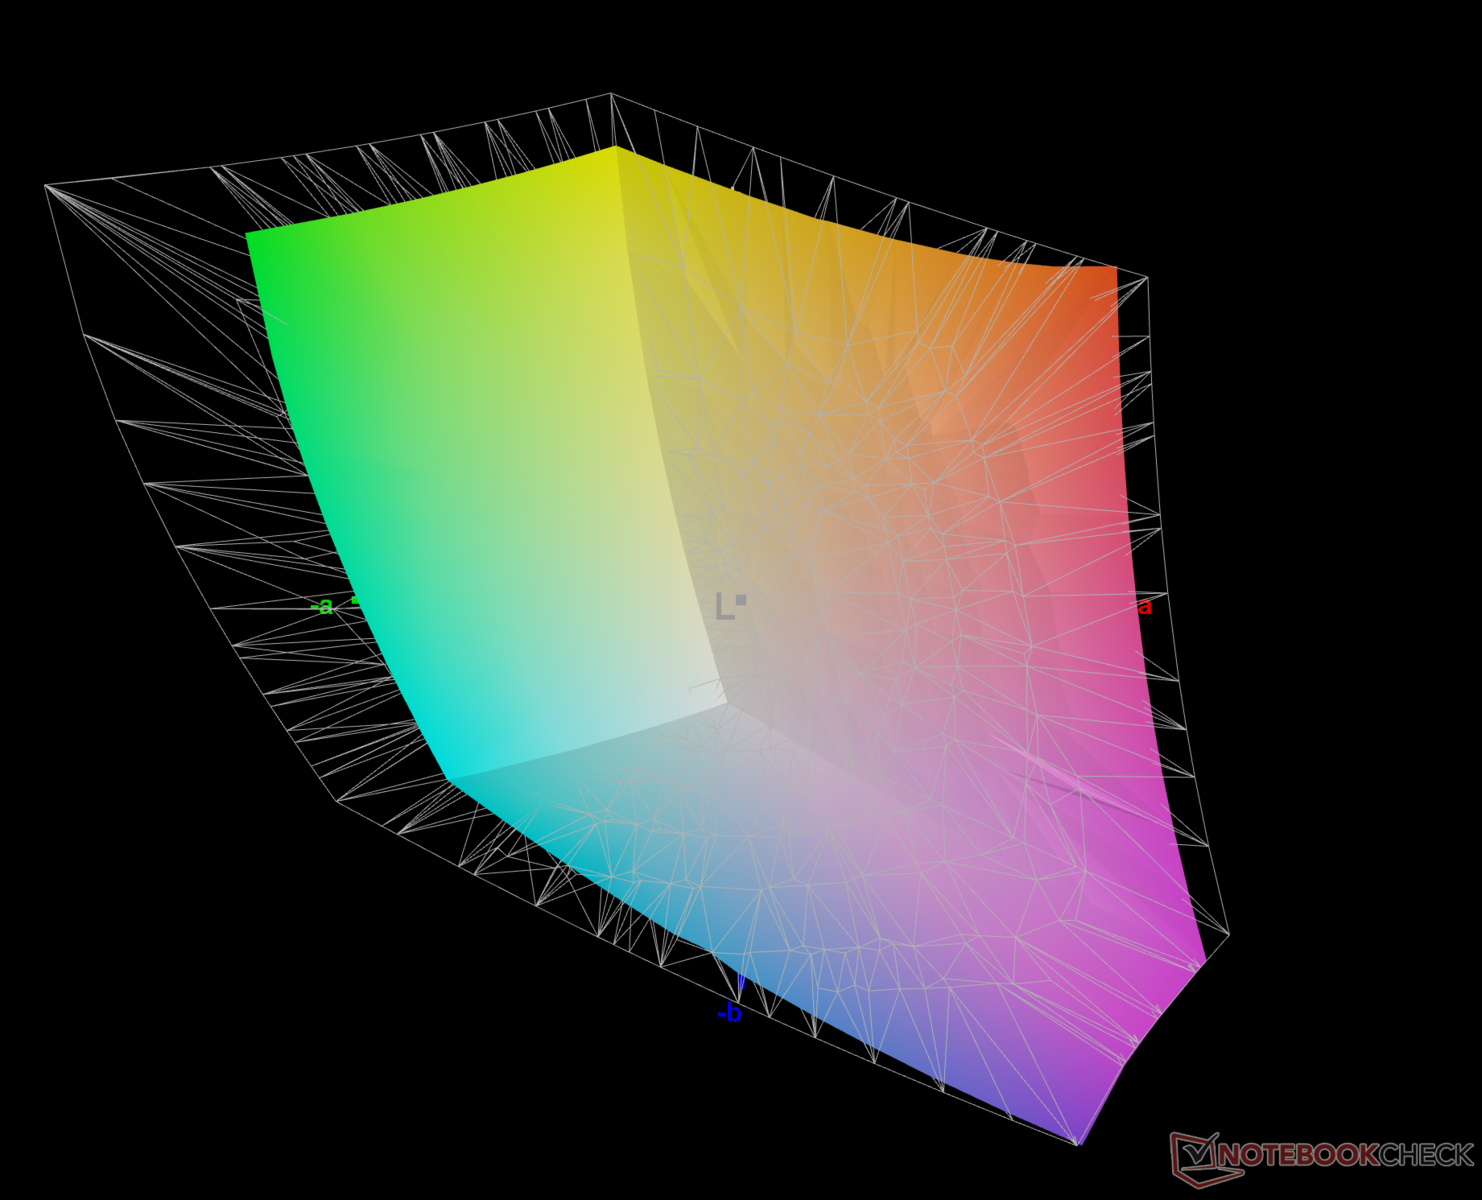
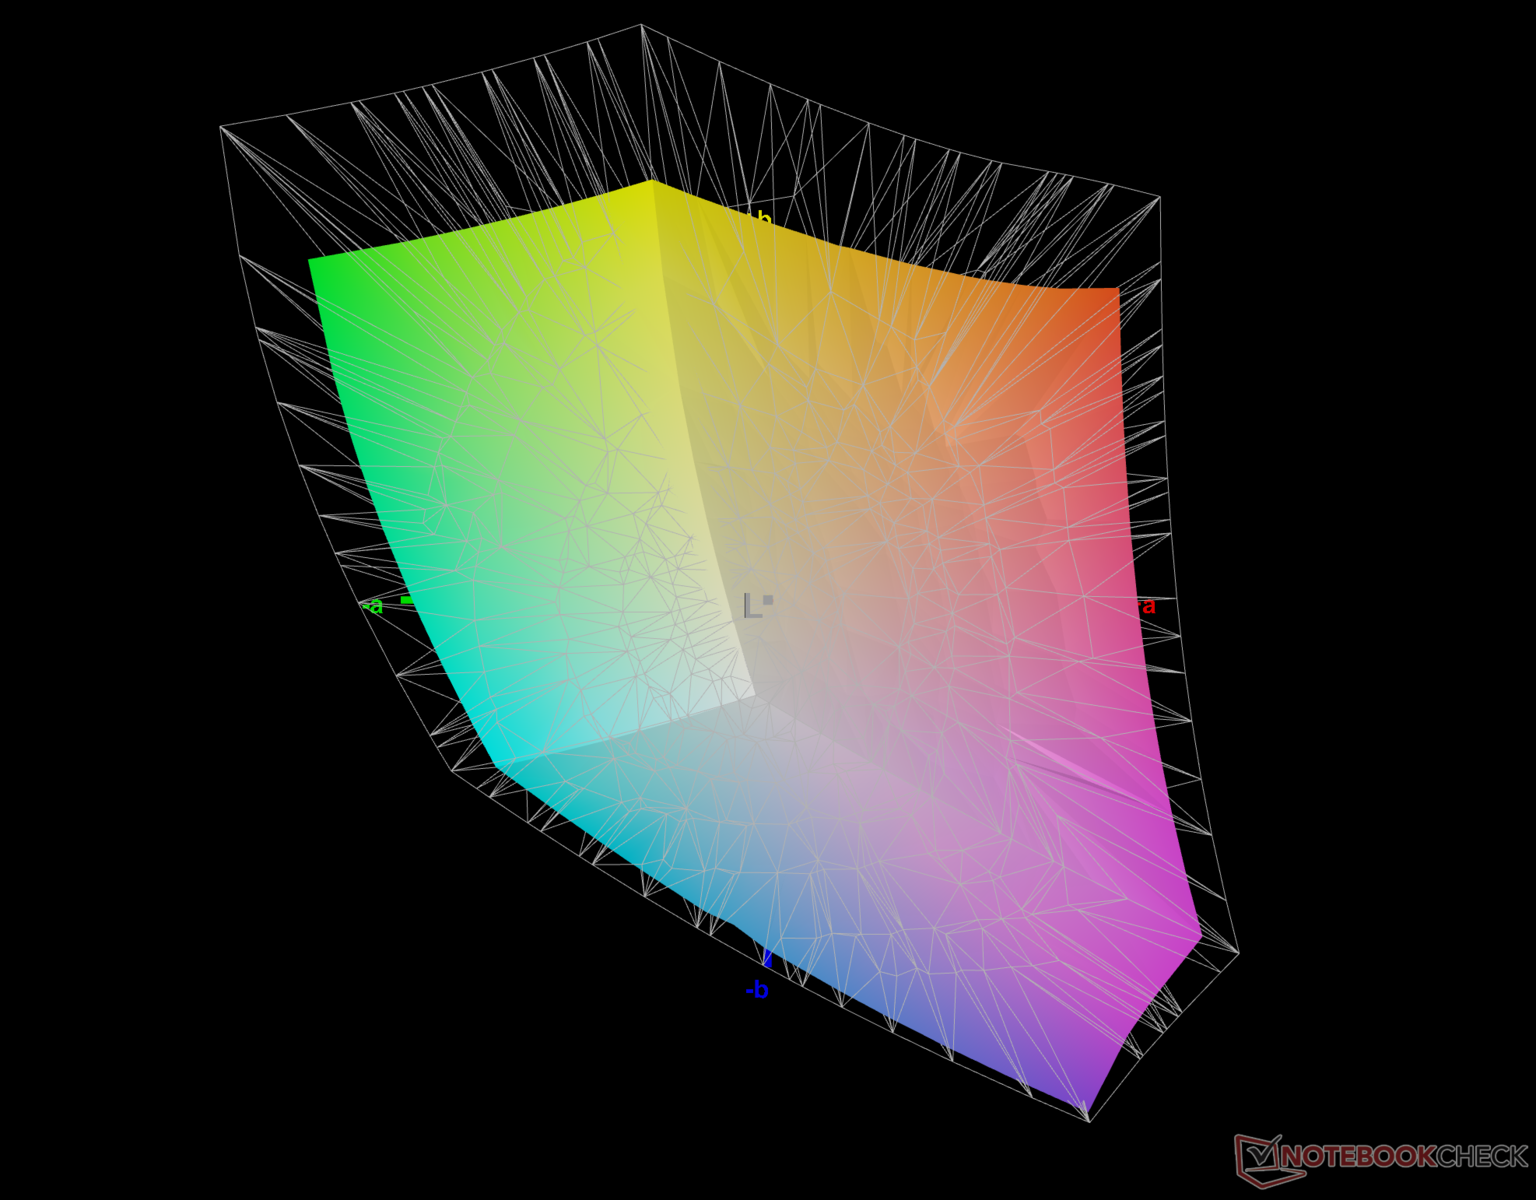
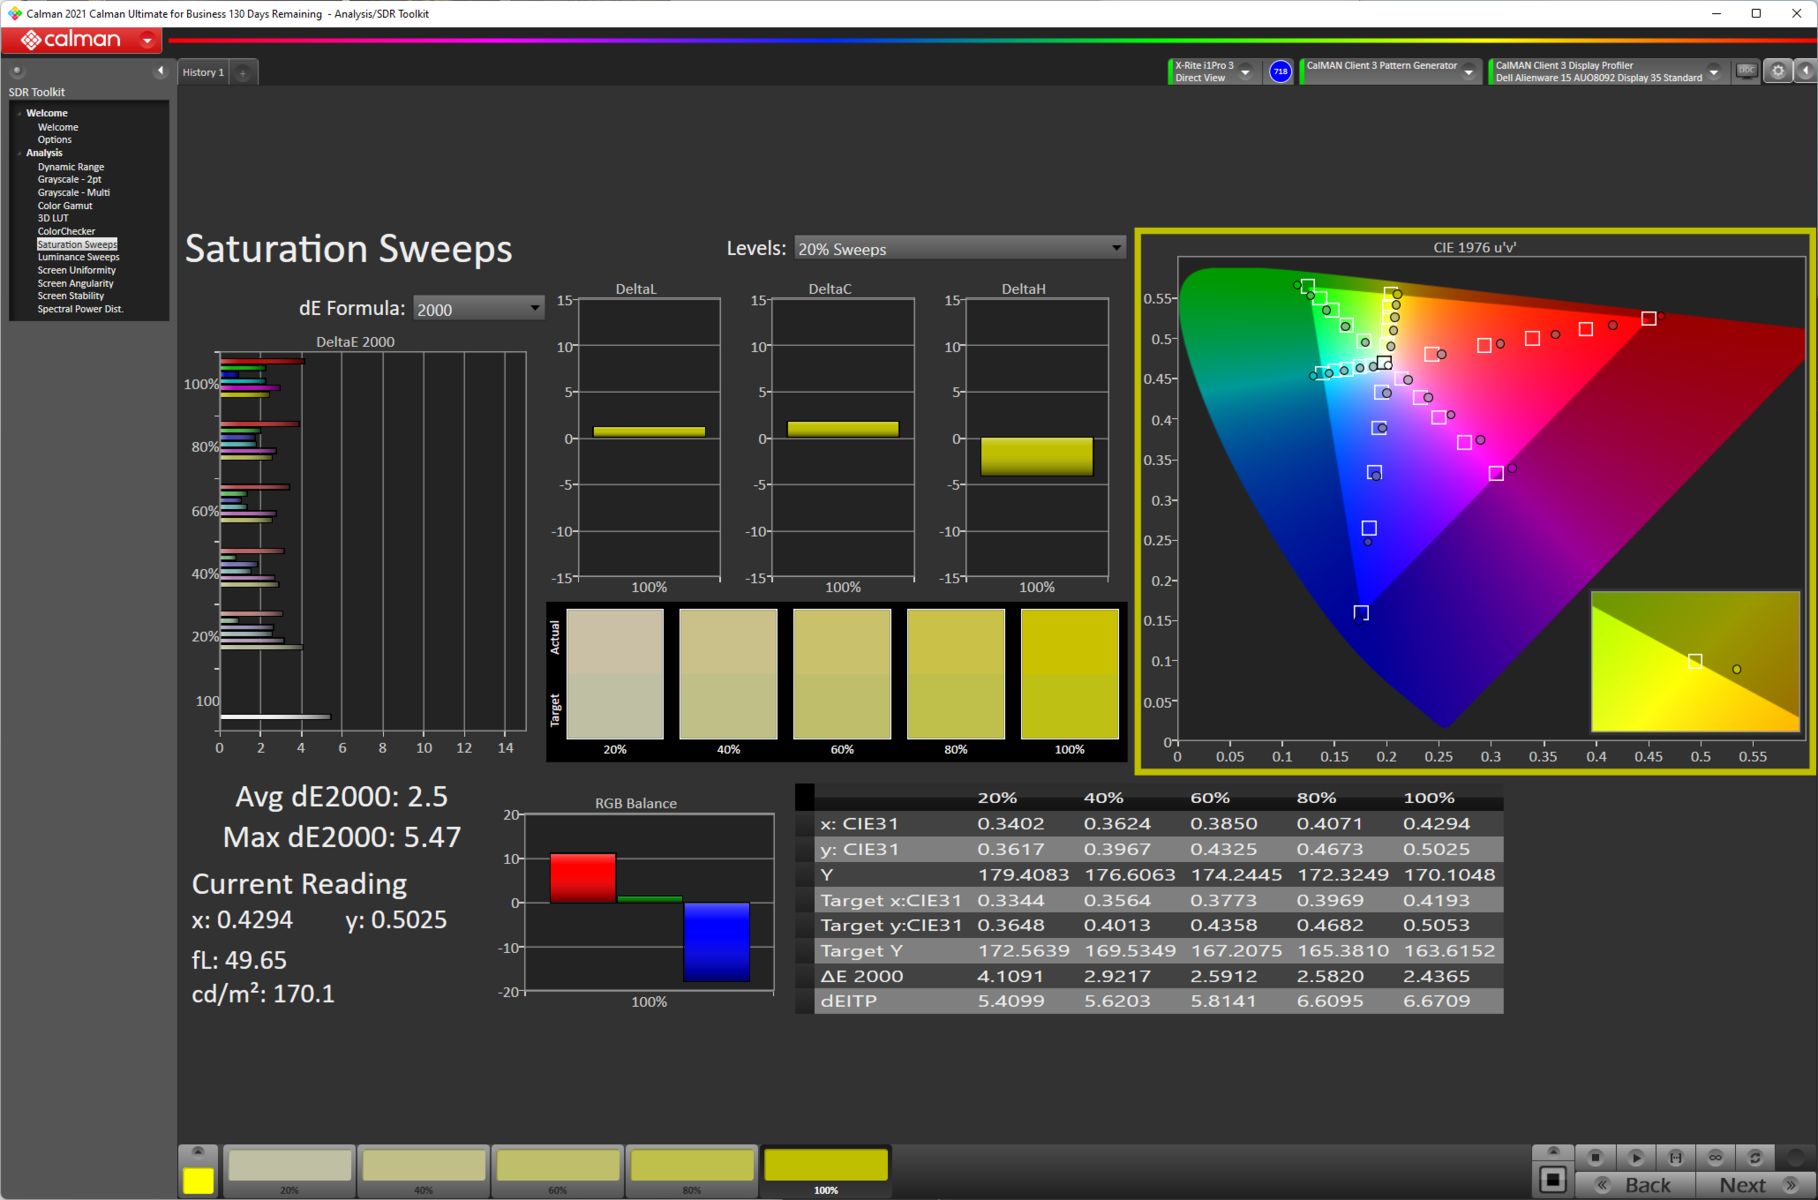
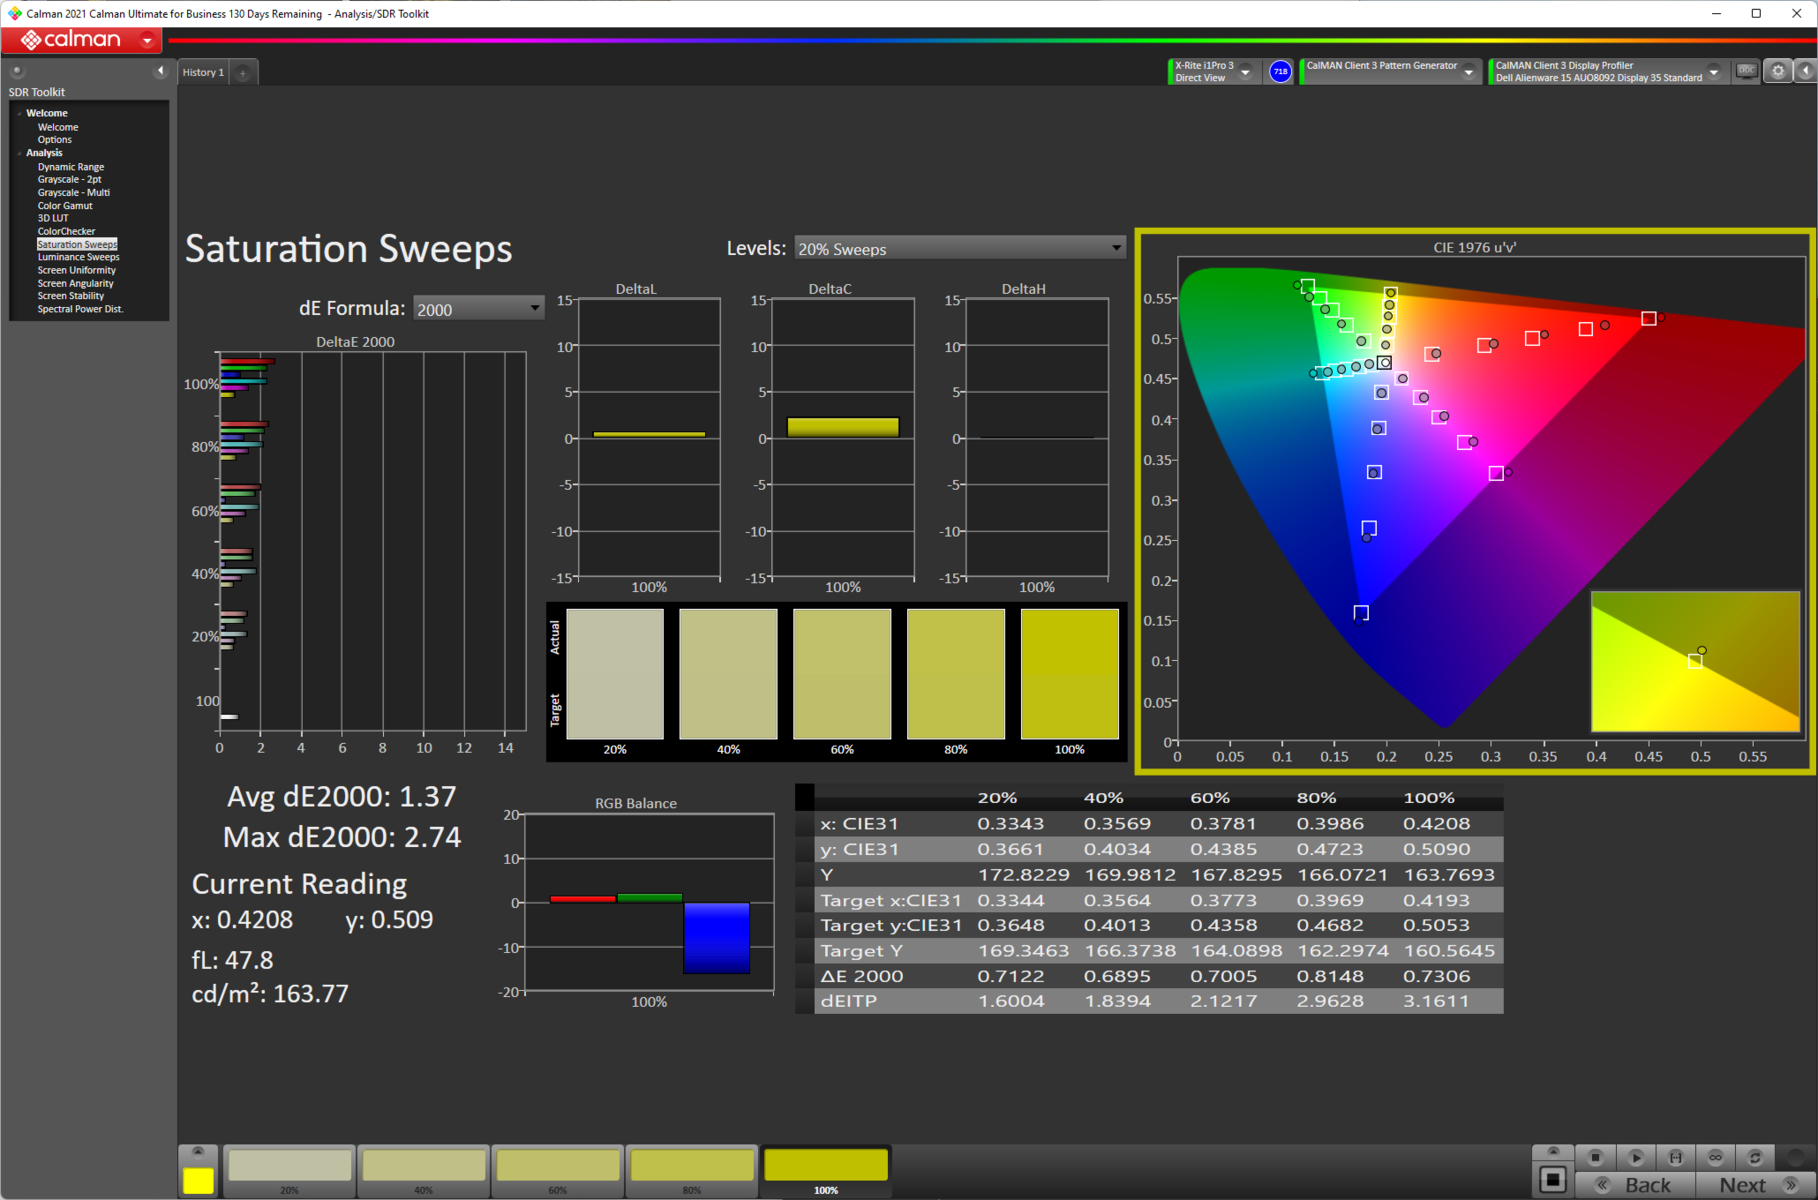
考虑到这主要是一台游戏笔记本,Alienware x15 R2的色彩空间覆盖率很好。sRGB色域被完全覆盖,而75.7%的AdobeRGB覆盖率对于非专业的内容创作来说应该还是可以接受的。显示P3的覆盖率也很好,为74.7%。
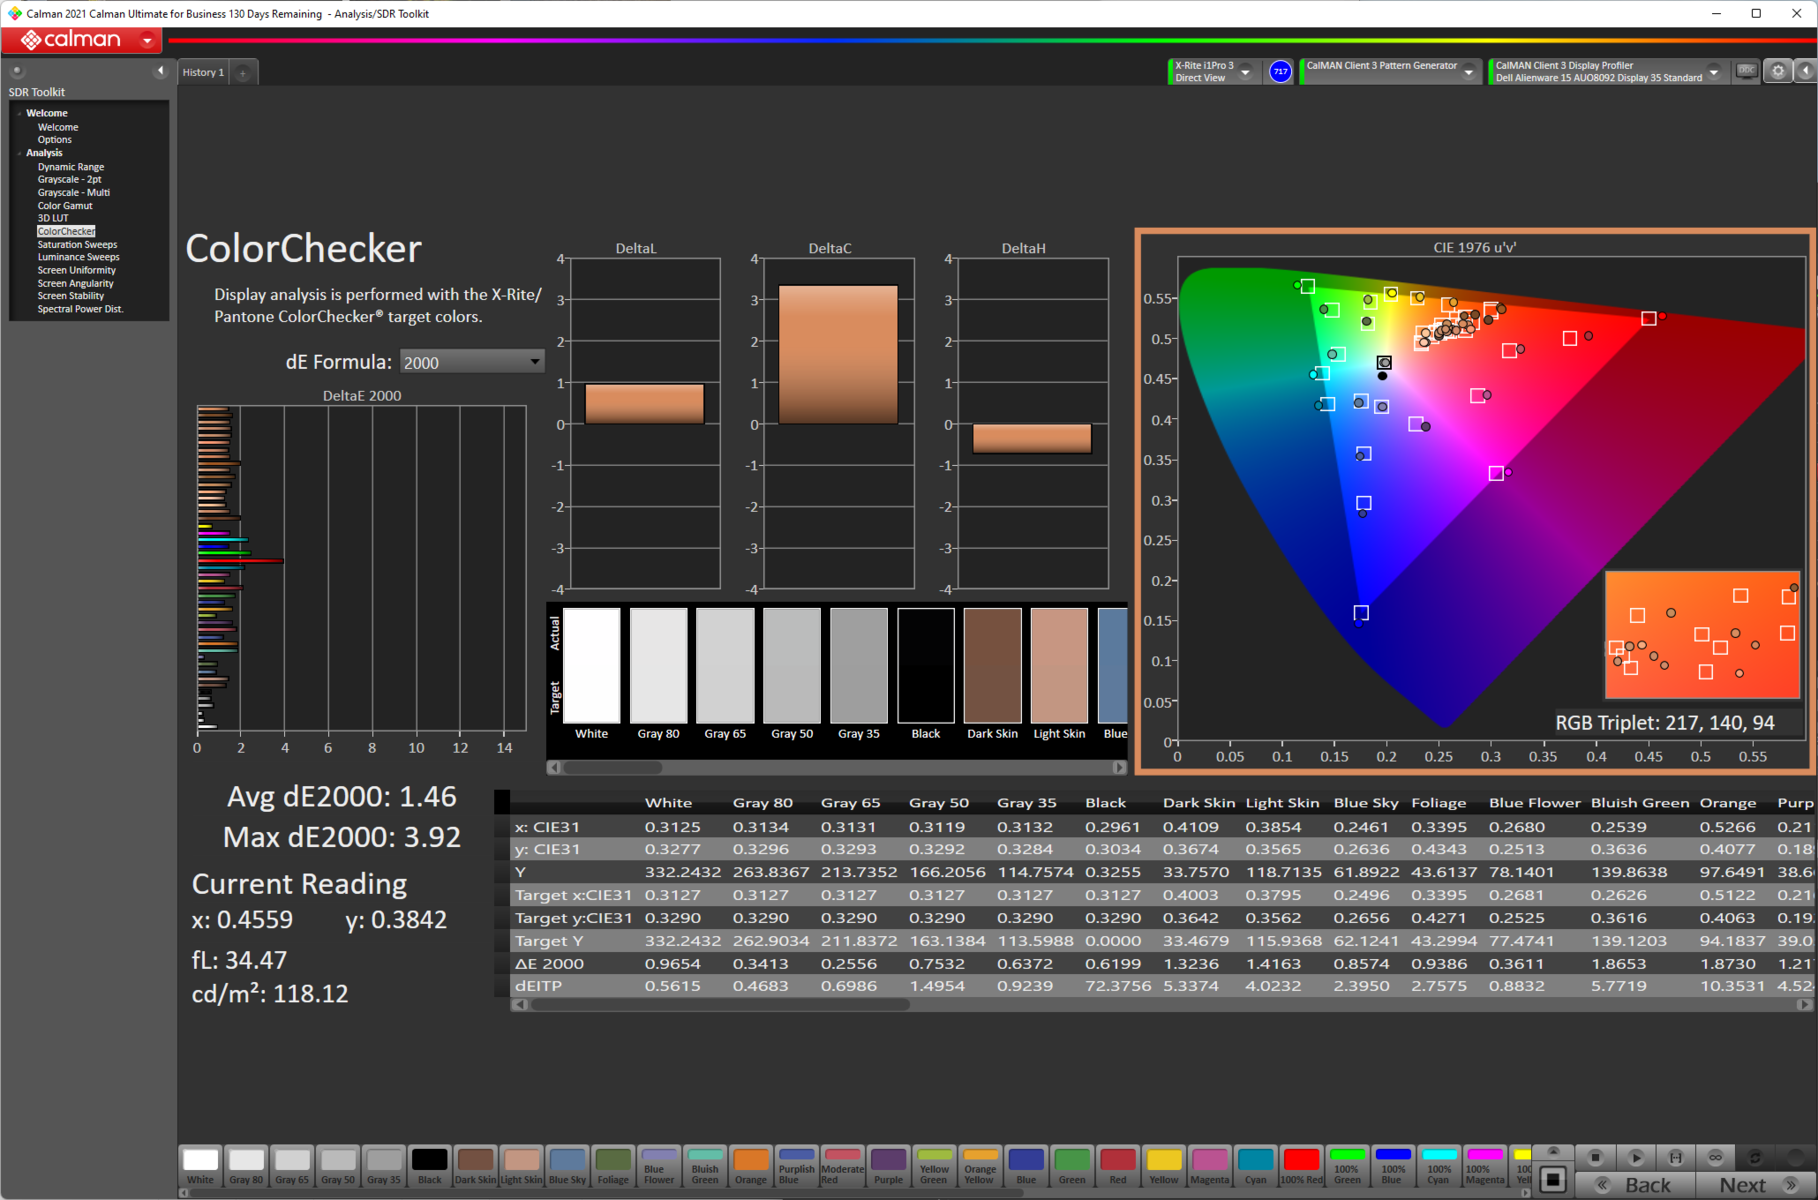
开箱即用的色彩精确度没有什么可写的,但还是可以使用的,平均灰度Delta E为3.7,平均ColorChecker Delta E为2.96。
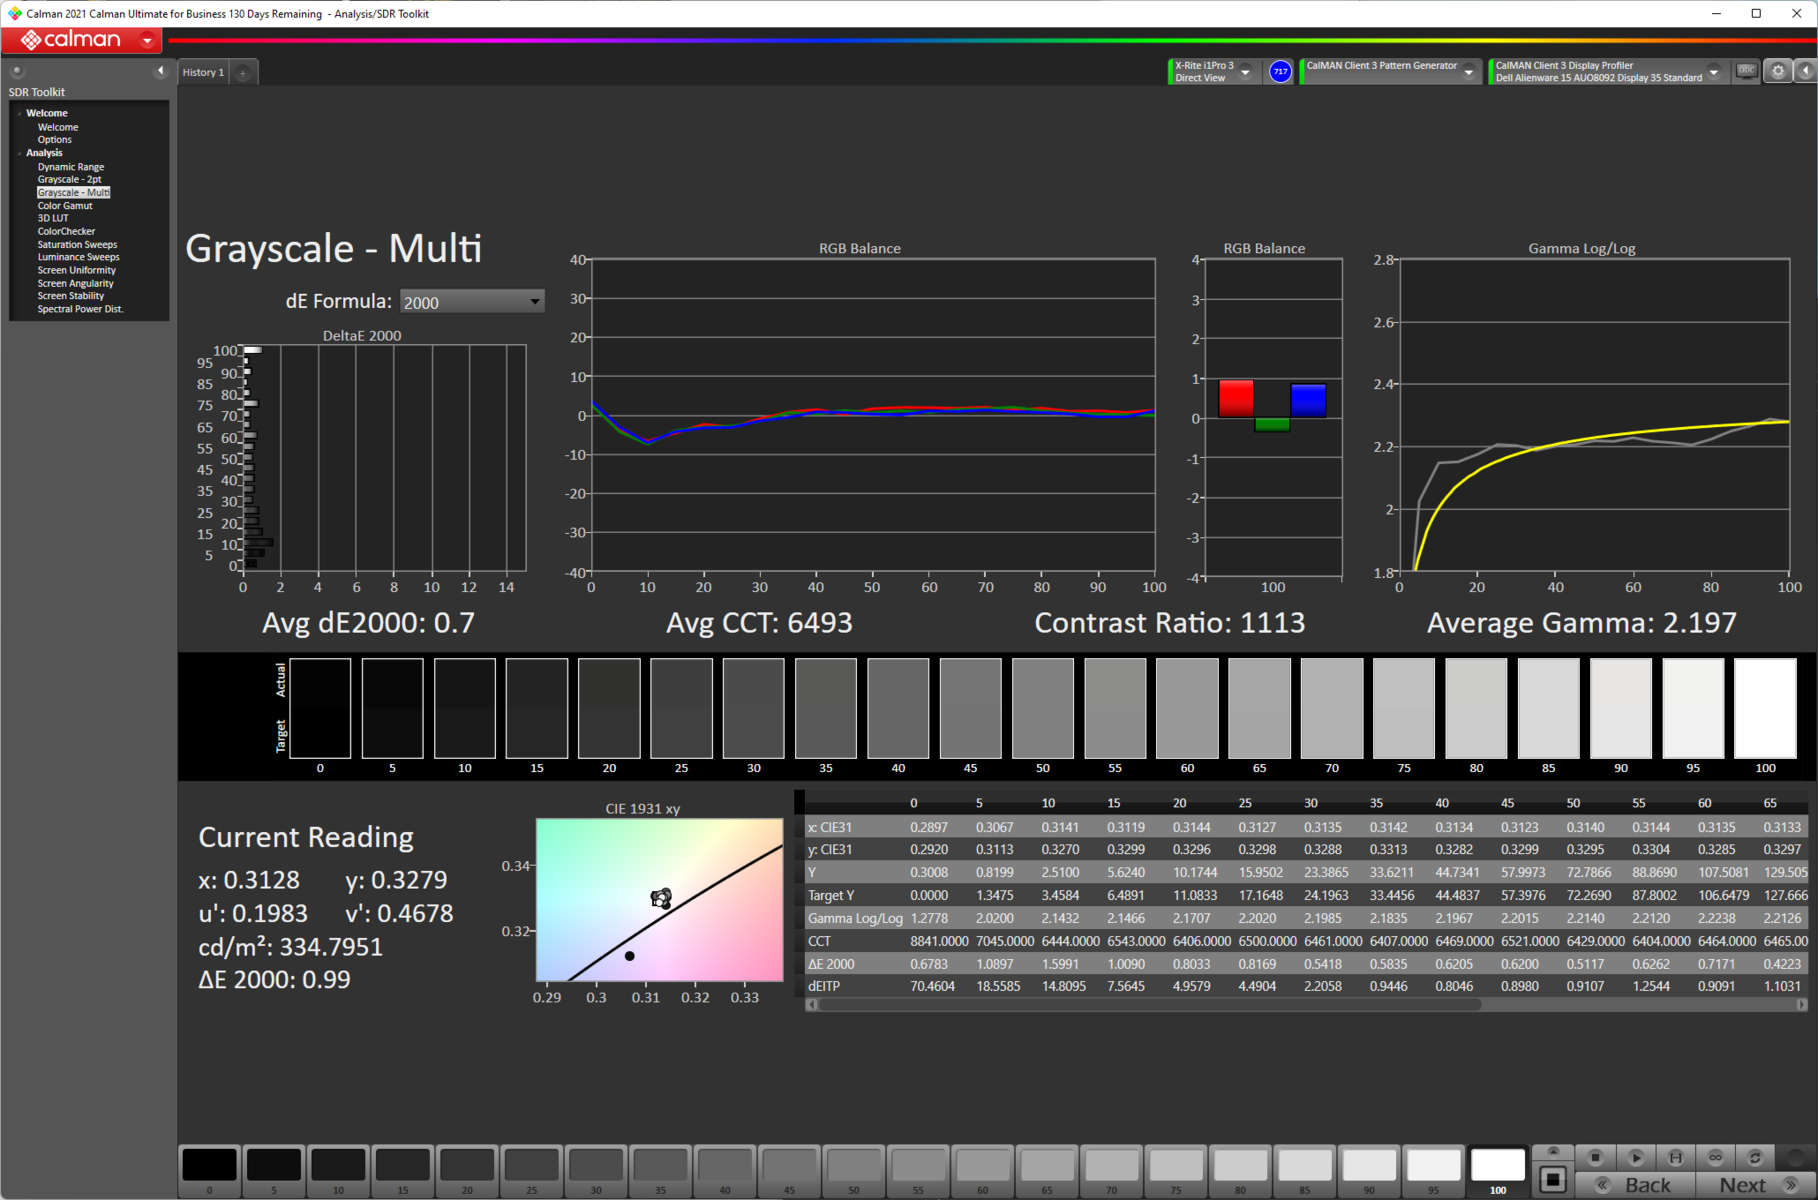
我们使用X-rite i1Basic Pro 3分光光度计和Portrait Displays公司的Calman Ultimate色彩校准软件进行标准化校准,将平均灰度Delta E缩小到0.7,平均ColorChecker Delta E缩小到1.46,这有助于明显改善色彩准确性。我们仍然注意到红色的偏离度较高。
校准后的ICC文件可以从上面的链接中下载。
Display Response Times
| ↔ Response Time Black to White | ||
|---|---|---|
| 4.32 ms ... rise ↗ and fall ↘ combined | ↗ 2.17 ms rise | 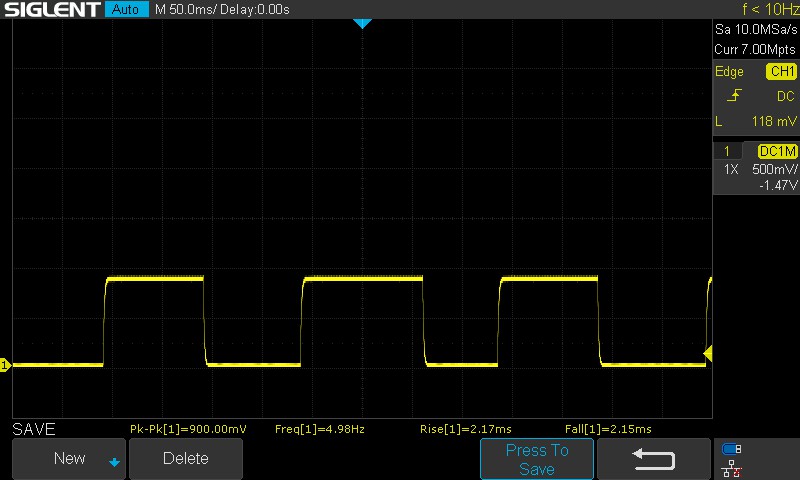 |
| ↘ 2.15 ms fall | ||
| The screen shows very fast response rates in our tests and should be very well suited for fast-paced gaming. In comparison, all tested devices range from 0.1 (minimum) to 240 (maximum) ms. » 17 % of all devices are better. This means that the measured response time is better than the average of all tested devices (19.8 ms). | ||
| ↔ Response Time 50% Grey to 80% Grey | ||
| 1.47 ms ... rise ↗ and fall ↘ combined | ↗ 0.49 ms rise | 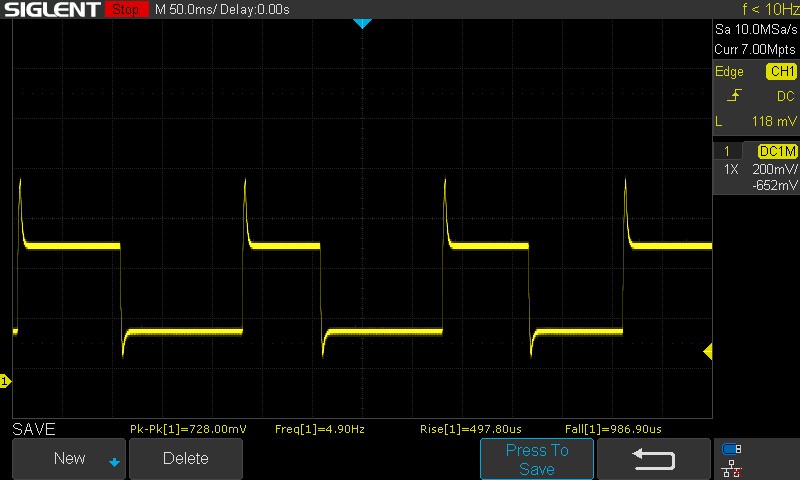 |
| ↘ 0.98 ms fall | ||
| The screen shows very fast response rates in our tests and should be very well suited for fast-paced gaming. In comparison, all tested devices range from 0.165 (minimum) to 636 (maximum) ms. » 7 % of all devices are better. This means that the measured response time is better than the average of all tested devices (31 ms). | ||
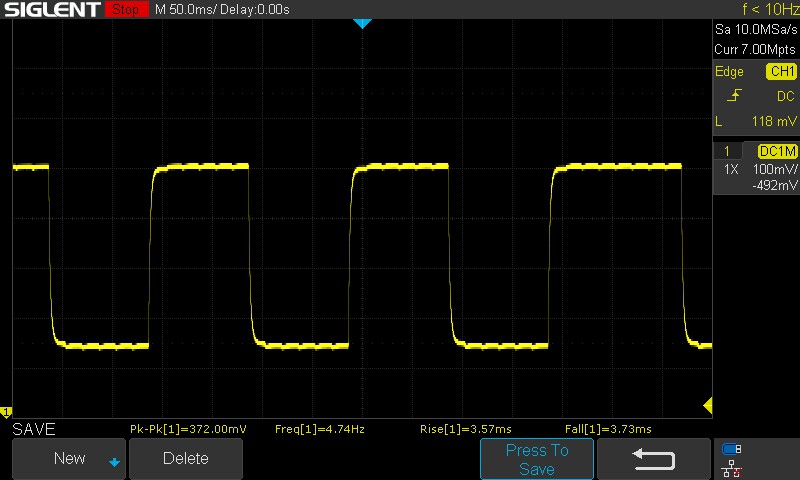
Alienware x15 R2的面板默认使用超速,这在50%灰度到80%灰度的响应时间图中被视为一个 "角"。因此,我们看到一个非常快的1.47毫秒的综合响应时间;这不是OLED水平,但对于快节奏的游戏来说应该是个好兆头。100%黑色到100%白色的综合响应时间也很好,为4.32毫秒。
面板超速在60赫兹刷新时被禁用,50%灰色到80%灰色的综合响应时间增加到7.3毫秒。
Screen Flickering / PWM (Pulse-Width Modulation)
| Screen flickering / PWM not detected | 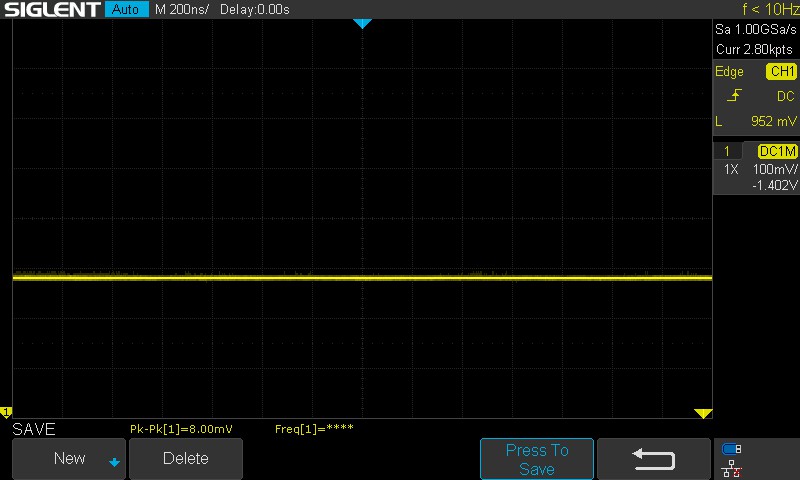 | ||
In comparison: 52 % of all tested devices do not use PWM to dim the display. If PWM was detected, an average of 7754 (minimum: 5 - maximum: 343500) Hz was measured. | |||
在所有测试的亮度水平上都没有观察到PWM闪烁,这应该是减少游戏时眼睛疲劳的好兆头。
欲了解更多信息,请参考我们的文章"为什么脉冲宽度调制(PWM)是如此令人头痛",还可以查看我们的PWM排名表以了解所有评测设备的PWM频率比较。
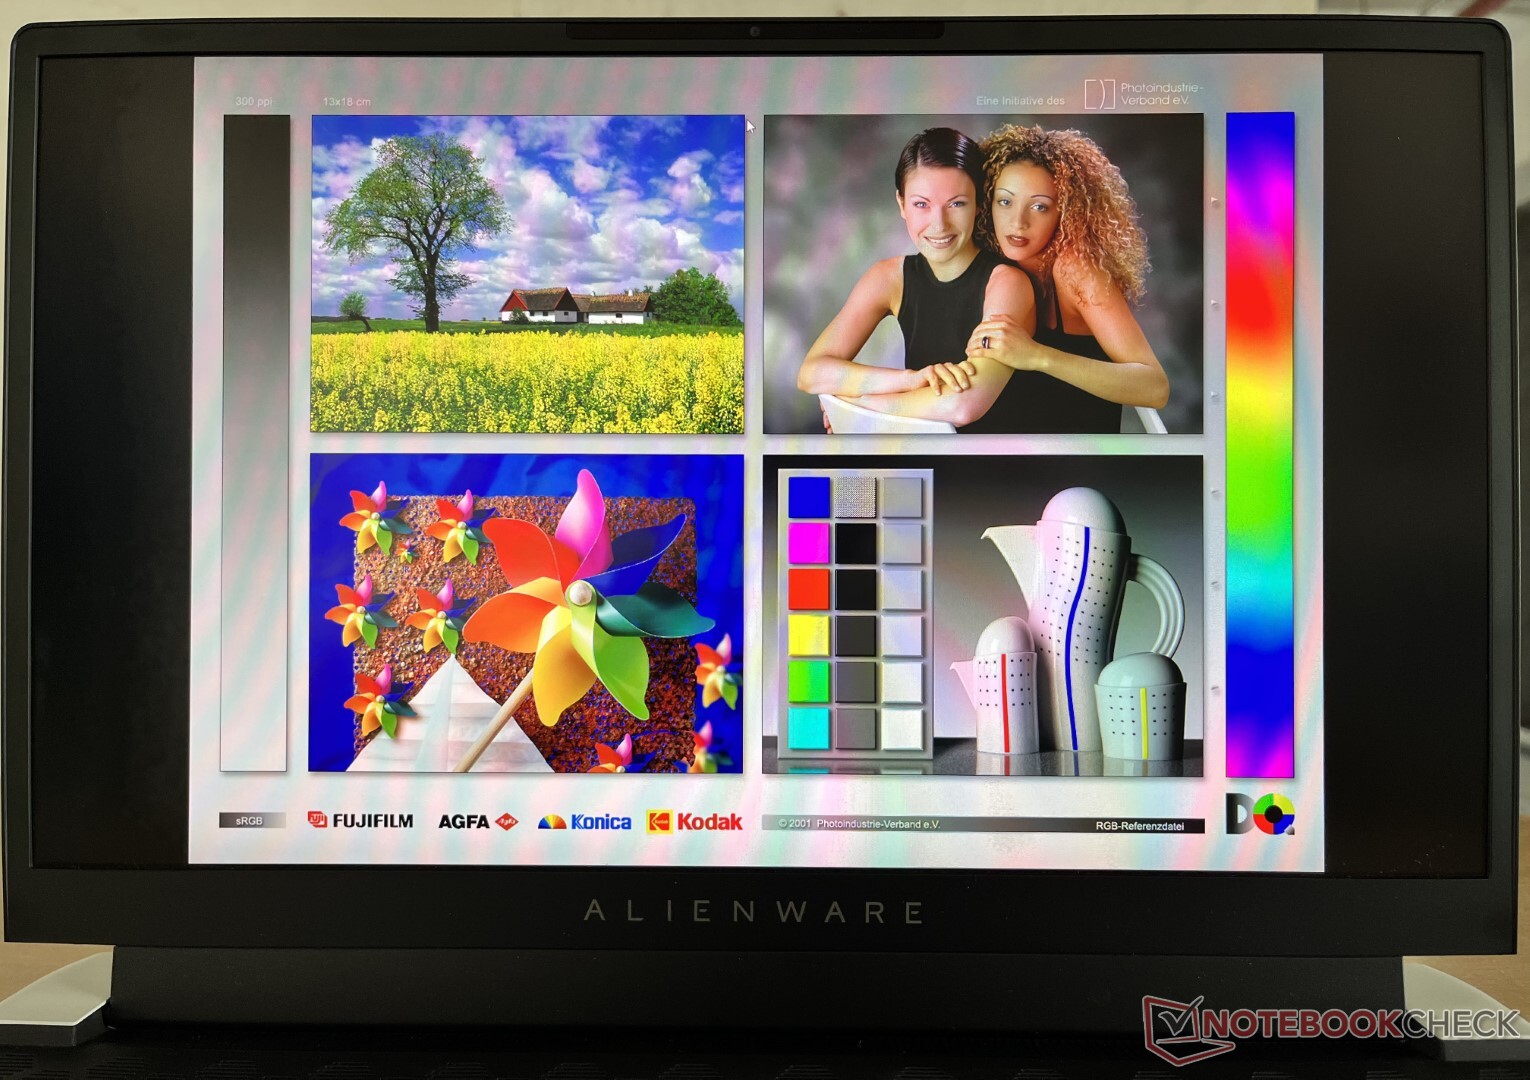
尽管峰值亮度略低,但只要没有刺眼的阳光直接照射在屏幕上,Alienware x15 R2的显示屏还是很适合在户外观看。
我们没有观察到在极端视角下亮度或色彩信息的任何明显损失。

性能。酷睿i9-12900H提供良好的持续性能
我们的Alienware x15 R2搭载了 英特尔酷睿i9-12900H处理器和一个140瓦的 NvidiaGeForce RTX 3080 Ti笔记本GPU.买家还可以为x15 R2配置一个 酷睿i7-12700H和一个 RTX 3060或 RTX 3070 Ti笔记本电脑GPU选项,以及16GB或32GB LPDDR5-5200内存。
测试条件
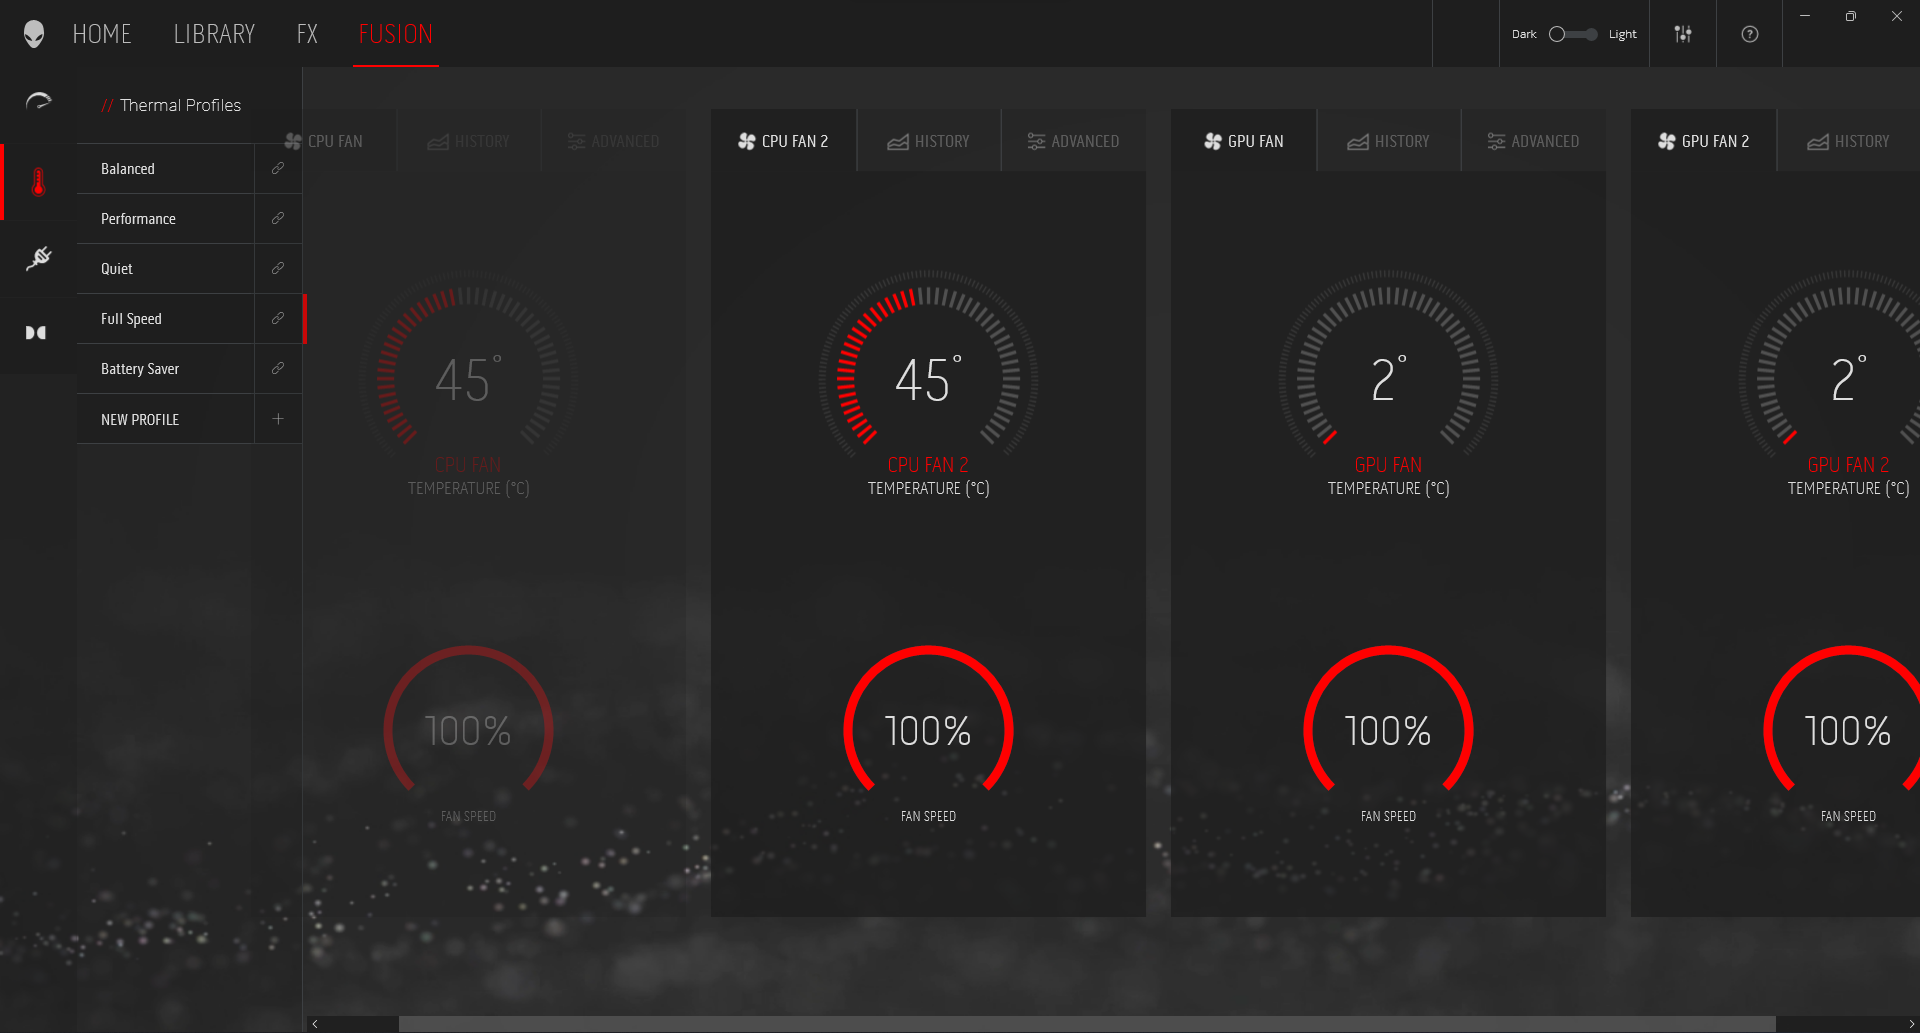
笔记本电脑的性能可以通过Alienware命令中心进行调整。我们不得不手动安装该应用程序,因为由于某种原因,它不存在于默认的出厂镜像中。我们在全速热配置文件中进行了所有测试。这导致处理器的基本功率(PL1)和最大涡轮增压功率(PL2)为140W。
包括平衡模式在内的大多数散热方案使用140瓦的PL1/PL2,而电池保护和安静模式使用65瓦的PL1和140瓦的PL2。散热曲线的选择主要对风扇噪音有影响,我们很快就会讨论这个问题。
Alienware x15 R2支持Advanced Optimus。所有图形测试都是在MSHybrid模式下进行的,但可以通过BIOS或Nvidia控制面板改变GPU的路由。
处理器
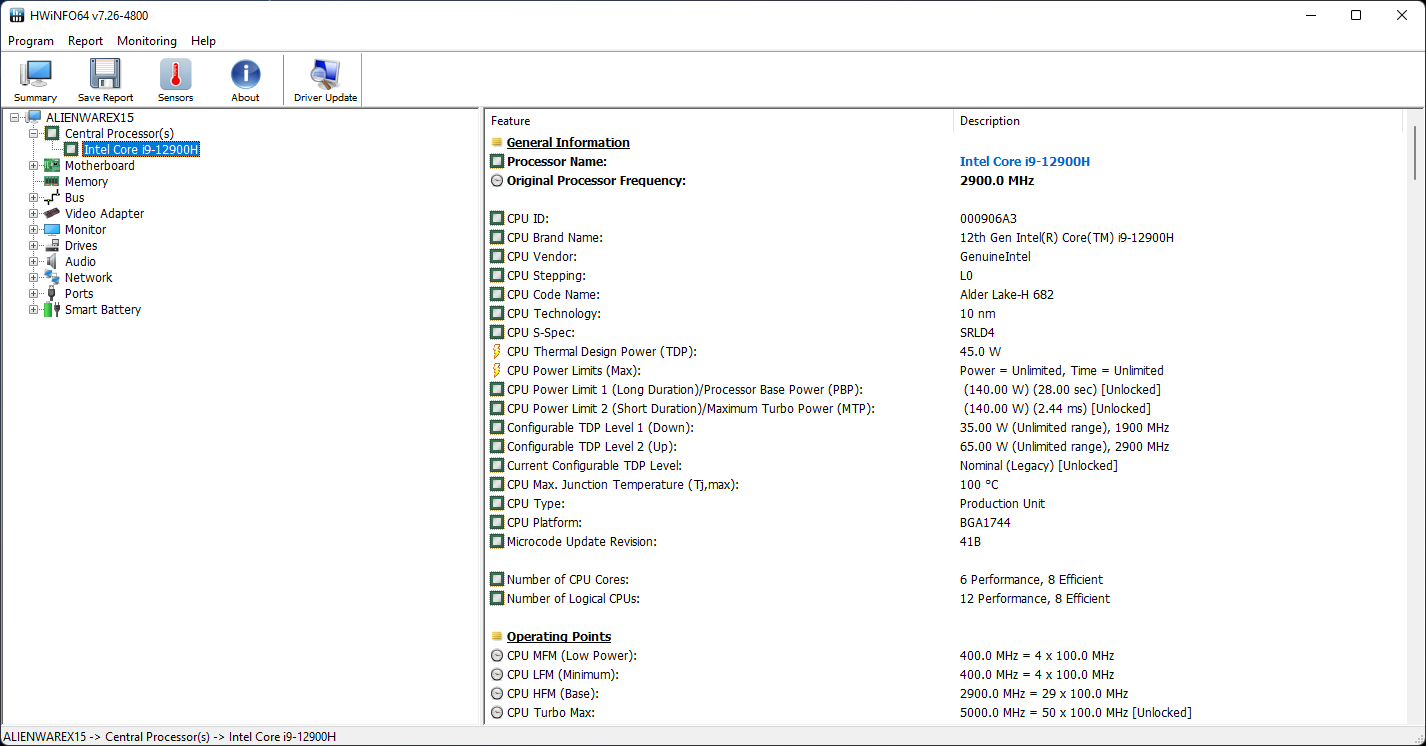
酷睿i9-12900H是一个14核20线程的Alder Lake-H处理器,提升到5GHz。在这14个内核中,有8个是金海湾性能(P)内核,其余6个是格雷斯蒙特效率(E)内核。P核支持超线程。
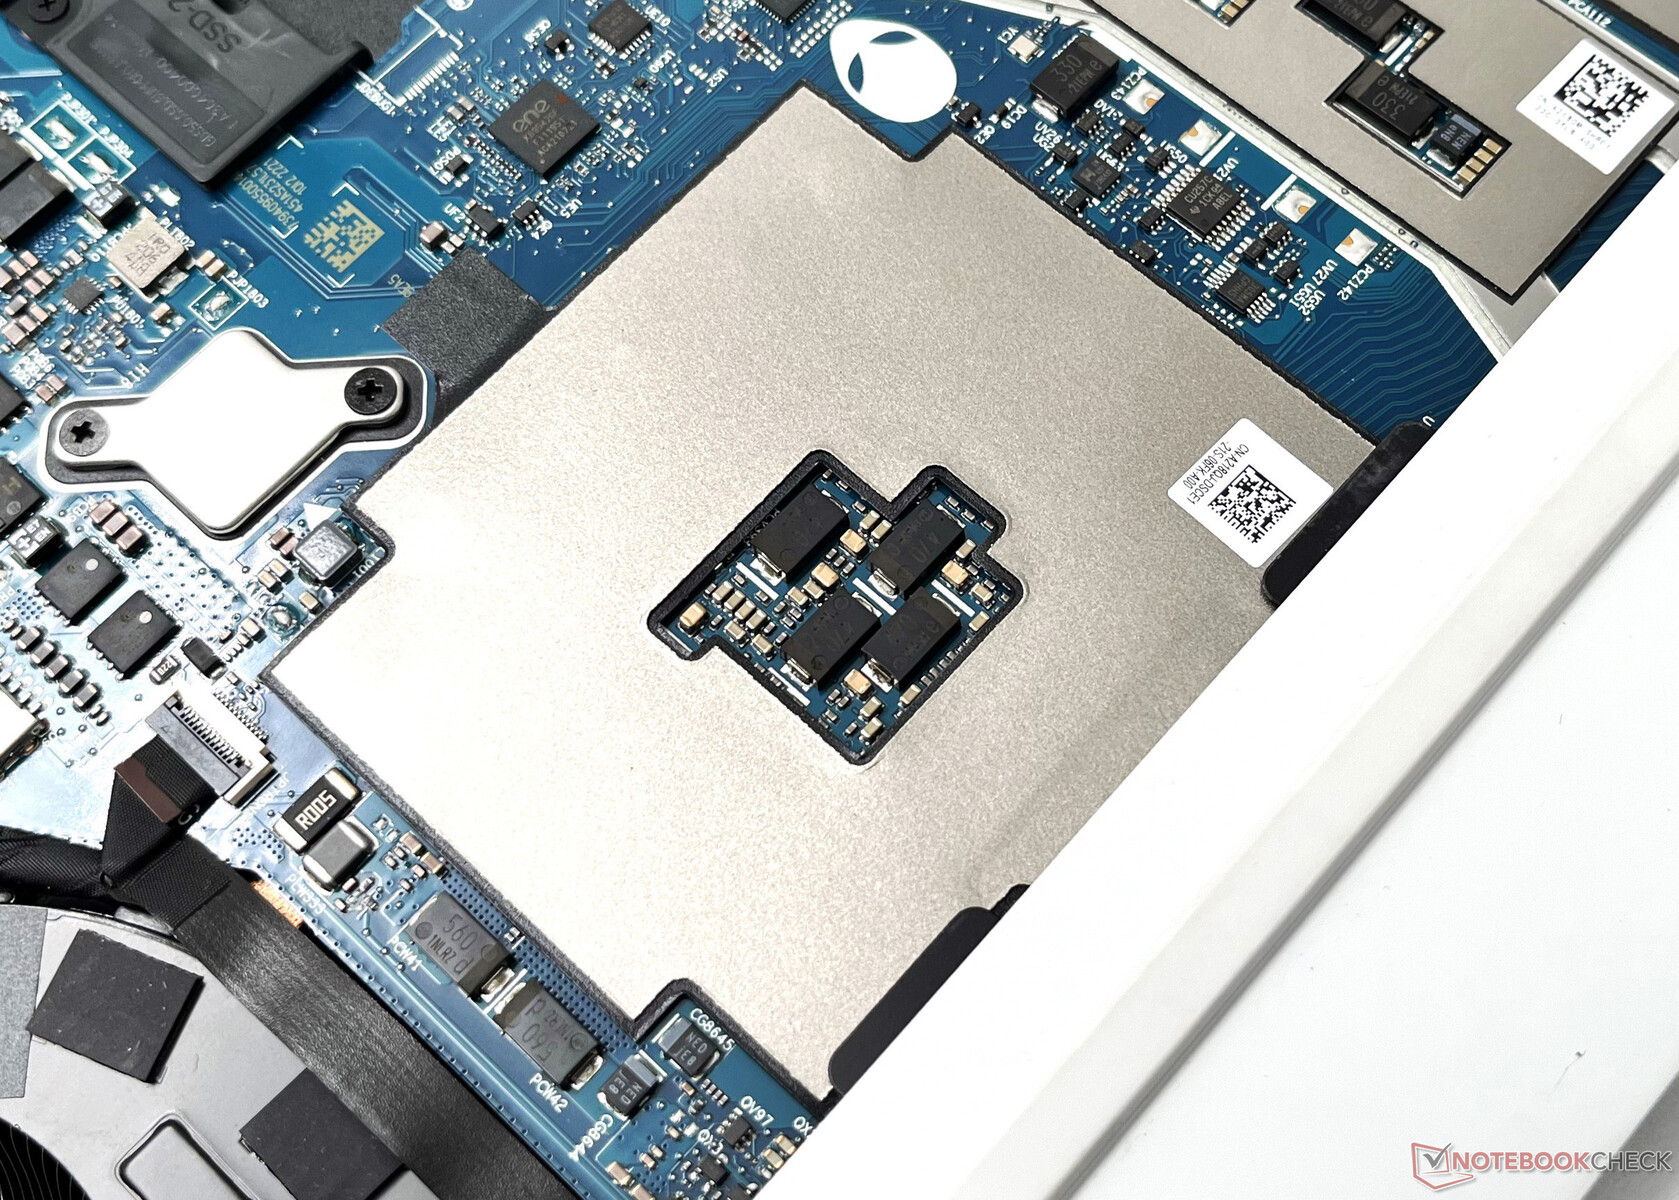
戴尔实施的31号元素(顺便说一下,它在周期表中表示镓)镓硅热界面材料(TIM)似乎正如宣传的那样工作。我们观察到,在Cinebench R15多核循环测试中,整个运行期间的性能保持良好。
也就是说,与华硕ROG Strix Scar 15 相比,Alienware x15 R2在这项测试中似乎慢了约9%,后者也采用了相同的处理器,功率为135W。
Cinebench R15 Multi Loop
单核性能与其他Alder Lake-H芯片甚至Alder Lake-HX相当。酷睿i9-12900HX中的微星泰坦GT77.我们看到酷睿i9-12900H的单核性能在1%到21%之间,与之相比AMD Ryzen 9 6900HX在华硕ROG Zephyrus Duo 16取决于基准测试。在大多数多核基准测试中,Scar 15能够领先于X15 R2。
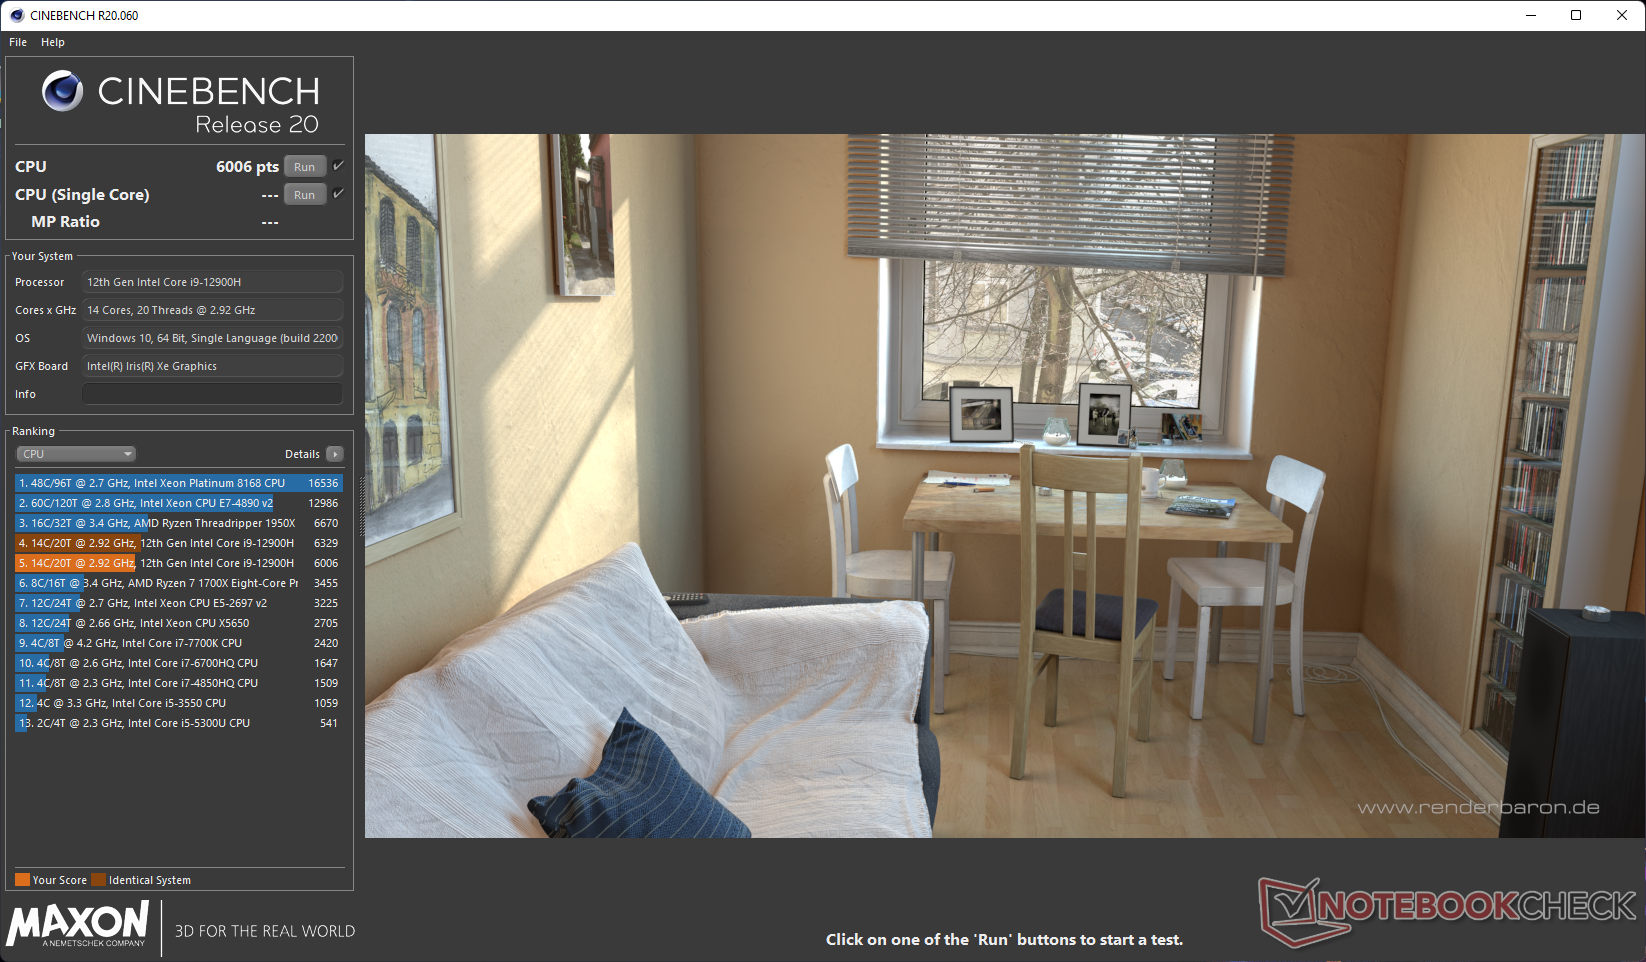
我们注意到Cinebench R20的多核性能在电池供电时下降了11%,这可能是由于PL1降到了65W。
总的来说,Alienware x15 R2在我们的CPU基准测试套件中没有带来任何惊喜,与x15 R1相比,其CPU性能提高了33%。薄薄的机箱可能造成了略低的分数,但戴尔的热管理能够确保良好的持续性能。
Cinebench R23: Multi Core | Single Core
Cinebench R20: CPU (Multi Core) | CPU (Single Core)
Cinebench R15: CPU Multi 64Bit | CPU Single 64Bit
Blender: v2.79 BMW27 CPU
7-Zip 18.03: 7z b 4 | 7z b 4 -mmt1
Geekbench 5.5: Multi-Core | Single-Core
HWBOT x265 Benchmark v2.2: 4k Preset
LibreOffice : 20 Documents To PDF
R Benchmark 2.5: Overall mean
| CPU Performance rating | |
| Average of class Gaming | |
| MSI Titan GT77 12UHS | |
| Asus ROG Strix Scar 15 G533ZW-LN106WS | |
| Alienware x15 R2 P111F | |
| MSI Raider GE66 12UHS | |
| MSI Vector GP66 12UGS | |
| Average Intel Core i9-12900H | |
| Asus ROG Zephyrus Duo 16 GX650RX | |
| Razer Blade 15 Advanced Model Early 2022 | |
| Alienware x15 RTX 3070 P111F -2! | |
| Cinebench R23 / Multi Core | |
| Average of class Gaming (10488 - 42661, n=107, last 2 years) | |
| MSI Titan GT77 12UHS | |
| Asus ROG Strix Scar 15 G533ZW-LN106WS | |
| MSI Vector GP66 12UGS | |
| Alienware x15 R2 P111F | |
| MSI Raider GE66 12UHS | |
| Average Intel Core i9-12900H (7359 - 19648, n=28) | |
| Asus ROG Zephyrus Duo 16 GX650RX | |
| Alienware x15 RTX 3070 P111F | |
| Razer Blade 15 Advanced Model Early 2022 | |
| Cinebench R23 / Single Core | |
| Average of class Gaming (1166 - 2415, n=107, last 2 years) | |
| Asus ROG Strix Scar 15 G533ZW-LN106WS | |
| MSI Titan GT77 12UHS | |
| Alienware x15 R2 P111F | |
| MSI Vector GP66 12UGS | |
| MSI Raider GE66 12UHS | |
| Average Intel Core i9-12900H (1634 - 1930, n=28) | |
| Razer Blade 15 Advanced Model Early 2022 | |
| Asus ROG Zephyrus Duo 16 GX650RX | |
| Alienware x15 RTX 3070 P111F | |
| Cinebench R20 / CPU (Multi Core) | |
| Average of class Gaming (4029 - 16433, n=106, last 2 years) | |
| MSI Titan GT77 12UHS | |
| Asus ROG Strix Scar 15 G533ZW-LN106WS | |
| Alienware x15 R2 P111F | |
| MSI Vector GP66 12UGS | |
| MSI Raider GE66 12UHS | |
| Average Intel Core i9-12900H (2681 - 7471, n=28) | |
| Asus ROG Zephyrus Duo 16 GX650RX | |
| Alienware x15 RTX 3070 P111F | |
| Razer Blade 15 Advanced Model Early 2022 | |
| Cinebench R20 / CPU (Single Core) | |
| Average of class Gaming (442 - 913, n=106, last 2 years) | |
| MSI Titan GT77 12UHS | |
| Alienware x15 R2 P111F | |
| MSI Vector GP66 12UGS | |
| Asus ROG Strix Scar 15 G533ZW-LN106WS | |
| MSI Raider GE66 12UHS | |
| Average Intel Core i9-12900H (624 - 738, n=28) | |
| Razer Blade 15 Advanced Model Early 2022 | |
| Asus ROG Zephyrus Duo 16 GX650RX | |
| Alienware x15 RTX 3070 P111F | |
| Cinebench R15 / CPU Multi 64Bit | |
| Average of class Gaming (1578 - 6330, n=105, last 2 years) | |
| MSI Titan GT77 12UHS | |
| Asus ROG Strix Scar 15 G533ZW-LN106WS | |
| Alienware x15 R2 P111F | |
| MSI Raider GE66 12UHS | |
| Average Intel Core i9-12900H (1395 - 3077, n=28) | |
| MSI Vector GP66 12UGS | |
| Asus ROG Zephyrus Duo 16 GX650RX | |
| Alienware x15 RTX 3070 P111F | |
| Razer Blade 15 Advanced Model Early 2022 | |
| Cinebench R15 / CPU Single 64Bit | |
| Average of class Gaming (188.8 - 350, n=106, last 2 years) | |
| MSI Titan GT77 12UHS | |
| Asus ROG Strix Scar 15 G533ZW-LN106WS | |
| Alienware x15 R2 P111F | |
| MSI Vector GP66 12UGS | |
| MSI Raider GE66 12UHS | |
| Average Intel Core i9-12900H (235 - 277, n=29) | |
| Asus ROG Zephyrus Duo 16 GX650RX | |
| Razer Blade 15 Advanced Model Early 2022 | |
| Alienware x15 RTX 3070 P111F | |
| Blender / v2.79 BMW27 CPU | |
| Razer Blade 15 Advanced Model Early 2022 | |
| Average Intel Core i9-12900H (160 - 451, n=28) | |
| Alienware x15 RTX 3070 P111F | |
| Asus ROG Zephyrus Duo 16 GX650RX | |
| MSI Vector GP66 12UGS | |
| MSI Raider GE66 12UHS | |
| Alienware x15 R2 P111F | |
| Asus ROG Strix Scar 15 G533ZW-LN106WS | |
| Average of class Gaming (79 - 330, n=104, last 2 years) | |
| MSI Titan GT77 12UHS | |
| 7-Zip 18.03 / 7z b 4 | |
| Average of class Gaming (33491 - 148086, n=105, last 2 years) | |
| MSI Titan GT77 12UHS | |
| Alienware x15 R2 P111F | |
| MSI Raider GE66 12UHS | |
| Asus ROG Strix Scar 15 G533ZW-LN106WS | |
| MSI Vector GP66 12UGS | |
| Asus ROG Zephyrus Duo 16 GX650RX | |
| Average Intel Core i9-12900H (34684 - 76677, n=28) | |
| Alienware x15 RTX 3070 P111F | |
| Razer Blade 15 Advanced Model Early 2022 | |
| 7-Zip 18.03 / 7z b 4 -mmt1 | |
| Average of class Gaming (4199 - 7436, n=105, last 2 years) | |
| MSI Titan GT77 12UHS | |
| MSI Vector GP66 12UGS | |
| MSI Raider GE66 12UHS | |
| Razer Blade 15 Advanced Model Early 2022 | |
| Asus ROG Strix Scar 15 G533ZW-LN106WS | |
| Alienware x15 R2 P111F | |
| Average Intel Core i9-12900H (5302 - 6289, n=28) | |
| Asus ROG Zephyrus Duo 16 GX650RX | |
| Alienware x15 RTX 3070 P111F | |
| Geekbench 5.5 / Multi-Core | |
| Average of class Gaming (6460 - 28263, n=105, last 2 years) | |
| MSI Titan GT77 12UHS | |
| Asus ROG Strix Scar 15 G533ZW-LN106WS | |
| Alienware x15 R2 P111F | |
| MSI Raider GE66 12UHS | |
| MSI Vector GP66 12UGS | |
| Average Intel Core i9-12900H (8519 - 14376, n=31) | |
| Asus ROG Zephyrus Duo 16 GX650RX | |
| Razer Blade 15 Advanced Model Early 2022 | |
| Geekbench 5.5 / Single-Core | |
| Average of class Gaming (986 - 2474, n=105, last 2 years) | |
| MSI Titan GT77 12UHS | |
| MSI Vector GP66 12UGS | |
| Alienware x15 R2 P111F | |
| MSI Raider GE66 12UHS | |
| Asus ROG Strix Scar 15 G533ZW-LN106WS | |
| Razer Blade 15 Advanced Model Early 2022 | |
| Average Intel Core i9-12900H (1631 - 1897, n=31) | |
| Asus ROG Zephyrus Duo 16 GX650RX | |
| HWBOT x265 Benchmark v2.2 / 4k Preset | |
| Average of class Gaming (11.5 - 44.4, n=105, last 2 years) | |
| MSI Titan GT77 12UHS | |
| Asus ROG Strix Scar 15 G533ZW-LN106WS | |
| Alienware x15 R2 P111F | |
| MSI Vector GP66 12UGS | |
| MSI Raider GE66 12UHS | |
| Asus ROG Zephyrus Duo 16 GX650RX | |
| Average Intel Core i9-12900H (8.05 - 22.5, n=28) | |
| Alienware x15 RTX 3070 P111F | |
| Razer Blade 15 Advanced Model Early 2022 | |
| LibreOffice / 20 Documents To PDF | |
| Average of class Gaming (33.2 - 88.8, n=105, last 2 years) | |
| Alienware x15 RTX 3070 P111F | |
| Alienware x15 R2 P111F | |
| Asus ROG Zephyrus Duo 16 GX650RX | |
| Razer Blade 15 Advanced Model Early 2022 | |
| Average Intel Core i9-12900H (36.8 - 59.8, n=28) | |
| MSI Vector GP66 12UGS | |
| Asus ROG Strix Scar 15 G533ZW-LN106WS | |
| MSI Titan GT77 12UHS | |
| MSI Raider GE66 12UHS | |
| R Benchmark 2.5 / Overall mean | |
| Alienware x15 RTX 3070 P111F | |
| Asus ROG Zephyrus Duo 16 GX650RX | |
| Average Intel Core i9-12900H (0.4218 - 0.506, n=28) | |
| Razer Blade 15 Advanced Model Early 2022 | |
| MSI Raider GE66 12UHS | |
| Alienware x15 R2 P111F | |
| Asus ROG Strix Scar 15 G533ZW-LN106WS | |
| Average of class Gaming (0.3439 - 0.759, n=106, last 2 years) | |
| MSI Vector GP66 12UGS | |
| MSI Titan GT77 12UHS | |
* ... smaller is better
AIDA64: FP32 Ray-Trace | FPU Julia | CPU SHA3 | CPU Queen | FPU SinJulia | FPU Mandel | CPU AES | CPU ZLib | FP64 Ray-Trace | CPU PhotoWorxx
| Performance rating | |
| Average of class Gaming | |
| MSI Titan GT77 12UHS | |
| Asus ROG Zephyrus Duo 16 GX650RX | |
| Alienware x15 R2 P111F | |
| Asus ROG Strix Scar 15 G533ZW-LN106WS | |
| Average Intel Core i9-12900H | |
| MSI Raider GE66 12UHS | |
| MSI Vector GP66 12UGS | |
| Razer Blade 15 Advanced Model Early 2022 | |
| Alienware x15 RTX 3070 P111F -9! | |
| AIDA64 / FP32 Ray-Trace | |
| Average of class Gaming (10227 - 85542, n=105, last 2 years) | |
| MSI Titan GT77 12UHS | |
| Asus ROG Zephyrus Duo 16 GX650RX | |
| Alienware x15 R2 P111F | |
| Average Intel Core i9-12900H (4074 - 18289, n=29) | |
| Asus ROG Strix Scar 15 G533ZW-LN106WS | |
| MSI Raider GE66 12UHS | |
| MSI Vector GP66 12UGS | |
| Razer Blade 15 Advanced Model Early 2022 | |
| AIDA64 / FPU Julia | |
| Average of class Gaming (51376 - 238426, n=105, last 2 years) | |
| MSI Titan GT77 12UHS | |
| Asus ROG Zephyrus Duo 16 GX650RX | |
| Alienware x15 R2 P111F | |
| Average Intel Core i9-12900H (22307 - 93236, n=29) | |
| Asus ROG Strix Scar 15 G533ZW-LN106WS | |
| MSI Raider GE66 12UHS | |
| MSI Vector GP66 12UGS | |
| Razer Blade 15 Advanced Model Early 2022 | |
| AIDA64 / CPU SHA3 | |
| Average of class Gaming (2180 - 10115, n=105, last 2 years) | |
| MSI Titan GT77 12UHS | |
| Alienware x15 R2 P111F | |
| Asus ROG Zephyrus Duo 16 GX650RX | |
| Asus ROG Strix Scar 15 G533ZW-LN106WS | |
| Average Intel Core i9-12900H (1378 - 4215, n=29) | |
| MSI Vector GP66 12UGS | |
| MSI Raider GE66 12UHS | |
| Razer Blade 15 Advanced Model Early 2022 | |
| AIDA64 / CPU Queen | |
| Average of class Gaming (49785 - 173351, n=90, last 2 years) | |
| Alienware x15 R2 P111F | |
| MSI Vector GP66 12UGS | |
| MSI Raider GE66 12UHS | |
| Asus ROG Zephyrus Duo 16 GX650RX | |
| Asus ROG Strix Scar 15 G533ZW-LN106WS | |
| MSI Titan GT77 12UHS | |
| Average Intel Core i9-12900H (78172 - 111241, n=28) | |
| Razer Blade 15 Advanced Model Early 2022 | |
| AIDA64 / FPU SinJulia | |
| Average of class Gaming (4424 - 33636, n=105, last 2 years) | |
| MSI Titan GT77 12UHS | |
| Asus ROG Zephyrus Duo 16 GX650RX | |
| Asus ROG Strix Scar 15 G533ZW-LN106WS | |
| Alienware x15 R2 P111F | |
| MSI Vector GP66 12UGS | |
| MSI Raider GE66 12UHS | |
| Average Intel Core i9-12900H (5709 - 10410, n=29) | |
| Razer Blade 15 Advanced Model Early 2022 | |
| AIDA64 / FPU Mandel | |
| Average of class Gaming (25115 - 128721, n=105, last 2 years) | |
| Asus ROG Zephyrus Duo 16 GX650RX | |
| MSI Titan GT77 12UHS | |
| Alienware x15 R2 P111F | |
| Average Intel Core i9-12900H (11257 - 45581, n=29) | |
| Asus ROG Strix Scar 15 G533ZW-LN106WS | |
| MSI Raider GE66 12UHS | |
| MSI Vector GP66 12UGS | |
| Razer Blade 15 Advanced Model Early 2022 | |
| AIDA64 / CPU AES | |
| MSI Titan GT77 12UHS | |
| Alienware x15 R2 P111F | |
| Asus ROG Zephyrus Duo 16 GX650RX | |
| Average of class Gaming (39258 - 247074, n=105, last 2 years) | |
| Asus ROG Strix Scar 15 G533ZW-LN106WS | |
| MSI Vector GP66 12UGS | |
| MSI Raider GE66 12UHS | |
| Average Intel Core i9-12900H (31935 - 151546, n=29) | |
| Razer Blade 15 Advanced Model Early 2022 | |
| AIDA64 / CPU ZLib | |
| Average of class Gaming (574 - 2531, n=105, last 2 years) | |
| MSI Titan GT77 12UHS | |
| Asus ROG Strix Scar 15 G533ZW-LN106WS | |
| Alienware x15 R2 P111F | |
| MSI Vector GP66 12UGS | |
| MSI Raider GE66 12UHS | |
| Average Intel Core i9-12900H (449 - 1193, n=29) | |
| Asus ROG Zephyrus Duo 16 GX650RX | |
| Razer Blade 15 Advanced Model Early 2022 | |
| Alienware x15 RTX 3070 P111F | |
| AIDA64 / FP64 Ray-Trace | |
| Average of class Gaming (5509 - 45446, n=105, last 2 years) | |
| MSI Titan GT77 12UHS | |
| Asus ROG Zephyrus Duo 16 GX650RX | |
| Alienware x15 R2 P111F | |
| Average Intel Core i9-12900H (2235 - 10511, n=29) | |
| Asus ROG Strix Scar 15 G533ZW-LN106WS | |
| MSI Raider GE66 12UHS | |
| MSI Vector GP66 12UGS | |
| Razer Blade 15 Advanced Model Early 2022 | |
| AIDA64 / CPU PhotoWorxx | |
| Average of class Gaming (12271 - 89891, n=105, last 2 years) | |
| MSI Titan GT77 12UHS | |
| MSI Raider GE66 12UHS | |
| Asus ROG Strix Scar 15 G533ZW-LN106WS | |
| Alienware x15 R2 P111F | |
| Razer Blade 15 Advanced Model Early 2022 | |
| Average Intel Core i9-12900H (20960 - 48269, n=30) | |
| Asus ROG Zephyrus Duo 16 GX650RX | |
| MSI Vector GP66 12UGS | |
查看我们专门的 英特尔酷睿i9-12900H页面,了解更多的基准测试和性能比较。
系统性能
Alienware x15 R2在PCMark 10的整体性能上仅比微星Titan GT77落后9%,最大的差距出现在该基准的数字内容创作部分。CrossMark得分与Scar 15相当,比搭载Ryzen 9 6900HX的Zephyrus Duo 16高出约15%。
主观上,我们在日常的生产力和网络浏览任务中没有遇到任何障碍。
CrossMark: Overall | Productivity | Creativity | Responsiveness
| PCMark 10 / Score | |
| Average of class Gaming (5828 - 12414, n=93, last 2 years) | |
| MSI Titan GT77 12UHS | |
| MSI Raider GE66 12UHS | |
| MSI Vector GP66 12UGS | |
| Asus ROG Strix Scar 15 G533ZW-LN106WS | |
| Average Intel Core i9-12900H, NVIDIA GeForce RTX 3080 Ti Laptop GPU (7139 - 8083, n=6) | |
| Alienware x15 R2 P111F | |
| Razer Blade 15 Advanced Model Early 2022 | |
| Alienware x15 RTX 3070 P111F | |
| Asus ROG Zephyrus Duo 16 GX650RX | |
| PCMark 10 / Essentials | |
| Alienware x15 R2 P111F | |
| MSI Titan GT77 12UHS | |
| MSI Raider GE66 12UHS | |
| MSI Vector GP66 12UGS | |
| Average Intel Core i9-12900H, NVIDIA GeForce RTX 3080 Ti Laptop GPU (10254 - 11178, n=6) | |
| Asus ROG Strix Scar 15 G533ZW-LN106WS | |
| Average of class Gaming (8810 - 11935, n=97, last 2 years) | |
| Razer Blade 15 Advanced Model Early 2022 | |
| Alienware x15 RTX 3070 P111F | |
| Asus ROG Zephyrus Duo 16 GX650RX | |
| PCMark 10 / Productivity | |
| Average of class Gaming (6845 - 25323, n=95, last 2 years) | |
| Asus ROG Strix Scar 15 G533ZW-LN106WS | |
| MSI Raider GE66 12UHS | |
| Alienware x15 R2 P111F | |
| MSI Titan GT77 12UHS | |
| MSI Vector GP66 12UGS | |
| Average Intel Core i9-12900H, NVIDIA GeForce RTX 3080 Ti Laptop GPU (9102 - 11186, n=6) | |
| Razer Blade 15 Advanced Model Early 2022 | |
| Alienware x15 RTX 3070 P111F | |
| Asus ROG Zephyrus Duo 16 GX650RX | |
| PCMark 10 / Digital Content Creation | |
| Average of class Gaming (7602 - 19954, n=95, last 2 years) | |
| MSI Titan GT77 12UHS | |
| MSI Raider GE66 12UHS | |
| MSI Vector GP66 12UGS | |
| Asus ROG Strix Scar 15 G533ZW-LN106WS | |
| Average Intel Core i9-12900H, NVIDIA GeForce RTX 3080 Ti Laptop GPU (9847 - 12627, n=6) | |
| Alienware x15 RTX 3070 P111F | |
| Razer Blade 15 Advanced Model Early 2022 | |
| Alienware x15 R2 P111F | |
| Asus ROG Zephyrus Duo 16 GX650RX | |
| CrossMark / Overall | |
| MSI Titan GT77 12UHS | |
| Asus ROG Strix Scar 15 G533ZW-LN106WS | |
| Average of class Gaming (1366 - 2409, n=94, last 2 years) | |
| Alienware x15 R2 P111F | |
| Average Intel Core i9-12900H, NVIDIA GeForce RTX 3080 Ti Laptop GPU (1696 - 1965, n=3) | |
| Razer Blade 15 Advanced Model Early 2022 | |
| Asus ROG Zephyrus Duo 16 GX650RX | |
| CrossMark / Productivity | |
| MSI Titan GT77 12UHS | |
| Asus ROG Strix Scar 15 G533ZW-LN106WS | |
| Alienware x15 R2 P111F | |
| Average of class Gaming (1386 - 2254, n=94, last 2 years) | |
| Average Intel Core i9-12900H, NVIDIA GeForce RTX 3080 Ti Laptop GPU (1622 - 1870, n=3) | |
| Razer Blade 15 Advanced Model Early 2022 | |
| Asus ROG Zephyrus Duo 16 GX650RX | |
| CrossMark / Creativity | |
| MSI Titan GT77 12UHS | |
| Average of class Gaming (1343 - 2786, n=94, last 2 years) | |
| Alienware x15 R2 P111F | |
| Asus ROG Strix Scar 15 G533ZW-LN106WS | |
| Average Intel Core i9-12900H, NVIDIA GeForce RTX 3080 Ti Laptop GPU (1855 - 2135, n=3) | |
| Razer Blade 15 Advanced Model Early 2022 | |
| Asus ROG Zephyrus Duo 16 GX650RX | |
| CrossMark / Responsiveness | |
| Asus ROG Strix Scar 15 G533ZW-LN106WS | |
| MSI Titan GT77 12UHS | |
| Alienware x15 R2 P111F | |
| Asus ROG Zephyrus Duo 16 GX650RX | |
| Average of class Gaming (1226 - 2334, n=94, last 2 years) | |
| Average Intel Core i9-12900H, NVIDIA GeForce RTX 3080 Ti Laptop GPU (1483 - 1777, n=3) | |
| Razer Blade 15 Advanced Model Early 2022 | |
| PCMark 8 Home Score Accelerated v2 | 6653 points | |
| PCMark 8 Creative Score Accelerated v2 | 10574 points | |
| PCMark 8 Work Score Accelerated v2 | 6944 points | |
| PCMark 10 Score | 7496 points | |
Help | ||
| AIDA64 / Memory Copy | |
| Average of class Gaming (21750 - 129946, n=105, last 2 years) | |
| Alienware x15 R2 P111F | |
| MSI Titan GT77 12UHS | |
| MSI Raider GE66 12UHS | |
| Razer Blade 15 Advanced Model Early 2022 | |
| Asus ROG Strix Scar 15 G533ZW-LN106WS | |
| Average Intel Core i9-12900H (34438 - 74264, n=29) | |
| Asus ROG Zephyrus Duo 16 GX650RX | |
| MSI Vector GP66 12UGS | |
| AIDA64 / Memory Read | |
| Average of class Gaming (22956 - 118858, n=105, last 2 years) | |
| MSI Raider GE66 12UHS | |
| Razer Blade 15 Advanced Model Early 2022 | |
| Alienware x15 R2 P111F | |
| Asus ROG Strix Scar 15 G533ZW-LN106WS | |
| MSI Titan GT77 12UHS | |
| Average Intel Core i9-12900H (36365 - 74642, n=29) | |
| Asus ROG Zephyrus Duo 16 GX650RX | |
| MSI Vector GP66 12UGS | |
| AIDA64 / Memory Write | |
| Average of class Gaming (22297 - 135096, n=105, last 2 years) | |
| Razer Blade 15 Advanced Model Early 2022 | |
| MSI Raider GE66 12UHS | |
| Asus ROG Strix Scar 15 G533ZW-LN106WS | |
| Alienware x15 R2 P111F | |
| MSI Titan GT77 12UHS | |
| Average Intel Core i9-12900H (32276 - 67858, n=29) | |
| Asus ROG Zephyrus Duo 16 GX650RX | |
| MSI Vector GP66 12UGS | |
| AIDA64 / Memory Latency | |
| Alienware x15 R2 P111F | |
| Average of class Gaming (75.3 - 259, n=105, last 2 years) | |
| Asus ROG Strix Scar 15 G533ZW-LN106WS | |
| Razer Blade 15 Advanced Model Early 2022 | |
| MSI Raider GE66 12UHS | |
| Asus ROG Zephyrus Duo 16 GX650RX | |
| MSI Vector GP66 12UGS | |
| MSI Titan GT77 12UHS | |
| Average Intel Core i9-12900H (74.7 - 118.1, n=28) | |
| Alienware x15 RTX 3070 P111F | |
* ... smaller is better
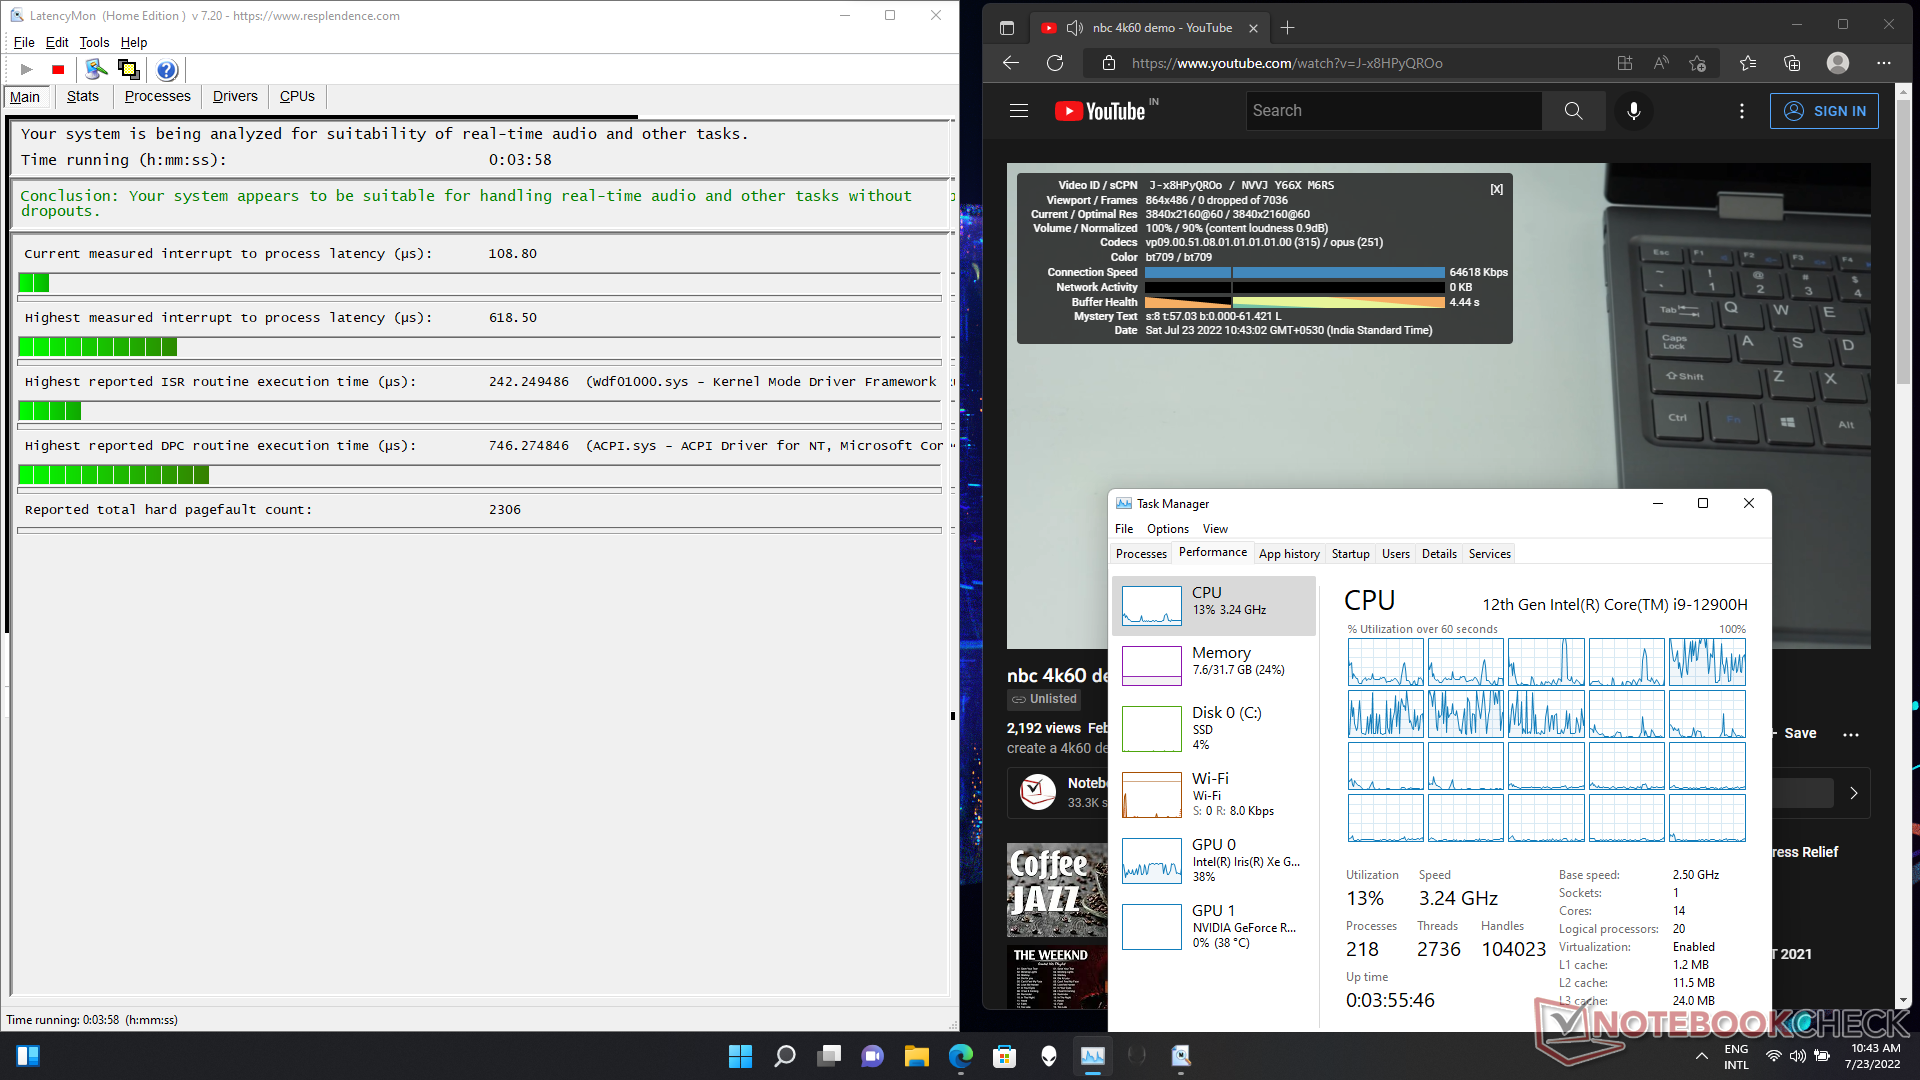
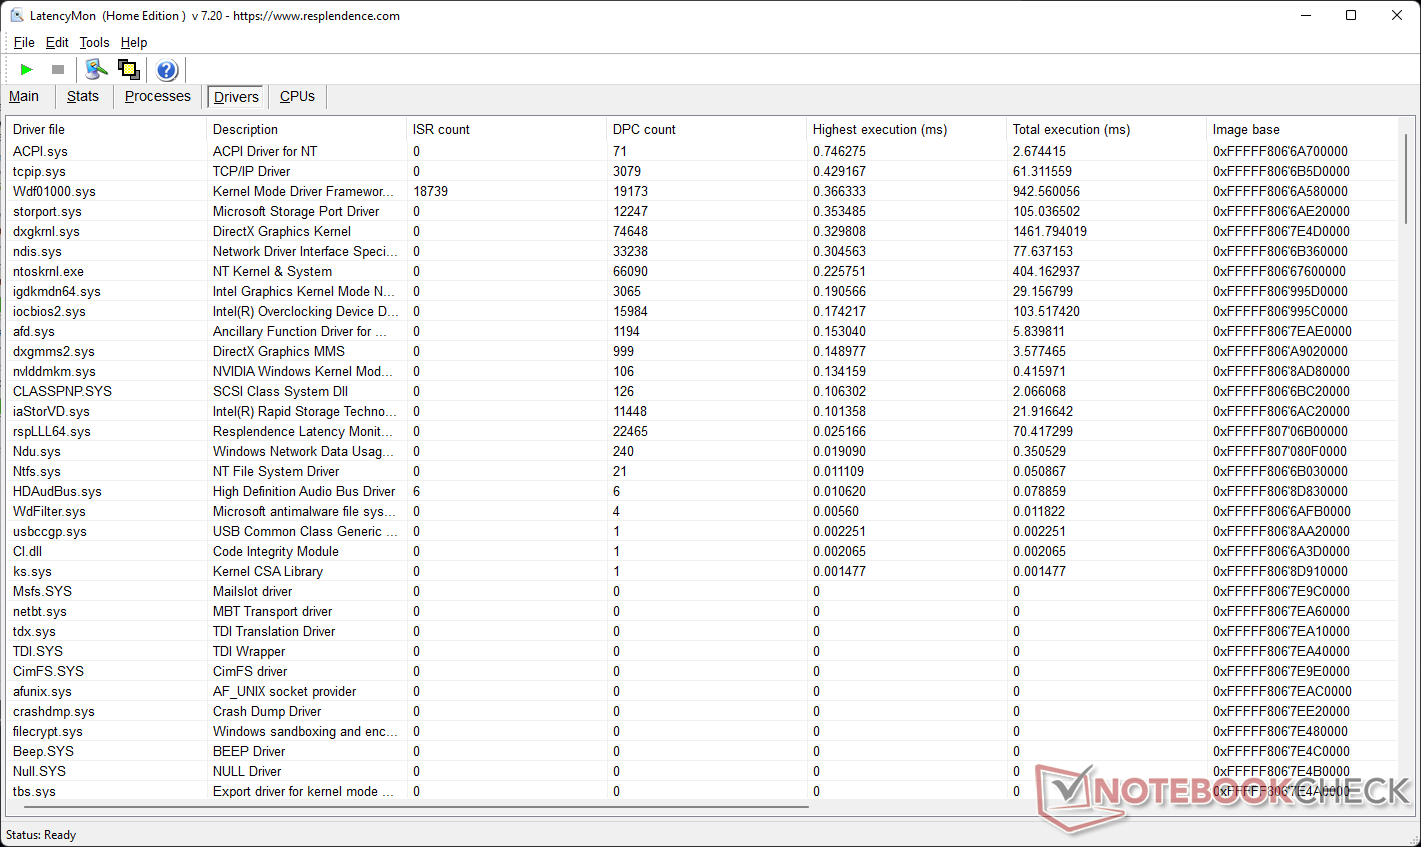
DPC延时
Alienware x15 R2的DPC延迟有些偏高,但我们的LatencyMon测试表明,它应该仍然适用于实时音频和视频工作流程。Windows ACPI.sys驱动程序似乎是造成观察到的延迟的原因。
| DPC Latencies / LatencyMon - interrupt to process latency (max), Web, Youtube, Prime95 | |
| MSI Raider GE66 12UHS | |
| Razer Blade 15 Advanced Model Early 2022 | |
| MSI Vector GP66 12UGS | |
| MSI Titan GT77 12UHS | |
| MSI Titan GT77 12UHS | |
| Alienware x15 RTX 3070 P111F | |
| Asus ROG Strix Scar 15 G533ZW-LN106WS | |
| Alienware x15 R2 P111F | |
| Asus ROG Zephyrus Duo 16 GX650RX | |
* ... smaller is better
更多的评测设备的比较可以在我们的 DPC延时排名页面。
存储设备
存储子系统是x15 R2的一个不足之处--我们以前在三星PM9A1硬盘上看到过更好的性能。也就是说,Q32T1的连续读取和写入速度接近该硬盘的宣传值。与x15 R1的西数SN730固态硬盘相比,今年的x15 R2的磁盘性能提高了40%。
在队列深度为8的DiskSpd读取循环测试中,在第43次运行时观察到磁盘节流。 SSD或底板上都没有提供散热解决方案。
鉴于机箱很薄,戴尔没有为2.5英寸SATA驱动器提供空间。然而,有一个条款可以添加另一个M.2 NVMe SSD。

* ... smaller is better
Disk Throttling: DiskSpd Read Loop, Queue Depth 8
我们专门的SSD和HDD基准测试页面提供更多的存储设备性能比较。
GPU性能
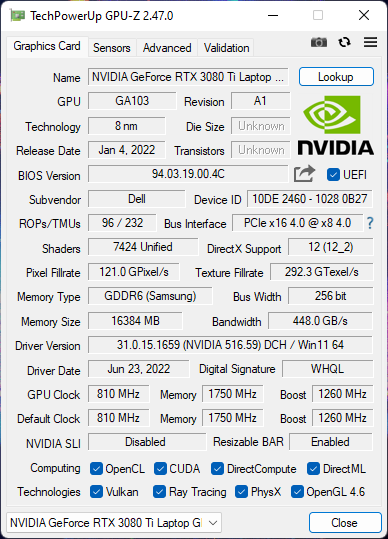
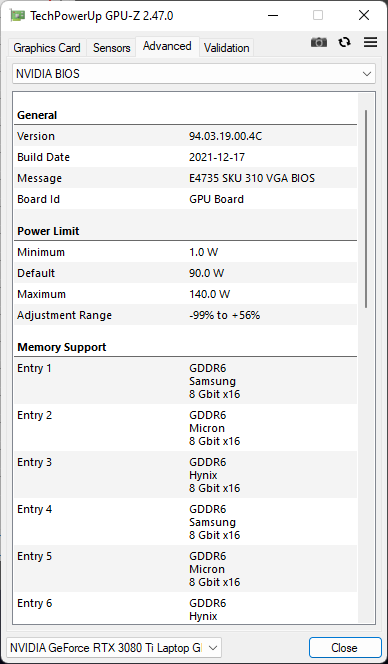
我们的Alienware x15 R2装置采用了 NvidiaGeForce RTX 3080 Ti笔记本GPU戴尔没有说明该GPU的动态提升瓦数。
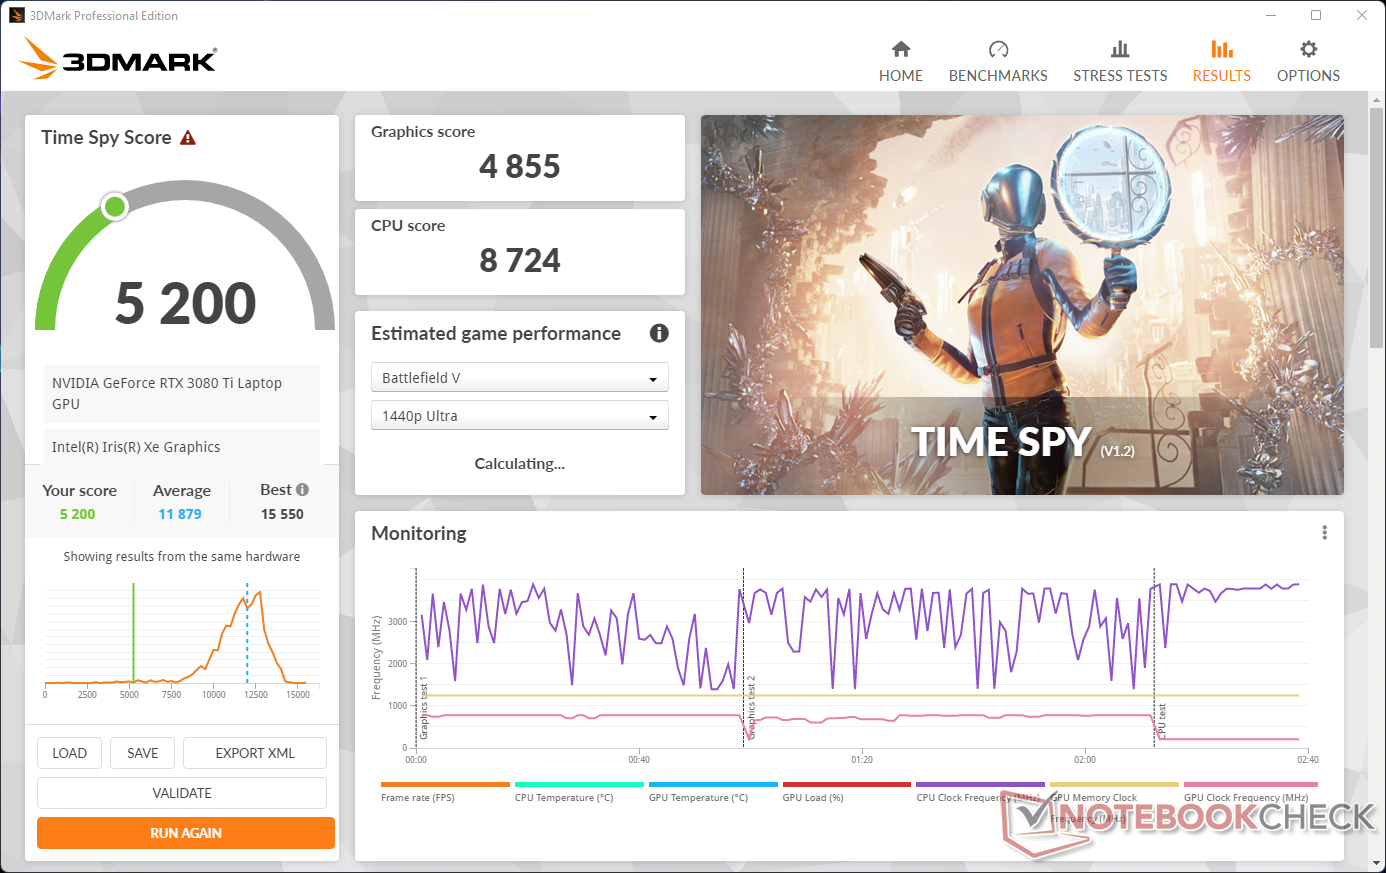
x15 R2中的RTX 3080 Ti的总体3DMark性能与下列产品相当 MSI Raider GE66(150W)和微星Titan GT77(175W)。得分稍低是由于薄型机箱所需的瓦数较低。Razer Blade 15 Advanced的RTX 3080 Ti由于110瓦的低额定值而落后。
| 3DMark 11 Performance | 33756 points | |
| 3DMark Ice Storm Standard Score | 265376 points | |
| 3DMark Cloud Gate Standard Score | 62500 points | |
| 3DMark Fire Strike Score | 24365 points | |
| 3DMark Fire Strike Extreme Score | 14539 points | |
| 3DMark Time Spy Score | 12393 points | |
Help | ||
在电池电量方面,我们看到3DMarkTime Spy 分数明显下降。总分下降了58%,而图形性能受到了60%的巨大打击。
当与电源断开时,屏幕刷新率自动从360赫兹切换到60赫兹。
游戏性能
Alienware x15 R2的游戏性能符合所提供硬件的预期,总体上与其他搭载RTX 3080 Ti的笔记本电脑相当。在非常低的质量设置中,华硕ROG Strix Scar 15以其150W的功率领先。 RTX 3070 Ti 笔记本电脑GPU在游戏中,如F1 2021, TheWitcher 3 , 和 Cyberpunk 2077, 但一旦图形设置被调高,x15 R2就会失去地位。
| F1 2021 | |
| 1920x1080 High Preset AA:T AF:16x | |
| MSI Titan GT77 12UHS | |
| MSI Raider GE66 12UHS | |
| Alienware x15 R2 P111F | |
| Average NVIDIA GeForce RTX 3080 Ti Laptop GPU (182.1 - 316, n=17) | |
| Asus ROG Strix Scar 15 G533ZW-LN106WS | |
| Asus ROG Zephyrus Duo 16 GX650RX | |
| 1920x1080 Ultra High Preset + Raytracing AA:T AF:16x | |
| MSI Titan GT77 12UHS | |
| Alienware x15 R2 P111F | |
| MSI Raider GE66 12UHS | |
| Asus ROG Strix Scar 15 G533ZW-LN106WS | |
| Asus ROG Zephyrus Duo 16 GX650RX | |
| Average NVIDIA GeForce RTX 3080 Ti Laptop GPU (30.2 - 160.6, n=30) | |
| Watch Dogs Legion | |
| 1920x1080 Ultra Preset (DX12) | |
| MSI Titan GT77 12UHS | |
| Average NVIDIA GeForce RTX 3080 Ti Laptop GPU (78.2 - 87, n=4) | |
| Alienware x15 R2 P111F | |
| 1920x1080 Ultra Preset + Ultra Ray Tracing (DX12) | |
| Average NVIDIA GeForce RTX 3080 Ti Laptop GPU (50 - 70, n=3) | |
| MSI Titan GT77 12UHS | |
| Alienware x15 R2 P111F | |
| Tiny Tina's Wonderlands | |
| 1920x1080 High Preset (DX12) | |
| Average NVIDIA GeForce RTX 3080 Ti Laptop GPU (123.5 - 137.1, n=4) | |
| Asus ROG Zephyrus Duo 16 GX650RX | |
| Alienware x15 R2 P111F | |
| Average of class Gaming (72.1 - 203, n=4, last 2 years) | |
| 1920x1080 Badass Preset (DX12) | |
| Average NVIDIA GeForce RTX 3080 Ti Laptop GPU (100.7 - 110.5, n=4) | |
| Asus ROG Zephyrus Duo 16 GX650RX | |
| Alienware x15 R2 P111F | |
| Average of class Gaming (55 - 159.4, n=4, last 2 years) | |
Witcher 3 FPS图表
Witcher 3在1080p Ultra下的持续性能是不错的,尽管我们看到了帧率的波动。在运行结束时,帧数有轻微下降,但x15 R2能够迅速恢复。
| low | med. | high | ultra | |
|---|---|---|---|---|
| The Witcher 3 (2015) | 391 | 345 | 229 | 116 |
| Dota 2 Reborn (2015) | 174.7 | 162.2 | 151.6 | 145.7 |
| Final Fantasy XV Benchmark (2018) | 209 | 156.4 | 120.5 | |
| X-Plane 11.11 (2018) | 146.9 | 137.7 | 105.5 | |
| Far Cry 5 (2018) | 172 | 152 | 143 | 135 |
| Strange Brigade (2018) | 458 | 246 | 200 | 180.5 |
| Watch Dogs Legion (2020) | 133.2 | 122.4 | 107.4 | 78.2 |
| F1 2021 (2021) | 361 | 319 | 248 | 146.9 |
| Cyberpunk 2077 1.6 (2022) | 133.7 | 124.6 | 102.6 | 86.1 |
| Tiny Tina's Wonderlands (2022) | 209 | 178.2 | 126.6 | 100.7 |
| Call of Duty Modern Warfare 2 2022 (2022) | 96 |
查看我们的 NvidiaGeForce RTX 3080 Ti Laptop GPU以了解更多信息和基准比较。
排放。这辆热力车跑得很快
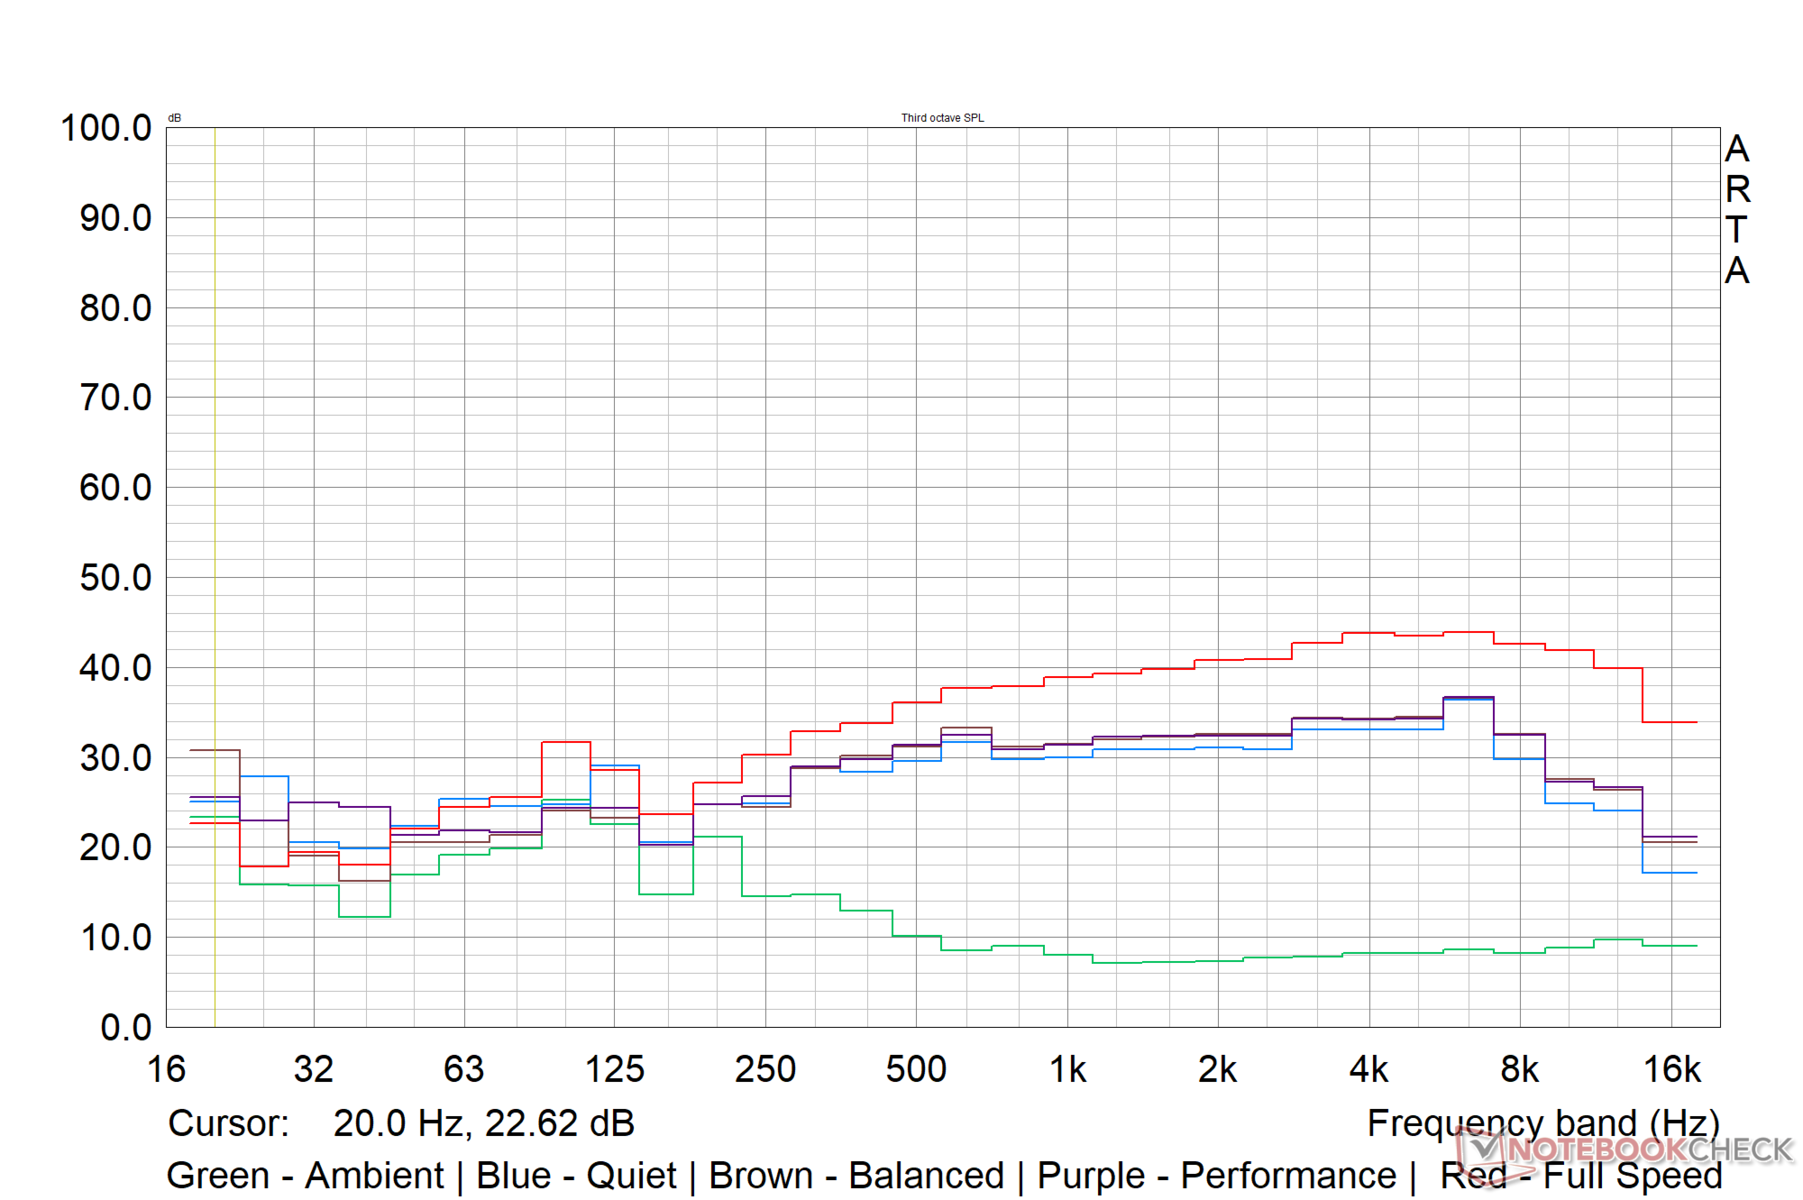
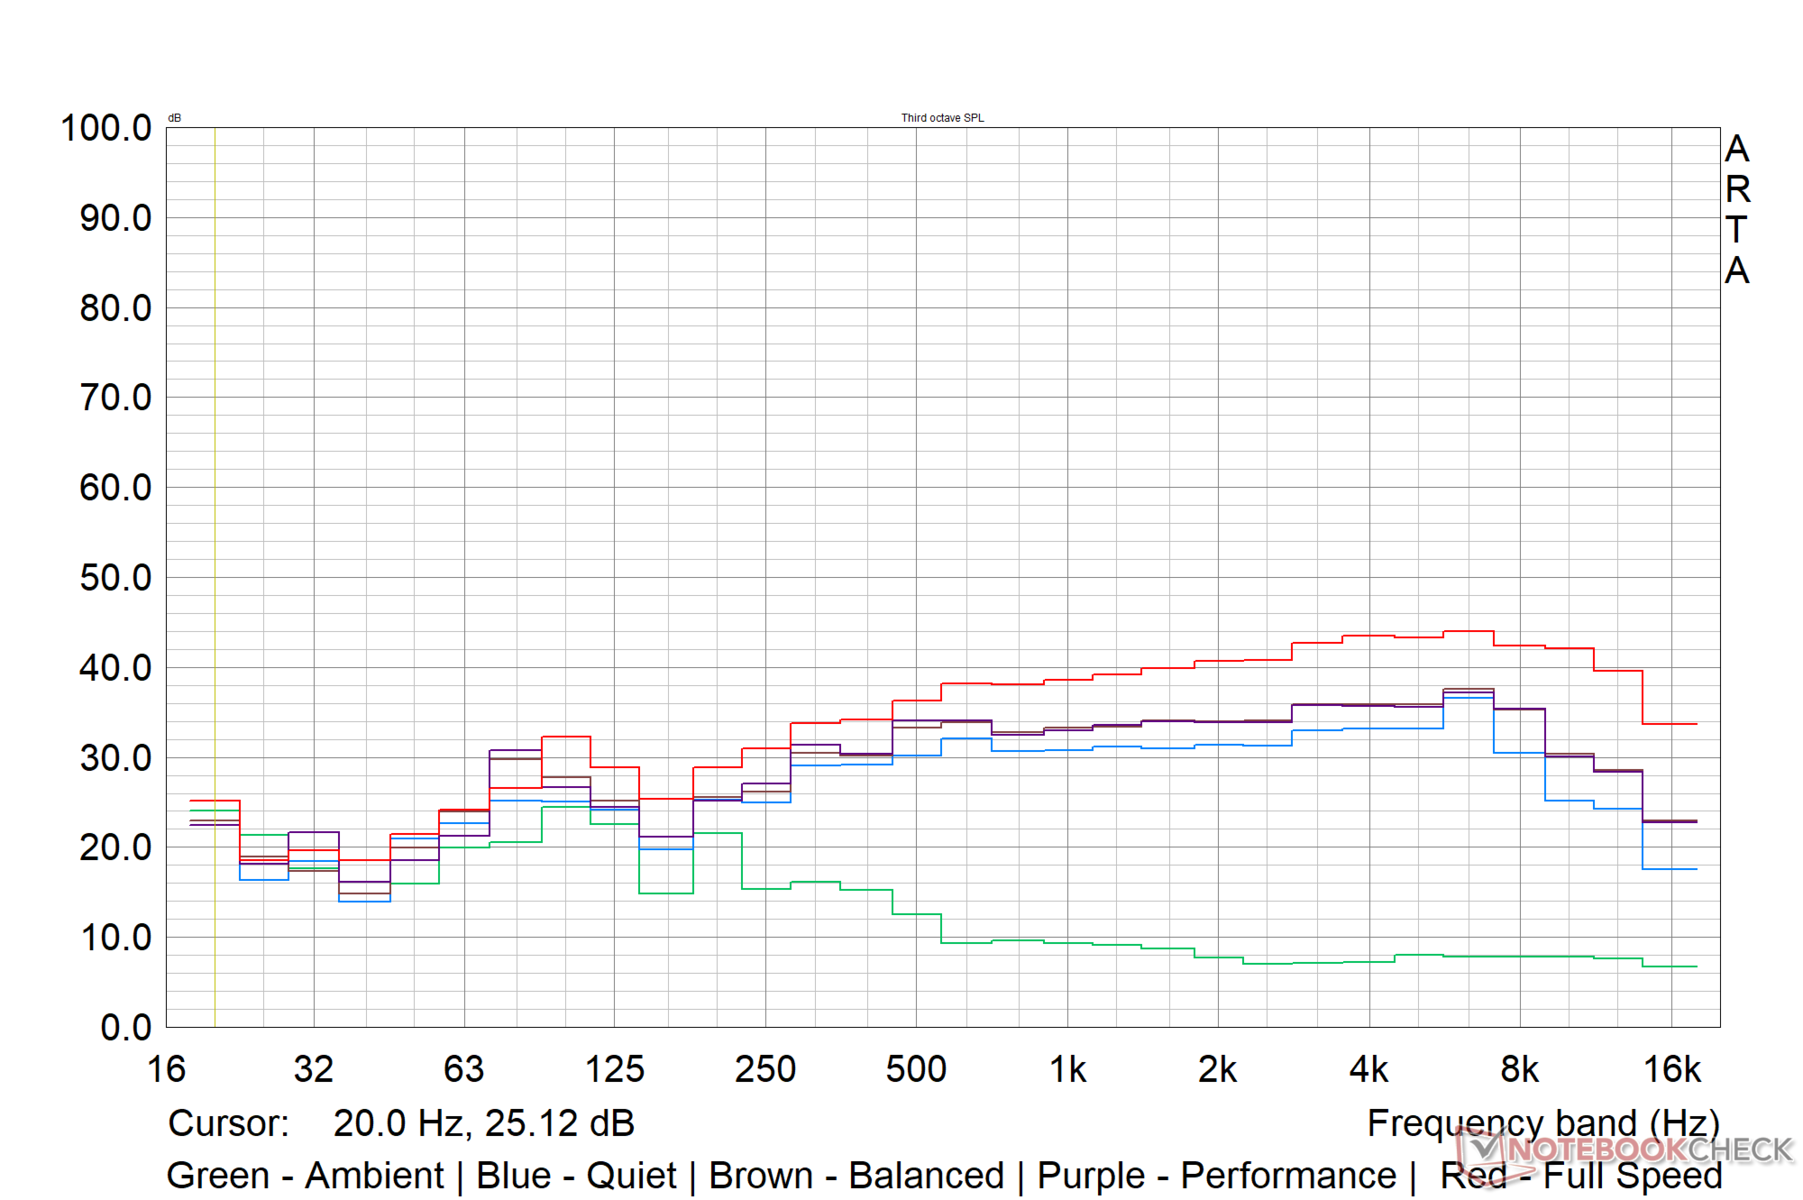
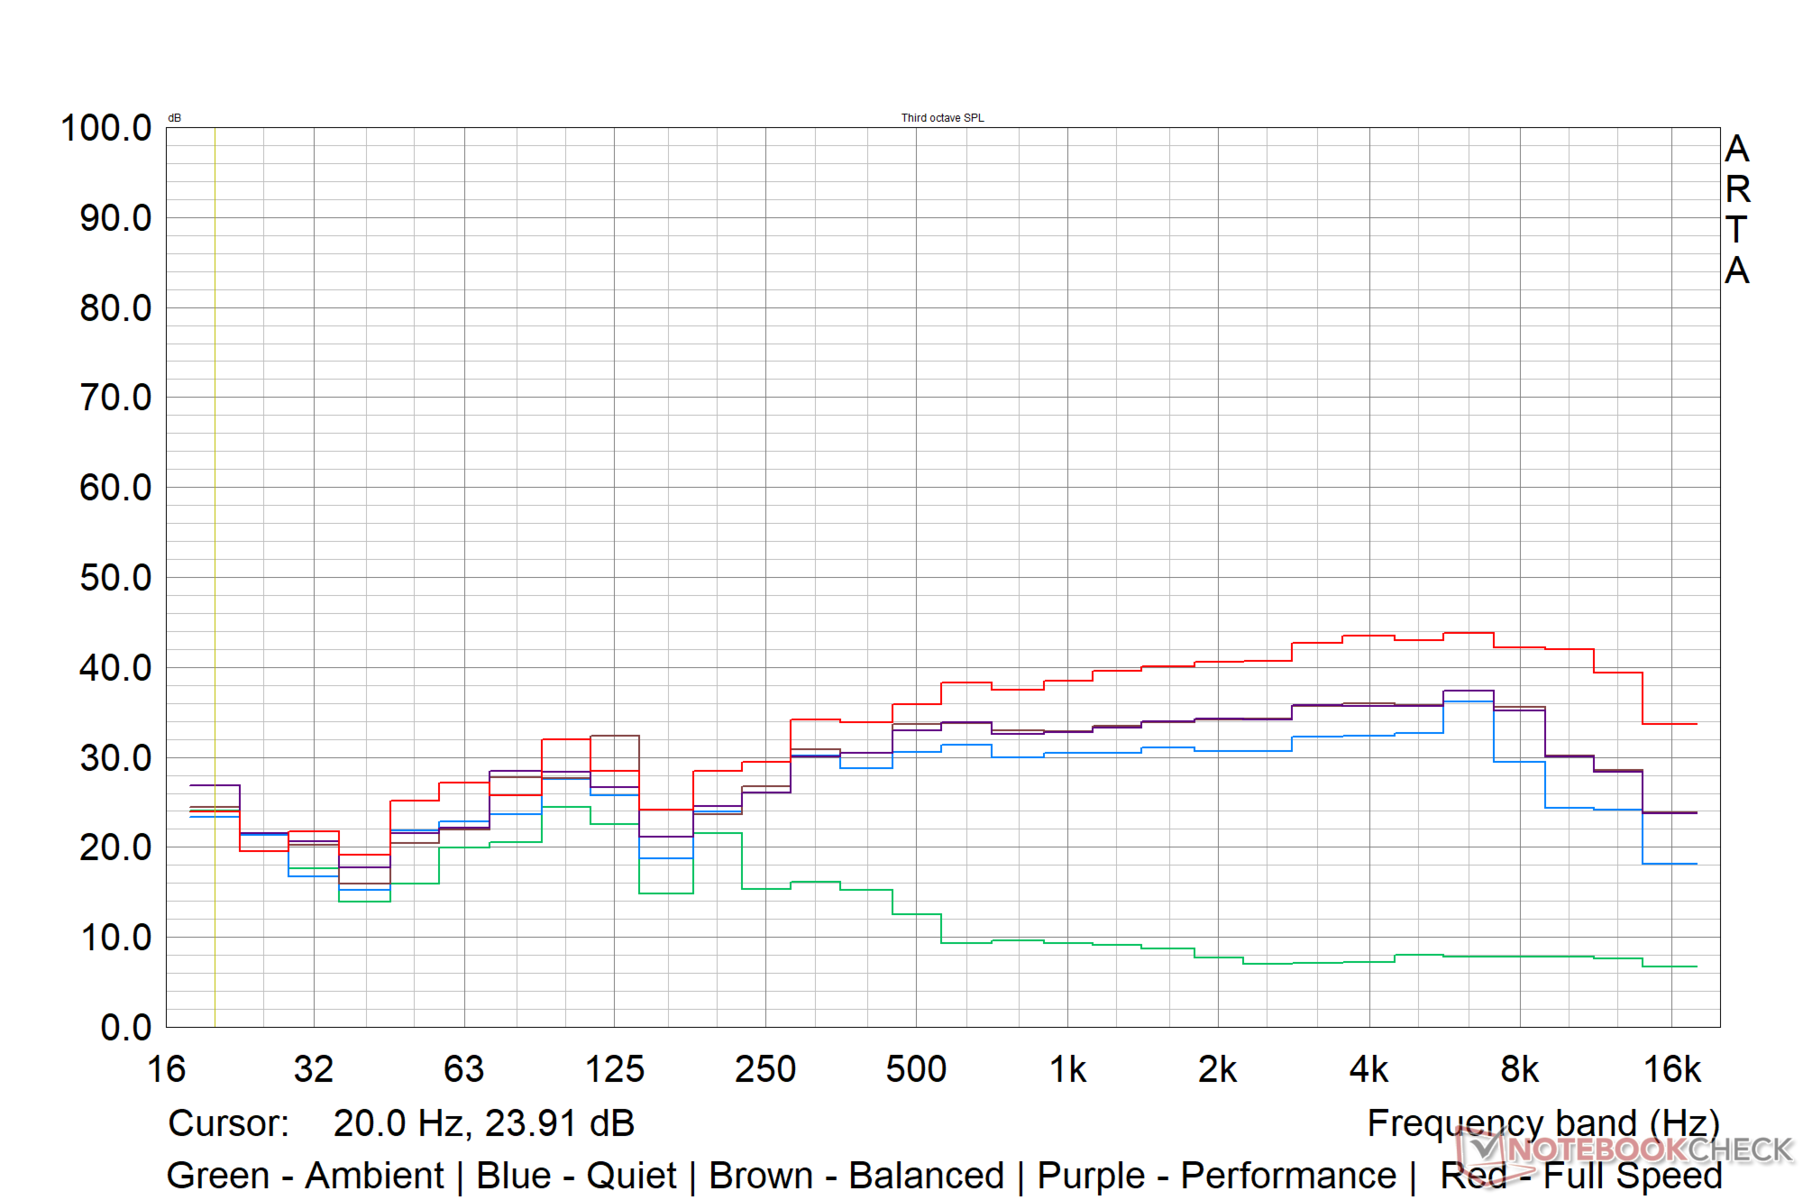
系统噪音
正如之前所讨论的,戴尔提供了四种热力配置文件供用户选择。对于大多数用途,平衡和性能模式可以很好地完成工作。只有在你想要绝对无阻碍的冷却时才需要全速模式。
在静音模式下,戴尔将风扇噪音限制在45分贝(A),无论负载如何。在平衡和性能模式下以1080p Ultra运行TheWitcher 3时,我们记录了接近47分贝(A)的风扇噪音。
我们测量了平衡模式下的风扇噪音水平。戴尔似乎将全速模式下的风扇噪音水平设定为53分贝(A),而不考虑负载,甚至在空转时也是如此。
Noise level
| Idle |
| 21.94 / 21.94 / 21.94 dB(A) |
| Load |
| 45.1 / 45.58 dB(A) |
 | ||
30 dB silent 40 dB(A) audible 50 dB(A) loud |
||
min: | ||
| Alienware x15 R2 P111F Intel Core i9-12900H, NVIDIA GeForce RTX 3080 Ti Laptop GPU | Asus ROG Strix Scar 15 G533ZW-LN106WS Intel Core i9-12900H, NVIDIA GeForce RTX 3070 Ti Laptop GPU | Asus ROG Zephyrus Duo 16 GX650RX AMD Ryzen 9 6900HX, NVIDIA GeForce RTX 3080 Ti Laptop GPU | MSI Vector GP66 12UGS Intel Core i9-12900H, NVIDIA GeForce RTX 3070 Ti Laptop GPU | Razer Blade 15 Advanced Model Early 2022 Intel Core i7-12800H, NVIDIA GeForce RTX 3080 Ti Laptop GPU | |
|---|---|---|---|---|---|
| Noise | -46% | -14% | -11% | -10% | |
| off / environment * (dB) | 21.79 | 26.86 -23% | 26 -19% | 22.9 -5% | 26 -19% |
| Idle Minimum * (dB) | 21.94 | 39.07 -78% | 26 -19% | 23.4 -7% | 26 -19% |
| Idle Average * (dB) | 21.94 | 39.07 -78% | 27 -23% | 23.4 -7% | 27 -23% |
| Idle Maximum * (dB) | 21.94 | 39.07 -78% | 29 -32% | 27.4 -25% | 29 -32% |
| Load Average * (dB) | 45.1 | 53.34 -18% | 41 9% | 36 20% | 37 18% |
| Witcher 3 ultra * (dB) | 46.56 | 56.6 -22% | 48 -3% | 58.2 -25% | 44 5% |
| Load Maximum * (dB) | 45.58 | 56.6 -24% | 50 -10% | 58 -27% | 45 1% |
* ... smaller is better
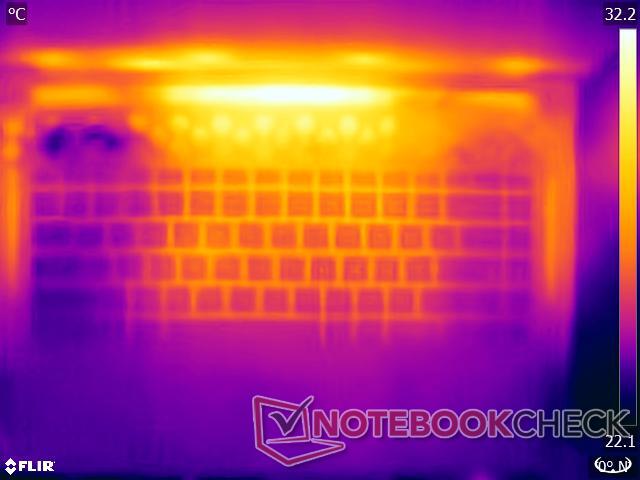
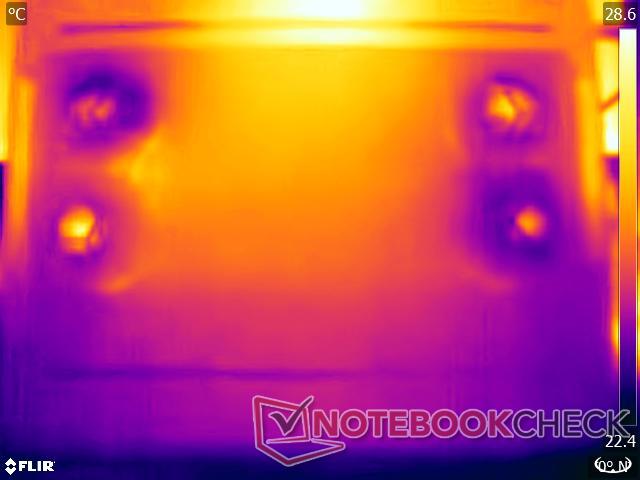
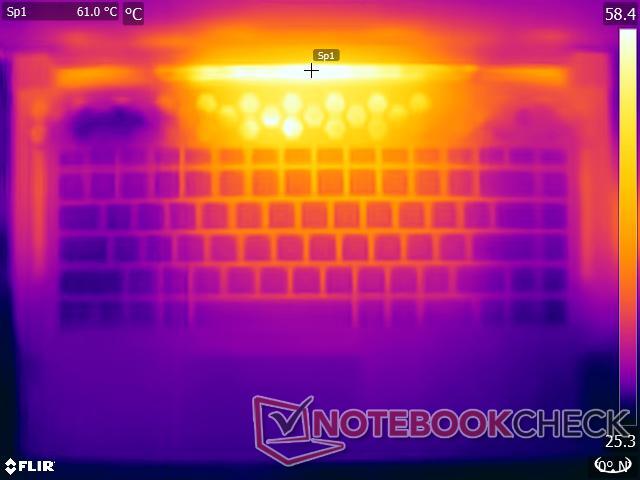
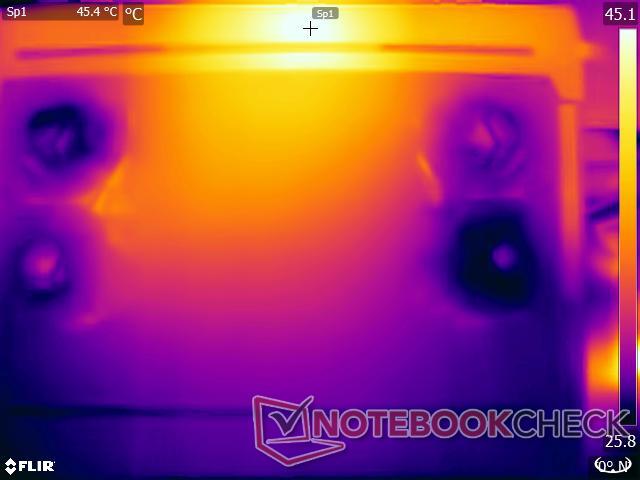
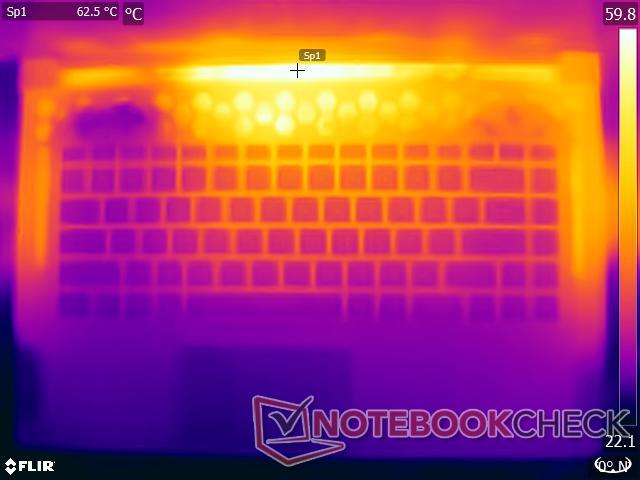
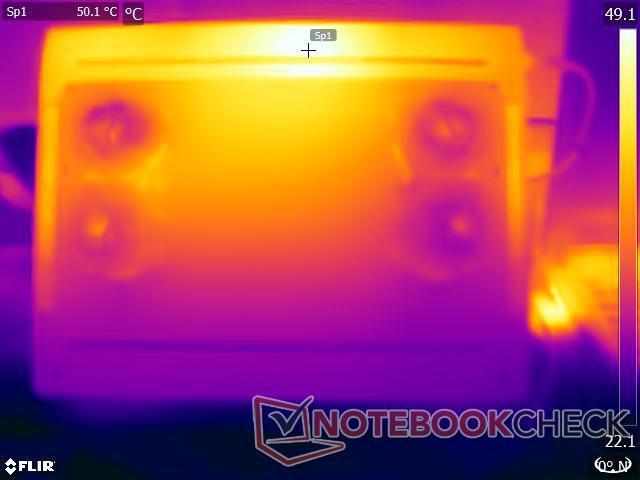
温度
即使有四个独立控制的风扇和四个热管以全速运行,我们在TheWitcher 3压力测试中观察到表面温度高达66.2℃。也就是说,即使在负载情况下,掌托区域也相对凉爽。
(-) The maximum temperature on the upper side is 58.6 °C / 137 F, compared to the average of 40.4 °C / 105 F, ranging from 21.2 to 68.8 °C for the class Gaming.
(-) The bottom heats up to a maximum of 51.8 °C / 125 F, compared to the average of 43.2 °C / 110 F
(+) In idle usage, the average temperature for the upper side is 31.4 °C / 89 F, compared to the device average of 33.9 °C / 93 F.
(-) Playing The Witcher 3, the average temperature for the upper side is 46.9 °C / 116 F, compared to the device average of 33.9 °C / 93 F.
(+) The palmrests and touchpad are reaching skin temperature as a maximum (33.4 °C / 92.1 F) and are therefore not hot.
(-) The average temperature of the palmrest area of similar devices was 28.8 °C / 83.8 F (-4.6 °C / -8.3 F).
我们的压力测试代表了极端的情况,但我们建议只在安静或平衡的热配置文件中运行时,在膝上使用x15 R2,没有太大的压力,以确保可容忍的表面温度。
| Alienware x15 R2 P111F Intel Core i9-12900H, NVIDIA GeForce RTX 3080 Ti Laptop GPU | Asus ROG Strix Scar 15 G533ZW-LN106WS Intel Core i9-12900H, NVIDIA GeForce RTX 3070 Ti Laptop GPU | Asus ROG Zephyrus Duo 16 GX650RX AMD Ryzen 9 6900HX, NVIDIA GeForce RTX 3080 Ti Laptop GPU | MSI Vector GP66 12UGS Intel Core i9-12900H, NVIDIA GeForce RTX 3070 Ti Laptop GPU | Razer Blade 15 Advanced Model Early 2022 Intel Core i7-12800H, NVIDIA GeForce RTX 3080 Ti Laptop GPU | |
|---|---|---|---|---|---|
| Heat | 0% | 7% | 8% | -4% | |
| Maximum Upper Side * (°C) | 58.6 | 42.6 27% | 45 23% | 40.2 31% | 53 10% |
| Maximum Bottom * (°C) | 51.8 | 50.2 3% | 50 3% | 43.8 15% | 53 -2% |
| Idle Upper Side * (°C) | 36.4 | 36.2 1% | 33 9% | 34.8 4% | 36 1% |
| Idle Bottom * (°C) | 31 | 40.2 -30% | 33 -6% | 37 -19% | 38 -23% |
* ... smaller is better
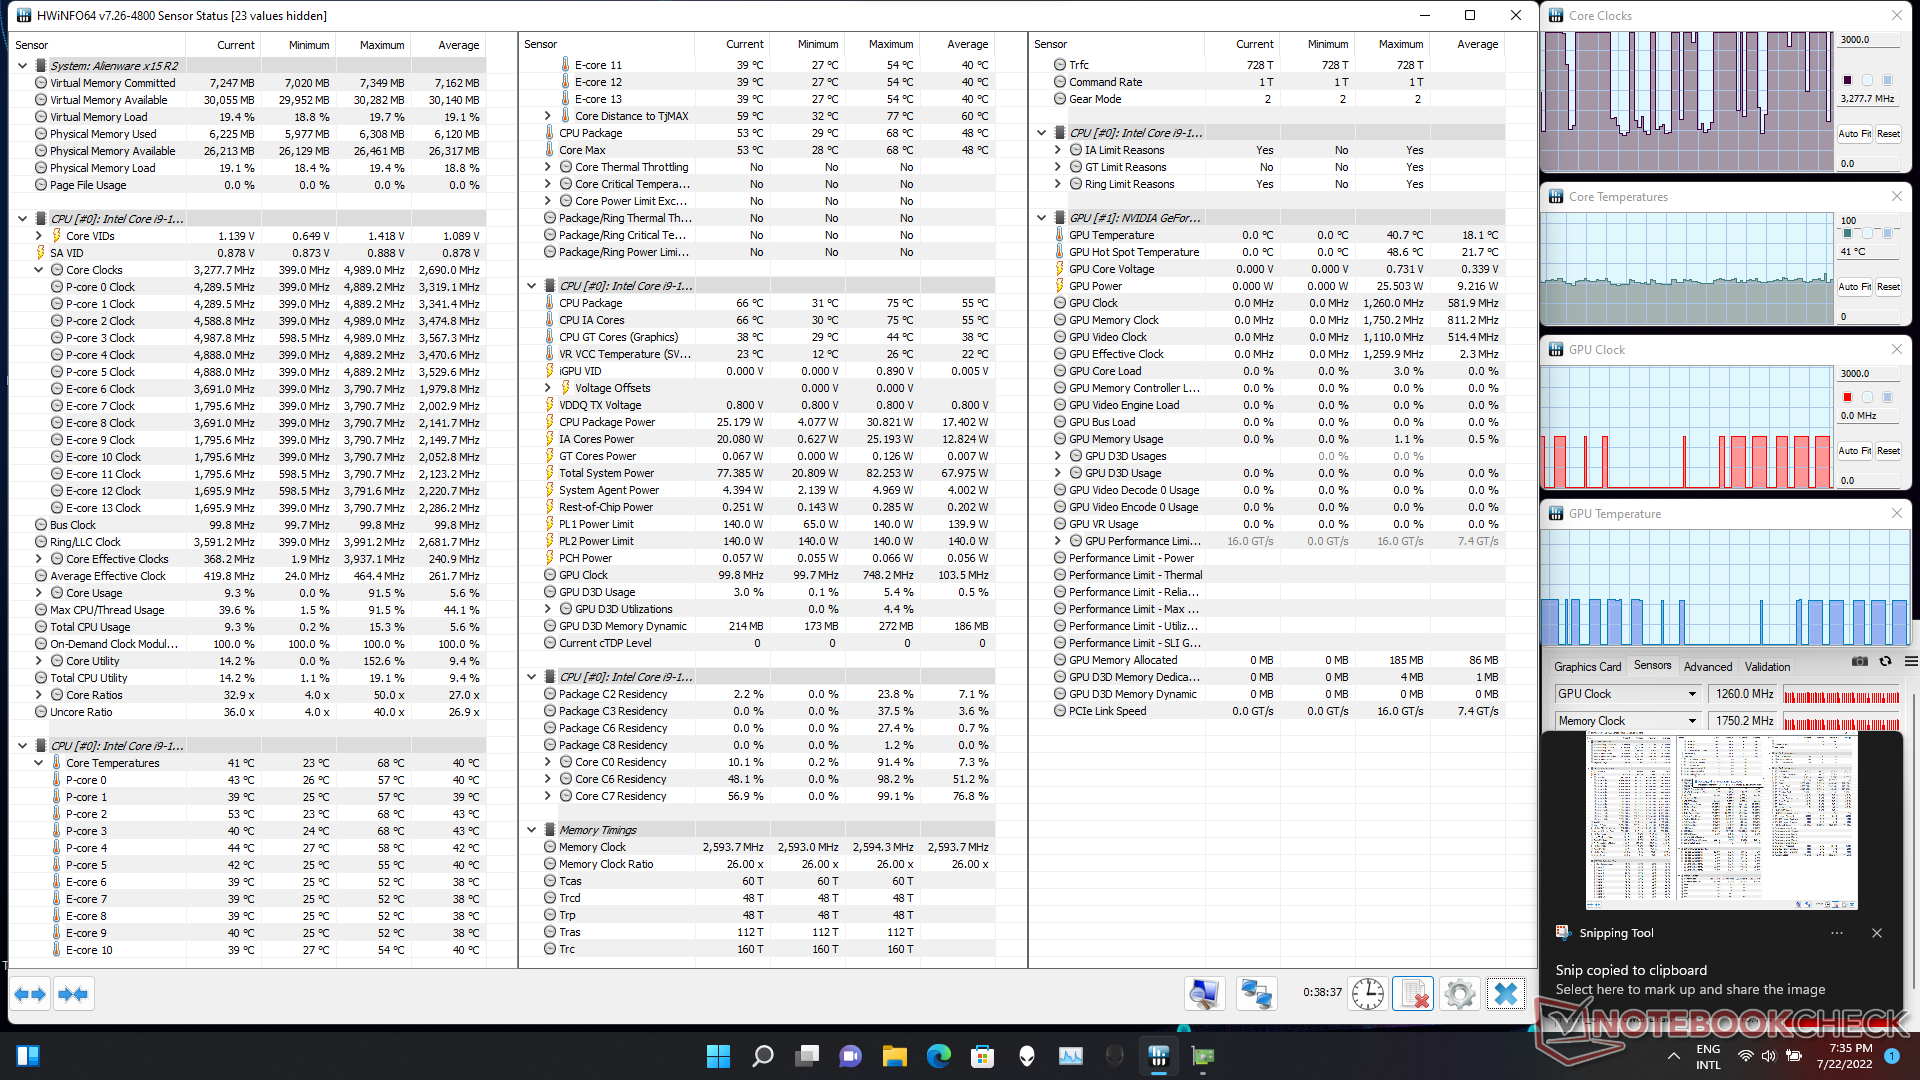
压力测试
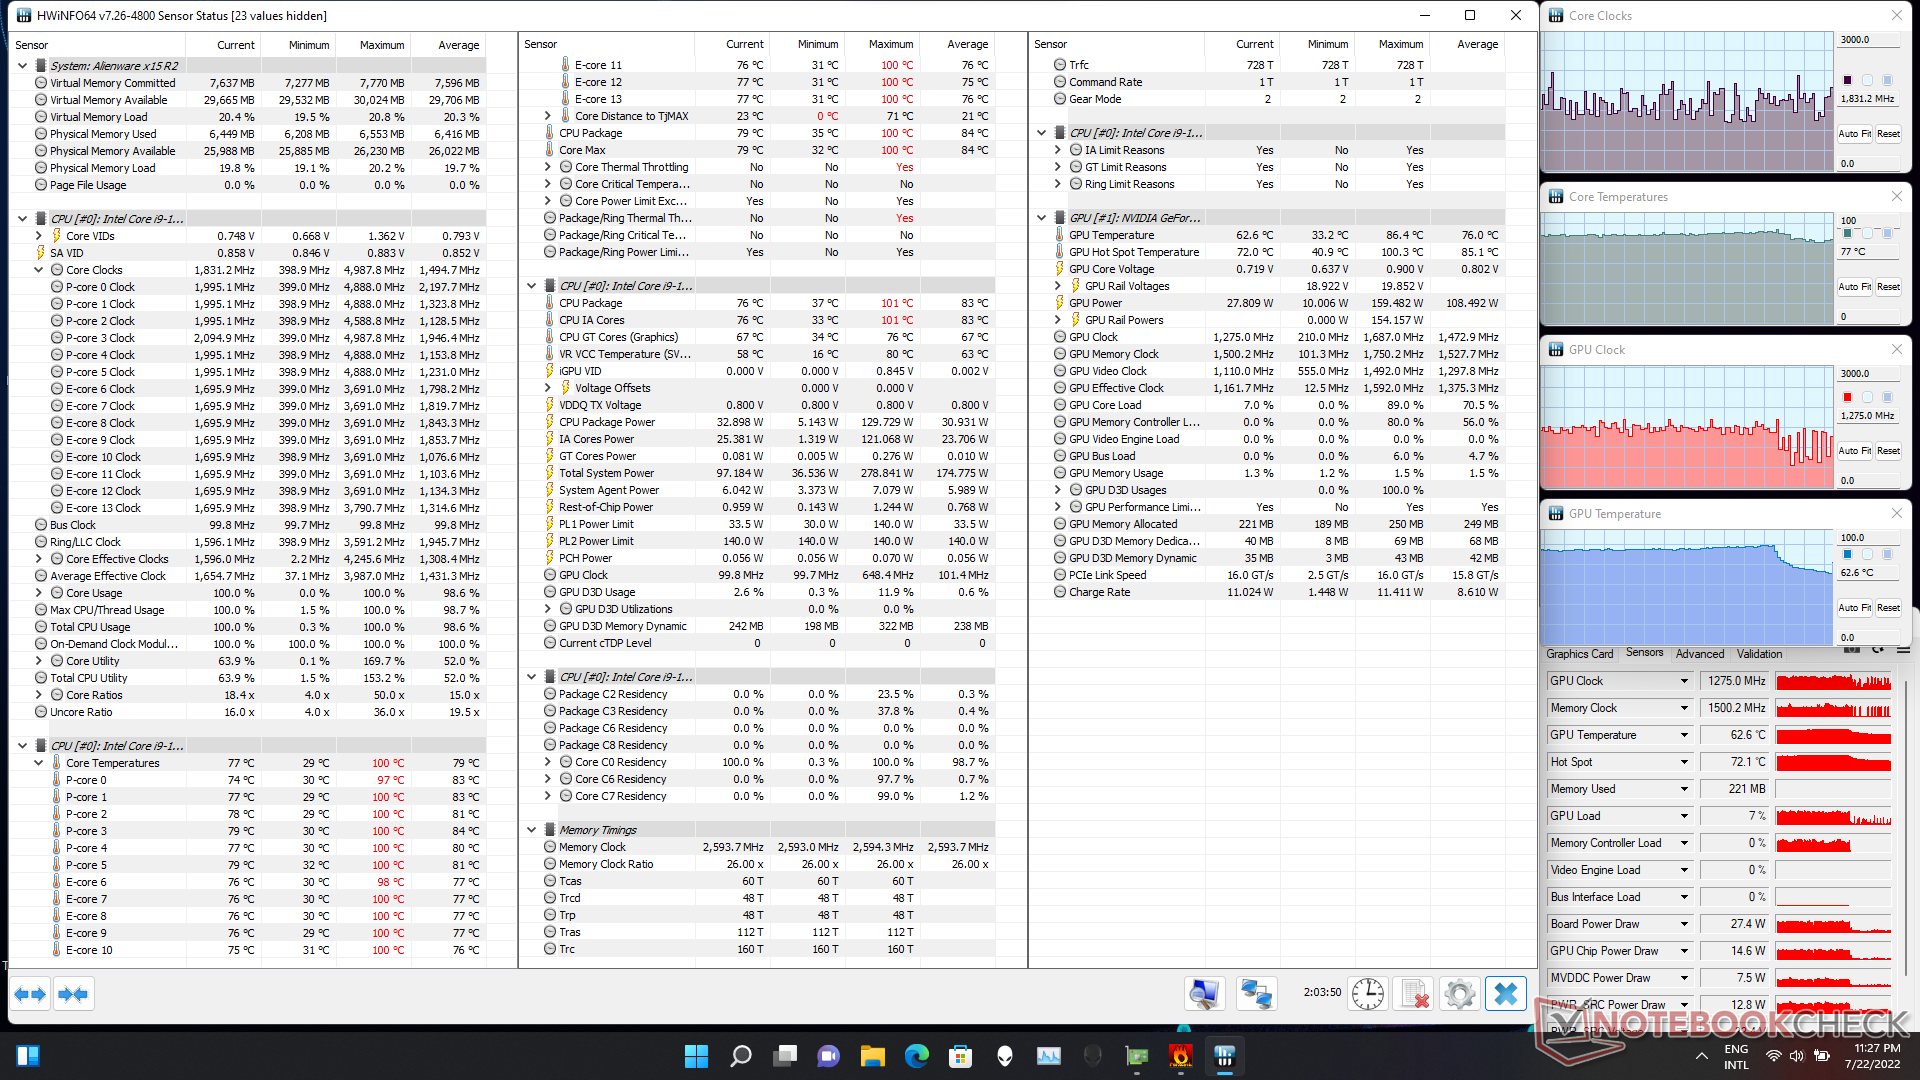
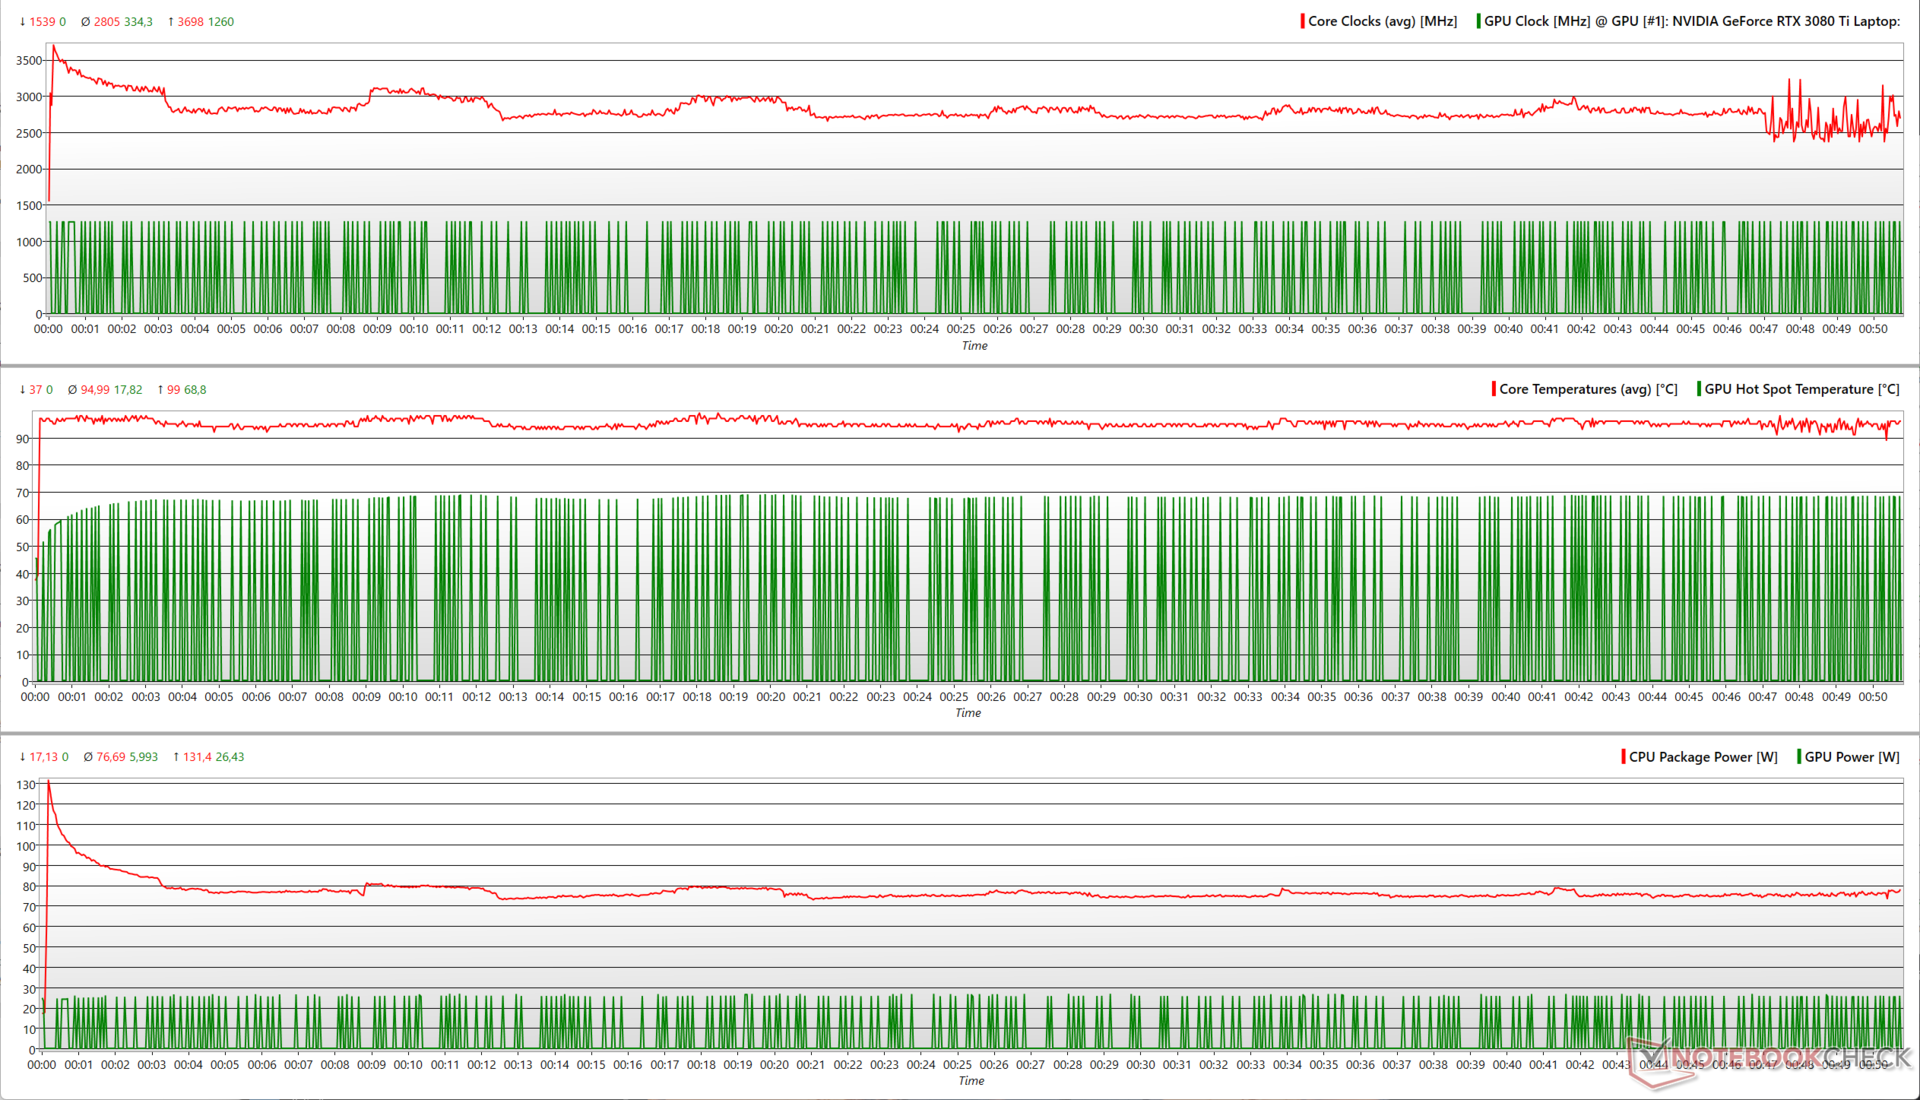
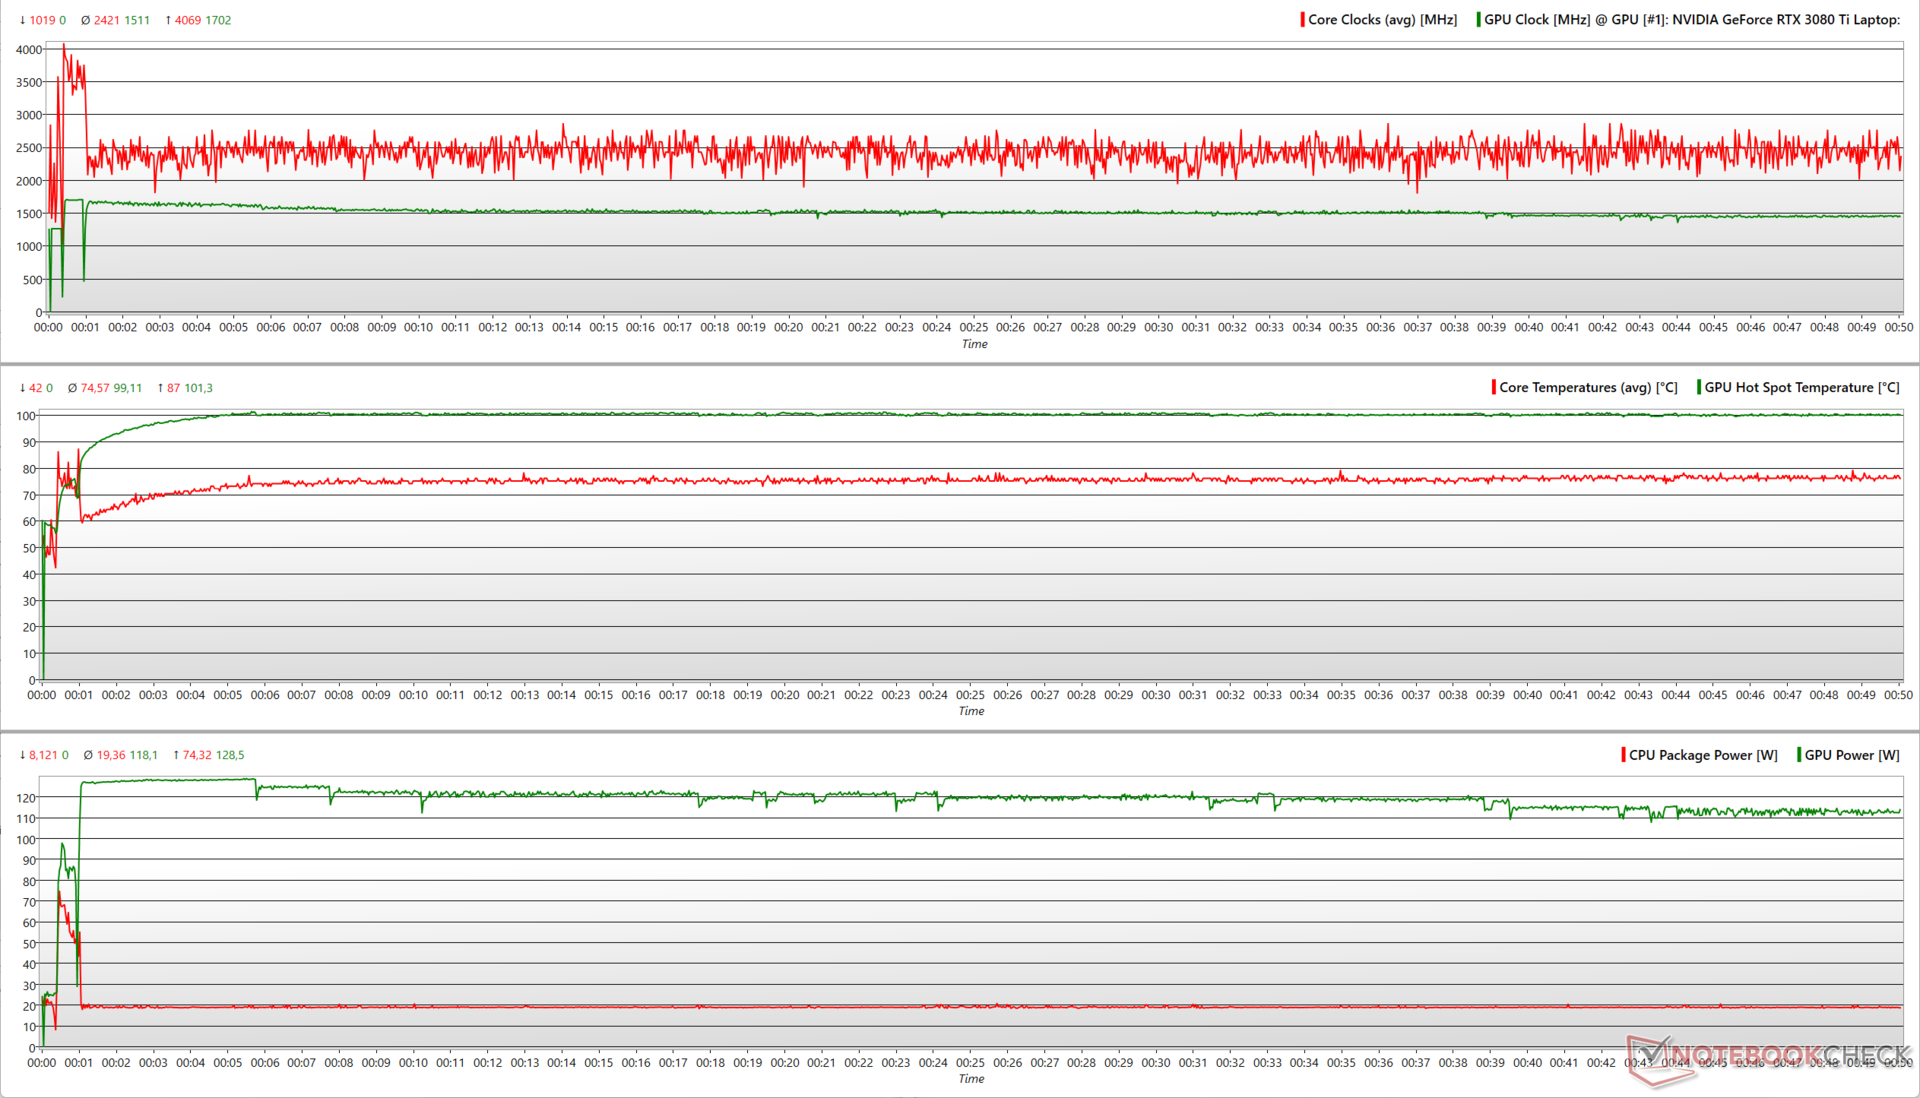
对Alienware x15 R2的压力测试告诉我们各种CPU和GPU参数在不同负载下的变化。
仅仅使用Prime95原地FFT,Core i9-12900H最初达到了接近3.7 GHz的峰值时钟,同时消耗了131 W。随后,时钟在2.6 GHz和3 GHz之间振荡,对应75 W和80 W PL1。
| 压力测试 | CPU时钟(GHz) | GPU时钟(MHz) | CPU平均温度(°C) | GPU平均温度(°C) |
| 系统空闲 | 3.2 | - | 40 | - |
| Prime95 | 2.69 | - | 95 | 57.2 |
| Prime95 + FurMark | 1.83 | 1,275 | 79 | 76 |
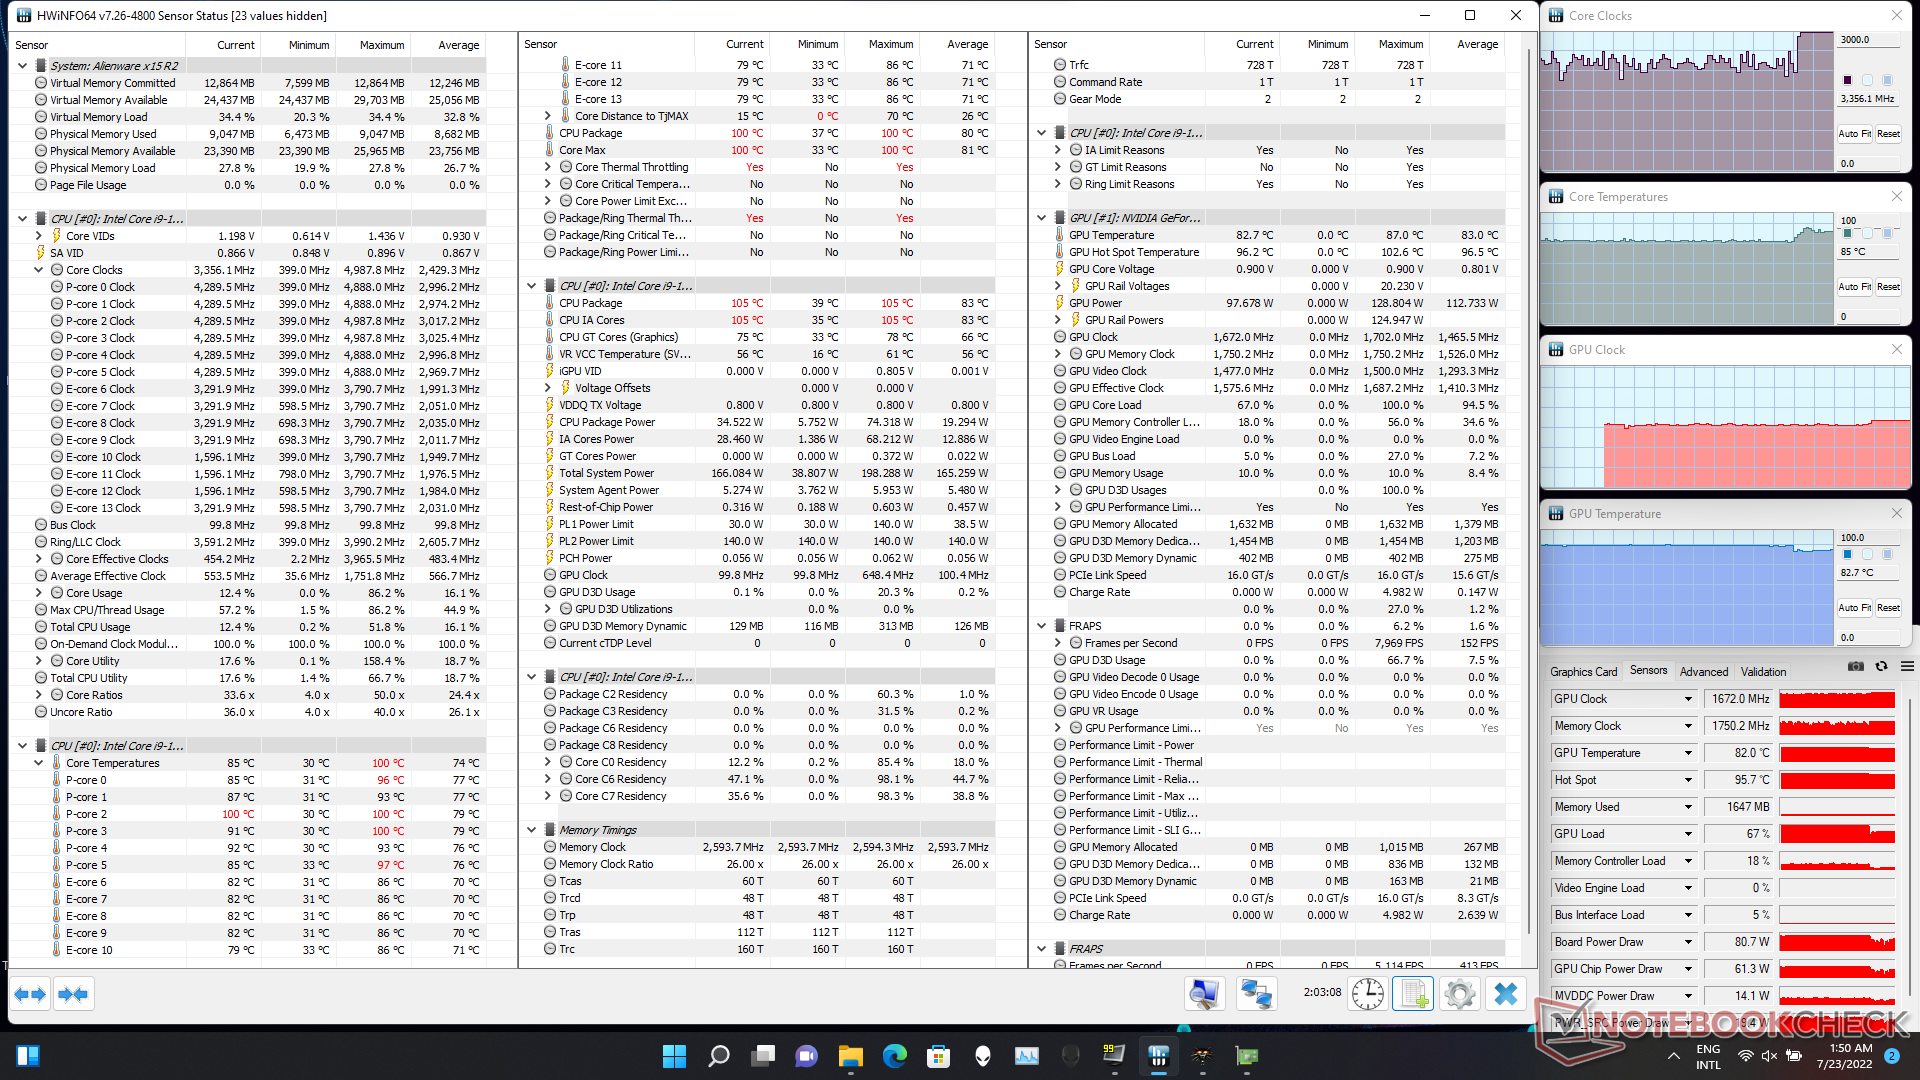
| TheWitcher 3 | 3.35 | 1,672 | 74 | 83 |
在加入FurMark后,我们看到Core i9-12900H能够达到130W,但很快下降到60W,然后逐渐下降到30W。这是为了适应RTX 3080 Ti的120W功率要求,它偶尔会飙升到150W。
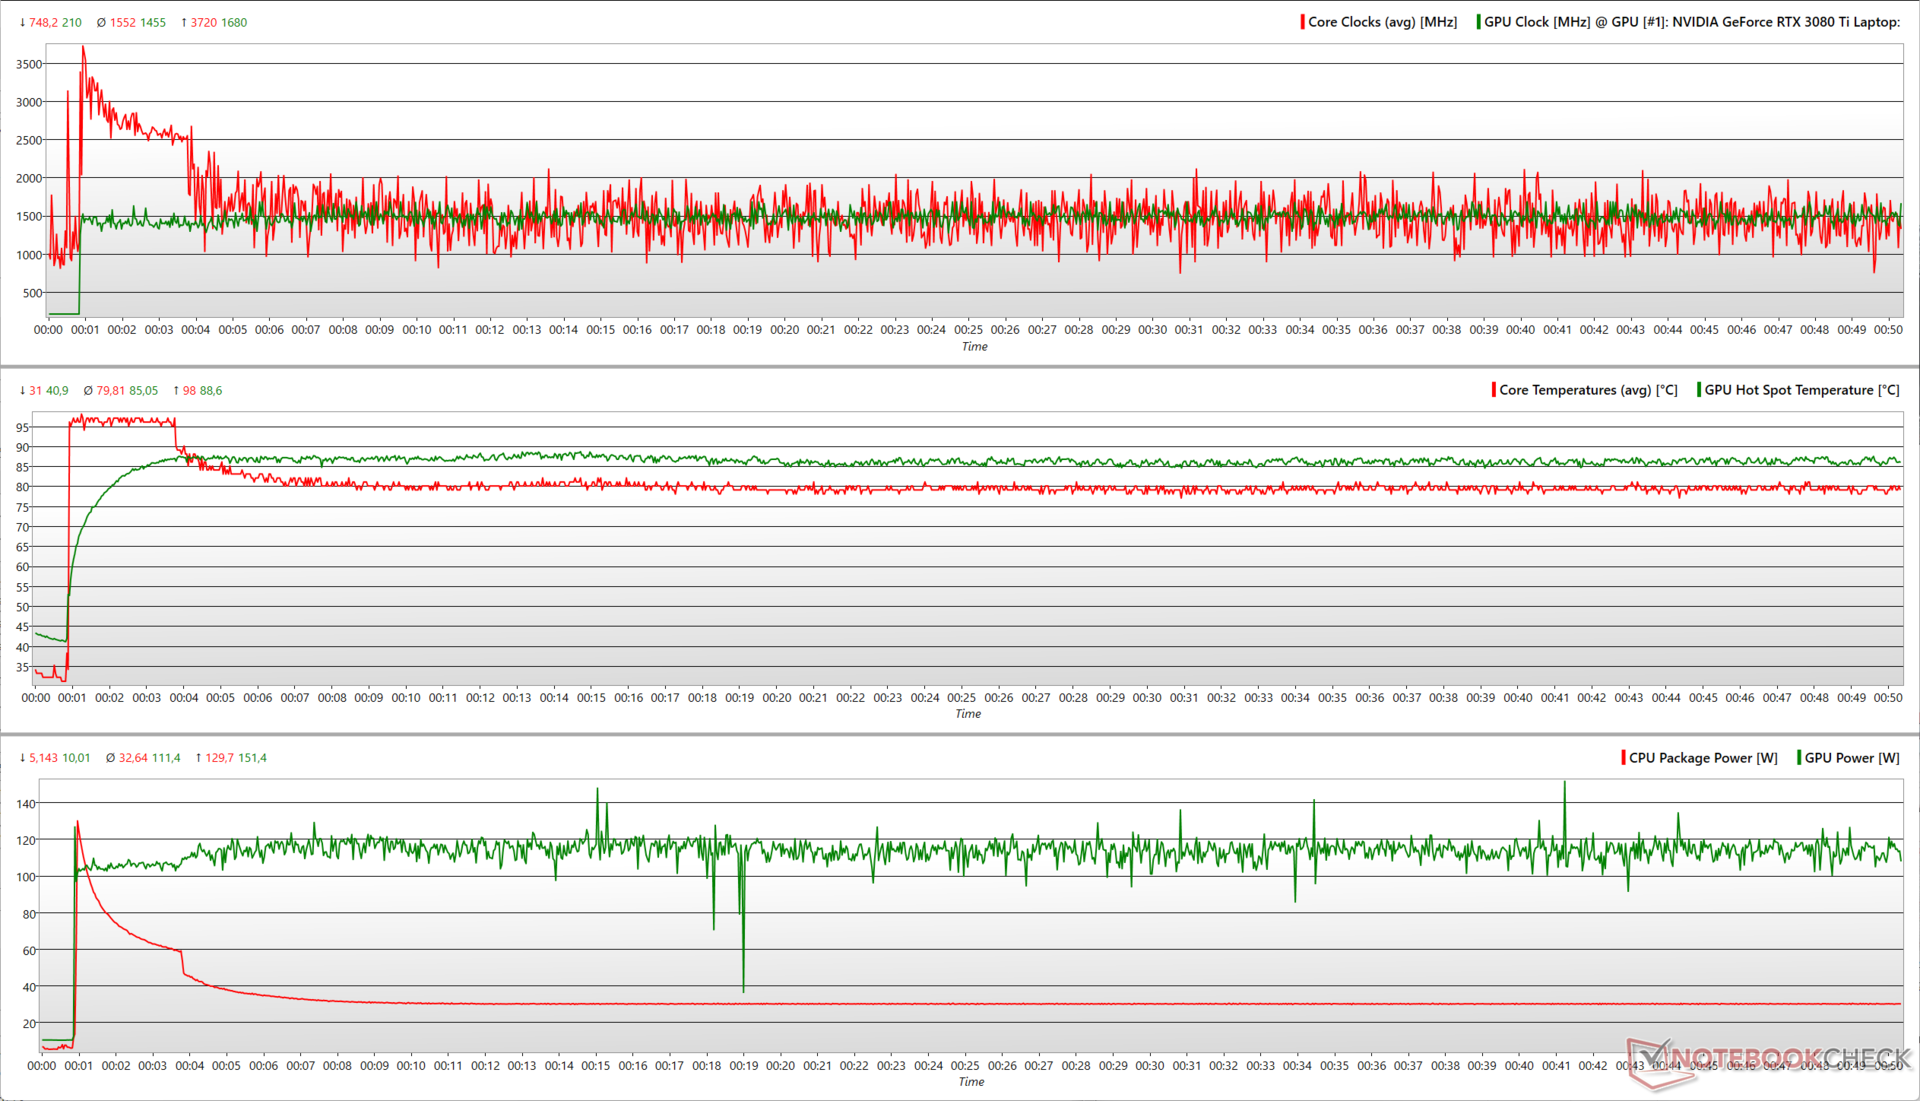
用 Witcher 3,呈现出一个更真实的场景,我们发现CPU时钟达到了4GHz的峰值,并很快稳定在2.5GHz附近,而RTX 3080 Ti从最初的1702MHz的高点下降,稳定在1500MHz左右。RTX 3080 Ti的功耗最初接近130瓦,但很快下降到120瓦。在运行期间,Core i9-12900H从大约75瓦下降到20瓦。
发言人
对于一个轻薄的机箱来说,Alienware x15 R2的板载音频是相当不错的。2个2瓦的扬声器能产生80.2分贝(A)的响度,在一般大小的房间里应该都能分辨出来。所有Alienware 2022年推出的产品都通过了杜比全景声认证。
低音响应严格来说还可以,但中音和高音的定义更清晰。在较高的音量下,没有可察觉的失真。主观上,板载音频可以完成大多数常规工作的任务。
游戏玩家可以通过蓝牙5.2或3.5毫米组合音频插孔连接一副更好的耳机。
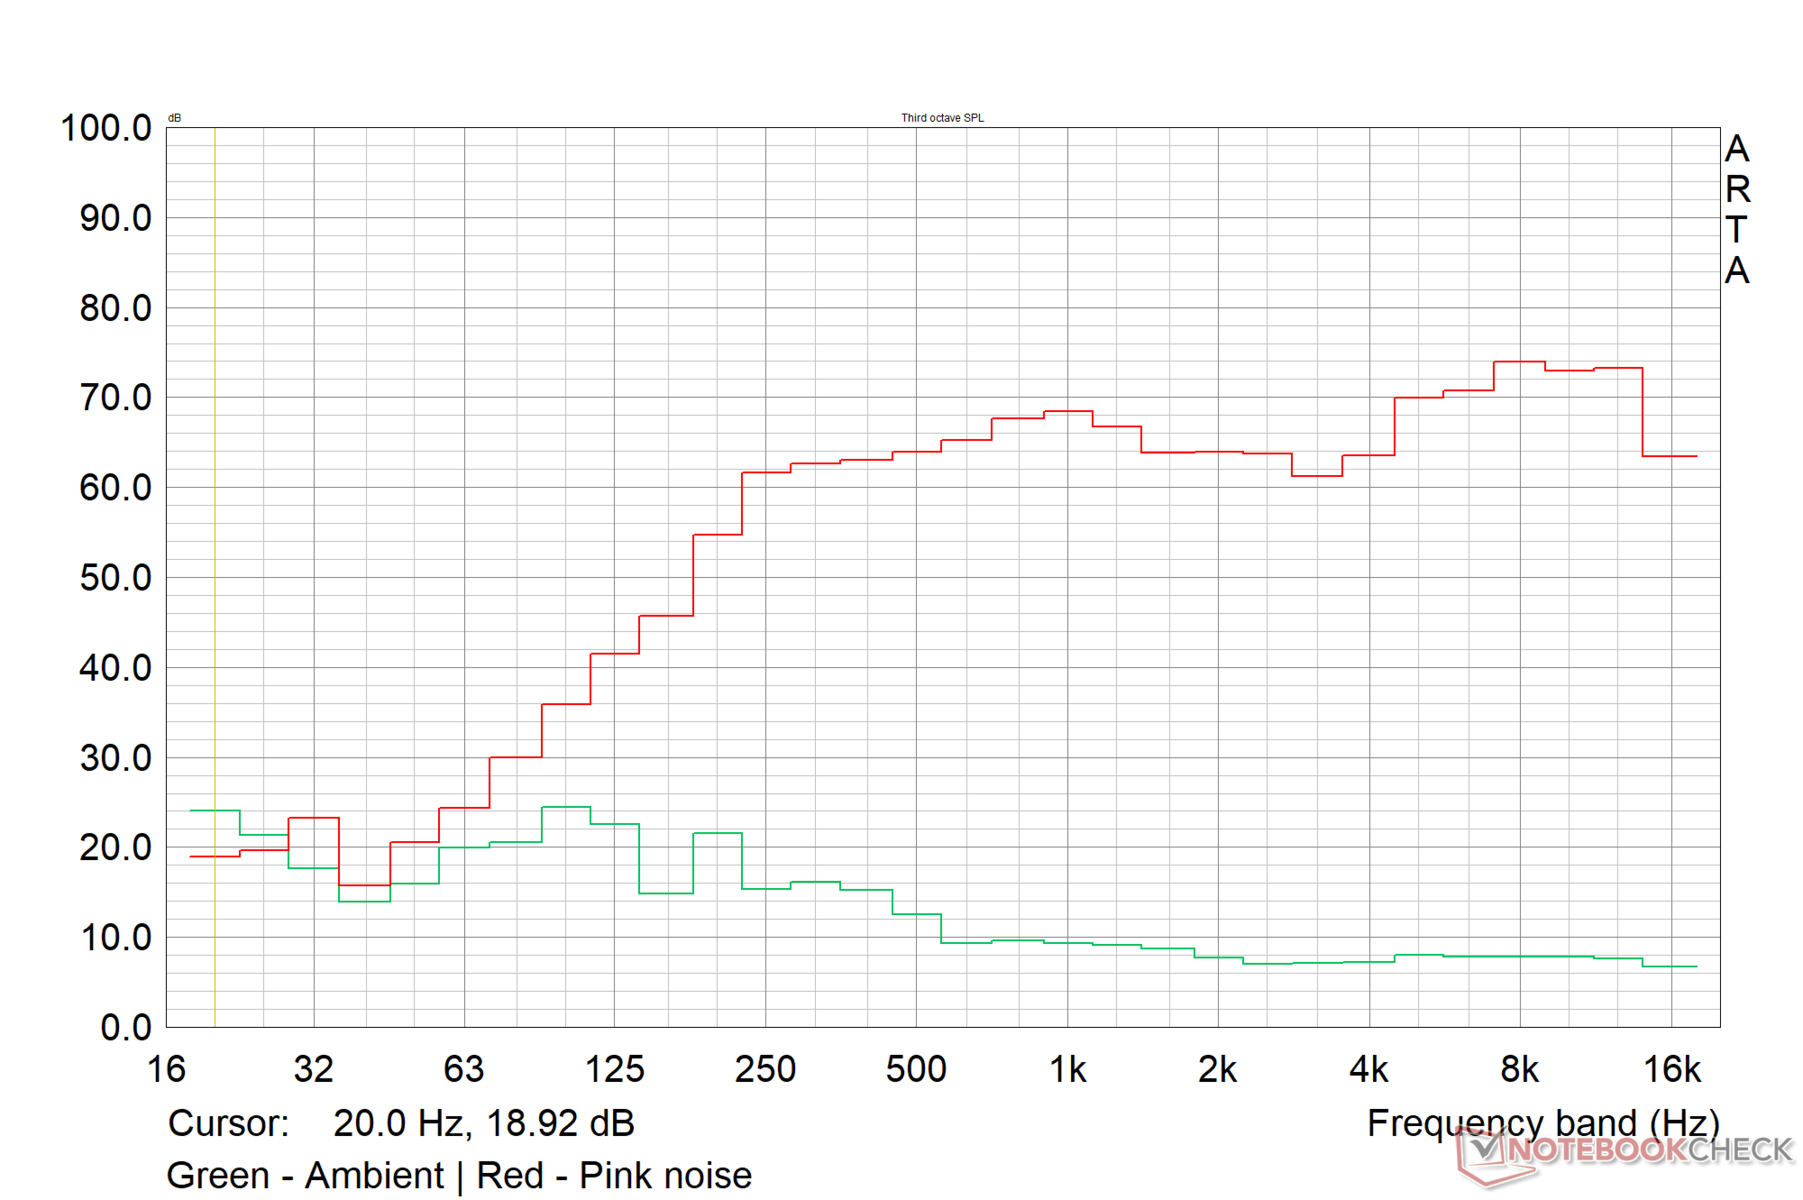
Alienware x15 R2 P111F audio analysis
(±) | speaker loudness is average but good (80.2 dB)
Bass 100 - 315 Hz
(±) | reduced bass - on average 13.5% lower than median
(±) | linearity of bass is average (9.9% delta to prev. frequency)
Mids 400 - 2000 Hz
(+) | balanced mids - only 1.7% away from median
(+) | mids are linear (2.4% delta to prev. frequency)
Highs 2 - 16 kHz
(±) | higher highs - on average 5% higher than median
(+) | highs are linear (4.3% delta to prev. frequency)
Overall 100 - 16.000 Hz
(+) | overall sound is linear (12.6% difference to median)
Compared to same class
» 16% of all tested devices in this class were better, 4% similar, 81% worse
» The best had a delta of 6%, average was 18%, worst was 132%
Compared to all devices tested
» 11% of all tested devices were better, 3% similar, 86% worse
» The best had a delta of 4%, average was 23%, worst was 134%
Apple MacBook Pro 16 2021 M1 Pro audio analysis
(+) | speakers can play relatively loud (84.7 dB)
Bass 100 - 315 Hz
(+) | good bass - only 3.8% away from median
(+) | bass is linear (5.2% delta to prev. frequency)
Mids 400 - 2000 Hz
(+) | balanced mids - only 1.3% away from median
(+) | mids are linear (2.1% delta to prev. frequency)
Highs 2 - 16 kHz
(+) | balanced highs - only 1.9% away from median
(+) | highs are linear (2.7% delta to prev. frequency)
Overall 100 - 16.000 Hz
(+) | overall sound is linear (4.6% difference to median)
Compared to same class
» 0% of all tested devices in this class were better, 0% similar, 100% worse
» The best had a delta of 5%, average was 17%, worst was 45%
Compared to all devices tested
» 0% of all tested devices were better, 0% similar, 100% worse
» The best had a delta of 4%, average was 23%, worst was 134%
能源管理。在最大负荷下经济实惠
消耗功率
所提供的240W电源适配器足以在各种工作负荷下为15R2供电。功率消耗偏高,但考虑到内部结构,它是在预期范围内。我们注意到,在接近180W大关之前,最大负载功耗可以飙升至近242W。
尽管如此,与竞争对手相比,x15 R2的功耗仍然是经济的,特别是在最大负荷下。Razer Blade 15 Advanced的整体功耗要求较低,可能是由于110 W RTX 3080 Ti的原因。
| Off / Standby | |
| Idle | |
| Load |
|
Key:
min: | |
| Alienware x15 R2 P111F i9-12900H, GeForce RTX 3080 Ti Laptop GPU, IPS, 1920x1080 | Asus ROG Strix Scar 15 G533ZW-LN106WS i9-12900H, GeForce RTX 3070 Ti Laptop GPU, IPS-level, 2560x1440 | Asus ROG Zephyrus Duo 16 GX650RX R9 6900HX, GeForce RTX 3080 Ti Laptop GPU, IPS-Level, 3840x2400 | MSI Vector GP66 12UGS i9-12900H, GeForce RTX 3070 Ti Laptop GPU, IPS, 1920x1080 | Razer Blade 15 Advanced Model Early 2022 i7-12800H, GeForce RTX 3080 Ti Laptop GPU, IPS, 1920x1080 | Average NVIDIA GeForce RTX 3080 Ti Laptop GPU | Average of class Gaming | |
|---|---|---|---|---|---|---|---|
| Power Consumption | 15% | -11% | -24% | 8% | -16% | 2% | |
| Idle Minimum * (Watt) | 16.2 | 7.56 53% | 19 -17% | 17.5 -8% | 17 -5% | 17.2 ? -6% | 13 ? 20% |
| Idle Average * (Watt) | 20 | 13.5 32% | 24 -20% | 20.1 -1% | 19 5% | 23.3 ? -17% | 19 ? 5% |
| Idle Maximum * (Watt) | 21.2 | 16.87 20% | 31 -46% | 47.3 -123% | 25 -18% | 30.8 ? -45% | 24.6 ? -16% |
| Load Average * (Watt) | 122.1 | 128.9 -6% | 104 15% | 107.3 12% | 108 12% | 121.2 ? 1% | 110.7 ? 9% |
| Witcher 3 ultra * (Watt) | 207 | 196.2 5% | 186.5 10% | 225 -9% | 150 28% | ||
| Load Maximum * (Watt) | 241.9 | 274.86 -14% | 256 -6% | 277.7 -15% | 179 26% | 276 ? -14% | 259 ? -7% |
* ... smaller is better
Power Consumption - The Witcher 3 / Stress test
Power Consumption - External monitor
电池寿命
我们使用我们的标准化网页脚本来评估全亮度和150cd/m2设置下的电池运行时间。电池运行时间测试是在MSHybrid模式下以60Hz的屏幕刷新率进行的。
x15 R2的87WHr电池在150cd/m2的情况下可以运行6个多小时。在全亮度下也观察到类似的运行时间。在dGPU模式下,在150cd/m2的亮度下,我们只能维持3小时36分钟的电池寿命。
| Alienware x15 R2 P111F i9-12900H, GeForce RTX 3080 Ti Laptop GPU, 87 Wh | Alienware x15 RTX 3070 P111F i7-11800H, GeForce RTX 3070 Laptop GPU, 87 Wh | Asus ROG Strix Scar 15 G533ZW-LN106WS i9-12900H, GeForce RTX 3070 Ti Laptop GPU, 90 Wh | Asus ROG Zephyrus Duo 16 GX650RX R9 6900HX, GeForce RTX 3080 Ti Laptop GPU, 90 Wh | Razer Blade 15 Advanced Model Early 2022 i7-12800H, GeForce RTX 3080 Ti Laptop GPU, 80 Wh | Average of class Gaming | |
|---|---|---|---|---|---|---|
| Battery runtime | 2% | 40% | 30% | -18% | 19% | |
| WiFi v1.3 (h) | 6 | 6.1 2% | 8.4 40% | 7.8 30% | 4.9 -18% | 7.11 ? 19% |
| Reader / Idle (h) | 9.7 | 12.5 | 8.1 | 8.27 ? | ||
| Load (h) | 0.9 | 0.9 | 1 | 2 | 1.502 ? | |
| H.264 (h) | 8.5 | 9.3 | 5.9 | 8.32 ? | ||
| Witcher 3 ultra (h) | 1.2 |
Pros
Cons
评语:这个外星人符合大多数条件
Alienware x15 R2是由去年的x15 R1演变而来,没有带来任何革命性的变化。今年所有的Alienware配置都有一些标准功能,如杜比视界和杜比全景声认证、Element 31 TIM和Advanced Optimus等等。
类似于超极本的机箱具有明显的Alienware特征,并带有所有相关的标志。端口的位置不是最理想的,但基本的东西都覆盖了。网络摄像头的质量仍然是一个事后的考虑。键盘提供了良好的触觉反馈,但次要功能仍然是不亮的。
显示质量对于其作为游戏笔记本电脑的主要应用来说是好的。然而,鉴于其强大的内部结构,大多数买家会想选择QHD变体。没有PWM,当启用360赫兹的超速时,响应时间是好的。
如果你正在寻找一款有效地将超极本的外形与顶级现代硬件结合起来的游戏笔记本电脑,只要较高的热量和噪音排放不是严重的问题,那么Alienware x15 R2就应该在你的优点清单上占据重要位置。"
尽管机箱很薄,但戴尔在确保负载下没有明显的节流方面做得很好。其他竞争对手,如 微星Vector GP66和 华硕ROG Strix Scar 15采用酷睿i9-12900H确实发布了更高的分数,但x15 R2很好地保持了其地位。与去年的x15 R1相比,其性能提高了 x15 R1是相当显著的。
也许Alienware x15 R2最大的问题是它的高热量和噪音排放。虽然可以通过选择适当的散热曲线在一定程度上控制风扇的噪音水平,但表面温度似乎肯定会偏高。该配置的功耗和电池寿命都在预期范围内,尽管Scar 15和 Razer Blade 15 Advanced是更经济的耗电者。
Alienware x15 R2提供了一个独特的美学和旗舰性能的组合,这是许多其他笔记本电脑所渴望的。然而,Alienware x15 R2的价格为3,68,190英镑(约合4,500美元或4,583欧元),在印度市场上没有竞争力,特别是当存在华硕ROG Strix Scar 15 G533等选择时。
价格和可用性
经过评测的Alienware x15 R2配置在印度亚马逊上的售价约为4,137美元。,美国亚马逊和Dell.com.一款搭载酷睿i7-12700H和RTX 3070 Ti的x15 R2变体在Best Buy上出售,价格为2700美元。售价为2700美元。
Alienware x15 R2 P111F
- 10/04/2022 v7 (old)
Vaidyanathan Subramaniam
Price comparison

