微星Titan GT77 12UHS笔记本电脑评测。桤木湖-HX的海报儿童,具有无阻碍的桌面级性能
微星泰坦一直是该公司的旗舰阵容,直到英特尔第十代处理器的出现。 泰坦GT76系列在2020年。在第11代中,微星选择将其旗舰产品限定为 GE76 Raider 11UH.在2022年,GE76 Raider也将获得Alder Lake的升级,推出了 GE76 Raider 12U.然而,英特尔推出Alder Lake-HX平台意味着微星现在有动力重振标志性的泰坦级笔记本电脑。
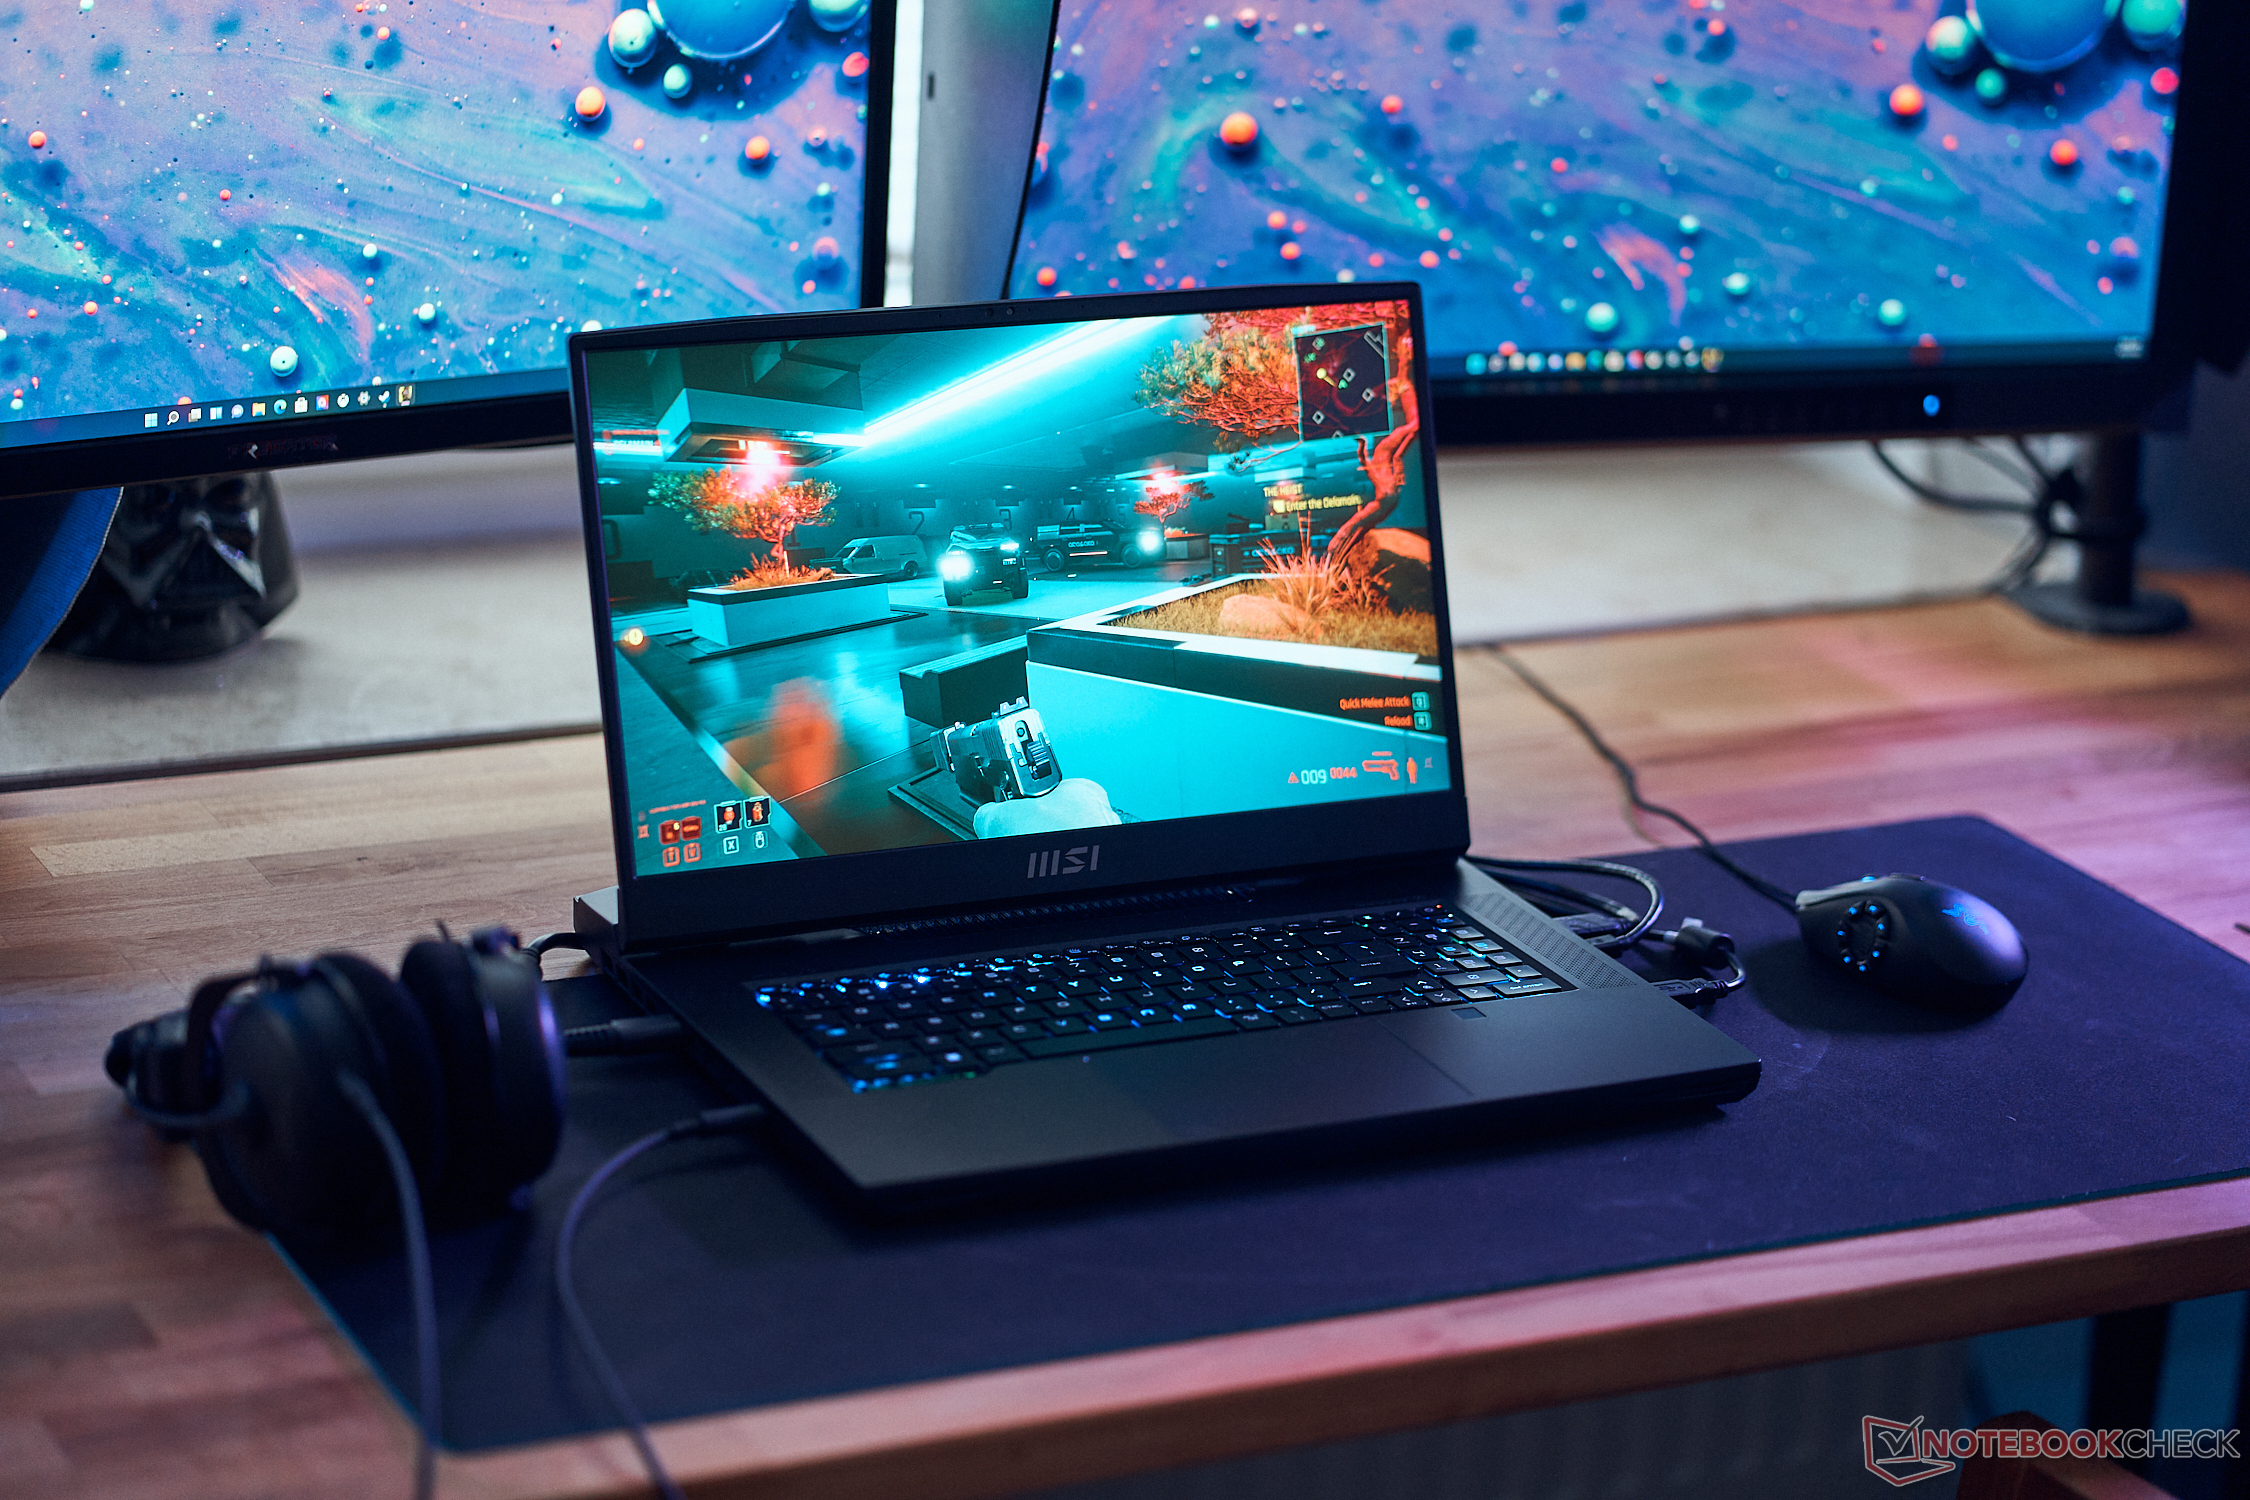
今年的微星泰坦GT77 12U系列试图成为一个整体,提供发烧级玩家希望得到的几乎一切。桌面级CPU?检查。最大的内存?对。可能的最快GPU?对。所有你能填满的存储?对。Cherry MX机械键盘?对。一个高刷新率的显示器?检查并重复检查。
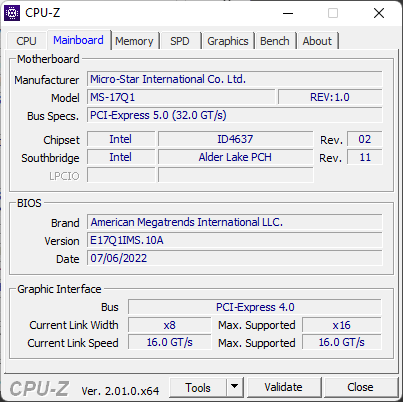
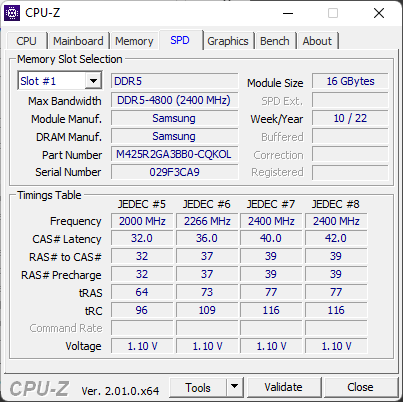
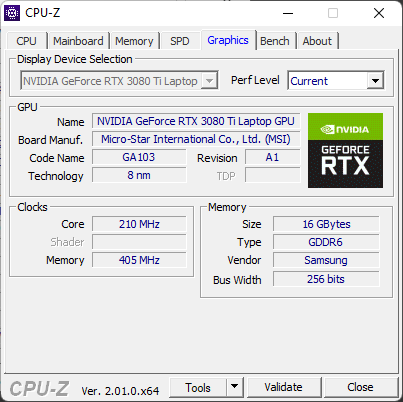
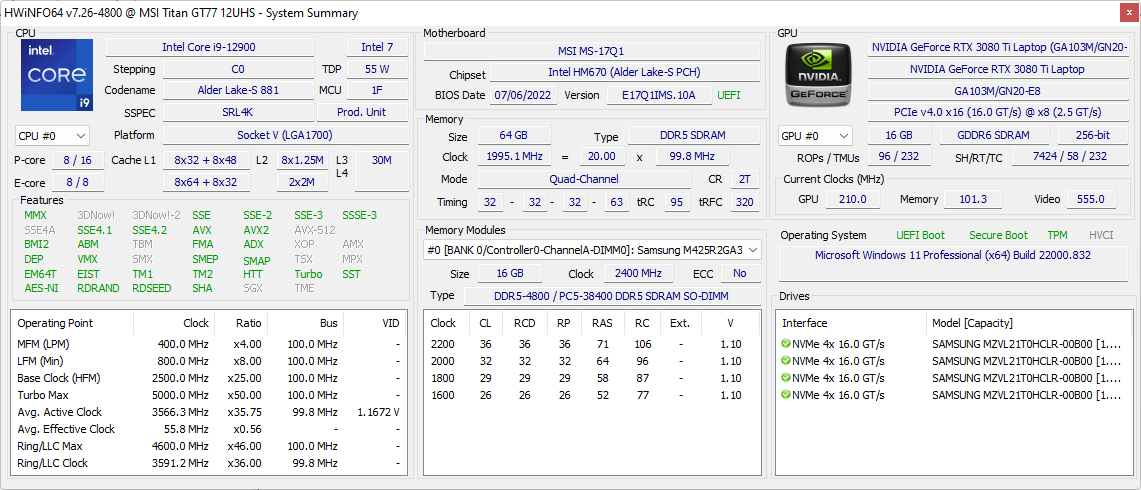
尽管微星已经在印度正式发布了HX系列,但在写这篇文章时,这些笔记本电脑还没有在印度的零售市场上市。我们的微星泰坦GT77 12UHS审查样本由英特尔印度公司提供,由 酷睿i9-12900HX,64GB DDR5-4800内存,一个175W的 RTX 3080 Ti笔记本GPU,4x 1TB三星PM9A1 NVMe固态硬盘,17.3英寸360赫兹FHD面板,以及99.9WHr电池。根据英特尔的说法,这个配置将让你花费约4,999美元(折算成实际约3,96617美元)。
也有一个更实惠的泰坦GT77模型,具有一个 酷睿i7-12800HX和一个 RTX 3070 Ti笔记本GPU价格约为3100美元。我们的FHD 360 Hz型号在微星或亚马逊上还没有上市,目前所有可用的配置都使用了120 Hz的UHD屏幕,对它的审查将很快进行。
在这篇评论中,我们将评估微星泰坦GT77,看看英特尔新的桌面级Alder Lake-HX处理器如何帮助标志性的泰坦复兴,以及使用可能是市场上最强大的游戏笔记本电脑的体验。
潜在的竞争对手比较
Rating | Date | Model | Weight | Height | Size | Resolution | Price |
|---|---|---|---|---|---|---|---|
| 88.3 % v7 (old) | 08 / 2022 | MSI Titan GT77 12UHS i9-12900HX, GeForce RTX 3080 Ti Laptop GPU | 3.3 kg | 23 mm | 17.30" | 1920x1080 | |
| 83.7 % v7 (old) | 08 / 2022 | Aorus 17X XES i9-12900HX, GeForce RTX 3070 Ti Laptop GPU | 2.7 kg | 30 mm | 17.30" | 1920x1080 | |
| 86.8 % v7 (old) | 07 / 2022 | MSI Raider GE77 HX 12UHS i9-12900HX, GeForce RTX 3080 Ti Laptop GPU | 3.1 kg | 25.9 mm | 17.30" | 3840x2160 | |
| 87.7 % v7 (old) | 07 / 2022 | MSI GE67 HX 12UGS i7-12800HX, GeForce RTX 3070 Ti Laptop GPU | 2.5 kg | 23.4 mm | 15.60" | 1920x1080 | |
| 88.2 % v7 (old) | 05 / 2022 | Asus ROG Zephyrus Duo 16 GX650RX R9 6900HX, GeForce RTX 3080 Ti Laptop GPU | 2.6 kg | 20.5 mm | 16.00" | 3840x2400 | |
| 89.2 % v7 (old) | 05 / 2022 | Alienware x17 R2 P48E i9-12900HK, GeForce RTX 3080 Ti Laptop GPU | 3.1 kg | 20.9 mm | 17.30" | 1920x1080 | |
| 84.7 % v7 (old) | 03 / 2022 | Gigabyte Aero 16 YE5 i9-12900HK, GeForce RTX 3080 Ti Laptop GPU | 2.3 kg | 22.4 mm | 16.00" | 3840x2400 | |
| 87.5 % v7 (old) | 01 / 2022 | MSI GE76 Raider i9-12900HK, GeForce RTX 3080 Ti Laptop GPU | 3 kg | 26 mm | 17.30" | 1920x1080 |
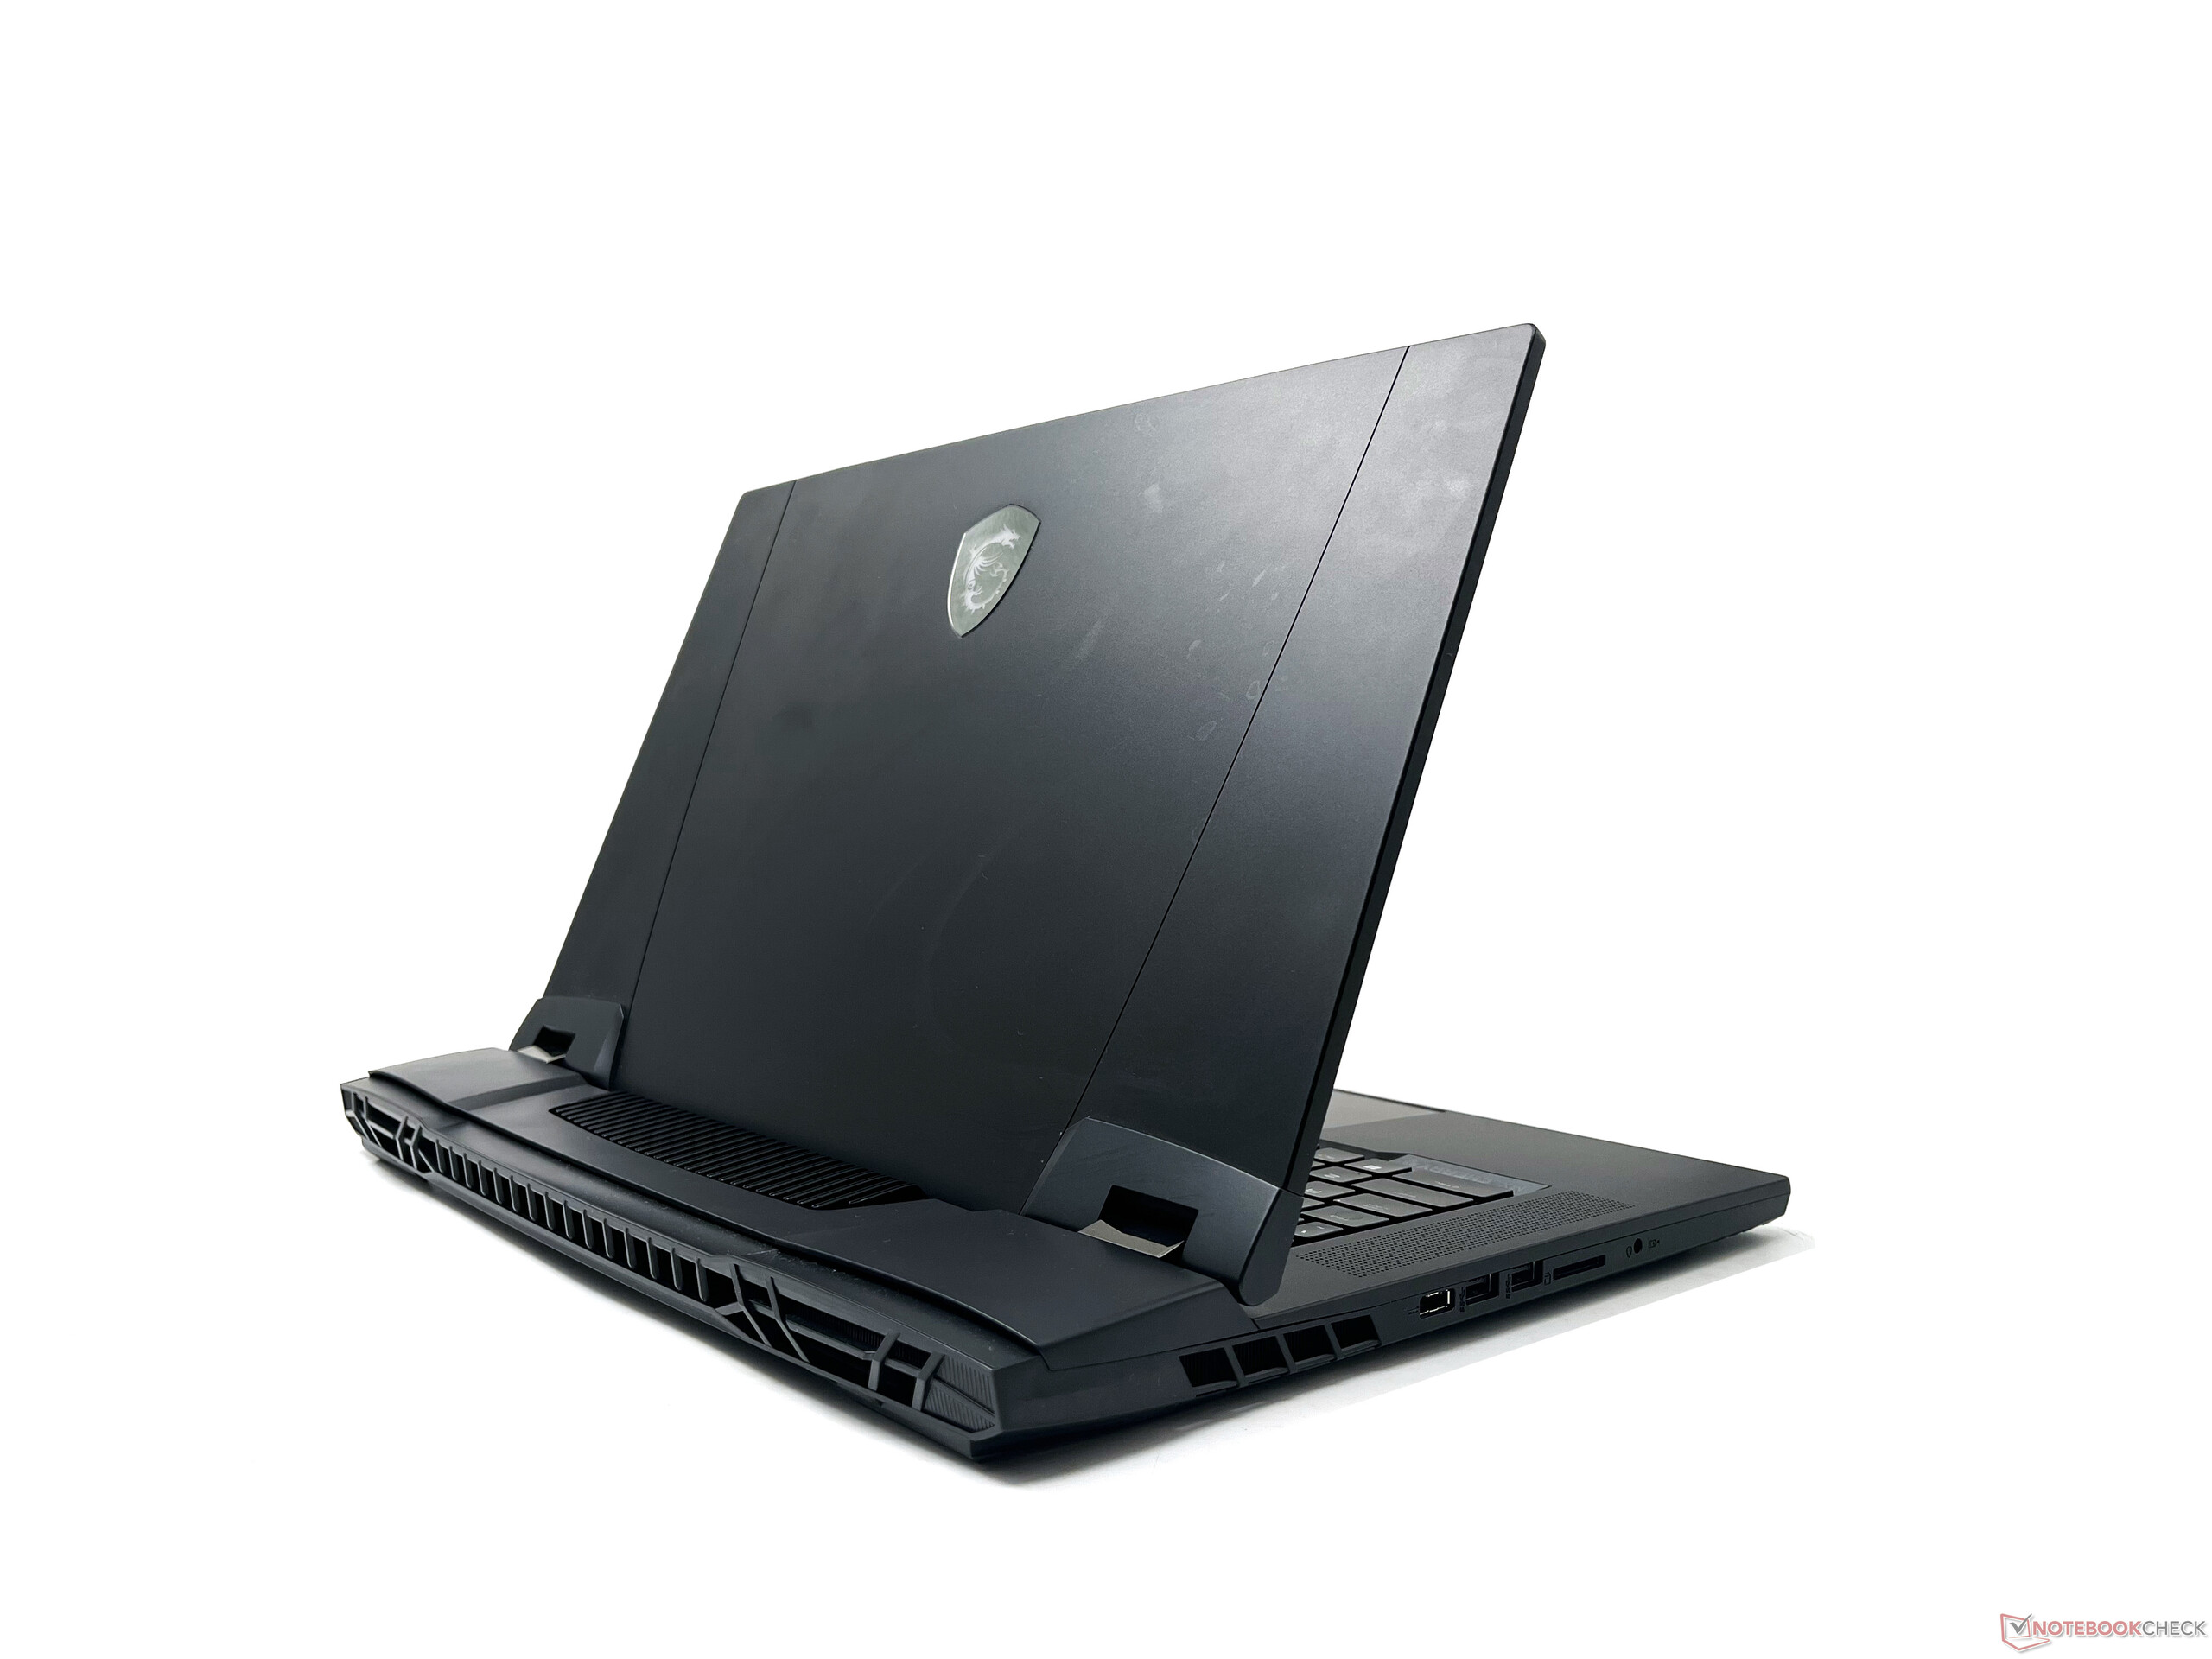
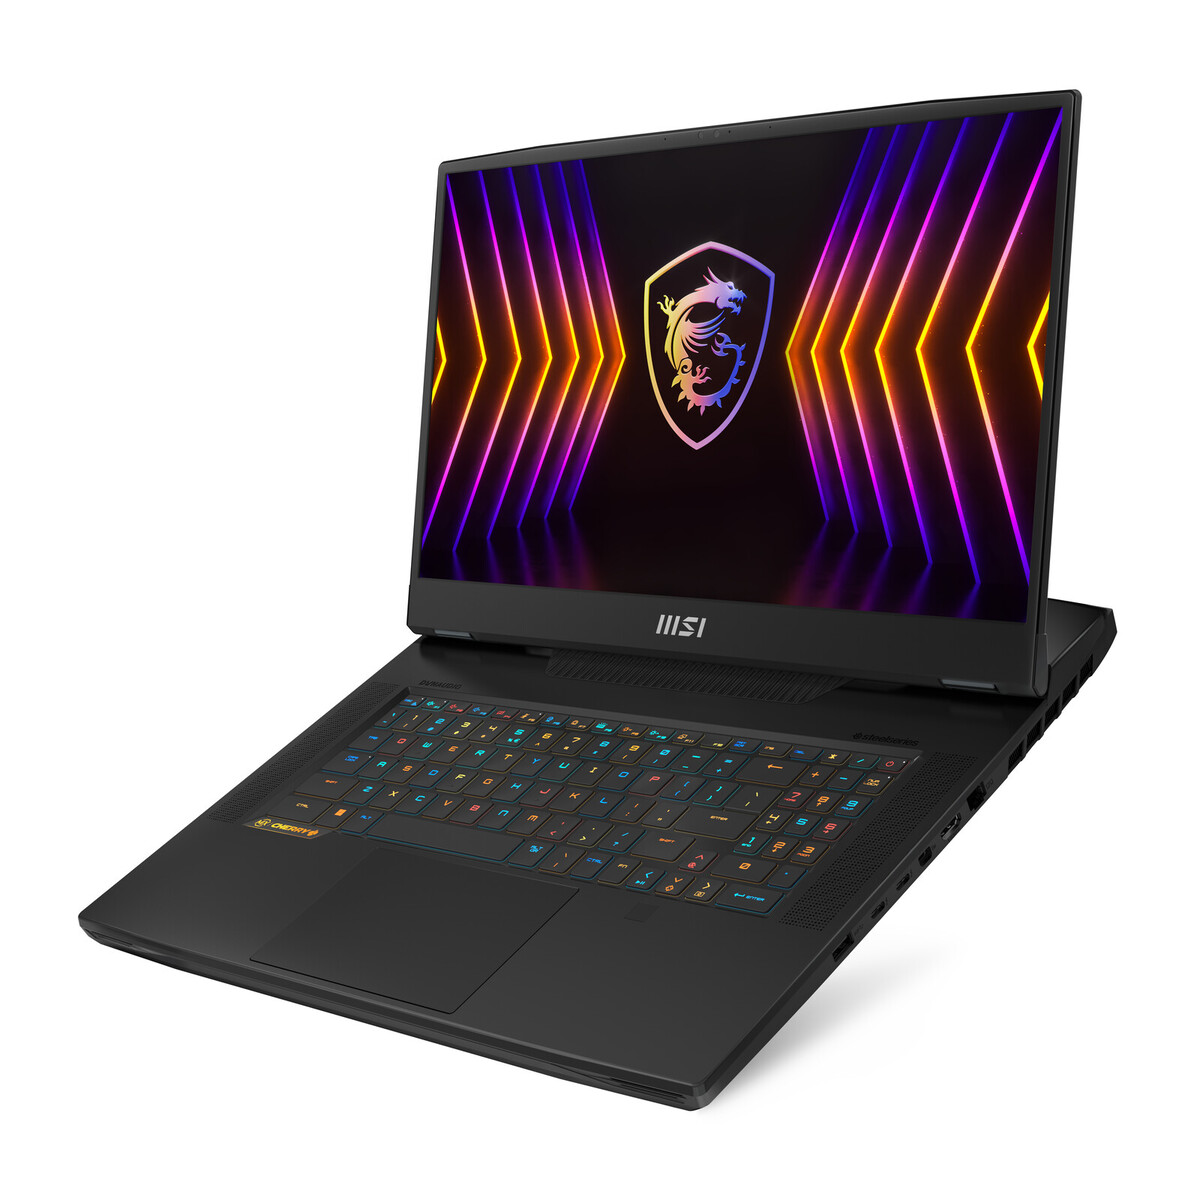
外壳:明显比泰坦GT76更薄
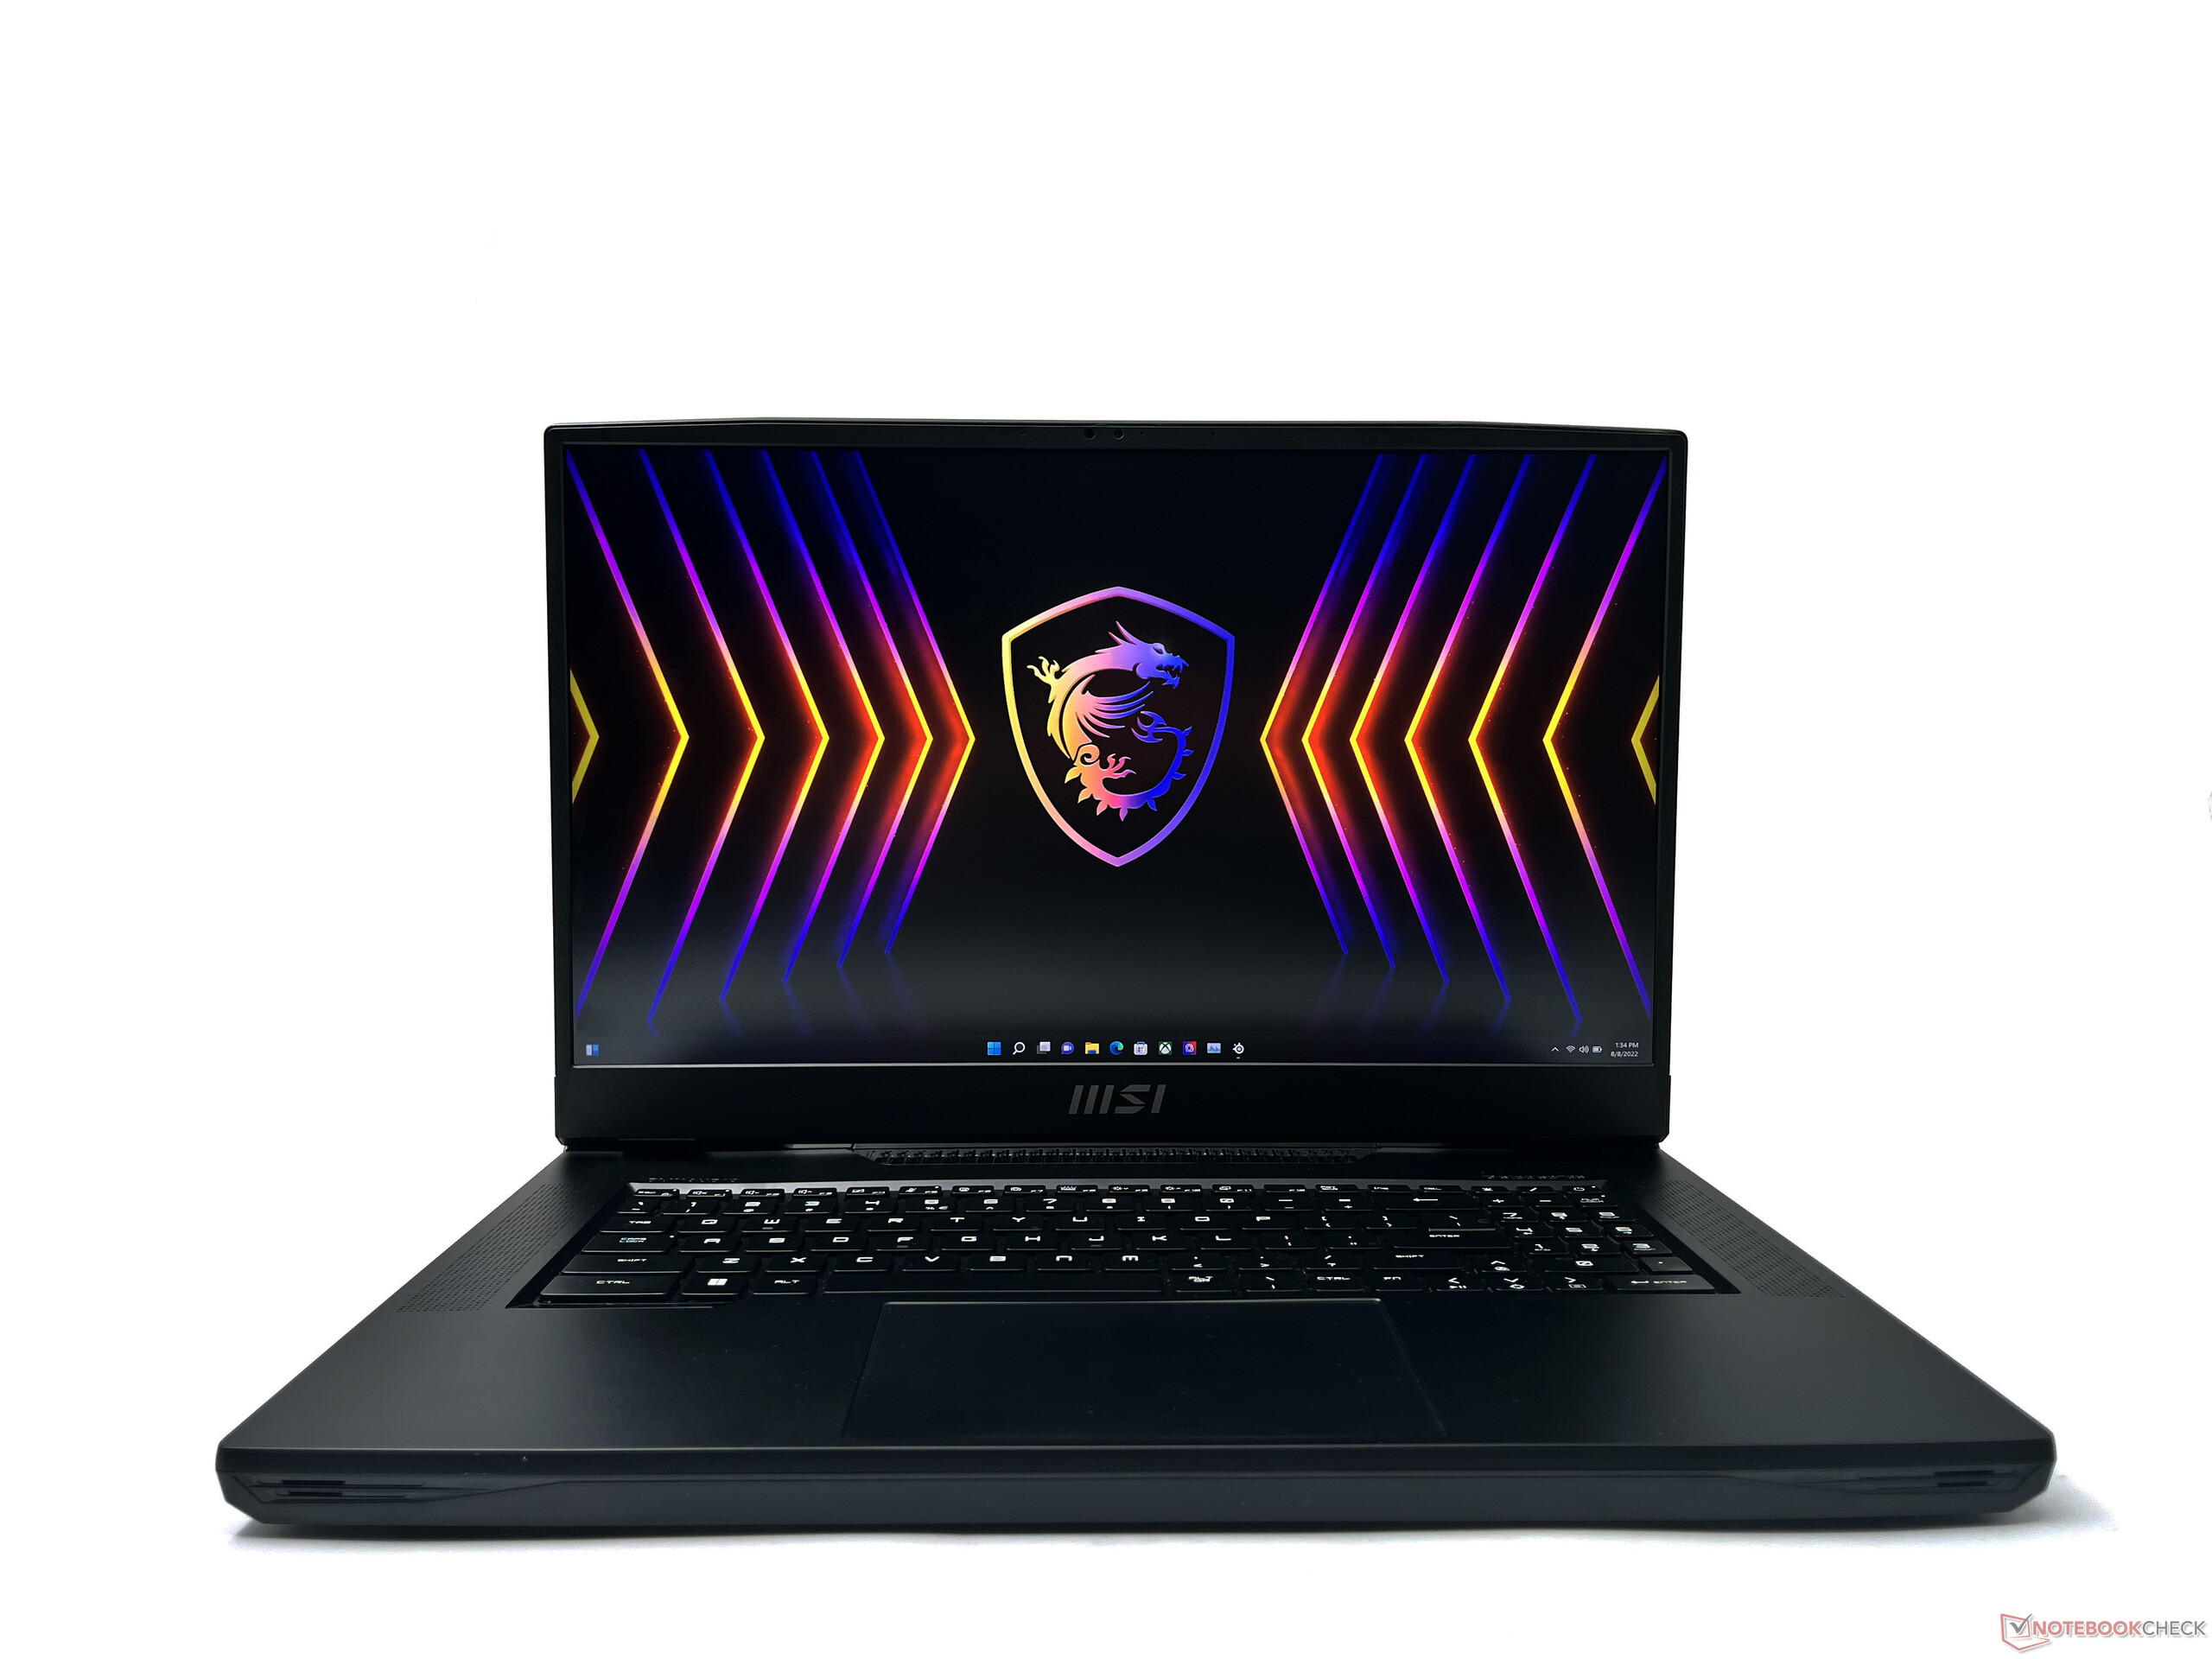
Titan GT77确实继承了老款Titan GT76的设计语言元素,但有一些明显的变化。这款笔记本电脑采用了全黑设计,与Titan GT76的42毫米厚度相比只有23毫米。微星将大部分的处理和冷却技术装在机箱后部的突出部分,所以它确实为制造商减少整体厚度提供了一些空间。
机箱主要是塑料的,但感觉足够高级,有助于保持设备的重量。对于发烧级游戏笔记本电脑来说,其审美是相当令人愉悦的,第一眼看去没有太多玩家的偏心。不过,要准备好经常擦拭你的指纹。
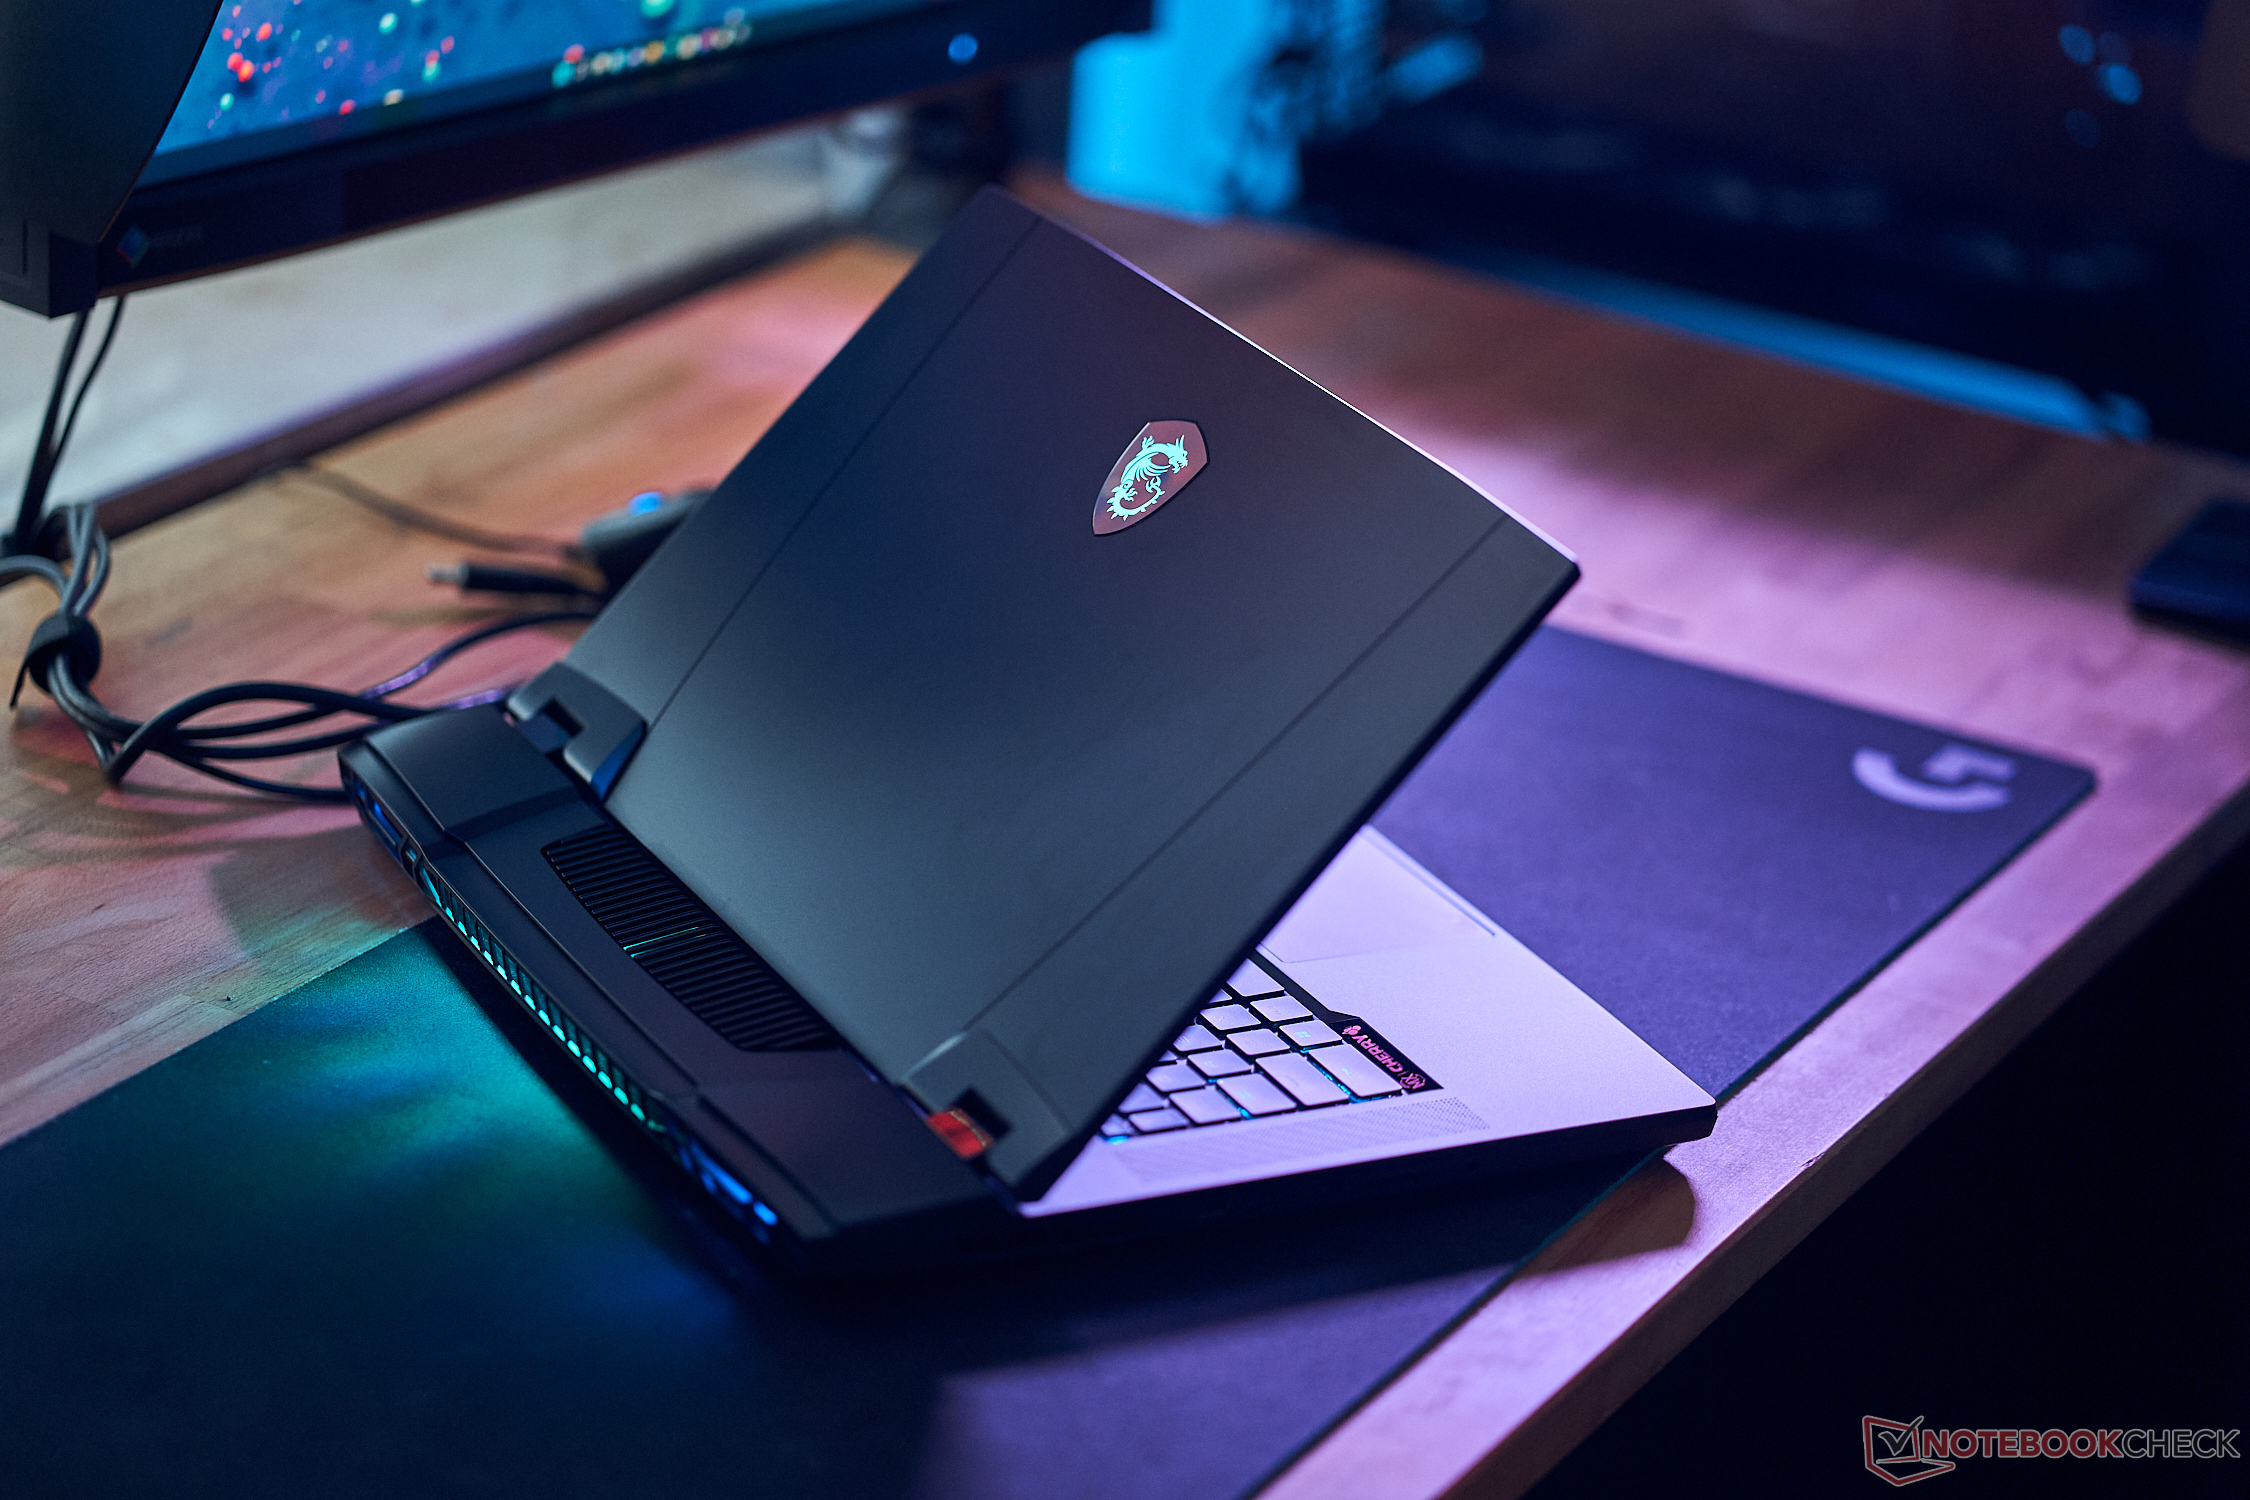
显示屏的盖子得到了一个铝制的表面,现在有一个微星的标志,在辉煌的RGB中闪闪发光。盖子可以用一个手指打开,而设备不会滑动。观察到盖子和键盘甲板都有一些弯曲,但在常规使用中并不明显。
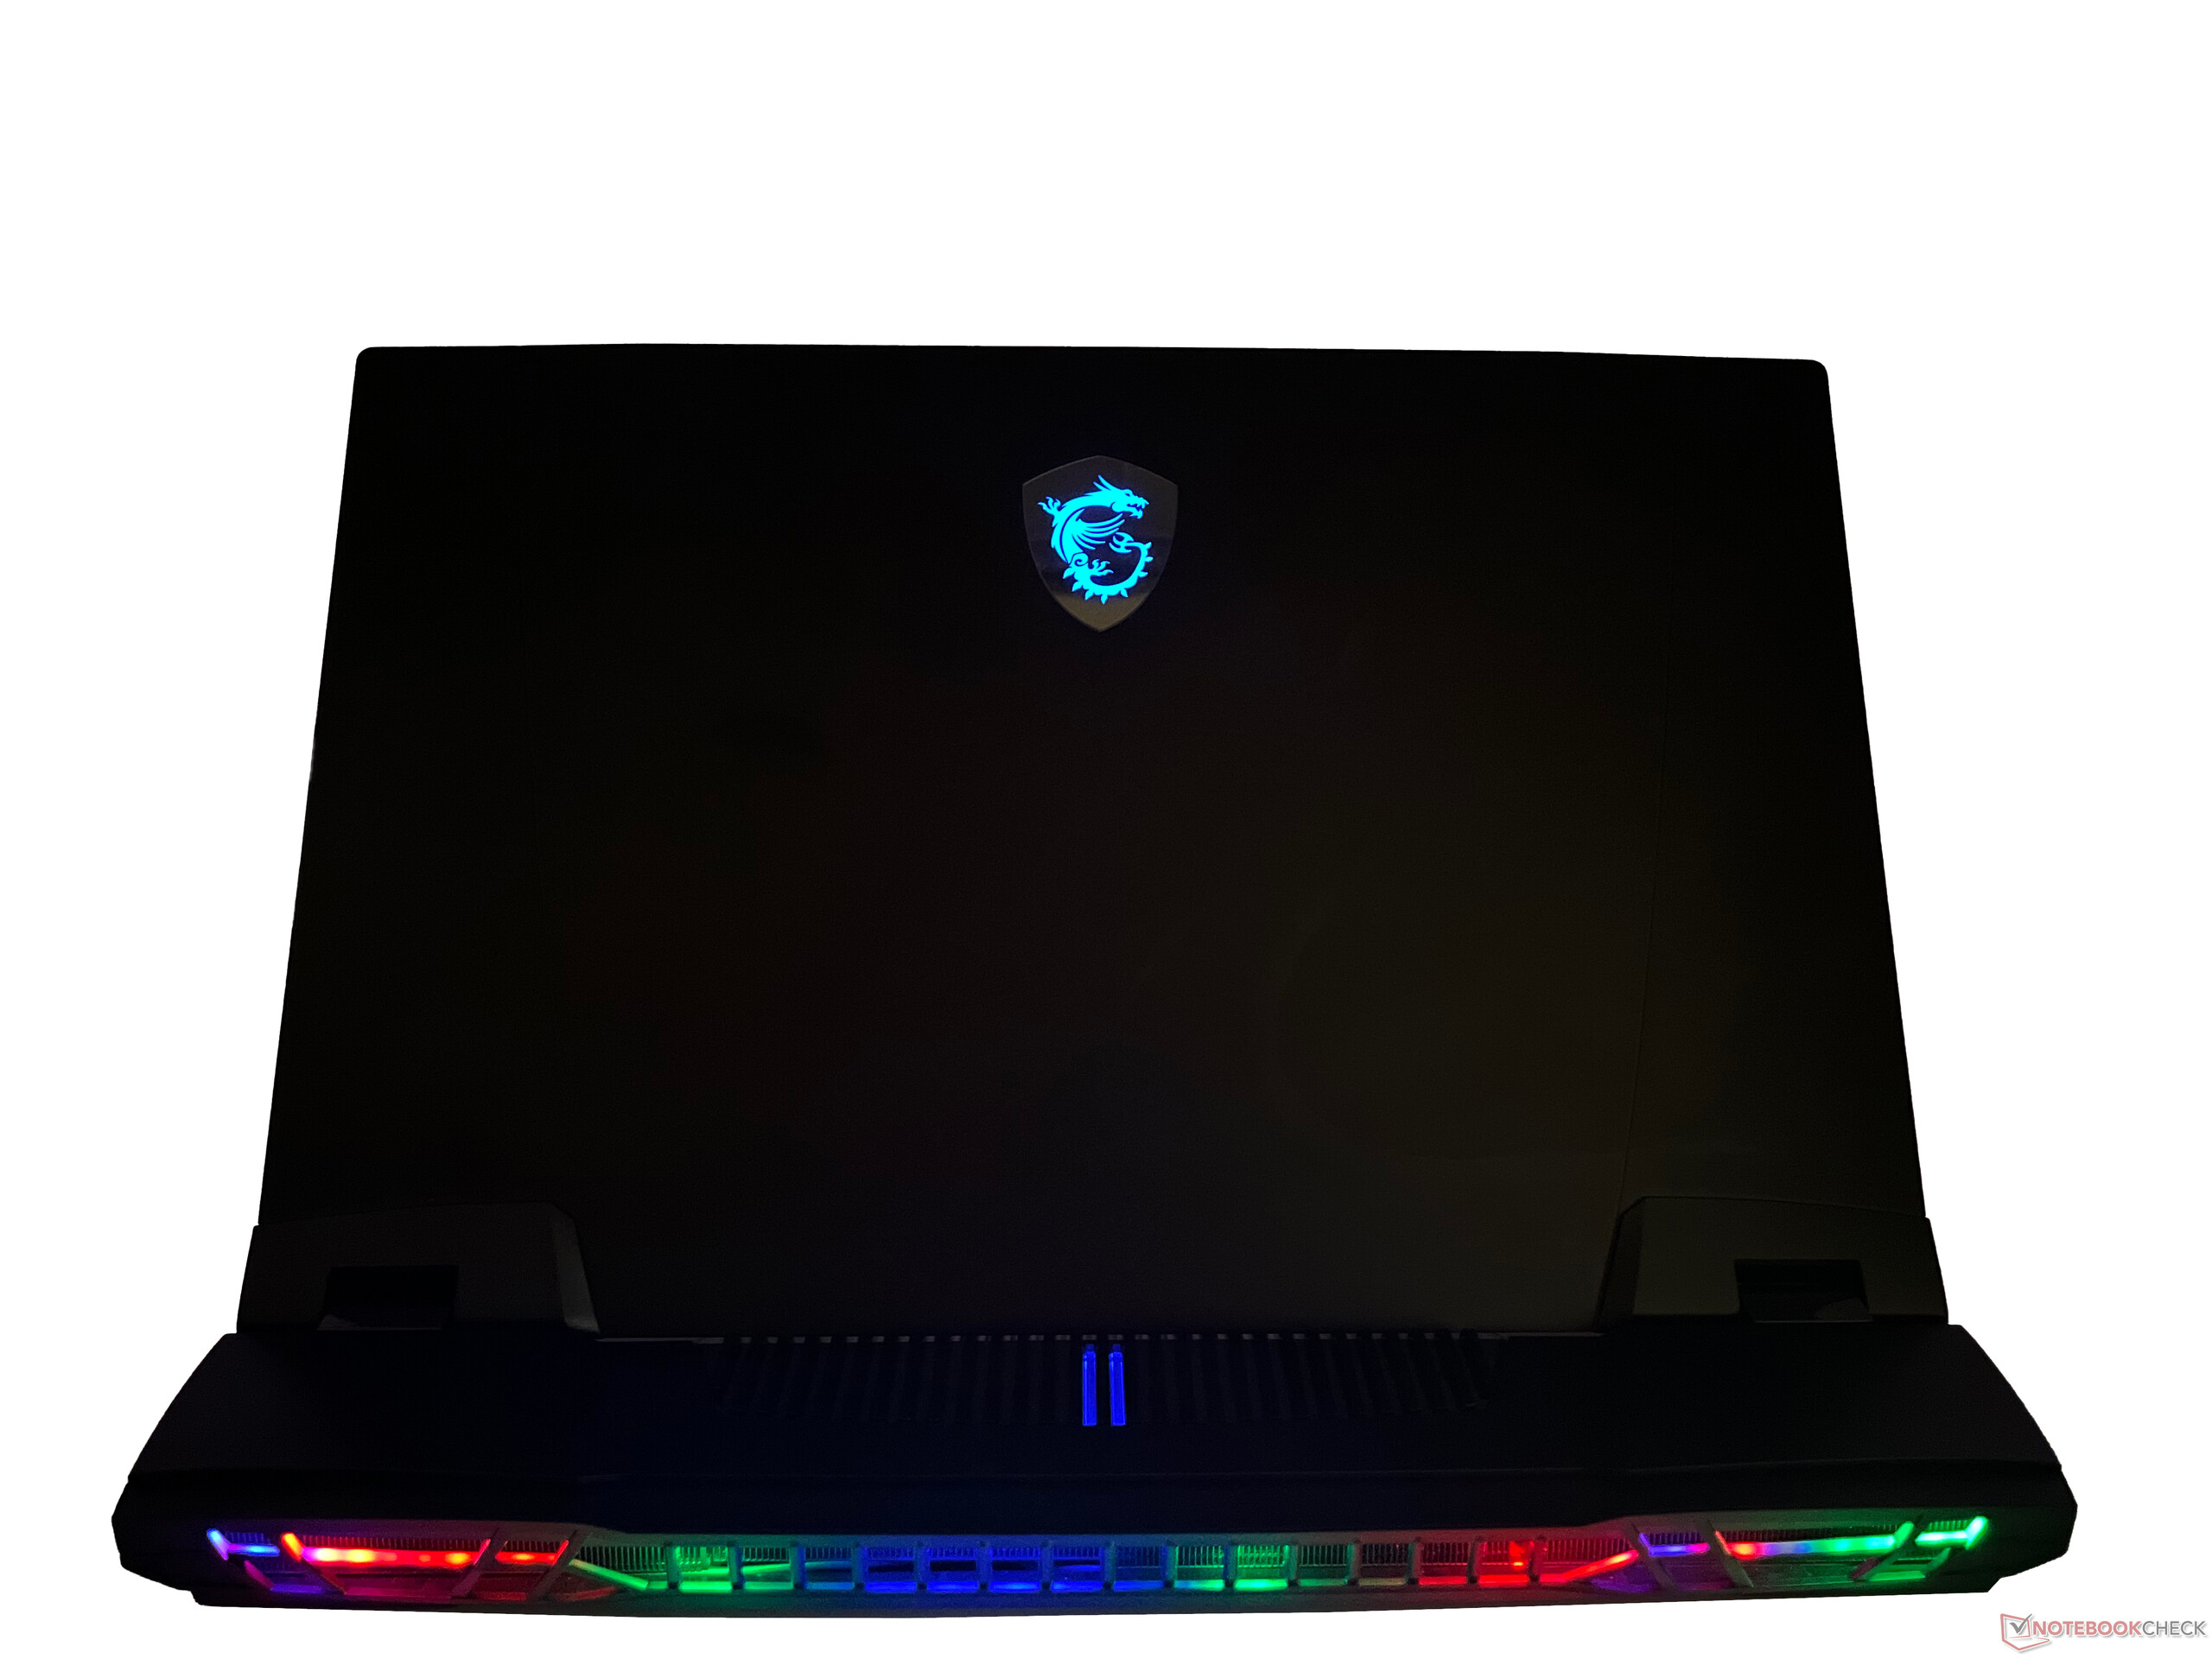
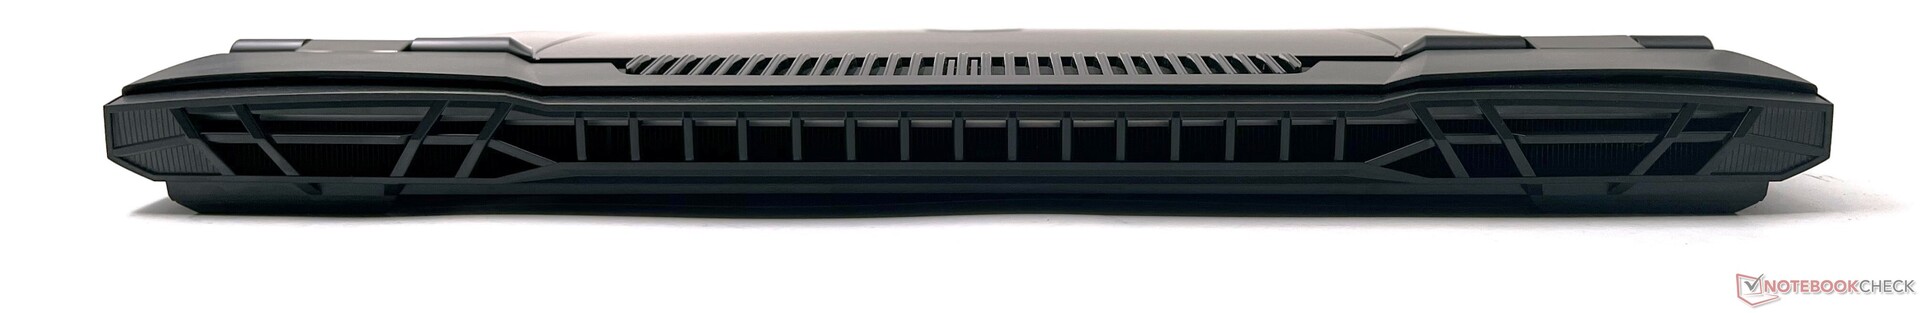
与GE76 Raider不同,前面没有RGB灯条。相反,微星在后部的排气口安装了大约27个RGB LED。在显示器后面的后部进气孔上也有一个短的、平行的RGB条。还有两个排气口,分别在笔记本电脑的两侧。
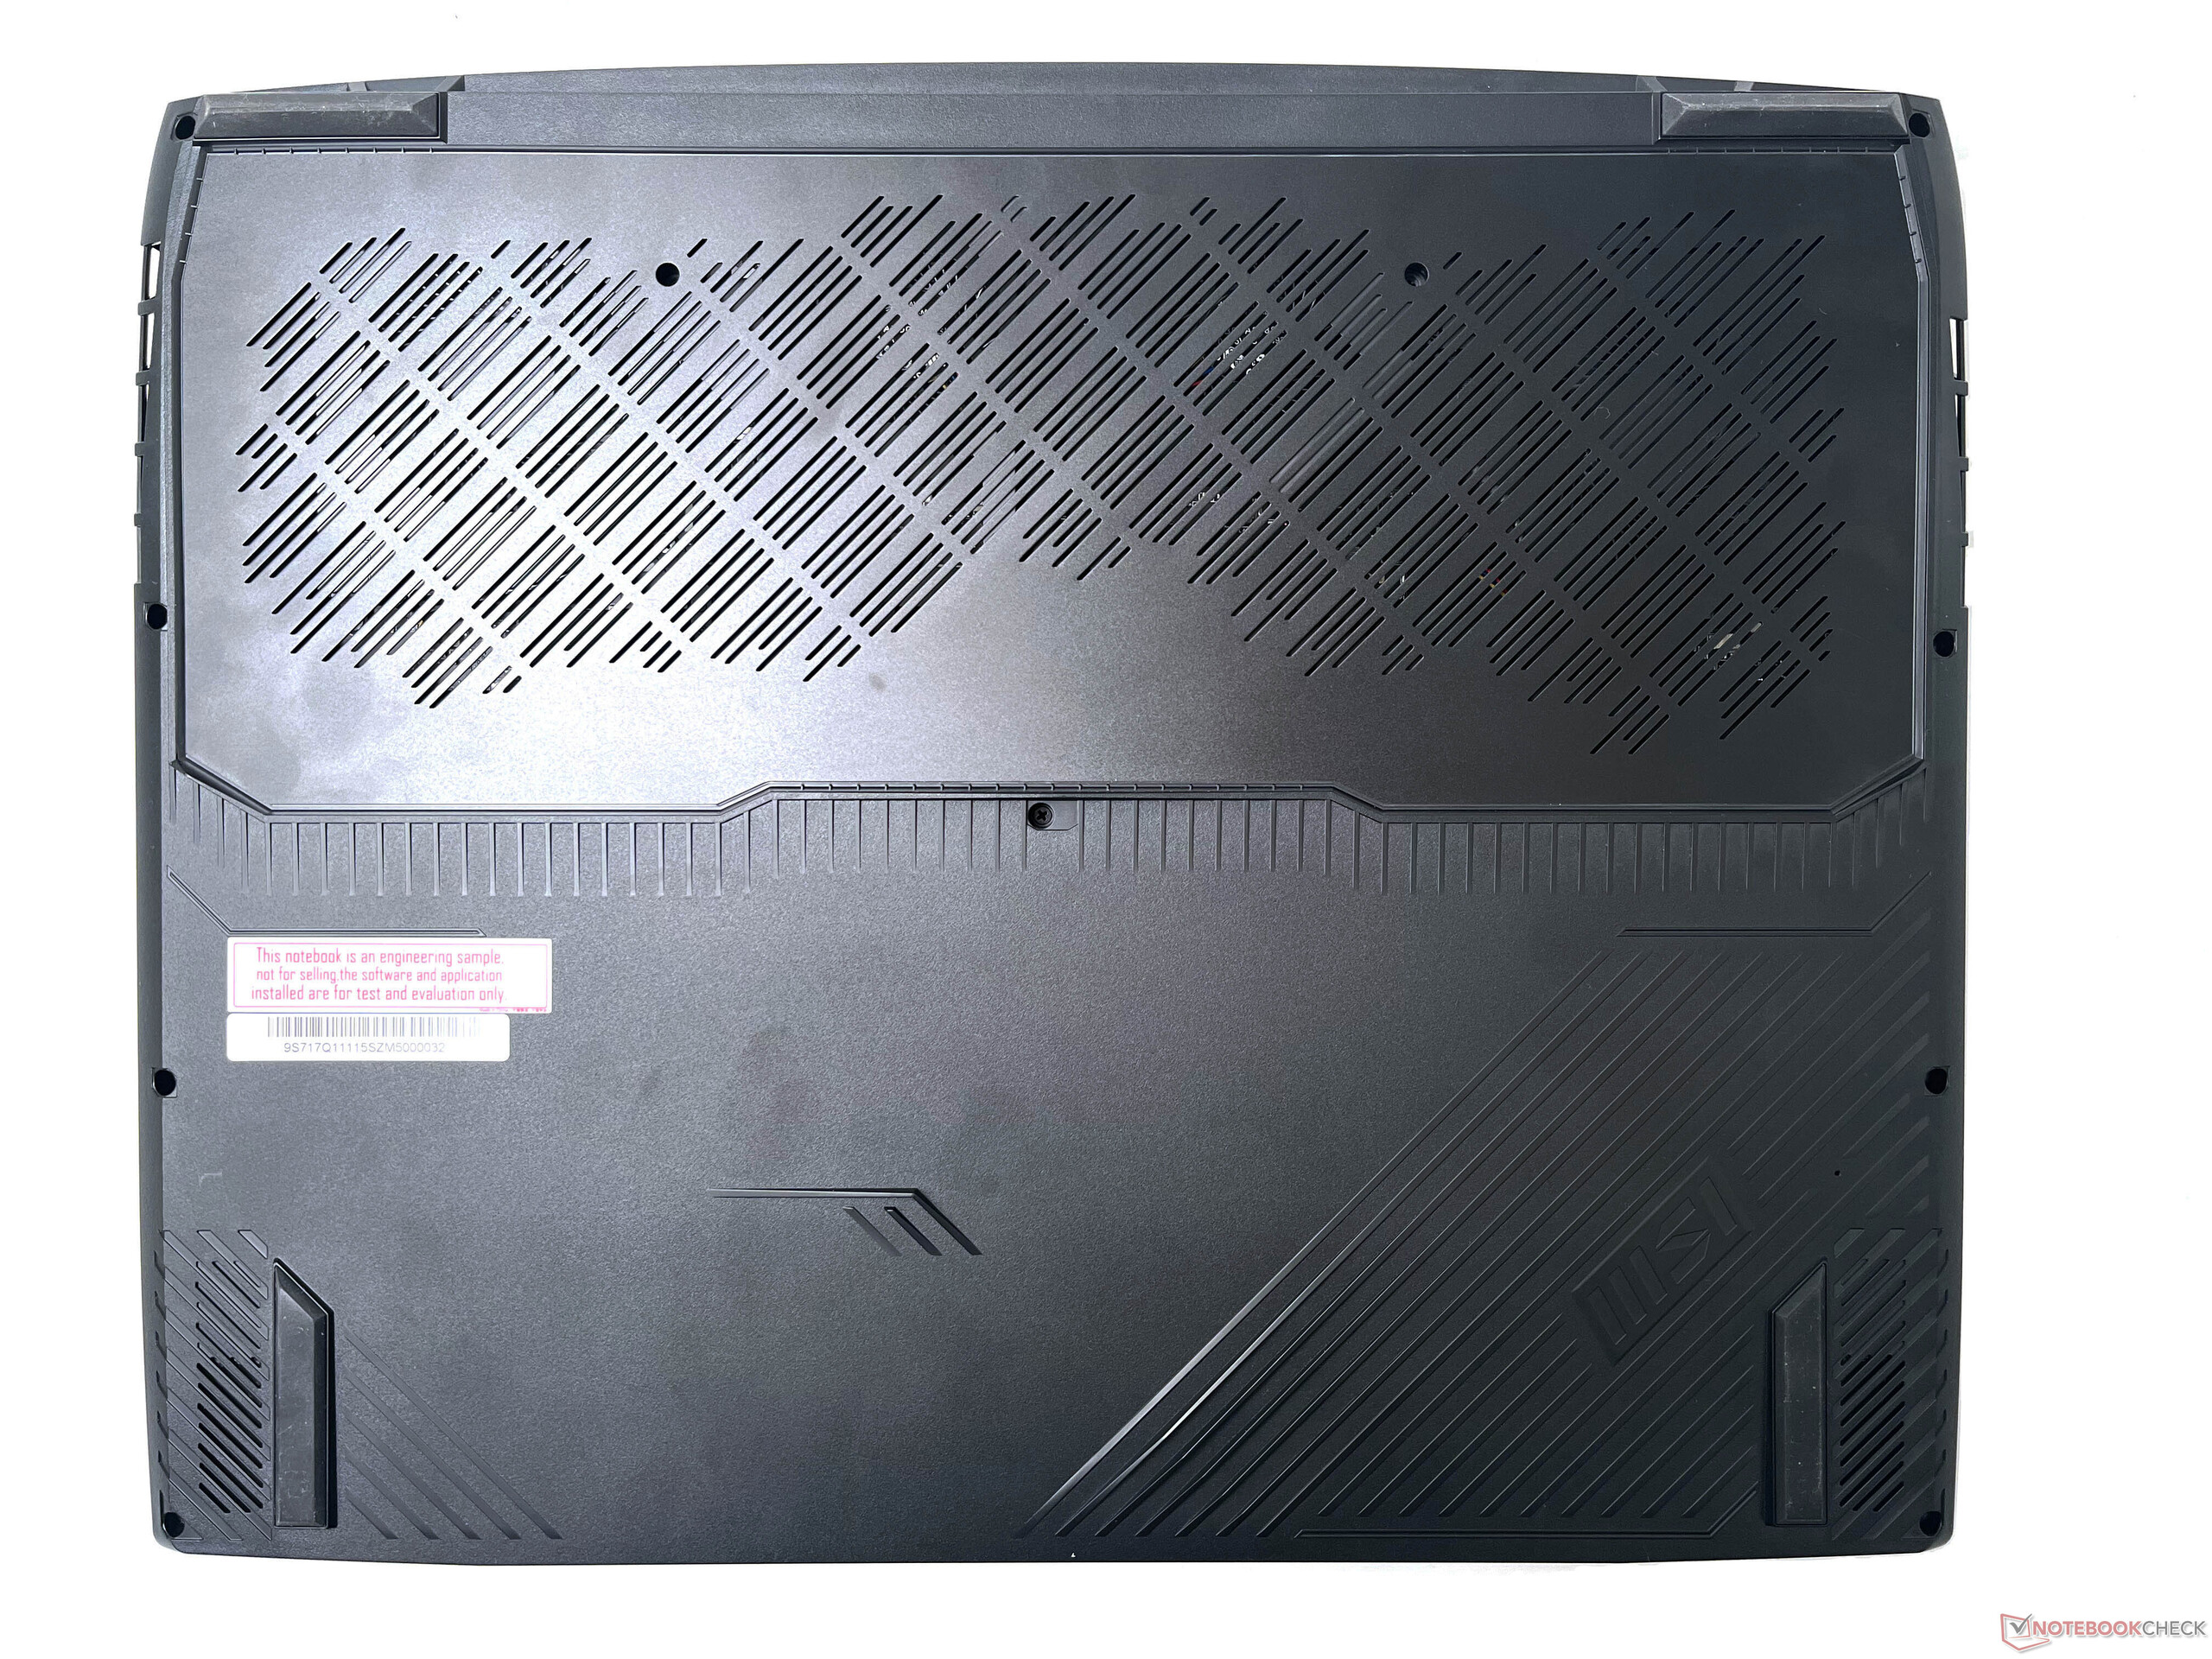
底部面板可能是机箱最薄弱的部分,与外壳的其他部分相比,其结构似乎不合格。考虑到你不会经常与底盖互动,这一点也许可以被忽略。不过,它确实提供了大量的进气孔。
总的来说,微星泰坦GT77有一个坚实的结构,与以前的泰坦相比,它的便携性有了可喜的改善。
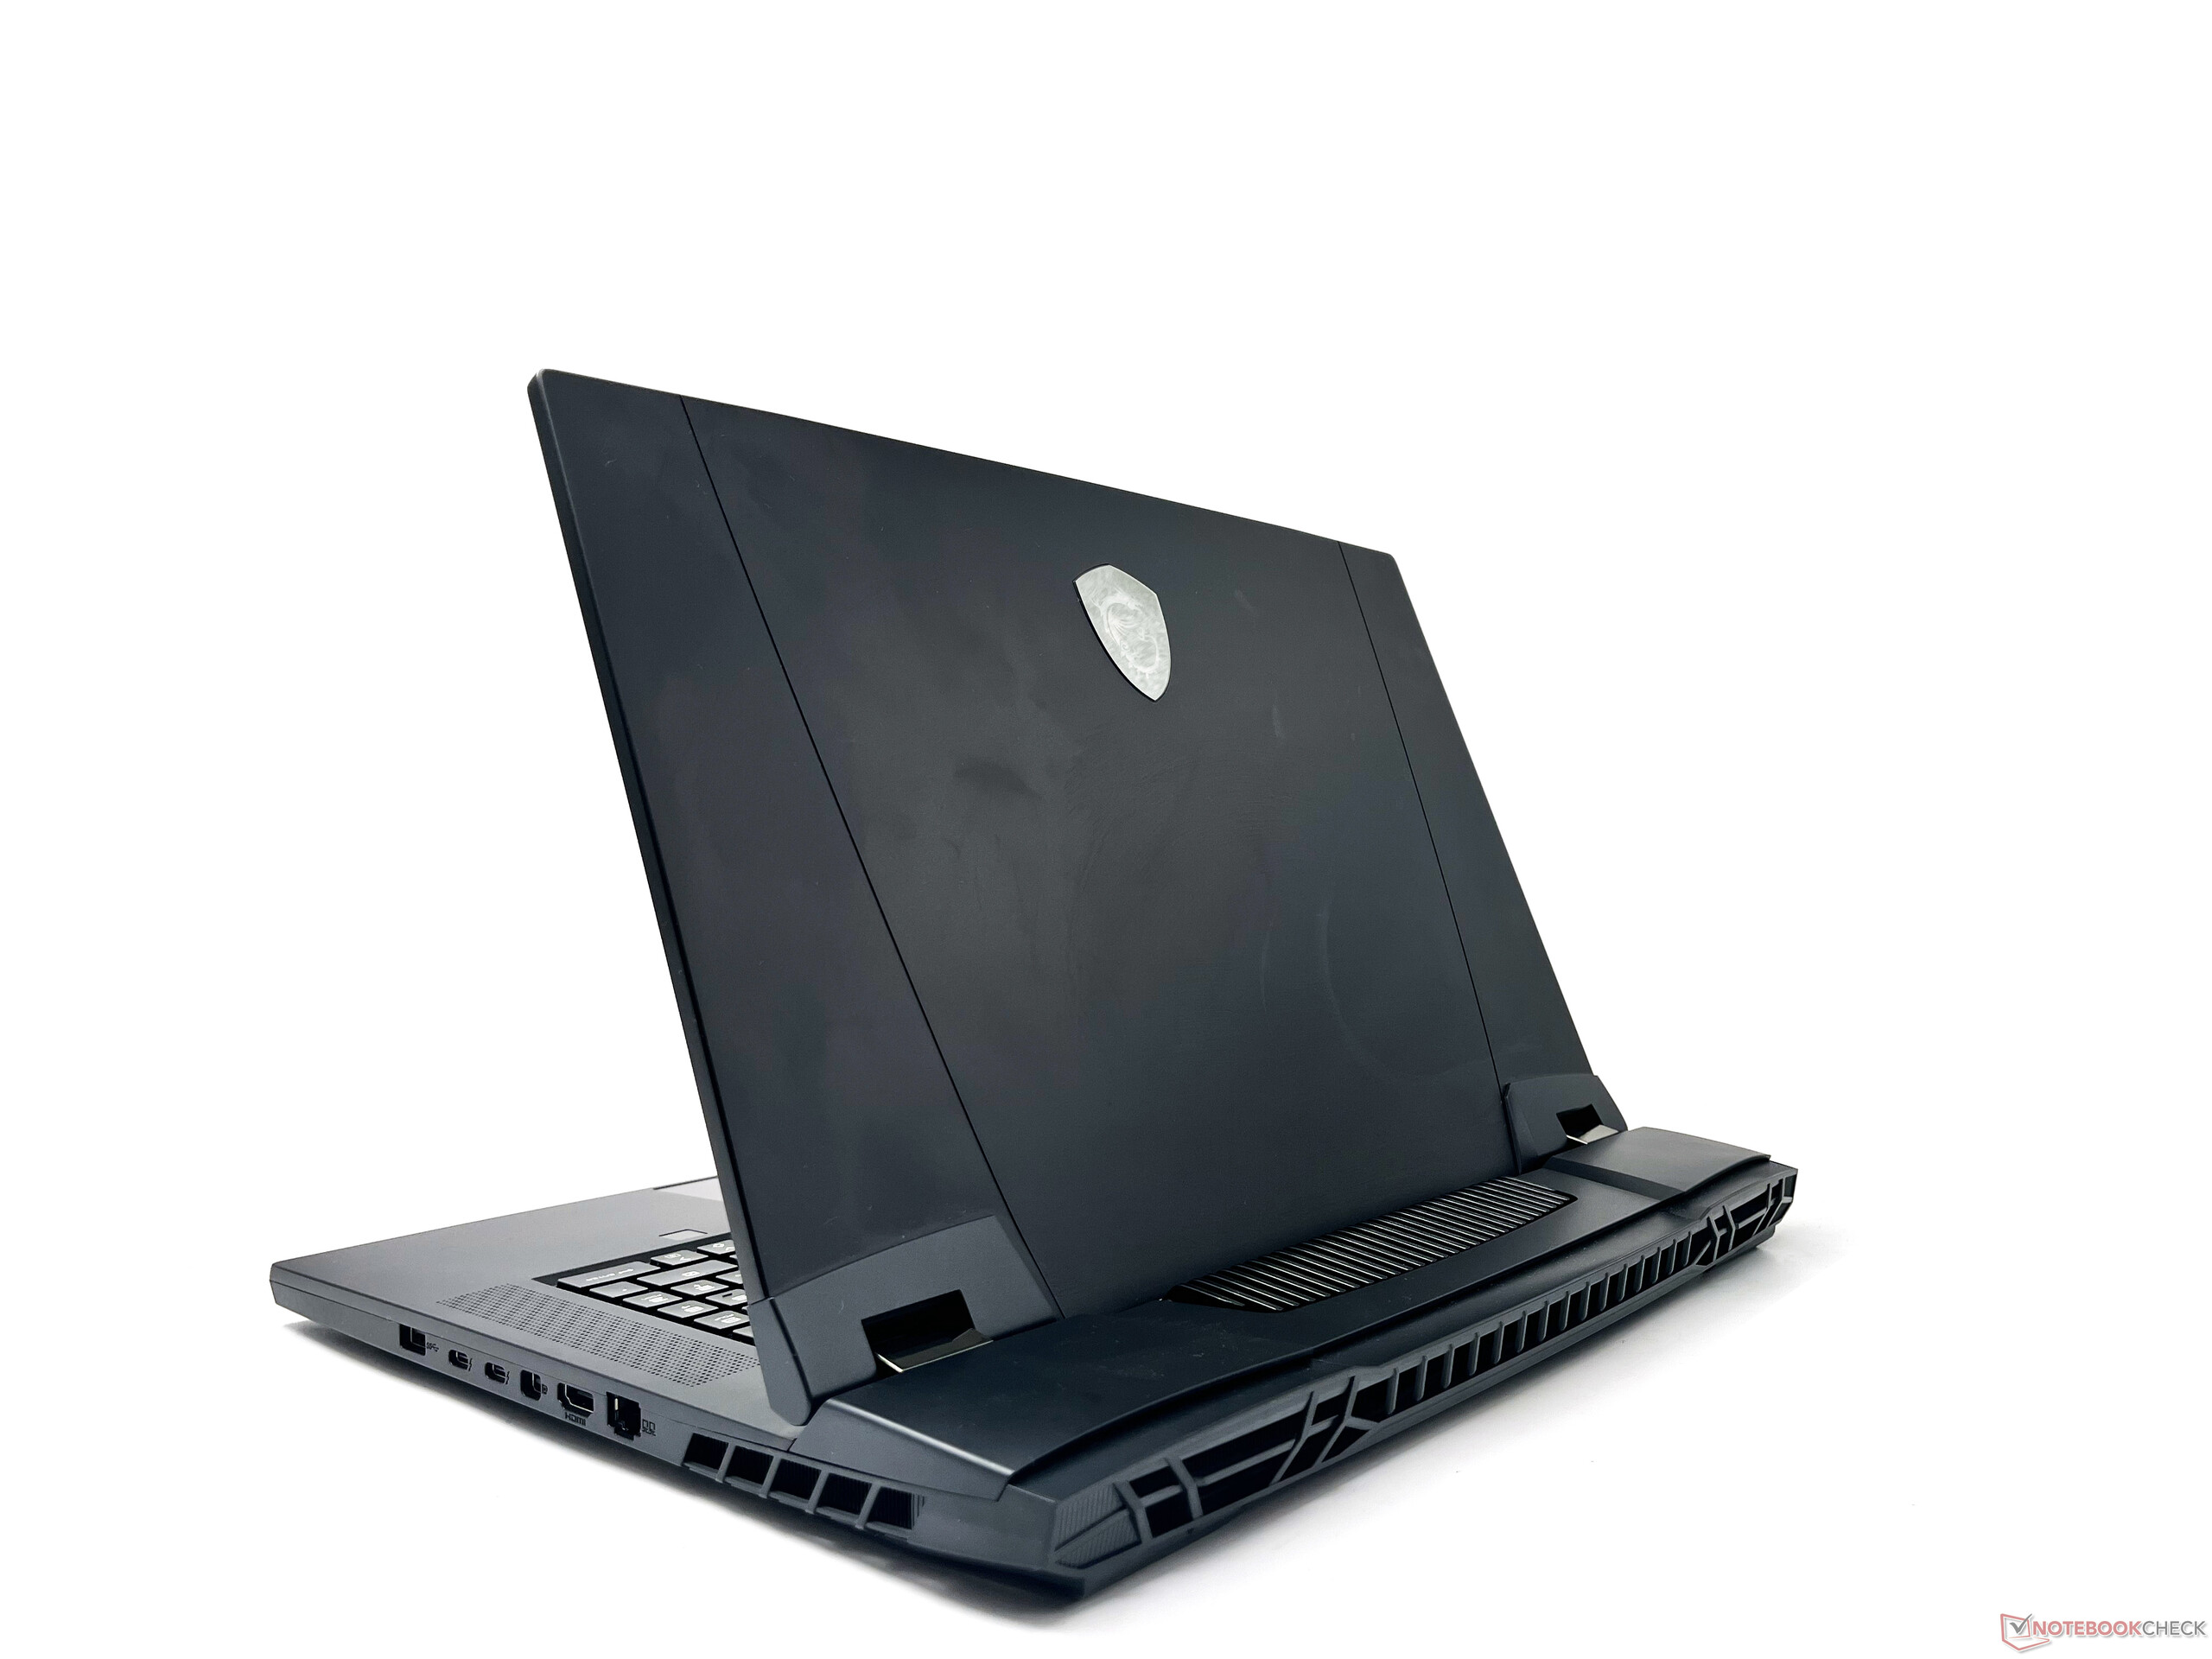
连接性。充足的端口选择,带有全尺寸SD读卡器和Wi-Fi 6E
与Titan GT76相比,Titan GT77提供了一个略有不同但足够的端口选择。此外,它实现了你期望在2022年的发烧级游戏笔记本电脑中找到的最新连接标准。
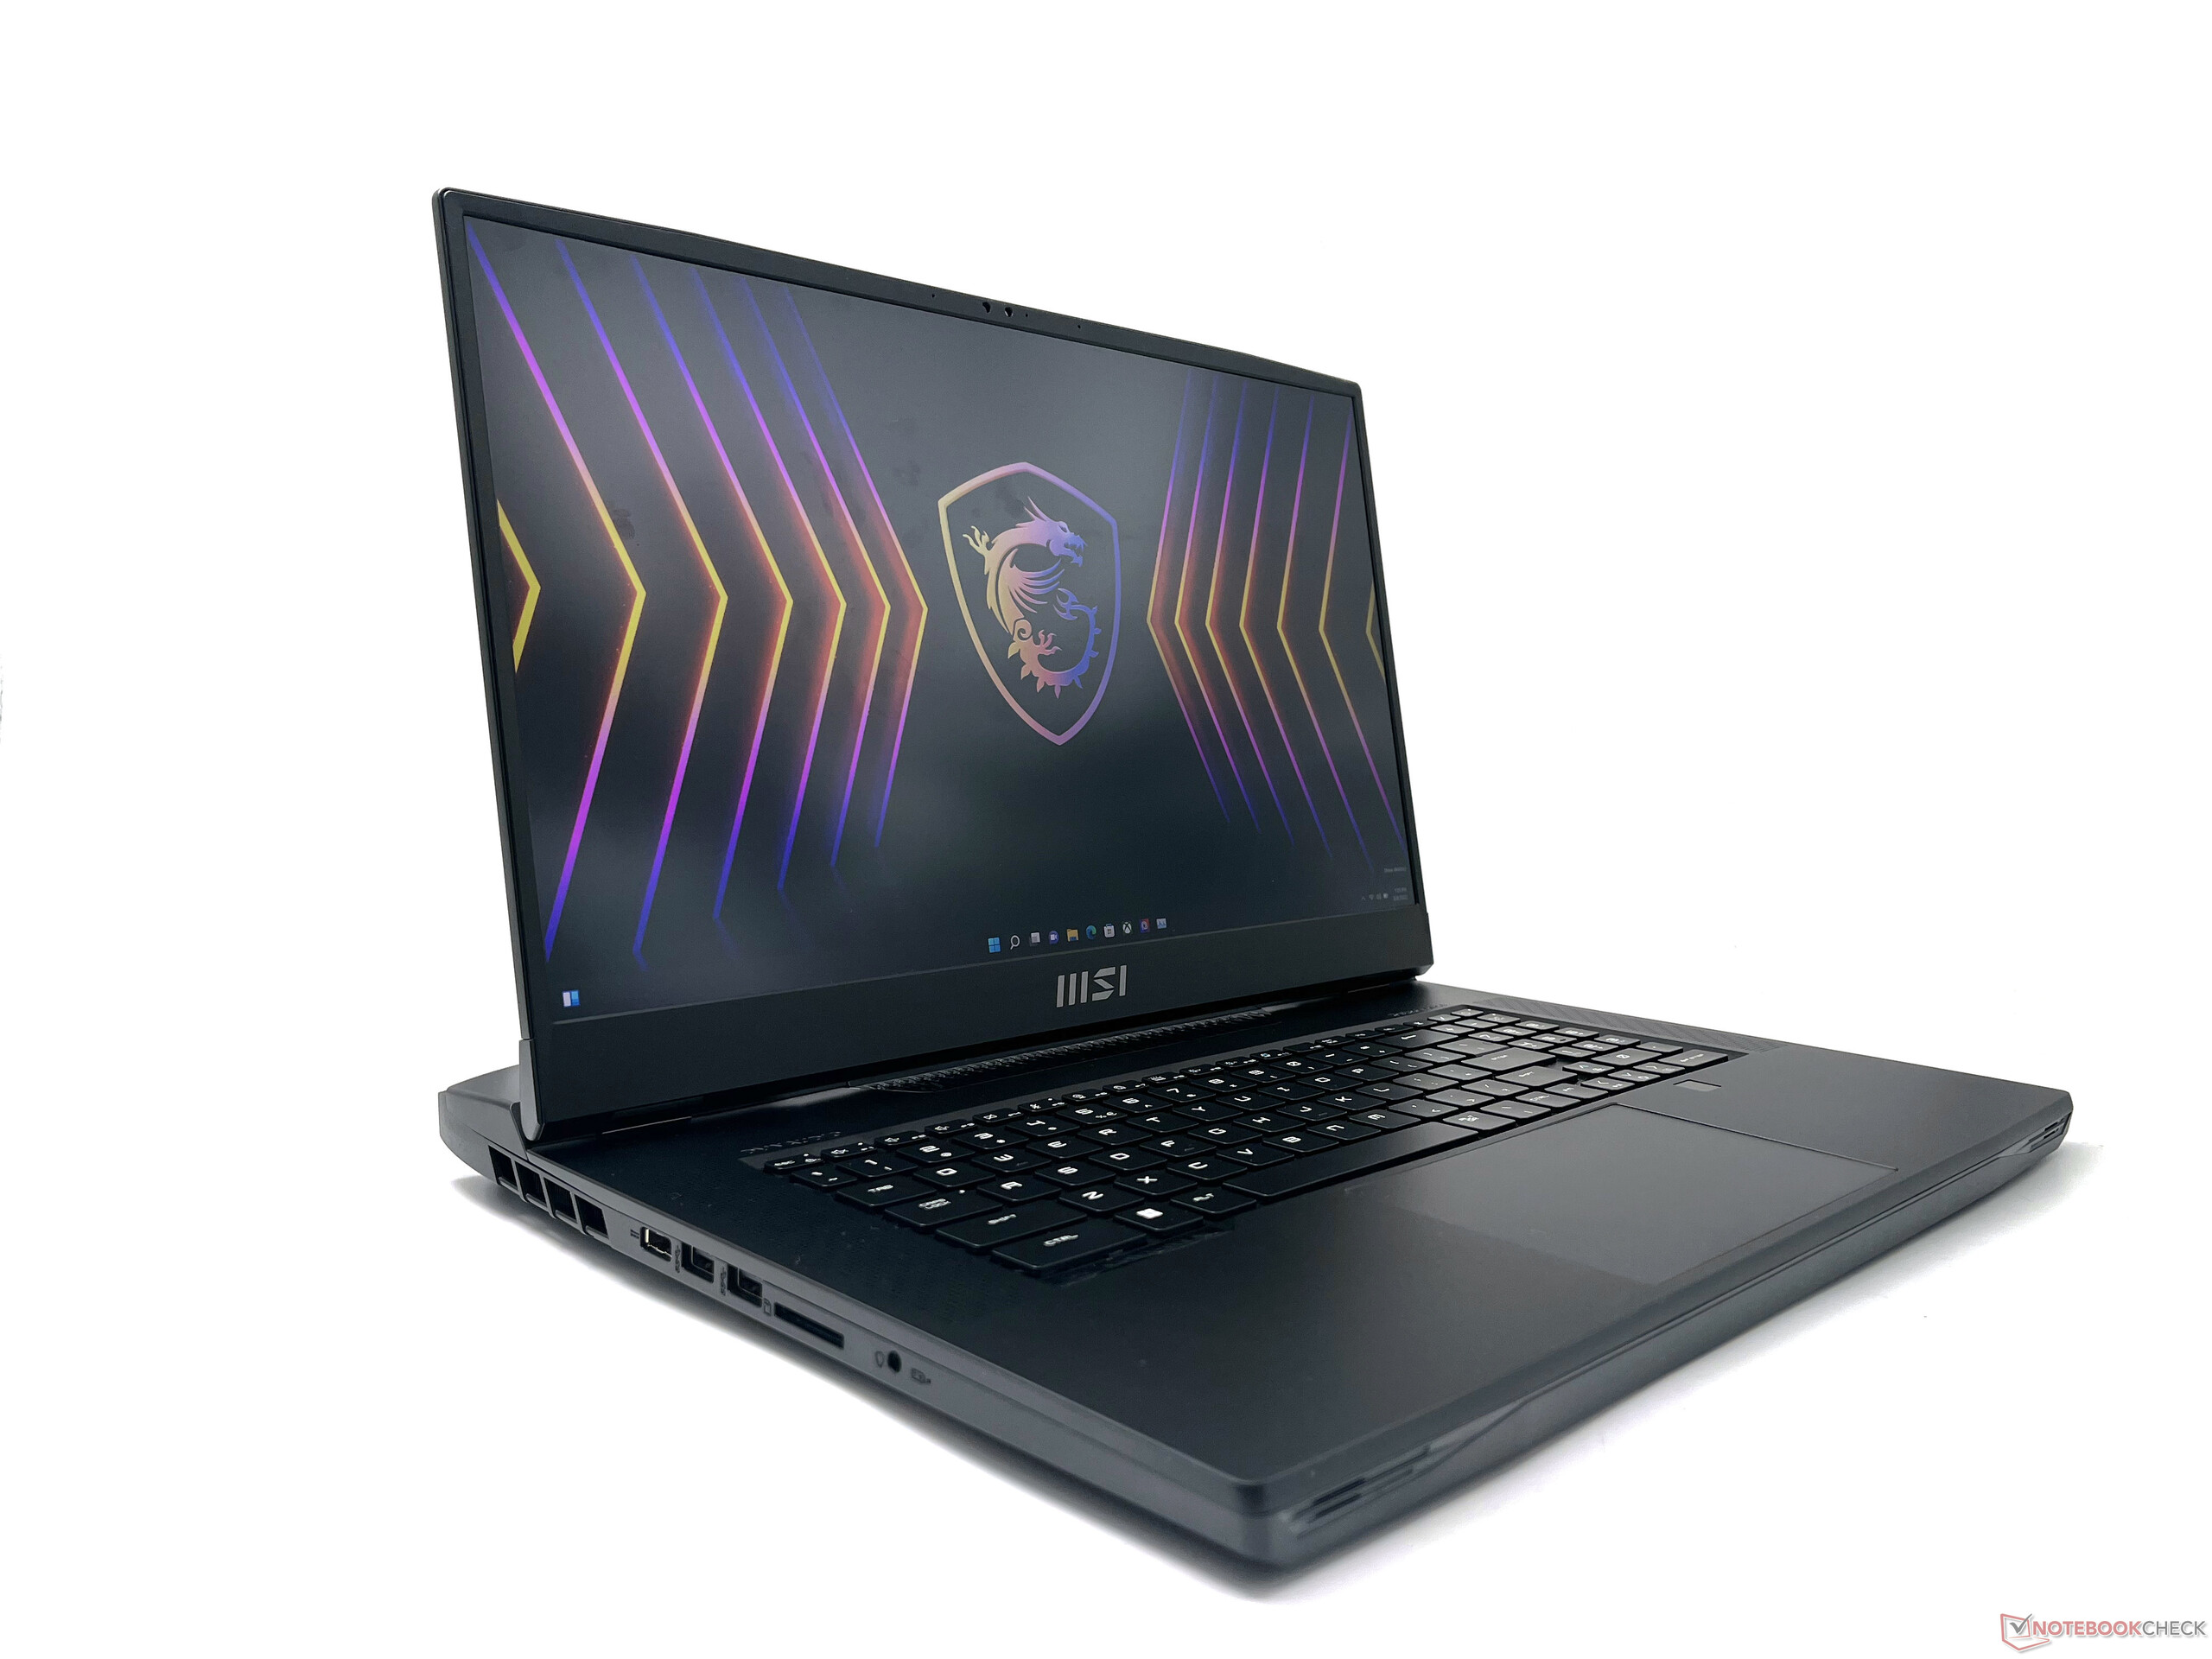
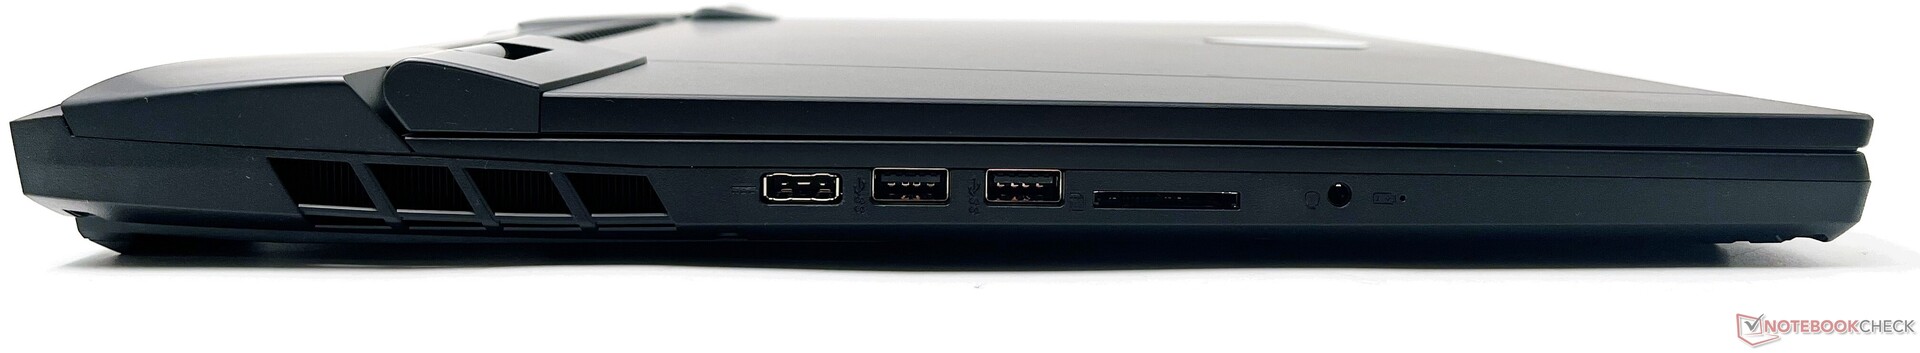
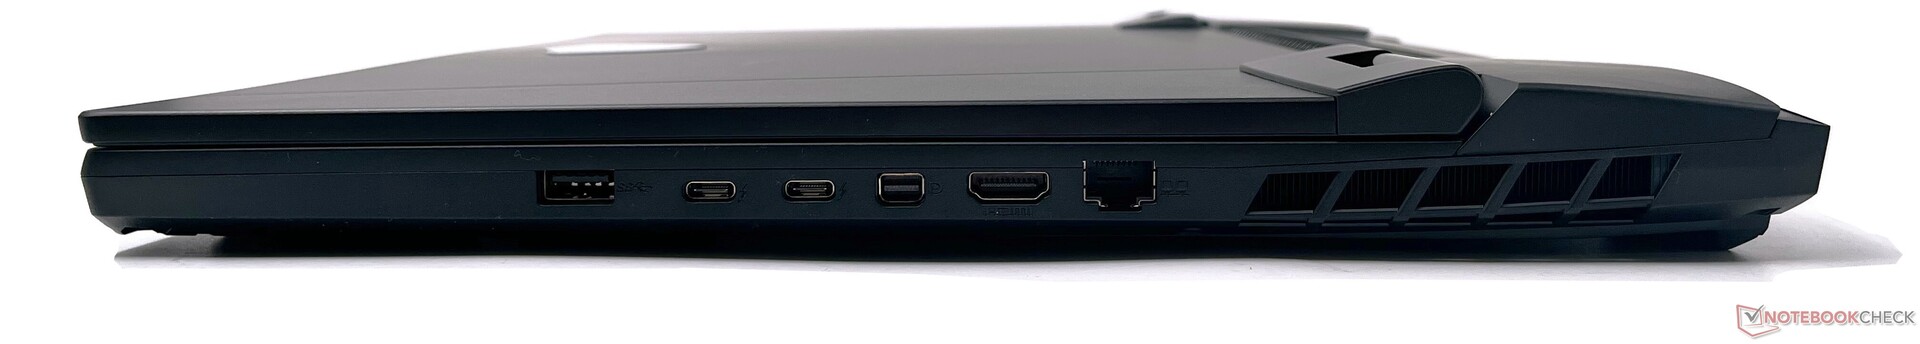
在左边,我们有微星专有的DC-in端口,2个USB 3.2 Gen2 Type-A端口,一个全尺寸的UHS-III SD Express读卡器,以及一个组合音频插孔。这次没有提供单独的麦克风输入端口。在右边,我们有另一个USB 3.2 Gen2 Type-A端口,2个Thunderbolt 4端口,一个mini-DisplayPort输出,HDMI输出,支持高达4K 120 Hz或8K 60 Hz,以及一个2.5 GbE RJ-45端口。
这些端口的位置很方便,不会妨碍外围的连接。没有Kensington锁插槽可用。
SD卡阅读器
Titan GT77终于提供了一个全尺寸的SD卡插槽,这是一个受欢迎的发展。该读卡器的速度明显比Raider GE77的读卡器快。 突袭者GE77 HX 12UHS但在竞争中落后于其他人。
| SD Card Reader | |
| average JPG Copy Test (av. of 3 runs) | |
| Alienware x17 R2 P48E (AV Pro V60) | |
| Asus ROG Zephyrus Duo 16 GX650RX (AV PRO microSD 128 GB V60) | |
| Average of class Gaming (20.9 - 210, n=54, last 2 years) | |
| MSI GE67 HX 12UGS (Toshiba Exceria Pro SDXC 64 GB UHS-II) | |
| MSI GE76 Raider (AV PRO microSD 128 GB V60) | |
| MSI Titan GT77 12UHS (AV PRO microSD 128 GB V60) | |
| MSI Raider GE77 HX 12UHS (AV PRO microSD 128 GB V60) | |
| maximum AS SSD Seq Read Test (1GB) | |
| Alienware x17 R2 P48E (AV Pro V60) | |
| Asus ROG Zephyrus Duo 16 GX650RX (AV PRO microSD 128 GB V60) | |
| Average of class Gaming (25.5 - 261, n=51, last 2 years) | |
| MSI Titan GT77 12UHS (AV PRO microSD 128 GB V60) | |
| MSI GE67 HX 12UGS (Toshiba Exceria Pro SDXC 64 GB UHS-II) | |
沟通
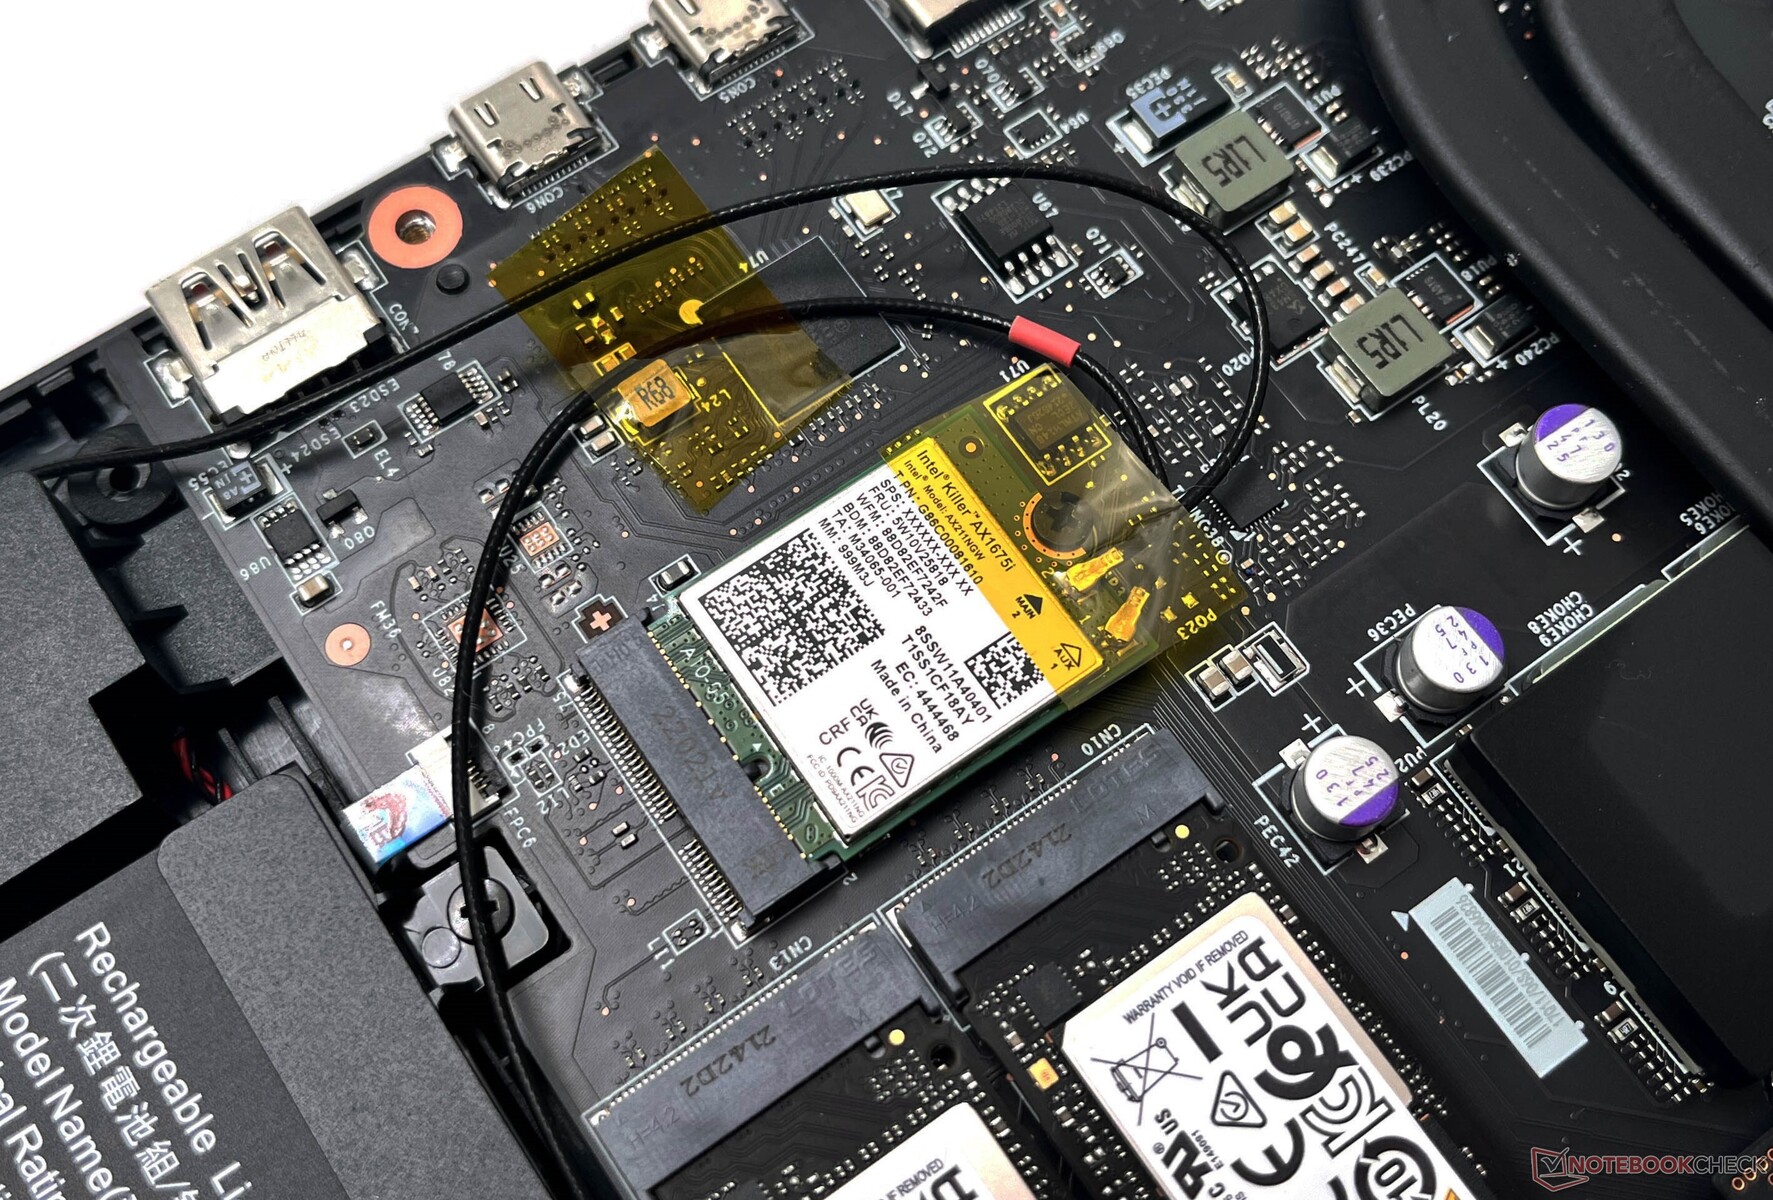
我们的泰坦GT77装置配备了一个杀手Wi-Fi 6E AX1675i WLAN卡。在与我们参考的华硕ROG Rapture GT-AXE11000路由器一起测试时,Wi-Fi性能在5GHz和6GHz频段上一般都高于同类平均水平,吞吐量的下降幅度很小。
我们观察到,AX1675i的6GHz性能在平均吞吐量方面似乎没有比5GHz提供任何实际的好处。然而,如果你有一个支持6E的路由器,使用这个频段可能有助于提高峰值吞吐率。
网络摄像头
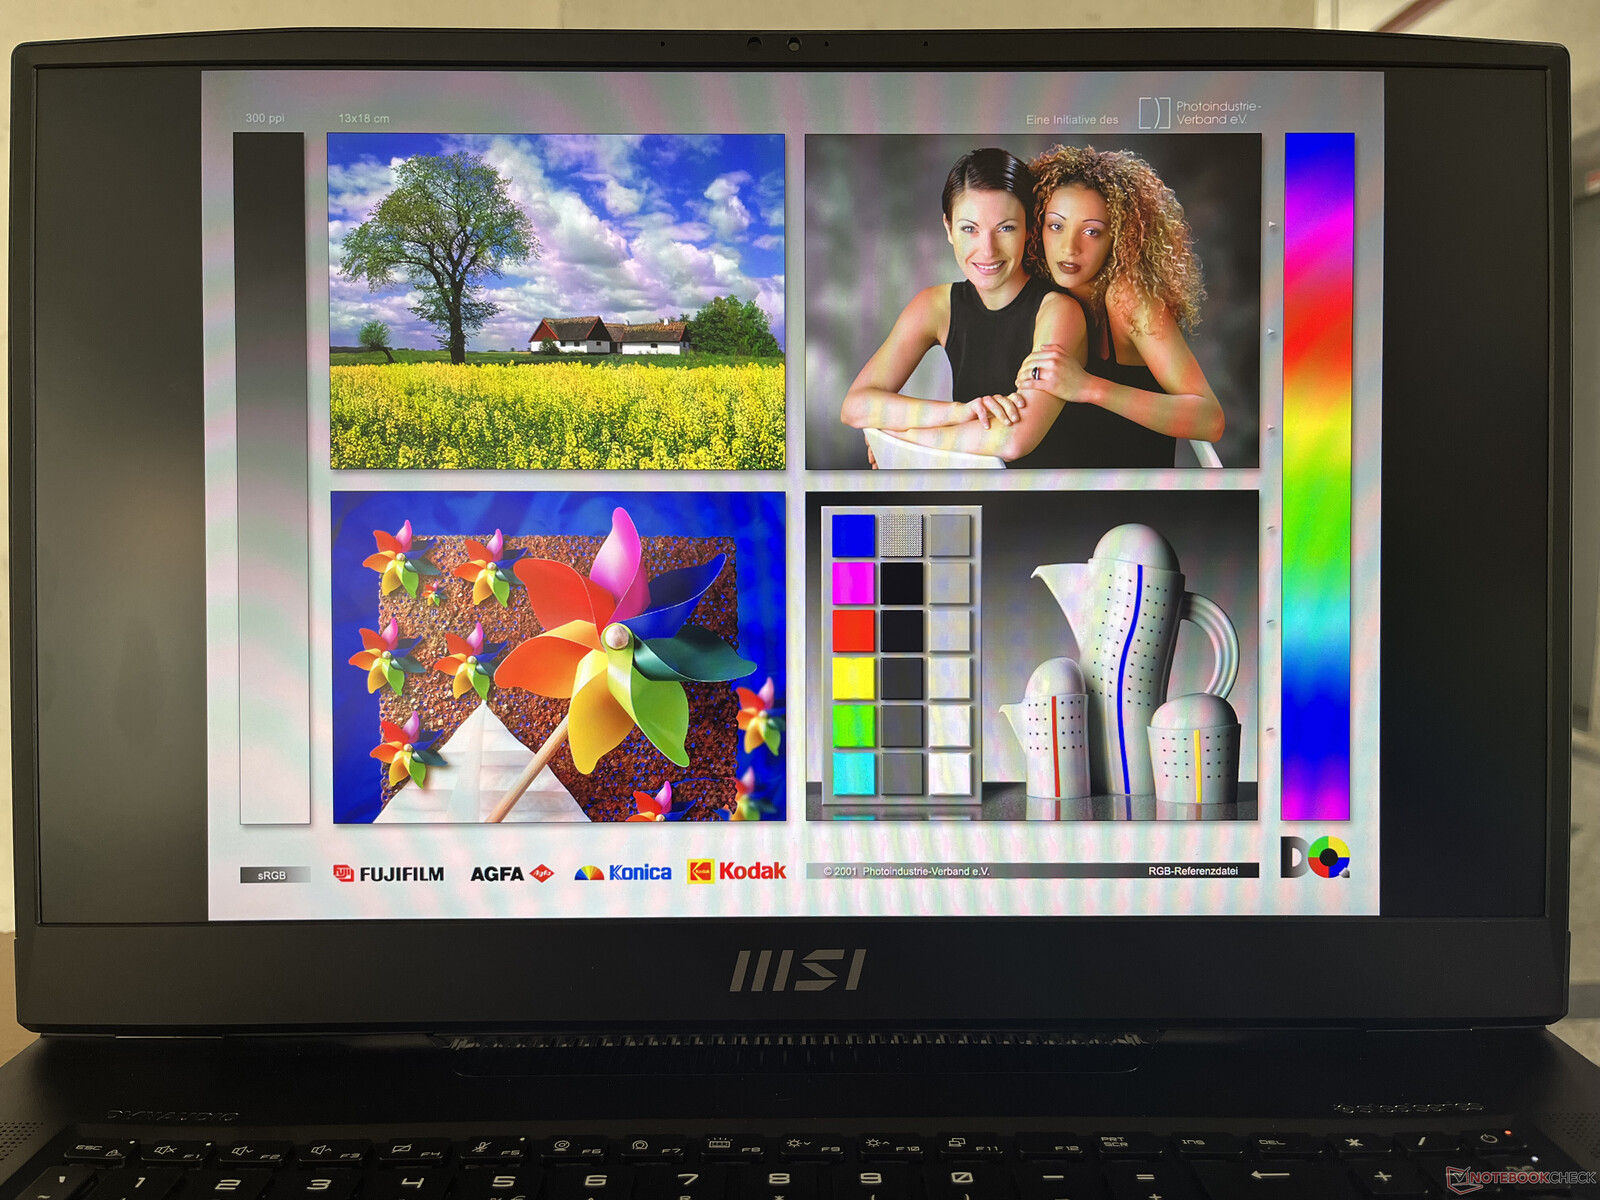
在游戏笔记本中发现糟糕的网络摄像头并不罕见,但是泰坦GT77的720p拍摄器对于一个2022年的设备来说表现相当糟糕。一个改进了的FHD网络摄像头可在 GE76 Raider 12U.
正如我们的ColorChecker Passport和下面的测试图所显示的那样,色彩准确度相当差,有很多噪音,即使在明亮的环境光线下,整体也缺乏清晰度。没有物理隐私快门,但网络摄像头可以使用键盘快捷键或通过微星中心切换开/关。


安全问题
泰坦GT77提供了与Windows Hello兼容的红外摄像头和基于指纹的生物识别技术,这在游戏笔记本中是非常罕见的。这两种形式的生物识别技术都很容易注册,而且速度相当快,反应灵敏。
此外,还存在一个TPM 2.0模块。
辅料
由于这是一个由英特尔播种的定制设备,除了巨大的330瓦电源砖之外,我们在盒子里没有发现任何额外的配件。
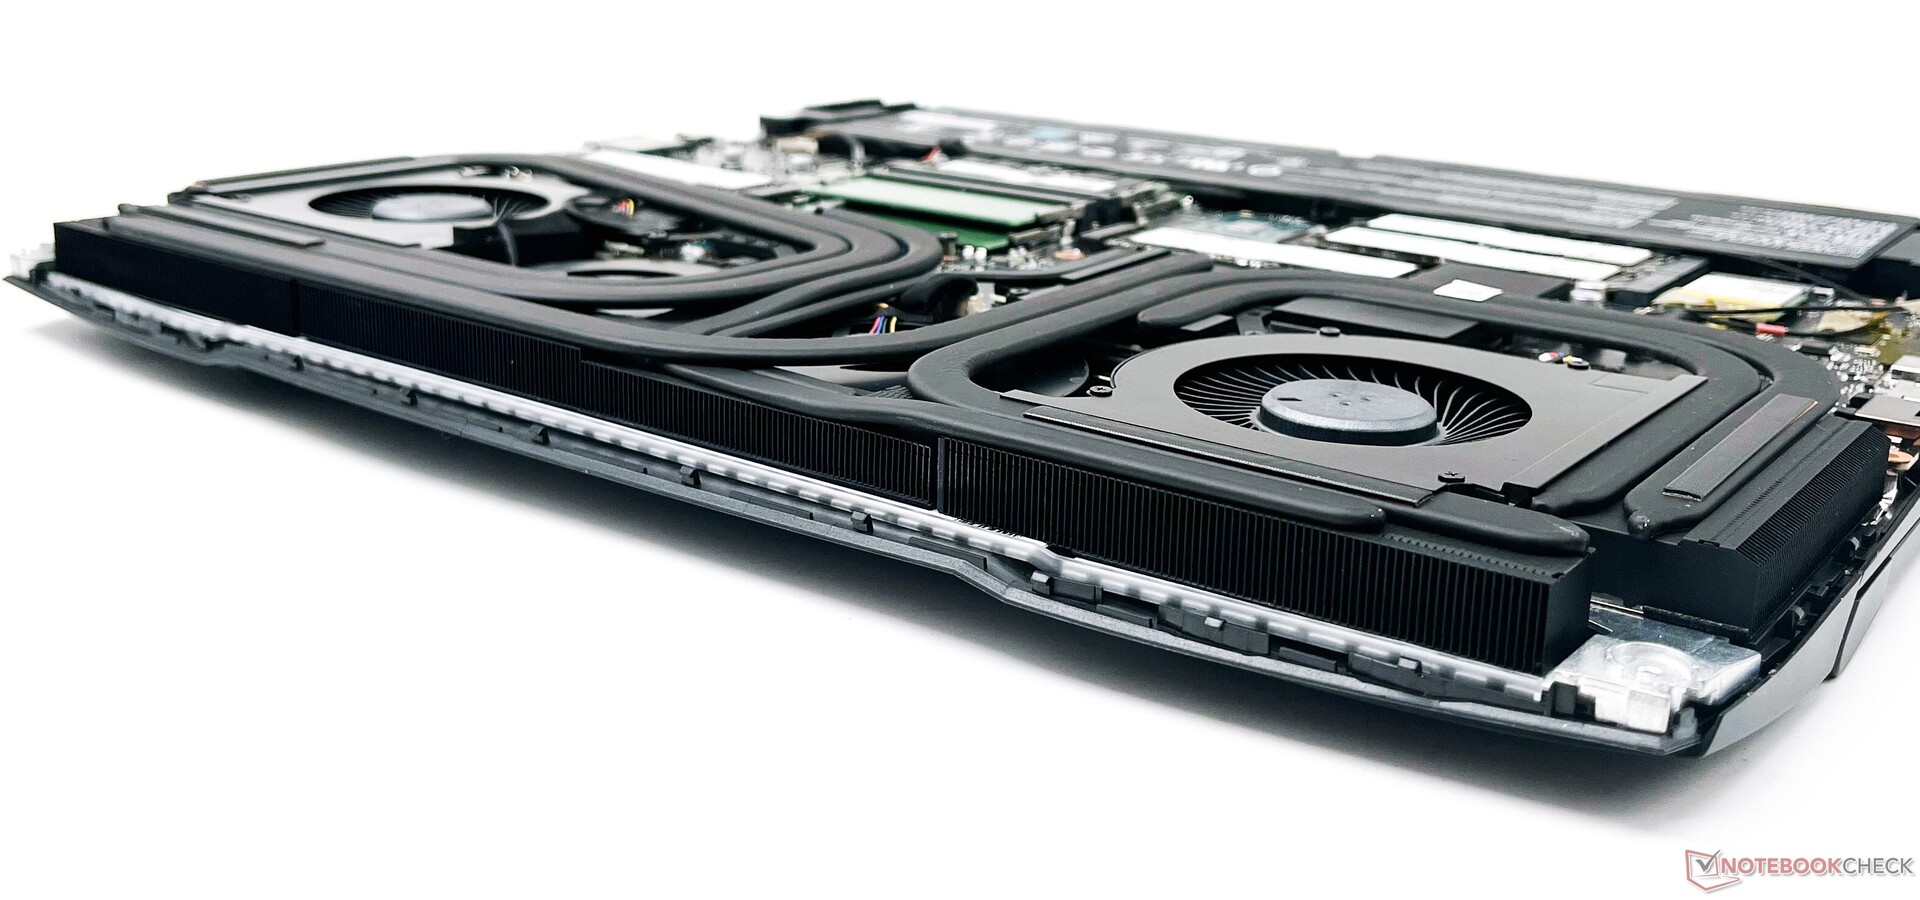
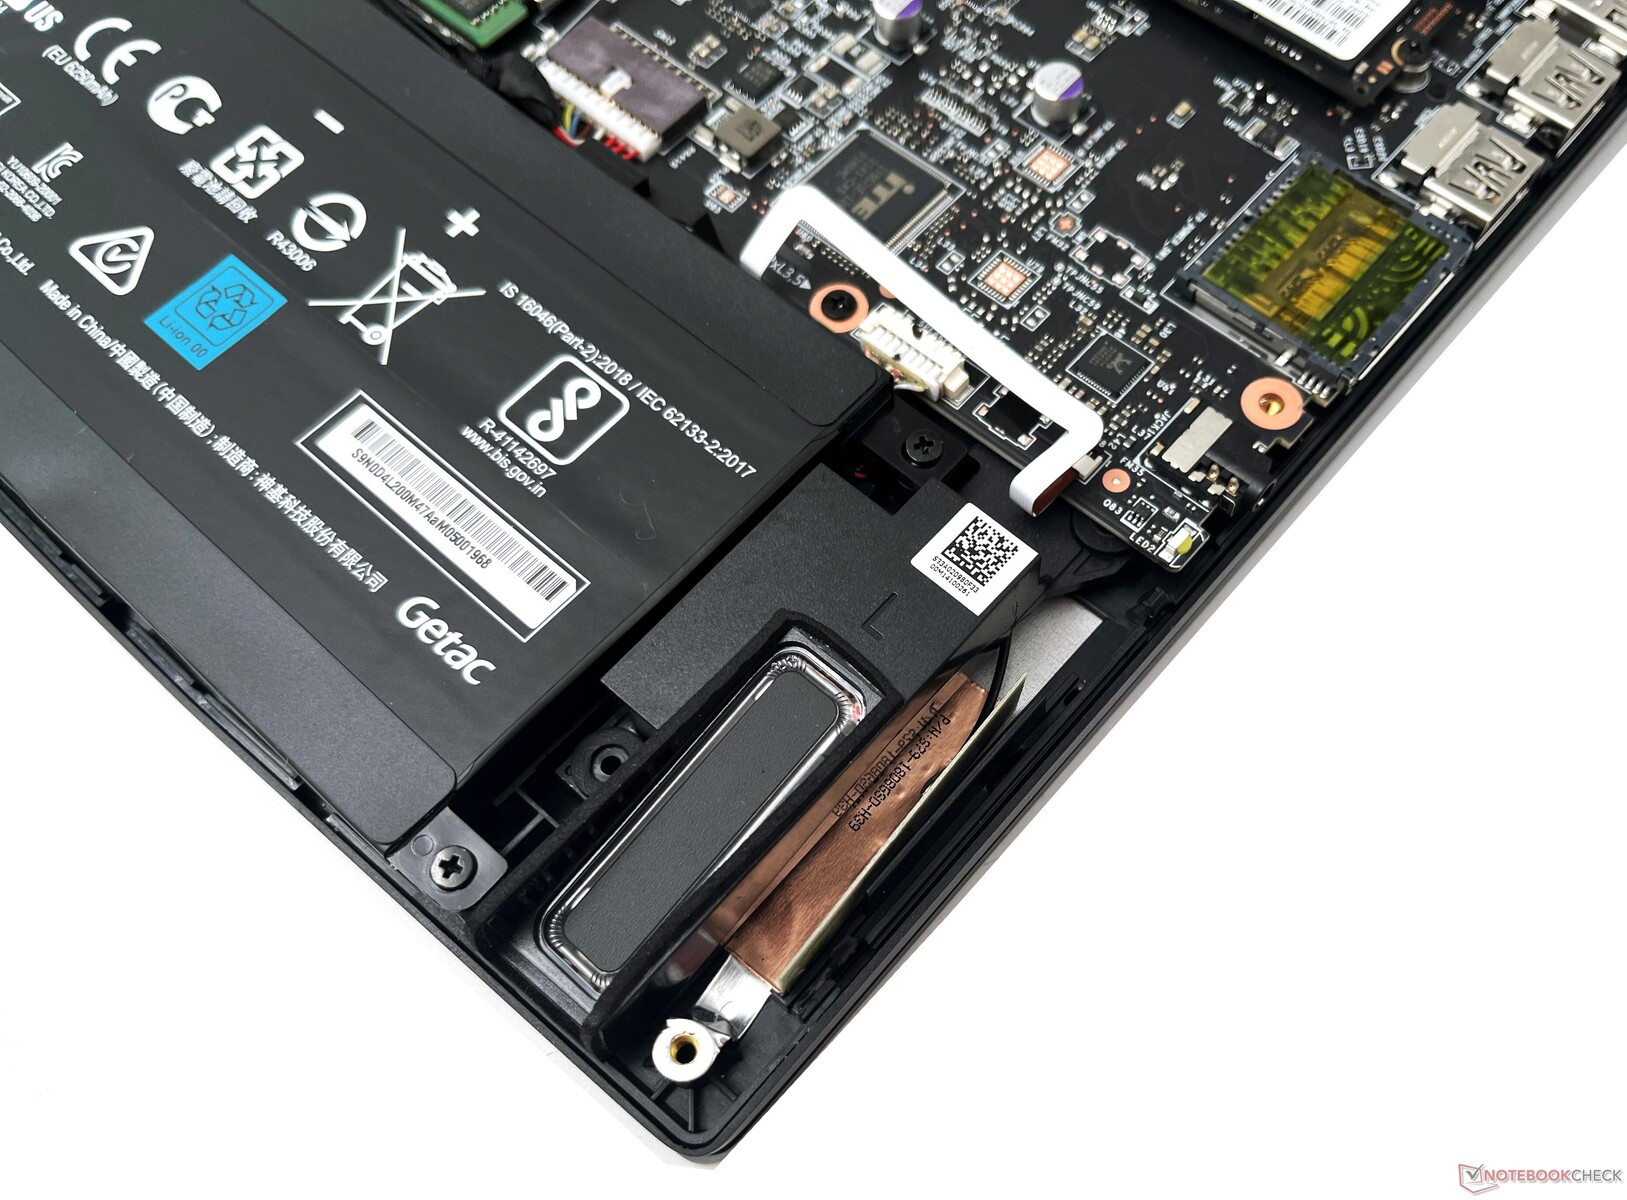
维护
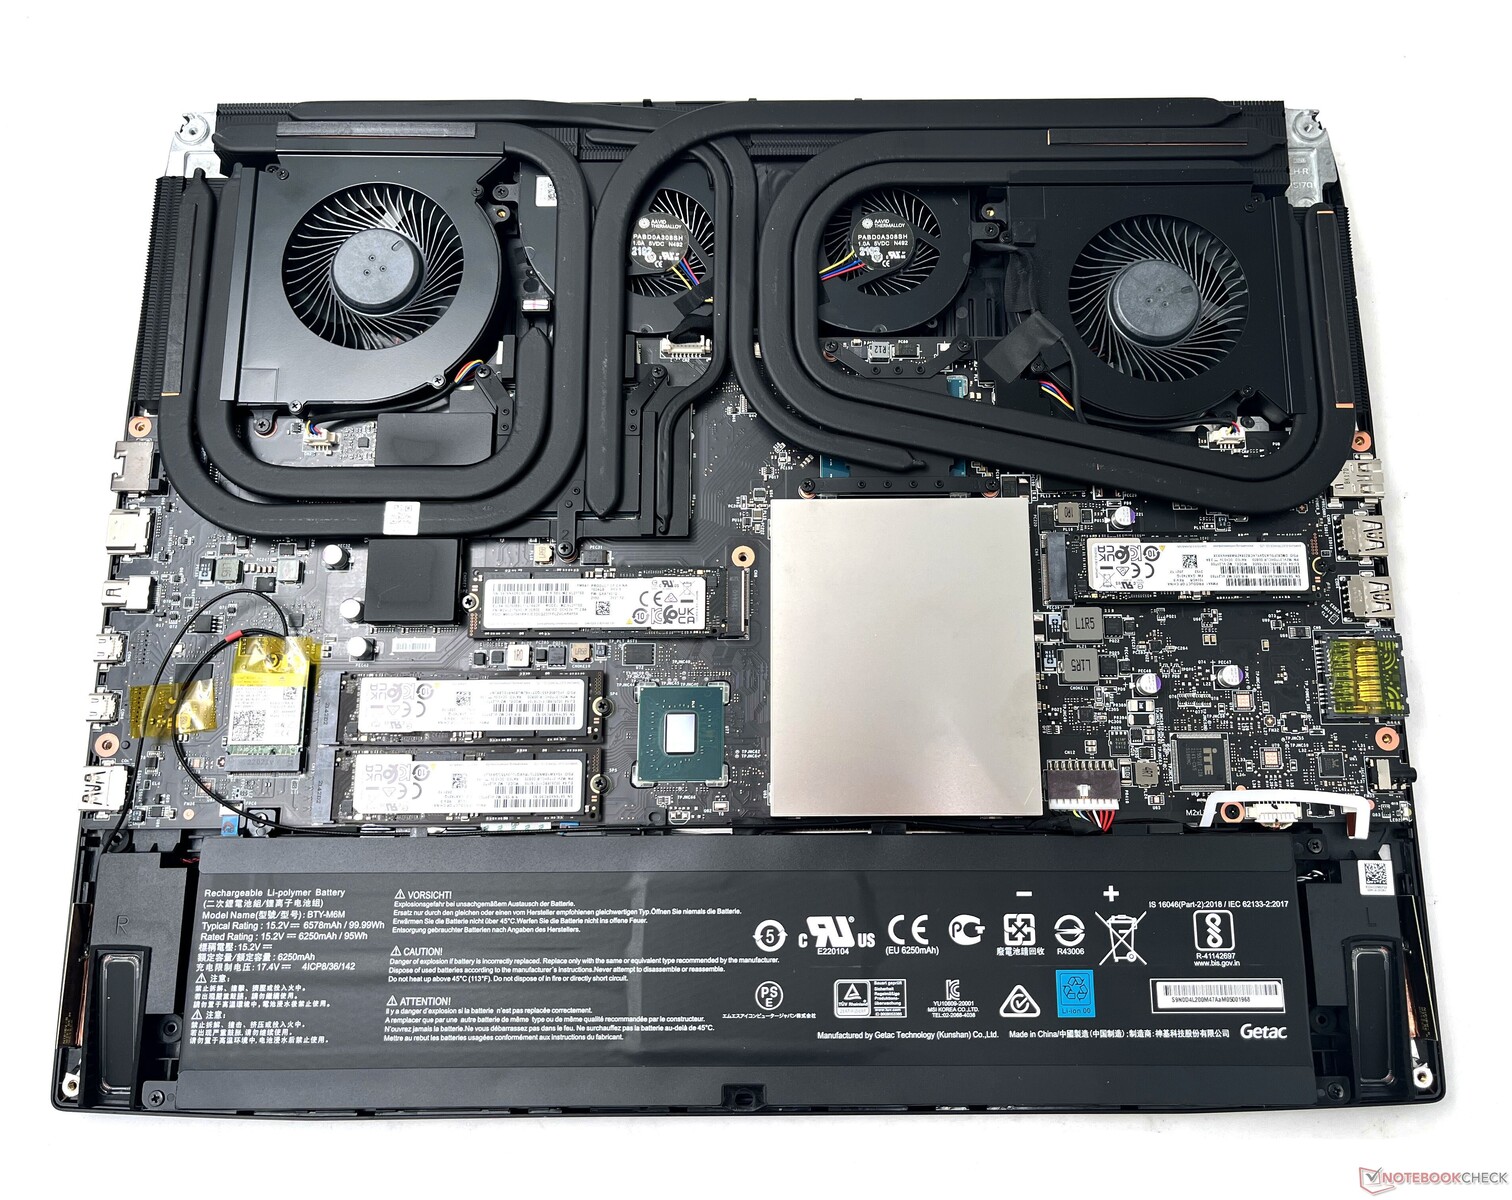
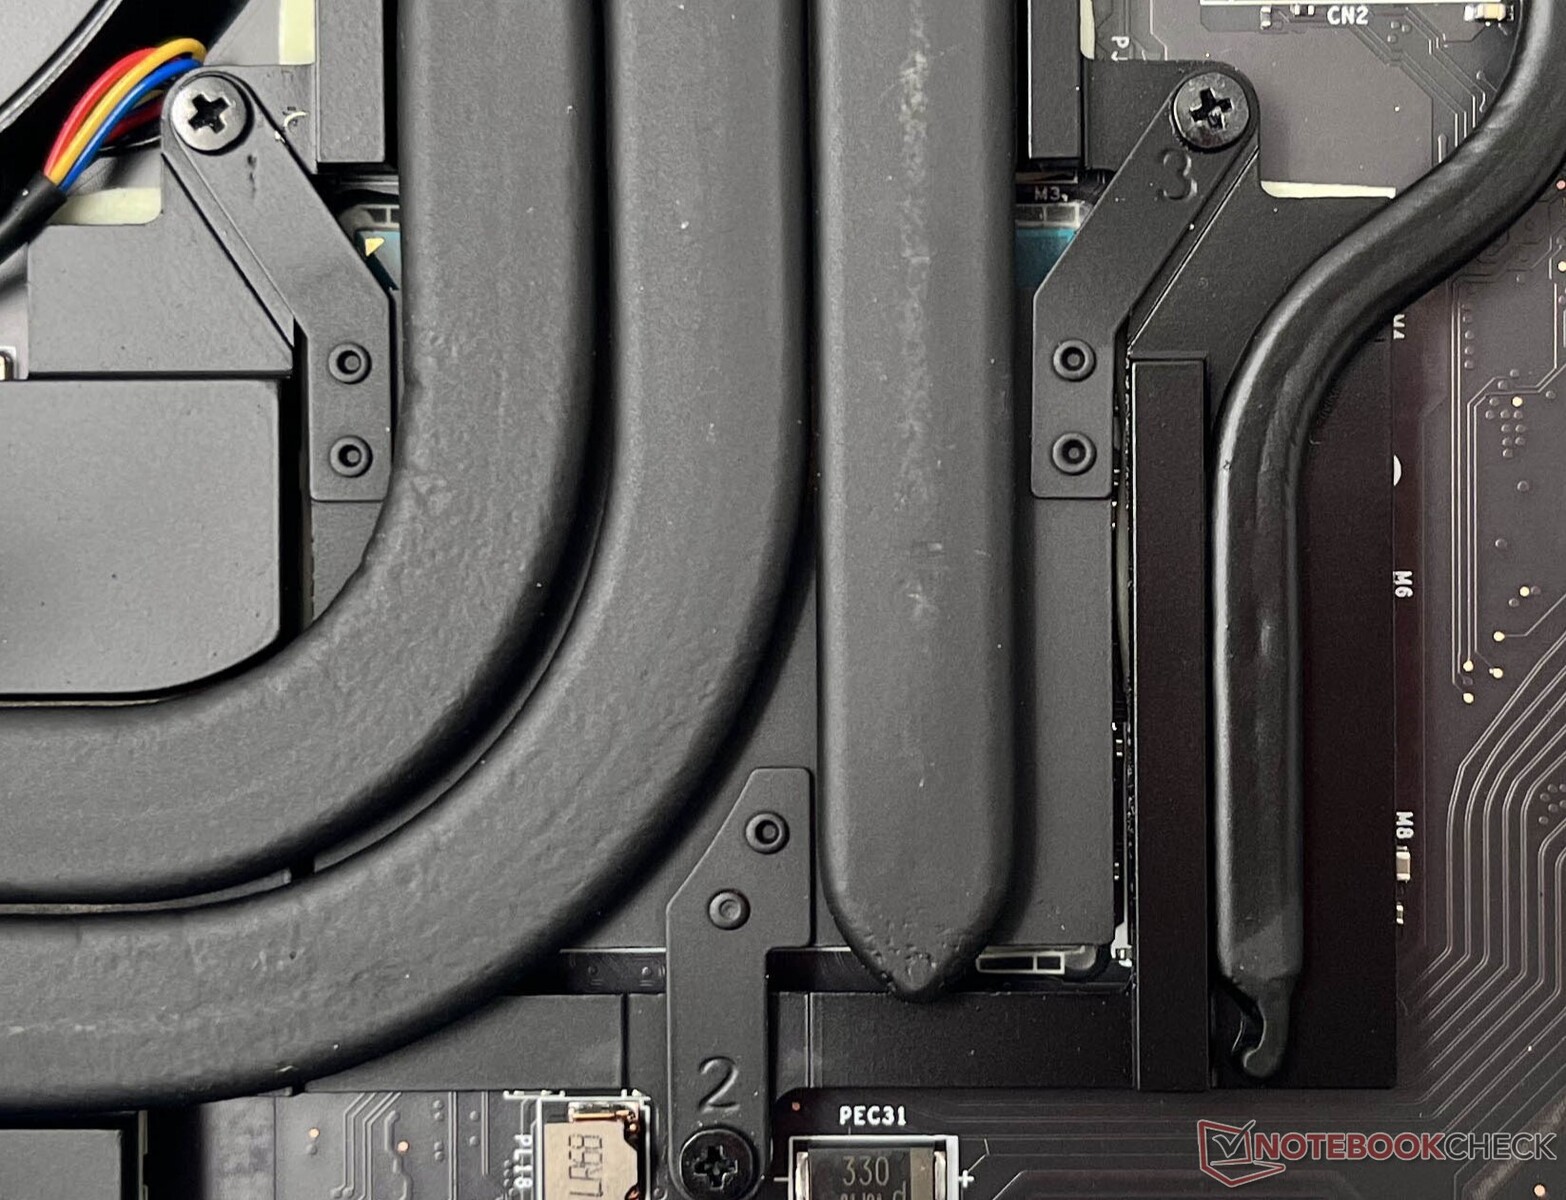
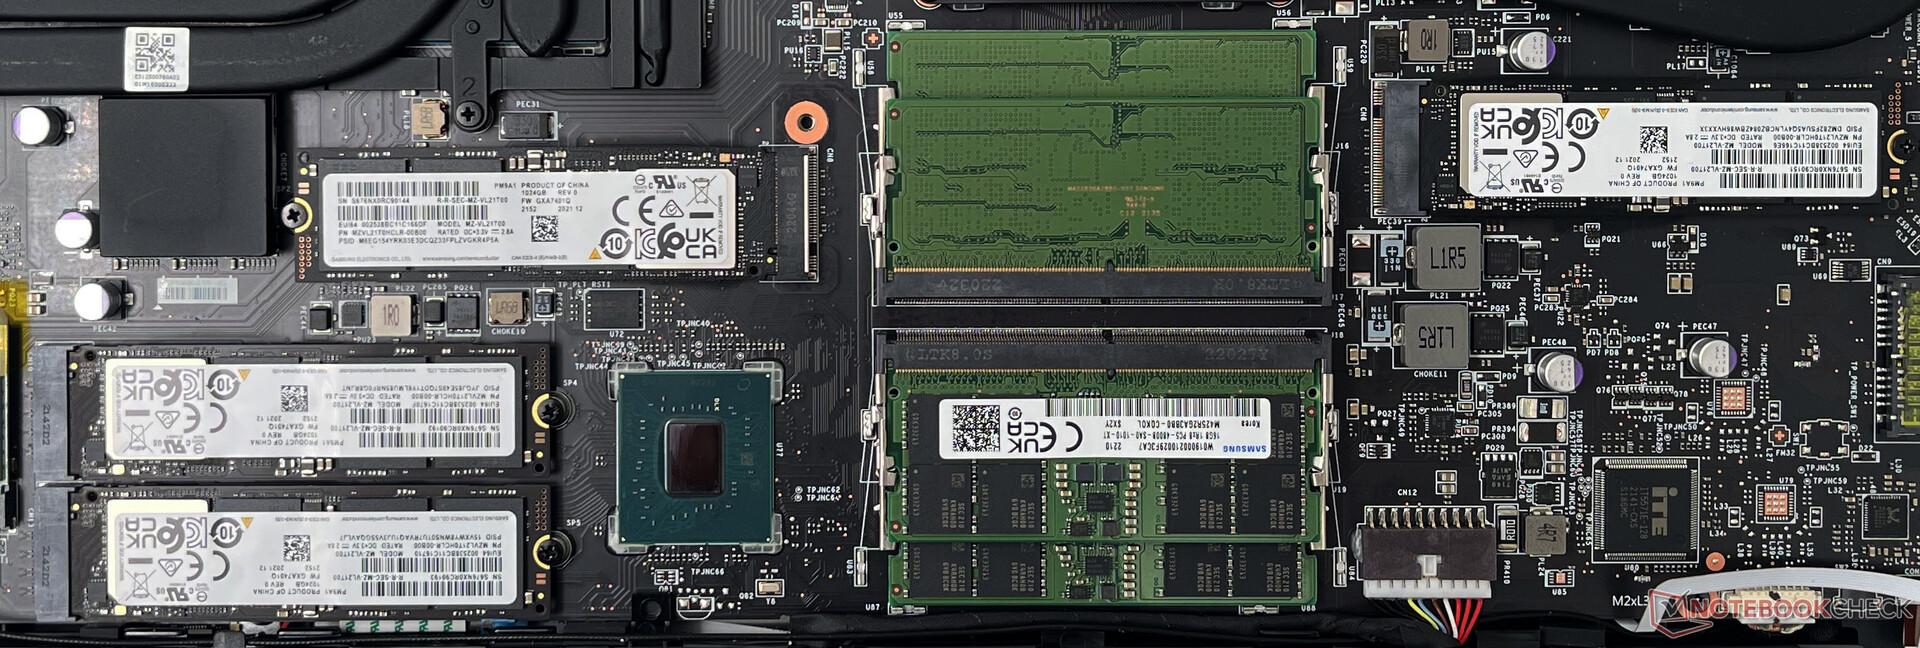
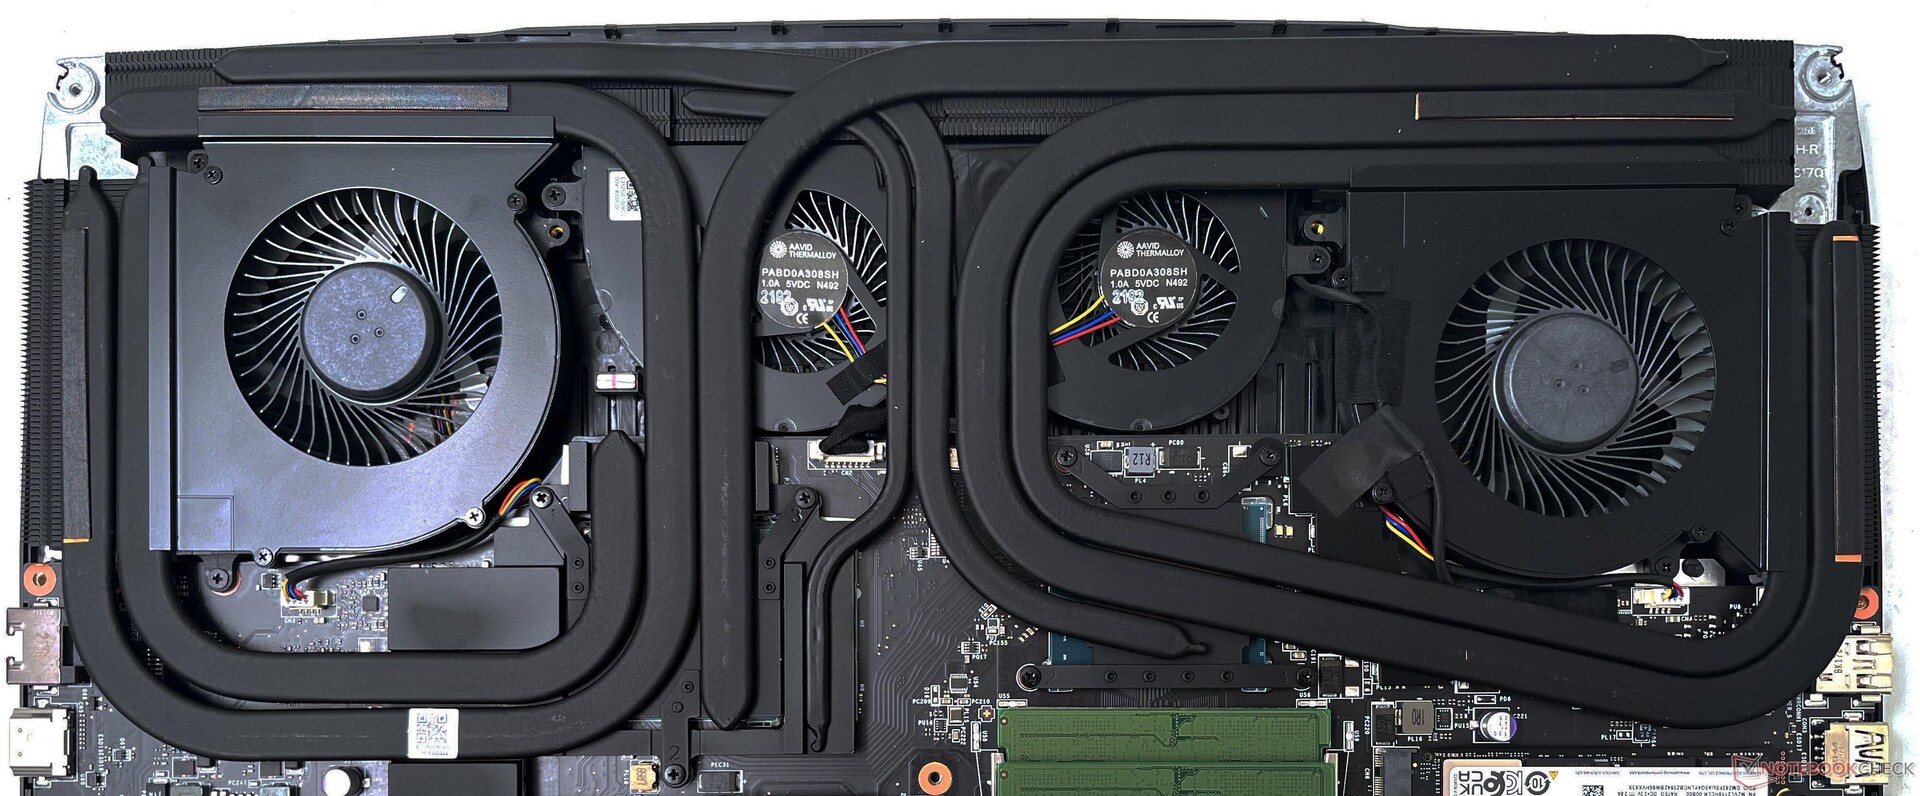
没有提供维护舱口。卸下11颗PH1螺丝后,底板可以打开,但要把它从机箱的其他部分完全撬开,确实需要一些努力。
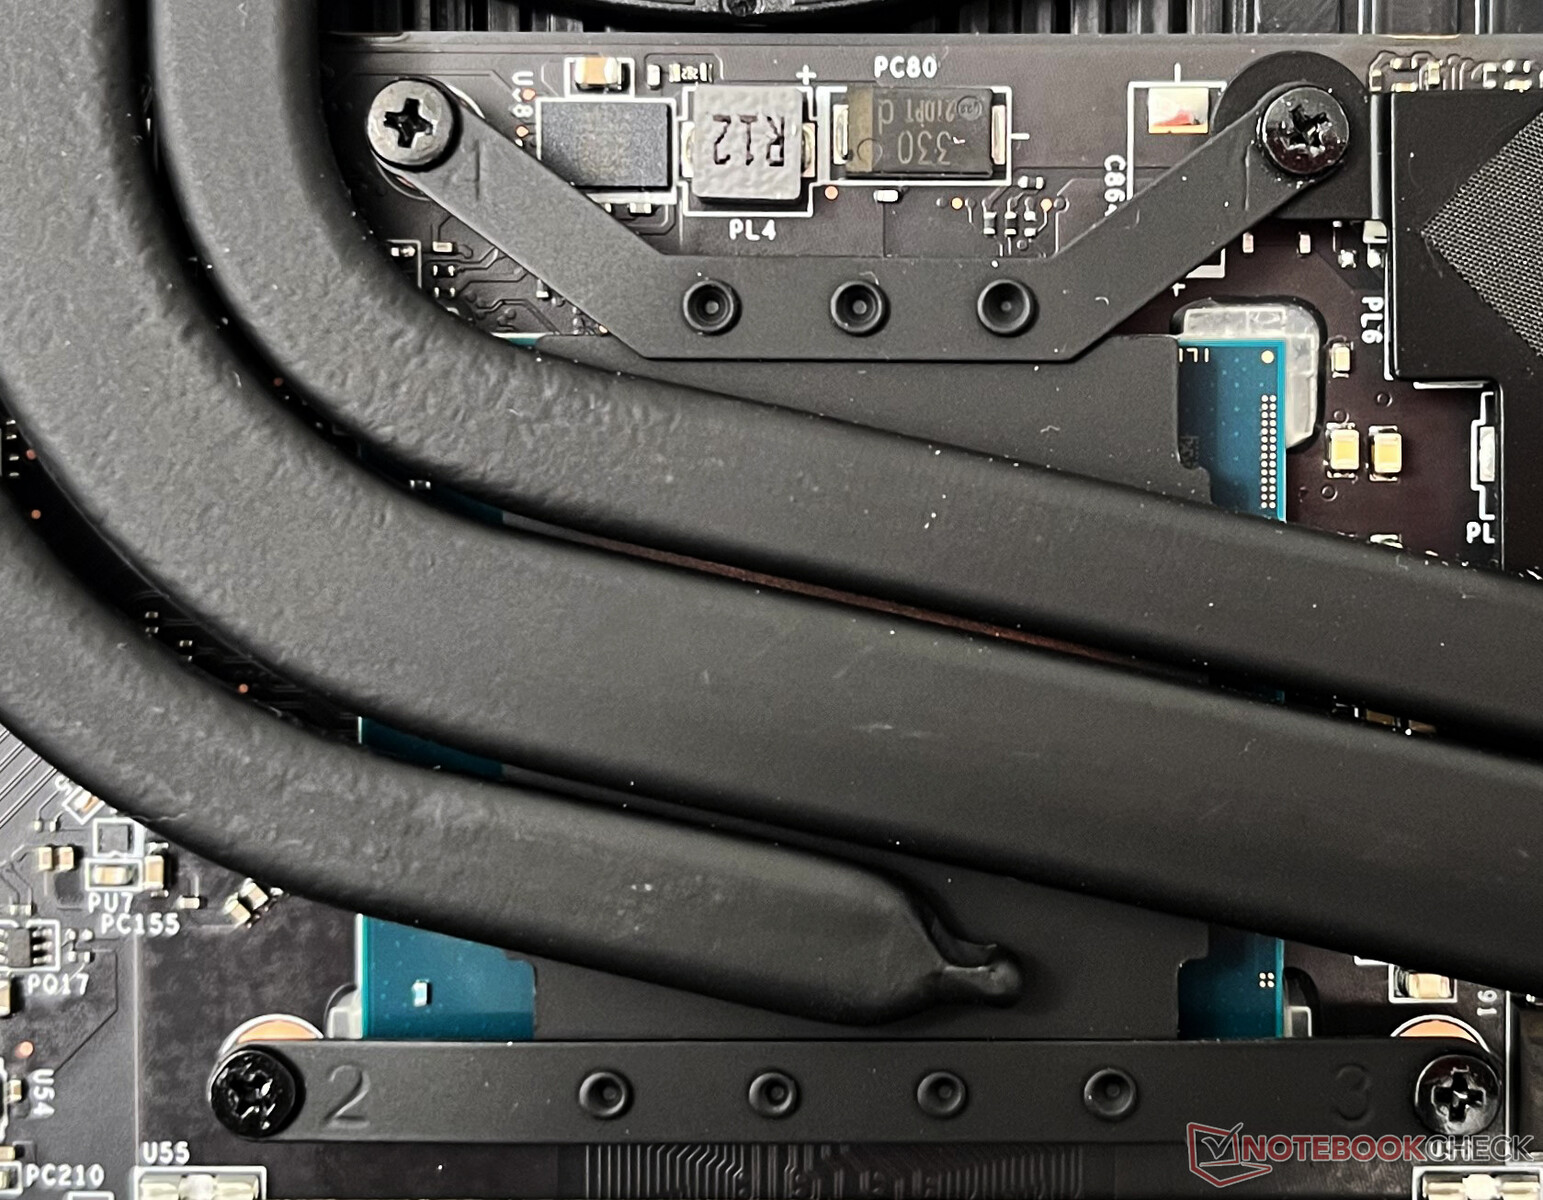
在里面,我们发现有相当多的零件安排。在真正的泰坦风格中,冷却系统是巨大的,有四个风扇,七个热管,和六个排气管。
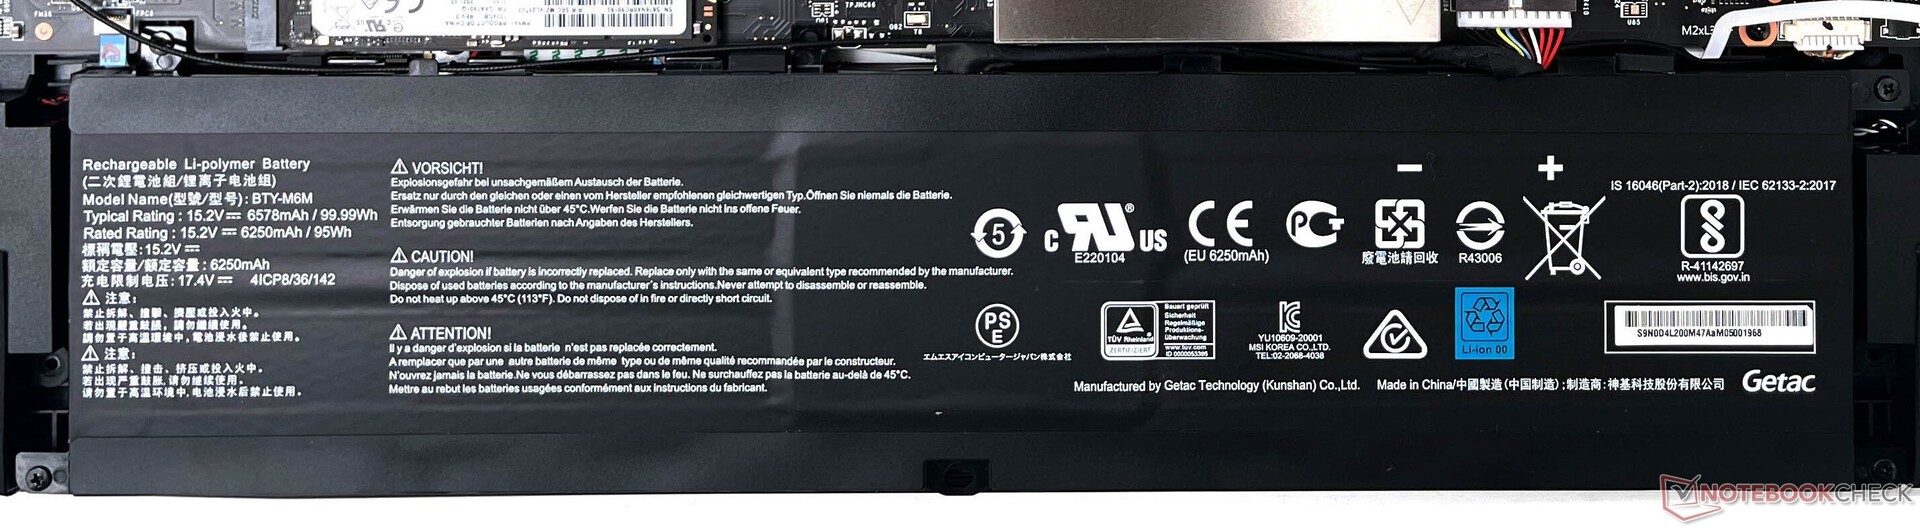
我们的设备中所有四个SSD插槽都被1TB PCIe Gen4 NVMe驱动器占据。铝制盖板下面有四根16GB DDR5-4800内存--你可以在这里塞进高达128GB的DDR5-4800内存。
99.9瓦时的电池可以被拆下来更换。杀手AX1675i WLAN卡、NVMe SSD和DDR5内存都可以升级。
担保
根据不同的地区,微星为其游戏笔记本提供标准的一年保修或两年保修,以及全球旅行保险。由于我们的设备是定制的,所以它没有附带任何保修信息。
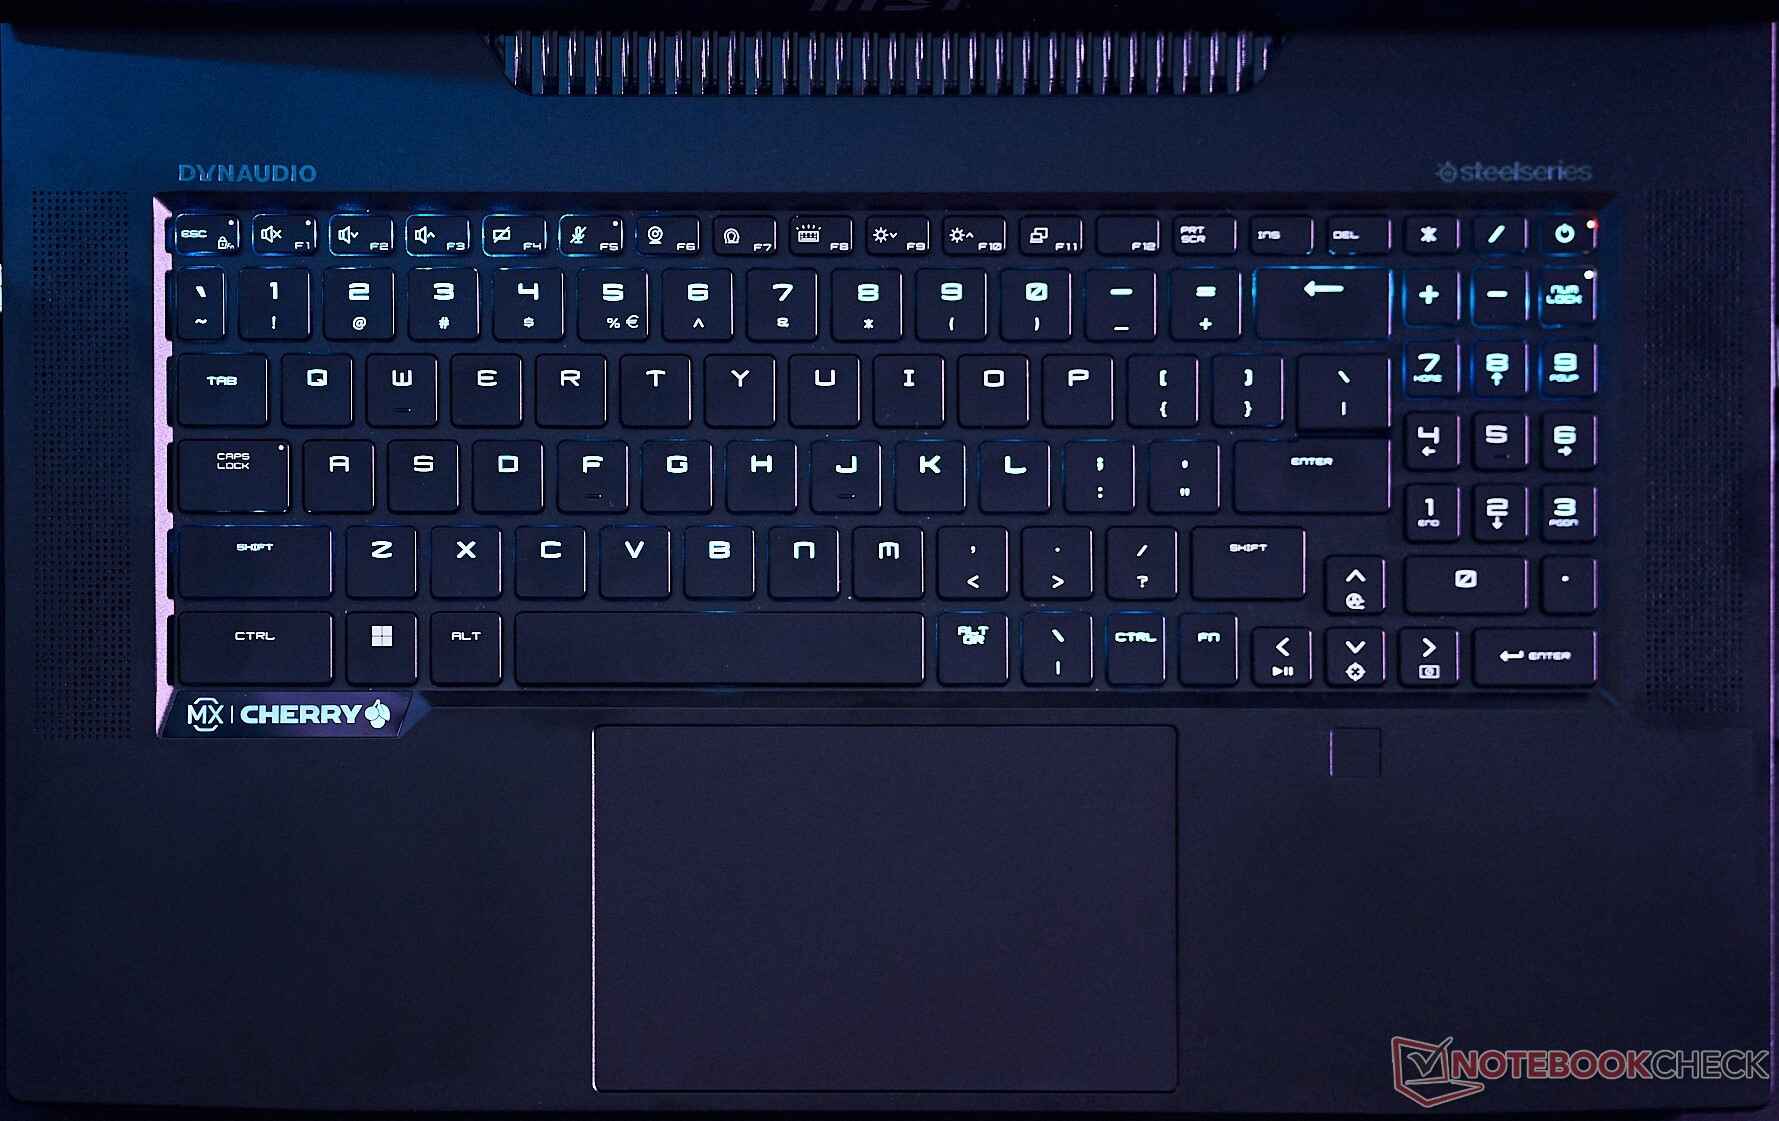
输入设备。令人愉快的Cherry MX键盘和大型触摸板
键盘
SteelSeries键盘采用Cherry MX Ultra Low Profile机械开关,以出色的触觉反馈、快速的响应和清脆的打字声呈现出良好的打字体验。所有按键都可以单独点亮,SteelSeries GG软件可以配置各种RGB灯光效果和宏指令快捷键。
然而,只有主要的打字区使用Cherry MX机械键。功能键、方向键和数字键盘似乎都采用了传统的薄膜开关。如果你是微星笔记本电脑的新手,Fn键的位置可能需要一些时间来适应。按下Fn键可以单独点亮F1-F12键上的附加功能,这有助于在黑暗环境中的易读性。
主页、结束、向上翻页和向下翻页键仅在数字键盘上可用,如果你想使用它们,需要解除数字锁。方向键大小适中,但如果你喜欢赛车游戏,这里缺少机械键是个遗憾。重要的是,键盘区域要保持相对清洁,因为灰尘或食物颗粒很容易卡在按键下面,造成启动的问题。
触摸板
触摸板比我们在Titan GT76中看到的更上一层楼。它现在采用了无按钮设计,尺寸为13 x 8.2厘米,因此能够毫不费力地滑行。
触摸板的点击相对不费力,支持WindowsPrecision 手势。
显示。360赫兹FHD面板,响应时间低,色彩软件有问题
我们的Titan GT77设备配备了360赫兹FHD面板。Titan GT77目前只能配置120赫兹的UHD面板,但该公司很可能也会提供360赫兹的FHD选项。
这款显示器不提供任何形式的HDR或G-Sync支持。在测试时,真彩只支持sRGB和其他一些减少蓝光的调整。现在,微星已经 更新了该应用程序以包括AdobeRGB和Display P3色彩空间。
也就是说,在这台笔记本电脑上使用真彩可能有点令人不快。该应用程序有一个错误,不允许它与最新的英特尔iGPU驱动程序配合使用。更新英特尔图形驱动会使所有颜色变白,并使整个显示器看起来非常不舒服。值得庆幸的是,微星承认了这个问题,并引导你到一个链接进行补救。基本上,你需要做的就是将英特尔iGPU驱动程序降级到旧版本。在我们的测试中,我们发现30.0.101.1994版本工作得很好。从MSHybrid切换到独立图形模式是另一个解决方法。
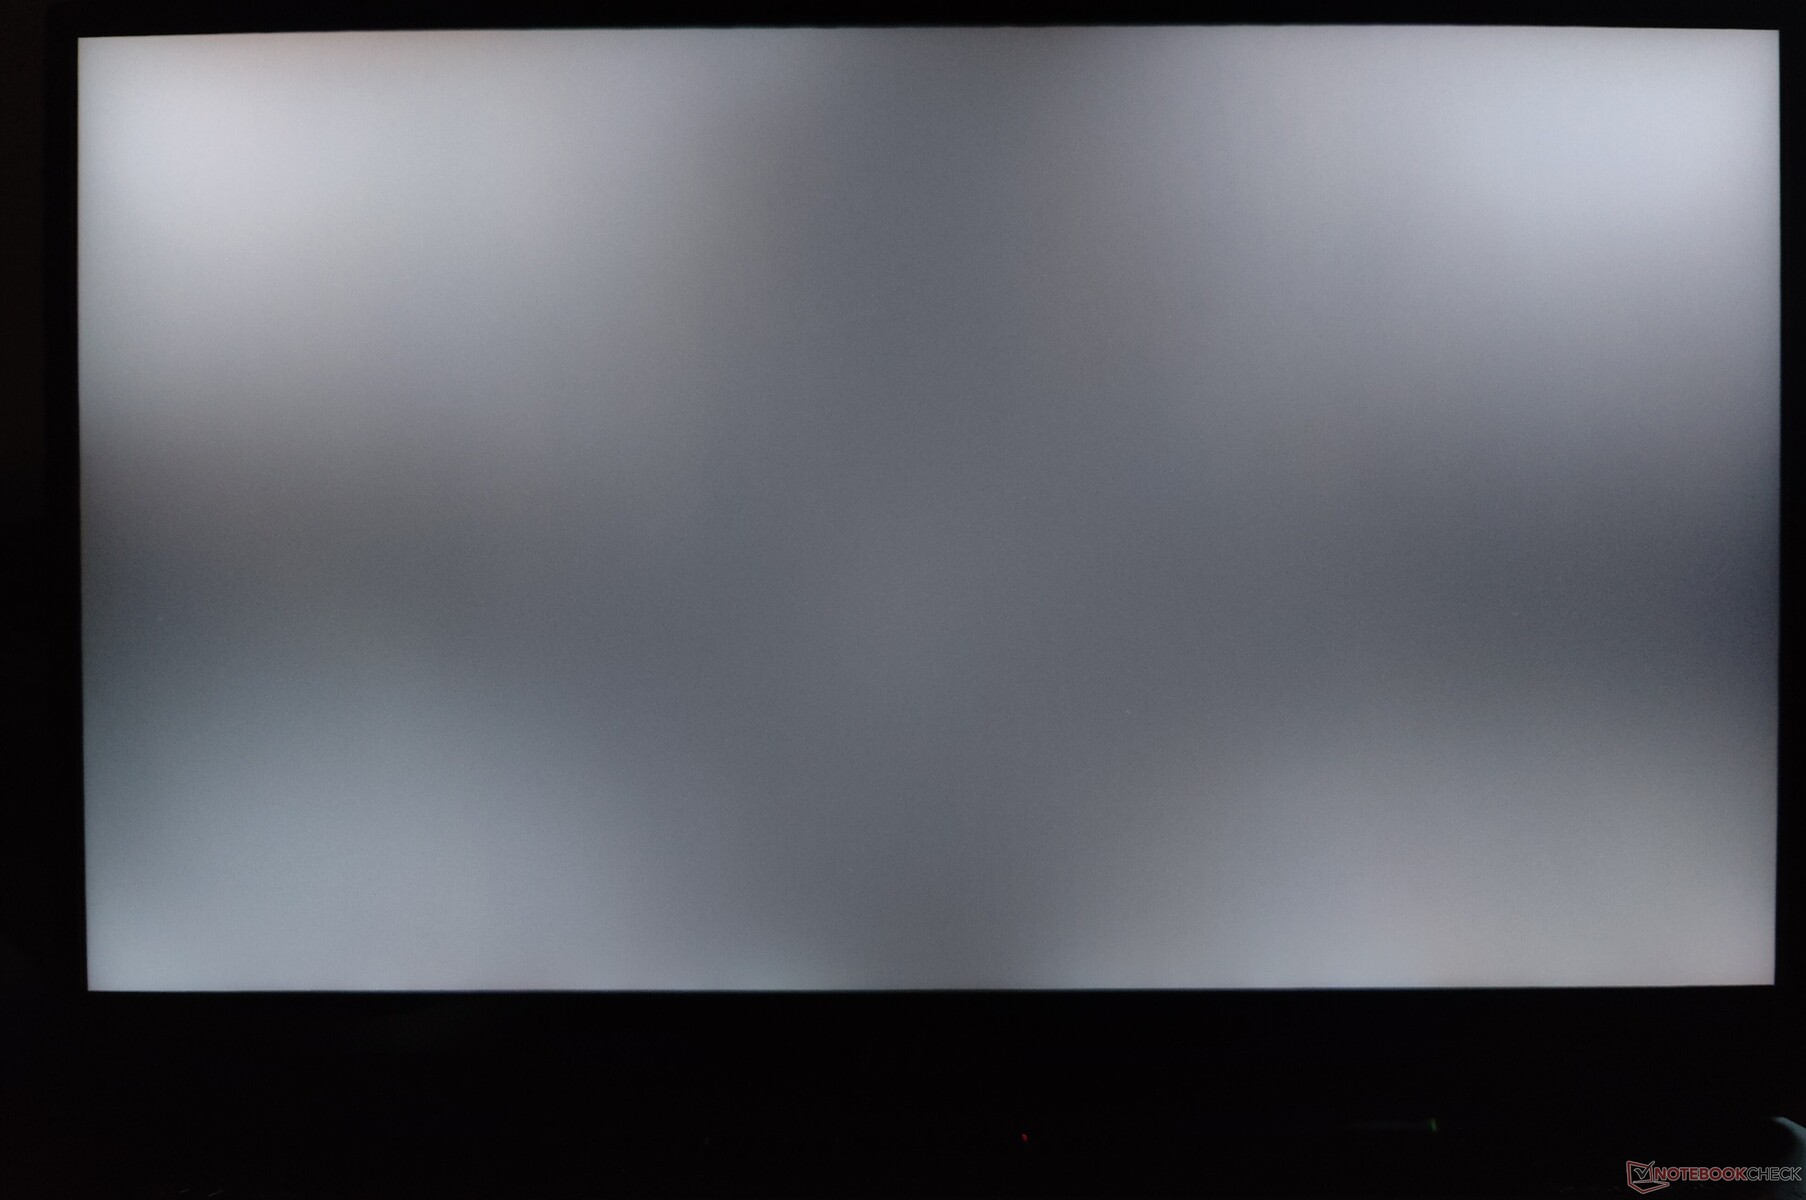
鉴于这只是一个127PPI的显示屏,单个像素的尺寸似乎相当大。我们观察到在长时间曝光的情况下,角落里有光渗出。
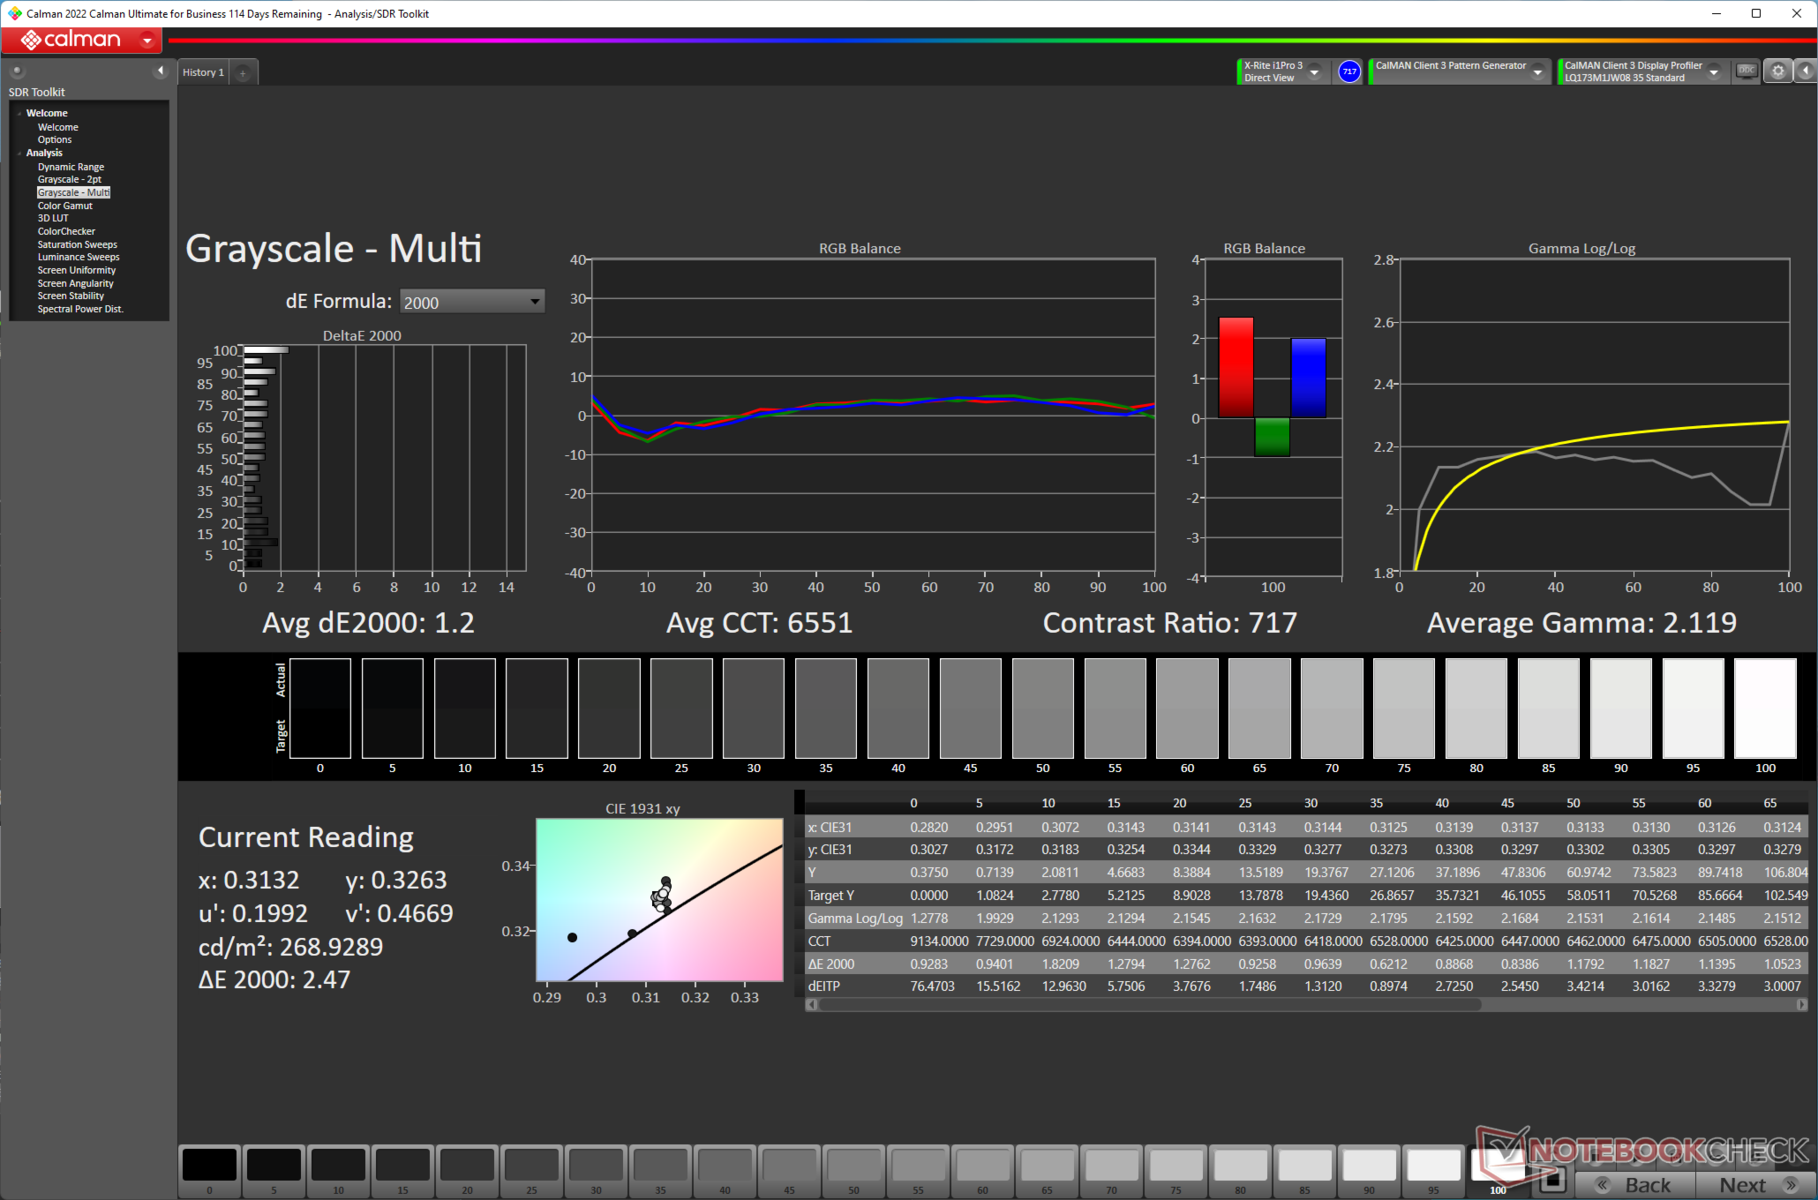
亮度分布为79%,还算不错,但700:1的对比度也只是平均水平。主观地说,如果你的主要使用情况是游戏,泰坦GT77的显示屏提供了一个体面的观看体验。

| |||||||||||||||||||||||||
Brightness Distribution: 79 %
Center on Battery: 280 cd/m²
Contrast: 700:1 (Black: 0.4 cd/m²)
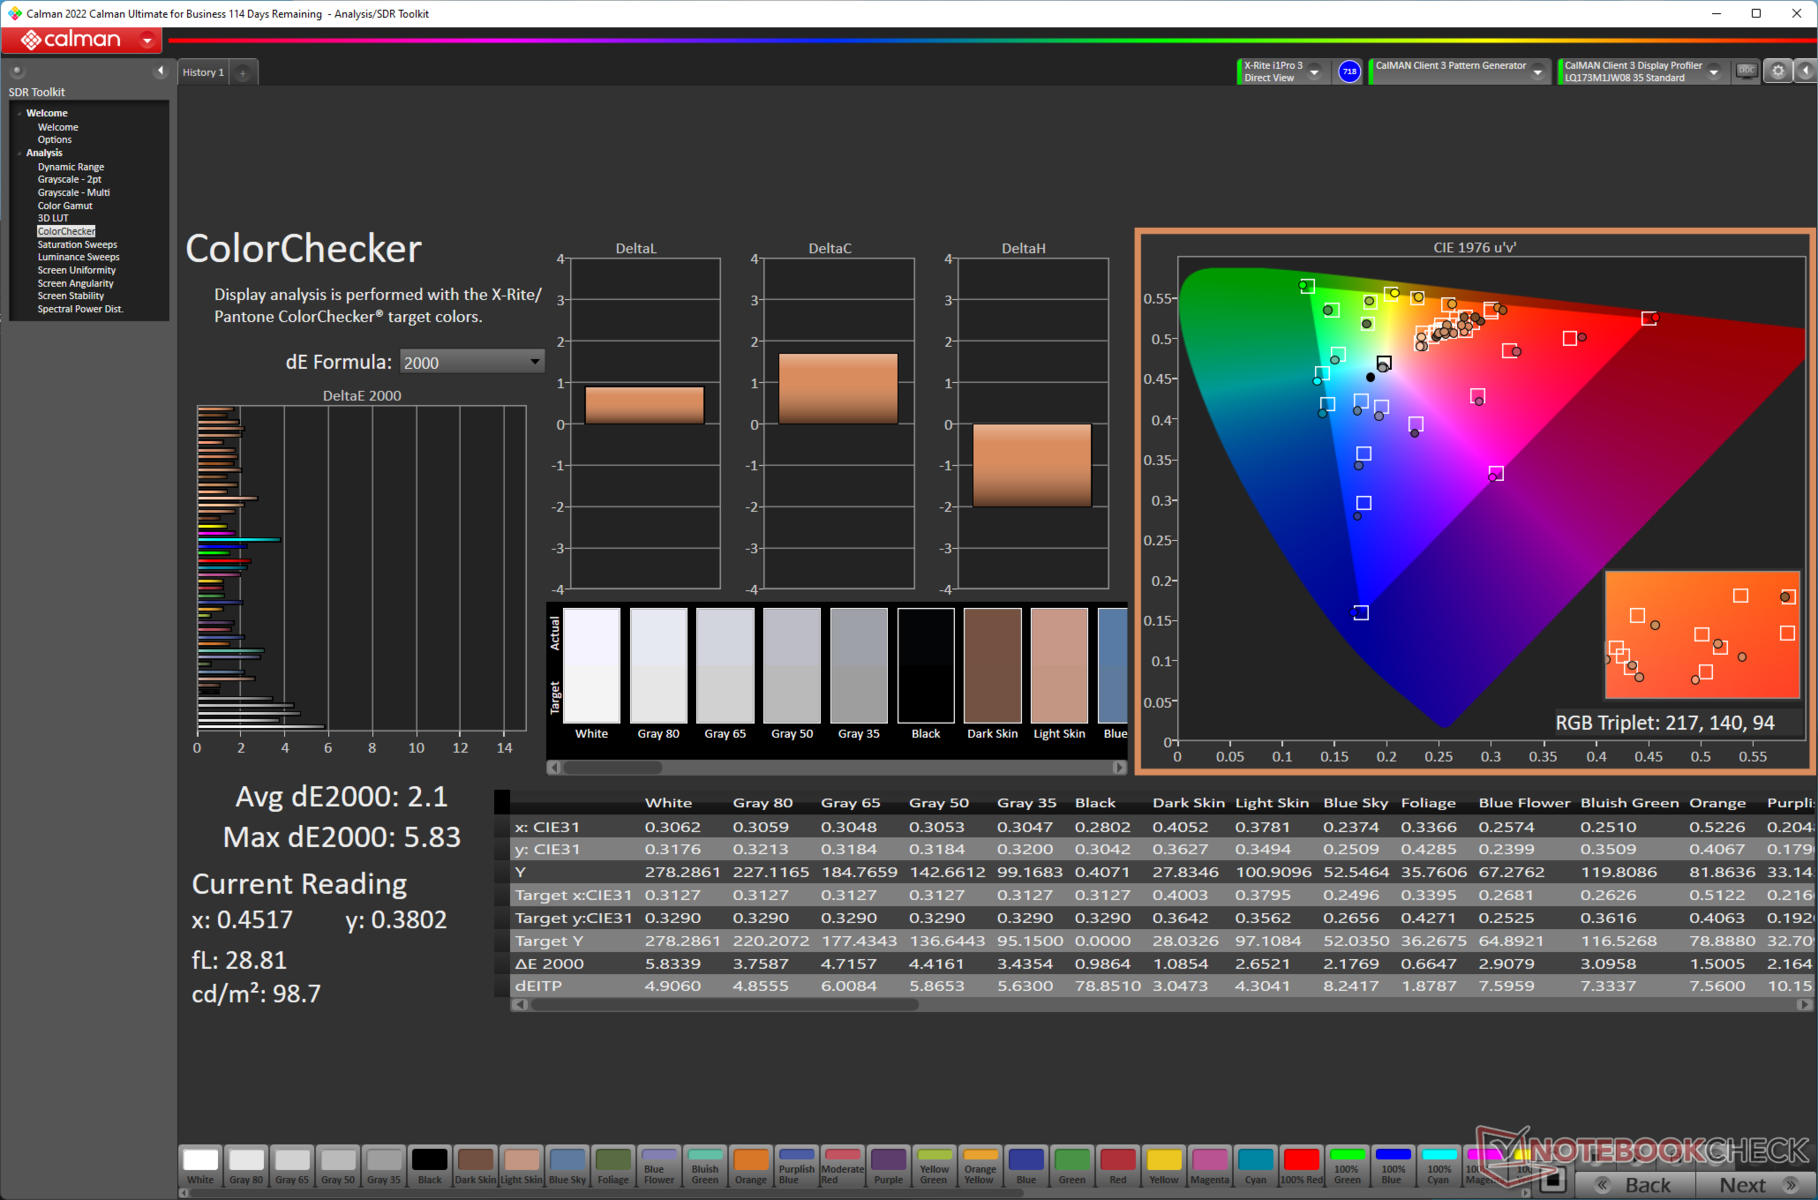
ΔE ColorChecker Calman: 2.1 | ∀{0.5-29.43 Ø4.71}
calibrated: 1.58
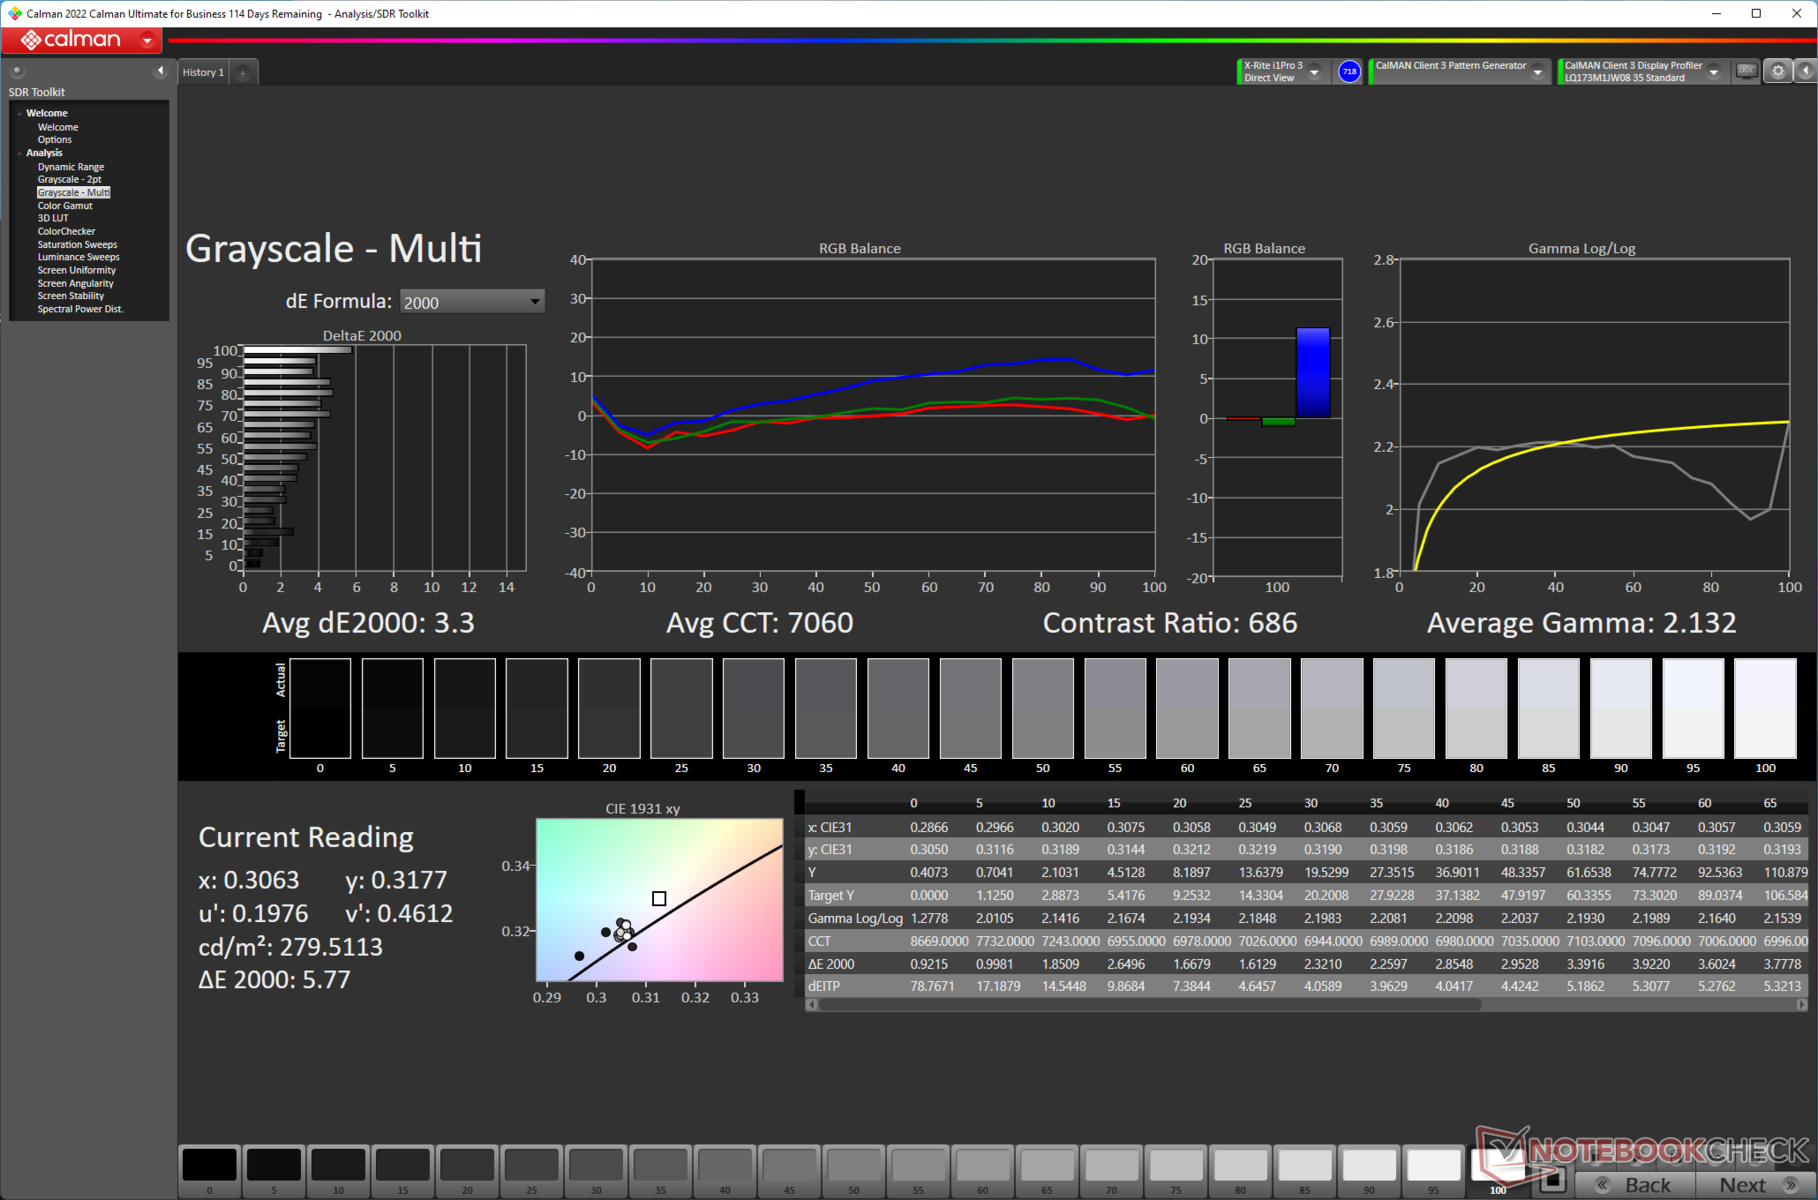
ΔE Greyscale Calman: 3.3 | ∀{0.09-98 Ø4.96}
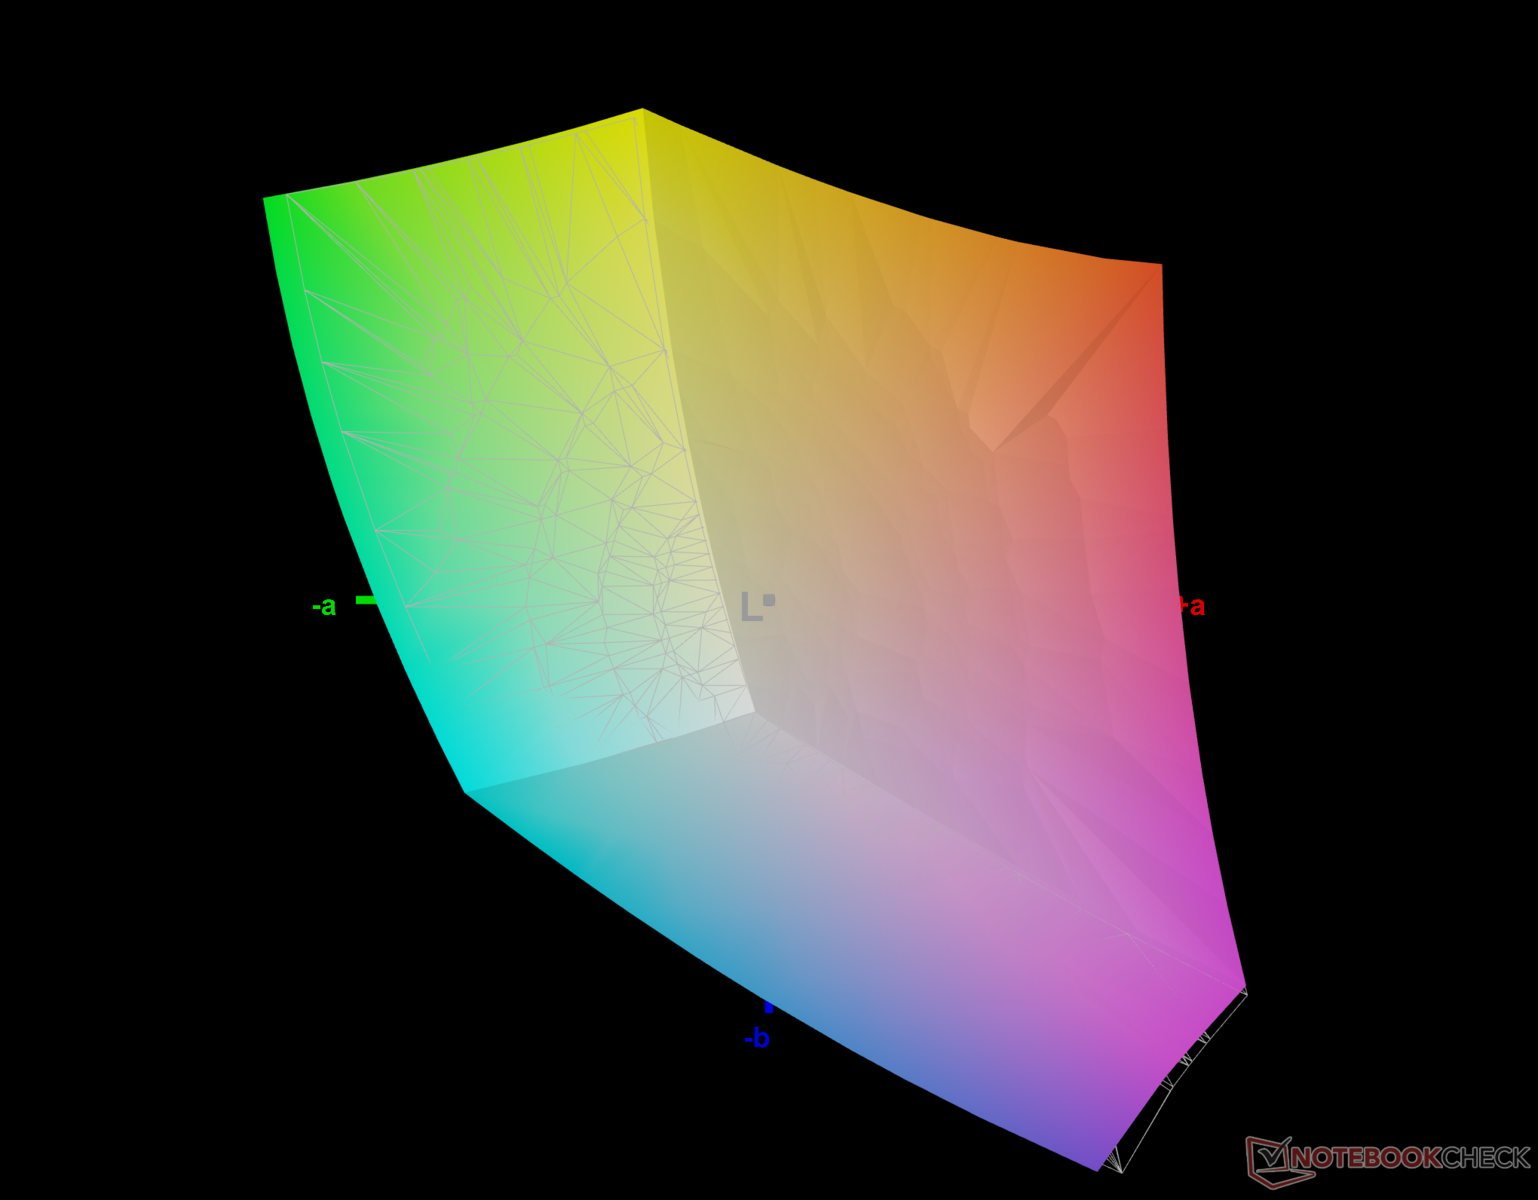
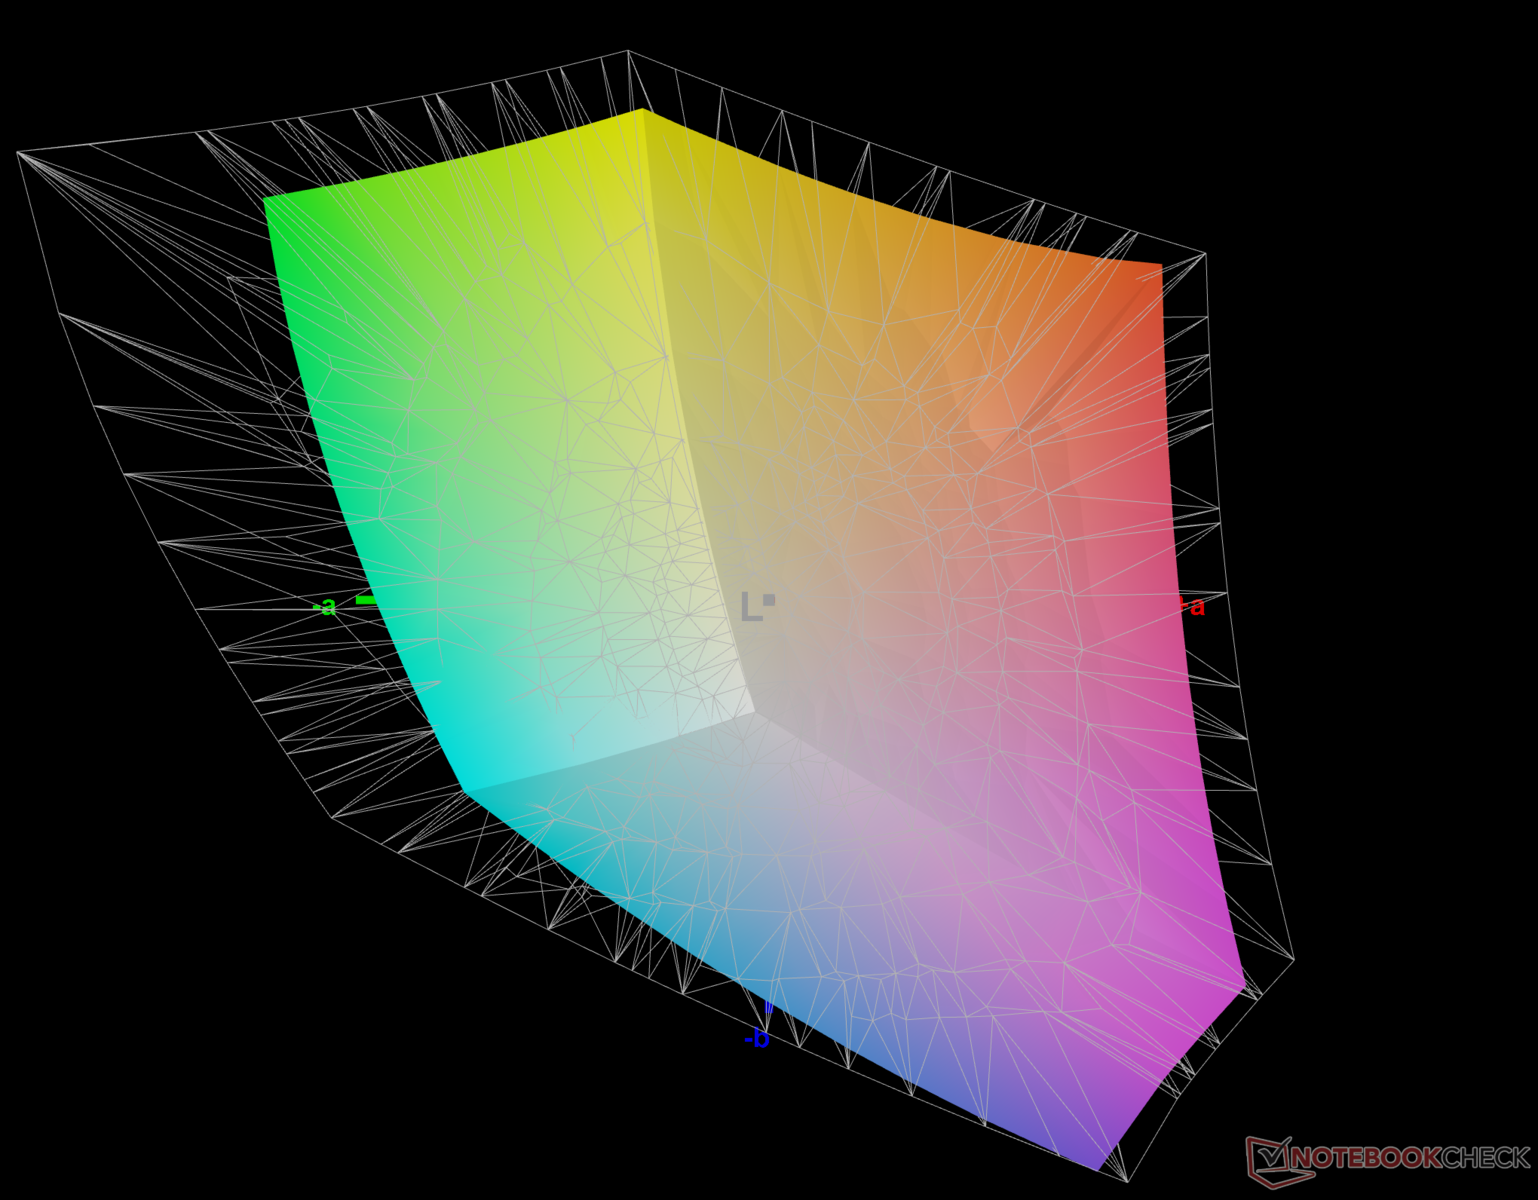
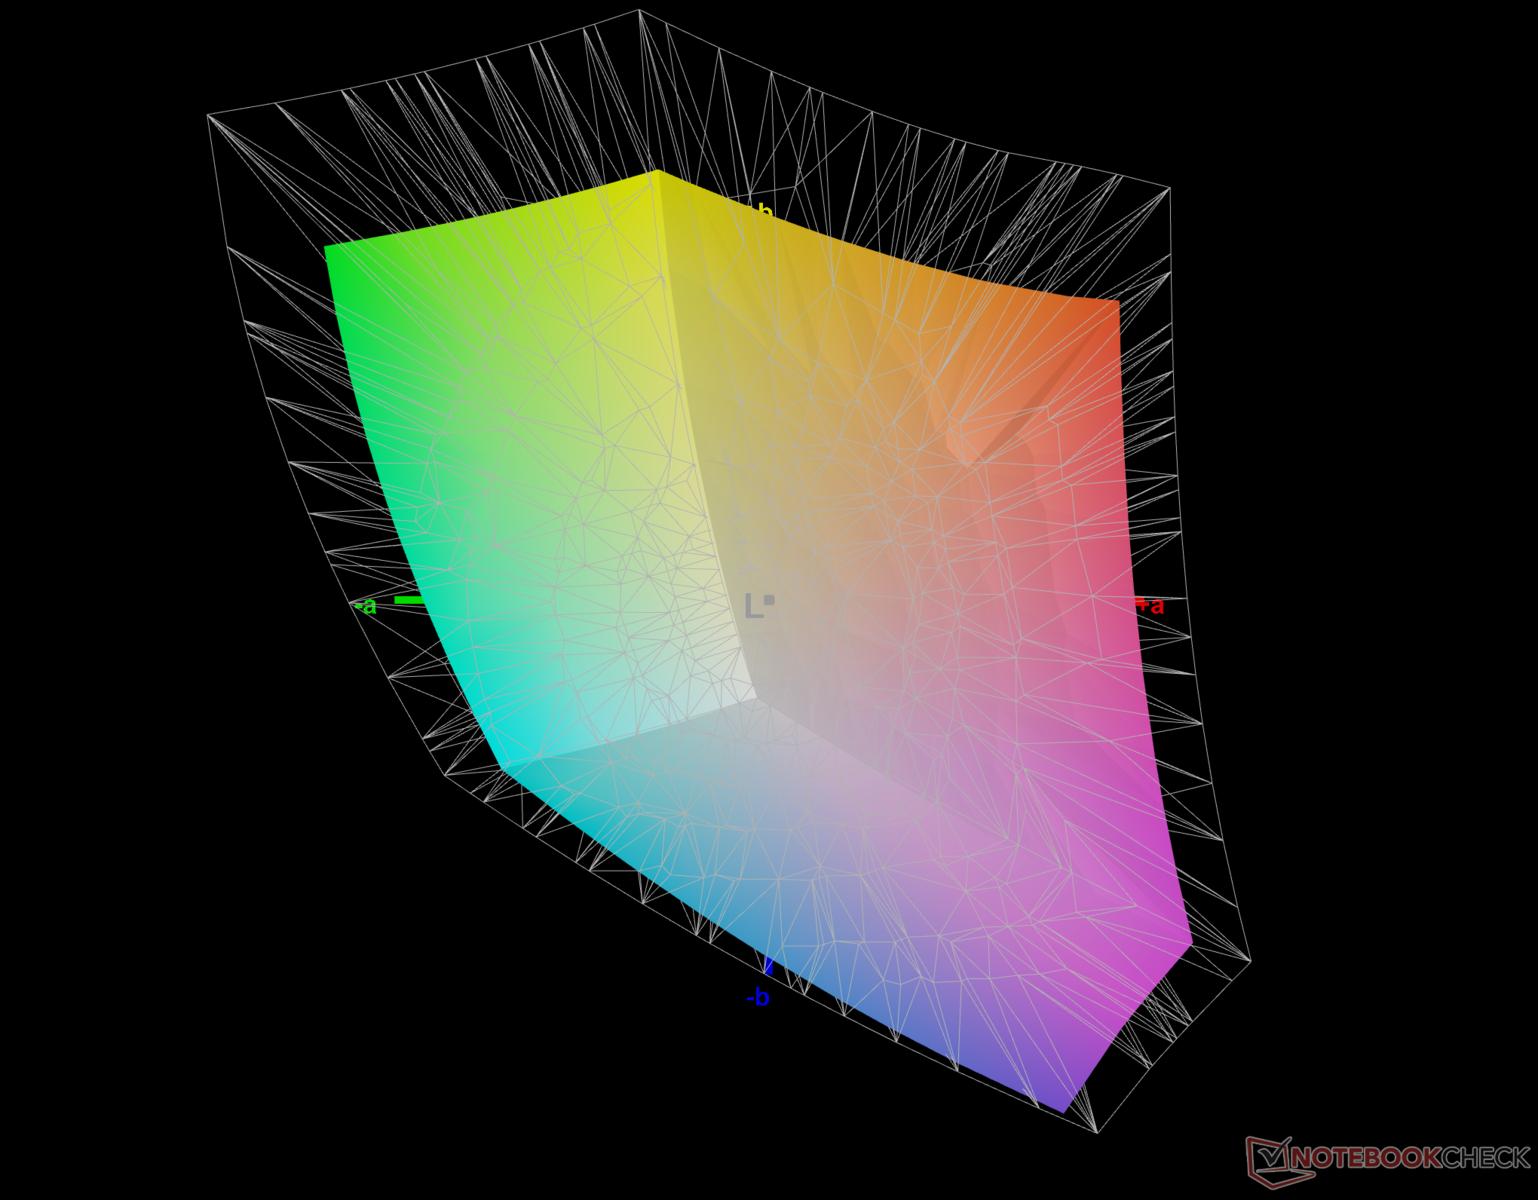
73% AdobeRGB 1998 (Argyll 3D)
98.9% sRGB (Argyll 3D)
70.8% Display P3 (Argyll 3D)
Gamma: 2.13
CCT: 7060 K
| MSI Titan GT77 12UHS Sharp SHP1544 LQ173M1JW08, IPS-Level, 1920x1080, 17.3" | MSI Titan GT77 12UHS AU Optronics B173ZAN06.1, IPS, 3840x2160, 17.3" | Aorus 17X XES Sharp SHP1563, IPS, 1920x1080, 17.3" | MSI Raider GE77 HX 12UHS AU Optronics B173ZAN06.1, IPS, 3840x2160, 17.3" | MSI GE67 HX 12UGS Samsung ATNA562P02-0, OLED, 1920x1080, 15.6" | Asus ROG Zephyrus Duo 16 GX650RX BOE NE160QAM-NX1, IPS-Level, 3840x2400, 16" | Alienware x17 R2 P48E AU Optronics B173HAN, IPS, 1920x1080, 17.3" | MSI GE76 Raider AU Optronics B173HAN05.4 (AUOE295), IPS-Level, 1920x1080, 17.3" | |
|---|---|---|---|---|---|---|---|---|
| Display | 19% | -1% | 18% | -2% | 19% | 7% | -9% | |
| Display P3 Coverage (%) | 70.8 | 97 37% | 70.1 -1% | 96.6 36% | 71.7 1% | 98 38% | 79.2 12% | 63.1 -11% |
| sRGB Coverage (%) | 98.9 | 99.8 1% | 99.9 1% | 99.8 1% | 89.7 -9% | 99.9 1% | 99.8 1% | 94 -5% |
| AdobeRGB 1998 Coverage (%) | 73 | 86.2 18% | 71.9 -2% | 85.8 18% | 75.2 3% | 86.3 18% | 79.6 9% | 65.2 -11% |
| Response Times | -35% | -11% | -49% | 92% | -194% | -192% | -84% | |
| Response Time Grey 50% / Grey 80% * (ms) | 3.03 ? | 5.2 ? -72% | 3.4 ? -12% | 5.8 ? -91% | 0.25 ? 92% | 14.6 ? -382% | 12.4 ? -309% | 5.6 ? -85% |
| Response Time Black / White * (ms) | 5.28 ? | 5.1 ? 3% | 5.8 ? -10% | 5.6 ? -6% | 0.4 ? 92% | 5.6 ? -6% | 9.2 ? -74% | 9.6 ? -82% |
| PWM Frequency (Hz) | 480.4 ? | |||||||
| Screen | 10% | -18% | -1% | -13% | 9% | 11% | 33% | |
| Brightness middle (cd/m²) | 280 | 418 49% | 278 -1% | 381 36% | 356.1 27% | 459 64% | 365.4 31% | 290 4% |
| Brightness (cd/m²) | 275 | 401 46% | 273 -1% | 371 35% | 358 30% | 434 58% | 344 25% | 290 5% |
| Brightness Distribution (%) | 79 | 91 15% | 79 0% | 84 6% | 99 25% | 88 11% | 85 8% | 96 22% |
| Black Level * (cd/m²) | 0.4 | 0.48 -20% | 0.26 35% | 0.52 -30% | 0.44 -10% | 0.29 28% | 0.23 43% | |
| Contrast (:1) | 700 | 871 24% | 1069 53% | 733 5% | 1043 49% | 1260 80% | 1261 80% | |
| Colorchecker dE 2000 * | 2.1 | 2.47 -18% | 3.96 -89% | 4.83 -130% | 2.97 -41% | 3.17 -51% | 1.59 24% | |
| Colorchecker dE 2000 max. * | 5.83 | 7.81 -34% | 10.78 -85% | 7.94 -36% | 8.13 -39% | 7.69 -32% | 3.17 46% | |
| Colorchecker dE 2000 calibrated * | 1.58 | 0.66 58% | 1.07 32% | 2.53 -60% | 1.03 35% | 0.51 68% | 0.87 45% | |
| Greyscale dE 2000 * | 3.3 | 4.4 -33% | 6.8 -106% | 3.1 6% | 4.9 -48% | 5.3 -61% | 2.5 24% | |
| Gamma | 2.13 103% | 2.129 103% | 2.224 99% | 2.2 100% | 2.235 98% | 2.18 101% | 2.253 98% | |
| CCT | 7060 92% | 7197 90% | 7651 85% | 5938 109% | 6775 96% | 5879 111% | 6640 98% | |
| Total Average (Program / Settings) | -2% /
5% | -10% /
-13% | -11% /
-5% | 26% /
9% | -55% /
-18% | -58% /
-19% | -20% /
7% |
* ... smaller is better
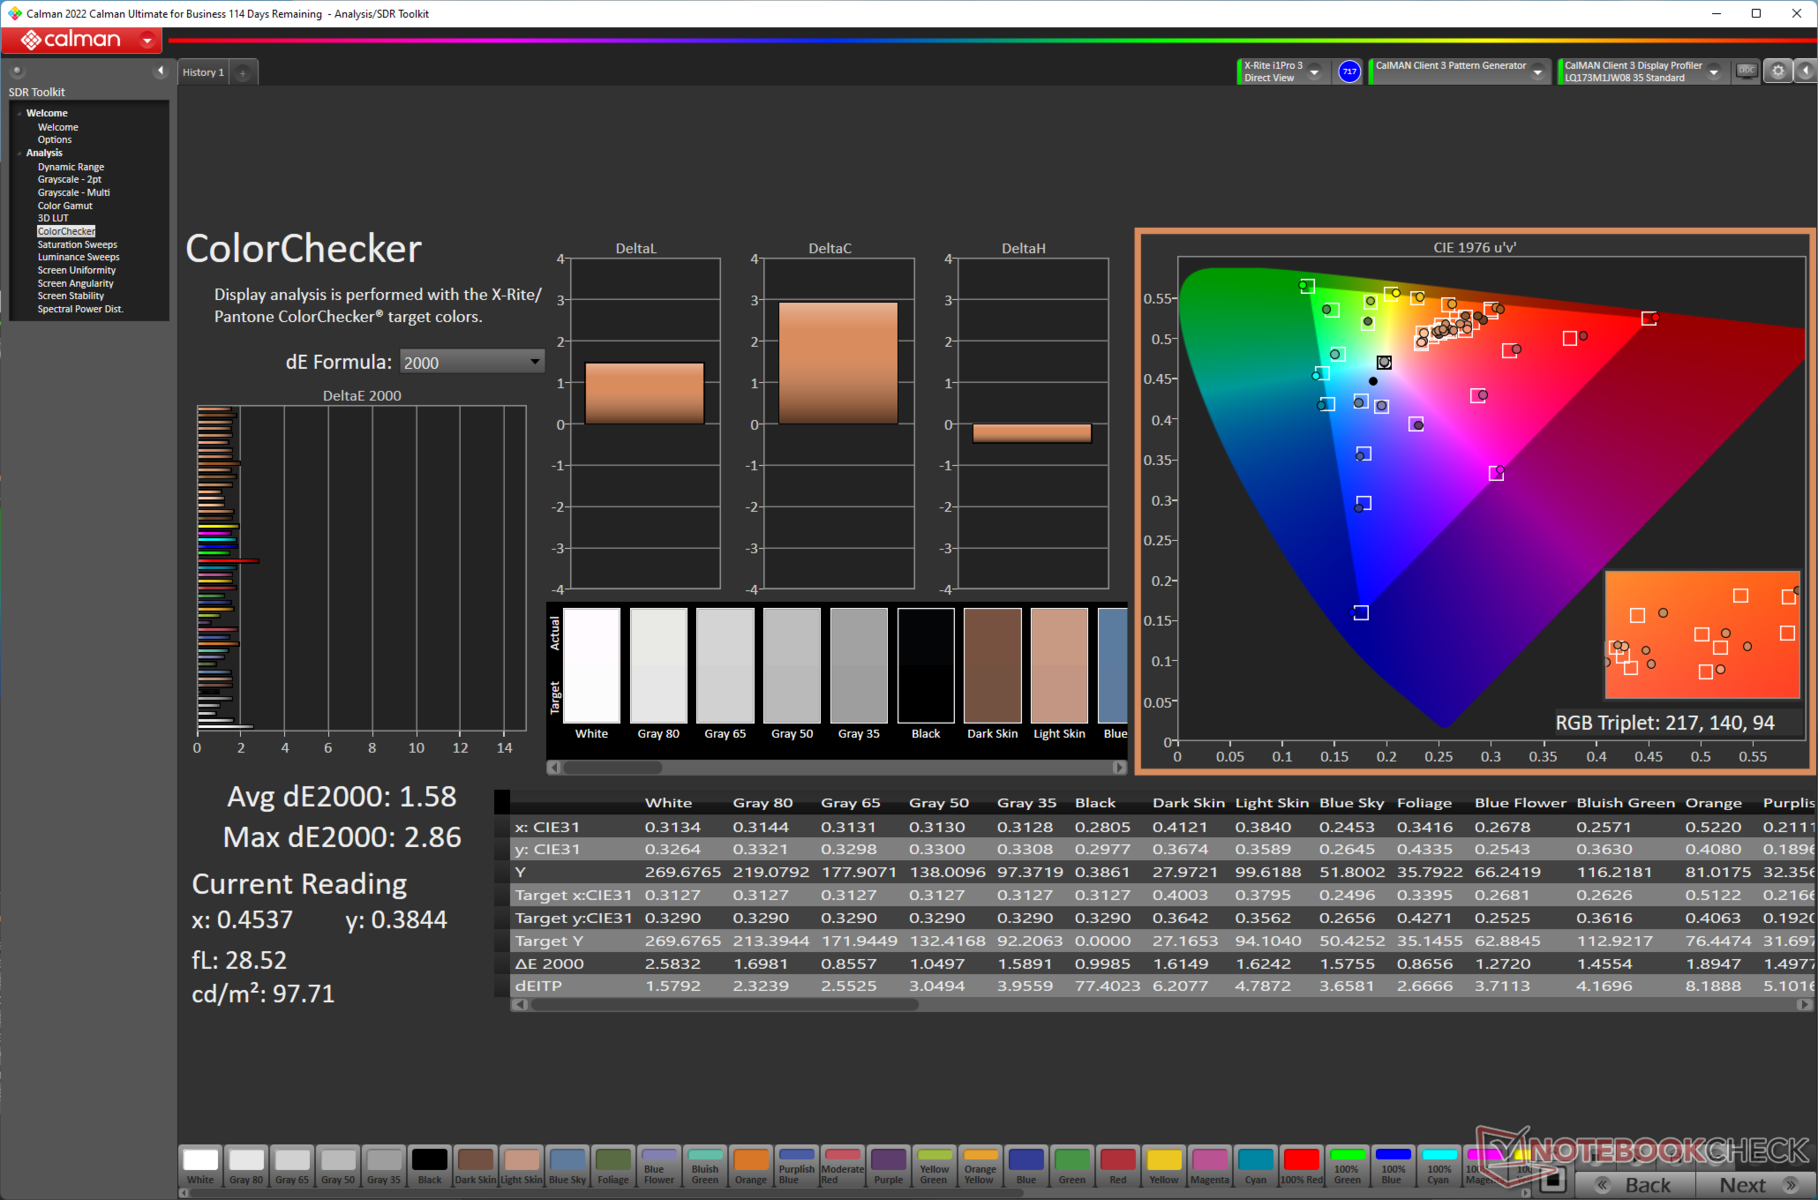
由于Titan GT77主要针对发烧级游戏玩家,因此色彩空间覆盖率并没有真正引起任何兴奋。98.9%的sRGB色域覆盖率很好,73%的AdobeRGB覆盖率对于非专业内容创作来说应该是个好兆头。带有UHD面板的SKU提供了大幅改善的AdobeRGB和Display P3覆盖率。
色彩准确性并不差,平均灰度Delta E为3.3,平均ColorChecker Delta E为2.1。通过使用X-rite i1Basic Pro 3分光光度计和Portrait Displays的Calman校准软件,我们可以将平均灰度Delta E进一步收紧到1.2,平均ColorChecker Delta E收紧到1.58。
我们校准的ICC文件可以从上面的链接下载。

Titan GT77的夏普SHP1544面板提供了非常好的响应时间。它显然不能与Raider GE67 HX 12UGS 的三星OLED面板提供的超低响应时间相提并论,但它与竞争对手相当。
Display Response Times
| ↔ Response Time Black to White | ||
|---|---|---|
| 5.28 ms ... rise ↗ and fall ↘ combined | ↗ 2.32 ms rise | 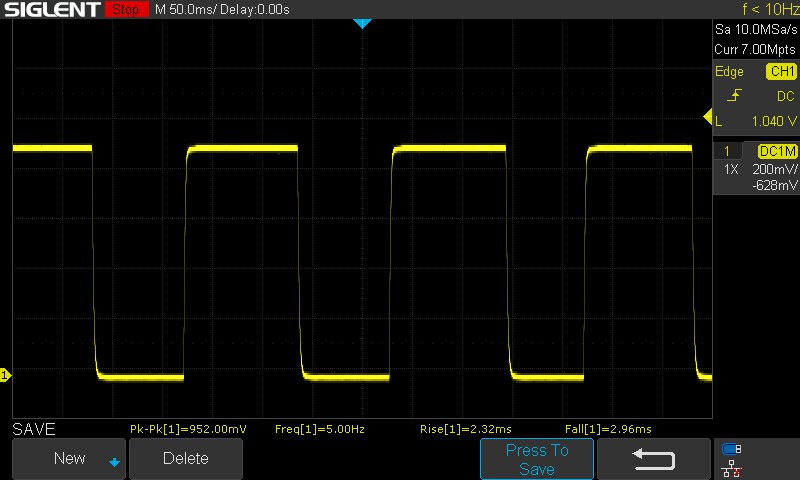 |
| ↘ 2.96 ms fall | ||
| The screen shows very fast response rates in our tests and should be very well suited for fast-paced gaming. In comparison, all tested devices range from 0.1 (minimum) to 240 (maximum) ms. » 18 % of all devices are better. This means that the measured response time is better than the average of all tested devices (19.8 ms). | ||
| ↔ Response Time 50% Grey to 80% Grey | ||
| 3.03 ms ... rise ↗ and fall ↘ combined | ↗ 1.28 ms rise | 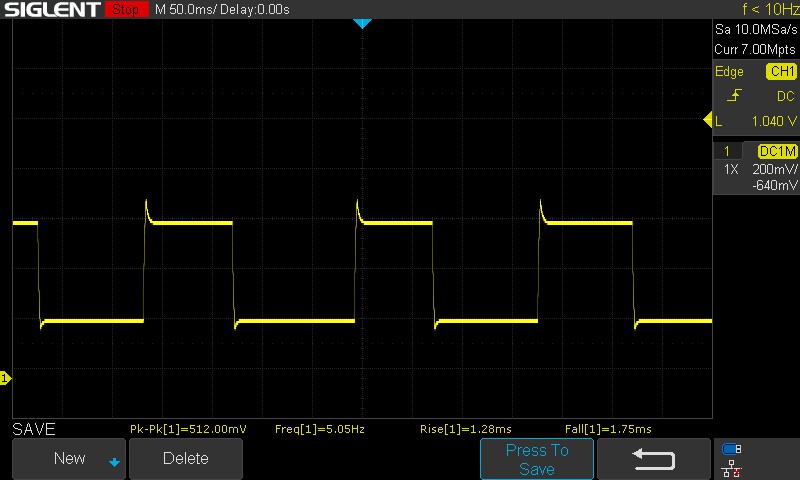 |
| ↘ 1.75 ms fall | ||
| The screen shows very fast response rates in our tests and should be very well suited for fast-paced gaming. In comparison, all tested devices range from 0.165 (minimum) to 636 (maximum) ms. » 13 % of all devices are better. This means that the measured response time is better than the average of all tested devices (31 ms). | ||
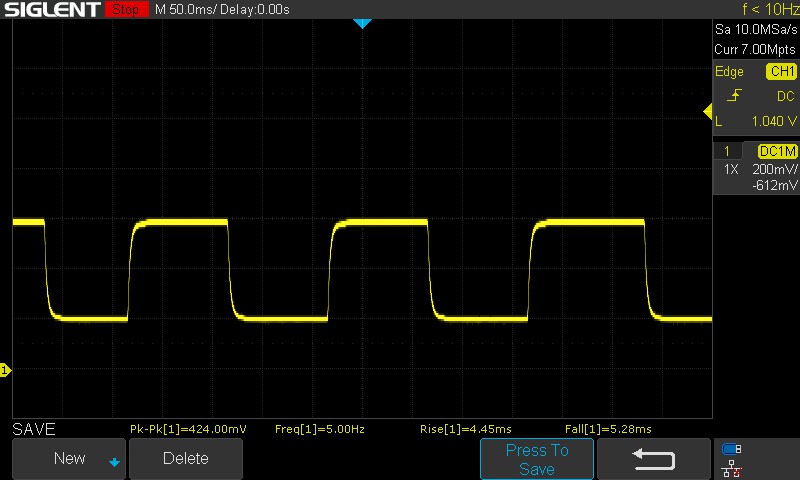
我们注意到,从100%的黑色过渡到100%的白色时,综合时间为5.28ms。面板默认使用超速,从示波器模式中的 "喇叭 "可以看出。这导致了3.03毫秒的50%灰色到80%灰色的快速响应时间。
我们观察到,在关闭过度驱动的情况下,这个数值可以上升到9.73毫秒。
Screen Flickering / PWM (Pulse-Width Modulation)
| Screen flickering / PWM not detected | ≤ 100 % brightness setting | 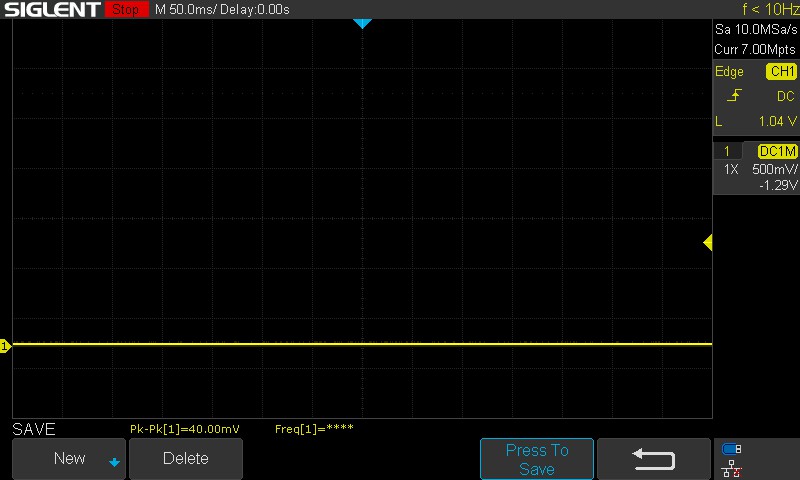 | |
In comparison: 52 % of all tested devices do not use PWM to dim the display. If PWM was detected, an average of 7757 (minimum: 5 - maximum: 343500) Hz was measured. | |||
在所有测试的亮度水平上,我们没有观察到任何PWM的闪烁,所以那些长时间的游戏马拉松应该不会造成眼睛的疲劳。
欲了解更多信息,请参阅我们的文章"为什么脉冲宽度调制(PWM)是如此令人头疼",还可以查看我们的PWM排名表以了解所有评测设备的PWM频率比较。
只要没有太多的阳光直接落在显示屏上,户外观看是可以应付的。我们观察到在极端视角下亮度和色彩信息的损失。


性能。榜上有名的Core i9-12900HX和RTX 3080 Ti组合
我们测试的泰坦GT77 12UHS设备采用了 英特尔酷睿i9-12900HX处理器和一个175瓦的 NvidiaGeForce RTX 3080 Ti 笔记本GPU.还有一个Titan GT77 12UGS SKU由Core i9-12900HX处理器提供动力,但有一个150瓦的 RTX 3070 Ti 笔记本电脑GPU.微星还提供了一个泰坦GT77由 酷睿i7-12800HX和RTX 3070 Ti笔记本GPU。
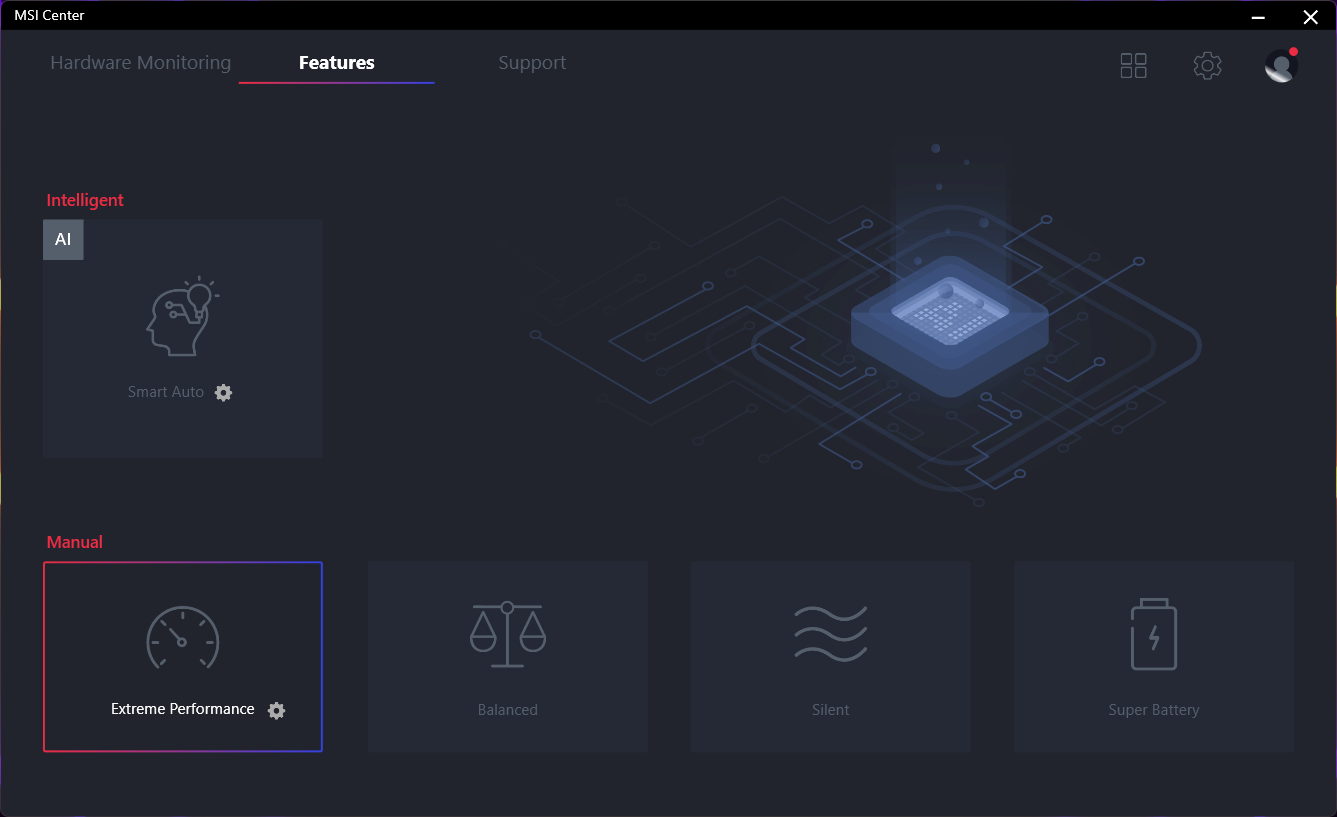
测试条件
作为微星笔记本电脑的标准,微星中心应用程序是进行各种性能调整的首选之地。考虑到这头野兽的性质,我们选择了极端性能配置文件,允许酷睿i9-12900HX在125W的PL1(处理器基本功率)和200W的PL2(最大涡轮功率)下运行。
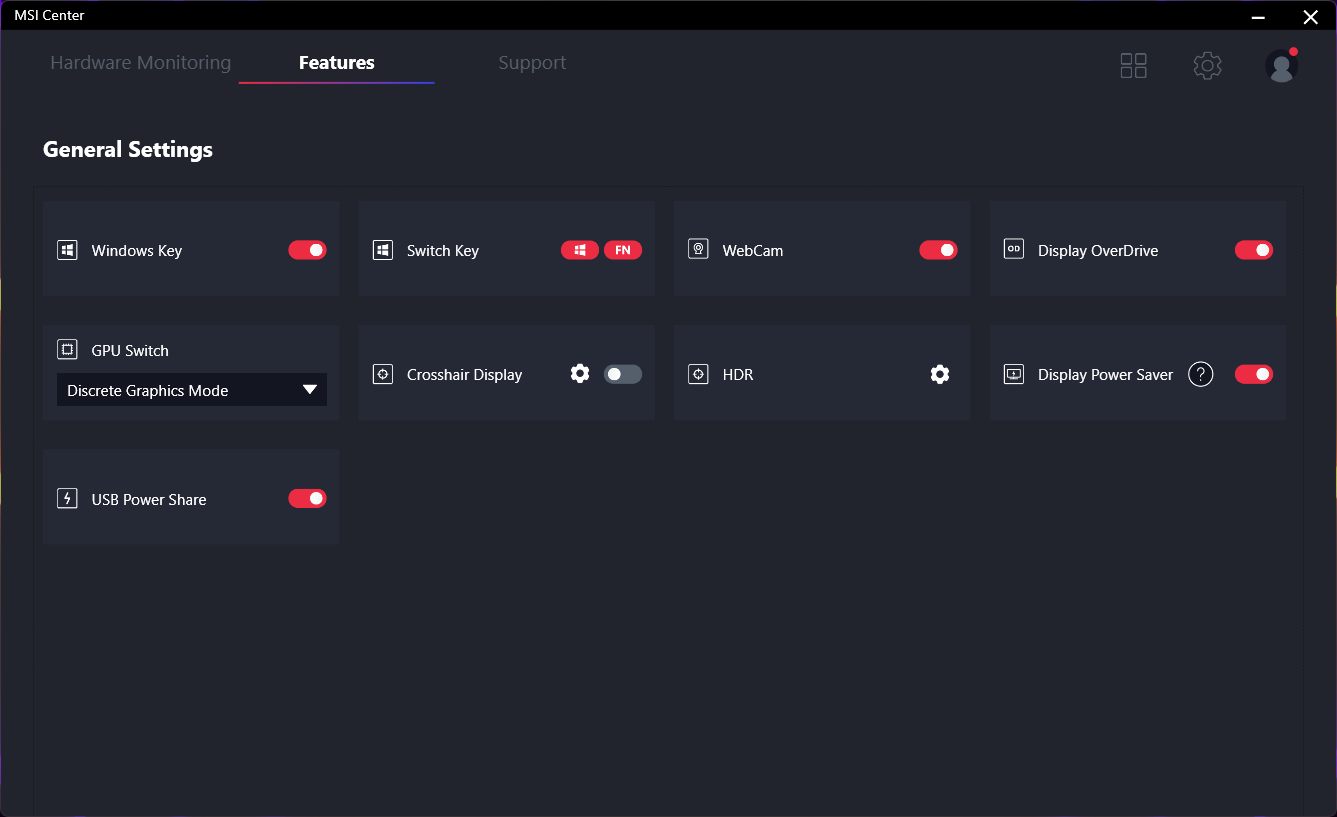
微星中心允许在MSHybrid和独立GPU模式之间进行MUX切换。我们选择了独立GPU选项,以便让RTX 3080 Ti充分施展其实力。没有高级优化功能,所以每次手动改变MUX时,你都必须重新启动笔记本电脑。
性能模式的选择对噪音水平有很大影响,我们很快就会看到。
下表说明了PL1(处理器基本功率)和PL2(最大涡轮增压功率)在不同性能模式下的变化。平衡模式和极限性能模式在大多数情况下是相似的,尽管后者允许更高的PL1。
虽然平衡模式应该足以满足包括游戏在内的大多数任务,但我们建议选择极限性能模式,以便从处理器中获取最大可能的能量。
| 性能模式 | PL1(PBP)/ Tau | PL2(MTP)/ Tau |
|---|---|---|
| 静音 | 30 W / 56 s | 30 W / 2.44 ms |
| 平衡 | 100 W / 56 s | 200 W / 2.44 ms |
| 极端性能 | 125 W / 56 s | 200 W / 2.44 ms |
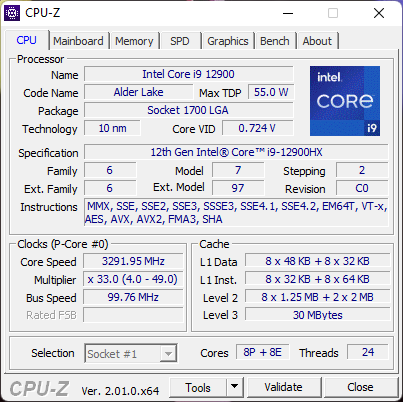
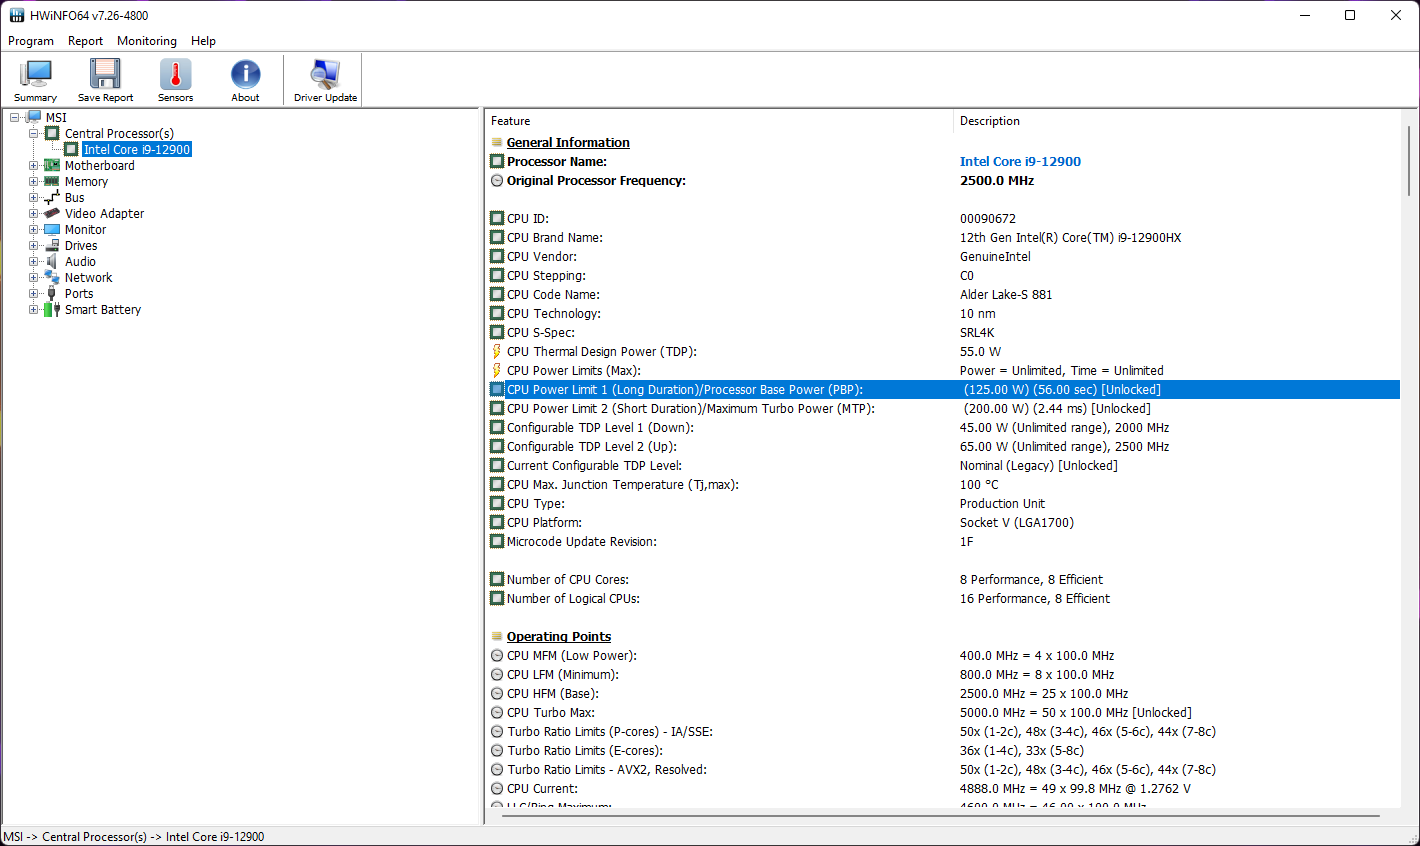
处理器
酷睿i9-12900HX是一款16核24线程的产品。 桤木湖-HX部分,有8个P核心和8个E核心。Alder Lake-HX本质上是桌面Alder Lake-S的移动版,采用BGA插座。这也是第一个提供PCIe Gen5支持的移动平台。
酷睿i9-12900HX是解锁的,你实际上可以进入微星隐藏的BIOS控制(按右键Shift +右键Ctrl +左键Alt + F2)来降低电压或超频CPU。然而,从下面的压力测试中可以看出,库存电源设置已经达到了可用的热能空间。
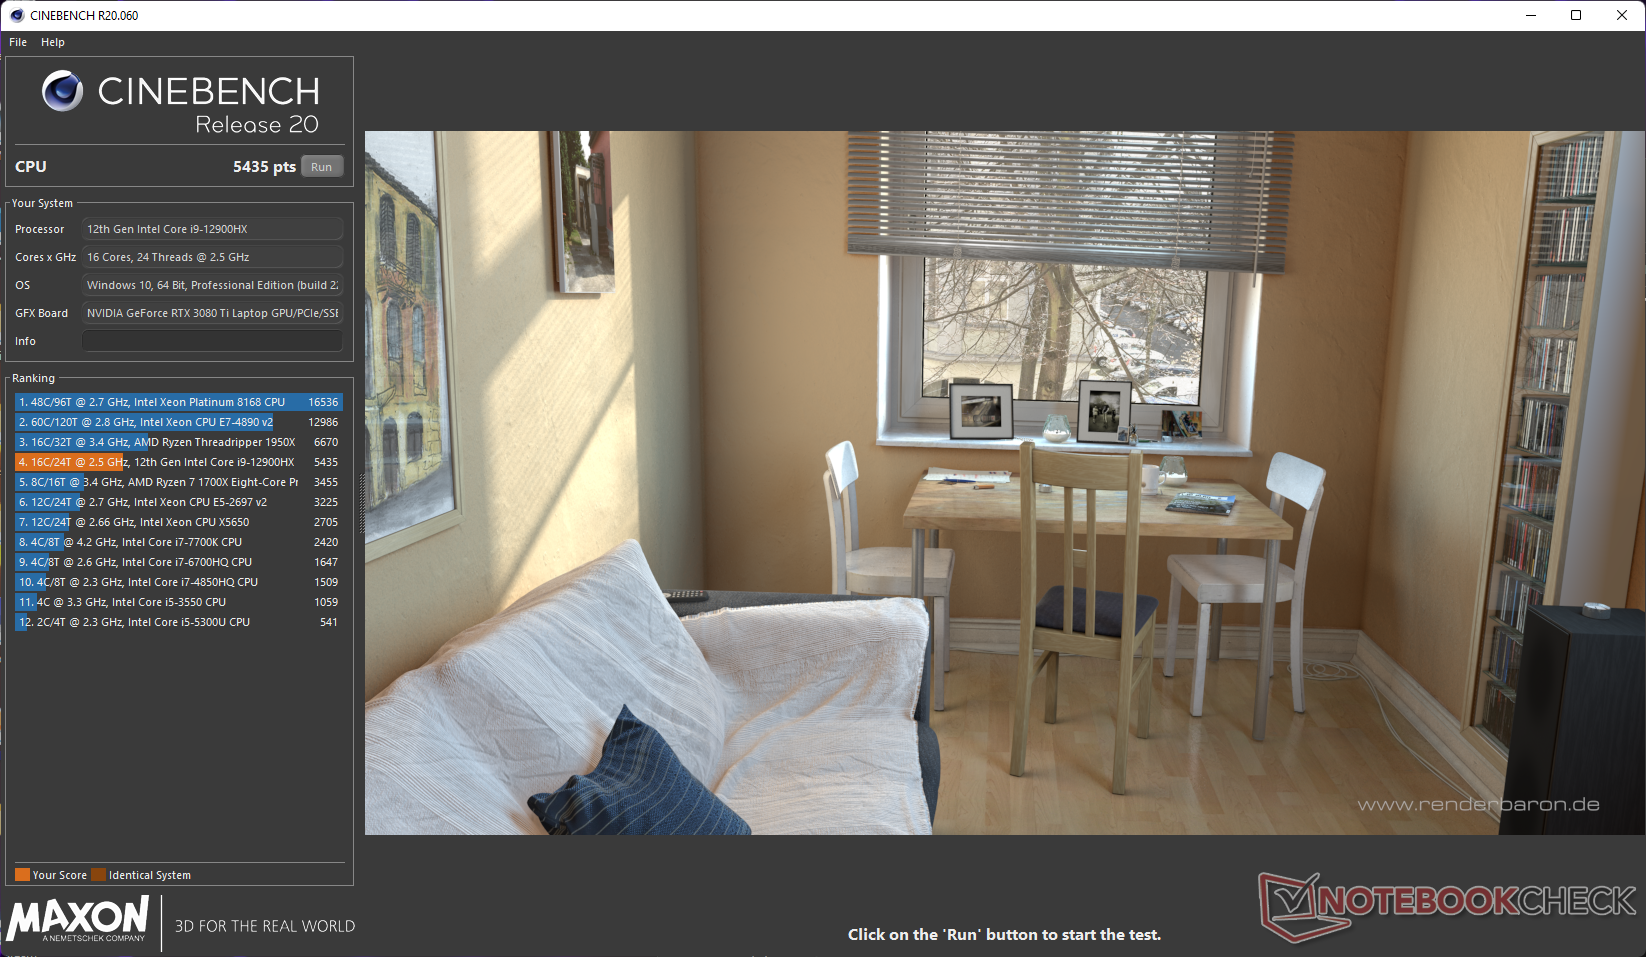
就CPU的整体性能而言,泰坦GT77名列前茅,只有Raider GE77 HX 12 UHS与之匹配。我们发现,在大多数CPU测试中,酷睿i9-12900HX与普通台式机酷睿i9-12900K 相差不大。
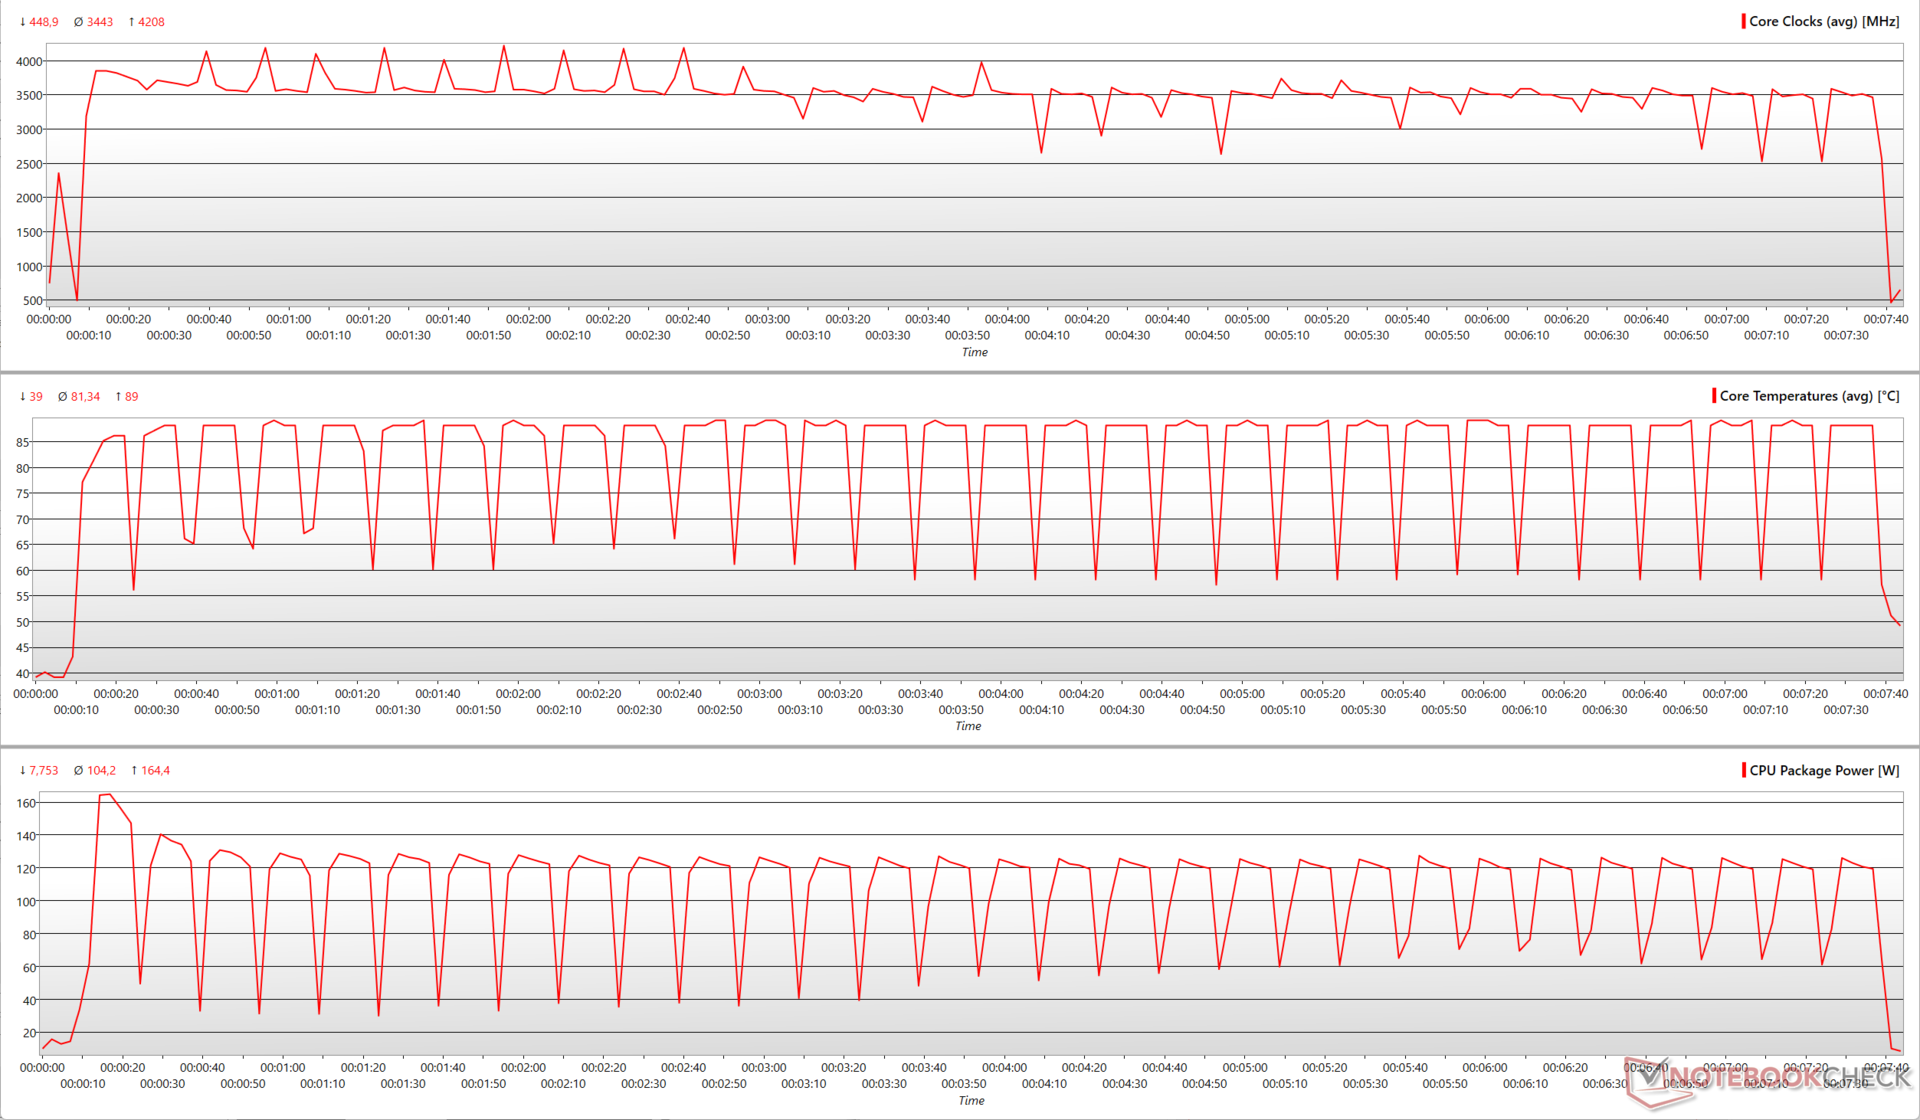
微星的Cooler Boost Titan能够确保酷睿i9-12900HX在负载下不会节流,这一点从Cinebench R15多核循环测试的一致表现中可以看出。
Cinebench R15 Multi Loop
下图说明了在Cinebench R15多核循环测试中CPU的重要参数是如何变化的。尽管Titan GT77的Core i9-12900HX被配置为在高达200W的PL2下运行,但我们发现峰值约为165W。P核可以提升到4.8GHz,而E核则在3.5GHz的水平运行。
我们注意到微星中心应用程序中的一个错误,每当启动一个以CPU为基础的基准测试(如Cinebench)时,总是将配置文件恢复到极限性能。这限制了我们在其他性能配置文件中运行相同的循环,如平衡、沉默或超级电池。希望微星能在未来的软件更新中解决这个问题。
Aorus 17X XES 中的Core i9-12900HX在单核测试中与Titan GT77持平,但在多核测试中落后。这可能是由于Aorus笔记本的功率限制较低。 Raider GE67 HX 12UGS 中的Core i7-12800HX在大多数CPU测试中仅有个位数的性能差距,紧随Core i9-12900HX之后。
因此,如果你想在牺牲性能的情况下节省一些钱,搭载酷睿i7-12800HX的泰坦GT77 SKU可能是一项明智的投资。
多核性能在电池上下降了约37.2%。
Cinebench R23: Multi Core | Single Core
Cinebench R20: CPU (Multi Core) | CPU (Single Core)
Cinebench R15: CPU Multi 64Bit | CPU Single 64Bit
Blender: v2.79 BMW27 CPU
7-Zip 18.03: 7z b 4 | 7z b 4 -mmt1
Geekbench 5.5: Multi-Core | Single-Core
HWBOT x265 Benchmark v2.2: 4k Preset
LibreOffice : 20 Documents To PDF
R Benchmark 2.5: Overall mean
| CPU Performance rating | |
| Average Intel Core i9-12900K | |
| Average of class Gaming | |
| MSI Titan GT77 12UHS | |
| MSI Raider GE77 HX 12UHS | |
| Average Intel Core i9-12900HX | |
| MSI GE67 HX 12UGS | |
| Aorus 17X XES | |
| MSI GE76 Raider | |
| Alienware x17 R2 P48E | |
| Gigabyte Aero 16 YE5 | |
| Asus ROG Zephyrus Duo 16 GX650RX | |
| Cinebench R23 / Multi Core | |
| Average of class Gaming (10488 - 42661, n=107, last 2 years) | |
| Average Intel Core i9-12900K (25245 - 27005, n=2) | |
| MSI Raider GE77 HX 12UHS | |
| MSI Titan GT77 12UHS | |
| Average Intel Core i9-12900HX (18337 - 23482, n=8) | |
| MSI GE67 HX 12UGS | |
| Alienware x17 R2 P48E | |
| Aorus 17X XES | |
| MSI GE76 Raider | |
| Gigabyte Aero 16 YE5 | |
| Asus ROG Zephyrus Duo 16 GX650RX | |
| Cinebench R23 / Single Core | |
| Average of class Gaming (1166 - 2415, n=107, last 2 years) | |
| Average Intel Core i9-12900K (1998 - 2011, n=2) | |
| Gigabyte Aero 16 YE5 | |
| Aorus 17X XES | |
| Average Intel Core i9-12900HX (1897 - 1936, n=8) | |
| MSI Titan GT77 12UHS | |
| MSI GE76 Raider | |
| MSI Raider GE77 HX 12UHS | |
| Alienware x17 R2 P48E | |
| MSI GE67 HX 12UGS | |
| Asus ROG Zephyrus Duo 16 GX650RX | |
| Cinebench R20 / CPU (Multi Core) | |
| Average of class Gaming (4029 - 16433, n=106, last 2 years) | |
| Average Intel Core i9-12900K (9630 - 10240, n=2) | |
| MSI Raider GE77 HX 12UHS | |
| MSI Titan GT77 12UHS | |
| Average Intel Core i9-12900HX (7037 - 9042, n=8) | |
| MSI GE67 HX 12UGS | |
| Alienware x17 R2 P48E | |
| Aorus 17X XES | |
| Gigabyte Aero 16 YE5 | |
| MSI GE76 Raider | |
| Asus ROG Zephyrus Duo 16 GX650RX | |
| Cinebench R20 / CPU (Single Core) | |
| Average of class Gaming (442 - 913, n=106, last 2 years) | |
| Average Intel Core i9-12900K (766 - 777, n=2) | |
| MSI Raider GE77 HX 12UHS | |
| Aorus 17X XES | |
| MSI Titan GT77 12UHS | |
| Average Intel Core i9-12900HX (728 - 745, n=8) | |
| MSI GE76 Raider | |
| Alienware x17 R2 P48E | |
| Gigabyte Aero 16 YE5 | |
| MSI GE67 HX 12UGS | |
| Asus ROG Zephyrus Duo 16 GX650RX | |
| Cinebench R15 / CPU Multi 64Bit | |
| Average of class Gaming (1578 - 6330, n=105, last 2 years) | |
| Average Intel Core i9-12900K (3473 - 4102, n=3) | |
| MSI Titan GT77 12UHS | |
| MSI Raider GE77 HX 12UHS | |
| Average Intel Core i9-12900HX (2830 - 3652, n=8) | |
| MSI GE67 HX 12UGS | |
| Alienware x17 R2 P48E | |
| MSI GE76 Raider | |
| Aorus 17X XES | |
| Gigabyte Aero 16 YE5 | |
| Asus ROG Zephyrus Duo 16 GX650RX | |
| Cinebench R15 / CPU Single 64Bit | |
| Average of class Gaming (188.8 - 350, n=106, last 2 years) | |
| Average Intel Core i9-12900K (286 - 292, n=3) | |
| MSI Raider GE77 HX 12UHS | |
| Gigabyte Aero 16 YE5 | |
| MSI Titan GT77 12UHS | |
| Average Intel Core i9-12900HX (274 - 282, n=8) | |
| Aorus 17X XES | |
| MSI GE76 Raider | |
| Alienware x17 R2 P48E | |
| MSI GE67 HX 12UGS | |
| Asus ROG Zephyrus Duo 16 GX650RX | |
| Blender / v2.79 BMW27 CPU | |
| Asus ROG Zephyrus Duo 16 GX650RX | |
| Aorus 17X XES | |
| Gigabyte Aero 16 YE5 | |
| MSI GE76 Raider | |
| Alienware x17 R2 P48E | |
| Average Intel Core i9-12900HX (144 - 201, n=8) | |
| MSI GE67 HX 12UGS | |
| MSI Raider GE77 HX 12UHS | |
| Average of class Gaming (79 - 330, n=104, last 2 years) | |
| MSI Titan GT77 12UHS | |
| Average Intel Core i9-12900K (121.1 - 128.3, n=2) | |
| 7-Zip 18.03 / 7z b 4 | |
| Average Intel Core i9-12900K (96960 - 97671, n=2) | |
| Average of class Gaming (33491 - 148086, n=105, last 2 years) | |
| MSI Raider GE77 HX 12UHS | |
| MSI Titan GT77 12UHS | |
| Average Intel Core i9-12900HX (69778 - 88128, n=7) | |
| MSI GE67 HX 12UGS | |
| MSI GE76 Raider | |
| Aorus 17X XES | |
| Alienware x17 R2 P48E | |
| Gigabyte Aero 16 YE5 | |
| Asus ROG Zephyrus Duo 16 GX650RX | |
| 7-Zip 18.03 / 7z b 4 -mmt1 | |
| Average Intel Core i9-12900K (6571 - 6580, n=2) | |
| Average of class Gaming (4199 - 7436, n=105, last 2 years) | |
| MSI Raider GE77 HX 12UHS | |
| Aorus 17X XES | |
| Average Intel Core i9-12900HX (6165 - 6358, n=7) | |
| MSI Titan GT77 12UHS | |
| Gigabyte Aero 16 YE5 | |
| MSI GE76 Raider | |
| Alienware x17 R2 P48E | |
| Asus ROG Zephyrus Duo 16 GX650RX | |
| MSI GE67 HX 12UGS | |
| Geekbench 5.5 / Multi-Core | |
| Average Intel Core i9-12900K (17698 - 17854, n=2) | |
| Average of class Gaming (6460 - 28263, n=105, last 2 years) | |
| MSI Raider GE77 HX 12UHS | |
| MSI Titan GT77 12UHS | |
| Average Intel Core i9-12900HX (15116 - 16925, n=8) | |
| Aorus 17X XES | |
| MSI GE67 HX 12UGS | |
| Gigabyte Aero 16 YE5 | |
| Alienware x17 R2 P48E | |
| MSI GE76 Raider | |
| Asus ROG Zephyrus Duo 16 GX650RX | |
| Geekbench 5.5 / Single-Core | |
| Average of class Gaming (986 - 2474, n=105, last 2 years) | |
| Average Intel Core i9-12900K (1969 - 2042, n=2) | |
| MSI Raider GE77 HX 12UHS | |
| MSI Titan GT77 12UHS | |
| MSI GE76 Raider | |
| Average Intel Core i9-12900HX (1874 - 1949, n=8) | |
| Aorus 17X XES | |
| Alienware x17 R2 P48E | |
| Gigabyte Aero 16 YE5 | |
| MSI GE67 HX 12UGS | |
| Asus ROG Zephyrus Duo 16 GX650RX | |
| HWBOT x265 Benchmark v2.2 / 4k Preset | |
| Average Intel Core i9-12900K (29 - 30, n=2) | |
| Average of class Gaming (11.5 - 44.4, n=105, last 2 years) | |
| MSI Raider GE77 HX 12UHS | |
| MSI Titan GT77 12UHS | |
| Average Intel Core i9-12900HX (19.6 - 26.6, n=7) | |
| MSI GE67 HX 12UGS | |
| Alienware x17 R2 P48E | |
| MSI GE76 Raider | |
| Aorus 17X XES | |
| Gigabyte Aero 16 YE5 | |
| Asus ROG Zephyrus Duo 16 GX650RX | |
| LibreOffice / 20 Documents To PDF | |
| Average of class Gaming (33.2 - 88.8, n=105, last 2 years) | |
| Asus ROG Zephyrus Duo 16 GX650RX | |
| MSI Raider GE77 HX 12UHS | |
| MSI GE67 HX 12UGS | |
| Alienware x17 R2 P48E | |
| Average Intel Core i9-12900K (38.1 - 40.6, n=2) | |
| Gigabyte Aero 16 YE5 | |
| MSI Titan GT77 12UHS | |
| MSI GE76 Raider | |
| Aorus 17X XES | |
| Average Intel Core i9-12900HX (33.6 - 42.4, n=7) | |
| R Benchmark 2.5 / Overall mean | |
| Asus ROG Zephyrus Duo 16 GX650RX | |
| MSI GE67 HX 12UGS | |
| Alienware x17 R2 P48E | |
| Average of class Gaming (0.3439 - 0.759, n=106, last 2 years) | |
| MSI GE76 Raider | |
| MSI Raider GE77 HX 12UHS | |
| Average Intel Core i9-12900HX (0.4159 - 0.4242, n=7) | |
| MSI Titan GT77 12UHS | |
| Aorus 17X XES | |
| Gigabyte Aero 16 YE5 | |
| Average Intel Core i9-12900K (0.3946 - 0.4216, n=2) | |
* ... smaller is better
AIDA64: FP32 Ray-Trace | FPU Julia | CPU SHA3 | CPU Queen | FPU SinJulia | FPU Mandel | CPU AES | CPU ZLib | FP64 Ray-Trace | CPU PhotoWorxx
| Performance rating | |
| Average of class Gaming | |
| MSI Raider GE77 HX 12UHS | |
| MSI Titan GT77 12UHS | |
| Average Intel Core i9-12900HX | |
| Average Intel Core i9-12900K | |
| Asus ROG Zephyrus Duo 16 GX650RX | |
| Aorus 17X XES | |
| MSI GE67 HX 12UGS | |
| Alienware x17 R2 P48E | |
| MSI GE76 Raider | |
| Gigabyte Aero 16 YE5 | |
| AIDA64 / FP32 Ray-Trace | |
| Average of class Gaming (10227 - 85542, n=105, last 2 years) | |
| MSI Titan GT77 12UHS | |
| MSI Raider GE77 HX 12UHS | |
| Average Intel Core i9-12900HX (11535 - 22183, n=7) | |
| Asus ROG Zephyrus Duo 16 GX650RX | |
| Aorus 17X XES | |
| Average Intel Core i9-12900K (12739 - 13345, n=3) | |
| MSI GE67 HX 12UGS | |
| Alienware x17 R2 P48E | |
| MSI GE76 Raider | |
| Gigabyte Aero 16 YE5 | |
| AIDA64 / FPU Julia | |
| Average of class Gaming (51376 - 238426, n=105, last 2 years) | |
| MSI Raider GE77 HX 12UHS | |
| MSI Titan GT77 12UHS | |
| Asus ROG Zephyrus Duo 16 GX650RX | |
| Average Intel Core i9-12900HX (52916 - 110093, n=7) | |
| Aorus 17X XES | |
| Average Intel Core i9-12900K (58406 - 59419, n=3) | |
| MSI GE67 HX 12UGS | |
| Alienware x17 R2 P48E | |
| MSI GE76 Raider | |
| Gigabyte Aero 16 YE5 | |
| AIDA64 / CPU SHA3 | |
| Average of class Gaming (2180 - 10115, n=105, last 2 years) | |
| MSI Raider GE77 HX 12UHS | |
| Average Intel Core i9-12900K (4796 - 5127, n=3) | |
| MSI Titan GT77 12UHS | |
| Average Intel Core i9-12900HX (3559 - 5123, n=7) | |
| MSI GE67 HX 12UGS | |
| Aorus 17X XES | |
| Asus ROG Zephyrus Duo 16 GX650RX | |
| Alienware x17 R2 P48E | |
| MSI GE76 Raider | |
| Gigabyte Aero 16 YE5 | |
| AIDA64 / CPU Queen | |
| Average of class Gaming (49785 - 173351, n=90, last 2 years) | |
| Average Intel Core i9-12900K (112066 - 112694, n=3) | |
| Alienware x17 R2 P48E | |
| Gigabyte Aero 16 YE5 | |
| MSI GE76 Raider | |
| Asus ROG Zephyrus Duo 16 GX650RX | |
| Aorus 17X XES | |
| MSI Titan GT77 12UHS | |
| Average Intel Core i9-12900HX (101029 - 104457, n=7) | |
| MSI Raider GE77 HX 12UHS | |
| MSI GE67 HX 12UGS | |
| AIDA64 / FPU SinJulia | |
| Average Intel Core i9-12900K (14590 - 14664, n=3) | |
| Average of class Gaming (4424 - 33636, n=105, last 2 years) | |
| MSI Titan GT77 12UHS | |
| Asus ROG Zephyrus Duo 16 GX650RX | |
| MSI Raider GE77 HX 12UHS | |
| Average Intel Core i9-12900HX (10475 - 13062, n=7) | |
| MSI GE67 HX 12UGS | |
| Aorus 17X XES | |
| Alienware x17 R2 P48E | |
| MSI GE76 Raider | |
| Gigabyte Aero 16 YE5 | |
| AIDA64 / FPU Mandel | |
| Average of class Gaming (25115 - 128721, n=105, last 2 years) | |
| Asus ROG Zephyrus Duo 16 GX650RX | |
| MSI Titan GT77 12UHS | |
| MSI Raider GE77 HX 12UHS | |
| Average Intel Core i9-12900HX (31779 - 53628, n=7) | |
| Aorus 17X XES | |
| Average Intel Core i9-12900K (35801 - 39323, n=3) | |
| MSI GE67 HX 12UGS | |
| Alienware x17 R2 P48E | |
| MSI GE76 Raider | |
| Gigabyte Aero 16 YE5 | |
| AIDA64 / CPU AES | |
| MSI Raider GE77 HX 12UHS | |
| MSI Titan GT77 12UHS | |
| Average Intel Core i9-12900HX (125268 - 183146, n=7) | |
| Asus ROG Zephyrus Duo 16 GX650RX | |
| Aorus 17X XES | |
| Average Intel Core i9-12900K (94062 - 140055, n=3) | |
| MSI GE67 HX 12UGS | |
| Average of class Gaming (39258 - 247074, n=105, last 2 years) | |
| Alienware x17 R2 P48E | |
| MSI GE76 Raider | |
| Gigabyte Aero 16 YE5 | |
| AIDA64 / CPU ZLib | |
| Average of class Gaming (574 - 2531, n=105, last 2 years) | |
| Average Intel Core i9-12900K (1537 - 1608, n=3) | |
| MSI Raider GE77 HX 12UHS | |
| MSI Titan GT77 12UHS | |
| MSI GE67 HX 12UGS | |
| Average Intel Core i9-12900HX (990 - 1408, n=7) | |
| Alienware x17 R2 P48E | |
| MSI GE76 Raider | |
| Aorus 17X XES | |
| Gigabyte Aero 16 YE5 | |
| Asus ROG Zephyrus Duo 16 GX650RX | |
| AIDA64 / FP64 Ray-Trace | |
| Average of class Gaming (5509 - 45446, n=105, last 2 years) | |
| MSI Titan GT77 12UHS | |
| MSI Raider GE77 HX 12UHS | |
| Average Intel Core i9-12900HX (6663 - 11913, n=7) | |
| Asus ROG Zephyrus Duo 16 GX650RX | |
| Aorus 17X XES | |
| Average Intel Core i9-12900K (7586 - 8283, n=3) | |
| MSI GE67 HX 12UGS | |
| Alienware x17 R2 P48E | |
| MSI GE76 Raider | |
| Gigabyte Aero 16 YE5 | |
| AIDA64 / CPU PhotoWorxx | |
| MSI Raider GE77 HX 12UHS | |
| Average of class Gaming (12271 - 89891, n=105, last 2 years) | |
| Average Intel Core i9-12900K (33311 - 49236, n=3) | |
| Average Intel Core i9-12900HX (40239 - 47710, n=7) | |
| MSI Titan GT77 12UHS | |
| Aorus 17X XES | |
| MSI GE76 Raider | |
| Gigabyte Aero 16 YE5 | |
| Alienware x17 R2 P48E | |
| MSI GE67 HX 12UGS | |
| Asus ROG Zephyrus Duo 16 GX650RX | |
查看我们专门的 英特尔酷睿i9-12900HX页面了解更多信息和基准比较。
系统性能
对于拥有如此强大内脏的笔记本电脑来说,整体系统性能是在预期范围内的。然而,内存的读/写速度,似乎在与Raider GE77 HX 12UHS相比时受到了影响。 锐取GE77 HX 12UHS.否则,我们在日常生产力或网络浏览任务中没有发现任何问题。
CrossMark: Overall | Productivity | Creativity | Responsiveness
| PCMark 10 / Score | |
| Average of class Gaming (5828 - 12414, n=93, last 2 years) | |
| MSI Titan GT77 12UHS | |
| Alienware x17 R2 P48E | |
| MSI GE67 HX 12UGS | |
| MSI GE76 Raider | |
| Average Intel Core i9-12900HX, NVIDIA GeForce RTX 3080 Ti Laptop GPU (6812 - 8636, n=6) | |
| Aorus 17X XES | |
| Gigabyte Aero 16 YE5 | |
| MSI Raider GE77 HX 12UHS | |
| Asus ROG Zephyrus Duo 16 GX650RX | |
| PCMark 10 / Essentials | |
| Alienware x17 R2 P48E | |
| MSI Titan GT77 12UHS | |
| Gigabyte Aero 16 YE5 | |
| MSI GE67 HX 12UGS | |
| MSI GE76 Raider | |
| Average of class Gaming (8810 - 11935, n=97, last 2 years) | |
| Average Intel Core i9-12900HX, NVIDIA GeForce RTX 3080 Ti Laptop GPU (9598 - 11192, n=6) | |
| Aorus 17X XES | |
| MSI Raider GE77 HX 12UHS | |
| Asus ROG Zephyrus Duo 16 GX650RX | |
| PCMark 10 / Productivity | |
| Average of class Gaming (6845 - 25323, n=95, last 2 years) | |
| Average Intel Core i9-12900HX, NVIDIA GeForce RTX 3080 Ti Laptop GPU (9365 - 10932, n=6) | |
| Aorus 17X XES | |
| MSI Titan GT77 12UHS | |
| Alienware x17 R2 P48E | |
| MSI GE76 Raider | |
| Gigabyte Aero 16 YE5 | |
| MSI GE67 HX 12UGS | |
| MSI Raider GE77 HX 12UHS | |
| Asus ROG Zephyrus Duo 16 GX650RX | |
| PCMark 10 / Digital Content Creation | |
| Average of class Gaming (7602 - 19954, n=95, last 2 years) | |
| MSI Titan GT77 12UHS | |
| Alienware x17 R2 P48E | |
| MSI GE76 Raider | |
| MSI GE67 HX 12UGS | |
| Average Intel Core i9-12900HX, NVIDIA GeForce RTX 3080 Ti Laptop GPU (9543 - 14291, n=6) | |
| Aorus 17X XES | |
| Gigabyte Aero 16 YE5 | |
| MSI Raider GE77 HX 12UHS | |
| Asus ROG Zephyrus Duo 16 GX650RX | |
| CrossMark / Overall | |
| MSI Raider GE77 HX 12UHS | |
| Aorus 17X XES | |
| Average Intel Core i9-12900HX, NVIDIA GeForce RTX 3080 Ti Laptop GPU (2108 - 2170, n=5) | |
| Gigabyte Aero 16 YE5 | |
| MSI Titan GT77 12UHS | |
| Average of class Gaming (1366 - 2409, n=94, last 2 years) | |
| MSI GE67 HX 12UGS | |
| Alienware x17 R2 P48E | |
| Asus ROG Zephyrus Duo 16 GX650RX | |
| CrossMark / Productivity | |
| MSI Raider GE77 HX 12UHS | |
| Gigabyte Aero 16 YE5 | |
| Aorus 17X XES | |
| Average Intel Core i9-12900HX, NVIDIA GeForce RTX 3080 Ti Laptop GPU (1978 - 2047, n=5) | |
| MSI Titan GT77 12UHS | |
| MSI GE67 HX 12UGS | |
| Average of class Gaming (1386 - 2254, n=94, last 2 years) | |
| Alienware x17 R2 P48E | |
| Asus ROG Zephyrus Duo 16 GX650RX | |
| CrossMark / Creativity | |
| MSI Raider GE77 HX 12UHS | |
| Average Intel Core i9-12900HX, NVIDIA GeForce RTX 3080 Ti Laptop GPU (2288 - 2366, n=5) | |
| Aorus 17X XES | |
| MSI Titan GT77 12UHS | |
| Average of class Gaming (1343 - 2786, n=94, last 2 years) | |
| Gigabyte Aero 16 YE5 | |
| Alienware x17 R2 P48E | |
| MSI GE67 HX 12UGS | |
| Asus ROG Zephyrus Duo 16 GX650RX | |
| CrossMark / Responsiveness | |
| Gigabyte Aero 16 YE5 | |
| Aorus 17X XES | |
| MSI Raider GE77 HX 12UHS | |
| Average Intel Core i9-12900HX, NVIDIA GeForce RTX 3080 Ti Laptop GPU (1991 - 2090, n=5) | |
| MSI Titan GT77 12UHS | |
| MSI GE67 HX 12UGS | |
| Asus ROG Zephyrus Duo 16 GX650RX | |
| Average of class Gaming (1226 - 2334, n=94, last 2 years) | |
| Alienware x17 R2 P48E | |
| PCMark 8 Home Score Accelerated v2 | 6253 points | |
| PCMark 8 Creative Score Accelerated v2 | 10390 points | |
| PCMark 8 Work Score Accelerated v2 | 7085 points | |
| PCMark 10 Score | 8203 points | |
Help | ||
| AIDA64 / Memory Copy | |
| Average of class Gaming (21750 - 129946, n=105, last 2 years) | |
| MSI Raider GE77 HX 12UHS | |
| Average Intel Core i9-12900HX (62852 - 70863, n=7) | |
| MSI Titan GT77 12UHS | |
| Aorus 17X XES | |
| MSI GE76 Raider | |
| Gigabyte Aero 16 YE5 | |
| Alienware x17 R2 P48E | |
| Asus ROG Zephyrus Duo 16 GX650RX | |
| MSI GE67 HX 12UGS | |
| AIDA64 / Memory Read | |
| Average of class Gaming (22956 - 118858, n=105, last 2 years) | |
| MSI Raider GE77 HX 12UHS | |
| Aorus 17X XES | |
| Average Intel Core i9-12900HX (62140 - 72930, n=7) | |
| Gigabyte Aero 16 YE5 | |
| MSI GE76 Raider | |
| MSI Titan GT77 12UHS | |
| MSI GE67 HX 12UGS | |
| Alienware x17 R2 P48E | |
| Asus ROG Zephyrus Duo 16 GX650RX | |
| AIDA64 / Memory Write | |
| Average of class Gaming (22297 - 135096, n=105, last 2 years) | |
| MSI Raider GE77 HX 12UHS | |
| MSI GE76 Raider | |
| Average Intel Core i9-12900HX (60001 - 68782, n=7) | |
| Gigabyte Aero 16 YE5 | |
| MSI Titan GT77 12UHS | |
| Aorus 17X XES | |
| MSI GE67 HX 12UGS | |
| Asus ROG Zephyrus Duo 16 GX650RX | |
| Alienware x17 R2 P48E | |
| AIDA64 / Memory Latency | |
| Average of class Gaming (75.3 - 259, n=105, last 2 years) | |
| Alienware x17 R2 P48E | |
| MSI GE67 HX 12UGS | |
| MSI GE76 Raider | |
| Asus ROG Zephyrus Duo 16 GX650RX | |
| Gigabyte Aero 16 YE5 | |
| MSI Titan GT77 12UHS | |
| Average Intel Core i9-12900HX (83.9 - 93.4, n=7) | |
| Aorus 17X XES | |
| MSI Raider GE77 HX 12UHS | |
* ... smaller is better
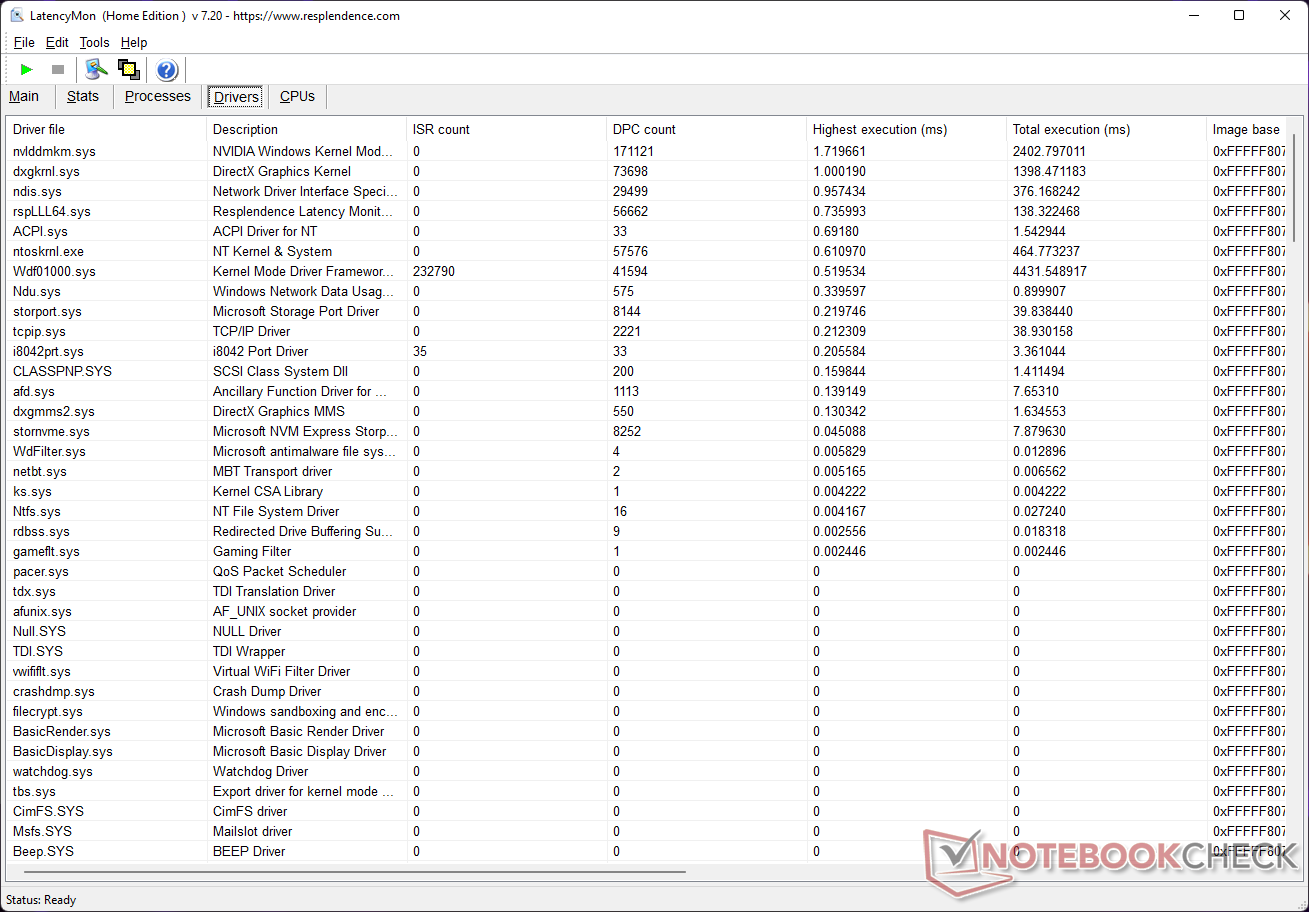
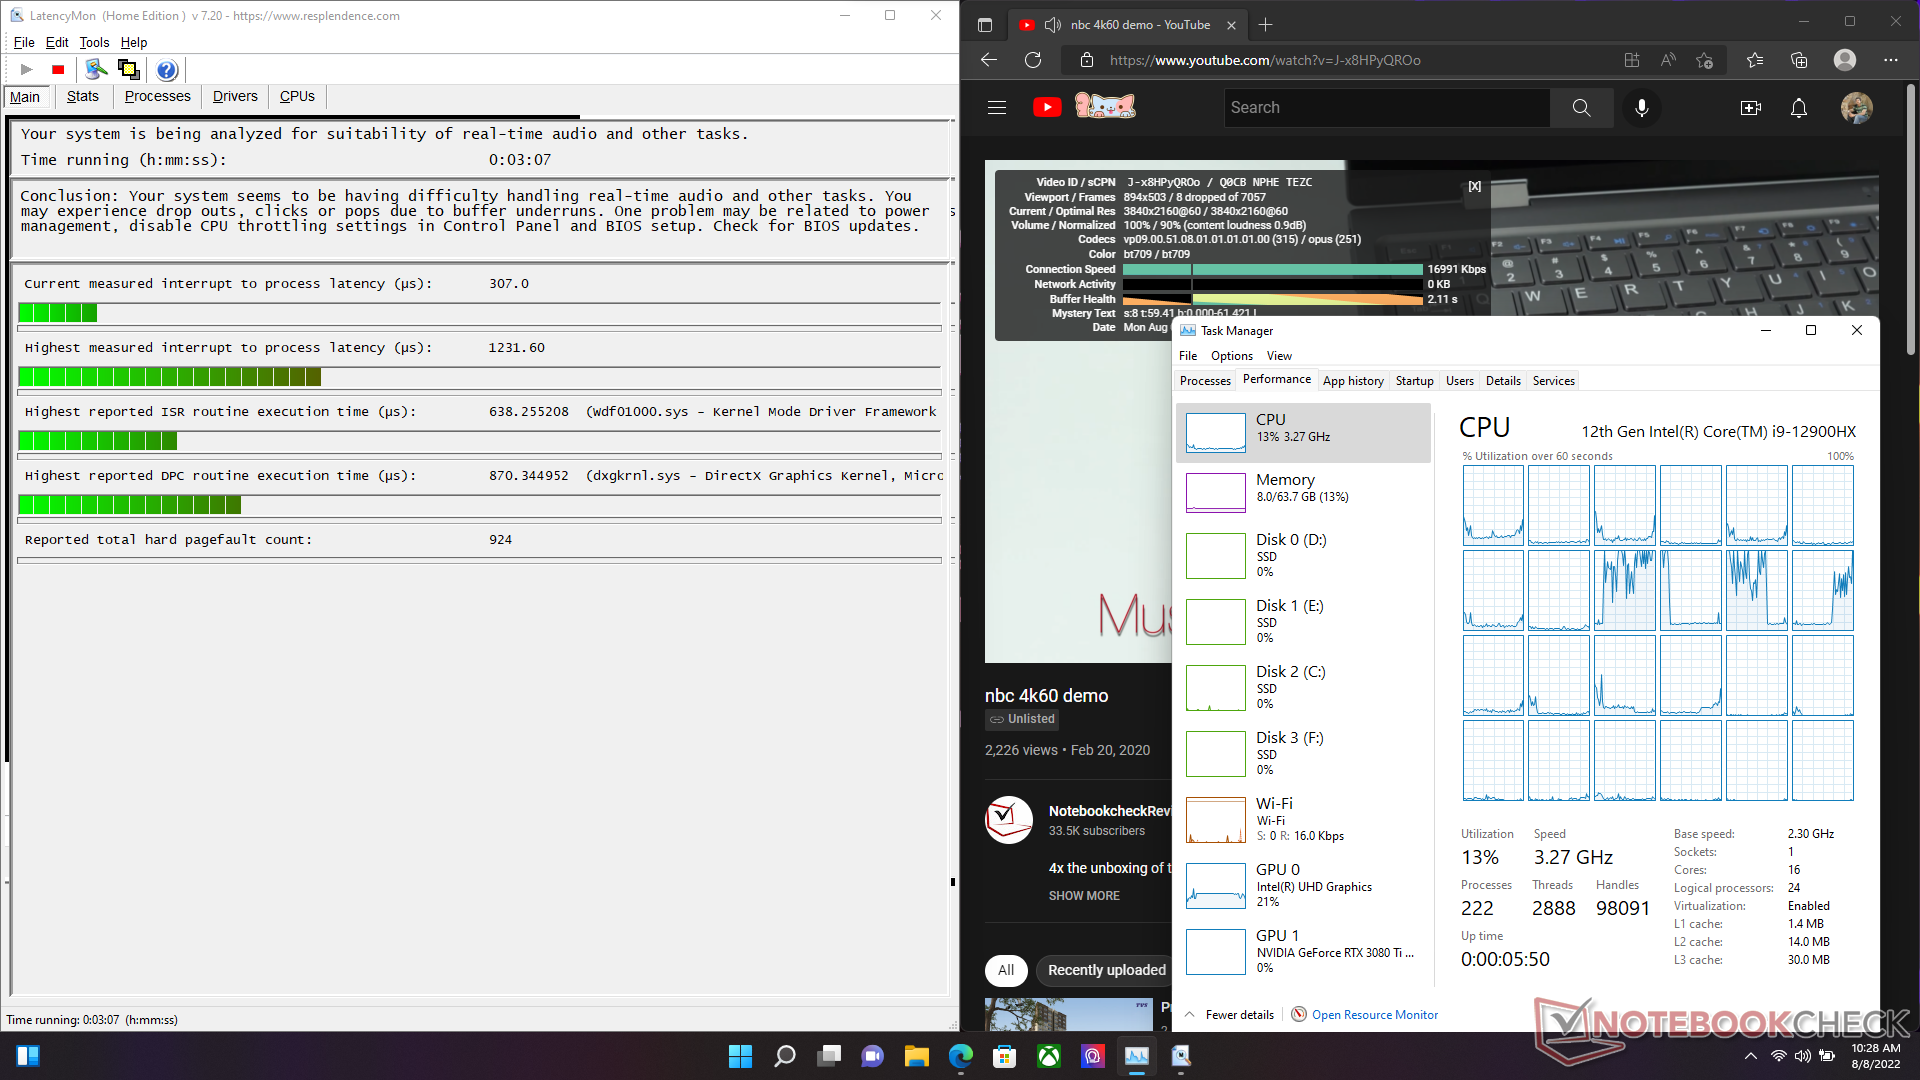
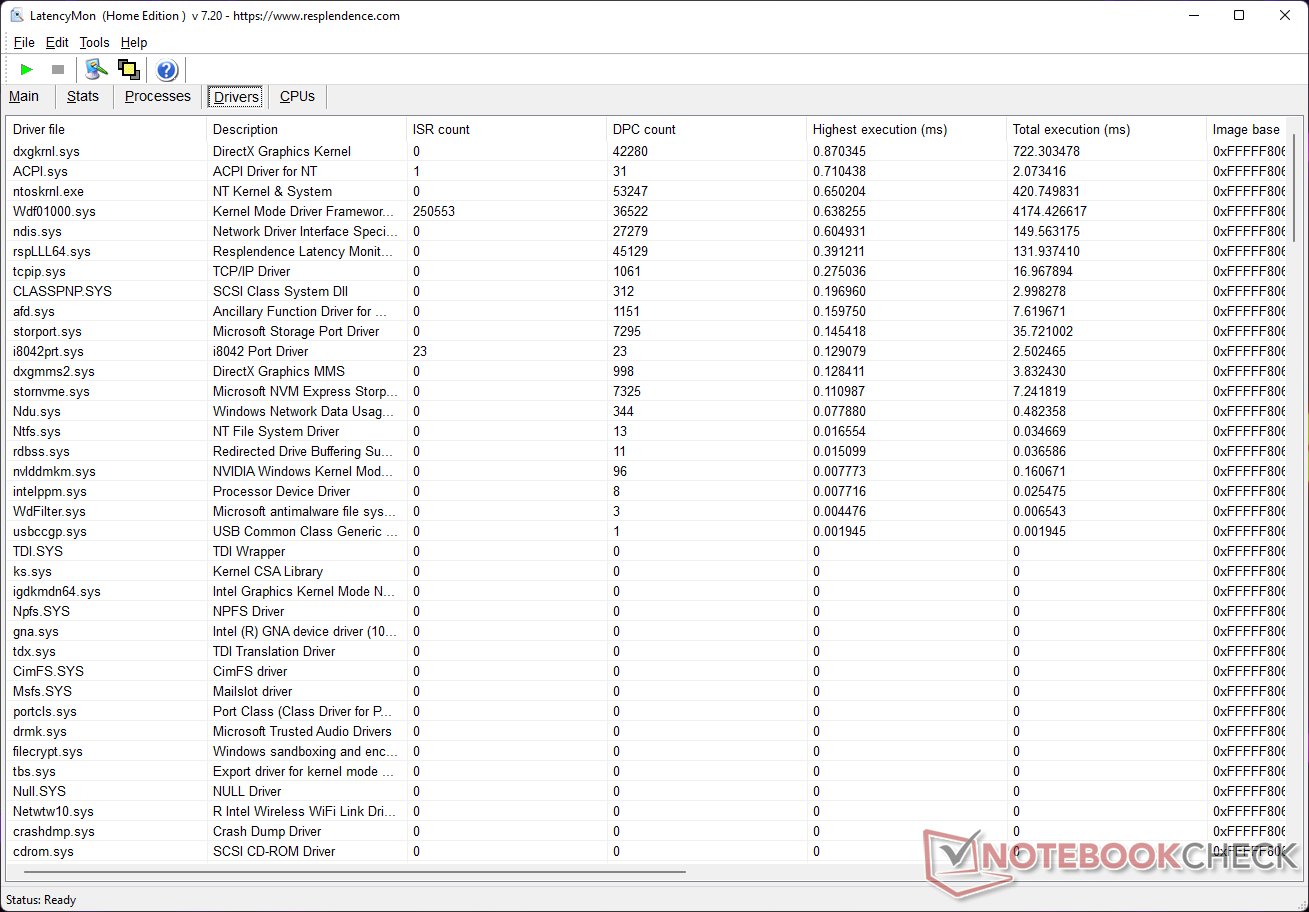
DPC延时
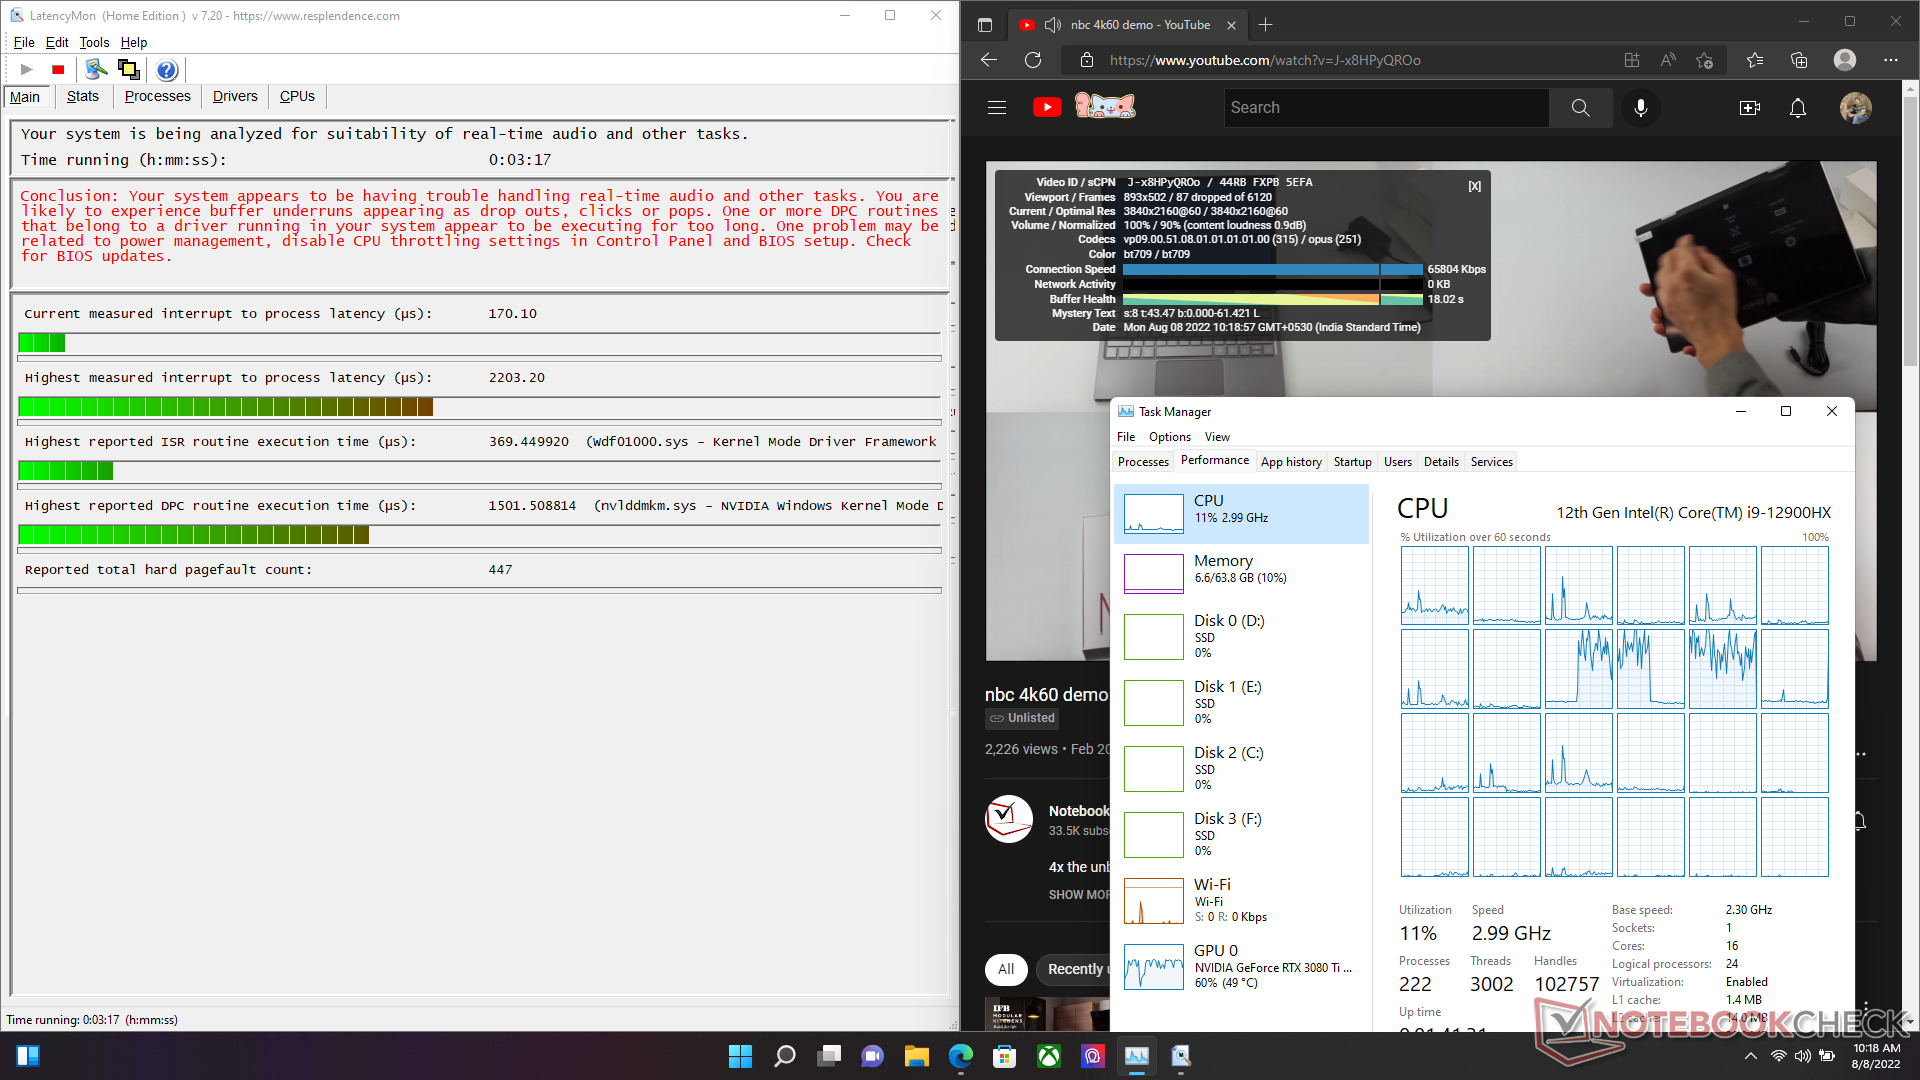
微星泰坦GT77在dGPU模式下运行时,由于Nvidia驱动程序的高执行时间,遭受了高DPC延迟问题。切换到MSHybrid模式可以大大改善DPC延迟,尽管你可能仍然想微调一些性能设置,如果你进入实时音频/视频工作流程。
| DPC Latencies / LatencyMon - interrupt to process latency (max), Web, Youtube, Prime95 | |
| MSI Titan GT77 12UHS (dGPU) | |
| MSI Titan GT77 12UHS (MSHybrid) | |
| MSI GE67 HX 12UGS (Edge 103.0.1264.37) | |
| MSI Raider GE77 HX 12UHS | |
| MSI GE76 Raider | |
| Aorus 17X XES | |
| Alienware x17 R2 P48E (Edge 101.0.1210.32) | |
| Gigabyte Aero 16 YE5 | |
| Asus ROG Zephyrus Duo 16 GX650RX | |
* ... smaller is better
我们的 DPC延时排行页面提供了更多经过审查的设备之间的延迟比较。
存储设备
存储子系统是微星本可以做得更好的一个领域。它确实使用了三星的高端PM9A1 NVMe固态硬盘--我们的设备里有四块--但是这些硬盘上缺乏任何类型的散热解决方案,严重阻碍了它们的性能。
在最初的基准运行中,我们观察到除了D:/驱动器之外,所有驱动器的连续读/写性能都很差。只有在随后的运行中,我们才能在所有安装的驱动器的性能上取得一些平衡。
第一个M.2插槽与PCIe Gen5兼容,如果你打算过渡到下一代存储,这是一件好事。这个和第二个M.2插槽是PCIe Gen4,直接连接到CPU。还有另外两个M.2 PCIe Gen4插槽,这些插槽连接到芯片组。
没有安装额外的2.5英寸SATA驱动器的范围。

* ... smaller is better
由于硬盘上或底板上缺乏有效的散热方案,我们在读/写基准测试中经常遇到严重的性能下降。在我们的DiskSpd读取循环测试中,三星PM9A1无法保持良好的持续读取速度,队列深度为8。
Disk Throttling: DiskSpd Read Loop, Queue Depth 8
查看我们专门的 SSD和HDD基准测试页面了解更多存储设备的比较。
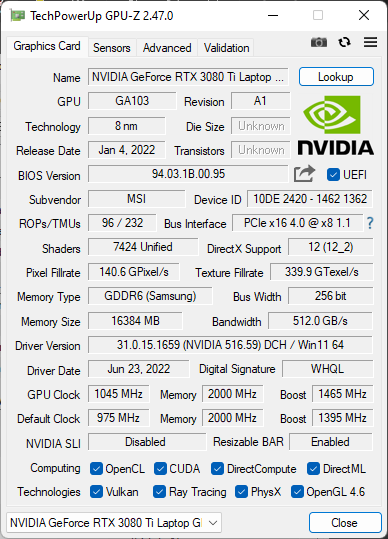
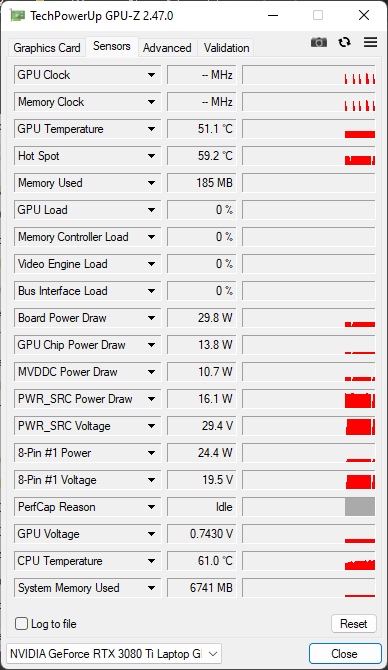
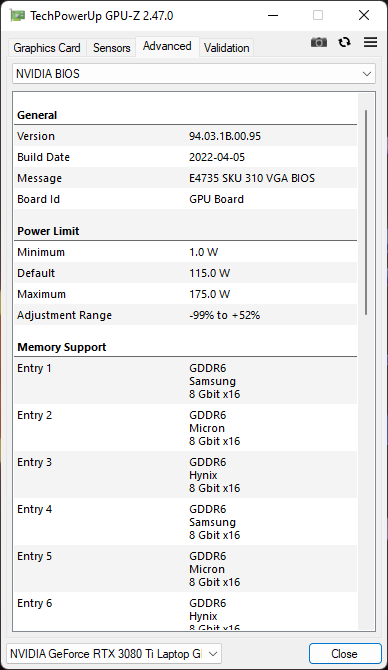
GPU性能
我们的泰坦GT77测试装置具有175瓦的RTX 3080 Ti笔记本GPU。微星或英特尔没有明确说明该GPU的动态提升,但我们认为它应该是15W。
总体而言,3DMark性能与其他RTX 3080 Ti供电的笔记本电脑在比较中并驾齐驱。RTX 3080 Ti在 Gigabyte Aero 16 YE5的RTX 3080 Ti在3DMark中总体上慢了约26%,因为TGP的功率很低,为105W。
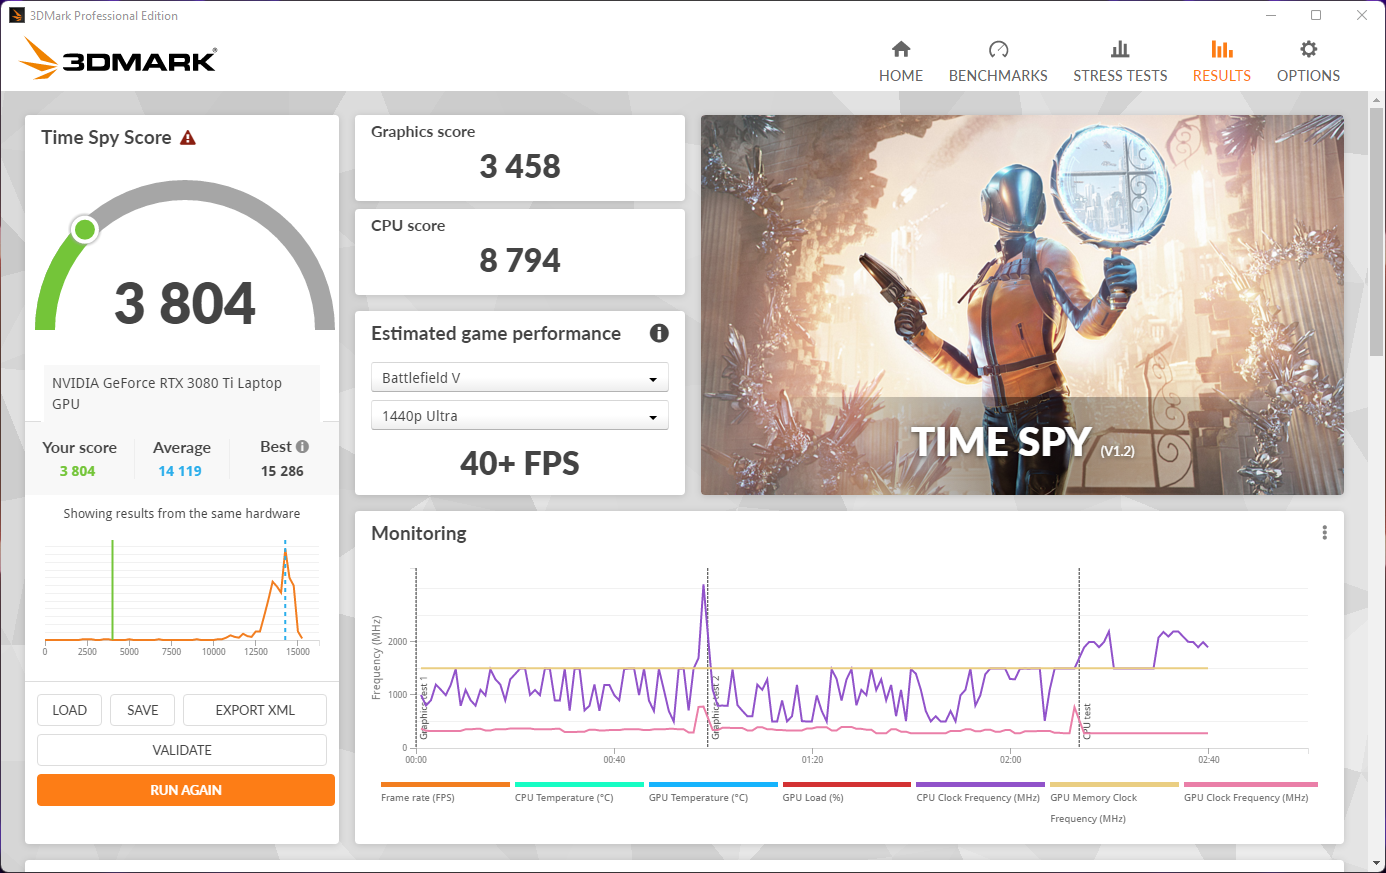
GPU性能在电池电量上出现了跳水,在Time Spy Graphics中的性能损失高达75%。根据3DMark,在Battlefield V ,在1440p Ultra下,降低的分数仍然相当于大约40+帧。
断开电源后,显示器的刷新率也从360赫兹降低到60赫兹。
| 3DMark 11 Performance | 36141 points | |
| 3DMark Ice Storm Standard Score | 290945 points | |
| 3DMark Cloud Gate Standard Score | 65134 points | |
| 3DMark Fire Strike Score | 30196 points | |
| 3DMark Fire Strike Extreme Score | 16347 points | |
| 3DMark Time Spy Score | 13618 points | |
Help | ||
游戏性能
泰坦GT77在我们测试的大多数游戏中都名列前茅,通常与雷蛇GE77 HX 12UHS并列。RTX 3080 Ti能够在4K Ultra下运行大量的现代游戏,帧率通常超过60帧。光线追踪性能不错,但你会想启用DLSS以获得更高的帧率。
| F1 2021 | |
| 1920x1080 Medium Preset AA:T AF:16x | |
| MSI Titan GT77 12UHS | |
| MSI GE76 Raider | |
| Average NVIDIA GeForce RTX 3080 Ti Laptop GPU (207 - 401, n=17) | |
| Asus ROG Zephyrus Duo 16 GX650RX | |
| MSI Raider GE77 HX 12UHS | |
| Gigabyte Aero 16 YE5 | |
| 1920x1080 High Preset AA:T AF:16x | |
| MSI Titan GT77 12UHS | |
| MSI GE76 Raider | |
| Average NVIDIA GeForce RTX 3080 Ti Laptop GPU (182.1 - 316, n=17) | |
| Asus ROG Zephyrus Duo 16 GX650RX | |
| MSI Raider GE77 HX 12UHS | |
| Gigabyte Aero 16 YE5 | |
| 1920x1080 Ultra High Preset + Raytracing AA:T AF:16x | |
| MSI Titan GT77 12UHS | |
| MSI GE76 Raider | |
| MSI Raider GE77 HX 12UHS | |
| Asus ROG Zephyrus Duo 16 GX650RX | |
| Average NVIDIA GeForce RTX 3080 Ti Laptop GPU (30.2 - 160.6, n=30) | |
| Gigabyte Aero 16 YE5 | |
Witcher 3 FPS图表
Witcher 3 在1080p Ultra下,人物在测试过程中保持静止,帧率相当稳定,没有显示出可察觉的节流迹象。
| low | med. | high | ultra | |
|---|---|---|---|---|
| GTA V (2015) | 187.1 | 186.8 | 182.7 | 131.8 |
| The Witcher 3 (2015) | 543 | 411 | 260 | 129.3 |
| Dota 2 Reborn (2015) | 204.5 | 184.5 | 179.8 | 170.5 |
| Final Fantasy XV Benchmark (2018) | 222 | 189.3 | 137.6 | |
| X-Plane 11.11 (2018) | 184 | 160.4 | 123.8 | |
| Far Cry 5 (2018) | 192 | 173 | 164 | 153 |
| Strange Brigade (2018) | 535 | 313 | 248 | 219 |
| Watch Dogs Legion (2020) | 141.4 | 134.1 | 121.4 | 84 |
| F1 2021 (2021) | 404 | 383 | 302 | 158.2 |
| Cyberpunk 2077 1.6 (2022) | 169.8 | 150.3 | 120.5 | 99.4 |
| F1 22 (2022) | 226 | 227 | 196.5 | 79.8 |
请参考我们专门的 NvidiaGeForce RTX 3080 Ti Laptop GPU和 游戏基准测试页面,了解更多信息和游戏比较。
排放。强大的动力带来巨大的噪音和热量
系统噪音
顶级的内部设备与巨大的冷却系统相结合,意味着泰坦GT77可以像其他产品一样启动其引擎,特别是在极限性能模式下。也就是说,在所有测试的性能模式下,笔记本电脑在空闲状态下是比较安静的。
平衡模式和极限性能模式非常相似,只是前者的PL1功率要小25W。因此,我们观察到,在这两种性能模式下,各种负载下的噪音情况或多或少是相似的。然而,微星似乎已经将平衡模式下的噪音控制在50分贝(A)左右,而在极限性能模式下,风扇的声音可以大一点,达到57分贝(A)。
如果你喜欢在要求不高的任务中使用更安静的操作模式,可以考虑使用静音模式,在这种模式下,风扇的噪音略低于35 dB(A)的标志。
Noise level
| Idle |
| 24.53 / 24.53 / 24.53 dB(A) |
| Load |
| 46.25 / 54.25 dB(A) |
 | ||
30 dB silent 40 dB(A) audible 50 dB(A) loud |
||
min: | ||
| MSI Titan GT77 12UHS Intel Core i9-12900HX, NVIDIA GeForce RTX 3080 Ti Laptop GPU | Aorus 17X XES Intel Core i9-12900HX, NVIDIA GeForce RTX 3070 Ti Laptop GPU | MSI Raider GE77 HX 12UHS Intel Core i9-12900HX, NVIDIA GeForce RTX 3080 Ti Laptop GPU | MSI GE67 HX 12UGS Intel Core i7-12800HX, NVIDIA GeForce RTX 3070 Ti Laptop GPU | Alienware x17 R2 P48E Intel Core i9-12900HK, NVIDIA GeForce RTX 3080 Ti Laptop GPU | |
|---|---|---|---|---|---|
| Noise | -18% | -23% | 2% | 8% | |
| off / environment * (dB) | 21.9 | 26 -19% | 26 -19% | 22.7 -4% | 22.7 -4% |
| Idle Minimum * (dB) | 24.53 | 28 -14% | 26 -6% | 22.9 7% | 23.1 6% |
| Idle Average * (dB) | 24.53 | 32 -30% | 34 -39% | 22.9 7% | 23.1 6% |
| Idle Maximum * (dB) | 24.53 | 38 -55% | 46 -88% | 22.9 7% | 23.1 6% |
| Load Average * (dB) | 46.25 | 53 -15% | 50 -8% | 44.4 4% | 31.9 31% |
| Witcher 3 ultra * (dB) | 56.86 | 54 5% | 55 3% | 55.7 2% | 52.5 8% |
| Load Maximum * (dB) | 54.25 | 55 -1% | 57 -5% | 57.4 -6% | 52.5 3% |
* ... smaller is better
温度
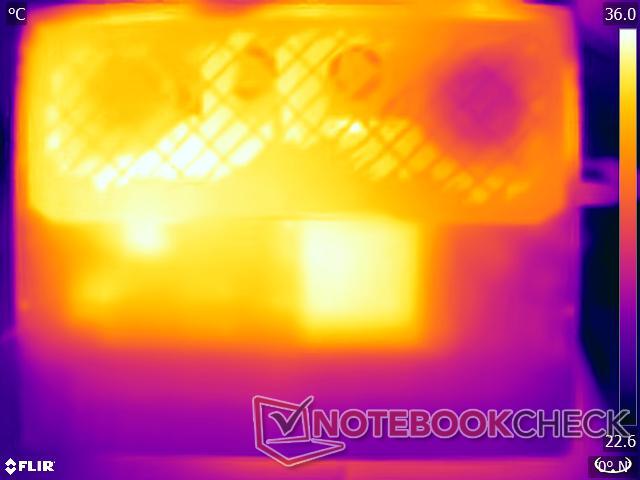
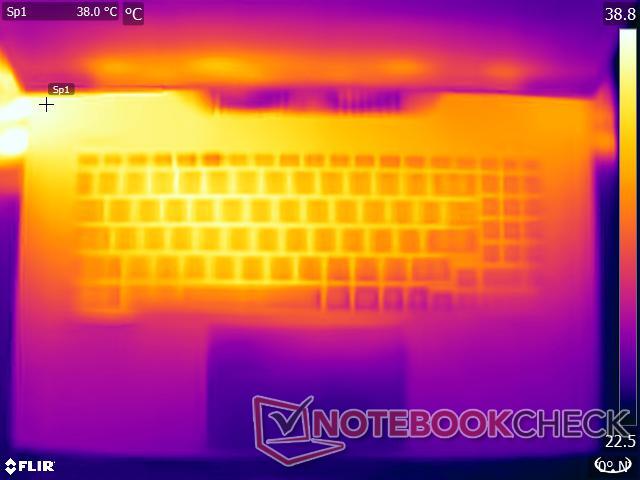
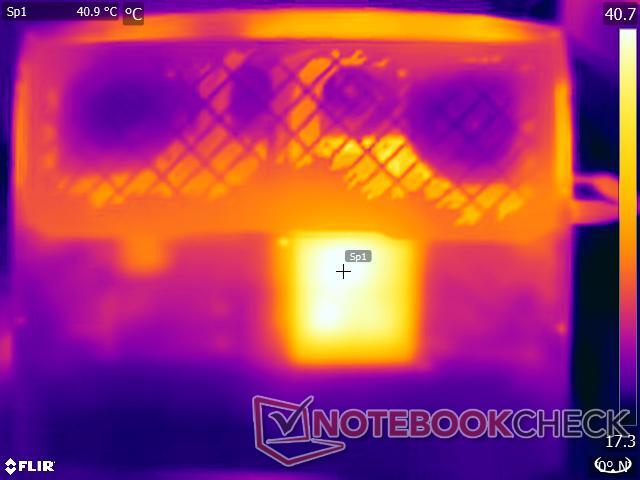
尽管有强大的冷却系统,表面温度肯定是偏高的。在Prime95和FurMark一起运行的最大负荷下,我们记录到上侧的最高温度为40.8℃,下侧为52.4℃。
在1080p Ultra条件下对TheWitcher 3进行压力测试,其顶部和底部的温度热点分别为47℃和47.6℃。即使在压力下,掌托和触摸板区域仍然相对凉爽。
(±) The maximum temperature on the upper side is 40.8 °C / 105 F, compared to the average of 40.4 °C / 105 F, ranging from 21.2 to 68.8 °C for the class Gaming.
(-) The bottom heats up to a maximum of 52.4 °C / 126 F, compared to the average of 43.2 °C / 110 F
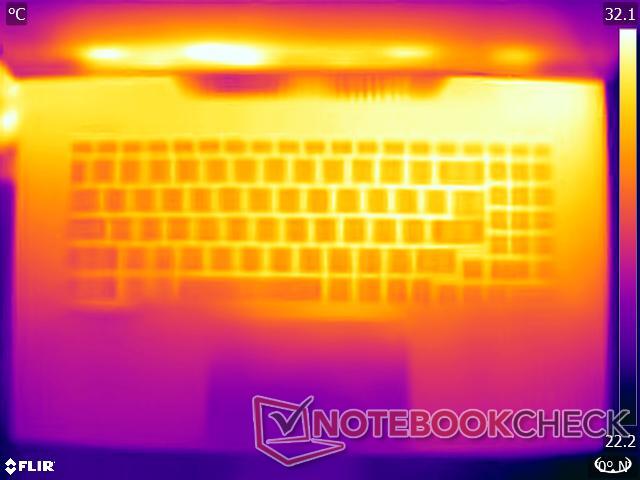
(±) In idle usage, the average temperature for the upper side is 32 °C / 90 F, compared to the device average of 33.9 °C / 93 F.
(-) Playing The Witcher 3, the average temperature for the upper side is 40.4 °C / 105 F, compared to the device average of 33.9 °C / 93 F.
(+) The palmrests and touchpad are reaching skin temperature as a maximum (33.4 °C / 92.1 F) and are therefore not hot.
(-) The average temperature of the palmrest area of similar devices was 28.8 °C / 83.8 F (-4.6 °C / -8.3 F).
鉴于其重量,Titan GT77不是你会在腿上使用的东西。虽然我们的压力测试代表了极端情况,但我们仍然建议使用静音或平衡性能模式,以确保表面温度在可容忍的范围内。


| MSI Titan GT77 12UHS Intel Core i9-12900HX, NVIDIA GeForce RTX 3080 Ti Laptop GPU | Aorus 17X XES Intel Core i9-12900HX, NVIDIA GeForce RTX 3070 Ti Laptop GPU | MSI Raider GE77 HX 12UHS Intel Core i9-12900HX, NVIDIA GeForce RTX 3080 Ti Laptop GPU | MSI GE67 HX 12UGS Intel Core i7-12800HX, NVIDIA GeForce RTX 3070 Ti Laptop GPU | Alienware x17 R2 P48E Intel Core i9-12900HK, NVIDIA GeForce RTX 3080 Ti Laptop GPU | |
|---|---|---|---|---|---|
| Heat | -13% | -16% | 20% | 8% | |
| Maximum Upper Side * (°C) | 40.8 | 54 -32% | 53 -30% | 34.4 16% | 49.6 -22% |
| Maximum Bottom * (°C) | 52.4 | 58 -11% | 58 -11% | 42 20% | 42.4 19% |
| Idle Upper Side * (°C) | 34.6 | 37 -7% | 38 -10% | 24 31% | 29.2 16% |
| Idle Bottom * (°C) | 38.4 | 39 -2% | 43 -12% | 33.2 14% | 32 17% |
* ... smaller is better
压力测试
用Prime95运行原地FFT给泰坦GT77施加压力,看到酷睿i9-12900HX在大约155W时飙升到4.1GHz,但我们观察到,在测试的四分钟内,时钟在3GHz和3.5GHz之间稳定下来,功率为120W。
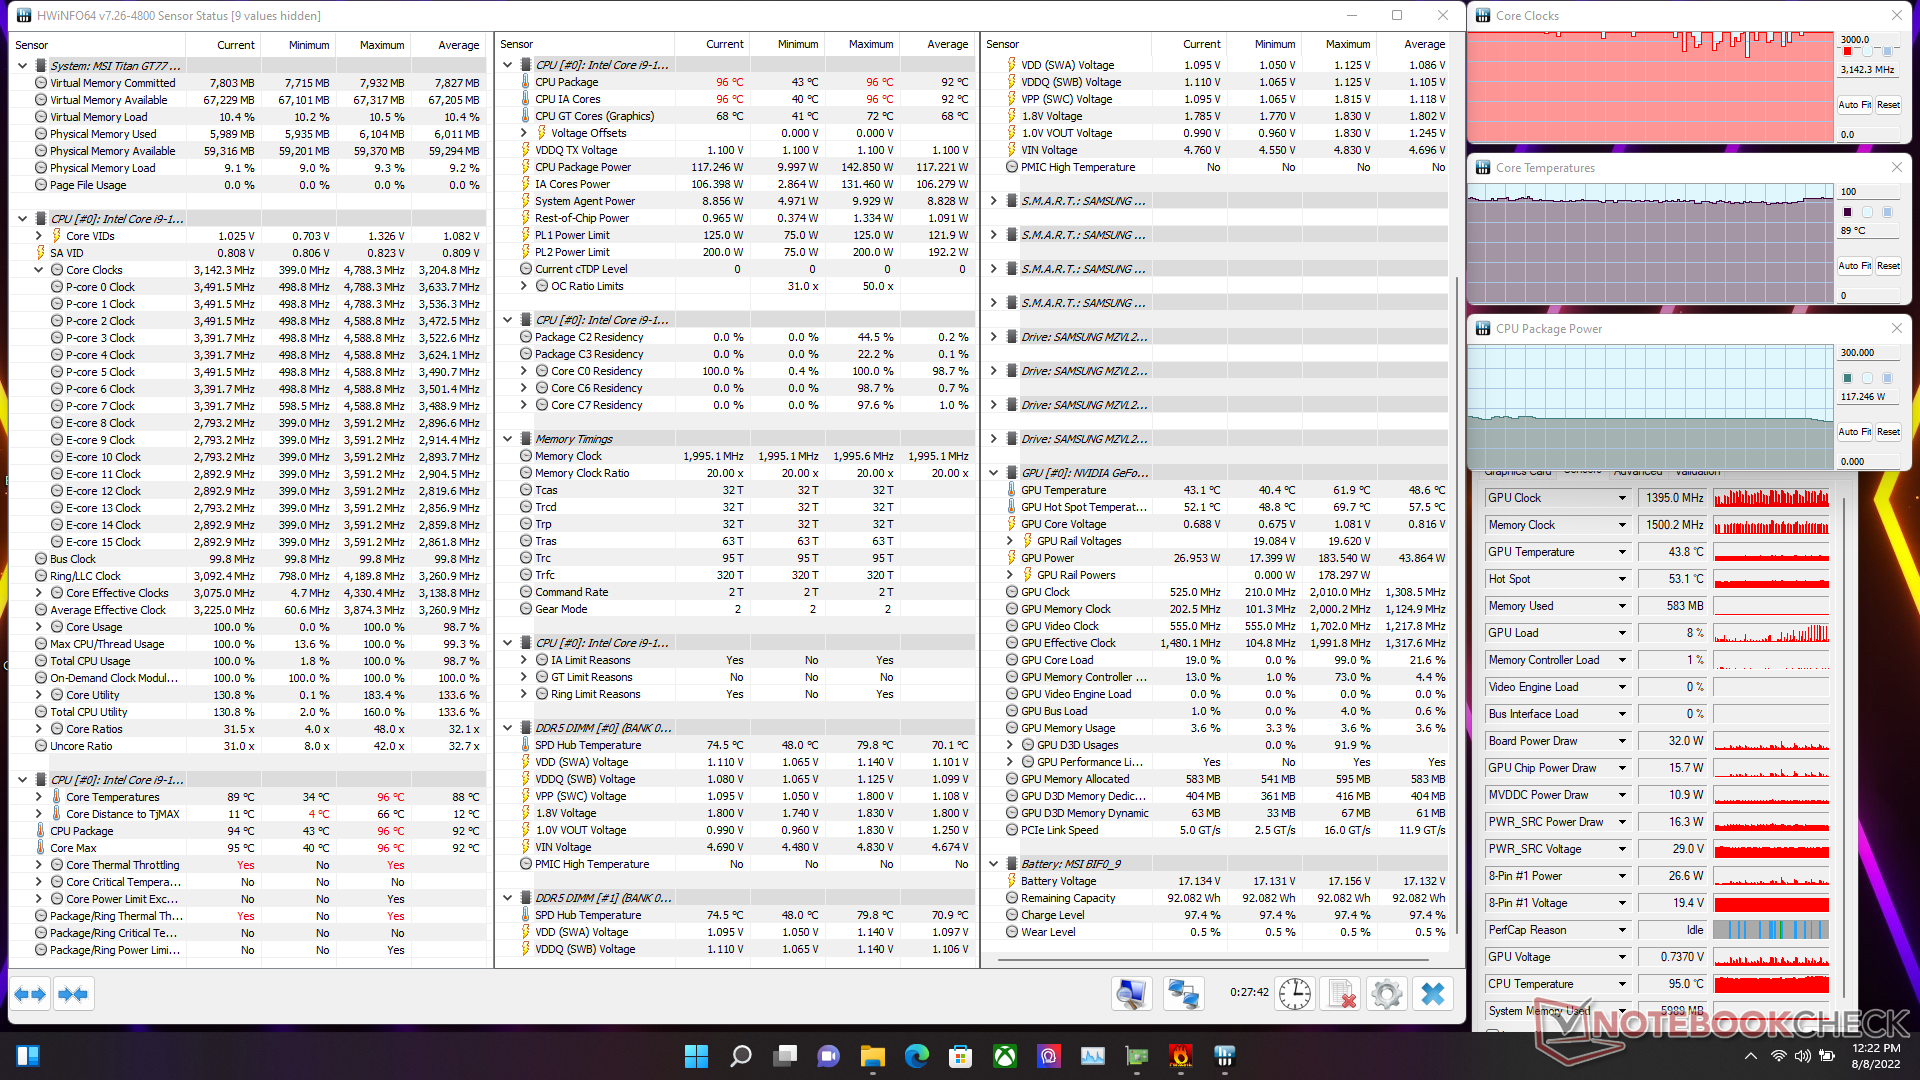
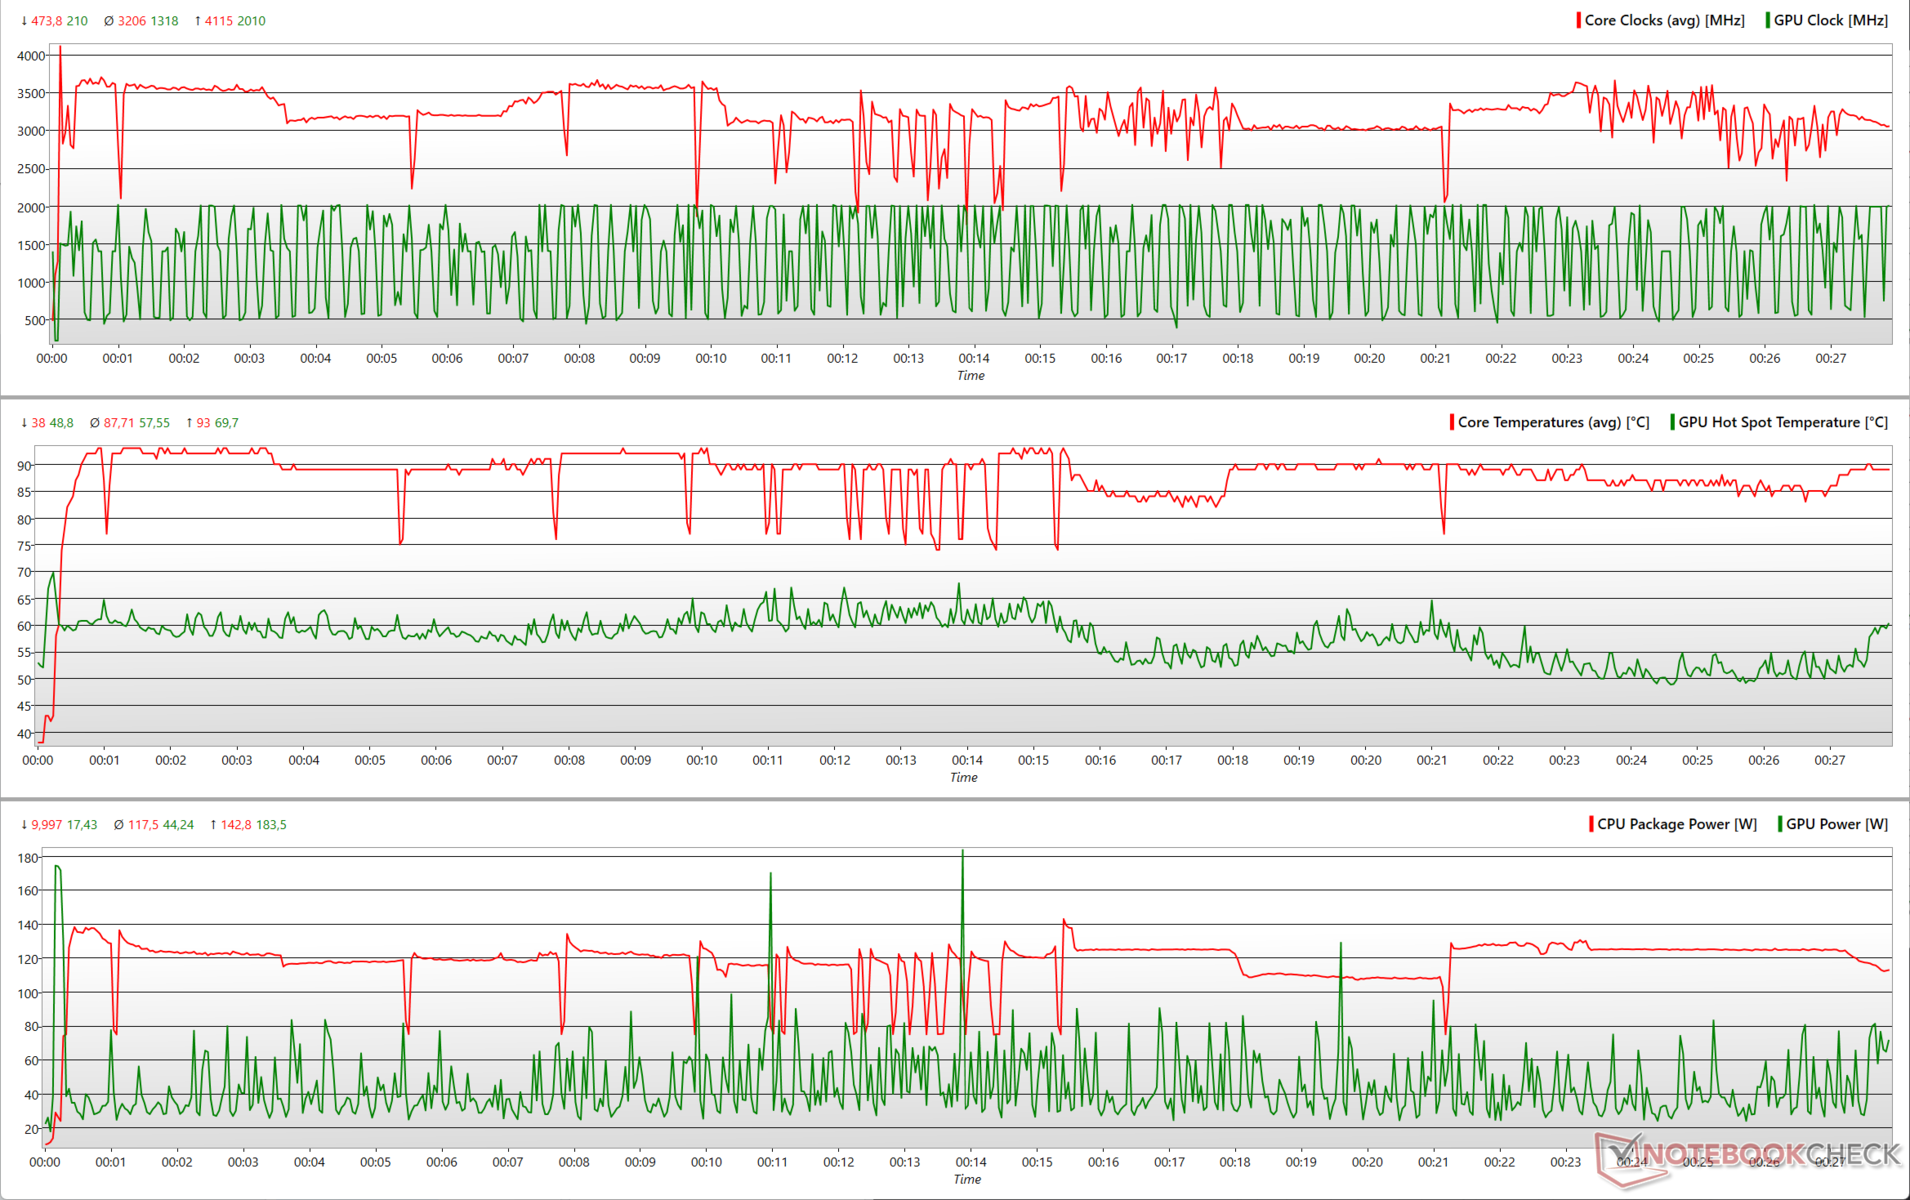
根据微星的说法,Titan GT77使用微星OverBoost,根据不同的情况,CPU和GPU的综合负载为250 W(75 W CPU + 175 W GPU)。在Prime95中加入FurMark,看到CPU时钟最初达到4.1 GHz,约140 W,此后在3 GHz和3.5 GHz之间震荡,120 W。
我们看到GPU在开始运行时接近175W的TGP,但在测试的主要时间内只能使用大约80-90W。在Prime95和FurMark的综合压力下,GPU的时钟并不稳定,为了适应CPU的功率要求,经常在基础时钟和提升时钟之间摆动。
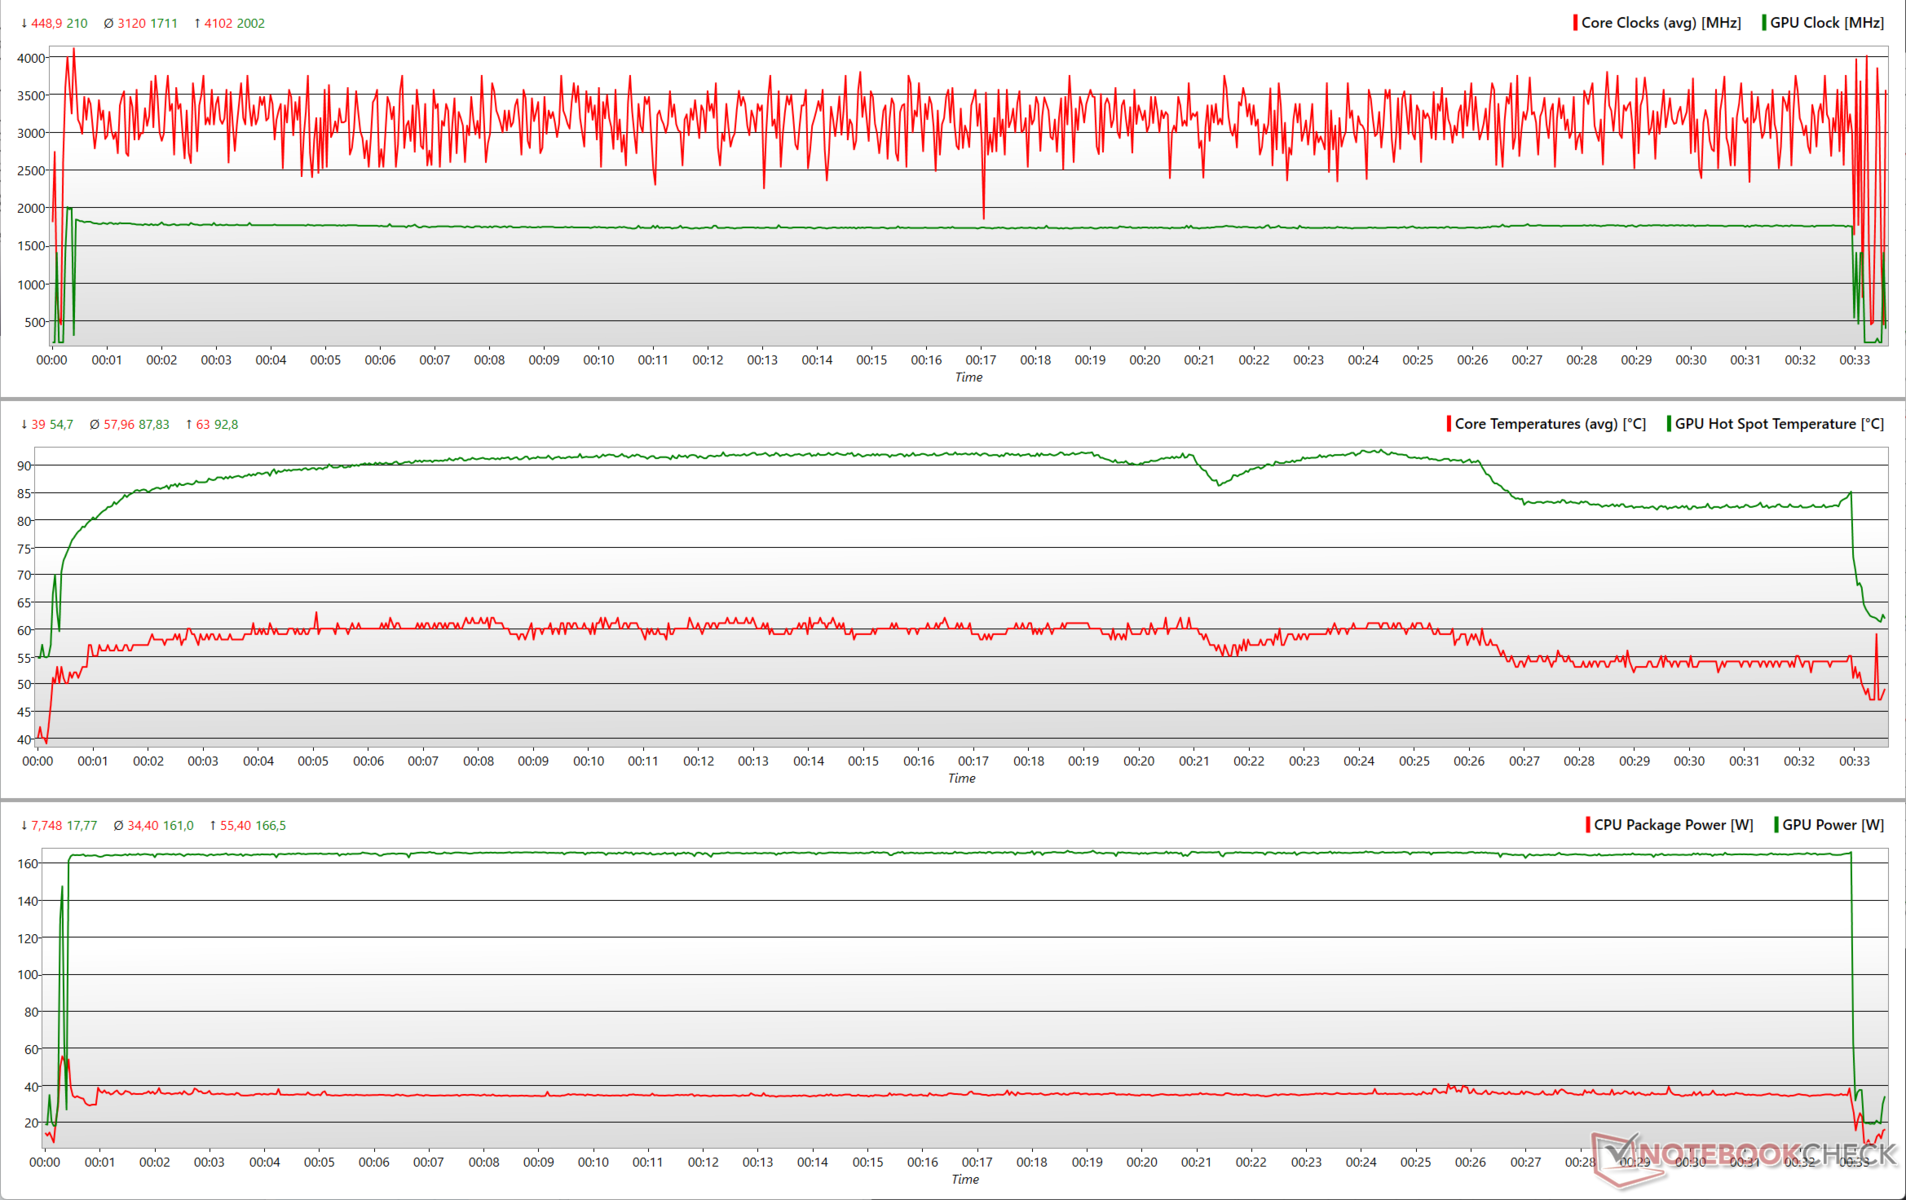
在1080p Ultra下运行 Witcher 3,呈现出一个更真实的压力场景,性能更可预测。虽然CPU时钟相对不稳定,但我们发现RTX 3080 Ti在最初的2GHz高点之后,在165W下的时钟稳定在1.8GHz。在这个测试中,CPU的TDP没有超过35W,导致综合负荷为200W。
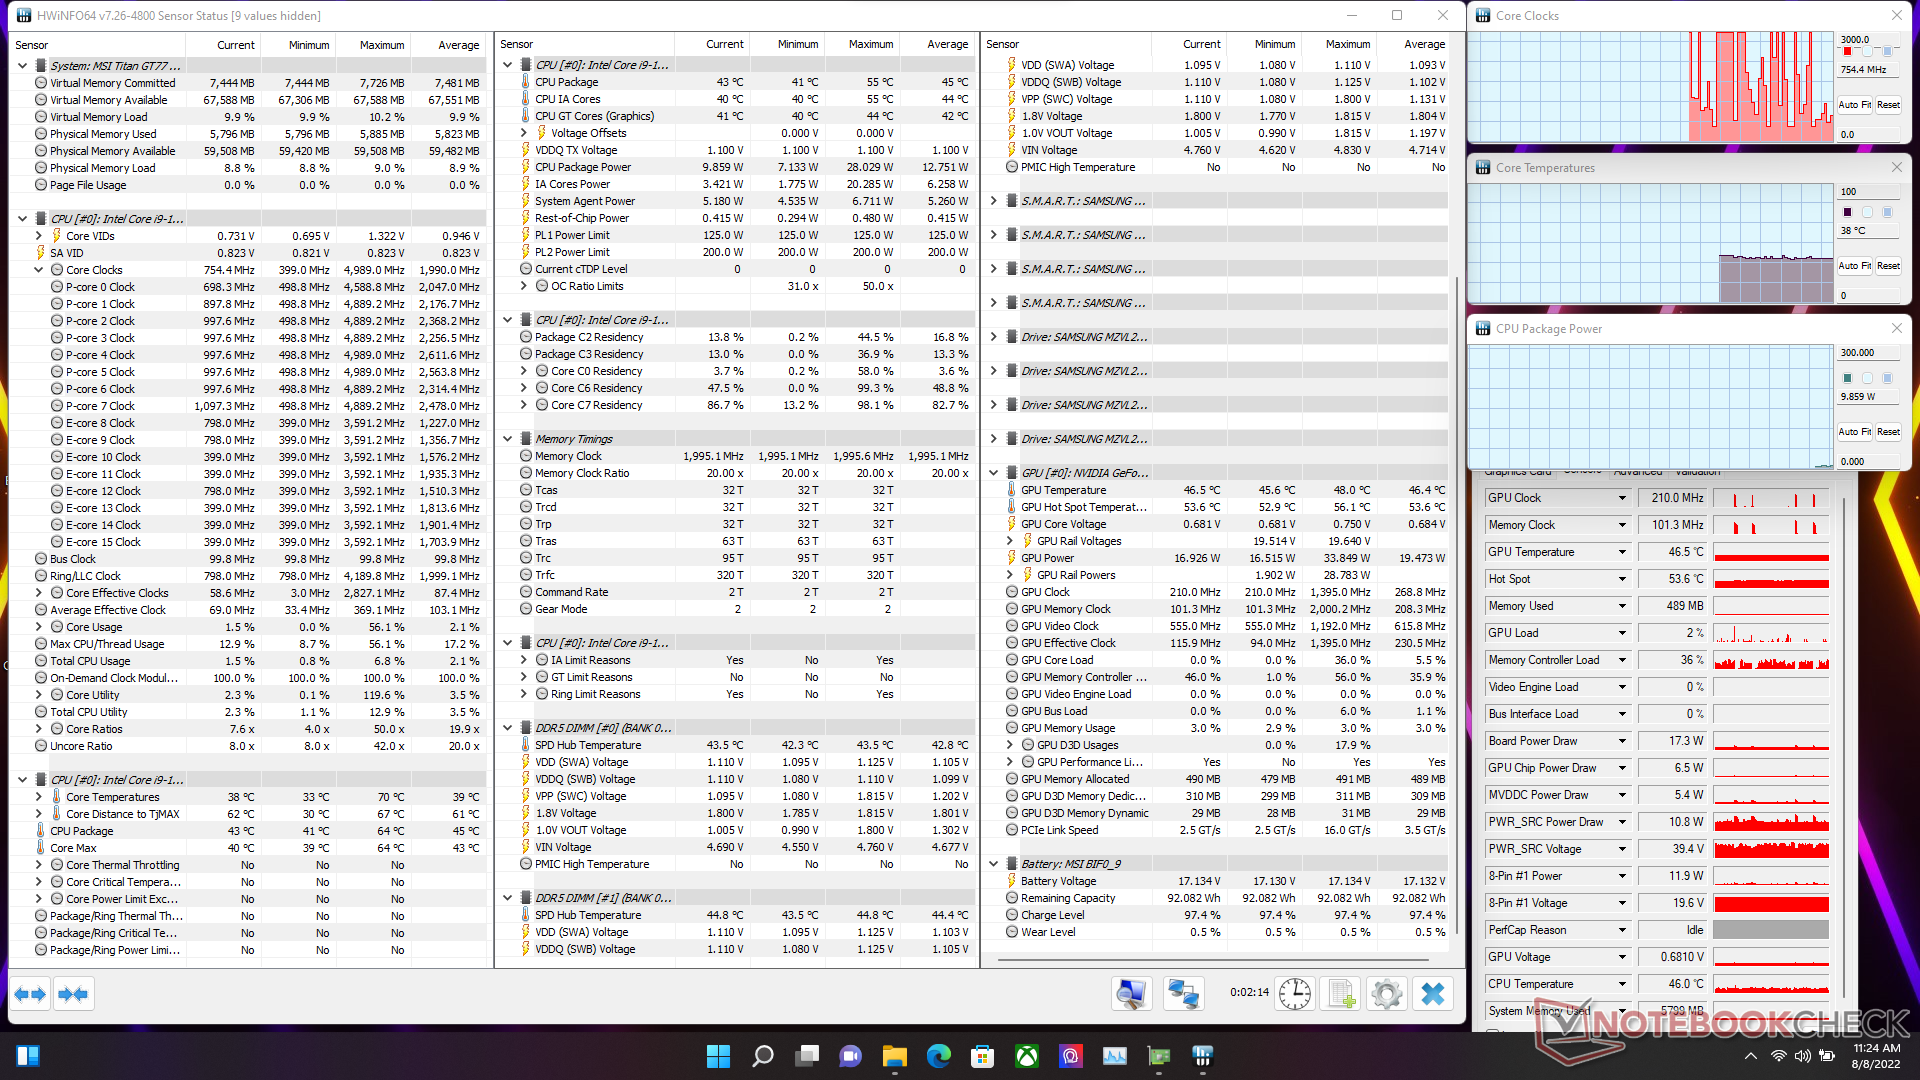
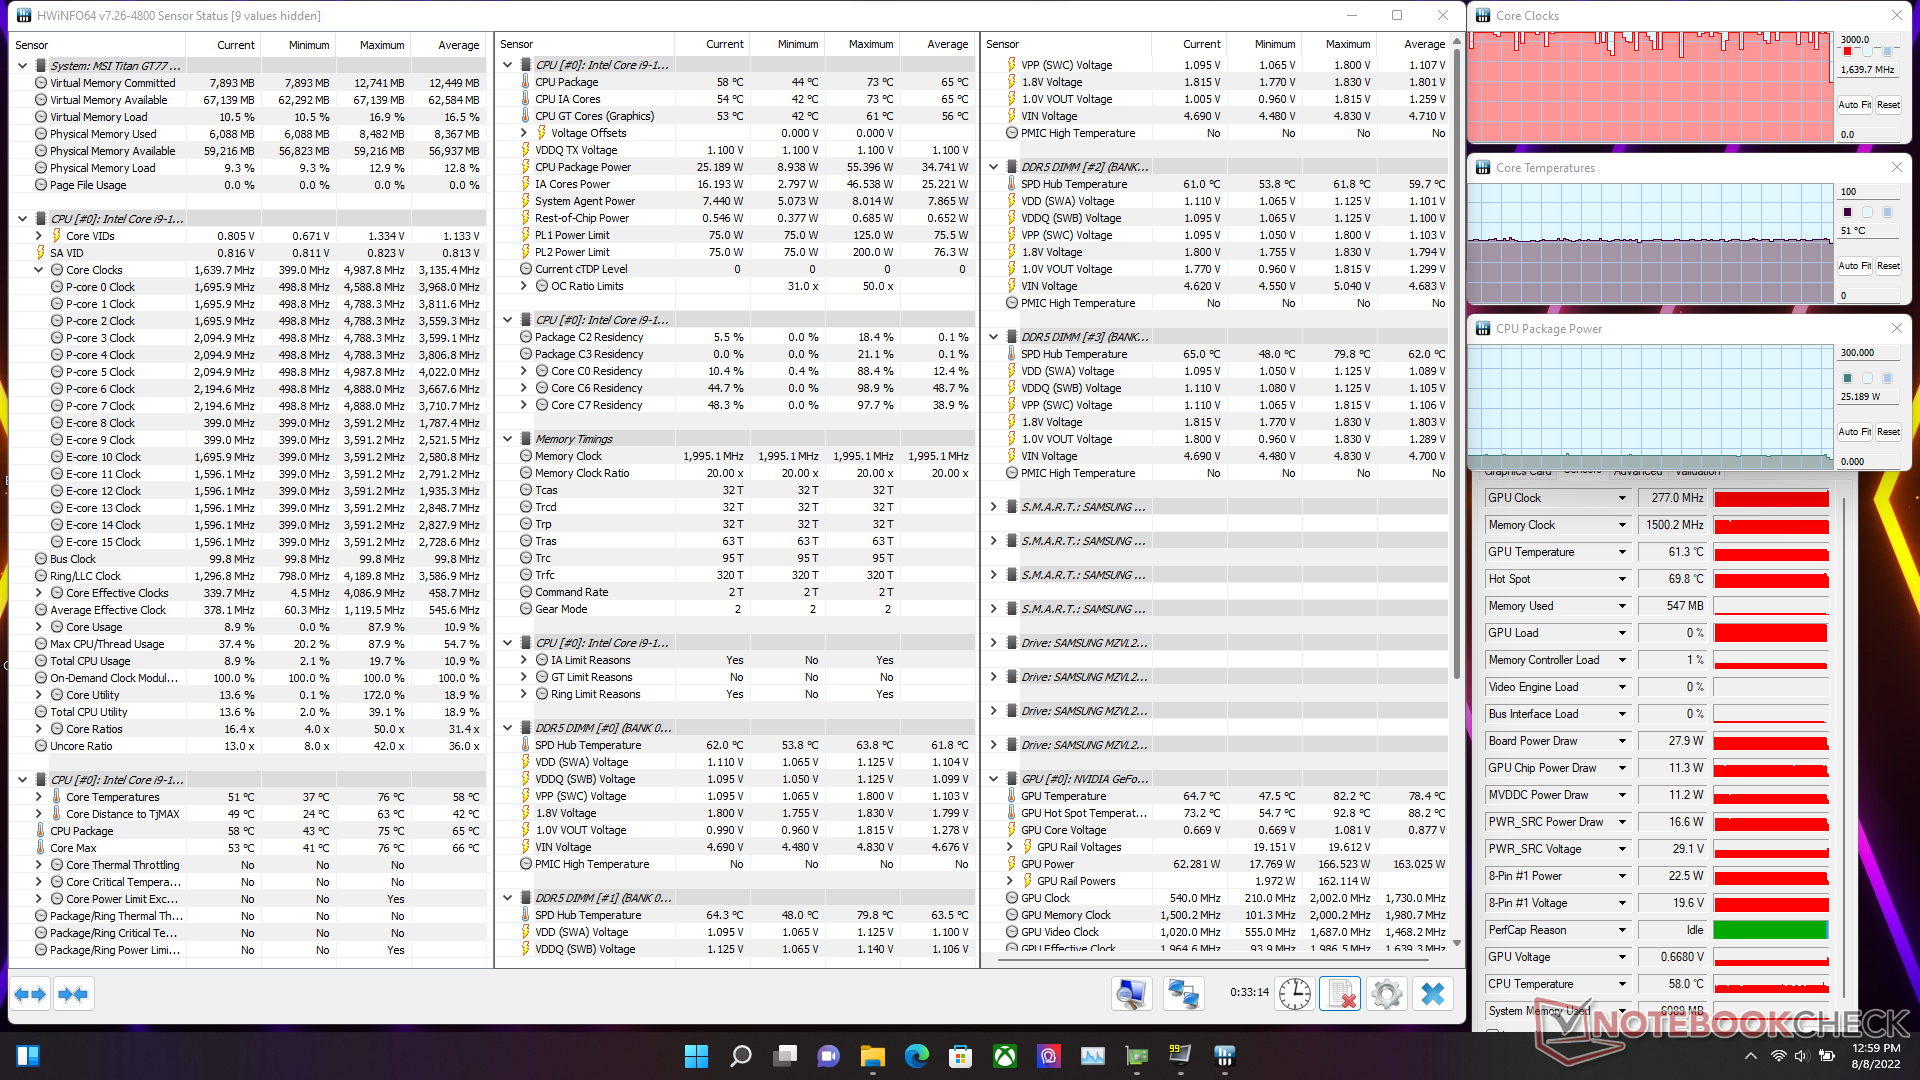
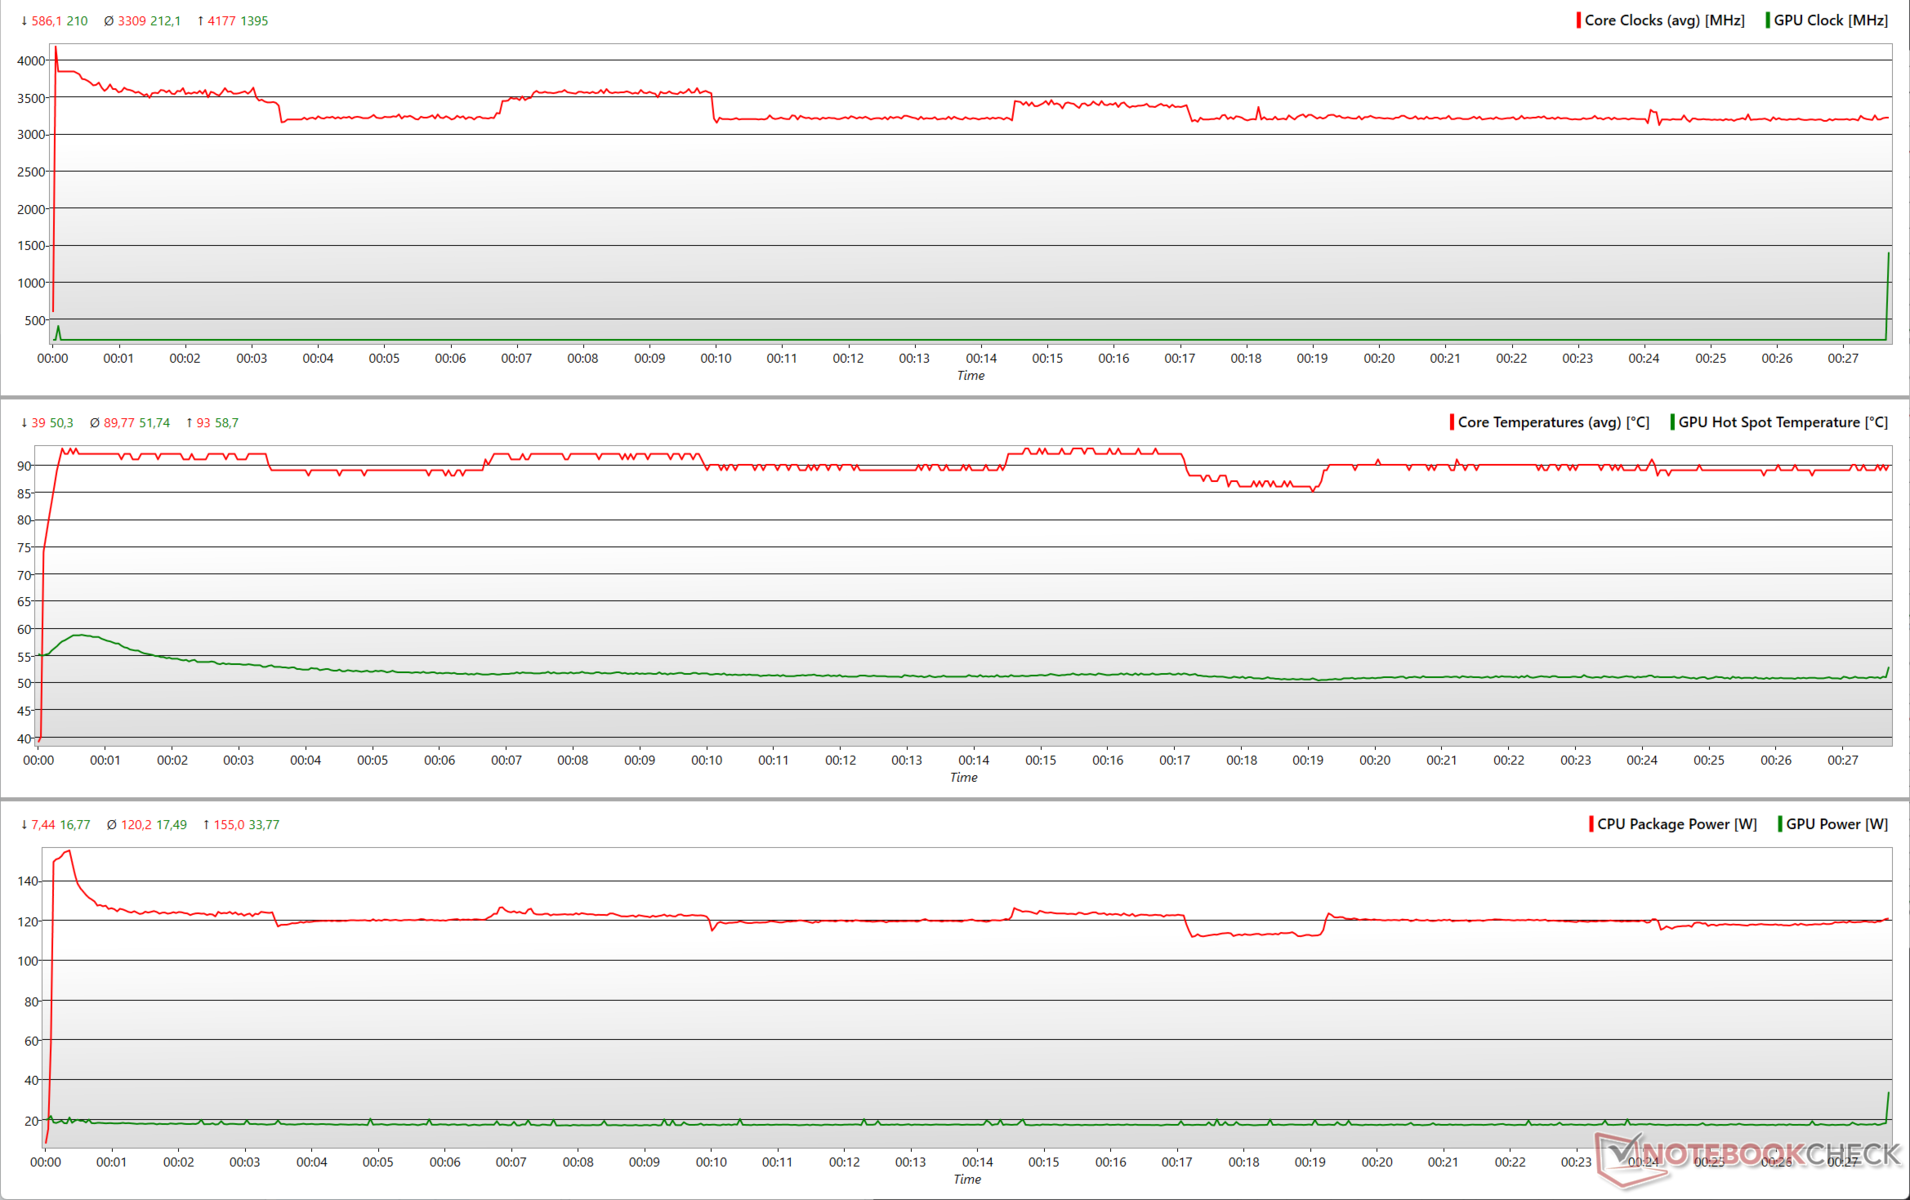
| 压力测试 | CPU时钟(GHz) | GPU时钟(MHz) | CPU平均温度(℃) | GPU平均温度(℃) |
| 系统空闲 | 0.75 | 210 | 39 | 46.4 |
| Prime95 | 3.2 | 210 | 85 | 42.1 |
| Prime95 + FurMark | 3.1 | 1,395 | 88 | 48.6 |
| TheWitcher 3 | 1.6 | 1,964.6 | 58 | 78.4 |
发言人
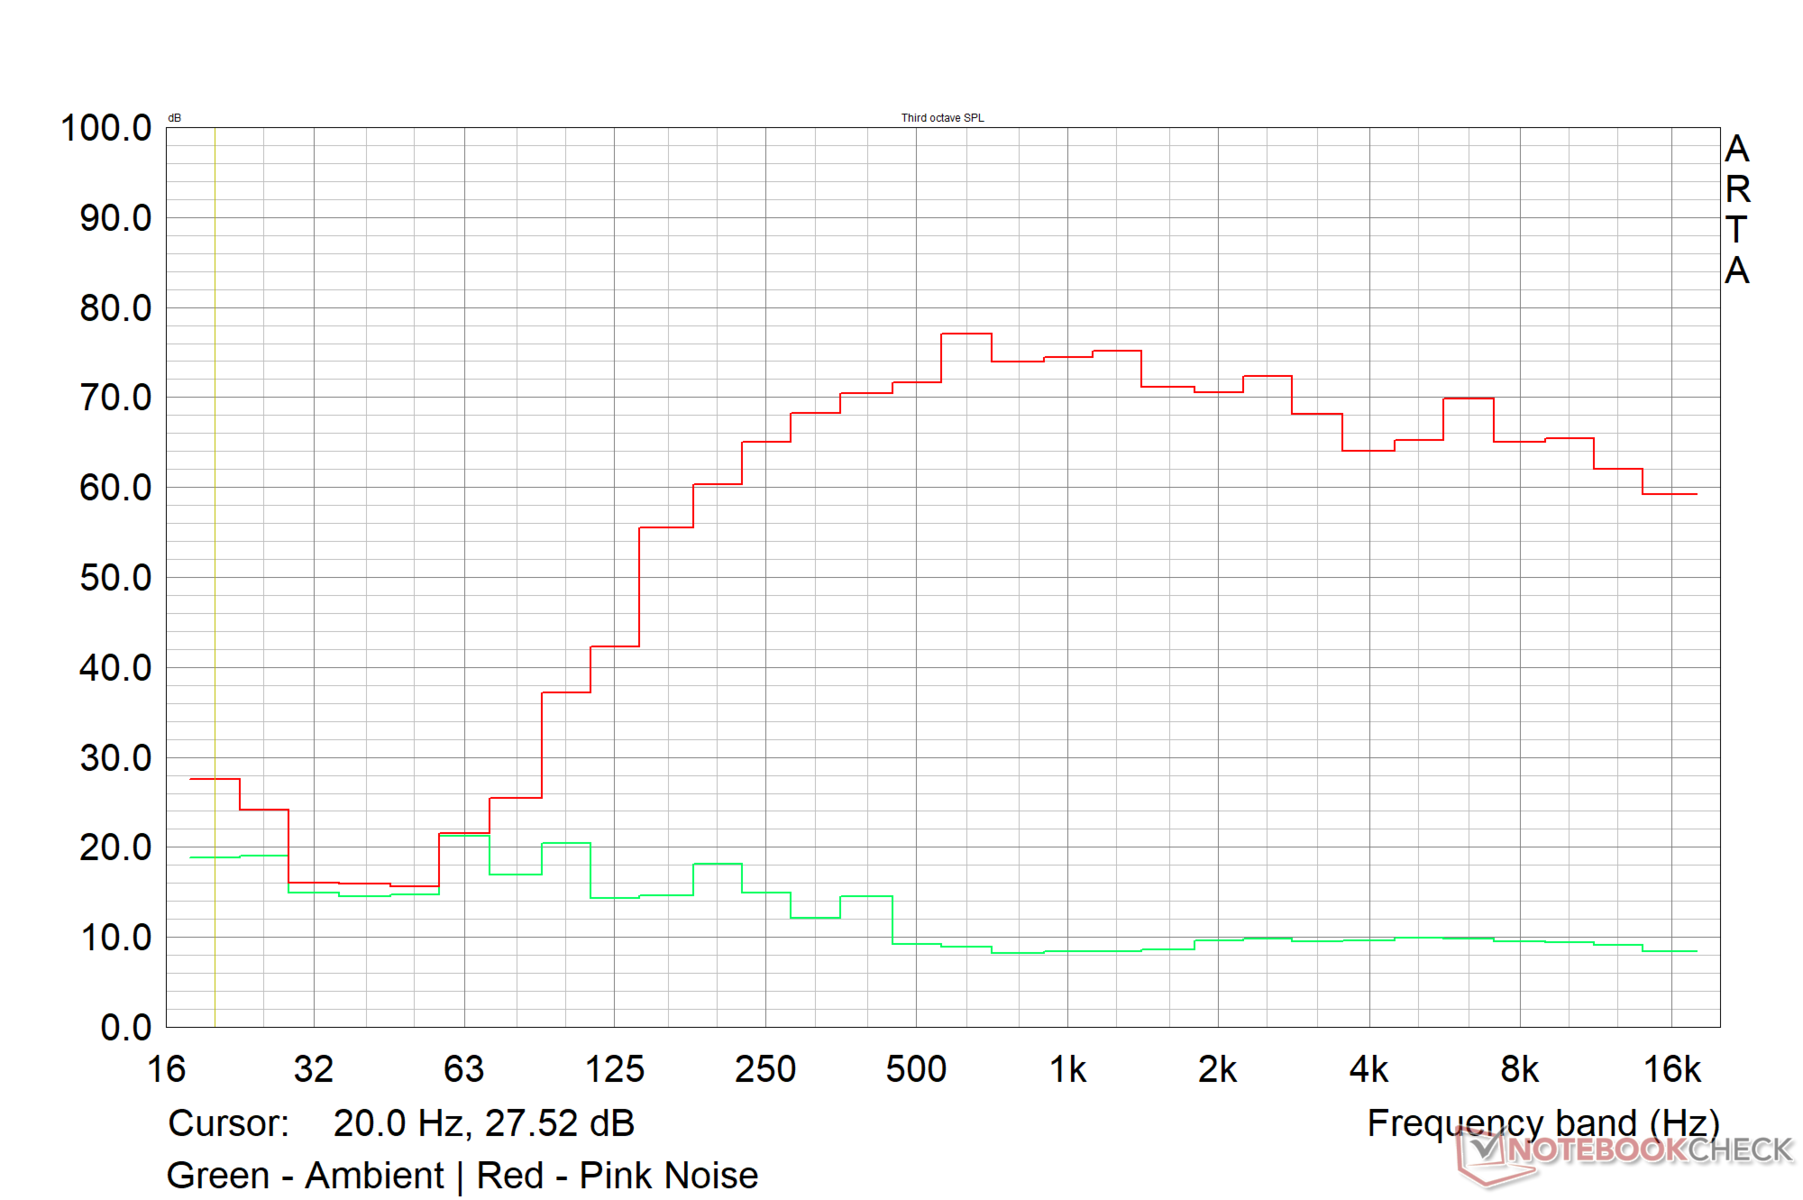
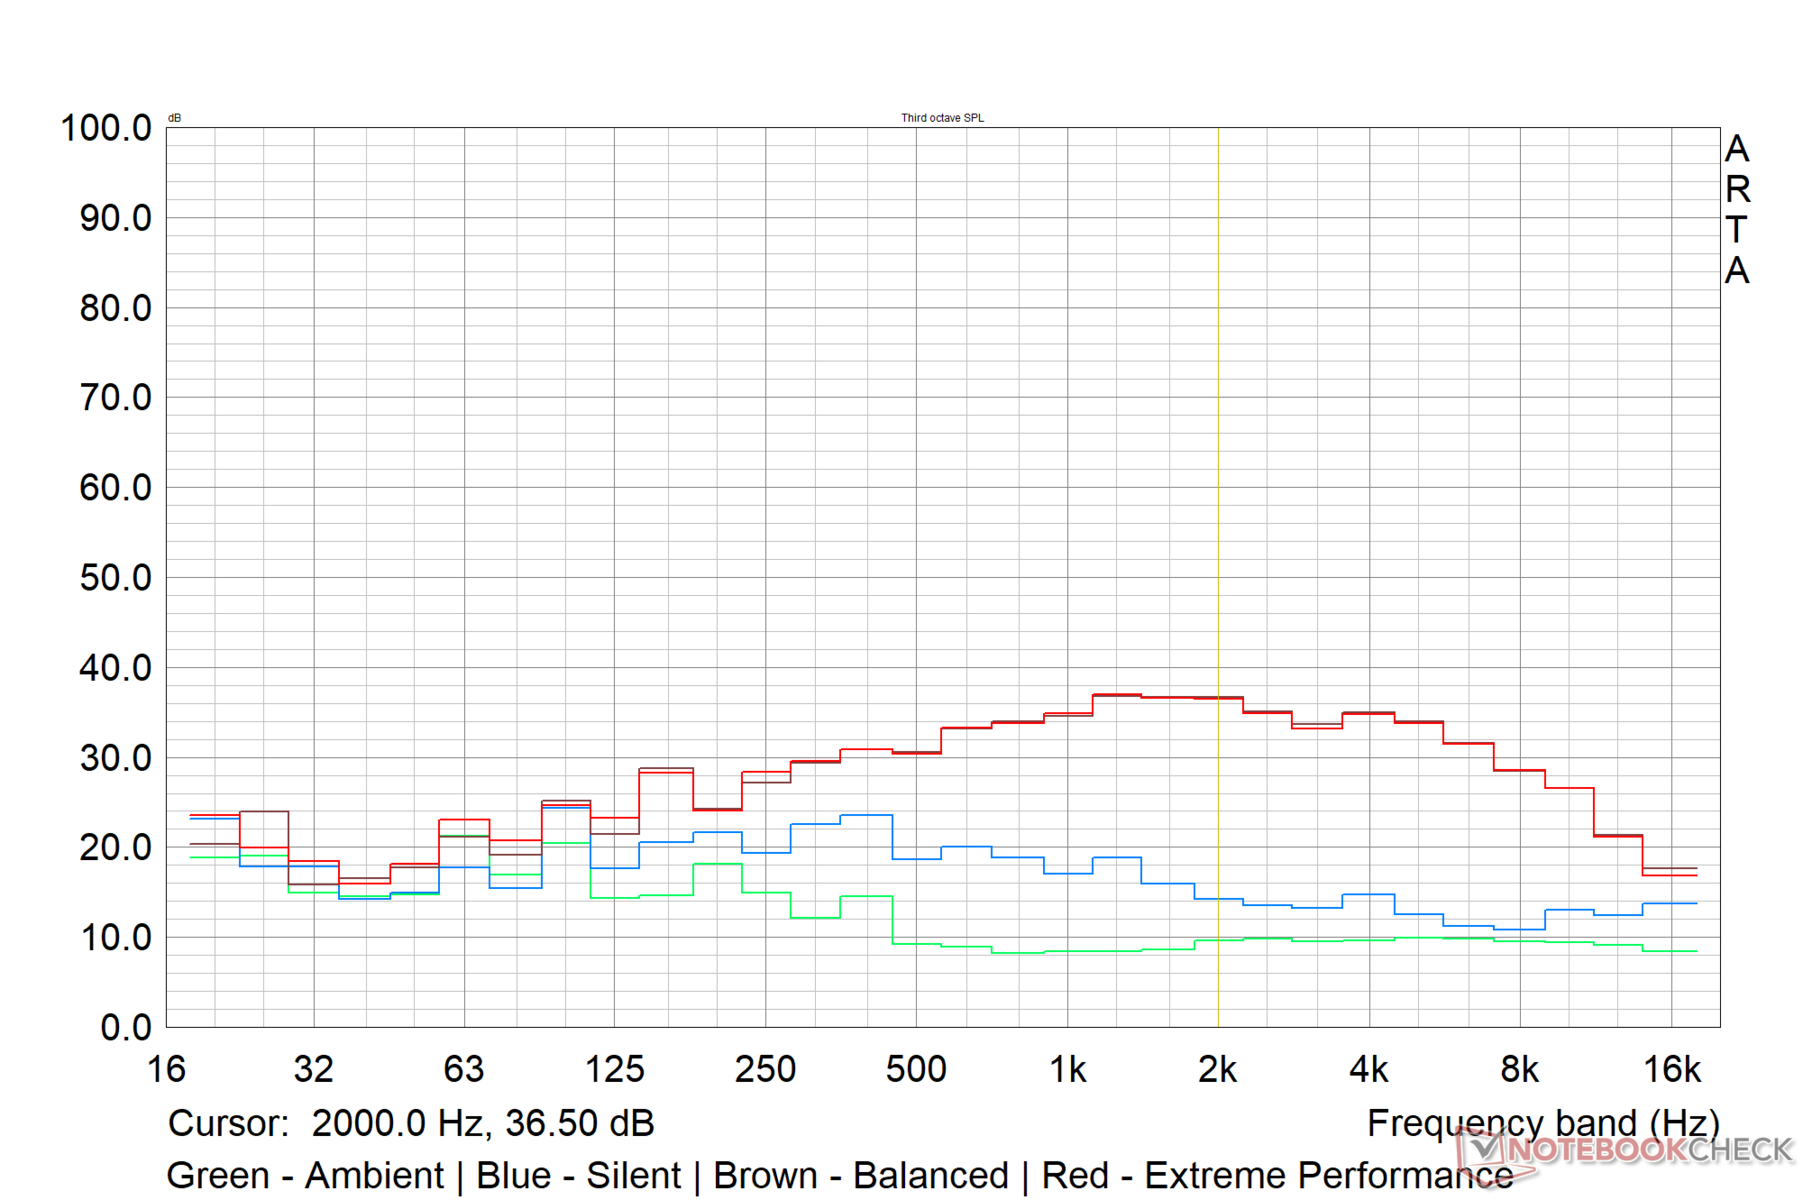
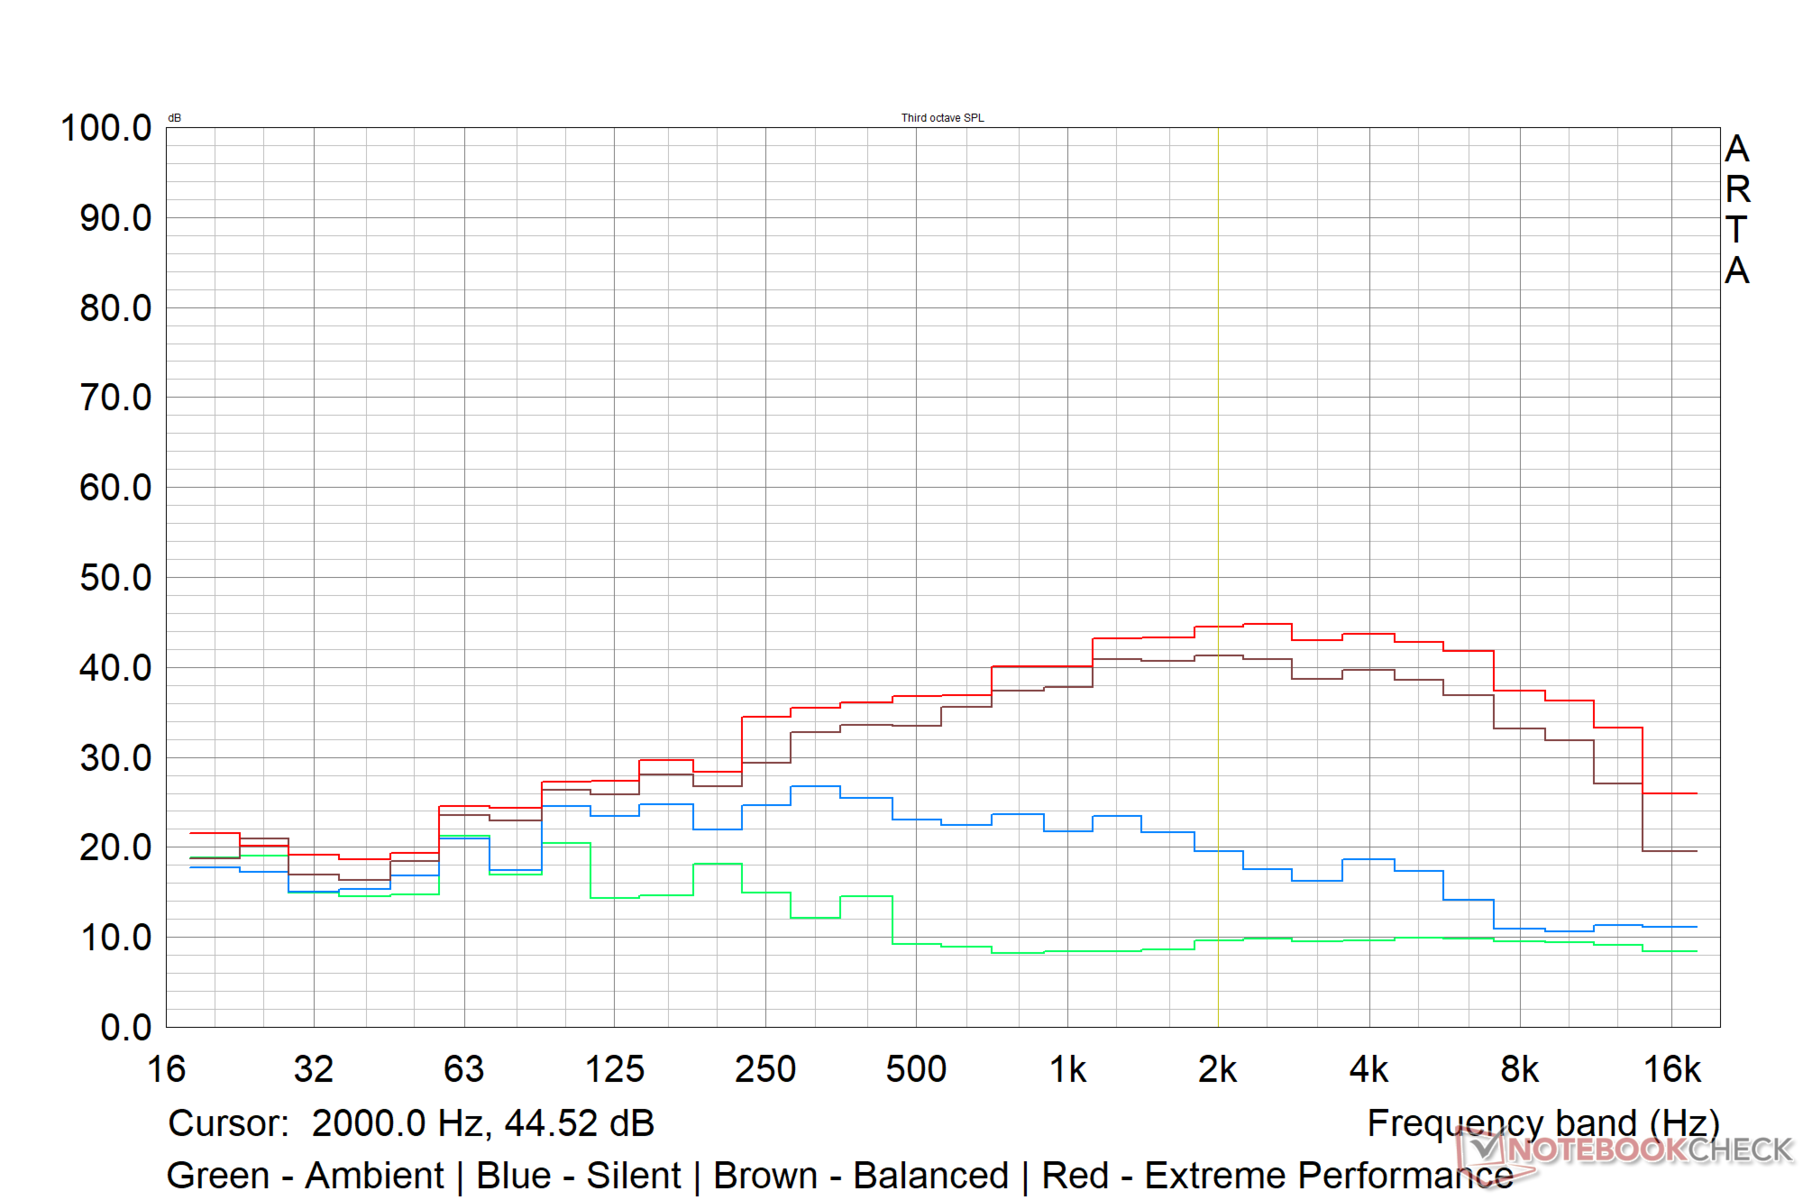
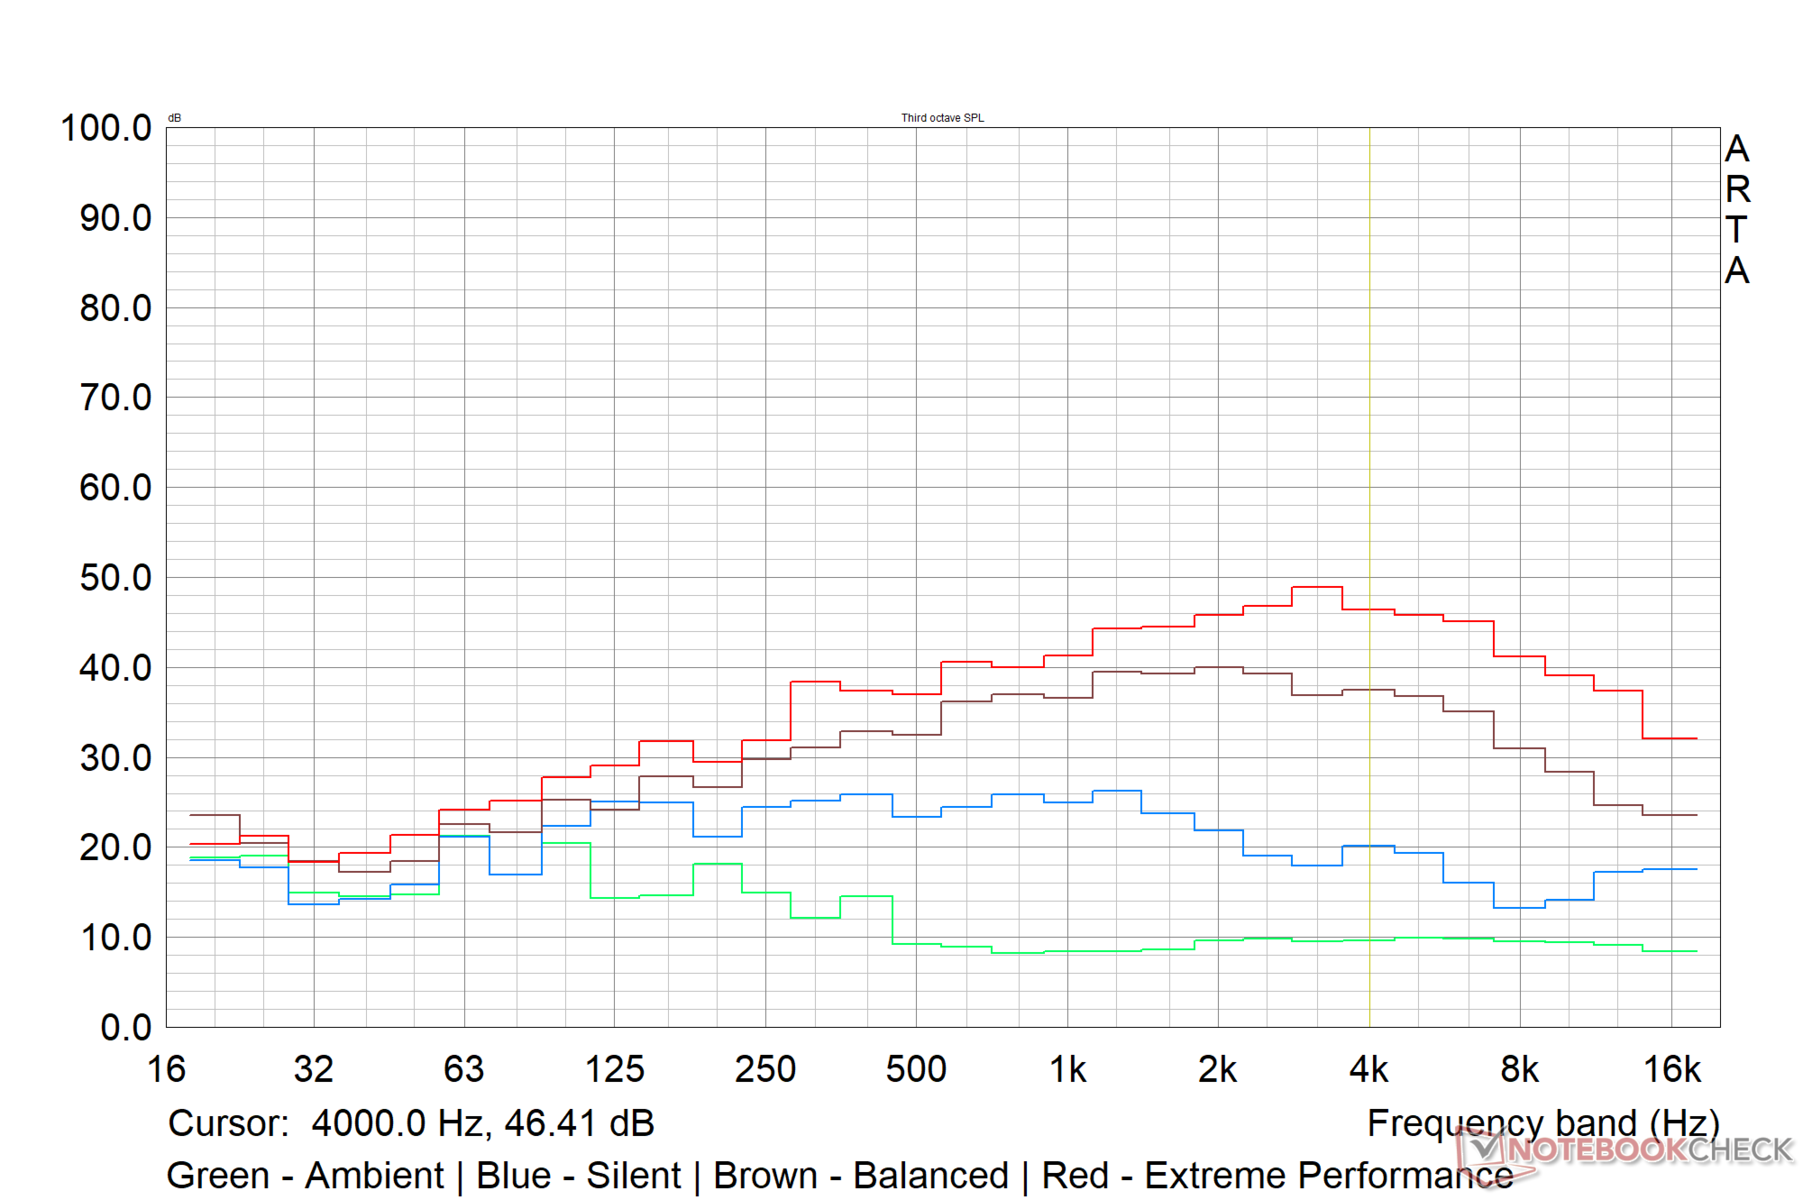
Titan GT77配备了一个四扬声器设置,有两个2W的低音扬声器和两个2W的扬声器。音质响亮,达到83.4 dB(A),足以填满一个中等大小的房间,在高音量时不会有太多失真。
相对较大的底盘确保无源辐射器有足够的空间来产生一个体面的低音响应。Titan GT77在再现中音和高音方面表现出色。从主观上讲,对于大多数使用情况来说,音频质量是比较合格的。
玩家将能够通过一副好的耳机,最大限度地发挥现有音频硬件的作用。然而,发烧友会发现缺少一个专用的麦克风/线路输入插孔有点令人失望。
微星没有为泰坦GT77提供杜比全景声认证,但附带的Nahimic应用程序提供了许多定制选项。
MSI Titan GT77 12UHS audio analysis
(+) | speakers can play relatively loud (83.4 dB)
Bass 100 - 315 Hz
(-) | nearly no bass - on average 71.8% lower than median
(+) | bass is linear (0% delta to prev. frequency)
Mids 400 - 2000 Hz
(-) | nearly no mids - on average 71.8% lower than median
(+) | mids are linear (0% delta to prev. frequency)
Highs 2 - 16 kHz
(-) | nearly no highs - on average 71.8% lower than median
(+) | highs are linear (0% delta to prev. frequency)
Overall 100 - 16.000 Hz
(-) | overall sound is not linear (107.7% difference to median)
Compared to same class
» 100% of all tested devices in this class were better, 0% similar, 0% worse
» The best had a delta of 6%, average was 18%, worst was 132%
Compared to all devices tested
» 96% of all tested devices were better, 0% similar, 4% worse
» The best had a delta of 4%, average was 23%, worst was 134%
Apple MacBook Pro 16 2021 M1 Pro audio analysis
(+) | speakers can play relatively loud (84.7 dB)
Bass 100 - 315 Hz
(+) | good bass - only 3.8% away from median
(+) | bass is linear (5.2% delta to prev. frequency)
Mids 400 - 2000 Hz
(+) | balanced mids - only 1.3% away from median
(+) | mids are linear (2.1% delta to prev. frequency)
Highs 2 - 16 kHz
(+) | balanced highs - only 1.9% away from median
(+) | highs are linear (2.7% delta to prev. frequency)
Overall 100 - 16.000 Hz
(+) | overall sound is linear (4.6% difference to median)
Compared to same class
» 0% of all tested devices in this class were better, 0% similar, 100% worse
» The best had a delta of 5%, average was 17%, worst was 45%
Compared to all devices tested
» 0% of all tested devices were better, 0% similar, 100% worse
» The best had a delta of 4%, average was 23%, worst was 134%
能源管理。最大负荷时的耗电量不一致
消耗功率
所提供的330瓦适配器足以为泰坦GT77提供动力,以应付苛刻的工作负荷。空闲和负载功耗较高,考虑到其内部结构,这并不令人惊讶。负载下的功耗与Raider GE77 HX 12UHS相当。
Prime95和Furmark的组合负载显示出高度振荡的功耗,与我们之前在压力测试中的观察一致。
这款 Alienware x17 R2配有Core i9-12900HK的Alienware x17 R2的整体能效要低大约8%。
| Off / Standby | |
| Idle | |
| Load |
|
Key:
min: | |
| MSI Titan GT77 12UHS i9-12900HX, GeForce RTX 3080 Ti Laptop GPU, 1920x1080, | Aorus 17X XES i9-12900HX, GeForce RTX 3070 Ti Laptop GPU, 1920x1080, | MSI Raider GE77 HX 12UHS i9-12900HX, GeForce RTX 3080 Ti Laptop GPU, 3840x2160, | MSI GE67 HX 12UGS i7-12800HX, GeForce RTX 3070 Ti Laptop GPU, 1920x1080, | Asus ROG Zephyrus Duo 16 GX650RX R9 6900HX, GeForce RTX 3080 Ti Laptop GPU, 3840x2400, | Alienware x17 R2 P48E i9-12900HK, GeForce RTX 3080 Ti Laptop GPU, 1920x1080, | Average NVIDIA GeForce RTX 3080 Ti Laptop GPU | Average of class Gaming | |
|---|---|---|---|---|---|---|---|---|
| Power Consumption | 8% | 16% | 23% | 23% | -8% | 19% | 31% | |
| Idle Minimum * (Watt) | 30.21 | 18 40% | 13 57% | 16.1 47% | 19 37% | 24.1 20% | 17.2 ? 43% | 13 ? 57% |
| Idle Average * (Watt) | 32.42 | 28 14% | 19 41% | 17.1 47% | 24 26% | 28.5 12% | 23.3 ? 28% | 19 ? 41% |
| Idle Maximum * (Watt) | 33.7 | 36 -7% | 29 14% | 26.6 21% | 31 8% | 60 -78% | 30.8 ? 9% | 24.6 ? 27% |
| Load Average * (Watt) | 125.09 | 153 -22% | 143 -14% | 116.3 7% | 104 17% | 128.7 -3% | 121.2 ? 3% | 110.7 ? 12% |
| Witcher 3 ultra * (Watt) | 256 | 221 14% | 247 4% | 237 7% | 186.5 27% | 254 1% | ||
| Load Maximum * (Watt) | 321.88 | 290 10% | 352 -9% | 291.1 10% | 256 20% | 323 -0% | 276 ? 14% | 259 ? 20% |
* ... smaller is better
Power Consumption - The Witcher 3 / Stress test
Power Consumption - External monitor
电池寿命
正如预期的那样,即使使用最大的4芯99.9WHr电池,离开墙壁的运行时间也只是平均水平。
我们在H.264 1080p视频循环测试中获得了大约7小时13分钟的时间,在标准化的Wi-Fi浏览脚本中获得了接近7小时的时间,两者的亮度都是150cd/m2。因此,谨慎地使用较低的屏幕亮度,在静音或超级电池模式下运行,并关闭机箱RGB效果,可以使你的运行时间接近一个典型的工作日。
即使在降低屏幕亮度的情况下,用电池供电的游戏时间也可以达到1.5小时左右。所有的电池运行时间测试都是在MSHybrid模式下以60Hz刷新率进行的。
| MSI Titan GT77 12UHS i9-12900HX, GeForce RTX 3080 Ti Laptop GPU, 99.9 Wh | Aorus 17X XES i9-12900HX, GeForce RTX 3070 Ti Laptop GPU, 99 Wh | MSI Raider GE77 HX 12UHS i9-12900HX, GeForce RTX 3080 Ti Laptop GPU, 99.99 Wh | MSI GE67 HX 12UGS i7-12800HX, GeForce RTX 3070 Ti Laptop GPU, 99.9 Wh | Asus ROG Zephyrus Duo 16 GX650RX R9 6900HX, GeForce RTX 3080 Ti Laptop GPU, 90 Wh | Alienware x17 R2 P48E i9-12900HK, GeForce RTX 3080 Ti Laptop GPU, 87 Wh | Average of class Gaming | |
|---|---|---|---|---|---|---|---|
| Battery runtime | -28% | 4% | 16% | 4% | -57% | 9% | |
| H.264 (h) | 7.2 | 3.8 -47% | 6.5 -10% | 9.3 29% | 8.32 ? 16% | ||
| WiFi v1.3 (h) | 6.9 | 4.4 -36% | 5.4 -22% | 5.6 -19% | 7.8 13% | 2 -71% | 7.11 ? 3% |
| Witcher 3 ultra (h) | 1.5 | ||||||
| Load (h) | 1.4 | 1.4 0% | 2 43% | 2.1 50% | 1 -29% | 0.8 -43% | 1.502 ? 7% |
| Reader / Idle (h) | 9.8 | 8.4 | 12.5 | 3.9 | 8.27 ? |
Pros
Cons
评语。阿尔德湖-HX的一个盛大的、5000美元的展示平台
微星公司在中断两年后恢复了其标志性的泰坦系列,而泰坦GT77尽其所能,不负众望。重新设计的机箱现在更加纤细,并提供了比上一代泰坦更好的美学效果。虽然主要由塑料制成,但泰坦GT77仍能给人以高级感和良好的构造。
连接功能对于2022年的旗舰笔记本电脑来说是正常的。720p的网络摄像头与这个价格不相称。Cherry MX机械键盘和宽敞的触摸板是Titan GT77中受欢迎的补充。
我们单位的FHD面板,目前还没有零售,充其量是平均水平,亮度分布和对比度平平。然而,它提供了360赫兹的刷新率和低响应时间,应该能让竞争激烈的游戏玩家满意。对于所有其他目的,我们建议选择带有UHD面板的SKU。
酷睿i9-12900HX和175W RTX 3080 Ti笔记本GPU的组合提供了大量的处理能力,只要你不介意高热量和噪音的排放,几乎可以满足你的任何工作负荷。
目前,在野外并没有太多桤木湖-HX笔记本电脑。但是,如果你腰缠万贯,并且需要绝对无障碍的顶级性能和相匹配的外观,那么很少有游戏笔记本能够与微星泰坦GT77相提并论。
不过,Titan GT77也不是没有一些明显的缺点。微星在存储子系统方面有一些工作要做--SD读卡器肯定可以使用一个速度提升,NVMe驱动器肯定值得一个有能力的散热解决方案。微星的软件套件也需要修复一些错误,特别是微星真彩。微星的OverDrive功能也可以使用一些调整,以确保CPU和GPU之间更公平的电源份额,实现一致的时钟和功耗。
你应该马上去买Titan GT77吗?如果你准备掏出五千美元,这是一个没有意义的问题。然而,泰坦GT77有一些有能力的竞争者,可以为你节省不少钱。例如,Raider GE67 HX 12UGS ,配备Core i9-12800HX和RTX 3070 Ti,通常以一半的价格(2500美元)接近顶级规格的Titan GT77。
如果你追求的是360赫兹的显示屏,Alienware x17 R2 ,虽然它采用酷睿i9-12900HK,但性能相当,价格为3900美元。Aorus 17X XES 在整体CPU和GPU性能方面确实落后于Titan GT77,但其2,999美元的价格确实值得考虑。如果机械键盘和大量NVMe插槽等功能更重要,你仍然可以以接近3100美元的价格买到配备Core i7-12800HX和RTX 3070 Ti的Titan GT77。
价格和可用性
我们测试的微星泰坦GT77是由英特尔直接播种的定制设备,所以没有官方定价信息。然而,英特尔确实告诉我们,这个配置接近于5000美元左右。
Titan GT77的零售单位正慢慢地在全球范围内进行。目前,采用酷睿i9-12900HX、RTX 3080 Ti、64GB DDR5-4800内存、2TB NVMe SSD和120赫兹UHD显示屏的泰坦GT77在微星马来西亚官方商店的售价约为5361美元。.
在美国的人,可以订购Titan GT77 12UHS-007配有Core i7-12800HX和RTX 3080 Ti,价格为3899美元。也有一个Titan GT77 12UHS-009配备酷睿i7-12800HX和RTX 3070 Ti,价格为3053美元。
MSI Titan GT77 12UHS
- 08/28/2022 v7 (old)
Vaidyanathan Subramaniam
Price comparison

