Apple MacBook Pro 16 2023 M3 Max 评测 - M3 Max 挑战 AMD 和 Intel 的 HX-CPU
| MBP 16 M3 Pro | MBP 16 M3 Max | MBP 16 M3 Max | |
|---|---|---|---|
| CPU | Apple M3 Pro 12 核 CPU (6P & 6E) |
Apple M3 Max 14 核 CPU (10P & 4E) |
Apple M3 Max 16 核 CPU (12P & 4E) |
| GPU | 18 核 GPU | 30 核 GPU | 40 核 |
| 内存 | 18GB (36GB) | 36GB (96GB) | 48GB (64/128GB) |
| SSD | 512 GB (1/2/4 TB) | 1 TB (2/4/8 TB) | 1 TB (2/4/8 TB) |
| 内存带宽 | 150 GB/s | 300 GB/s | 400 GB/s |
| 端口 | 3x USB-C 4.0 w/ Thunderbolt 4 HDMI、SD 读卡器 |
3x USB-C 4.0 w/ Thunderbolt 4 HDMI、SD 读卡器 |
3x USB-C 4.0 w/ Thunderbolt 4 HDMI、SD 读卡器 |
| 价格 | 2499 美元起 | 3499 美元起 | 3999 美元起 |
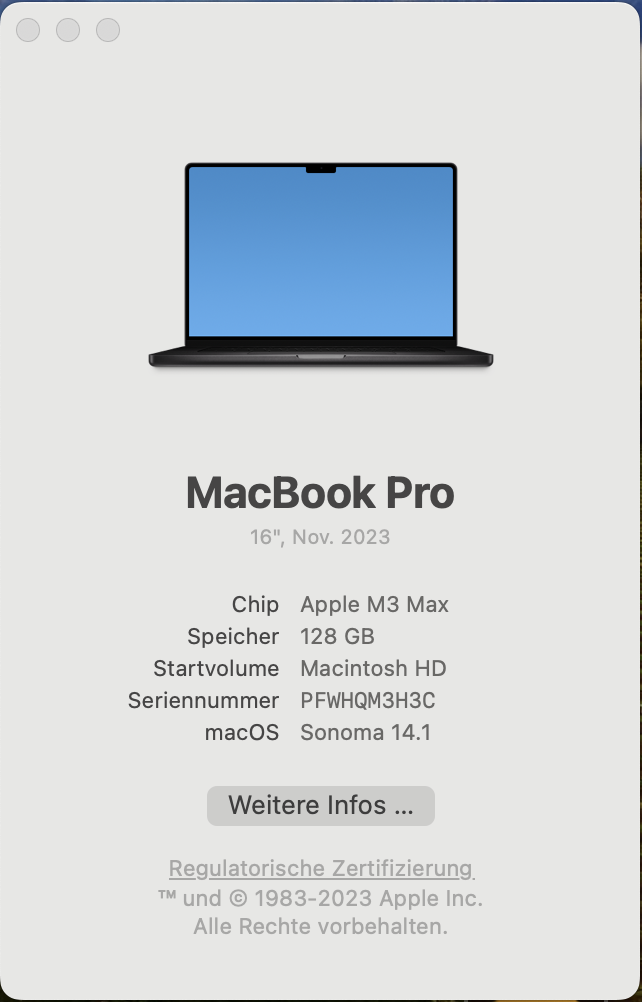
我们的评测机是 MacBook Pro 16,配备了两款 M3 Max 芯片中速度更快的一款,具有 16 个 CPU 内核和 40 个 CPU 内核。配备 48GB 内存和 1TB 固态硬盘的基本售价为 3999 美元,但我们的评测机配备了包括 128GB 内存和 8TB 固态硬盘在内的所有选件,因此售价增至 7199 美元。
潜在的竞争对手比较
Rating | Date | Model | Weight | Height | Size | Resolution | Price |
|---|---|---|---|---|---|---|---|
| 93.2 % v7 (old) | 11 / 2023 | Apple MacBook Pro 16 2023 M3 Max Apple M3 Max 16-Core, M3 Max 40-Core GPU | 2.1 kg | 16.9 mm | 16.00" | 3456x2234 | |
| 93.7 % v7 (old) | 03 / 2023 | Apple MacBook Pro 16 2023 M2 Max M2 Max, M2 Max 38-Core GPU | 2.2 kg | 16.8 mm | 16.20" | 3456x2234 | |
| 91.2 % v7 (old) | 02 / 2023 | Razer Blade 16 Early 2023 i9-13950HX, GeForce RTX 4080 Laptop GPU | 2.4 kg | 21.99 mm | 16.00" | 2560x1600 | |
| 88.4 % v7 (old) | 08 / 2023 | Lenovo Yoga Pro 9 16-IRP G8 i7-13705H, GeForce RTX 4060 Laptop GPU | 2.2 kg | 18.2 mm | 16.00" | 3200x2000 | |
| 86.1 % v7 (old) | 06 / 2023 | Asus ProArt Studiobook 16 OLED H7604 i9-13980HX, GeForce RTX 4070 Laptop GPU | 2.4 kg | 23.9 mm | 16.00" | 3200x2000 | |
| 87.9 % v7 (old) | 10 / 2023 | Schenker XMG Pro 16 Studio (Mid 23) i9-13900H, GeForce RTX 4070 Laptop GPU | 2.6 kg | 19.9 mm | 16.00" | 2560x1600 |
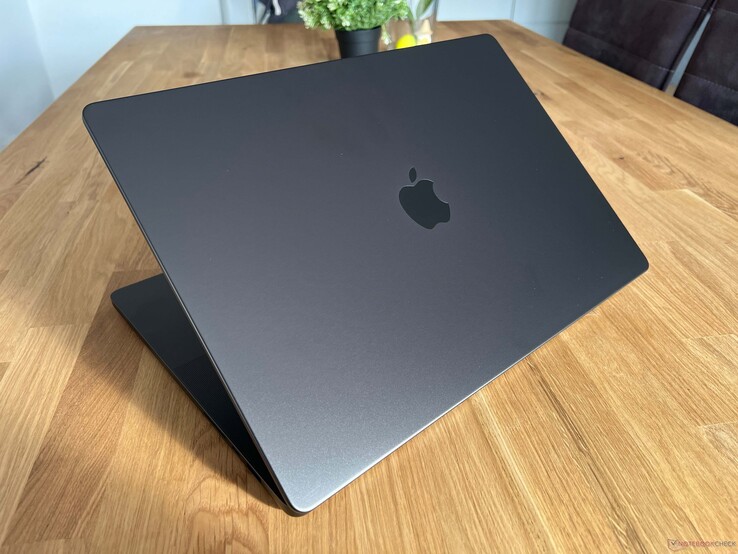
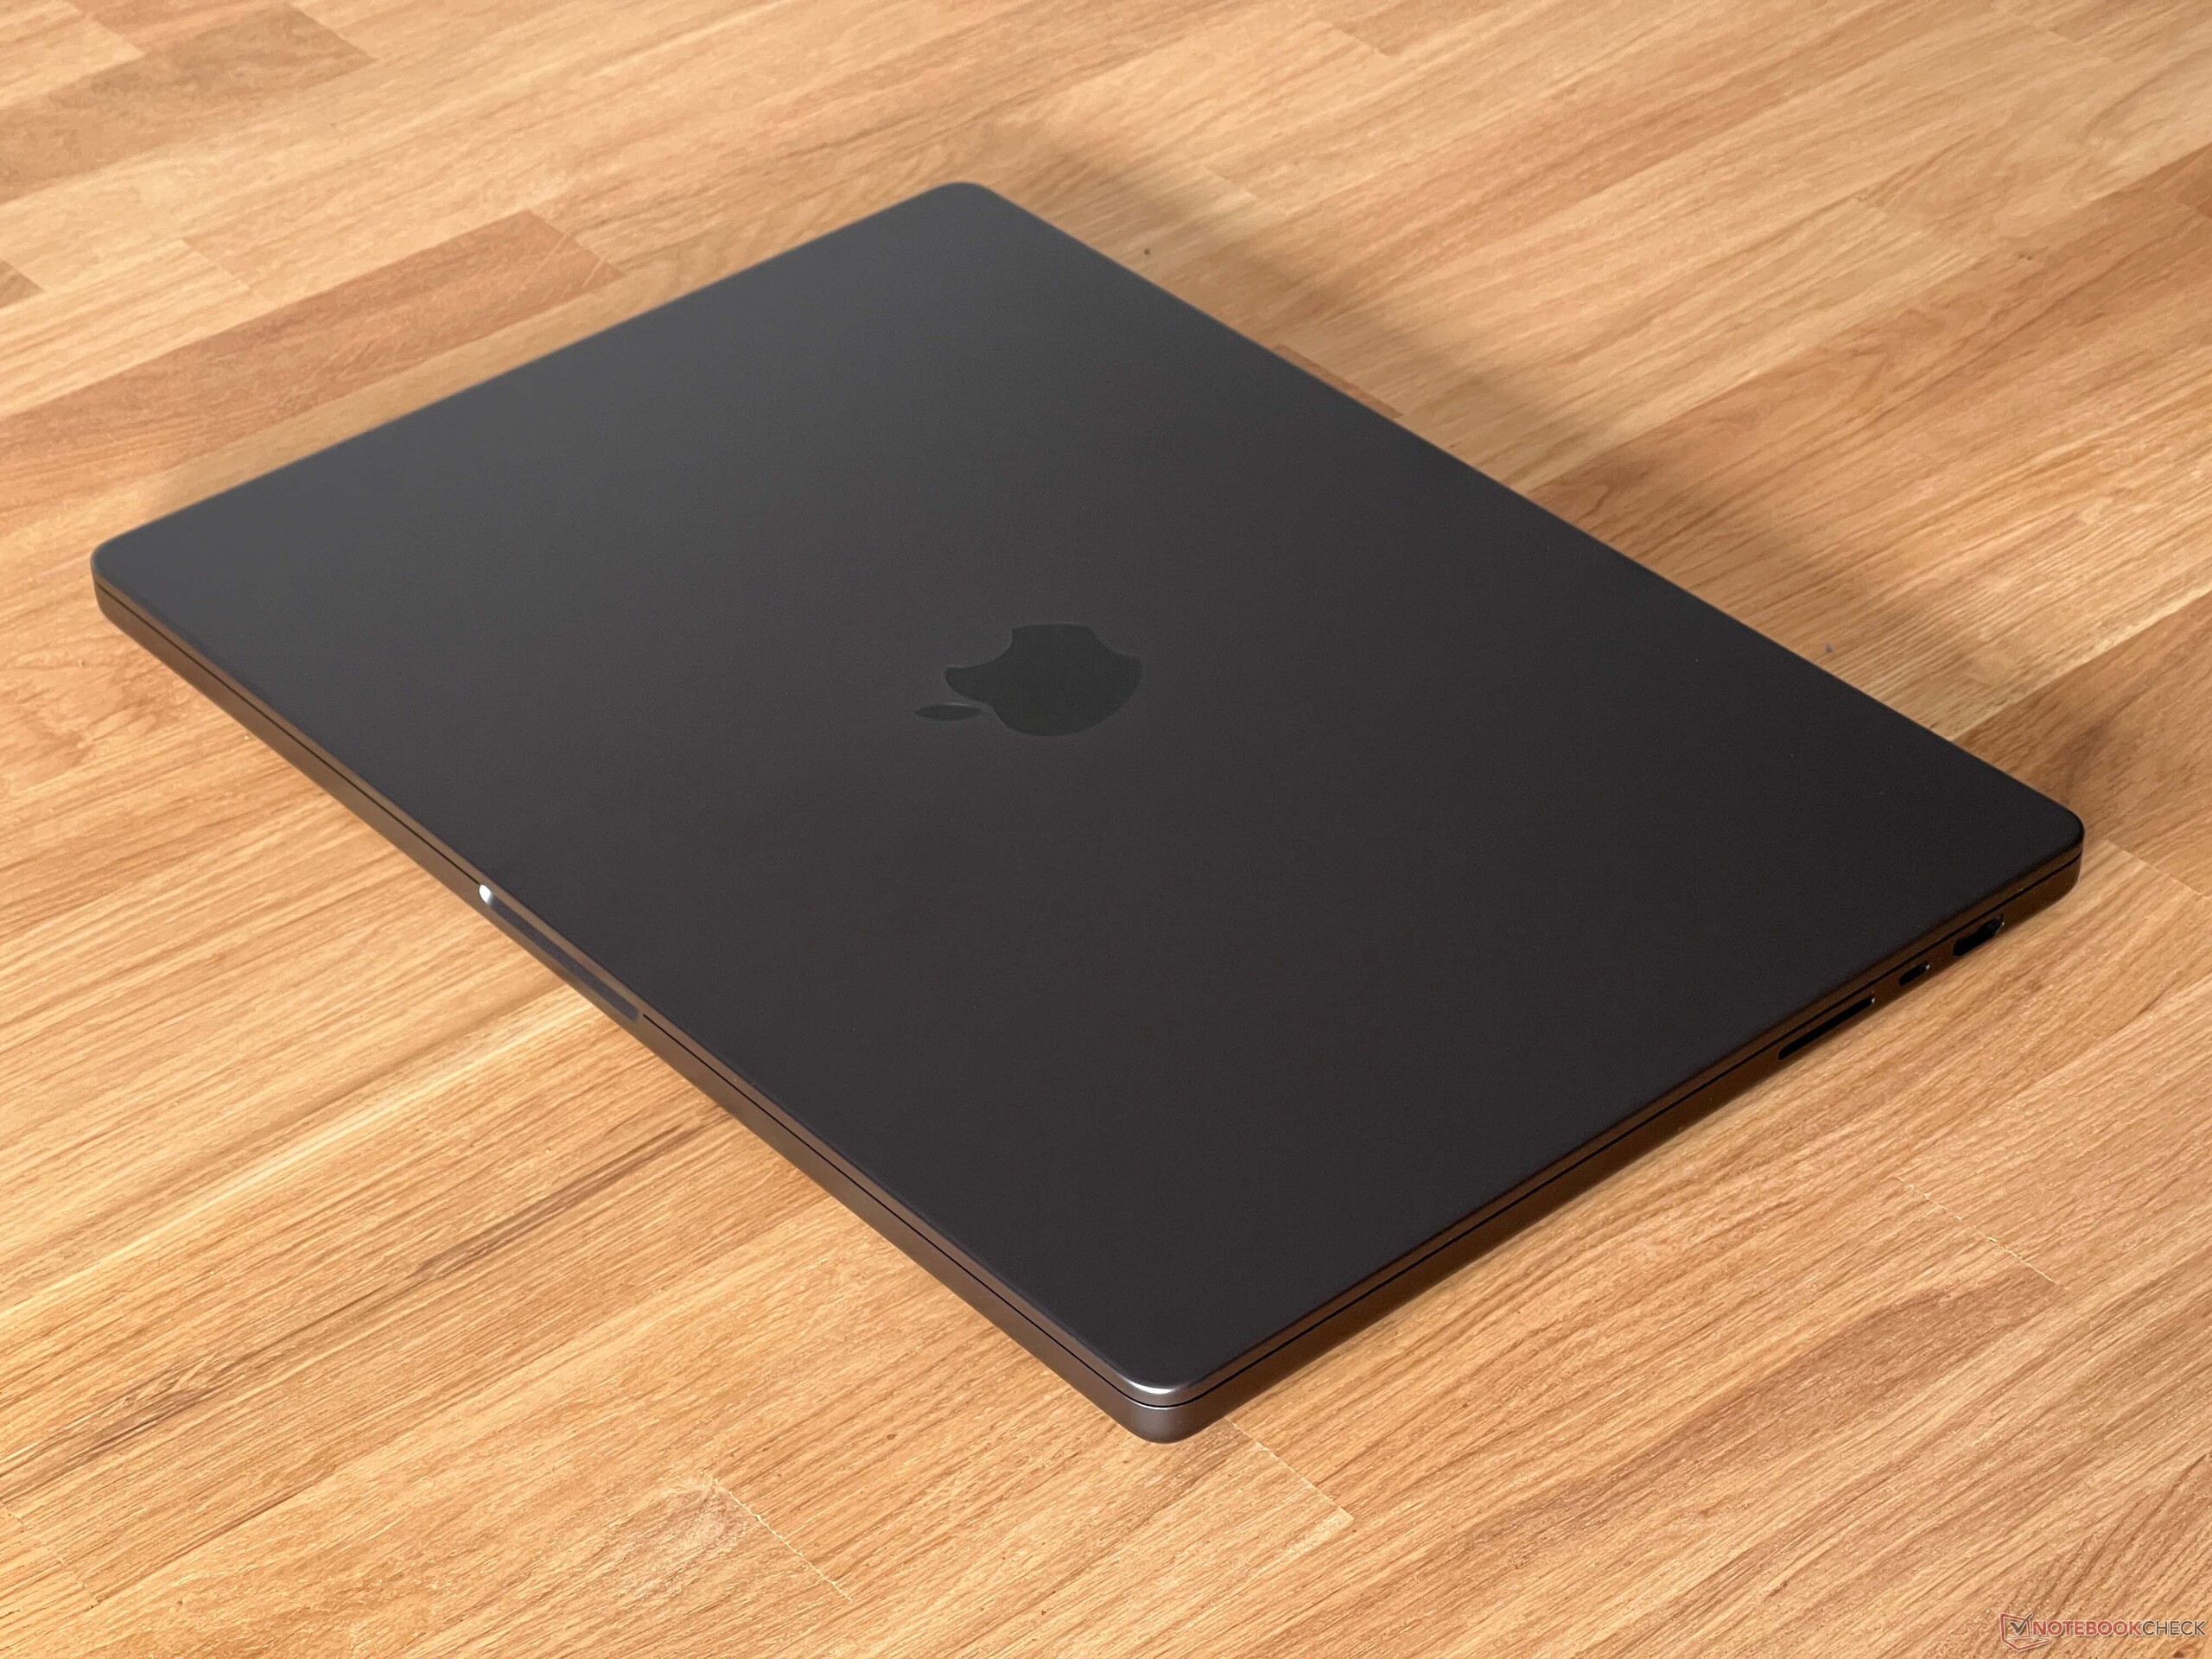
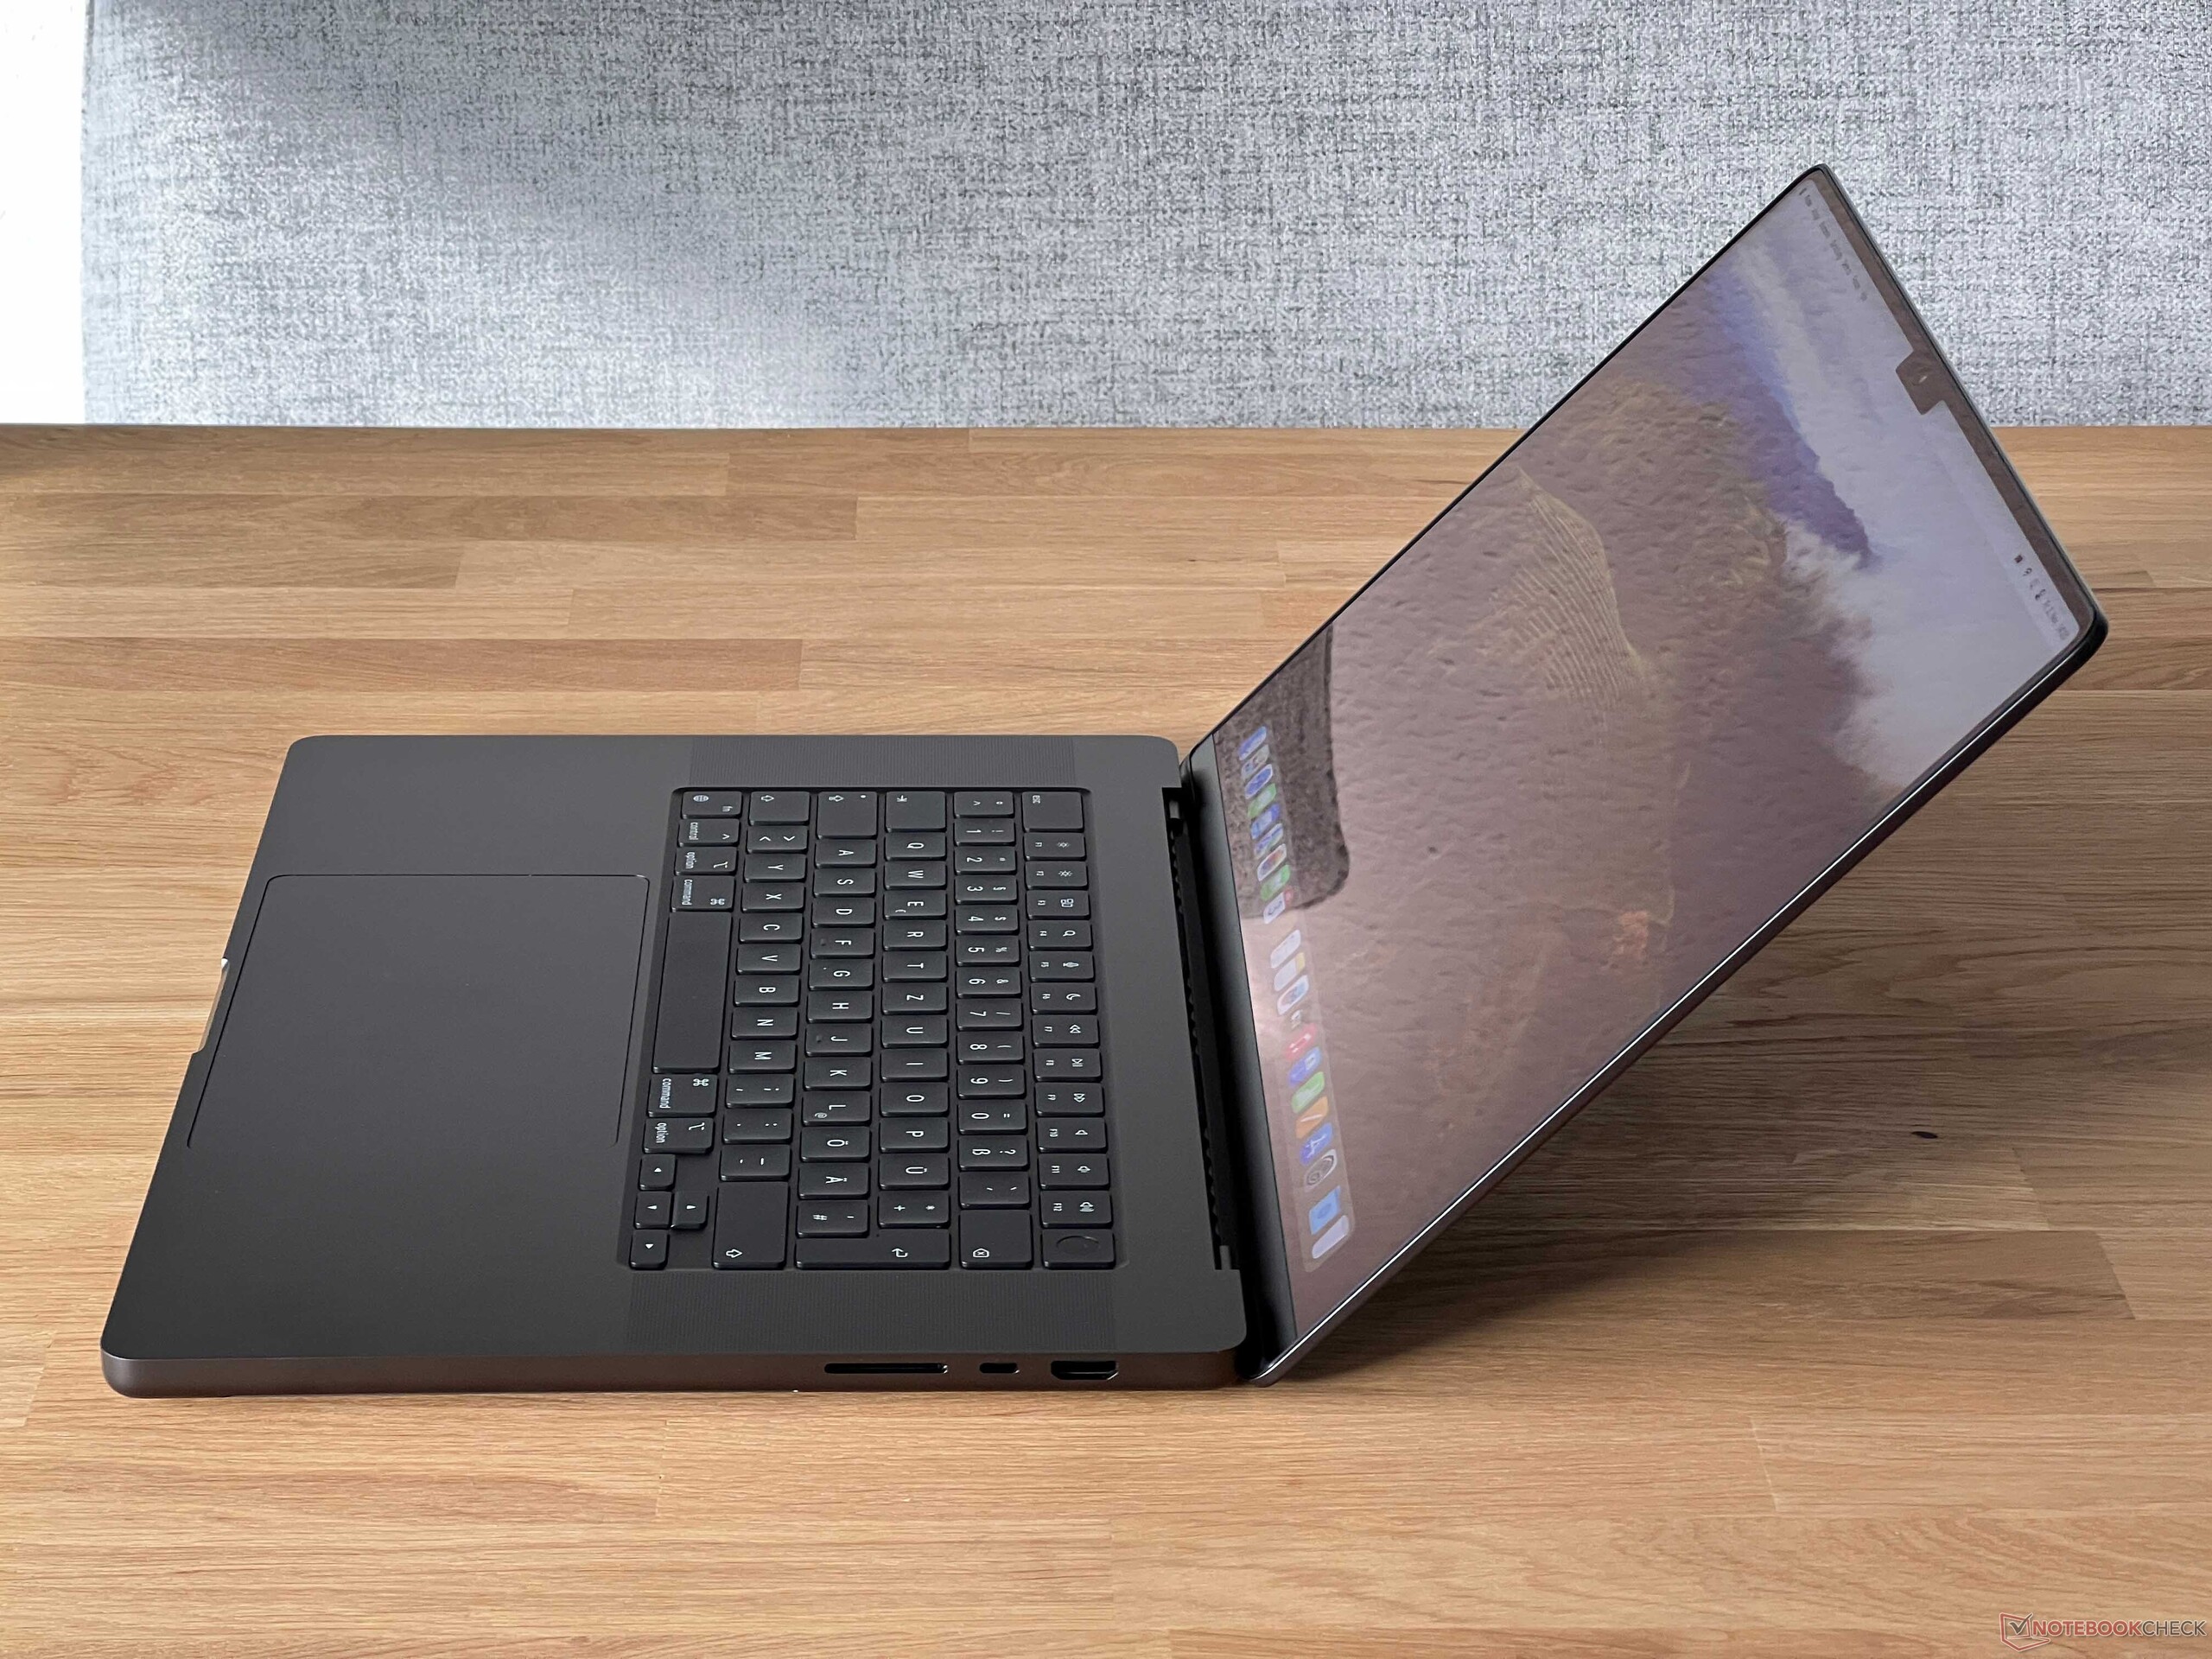
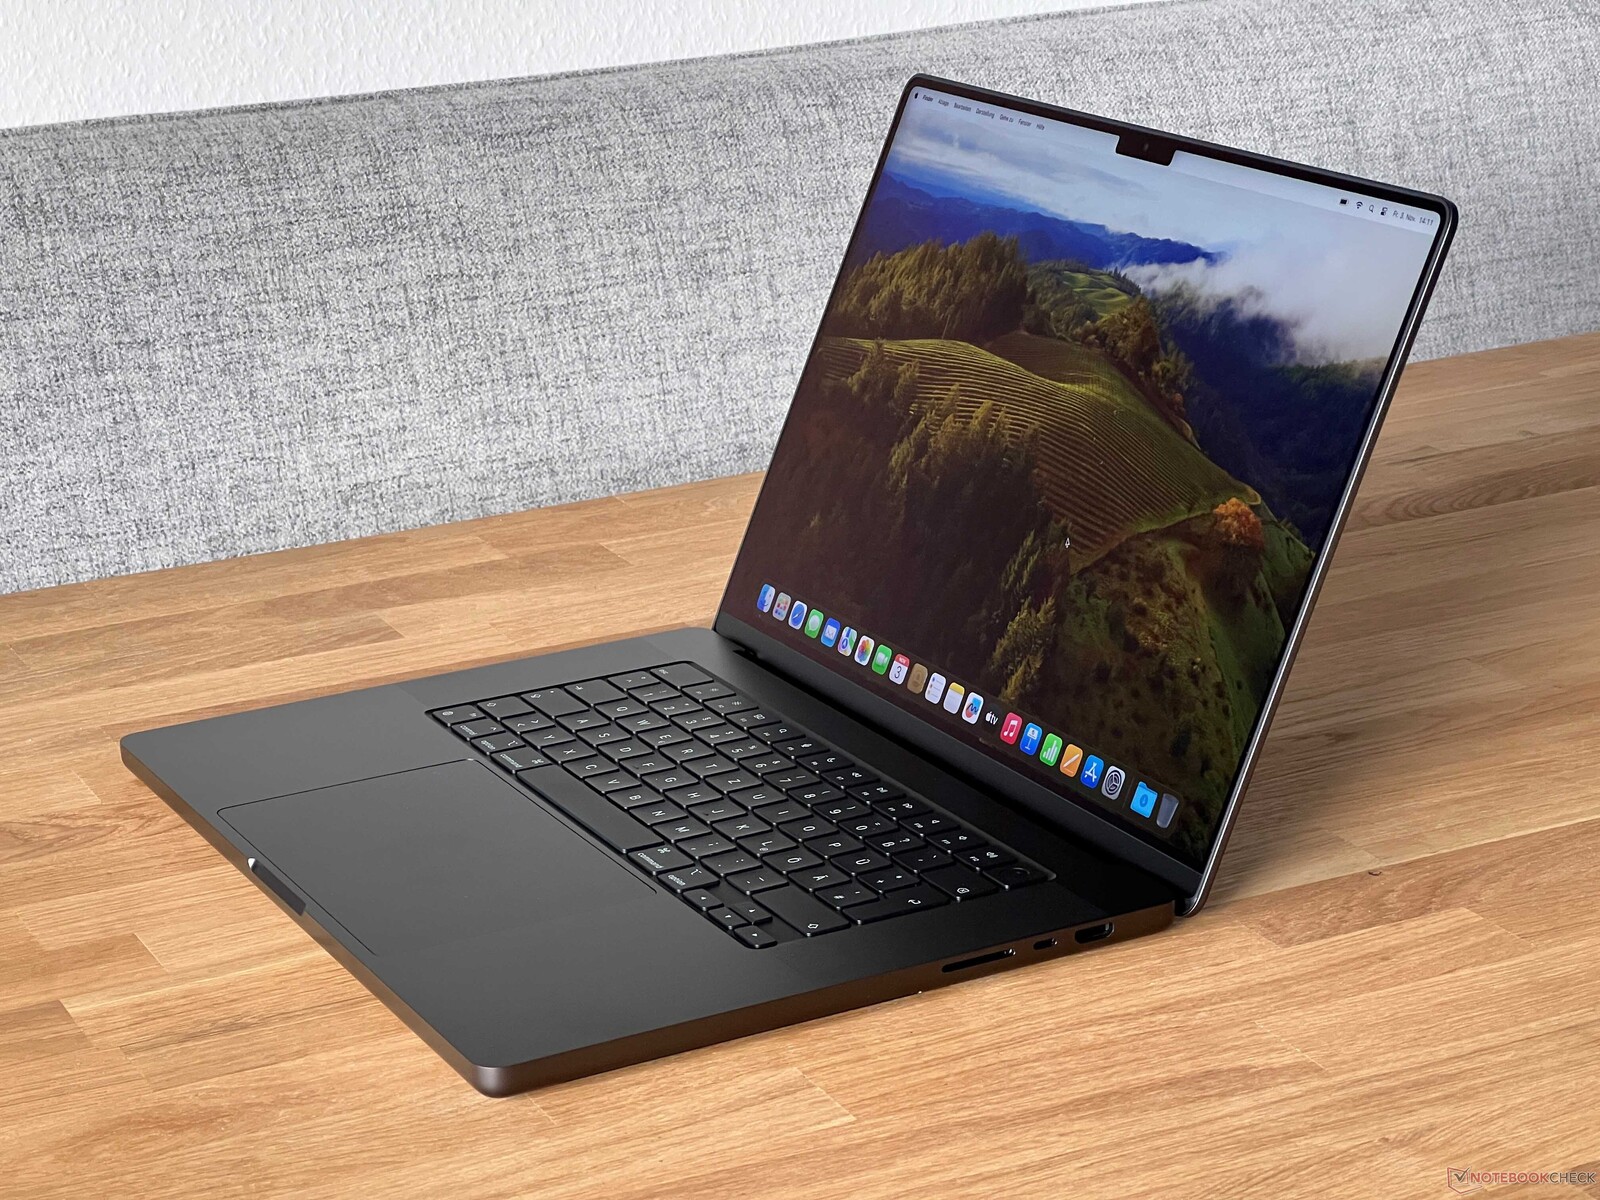
保护壳 - MacBook Pro 16(太空黑
Apple MacBook 保留了我们熟悉的前两款机型的机身,但颜色发生了变化。你仍然可以买到银色的 MacBook,但第二种颜色不再是太空灰,而是太空黑。笔记本电脑的黑色看起来非常不错,根据环境光线的不同,颜色会显得更亮或更暗,但与黑色键盘总是有明显的区别,黑色键盘的颜色明显要深一些。较小的MacBook Air的 "午夜 "色纯粹是一块指纹磁铁,你不得不经常清洁它,但新的黑色机型在这方面要好一些,但与银色机型相比,你还是会更快地看到指纹。Apple ,它采用了化学工艺,属于阳极氧化的一部分,而不是涂层。
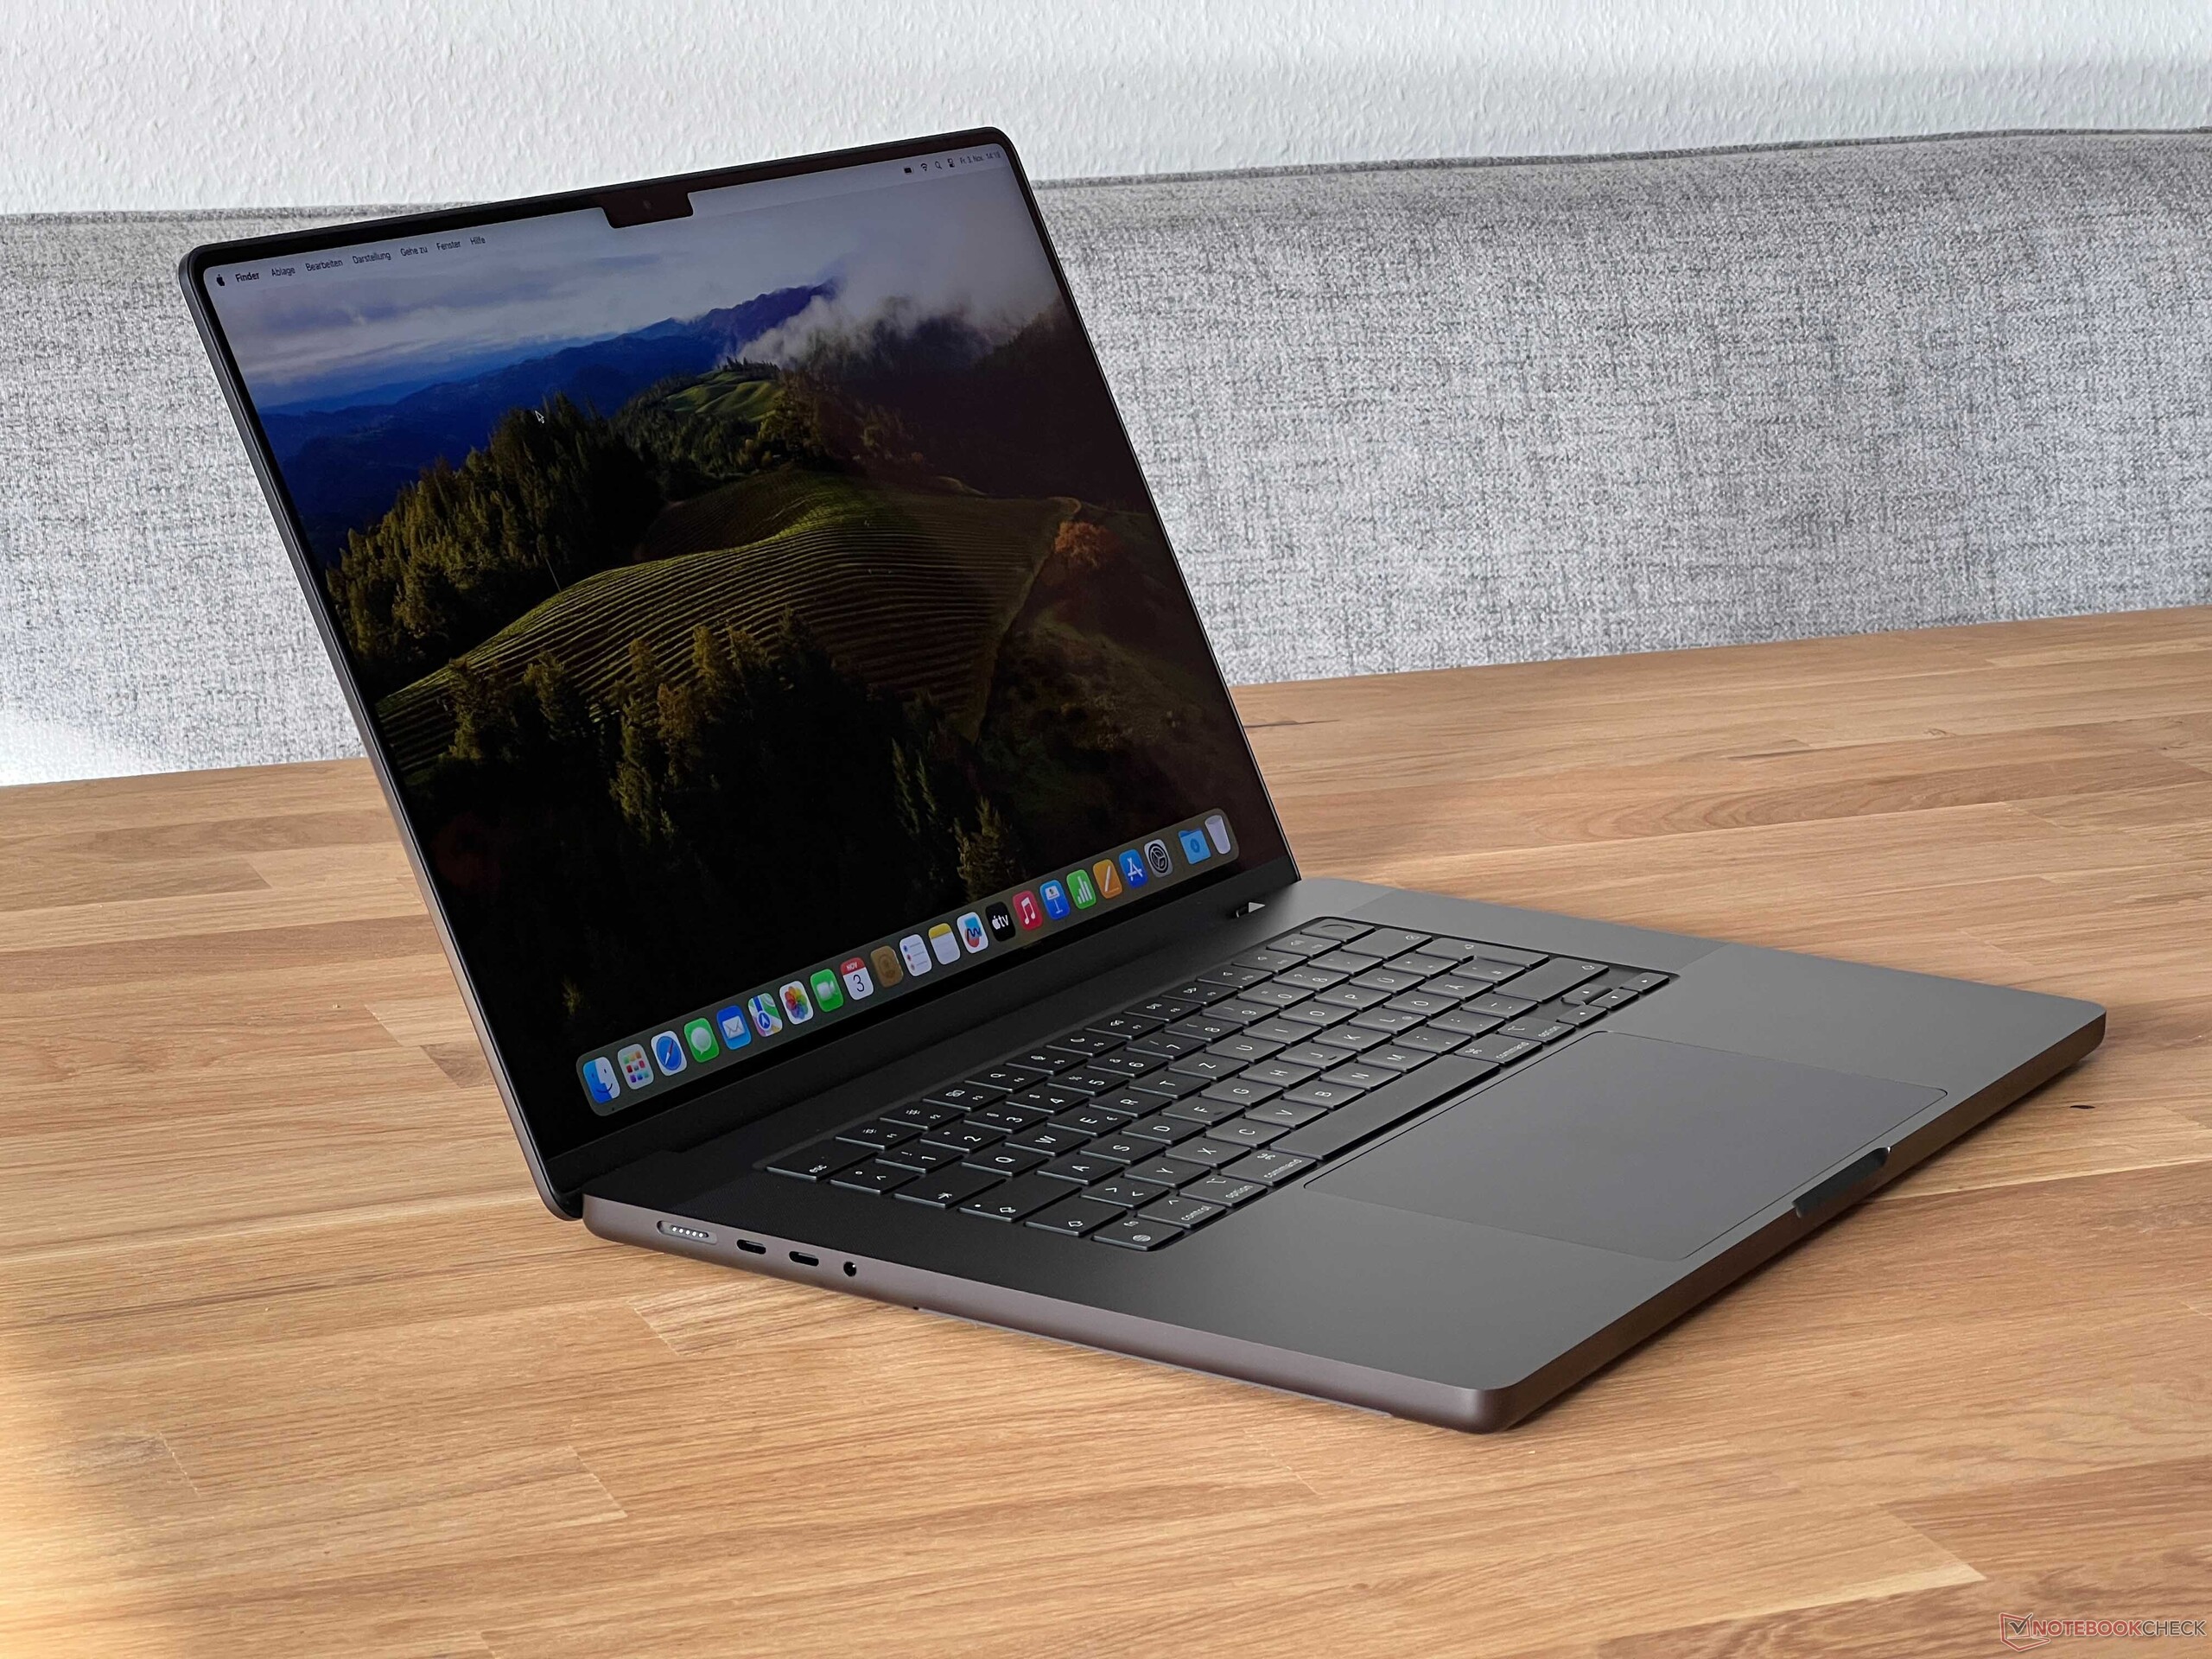
机身的质量仍然非常出色,铝制机身给人的感觉就是高级和非常稳定。显示屏铰链也给人留下了不错的印象,只是最大开启角度(135 度)还可以再大一些。底座的前缘较硬,长时间使用键盘时可能会割伤手腕。与较小的MacBook Pro 14 一样,底座的任何一侧都没有变细,但由于占地面积更大,较大的 MBP 16 感觉并不笨重。
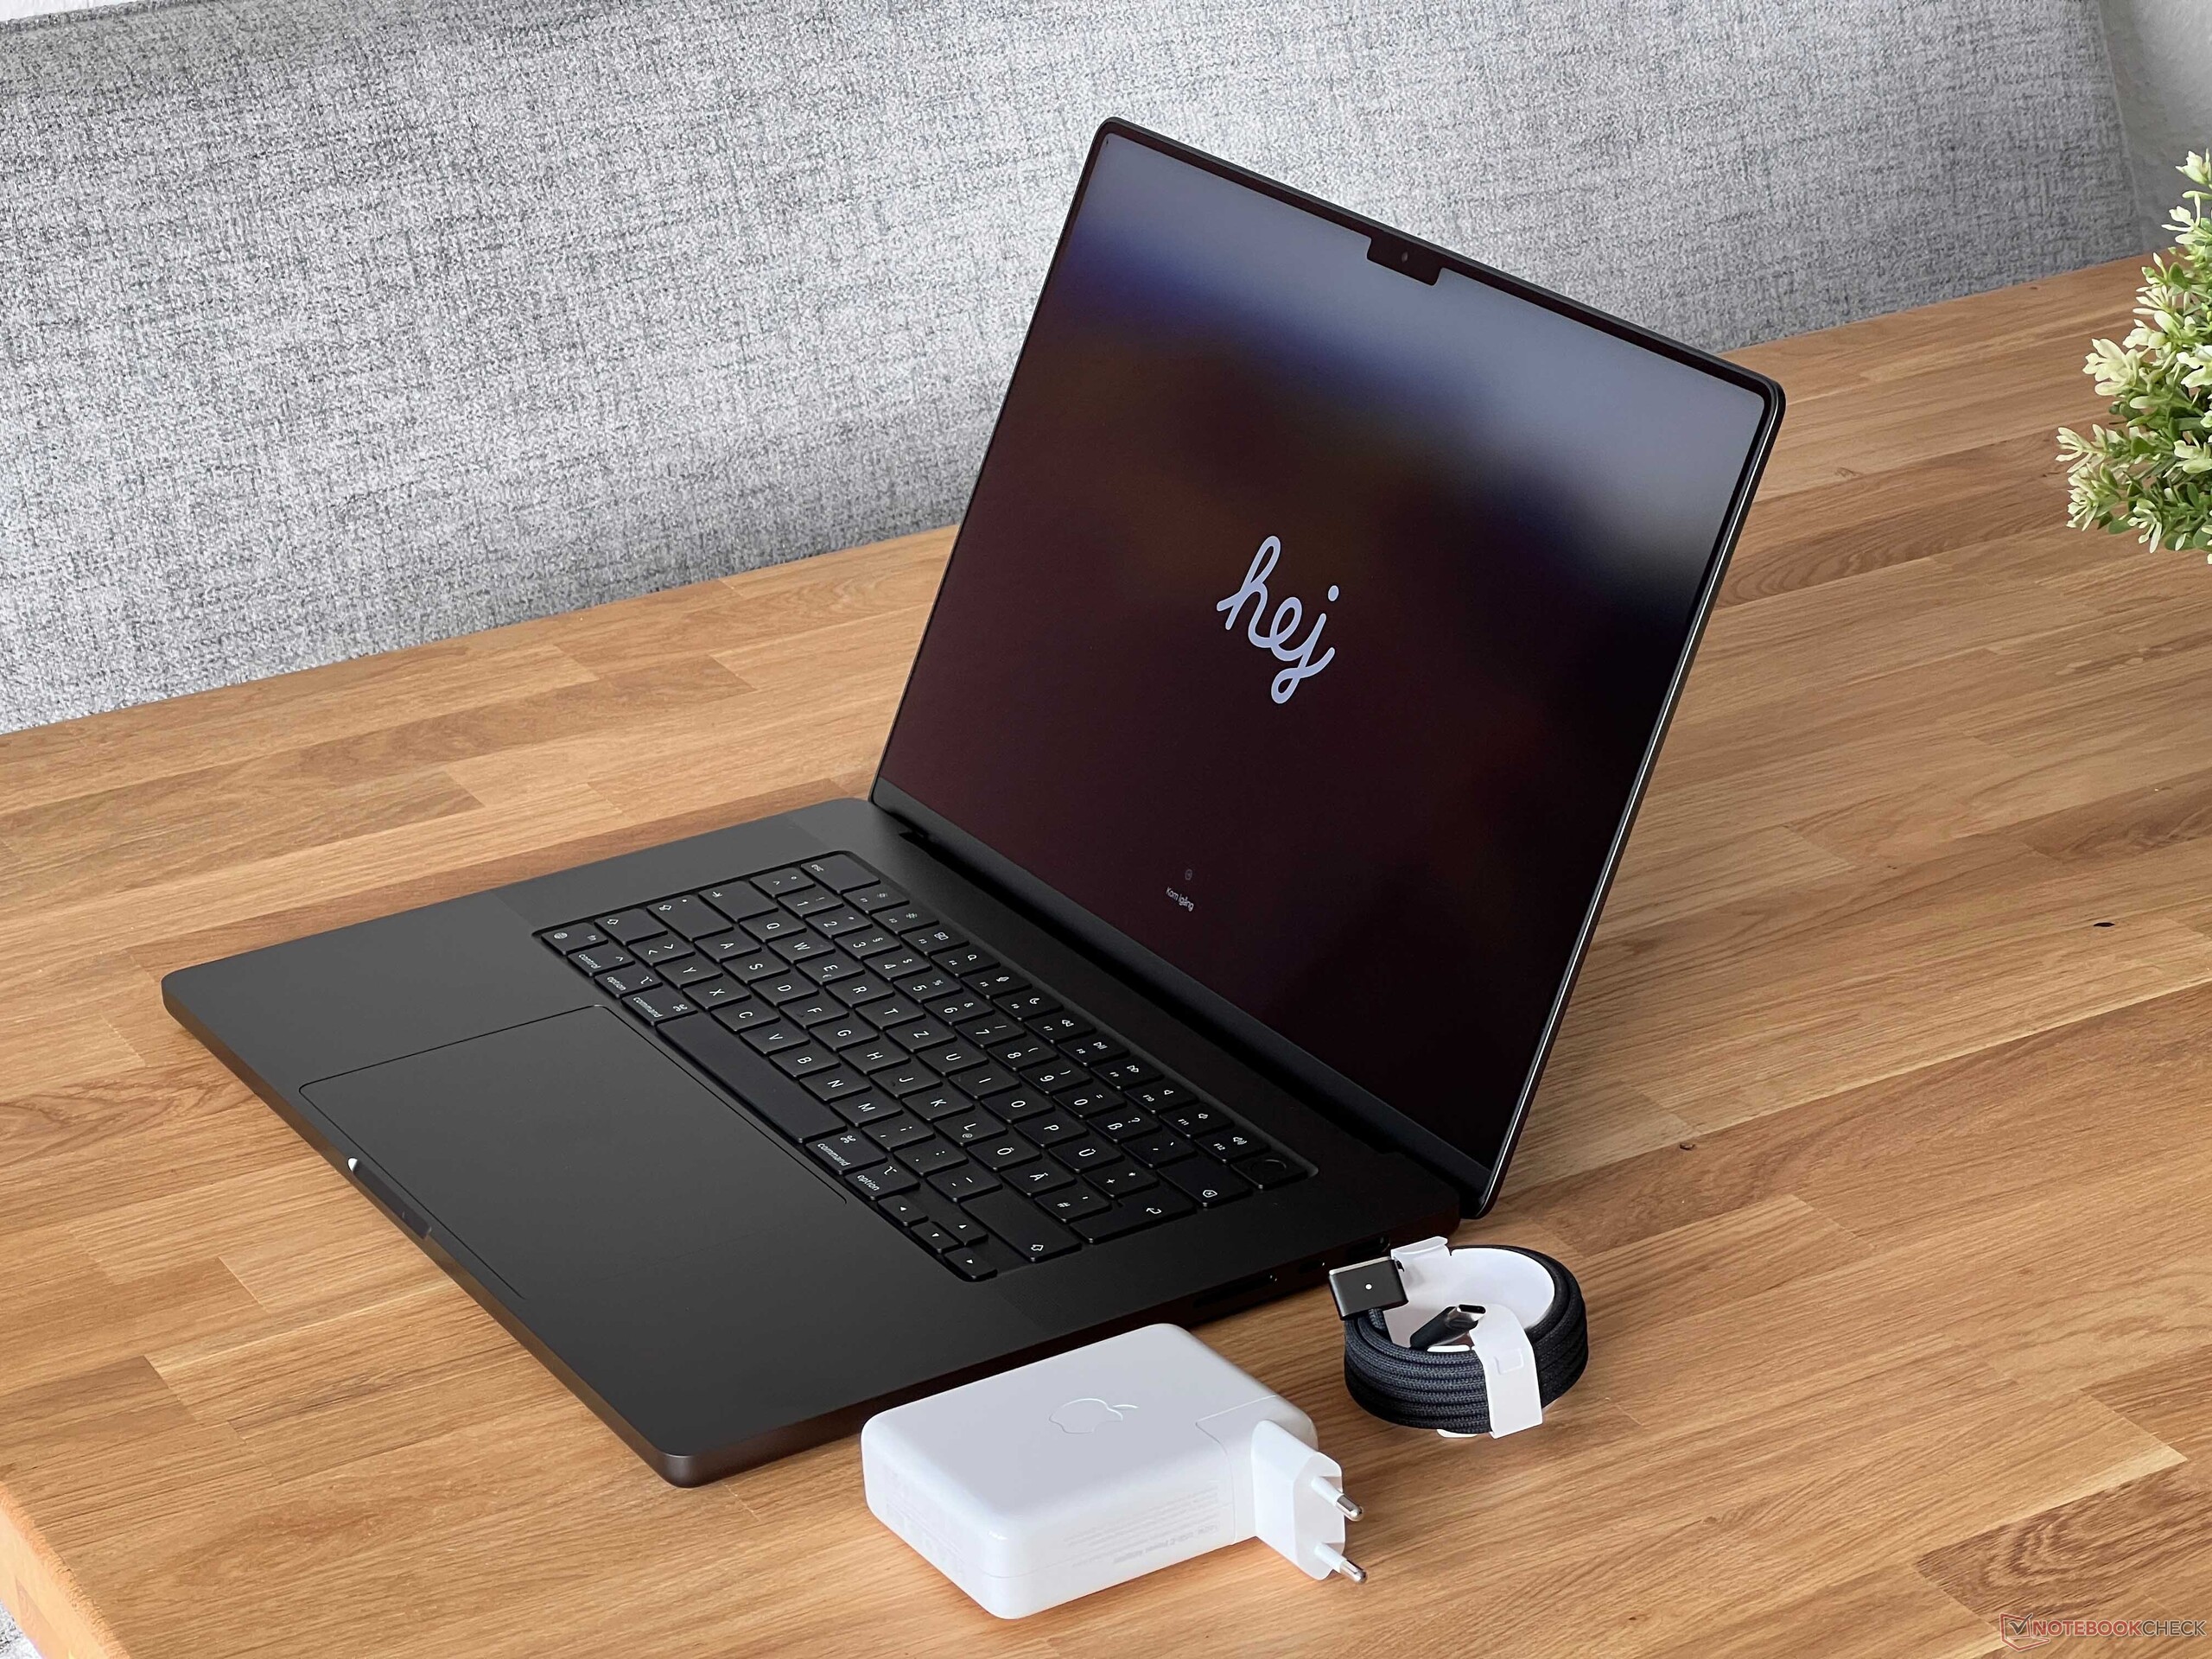
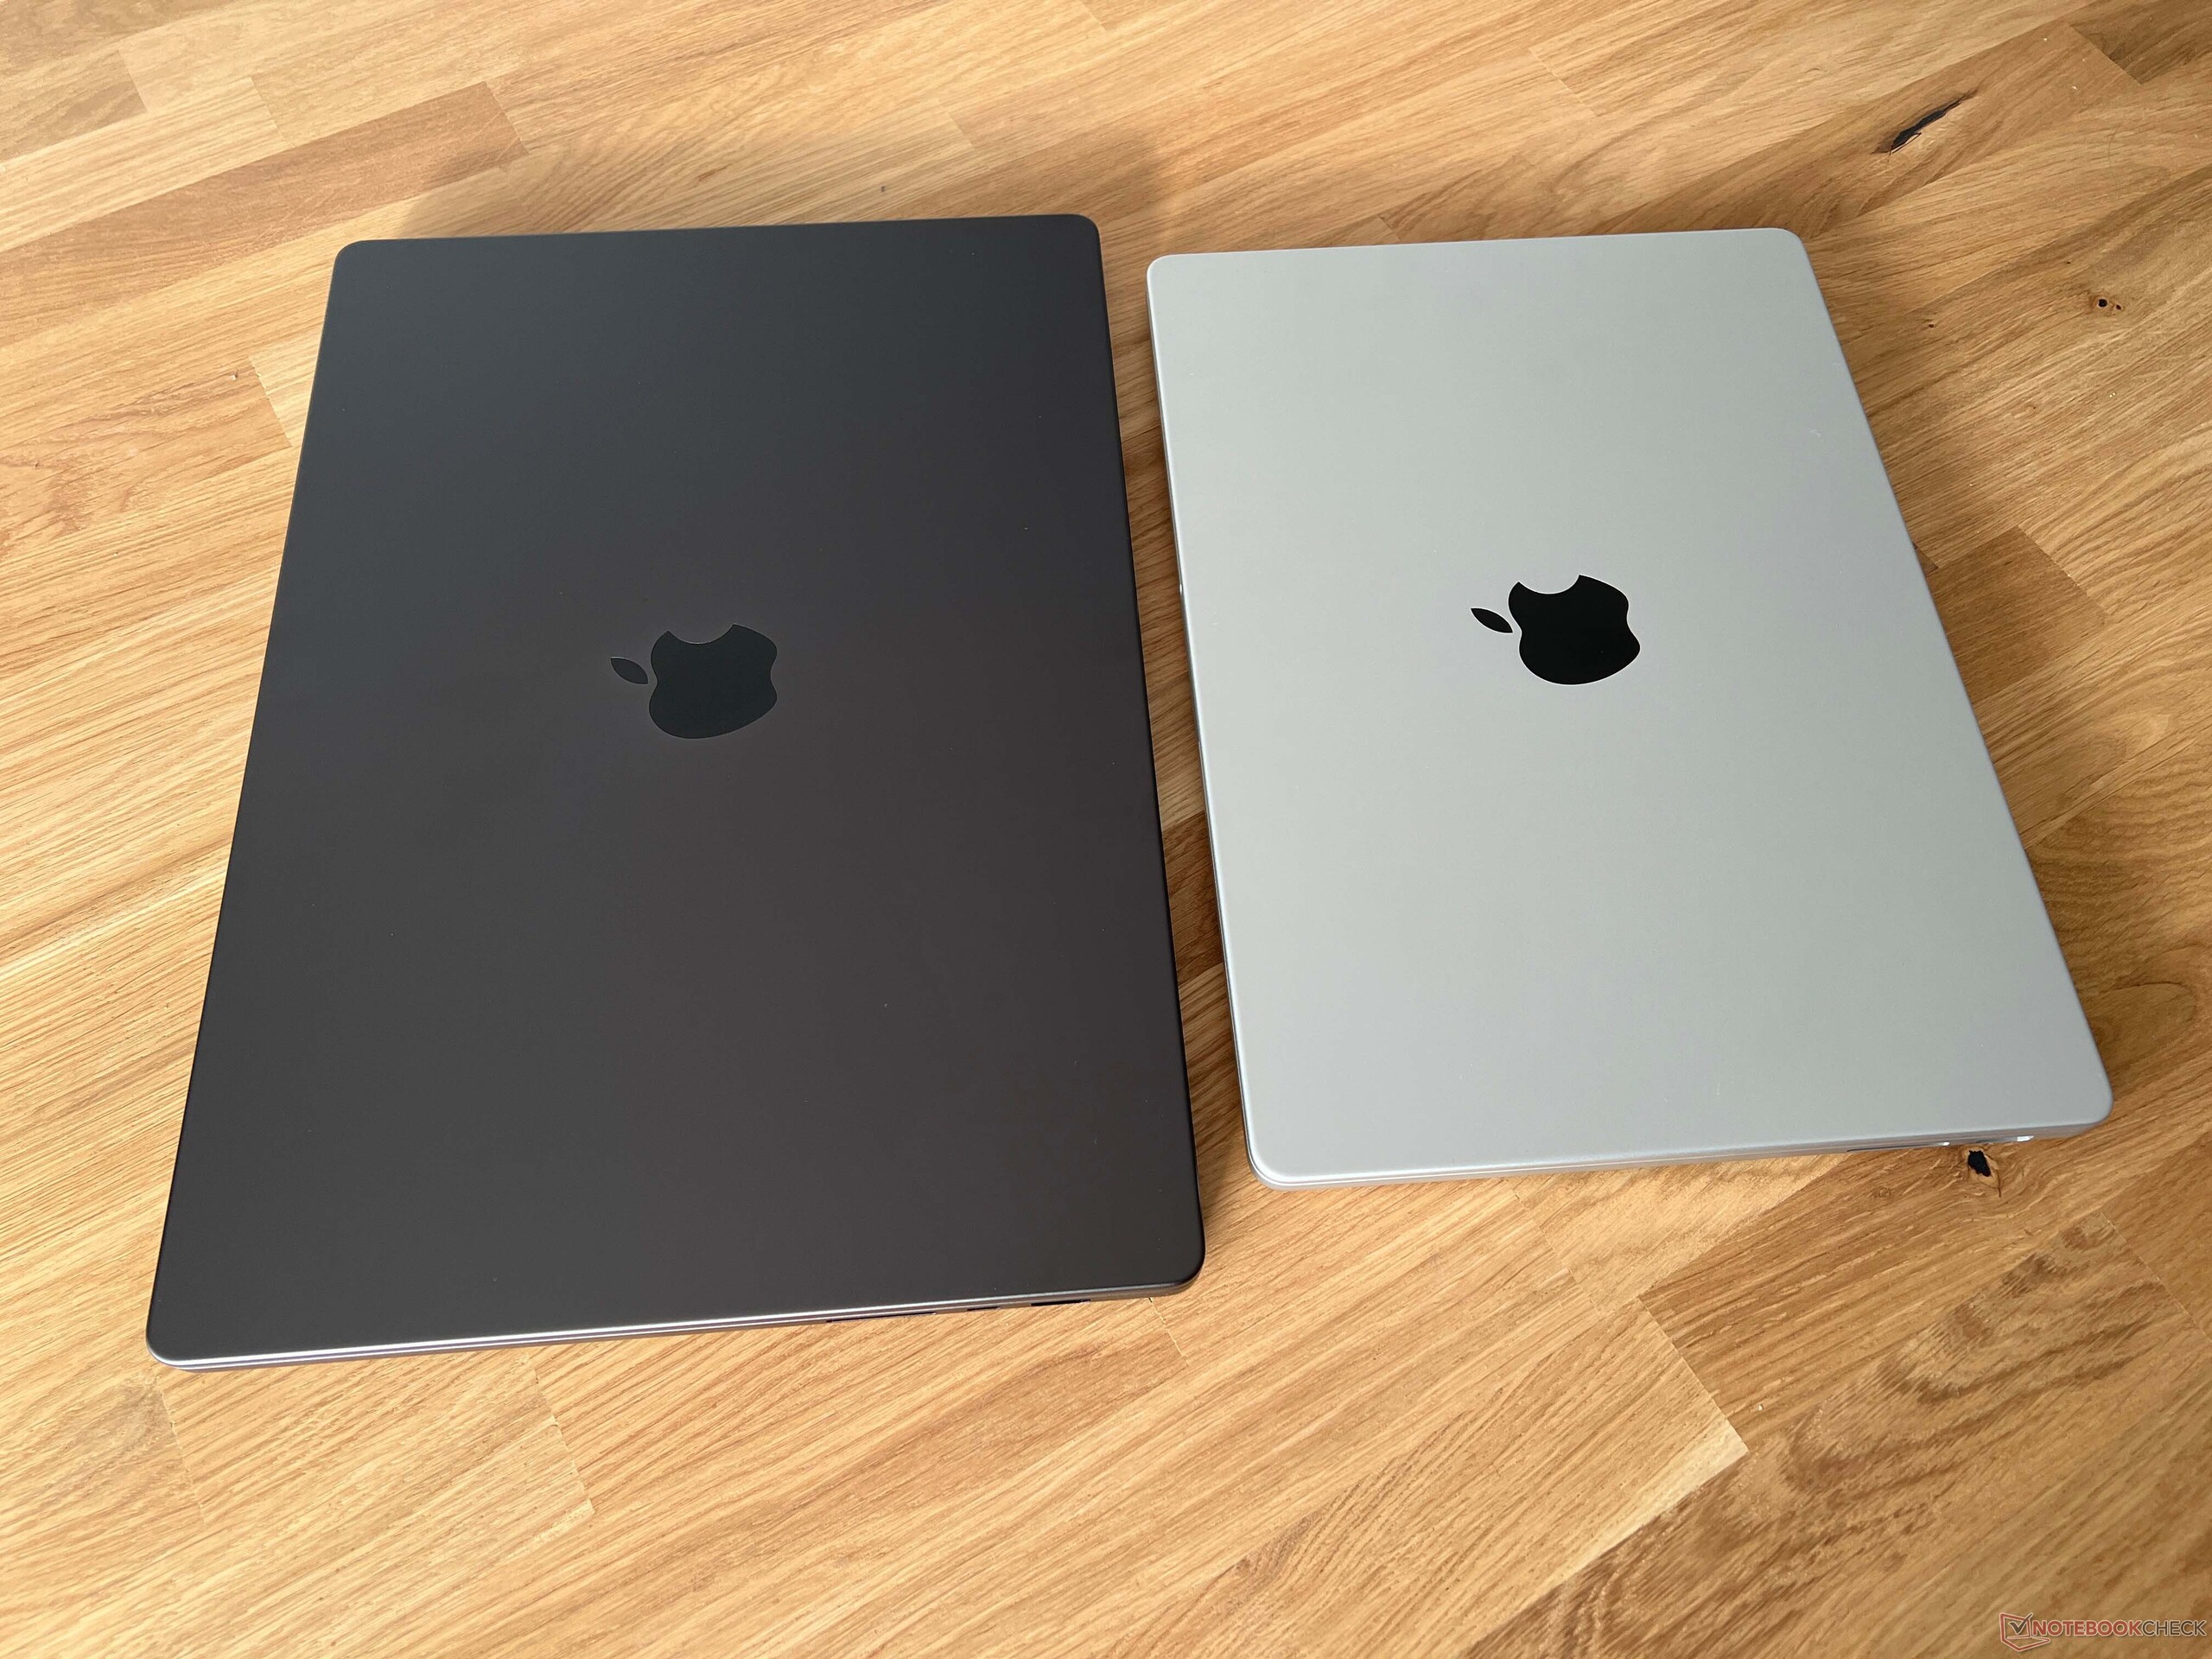
MBP 16 M3 Max 是我们对比组中最轻的设备,仅重 2.147 千克,也是最紧凑的设备之一。不过,如果你经常旅行,你应该考虑体积较小的 MacBook Pro 14它明显更小巧,重量也轻了半公斤。包括黑色 MagSafe 线缆(2 米)在内的 140 瓦电源适配器仅重 347 克。
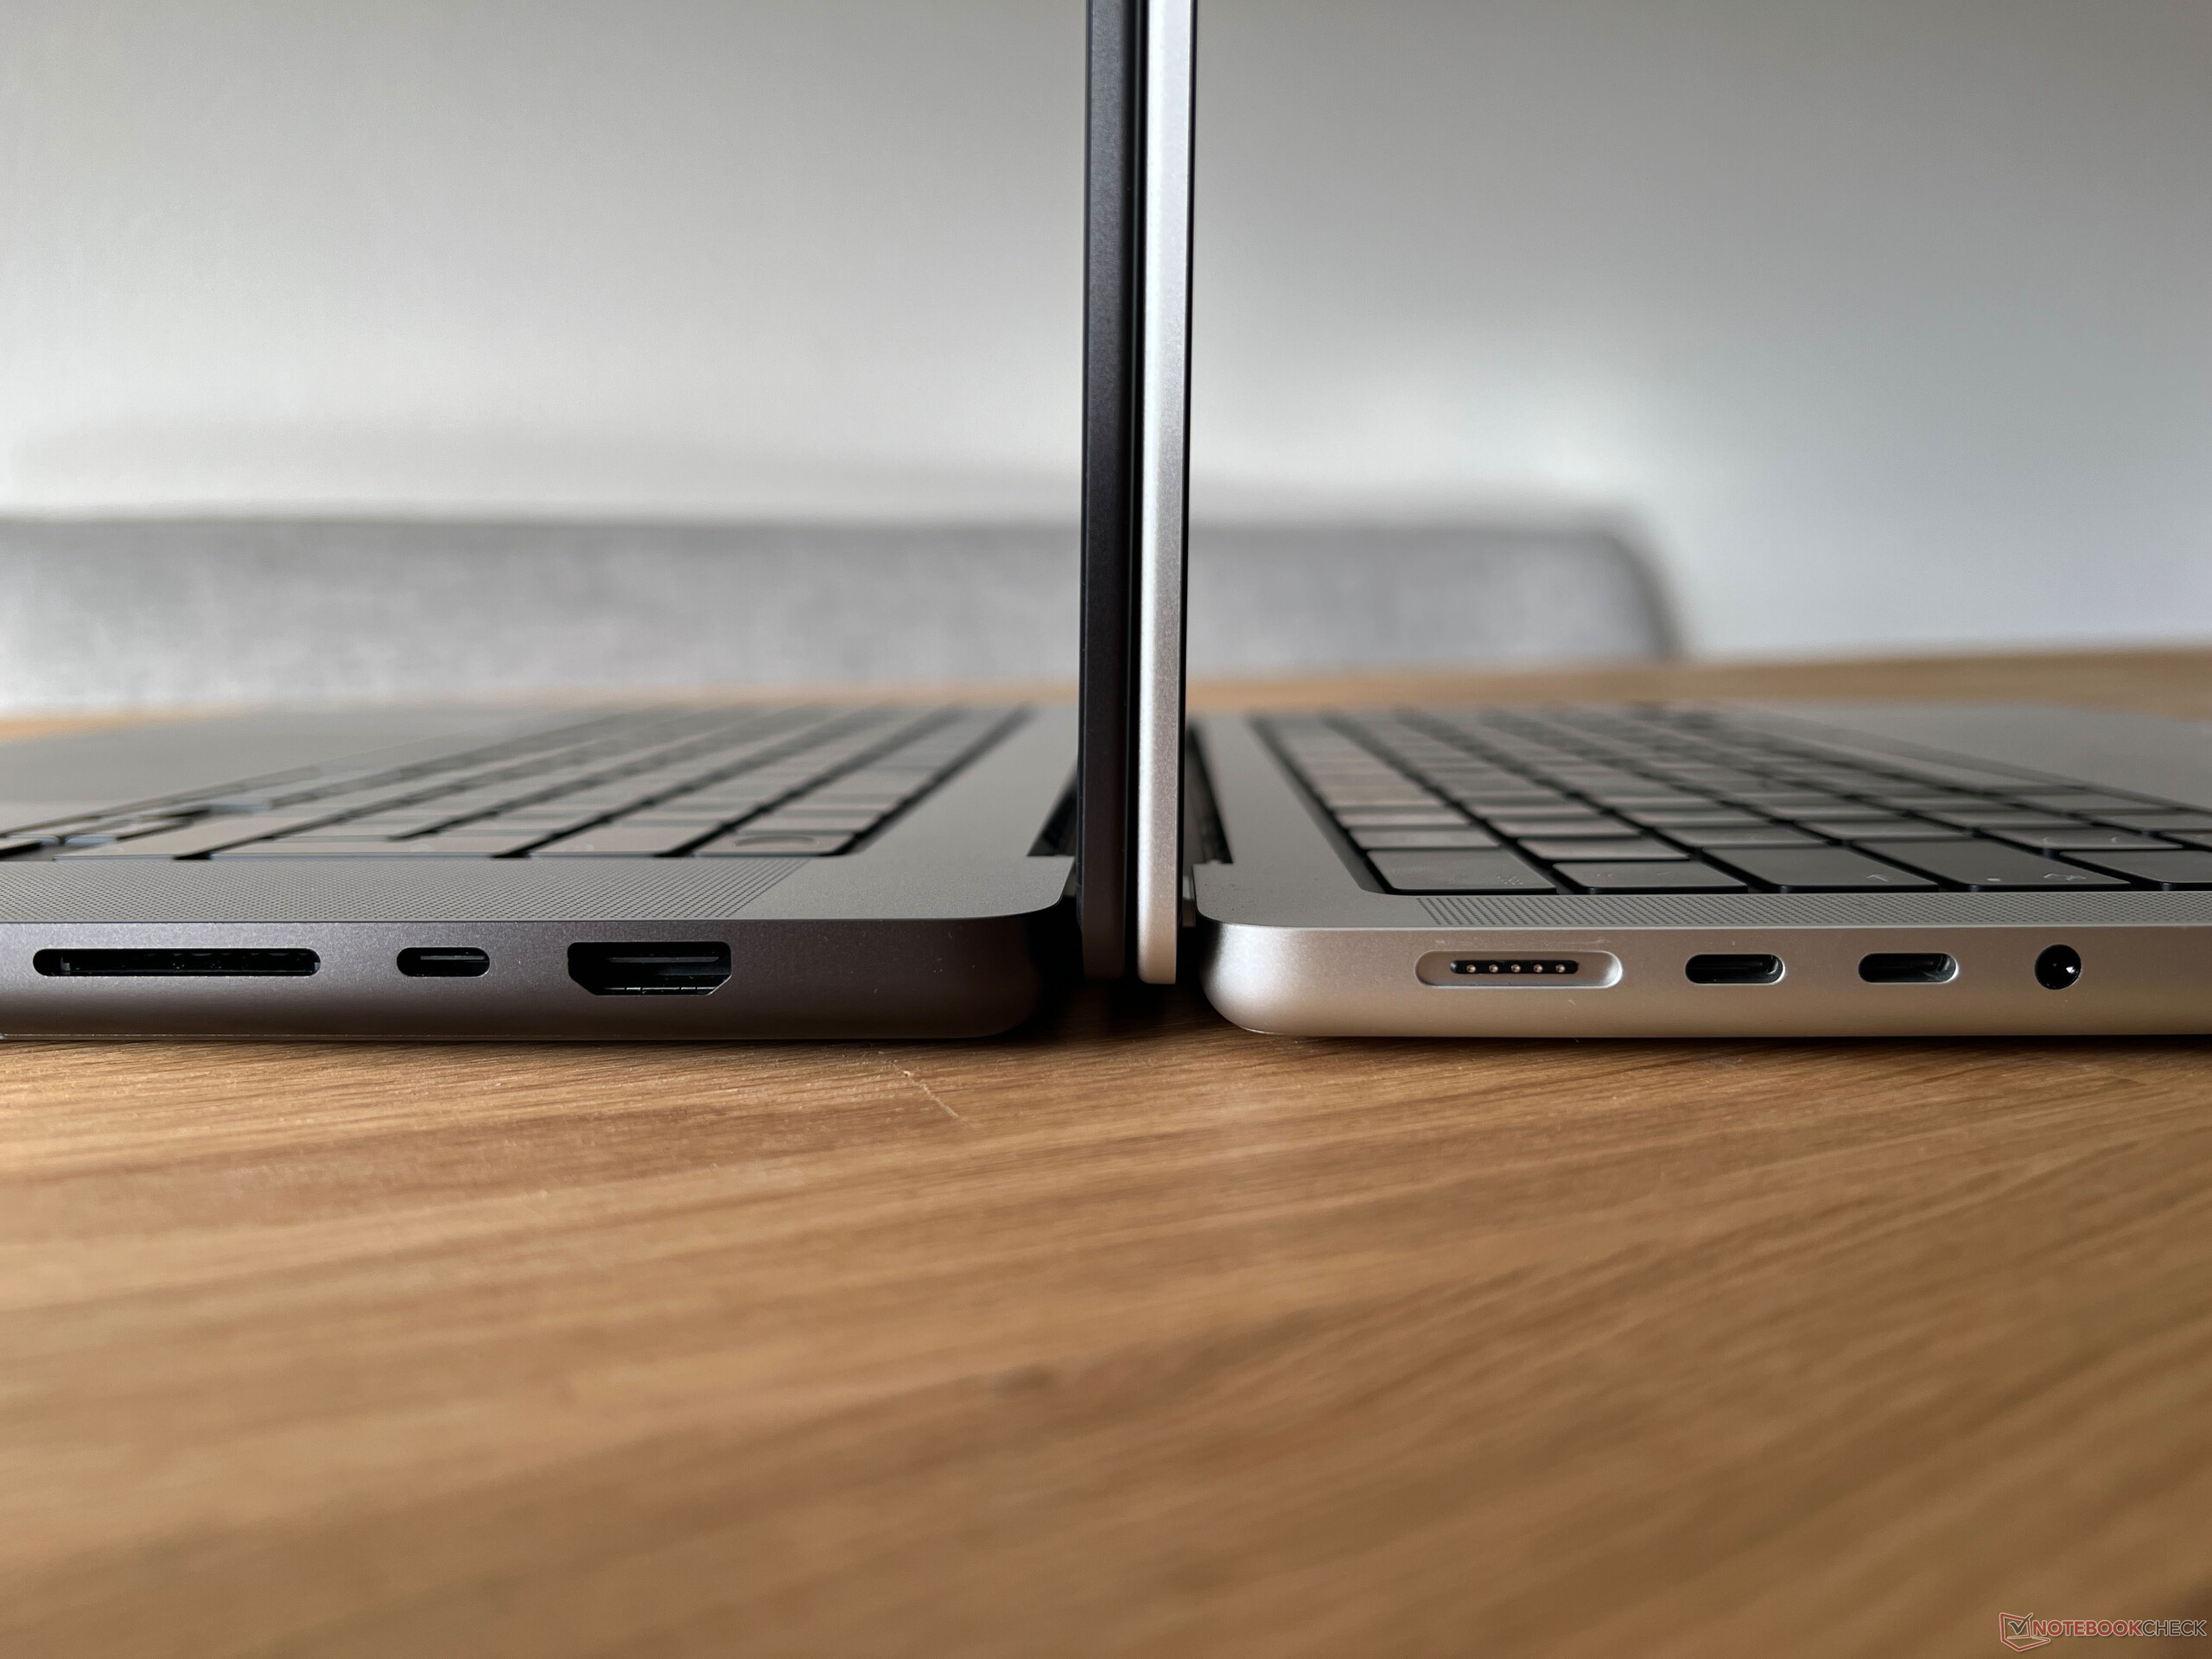
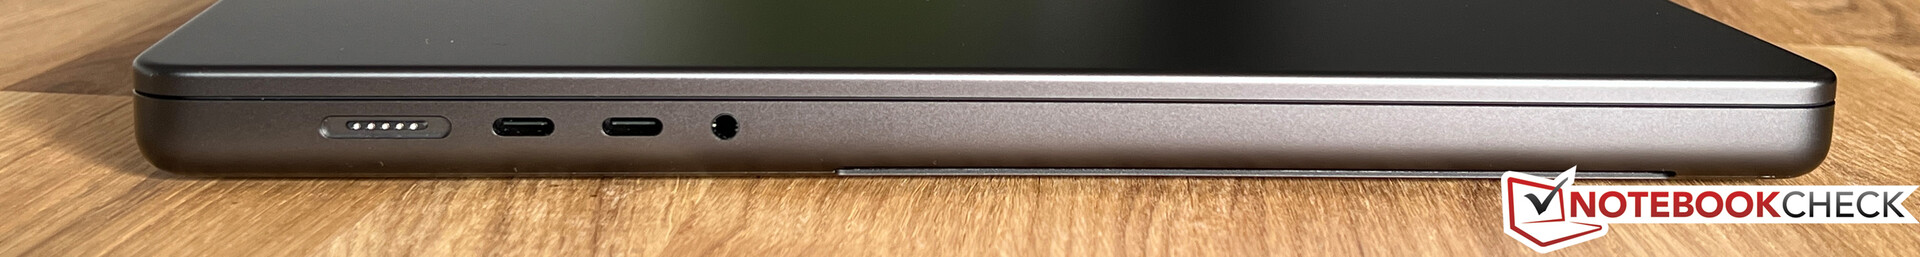
连接性 - 配备 Thunderbolt 4 的 MBP 16
与前代机型相比,MBP 16 的端口情况没有变化,仍然有三个 USB-C 端口(包括 Thunderbolt 4)和一个现代 HDMI 2.1 输出端口。配备 M3 Max 的 MBP 16 最多可同时驱动四台外接显示器(通过 Thunderbolt 可驱动 3x 6K @60 Hz,通过 HDMI 可驱动 1x 4K @144 Hz),通过 HDMI 的最大分辨率为 8K @60 Hz 或 4K @240 Hz。除了 MagSafe 连接器,你还可以通过 USB-C 为大型 MBP 充电,并可与 65W 电源适配器配合使用(在这种情况下显然无法发挥全部性能)。
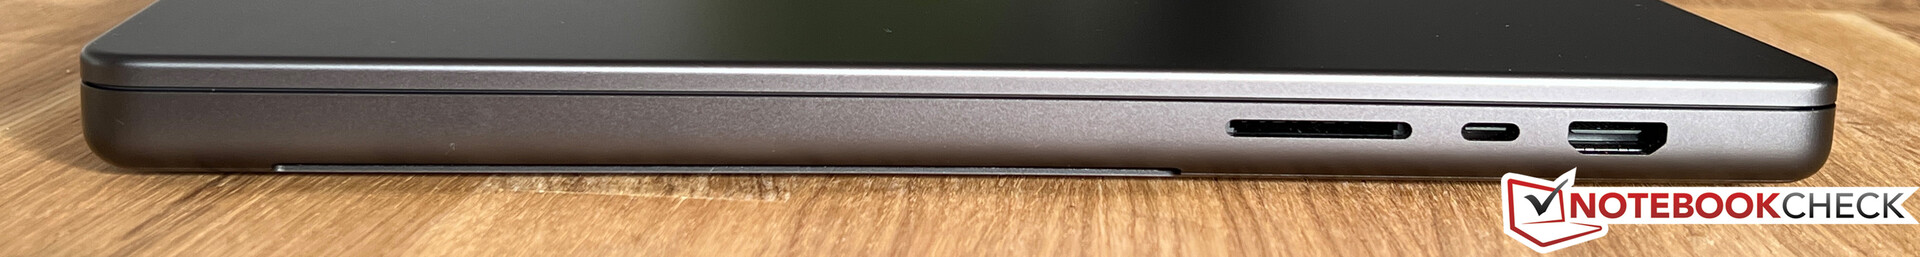
SD 读卡器
右侧的 SDXC 读卡器速度仍然非常快,我们在使用参考卡(Angelbird AV Pro V60)时测得的速度高达 226 MB/s,在从卡中复制图像文件时测得的速度仍为 163 MB/s,这也是一个不错的结果。插卡突出约 1.5 厘米。
| SD Card Reader | |
| average JPG Copy Test (av. of 3 runs) | |
| Apple MacBook Pro 16 2023 M2 Max (Angelbird AV Pro V60) | |
| Apple MacBook Pro 16 2023 M3 Max (Angelbird AV Pro V60) | |
| Average of class Multimedia (23 - 531, n=37, last 2 years) | |
| Razer Blade 16 Early 2023 (AV PRO microSD 128 GB V60) | |
| Asus Zenbook Pro 16X UX7602BZ-MY005W | |
| Schenker XMG Pro 16 Studio (Mid 23) (AV PRO microSD 128 GB V60) | |
| Lenovo Yoga Pro 9 16-IRP G8 (Angelibird AV Pro V60) | |
| Asus ProArt Studiobook 16 OLED H7604 (Angelibird AV Pro V60) | |
| maximum AS SSD Seq Read Test (1GB) | |
| Apple MacBook Pro 16 2023 M3 Max (Angelbird AV Pro V60) | |
| Apple MacBook Pro 16 2023 M2 Max (Angelbird AV Pro V60) | |
| Razer Blade 16 Early 2023 (AV PRO microSD 128 GB V60) | |
| Average of class Multimedia (37.3 - 1455, n=36, last 2 years) | |
| Schenker XMG Pro 16 Studio (Mid 23) (AV PRO microSD 128 GB V60) | |
| Asus Zenbook Pro 16X UX7602BZ-MY005W | |
| Asus ProArt Studiobook 16 OLED H7604 (Angelibird AV Pro V60) | |
| Lenovo Yoga Pro 9 16-IRP G8 (Angelibird AV Pro V60) | |
交流
Apple 该产品仍然使用去年的 Wi-Fi 6E 模块(包括蓝牙 5.3),与我们的华硕参考路由器配合使用,整体性能非常好,传输速率稳定。 目前还没有提供 Wi-Fi 7 模块。Apple
| Networking | |
| Apple MacBook Pro 16 2023 M3 Max | |
| iperf3 transmit AXE11000 | |
| iperf3 receive AXE11000 | |
| Apple MacBook Pro 16 2023 M2 Max | |
| iperf3 transmit AXE11000 6GHz | |
| iperf3 receive AXE11000 6GHz | |
| Razer Blade 16 Early 2023 | |
| iperf3 transmit AXE11000 | |
| iperf3 receive AXE11000 | |
| iperf3 transmit AXE11000 6GHz | |
| iperf3 receive AXE11000 6GHz | |
| Lenovo Yoga Pro 9 16-IRP G8 | |
| iperf3 transmit AXE11000 | |
| iperf3 receive AXE11000 | |
| Asus ProArt Studiobook 16 OLED H7604 | |
| iperf3 transmit AXE11000 | |
| iperf3 receive AXE11000 | |
| Asus Zenbook Pro 16X UX7602BZ-MY005W | |
| iperf3 transmit AXE11000 | |
| iperf3 receive AXE11000 | |
| iperf3 transmit AXE11000 6GHz | |
| iperf3 receive AXE11000 6GHz | |
| Schenker XMG Pro 16 Studio (Mid 23) | |
| iperf3 transmit AXE11000 | |
| iperf3 receive AXE11000 | |
网络摄像头
1080p 网络摄像头的图像质量仍然不错,但无法与 iPad 的前置摄像头相比。面部识别(Face ID)或中心舞台(Center Stage)功能也仍然不可用。


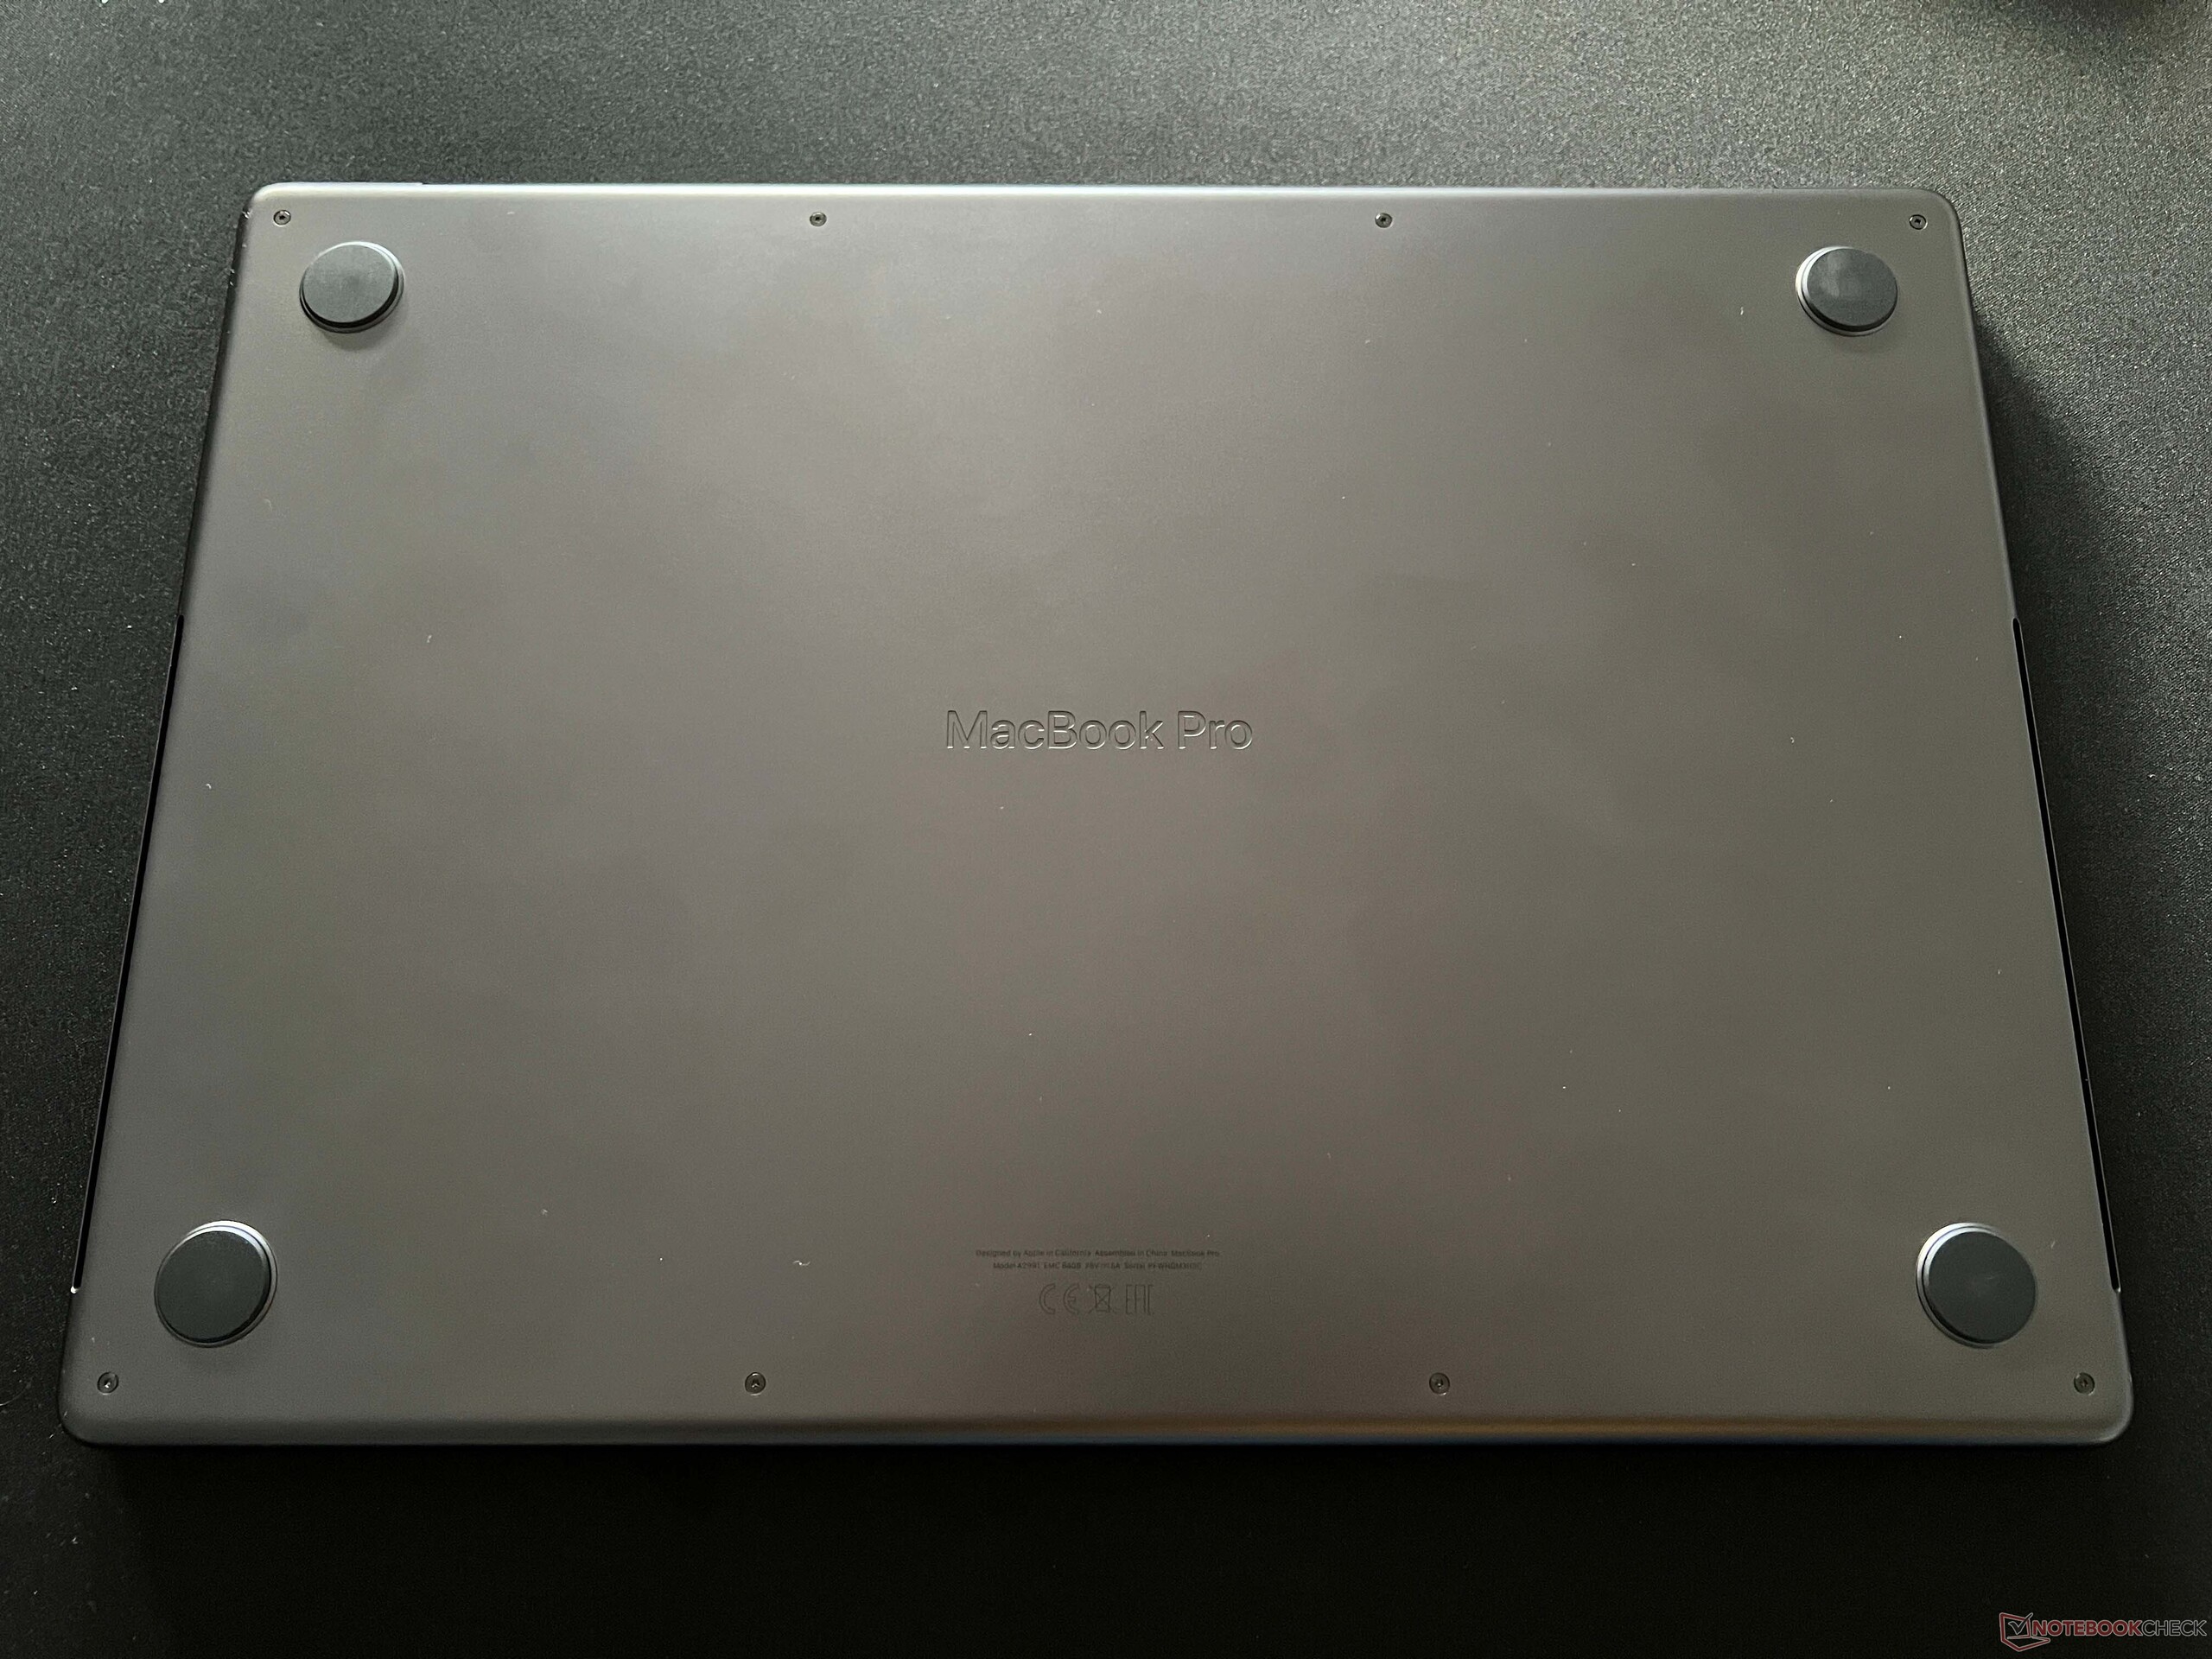
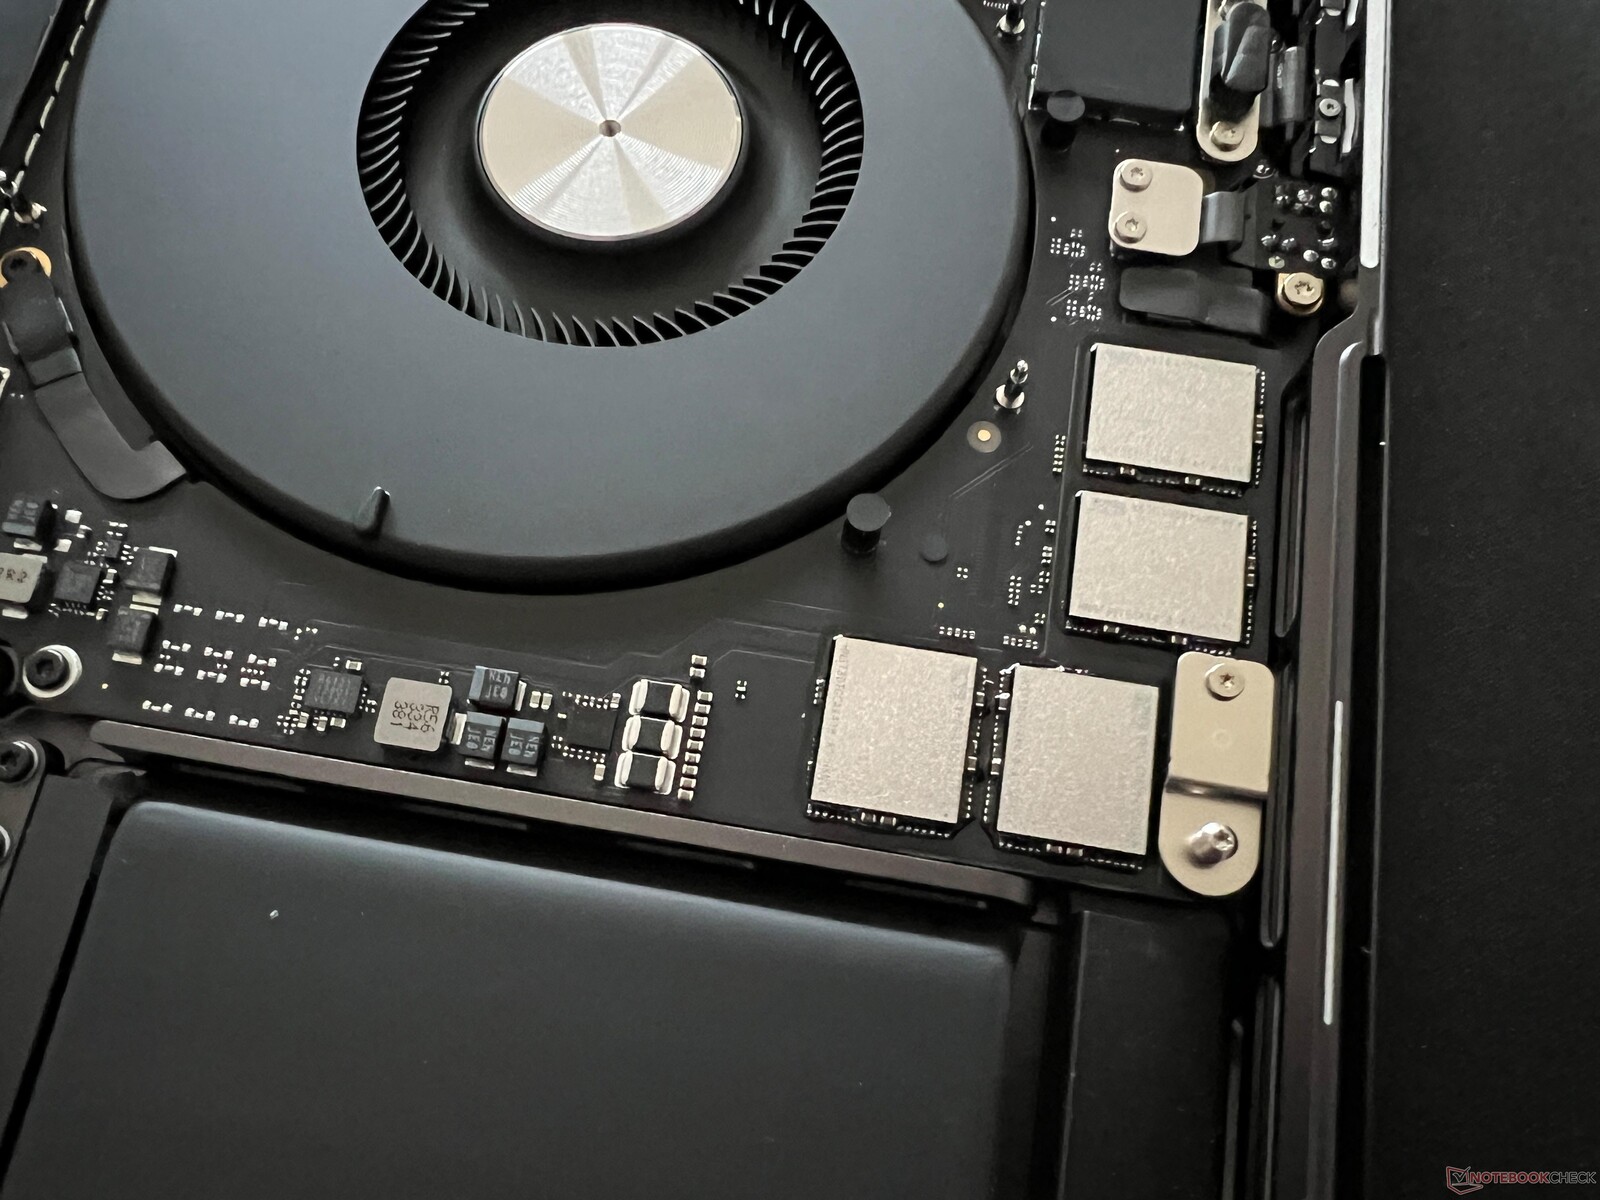
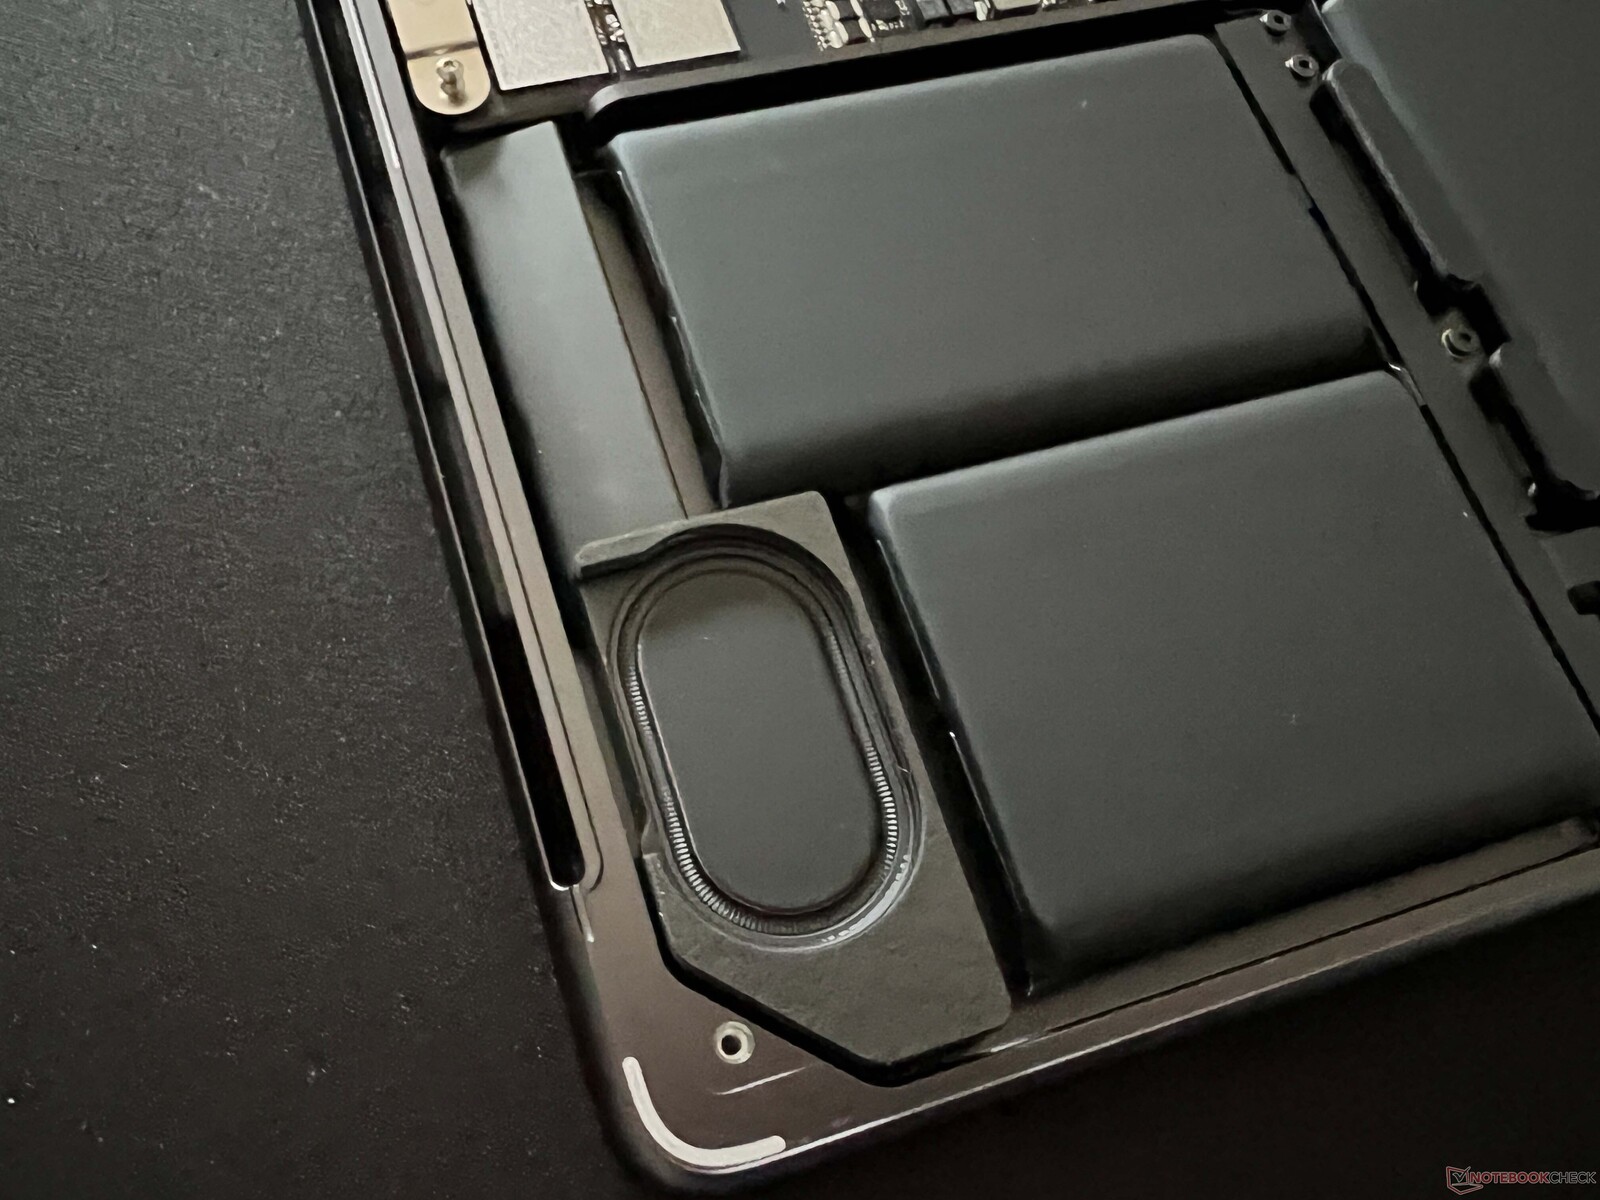
维护
底板由 Pentalobe 螺钉(P5)和背面的小金属钩固定,这意味着卸下所有螺钉后,必须将盖子推向前面。两侧中间还有两个夹子,需要用力夹住(建议使用吸盘)。进入机箱后就没什么可做的了,只有风扇可以由用户自己清洁。所有其他组件都是焊接的,无法升级任何组件。

保修
MacBook Pro 的基本保修期为一年。你可以购买为期三年的延长保修(Apple Care+),费用为 399 美元。这还包括意外损坏的费用(屏幕损坏或外壳损坏需支付 99 美元的服务费,其他意外损坏需支付 299 美元)。也可以每年支付 149.99 美元购买 AppleCare+。
输入设备 - 完美触控板
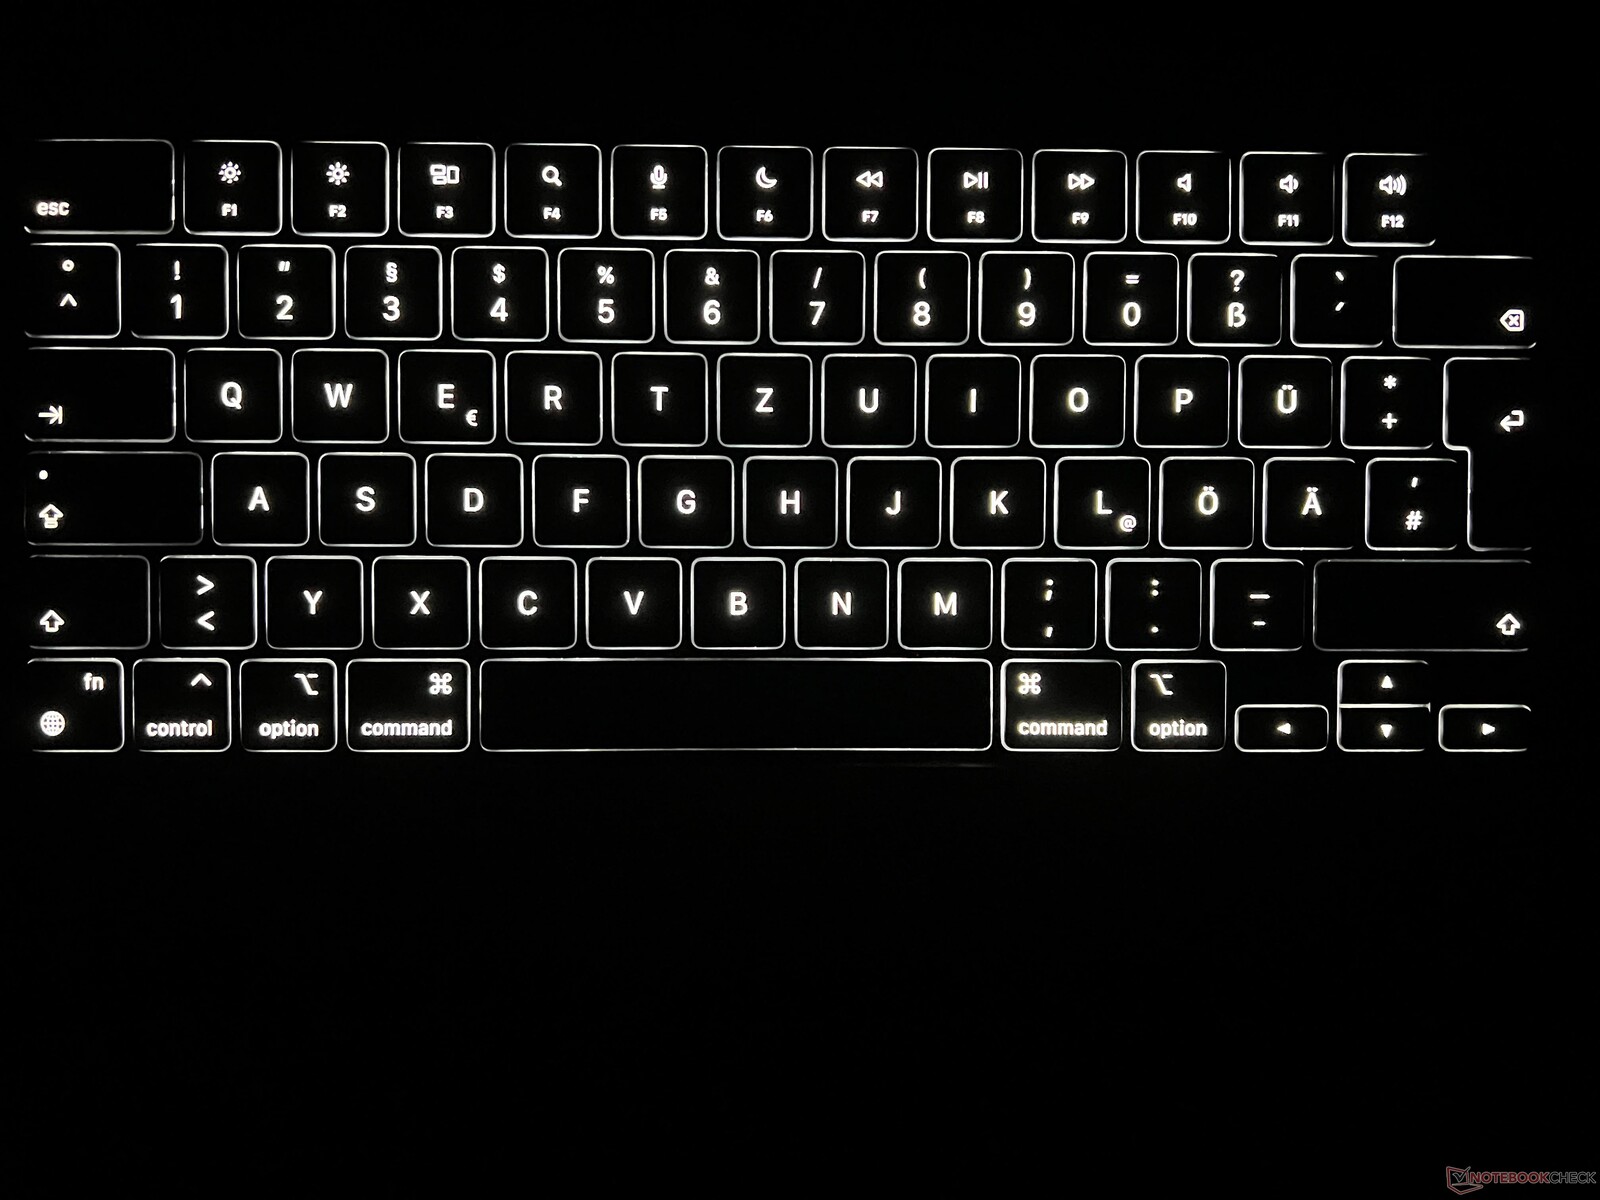
输入设备没有变化,黑色键盘尽管键程相对较浅,但仍能提供舒适、精确的键入体验。与最好的商务笔记本电脑相比仍有改进的余地,但长时间打字不成问题。按键的声音还可以再小一些,方向键也非常小。即使过了这么多年,MacBook 在键盘照明方面仍然优于 Windows 笔记本电脑。Apple 没有集成专用数字键盘,而是将键盘旁边的空间用于扬声器。
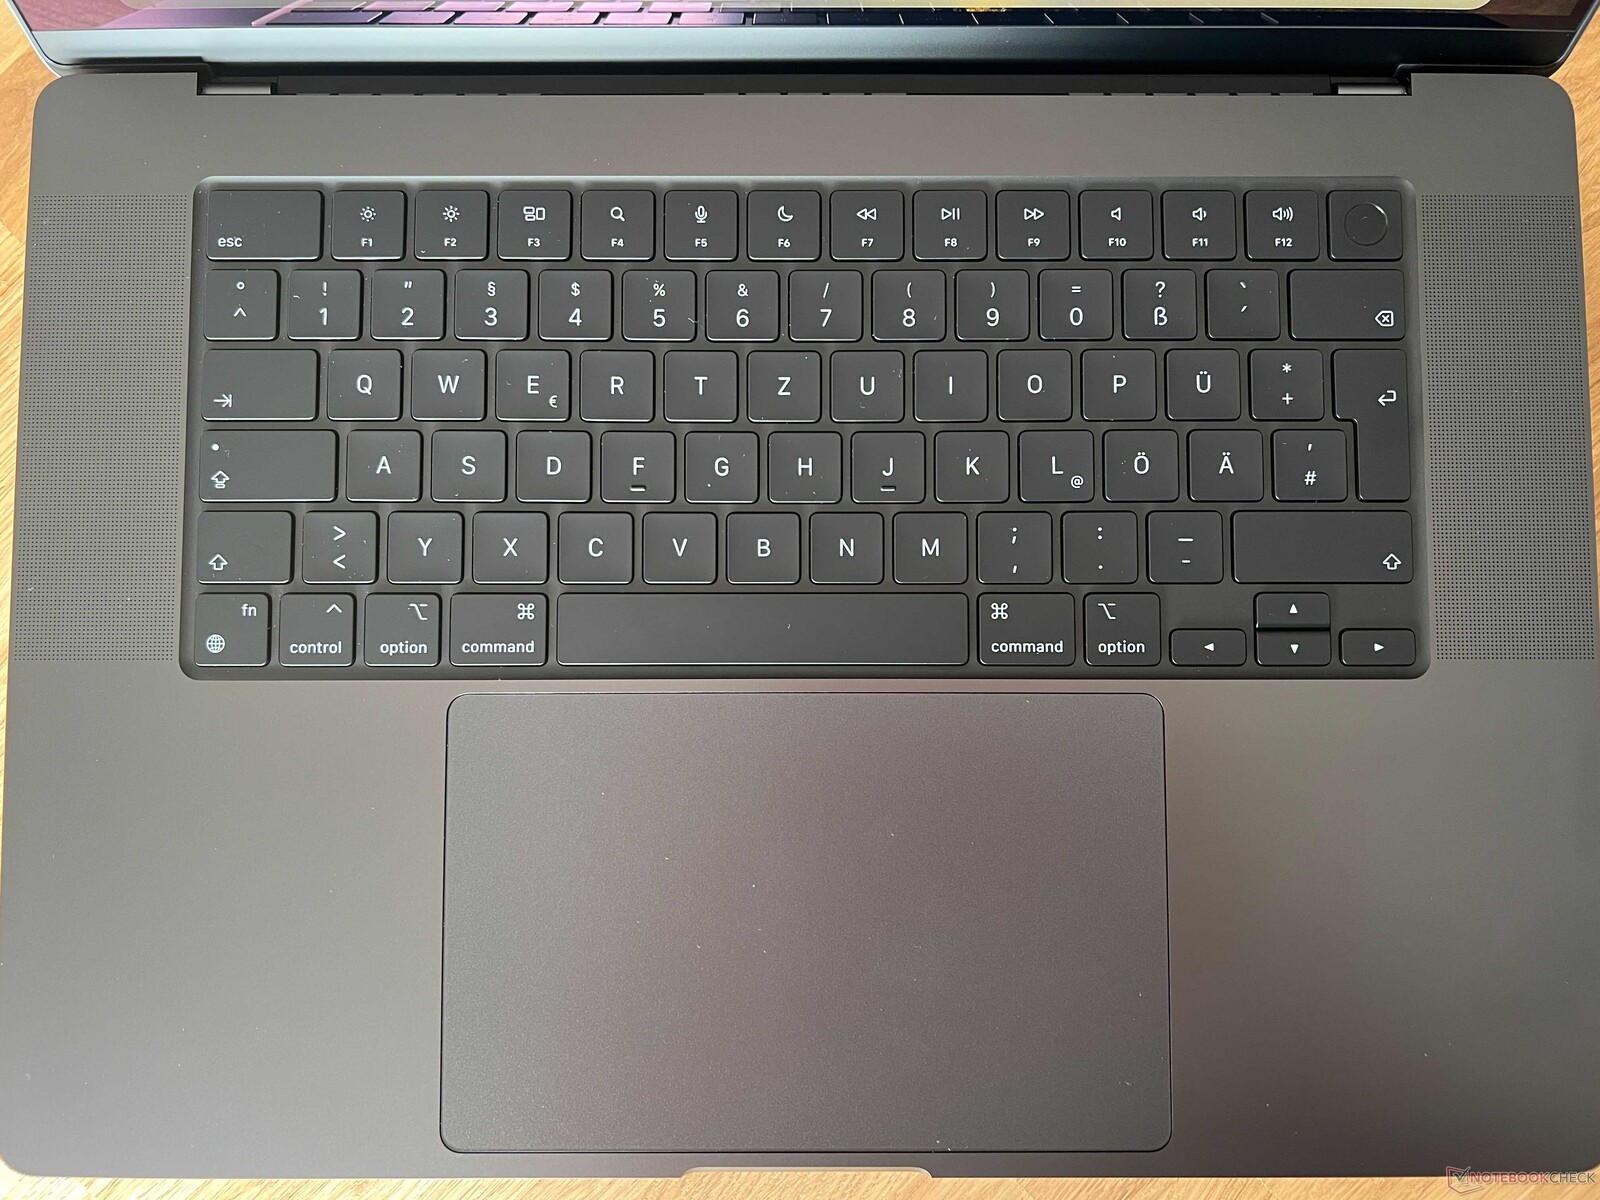
多年来,触控板一直是标杆性产品,而 macOS 的触控板实现得非常出色。由于触控板上没有移动部件,因此在任何地方都能获得完全相同的点击体验。
显示屏 - Mini-LED 现在具有更高的 SDR 亮度
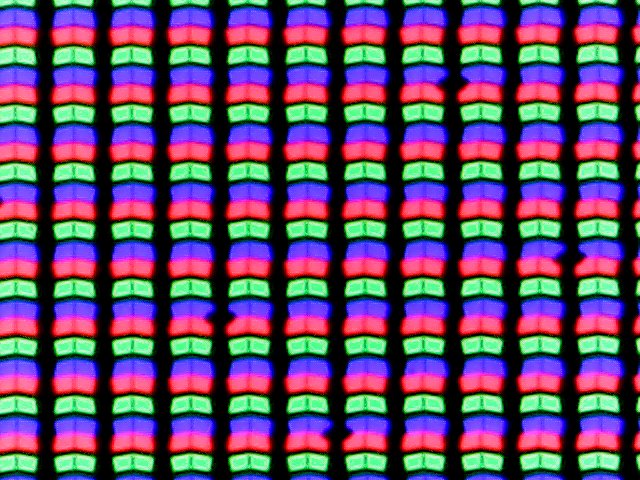
MacBook Pro 16 内部 Mini-LED 面板的基本规格没有变化。中间的摄像头凹槽看起来仍然不太好,但并没有占用 16:10 面板的空间。凹槽旁边的垂直区域(用于菜单元素)被添加到了顶部,这使得分辨率达到了 3456 x 2234 像素。这意味着与普通的 16:10 面板相比,你拥有了更多的空间。主观画质依然出色,得益于高刷新率(120 Hz),必要时系统会动态应用刷新率。黑色内容也是纯黑(与 OLED 屏幕一样),从而产生了极高的对比度。唯一的缺点是,当黑暗背景上出现明亮物体时会产生混浊。这主要在显示徽标时比较明显,你显然可以挑起这个问题,但在实际使用中通常并不明显。亮度和色温(True Tone)均可根据环境光线自动调节,效果完美。在 macOS 中也不会出现缩放问题。
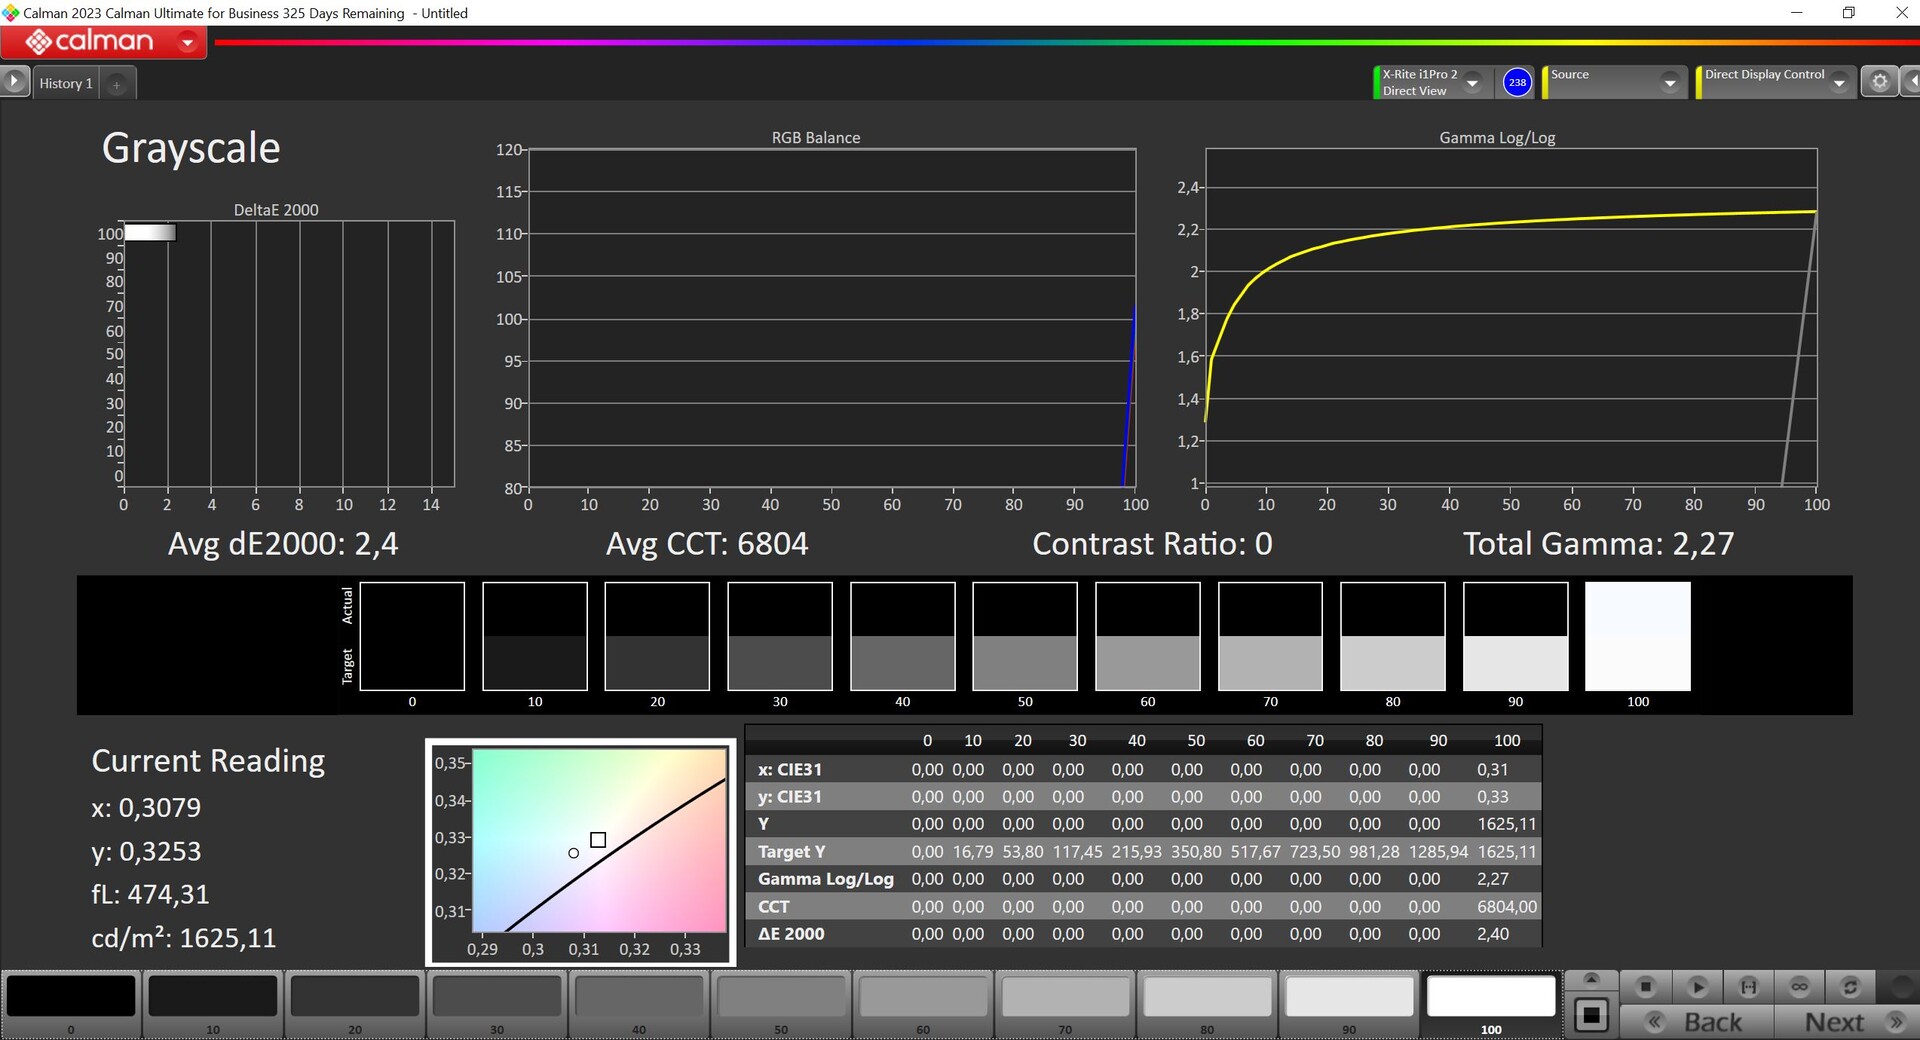
Apple SDR 的最大亮度从 500 尼特提高到 600 尼特,我们甚至可以在评测设备的中心测得高达 630 尼特的亮度(平均为 604 尼特),由于黑色值较低,对比度非常高。小部分屏幕的最大 HDR 亮度为 1625 尼特,全屏模式下全白图像的最大 HDR 亮度可达 1241 尼特。Windows 竞争对手的 Mini-LED 面板Yoga Pro 9i 16Apple 在处理 HDR 内容方面也比 Windows 竞争对手更胜一筹,因为在显示相应内容时,显示屏会自动增加亮度,你无需做任何操作。
| |||||||||||||||||||||||||
Brightness Distribution: 94 %
Center on Battery: 630 cd/m²
Contrast: ∞:1 (Black: 0 cd/m²)
ΔE ColorChecker Calman: 1.2 | ∀{0.5-29.43 Ø4.71}
ΔE Greyscale Calman: 1.9 | ∀{0.09-98 Ø4.96}
99.2% Display P3 (Argyll 3D)
Gamma: 2.29
CCT: 6812 K
| Apple MacBook Pro 16 2023 M3 Max Mini-LED, 3456x2234, 16" | Apple MacBook Pro 16 2023 M2 Max Mini-LED, 3456x2234, 16.2" | Razer Blade 16 Early 2023 CSOT T3 MNG007DA4-1, IPS, 2560x1600, 16" | Lenovo Yoga Pro 9 16-IRP G8 LEN160-3.2K, Mini-LED, 3200x2000, 16" | Asus ProArt Studiobook 16 OLED H7604 ATNA60BX01-1, OLED, 3200x2000, 16" | Asus Zenbook Pro 16X UX7602BZ-MY005W ATNA60BX01-1, OLED, 3200x2000, 16" | Schenker XMG Pro 16 Studio (Mid 23) BOE CQ NE160QDM-NZ1, IPS, 2560x1600, 16" | |
|---|---|---|---|---|---|---|---|
| Display | 0% | -1% | -2% | 0% | 1% | -30% | |
| Display P3 Coverage (%) | 99.2 | 99 0% | 98.5 -1% | 97 -2% | 99.6 0% | 99.93 1% | 69.4 -30% |
| sRGB Coverage (%) | 100 | 100 | 99.8 | 100 | 100 | 98.2 | |
| AdobeRGB 1998 Coverage (%) | 88.5 | 89.7 | 95.1 | 89.4 | 97.48 | 70.1 | |
| Response Times | -14% | 81% | 79% | 99% | 97% | 82% | |
| Response Time Grey 50% / Grey 80% * (ms) | 66.9 ? | 80.5 ? -20% | 6.6 ? 90% | 14 ? 79% | 0.59 ? 99% | 1.4 ? 98% | 12.2 ? 82% |
| Response Time Black / White * (ms) | 43.6 ? | 47.2 ? -8% | 12 ? 72% | 9.2 ? 79% | 0.79 ? 98% | 2 ? 95% | 7.7 ? 82% |
| PWM Frequency (Hz) | 14877 | 14880 ? | 5800 ? | 240 ? | 250 ? | ||
| Screen | -16% | -74% | -5% | -37% | -49% | -66% | |
| Brightness middle (cd/m²) | 630 | 504 -20% | 456.8 -27% | 539 -14% | 349 -45% | 331.8 -47% | 349 -45% |
| Brightness (cd/m²) | 604 | 487 -19% | 437 -28% | 546 -10% | 350 -42% | 334 -45% | 348 -42% |
| Brightness Distribution (%) | 94 | 94 0% | 83 -12% | 96 2% | 95 1% | 98 4% | 93 -1% |
| Black Level * (cd/m²) | 0.001 | 0.35 | 0.18 | 0.02 | 0.07 | 0.32 | |
| Colorchecker dE 2000 * | 1.2 | 1.5 -25% | 3.7 -208% | 1.4 -17% | 2.1 -75% | 1.58 -32% | 1.98 -65% |
| Colorchecker dE 2000 max. * | 2.8 | 3.3 -18% | 6.42 -129% | 2.1 25% | 5.5 -96% | 4.23 -51% | 7.56 -170% |
| Greyscale dE 2000 * | 1.9 | 2.1 -11% | 2.6 -37% | 2.2 -16% | 1.2 37% | 4.25 -124% | 3.3 -74% |
| Gamma | 2.29 96% | 2.25 98% | 2.3 96% | 2.19 100% | 2.19 100% | 2.206 100% | 2.137 103% |
| CCT | 6812 95% | 6882 94% | 6108 106% | 6479 100% | 6545 99% | 6249 104% | 6672 97% |
| Contrast (:1) | 504000 | 1305 | 2994 | 17450 | 4740 | 1091 | |
| Colorchecker dE 2000 calibrated * | 0.66 | 2.1 | 6.66 | 1.45 | |||
| Total Average (Program / Settings) | -10% /
-13% | 2% /
-31% | 24% /
14% | 21% /
-3% | 16% /
-11% | -5% /
-29% |
* ... smaller is better
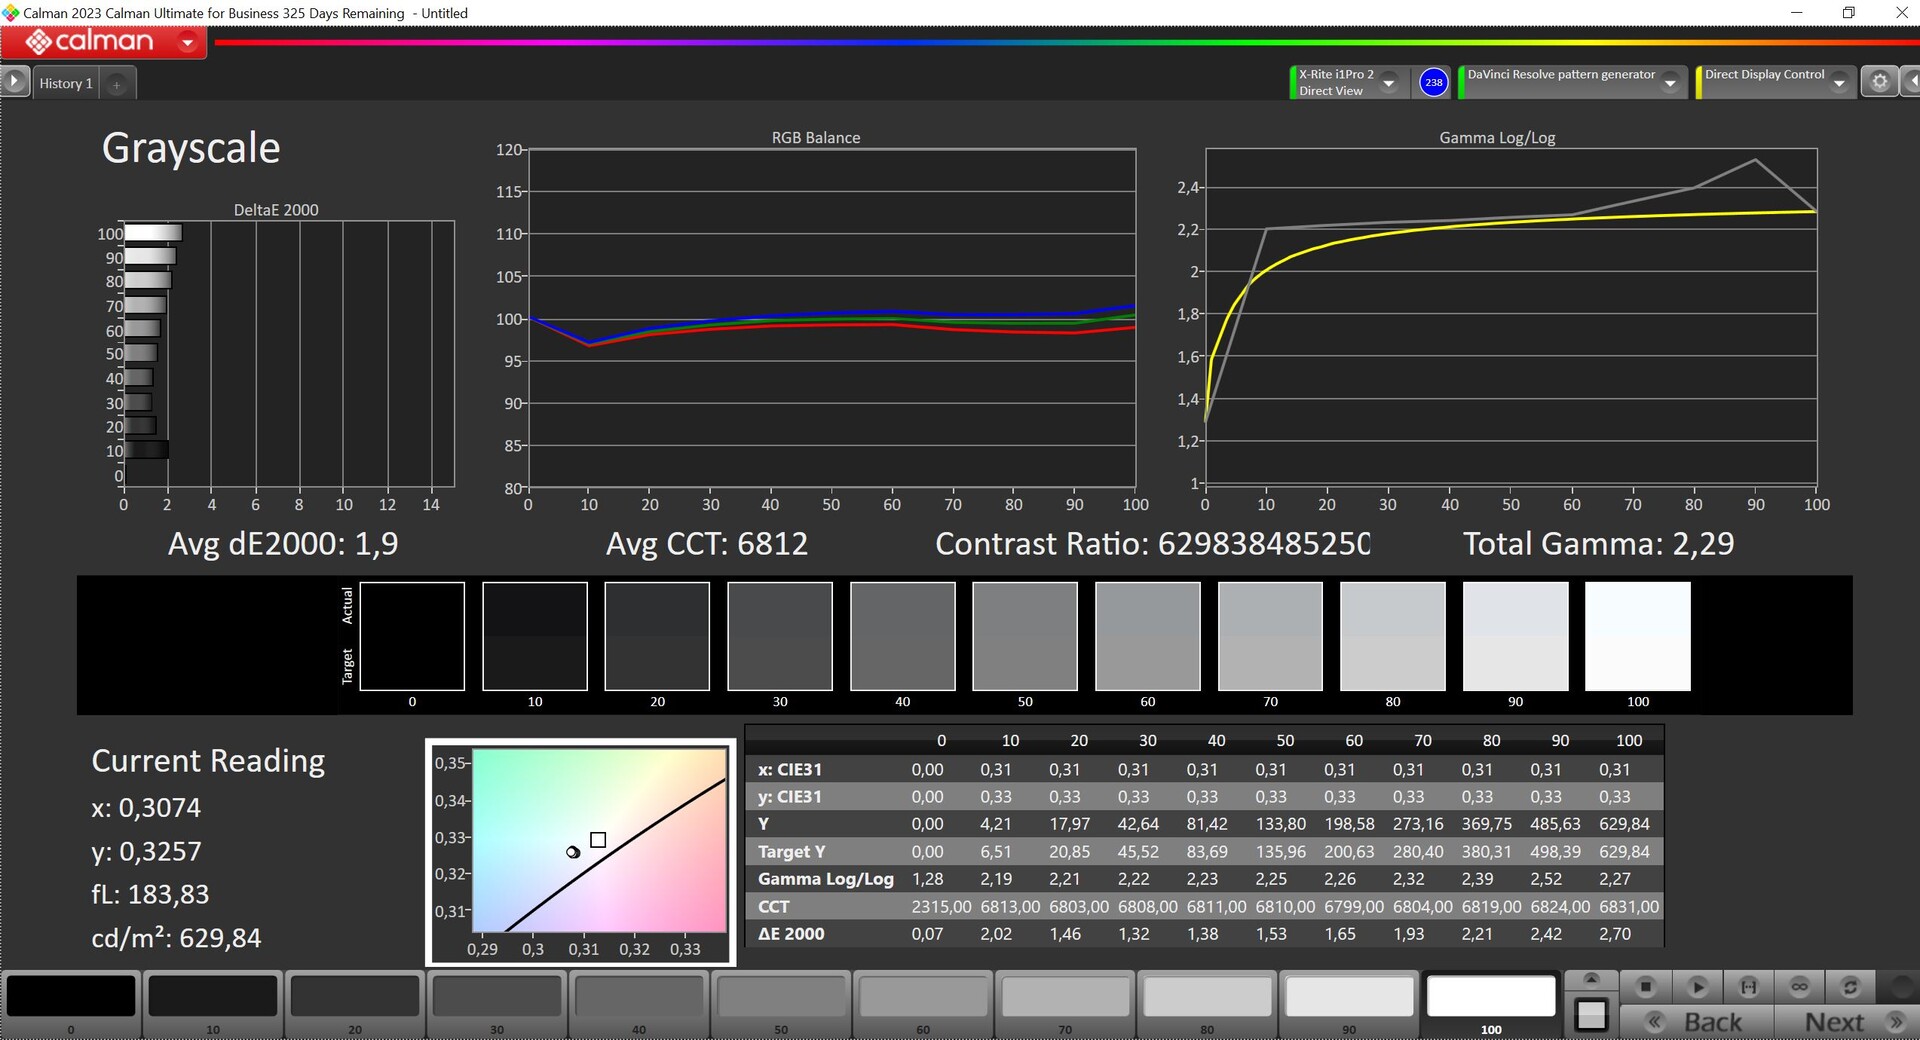
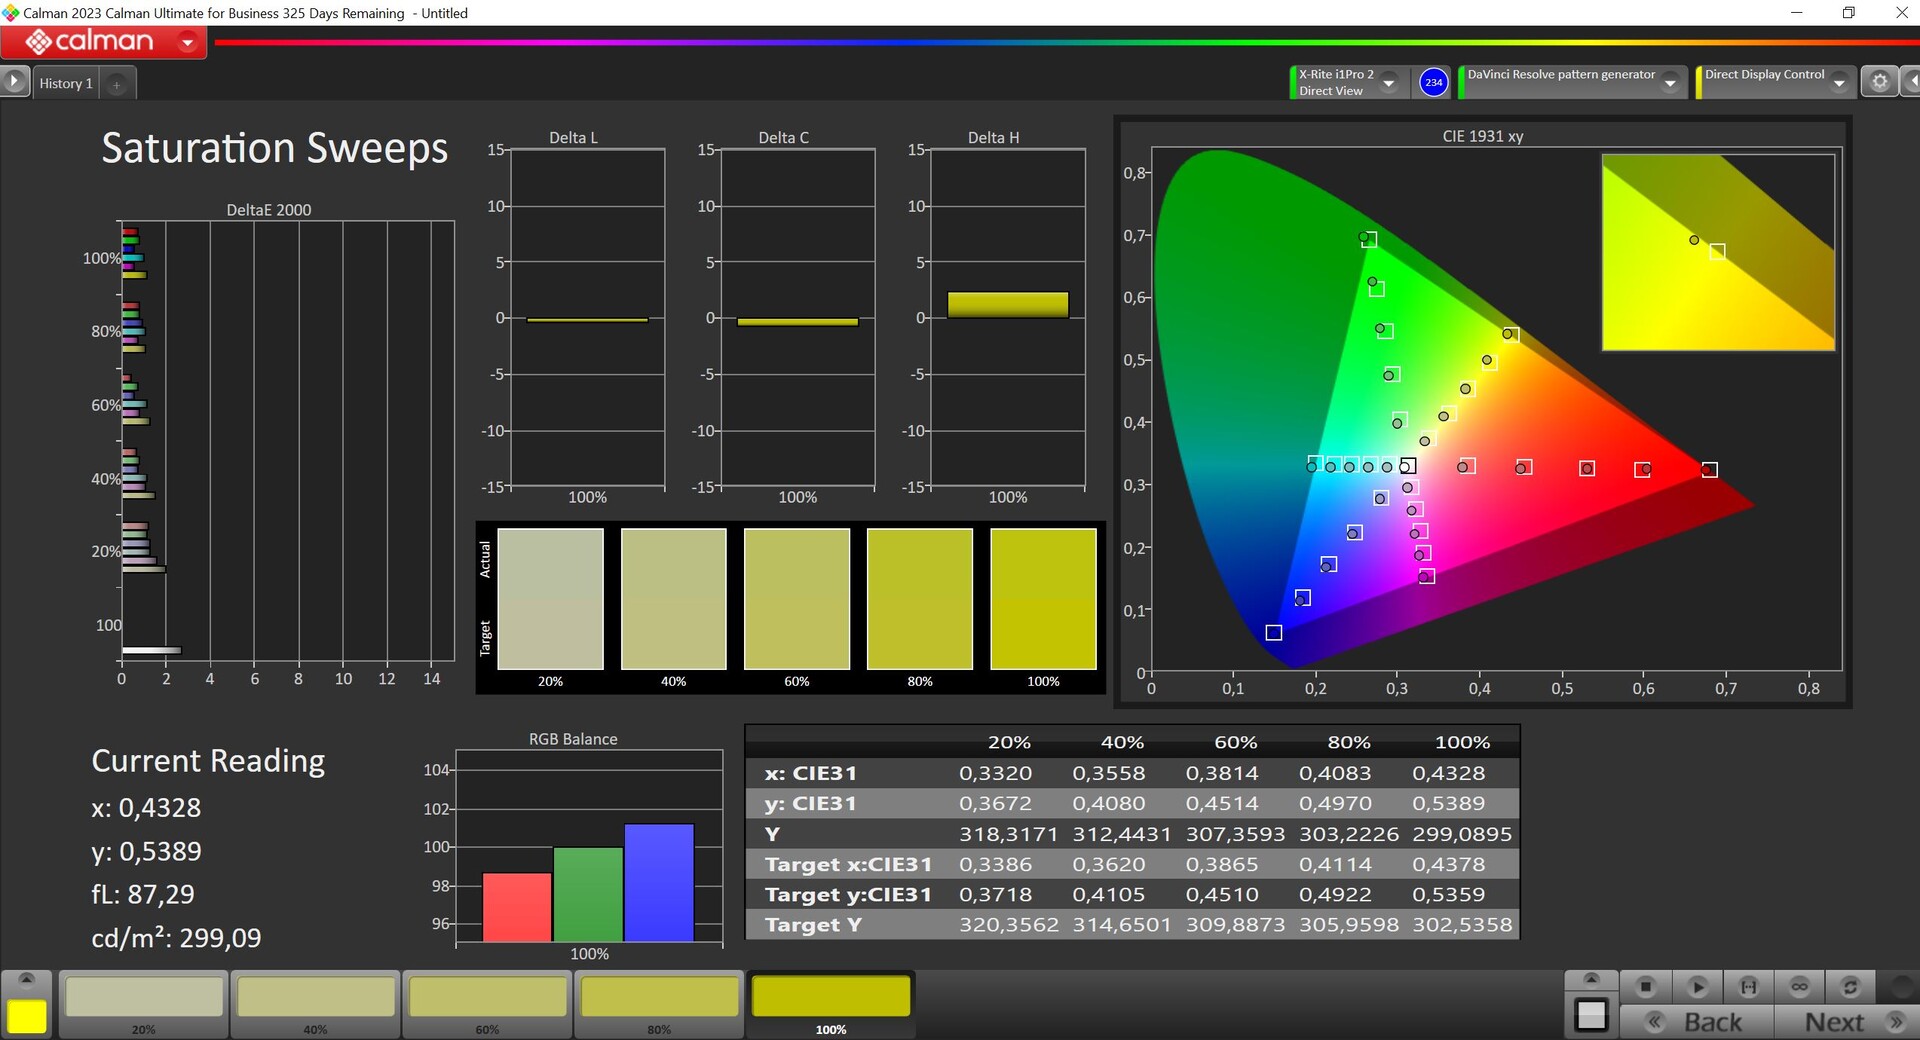
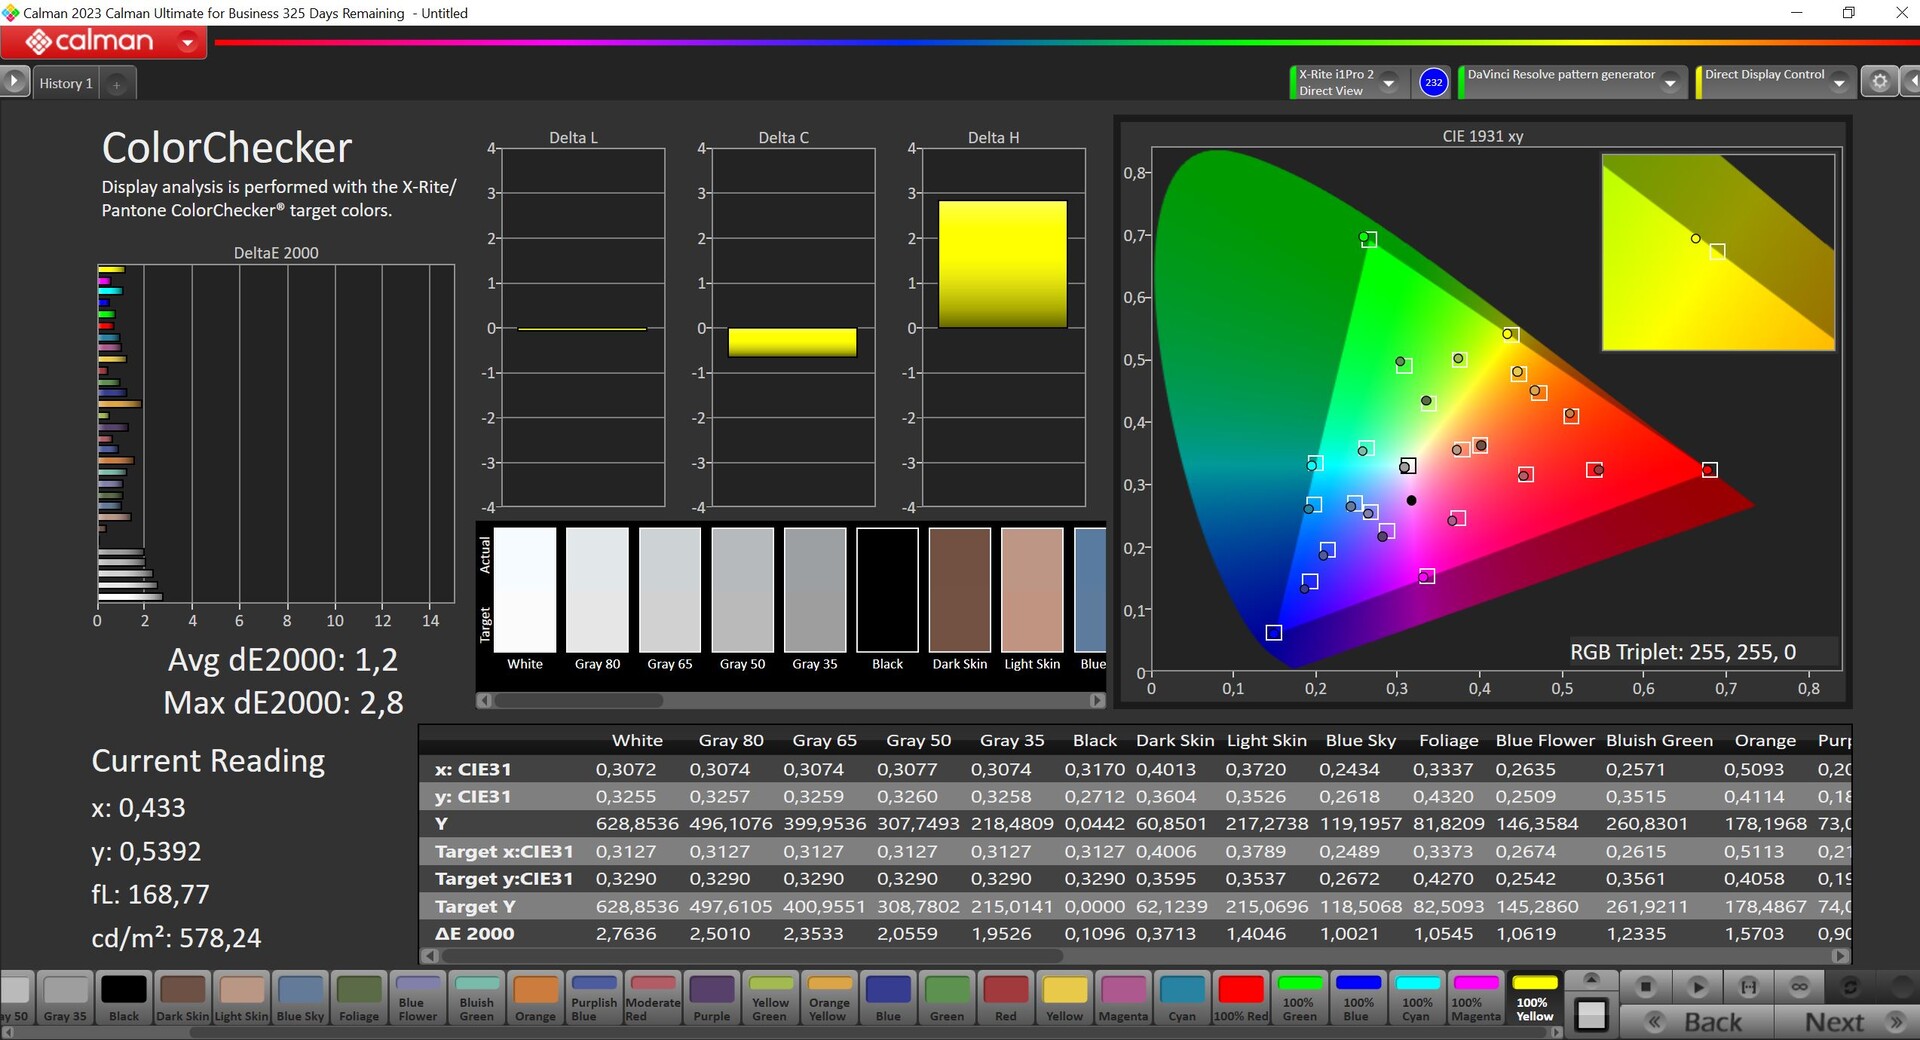
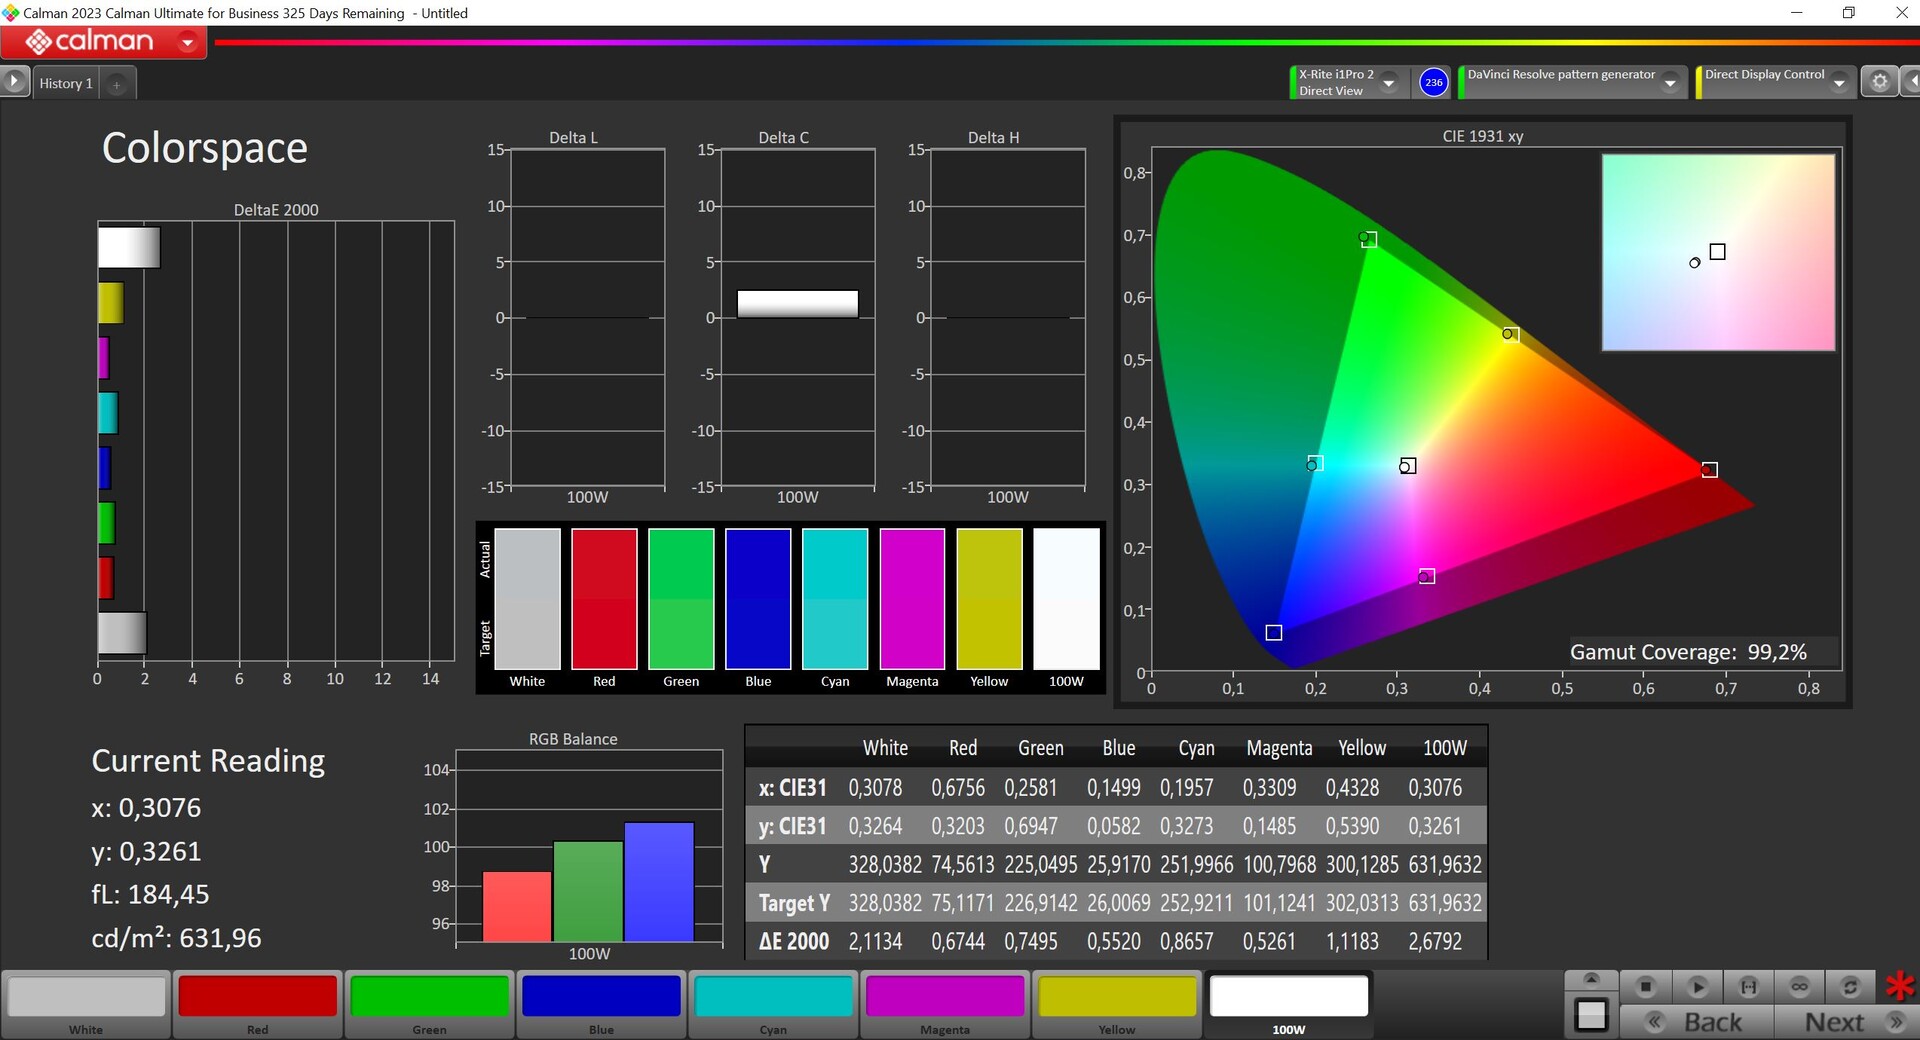
我们使用专业的 CalMAN 软件(X-Rite i1 Pro 2)对面板进行了分析,出厂校准结果已经非常不错。与 P3 参考色彩空间相比,无论是色彩还是灰度的 DeltaE-2000 偏差都不超过 3。也没有偏色,只是色温有点过冷。我们无法通过自己的校准来提高图像质量,因此目前还无法下载相应的配置文件。面板覆盖了 99.2% 的 P3 参考色。
Display Response Times
| ↔ Response Time Black to White | ||
|---|---|---|
| 43.6 ms ... rise ↗ and fall ↘ combined | ↗ 13.6 ms rise | 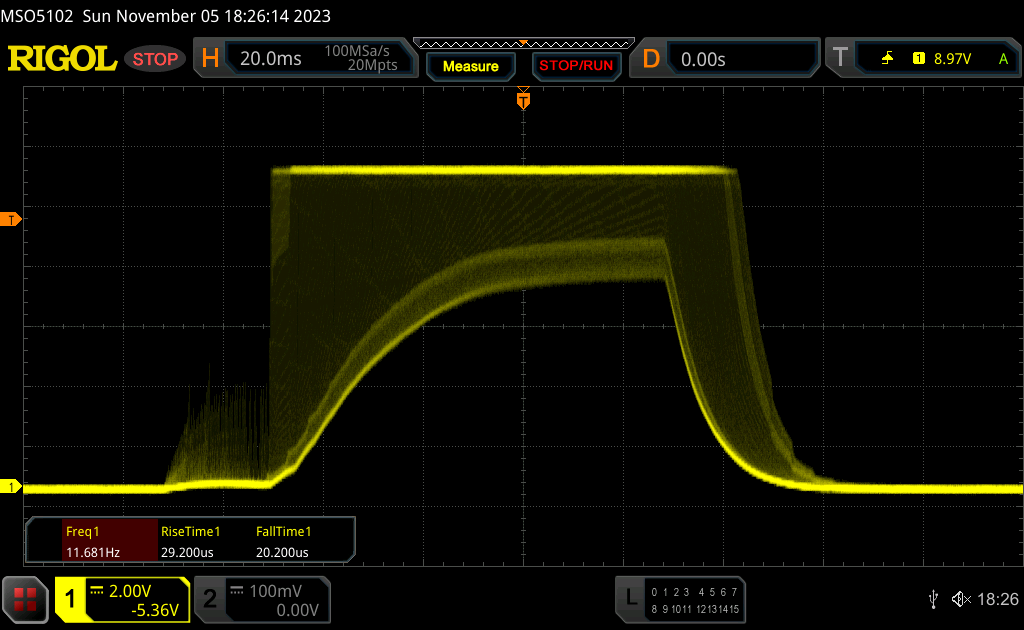 |
| ↘ 30 ms fall | ||
| The screen shows slow response rates in our tests and will be unsatisfactory for gamers. In comparison, all tested devices range from 0.1 (minimum) to 240 (maximum) ms. » 98 % of all devices are better. This means that the measured response time is worse than the average of all tested devices (19.8 ms). | ||
| ↔ Response Time 50% Grey to 80% Grey | ||
| 66.9 ms ... rise ↗ and fall ↘ combined | ↗ 29.4 ms rise | 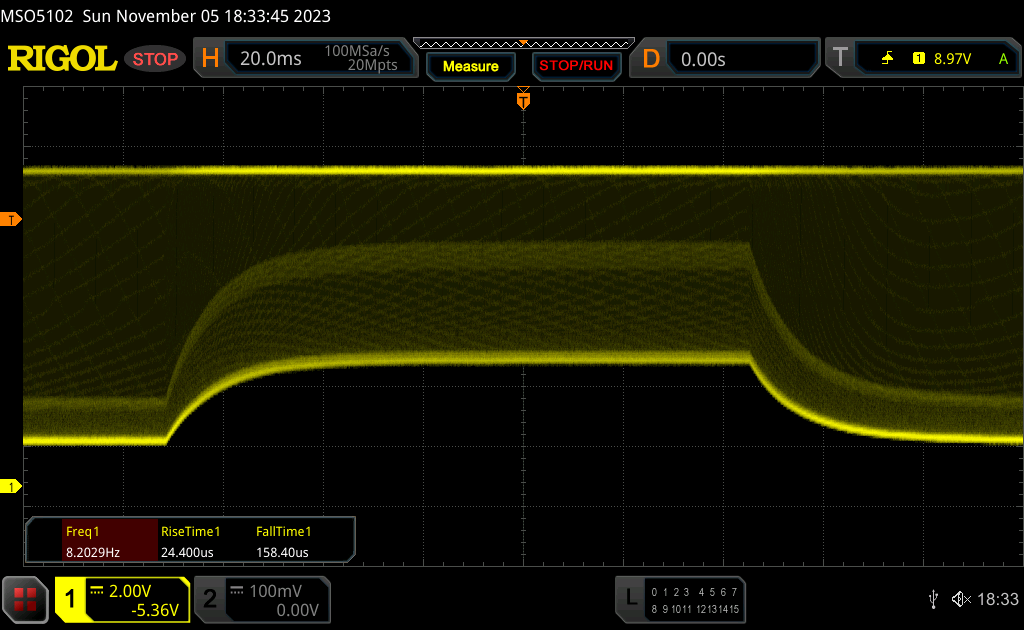 |
| ↘ 37.5 ms fall | ||
| The screen shows slow response rates in our tests and will be unsatisfactory for gamers. In comparison, all tested devices range from 0.165 (minimum) to 636 (maximum) ms. » 98 % of all devices are better. This means that the measured response time is worse than the average of all tested devices (31 ms). | ||
Screen Flickering / PWM (Pulse-Width Modulation)
| Screen flickering / PWM detected | 14877 Hz | 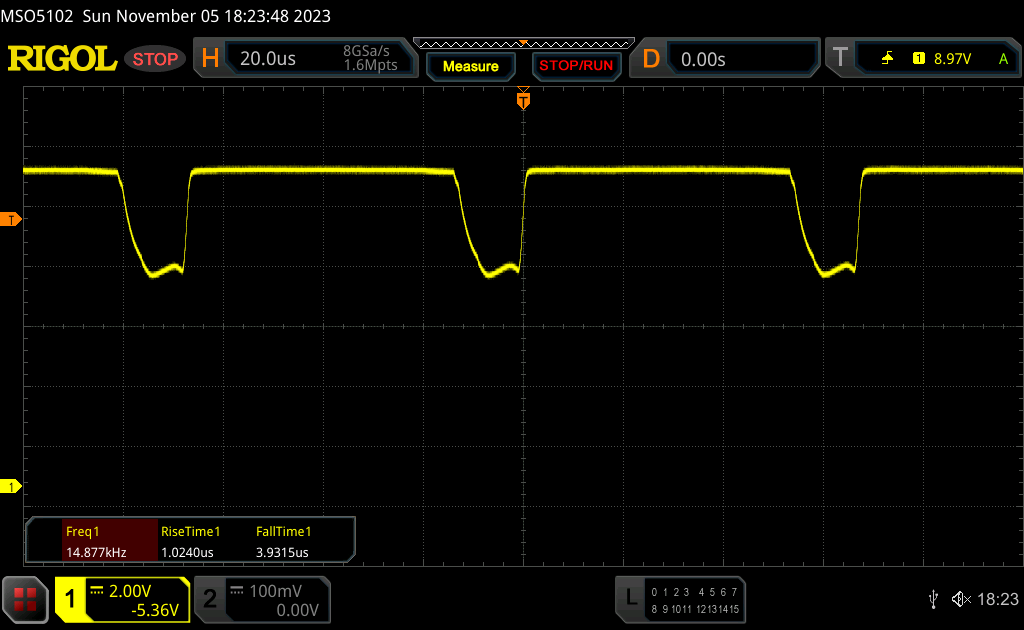 | |
The display backlight flickers at 14877 Hz (worst case, e.g., utilizing PWM) . The frequency of 14877 Hz is quite high, so most users sensitive to PWM should not notice any flickering. In comparison: 52 % of all tested devices do not use PWM to dim the display. If PWM was detected, an average of 7757 (minimum: 5 - maximum: 343500) Hz was measured. | |||
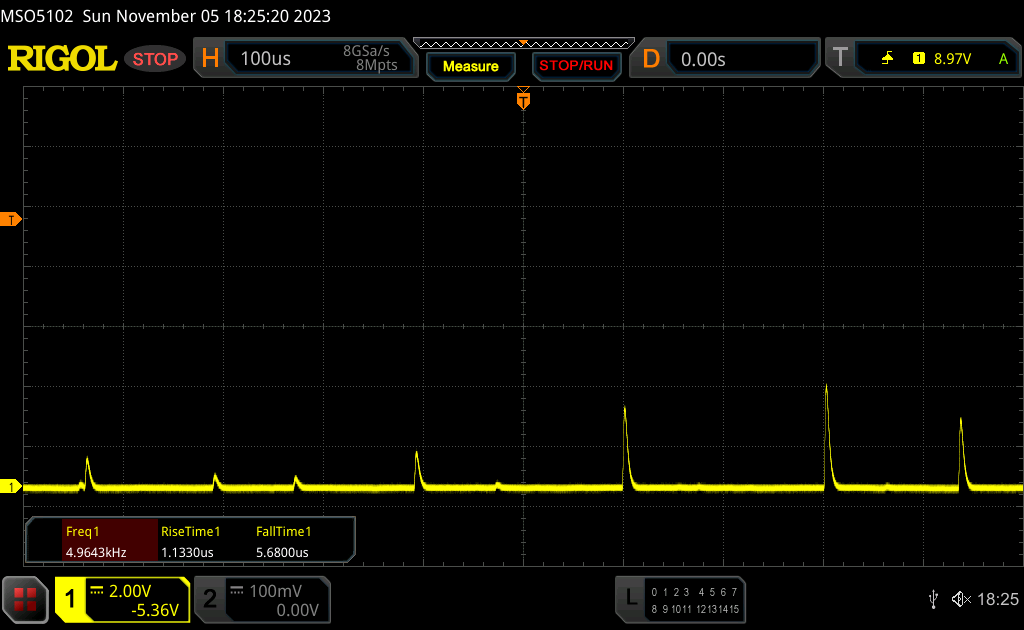
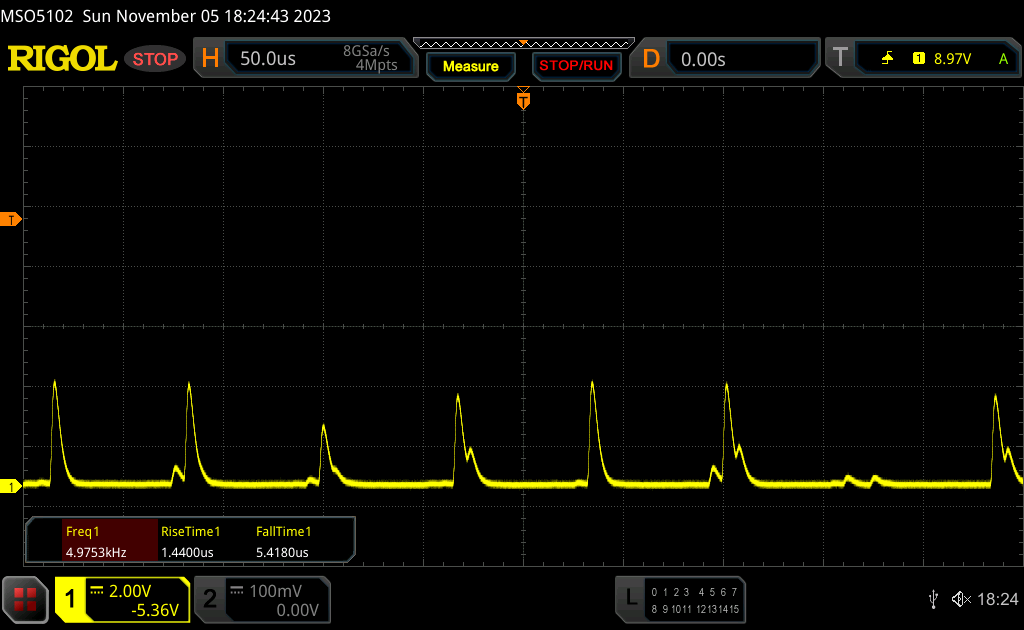
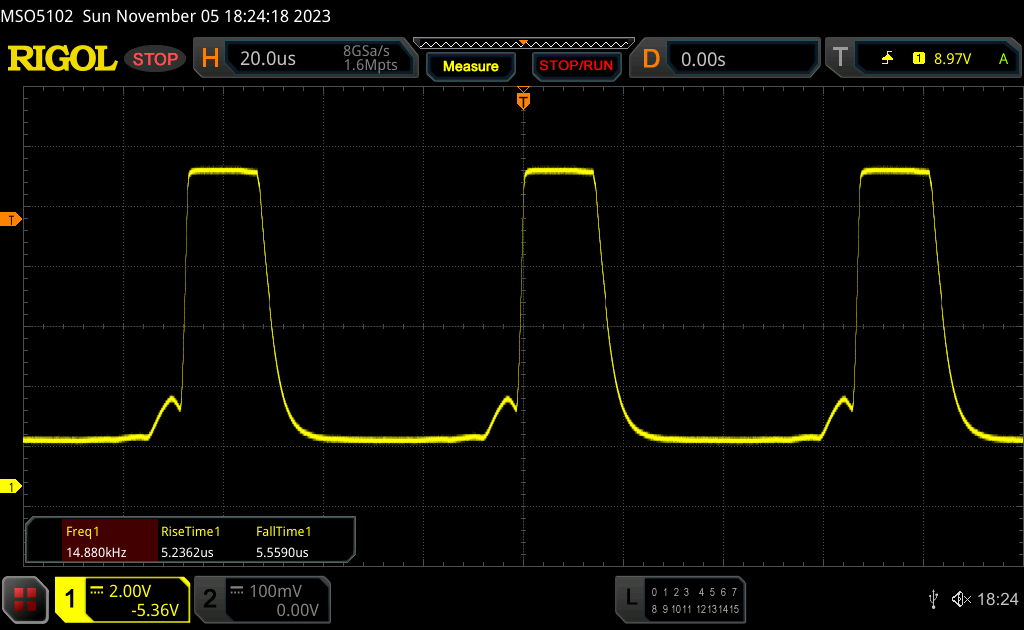
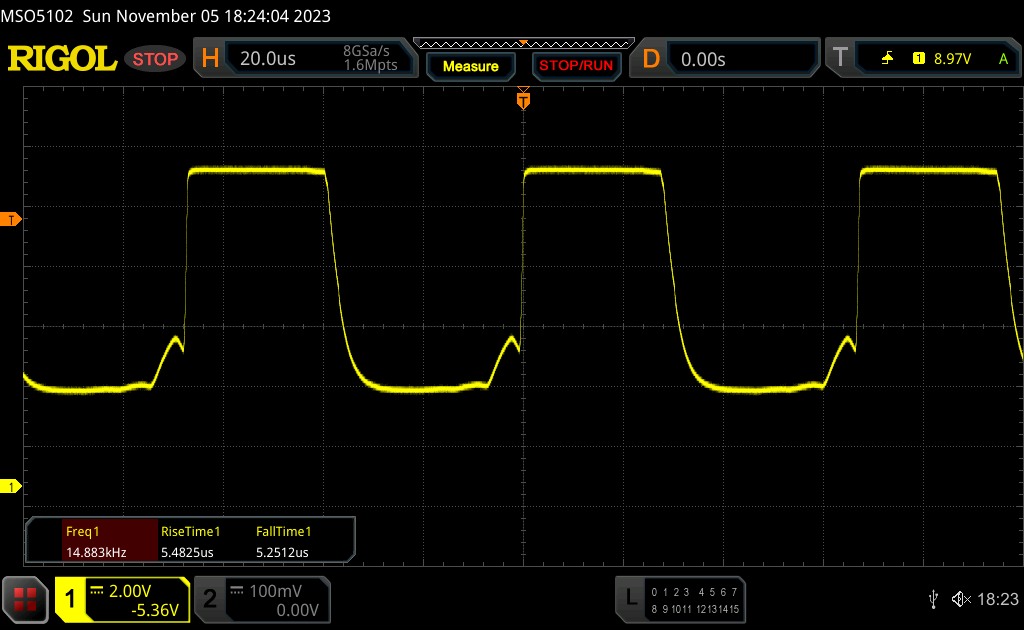
与前代机型一样,我们在新款 MacBook Pro 16 上再次测量到 15 kHz 的持续闪烁,但由于频率较高,应该不会有任何问题。持续的闪烁使我们更难确定准确的响应时间,我们确定配备 Mini-LED 背光的 IPS 面板的响应时间相当慢。通过特殊测试可以看到一些重影现象,但在日常使用中通常看不到,120 Hz 的高频率肯定会有所帮助。
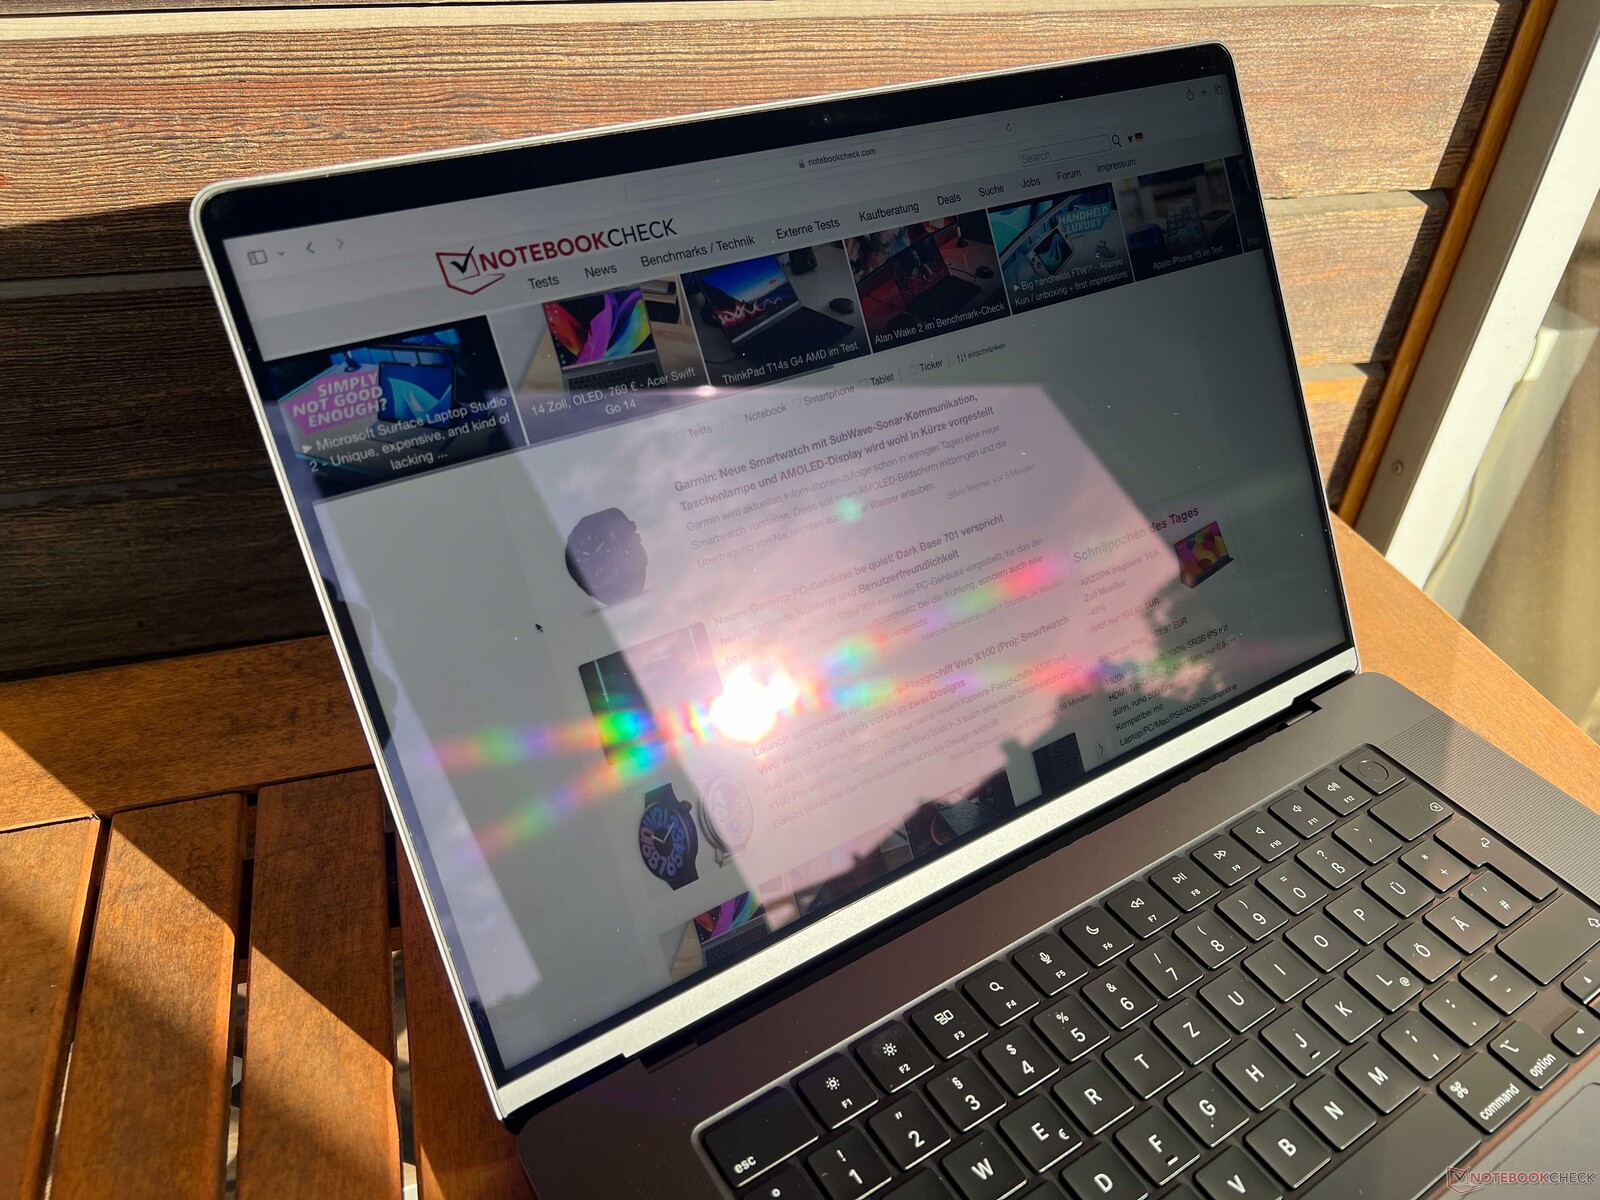
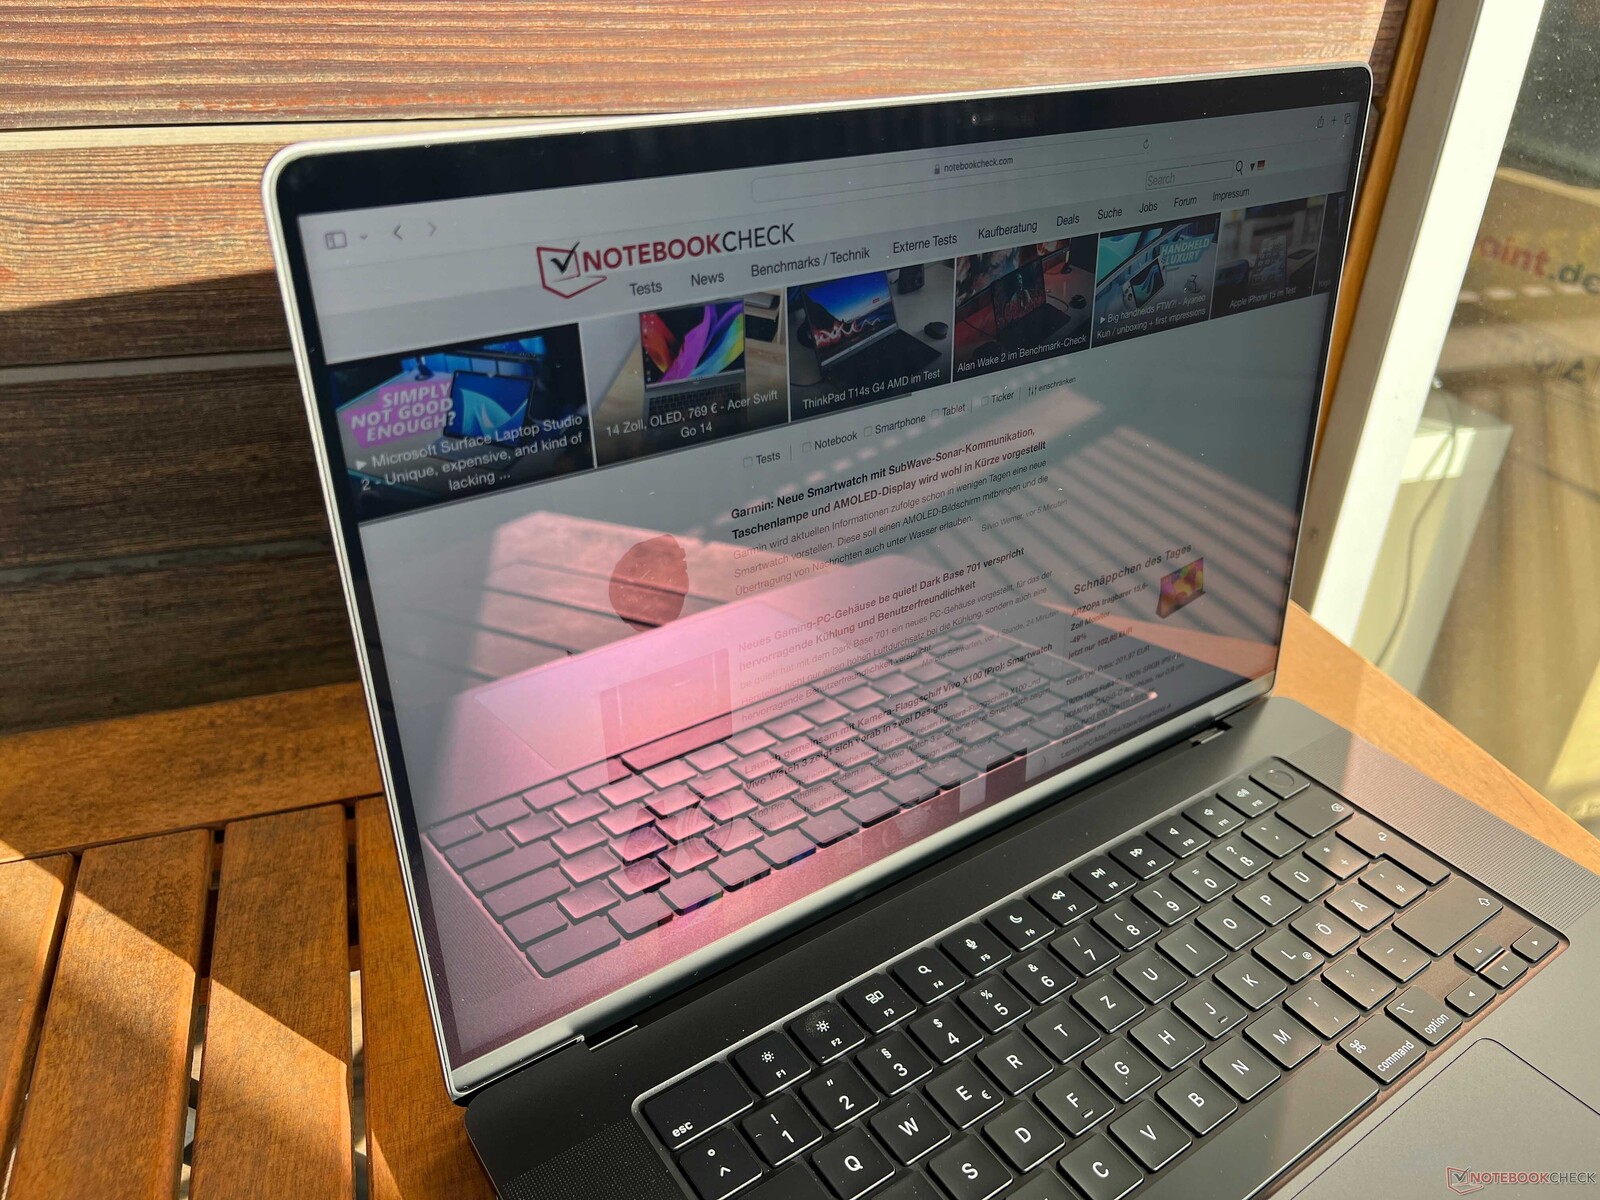
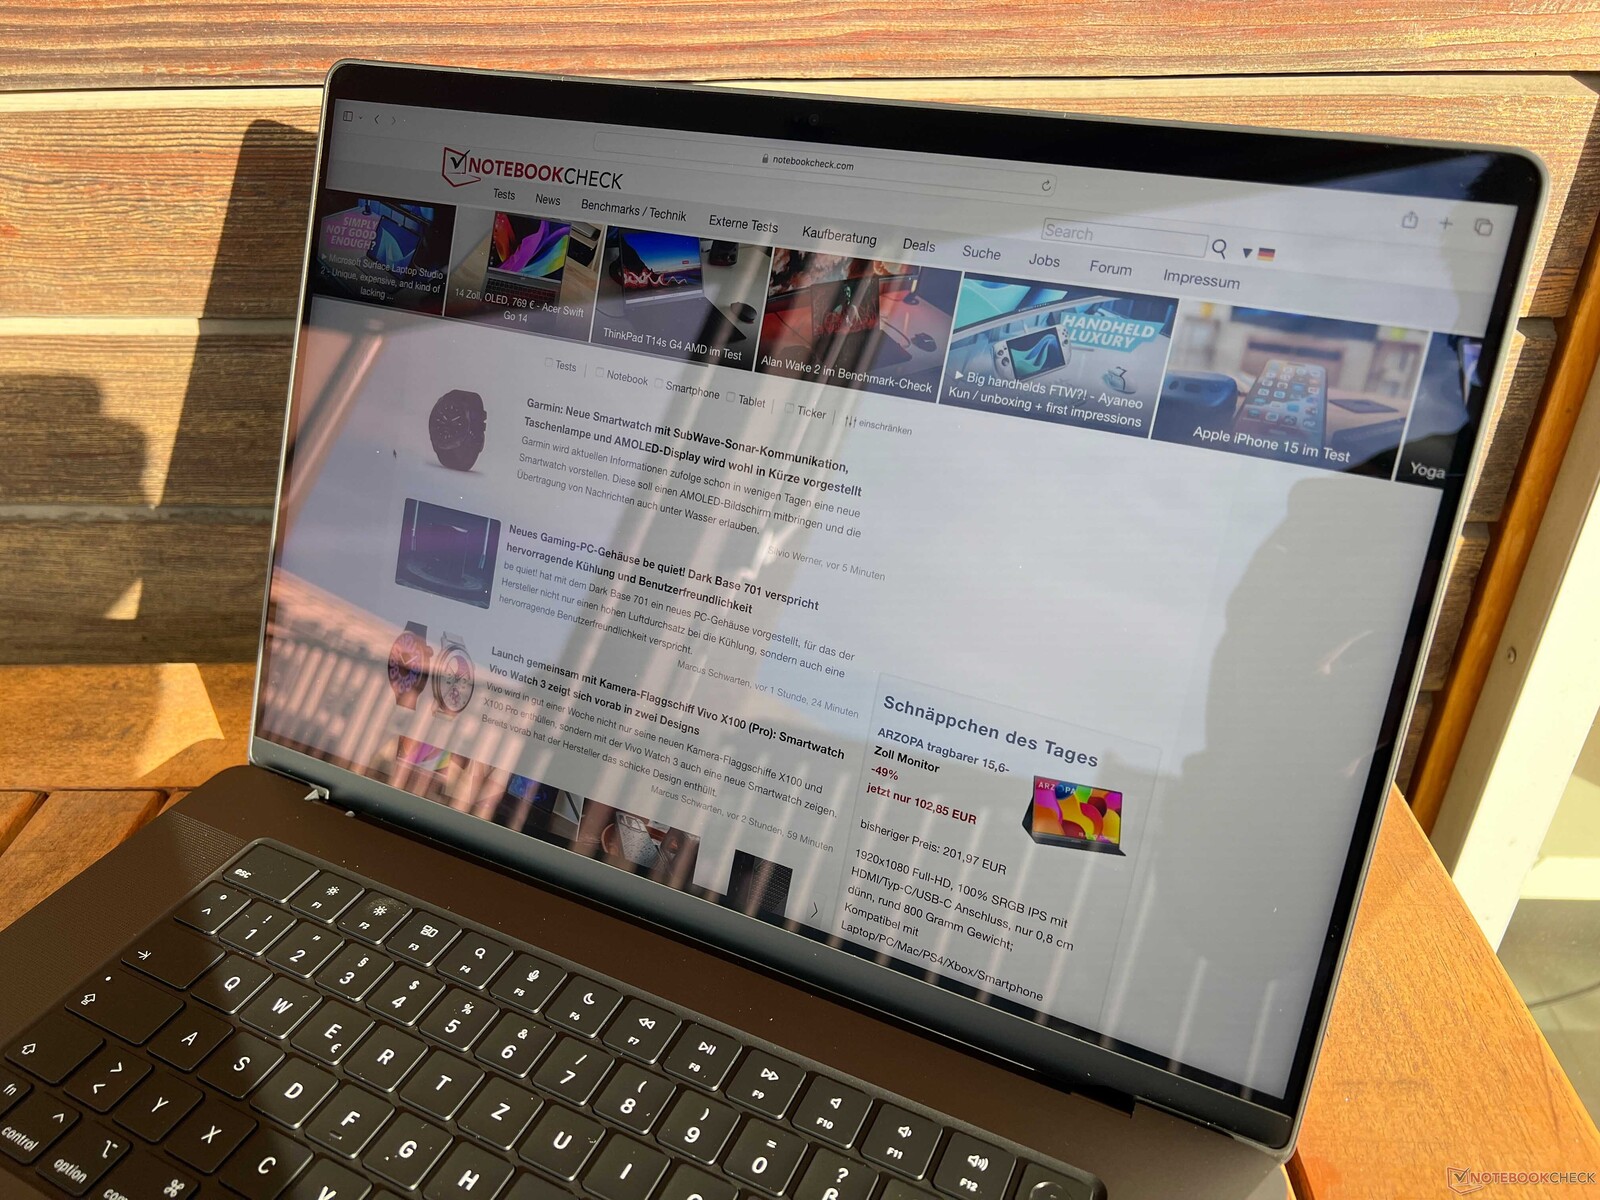
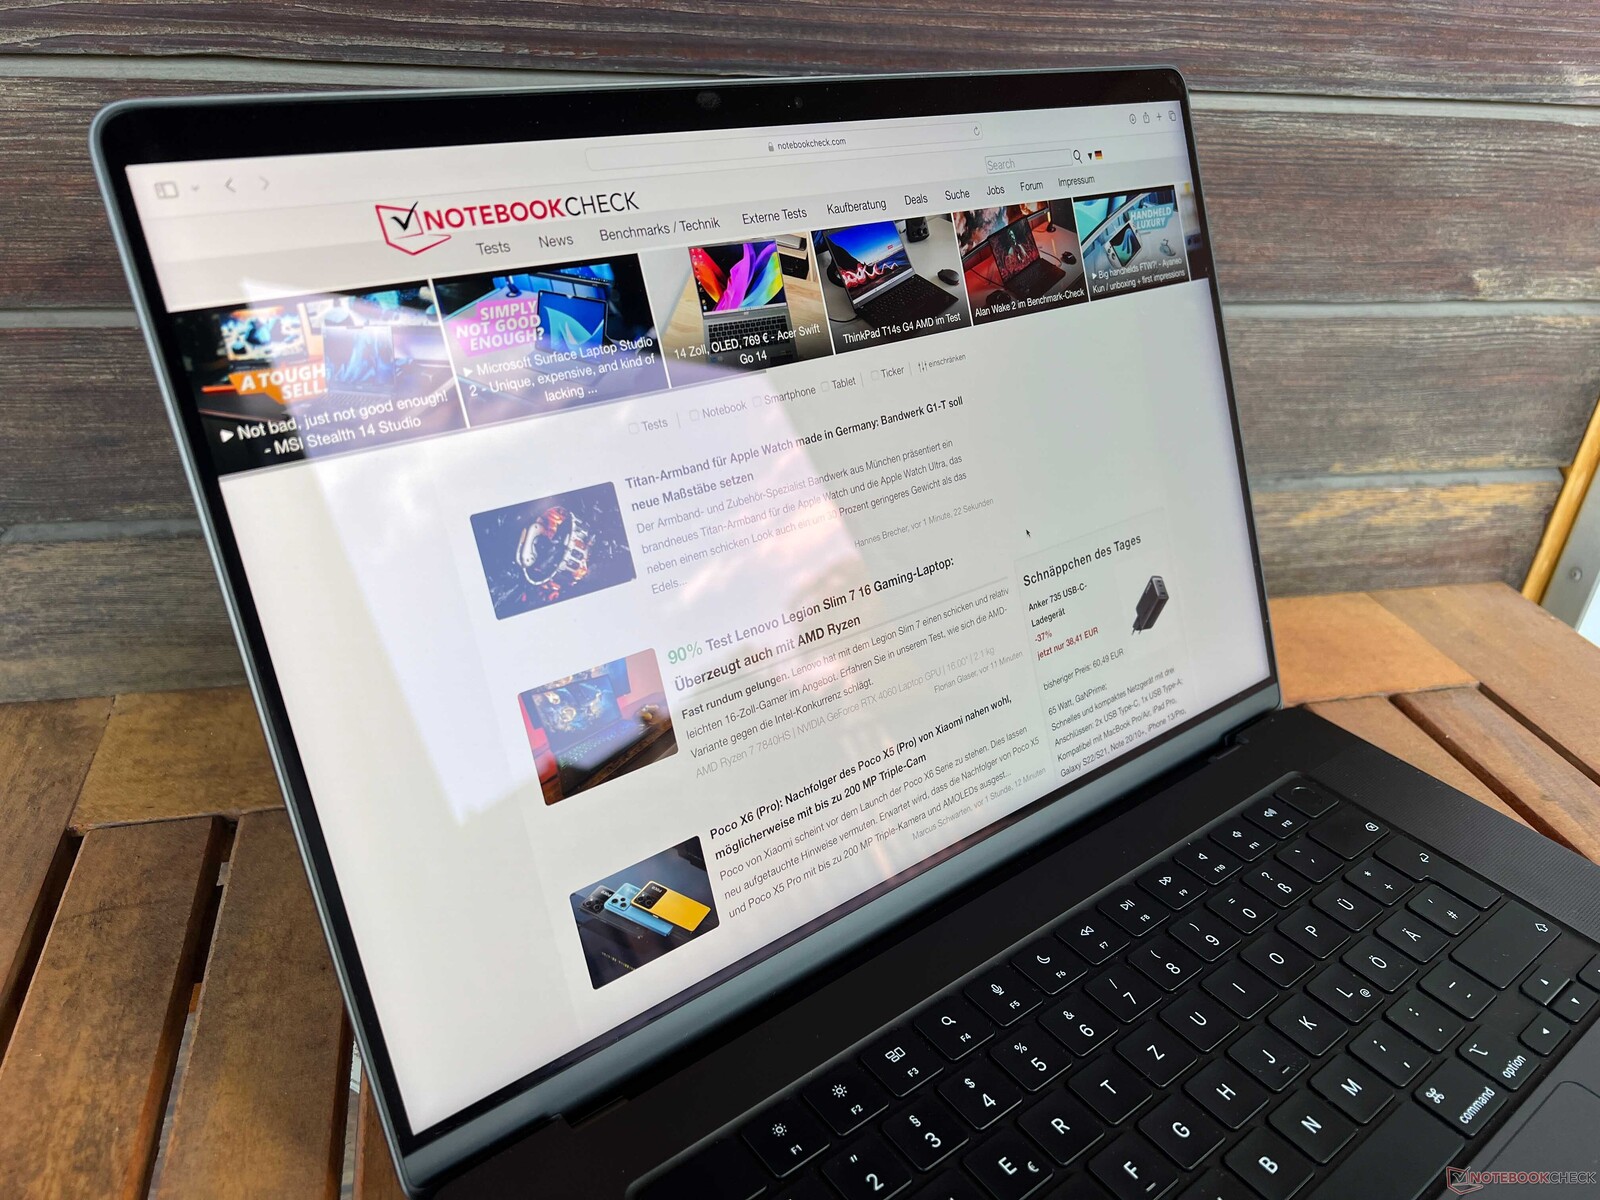
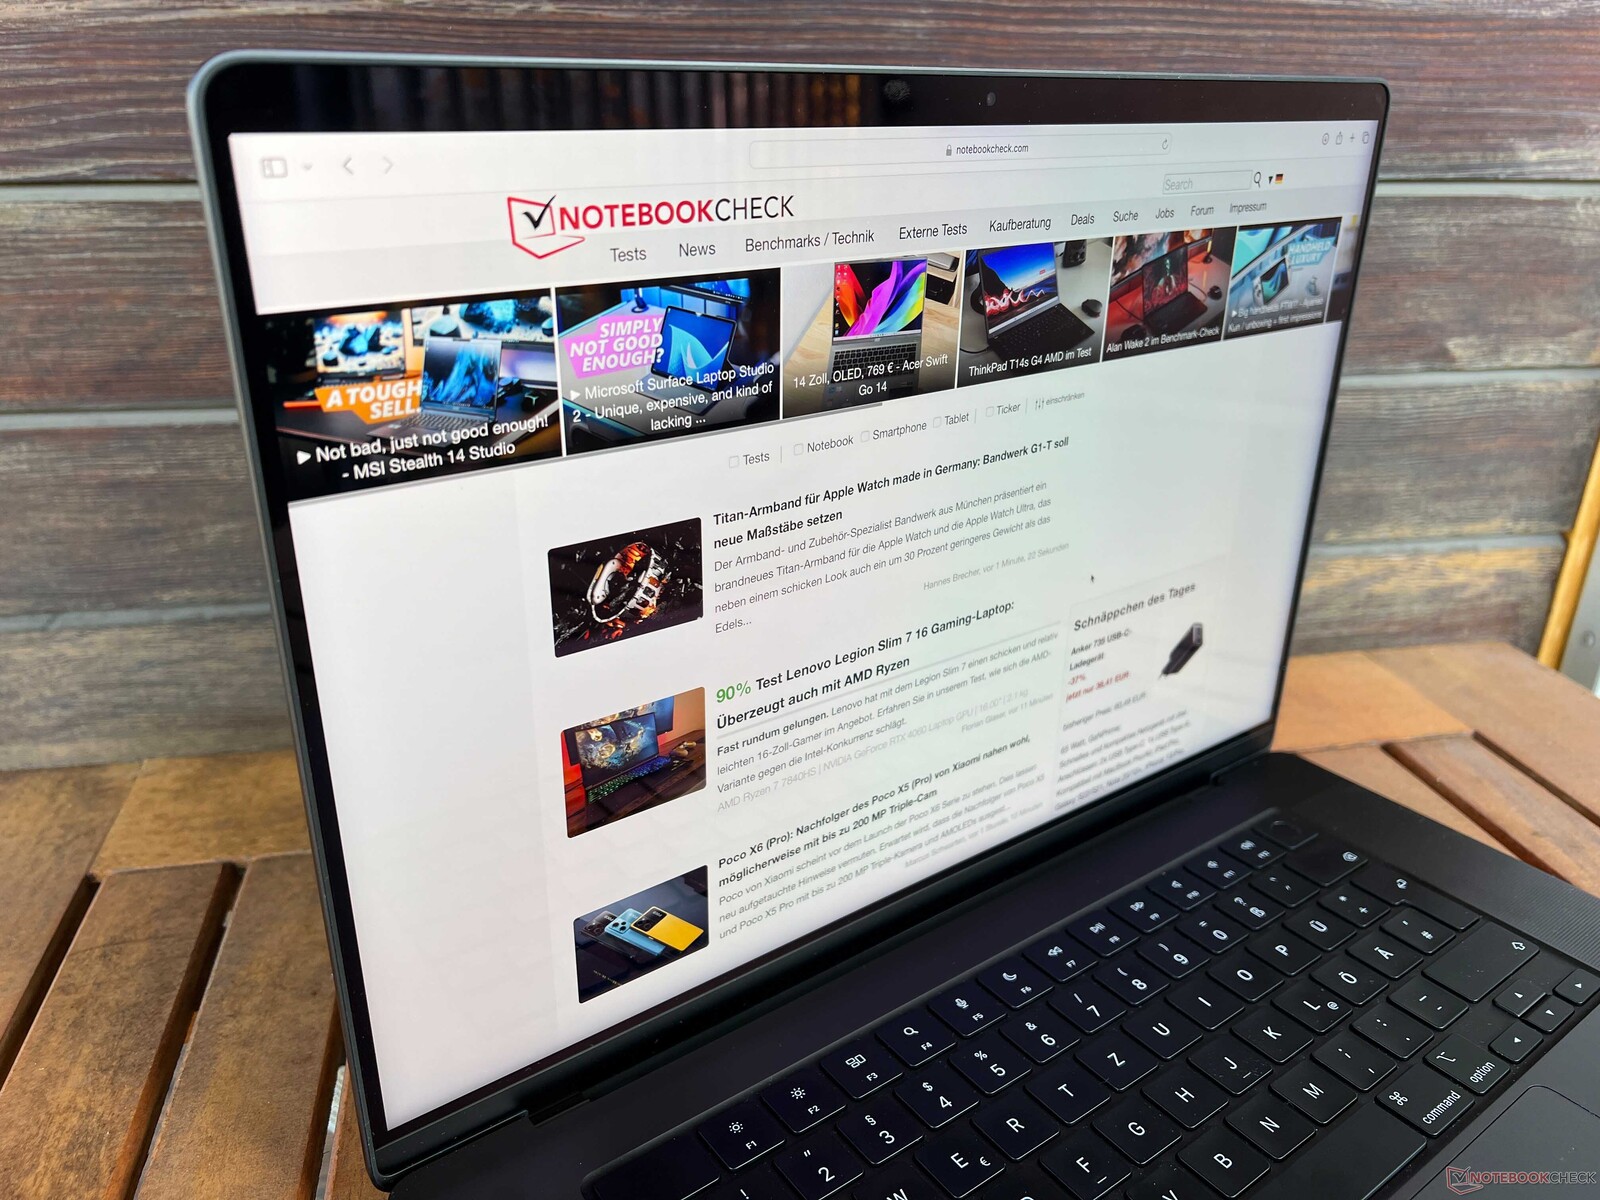
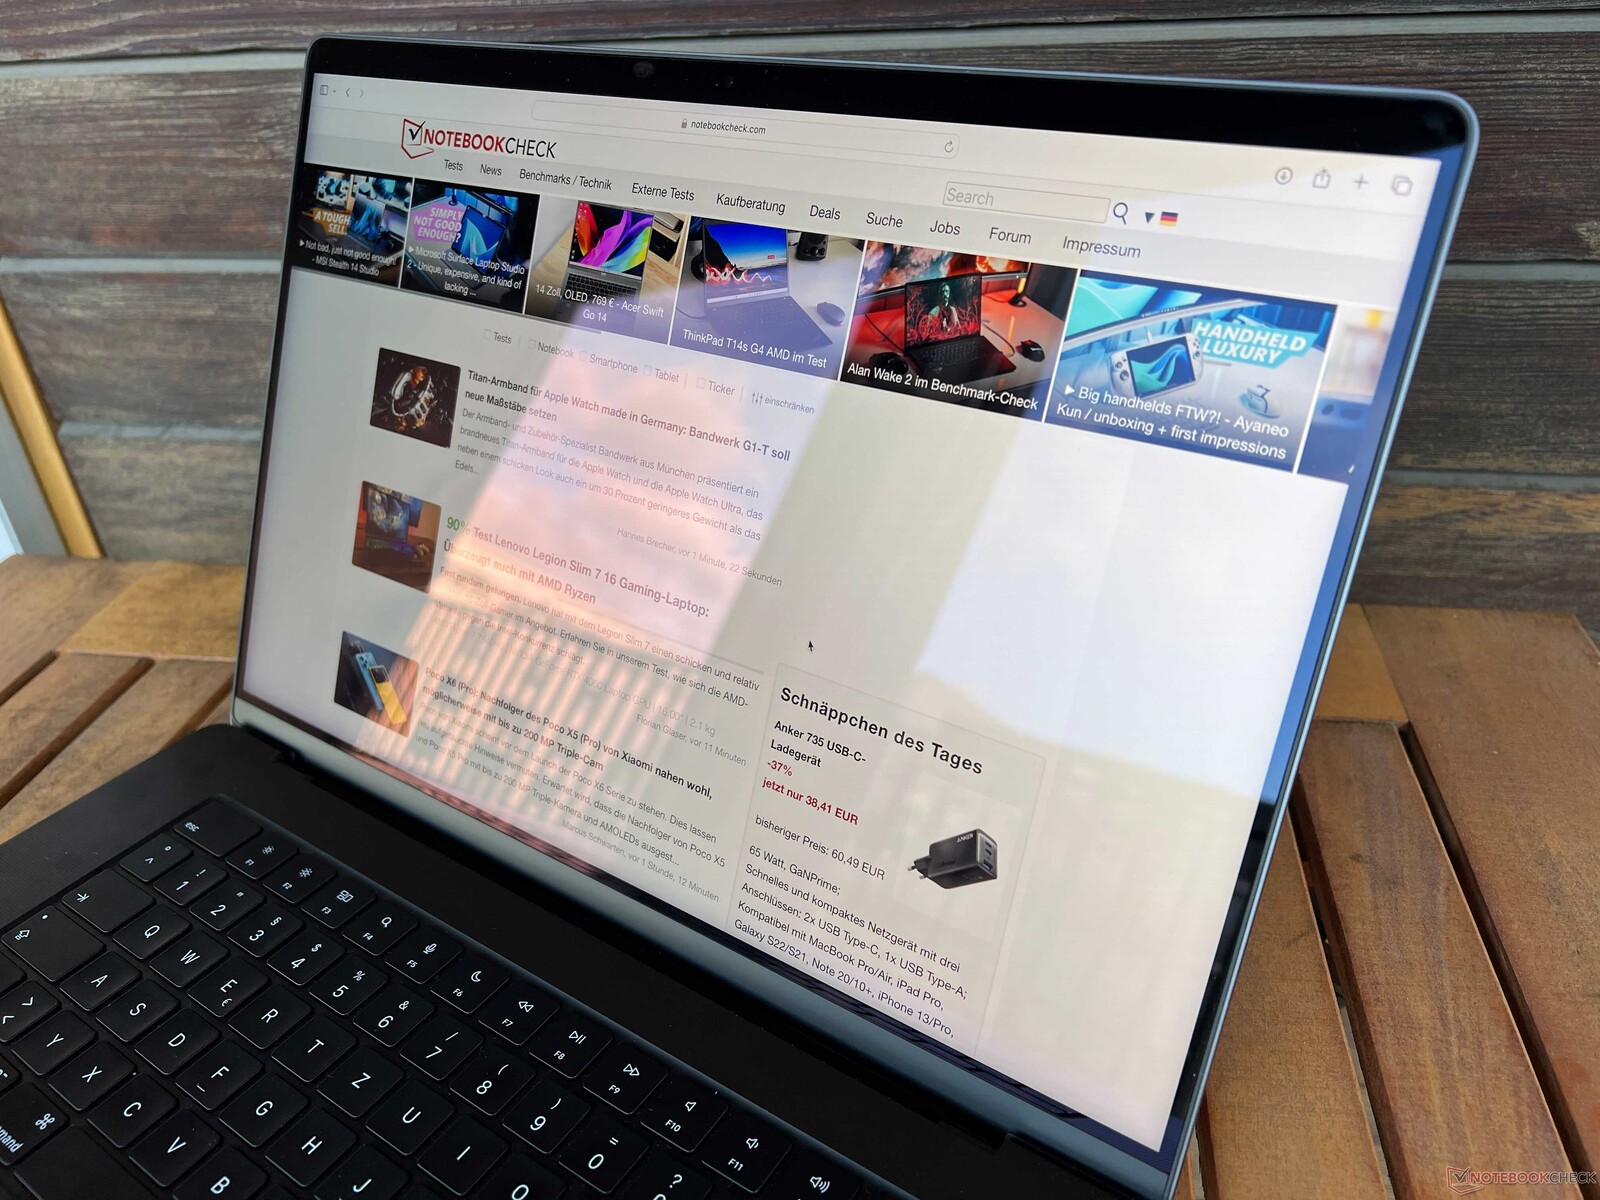
MacBook Pro 16 采用的是亮面屏幕,但它的反光性不如其他许多亮面面板。高亮度值和高对比度显然也有帮助。我们的示例图片显示,只要避免阳光直射,你甚至可以在晴朗的户外使用 MacBook。在视角稳定性方面没有任何限制。

性能 - M3 Max 新增更多 CPU 内核
我们已经提到,与 M3 Pro 型号相比,新的 M3 Max SoC 首次配备了额外的 CPU 内核。M3 Pro 提供多达六个性能核心和六个效率核心,而 M3 Max 则舍弃了两个效率核心,转而提供更多的性能核心。基础版 M3 Max 有 10 个性能内核,可选的高端版甚至有 12 个性能内核。
审查设置
配备 M3 Max 的 MacBook Pro 16 在电源和电池供电方面提供三种能耗设置:低功率、自动、高功率。低功耗模式将芯片功耗限制在 24 瓦,但我们没有注意到其他两种模式的性能差异,但高功率模式下风扇的声音要大得多。我们使用默认的自动模式进行了以下基准测试和测量。
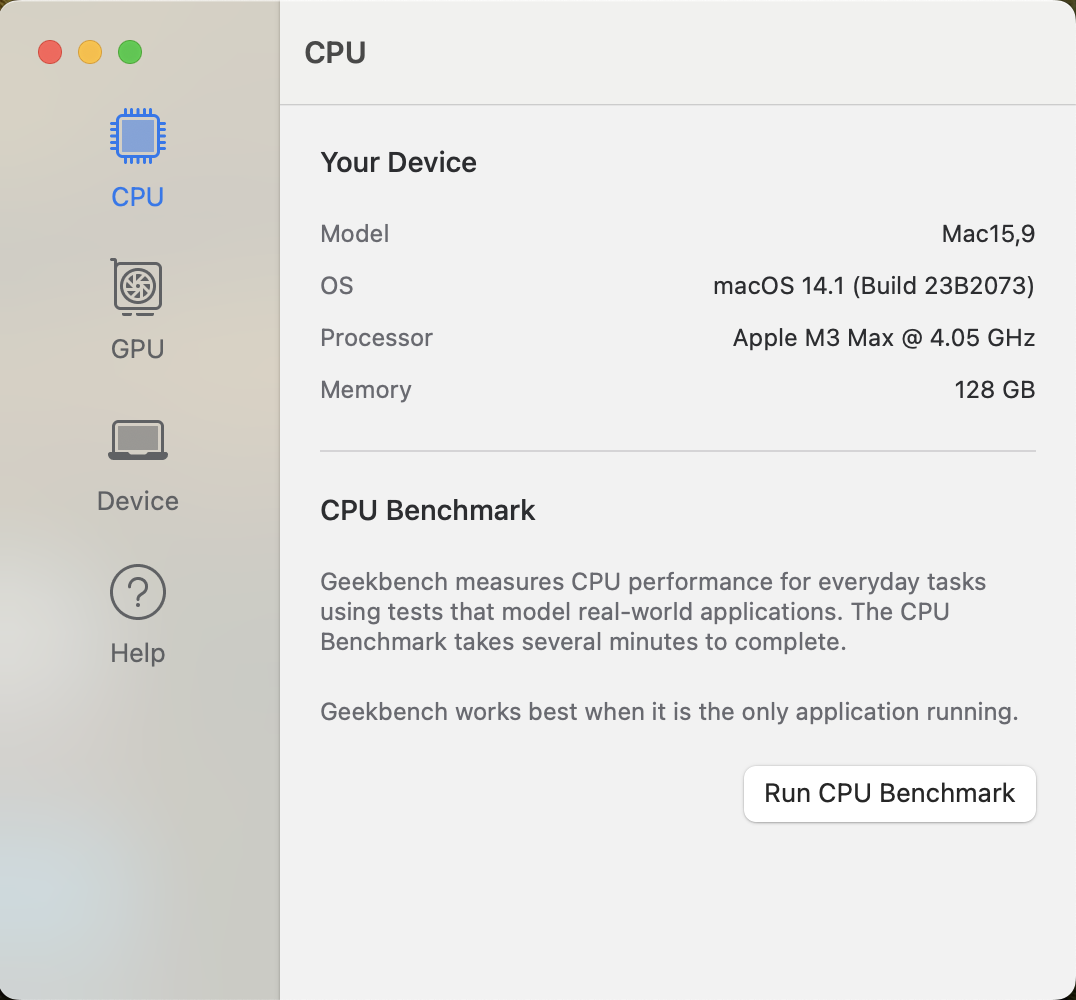
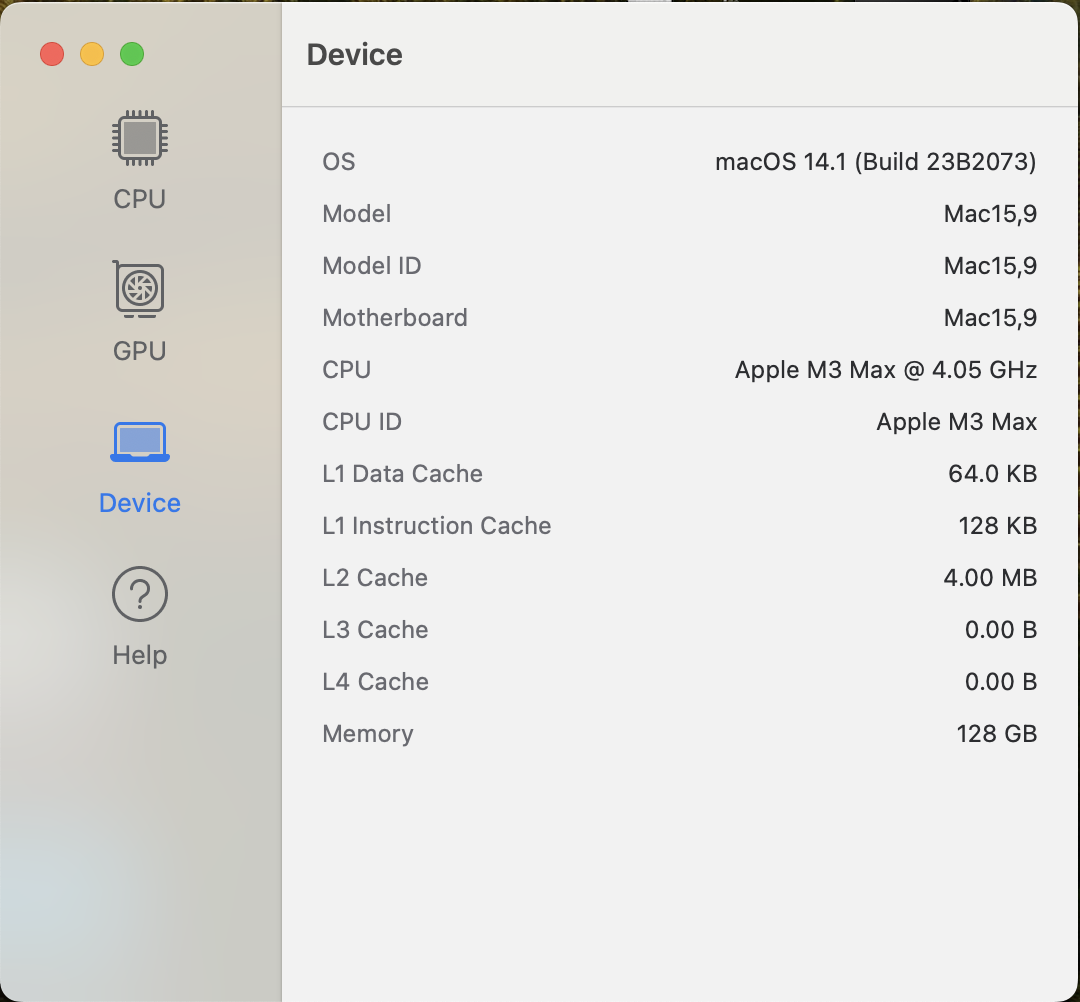
处理器 - M3 Max,12 个高性能内核
M3 Max 采用先进的 3 纳米工艺制造,其高端型号比 M2 Max 增加了四个性能内核(共 12 个)。 M2 Max.除四个高效内核外,CPU 还可同时执行多达 16 个线程。更多的内核也导致功耗的显著增加,因为在 CPU 基准测试中,M2 Max 的功耗高达 36 瓦,而新的 M3 Max 功耗高达 56 瓦。
性能内核的主频可达 4.056 GHz,同时使用所有内核时主频约为 3.6 GHz。四个效率内核的频率最高可达 2.567 MHz(满载时为 2.418 GHz),比基础M3 SoC 的效率内核慢。在 Cinebench R23 Multi 测试中,性能明显优于旧版 M2 Max,优势达 63%。这意味着Apple 超越了英特尔的普通 H45 CPU 和 AMD 的 HS CPU(Zen4)--只有 AMD 的 HX-CPU 和英特尔的酷睿 i9 HX-CPU 有优势。而Core i7-13700HX 的速度则较慢。在 Geekbench Multi 测试中,Apple 的新高端芯片甚至领先于所有对手。
Cinebench 2024: CPU Multi Core | CPU Single Core
Geekbench 5.5: Multi-Core | Single-Core
Geekbench 6.7: Multi-Core | Single-Core
| Cinebench R23 / Multi Core | |
| Asus Zephyrus Duo 16 GX650PY-NM006W | |
| Asus ProArt Studiobook 16 OLED H7604 | |
| Alienware m16 R1 AMD | |
| Razer Blade 16 Early 2023 | |
| Apple MacBook Pro 16 2023 M3 Max | |
| Average Apple M3 Max 16-Core (24020 - 24024, n=2) | |
| MSI Raider GE68 HX 13VG, i7-13700HX | |
| Asus Zenbook Pro 16X UX7602BZ-MY005W | |
| Lenovo Yoga Pro 9 16-IRP G8 | |
| Schenker XMG Pro 16 Studio (Mid 23) | |
| Average of class Multimedia (4861 - 33362, n=74, last 2 years) | |
| Asus ROG Flow X13 GV302XV | |
| Lenovo LOQ 15IRH8 Core i7 | |
| Lenovo Yoga Slim 7 14APU G8 | |
| Apple MacBook Pro 16 2023 M2 Max | |
| Apple MacBook Pro 16 2021 M1 Max | |
| Cinebench R23 / Single Core | |
| Asus ProArt Studiobook 16 OLED H7604 | |
| Asus Zenbook Pro 16X UX7602BZ-MY005W | |
| Razer Blade 16 Early 2023 | |
| Apple MacBook Pro 16 2023 M3 Max | |
| Average Apple M3 Max 16-Core (1950 - 1968, n=2) | |
| Average of class Multimedia (1128 - 2459, n=66, last 2 years) | |
| Asus Zephyrus Duo 16 GX650PY-NM006W | |
| Schenker XMG Pro 16 Studio (Mid 23) | |
| Lenovo Yoga Pro 9 16-IRP G8 | |
| MSI Raider GE68 HX 13VG, i7-13700HX | |
| Lenovo LOQ 15IRH8 Core i7 | |
| Alienware m16 R1 AMD | |
| Asus ROG Flow X13 GV302XV | |
| Lenovo Yoga Slim 7 14APU G8 | |
| Apple MacBook Pro 16 2023 M2 Max | |
| Apple MacBook Pro 16 2021 M1 Max | |
| Cinebench 2024 / CPU Multi Core | |
| Apple MacBook Pro 16 2023 M3 Max | |
| Average Apple M3 Max 16-Core (1532 - 1612, n=2) | |
| Razer Blade 16 Early 2023 | |
| Average of class Multimedia (327 - 2437, n=73, last 2 years) | |
| Lenovo Yoga Slim 7 14APU G8 | |
| Lenovo LOQ 15IRH8 Core i7 | |
| Cinebench 2024 / CPU Single Core | |
| Average Apple M3 Max 16-Core (139 - 140, n=2) | |
| Apple MacBook Pro 16 2023 M3 Max | |
| Average of class Multimedia (72.5 - 201, n=58, last 2 years) | |
| Razer Blade 16 Early 2023 | |
| Lenovo LOQ 15IRH8 Core i7 | |
| Lenovo Yoga Slim 7 14APU G8 | |
| Geekbench 5.5 / Multi-Core | |
| Average Apple M3 Max 16-Core (22816 - 23059, n=2) | |
| Apple MacBook Pro 16 2023 M3 Max | |
| Asus ProArt Studiobook 16 OLED H7604 | |
| Asus Zephyrus Duo 16 GX650PY-NM006W | |
| Razer Blade 16 Early 2023 | |
| MSI Raider GE68 HX 13VG, i7-13700HX | |
| Apple MacBook Pro 16 2023 M2 Max | |
| Alienware m16 R1 AMD | |
| Lenovo Yoga Pro 9 16-IRP G8 | |
| Asus Zenbook Pro 16X UX7602BZ-MY005W | |
| Schenker XMG Pro 16 Studio (Mid 23) | |
| Average of class Multimedia (4652 - 20422, n=56, last 2 years) | |
| Apple MacBook Pro 16 2021 M1 Max | |
| Lenovo LOQ 15IRH8 Core i7 | |
| Lenovo Yoga Slim 7 14APU G8 | |
| Asus ROG Flow X13 GV302XV | |
| Geekbench 5.5 / Single-Core | |
| Apple MacBook Pro 16 2023 M3 Max | |
| Average Apple M3 Max 16-Core (2318 - 2331, n=2) | |
| Asus ProArt Studiobook 16 OLED H7604 | |
| Asus Zephyrus Duo 16 GX650PY-NM006W | |
| Alienware m16 R1 AMD | |
| Asus ROG Flow X13 GV302XV | |
| Apple MacBook Pro 16 2023 M2 Max | |
| Average of class Multimedia (805 - 2974, n=56, last 2 years) | |
| Lenovo Yoga Slim 7 14APU G8 | |
| MSI Raider GE68 HX 13VG, i7-13700HX | |
| Lenovo LOQ 15IRH8 Core i7 | |
| Schenker XMG Pro 16 Studio (Mid 23) | |
| Razer Blade 16 Early 2023 | |
| Lenovo Yoga Pro 9 16-IRP G8 | |
| Apple MacBook Pro 16 2021 M1 Max | |
| Asus Zenbook Pro 16X UX7602BZ-MY005W | |
| Geekbench 6.7 / Multi-Core | |
| Average Apple M3 Max 16-Core (21243 - 21264, n=2) | |
| Apple MacBook Pro 16 2023 M3 Max | |
| Razer Blade 16 Early 2023 | |
| Razer Blade 16 Early 2023 | |
| Razer Blade 16 Early 2023 | |
| Average of class Multimedia (4983 - 29415, n=69, last 2 years) | |
| MSI Raider GE68 HX 13VG, i7-13700HX | |
| Lenovo Yoga Pro 9 16-IRP G8 | |
| Asus Zenbook Pro 16X UX7602BZ-MY005W | |
| Schenker XMG Pro 16 Studio (Mid 23) | |
| Lenovo Yoga Slim 7 14APU G8 | |
| Alienware m16 R1 AMD | |
| Lenovo LOQ 15IRH8 Core i7 | |
| Asus ROG Flow X13 GV302XV | |
| Geekbench 6.7 / Single-Core | |
| Average Apple M3 Max 16-Core (3096 - 3157, n=2) | |
| Apple MacBook Pro 16 2023 M3 Max | |
| Average of class Multimedia (1534 - 4335, n=68, last 2 years) | |
| Razer Blade 16 Early 2023 | |
| Razer Blade 16 Early 2023 | |
| Razer Blade 16 Early 2023 | |
| Alienware m16 R1 AMD | |
| Schenker XMG Pro 16 Studio (Mid 23) | |
| Lenovo Yoga Slim 7 14APU G8 | |
| MSI Raider GE68 HX 13VG, i7-13700HX | |
| Lenovo LOQ 15IRH8 Core i7 | |
| Asus ROG Flow X13 GV302XV | |
| Lenovo Yoga Pro 9 16-IRP G8 | |
| Asus Zenbook Pro 16X UX7602BZ-MY005W | |
Cinebench 2024: CPU Multi Core | CPU Single Core
Geekbench 5.5: Multi-Core | Single-Core
Geekbench 6.7: Multi-Core | Single-Core
单核性能也比 M2 Max 提升了约 20%,Apple ,可与英特尔 H45 CPU 相媲美。HX 型号凭借其极高的涡轮时钟仍具有优势,但所需功耗仍要高得多。
在分析 AMD Ryzen 9 7945HX 时,我们检查了 AMD 和英特尔当前 HX 处理器在较低 TDP 水平下的多核性能,结果再次显示出 M3 Max 的惊人性能。在 55 瓦时,只有 Ryzen 9 7945HX的多核性能略高,但使用的是 32 个线程。英特尔的 HX CPU 也不甘示弱,其中包括顶级型号 酷睿 i9-13980HX(理论上是 55 瓦的处理器,但最高可达 157 瓦)。
| 功率限制 | Core i9-13900HX | Core i9-13950HX | Core i9-13980HX | Ryzen 9 7945HX | Apple M3 最大 16 核 CPU |
|---|---|---|---|---|---|
| 170 瓦 | 31,958 | 31,903 | |||
| 150 瓦 | 30,655 | 30,623 | |||
| 130 瓦 | 28,239 | 29,141 | 29,281 | 34,202 | |
| 115 瓦特 | 27,369 | 28,199 | 28,073 | 33,361 | |
| 100 瓦特 | 25,942 | 26,653 | 26,507 | 32,947 | |
| 80 瓦特 | 23,216 | 23,950 | 23,766 | 30,907 | |
| 55 瓦特 | 18,843 | 19,772 | 19,478 | 26,045 | 24,024 |
按照惯例,在电池电量降至 3% 之前,处理器性能不会因电池电量不足而降低。我们的 技术部分我们还推荐您阅读我们的 M3 Pro/M3 Max 分析文章,了解更多有关效率的信息,该文章即将发布。
我们还进行了 Cinebench R15 多循环测试,但需要注意的是,这个基准测试是模拟的,会影响性能。性能仍然非常出色,循环测试清楚地表明,即使在持续工作负荷下,CPU 性能也非常稳定。
Cinebench R15 Multi Loop
系统性能
所有配备Apple自家芯片的 MacBook 都是反应非常灵敏、速度非常快的系统,尤其是原生应用程序,即使是像 Adobe Photoshop 或 DaVinci Resolve 这样复杂的应用程序,也能流畅运行。MacBook 还可以通过 Rosetta 2 模拟英特尔应用程序,效果也很好,但性能通常会受到影响,尤其是在复杂的应用程序中。我们提供了 Adobe Photoshop 和 Premiere Pro 的 Pugetbench 基准测试成绩,但请注意,这些测试使用的是这些应用程序的英特尔模拟版本。Apple 硅芯片的原生版本明显更加流畅。
Blackmagic RAW Speed Test: 12:1 8K Metal | 12:1 8K CPU
Photoshop PugetBench: Filter Score | General Score | GPU Score | Overall Score
Premiere Pro PugetBench: Overall Score 0.98 | LongGOP 0.98 | Intraframe 0.98 | RAW 0.98 | GPU Effects 0.98
Jetstream 2: 2.0 Total
WebXPRT 3: Overall
| CrossMark / Overall | |
| Asus ProArt Studiobook 16 OLED H7604 | |
| Apple MacBook Pro 16 2023 M3 Max | |
| Average Apple M3 Max 16-Core, Apple M3 Max 40-Core GPU (2032 - 2051, n=2) | |
| Asus Zenbook Pro 16X UX7602BZ-MY005W | |
| Schenker XMG Pro 16 Studio (Mid 23) | |
| Apple MacBook Pro 16 2023 M2 Max | |
| Average of class Multimedia (866 - 2728, n=60, last 2 years) | |
| Lenovo Yoga Pro 9 16-IRP G8 | |
| Razer Blade 16 Early 2023 | |
| CrossMark / Productivity | |
| Asus ProArt Studiobook 16 OLED H7604 | |
| Schenker XMG Pro 16 Studio (Mid 23) | |
| Asus Zenbook Pro 16X UX7602BZ-MY005W | |
| Average Apple M3 Max 16-Core, Apple M3 Max 40-Core GPU (1828 - 1832, n=2) | |
| Apple MacBook Pro 16 2023 M3 Max | |
| Average of class Multimedia (931 - 2489, n=60, last 2 years) | |
| Lenovo Yoga Pro 9 16-IRP G8 | |
| Apple MacBook Pro 16 2023 M2 Max | |
| Razer Blade 16 Early 2023 | |
| CrossMark / Creativity | |
| Apple MacBook Pro 16 2023 M3 Max | |
| Average Apple M3 Max 16-Core, Apple M3 Max 40-Core GPU (2509 - 2564, n=2) | |
| Apple MacBook Pro 16 2023 M2 Max | |
| Asus ProArt Studiobook 16 OLED H7604 | |
| Asus Zenbook Pro 16X UX7602BZ-MY005W | |
| Average of class Multimedia (907 - 3465, n=60, last 2 years) | |
| Lenovo Yoga Pro 9 16-IRP G8 | |
| Schenker XMG Pro 16 Studio (Mid 23) | |
| Razer Blade 16 Early 2023 | |
| CrossMark / Responsiveness | |
| Schenker XMG Pro 16 Studio (Mid 23) | |
| Asus ProArt Studiobook 16 OLED H7604 | |
| Asus Zenbook Pro 16X UX7602BZ-MY005W | |
| Lenovo Yoga Pro 9 16-IRP G8 | |
| Average of class Multimedia (605 - 2024, n=60, last 2 years) | |
| Apple MacBook Pro 16 2023 M3 Max | |
| Average Apple M3 Max 16-Core, Apple M3 Max 40-Core GPU (1474 - 1486, n=2) | |
| Apple MacBook Pro 16 2023 M2 Max | |
| Razer Blade 16 Early 2023 | |
| Blackmagic RAW Speed Test / 12:1 8K Metal | |
| Average Apple M3 Max 16-Core, Apple M3 Max 40-Core GPU (293 - 294, n=2) | |
| Apple MacBook Pro 16 2023 M3 Max | |
| Average of class Multimedia (78 - 430, n=7, last 2 years) | |
| Apple MacBook Pro 16 2023 M2 Max | |
| Blackmagic RAW Speed Test / 12:1 8K CPU | |
| Average of class Multimedia (44 - 102, n=7, last 2 years) | |
| Apple MacBook Pro 16 2023 M3 Max | |
| Average Apple M3 Max 16-Core, Apple M3 Max 40-Core GPU (68 - 68, n=2) | |
| Apple MacBook Pro 16 2023 M2 Max | |
| Photoshop PugetBench / Filter Score | |
| Average Apple M3 Max 16-Core, Apple M3 Max 40-Core GPU (122.4 - 123.3, n=2) | |
| Apple MacBook Pro 16 2023 M3 Max | |
| Apple MacBook Pro 16 2023 M2 Max | |
| Asus Zenbook Pro 16X UX7602BZ-MY005W | |
| Asus ProArt Studiobook 16 OLED H7604 | |
| Photoshop PugetBench / General Score | |
| Average Apple M3 Max 16-Core, Apple M3 Max 40-Core GPU (162.6 - 165, n=2) | |
| Apple MacBook Pro 16 2023 M3 Max | |
| Asus Zenbook Pro 16X UX7602BZ-MY005W | |
| Asus ProArt Studiobook 16 OLED H7604 | |
| Apple MacBook Pro 16 2023 M2 Max | |
| Photoshop PugetBench / GPU Score | |
| Average Apple M3 Max 16-Core, Apple M3 Max 40-Core GPU (145.1 - 146.8, n=2) | |
| Apple MacBook Pro 16 2023 M3 Max | |
| Apple MacBook Pro 16 2023 M2 Max | |
| Asus Zenbook Pro 16X UX7602BZ-MY005W | |
| Asus ProArt Studiobook 16 OLED H7604 | |
| Photoshop PugetBench / Overall Score | |
| Average Apple M3 Max 16-Core, Apple M3 Max 40-Core GPU (1425 - 1442, n=2) | |
| Apple MacBook Pro 16 2023 M3 Max | |
| Apple MacBook Pro 16 2023 M2 Max | |
| Asus Zenbook Pro 16X UX7602BZ-MY005W | |
| Asus ProArt Studiobook 16 OLED H7604 | |
| Premiere Pro PugetBench / Overall Score 0.98 | |
| Asus Zenbook Pro 16X UX7602BZ-MY005W | |
| Average Apple M3 Max 16-Core, Apple M3 Max 40-Core GPU (760 - 762, n=2) | |
| Apple MacBook Pro 16 2023 M3 Max | |
| Premiere Pro PugetBench / LongGOP 0.98 | |
| Asus Zenbook Pro 16X UX7602BZ-MY005W | |
| Apple MacBook Pro 16 2023 M3 Max | |
| Average Apple M3 Max 16-Core, Apple M3 Max 40-Core GPU (84.2 - 85.4, n=2) | |
| Premiere Pro PugetBench / Intraframe 0.98 | |
| Average Apple M3 Max 16-Core, Apple M3 Max 40-Core GPU (121.3 - 123.9, n=2) | |
| Apple MacBook Pro 16 2023 M3 Max | |
| Asus Zenbook Pro 16X UX7602BZ-MY005W | |
| Premiere Pro PugetBench / RAW 0.98 | |
| Asus Zenbook Pro 16X UX7602BZ-MY005W | |
| Apple MacBook Pro 16 2023 M3 Max | |
| Average Apple M3 Max 16-Core, Apple M3 Max 40-Core GPU (55.9 - 55.9, n=2) | |
| Premiere Pro PugetBench / GPU Effects 0.98 | |
| Asus Zenbook Pro 16X UX7602BZ-MY005W | |
| Average Apple M3 Max 16-Core, Apple M3 Max 40-Core GPU (57.6 - 57.9, n=2) | |
| Apple MacBook Pro 16 2023 M3 Max | |
| Jetstream 2 / 2.0 Total | |
| Average of class Multimedia (287 - 481, n=31, last 2 years) | |
| Asus ProArt Studiobook 16 OLED H7604 | |
| Average Apple M3 Max 16-Core, Apple M3 Max 40-Core GPU (309 - 311, n=2) | |
| Apple MacBook Pro 16 2023 M3 Max | |
| Razer Blade 16 Early 2023 | |
| Lenovo Yoga Pro 9 16-IRP G8 | |
| Apple MacBook Pro 16 2023 M2 Max | |
| WebXPRT 3 / Overall | |
| Apple MacBook Pro 16 2023 M3 Max | |
| Average Apple M3 Max 16-Core, Apple M3 Max 40-Core GPU (416 - 426, n=2) | |
| Apple MacBook Pro 16 2023 M2 Max | |
| Average of class Multimedia (136.4 - 596, n=63, last 2 years) | |
| Asus ProArt Studiobook 16 OLED H7604 | |
| Schenker XMG Pro 16 Studio (Mid 23) | |
| Lenovo Yoga Pro 9 16-IRP G8 | |
| Razer Blade 16 Early 2023 | |
存储设备
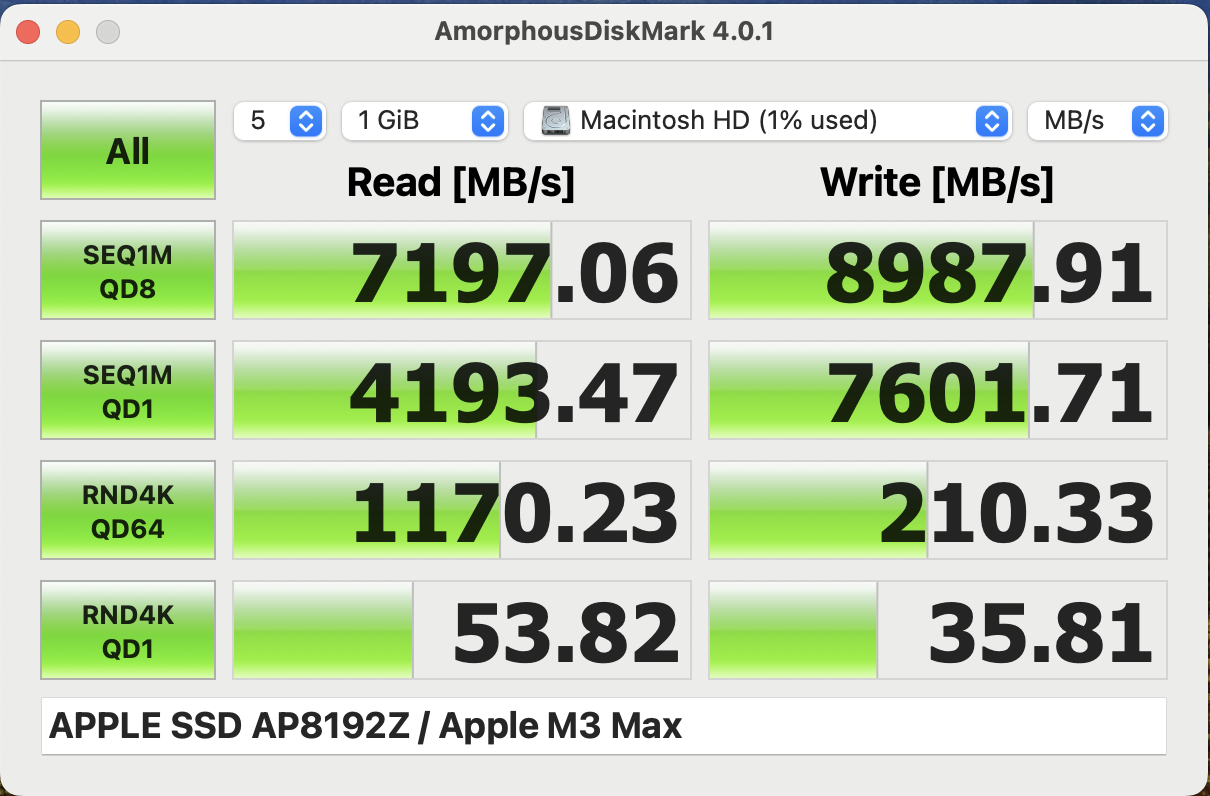
我们评测的 MacBook Pro 16 配备了最高容量的固态硬盘:8 TB。在上面的维护部分,你还可以清楚地看到全部 8 个内存芯片。MacBook 是为数不多的可以配备如此大存储容量的设备之一,但Apple 为此收取了高昂的费用。从 1 TB 升级到 8 TB 需要支付 2200 美元。作为比较:4 TB 版本的三星 990 Pro(M.2-2280)售价为 280 美元。不过,Apple SSD(AP8192Z)的性能非常出色,传输速率高达 8 GB/s。更多固态硬盘基准测试 这里.
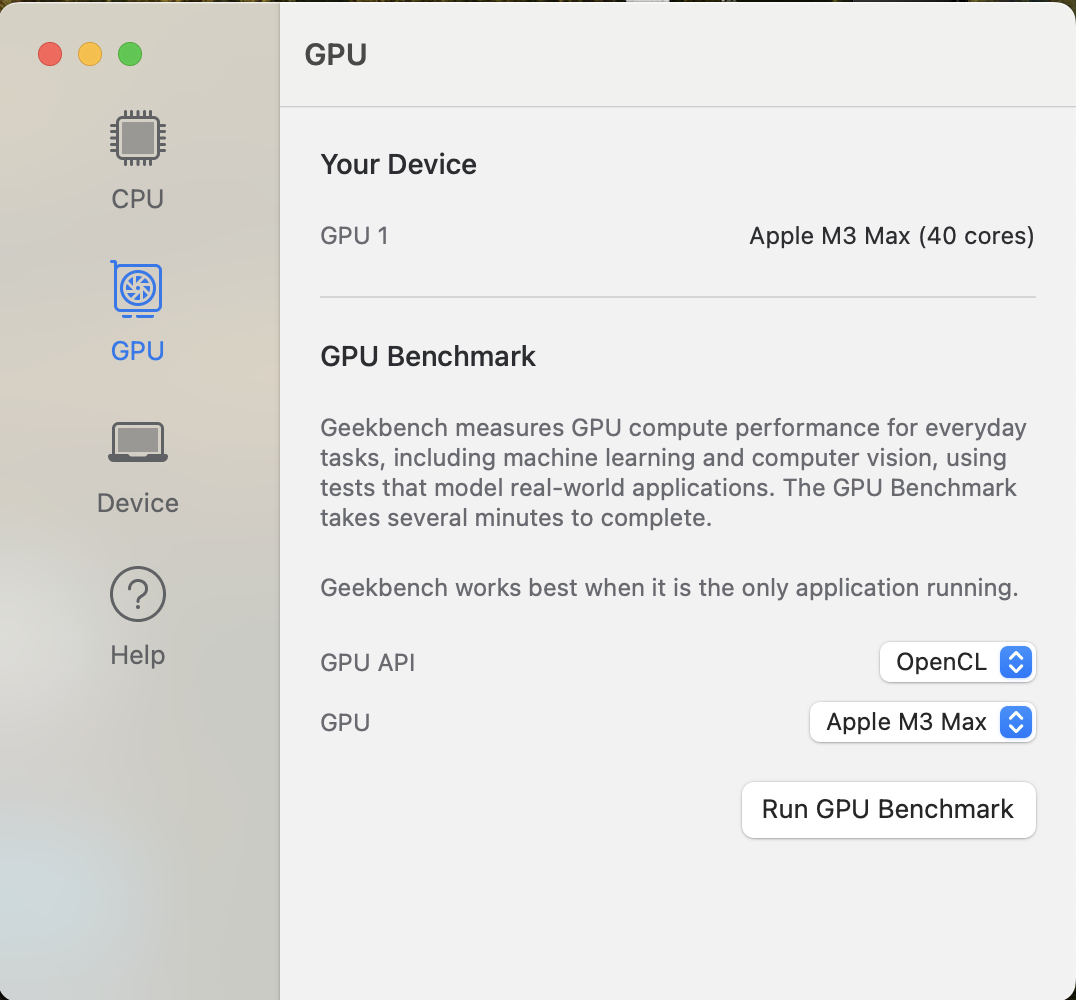
图形处理器性能
高端M3 Max芯片配备了 40 核 GPU,这意味着比之前的 38 核增加了两个核心。我们还怀疑其核心时钟频率更高。根据测试结果,性能提高了 13-25 %,但最大功耗从 64 瓦下降到 60 瓦。GPU 的最大优势仍然是共享内存,尤其是在视频编辑过程中。我们使用 DaVinci Resolve 为 YouTube 编辑评论视频,在编辑过程中偶尔会遇到 RTX 4090 的 16 GB VRAM 限制。
与 Nvidia 当前的笔记本电脑 GPU 相比,M3 Max GPU 在跨平台 3DMark Wildlife Unlimited 测试中明显优于 RTX 4070 笔记本电脑,仅落后于 RTX 4090 笔记本电脑 9%。GeForce RTX 4090 笔记本电脑125 瓦和 4090 笔记本电脑 175 瓦的 23%。在 GFXBench 测试中,M3 Max 与 RTX 4080 笔记本电脑相比落后 4%。RTX 4080 笔记本电脑相比,M3 Max 在 175 瓦时的性能下降了 4%。OpenCL 性能较差,速度更快的 RTX GPU 明显领先,但RTX 4070 笔记本电脑60 瓦 TGP (Galaxy Book3 16 Ultra在 Geekbench 中要慢 11%。
在长时间工作负载和电池供电情况下,GPU 性能完全稳定,而强大的GeForce GPU 则不然。更多 GPU 基准测试请参见我们的 技术部分.
* ... smaller is better
游戏性能
Mac 上的游戏越来越有趣,新的 macOS 14(Sonoma)还提供了全屏模式下的游戏模式。除了模拟游戏(如《古墓丽影:暗影》和《全面战争:三国》),你还可以使用 CrossOver 玩 Windows 游戏。根据游戏的不同,CrossOver 的效果也不错(如《GTA V》、《Far Cry 5》),但有时需要进行一些实验,而且我们并不总能看到与基本版相比的预期差异。 M3-SoC.有时仿真无法充分发挥硬件性能,例如《GTA V》几乎没有显示 GPU 负载,而主要负载由 CPU 承担。
Apple芯片的原生游戏显然要好得多,这包括《生化危机村》或《无主之地》等游戏。Apple M3 Max 的性能确实令人印象深刻,在 QHD 和最高设置下,两款游戏都能完全流畅运行(+100 fps),这在下面的游戏基准测试视频中也能看到。
| Total War: Three Kingdoms | |
| 1920x1080 Ultra (incl textures) | |
| Apple MacBook Pro 16 2023 M3 Max | |
| Average Apple M3 Max 40-Core GPU (80 - 84, n=2) | |
| Apple MacBook Pro 16 2023 M2 Max | |
| Average of class Multimedia (49.6 - 55, n=2, last 2 years) | |
| 2560x1440 Ultra (incl textures) | |
| Apple MacBook Pro 16 2023 M3 Max | |
| Average Apple M3 Max 40-Core GPU (54 - 58, n=2) | |
| Apple MacBook Pro 16 2023 M2 Max | |
| Average of class Multimedia (31.5 - 35.6, n=2, last 2 years) | |
| Star Wars Jedi Survivor - 1920x1080 Epic Preset | |
| Lenovo Yoga Pro 9 16-IRP G8 | |
| Apple MacBook Pro 16 2023 M3 Max | |
| Average Apple M3 Max 40-Core GPU (n=1) | |
| low | med. | high | ultra | QHD | |
|---|---|---|---|---|---|
| GTA V (2015) | 77 | 53 | 51 | ||
| The Witcher 3 (2015) | 87 | 69 | |||
| Far Cry 5 (2018) | 56 | 54 | 50 | 49 | |
| Shadow of the Tomb Raider (2018) | 150 | 143 | 122 | 88 | |
| Total War: Three Kingdoms (2019) | 170 | 113 | 84 | 58 | |
| Star Wars Jedi Survivor (2023) | 51 | ||||
| Cyberpunk 2077 (2023) | 45 | 44 | 43.7 | 42.8 | 37.4 |
| Total War Pharaoh (2023) | 212 | 139 | 121 | 82 |
排放 - 配备出色扬声器的 MBP
系统噪音
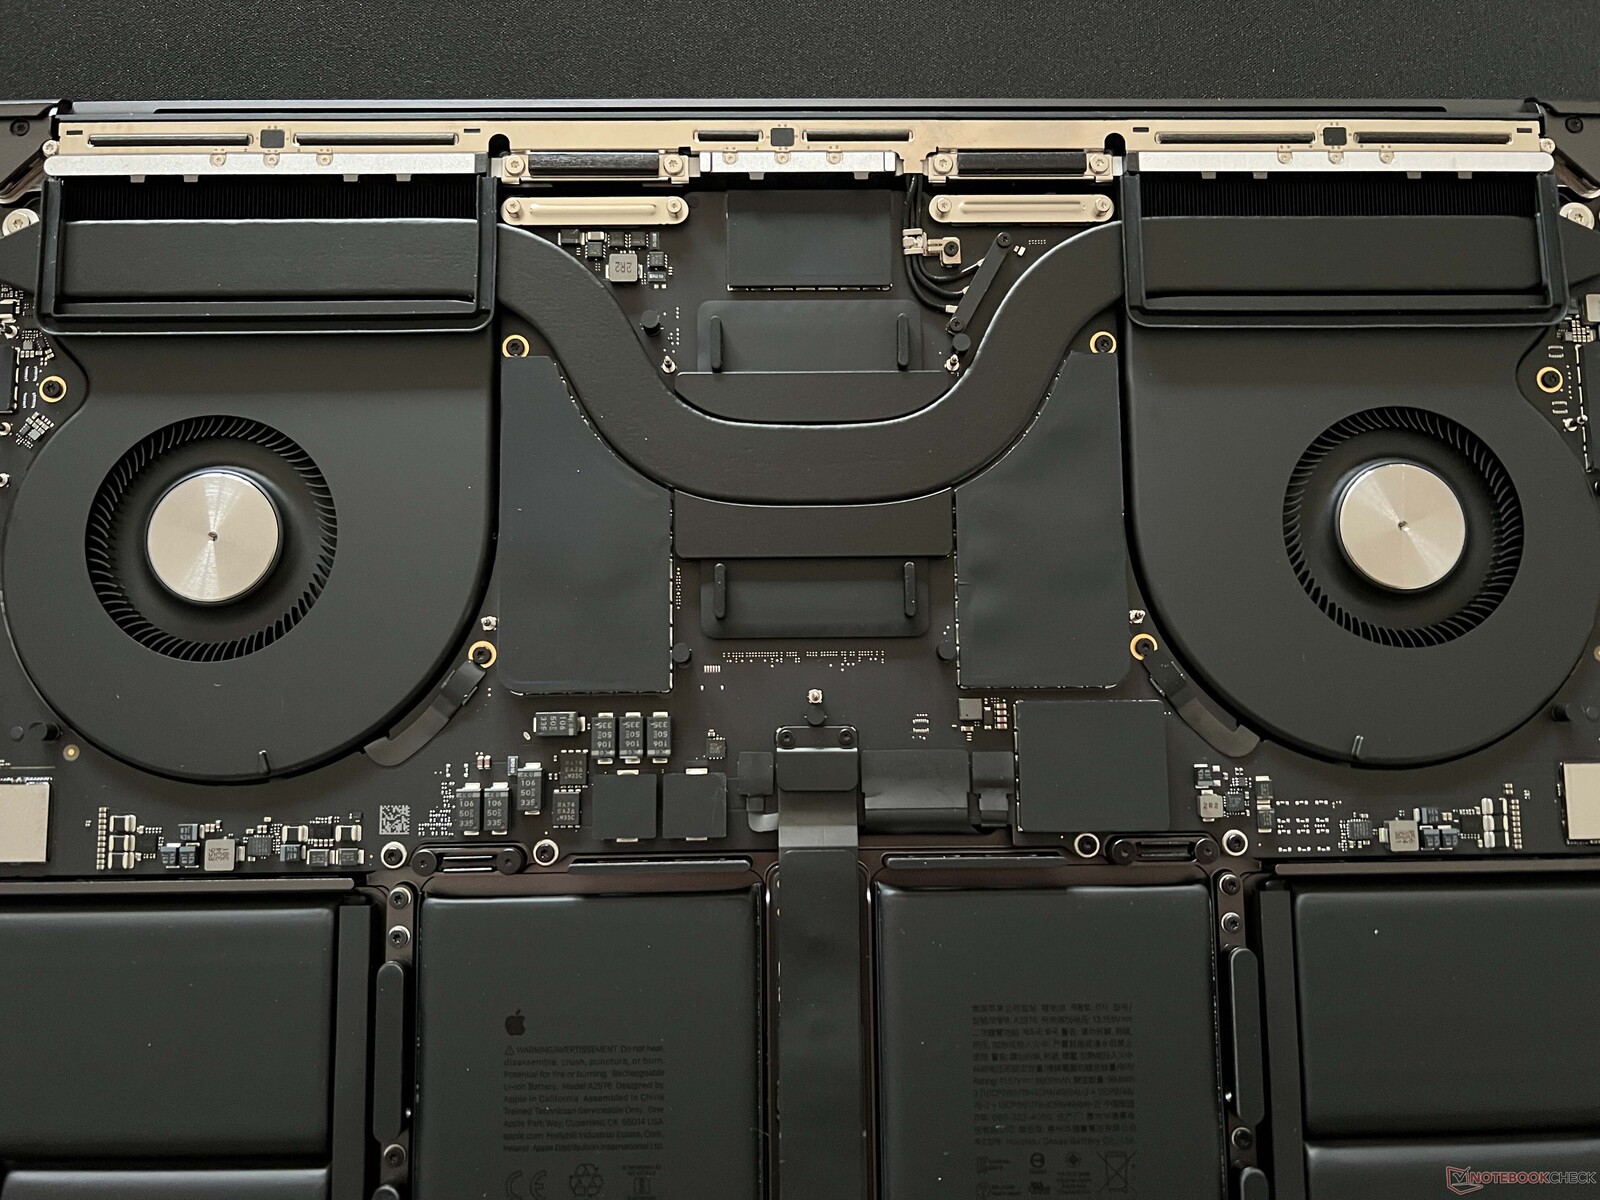
冷却解决方案仍然使用两个不同转速的大风扇。一个风扇的转速为 1350-5349 rpm,另一个为 1458-5777 rpm。MacBook Pro 在日常情况下通常是完全静音的,即使在编辑/导出小型视频项目时也听不到任何声音(如上文游戏基准测试的 1080p 视频)。
风扇转速平稳上升,高负载(游戏、压力测试)时,转速在 3600 转/分钟时可达 42.8 dB(A)。风扇噪音非常稳定,明显可闻,但并不扰人。在测试过程中,我们没有注意到更高的转速,只有在使用高性能模式时,风扇转速才会提高到 5600 rpm,从而产生 55.2 dB(A) 的巨大噪音。在低功率模式下,风扇转速会降至每分钟 1400 转,几乎听不到任何噪音(25.3 dB(A))。在一些基准测试中,我们偶尔会注意到线圈啸叫(25.5 dB(A))。
Noise level
| Idle |
| 23.7 / 23.7 / 23.7 dB(A) |
| Load |
| 40.8 / 42.8 dB(A) |
 | ||
30 dB silent 40 dB(A) audible 50 dB(A) loud |
||
min: | ||
| Apple MacBook Pro 16 2023 M3 Max M3 Max 40-Core GPU, Apple M3 Max 16-Core, Apple SSD AP8192Z | Apple MacBook Pro 16 2023 M2 Max M2 Max 38-Core GPU, M2 Max, Apple SSD AP2048Z | Razer Blade 16 Early 2023 GeForce RTX 4080 Laptop GPU, i9-13950HX, SSSTC CA6-8D1024 | Lenovo Yoga Pro 9 16-IRP G8 GeForce RTX 4060 Laptop GPU, i7-13705H, Samsung PM9A1 MZVL21T0HCLR | Asus ProArt Studiobook 16 OLED H7604 GeForce RTX 4070 Laptop GPU, i9-13980HX, Phison EM2804TBMTCB47 | Asus Zenbook Pro 16X UX7602BZ-MY005W GeForce RTX 4080 Laptop GPU, i9-13905H, Samsung PM9A1 MZVL22T0HBLB | Schenker XMG Pro 16 Studio (Mid 23) GeForce RTX 4070 Laptop GPU, i9-13900H, Samsung 990 Pro 1 TB | |
|---|---|---|---|---|---|---|---|
| Noise | 3% | -4% | -11% | -13% | -5% | -16% | |
| off / environment * (dB) | 23.7 | 23.9 -1% | 23 3% | 24.7 -4% | 24.5 -3% | 24.9 -5% | 25 -5% |
| Idle Minimum * (dB) | 23.7 | 23.9 -1% | 23 3% | 24.7 -4% | 24.5 -3% | 24.9 -5% | 26 -10% |
| Idle Average * (dB) | 23.7 | 23.9 -1% | 23 3% | 26.2 -11% | 24.5 -3% | 24.9 -5% | 29 -22% |
| Idle Maximum * (dB) | 23.7 | 23.9 -1% | 23.6 -0% | 26.2 -11% | 24.5 -3% | 24.9 -5% | 34 -43% |
| Load Average * (dB) | 40.8 | 36.6 10% | 39 4% | 39.7 3% | 47.6 -17% | 38 7% | 43 -5% |
| Witcher 3 ultra * (dB) | 42.8 | 35.1 18% | 51.6 -21% | 53.2 -24% | 55.9 -31% | 48 -12% | |
| Load Maximum * (dB) | 42.8 | 43.2 -1% | 51.3 -20% | 53.2 -24% | 56.7 -32% | 51 -19% | 48 -12% |
* ... smaller is better
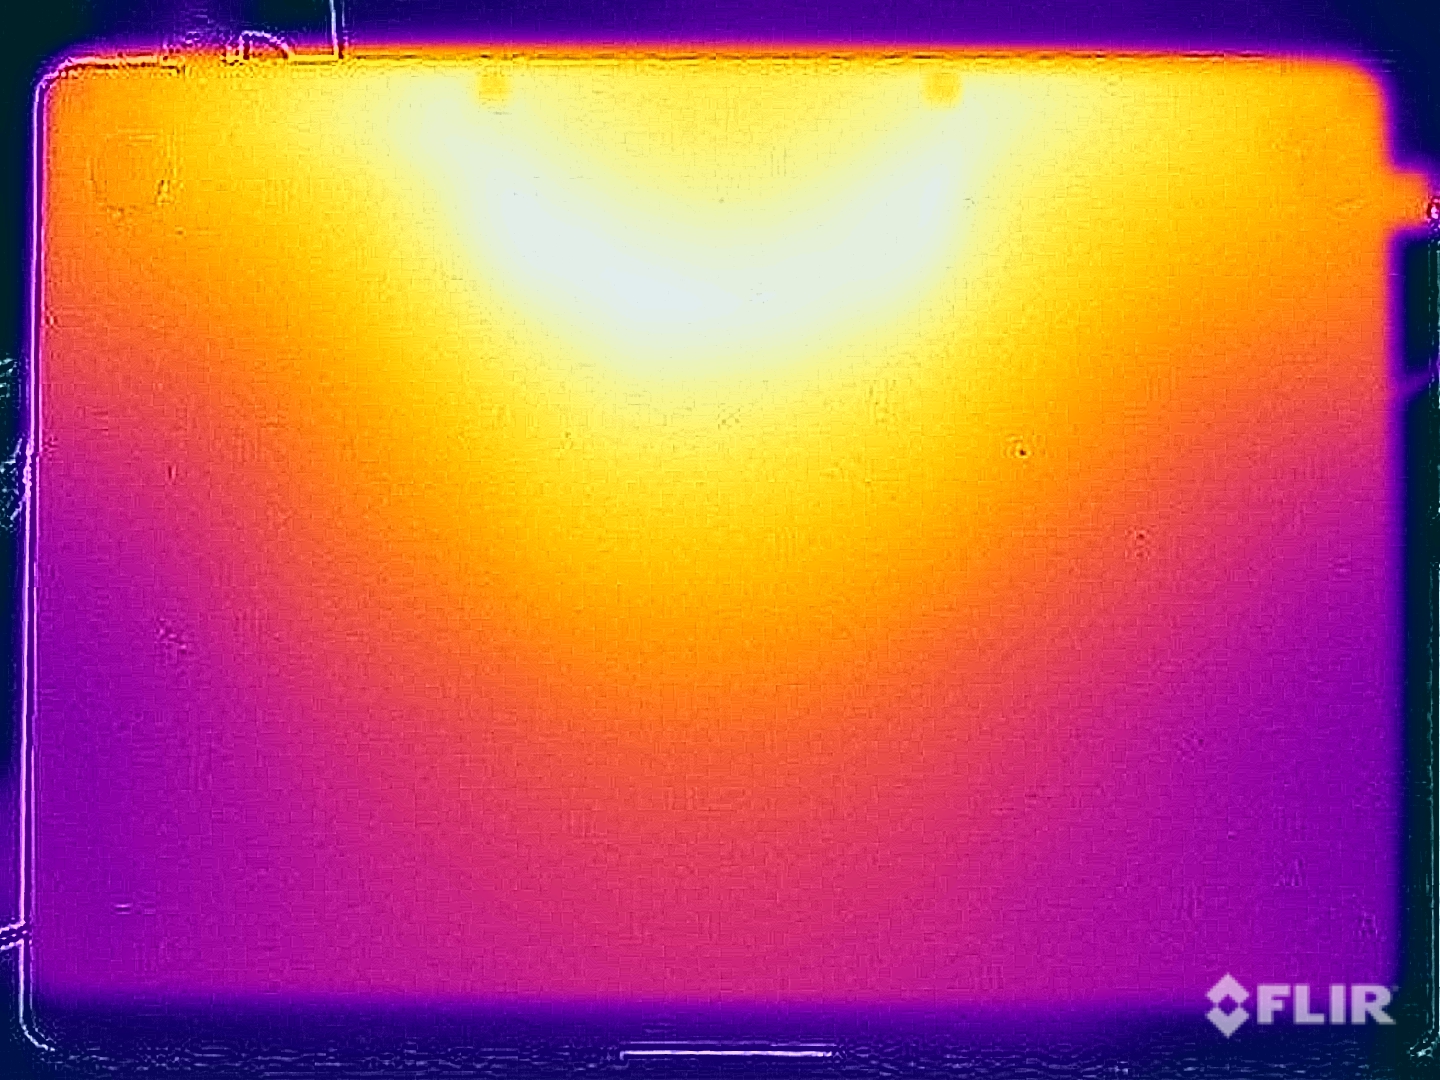
温度
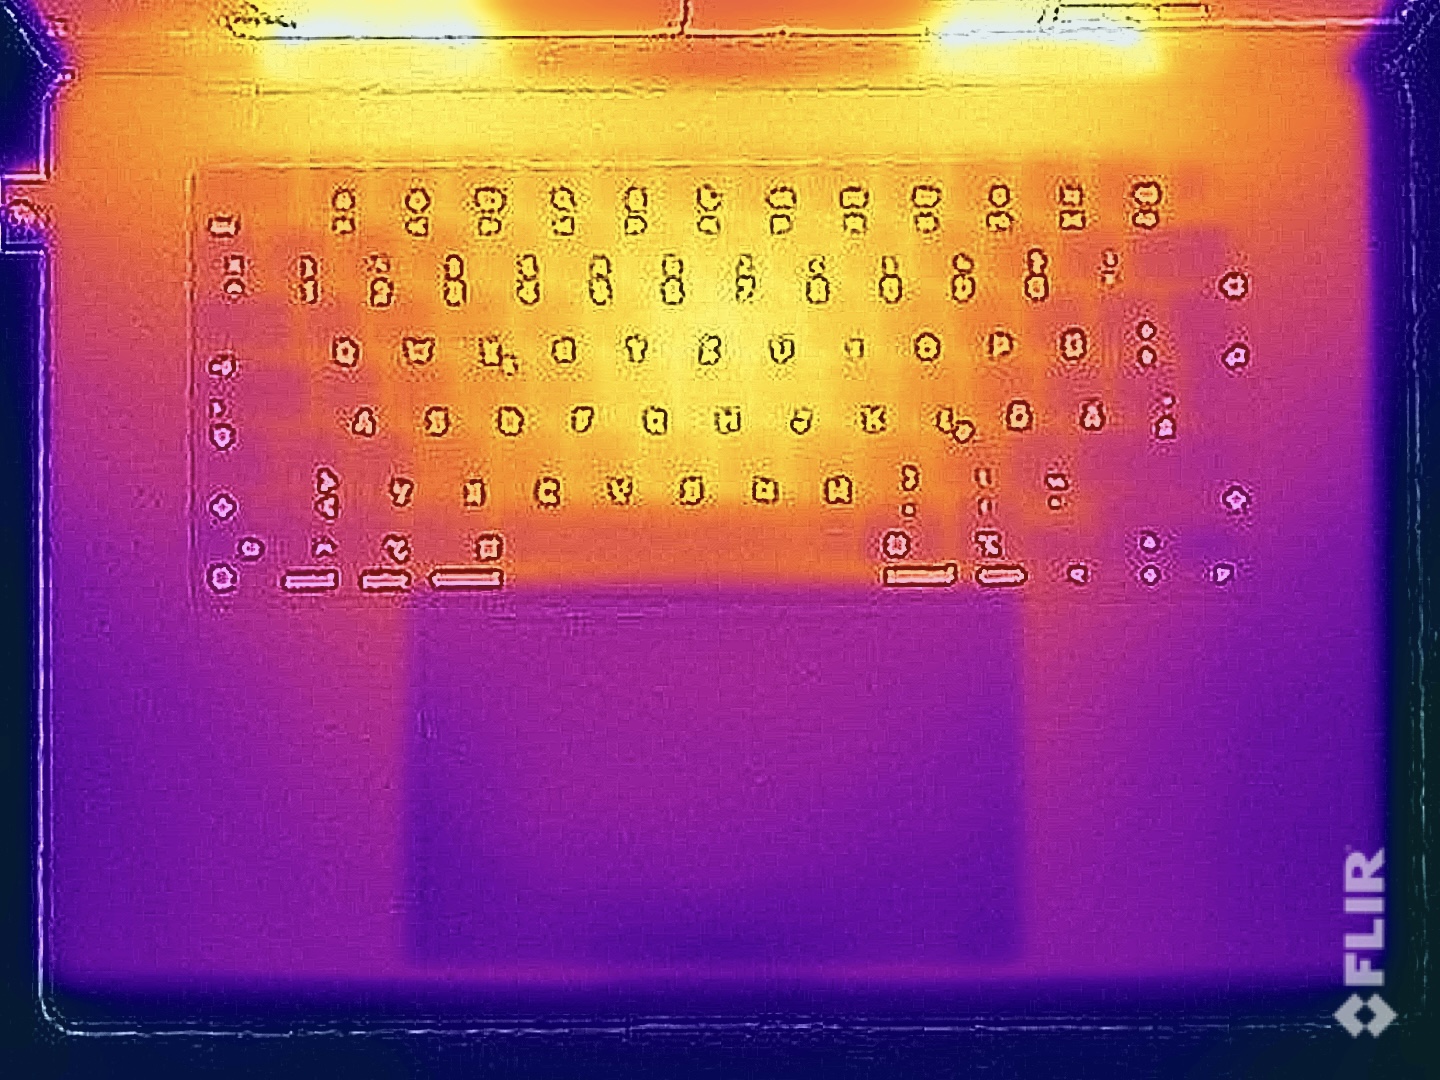
MacBook Pro 16 的表面温度完全不挑剔。在轻度工作负载下,机身温度其实并不高,我们只能在游戏和压力测试中测得 42 °C。键盘某些位置的温度也超过了 40 °C,但对打字没有任何限制,即使在最大负载情况下,你也可以将 MBP 16 舒适地放在膝盖上。在压力测试中,SoC 温度也相当低,仅为 78 °C。
(±) The maximum temperature on the upper side is 42.3 °C / 108 F, compared to the average of 36.8 °C / 98 F, ranging from 21 to 71 °C for the class Multimedia.
(±) The bottom heats up to a maximum of 42 °C / 108 F, compared to the average of 39.1 °C / 102 F
(+) In idle usage, the average temperature for the upper side is 22.4 °C / 72 F, compared to the device average of 31.3 °C / 88 F.
(±) Playing The Witcher 3, the average temperature for the upper side is 36.9 °C / 98 F, compared to the device average of 31.3 °C / 88 F.
(+) The palmrests and touchpad are cooler than skin temperature with a maximum of 30 °C / 86 F and are therefore cool to the touch.
(±) The average temperature of the palmrest area of similar devices was 28.7 °C / 83.7 F (-1.3 °C / -2.3 F).
| Apple MacBook Pro 16 2023 M3 Max Apple M3 Max 16-Core, Apple M3 Max 40-Core GPU | Apple MacBook Pro 16 2023 M2 Max Apple M2 Max, Apple M2 Max 38-Core GPU | Razer Blade 16 Early 2023 Intel Core i9-13950HX, NVIDIA GeForce RTX 4080 Laptop GPU | Lenovo Yoga Pro 9 16-IRP G8 Intel Core i7-13705H, NVIDIA GeForce RTX 4060 Laptop GPU | Asus ProArt Studiobook 16 OLED H7604 Intel Core i9-13980HX, NVIDIA GeForce RTX 4070 Laptop GPU | Schenker XMG Pro 16 Studio (Mid 23) Intel Core i9-13900H, NVIDIA GeForce RTX 4070 Laptop GPU | |
|---|---|---|---|---|---|---|
| Heat | -1% | -17% | -15% | -29% | -47% | |
| Maximum Upper Side * (°C) | 42.3 | 44.2 -4% | 40 5% | 41.6 2% | 44.1 -4% | 55 -30% |
| Maximum Bottom * (°C) | 42 | 42.9 -2% | 37.6 10% | 50 -19% | 48 -14% | 66 -57% |
| Idle Upper Side * (°C) | 22.5 | 22.4 -0% | 32.4 -44% | 26.8 -19% | 32.7 -45% | 33 -47% |
| Idle Bottom * (°C) | 22.9 | 22.3 3% | 31.4 -37% | 27.9 -22% | 34.9 -52% | 35 -53% |
* ... smaller is better
压力测试
在压力测试中,系统偏向于 GPU 性能,我们可以看到测试开始时的综合(CPU+GPU)功耗为 78 瓦。GPU 的功耗很快降到 37 瓦左右,但处理器的功耗在几分钟后降至 11 瓦,综合功耗约为 48 瓦。
发言人
6 扬声器系统与前代机型基本相同,仍然是笔记本电脑中最好的音频系统之一。不过,我们的音频分析表明,低音覆盖范围比以前稍差,但听不出差别。Windows 竞争对手也在缩小差距,而联想 Yoga Pro 9i 16的音响系统也差不了多少。
Apple MacBook Pro 16 2023 M3 Max audio analysis
(+) | speakers can play relatively loud (84.3 dB)
Bass 100 - 315 Hz
(±) | reduced bass - on average 5% lower than median
(+) | bass is linear (5.6% delta to prev. frequency)
Mids 400 - 2000 Hz
(+) | balanced mids - only 1.2% away from median
(+) | mids are linear (3.1% delta to prev. frequency)
Highs 2 - 16 kHz
(+) | balanced highs - only 2.4% away from median
(+) | highs are linear (2.4% delta to prev. frequency)
Overall 100 - 16.000 Hz
(+) | overall sound is linear (5.3% difference to median)
Compared to same class
» 1% of all tested devices in this class were better, 1% similar, 98% worse
» The best had a delta of 5%, average was 17%, worst was 45%
Compared to all devices tested
» 0% of all tested devices were better, 0% similar, 100% worse
» The best had a delta of 4%, average was 23%, worst was 134%
Apple MacBook Pro 16 2023 M2 Max audio analysis
(+) | speakers can play relatively loud (86.1 dB)
Bass 100 - 315 Hz
(+) | good bass - only 3.9% away from median
(+) | bass is linear (5.7% delta to prev. frequency)
Mids 400 - 2000 Hz
(+) | balanced mids - only 1.2% away from median
(+) | mids are linear (1.5% delta to prev. frequency)
Highs 2 - 16 kHz
(+) | balanced highs - only 2.5% away from median
(+) | highs are linear (1.7% delta to prev. frequency)
Overall 100 - 16.000 Hz
(+) | overall sound is linear (4.9% difference to median)
Compared to same class
» 0% of all tested devices in this class were better, 0% similar, 99% worse
» The best had a delta of 5%, average was 17%, worst was 45%
Compared to all devices tested
» 0% of all tested devices were better, 0% similar, 100% worse
» The best had a delta of 4%, average was 23%, worst was 134%
Lenovo Yoga Pro 9 16-IRP G8 audio analysis
(±) | speaker loudness is average but good (80.5 dB)
Bass 100 - 315 Hz
(+) | good bass - only 4.9% away from median
(±) | linearity of bass is average (9.1% delta to prev. frequency)
Mids 400 - 2000 Hz
(+) | balanced mids - only 3.2% away from median
(+) | mids are linear (6.5% delta to prev. frequency)
Highs 2 - 16 kHz
(+) | balanced highs - only 2.9% away from median
(+) | highs are linear (3% delta to prev. frequency)
Overall 100 - 16.000 Hz
(+) | overall sound is linear (8.4% difference to median)
Compared to same class
» 9% of all tested devices in this class were better, 2% similar, 89% worse
» The best had a delta of 5%, average was 17%, worst was 45%
Compared to all devices tested
» 2% of all tested devices were better, 1% similar, 97% worse
» The best had a delta of 4%, average was 23%, worst was 134%
能源管理 - 改进运行时间的 MBP 16
耗电量
新款 MacBook Pro 16 M3 Max 的最大闲置功耗略高于旧款 MBP 16M2 Max相比略高,但考虑到 SDR 亮度的提高,差异很小。负载情况下的功耗也略高一些,但在压力测试开始时,我们看到的极限功耗同样为 145 瓦,几分钟后将稳定在 130 瓦左右。因此,附带的 140 瓦电源适配器已经足够,但在负载情况下为电池充电的余量并不大。
| Off / Standby | |
| Idle | |
| Load |
|
Key:
min: | |
| Apple MacBook Pro 16 2023 M3 Max Apple M3 Max 16-Core, M3 Max 40-Core GPU, Apple SSD AP8192Z, Mini-LED, 3456x2234, 16" | Apple MacBook Pro 16 2023 M2 Max M2 Max, M2 Max 38-Core GPU, Apple SSD AP2048Z, Mini-LED, 3456x2234, 16.2" | Razer Blade 16 Early 2023 i9-13950HX, GeForce RTX 4080 Laptop GPU, SSSTC CA6-8D1024, IPS, 2560x1600, 16" | Lenovo Yoga Pro 9 16-IRP G8 i7-13705H, GeForce RTX 4060 Laptop GPU, Samsung PM9A1 MZVL21T0HCLR, Mini-LED, 3200x2000, 16" | Asus ProArt Studiobook 16 OLED H7604 i9-13980HX, GeForce RTX 4070 Laptop GPU, Phison EM2804TBMTCB47, OLED, 3200x2000, 16" | Schenker XMG Pro 16 Studio (Mid 23) i9-13900H, GeForce RTX 4070 Laptop GPU, Samsung 990 Pro 1 TB, IPS, 2560x1600, 16" | Average Apple M3 Max 40-Core GPU | Average of class Multimedia | |
|---|---|---|---|---|---|---|---|---|
| Power Consumption | -1% | -110% | -40% | -63% | -30% | 13% | 22% | |
| Idle Minimum * (Watt) | 5.2 | 5.2 -0% | 15.2 -192% | 10.9 -110% | 12.8 -146% | 8 -54% | 3.9 ? 25% | 5.66 ? -9% |
| Idle Average * (Watt) | 16.9 | 16.5 2% | 22.8 -35% | 22.6 -34% | 19.9 -18% | 12 29% | 14.4 ? 15% | 10.2 ? 40% |
| Idle Maximum * (Watt) | 17.2 | 16.8 2% | 49.8 -190% | 23.5 -37% | 20.3 -18% | 23 -34% | 14.7 ? 15% | 12.5 ? 27% |
| Load Average * (Watt) | 90.5 | 113 -25% | 121.2 -34% | 84.6 7% | 131.4 -45% | 94 -4% | 95.2 ? -5% | 65.2 ? 28% |
| Witcher 3 ultra * (Watt) | 109 | 92 16% | 242 -122% | 159.5 -46% | 196.5 -80% | 181.5 -67% | ||
| Load Maximum * (Watt) | 145.2 | 145 -0% | 273.7 -88% | 177.3 -22% | 246.8 -70% | 215 -48% | 123.4 ? 15% | 113.5 ? 22% |
* ... smaller is better
Power consumption Witcher 3 / Stress test
Power consumption with external screen
电池运行时间
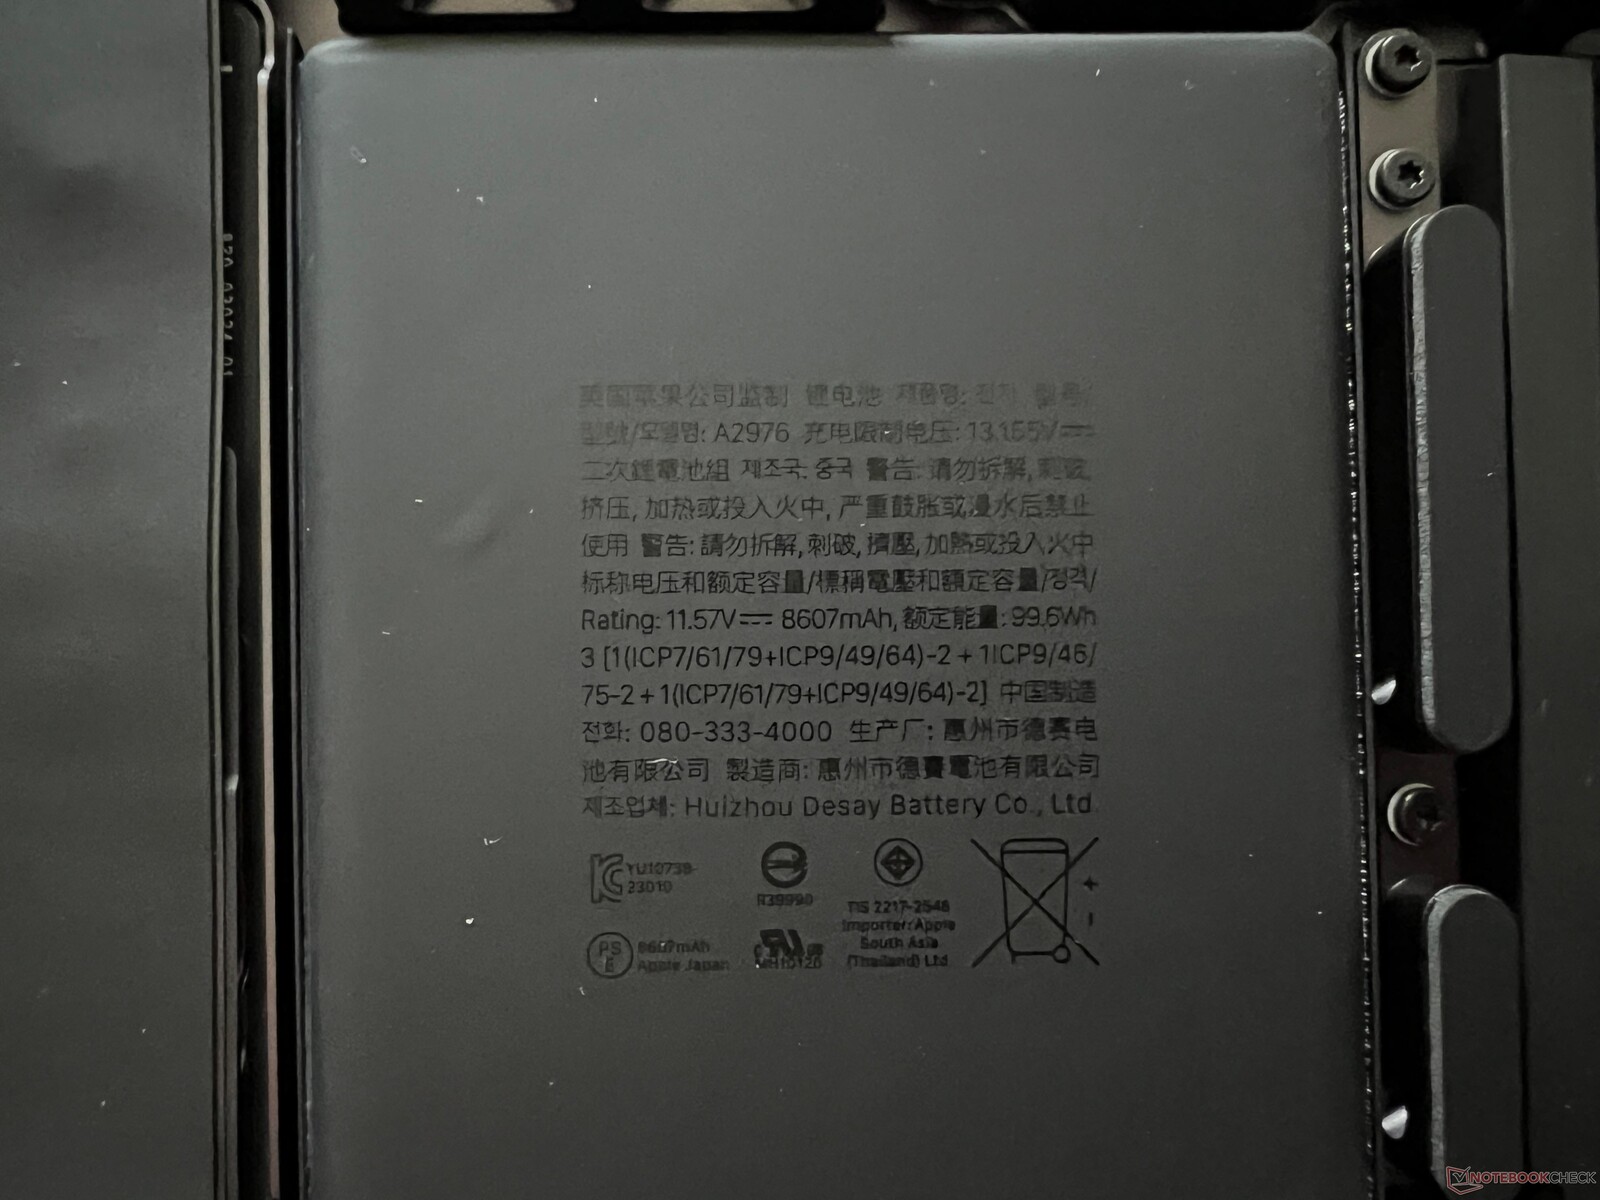
99.6 Wh 电池的大小没有变化,但Apple 设法改善了电池在大多数情况下的运行时间。在最大 SDR 亮度下进行的 Wi-Fi 测试中,我们只能看到一个下降的结果。由于亮度从 500 尼特提高到 600 尼特以上,运行时间减少了 20 分钟,但 06:45 小时的成绩仍然可观。在 150 尼特条件下进行的 Wi-Fi 测试结果要好得多,从上一代产品的 14:47 小时缩短至 16:39 小时。Windows 系统的直接竞争对手根本无法与之抗衡。在负载情况下,电池可在 70 分钟左右耗尽,但也能充分发挥性能。
150 尼特条件下的视频运行时间也从 18:44 小时增加到 20:21 小时,而最大亮度下的 HDR 视频将在电池耗尽前运行 05:40 小时。140 瓦电源适配器可在设备开机后约 1.5 小时内为电池充电;50 分钟后电池容量可达到 80%。
| psu | 20 % | 40 % | 50 % | 80 % | 100 % |
|---|---|---|---|---|---|
| 140 瓦特 | 11 分钟 | 23 分钟 | 28 分钟 | 50 分钟 | 88 分钟 |
| Apple MacBook Pro 16 2023 M3 Max Apple M3 Max 16-Core, M3 Max 40-Core GPU, 99.6 Wh | Apple MacBook Pro 16 2023 M2 Max M2 Max, M2 Max 38-Core GPU, 99.6 Wh | Razer Blade 16 Early 2023 i9-13950HX, GeForce RTX 4080 Laptop GPU, 95.2 Wh | Lenovo Yoga Pro 9 16-IRP G8 i7-13705H, GeForce RTX 4060 Laptop GPU, 75 Wh | Asus ProArt Studiobook 16 OLED H7604 i9-13980HX, GeForce RTX 4070 Laptop GPU, 90 Wh | Asus Zenbook Pro 16X UX7602BZ-MY005W i9-13905H, GeForce RTX 4080 Laptop GPU, 96 Wh | Schenker XMG Pro 16 Studio (Mid 23) i9-13900H, GeForce RTX 4070 Laptop GPU, 73 Wh | Average of class Multimedia | |
|---|---|---|---|---|---|---|---|---|
| Battery runtime | -9% | -23% | -56% | -48% | 24% | -59% | -1% | |
| H.264 (h) | 20.4 | 18.7 -8% | 7.5 -63% | 6 -71% | 17.1 ? -16% | |||
| WiFi v1.3 (h) | 16.7 | 14.8 -11% | 6.1 -63% | 6.4 -62% | 5.6 -66% | 7.9 -53% | 6.8 -59% | 12.2 ? -27% |
| Load (h) | 1.2 | 1.1 -8% | 1.4 17% | 0.7 -42% | 1.1 -8% | 2.4 100% | 1.664 ? 39% |
Pros
Cons
结论:MacBook Pro 16 的性能大幅提升得益于 M3 Max
新款 M3 Max 主要提升了 CPU 性能,效果确实不错。与 M2 Max 相比,多核性能提高了 60% 以上。 M2 Max多核性能比 M2 Max 提高了 60%,甚至明显优于英特尔的 H45 芯片和 AMD 的 HS 处理器(Zen4)。单核性能(+20%)也与英特尔 H45 CPU 不相上下。Apple 还提高了 GPU 性能,考虑到 60 瓦的最大功耗,结果也非常不错,但 Nvidia 的 GPU 肯定更快,至少在连接电源适配器时是这样。
在其他方面,MacBook Pro 16 再次成为一款出色的多媒体笔记本电脑,即使使用 M3 Max,由于采用了统一内存(GPU 也使用该内存),它几乎是视频编辑的完美机器。包括端口和输入设备在内的外壳没有任何变化,只有最大 SDR 亮度增加了Apple ,现在超过了 600 尼特。最大 HDR 亮度仍然非常高,与 Windows 相比,在 macOS 中执行 HDR 内容仍然要舒适得多。
配备 M3 Max 的 MacBook Pro 16 是Apple 最快的笔记本电脑,由于增加了 CPU 内核,CPU 性能大大提升。GPU 性能也更出色,Apple ,从而提高了效率,更长的电池续航时间也证明了这一点。MBP 16 仍然是市场上最好的多媒体笔记本电脑之一,也是整体性能最好的笔记本电脑,但这是有代价的。
新的 M3 SoC 更高效,因为Apple 设法改善了电池的运行时间。风扇在中等工作负荷时声音稍大,但最大风扇噪音基本相同。新的太空黑颜色看起来非常不错,不像小尺寸 MacBook Air 的午夜色那样容易沾染指纹,但你仍然需要不时地清洁它。
对手肯定在个别方面更胜一筹,但尤其是缺乏维护选项,再加上Apple 价格极高,无法获得更多内存和固态硬盘存储空间,这些都是主要缺点。尽管如此,对于多媒体用途或视频编辑来说,你很难找到一款更好的整体软件包。如果你想玩游戏,尤其是 AAA 级游戏,Apple 仍然不是最佳解决方案,但情况正在慢慢改善。原生游戏在Apple 硬件上运行得非常好,但选择非常有限。
由于 M2 Max 的 CPU 性能大幅提升,从 MBP 16 升级到 M3 Max 可能是一个选择,但对于M1 Max 老机型 的用户来说,或者在需要额外性能时从 M1/M2 Pro 升级到新的 MBP 16,M3 Max 可能更有吸引力。SDR 亮度的提高当然值得赞赏,但这并不能成为换机的理由。
Apple MacBook Pro 16 2023 M3 Max
- 11/08/2023 v7 (old)
Andreas Osthoff
Transparency
The selection of devices to be reviewed is made by our editorial team. The test sample was provided to the author as a loan by the manufacturer or retailer for the purpose of this review. The lender had no influence on this review, nor did the manufacturer receive a copy of this review before publication. There was no obligation to publish this review. As an independent media company, Notebookcheck is not subjected to the authority of manufacturers, retailers or publishers.
This is how Notebookcheck is testing
Every year, Notebookcheck independently reviews hundreds of laptops and smartphones using standardized procedures to ensure that all results are comparable. We have continuously developed our test methods for around 20 years and set industry standards in the process. In our test labs, high-quality measuring equipment is utilized by experienced technicians and editors. These tests involve a multi-stage validation process. Our complex rating system is based on hundreds of well-founded measurements and benchmarks, which maintains objectivity. Further information on our test methods can be found here.
Price comparison

