Radeon RX 6850M XT性能首次亮相。联想Legion 7 16ARHA7笔记本电脑评测
16英寸的Legion 7 16是联想推出的高端游戏笔记本电脑,以对比中档的 Legion 5系列或预算 IdeaPad游戏系列.这个最新的2022型号是一个完整的刷新,从 2021年版本修订的内部结构和新的机箱设计。
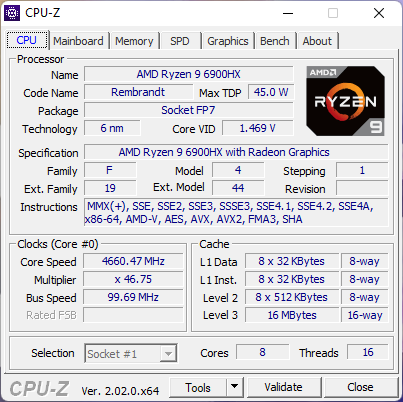
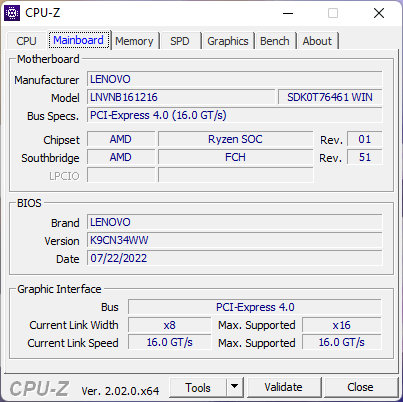
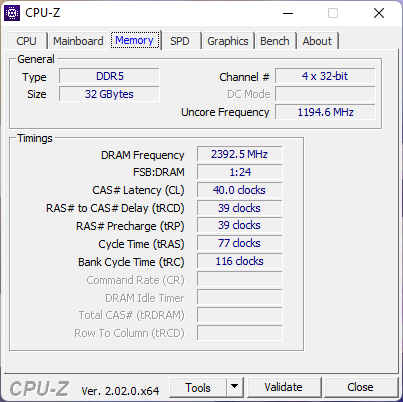
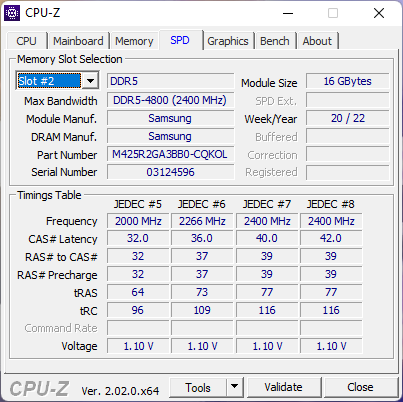
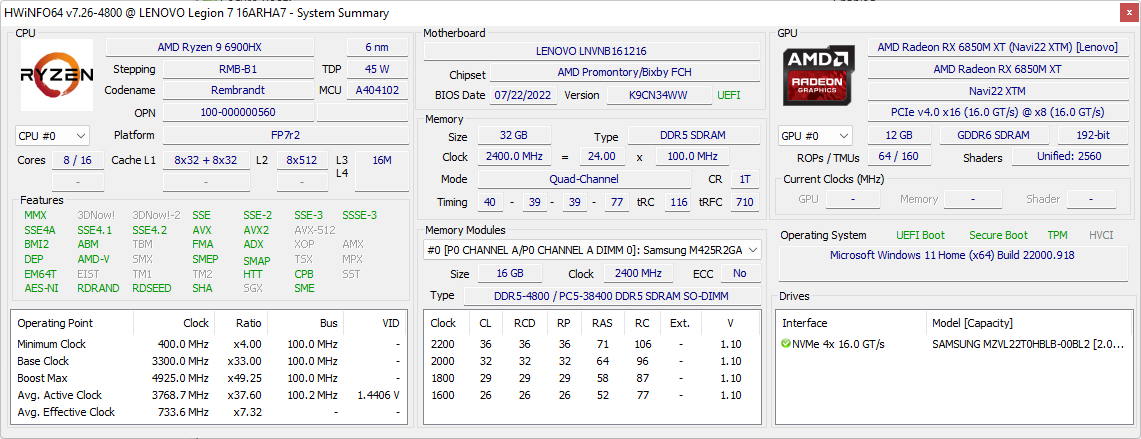
我们审查的配置配备了AMD Zen 3+ Ryzen 9 6900HX CPU,140 W Radeon RX 6850M XT GPU,32 GB DDR5-4800内存和1 TB PCIe4 x4 NVMe SSD,零售价约2600美元。配备Ryzen 7 6800H或Radeon RX 6700M的较少的SKU也是可用的,但所有选项都只配备相同的哑光2560 x 1600 165 Hz IPS显示屏。
Legion 7 16的替代品包括其他高端16英寸游戏笔记本电脑,如华硕ROG Zephyrus Duo 16或 HP Omen 16.然而,15.6英寸和17.3英寸的屏幕尺寸更为常见,因此我们也会将联想与一些高端的15.6英寸机型进行比较,如 微星GE66.
更多联想的评论。
潜在的竞争对手比较
Rating | Date | Model | Weight | Height | Size | Resolution | Price |
|---|---|---|---|---|---|---|---|
| 90.8 % v7 (old) | 09 / 2022 | Lenovo Legion 7 16ARHA7 R9 6900HX, Radeon RX 6850M XT | 2.6 kg | 19.4 mm | 16.00" | 2560x1600 | |
| 87.4 % v7 (old) | 06 / 2022 | MSI Raider GE66 12UHS i9-12900HK, GeForce RTX 3080 Ti Laptop GPU | 2.4 kg | 23.4 mm | 15.60" | 3840x2160 | |
| 87.9 % v7 (old) | 11 / 2022 | Lenovo Legion Slim 7-16IAH 82TF004YGE i7-12700H, GeForce RTX 3060 Laptop GPU | 2.2 kg | 16.9 mm | 16.00" | 2560x1600 | |
| 88.2 % v7 (old) | 05 / 2022 | Asus ROG Zephyrus Duo 16 GX650RX R9 6900HX, GeForce RTX 3080 Ti Laptop GPU | 2.6 kg | 20.5 mm | 16.00" | 3840x2400 | |
| 86 % v7 (old) | 04 / 2022 | HP Omen 16-c0077ng R7 5800H, Radeon RX 6600M | 2.3 kg | 26 mm | 16.10" | 2560x1440 | |
| 87.4 % v7 (old) | 08 / 2021 | Lenovo Legion 5 Pro 16ACH6H (82JQ001PGE) R7 5800H, GeForce RTX 3070 Laptop GPU | 2.6 kg | 26.85 mm | 16.00" | 2560x1600 |
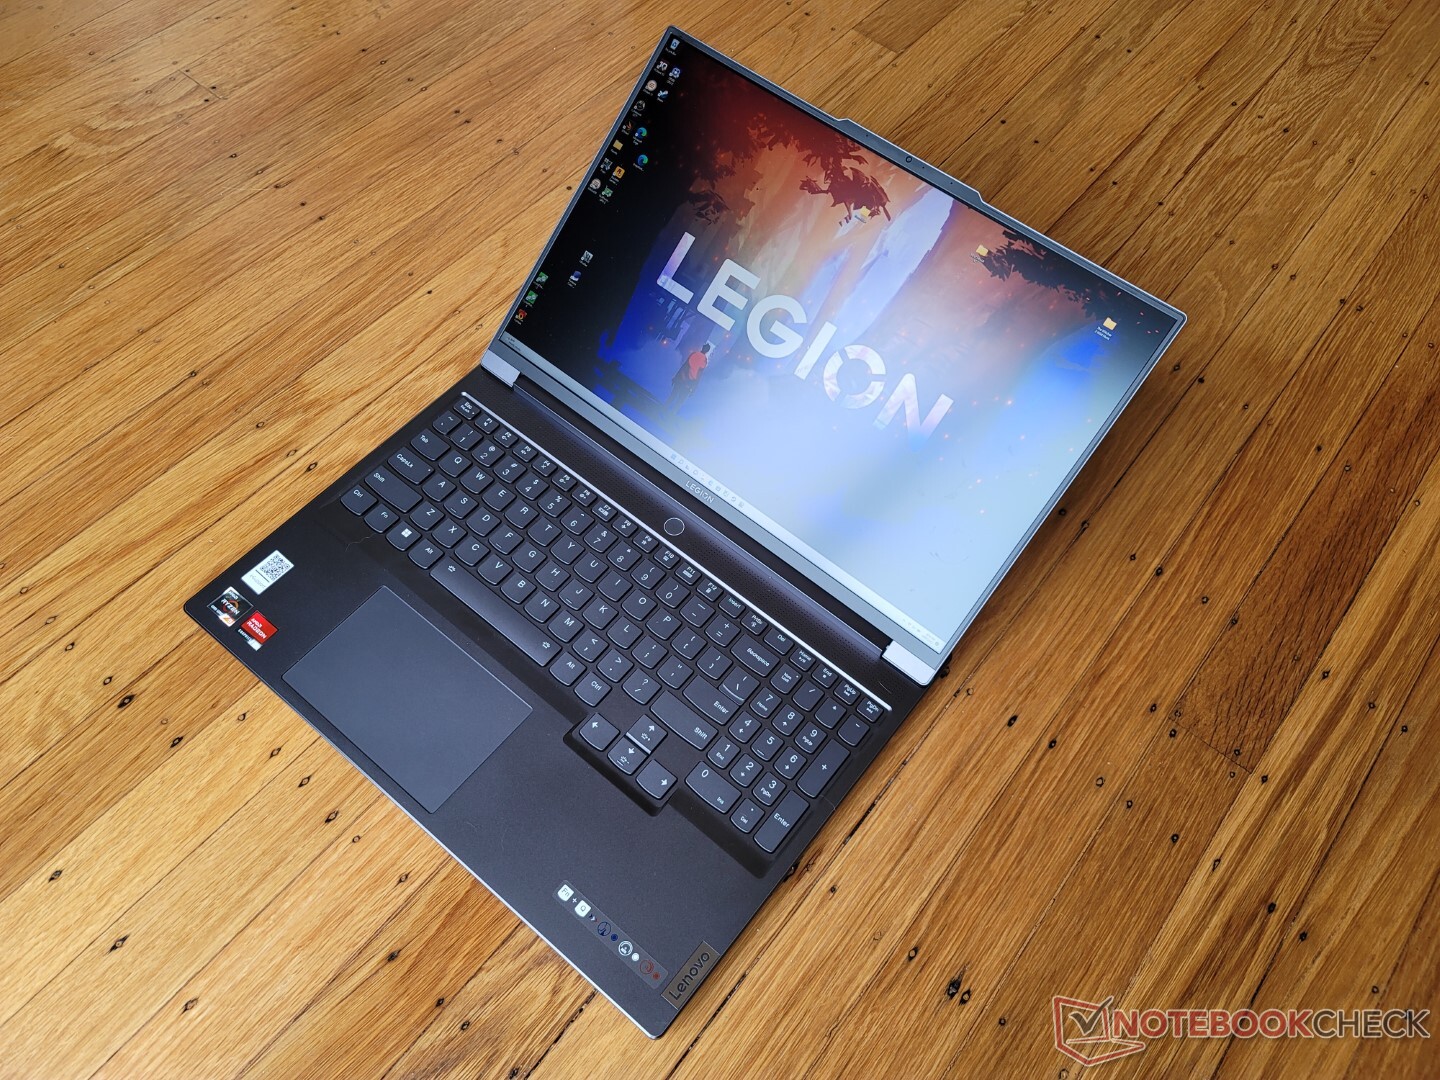
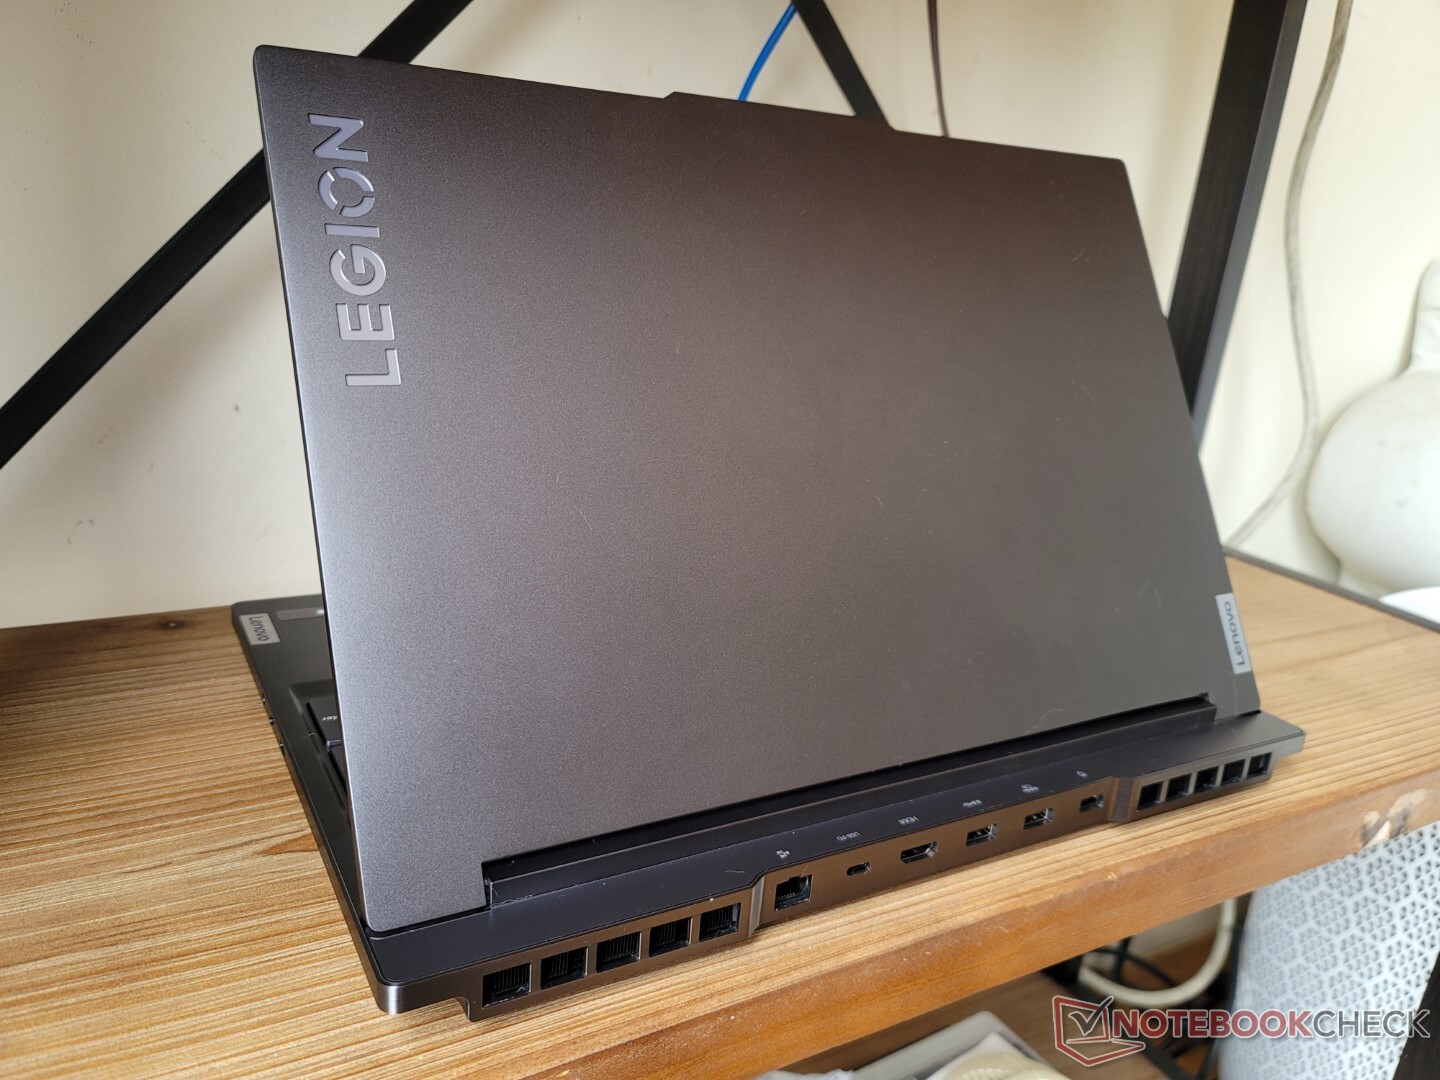
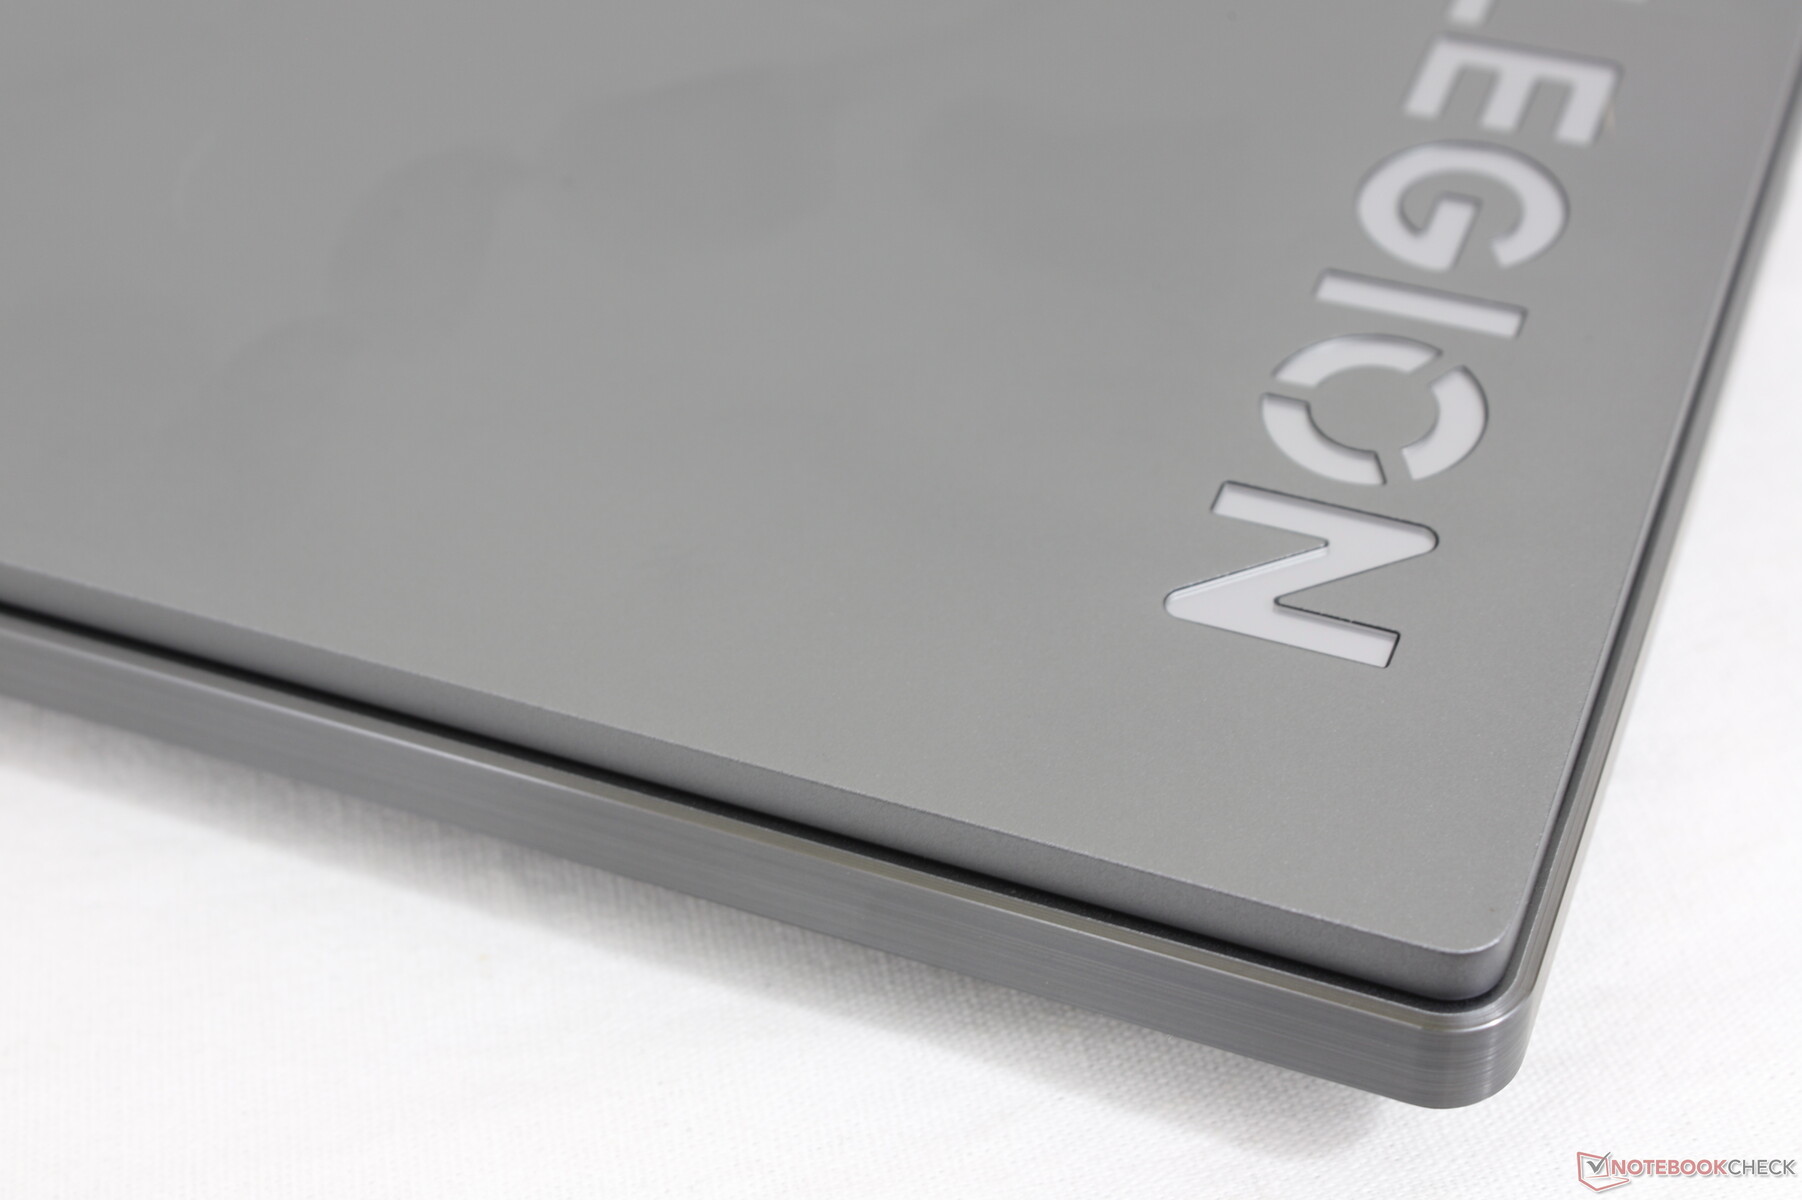
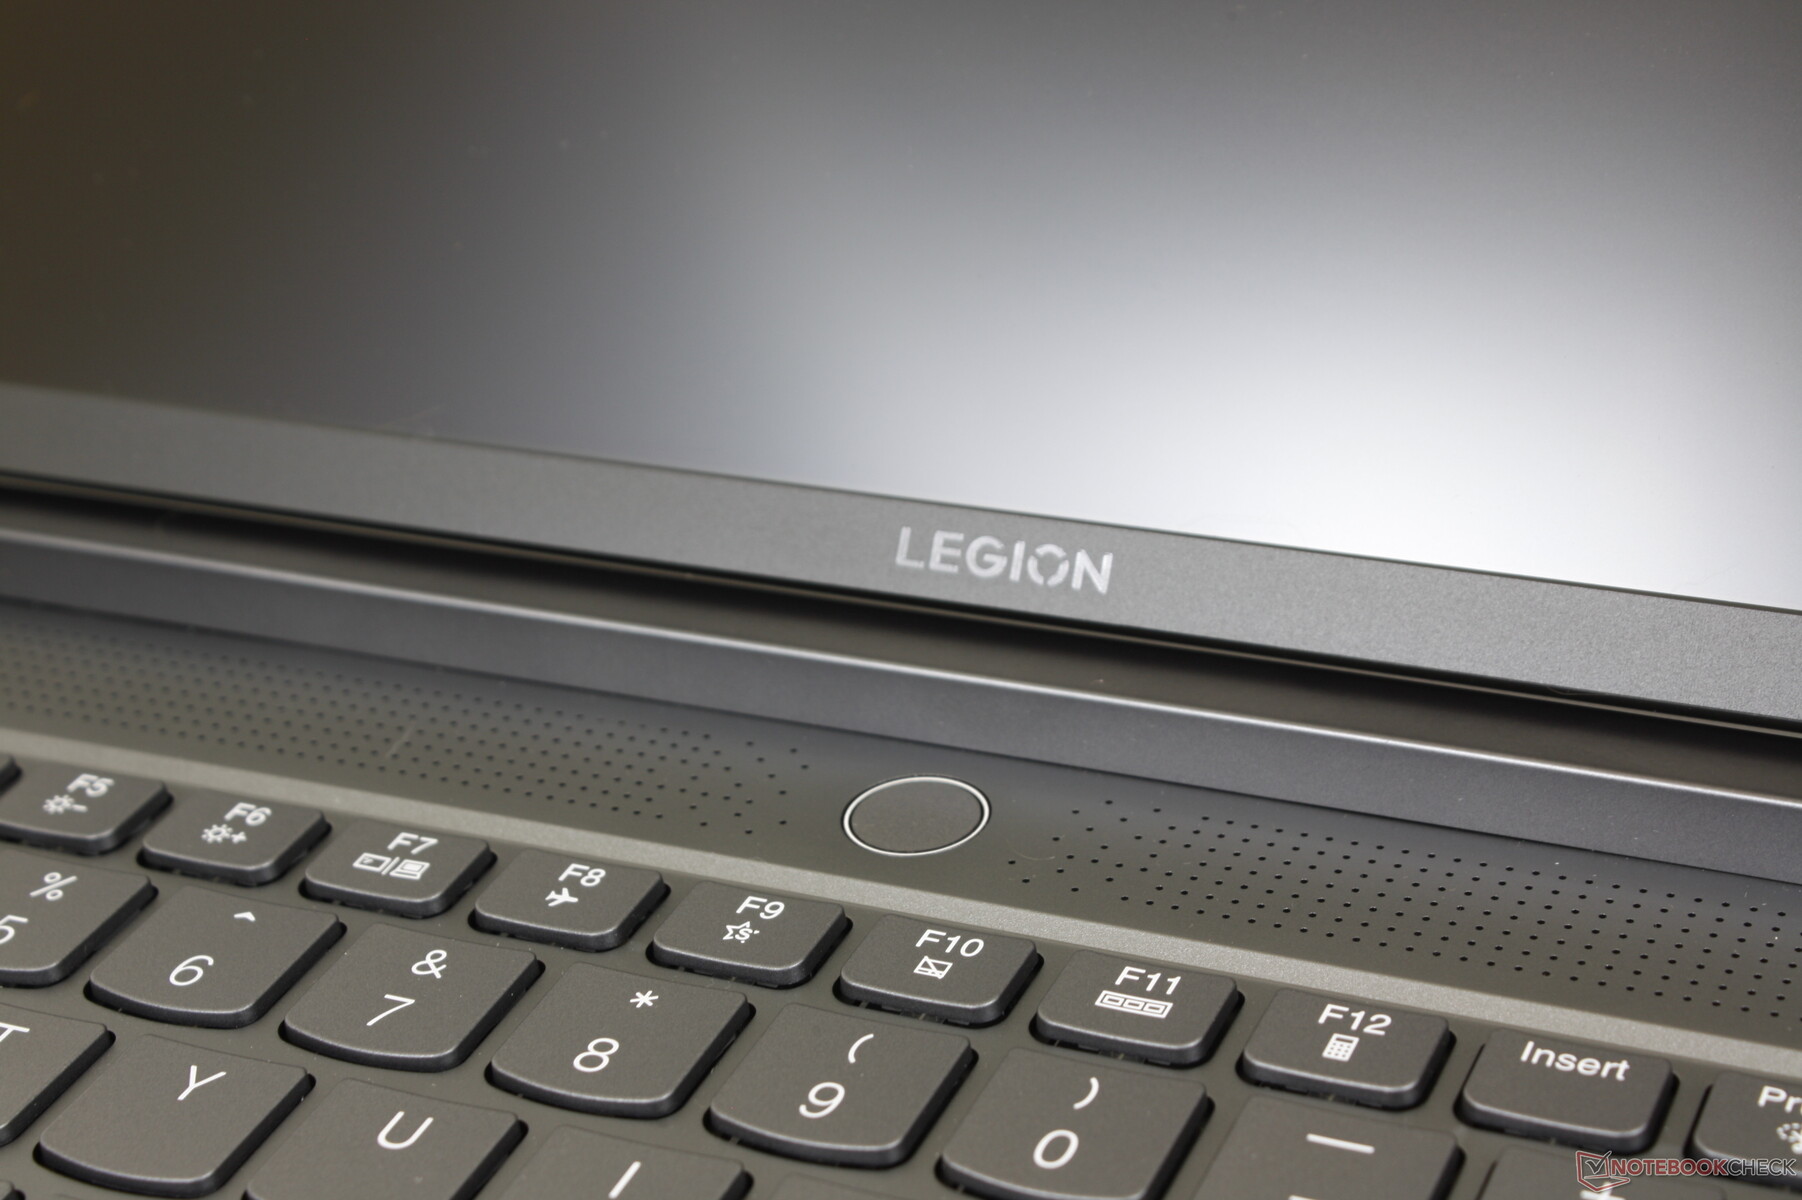
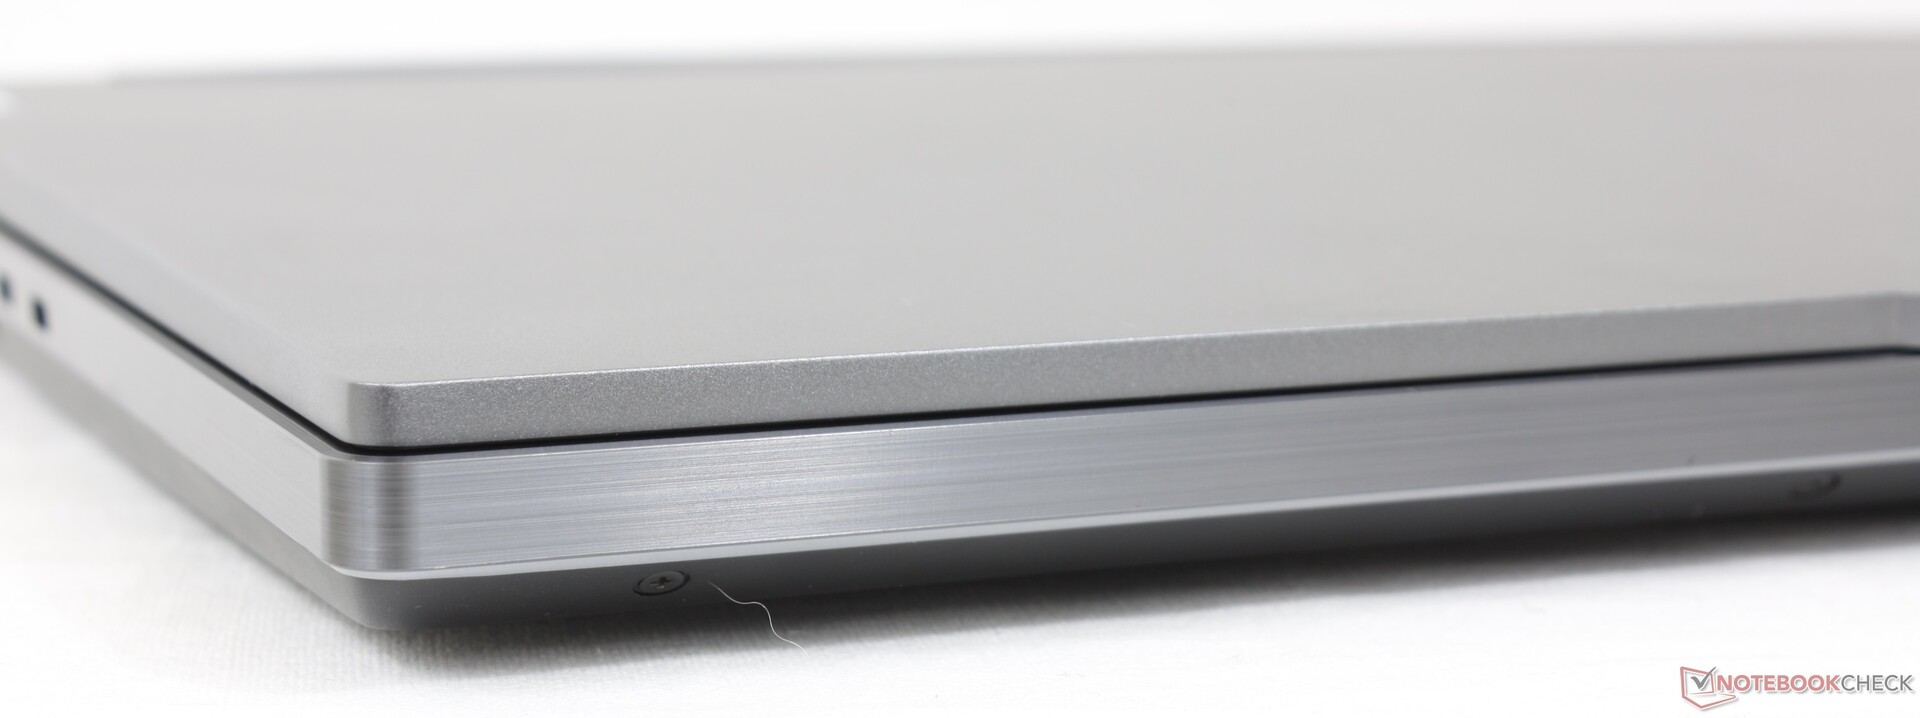
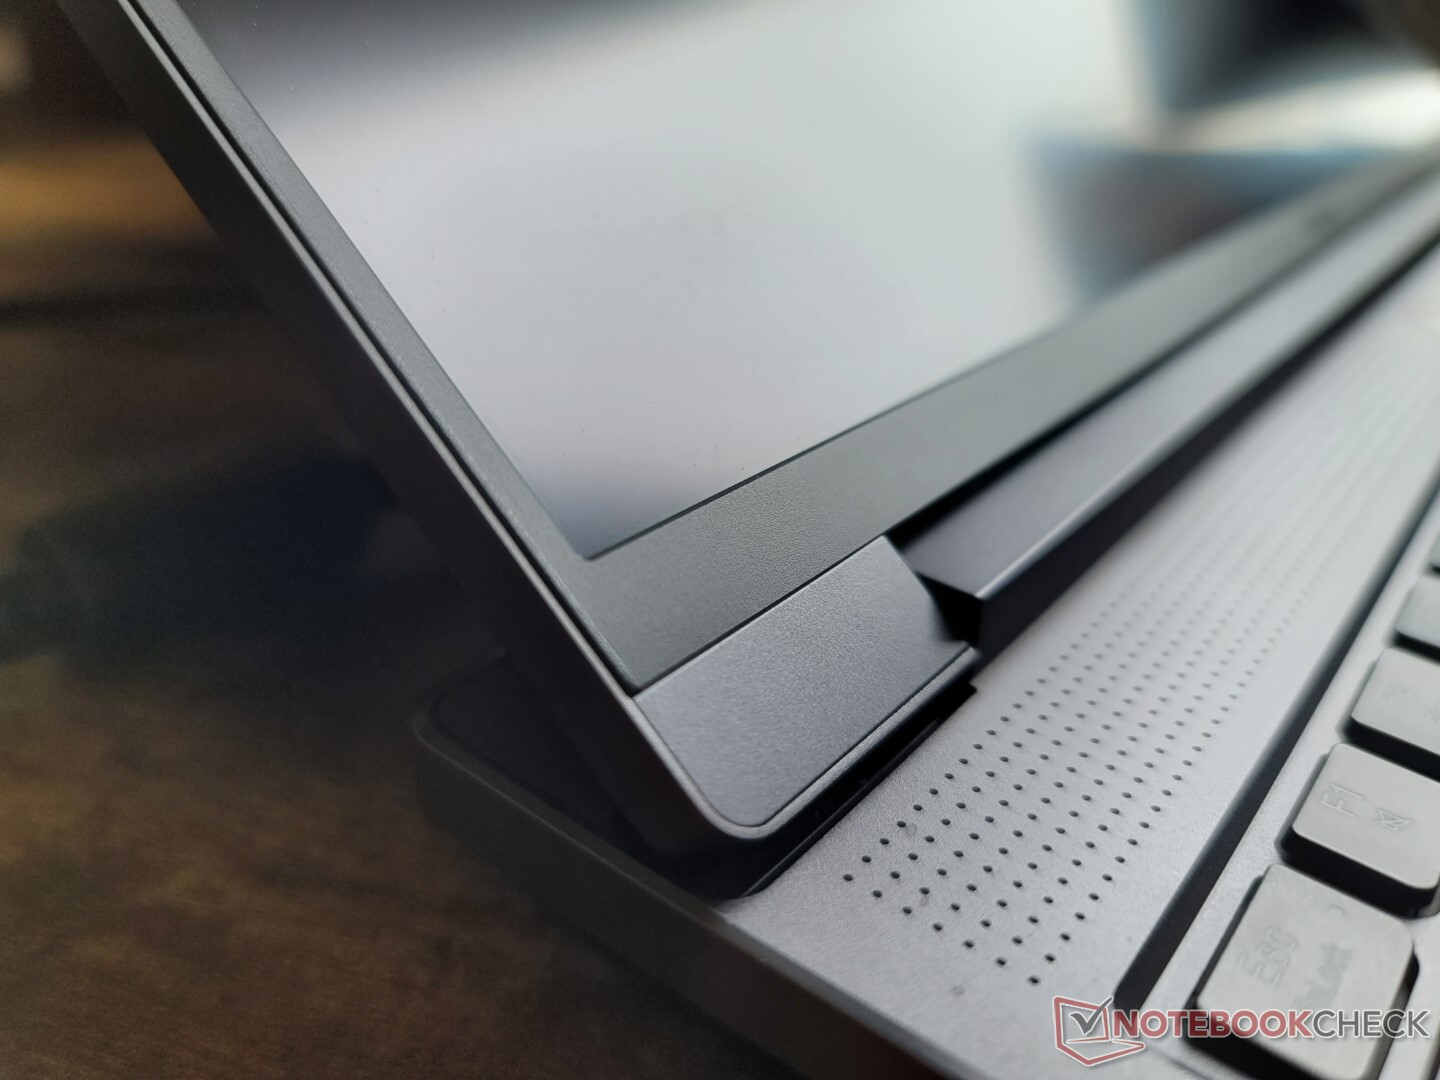
案例 - 专业外观
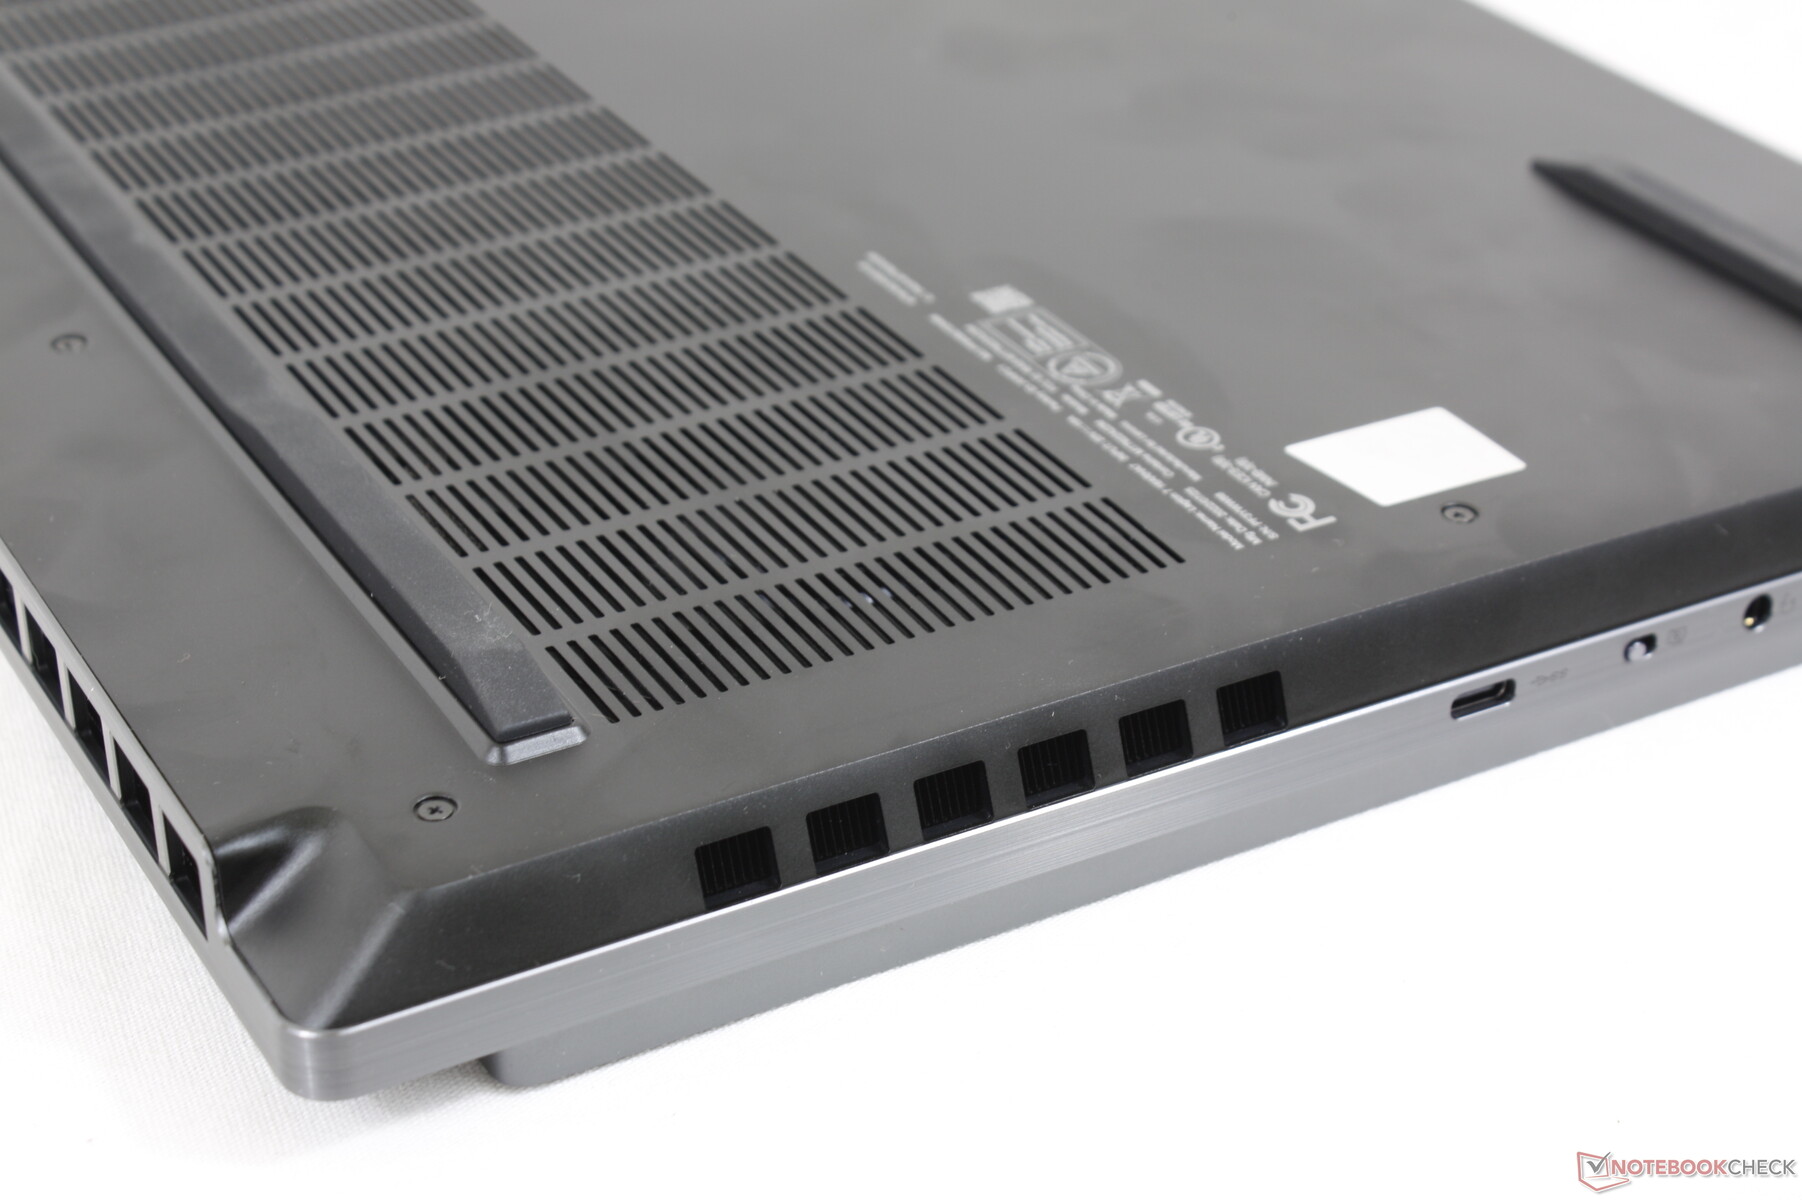
2022年的车型保留了2021年车型的阳极氧化铝材料和金属饰件,但有一些明显的变化。例如,沿着两侧的通风格栅现在是平齐的,而不是从边缘突出,看起来更干净。同时,车尾已被完全重新设计,转角更圆,视觉更流畅。2021年车型的LED功能保持不变,包括沿前缘和两侧的细灯条。当灯光关闭时,单调的深灰色外观很容易被认为是一个潜在的移动工作站或Nvidia Studio模型。
就质量而言,底座是刚性的,即使在对键盘中心施加压力时,也能很好地防止任何扭曲或凹陷。然而,盖子和铰链较弱,随着时间的推移更容易受到损害。盖子的扭曲比Razer Blade 15的盖子更容易发生。 雷蛇刀片15而铰链在调整角度时容易摇晃。
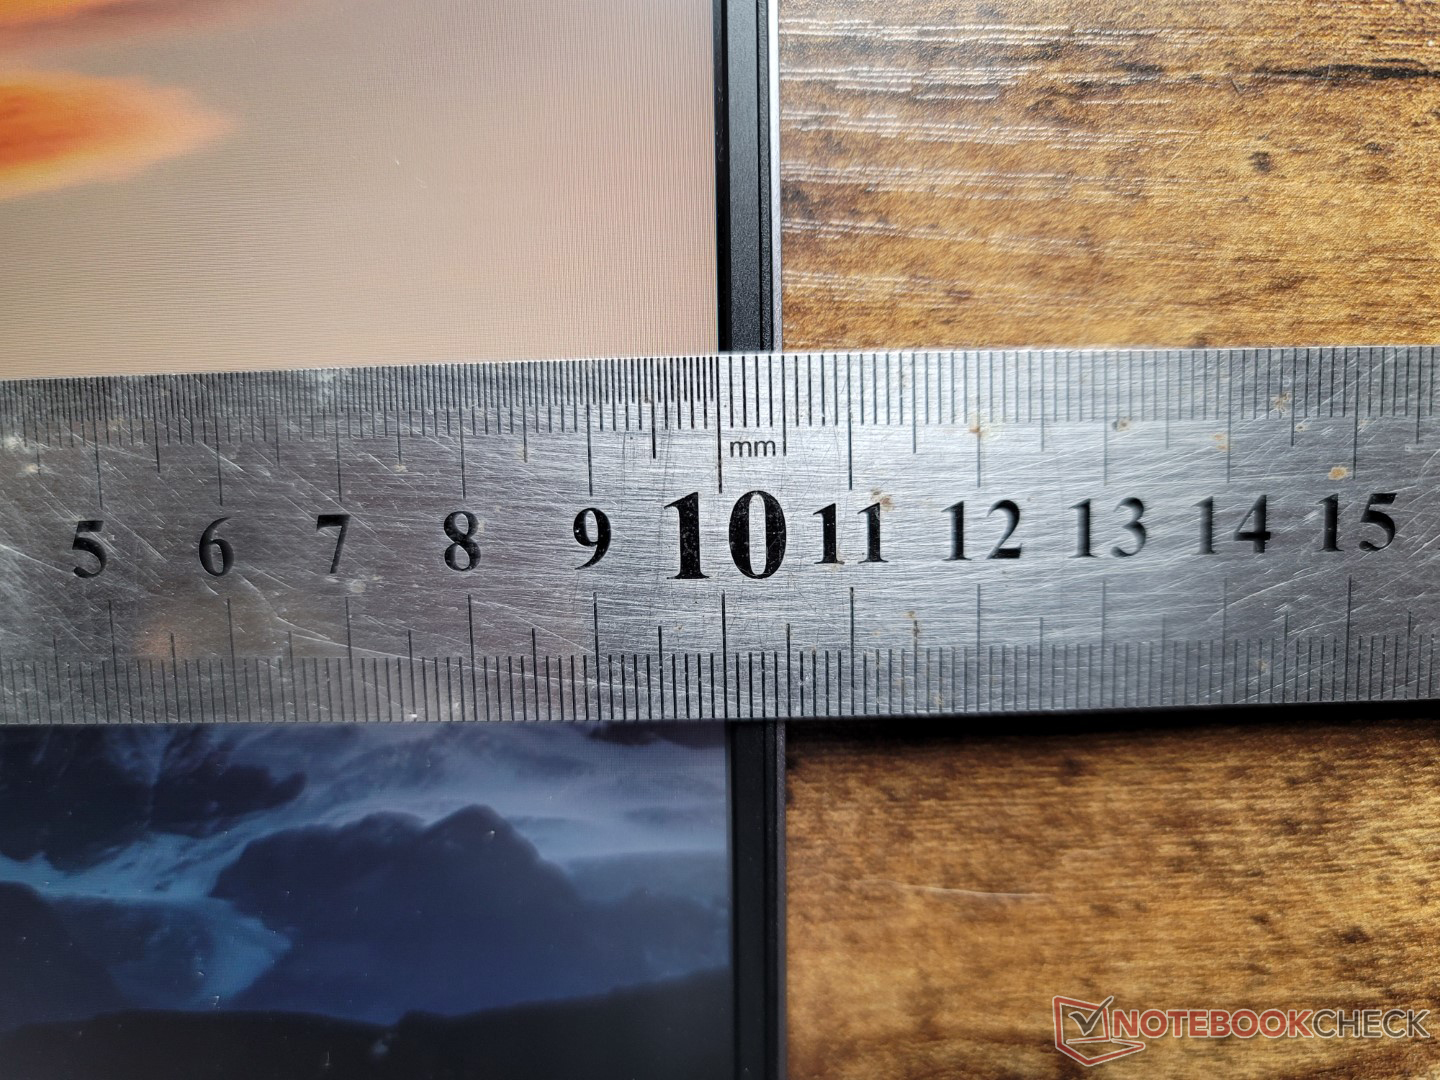
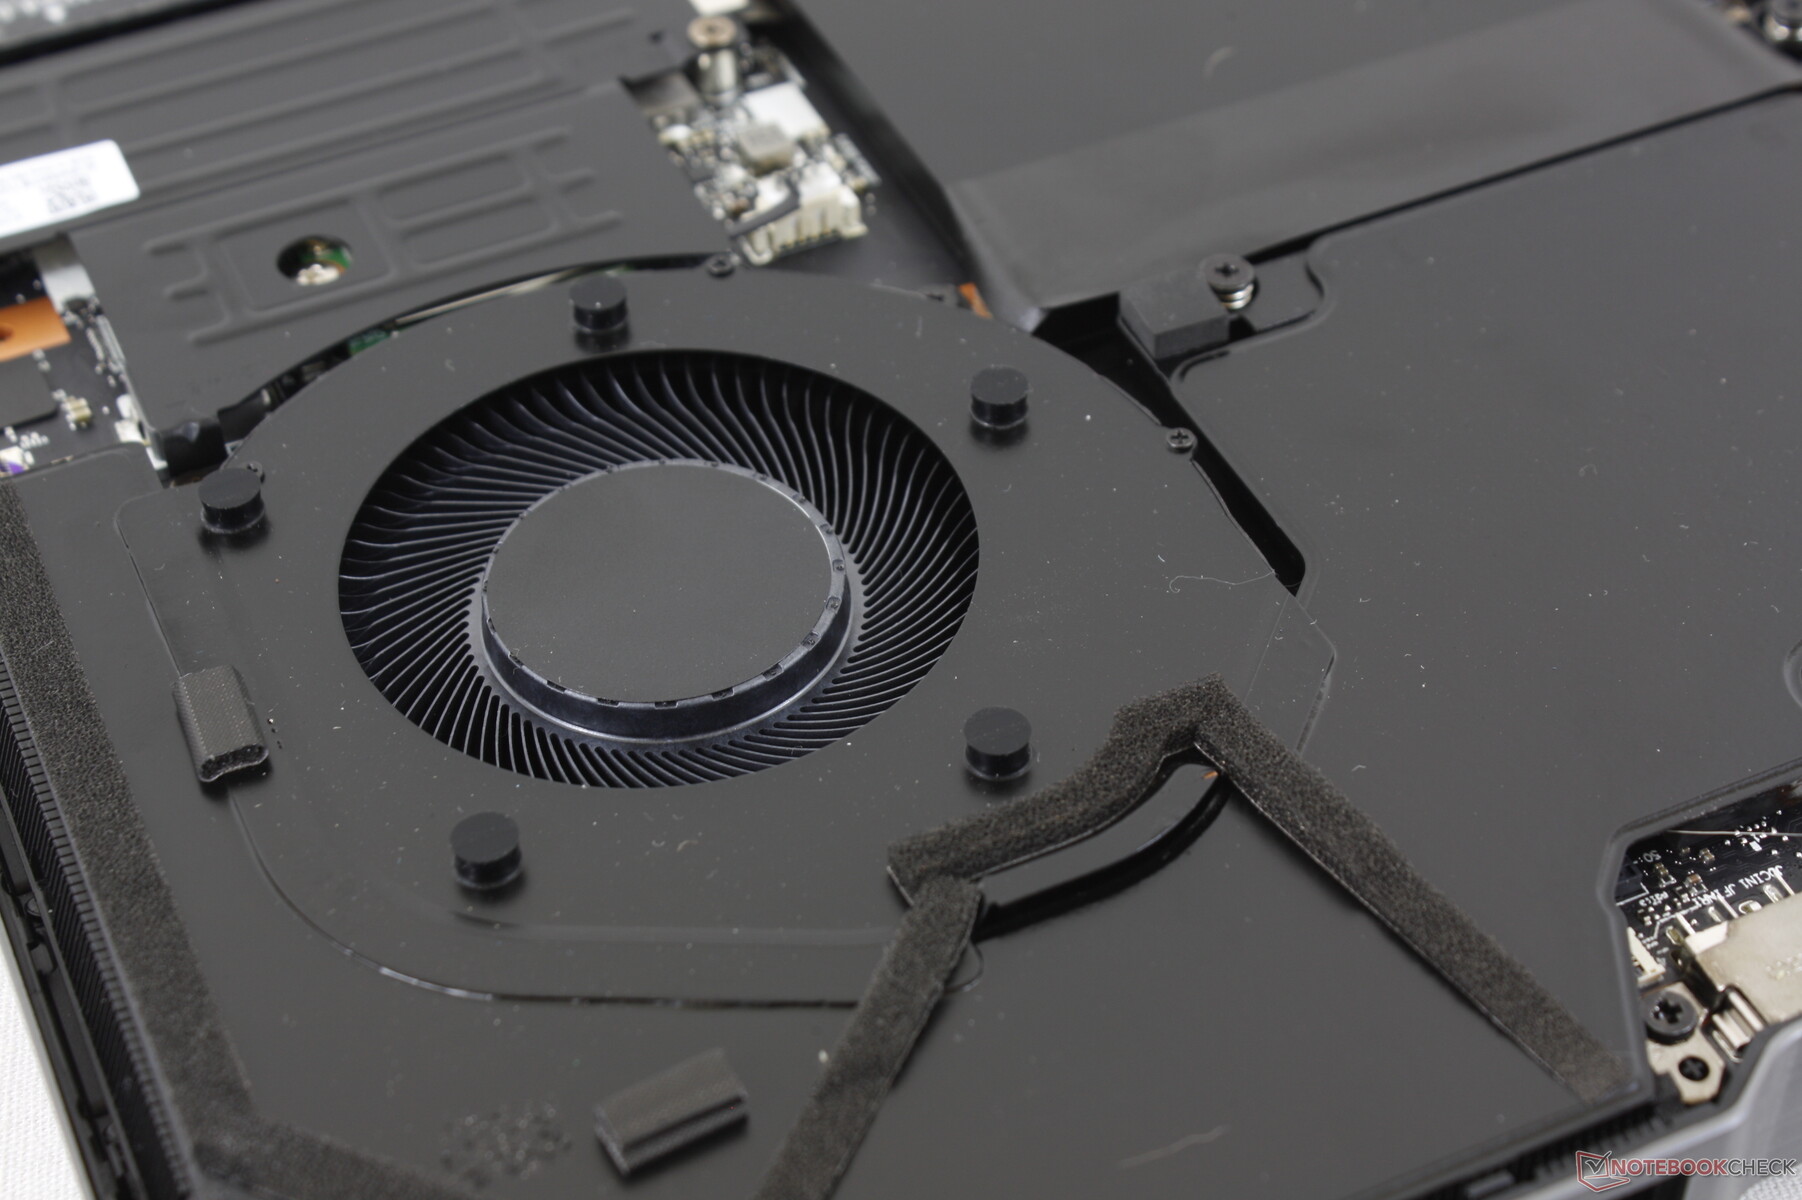
整体尺寸和重量与华硕ROG Zephyrus Duo 16非常接近,成为市场上较重的游戏笔记本电脑之一,尽管其外形尺寸薄<20毫米。也许最值得注意的是,华硕系统能够整合第二个屏幕,而不需要比我们的联想更重或更大。军团非常密集的感觉可以归因于它的蒸汽室冷却解决方案,这在传统上比通常的铜热管更重。
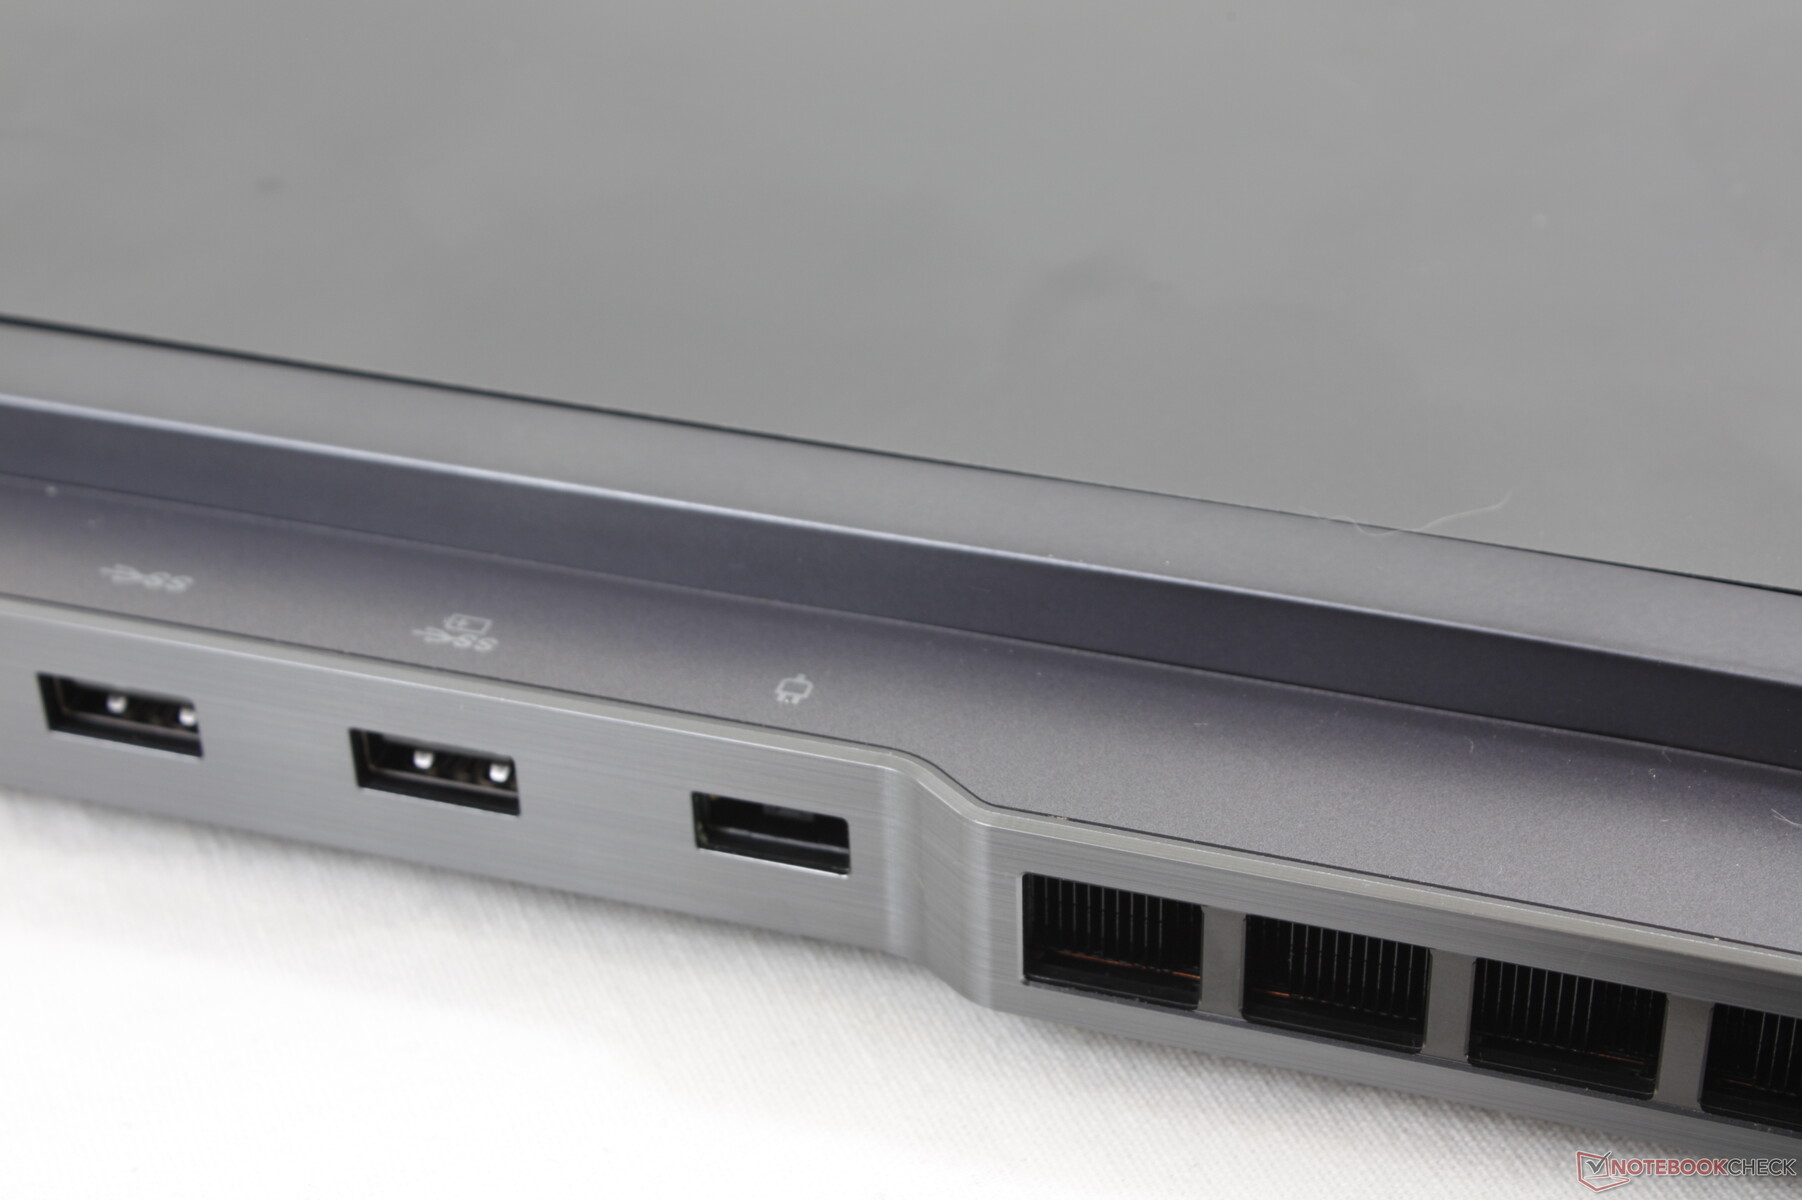
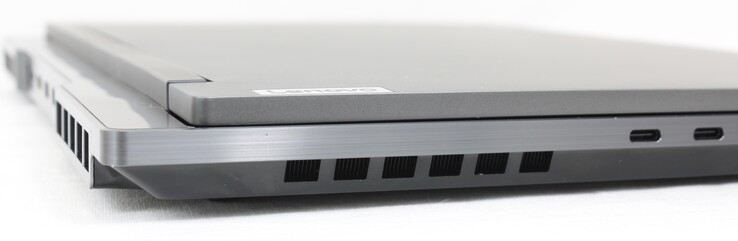
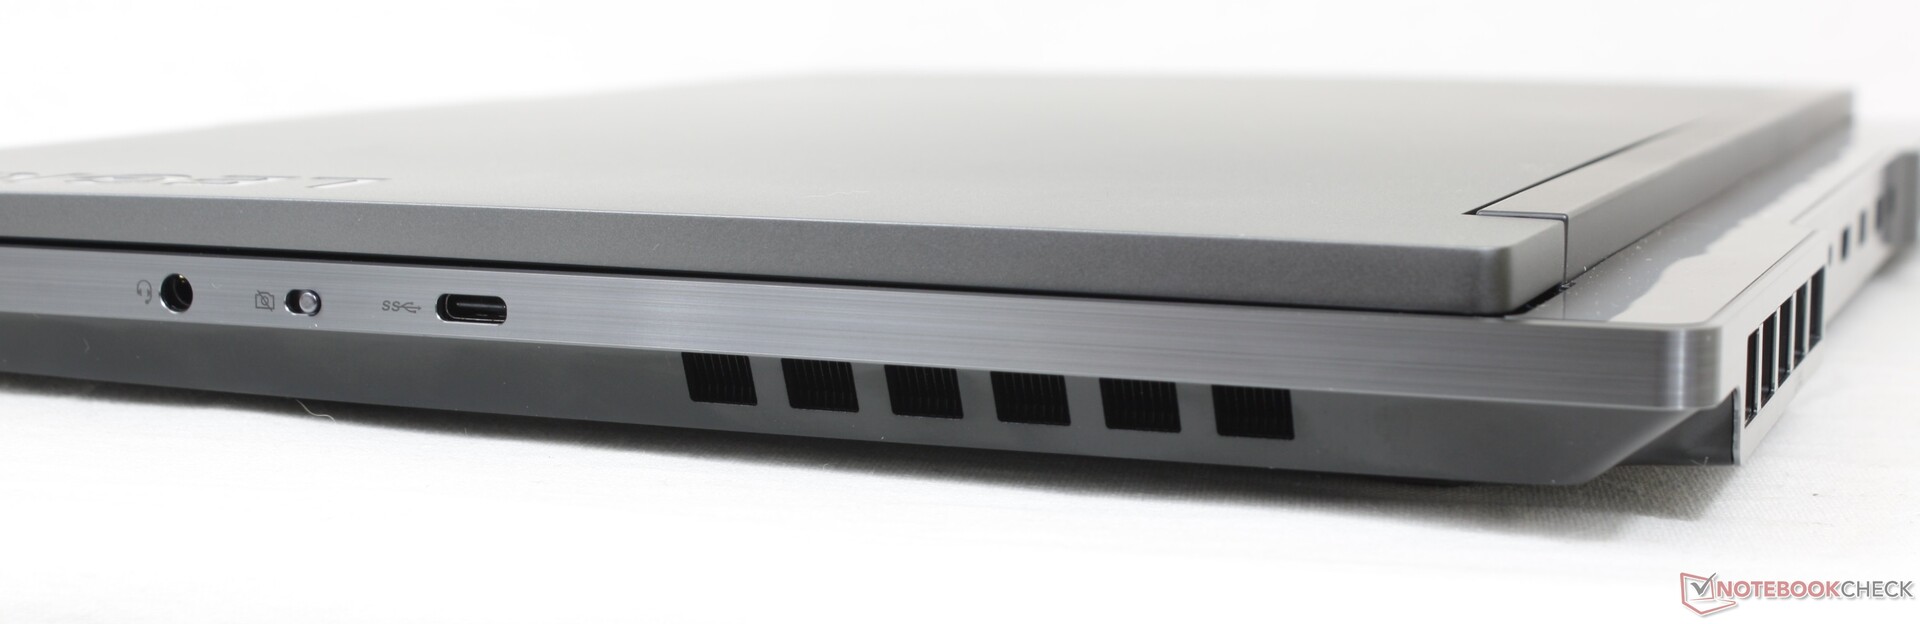
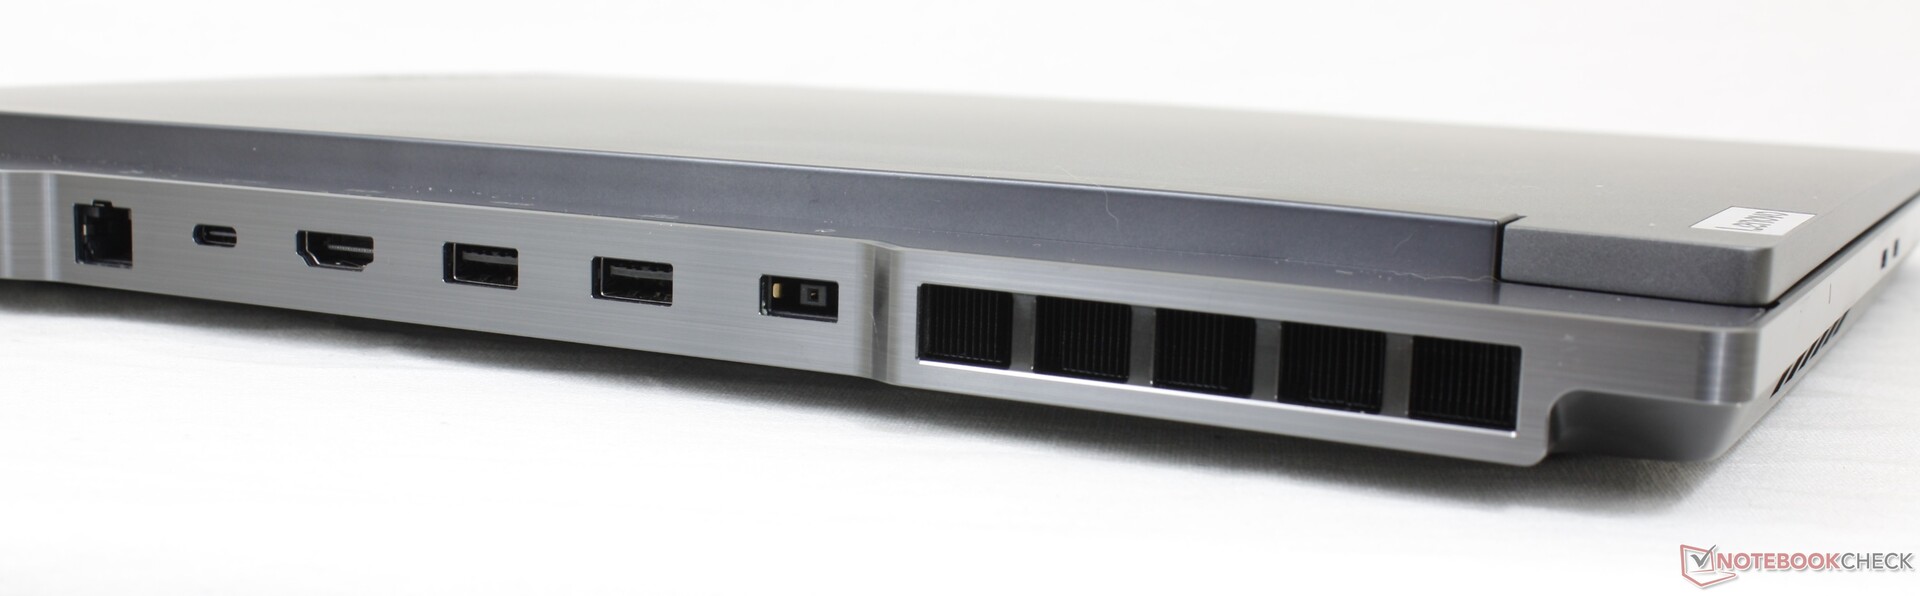
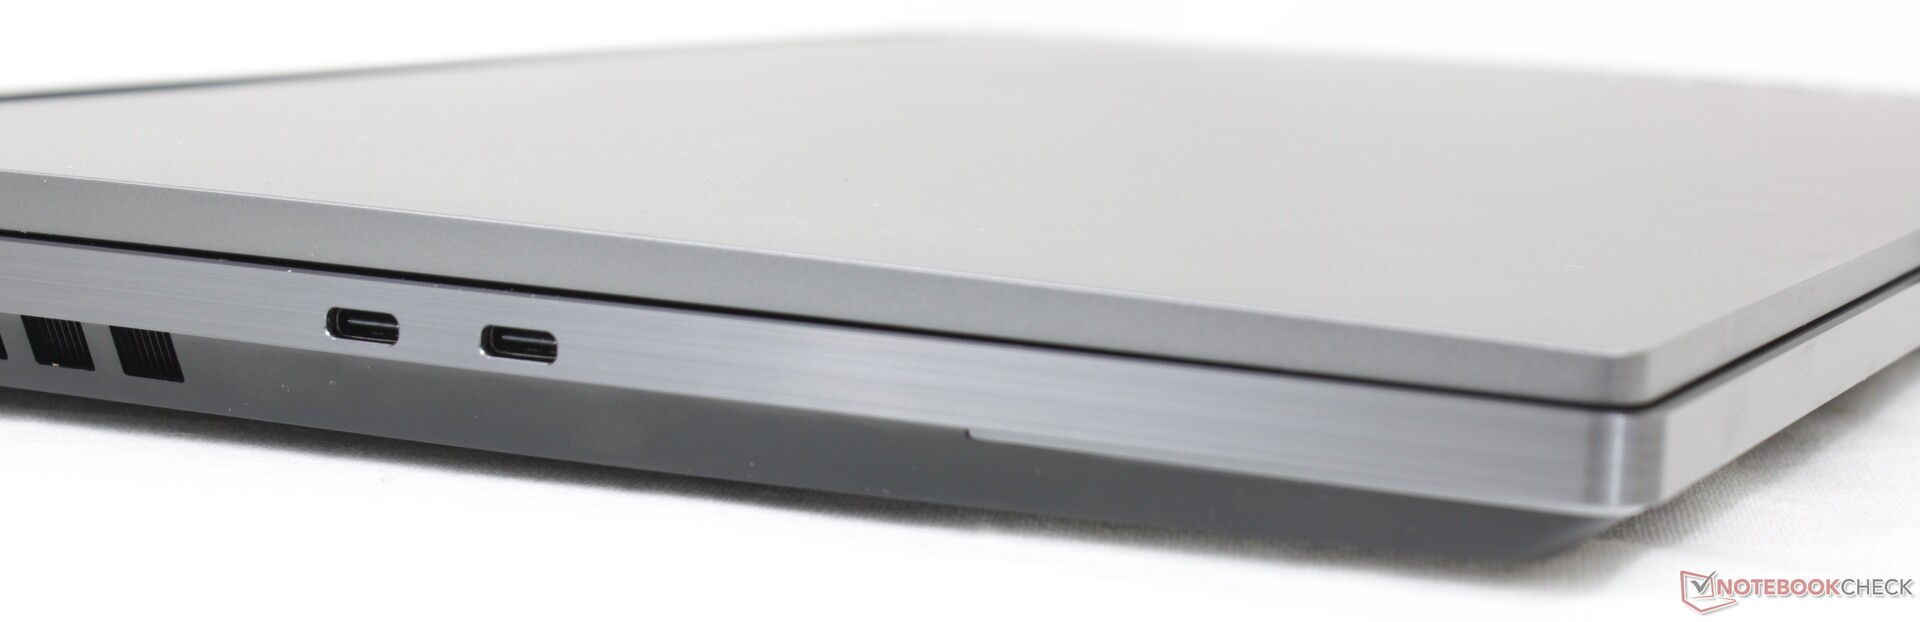
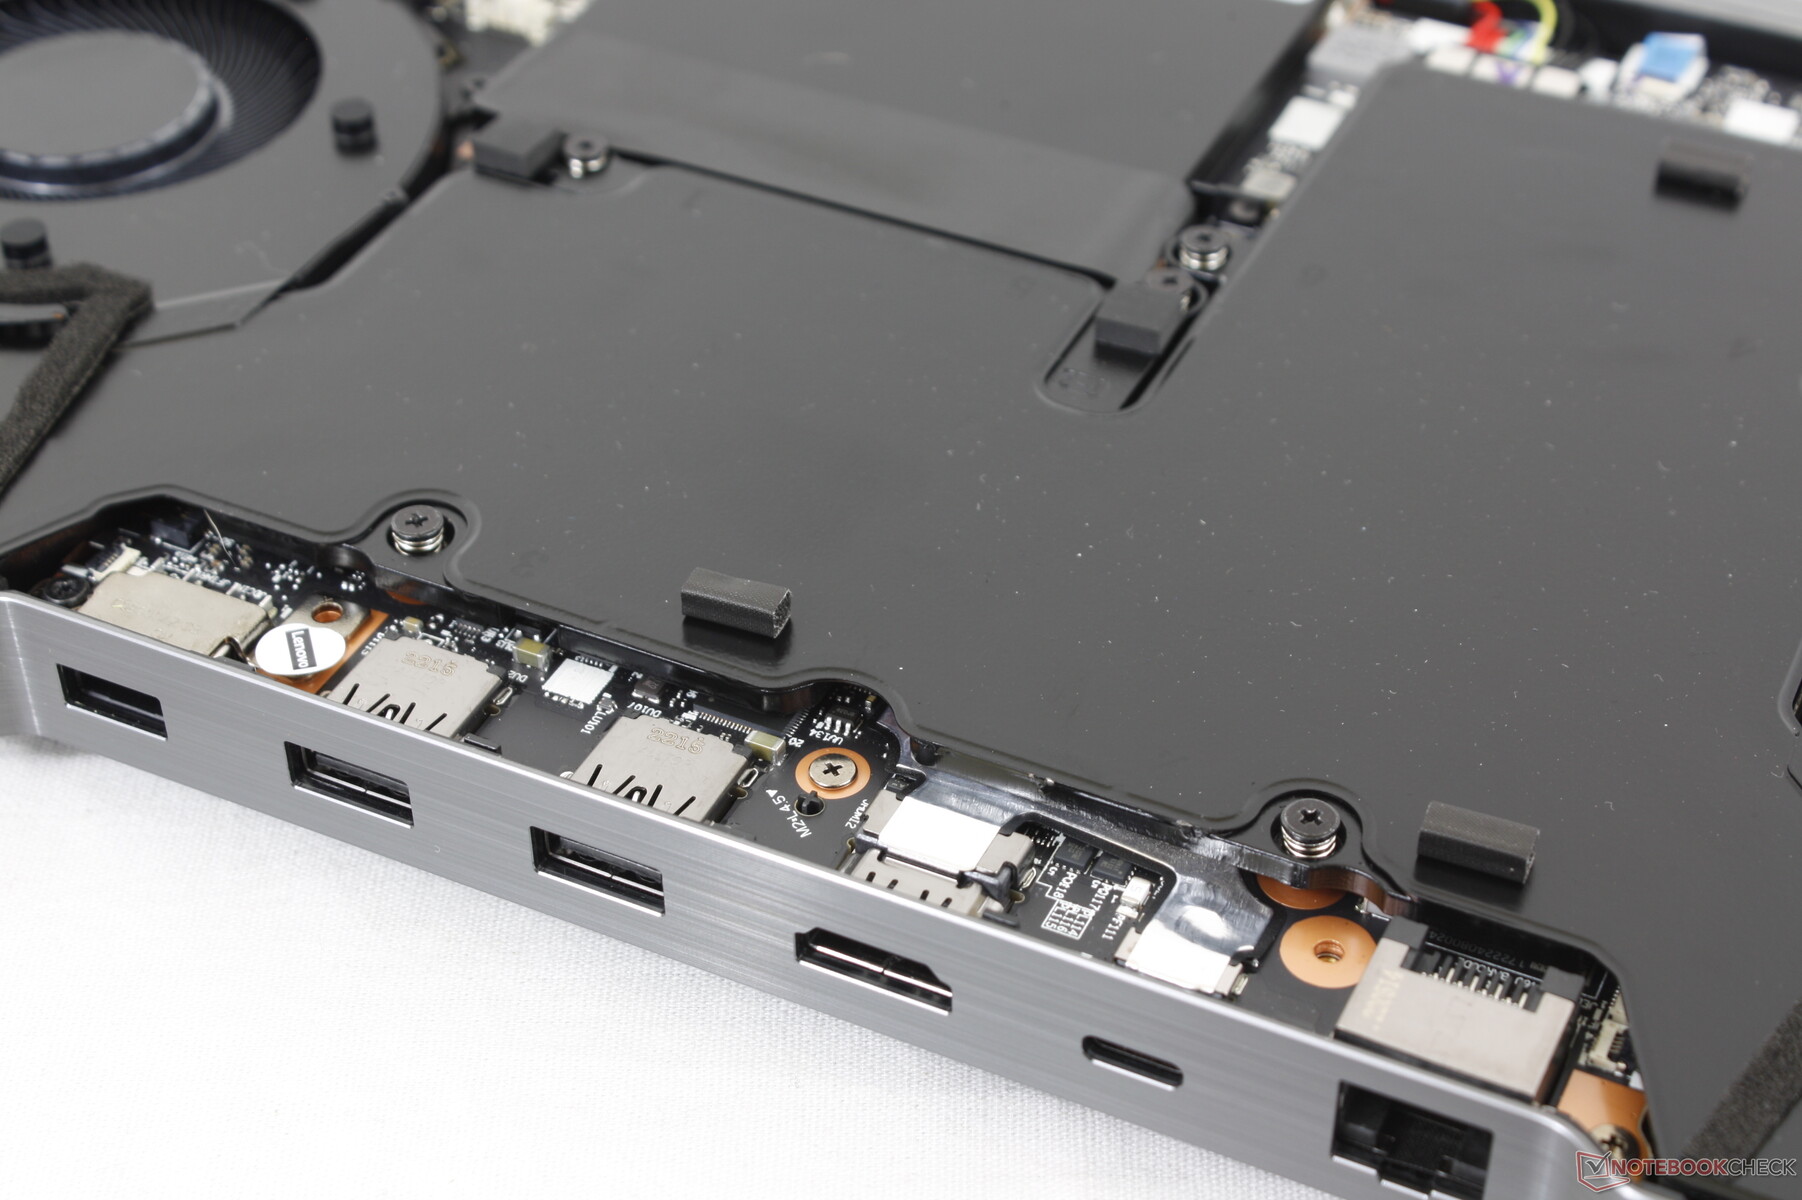
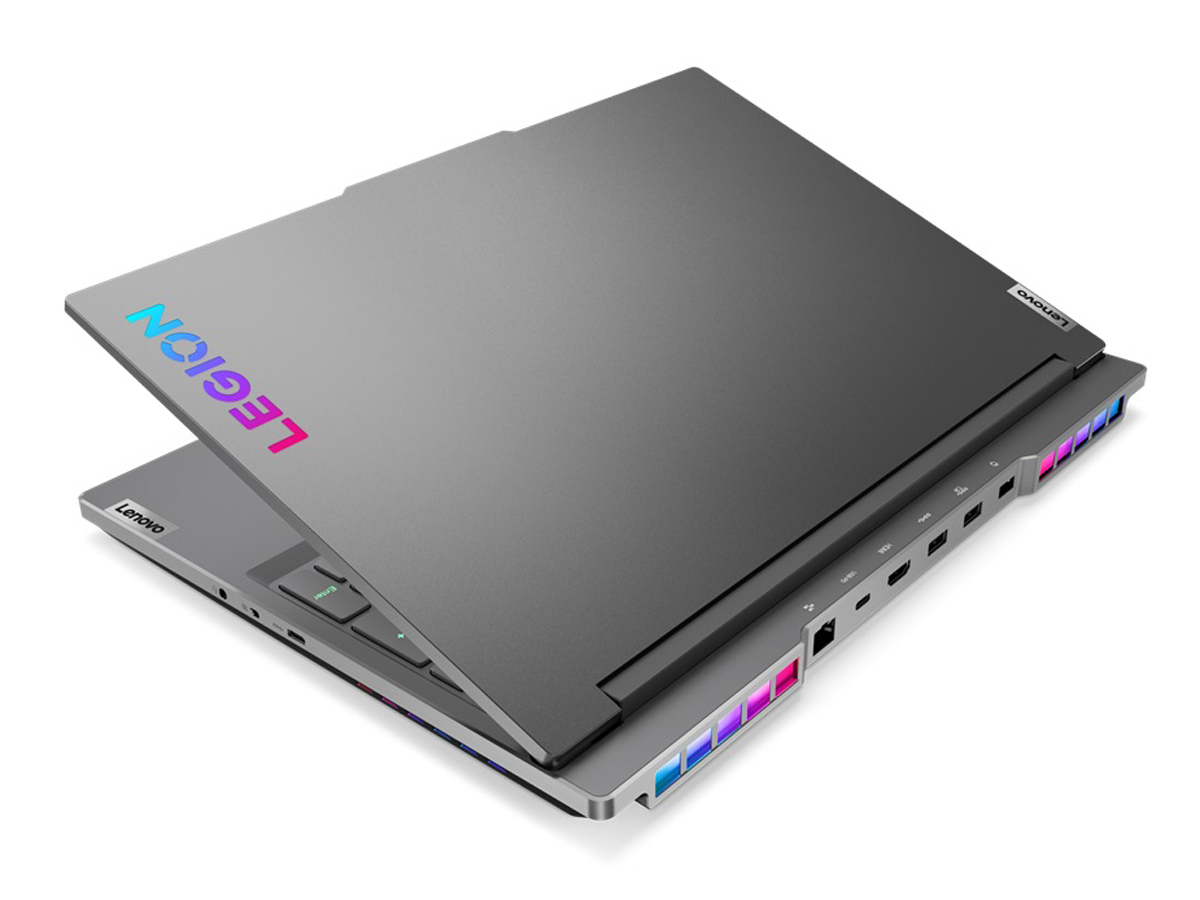
连接性 - 大量的USB-C端口
端口选项是多种多样的,主要是沿着机箱的后边缘而不是两侧。有四个独立的USB-C端口,这比其他大多数游戏笔记本要多。然而,它们并不平等,因为只有某些USB-C端口支持DisplayPort,而另一个可能支持Power Delivery,正如我们下面的图片所示。
与大多数英特尔驱动的游戏笔记本不同,没有对Thunderbolt的支持。
沟通
该系统配备了不常见的联发科RZ616,用于Wi-Fi 6E和蓝牙5.2连接,而不是通常的英特尔AX解决方案。当与我们的6GHz家庭网络配对时,传输率快速而稳定,但接收率比预期的稍慢。
| Networking | |
| iperf3 transmit AX12 | |
| Lenovo Legion 5 Pro 16ACH6H (82JQ001PGE) | |
| HP Omen 16-c0077ng | |
| iperf3 receive AX12 | |
| Lenovo Legion 5 Pro 16ACH6H (82JQ001PGE) | |
| HP Omen 16-c0077ng | |
| iperf3 receive AXE11000 6GHz | |
| Lenovo Legion 7 16ARHA7 | |
| iperf3 transmit AXE11000 | |
| Asus ROG Zephyrus Duo 16 GX650RX | |
| Lenovo Legion Slim 7-16IAH 82TF004YGE | |
| MSI Raider GE66 12UHS | |
| iperf3 receive AXE11000 | |
| MSI Raider GE66 12UHS | |
| Lenovo Legion Slim 7-16IAH 82TF004YGE | |
| Asus ROG Zephyrus Duo 16 GX650RX | |
| iperf3 transmit AXE11000 6GHz | |
| Lenovo Legion 7 16ARHA7 | |
网络摄像头
200万像素的网络摄像头提供了比其他大多数笔记本电脑更清晰的画面,在那里,720p仍然是常见的。沿着右侧边缘有一个摄像头杀毒开关,但没有视觉指示器显示摄像头镜头被以任何方式挡住了。
没有支持 "你好 "的红外传感器。


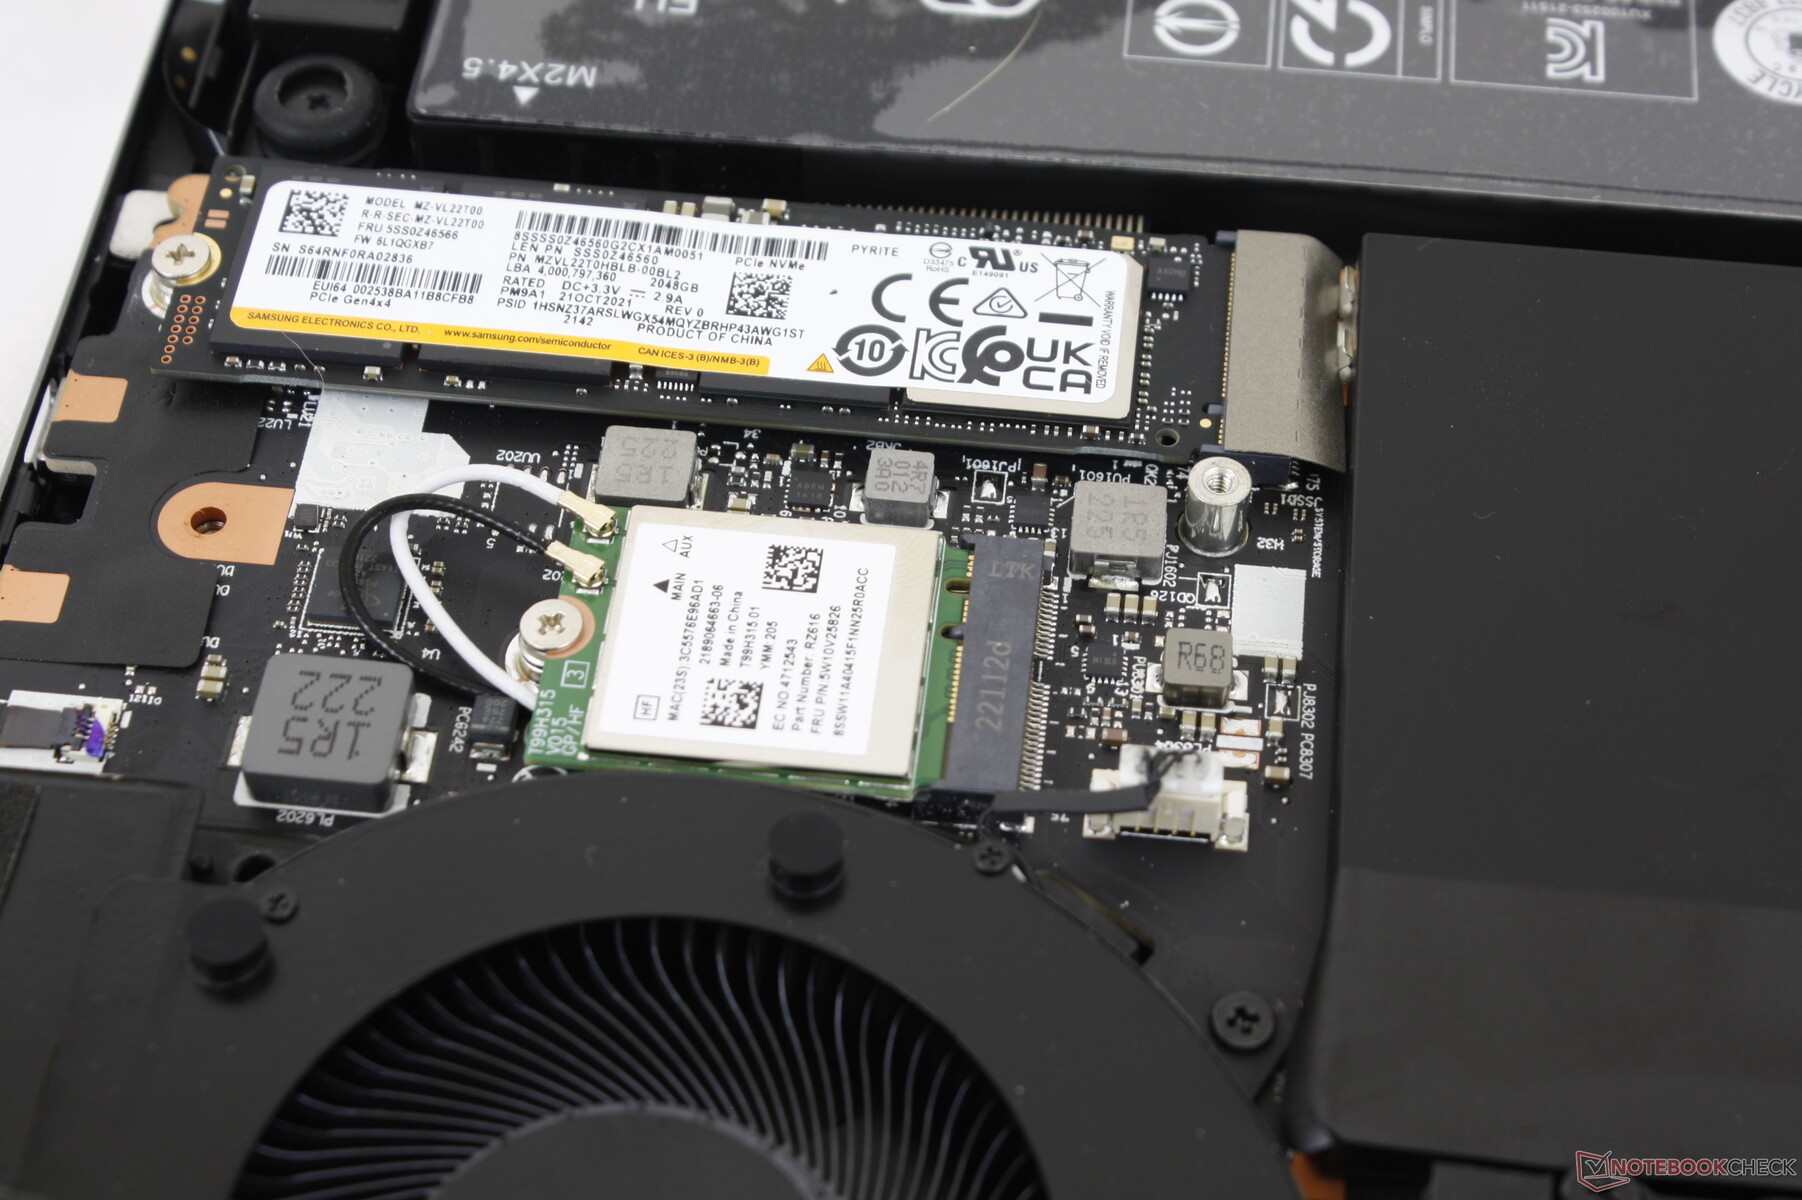
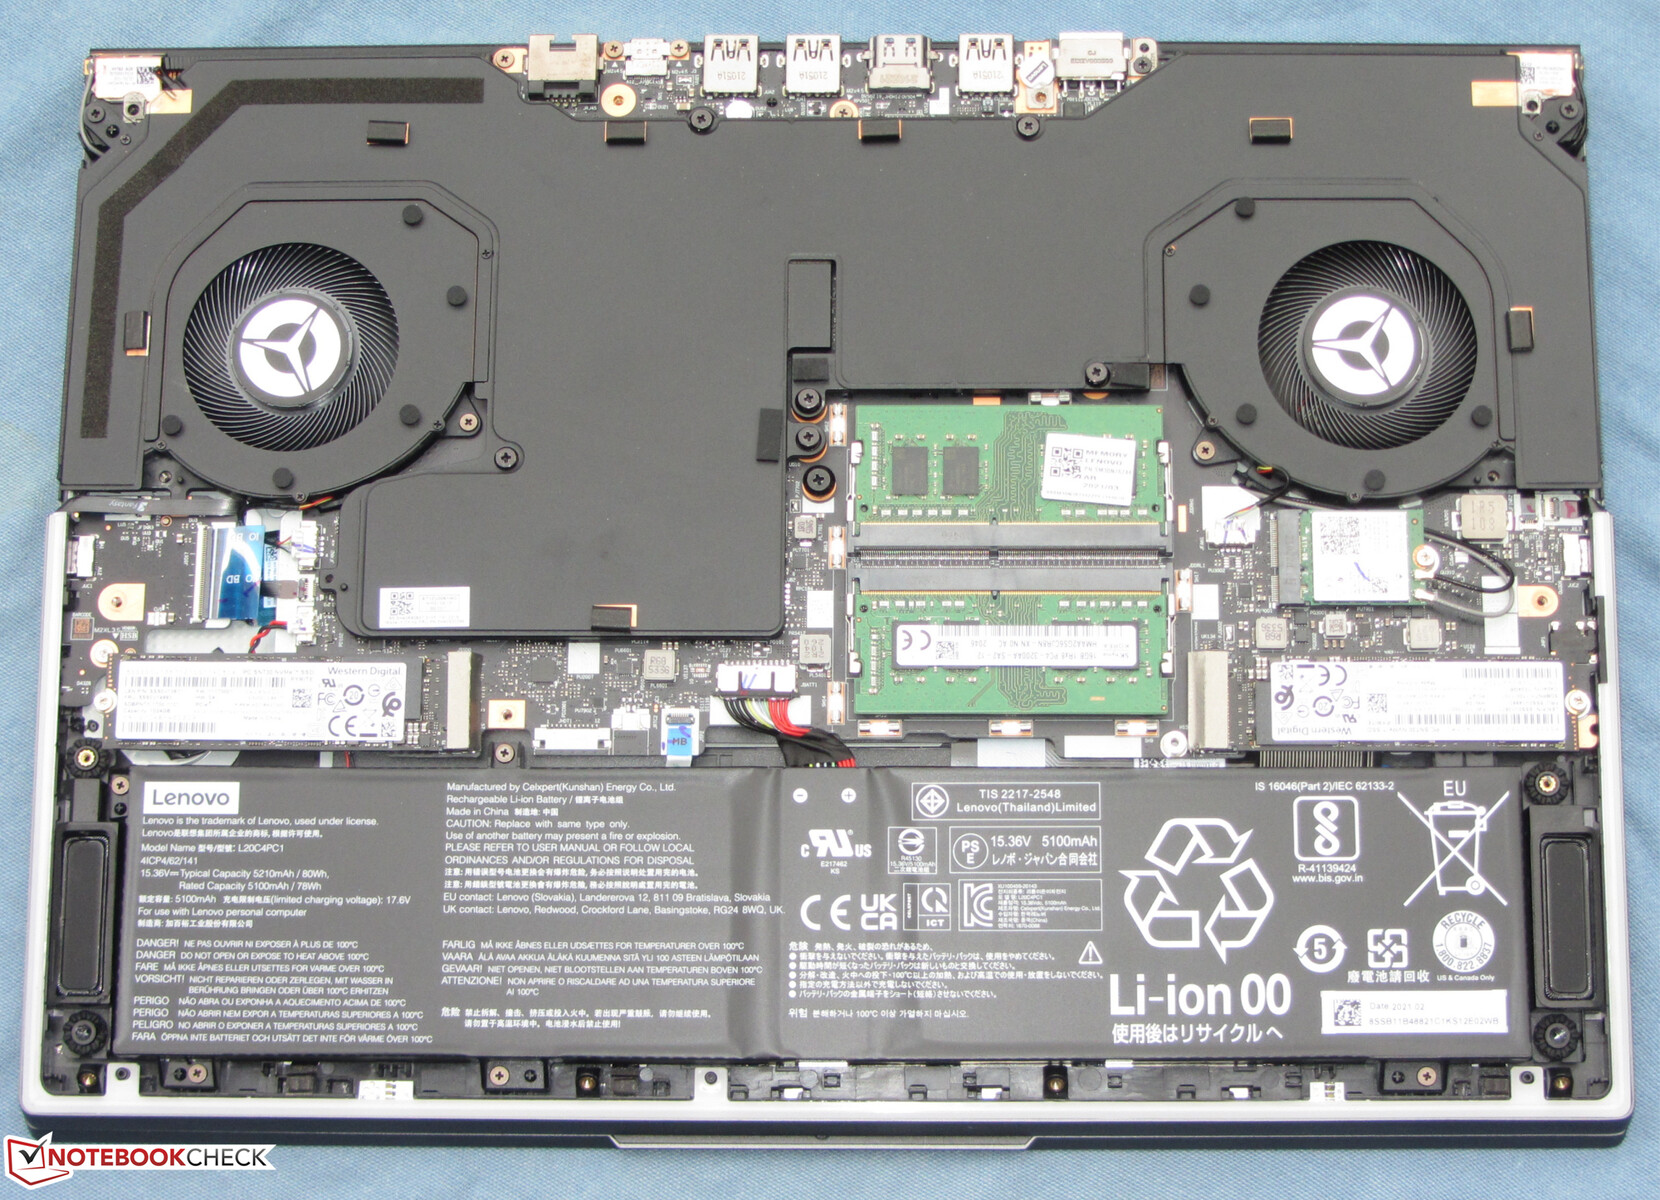
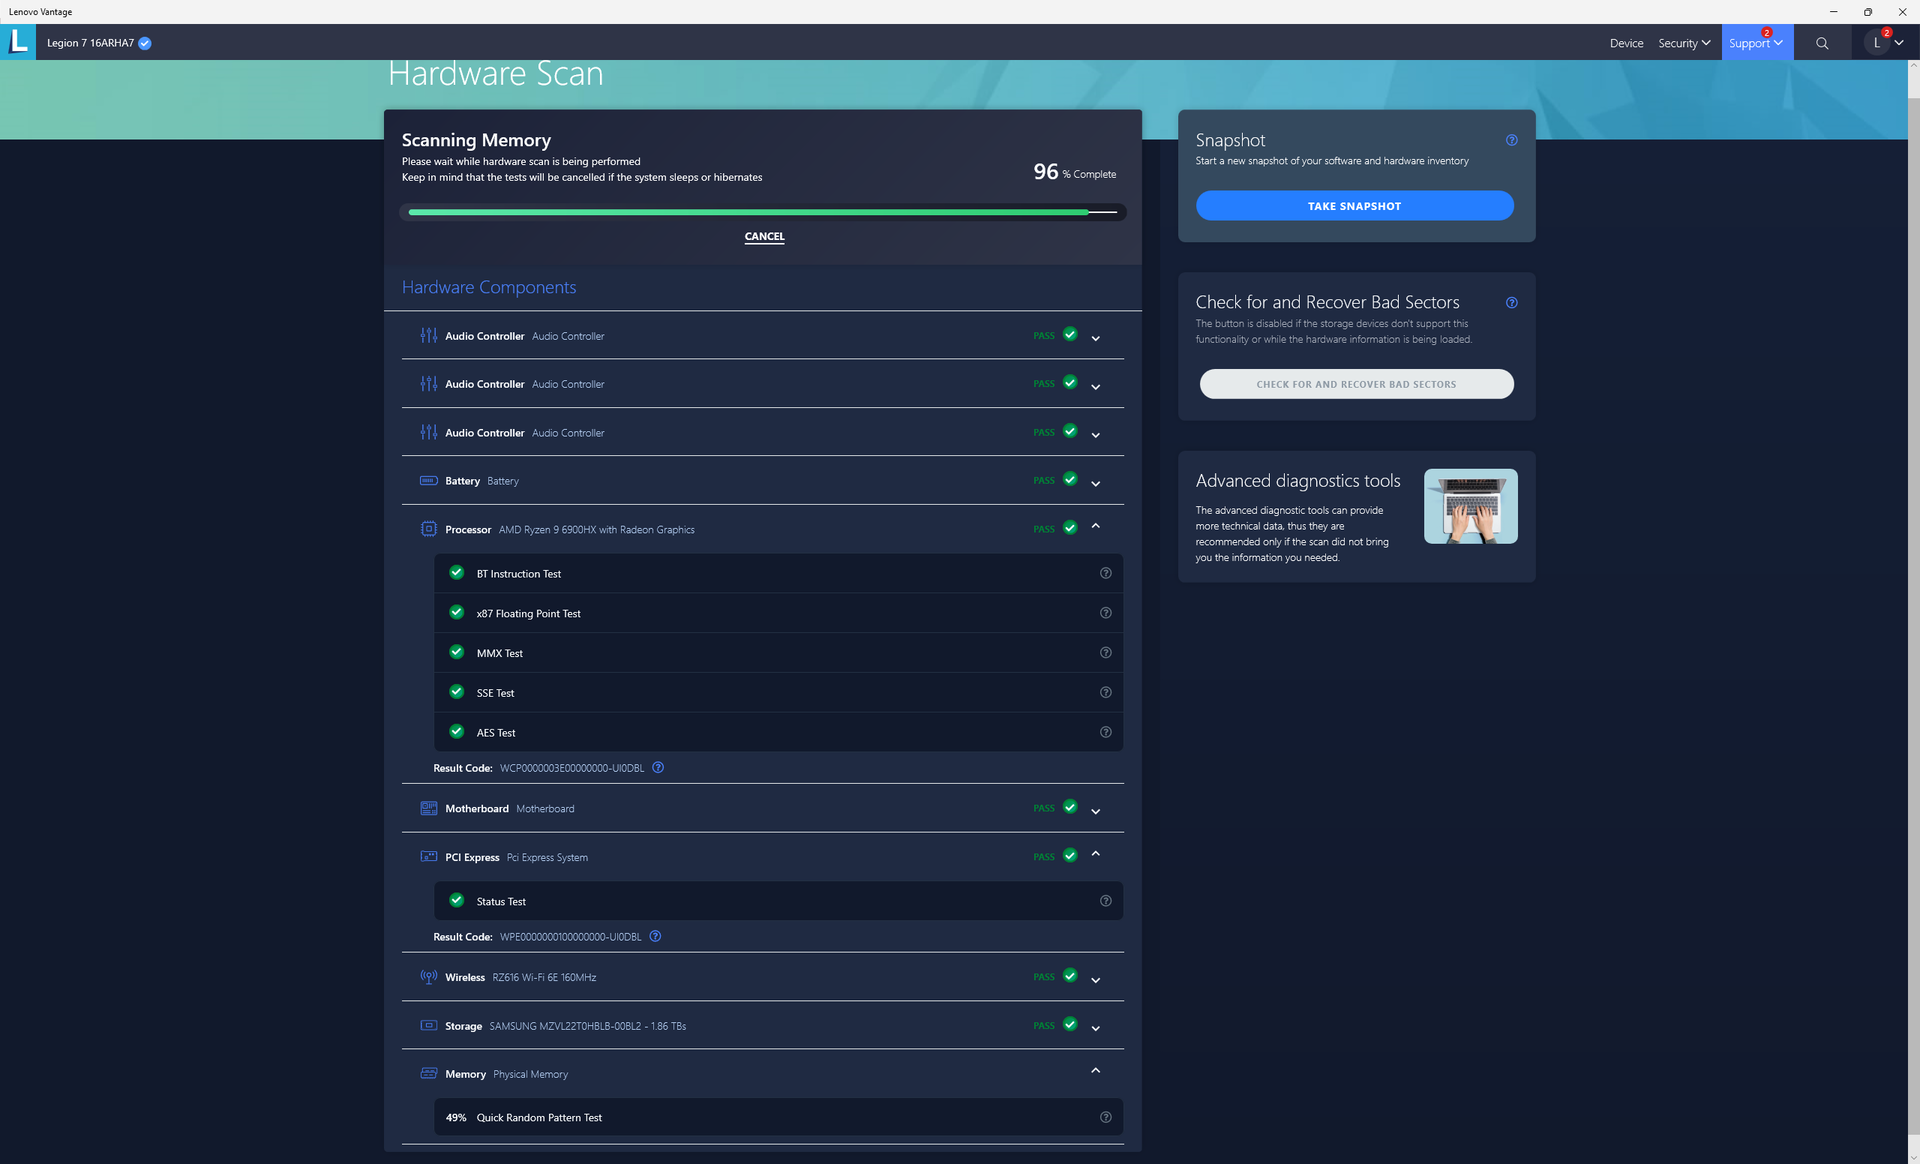
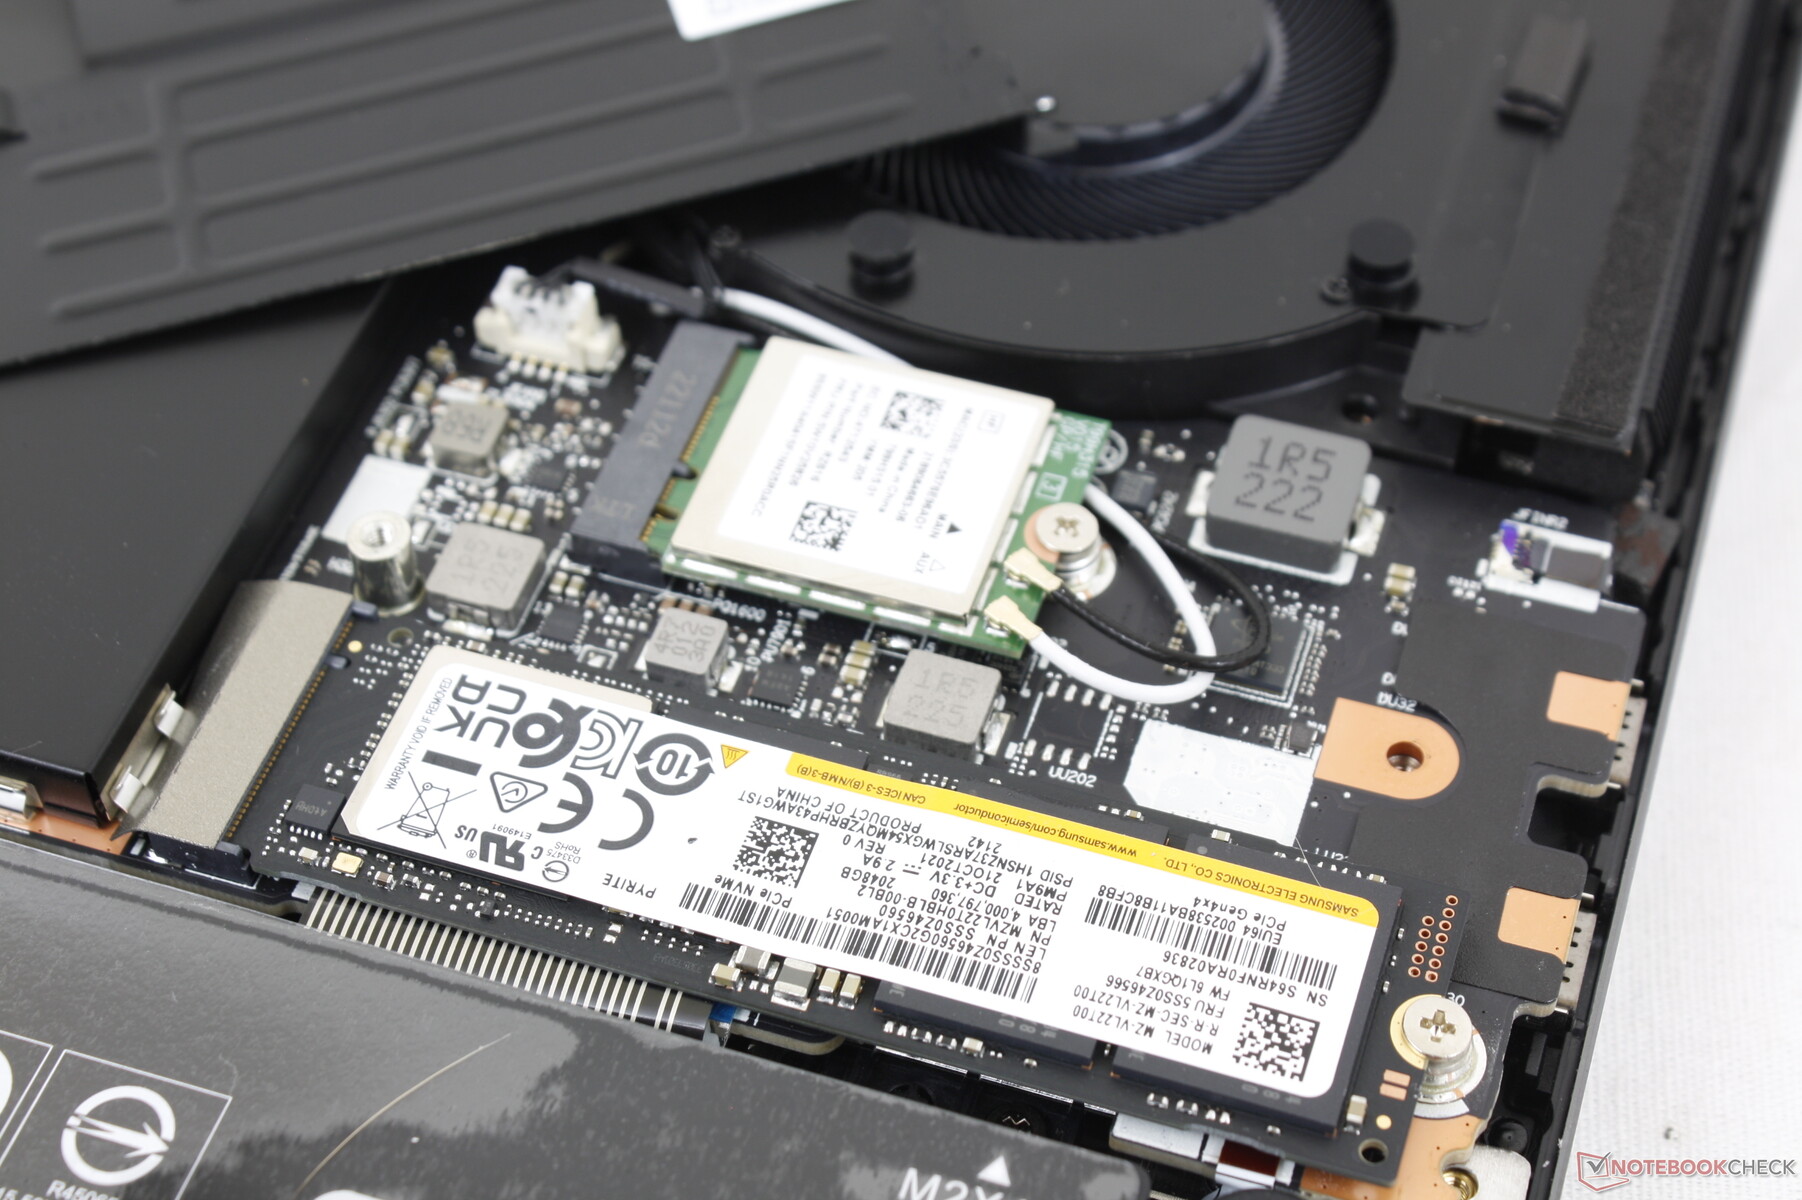
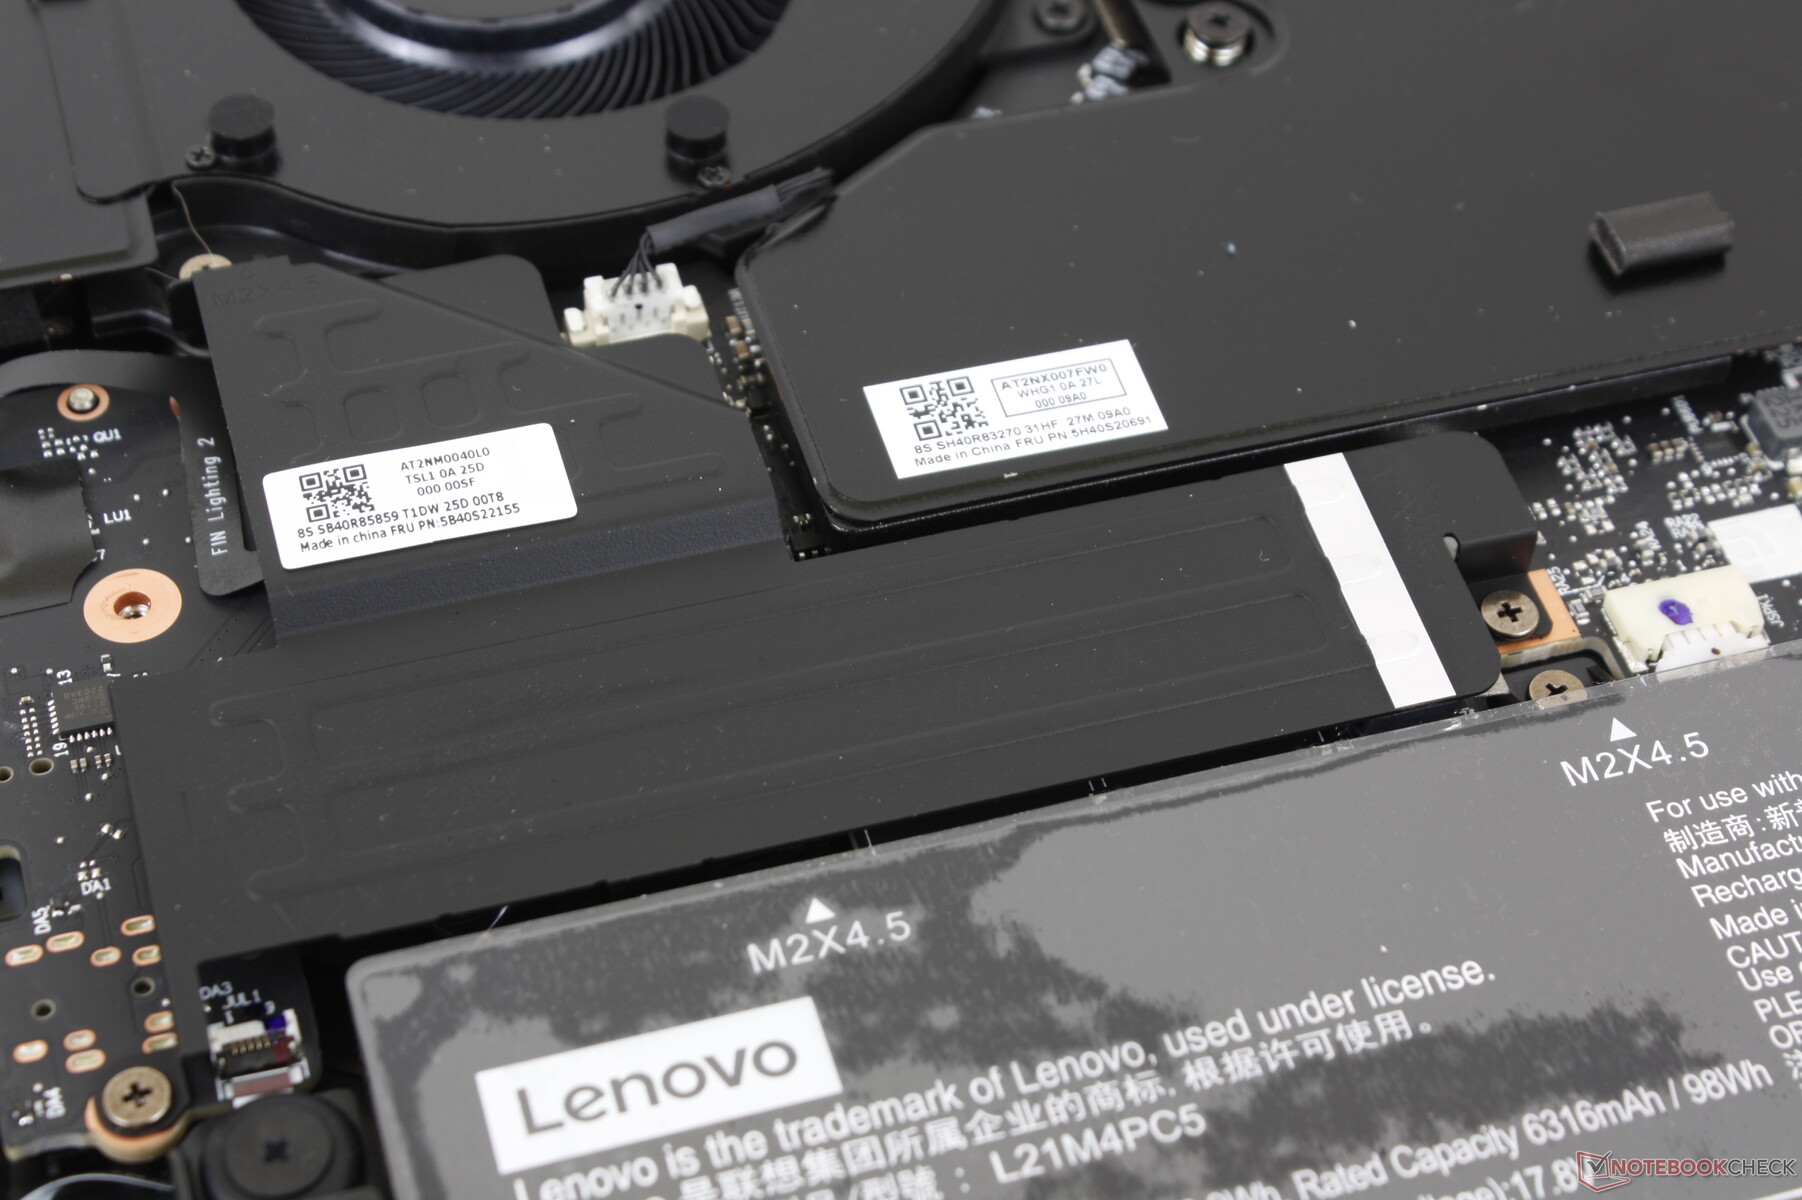
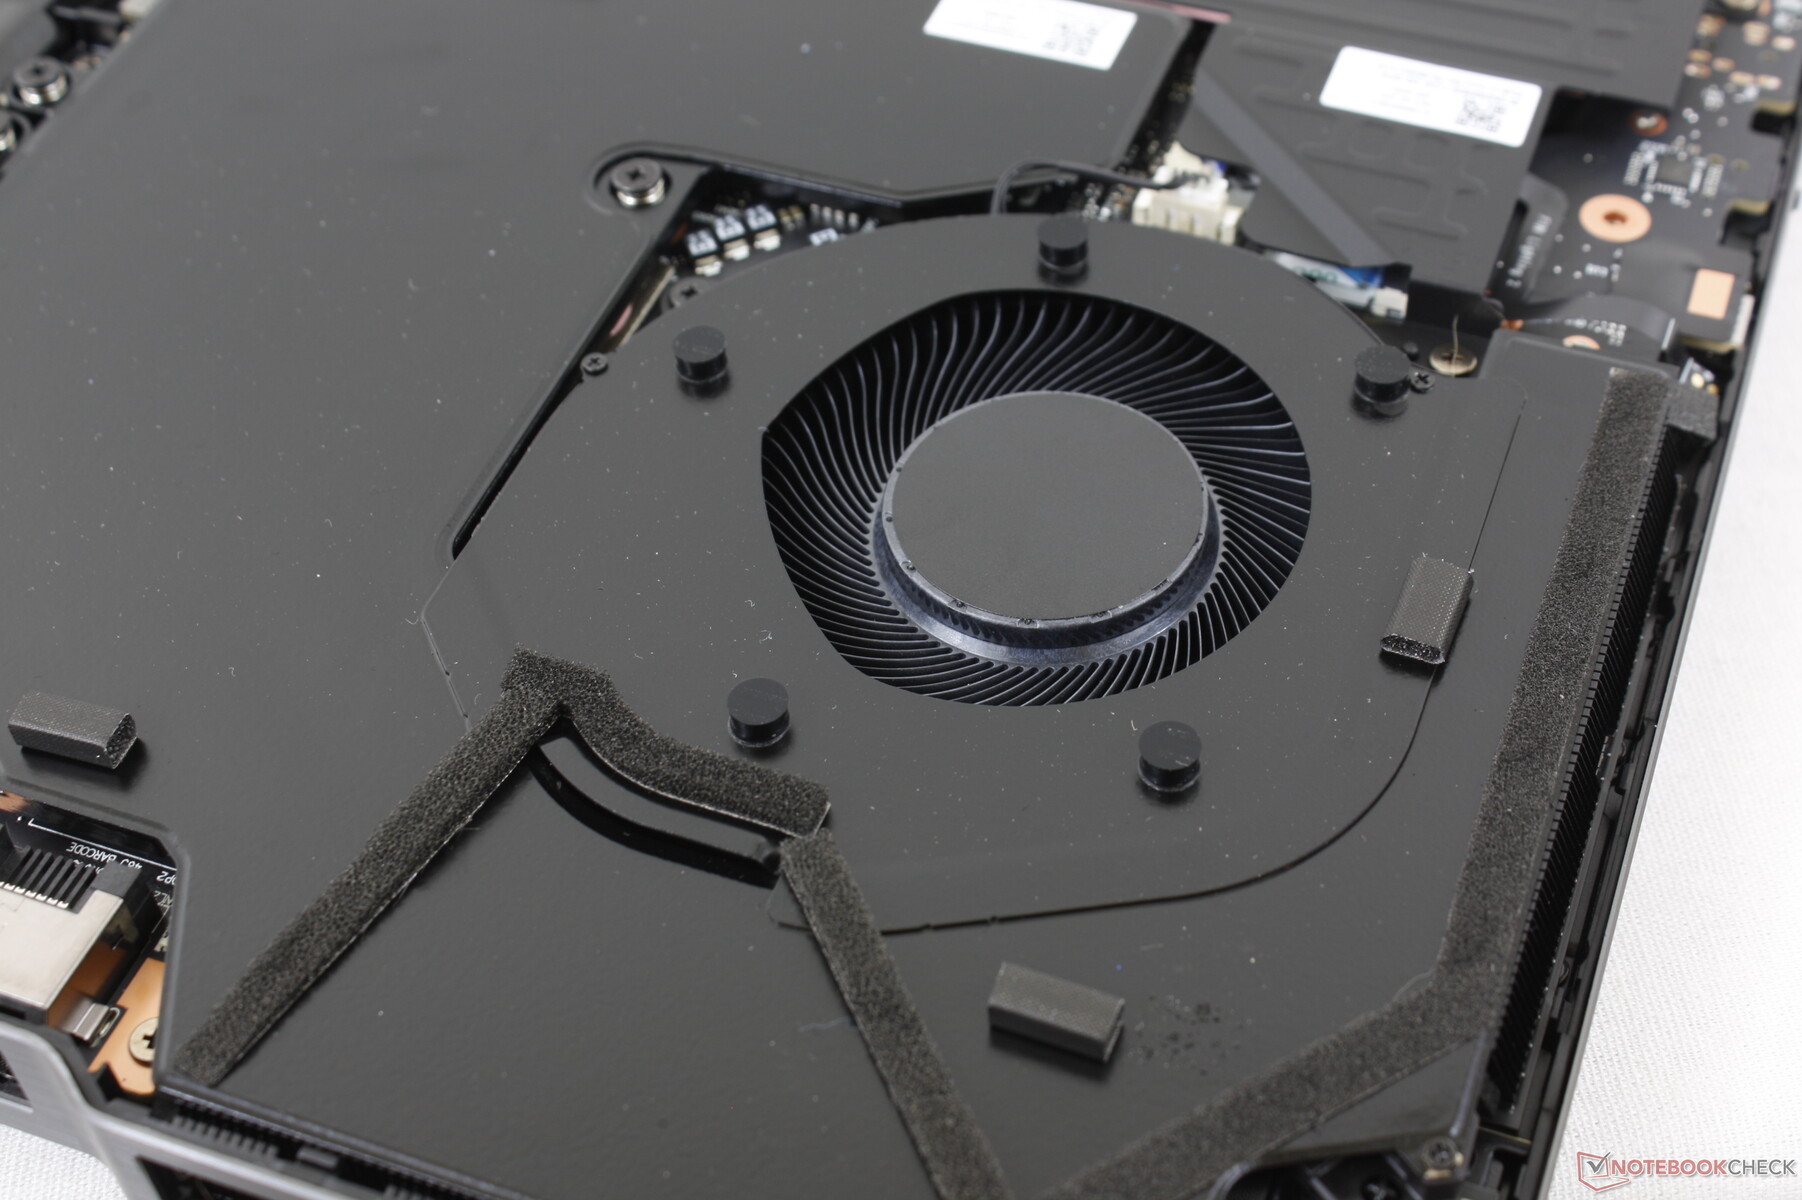
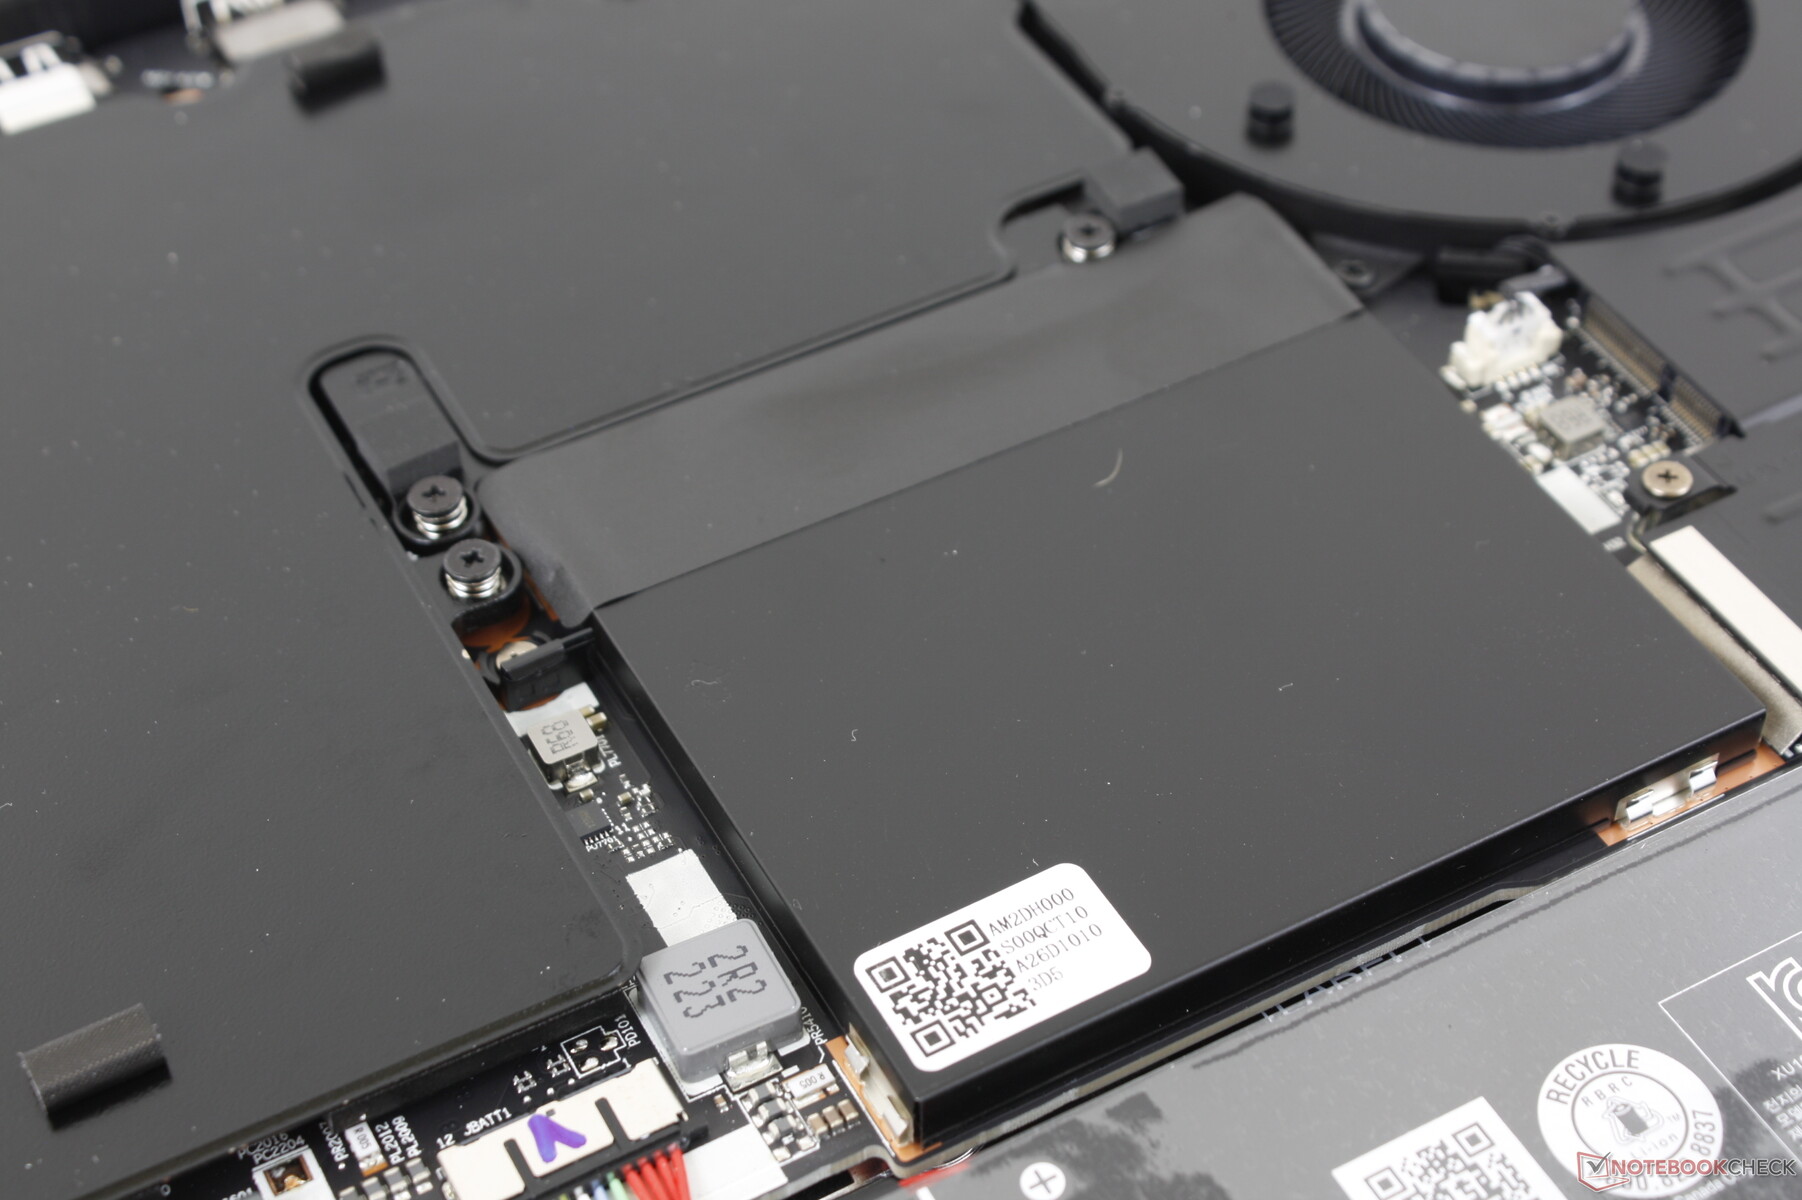
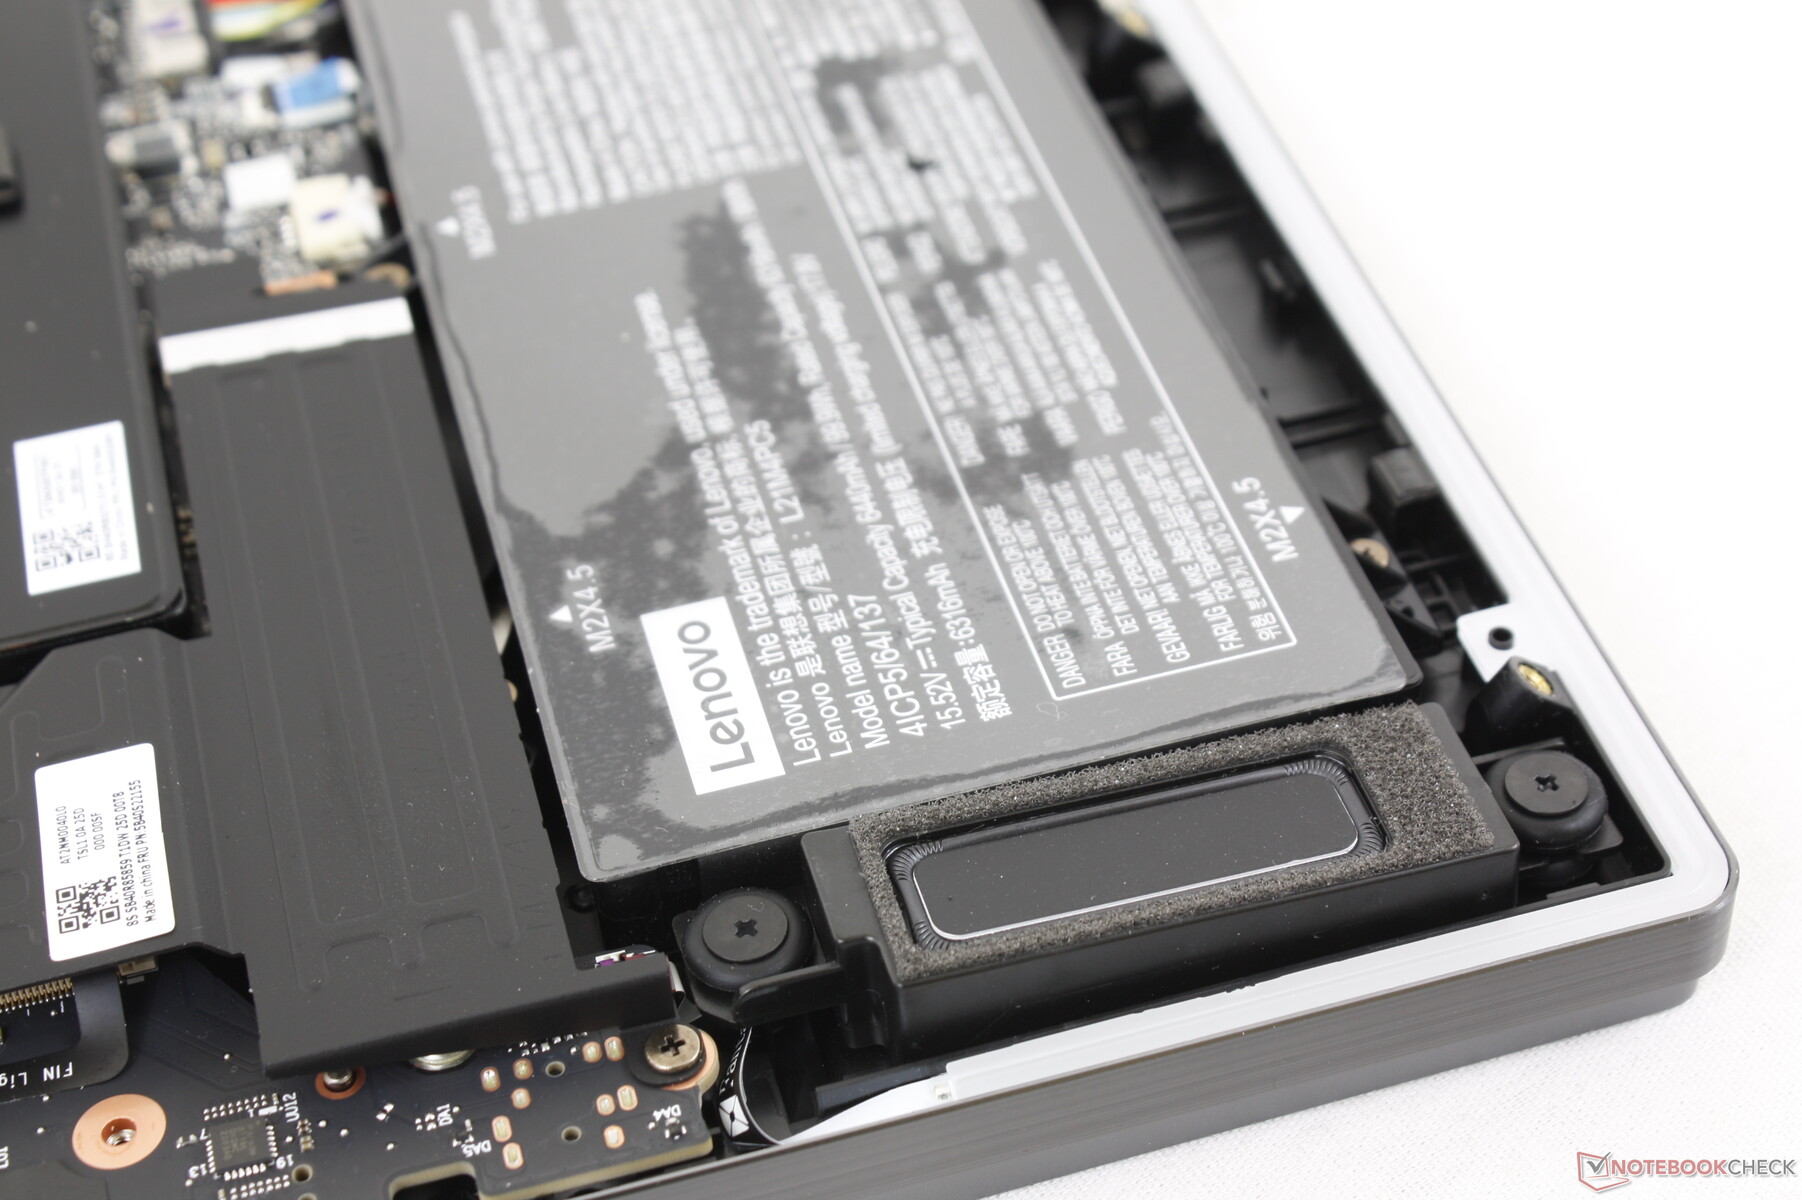
维护
底部面板由10颗飞利浦螺钉固定,相对来说比较容易维修。用户可以使用两个M.2 2280存储插槽和两个SODIMM插槽,每个都有自己的金属盖。
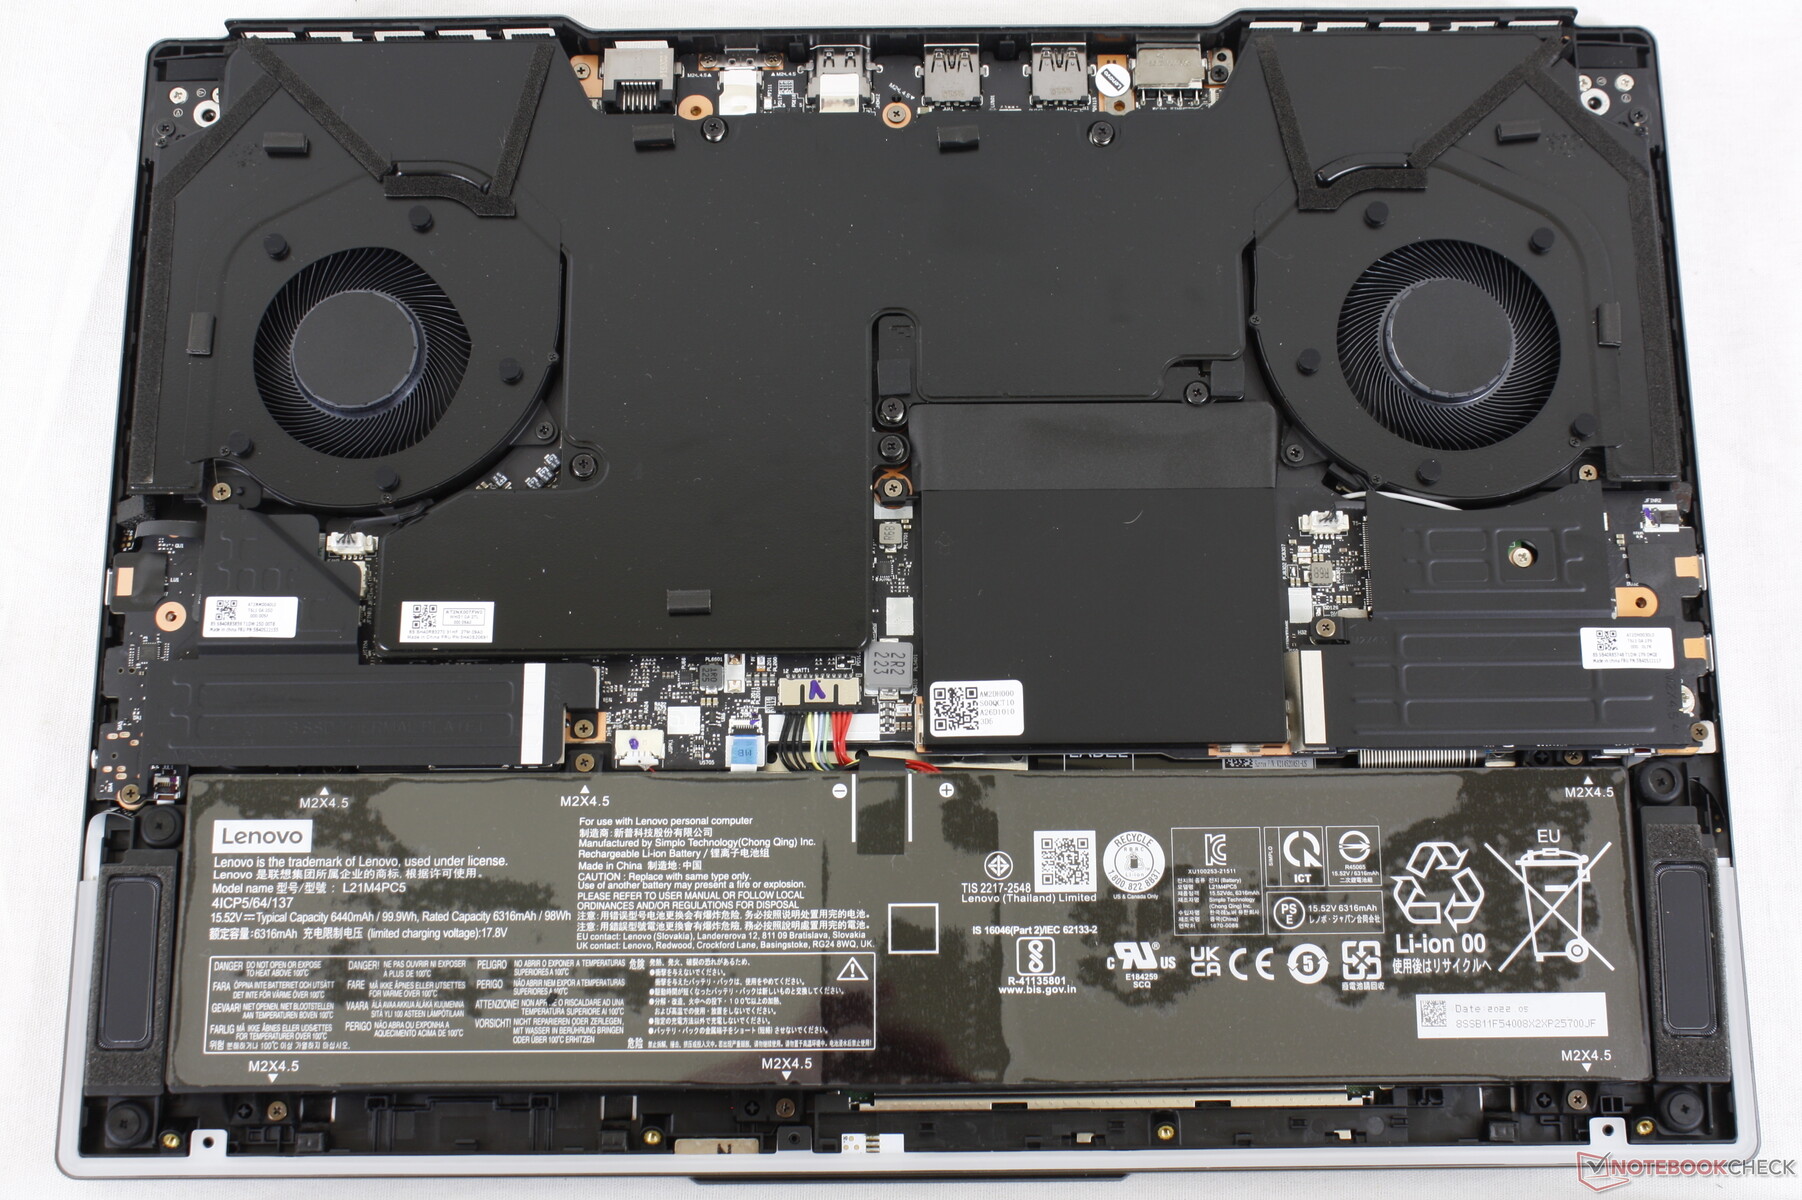
配件和保修
联想包括一个工具,用于拆卸键帽进行清洁或更换。如果在美国购买,则适用标准的一年有限保修。
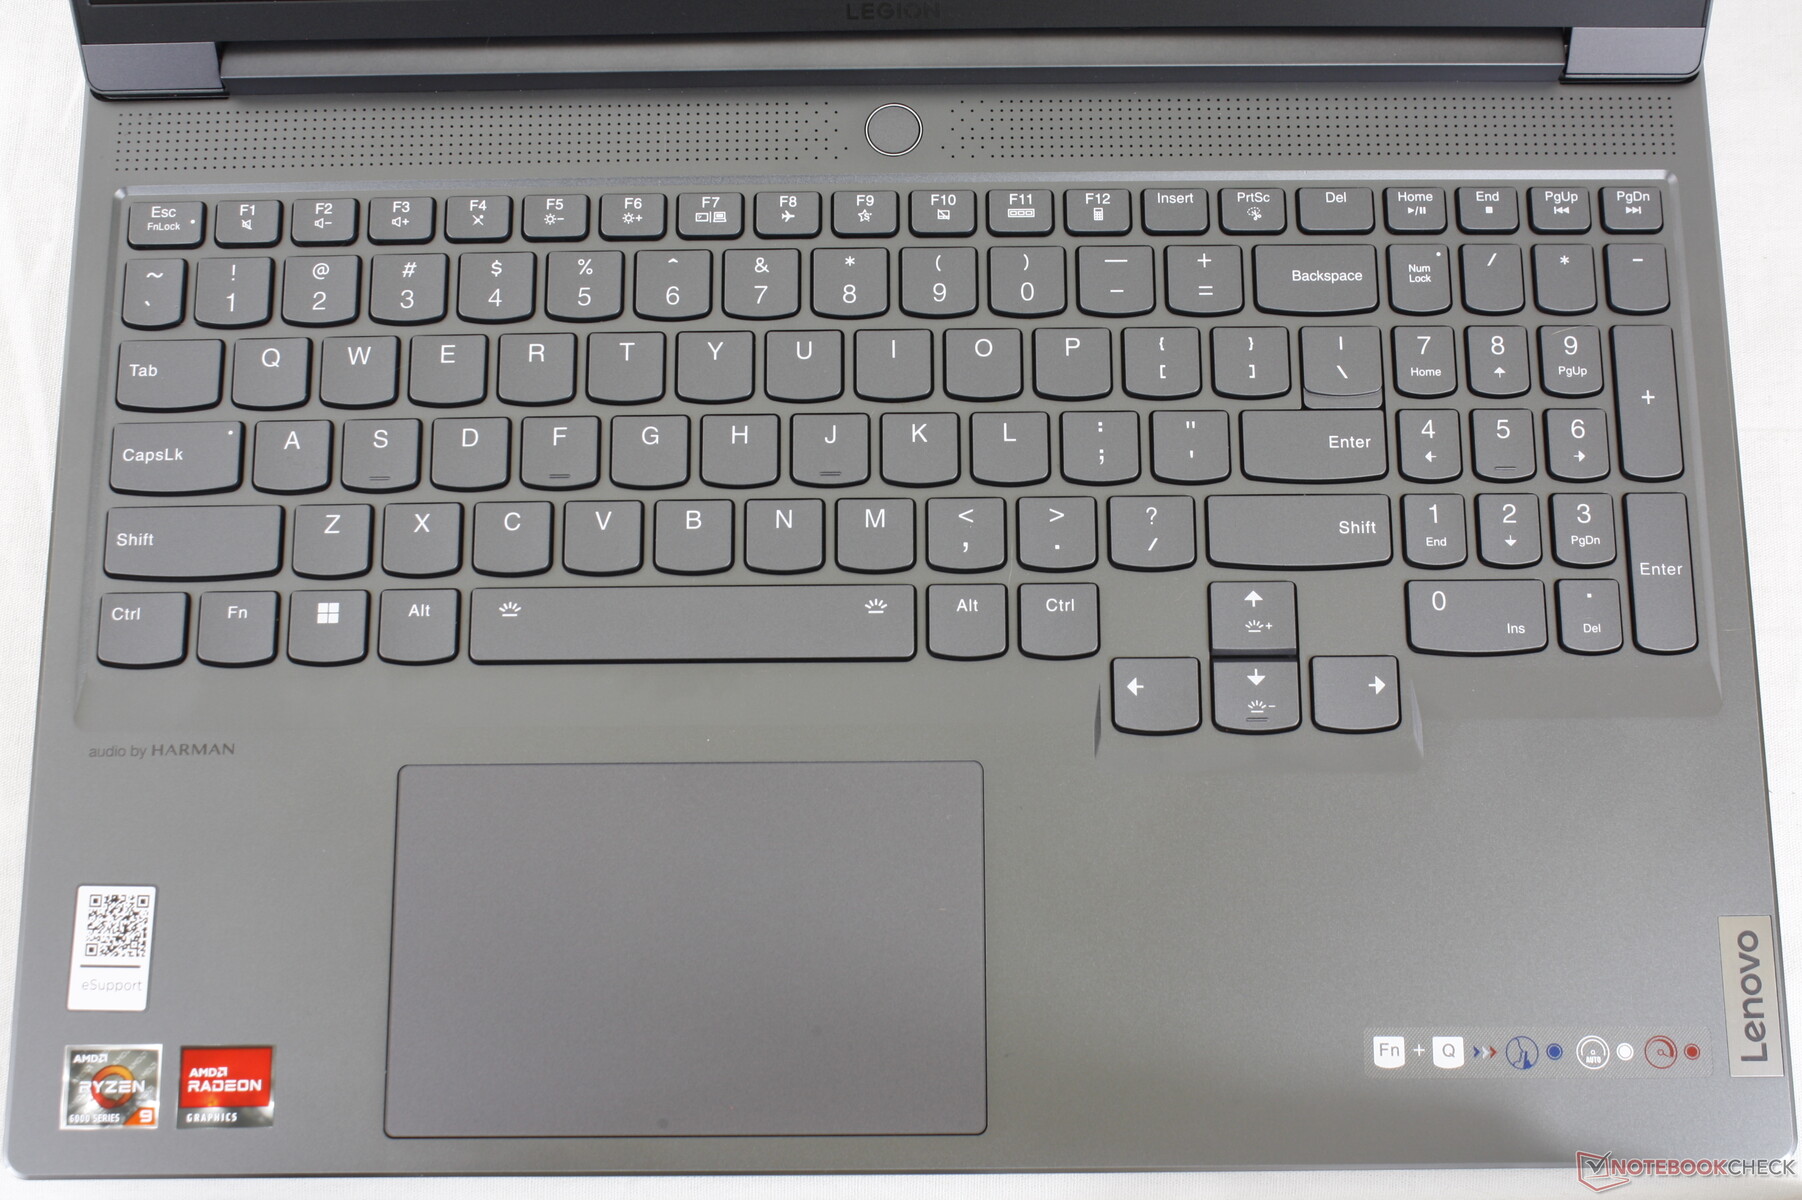
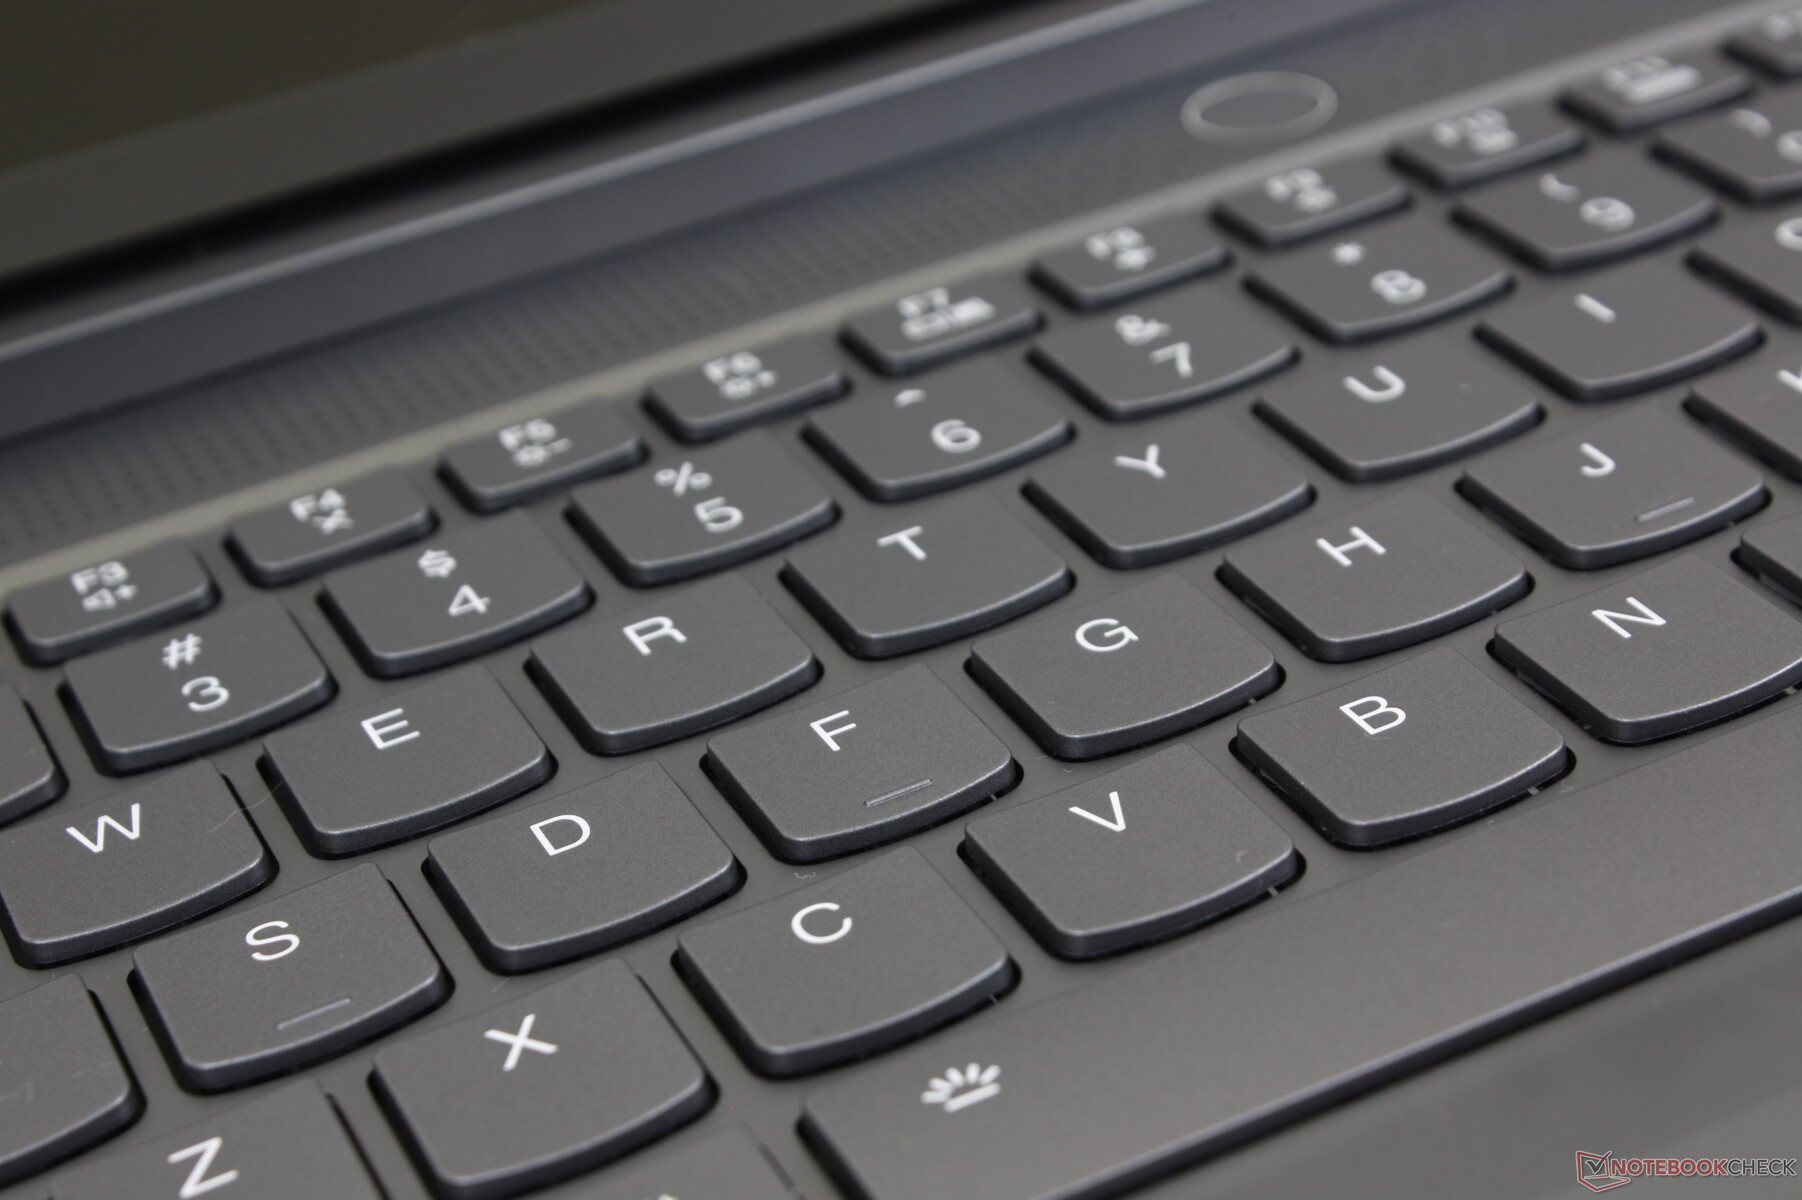
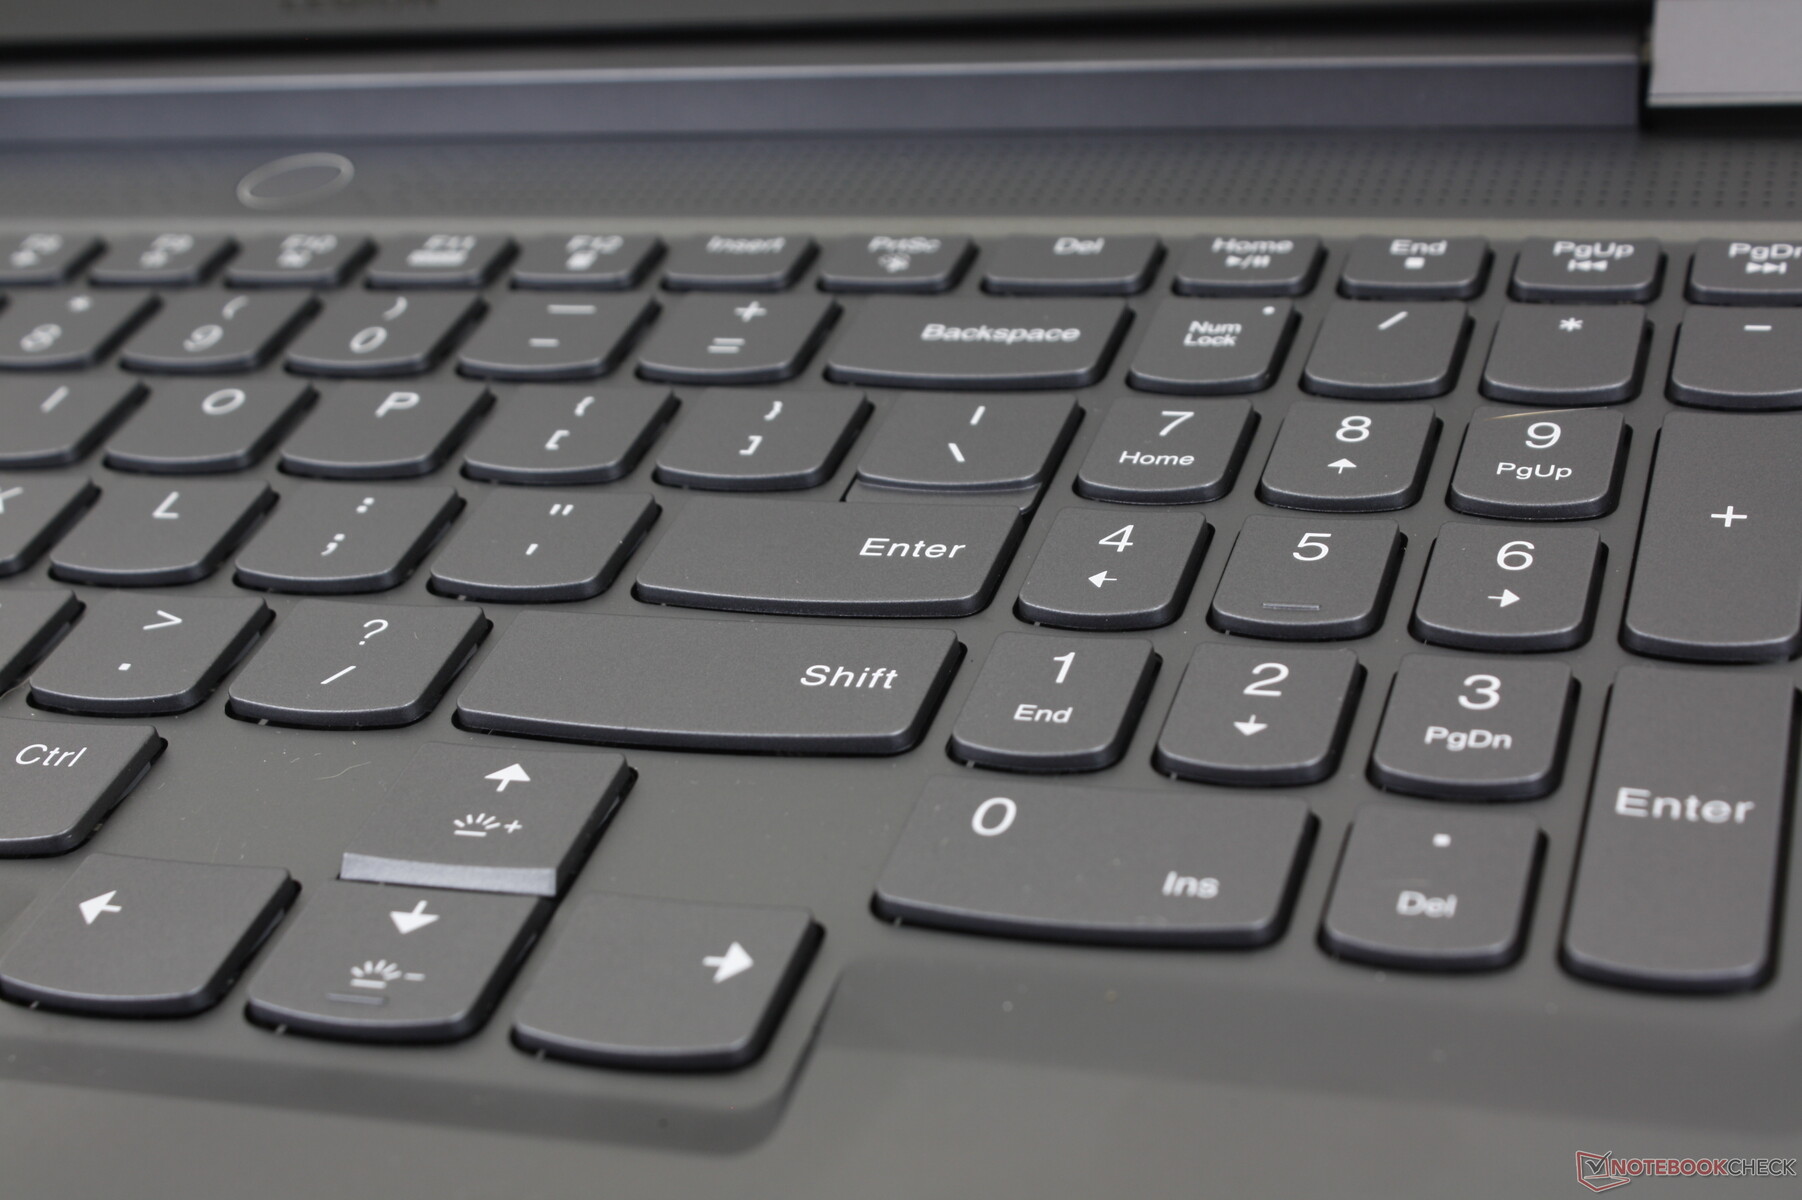
输入设备 - 比IdeaPad或Yoga更好
键盘
我们最初担心键盘会和便宜的IdeaPad键盘一样,行程浅,反馈软。幸运的是,Legion 7 16的键盘比IdeaPad和Yoga型号的键盘质量更高。键程明显更深,反馈更硬,打字体验更令人满意,特别是在空格键和回车键方面。它不完全是ThinkPad,但键盘相当接近。
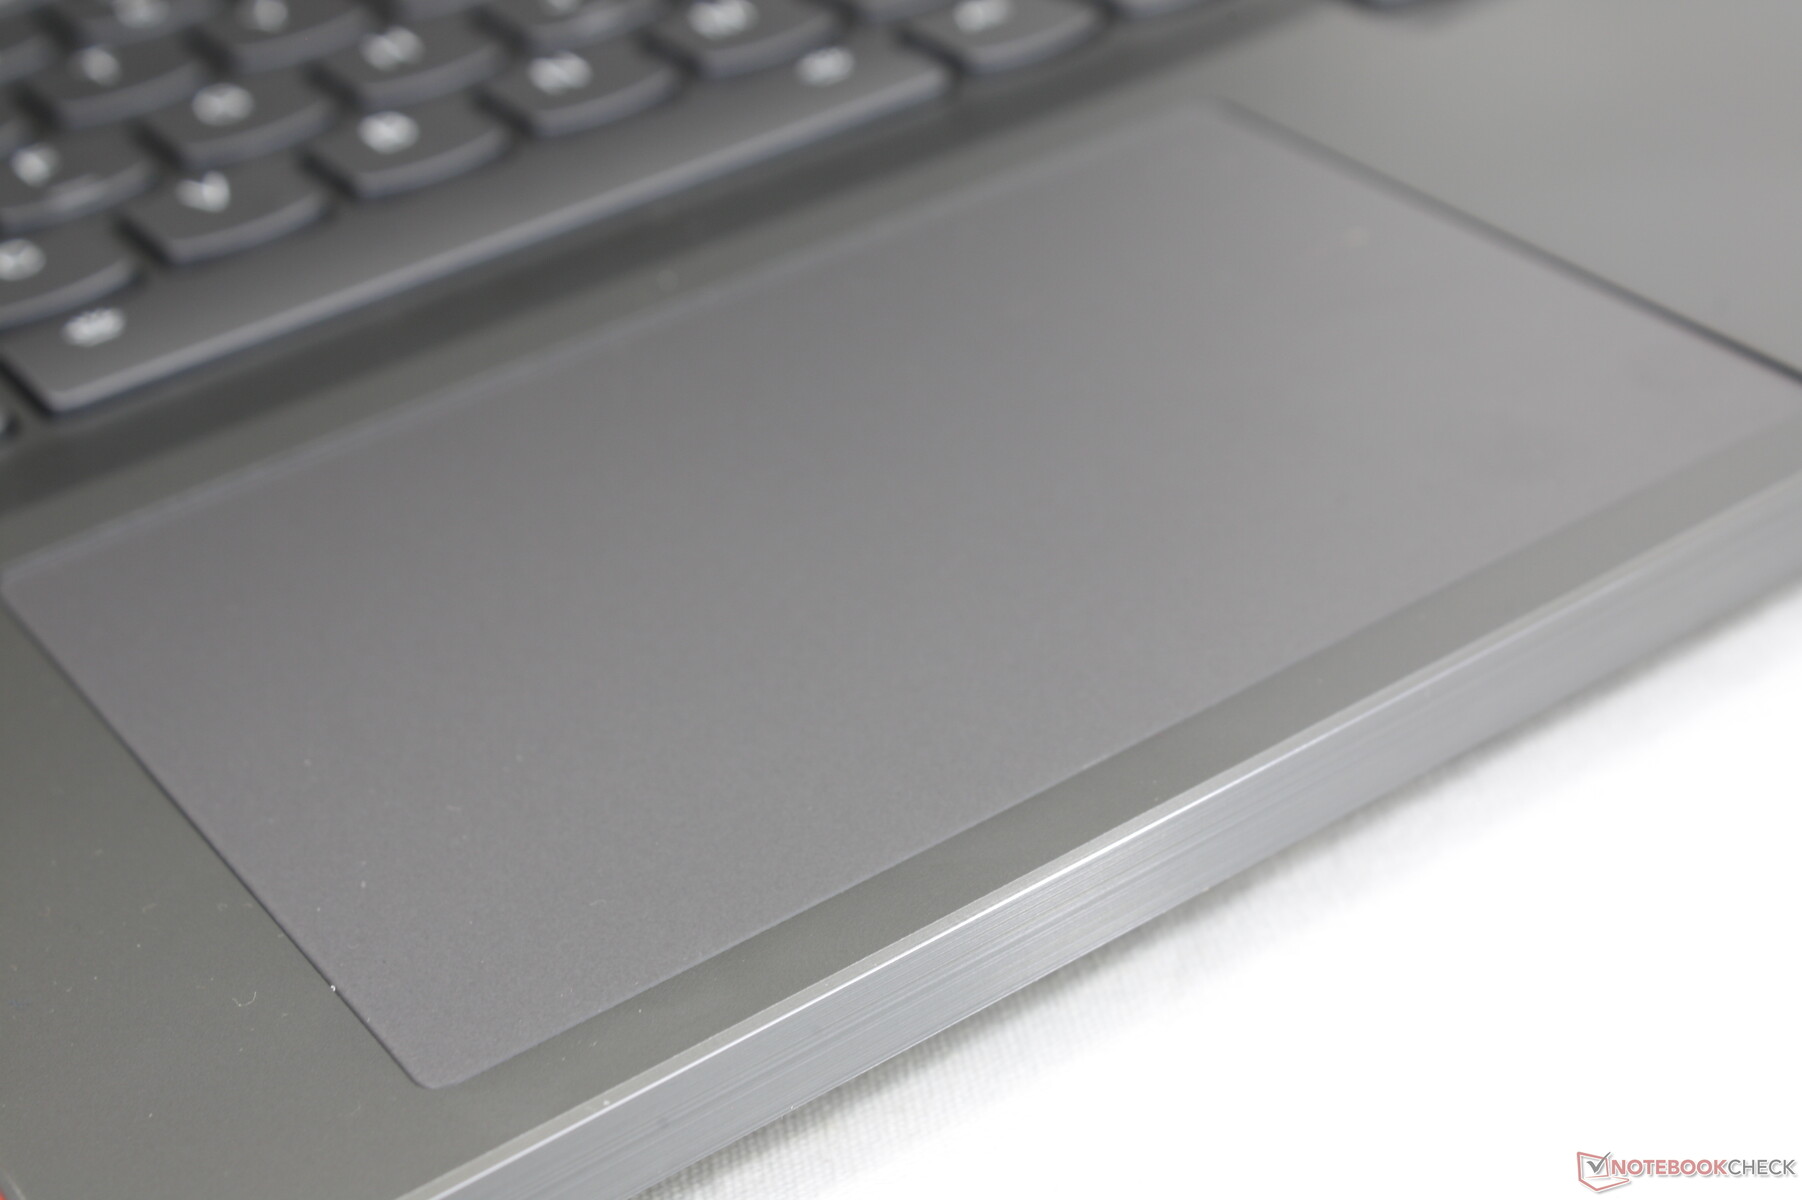
触摸板
点击板的大小几乎与戴尔 Inspiron 16 Plus 7620 Plus(12 x 7.5 cm vs. 11.5 x 8 cm)。牵引力非常平稳,只有在以较慢速度滑行时才有一点粘性,便于拖动和放下。
在点击板上的点击是浅的,但反馈很好。虽然略微偏软,但反馈至少比其他一些游戏笔记本如 微星Stealth GS77.
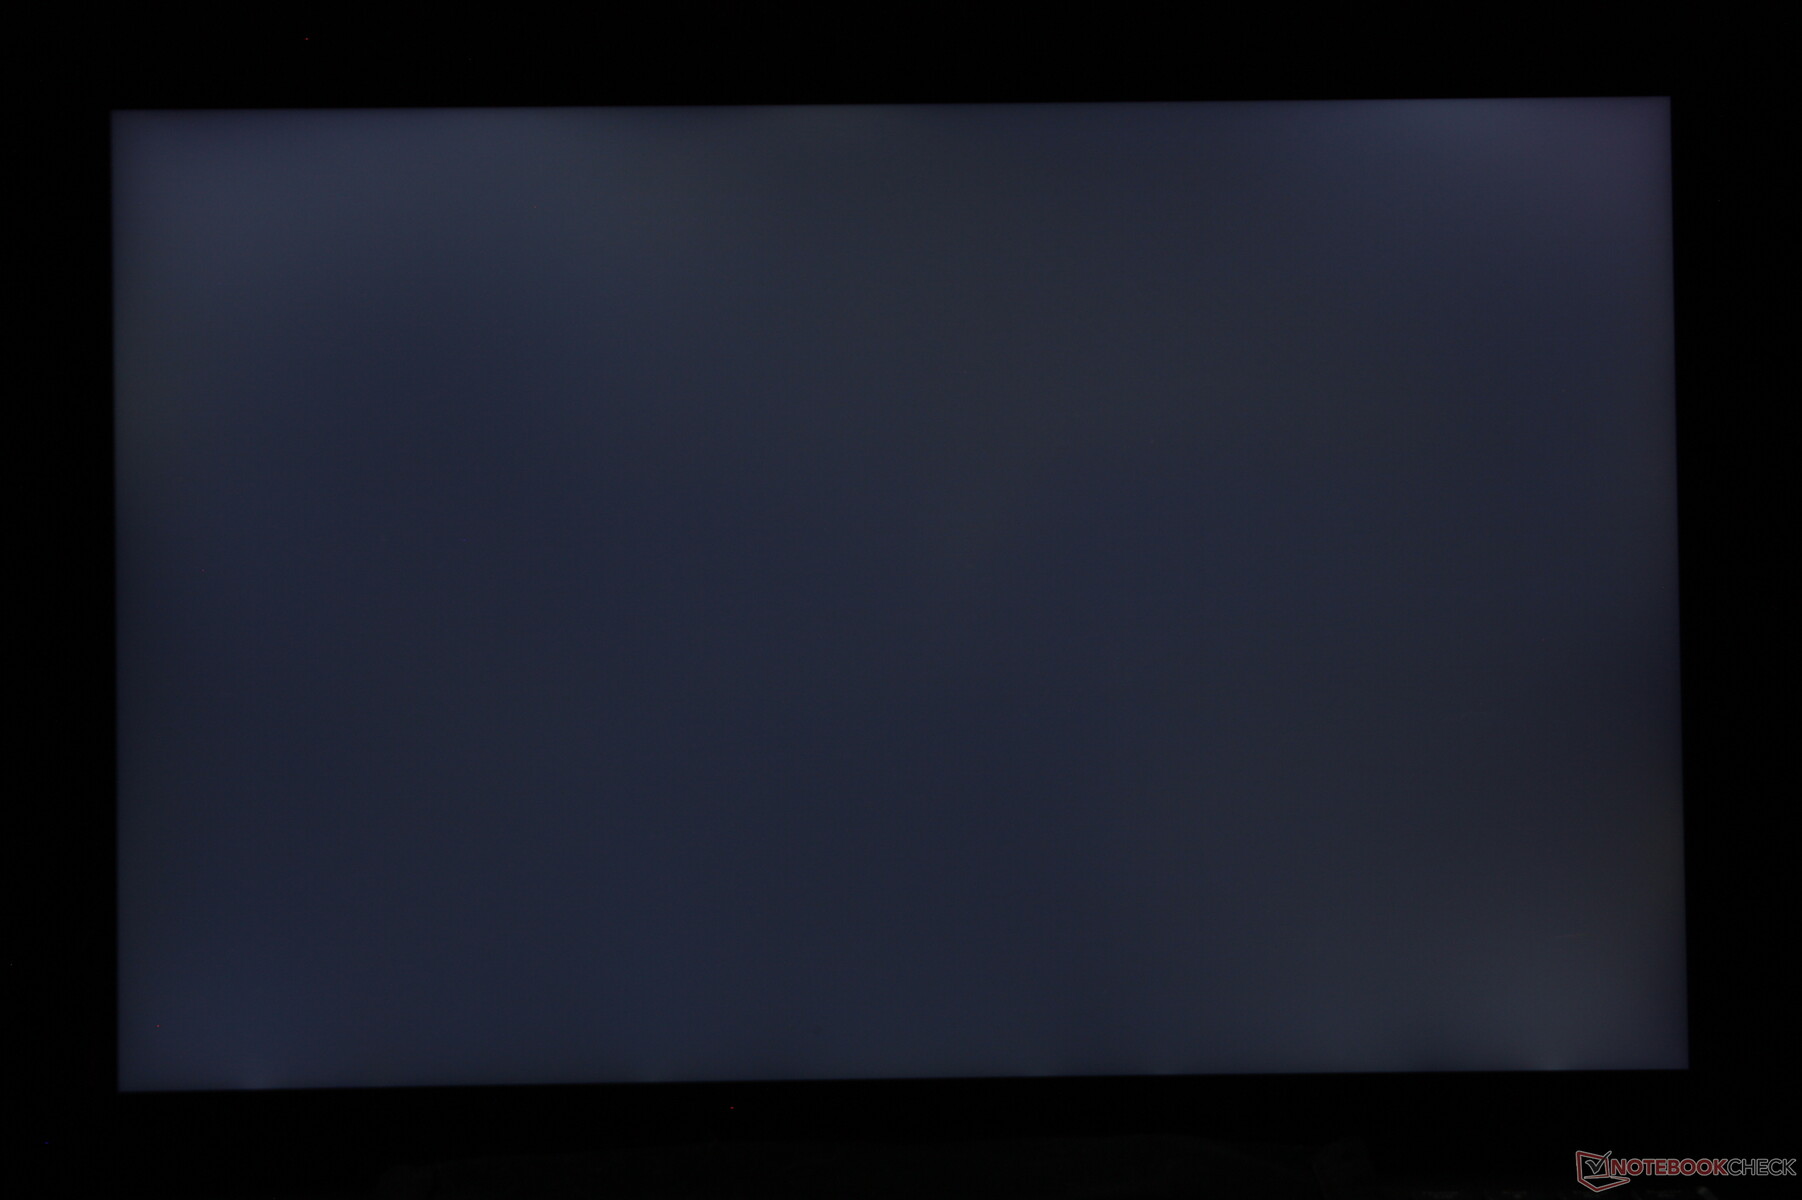
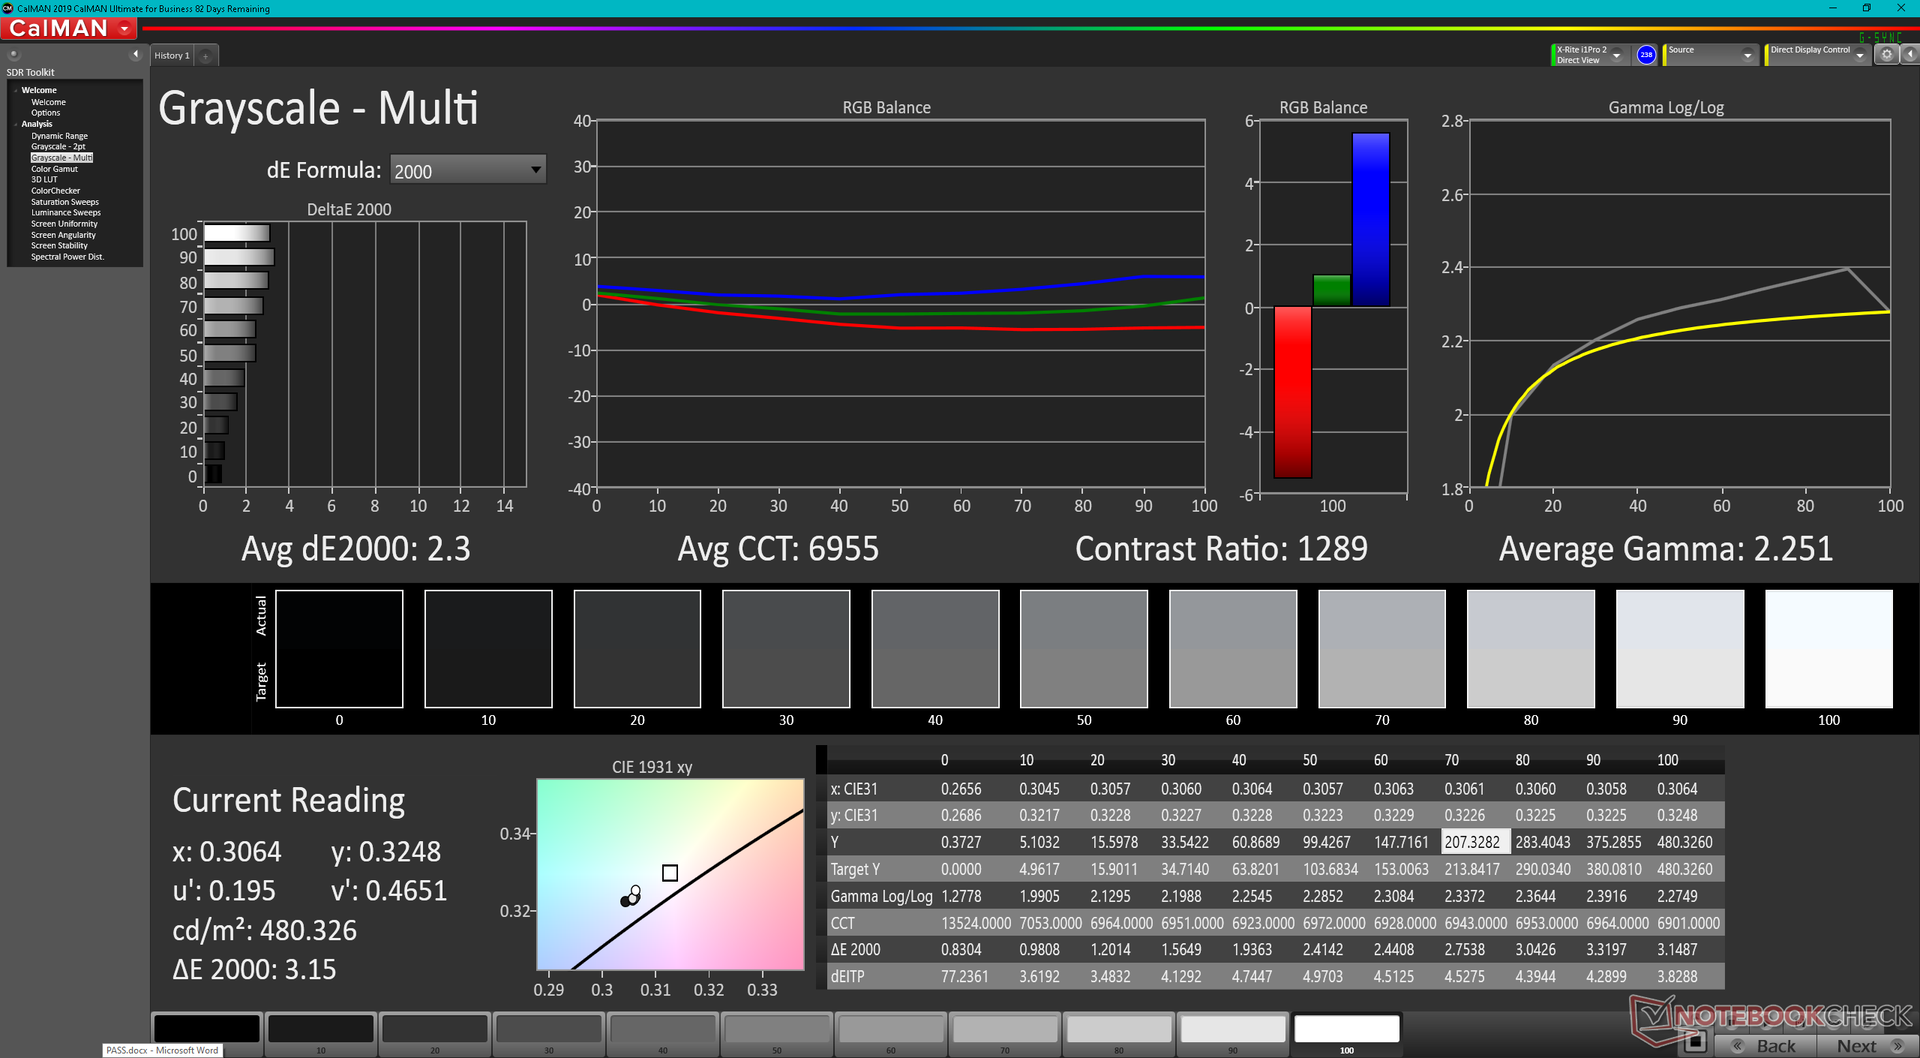
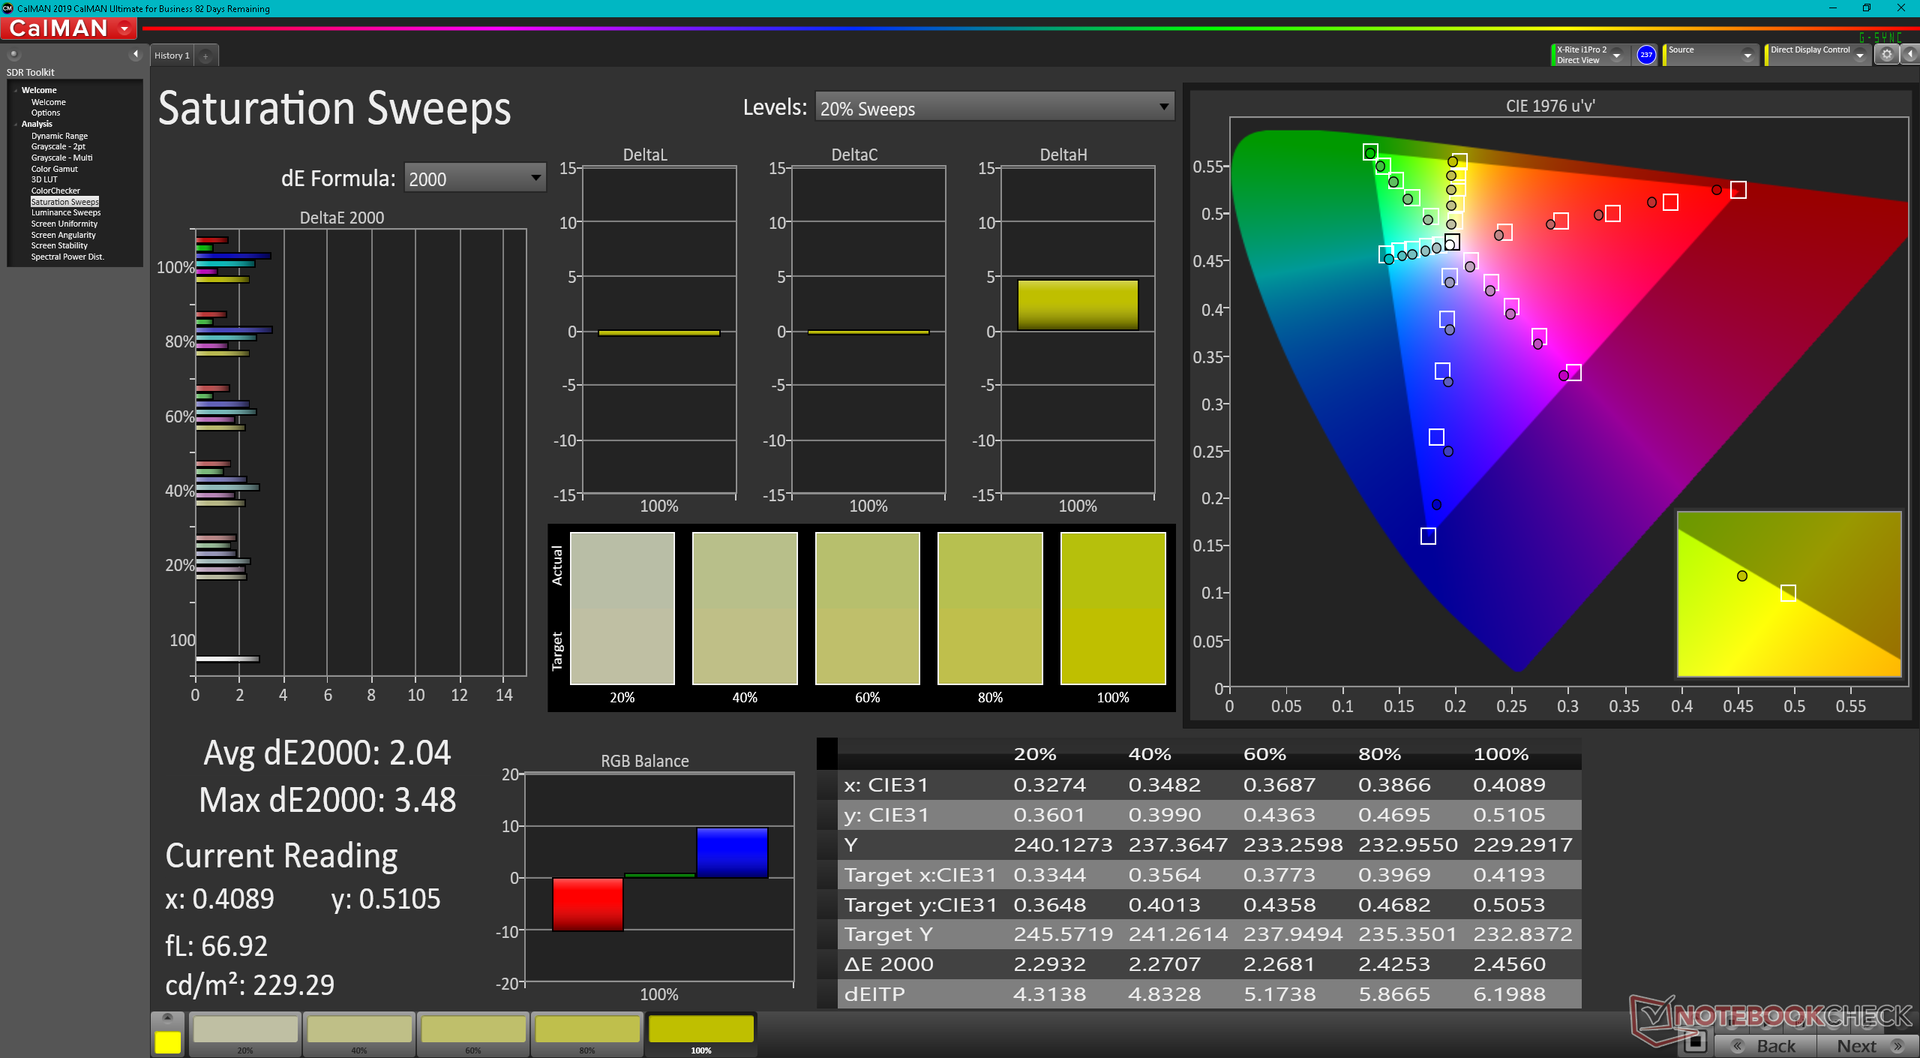
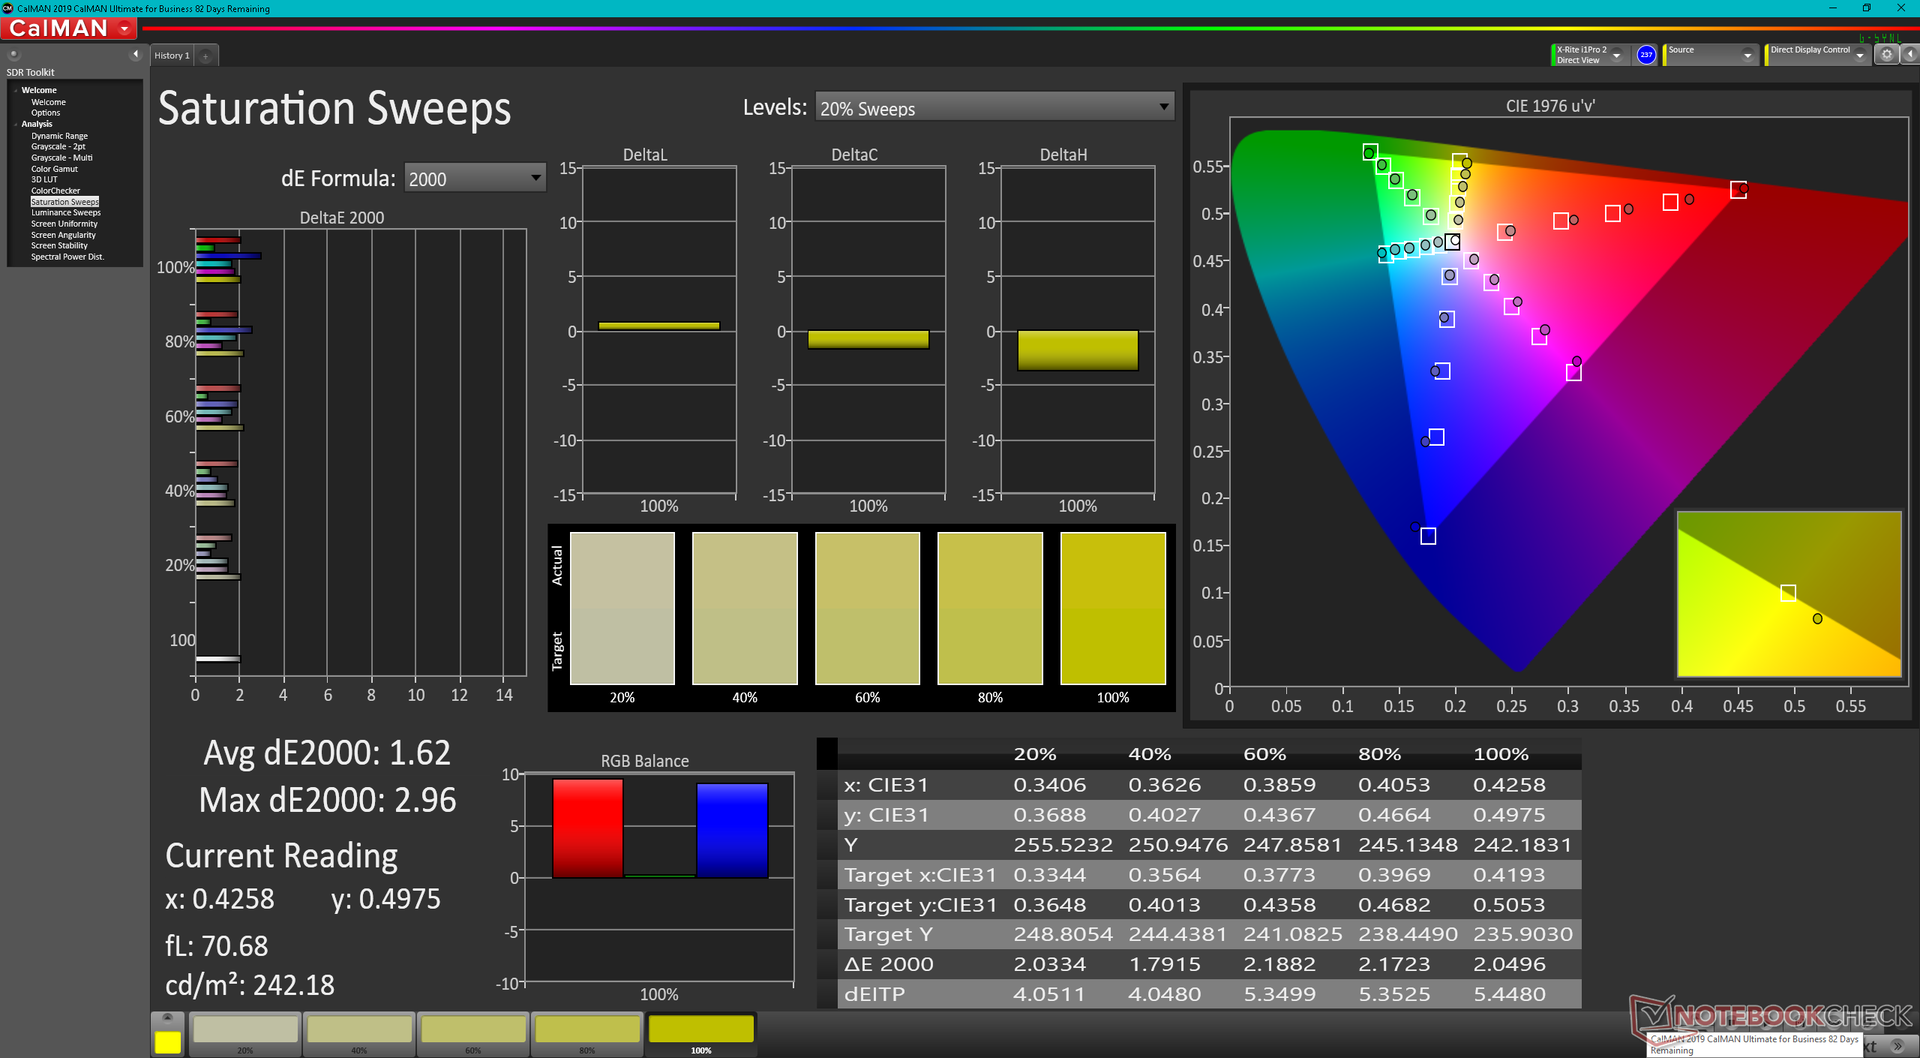
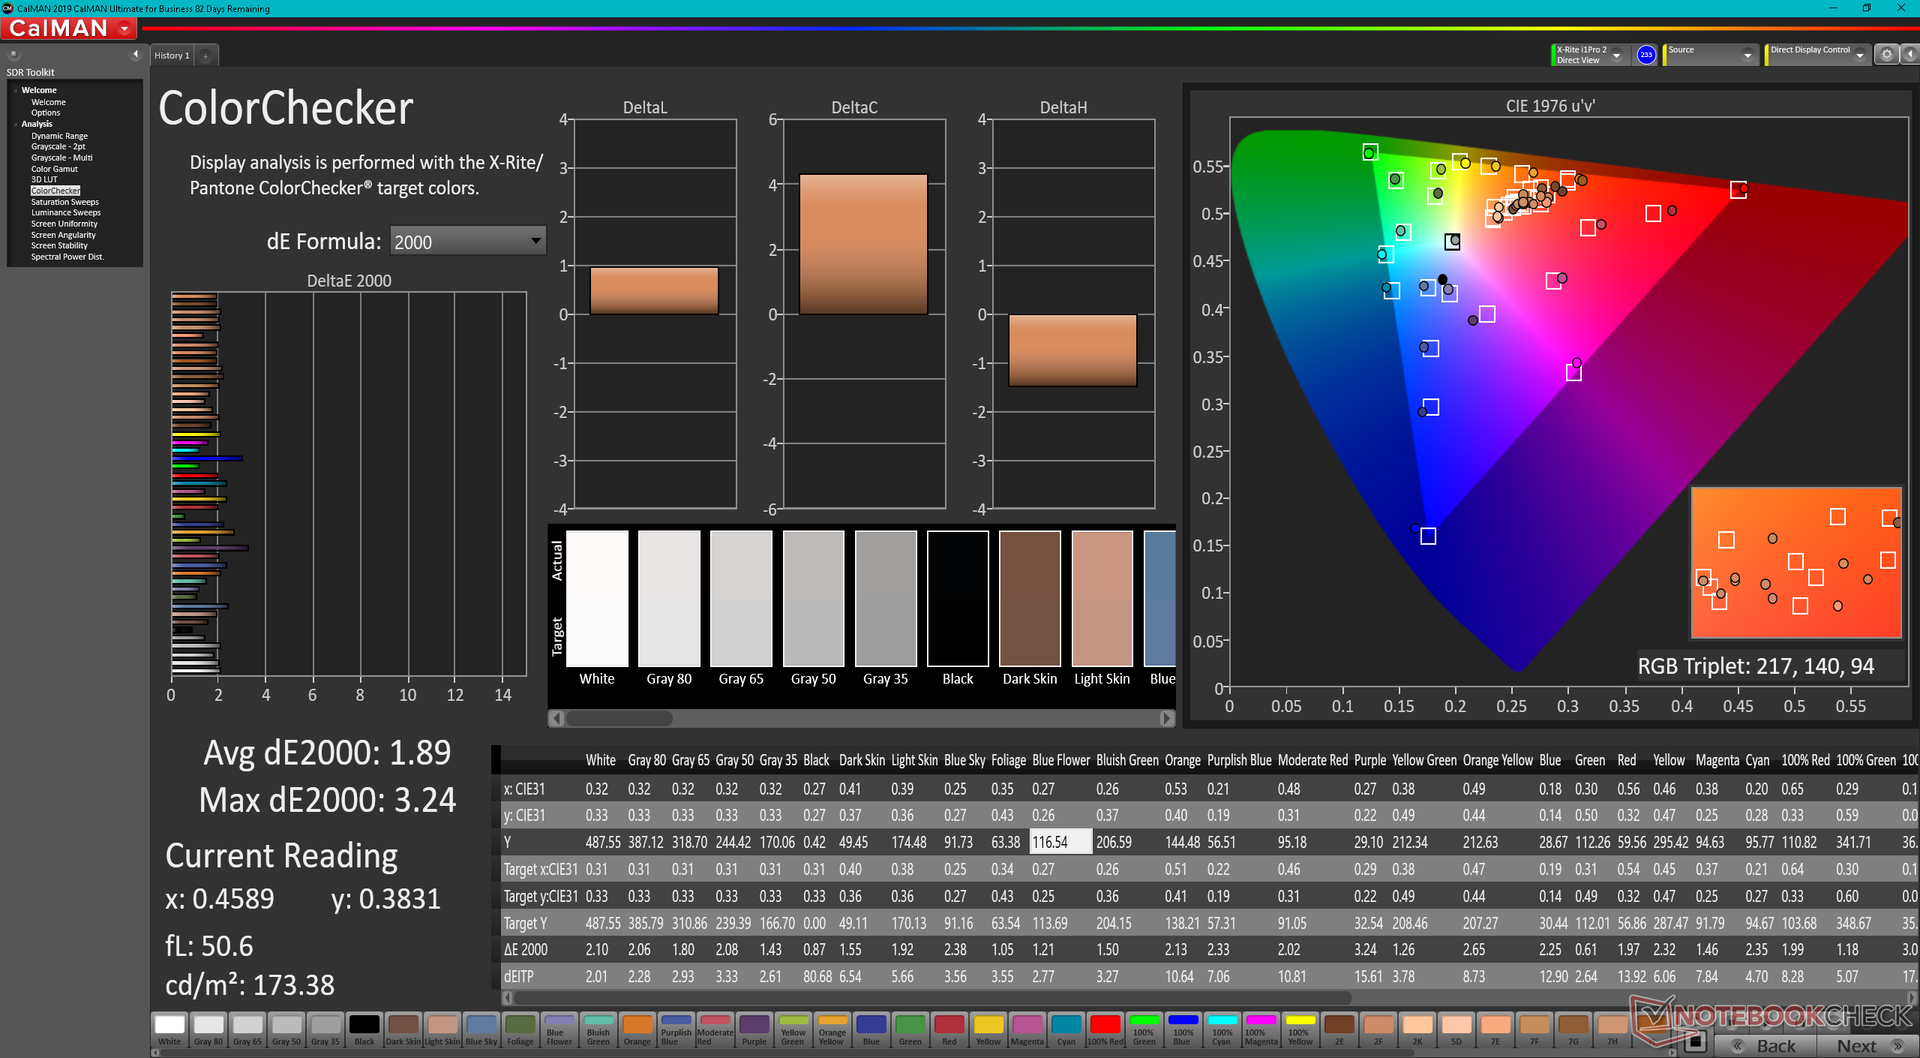
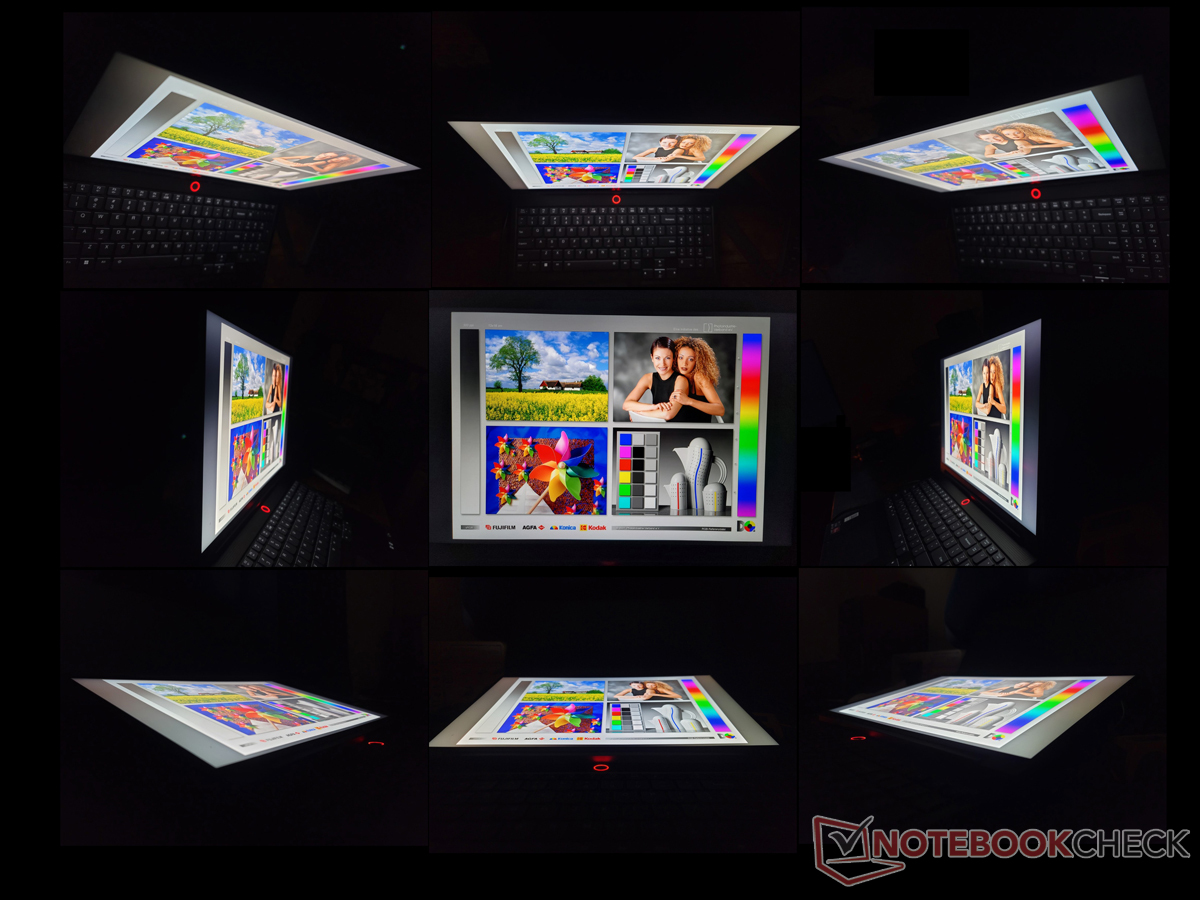
显示器 - 165赫兹,FreeSync,100% sRGB标准
Legion 7 16配备了高质量的京东方IPS面板,几乎与华硕ROG Zephyrus Duo 16的面板类似(NE160QDM-NY1对NE160QDM-NX1)。这两块面板的特点非常相似,包括响应时间、亮度水平和对比度,但它们在两个关键方面有所不同:刷新率和色彩覆盖率。联想的显示屏以sRGB覆盖率为目标,具有更快的165赫兹原生刷新率,而华硕的P3色彩更宽,但刷新率较慢,为120赫兹。一个面板不一定比另一个好,这取决于用户的喜好。
| |||||||||||||||||||||||||
Brightness Distribution: 90 %
Center on Battery: 478.8 cd/m²
Contrast: 1113:1 (Black: 0.43 cd/m²)
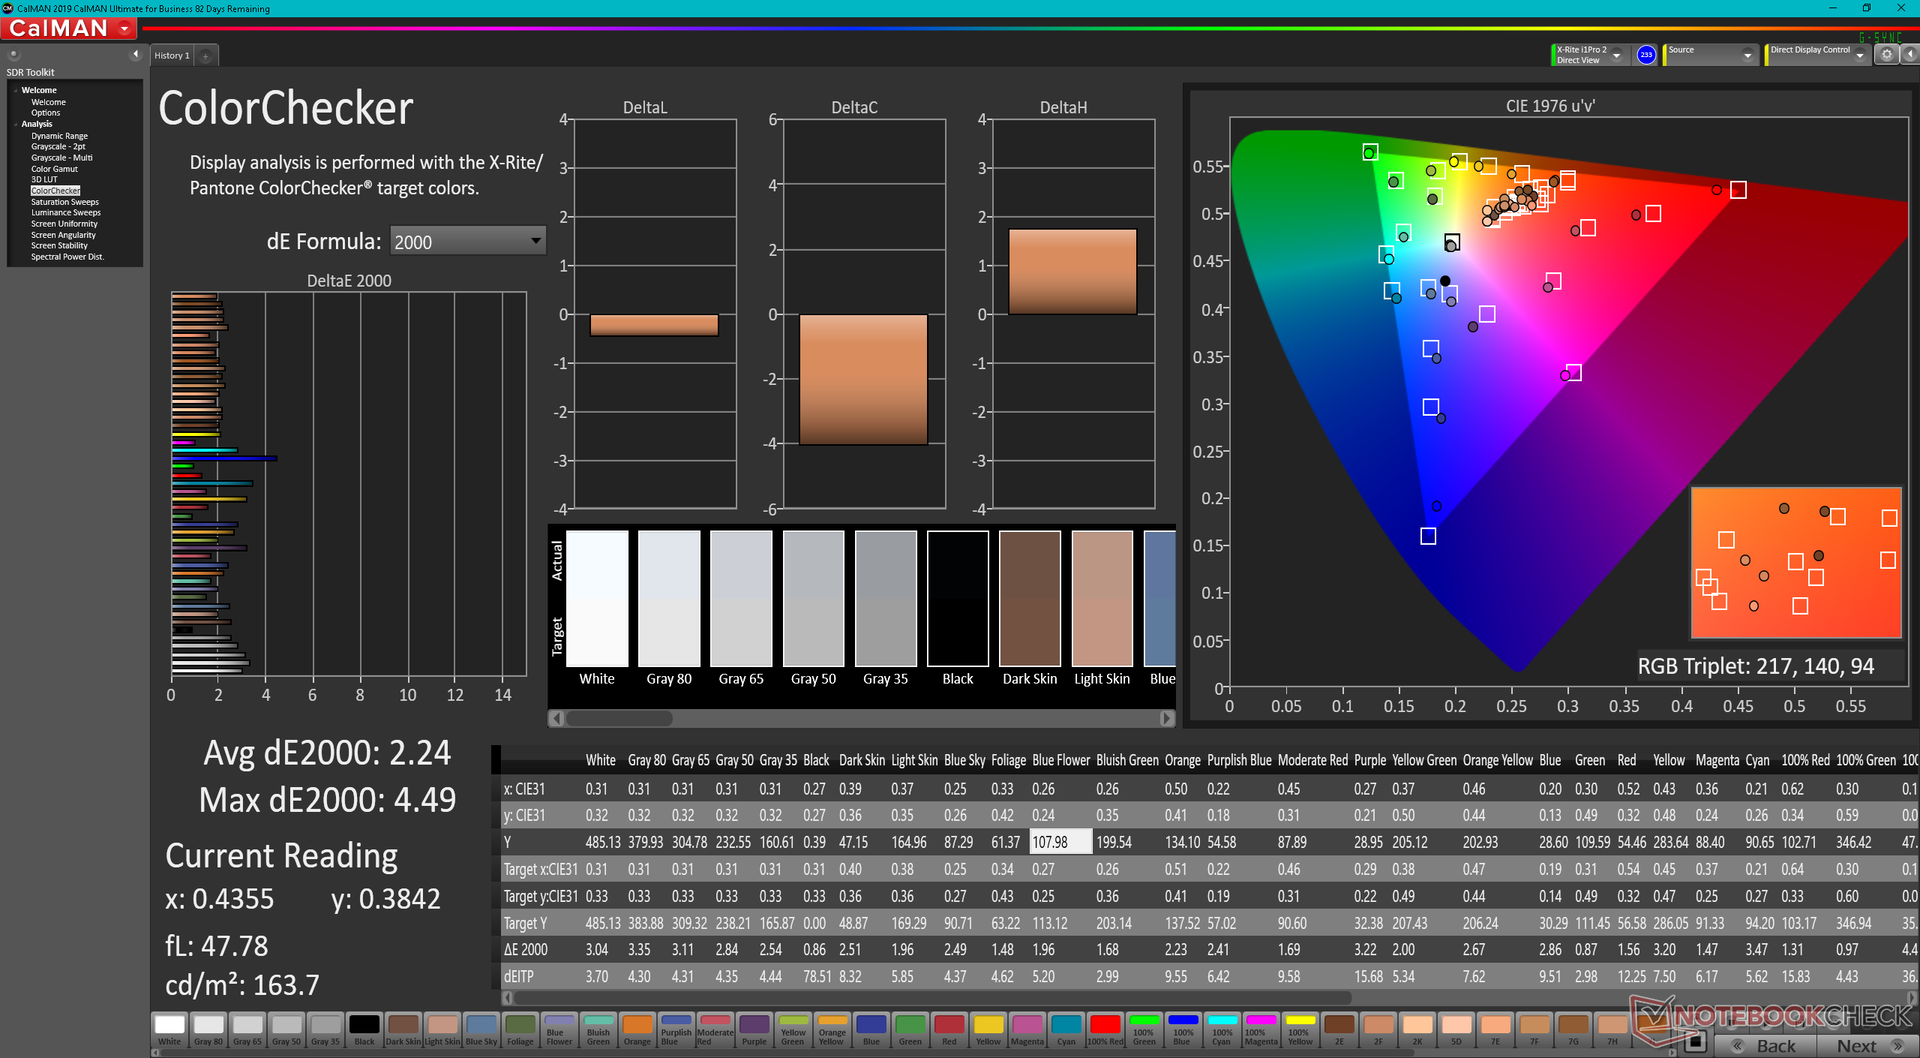
ΔE ColorChecker Calman: 2.24 | ∀{0.5-29.43 Ø4.71}
calibrated: 1.89
ΔE Greyscale Calman: 2.3 | ∀{0.09-98 Ø4.96}
65.7% AdobeRGB 1998 (Argyll 3D)
95.3% sRGB (Argyll 3D)
63.7% Display P3 (Argyll 3D)
Gamma: 2.25
CCT: 6955 K
| Lenovo Legion 7 16ARHA7 BOE CQ NE160QDM-NY1, IPS, 2560x1600, 16" | MSI Raider GE66 12UHS AUO51EB, IPS, 3840x2160, 15.6" | Lenovo Legion Slim 7-16IAH 82TF004YGE MNG007DA1-G , IPS LED, 2560x1600, 16" | Asus ROG Zephyrus Duo 16 GX650RX BOE NE160QAM-NX1, IPS-Level, 3840x2400, 16" | HP Omen 16-c0077ng BOE09E5, IPS, 2560x1440, 16.1" | Lenovo Legion 5 Pro 16ACH6H (82JQ001PGE) CSOT T3 MNG007DA1-1, IPS, 2560x1600, 16" | |
|---|---|---|---|---|---|---|
| Display | 24% | 9% | 30% | 6% | 8% | |
| Display P3 Coverage (%) | 63.7 | 80.4 26% | 70.5 11% | 98 54% | 68.8 8% | |
| sRGB Coverage (%) | 95.3 | 98.4 3% | 99.1 4% | 99.9 5% | 96.9 2% | 99 4% |
| AdobeRGB 1998 Coverage (%) | 65.7 | 94.7 44% | 72.8 11% | 86.3 31% | 71.1 8% | 73 11% |
| Response Times | -69% | -2% | -9% | -23% | 25% | |
| Response Time Grey 50% / Grey 80% * (ms) | 9.2 ? | 18.8 ? -104% | 12 ? -30% | 14.6 ? -59% | 13 ? -41% | 9.2 ? -0% |
| Response Time Black / White * (ms) | 9.6 ? | 12.8 ? -33% | 7 ? 27% | 5.6 ? 42% | 10 ? -4% | 4.8 50% |
| PWM Frequency (Hz) | ||||||
| Screen | -17% | 2% | -23% | -28% | 9% | |
| Brightness middle (cd/m²) | 478.8 | 351 -27% | 523 9% | 459 -4% | 297 -38% | 551 15% |
| Brightness (cd/m²) | 477 | 347 -27% | 494 4% | 434 -9% | 283 -41% | 523 10% |
| Brightness Distribution (%) | 90 | 90 0% | 90 0% | 88 -2% | 91 1% | 88 -2% |
| Black Level * (cd/m²) | 0.43 | 0.35 19% | 0.4 7% | 0.44 -2% | 0.22 49% | 0.54 -26% |
| Contrast (:1) | 1113 | 1003 -10% | 1308 18% | 1043 -6% | 1350 21% | 1020 -8% |
| Colorchecker dE 2000 * | 2.24 | 2.54 -13% | 2.6 -16% | 2.97 -33% | 3.25 -45% | 1.8 20% |
| Colorchecker dE 2000 max. * | 4.49 | 8.36 -86% | 5 -11% | 8.13 -81% | 6.33 -41% | 2.53 44% |
| Colorchecker dE 2000 calibrated * | 1.89 | 0.67 65% | 1 47% | 1.03 46% | 1.11 41% | 1.66 12% |
| Greyscale dE 2000 * | 2.3 | 4.1 -78% | 3.3 -43% | 4.9 -113% | 6.97 -203% | 1.85 20% |
| Gamma | 2.25 98% | 2.089 105% | 2.17 101% | 2.235 98% | 2.3 96% | 2.3 96% |
| CCT | 6955 93% | 7036 92% | 6013 108% | 6775 96% | 6050 107% | 6338 103% |
| Color Space (Percent of AdobeRGB 1998) (%) | 72.81 | |||||
| Color Space (Percent of sRGB) (%) | 99.41 | |||||
| Total Average (Program / Settings) | -21% /
-16% | 3% /
3% | -1% /
-9% | -15% /
-20% | 14% /
12% |
* ... smaller is better
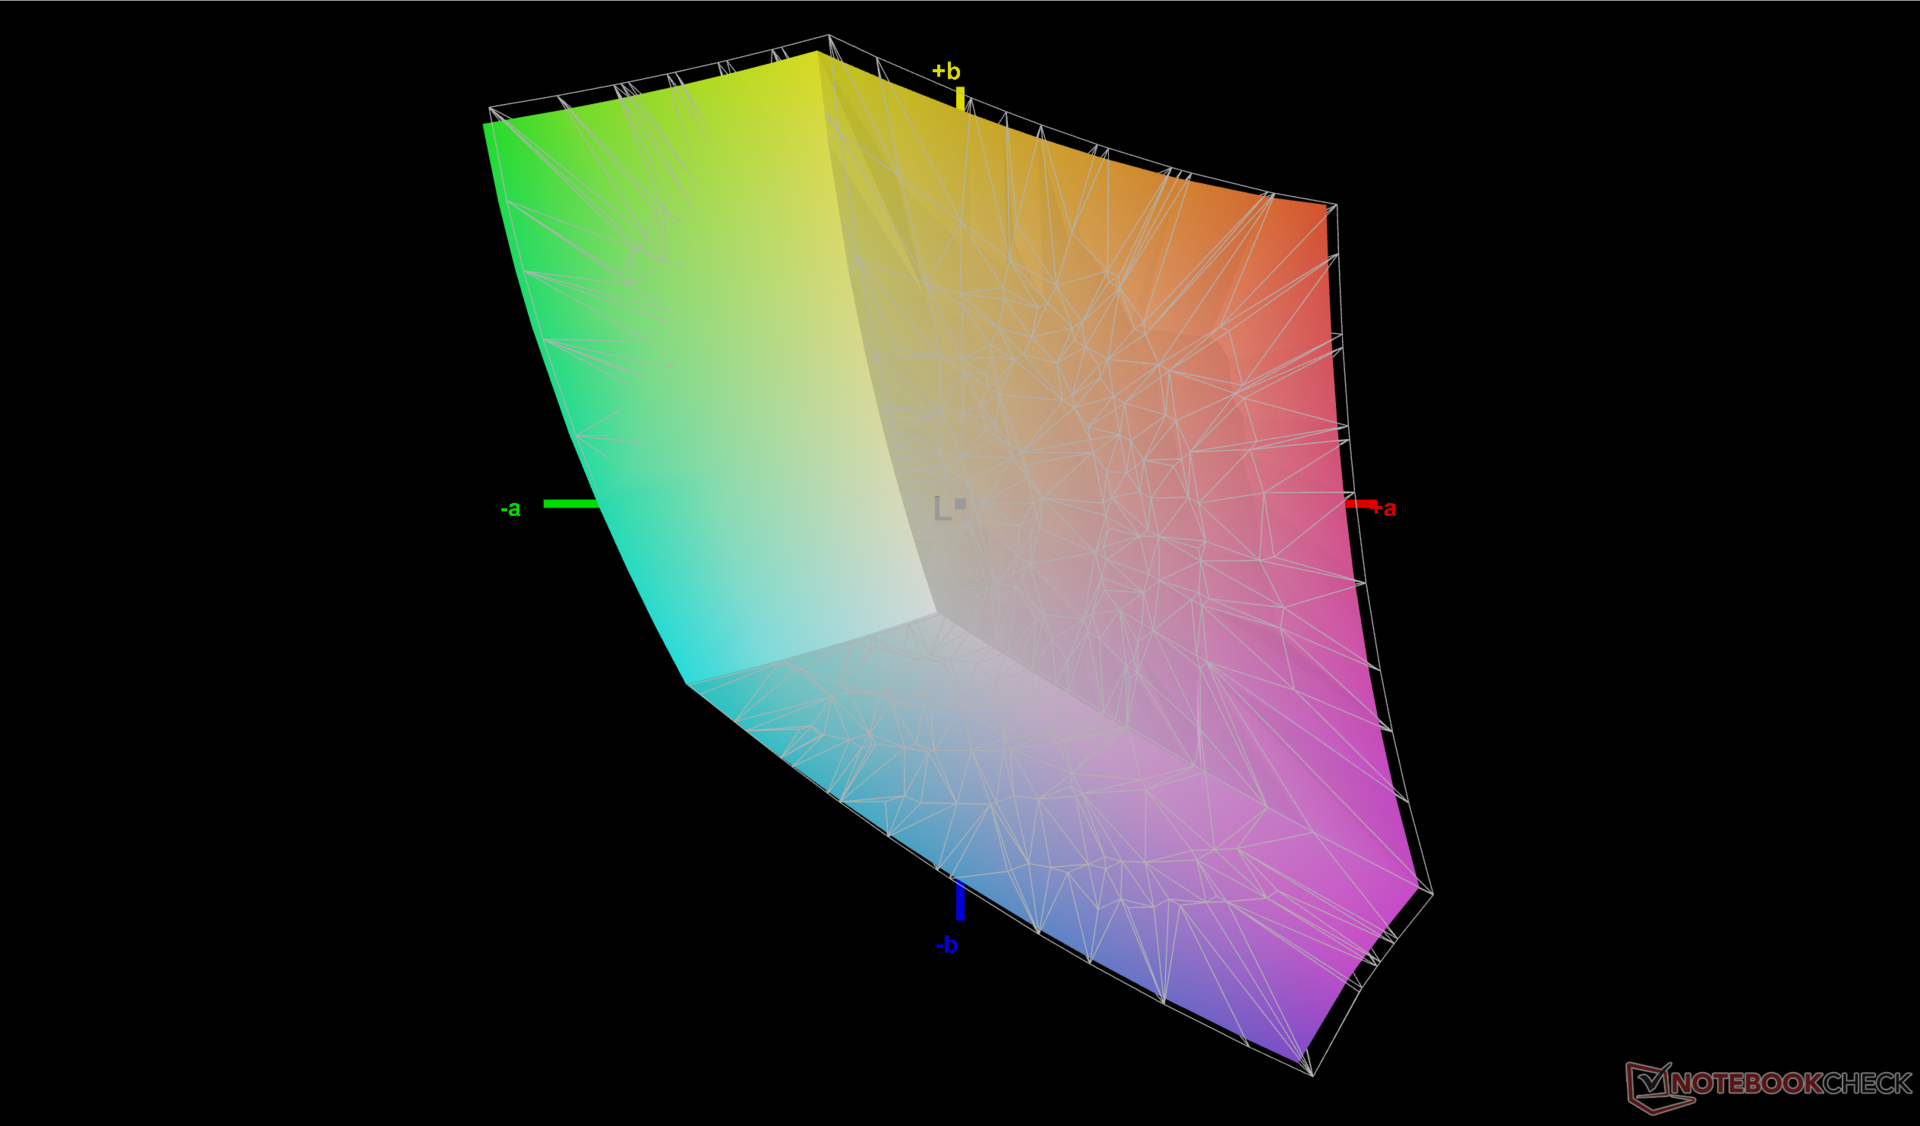
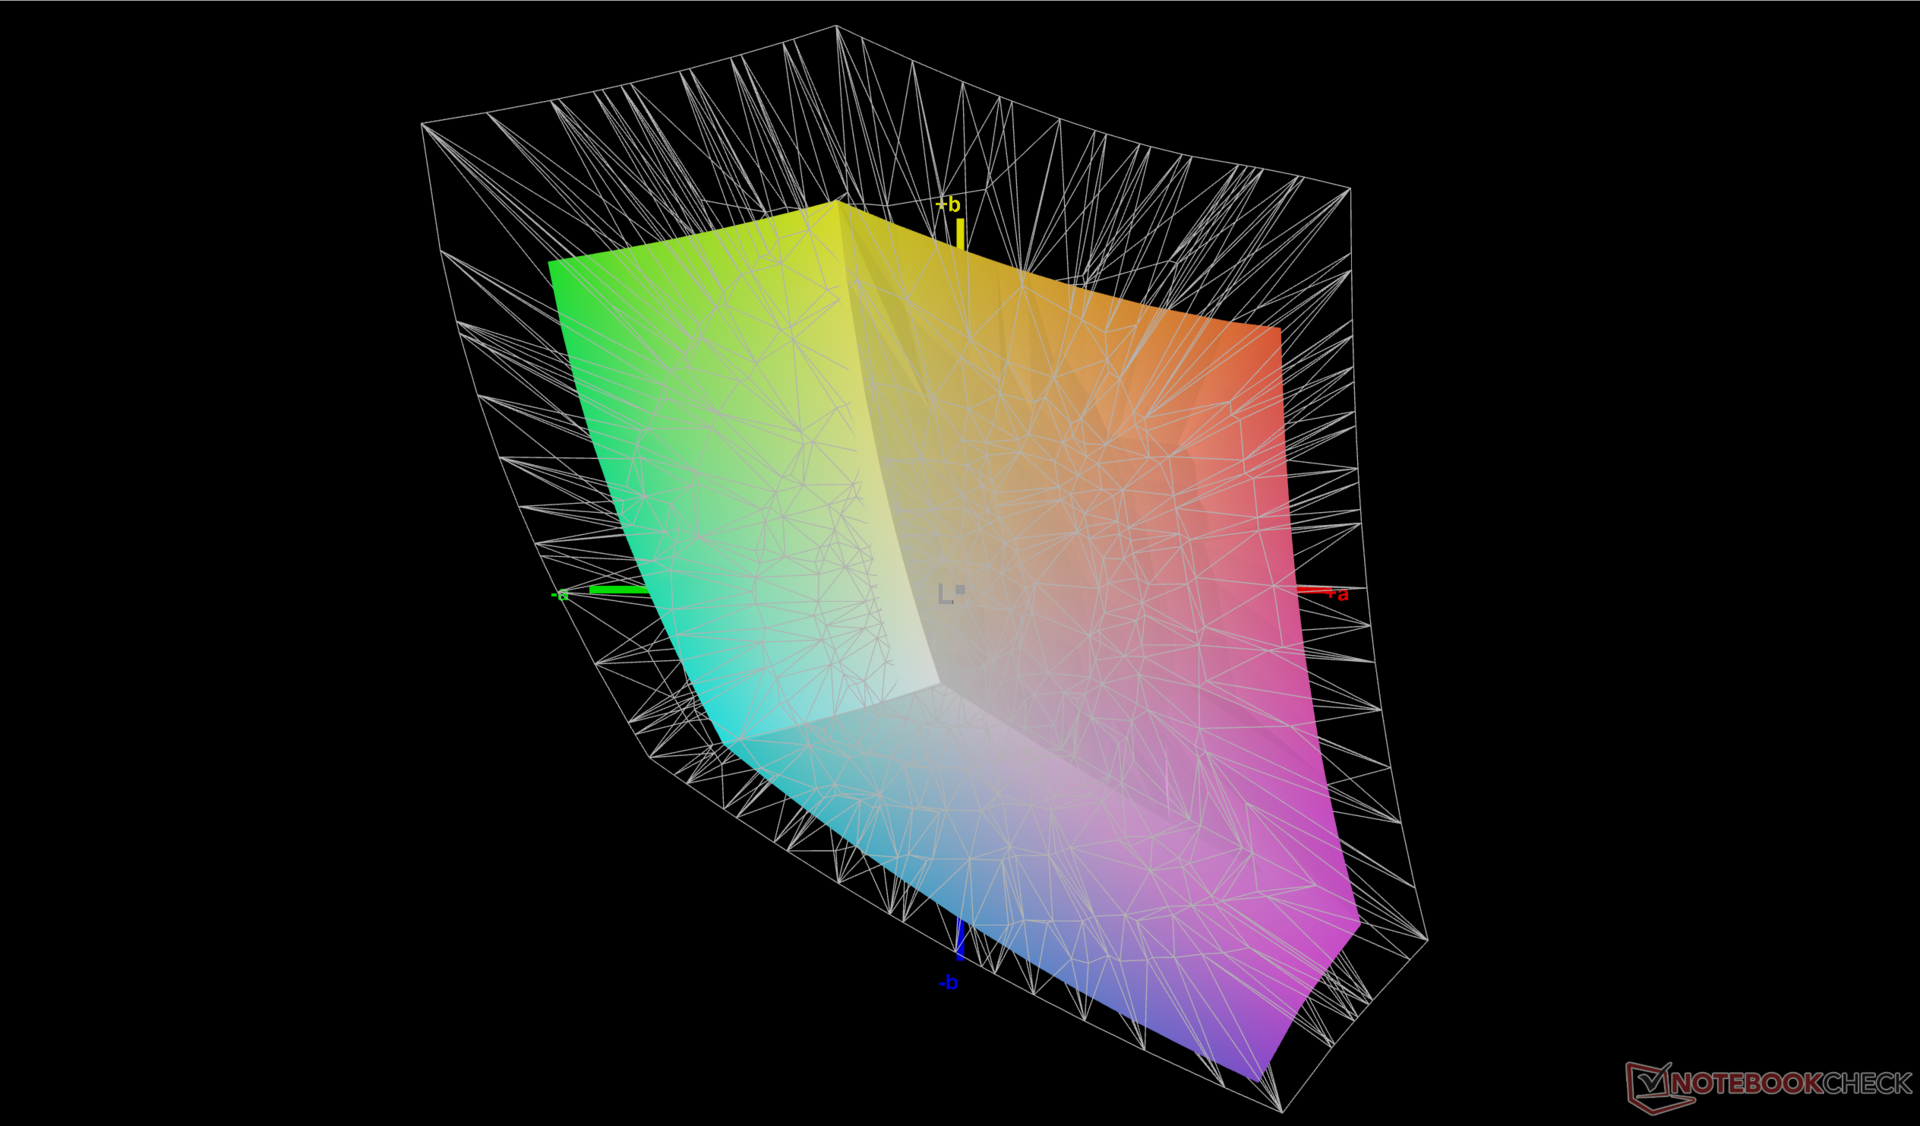
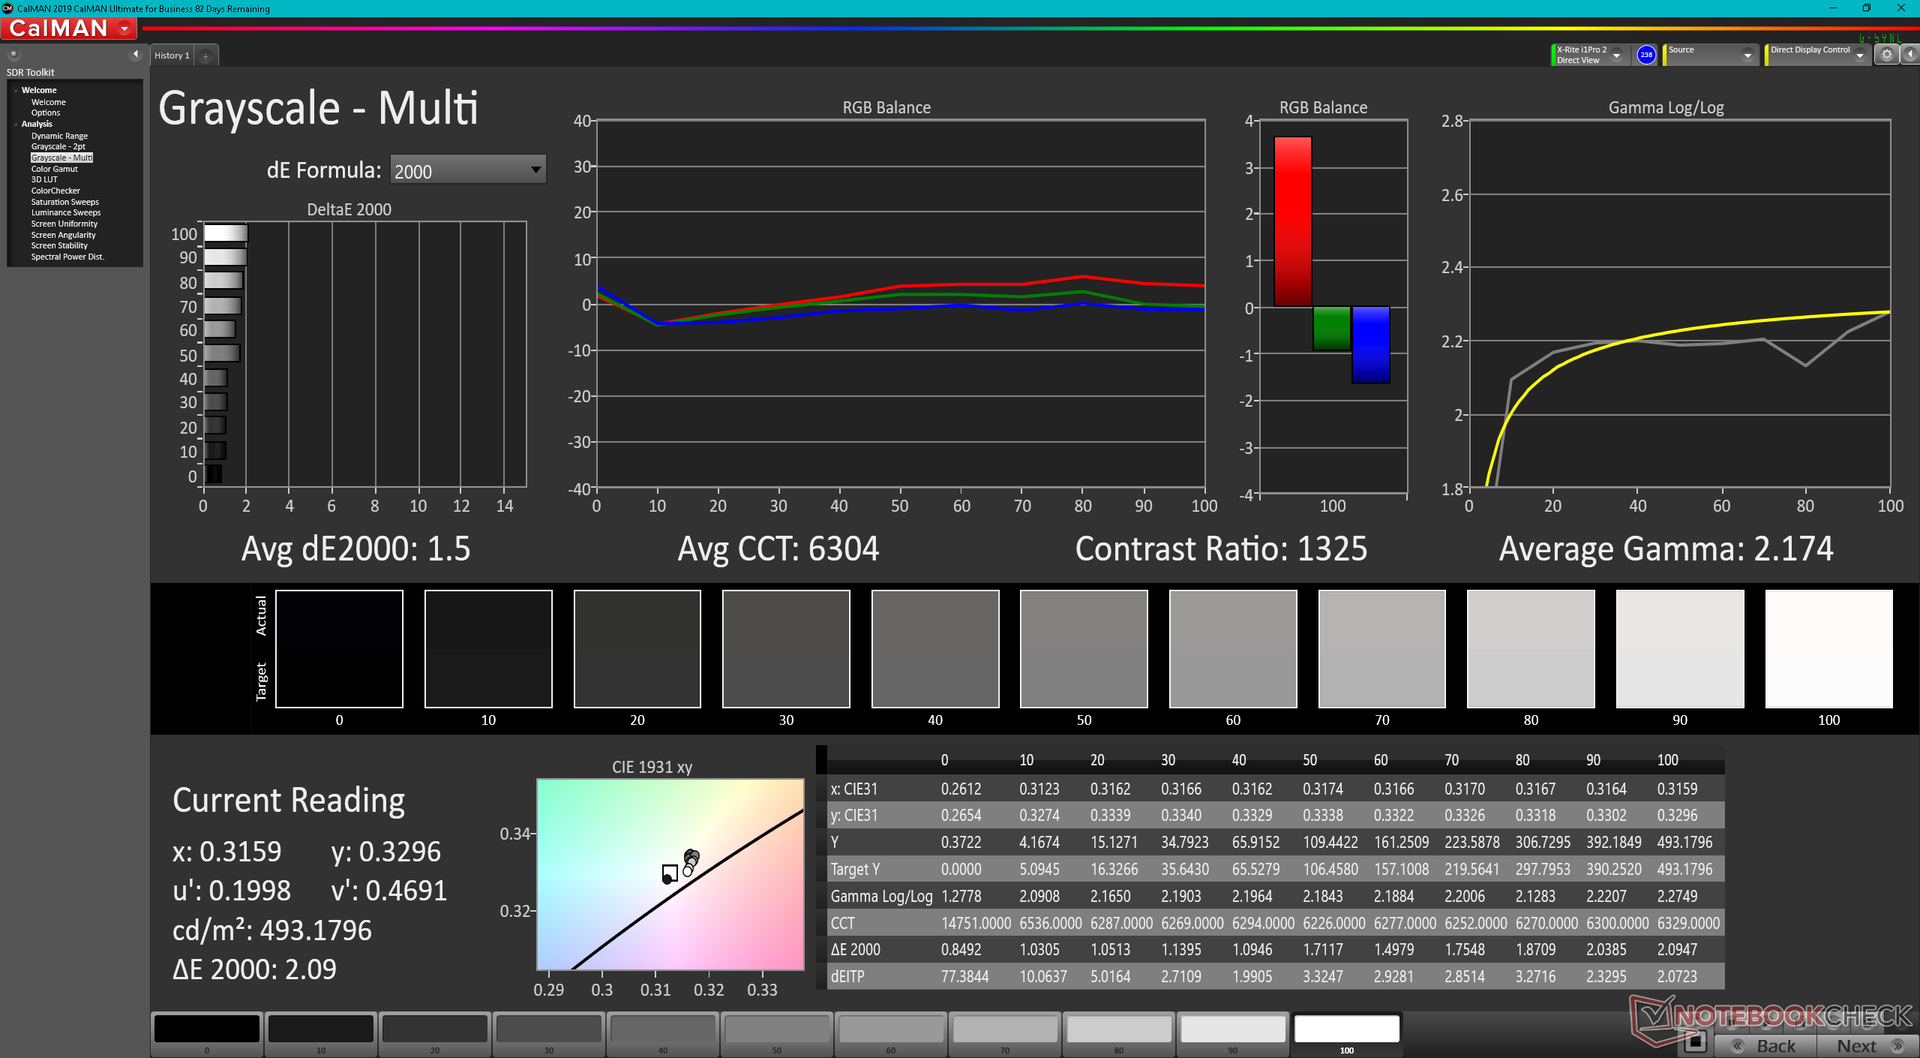
这款显示器开箱后就被校准得很好,平均灰度和ColorChecker DeltaE值分别只有2.3和2.24。如果我们进一步校准面板,就可以将DeltaE值提高到1.5和1.8,以更好地利用整个sRGB覆盖范围。
Display Response Times
| ↔ Response Time Black to White | ||
|---|---|---|
| 9.6 ms ... rise ↗ and fall ↘ combined | ↗ 4.8 ms rise | 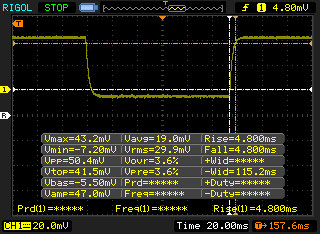 |
| ↘ 4.8 ms fall | ||
| The screen shows fast response rates in our tests and should be suited for gaming. In comparison, all tested devices range from 0.1 (minimum) to 240 (maximum) ms. » 26 % of all devices are better. This means that the measured response time is better than the average of all tested devices (19.8 ms). | ||
| ↔ Response Time 50% Grey to 80% Grey | ||
| 9.2 ms ... rise ↗ and fall ↘ combined | ↗ 4.8 ms rise | 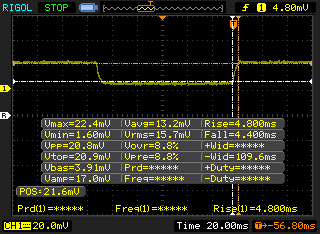 |
| ↘ 4.4 ms fall | ||
| The screen shows fast response rates in our tests and should be suited for gaming. In comparison, all tested devices range from 0.165 (minimum) to 636 (maximum) ms. » 23 % of all devices are better. This means that the measured response time is better than the average of all tested devices (30.9 ms). | ||
Screen Flickering / PWM (Pulse-Width Modulation)
| Screen flickering / PWM not detected | 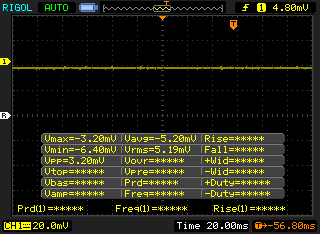 | ||
In comparison: 52 % of all tested devices do not use PWM to dim the display. If PWM was detected, an average of 7748 (minimum: 5 - maximum: 343500) Hz was measured. | |||
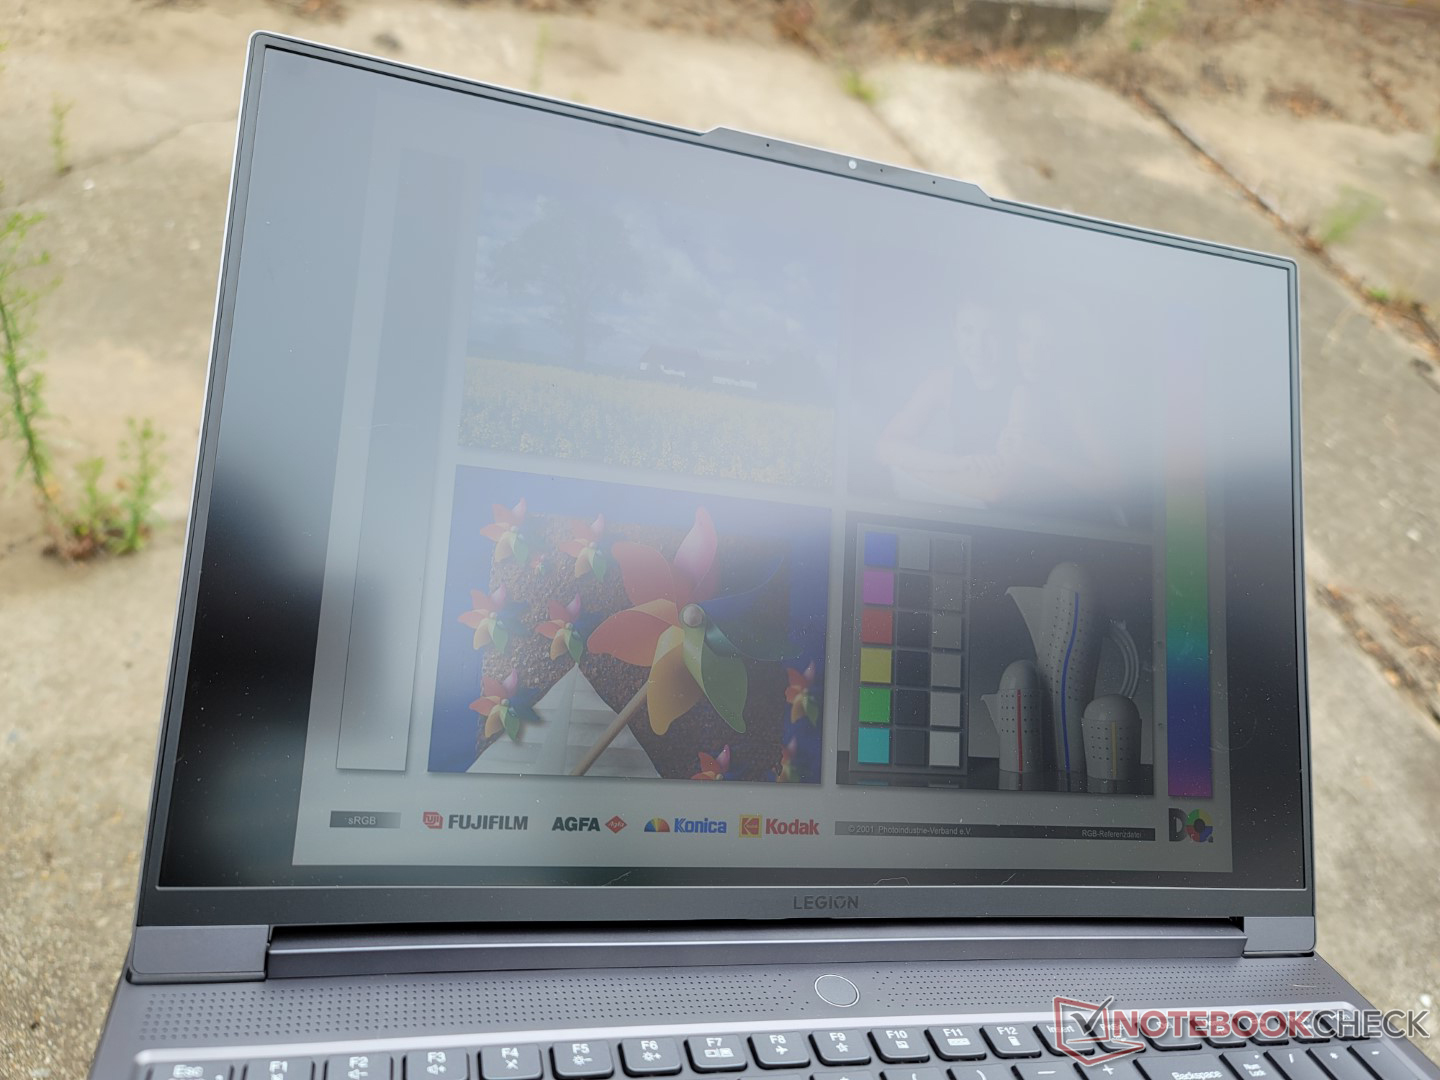
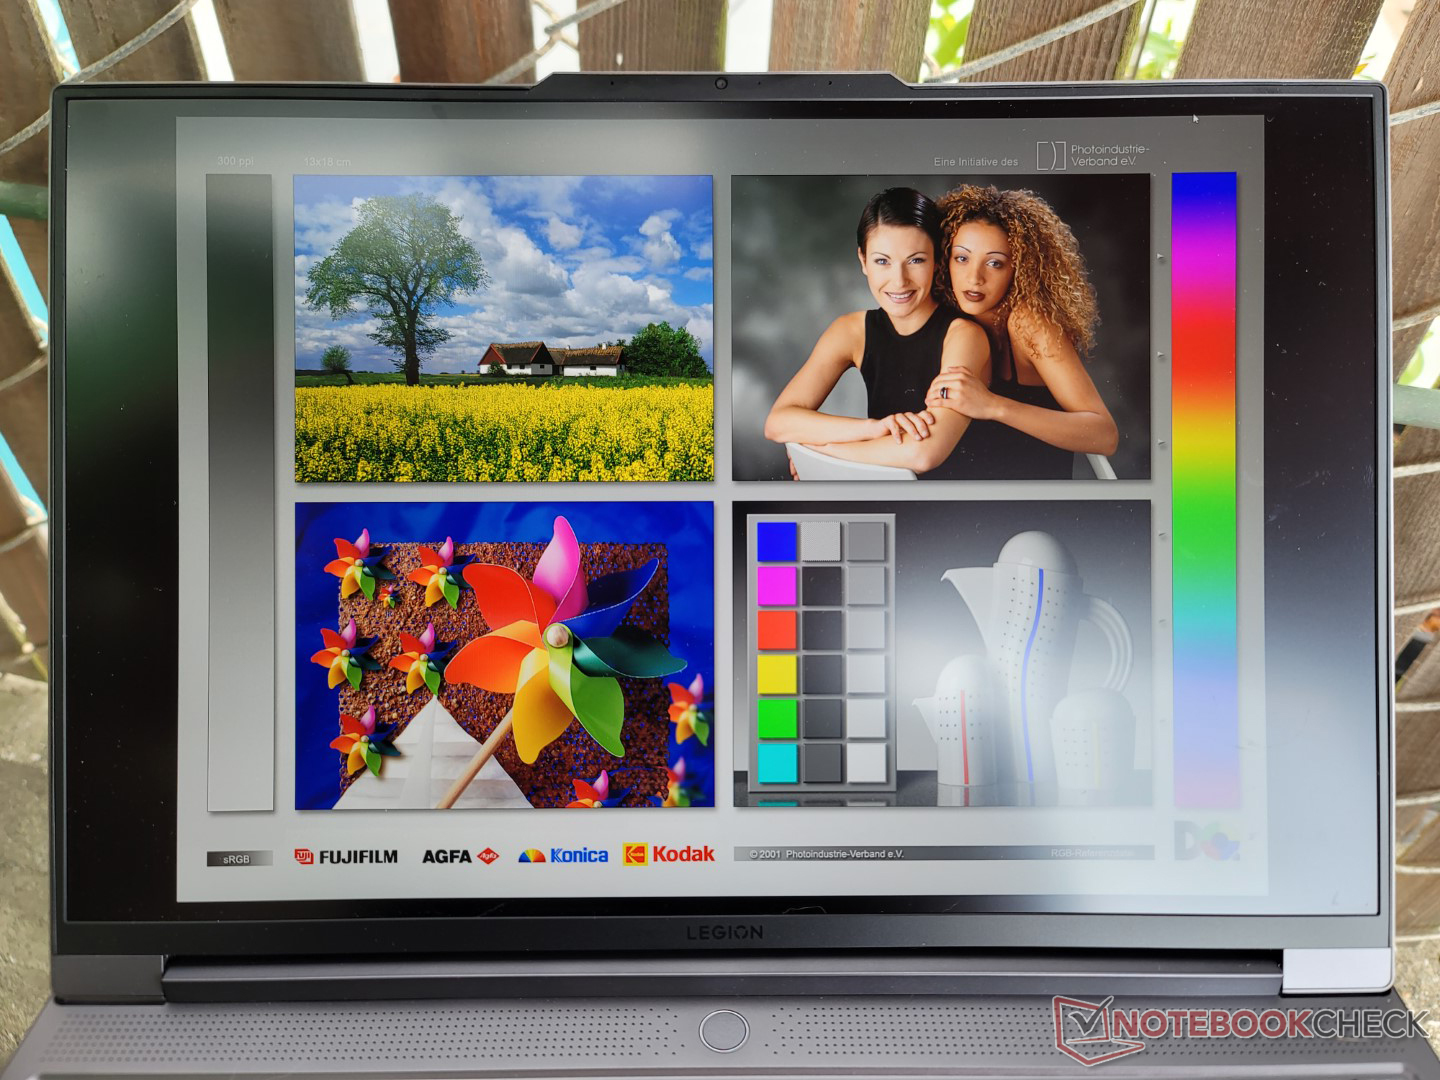
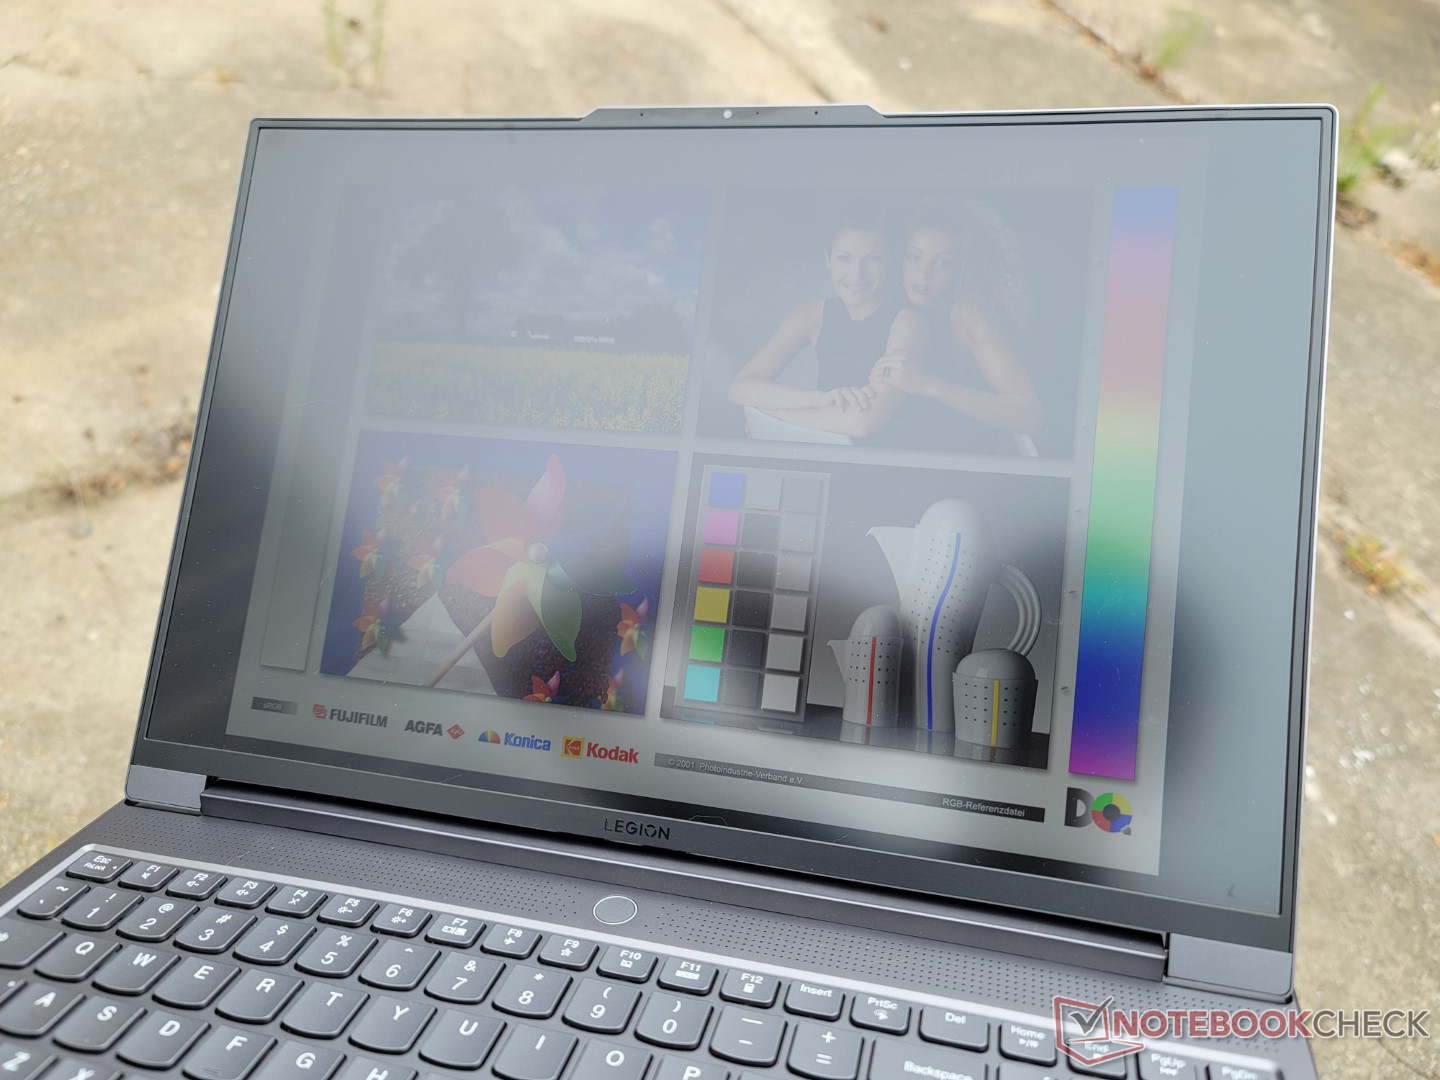
由于采用了明亮的500尼特显示屏,户外能见度比大多数其他游戏笔记本电脑要好。然而,你仍然希望避免在阳光直射下使用该系统,以最大限度地提高可视性。如果在树荫下工作,眩光会变得更容易控制。
业绩
测试条件
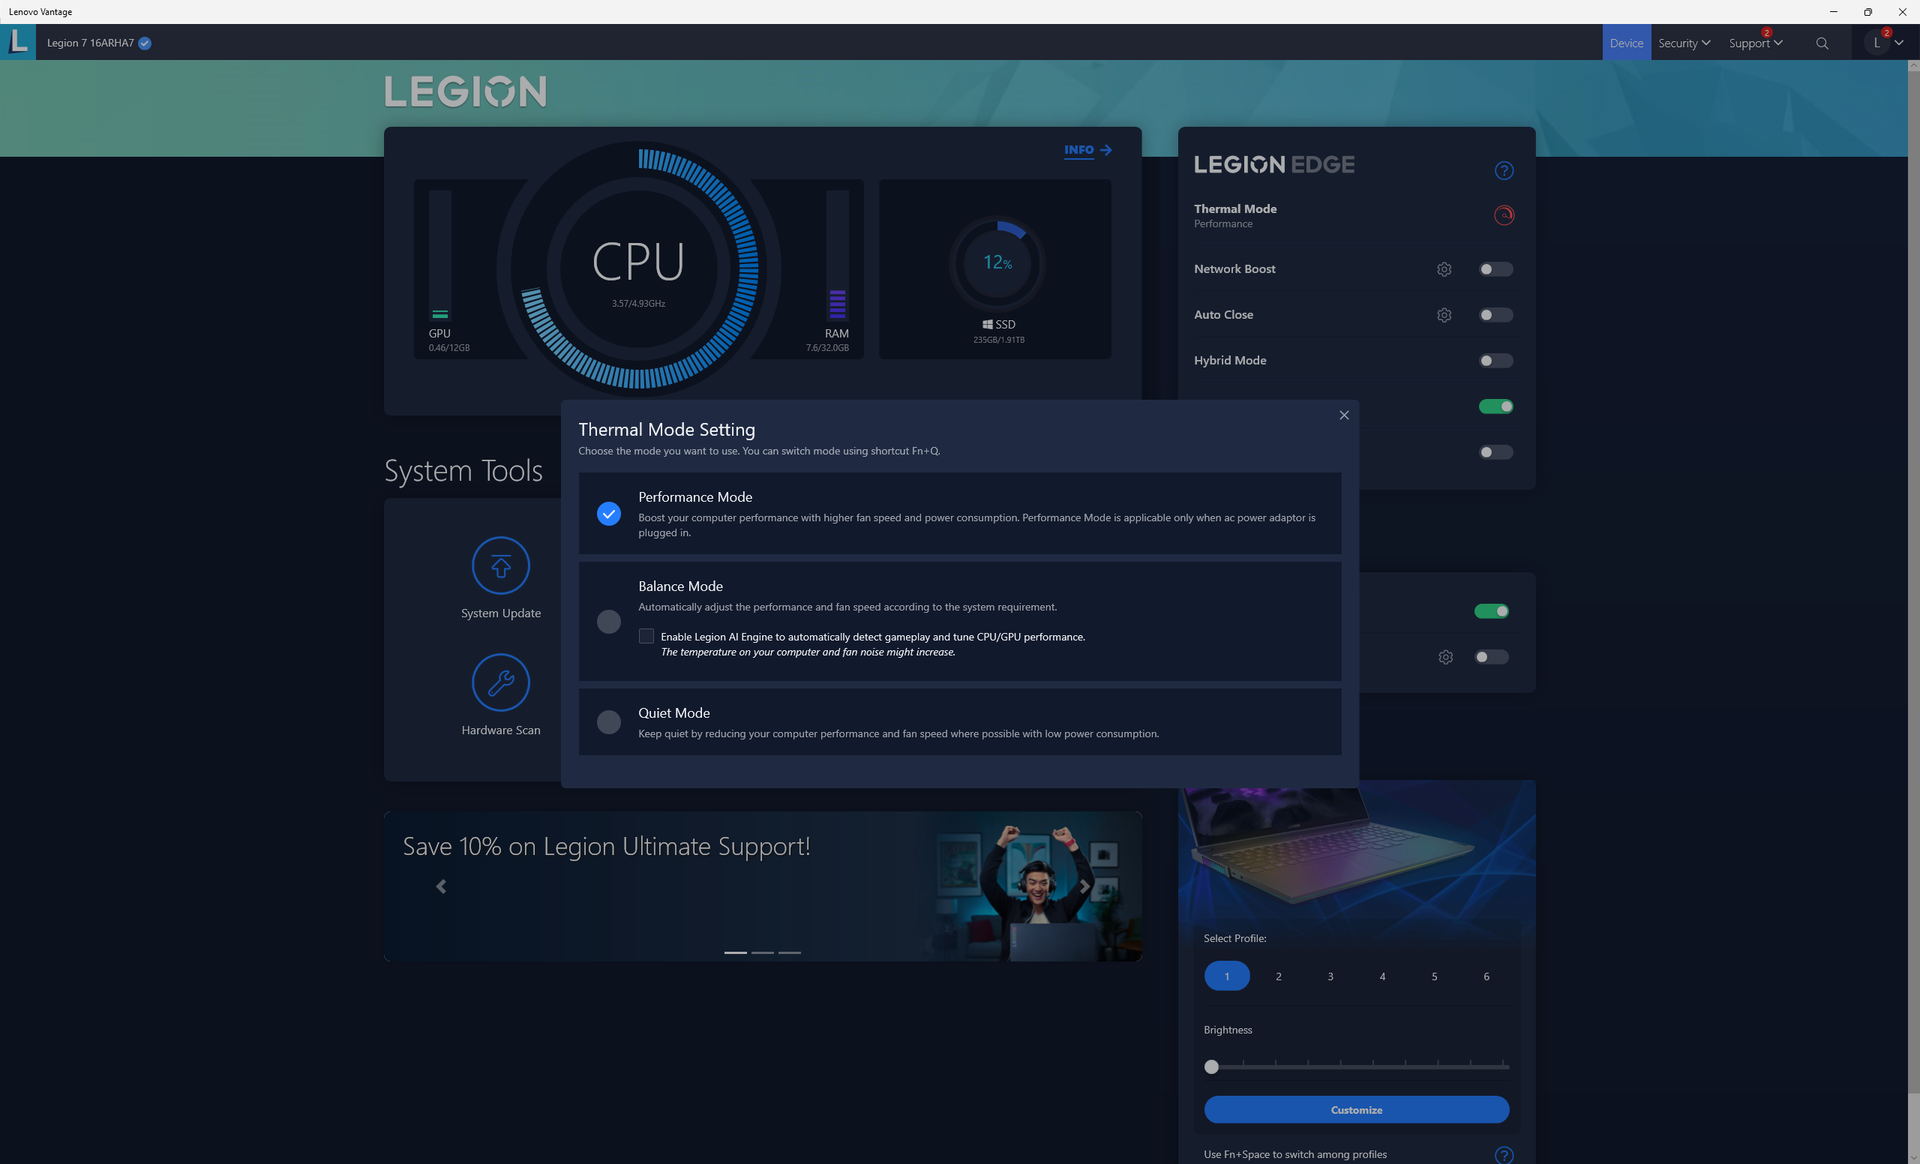
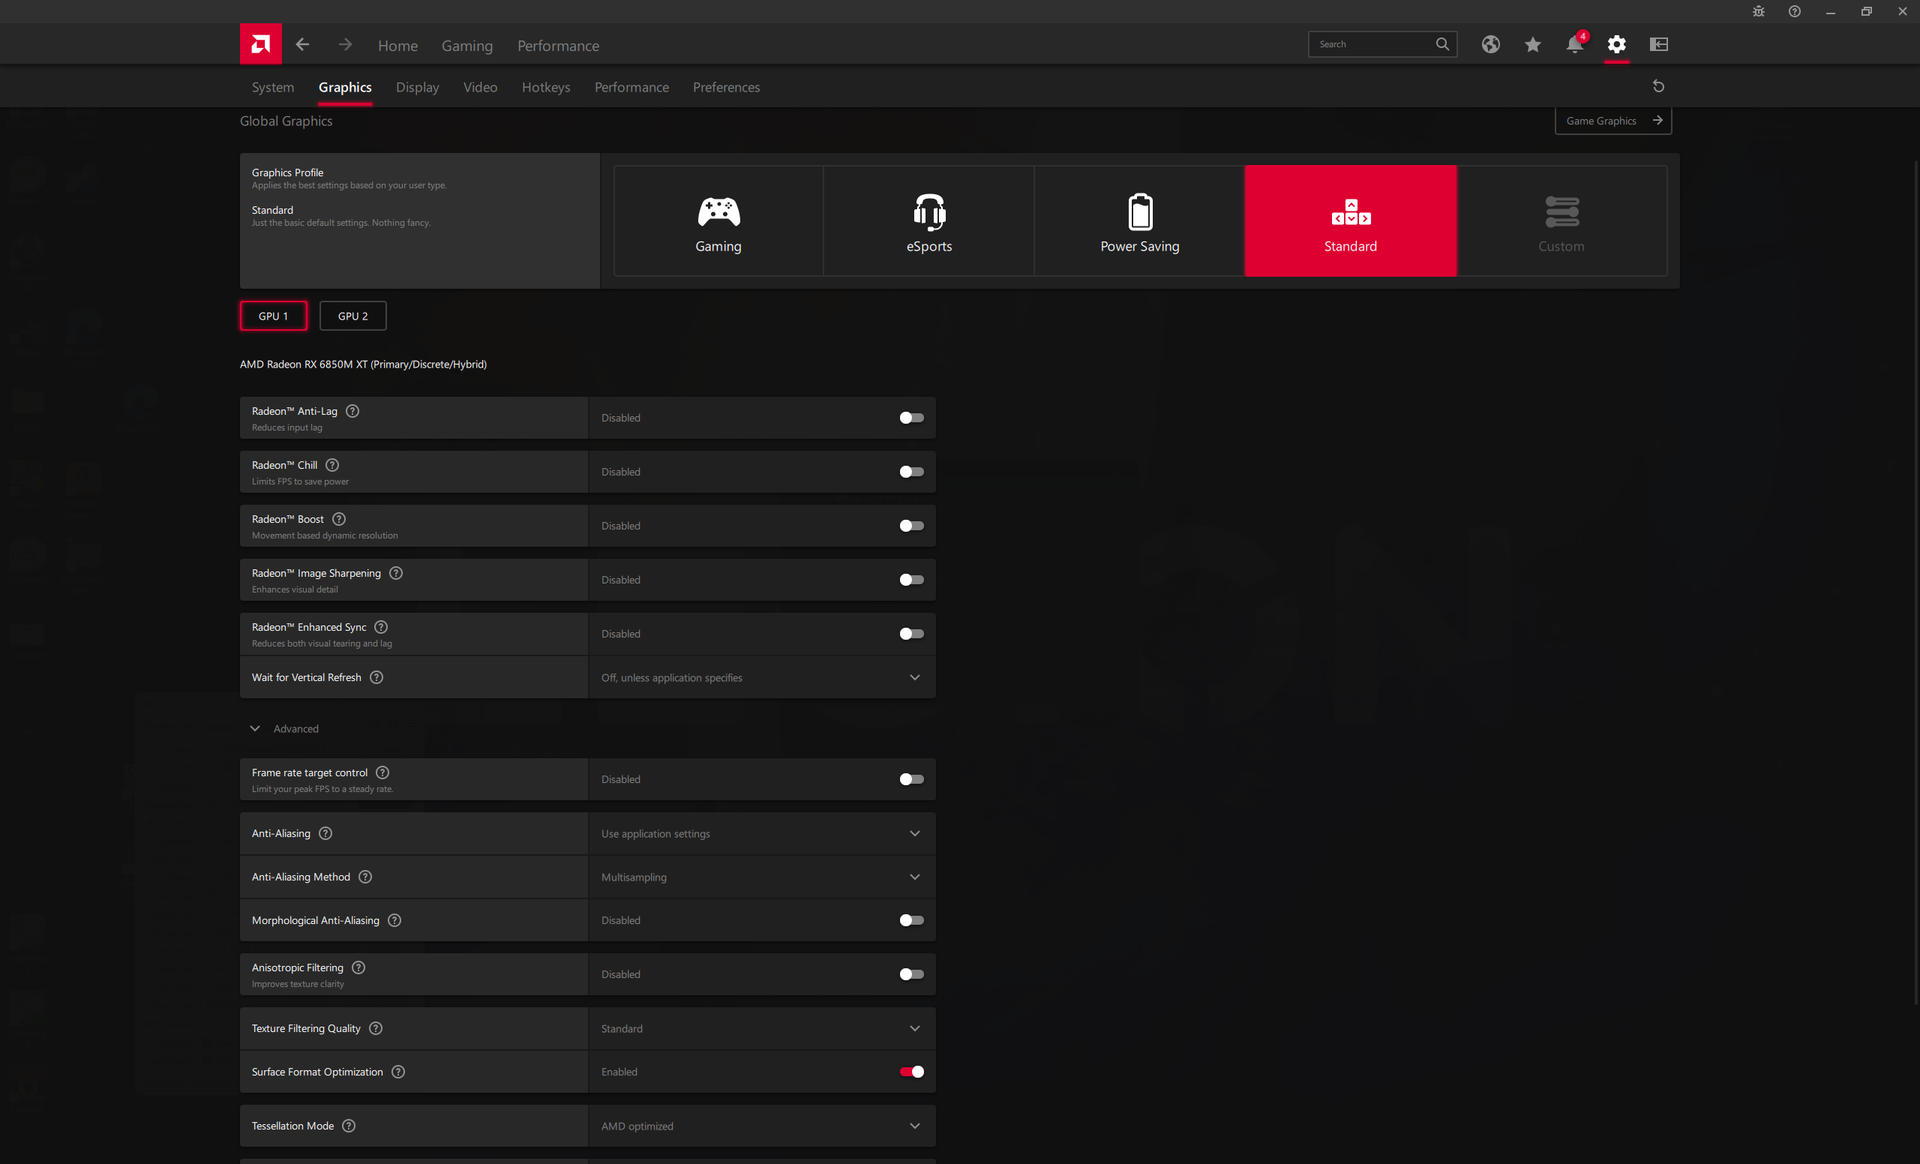
在运行以下任何基准测试之前,我们通过联想Vantage将我们的设备设置为性能模式,通过Windows设置为高性能模式。我们还确保Vantage上的 "混合模式 "被关闭,以更好地利用独立的Radeon GPU。
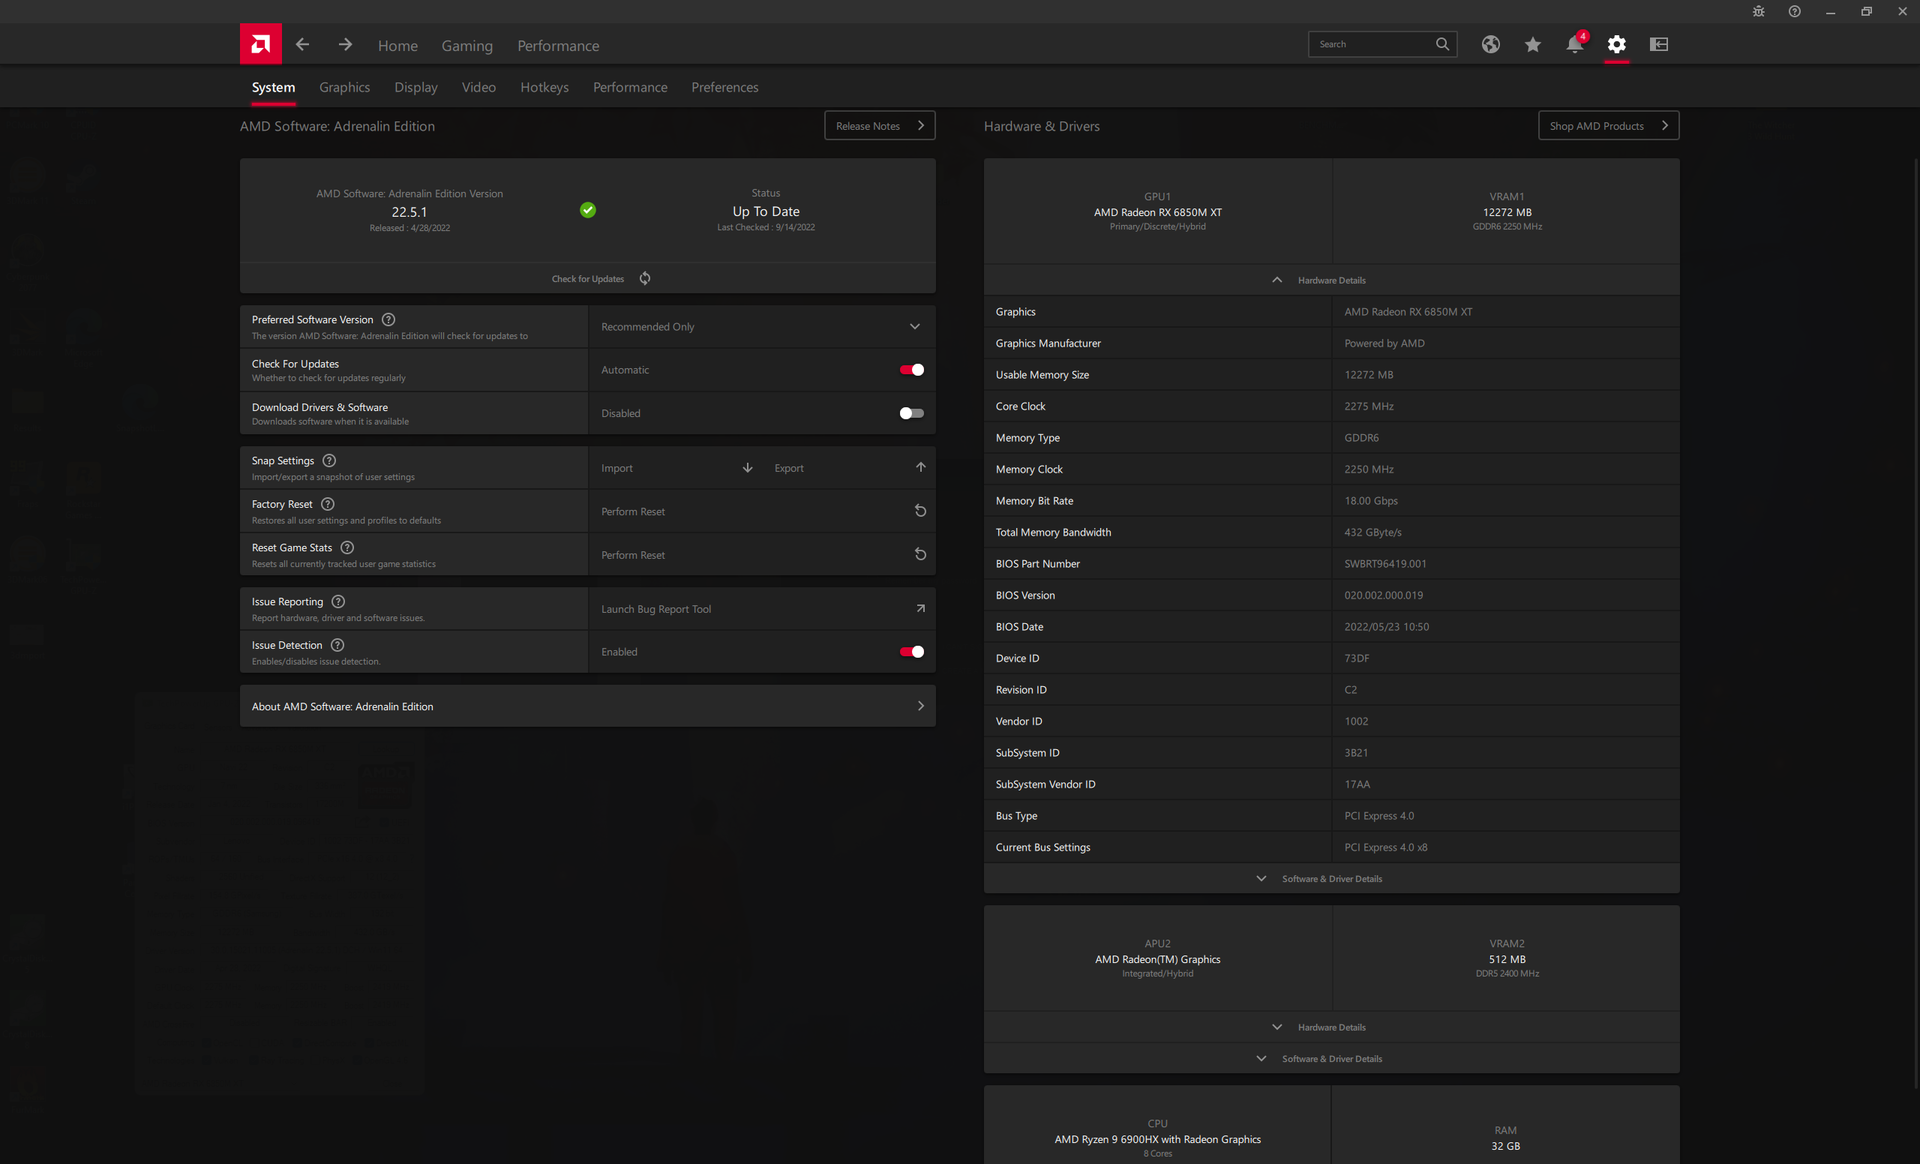
我们强烈建议用户熟悉联想Vantage和Radeon软件。系统性能、LED效果和重要的更新都与这两个特定的应用程序有关。我们的特定测试设备在更新图形驱动时出现了问题,重启后显示屏会保持黑色。我们不得不第二次重新安装驱动程序,然后Radeon软件才能顺利启动。


处理器--Zen 3+的边际改进
CPU性能非常好,几乎完全达到了我们预期的水平,相对于其他配备相同设备的笔记本电脑而言 Ryzen 9 6900HX处理器。尽管如此,不要指望比去年的 Ryzen 9 5900HX因为6900HX最多只有5%到25%的速度,这取决于5900HX笔记本电脑。总体性能落后于最新的第12代英特尔Alder Lake-H选项,如酷睿i7-12700H或 i9-12900HK15%至20%。
循环运行CineBench R15 xT显示出一致的结果,表明在压力下具有出色的性能可持续性。
Cinebench R15 Multi Loop
Cinebench R23: Multi Core | Single Core
Cinebench R15: CPU Multi 64Bit | CPU Single 64Bit
Blender: v2.79 BMW27 CPU
7-Zip 18.03: 7z b 4 | 7z b 4 -mmt1
Geekbench 5.5: Multi-Core | Single-Core
HWBOT x265 Benchmark v2.2: 4k Preset
LibreOffice : 20 Documents To PDF
R Benchmark 2.5: Overall mean
| Cinebench R20 / CPU (Multi Core) | |
| MSI GE67 HX 12UGS | |
| Lenovo Legion Slim 7-16IAH 82TF004YGE | |
| MSI Raider GE66 12UHS | |
| Lenovo Legion 7 16ARHA7 | |
| Average AMD Ryzen 9 6900HX (3742 - 5813, n=19) | |
| Asus ROG Strix G15 G513QY | |
| MSI GS76 Stealth 11UH | |
| Eurocom RX315 NH57AF1 | |
| HP Omen 16-c0077ng | |
| MSI Delta 15 A5EFK | |
| MSI GS66 Stealth 10UG | |
| Cinebench R20 / CPU (Single Core) | |
| MSI Raider GE66 12UHS | |
| MSI GE67 HX 12UGS | |
| Lenovo Legion Slim 7-16IAH 82TF004YGE | |
| Lenovo Legion 7 16ARHA7 | |
| MSI GS76 Stealth 11UH | |
| Average AMD Ryzen 9 6900HX (595 - 631, n=19) | |
| Asus ROG Strix G15 G513QY | |
| Eurocom RX315 NH57AF1 | |
| MSI Delta 15 A5EFK | |
| HP Omen 16-c0077ng | |
| MSI GS66 Stealth 10UG | |
| Cinebench R15 / CPU Multi 64Bit | |
| MSI GE67 HX 12UGS | |
| Lenovo Legion Slim 7-16IAH 82TF004YGE | |
| MSI Raider GE66 12UHS | |
| Lenovo Legion 7 16ARHA7 | |
| Asus ROG Strix G15 G513QY | |
| Average AMD Ryzen 9 6900HX (1588 - 2411, n=19) | |
| MSI GS76 Stealth 11UH | |
| MSI Delta 15 A5EFK | |
| HP Omen 16-c0077ng | |
| Eurocom RX315 NH57AF1 | |
| MSI GS66 Stealth 10UG | |
| Cinebench R15 / CPU Single 64Bit | |
| MSI Raider GE66 12UHS | |
| MSI GE67 HX 12UGS | |
| Lenovo Legion Slim 7-16IAH 82TF004YGE | |
| Lenovo Legion 7 16ARHA7 | |
| Average AMD Ryzen 9 6900HX (241 - 261, n=19) | |
| Asus ROG Strix G15 G513QY | |
| MSI Delta 15 A5EFK | |
| MSI GS76 Stealth 11UH | |
| HP Omen 16-c0077ng | |
| Eurocom RX315 NH57AF1 | |
| MSI GS66 Stealth 10UG | |
| HWBOT x265 Benchmark v2.2 / 4k Preset | |
| MSI GE67 HX 12UGS | |
| Lenovo Legion Slim 7-16IAH 82TF004YGE | |
| MSI Raider GE66 12UHS | |
| Lenovo Legion 7 16ARHA7 | |
| Average AMD Ryzen 9 6900HX (12.6 - 18.7, n=20) | |
| MSI Delta 15 A5EFK | |
| Asus ROG Strix G15 G513QY | |
| HP Omen 16-c0077ng | |
| MSI GS76 Stealth 11UH | |
| Eurocom RX315 NH57AF1 | |
| MSI GS66 Stealth 10UG | |
| LibreOffice / 20 Documents To PDF | |
| HP Omen 16-c0077ng | |
| Lenovo Legion 7 16ARHA7 | |
| Average AMD Ryzen 9 6900HX (44.8 - 81.7, n=20) | |
| MSI Delta 15 A5EFK | |
| Asus ROG Strix G15 G513QY | |
| MSI GS76 Stealth 11UH | |
| Eurocom RX315 NH57AF1 | |
| MSI GS66 Stealth 10UG | |
| MSI GE67 HX 12UGS | |
| Lenovo Legion Slim 7-16IAH 82TF004YGE | |
| MSI Raider GE66 12UHS | |
* ... smaller is better
AIDA64: FP32 Ray-Trace | FPU Julia | CPU SHA3 | CPU Queen | FPU SinJulia | FPU Mandel | CPU AES | CPU ZLib | FP64 Ray-Trace | CPU PhotoWorxx
| Performance rating | |
| Lenovo Legion 7 16ARHA7 | |
| Asus ROG Zephyrus Duo 16 GX650RX | |
| Lenovo Legion Slim 7-16IAH 82TF004YGE | |
| Average AMD Ryzen 9 6900HX | |
| HP Omen 16-c0077ng | |
| MSI Alpha 15 B5EEK-008 | |
| MSI Raider GE66 12UHS | |
| AIDA64 / FP32 Ray-Trace | |
| Lenovo Legion 7 16ARHA7 | |
| Asus ROG Zephyrus Duo 16 GX650RX | |
| Lenovo Legion Slim 7-16IAH 82TF004YGE | |
| Average AMD Ryzen 9 6900HX (10950 - 17963, n=20) | |
| HP Omen 16-c0077ng | |
| MSI Alpha 15 B5EEK-008 | |
| MSI Raider GE66 12UHS | |
| AIDA64 / FPU Julia | |
| Lenovo Legion 7 16ARHA7 | |
| Asus ROG Zephyrus Duo 16 GX650RX | |
| Average AMD Ryzen 9 6900HX (71414 - 110797, n=20) | |
| HP Omen 16-c0077ng | |
| MSI Alpha 15 B5EEK-008 | |
| Lenovo Legion Slim 7-16IAH 82TF004YGE | |
| MSI Raider GE66 12UHS | |
| AIDA64 / CPU SHA3 | |
| Lenovo Legion Slim 7-16IAH 82TF004YGE | |
| Lenovo Legion 7 16ARHA7 | |
| Asus ROG Zephyrus Duo 16 GX650RX | |
| Average AMD Ryzen 9 6900HX (2471 - 3804, n=20) | |
| HP Omen 16-c0077ng | |
| MSI Alpha 15 B5EEK-008 | |
| MSI Raider GE66 12UHS | |
| AIDA64 / CPU Queen | |
| Lenovo Legion 7 16ARHA7 | |
| MSI Raider GE66 12UHS | |
| Asus ROG Zephyrus Duo 16 GX650RX | |
| Lenovo Legion Slim 7-16IAH 82TF004YGE | |
| Average AMD Ryzen 9 6900HX (84185 - 107544, n=20) | |
| HP Omen 16-c0077ng | |
| MSI Alpha 15 B5EEK-008 | |
| AIDA64 / FPU SinJulia | |
| Lenovo Legion 7 16ARHA7 | |
| Asus ROG Zephyrus Duo 16 GX650RX | |
| Average AMD Ryzen 9 6900HX (10970 - 13205, n=20) | |
| HP Omen 16-c0077ng | |
| MSI Alpha 15 B5EEK-008 | |
| Lenovo Legion Slim 7-16IAH 82TF004YGE | |
| MSI Raider GE66 12UHS | |
| AIDA64 / FPU Mandel | |
| Lenovo Legion 7 16ARHA7 | |
| Asus ROG Zephyrus Duo 16 GX650RX | |
| Average AMD Ryzen 9 6900HX (39164 - 61370, n=20) | |
| HP Omen 16-c0077ng | |
| MSI Alpha 15 B5EEK-008 | |
| Lenovo Legion Slim 7-16IAH 82TF004YGE | |
| MSI Raider GE66 12UHS | |
| AIDA64 / CPU AES | |
| Lenovo Legion 7 16ARHA7 | |
| Asus ROG Zephyrus Duo 16 GX650RX | |
| Lenovo Legion Slim 7-16IAH 82TF004YGE | |
| HP Omen 16-c0077ng | |
| MSI Alpha 15 B5EEK-008 | |
| Average AMD Ryzen 9 6900HX (54613 - 142360, n=20) | |
| MSI Raider GE66 12UHS | |
| AIDA64 / CPU ZLib | |
| MSI Raider GE66 12UHS | |
| Lenovo Legion Slim 7-16IAH 82TF004YGE | |
| Lenovo Legion 7 16ARHA7 | |
| Asus ROG Zephyrus Duo 16 GX650RX | |
| HP Omen 16-c0077ng | |
| Average AMD Ryzen 9 6900HX (578 - 911, n=20) | |
| MSI Alpha 15 B5EEK-008 | |
| AIDA64 / FP64 Ray-Trace | |
| Lenovo Legion 7 16ARHA7 | |
| Asus ROG Zephyrus Duo 16 GX650RX | |
| Lenovo Legion Slim 7-16IAH 82TF004YGE | |
| Average AMD Ryzen 9 6900HX (5798 - 9540, n=20) | |
| HP Omen 16-c0077ng | |
| MSI Alpha 15 B5EEK-008 | |
| MSI Raider GE66 12UHS | |
| AIDA64 / CPU PhotoWorxx | |
| MSI Raider GE66 12UHS | |
| Lenovo Legion Slim 7-16IAH 82TF004YGE | |
| Lenovo Legion 7 16ARHA7 | |
| Asus ROG Zephyrus Duo 16 GX650RX | |
| Average AMD Ryzen 9 6900HX (26873 - 30604, n=20) | |
| MSI Alpha 15 B5EEK-008 | |
| HP Omen 16-c0077ng | |
系统性能
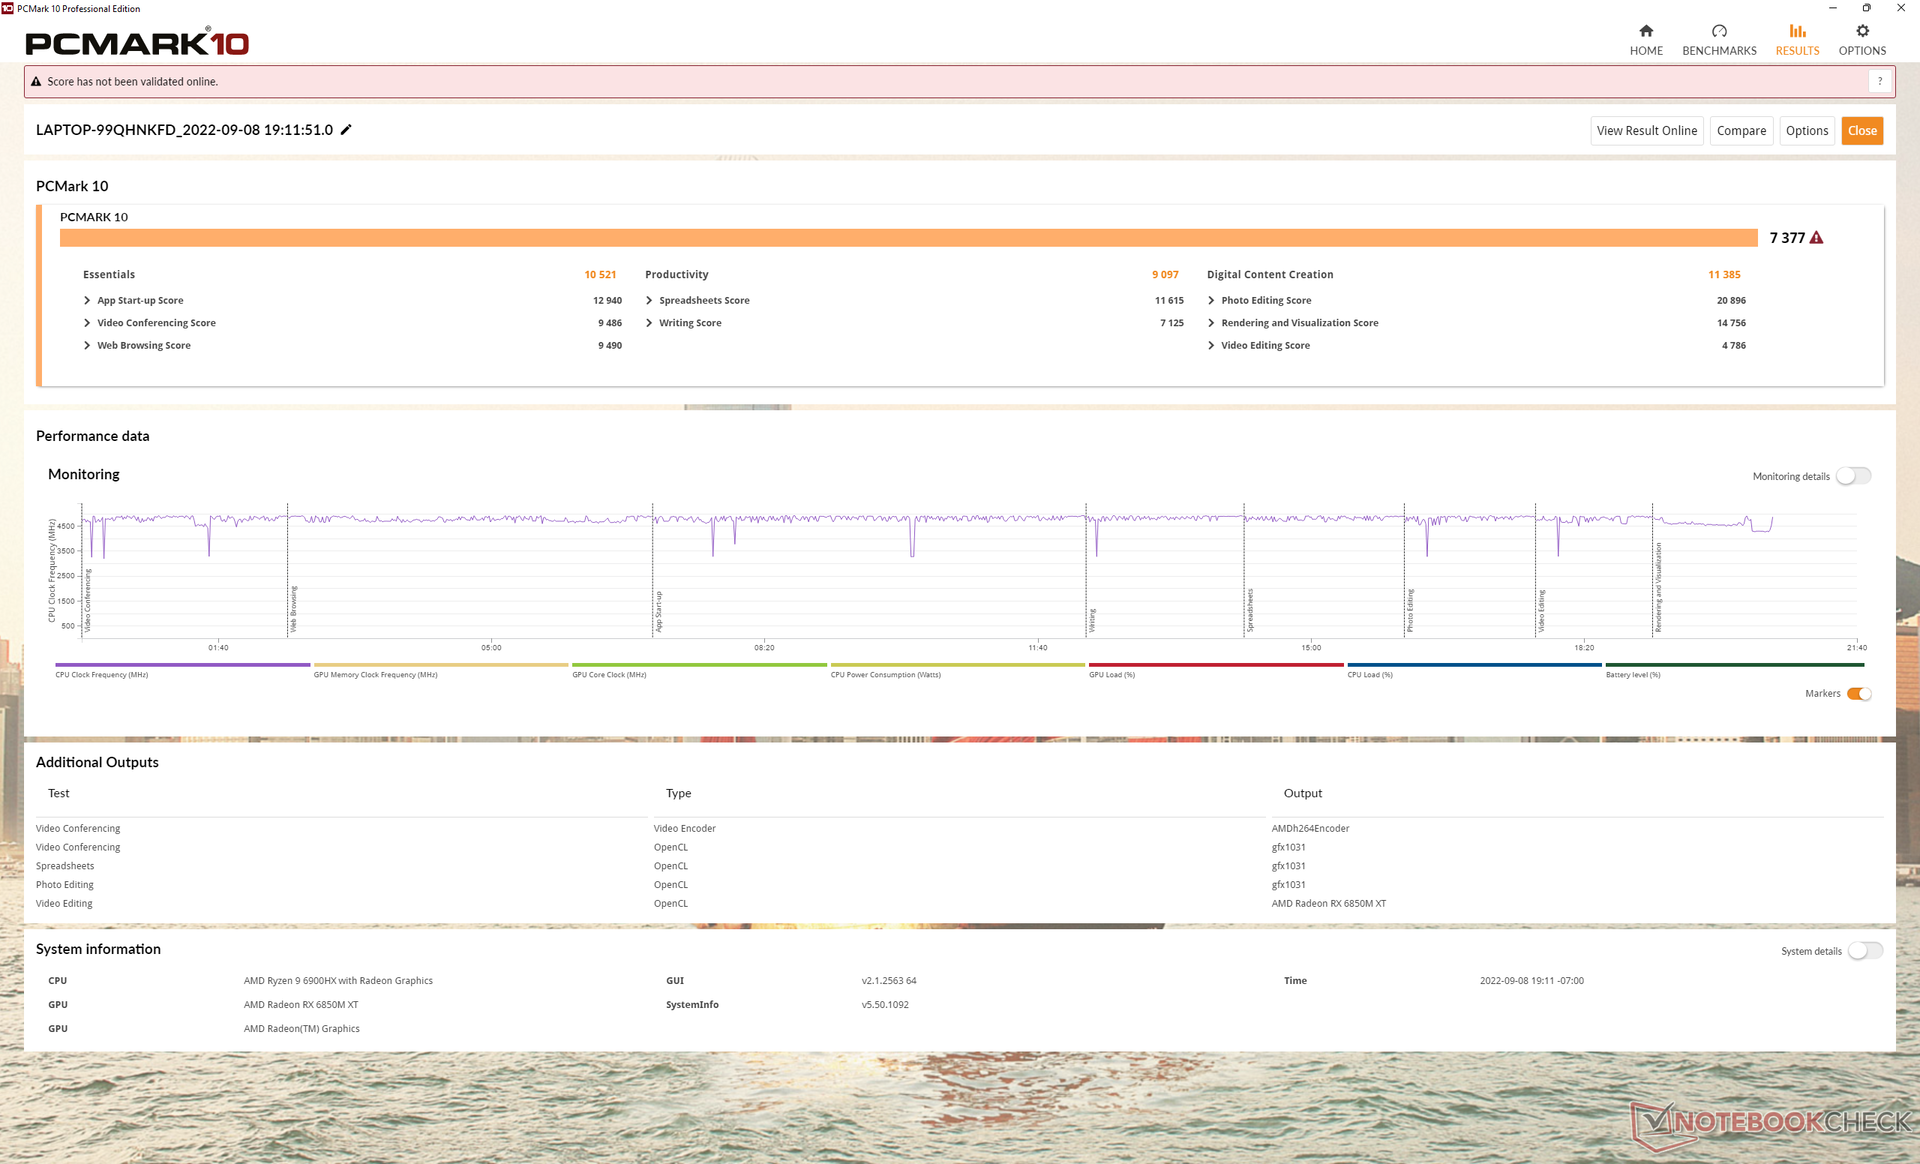
PCMark 10的结果很好,但仍然一直落后于由更快的英特尔第12代酷睿i9 CPU和GeForce RTX 3080 Ti GPU驱动的微星GE66。
在我们的测试设备上,我们至少经历了一次从睡眠中唤醒的问题。当打开盖子时,系统将无法唤醒,这需要硬性关闭和冷重启。
CrossMark: Overall | Productivity | Creativity | Responsiveness
| PCMark 10 / Score | |
| MSI Raider GE66 12UHS | |
| Lenovo Legion Slim 7-16IAH 82TF004YGE | |
| Lenovo Legion 7 16ARHA7 | |
| Average AMD Ryzen 9 6900HX, AMD Radeon RX 6850M XT (7292 - 7377, n=2) | |
| HP Omen 16-c0077ng | |
| Lenovo Legion 5 Pro 16ACH6H (82JQ001PGE) | |
| Asus ROG Zephyrus Duo 16 GX650RX | |
| PCMark 10 / Essentials | |
| MSI Raider GE66 12UHS | |
| Lenovo Legion Slim 7-16IAH 82TF004YGE | |
| Lenovo Legion 7 16ARHA7 | |
| HP Omen 16-c0077ng | |
| Average AMD Ryzen 9 6900HX, AMD Radeon RX 6850M XT (10250 - 10521, n=2) | |
| Lenovo Legion 5 Pro 16ACH6H (82JQ001PGE) | |
| Asus ROG Zephyrus Duo 16 GX650RX | |
| PCMark 10 / Productivity | |
| MSI Raider GE66 12UHS | |
| Lenovo Legion Slim 7-16IAH 82TF004YGE | |
| HP Omen 16-c0077ng | |
| Lenovo Legion 7 16ARHA7 | |
| Average AMD Ryzen 9 6900HX, AMD Radeon RX 6850M XT (9090 - 9097, n=2) | |
| Lenovo Legion 5 Pro 16ACH6H (82JQ001PGE) | |
| Asus ROG Zephyrus Duo 16 GX650RX | |
| PCMark 10 / Digital Content Creation | |
| MSI Raider GE66 12UHS | |
| Lenovo Legion 7 16ARHA7 | |
| Average AMD Ryzen 9 6900HX, AMD Radeon RX 6850M XT (11296 - 11385, n=2) | |
| Lenovo Legion Slim 7-16IAH 82TF004YGE | |
| HP Omen 16-c0077ng | |
| Lenovo Legion 5 Pro 16ACH6H (82JQ001PGE) | |
| Asus ROG Zephyrus Duo 16 GX650RX | |
| CrossMark / Overall | |
| Lenovo Legion Slim 7-16IAH 82TF004YGE | |
| Asus ROG Zephyrus Duo 16 GX650RX | |
| Average AMD Ryzen 9 6900HX, AMD Radeon RX 6850M XT (1596 - 1597, n=2) | |
| Lenovo Legion 7 16ARHA7 | |
| CrossMark / Productivity | |
| Lenovo Legion Slim 7-16IAH 82TF004YGE | |
| Asus ROG Zephyrus Duo 16 GX650RX | |
| Average AMD Ryzen 9 6900HX, AMD Radeon RX 6850M XT (1551 - 1565, n=2) | |
| Lenovo Legion 7 16ARHA7 | |
| CrossMark / Creativity | |
| Lenovo Legion Slim 7-16IAH 82TF004YGE | |
| Lenovo Legion 7 16ARHA7 | |
| Average AMD Ryzen 9 6900HX, AMD Radeon RX 6850M XT (1738 - 1754, n=2) | |
| Asus ROG Zephyrus Duo 16 GX650RX | |
| CrossMark / Responsiveness | |
| Lenovo Legion Slim 7-16IAH 82TF004YGE | |
| Asus ROG Zephyrus Duo 16 GX650RX | |
| Average AMD Ryzen 9 6900HX, AMD Radeon RX 6850M XT (1310 - 1315, n=2) | |
| Lenovo Legion 7 16ARHA7 | |
| PCMark 10 Score | 7377 points | |
Help | ||
| AIDA64 / Memory Copy | |
| MSI Raider GE66 12UHS | |
| Asus ROG Zephyrus Duo 16 GX650RX | |
| Lenovo Legion 7 16ARHA7 | |
| Average AMD Ryzen 9 6900HX (47938 - 53345, n=20) | |
| Lenovo Legion Slim 7-16IAH 82TF004YGE | |
| Asus ROG Flow X16 GV601RW-M5082W | |
| HP Omen 16-c0077ng | |
| AIDA64 / Memory Read | |
| MSI Raider GE66 12UHS | |
| Lenovo Legion Slim 7-16IAH 82TF004YGE | |
| Asus ROG Zephyrus Duo 16 GX650RX | |
| Lenovo Legion 7 16ARHA7 | |
| Average AMD Ryzen 9 6900HX (43892 - 53321, n=20) | |
| Asus ROG Flow X16 GV601RW-M5082W | |
| HP Omen 16-c0077ng | |
| AIDA64 / Memory Write | |
| MSI Raider GE66 12UHS | |
| Lenovo Legion Slim 7-16IAH 82TF004YGE | |
| Asus ROG Zephyrus Duo 16 GX650RX | |
| Lenovo Legion 7 16ARHA7 | |
| Average AMD Ryzen 9 6900HX (51085 - 57202, n=20) | |
| Asus ROG Flow X16 GV601RW-M5082W | |
| HP Omen 16-c0077ng | |
| AIDA64 / Memory Latency | |
| Lenovo Legion Slim 7-16IAH 82TF004YGE | |
| Asus ROG Flow X16 GV601RW-M5082W | |
| MSI Raider GE66 12UHS | |
| Asus ROG Zephyrus Duo 16 GX650RX | |
| Average AMD Ryzen 9 6900HX (80.7 - 120.6, n=20) | |
| HP Omen 16-c0077ng | |
| Lenovo Legion 7 16ARHA7 | |
* ... smaller is better
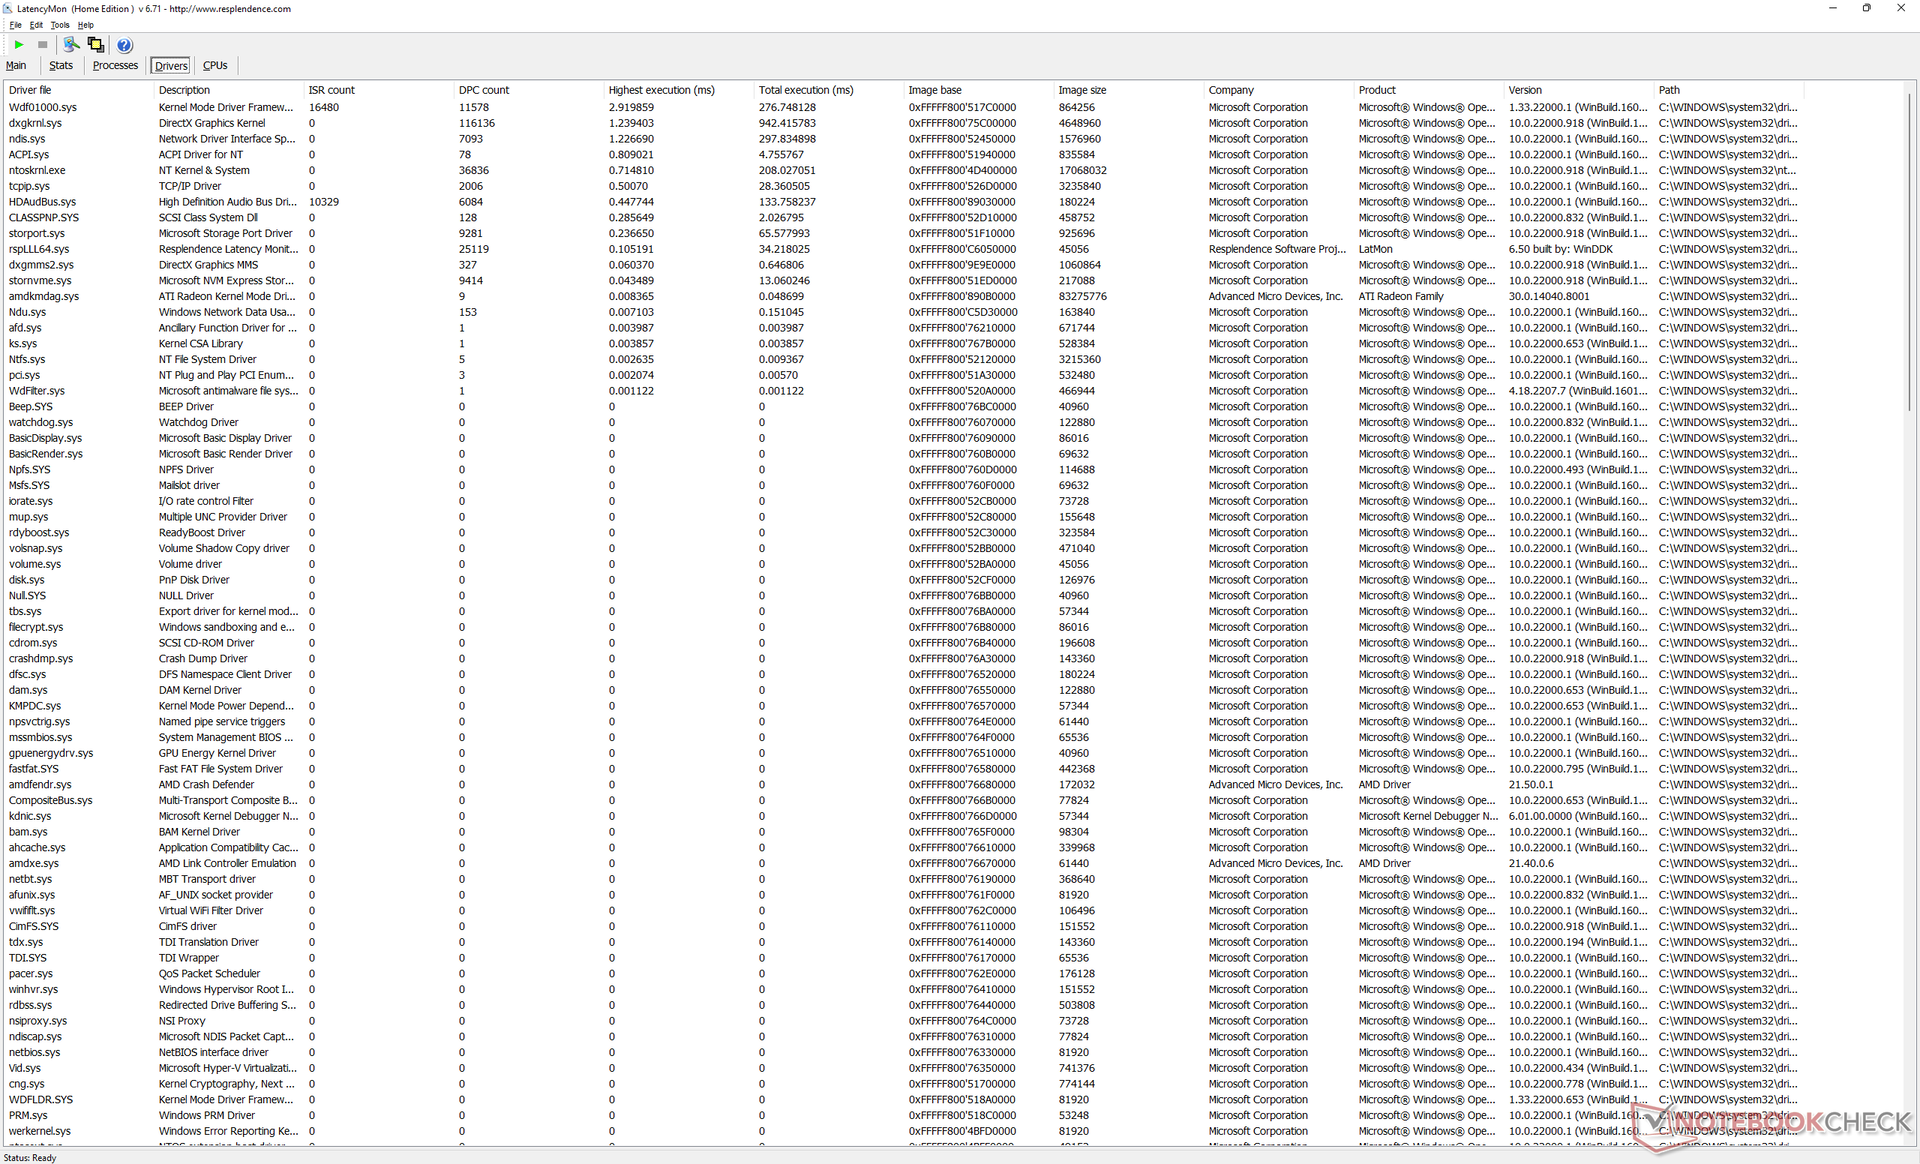
DPC延时
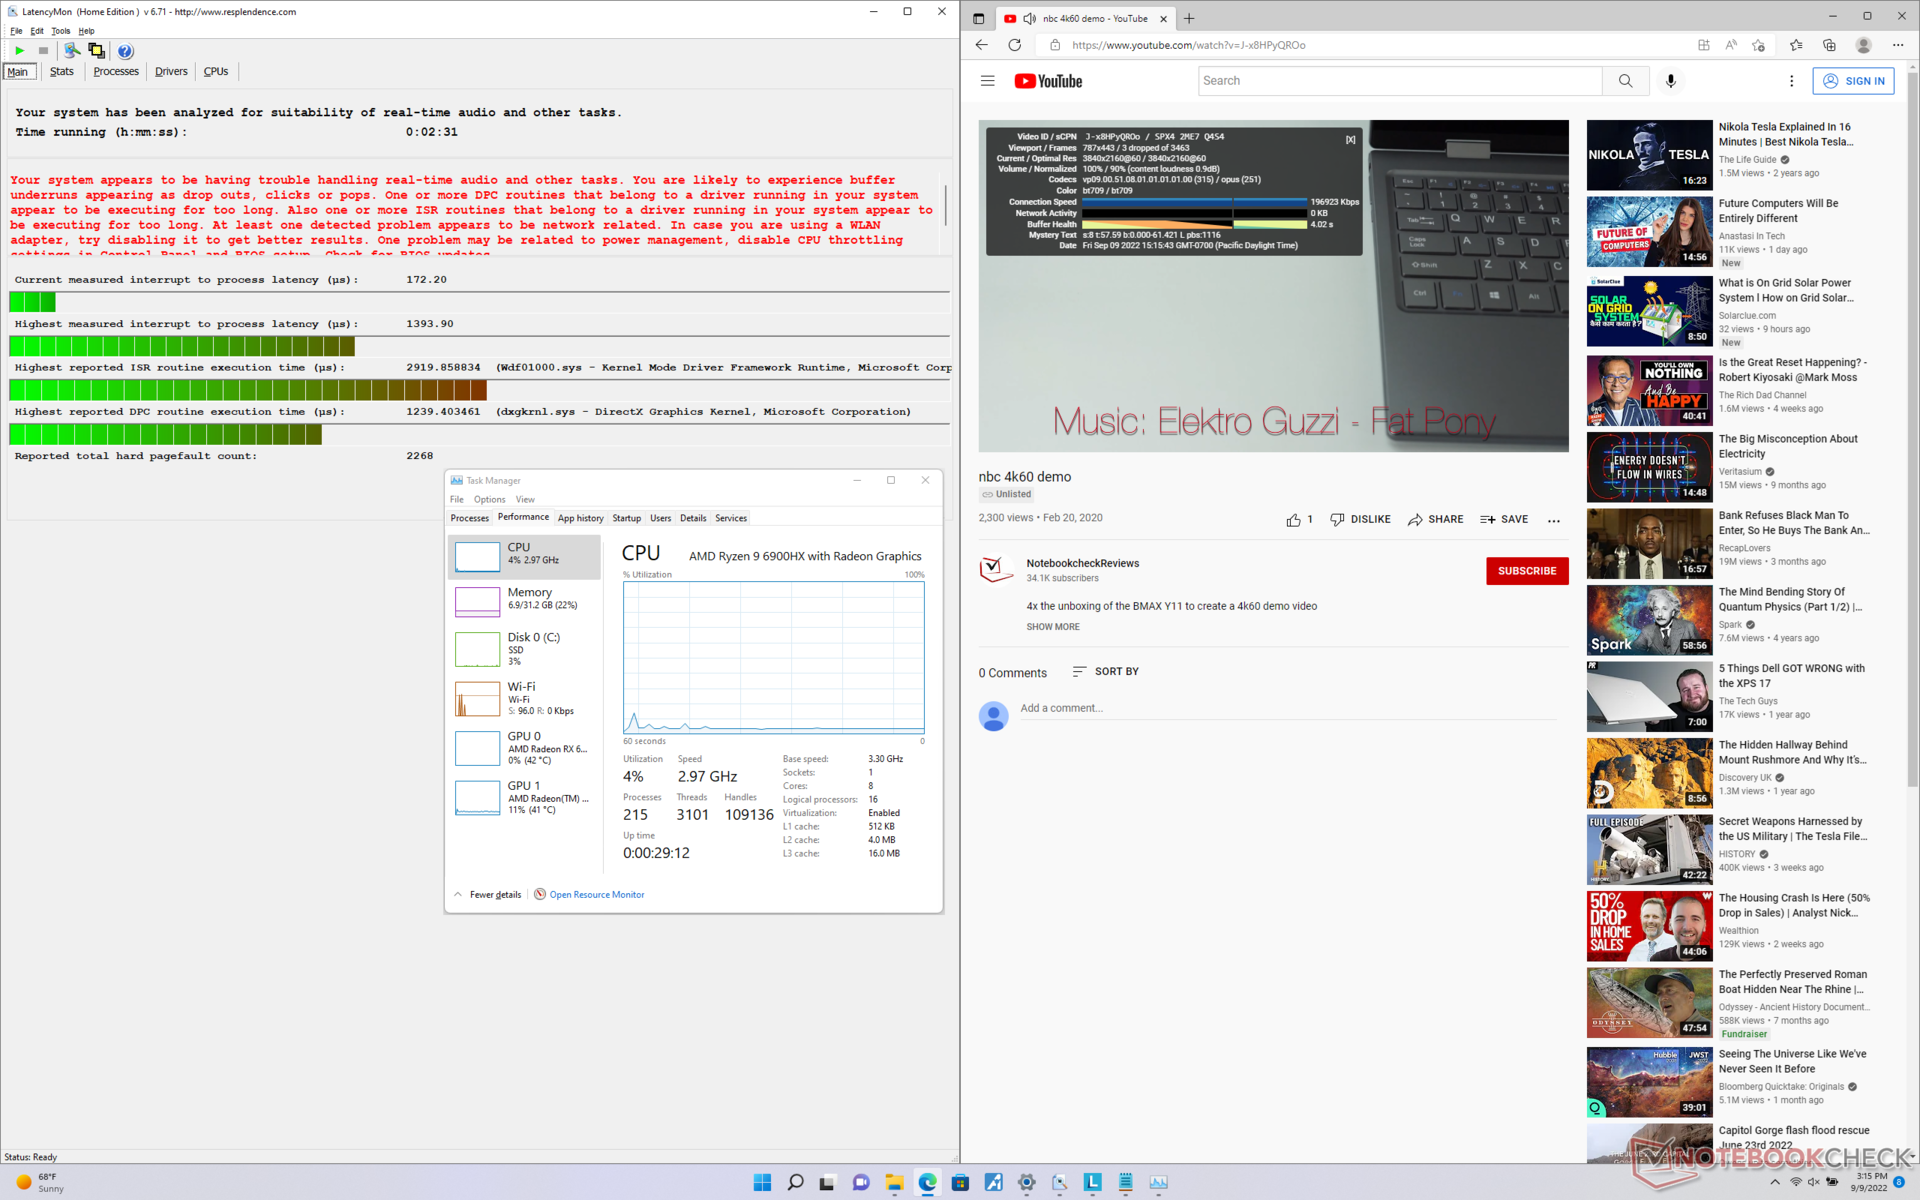
LatencyMon显示了在主页上打开多个浏览器标签时的DPC问题。在我们长达1分钟的视频测试中,4K视频在60FPS下的播放基本流畅,只有3个丢帧。
| DPC Latencies / LatencyMon - interrupt to process latency (max), Web, Youtube, Prime95 | |
| MSI Raider GE66 12UHS | |
| HP Omen 16-c0077ng | |
| Lenovo Legion 7 16ARHA7 | |
| Lenovo Legion 5 Pro 16ACH6H (82JQ001PGE) | |
| Lenovo Legion Slim 7-16IAH 82TF004YGE | |
| Asus ROG Zephyrus Duo 16 GX650RX | |
* ... smaller is better
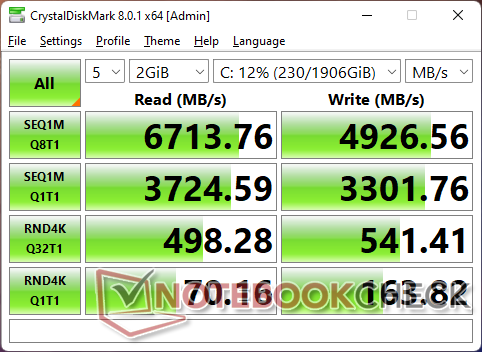
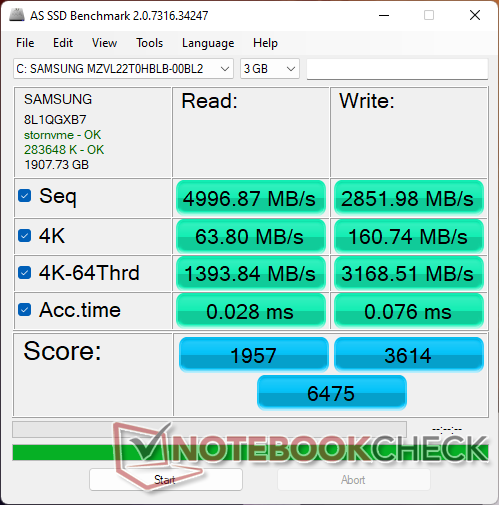
存储设备 - 多达两个PCIe4 x4固态硬盘
我们的测试设备配备了相同的 三星MZVL22T0HBLBPCIe4 x4 NVMe SSD,与微星GE66 Raider上的一样。然而,根据多项固态硬盘基准测试,Legion 上的性能似乎比MSI上的几乎所有情况都要慢。当循环运行DiskSpd时,传输率会莫名其妙地下降到3300MB/s,然后再回升,而GE66中的相同驱动器则不会出现这种行为。

* ... smaller is better
Disk Throttling: DiskSpd Read Loop, Queue Depth 8
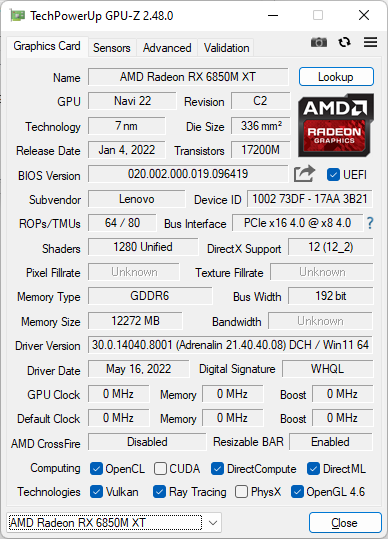
GPU性能--就像一个GeForce RTX 3080
3DMark基准测试将我们的140W 排名在140W的Radeon RX 6850M XT的排名在个位数百分点之内。 Radeon RX 6800M在华硕ROG Strix G15上发现。因此,用户不应该期望这两款GPU之间有更多的性能差异。
某些SKU配备了 Radeon RX 6700M的图形性能比我们的6850M XT大约慢15%到20%。这两个选项最相当于GeForce RTX 3070 Ti或3080,因为在其他超薄游戏笔记本电脑中发现,如主设备Vector Pro或Razer Blade 15。微星微星GS76是一个明显的例外,因为它的低TGP GPU比预期的要慢,甚至对于其超薄的尺寸类别。
根据3DMarkFire Strike ,运行在平衡模式而不是性能模式下,图形性能降低了11%之多。
实际的游戏性能是在10%以内的 微星GE66和它的RTX 3080 Ti GPU在大多数情况下都在10%以内。微星在大多数情况下都是领先的,但在大多数情况下,帧率的优势是轻微的。DOTA 2是一个不寻常的例外,因为联想的系统似乎比预期的慢得多。
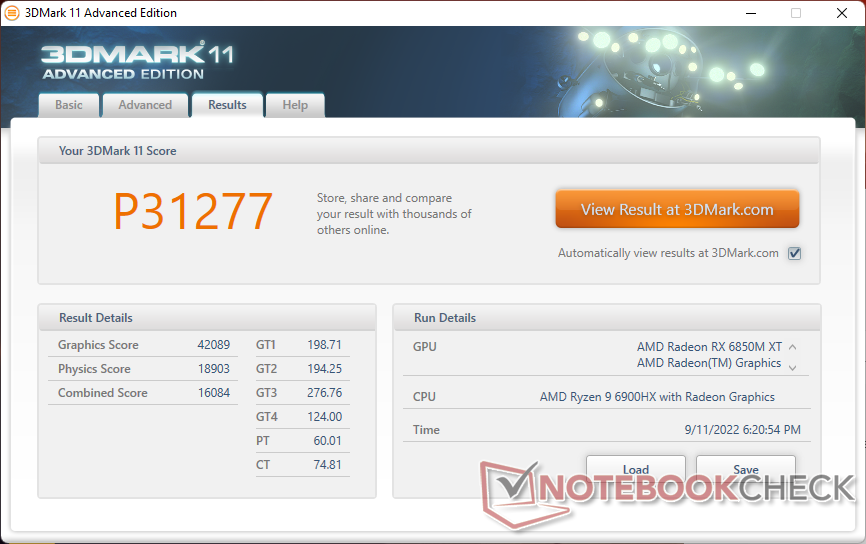
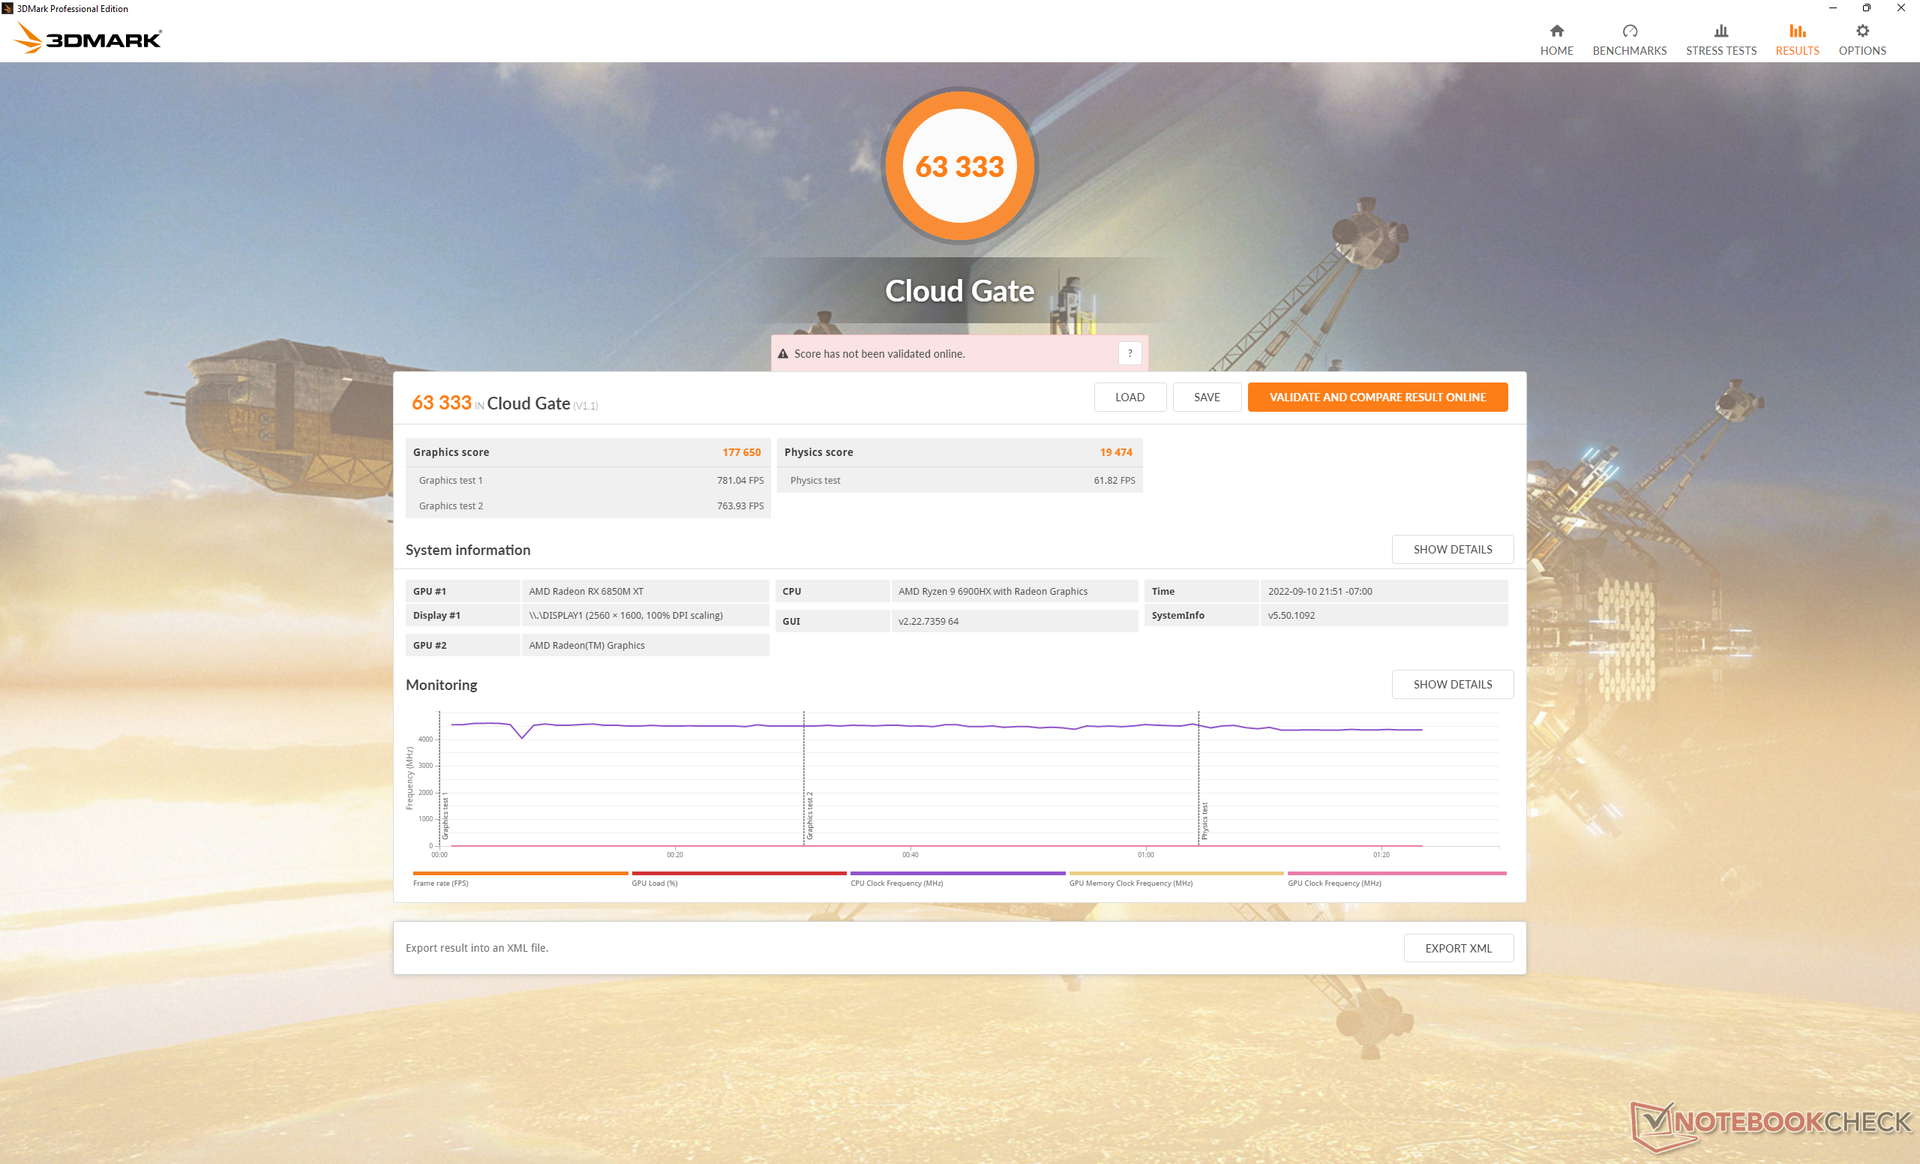
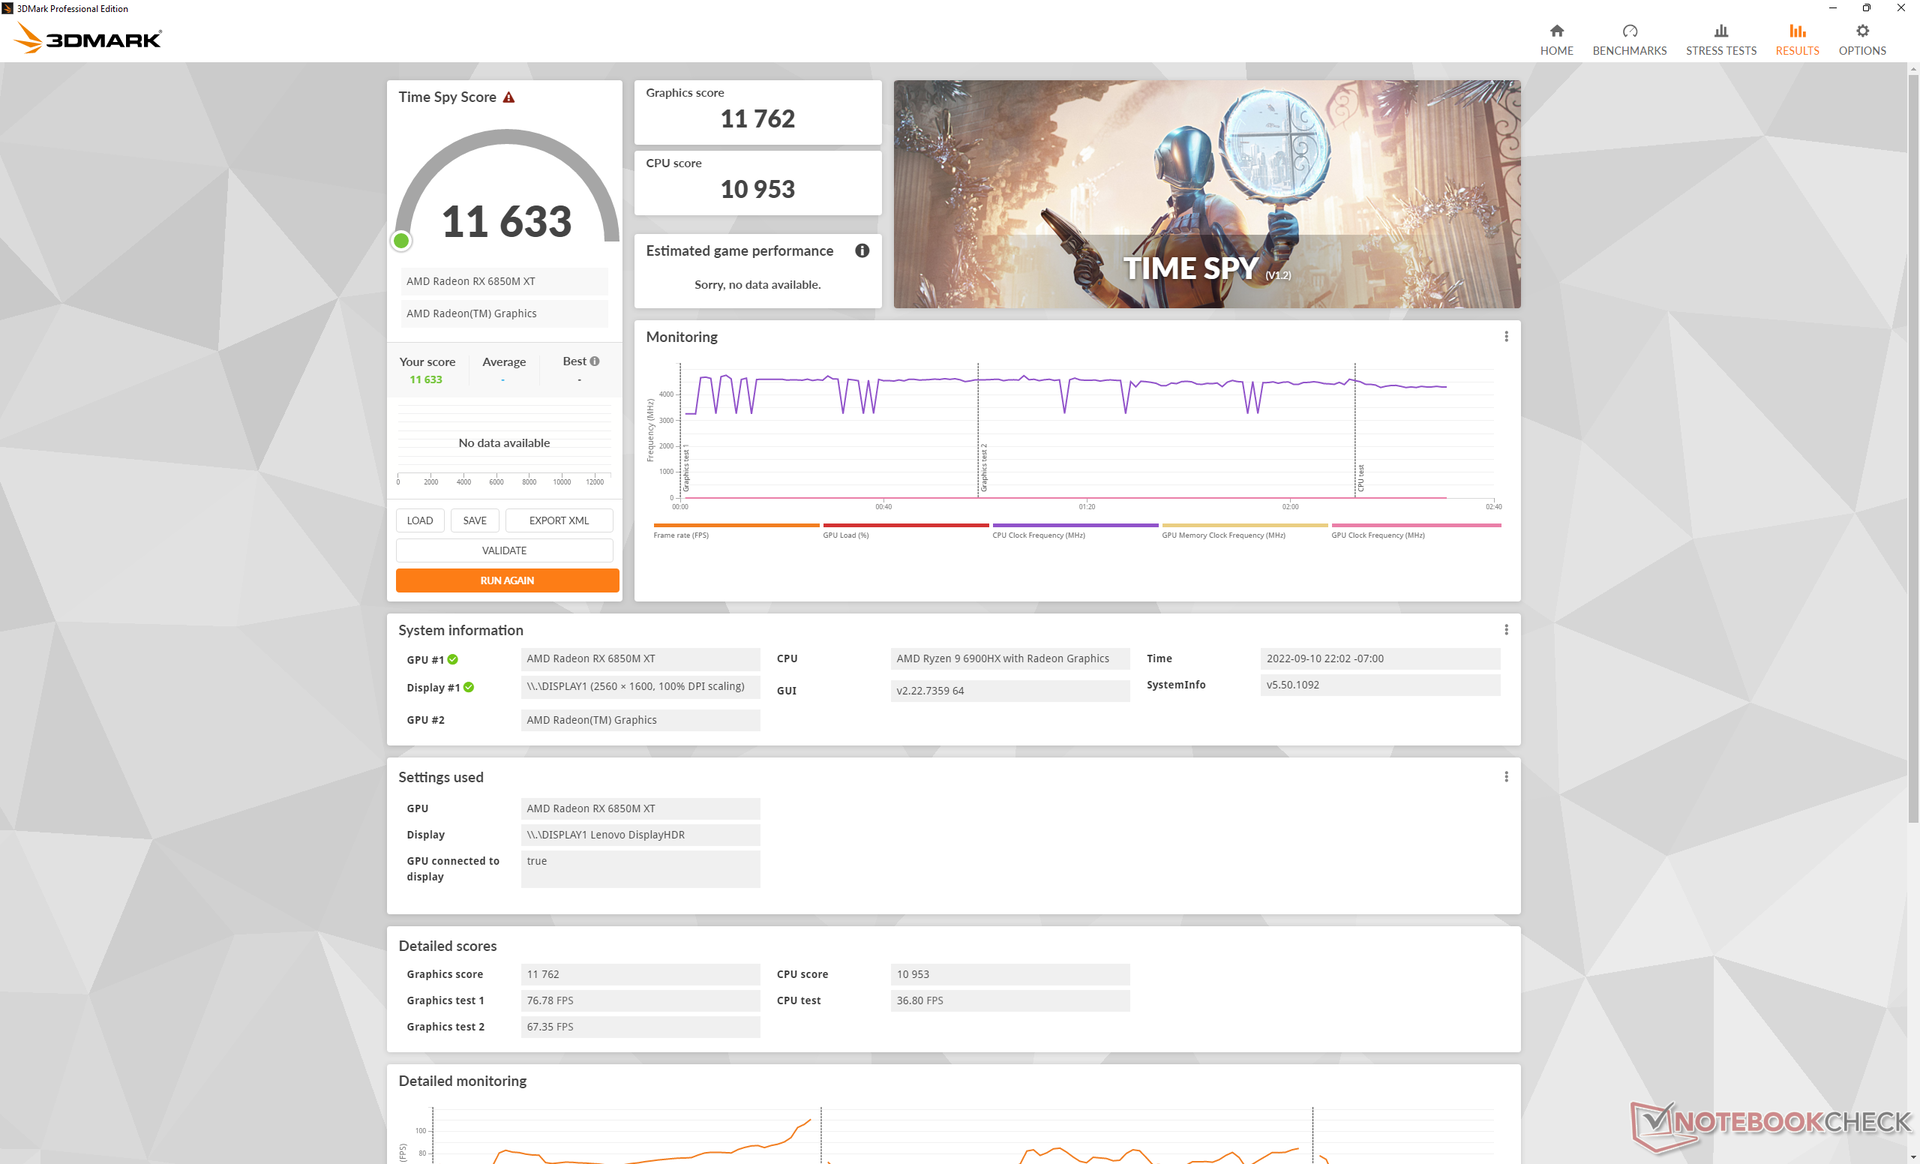
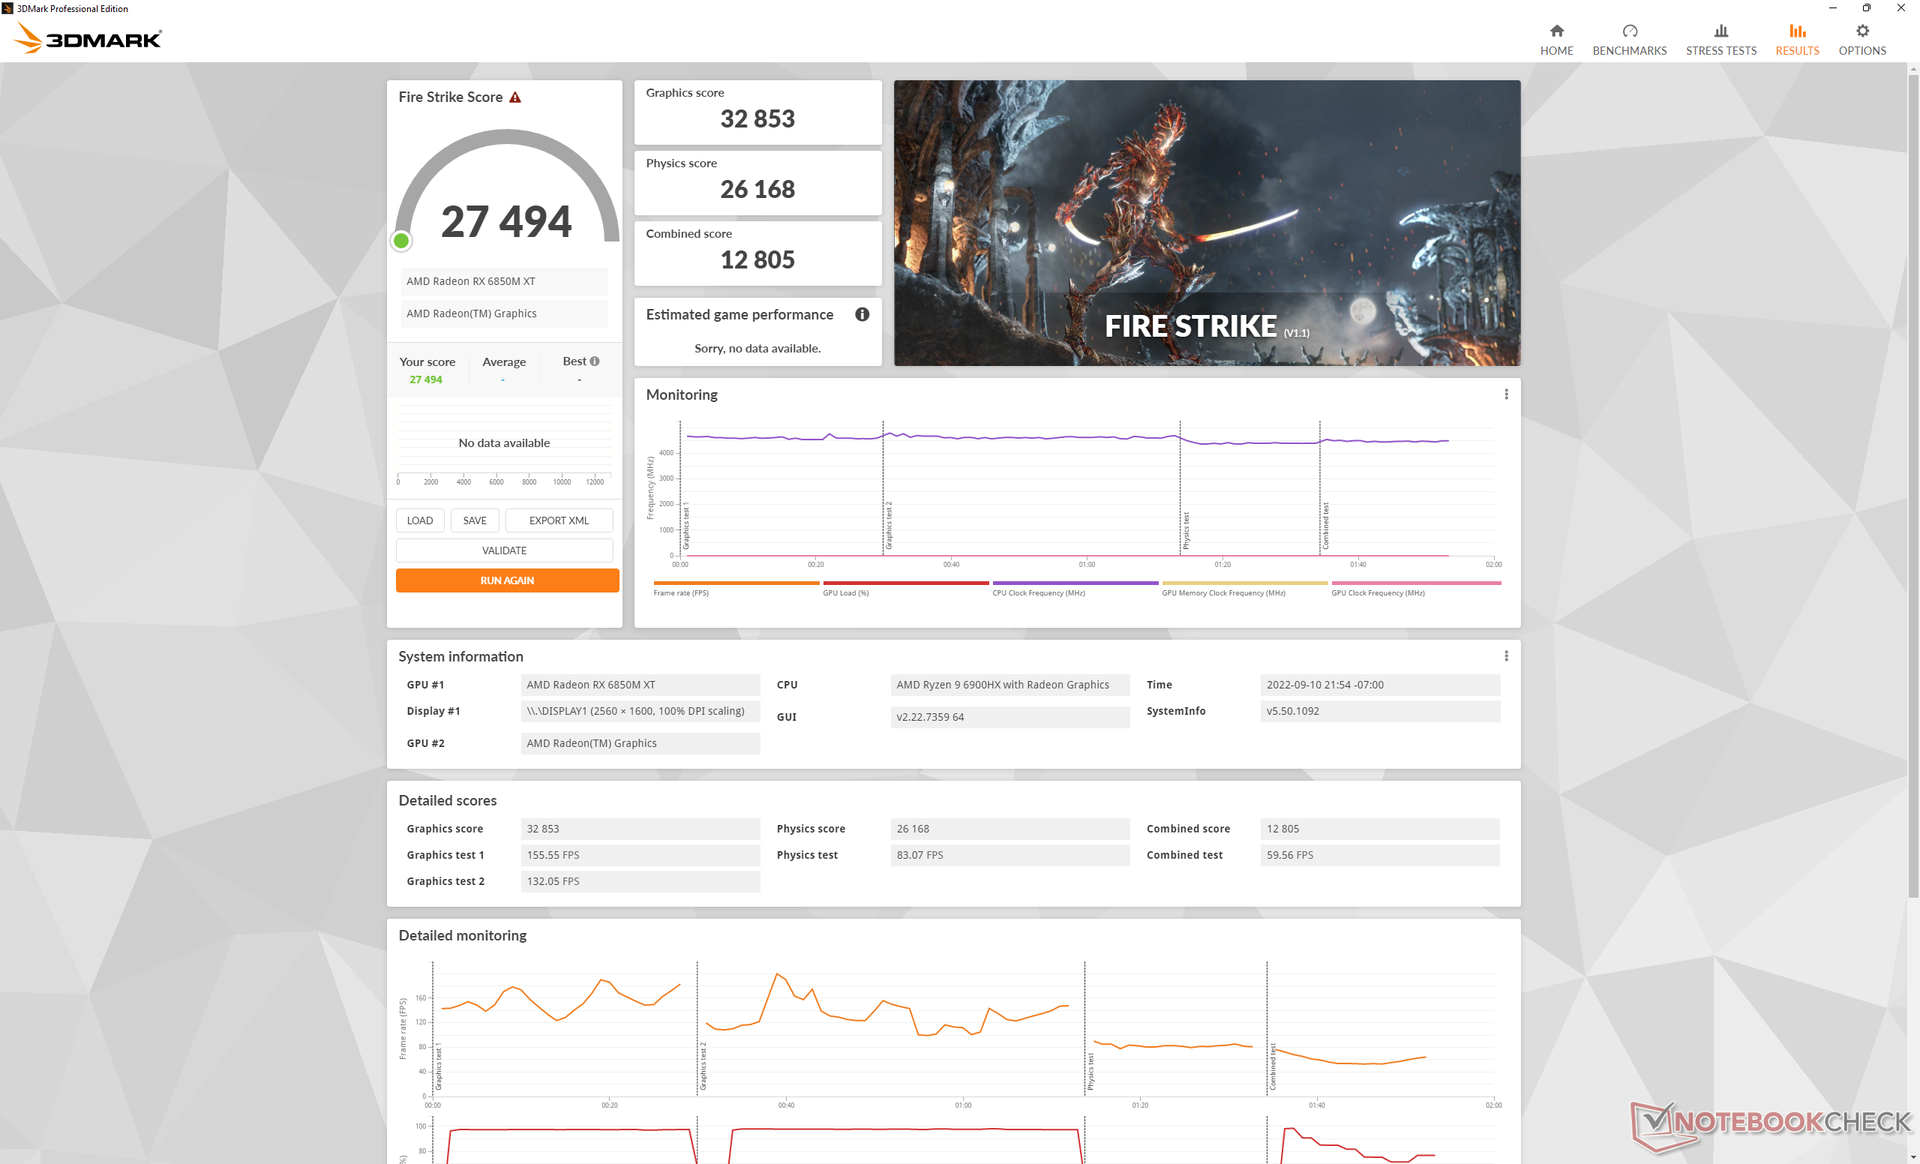
| 3DMark 11 Performance | 31277 points | |
| 3DMark Cloud Gate Standard Score | 63333 points | |
| 3DMark Fire Strike Score | 27494 points | |
| 3DMark Time Spy Score | 11633 points | |
Help | ||
| Cyberpunk 2077 1.6 | |
| 1920x1080 Low Preset | |
| Lenovo Legion 7 16ARHA7 | |
| Average AMD Radeon RX 6850M XT (n=1) | |
| MSI Raider GE66 12UHS | |
| MSI GE67 HX 12UGS | |
| 1920x1080 Medium Preset | |
| MSI Raider GE66 12UHS | |
| Lenovo Legion 7 16ARHA7 | |
| Average AMD Radeon RX 6850M XT (n=1) | |
| MSI GE67 HX 12UGS | |
| 1920x1080 High Preset | |
| MSI Raider GE66 12UHS | |
| MSI GE67 HX 12UGS | |
| Lenovo Legion 7 16ARHA7 | |
| Average AMD Radeon RX 6850M XT (n=1) | |
| 1920x1080 Ultra Preset | |
| MSI Raider GE66 12UHS | |
| MSI GE67 HX 12UGS | |
| Lenovo Legion 7 16ARHA7 | |
| Average AMD Radeon RX 6850M XT (n=1) | |
| 2560x1440 Ultra Preset | |
| MSI Raider GE66 12UHS | |
| MSI GE67 HX 12UGS | |
| Average AMD Radeon RX 6850M XT (53.6 - 57, n=2) | |
| Lenovo Legion 7 16ARHA7 | |
Witcher 3 FPS Chart
| low | med. | high | ultra | QHD | |
|---|---|---|---|---|---|
| GTA V (2015) | 179.2 | 173.4 | 162.4 | 96.9 | 90 |
| The Witcher 3 (2015) | 384.5 | 251.6 | 208.1 | 118.1 | |
| Dota 2 Reborn (2015) | 147.3 | 110.9 | 113.7 | 95.2 | |
| Final Fantasy XV Benchmark (2018) | 180.6 | 148.5 | 111.9 | 83.8 | |
| X-Plane 11.11 (2018) | 63.3 | 51.2 | 44.1 | ||
| Strange Brigade (2018) | 445 | 303 | 261 | 224 | 161.7 |
| Metro Exodus (2019) | 157.4 | 150.7 | 109.6 | 86.9 | 68.4 |
| Borderlands 3 (2019) | 112.8 | 102.1 | 94.2 | 85.6 | 68.6 |
| Gears Tactics (2020) | 153 | 252.2 | 155.5 | 117.8 | 83.6 |
| Horizon Zero Dawn (2020) | 181 | 159 | 142 | 123 | 100 |
| Watch Dogs Legion (2020) | 120 | 119 | 108 | 83 | 60 |
| Dirt 5 (2020) | 270 | 169.5 | 131.7 | 110.5 | 89.3 |
| Assassin´s Creed Valhalla (2020) | 235 | 159 | 130 | 112 | 82 |
| Hitman 3 (2021) | 211.9 | 192.6 | 192.9 | 191.3 | 136.1 |
| F1 2021 (2021) | 351 | 308 | 297 | 146 | 95 |
| Far Cry 6 (2021) | 123 | 112 | 100 | 99 | 87 |
| Guardians of the Galaxy (2021) | 130 | 131 | 132 | 129 | 103 |
| God of War (2022) | 89 | 95.6 | 94.5 | 78.4 | 64.7 |
| Cyberpunk 2077 1.6 (2022) | 160 | 135.5 | 105.8 | 87.2 | 53.6 |
| F1 22 (2022) | 245 | 241 | 204 | 52 | 31 |
排放
系统噪音 - 大声玩家
在低到中度负载下,内部风扇通常非常安静。例如,当运行3DMark 06时,在第一个90秒的基准场景结束时,系统噪音最高只有26.8 dB(A),而安静的背景为22.8 dB(A)。在微星GE66或Omen 16上重复这个相同的测试。 Omen 16会导致风扇的声音明显增大,达到40至50多分贝(A)的范围。
当运行在平衡和性能模式下时,风扇噪音稳定在47.2 dB(A)和54.3 dB(A)。 Witcher 3在平衡和性能模式下运行时,风扇噪音分别稳定在47.2 dB(A)和54.3 dB(A)。因此,在平衡模式下游戏时,系统明显更安静,所以用户可能要考虑牺牲一些图形性能来换取更安静的风扇,这取决于环境。50 dB(A)的范围是非常大的,不幸的是它在大多数游戏笔记本电脑中是很常见的。
Noise level
| Idle |
| 23 / 23 / 23 dB(A) |
| Load |
| 26.8 / 54.2 dB(A) |
 | ||
30 dB silent 40 dB(A) audible 50 dB(A) loud |
||
min: | ||
| Lenovo Legion 7 16ARHA7 Radeon RX 6850M XT, R9 6900HX, Samsung PM9A1 MZVL22T0HBLB | MSI Raider GE66 12UHS GeForce RTX 3080 Ti Laptop GPU, i9-12900HK, Samsung PM9A1 MZVL22T0HBLB | Lenovo Legion Slim 7-16IAH 82TF004YGE GeForce RTX 3060 Laptop GPU, i7-12700H, SK Hynix HFS001TEJ9X115N | Asus ROG Zephyrus Duo 16 GX650RX GeForce RTX 3080 Ti Laptop GPU, R9 6900HX, 2x Samsung SSD 980 Pro 2TB MZ-V8P2T0 (RAID 0) | HP Omen 16-c0077ng Radeon RX 6600M, R7 5800H, Samsung PM981a MZVLB1T0HBLR | Lenovo Legion 5 Pro 16ACH6H (82JQ001PGE) GeForce RTX 3070 Laptop GPU, R7 5800H, WDC PC SN730 SDBPNTY-1T00 | |
|---|---|---|---|---|---|---|
| Noise | -24% | -8% | -15% | -35% | -6% | |
| off / environment * (dB) | 22.8 | 26 -14% | 23 -1% | 26 -14% | 25 -10% | 23 -1% |
| Idle Minimum * (dB) | 23 | 27 -17% | 23 -0% | 26 -13% | 25 -9% | 25 -9% |
| Idle Average * (dB) | 23 | 30 -30% | 23 -0% | 27 -17% | 31.2 -36% | 25 -9% |
| Idle Maximum * (dB) | 23 | 39 -70% | 23 -0% | 29 -26% | 33.8 -47% | 25 -9% |
| Load Average * (dB) | 26.8 | 45 -68% | 43.7 -63% | 41 -53% | 55.4 -107% | 35.5 -32% |
| Witcher 3 ultra * (dB) | 54.3 | 45 17% | 51.7 5% | 48 12% | 46.67 14% | |
| Load Maximum * (dB) | 54.2 | 47 13% | 52 4% | 50 8% | 56 -3% | 50.35 7% |
* ... smaller is better
温度
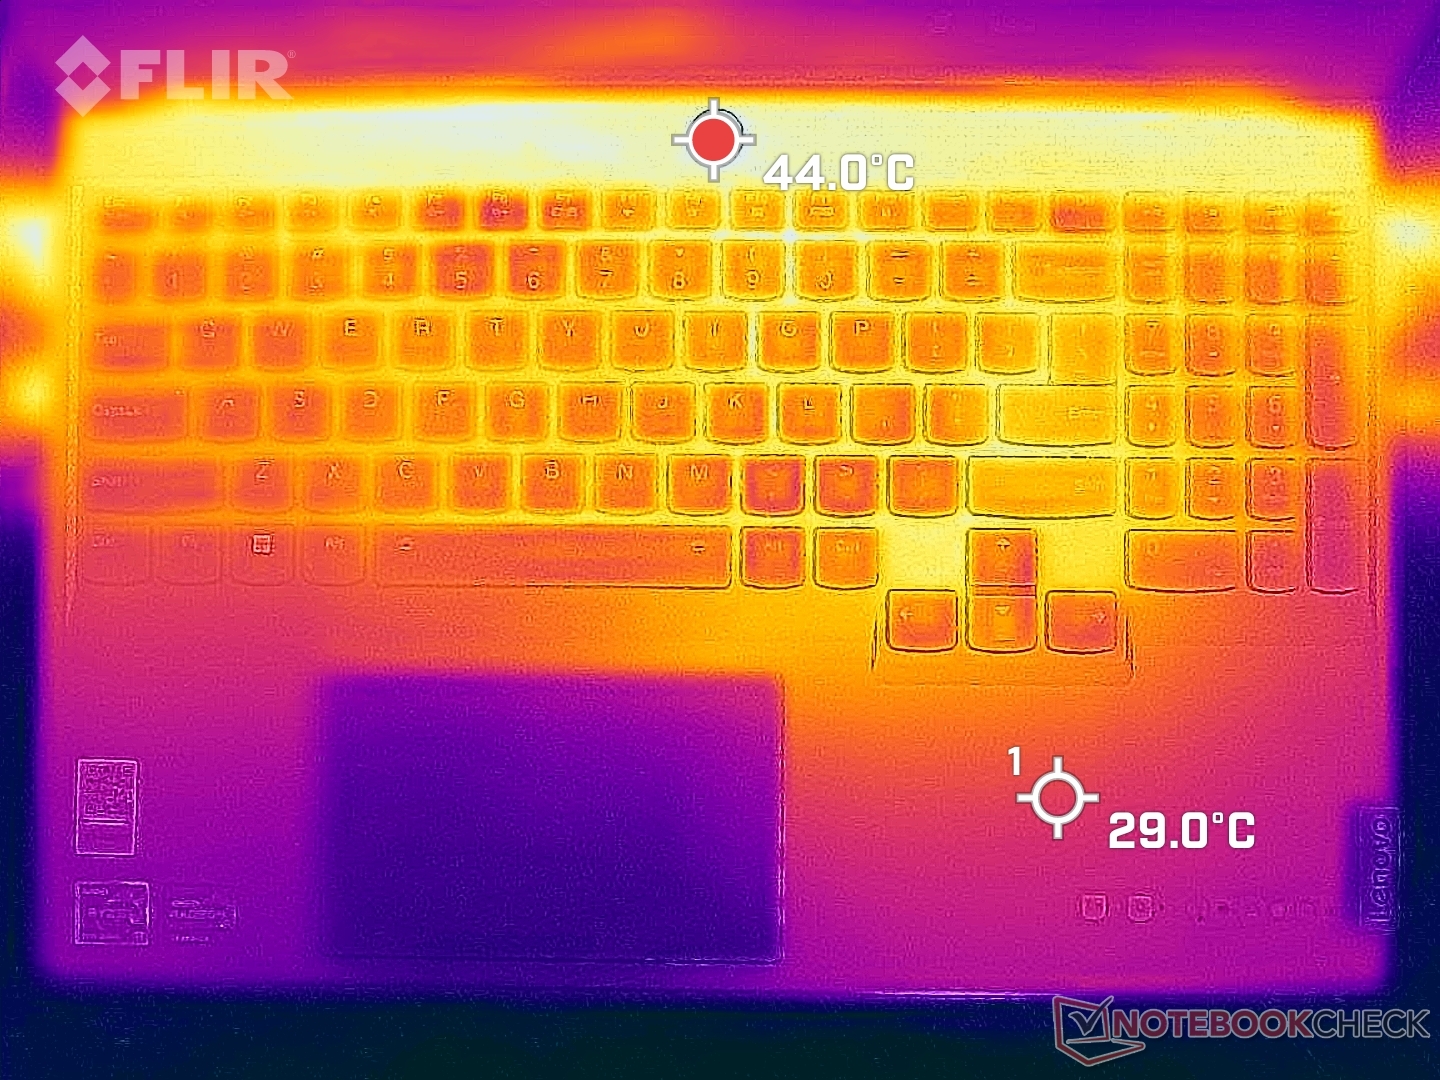
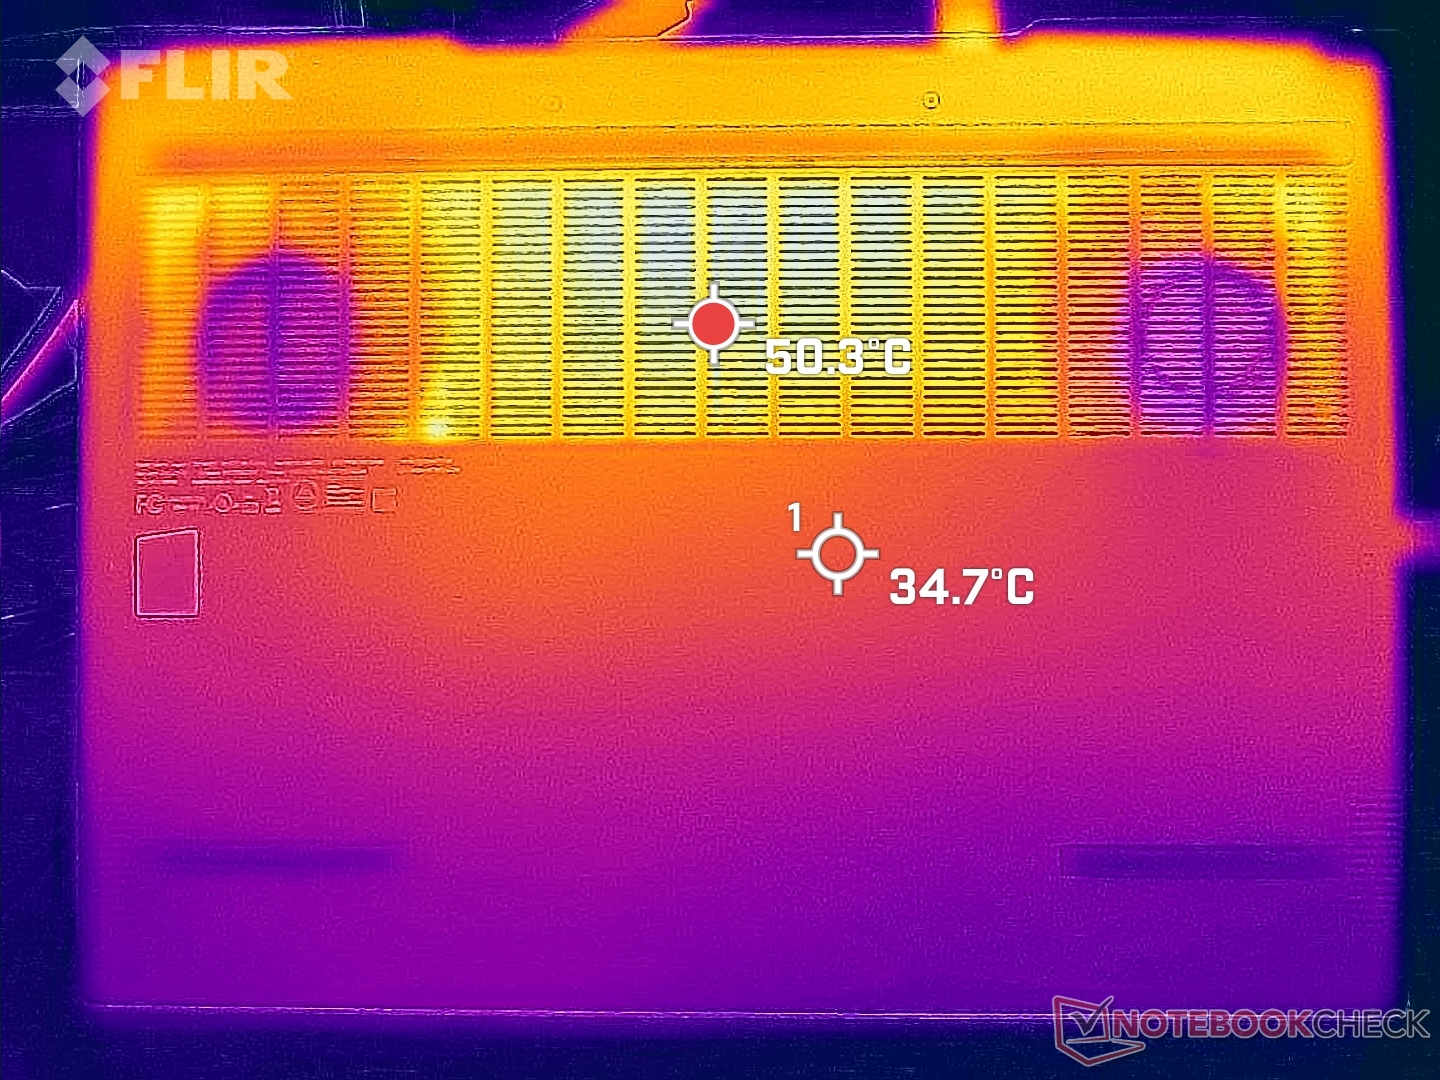
长时间游戏时,顶部和底部的表面温度热点可分别达到46℃和49℃。值得庆幸的是,这些热点都在后面,远离键盘按键。相比之下,微星Raider GE66在类似的负载下,可以达到更高的温度,高达54℃至62℃。大量的通风格栅在保持系统相对凉爽方面做得很好,尽管其外形很薄。
请注意,该系统在运行时的温度要比运行Prime95和Furur的温度高。 Witcher 3比同时运行Prime95和FurMark时更热。这些结果与我们下面的功耗观察相吻合,即 Witcher 3实际上对电源的要求比Prime95和FurMark更高。
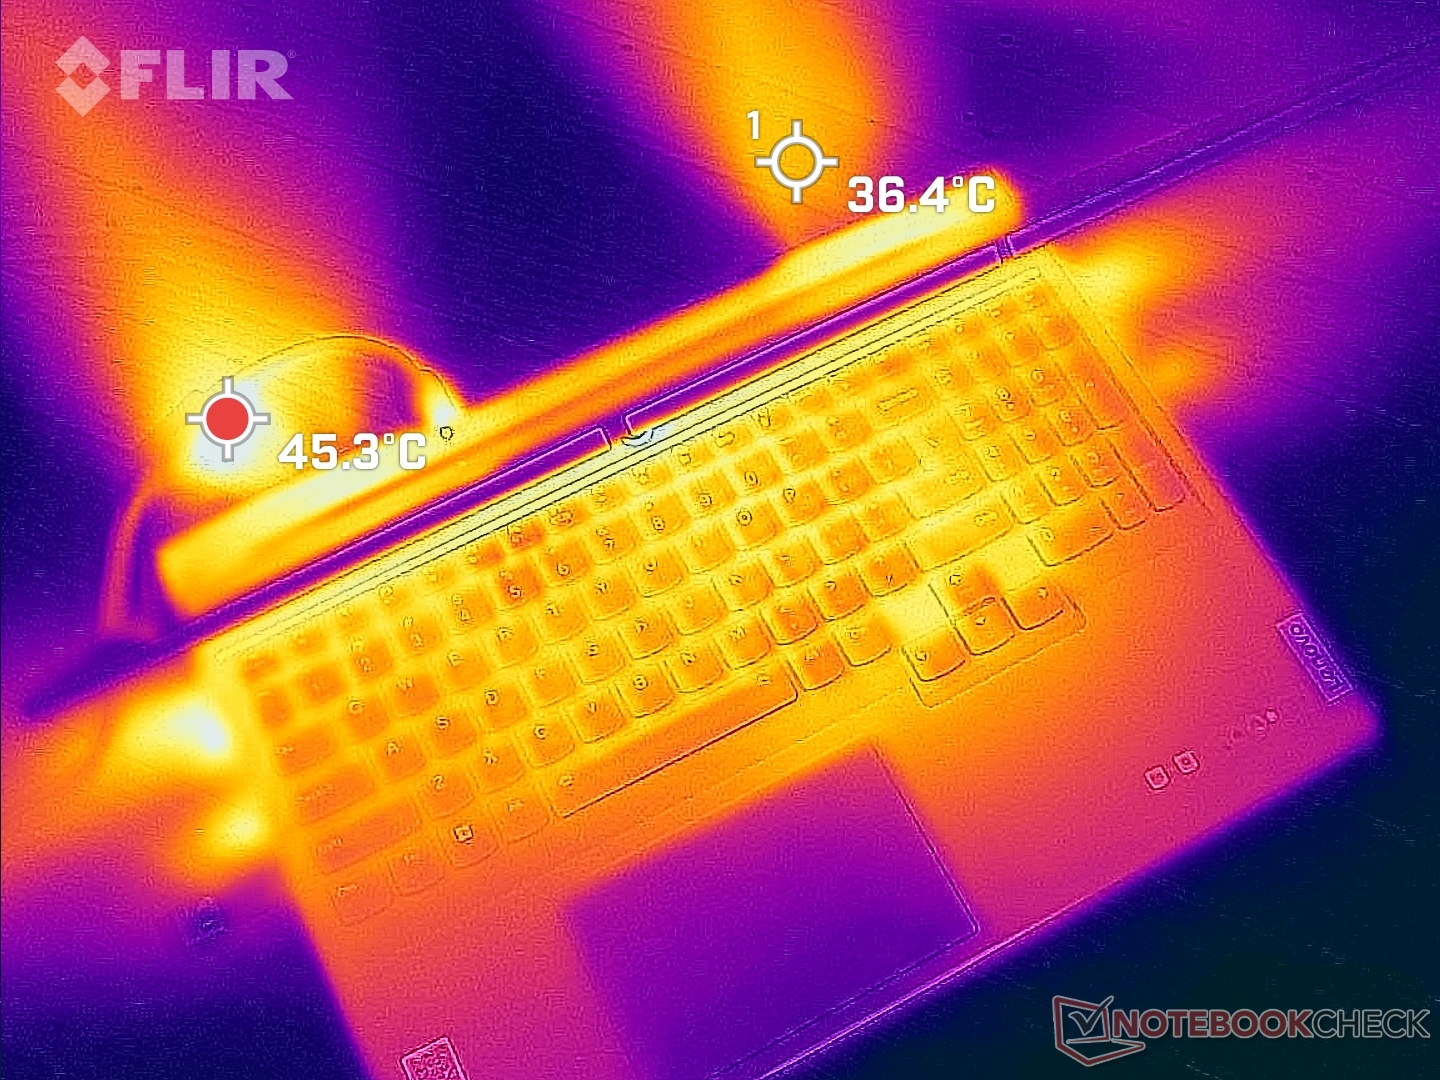
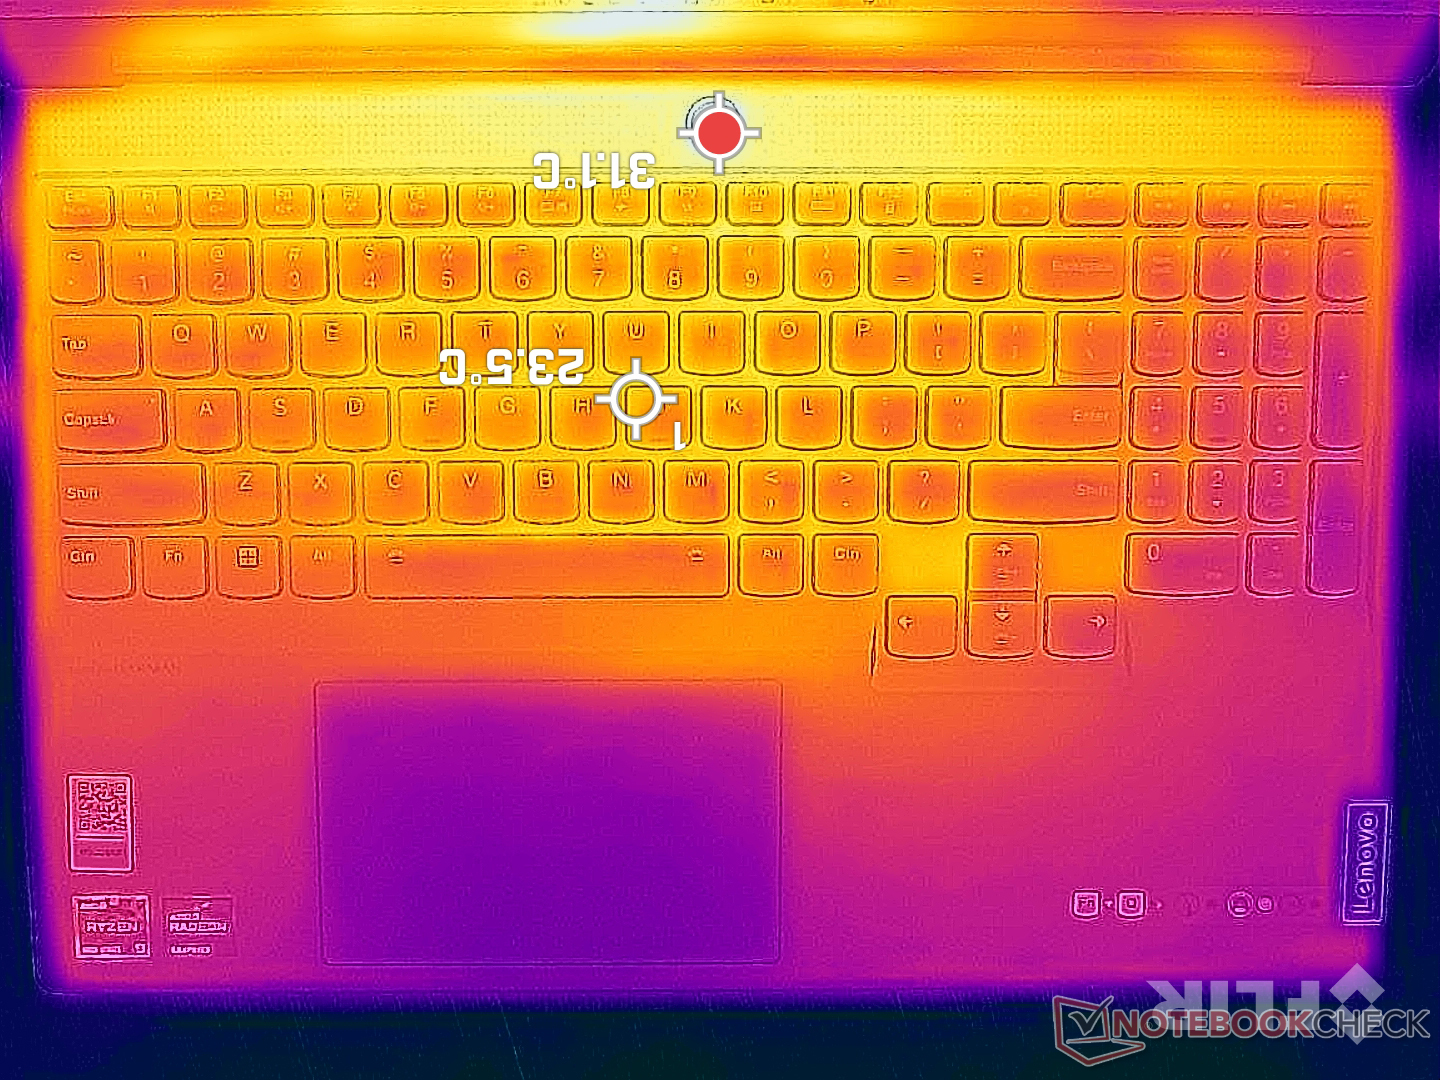
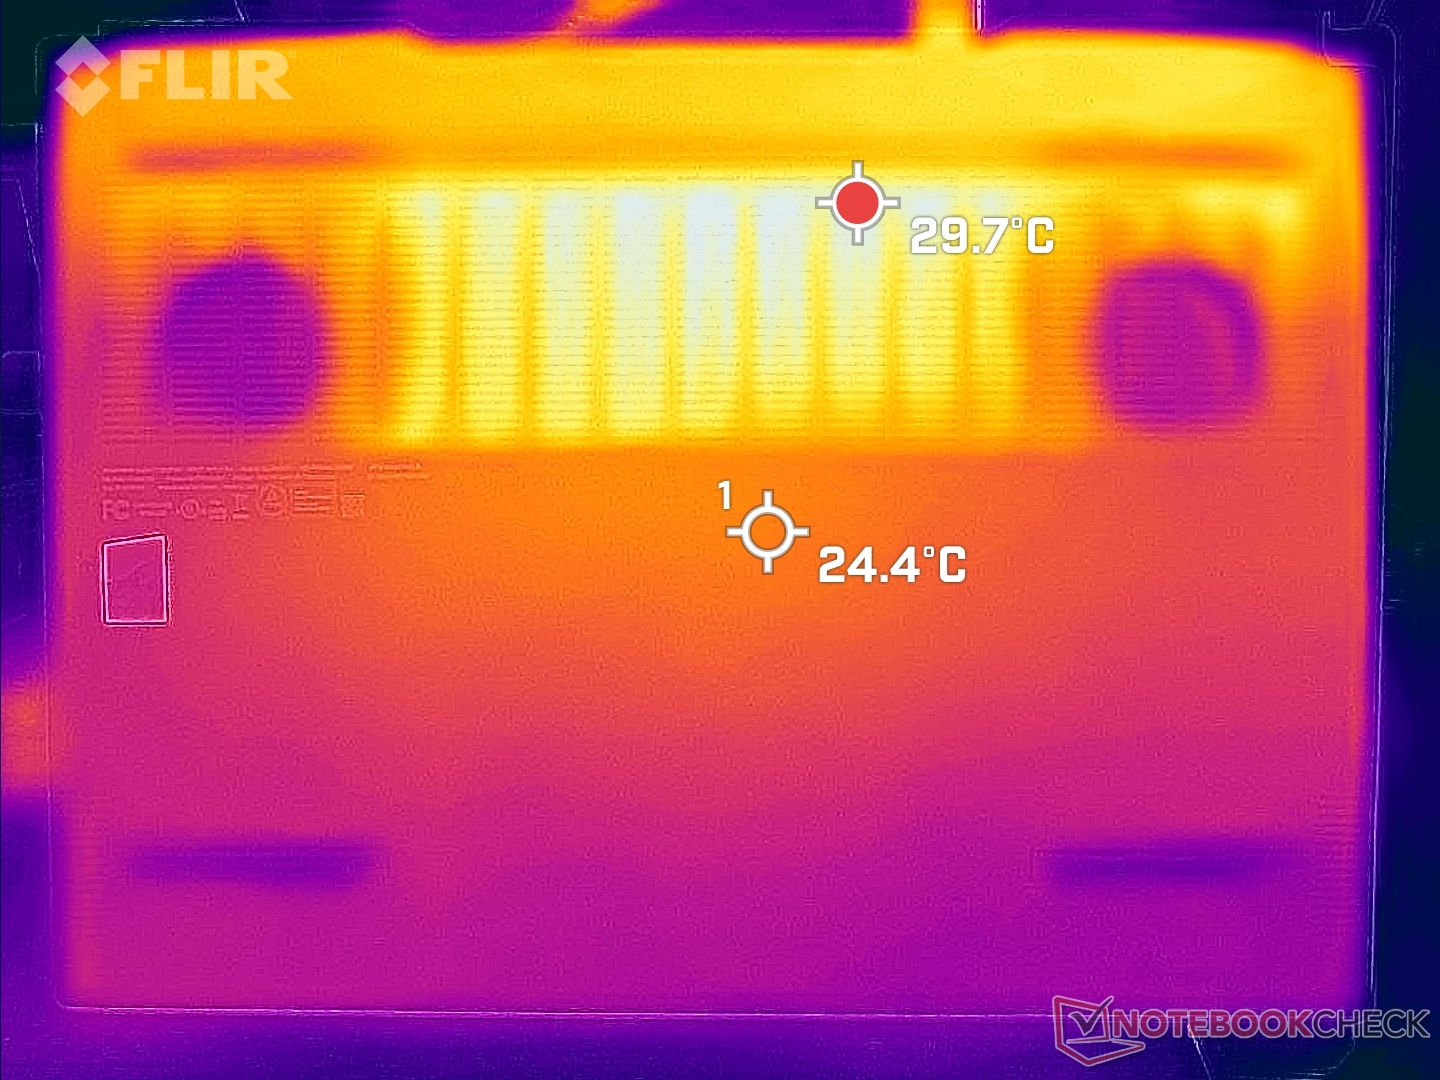
(+) The maximum temperature on the upper side is 37.2 °C / 99 F, compared to the average of 40.4 °C / 105 F, ranging from 21.2 to 68.8 °C for the class Gaming.
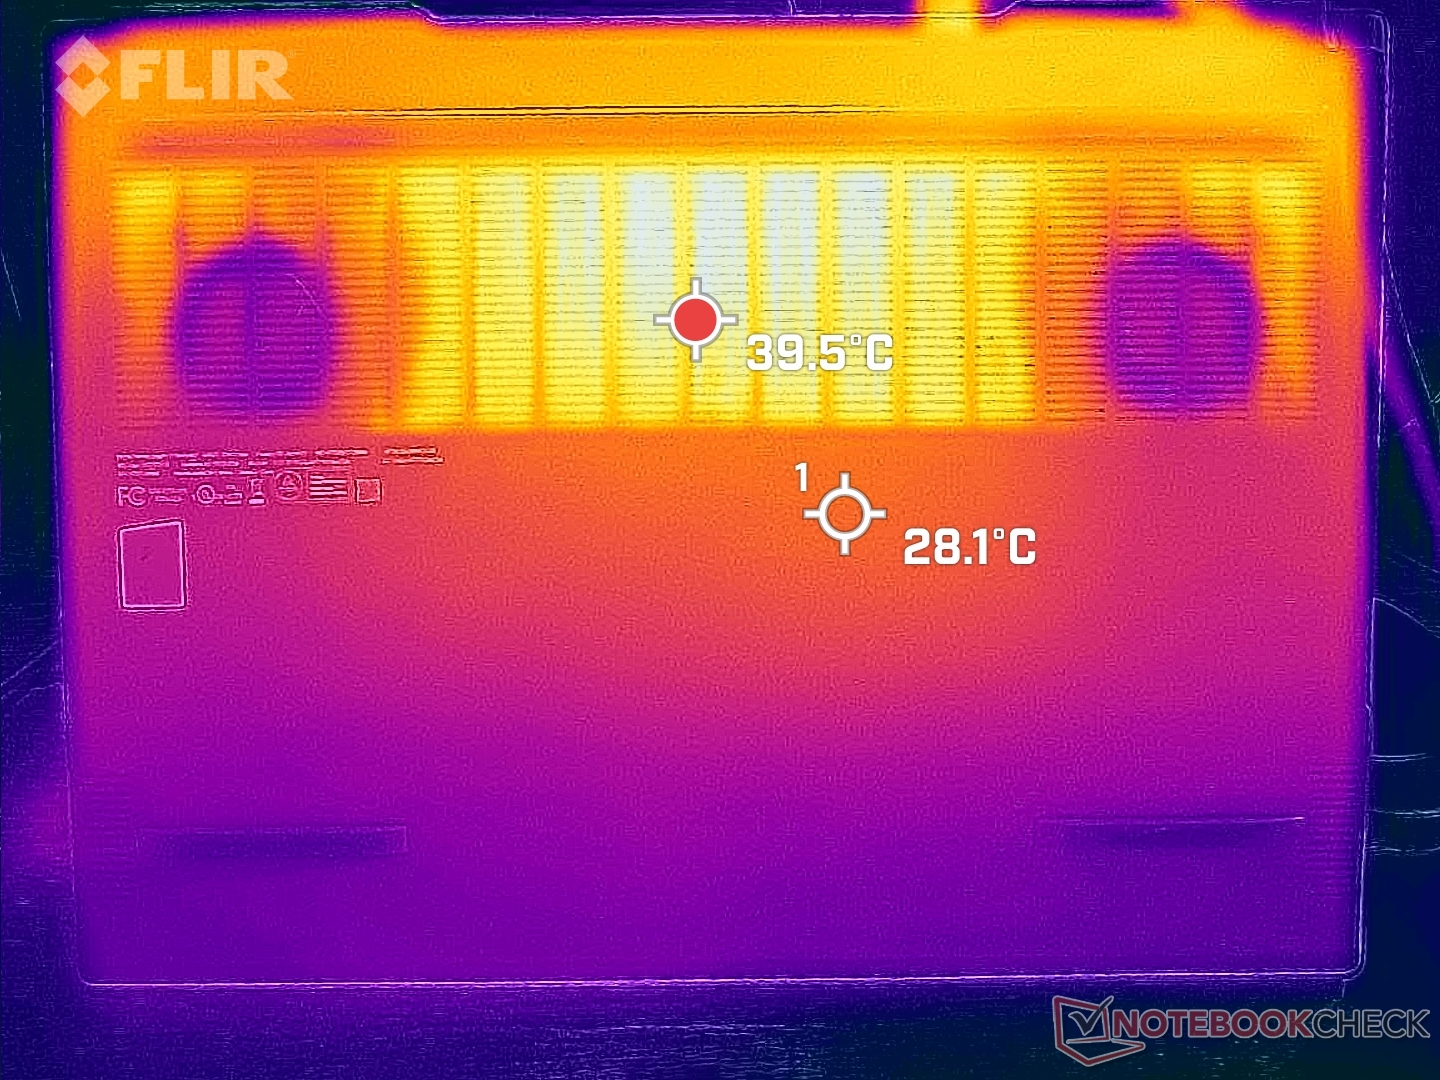
(±) The bottom heats up to a maximum of 43 °C / 109 F, compared to the average of 43.2 °C / 110 F
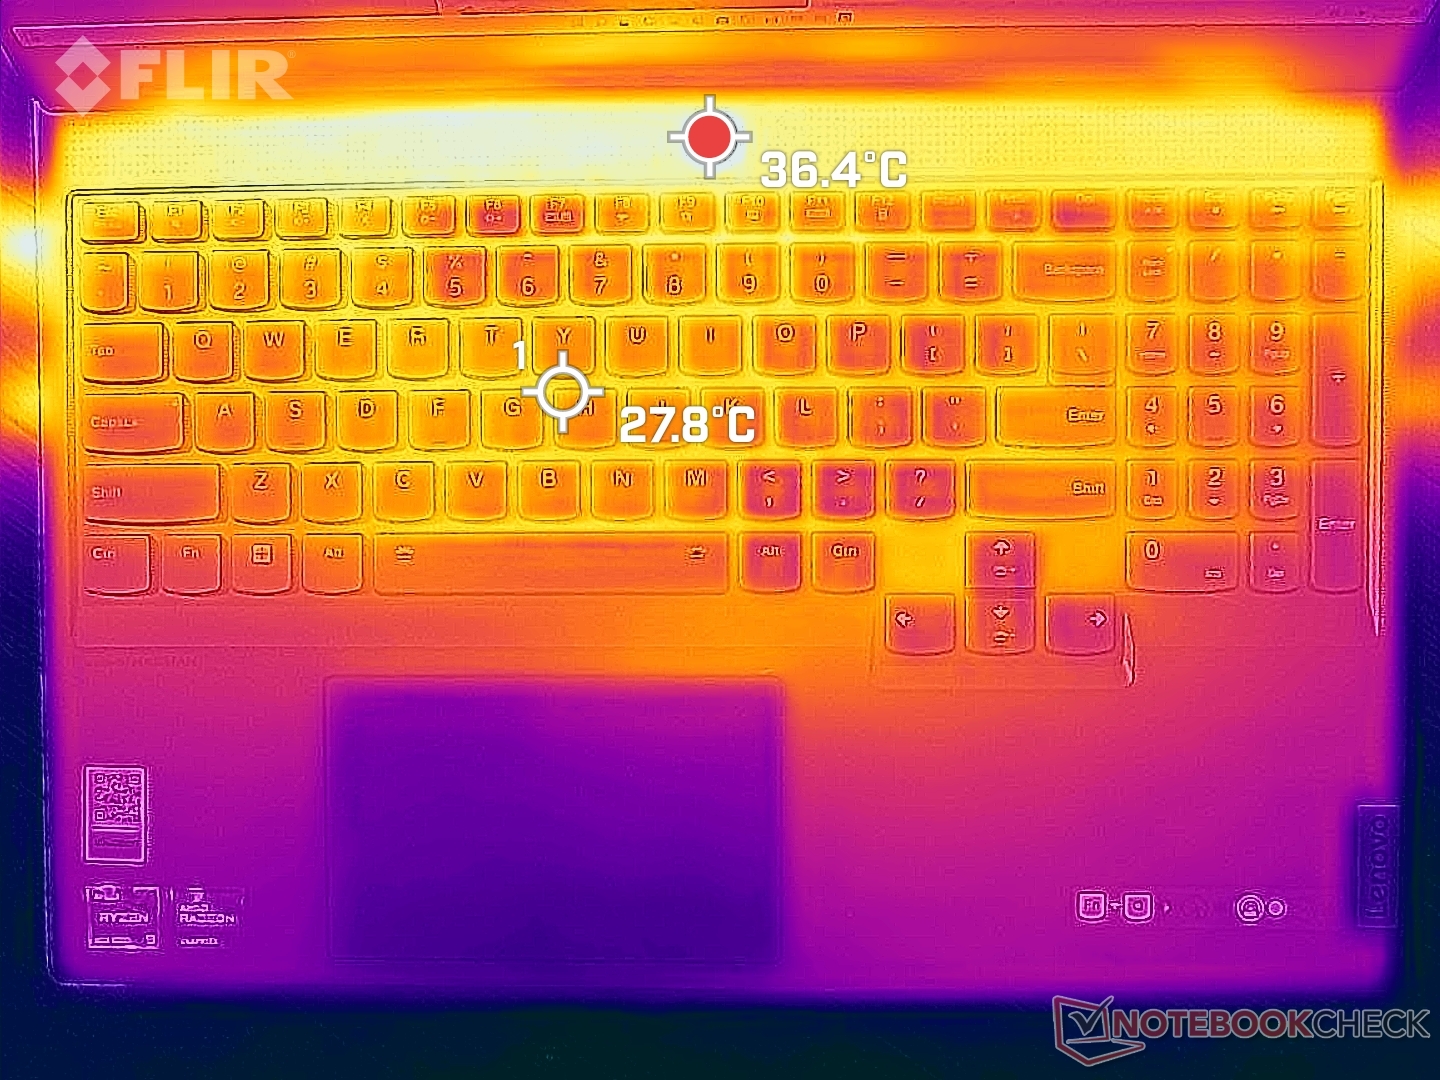
(+) In idle usage, the average temperature for the upper side is 29.7 °C / 85 F, compared to the device average of 33.9 °C / 93 F.
(-) Playing The Witcher 3, the average temperature for the upper side is 41 °C / 106 F, compared to the device average of 33.9 °C / 93 F.
(±) The palmrests and touchpad can get very hot to the touch with a maximum of 38 °C / 100.4 F.
(-) The average temperature of the palmrest area of similar devices was 28.8 °C / 83.8 F (-9.2 °C / -16.6 F).
| Lenovo Legion 7 16ARHA7 AMD Ryzen 9 6900HX, AMD Radeon RX 6850M XT | MSI Raider GE66 12UHS Intel Core i9-12900HK, NVIDIA GeForce RTX 3080 Ti Laptop GPU | Lenovo Legion Slim 7-16IAH 82TF004YGE Intel Core i7-12700H, NVIDIA GeForce RTX 3060 Laptop GPU | Asus ROG Zephyrus Duo 16 GX650RX AMD Ryzen 9 6900HX, NVIDIA GeForce RTX 3080 Ti Laptop GPU | HP Omen 16-c0077ng AMD Ryzen 7 5800H, AMD Radeon RX 6600M | Lenovo Legion 5 Pro 16ACH6H (82JQ001PGE) AMD Ryzen 7 5800H, NVIDIA GeForce RTX 3070 Laptop GPU | |
|---|---|---|---|---|---|---|
| Heat | -23% | -20% | -9% | 1% | -19% | |
| Maximum Upper Side * (°C) | 37.2 | 54 -45% | 48.3 -30% | 45 -21% | 40.6 -9% | 50 -34% |
| Maximum Bottom * (°C) | 43 | 65 -51% | 55.3 -29% | 50 -16% | 36 16% | 55 -28% |
| Idle Upper Side * (°C) | 34 | 30 12% | 35.7 -5% | 33 3% | 31.3 8% | 34 -0% |
| Idle Bottom * (°C) | 32.8 | 35 -7% | 37.6 -15% | 33 -1% | 36 -10% | 37 -13% |
* ... smaller is better
压力测试 - 140 W TGP GPU
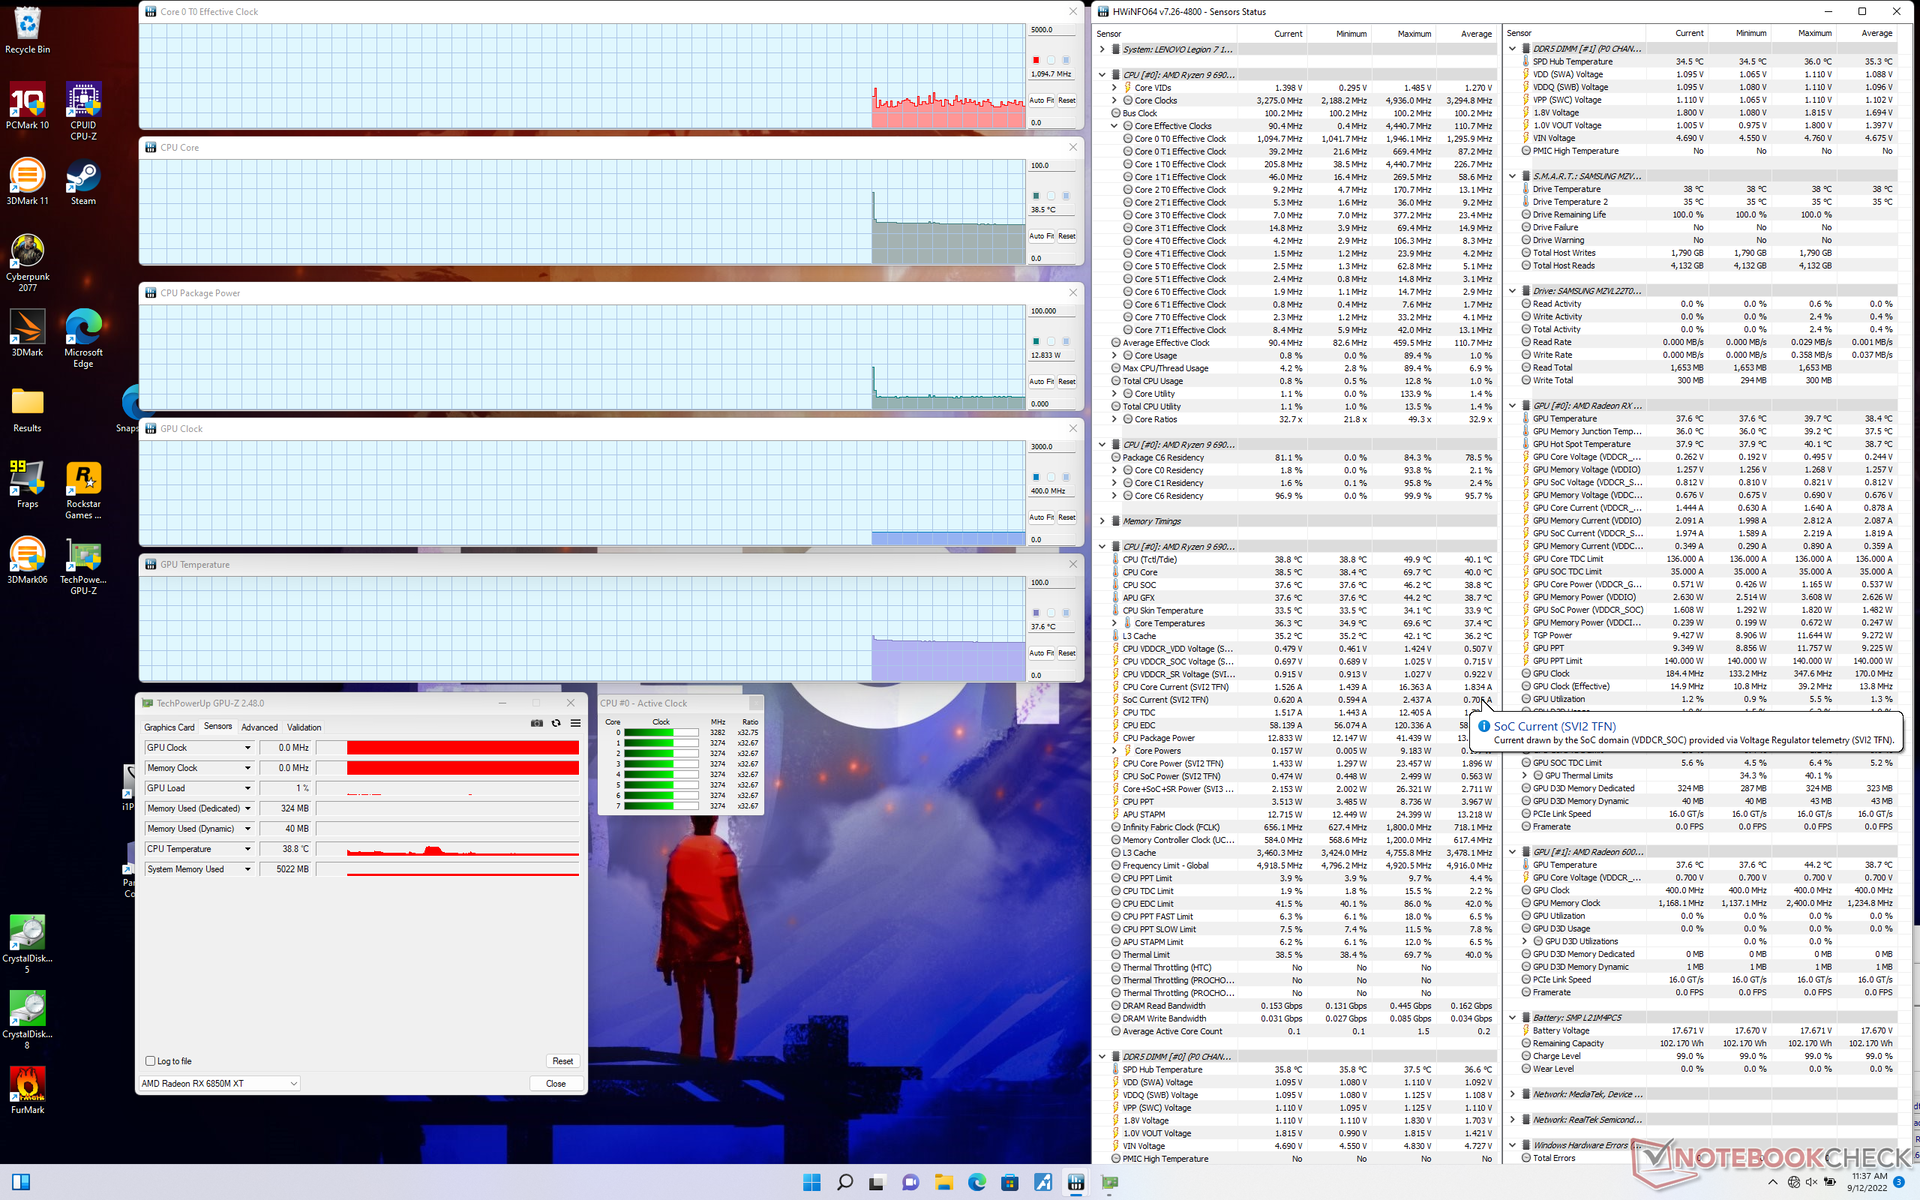
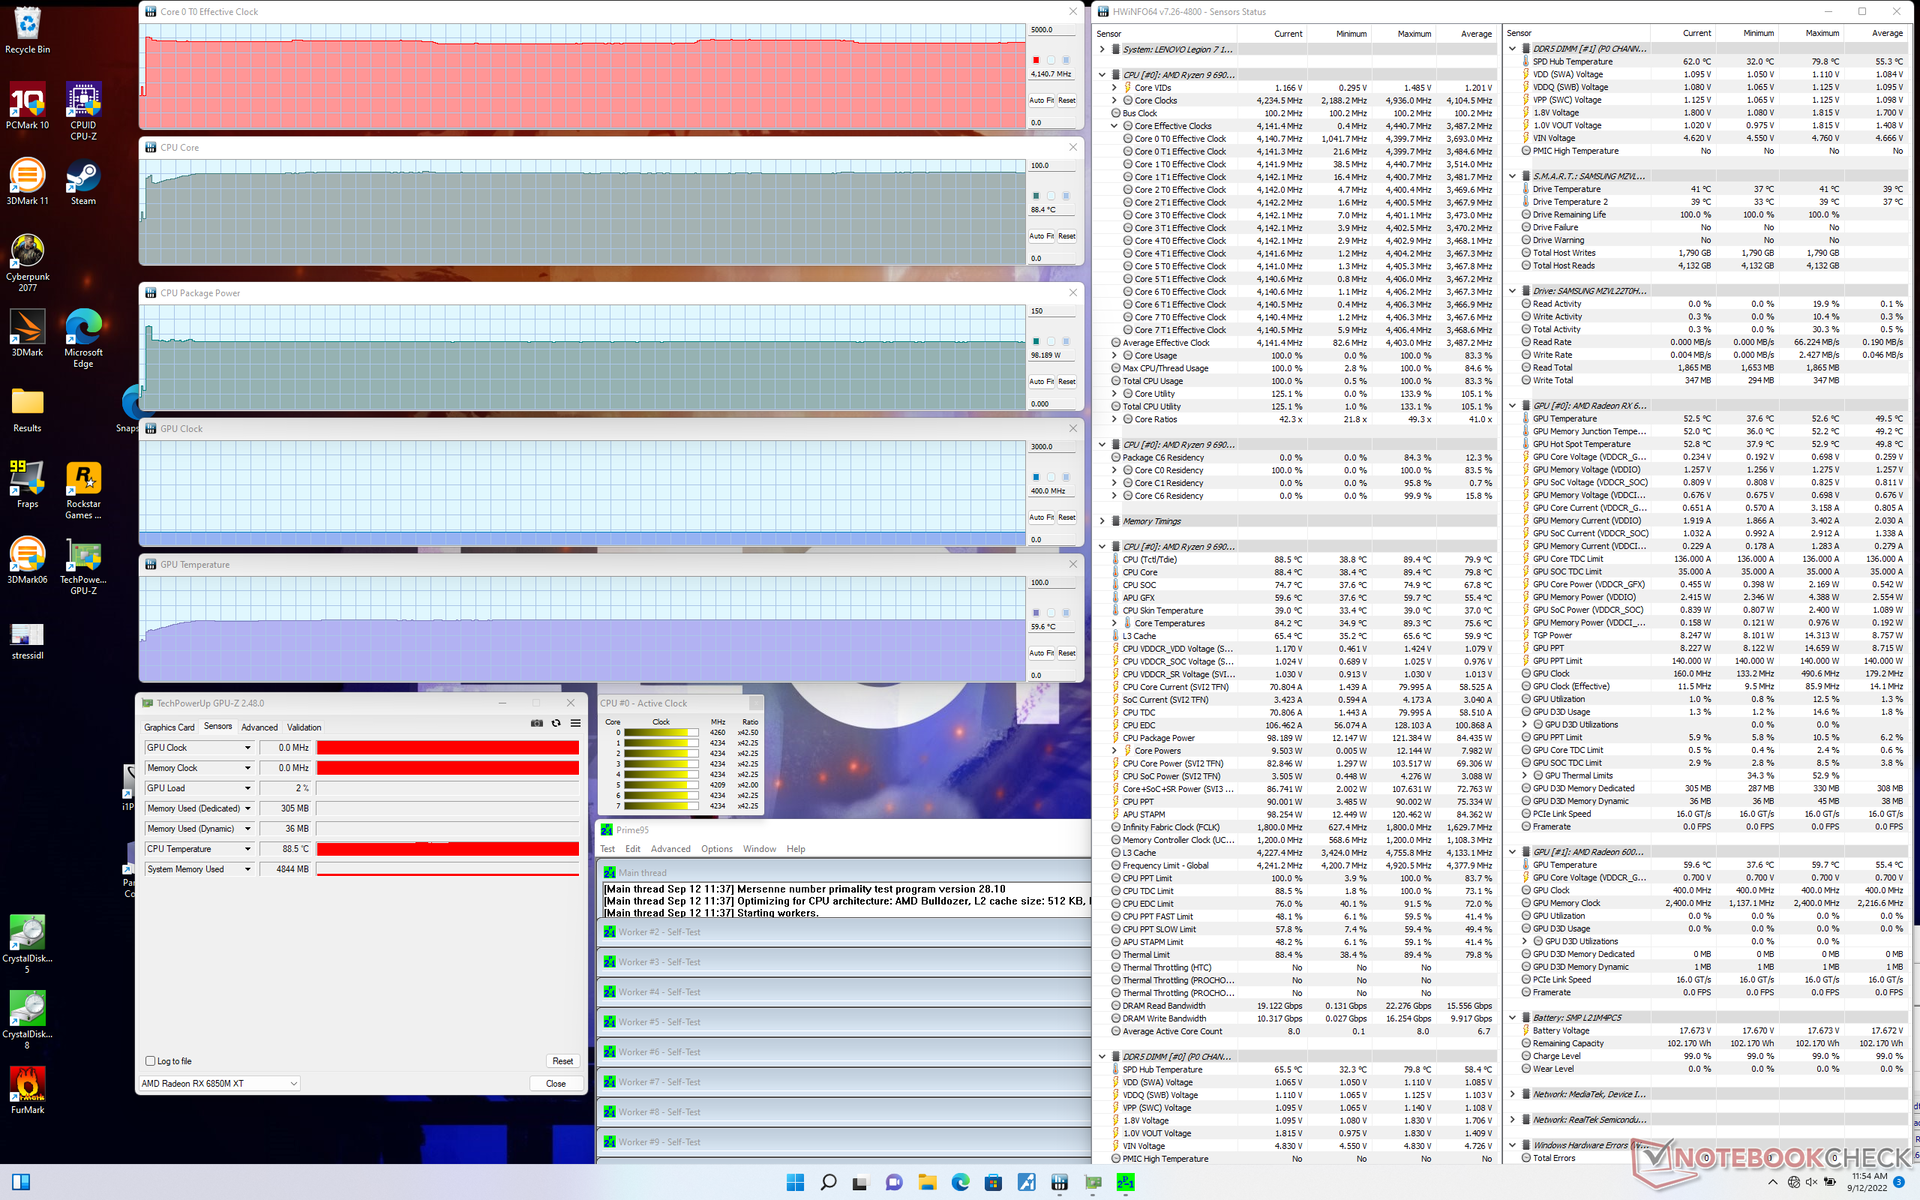
在启动Prime95时,CPU的时钟频率、温度和电路板的功耗将分别提升到3.3 GHz、86 C和120 W。然后,处理器将迅速稳定在4.2 GHz、89 C和99 W,仅几秒钟后就会无限期地稳定。相比之下,在去年的华硕ROG Zephyrus上重复这个相同的测试。华硕ROG Zephyrus Duo 15与Ryzen 9 5900HX相比,在去年的华硕ROG Zephyrus Duo 15上重复同样的测试,会看到CPU时钟速率在类似的4.2GHz范围内,但核心温度更低,为75C。
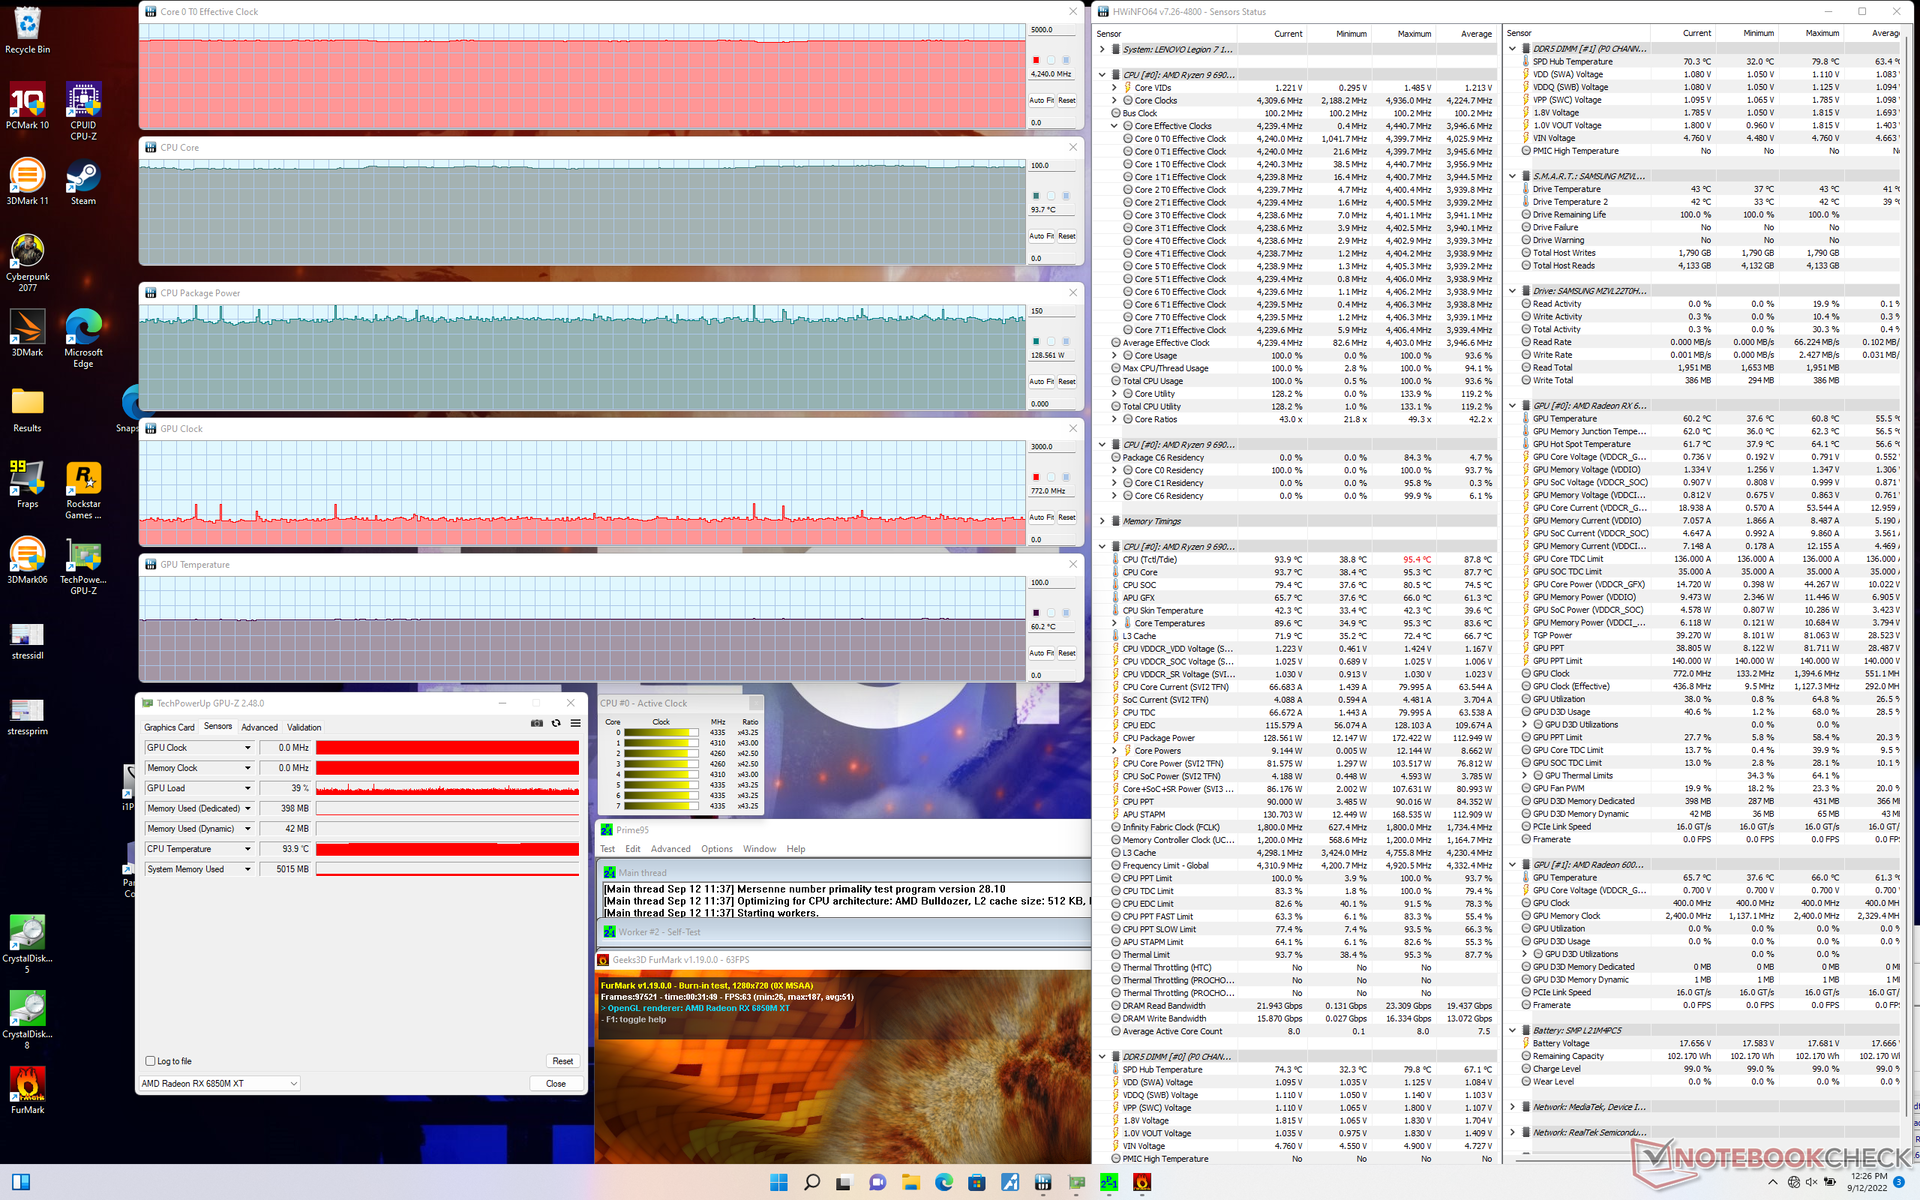
如果Priem95和FurMark同时运行,系统似乎会为了保持CPU的高性能而节制GPU的性能。
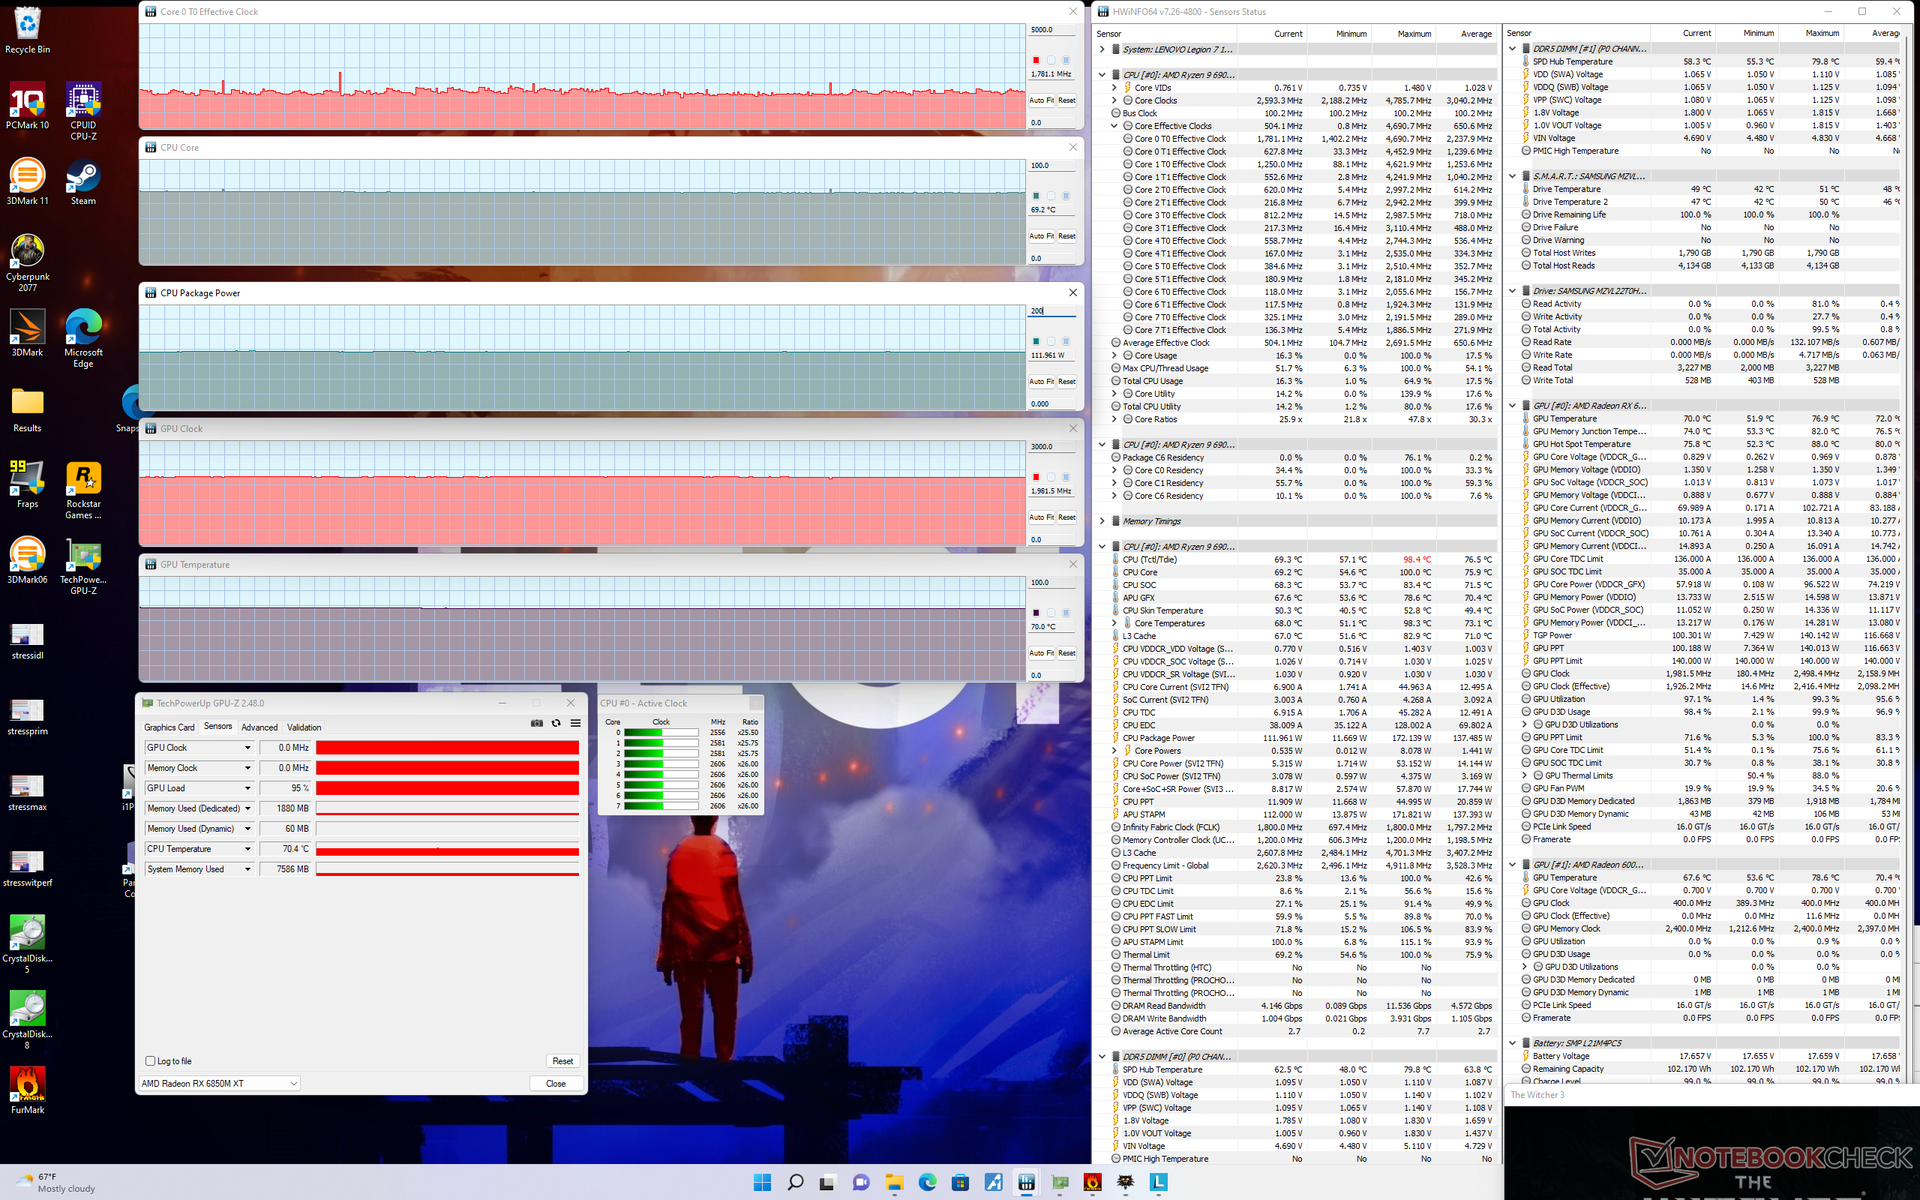
在性能模式下运行时,GPU时钟速率、TGP功率和温度将稳定在239%。 Witcher 3在性能模式下将分别稳定在2391 MHz、140 W和77 C,而在平衡模式下只有1982 MHz、100 W和70 C。因此,如果用户希望充分发挥独立GPU的潜力,就必须忍受性能模式下大得多的风扇噪音。
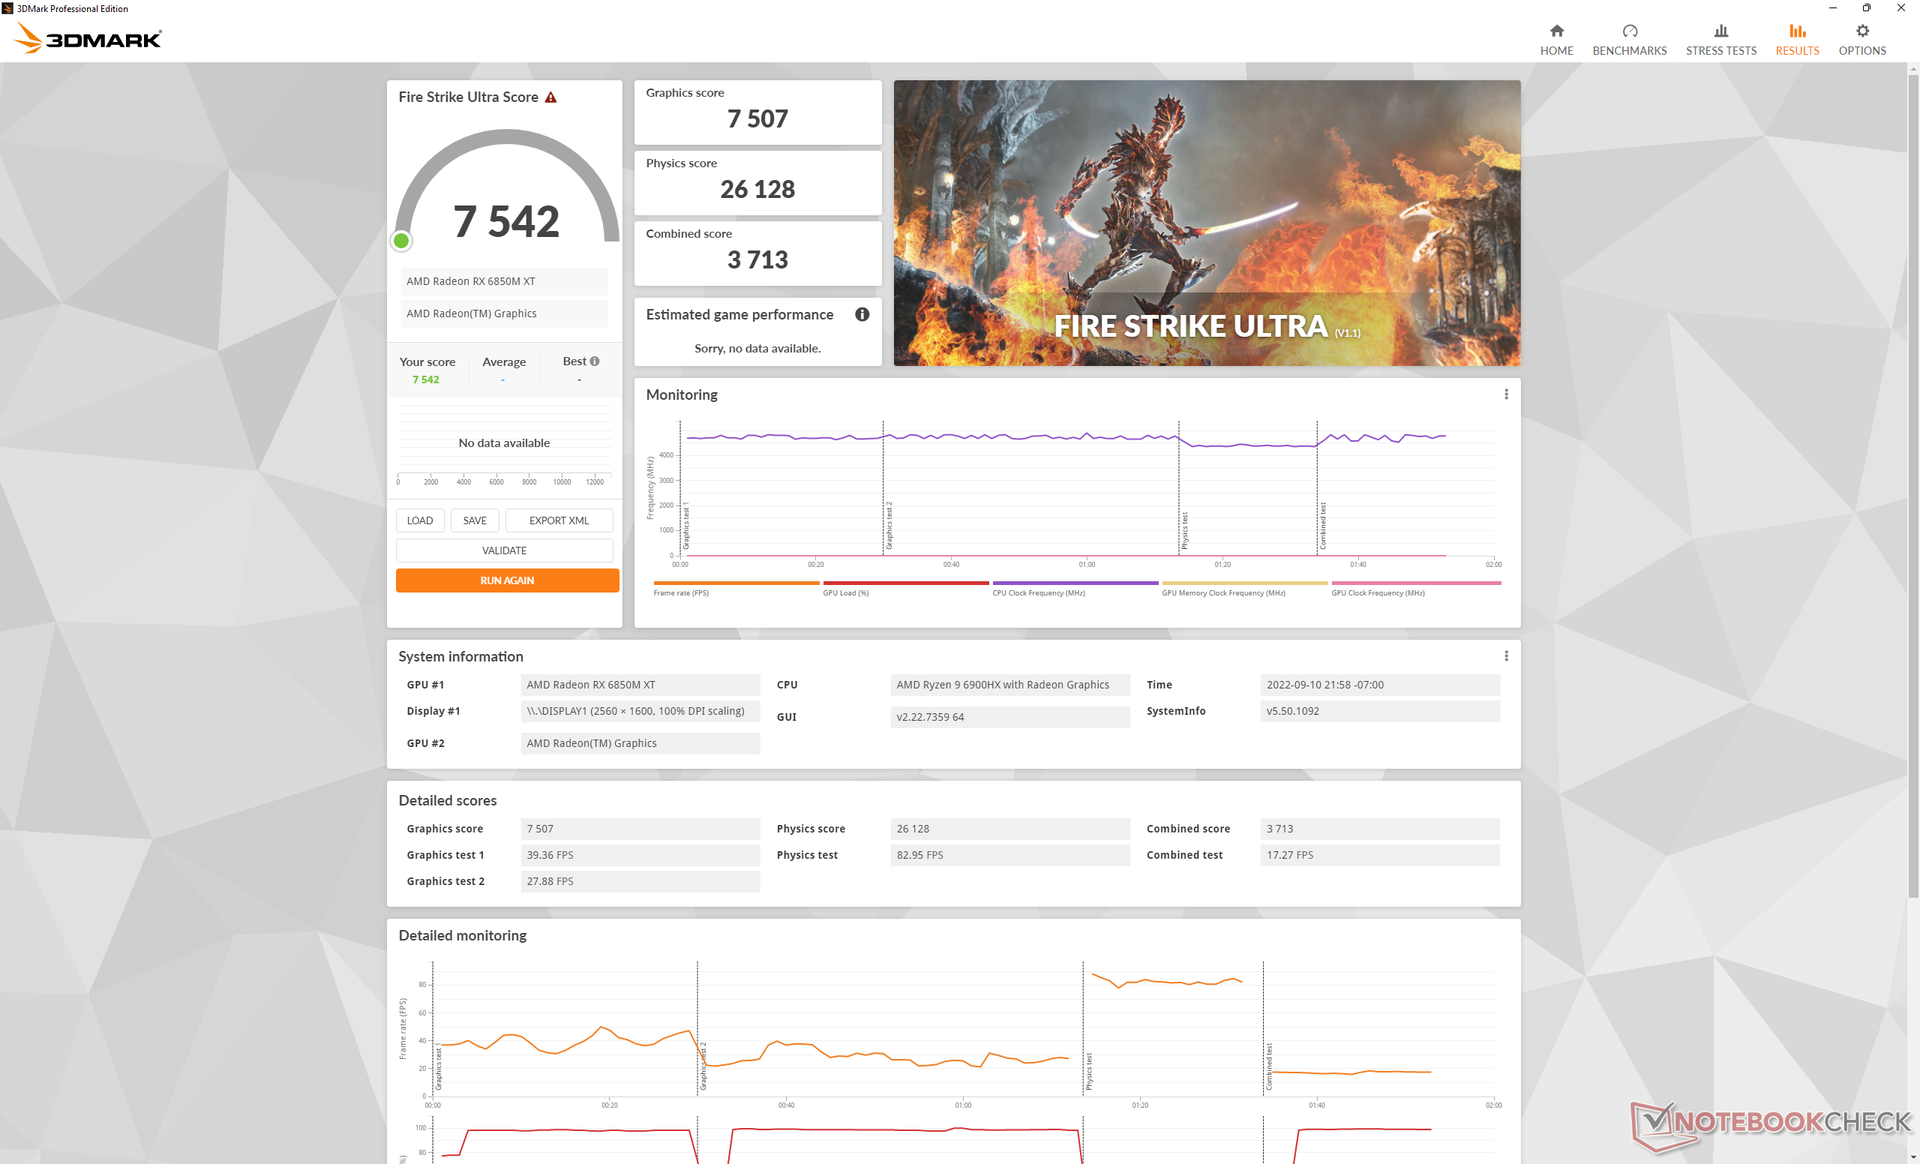
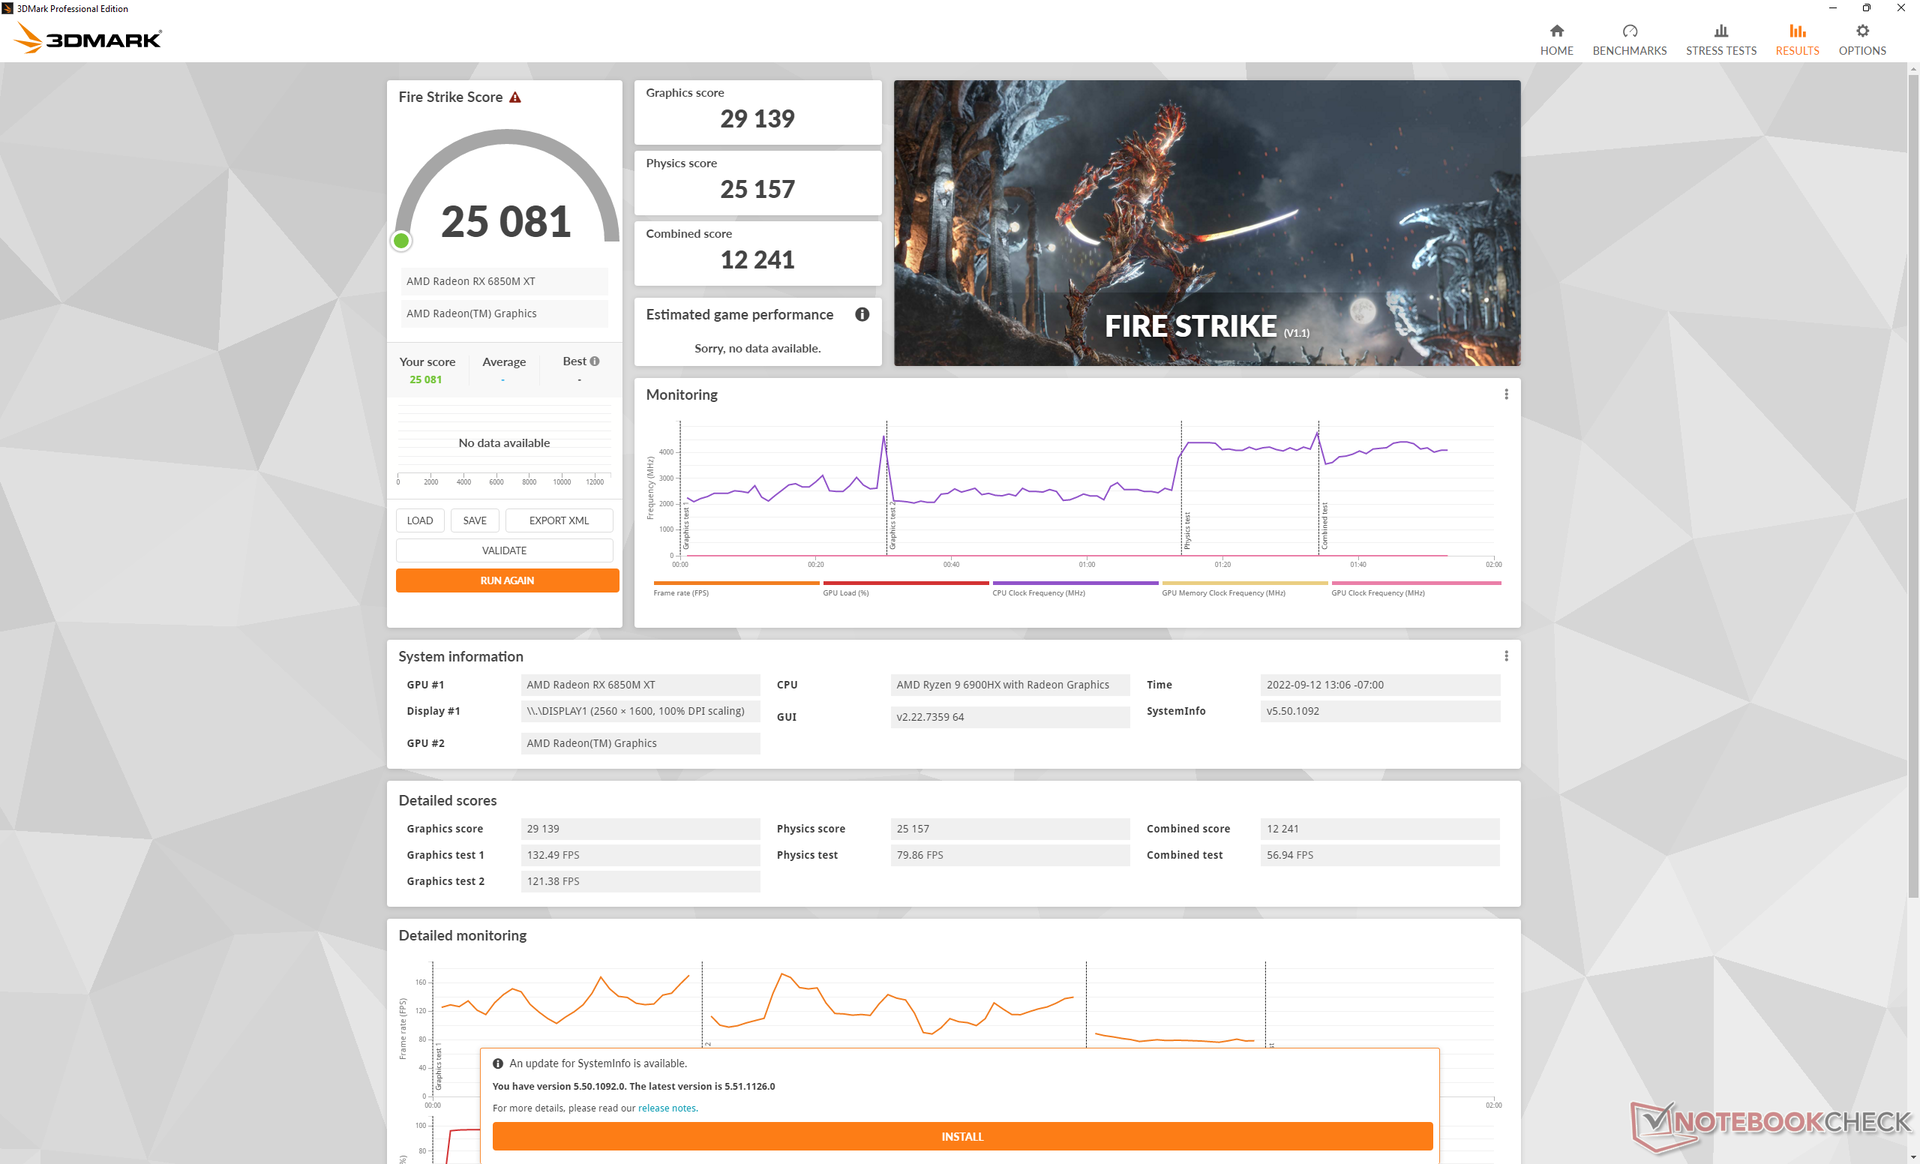
在电池上运行限制了性能,特别是因为如果不在主电源上,性能模式会自动禁用。在电池上运行Fire Strike ,物理和图形分数分别为20389和12512分,而在主电源上则为26168和32853分。
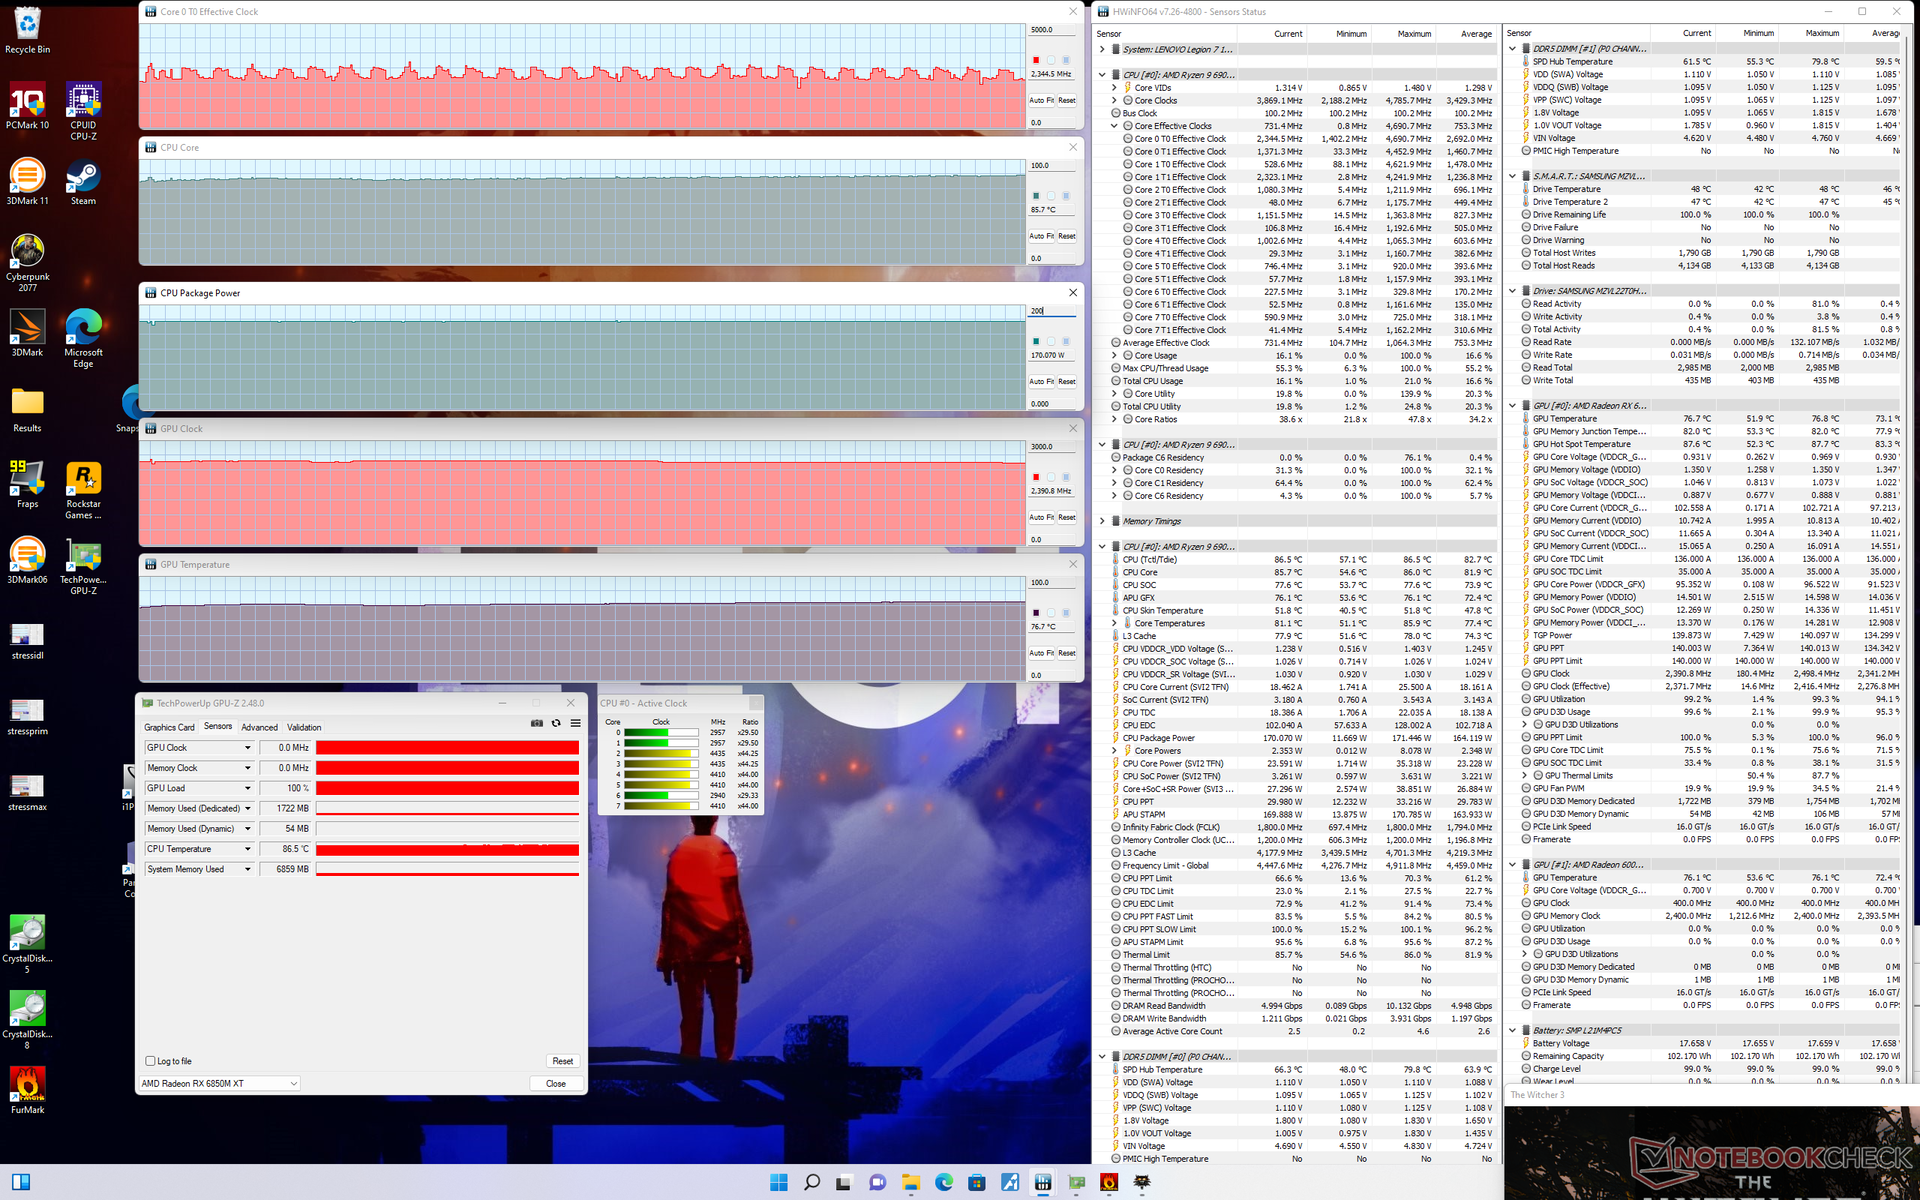
| CPU时钟(GHz) | GPU时钟(MHz) | CPU平均温度(℃) | GPU平均温度(℃) | |
| 系统空闲 | -- | -- | 39 | 38 |
| Prime95压力 | 4.1 - 4.2 | -- | 88 | 53 |
| Prime95 + FurMark 压力 | 4.2 | 772 | 94 | 60 |
| Witcher 3 压力(平衡模式) | 1.8 | 1982 | 69 | 70 |
| Witcher 3 压力(性能模式) | 2.4 - 2.9 | 2391 | 86 | 77 |
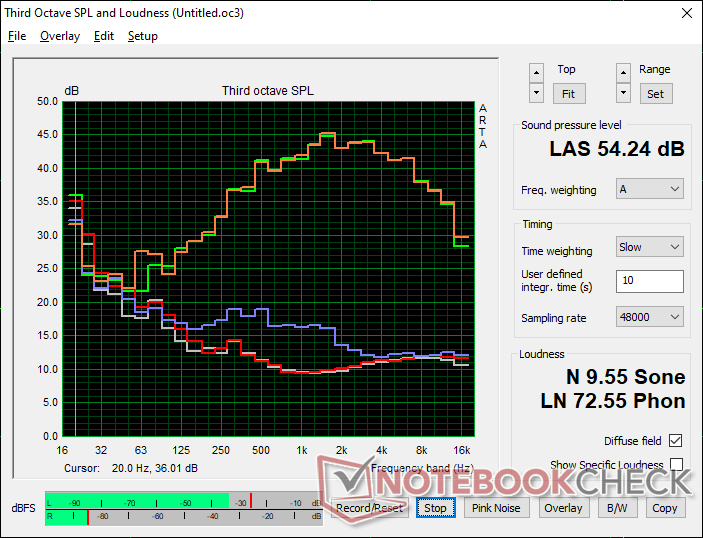
发言人
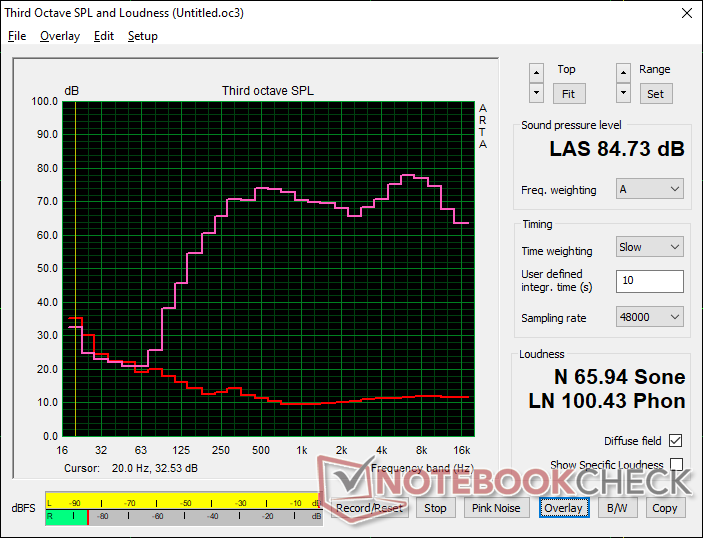
Lenovo Legion 7 16ARHA7 audio analysis
(+) | speakers can play relatively loud (84.7 dB)
Bass 100 - 315 Hz
(±) | reduced bass - on average 14.2% lower than median
(±) | linearity of bass is average (12.8% delta to prev. frequency)
Mids 400 - 2000 Hz
(+) | balanced mids - only 1.8% away from median
(+) | mids are linear (2.1% delta to prev. frequency)
Highs 2 - 16 kHz
(+) | balanced highs - only 4.6% away from median
(+) | highs are linear (4.4% delta to prev. frequency)
Overall 100 - 16.000 Hz
(+) | overall sound is linear (10.9% difference to median)
Compared to same class
» 7% of all tested devices in this class were better, 3% similar, 90% worse
» The best had a delta of 6%, average was 18%, worst was 132%
Compared to all devices tested
» 6% of all tested devices were better, 2% similar, 92% worse
» The best had a delta of 4%, average was 23%, worst was 134%
Apple MacBook Pro 16 2021 M1 Pro audio analysis
(+) | speakers can play relatively loud (84.7 dB)
Bass 100 - 315 Hz
(+) | good bass - only 3.8% away from median
(+) | bass is linear (5.2% delta to prev. frequency)
Mids 400 - 2000 Hz
(+) | balanced mids - only 1.3% away from median
(+) | mids are linear (2.1% delta to prev. frequency)
Highs 2 - 16 kHz
(+) | balanced highs - only 1.9% away from median
(+) | highs are linear (2.7% delta to prev. frequency)
Overall 100 - 16.000 Hz
(+) | overall sound is linear (4.6% difference to median)
Compared to same class
» 0% of all tested devices in this class were better, 0% similar, 100% worse
» The best had a delta of 5%, average was 17%, worst was 45%
Compared to all devices tested
» 0% of all tested devices were better, 0% similar, 100% worse
» The best had a delta of 4%, average was 23%, worst was 134%
能源管理
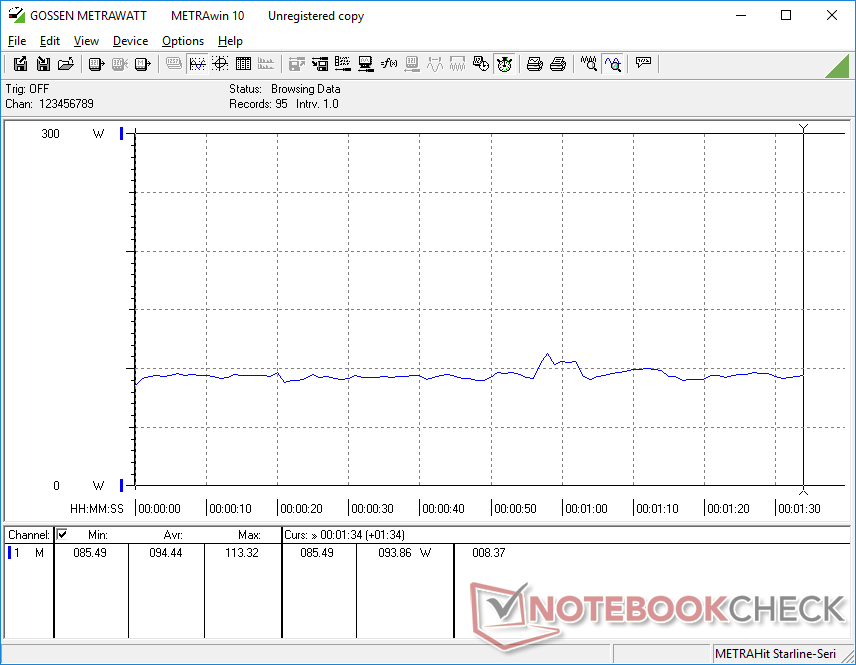
耗电量--比英特尔要求更高
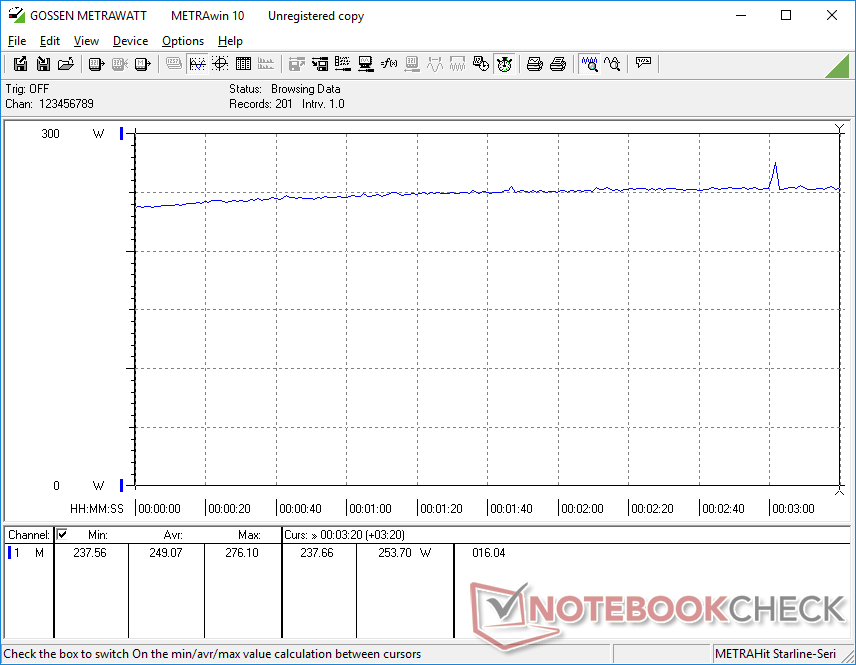
当简单地在桌面上闲置或运行3DMark 06等中等负荷时,功耗处于预期水平。然而,当游戏时,该系统变得比大多数其他笔记本电脑要求更高。运行 Witcher 3平均耗电249瓦,而微星Raider GE66或华硕Zephyrus Duo 16则分别只有202瓦或187瓦,它们都有类似的RTX 3080图形和H系列处理器。
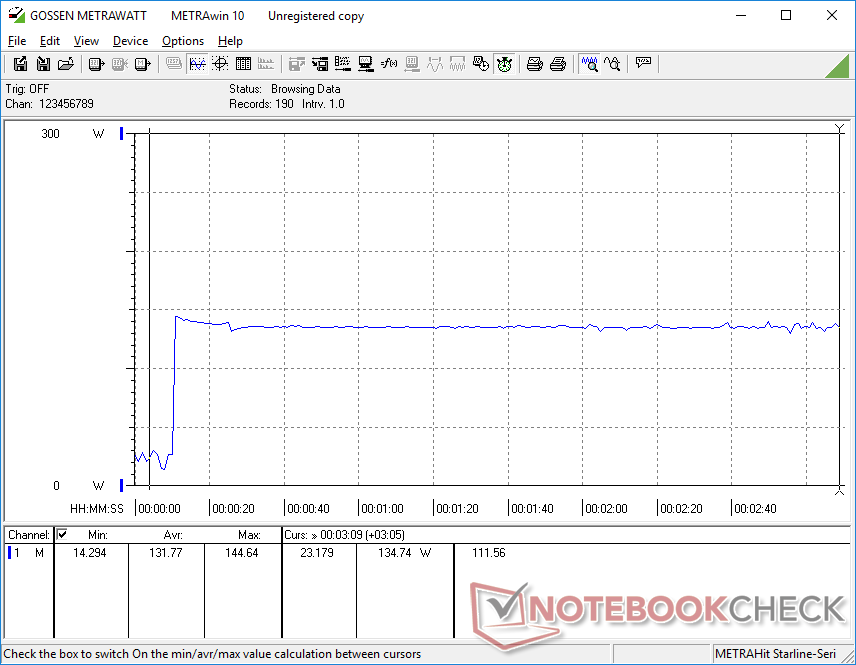
高功耗也延续到Ryzen 9 6900HX上。当在外部显示器上运行Prime95时,我们的联想平均耗电135W,而搭载Core i9-12900HK的微星Raider只有90W。换句话说,以英特尔为动力的微星系统对插座的要求较低,同时仍比我们的联想提供10%到15%的多线程性能。
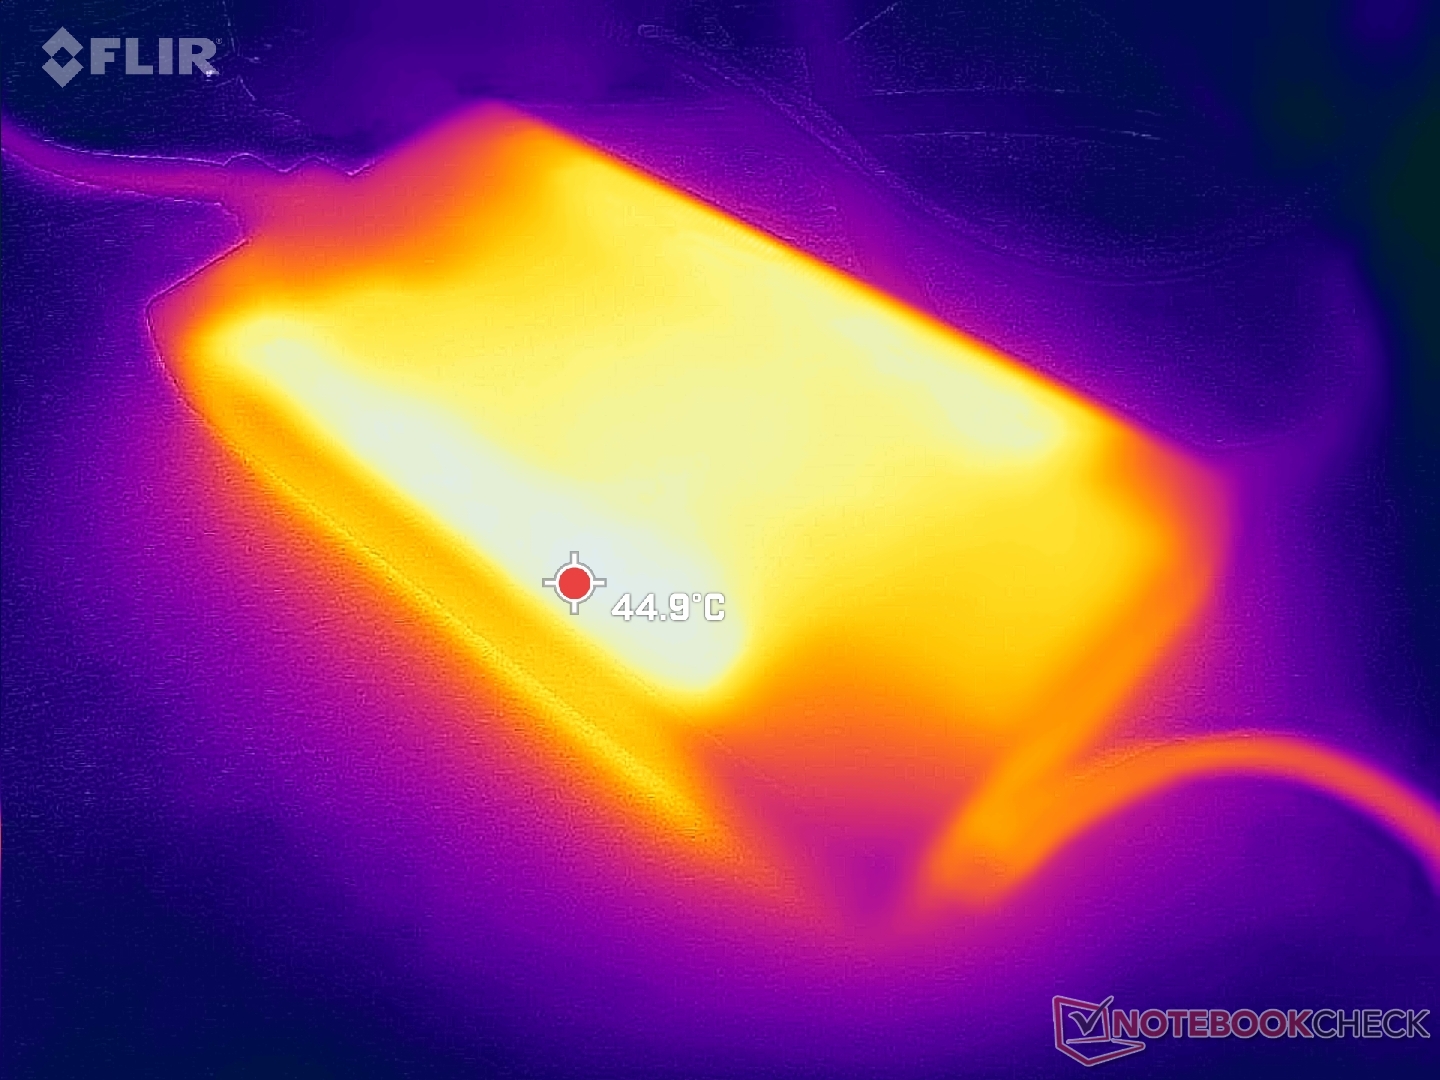
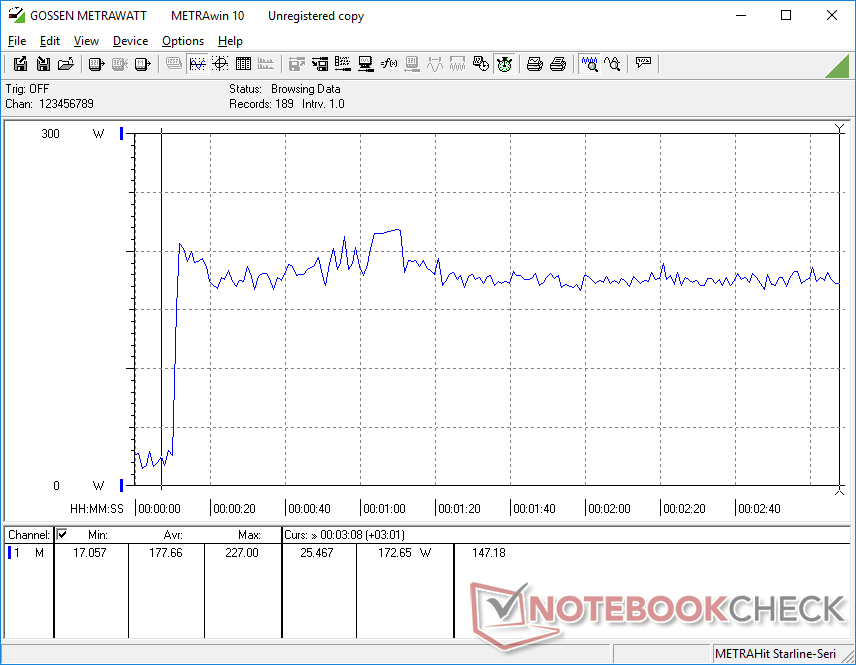
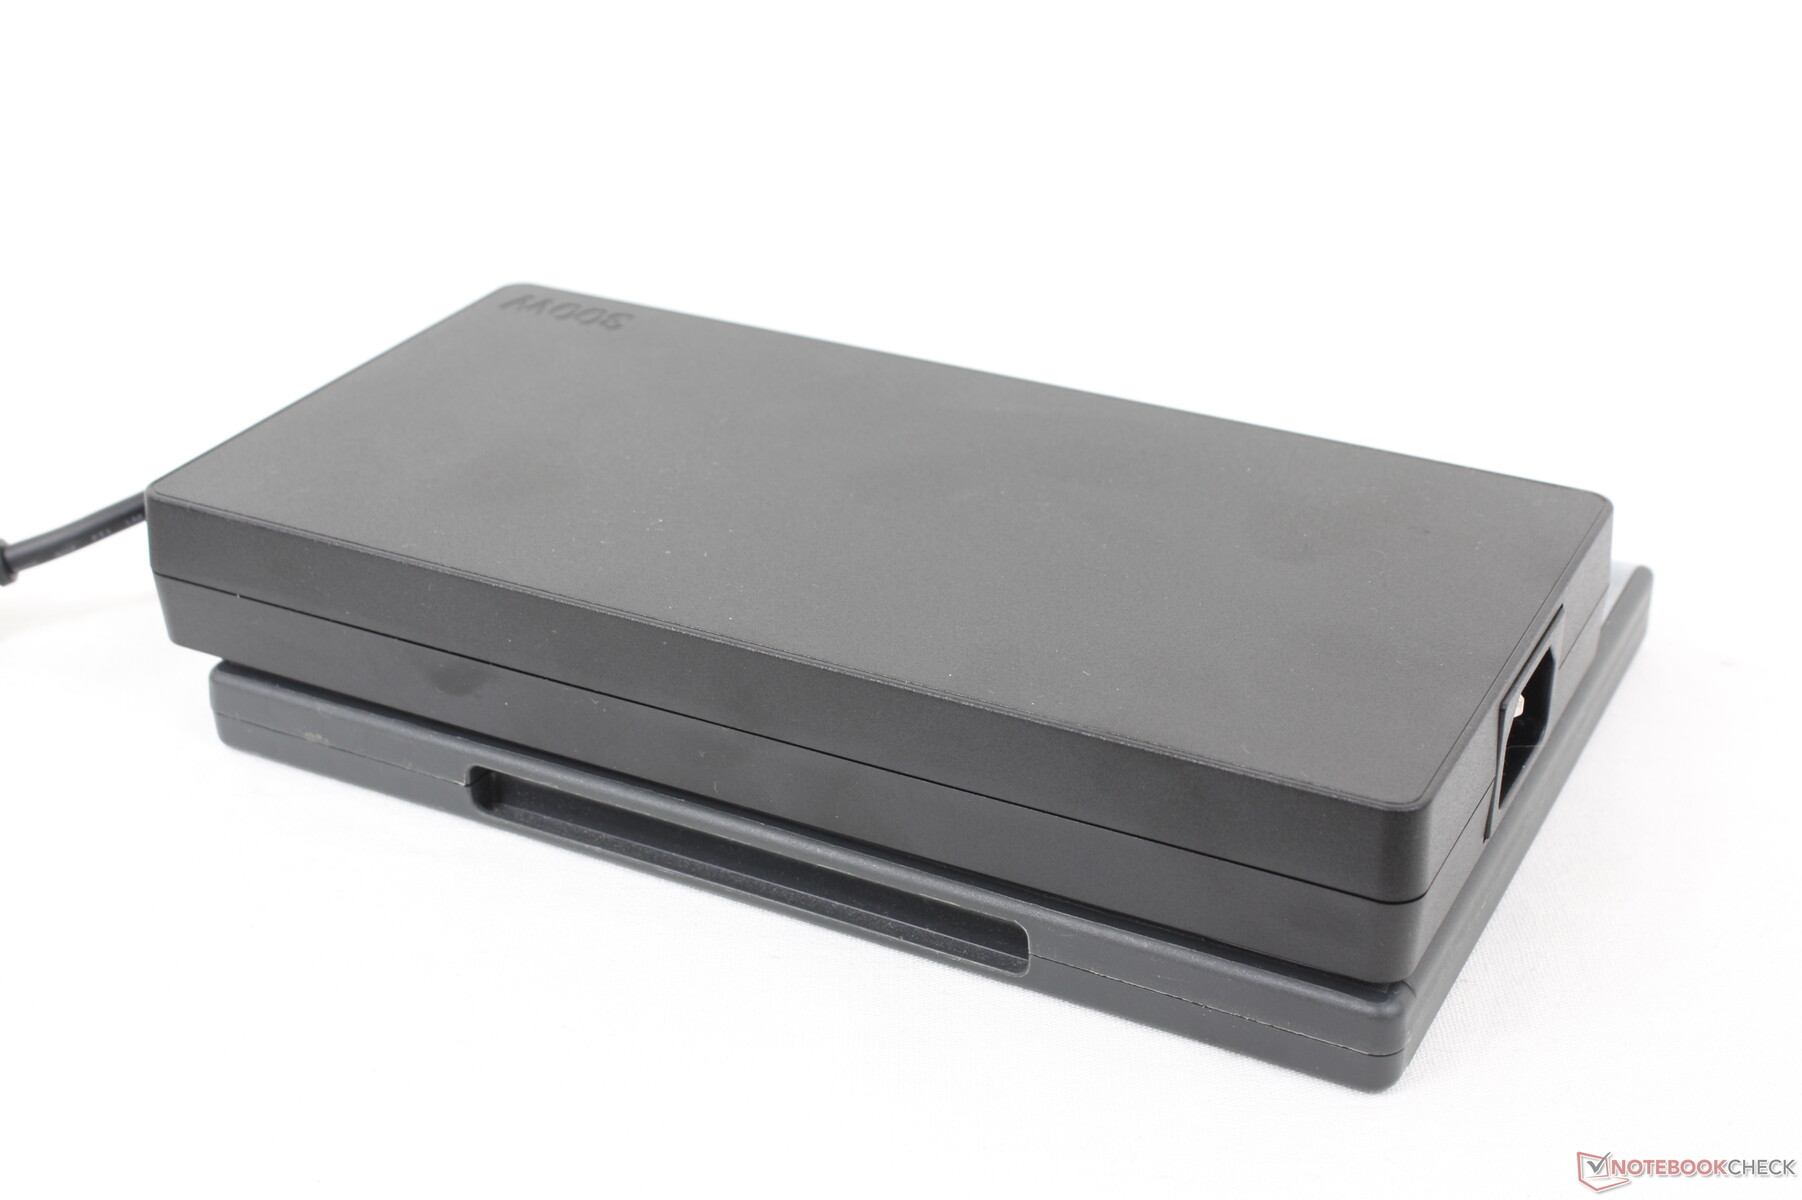
我们能够从中型(约20 x 10 x 2.6厘米)的300瓦交流适配器中记录到276瓦的临时最大耗电,当运行在性能模式时。 Witcher 3在性能模式下。如下图所示,在同时运行Prime95和FurMark时,消耗量较低,这是由于GPU的节流,如果每一个都处于100%的利用率。
| Off / Standby | |
| Idle | |
| Load |
|
Key:
min: | |
| Lenovo Legion 7 16ARHA7 R9 6900HX, Radeon RX 6850M XT, Samsung PM9A1 MZVL22T0HBLB, IPS, 2560x1600, 16" | MSI Raider GE66 12UHS i9-12900HK, GeForce RTX 3080 Ti Laptop GPU, Samsung PM9A1 MZVL22T0HBLB, IPS, 3840x2160, 15.6" | Asus ROG Zephyrus Duo 16 GX650RX R9 6900HX, GeForce RTX 3080 Ti Laptop GPU, 2x Samsung SSD 980 Pro 2TB MZ-V8P2T0 (RAID 0), IPS-Level, 3840x2400, 16" | HP Omen 16-c0077ng R7 5800H, Radeon RX 6600M, Samsung PM981a MZVLB1T0HBLR, IPS, 2560x1440, 16.1" | Lenovo Legion 5 Pro 16ACH6H (82JQ001PGE) R7 5800H, GeForce RTX 3070 Laptop GPU, WDC PC SN730 SDBPNTY-1T00, IPS, 2560x1600, 16" | Aorus 5 KB i7-10750H, GeForce RTX 2060 Mobile, ADATA XPG SX8200 Pro (ASX8200PNP-512GT), IPS, 1920x1080, 15.6" | |
|---|---|---|---|---|---|---|
| Power Consumption | -8% | -19% | -2% | 15% | 17% | |
| Idle Minimum * (Watt) | 9.9 | 16 -62% | 19 -92% | 12 -21% | 10.45 -6% | 8 19% |
| Idle Average * (Watt) | 22 | 19 14% | 24 -9% | 12.8 42% | 14.92 32% | 12 45% |
| Idle Maximum * (Watt) | 23.1 | 26 -13% | 31 -34% | 18.5 20% | 16.02 31% | 21 9% |
| Load Average * (Watt) | 94.4 | 110 -17% | 104 -10% | 190 -101% | 119.65 -27% | 128 -36% |
| Witcher 3 ultra * (Watt) | 249 | 202 19% | 186.5 25% | 194 22% | 174.9 30% | 138 45% |
| Load Maximum * (Watt) | 276 | 242 12% | 256 7% | 200 28% | 187.26 32% | 217 21% |
* ... smaller is better
Power Consumption Witcher 3 / Stresstest
Power Consumption external Monitor
电池寿命 - 节电问题
平衡电源配置文件上的WLAN运行时间是体面的,与华硕ROG Zephyrus Duo 16的近7.5小时相媲美。如果在省电模式下,电池寿命会异常缩短,我们认为这可能是某些AMD驱动的 笔记本电脑的一个错误。 我们认为,这可能是一些采用AMD技术的Legion 笔记本电脑上的一个错误。.
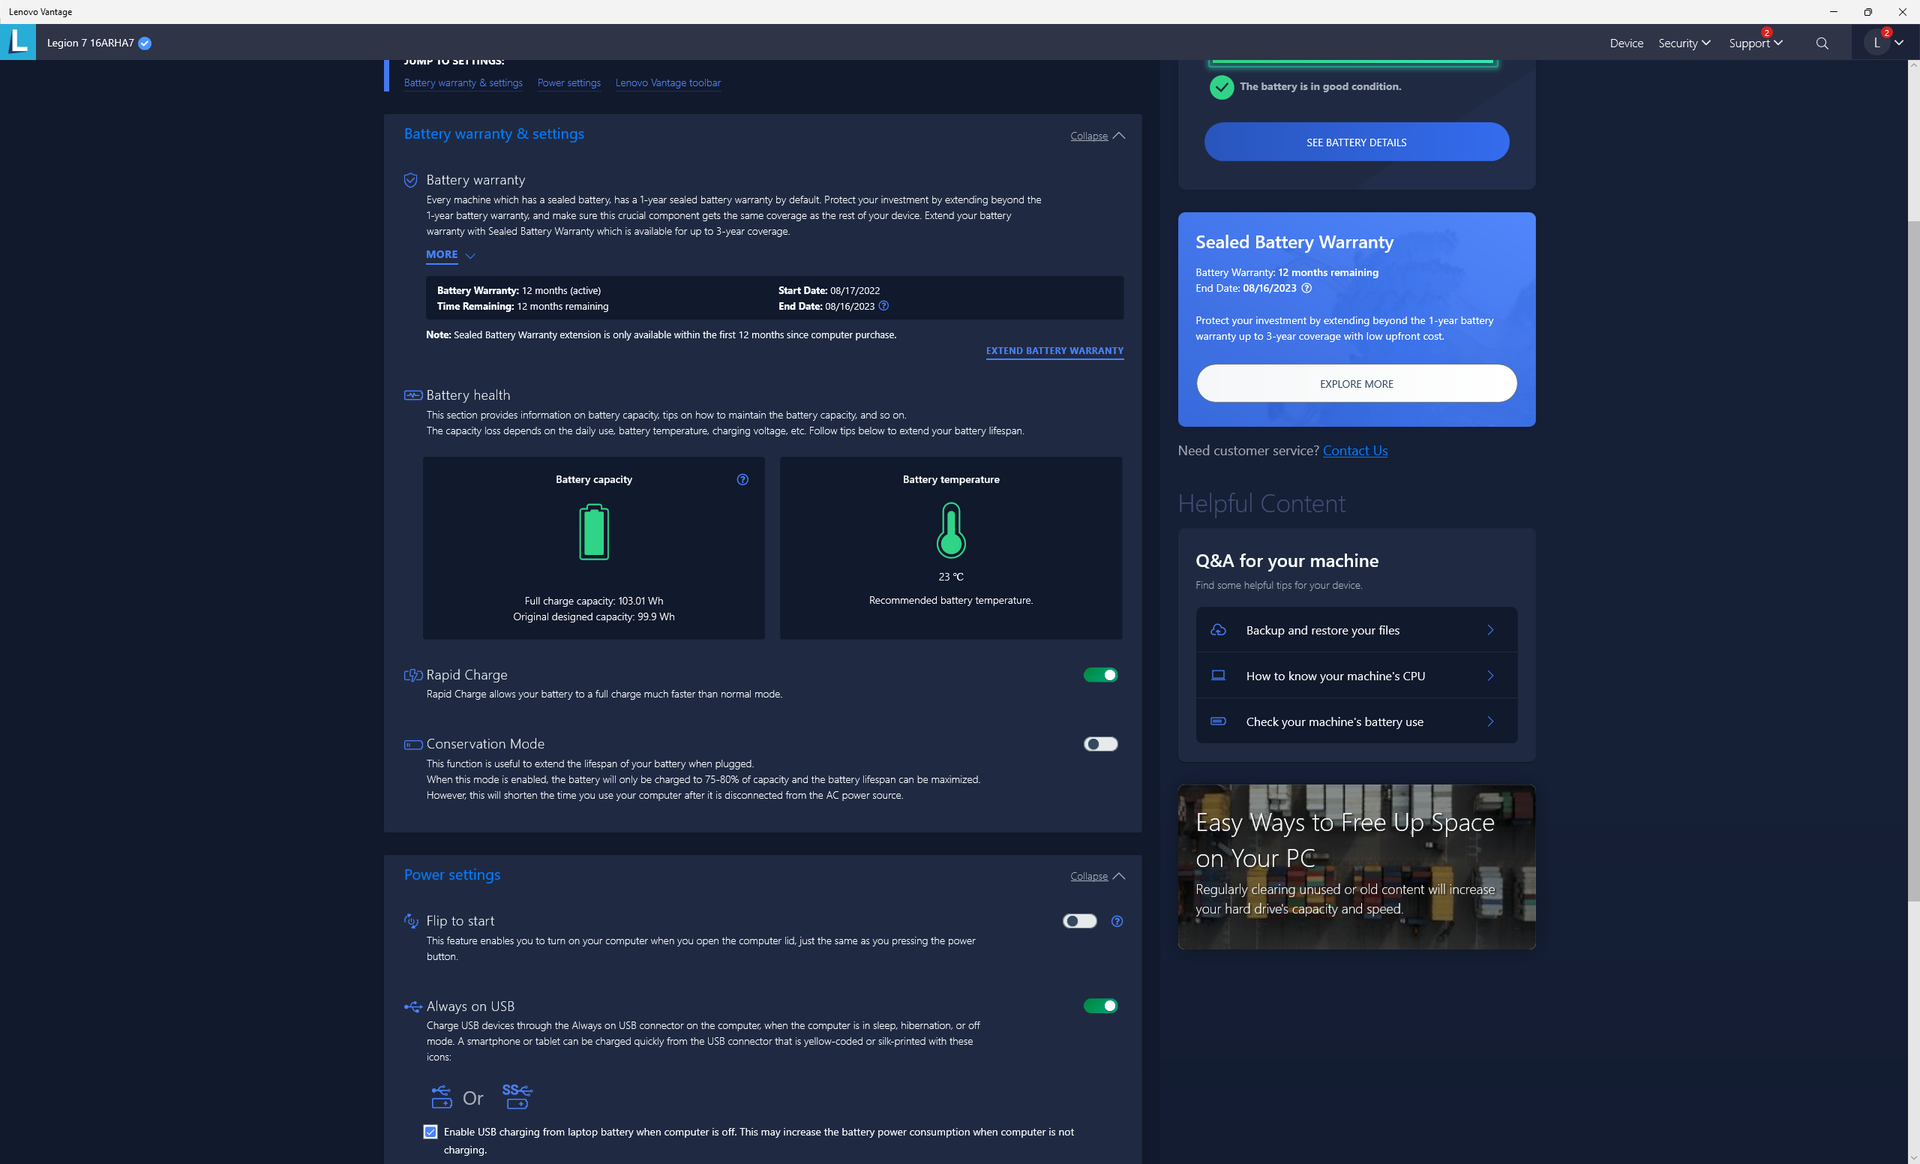
如果通过联想Vantage软件启用快速充电,从空到满的充电速度相对较快,为1至1.5小时。该系统也可以用第三方USB-C适配器进行充电,尽管速度要慢得多。
| Lenovo Legion 7 16ARHA7 R9 6900HX, Radeon RX 6850M XT, 99 Wh | MSI Raider GE66 12UHS i9-12900HK, GeForce RTX 3080 Ti Laptop GPU, 99 Wh | Asus ROG Zephyrus Duo 16 GX650RX R9 6900HX, GeForce RTX 3080 Ti Laptop GPU, 90 Wh | HP Omen 16-c0077ng R7 5800H, Radeon RX 6600M, 70 Wh | Lenovo Legion 5 Pro 16ACH6H (82JQ001PGE) R7 5800H, GeForce RTX 3070 Laptop GPU, 80 Wh | Asus ROG Flow X16 GV601RW-M5082W R9 6900HS, GeForce RTX 3070 Ti Laptop GPU, 90 Wh | |
|---|---|---|---|---|---|---|
| Battery runtime | -14% | 39% | -16% | 7% | -36% | |
| Reader / Idle (h) | 4.9 | 12.5 155% | 9.1 86% | |||
| WiFi v1.3 (h) | 7.3 | 5.7 -22% | 7.8 7% | 6.1 -16% | 7 -4% | 5.7 -22% |
| Load (h) | 1.8 | 1.7 -6% | 1 -44% | 0.7 -61% | 0.9 -50% | |
| H.264 (h) | 7.1 | 9.3 | 7 | |||
| Witcher 3 ultra (h) | 1.4 | 0.9 |
Pros
Cons
评语--玩起来像玩家,看起来像工作站
花了一段时间,但联想终于通过这个最新的2022年Legion 7模型在游戏笔记本市场找到了自己的立足点。机箱设计已经完善到可以轻松地与更多经验丰富的超薄游戏替代品,如 微星GS系列, 华硕Zephyrus S系列,甚至是 Razer Blade系列在许多方面都是如此。时尚的外观并没有牺牲其他同样重要的特性,如端口选项、数字键盘、舒适的键盘、坚硬的金属骨架、TDP和TGP性能,以及易维修性。它比看上去要重一些,但密集的感觉不一定能阻止游戏者。
2022Legion 7 16在外观和设计方面是联想的一个全垒打。所有的AMD硬件也能很好地对抗目前市场上一些最快的英特尔-英伟达游戏笔记本电脑。
至于Ryzen 9 6900HX CPU和Radeon RX 6850M XT GPU,它们只比5900HX和6800M快一线,因为在更便宜的笔记本电脑上发现,如 华硕ROG Strix G15.总体性能仅略微落后于大多数GeForce RTX 3080 Ti笔记本电脑,因此,尽管如此,这仍然是一台强大的游戏机。
游戏时的功耗是全AMDLegion 系统的一个关键挫折,因为它比目前市场上许多英特尔-英伟达的替代品要高。当系统需要更多的电力,同时运行速度比竞争对手慢,每瓦性能更差时,这对联想或AMD来说不是一个好现象。OLED显示屏选项和一些OTA错误修复也不会有什么影响。
价格和可用性
Legion 7 16ARHA7在发布时尚未通过第三方渠道广泛销售。我们目前的配置还没有向客户发货。我们建议查看联想官方产品页面以了解最新情况。目前唯一的配置是较少的Ryzen 7和Radeon RX 6700M SKU,价格为2380美元。
Lenovo Legion 7 16ARHA7
- 09/14/2022 v7 (old)
Allen Ngo
Price comparison

