Corsair One i300台式电脑在12升的机箱中驯服了Core i9-12900K和RTX 3080 Ti

海盗船自2018年以来一直在销售One系列,将当前的游戏硬件包装在一个包括水冷的紧凑型机箱中。我们已经看到在海盗船One i160中,我们已经看到了这个系统的作用。
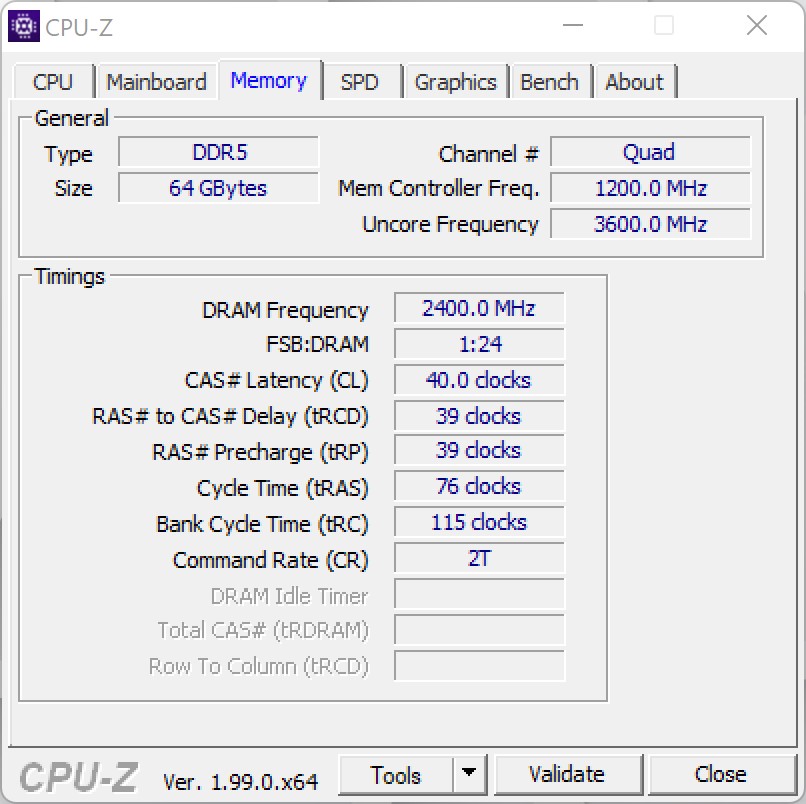
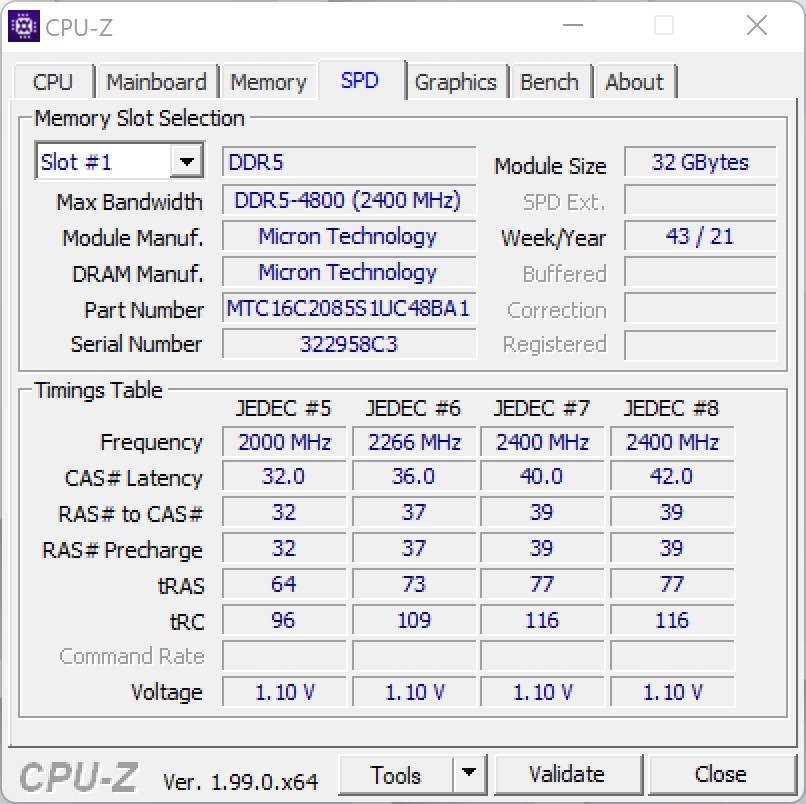
在今年的CES上,海盗船宣布了海盗船一号的更新,它配备了当前的阿尔德湖系列,现在已经重新获得了最快游戏CPU的性能冠军。除了 英特尔酷睿i9-12900K,海盗船还包括一个NvidiaGeForce RTX 3080 Ti.这两个组件为4K游戏提供了一个很好的基础,没有任何妥协。 经过我们的初步测试,我们也能够证实这一点,尽管制造商仍然保持英特尔酷睿i9-12900K有点拴住了。稍后的测试中会有更多关于这一点的内容。在强大的组件方面,还有充足的64GB工作内存和快如闪电的2TB固态硬盘,包括专业版的Windows 11。
海盗船要求为我们测试中配备的系统提供5100欧元(约5724美元)。如果你满足于32GB的工作内存和一个NvidiaGeForce RTX 3080你必须少付1000欧元(约1122美元)。
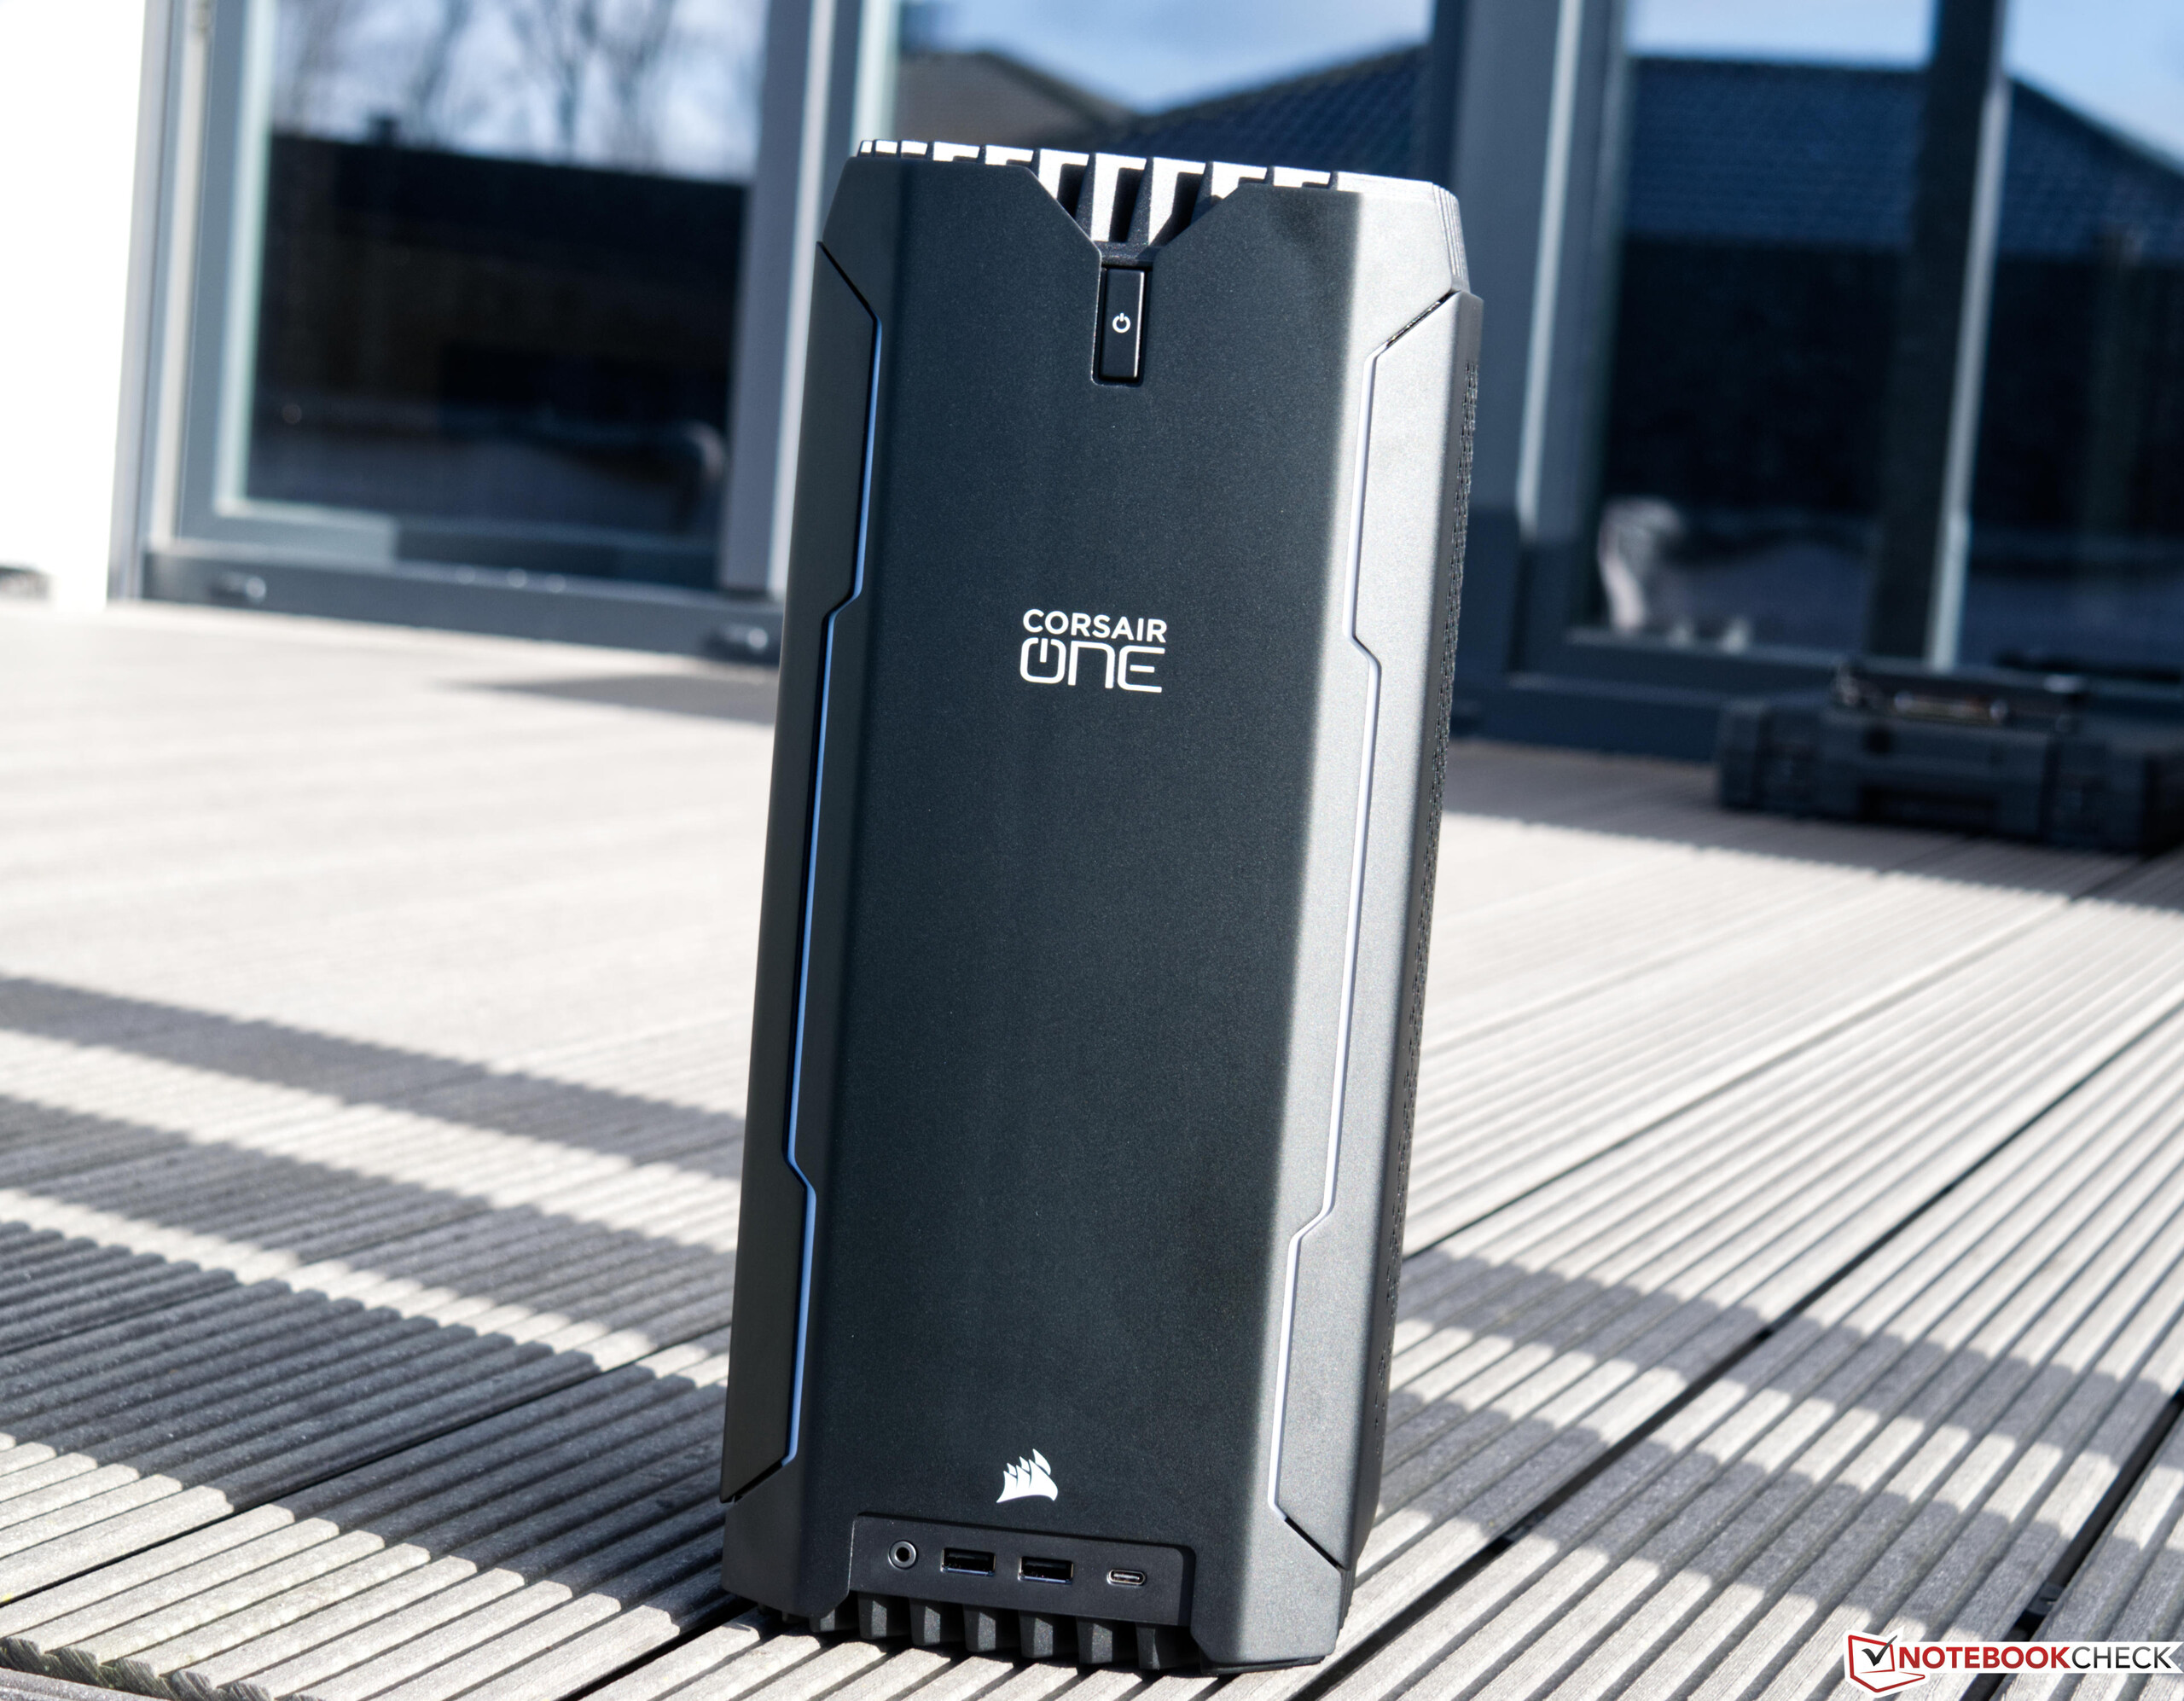
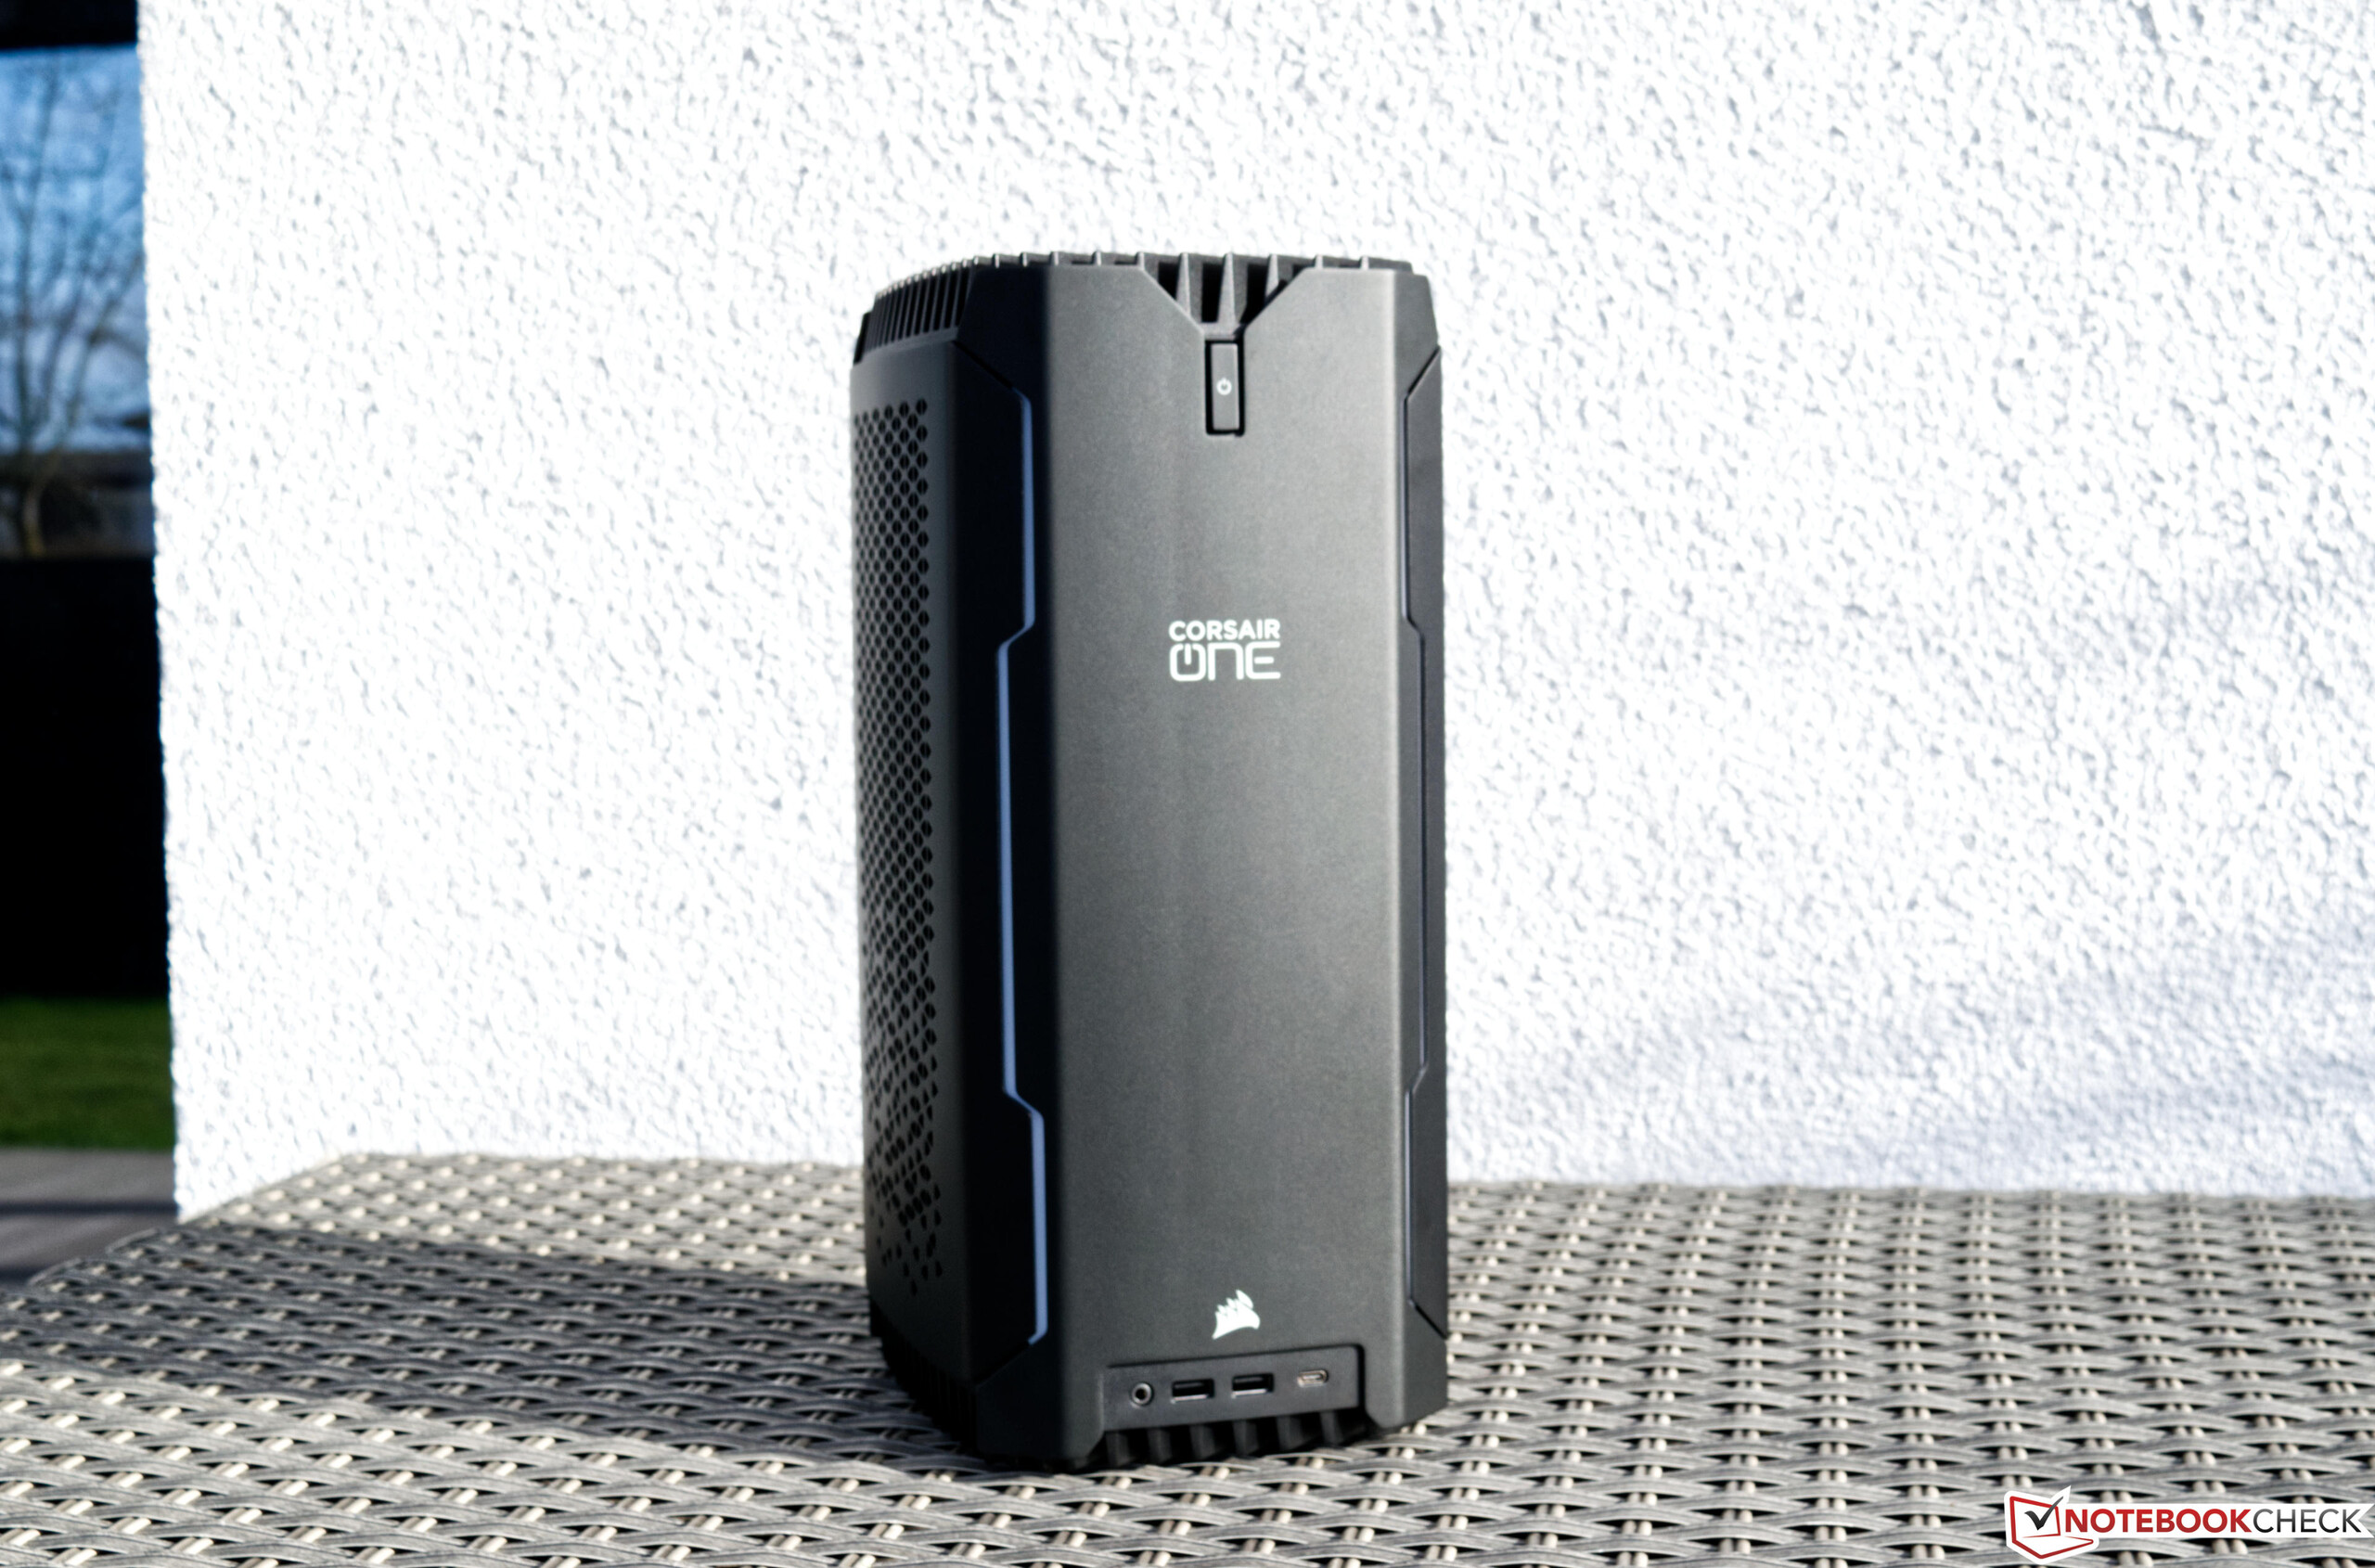
案例
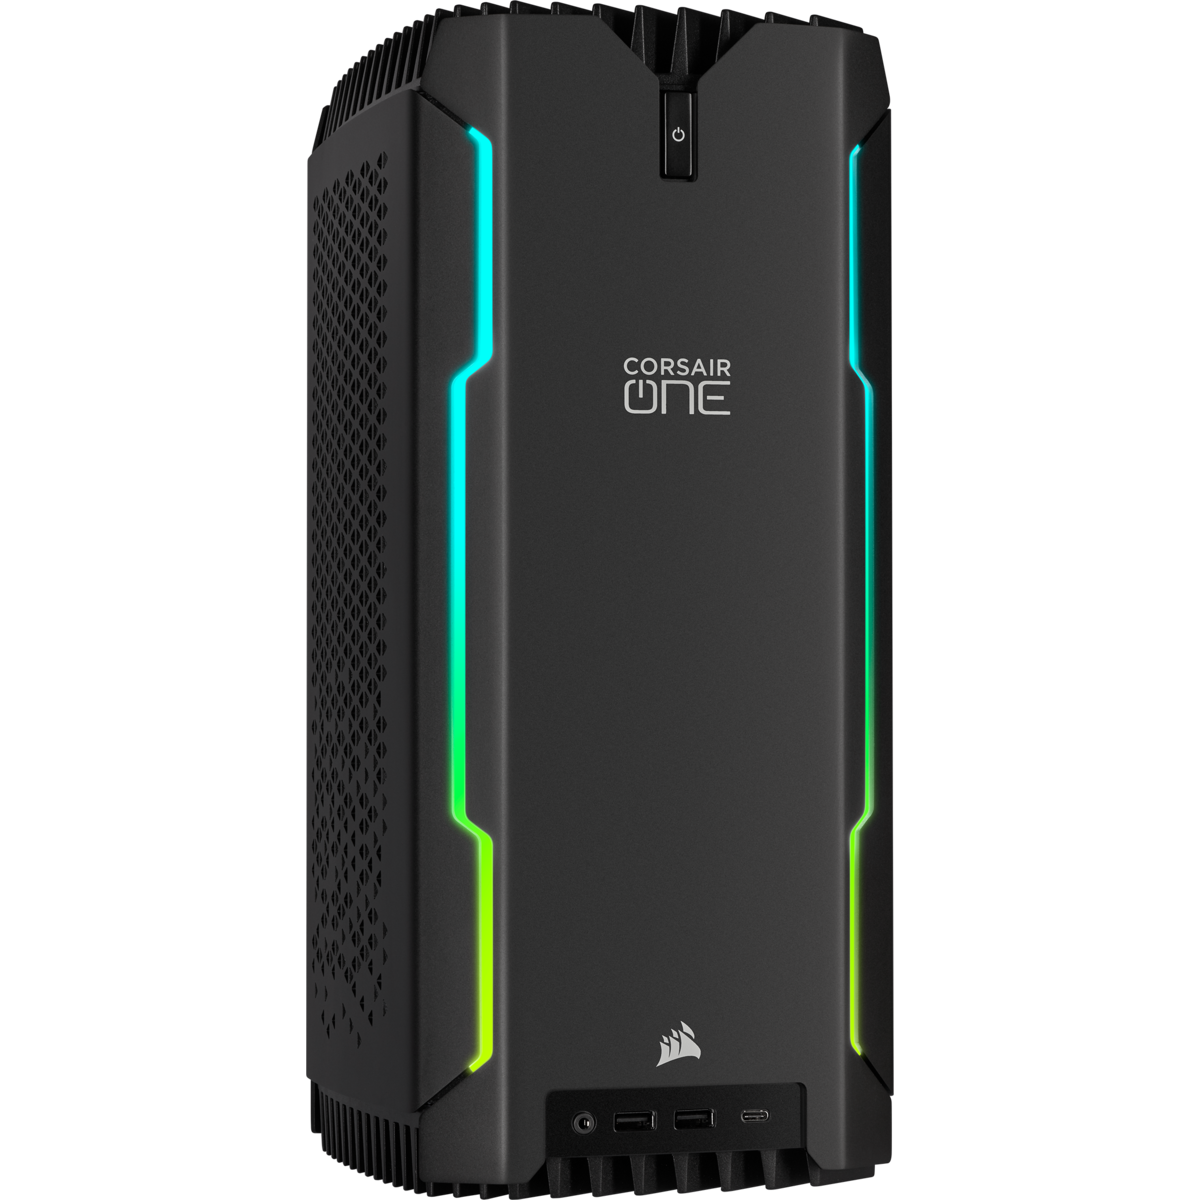
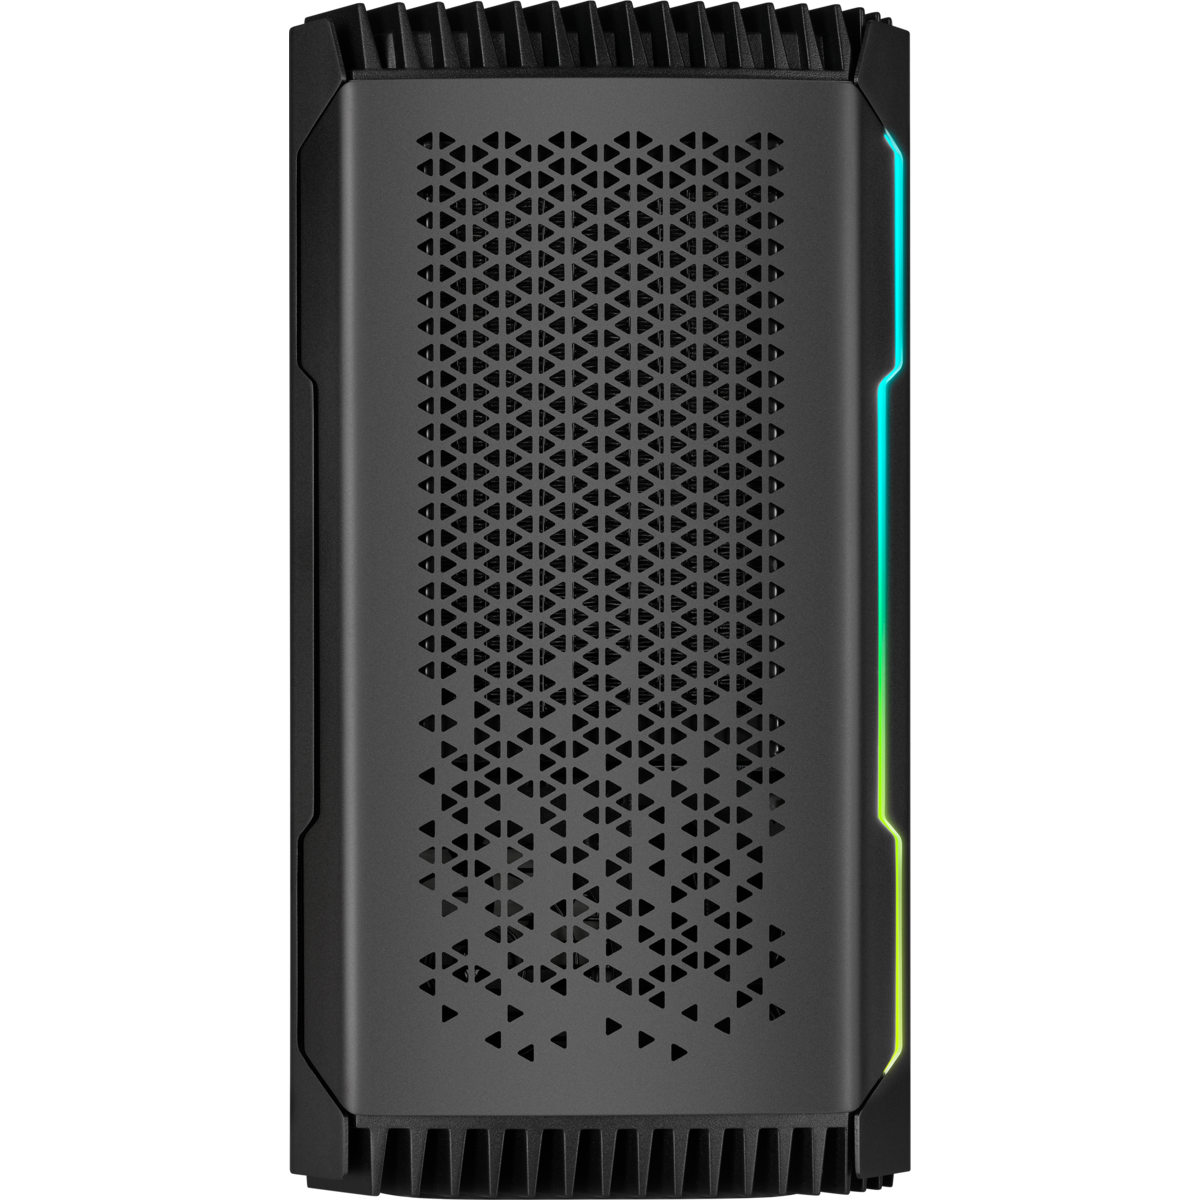
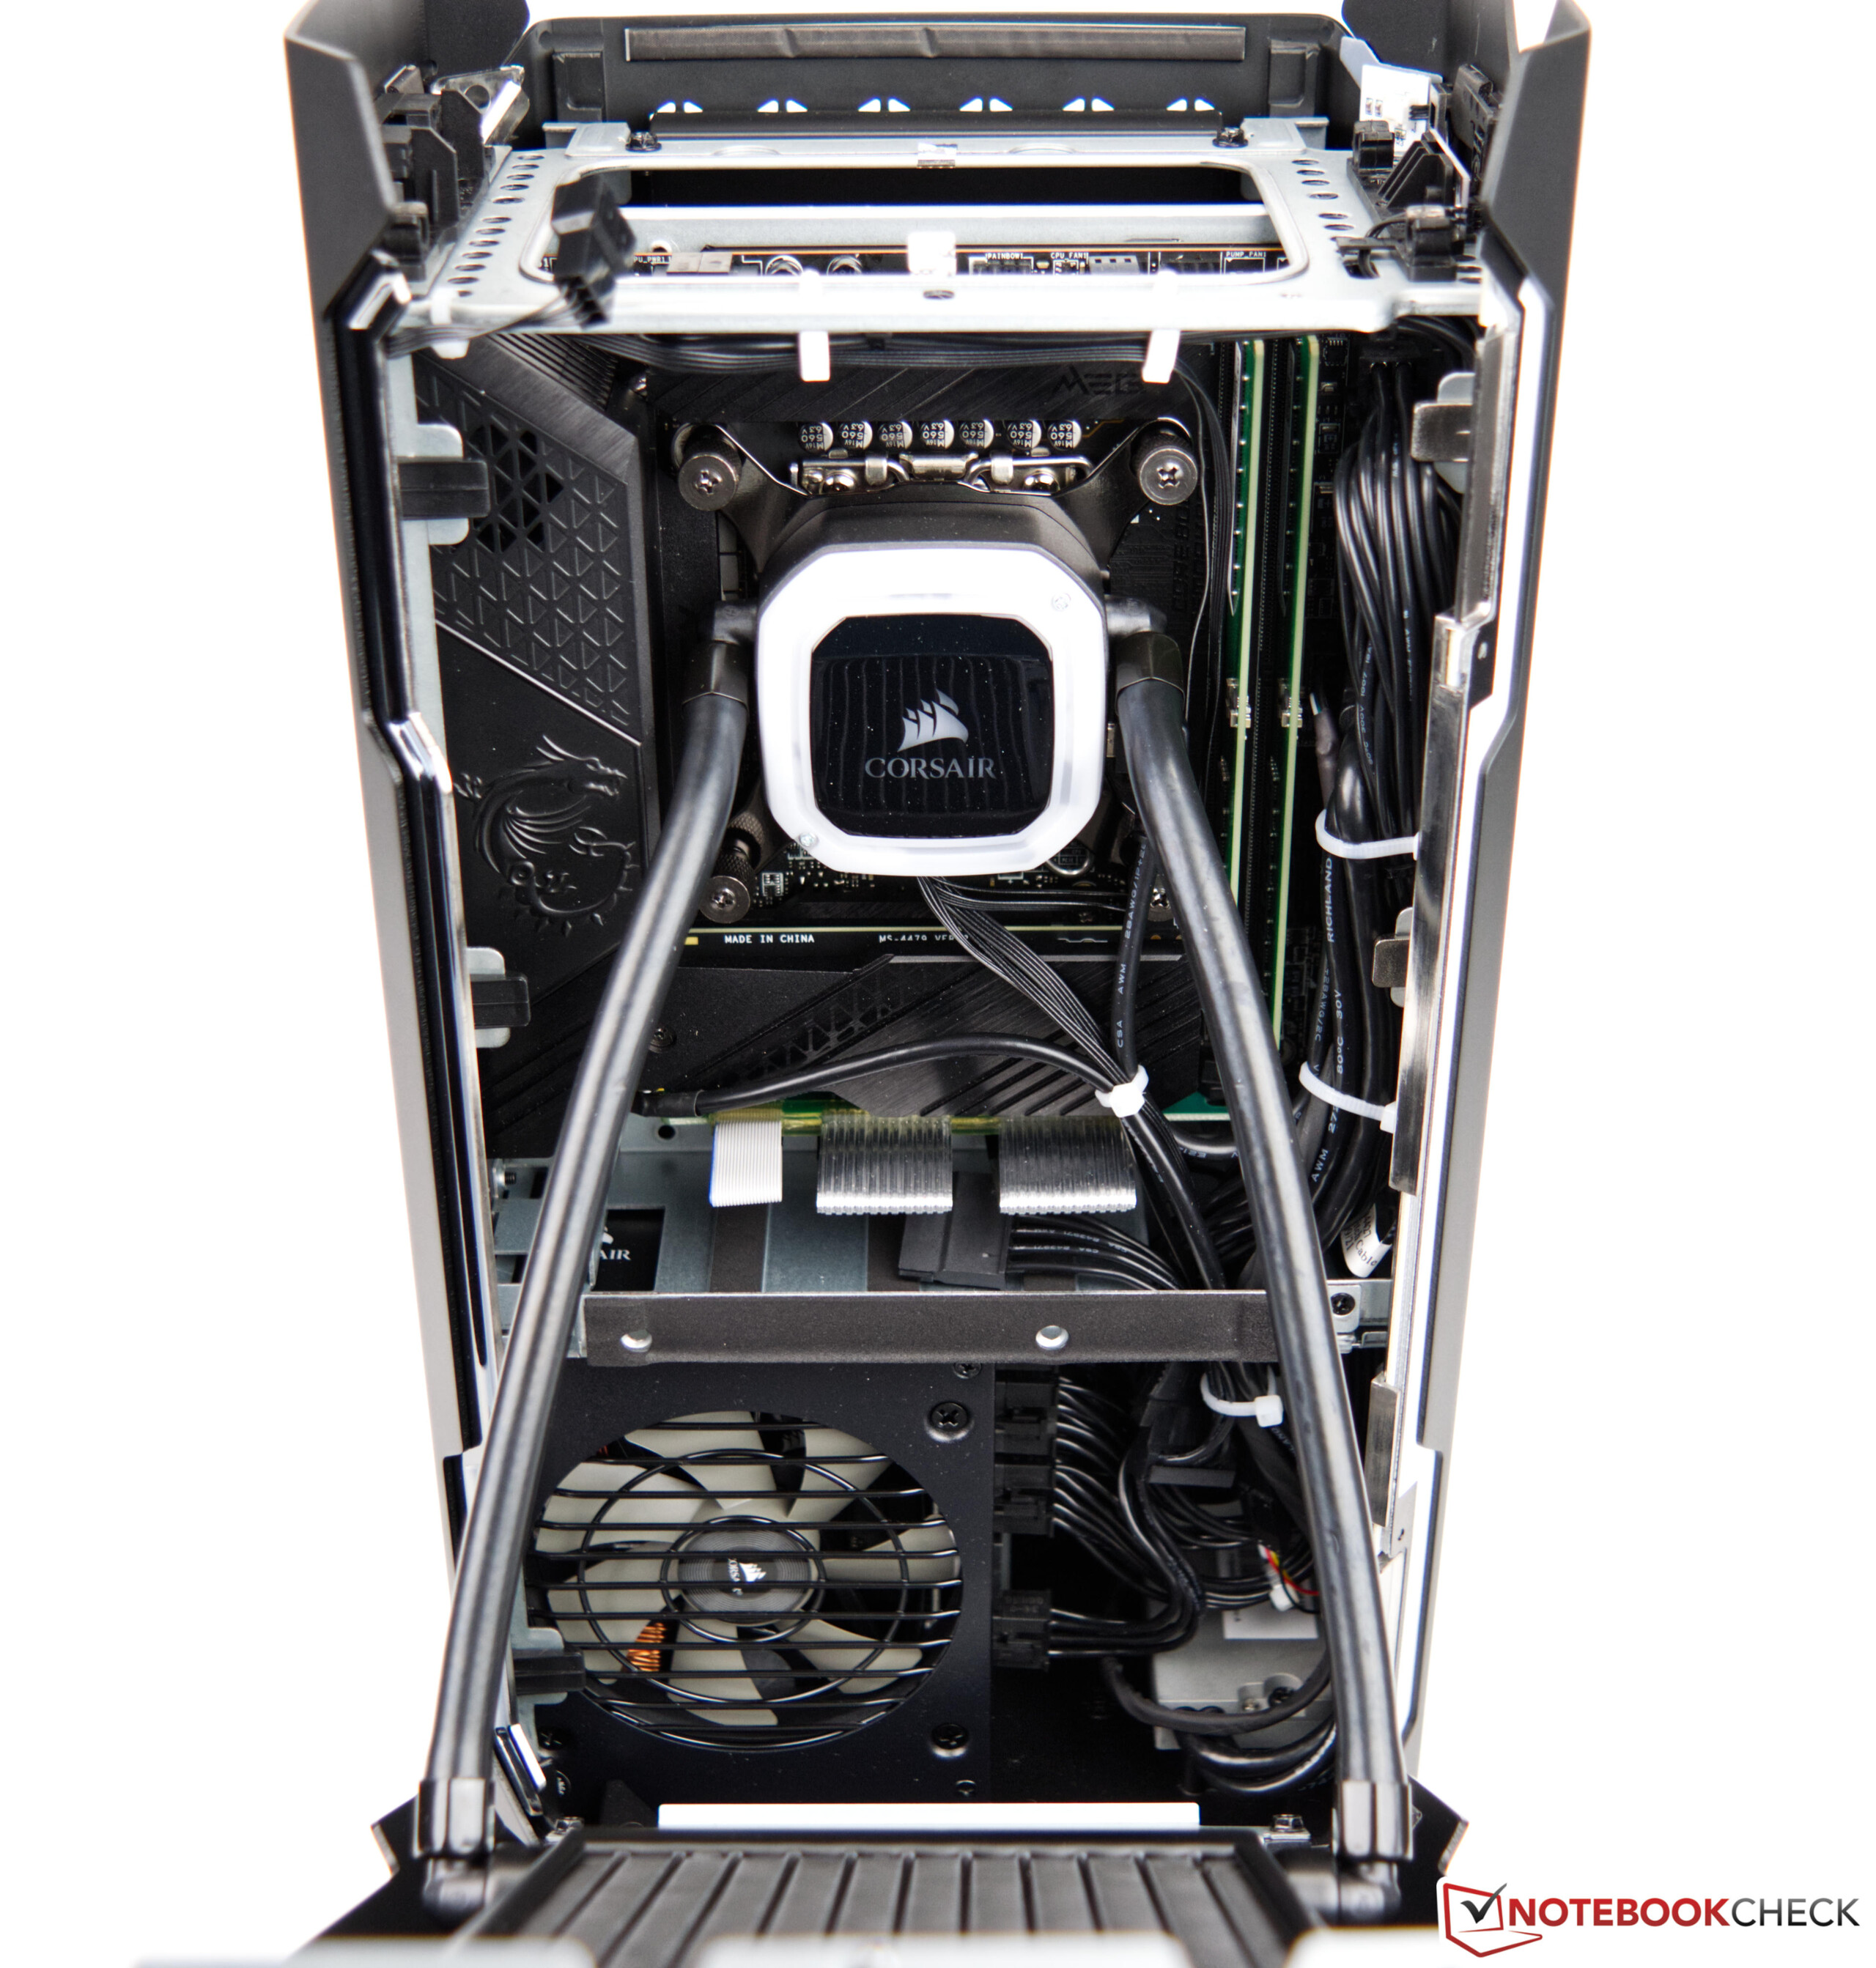
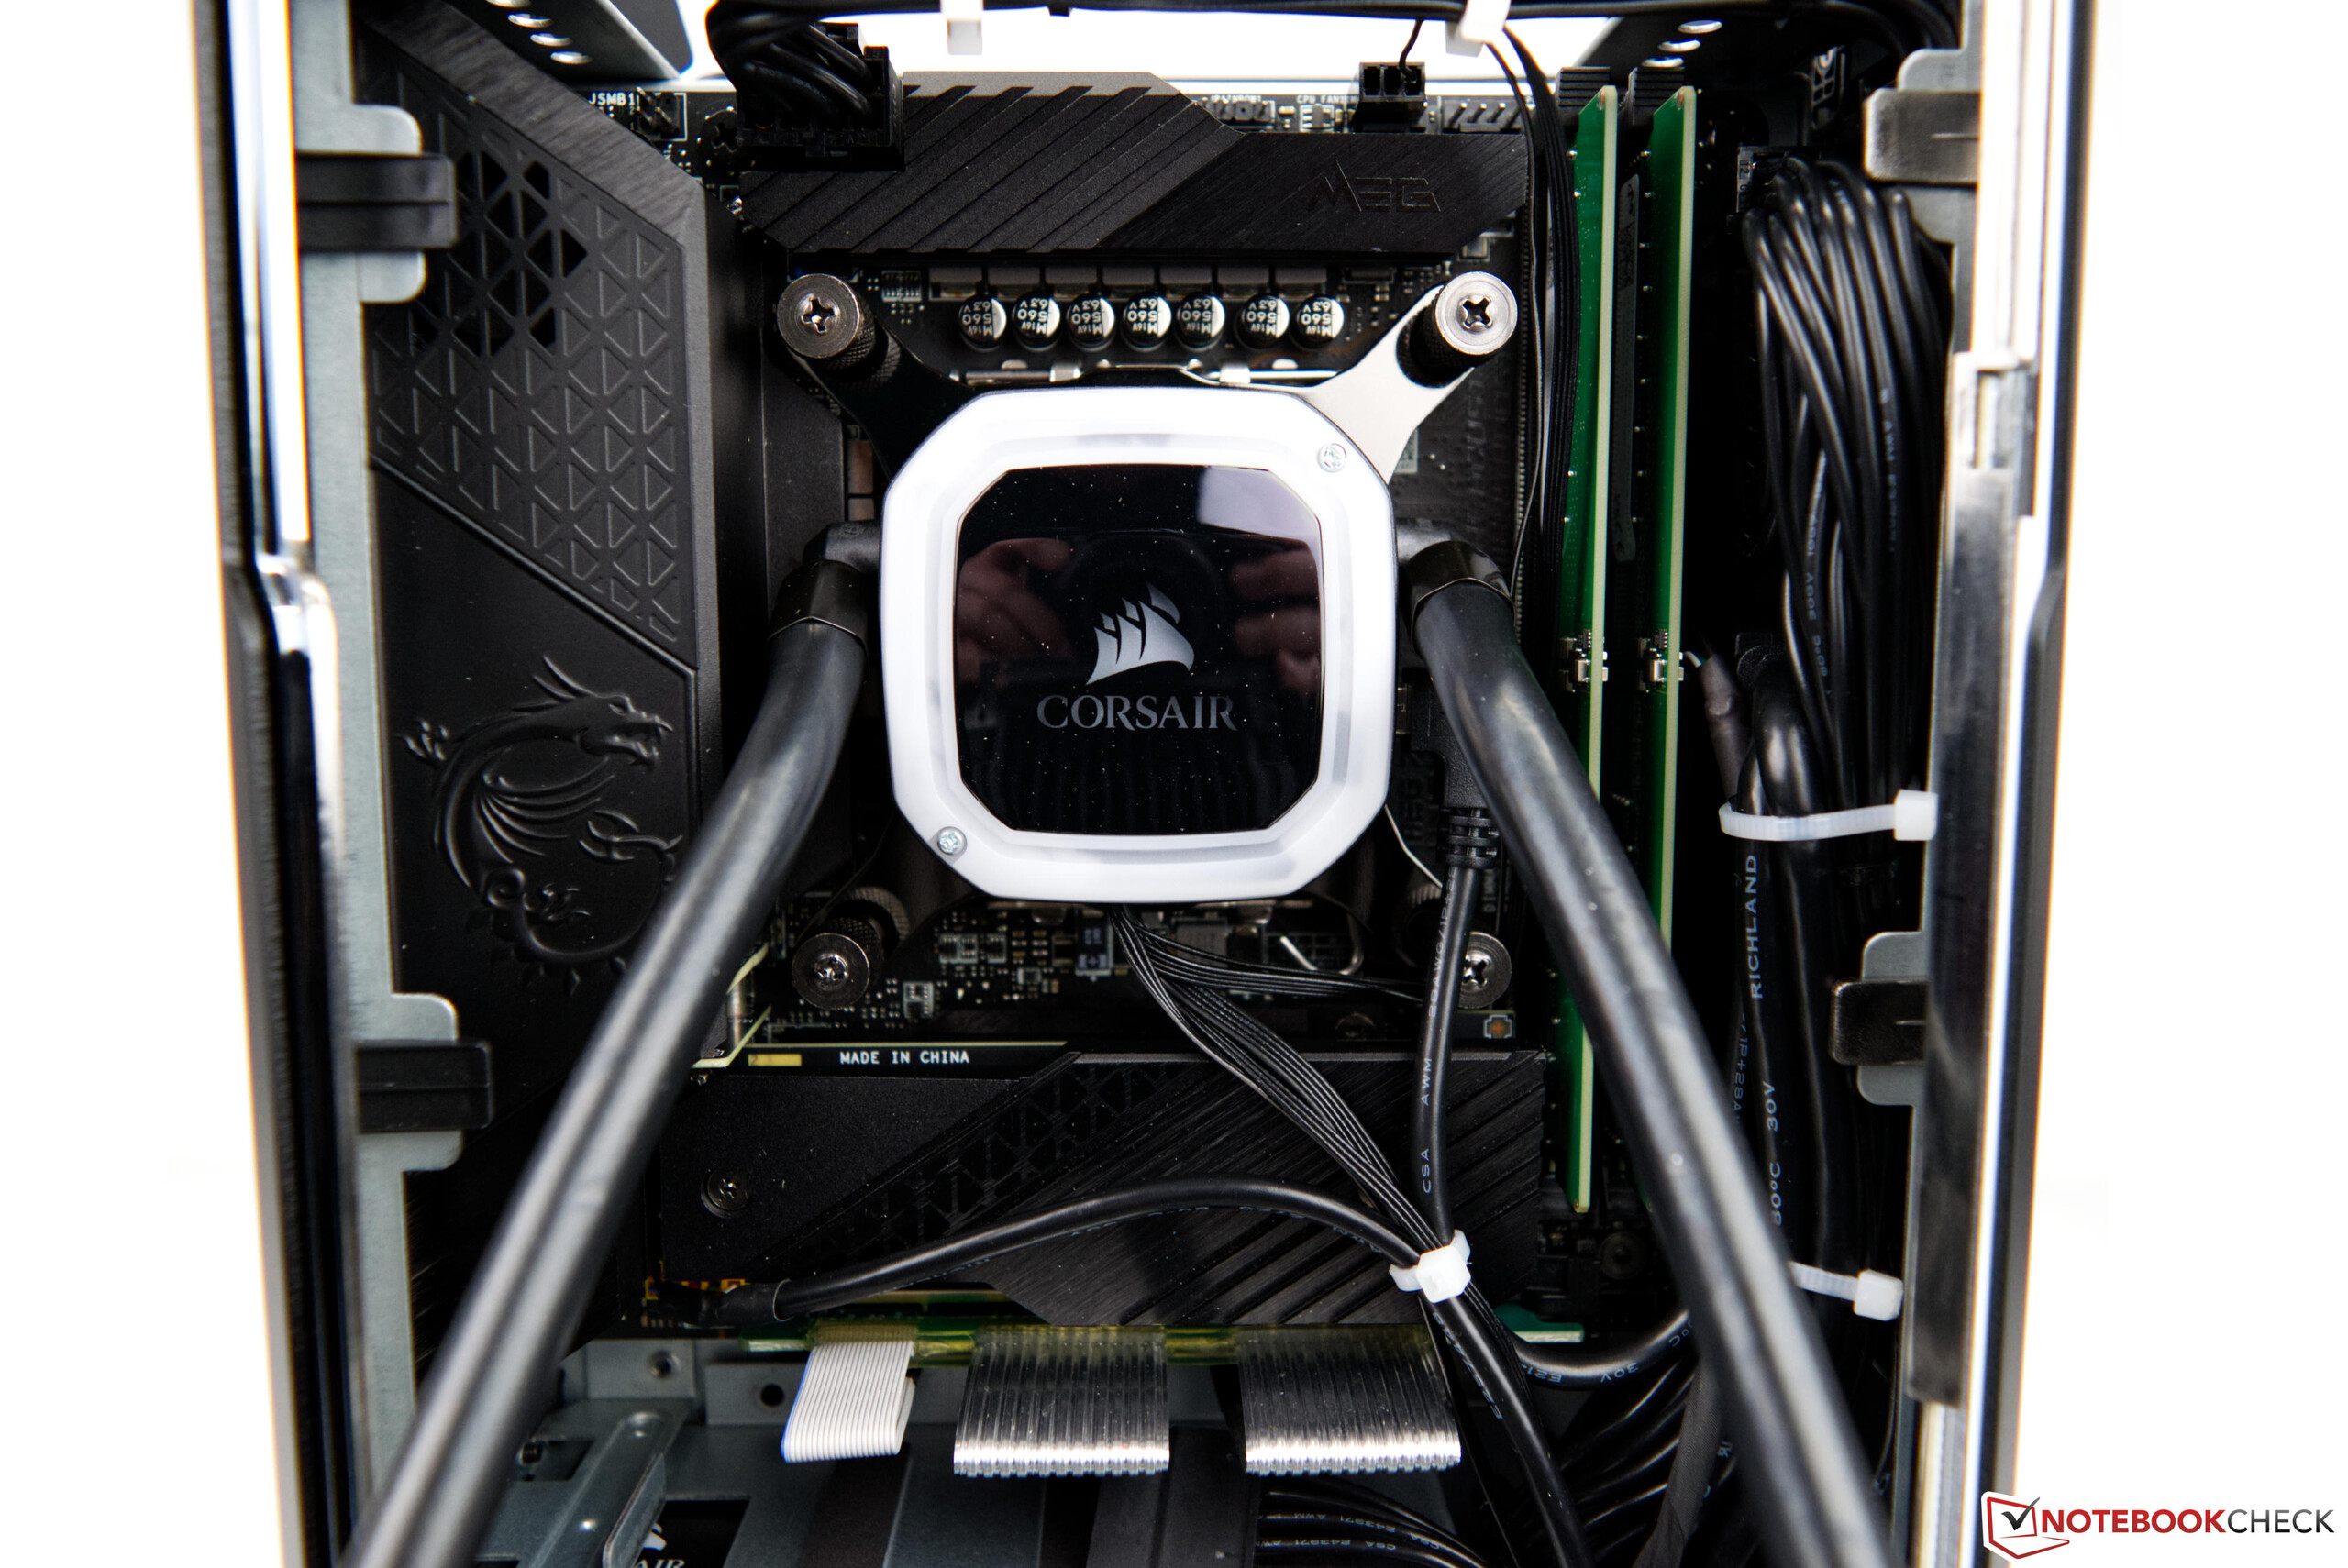
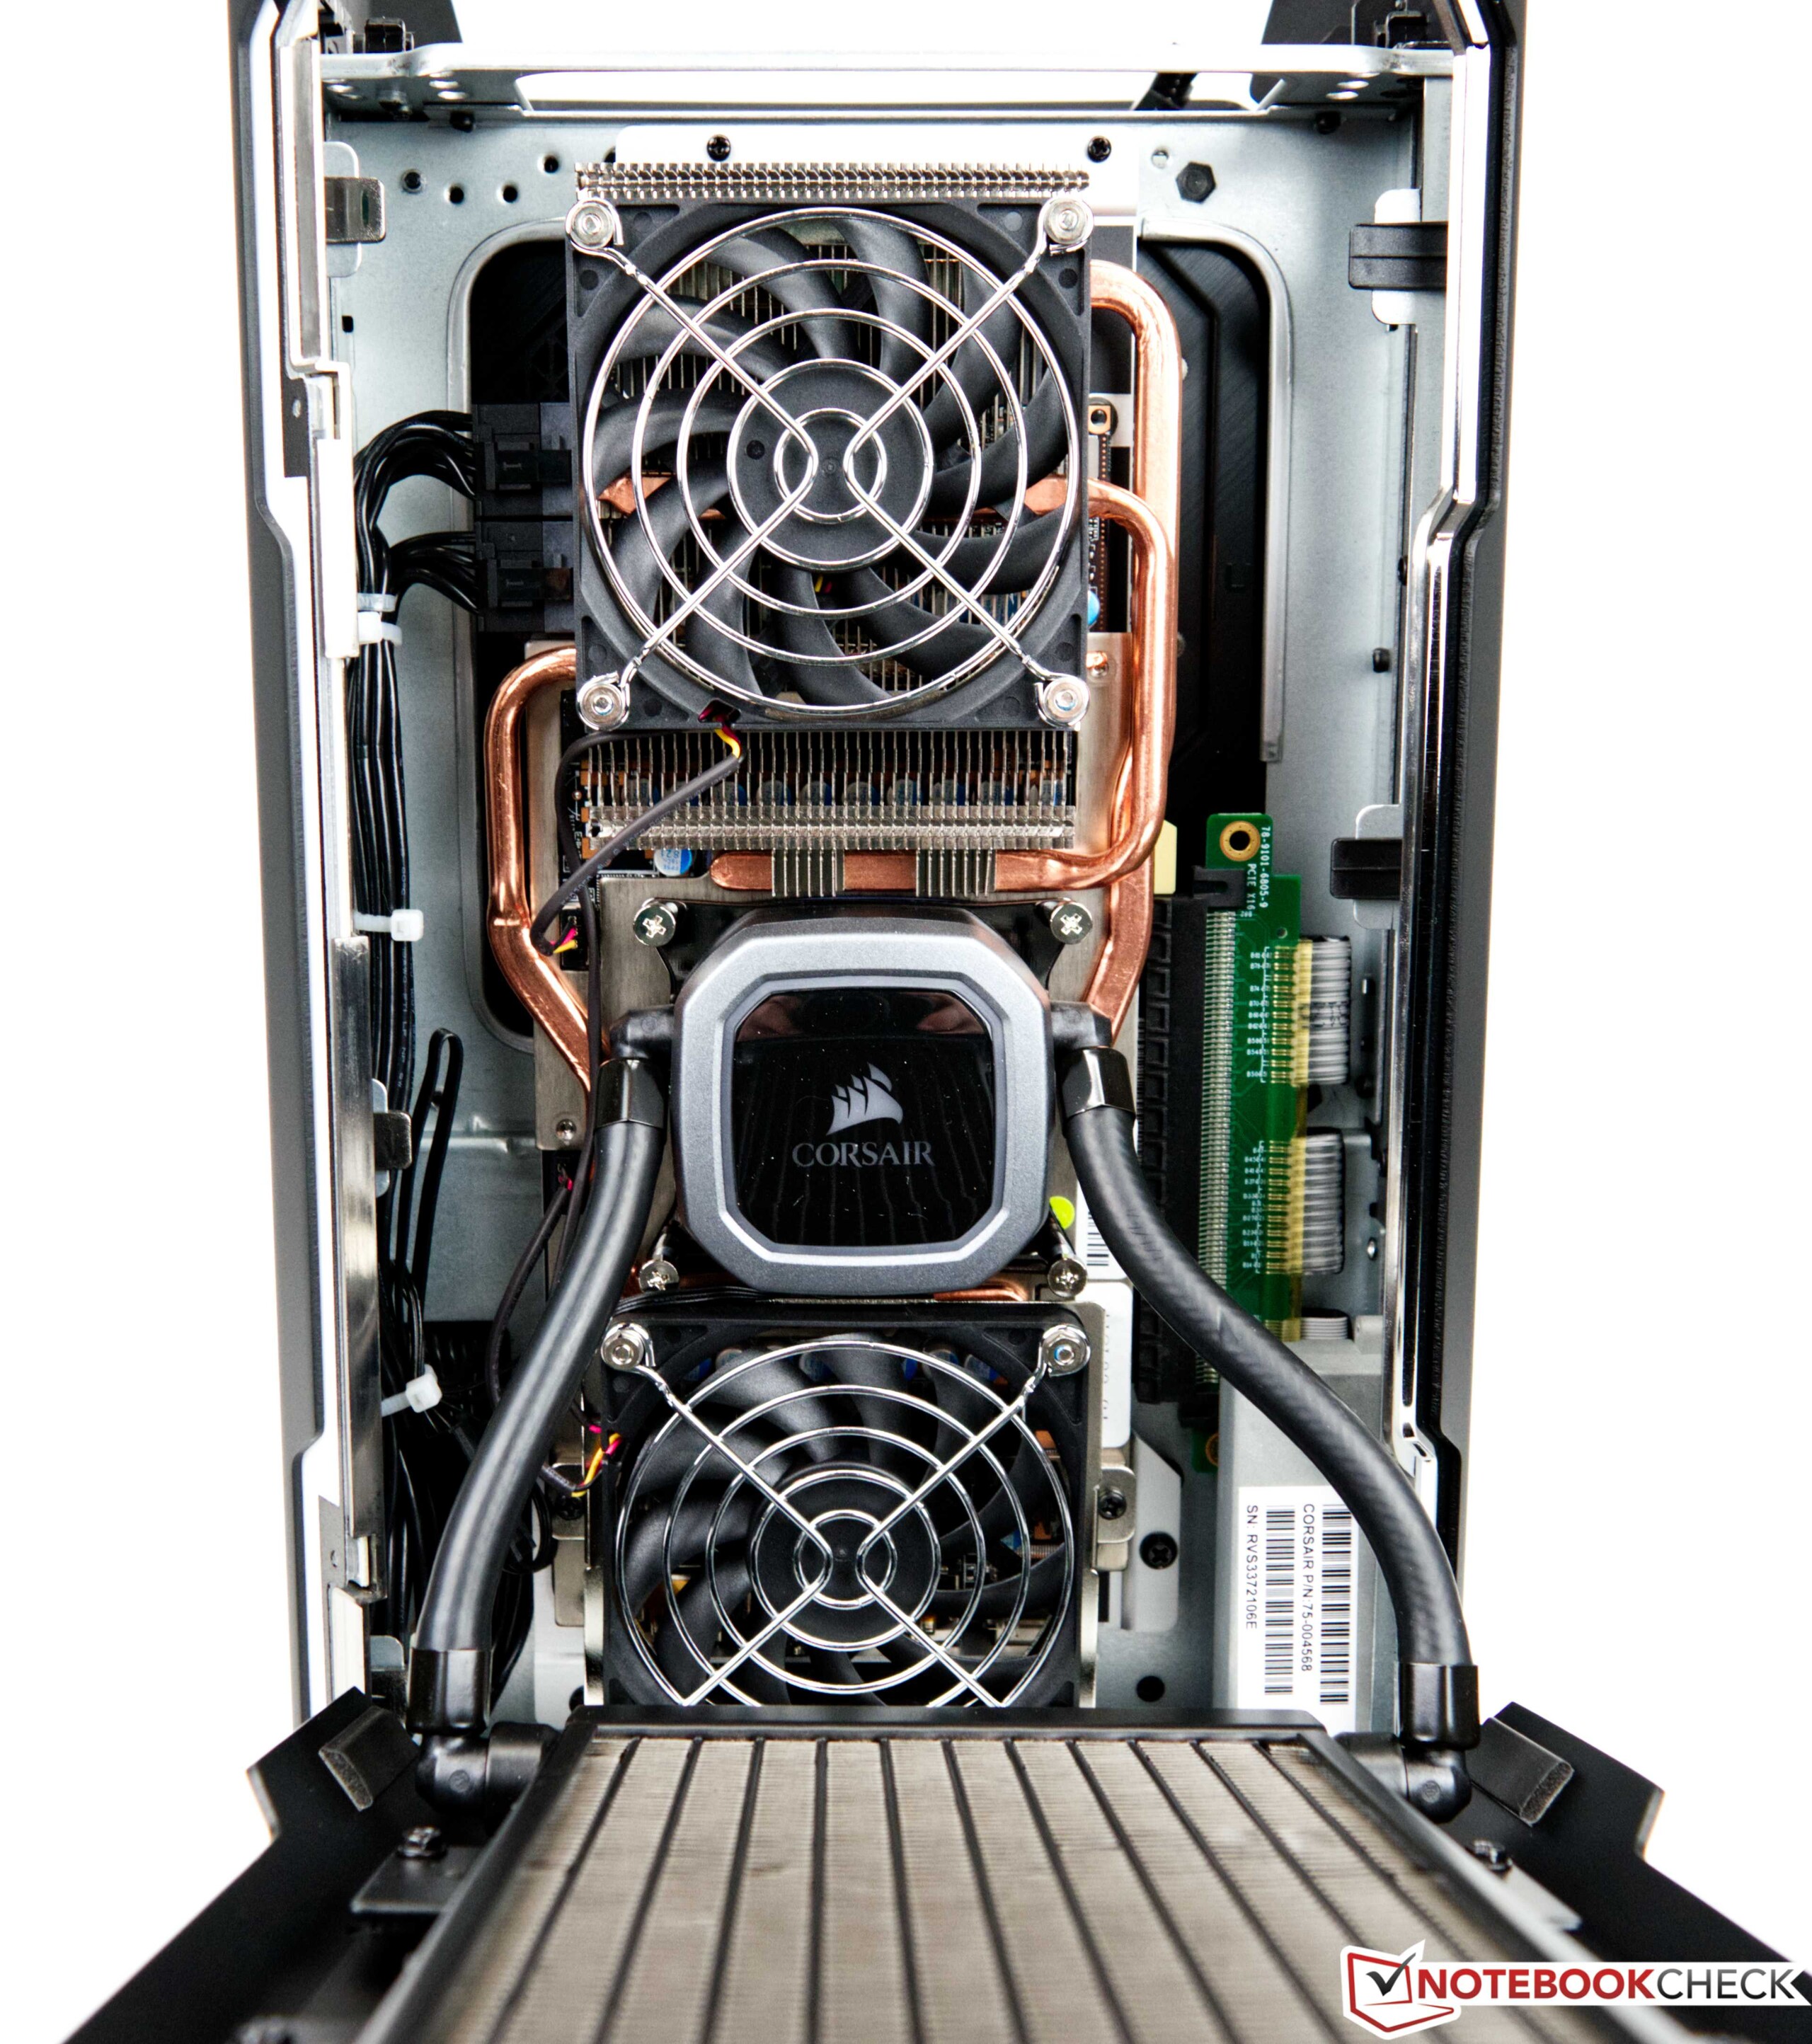
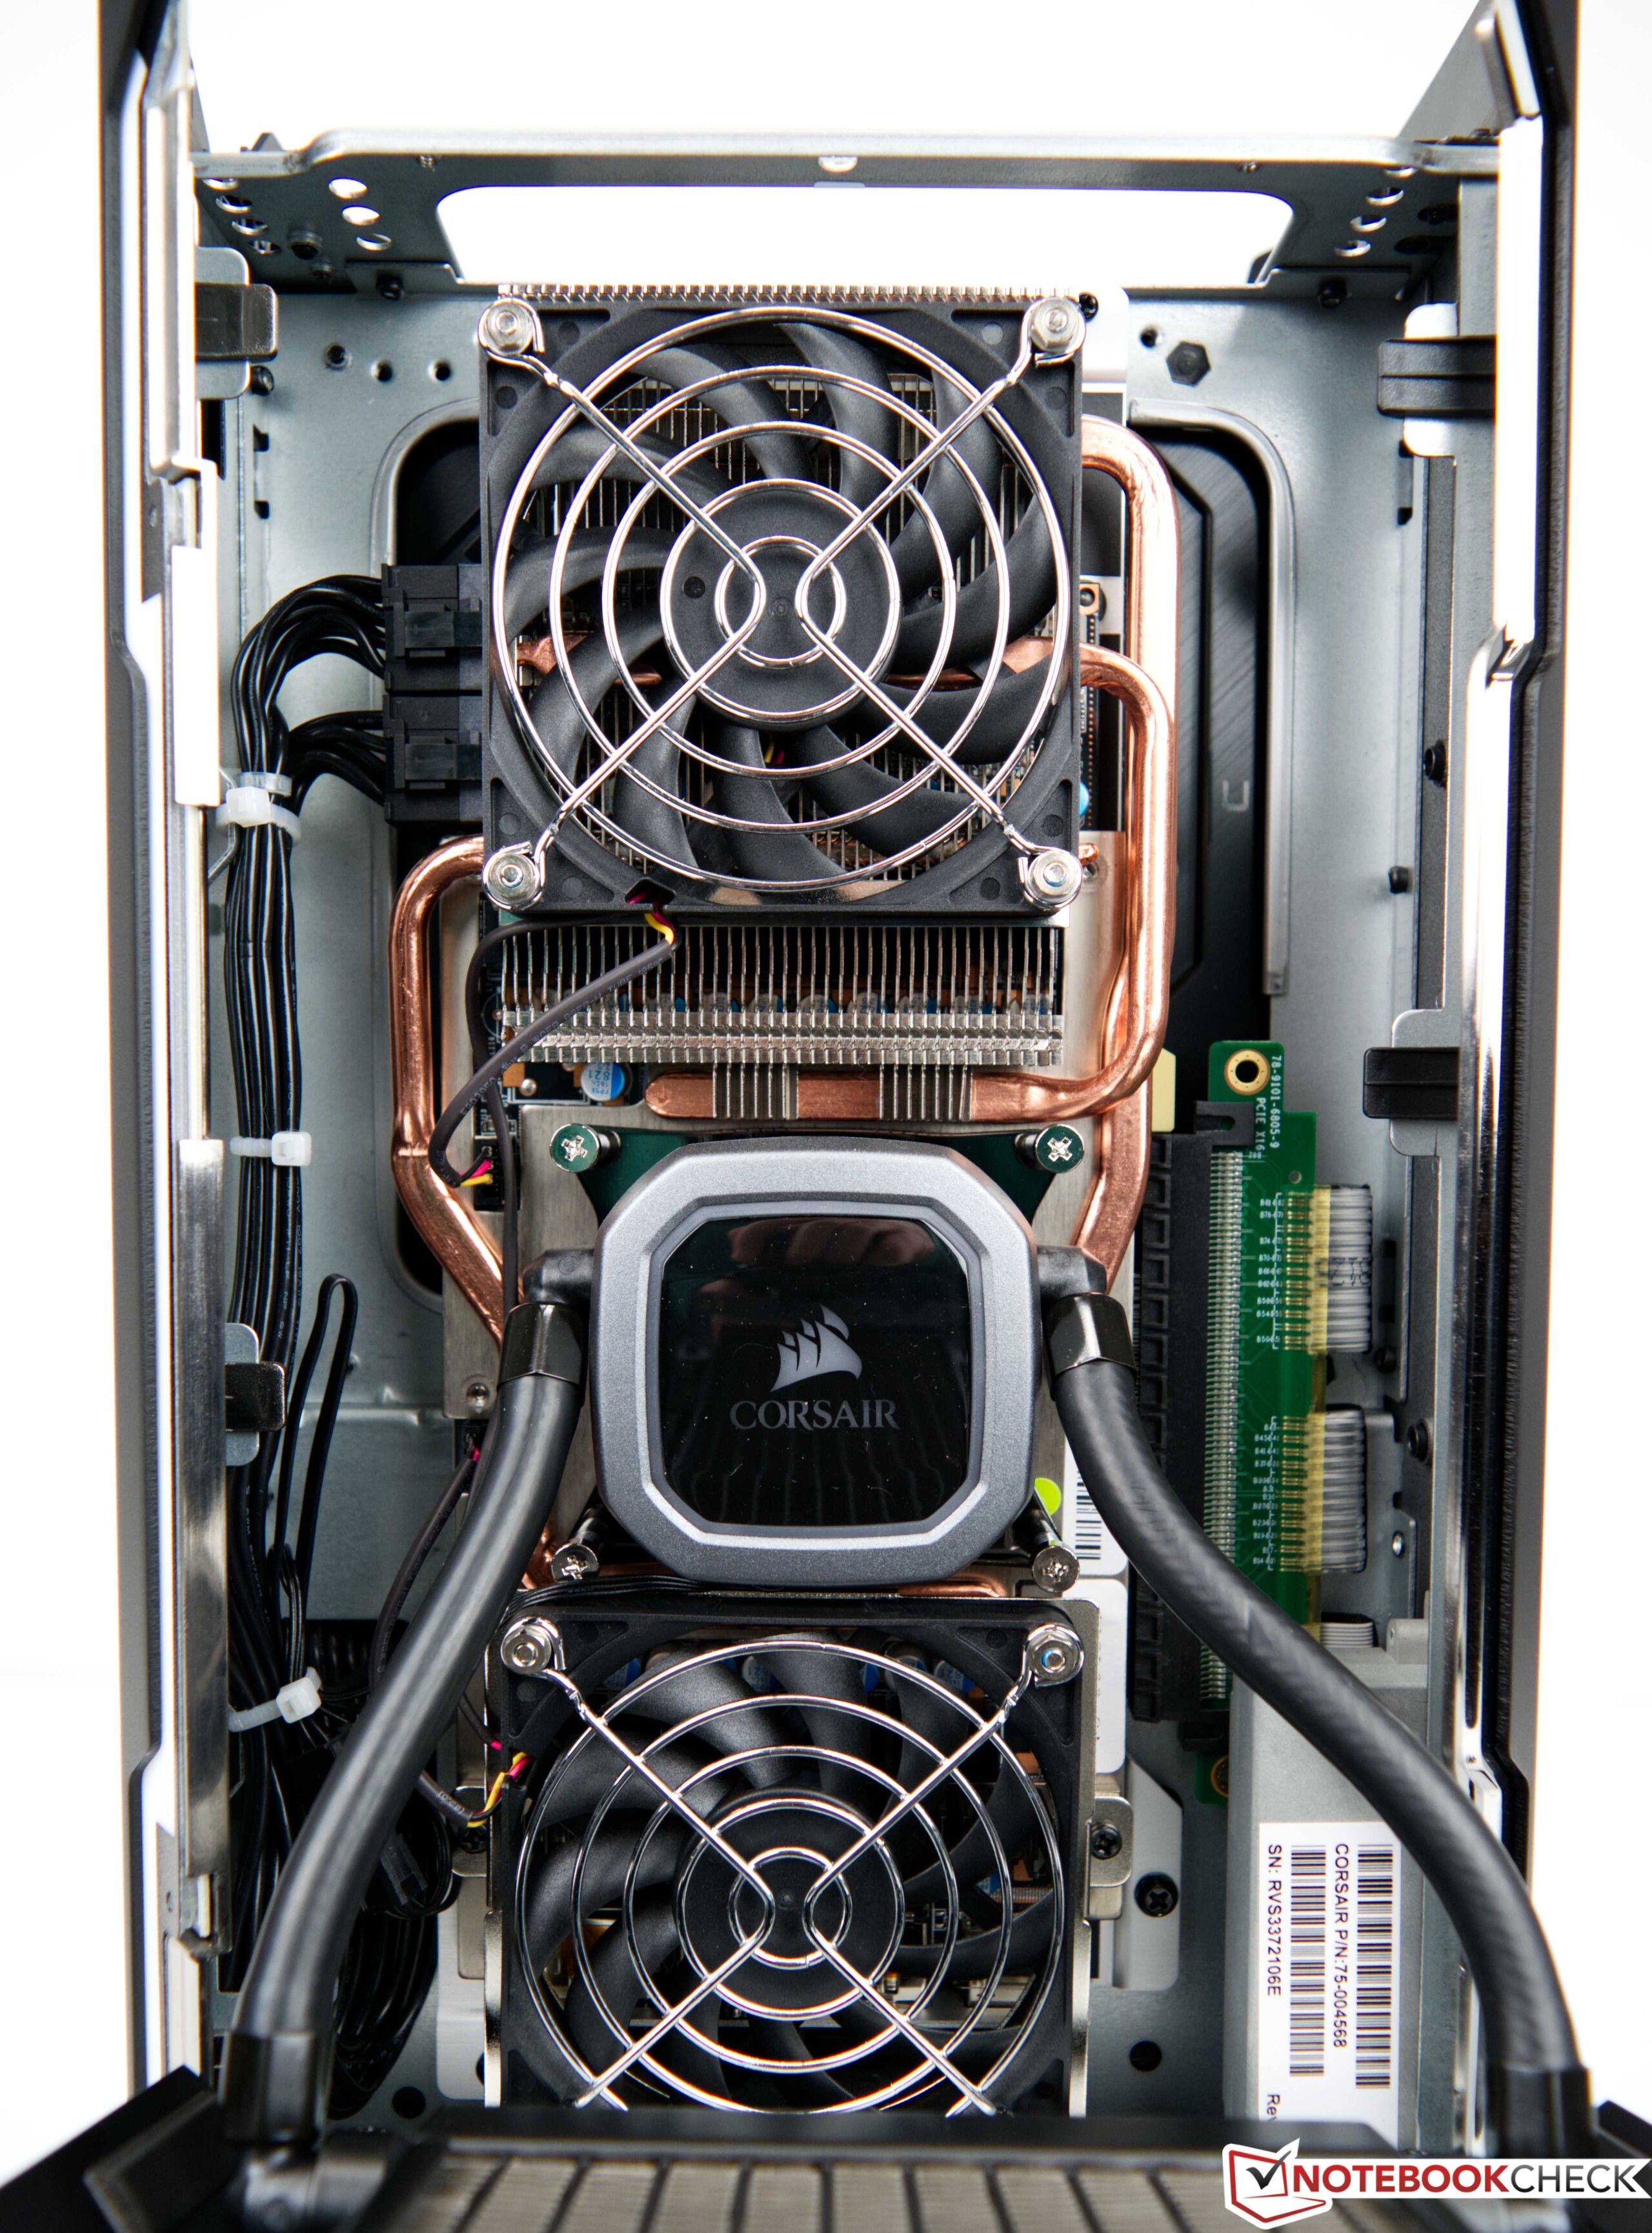
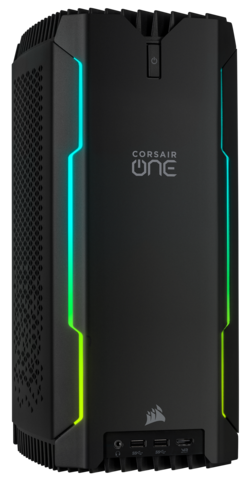
从外观上看,海盗船One i300的情况下,很难区分从海卫一i160在材料的选择方面,制造商也保持了相同的概念,所有的表面由金属制成,不仅在外观上提供了高品质的印象。黑色的简约设计,前面有两个RGB灯条,可以根据自己的喜好使用iCUE软件进行调节。做工是一流的,我们没有看到任何缺陷。内部的设计为CPU和GPU的两个独立水冷系统提供了空间。
尽管其结构紧凑,但这台小型PC带来了7.5公斤的重量。乍一看,你不会想到这一点,但这也证实了所使用的材料,因为在这样一个小箱子里,需要使用一切可能的方法来传递所产生的热量。
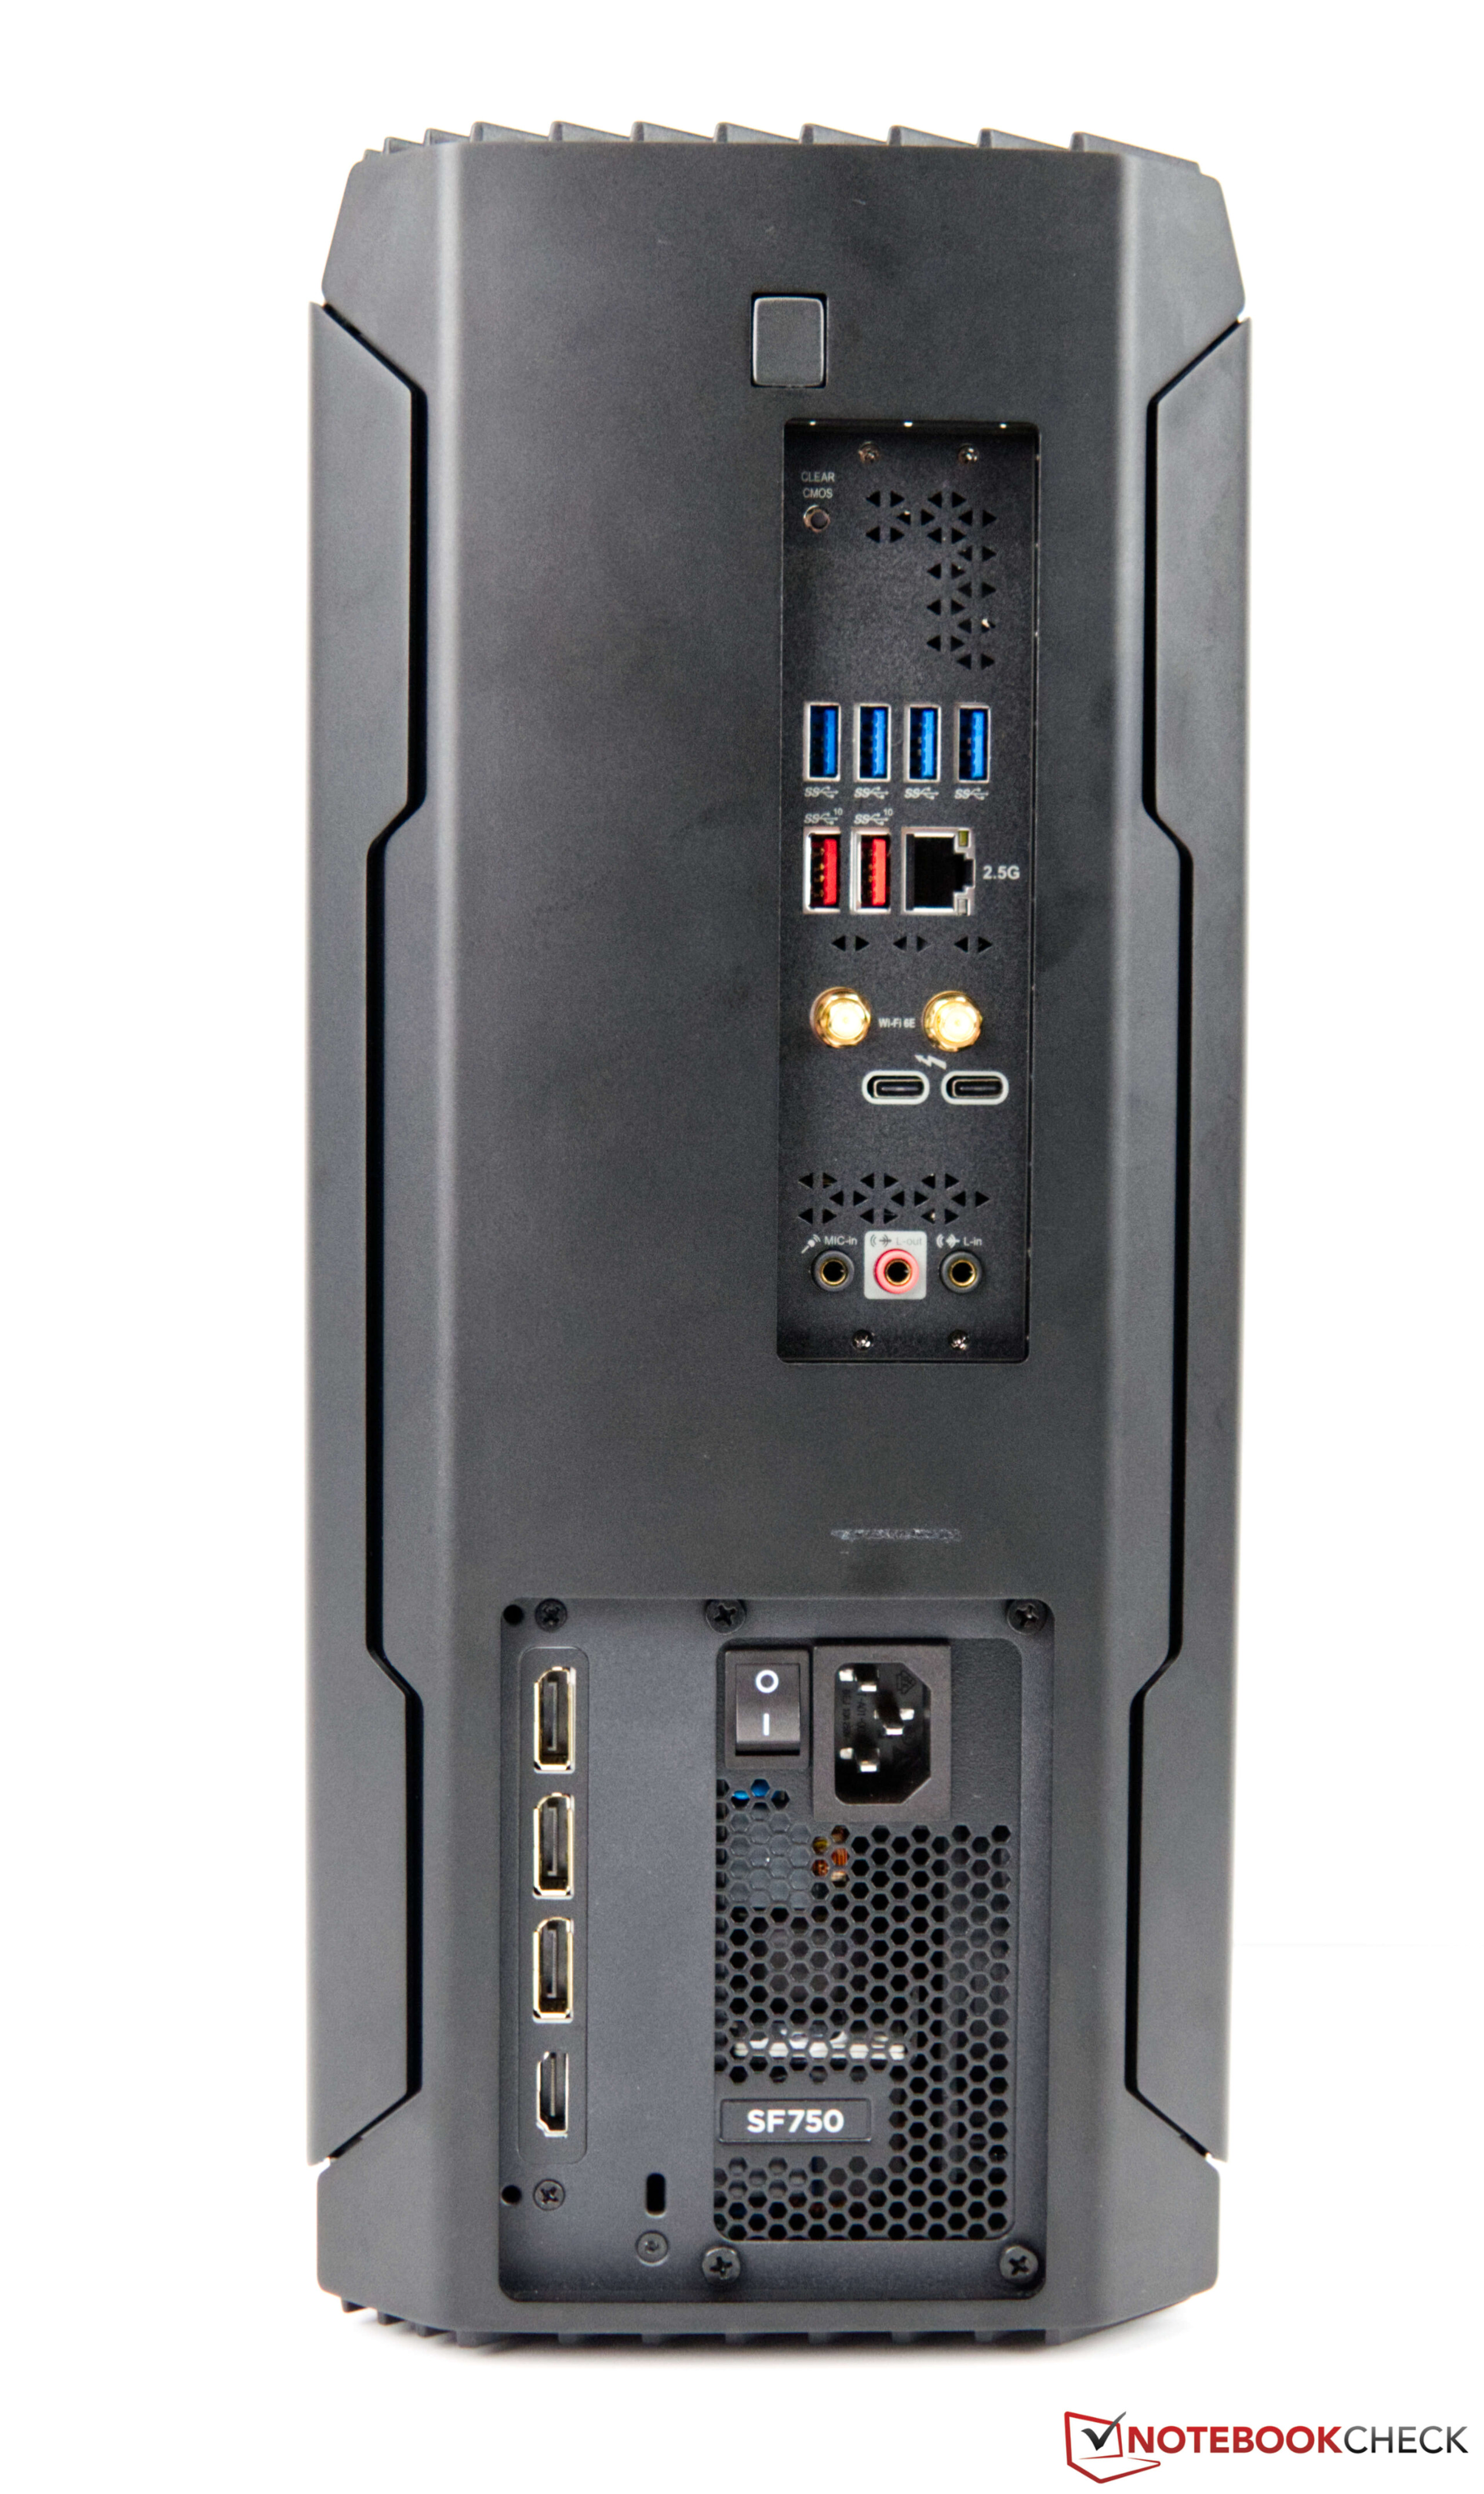
设备 - 最新的

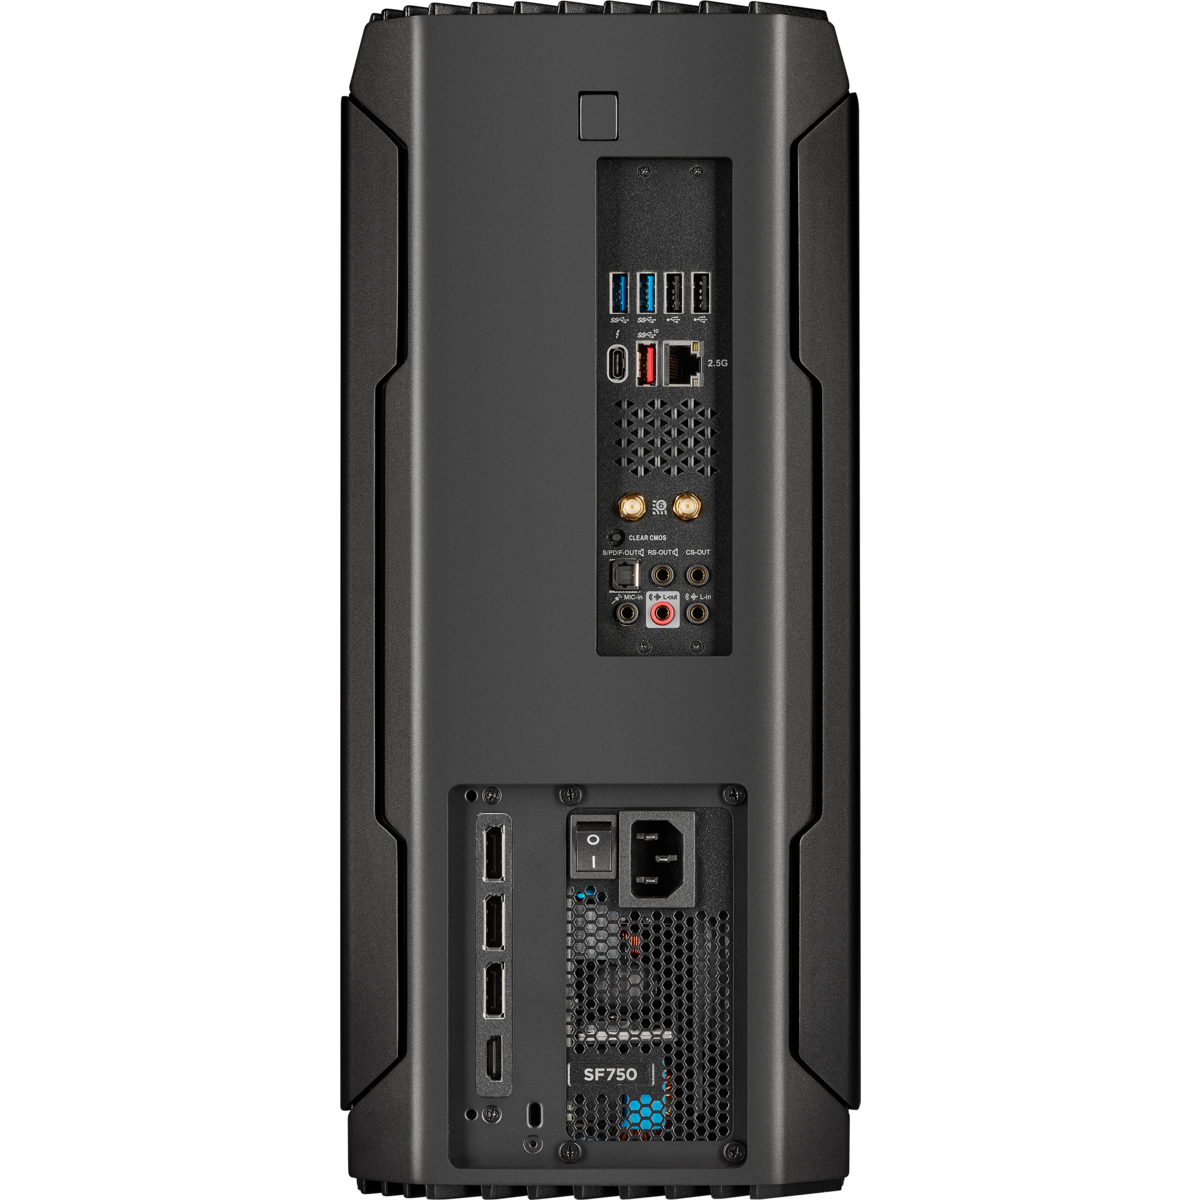
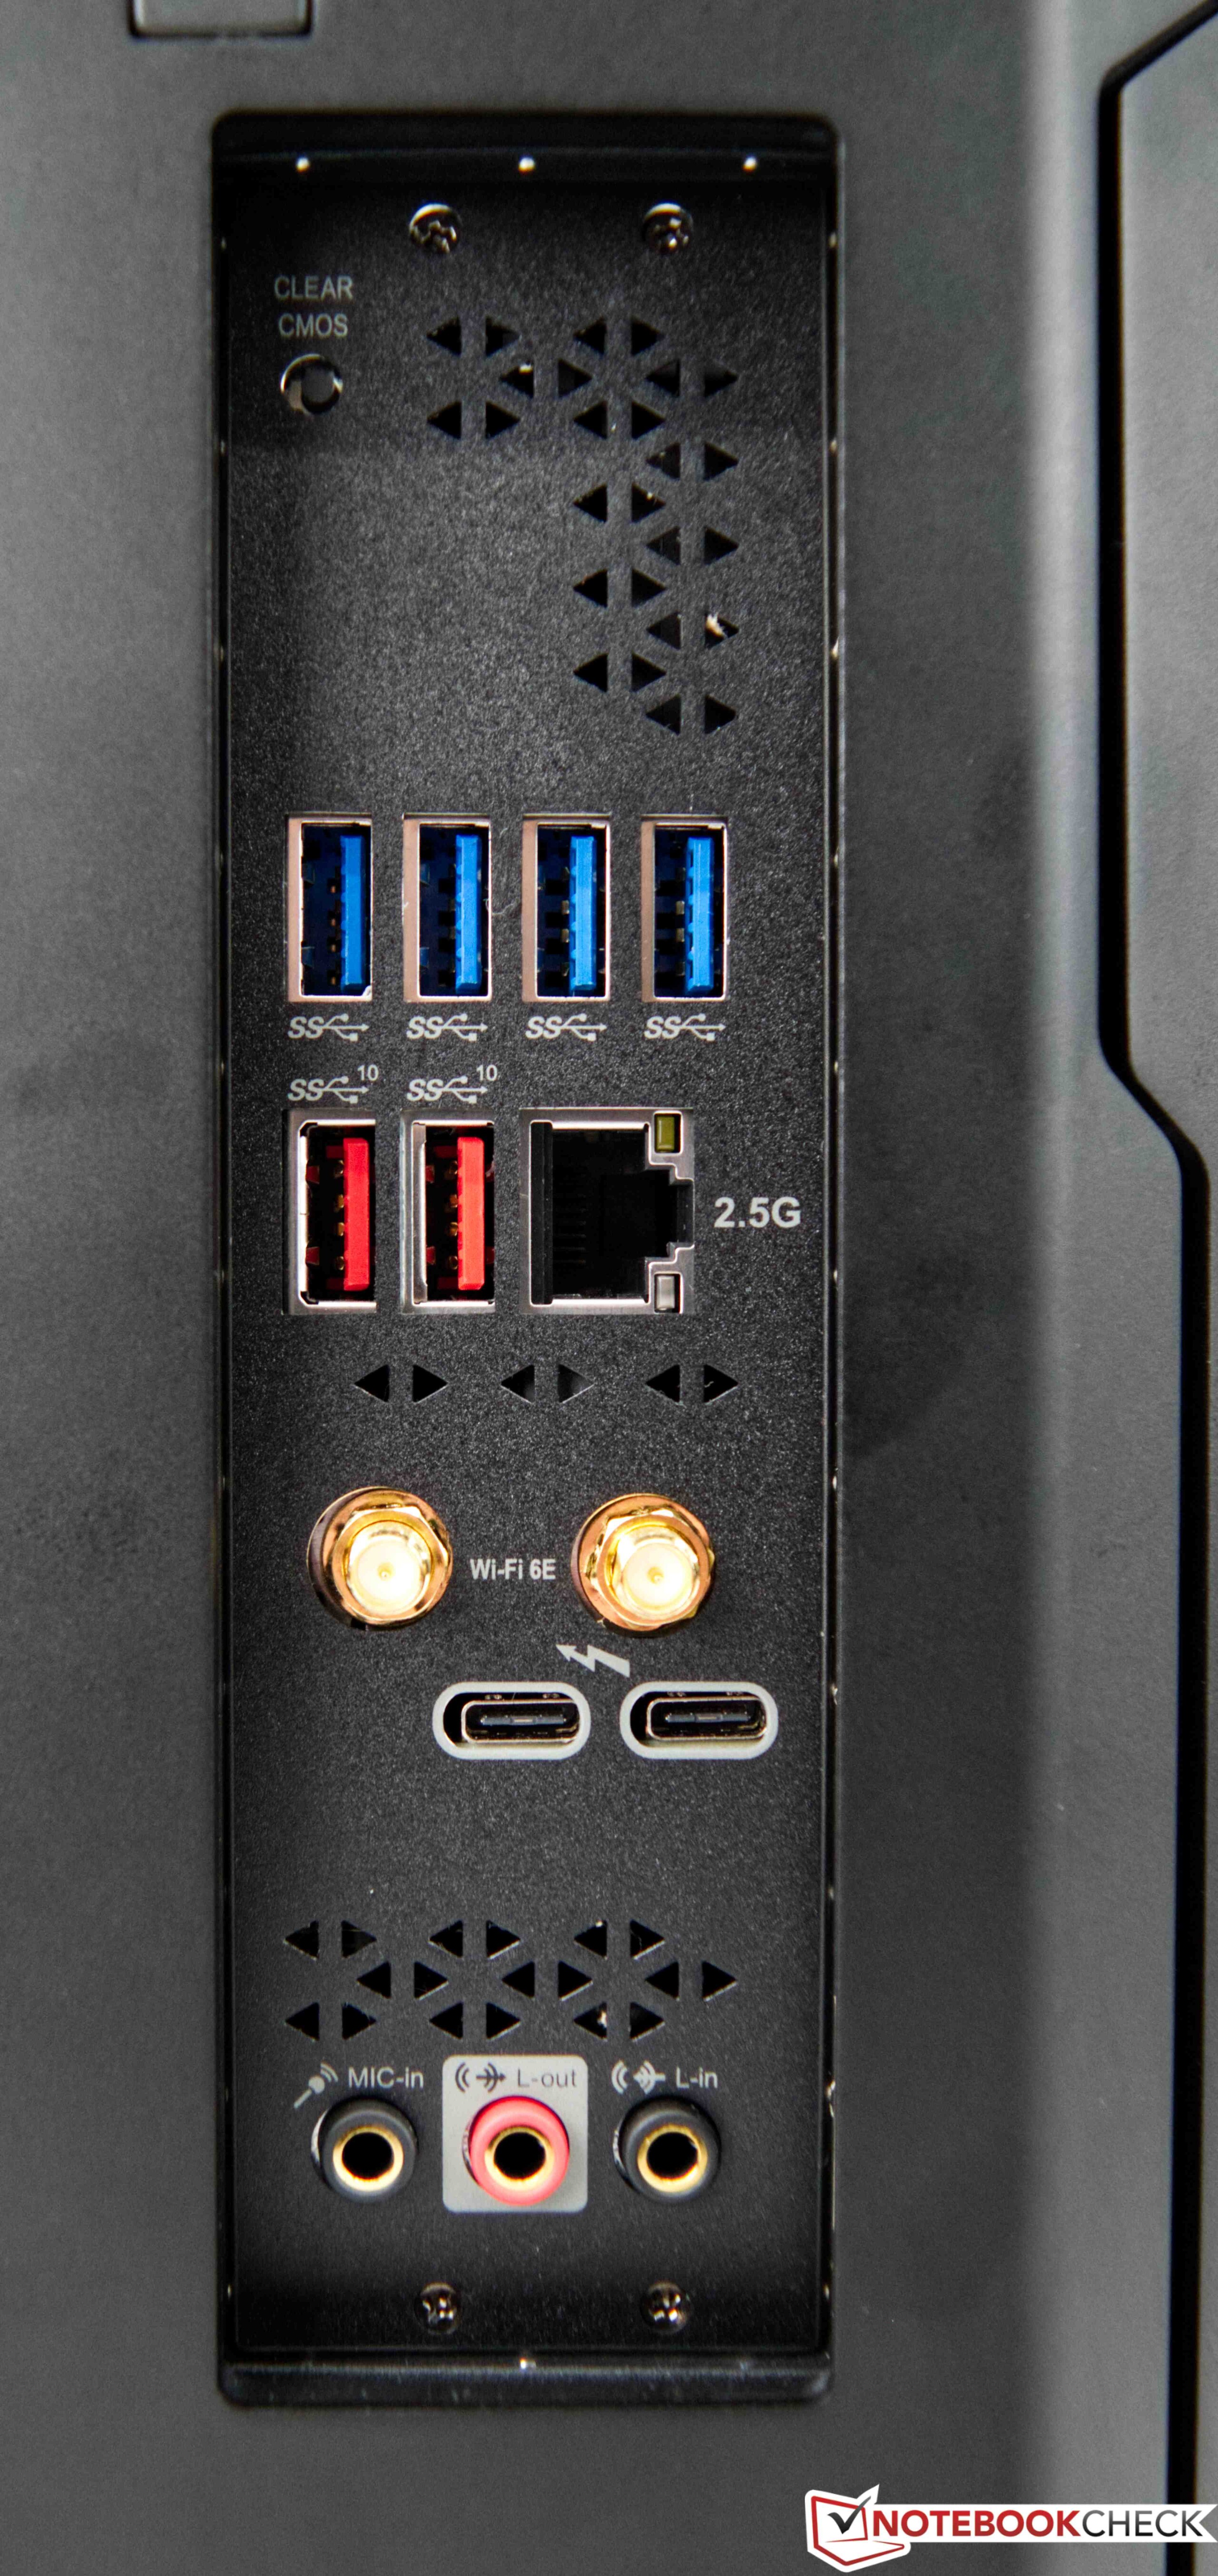
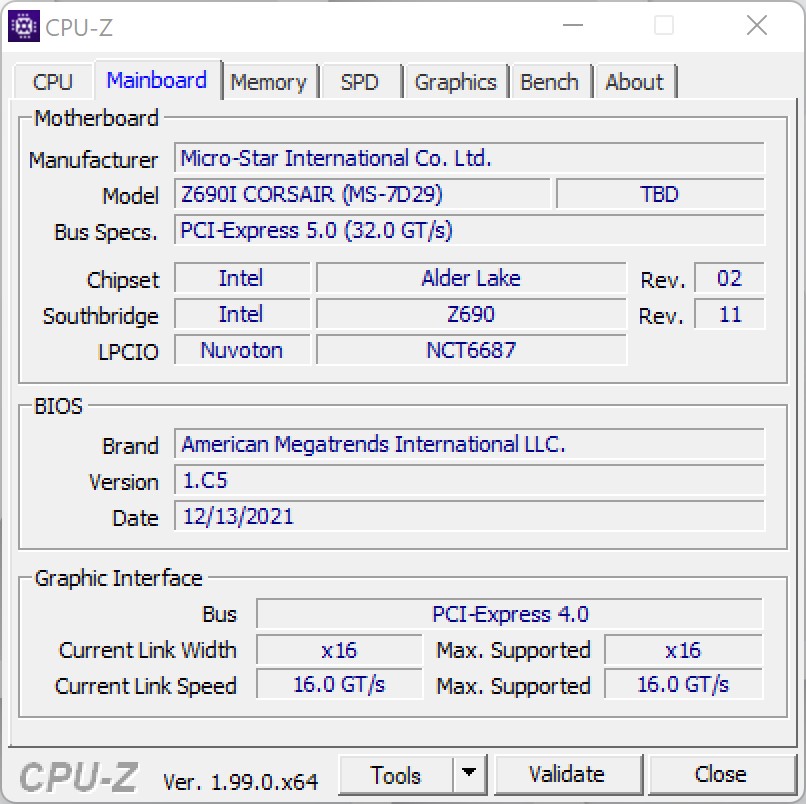
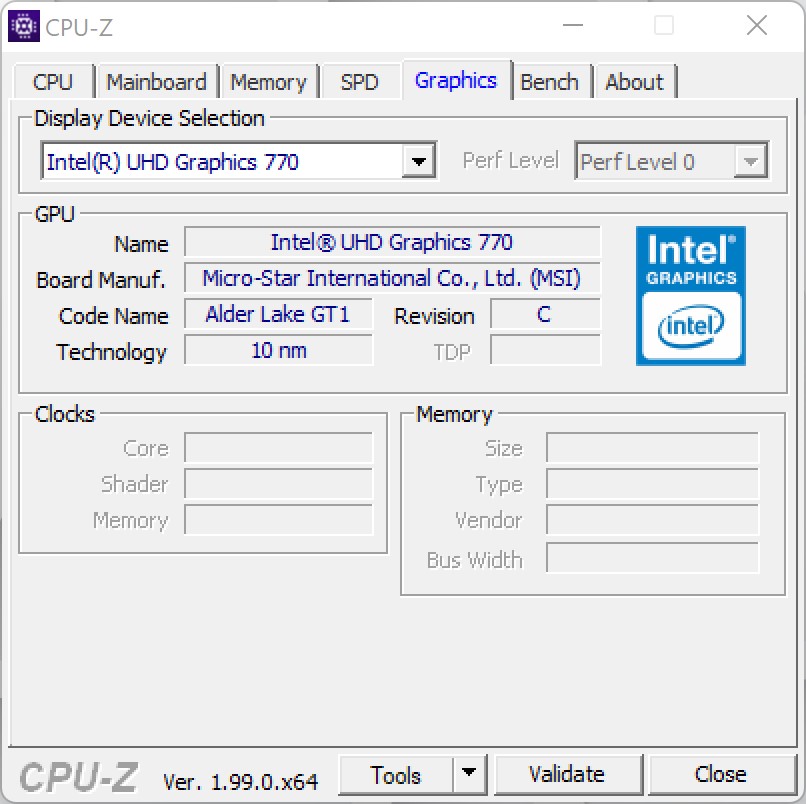
在One i300中,海盗船使用了微星的传统Mini-ITX主板。确切地说,海盗船在我们的测试装置中使用了微星MEG Z690I Unify。有了这个,这台台式电脑还配备了良好的外部连接。后面总共有8个USB端口,其中两个还支持雷电4。前面有另外3个USB端口。NvidiaGeForce RTX 3080 Ti本身也增加了3个DisplayPort和一个HDMI连接。
在网络连接方面,用户可以选择最新标准的WLAN或以太网(2.5G)。
沟通
主板上内置的英特尔Wi-Fi 6E AX211模块是目前最先进的,所以你也可以使用Wi-Fi 6G网络。使用我们目前的测试路由器,也支持最新的标准,海盗船One i300在我们的WLAN测试中提供快速和稳定的传输速率。
注意:由于我们的测试装置不幸地被送到我们这里,没有原来的WLAN天线,我们使用替代天线进行了这项测试。我们目前还不能说使用原始天线时的传输率是否会稍好。
| Networking | |
| iperf3 transmit AX12 | |
| Asus ROG Flow Z13 GZ301ZE | |
| Average Intel Wi-Fi 6E AX211 (1003 - 1501, n=4) | |
| Huawei MateBook 13s i5 11300H | |
| iperf3 receive AX12 | |
| Average Intel Wi-Fi 6E AX211 (1178 - 1623, n=4) | |
| Asus ROG Flow Z13 GZ301ZE | |
| Huawei MateBook 13s i5 11300H | |
| iperf3 receive AXE11000 | |
| MSI Stealth GS66 12UGS | |
| Average Intel Wi-Fi 6E AX211 (582 - 1890, n=276) | |
| Corsair One i300 | |
| Average of class Desktop (n=1last 2 years) | |
| iperf3 transmit AXE11000 | |
| Corsair One i300 | |
| Average Intel Wi-Fi 6E AX211 (64 - 1921, n=276) | |
| Average of class Desktop (n=1last 2 years) | |
维护
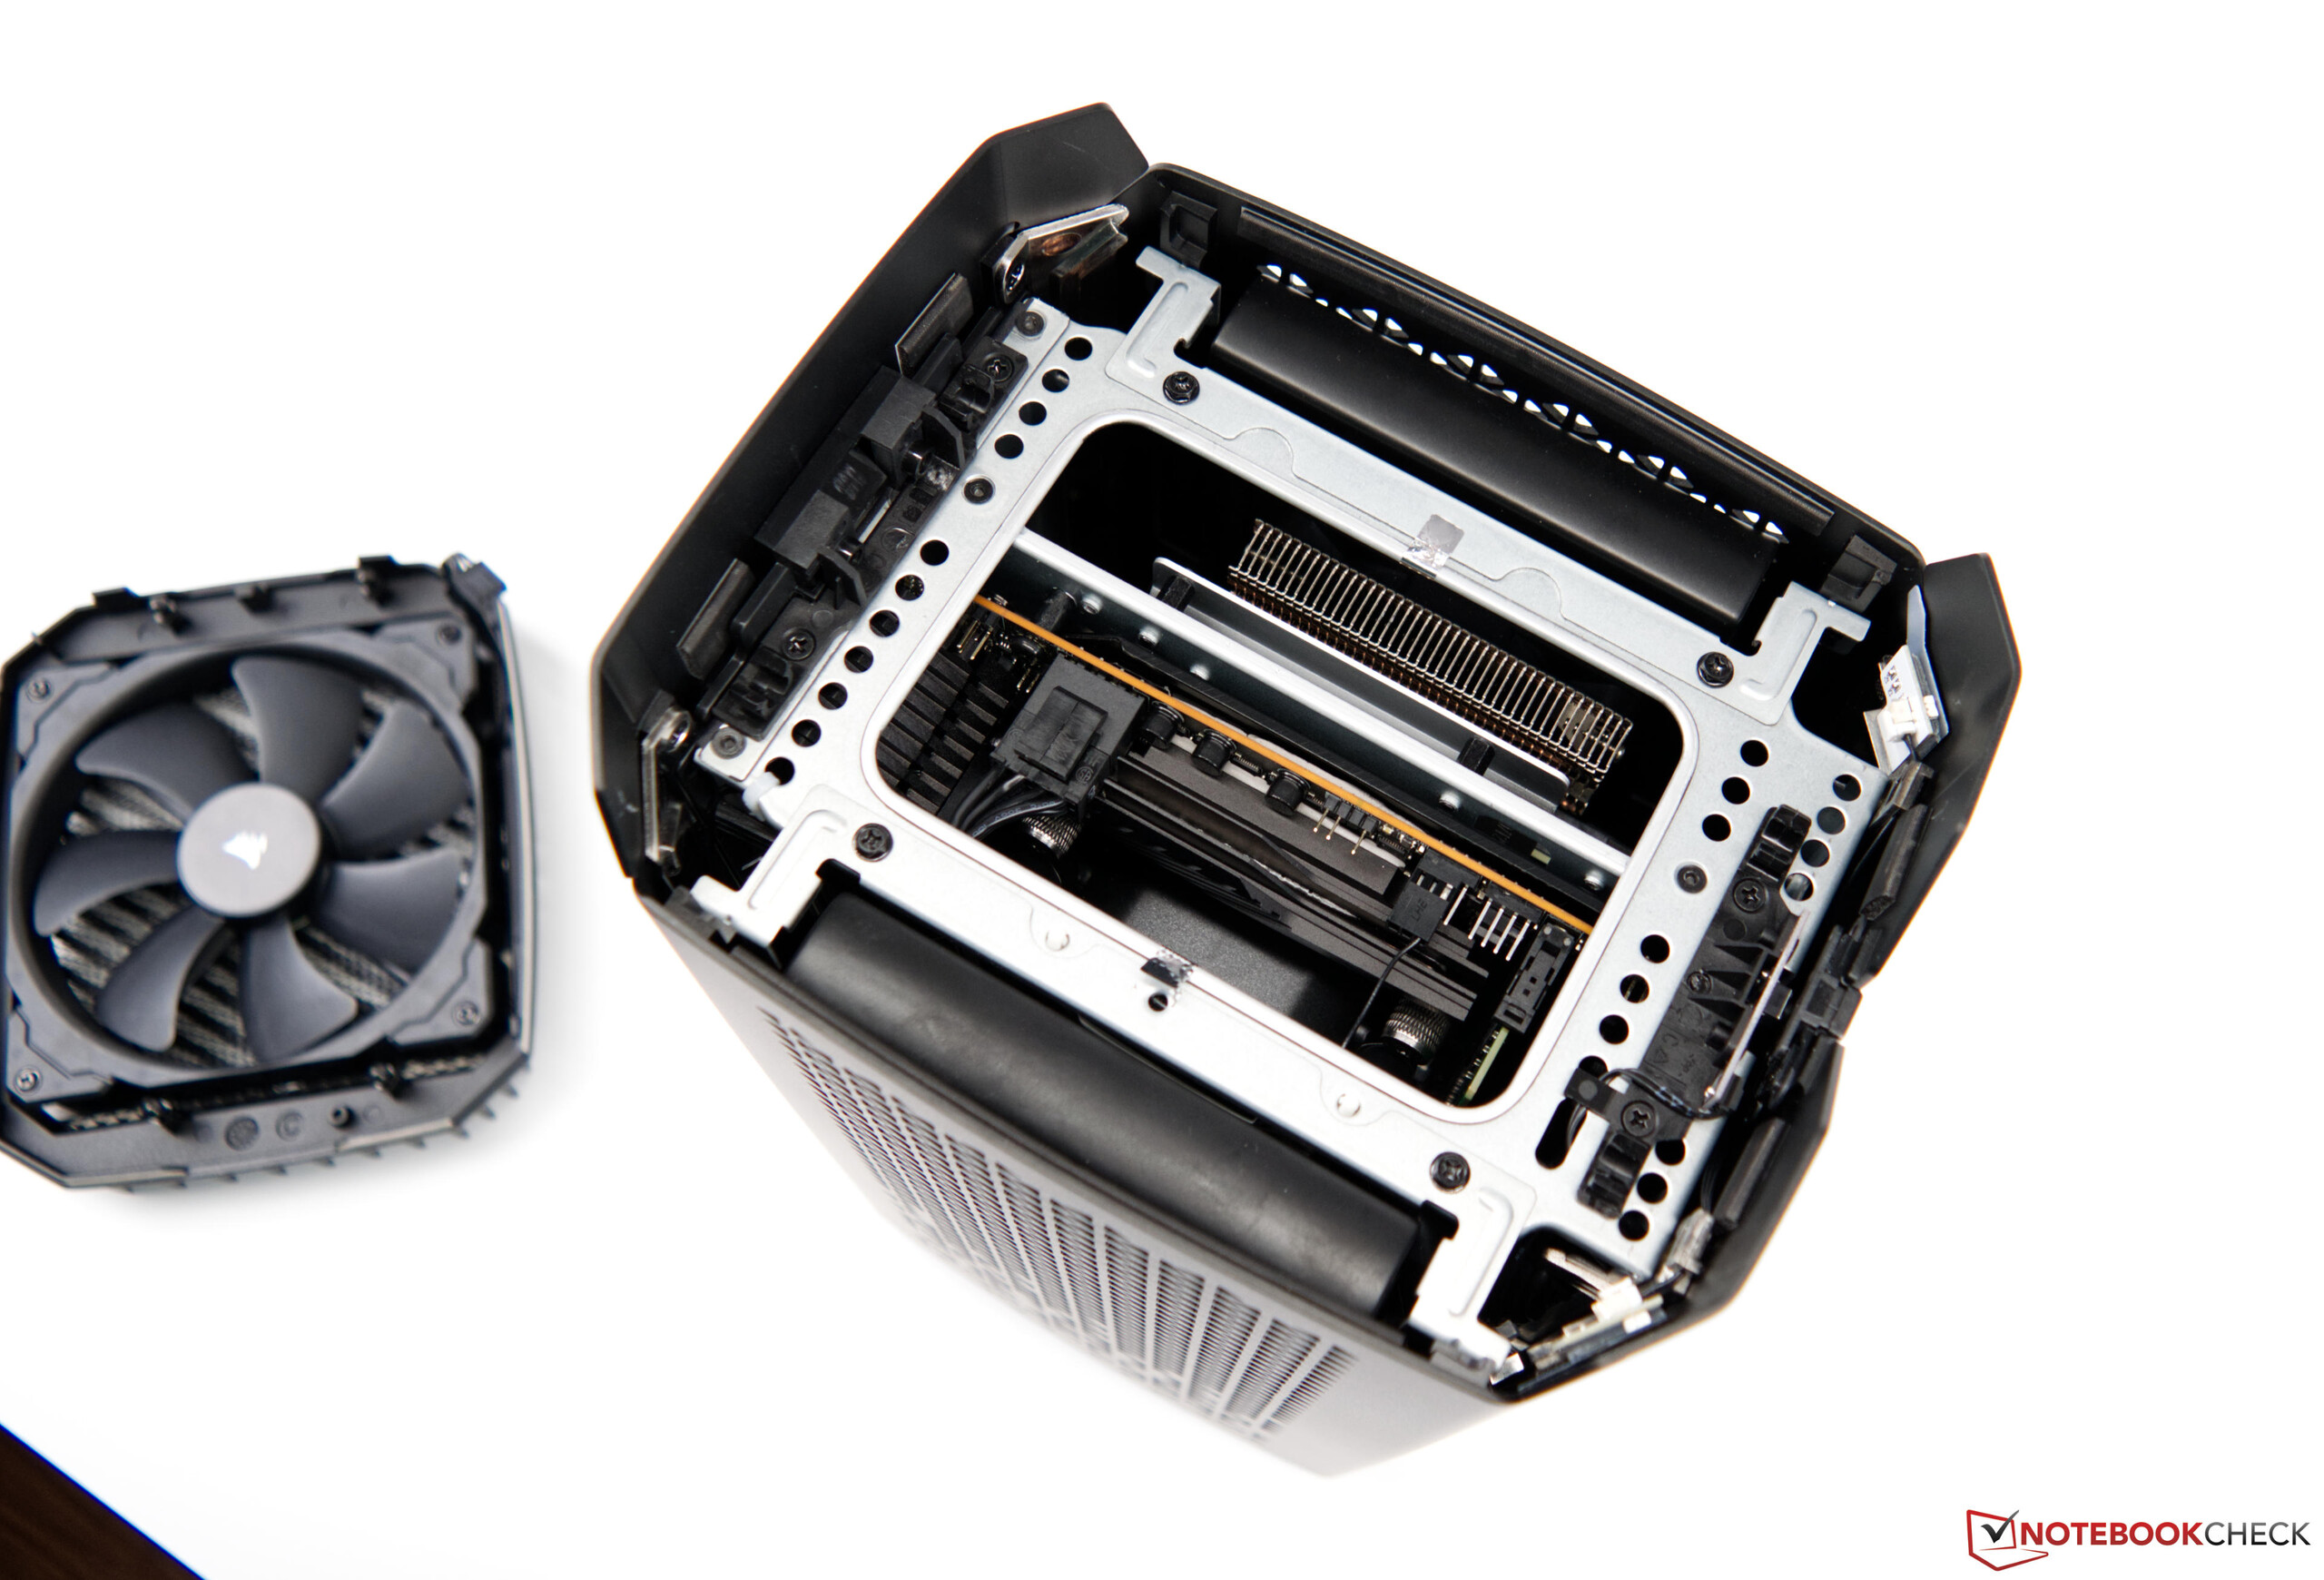
如果Corsair One i300的性能不够,或者存储解决方案原来太小,你也可以升级电脑。然而,你应该小心,因为里面的空间非常有限。这台台式电脑可以很容易地打开。带有140毫米风扇的机箱顶盖可以很快拆下,侧盖只用两颗螺丝固定。但这样一来,AiO的软管就会阻碍快速更换组件的工作。虽然你仍然可以相当容易地访问工作存储器,但如果你想获得存储解决方案,事情看起来更困难。出于这个原因,我们希望在可用的配置中再有一个选择,因为主板上总共有三个M.2插槽。然而,该系统已经配备了2TB的存储空间。
业绩
单纯从使用的组件来看,海盗船One i300为游戏提供了非常快的处理器,包括 英特尔酷睿i9-12900K和NvidiaGeForce RTX 3080 Ti.目前,GeForce RTX 3080 Ti是Nvidia第二快的显卡,仅落后几个百分点。 GeForce RTX 3090.尽管如果你只考虑物理尺寸,这也可能适合这个箱子,但VRAM芯片的冷却可能导致海盗船 "只 "用GeForce RTX 3080 Ti。Corsair One i300的稍弱型号配备了GeForce RTX 3080,这可能是更合理的选择,因为其购买价格较低。
处理器
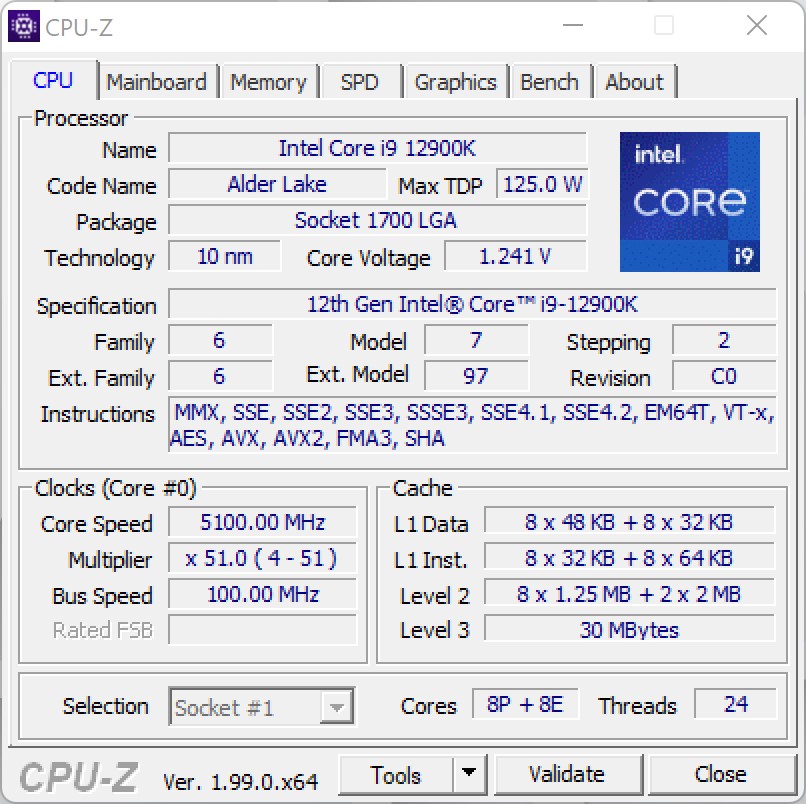
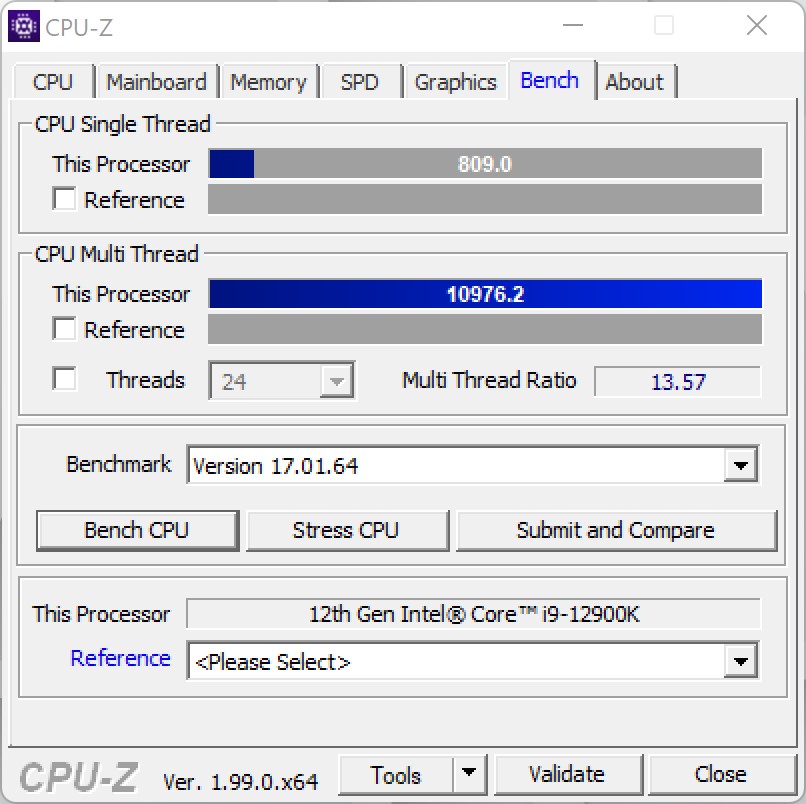
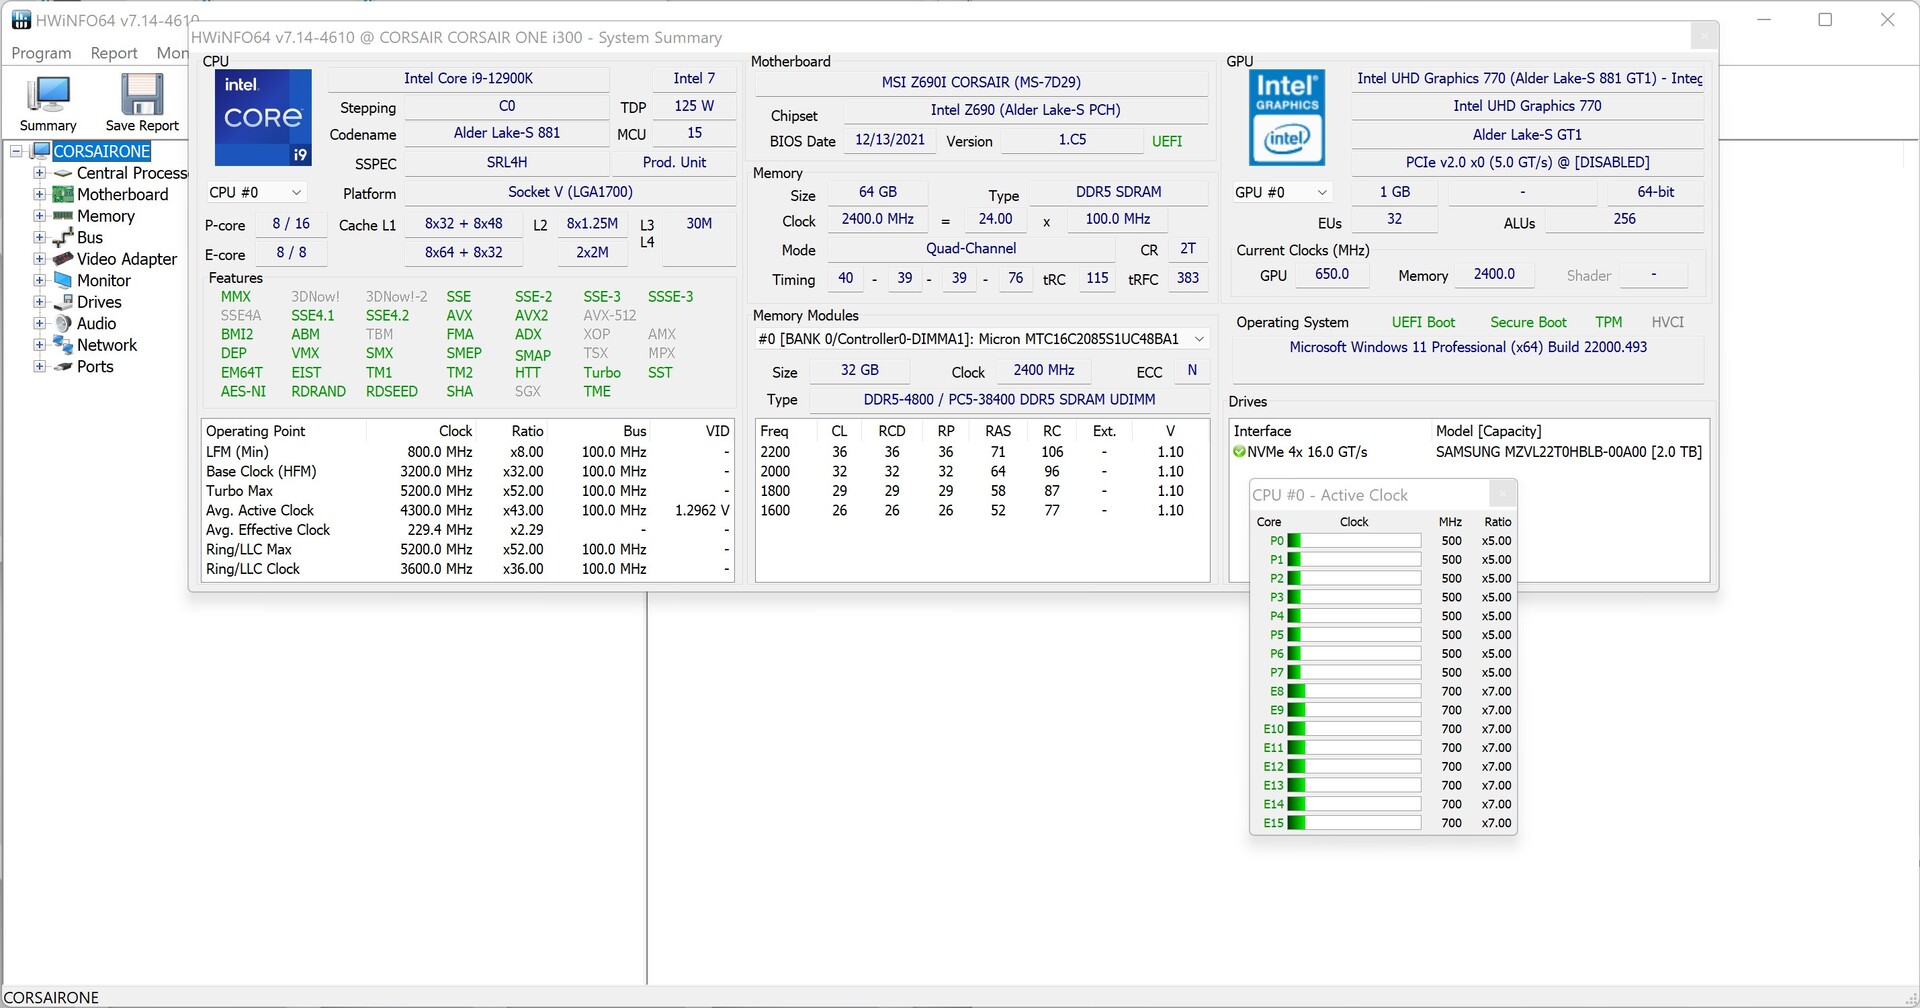
Corsair One i300配备了英特尔目前在游戏方面最快的处理器。确切地说,海盗船使用的是英特尔酷睿i9-12900K基于微星的Z690板。我们已经能够提前看到英特尔的新旗舰可以提供什么性能。关于更多的细节 英特尔酷睿i9-12900K的更多细节,我们参考了这个 网页.然而,在最大功耗方面,Corsair One i300有一个小的限制。PL1和PL2分别被限制在165和175瓦的数值,这意味着处理器在负载下会略微节流。 如果没有这个限制,那么 英特尔酷睿i9-12900K应该能够消耗高达241瓦的功率。另一方面,这个选项可以在BIOS中修改。但这样一来,也会导致更高的噪音量和更高的温度。
在我们运行的基准测试中,英特尔酷睿i9-12900K表现非常好,即使它在负载下无法使用其全部性能。相比之下,性能的提高 Corsair One i160是巨大的。在总体评级中,目前的系统提供了48%的性能。
关于更多的比较和基准,我们请你参考我们的 CPU比较表.
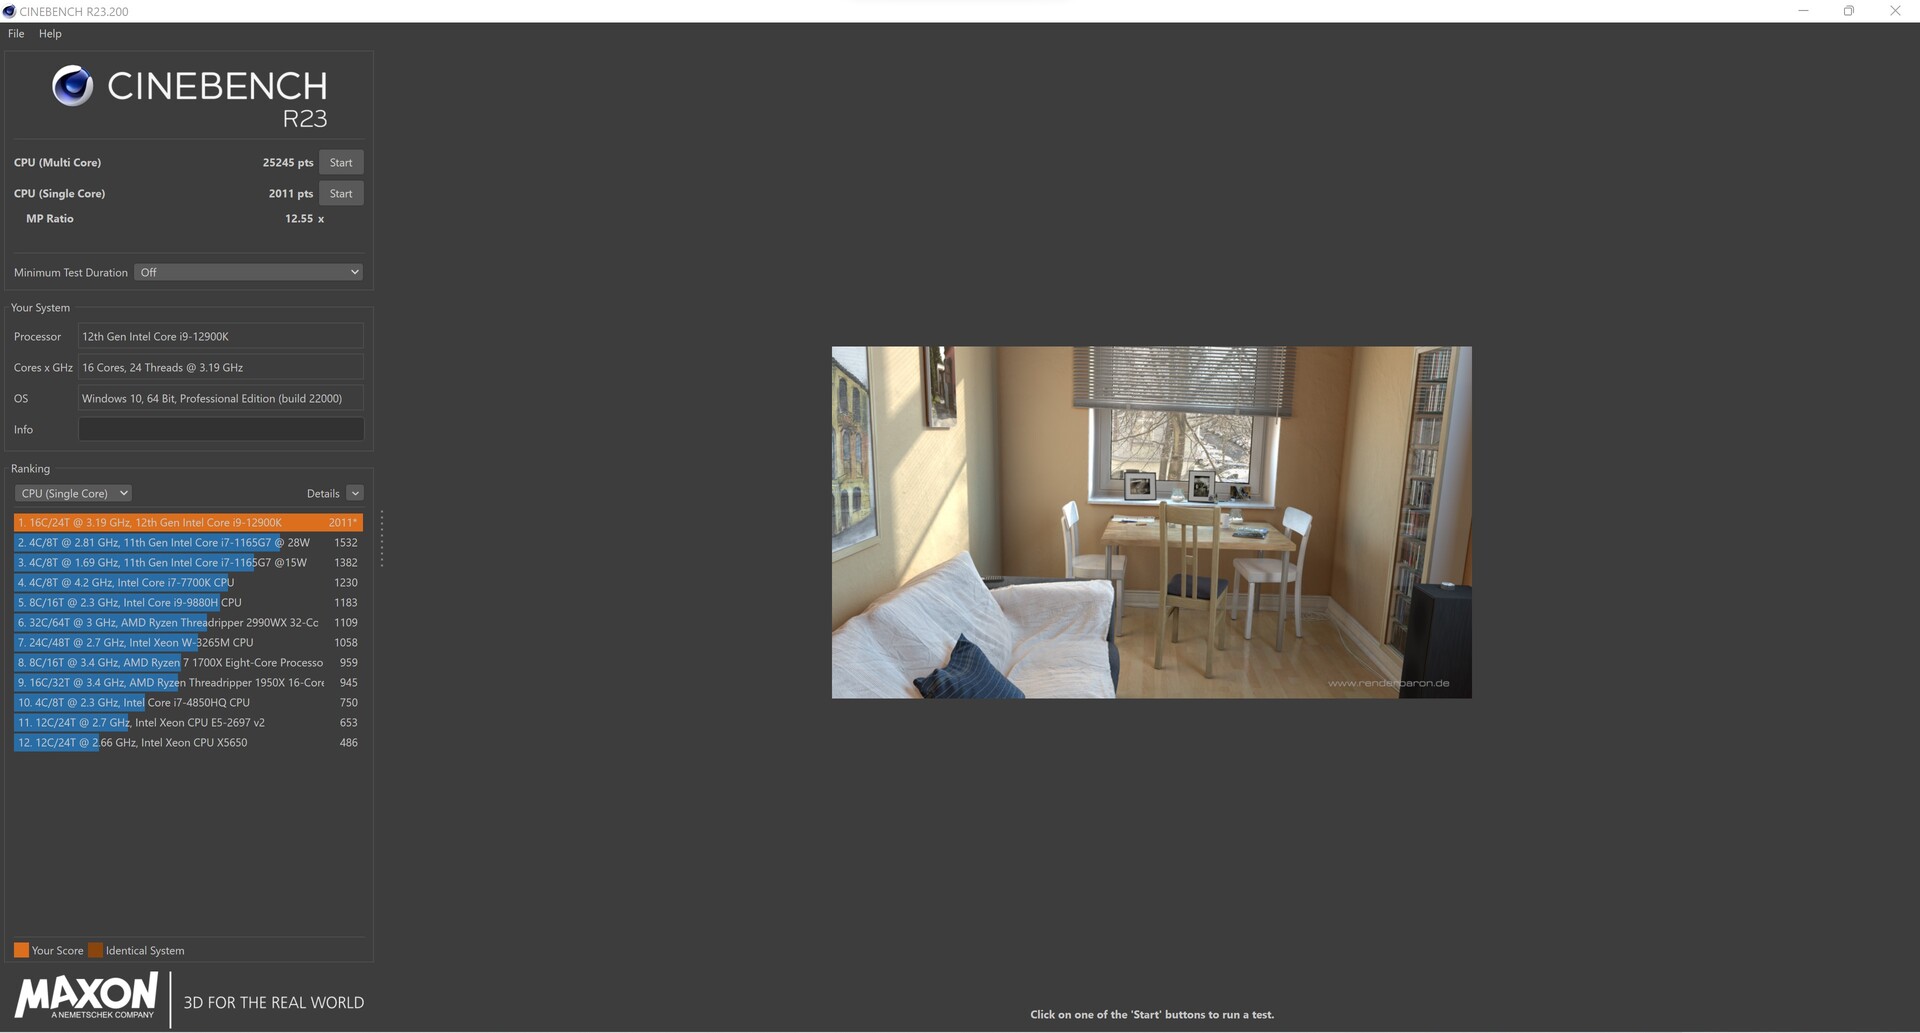
Cinebench R23: Multi Core | Single Core
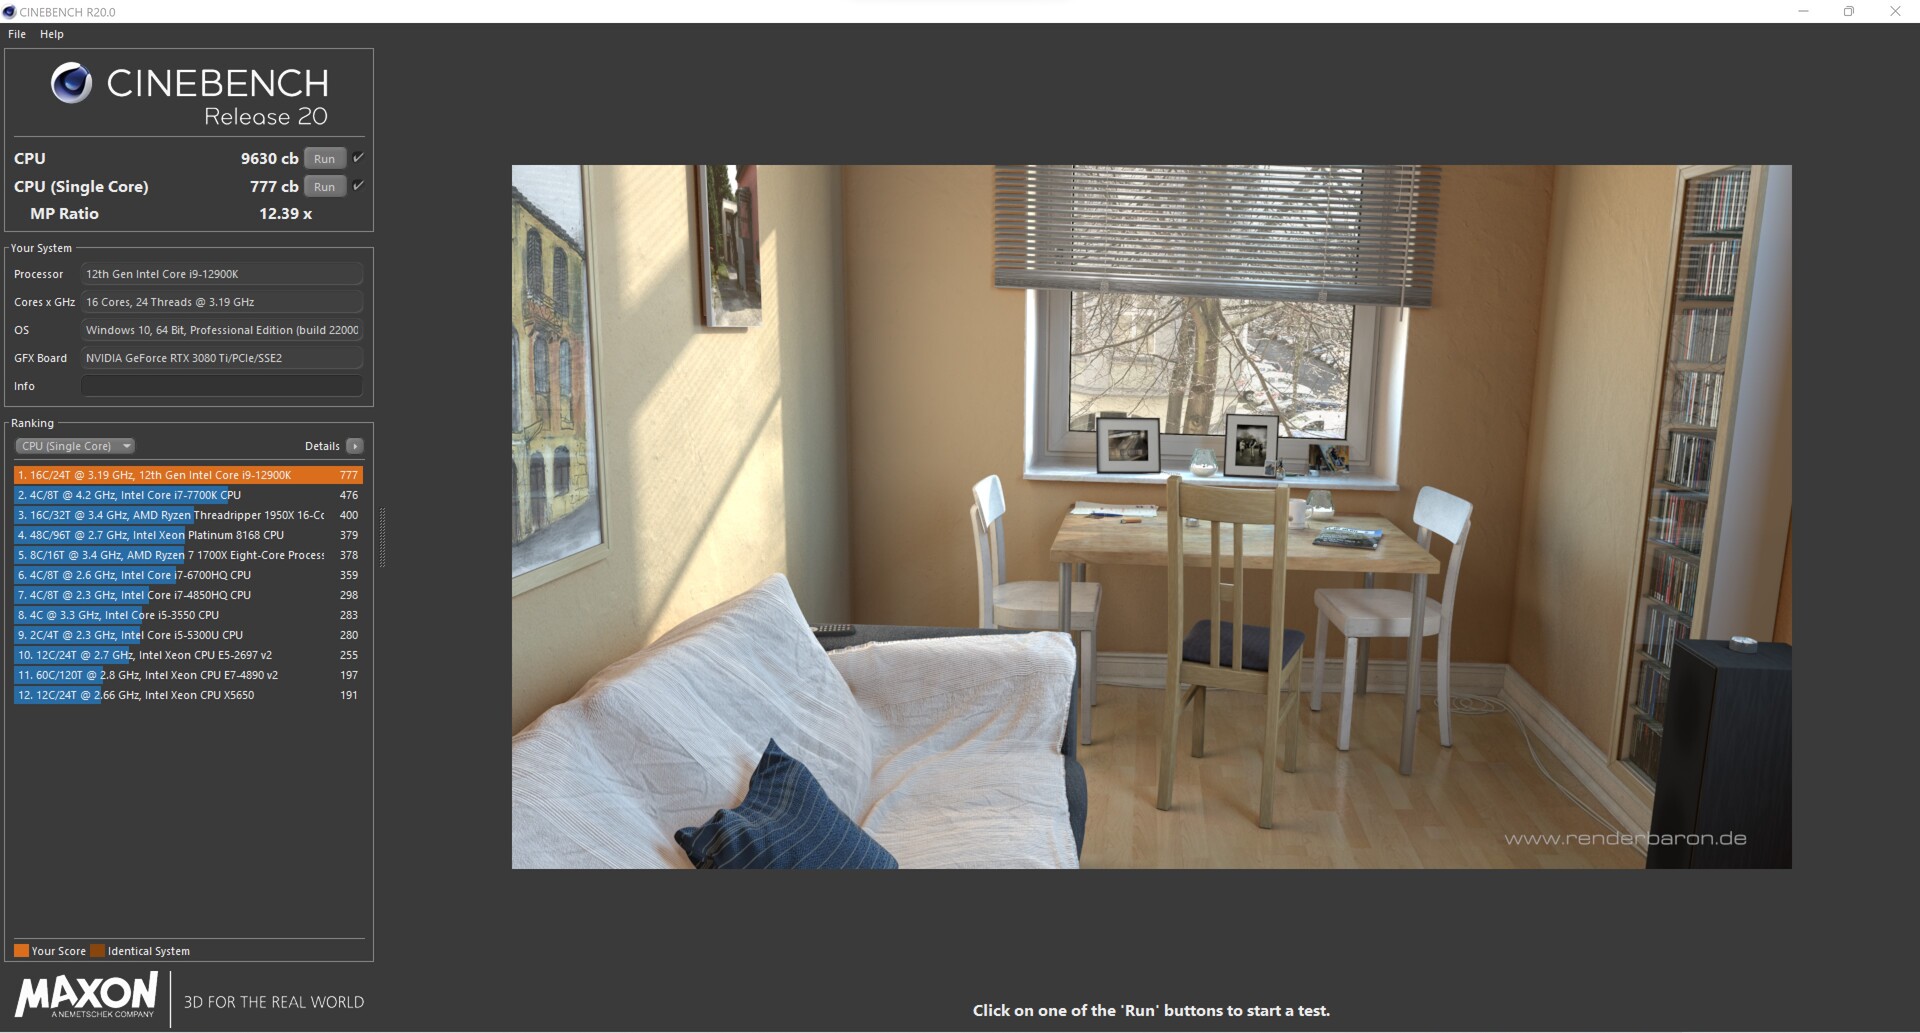
Cinebench R20: CPU (Multi Core) | CPU (Single Core)
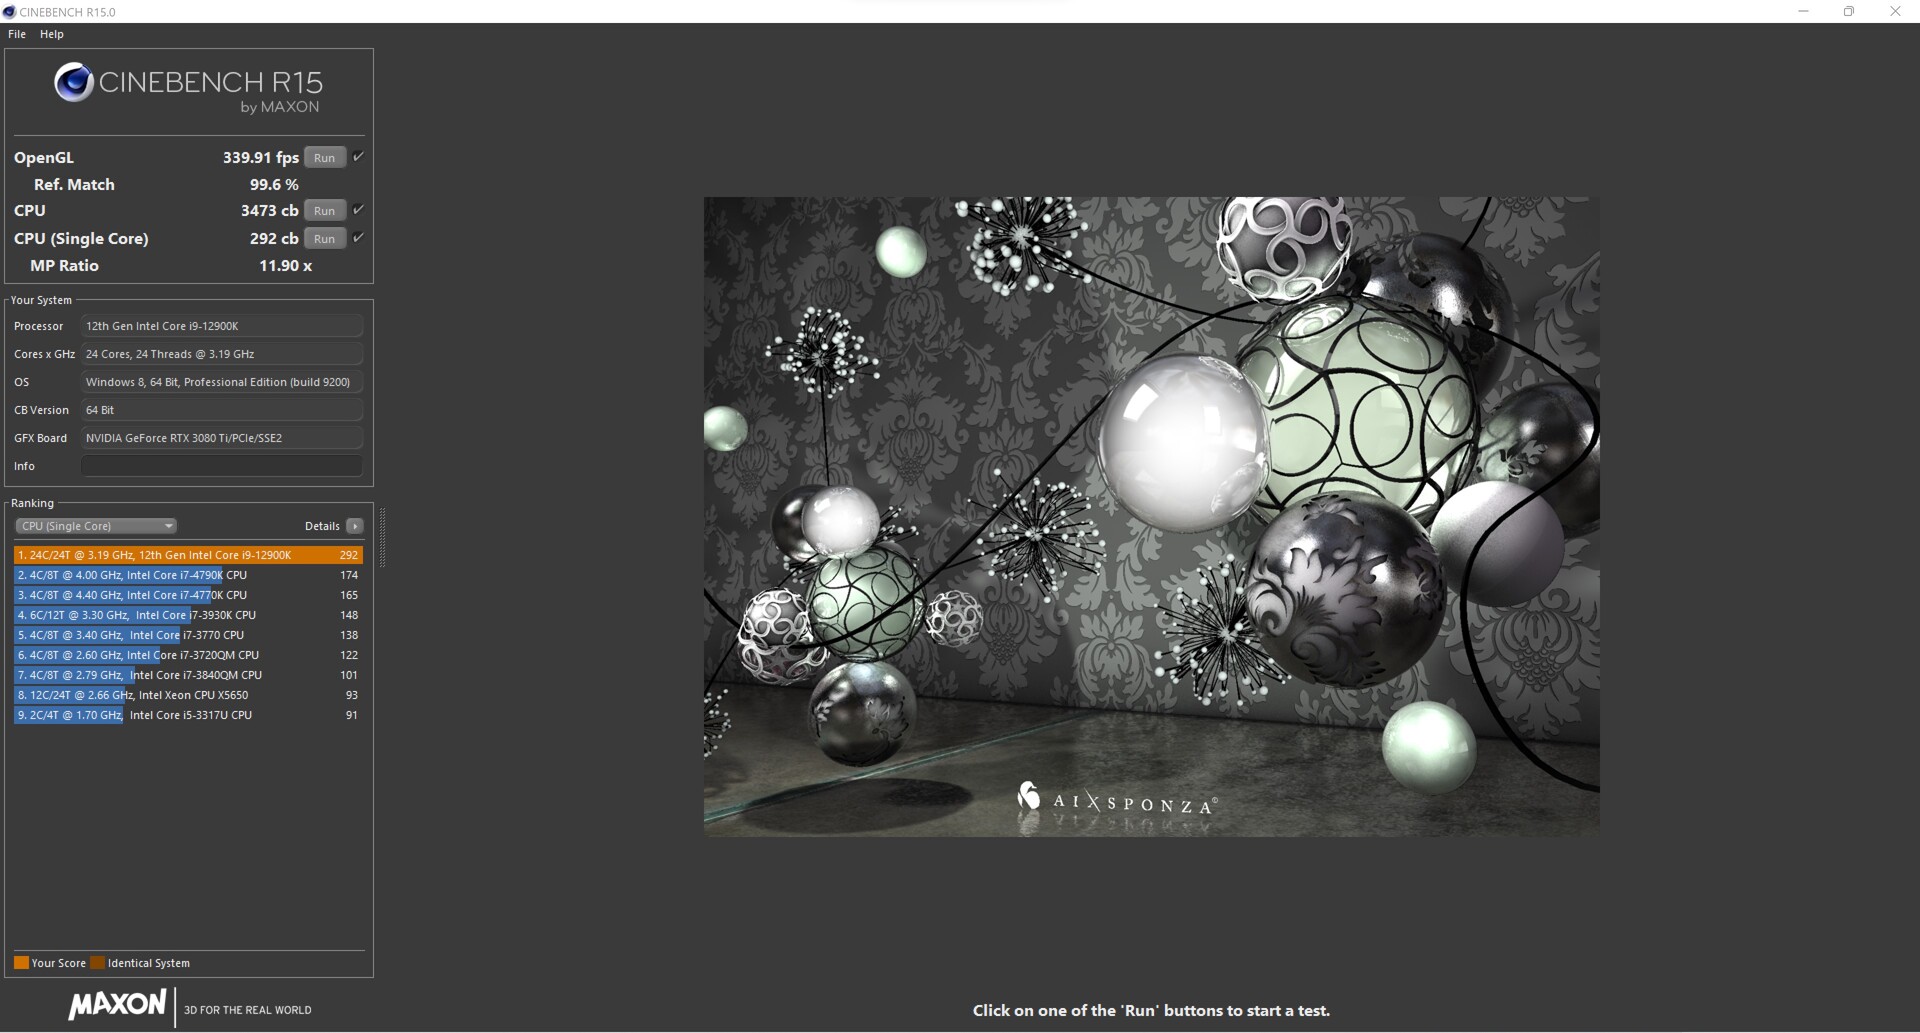
Cinebench R15: CPU Multi 64Bit | CPU Single 64Bit
Blender: v2.79 BMW27 CPU
7-Zip 18.03: 7z b 4 | 7z b 4 -mmt1
Geekbench 5.5: Multi-Core | Single-Core
HWBOT x265 Benchmark v2.2: 4k Preset
LibreOffice : 20 Documents To PDF
R Benchmark 2.5: Overall mean
| CPU Performance rating | |
| Average of class Desktop | |
| Intel Core i9-12900K | |
| Average Intel Core i9-12900K | |
| AMD Ryzen 9 5950X | |
| Intel Core i9-12900K | |
| AMD Ryzen 9 5900X | |
| Intel Core i9-11900K | |
| Intel Core i9-10900K | |
| Intel Core i9-9900K -6! | |
| Cinebench R23 / Multi Core | |
| Average of class Desktop (16119 - 44253, n=16, last 2 years) | |
| AMD Ryzen 9 5950X | |
| Intel Core i9-12900K | |
| Average Intel Core i9-12900K (25245 - 27005, n=2) | |
| Intel Core i9-12900K | |
| AMD Ryzen 9 5900X | |
| Intel Core i9-10900K | |
| Intel Core i9-11900K | |
| Cinebench R23 / Single Core | |
| Average of class Desktop (1722 - 2439, n=16, last 2 years) | |
| Intel Core i9-12900K | |
| Average Intel Core i9-12900K (1998 - 2011, n=2) | |
| Intel Core i9-12900K | |
| Intel Core i9-11900K | |
| AMD Ryzen 9 5950X | |
| AMD Ryzen 9 5900X | |
| Intel Core i9-10900K | |
| Cinebench R20 / CPU (Multi Core) | |
| Average of class Desktop (5710 - 17190, n=15, last 2 years) | |
| AMD Ryzen 9 5950X | |
| Intel Core i9-12900K | |
| Average Intel Core i9-12900K (9630 - 10240, n=2) | |
| Intel Core i9-12900K | |
| AMD Ryzen 9 5900X | |
| Intel Core i9-10900K | |
| Intel Core i9-11900K | |
| Intel Core i9-9900K | |
| Cinebench R20 / CPU (Single Core) | |
| Average of class Desktop (674 - 922, n=15, last 2 years) | |
| Intel Core i9-12900K | |
| Average Intel Core i9-12900K (766 - 777, n=2) | |
| Intel Core i9-12900K | |
| Intel Core i9-11900K | |
| AMD Ryzen 9 5950X | |
| AMD Ryzen 9 5900X | |
| Intel Core i9-10900K | |
| Intel Core i9-9900K | |
| Cinebench R15 / CPU Multi 64Bit | |
| Average of class Desktop (2652 - 6656, n=16, last 2 years) | |
| AMD Ryzen 9 5950X | |
| Intel Core i9-12900K | |
| Average Intel Core i9-12900K (3473 - 4102, n=3) | |
| AMD Ryzen 9 5900X | |
| Intel Core i9-12900K | |
| Intel Core i9-10900K | |
| Intel Core i9-11900K | |
| Intel Core i9-9900K | |
| Cinebench R15 / CPU Single 64Bit | |
| Average of class Desktop (246 - 356, n=16, last 2 years) | |
| Intel Core i9-12900K | |
| Average Intel Core i9-12900K (286 - 292, n=3) | |
| Intel Core i9-12900K | |
| AMD Ryzen 9 5950X | |
| AMD Ryzen 9 5900X | |
| Intel Core i9-11900K | |
| Intel Core i9-10900K | |
| Intel Core i9-9900K | |
| Blender / v2.79 BMW27 CPU | |
| Intel Core i9-9900K | |
| Intel Core i9-11900K | |
| Intel Core i9-10900K | |
| AMD Ryzen 9 5900X | |
| Intel Core i9-12900K | |
| Average Intel Core i9-12900K (121.1 - 128.3, n=2) | |
| Intel Core i9-12900K | |
| Average of class Desktop (75 - 218, n=15, last 2 years) | |
| AMD Ryzen 9 5950X | |
| 7-Zip 18.03 / 7z b 4 | |
| AMD Ryzen 9 5950X | |
| Average of class Desktop (91898 - 163125, n=17, last 2 years) | |
| Intel Core i9-12900K | |
| Average Intel Core i9-12900K (96960 - 97671, n=2) | |
| Intel Core i9-12900K | |
| AMD Ryzen 9 5900X | |
| Intel Core i9-10900K | |
| Intel Core i9-11900K | |
| Intel Core i9-9900K | |
| 7-Zip 18.03 / 7z b 4 -mmt1 | |
| Average of class Desktop (5092 - 8790, n=17, last 2 years) | |
| AMD Ryzen 9 5950X | |
| AMD Ryzen 9 5900X | |
| Intel Core i9-11900K | |
| Intel Core i9-12900K | |
| Average Intel Core i9-12900K (6571 - 6580, n=2) | |
| Intel Core i9-12900K | |
| Intel Core i9-10900K | |
| Intel Core i9-9900K | |
| Geekbench 5.5 / Multi-Core | |
| Average of class Desktop (12626 - 28535, n=30, last 2 years) | |
| Intel Core i9-12900K | |
| Average Intel Core i9-12900K (17698 - 17854, n=2) | |
| Intel Core i9-12900K | |
| AMD Ryzen 9 5950X | |
| AMD Ryzen 9 5900X | |
| Intel Core i9-10900K | |
| Intel Core i9-11900K | |
| Geekbench 5.5 / Single-Core | |
| Average of class Desktop (1755 - 2597, n=30, last 2 years) | |
| Intel Core i9-12900K | |
| Average Intel Core i9-12900K (1969 - 2042, n=2) | |
| Intel Core i9-12900K | |
| Intel Core i9-11900K | |
| AMD Ryzen 9 5950X | |
| AMD Ryzen 9 5900X | |
| Intel Core i9-10900K | |
| HWBOT x265 Benchmark v2.2 / 4k Preset | |
| Average of class Desktop (18.6 - 48.5, n=15, last 2 years) | |
| AMD Ryzen 9 5950X | |
| Intel Core i9-12900K | |
| Average Intel Core i9-12900K (29 - 30, n=2) | |
| Intel Core i9-12900K | |
| AMD Ryzen 9 5900X | |
| Intel Core i9-10900K | |
| Intel Core i9-11900K | |
| Intel Core i9-9900K | |
| LibreOffice / 20 Documents To PDF | |
| Intel Core i9-10900K | |
| Intel Core i9-11900K | |
| AMD Ryzen 9 5900X | |
| AMD Ryzen 9 5950X | |
| Average of class Desktop (35.5 - 79.2, n=16, last 2 years) | |
| Intel Core i9-12900K | |
| Average Intel Core i9-12900K (38.1 - 40.6, n=2) | |
| Intel Core i9-12900K | |
| R Benchmark 2.5 / Overall mean | |
| Intel Core i9-10900K | |
| Intel Core i9-11900K | |
| AMD Ryzen 9 5950X | |
| AMD Ryzen 9 5900X | |
| Intel Core i9-12900K | |
| Average Intel Core i9-12900K (0.3946 - 0.4216, n=2) | |
| Intel Core i9-12900K | |
| Average of class Desktop (0.3299 - 0.4909, n=16, last 2 years) | |
* ... smaller is better
AIDA64: FP32 Ray-Trace | FPU Julia | CPU SHA3 | CPU Queen | FPU SinJulia | FPU Mandel | CPU AES | CPU ZLib | FP64 Ray-Trace | CPU PhotoWorxx
| Performance rating | |
| Average of class Desktop | |
| AMD Ryzen 9 5950X, NVIDIA Titan RTX | |
| AMD Ryzen 9 5900X, NVIDIA Titan RTX | |
| Intel Core i9-11900K, NVIDIA Titan RTX | |
| Intel Core i9-12900K, NVIDIA GeForce RTX 3080 Ti | |
| Average Intel Core i9-12900K | |
| Intel Core i9-12900K, NVIDIA Titan RTX | |
| AIDA64 / FP32 Ray-Trace | |
| Average of class Desktop (12248 - 84577, n=21, last 2 years) | |
| AMD Ryzen 9 5950X, NVIDIA Titan RTX | |
| AMD Ryzen 9 5900X, NVIDIA Titan RTX | |
| Intel Core i9-11900K, NVIDIA Titan RTX | |
| Intel Core i9-12900K, NVIDIA Titan RTX | |
| Average Intel Core i9-12900K (12739 - 13345, n=3) | |
| Intel Core i9-12900K, NVIDIA GeForce RTX 3080 Ti | |
| AIDA64 / FPU Julia | |
| Average of class Desktop (65152 - 246125, n=21, last 2 years) | |
| AMD Ryzen 9 5950X, NVIDIA Titan RTX | |
| AMD Ryzen 9 5900X, NVIDIA Titan RTX | |
| Intel Core i9-11900K, NVIDIA Titan RTX | |
| Intel Core i9-12900K, NVIDIA Titan RTX | |
| Average Intel Core i9-12900K (58406 - 59419, n=3) | |
| Intel Core i9-12900K, NVIDIA GeForce RTX 3080 Ti | |
| AIDA64 / CPU SHA3 | |
| Average of class Desktop (2982 - 10804, n=21, last 2 years) | |
| Intel Core i9-11900K, NVIDIA Titan RTX | |
| Average Intel Core i9-12900K (4796 - 5127, n=3) | |
| Intel Core i9-12900K, NVIDIA Titan RTX | |
| Intel Core i9-12900K, NVIDIA GeForce RTX 3080 Ti | |
| AMD Ryzen 9 5950X, NVIDIA Titan RTX | |
| AMD Ryzen 9 5900X, NVIDIA Titan RTX | |
| AIDA64 / CPU Queen | |
| AMD Ryzen 9 5950X, NVIDIA Titan RTX | |
| AMD Ryzen 9 5900X, NVIDIA Titan RTX | |
| Average of class Desktop (76512 - 187912, n=18, last 2 years) | |
| Intel Core i9-12900K, NVIDIA Titan RTX | |
| Average Intel Core i9-12900K (112066 - 112694, n=3) | |
| Intel Core i9-12900K, NVIDIA GeForce RTX 3080 Ti | |
| Intel Core i9-11900K, NVIDIA Titan RTX | |
| AIDA64 / FPU SinJulia | |
| AMD Ryzen 9 5950X, NVIDIA Titan RTX | |
| AMD Ryzen 9 5900X, NVIDIA Titan RTX | |
| Average of class Desktop (6443 - 35251, n=21, last 2 years) | |
| Intel Core i9-12900K, NVIDIA Titan RTX | |
| Average Intel Core i9-12900K (14590 - 14664, n=3) | |
| Intel Core i9-12900K, NVIDIA GeForce RTX 3080 Ti | |
| Intel Core i9-11900K, NVIDIA Titan RTX | |
| AIDA64 / FPU Mandel | |
| Average of class Desktop (31697 - 129745, n=21, last 2 years) | |
| AMD Ryzen 9 5950X, NVIDIA Titan RTX | |
| AMD Ryzen 9 5900X, NVIDIA Titan RTX | |
| Intel Core i9-11900K, NVIDIA Titan RTX | |
| Intel Core i9-12900K, NVIDIA Titan RTX | |
| Average Intel Core i9-12900K (35801 - 39323, n=3) | |
| Intel Core i9-12900K, NVIDIA GeForce RTX 3080 Ti | |
| AIDA64 / CPU AES | |
| Intel Core i9-11900K, NVIDIA Titan RTX | |
| AMD Ryzen 9 5950X, NVIDIA Titan RTX | |
| Average of class Desktop (57777 - 513073, n=21, last 2 years) | |
| Intel Core i9-12900K, NVIDIA GeForce RTX 3080 Ti | |
| Average Intel Core i9-12900K (94062 - 140055, n=3) | |
| AMD Ryzen 9 5900X, NVIDIA Titan RTX | |
| Intel Core i9-12900K, NVIDIA Titan RTX | |
| AIDA64 / CPU ZLib | |
| AMD Ryzen 9 5950X, NVIDIA Titan RTX | |
| Average of class Desktop (887 - 2674, n=21, last 2 years) | |
| Average Intel Core i9-12900K (1537 - 1608, n=3) | |
| Intel Core i9-12900K, NVIDIA Titan RTX | |
| Intel Core i9-12900K, NVIDIA GeForce RTX 3080 Ti | |
| AMD Ryzen 9 5900X, NVIDIA Titan RTX | |
| Intel Core i9-11900K, NVIDIA Titan RTX | |
| AIDA64 / FP64 Ray-Trace | |
| Average of class Desktop (6471 - 44013, n=21, last 2 years) | |
| AMD Ryzen 9 5950X, NVIDIA Titan RTX | |
| AMD Ryzen 9 5900X, NVIDIA Titan RTX | |
| Intel Core i9-11900K, NVIDIA Titan RTX | |
| Intel Core i9-12900K, NVIDIA Titan RTX | |
| Average Intel Core i9-12900K (7586 - 8283, n=3) | |
| Intel Core i9-12900K, NVIDIA GeForce RTX 3080 Ti | |
| AIDA64 / CPU PhotoWorxx | |
| Intel Core i9-12900K, NVIDIA GeForce RTX 3080 Ti | |
| Intel Core i9-12900K, NVIDIA Titan RTX | |
| Average of class Desktop (38071 - 63949, n=21, last 2 years) | |
| Average Intel Core i9-12900K (33311 - 49236, n=3) | |
| Intel Core i9-11900K, NVIDIA Titan RTX | |
| AMD Ryzen 9 5950X, NVIDIA Titan RTX | |
| AMD Ryzen 9 5900X, NVIDIA Titan RTX | |
Cinebench R15多重恒定负载测试
我们使用Cinebench-R15多循环看一下恒定负载下的系统。通过这种方式,我们可以确定冷却系统是否足够强大,能够有效冷却处理器。在Corsair One i300中,AiO的工作非常可靠,即使在运行50次后,其结果也保持不变。然而,略低的TDP的英特尔酷睿i9-12900K在这里明显可以看出。如果你让酷睿i9-12900K不受限制地运行,它可以多实现近500分。
系统性能
在我们测试期间,整个系统的运行速度非常快。这也反映在系统基准测试中。在PCMark 10测试中,Corsair One i300在所有单项测试中都取得了领先。只有在渲染测试中,由于显卡的原因,Corsair One i300不大能够跟上。该 Nvidia Titan RTX的对比系统在这里是更好的选择,这是因为它与四核系列很接近。
| PCMark 10 | |
| Score | |
| Intel Core i9-12900K | |
| AMD Ryzen 9 5950X | |
| Intel Core i9-12900K | |
| AMD Ryzen 9 5900X | |
| Intel Core i9-11900K | |
| Intel Core i9-10900K | |
| Intel Core i9-9900K | |
| Essentials | |
| Intel Core i9-12900K | |
| AMD Ryzen 9 5950X | |
| Intel Core i9-12900K | |
| AMD Ryzen 9 5900X | |
| Intel Core i9-9900K | |
| Intel Core i9-11900K | |
| Intel Core i9-10900K | |
| Productivity | |
| AMD Ryzen 9 5950X | |
| Intel Core i9-12900K | |
| Intel Core i9-12900K | |
| AMD Ryzen 9 5900X | |
| Intel Core i9-11900K | |
| Intel Core i9-10900K | |
| Intel Core i9-9900K | |
| Digital Content Creation | |
| Intel Core i9-12900K | |
| AMD Ryzen 9 5950X | |
| Intel Core i9-12900K | |
| AMD Ryzen 9 5900X | |
| Intel Core i9-10900K | |
| Intel Core i9-9900K | |
| Intel Core i9-11900K | |
| SPECviewperf 12 | |
| 1900x1060 Solidworks (sw-03) | |
| AMD Ryzen 9 5950X | |
| Intel Core i9-11900K | |
| AMD Ryzen 9 5900X | |
| Intel Core i9-12900K | |
| Intel Core i9-10900K | |
| Intel Core i9-12900K | |
| Intel Core i9-9900K | |
| 1900x1060 Siemens NX (snx-02) | |
| Intel Core i9-12900K | |
| AMD Ryzen 9 5900X | |
| AMD Ryzen 9 5950X | |
| Intel Core i9-10900K | |
| Intel Core i9-11900K | |
| Intel Core i9-12900K | |
| Intel Core i9-9900K | |
| 1900x1060 Showcase (showcase-01) | |
| Intel Core i9-12900K | |
| Intel Core i9-11900K | |
| Intel Core i9-12900K | |
| Intel Core i9-10900K | |
| AMD Ryzen 9 5900X | |
| AMD Ryzen 9 5950X | |
| Intel Core i9-9900K | |
| 1900x1060 Medical (medical-01) | |
| Intel Core i9-12900K | |
| Intel Core i9-10900K | |
| AMD Ryzen 9 5900X | |
| Intel Core i9-12900K | |
| AMD Ryzen 9 5950X | |
| Intel Core i9-11900K | |
| Intel Core i9-9900K | |
| 1900x1060 Maya (maya-04) | |
| Intel Core i9-12900K | |
| Intel Core i9-12900K | |
| Intel Core i9-11900K | |
| Intel Core i9-9900K | |
| AMD Ryzen 9 5950X | |
| Intel Core i9-10900K | |
| AMD Ryzen 9 5900X | |
| 1900x1060 Energy (energy-01) | |
| Intel Core i9-12900K | |
| Intel Core i9-10900K | |
| AMD Ryzen 9 5900X | |
| Intel Core i9-11900K | |
| AMD Ryzen 9 5950X | |
| Intel Core i9-12900K | |
| Intel Core i9-9900K | |
| 1900x1060 Creo (creo-01) | |
| Intel Core i9-12900K | |
| AMD Ryzen 9 5900X | |
| Intel Core i9-11900K | |
| Intel Core i9-10900K | |
| AMD Ryzen 9 5950X | |
| Intel Core i9-12900K | |
| Intel Core i9-9900K | |
| 1900x1060 Catia (catia-04) | |
| Intel Core i9-12900K | |
| Intel Core i9-11900K | |
| AMD Ryzen 9 5900X | |
| AMD Ryzen 9 5950X | |
| Intel Core i9-10900K | |
| Intel Core i9-12900K | |
| Intel Core i9-9900K | |
| 1900x1060 3ds Max (3dsmax-05) | |
| Intel Core i9-12900K | |
| Intel Core i9-10900K | |
| AMD Ryzen 9 5900X | |
| AMD Ryzen 9 5950X | |
| Intel Core i9-11900K | |
| Intel Core i9-9900K | |
| Intel Core i9-12900K | |
| SPECviewperf 13 | |
| Solidworks (sw-04) | |
| Intel Core i9-12900K | |
| Intel Core i9-11900K | |
| AMD Ryzen 9 5900X | |
| AMD Ryzen 9 5950X | |
| Intel Core i9-10900K | |
| Intel Core i9-12900K | |
| Intel Core i9-9900K | |
| Siemens NX (snx-03) | |
| Intel Core i9-12900K | |
| AMD Ryzen 9 5900X | |
| AMD Ryzen 9 5950X | |
| Intel Core i9-10900K | |
| Intel Core i9-11900K | |
| Intel Core i9-12900K | |
| Intel Core i9-9900K | |
| Showcase (showcase-02) | |
| Intel Core i9-12900K | |
| Intel Core i9-12900K | |
| Intel Core i9-10900K | |
| Intel Core i9-11900K | |
| AMD Ryzen 9 5950X | |
| AMD Ryzen 9 5900X | |
| Intel Core i9-9900K | |
| Medical (medical-02) | |
| Intel Core i9-12900K | |
| Intel Core i9-12900K | |
| AMD Ryzen 9 5900X | |
| AMD Ryzen 9 5950X | |
| Intel Core i9-11900K | |
| Intel Core i9-10900K | |
| Intel Core i9-9900K | |
| Maya (maya-05) | |
| Intel Core i9-12900K | |
| Intel Core i9-12900K | |
| AMD Ryzen 9 5950X | |
| AMD Ryzen 9 5900X | |
| Intel Core i9-11900K | |
| Intel Core i9-10900K | |
| Intel Core i9-9900K | |
| Energy (energy-02) | |
| Intel Core i9-11900K | |
| Intel Core i9-10900K | |
| Intel Core i9-12900K | |
| AMD Ryzen 9 5900X | |
| AMD Ryzen 9 5950X | |
| Intel Core i9-12900K | |
| Intel Core i9-9900K | |
| Creo (creo-02) | |
| Intel Core i9-12900K | |
| Intel Core i9-12900K | |
| Intel Core i9-11900K | |
| AMD Ryzen 9 5900X | |
| AMD Ryzen 9 5950X | |
| Intel Core i9-10900K | |
| Intel Core i9-9900K | |
| Catia (catia-05) | |
| Intel Core i9-12900K | |
| AMD Ryzen 9 5950X | |
| Intel Core i9-11900K | |
| AMD Ryzen 9 5900X | |
| Intel Core i9-10900K | |
| Intel Core i9-12900K | |
| Intel Core i9-9900K | |
| 3ds Max (3dsmax-06) | |
| Intel Core i9-12900K | |
| Intel Core i9-10900K | |
| AMD Ryzen 9 5900X | |
| AMD Ryzen 9 5950X | |
| Intel Core i9-11900K | |
| Intel Core i9-9900K | |
| Intel Core i9-12900K | |
| LuxMark v2.0 64Bit | |
| Room GPUs-only | |
| Intel Core i9-12900K | |
| Intel Core i9-9900K | |
| Sala GPUs-only | |
| Intel Core i9-12900K | |
| Intel Core i9-9900K | |
| ComputeMark v2.1 | |
| 1024x600 Normal, Score | |
| Intel Core i9-12900K | |
| Intel Core i9-9900K | |
| 1024x600 Normal, Fluid 3DTex | |
| Intel Core i9-12900K | |
| Intel Core i9-9900K | |
| 1024x600 Normal, Fluid 2DTexArr | |
| Intel Core i9-12900K | |
| Intel Core i9-9900K | |
| 1024x600 Normal, Mandel Vector | |
| Intel Core i9-12900K | |
| Intel Core i9-9900K | |
| 1024x600 Normal, Mandel Scalar | |
| Intel Core i9-12900K | |
| Intel Core i9-9900K | |
| 1024x600 Normal, QJuliaRayTrace | |
| Intel Core i9-12900K | |
| Intel Core i9-9900K | |
| PCMark 10 Score | 8897 points | |
Help | ||
存储解决方案
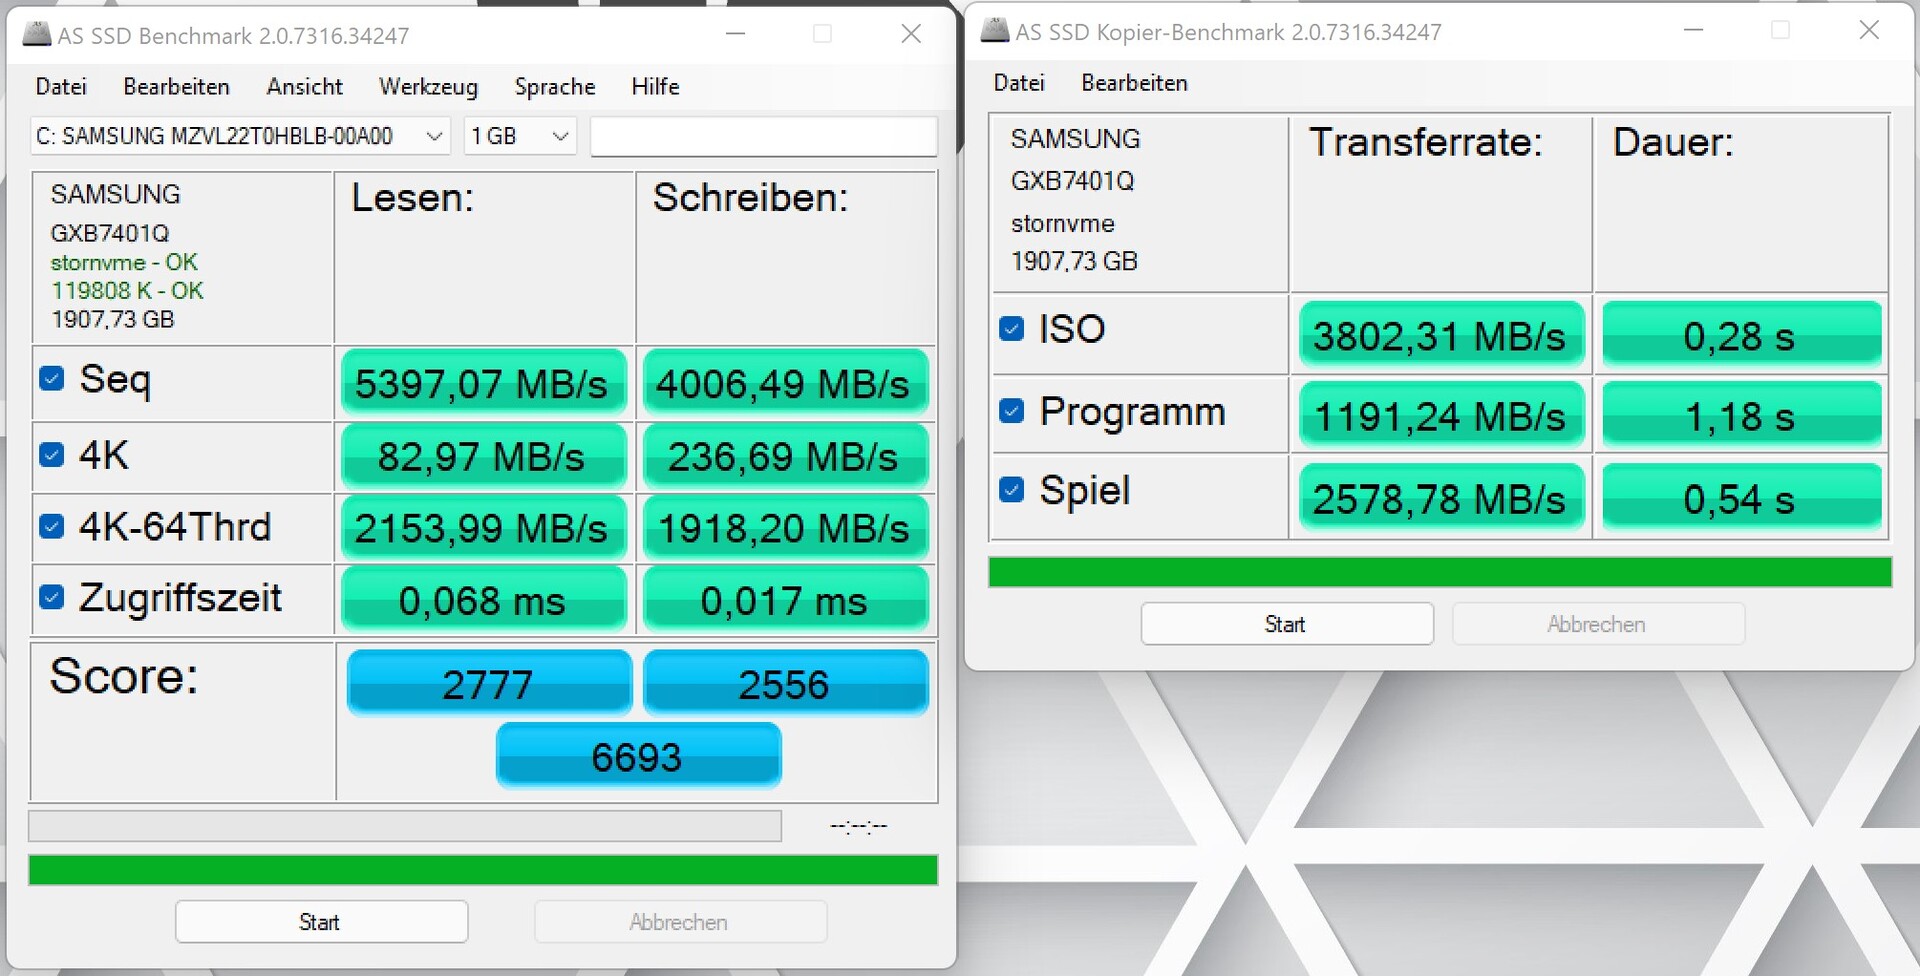
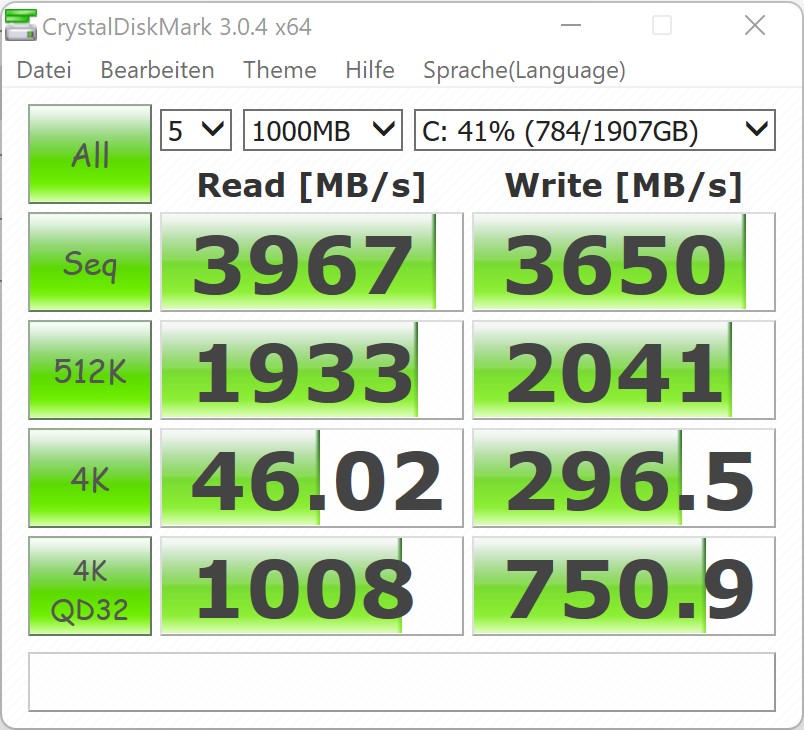
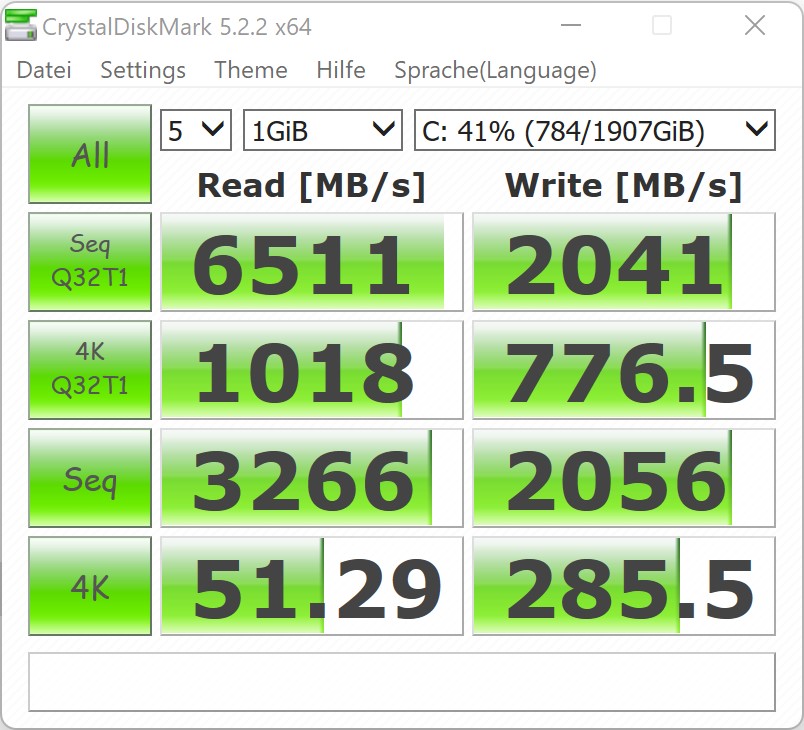
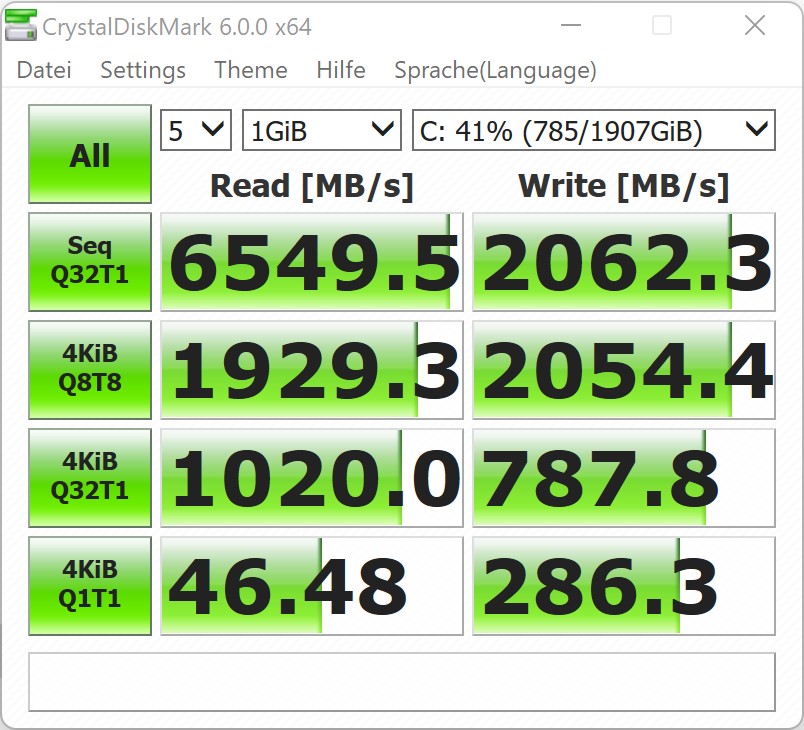
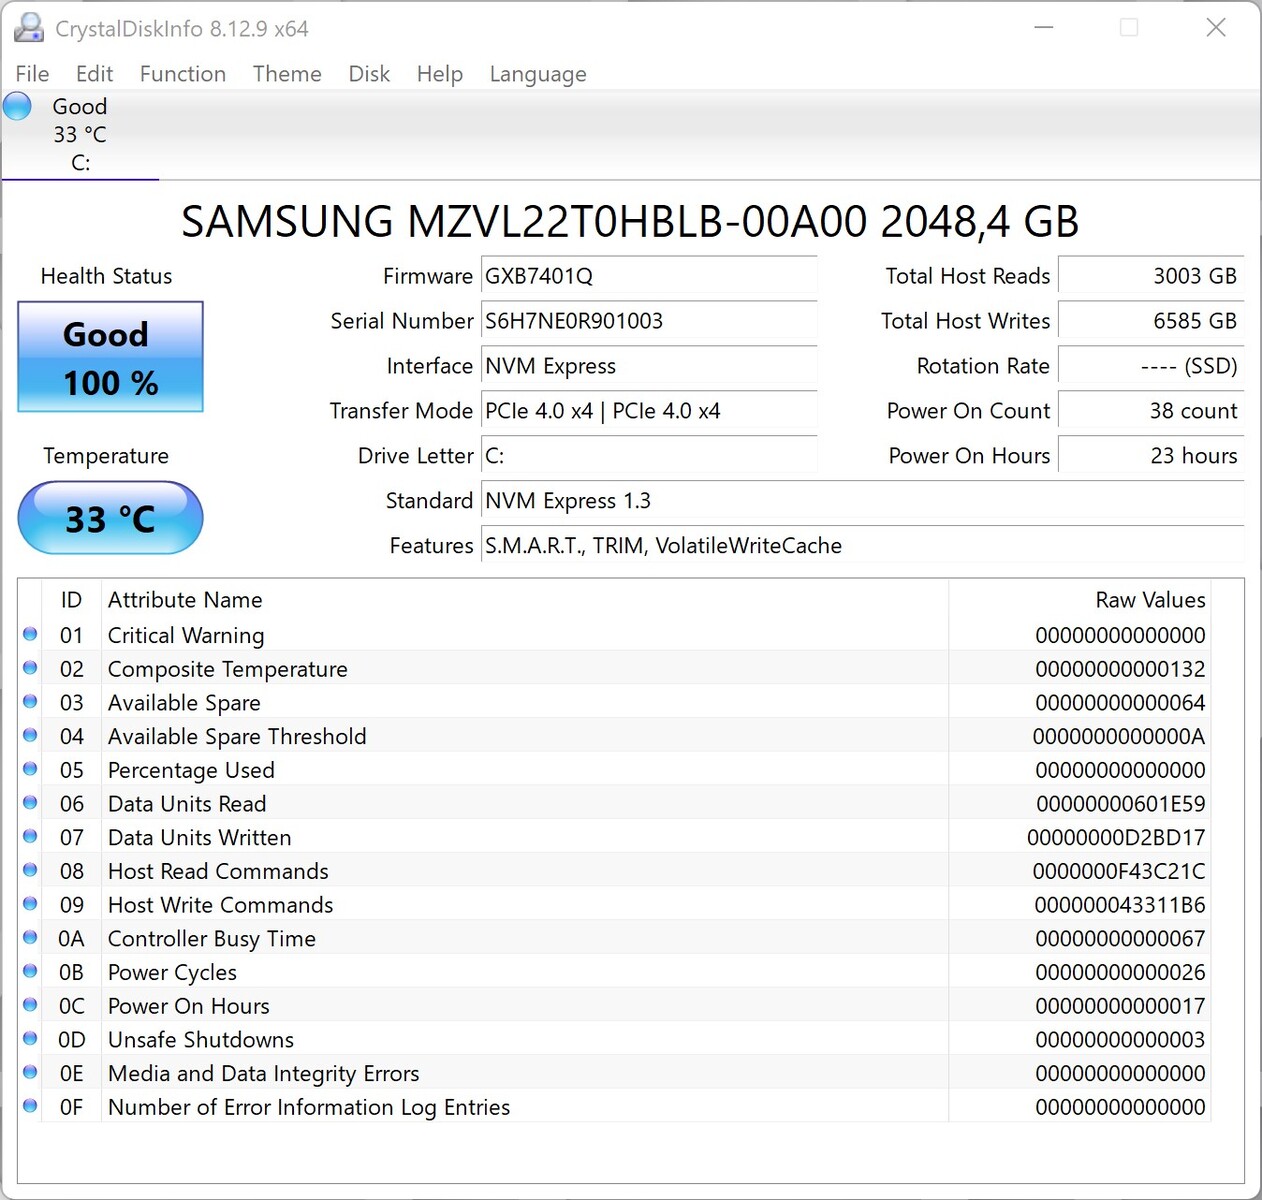
正如上面已经提到的,海盗船One i160配备了两个存储模块。该系统安装了三星的512GB快速PCIe固态硬盘,还有一个提供2TB存储的传统硬盘。
在测试中,三星固态硬盘提供了一个非常好的性能,使整个系统受益。然而,为了获得更好的整体性能,海盗船应该只给PC配备固态硬盘。希捷硬盘的平均传输速率为107MB/s。虽然这个数值并不差,但与固态硬盘相比,硬盘在性能方面有明显的劣势。
不幸的是,紧凑的机箱并没有为额外的存储模块提供任何空间。

| Drive Performance rating - Percent | |
| Average of class Desktop | |
| Corsair One i300 | |
| Average Samsung PM9A1 MZVL22T0HBLB | |
| AMD Ryzen 9 5950X | |
| Intel Beast Canyon NUC | |
| Corsair One i160 -8! | |
| Zotac Magnus One (ECM73070C) | |
* ... smaller is better
图形卡
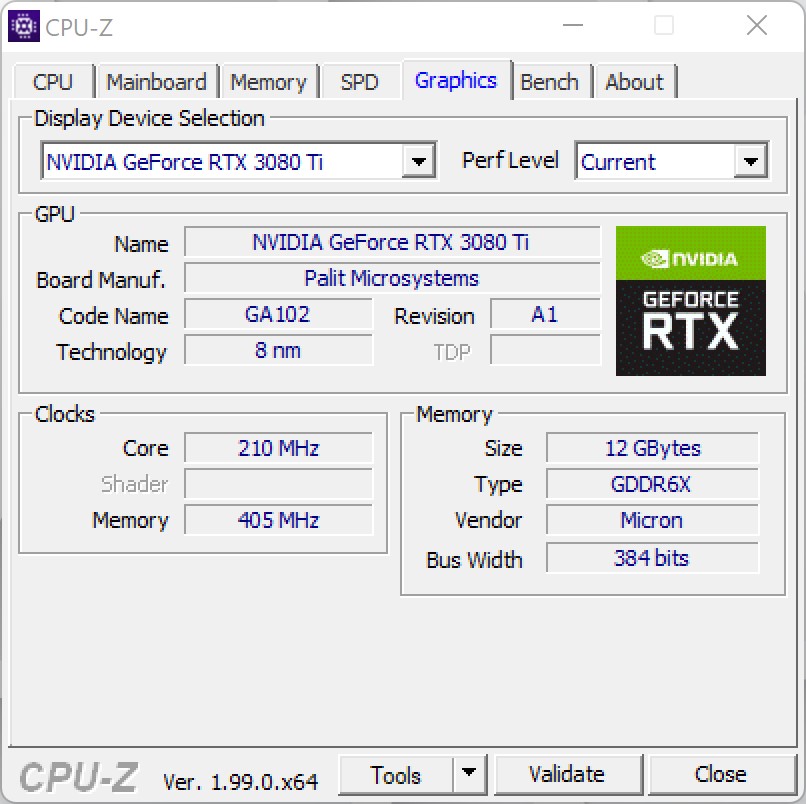
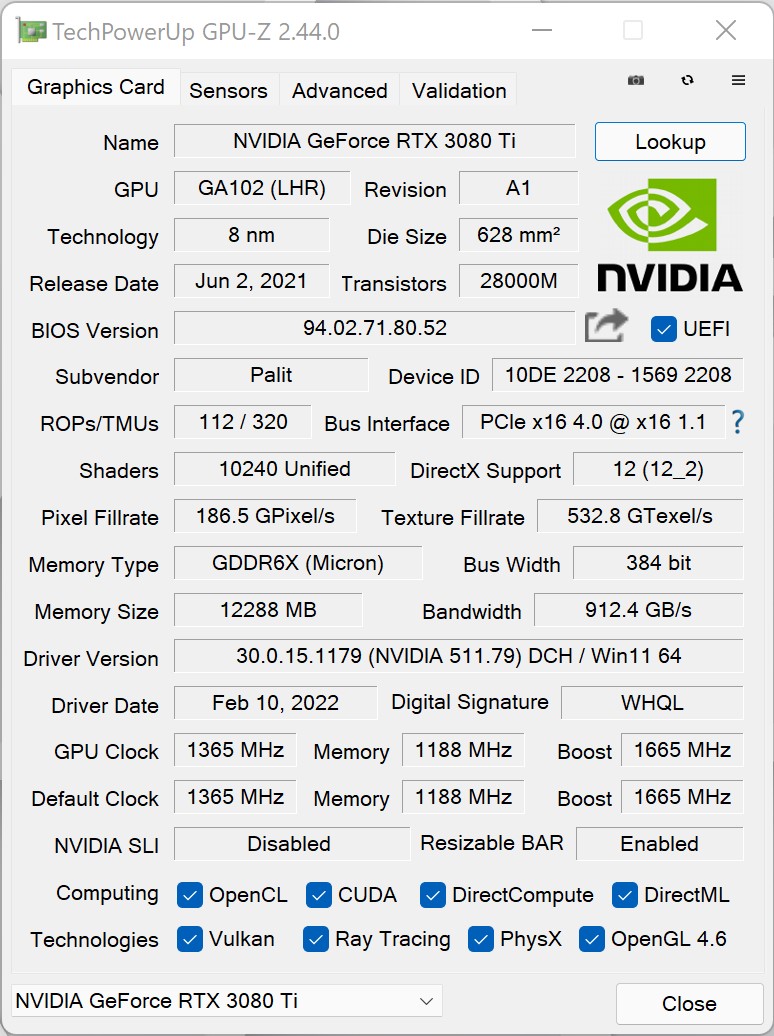
在这个紧凑的游戏系统中,海盗船使用了一个NvidiaGeForce RTX 3080 Ti,在性能方面与NvidiaGeForce RTX 3090几乎相同。然而,12GB的VRAM,它只提供了Nvidia顶级型号的一半内存,但这对于目前的游戏来说并不重要。显卡的冷却设计得非常好,因为它和CPU一样采用了AiO。此外,显卡上还有两个小风扇,以便为变压器和VRAM提供一些额外的主动冷却。 如果你看一下合成基准,你就会发现这种设计效果很好。Corsair One i300也取得了最好的价值,因为它采用了 英特尔酷睿i9-12900K.
相比之下 海卫一i160相比,你可以期待性能提高20-30%。
| 3DMark 11 - 1280x720 Performance GPU | |
| Average of class Desktop (3175 - 130697, n=34, last 2 years) | |
| Average NVIDIA GeForce RTX 3080 Ti (59799 - 62189, n=4) | |
| Corsair One i300 | |
| Nvidia GeForce RTX 3090 Founders Edition | |
| AMD Radeon RX 6800 | |
| Intel Core i9-12900K | |
| MSI GeForce RTX 3080 Gaming X Trio | |
| Corsair One i160 | |
| AMD Radeon RX 6700 XT | |
| MSI GeForce RTX 3070 Ventus 3X | |
| 3DMark | |
| 2560x1440 Time Spy Graphics | |
| Average of class Desktop (669 - 49144, n=50, last 2 years) | |
| Average NVIDIA GeForce RTX 3080 Ti (19041 - 19460, n=4) | |
| Corsair One i300 | |
| Nvidia GeForce RTX 3090 Founders Edition | |
| MSI GeForce RTX 3080 Gaming X Trio | |
| AMD Radeon RX 6800 | |
| Intel Core i9-12900K | |
| Corsair One i160 | |
| MSI GeForce RTX 3070 Ventus 3X | |
| AMD Radeon RX 6700 XT | |
| 3840x2160 Fire Strike Ultra Graphics | |
| Average of class Desktop (473 - 33689, n=44, last 2 years) | |
| Corsair One i300 | |
| Average NVIDIA GeForce RTX 3080 Ti (12050 - 12341, n=4) | |
| Nvidia GeForce RTX 3090 Founders Edition | |
| MSI GeForce RTX 3080 Gaming X Trio | |
| AMD Radeon RX 6800 | |
| Intel Core i9-12900K | |
| AMD Radeon RX 6700 XT | |
| MSI GeForce RTX 3070 Ventus 3X | |
| Corsair One i160 | |
| Fire Strike Extreme Graphics | |
| Average of class Desktop (1015 - 62405, n=44, last 2 years) | |
| Corsair One i300 | |
| Average NVIDIA GeForce RTX 3080 Ti (23127 - 24250, n=4) | |
| Nvidia GeForce RTX 3090 Founders Edition | |
| AMD Radeon RX 6800 | |
| MSI GeForce RTX 3080 Gaming X Trio | |
| Intel Core i9-12900K | |
| AMD Radeon RX 6700 XT | |
| Corsair One i160 | |
| MSI GeForce RTX 3070 Ventus 3X | |
| 3DMark 05 Standard | 63621 points | |
| 3DMark 06 Standard Score | 66161 points | |
| 3DMark Vantage P Result | 120236 points | |
| 3DMark 11 Performance | 47170 points | |
| 3DMark Ice Storm Standard Score | 336443 points | |
| 3DMark Cloud Gate Standard Score | 81921 points | |
| 3DMark Fire Strike Score | 40079 points | |
| 3DMark Fire Strike Extreme Score | 23109 points | |
| 3DMark Time Spy Score | 18985 points | |
Help | ||
游戏性能
由于海盗船在One i300中使用了最先进的硬件,因此很明显,该系统的游戏性能也达到了顶级水平。目前,你可以在2160p下享受所有的游戏,没有任何妥协。与我们之前测试的其他桌面GPU相比,我们的测试装置的性能原来明显更好。相比之下,相对较高的优势是 NvidiaGeForce RTX 3090是由于Corsair One i300的CPU更好。我们的GPU测试系统是基于一个 AMD Ryzen 9 5900X,与英特尔酷睿i9-12900K相比,它有一个明显的缺点 英特尔酷睿i9-12900K.
如同在CPU测试中一样,我们也将显卡置于较长时间的负载之下。为了做到这一点,我们使用了 "Witcher 3"的超预设。在测试过程中,显示卡的性能 NvidiaGeForce RTX 3080 Ti的性能始终保持稳定,我们没有注意到任何性能下降。在平均每秒189帧的情况下,游戏运行得非常好,允许你也使用165赫兹的显示器。
| The Witcher 3 | |
| 1920x1080 Ultra Graphics & Postprocessing (HBAO+) | |
| Corsair One i300 | |
| Average NVIDIA GeForce RTX 3090 (160 - 192.6, n=18) | |
| Average AMD Radeon RX 6800 (152.1 - 156, n=3) | |
| Average NVIDIA GeForce RTX 3080 (145 - 152, n=2) | |
| Average NVIDIA Titan RTX (124 - 150, n=28) | |
| Average AMD Radeon RX 6700 XT (117 - 130.4, n=3) | |
| Average NVIDIA GeForce RTX 3070 (52.8 - 132.2, n=7) | |
| 3840x2160 High Graphics & Postprocessing (Nvidia HairWorks Off) | |
| Average NVIDIA GeForce RTX 3090 (128 - 160.2, n=14) | |
| Corsair One i300 | |
| Average NVIDIA GeForce RTX 3080 (114 - 115, n=2) | |
| Average NVIDIA Titan RTX (94 - 107.1, n=28) | |
| Average AMD Radeon RX 6800 (96.8 - 100.7, n=3) | |
| Average NVIDIA GeForce RTX 3070 (84 - 93.9, n=5) | |
| Average AMD Radeon RX 6700 XT (63 - 75.7, n=3) | |
| Rise of the Tomb Raider | |
| 1920x1080 Very High Preset AA:FX AF:16x | |
| Average NVIDIA GeForce RTX 3090 (240 - 254, n=2) | |
| Average NVIDIA GeForce RTX 3080 (217 - 233, n=2) | |
| Corsair One i300 | |
| Average NVIDIA Titan RTX (n=1) | |
| Average AMD Radeon RX 6800 (n=1) | |
| Average NVIDIA GeForce RTX 3070 (151 - 169, n=3) | |
| Average AMD Radeon RX 6700 XT (n=1) | |
| 3840x2160 High Preset AA:FX AF:4x | |
| Average NVIDIA GeForce RTX 3090 (128 - 128.1, n=2) | |
| Corsair One i300 | |
| Average NVIDIA GeForce RTX 3080 (107 - 114, n=2) | |
| Average NVIDIA Titan RTX (n=1) | |
| Average AMD Radeon RX 6800 (n=1) | |
| Average NVIDIA GeForce RTX 3070 (76.7 - 83.8, n=3) | |
| Average AMD Radeon RX 6700 XT (n=1) | |
| Far Cry 6 | |
| 1920x1080 Ultra Graphics Quality + HD Textures AA:T | |
| Corsair One i300 | |
| Average NVIDIA GeForce RTX 3090 (94 - 177.6, n=10) | |
| Average AMD Radeon RX 6800 (116 - 152.5, n=3) | |
| Average NVIDIA Titan RTX (94.7 - 138.9, n=6) | |
| Average AMD Radeon RX 6700 XT (102 - 136.6, n=3) | |
| Average NVIDIA GeForce RTX 3070 (91 - 114.2, n=2) | |
| Average NVIDIA GeForce RTX 3080 (n=1) | |
| 3840x2160 Ultra Graphics Quality + HD Textures AA:T | |
| Average NVIDIA GeForce RTX 3090 (77 - 86.7, n=10) | |
| Corsair One i300 | |
| Average NVIDIA GeForce RTX 3080 (n=1) | |
| Average AMD Radeon RX 6800 (68.1 - 69.7, n=3) | |
| Average NVIDIA Titan RTX (52.8 - 64.2, n=6) | |
| Average AMD Radeon RX 6700 XT (50 - 52.7, n=3) | |
| Average NVIDIA GeForce RTX 3070 (26.4 - 57, n=2) | |
| F1 2021 | |
| 1920x1080 Ultra High Preset + Raytracing AA:T AF:16x | |
| Corsair One i300 | |
| Average NVIDIA GeForce RTX 3090 (154 - 244, n=13) | |
| Average AMD Radeon RX 6800 (167 - 175.5, n=3) | |
| Average NVIDIA Titan RTX (160 - 172, n=6) | |
| Average NVIDIA GeForce RTX 3070 (148 - 158, n=2) | |
| Average NVIDIA GeForce RTX 3080 (n=1) | |
| Average AMD Radeon RX 6700 XT (143 - 145.2, n=3) | |
| 3840x2160 Ultra High Preset + Raytracing AA:T AF:16x | |
| Average NVIDIA GeForce RTX 3090 (100.4 - 110, n=13) | |
| Corsair One i300 | |
| Average NVIDIA GeForce RTX 3080 (n=1) | |
| Average NVIDIA Titan RTX (71.9 - 74.5, n=6) | |
| Average AMD Radeon RX 6800 (71.8 - 74, n=3) | |
| Average NVIDIA GeForce RTX 3070 (64 - 67.3, n=2) | |
| Average AMD Radeon RX 6700 XT (56.3 - 56.9, n=3) | |
The Witcher 3 FPS Chart
| low | med. | high | ultra | QHD | 4K | |
|---|---|---|---|---|---|---|
| GTA V (2015) | 187 | 187 | 187 | 149 | 147 | 180 |
| The Witcher 3 (2015) | 681 | 554 | 365 | 183 | 149 | |
| Dota 2 Reborn (2015) | 240.3 | 214.8 | 207.6 | 196.1 | 191.5 | |
| Rise of the Tomb Raider (2016) | 487 | 340 | 257 | 221 | 114 | |
| Final Fantasy XV Benchmark (2018) | 232 | 227 | 175 | 136 | 84 | |
| X-Plane 11.11 (2018) | 205 | 178 | 135 | 118 | ||
| Far Cry 5 (2018) | 230 | 200 | 190 | 175 | 168 | 108 |
| Strange Brigade (2018) | 667 | 484 | 392 | 345 | 260 | 156 |
| Shadow of the Tomb Raider (2018) | 245 | 226 | 226 | 212 | 164 | 93.7 |
| Far Cry New Dawn (2019) | 190 | 165 | 157 | 141 | 137 | 107 |
| Metro Exodus (2019) | 258 | 212 | 169 | 137 | 113 | 75 |
| Anno 1800 (2019) | 159 | 163 | 124 | 69.4 | 66.1 | 55.9 |
| Control (2019) | 240 | 233 | 187 | 124 | 63.9 | |
| Borderlands 3 (2019) | 208 | 181 | 167 | 152 | 125 | 72 |
| F1 2020 (2020) | 478 | 379 | 397 | 298 | 233 | 143 |
| F1 2021 (2021) | 534 | 498 | 410 | 219 | 170 | 101 |
| New World (2021) | 194 | 165 | 153 | 142 | 133 | 79.2 |
| Far Cry 6 (2021) | 200 | 176 | 155 | 149 | 129 | 81.6 |
| Guardians of the Galaxy (2021) | 194 | 196 | 191 | 191 | 186 | 110 |
| Riders Republic (2021) | 284 | 220 | 188 | 176 | 136 | 80 |
| Forza Horizon 5 (2021) | 292 | 200 | 188 | 126 | 111 | 84 |
| Battlefield 2042 (2021) | 216 | 194 | 169 | 150 | 123 | 83 |
| Farming Simulator 22 (2021) | 349 | 270 | 226 | 203 | 201 | 157 |
| Halo Infinite (2021) | 229 | 198 | 188 | 142 | 83.1 | |
| God of War (2022) | 209 | 181 | 163 | 117 | 98.7 | 64.7 |
| Rainbow Six Extraction (2022) | 365 | 353 | 348 | 282 | 194 | 104 |
| Dying Light 2 (2022) | 189 | 164 | 149 | 109 | 61.5 |
排放
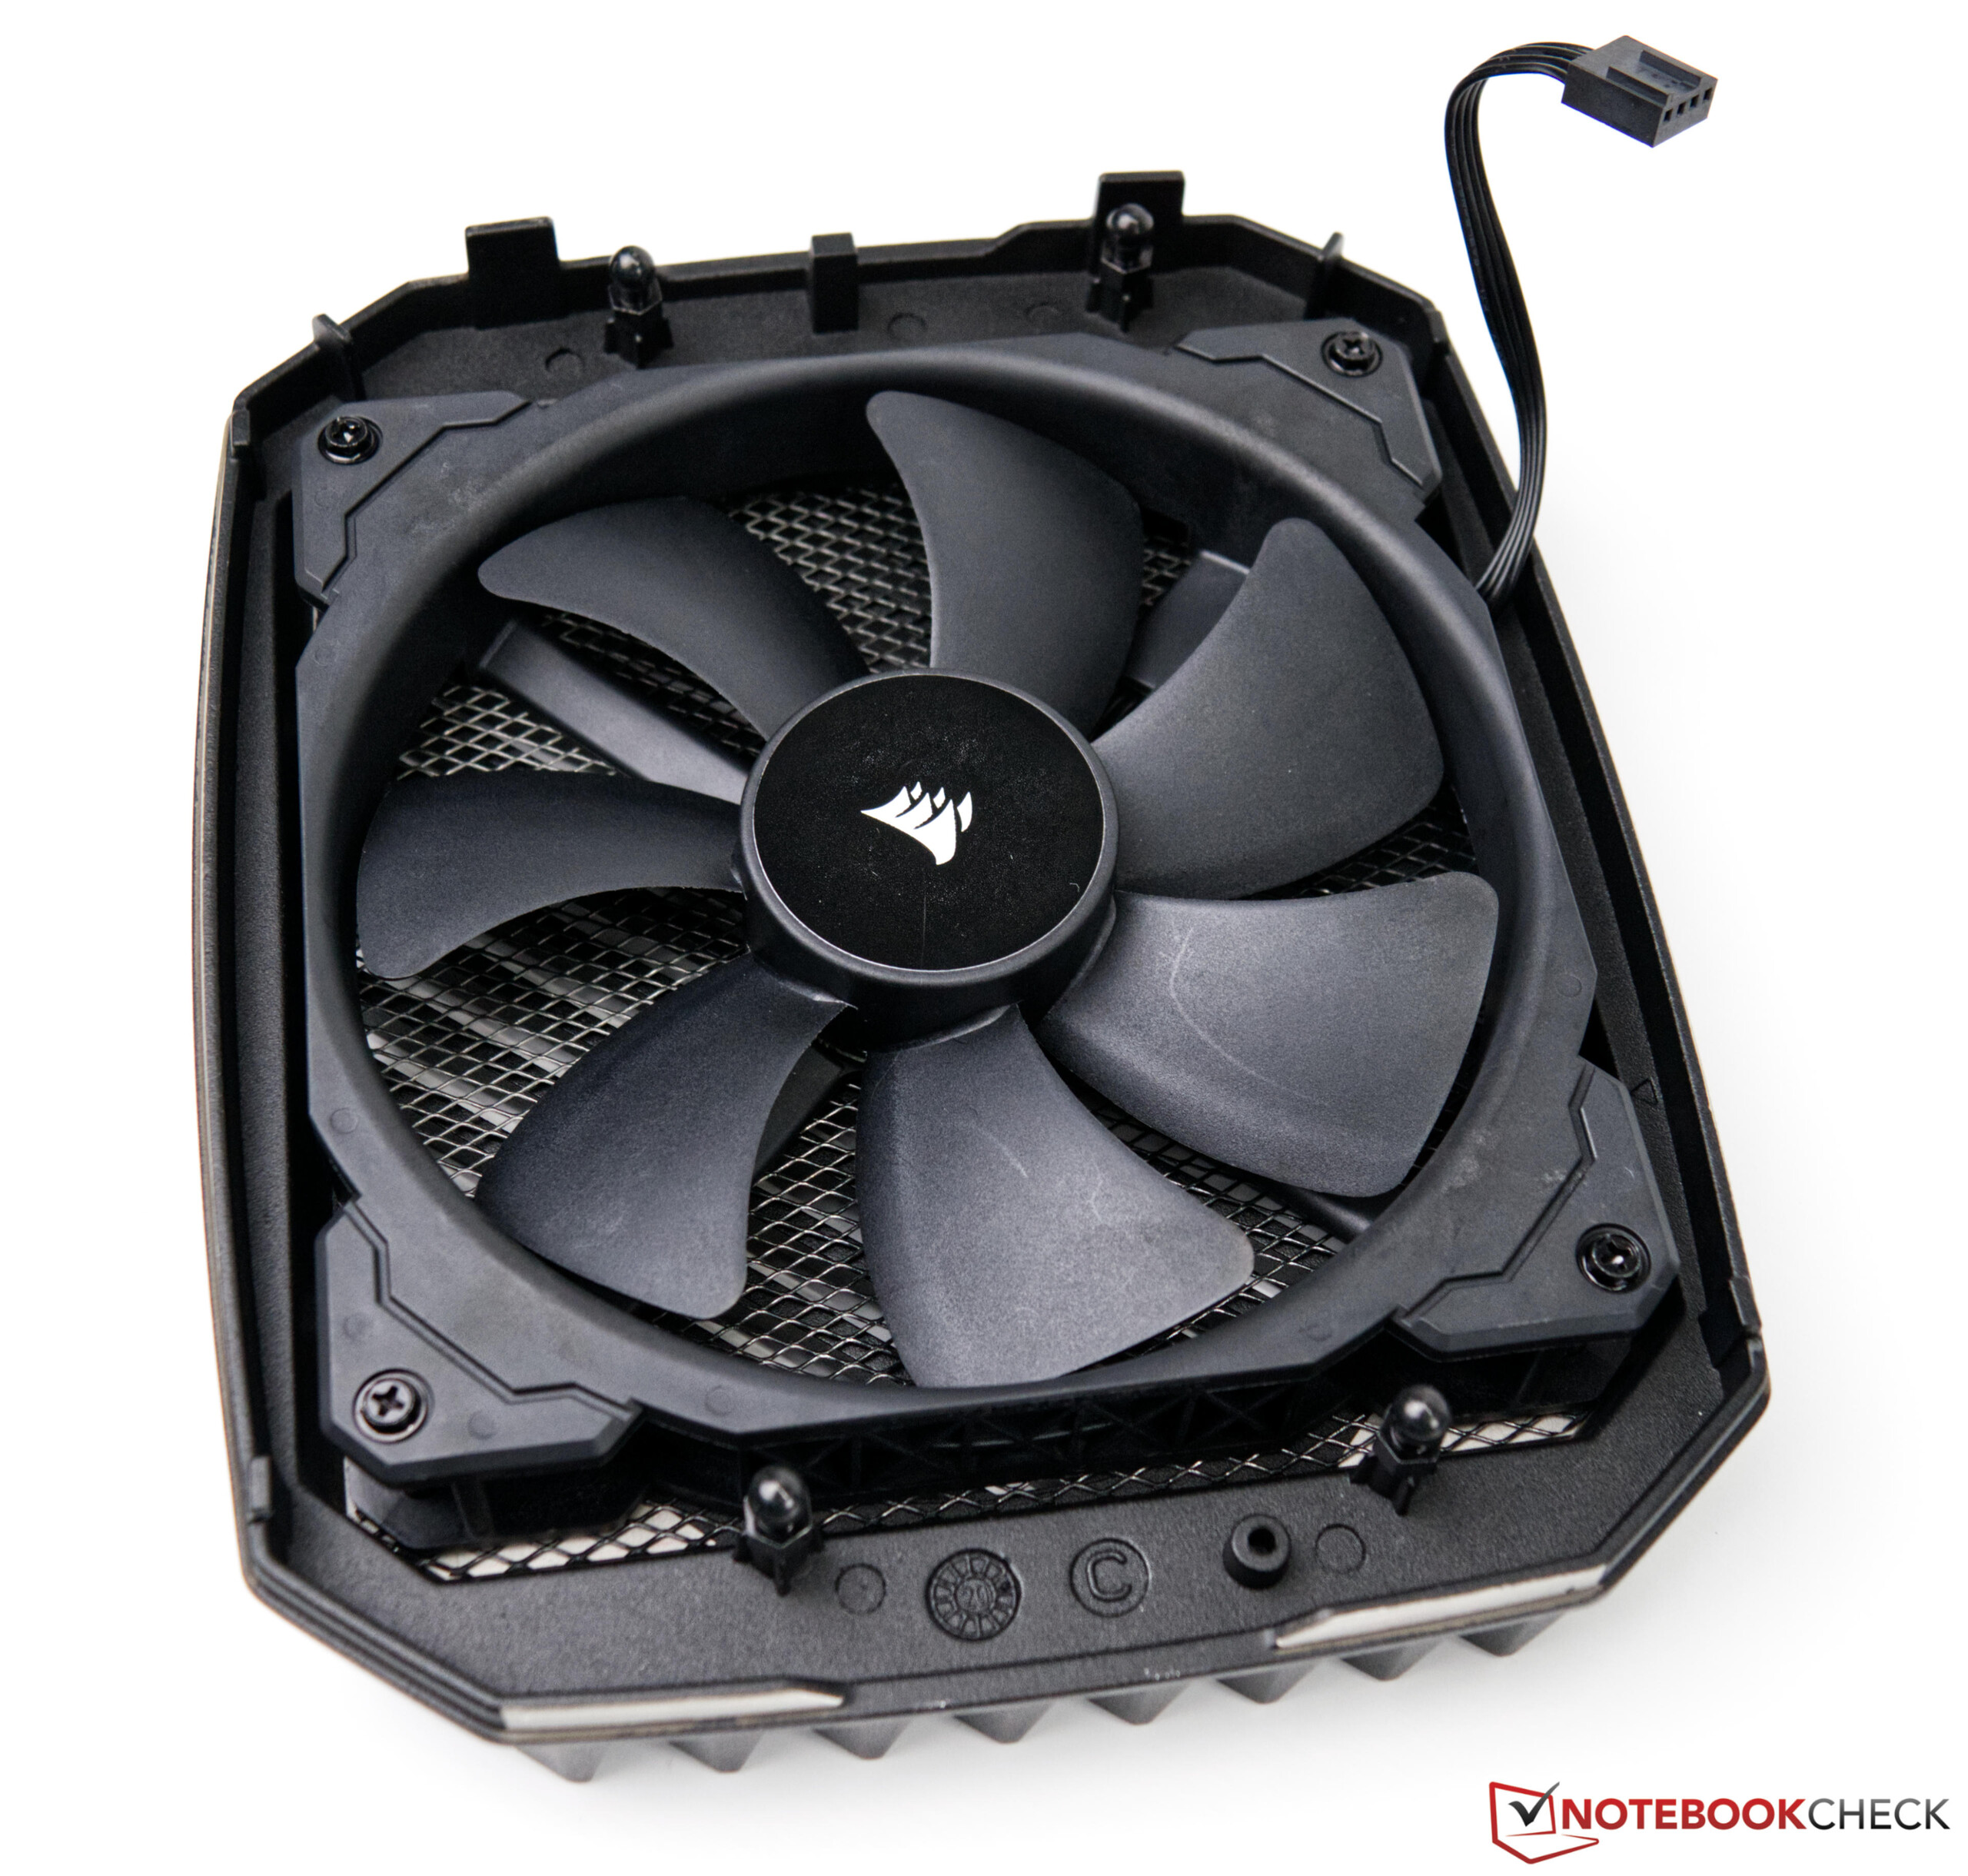
噪声排放
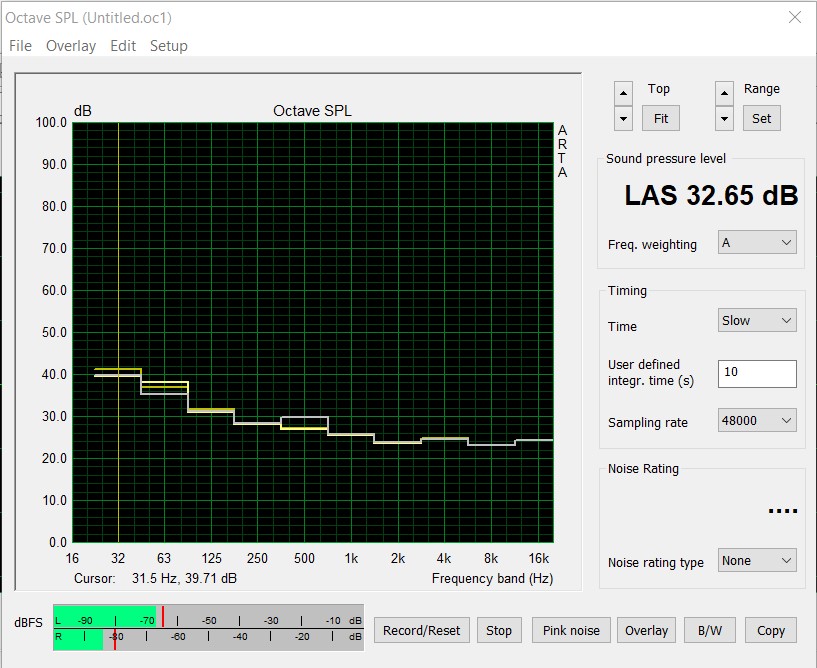
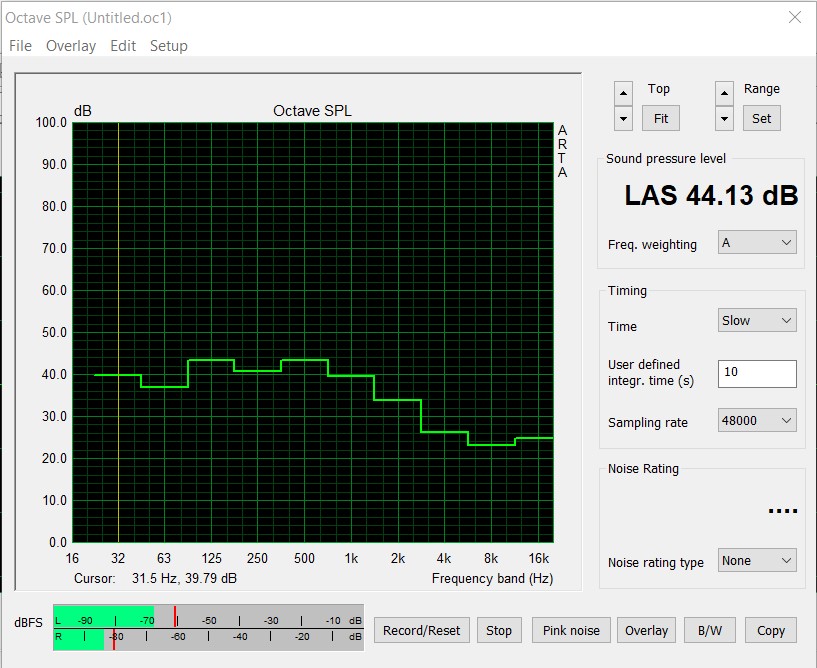
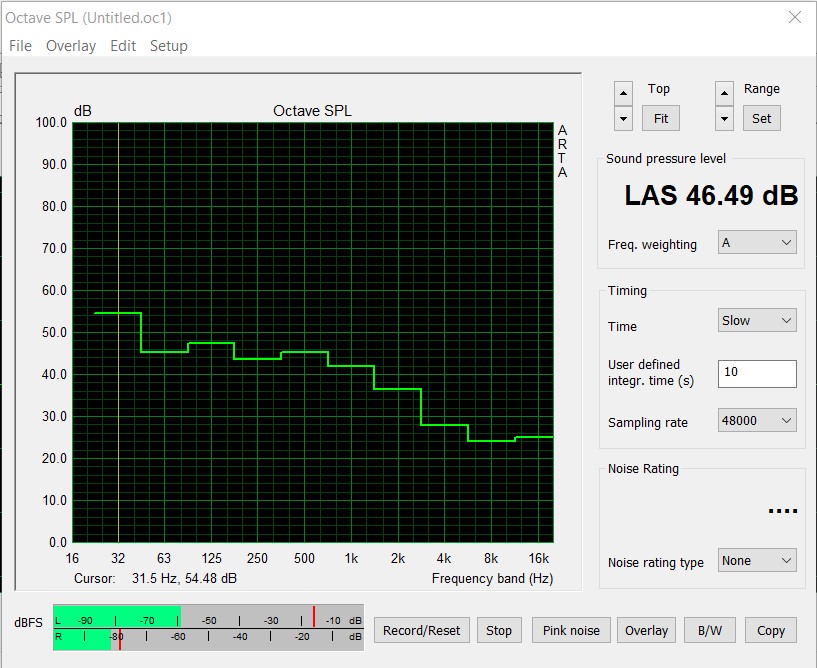
Corsair One i300的冷却方式与Corsair One i160的冷却方式相同。在2D操作中,系统运行相对安静,约为32.6分贝(A)。在这一点上,140毫米的大风扇还没有运行,但你可以听到AiO的两个泵,它们的声音始终存在。不幸的是,从长远来看,这并不令人愉快。 一定还有一些泵可以在工作的同时保持明显的安静。 在负载下,机箱盖上的140毫米风扇也会在短时间内开始运转。在压力测试中,44dB(A),然后可以清楚地听到系统。在游戏时,它甚至会变得更响一点,略高于46 dB(A)。
Noise level
| Idle |
| 32.4 / 32.5 / 32.6 dB(A) |
| Load |
| / 44.13 dB(A) |
 | ||
30 dB silent 40 dB(A) audible 50 dB(A) loud |
||
min: | ||
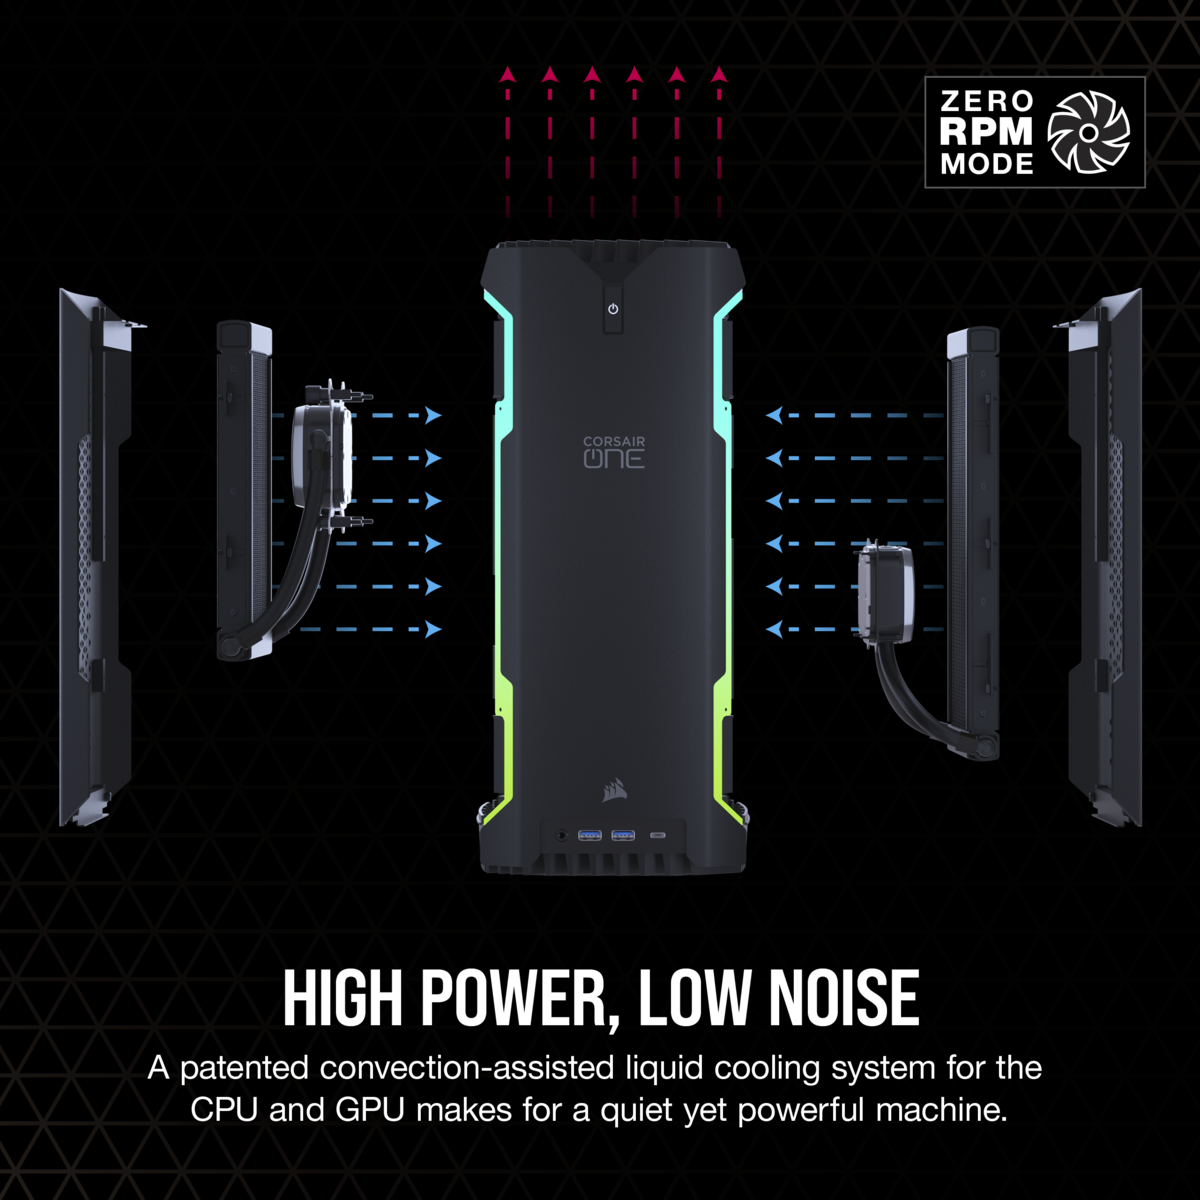
温度和功率消耗
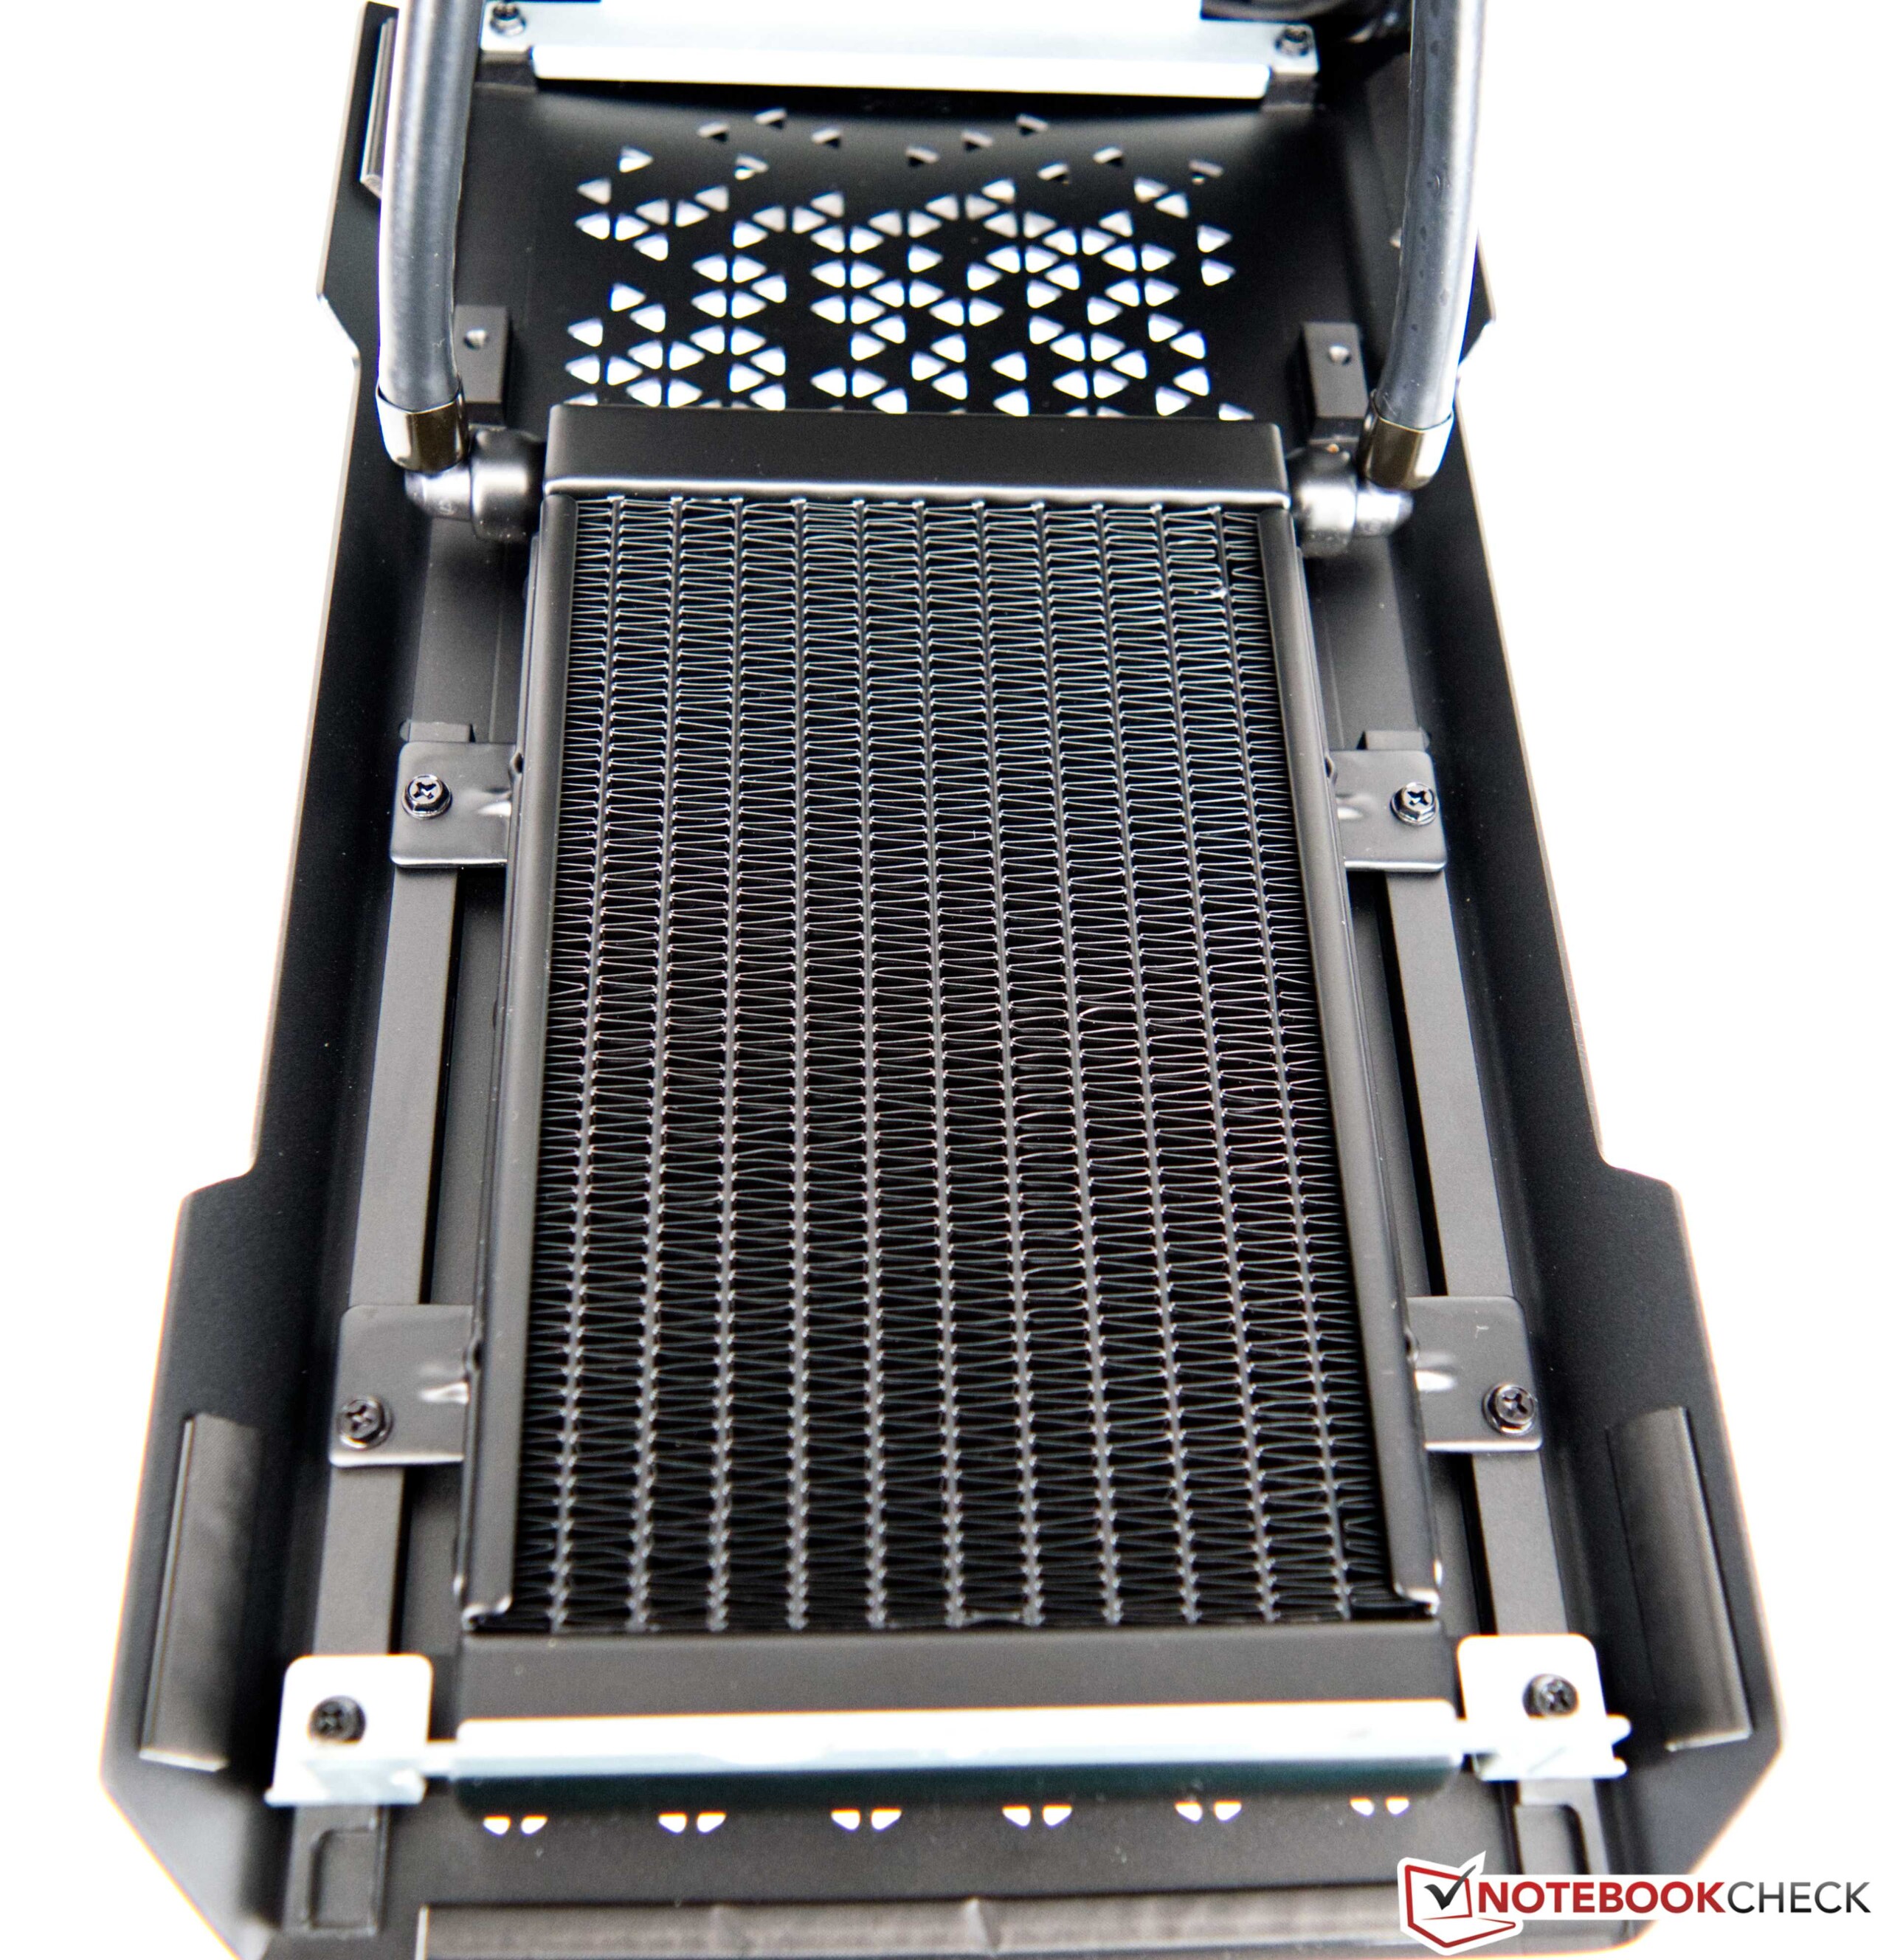
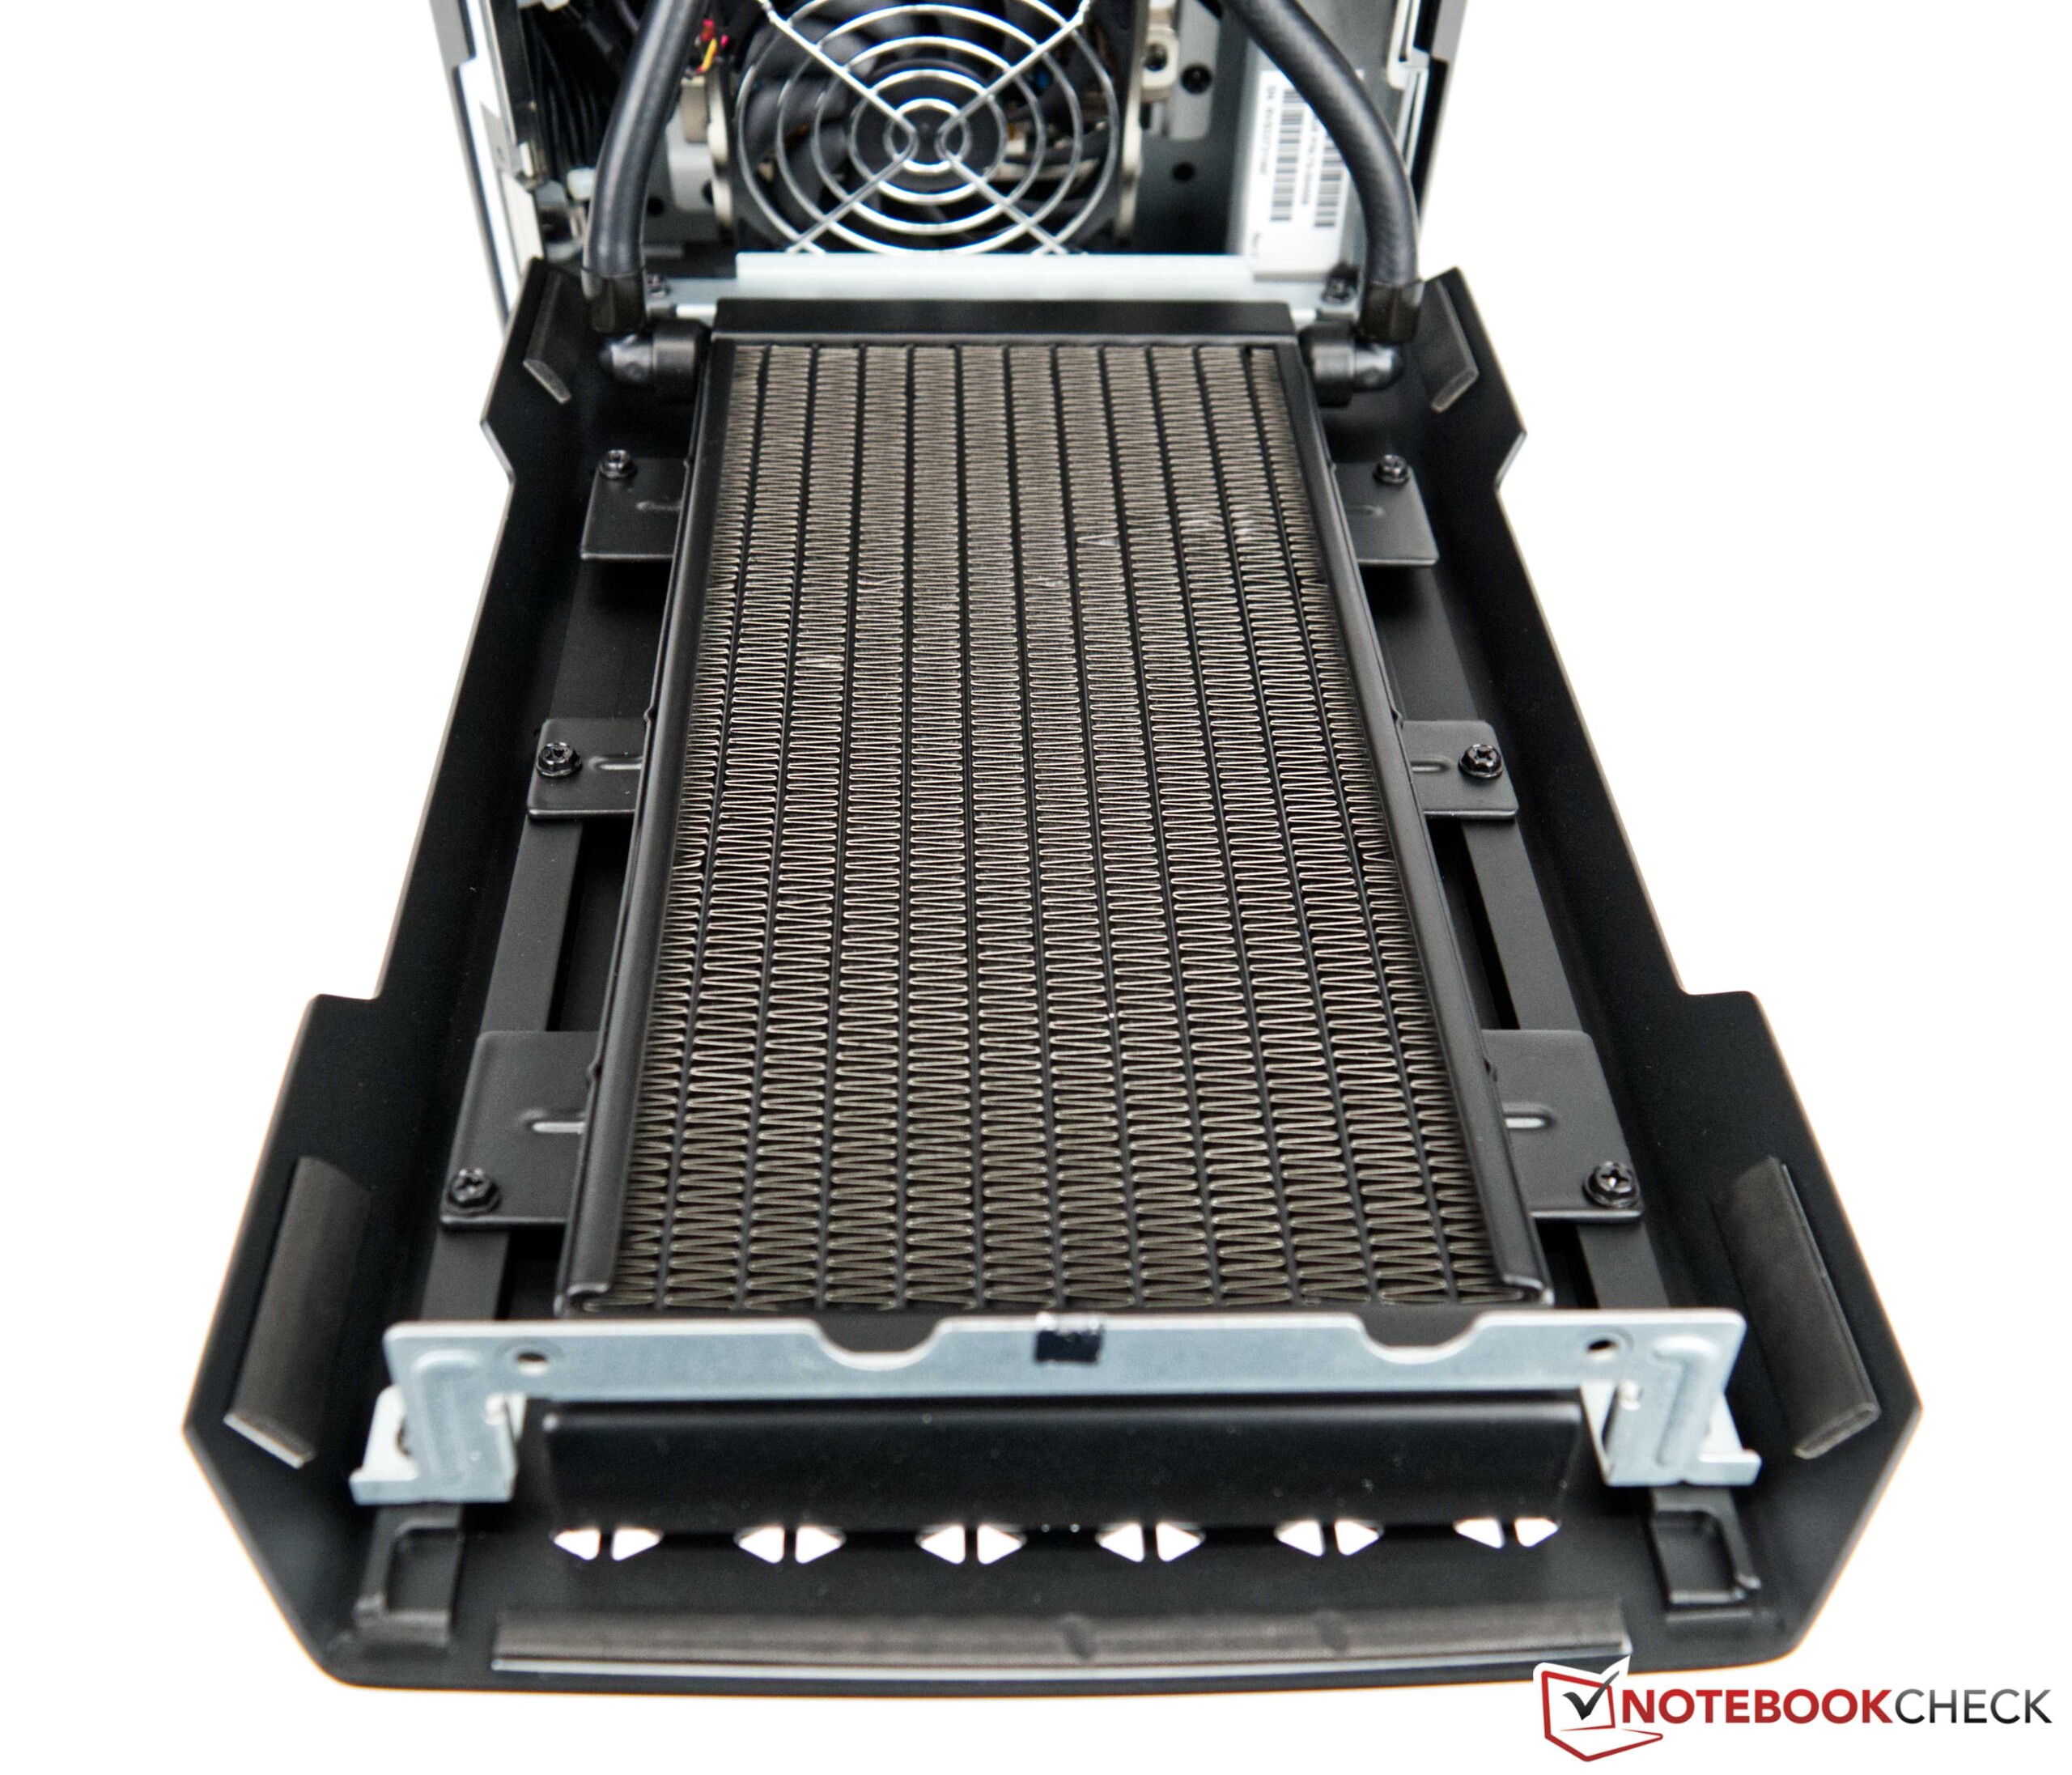
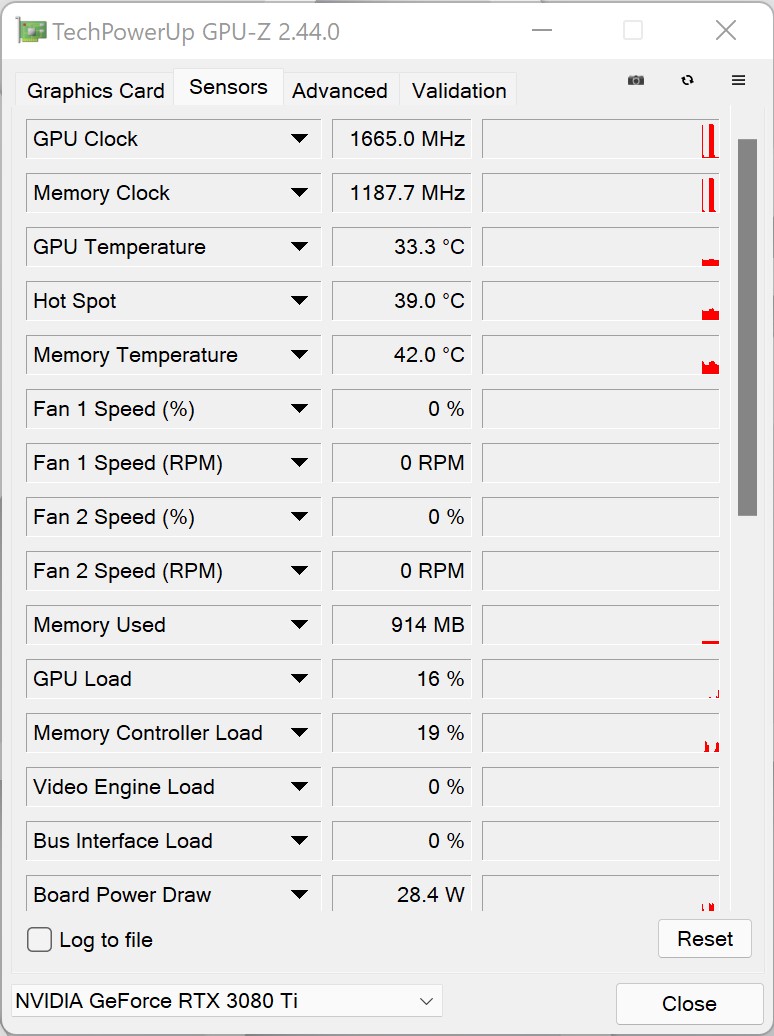
巨大的机箱提供了一个非常大的表面积,以实现热传递。在负载情况下,它明显升温,所谓的烟囱效应确保冷空气从侧面被拉进来,直接经过两个AiO的冷却鳍片,然后被顶部的140毫米大风扇推出机箱。为了有效地冷却显卡,还另外配备了两个较小的风扇来冷却变压器和VRAM。
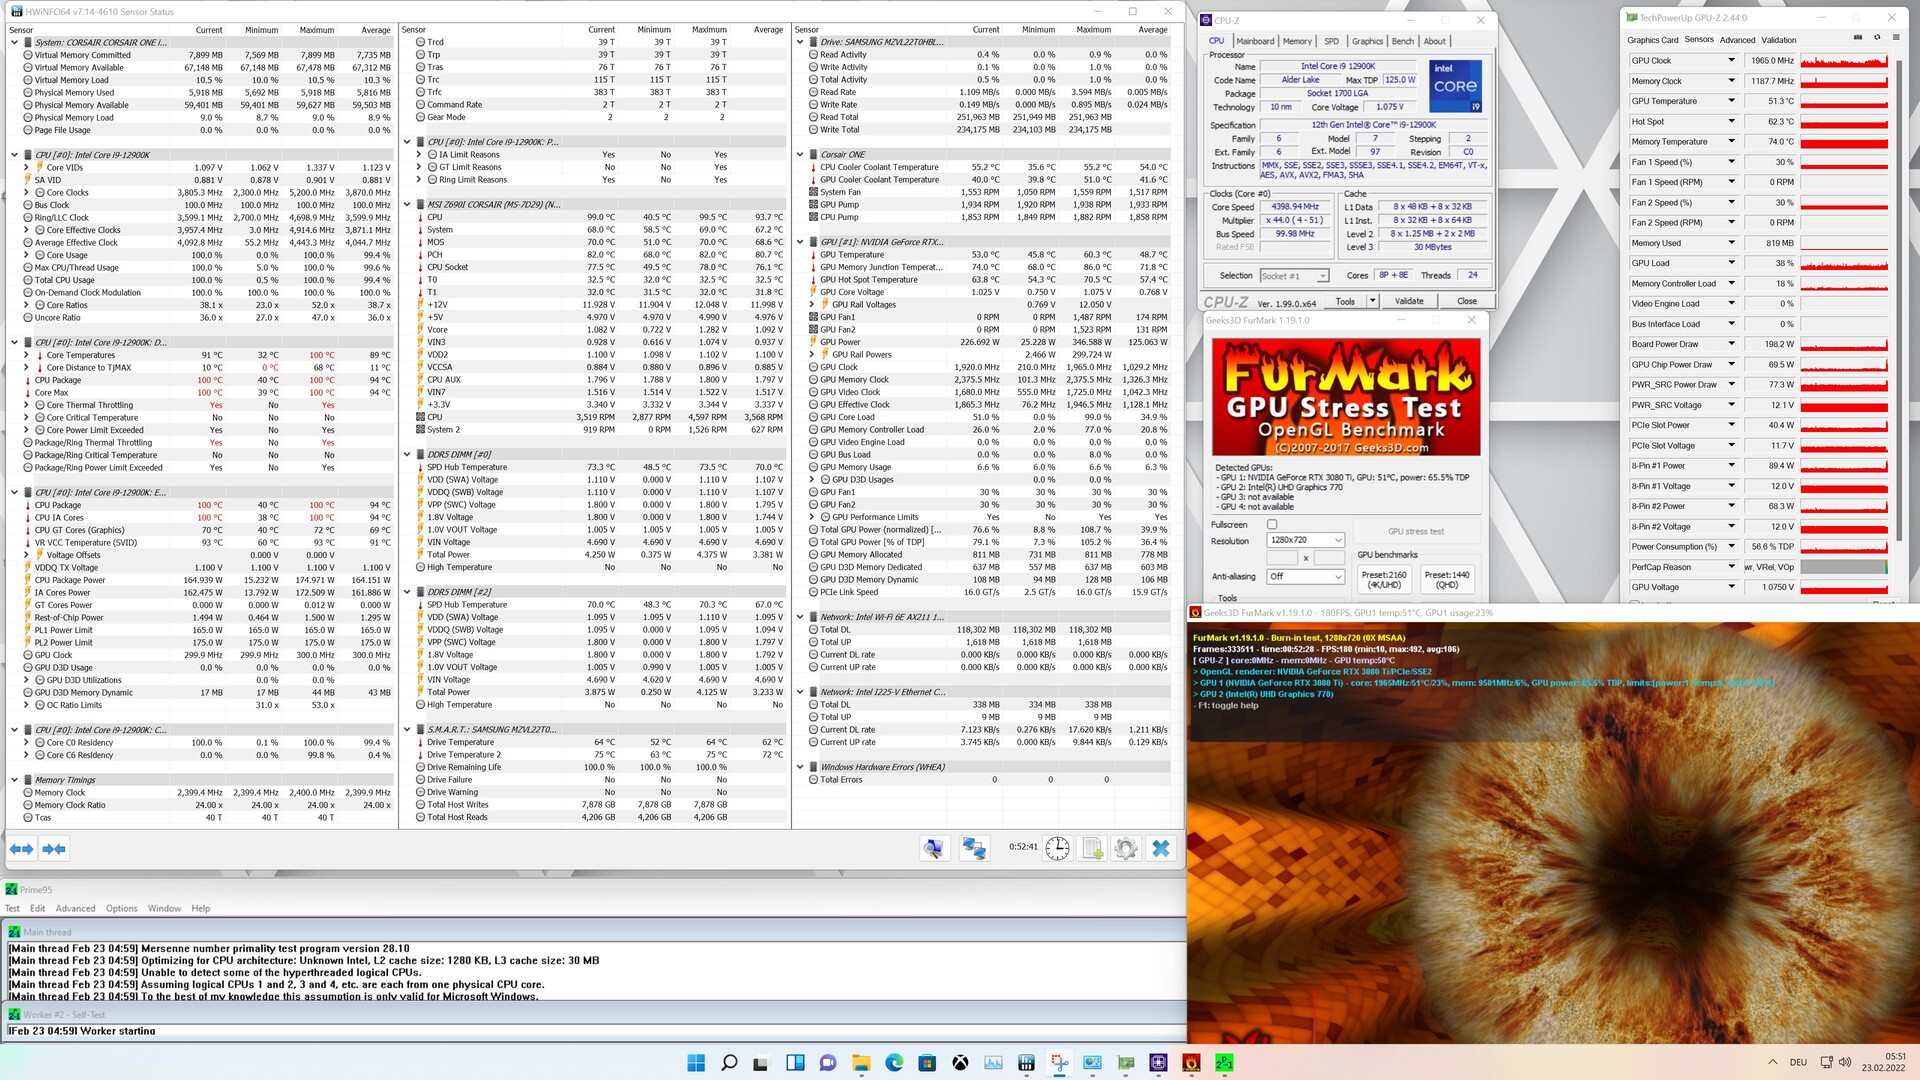
这种冷却概念效果很好,所有的组件都得到了有效的冷却,在满负荷的情况下没有过热现象。然而,在压力测试中,CPU仍然达到100℃(212°F)。这表明为什么海盗船将其性能节流到最大175瓦。对那些100℃的温度仍然太高的人来说,还可以在BIOS中进一步降低性能。然而,英特尔酷睿i9-12900K的温度 英特尔酷睿i9-12900K仍然不构成任何问题,正如我们在Cinebench R15多循环测试中已经发现的。FurMark和Prime95同时运行的压力测试代表了一种极端情况,这种情况在日常运行中几乎不会发生。
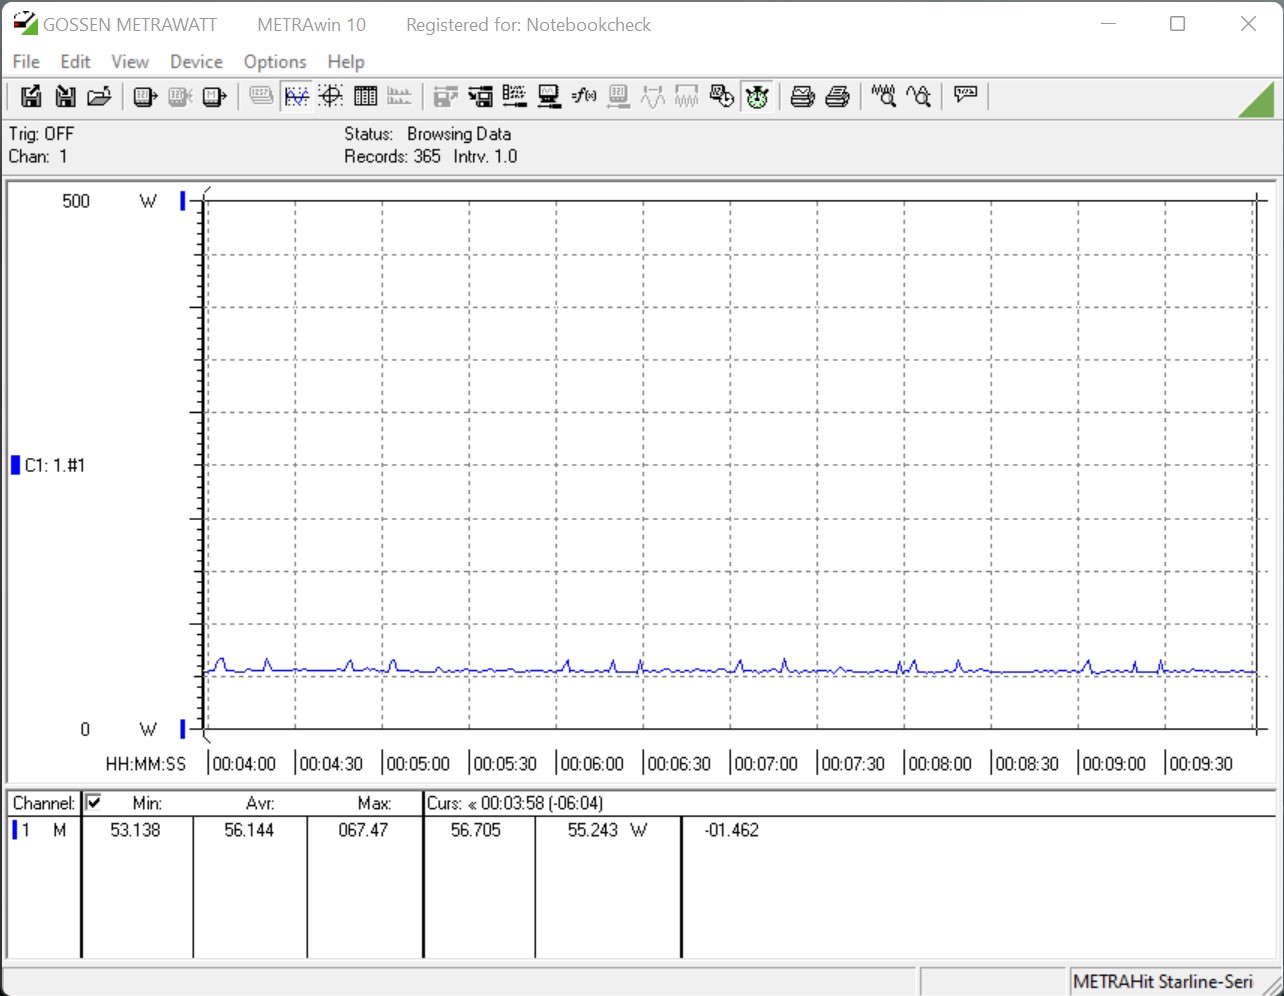
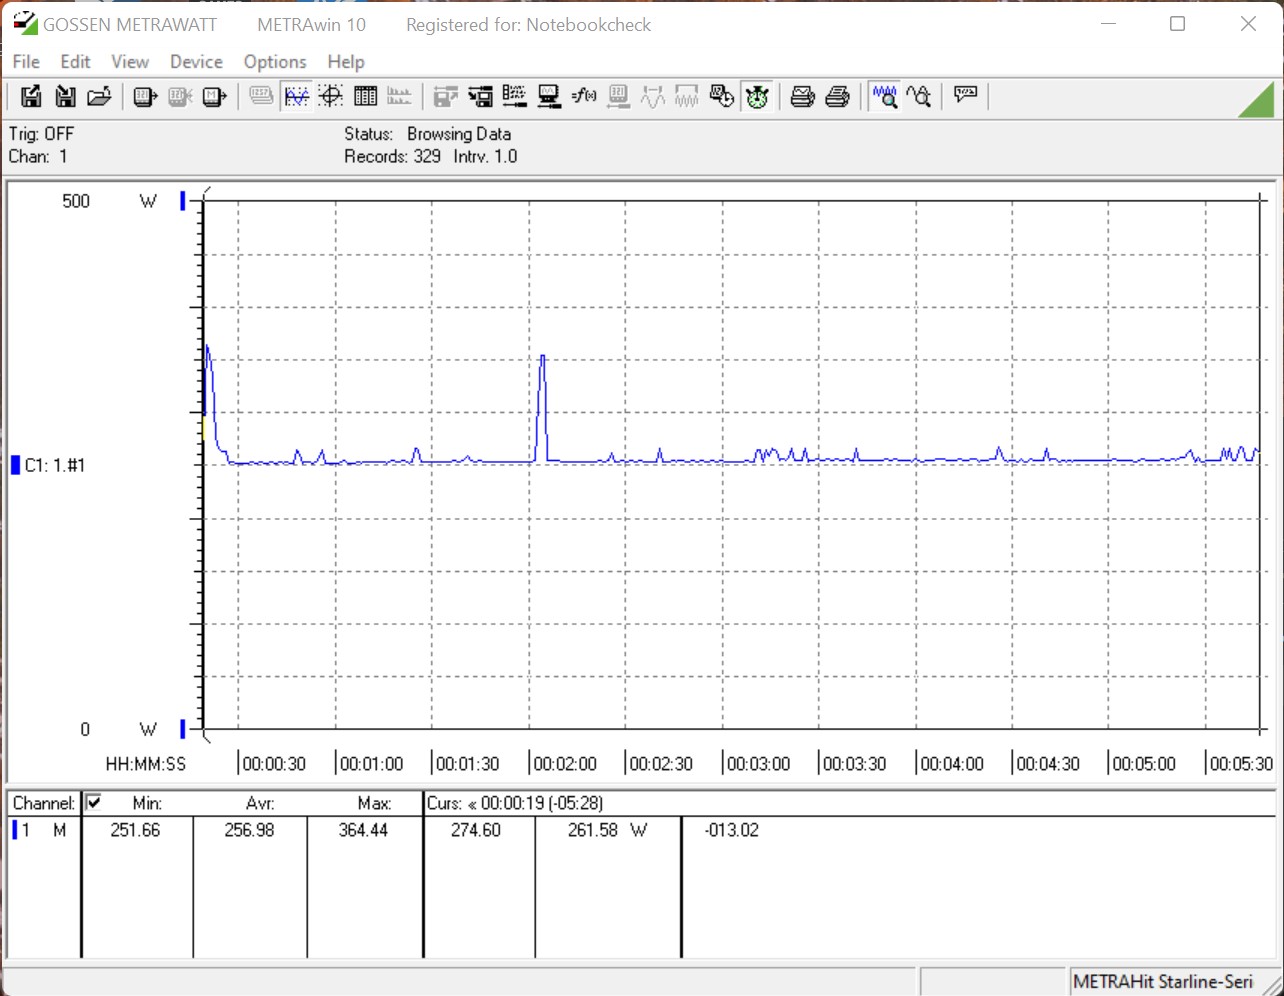
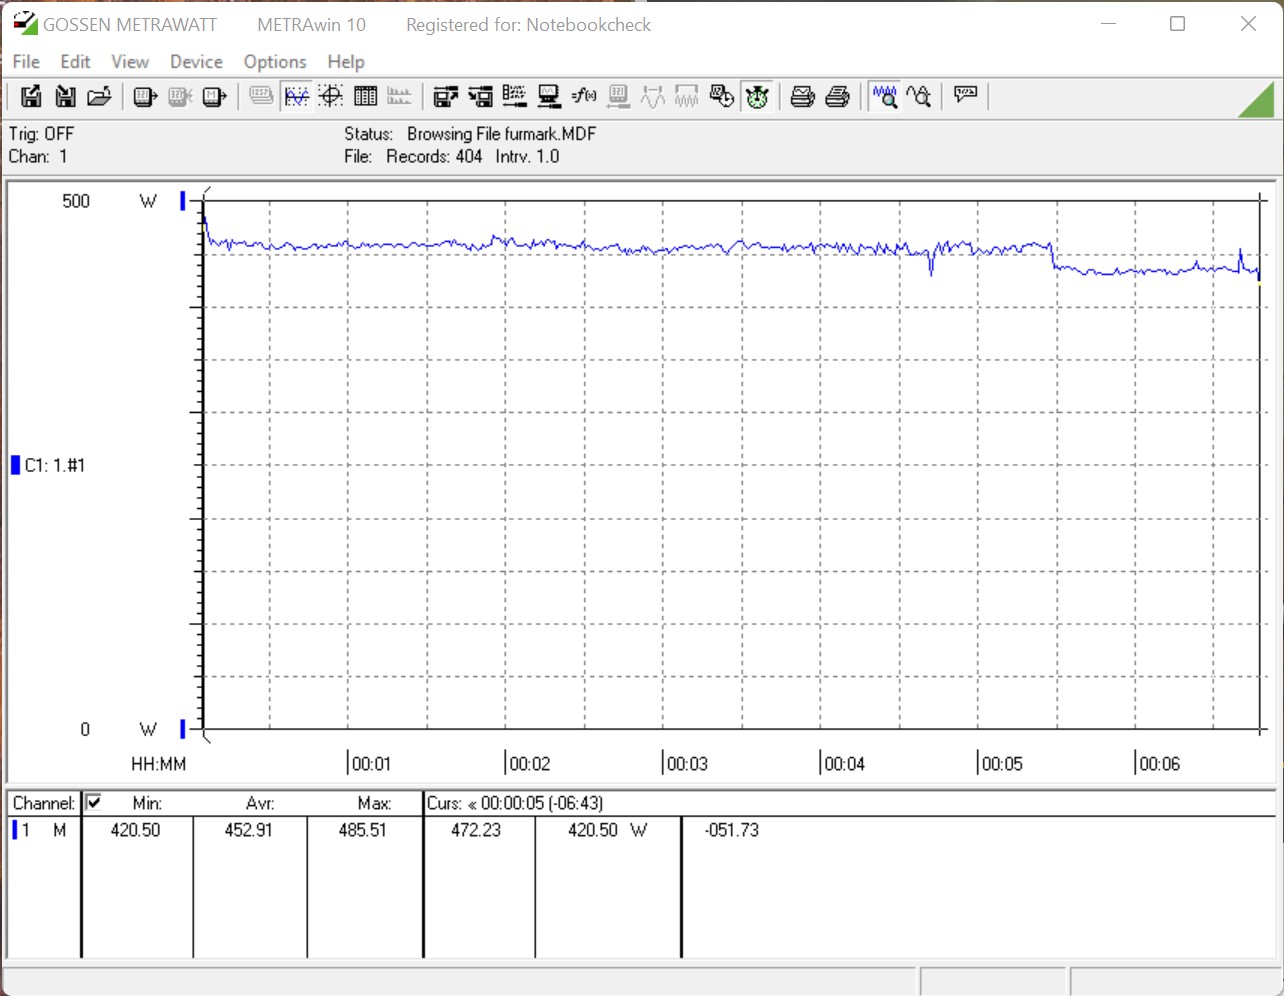
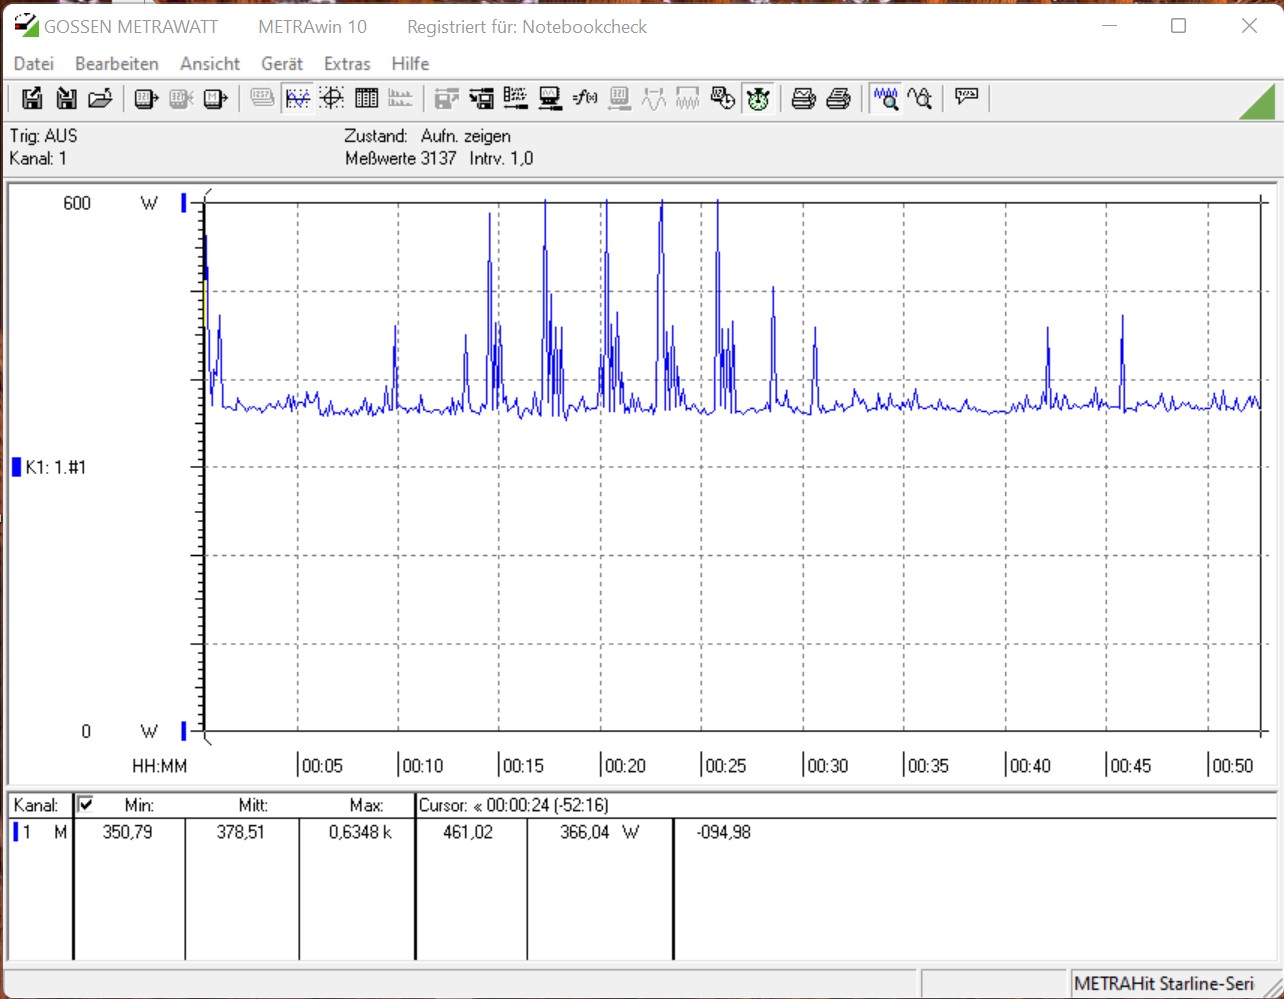
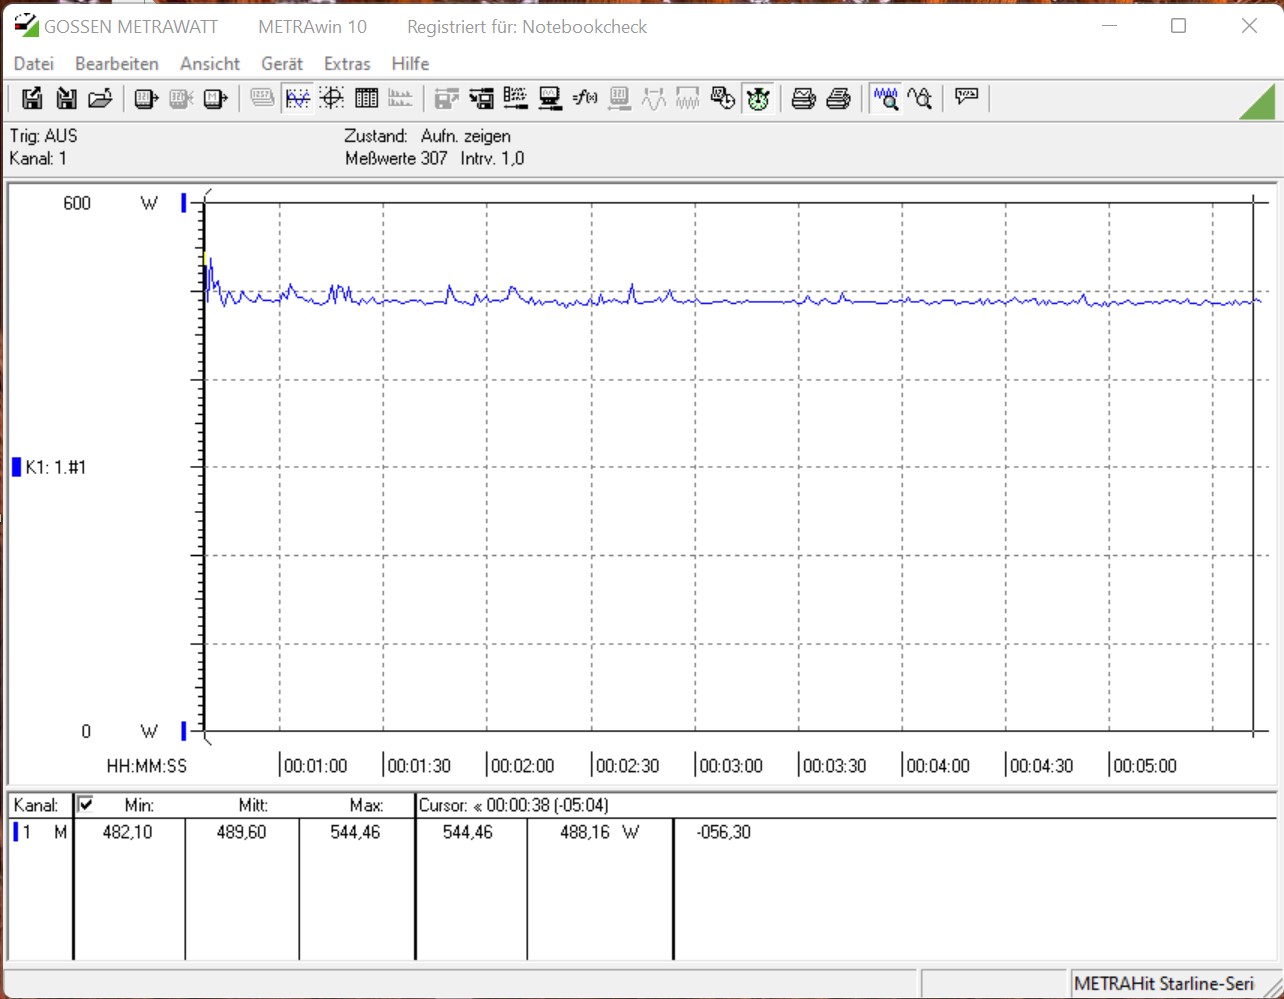
在功耗方面,该系统在空闲运行时以低消耗而脱颖而出。在游戏时,紧凑的750瓦(SFF构建)电源必须提供489瓦的平均功率,峰值达到544瓦的功率。在压力测试中,我们甚至短暂地测量了635瓦。该电源始终能够处理这个问题,而且我们没有注意到任何问题。
| Power Consumption - 1920x1080 The Witcher 3 ultra (external Monitor) | |
| Intel Core i9-12900K, NVIDIA GeForce RTX 3080 Ti | |
| Intel Core i9-12900K, NVIDIA Titan RTX (Idle: 70.5 W) | |
| AMD Ryzen 9 5950X, NVIDIA Titan RTX (Idle: 78 W) | |
| AMD Ryzen 9 5900X, NVIDIA Titan RTX (Idle: 78.1 W) | |
| Intel Core i5-11600K, NVIDIA Titan RTX (Idle: 69.49 W) | |
| Intel Core i5-12600K, NVIDIA Titan RTX (Idle: 70.45 W) | |
| Intel Core i9-11900K, NVIDIA Titan RTX (Idle: 57.3 W) | |
* ... smaller is better
| Power Consumption - 1280x720 FurMark 1.19 GPU Stress Test (external Monitor) | |
| AMD Ryzen 9 5900X, NVIDIA GeForce RTX 3090 (Idle: 105.9 W) | |
| AMD Ryzen 9 5900X, NVIDIA GeForce RTX 3080 (Idle: 88.3 W) | |
| Intel Core i9-12900K, NVIDIA GeForce RTX 3080 Ti | |
| AMD Ryzen 9 5950X, AMD Radeon RX 6800 XT (Idle: 99.5 W) | |
| AMD Ryzen 9 5900X, NVIDIA GeForce RTX 3070 (Idle: 95.1 W) | |
| AMD Ryzen 9 5900X, AMD Radeon RX 6800 (Idle: 81.4 W) | |
| AMD Ryzen 9 5900X, AMD Radeon RX 6700 XT (Idle: 77.1 W) | |
* ... smaller is better
Power consumption The Witcher 3 / stress test
Power consumption with external monitor
结论 - 一个完美的4K游戏PC
Pros
Cons
虽然Corsair One i300不是一个完全新奇的产品,但这也不是绝对必要的。这款紧凑型高级PC的外观简单而现代。此外,内部设计允许在主板和电源方面使用传统组件。只有冷却系统是一个内部设计。在我们的测试模型中,不幸的是,它并没有为高端市场带来公正。尽管如此,两个AiO工作良好,可靠地冷却系统。然而,这两个泵在声音上很明显。从长远来看,这是令人不快的,考虑到5099欧元(约5722美元)的购买价格,这也不是你必须接受的。 但除了最先进的组件外,冷却系统的设计仍然是亮点。随着 英特尔酷睿i9-12900K,有最快的游戏CPU,再加上目前的主板,包括DDR5内存和一个NvidiaGeForce RTX 3080 Ti允许4K游戏,没有任何妥协。此外,还有一个2TB的固态硬盘,传输速率非常好。
由于英特尔酷睿i9-12900K和NvidiaGeForce RTX 3080 Ti,海盗船One i300使用最小的空间提供4K
游戏性能。
高端产品自然也有其价格。我们的测试装置为5099欧元(约5722),这并不完全是便宜的,而且我们仍然不应该对独立的组件说三道四。该机箱不是现成的,不能单独购买。此外,各种显卡和其他当前组件的可用性仍然是一个问题,这几乎使价格总体上是合理的。 该系统还配备了两个专门为海盗船One系列开发的AiO。在考虑价格时必须考虑到这一点。然而,在我们看来,配备英特尔酷睿i9-12900K和NvidiaGeForce RTX 3080的Corsair One i300在价格方面将是更合理的系统。但这样一来,内存和固态硬盘就只有一半大小,分别为32GB和1TB。带有这些组件的系统售价为4099欧元(4562美元)。与Ti型号相比,NvidiaGeForce RTX 3080的性能差距有限,可以接受。
价格和可用性
在进行这项测试时,该设备可以直接从Corsair购买,价格为5000美元。.另外,较小的型号也可以从亚马逊购买,价格为4000美元。.

