联想Legion Slim 7-16IAH7笔记本评测:超薄的Legion 笔记本与Nvidia和Intel一样优秀
在过去的几年里,联想已经成功地将其 "Legion" 游戏品牌变成了笔记本电脑市场上相当受欢迎的名字。Legion 7系列包括有普通和 "超薄 "两种版本的高端机型。今天,我们将评测一个这样的超薄机型:联想Legion Slim 7 16IAH7(也被称为Legion S7i)。
缩写 "IAH "已经告诉你一些关于笔记本电脑的规格。"I "代表英特尔,"AH "代表Alder Lake-H。这很重要,因为还有一个 基于AMD的变体Legion Slim 7,我们已经审查过。那么这两款机型中哪一款性能更好呢?这当然是本次评测中要回答的最激动人心的问题之一。
潜在的竞争对手比较
Rating | Date | Model | Weight | Height | Size | Resolution | Price |
|---|---|---|---|---|---|---|---|
| 87.9 % v7 (old) | 11 / 2022 | Lenovo Legion Slim 7-16IAH 82TF004YGE i7-12700H, GeForce RTX 3060 Laptop GPU | 2.2 kg | 16.9 mm | 16.00" | 2560x1600 | |
| 89.3 % v7 (old) | 01 / 2023 | Lenovo Legion S7 16ARHA7 R9 6900HX, Radeon RX 6800S | 2.2 kg | 16.9 mm | 16.00" | 2560x1600 | |
| 87.2 % v7 (old) | 06 / 2022 | Acer Predator Triton 500 SE PT516-52s-70KX i7-12700H, GeForce RTX 3080 Ti Laptop GPU | 2.3 kg | 19.9 mm | 16.00" | 2560x1600 | |
| 85.5 % v7 (old) | 05 / 2022 | HP Omen 16-b1090ng i7-12700H, GeForce RTX 3070 Ti Laptop GPU | 2.3 kg | 23 mm | 16.10" | 2560x1440 | |
| 85.6 % v7 (old) | 06 / 2021 | Asus ROG Zephyrus M16 GU603H i9-11900H, GeForce RTX 3070 Laptop GPU | 2 kg | 20 mm | 16.00" | 2560x1600 |
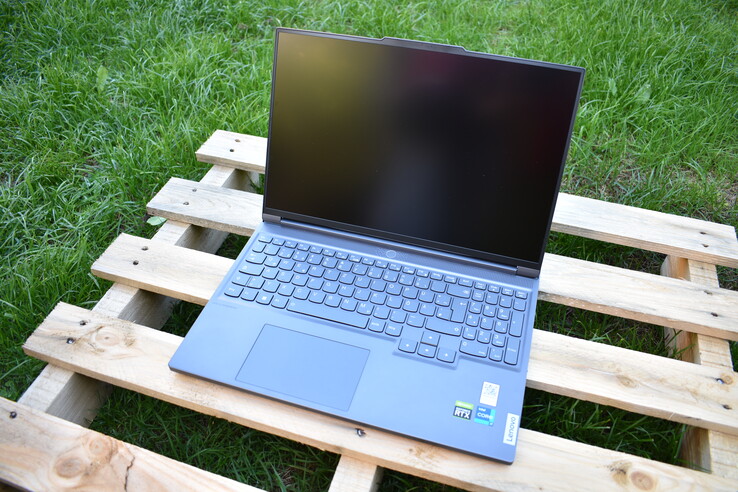
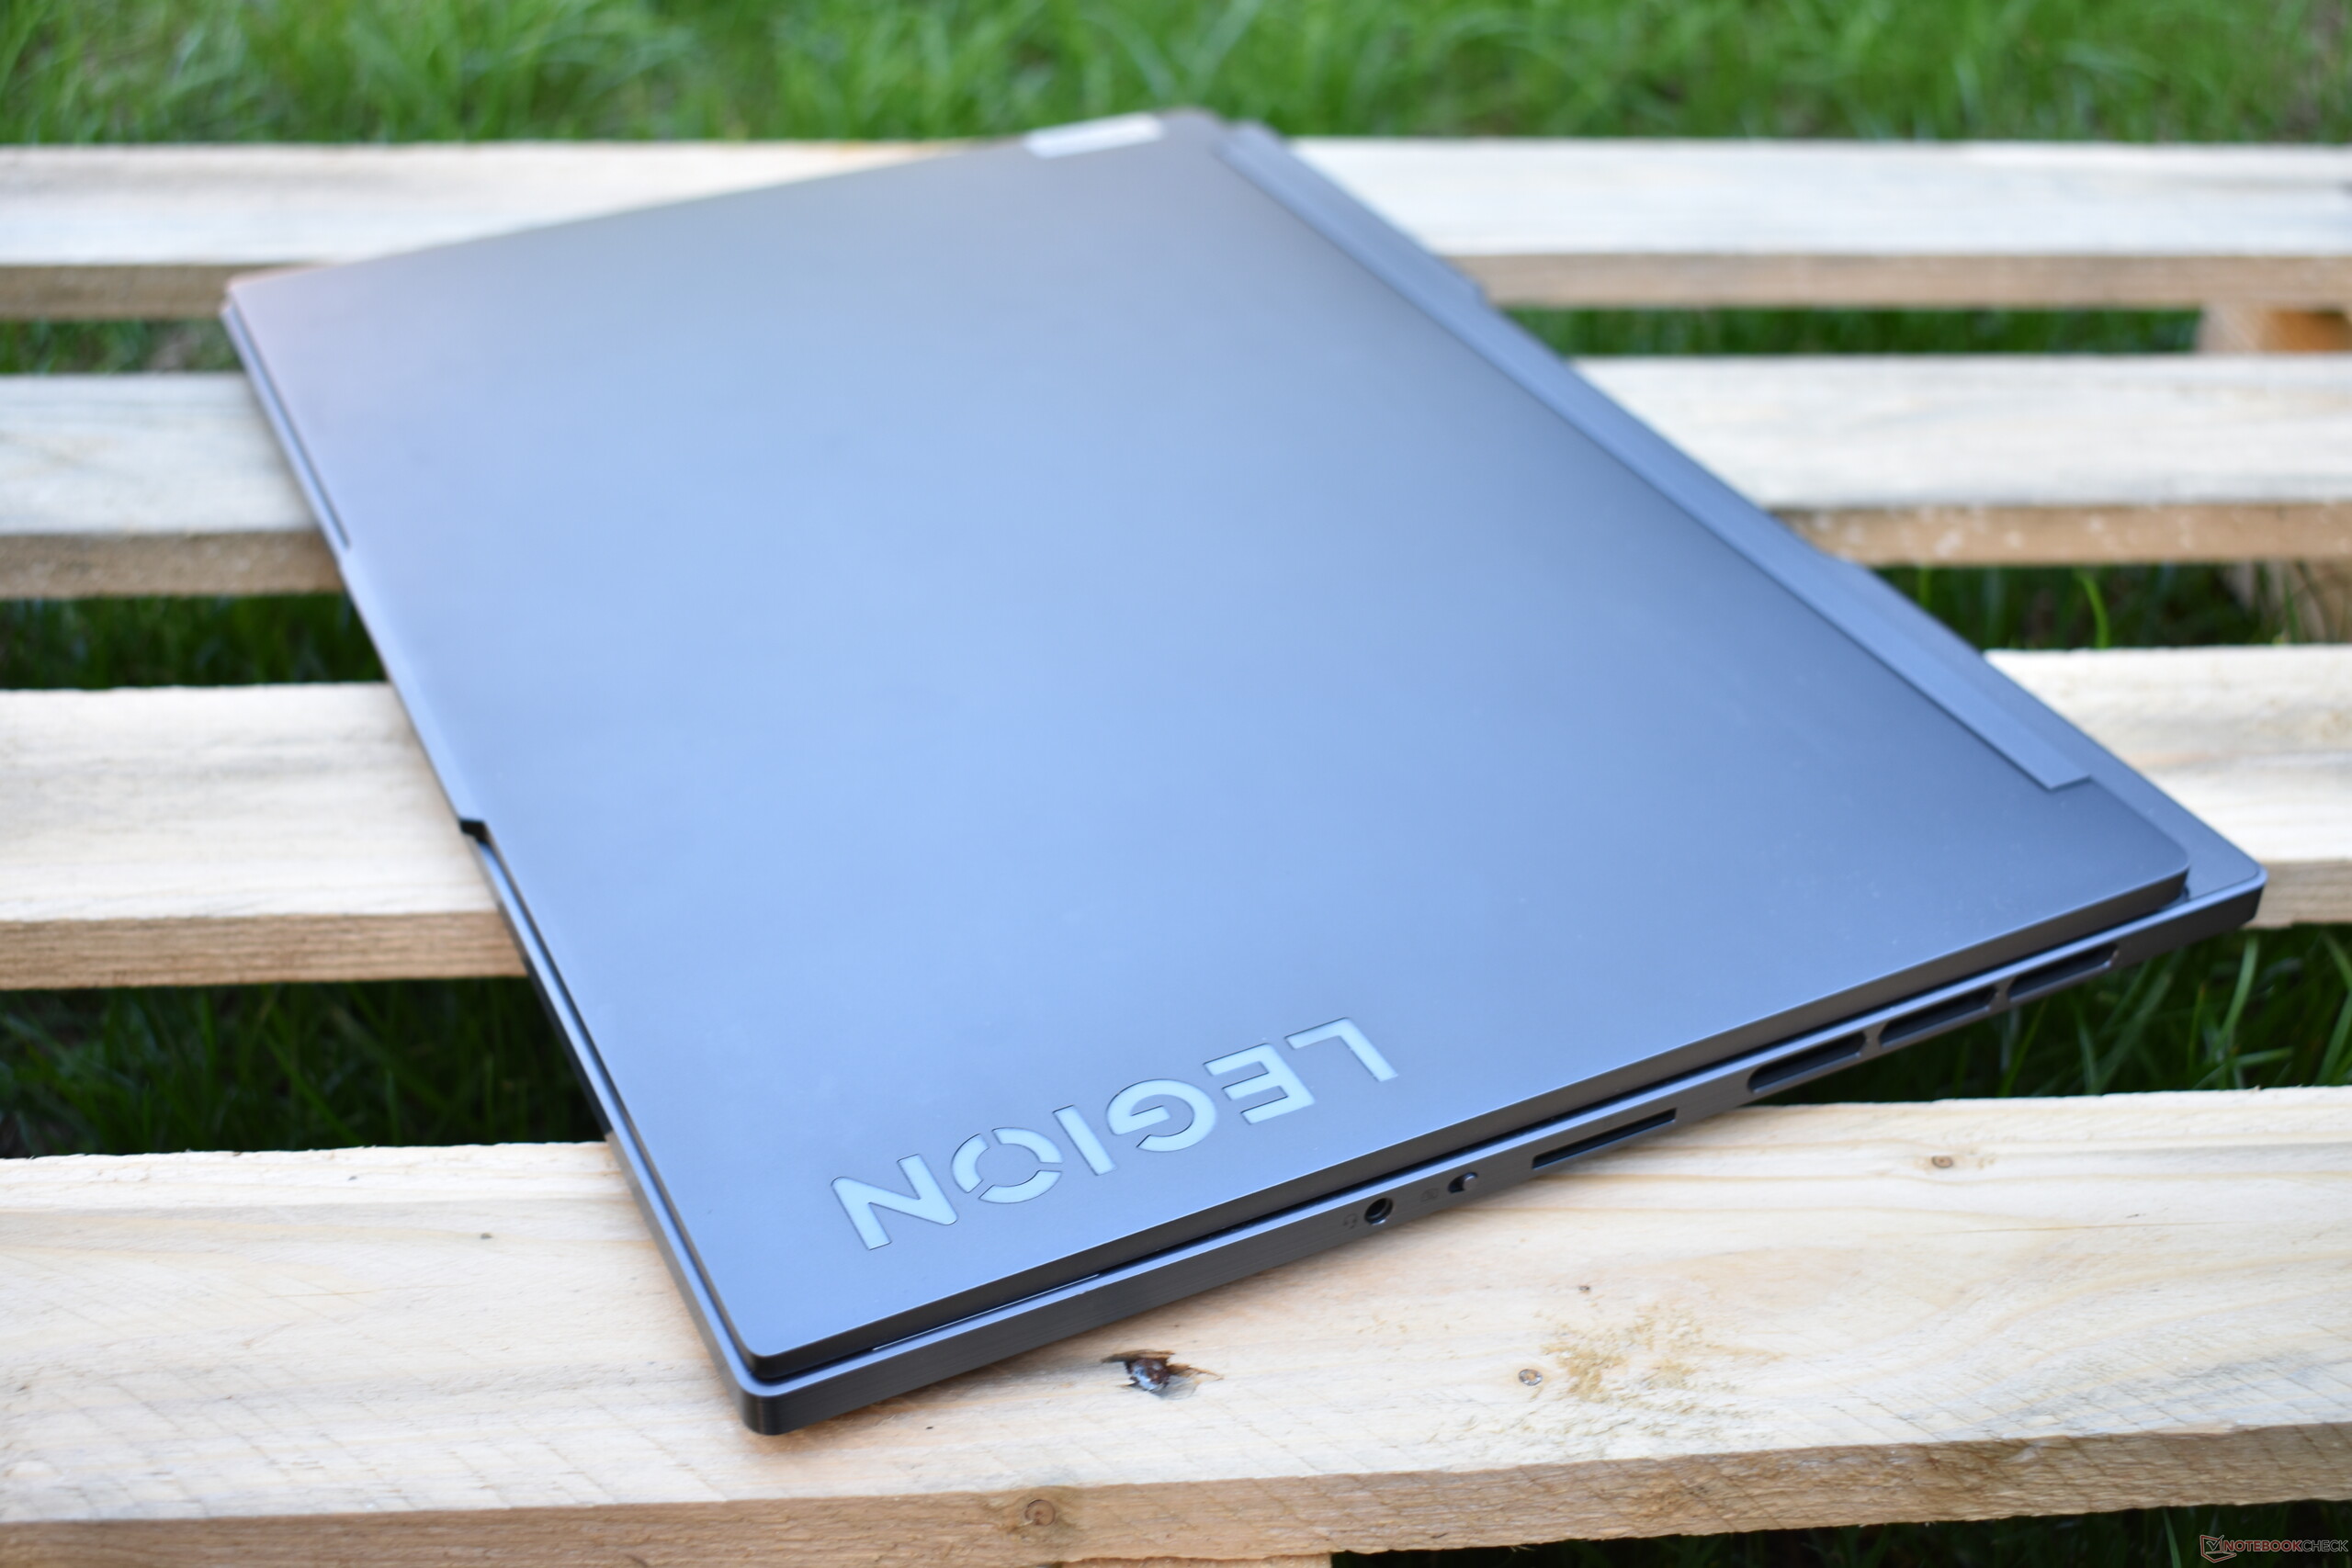
外壳。联想Legion ,灰色铝制设计
虽然便宜的联想Legion 5笔记本电脑部分是由塑料制成的,但Legion Slim 7的结构大部分是铝。显示器边框是机箱上唯一的塑料部件。在设计方面,Legion Slim 7要比更厚的 7更克制。 联想Legion 7.联想选择不给Slim 7提供华丽的RGB灯光,而是采用深灰色的配色方案,在商务笔记本上看起来不会太出格。白色的键盘照明也让人想起联想的ThinkPad商务系列。电源按钮上的LED是该设备上为数不多的颜色之一。根据所选择的性能配置文件,它可以亮起蓝色(省电模式)、白色(平衡模式)或红色(性能模式)。
尽管有一个更简单的设计,S7仍然很容易被识别为一个Legion 笔记本电脑。在质量方面,联想已经做得很好了。装配和加工都很完美,铝制底盘也非常稳健。尽管显示屏盖子很薄,边框也很细,但相对来说还是很结实的。
铰链与底座部分相连,可以将笔记本电脑打开到180度。然而,我们不建议将我们评测单位的屏幕向后折叠超过135度--否则显示屏上的图像会变得扭曲。至少铰链将屏幕牢牢地固定住了,而且调整得非常好,可以用一只手打开笔记本电脑。
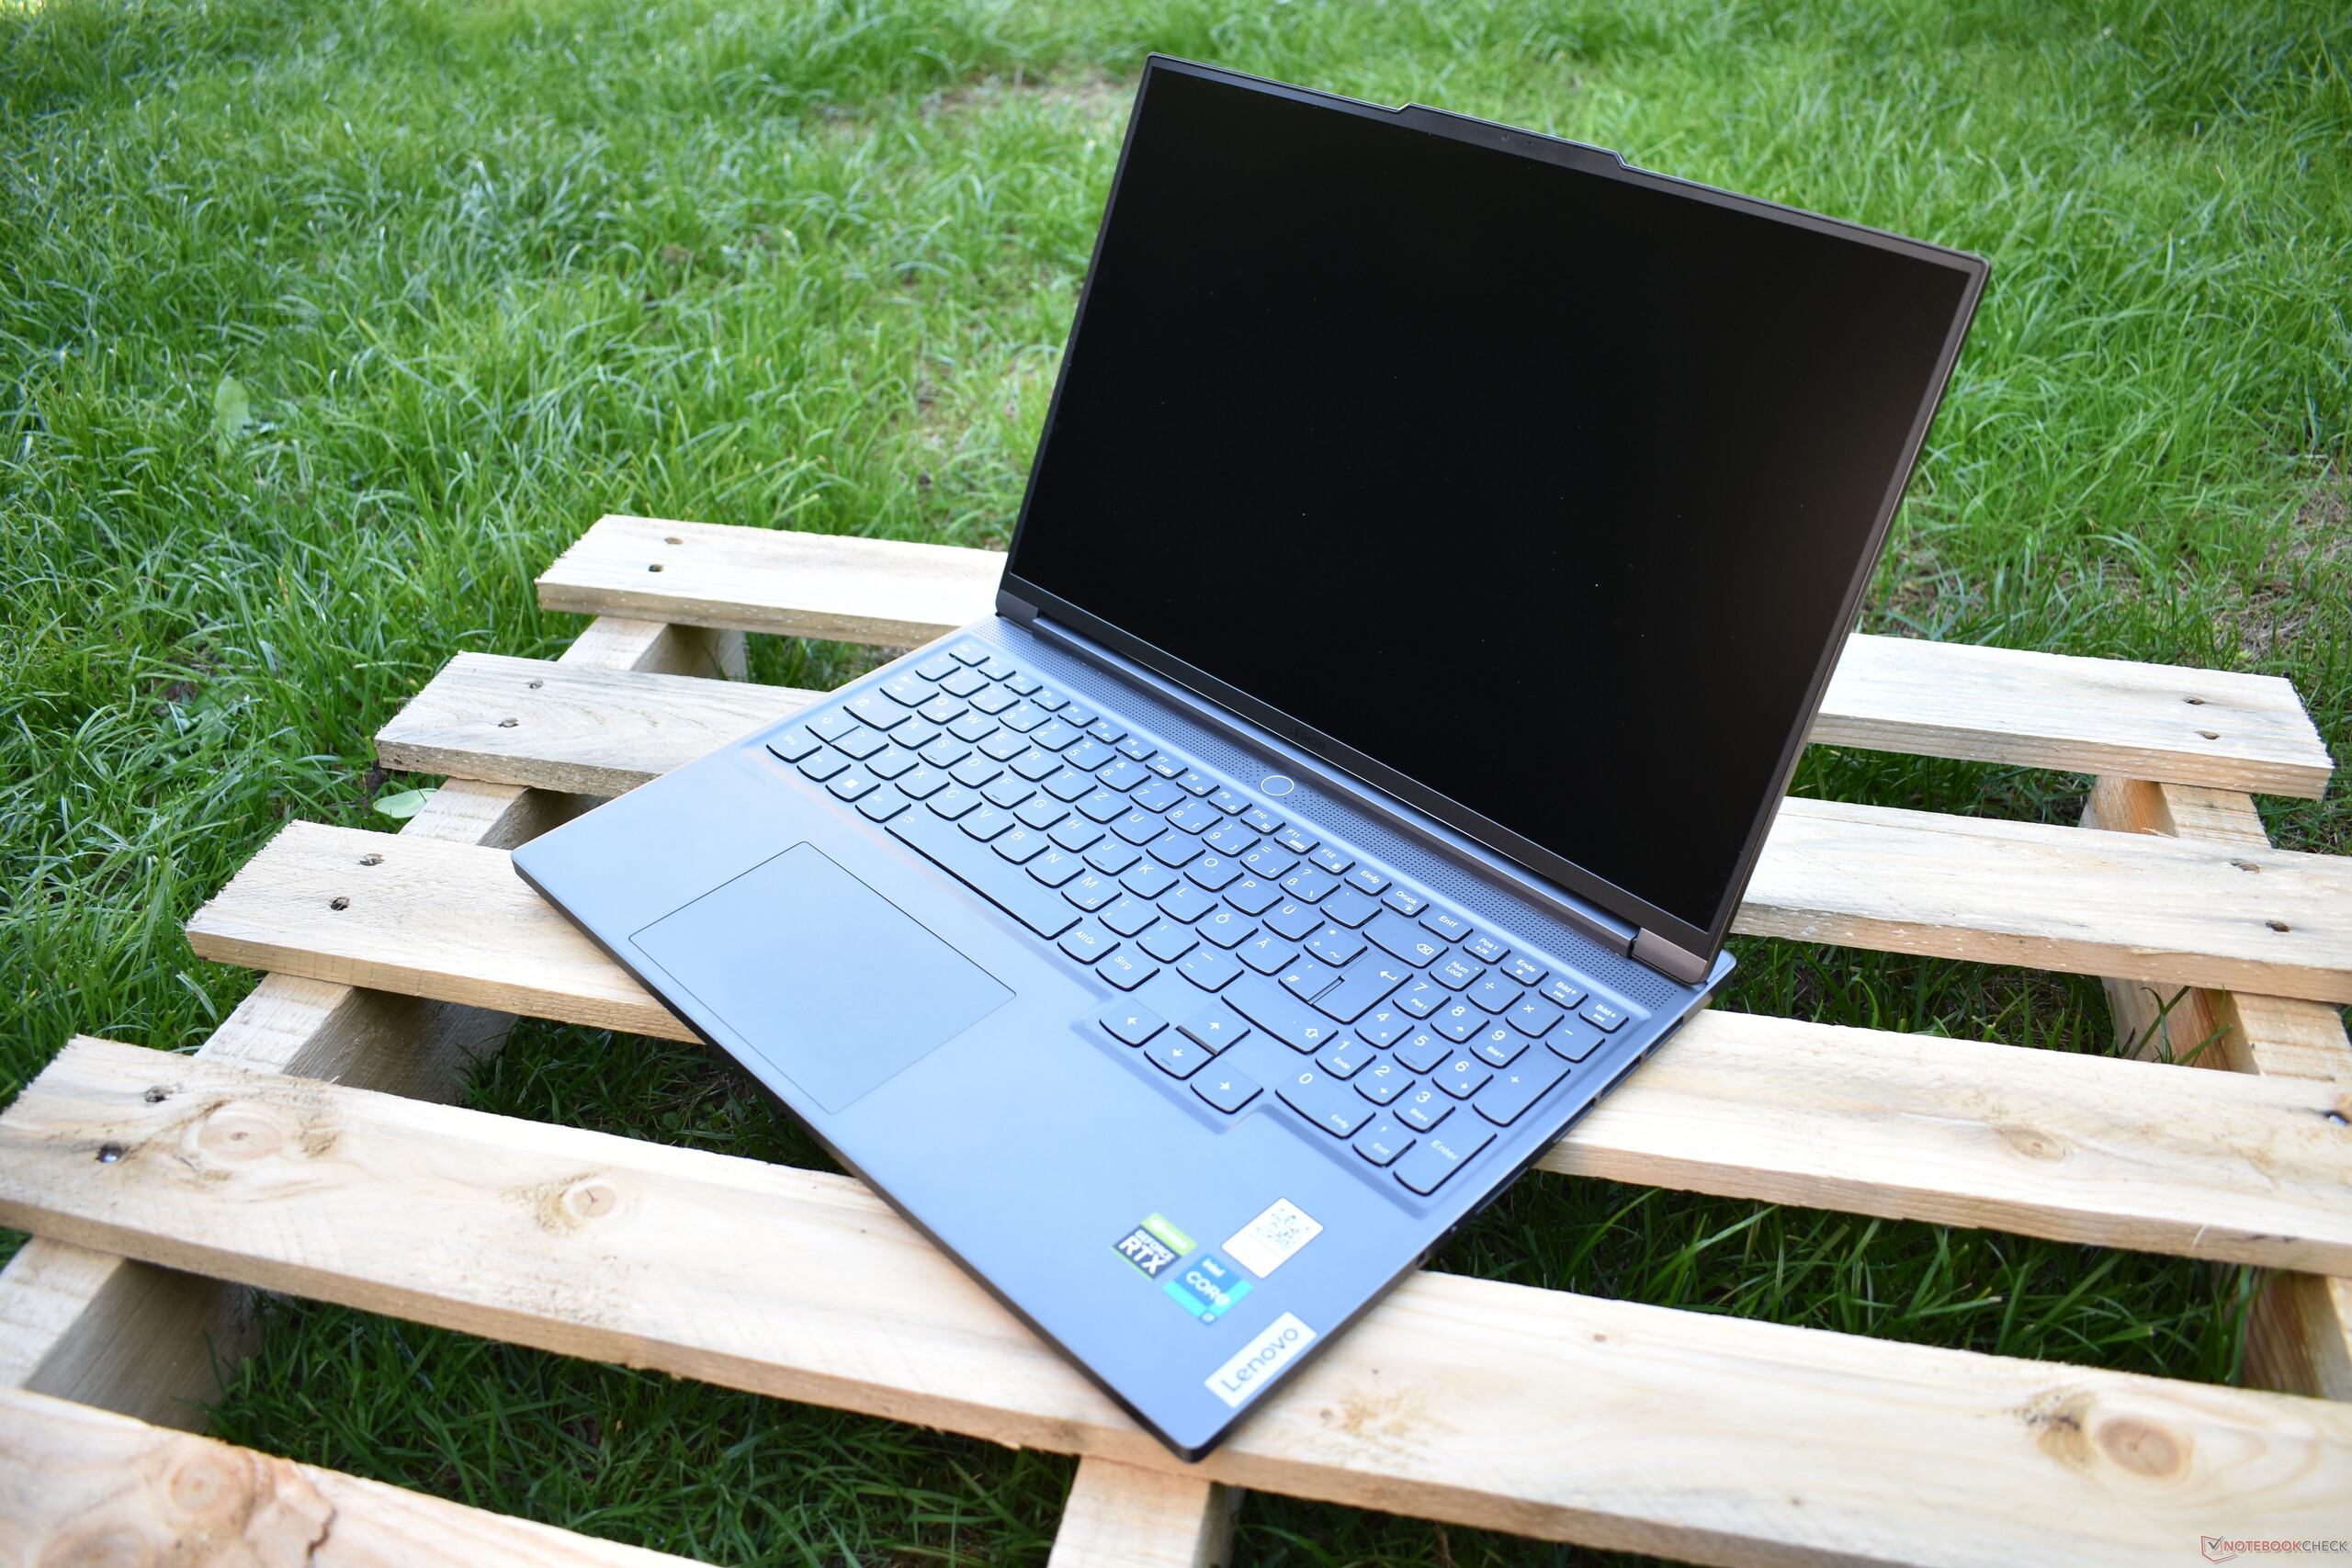
联想Legion S7i第7代在所有游戏笔记本的比较中拥有最薄的机箱。该设备仅有16.9毫米薄,几乎处于超极本领域。但是它的重量就不一样了。虽然不是很重,但联想Legion Slim 7也不是一个轻量级的产品,只有2.2公斤(4.85磅)。笔记本电脑 华硕ROG Zephyrus M16比Slim 7略微轻一些。
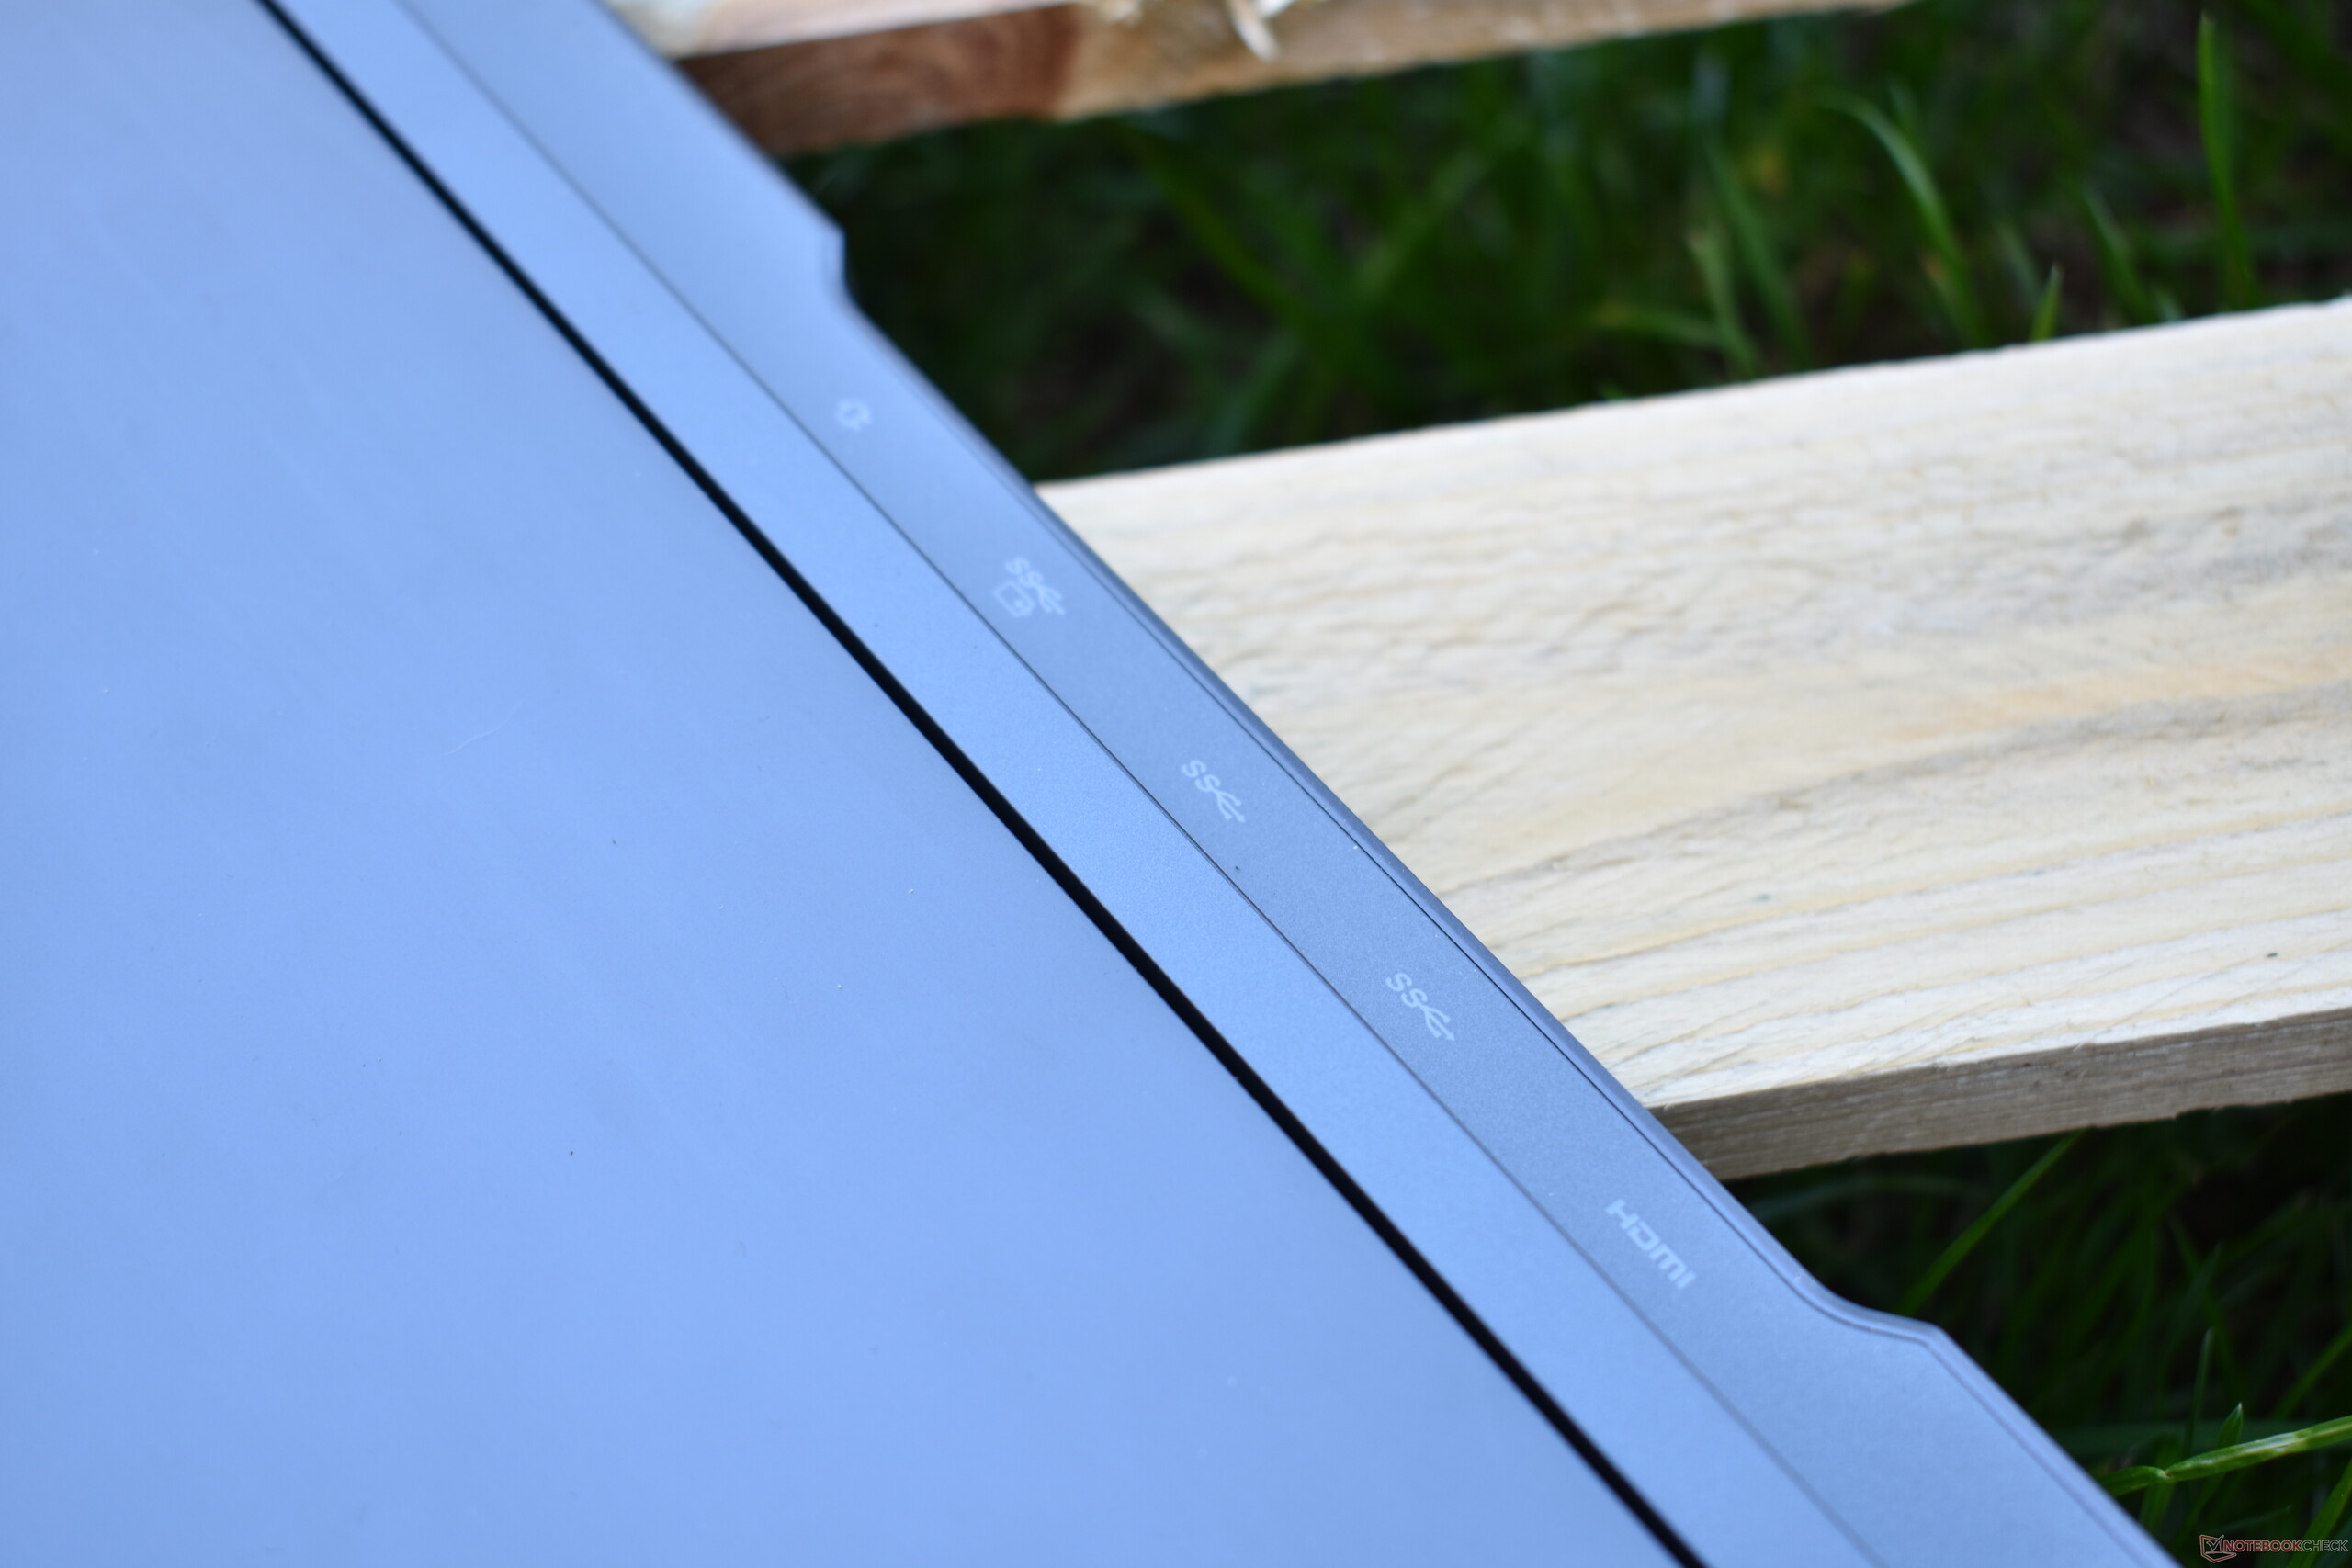
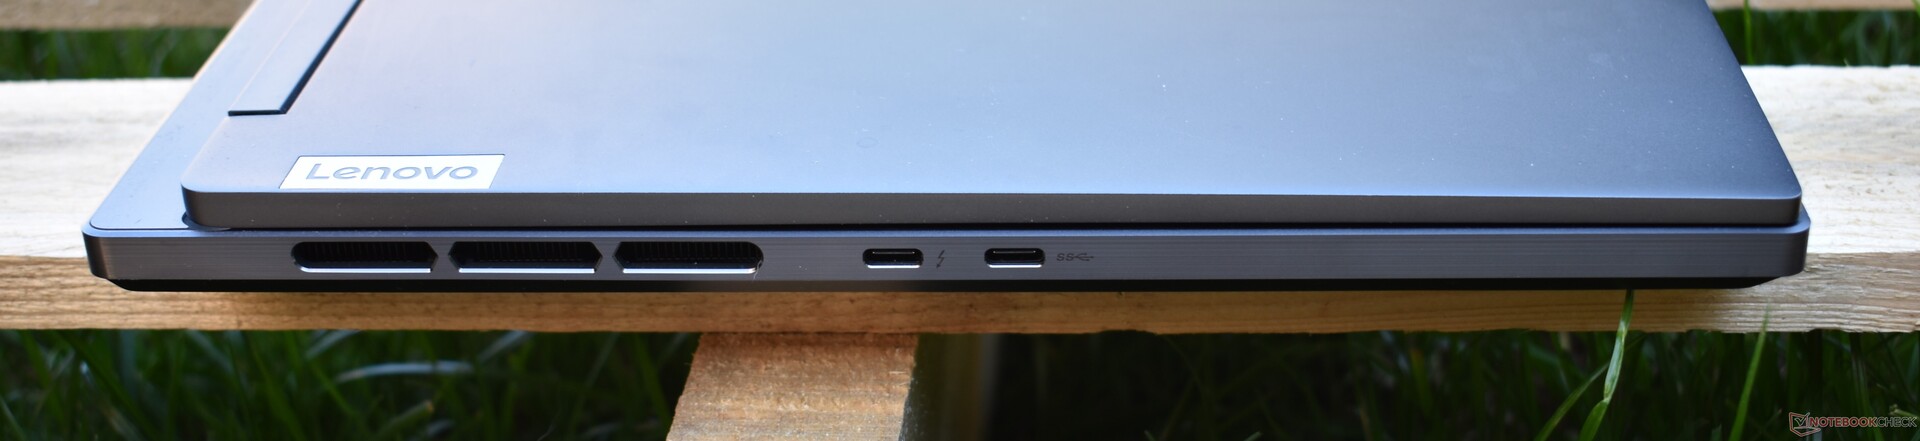
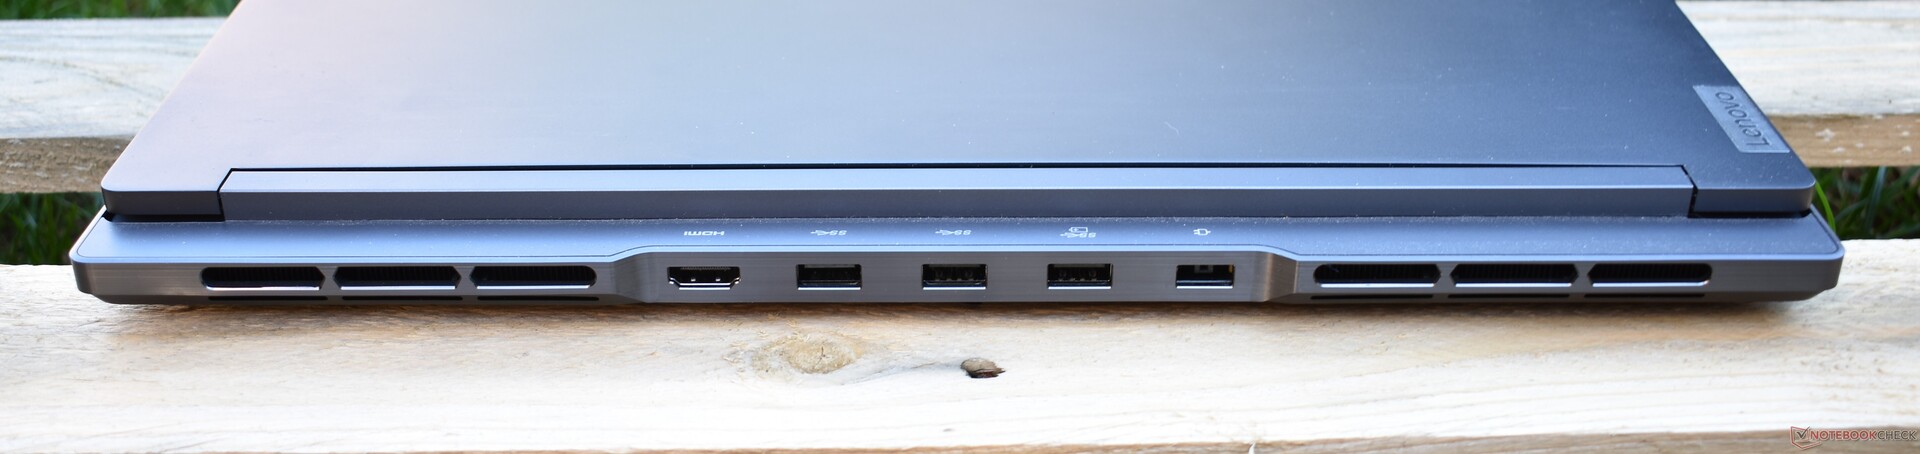
规格。 Legion 带有雷电4的S7i
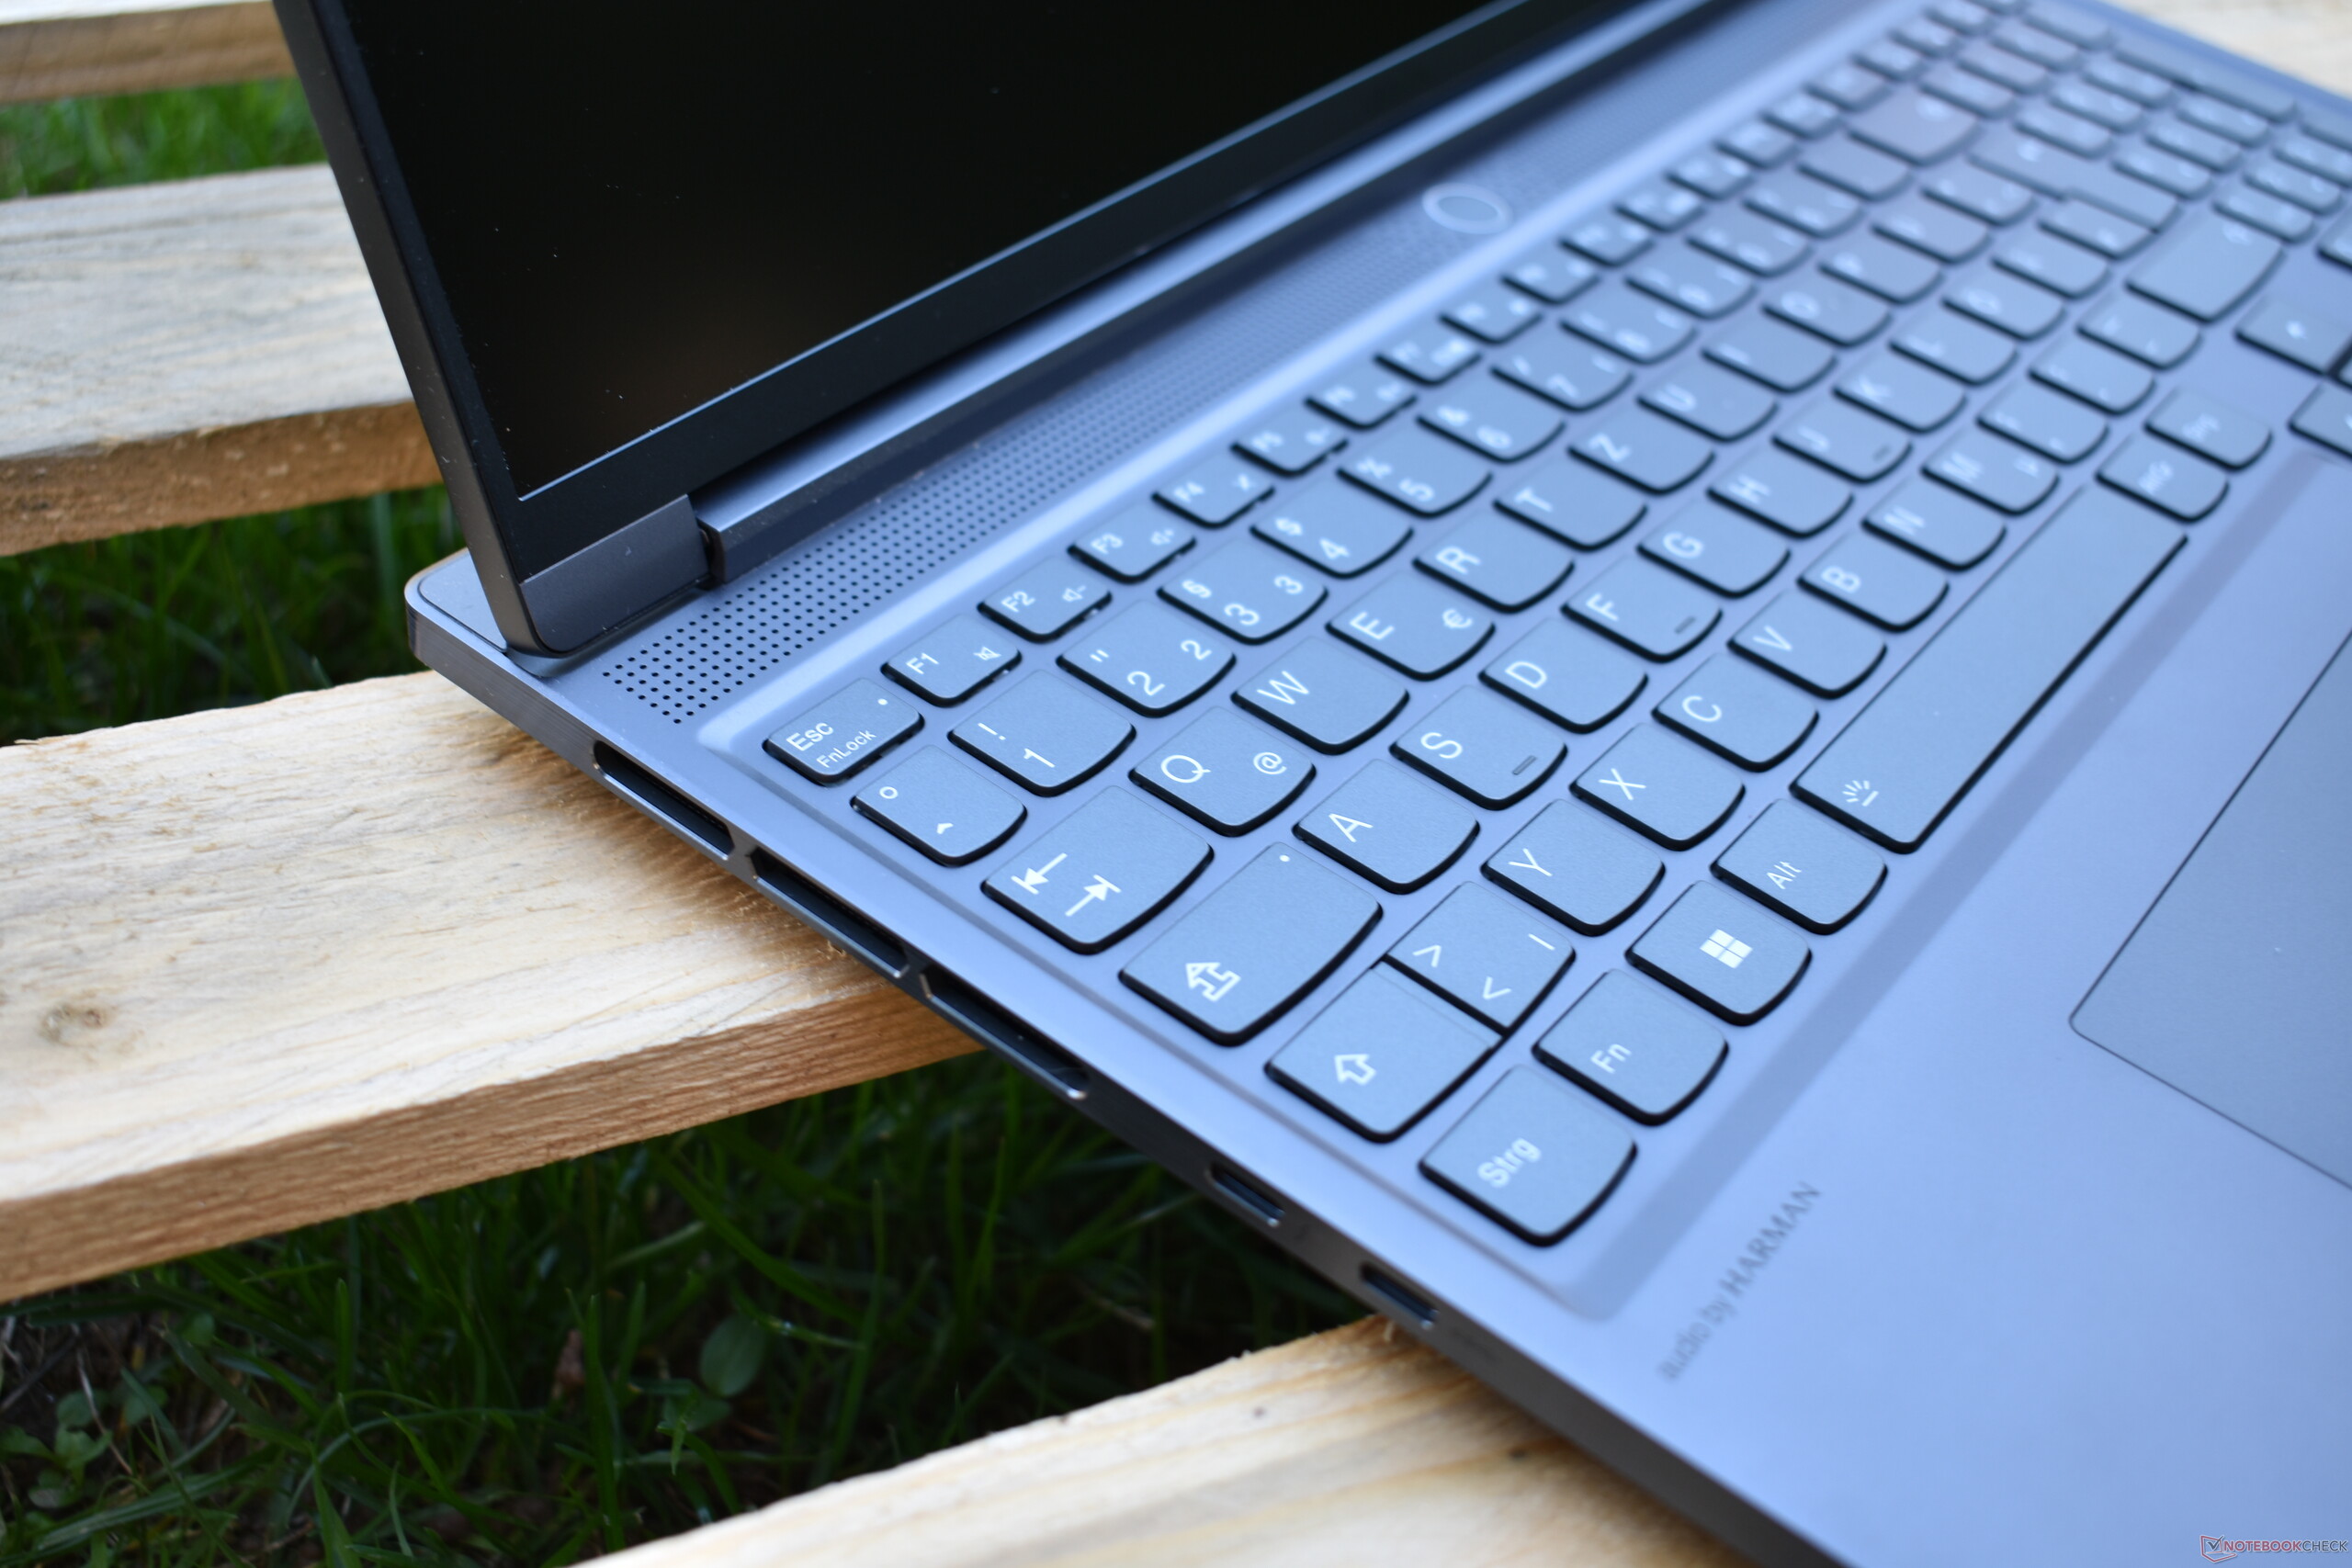
与AMD的变体不同,联想Legion S7-16IAH有一个雷电4端口。它还配备了大量的端口(分布在侧面和背面),但缺少一个RJ45插座。那些想要一个以太网端口的人可以看看普通的 "非瘦身 "版本。 联想Legion 7.
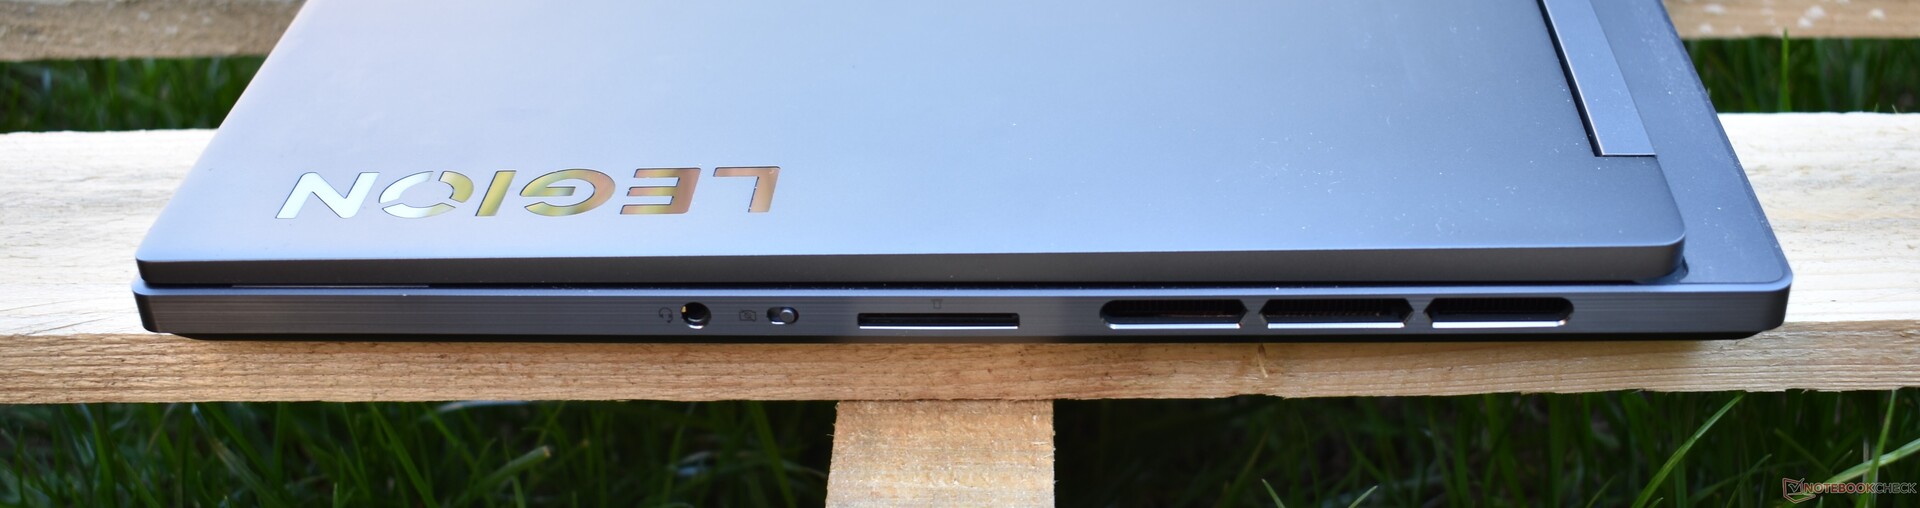
SD卡阅读器
SD读卡器不允许将卡完全插入,这意味着它不适合长期存储扩展。在我们使用AV Pro MicroSD V60参考卡进行的基准测试中,这台笔记本电脑提供了一个平均结果。
| SD Card Reader | |
| average JPG Copy Test (av. of 3 runs) | |
| Average of class Gaming (20.9 - 210, n=54, last 2 years) | |
| Asus ROG Zephyrus M16 GU603H (AV PRO microSD 128 GB V60) | |
| Lenovo Legion S7 16ARHA7 (AV PRO microSD 128 GB V60) | |
| Lenovo Legion Slim 7-16IAH 82TF004YGE | |
| Acer Predator Triton 500 SE PT516-52s-70KX (AV PRO microSD 128 GB V60) | |
| HP Omen 16-b1090ng (AV PRO microSD 128 GB V60) | |
| maximum AS SSD Seq Read Test (1GB) | |
| Asus ROG Zephyrus M16 GU603H (AV PRO microSD 128 GB V60) | |
| Average of class Gaming (25.5 - 261, n=51, last 2 years) | |
| Lenovo Legion S7 16ARHA7 (AV PRO microSD 128 GB V60) | |
| Lenovo Legion Slim 7-16IAH 82TF004YGE | |
| Acer Predator Triton 500 SE PT516-52s-70KX (AV PRO microSD 128 GB V60) | |
连接性
联想Legion Slim 7-16IAH采用了Killer Wi-Fi 6E AX1675i,它支持新的Wi-Fi 6E标准。在我们的测试中,这个2x2模块提供了很高的传输速率,在传输测试中出现了一些小波动。从技术上讲,这也应该适用于Wi-Fi 6E模式,但笔记本电脑无法找到6GHz网络--可能是由于驱动问题。
网络摄像头
Legion Slim 7可以配置1080p或720p网络摄像头。我们的评测单位配备了更高的分辨率选项。尽管如此,网络摄像头的性能很差,产生的图像像素相对较低,而且有噪音。


辅料
除了一个带有Slim-tip插头的230瓦充电器,联想没有为Legion Slim 7提供任何附件。
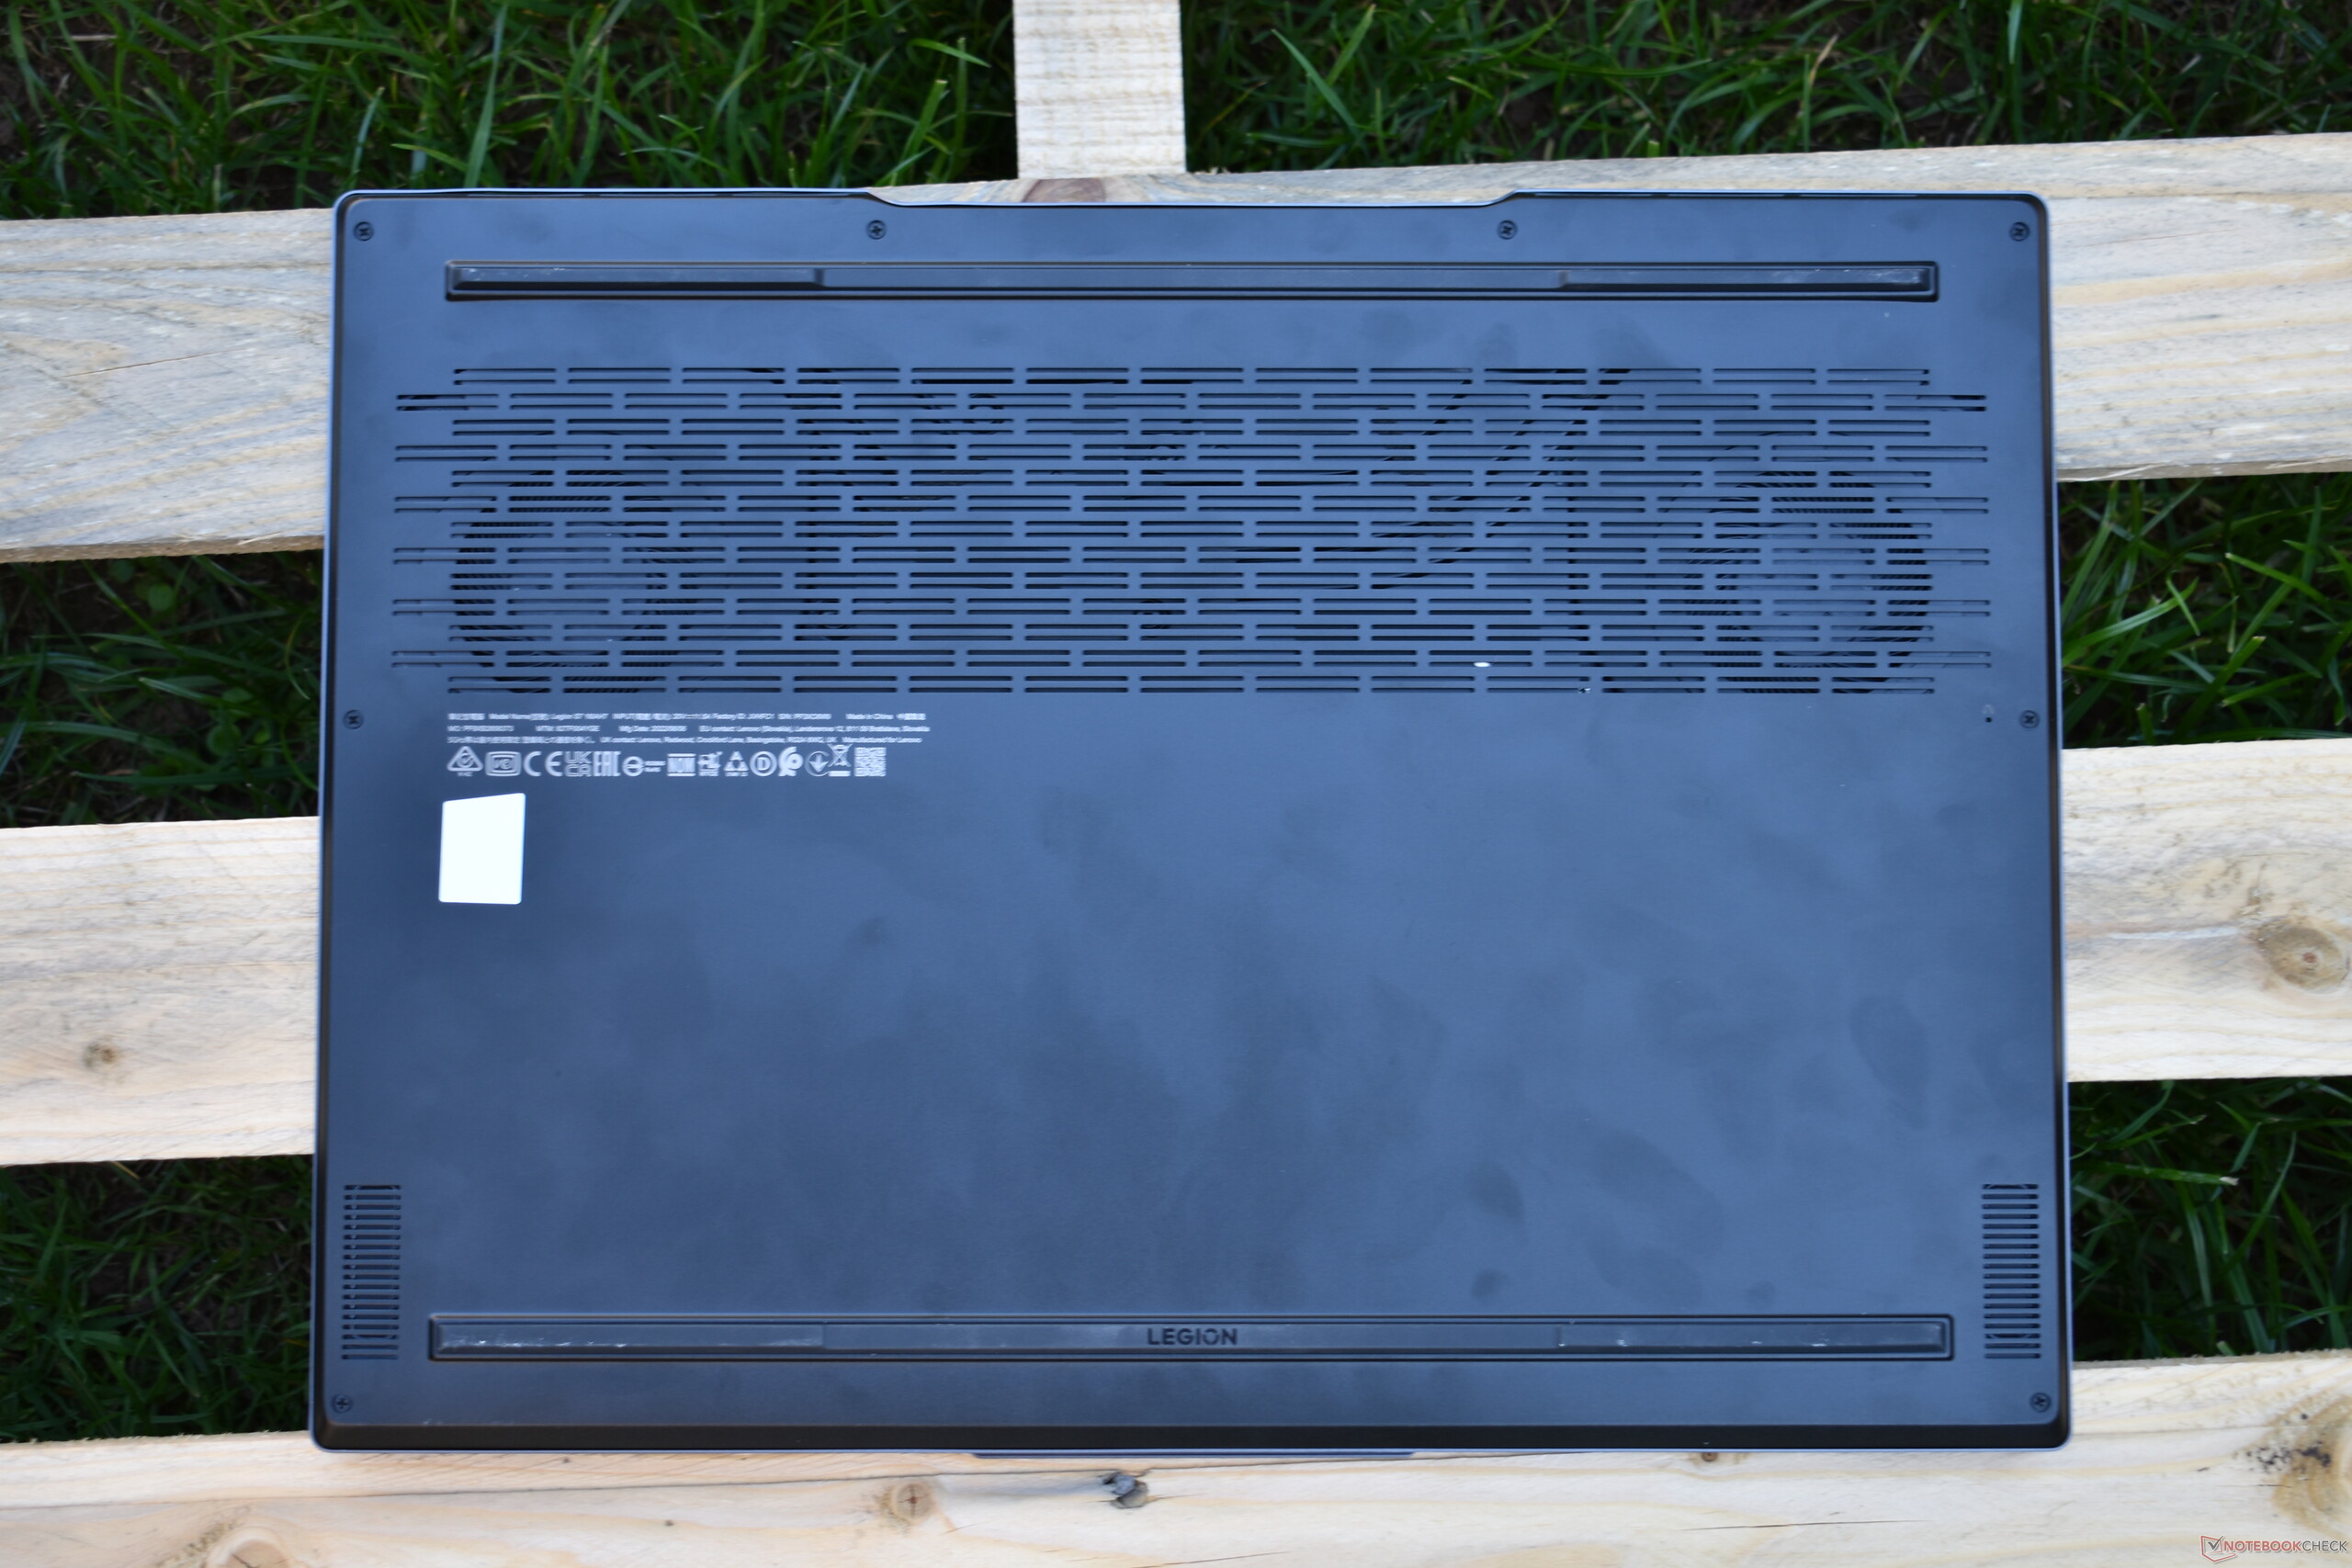
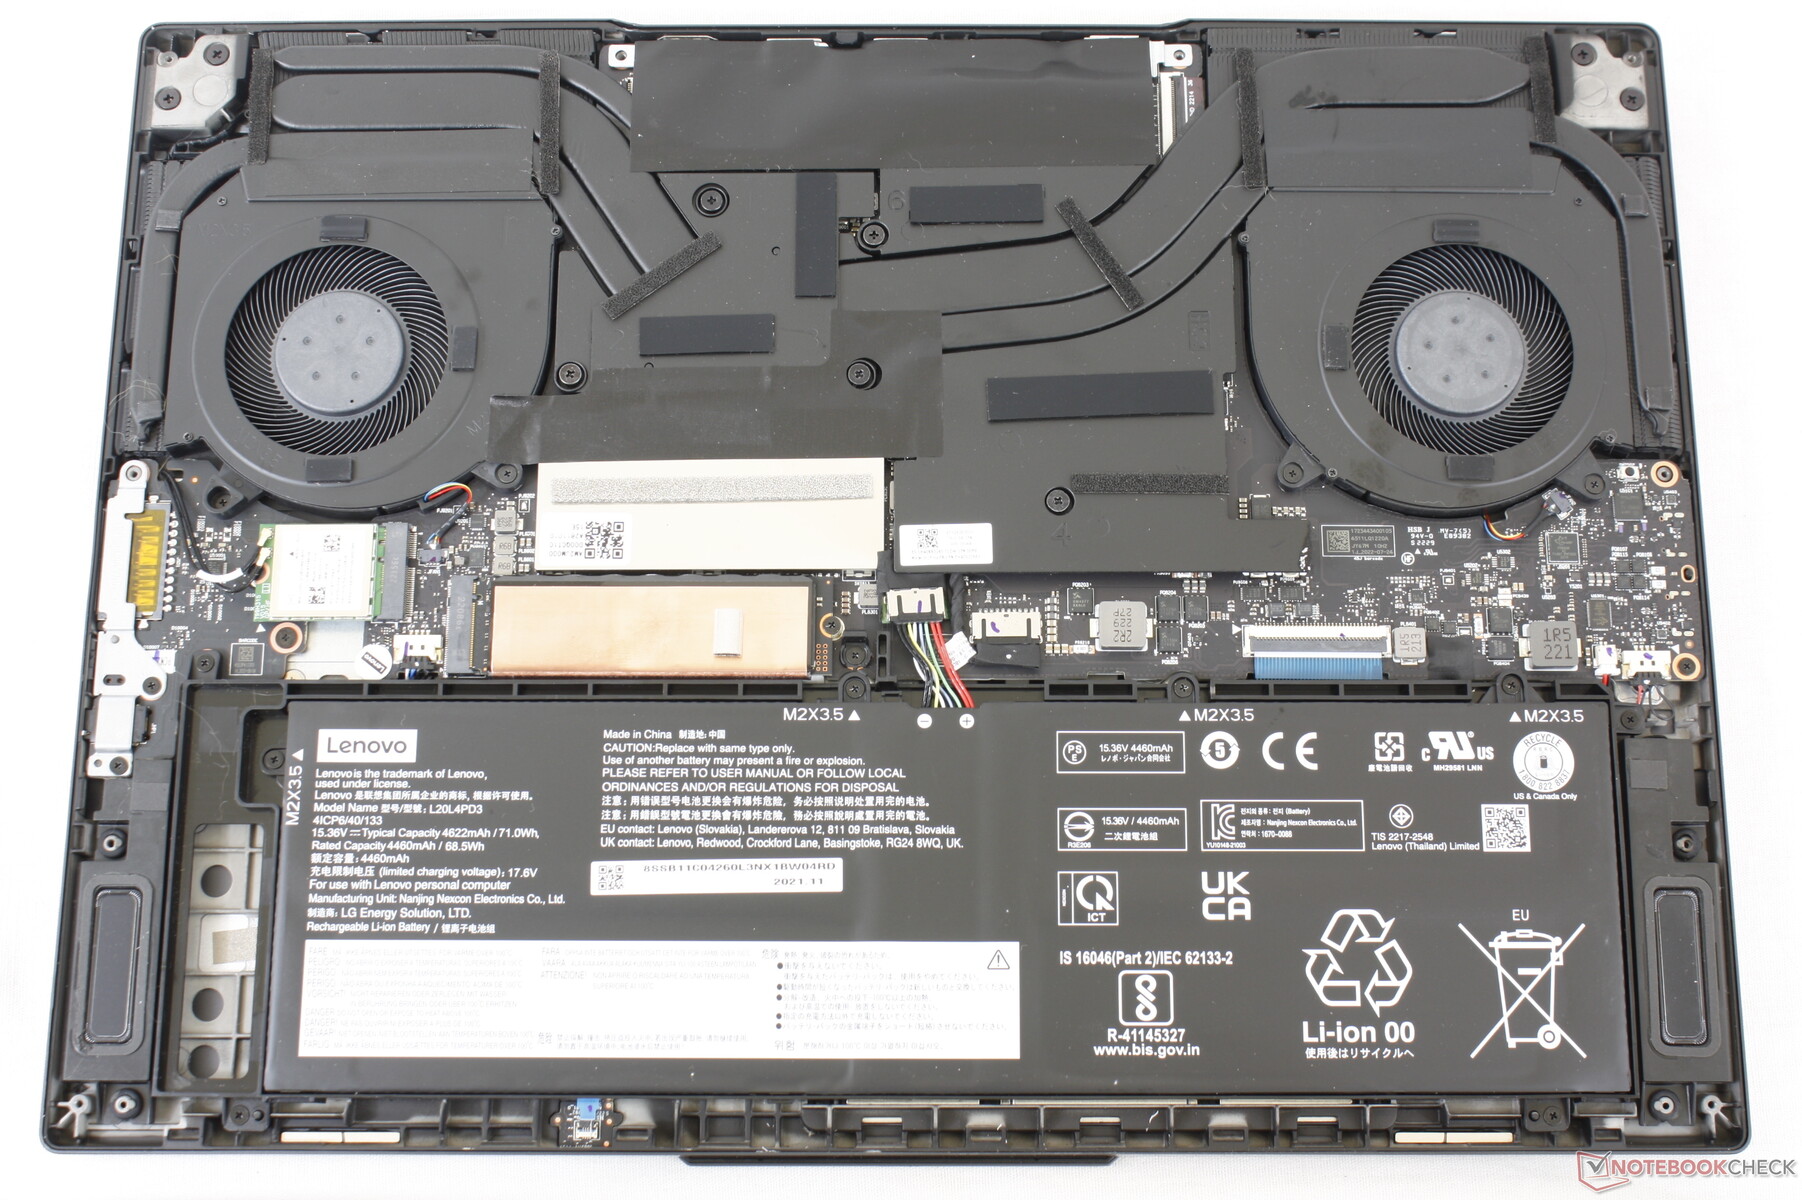
维护
理论上,联想Legion Slim 7i可以被打开和升级。要做到这一点,你必须卸下底板,底板由八个螺丝和许多夹子固定。我们说 "理论上 "是因为我们尝试了几次都无法打开设备。在不损害机箱的情况下,不可能解开这些夹子。尽管如此,内部结构的布局应该与AMD版本的类似。 AMD的版本因此,我们从该评论中借用了一张相应的图片。
除了M.2 2280固态硬盘,SODIMM内存和Wi-Fi模块都是可以升级的。电池也同样可以被替换。
担保
联想为在德国购买的联想Legion S7提供24个月的保修期,并提供带入服务。保修期可能因国家而异。例如,美国的客户默认只获得一年的保修期。
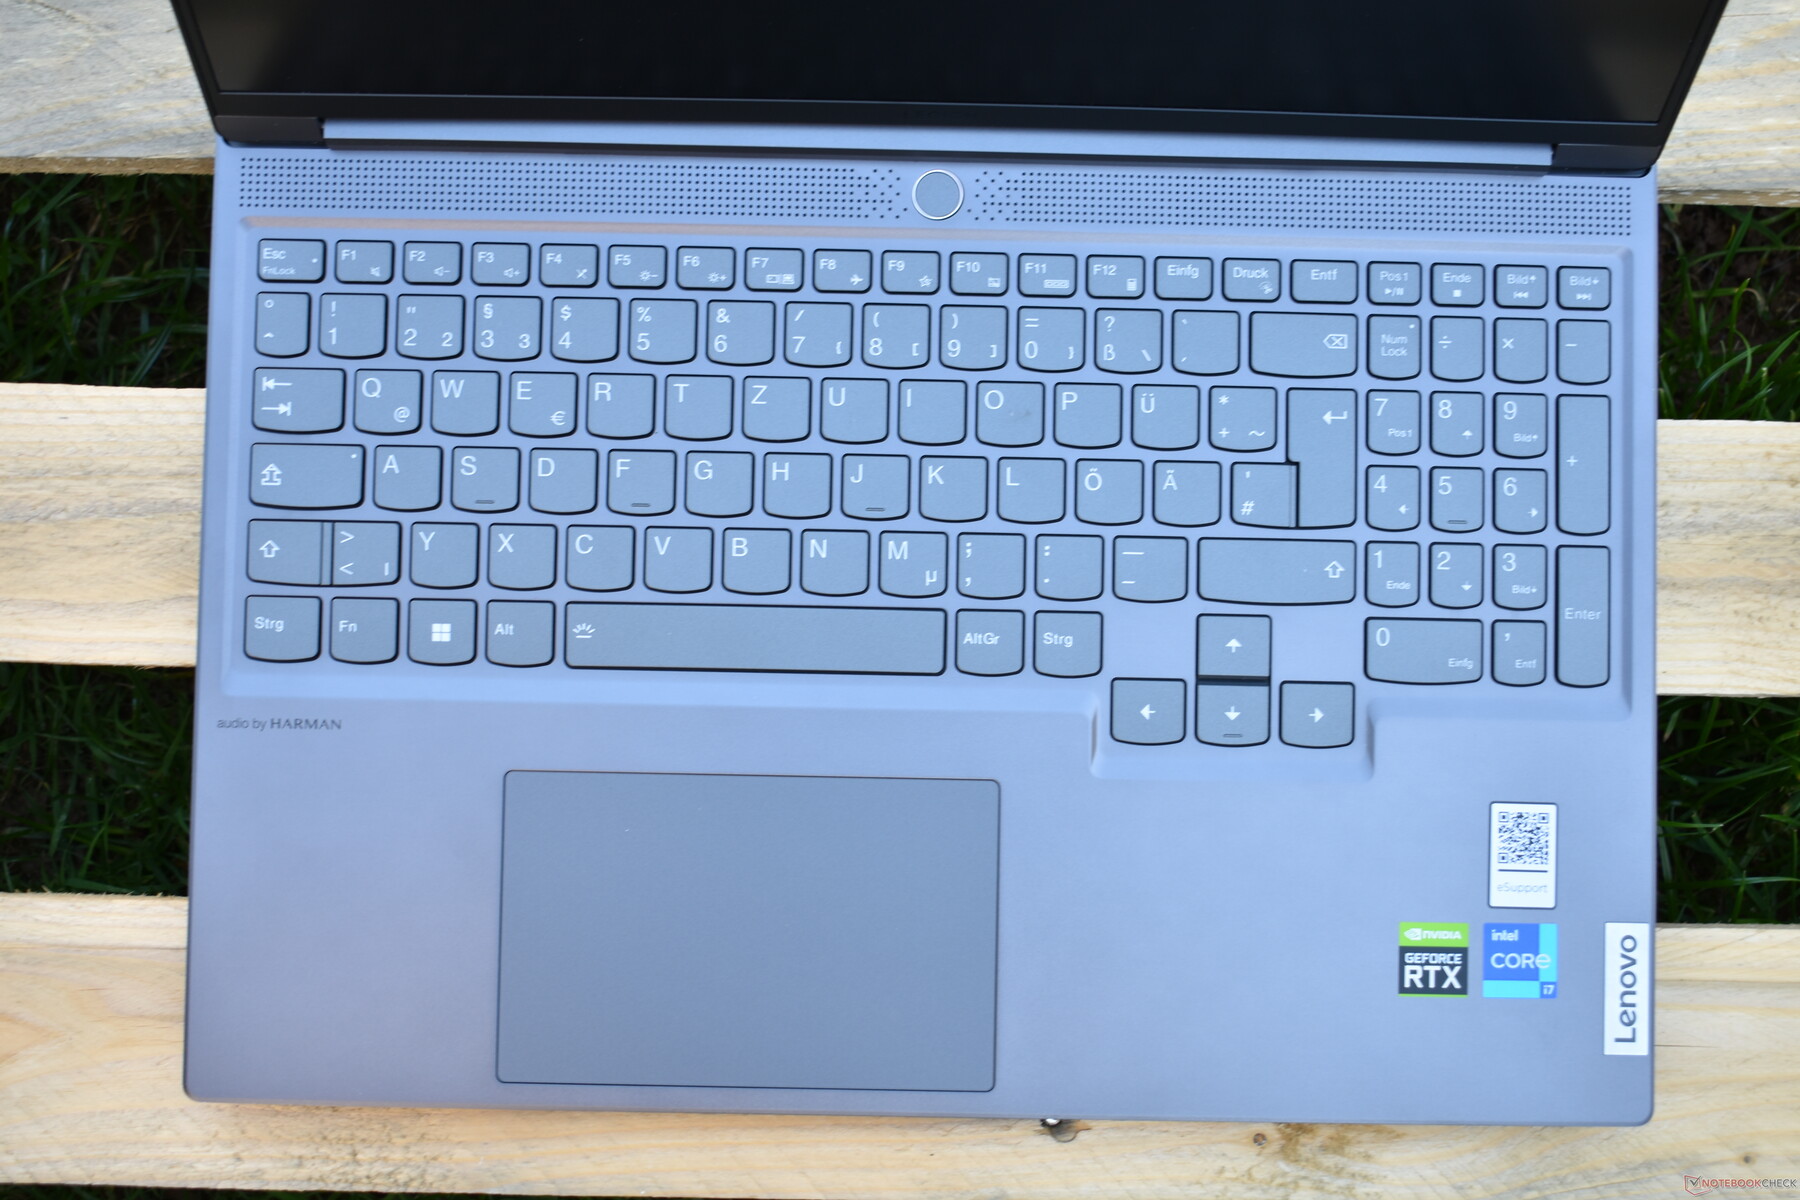
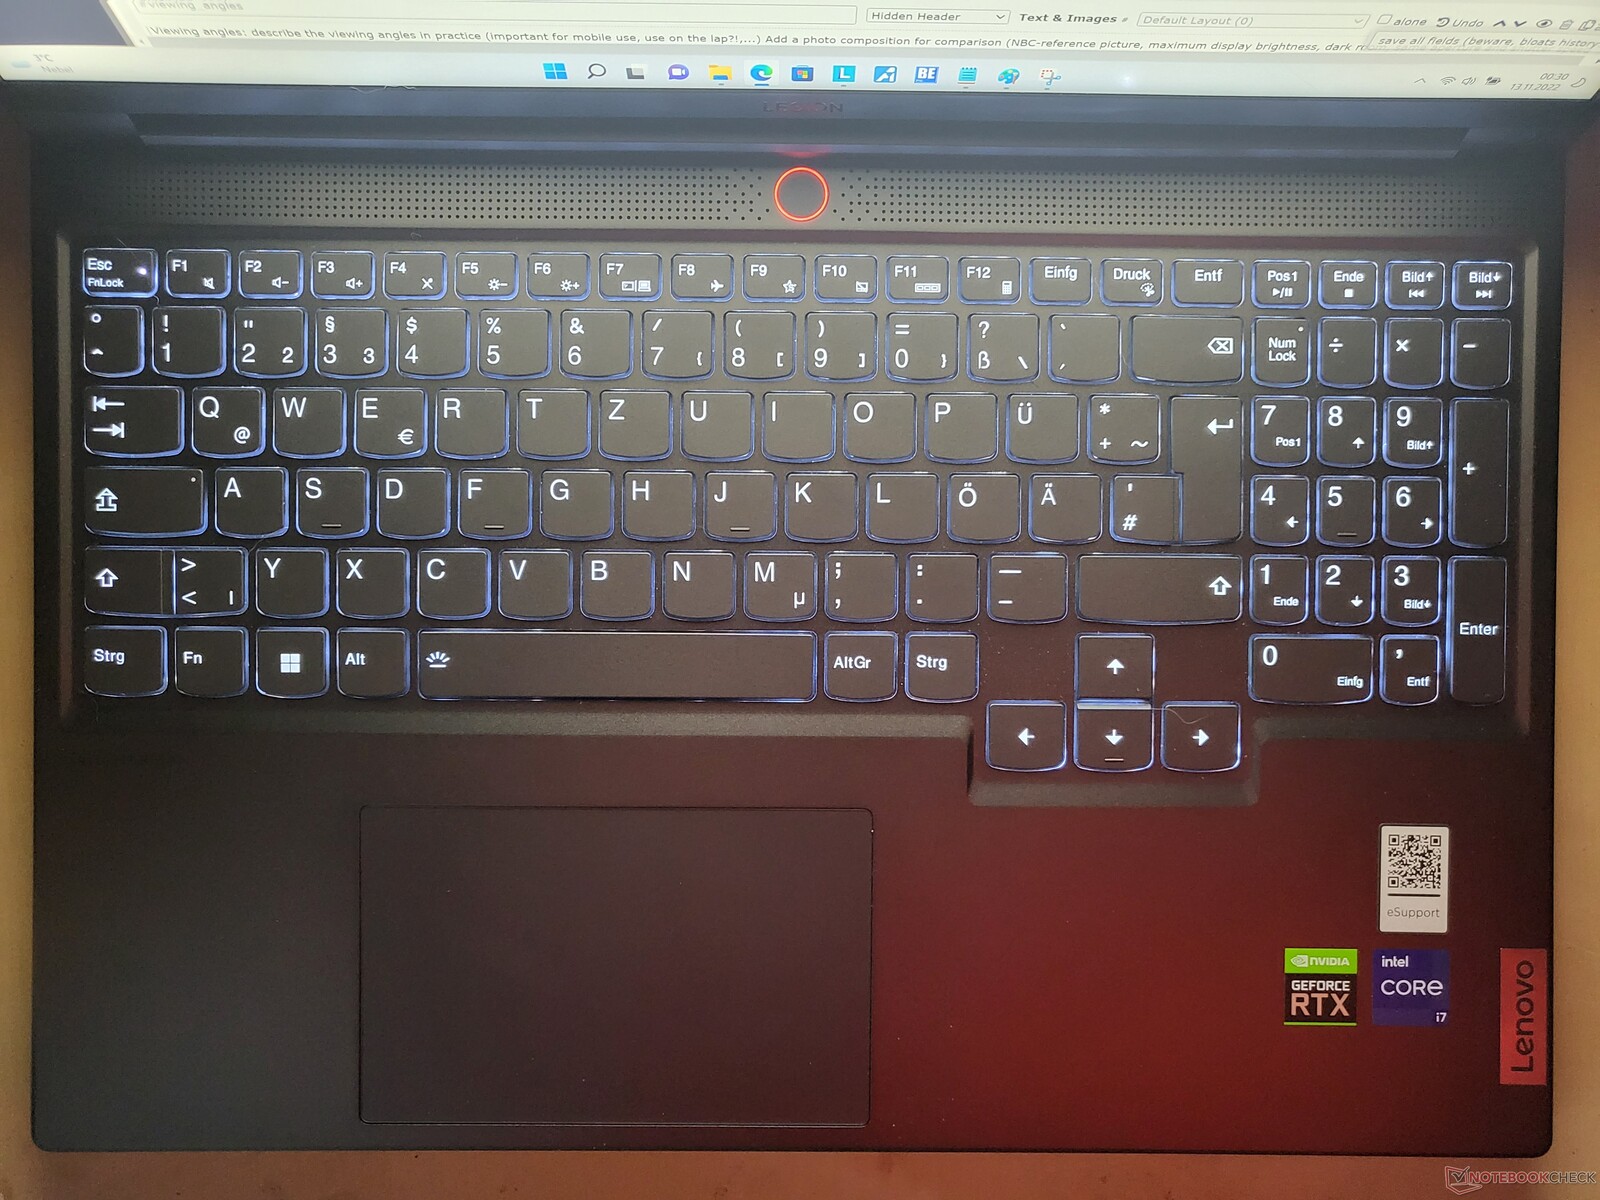
输入设备。没有RGB键盘的游戏笔记本
键盘
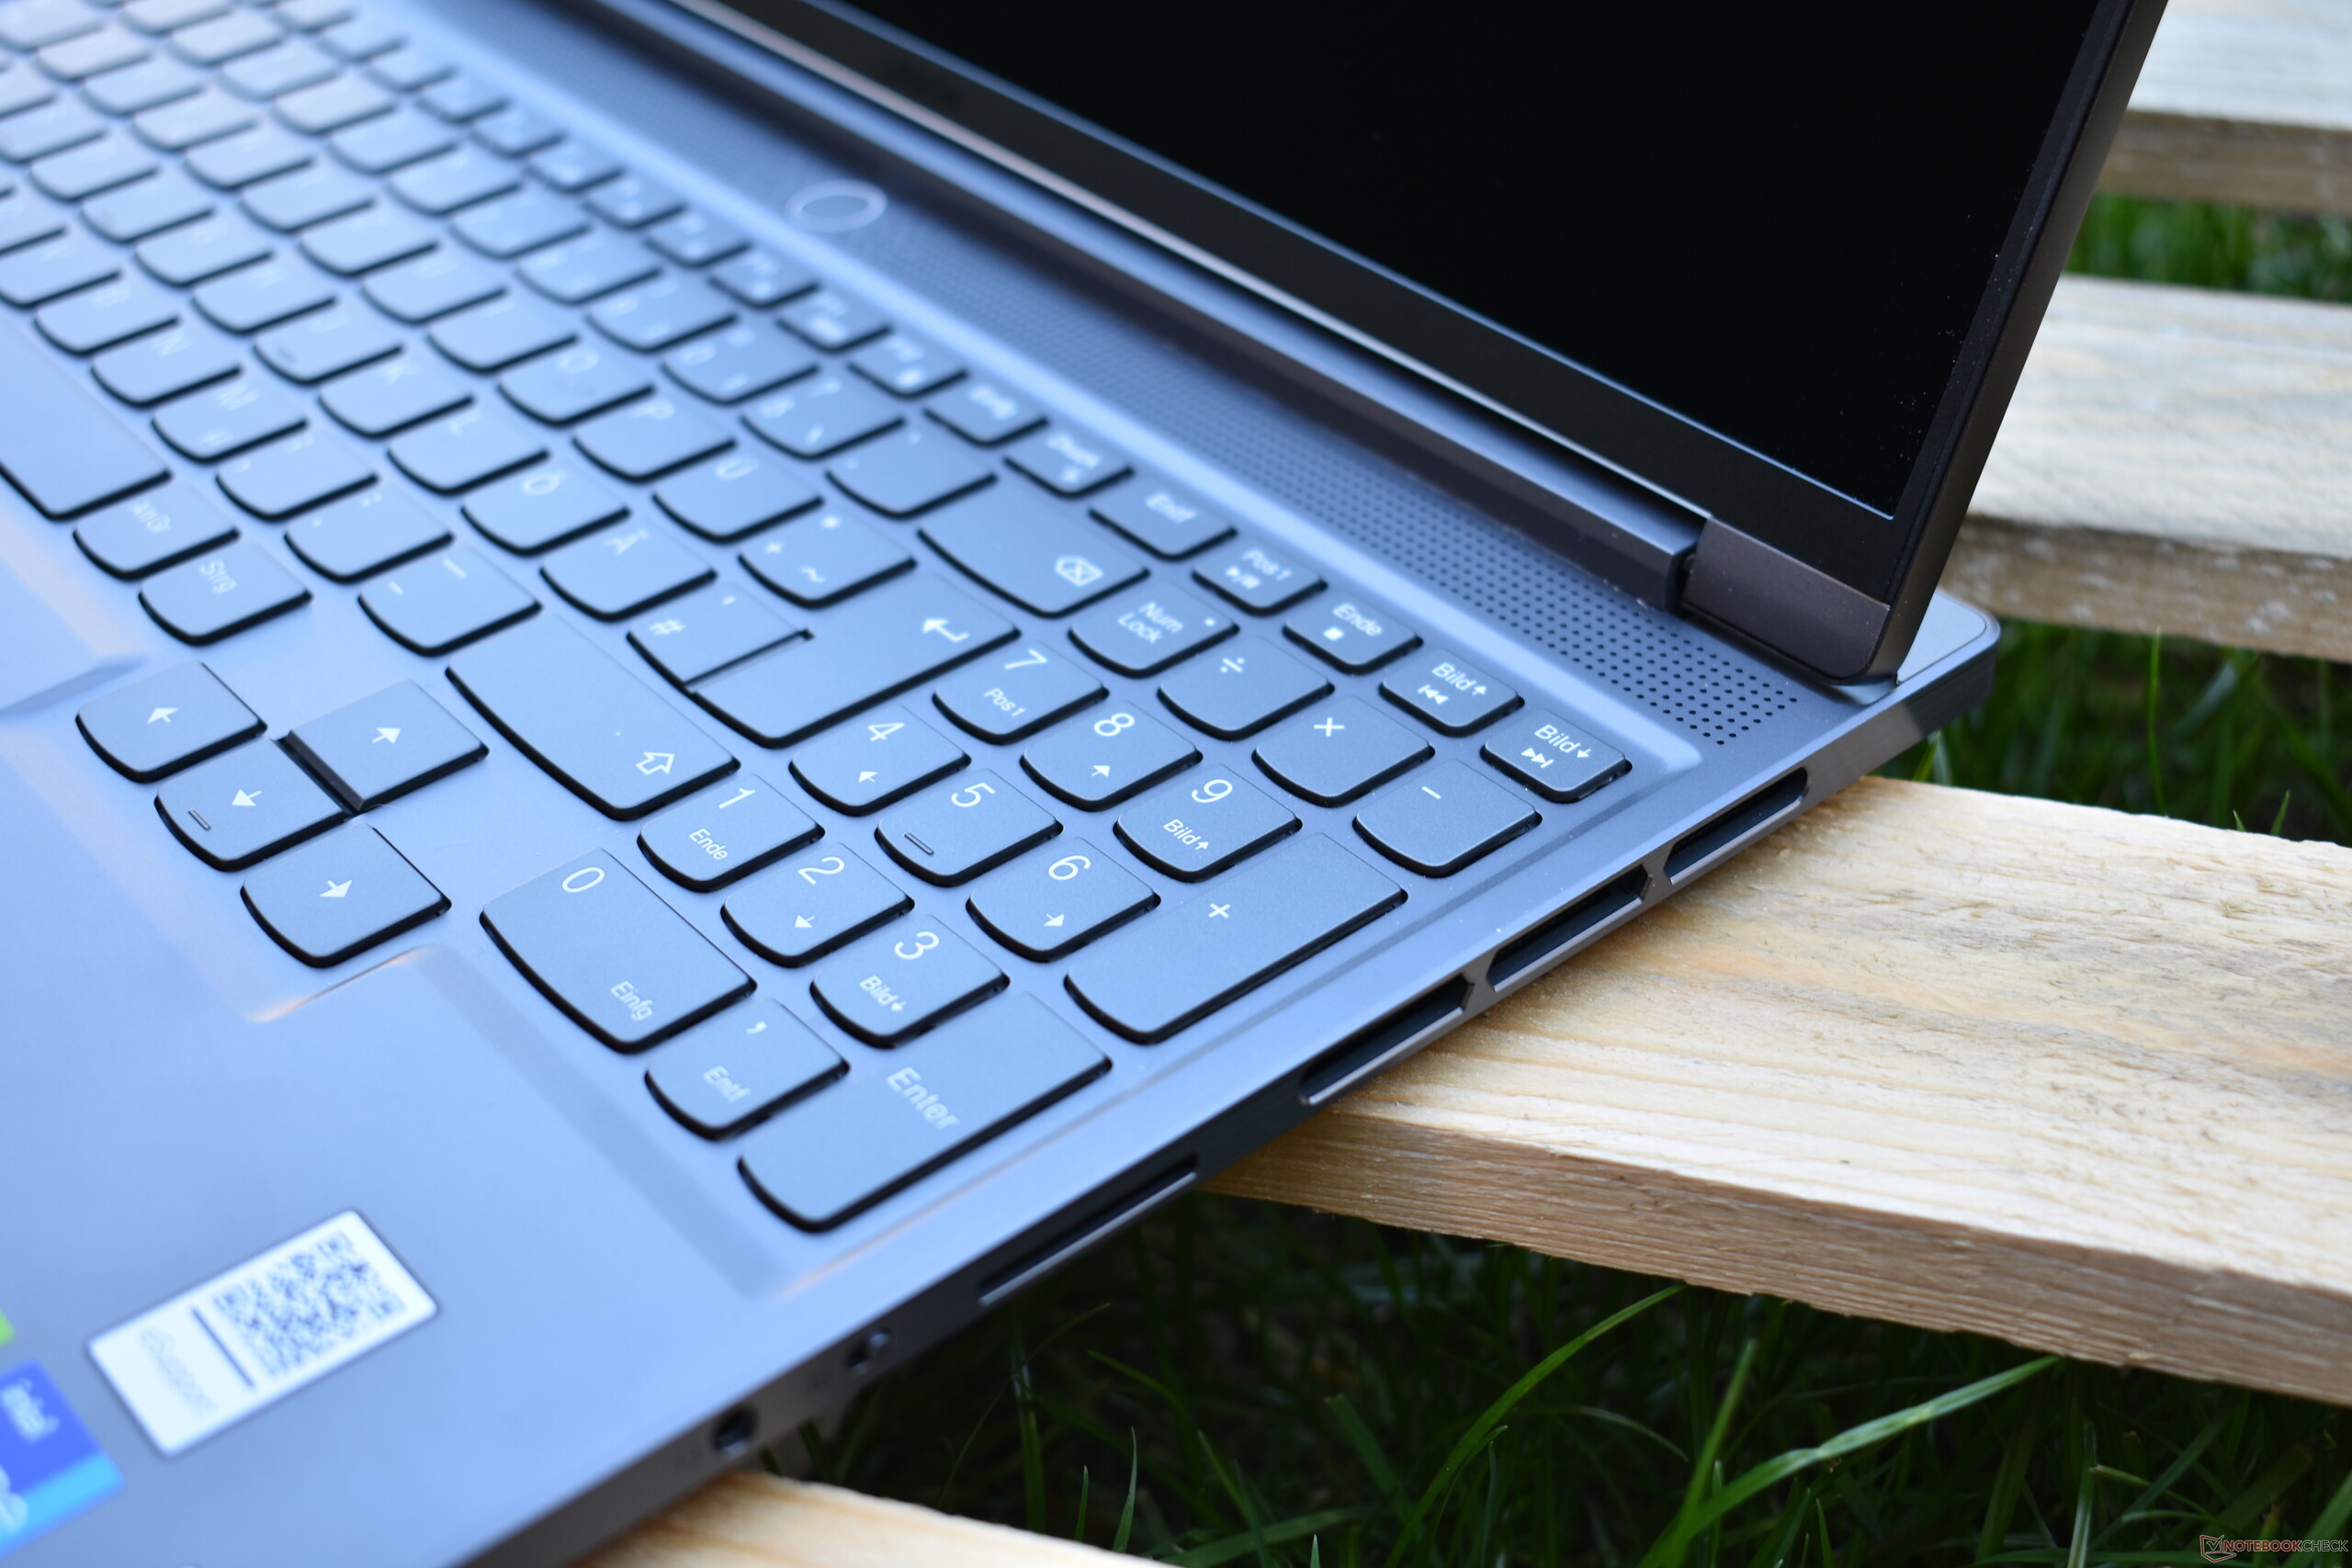
键盘上的小键盘是深灰色的,与机箱的颜色相匹配。正如之前在本评论的机箱部分提到的,联想决定不使用任何游戏笔记本上常见的RGB噱头,而是给键盘一个蓝白色的背光。这就是说,可以选择RGB背光键盘,但需要额外费用。
键盘几乎占据了机箱的整个宽度,有一个数字键盘。一个值得注意的特点是超大的方向键,这在笔记本电脑上并不常见。虽然这很好,但我们并不喜欢狭窄的回车键。总的来说,联想超薄7i的打字效果很好。按键有大约1.5毫米(0.06英寸)的行程和清晰的启动点,因此不会感觉到粘滞。此外,金属底盘很结实,可以防止键盘在打字时弯曲。
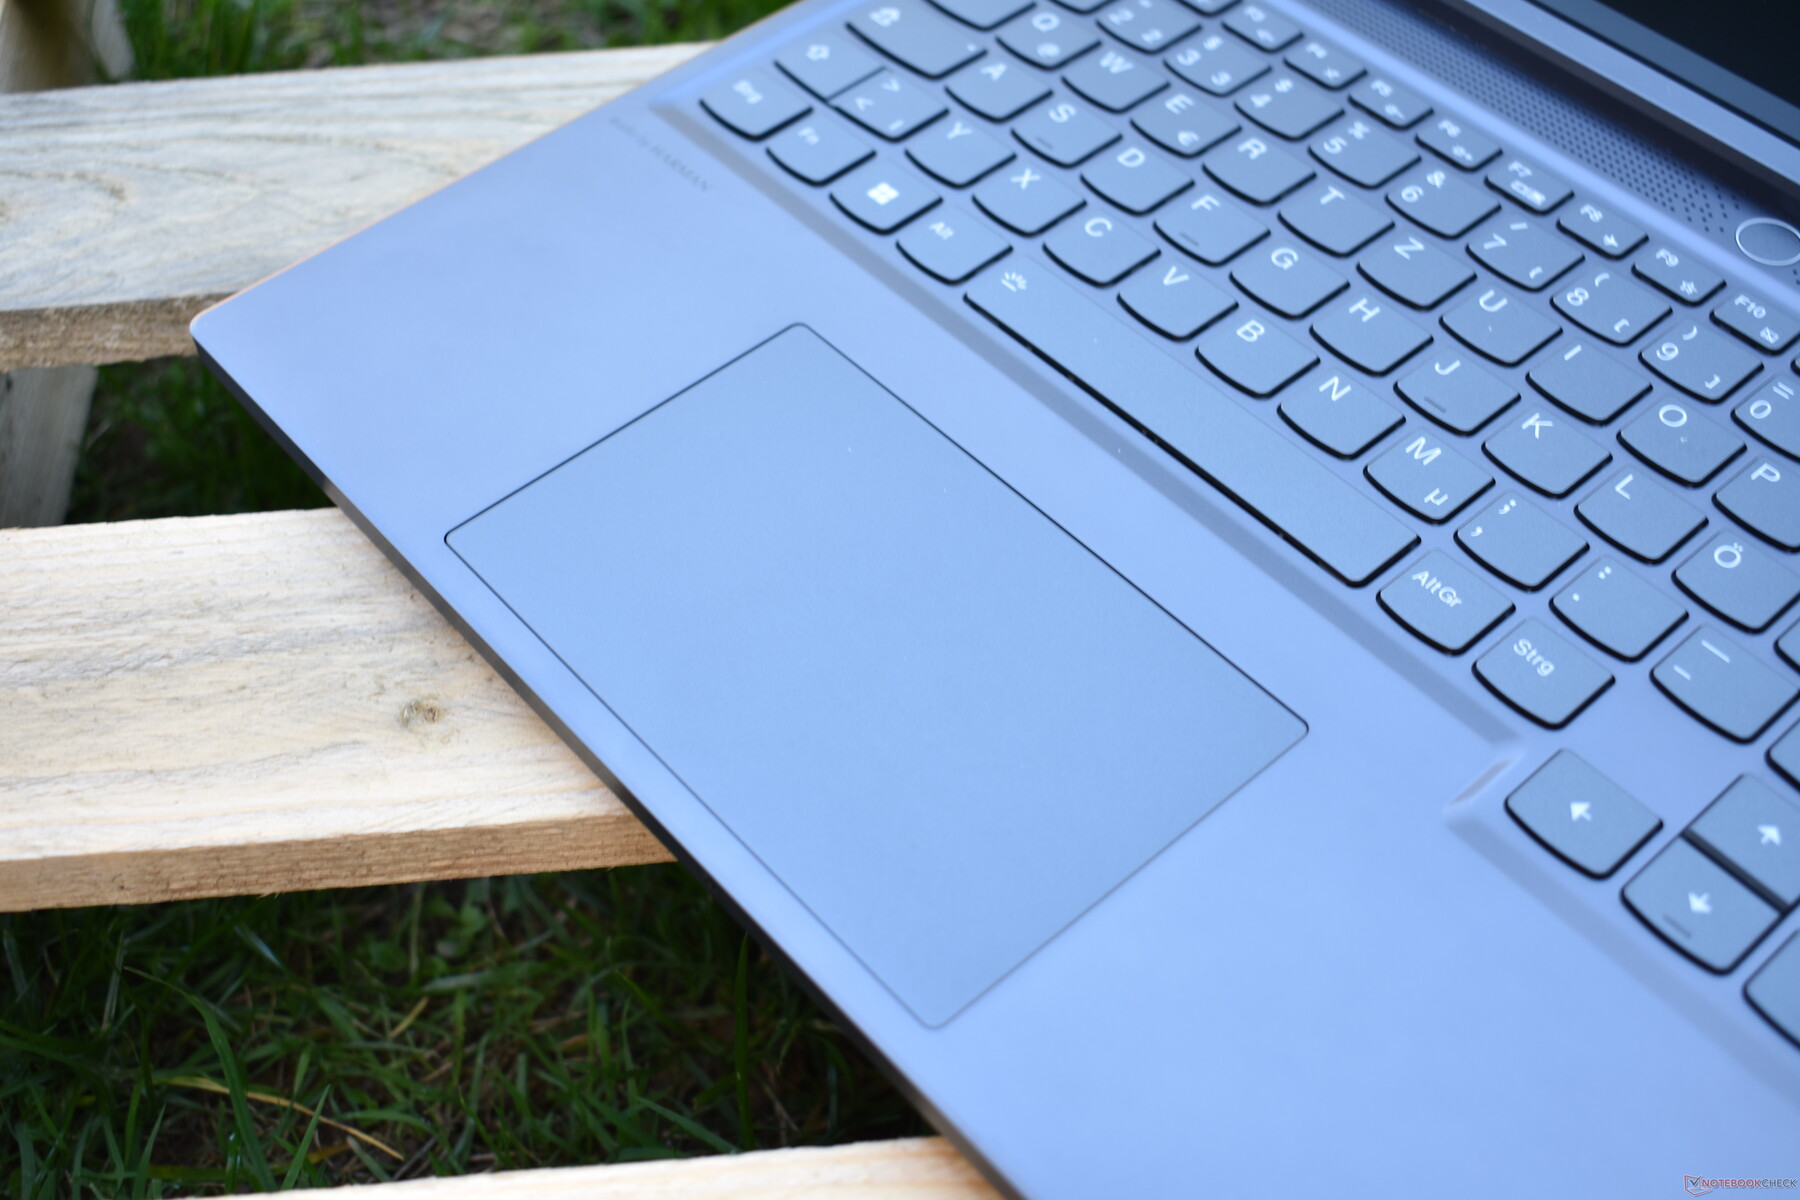
触摸板
触摸板尺寸为12 x 7.5厘米(4.72 x 2.95英寸),足够了,但我们觉得它还可以再大一点。玻璃触控板有一个光滑的哑光表面,感觉很好,可以让手指非常轻松地滑过。我们对该触控板的传统点击机制(通过按压下部区域进行操作)印象不深。原因是触摸板发出相当响亮的点击声,这可能会让人讨厌。然而,这是我们对触摸板的唯一不满;软件对多点触摸手势等功能的实现是无可挑剔的,而且鼠标指针的控制精度非常高。
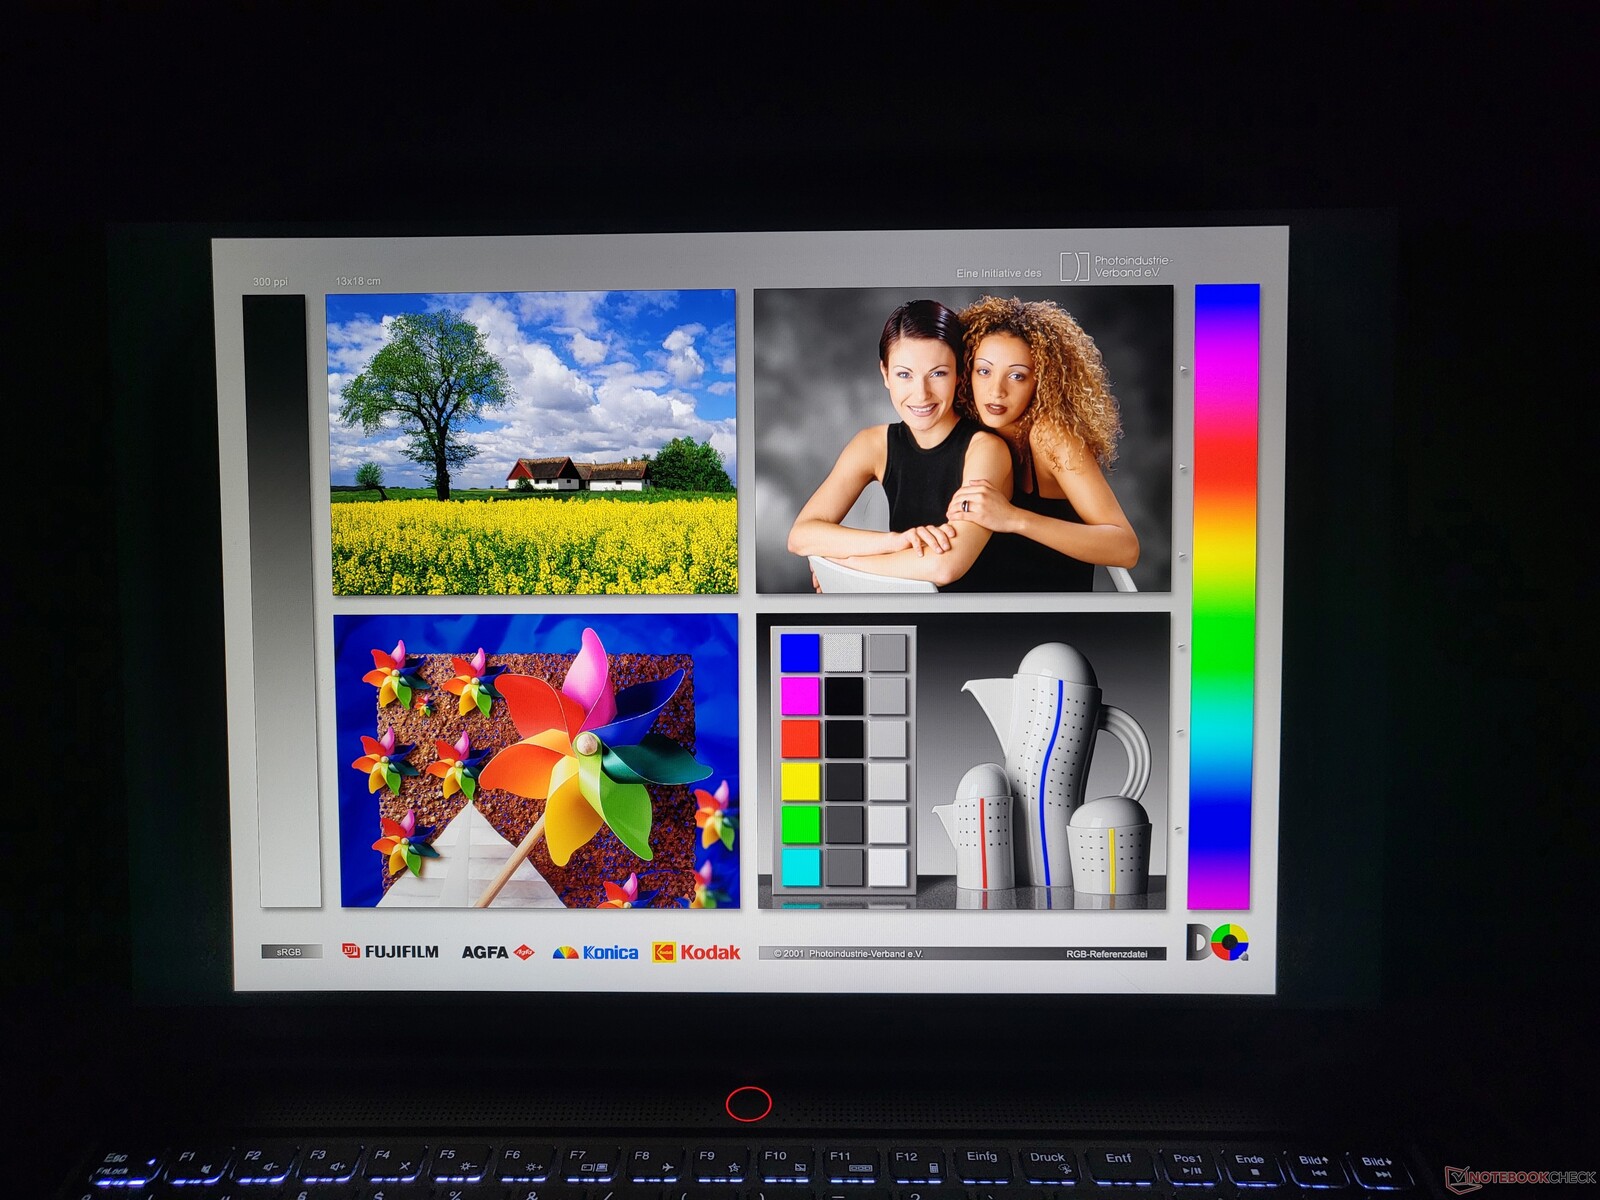
出色的WQXGA显示屏,能够达到165赫兹的刷新率
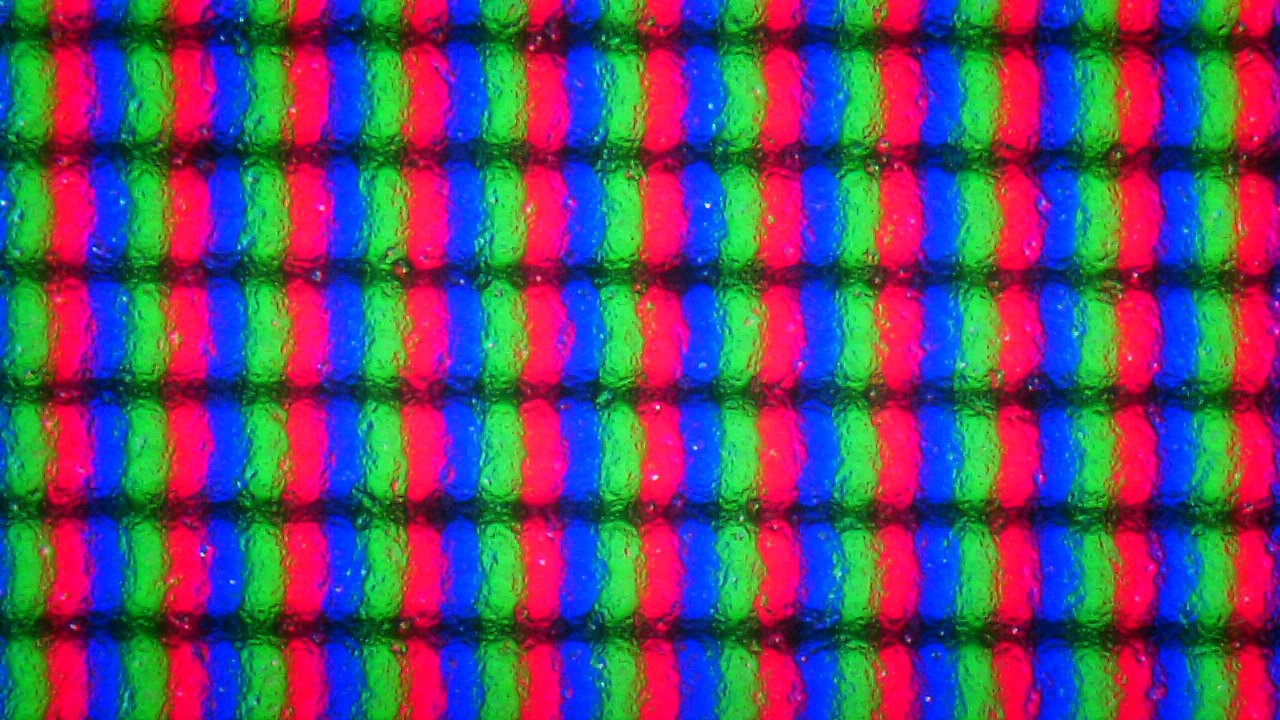
Legion S7i的所有显示屏选项都是哑光IPS面板,长宽比为16:10,对角线为16英寸。它们在分辨率和功能设置方面有所不同。
- WUXGA(1,920 x 1,200),300 cd/m²,100% sRGB,165 Hz
- WQXGA (2,560 x 1,600), 500 cd/m², 100% sRGB, 165 Hz
- WQXGA (2,560 x 1,600), 500 cd/m², 100% sRGB, 240 Hz
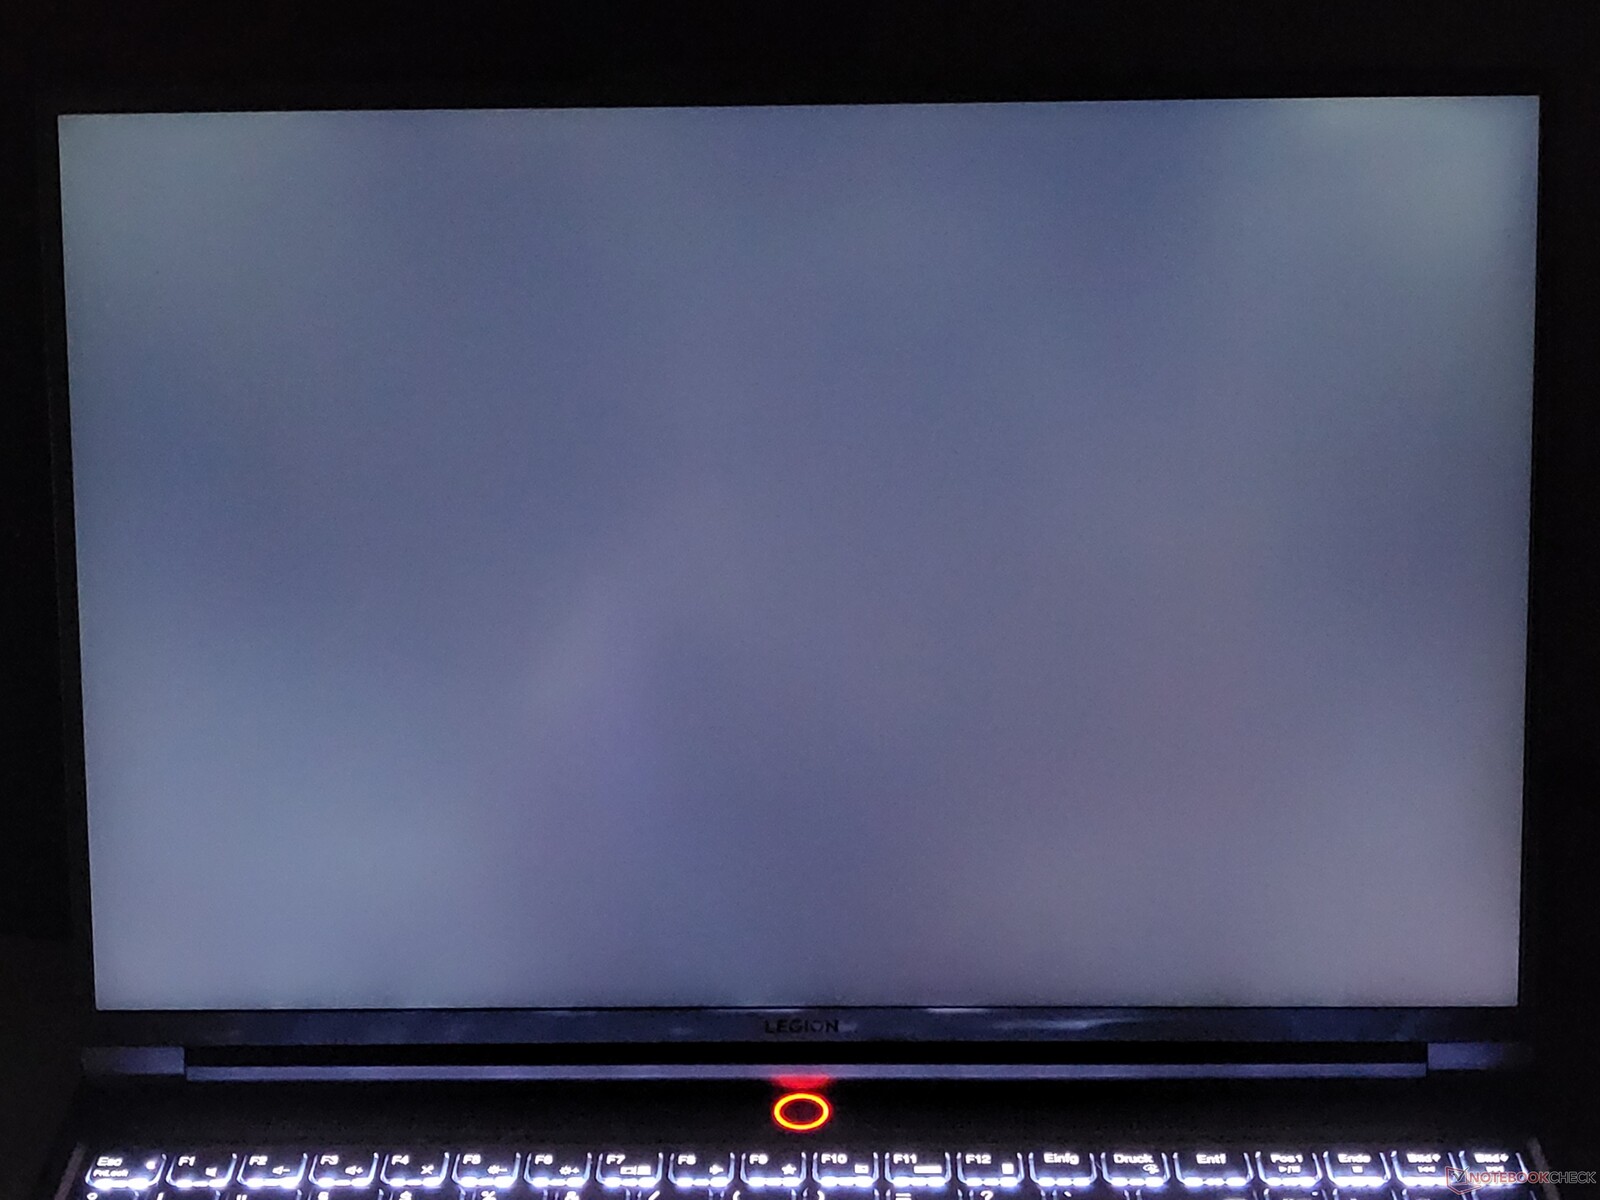
我们的评测设备超过了声称的500cd/m²的峰值亮度,屏幕的亮度达到了523cd/m²。该显示器的平均峰值亮度为494 cd/m²,这意味着联想Legion S7-16IAH7的屏幕是比较中最亮的。
由于165赫兹的刷新率,屏幕上的内容在运动中看起来非常流畅,这是游戏的理想选择。此外,对于IPS面板来说,该显示器的响应时间也很低。
| |||||||||||||||||||||||||
Brightness Distribution: 90 %
Center on Battery: 523 cd/m²
Contrast: 1308:1 (Black: 0.4 cd/m²)
ΔE ColorChecker Calman: 2.6 | ∀{0.5-29.43 Ø4.71}
calibrated: 1
ΔE Greyscale Calman: 3.3 | ∀{0.09-98 Ø4.96}
72.8% AdobeRGB 1998 (Argyll 3D)
99.1% sRGB (Argyll 3D)
70.5% Display P3 (Argyll 3D)
Gamma: 2.17
CCT: 6013 K
| Lenovo Legion Slim 7-16IAH 82TF004YGE MNG007DA1-G , IPS LED, 2560x1600, 16" | Lenovo Legion S7 16ARHA7 BOE CQ NE160QDM-NY1, IPS, 2560x1600, 16" | Acer Predator Triton 500 SE PT516-52s-70KX NE160QDM-NZ2, IPS LED, 2560x1600, 16" | HP Omen 16-b1090ng BOE09E5, IPS, 2560x1440, 16.1" | Asus ROG Zephyrus M16 GU603H AU Optronics AUOC199, IPS, 2560x1600, 16" | |
|---|---|---|---|---|---|
| Display | -1% | 19% | 0% | ||
| Display P3 Coverage (%) | 70.5 | 69.8 -1% | 97.3 38% | 71 1% | |
| sRGB Coverage (%) | 99.1 | 98.1 -1% | 100 1% | 97.9 -1% | |
| AdobeRGB 1998 Coverage (%) | 72.8 | 71.9 -1% | 84.9 17% | 73.3 1% | |
| Response Times | -33% | -3% | -28% | 37% | |
| Response Time Grey 50% / Grey 80% * (ms) | 12 ? | 10 ? 17% | 13.8 ? -15% | 14.5 ? -21% | 4.8 ? 60% |
| Response Time Black / White * (ms) | 7 ? | 12.8 ? -83% | 6.4 ? 9% | 9.4 ? -34% | 6 ? 14% |
| PWM Frequency (Hz) | |||||
| Screen | 9% | 10% | -39% | -34% | |
| Brightness middle (cd/m²) | 523 | 492.4 -6% | 498 -5% | 335 -36% | 448 -14% |
| Brightness (cd/m²) | 494 | 471 -5% | 468 -5% | 319 -35% | 446 -10% |
| Brightness Distribution (%) | 90 | 90 0% | 80 -11% | 90 0% | 86 -4% |
| Black Level * (cd/m²) | 0.4 | 0.4 -0% | 0.36 10% | 0.28 30% | 0.48 -20% |
| Contrast (:1) | 1308 | 1231 -6% | 1383 6% | 1196 -9% | 933 -29% |
| Colorchecker dE 2000 * | 2.6 | 1.9 27% | 1.77 32% | 4.38 -68% | 2.76 -6% |
| Colorchecker dE 2000 max. * | 5 | 3.81 24% | 5.24 -5% | 9.48 -90% | 7.09 -42% |
| Colorchecker dE 2000 calibrated * | 1 | 0.99 1% | 0.63 37% | 1.33 -33% | 2.86 -186% |
| Greyscale dE 2000 * | 3.3 | 1.7 48% | 2.4 27% | 7 -112% | 3.1 6% |
| Gamma | 2.17 101% | 2.36 93% | 2.14 103% | 2.103 105% | 2.153 102% |
| CCT | 6013 108% | 6497 100% | 7046 92% | 6244 104% | 6826 95% |
| Color Space (Percent of AdobeRGB 1998) (%) | 87 | ||||
| Color Space (Percent of sRGB) (%) | 100 | ||||
| Total Average (Program / Settings) | -8% /
1% | 9% /
10% | -22% /
-29% | 2% /
-21% |
* ... smaller is better
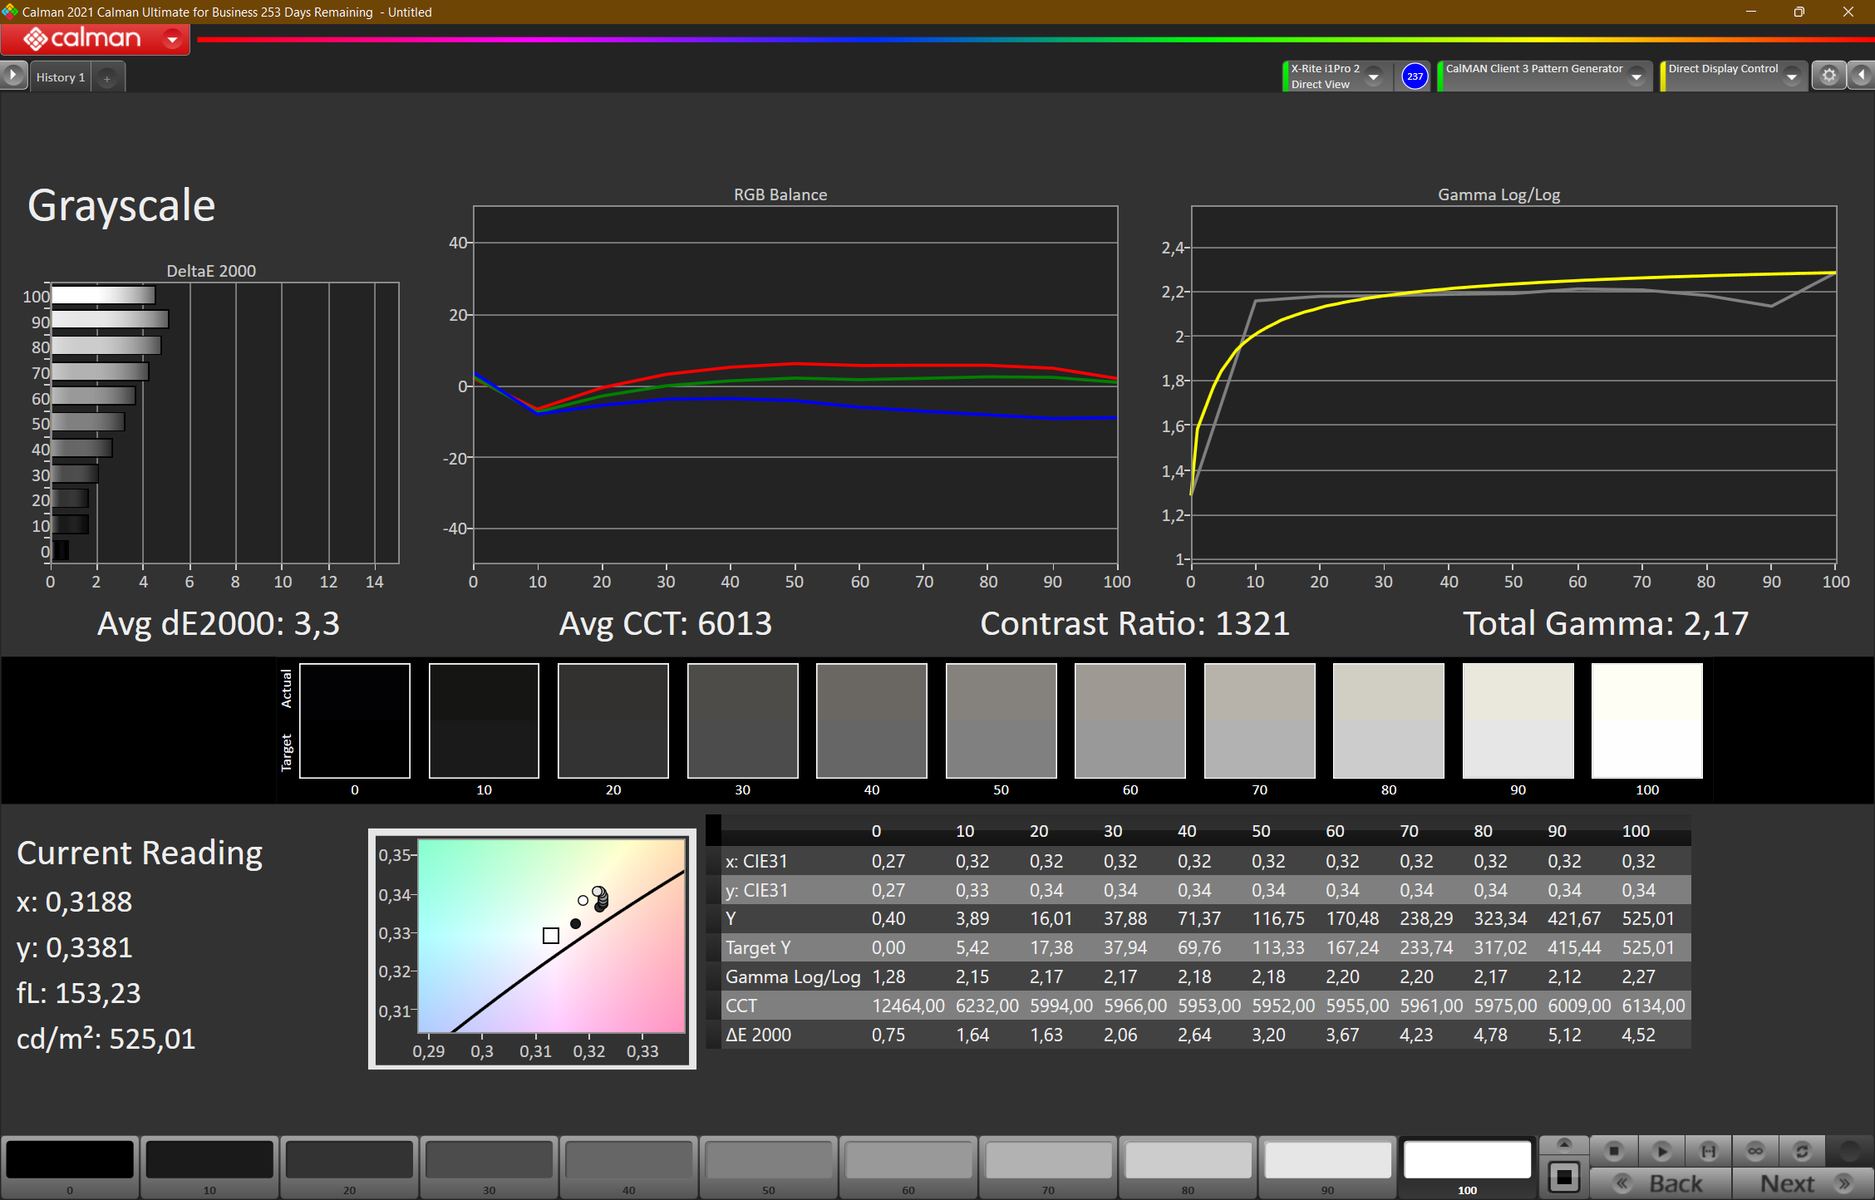
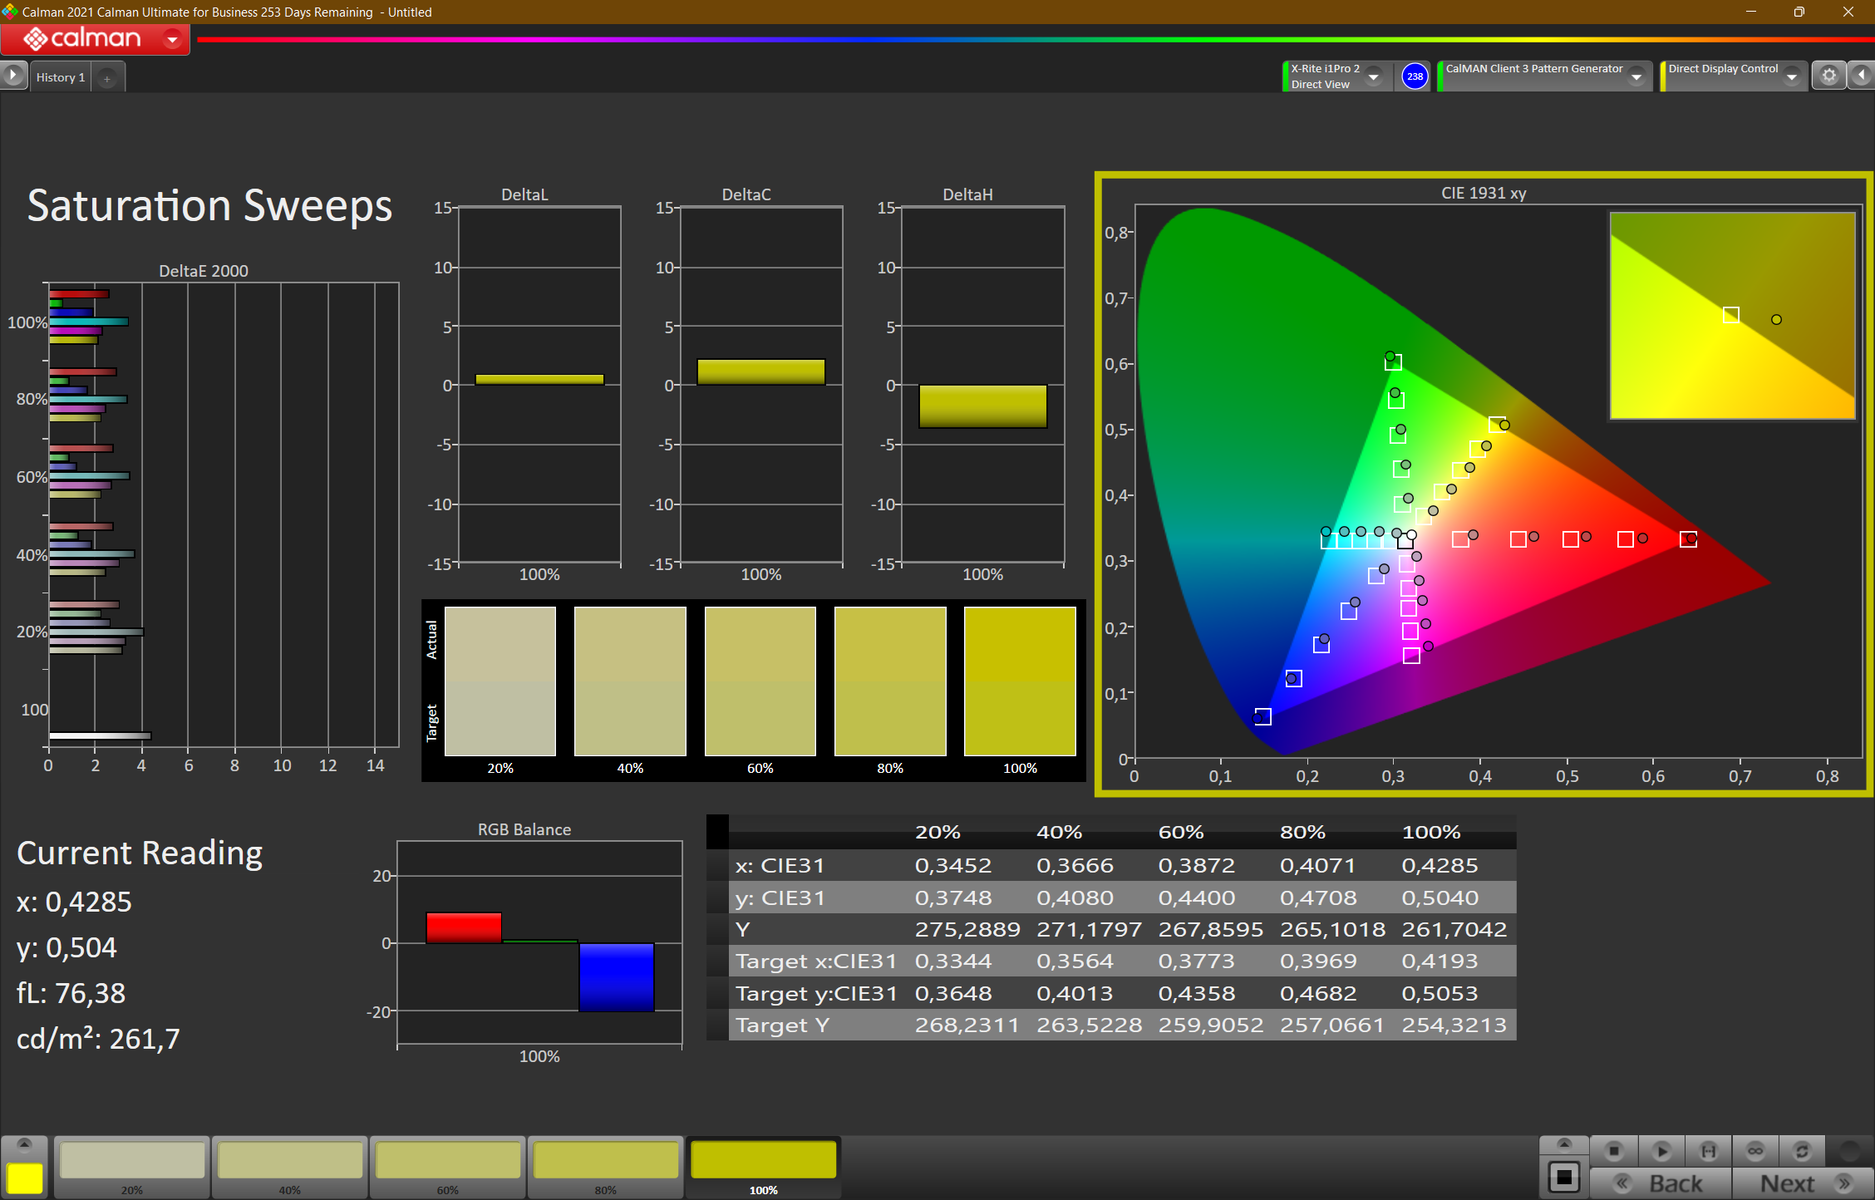
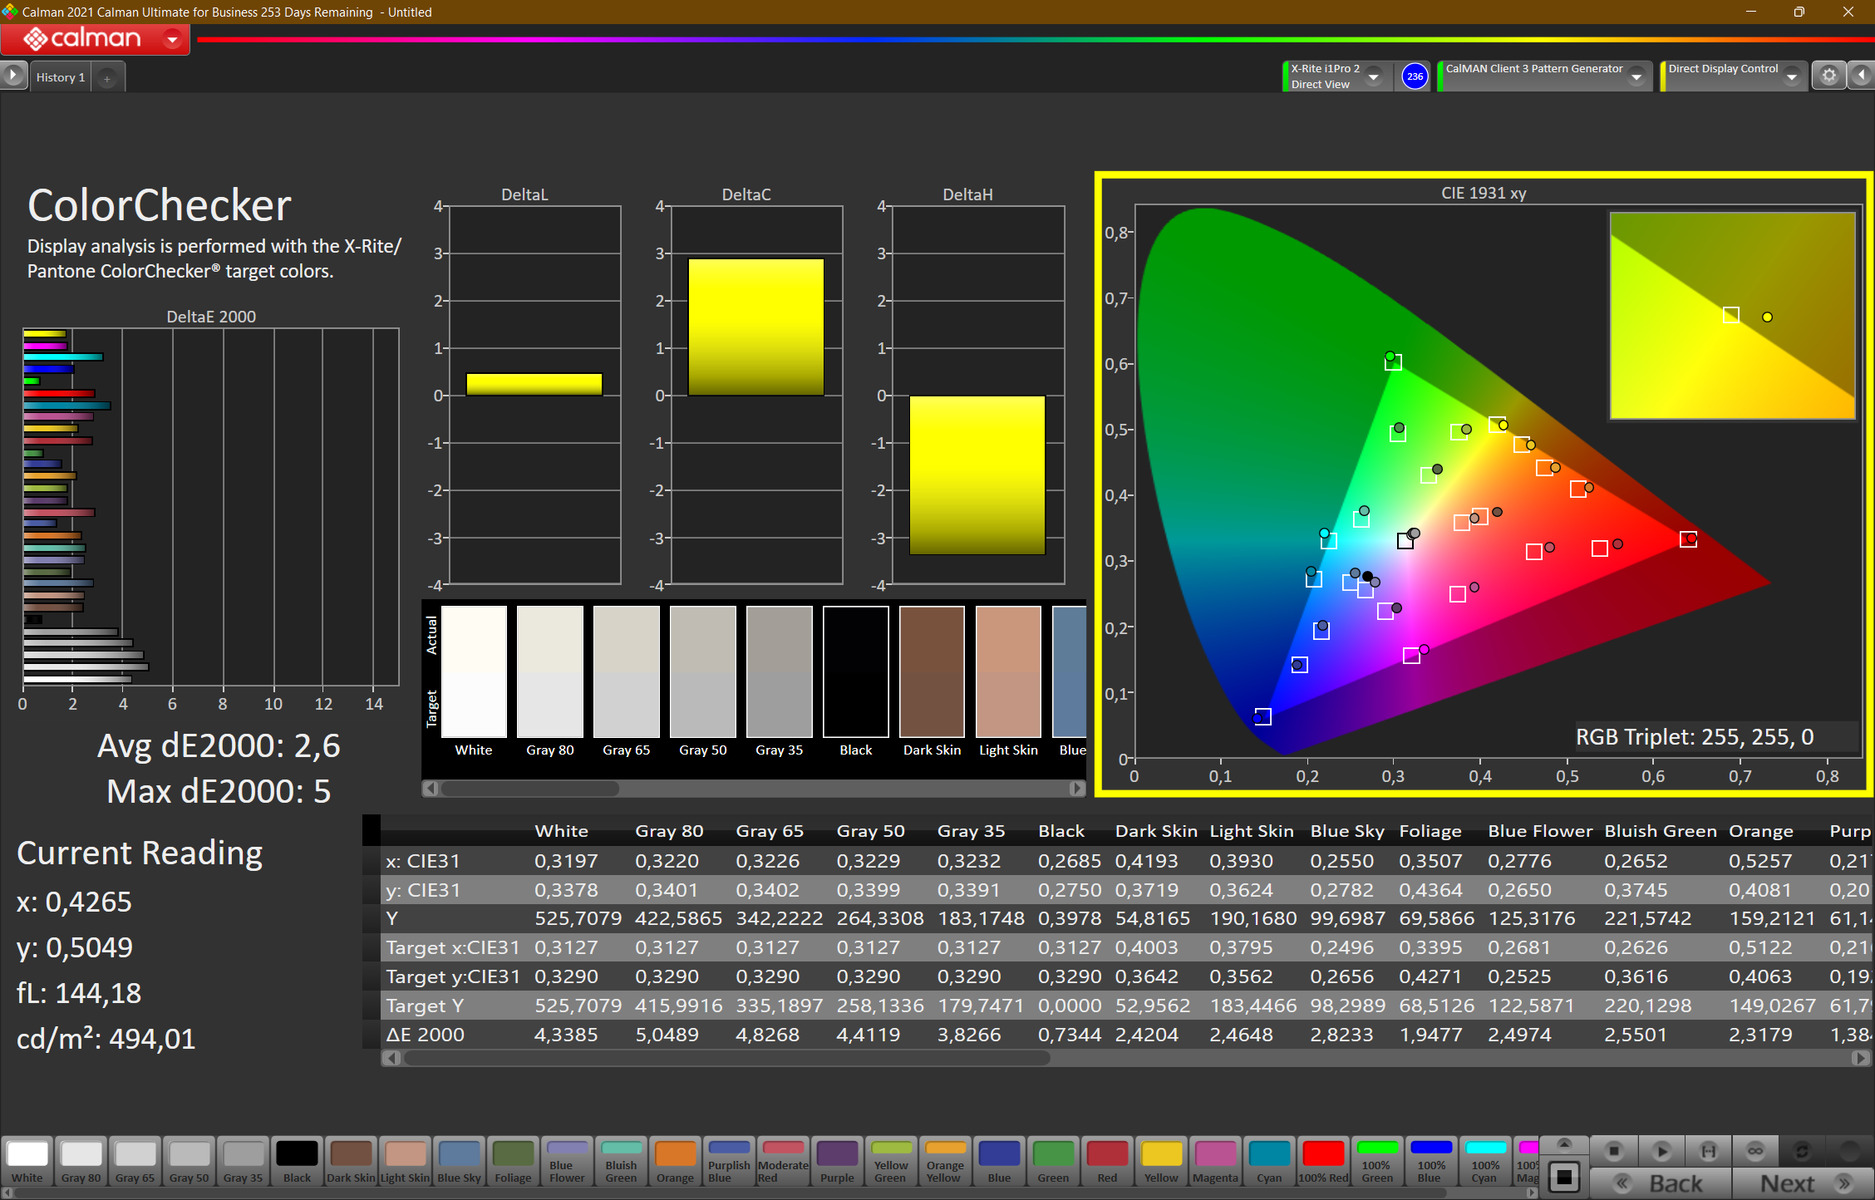
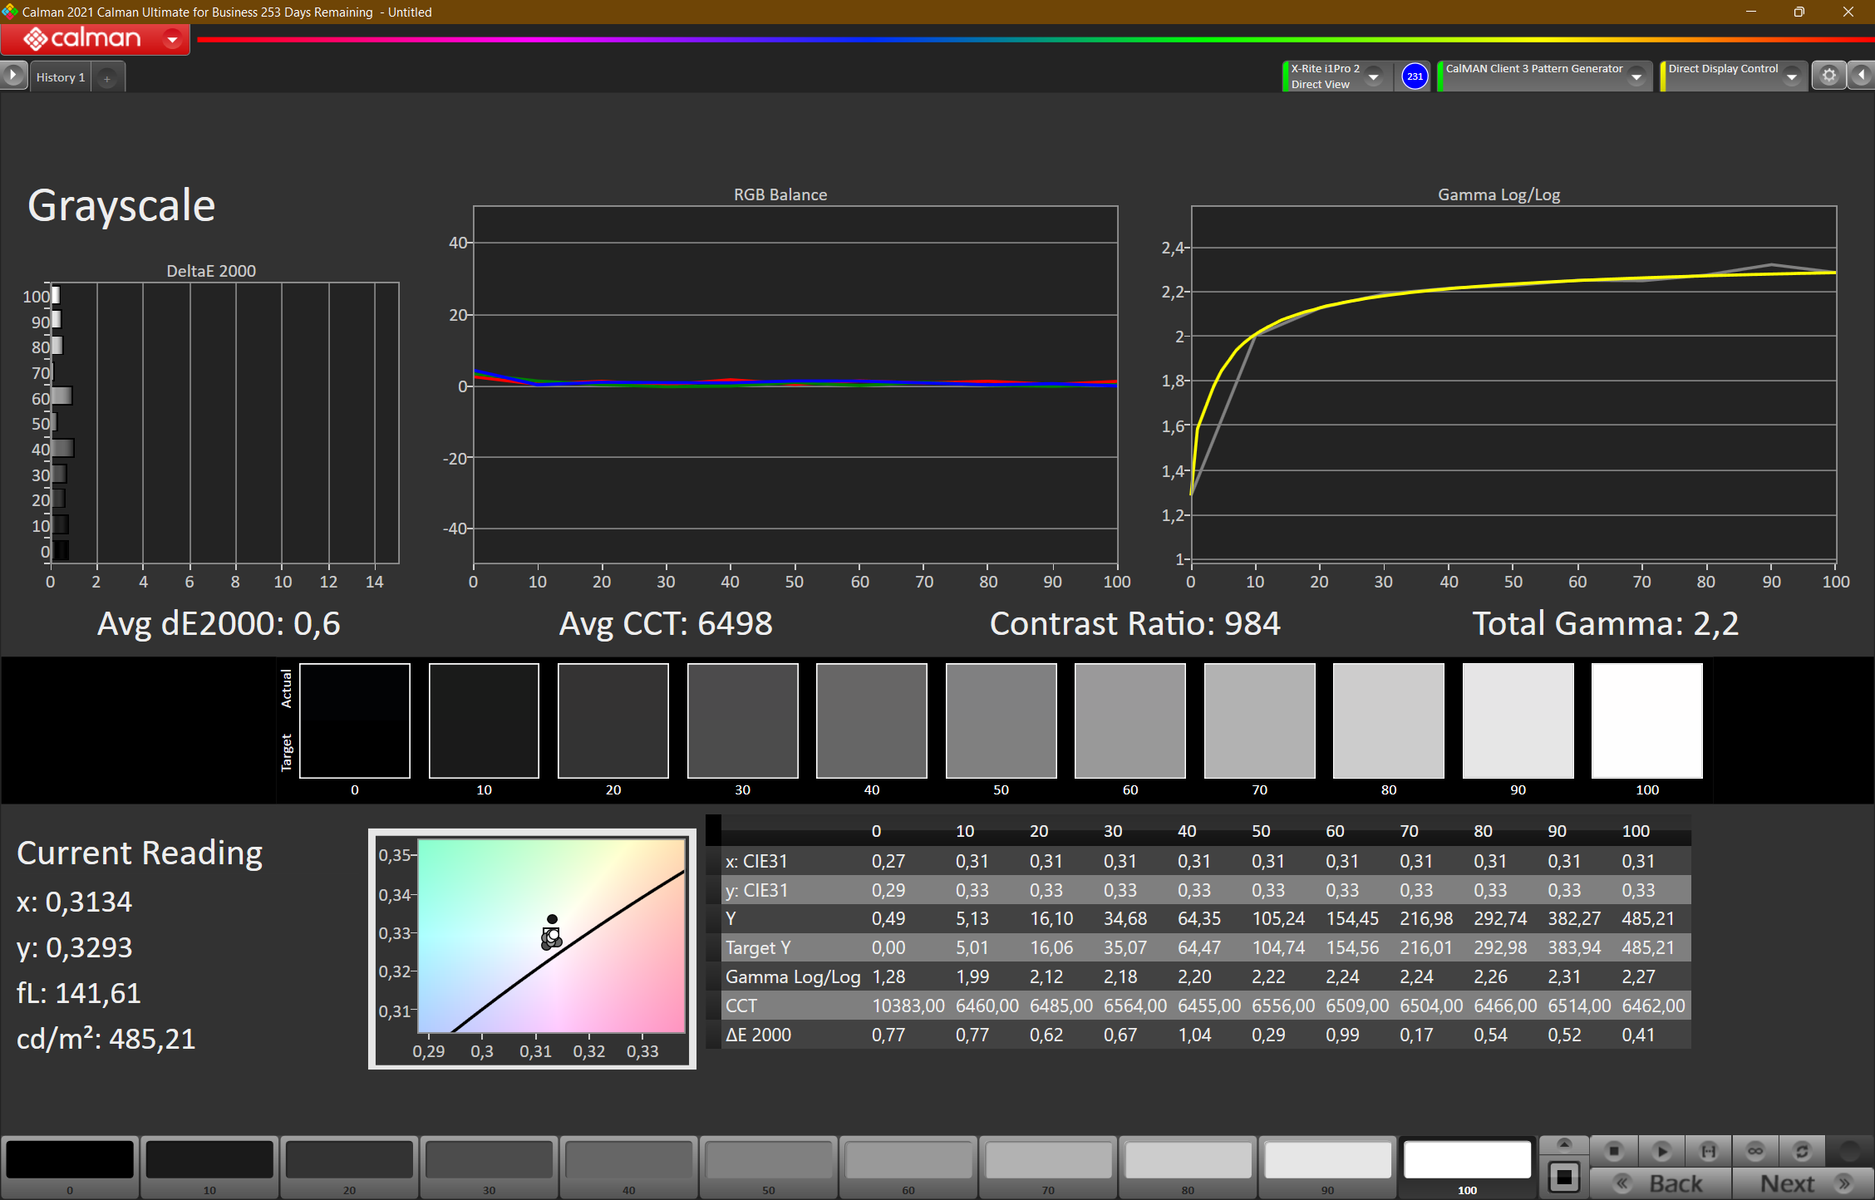
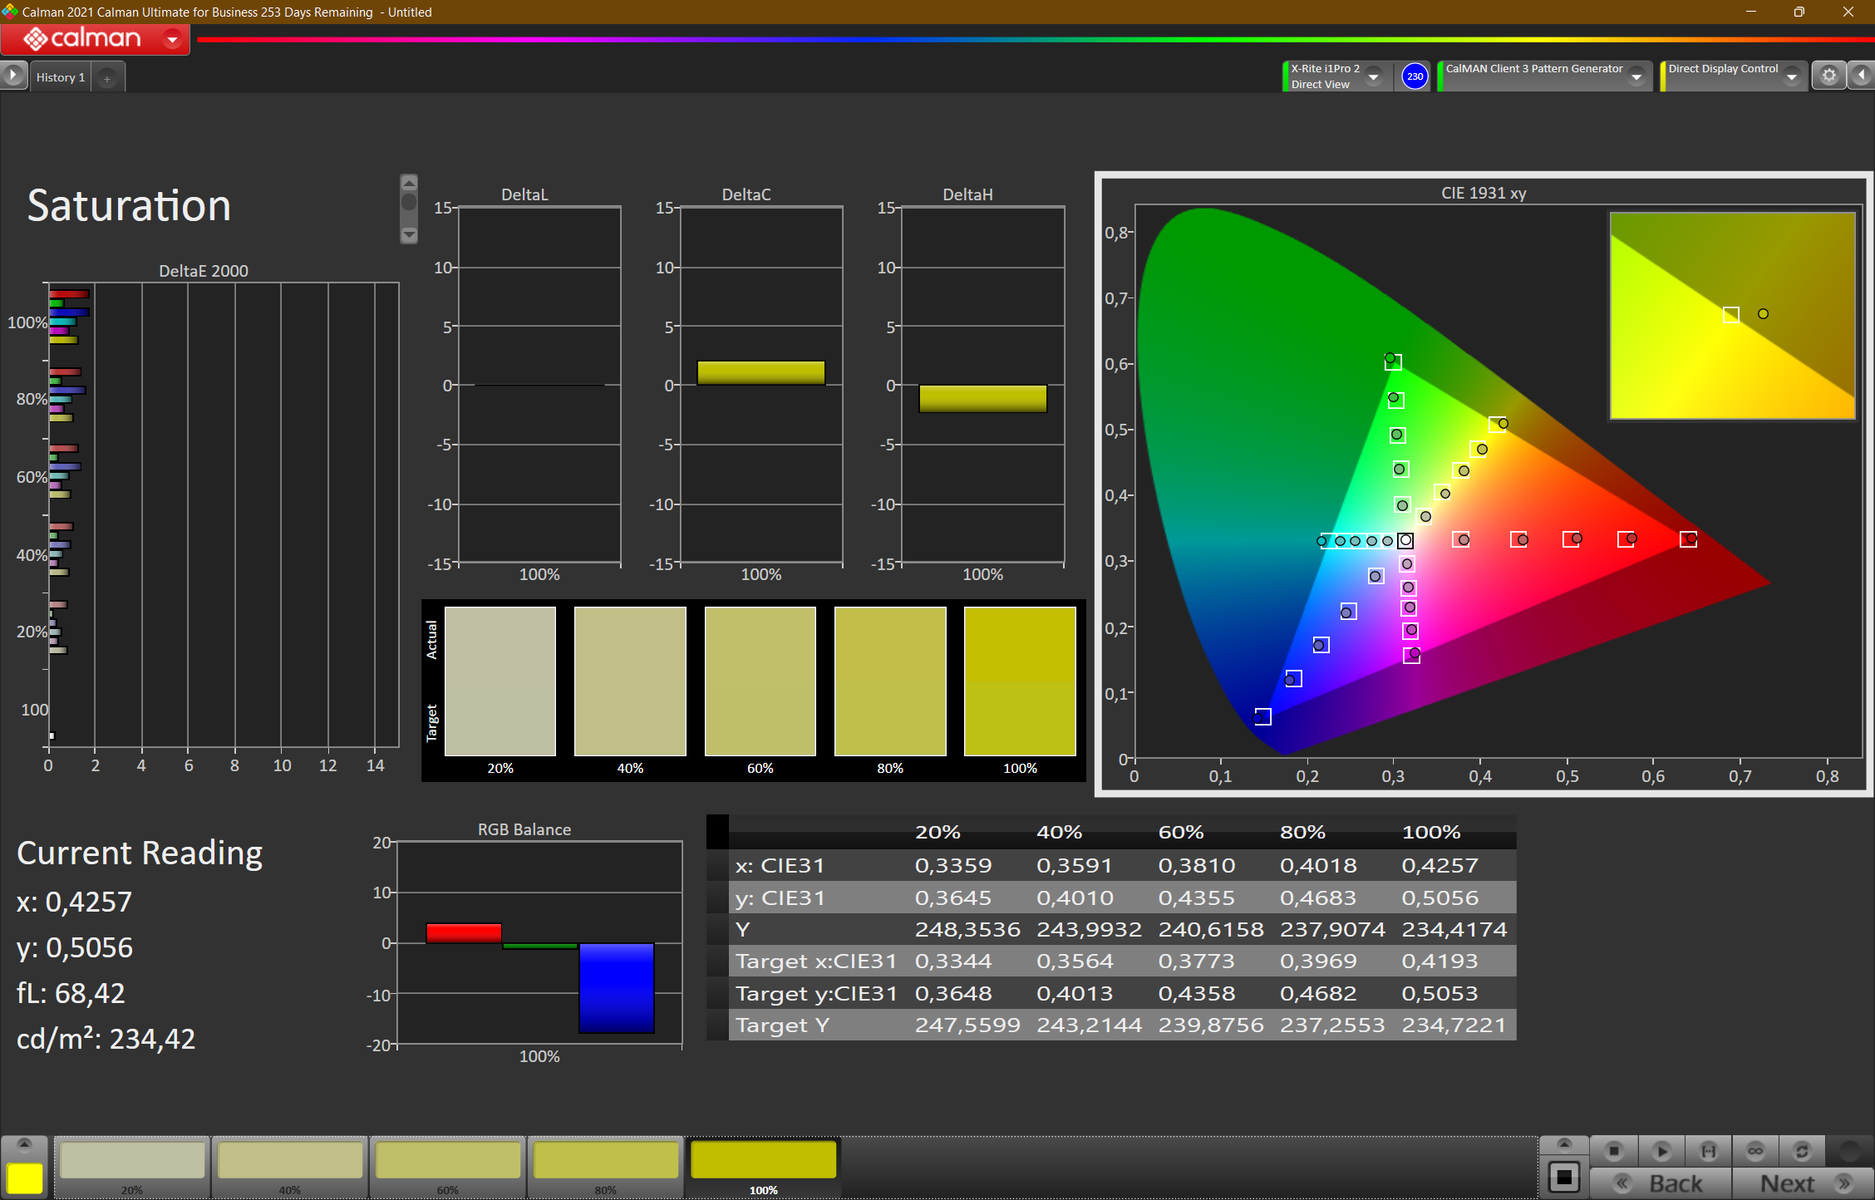
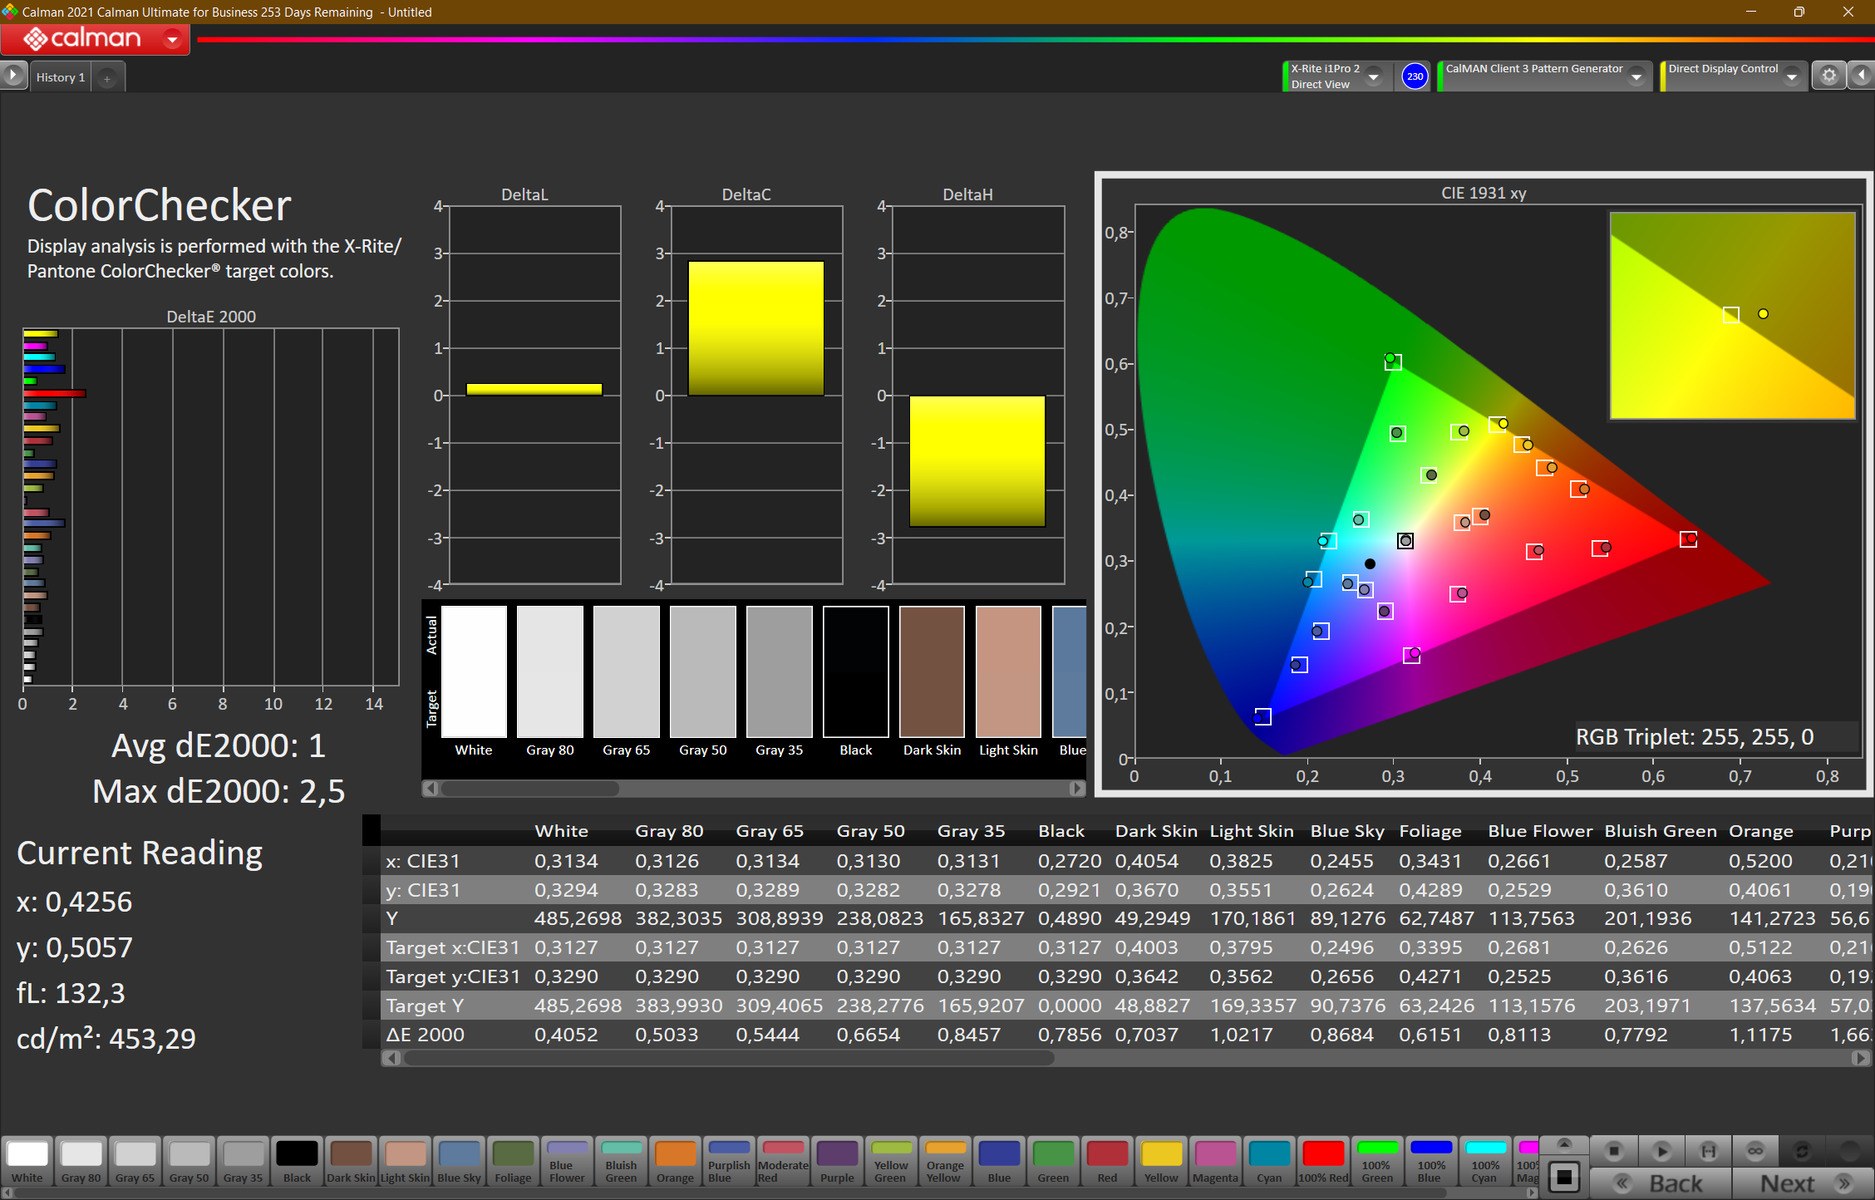
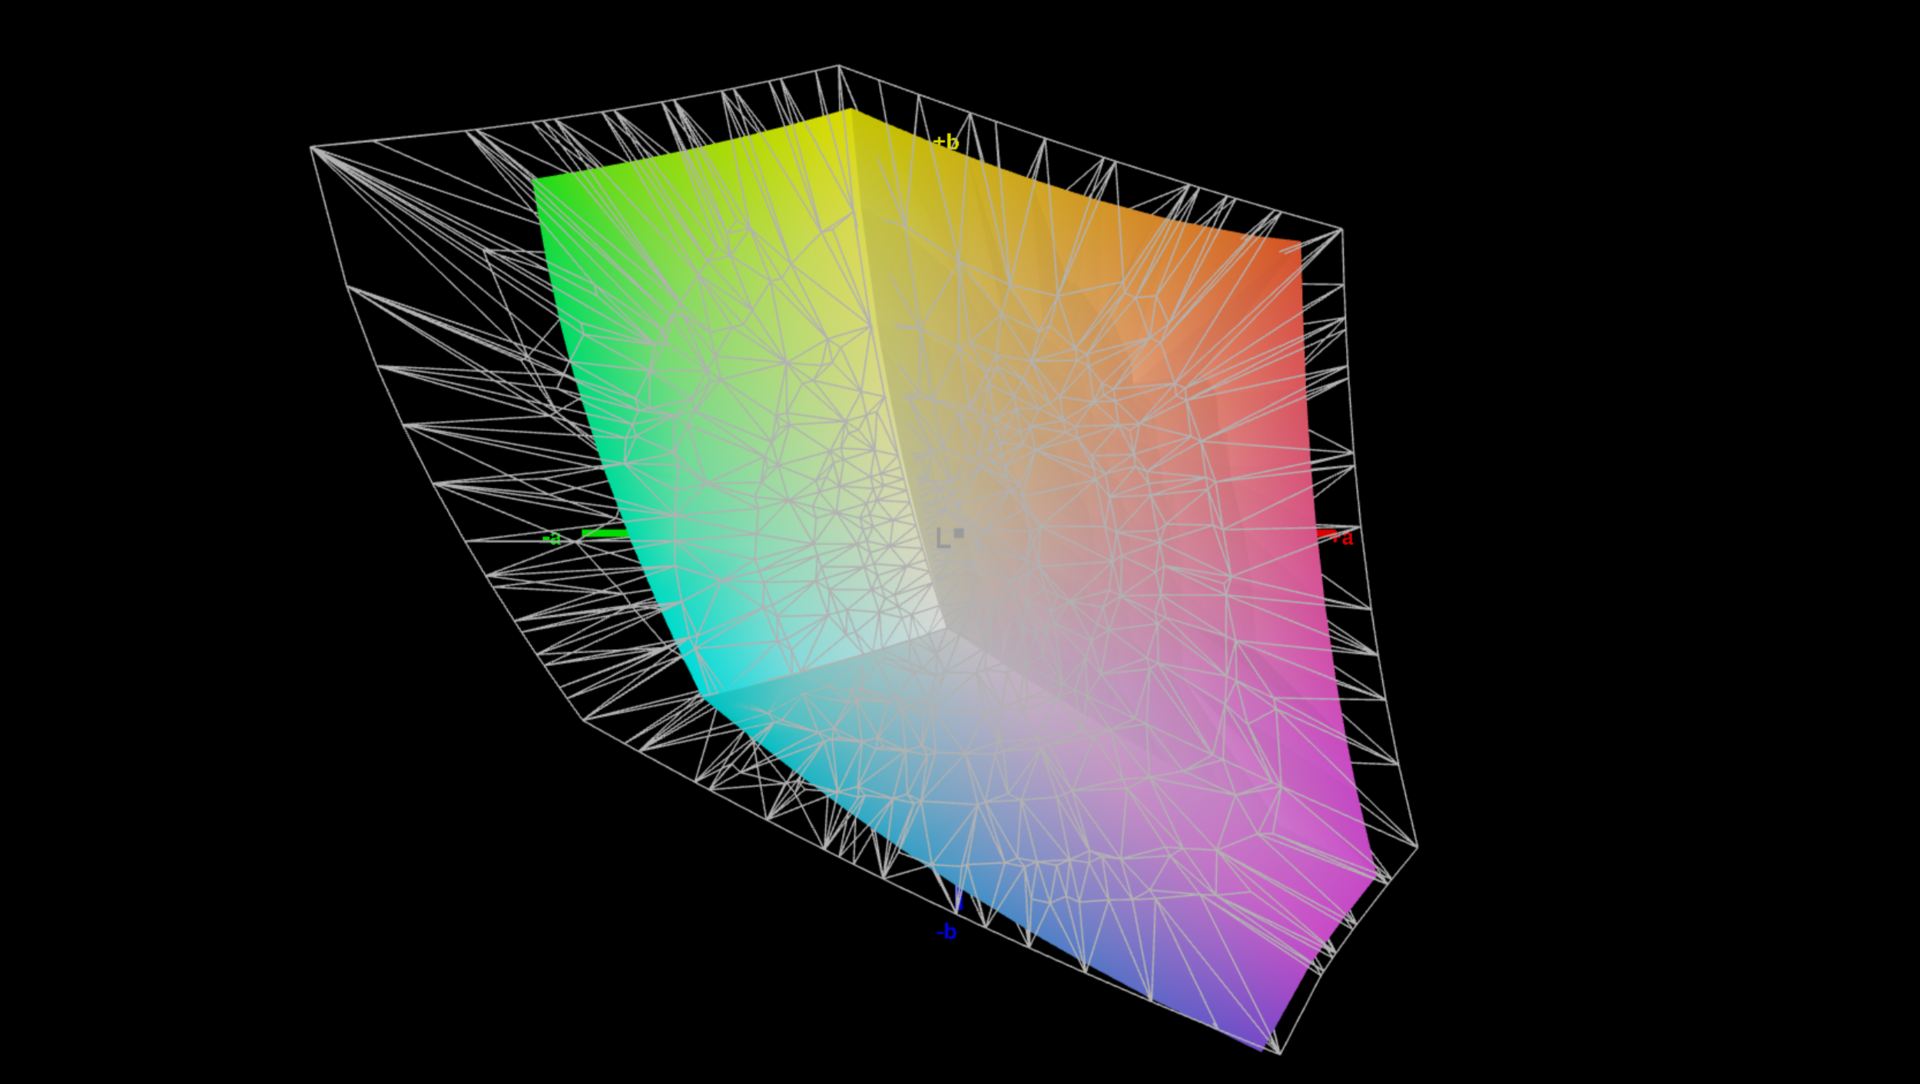
我们使用CalMan和X-Rite i1Pro 2色度计来分析显示器。X-Rite i1 Profiler也与i1Pro 2一起用于校准屏幕。屏幕从校准中受益,并取得了明显较低的Delta E值。这意味着色彩再现变得更加准确。像往常一样,在上面的灰色框中有一个链接,供你下载由我们创建的色彩配置文件。
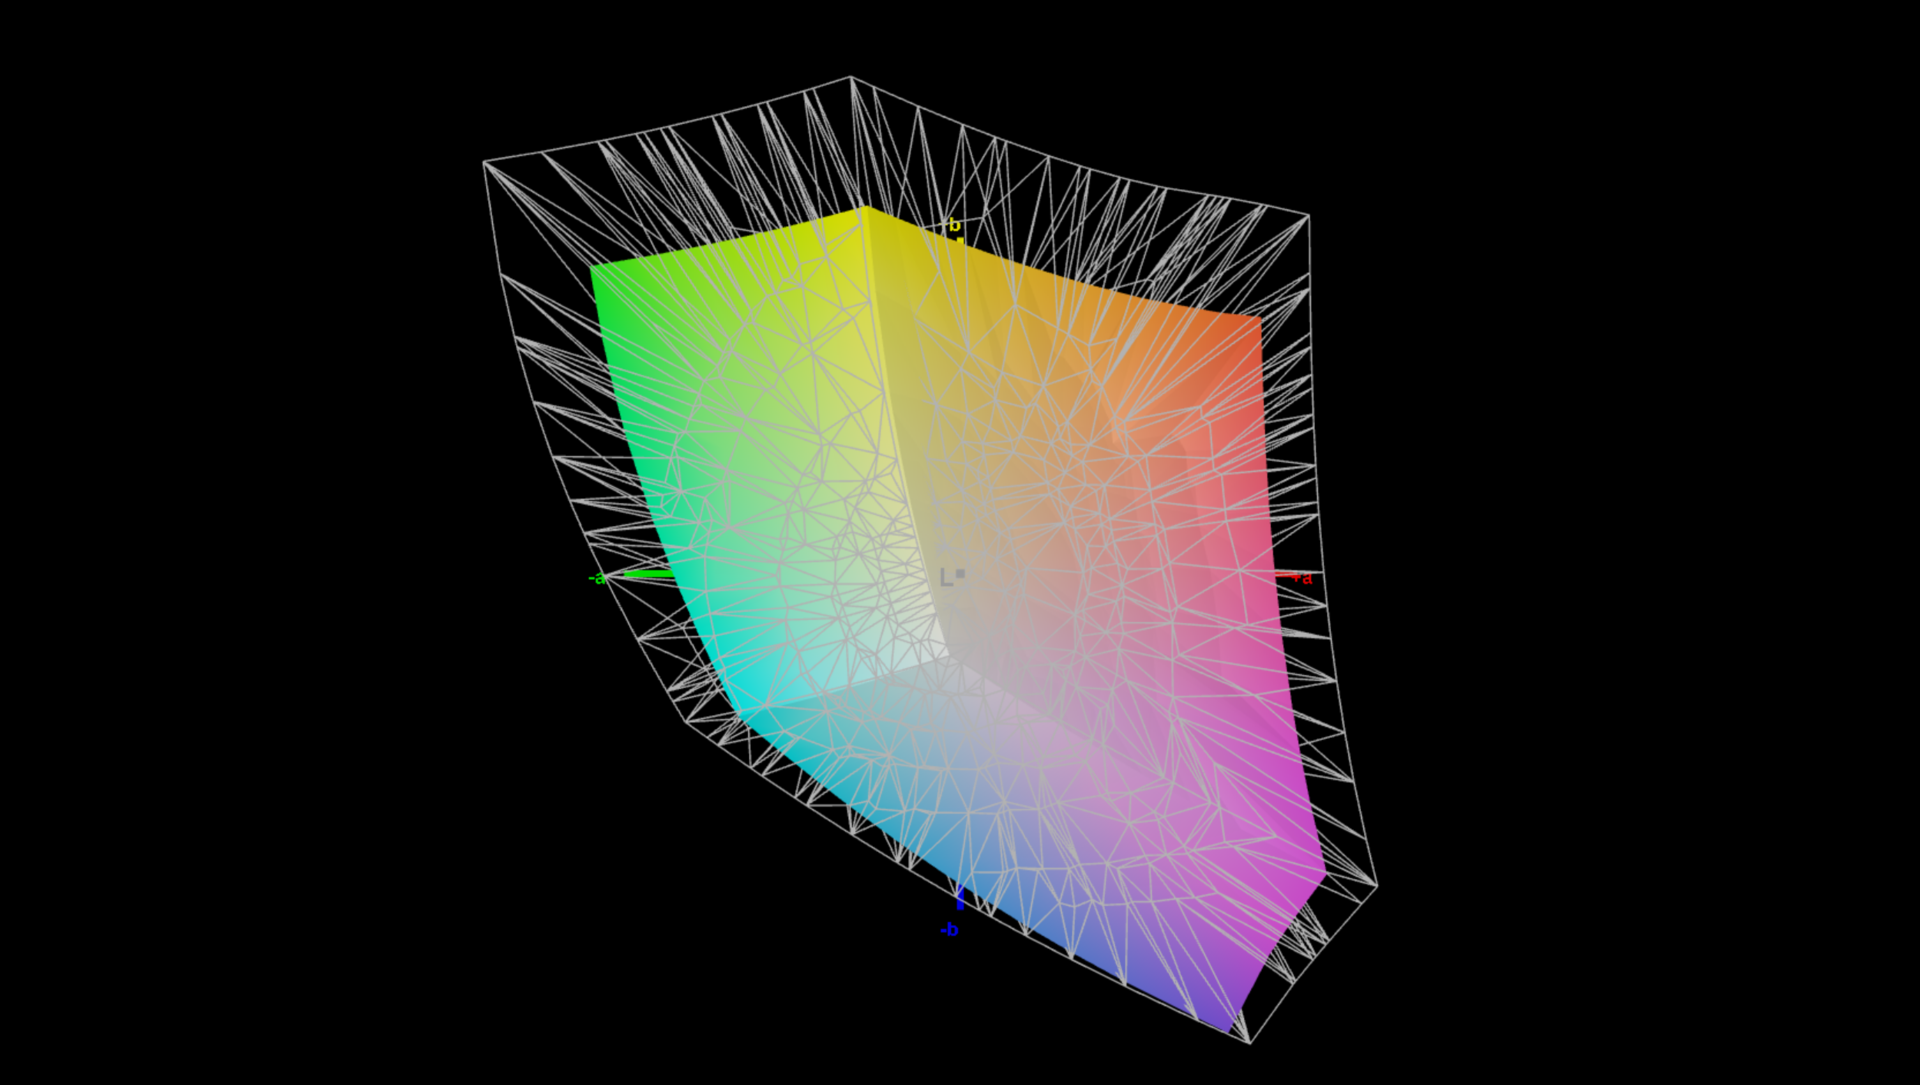
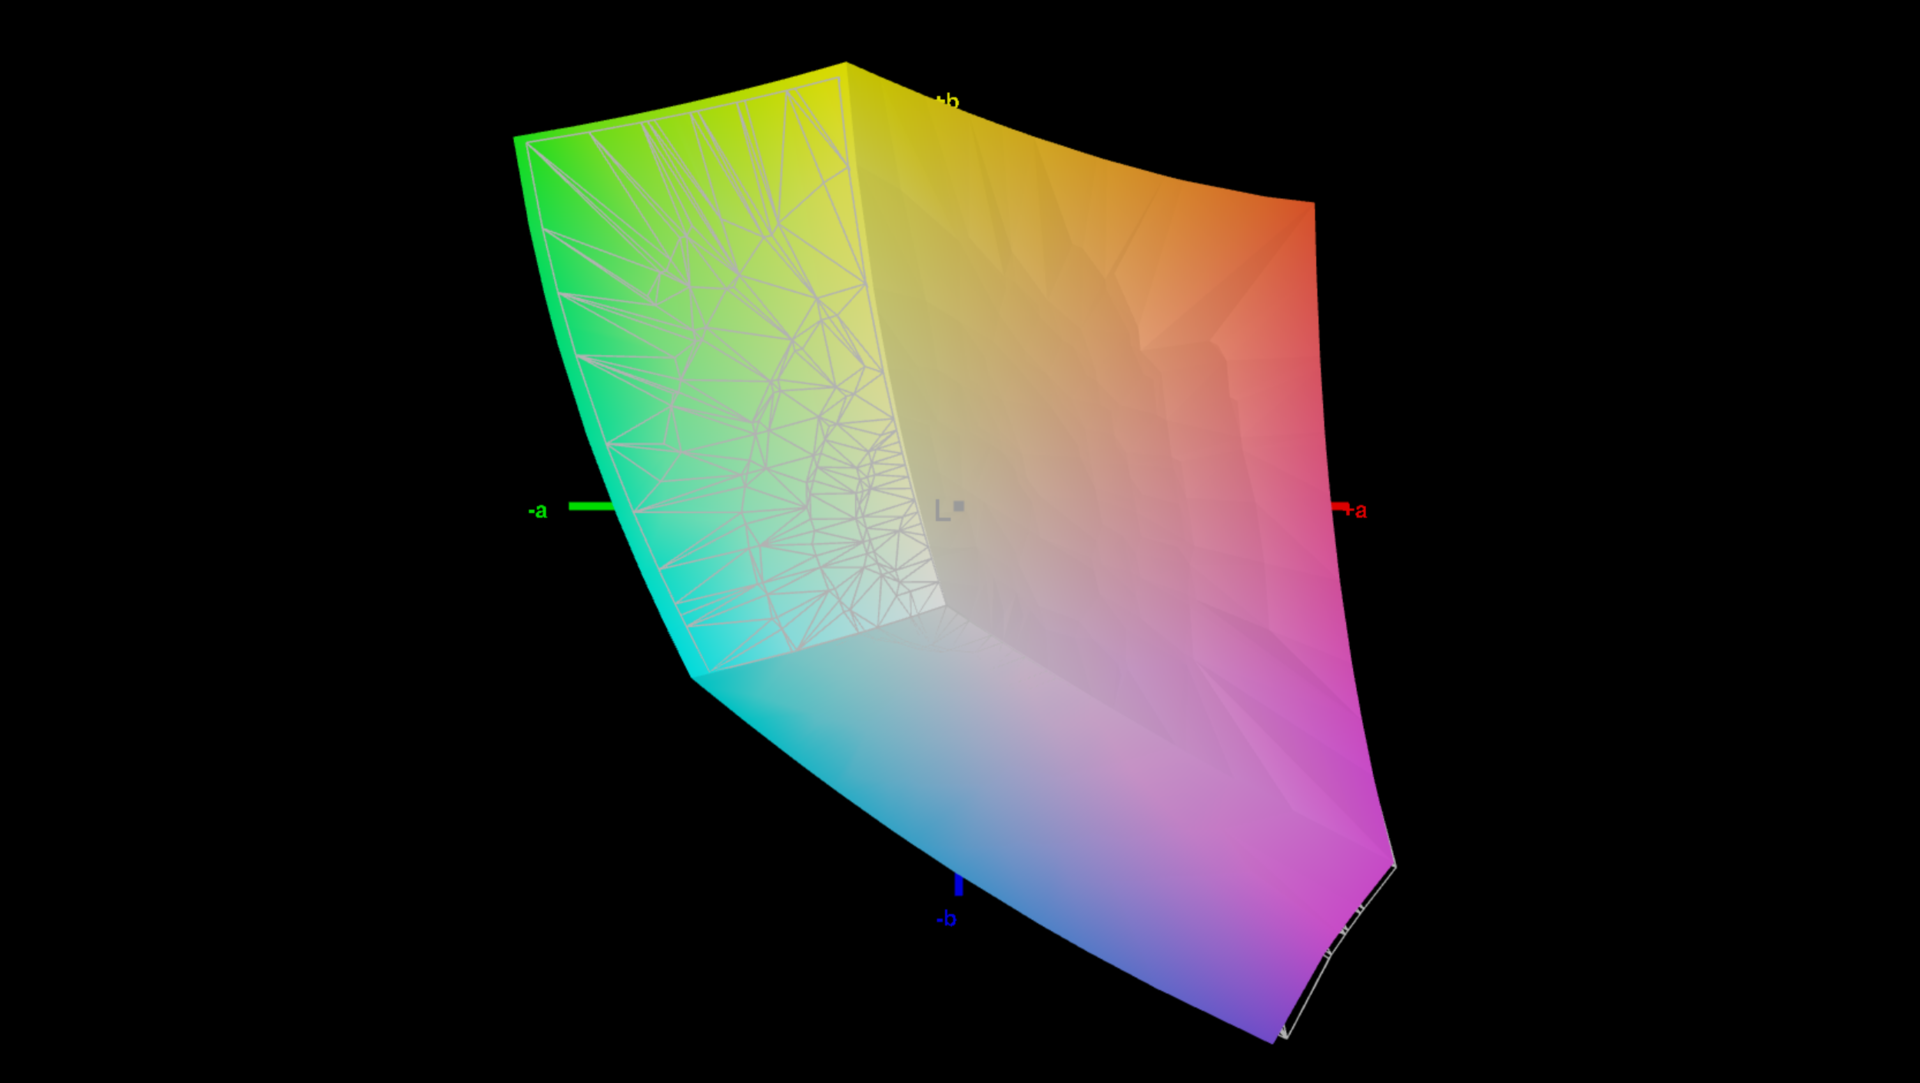
该显示器的色彩覆盖率并不完全是最好的。尽管较小的sRGB色域几乎被完全覆盖,但在更广泛的P3和AdobeRGB色彩空间中,情况就不同了。更昂贵的 Acer Predator Triton 500 SE拥有卓越的色彩覆盖率,这对照片编辑特别有用。
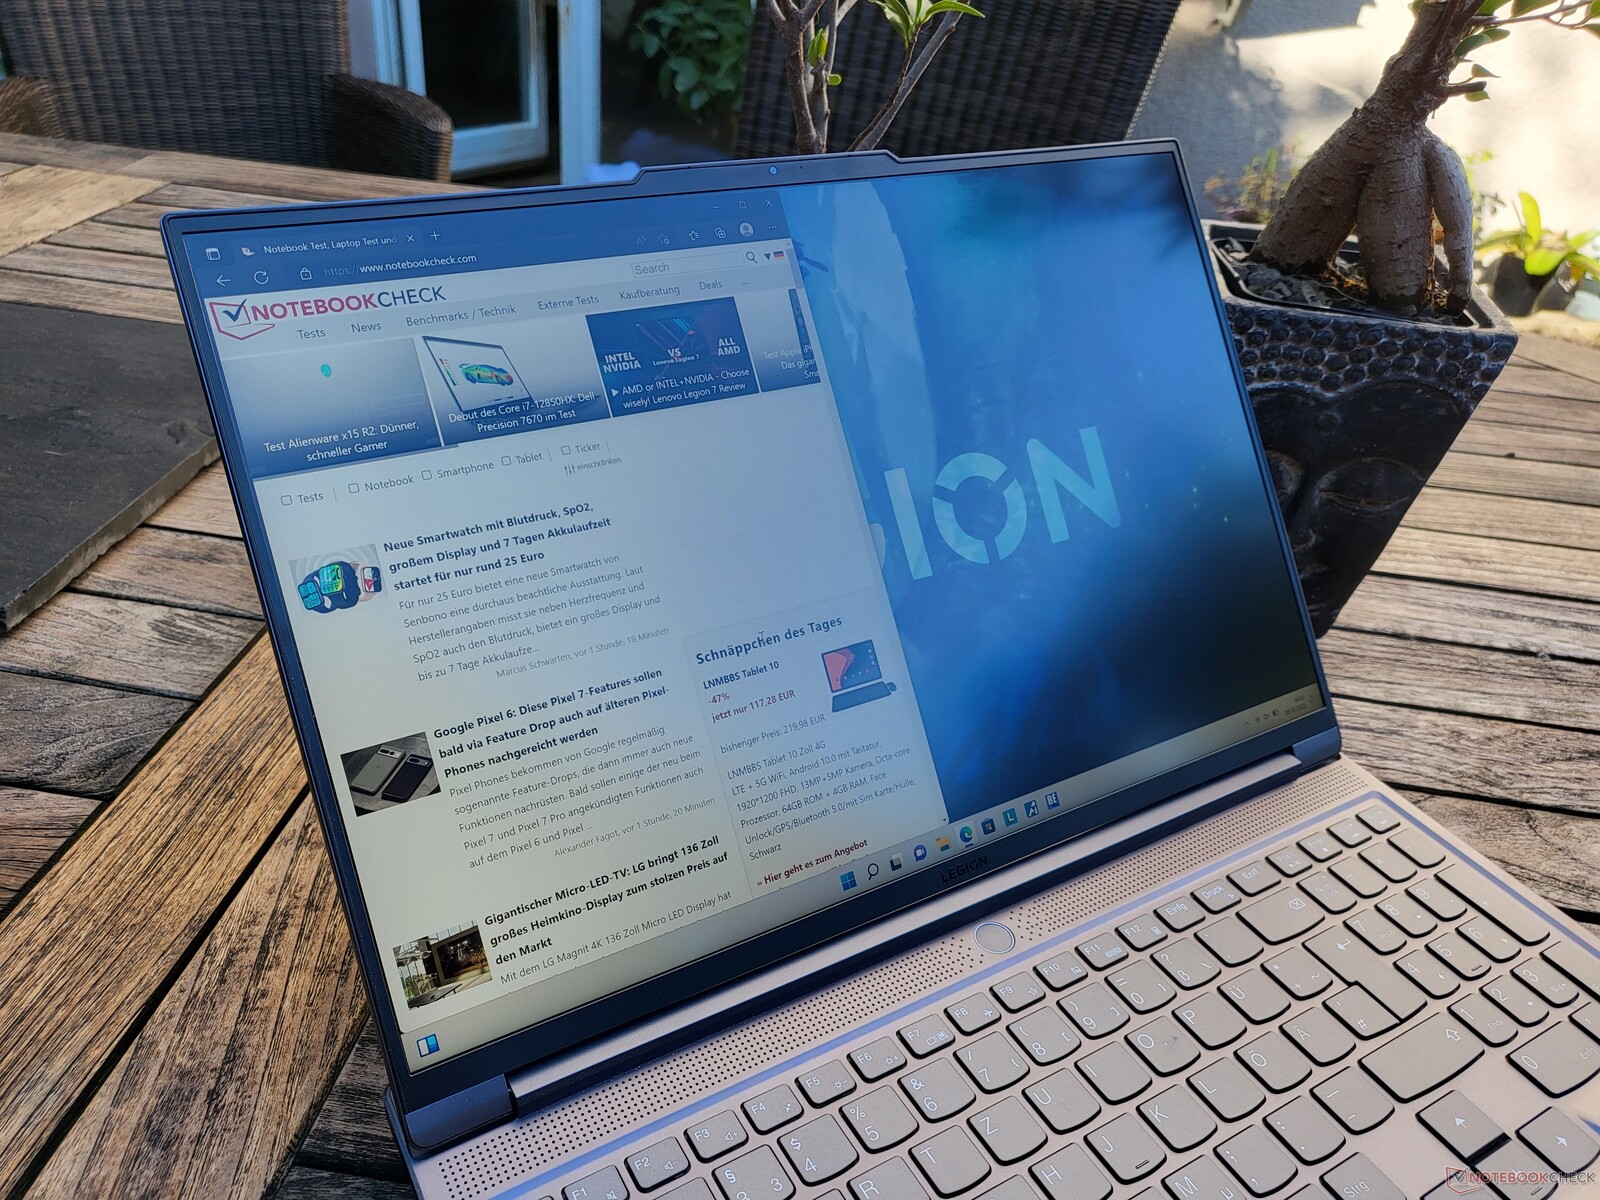
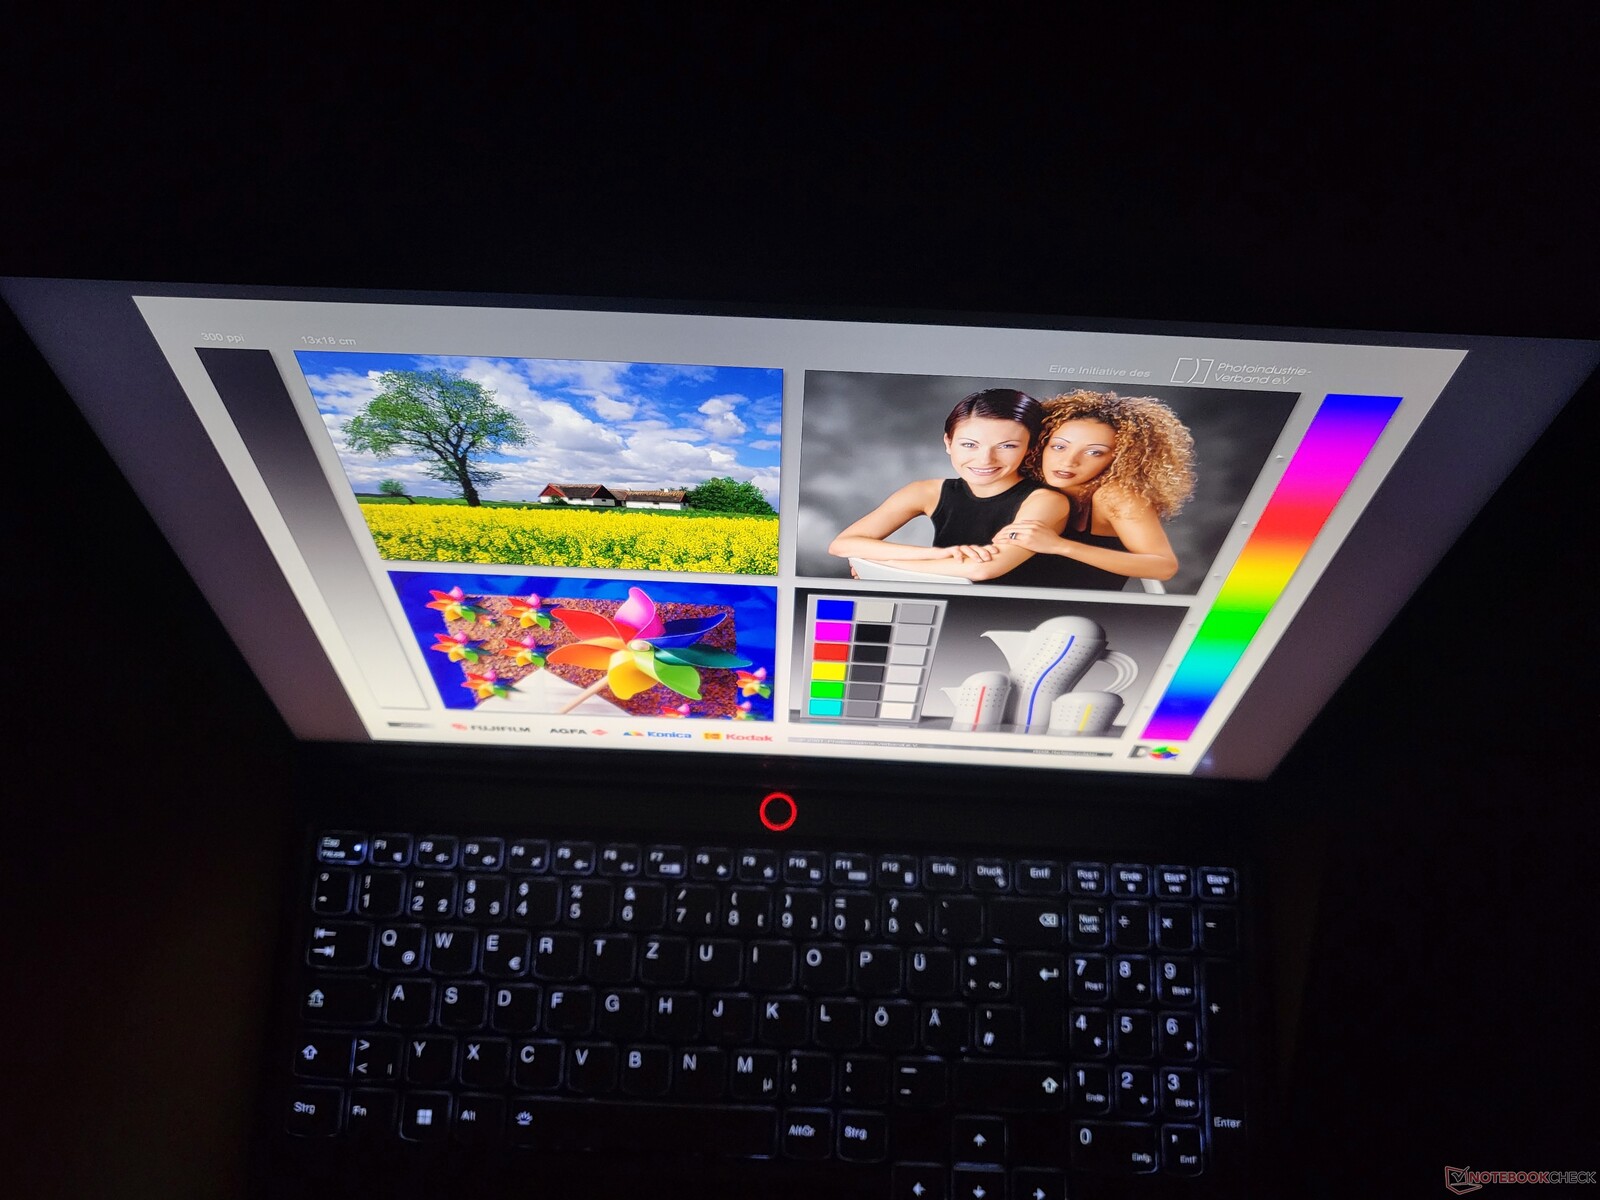
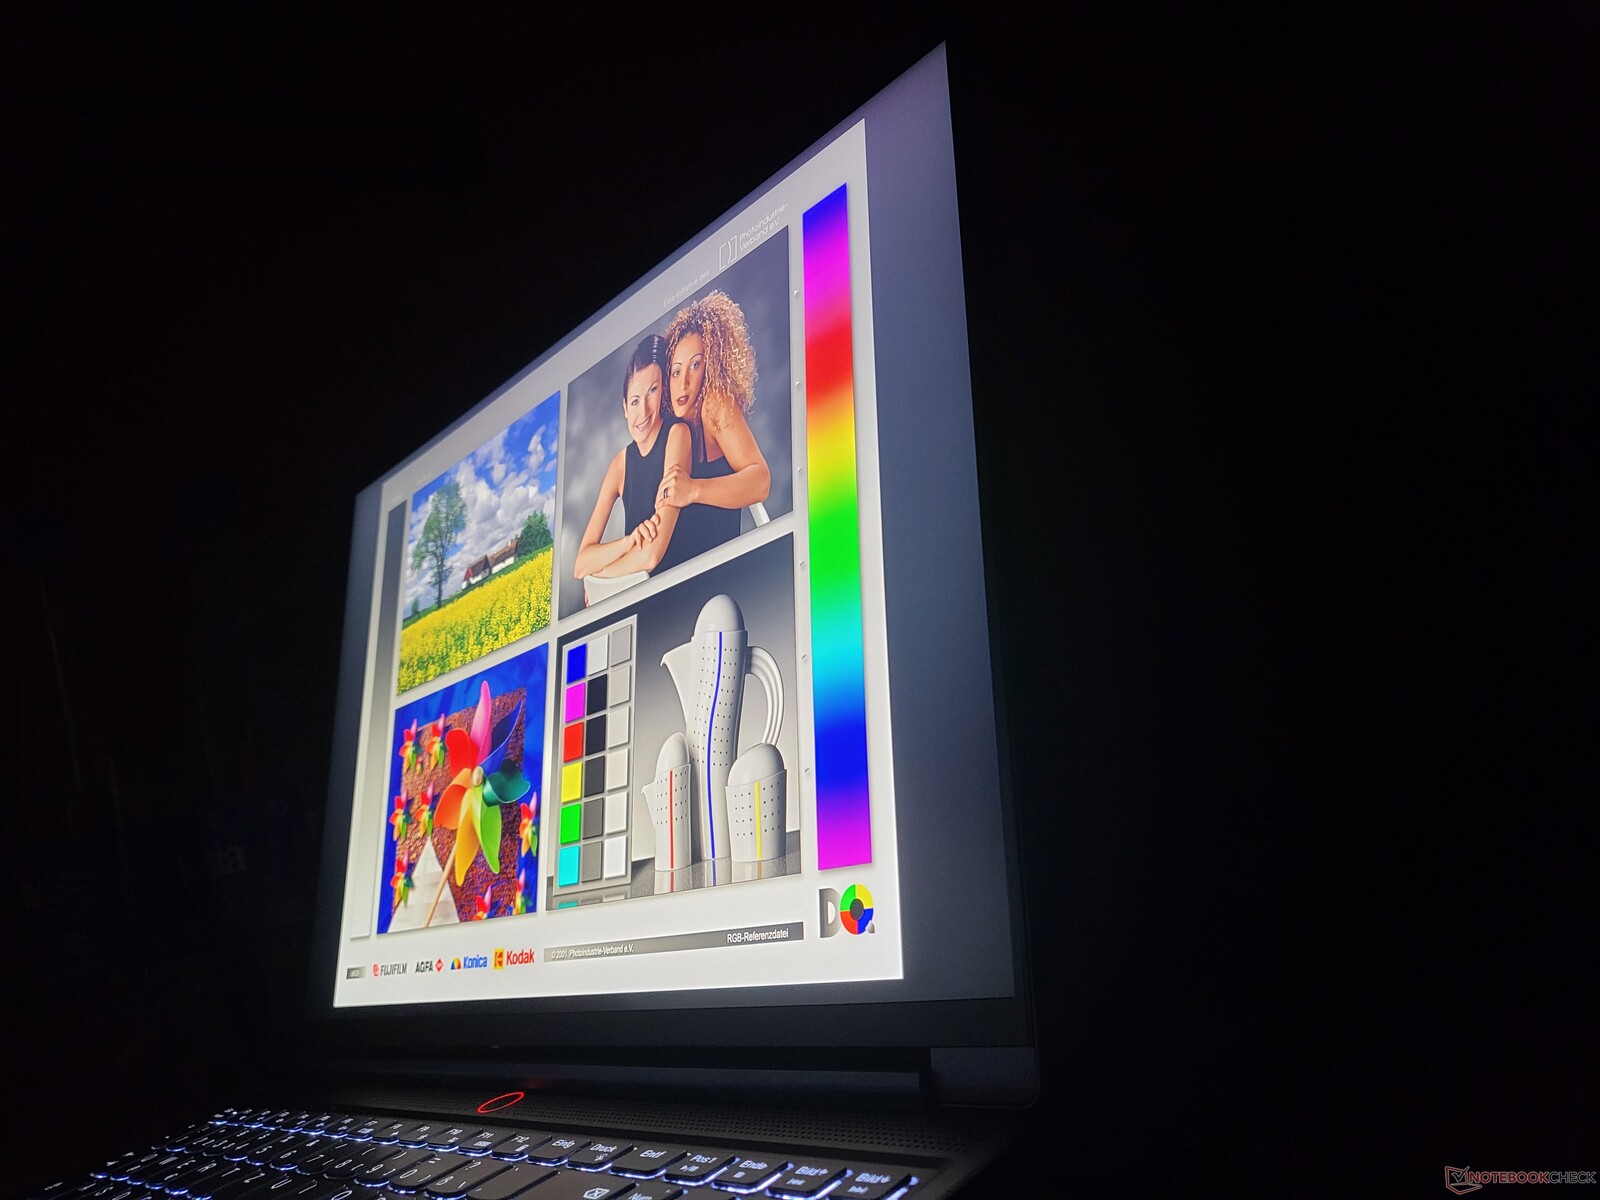
联想Legion S7i由于其磨砂显示屏和高屏幕亮度,在户外非常可用。它是一台可以带着去参加户外局域网聚会的优秀笔记本电脑。
Display Response Times
| ↔ Response Time Black to White | ||
|---|---|---|
| 7 ms ... rise ↗ and fall ↘ combined | ↗ 4 ms rise | 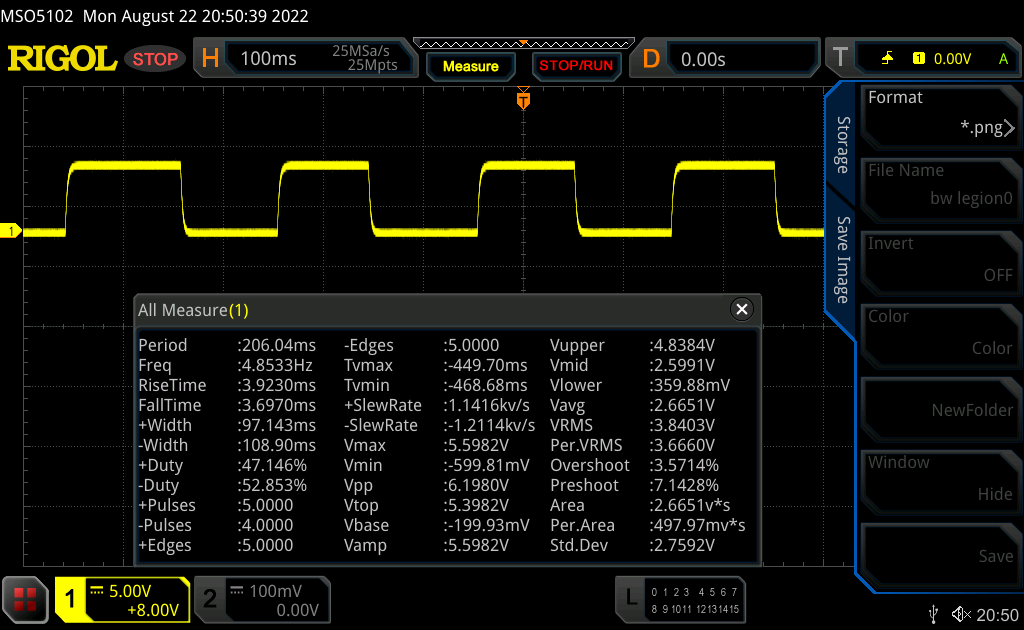 |
| ↘ 3 ms fall | ||
| The screen shows very fast response rates in our tests and should be very well suited for fast-paced gaming. In comparison, all tested devices range from 0.1 (minimum) to 240 (maximum) ms. » 21 % of all devices are better. This means that the measured response time is better than the average of all tested devices (19.8 ms). | ||
| ↔ Response Time 50% Grey to 80% Grey | ||
| 12 ms ... rise ↗ and fall ↘ combined | ↗ 6 ms rise | 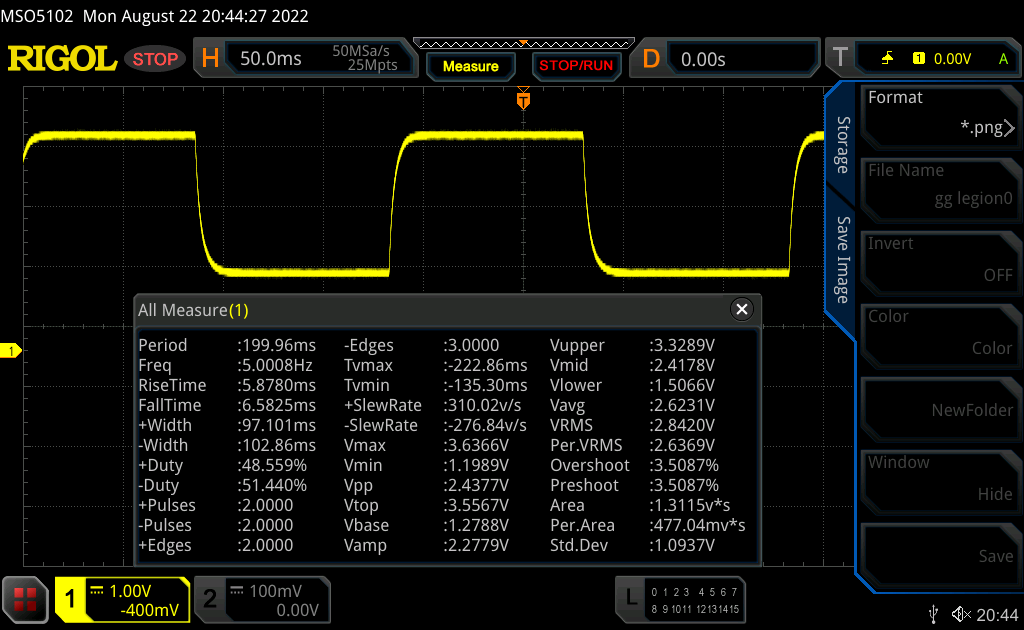 |
| ↘ 6 ms fall | ||
| The screen shows good response rates in our tests, but may be too slow for competitive gamers. In comparison, all tested devices range from 0.165 (minimum) to 636 (maximum) ms. » 25 % of all devices are better. This means that the measured response time is better than the average of all tested devices (31 ms). | ||
Screen Flickering / PWM (Pulse-Width Modulation)
| Screen flickering / PWM not detected |  | ||
In comparison: 52 % of all tested devices do not use PWM to dim the display. If PWM was detected, an average of 7754 (minimum: 5 - maximum: 343500) Hz was measured. | |||
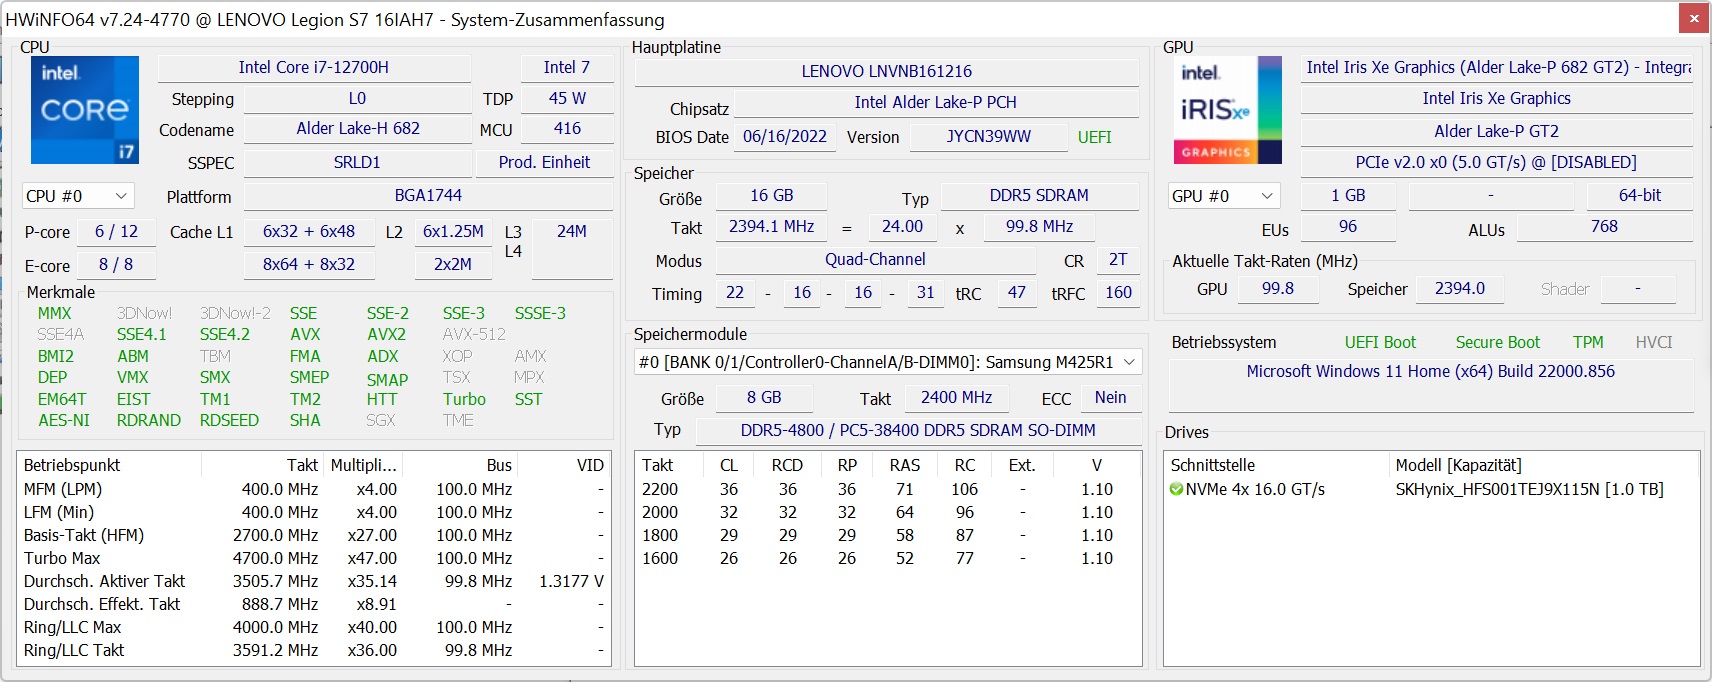
使用Nvidia RTX和英特尔Alder Lake的出色性能
联想为Legion S7-16IAH提供三种处理器选择: 英特尔酷睿i5-12500H, 酷睿i7-12700H和 酷睿i9-12900H.笔记本电脑也有相同数量的GPU选项(这次是来自Nvidia)。 GeForce RTX 3050 Ti, GeForce RTX 3060和 GeForce RTX 3070.
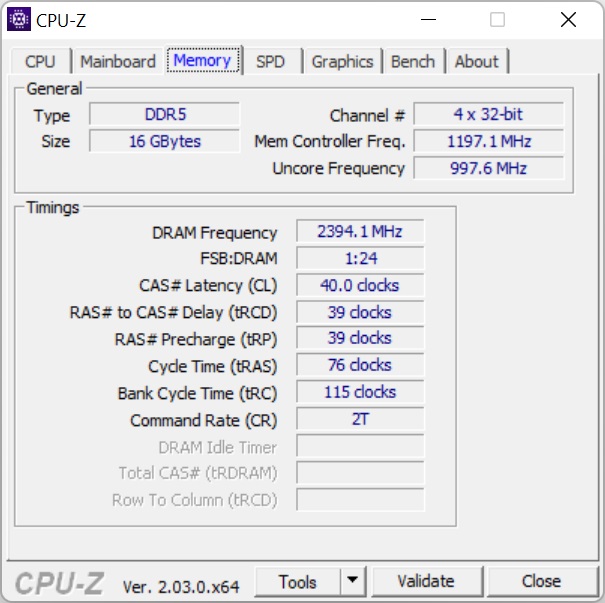
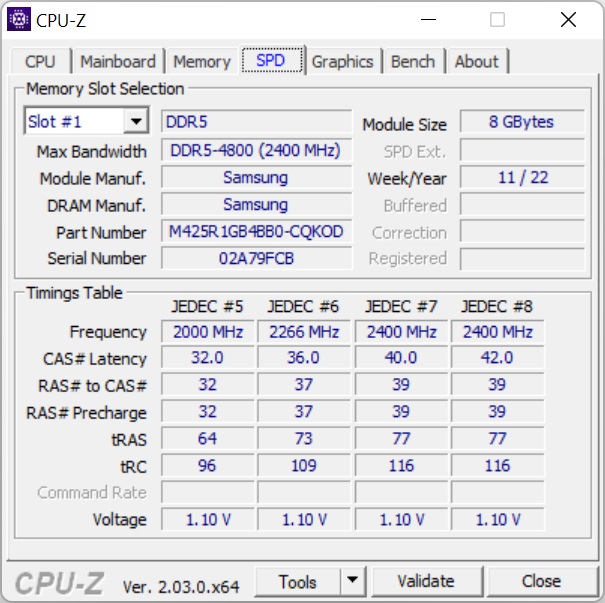
联想Legion S7配备了8GB焊接的DDR5-4800内存以及一个SODIMM插槽(我们的评测单元有一个8GB模块)。联想销售的笔记本电脑最多有24GB的内存,但应该可以将内存量增加到40GB。有一个M.2 2280插槽用于存储。
测试条件
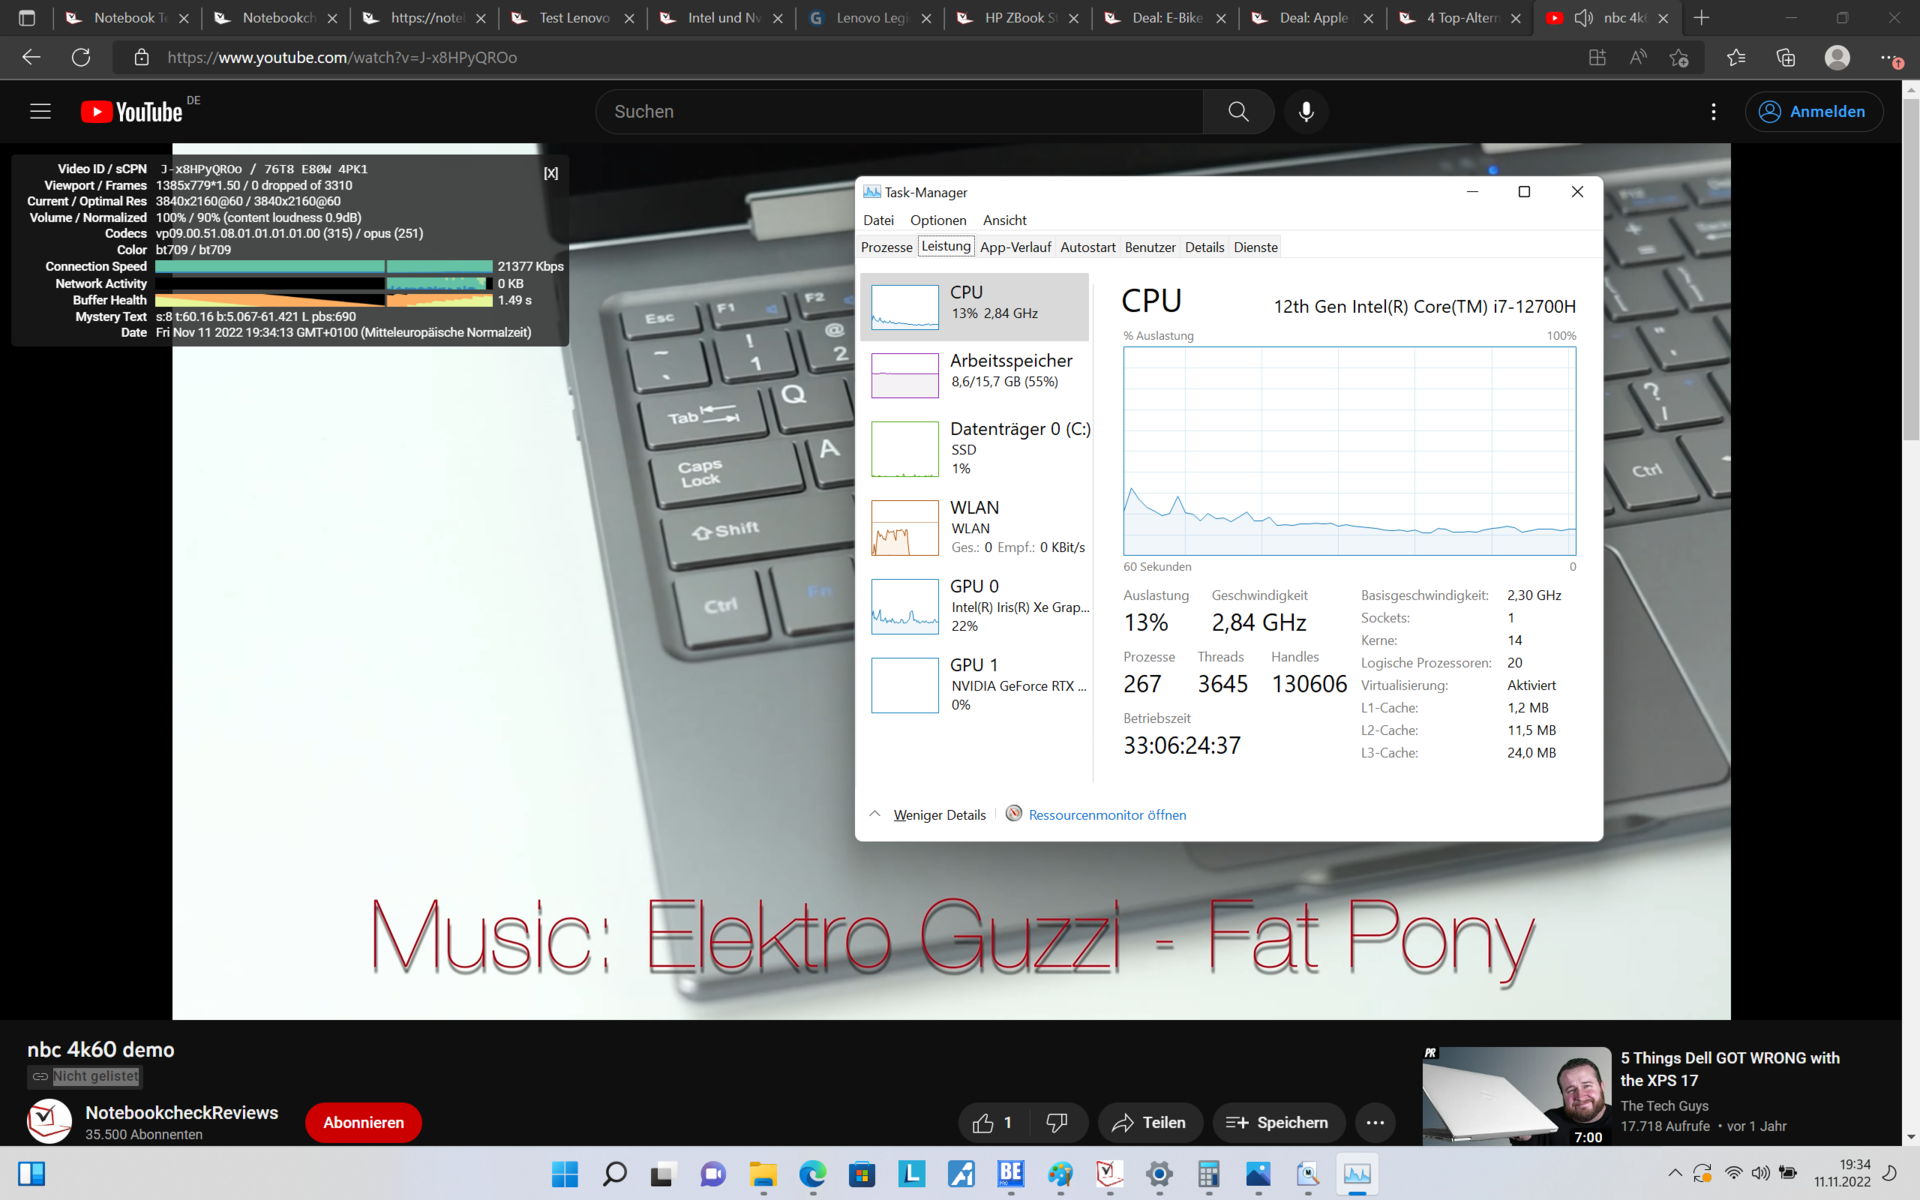
联想Legion S7-16IAH中的处理器在短时间内可以消耗高达100瓦的功率。在绝对峰值负载下,它甚至可以略高。在持续负载下,静音模式下的功率使用上限为70瓦,自动模式下为80瓦,性能模式下为90瓦。你可以通过按Fn+Q键在电源配置文件之间进行切换。
处理器
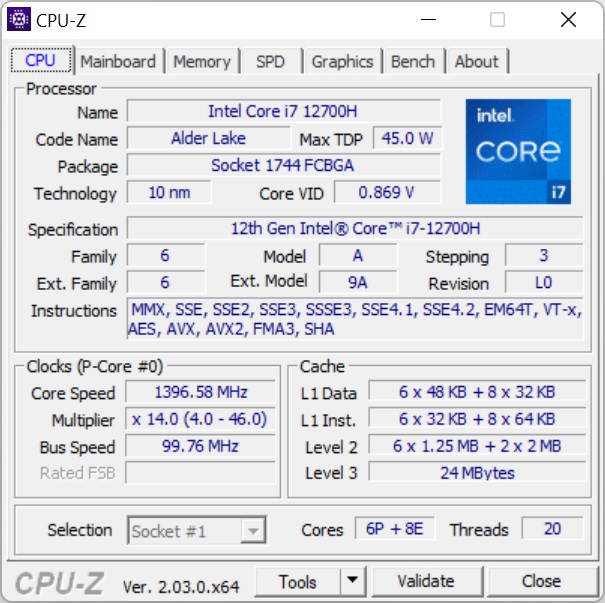
笔记本电脑 英特尔酷睿i7-12700H是桤木湖阵容的一部分。它采用新的混合架构,有两种类型的核心:六个大型性能核心和八个小型效率核心。该CPU共有14个核心和20个线程,因为六个大核心支持超线程。它的TDP通常在45瓦左右,时钟速度为:P核的2.4至4.7GHz,E核的1.8至3.5GHz。关于详细的基准比较,你可以参考我们的CPU比较列表.
Alder Lake处理器在联想Legion S7i中提供了出色的性能。在我们的比较中,这款联想笔记本电脑是所有采用 "H "处理器的设备中最快的,甚至击败了Legion Slim 7的AMD变体。这款 惠普Omen 16最初取得了微小的领先优势,但在持续的负载下却落后了。华硕 华硕ROG Zephyrus M16,它有一个更老的Tiger Lake 芯片,速度要慢得多。然而,如果你想获得最大的CPU性能,还有一个更快的选择,那就是英特尔的 "HX "处理器。更重的是 联想Legion 7凭借其更强大的冷却系统,平均能多带来大约22%的功率。
当笔记本电脑在电池上运行时,性能模式是不可用的。在这种情况下,CPU功率的使用被限制在自动模式的80瓦左右。在Cinebench R20中,Legion S7i在拔掉电源时得到4886分--相当于性能下降了28%。
Cinebench R15 Multi Sustained Load
Cinebench R23: Multi Core | Single Core
Cinebench R20: CPU (Multi Core) | CPU (Single Core)
Cinebench R15: CPU Multi 64Bit | CPU Single 64Bit
Blender: v2.79 BMW27 CPU
7-Zip 18.03: 7z b 4 | 7z b 4 -mmt1
Geekbench 5.5: Multi-Core | Single-Core
HWBOT x265 Benchmark v2.2: 4k Preset
LibreOffice : 20 Documents To PDF
R Benchmark 2.5: Overall mean
| CPU Performance rating | |
| Average of class Gaming | |
| Lenovo Legion 7 16IAX7-82TD004SGE | |
| HP Omen 16-b1090ng | |
| Lenovo Legion Slim 7-16IAH 82TF004YGE | |
| Acer Predator Triton 500 SE PT516-52s-70KX | |
| Average Intel Core i7-12700H | |
| Lenovo Legion S7 16ARHA7 | |
| Asus ROG Zephyrus M16 GU603H -2! | |
| Cinebench R23 / Multi Core | |
| Average of class Gaming (10488 - 42661, n=107, last 2 years) | |
| Lenovo Legion 7 16IAX7-82TD004SGE | |
| Lenovo Legion Slim 7-16IAH 82TF004YGE | |
| Acer Predator Triton 500 SE PT516-52s-70KX | |
| HP Omen 16-b1090ng | |
| Average Intel Core i7-12700H (4032 - 19330, n=64) | |
| Lenovo Legion S7 16ARHA7 | |
| Cinebench R23 / Single Core | |
| Average of class Gaming (1166 - 2415, n=107, last 2 years) | |
| Lenovo Legion 7 16IAX7-82TD004SGE | |
| HP Omen 16-b1090ng | |
| Average Intel Core i7-12700H (778 - 1826, n=63) | |
| Lenovo Legion Slim 7-16IAH 82TF004YGE | |
| Acer Predator Triton 500 SE PT516-52s-70KX | |
| Lenovo Legion S7 16ARHA7 | |
| Cinebench R20 / CPU (Multi Core) | |
| Average of class Gaming (4029 - 16433, n=106, last 2 years) | |
| Lenovo Legion 7 16IAX7-82TD004SGE | |
| Lenovo Legion Slim 7-16IAH 82TF004YGE | |
| Acer Predator Triton 500 SE PT516-52s-70KX | |
| Average Intel Core i7-12700H (1576 - 7407, n=64) | |
| HP Omen 16-b1090ng | |
| Lenovo Legion S7 16ARHA7 | |
| Asus ROG Zephyrus M16 GU603H | |
| Cinebench R20 / CPU (Single Core) | |
| Average of class Gaming (442 - 913, n=106, last 2 years) | |
| Lenovo Legion 7 16IAX7-82TD004SGE | |
| HP Omen 16-b1090ng | |
| Average Intel Core i7-12700H (300 - 704, n=64) | |
| Lenovo Legion Slim 7-16IAH 82TF004YGE | |
| Acer Predator Triton 500 SE PT516-52s-70KX | |
| Lenovo Legion S7 16ARHA7 | |
| Asus ROG Zephyrus M16 GU603H | |
| Cinebench R15 / CPU Multi 64Bit | |
| Average of class Gaming (1578 - 6330, n=105, last 2 years) | |
| Lenovo Legion 7 16IAX7-82TD004SGE | |
| HP Omen 16-b1090ng | |
| Lenovo Legion Slim 7-16IAH 82TF004YGE | |
| Acer Predator Triton 500 SE PT516-52s-70KX | |
| Average Intel Core i7-12700H (1379 - 2916, n=70) | |
| Lenovo Legion S7 16ARHA7 | |
| Asus ROG Zephyrus M16 GU603H | |
| Cinebench R15 / CPU Single 64Bit | |
| Average of class Gaming (188.8 - 350, n=106, last 2 years) | |
| Lenovo Legion 7 16IAX7-82TD004SGE | |
| HP Omen 16-b1090ng | |
| Lenovo Legion S7 16ARHA7 | |
| Lenovo Legion Slim 7-16IAH 82TF004YGE | |
| Average Intel Core i7-12700H (113 - 263, n=65) | |
| Asus ROG Zephyrus M16 GU603H | |
| Acer Predator Triton 500 SE PT516-52s-70KX | |
| Blender / v2.79 BMW27 CPU | |
| Asus ROG Zephyrus M16 GU603H | |
| Average Intel Core i7-12700H (168 - 732, n=63) | |
| Lenovo Legion S7 16ARHA7 | |
| Acer Predator Triton 500 SE PT516-52s-70KX | |
| HP Omen 16-b1090ng | |
| Lenovo Legion Slim 7-16IAH 82TF004YGE | |
| Average of class Gaming (79 - 330, n=104, last 2 years) | |
| Lenovo Legion 7 16IAX7-82TD004SGE | |
| 7-Zip 18.03 / 7z b 4 | |
| Average of class Gaming (33491 - 148086, n=105, last 2 years) | |
| Lenovo Legion 7 16IAX7-82TD004SGE | |
| HP Omen 16-b1090ng | |
| Lenovo Legion Slim 7-16IAH 82TF004YGE | |
| Acer Predator Triton 500 SE PT516-52s-70KX | |
| Lenovo Legion S7 16ARHA7 | |
| Average Intel Core i7-12700H (22844 - 73067, n=63) | |
| Asus ROG Zephyrus M16 GU603H | |
| 7-Zip 18.03 / 7z b 4 -mmt1 | |
| Average of class Gaming (4199 - 7436, n=105, last 2 years) | |
| Lenovo Legion 7 16IAX7-82TD004SGE | |
| Lenovo Legion S7 16ARHA7 | |
| HP Omen 16-b1090ng | |
| Average Intel Core i7-12700H (2743 - 5972, n=63) | |
| Asus ROG Zephyrus M16 GU603H | |
| Lenovo Legion Slim 7-16IAH 82TF004YGE | |
| Acer Predator Triton 500 SE PT516-52s-70KX | |
| Geekbench 5.5 / Multi-Core | |
| Average of class Gaming (6460 - 28263, n=105, last 2 years) | |
| Lenovo Legion 7 16IAX7-82TD004SGE | |
| HP Omen 16-b1090ng | |
| Lenovo Legion Slim 7-16IAH 82TF004YGE | |
| Acer Predator Triton 500 SE PT516-52s-70KX | |
| Average Intel Core i7-12700H (5144 - 13745, n=64) | |
| Lenovo Legion S7 16ARHA7 | |
| Asus ROG Zephyrus M16 GU603H | |
| Geekbench 5.5 / Single-Core | |
| Average of class Gaming (986 - 2474, n=105, last 2 years) | |
| Lenovo Legion 7 16IAX7-82TD004SGE | |
| HP Omen 16-b1090ng | |
| Acer Predator Triton 500 SE PT516-52s-70KX | |
| Average Intel Core i7-12700H (803 - 1851, n=64) | |
| Lenovo Legion Slim 7-16IAH 82TF004YGE | |
| Lenovo Legion S7 16ARHA7 | |
| Asus ROG Zephyrus M16 GU603H | |
| HWBOT x265 Benchmark v2.2 / 4k Preset | |
| Average of class Gaming (11.5 - 44.4, n=105, last 2 years) | |
| Lenovo Legion 7 16IAX7-82TD004SGE | |
| HP Omen 16-b1090ng | |
| Lenovo Legion Slim 7-16IAH 82TF004YGE | |
| Acer Predator Triton 500 SE PT516-52s-70KX | |
| Lenovo Legion S7 16ARHA7 | |
| Average Intel Core i7-12700H (4.67 - 21.8, n=64) | |
| Asus ROG Zephyrus M16 GU603H | |
| LibreOffice / 20 Documents To PDF | |
| Average of class Gaming (33.2 - 88.8, n=105, last 2 years) | |
| Lenovo Legion S7 16ARHA7 | |
| Average Intel Core i7-12700H (34.2 - 95.3, n=63) | |
| Acer Predator Triton 500 SE PT516-52s-70KX | |
| HP Omen 16-b1090ng | |
| Asus ROG Zephyrus M16 GU603H | |
| Lenovo Legion Slim 7-16IAH 82TF004YGE | |
| Lenovo Legion 7 16IAX7-82TD004SGE | |
| R Benchmark 2.5 / Overall mean | |
| Asus ROG Zephyrus M16 GU603H | |
| Average Intel Core i7-12700H (0.4441 - 1.052, n=63) | |
| Lenovo Legion Slim 7-16IAH 82TF004YGE | |
| Acer Predator Triton 500 SE PT516-52s-70KX | |
| Lenovo Legion S7 16ARHA7 | |
| HP Omen 16-b1090ng | |
| Average of class Gaming (0.3439 - 0.759, n=106, last 2 years) | |
| Lenovo Legion 7 16IAX7-82TD004SGE | |
* ... smaller is better
AIDA64: FP32 Ray-Trace | FPU Julia | CPU SHA3 | CPU Queen | FPU SinJulia | FPU Mandel | CPU AES | CPU ZLib | FP64 Ray-Trace | CPU PhotoWorxx
| Performance rating | |
| Average of class Gaming | |
| Lenovo Legion S7 16ARHA7 | |
| Lenovo Legion Slim 7-16IAH 82TF004YGE | |
| Lenovo Legion 7 16IAX7-82TD004SGE | |
| Acer Predator Triton 500 SE PT516-52s-70KX | |
| Average Intel Core i7-12700H | |
| HP Omen 16-b1090ng | |
| Asus ROG Zephyrus M16 GU603H -9! | |
| AIDA64 / FP32 Ray-Trace | |
| Average of class Gaming (10227 - 85542, n=105, last 2 years) | |
| Lenovo Legion Slim 7-16IAH 82TF004YGE | |
| Lenovo Legion S7 16ARHA7 | |
| Lenovo Legion 7 16IAX7-82TD004SGE | |
| Average Intel Core i7-12700H (2585 - 17957, n=64) | |
| Acer Predator Triton 500 SE PT516-52s-70KX | |
| HP Omen 16-b1090ng | |
| AIDA64 / FPU Julia | |
| Average of class Gaming (51376 - 238426, n=105, last 2 years) | |
| Lenovo Legion S7 16ARHA7 | |
| Lenovo Legion Slim 7-16IAH 82TF004YGE | |
| Average Intel Core i7-12700H (12439 - 90760, n=64) | |
| Lenovo Legion 7 16IAX7-82TD004SGE | |
| Acer Predator Triton 500 SE PT516-52s-70KX | |
| HP Omen 16-b1090ng | |
| AIDA64 / CPU SHA3 | |
| Average of class Gaming (2180 - 10115, n=105, last 2 years) | |
| Lenovo Legion 7 16IAX7-82TD004SGE | |
| Lenovo Legion Slim 7-16IAH 82TF004YGE | |
| Lenovo Legion S7 16ARHA7 | |
| Acer Predator Triton 500 SE PT516-52s-70KX | |
| Average Intel Core i7-12700H (833 - 4242, n=64) | |
| HP Omen 16-b1090ng | |
| AIDA64 / CPU Queen | |
| Average of class Gaming (49785 - 173351, n=90, last 2 years) | |
| Lenovo Legion S7 16ARHA7 | |
| Lenovo Legion Slim 7-16IAH 82TF004YGE | |
| Lenovo Legion 7 16IAX7-82TD004SGE | |
| HP Omen 16-b1090ng | |
| Acer Predator Triton 500 SE PT516-52s-70KX | |
| Average Intel Core i7-12700H (57923 - 103202, n=63) | |
| AIDA64 / FPU SinJulia | |
| Average of class Gaming (4424 - 33636, n=105, last 2 years) | |
| Lenovo Legion 7 16IAX7-82TD004SGE | |
| Lenovo Legion S7 16ARHA7 | |
| Acer Predator Triton 500 SE PT516-52s-70KX | |
| Lenovo Legion Slim 7-16IAH 82TF004YGE | |
| HP Omen 16-b1090ng | |
| Average Intel Core i7-12700H (3249 - 9939, n=64) | |
| AIDA64 / FPU Mandel | |
| Average of class Gaming (25115 - 128721, n=105, last 2 years) | |
| Lenovo Legion S7 16ARHA7 | |
| Lenovo Legion Slim 7-16IAH 82TF004YGE | |
| Lenovo Legion 7 16IAX7-82TD004SGE | |
| Average Intel Core i7-12700H (7135 - 44760, n=64) | |
| Acer Predator Triton 500 SE PT516-52s-70KX | |
| HP Omen 16-b1090ng | |
| AIDA64 / CPU AES | |
| Lenovo Legion Slim 7-16IAH 82TF004YGE | |
| Lenovo Legion S7 16ARHA7 | |
| Lenovo Legion 7 16IAX7-82TD004SGE | |
| Average of class Gaming (39258 - 247074, n=105, last 2 years) | |
| Acer Predator Triton 500 SE PT516-52s-70KX | |
| Average Intel Core i7-12700H (31839 - 144360, n=64) | |
| HP Omen 16-b1090ng | |
| AIDA64 / CPU ZLib | |
| Average of class Gaming (574 - 2531, n=105, last 2 years) | |
| Lenovo Legion 7 16IAX7-82TD004SGE | |
| Acer Predator Triton 500 SE PT516-52s-70KX | |
| Lenovo Legion Slim 7-16IAH 82TF004YGE | |
| Average Intel Core i7-12700H (305 - 1171, n=64) | |
| HP Omen 16-b1090ng | |
| Lenovo Legion S7 16ARHA7 | |
| Asus ROG Zephyrus M16 GU603H | |
| AIDA64 / FP64 Ray-Trace | |
| Average of class Gaming (5509 - 45446, n=105, last 2 years) | |
| Lenovo Legion S7 16ARHA7 | |
| Lenovo Legion Slim 7-16IAH 82TF004YGE | |
| Lenovo Legion 7 16IAX7-82TD004SGE | |
| Average Intel Core i7-12700H (1437 - 9692, n=64) | |
| Acer Predator Triton 500 SE PT516-52s-70KX | |
| HP Omen 16-b1090ng | |
| AIDA64 / CPU PhotoWorxx | |
| Average of class Gaming (12271 - 89891, n=105, last 2 years) | |
| HP Omen 16-b1090ng | |
| Lenovo Legion 7 16IAX7-82TD004SGE | |
| Acer Predator Triton 500 SE PT516-52s-70KX | |
| Lenovo Legion Slim 7-16IAH 82TF004YGE | |
| Average Intel Core i7-12700H (12863 - 52207, n=64) | |
| Lenovo Legion S7 16ARHA7 | |
系统性能
鉴于联想Legion Slim 7i中的所有强大组件,该设备不仅在日常使用中具有出色的性能,而且在系统性能基准测试中也表现良好,这并不令人惊讶。
CrossMark: Overall | Productivity | Creativity | Responsiveness
| PCMark 10 / Score | |
| Lenovo Legion 7 16IAX7-82TD004SGE | |
| Average of class Gaming (5828 - 12414, n=93, last 2 years) | |
| Lenovo Legion S7 16ARHA7 | |
| Acer Predator Triton 500 SE PT516-52s-70KX | |
| Lenovo Legion Slim 7-16IAH 82TF004YGE | |
| HP Omen 16-b1090ng | |
| Average Intel Core i7-12700H, NVIDIA GeForce RTX 3060 Laptop GPU (5986 - 8156, n=12) | |
| Asus ROG Zephyrus M16 GU603H | |
| PCMark 10 / Essentials | |
| Lenovo Legion 7 16IAX7-82TD004SGE | |
| Lenovo Legion Slim 7-16IAH 82TF004YGE | |
| Acer Predator Triton 500 SE PT516-52s-70KX | |
| Lenovo Legion S7 16ARHA7 | |
| Average of class Gaming (8810 - 11935, n=97, last 2 years) | |
| Average Intel Core i7-12700H, NVIDIA GeForce RTX 3060 Laptop GPU (9289 - 12144, n=12) | |
| Asus ROG Zephyrus M16 GU603H | |
| HP Omen 16-b1090ng | |
| PCMark 10 / Productivity | |
| Average of class Gaming (6845 - 25323, n=95, last 2 years) | |
| Lenovo Legion 7 16IAX7-82TD004SGE | |
| Lenovo Legion S7 16ARHA7 | |
| Acer Predator Triton 500 SE PT516-52s-70KX | |
| HP Omen 16-b1090ng | |
| Lenovo Legion Slim 7-16IAH 82TF004YGE | |
| Average Intel Core i7-12700H, NVIDIA GeForce RTX 3060 Laptop GPU (6161 - 10362, n=12) | |
| Asus ROG Zephyrus M16 GU603H | |
| PCMark 10 / Digital Content Creation | |
| Lenovo Legion 7 16IAX7-82TD004SGE | |
| Average of class Gaming (7602 - 19954, n=95, last 2 years) | |
| Lenovo Legion S7 16ARHA7 | |
| Acer Predator Triton 500 SE PT516-52s-70KX | |
| HP Omen 16-b1090ng | |
| Lenovo Legion Slim 7-16IAH 82TF004YGE | |
| Average Intel Core i7-12700H, NVIDIA GeForce RTX 3060 Laptop GPU (8950 - 12554, n=12) | |
| Asus ROG Zephyrus M16 GU603H | |
| CrossMark / Overall | |
| Lenovo Legion 7 16IAX7-82TD004SGE | |
| Average of class Gaming (1366 - 2409, n=94, last 2 years) | |
| Lenovo Legion Slim 7-16IAH 82TF004YGE | |
| Acer Predator Triton 500 SE PT516-52s-70KX | |
| Average Intel Core i7-12700H, NVIDIA GeForce RTX 3060 Laptop GPU (1649 - 2017, n=11) | |
| Lenovo Legion S7 16ARHA7 | |
| CrossMark / Productivity | |
| Lenovo Legion 7 16IAX7-82TD004SGE | |
| Average of class Gaming (1386 - 2254, n=94, last 2 years) | |
| Lenovo Legion Slim 7-16IAH 82TF004YGE | |
| Acer Predator Triton 500 SE PT516-52s-70KX | |
| Average Intel Core i7-12700H, NVIDIA GeForce RTX 3060 Laptop GPU (1536 - 1958, n=11) | |
| Lenovo Legion S7 16ARHA7 | |
| CrossMark / Creativity | |
| Lenovo Legion 7 16IAX7-82TD004SGE | |
| Average of class Gaming (1343 - 2786, n=94, last 2 years) | |
| Lenovo Legion Slim 7-16IAH 82TF004YGE | |
| Average Intel Core i7-12700H, NVIDIA GeForce RTX 3060 Laptop GPU (1816 - 2084, n=11) | |
| Acer Predator Triton 500 SE PT516-52s-70KX | |
| Lenovo Legion S7 16ARHA7 | |
| CrossMark / Responsiveness | |
| Lenovo Legion 7 16IAX7-82TD004SGE | |
| Acer Predator Triton 500 SE PT516-52s-70KX | |
| Lenovo Legion Slim 7-16IAH 82TF004YGE | |
| Average of class Gaming (1226 - 2334, n=94, last 2 years) | |
| Average Intel Core i7-12700H, NVIDIA GeForce RTX 3060 Laptop GPU (1210 - 2207, n=11) | |
| Lenovo Legion S7 16ARHA7 | |
| PCMark 10 Score | 7380 points | |
Help | ||
| AIDA64 / Memory Copy | |
| Average of class Gaming (21750 - 129946, n=105, last 2 years) | |
| HP Omen 16-b1090ng | |
| Acer Predator Triton 500 SE PT516-52s-70KX | |
| Average Intel Core i7-12700H (25615 - 80511, n=64) | |
| Lenovo Legion Slim 7-16IAH 82TF004YGE | |
| Lenovo Legion S7 16ARHA7 | |
| AIDA64 / Memory Read | |
| Average of class Gaming (22956 - 118858, n=105, last 2 years) | |
| Acer Predator Triton 500 SE PT516-52s-70KX | |
| HP Omen 16-b1090ng | |
| Lenovo Legion Slim 7-16IAH 82TF004YGE | |
| Average Intel Core i7-12700H (25586 - 79442, n=64) | |
| Lenovo Legion S7 16ARHA7 | |
| AIDA64 / Memory Write | |
| Average of class Gaming (22297 - 135096, n=105, last 2 years) | |
| HP Omen 16-b1090ng | |
| Lenovo Legion Slim 7-16IAH 82TF004YGE | |
| Lenovo Legion S7 16ARHA7 | |
| Average Intel Core i7-12700H (23679 - 88660, n=64) | |
| Acer Predator Triton 500 SE PT516-52s-70KX | |
| AIDA64 / Memory Latency | |
| Acer Predator Triton 500 SE PT516-52s-70KX | |
| Average of class Gaming (75.3 - 259, n=105, last 2 years) | |
| Lenovo Legion Slim 7-16IAH 82TF004YGE | |
| HP Omen 16-b1090ng | |
| Lenovo Legion S7 16ARHA7 | |
| Average Intel Core i7-12700H (76.2 - 133.9, n=62) | |
| Asus ROG Zephyrus M16 GU603H | |
* ... smaller is better
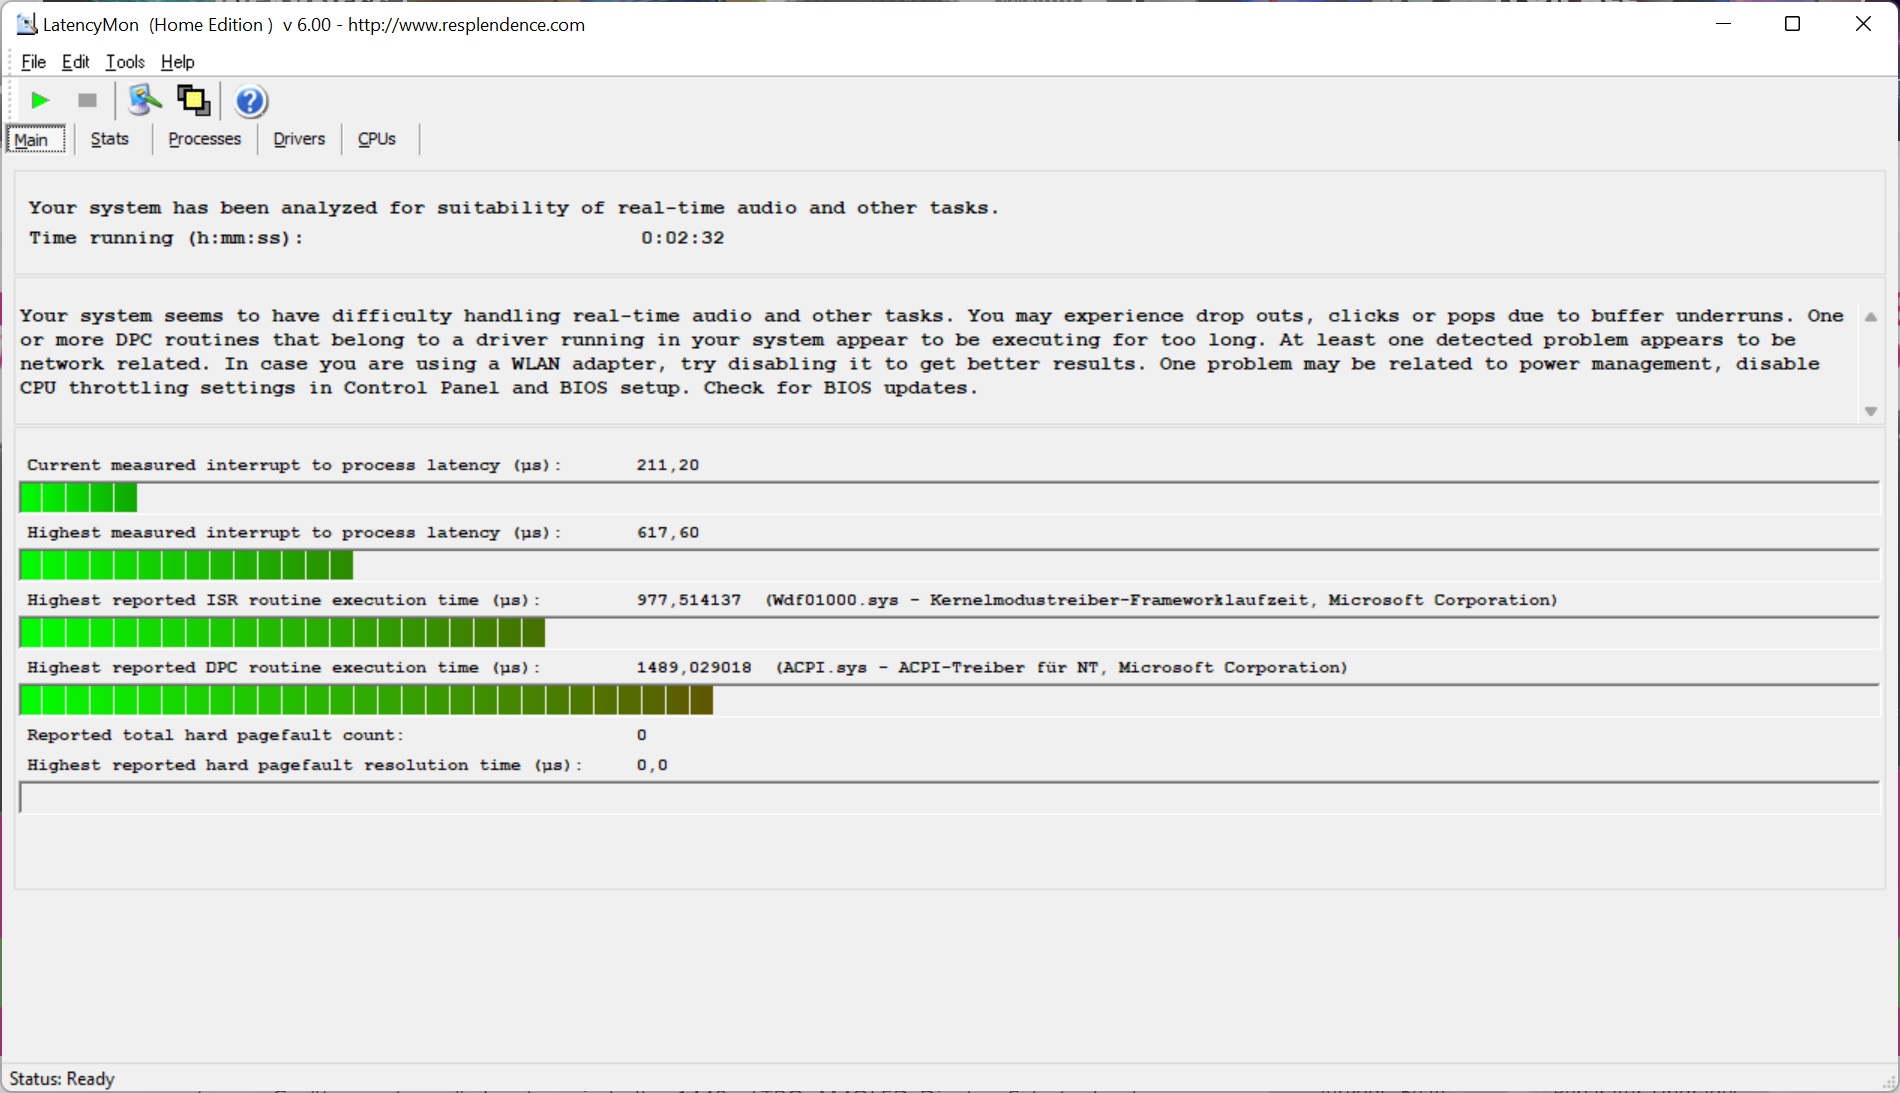
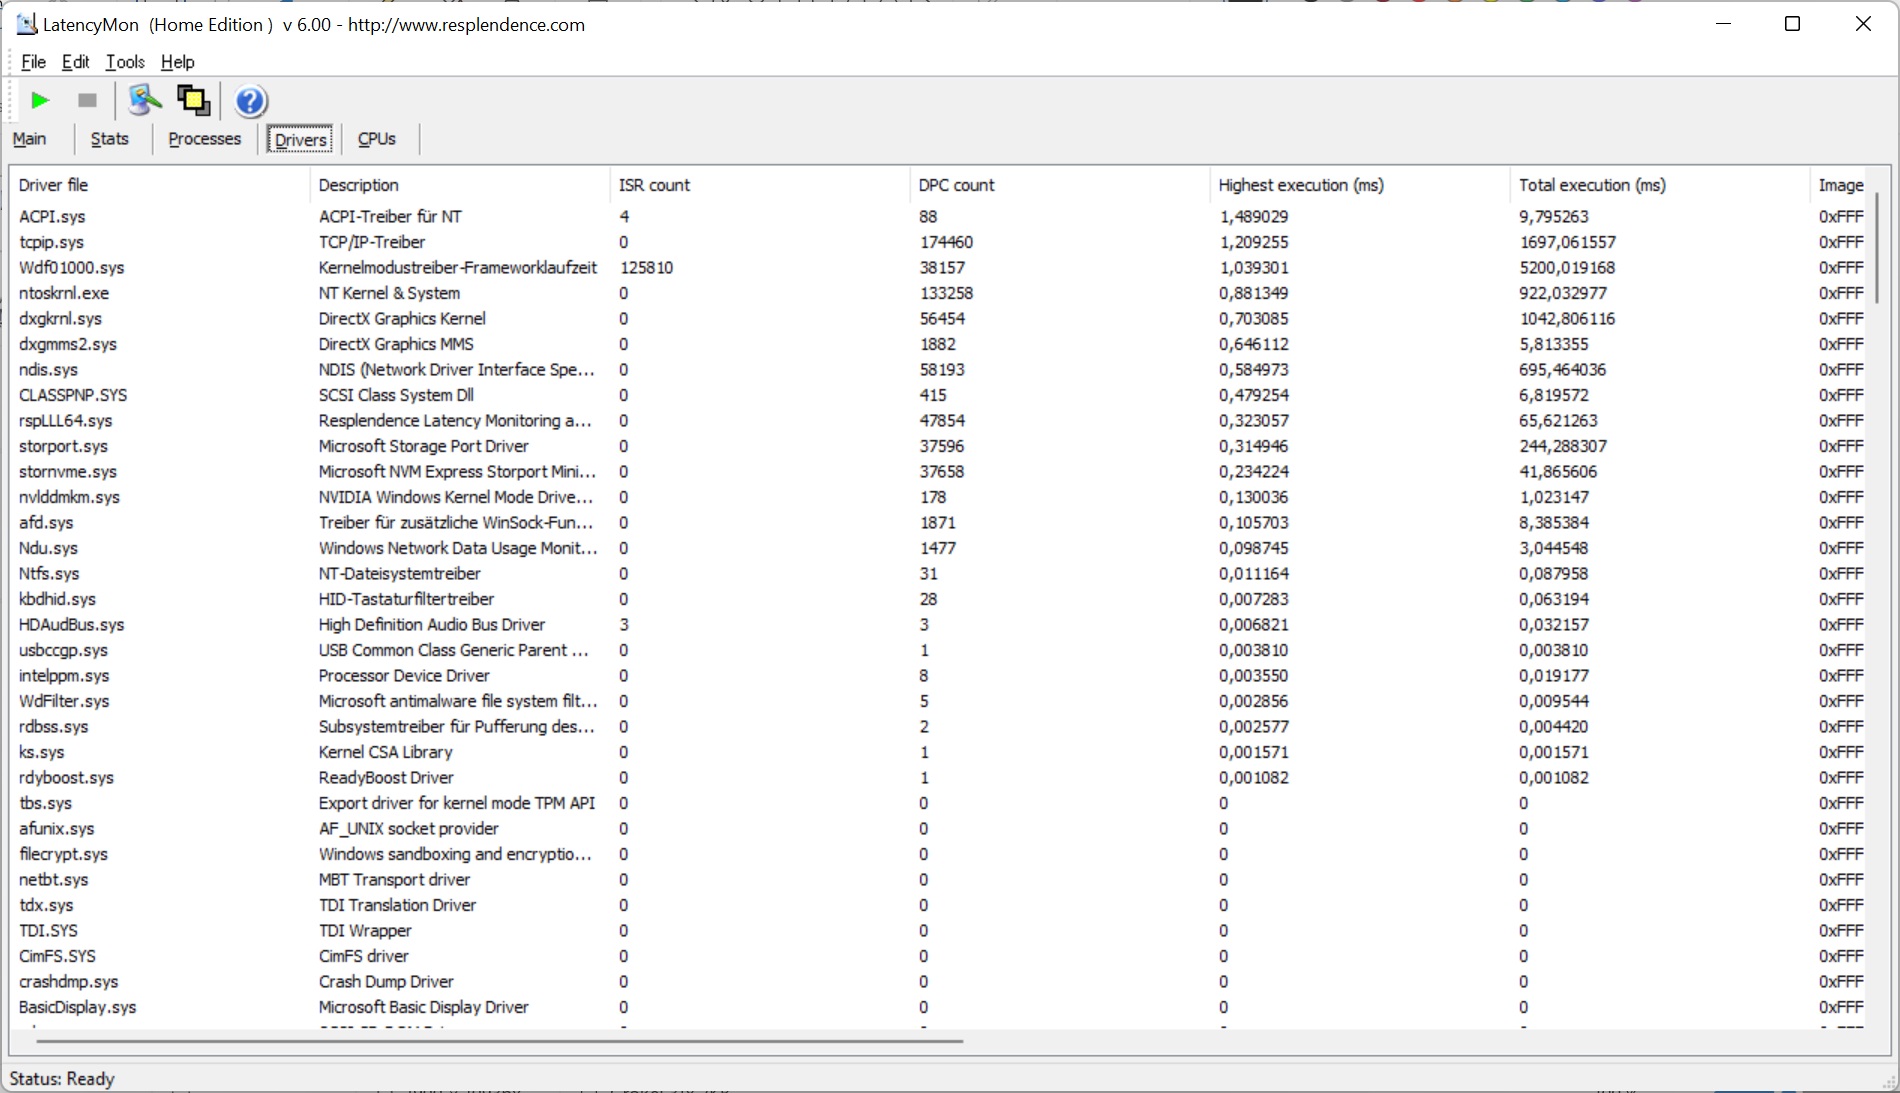
DPC延时
虽然延迟相对较低,但我们的评测单元在处理实时音频时有一些问题。另一方面,在我们的YouTube测试中,没有任何掉帧。
| DPC Latencies / LatencyMon - interrupt to process latency (max), Web, Youtube, Prime95 | |
| Acer Predator Triton 500 SE PT516-52s-70KX | |
| Asus ROG Zephyrus M16 GU603H | |
| Lenovo Legion S7 16ARHA7 | |
| HP Omen 16-b1090ng | |
| Lenovo Legion Slim 7-16IAH 82TF004YGE | |
* ... smaller is better
大容量存储
Legion Slim 7-16IAH配备了SK Hynix制造的M.2 2280固态硬盘。这块容量为1TB的NVMe PCIe 4.0硬盘在我们的基准测试中运行迅速,在持续负载下没有经历任何明显的性能下降。

* ... smaller is better
Sustained Read: DiskSpd Read Loop, Queue Depth 8
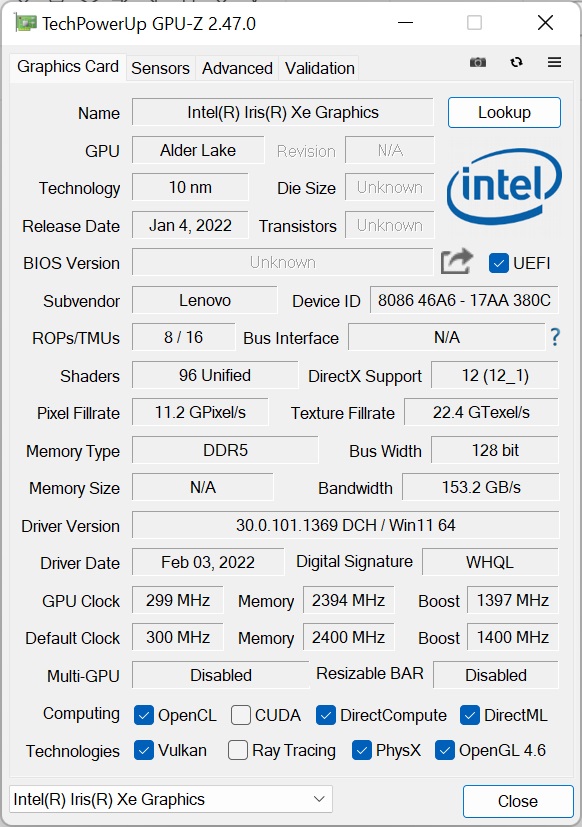
图形卡
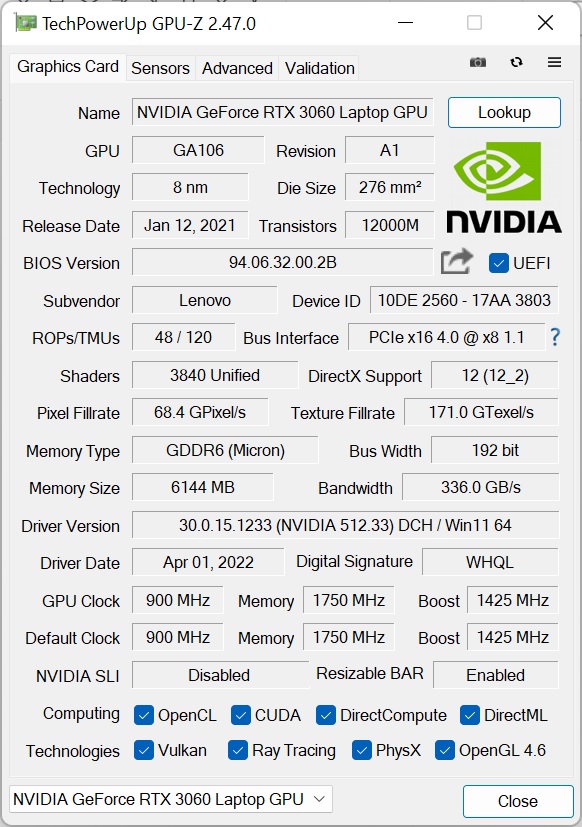
该 GeForce RTX 3060是Nvidia移动GPU阵容中的一个中层卡。GA106芯片有3840个着色器单元和6GB的专用GDDR6内存。你可以在我们的GPU列表中找到更多关于这个和其他许多图形卡的数据.
这次比较中的其他笔记本电脑都配备了明显更强大的GPU。这就是为什么联想Legion S7i在3DMark测试中的表现比它们中的大多数都差。唯一的例外是 华硕ROG Zephyrus M16,它的运行速度较慢,尽管它有一个 GeForce RTX 3070.
笔记本不插电时,GPU的性能明显受到限制。在电池供电的情况下,联想Legion S7i在3DMark 11图形测试中只取得了9412分--比插电时低65%。
| 3DMark 11 Performance | 25620 points | |
| 3DMark Fire Strike Score | 18596 points | |
| 3DMark Time Spy Score | 8319 points | |
Help | ||
有趣的是,基于英特尔的Legion S7在Blender基准测试中的表现超过了AMD的同类产品。当使用CPU渲染场景时,性能差距很小。但英特尔模型(使用CUDA或OptiX)的速度大大高于 Legion Slim 7 AMD(使用HIP)的GPU渲染基准。
| Blender | |
| v3.3 Classroom CPU | |
| Lenovo Legion S7 16ARHA7 | |
| Lenovo Legion Slim 7-16IAH 82TF004YGE | |
| Lenovo Legion 7 16IAX7-82TD004SGE | |
| v3.3 Classroom CUDA | |
| Lenovo Legion Slim 7-16IAH 82TF004YGE | |
| Lenovo Legion 7 16IAX7-82TD004SGE | |
| v3.3 Classroom OPTIX/RTX | |
| Lenovo Legion Slim 7-16IAH 82TF004YGE | |
| Lenovo Legion 7 16IAX7-82TD004SGE | |
| v3.3 Classroom HIP/AMD | |
| Lenovo Legion S7 16ARHA7 | |
* ... smaller is better
游戏性能
在游戏基准测试中,联想Legion Slim 7i比对比组中的其他设备慢,这并不是一个巨大的惊喜,考虑到它们都有更快的GPU。尽管如此,Legion S7i与普通的RTX 3060相比,只是稍微慢了一点。它也有足够的GPU性能,可以毫不费力地以2K(2,560 x 1,440)和高设置运行现代游戏。
| The Witcher 3 - 1920x1080 Ultra Graphics & Postprocessing (HBAO+) | |
| Average of class Gaming (104.7 - 240, n=7, last 2 years) | |
| Acer Predator Triton 500 SE PT516-52s-70KX | |
| HP Omen 16-b1090ng | |
| Lenovo Legion S7 16ARHA7 | |
| Asus ROG Zephyrus M16 GU603H | |
| Average NVIDIA GeForce RTX 3060 Laptop GPU (58.2 - 91.5, n=48) | |
| Lenovo Legion Slim 7-16IAH 82TF004YGE | |
Witcher 3 FPS chart
| low | med. | high | ultra | QHD | |
|---|---|---|---|---|---|
| GTA V (2015) | 183.5 | 179.8 | 169.3 | 98 | 70.9 |
| The Witcher 3 (2015) | 362 | 246 | 139.3 | 73.7 | |
| Dota 2 Reborn (2015) | 177.3 | 163.2 | 153.4 | 146.2 | |
| Final Fantasy XV Benchmark (2018) | 175.5 | 100 | 75 | 55.2 | |
| X-Plane 11.11 (2018) | 146.6 | 132.8 | 105 | ||
| Strange Brigade (2018) | 390 | 186.4 | 151.9 | 131.8 | 100.2 |
排放。 Legion Slim 7i为其高性能付出代价
噪声排放
尽管有很好的性能,联想Legion Slim 7i的风扇控制调得很好,让它在空闲时静静地运行。在负载情况下,该笔记本产生了高达52 dB(a)的噪音,但仍然比竞争对手安静。作为唯一的例外,基于AMD的Legion Slim 7在负载下运行得更安静。
当我们把耳朵贴近键盘时,可以听到笔记本电脑发出的轻柔的嘶嘶声。然而,当我们与设备保持正常距离时,这种噪音就听不到了。
Noise level
| Idle |
| 23 / 23 / 23 dB(A) |
| Load |
| 43.7 / 52 dB(A) |
 | ||
30 dB silent 40 dB(A) audible 50 dB(A) loud |
||
min: | ||
| Lenovo Legion Slim 7-16IAH 82TF004YGE GeForce RTX 3060 Laptop GPU, i7-12700H, SK Hynix HFS001TEJ9X115N | Lenovo Legion S7 16ARHA7 Radeon RX 6800S, R9 6900HX, SK Hynix HFS001TEJ9X115N | Acer Predator Triton 500 SE PT516-52s-70KX GeForce RTX 3080 Ti Laptop GPU, i7-12700H, Micron 3400 1TB MTFDKBA1T0TFH | HP Omen 16-b1090ng GeForce RTX 3070 Ti Laptop GPU, i7-12700H, WDC PC SN810 1TB | Asus ROG Zephyrus M16 GU603H GeForce RTX 3070 Laptop GPU, i9-11900H, Samsung PM9A1 MZVL22T0HBLB | |
|---|---|---|---|---|---|
| Noise | 4% | -18% | -21% | -22% | |
| off / environment * (dB) | 23 | 23.1 -0% | 26 -13% | 26 -13% | 25 -9% |
| Idle Minimum * (dB) | 23 | 23.1 -0% | 26 -13% | 30 -30% | 25 -9% |
| Idle Average * (dB) | 23 | 23.1 -0% | 29 -26% | 31 -35% | 31 -35% |
| Idle Maximum * (dB) | 23 | 23.1 -0% | 34 -48% | 33 -43% | 42 -83% |
| Load Average * (dB) | 43.7 | 31.4 28% | 50 -14% | 49 -12% | 48 -10% |
| Witcher 3 ultra * (dB) | 51.7 | 51.4 1% | 53 -3% | 53 -3% | 52 -1% |
| Load Maximum * (dB) | 52 | 51.2 2% | 56 -8% | 57 -10% | 56 -8% |
* ... smaller is better
温度
薄薄的机箱配上强大的组件,是产生高温的秘诀。在空闲状态下,联想笔记本电脑能够保持相对凉爽。尽管如此,它仍然产生了明显的热量,机箱温度达到37.6℃(99.7℉)。在压力测试中,我们在设备底部的一个热点处测量到55℃(131℉)的峰值温度,这已经超出了可接受的范围。在Witcher 3 (对游戏笔记本来说很重要),底部的机箱温度没有超过50°C(122°F),但键盘甲板的温度比压力测试时略高。这意味着当你在该设备上进行游戏时,你的手可能会出汗。
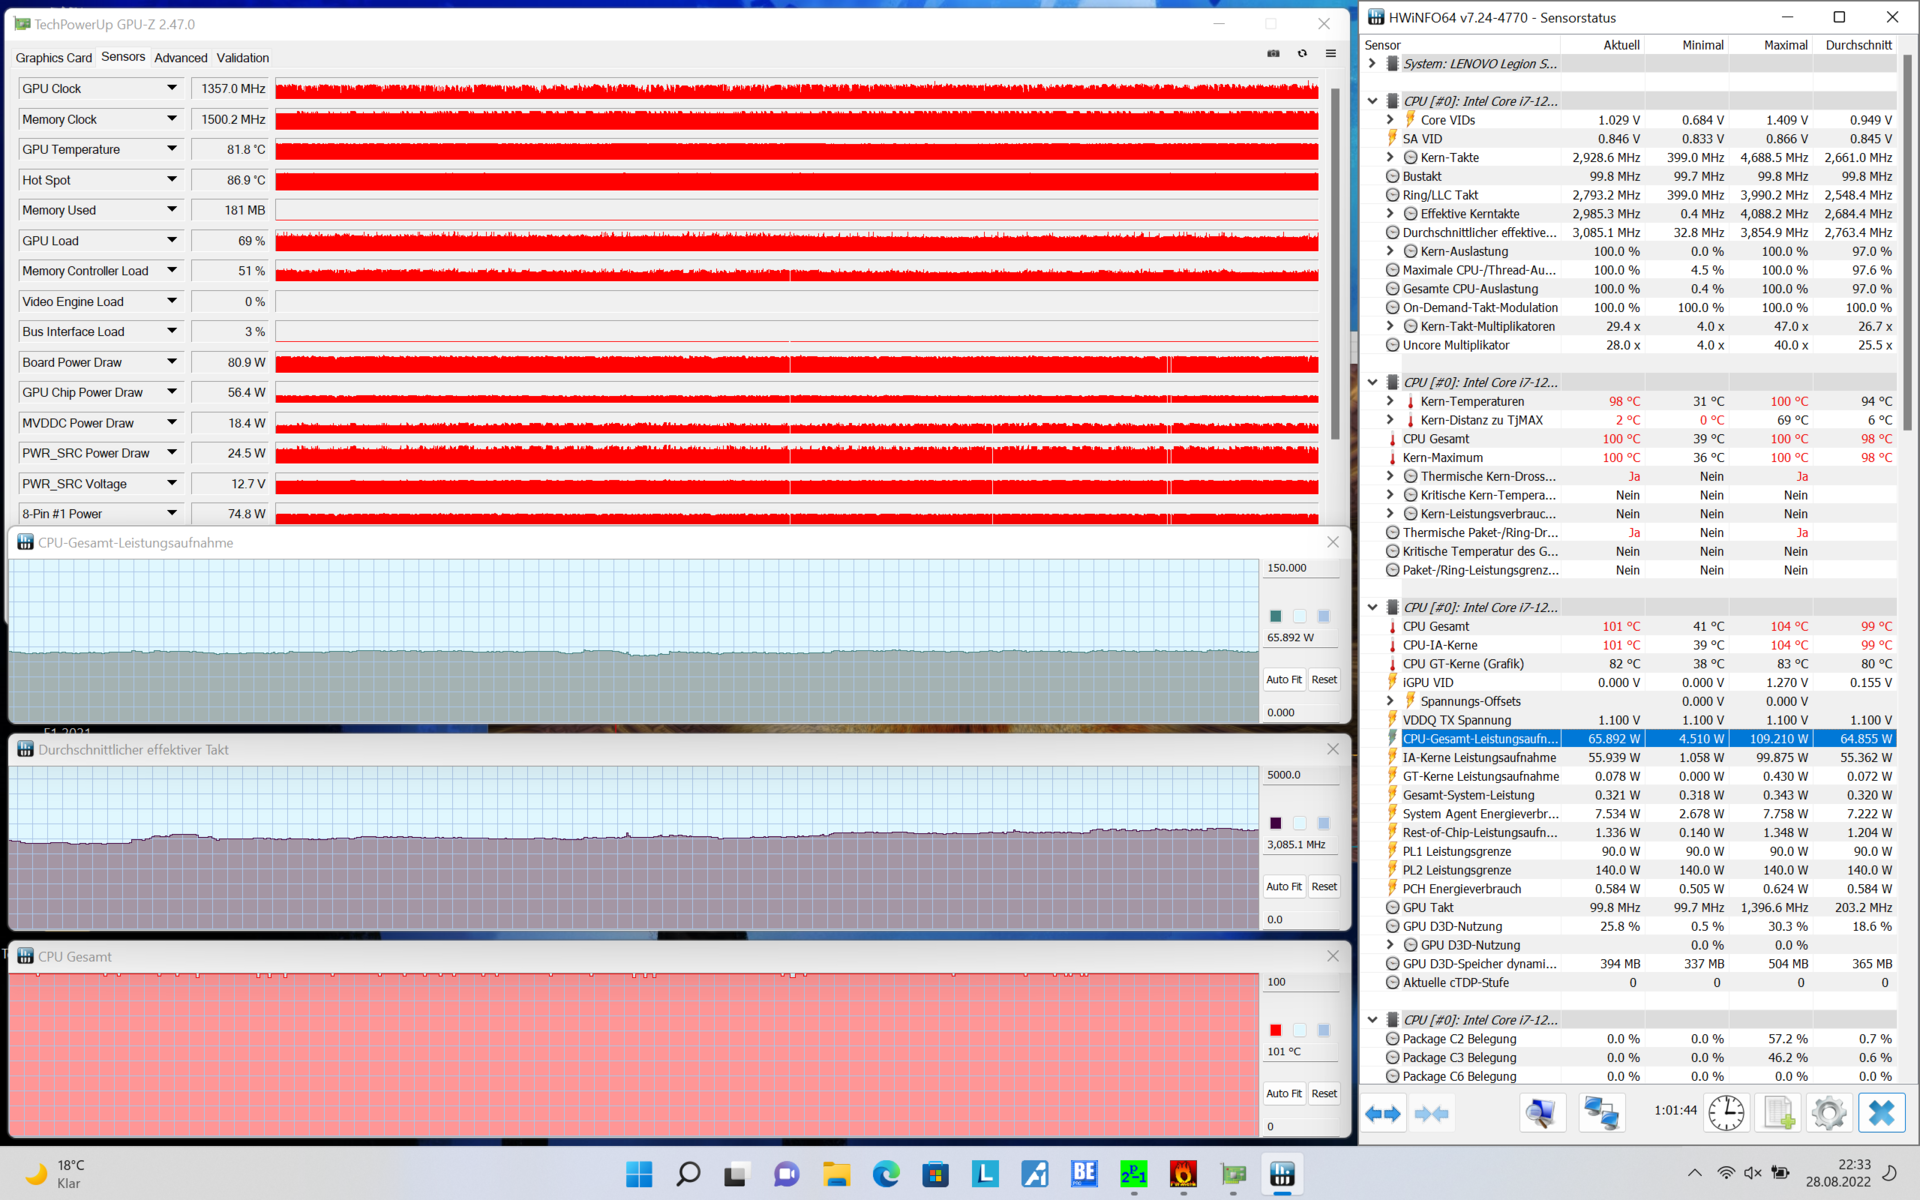
在CPU/GPU综合压力测试中,处理器的功耗上限为65瓦,而GPU的功耗略高,为80瓦。联想Legion Slim 7-16IAH没有任何问题,CPU或GPU不会因为节流而低于其基本时钟。
(-) The maximum temperature on the upper side is 48.3 °C / 119 F, compared to the average of 40.4 °C / 105 F, ranging from 21.2 to 68.8 °C for the class Gaming.
(-) The bottom heats up to a maximum of 55.3 °C / 132 F, compared to the average of 43.2 °C / 110 F
(+) In idle usage, the average temperature for the upper side is 31.3 °C / 88 F, compared to the device average of 33.9 °C / 93 F.
(-) Playing The Witcher 3, the average temperature for the upper side is 39.2 °C / 103 F, compared to the device average of 33.9 °C / 93 F.
(±) The palmrests and touchpad can get very hot to the touch with a maximum of 39.5 °C / 103.1 F.
(-) The average temperature of the palmrest area of similar devices was 28.8 °C / 83.8 F (-10.7 °C / -19.3 F).
| Lenovo Legion Slim 7-16IAH 82TF004YGE Intel Core i7-12700H, NVIDIA GeForce RTX 3060 Laptop GPU | Lenovo Legion S7 16ARHA7 AMD Ryzen 9 6900HX, AMD Radeon RX 6800S | Acer Predator Triton 500 SE PT516-52s-70KX Intel Core i7-12700H, NVIDIA GeForce RTX 3080 Ti Laptop GPU | HP Omen 16-b1090ng Intel Core i7-12700H, NVIDIA GeForce RTX 3070 Ti Laptop GPU | Asus ROG Zephyrus M16 GU603H Intel Core i9-11900H, NVIDIA GeForce RTX 3070 Laptop GPU | |
|---|---|---|---|---|---|
| Heat | 17% | 11% | 16% | -5% | |
| Maximum Upper Side * (°C) | 48.3 | 46.6 4% | 47 3% | 41 15% | 52 -8% |
| Maximum Bottom * (°C) | 55.3 | 50.8 8% | 49 11% | 62 -12% | 53 4% |
| Idle Upper Side * (°C) | 35.7 | 26.4 26% | 31 13% | 25 30% | 38 -6% |
| Idle Bottom * (°C) | 37.6 | 27.2 28% | 32 15% | 26 31% | 41 -9% |
* ... smaller is better
发言人
扬声器位于Legion S7i的键盘上方。对于一对笔记本电脑的扬声器来说,它们听起来相当不错,因为它们确实有一些低音,可以变得相当响亮。
Lenovo Legion Slim 7-16IAH 82TF004YGE audio analysis
(±) | speaker loudness is average but good (73.4 dB)
Bass 100 - 315 Hz
(±) | reduced bass - on average 10% lower than median
(±) | linearity of bass is average (13.4% delta to prev. frequency)
Mids 400 - 2000 Hz
(+) | balanced mids - only 1.2% away from median
(+) | mids are linear (3.3% delta to prev. frequency)
Highs 2 - 16 kHz
(±) | higher highs - on average 5.5% higher than median
(±) | linearity of highs is average (10.6% delta to prev. frequency)
Overall 100 - 16.000 Hz
(+) | overall sound is linear (13% difference to median)
Compared to same class
» 18% of all tested devices in this class were better, 3% similar, 79% worse
» The best had a delta of 6%, average was 18%, worst was 132%
Compared to all devices tested
» 13% of all tested devices were better, 3% similar, 85% worse
» The best had a delta of 4%, average was 23%, worst was 134%
Asus ROG Zephyrus M16 GU603H audio analysis
(±) | speaker loudness is average but good (80 dB)
Bass 100 - 315 Hz
(±) | reduced bass - on average 7.4% lower than median
(±) | linearity of bass is average (9.2% delta to prev. frequency)
Mids 400 - 2000 Hz
(±) | higher mids - on average 5.6% higher than median
(+) | mids are linear (4% delta to prev. frequency)
Highs 2 - 16 kHz
(+) | balanced highs - only 2.6% away from median
(+) | highs are linear (6.7% delta to prev. frequency)
Overall 100 - 16.000 Hz
(+) | overall sound is linear (12.1% difference to median)
Compared to same class
» 12% of all tested devices in this class were better, 4% similar, 84% worse
» The best had a delta of 6%, average was 18%, worst was 132%
Compared to all devices tested
» 10% of all tested devices were better, 2% similar, 88% worse
» The best had a delta of 4%, average was 23%, worst was 134%
电源管理。联想Legion S7i的效率并不高
消耗功率
联想超薄7i的一个主要弱点是它的高耗电量。在空闲状态下,其功耗已经非常高,达到13.3瓦。基于AMD的型号在这方面要好一些。
在我们的测试中,我们测量了232瓦的峰值用电量--略高于充电器可输出的230瓦。尽管如此,你不必担心笔记本插电时电池会放电,因为这代表了绝对的峰值,笔记本的耗电量很快就降到了临界值以下。
| Off / Standby | |
| Idle | |
| Load |
|
Key:
min: | |
| Lenovo Legion Slim 7-16IAH 82TF004YGE i7-12700H, GeForce RTX 3060 Laptop GPU, SK Hynix HFS001TEJ9X115N, IPS LED, 2560x1600, 16" | Lenovo Legion S7 16ARHA7 R9 6900HX, Radeon RX 6800S, SK Hynix HFS001TEJ9X115N, IPS, 2560x1600, 16" | Acer Predator Triton 500 SE PT516-52s-70KX i7-12700H, GeForce RTX 3080 Ti Laptop GPU, Micron 3400 1TB MTFDKBA1T0TFH, IPS LED, 2560x1600, 16" | HP Omen 16-b1090ng i7-12700H, GeForce RTX 3070 Ti Laptop GPU, WDC PC SN810 1TB, IPS, 2560x1440, 16.1" | Asus ROG Zephyrus M16 GU603H i9-11900H, GeForce RTX 3070 Laptop GPU, Samsung PM9A1 MZVL22T0HBLB, IPS, 2560x1600, 16" | Average NVIDIA GeForce RTX 3060 Laptop GPU | Average of class Gaming | |
|---|---|---|---|---|---|---|---|
| Power Consumption | 11% | -1% | 17% | -6% | 9% | -8% | |
| Idle Minimum * (Watt) | 13.3 | 8.8 34% | 7 47% | 4 70% | 11 17% | 10.4 ? 22% | 13 ? 2% |
| Idle Average * (Watt) | 17.5 | 14.7 16% | 19 -9% | 10 43% | 20 -14% | 14.5 ? 17% | 19 ? -9% |
| Idle Maximum * (Watt) | 18.4 | 19.8 -8% | 28 -52% | 19 -3% | 30 -63% | 21.4 ? -16% | 24.6 ? -34% |
| Load Average * (Watt) | 122.8 | 85.3 31% | 114 7% | 114 7% | 111 10% | 109.3 ? 11% | 110.7 ? 10% |
| Witcher 3 ultra * (Watt) | 154.7 | 167.5 -8% | 159 -3% | 183.2 -18% | 156 -1% | ||
| Load Maximum * (Watt) | 232.6 | 230.7 1% | 227 2% | 221 5% | 197 15% | 206 ? 11% | 259 ? -11% |
* ... smaller is better
Power consumption Witcher 3 / Stress test
Power consumption with external monitor
电池寿命
在电池容量方面,联想不遗余力,投入了根据旅行规定允许的最大电池(99.99Wh)的笔记本电脑。然而,由于该设备的高耗电量,电池寿命相当平庸。在Wi-Fi测试中(屏幕亮度为150cd/m²),这台笔记本电脑只运行了5个小时。相比之下,效率更高的AMD型号大约多坚持了一个小时。
| Lenovo Legion Slim 7-16IAH 82TF004YGE i7-12700H, GeForce RTX 3060 Laptop GPU, 99.99 Wh | Lenovo Legion S7 16ARHA7 R9 6900HX, Radeon RX 6800S, 71 Wh | Acer Predator Triton 500 SE PT516-52s-70KX i7-12700H, GeForce RTX 3080 Ti Laptop GPU, 99.98 Wh | HP Omen 16-b1090ng i7-12700H, GeForce RTX 3070 Ti Laptop GPU, 83 Wh | Asus ROG Zephyrus M16 GU603H i9-11900H, GeForce RTX 3070 Laptop GPU, 90 Wh | Average of class Gaming | |
|---|---|---|---|---|---|---|
| Battery runtime | 19% | 22% | 27% | 36% | 14% | |
| H.264 (h) | 9.5 | 8.2 -14% | 8.32 ? -12% | |||
| WiFi v1.3 (h) | 5.2 | 6.2 19% | 5.7 10% | 5.6 8% | 7.7 48% | 7.11 ? 37% |
| Witcher 3 ultra (h) | 1.5 | |||||
| Load (h) | 1.3 | 2.2 69% | 1.9 46% | 1.6 23% | 1.502 ? 16% |
Pros
Cons
结论:Legion Slim 7i因电池寿命不足而略显逊色

完整的AMD或英特尔对Nvidia--联想允许消费者在购买Legion Slim 7时做出自己的选择。两种变体都有各自的优势,同时有许多共同的优势。
尽管CPU和GPU有很大的不同,但这两个变种都有相同的超薄铝制机箱,优秀的输入设备,体面的端口选择,快速的高质量WQXGA显示屏和出色的性能。支持Thunderbolt 4是本评论中测试的英特尔/英伟达机型的一个优势。此外,这个变体的CPU性能略高,以及在某些应用(如基于CUDA的应用)中具有更好的GPU性能。
联想Legion S7i很薄,质量好,性能好--但效率不如其AMD对应产品。
尽管如此,基于AMD的变体最终是一个卓越的选择。联想Legion S7i 16IAH7不仅运行起来更热、更吵,而且电池寿命也比AMD的短。联想Legion S7 16ARHA7.我们认为,电池寿命尤其是一个关键因素,它破坏了联想将Slim 7i 16IAH7定位为轻薄便携游戏笔记本的企图。Legion S7i有点介于两个凳子之间:AMD的型号更适合于便携式使用,而更厚的 联想Legion 7 16IAX7采用HX处理器,对于那些真正想要最后一点性能的人来说,可能是更好的选择。
在竞争对手中, 宏碁掠夺者Triton 500 SE是一个特别令人兴奋的选择,因为它有更快的GPU和更好的显示屏。然而,它的价格更高,而且只有焊接的内存。另外值得一提的是 华硕ROG Zephyrus M16,但它仍然配备了一个较旧的处理器。
价格和可用性
Lenovo Legion Slim 7-16IAH 82TF004YGE
- 11/13/2022 v7 (old)
Benjamin Herzig
Price comparison

