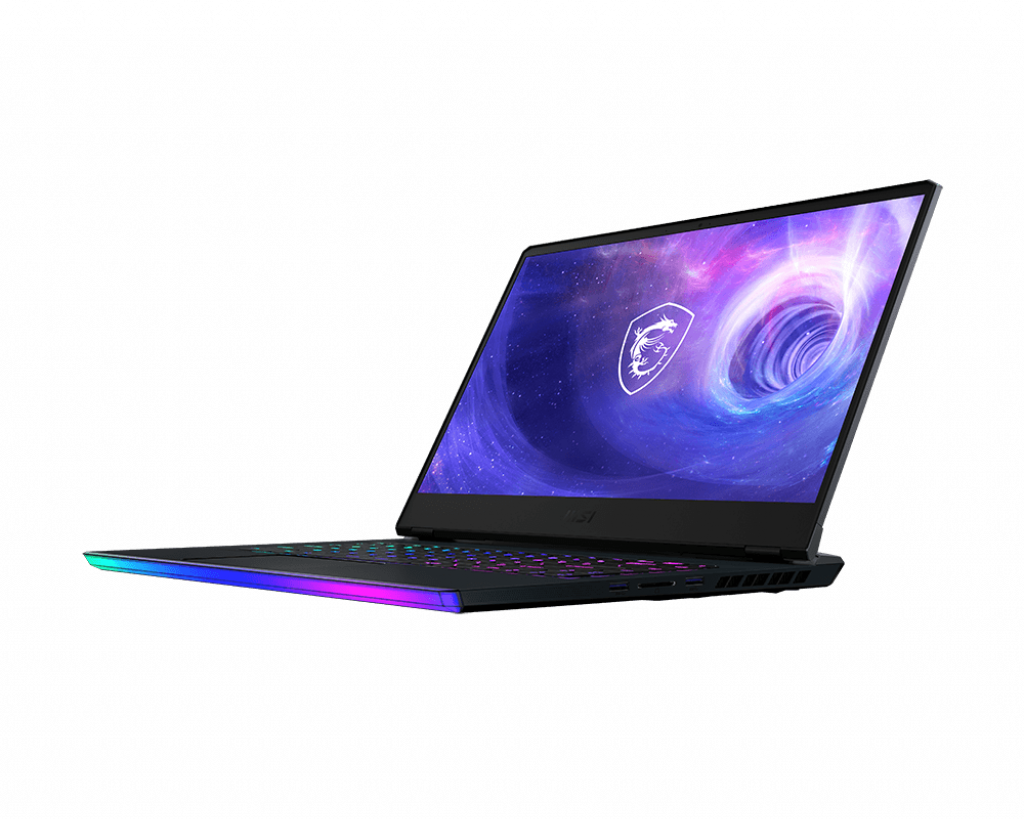
MSI Raider GE66 12UHS笔记本评测。以优异的成绩通过
微星公司继续扩大其高端游戏笔记本的品种。通过GE66 12UHS,这家台湾公司的目标是利用英特尔酷睿i9 12900HK的强大功能。英特尔Core i9 12900HK和Nvidia RTX 3080 Ti的力量,在CPU上的 "相变液态金属垫 "以及改进的散热器的帮助下。虽然整体设计与前代产品(微星GE66 10SFS)相比变化不大。 微星GE66 10SFS),但制造商还是在引擎盖下做了许多调整。
在下面的评论中,我们将了解该设备是否能够跟上竞争者的形式,即 Razer Blade 15 Advanced Early 2022,以及 申克XMG Neo 15 Early 2022和 联想Legion 5 Pro 16 G7.
潜在的竞争对手比较
Rating | Date | Model | Weight | Height | Size | Resolution | Price |
|---|---|---|---|---|---|---|---|
| 87.4 % v7 (old) | 06 / 2022 | MSI Raider GE66 12UHS i9-12900HK, GeForce RTX 3080 Ti Laptop GPU | 2.4 kg | 23.4 mm | 15.60" | 3840x2160 | |
| 84.6 % v7 (old) | 12 / 2020 | MSI GE66 Raider 10SFS i9-10980HK, GeForce RTX 2070 Super Mobile | 2.4 kg | 23 mm | 15.60" | 1920x1080 | |
| 89.1 % v7 (old) | 03 / 2022 | Razer Blade 15 2022 i7-12800H, GeForce RTX 3080 Ti Laptop GPU | 2.1 kg | 16.99 mm | 15.60" | 2560x1440 | |
v (old) | 03 / 2022 | Schenker XMG Neo 15 E22 (Early 2022, RTX 3080 Ti) i7-12700H, GeForce RTX 3080 Ti Laptop GPU | 2.2 kg | 26.6 mm | 15.60" | 2560x1440 | |
| 88 % v7 (old) | 03 / 2022 | Lenovo Legion 5 Pro 16 G7 i7 RTX 3070Ti i7-12700H, GeForce RTX 3070 Ti Laptop GPU | 2.6 kg | 26.6 mm | 16.00" | 2560x1600 |
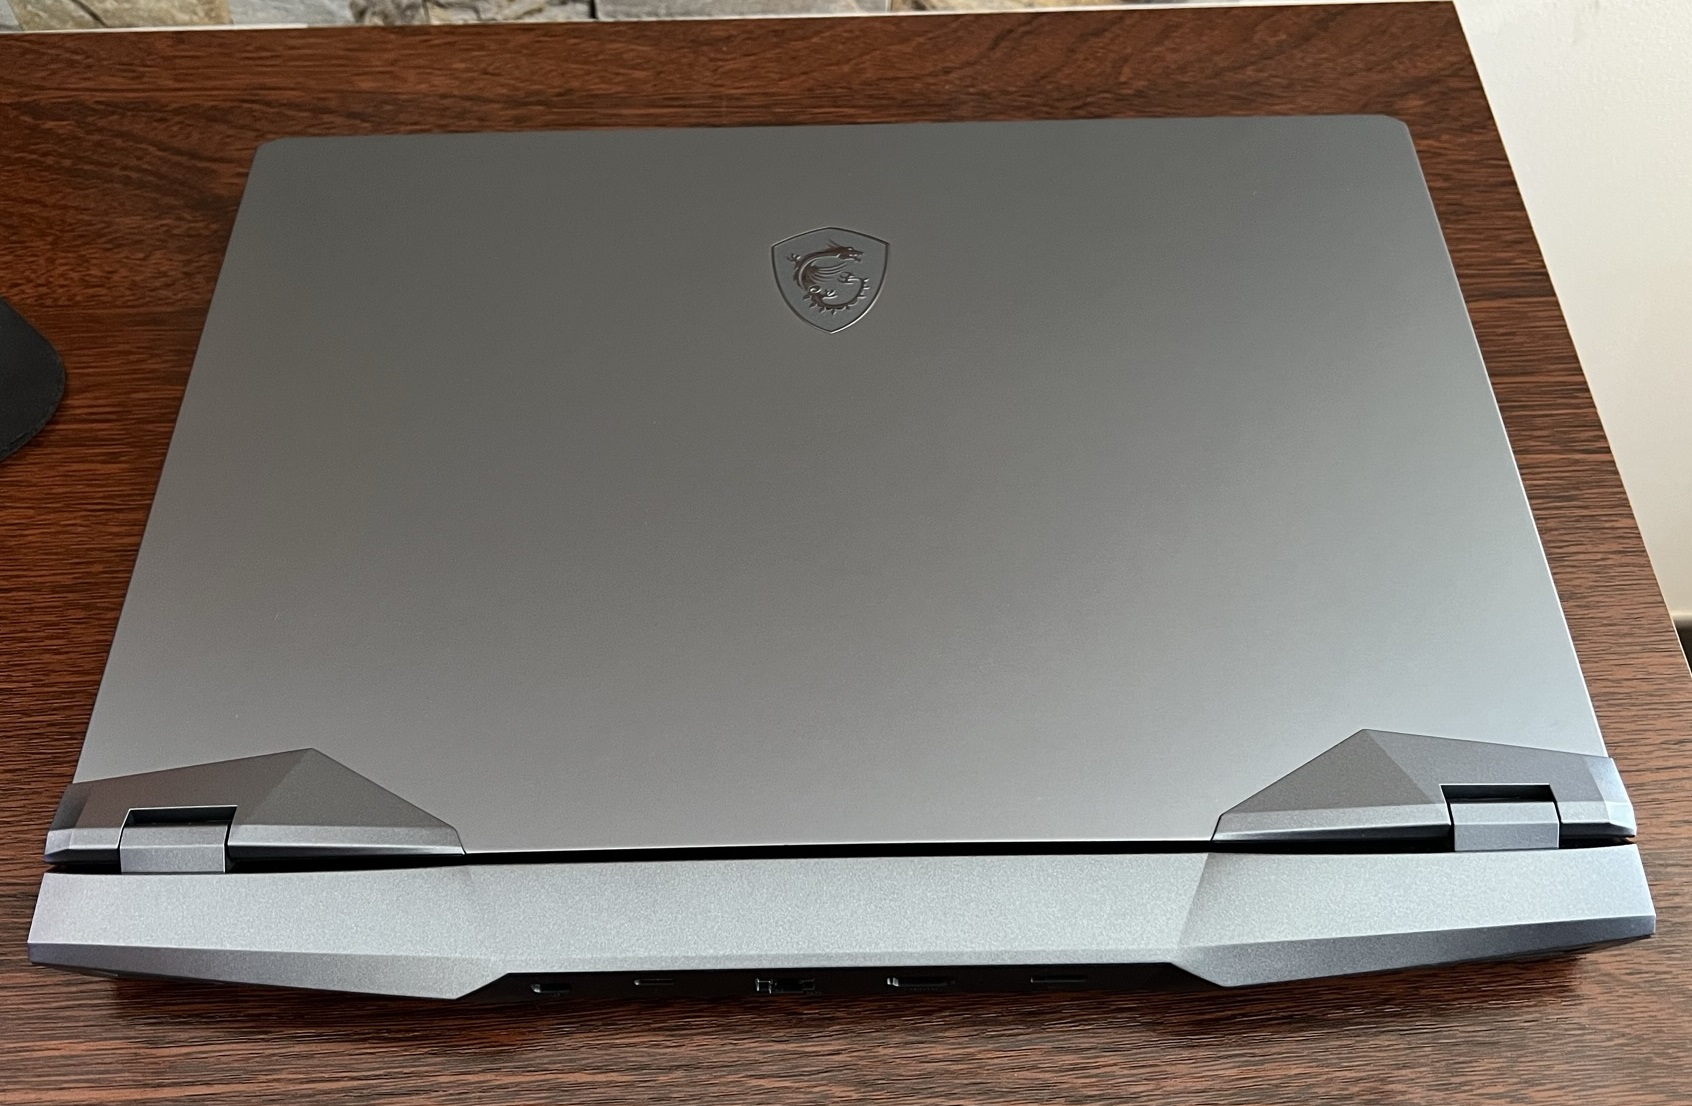
箱子。微星笔记本电脑,外观略有改变
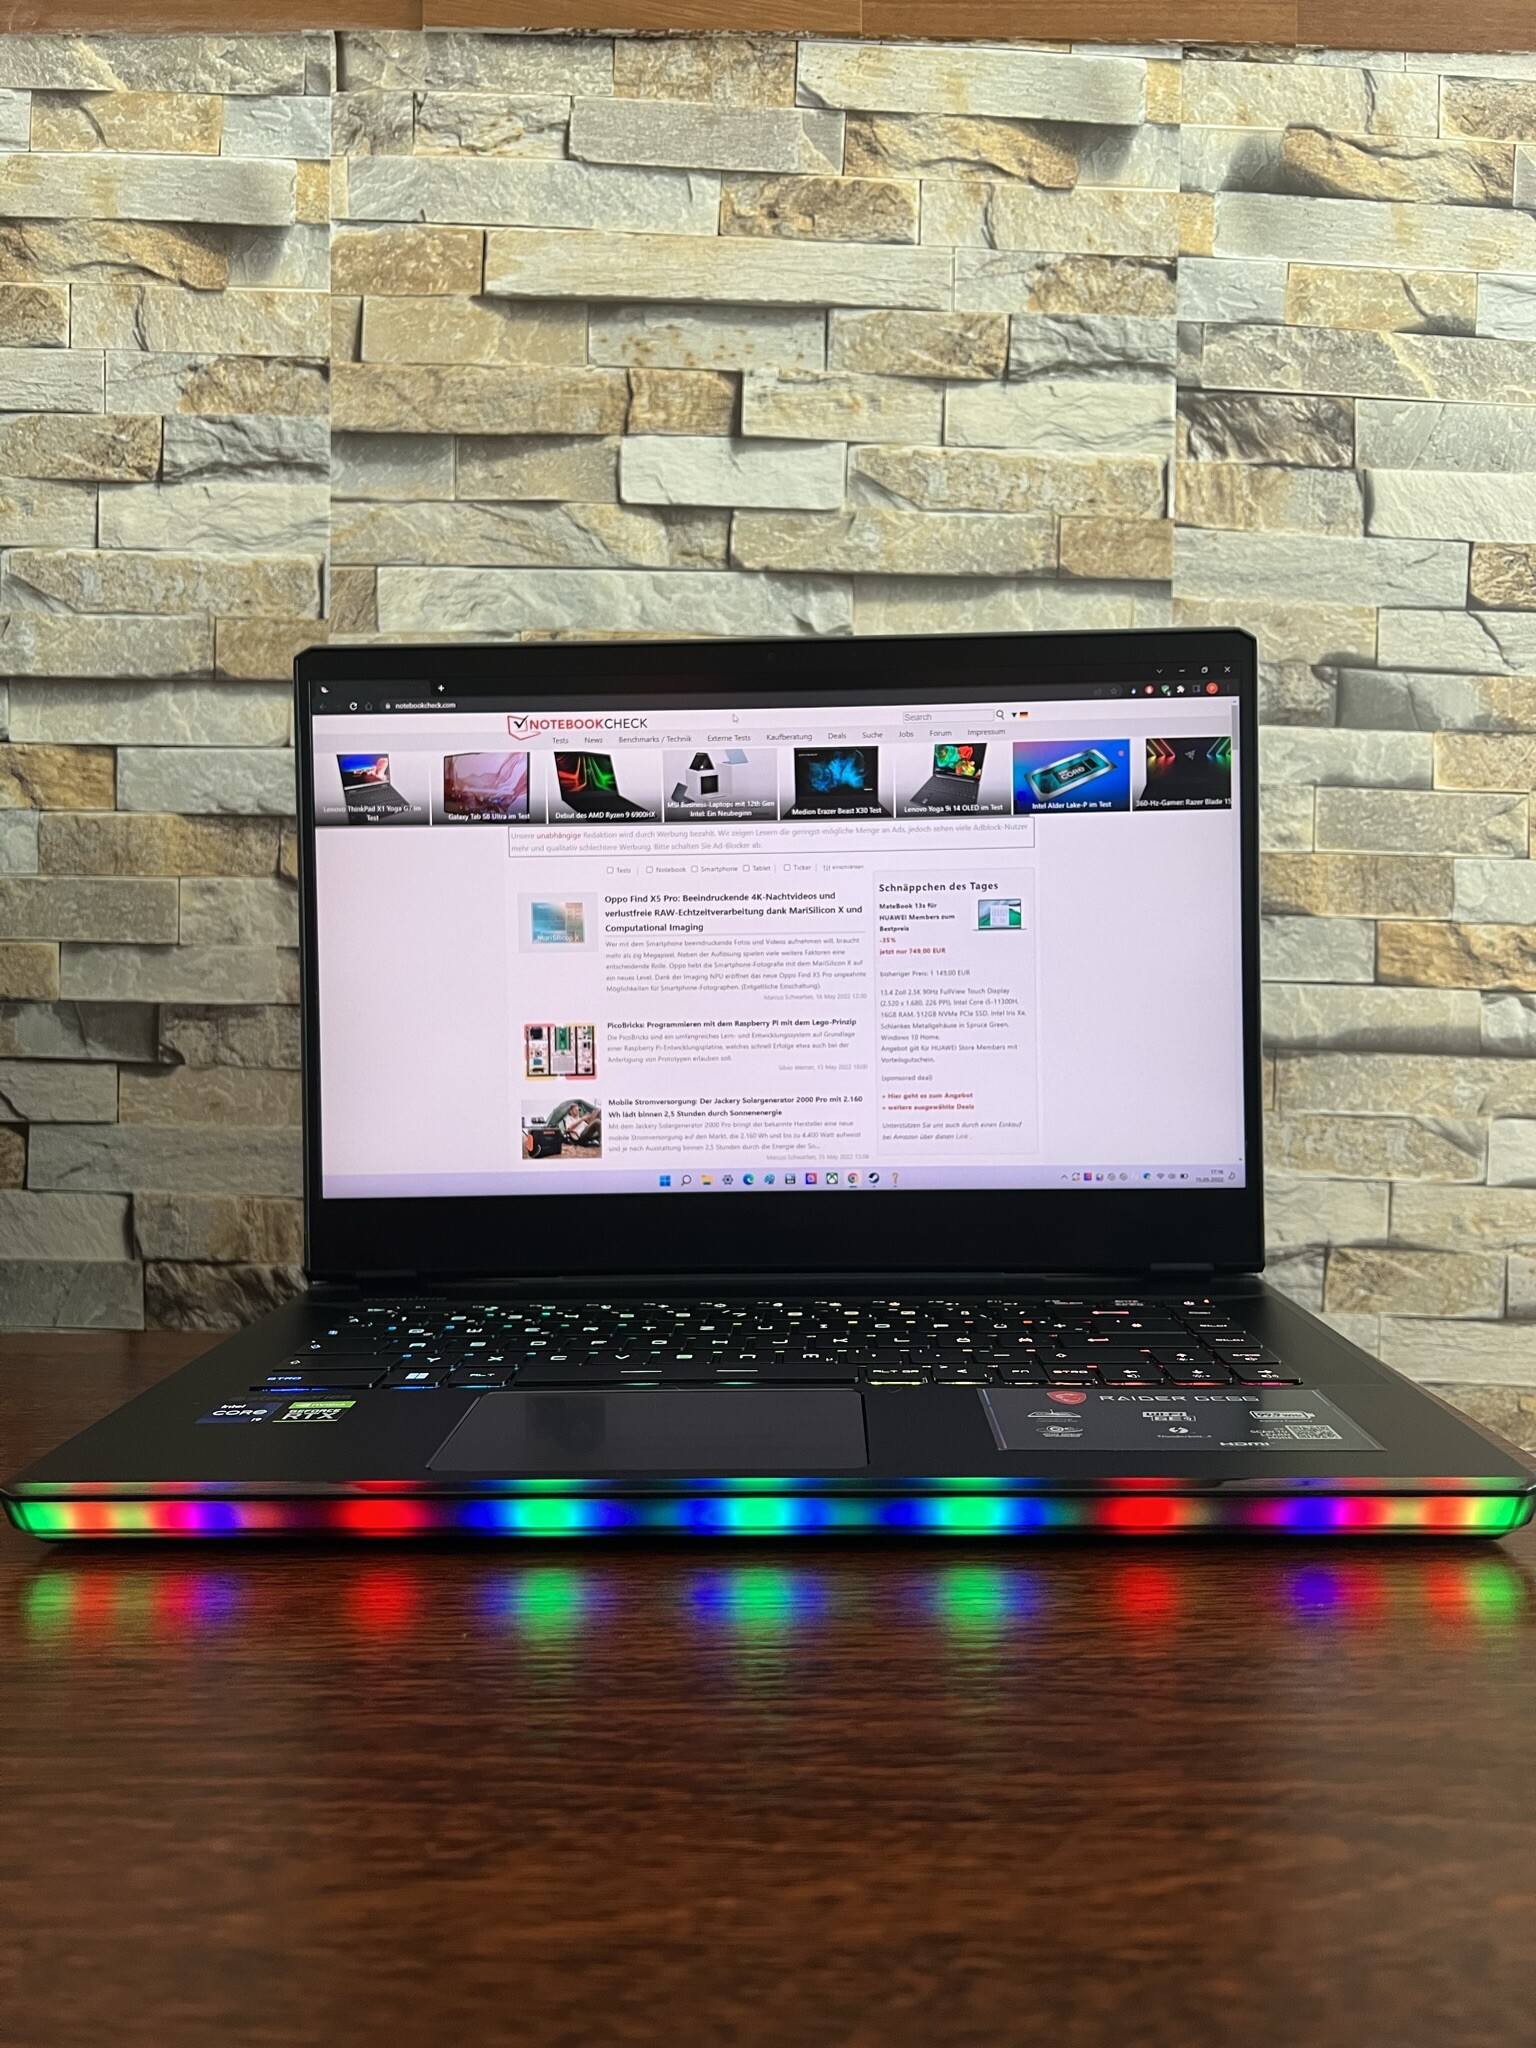
MSI Raider GE66 12 UHS的外壳和设计与前代产品相比没有变化,只是前面的灯条更加悦目以及质量更高。因此,我们建议你参考上一代产品的评测,以了解更多关于该机箱的细节。微星GE66 10SFS.
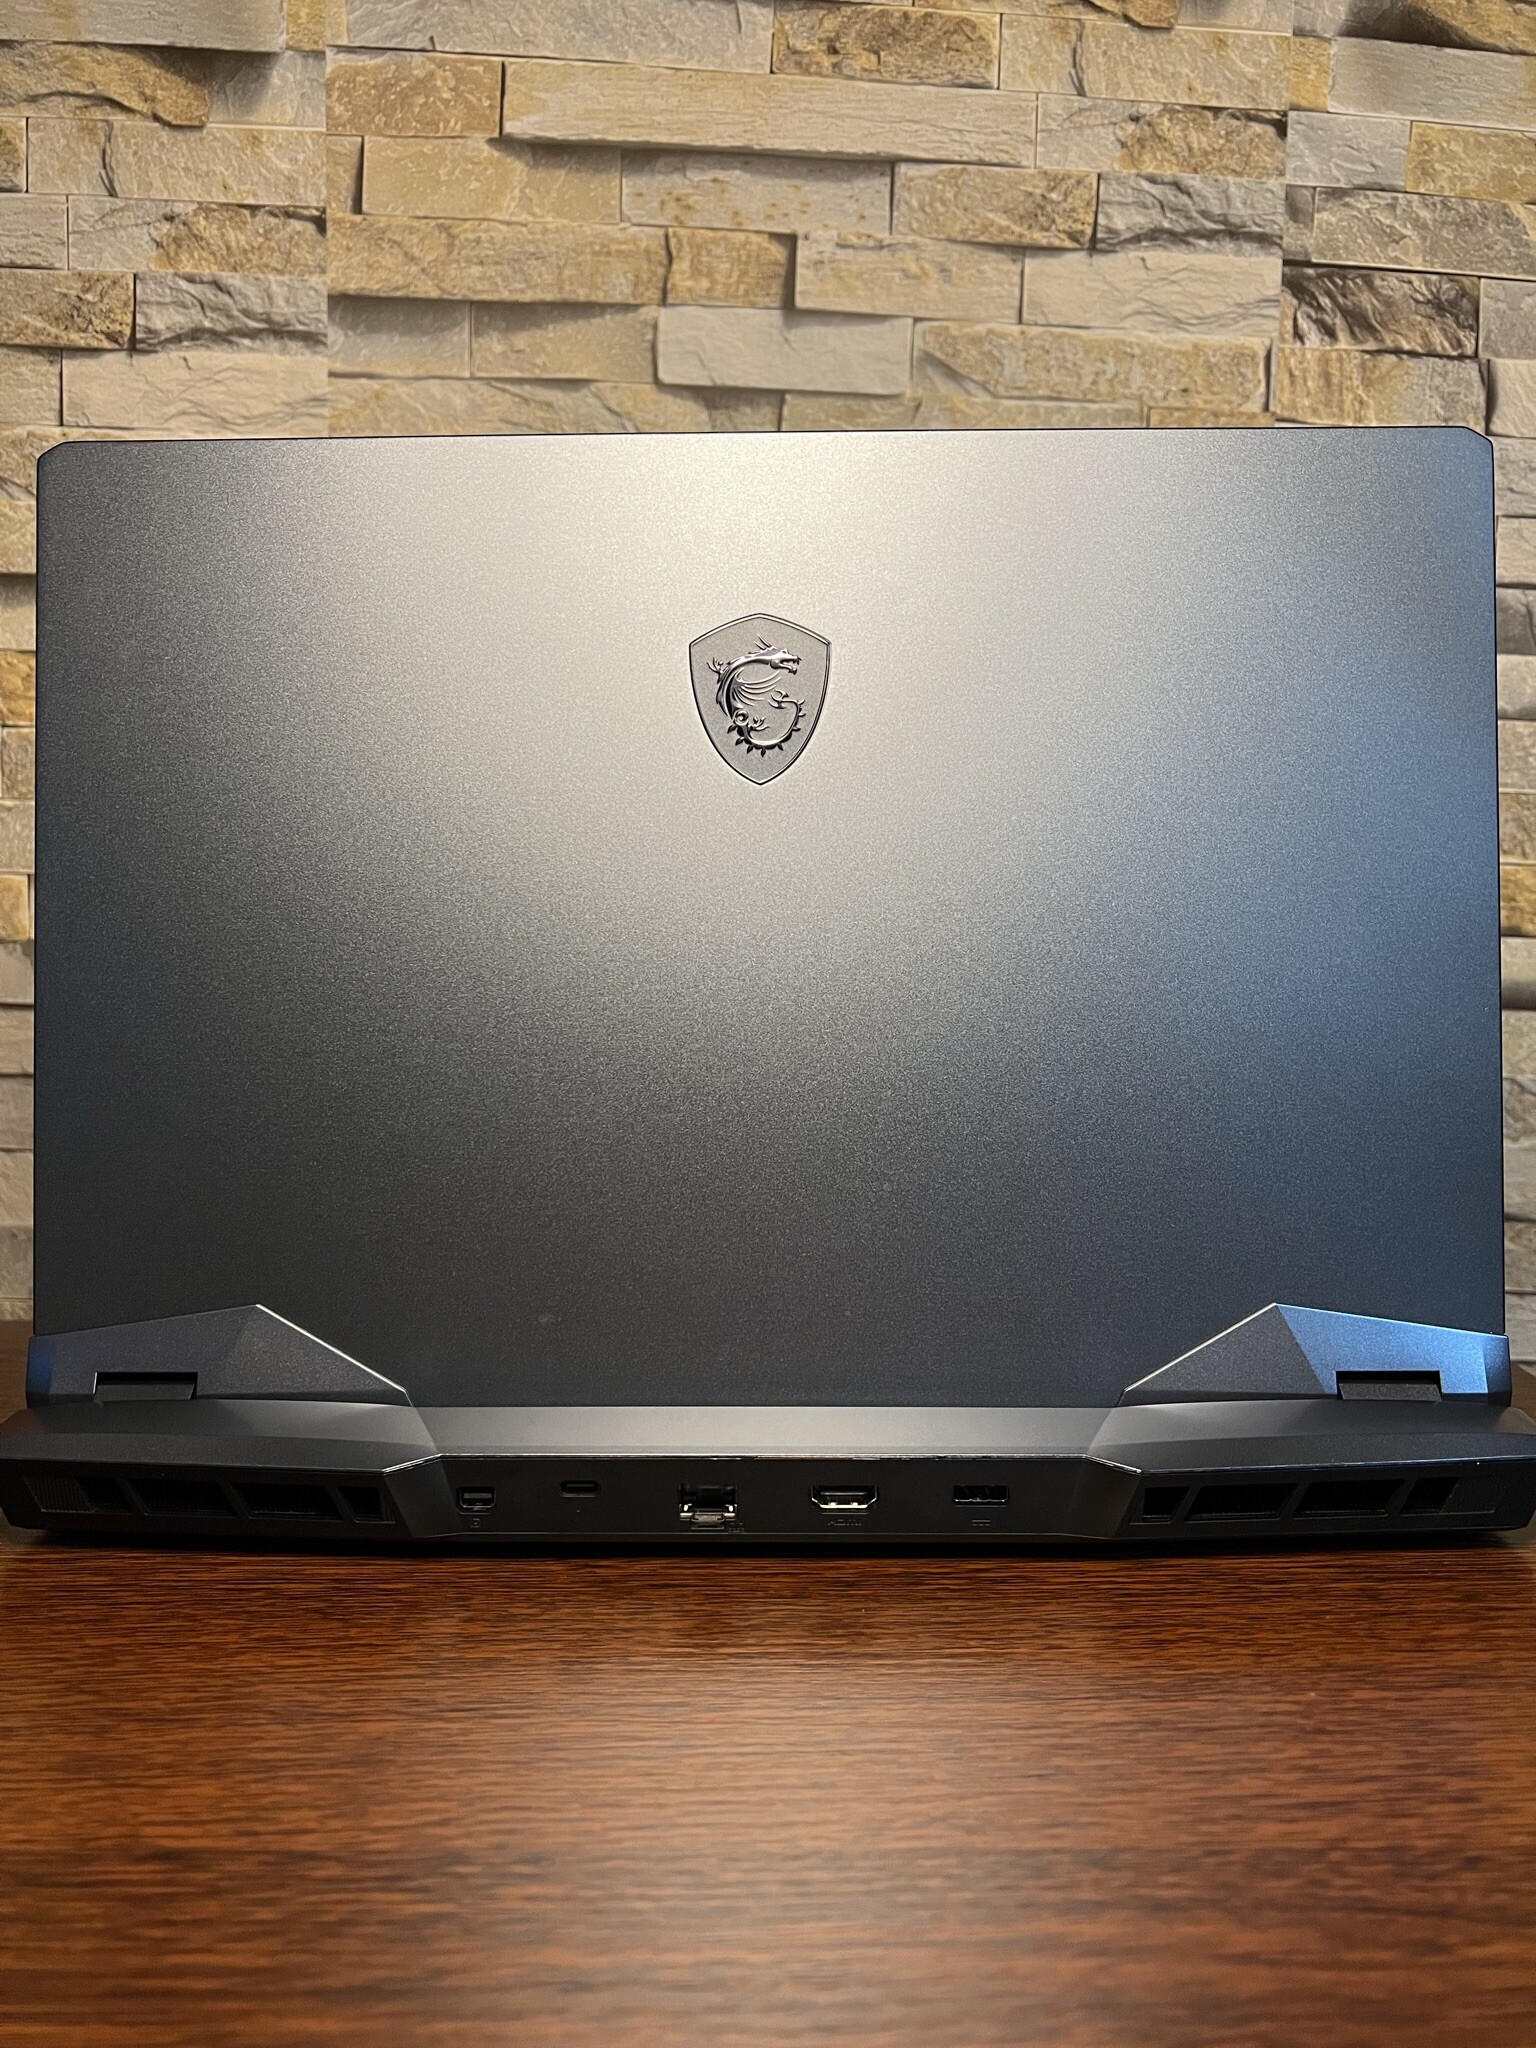
与其他游戏笔记本相比,我们的评测设备的重量是第二高的(2.4公斤)。就尺寸而言,GE66更像是一个笔记本巨人。Razer Blade展示了在移动性方面的可能性。
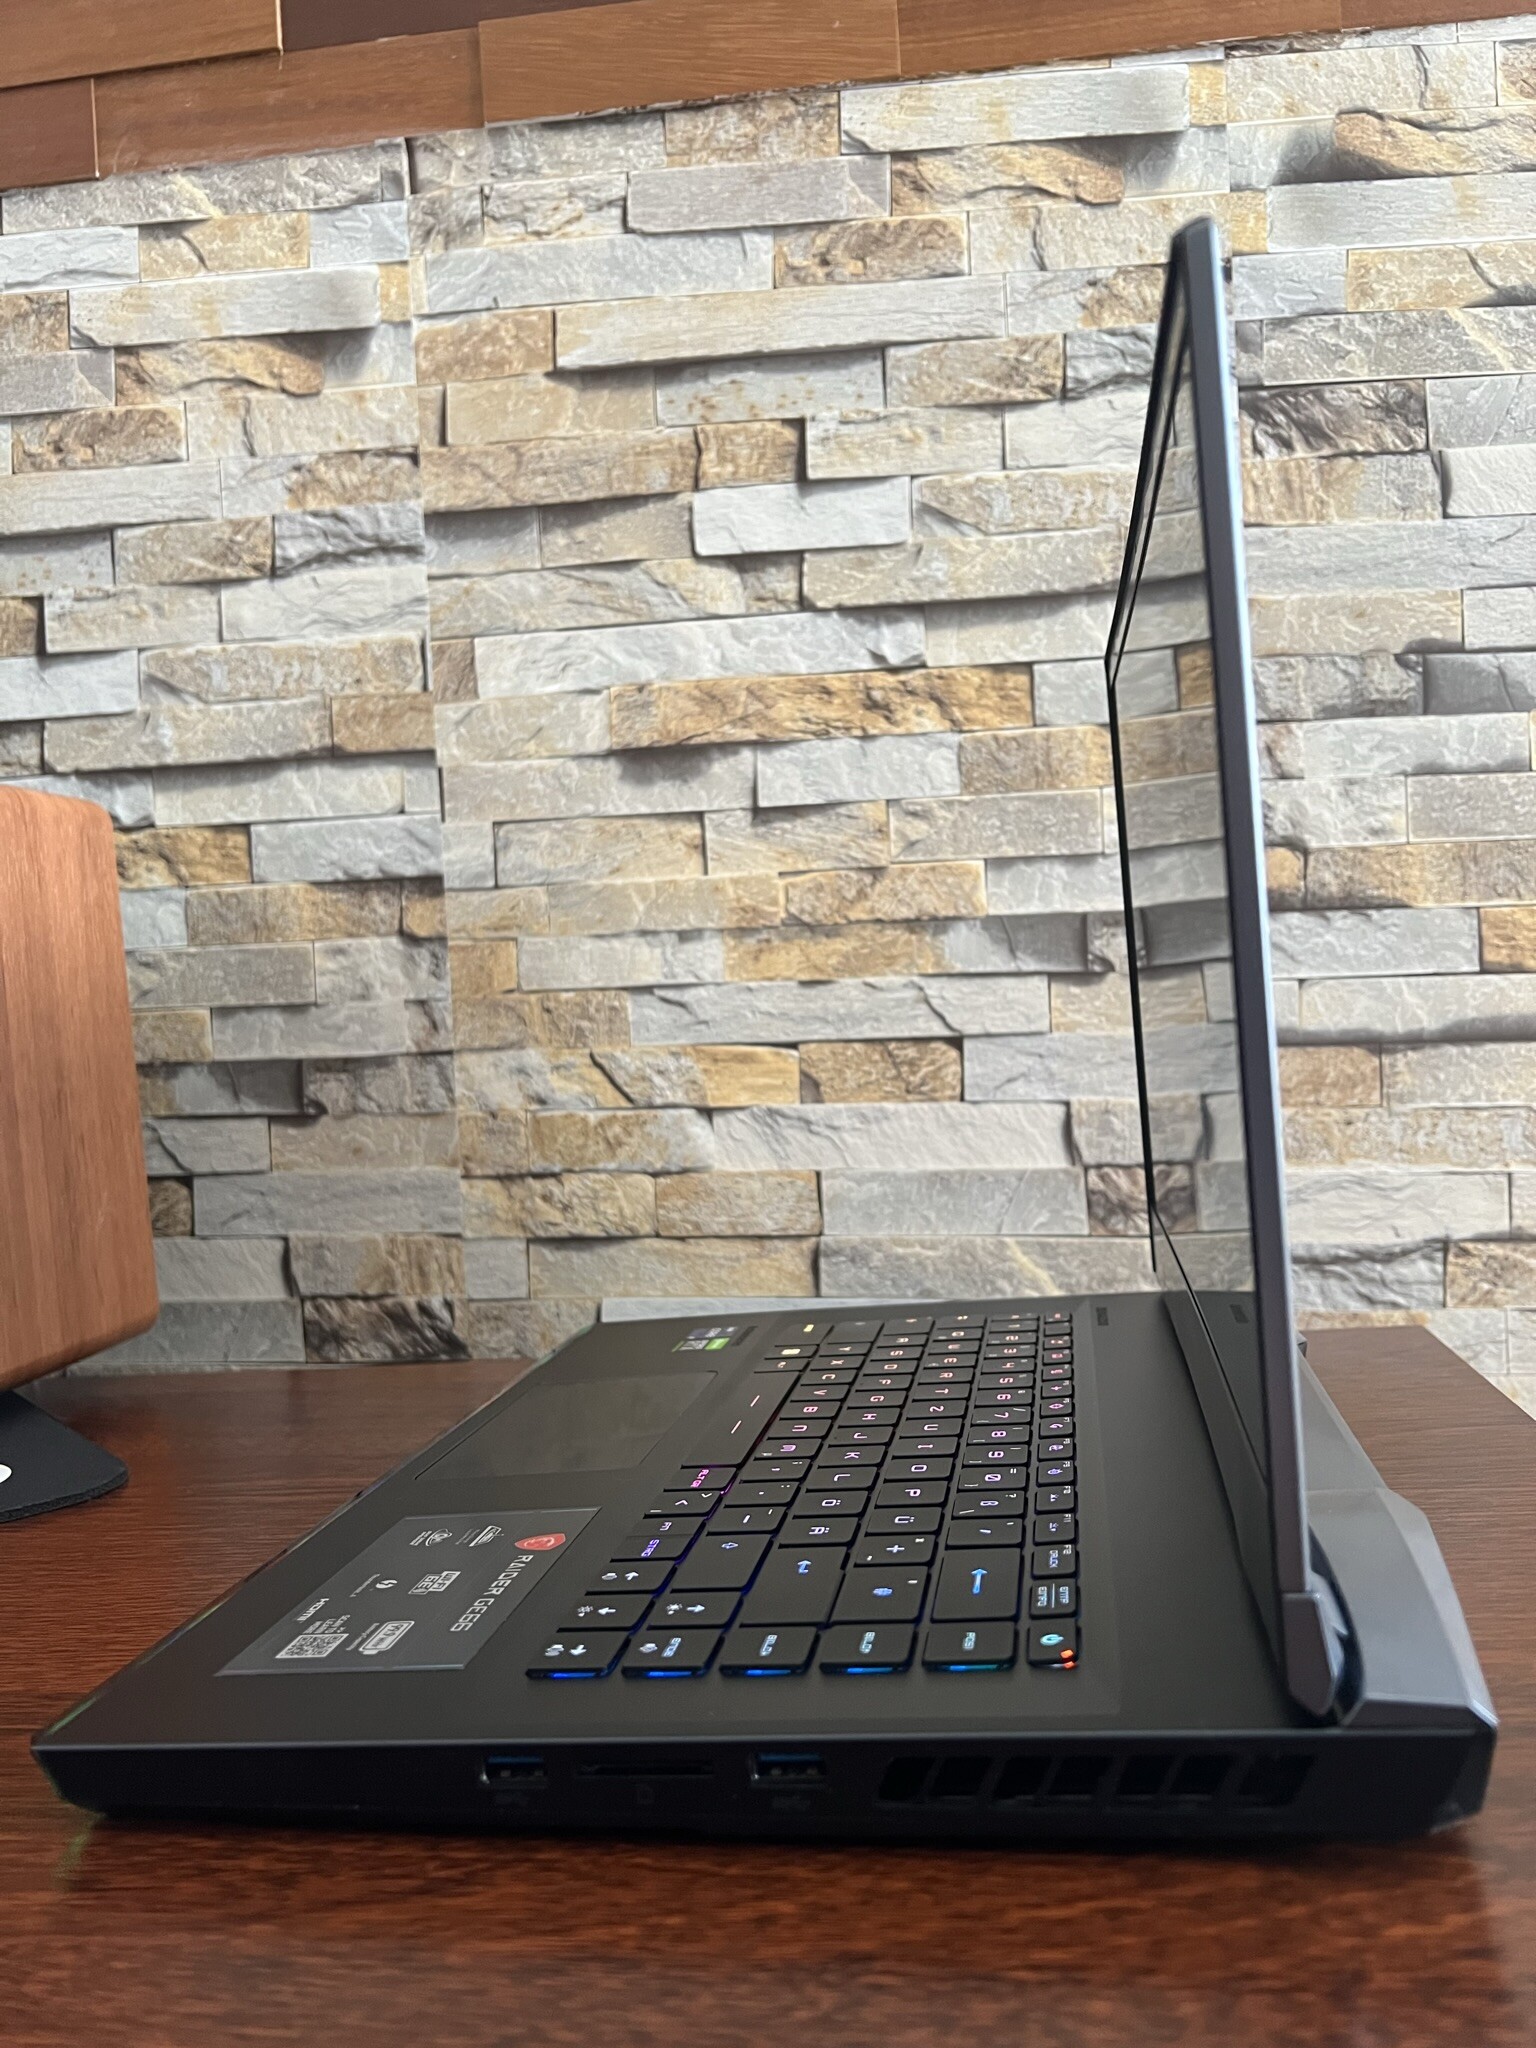
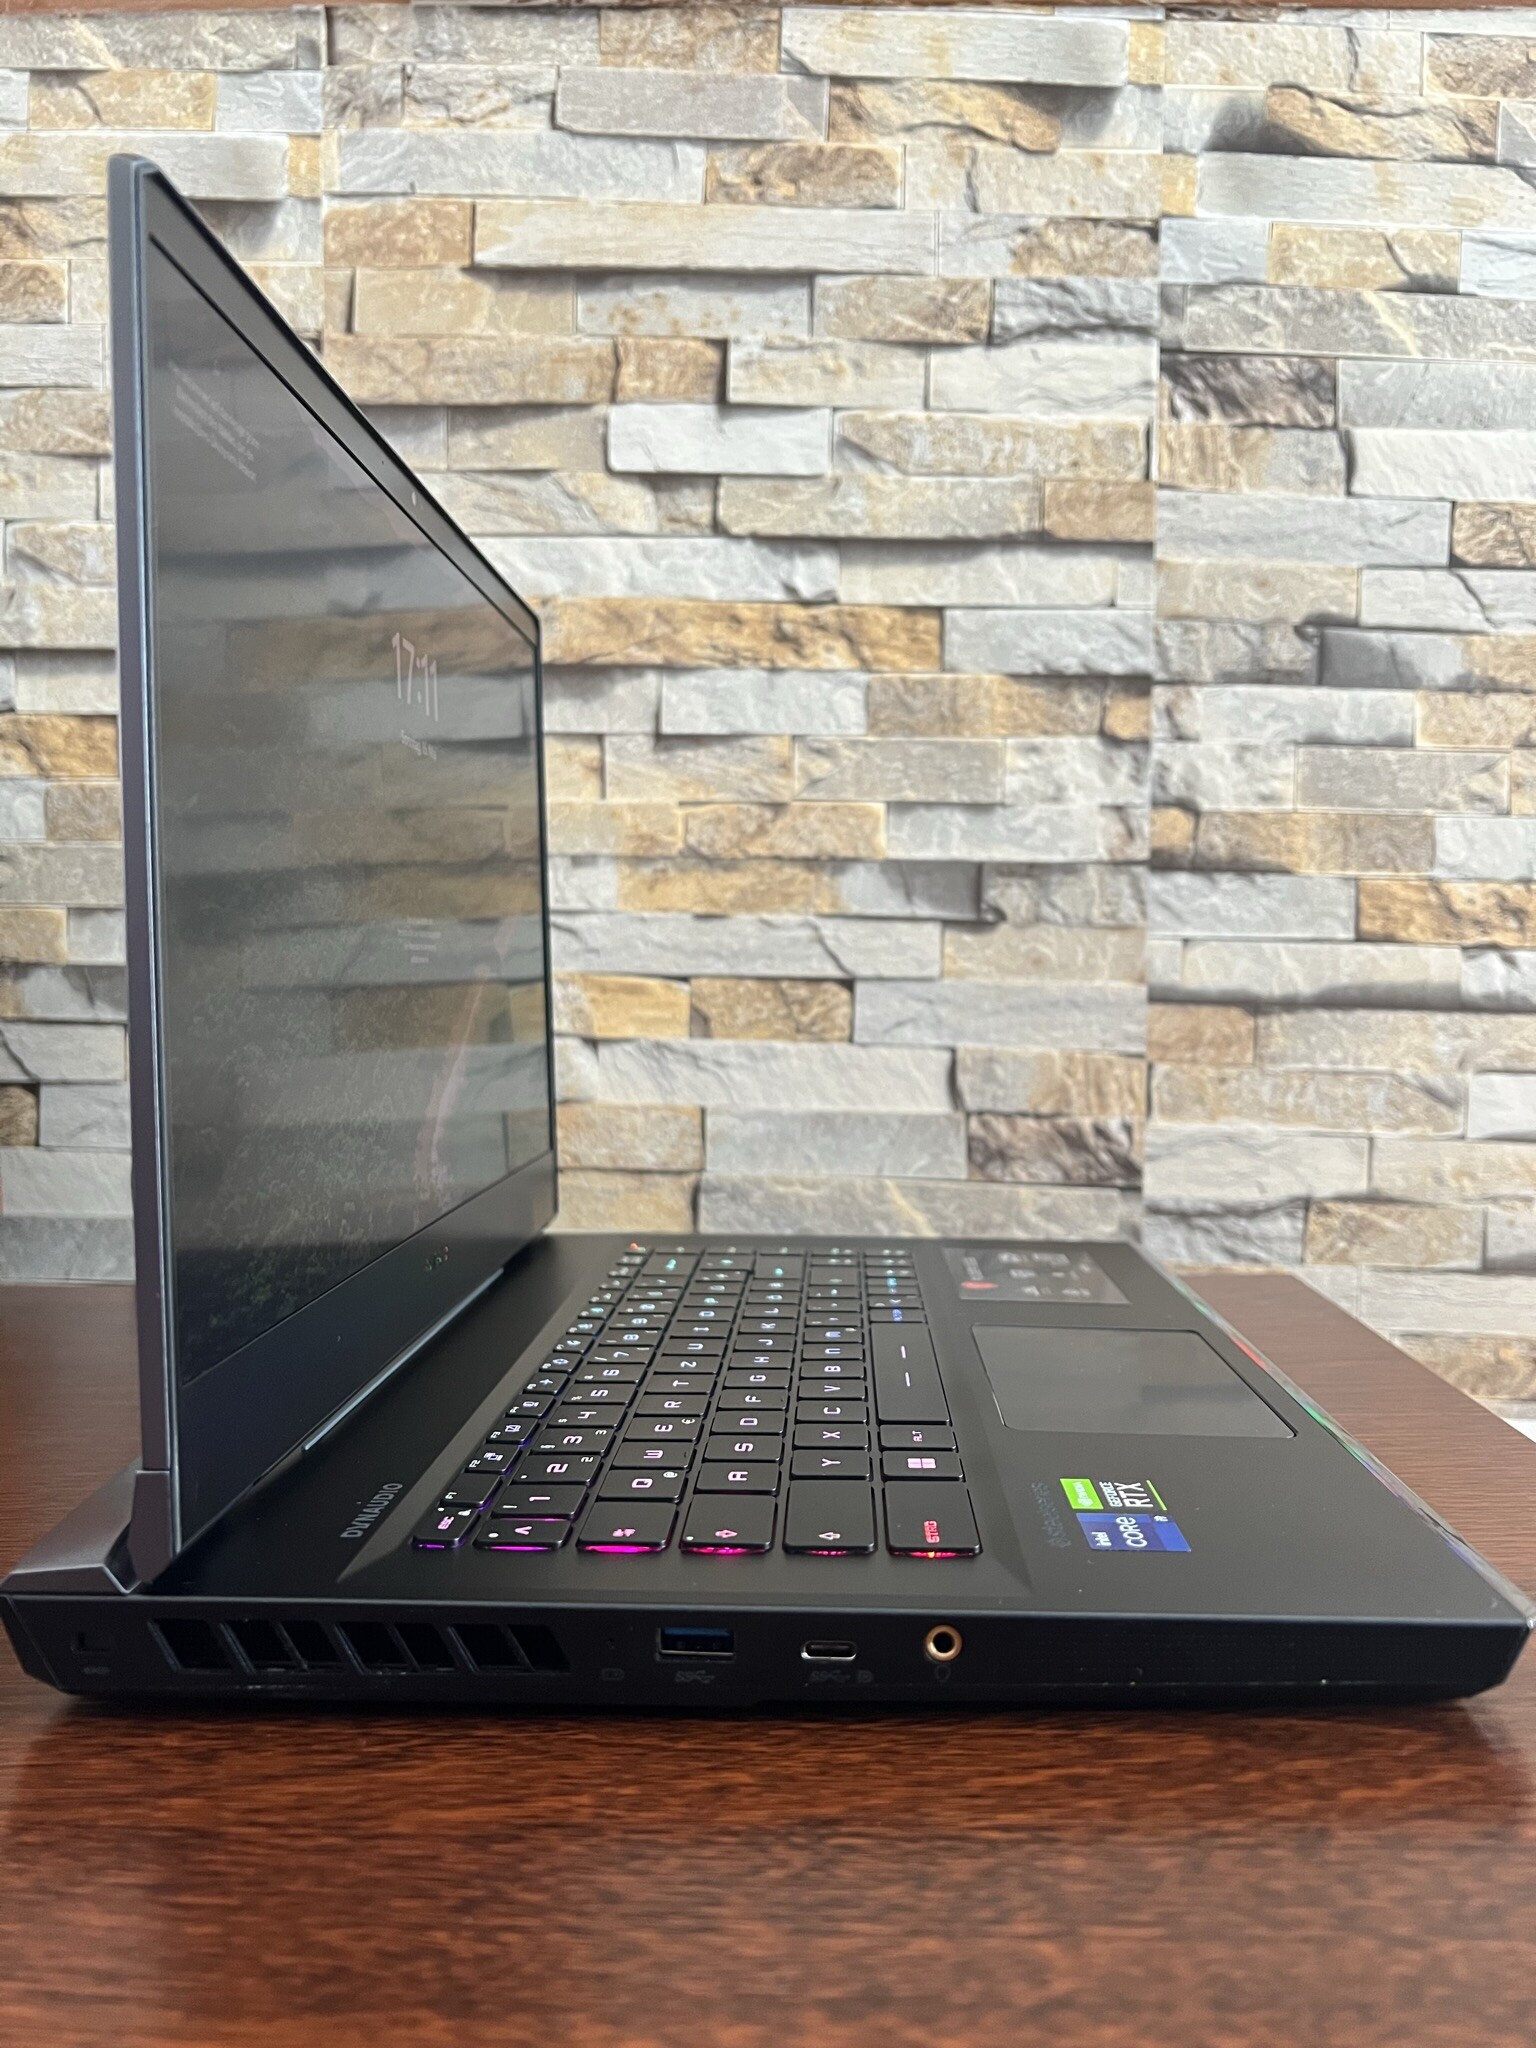
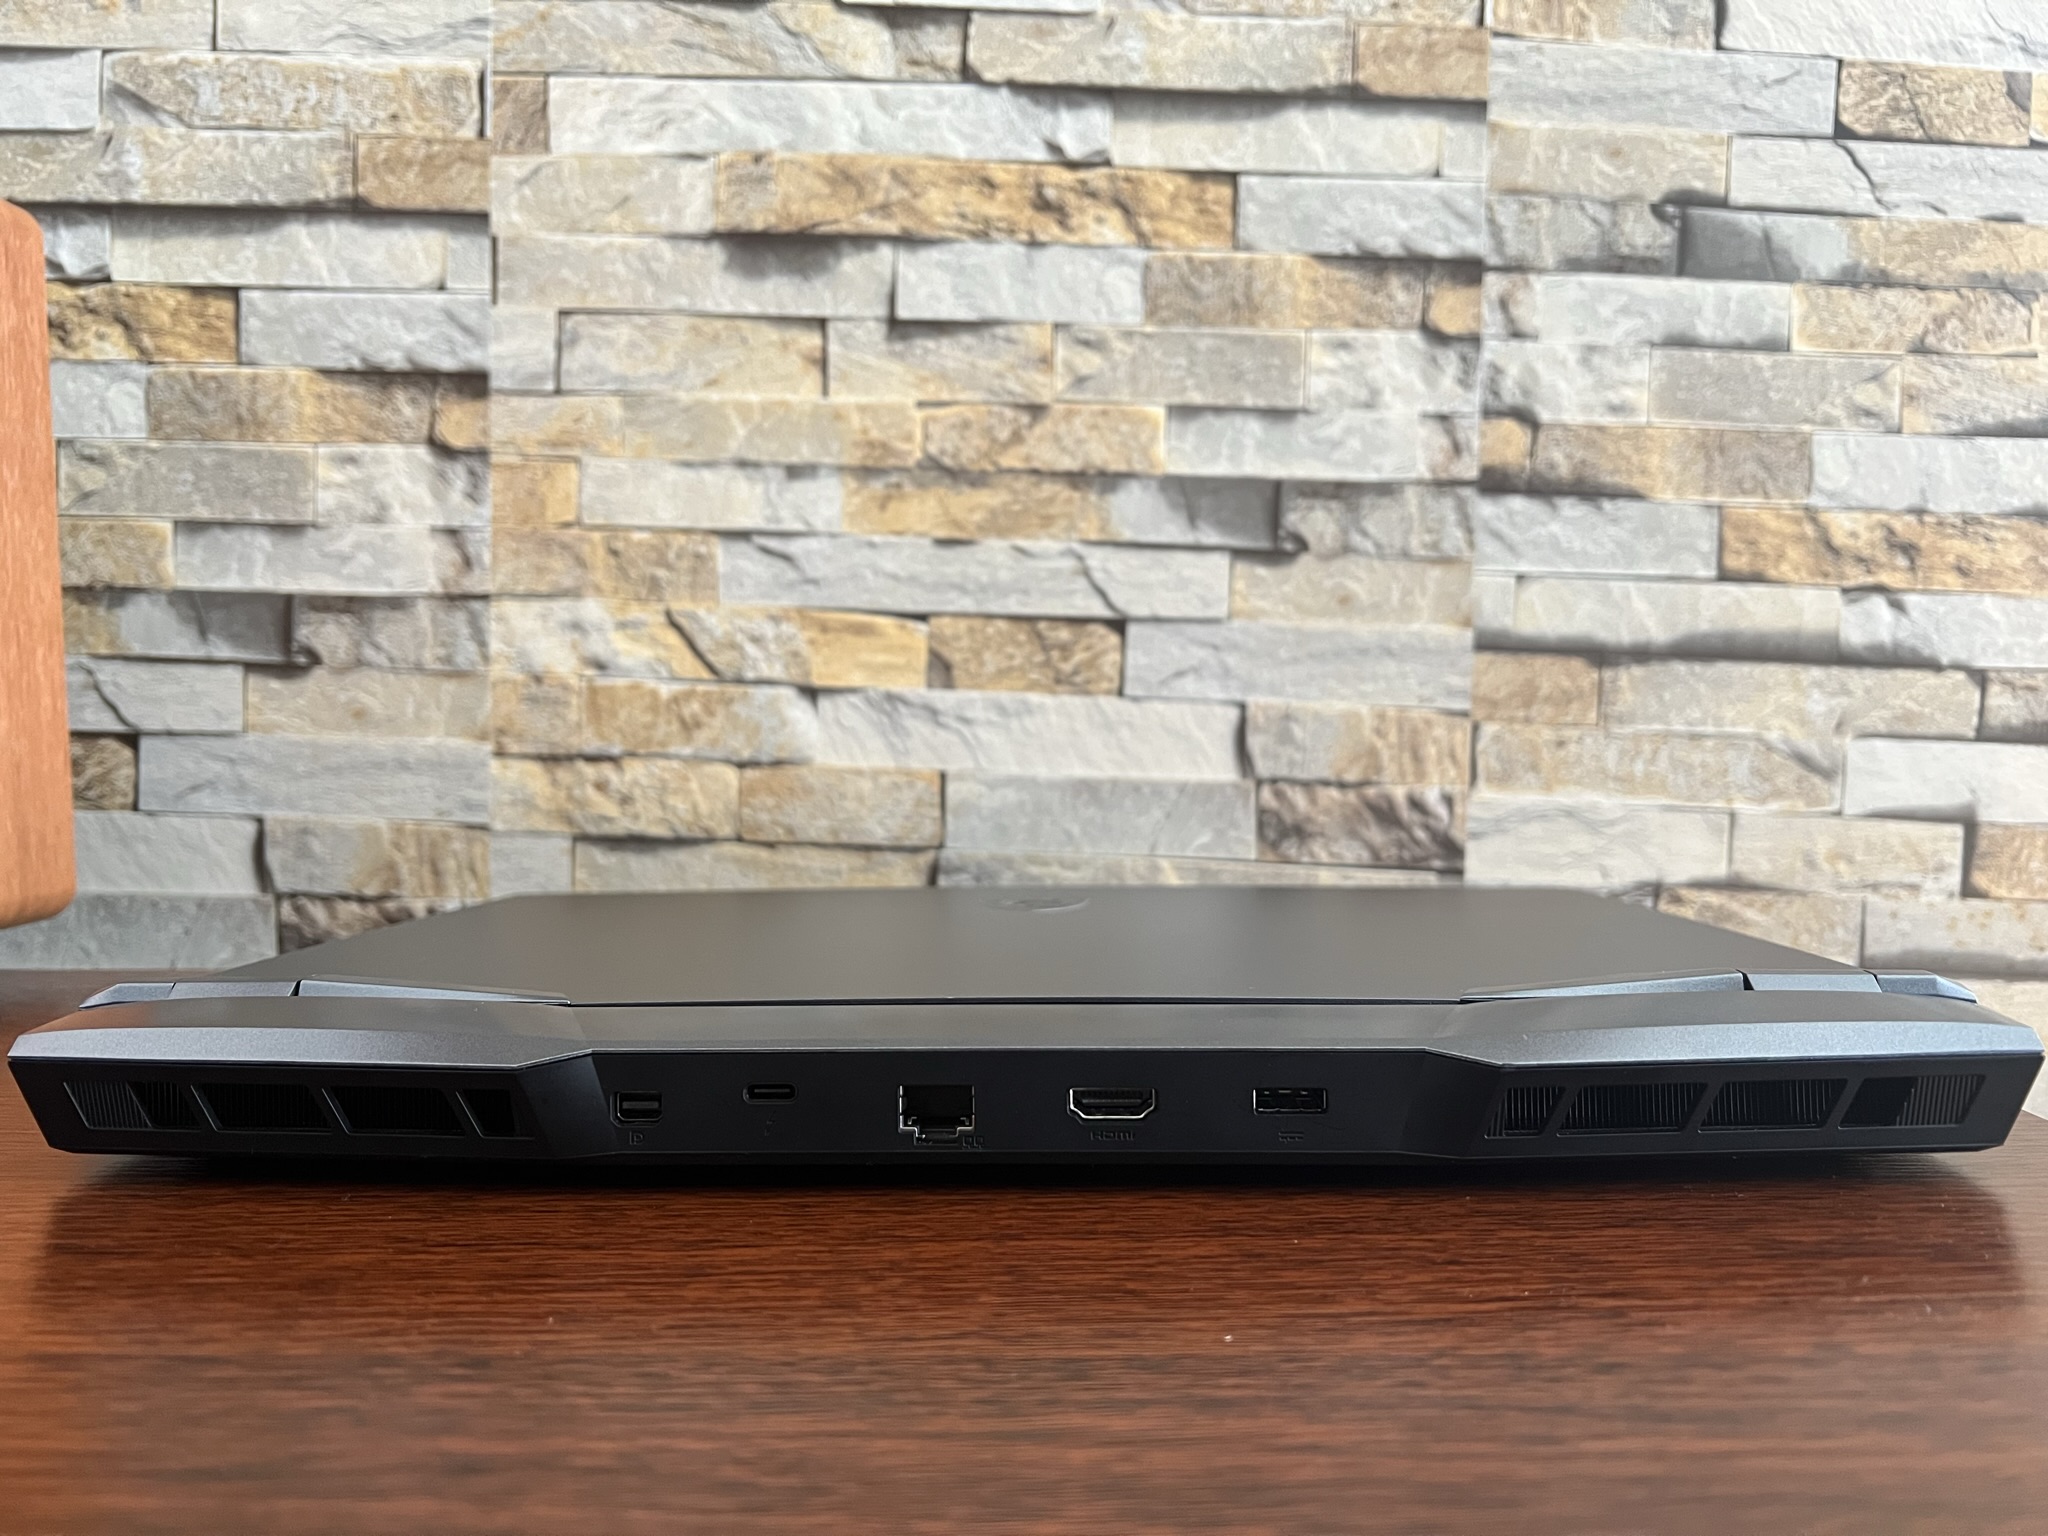
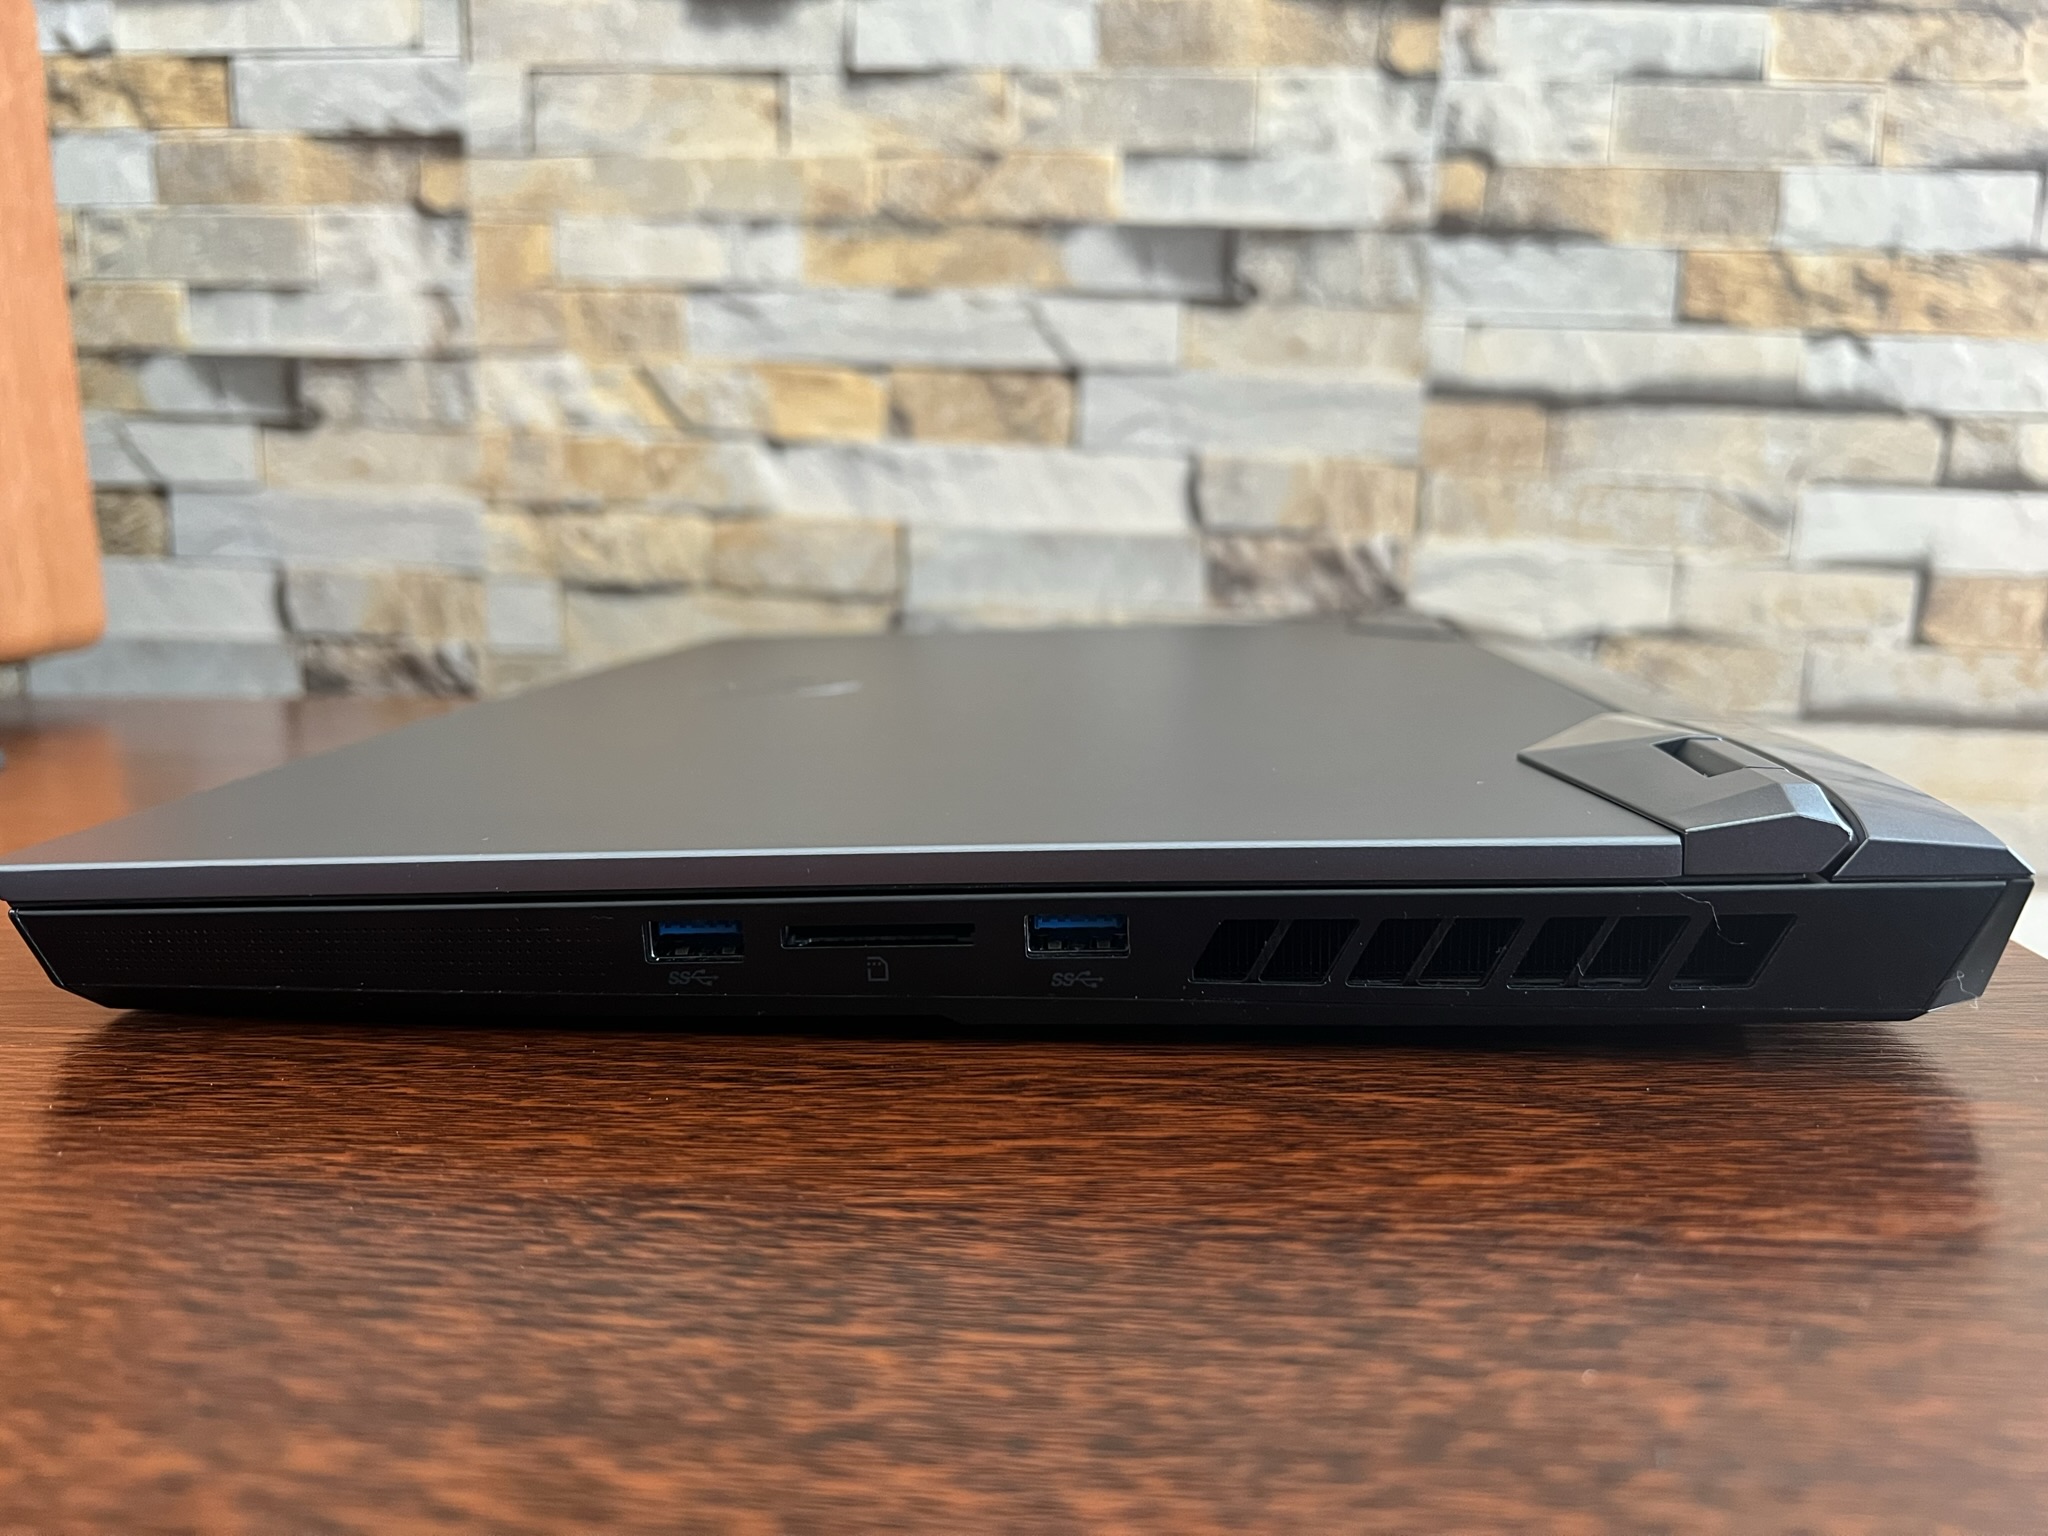
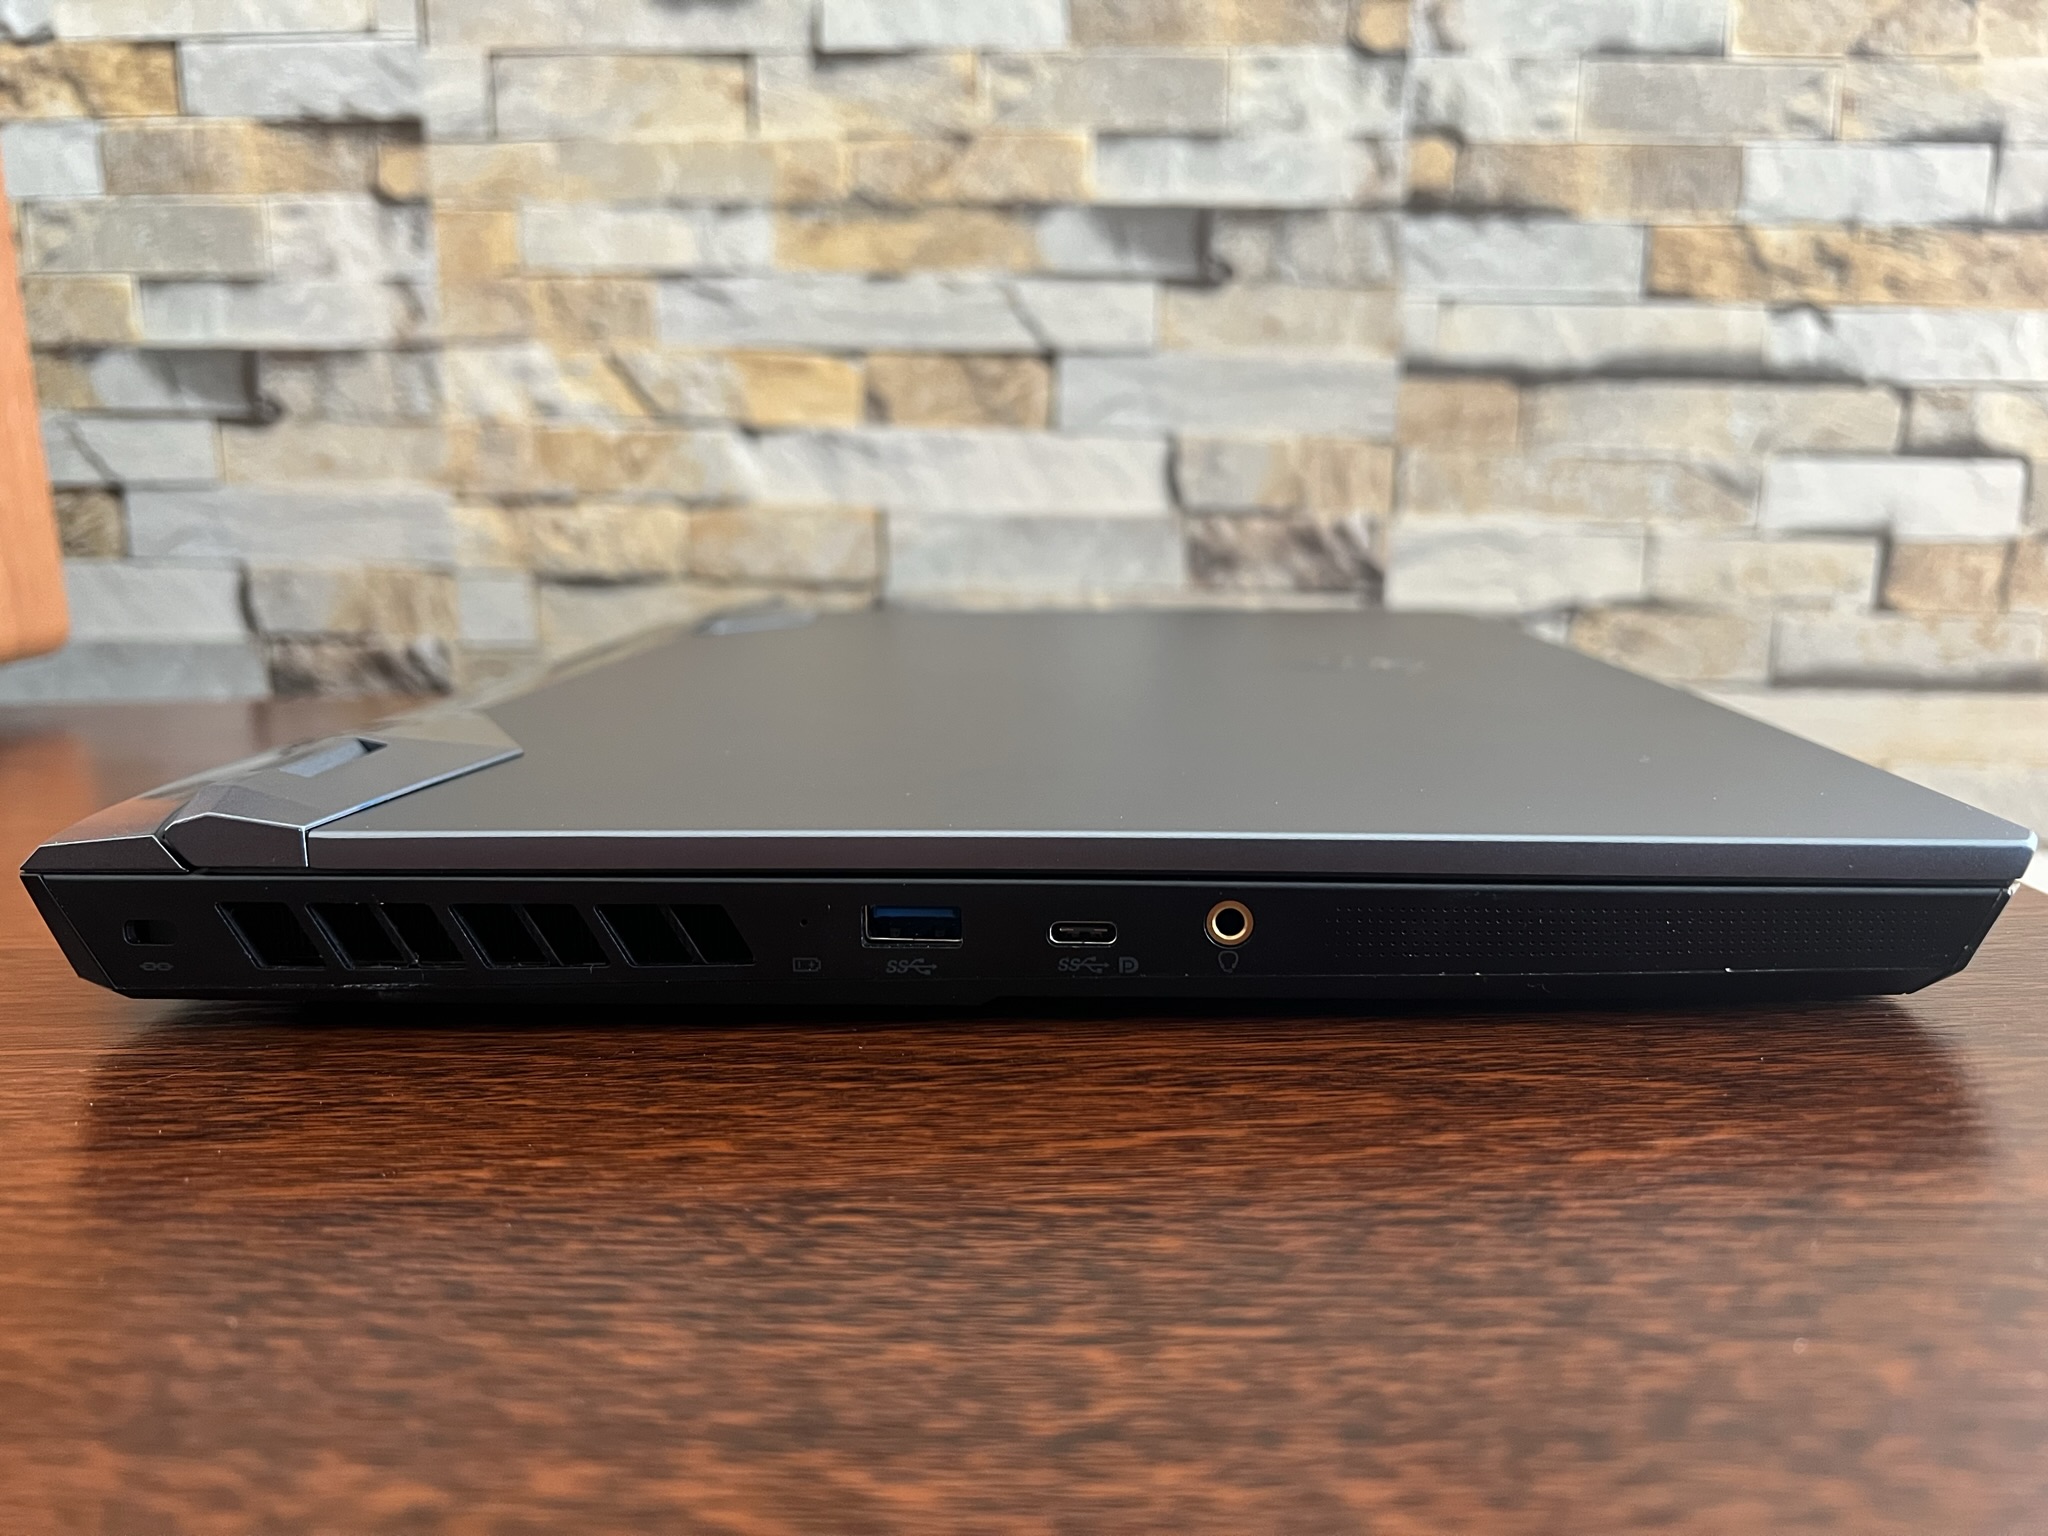
连接性。升级为现代端口
所有的端口位置也保持不变,相对于微星GE66 10SFS。.只有背面的USB-C端口升级为Thunderbolt 4,而左侧的USB-C 3.2端口现在支持DisplayPort功能。
SD卡阅读器
在使用我们的AV PRO V60 microSD参考卡的测试中,SD读卡器的性能没有达到预期。只有 申克XMG Neo 15 Early 2022在比较领域表现得更差。
| SD Card Reader - average JPG Copy Test (av. of 3 runs) | |
| MSI GE66 Raider 10SFS (Toshiba Exceria Pro SDXC 64 GB UHS-II) | |
| Razer Blade 15 2022 (Toshiba Exceria Pro SDXC 64 GB UHS-II) | |
| Average of class Gaming (20.9 - 210, n=55, last 2 years) | |
| MSI Raider GE66 12UHS (AV PRO microSD 128 GB V60) | |
| Schenker XMG Neo 15 E22 (Early 2022, RTX 3080 Ti) | |
沟通
我们的评测设备在Wi-Fi性能方面名列前茅,并显示出优秀的速率,只是刚刚被超越了。Razer Blade 15 Advanced Early 2022.
网络摄像头
网络摄像头提供全高清,为笔记本网络摄像头提供体面的图像。虽然在低光照条件下,这些图像往往是嘈杂和模糊的,但总体图像质量应该足以满足日常任务,如视频会议。


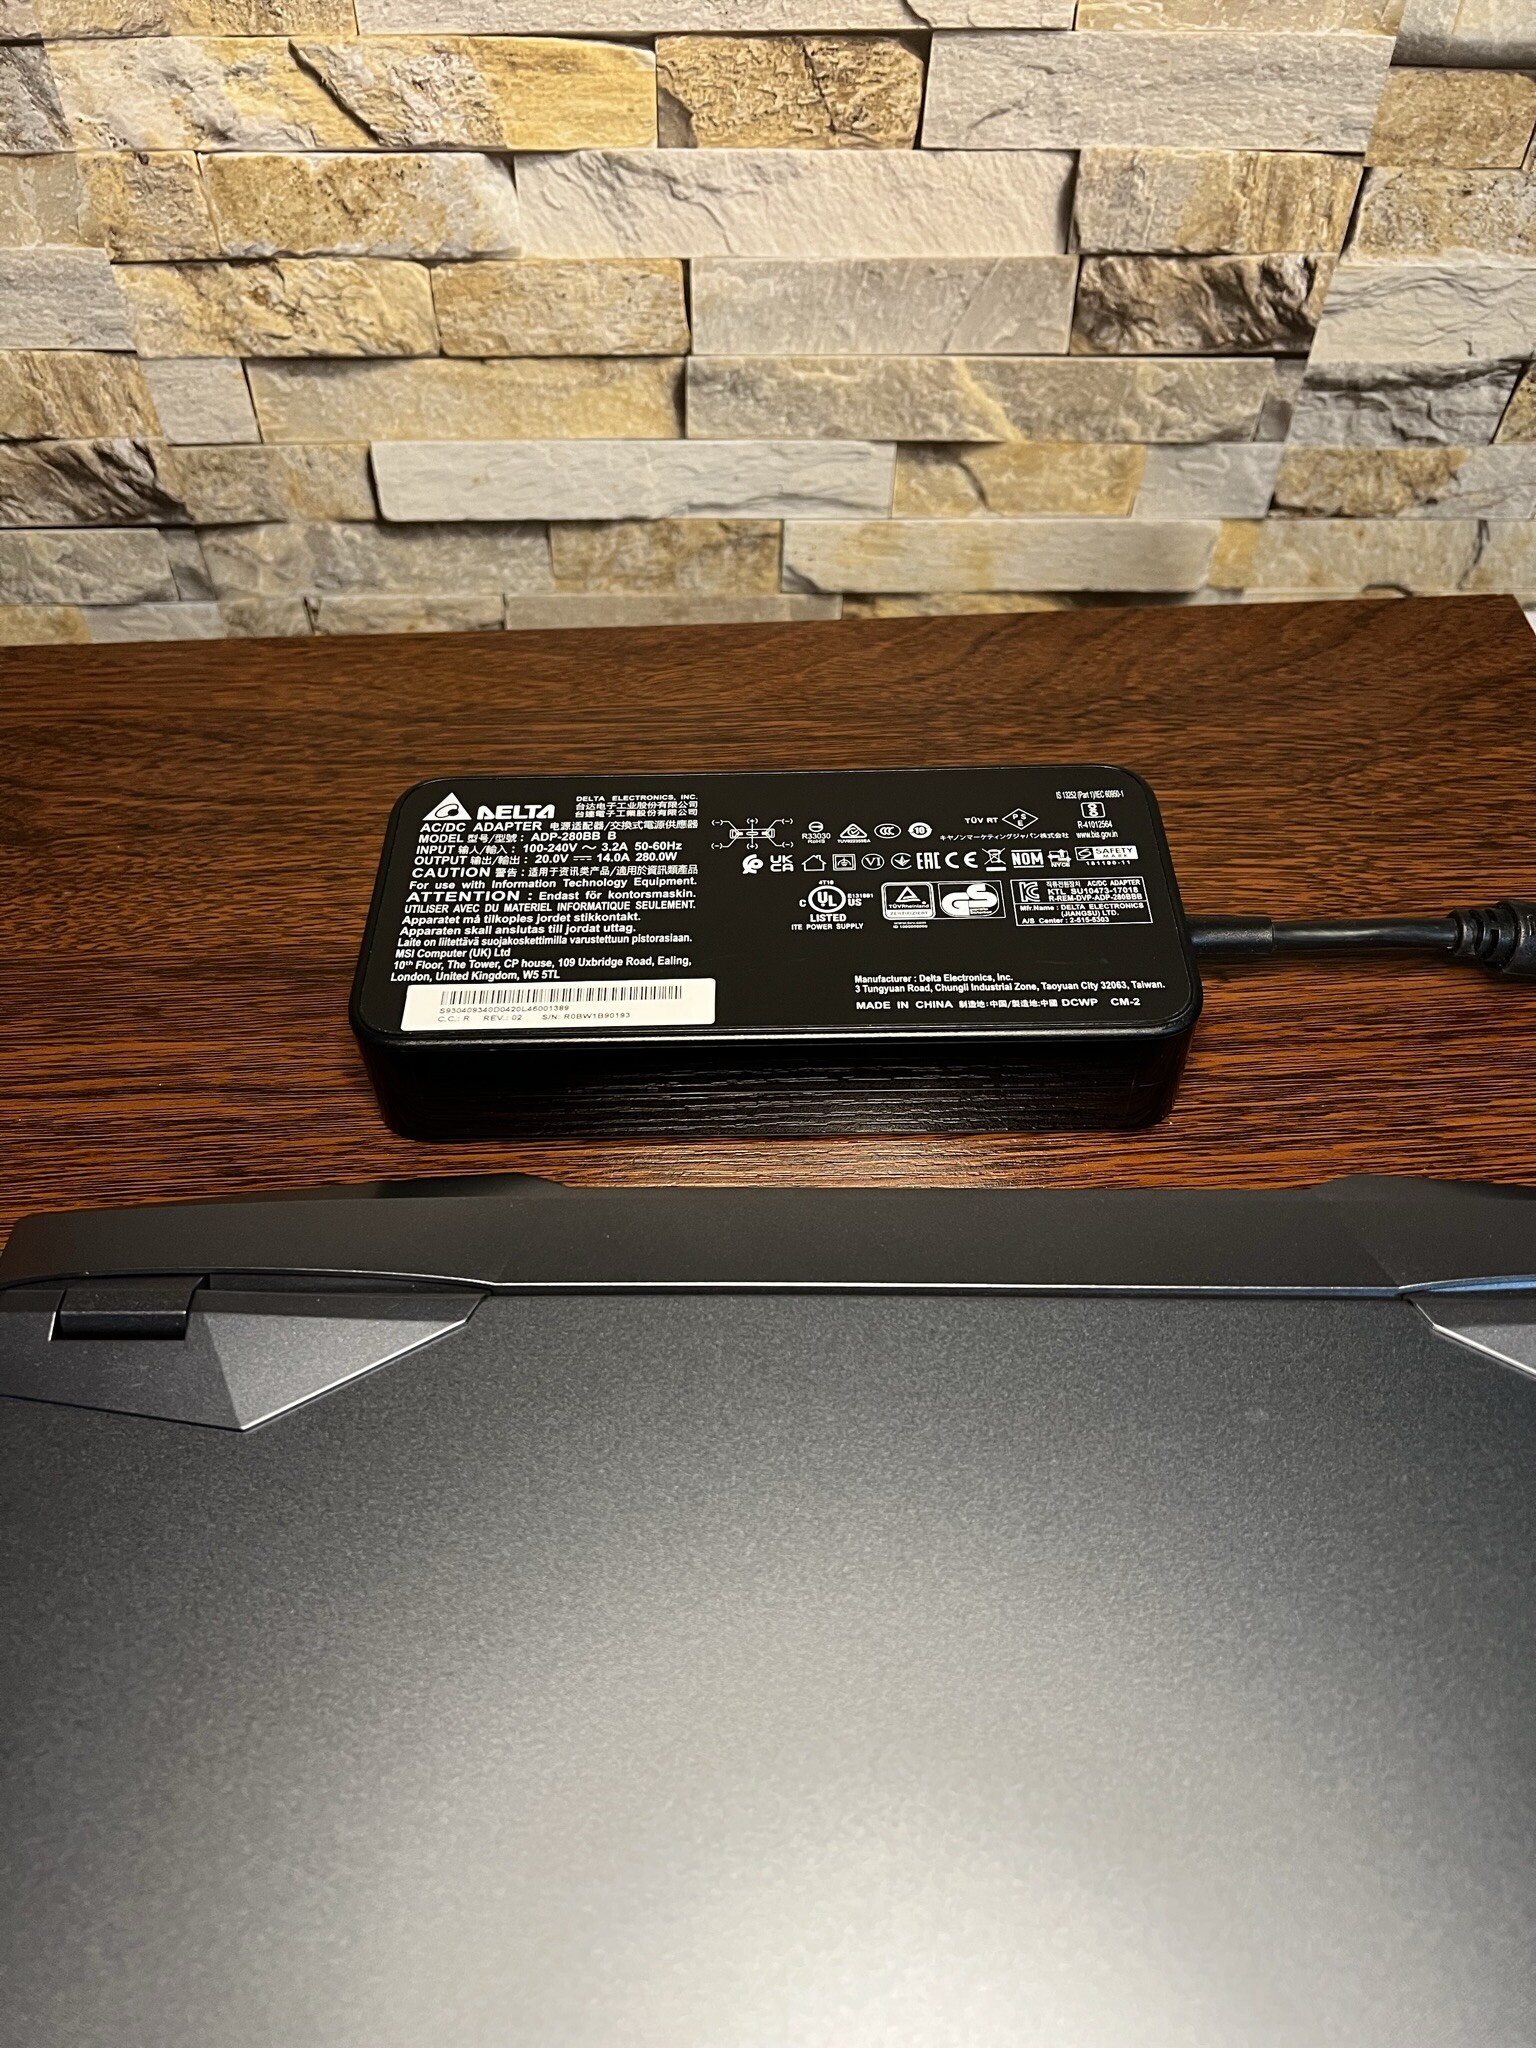
辅料
除笔记本外,交货范围包括设备的必要文件以及电源适配器。与其前身的280瓦一样,没有变化的电源仍然为所安装的硬件提供足够的电力。
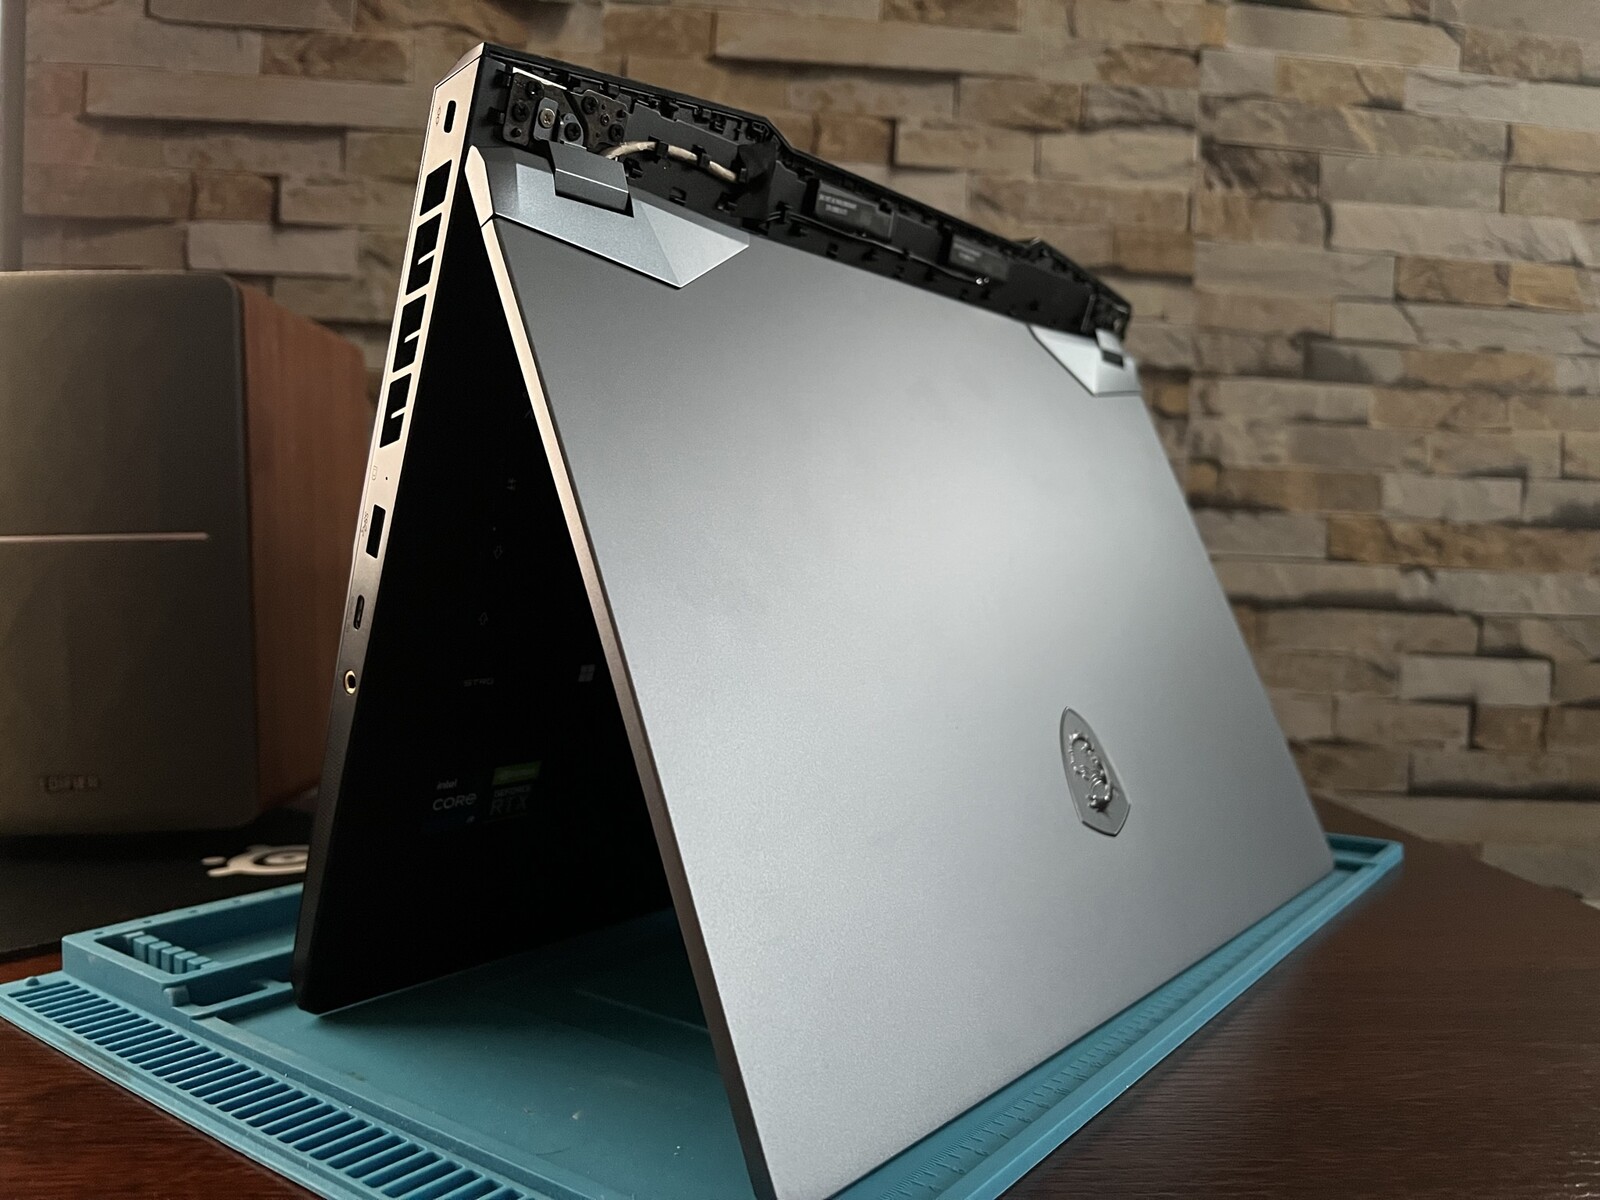
维护
在2022年,服务支持并不总是每个设备都有的。一些制造商故意让那些想自己维护设备的用户感到困难。例如,戴尔在其Alienware笔记本电脑中从后往前安装主板(风扇和散热器在键盘的正下方,难以接近)。那些想要更换导热垫或浆糊的人因此面临着一个繁琐的程序。
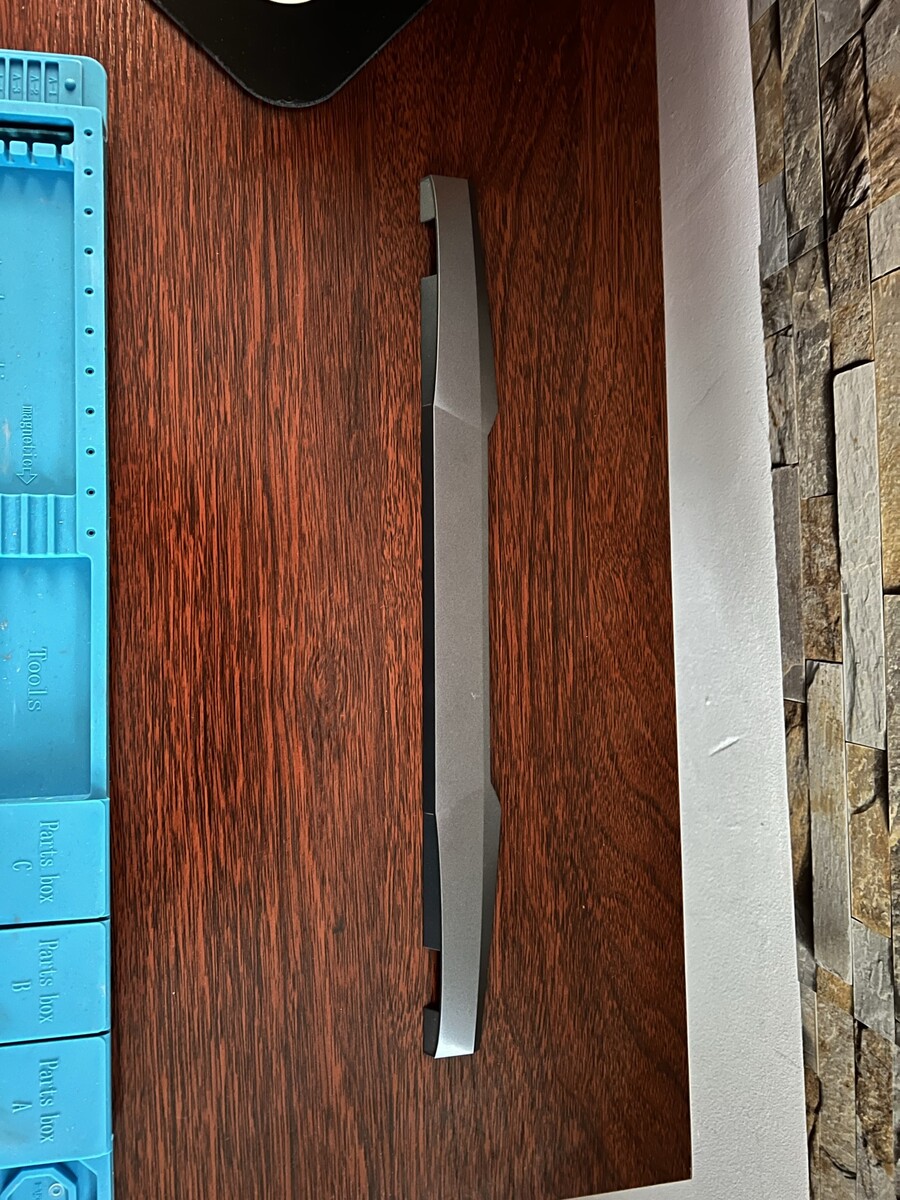
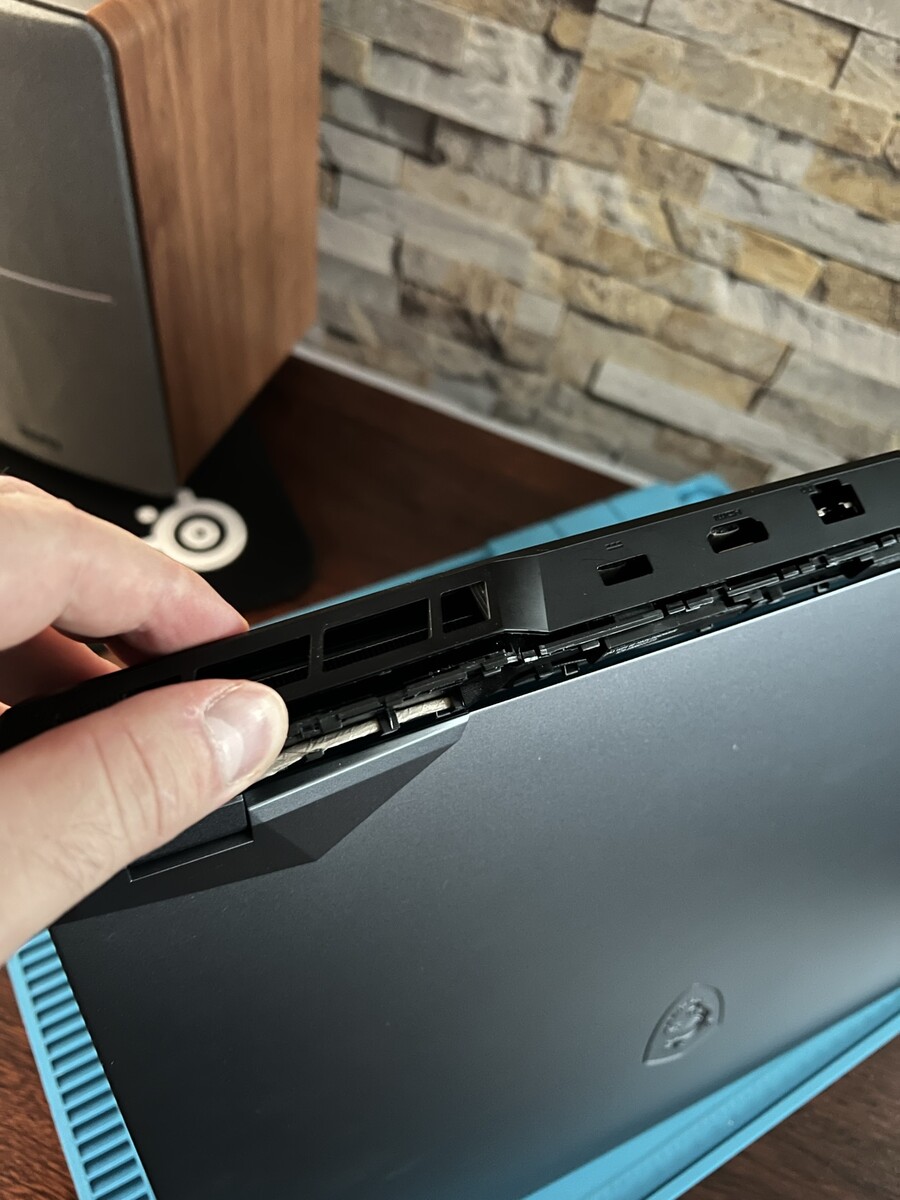
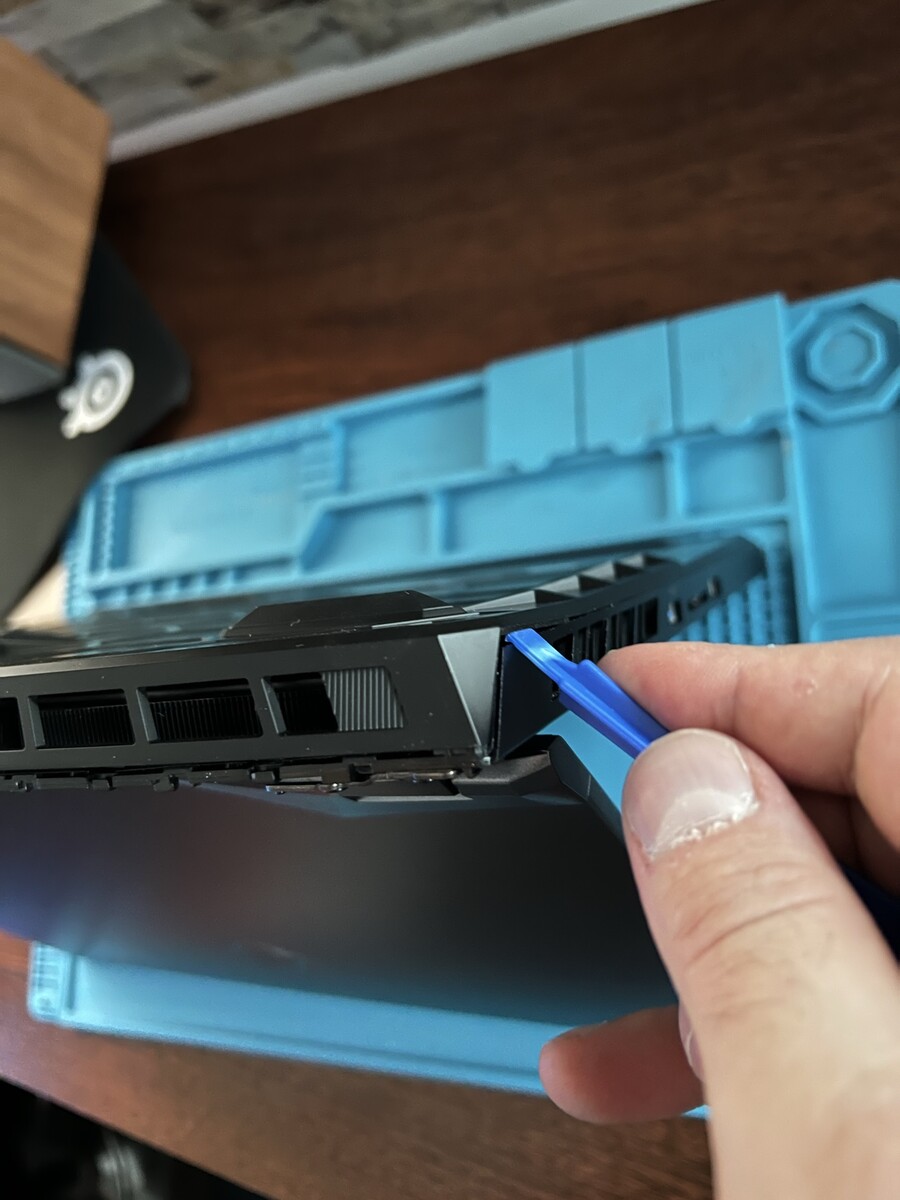
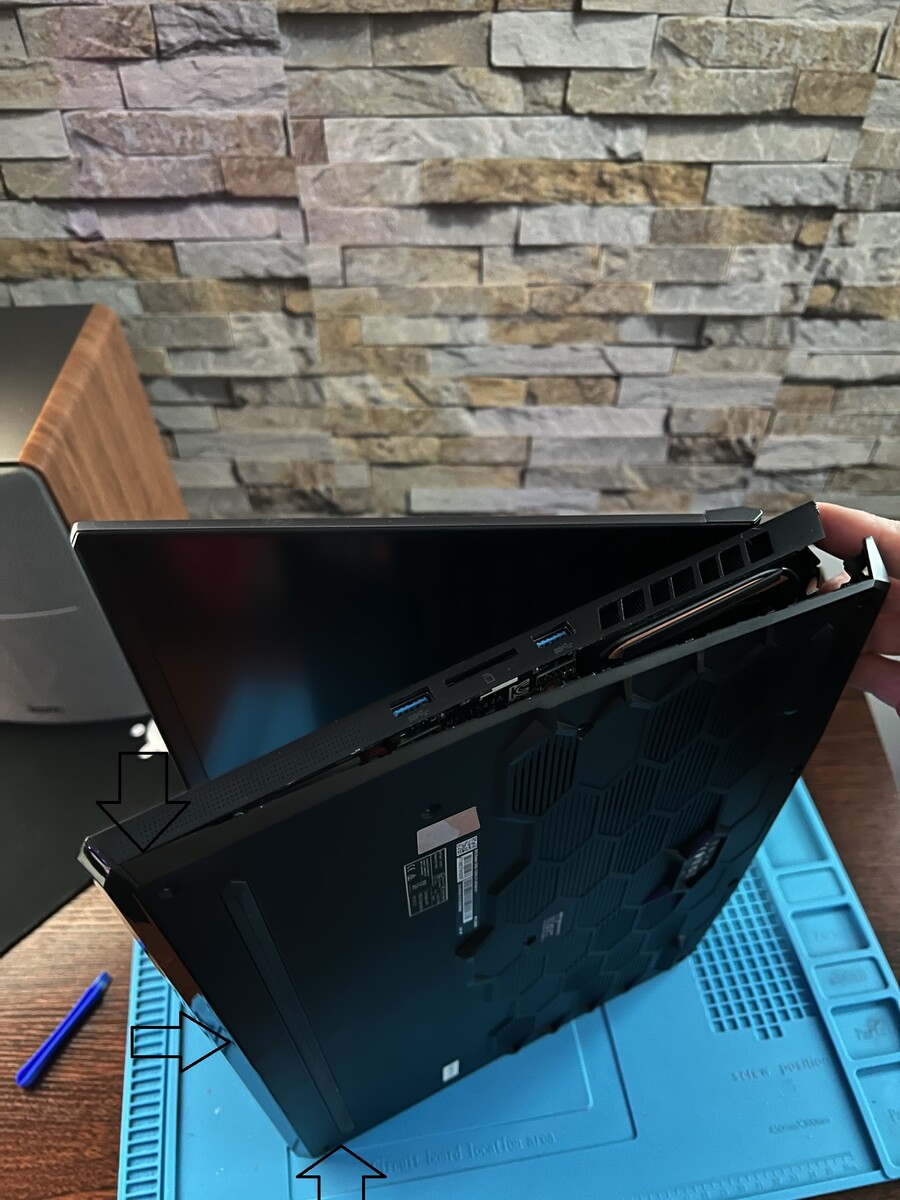
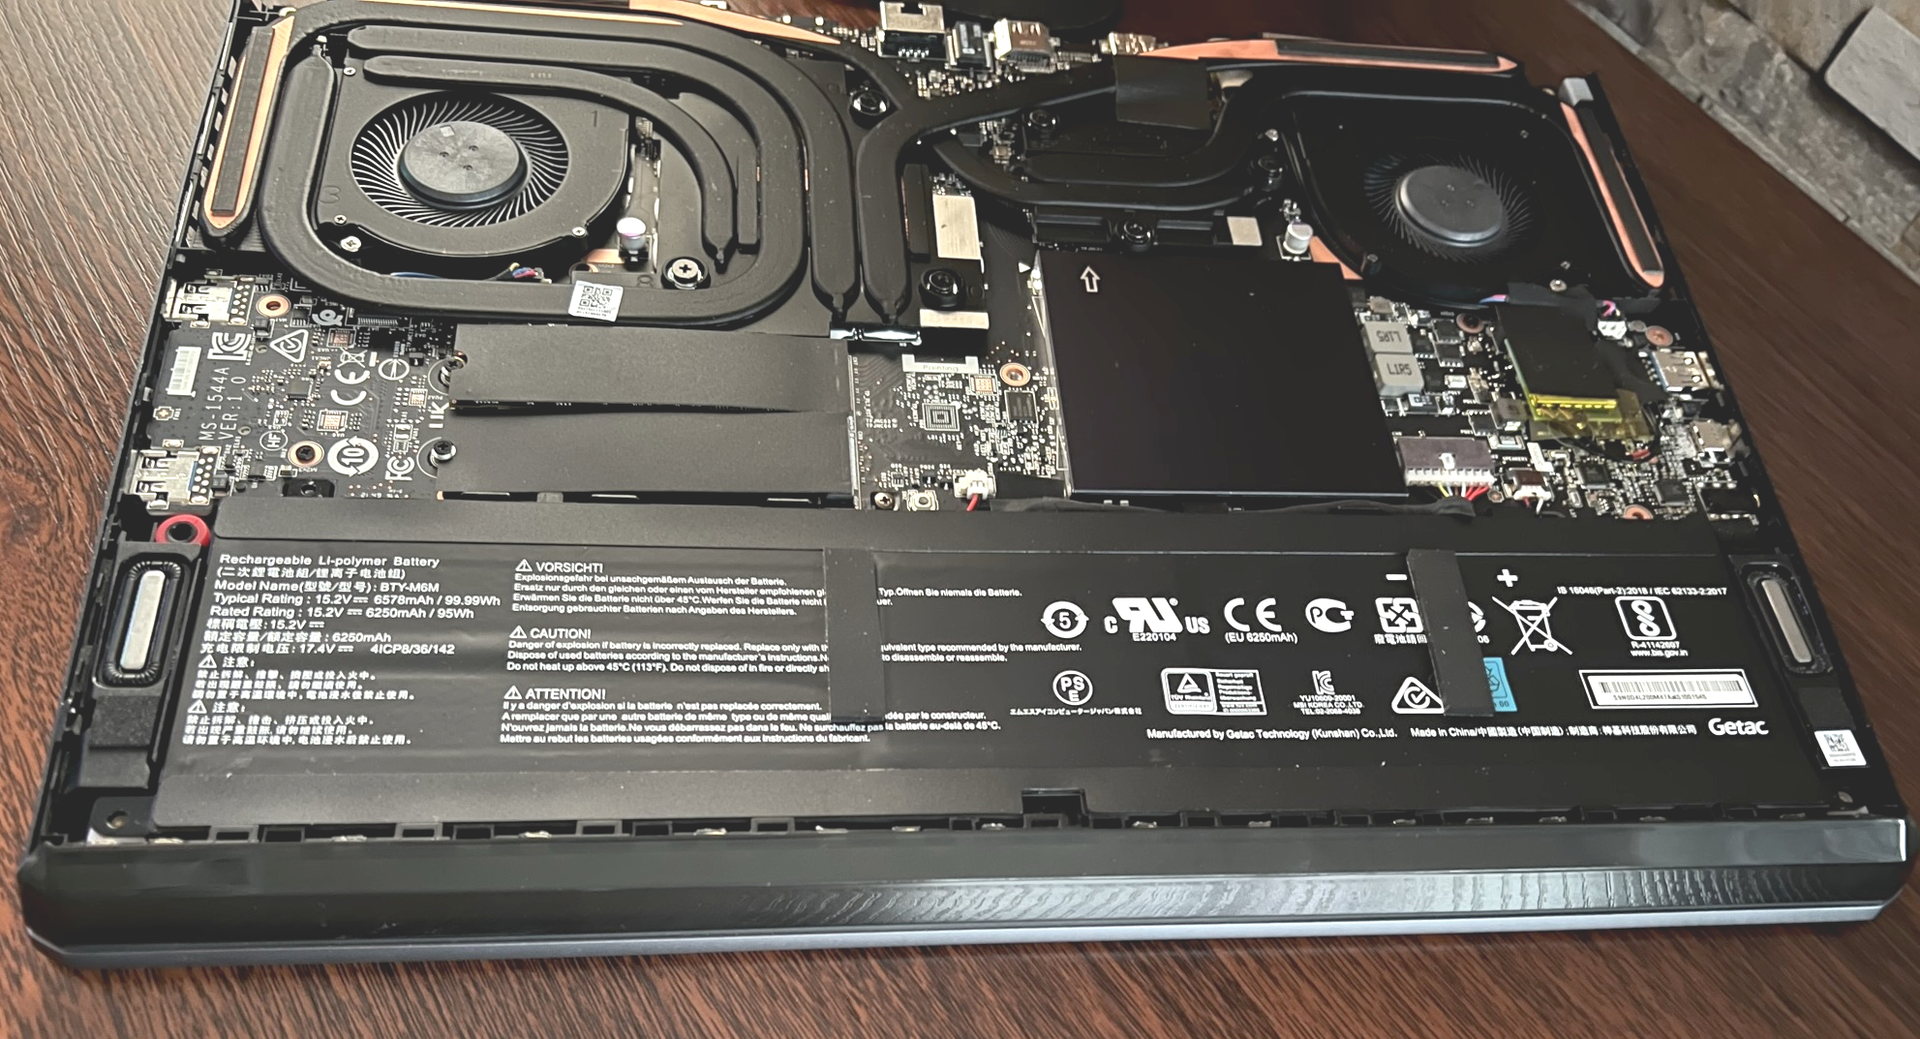
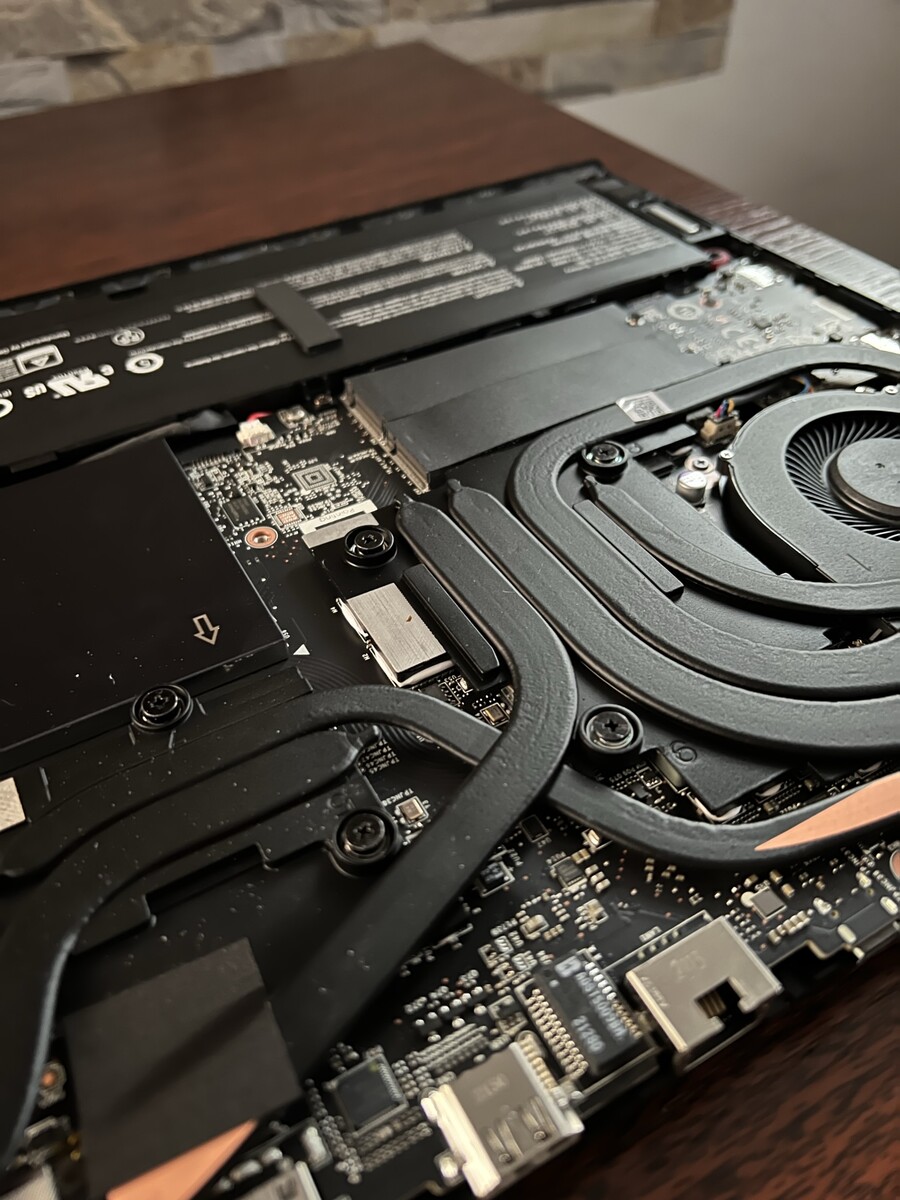
我们的MSI Raider GE66 12 UHS不是这种情况,唯一有难度的任务是拆下11颗十字螺丝来拆开底板。这也适用于显示屏后面的塑料盖。对于那些感兴趣的人,下面有一个小系列的照片,显示了如何在不损坏敏感塑料部件的情况下进入微星突袭者GE66 12 UHS的内部工作。
一旦你取下顶盖和底壳,你就可以直接接触到两个PCI Gen 4插槽。你还可以更换Wi-Fi卡,清洁风扇,如果有必要,可以更换冷却系统和SO-DIMM模块,这些模块位于被动冷却块下面。
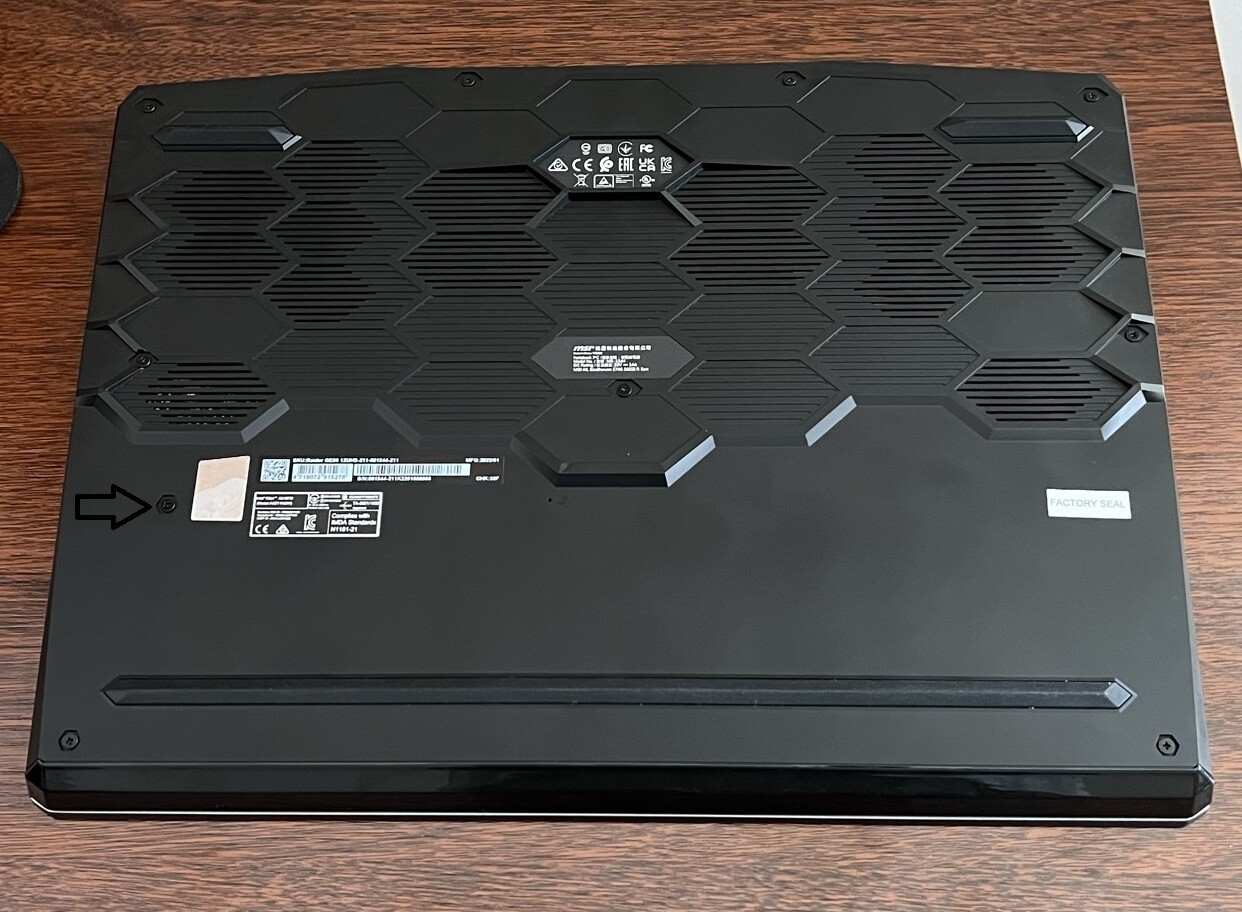
担保
与上一代产品一样,微星给予Raider GE66 24个月的保修期,并提供提货和退货服务。这只适用于德国,所以其他国家的保修政策可能有所不同。需要注意的是,保修封条对于德语国家来说没有意义,因为用户可以打开设备进行升级和维护,而不会导致保修失效。然而,这只适用于专业工作的条件。如果损坏或缺陷表明工作不是专业进行的,这可能导致保修无效。此外,如果需要维修,设备必须恢复到原来的配置,因为维修时可能需要更换部件,而微星要求使用原始部件。
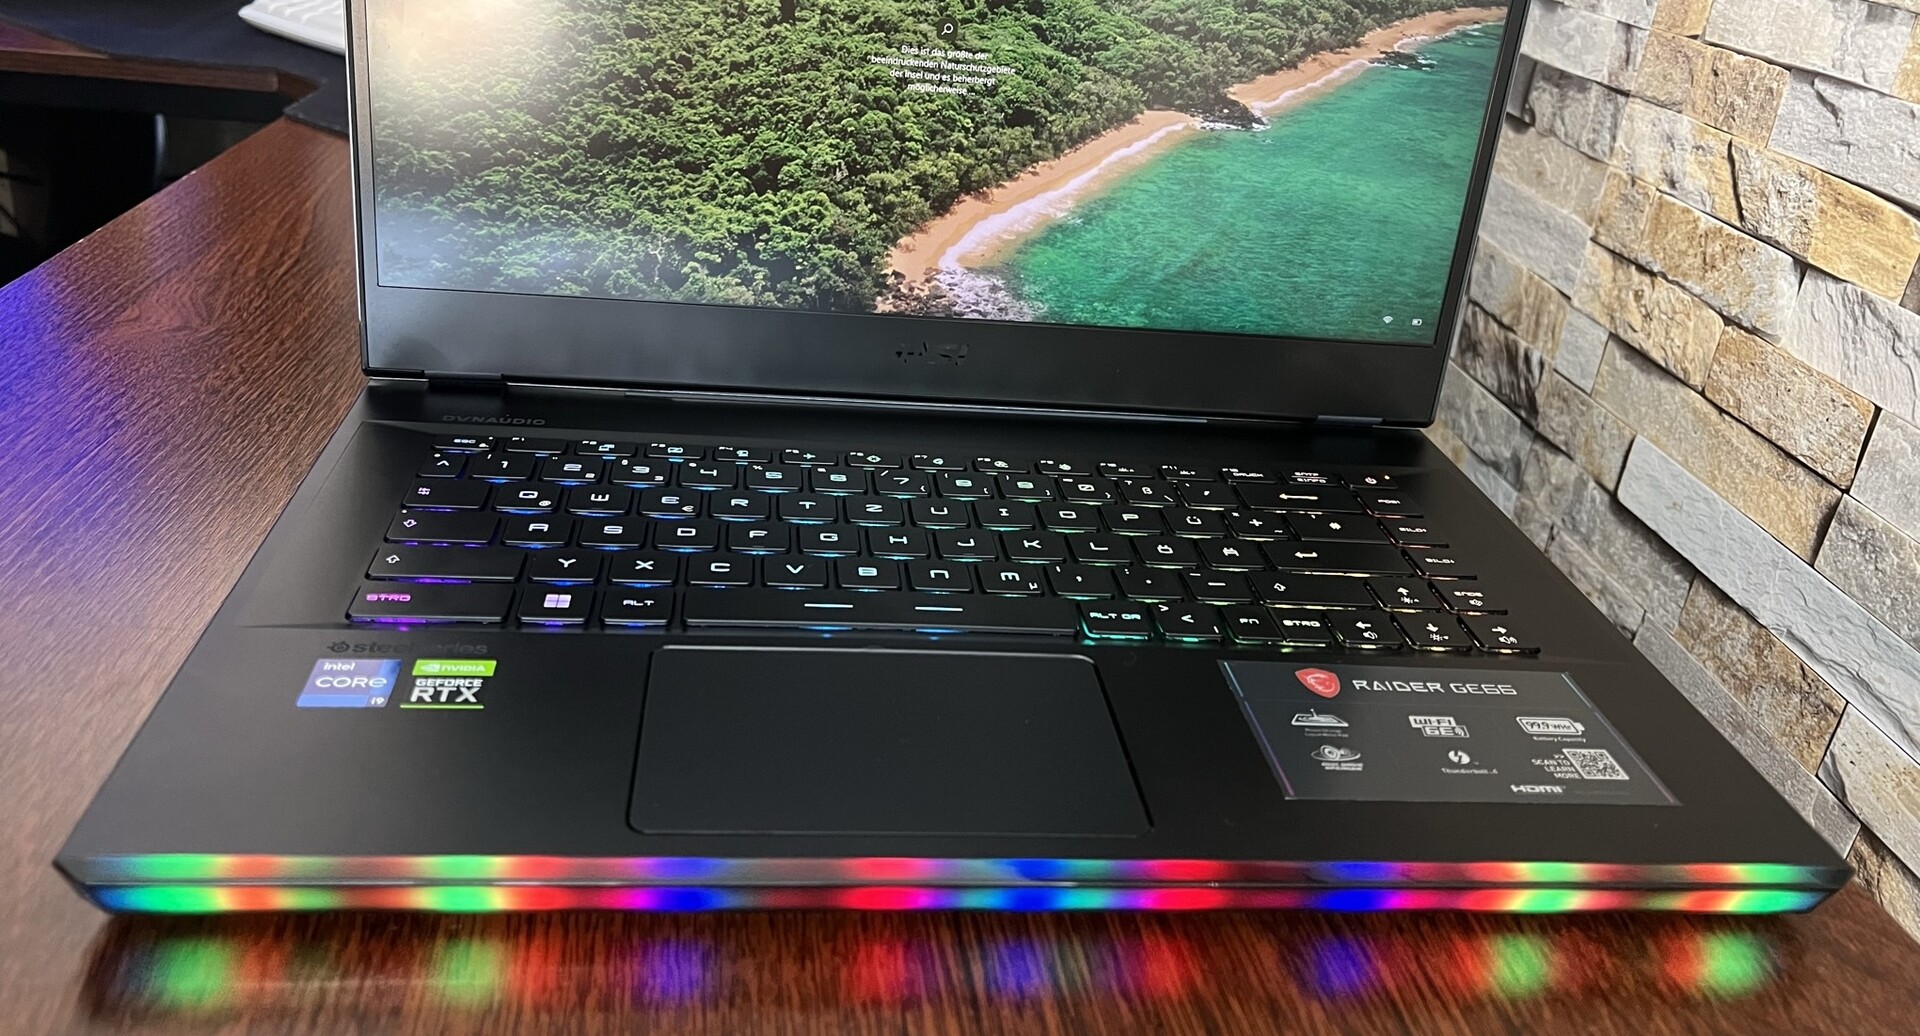
输入设备。优秀的游戏键盘,带有光滑的光条
与微星GE66 10SFS相比,键盘和布局以及触摸板都没有改变。因此,我们再次向您推荐的是 前任 模型。
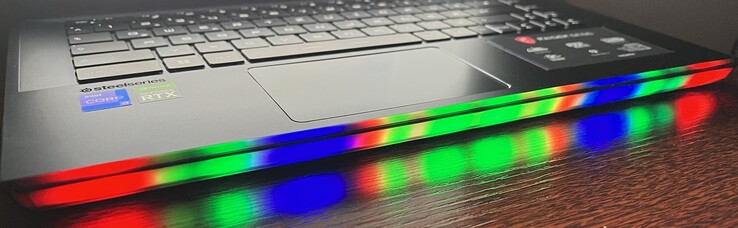
值得一提的一点是灯条,它被放大了,在机箱和前面为RGB风扇提供了更多照明。照明看起来也更令人愉快,质量更高。
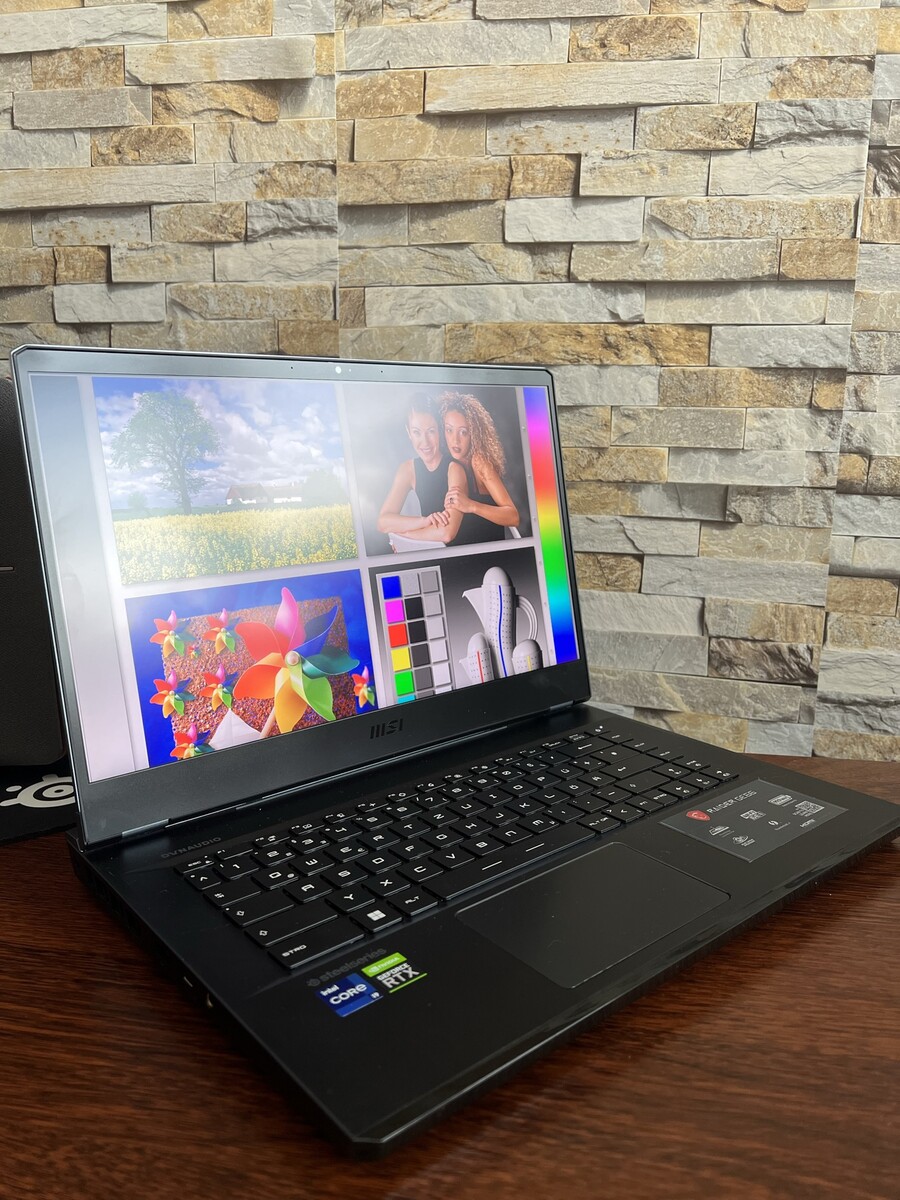
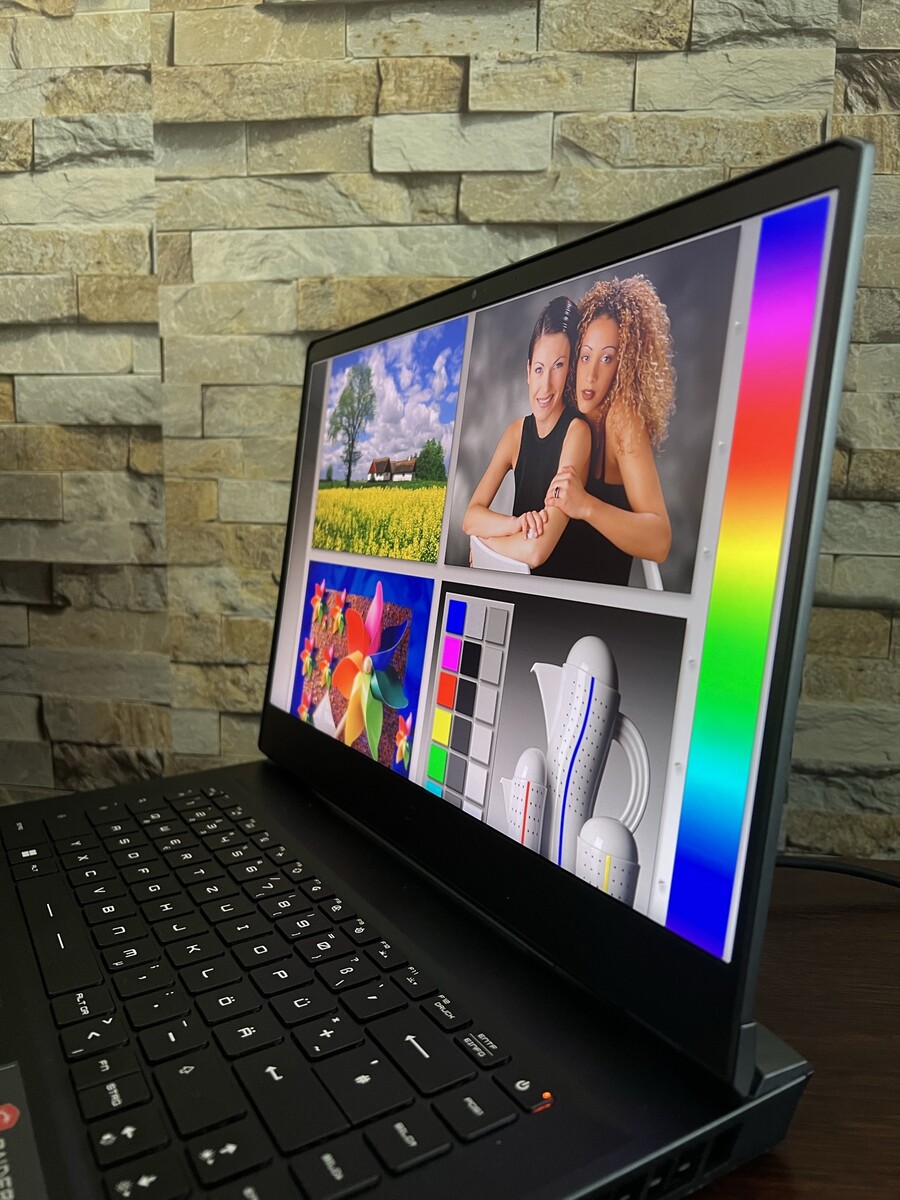
显示器。4K面板,120赫兹

微星在Raider GE66 12UHS中安装了刷新率为120赫兹的非反射式IPS面板,它具有4K分辨率,主观上看起来非常出色。4K面板是否适用于15英寸的显示器是值得商榷的:对于那些同时喜欢游戏的专业用户来说,这绝对是一个优势。除此之外,所安装的硬件属于绝对的高端范围,其配置绝对可以在4K分辨率下流畅地运行游戏。微星还提供替代方案,从240赫兹或165赫兹的QHD面板开始(每种情况下都有100%的DCI-P3覆盖率),直到360赫兹的全高清面板。
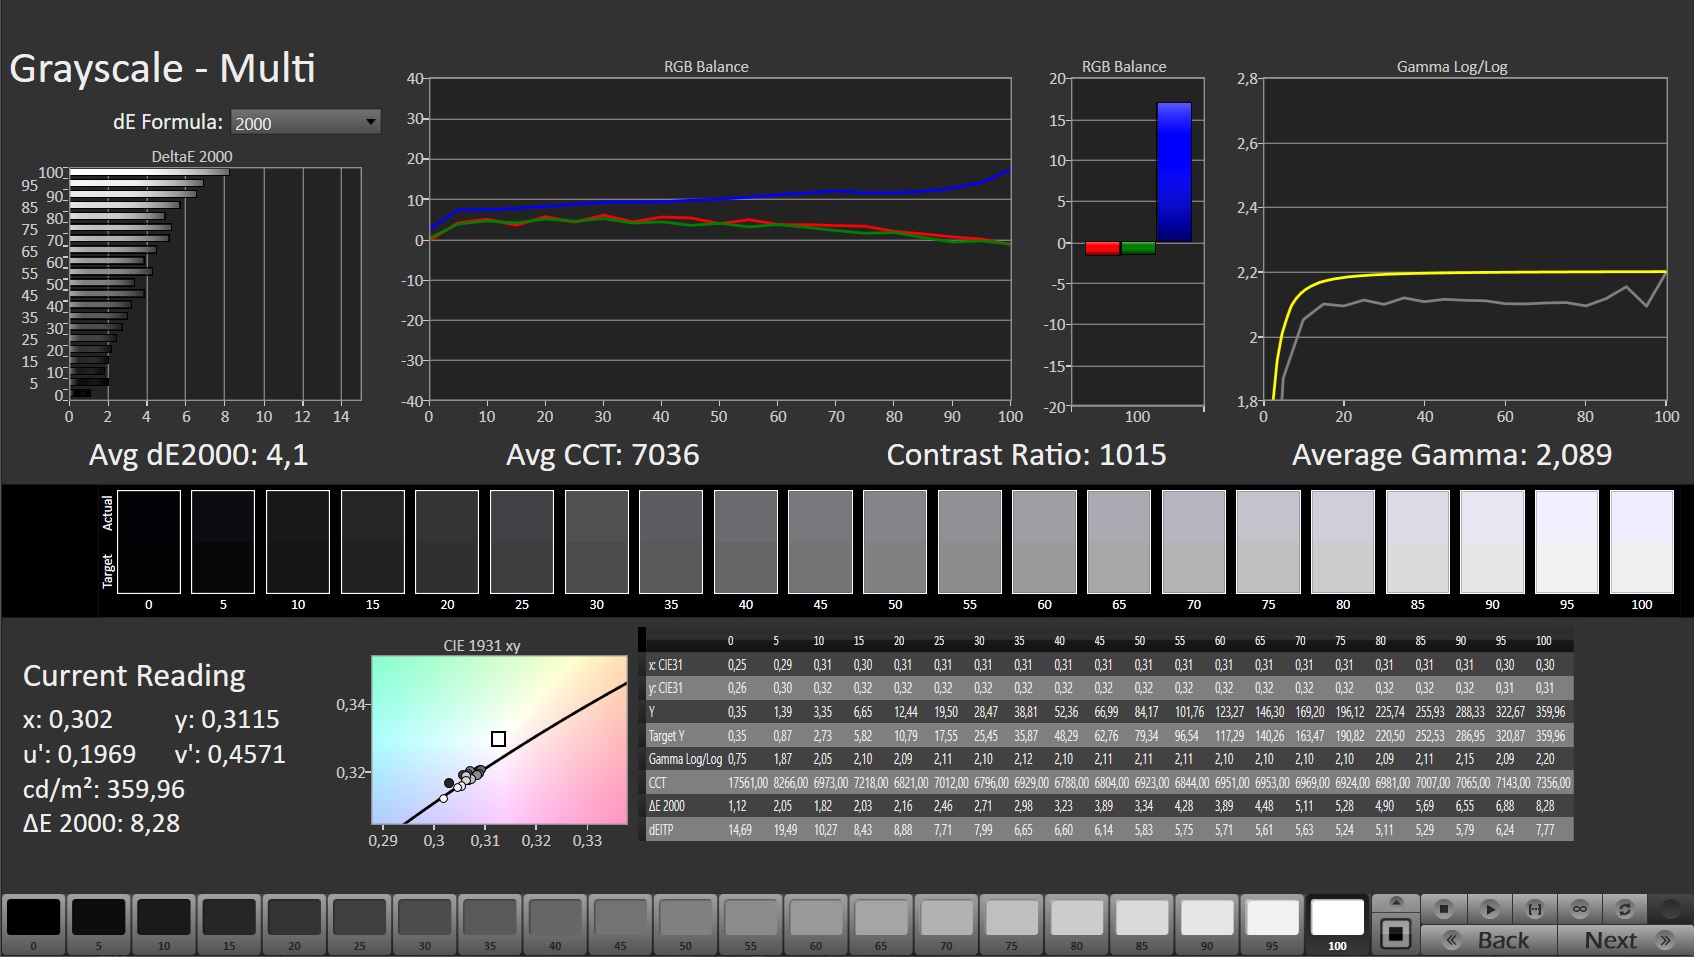
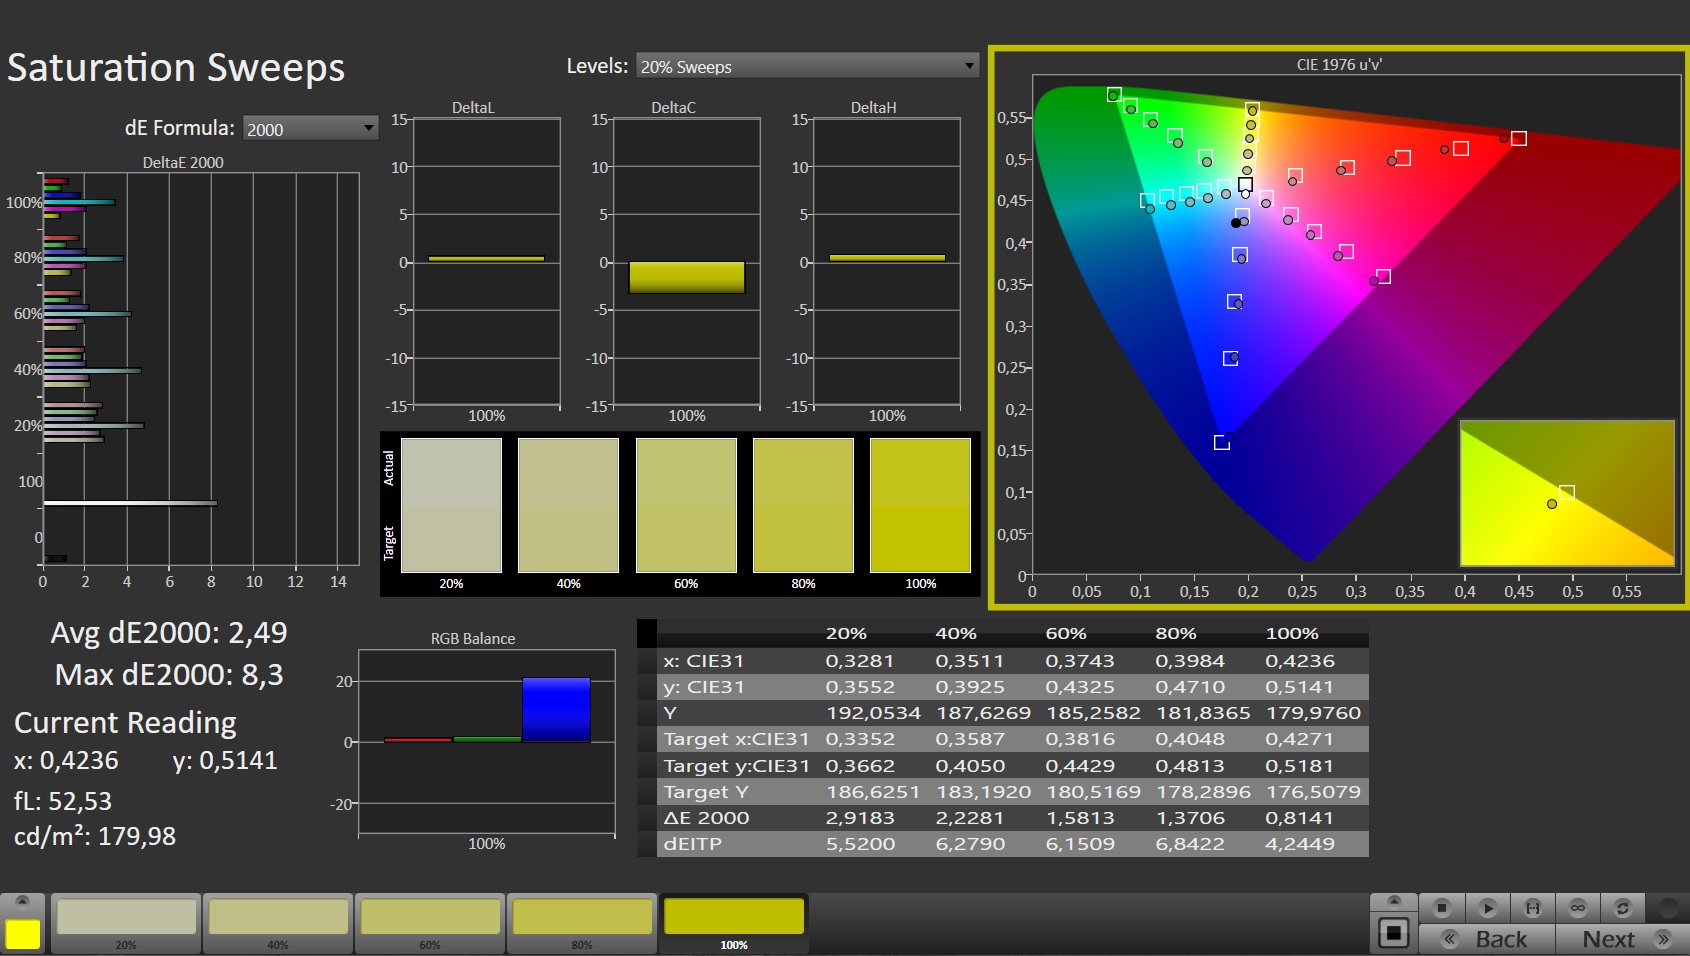
将评测设备中的4K显示屏的数值与前代产品中的FHD面板(240赫兹)的数值相比较,出现了以下情况。GE66 12UHS的4K面板亮度提高了20%,达到347 cd/m²,并提供了更高的色彩空间覆盖率,DCI-P3为80.4%,而AdobeRGB为68%,AdobeRGB为94.7%,而AdobeRGB为69.8%。带有4K显示屏的评测设备不使用PWM,尽管前代产品只在非常高的频率下有这个功能。然而,也有一些缺点,如较高的响应时间和较差的黑色和对比度值。
| |||||||||||||||||||||||||
Brightness Distribution: 90 %
Center on Battery: 351 cd/m²
Contrast: 1003:1 (Black: 0.35 cd/m²)
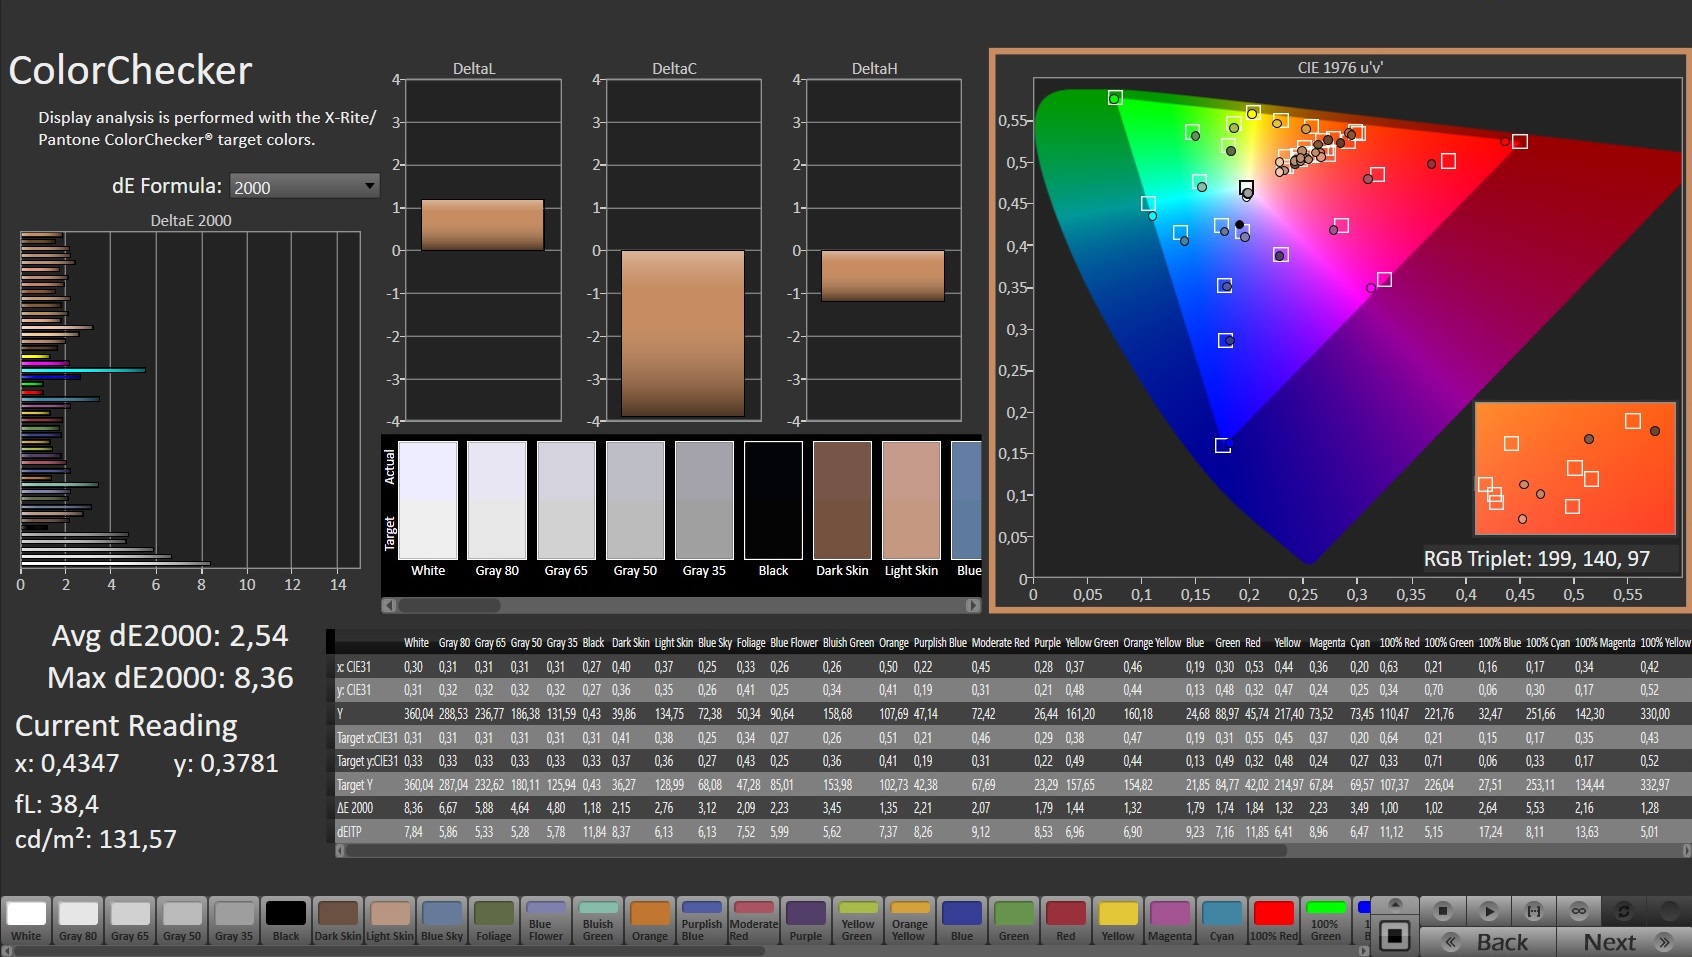
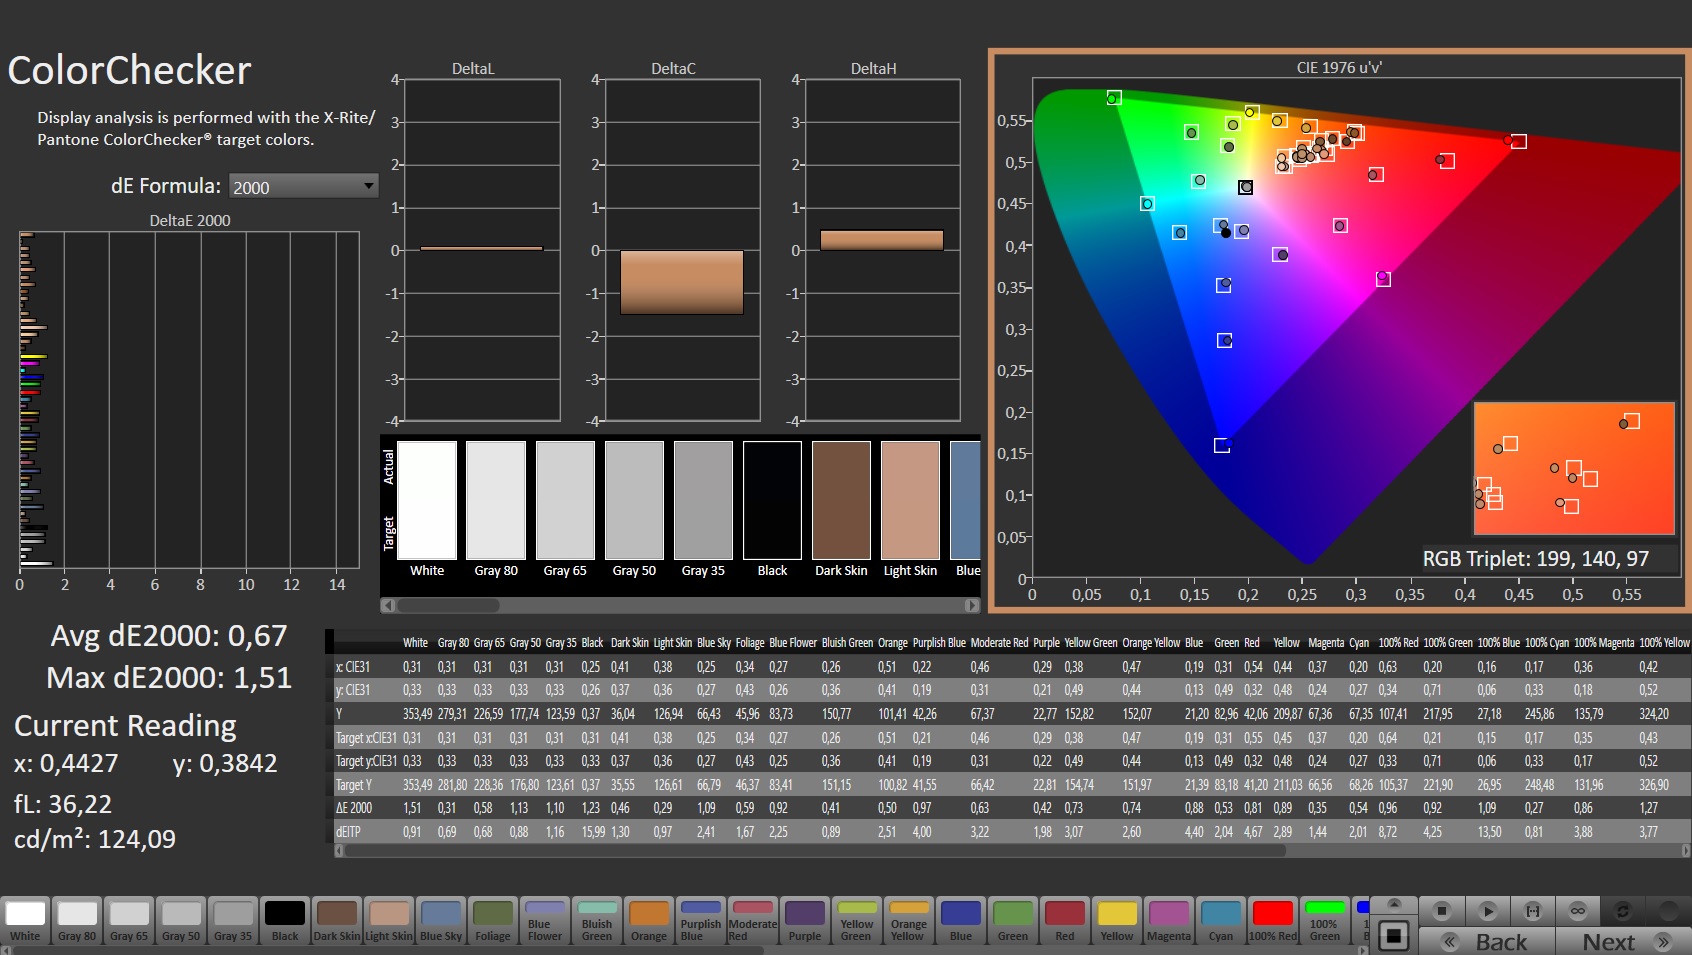
ΔE ColorChecker Calman: 2.54 | ∀{0.5-29.43 Ø4.73}
calibrated: 0.67
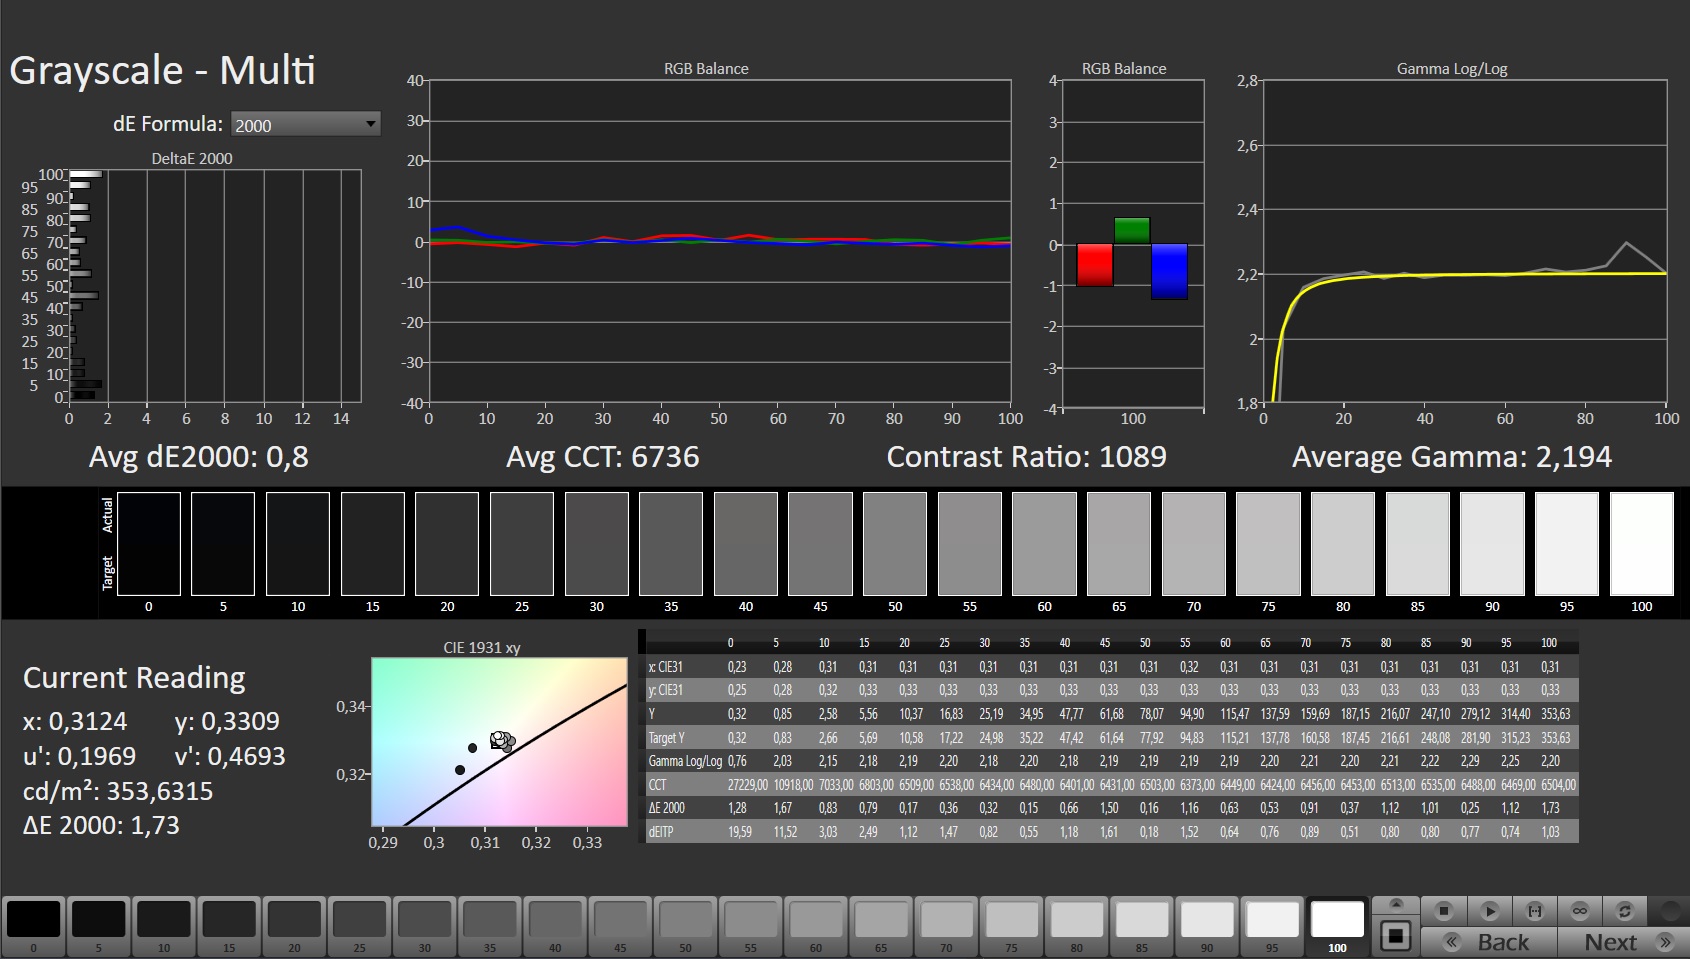
ΔE Greyscale Calman: 4.1 | ∀{0.09-98 Ø4.97}
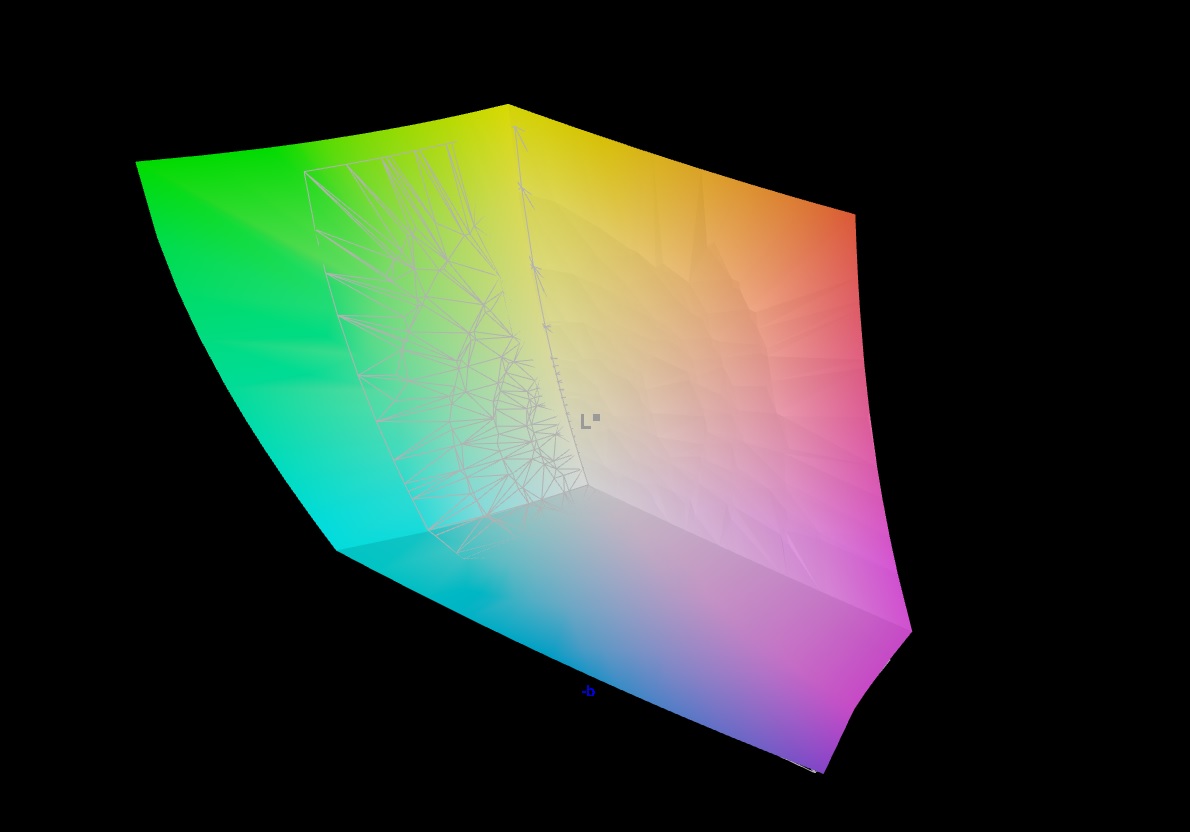
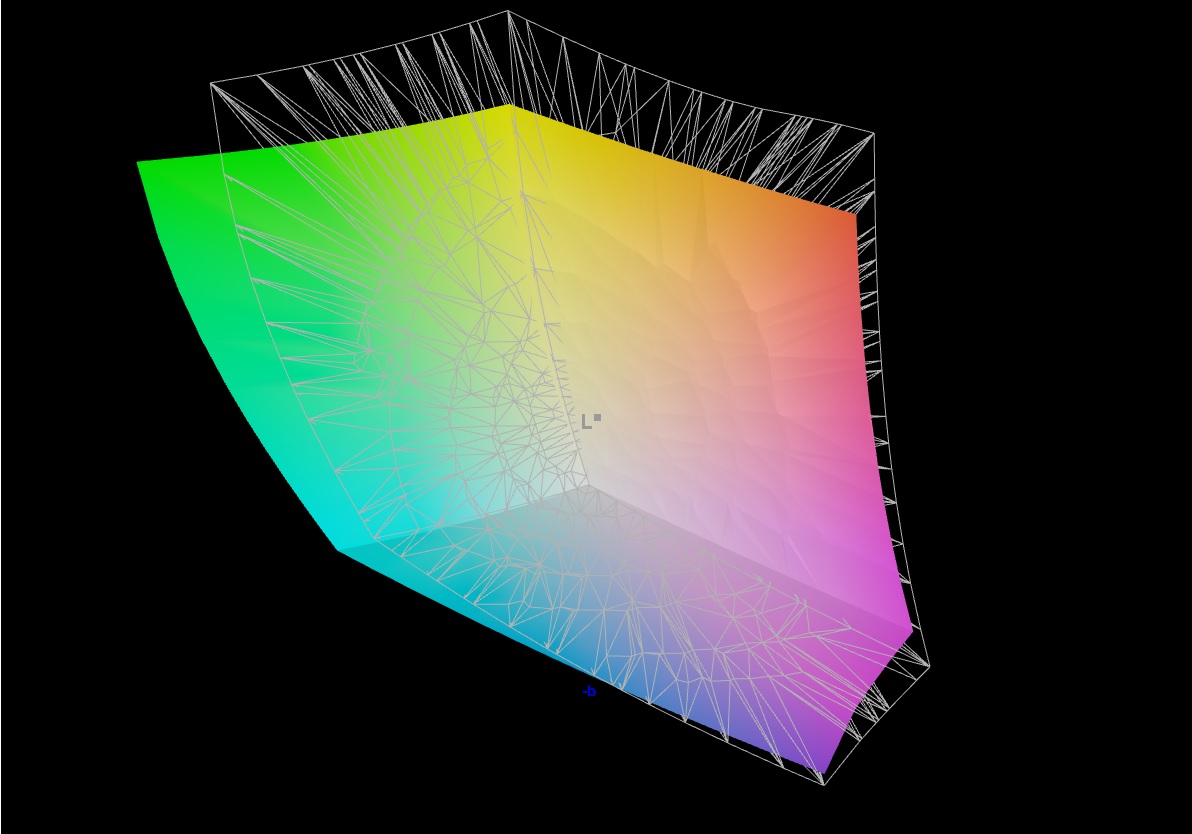
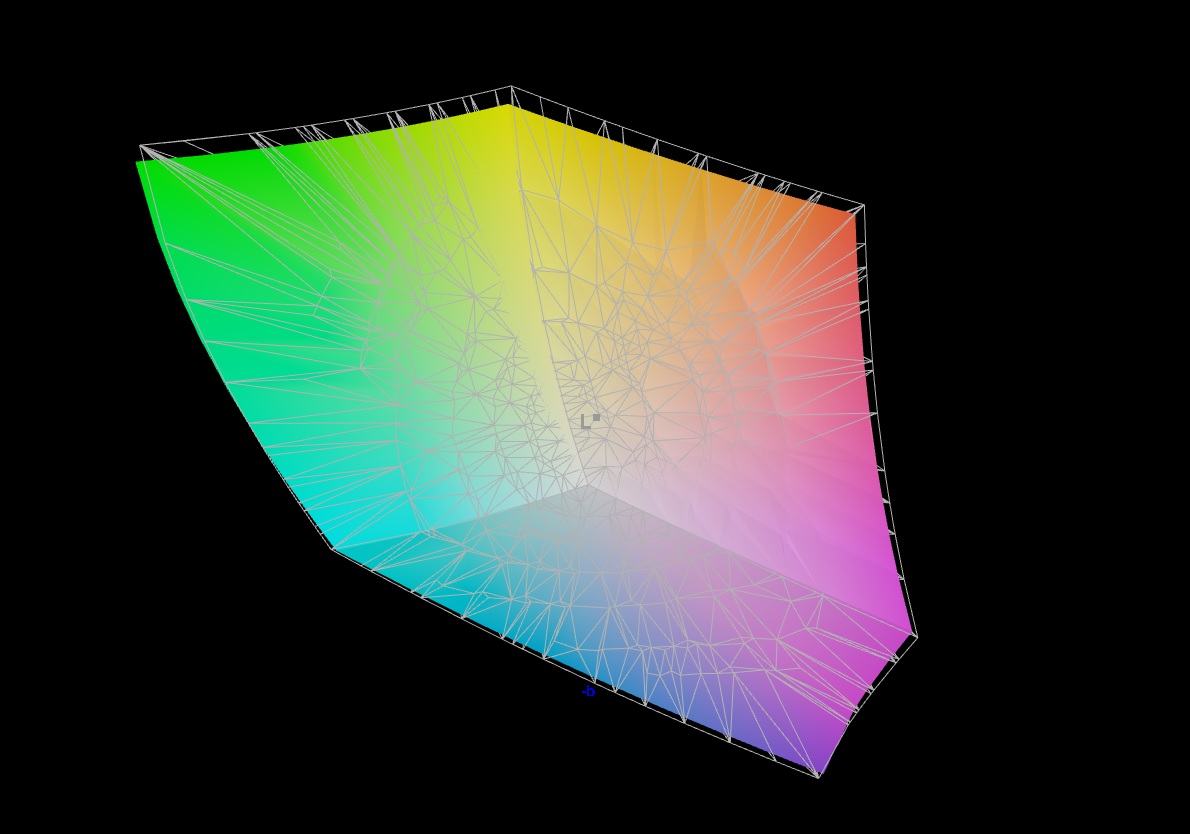
94.7% AdobeRGB 1998 (Argyll 3D)
98.4% sRGB (Argyll 3D)
80.4% Display P3 (Argyll 3D)
Gamma: 2.089
CCT: 7036 K
| MSI Raider GE66 12UHS AUO51EB, IPS, 3840x2160, 15.6" | MSI GE66 Raider 10SFS Sharp LQ156M1JW03 (SHP14C5), IPS-Level, 1920x1080, 15.6" | Razer Blade 15 2022 Sharp LQ156T1JW03, IPS, 2560x1440, 15.6" | Schenker XMG Neo 15 E22 (Early 2022, RTX 3080 Ti) BOE0A67 (BOE CQ NE156QHM-NZ1), IPS, 2560x1440, 15.6" | Lenovo Legion 5 Pro 16 G7 i7 RTX 3070Ti NE160QDM-NY1, IPS, 2560x1600, 16" | |
|---|---|---|---|---|---|
| Display | -13% | 6% | -14% | ||
| Display P3 Coverage (%) | 80.4 | 68 -15% | 99.1 23% | 68.7 -15% | |
| sRGB Coverage (%) | 98.4 | 99 1% | 99.9 2% | 97.6 -1% | |
| AdobeRGB 1998 Coverage (%) | 94.7 | 69.8 -26% | 86.8 -8% | 70.9 -25% | |
| Response Times | 16% | 16% | 20% | 24% | |
| Response Time Grey 50% / Grey 80% * (ms) | 18.8 ? | 16.4 ? 13% | 14.4 ? 23% | 14.4 ? 23% | 17.6 ? 6% |
| Response Time Black / White * (ms) | 12.8 ? | 10.4 ? 19% | 11.6 ? 9% | 10.8 ? 16% | 7.6 ? 41% |
| PWM Frequency (Hz) | 23580 ? | ||||
| Screen | 23% | -19% | 4% | 9% | |
| Brightness middle (cd/m²) | 351 | 291 -17% | 286 -19% | 295 -16% | 502 43% |
| Brightness (cd/m²) | 347 | 278 -20% | 271 -22% | 277 -20% | 491 41% |
| Brightness Distribution (%) | 90 | 91 1% | 89 -1% | 62 -31% | 91 1% |
| Black Level * (cd/m²) | 0.35 | 0.25 29% | 0.25 29% | 0.28 20% | 0.37 -6% |
| Contrast (:1) | 1003 | 1164 16% | 1144 14% | 1054 5% | 1357 35% |
| Colorchecker dE 2000 * | 2.54 | 1.19 53% | 2.74 -8% | 2.36 7% | 2.7 -6% |
| Colorchecker dE 2000 max. * | 8.36 | 3.04 64% | 5.21 38% | 4.24 49% | 4.5 46% |
| Colorchecker dE 2000 calibrated * | 0.67 | 2.52 -276% | 1.4 -109% | ||
| Greyscale dE 2000 * | 4.1 | 1.9 54% | 1.1 73% | 3.43 16% | 2.7 34% |
| Gamma | 2.089 105% | 2.216 99% | 2.2 100% | 2.44 90% | 2.44 90% |
| CCT | 7036 92% | 7018 93% | 6408 101% | 6266 104% | 6326 103% |
| Color Space (Percent of AdobeRGB 1998) (%) | 70 | ||||
| Color Space (Percent of sRGB) (%) | 92 | ||||
| Total Average (Program / Settings) | 9% /
13% | 1% /
-9% | 12% /
7% | 6% /
6% |
* ... smaller is better
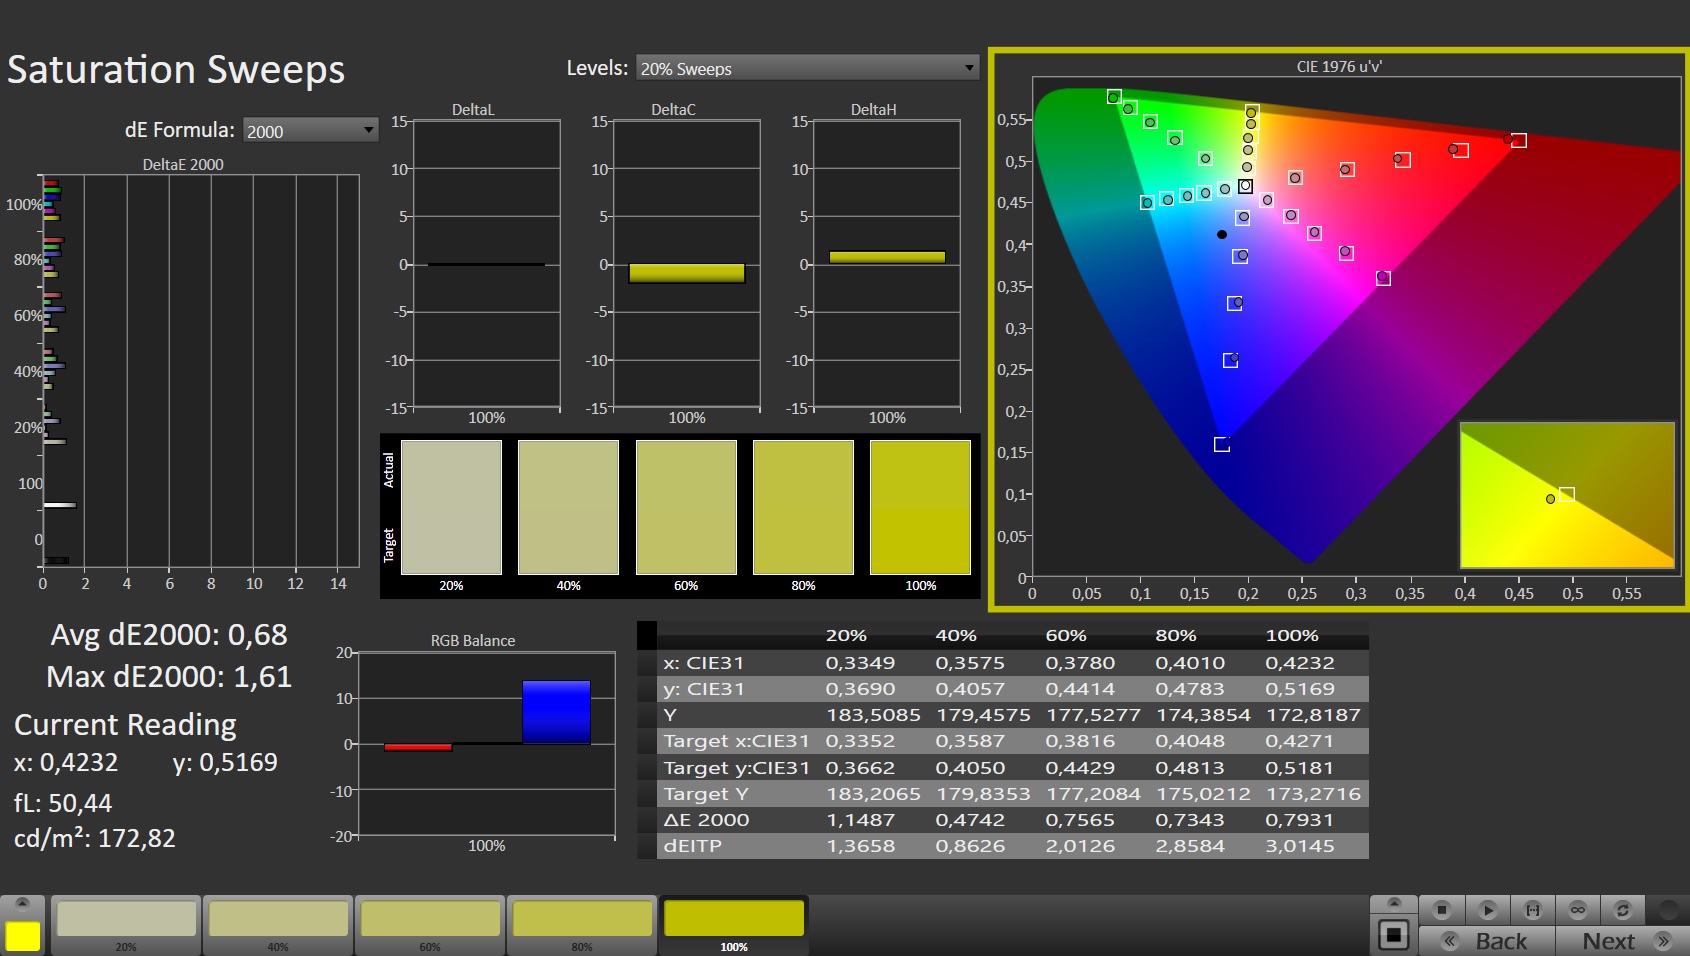
显示屏的颜色精度可以得到改善,特别是灰度。在用光谱仪校准后,我们取得了非常好的平均灰度和色彩DeltaE值,分别为0.8和0.67。我们校准的ICC档案可在 在这里下载。
Display Response Times
| ↔ Response Time Black to White | ||
|---|---|---|
| 12.8 ms ... rise ↗ and fall ↘ combined | ↗ 6.8 ms rise | 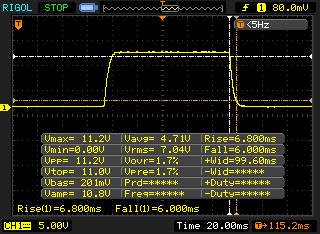 |
| ↘ 6 ms fall | ||
| The screen shows good response rates in our tests, but may be too slow for competitive gamers. In comparison, all tested devices range from 0.1 (minimum) to 240 (maximum) ms. » 33 % of all devices are better. This means that the measured response time is better than the average of all tested devices (19.9 ms). | ||
| ↔ Response Time 50% Grey to 80% Grey | ||
| 18.8 ms ... rise ↗ and fall ↘ combined | ↗ 9.2 ms rise | 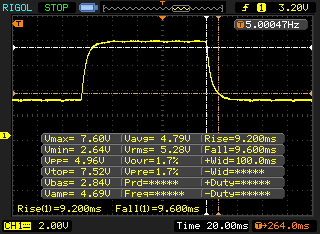 |
| ↘ 9.6 ms fall | ||
| The screen shows good response rates in our tests, but may be too slow for competitive gamers. In comparison, all tested devices range from 0.165 (minimum) to 636 (maximum) ms. » 32 % of all devices are better. This means that the measured response time is better than the average of all tested devices (31.1 ms). | ||
Screen Flickering / PWM (Pulse-Width Modulation)
| Screen flickering / PWM not detected | 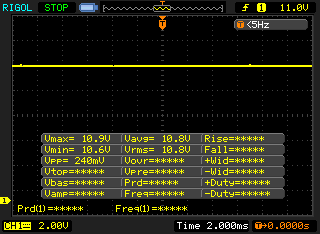 | ||
In comparison: 52 % of all tested devices do not use PWM to dim the display. If PWM was detected, an average of 7798 (minimum: 5 - maximum: 343500) Hz was measured. | |||
即使拥有不反光的显示屏和347cd/m²的亮度,我们也不能推荐雷蛇GE66 12UHS在阳光直射下使用,至少在没有微星真彩的情况下工作。通过这个工具及其多样化的设置,显示内容的可读性可以得到一定程度的改善。但就整体户外使用而言,你应该寻找一个阴凉的地方以获得最佳条件。
我们评测设备的内置IPS面板,即使从极广的角度看,也能保持视角稳定。亮度保持不变,颜色也不会失真。
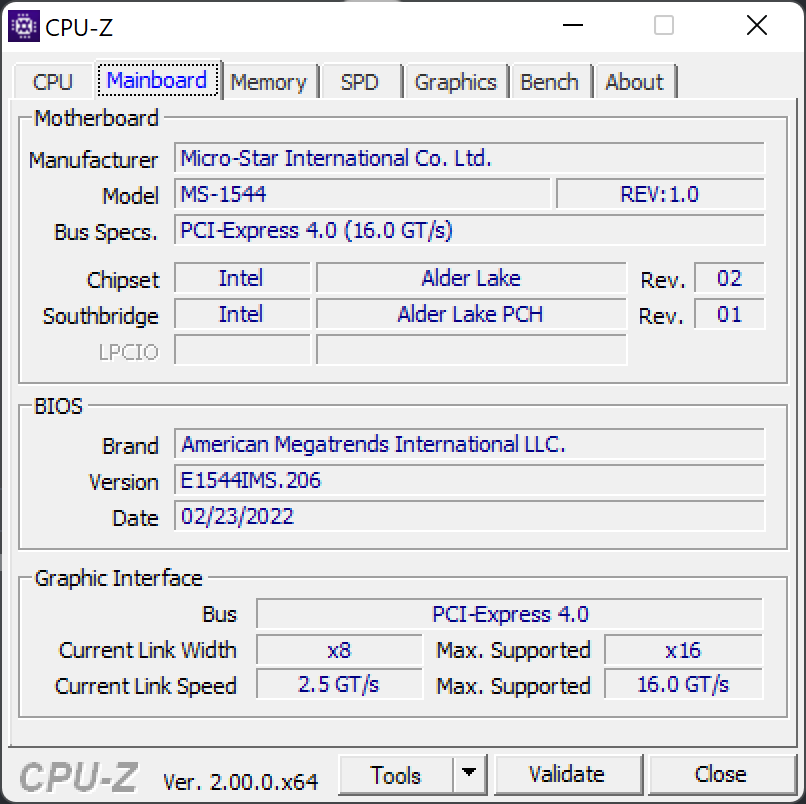
性能。微星GE66 12UHS巧妙的液态金属冷却解决方案
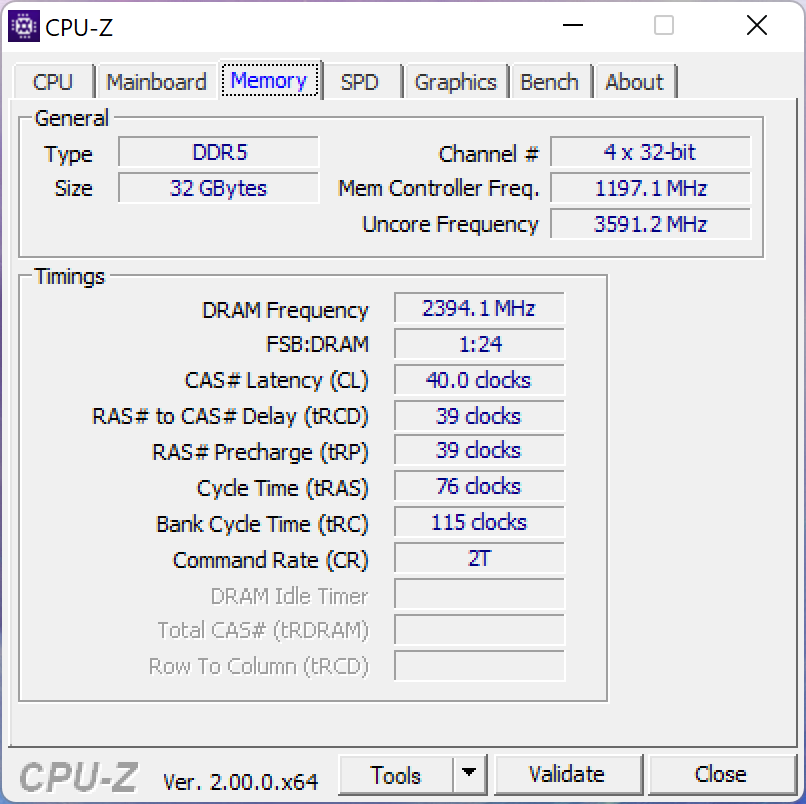
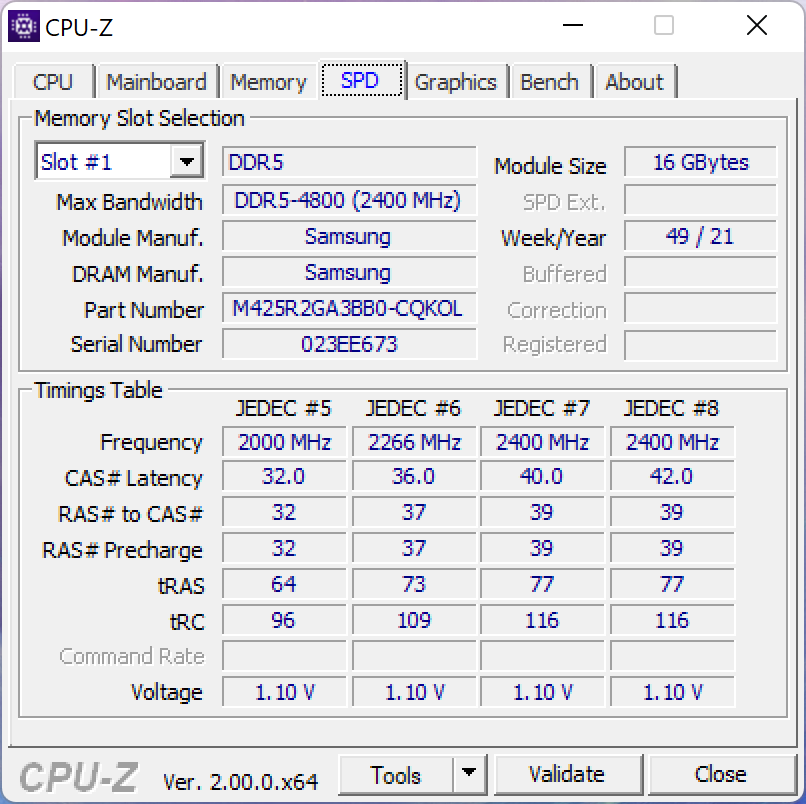
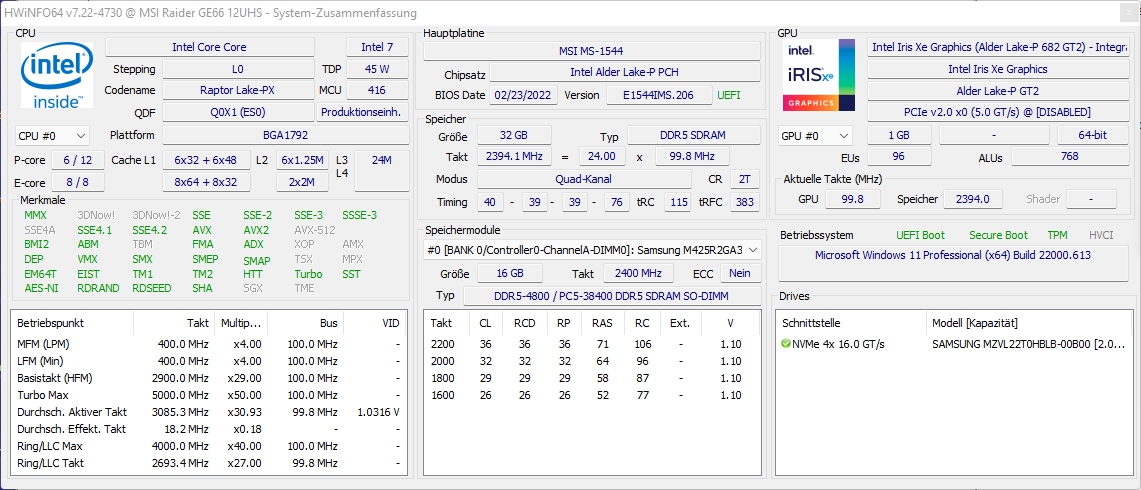
微星GE66 12UHS有多种配置。因此,你可以购买带有以下配置的系统 英特尔酷睿i7 12700H而不是英特尔酷睿i9 12900HK。关于GPU配置,该系统可以选择配备8GB VRAM和150瓦TDP(总动态功率)的RTX 3080,也可以选择配备16GB VRAM和同样具有150瓦TDP的RTX 3080 Ti。这两种配置都使用16GB DDR5内存,频率为4800MHz,或32GB DDR5内存,频率相同,都以双通道模式运行。固态硬盘安装在1TB或2TB的尺寸中。
我们的审查设备是最高端版本,配备了 英特尔酷睿i9 12900HK,RTX 3080 Ti和32GB DDR5内存,由2TB固态硬盘完成。
测试条件
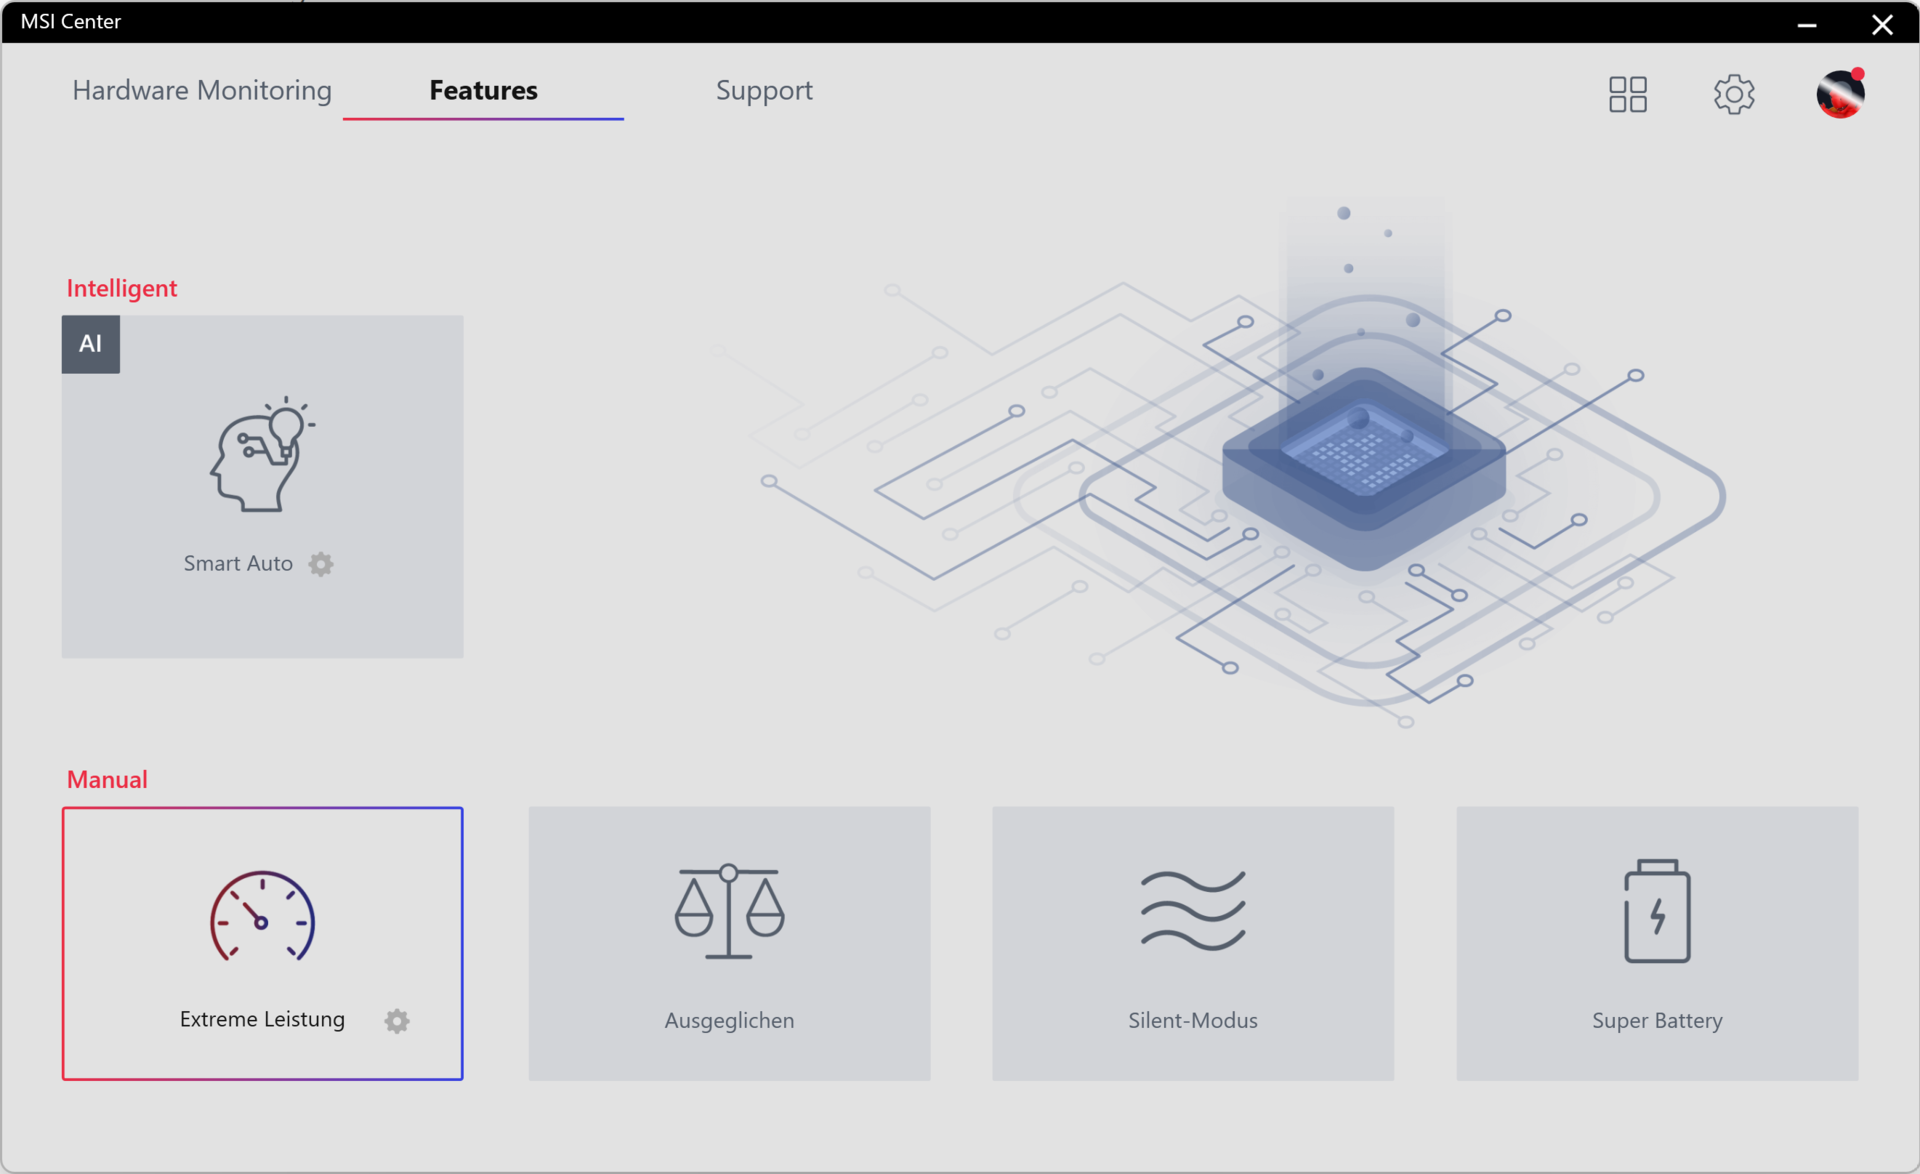
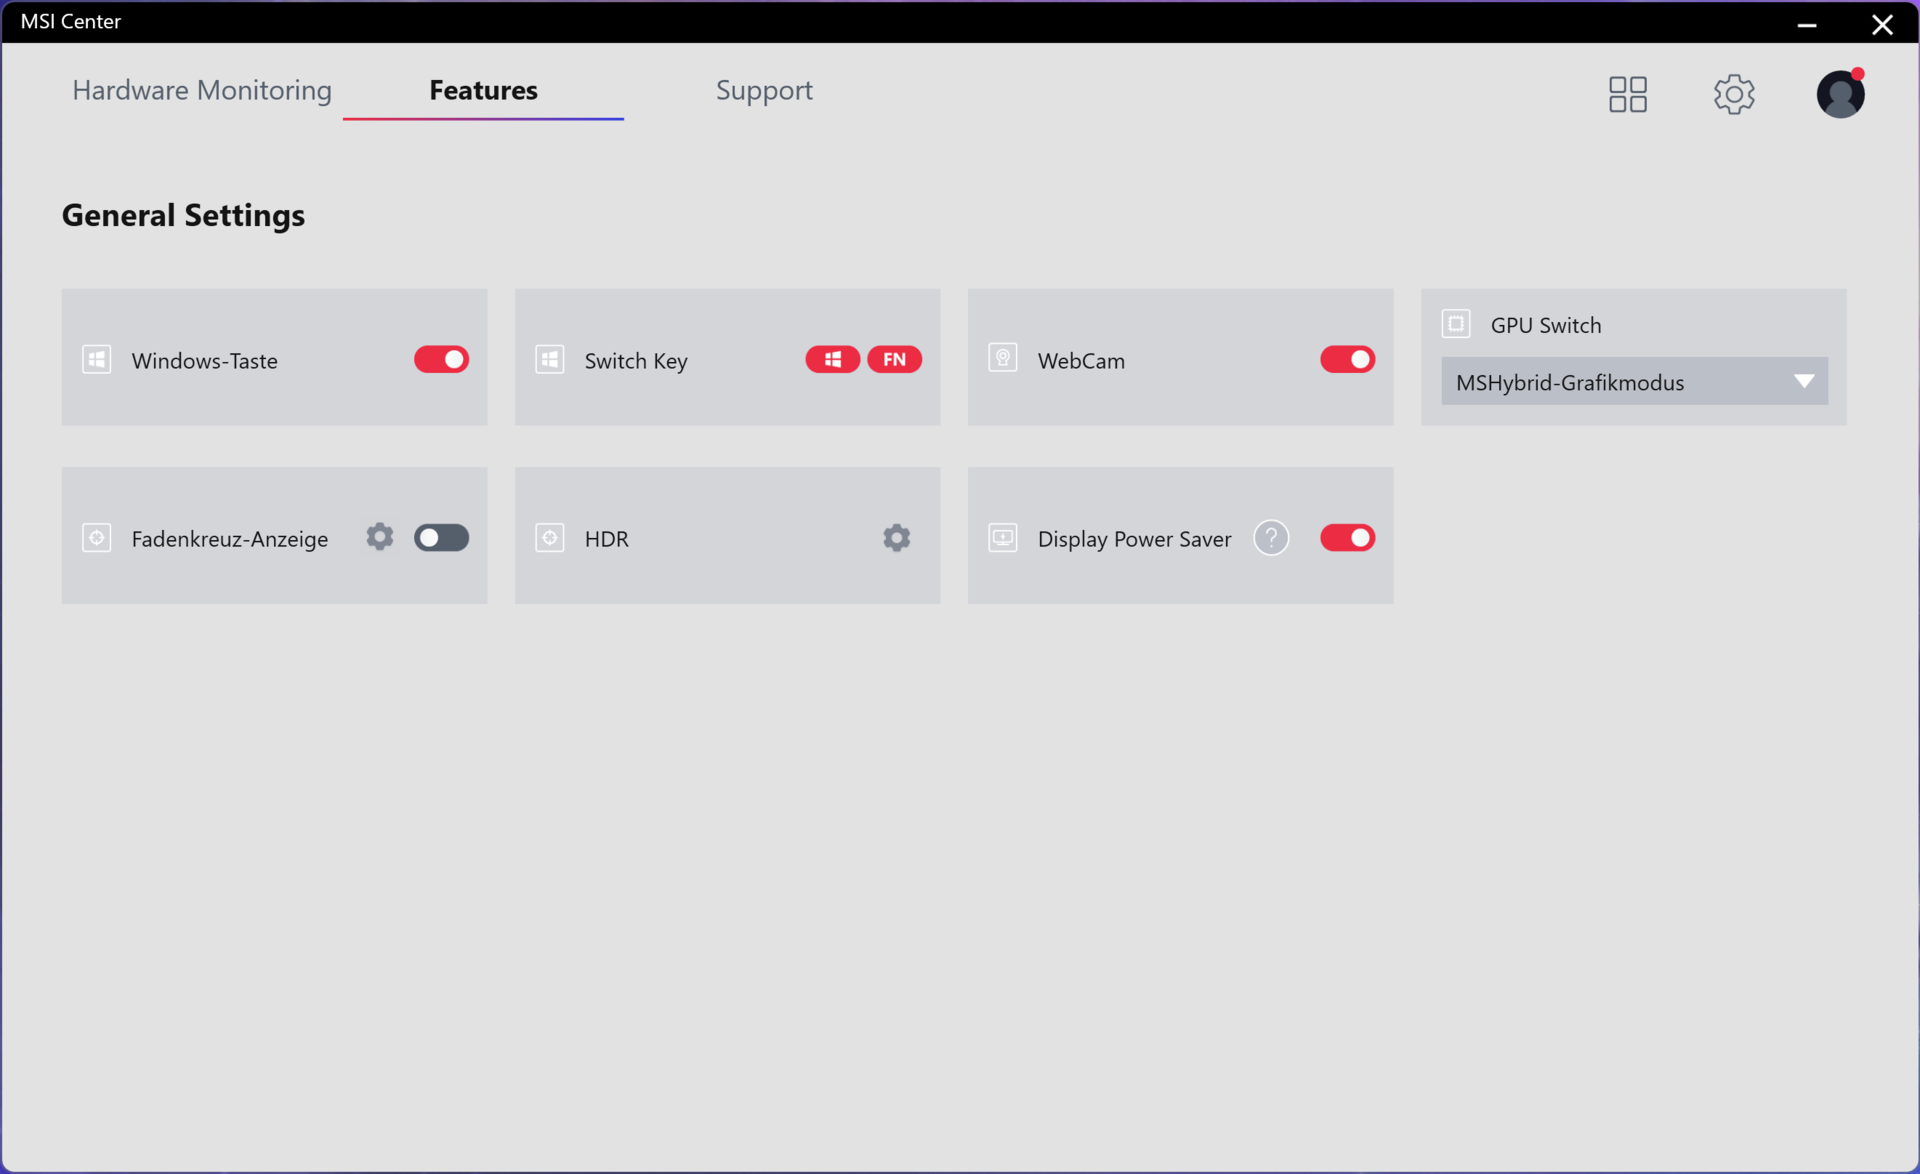
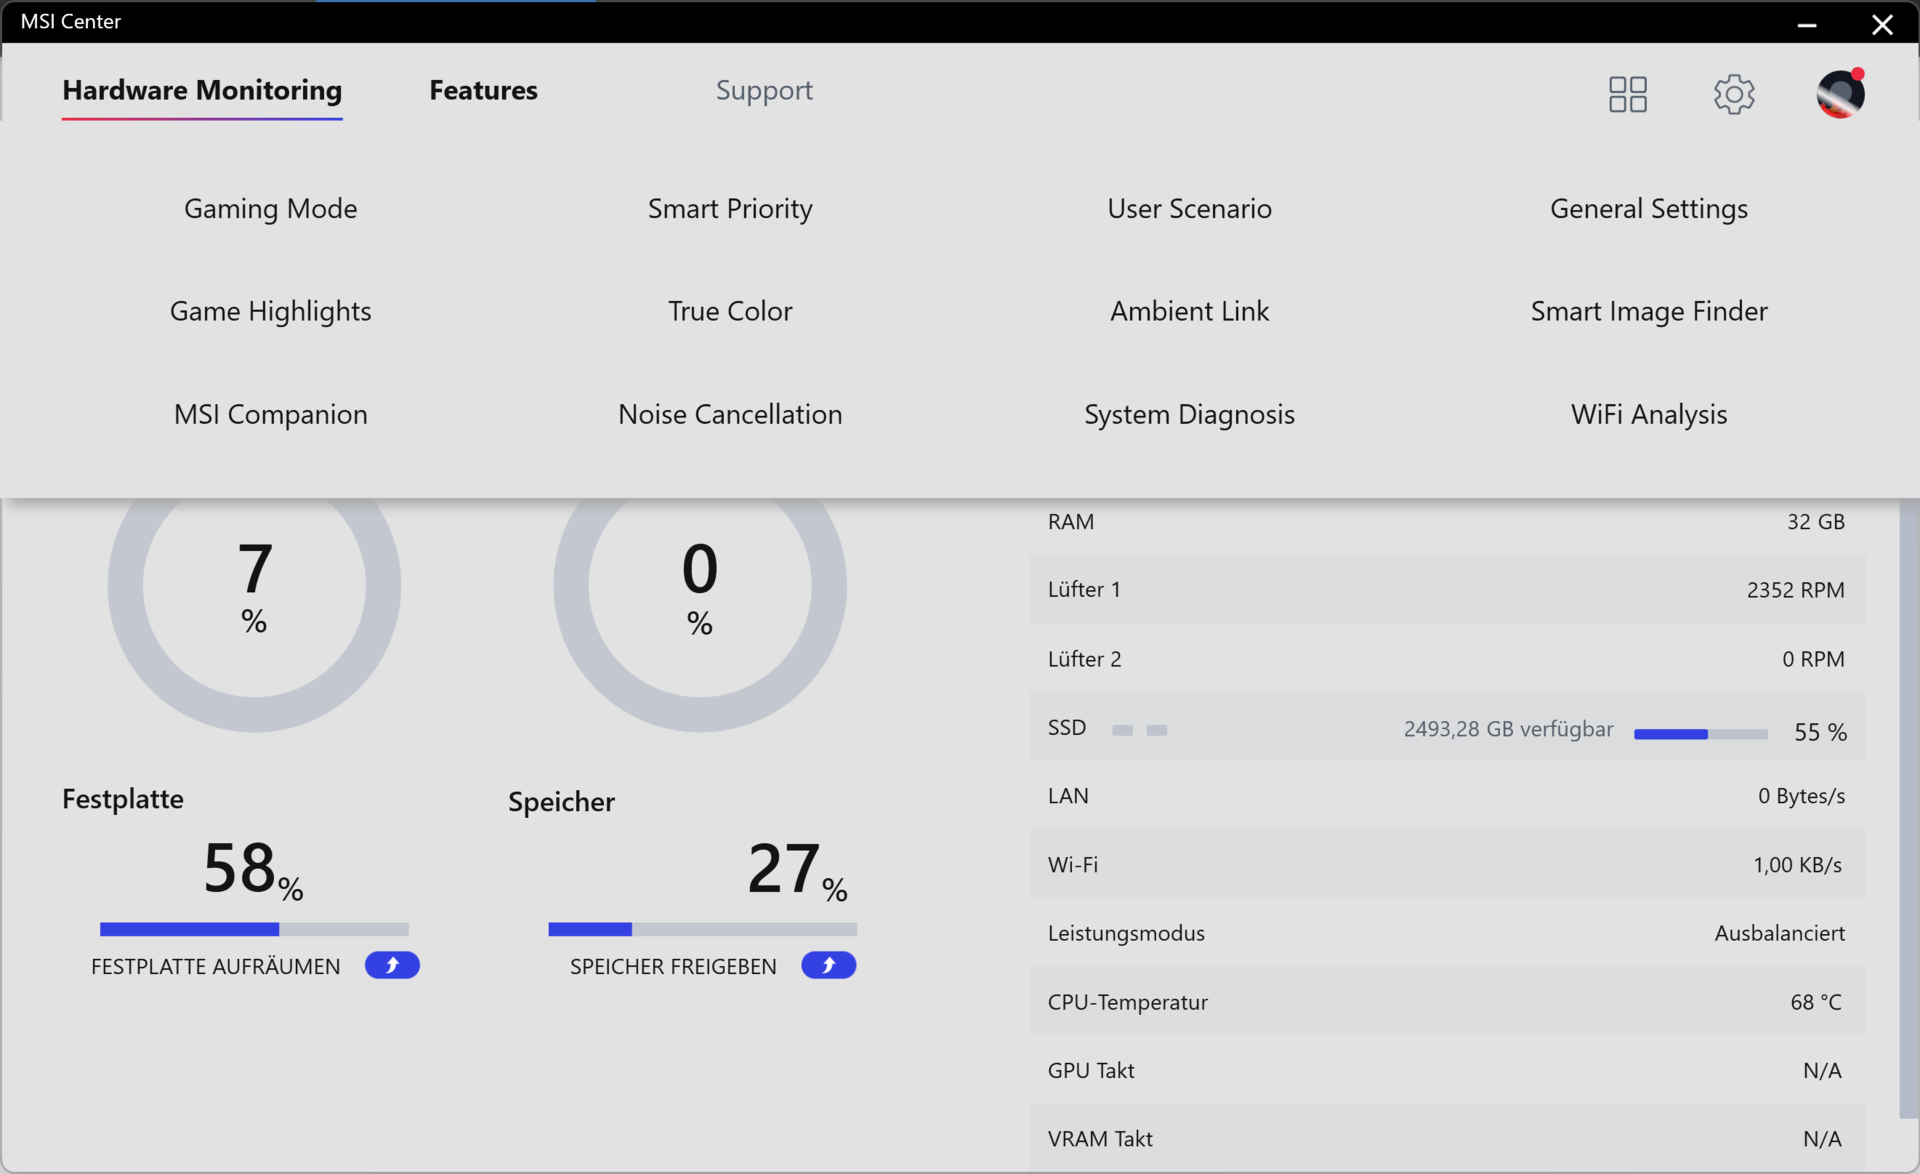
为了获得最佳的基准测试结果,我们通过微星中心将笔记本电脑设置为 "极限性能 "模式(否则设置为 "智能自动 "为默认设置)。许多重要的系统设置可以通过该平台进行调整(无需创建账户)。这些包括风扇配置文件以及一般设置和其他功能,如用于寻找最新系统驱动程序的 "实时更新"。不幸的是,并非所有的驱动程序都能自动安装,有些必须手动安装。我们还喜欢在 "独立图形模式"(仅RTX 3080 Ti)或 "MSHybrid图形模式"(Advanced-Optimus)下运行GPU的选项,不仅可以节省电池寿命,还可以使用雷电4视频输出,因为这在 "独立图形模式 "下是禁用的。在每种情况下都需要重新启动系统。
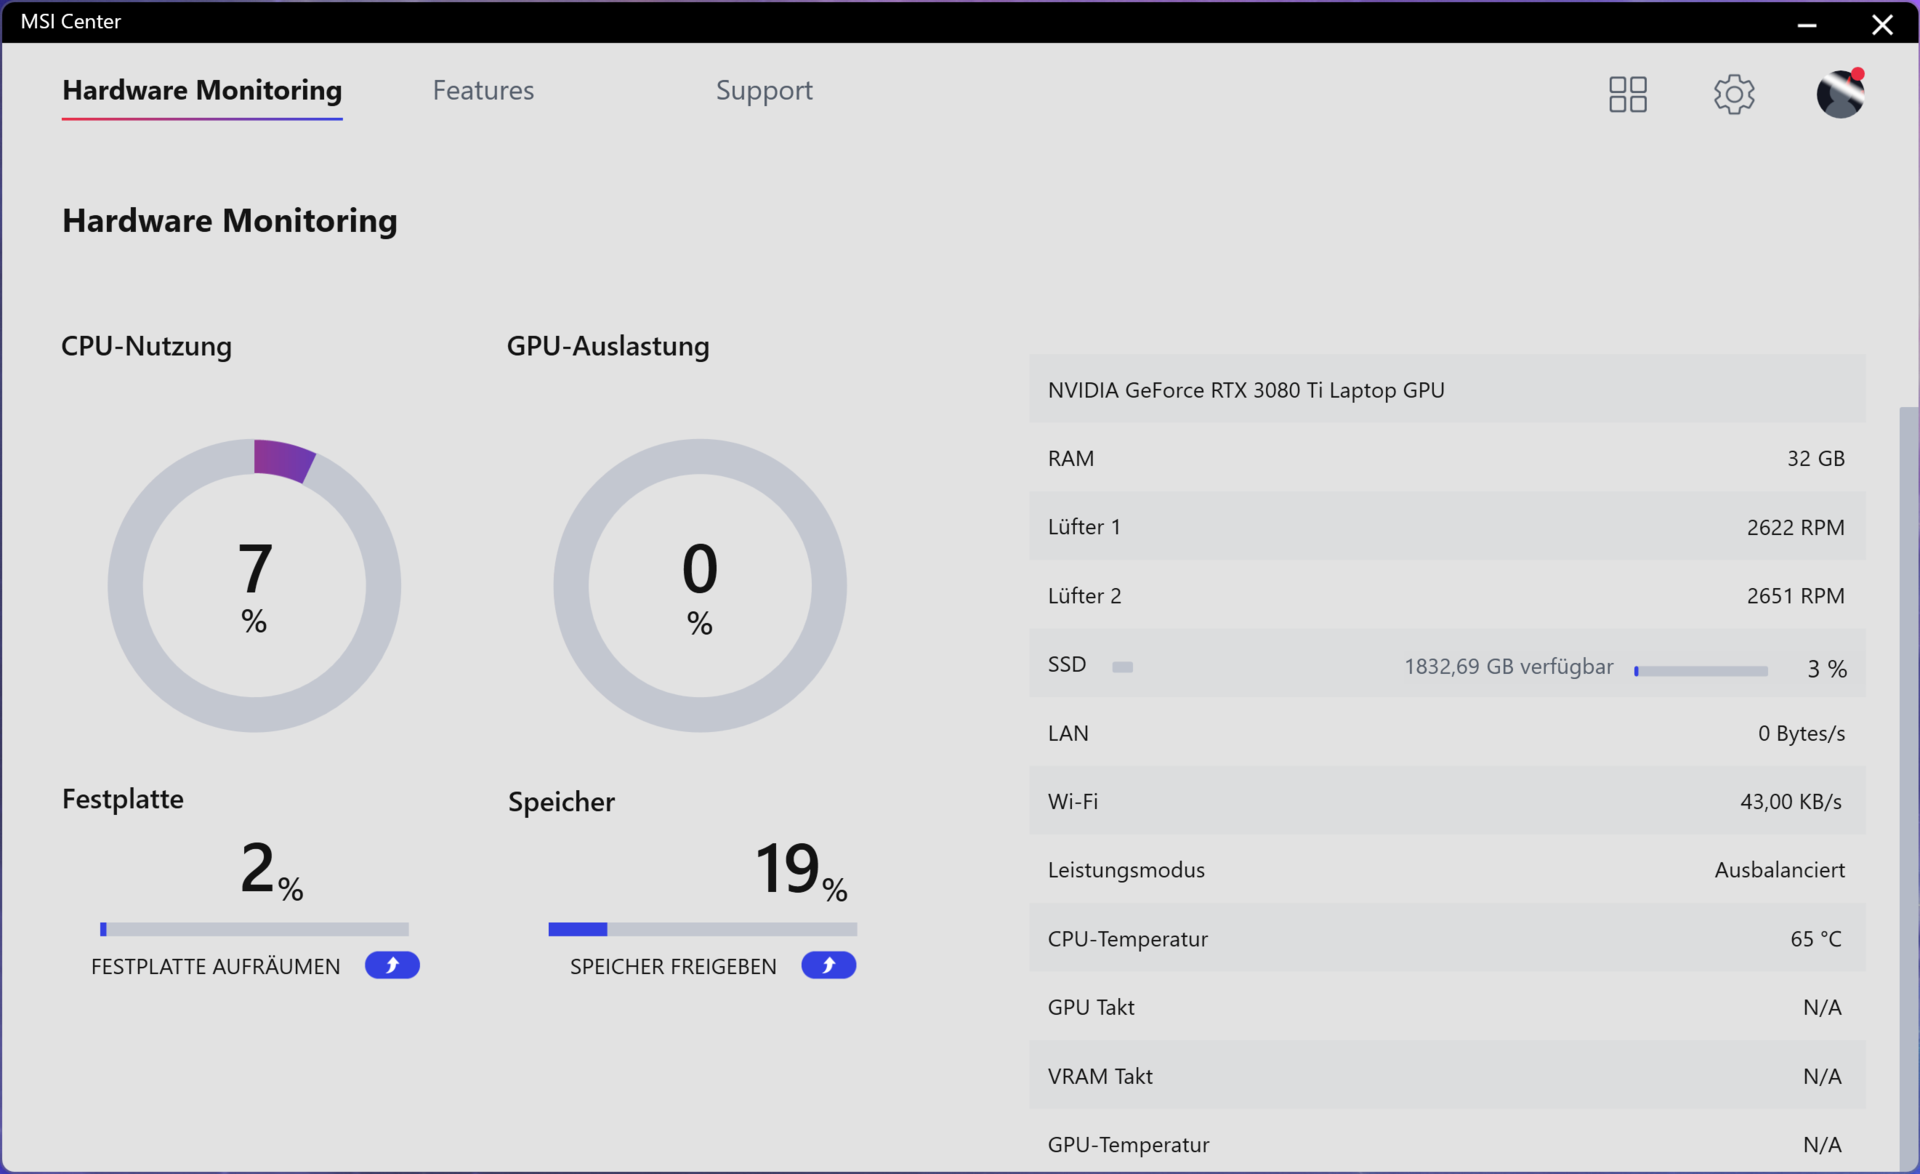
我们观察到几个缺点,在MSI中心启动时偶尔会有很长的等待时间,它也经常无缘无故地崩溃,而且在我们的评测设备中,"硬件监控 "工具不断冻结。
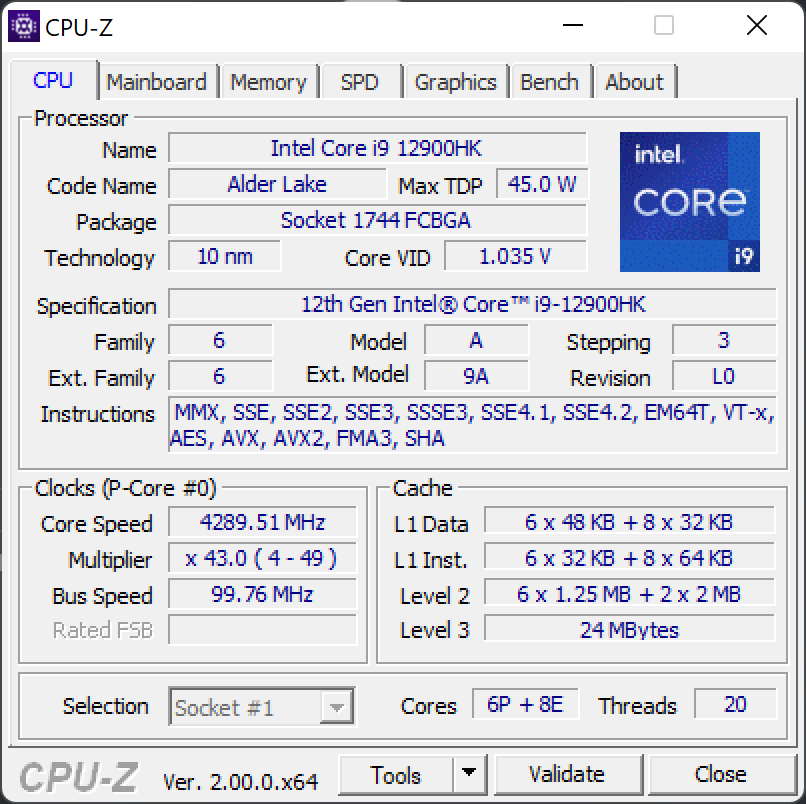
处理器
我们的评测设备使用的是英特尔酷睿i9 12900HK。 是英特尔最强大的移动CPU之一,与即将发布的 英特尔酷睿i9 12950HX。英特尔酷睿i9 12900HK有14个核心(20个线程),6个性能核心和8个效率核心,提供高达5GHz的涡轮增压和24MB L3缓存。
在具有自动风扇控制的Cinebench R23基准测试以及 "极端性能 "配置文件中,CPU在被热控之前短暂地消耗了86瓦特。在这种情况下,多核基准测试的最高得分是16236分。在相同条件下,在电池模式下,这一分数下降到12,729分。如果你把性能和风扇控制留给 "智能自动模式 "中的AI(人工智能),分数只略微增加到16,533分,CPU短暂消耗90瓦而不是86瓦。如果你在 "极限性能 "配置文件中把风扇模式改为 "冷却器提升",你将达到近17,000分和92瓦的峰值负载,但你必须忍受高得多的噪音。
微星为所安装的处理器配备了一个 "相变液态金属垫",其功能是作为固体形式的热传导垫,直到它在58摄氏度时融化并变成液态金属,然后据说可以显著改善高温下的热传导性。
我们的测试结果。即使使用液态金属,这台15英寸的电脑也没有完全发挥出其英特尔酷睿i9 12900HK的潜力,甚至被英特尔酷睿i7 12700H的某些对比设备。微星GE66 12UHS的老大哥,即 GE76 12UHS在我们的Cinebench R15多重持续负载测试中,同样的CPU也 "只 "得到了2722分。在我们的 联想Legion 5 Pro 16 G7和 Schenker Neo 15都采用了12700H处理器,性能超过了GE66和更大的MSI GE76 12UHS。与前者相比,采用英特尔 Core i9 10980HK相比,我们的评测设备的性能还是有了超过50%的显著提升。
Cinebench R15 Multi Sustained Load
* ... smaller is better
AIDA64: FP32 Ray-Trace | FPU Julia | CPU SHA3 | CPU Queen | FPU SinJulia | FPU Mandel | CPU AES | CPU ZLib | FP64 Ray-Trace | CPU PhotoWorxx
| Performance rating | |
| Average of class Gaming | |
| Lenovo Legion 5 Pro 16 G7 i7 RTX 3070Ti | |
| MSI Raider GE66 12UHS | |
| Schenker XMG Neo 15 E22 (Early 2022, RTX 3080 Ti) | |
| Average Intel Core i9-12900HK | |
| MSI GE66 Raider 10SFS | |
| Razer Blade 15 2022 | |
| AIDA64 / FP32 Ray-Trace | |
| Average of class Gaming (10227 - 85542, n=110, last 2 years) | |
| MSI GE66 Raider 10SFS | |
| Average Intel Core i9-12900HK (2677 - 13948, n=15) | |
| Lenovo Legion 5 Pro 16 G7 i7 RTX 3070Ti | |
| Schenker XMG Neo 15 E22 (Early 2022, RTX 3080 Ti) | |
| MSI Raider GE66 12UHS | |
| Razer Blade 15 2022 | |
| AIDA64 / FPU Julia | |
| Average of class Gaming (51376 - 238426, n=110, last 2 years) | |
| MSI GE66 Raider 10SFS | |
| Average Intel Core i9-12900HK (12762 - 70764, n=15) | |
| Schenker XMG Neo 15 E22 (Early 2022, RTX 3080 Ti) | |
| Lenovo Legion 5 Pro 16 G7 i7 RTX 3070Ti | |
| MSI Raider GE66 12UHS | |
| Razer Blade 15 2022 | |
| AIDA64 / CPU SHA3 | |
| Average of class Gaming (2180 - 9817, n=110, last 2 years) | |
| Lenovo Legion 5 Pro 16 G7 i7 RTX 3070Ti | |
| Schenker XMG Neo 15 E22 (Early 2022, RTX 3080 Ti) | |
| MSI Raider GE66 12UHS | |
| Average Intel Core i9-12900HK (841 - 3504, n=15) | |
| MSI GE66 Raider 10SFS | |
| Razer Blade 15 2022 | |
| AIDA64 / CPU Queen | |
| Average of class Gaming (49785 - 173351, n=101, last 2 years) | |
| MSI Raider GE66 12UHS | |
| Lenovo Legion 5 Pro 16 G7 i7 RTX 3070Ti | |
| Schenker XMG Neo 15 E22 (Early 2022, RTX 3080 Ti) | |
| Average Intel Core i9-12900HK (60202 - 107161, n=15) | |
| MSI GE66 Raider 10SFS | |
| Razer Blade 15 2022 | |
| AIDA64 / FPU SinJulia | |
| Average of class Gaming (4424 - 33636, n=110, last 2 years) | |
| MSI GE66 Raider 10SFS | |
| Schenker XMG Neo 15 E22 (Early 2022, RTX 3080 Ti) | |
| Lenovo Legion 5 Pro 16 G7 i7 RTX 3070Ti | |
| MSI Raider GE66 12UHS | |
| Razer Blade 15 2022 | |
| Average Intel Core i9-12900HK (3225 - 10402, n=15) | |
| AIDA64 / FPU Mandel | |
| Average of class Gaming (25115 - 128721, n=110, last 2 years) | |
| MSI GE66 Raider 10SFS | |
| Lenovo Legion 5 Pro 16 G7 i7 RTX 3070Ti | |
| Schenker XMG Neo 15 E22 (Early 2022, RTX 3080 Ti) | |
| Average Intel Core i9-12900HK (7417 - 34233, n=15) | |
| MSI Raider GE66 12UHS | |
| Razer Blade 15 2022 | |
| AIDA64 / CPU AES | |
| Average of class Gaming (39258 - 247074, n=110, last 2 years) | |
| Lenovo Legion 5 Pro 16 G7 i7 RTX 3070Ti | |
| MSI Raider GE66 12UHS | |
| Average Intel Core i9-12900HK (32382 - 112498, n=15) | |
| Schenker XMG Neo 15 E22 (Early 2022, RTX 3080 Ti) | |
| Razer Blade 15 2022 | |
| MSI GE66 Raider 10SFS | |
| AIDA64 / CPU ZLib | |
| Average of class Gaming (574 - 2531, n=110, last 2 years) | |
| Lenovo Legion 5 Pro 16 G7 i7 RTX 3070Ti | |
| Schenker XMG Neo 15 E22 (Early 2022, RTX 3080 Ti) | |
| MSI Raider GE66 12UHS | |
| Average Intel Core i9-12900HK (314 - 1209, n=15) | |
| Razer Blade 15 2022 | |
| MSI GE66 Raider 10SFS | |
| AIDA64 / FP64 Ray-Trace | |
| Average of class Gaming (5509 - 45446, n=110, last 2 years) | |
| MSI GE66 Raider 10SFS | |
| Lenovo Legion 5 Pro 16 G7 i7 RTX 3070Ti | |
| Schenker XMG Neo 15 E22 (Early 2022, RTX 3080 Ti) | |
| Average Intel Core i9-12900HK (1501 - 7616, n=15) | |
| MSI Raider GE66 12UHS | |
| Razer Blade 15 2022 | |
| AIDA64 / CPU PhotoWorxx | |
| Average of class Gaming (12271 - 89891, n=110, last 2 years) | |
| Razer Blade 15 2022 | |
| MSI Raider GE66 12UHS | |
| Schenker XMG Neo 15 E22 (Early 2022, RTX 3080 Ti) | |
| Average Intel Core i9-12900HK (24446 - 42462, n=15) | |
| Lenovo Legion 5 Pro 16 G7 i7 RTX 3070Ti | |
| MSI GE66 Raider 10SFS | |
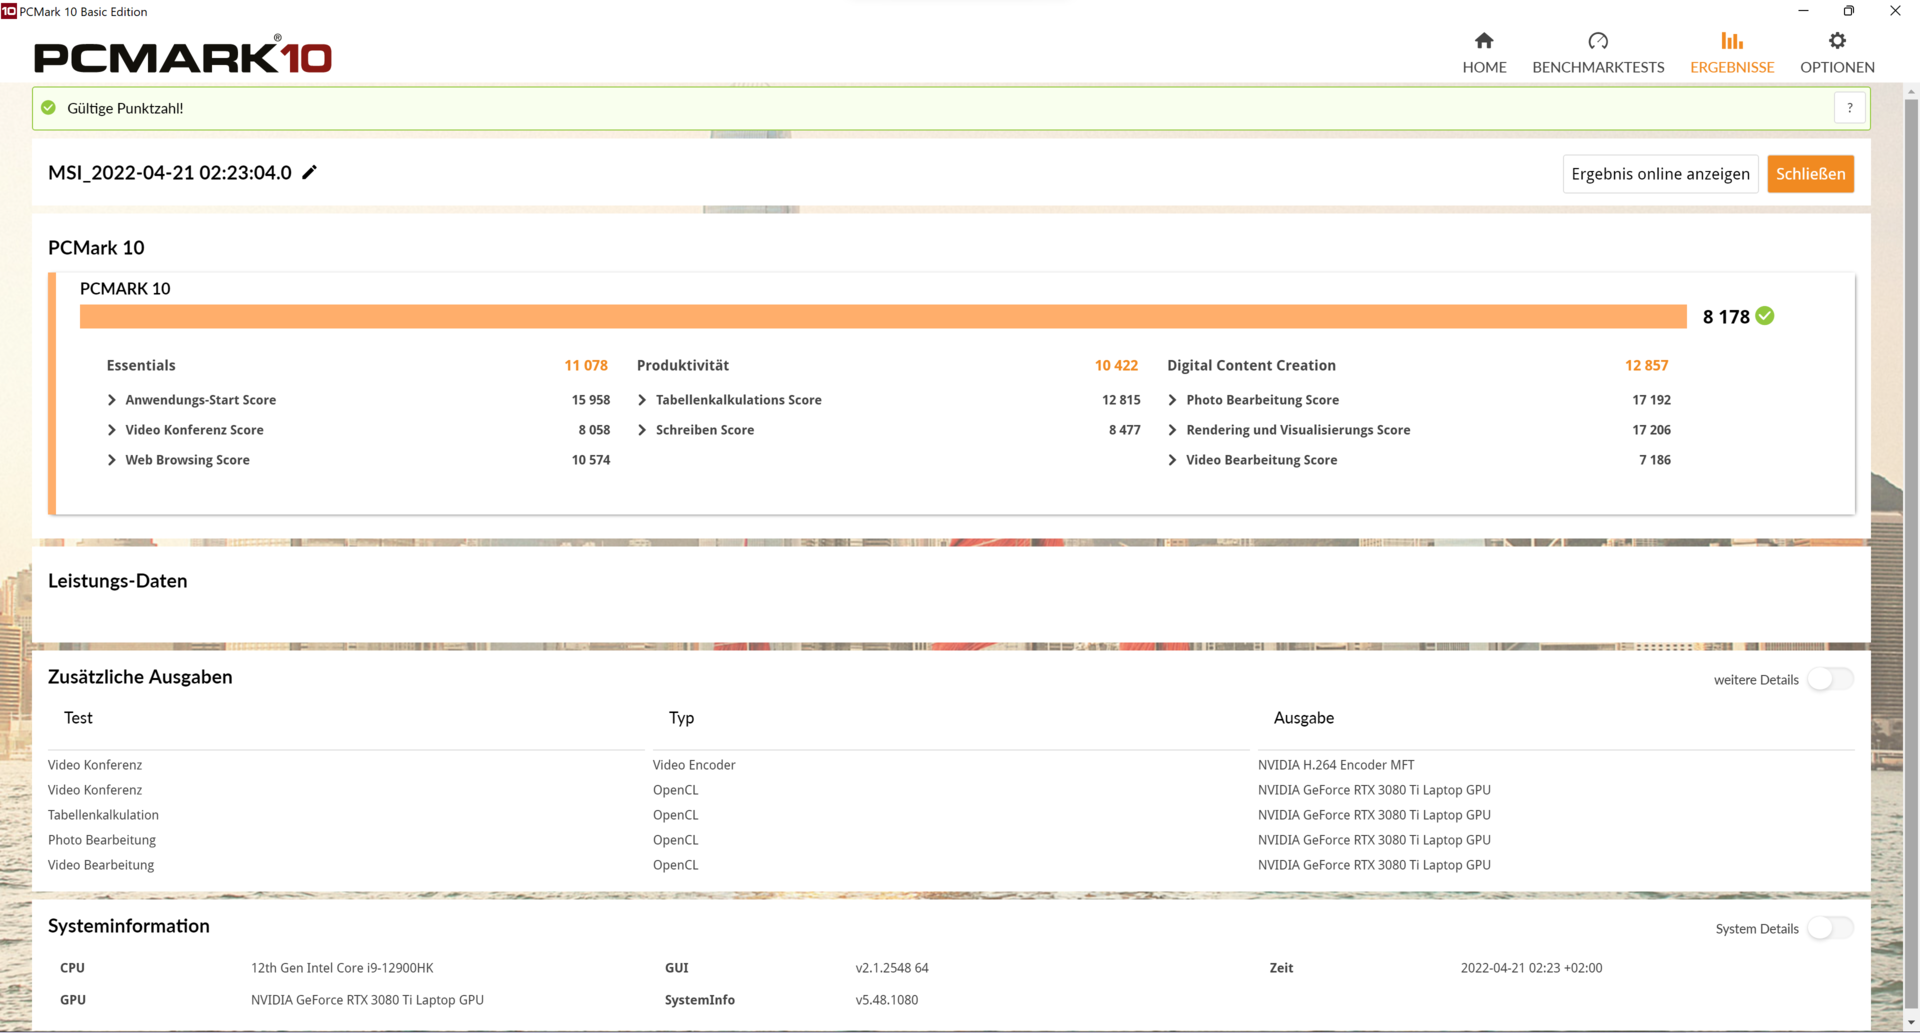
系统性能
正如预期的那样,系统性能原来是很高的。我们的微星GE66 12UHS与竞争对手擦肩而过,并在所有测试类别中显示出卓越的性能。
CrossMark: Overall | Productivity | Creativity | Responsiveness
| PCMark 10 / Score | |
| Average of class Gaming (5828 - 11574, n=96, last 2 years) | |
| MSI Raider GE66 12UHS | |
| Average Intel Core i9-12900HK, NVIDIA GeForce RTX 3080 Ti Laptop GPU (7149 - 8186, n=5) | |
| Razer Blade 15 2022 | |
| Lenovo Legion 5 Pro 16 G7 i7 RTX 3070Ti | |
| Schenker XMG Neo 15 E22 (Early 2022, RTX 3080 Ti) | |
| MSI GE66 Raider 10SFS | |
| PCMark 10 / Essentials | |
| MSI Raider GE66 12UHS | |
| Average Intel Core i9-12900HK, NVIDIA GeForce RTX 3080 Ti Laptop GPU (9870 - 11205, n=5) | |
| Razer Blade 15 2022 | |
| Average of class Gaming (8810 - 12600, n=100, last 2 years) | |
| Schenker XMG Neo 15 E22 (Early 2022, RTX 3080 Ti) | |
| Lenovo Legion 5 Pro 16 G7 i7 RTX 3070Ti | |
| MSI GE66 Raider 10SFS | |
| PCMark 10 / Productivity | |
| Average of class Gaming (6845 - 18766, n=98, last 2 years) | |
| MSI Raider GE66 12UHS | |
| Average Intel Core i9-12900HK, NVIDIA GeForce RTX 3080 Ti Laptop GPU (9173 - 10422, n=5) | |
| Lenovo Legion 5 Pro 16 G7 i7 RTX 3070Ti | |
| Razer Blade 15 2022 | |
| Schenker XMG Neo 15 E22 (Early 2022, RTX 3080 Ti) | |
| MSI GE66 Raider 10SFS | |
| PCMark 10 / Digital Content Creation | |
| Average of class Gaming (7602 - 19657, n=98, last 2 years) | |
| MSI Raider GE66 12UHS | |
| Average Intel Core i9-12900HK, NVIDIA GeForce RTX 3080 Ti Laptop GPU (10951 - 13098, n=5) | |
| Razer Blade 15 2022 | |
| Lenovo Legion 5 Pro 16 G7 i7 RTX 3070Ti | |
| Schenker XMG Neo 15 E22 (Early 2022, RTX 3080 Ti) | |
| MSI GE66 Raider 10SFS | |
| CrossMark / Overall | |
| Average of class Gaming (1366 - 2409, n=98, last 2 years) | |
| Lenovo Legion 5 Pro 16 G7 i7 RTX 3070Ti | |
| Average Intel Core i9-12900HK, NVIDIA GeForce RTX 3080 Ti Laptop GPU (970 - 2138, n=5) | |
| CrossMark / Productivity | |
| Lenovo Legion 5 Pro 16 G7 i7 RTX 3070Ti | |
| Average of class Gaming (1386 - 2254, n=98, last 2 years) | |
| Average Intel Core i9-12900HK, NVIDIA GeForce RTX 3080 Ti Laptop GPU (921 - 2038, n=5) | |
| CrossMark / Creativity | |
| Average of class Gaming (1343 - 2729, n=98, last 2 years) | |
| Lenovo Legion 5 Pro 16 G7 i7 RTX 3070Ti | |
| Average Intel Core i9-12900HK, NVIDIA GeForce RTX 3080 Ti Laptop GPU (1007 - 2210, n=5) | |
| CrossMark / Responsiveness | |
| Lenovo Legion 5 Pro 16 G7 i7 RTX 3070Ti | |
| Average Intel Core i9-12900HK, NVIDIA GeForce RTX 3080 Ti Laptop GPU (1012 - 2234, n=5) | |
| Average of class Gaming (1226 - 2334, n=98, last 2 years) | |
| PCMark 10 Score | 8178 points | |
Help | ||
| AIDA64 / Memory Copy | |
| Average of class Gaming (21750 - 129946, n=110, last 2 years) | |
| Schenker XMG Neo 15 E22 (Early 2022, RTX 3080 Ti) | |
| MSI Raider GE66 12UHS | |
| Razer Blade 15 2022 | |
| Average Intel Core i9-12900HK (42967 - 62959, n=15) | |
| Lenovo Legion 5 Pro 16 G7 i7 RTX 3070Ti | |
| MSI GE66 Raider 10SFS | |
| AIDA64 / Memory Read | |
| Average of class Gaming (22956 - 118858, n=110, last 2 years) | |
| MSI Raider GE66 12UHS | |
| Schenker XMG Neo 15 E22 (Early 2022, RTX 3080 Ti) | |
| Razer Blade 15 2022 | |
| Average Intel Core i9-12900HK (44419 - 66989, n=15) | |
| Lenovo Legion 5 Pro 16 G7 i7 RTX 3070Ti | |
| MSI GE66 Raider 10SFS | |
| AIDA64 / Memory Write | |
| Average of class Gaming (22297 - 135096, n=110, last 2 years) | |
| Razer Blade 15 2022 | |
| Schenker XMG Neo 15 E22 (Early 2022, RTX 3080 Ti) | |
| MSI Raider GE66 12UHS | |
| Lenovo Legion 5 Pro 16 G7 i7 RTX 3070Ti | |
| Average Intel Core i9-12900HK (42144 - 65268, n=15) | |
| MSI GE66 Raider 10SFS | |
| AIDA64 / Memory Latency | |
| Average of class Gaming (75.3 - 259, n=110, last 2 years) | |
| Lenovo Legion 5 Pro 16 G7 i7 RTX 3070Ti | |
| MSI Raider GE66 12UHS | |
| Average Intel Core i9-12900HK (79.9 - 109, n=15) | |
| MSI GE66 Raider 10SFS | |
| Schenker XMG Neo 15 E22 (Early 2022, RTX 3080 Ti) | |
| Razer Blade 15 2022 | |
* ... smaller is better
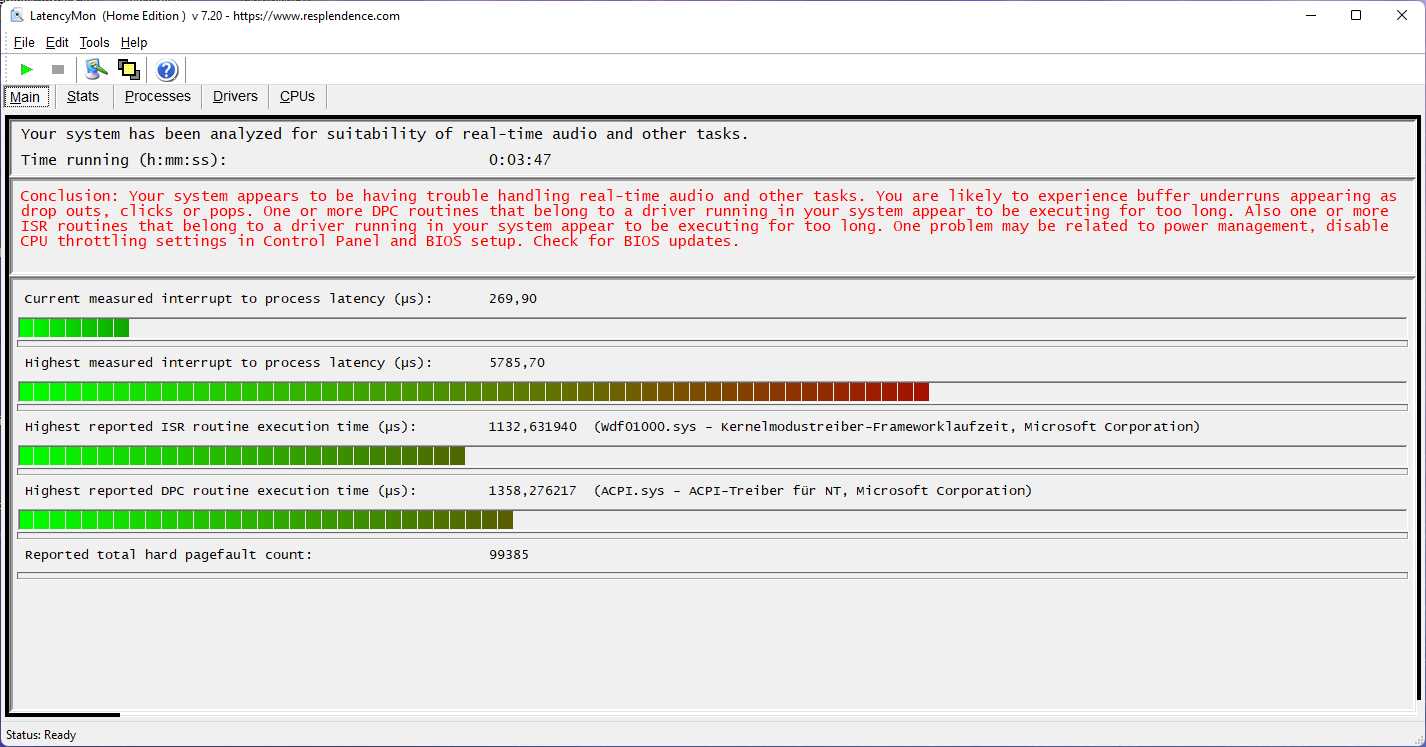
DPC延迟
对DPC延迟的测试显示,我们的评测设备不适合用目前的驱动和系统软件进行实时视频处理。在YouTube 4K视频和实时音频处理中都发现了延迟问题。
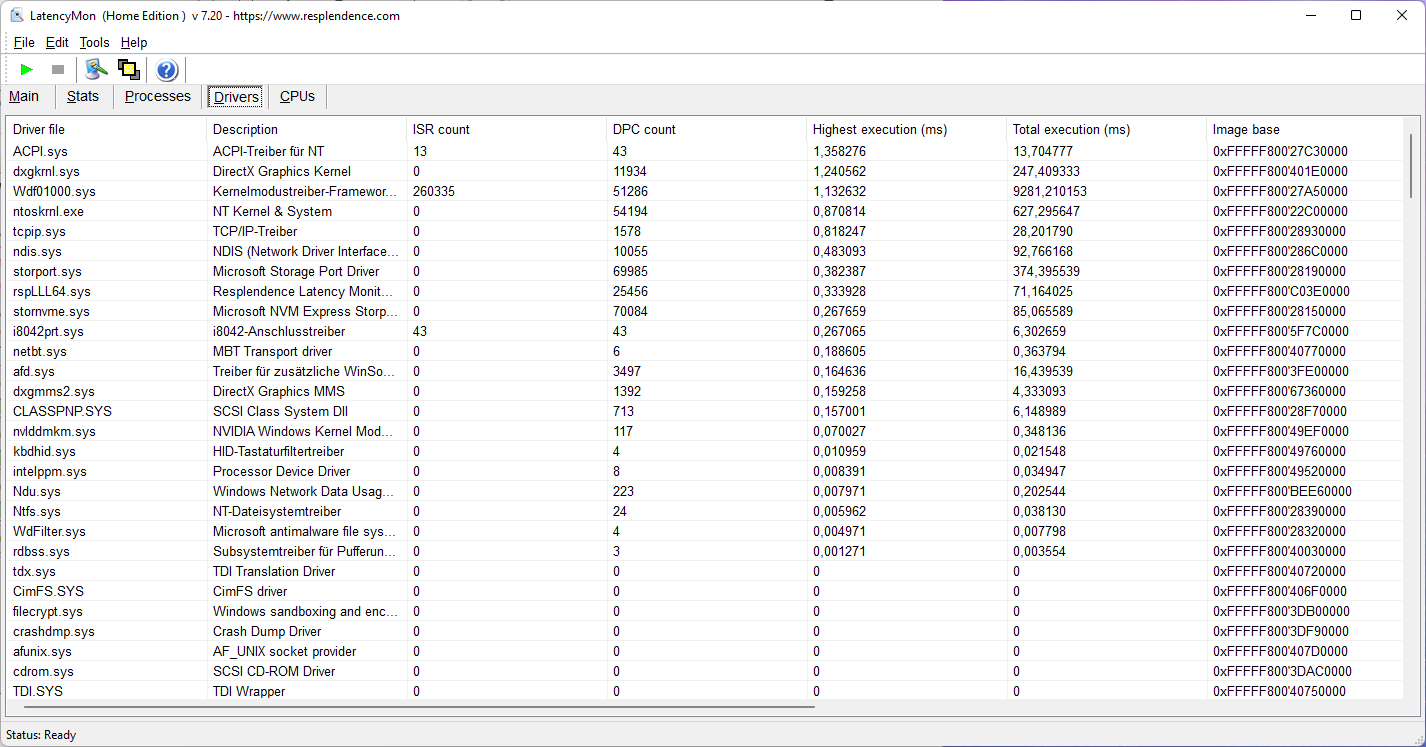
| DPC Latencies / LatencyMon - interrupt to process latency (max), Web, Youtube, Prime95 | |
| MSI Raider GE66 12UHS | |
| Razer Blade 15 2022 | |
| MSI GE66 Raider 10SFS | |
| Schenker XMG Neo 15 E22 (Early 2022, RTX 3080 Ti) | |
| Lenovo Legion 5 Pro 16 G7 i7 RTX 3070Ti | |
* ... smaller is better
存储设备
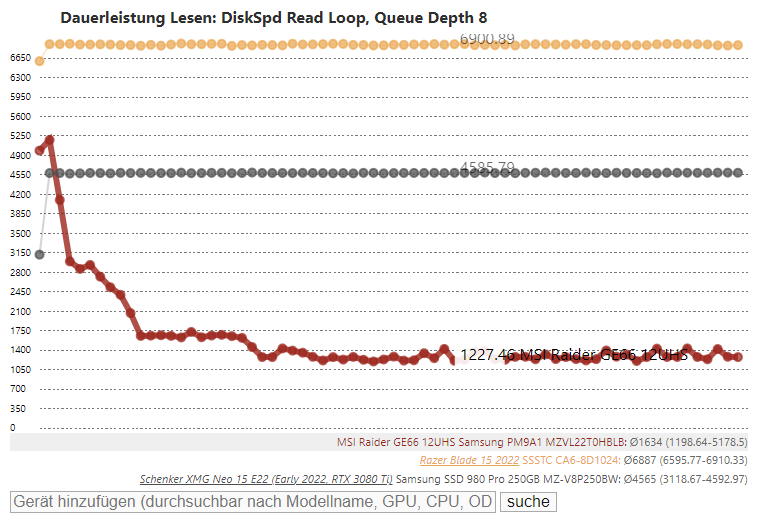
安装在我们系统中的2TB固态硬盘(代号为PM9A1,与三星Evo 980 Pro的OEM对应产品)提供了非常好的性能,仅次于同样的1TB版本的固态硬盘,后者也安装于联想的Legion 5 Pro 16 G7.然而,我们的磁盘速度基准显示,在整个测试期间,性能大幅下降,持续不断。我们在对华硕ROG Strix Scar 15的审查中也观察到了同样的问题。 华硕ROG Strix Scar 15 G533ZW。中也观察到了同样的问题,该产品配备了相同的固态硬盘。微星公司已经被告知这个问题。
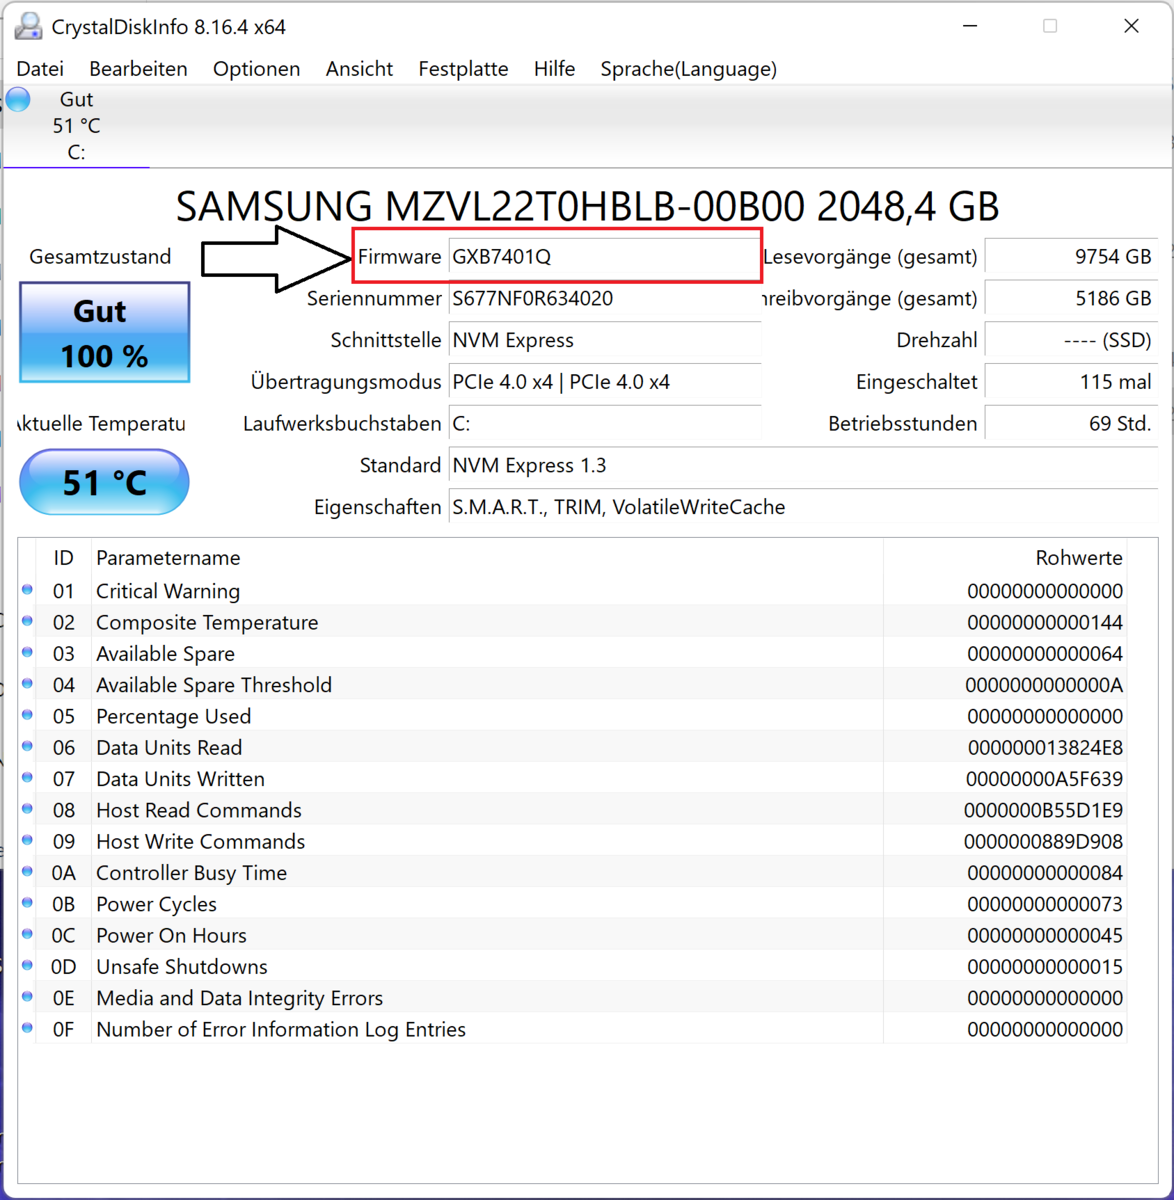
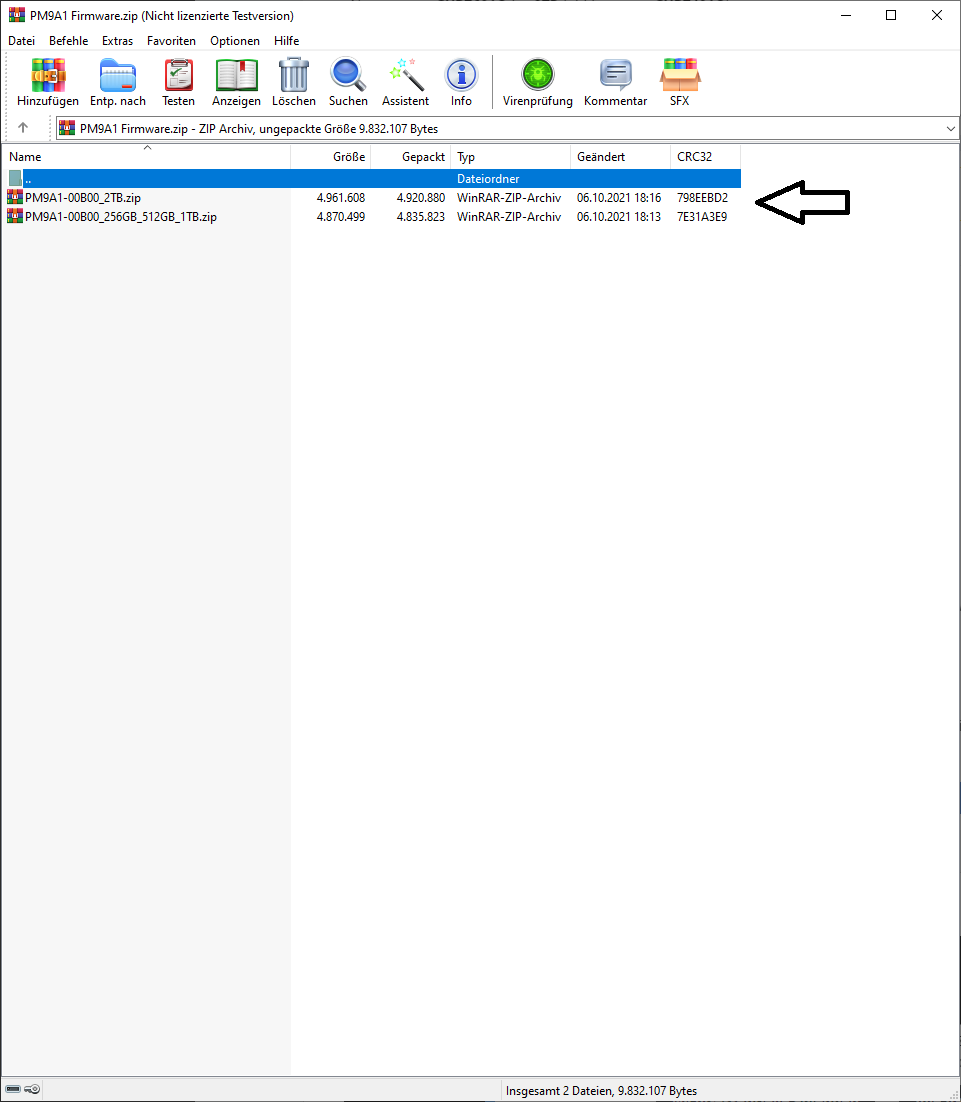
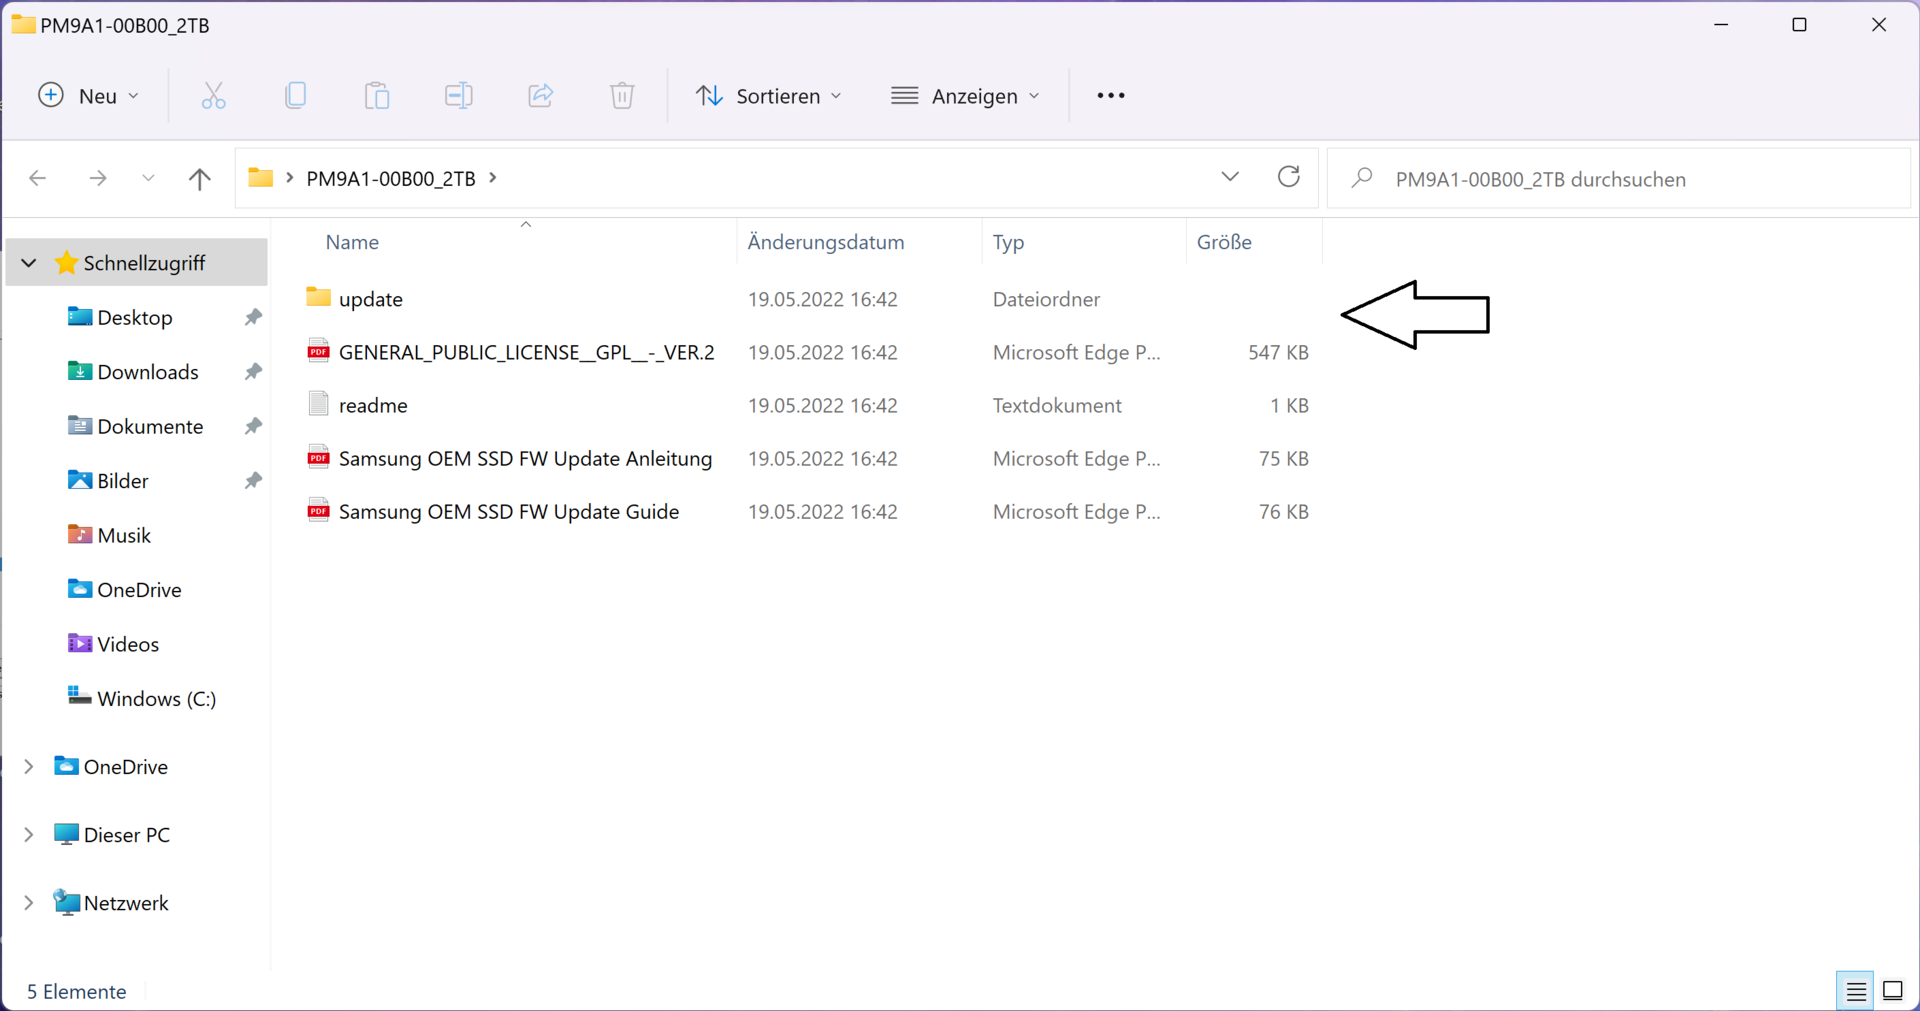
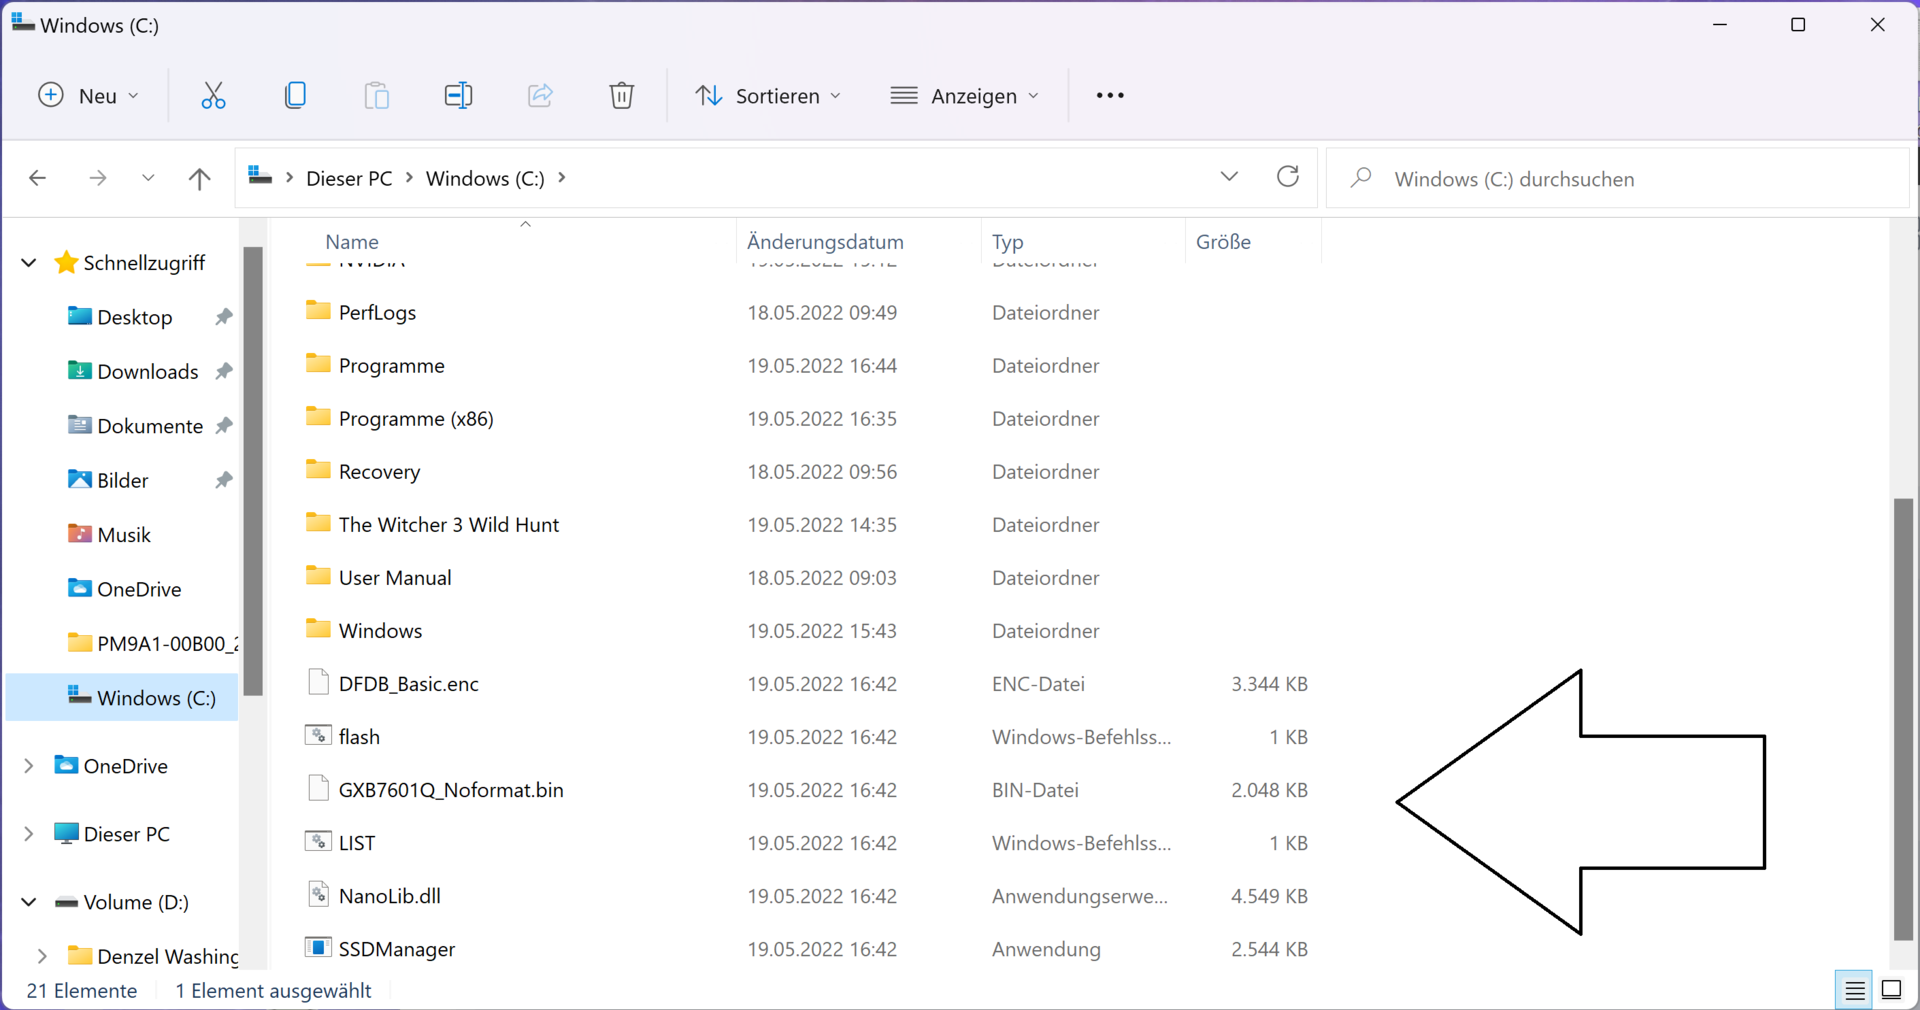
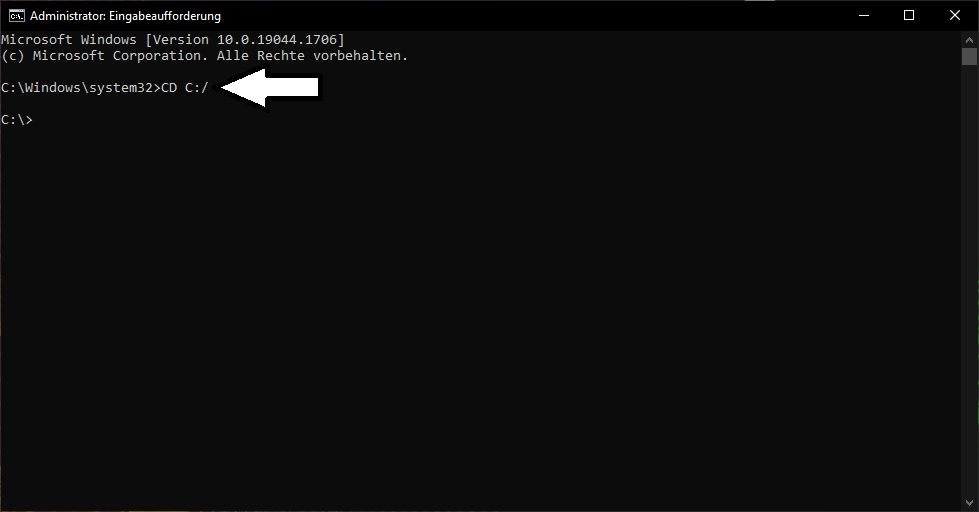
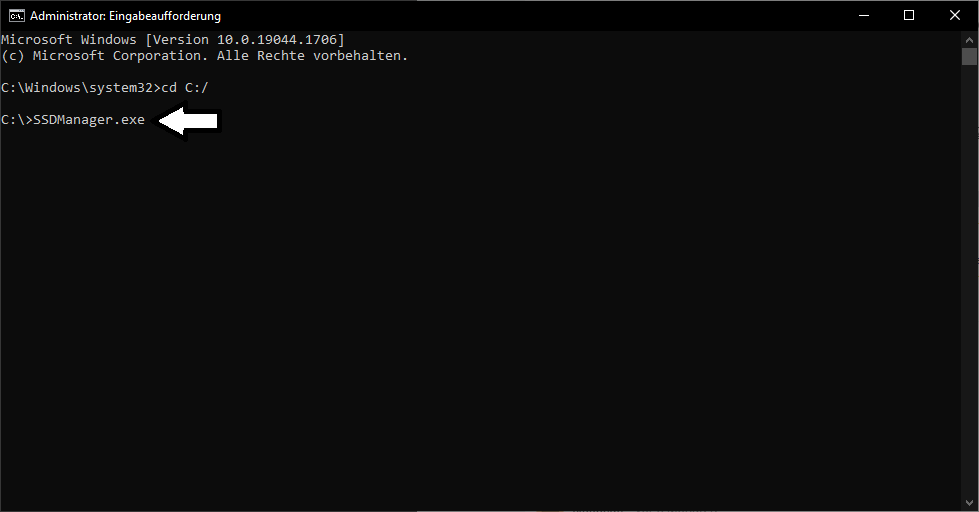
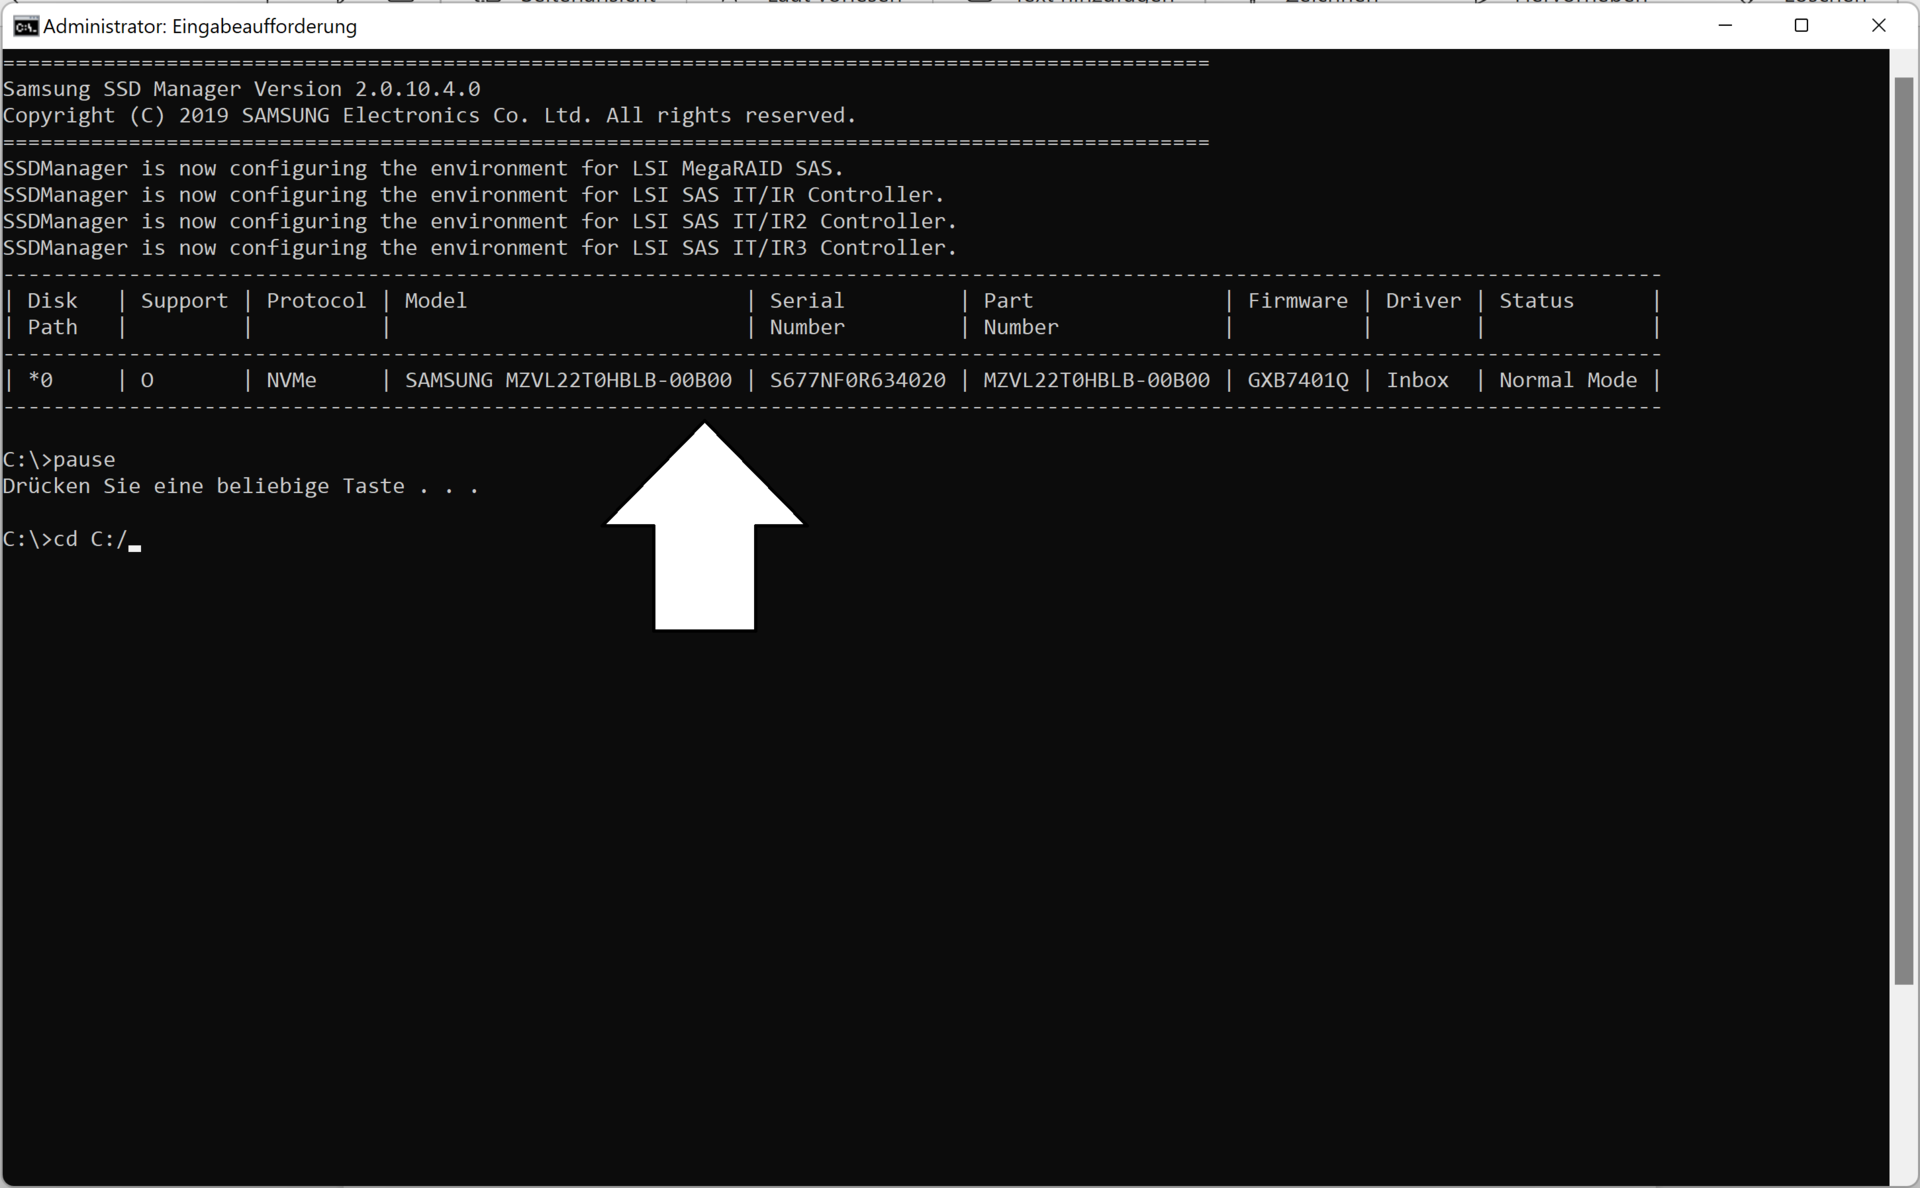
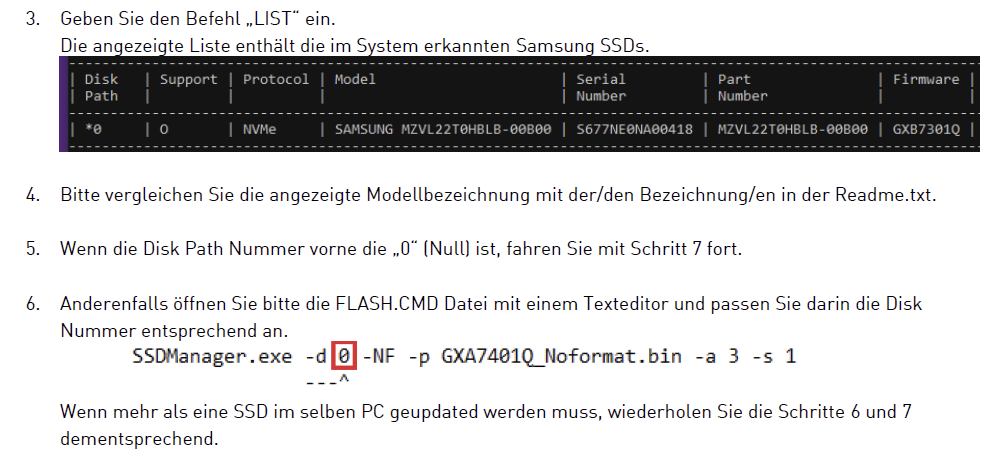
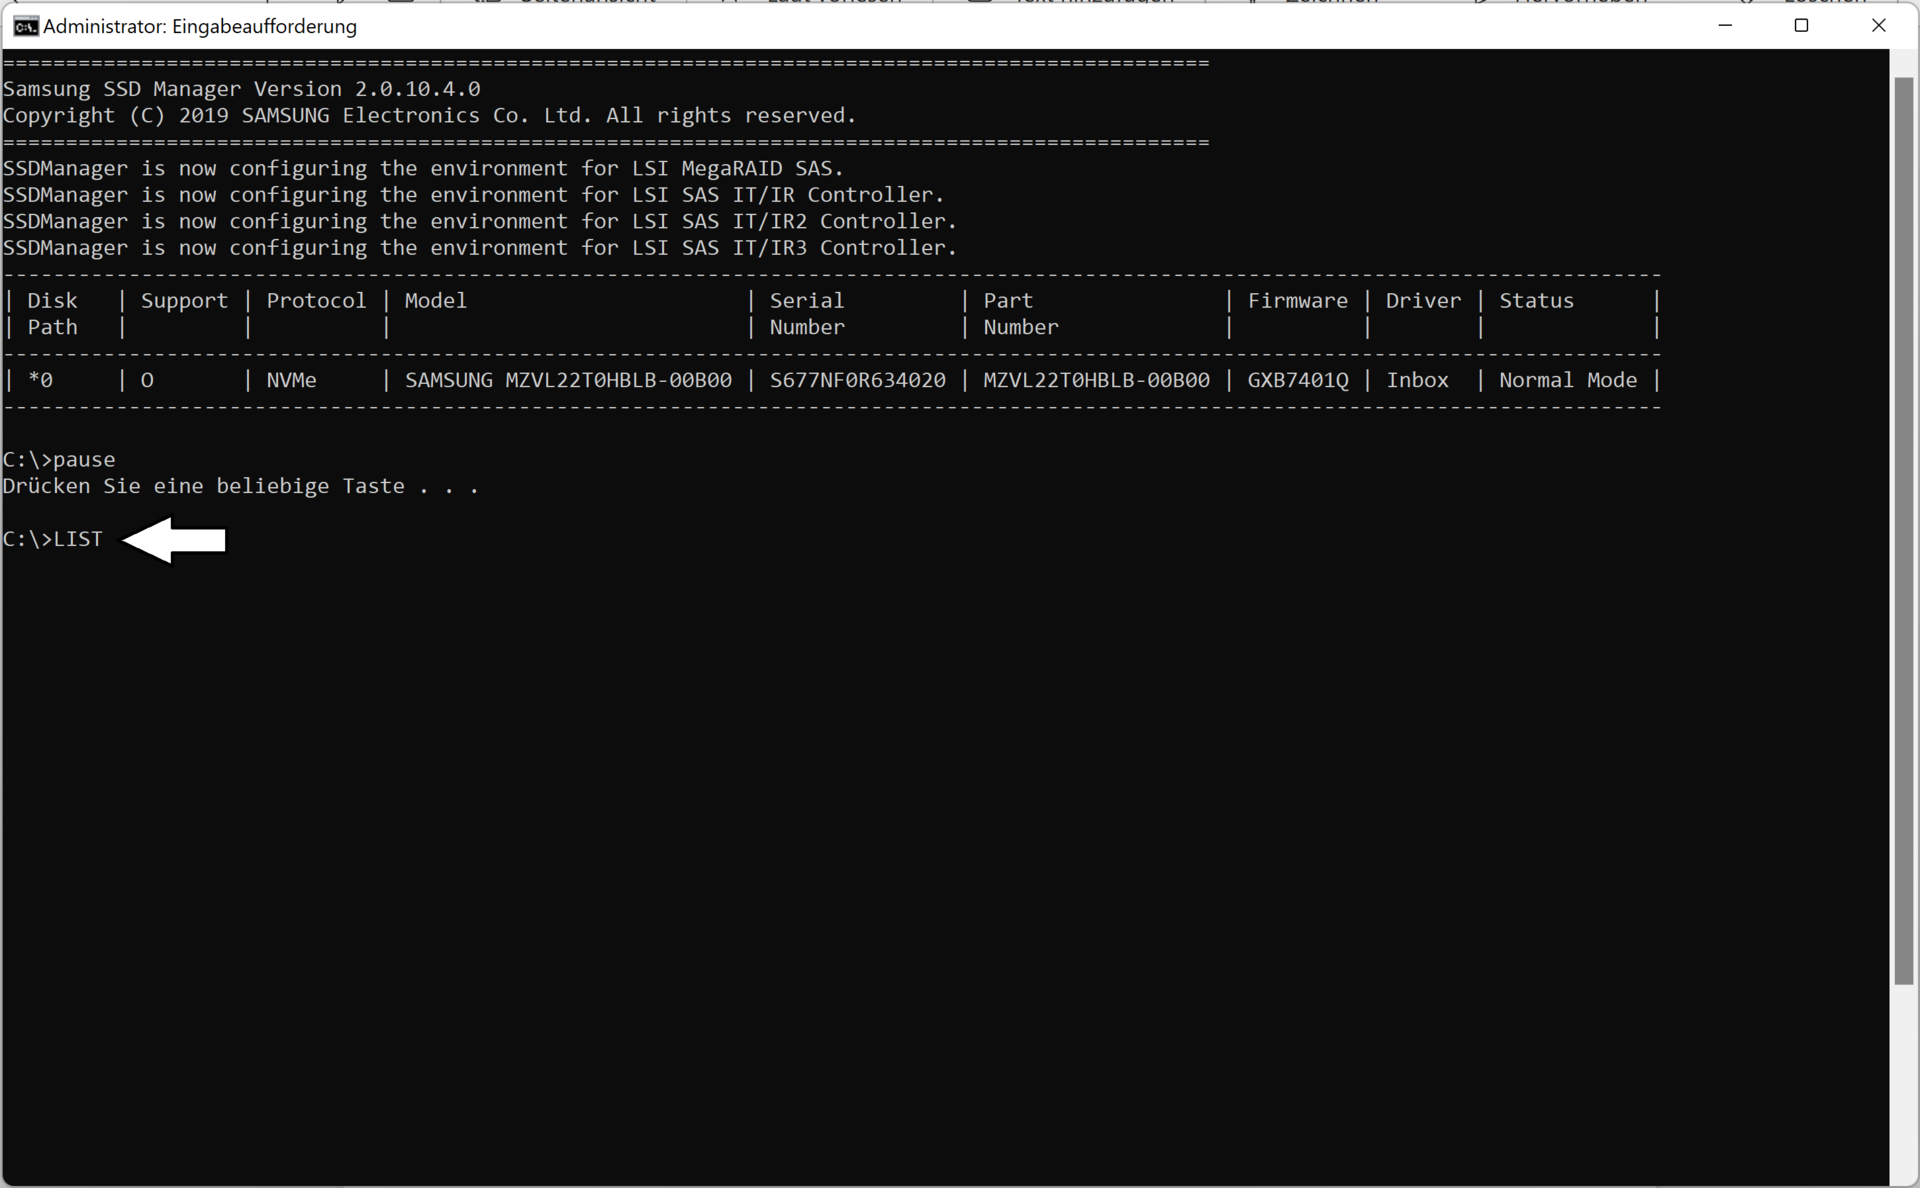
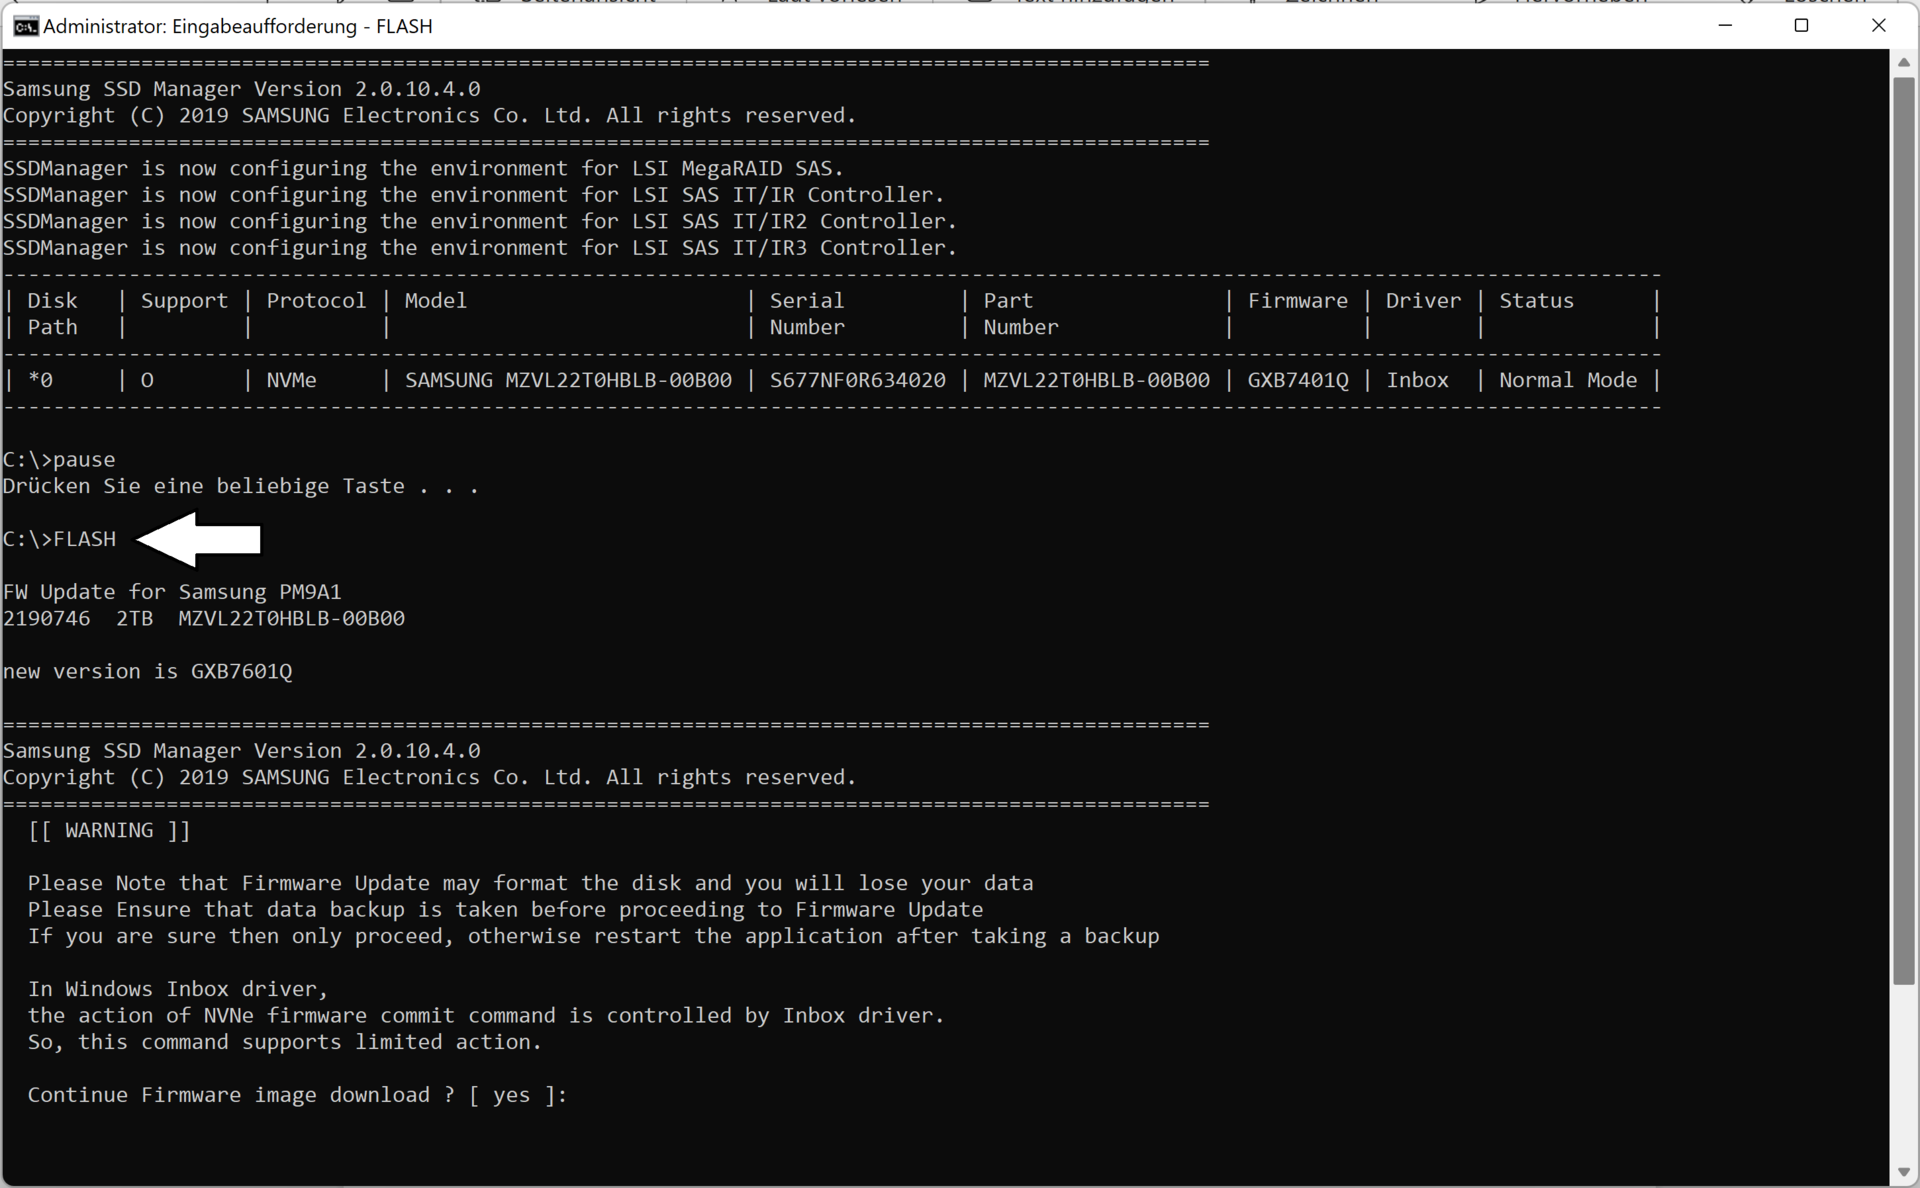
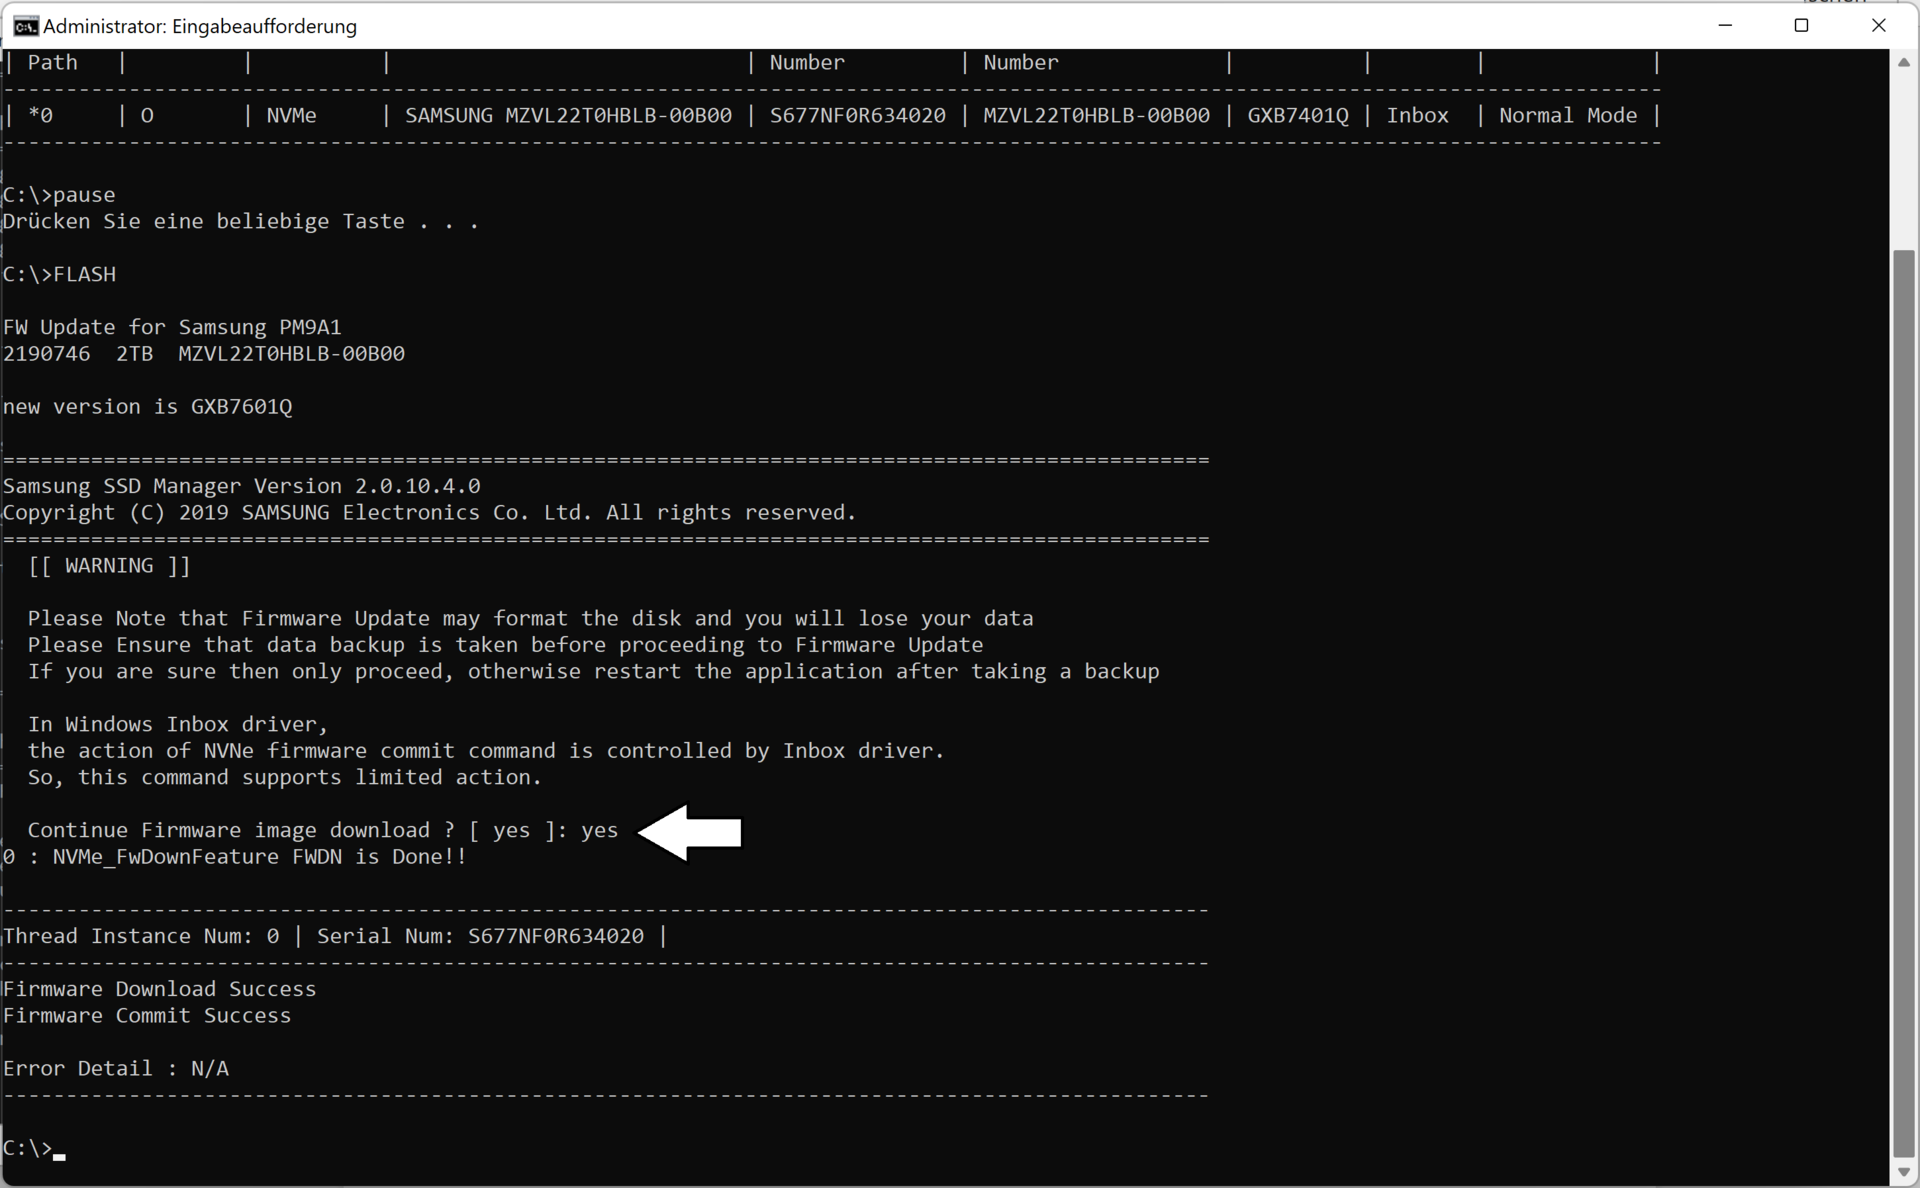
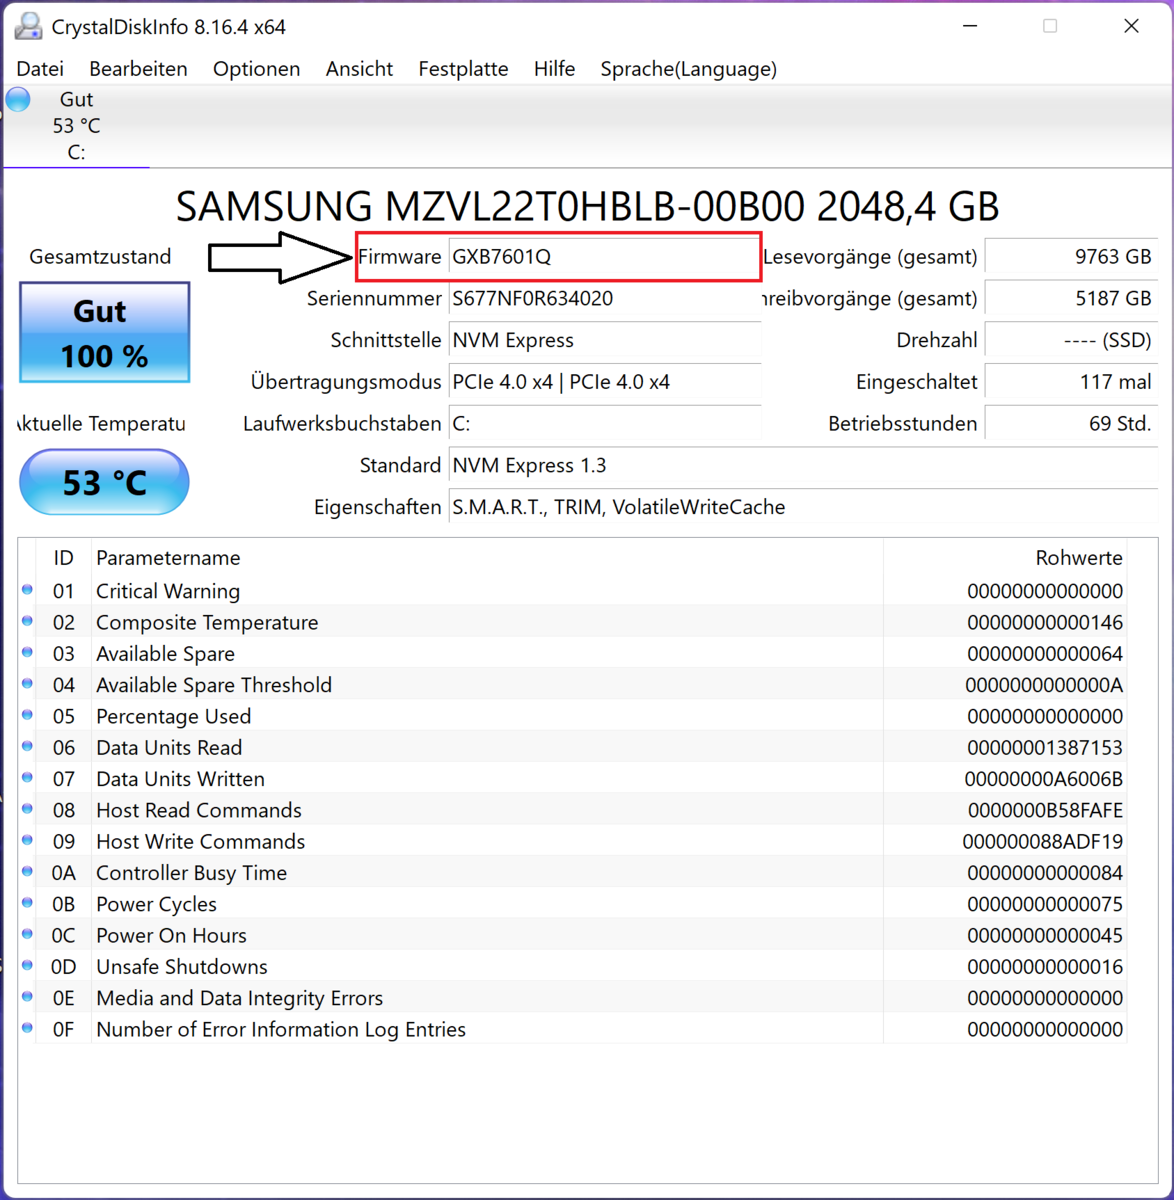
有两个原因:主要原因是固件的问题,无法通过Windows或MSI支持页面自动解决。对于过时的固件(版本:GXB7401Q),现在有一个修复方法,你可以通过命令提示更新到当前的版本(GXB7601Q)。不幸的是,该驱动程序不能通过设备管理器安装。进一步研究发现,这是256GB、512GB、1TB和2TB格式的三星PM9A1的一个著名问题。
在较长的持续负载期间,SDD性能下降的第二个原因是由于其被动冷却。即使在 "冷却器提升模式 "下也不能充分冷却,因此作为固态硬盘核心的三星Elpis S4LV003控制器从74摄氏度开始就会出现节流现象。有经验的用户如果有足够的信心打开他们的设备,也许可以通过在被动冷却板下面放置一个良好的固态硬盘热垫来补救这个问题。
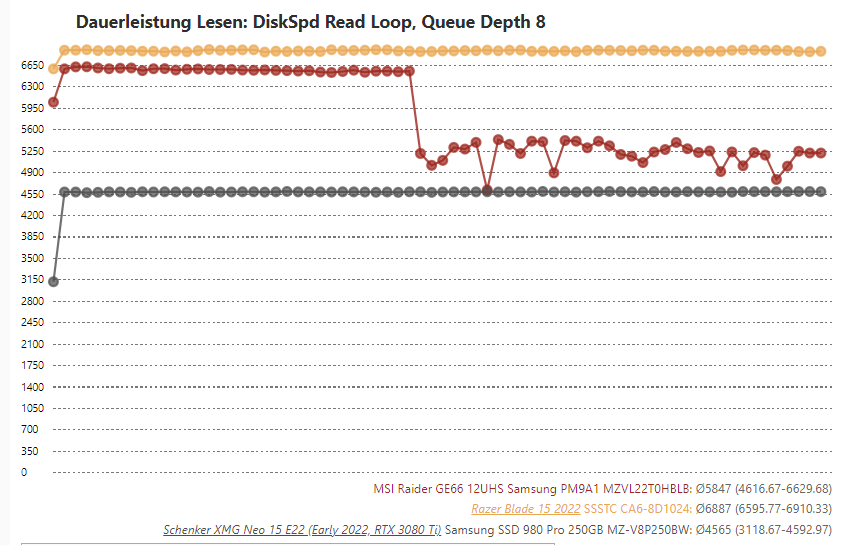
在下面的一系列图片中,我们向你展示如何在不损失数据的情况下安装更新。该固件可以在这里下载https://drive.google.com/file/d/1iV9SEqyyt5LlOFUdj56w_SDM6yHUbYKq/view (来源: :Reddit)。 注意。刷新固件的风险由你自己承担。

* ... smaller is better
更新前的持续读取:DiskSpd读取循环,队列深度为8
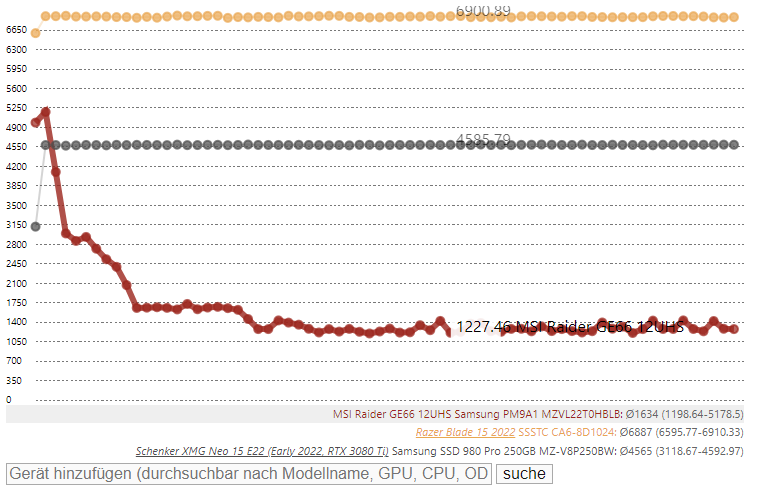
Sustained Read after the update: DiskSpd Read Loop, Queue Depth 8
图形卡
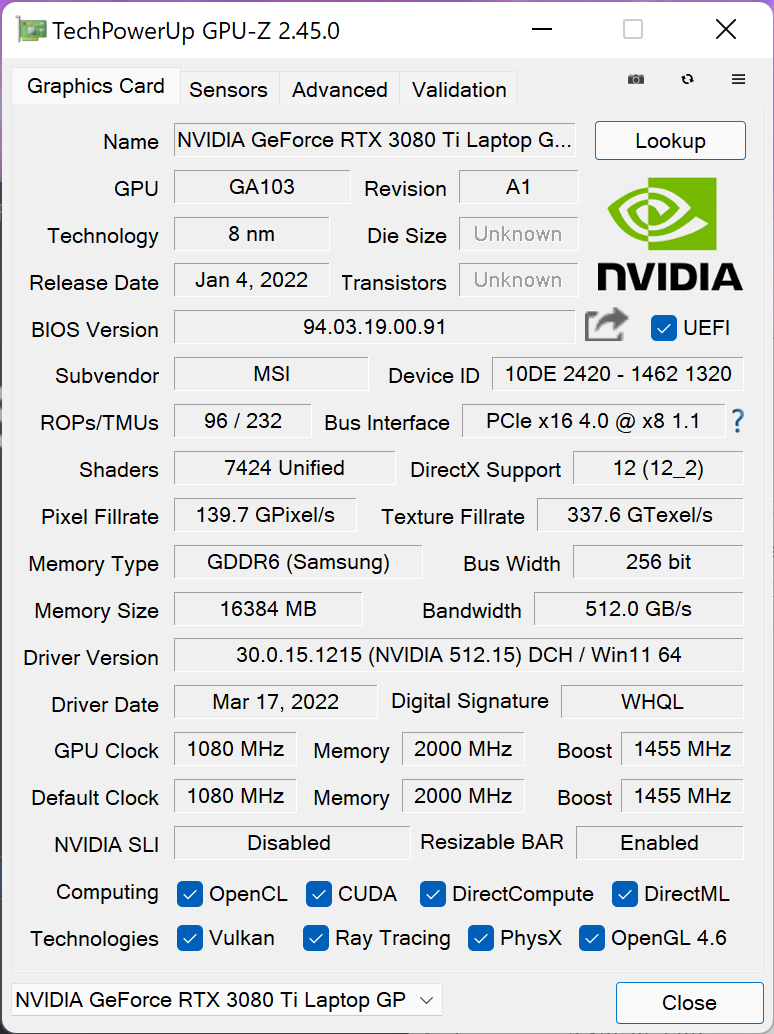
微星在我们的评测设备中使用了目前最强大的移动图形解决方案:Nvidia Geforce RTX 3080 Ti,它配备了16GB的GDDR6内存,最大图形功率为150瓦。
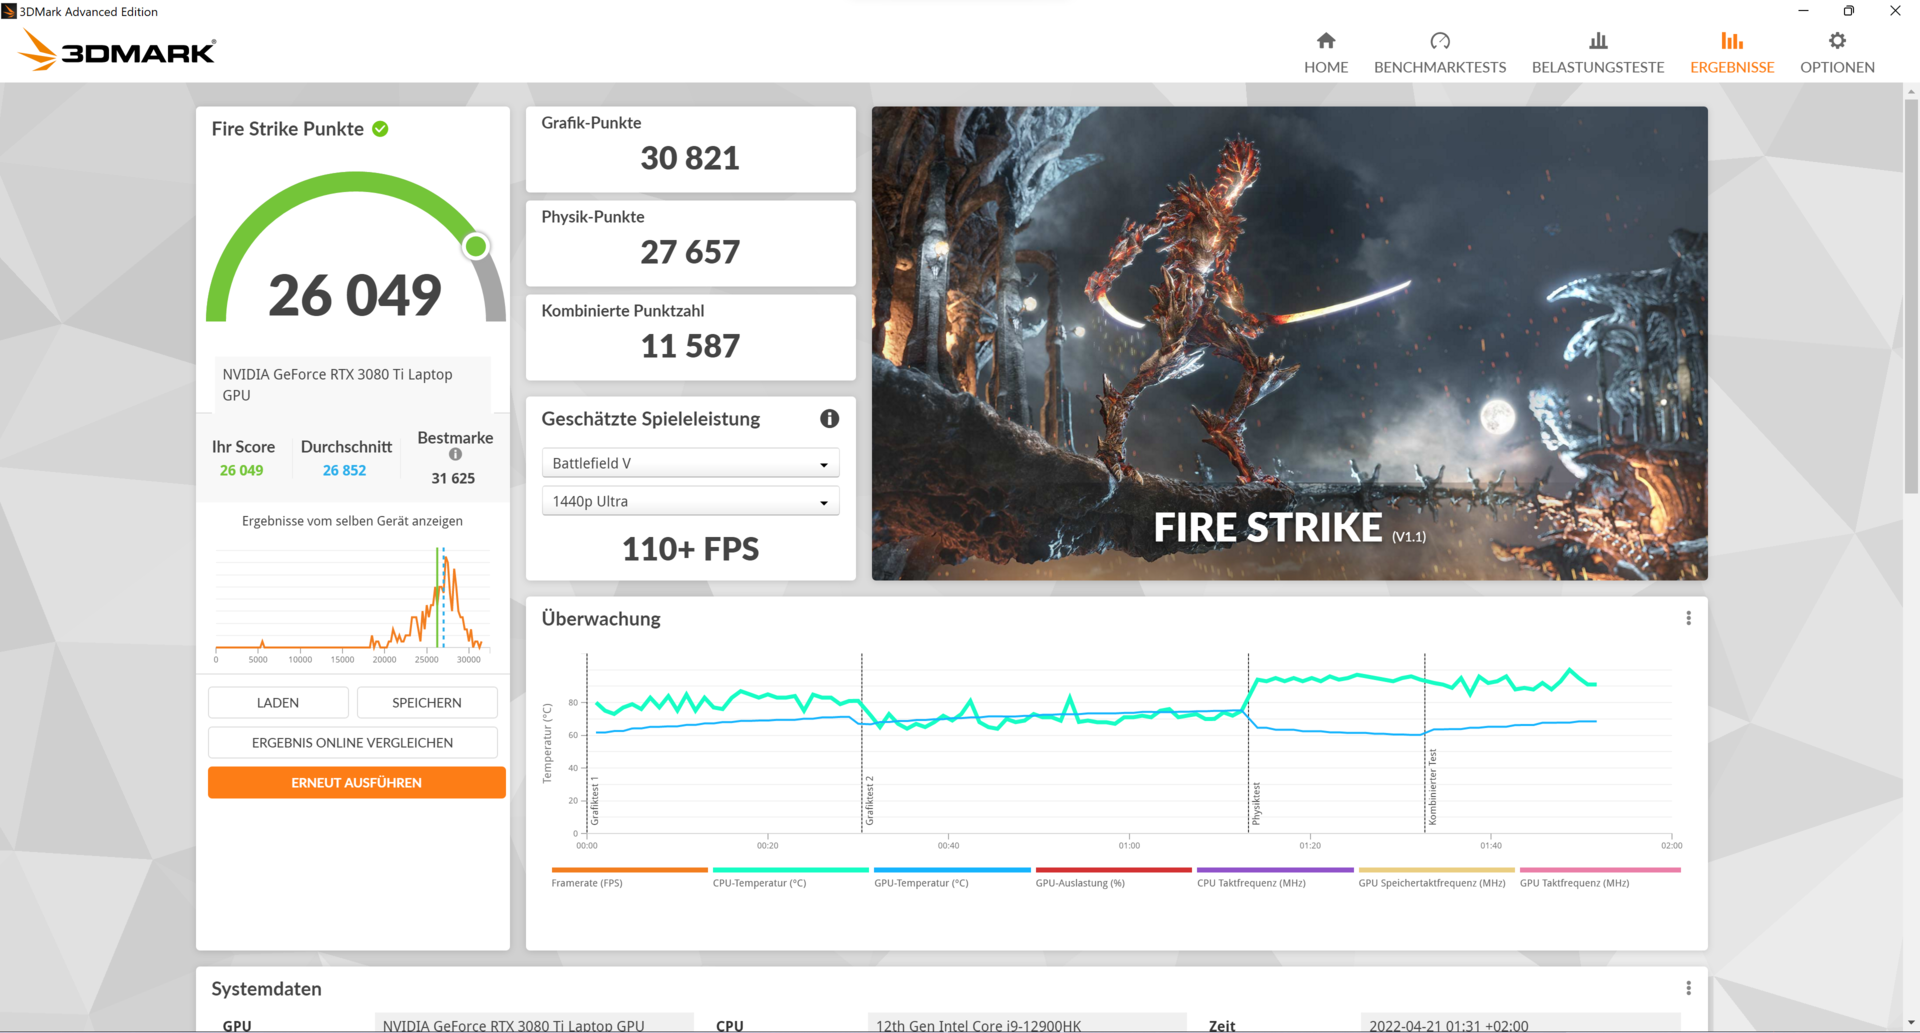
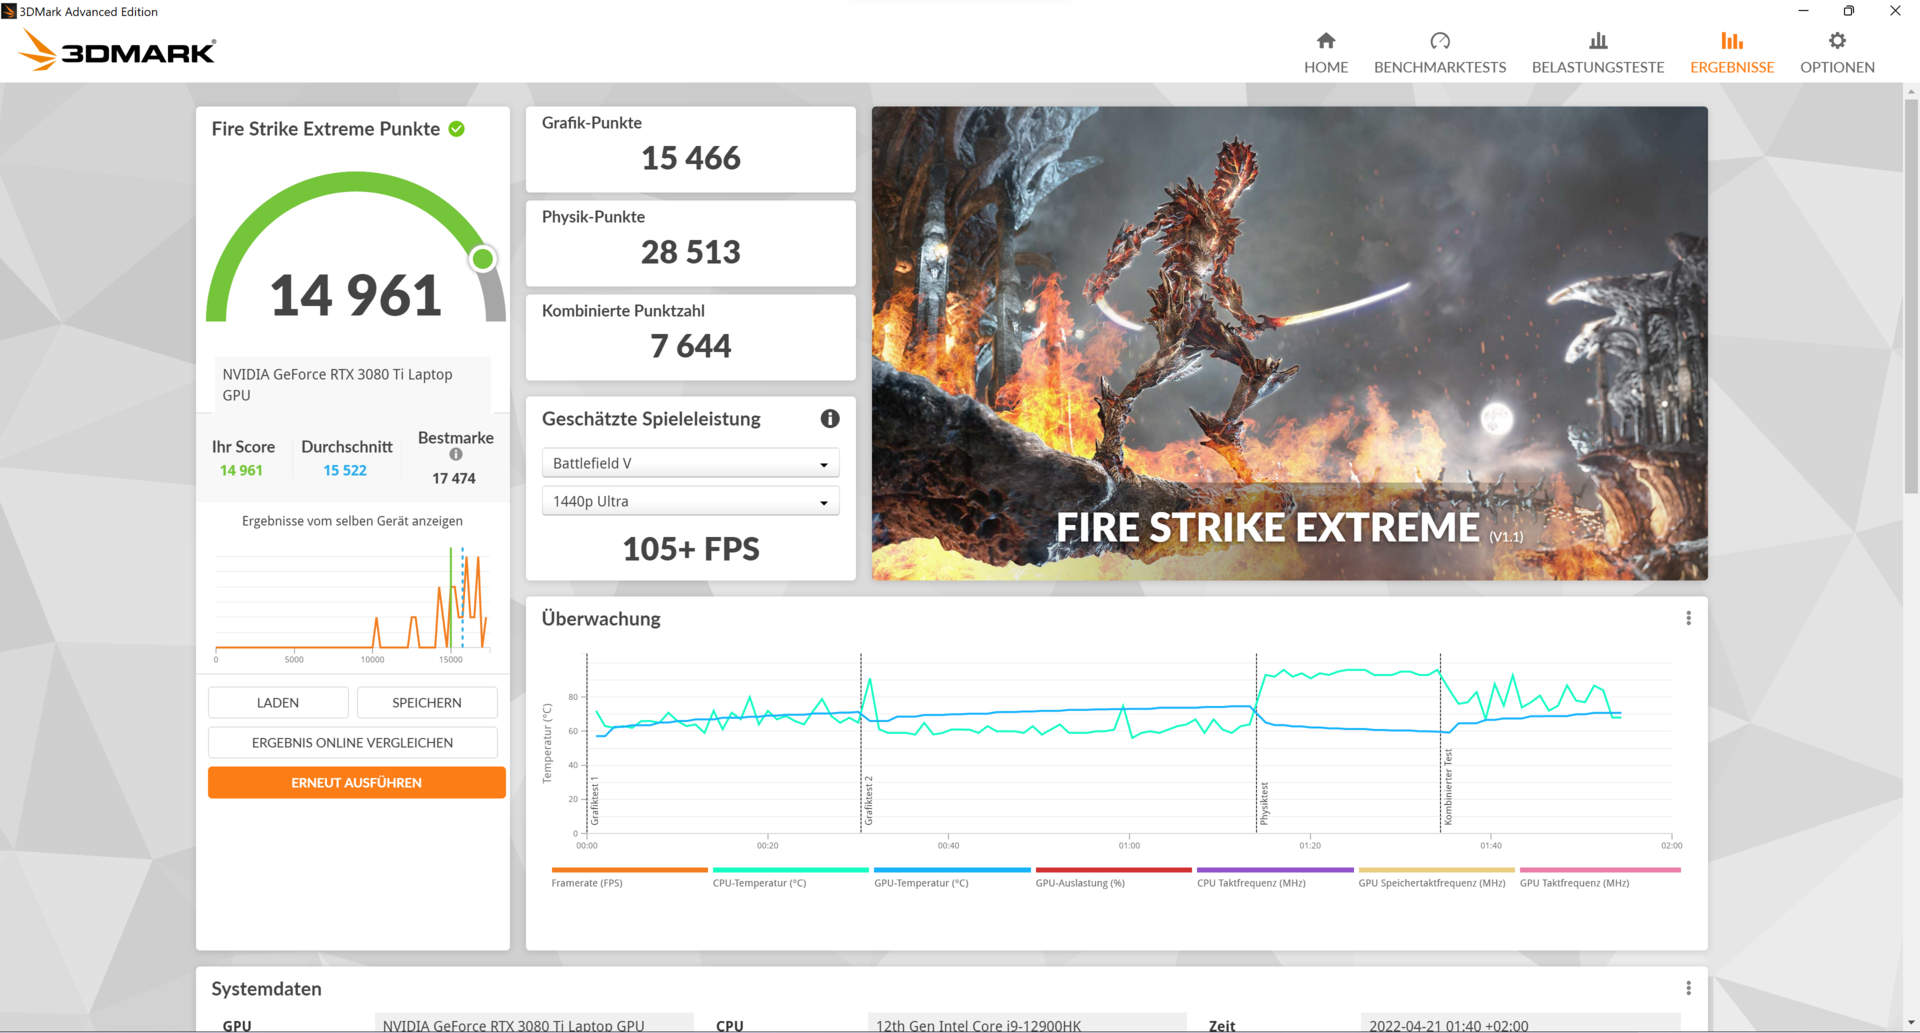
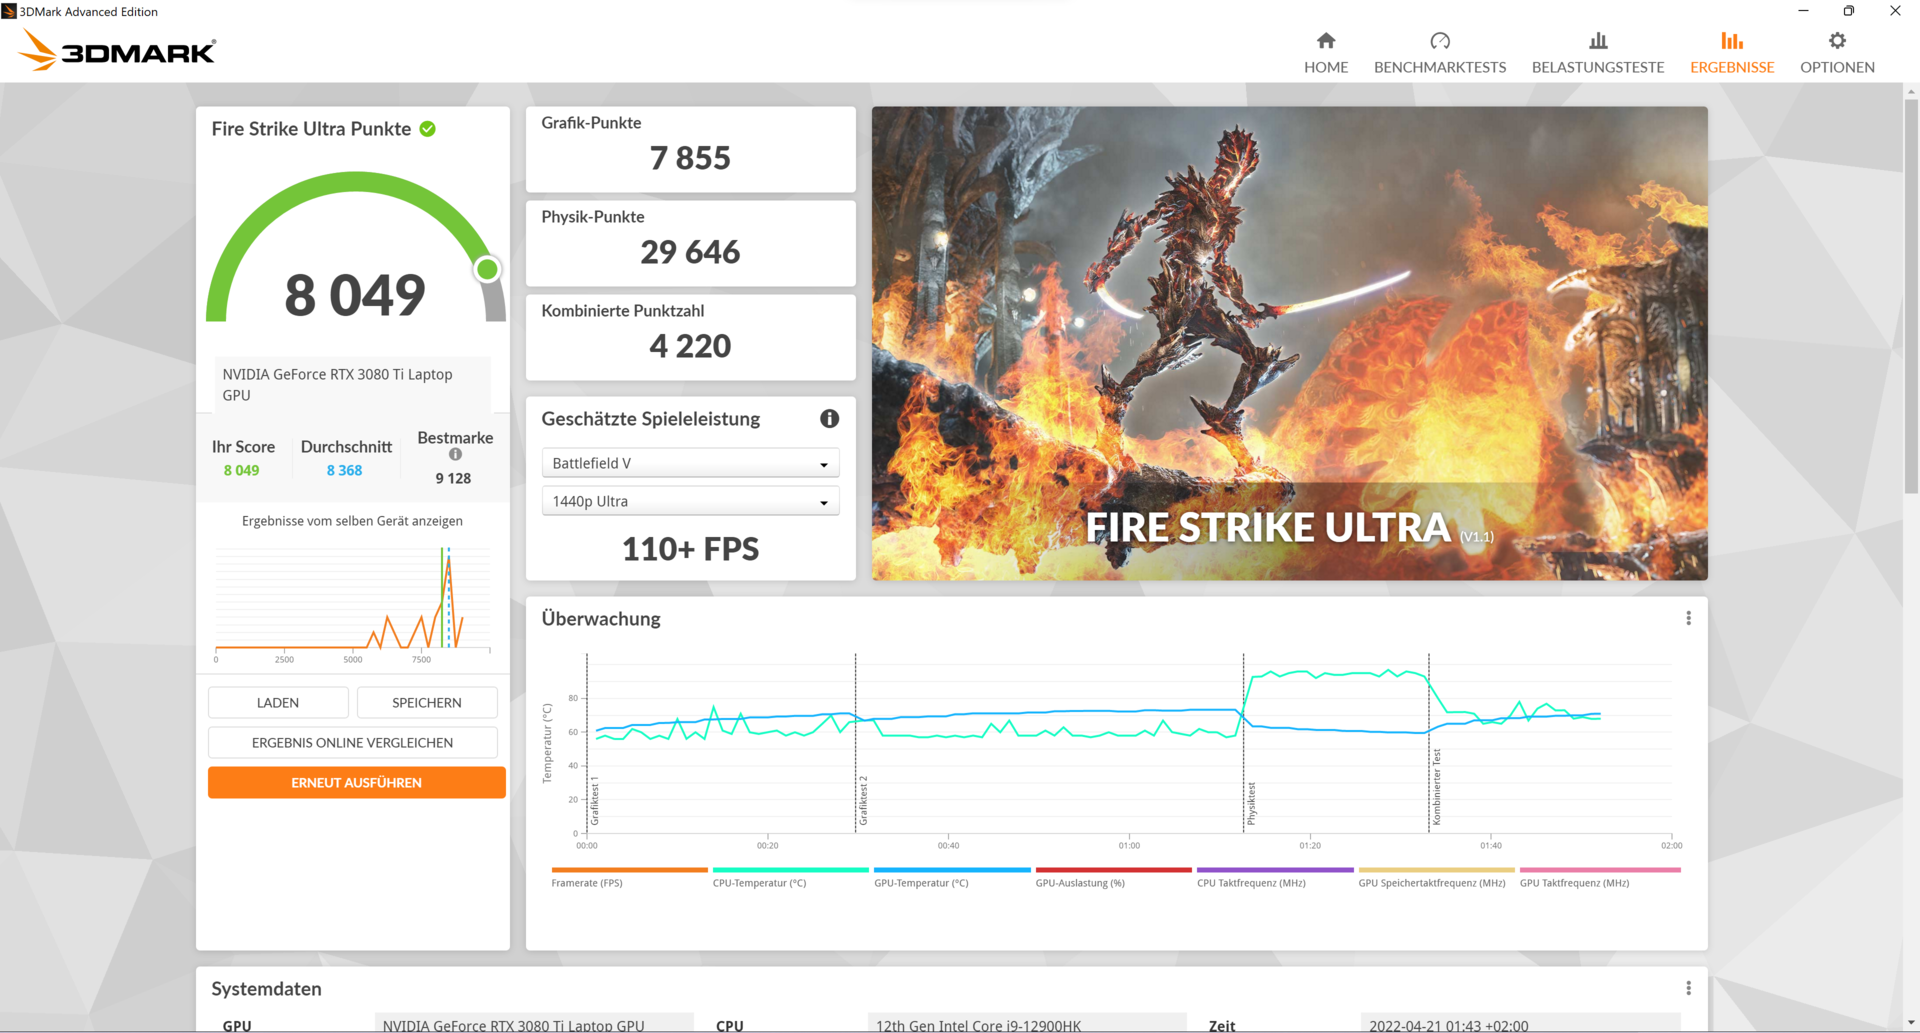
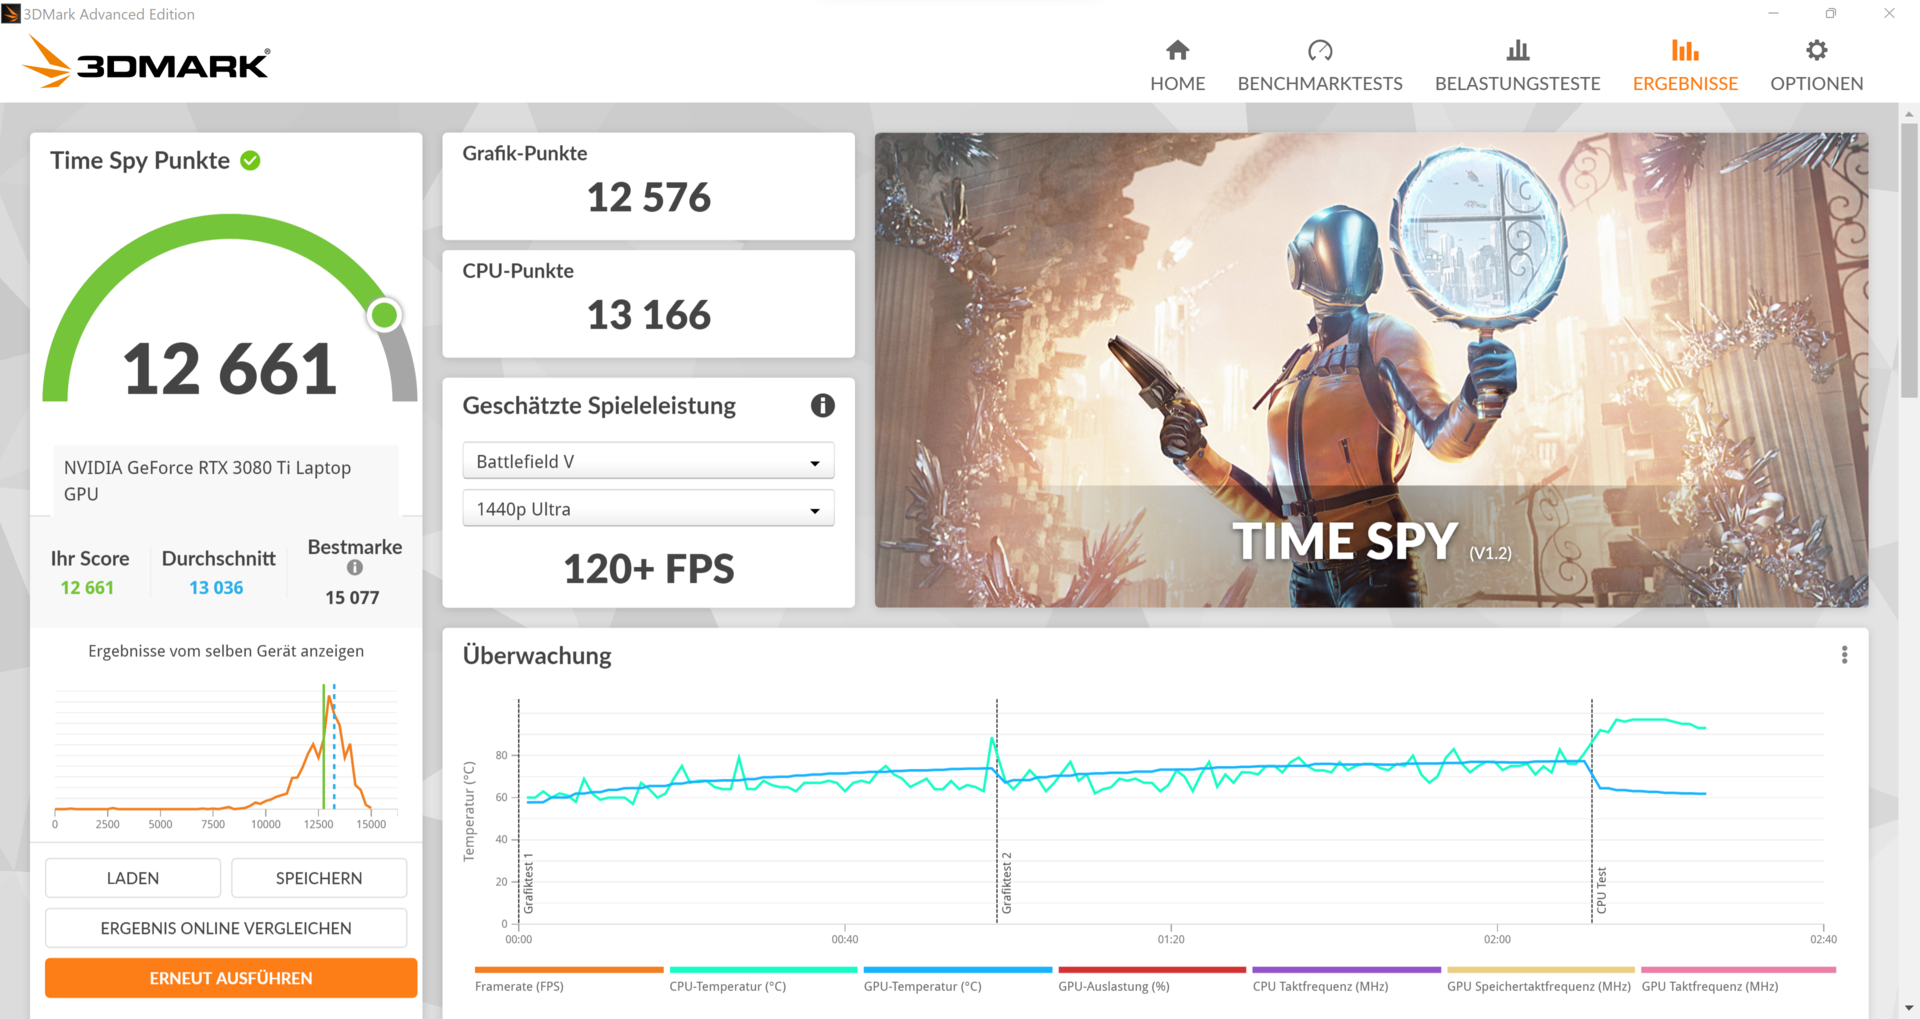
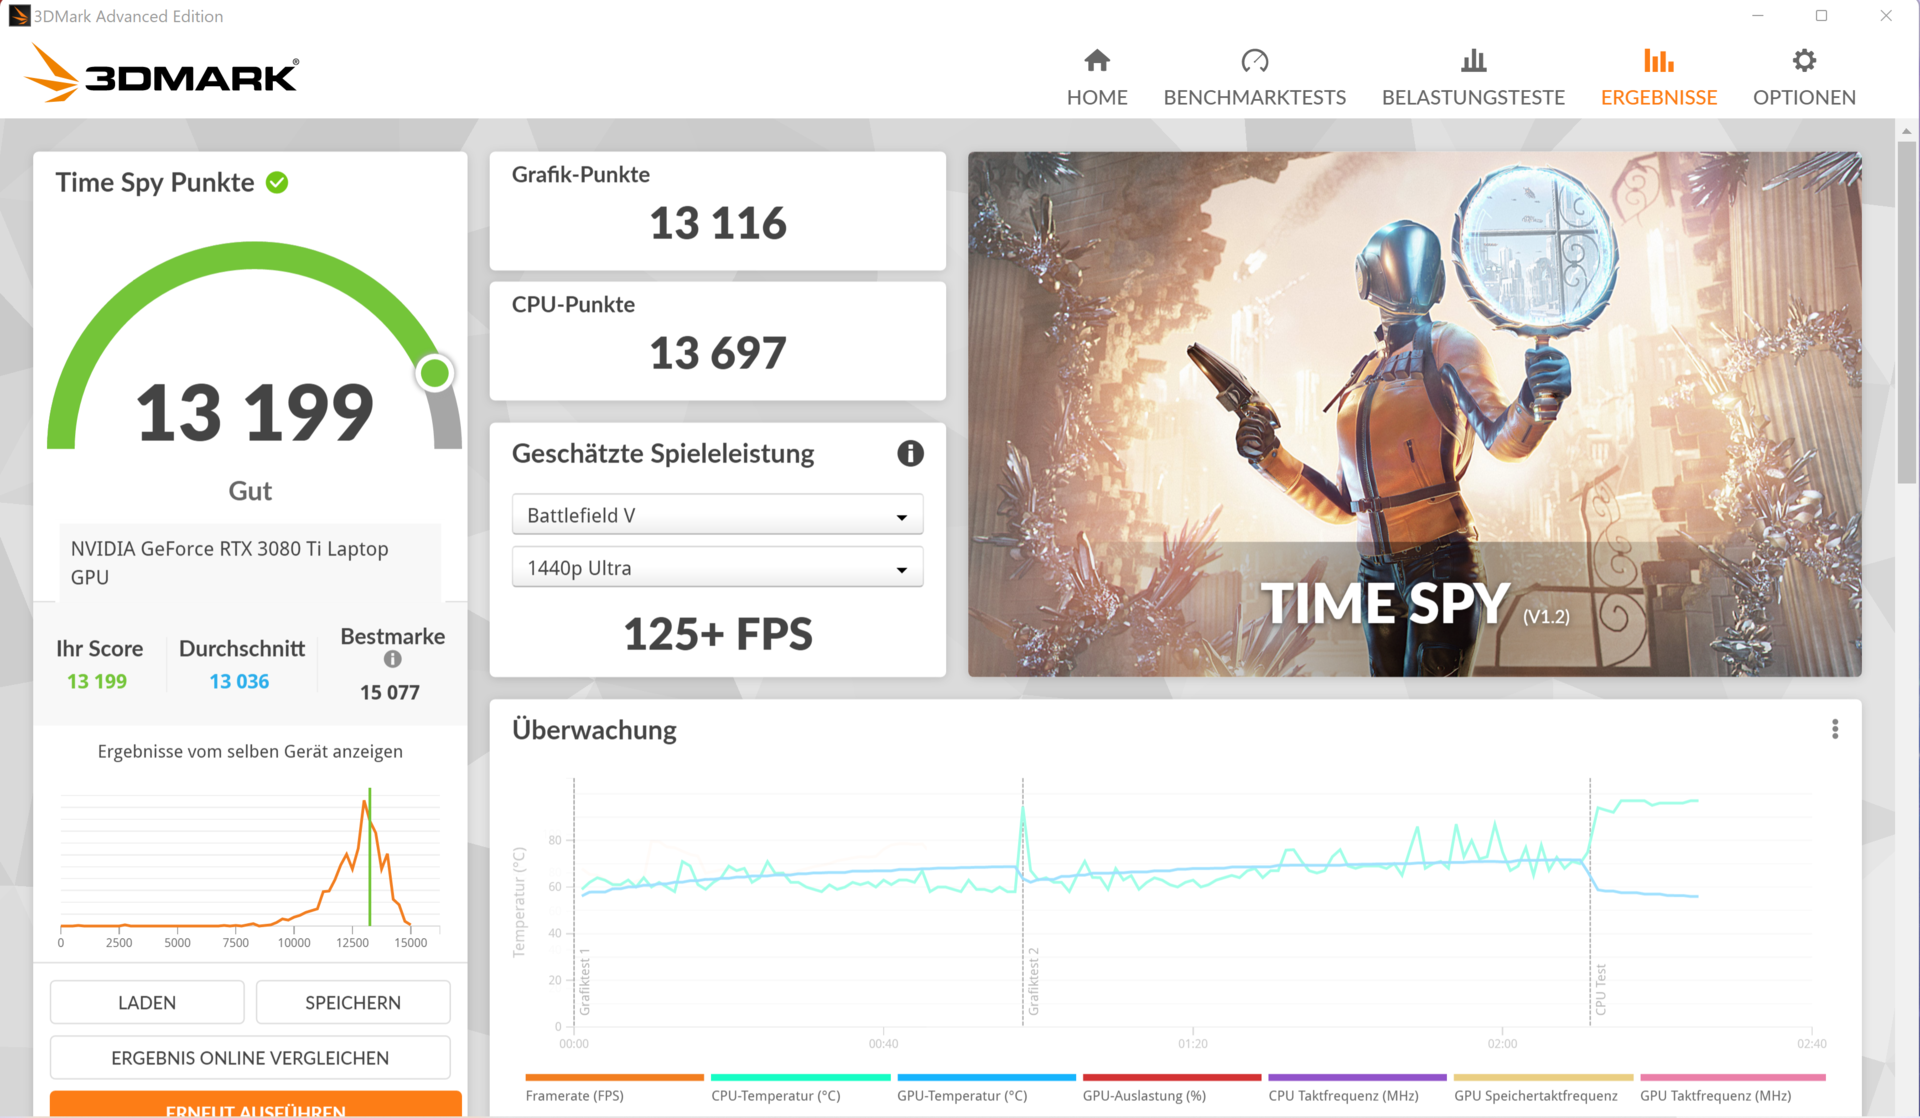
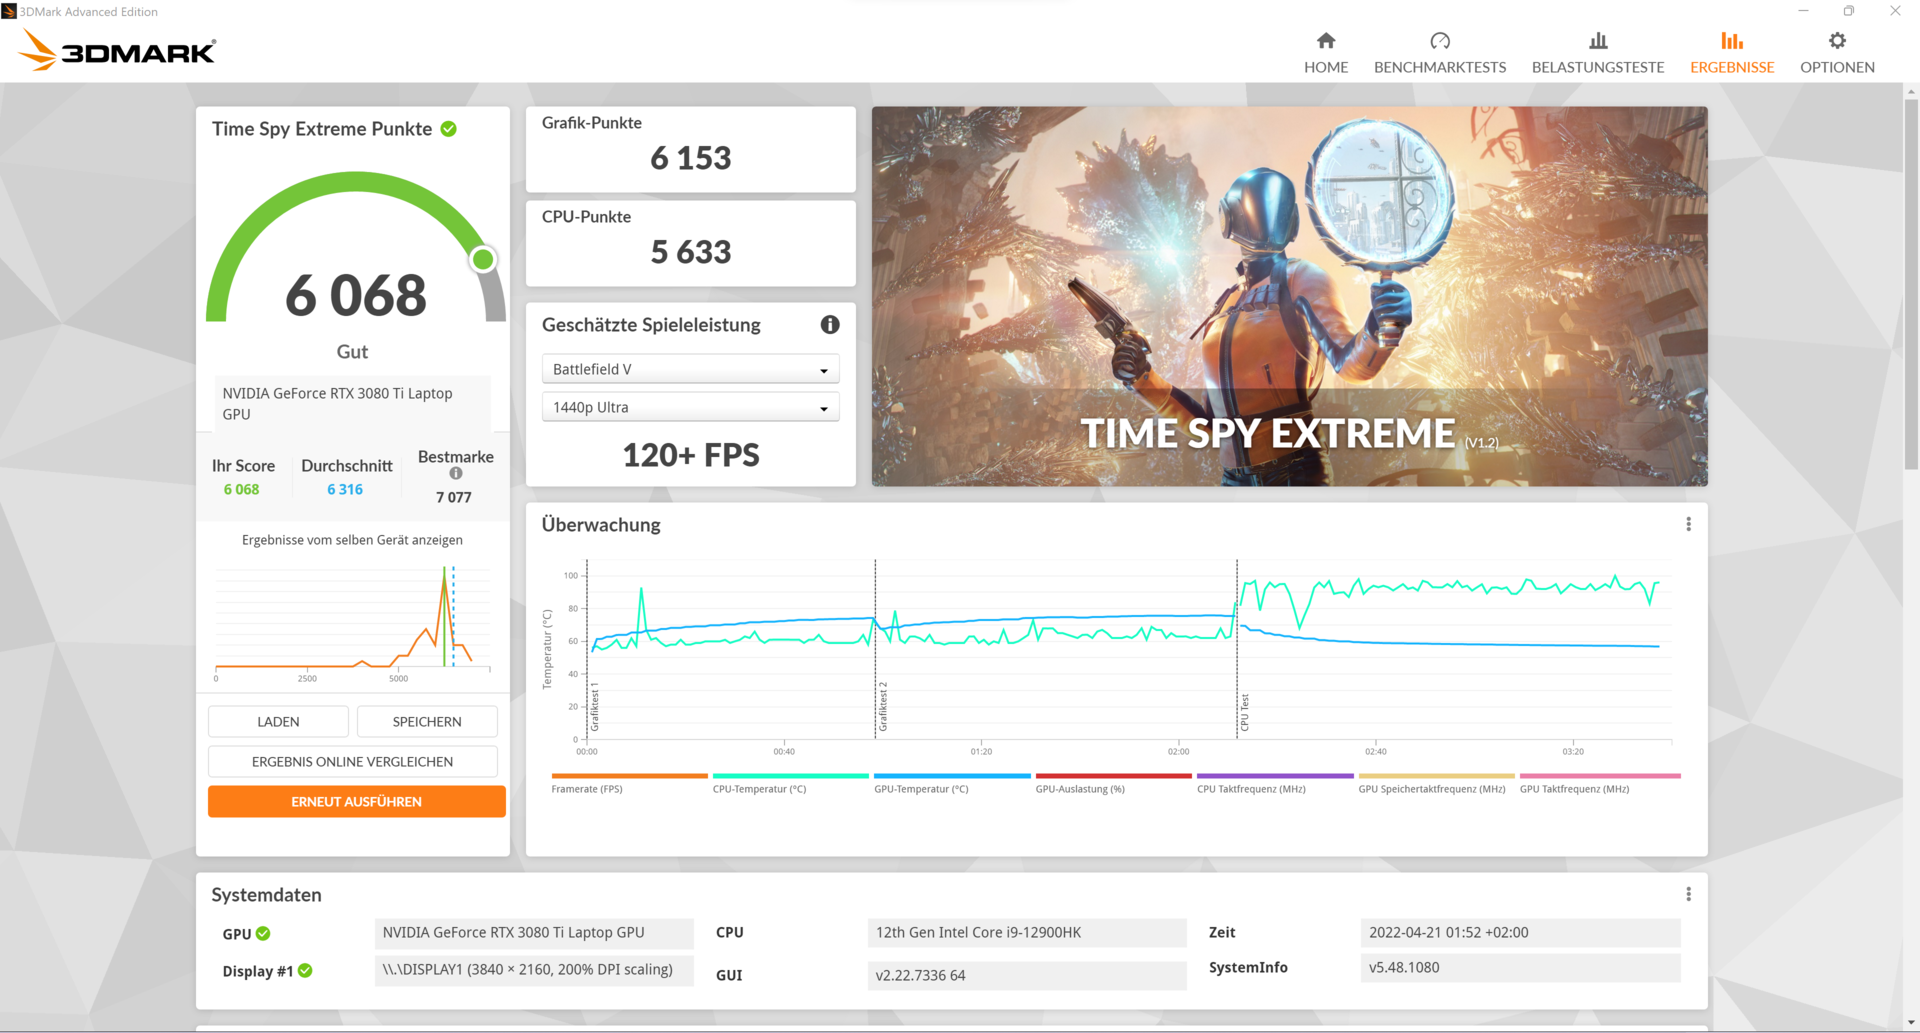
在我们的基准测试中也达到了微星150瓦的规格,这反映在出色的结果中。我们的微星GE66 12UHS在合成基准测试中超过了整个竞争对手。一个例外是Schenker XMG Neo 15 Early 2022(i7-12700H和RTX 3080 Ti),其TDP为175瓦,在3DMarkFire Strike 基准测试中超过我们的审查设备6%。另一方面,微星GE66在所有其他合成基准中击败了Neo 15。
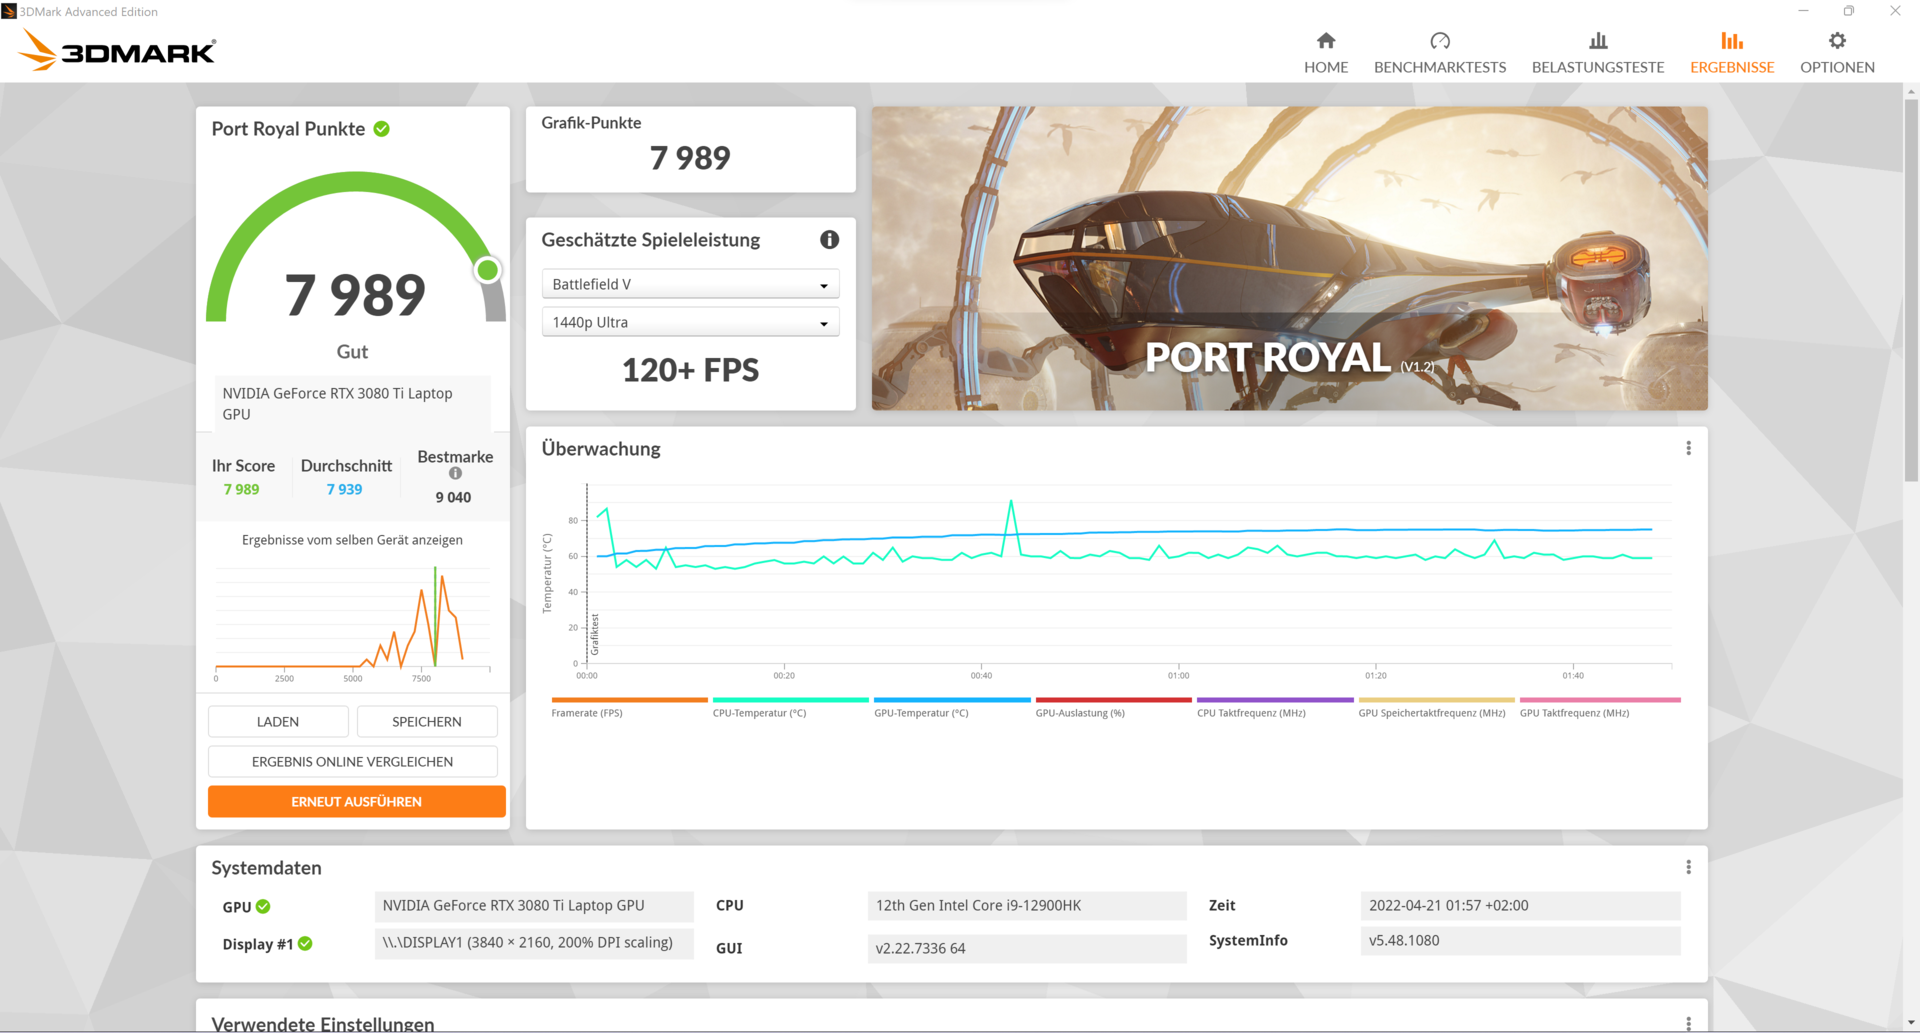
如果我们通过微星中心的GPU开关将GE66 12UHS从 "MSHybrid "切换到 "Discrete Graphics " 模式,我们在3DMarkTime Spy 基准测试中看到超过500分的性能提升。然而,如果我们拔掉电源,我们看到性能下降了80%。因此,用电池供电的游戏不应该出现在愿望清单上。
| 3DMark Performance rating - Percent | |
| Average of class Gaming | |
| Schenker XMG Neo 15 E22 (Early 2022, RTX 3080 Ti) -2! | |
| MSI Raider GE66 12UHS | |
| Average NVIDIA GeForce RTX 3080 Ti Laptop GPU | |
| Razer Blade 15 2022 -1! | |
| Lenovo Legion 5 Pro 16 G7 i7 RTX 3070Ti -3! | |
| MSI GE66 Raider 10SFS -1! | |
| 3DMark 11 Performance | 35599 points | |
| 3DMark Cloud Gate Standard Score | 65582 points | |
| 3DMark Fire Strike Score | 26049 points | |
| 3DMark Fire Strike Extreme Score | 14961 points | |
| 3DMark Time Spy Score | 12848 points | |
Help | ||
游戏性能
在实际测试中,微星GE66 12 UHS的游戏性能非常好。微星以其150瓦的最大容许量从安装的RTX 3080 Ti中获得了一切,甚至超过了诸如Schenker XMG Neo 15等设备,其RTX 3080 Ti甚至有额外的25瓦可供支配。
| The Witcher 3 | |
| 3840x2160 High Graphics & Postprocessing (Nvidia HairWorks Off) | |
| Average of class Gaming (114 - 169.8, n=3, last 2 years) | |
| Average NVIDIA GeForce RTX 3080 Ti Laptop GPU (62.1 - 94.3, n=8) | |
| MSI Raider GE66 12UHS | |
| MSI GE66 Raider 10SFS | |
| 1920x1080 Ultra Graphics & Postprocessing (HBAO+) | |
| Average of class Gaming (95 - 240, n=8, last 2 years) | |
| Schenker XMG Neo 15 E22 (Early 2022, RTX 3080 Ti) | |
| Average NVIDIA GeForce RTX 3080 Ti Laptop GPU (30 - 130.6, n=43) | |
| MSI Raider GE66 12UHS | |
| Razer Blade 15 2022 | |
| Lenovo Legion 5 Pro 16 G7 i7 RTX 3070Ti | |
| MSI GE66 Raider 10SFS | |
| F1 2021 | |
| 2560x1440 Ultra High Preset + Raytracing AA:T AF:16x | |
| Lenovo Legion 5 Pro 16 G7 i7 RTX 3070Ti | |
| Average NVIDIA GeForce RTX 3080 Ti Laptop GPU (30 - 120.1, n=19) | |
| 1920x1080 Ultra High Preset + Raytracing AA:T AF:16x | |
| MSI Raider GE66 12UHS | |
| Lenovo Legion 5 Pro 16 G7 i7 RTX 3070Ti | |
| Average NVIDIA GeForce RTX 3080 Ti Laptop GPU (30.2 - 160.6, n=30) | |
| F1 2020 - 1920x1080 Ultra High Preset AA:T AF:16x | |
| Average NVIDIA GeForce RTX 3080 Ti Laptop GPU (190.4 - 197.9, n=2) | |
| MSI Raider GE66 12UHS | |
| Horizon Zero Dawn | |
| 3840x2160 Ultimate Quality | |
| Average NVIDIA GeForce RTX 3080 Ti Laptop GPU (56 - 61, n=2) | |
| MSI Raider GE66 12UHS | |
| 2560x1440 Ultimate Quality | |
| Average NVIDIA GeForce RTX 3080 Ti Laptop GPU (98 - 109, n=3) | |
| MSI Raider GE66 12UHS | |
| 1920x1080 Ultimate Quality | |
| Average NVIDIA GeForce RTX 3080 Ti Laptop GPU (118 - 128, n=3) | |
| MSI Raider GE66 12UHS | |
| 1920x1080 Favor Quality | |
| MSI Raider GE66 12UHS | |
| Average NVIDIA GeForce RTX 3080 Ti Laptop GPU (130 - 141, n=3) | |
| Far Cry 6 | |
| 1920x1080 Ultra Graphics Quality + HD Textures + DXR AA:T | |
| Average of class Gaming (n=1last 2 years) | |
| MSI Raider GE66 12UHS | |
| Average NVIDIA GeForce RTX 3080 Ti Laptop GPU (91 - 92, n=3) | |
| 3840x2160 Ultra Graphics Quality + HD Textures AA:T | |
| MSI Raider GE66 12UHS | |
| Average NVIDIA GeForce RTX 3080 Ti Laptop GPU (46.2 - 57, n=4) | |
| Average of class Gaming (n=1last 2 years) | |
| 2560x1440 Ultra Graphics Quality + HD Textures AA:T | |
| Average of class Gaming (74.5 - 116.7, n=2, last 2 years) | |
| MSI Raider GE66 12UHS | |
| Average NVIDIA GeForce RTX 3080 Ti Laptop GPU (75.2 - 93, n=5) | |
| 1920x1080 Ultra Graphics Quality + HD Textures AA:T | |
| Average of class Gaming (96.3 - 135.7, n=3, last 2 years) | |
| MSI Raider GE66 12UHS | |
| Average NVIDIA GeForce RTX 3080 Ti Laptop GPU (71.3 - 114, n=6) | |
| Assassin´s Creed Valhalla | |
| 3840x2160 Ultra High Preset | |
| Average NVIDIA GeForce RTX 3080 Ti Laptop GPU (45 - 50, n=2) | |
| MSI Raider GE66 12UHS | |
| 2560x1440 Ultra High Preset | |
| Average NVIDIA GeForce RTX 3080 Ti Laptop GPU (68 - 74, n=3) | |
| MSI Raider GE66 12UHS | |
| 1920x1080 Ultra High Preset | |
| Average NVIDIA GeForce RTX 3080 Ti Laptop GPU (85 - 93, n=3) | |
| MSI Raider GE66 12UHS | |
| 1920x1080 High Preset | |
| Average NVIDIA GeForce RTX 3080 Ti Laptop GPU (99 - 103, n=3) | |
| MSI Raider GE66 12UHS | |
在其他关于连续负载下的性能的基准测试中,我们记录了高达12%的游戏性能下降。在带有自动风扇控制的 "极限性能 "配置文件中,风扇被限制在最高5100RPM(每分钟转数),这显然不足以在较长的游戏时间内保持CPU和GPU的充分冷却,因此导致了最终的节流现象。我们在相同的配置文件下重复了整个过程,并激活了 "冷却器提升模式"(风扇以6,000 RPM运行)。结果是:在这些条件下,组件的废热被充分消散,我们在测试期间不再观察到任何FPS率的降低。
Witcher 3 FPS Chart
| low | med. | high | ultra | QHD | 4K | |
|---|---|---|---|---|---|---|
| GTA V (2015) | 187 | 181 | 172.6 | 109.4 | ||
| The Witcher 3 (2015) | 411 | 344 | 223 | 110 | 77.49 | |
| Dota 2 Reborn (2015) | 187.4 | 170.8 | 166.9 | 156.8 | 142.3 | |
| Final Fantasy XV Benchmark (2018) | 212 | 160.3 | 119.6 | 89.5 | 52.1 | |
| X-Plane 11.11 (2018) | 170 | 149.6 | 117.5 | 102.1 | ||
| Far Cry 5 (2018) | 164 | 153 | 144 | 124 | 70 | |
| Strange Brigade (2018) | 490 | 284 | 224 | 199.8 | 146.9 | 86.9 |
| F1 2020 (2020) | 345 | 303 | 270 | 190.4 | ||
| Horizon Zero Dawn (2020) | 168 | 156 | 141 | 122 | 98 | 56 |
| Assassin´s Creed Valhalla (2020) | 115 | 100 | 87 | 70 | 45 | |
| F1 2021 (2021) | 394 | 351 | 292 | 142.7 | ||
| Far Cry 6 (2021) | 143 | 126 | 114 | 92 | 54 | |
| Cyberpunk 2077 1.6 (2022) | 158.75 | 159.68 | 145.61 | 144.08 | 56.83 | 27.62 |
排放。GE66在性能和体积之间取得了良好的平衡
噪声
对于已安装的硬件,微星GE 66 12UHS在风扇噪音方面给出了一个整体平衡的画面。在日常使用中,风扇偶尔会根据活动和风扇的情况而转速升高。在负载下,风扇控制迅速反应,以避免由于温度上升过快而导致性能下降。即使在 "极限性能 "下,两个风扇也被限制在最高5,100转/分钟,尽管最高6000转/分钟是可能的,但这是为 "冷却器提升 "模式保留的。也就是说,用户还可以为CPU和GPU创建一个自定义的风扇配置文件,从而根据他们的需要调整音量。此外,还有可能通过AI自动管理风扇控制。这在日常使用中的功能相当好,但在面对温度快速上升和高负载时,风扇有时反应太慢。总的来说,在游戏时,即使是5100转的45分贝似乎也是可以忍受的。这部分是由于所安装的风扇不倾向于发出高频噪音或线圈啸叫的事实。
Noise level
| Idle |
| 27 / 30 / 39 dB(A) |
| Load |
| 45 / 47 dB(A) |
 | ||
30 dB silent 40 dB(A) audible 50 dB(A) loud |
||
min: | ||
| MSI Raider GE66 12UHS Intel Core i9-12900HK, NVIDIA GeForce RTX 3080 Ti Laptop GPU | MSI GE66 Raider 10SFS Intel Core i9-10980HK, NVIDIA GeForce RTX 2070 Super Mobile | Razer Blade 15 2022 Intel Core i7-12800H, NVIDIA GeForce RTX 3080 Ti Laptop GPU | Schenker XMG Neo 15 E22 (Early 2022, RTX 3080 Ti) Intel Core i7-12700H, NVIDIA GeForce RTX 3080 Ti Laptop GPU | Lenovo Legion 5 Pro 16 G7 i7 RTX 3070Ti Intel Core i7-12700H, NVIDIA GeForce RTX 3070 Ti Laptop GPU | |
|---|---|---|---|---|---|
| Noise | -16% | 5% | 7% | -1% | |
| off / environment * (dB) | 26 | 30 -15% | 25.4 2% | 24 8% | 24.6 5% |
| Idle Minimum * (dB) | 27 | 30 -11% | 26.2 3% | 24 11% | 28.4 -5% |
| Idle Average * (dB) | 30 | 35 -17% | 26.2 13% | 24 20% | 28.4 5% |
| Idle Maximum * (dB) | 39 | 44 -13% | 28.4 27% | 27.76 29% | 28.4 27% |
| Load Average * (dB) | 45 | 53 -18% | 44.7 1% | 38.81 14% | 49.4 -10% |
| Witcher 3 ultra * (dB) | 45 | 53 -18% | 44.7 1% | 54.2 -20% | 49.4 -10% |
| Load Maximum * (dB) | 47 | 55 -17% | 51.9 -10% | 54.18 -15% | 54.7 -16% |
* ... smaller is better
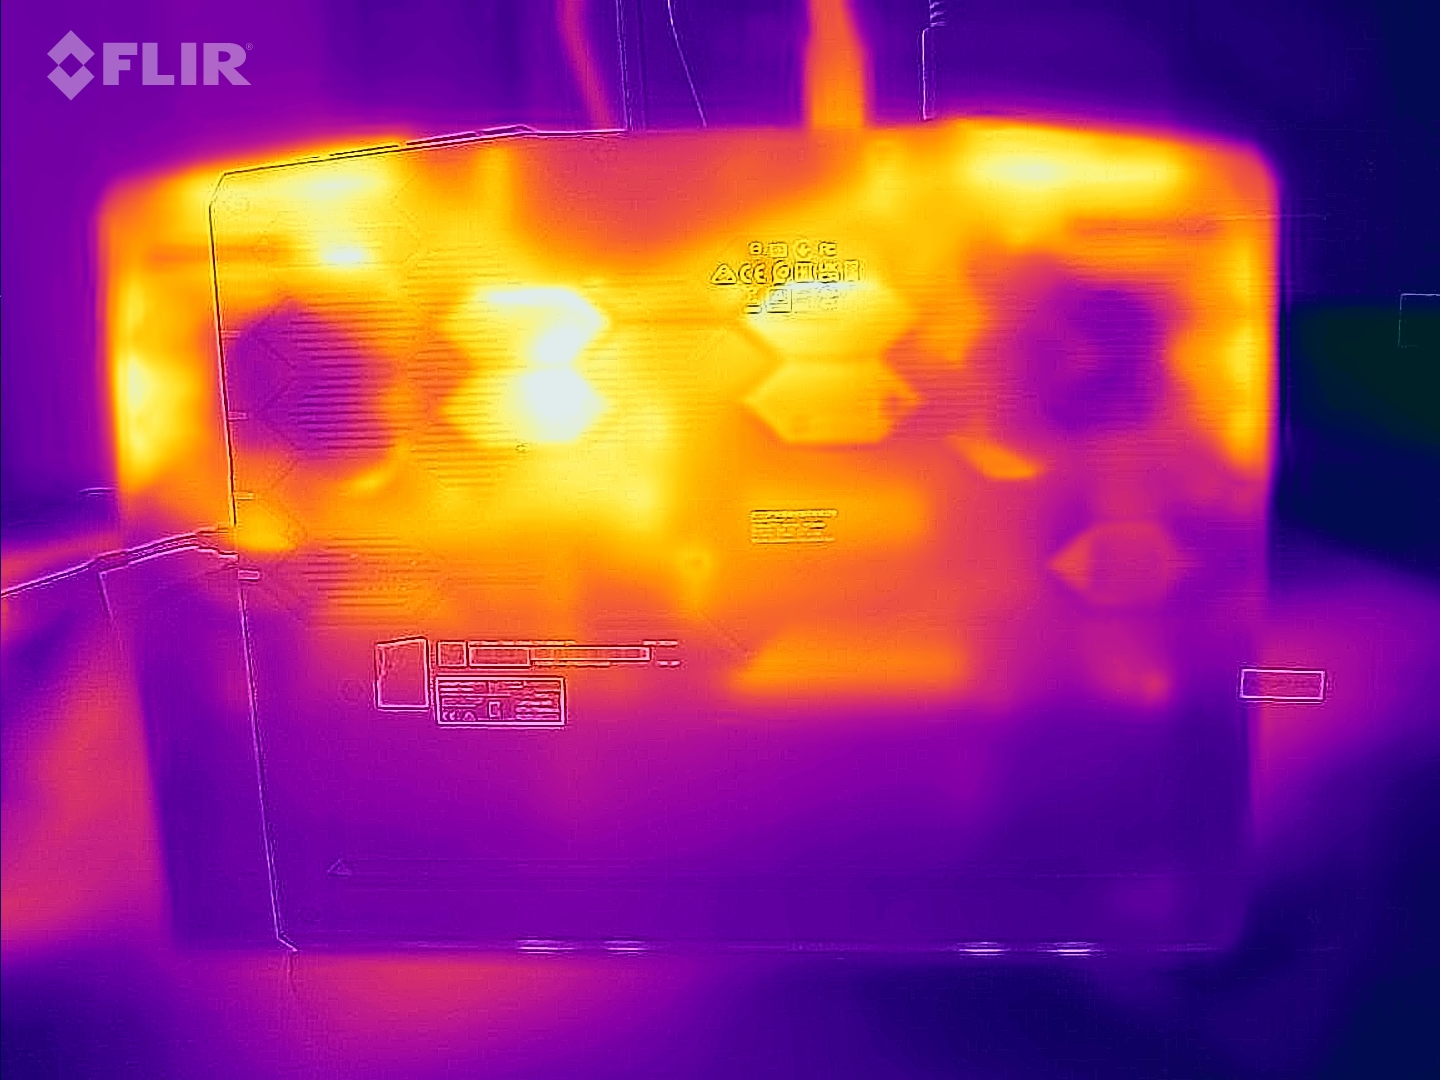
温度
在日常工作中,如浏览网页、使用Office或播放媒体,触控板和掌托总是保持令人愉快的凉爽。另一方面,键盘会轻微发热,但这并不影响打字体验。在这种情况下,理论上甚至可以在夏天的温度下进行操作,尽管由于笔记本电脑的尺寸和重量,这是很不可能的。在其他方面,风扇控制确保设备的底部在没有要求的任务中只稍微发热。
在负载情况下(压力测试,Witcher 3 测试),笔记本会明显发热。底部平均升温至52摄氏度,并显示出62至65摄氏度的最高温度。我们记录到上侧的平均温度为45摄氏度,大部分的废热都集中在后部以及键盘上。键盘也会发热,但仍然可以使用,没有不适感。在掌托和触摸板上测得的平均温度仅为34摄氏度,即使在高负荷的情况下也是如此。
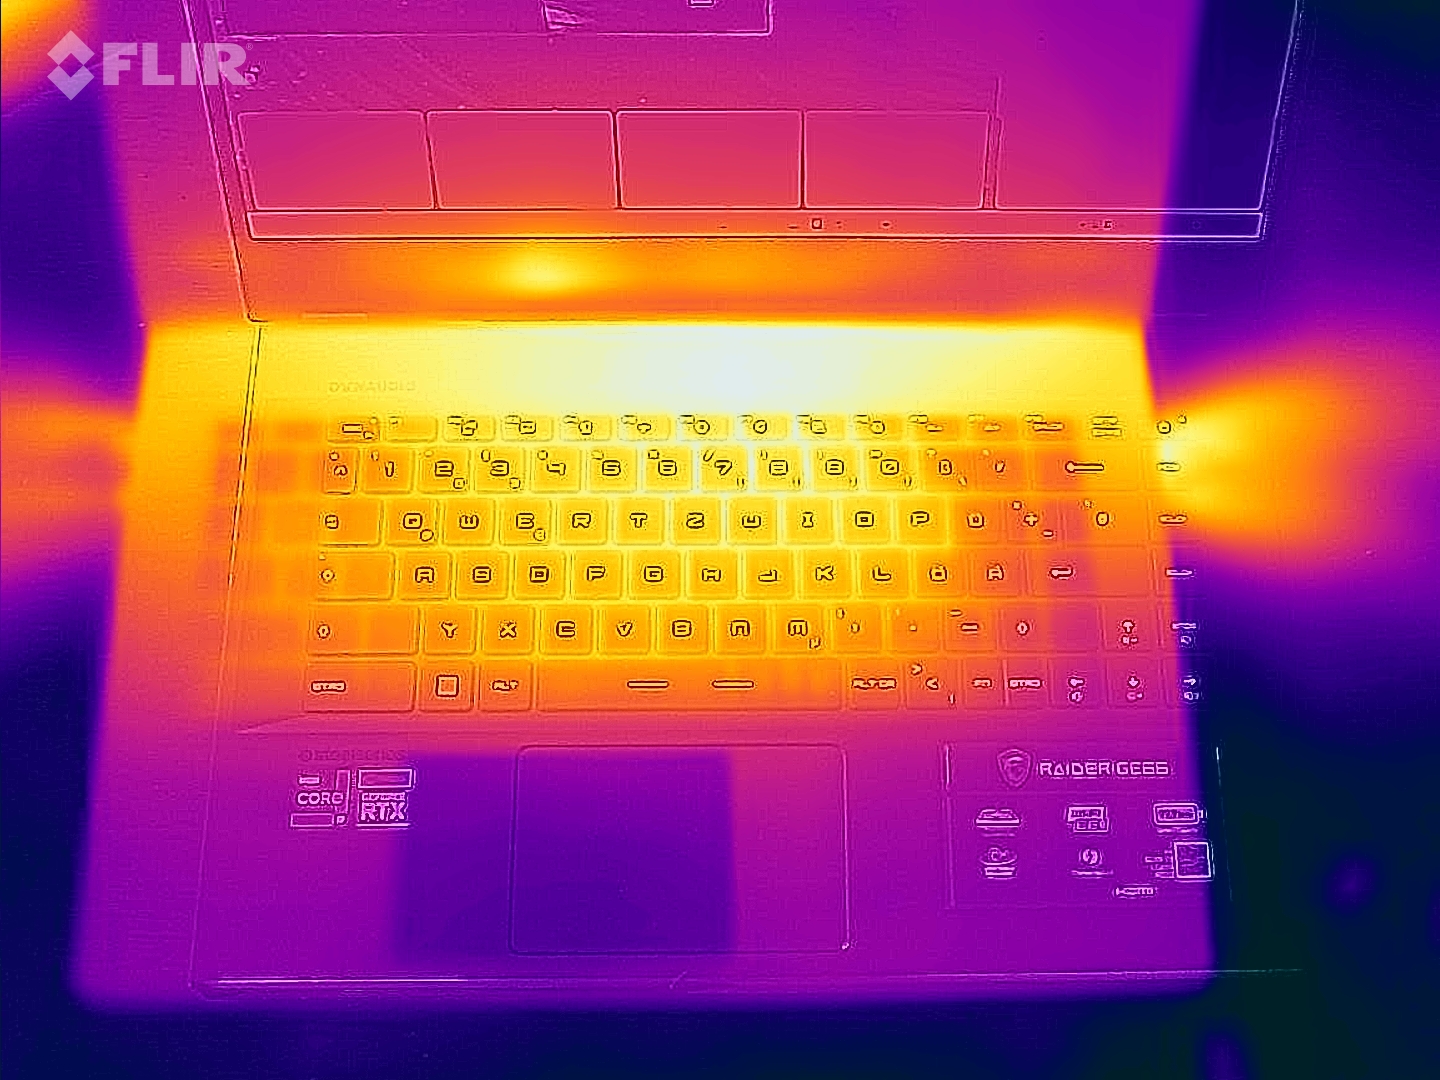
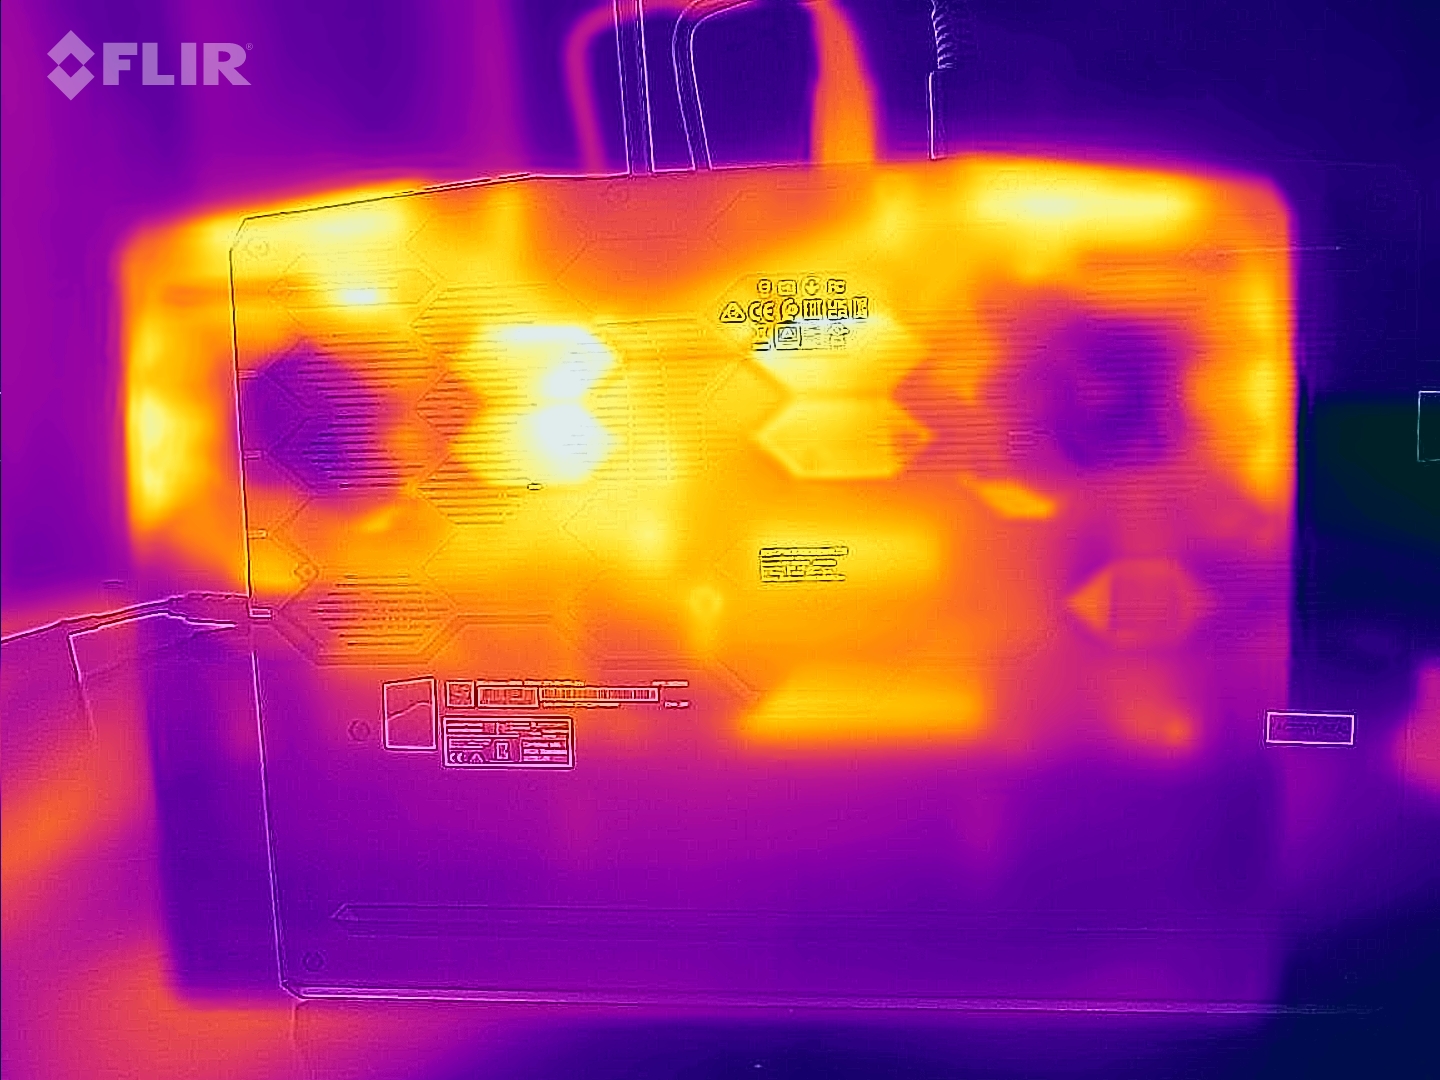
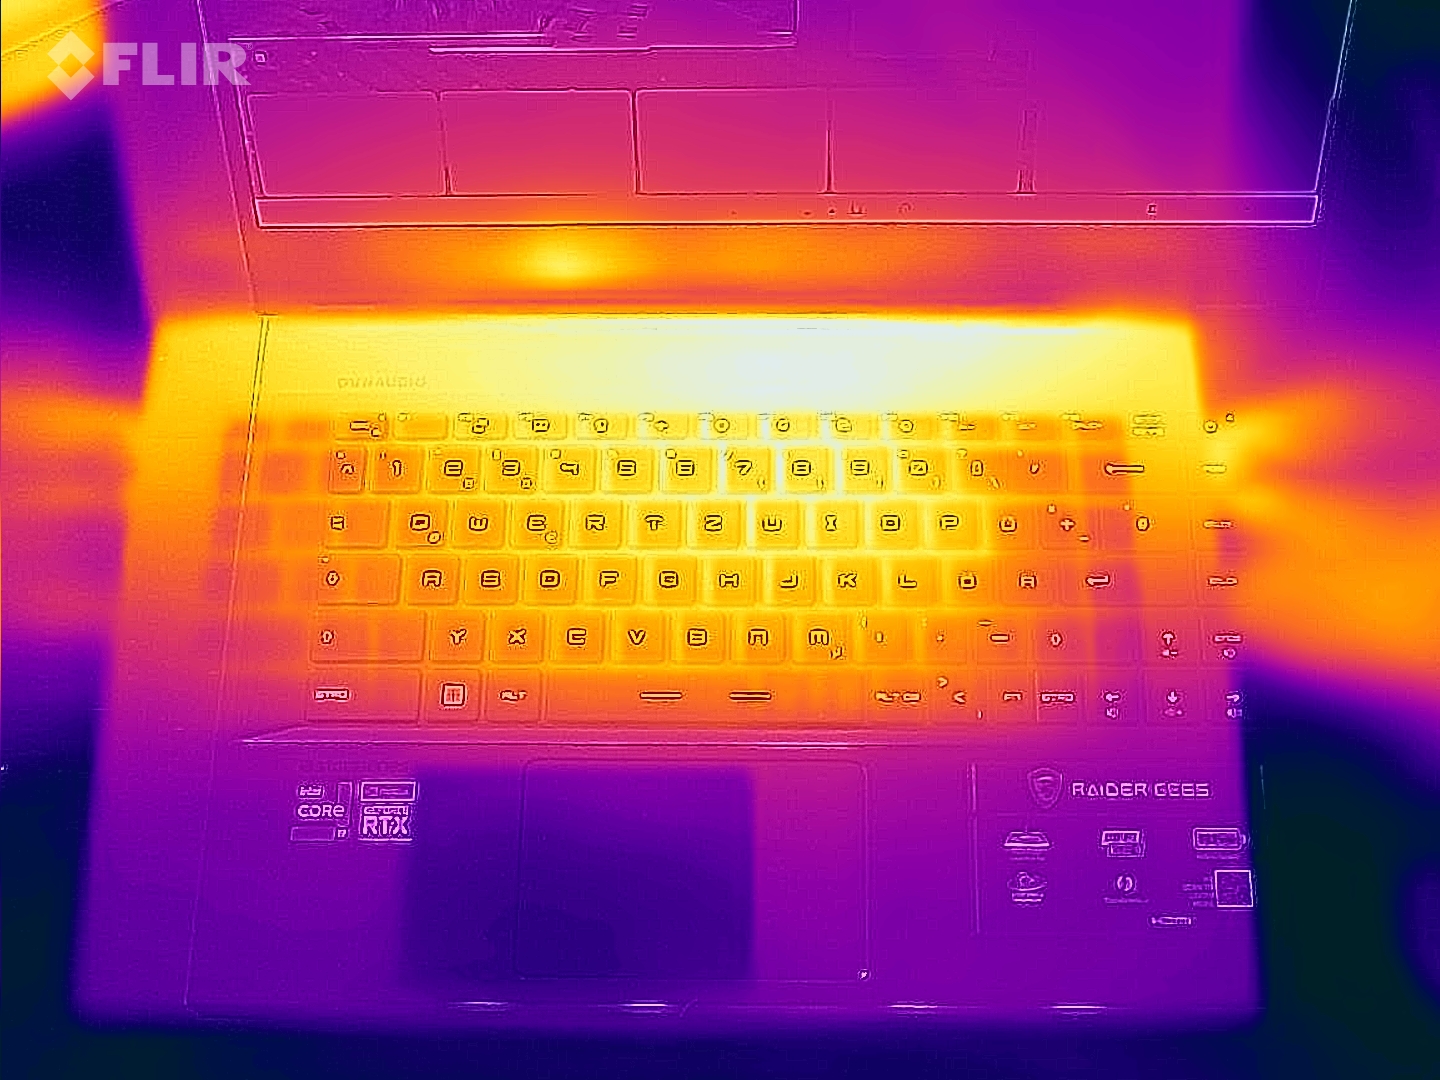
(-) The maximum temperature on the upper side is 54 °C / 129 F, compared to the average of 40.4 °C / 105 F, ranging from 21.2 to 68.8 °C for the class Gaming.
(-) The bottom heats up to a maximum of 65 °C / 149 F, compared to the average of 43.2 °C / 110 F
(+) In idle usage, the average temperature for the upper side is 28.7 °C / 84 F, compared to the device average of 33.9 °C / 93 F.
(-) Playing The Witcher 3, the average temperature for the upper side is 45.4 °C / 114 F, compared to the device average of 33.9 °C / 93 F.
(±) The palmrests and touchpad can get very hot to the touch with a maximum of 36 °C / 96.8 F.
(-) The average temperature of the palmrest area of similar devices was 28.8 °C / 83.8 F (-7.2 °C / -13 F).
| MSI Raider GE66 12UHS Intel Core i9-12900HK, NVIDIA GeForce RTX 3080 Ti Laptop GPU | MSI GE66 Raider 10SFS Intel Core i9-10980HK, NVIDIA GeForce RTX 2070 Super Mobile | Razer Blade 15 2022 Intel Core i7-12800H, NVIDIA GeForce RTX 3080 Ti Laptop GPU | Schenker XMG Neo 15 E22 (Early 2022, RTX 3080 Ti) Intel Core i7-12700H, NVIDIA GeForce RTX 3080 Ti Laptop GPU | Lenovo Legion 5 Pro 16 G7 i7 RTX 3070Ti Intel Core i7-12700H, NVIDIA GeForce RTX 3070 Ti Laptop GPU | |
|---|---|---|---|---|---|
| Heat | 8% | 0% | -3% | 9% | |
| Maximum Upper Side * (°C) | 54 | 49 9% | 50 7% | 52 4% | 45.3 16% |
| Maximum Bottom * (°C) | 65 | 52 20% | 47 28% | 68 -5% | 61.2 6% |
| Idle Upper Side * (°C) | 30 | 30 -0% | 37.4 -25% | 32 -7% | 28.6 5% |
| Idle Bottom * (°C) | 35 | 34 3% | 38.4 -10% | 36 -3% | 31.4 10% |
* ... smaller is better
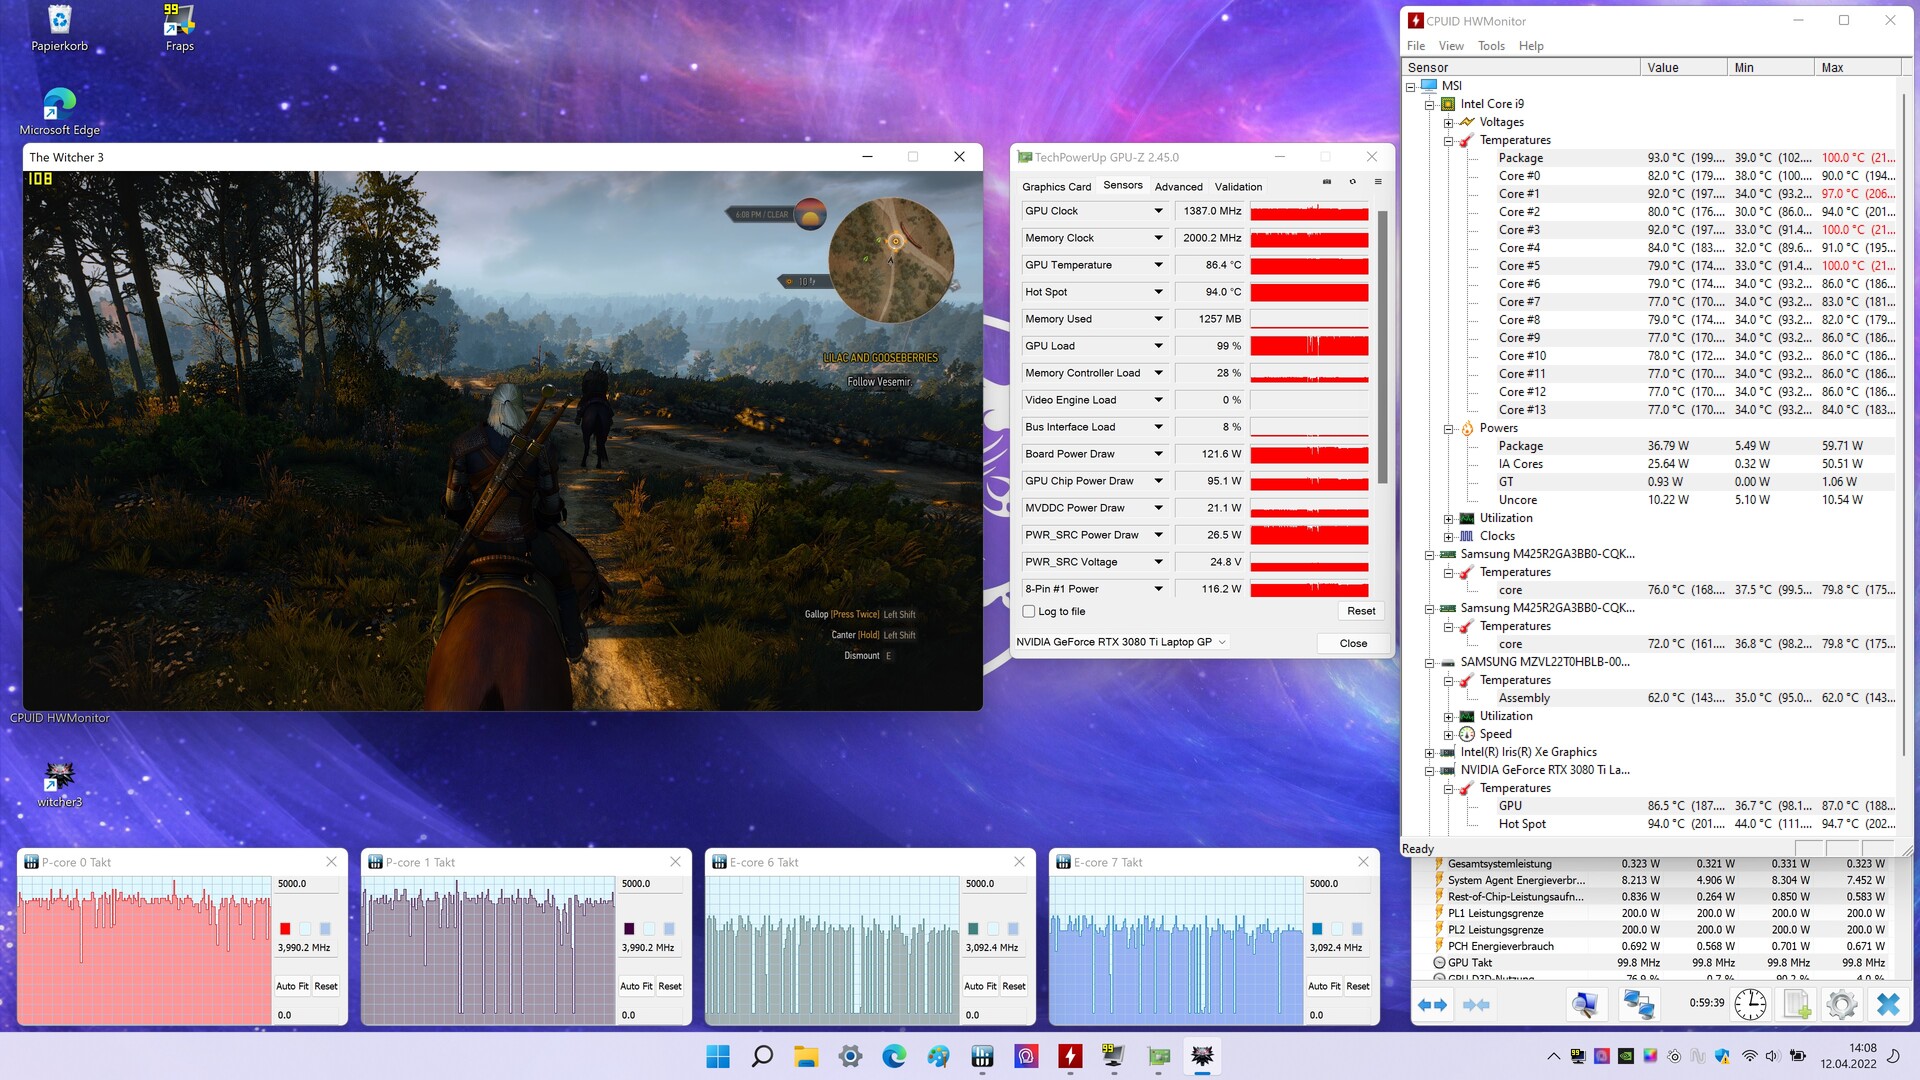
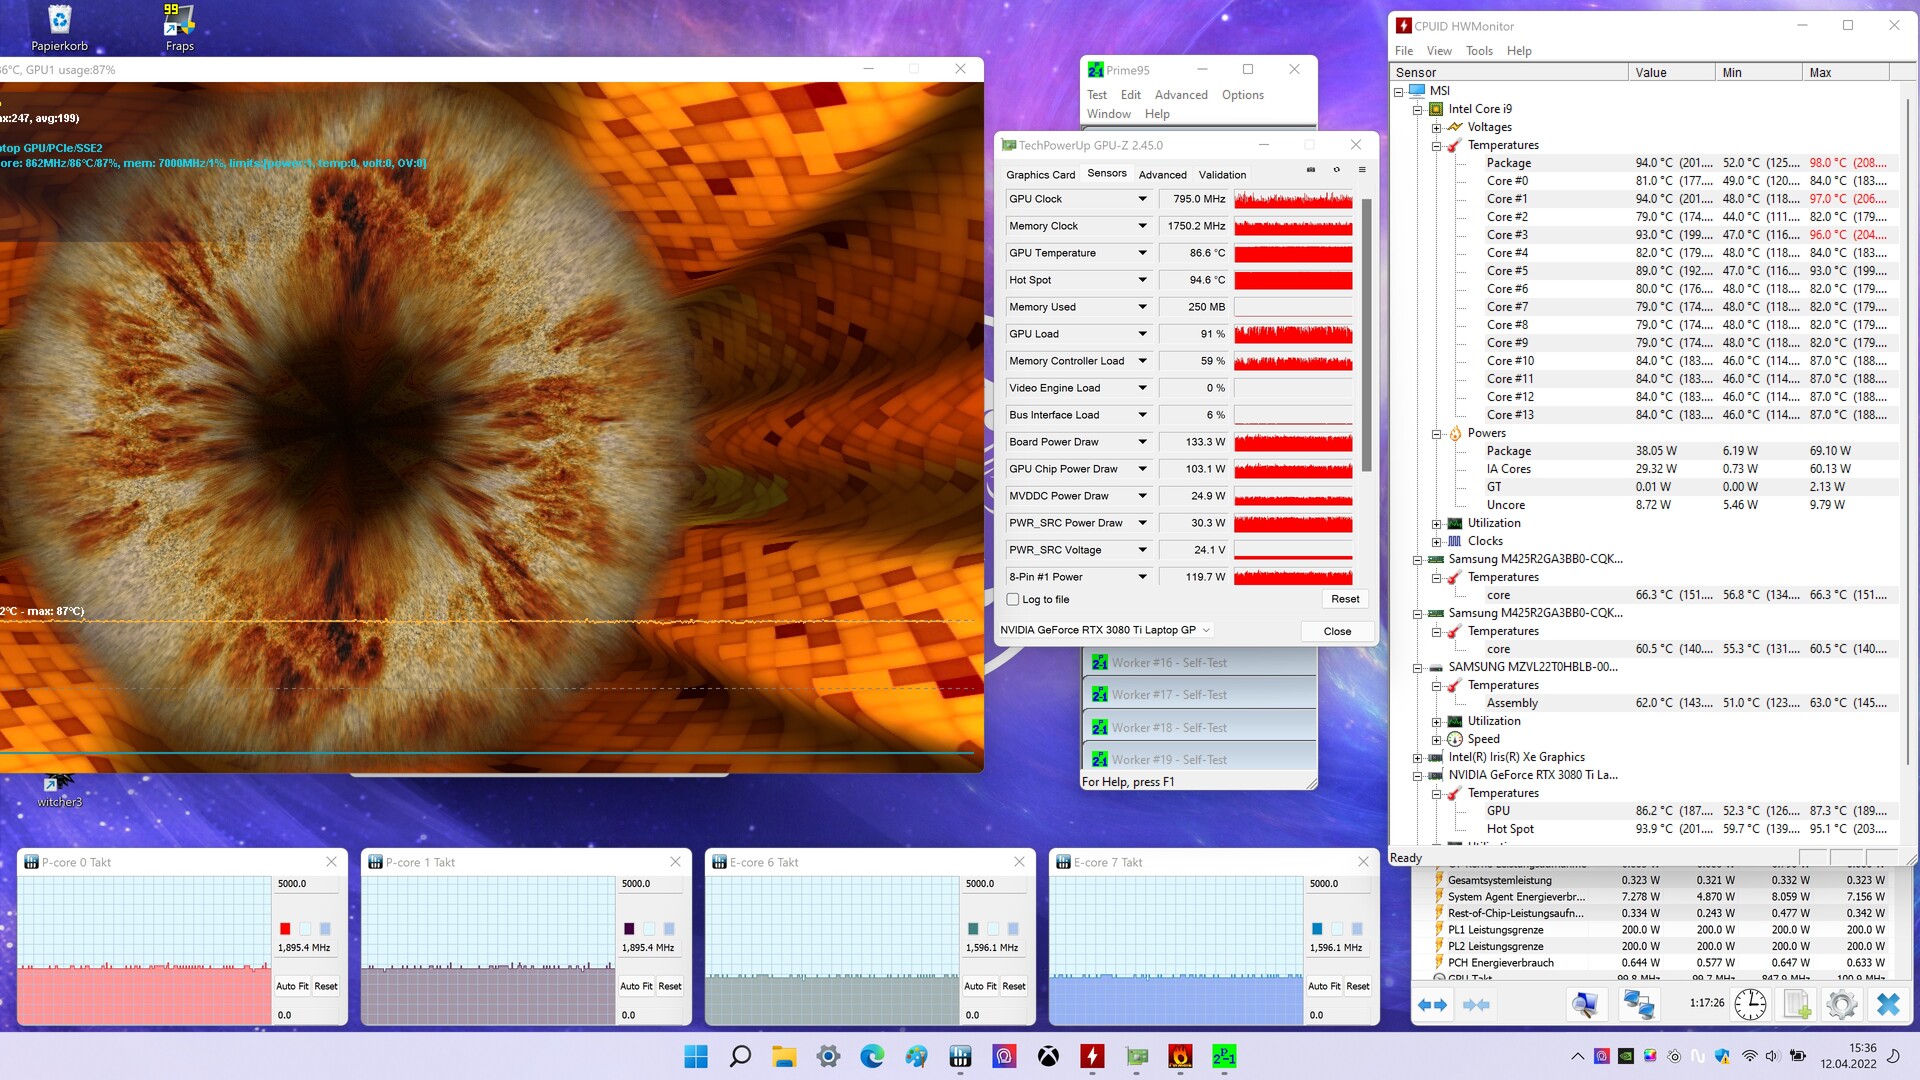
压力测试
在Witcher 3 测试中,该系统能够同时排出最大约160瓦的能量。这分为122瓦的GPU功率和37瓦的CPU功率。在这种情况下,CPU方面的温度平均为93摄氏度,最高值可达100摄氏度。对于显卡,我们看到平均温度为86摄氏度。在P-cores中,CPU时钟最初运行在4800MHz,然后稳定在3990MHz。E核短暂地以3800兆赫运行,然后下降到3100兆赫。显卡的平均时钟速率为1,387 MHz。
在Furmark和Prime 95同时运行的压力测试中,该设备以133瓦的GPU功率对待自己。CPU消耗38瓦,因此,在冷却系统的作用下,测试系统能够耗散略高于170瓦的功率。与Witcher 3 测试不同,处理器的温度最高上升到98摄氏度,然后稳定在94摄氏度。显卡的温度值再次稳定在平均86摄氏度。CPU时钟最初以第一种情况下的速度运行,然后在P-cores的1,900 MHz和E-cores的1,600 MHz处趋于平稳。RTX 3080 Ti的时钟速率下降到795 MHz。在压力测试中,两个风扇以最大的5100 RPM运行。尽管在极端条件下,GPU风扇表现得很动态,在测试期间在4,000 RPM和5,100 RPM之间移动。
发言人
微星安装的双波扬声器与前代产品相比,有更多的低音,更平衡的中音以及高音,使其适合各种媒体消费,并产生了良好的音量。然而,我们发现在玩游戏和听音乐时,低音有点不足。
MSI Raider GE66 12UHS audio analysis
(+) | speakers can play relatively loud (84 dB)
Bass 100 - 315 Hz
(-) | nearly no bass - on average 17% lower than median
(±) | linearity of bass is average (11% delta to prev. frequency)
Mids 400 - 2000 Hz
(±) | higher mids - on average 5.6% higher than median
(+) | mids are linear (3.9% delta to prev. frequency)
Highs 2 - 16 kHz
(+) | balanced highs - only 4.6% away from median
(+) | highs are linear (6.3% delta to prev. frequency)
Overall 100 - 16.000 Hz
(±) | linearity of overall sound is average (17.1% difference to median)
Compared to same class
» 46% of all tested devices in this class were better, 12% similar, 43% worse
» The best had a delta of 6%, average was 18%, worst was 132%
Compared to all devices tested
» 31% of all tested devices were better, 8% similar, 61% worse
» The best had a delta of 4%, average was 24%, worst was 134%
MSI GE66 Raider 10SFS audio analysis
(+) | speakers can play relatively loud (84 dB)
Bass 100 - 315 Hz
(-) | nearly no bass - on average 32.4% lower than median
(+) | bass is linear (5.9% delta to prev. frequency)
Mids 400 - 2000 Hz
(±) | higher mids - on average 7.4% higher than median
(±) | linearity of mids is average (8.9% delta to prev. frequency)
Highs 2 - 16 kHz
(±) | higher highs - on average 5.3% higher than median
(±) | linearity of highs is average (8.9% delta to prev. frequency)
Overall 100 - 16.000 Hz
(±) | linearity of overall sound is average (26.7% difference to median)
Compared to same class
» 93% of all tested devices in this class were better, 1% similar, 6% worse
» The best had a delta of 6%, average was 18%, worst was 132%
Compared to all devices tested
» 82% of all tested devices were better, 4% similar, 14% worse
» The best had a delta of 4%, average was 24%, worst was 134%
能源管理。良好的运行时间
消耗功率
微星GE66 12UHS的能耗在空闲模式、负载和Witcher 3 压力测试中是可以接受的。尽管我们的设备比它的前辈消耗更多的能量,但它也安装了相当强大的硬件。280瓦的电源的最大容量并没有被用尽,记录的峰值消耗为242瓦。在Witcher 3 测试中,202瓦的消耗大多低于竞争对手的数值。该联想Legion配有 英特尔酷睿i7 12700H和RTX 3070 Ti的消耗量为227瓦,比我们的评测设备的 英特尔酷睿i9 12900HK和RTX 3080 Ti。
| Off / Standby | |
| Idle | |
| Load |
|
Key:
min: | |
| MSI Raider GE66 12UHS Intel Core i9-12900HK, | MSI GE66 Raider 10SFS Intel Core i9-10980HK, | Razer Blade 15 2022 Intel Core i7-12800H, | Schenker XMG Neo 15 E22 (Early 2022, RTX 3080 Ti) Intel Core i7-12700H, | Lenovo Legion 5 Pro 16 G7 i7 RTX 3070Ti Intel Core i7-12700H, | Average of class Gaming | |
|---|---|---|---|---|---|---|
| Power Consumption | 14% | -38% | -0% | 8% | 4% | |
| Idle Minimum * (Watt) | 16 | 6 62% | 33.2 -108% | 14 12% | 8.6 46% | 13.3 ? 17% |
| Idle Average * (Watt) | 19 | 14 26% | 36.4 -92% | 18 5% | 17.6 7% | 19 ? -0% |
| Idle Maximum * (Watt) | 26 | 25 4% | 37.6 -45% | 19 27% | 18.5 29% | 24.5 ? 6% |
| Load Average * (Watt) | 110 | 108 2% | 116.7 -6% | 115 -5% | 110 -0% | 108.1 ? 2% |
| Witcher 3 ultra * (Watt) | 202 | 195 3% | 172 15% | 228 -13% | 227 -12% | |
| Load Maximum * (Watt) | 242 | 280 -16% | 228.6 6% | 307 -27% | 294.6 -22% | 254 ? -5% |
* ... smaller is better
Power Consumption Witcher 3 / Stress Test
Use with an external monitor
电池寿命
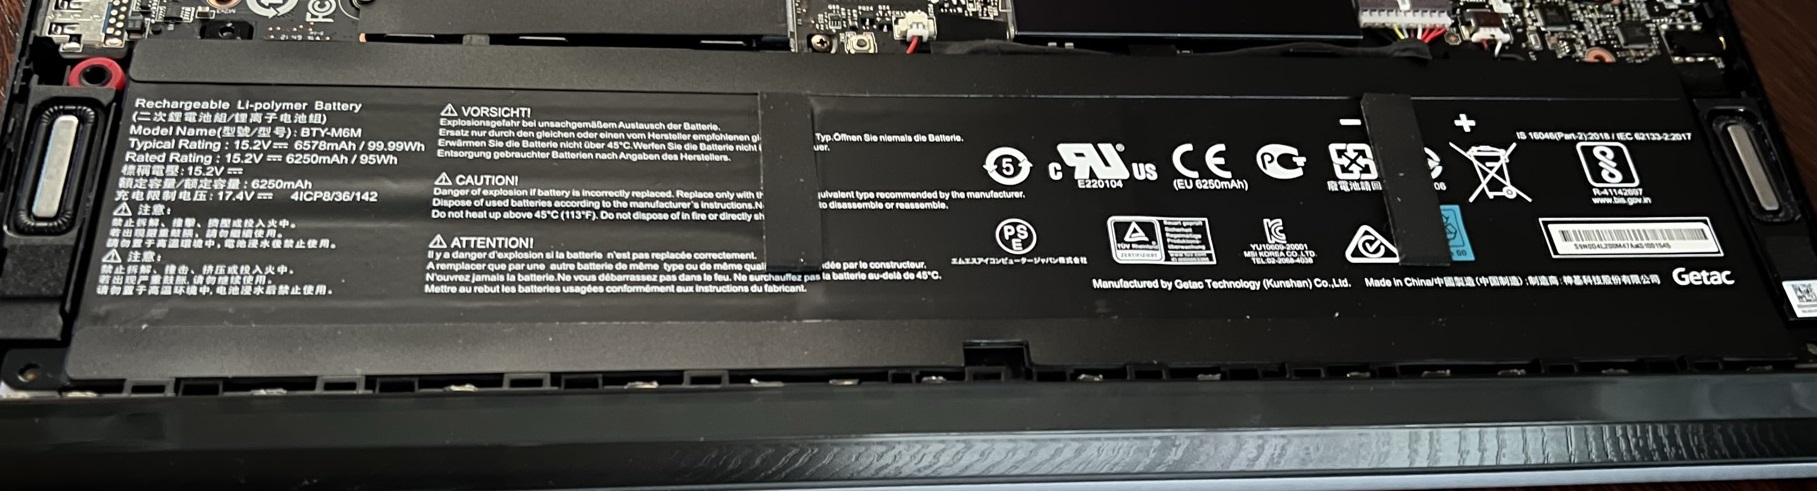
相较于 微星GE66 10SFS我们的评测设备在Wi-Fi测试中提供了一个稍短的运行时间,但性能更好,电池容量相同。这款 Razer Blade 15 2022和 联想Legion 5 Pro其名义上较弱的硬件被我们的微星GE66 12UHS超越了。只有 申克XMG Neo 15 Early 2022电池较小,处理器较弱,才能比我们的评测样本高出20%左右。
| MSI Raider GE66 12UHS i9-12900HK, GeForce RTX 3080 Ti Laptop GPU, 99 Wh | MSI GE66 Raider 10SFS i9-10980HK, GeForce RTX 2070 Super Mobile, 99.99 Wh | Razer Blade 15 2022 i7-12800H, GeForce RTX 3080 Ti Laptop GPU, 80 Wh | Schenker XMG Neo 15 E22 (Early 2022, RTX 3080 Ti) i7-12700H, GeForce RTX 3080 Ti Laptop GPU, 93 Wh | Lenovo Legion 5 Pro 16 G7 i7 RTX 3070Ti i7-12700H, GeForce RTX 3070 Ti Laptop GPU, 80 Wh | Average of class Gaming | |
|---|---|---|---|---|---|---|
| Battery runtime | 7% | -14% | 46% | -27% | 8% | |
| H.264 (h) | 7.1 | 6.9 -3% | 6.3 -11% | 8.26 ? 16% | ||
| WiFi v1.3 (h) | 5.7 | 6.1 7% | 4.9 -14% | 6.7 18% | 5.4 -5% | 7.01 ? 23% |
| Load (h) | 1.7 | 1.8 6% | 3.8 124% | 0.6 -65% | 1.47 ? -14% | |
| Reader / Idle (h) | 7.6 | 8.71 ? |
Pros
Cons
结论:具有强大性能的高端笔记本
与它的前辈,即微星GE66 10SFS ,我们发现微星GE66 12UHS除了修改过的灯条之外,在视觉上是相同的。键盘和触控板仍然非常好,并以精确的输入以及高制造质量获得了不错的成绩。由于采用了新的液态金属冷却解决方案,英特尔酷睿i9 12900HK ,比前辈的英特尔酷睿i9 10980HK ,带来了约50%的性能提升。我们设备中安装的显卡比微星GE66 10SFS中的RTX 2070超级 ,帧率高达30%。然而,打开笔记本仍然不是一件容易的事。另一个小缺点是,如果你玩了几个小时,特别是按键会明显发热。我们的测试设备以其120赫兹4K IPS面板提供了良好的速率。升级到DDR5内存的可能性,以及通过PCI Gen 4接口连接两个NVMe SSD的选择,确保了设备的未来可行性。
微星GE66 12UHS的游戏性能非常出色。在我们的审查中,所有标题都在4K分辨率下以高到最大的细节顺利运行。
另一个积极方面是改进的冷却系统。自动的、AI支持的风扇控制在性能和噪音之间提供了一个很好的妥协。不幸的是,在长时间的游戏过程中,该系统无法足够快地散去产生的热量,这导致性能下降约10%。不过,这个问题也可以通过手动将风扇设置为全速(Cooler Boost)来解决。微星中心可以用来控制笔记本的许多核心功能,并为用户提供有用的附加功能。然而,微星中心仍然很容易出错,在我们的测试中随机崩溃,并重置了先前设置的性能配置文件。我们还观察到安装的三星PM9A1固态硬盘在持续负载下的性能损失高达80%。
MSI Raider GE66 12UHS
- 05/30/2022 v7 (old)
Patrick Schüdzig
Price comparison

