英特尔酷睿i7-12800HX是疯狂的。微星突击队GE67 HX 12UGS笔记本评测
微星GE67是一个高端游戏系列,位于价格较低的Katana GF或Vector GP系列之上,但低于发烧级的Titan GT系列。我们的GE67测试装置是2020年GE66的直接继承者。GE67没有配备英特尔第十代Comet Lake-H CPU和NvidiaGeForce Super GPU,而是配备了第十二代Alder Lake-H CPU和移动GeForce Ti GPU。
我们建议查看我们的 现有的 两篇评论因为GE67采用了大部分相同的机箱设计和功能。尽管如此,仍有一些相对较小的视觉差异,我们将在下面的评论中详细说明。
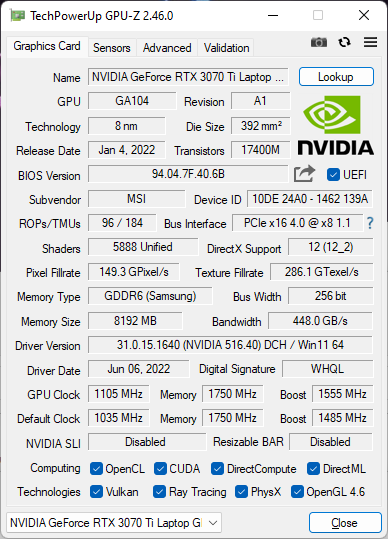
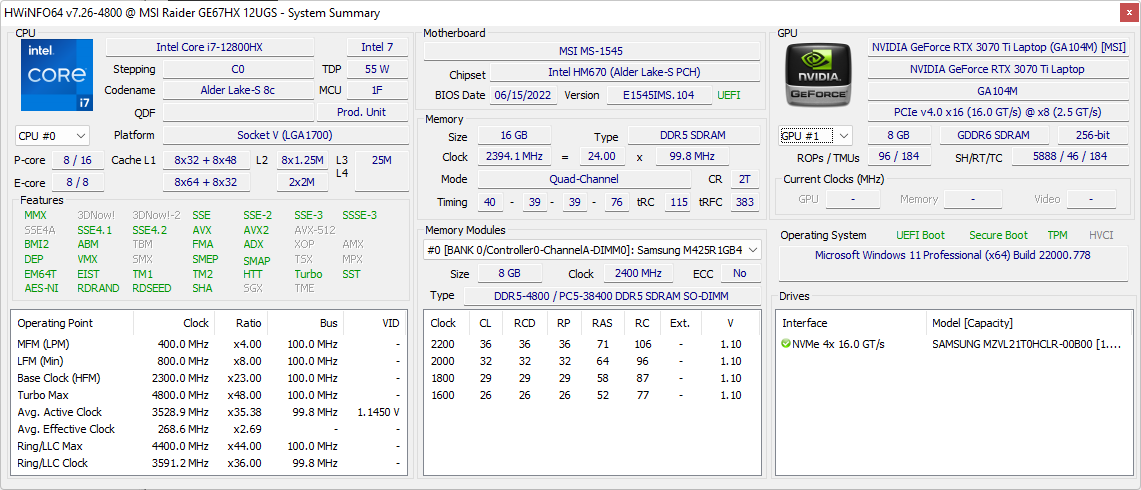
我们的测试装置配备了16核酷睿i7-12800HX CPU,GeForce RTX 3070 Ti GPU,以及240赫兹的QHD OLED面板,承诺完全覆盖DCI-P3,零售价约2500美元。这一领域的直接竞争对手包括其他高端15.6英寸游戏笔记本电脑,如 华硕ROG Strix Scar 15, Razer Blade 15,或Alienware m15 R6.
更多MSI评论。
潜在的竞争对手比较
Rating | Date | Model | Weight | Height | Size | Resolution | Price |
|---|---|---|---|---|---|---|---|
| 87.7 % v7 (old) | 07 / 2022 | MSI GE67 HX 12UGS i7-12800HX, GeForce RTX 3070 Ti Laptop GPU | 2.5 kg | 23.4 mm | 15.60" | 1920x1080 | |
| 87.4 % v7 (old) | 06 / 2022 | MSI Raider GE66 12UHS i9-12900HK, GeForce RTX 3080 Ti Laptop GPU | 2.4 kg | 23.4 mm | 15.60" | 3840x2160 | |
| 86.9 % v7 (old) | 03 / 2022 | MSI Vector GP66 12UGS i9-12900H, GeForce RTX 3070 Ti Laptop GPU | 2.3 kg | 23.4 mm | 15.60" | 1920x1080 | |
| 86.3 % v7 (old) | 06 / 2022 | Asus ROG Strix Scar 15 G533ZW-LN106WS i9-12900H, GeForce RTX 3070 Ti Laptop GPU | 2.3 kg | 27.2 mm | 15.60" | 2560x1440 | |
| 86.1 % v7 (old) | 11 / 2021 | Alienware m15 R6, i7-11800H RTX 3080 i7-11800H, GeForce RTX 3080 Laptop GPU | 2.5 kg | 22.85 mm | 15.60" | 1920x1080 | |
| 89.1 % v7 (old) | 03 / 2022 | Razer Blade 15 2022 i7-12800H, GeForce RTX 3080 Ti Laptop GPU | 2.1 kg | 16.99 mm | 15.60" | 2560x1440 |
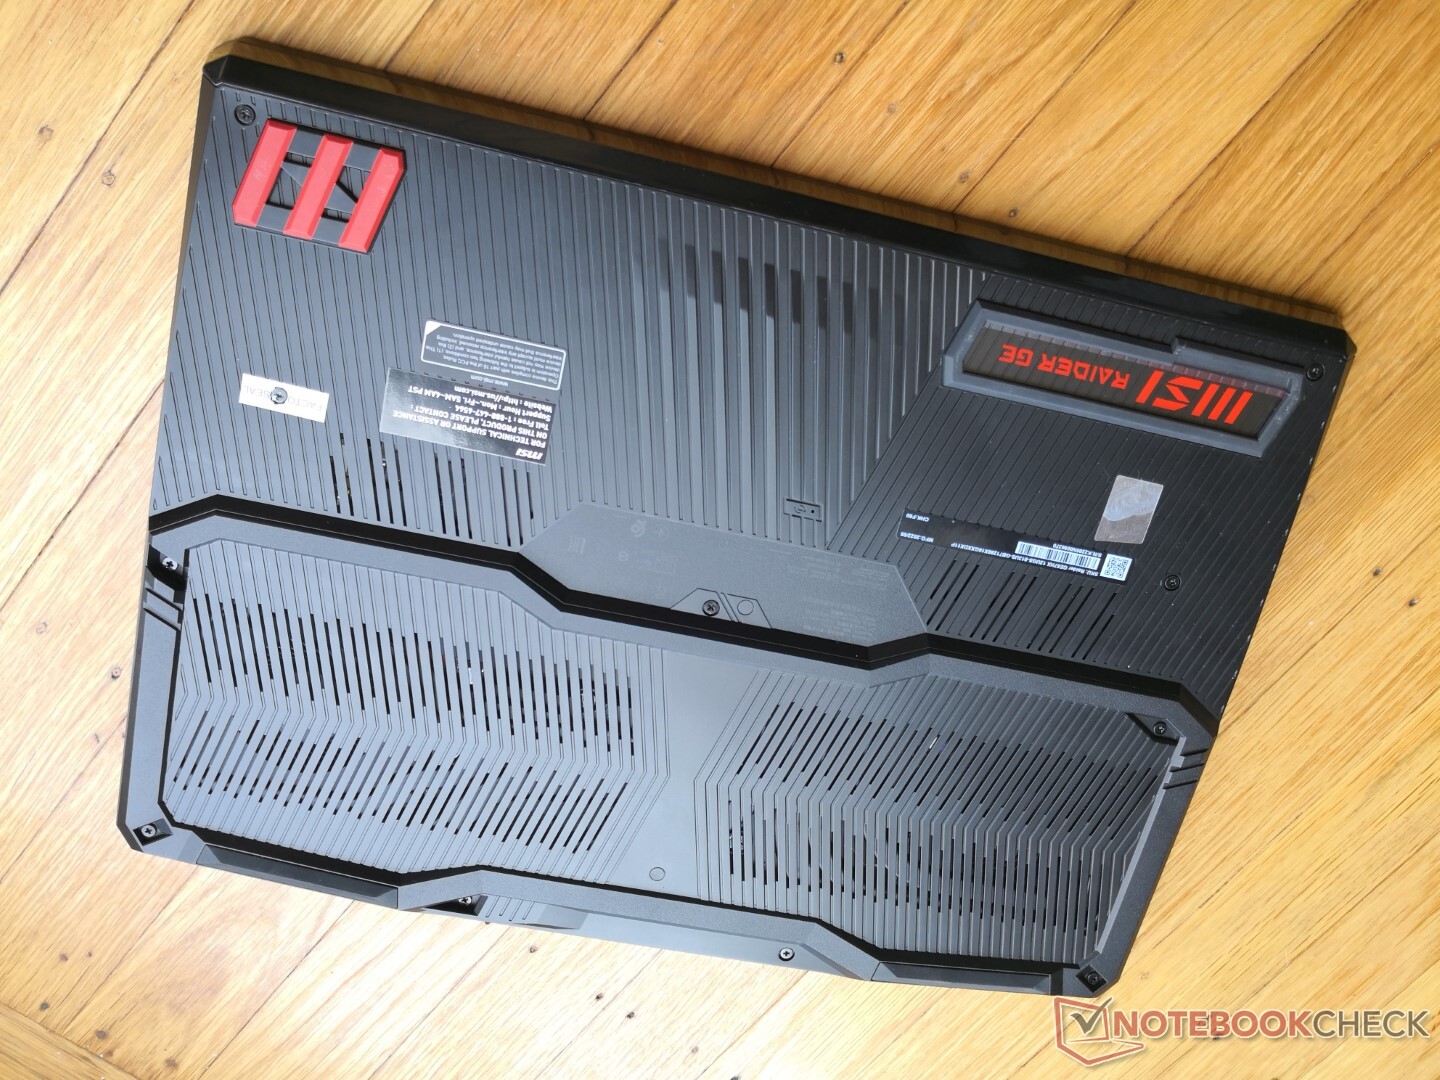
案例 - 顶部相同,底部不同
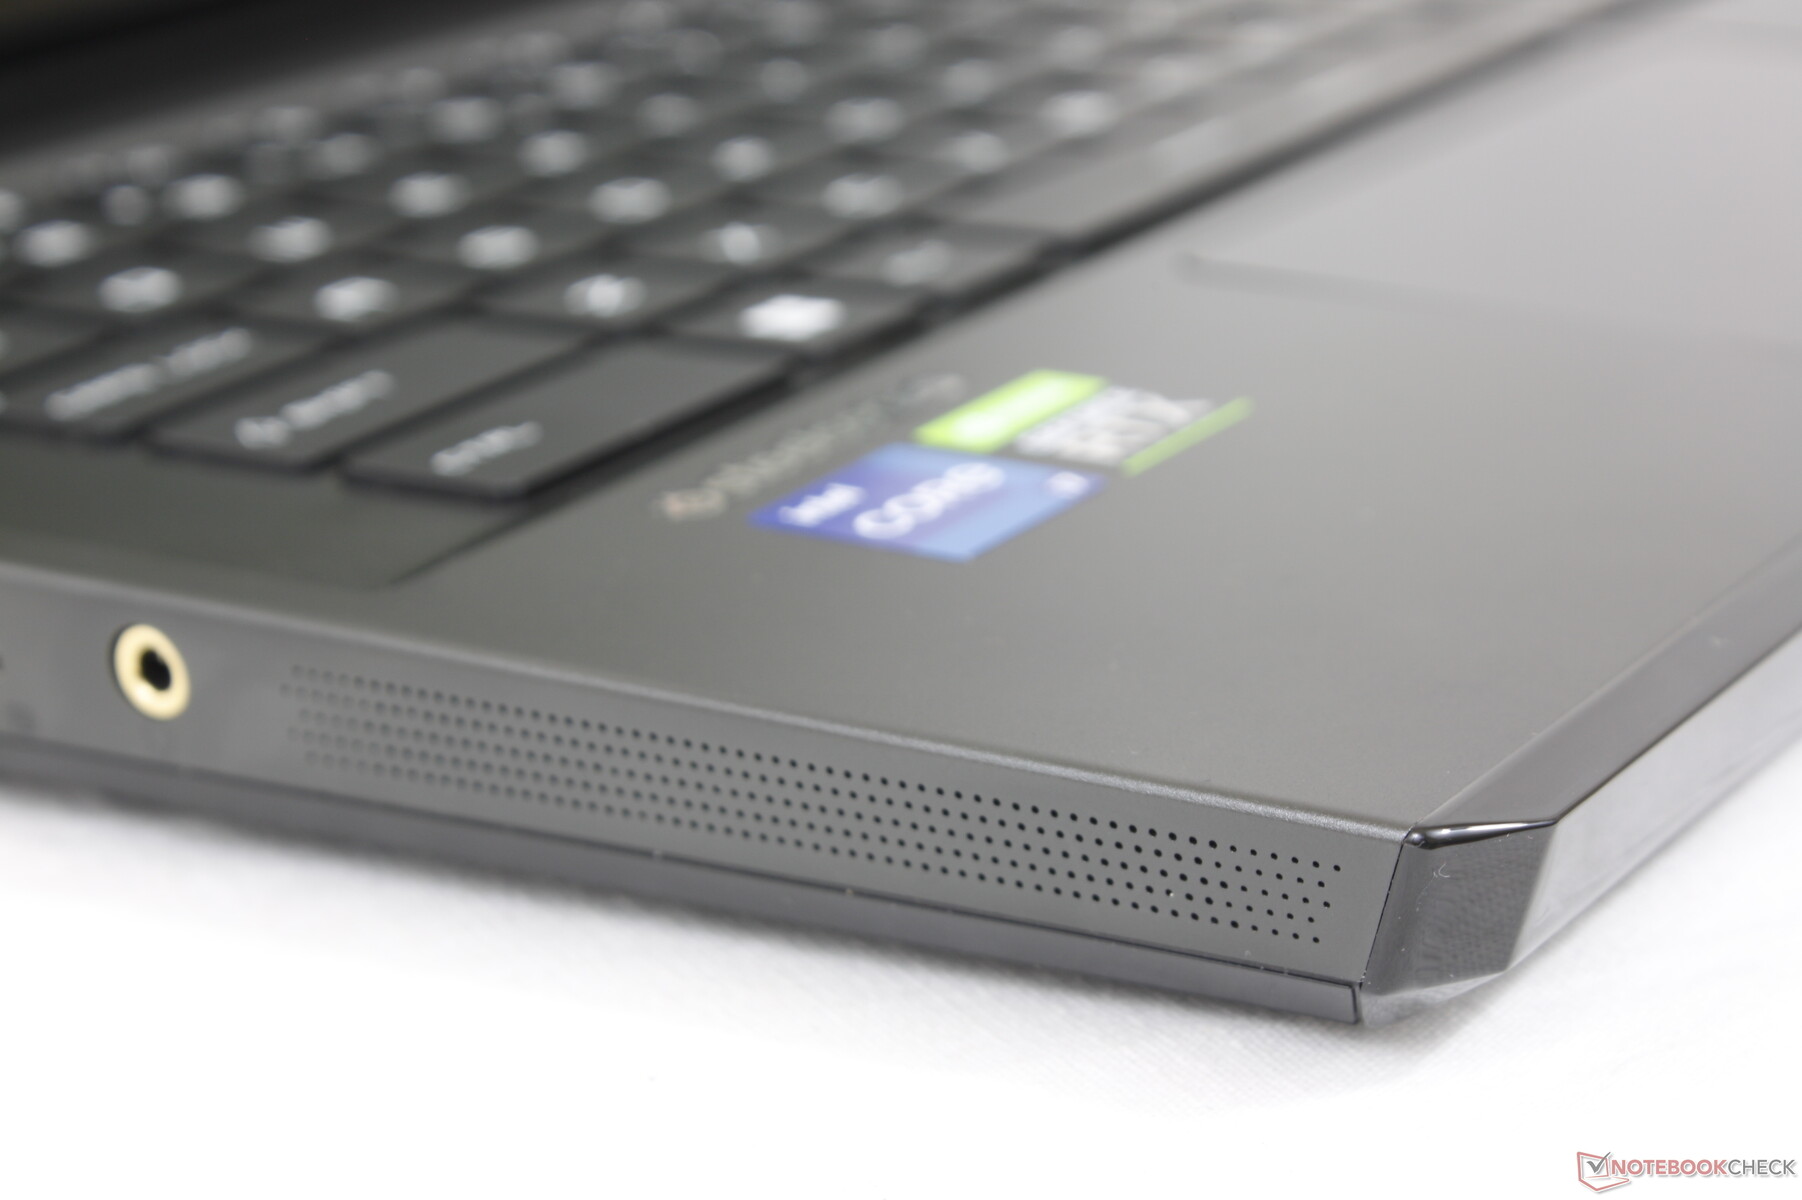
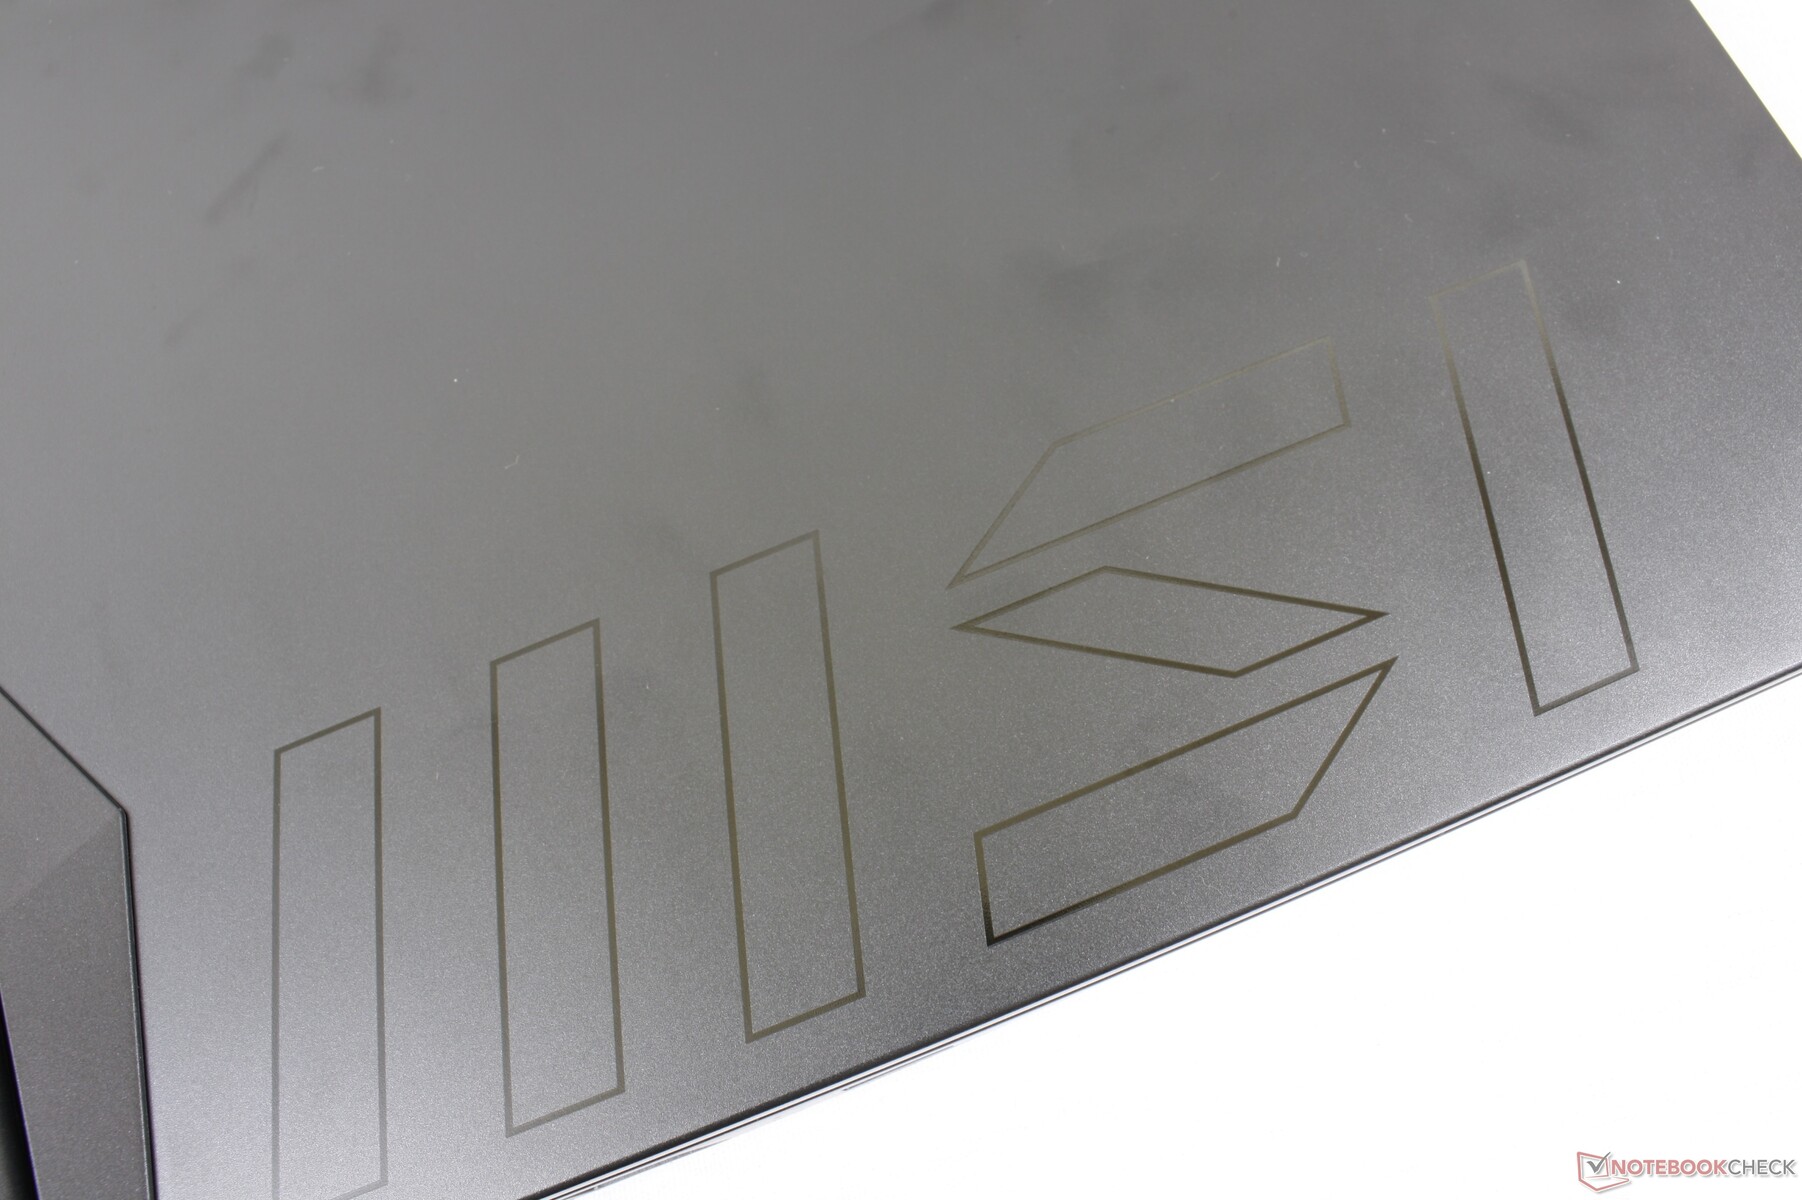
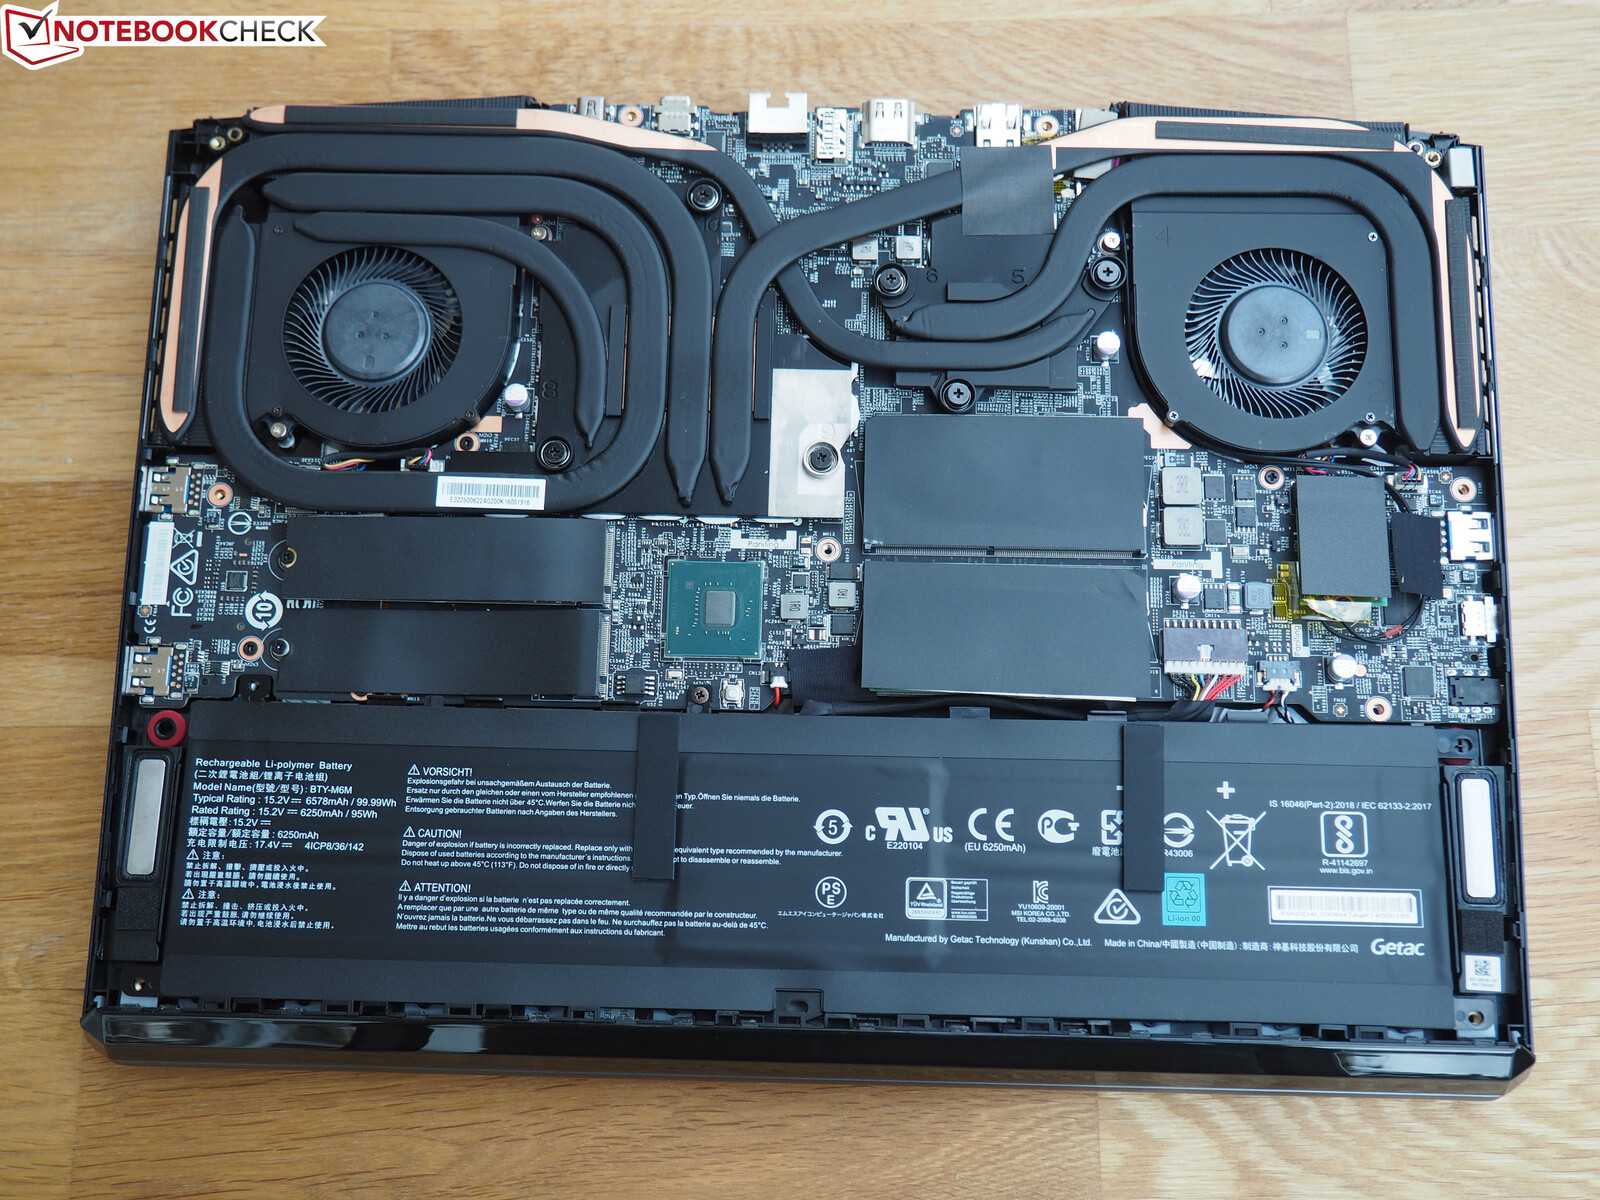
虽然机箱尺寸与GE66完全相同,但有一些视觉上的差异。首先,GE67的外盖左边缘有一个大的微星标志,这有助于更容易区分GE66和GE67的区别。其次,微星已经完全重新设计了GE67的底面,可能是为了提高该模型的整体冷却潜力。除此之外,GE66和GE67的盖子和键盘板都采用了类似的金属材料,底板则采用了塑料。沿着前缘的标志性LED条仍然没有受到影响。
新机型比前代机型略重约100克,这可能是由于这些微小的变化。
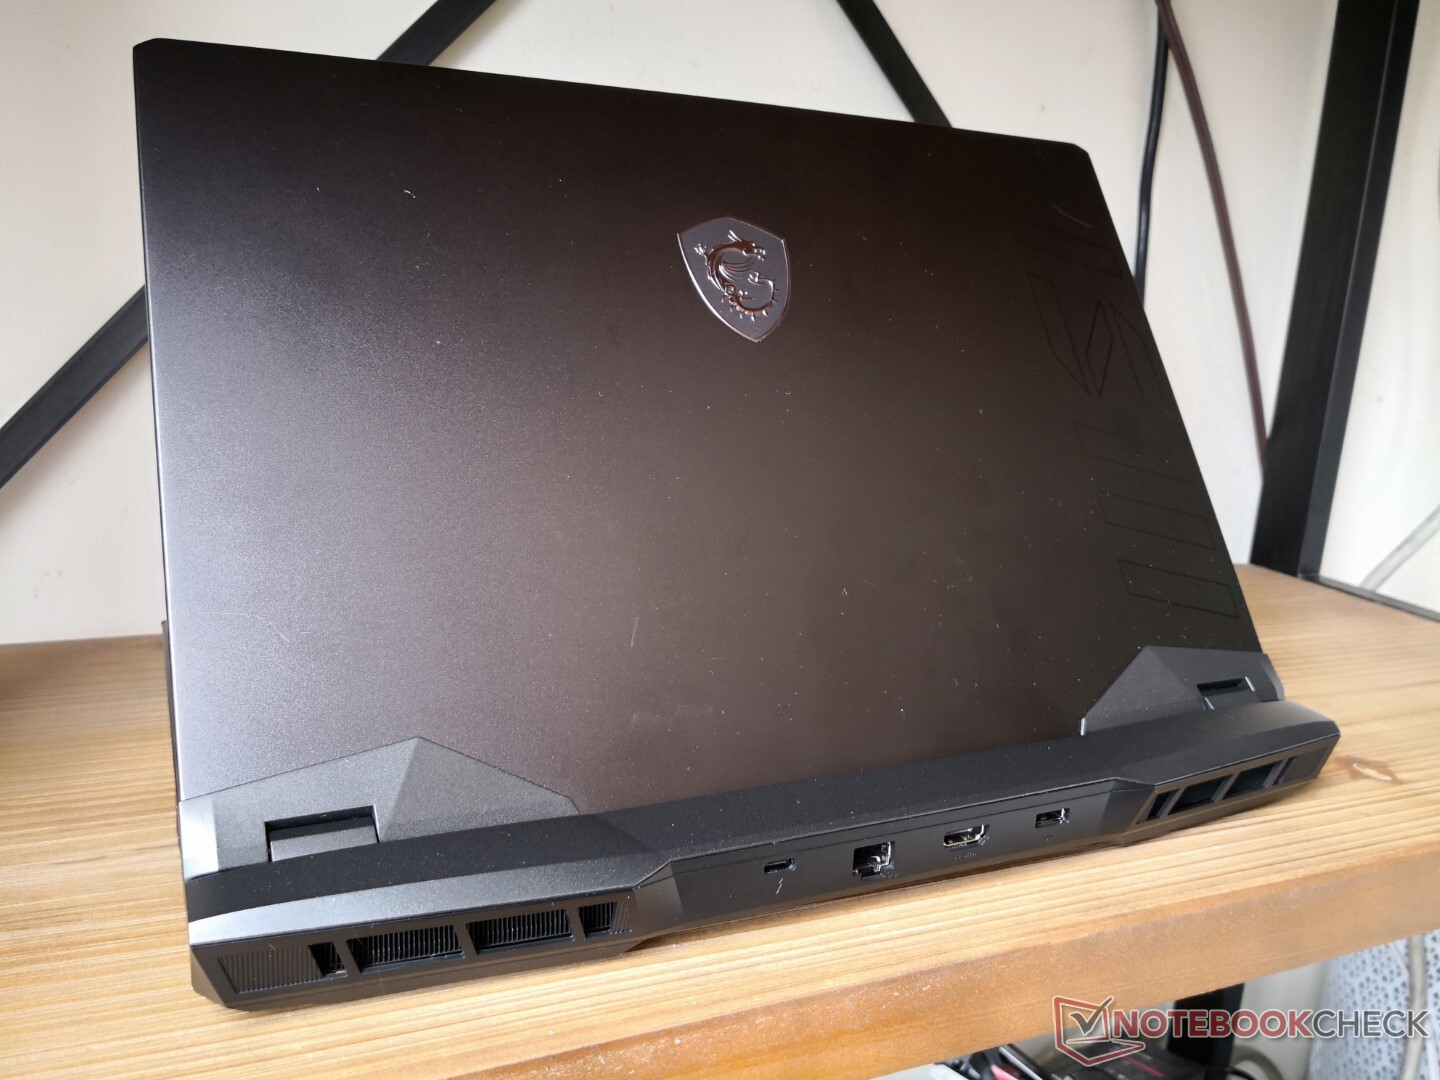
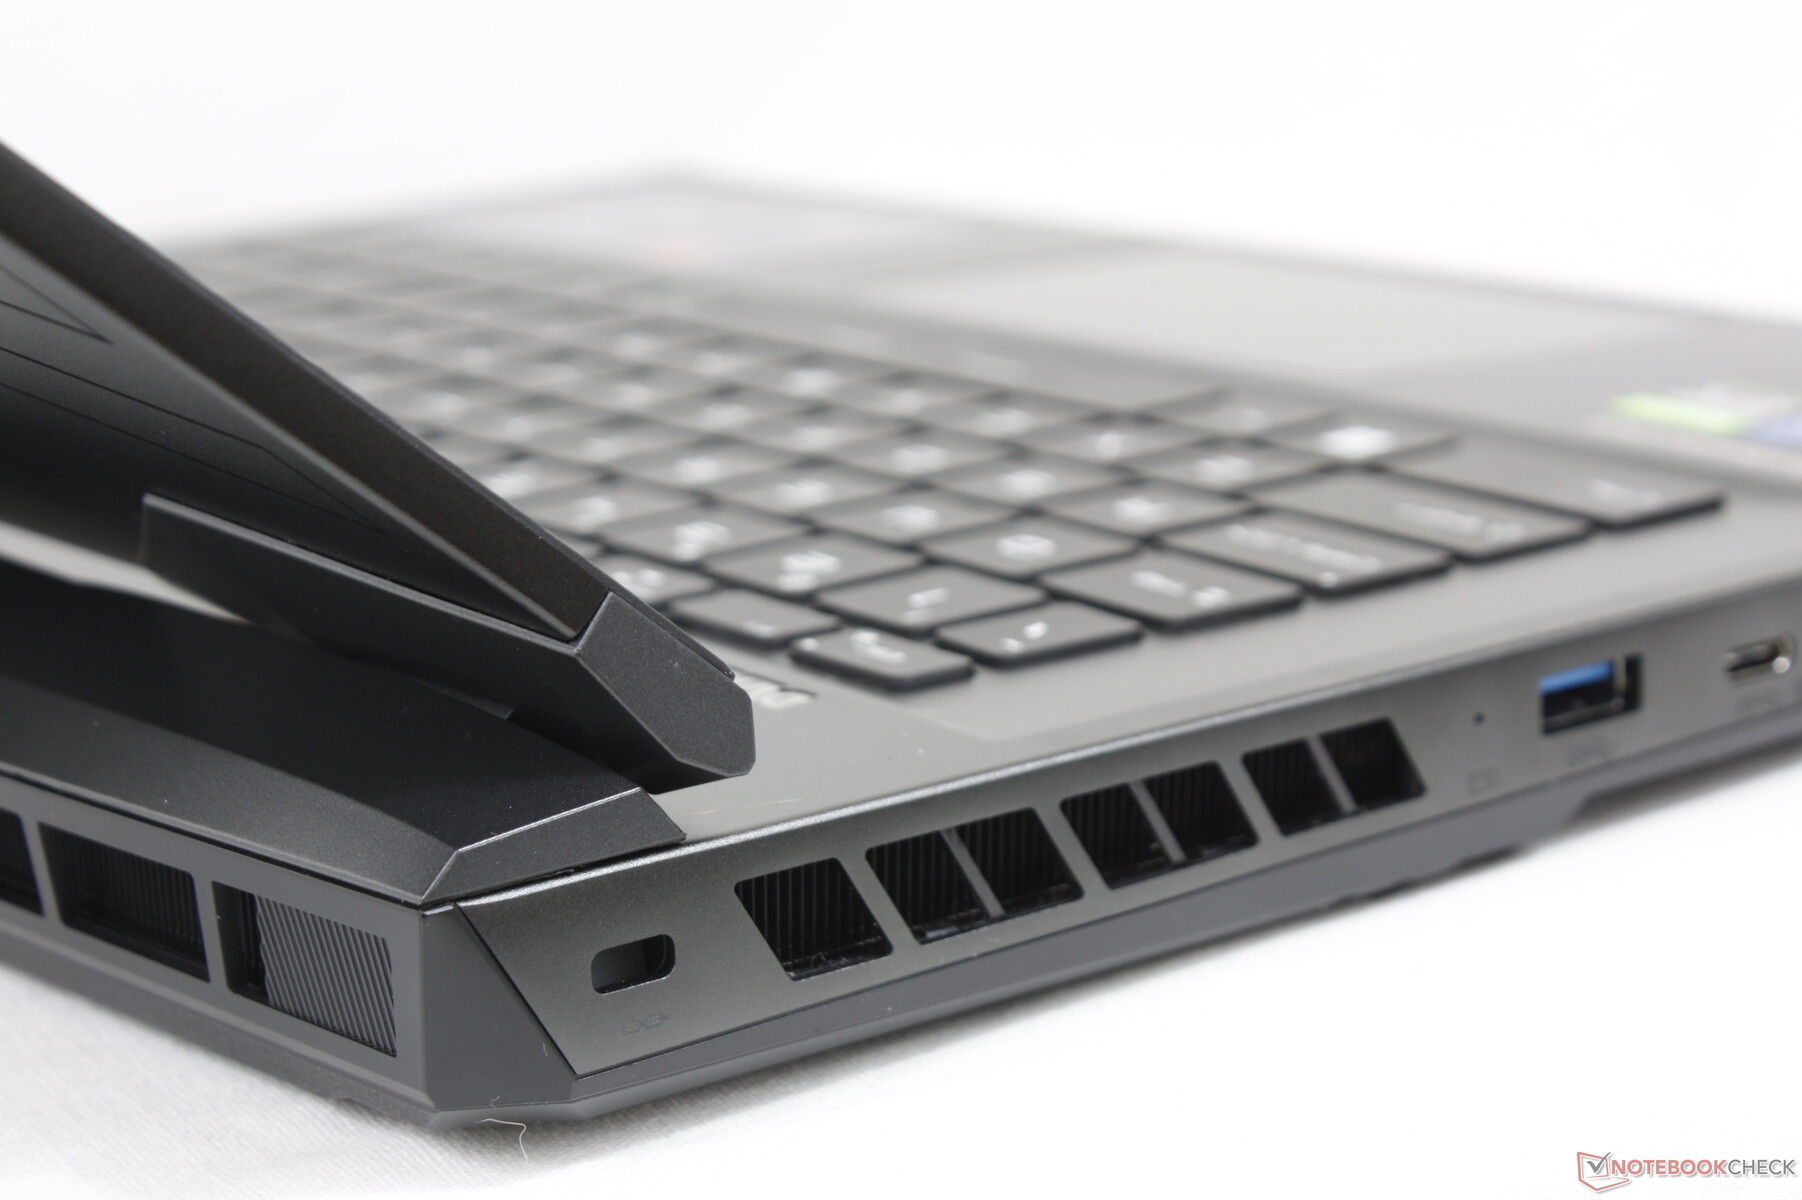
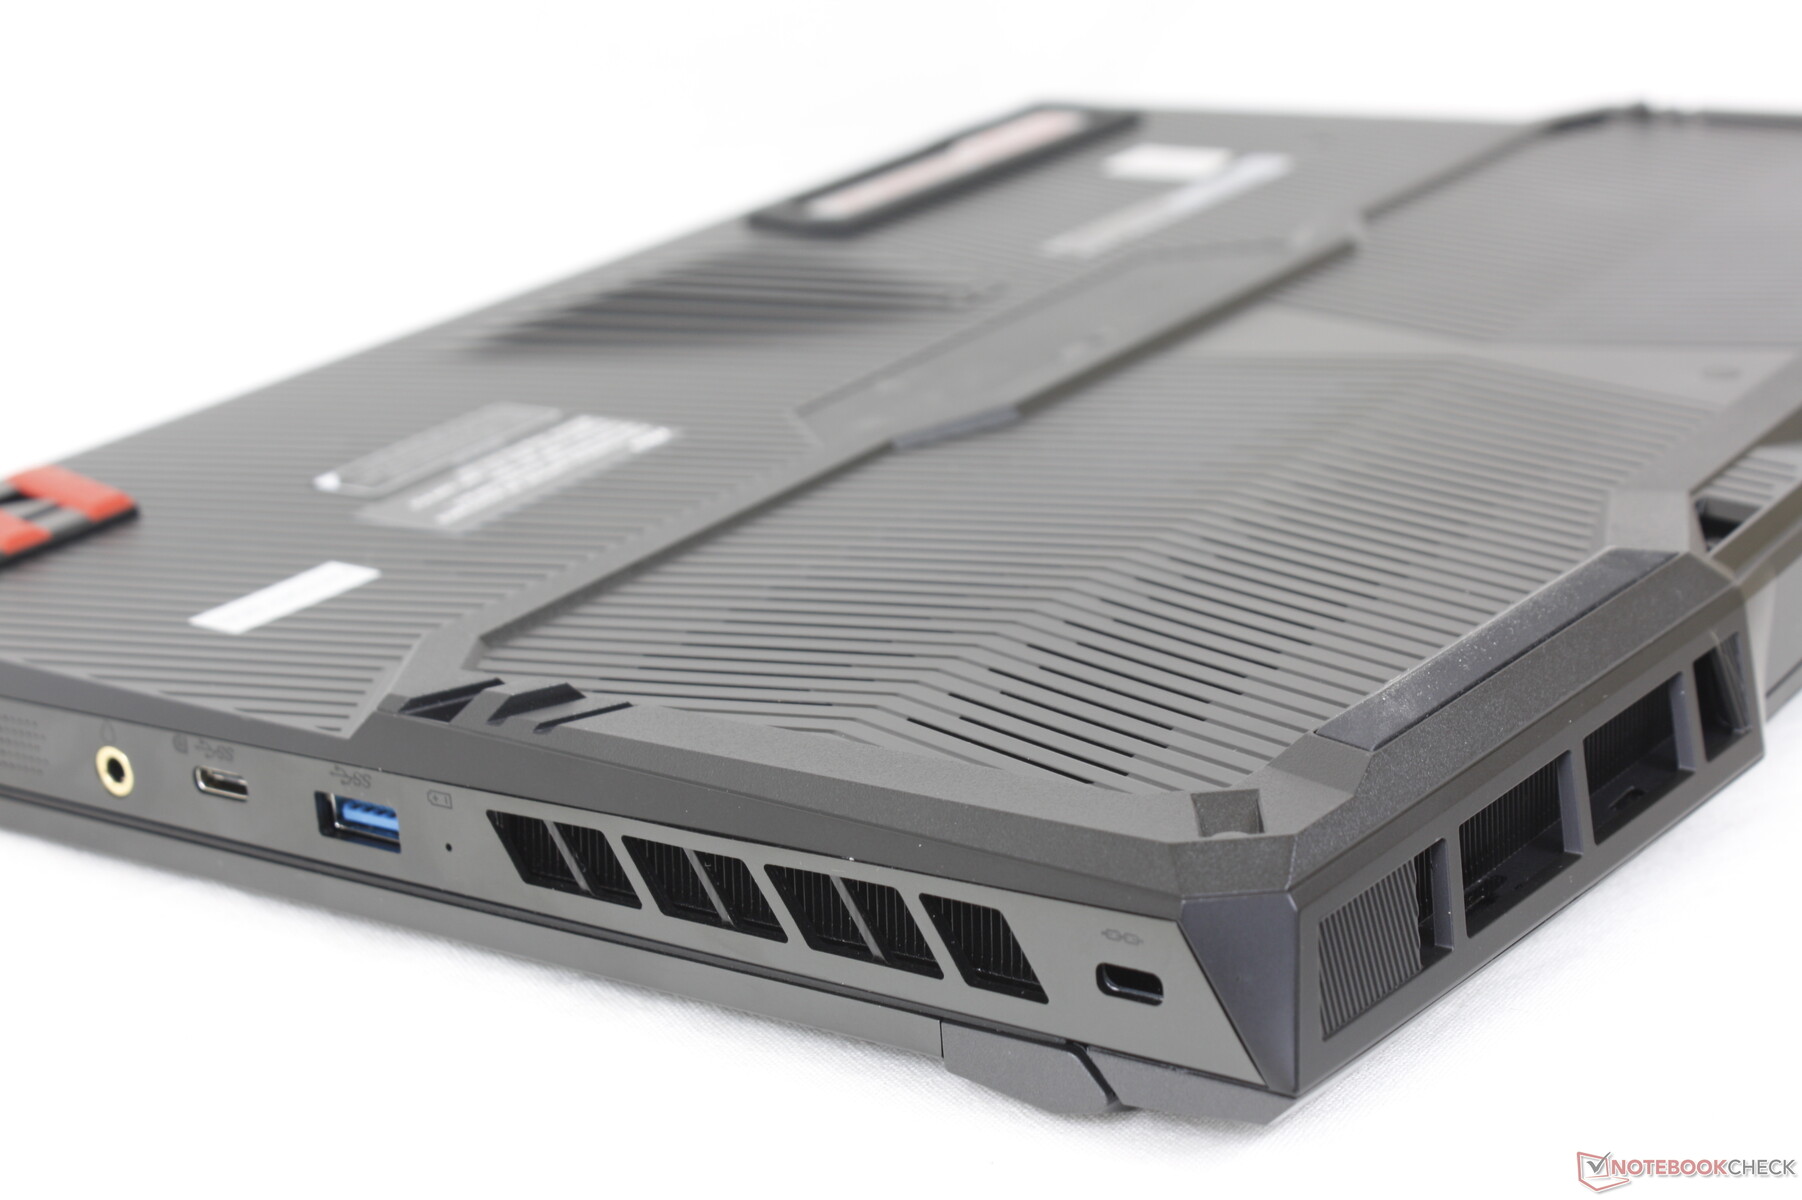
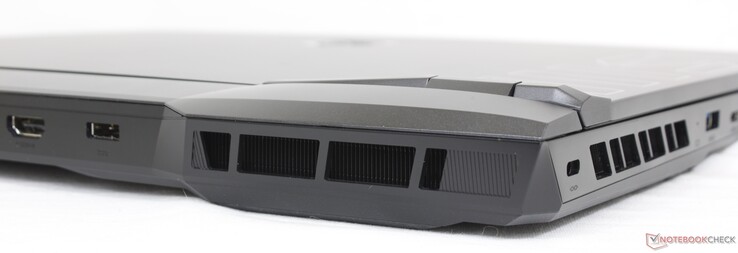
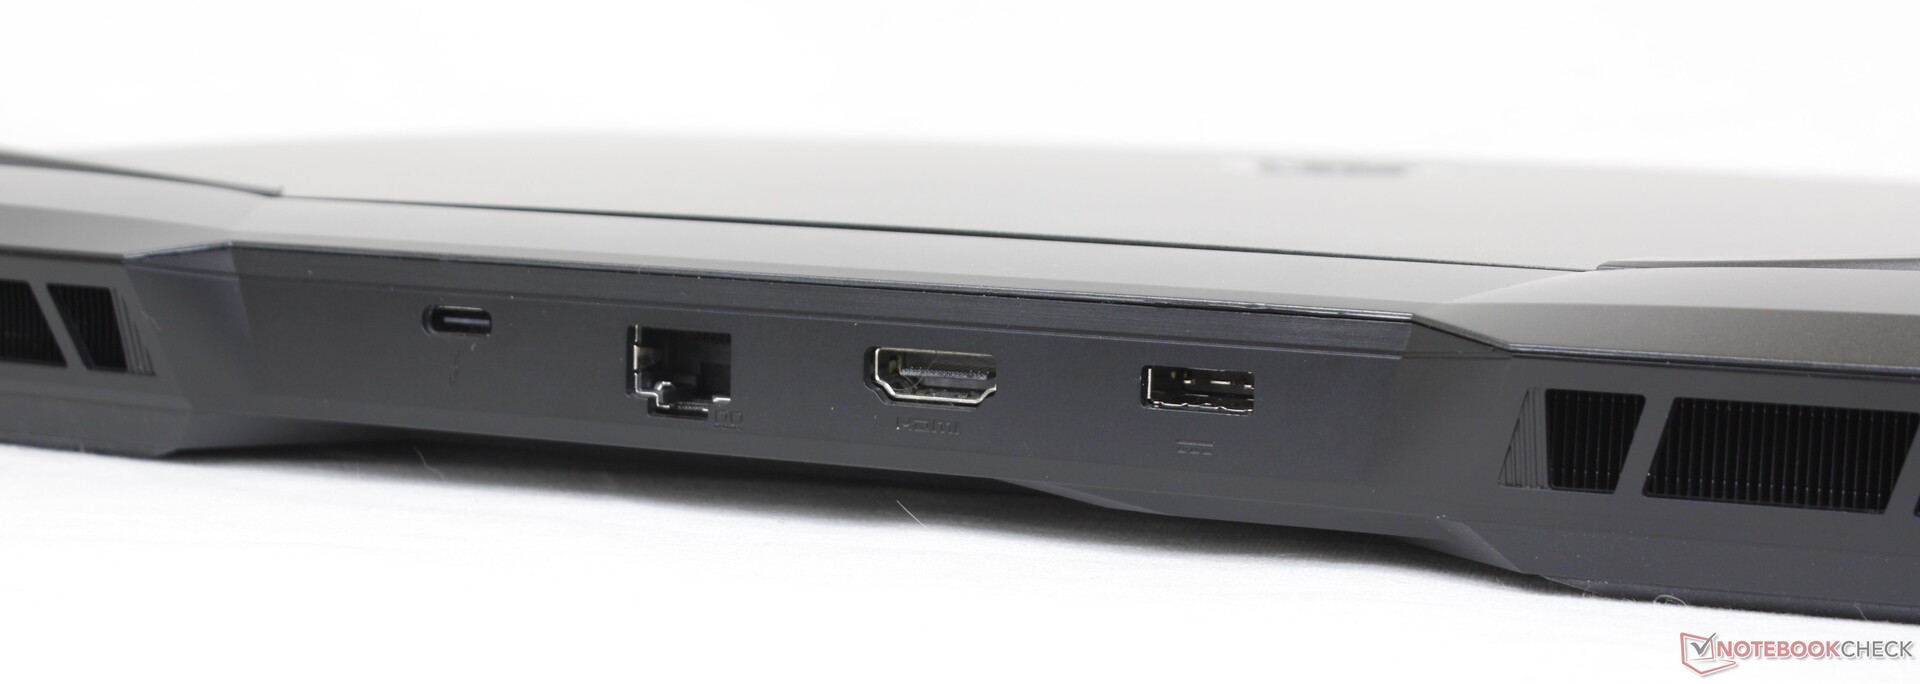
连接性 - 不再有迷你显示端口
GE67放弃了GE66上的专用迷你显示端口。DisplayPort仍然通过两个USB-C端口支持。
与其他基于Alder-Lake-H平台的游戏笔记本电脑一样,如 华硕TUF游戏F15 FX507ZM如果在独立显卡模式下运行,Thunderbolt 4连接将被禁用。
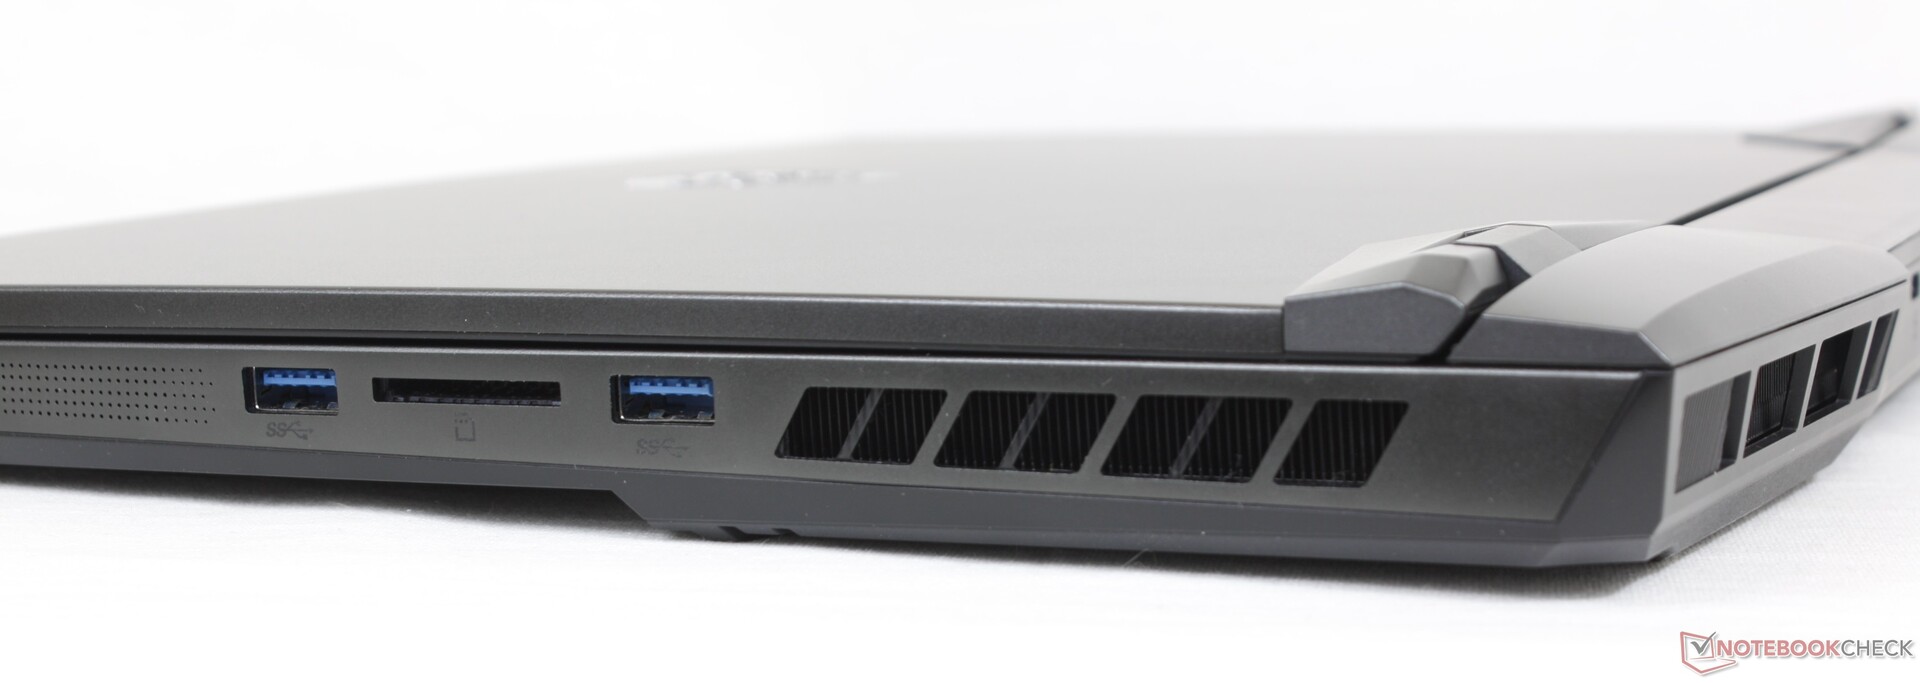
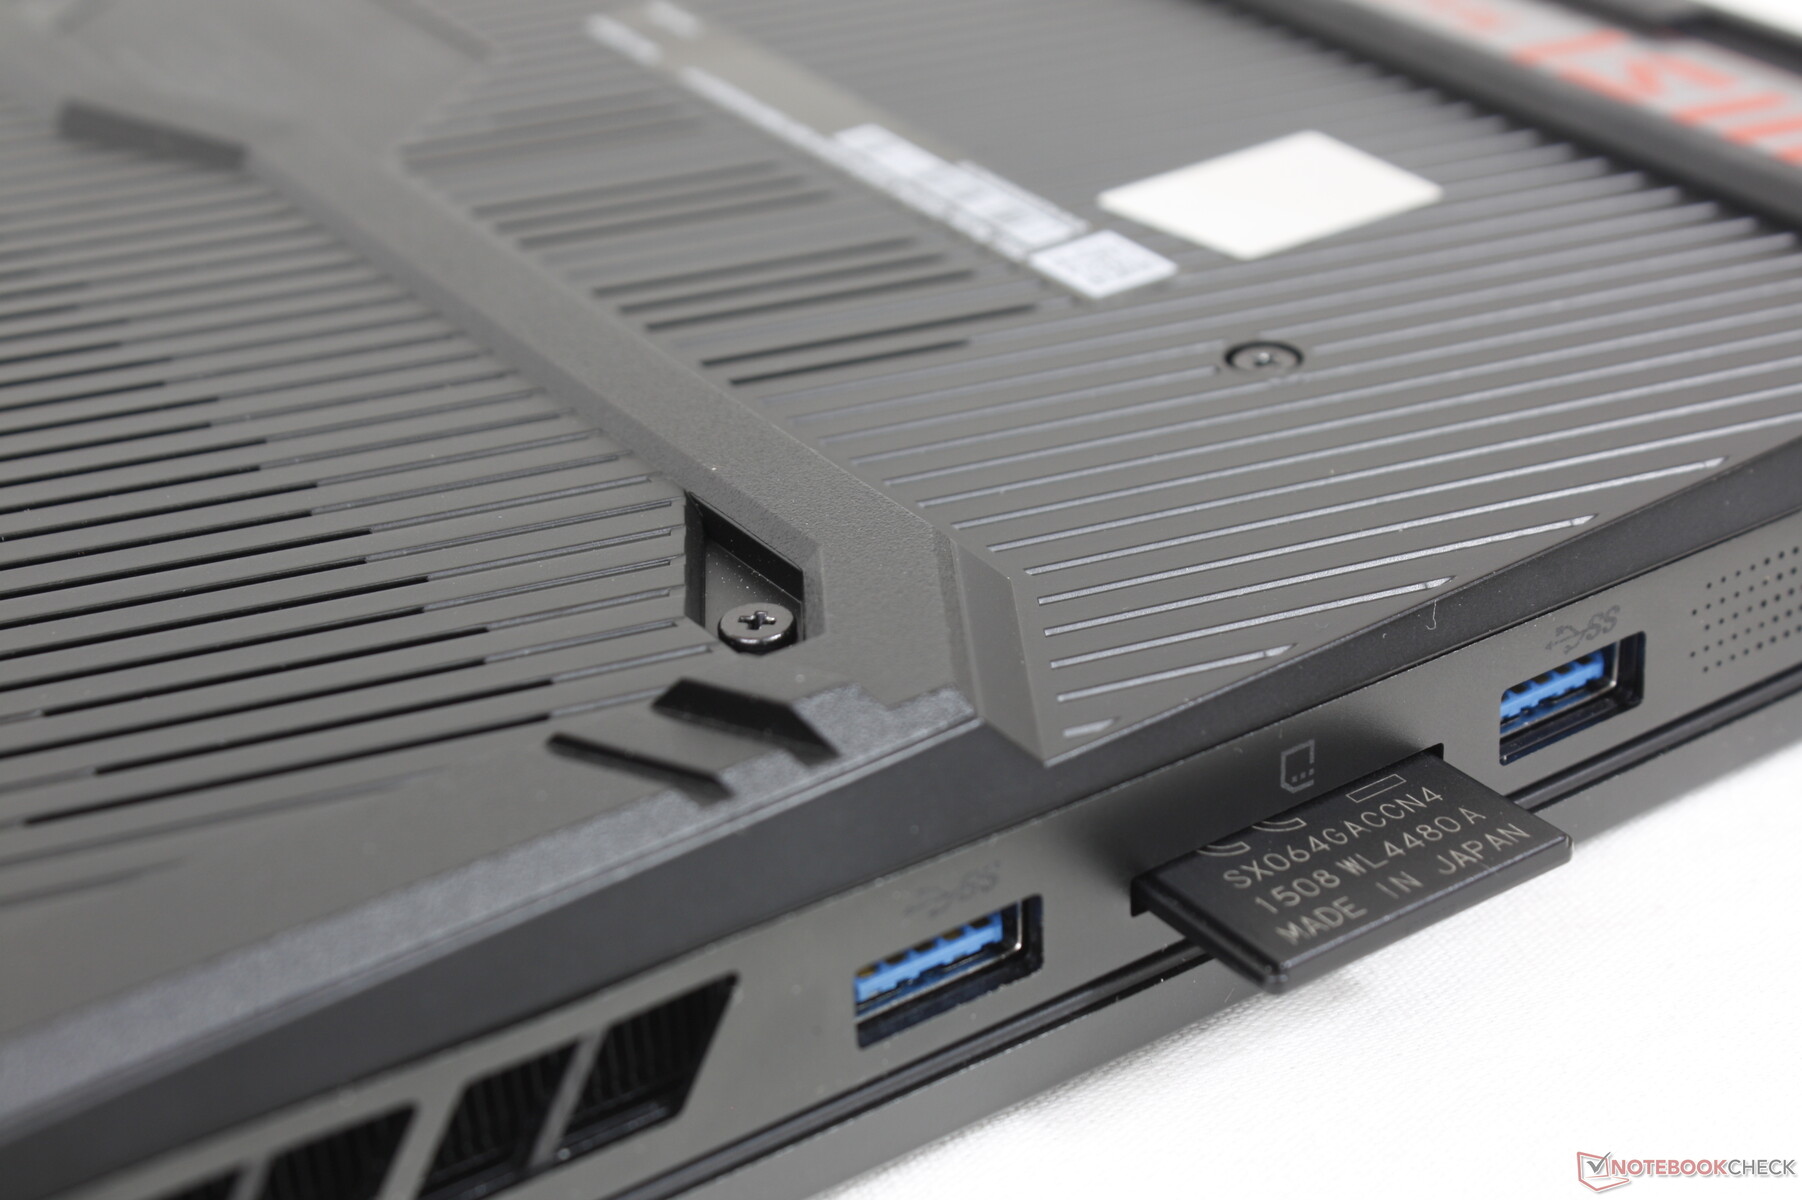
SD卡阅读器
相对于该配置的要价,集成SD卡读卡器的传输速度很慢。用户将从雷蛇Blade 15或华硕ROG Zephyrus Duo 16等竞争机型中看到2倍的SD读卡器性能。
| SD Card Reader | |
| average JPG Copy Test (av. of 3 runs) | |
| Razer Blade 15 2022 (Toshiba Exceria Pro SDXC 64 GB UHS-II) | |
| MSI GE67 HX 12UGS (Toshiba Exceria Pro SDXC 64 GB UHS-II) | |
| MSI Raider GE66 12UHS (AV PRO microSD 128 GB V60) | |
| maximum AS SSD Seq Read Test (1GB) | |
| Razer Blade 15 2022 (Toshiba Exceria Pro SDXC 64 GB UHS-II) | |
| MSI GE67 HX 12UGS (Toshiba Exceria Pro SDXC 64 GB UHS-II) | |
沟通
| Networking | |
| iperf3 transmit AX12 | |
| Razer Blade 15 2022 | |
| MSI Vector GP66 12UGS | |
| Alienware m15 R6, i7-11800H RTX 3080 | |
| iperf3 receive AX12 | |
| Razer Blade 15 2022 | |
| MSI Vector GP66 12UGS | |
| Alienware m15 R6, i7-11800H RTX 3080 | |
| iperf3 receive AXE11000 6GHz | |
| Asus ROG Strix Scar 15 G533ZW-LN106WS | |
| MSI GE67 HX 12UGS | |
| iperf3 transmit AXE11000 6GHz | |
| Asus ROG Strix Scar 15 G533ZW-LN106WS | |
| MSI GE67 HX 12UGS | |
网络摄像头
200万像素的网络摄像头没有变化,这也意味着仍然没有物理隐私快门,甚至不支持Windows Hello。用户可以通过F4键以电子方式禁用网络摄像头。
请注意,当网络摄像头处于活动状态时,网络摄像头的活动指示灯总是闪烁的。这在视频通话中特别令人讨厌,而且我们找不到关闭闪烁灯的选项。


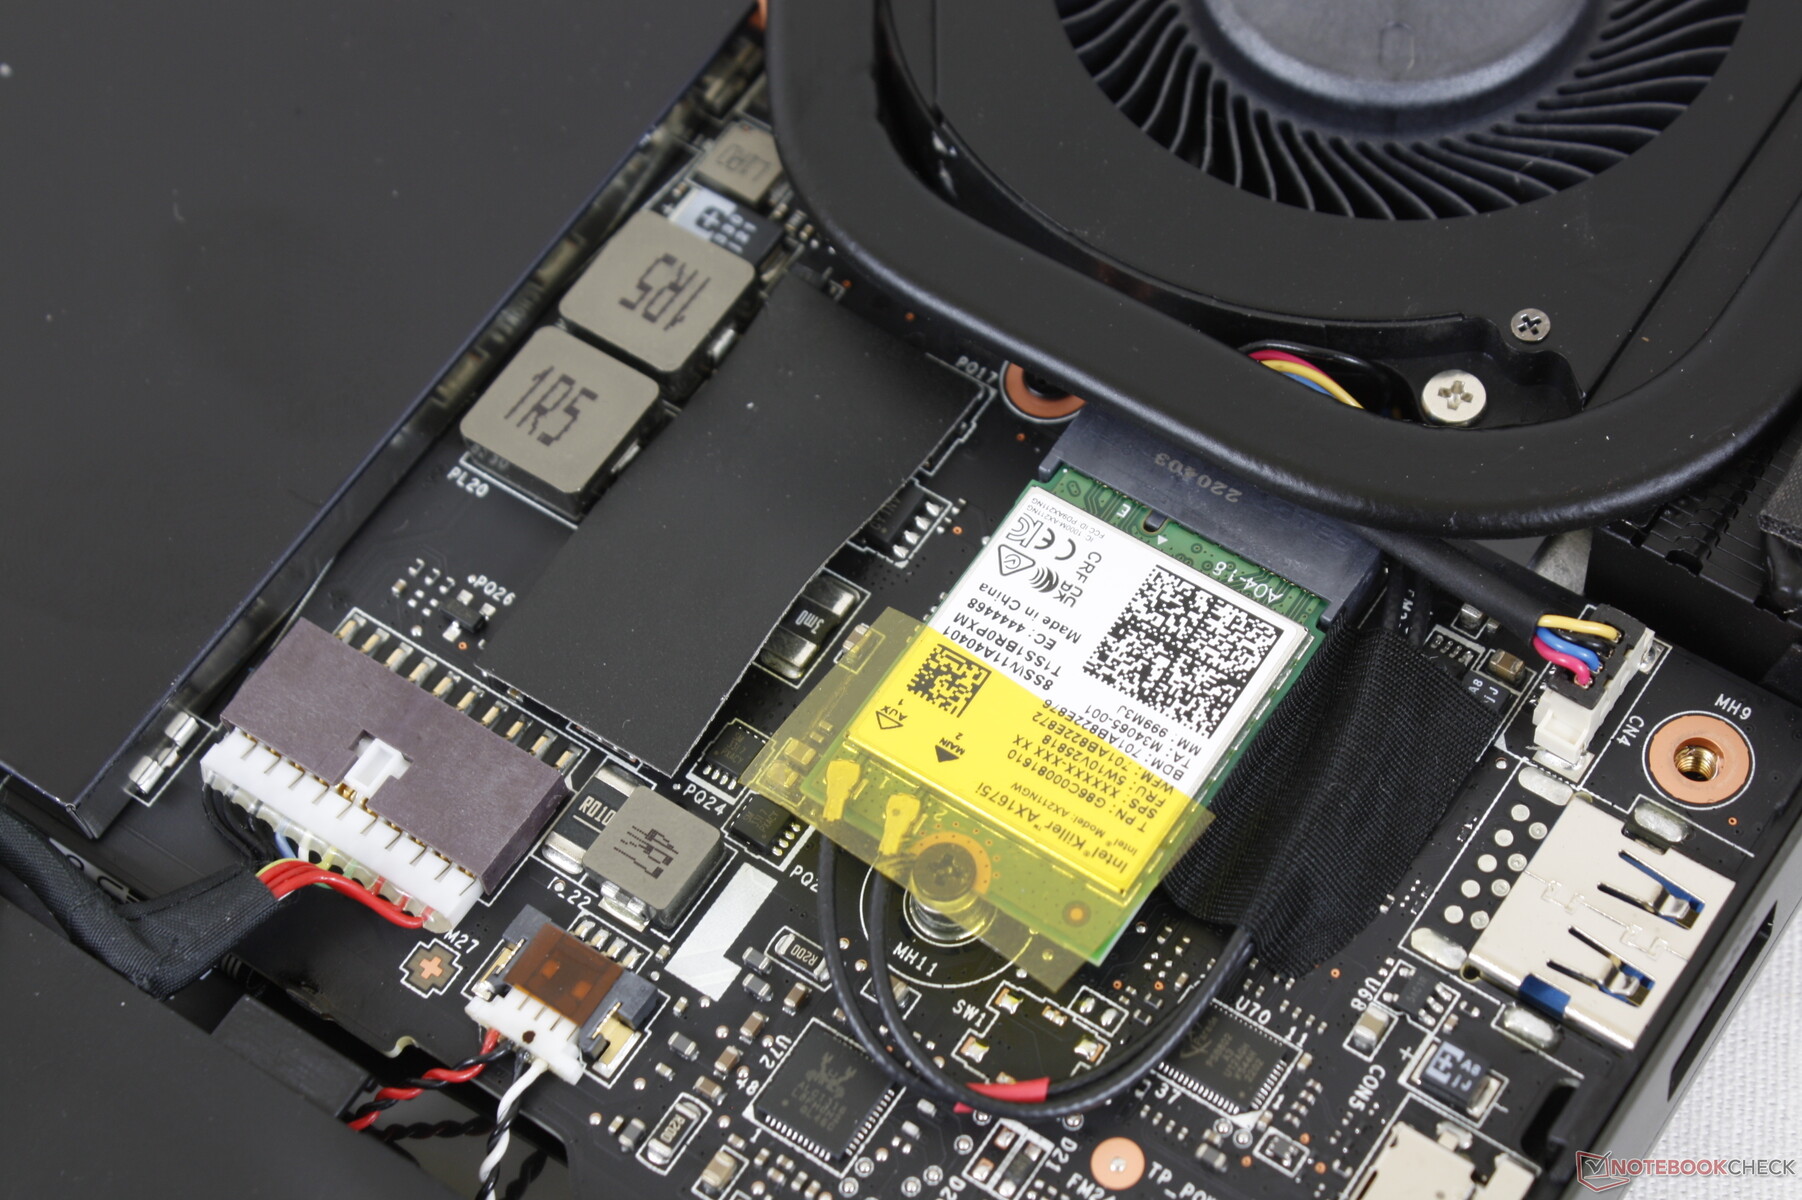
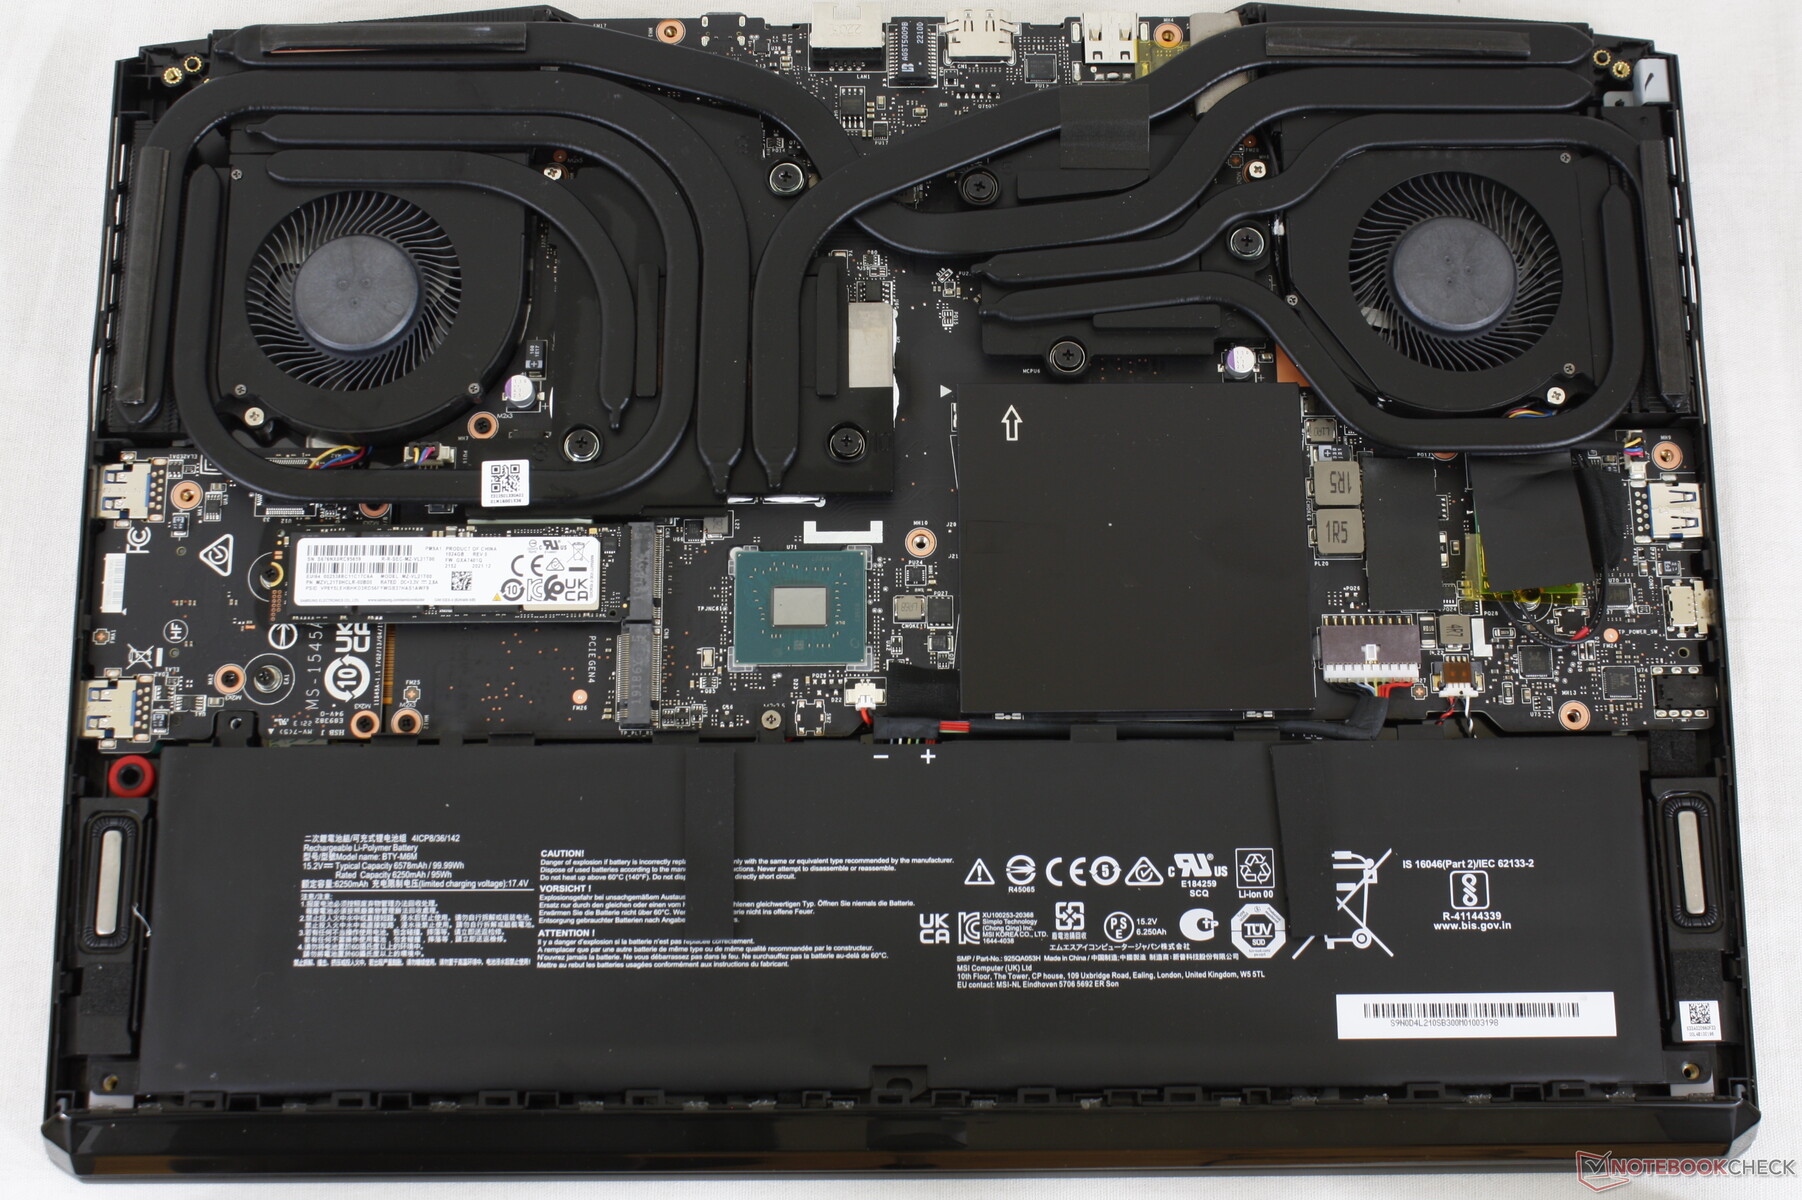
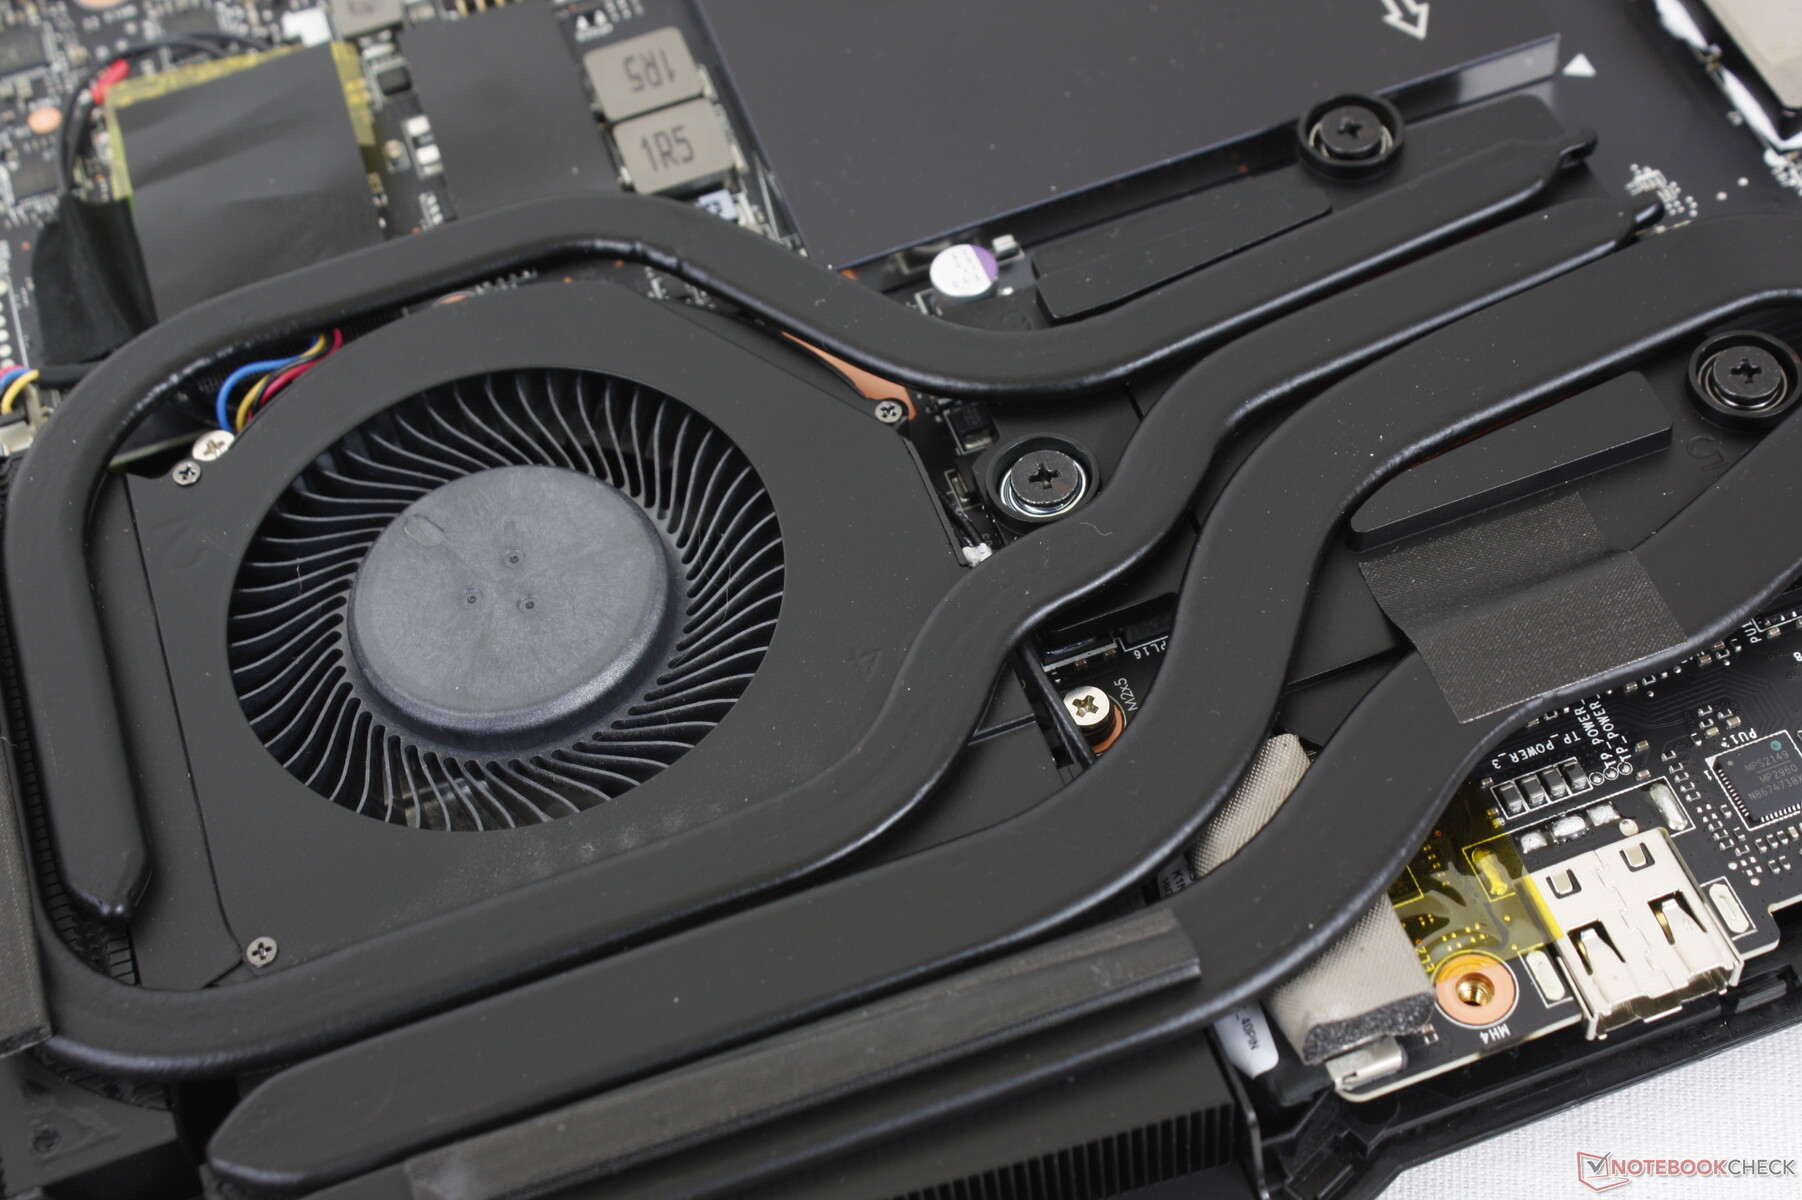
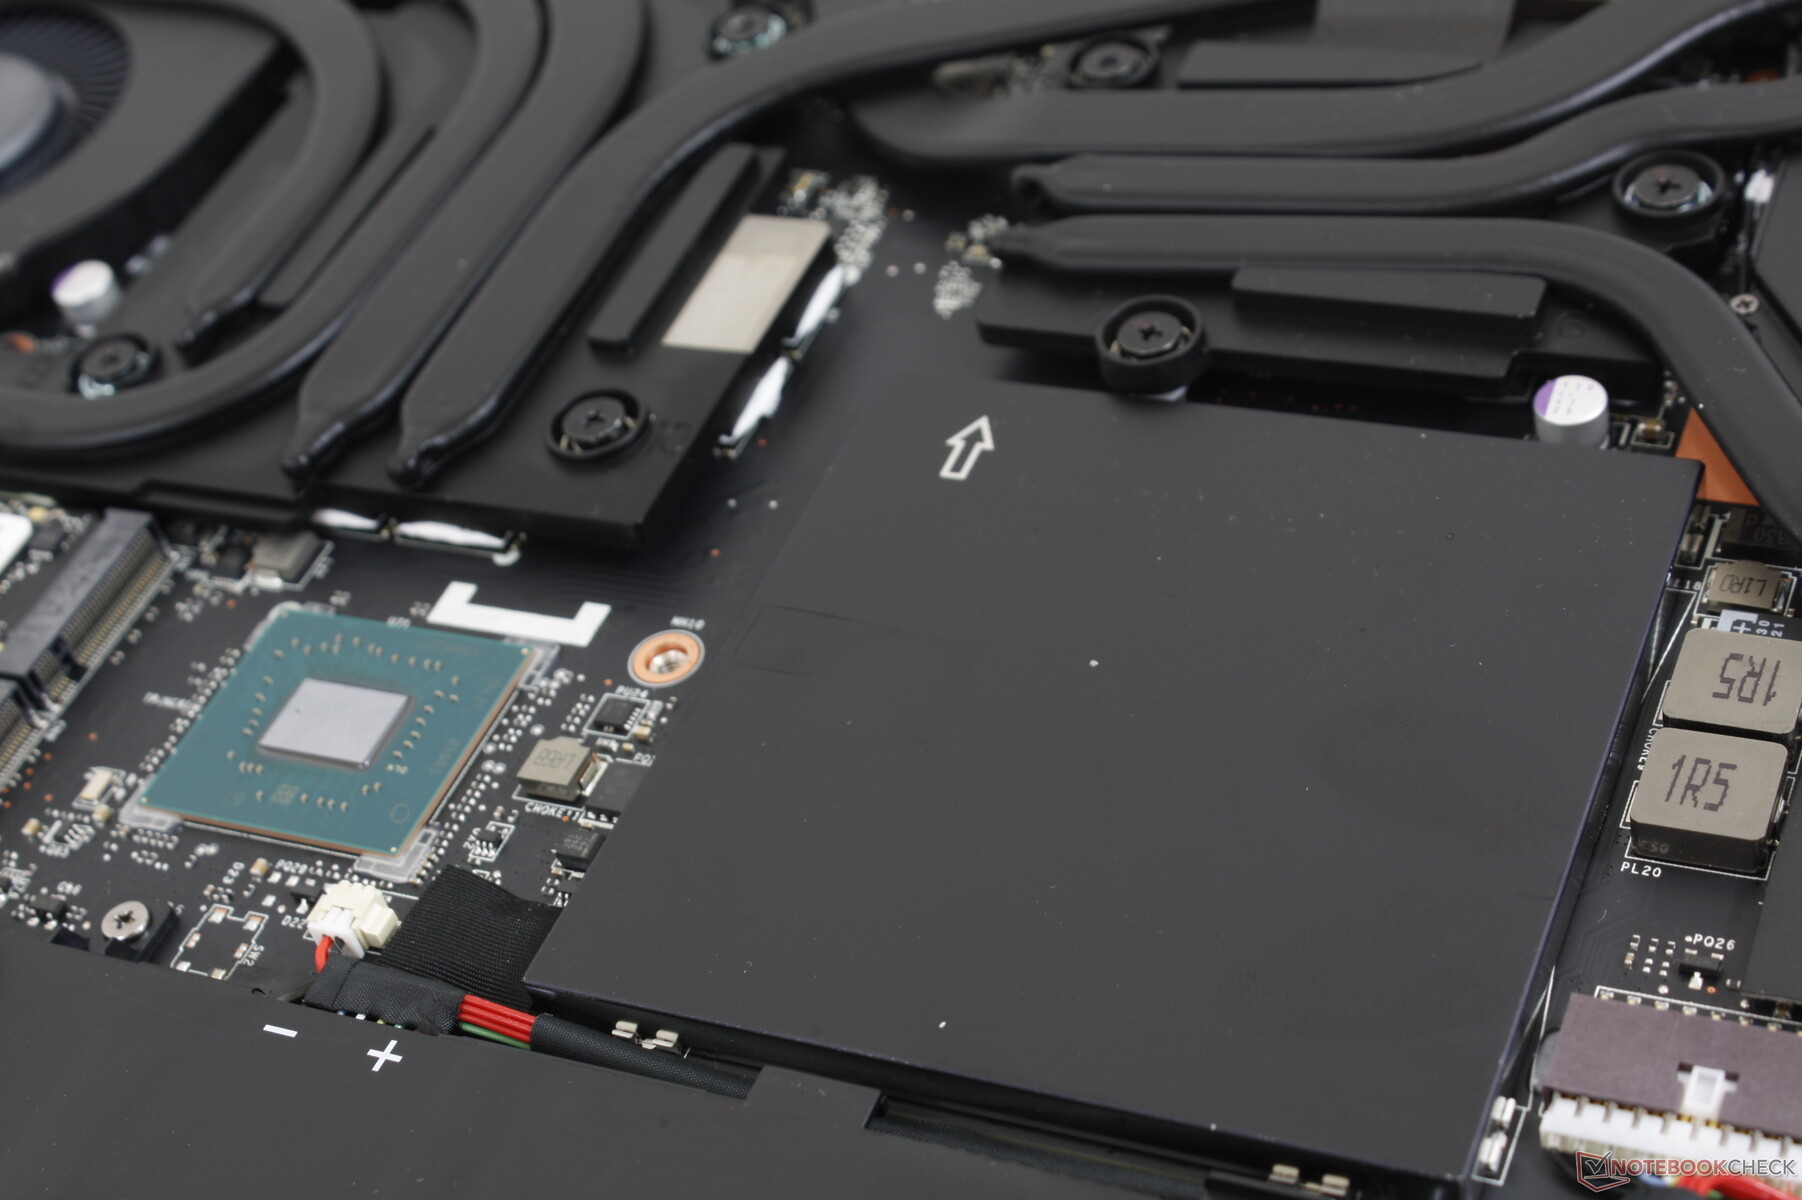
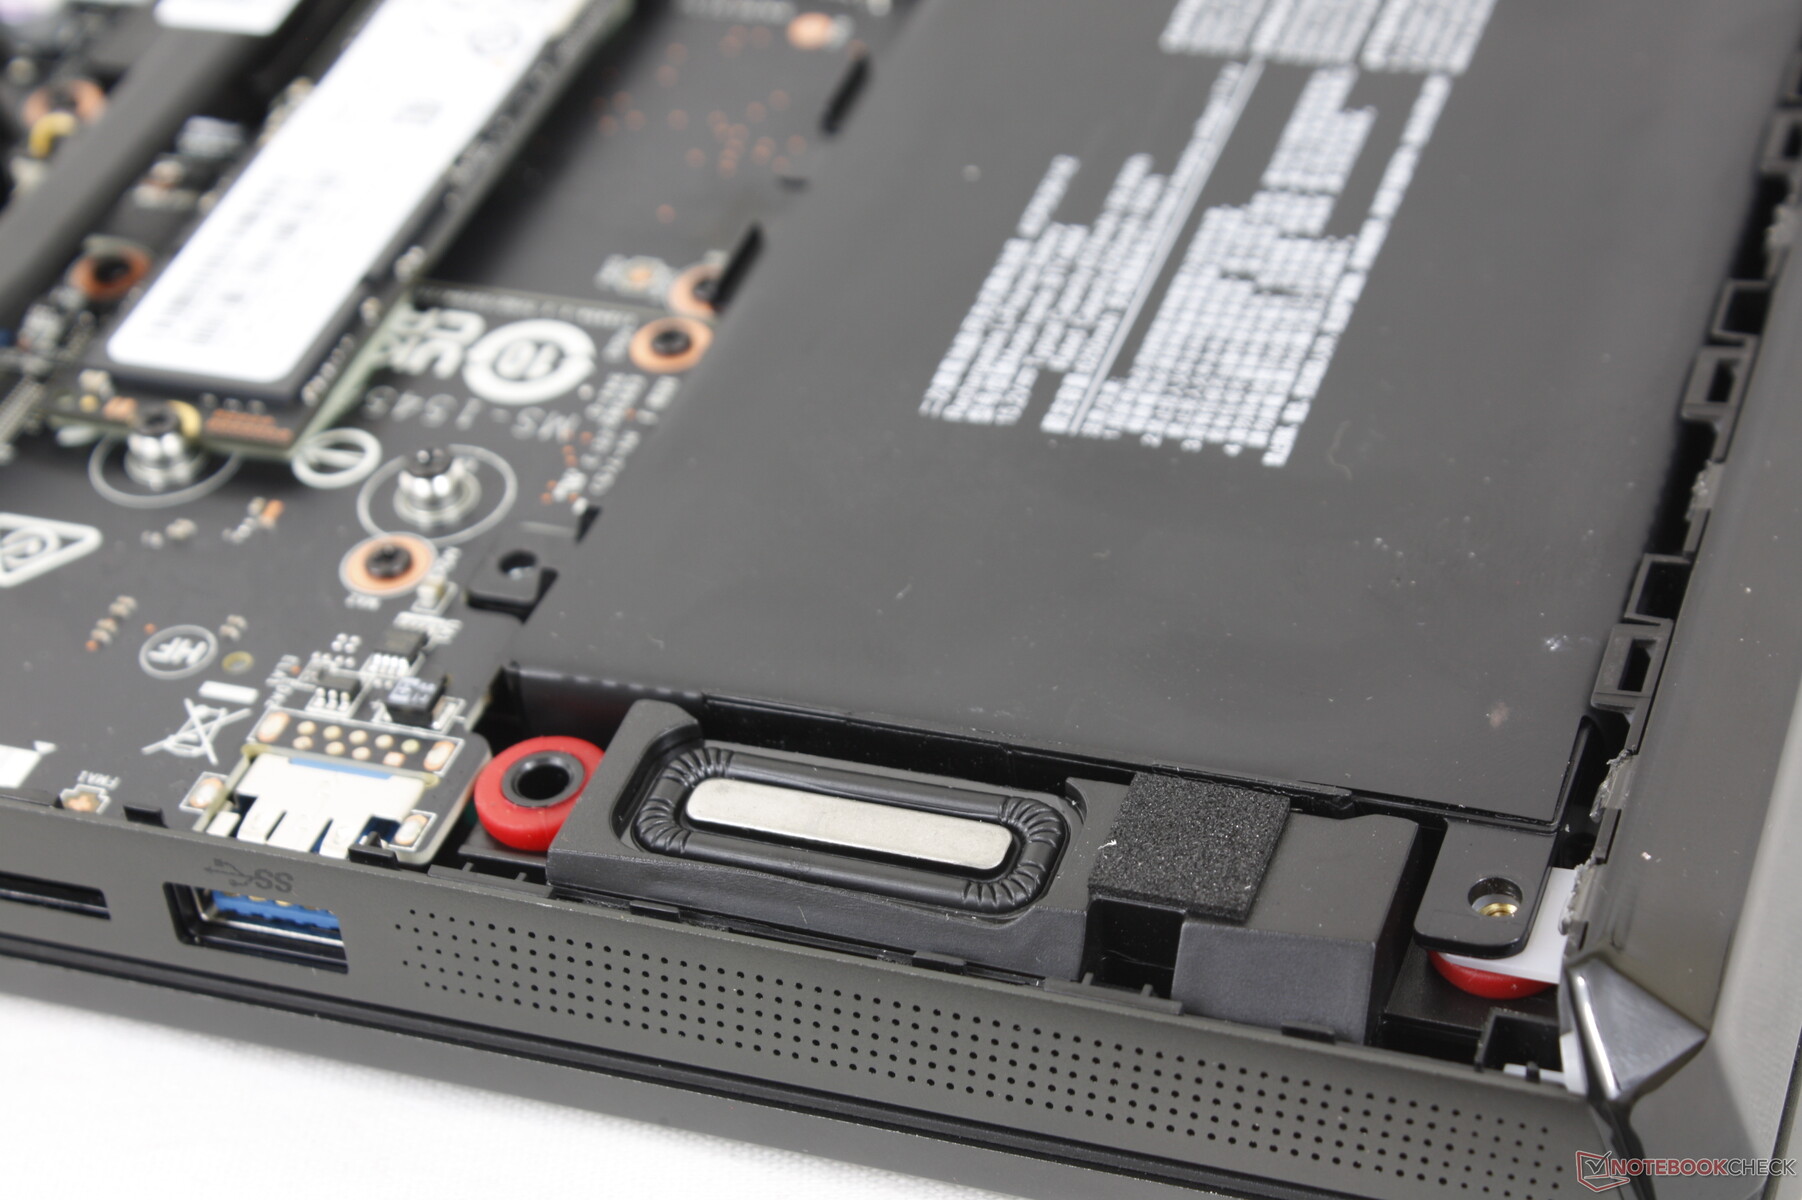
维护
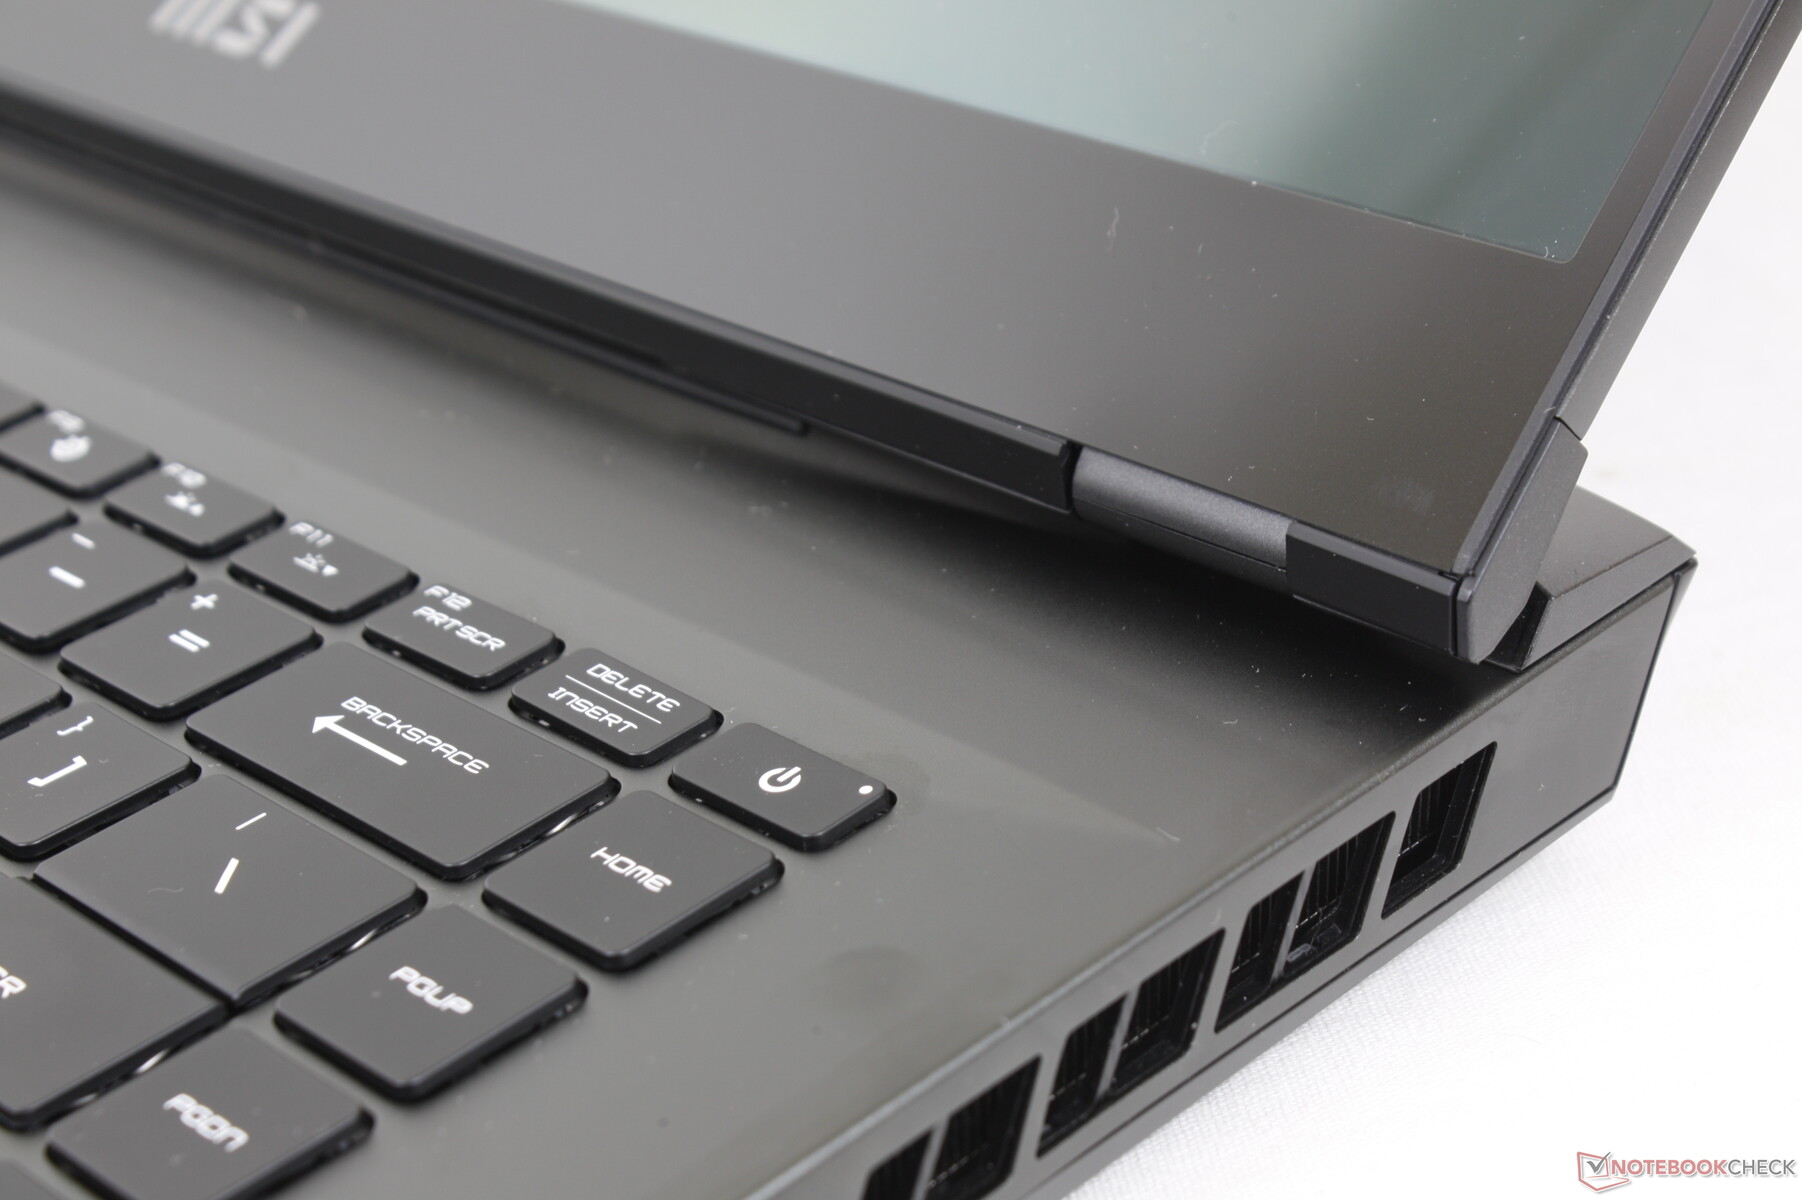
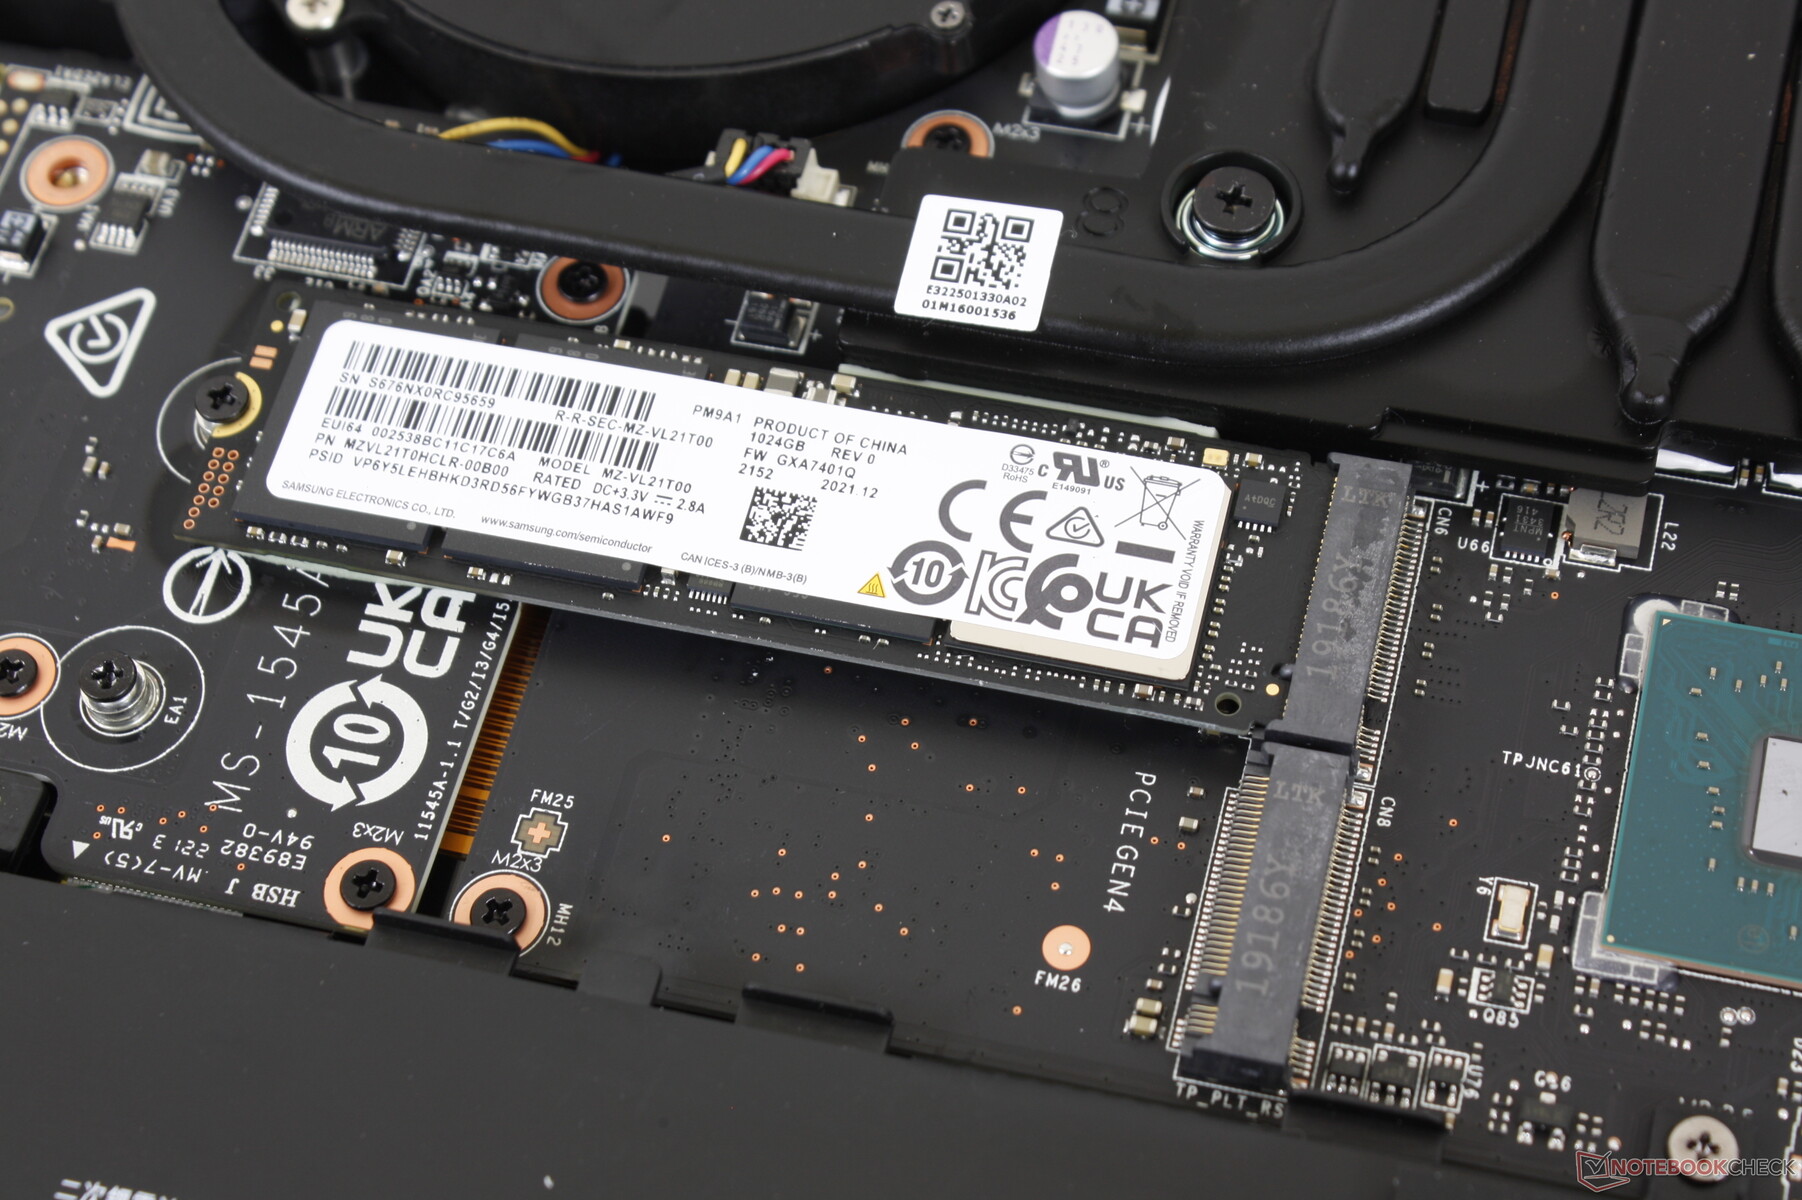
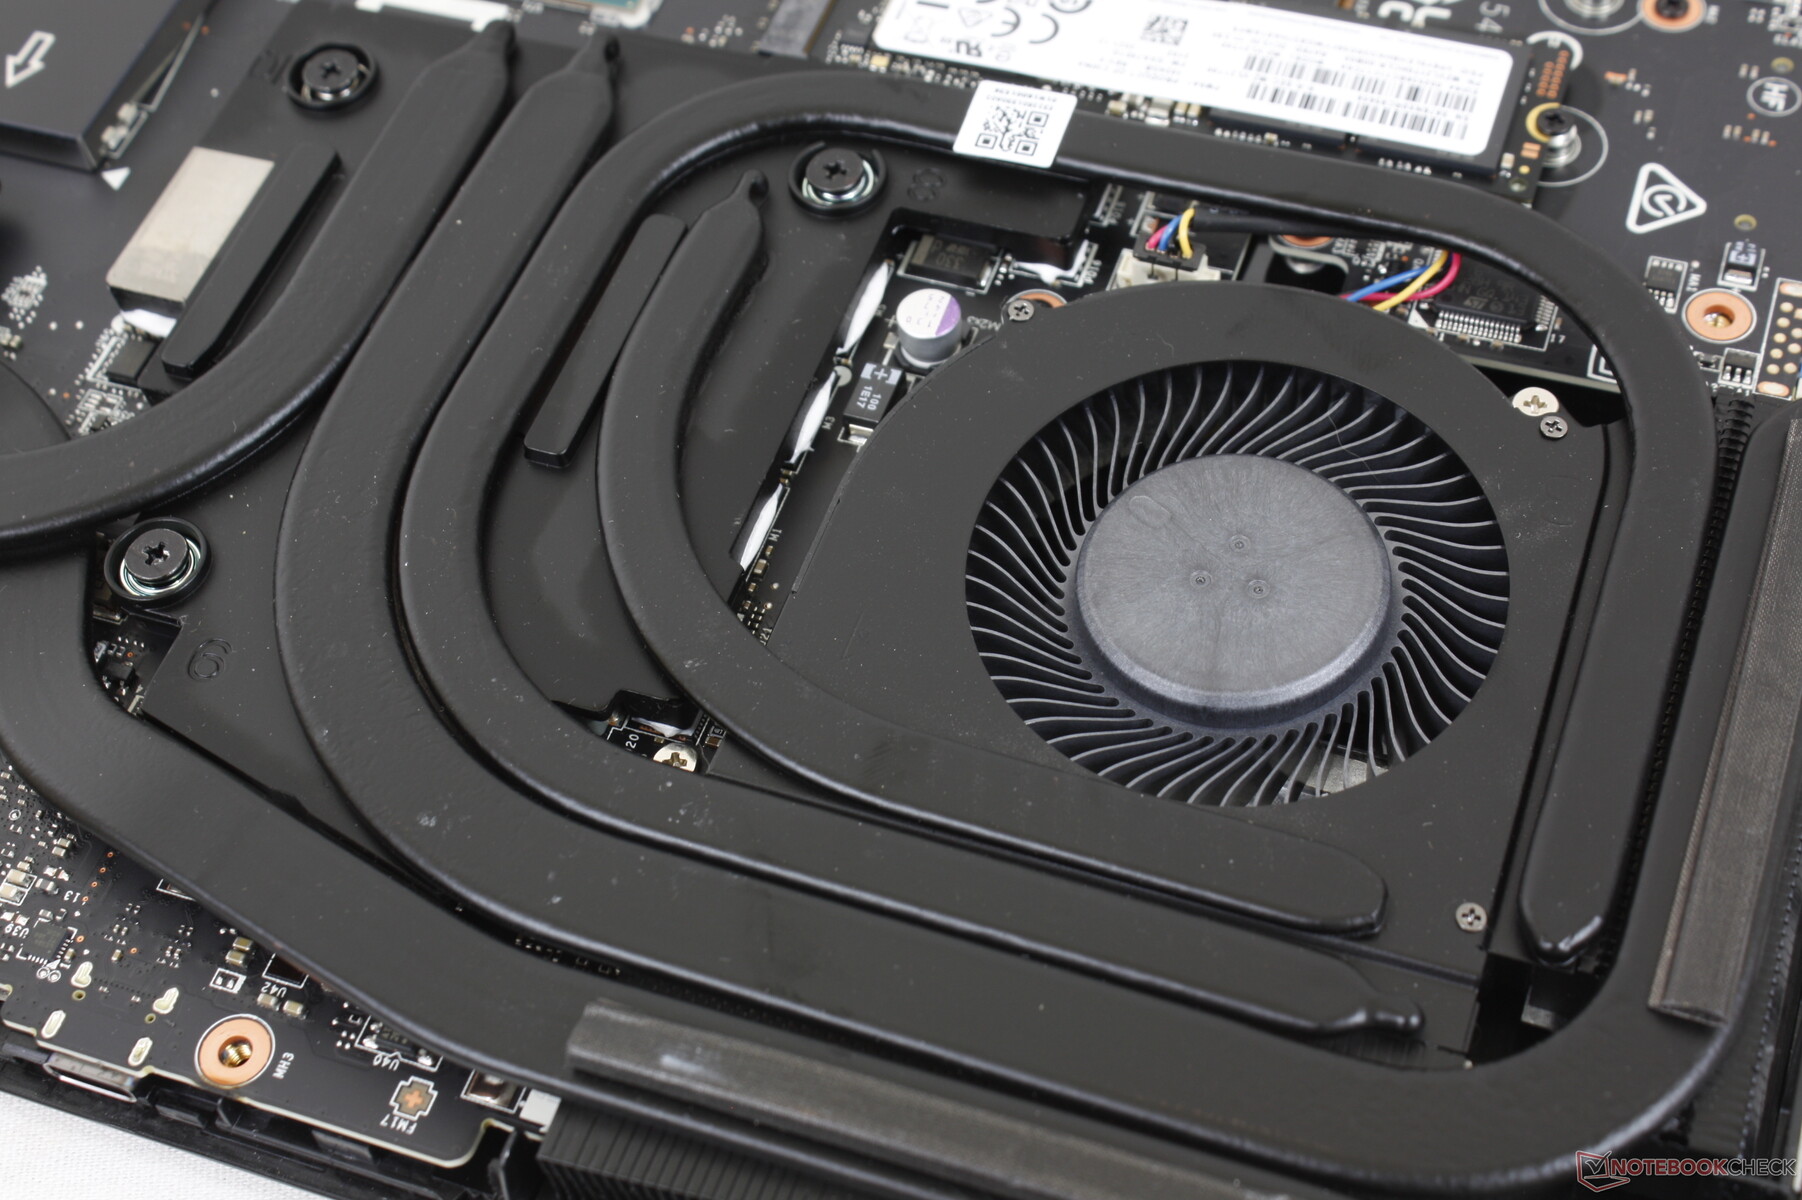
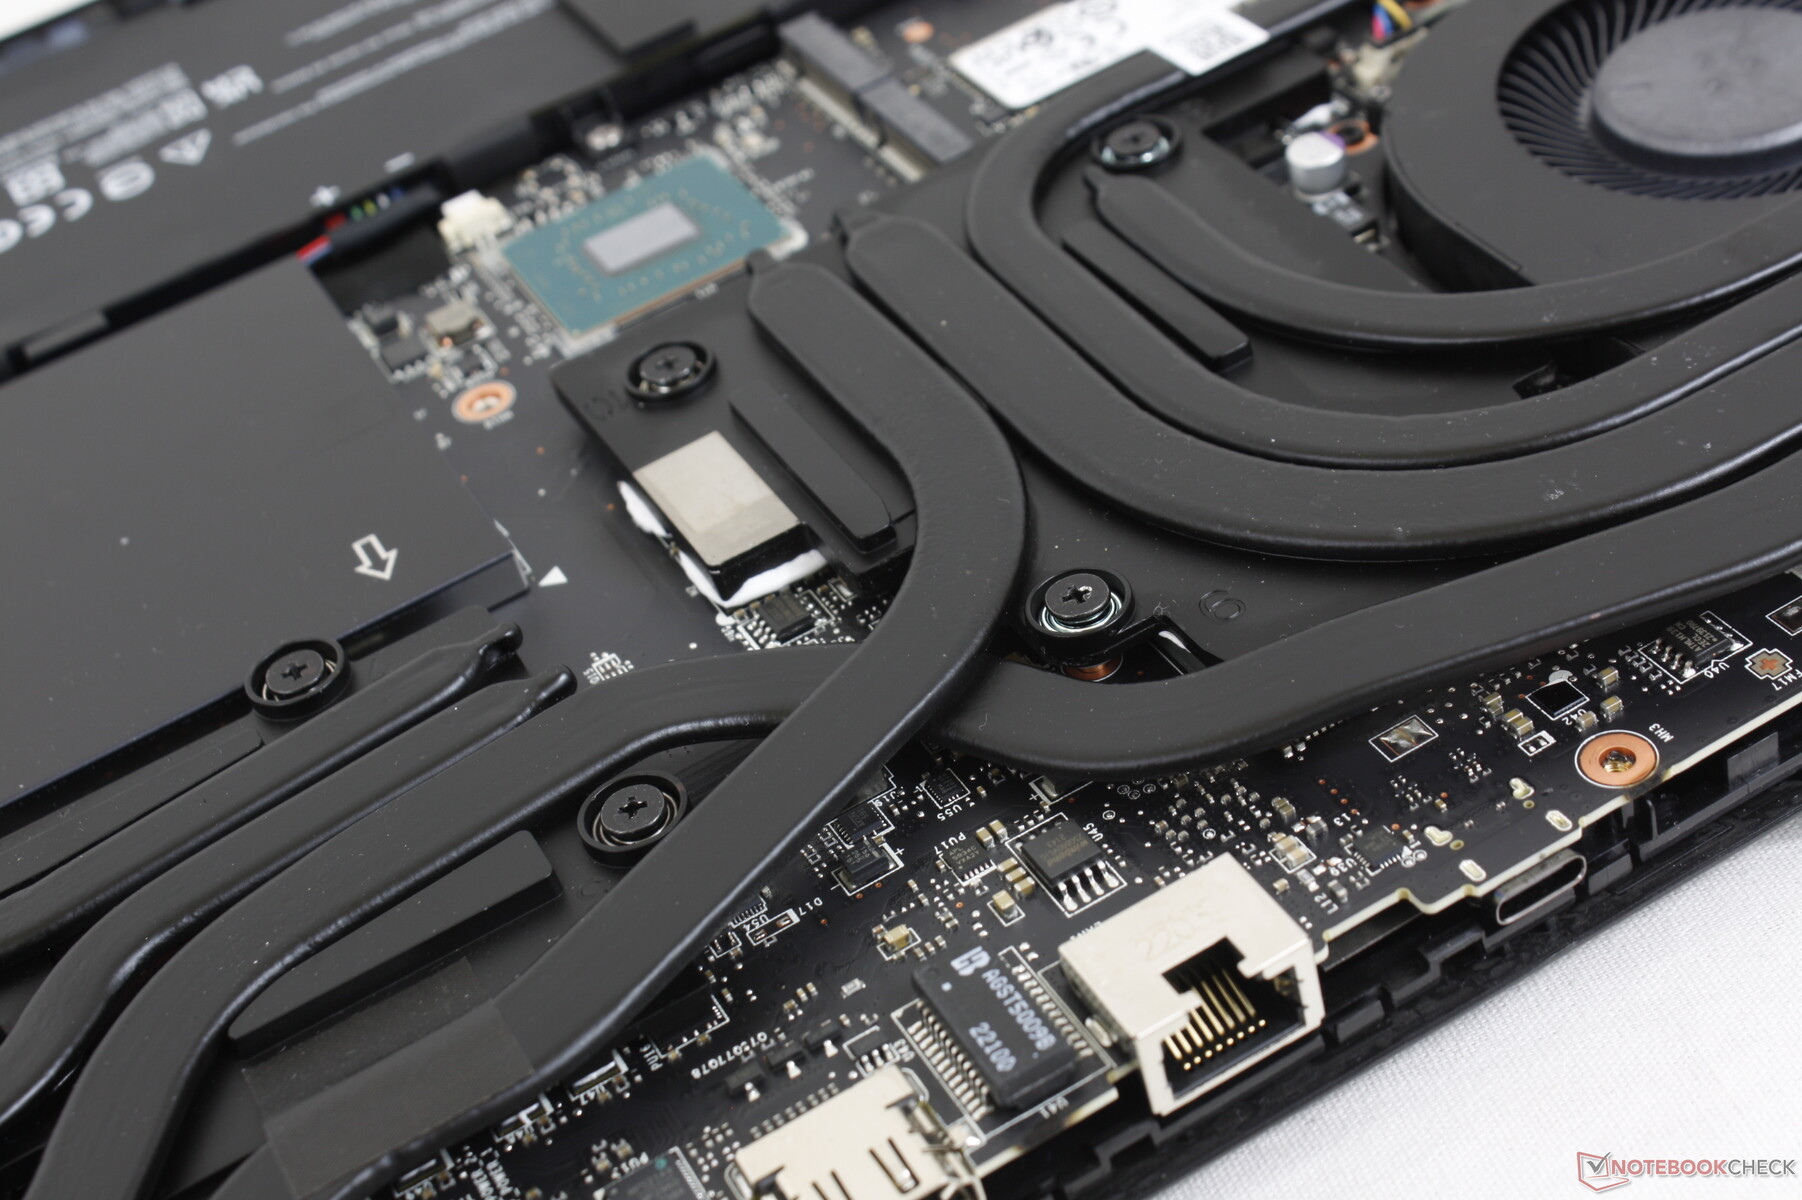
底部面板需要一把飞利浦螺丝刀和一个平边来拆卸。与GE66相比,GE67在CPU上方有一个额外的热管,如下图所示,以改善散热。
配件和保修
零售盒中除了AC适配器和文件外,还包括一个大的天鹅绒擦拭物。如果在美国购买,标准的一年制造商保修期适用。
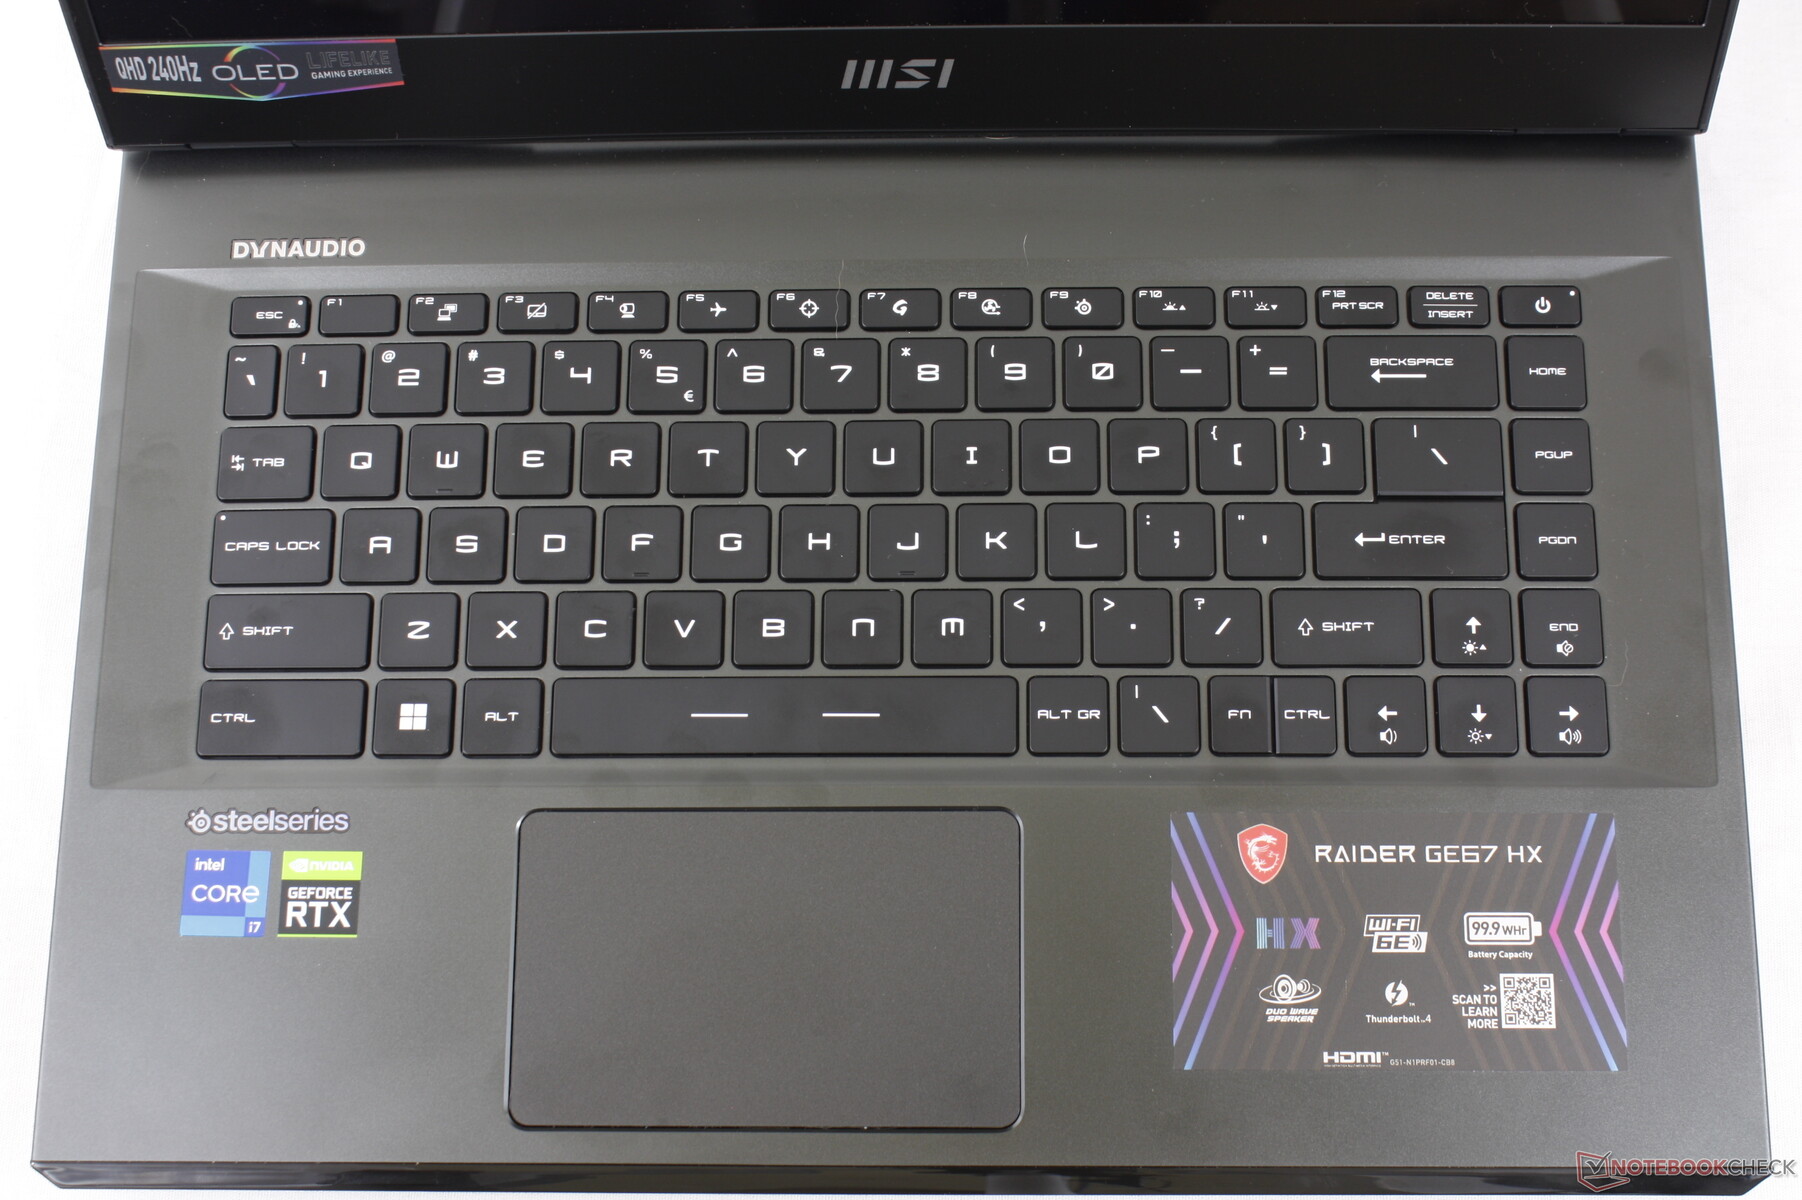
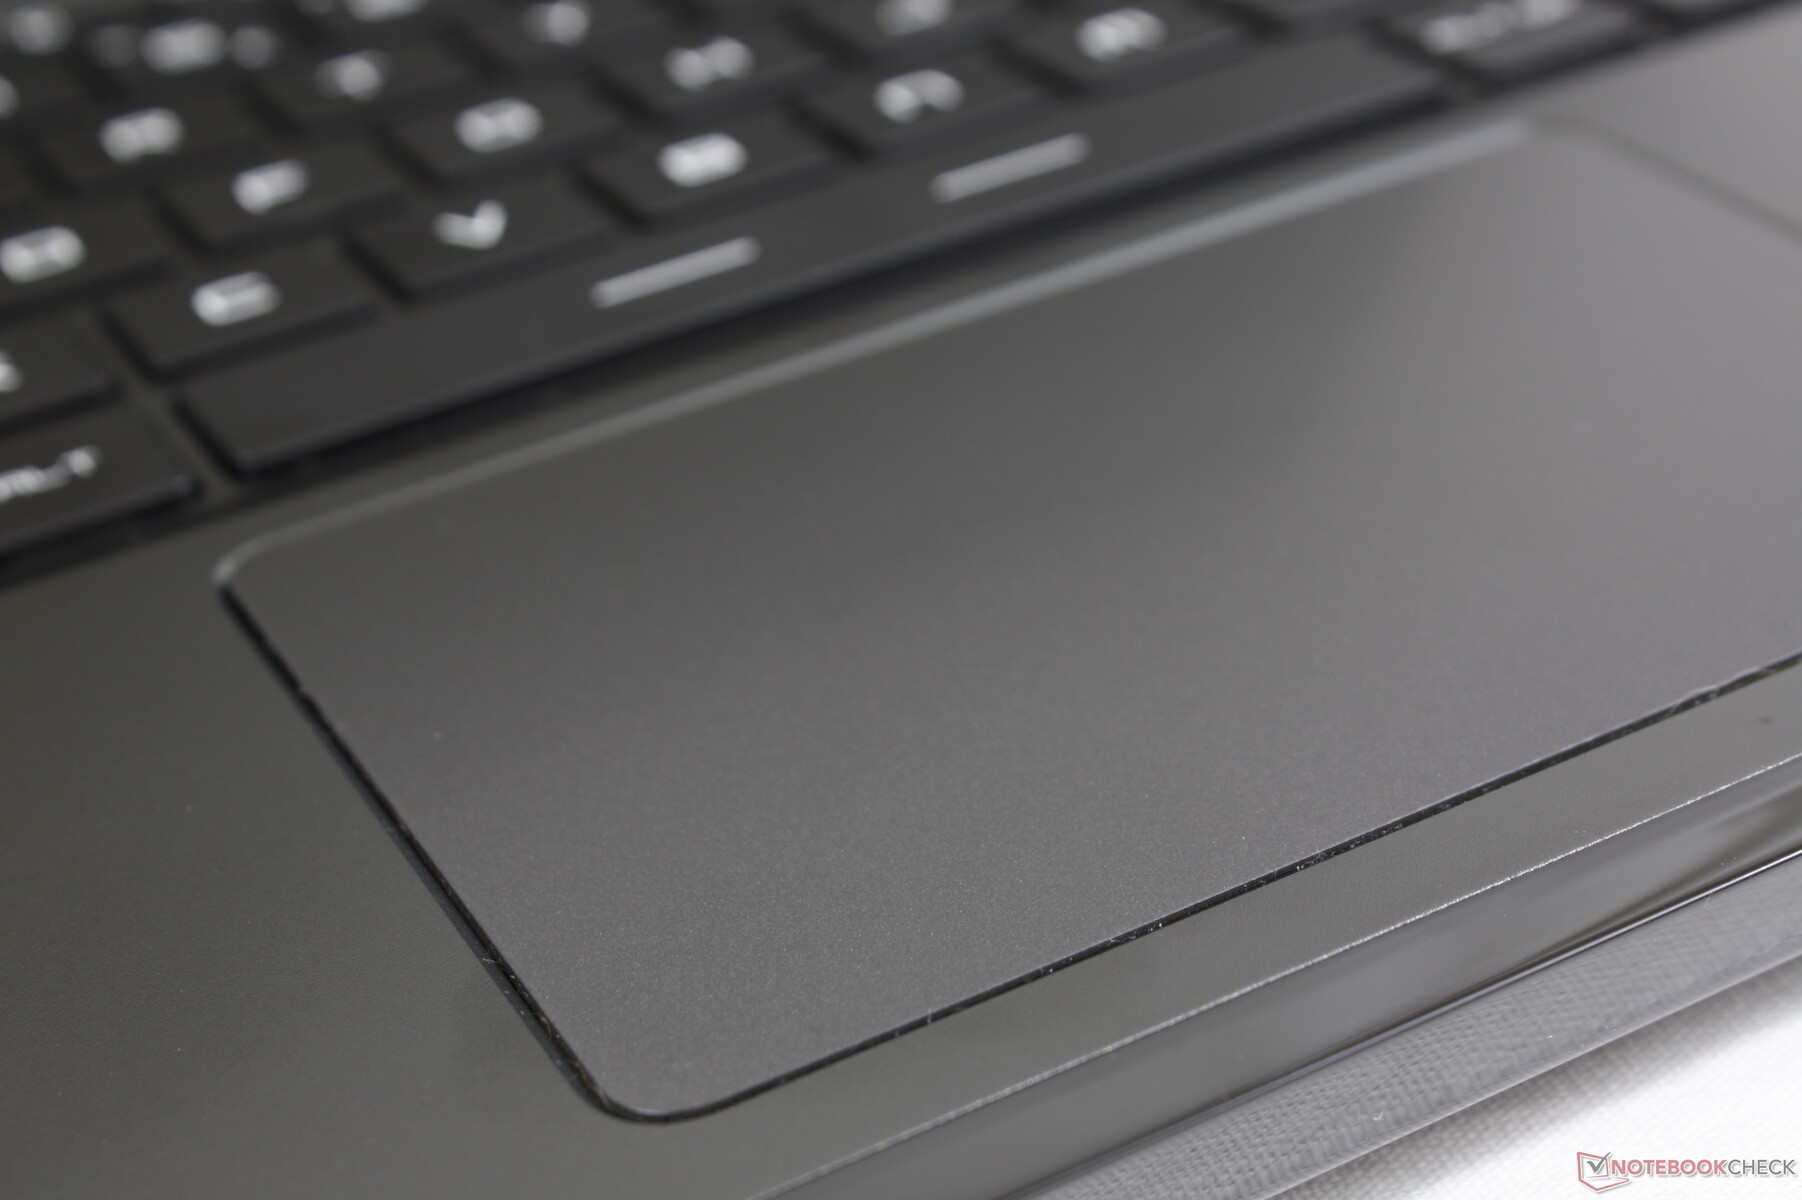
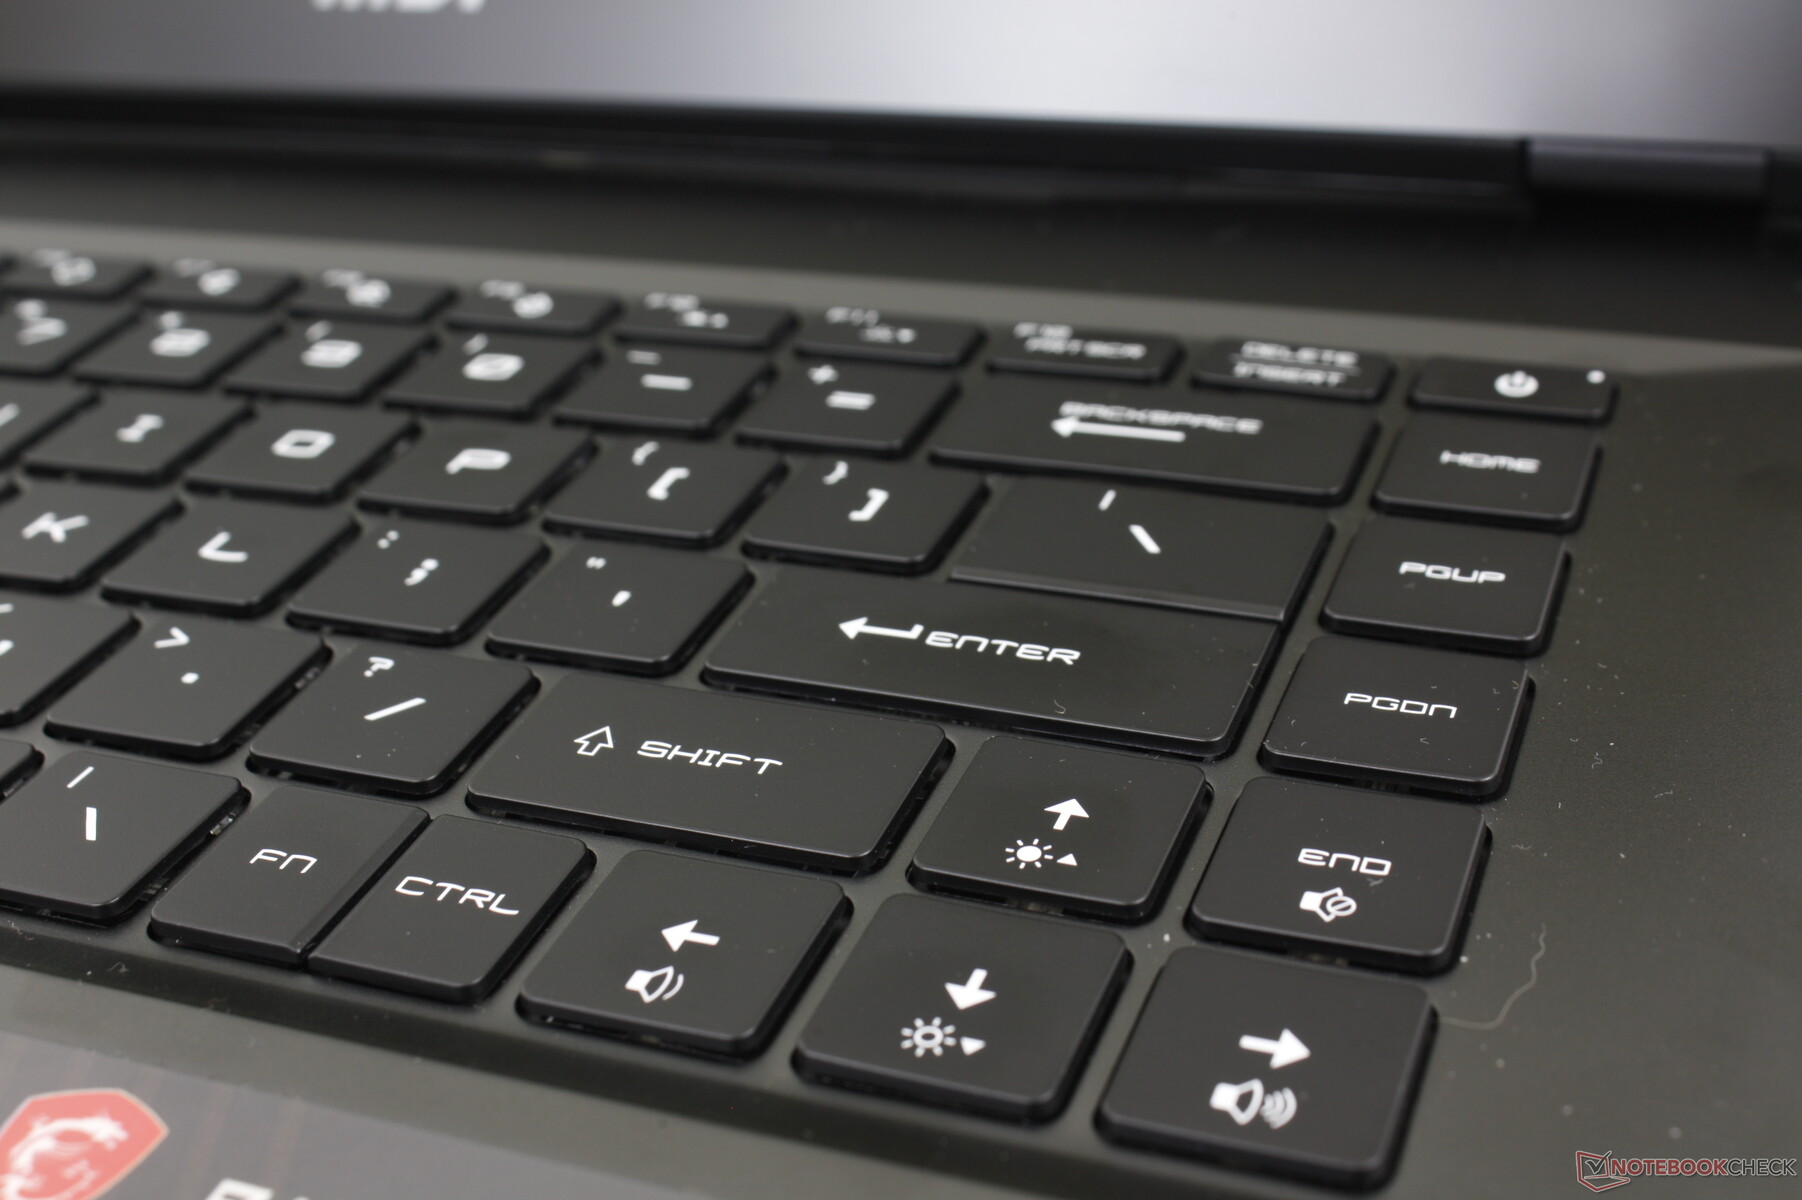
输入设备 - 与GE66相比没有重大变化
键盘和触摸板

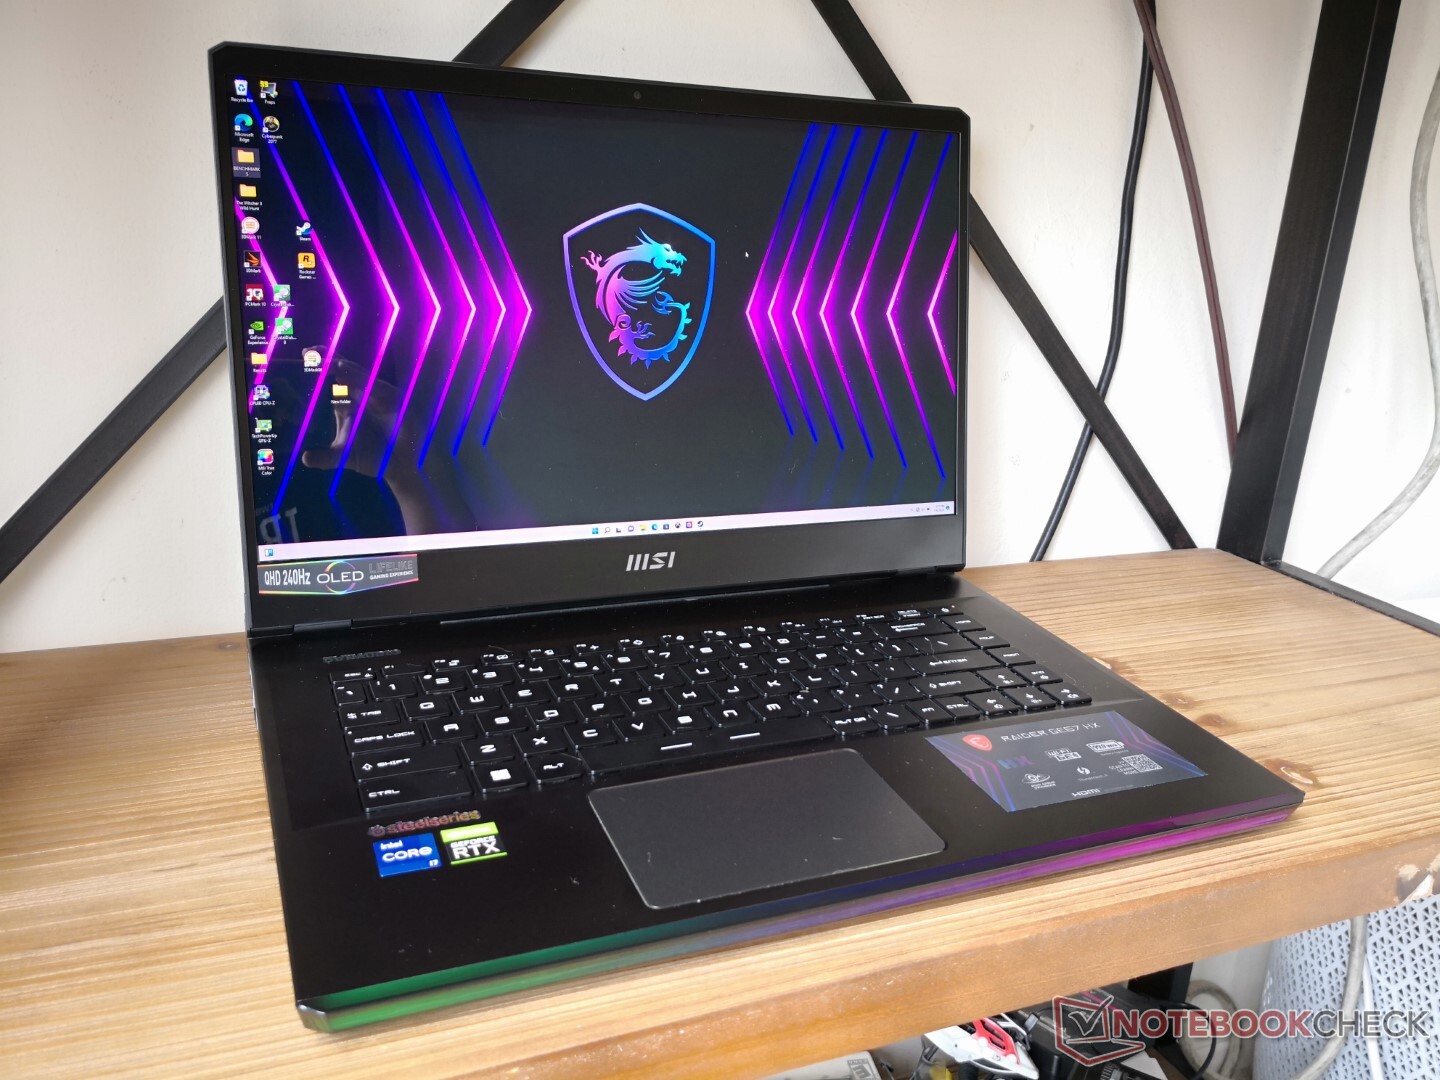
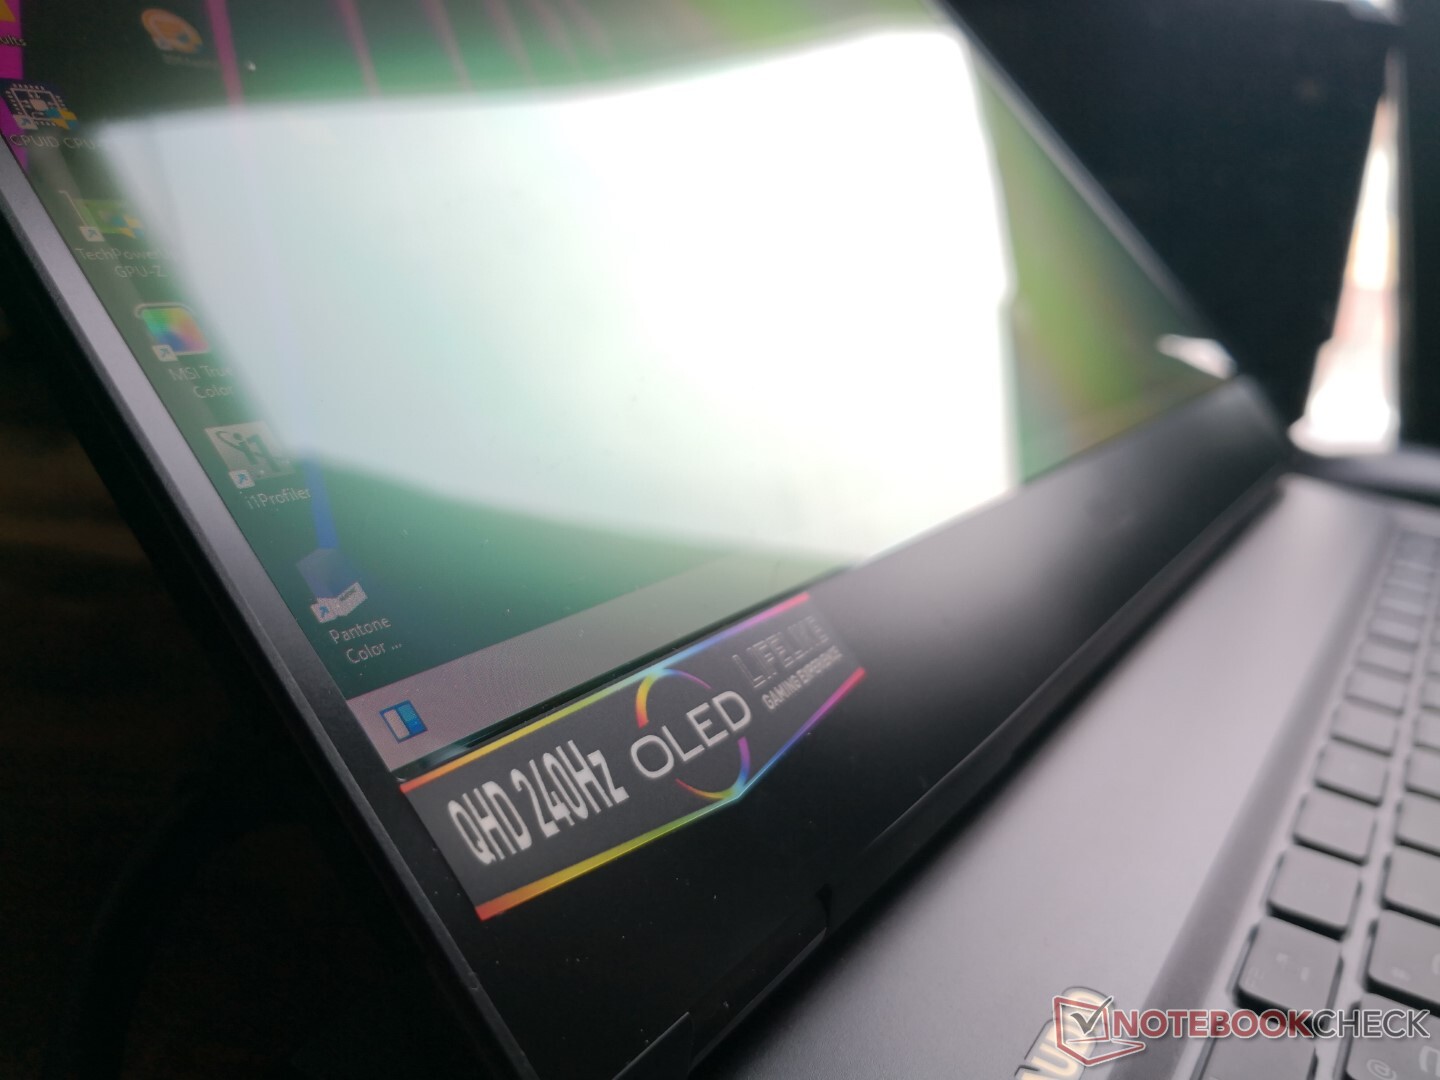
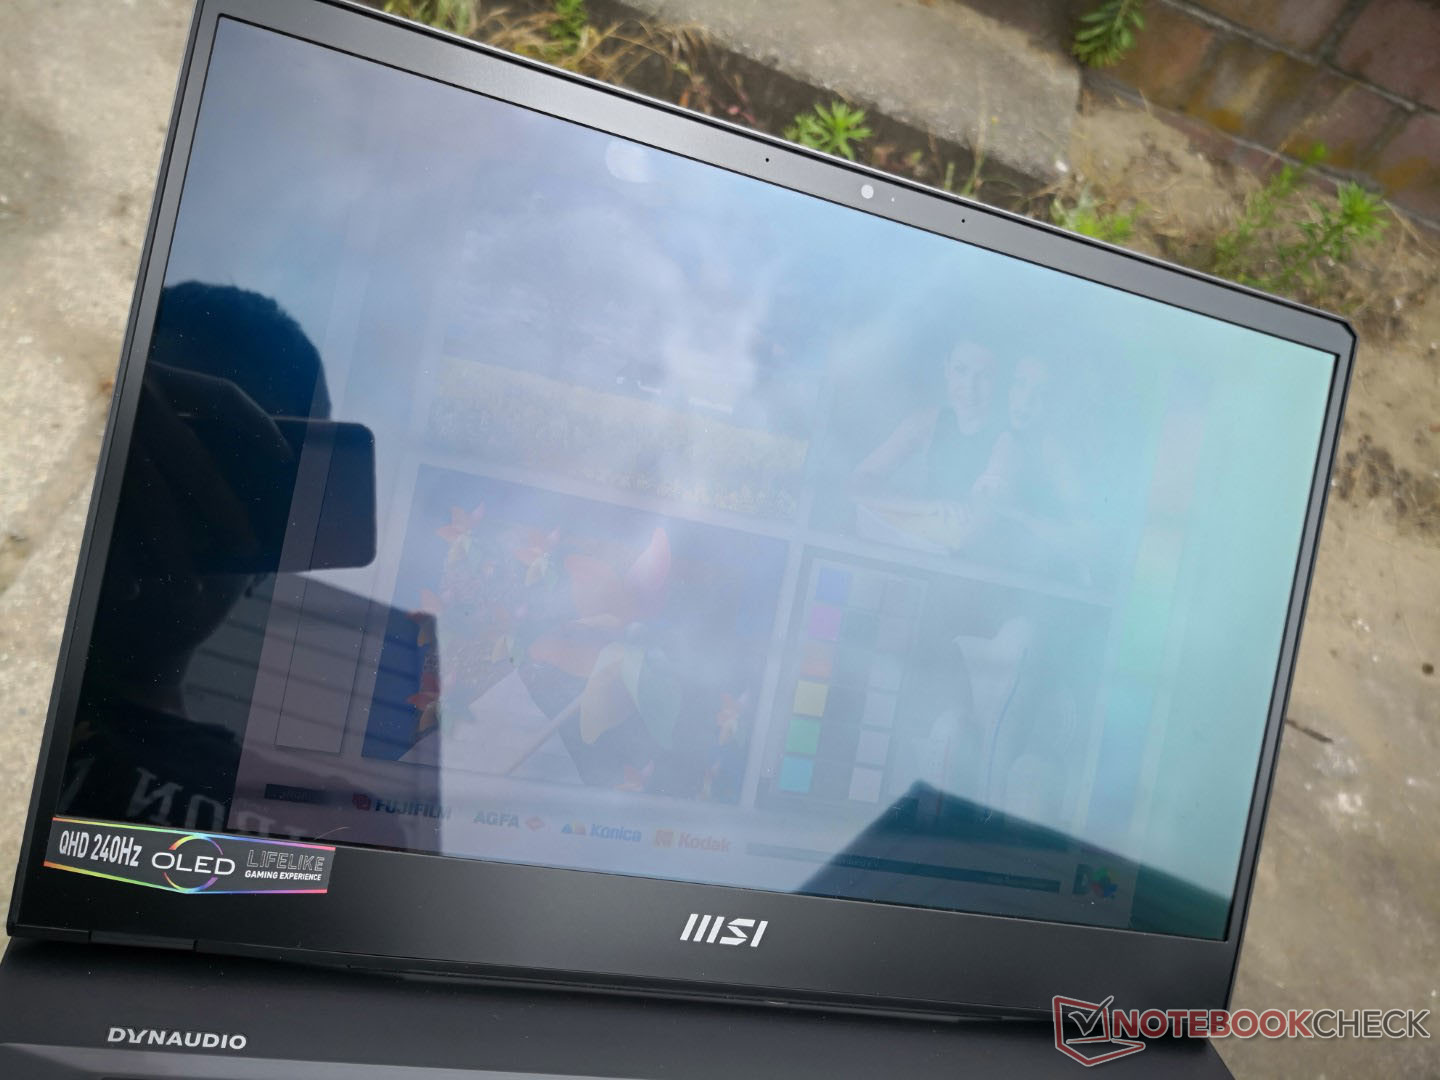
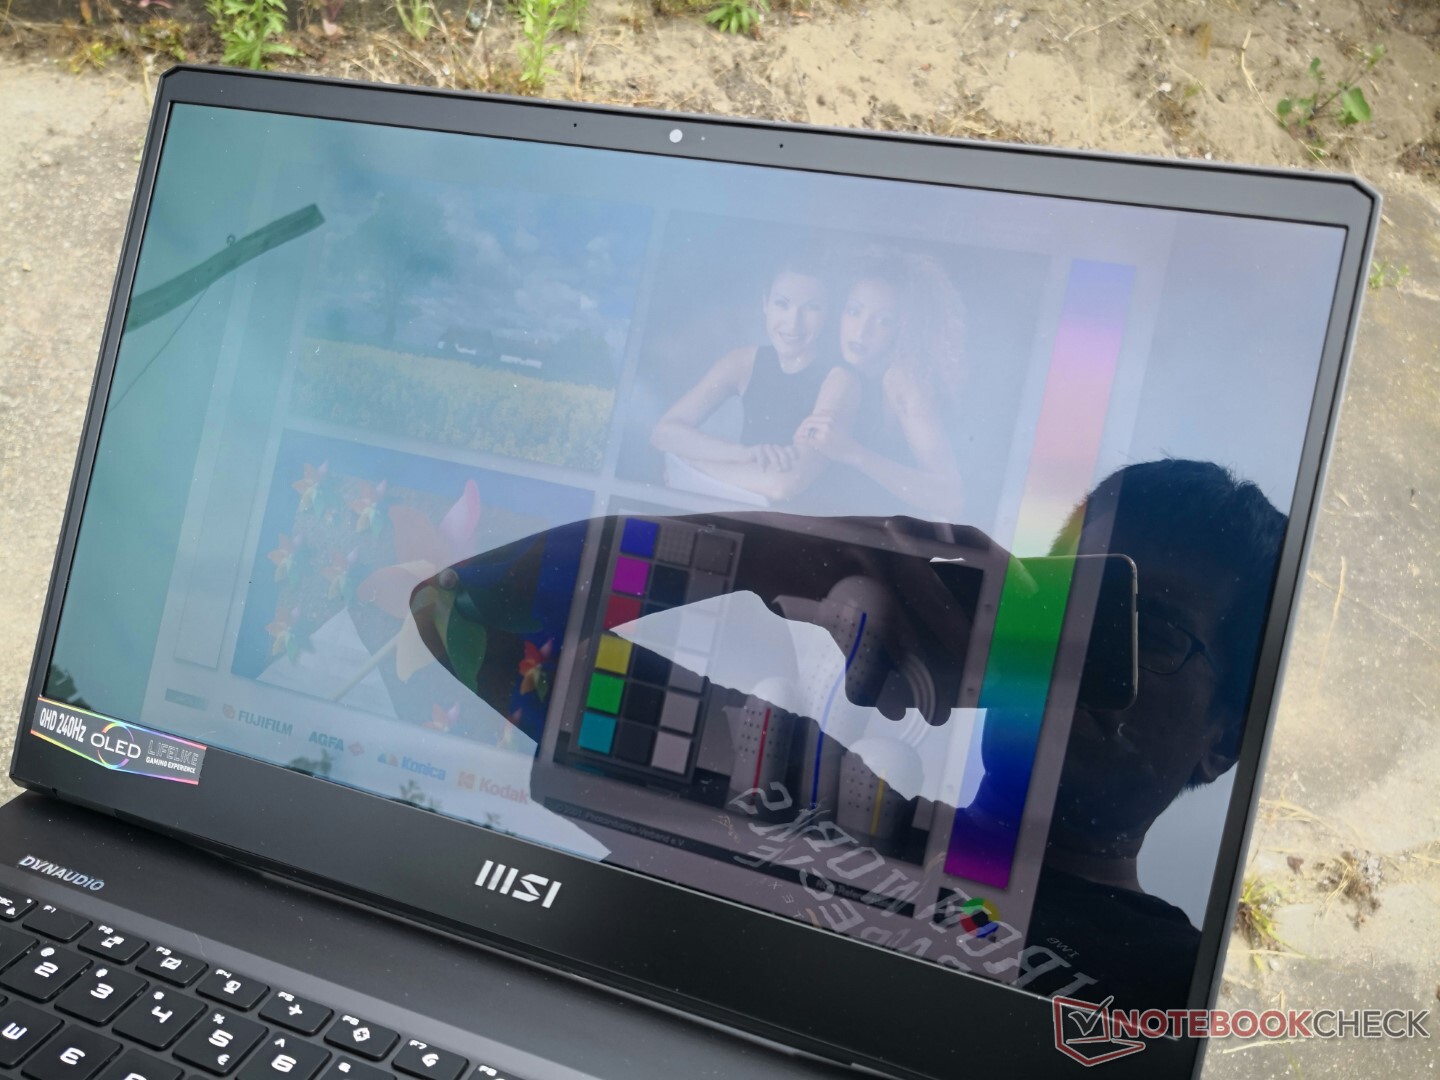
显示屏 - 几乎是游戏的理想选择
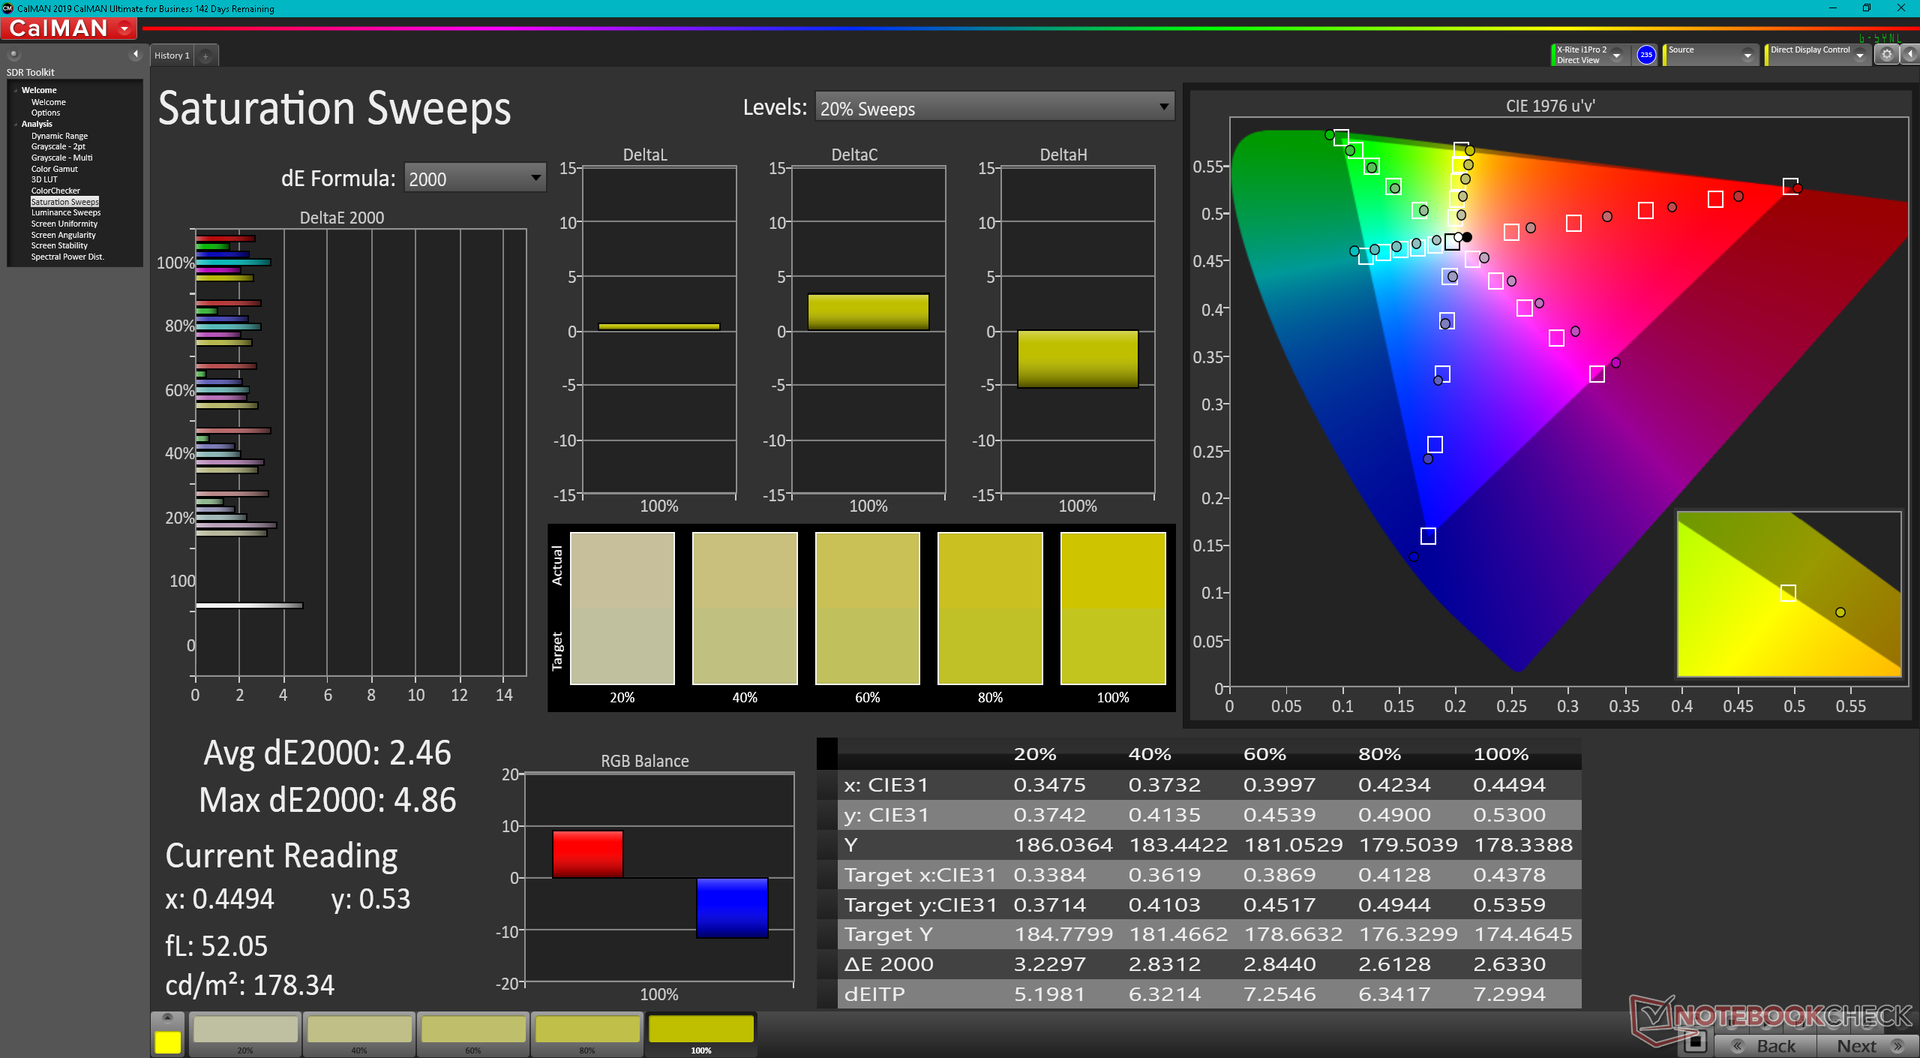
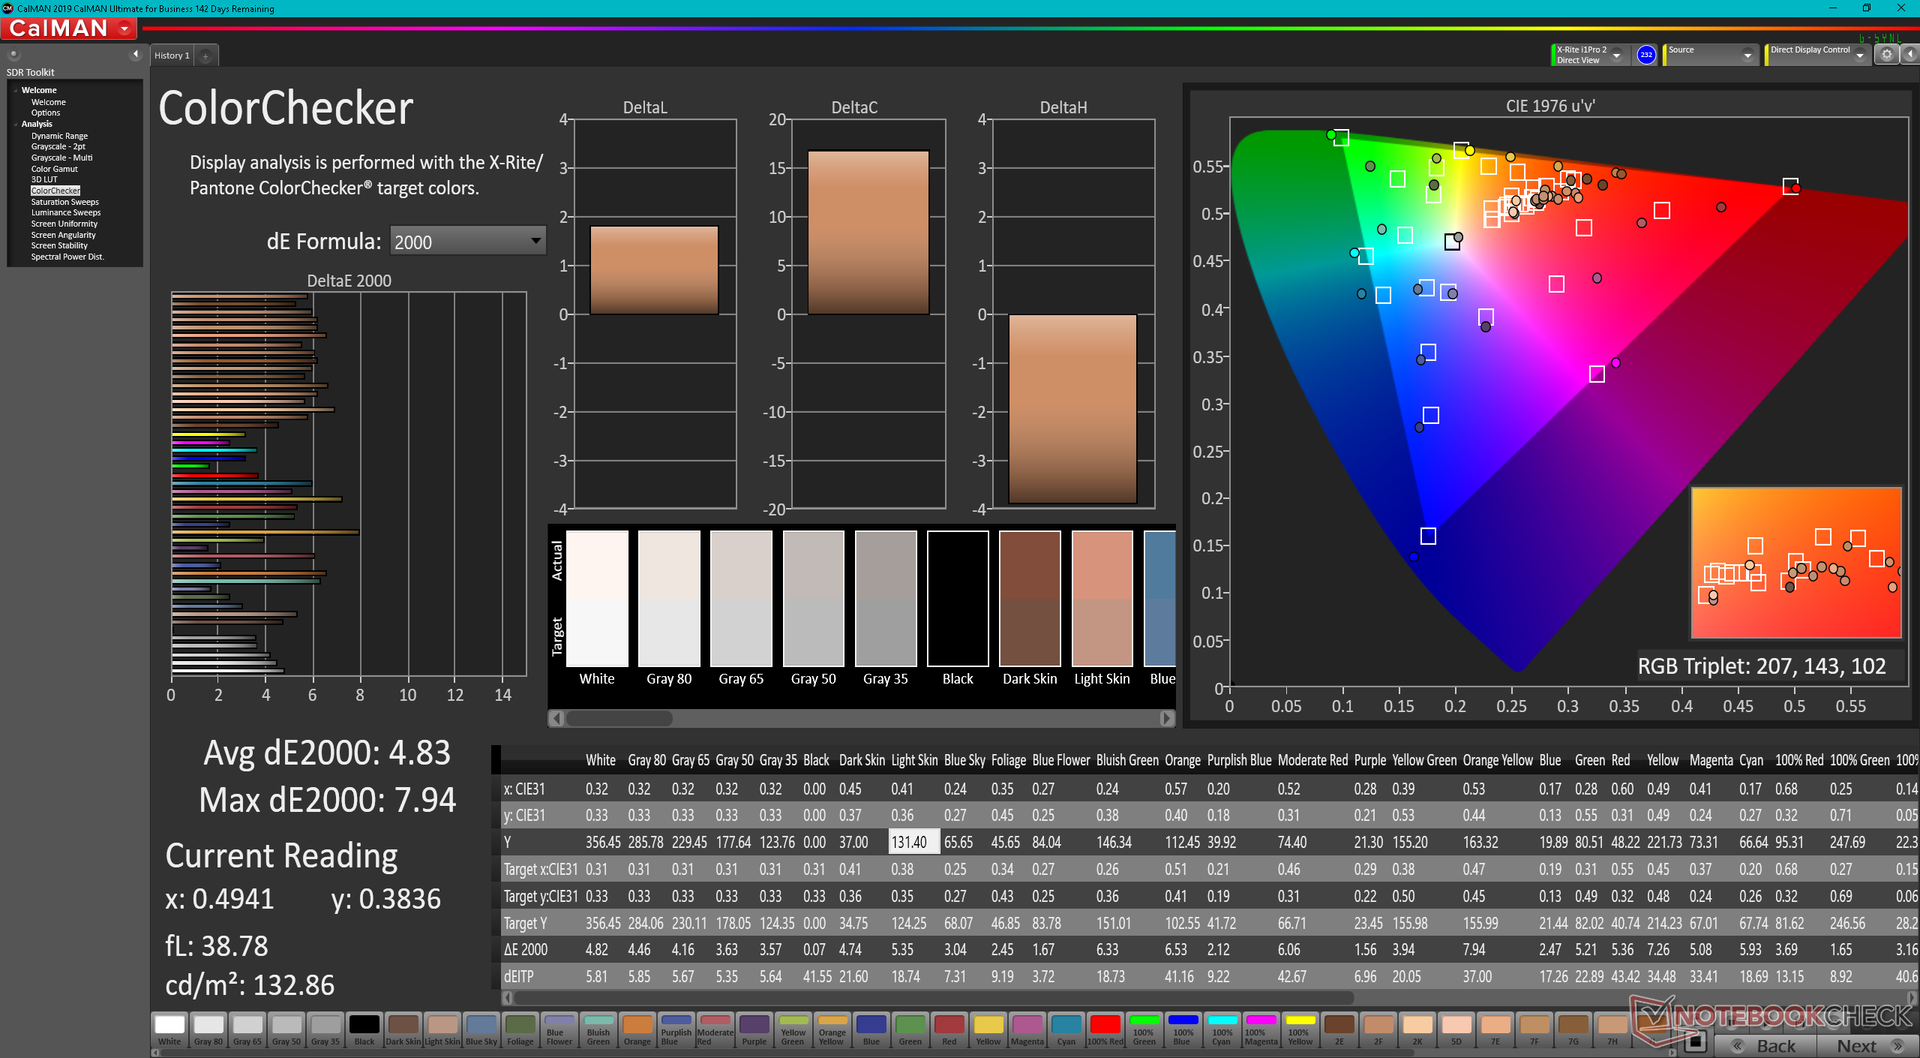
微星GE67和 Razer Blade 15是首批提供QHD OLED 240 Hz显示屏选项的两款笔记本电脑。虽然这在纸面上听起来很好,但也有一些星号需要记住。
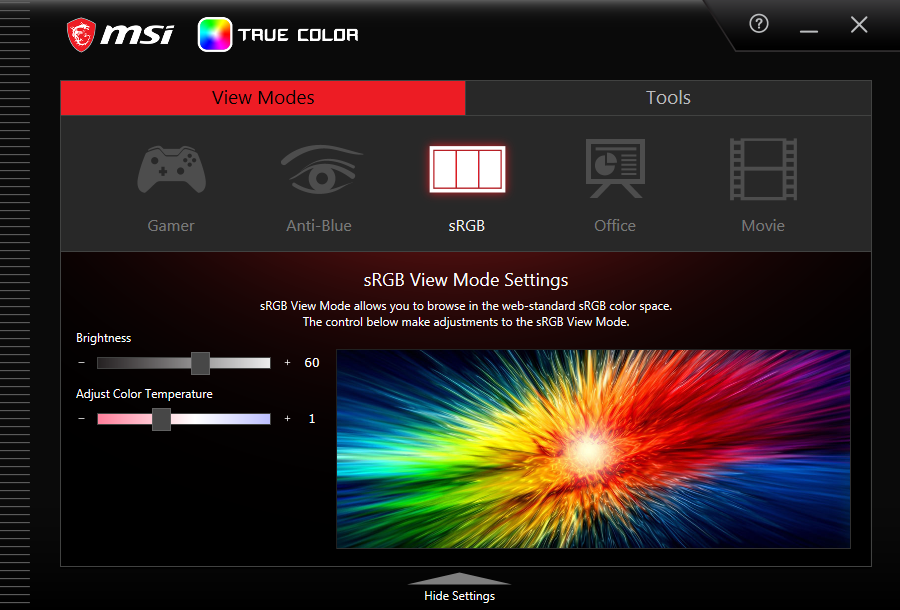
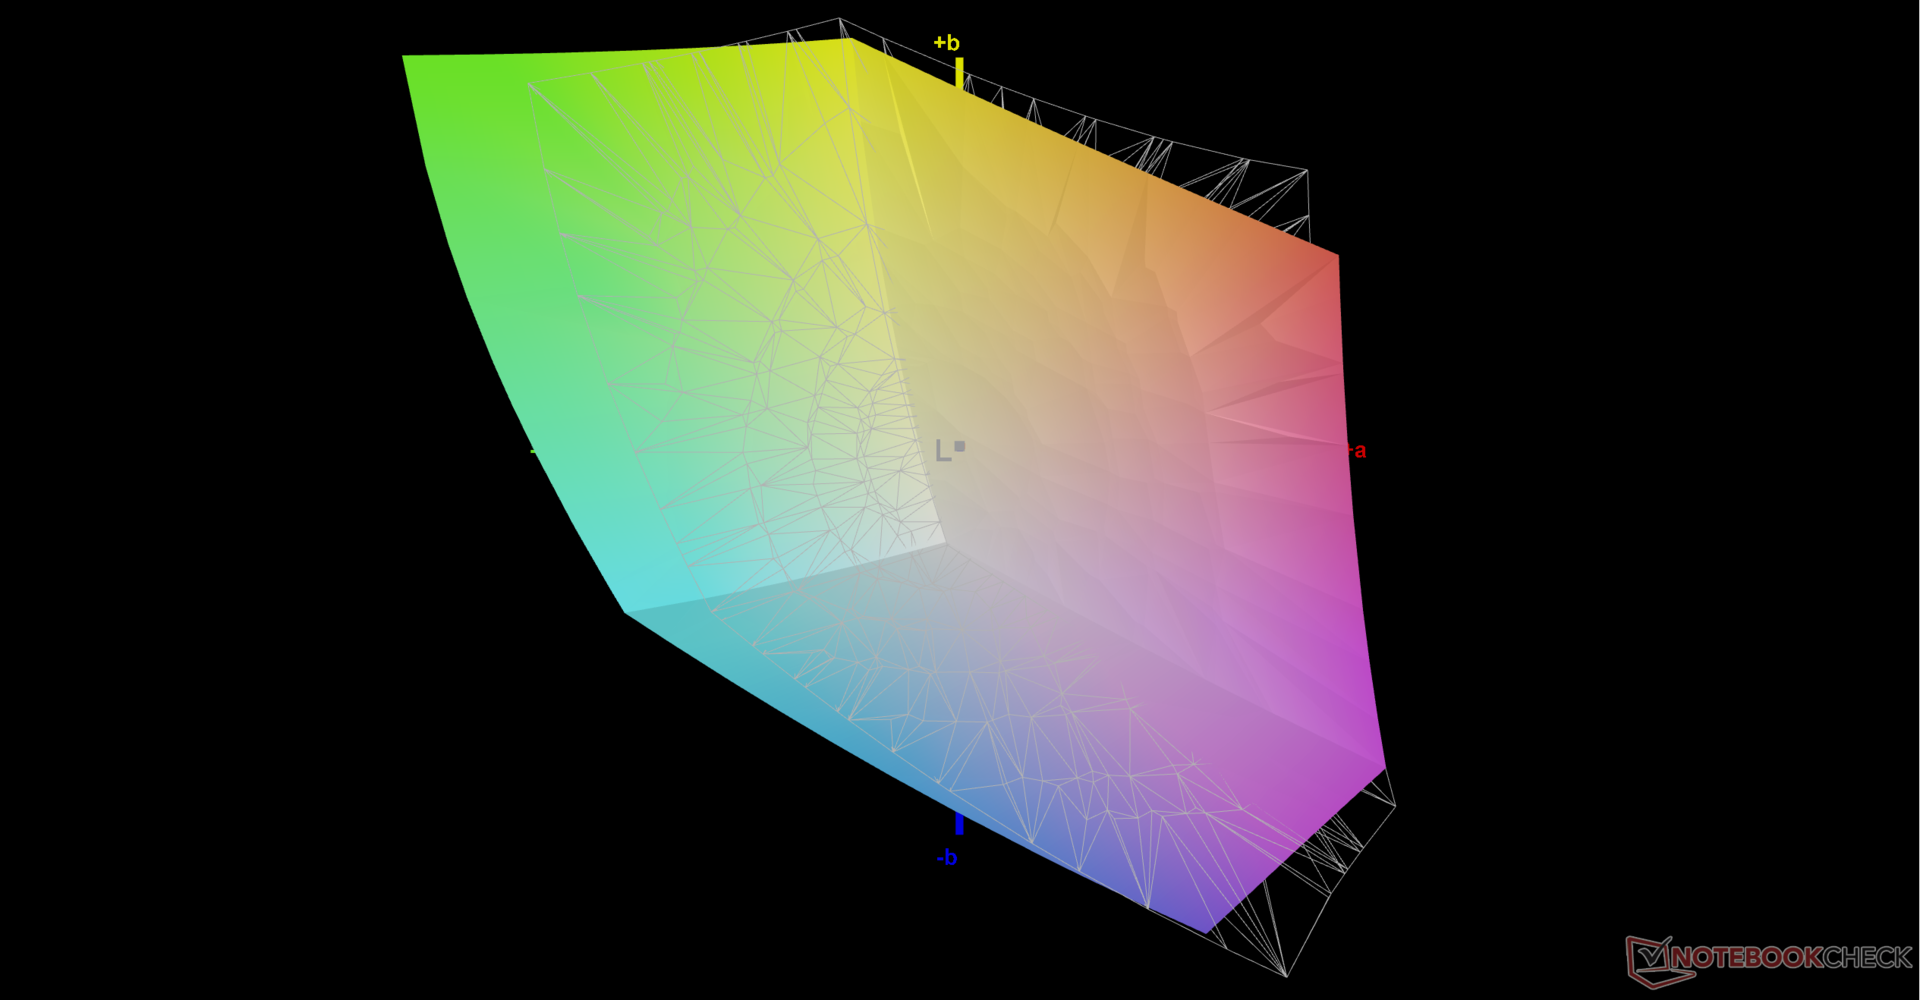
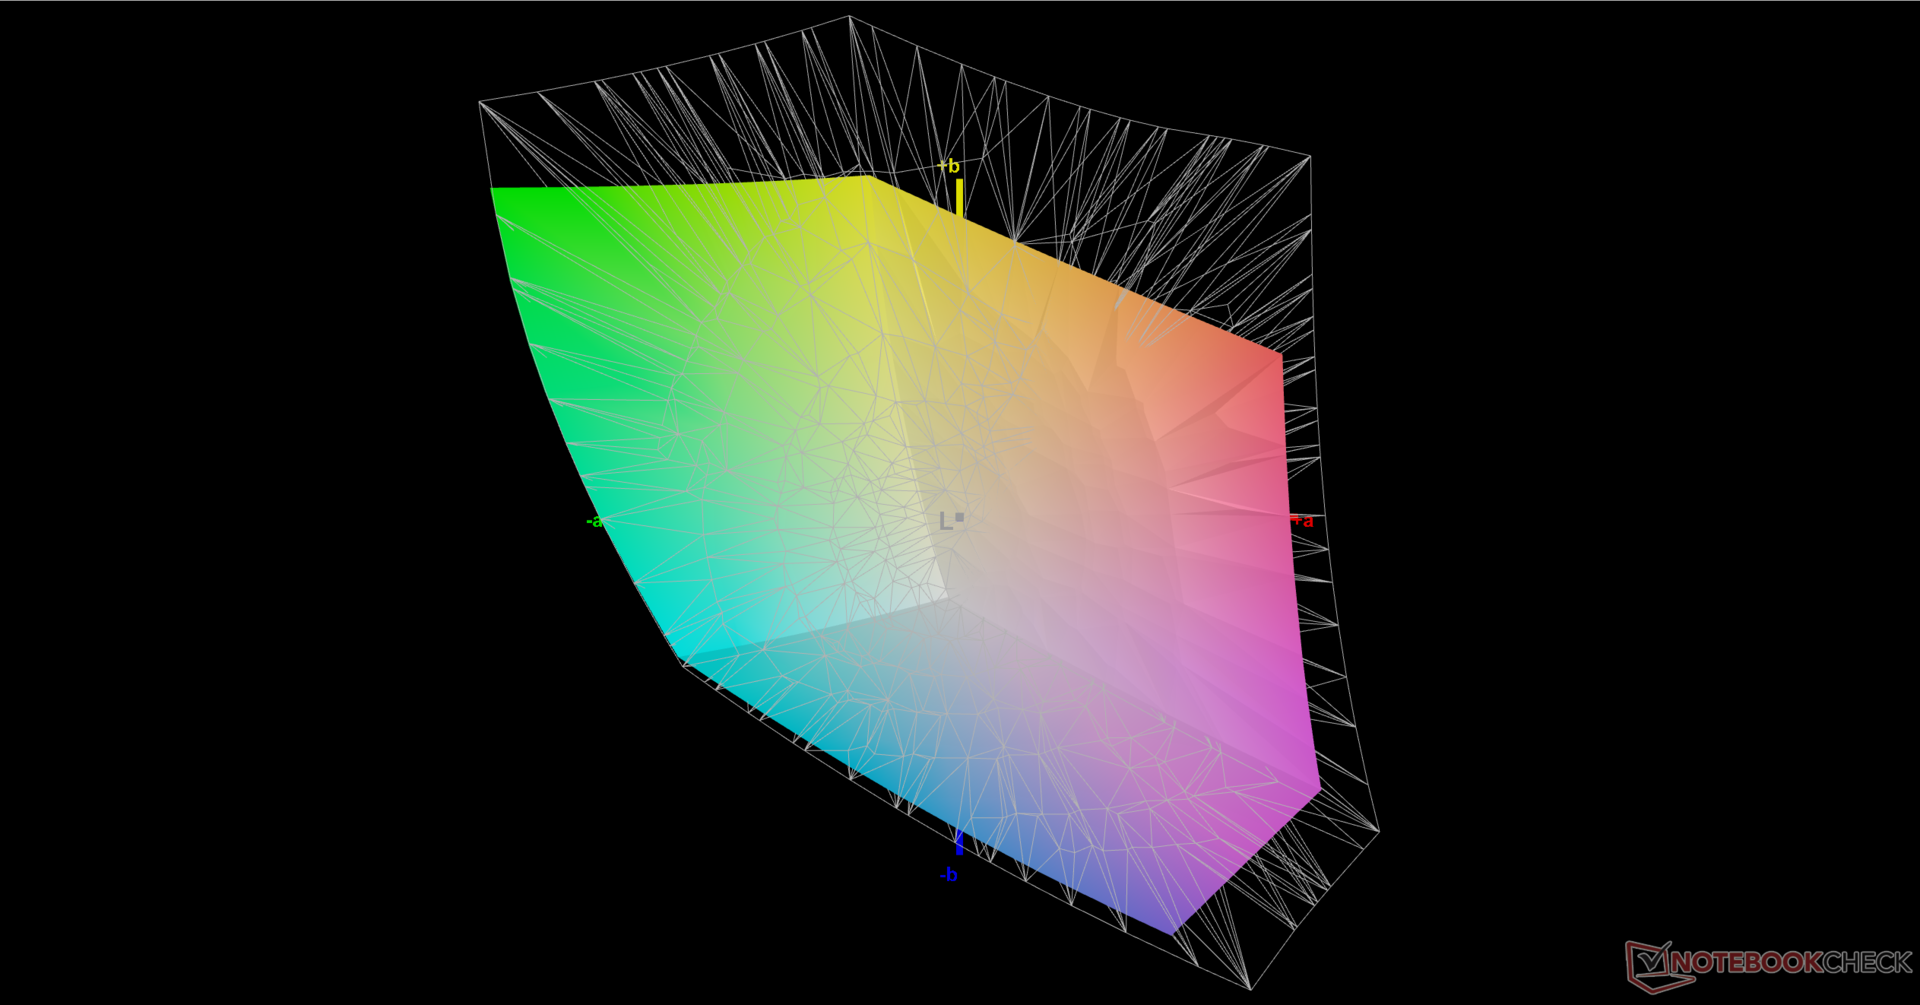
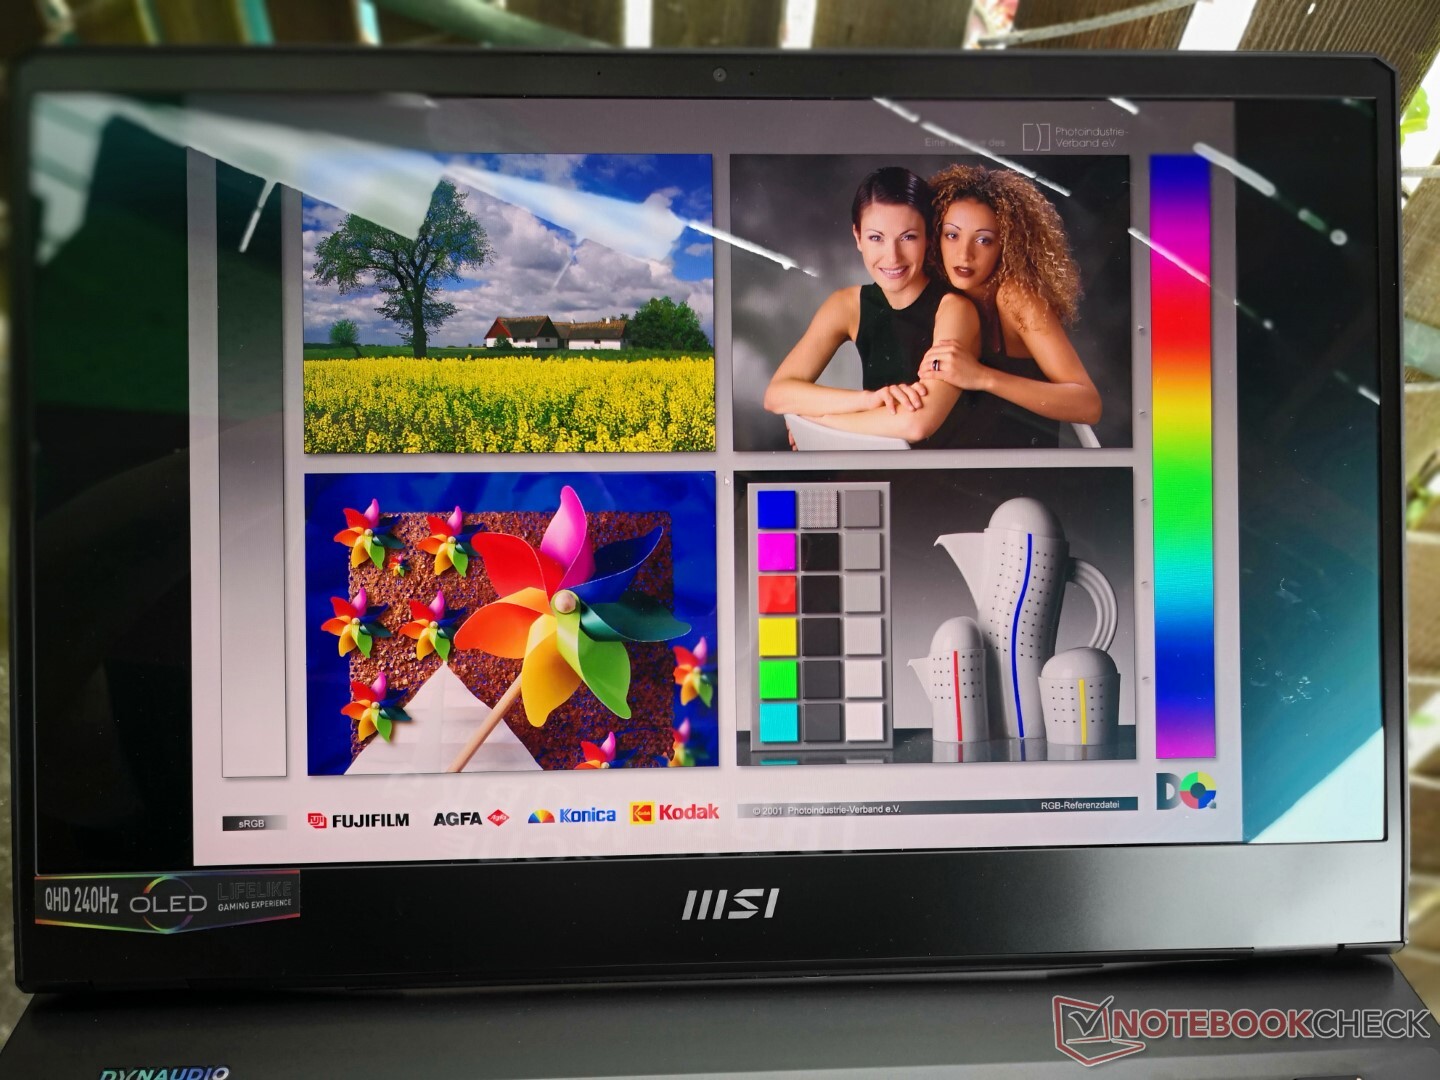
首先,GE67显示器在出厂时没有经过校准,尽管OLED面板宣传说完全覆盖DCI-P3。事实上,我们只能记录到72%的覆盖率,而且微星真彩软件本身没有DCI-P3选项可供选择。当被要求发表评论时,微星回应说,DCI-P3模式 "更多的是用于视频编辑和我们的创造者笔记本电脑系列",GE67实现了显示P3模式。
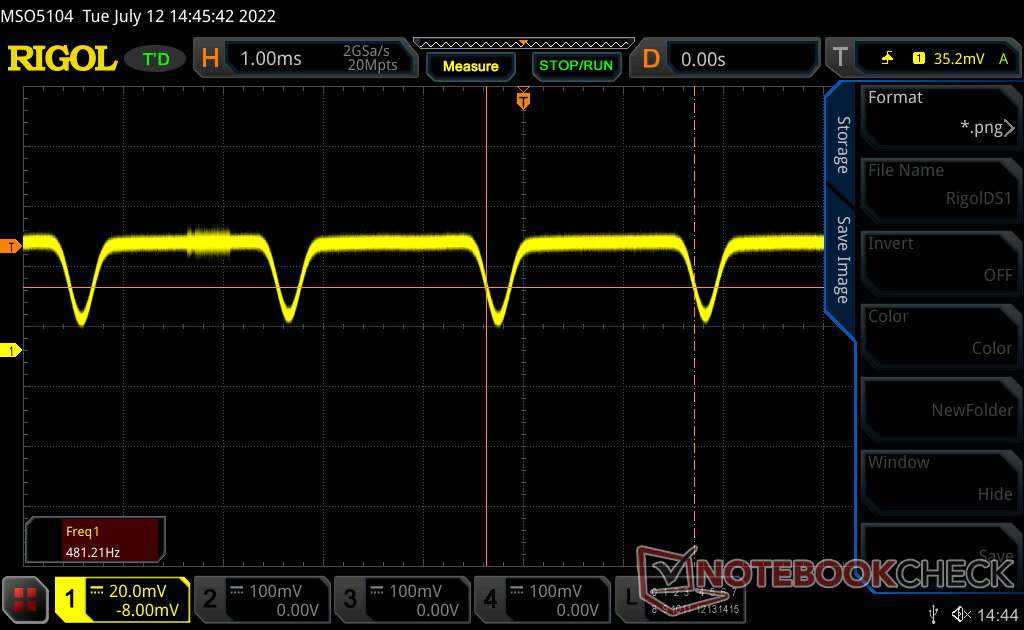
第二,该面板在所有亮度水平(包括100%的设置)上表现出480赫兹的闪烁。我们已经记录了许多类似的结果 最近的华硕Vivobook和Zenbook OLED笔记本电脑上也有类似的结果。如果你的眼睛对屏幕上的闪烁很敏感,那么最好降低亮度或避免长时间使用GE67。
最后,内部显示屏不支持G-Sync或自适应同步。
除了上述缺点外,QHD OLED 240 Hz面板绝对是我们在游戏时看到的最流畅的OLED体验之一。旧的OLED面板被限制在60赫兹,虽然对于编辑目的来说完全没有问题,但对于发烧级的游戏玩家来说是不可取的。微星为游戏目的塑造了显示器,而对于编辑或专业人士来说,这里的显示器就不那么重要了。
| |||||||||||||||||||||||||
Brightness Distribution: 99 %
Center on Battery: 356.1 cd/m²
Contrast: ∞:1 (Black: 0 cd/m²)
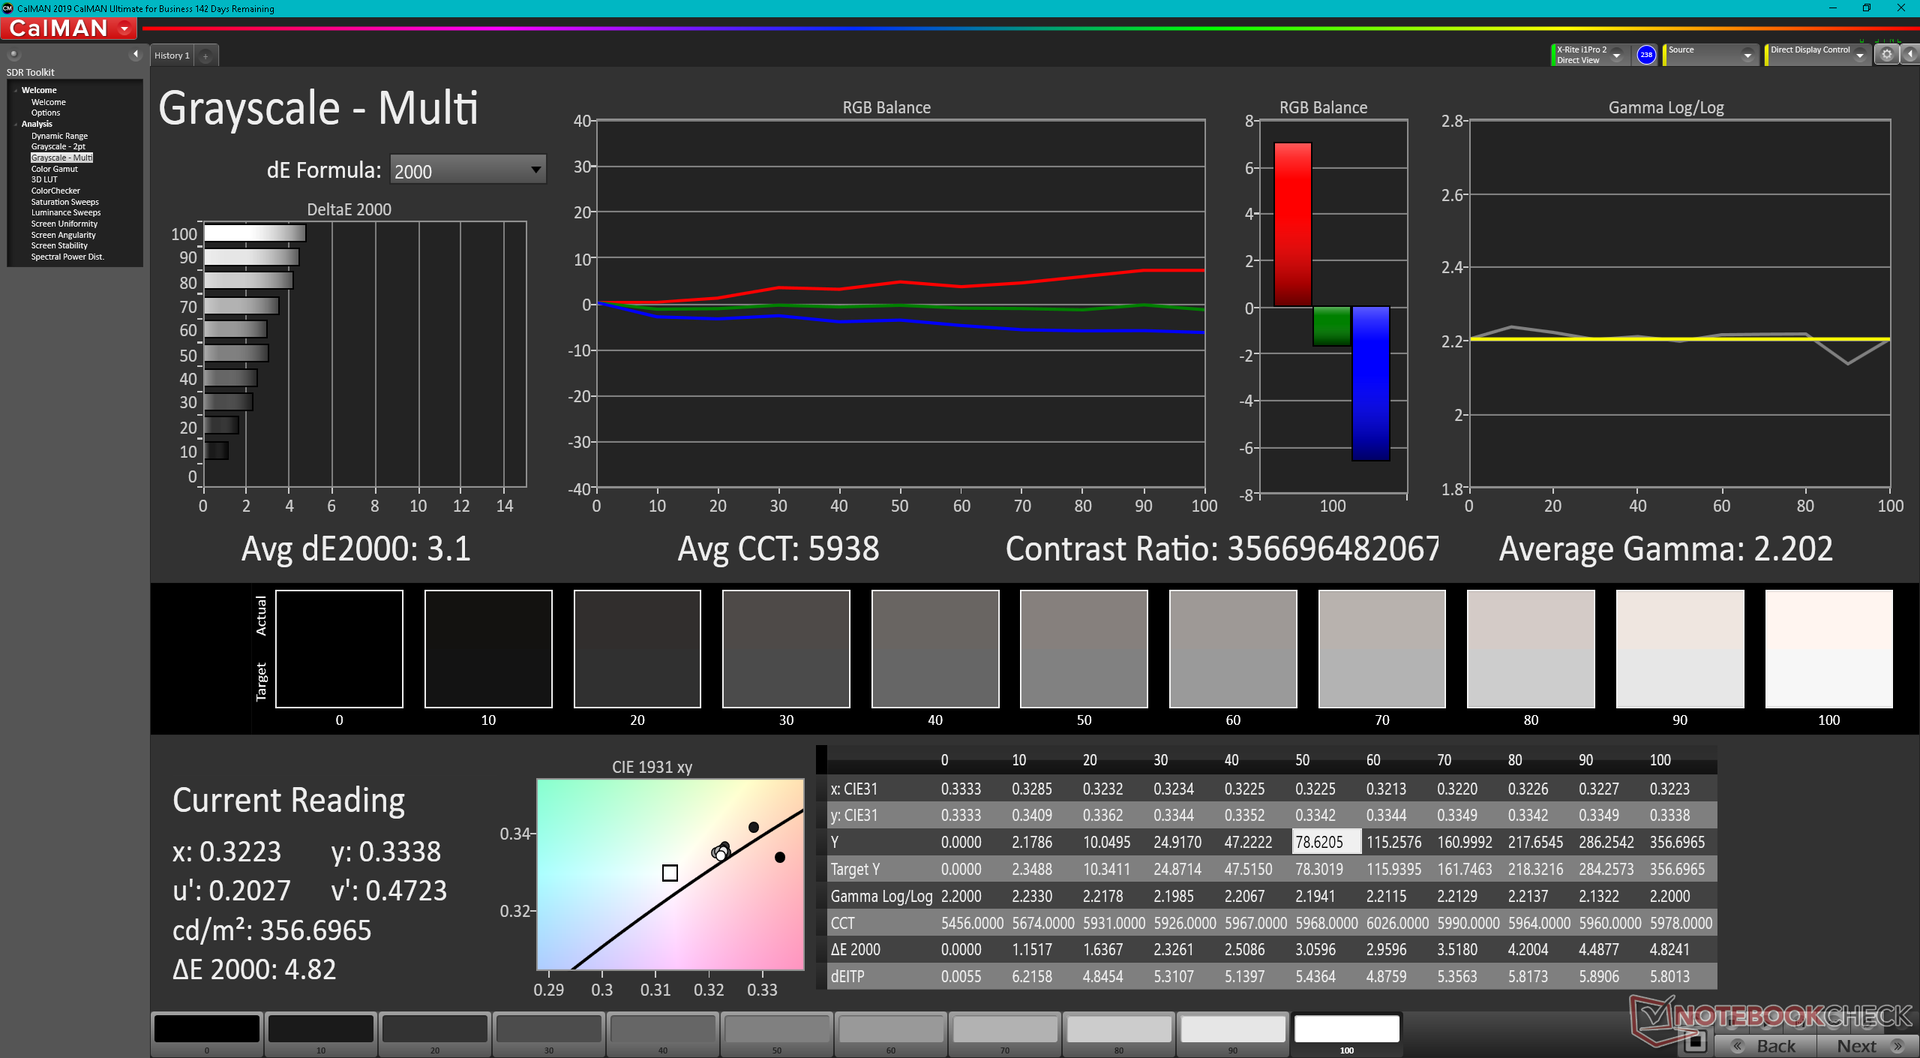
ΔE ColorChecker Calman: 4.83 | ∀{0.5-29.43 Ø4.71}
ΔE Greyscale Calman: 3.1 | ∀{0.09-98 Ø4.96}
75.2% AdobeRGB 1998 (Argyll 3D)
89.7% sRGB (Argyll 3D)
71.7% Display P3 (Argyll 3D)
Gamma: 2.2
CCT: 5938 K
| MSI GE67 HX 12UGS Samsung ATNA562P02-0, OLED, 1920x1080, 15.6" | MSI Raider GE66 12UHS AUO51EB, IPS, 3840x2160, 15.6" | MSI Vector GP66 12UGS BOE NE156FHM-NZ3, IPS, 1920x1080, 15.6" | Asus ROG Strix Scar 15 G533ZW-LN106WS BOE CQ NE156QHM-NZ2, IPS-level, 2560x1440, 15.6" | Alienware m15 R6, i7-11800H RTX 3080 AU Optronics AUO9092 (B156HAN), IPS, 1920x1080, 15.6" | Razer Blade 15 2022 Sharp LQ156T1JW03, IPS, 2560x1440, 15.6" | |
|---|---|---|---|---|---|---|
| Display | 16% | 2% | 19% | 5% | 21% | |
| Display P3 Coverage (%) | 71.7 | 80.4 12% | 70.1 -2% | 96.2 34% | 74.1 3% | 99.1 38% |
| sRGB Coverage (%) | 89.7 | 98.4 10% | 99.5 11% | 99.9 11% | 99.5 11% | 99.9 11% |
| AdobeRGB 1998 Coverage (%) | 75.2 | 94.7 26% | 72.1 -4% | 84.5 12% | 75.7 1% | 86.8 15% |
| Response Times | -5260% | -2260% | -2134% | -1160% | -4230% | |
| Response Time Grey 50% / Grey 80% * (ms) | 0.25 ? | 18.8 ? -7420% | 5.8 ? -2220% | 7.86 ? -3044% 4.21 ? -1584% | 2.8 -1020% | 14.4 ? -5660% |
| Response Time Black / White * (ms) | 0.4 ? | 12.8 ? -3100% | 9.6 ? -2300% | 7.5 ? -1775% | 5.6 -1300% | 11.6 ? -2800% |
| PWM Frequency (Hz) | 480.4 ? | |||||
| Screen | -1% | 6% | 9% | 6% | 15% | |
| Brightness middle (cd/m²) | 356.1 | 351 -1% | 353.1 -1% | 346 -3% | 359 1% | 286 -20% |
| Brightness (cd/m²) | 358 | 347 -3% | 325 -9% | 329 -8% | 344 -4% | 271 -24% |
| Brightness Distribution (%) | 99 | 90 -9% | 85 -14% | 91 -8% | 85 -14% | 89 -10% |
| Black Level * (cd/m²) | 0.35 | 0.38 | 0.59 | 0.35 | 0.25 | |
| Colorchecker dE 2000 * | 4.83 | 2.54 47% | 2.24 54% | 3.06 37% | 3.3 32% | 2.74 43% |
| Colorchecker dE 2000 max. * | 7.94 | 8.36 -5% | 5 37% | 5.81 27% | 4.84 39% | 5.21 34% |
| Greyscale dE 2000 * | 3.1 | 4.1 -32% | 4 -29% | 3.66 -18% | 1.1 65% | |
| Gamma | 2.2 100% | 2.089 105% | 2.24 98% | 2.12 104% | 2.43 91% | 2.2 100% |
| CCT | 5938 109% | 7036 92% | 6864 95% | 7021 93% | 5896 110% | 6408 101% |
| Contrast (:1) | 1003 | 929 | 586 | 1026 | 1144 | |
| Colorchecker dE 2000 calibrated * | 0.67 | 1.02 | 2.57 | 3.28 | 2.52 | |
| Total Average (Program / Settings) | -1748% /
-952% | -751% /
-407% | -702% /
-573% | -383% /
-206% | -1398% /
-755% |
* ... smaller is better
Display Response Times
| ↔ Response Time Black to White | ||
|---|---|---|
| 0.4 ms ... rise ↗ and fall ↘ combined | ↗ 0.2 ms rise | 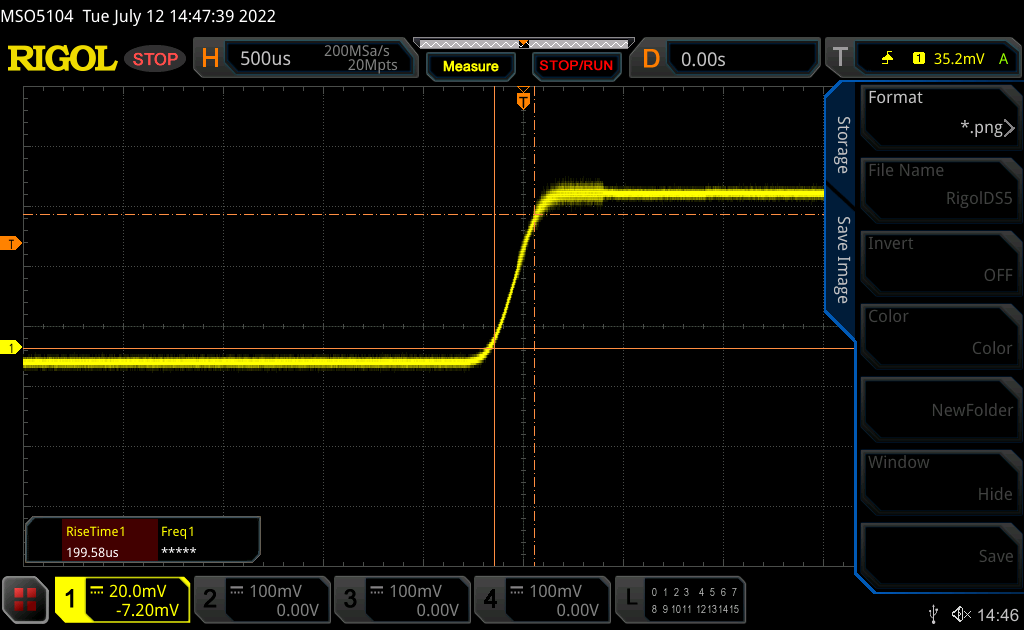 |
| ↘ 0.2 ms fall | ||
| The screen shows very fast response rates in our tests and should be very well suited for fast-paced gaming. In comparison, all tested devices range from 0.1 (minimum) to 240 (maximum) ms. » 0 % of all devices are better. This means that the measured response time is better than the average of all tested devices (19.8 ms). | ||
| ↔ Response Time 50% Grey to 80% Grey | ||
| 0.25 ms ... rise ↗ and fall ↘ combined | ↗ 0.13 ms rise | 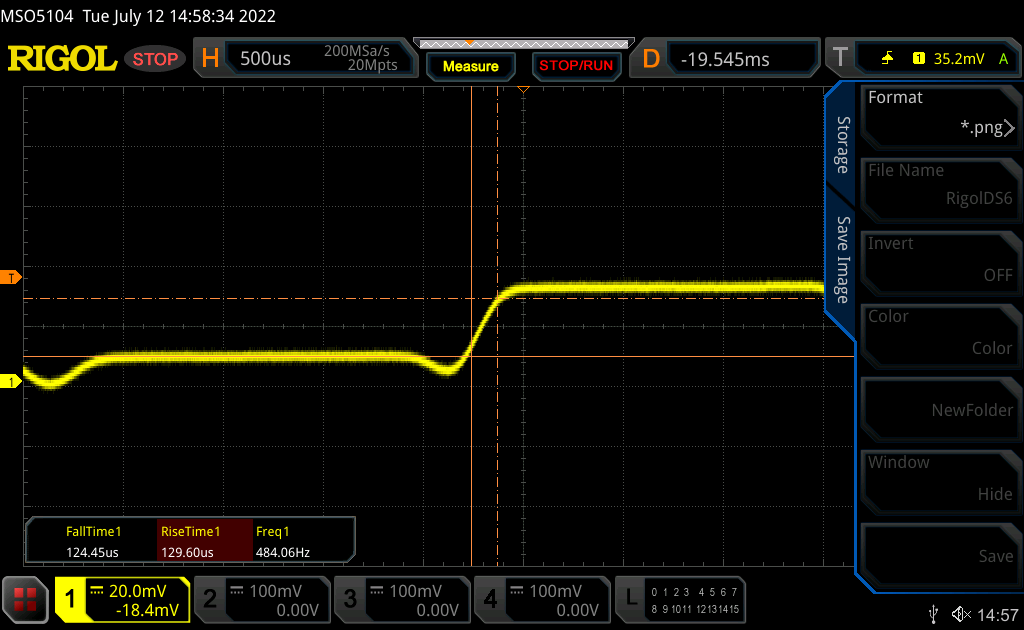 |
| ↘ 0.12 ms fall | ||
| The screen shows very fast response rates in our tests and should be very well suited for fast-paced gaming. In comparison, all tested devices range from 0.165 (minimum) to 636 (maximum) ms. » 0 % of all devices are better. This means that the measured response time is better than the average of all tested devices (31 ms). | ||
Screen Flickering / PWM (Pulse-Width Modulation)
| Screen flickering / PWM detected | 480.4 Hz | ≤ 100 % brightness setting | 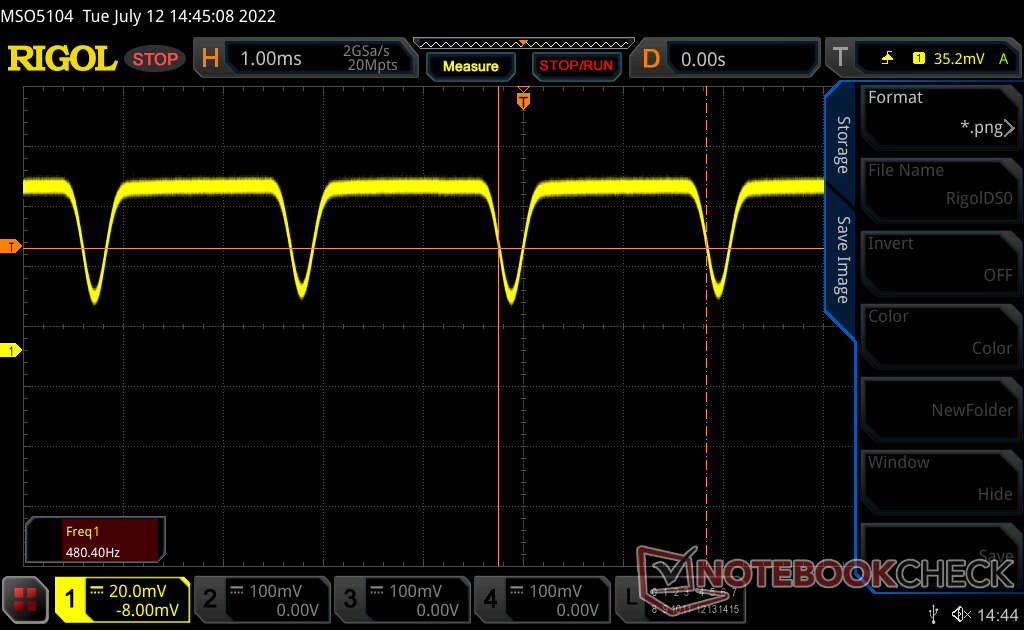 |
The display backlight flickers at 480.4 Hz (worst case, e.g., utilizing PWM) Flickering detected at a brightness setting of 100 % and below. There should be no flickering or PWM above this brightness setting. The frequency of 480.4 Hz is relatively high, so most users sensitive to PWM should not notice any flickering. However, there are reports that some users are still sensitive to PWM at 500 Hz and above, so be aware. In comparison: 52 % of all tested devices do not use PWM to dim the display. If PWM was detected, an average of 7757 (minimum: 5 - maximum: 343500) Hz was measured. | |||


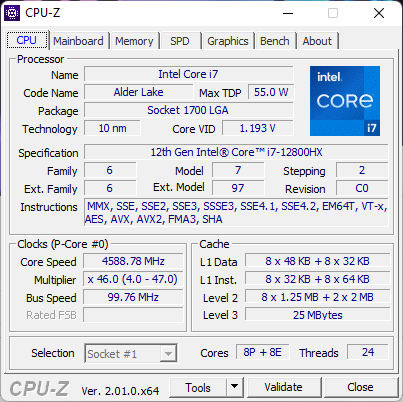
性能 - 16个内核和24个线程
测试条件
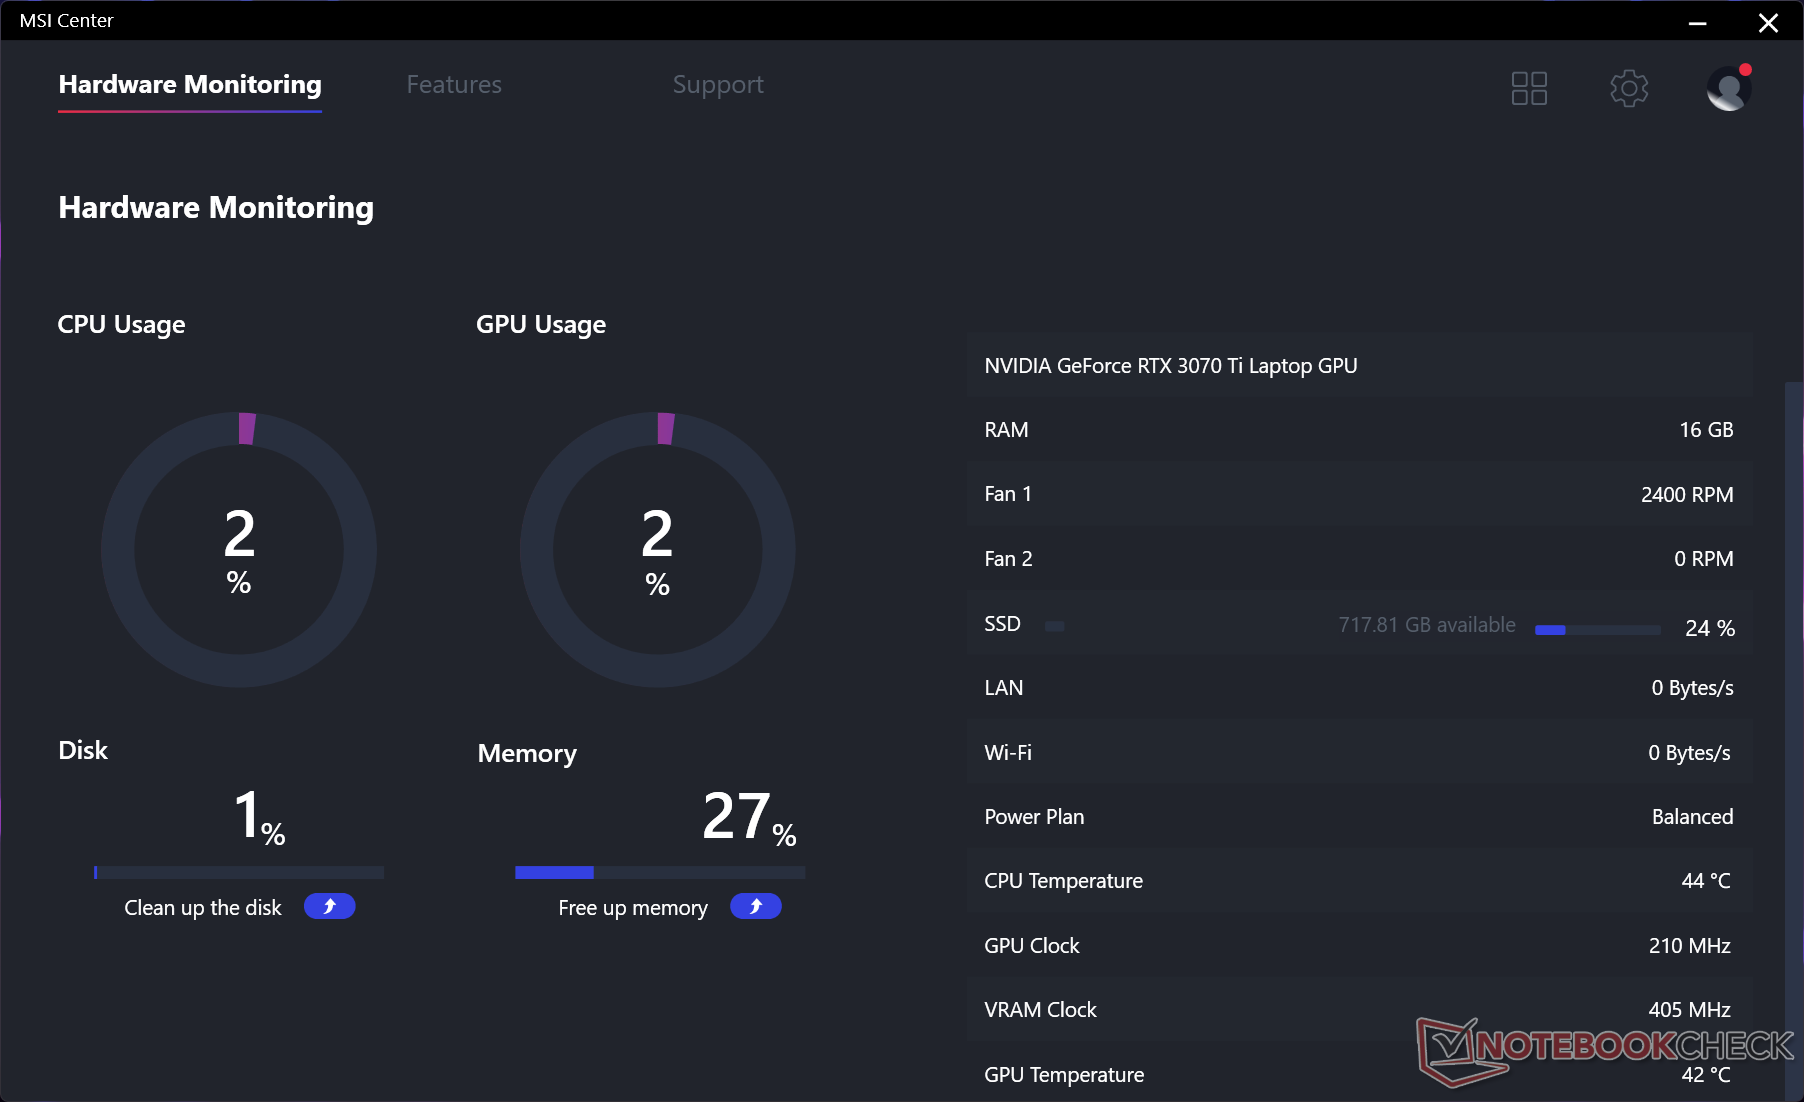
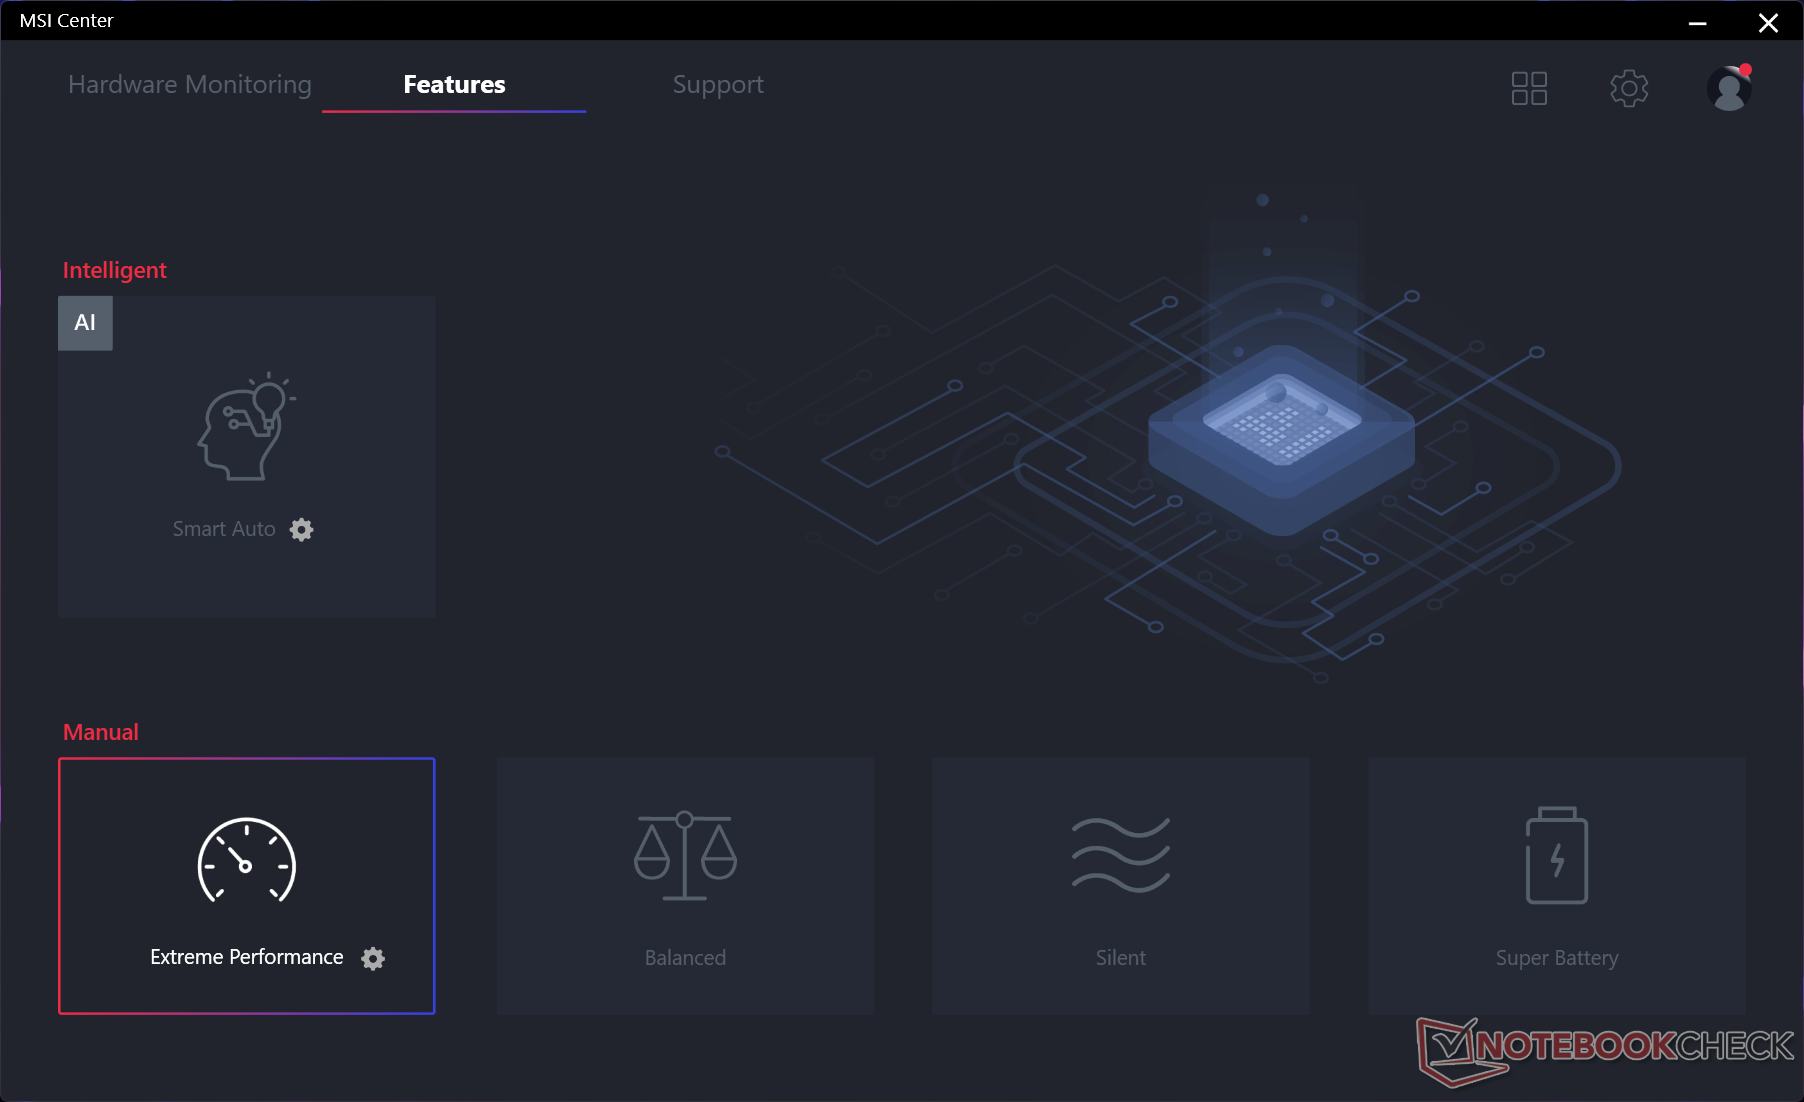
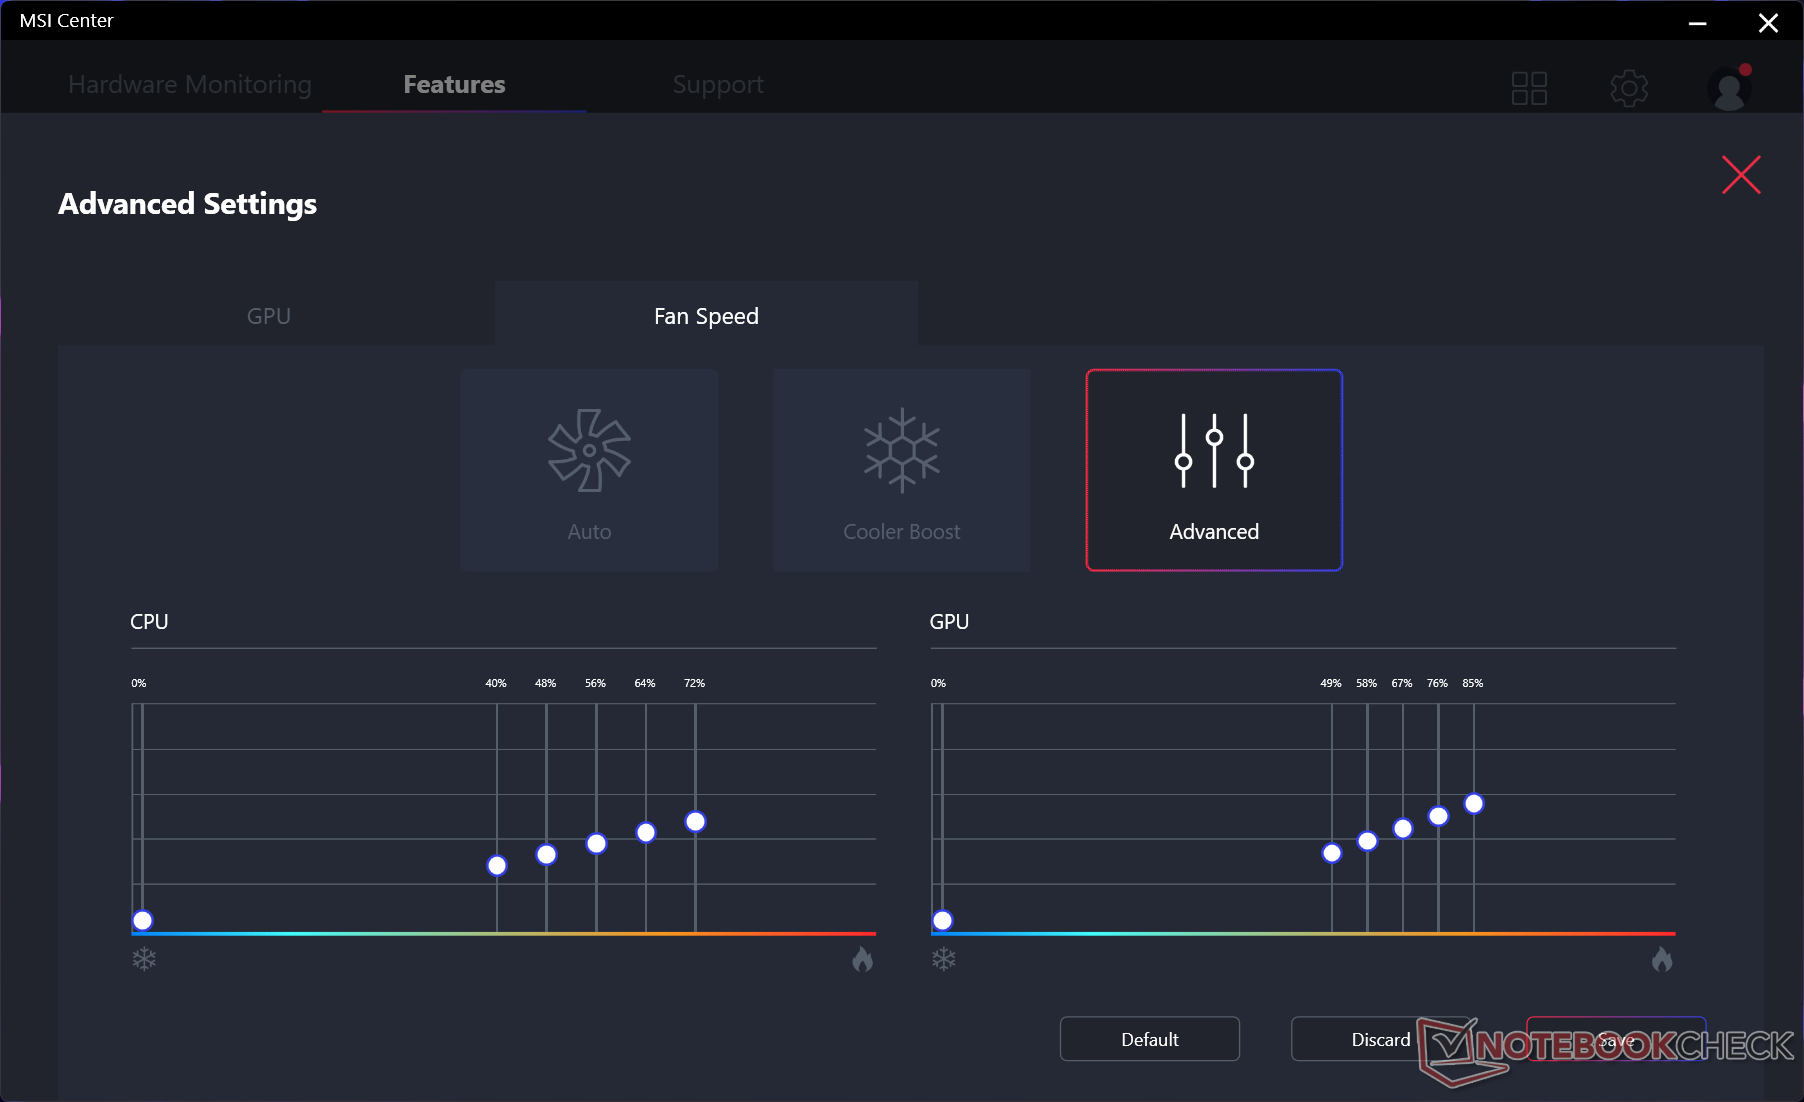
在运行下面的任何基准测试之前,我们通过Windows将我们的设备设置为性能模式,极限性能模式见MSI中心,独立GPU处于激活状态而不是MSHybrid模式。我们建议用户熟悉预装的微星中心软件,因为关键的性能和辅助功能是在这里切换的。
处理器
芯片酷睿i7-12800HX很容易成为GE67 HX的一个亮点。原始多线程性能比Core i9-12900HK快约25%。酷睿i9-12900HK比2022年第一季度的GE66中的酷睿i9-12900HK快约25%,而与第十代酷睿i9-10980HK相比,这一差距甚至更大。 酷睿i9-10980HK与原2020年GE66中的第十代酷睿i9-10980HK相比,这一差距更大。它轻松地超过了AMD Zen 3阵容中的任何移动处理器。这款 Ryzen 9 5900HX例如,在多线程负载中要慢40%到45%。
性能的可持续性也非常好,即使在长时间的压力下,时钟速率也没有大的下降。
单线程性能仍然与Core i9-12900HK相似,尽管它们在核心数(16对14)和线程数(24对20)方面存在差异。
Cinebench R15 Multi Loop
Cinebench R23: Multi Core | Single Core
Cinebench R15: CPU Multi 64Bit | CPU Single 64Bit
Blender: v2.79 BMW27 CPU
7-Zip 18.03: 7z b 4 | 7z b 4 -mmt1
Geekbench 5.5: Multi-Core | Single-Core
HWBOT x265 Benchmark v2.2: 4k Preset
LibreOffice : 20 Documents To PDF
R Benchmark 2.5: Overall mean
| Cinebench R20 / CPU (Multi Core) | |
| Intel Core i9-12900K | |
| MSI GE67 HX 12UGS | |
| Average Intel Core i7-12800HX (n=1) | |
| Eurocom Raptor X15 | |
| MSI GE76 Raider | |
| Schenker XMG Neo 15 (i7-12700H, RTX 3080 Ti) | |
| MSI Raider GE66 12UHS | |
| Asus ROG Strix Scar 15 G533zm | |
| Schenker XMG Apex 15 NH57E PS | |
| MSI Delta 15 A5EFK | |
| Eurocom Sky X4C i9-9900KS | |
| Dell G5 15 SE 5505 P89F | |
| Asus Zephyrus S15 GX502L | |
| MSI GE66 Raider 10SFS | |
| Cinebench R20 / CPU (Single Core) | |
| Intel Core i9-12900K | |
| Eurocom Raptor X15 | |
| MSI GE76 Raider | |
| Asus ROG Strix Scar 15 G533zm | |
| MSI Raider GE66 12UHS | |
| Schenker XMG Neo 15 (i7-12700H, RTX 3080 Ti) | |
| MSI GE67 HX 12UGS | |
| Average Intel Core i7-12800HX (n=1) | |
| MSI Delta 15 A5EFK | |
| Schenker XMG Apex 15 NH57E PS | |
| Eurocom Sky X4C i9-9900KS | |
| Dell G5 15 SE 5505 P89F | |
| MSI GE66 Raider 10SFS | |
| Asus Zephyrus S15 GX502L | |
| Cinebench R23 / Multi Core | |
| Intel Core i9-12900K | |
| MSI GE67 HX 12UGS | |
| Average Intel Core i7-12800HX (n=1) | |
| MSI GE76 Raider | |
| Schenker XMG Neo 15 (i7-12700H, RTX 3080 Ti) | |
| Eurocom Raptor X15 | |
| Asus ROG Strix Scar 15 G533zm | |
| MSI Raider GE66 12UHS | |
| Schenker XMG Apex 15 NH57E PS | |
| MSI Delta 15 A5EFK | |
| Cinebench R23 / Single Core | |
| Intel Core i9-12900K | |
| MSI GE76 Raider | |
| MSI Raider GE66 12UHS | |
| MSI GE67 HX 12UGS | |
| Average Intel Core i7-12800HX (n=1) | |
| Schenker XMG Neo 15 (i7-12700H, RTX 3080 Ti) | |
| Eurocom Raptor X15 | |
| Asus ROG Strix Scar 15 G533zm | |
| MSI Delta 15 A5EFK | |
| Schenker XMG Apex 15 NH57E PS | |
| Cinebench R15 / CPU Multi 64Bit | |
| Intel Core i9-12900K | |
| MSI GE67 HX 12UGS | |
| Average Intel Core i7-12800HX (n=1) | |
| Asus ROG Strix Scar 15 G533zm | |
| MSI GE76 Raider | |
| Schenker XMG Neo 15 (i7-12700H, RTX 3080 Ti) | |
| MSI Raider GE66 12UHS | |
| MSI Delta 15 A5EFK | |
| Schenker XMG Apex 15 NH57E PS | |
| Dell G5 15 SE 5505 P89F | |
| Eurocom Sky X4C i9-9900KS | |
| MSI GE66 Raider 10SFS | |
| Asus Zephyrus S15 GX502L | |
| Cinebench R15 / CPU Single 64Bit | |
| Intel Core i9-12900K | |
| Asus ROG Strix Scar 15 G533zm | |
| MSI GE76 Raider | |
| MSI Raider GE66 12UHS | |
| Schenker XMG Neo 15 (i7-12700H, RTX 3080 Ti) | |
| MSI GE67 HX 12UGS | |
| Average Intel Core i7-12800HX (n=1) | |
| MSI Delta 15 A5EFK | |
| Schenker XMG Apex 15 NH57E PS | |
| Eurocom Sky X4C i9-9900KS | |
| MSI GE66 Raider 10SFS | |
| Asus Zephyrus S15 GX502L | |
| Dell G5 15 SE 5505 P89F | |
| Blender / v2.79 BMW27 CPU | |
| MSI GE66 Raider 10SFS | |
| Dell G5 15 SE 5505 P89F | |
| Asus Zephyrus S15 GX502L | |
| Eurocom Sky X4C i9-9900KS | |
| Schenker XMG Apex 15 NH57E PS | |
| MSI Delta 15 A5EFK | |
| MSI Raider GE66 12UHS | |
| Eurocom Raptor X15 | |
| MSI GE76 Raider | |
| Schenker XMG Neo 15 (i7-12700H, RTX 3080 Ti) | |
| Asus ROG Strix Scar 15 G533zm | |
| MSI GE67 HX 12UGS | |
| Average Intel Core i7-12800HX (n=1) | |
| Intel Core i9-12900K | |
| 7-Zip 18.03 / 7z b 4 | |
| Intel Core i9-12900K | |
| MSI GE67 HX 12UGS | |
| Average Intel Core i7-12800HX (n=1) | |
| Asus ROG Strix Scar 15 G533zm | |
| MSI GE76 Raider | |
| Schenker XMG Neo 15 (i7-12700H, RTX 3080 Ti) | |
| MSI Raider GE66 12UHS | |
| Eurocom Raptor X15 | |
| MSI Delta 15 A5EFK | |
| Schenker XMG Apex 15 NH57E PS | |
| Eurocom Sky X4C i9-9900KS | |
| Dell G5 15 SE 5505 P89F | |
| Asus Zephyrus S15 GX502L | |
| MSI GE66 Raider 10SFS | |
| 7-Zip 18.03 / 7z b 4 -mmt1 | |
| Intel Core i9-12900K | |
| Eurocom Raptor X15 | |
| MSI GE76 Raider | |
| Asus ROG Strix Scar 15 G533zm | |
| MSI Raider GE66 12UHS | |
| Schenker XMG Neo 15 (i7-12700H, RTX 3080 Ti) | |
| MSI Delta 15 A5EFK | |
| Eurocom Sky X4C i9-9900KS | |
| MSI GE67 HX 12UGS | |
| Average Intel Core i7-12800HX (n=1) | |
| Schenker XMG Apex 15 NH57E PS | |
| MSI GE66 Raider 10SFS | |
| Asus Zephyrus S15 GX502L | |
| Dell G5 15 SE 5505 P89F | |
| Geekbench 5.5 / Multi-Core | |
| Intel Core i9-12900K | |
| MSI GE67 HX 12UGS | |
| Average Intel Core i7-12800HX (n=1) | |
| MSI Raider GE66 12UHS | |
| MSI GE76 Raider | |
| Asus ROG Strix Scar 15 G533zm | |
| Schenker XMG Neo 15 (i7-12700H, RTX 3080 Ti) | |
| Eurocom Raptor X15 | |
| Eurocom Sky X4C i9-9900KS | |
| MSI Delta 15 A5EFK | |
| Schenker XMG Apex 15 NH57E PS | |
| MSI GE66 Raider 10SFS | |
| Dell G5 15 SE 5505 P89F | |
| Asus Zephyrus S15 GX502L | |
| Geekbench 5.5 / Single-Core | |
| Intel Core i9-12900K | |
| Eurocom Raptor X15 | |
| MSI GE76 Raider | |
| MSI Raider GE66 12UHS | |
| Asus ROG Strix Scar 15 G533zm | |
| MSI GE67 HX 12UGS | |
| Average Intel Core i7-12800HX (n=1) | |
| Schenker XMG Neo 15 (i7-12700H, RTX 3080 Ti) | |
| MSI Delta 15 A5EFK | |
| Schenker XMG Apex 15 NH57E PS | |
| Eurocom Sky X4C i9-9900KS | |
| MSI GE66 Raider 10SFS | |
| Asus Zephyrus S15 GX502L | |
| Dell G5 15 SE 5505 P89F | |
| HWBOT x265 Benchmark v2.2 / 4k Preset | |
| Intel Core i9-12900K | |
| MSI GE67 HX 12UGS | |
| Average Intel Core i7-12800HX (n=1) | |
| Asus ROG Strix Scar 15 G533zm | |
| Schenker XMG Neo 15 (i7-12700H, RTX 3080 Ti) | |
| MSI GE76 Raider | |
| MSI Raider GE66 12UHS | |
| MSI Delta 15 A5EFK | |
| Schenker XMG Apex 15 NH57E PS | |
| Eurocom Sky X4C i9-9900KS | |
| Eurocom Raptor X15 | |
| Asus Zephyrus S15 GX502L | |
| MSI GE66 Raider 10SFS | |
| Dell G5 15 SE 5505 P89F | |
| LibreOffice / 20 Documents To PDF | |
| Dell G5 15 SE 5505 P89F | |
| Schenker XMG Apex 15 NH57E PS | |
| MSI GE66 Raider 10SFS | |
| MSI Delta 15 A5EFK | |
| Schenker XMG Neo 15 (i7-12700H, RTX 3080 Ti) | |
| Asus Zephyrus S15 GX502L | |
| MSI GE67 HX 12UGS | |
| Average Intel Core i7-12800HX (n=1) | |
| Intel Core i9-12900K | |
| Asus ROG Strix Scar 15 G533zm | |
| MSI GE76 Raider | |
| Eurocom Raptor X15 | |
| MSI Raider GE66 12UHS | |
| R Benchmark 2.5 / Overall mean | |
| Asus Zephyrus S15 GX502L | |
| Dell G5 15 SE 5505 P89F | |
| MSI GE66 Raider 10SFS | |
| Schenker XMG Apex 15 NH57E PS | |
| MSI Delta 15 A5EFK | |
| MSI GE67 HX 12UGS | |
| Average Intel Core i7-12800HX (n=1) | |
| Schenker XMG Neo 15 (i7-12700H, RTX 3080 Ti) | |
| MSI Raider GE66 12UHS | |
| Asus ROG Strix Scar 15 G533zm | |
| MSI GE76 Raider | |
| Intel Core i9-12900K | |
| Eurocom Raptor X15 | |
Cinebench R23: Multi Core | Single Core
Cinebench R15: CPU Multi 64Bit | CPU Single 64Bit
Blender: v2.79 BMW27 CPU
7-Zip 18.03: 7z b 4 | 7z b 4 -mmt1
Geekbench 5.5: Multi-Core | Single-Core
HWBOT x265 Benchmark v2.2: 4k Preset
LibreOffice : 20 Documents To PDF
R Benchmark 2.5: Overall mean
* ... smaller is better
AIDA64: FP32 Ray-Trace | FPU Julia | CPU SHA3 | CPU Queen | FPU SinJulia | FPU Mandel | CPU AES | CPU ZLib | FP64 Ray-Trace | CPU PhotoWorxx
| Performance rating | |
| Alienware m15 R6, i7-11800H RTX 3080 | |
| MSI GE67 HX 12UGS | |
| Average Intel Core i7-12800HX | |
| Asus ROG Strix Scar 15 G533ZW-LN106WS | |
| MSI Raider GE66 12UHS | |
| MSI Vector GP66 12UGS | |
| Razer Blade 15 2022 | |
| AIDA64 / FP32 Ray-Trace | |
| Alienware m15 R6, i7-11800H RTX 3080 | |
| MSI GE67 HX 12UGS | |
| Average Intel Core i7-12800HX (n=1) | |
| Asus ROG Strix Scar 15 G533ZW-LN106WS | |
| MSI Raider GE66 12UHS | |
| MSI Vector GP66 12UGS | |
| Razer Blade 15 2022 | |
| AIDA64 / FPU Julia | |
| Alienware m15 R6, i7-11800H RTX 3080 | |
| MSI GE67 HX 12UGS | |
| Average Intel Core i7-12800HX (n=1) | |
| Asus ROG Strix Scar 15 G533ZW-LN106WS | |
| MSI Raider GE66 12UHS | |
| MSI Vector GP66 12UGS | |
| Razer Blade 15 2022 | |
| AIDA64 / CPU SHA3 | |
| Alienware m15 R6, i7-11800H RTX 3080 | |
| MSI GE67 HX 12UGS | |
| Average Intel Core i7-12800HX (n=1) | |
| Asus ROG Strix Scar 15 G533ZW-LN106WS | |
| MSI Vector GP66 12UGS | |
| MSI Raider GE66 12UHS | |
| Razer Blade 15 2022 | |
| AIDA64 / CPU Queen | |
| MSI Vector GP66 12UGS | |
| MSI Raider GE66 12UHS | |
| Asus ROG Strix Scar 15 G533ZW-LN106WS | |
| Razer Blade 15 2022 | |
| Alienware m15 R6, i7-11800H RTX 3080 | |
| MSI GE67 HX 12UGS | |
| Average Intel Core i7-12800HX (n=1) | |
| AIDA64 / FPU SinJulia | |
| MSI GE67 HX 12UGS | |
| Average Intel Core i7-12800HX (n=1) | |
| Asus ROG Strix Scar 15 G533ZW-LN106WS | |
| Alienware m15 R6, i7-11800H RTX 3080 | |
| MSI Vector GP66 12UGS | |
| MSI Raider GE66 12UHS | |
| Razer Blade 15 2022 | |
| AIDA64 / FPU Mandel | |
| Alienware m15 R6, i7-11800H RTX 3080 | |
| MSI GE67 HX 12UGS | |
| Average Intel Core i7-12800HX (n=1) | |
| Asus ROG Strix Scar 15 G533ZW-LN106WS | |
| MSI Raider GE66 12UHS | |
| MSI Vector GP66 12UGS | |
| Razer Blade 15 2022 | |
| AIDA64 / CPU AES | |
| Alienware m15 R6, i7-11800H RTX 3080 | |
| MSI GE67 HX 12UGS | |
| Average Intel Core i7-12800HX (n=1) | |
| Asus ROG Strix Scar 15 G533ZW-LN106WS | |
| MSI Vector GP66 12UGS | |
| MSI Raider GE66 12UHS | |
| Razer Blade 15 2022 | |
| AIDA64 / CPU ZLib | |
| MSI GE67 HX 12UGS | |
| Average Intel Core i7-12800HX (n=1) | |
| Asus ROG Strix Scar 15 G533ZW-LN106WS | |
| MSI Vector GP66 12UGS | |
| MSI Raider GE66 12UHS | |
| Razer Blade 15 2022 | |
| Alienware m15 R6, i7-11800H RTX 3080 | |
| AIDA64 / FP64 Ray-Trace | |
| Alienware m15 R6, i7-11800H RTX 3080 | |
| MSI GE67 HX 12UGS | |
| Average Intel Core i7-12800HX (n=1) | |
| Asus ROG Strix Scar 15 G533ZW-LN106WS | |
| MSI Raider GE66 12UHS | |
| MSI Vector GP66 12UGS | |
| Razer Blade 15 2022 | |
| AIDA64 / CPU PhotoWorxx | |
| Razer Blade 15 2022 | |
| MSI Raider GE66 12UHS | |
| Asus ROG Strix Scar 15 G533ZW-LN106WS | |
| MSI GE67 HX 12UGS | |
| Average Intel Core i7-12800HX (n=1) | |
| MSI Vector GP66 12UGS | |
| Alienware m15 R6, i7-11800H RTX 3080 | |
系统性能
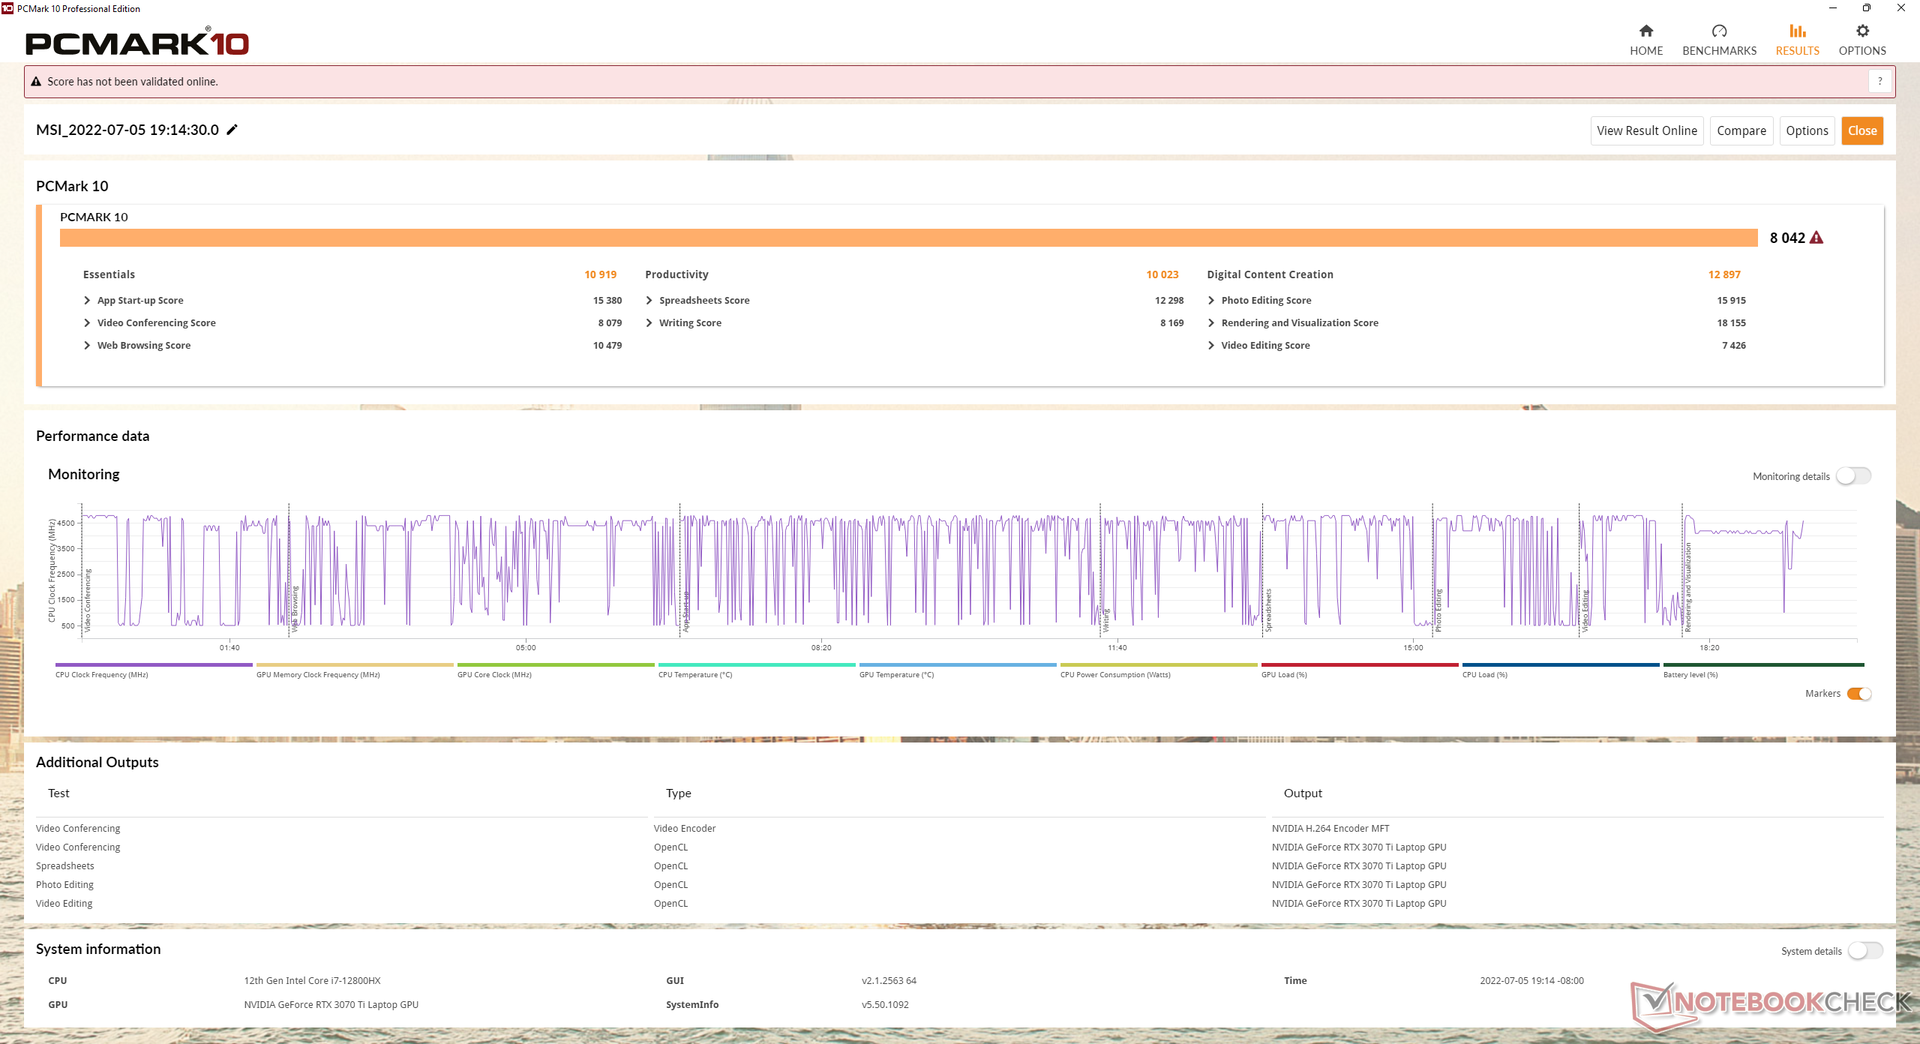
PCMark 10的结果是我们数据库中最高的一些分数,与我们在运行在较慢的Core i9-12900HK但较快的GeForce RTX 3080 Ti上的旧GE66上观察到的分数相似。
有趣的是,在MSHybrid模式下,数字内容创作子得分将从12897分下降到只有9568分。
CrossMark: Overall | Productivity | Creativity | Responsiveness
| PCMark 10 / Score | |
| MSI Raider GE66 12UHS | |
| MSI GE67 HX 12UGS | |
| Average Intel Core i7-12800HX, NVIDIA GeForce RTX 3070 Ti Laptop GPU (n=1) | |
| MSI Vector GP66 12UGS | |
| Asus ROG Strix Scar 15 G533ZW-LN106WS | |
| Razer Blade 15 2022 | |
| Alienware m15 R6, i7-11800H RTX 3080 | |
| PCMark 10 / Essentials | |
| MSI Raider GE66 12UHS | |
| MSI Vector GP66 12UGS | |
| MSI GE67 HX 12UGS | |
| Average Intel Core i7-12800HX, NVIDIA GeForce RTX 3070 Ti Laptop GPU (n=1) | |
| Razer Blade 15 2022 | |
| Asus ROG Strix Scar 15 G533ZW-LN106WS | |
| Alienware m15 R6, i7-11800H RTX 3080 | |
| PCMark 10 / Productivity | |
| Asus ROG Strix Scar 15 G533ZW-LN106WS | |
| MSI Raider GE66 12UHS | |
| MSI Vector GP66 12UGS | |
| MSI GE67 HX 12UGS | |
| Average Intel Core i7-12800HX, NVIDIA GeForce RTX 3070 Ti Laptop GPU (n=1) | |
| Razer Blade 15 2022 | |
| Alienware m15 R6, i7-11800H RTX 3080 | |
| PCMark 10 / Digital Content Creation | |
| MSI GE67 HX 12UGS | |
| Average Intel Core i7-12800HX, NVIDIA GeForce RTX 3070 Ti Laptop GPU (n=1) | |
| MSI Raider GE66 12UHS | |
| MSI Vector GP66 12UGS | |
| Razer Blade 15 2022 | |
| Asus ROG Strix Scar 15 G533ZW-LN106WS | |
| Alienware m15 R6, i7-11800H RTX 3080 | |
| CrossMark / Overall | |
| Asus ROG Strix Scar 15 G533ZW-LN106WS | |
| MSI GE67 HX 12UGS | |
| Average Intel Core i7-12800HX, NVIDIA GeForce RTX 3070 Ti Laptop GPU (n=1) | |
| CrossMark / Productivity | |
| Asus ROG Strix Scar 15 G533ZW-LN106WS | |
| MSI GE67 HX 12UGS | |
| Average Intel Core i7-12800HX, NVIDIA GeForce RTX 3070 Ti Laptop GPU (n=1) | |
| CrossMark / Creativity | |
| Asus ROG Strix Scar 15 G533ZW-LN106WS | |
| MSI GE67 HX 12UGS | |
| Average Intel Core i7-12800HX, NVIDIA GeForce RTX 3070 Ti Laptop GPU (n=1) | |
| CrossMark / Responsiveness | |
| Asus ROG Strix Scar 15 G533ZW-LN106WS | |
| MSI GE67 HX 12UGS | |
| Average Intel Core i7-12800HX, NVIDIA GeForce RTX 3070 Ti Laptop GPU (n=1) | |
| PCMark 10 Score | 8042 points | |
Help | ||
| AIDA64 / Memory Copy | |
| MSI Raider GE66 12UHS | |
| Razer Blade 15 2022 | |
| Asus ROG Strix Scar 15 G533ZW-LN106WS | |
| MSI GE67 HX 12UGS | |
| Average Intel Core i7-12800HX (n=1) | |
| MSI Vector GP66 12UGS | |
| Alienware m15 R6, i7-11800H RTX 3080 | |
| AIDA64 / Memory Read | |
| MSI Raider GE66 12UHS | |
| Razer Blade 15 2022 | |
| Asus ROG Strix Scar 15 G533ZW-LN106WS | |
| MSI GE67 HX 12UGS | |
| Average Intel Core i7-12800HX (n=1) | |
| Alienware m15 R6, i7-11800H RTX 3080 | |
| MSI Vector GP66 12UGS | |
| AIDA64 / Memory Write | |
| Razer Blade 15 2022 | |
| MSI Raider GE66 12UHS | |
| Asus ROG Strix Scar 15 G533ZW-LN106WS | |
| MSI GE67 HX 12UGS | |
| Average Intel Core i7-12800HX (n=1) | |
| MSI Vector GP66 12UGS | |
| Alienware m15 R6, i7-11800H RTX 3080 | |
| AIDA64 / Memory Latency | |
| Asus ROG Strix Scar 15 G533ZW-LN106WS | |
| Alienware m15 R6, i7-11800H RTX 3080 | |
| MSI GE67 HX 12UGS | |
| Average Intel Core i7-12800HX (n=1) | |
| MSI Raider GE66 12UHS | |
| MSI Vector GP66 12UGS | |
| Razer Blade 15 2022 | |
* ... smaller is better
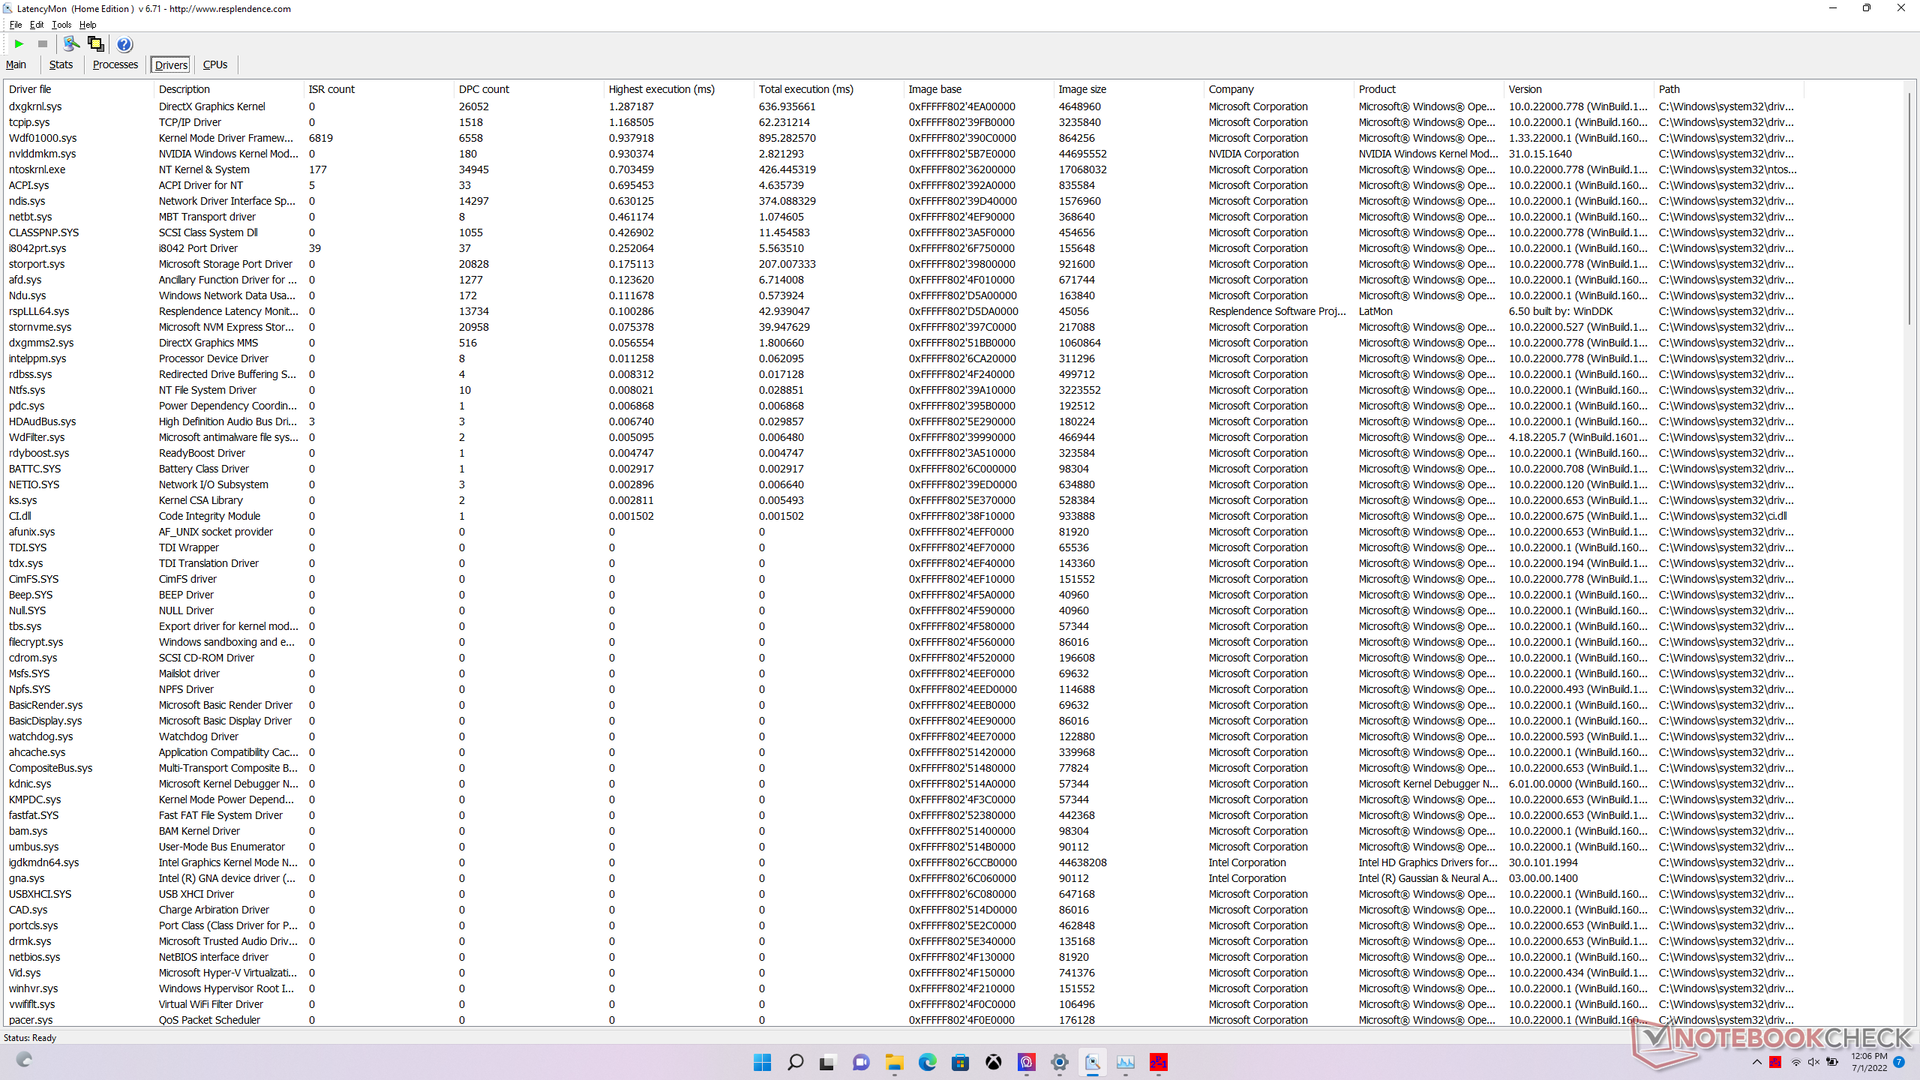
DPC延时
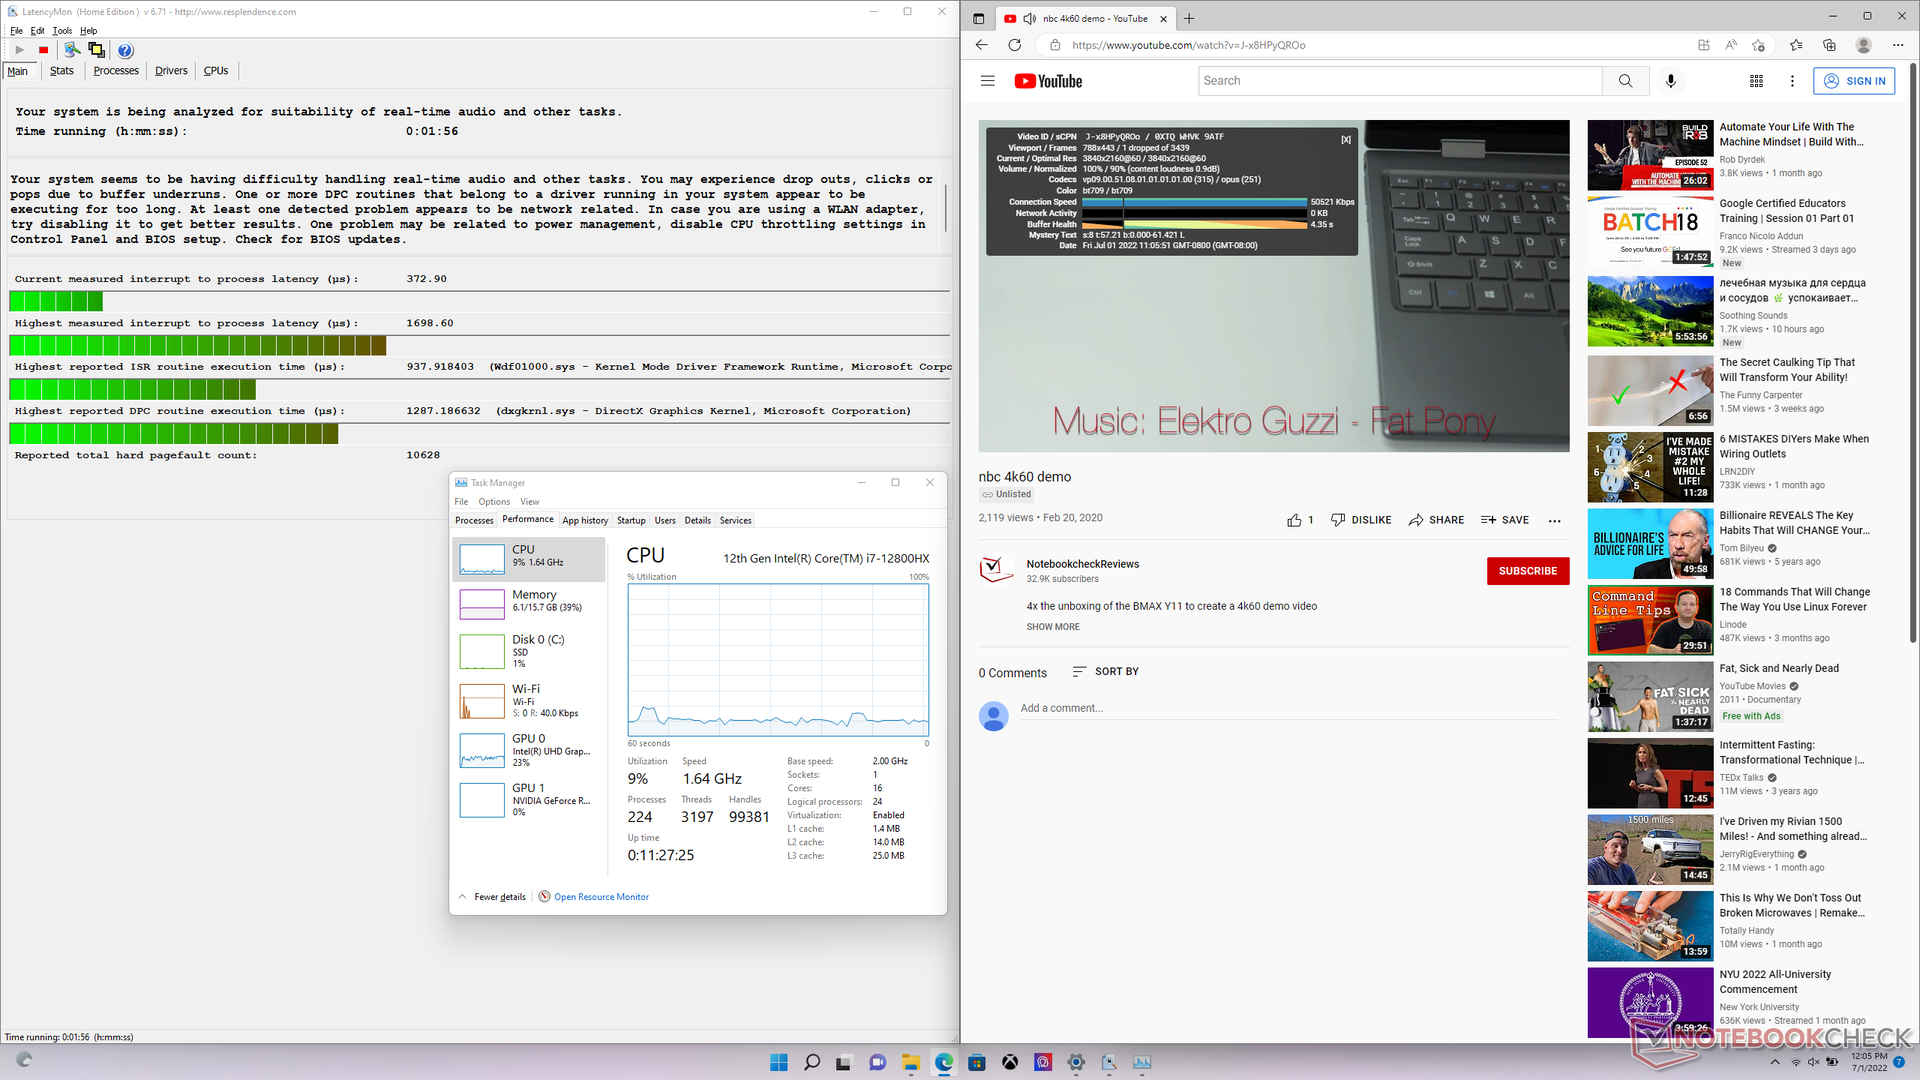
LatencyMon显示,在我们的主页上打开多个浏览器标签时,存在轻微的DPC问题。在60 FPS下的4K视频播放很流畅,在我们的60秒视频测试中只有一个丢帧。
| DPC Latencies / LatencyMon - interrupt to process latency (max), Web, Youtube, Prime95 | |
| MSI Raider GE66 12UHS | |
| MSI Vector GP66 12UGS | |
| MSI GE67 HX 12UGS | |
| Razer Blade 15 2022 | |
| Alienware m15 R6, i7-11800H RTX 3080 | |
| Asus ROG Strix Scar 15 G533ZW-LN106WS | |
* ... smaller is better
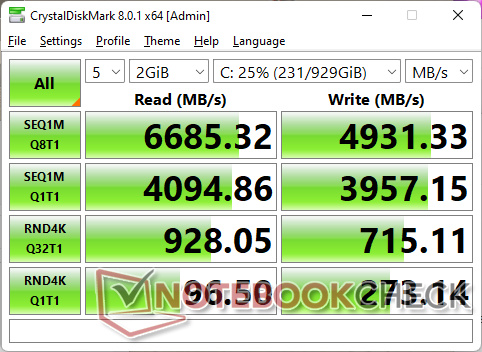
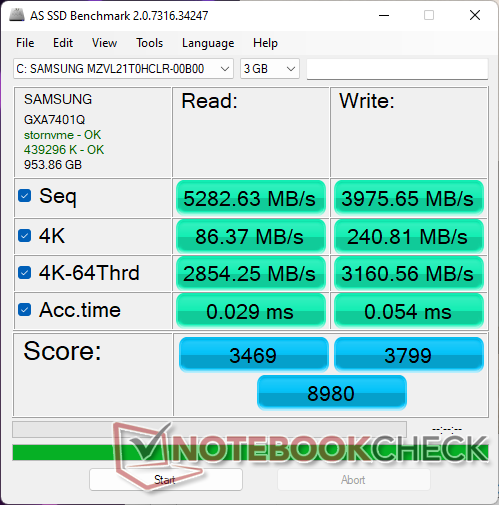
存储设备 - PCIe4 x4标准
我们的设备配备了一个1TB三星PM9A1PCIe4 x4 NVMe固态硬盘,连续读取和写入速率分别高达7000 MB/s和5100 MB/s。不幸的是,我们的硬盘会有问题,如下面DiskSpd循环测试所示,长时间保持其最大读取速率。读取率最终会下降到1500MB/s,这可能是由于温度限制和固态硬盘上缺乏适当的散热片。

* ... smaller is better
Disk Throttling: DiskSpd Read Loop, Queue Depth 8
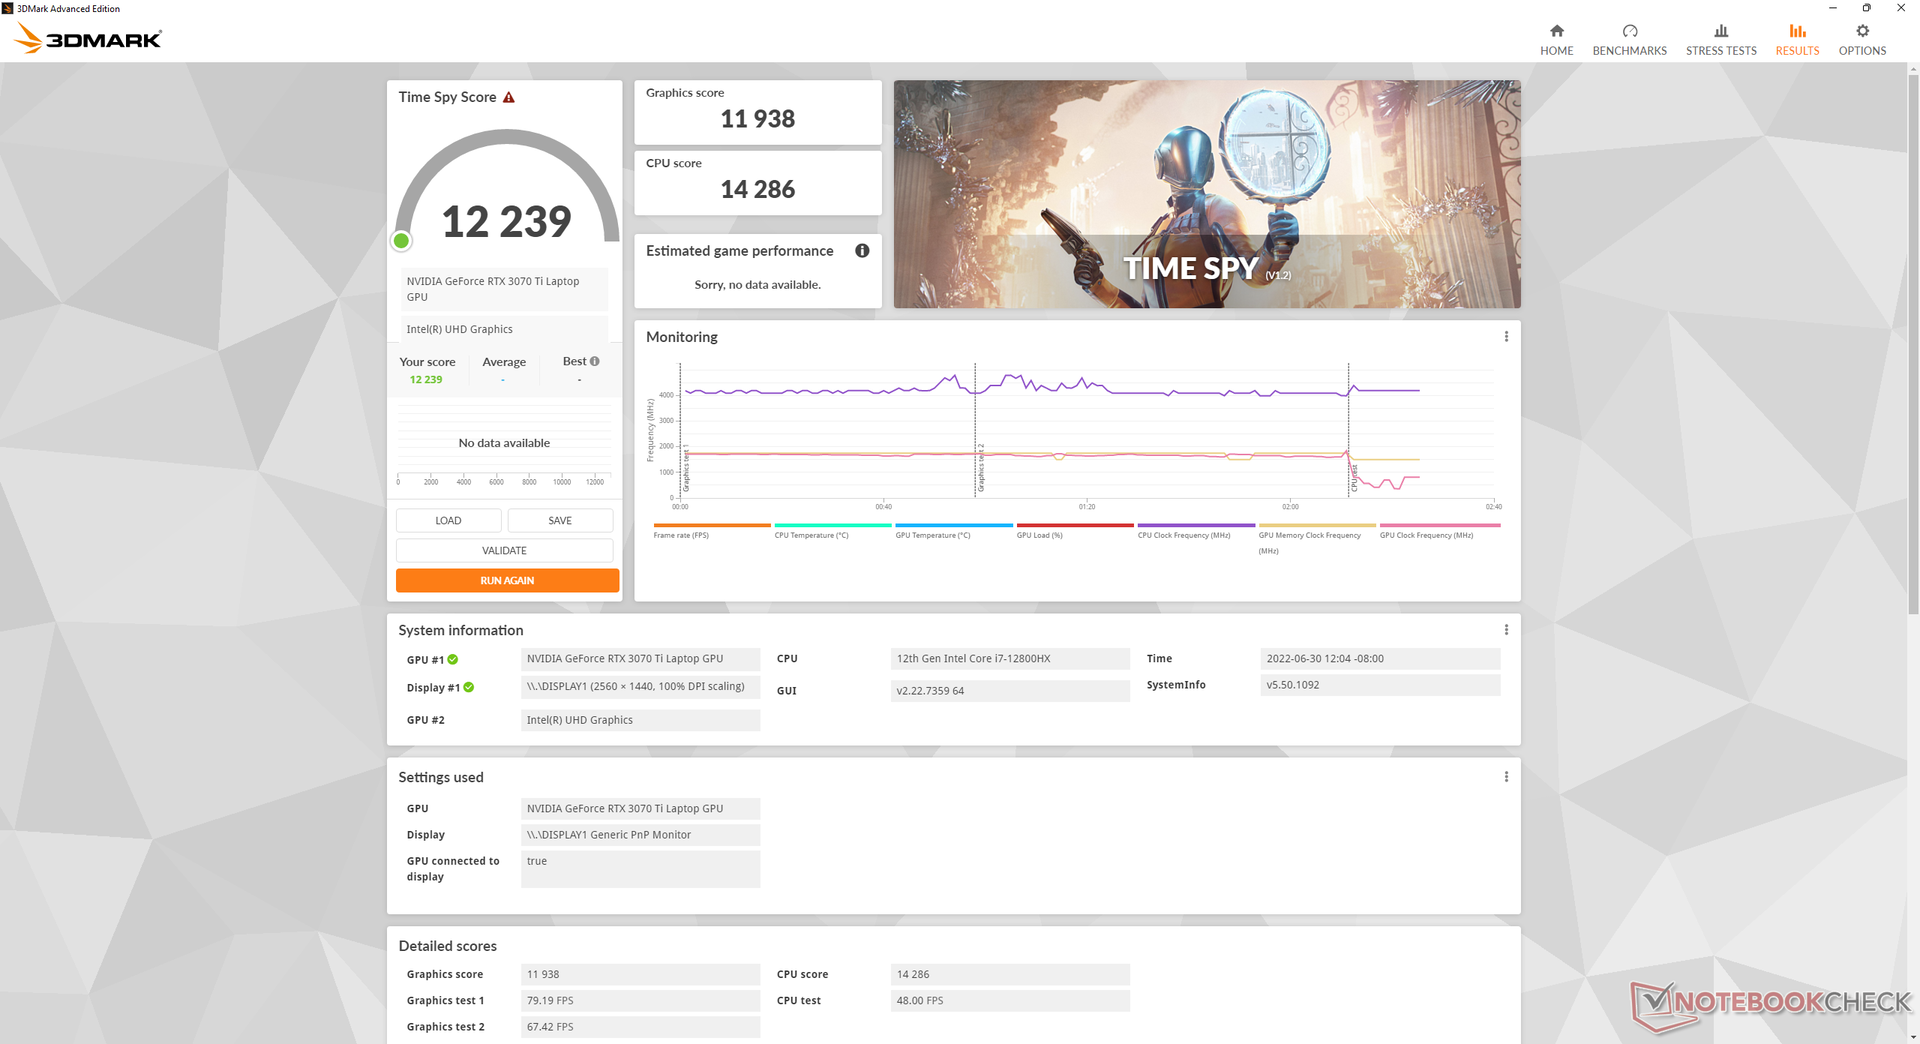
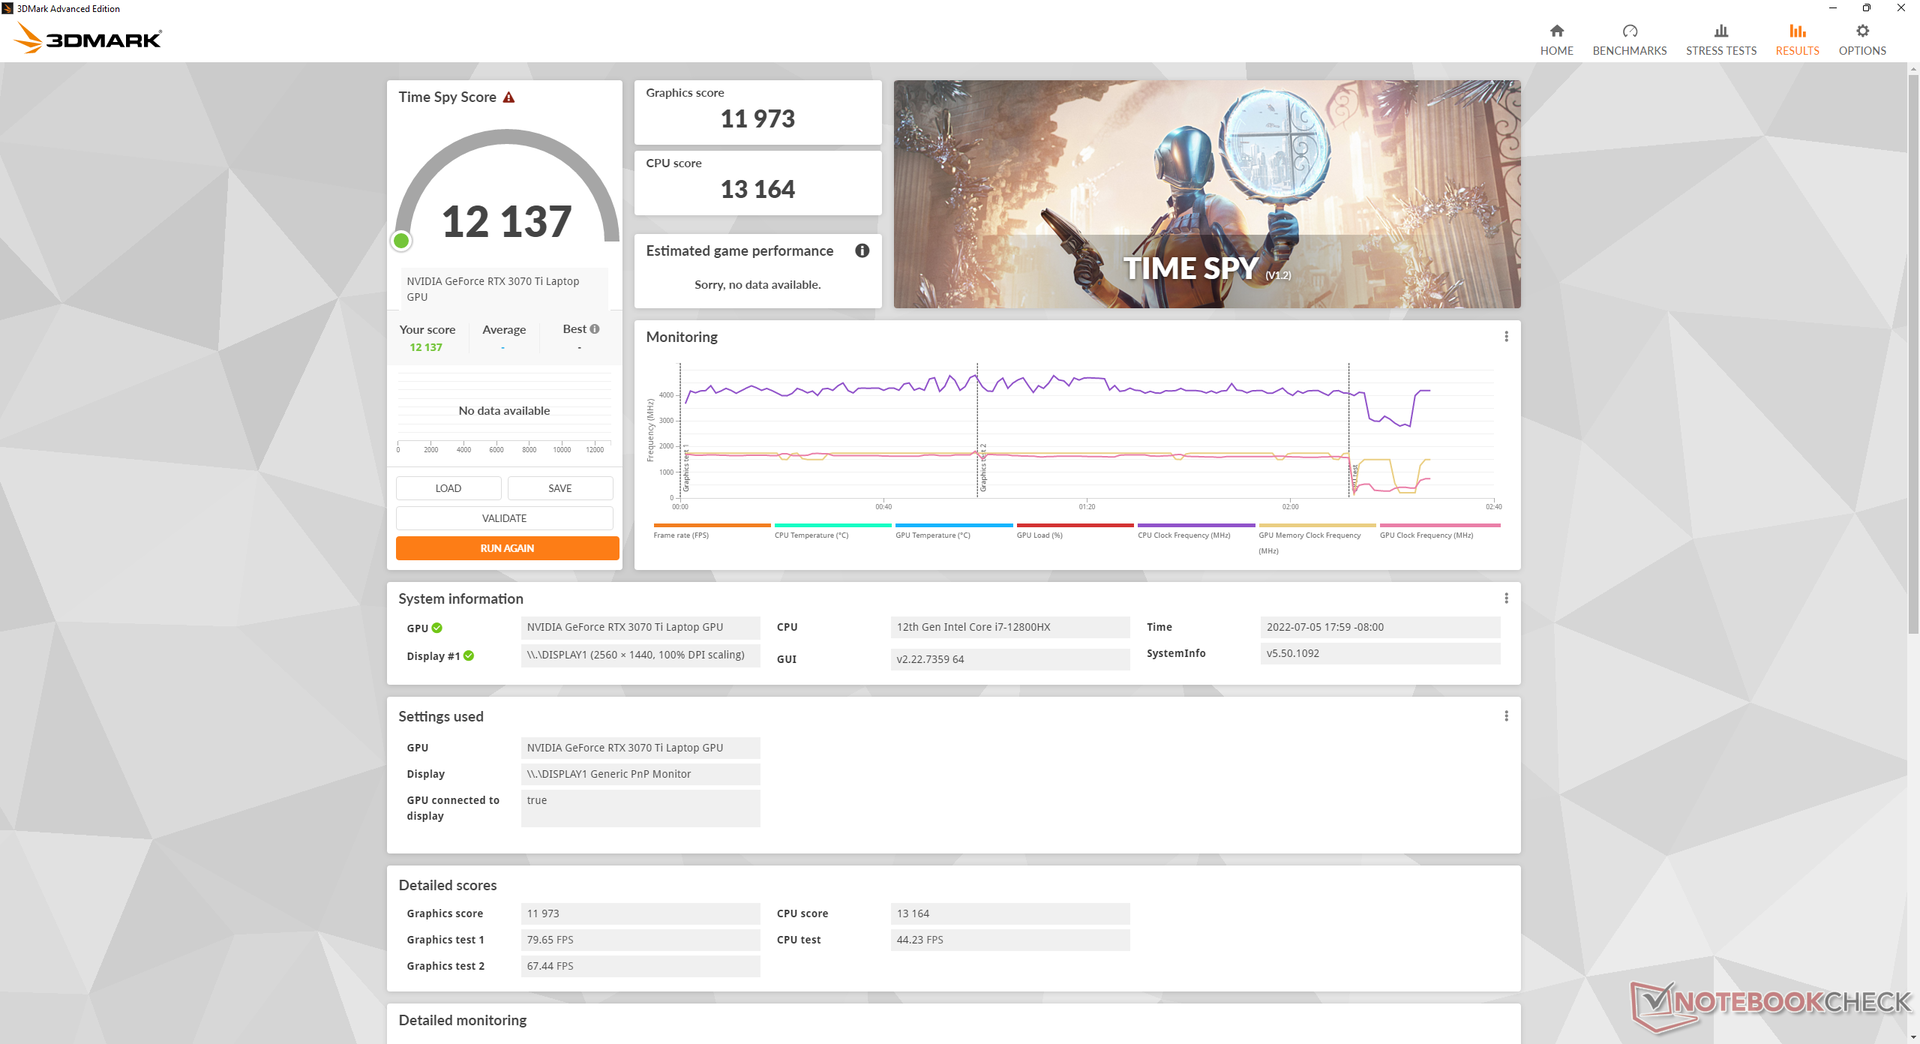
GPU性能 - 150 W,25 W动态提升
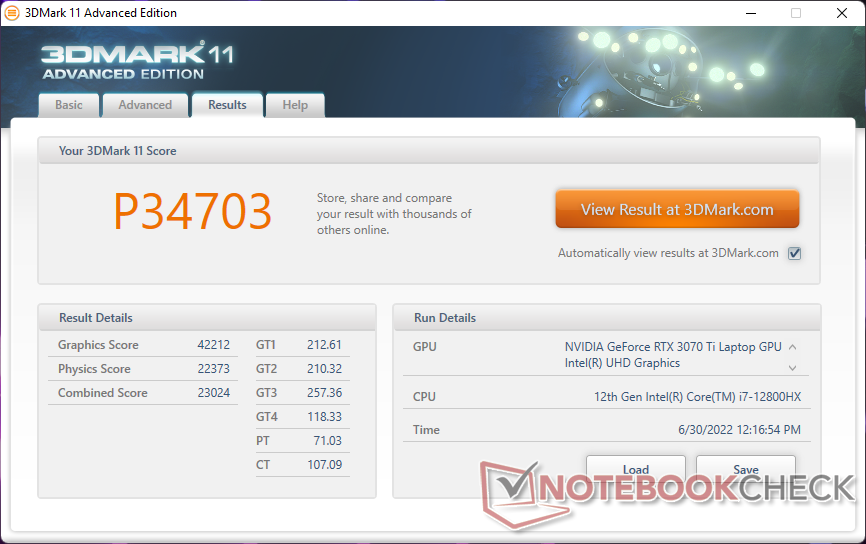
3DMark结果比我们数据库中配备相同的mobileGeForce RTX 3070 Ti GPU的普通笔记本电脑高出约12%。高于预期的数字可以归因于150W的TGP目标和快速的DDR5内存,而大多数游戏笔记本电脑仍然运行在130W或更低的GPU和/或更慢的DDR4内存上。这些差异足以推动我们的移动GTX 3070 Ti的性能与移动RTX 3080 Ti 运行在旧的Q1 2022 GE66上的性能相似。
就游戏而言,Nvidia GPU在MSHybrid和独立模式之间的表现几乎相同。
| 3DMark 11 - 1280x720 Performance GPU | |
| MSI GeForce RTX 3080 Gaming X Trio | |
| MSI Raider GE66 12UHS | |
| MSI GE67 HX 12UGS | |
| MSI GeForce RTX 3070 Gaming X Trio | |
| MSI GP66 Leopard 11UH-028 | |
| Average NVIDIA GeForce RTX 3070 Ti Laptop GPU (13799 - 42569, n=36) | |
| MSI GE63 Raider 8SG | |
| Lenovo Legion 7 15IMH05-81YT001VGE | |
| Asus TUF Gaming F15 FX507ZM | |
| MSI GE66 Raider 10SFS | |
| Schenker XMG Neo 15 Comet Lake | |
| Dell G15 5510-43NHT | |
| Dell G15 5510 | |
| 3DMark 11 Performance | 34703 points | |
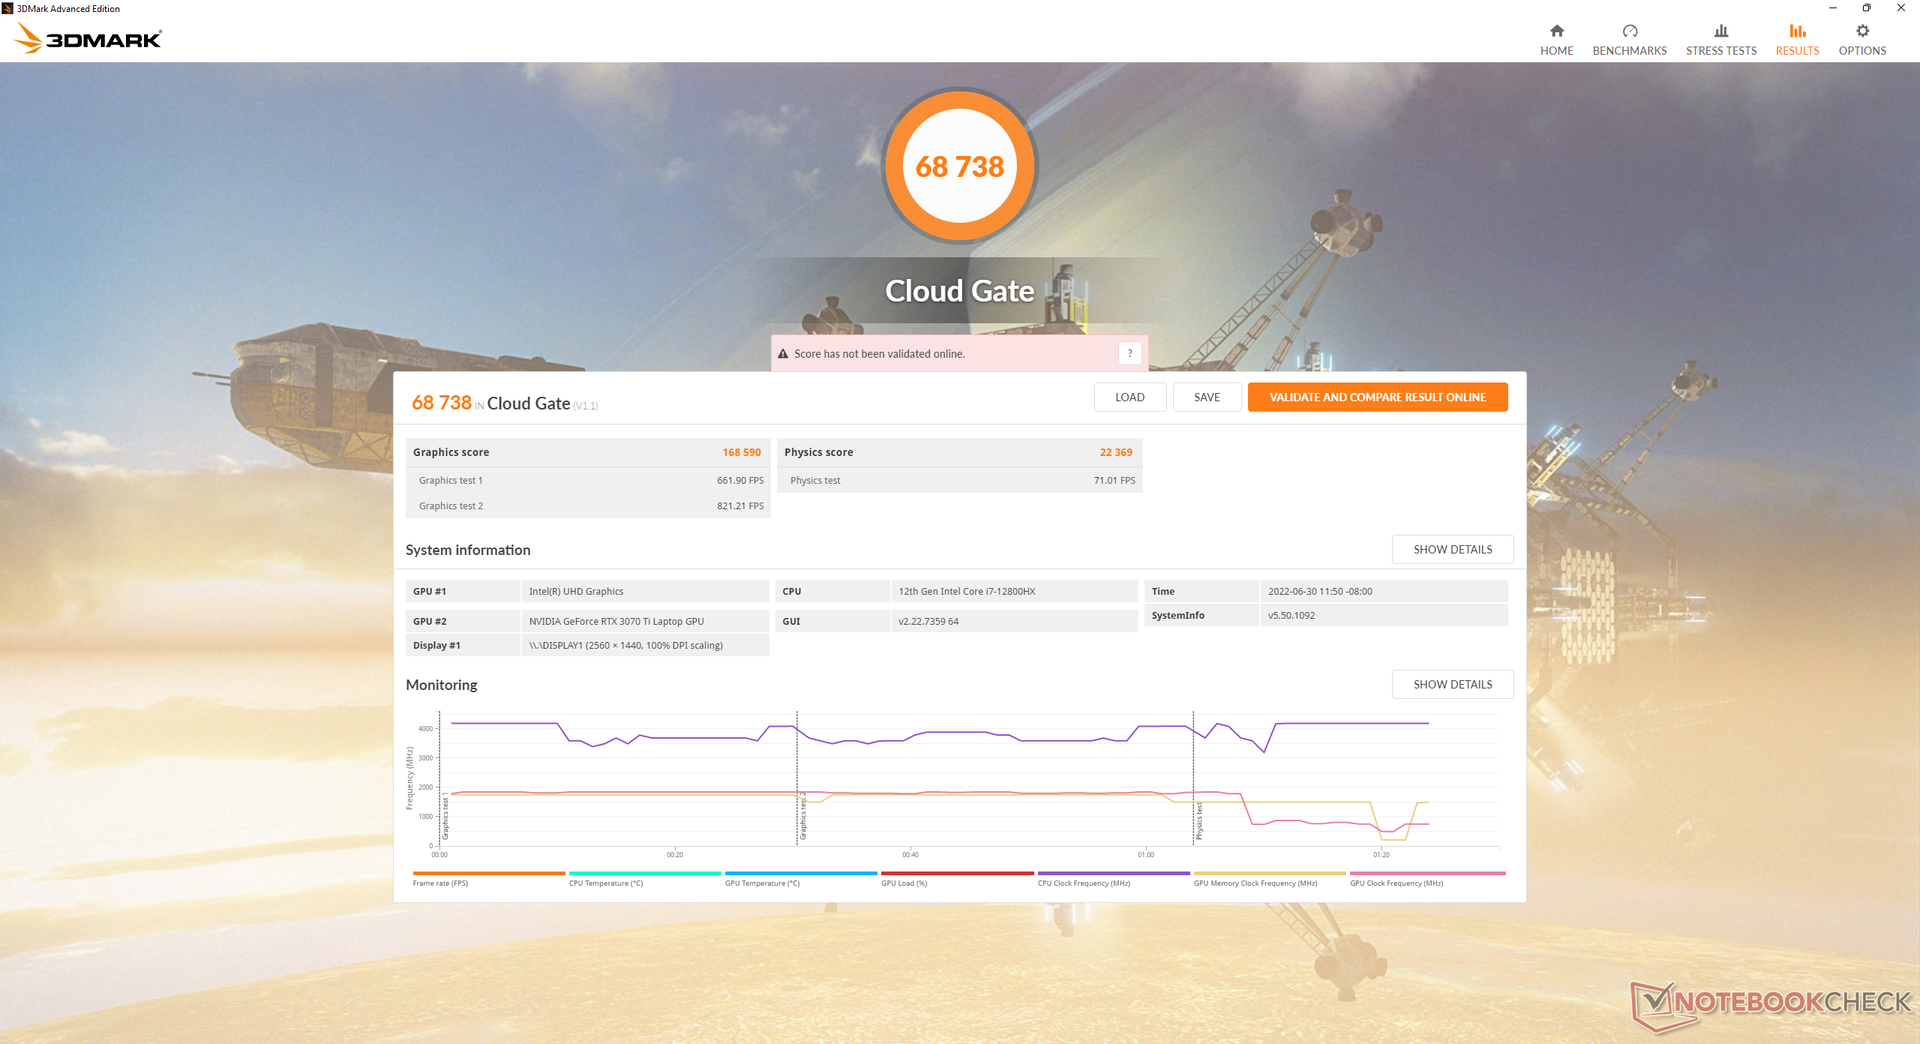
| 3DMark Cloud Gate Standard Score | 68738 points | |
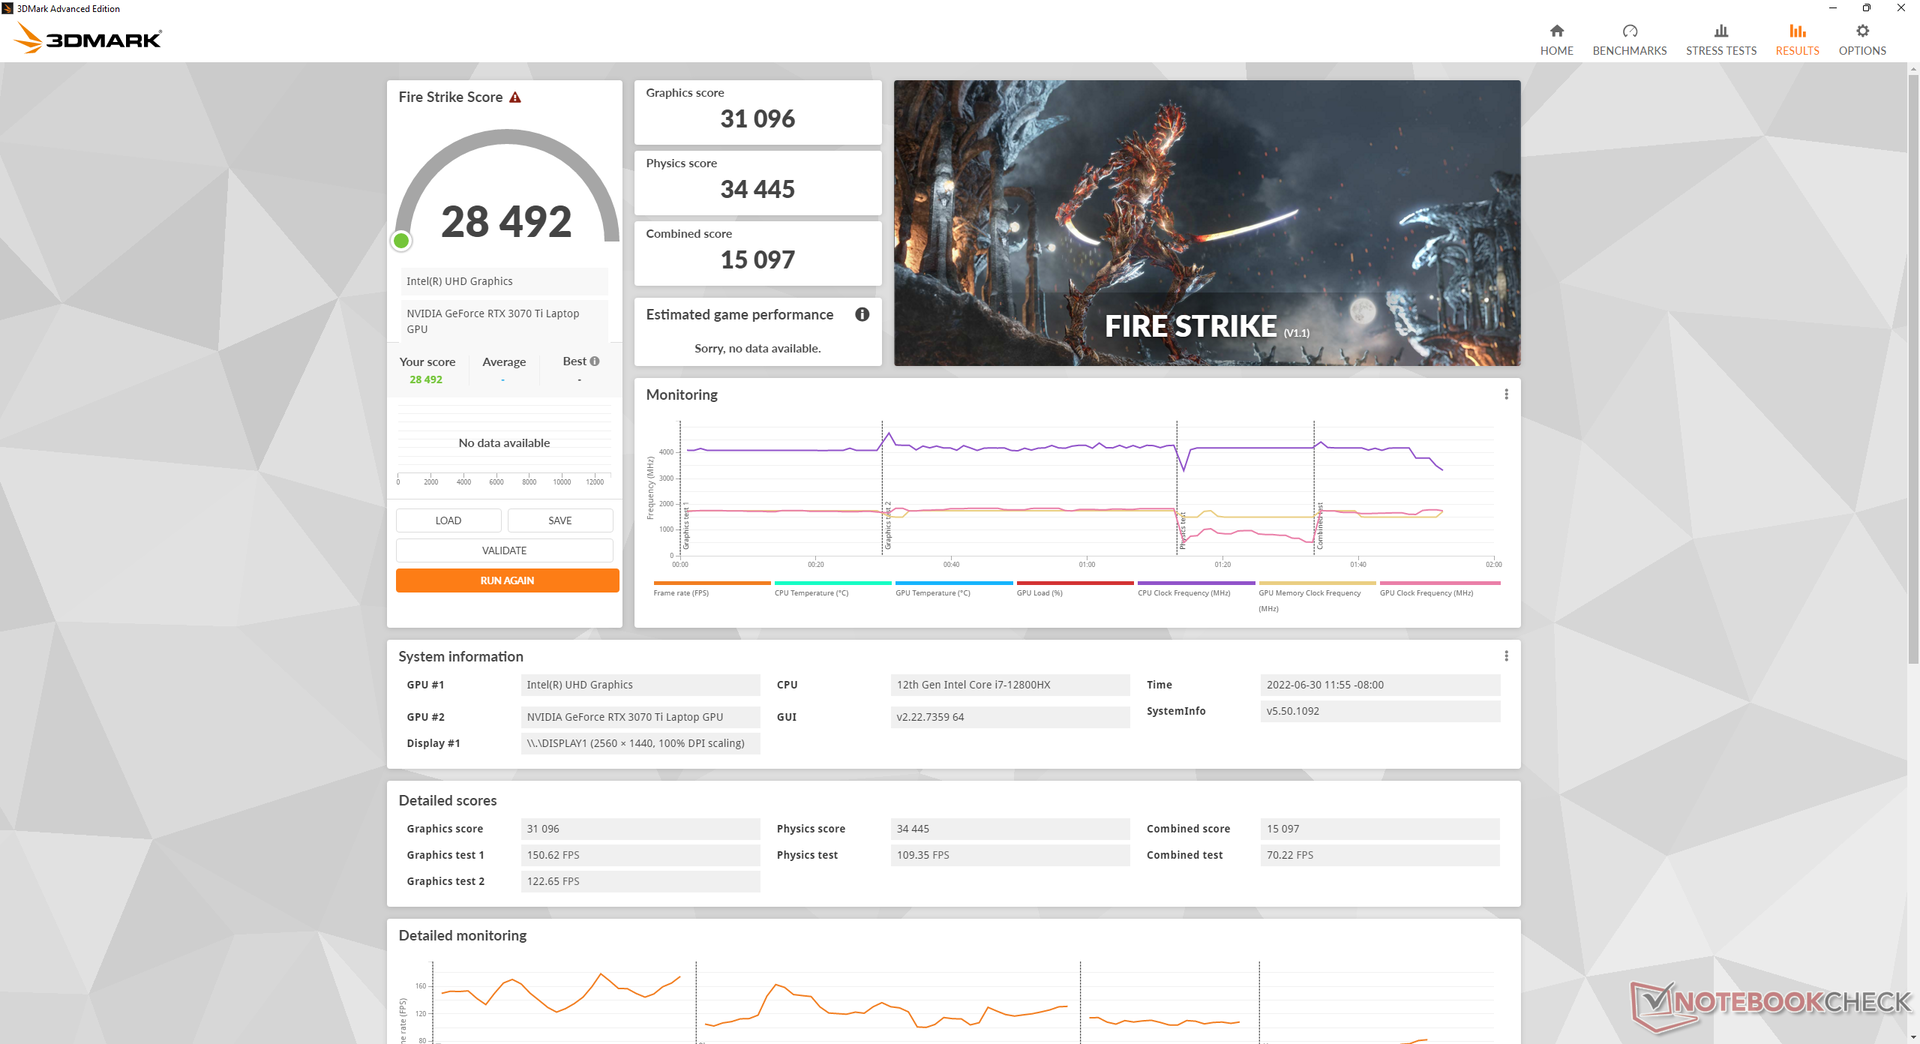
| 3DMark Fire Strike Score | 28492 points | |
| 3DMark Time Spy Score | 12239 points | |
Help | ||
Witcher 3 FPS Chart
| low | med. | high | ultra | QHD | 4K | |
|---|---|---|---|---|---|---|
| GTA V (2015) | 186.8 | 184.7 | 178.1 | 122 | 108.7 | |
| The Witcher 3 (2015) | 426.4 | 329 | 223.3 | 112.7 | ||
| Dota 2 Reborn (2015) | 181.2 | 165.6 | 155.3 | 147.7 | 148.9 | |
| Final Fantasy XV Benchmark (2018) | 201 | 162.6 | 122.4 | 93 | ||
| X-Plane 11.11 (2018) | 145.5 | 133.4 | 105.9 | |||
| Strange Brigade (2018) | 453 | 288 | 235 | 207 | 154.1 | |
| Cyberpunk 2077 1.6 (2022) | 141.2 | 133.2 | 106 | 88.1 | 56.4 |
排放
系统噪音
风扇噪音取决于上述测试条件中提到的五个预设电源配置文件。当在桌面上闲置,没有运行任何应用程序时,我们的设备能够保持安静,即使设置为极限性能配置,也只有22.9分贝(A)。然而,像网页浏览或视频流这样的小需求,无论配置文件设置如何,都会引起30至34dB(A)范围内的风扇噪音。在平衡模式下运行3DMark 06的第一个基准场景会引起44 dB(A)的风扇噪音,与我们在GE66或Razer Blade 15上记录的情况相似。 Razer Blade 15.
在平衡模式和极限性能模式下运行Witcher 3 ,将导致风扇噪音分别为49.8 dB(A)和55.7 dB(A)。我们认为任何在50 dB(A)范围内的噪音都是非常大的,以至于在游戏时建议使用耳机。尽管如此,这个范围不幸在许多发烧级游戏笔记本上很常见,包括Vector GP66、华硕ROG Strix Scar 15或Alienware m15 R6。如果Cooler Boost(即最大风扇噪音模式)被激活,风扇噪音将更高,达到57.4 dB(A)。用户必须在GE67的极限性能模式下进行游戏,以最大限度地提高TGP,我们下面的压力测试部分将显示。在类似条件下,GE66的噪音没有那么大。
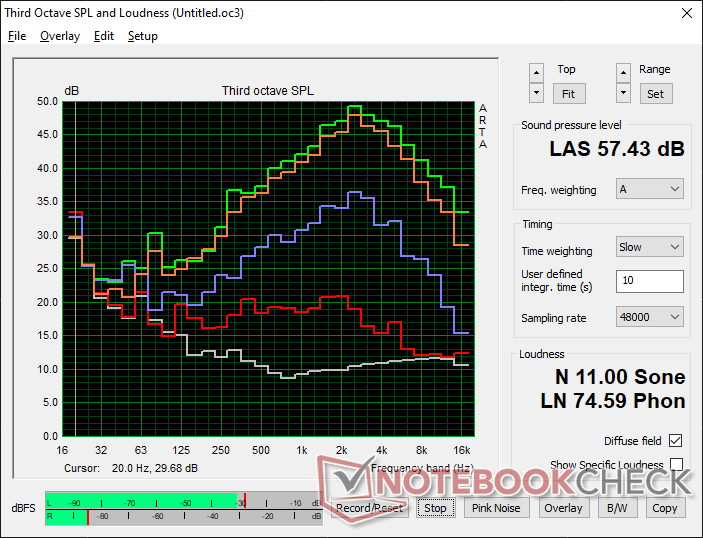
Noise level
| Idle |
| 22.9 / 22.9 / 22.9 dB(A) |
| Load |
| 44.4 / 57.4 dB(A) |
 | ||
30 dB silent 40 dB(A) audible 50 dB(A) loud |
||
min: | ||
| MSI GE67 HX 12UGS GeForce RTX 3070 Ti Laptop GPU, i7-12800HX, Samsung PM9A1 MZVL21T0HCLR | MSI Raider GE66 12UHS GeForce RTX 3080 Ti Laptop GPU, i9-12900HK, Samsung PM9A1 MZVL22T0HBLB | MSI Vector GP66 12UGS GeForce RTX 3070 Ti Laptop GPU, i9-12900H | Asus ROG Strix Scar 15 G533ZW-LN106WS GeForce RTX 3070 Ti Laptop GPU, i9-12900H, Samsung PM9A1 MZVL22T0HBLB | Alienware m15 R6, i7-11800H RTX 3080 GeForce RTX 3080 Laptop GPU, i7-11800H, Samsung PM9A1 MZVL21T0HCLR | Razer Blade 15 2022 GeForce RTX 3080 Ti Laptop GPU, i7-12800H, SSSTC CA6-8D1024 | |
|---|---|---|---|---|---|---|
| Noise | -14% | -2% | -36% | -2% | -5% | |
| off / environment * (dB) | 22.7 | 26 -15% | 22.9 -1% | 26.86 -18% | 23 -1% | 25.4 -12% |
| Idle Minimum * (dB) | 22.9 | 27 -18% | 23.4 -2% | 39.07 -71% | 23 -0% | 26.2 -14% |
| Idle Average * (dB) | 22.9 | 30 -31% | 23.4 -2% | 39.07 -71% | 23 -0% | 26.2 -14% |
| Idle Maximum * (dB) | 22.9 | 39 -70% | 27.4 -20% | 39.07 -71% | 30 -31% | 28.4 -24% |
| Load Average * (dB) | 44.4 | 45 -1% | 36 19% | 53.34 -20% | 41.26 7% | 44.7 -1% |
| Witcher 3 ultra * (dB) | 55.7 | 45 19% | 58.2 -4% | 56.6 -2% | 53.4 4% | 44.7 20% |
| Load Maximum * (dB) | 57.4 | 47 18% | 58 -1% | 56.6 1% | 53.37 7% | 51.9 10% |
* ... smaller is better
温度
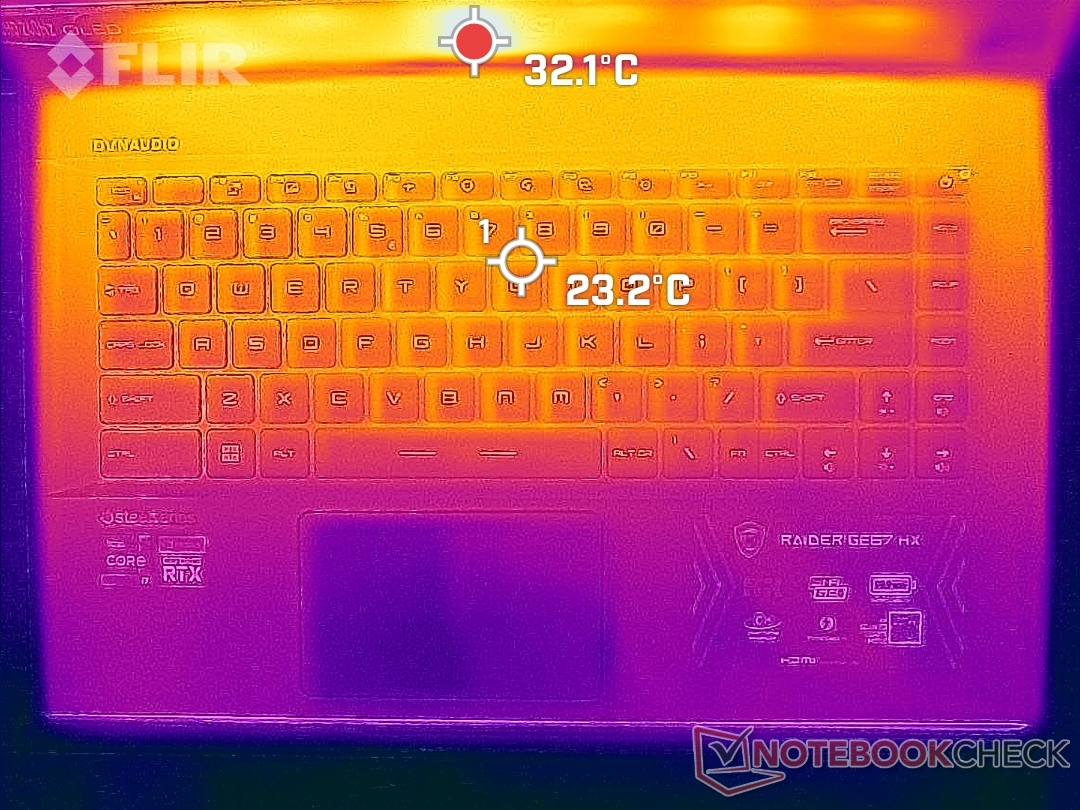
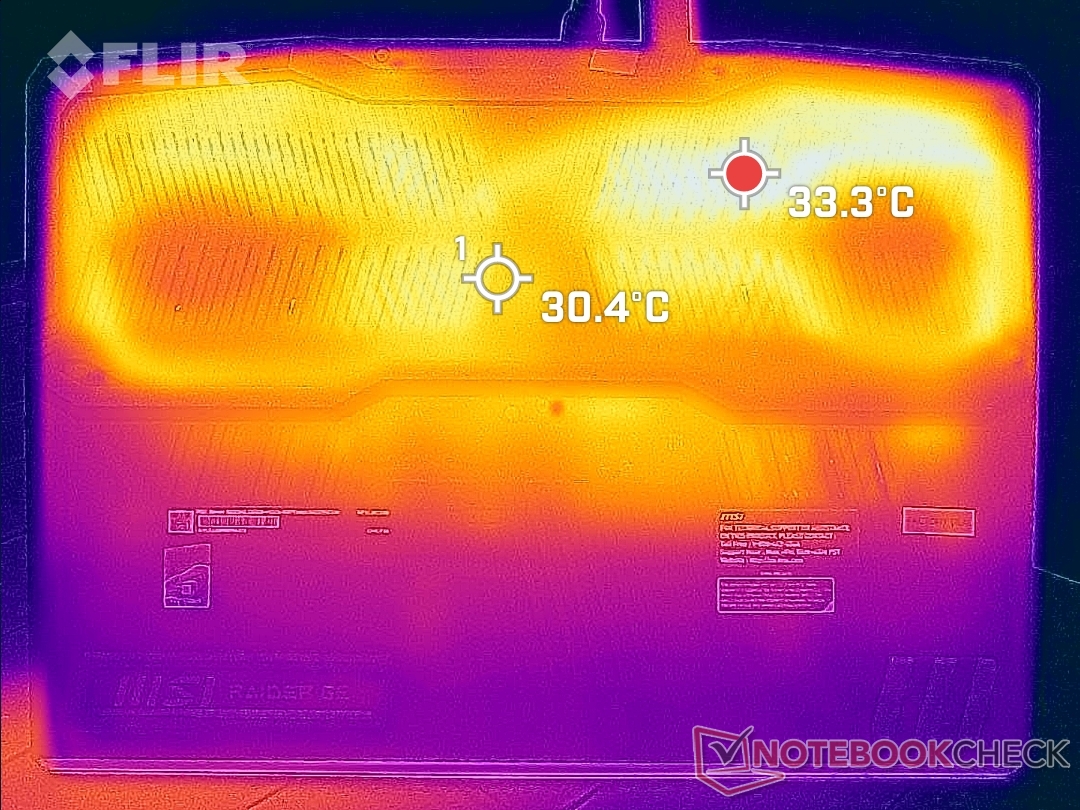
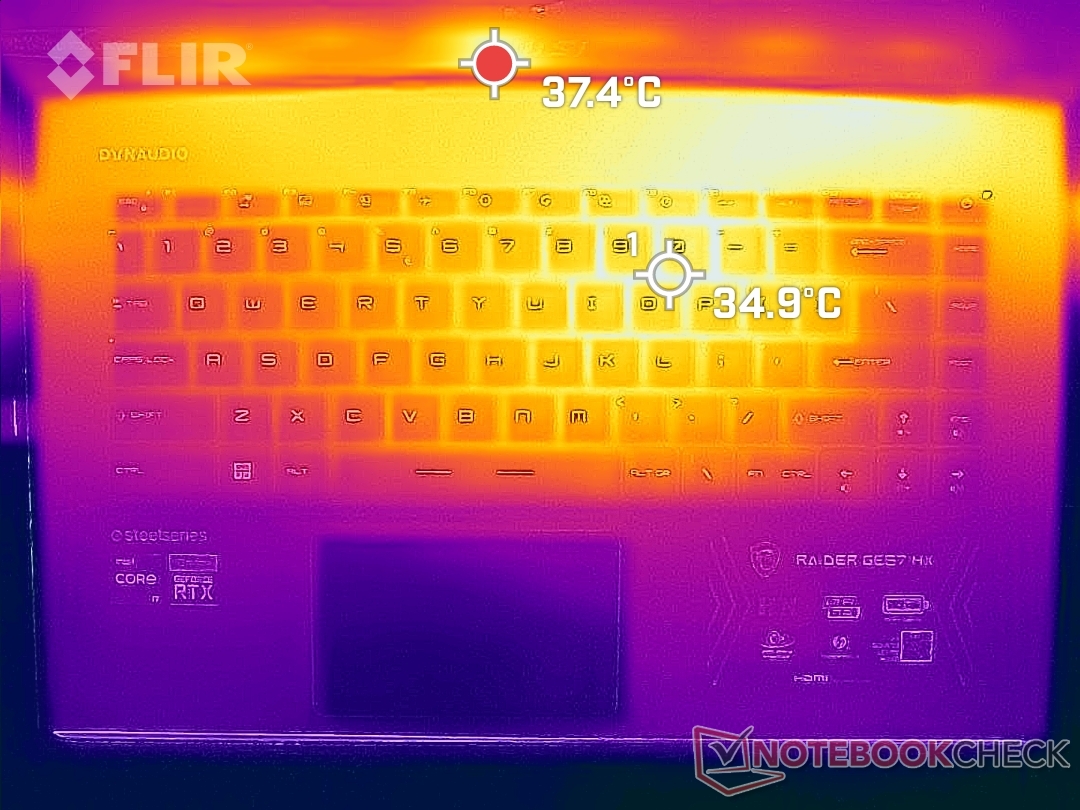
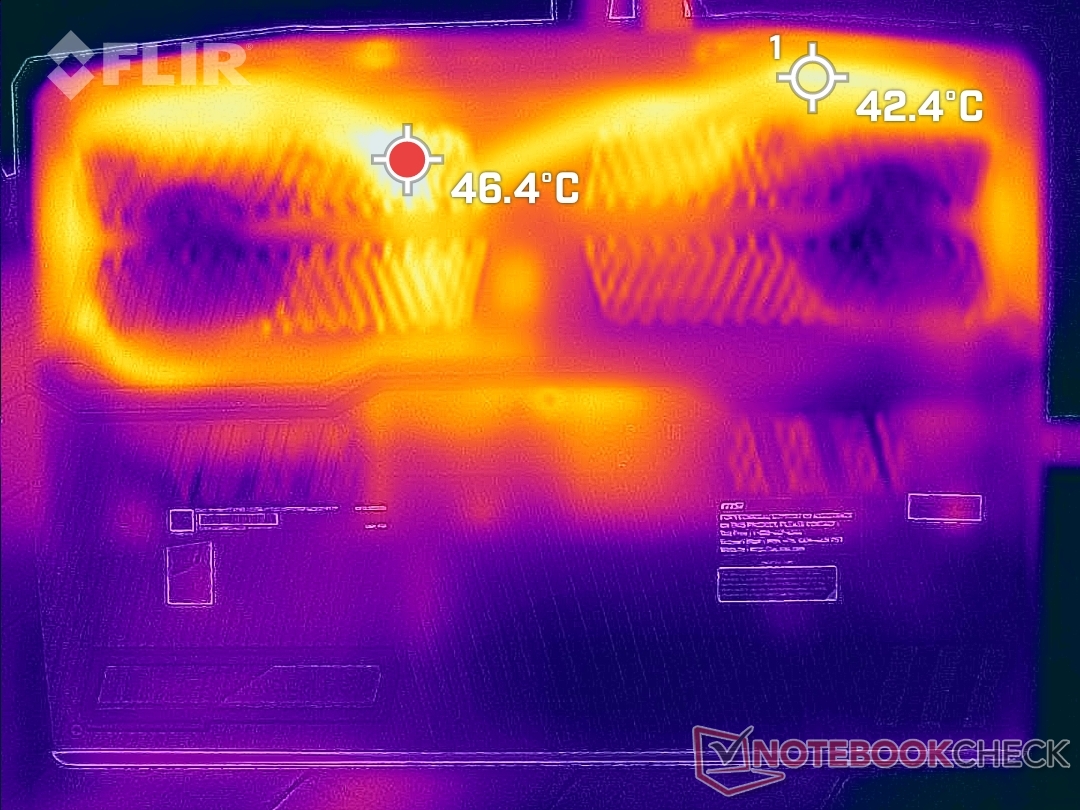
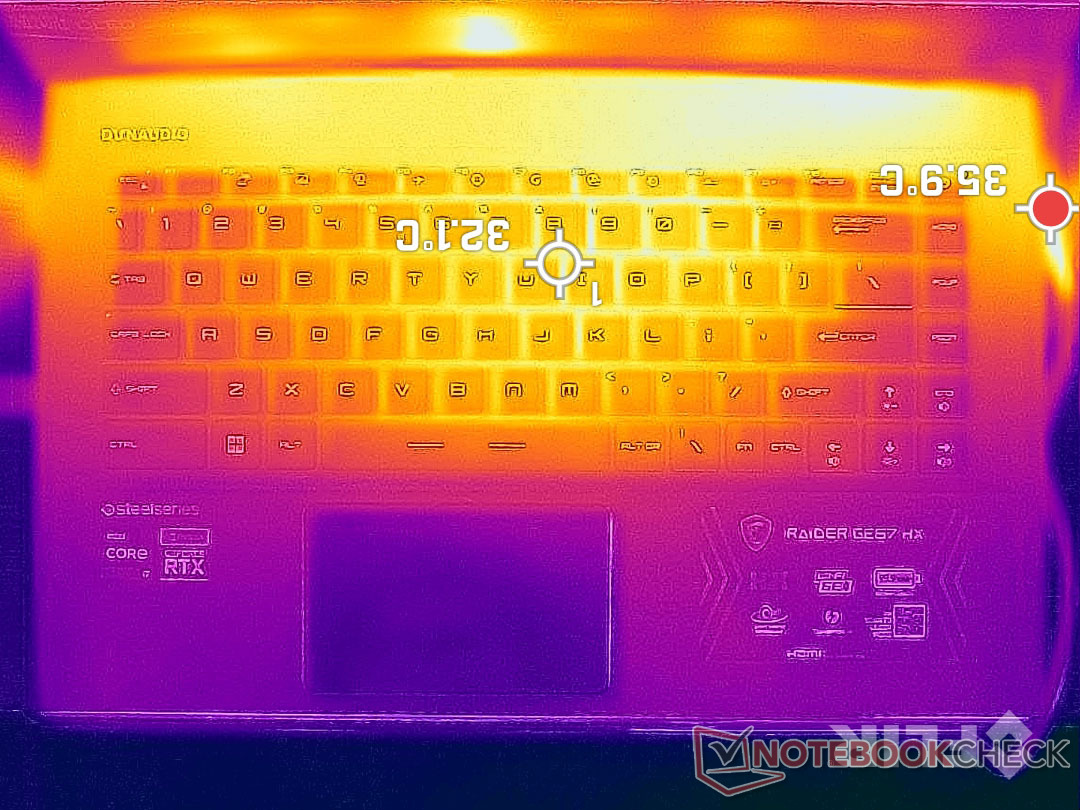
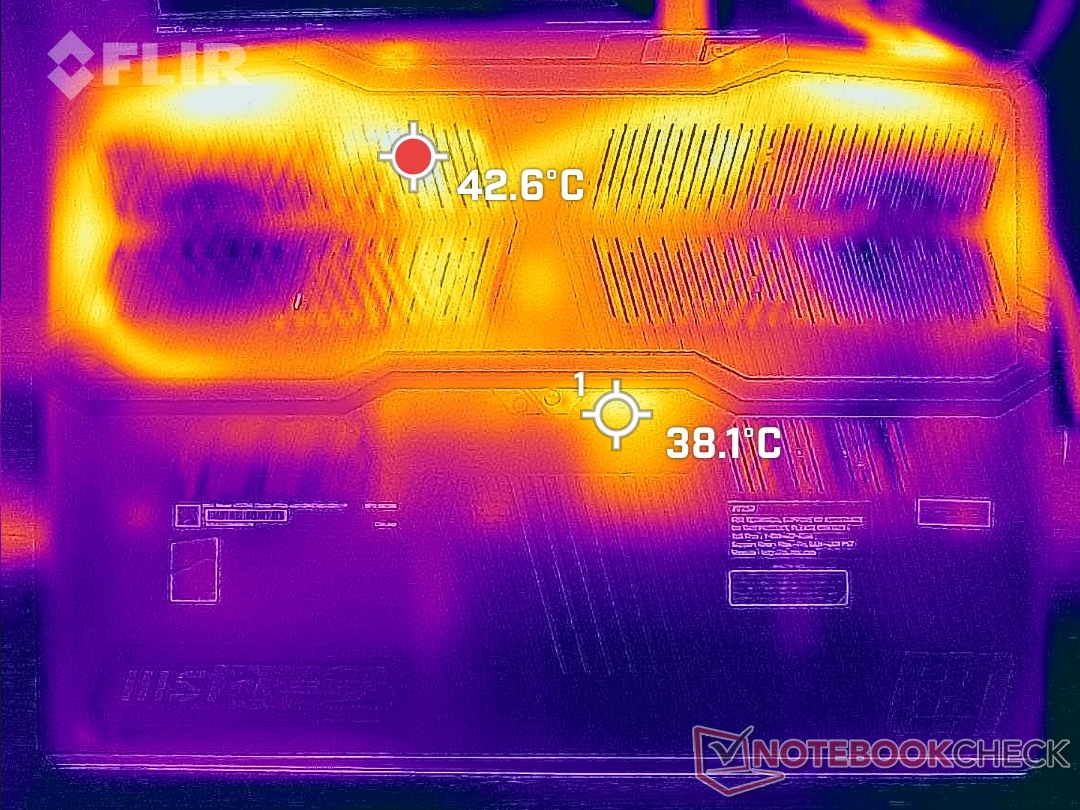
表面温度比我们在老款GE66上观察到的温度要低。游戏时,键盘甲板和底板上的热点可以分别达到35℃和46℃。如下面的温度图所示,这些区域都在机箱的后部。
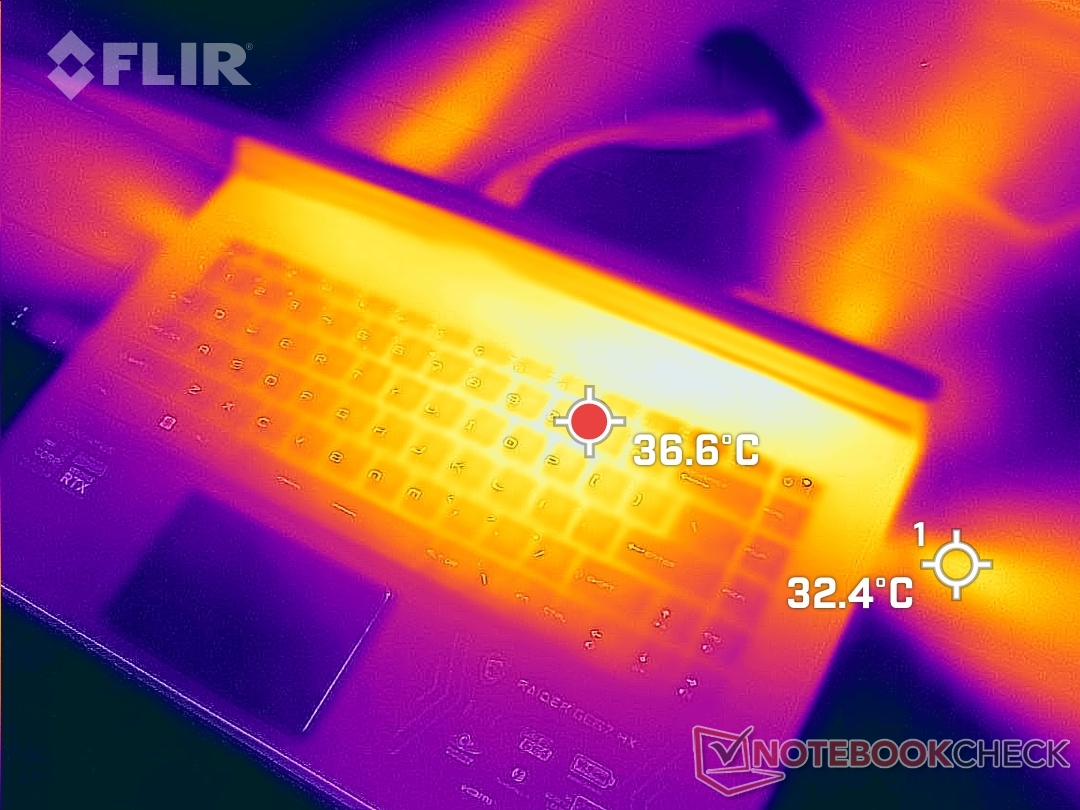

(+) The maximum temperature on the upper side is 34.4 °C / 94 F, compared to the average of 40.4 °C / 105 F, ranging from 21.2 to 68.8 °C for the class Gaming.
(±) The bottom heats up to a maximum of 42 °C / 108 F, compared to the average of 43.2 °C / 110 F
(+) In idle usage, the average temperature for the upper side is 21.4 °C / 71 F, compared to the device average of 33.9 °C / 93 F.
(+) Playing The Witcher 3, the average temperature for the upper side is 27.9 °C / 82 F, compared to the device average of 33.9 °C / 93 F.
(+) The palmrests and touchpad are cooler than skin temperature with a maximum of 20.4 °C / 68.7 F and are therefore cool to the touch.
(+) The average temperature of the palmrest area of similar devices was 28.8 °C / 83.8 F (+8.4 °C / 15.1 F).
| MSI GE67 HX 12UGS Intel Core i7-12800HX, NVIDIA GeForce RTX 3070 Ti Laptop GPU | MSI Raider GE66 12UHS Intel Core i9-12900HK, NVIDIA GeForce RTX 3080 Ti Laptop GPU | MSI Vector GP66 12UGS Intel Core i9-12900H, NVIDIA GeForce RTX 3070 Ti Laptop GPU | Asus ROG Strix Scar 15 G533ZW-LN106WS Intel Core i9-12900H, NVIDIA GeForce RTX 3070 Ti Laptop GPU | Alienware m15 R6, i7-11800H RTX 3080 Intel Core i7-11800H, NVIDIA GeForce RTX 3080 Laptop GPU | Razer Blade 15 2022 Intel Core i7-12800H, NVIDIA GeForce RTX 3080 Ti Laptop GPU | |
|---|---|---|---|---|---|---|
| Heat | -36% | -19% | -29% | -45% | -32% | |
| Maximum Upper Side * (°C) | 34.4 | 54 -57% | 40.2 -17% | 42.6 -24% | 61 -77% | 50 -45% |
| Maximum Bottom * (°C) | 42 | 65 -55% | 43.8 -4% | 50.2 -20% | 58 -38% | 47 -12% |
| Idle Upper Side * (°C) | 24 | 30 -25% | 34.8 -45% | 36.2 -51% | 38 -58% | 37.4 -56% |
| Idle Bottom * (°C) | 33.2 | 35 -5% | 37 -11% | 40.2 -21% | 36 -8% | 38.4 -16% |
* ... smaller is better
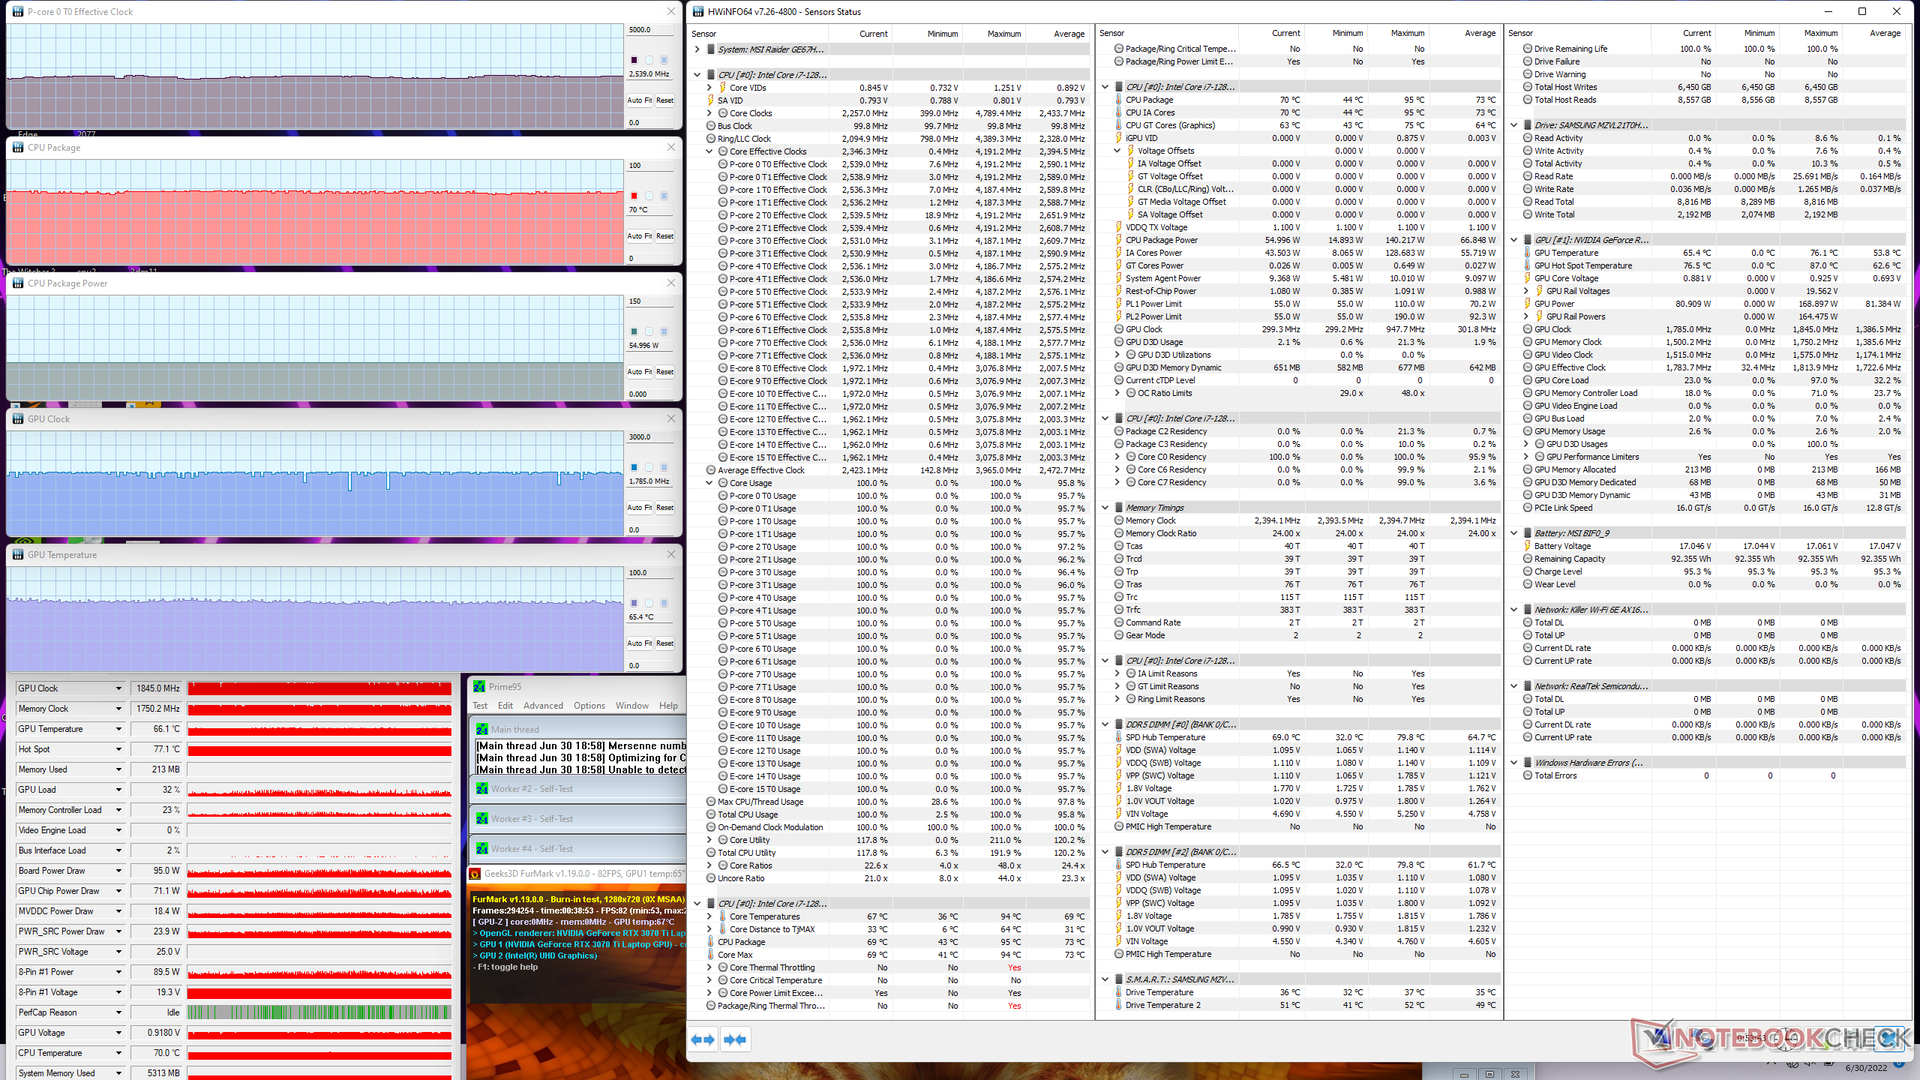
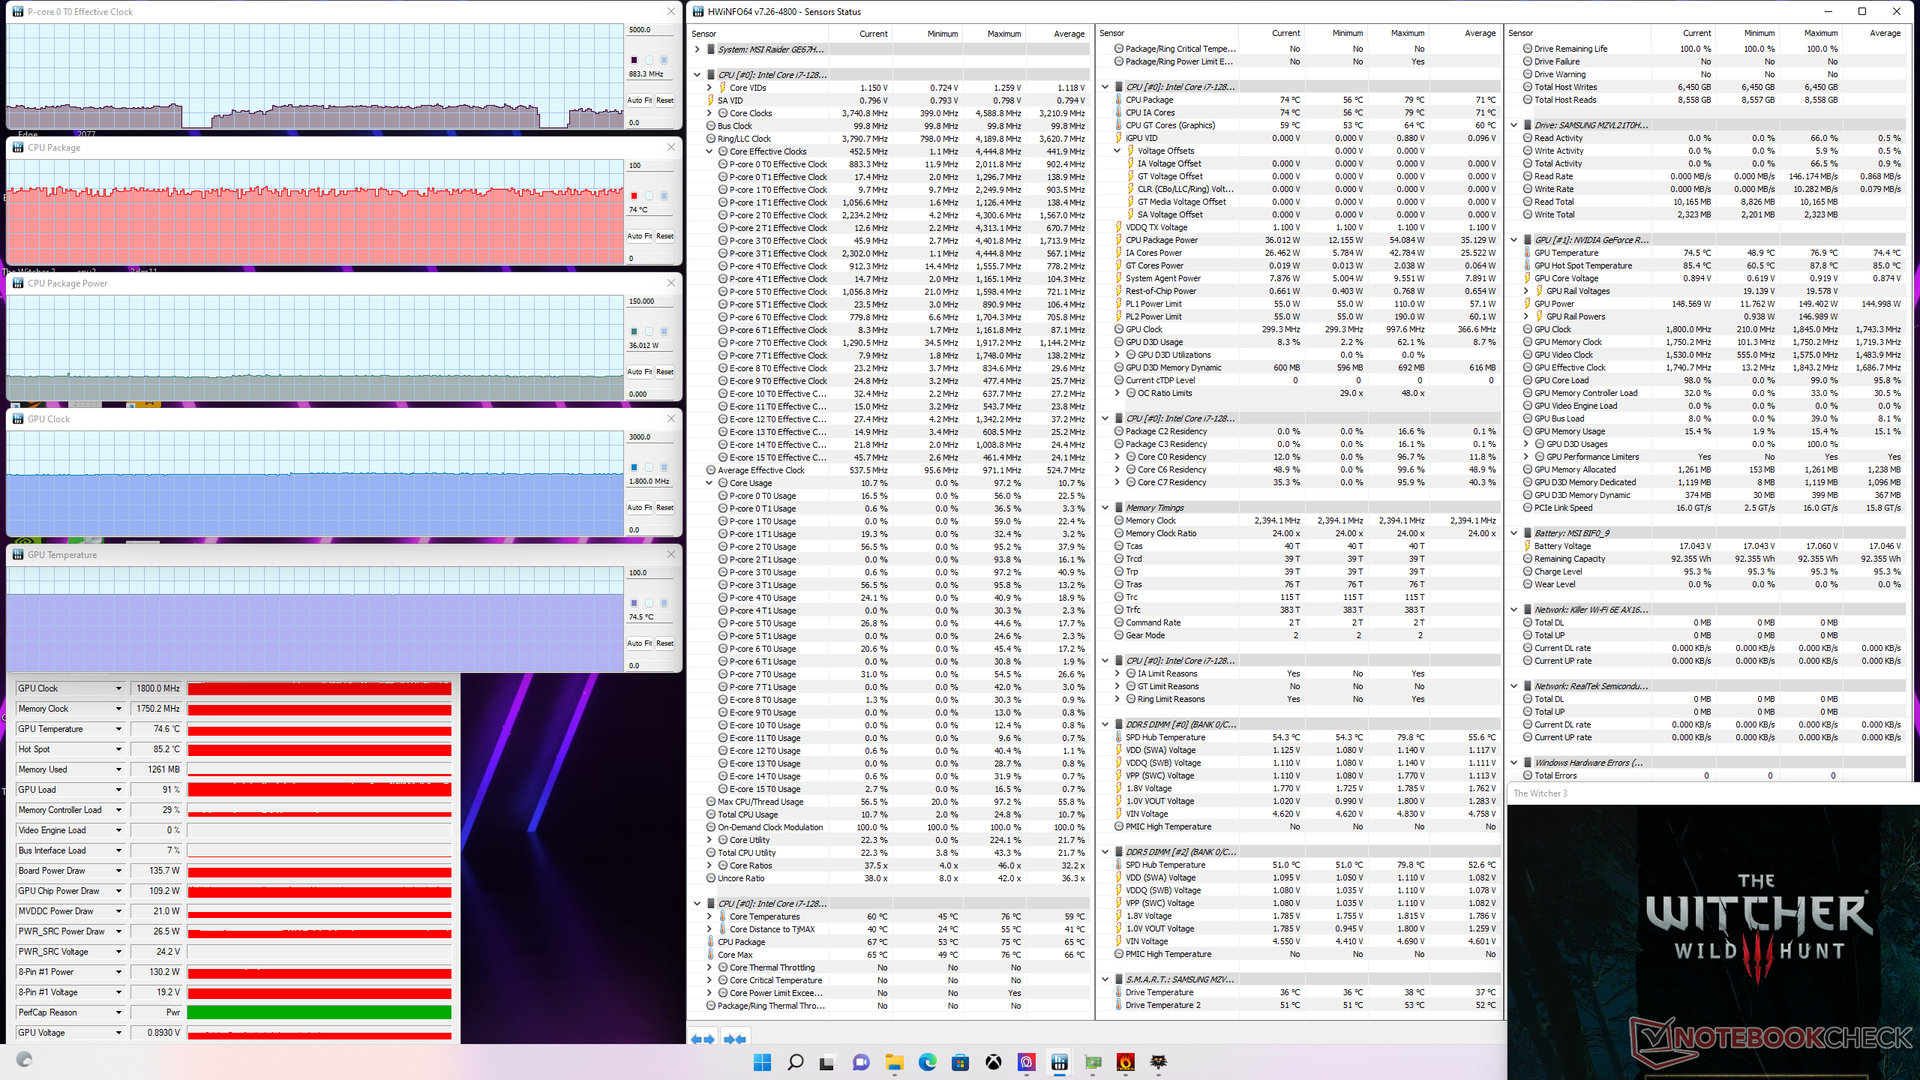
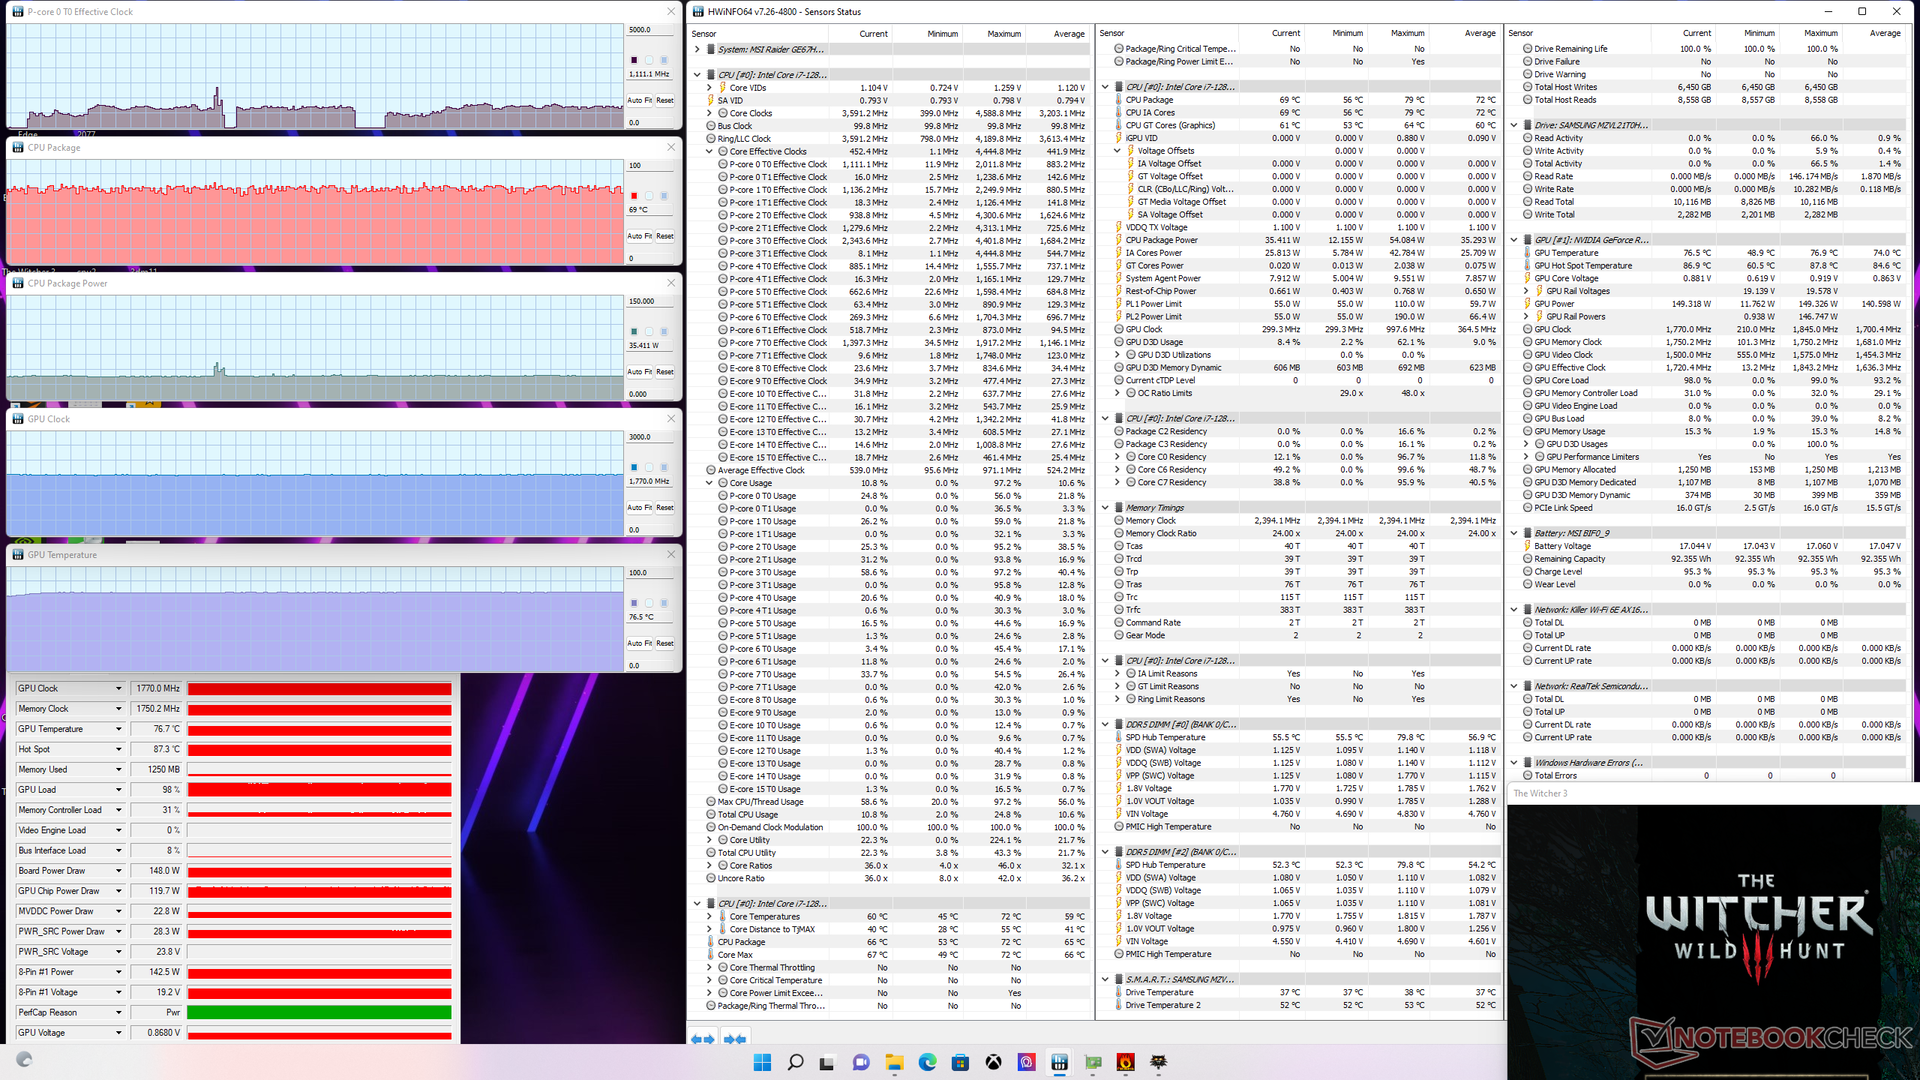
压力测试
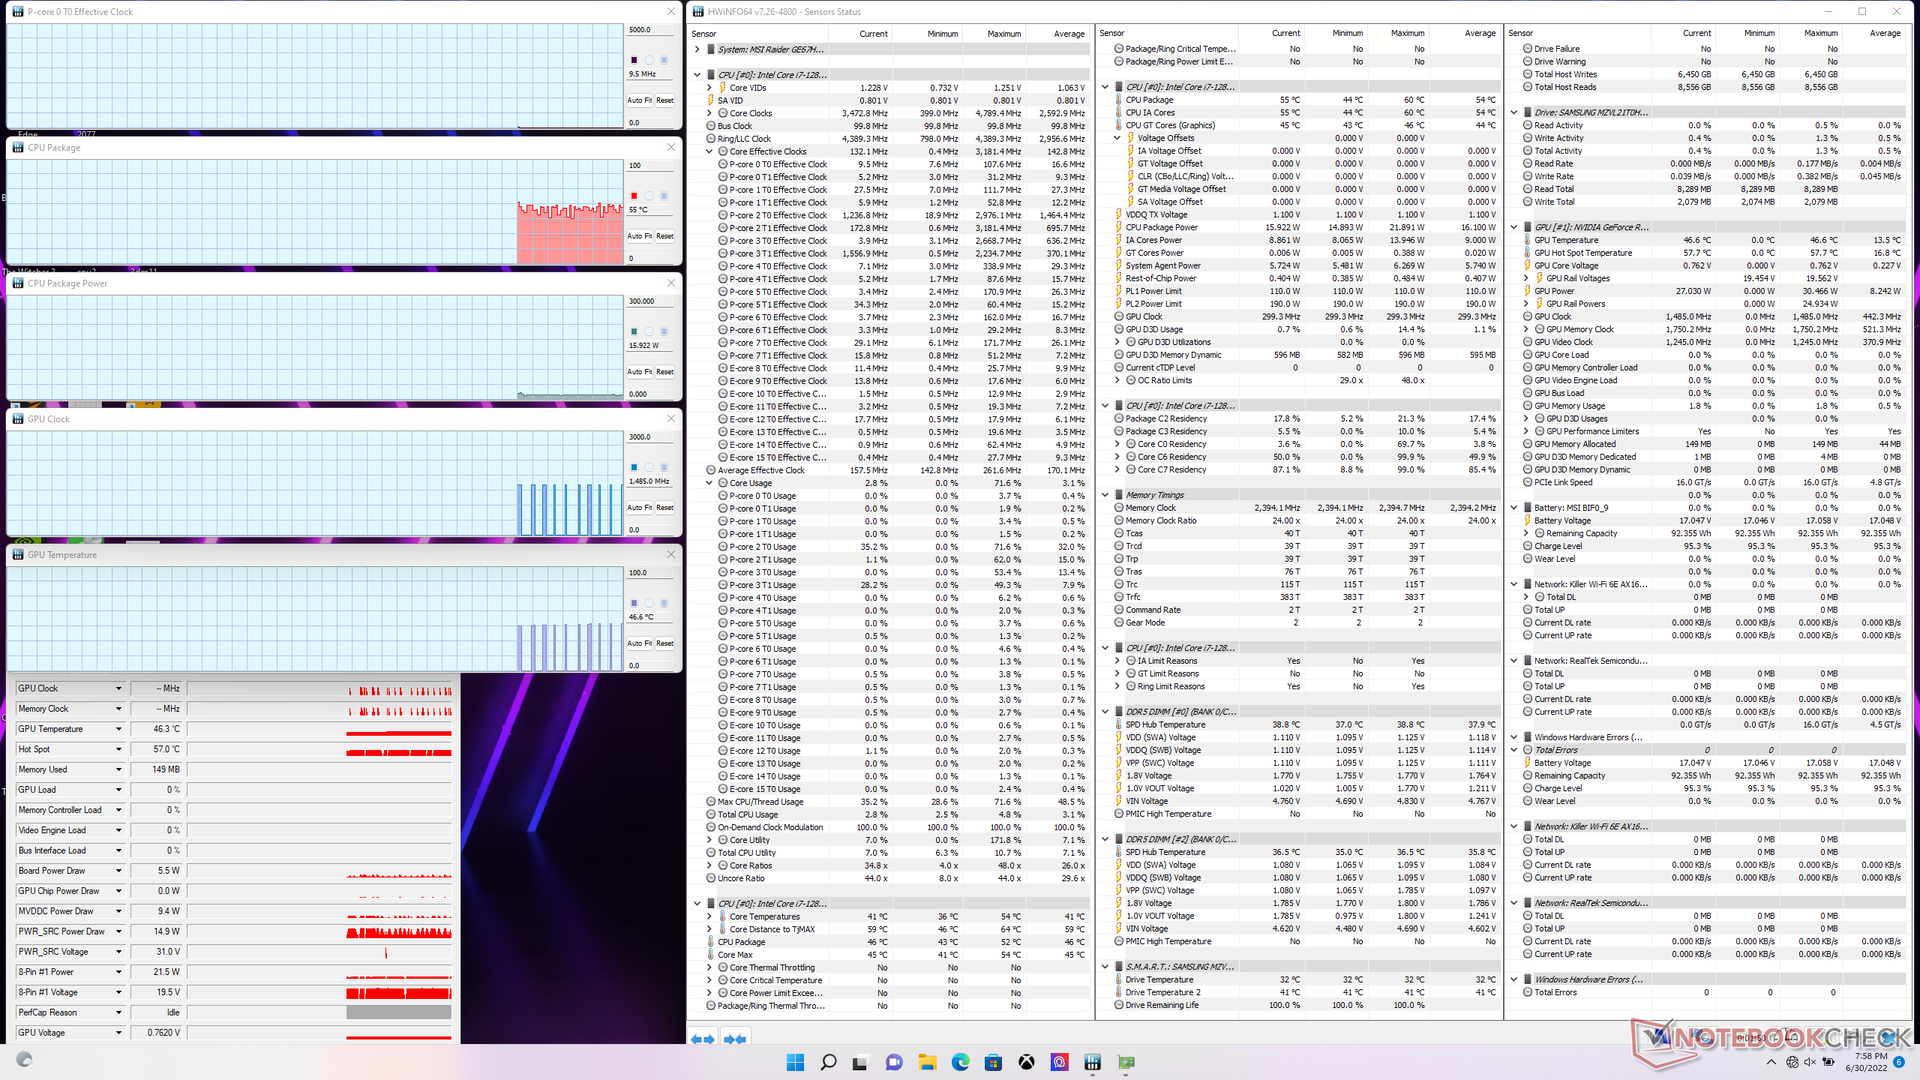
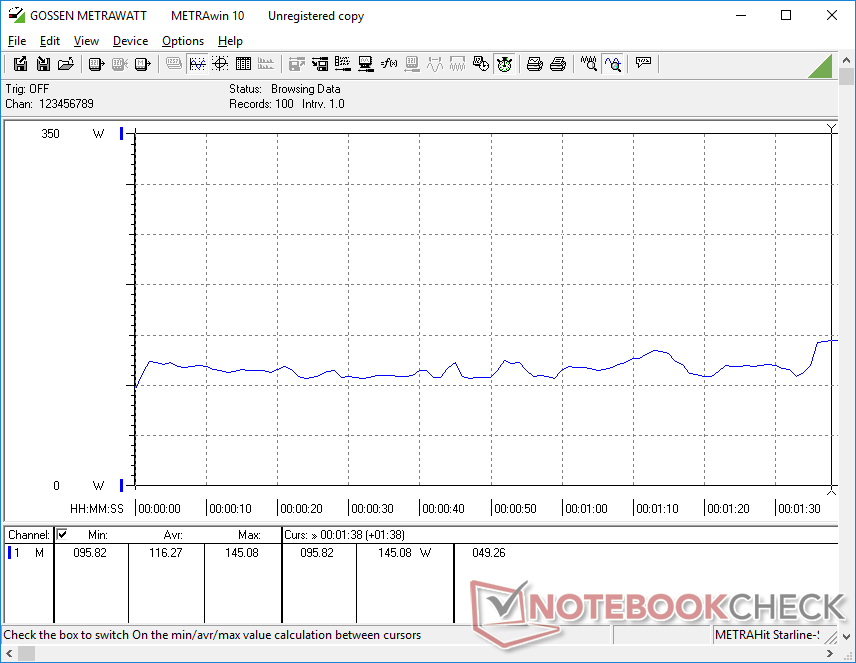
当在Prime95下受压时,CPU会提升到4.2GHz,直到大约90秒后核心温度达到96C。此后,时钟频率会下降到3.4至3.7GHz范围,以保持87C左右的较低核心温度。
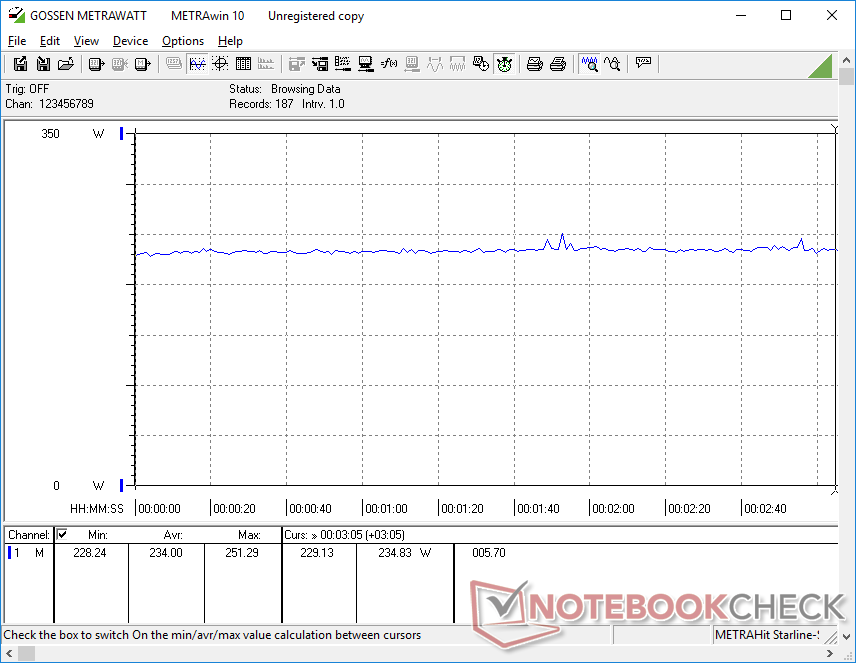
在极端性能模式下,GPU板的功耗最高为148瓦,而在平衡电源模式下则为135瓦。因此,你会想启用极限性能模式来最大限度地发挥GPU的潜力。CPU和GPU的平均温度是合理的,分别为69℃和77℃,而Vector GP66的温度为71℃和70℃。 Vector GP66它配备了相同的GeForce RTX 3070 Ti GPU,但有一个较慢的第11代CPU。
值得注意的是,尽管微星宣传150W+25W动态提升,但我们只能达到148W的GPU板功耗,即使在极限性能模式下运行,至少根据GPU-Z的数据。
使用电池运行会影响性能。在电池供电的情况下,Fire Strike ,物理和图形得分分别为22492和11614分,而在主电源供电的情况下,得分分别为34445和31096分。
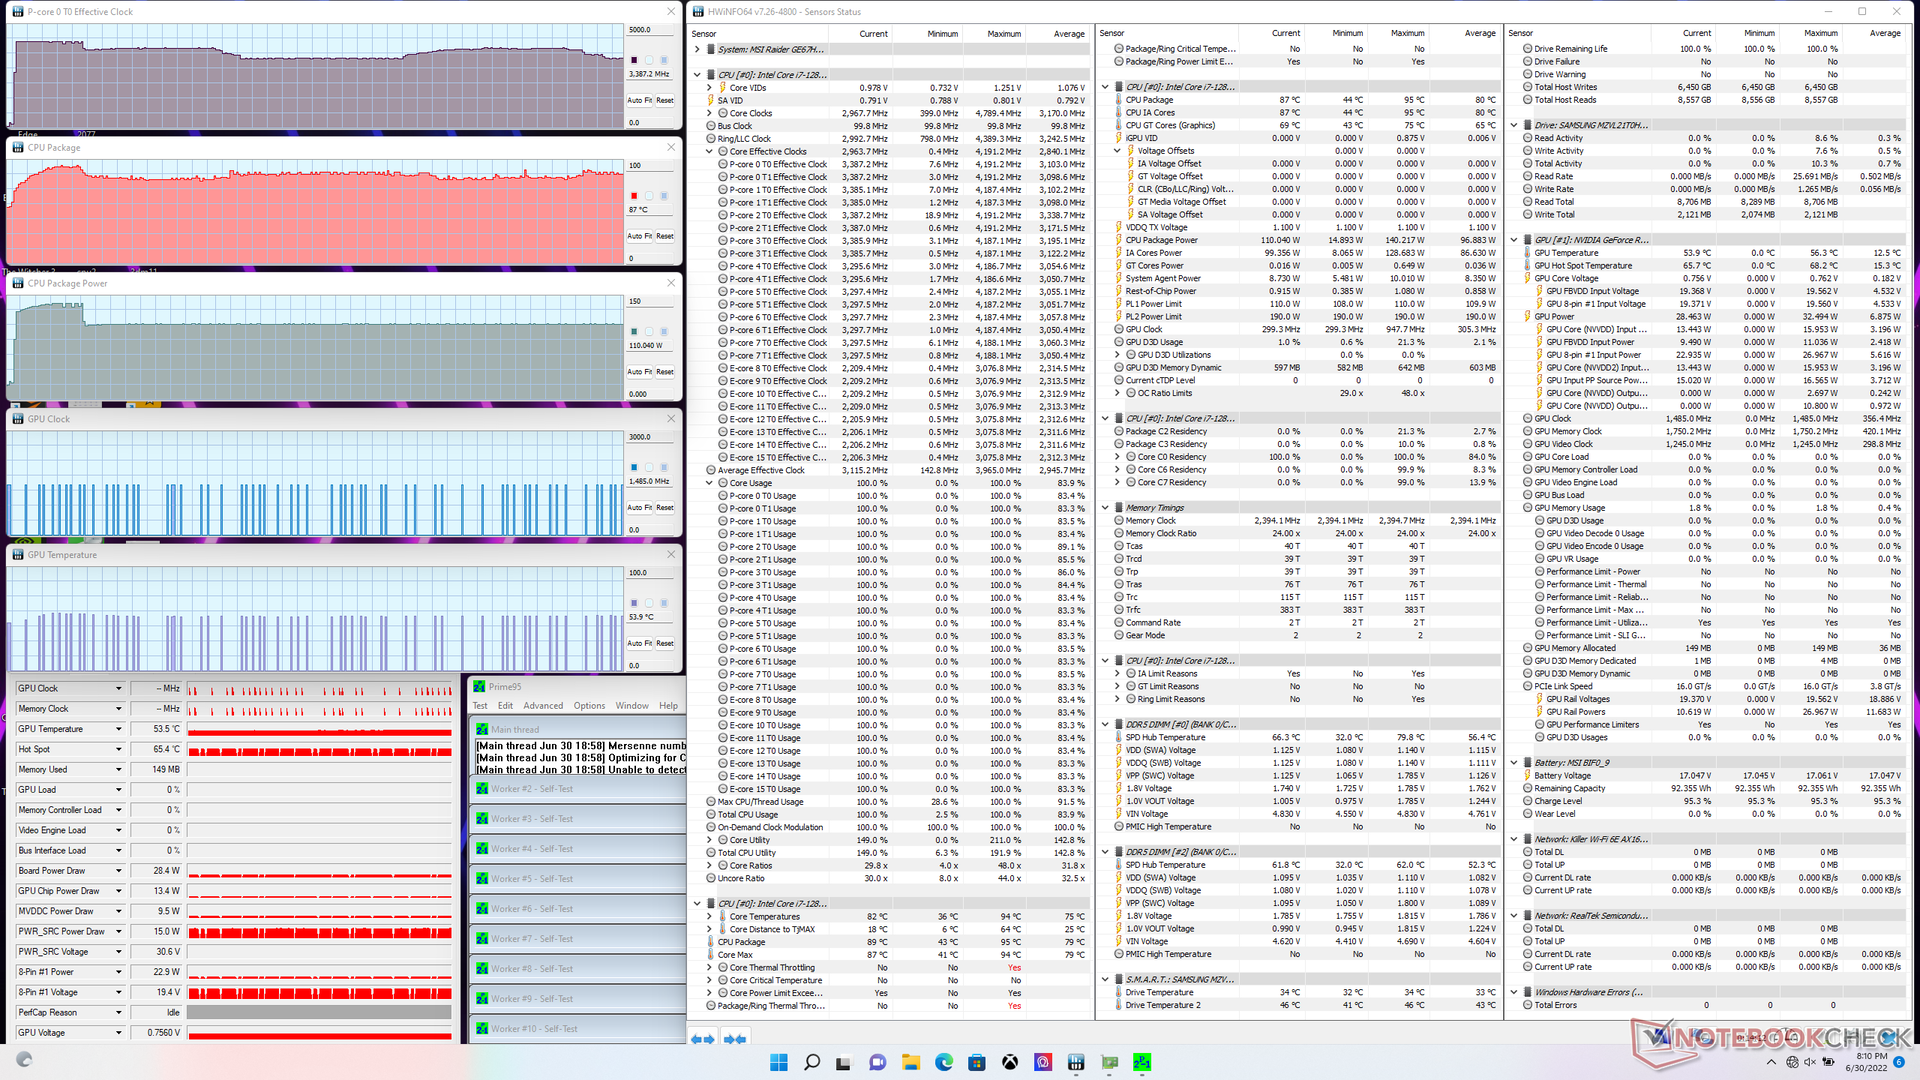
| CPU时钟(GHz) | GPU时钟(MHz) | CPU平均温度(°C) | GPU平均温度(°C) | |
| 系统空闲 | -- | -- | 55 | 47 |
| Prime95压力 | 3.4 - 3.7 | -- | 87 | 54 |
| Prime95 + FurMark 压力 | 2.6 | 1845 | 70 | 65 |
| Witcher 3 压力(平衡模式) | 0.9 | 1800 | 74 | 75 |
| Witcher 3 压力(极端性能模式) | 1.1 | 1770 | 69 | 77 |
发言人
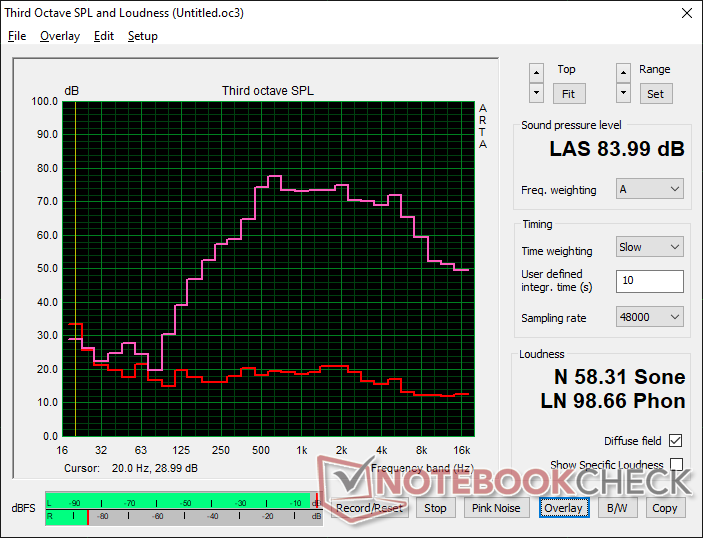
MSI GE67 HX 12UGS audio analysis
(+) | speakers can play relatively loud (84 dB)
Bass 100 - 315 Hz
(-) | nearly no bass - on average 17.9% lower than median
(±) | linearity of bass is average (13.7% delta to prev. frequency)
Mids 400 - 2000 Hz
(±) | higher mids - on average 7.9% higher than median
(+) | mids are linear (6.6% delta to prev. frequency)
Highs 2 - 16 kHz
(±) | higher highs - on average 5.5% higher than median
(±) | linearity of highs is average (8.6% delta to prev. frequency)
Overall 100 - 16.000 Hz
(±) | linearity of overall sound is average (22.1% difference to median)
Compared to same class
» 79% of all tested devices in this class were better, 6% similar, 15% worse
» The best had a delta of 6%, average was 18%, worst was 132%
Compared to all devices tested
» 64% of all tested devices were better, 6% similar, 30% worse
» The best had a delta of 4%, average was 23%, worst was 134%
Apple MacBook Pro 16 2021 M1 Pro audio analysis
(+) | speakers can play relatively loud (84.7 dB)
Bass 100 - 315 Hz
(+) | good bass - only 3.8% away from median
(+) | bass is linear (5.2% delta to prev. frequency)
Mids 400 - 2000 Hz
(+) | balanced mids - only 1.3% away from median
(+) | mids are linear (2.1% delta to prev. frequency)
Highs 2 - 16 kHz
(+) | balanced highs - only 1.9% away from median
(+) | highs are linear (2.7% delta to prev. frequency)
Overall 100 - 16.000 Hz
(+) | overall sound is linear (4.6% difference to median)
Compared to same class
» 0% of all tested devices in this class were better, 0% similar, 100% worse
» The best had a delta of 5%, average was 17%, worst was 45%
Compared to all devices tested
» 0% of all tested devices were better, 0% similar, 100% worse
» The best had a delta of 4%, average was 23%, worst was 134%
能源管理--高消耗和高功率的砖块
消耗功率
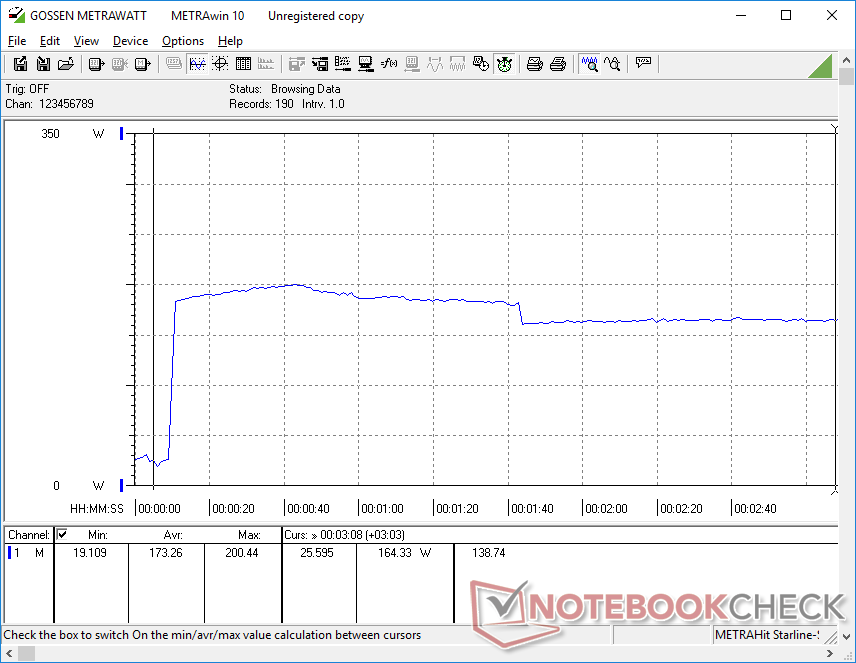
消耗量明显高于我们在老款Core i9-12900HK GE66上的记录,特别是在运行CPU重的应用程序时。例如,Prime95在我们的GE67上将消耗约165W,而在GE66上只有90W,代表83%的增长。对于酷睿i9-12900HK和酷睿i7-12800HX之间原始多线程性能增加35%至40%来说,这是一个很高的代价。
运行 Witcher 3将消耗约237瓦,这又高于我们在GE66上记录的202瓦。即使与其他高性能游戏笔记本电脑相比,如华硕ROG Strix Scar 15或 Alienware m15 R6,或GE67在这两种情况下会更耗电。
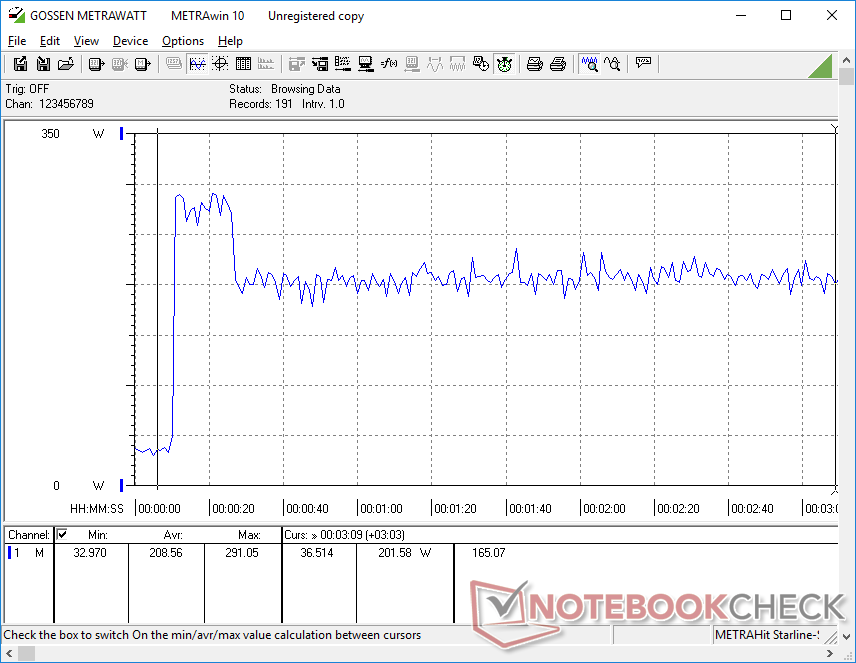
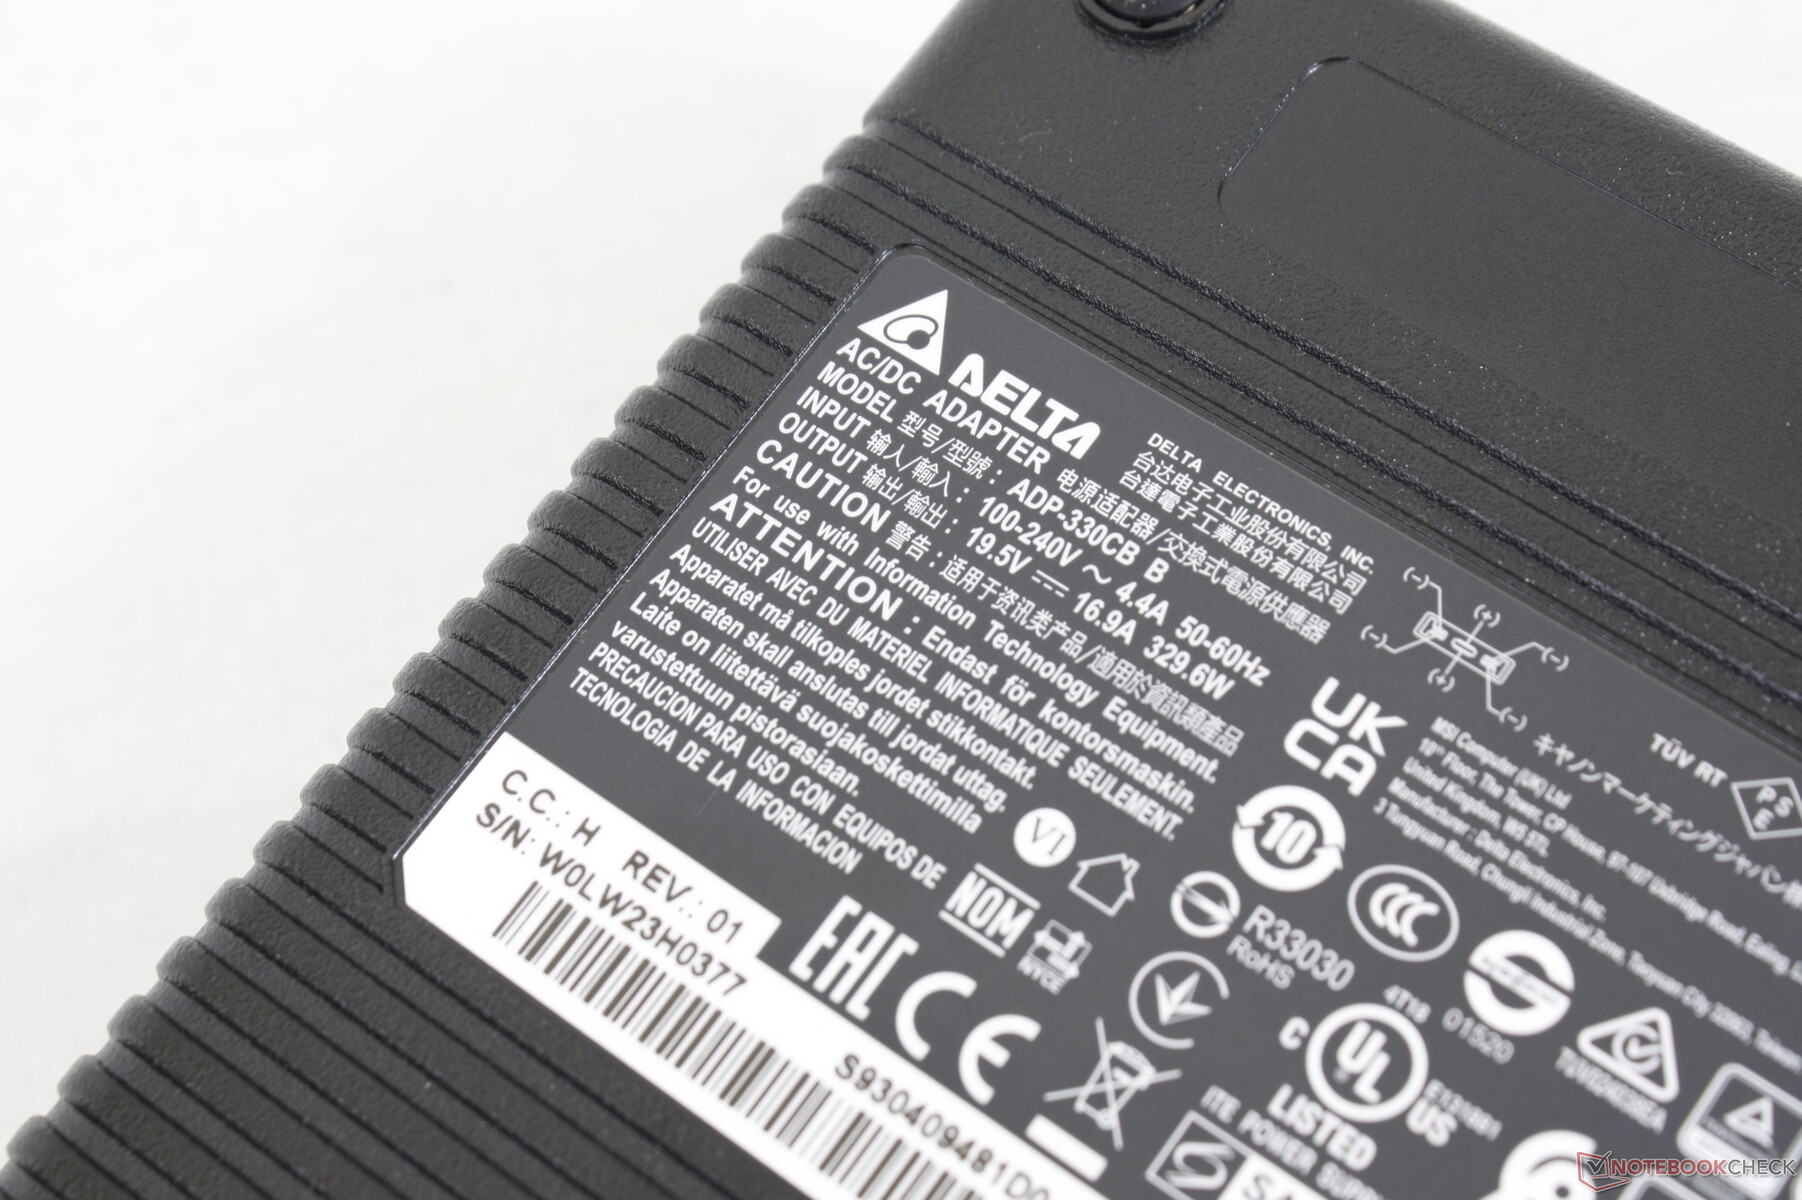
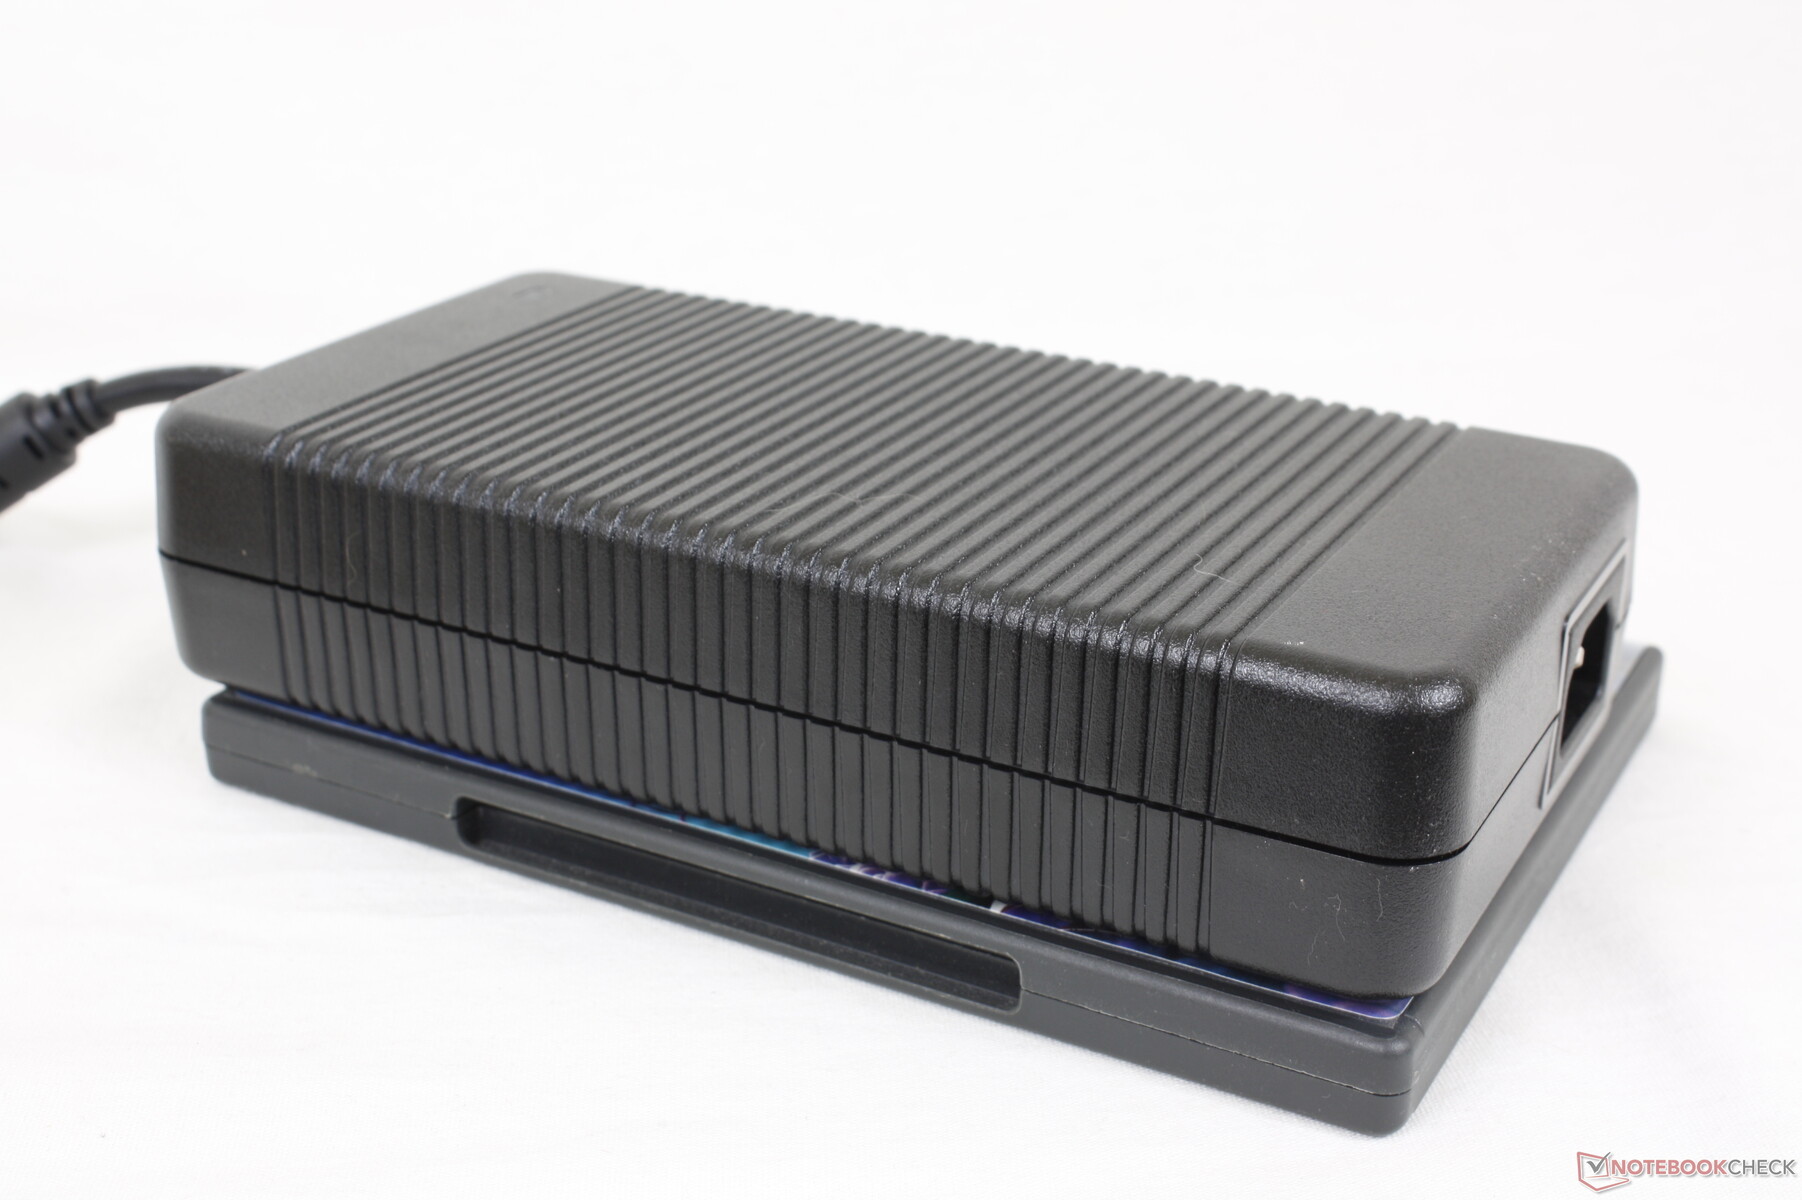
在同时运行Prime95和FurMark时,我们能够从巨大的(约20 x 9.8 x 4.3厘米)和沉重的(1.3公斤)330瓦电源砖中记录到291瓦的最大消耗。请注意,大多数其他游戏笔记本都配有280瓦或更小的交流适配器。
| Off / Standby | |
| Idle | |
| Load |
|
Key:
min: | |
| MSI GE67 HX 12UGS i7-12800HX, GeForce RTX 3070 Ti Laptop GPU, Samsung PM9A1 MZVL21T0HCLR, OLED, 1920x1080, 15.6" | MSI Raider GE66 12UHS i9-12900HK, GeForce RTX 3080 Ti Laptop GPU, Samsung PM9A1 MZVL22T0HBLB, IPS, 3840x2160, 15.6" | MSI Vector GP66 12UGS i9-12900H, GeForce RTX 3070 Ti Laptop GPU, , IPS, 1920x1080, 15.6" | Asus ROG Strix Scar 15 G533ZW-LN106WS i9-12900H, GeForce RTX 3070 Ti Laptop GPU, Samsung PM9A1 MZVL22T0HBLB, IPS-level, 2560x1440, 15.6" | Alienware m15 R6, i7-11800H RTX 3080 i7-11800H, GeForce RTX 3080 Laptop GPU, Samsung PM9A1 MZVL21T0HCLR, IPS, 1920x1080, 15.6" | Razer Blade 15 2022 i7-12800H, GeForce RTX 3080 Ti Laptop GPU, SSSTC CA6-8D1024, IPS, 2560x1440, 15.6" | |
|---|---|---|---|---|---|---|
| Power Consumption | 5% | -15% | 21% | 12% | -35% | |
| Idle Minimum * (Watt) | 16.1 | 16 1% | 17.5 -9% | 7.56 53% | 14 13% | 33.2 -106% |
| Idle Average * (Watt) | 17.1 | 19 -11% | 20.1 -18% | 13.5 21% | 18 -5% | 36.4 -113% |
| Idle Maximum * (Watt) | 26.6 | 26 2% | 47.3 -78% | 16.87 37% | 29 -9% | 37.6 -41% |
| Load Average * (Watt) | 116.3 | 110 5% | 107.3 8% | 128.9 -11% | 93 20% | 116.7 -0% |
| Witcher 3 ultra * (Watt) | 237 | 202 15% | 225 5% | 196.2 17% | 190 20% | 172 27% |
| Load Maximum * (Watt) | 291.1 | 242 17% | 277.7 5% | 274.86 6% | 203 30% | 228.6 21% |
* ... smaller is better
Power Consumption Witcher 3 / Stresstest
Power Consumption external Monitor
电池寿命 - 实际上并不坏
电池容量是允许的最大容量,为99.9Wh,因为再高就会违反美国联邦航空局的锂电池安全规定。用户可以预期,当设置为平衡电源配置文件时,WLAN运行时间约为5.5小时,这与我们在GE66上记录的时间相似,尽管它们的性能不同。
从空到满的充电时间很慢,为2至2.5小时。与Razer Blade系列或大多数华硕ROG型号不同,该系统不能通过USB-C充电。
| MSI GE67 HX 12UGS i7-12800HX, GeForce RTX 3070 Ti Laptop GPU, 99.9 Wh | MSI Raider GE66 12UHS i9-12900HK, GeForce RTX 3080 Ti Laptop GPU, 99 Wh | MSI Vector GP66 12UGS i9-12900H, GeForce RTX 3070 Ti Laptop GPU, 65 Wh | Asus ROG Strix Scar 15 G533ZW-LN106WS i9-12900H, GeForce RTX 3070 Ti Laptop GPU, 90 Wh | Alienware m15 R6, i7-11800H RTX 3080 i7-11800H, GeForce RTX 3080 Laptop GPU, 84 Wh | Razer Blade 15 2022 i7-12800H, GeForce RTX 3080 Ti Laptop GPU, 80 Wh | |
|---|---|---|---|---|---|---|
| Battery runtime | -9% | -19% | -4% | -18% | -12% | |
| Reader / Idle (h) | 8.4 | 7.9 -6% | ||||
| WiFi v1.3 (h) | 5.6 | 5.7 2% | 5.7 2% | 8.4 50% | 5 -11% | 4.9 -12% |
| Load (h) | 2.1 | 1.7 -19% | 1 -52% | 0.9 -57% | 1.6 -24% | |
| H.264 (h) | 7.1 | 8.5 | 5.6 | |||
| Witcher 3 ultra (h) | 1.2 |
Pros
Cons
结论 - 更高的性能,更高的电费
酷睿i7-12800HX的性能优势是不可否认的。当与 Ryzen 7 5800H甚至是 酷睿i9-12900H相比,英特尔HX CPU可以提供比前者快80%的多线程性能,比后者快30%至60%的性能。这些收益显著,足以领先于桌面级的 酷睿i7-12700K在许多情况下。发烧友和游戏玩家知道他们可以利用该处理器,比如在游戏时获得更高的帧率,他们会发现GE67所能提供的很多东西值得喜欢。
所有这些额外的性能并不是免费的。虽然GE66配备了更薄的280瓦交流适配器,但GE67配备了更大的330瓦交流适配器,以适应耗电的英特尔12代HX CPU。因此,耗电量无疑会更高。考虑到CPU的巨大收益,一些用户可能会发现这些缺点是值得的,但如果从每瓦性能的角度来看,这仍然是需要记住的。
由于Core i7-12800HX CPU和150 WGeForce RTX GPU,GE67是最快的15.6英寸游戏笔记本电脑之一。它也是最耗电的产品之一,因为它需要一个大的330瓦电源砖来运行。
至于QHD OLED 240 Hz显示屏,它很容易成为目前可用于游戏目的的最佳OLED面板,它与HX CPU和150 WGeForce RTX 3070 Ti GPU搭配得非常好。然而,它在GE67上的实现并不适合专业编辑的目的,而且闪烁可能会影响少数用户。
价格和可用性
截至目前,微星GE67还没有在亚马逊或百思买上广泛销售。然而,像XoticPC和EXcaliberPC有库存的SKU,起价2500美元。
MSI GE67 HX 12UGS
- 08/30/2022 v7 (old)
Allen Ngo
Price comparison

