联想Legion 7 16IAX7笔记本电脑评论。快速的16英寸游戏机,165赫兹的显示屏
Legion 7 16是联想在16英寸格式的游戏旗舰,提供了目前市场上的一切:英特尔HX CPU、GeForce RTX 3080 Ti,165赫兹的WQHD面板,以及最新的PCIe 4.0 SSD。然而,这也是有代价的,因为联想对高端玩家收取了4500欧元(约合4500美元)的高额费用。在这篇评论中,我们将新的Legion 7 16与主要由17英寸机型组成的游戏竞争产品进行比较,同时也与 Legion 采用AMD硬件的7 16.
潜在的竞争对手比较
Rating | Date | Model | Weight | Height | Size | Resolution | Price |
|---|---|---|---|---|---|---|---|
| 88.9 % v7 (old) | 09 / 2022 | Lenovo Legion 7 16IAX7-82TD004SGE i9-12900HX, GeForce RTX 3080 Ti Laptop GPU | 2.6 kg | 20 mm | 16.00" | 2560x1600 | |
| 87.6 % v7 (old) | 09 / 2022 | Schenker XMG Neo 17 M22 R9 6900HX, GeForce RTX 3080 Ti Laptop GPU | 2.8 kg | 27 mm | 17.00" | 2560x1600 | |
| 88.3 % v7 (old) | 08 / 2022 | MSI Titan GT77 12UHS i9-12900HX, GeForce RTX 3080 Ti Laptop GPU | 3.3 kg | 23 mm | 17.30" | 1920x1080 | |
| 83.7 % v7 (old) | 08 / 2022 | Aorus 17X XES i9-12900HX, GeForce RTX 3070 Ti Laptop GPU | 2.7 kg | 30 mm | 17.30" | 1920x1080 | |
| 89.5 % v7 (old) | 08 / 2022 | Asus ROG Flow X16 GV601RW-M5082W R9 6900HS, GeForce RTX 3070 Ti Laptop GPU | 2.1 kg | 19.4 mm | 16.10" | 2560x1600 | |
| 89.9 % v7 (old) | 07 / 2022 | Razer Blade 17 Early 2022 i9-12900H, GeForce RTX 3080 Ti Laptop GPU | 2.8 kg | 19.9 mm | 17.30" | 3840x2160 | |
| 88.2 % v7 (old) | 05 / 2022 | Asus ROG Zephyrus Duo 16 GX650RX R9 6900HX, GeForce RTX 3080 Ti Laptop GPU | 2.6 kg | 20.5 mm | 16.00" | 3840x2400 |
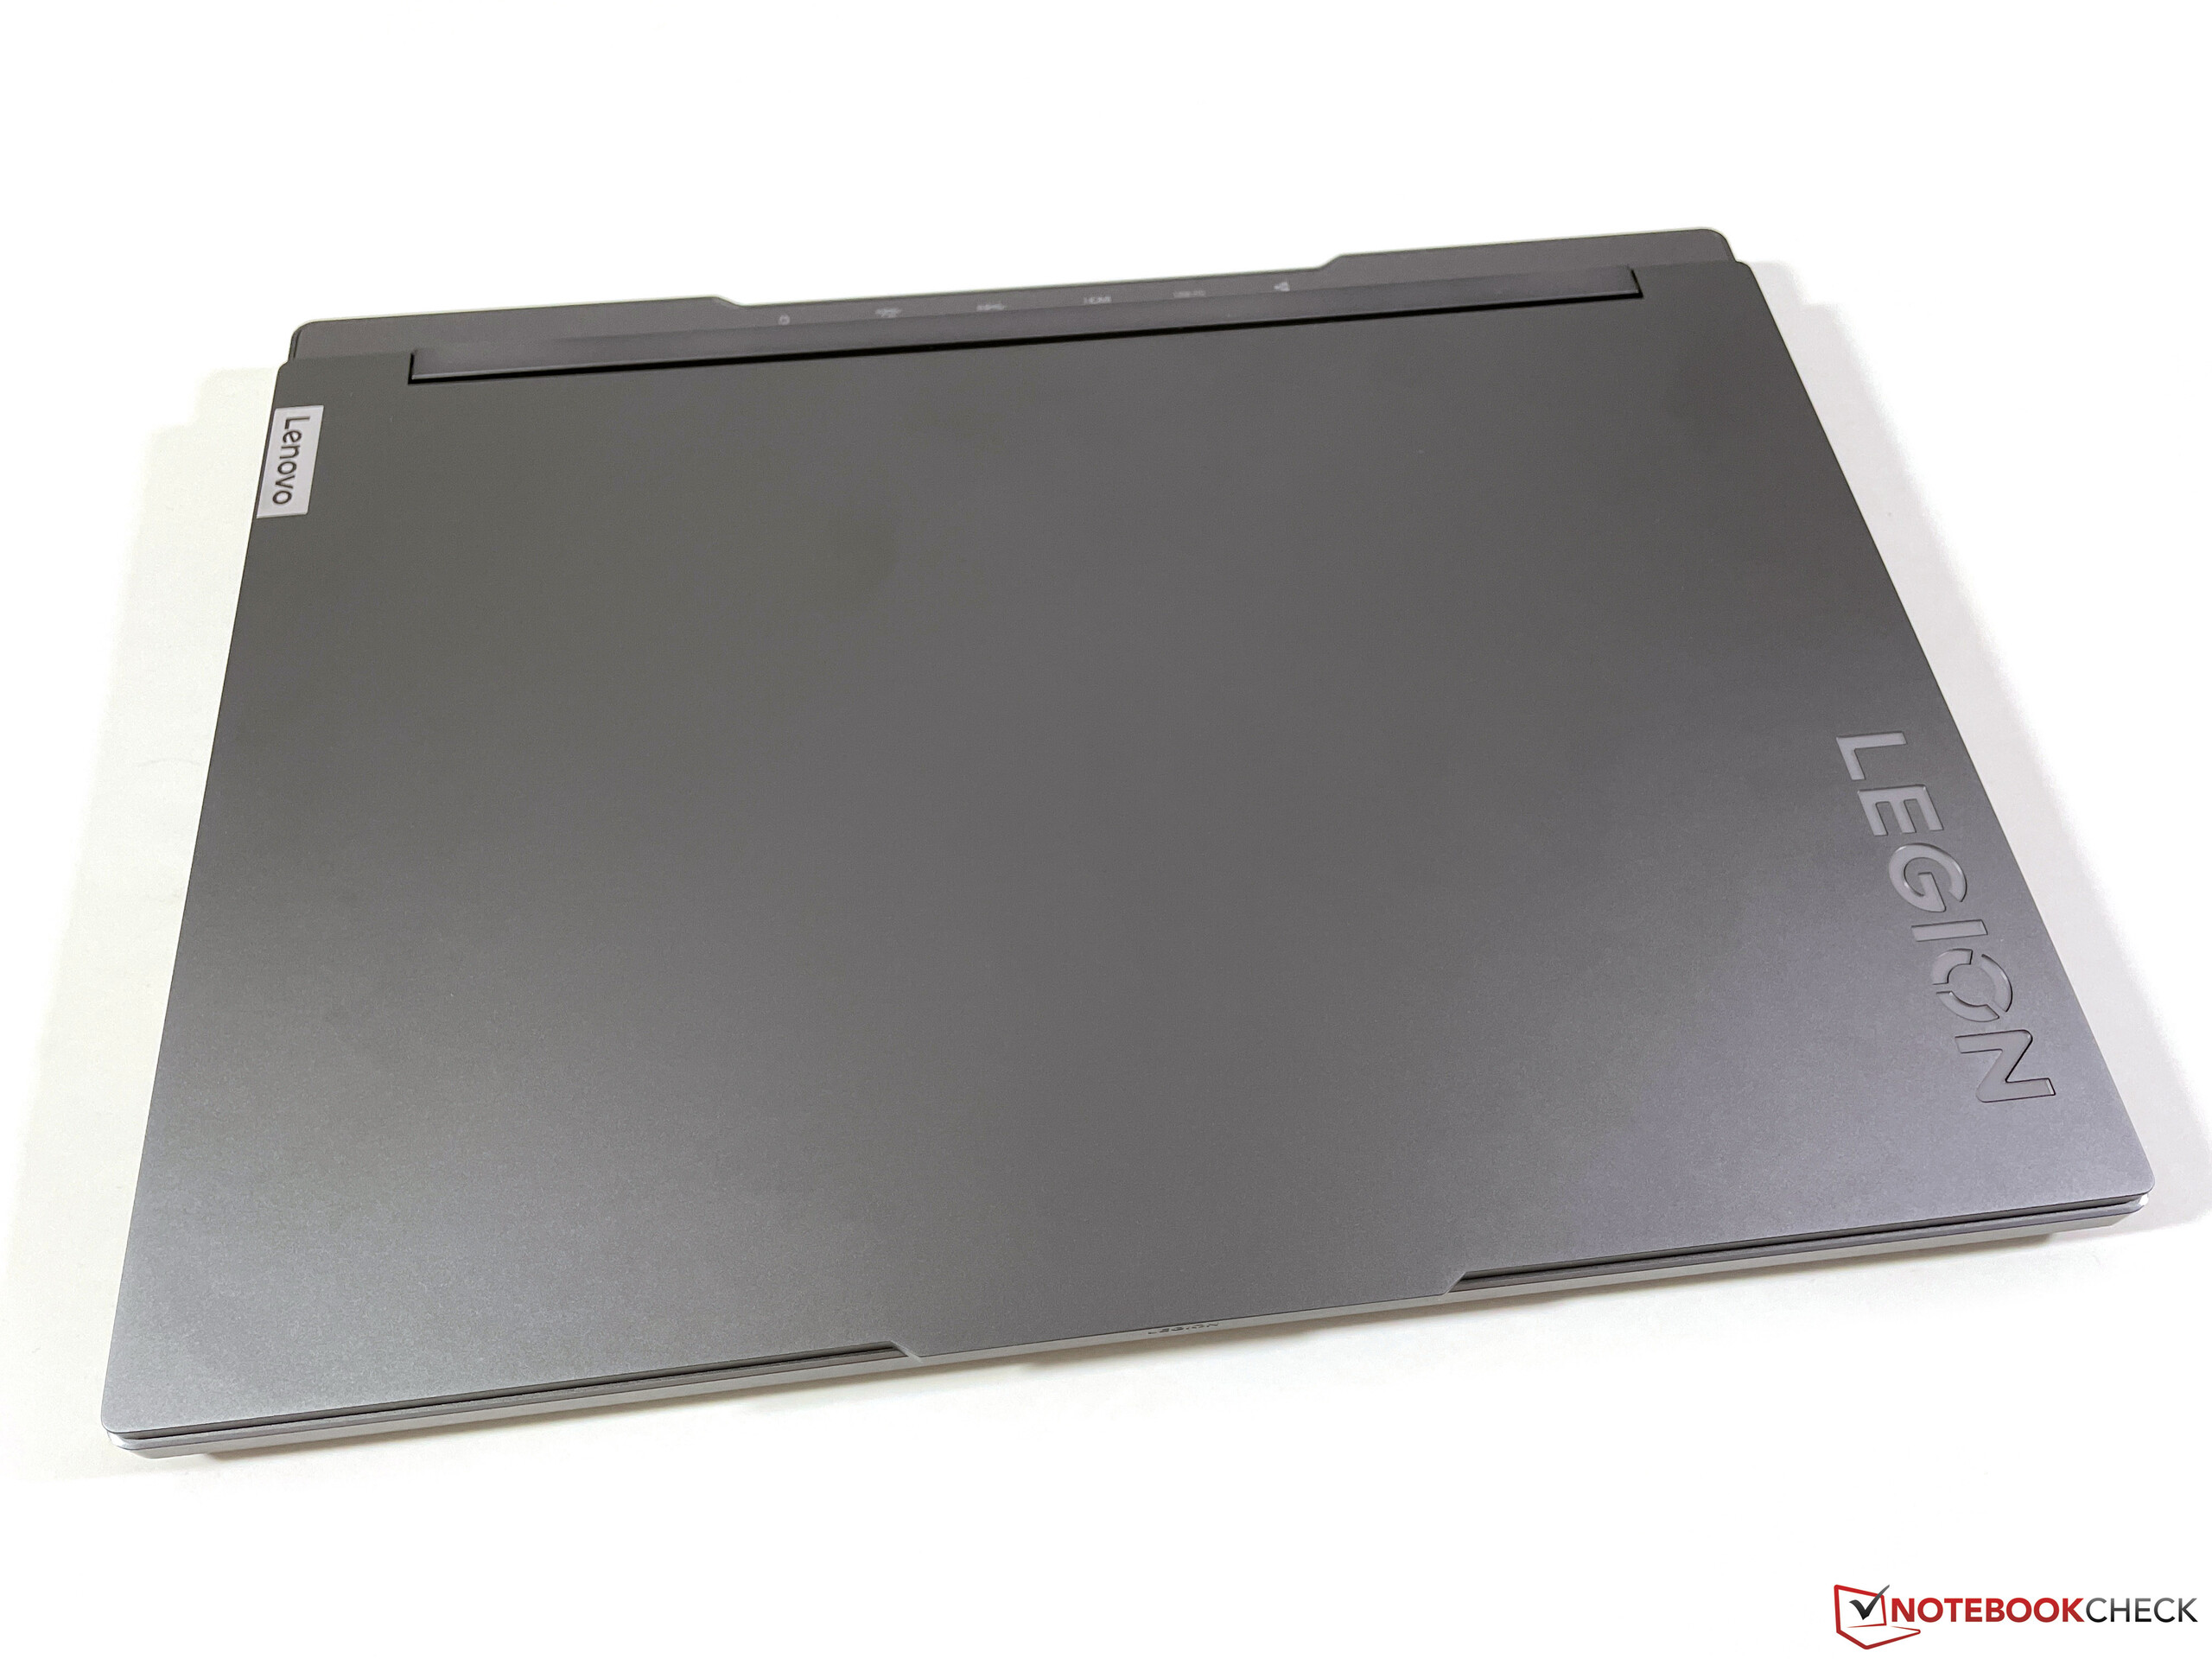
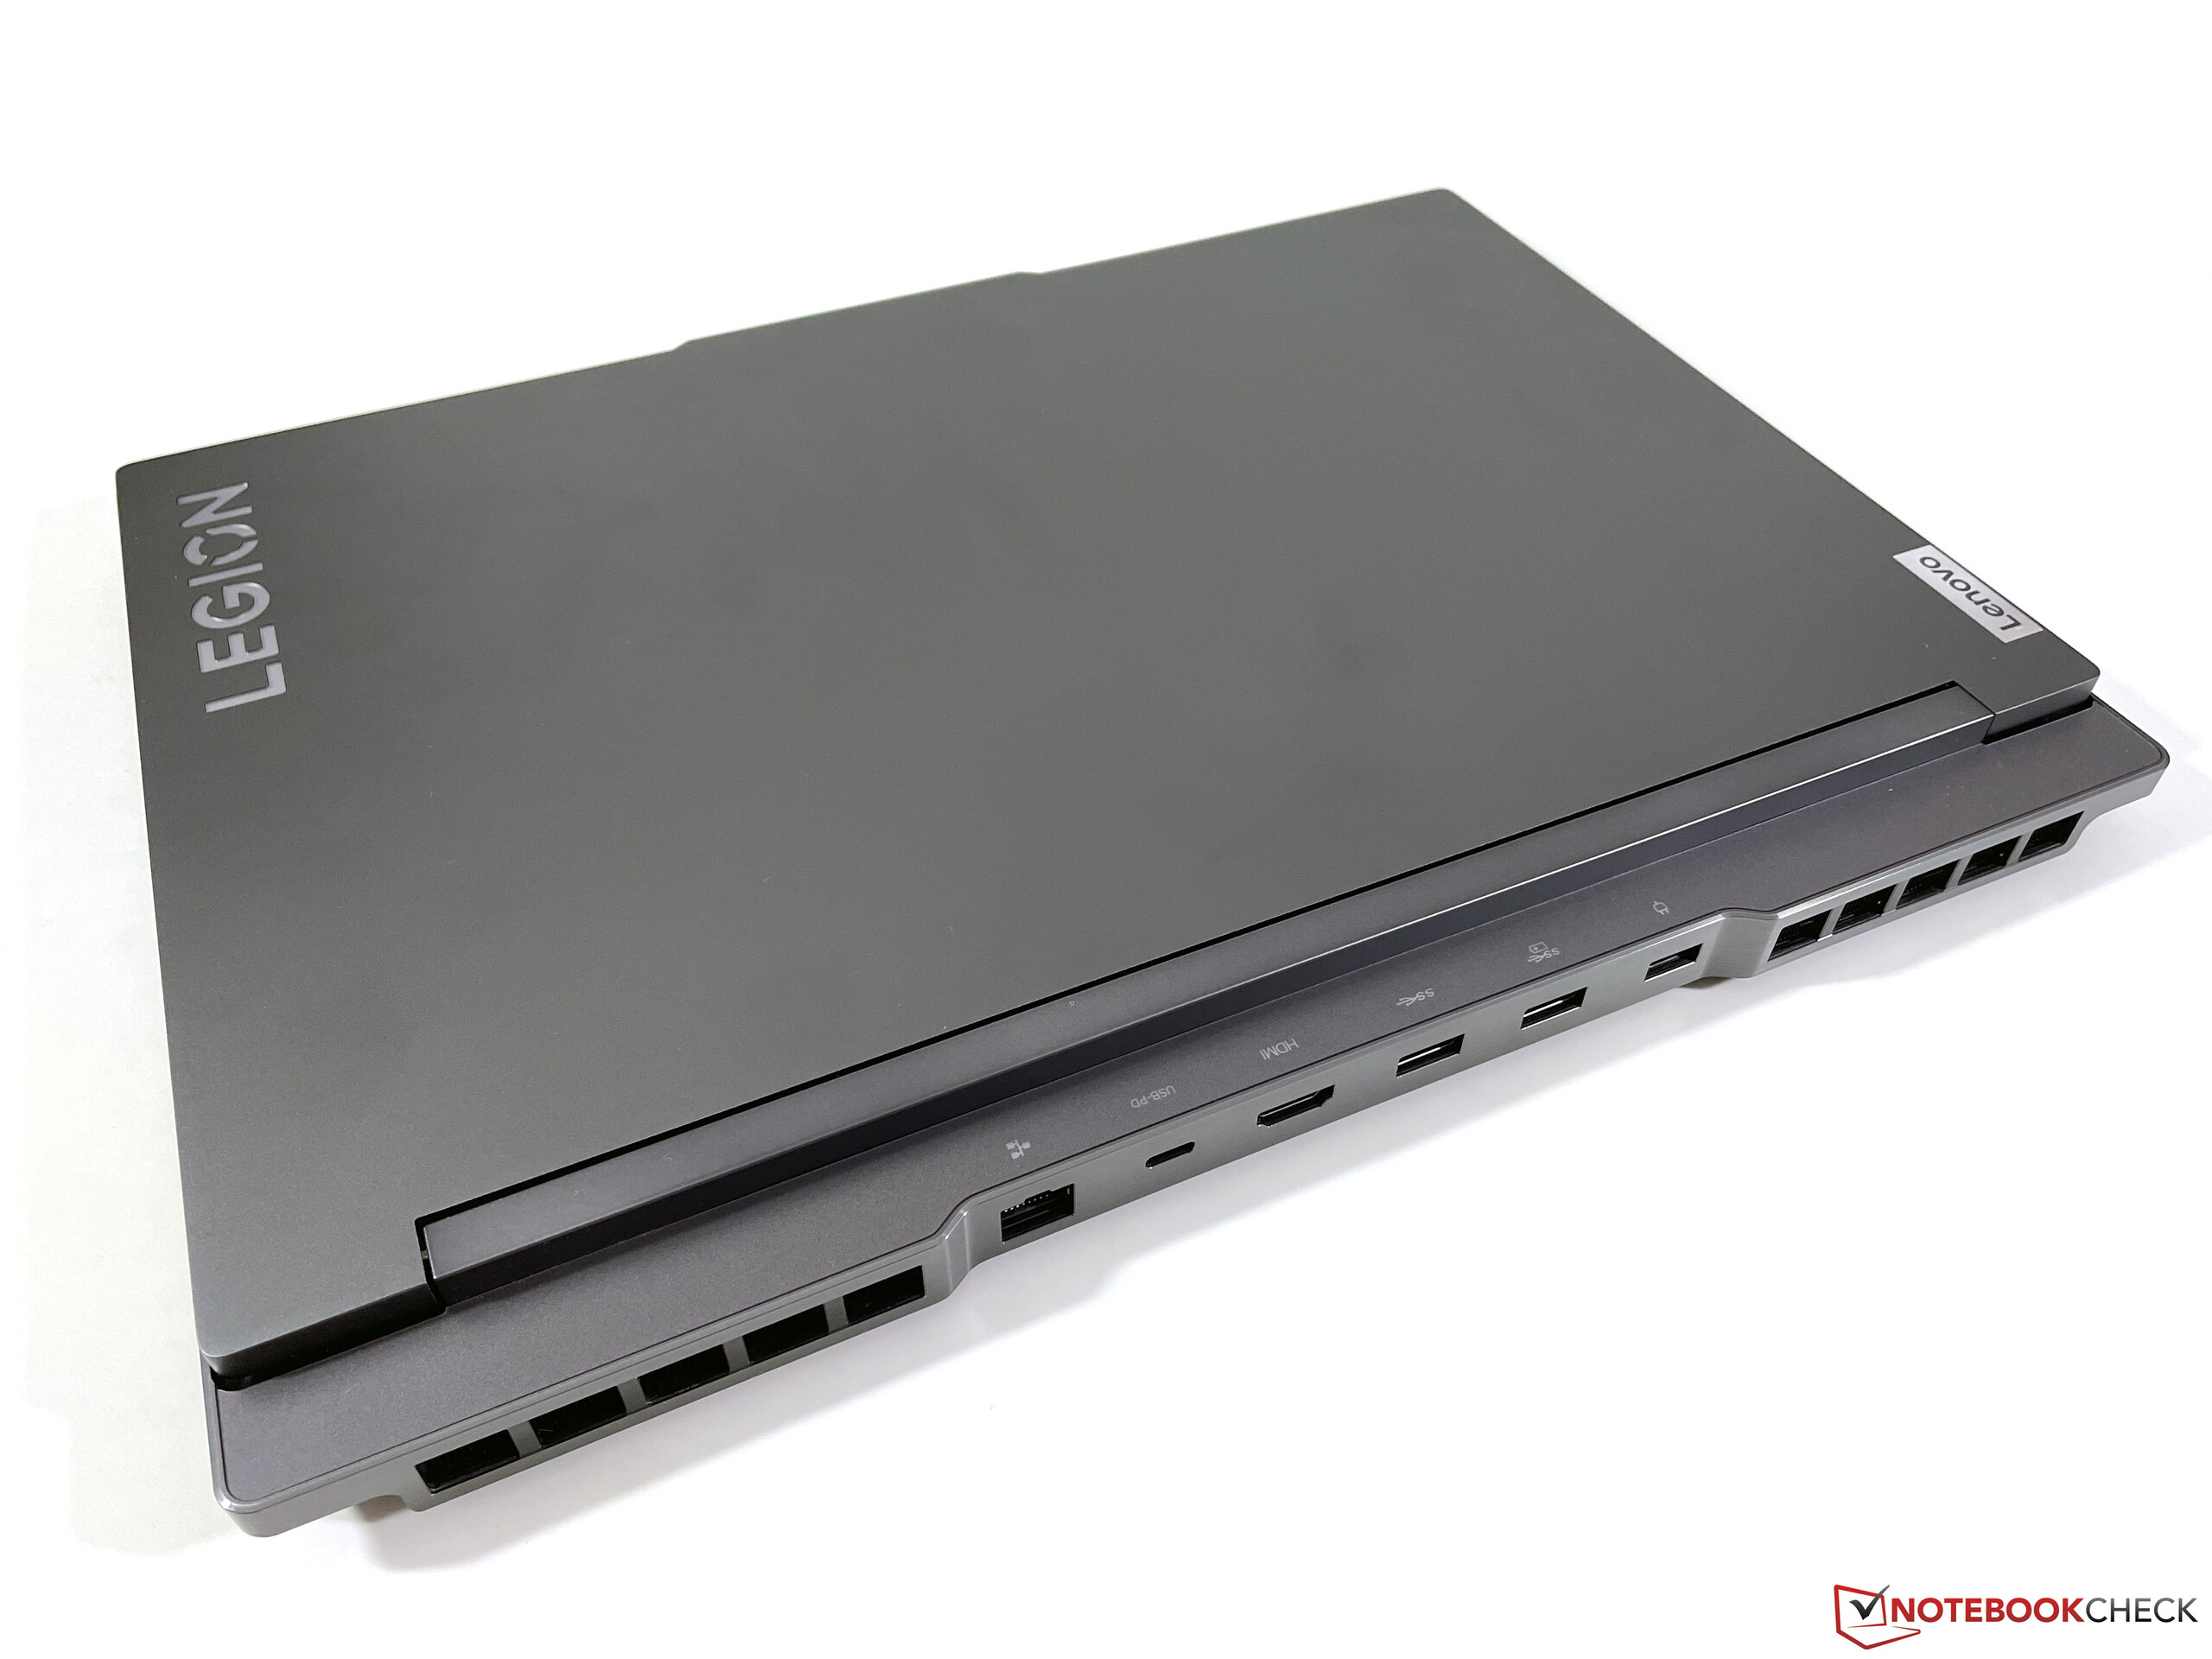
机箱 -Legion 7,铝制机箱
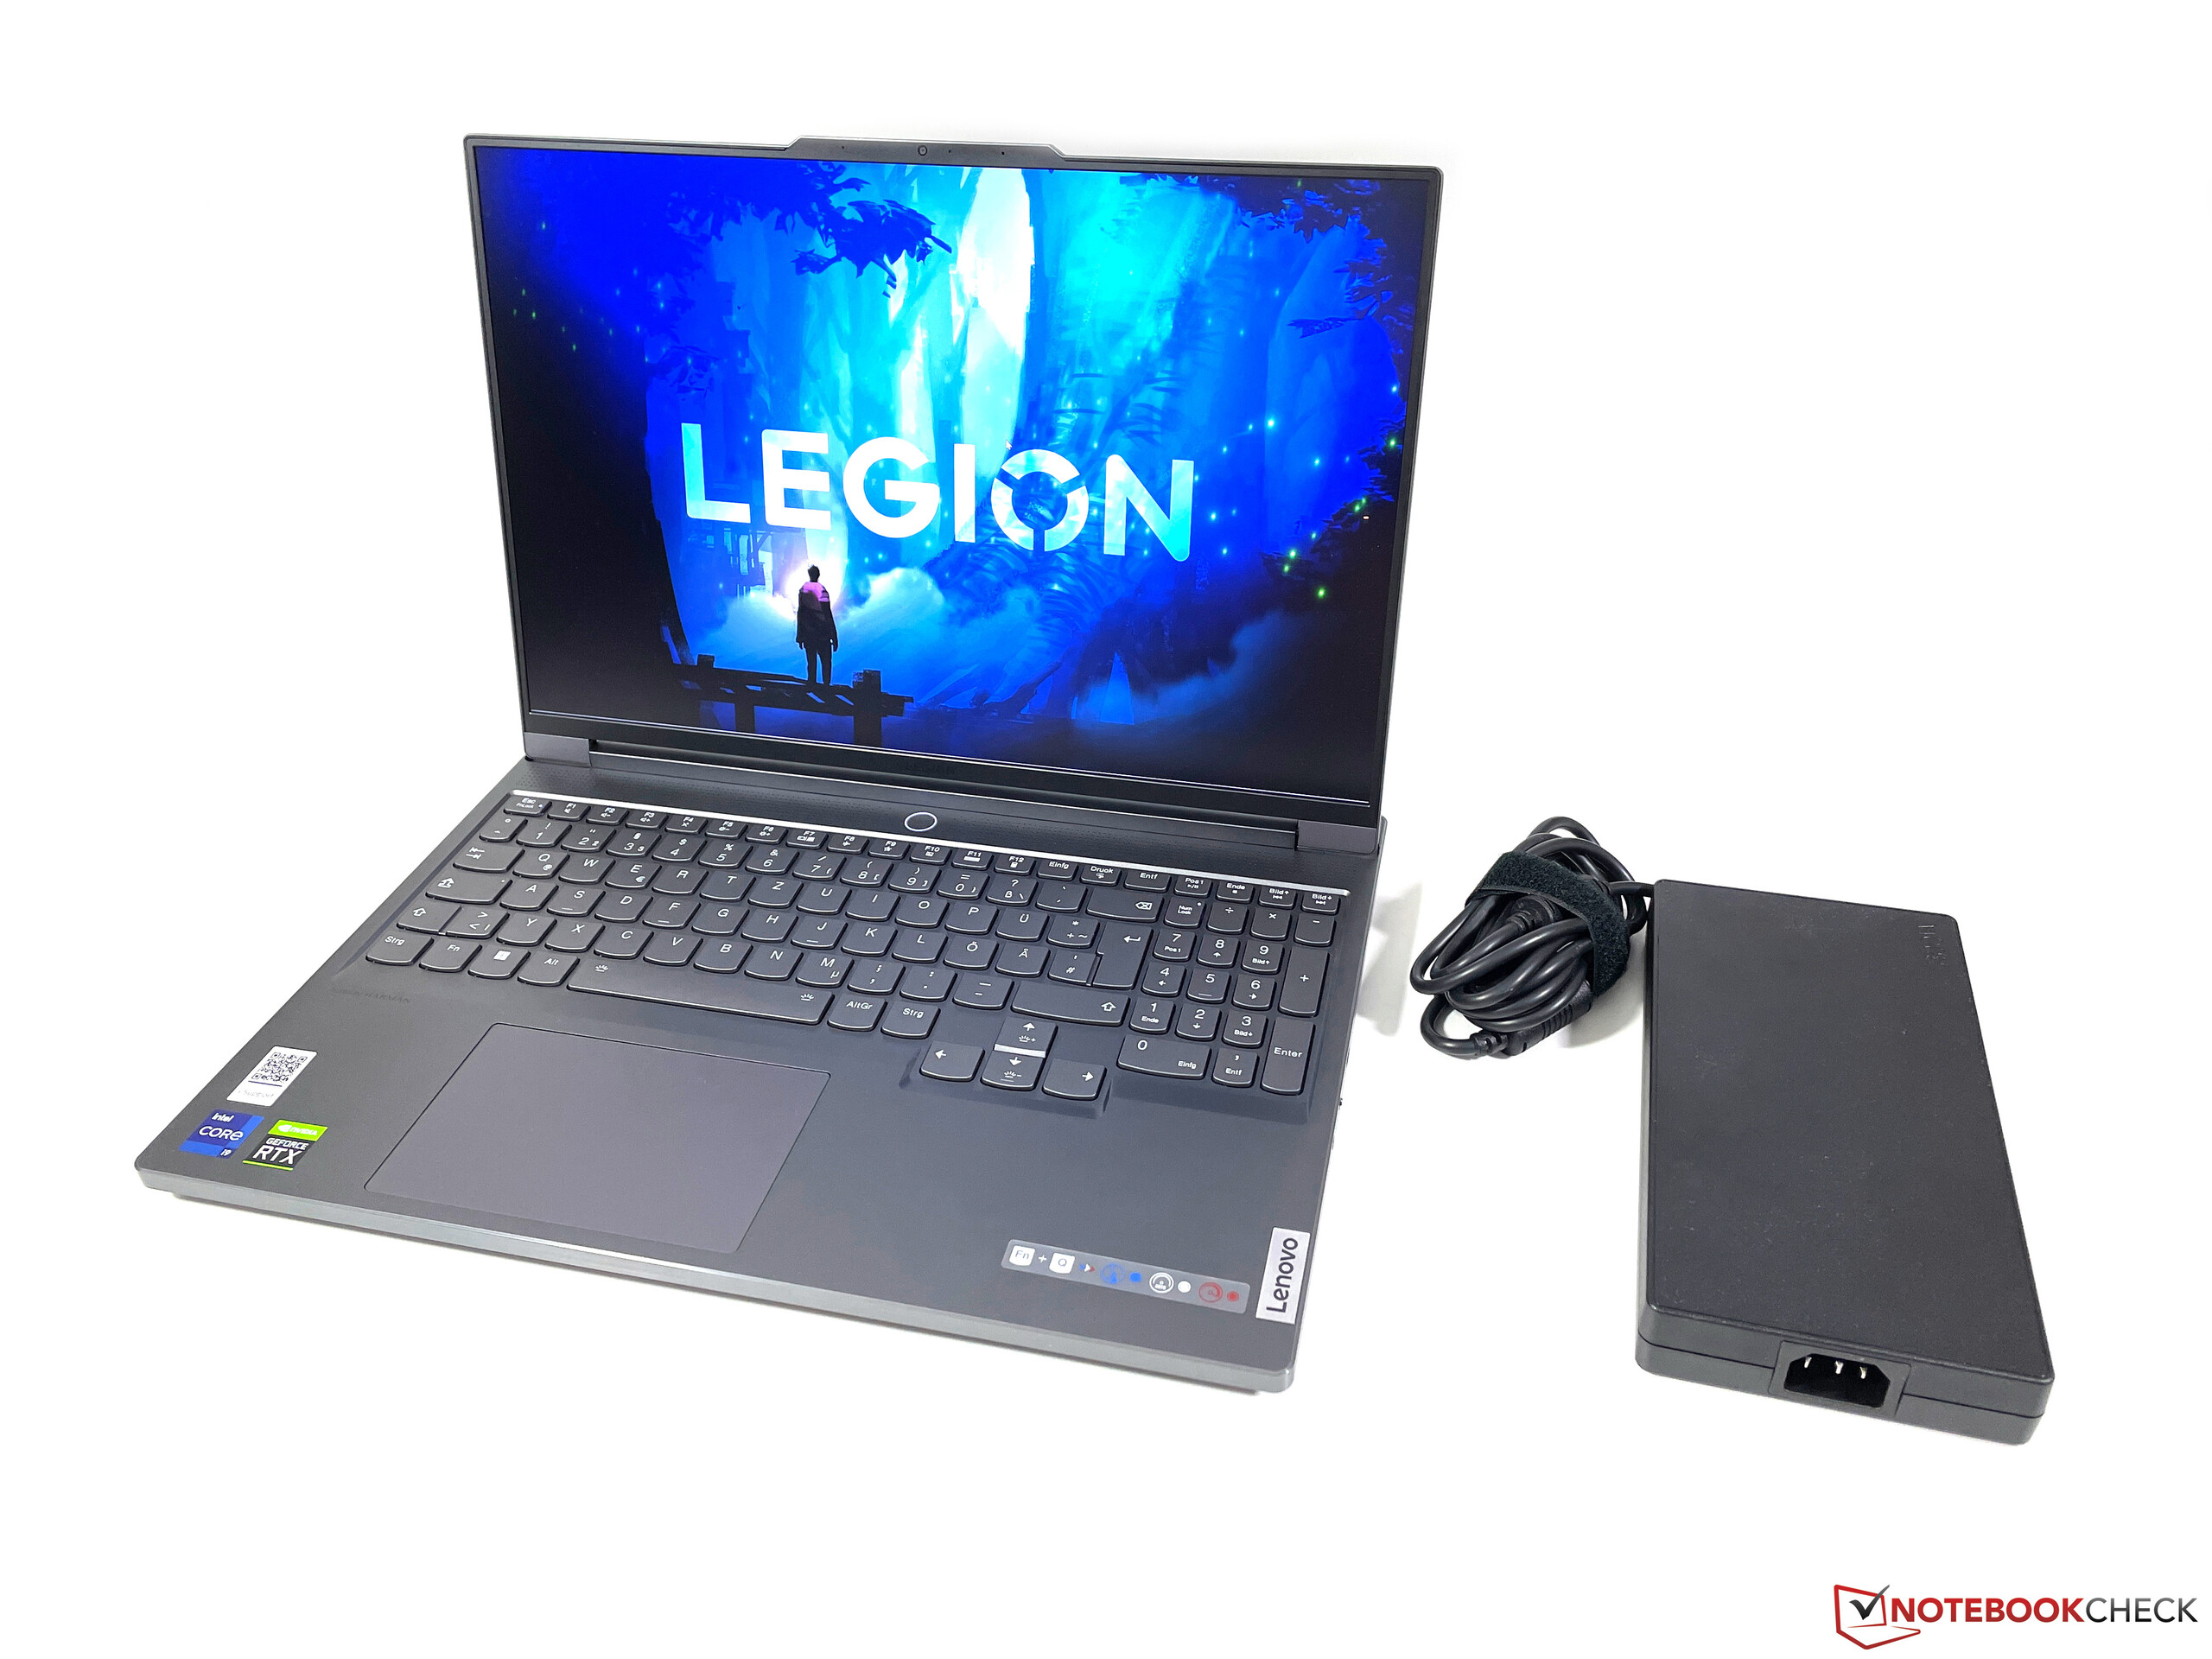
Legion 7 16采用了银灰色的铝制机箱,对于这样一台强大的游戏笔记本电脑来说,视觉上相当谨慎。我们非常喜欢这种内敛的设计,而且稳定性也很好。底座和显示器盖子都不会凹陷或扭曲,而且完全没有吱吱作响的声音。屏幕的边缘非常薄,设备看起来非常现代。
虽然屏幕铰链在前面稍有偏移,但它允许180度的最大开启角度。显示屏也可以用一只手轻松打开,跷二郎腿也不是问题。选择性地施加压力并没有导致任何图像失真。
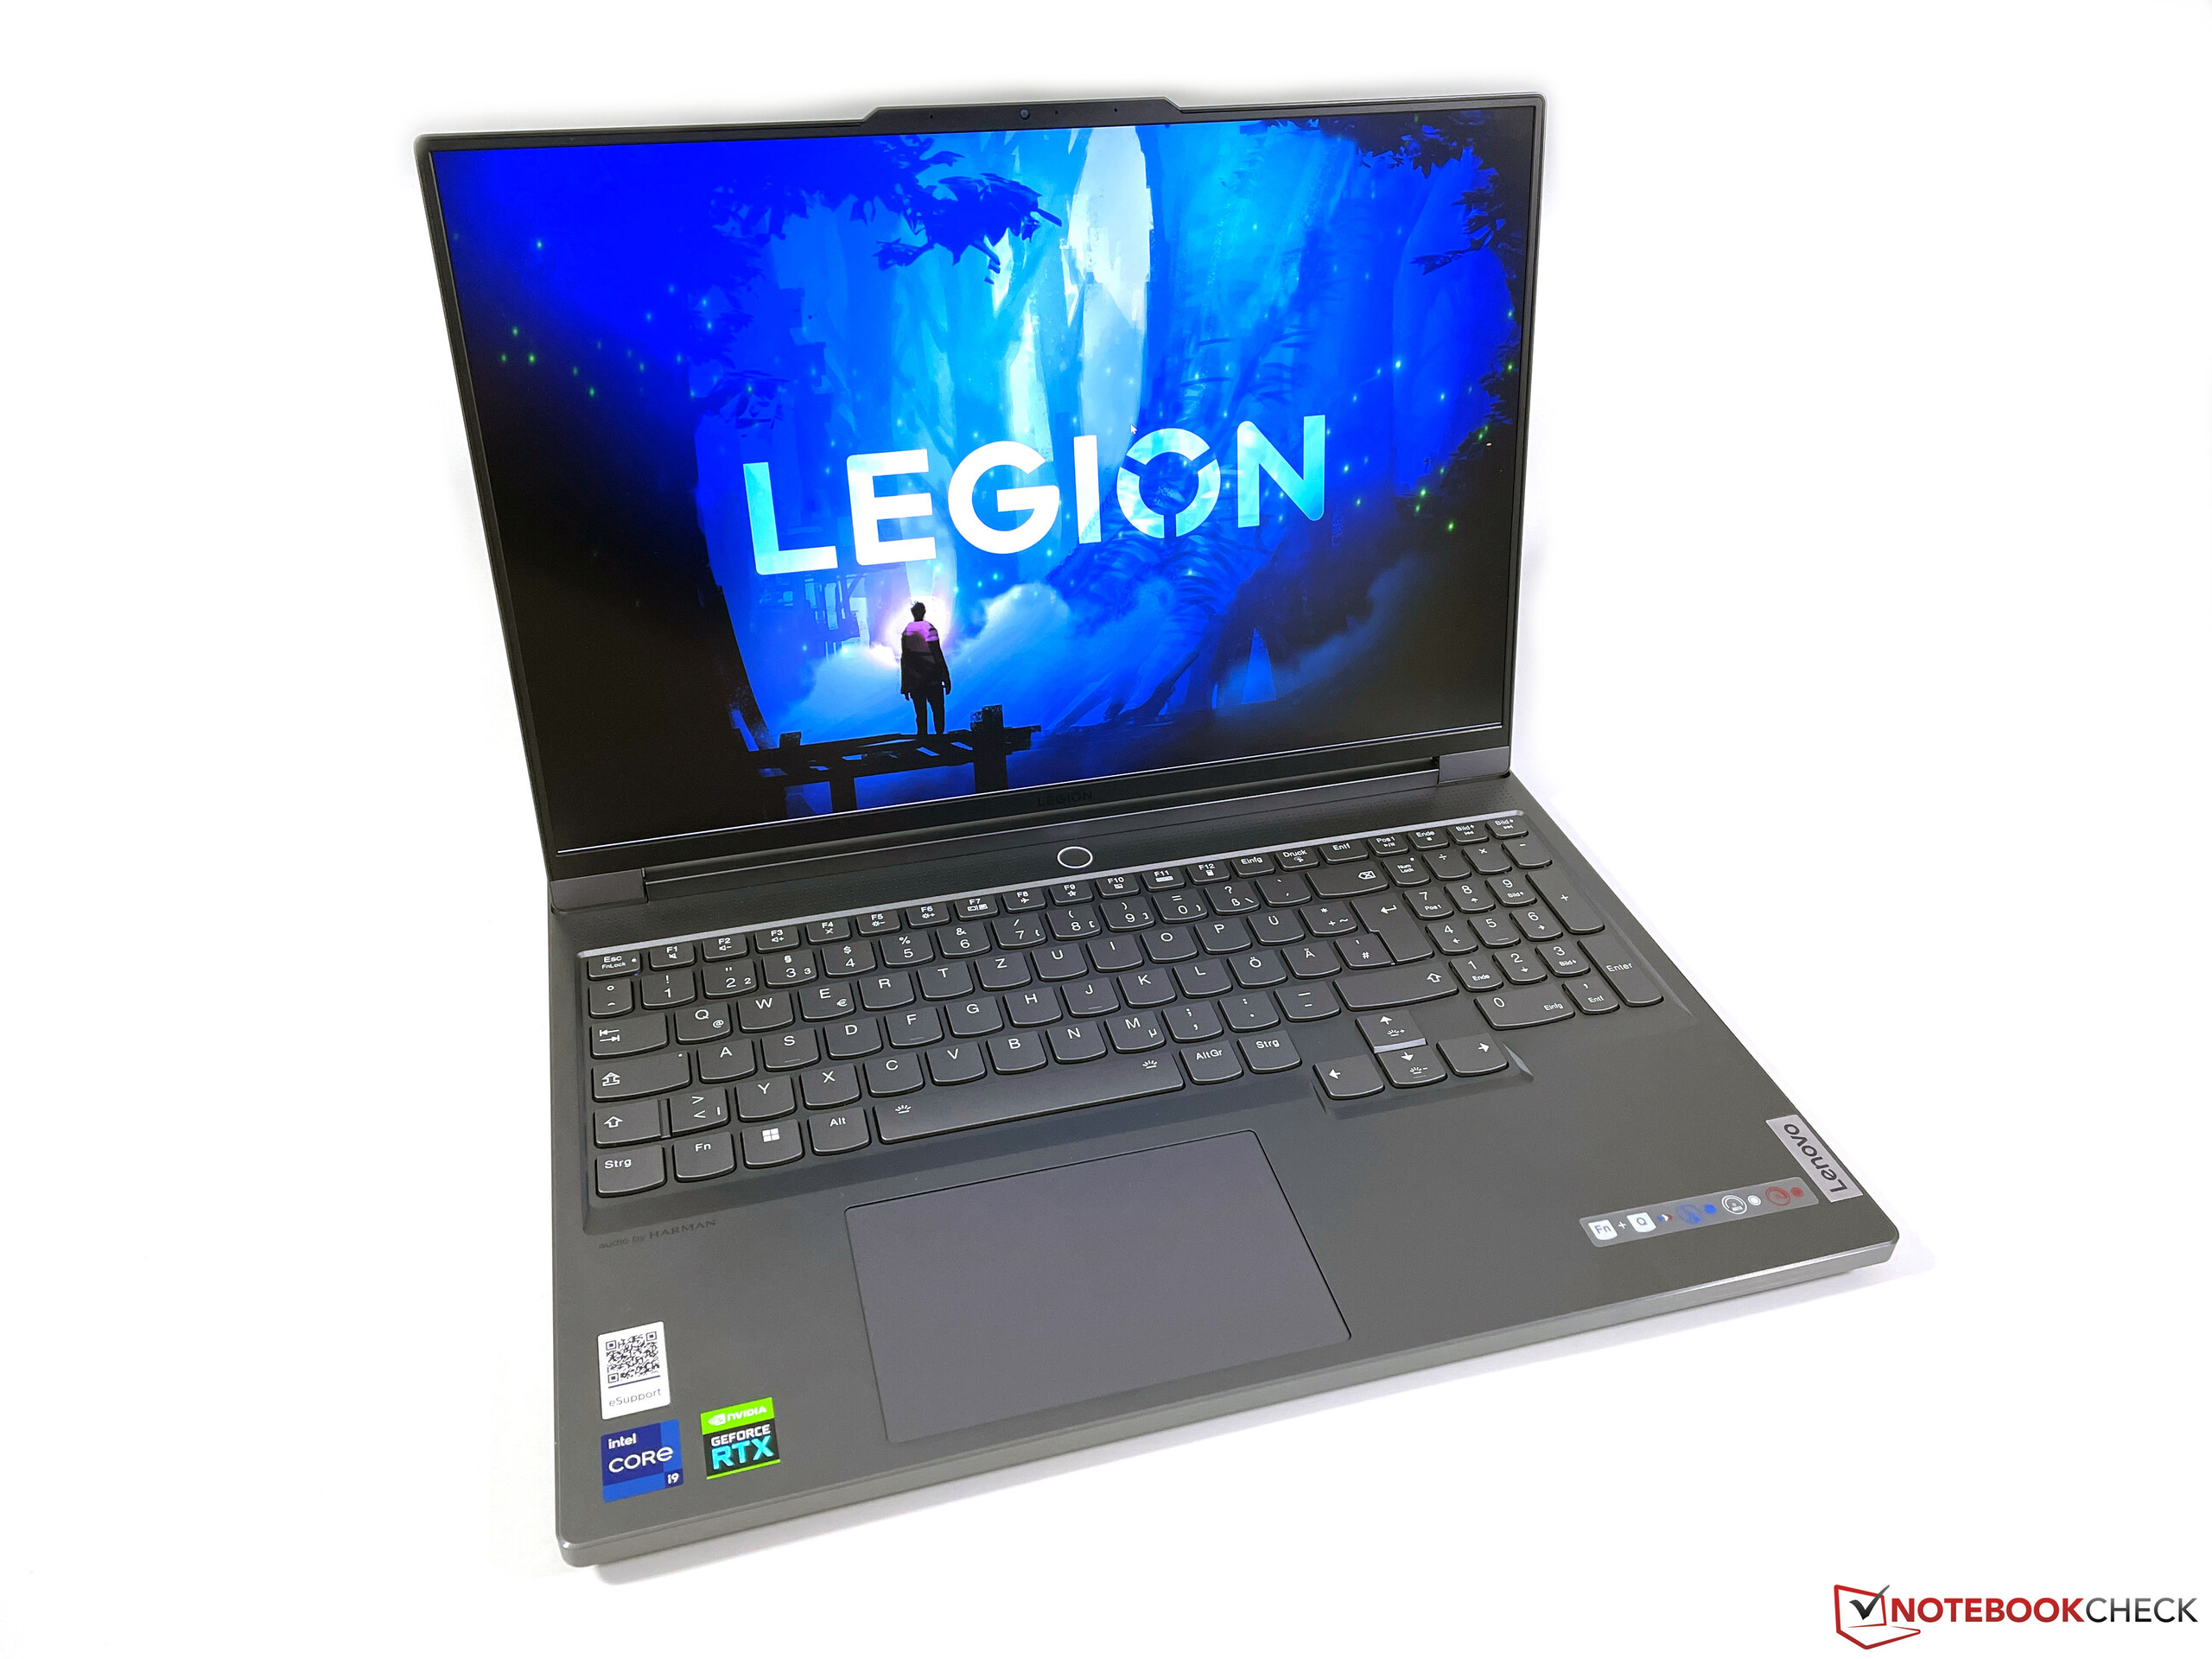
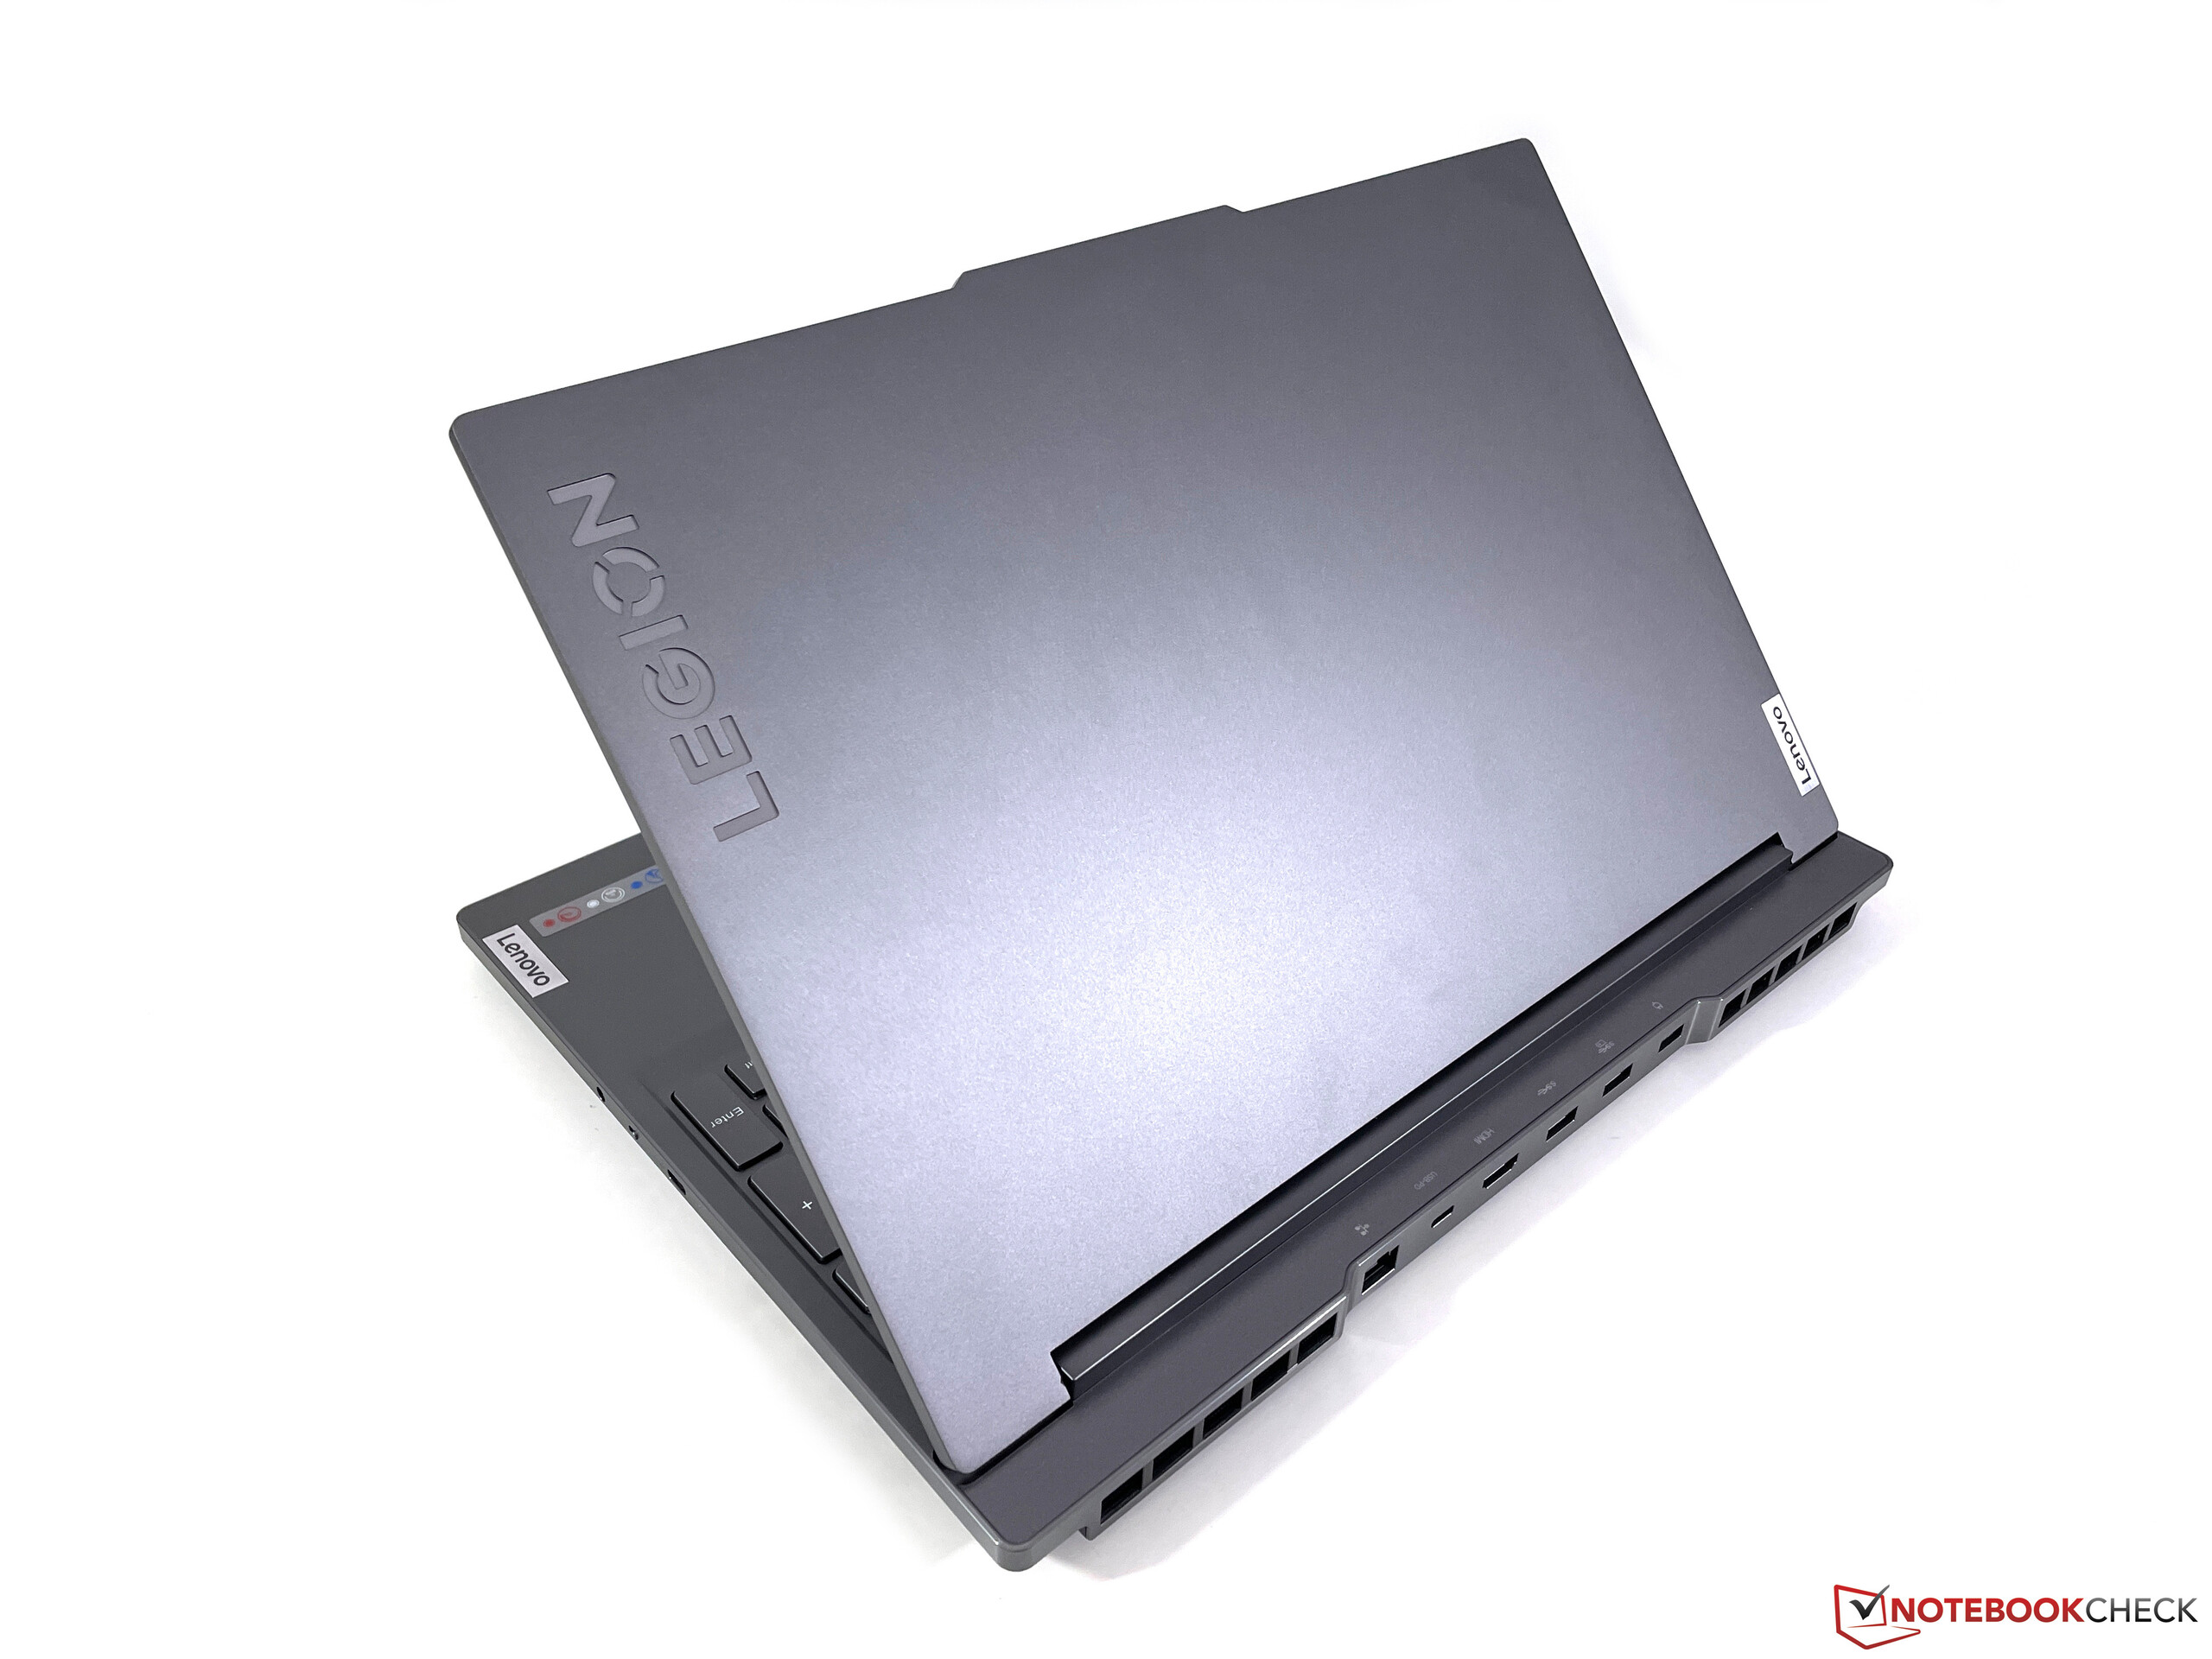
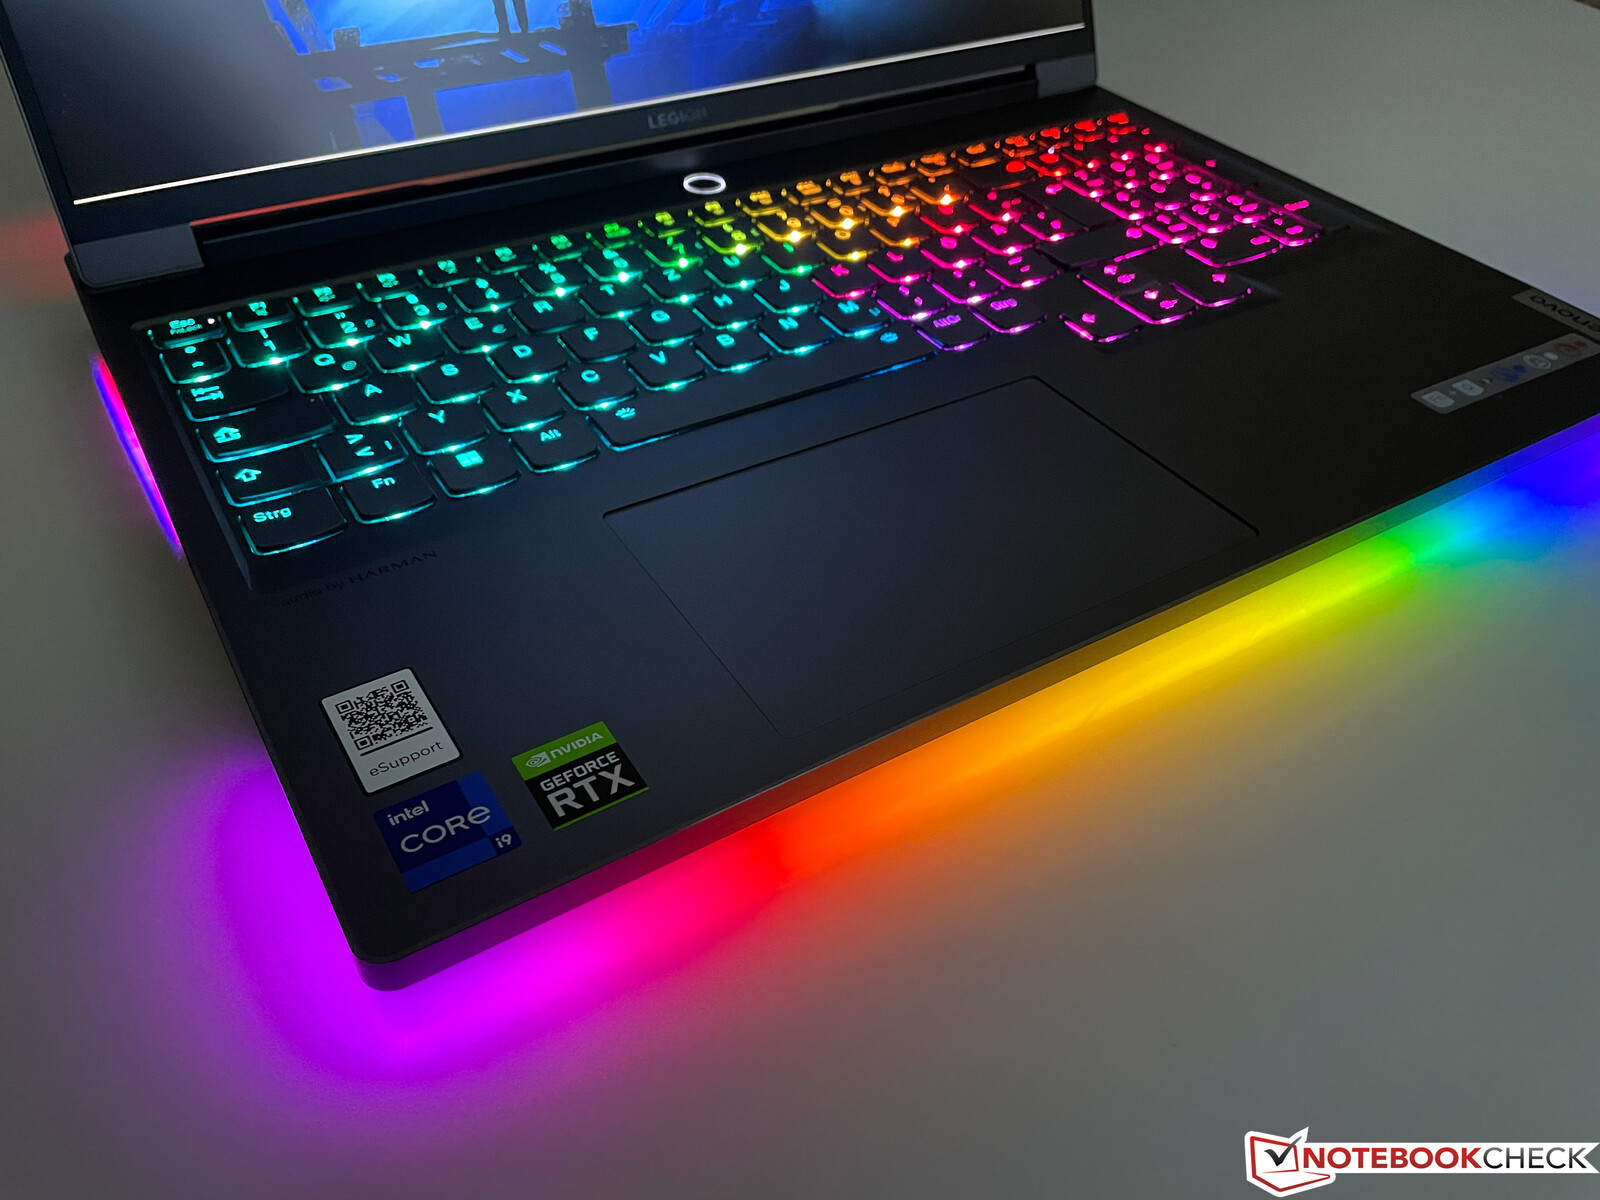
当大量的机箱照明亮起时,这种低调的外观很快就成为过去。除了基本单元前部的环形光条外,所有的风扇栅栏也有灯光效果,盖子上的Legion 标志也被照亮了。总共有七个不同的配置文件,但你也可以手动调整一切。
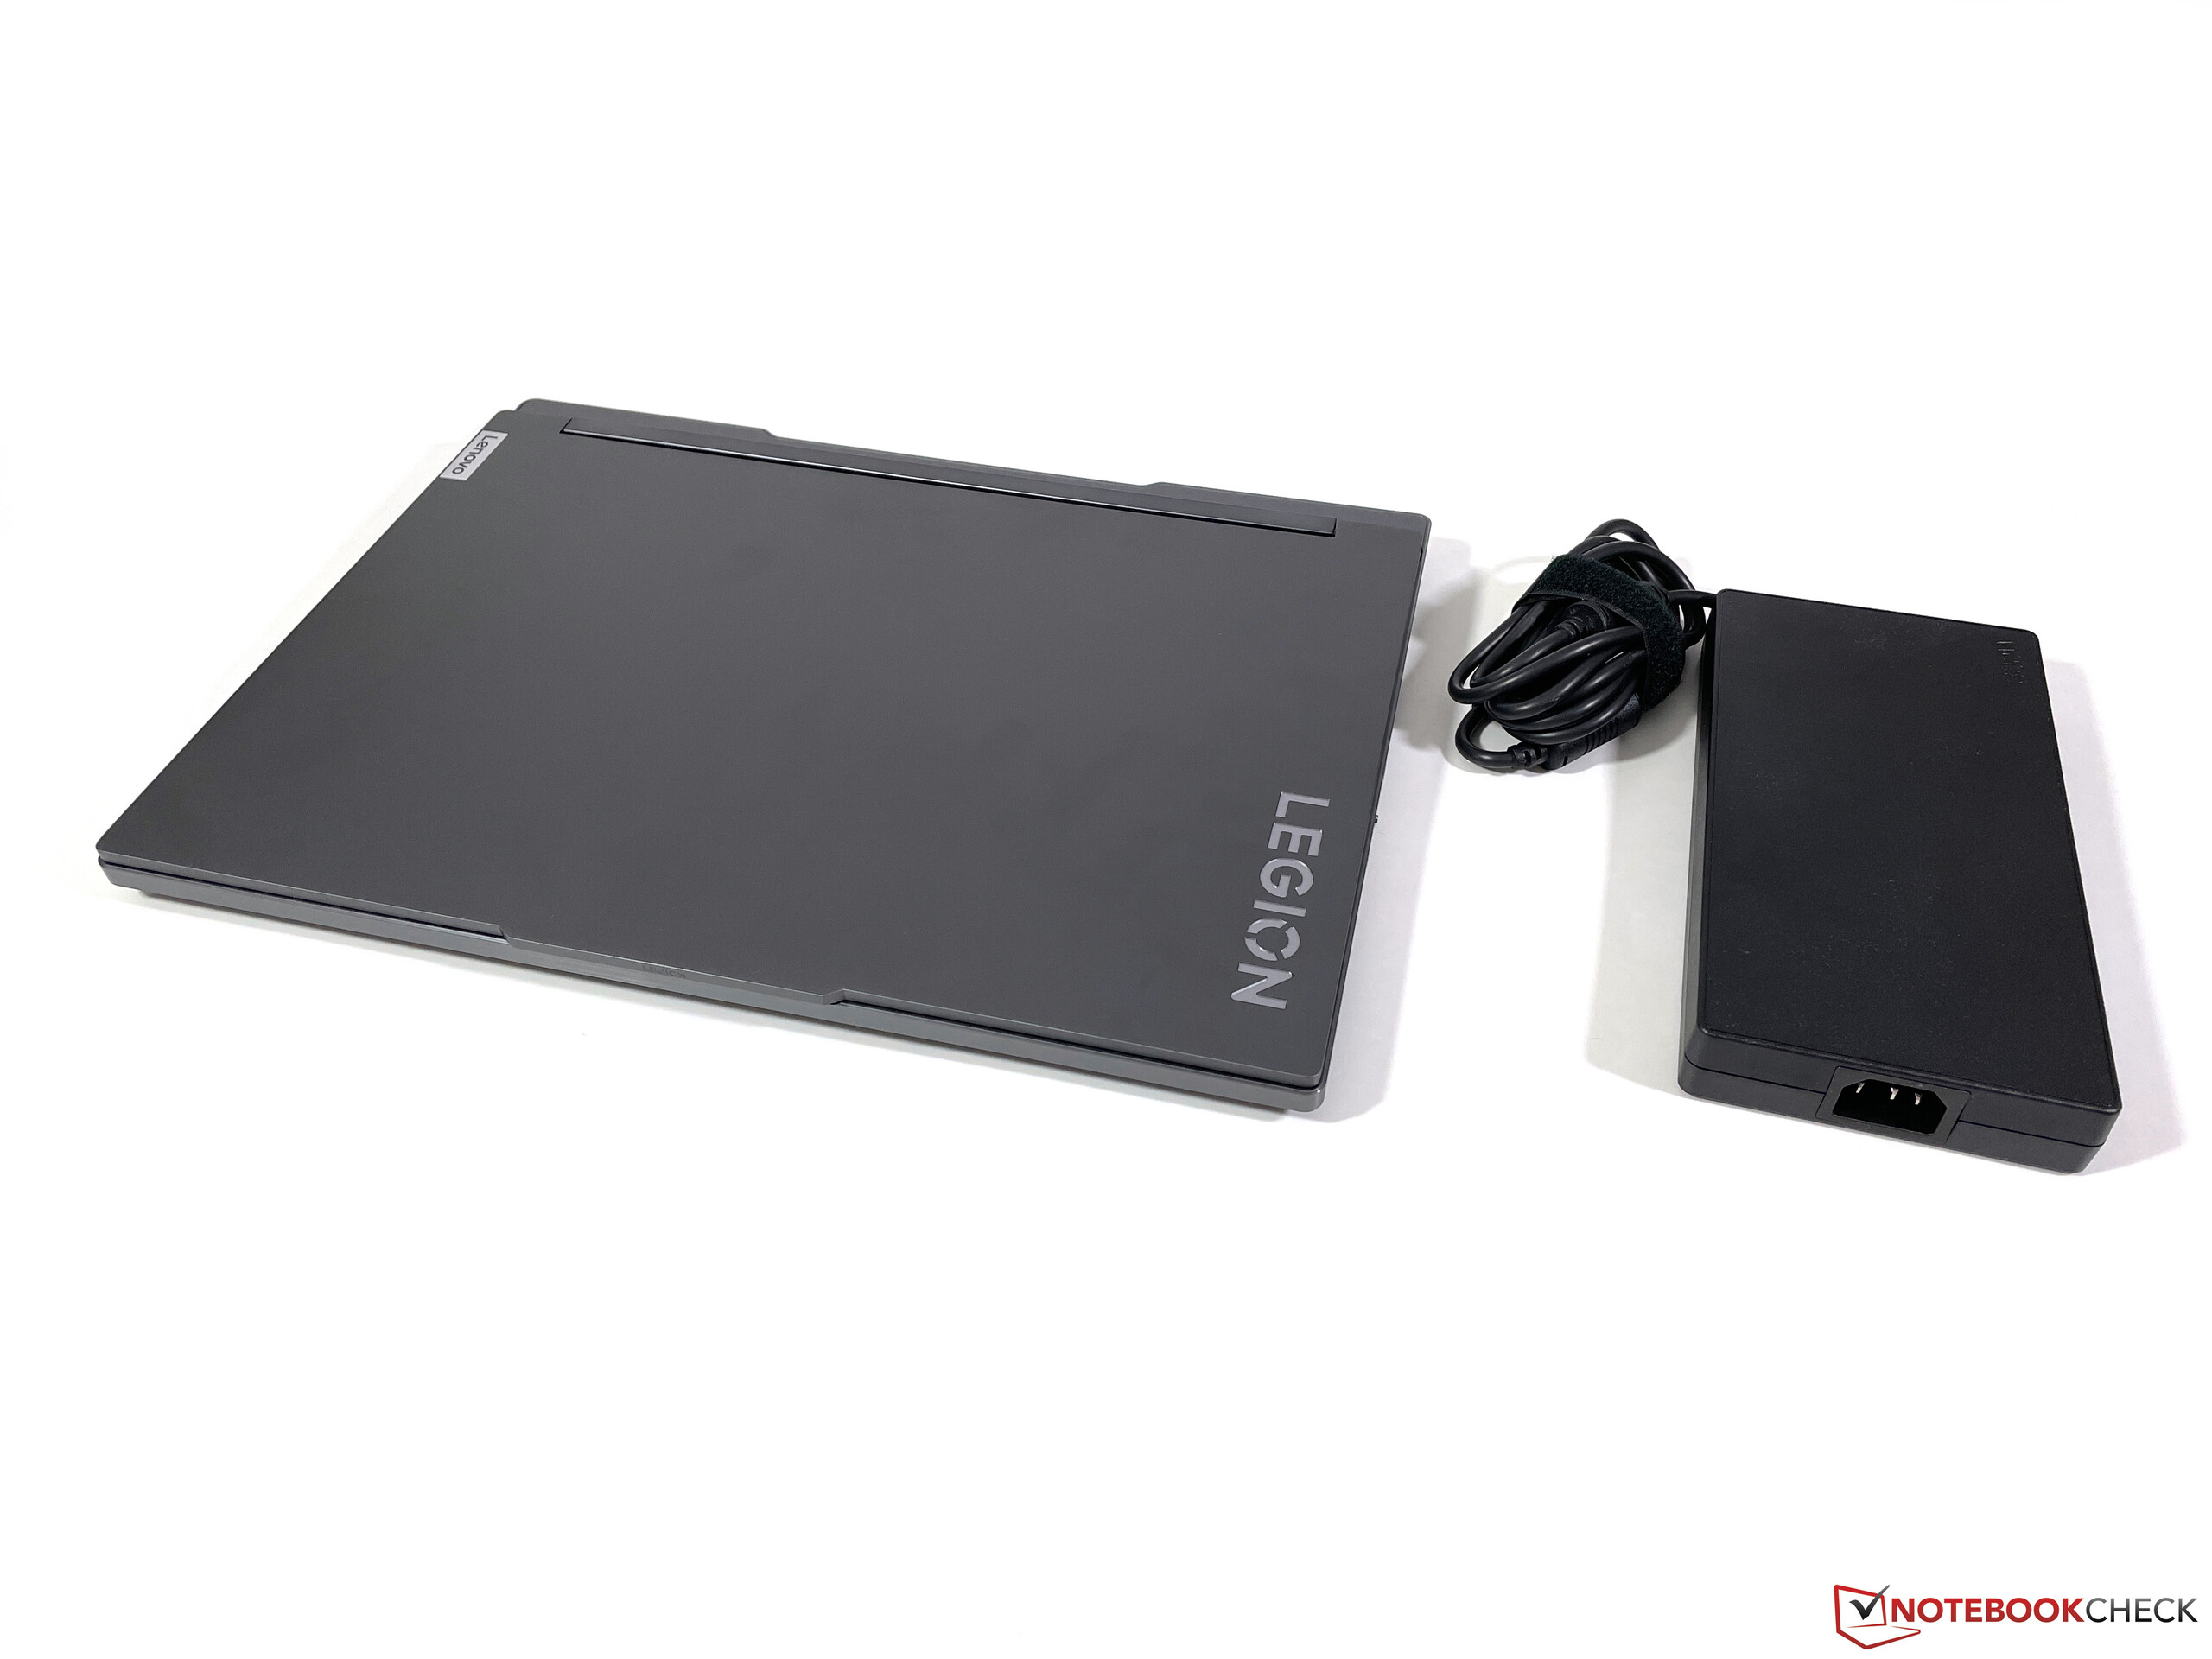
与华硕的两款16英寸机型一起,Legion 7 16是比较领域中最紧凑的机型之一。2.6公斤,它本身并不轻,但大多数竞争对手在这里也要重一点。然而,你不应该忘记笨重的300瓦电源适配器,它比一些超极本更重,超过一公斤。
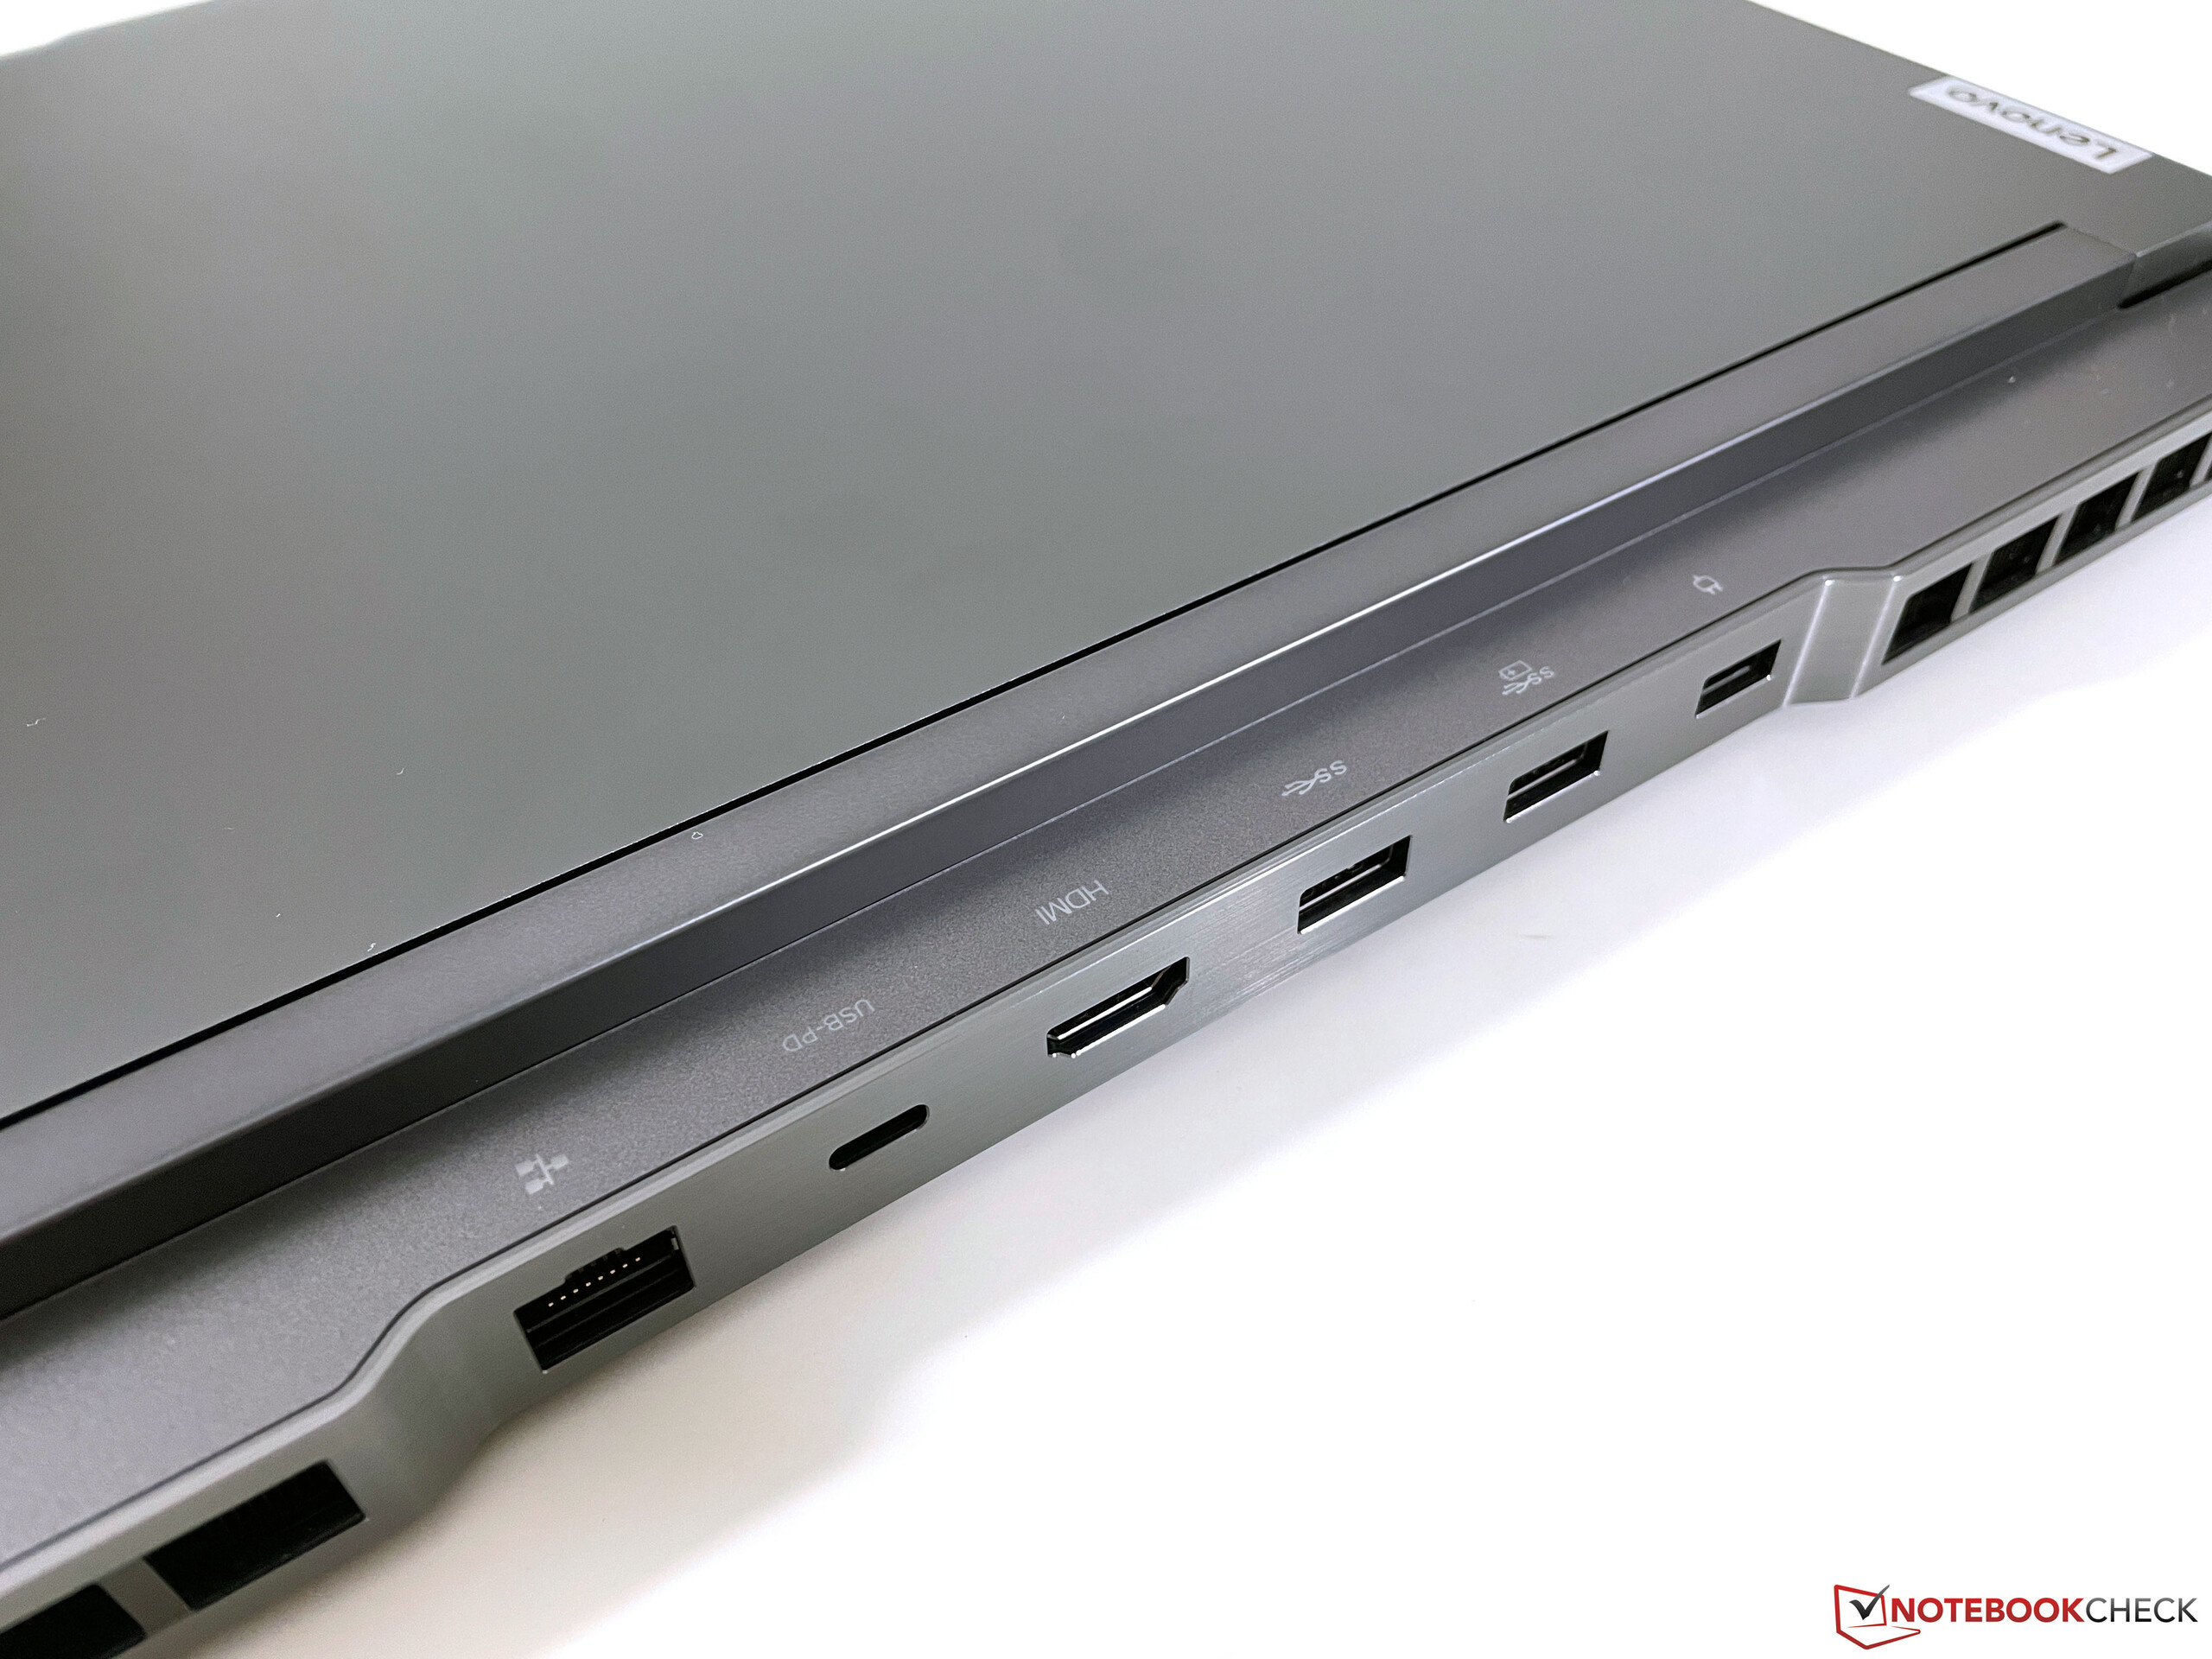
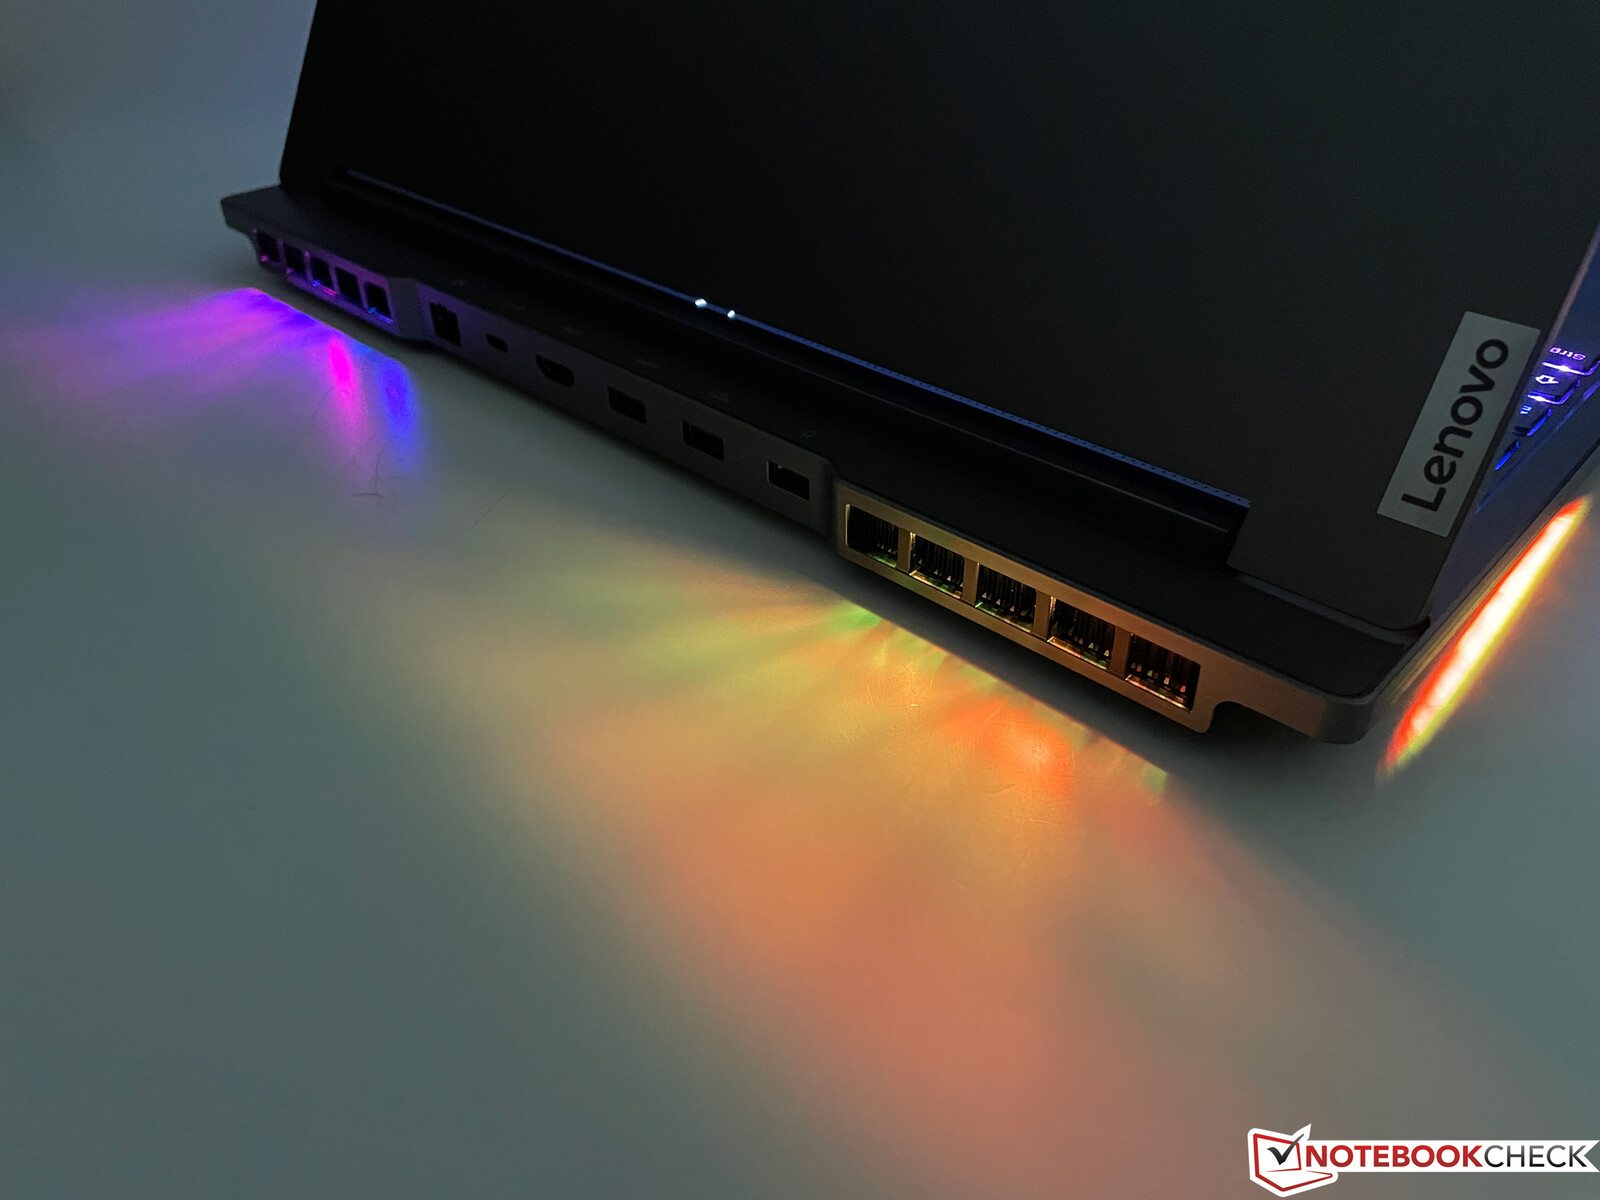
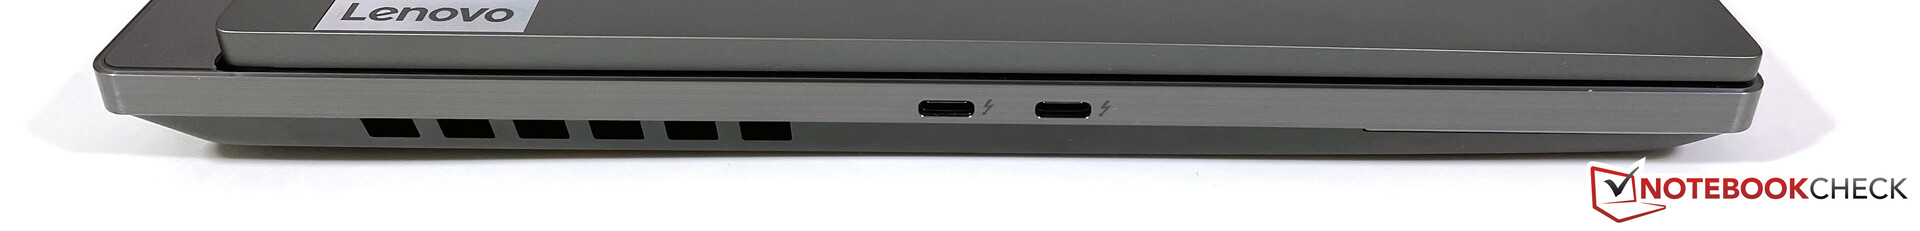
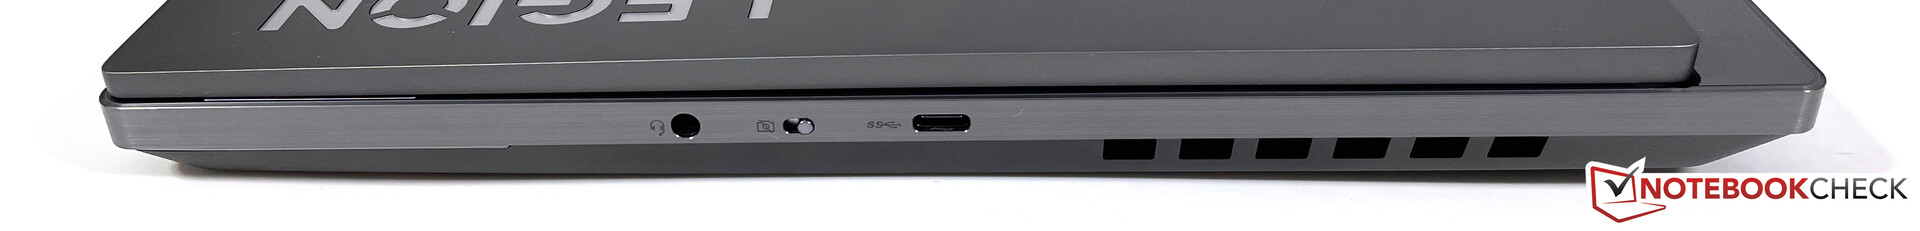
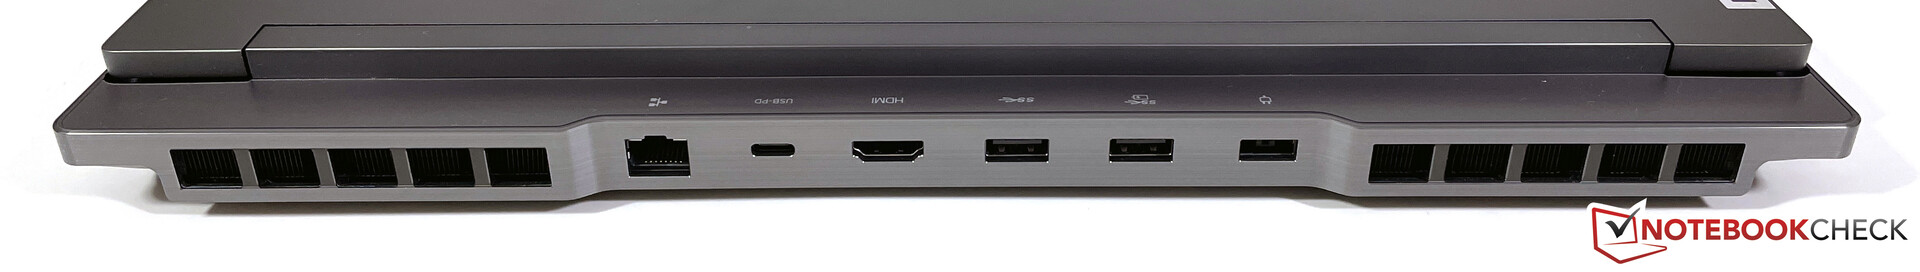
设备 - 带有2.5 GBit/s以太网和Thunderbolt 4的玩家
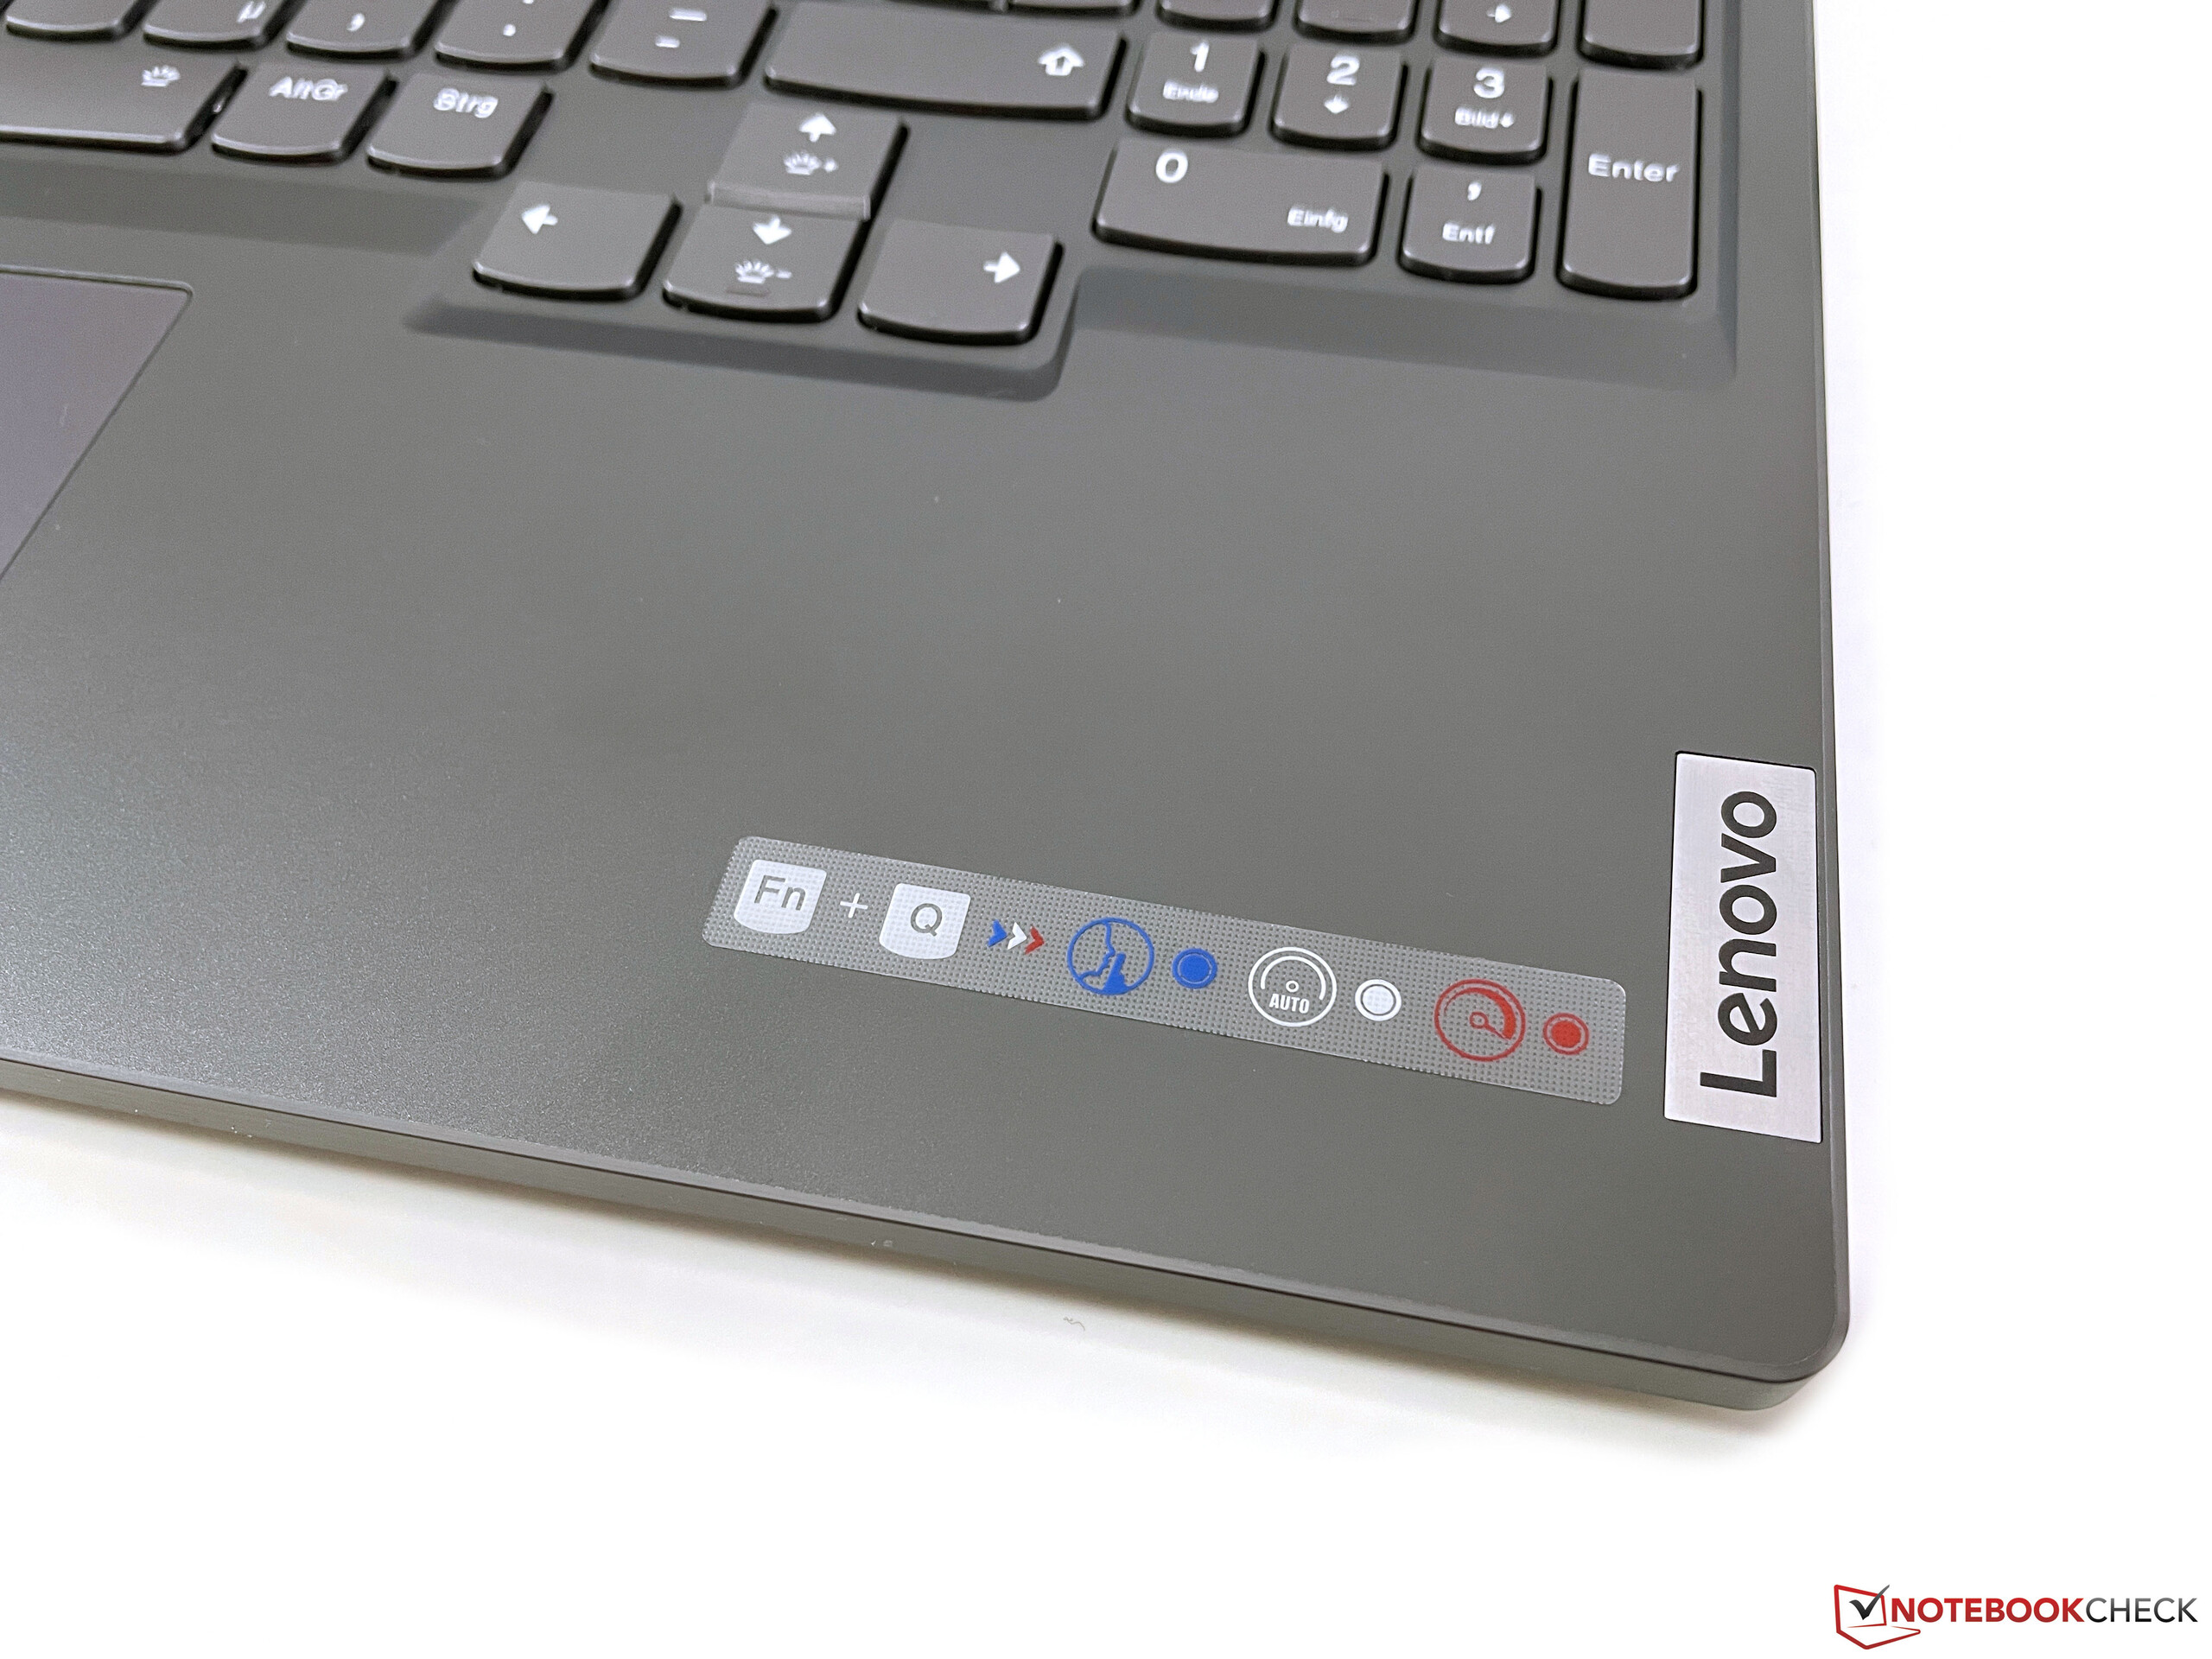
Legion 提供大量最新的接口,其中大部分位于背面。在底座的上侧有一些有用的标签,使插入电缆更容易。我们希望在侧面有一个标准的USB-A端口(例如用于U盘)以及一个读卡器,实际上有足够的空间用于此。
沟通
除了快速的2.5Gbit/s以太网端口外,Legion 7 16还提供了一个非常现代的WLAN模块(Wi-Fi 6E),包括对现代6GHz网络以及蓝牙5.2的支持。在我们用华硕参考路由器进行的标准化WLAN测试中,杀手AX1675i实现了非常高和稳定的传输速率,我们能够毫无问题地连接到6GHz网络。
网络摄像头
联想在上层显示框中安装了一个1080p网络摄像头,可以通过机箱右侧的开关停用。图像质量比720p的模块略好。总的来说,网络摄像头达到了它的目的。没有红外传感器用于通过Windows Hello进行面部识别。


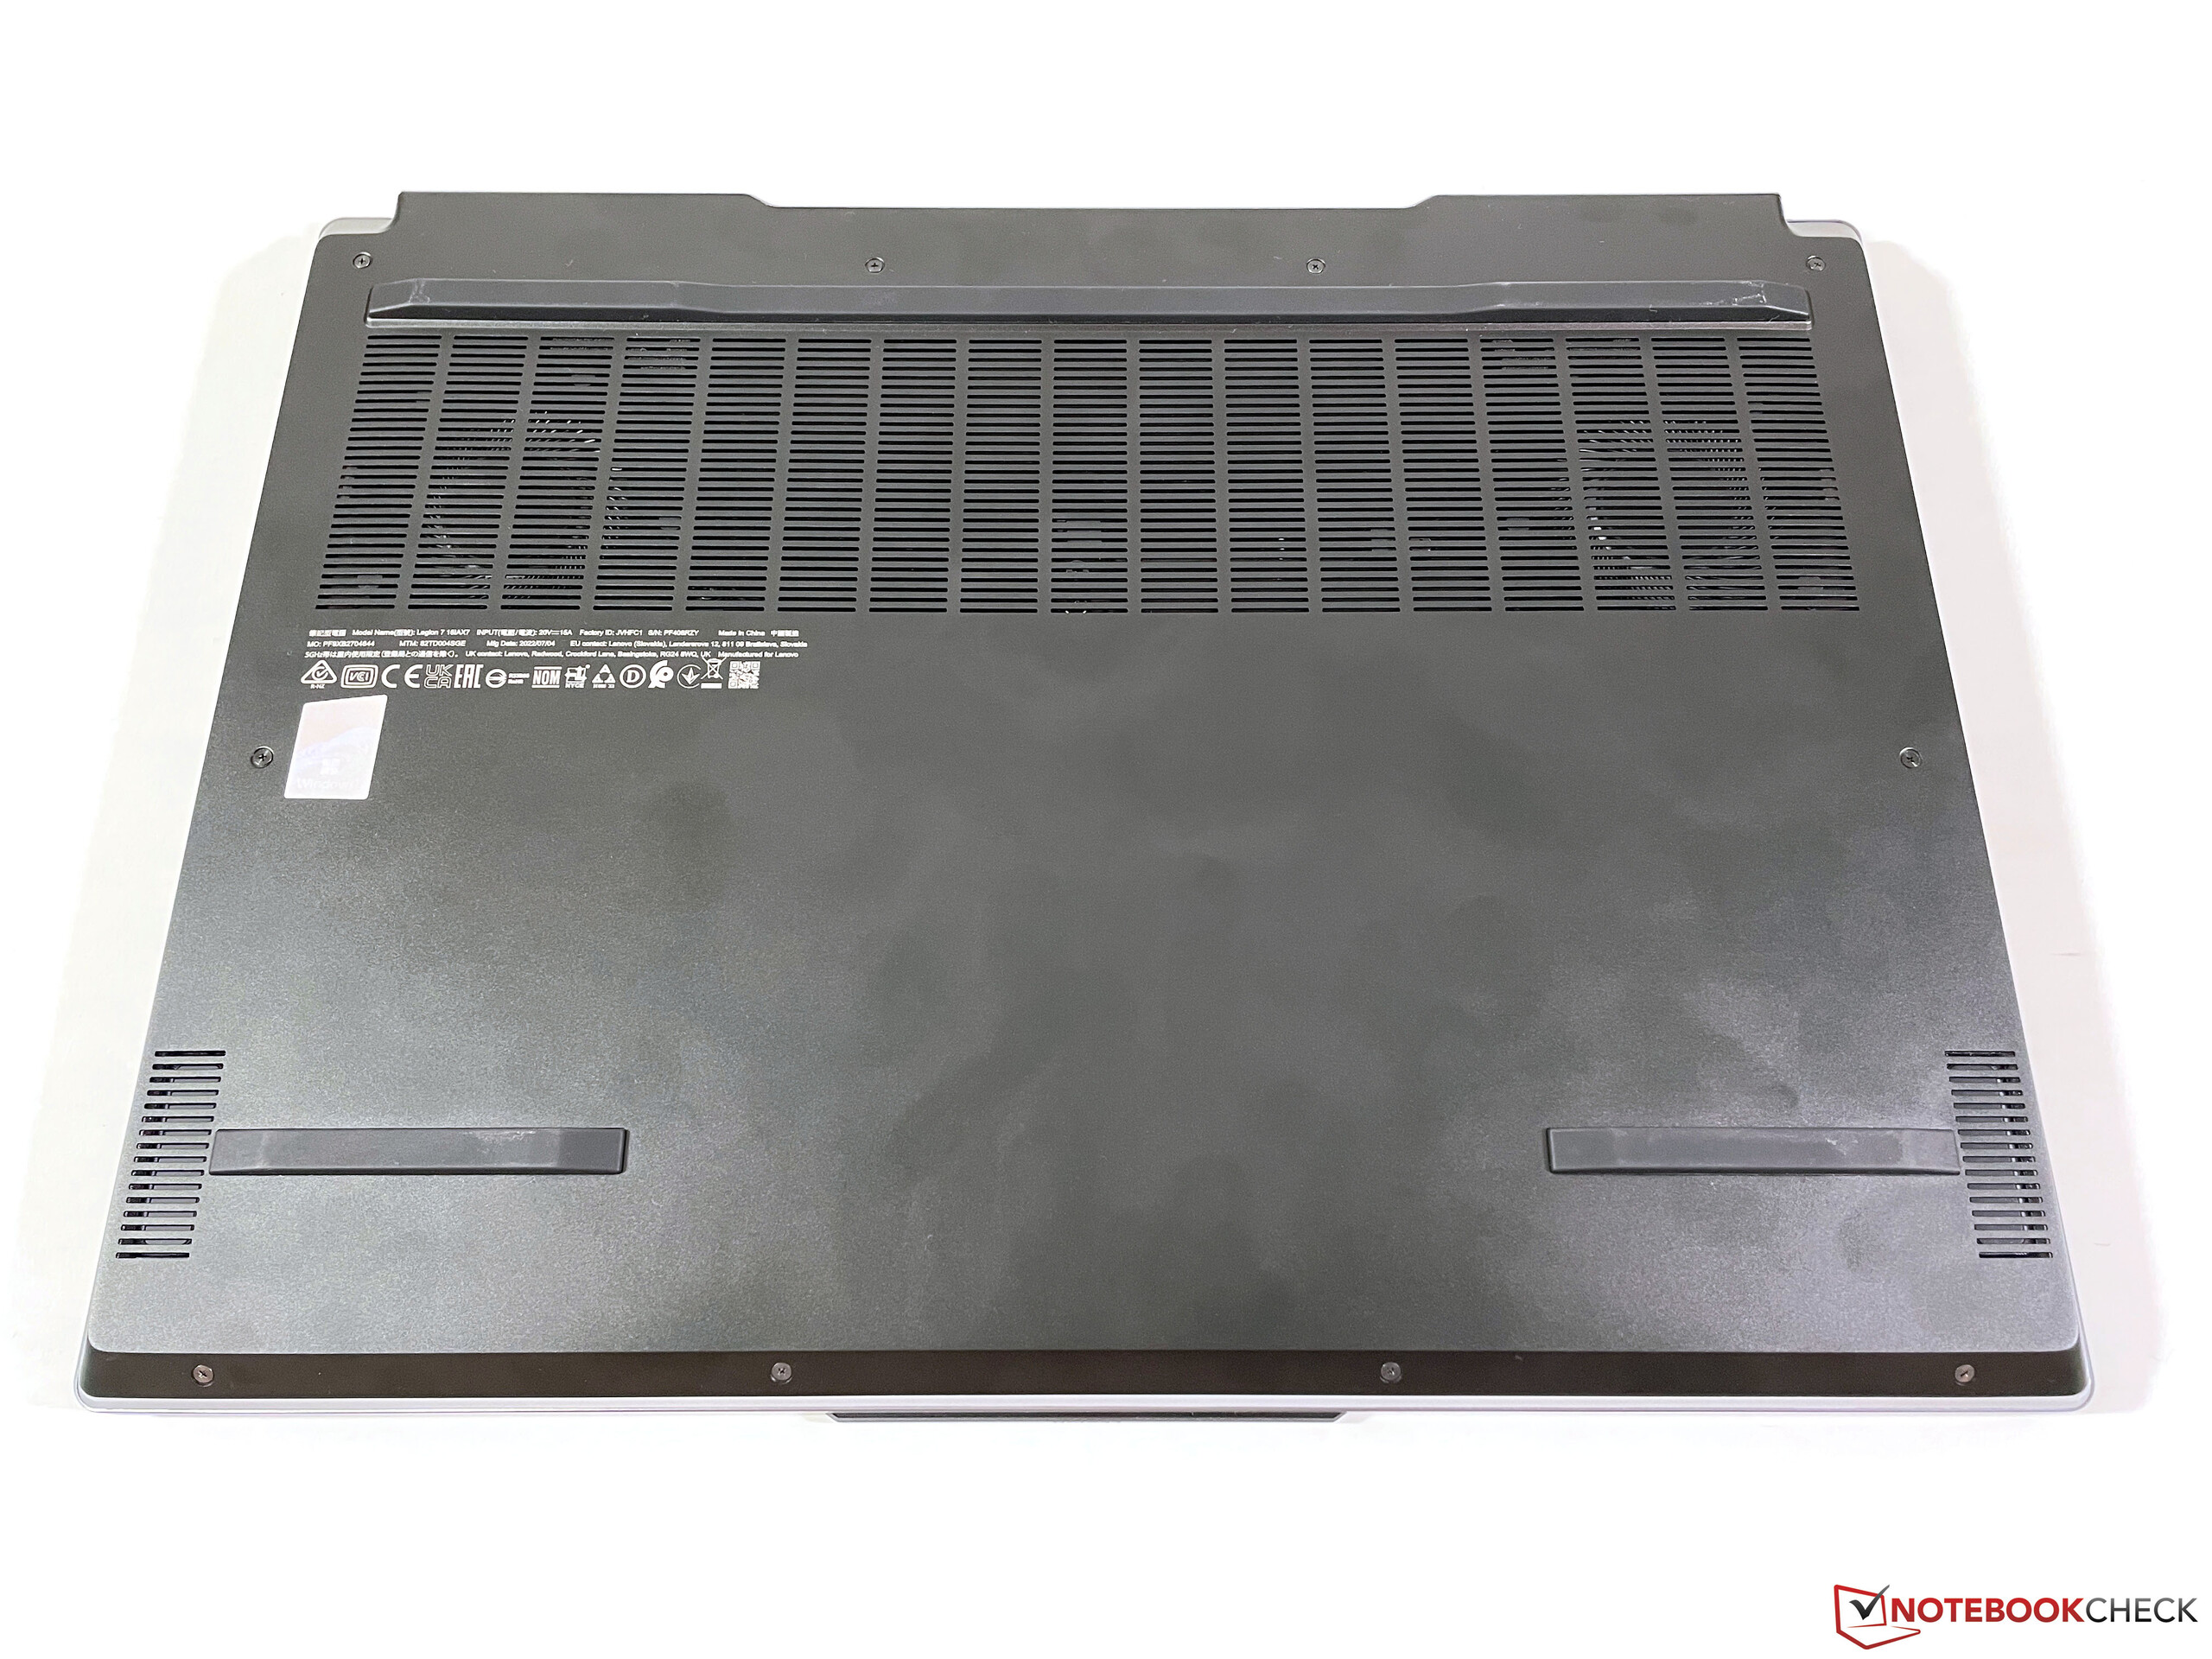
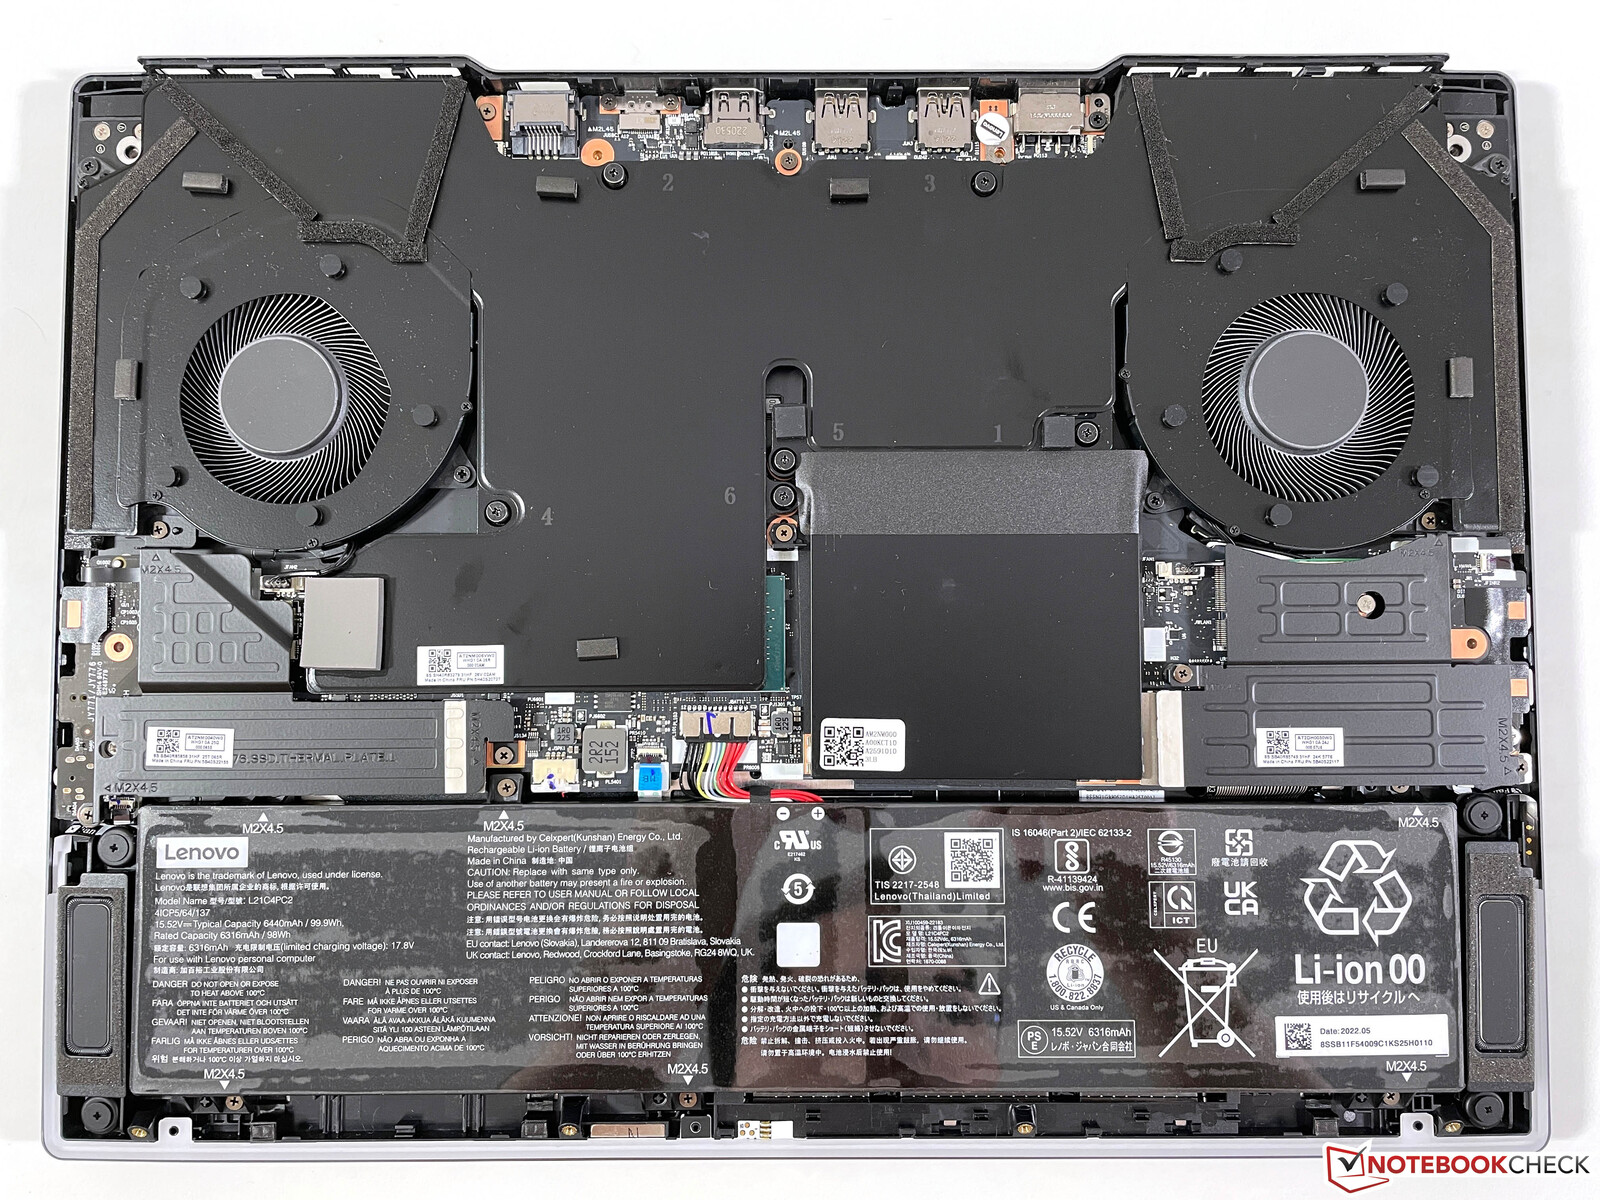
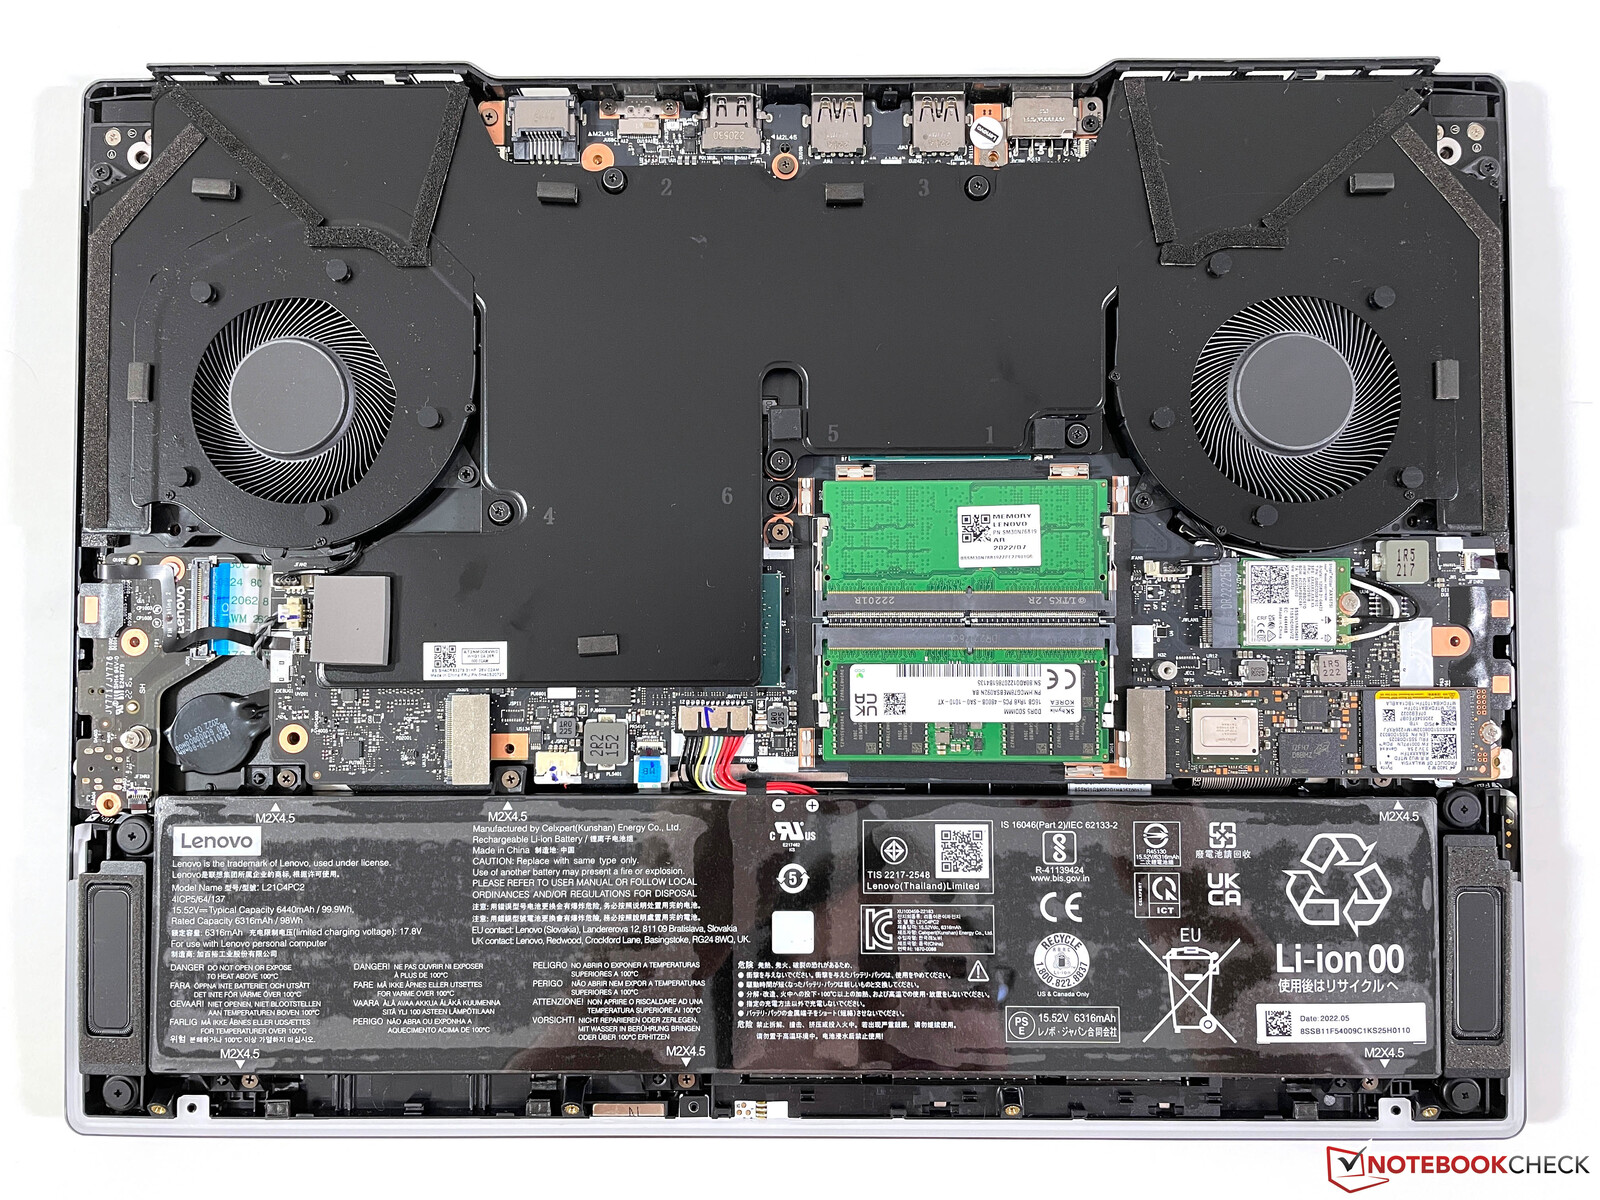
维护
底板用六个十字螺丝固定,松开螺丝后仍然非常紧,这就是为什么最好用吸盘来松开底板。在内部,风扇可以被清洁,你可以接触到两个内存插槽、WLAN模块和两个M.2-2280 SSD插槽。然而,为此必须拆除其他盖子,其中一些盖子还用螺丝固定。
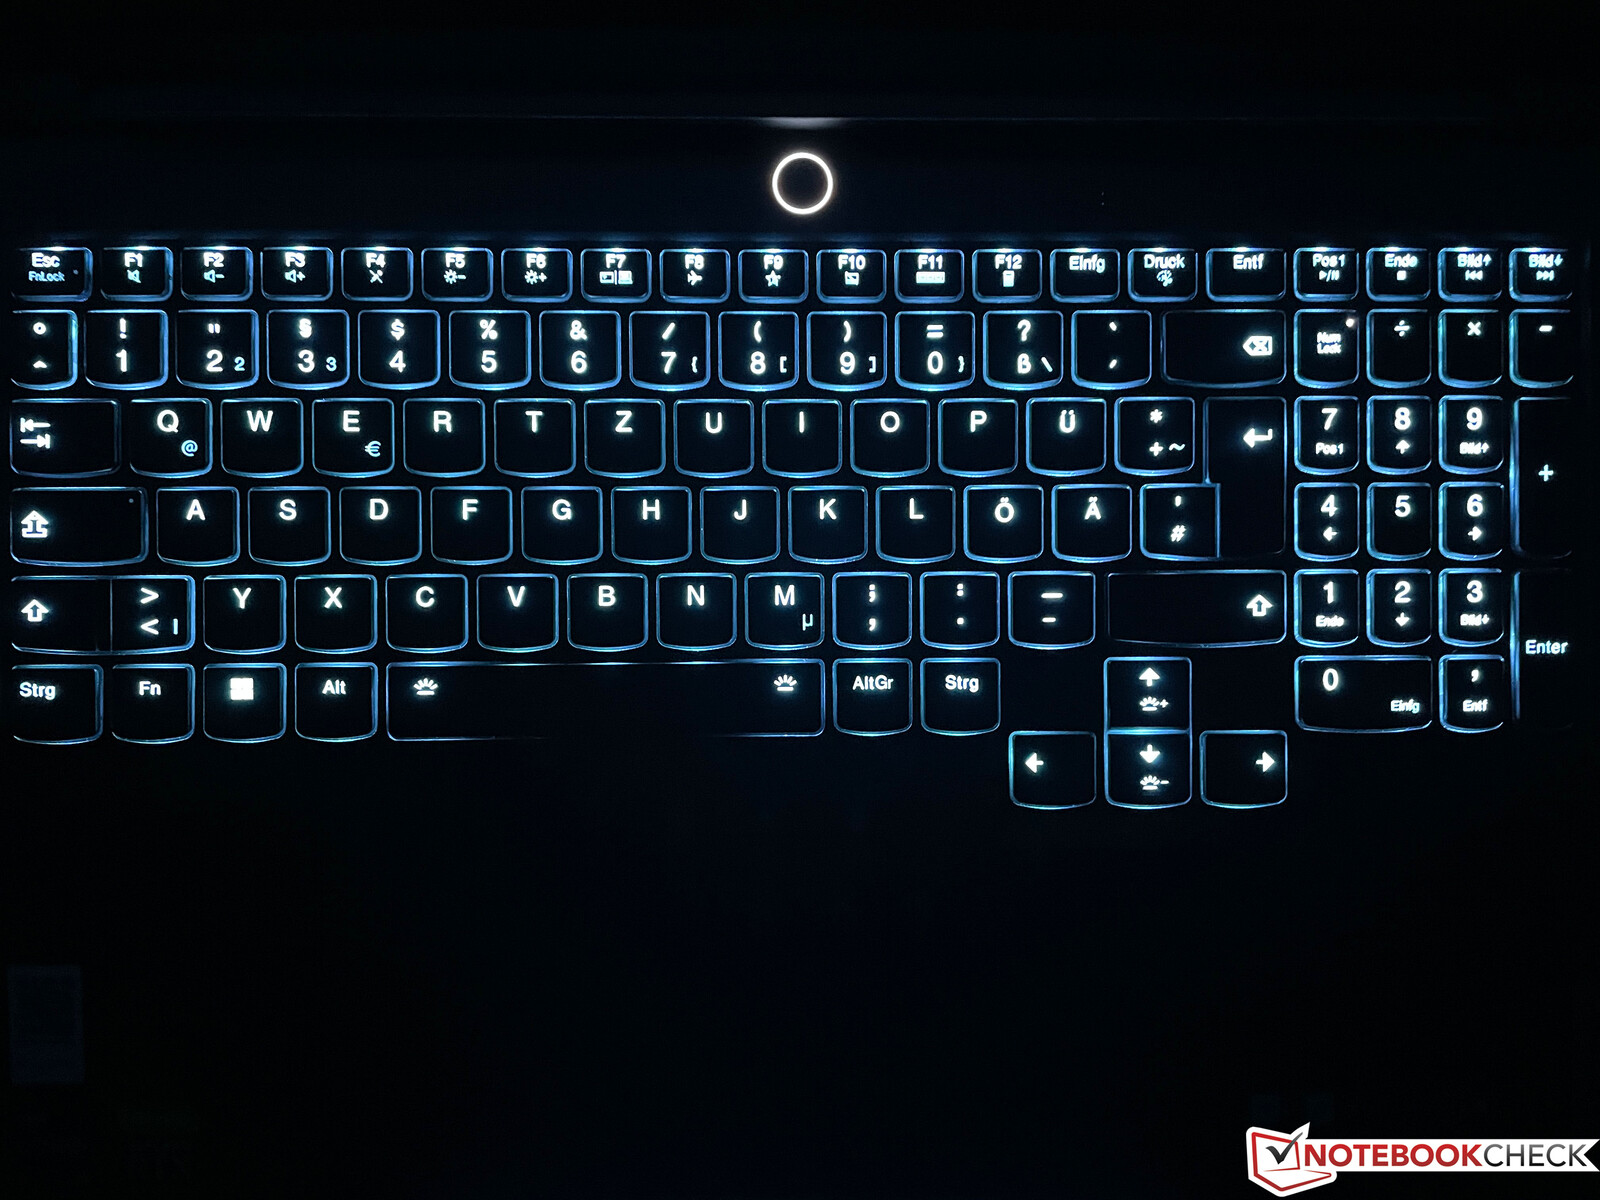
输入设备 - 联想安装单键照明系统
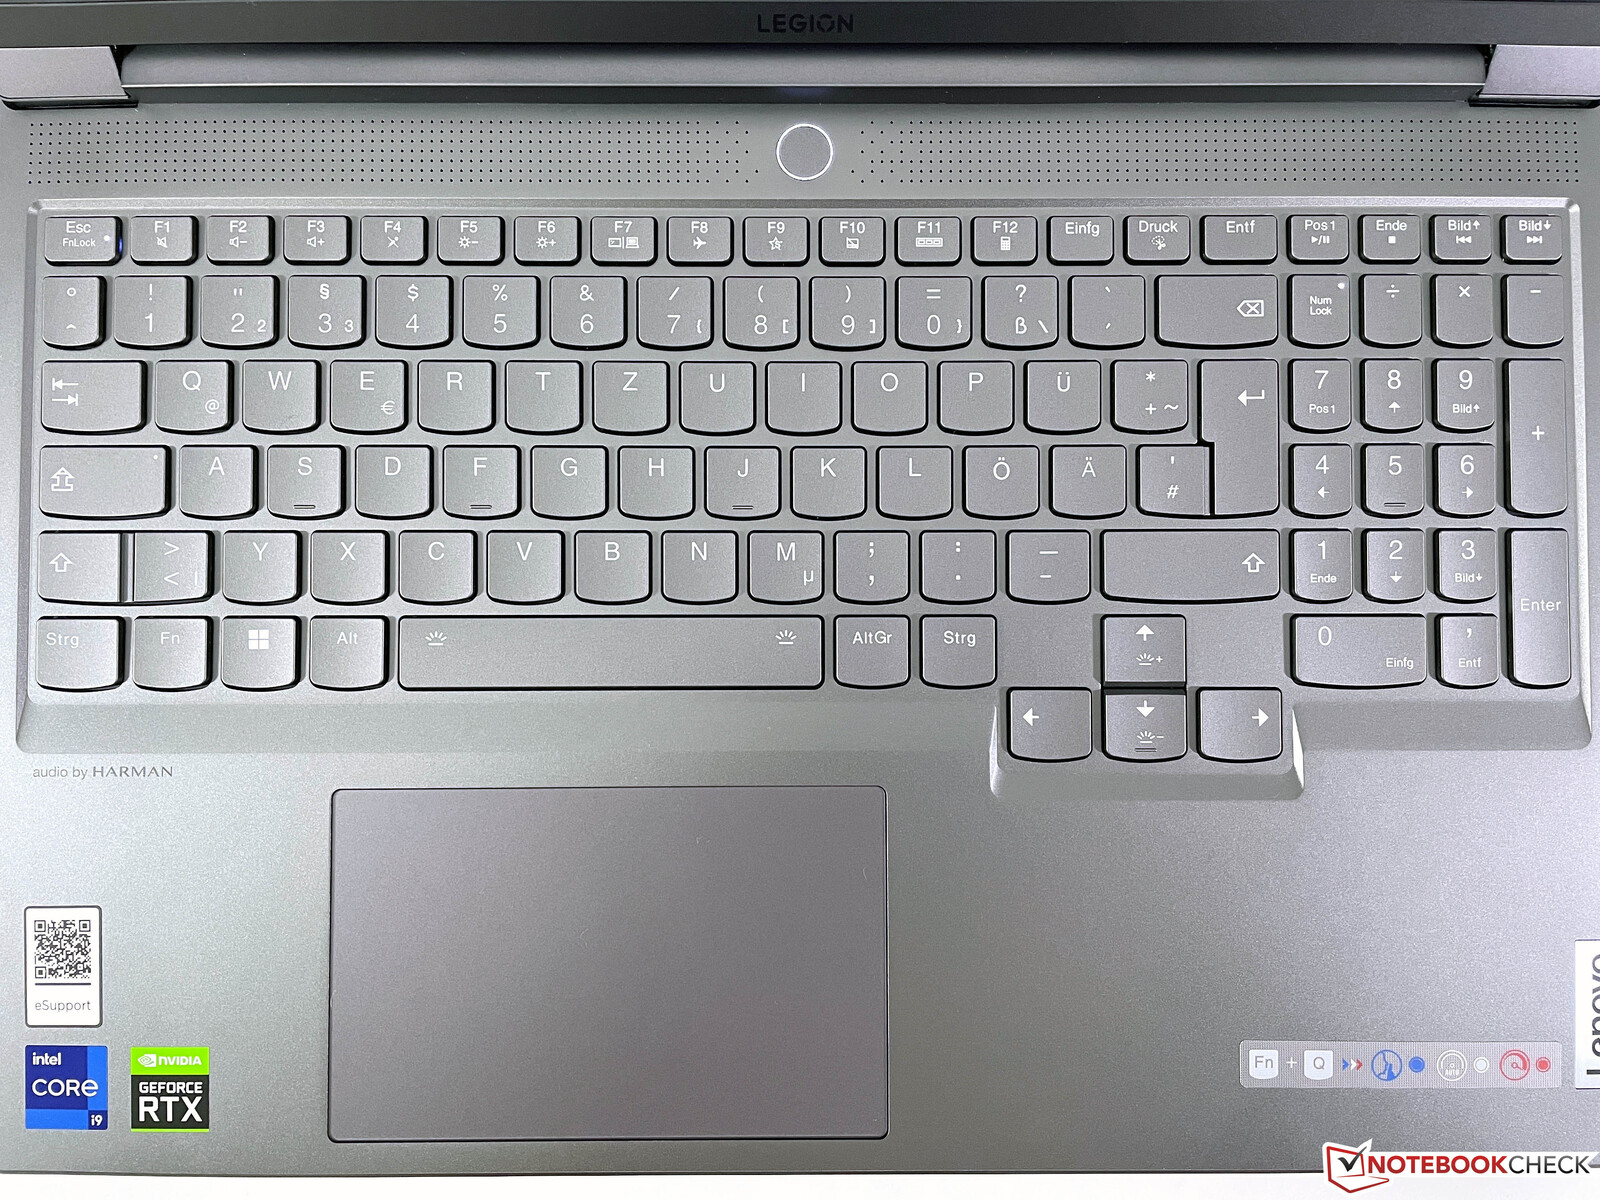
带有专用数字键盘的键盘总体上提供了体面的质量,有足够的键程,但仍有改进的余地。键位有时看起来有点摇摇欲坠,而空格键和回车键的声音相对较大。其他游戏笔记本电脑在这方面略胜一筹。对键盘照明没有任何批评,它可以为每个键单独配置,你可以在这里让你的创造力尽情发挥。
大型点击板(12 x 7.5厘米)在基本单元中略微向左偏移,正常的指针控制效果很好。只有在点击下部区域时,噪音才会相当大。反正大多数用户都会使用外部鼠标进行游戏。
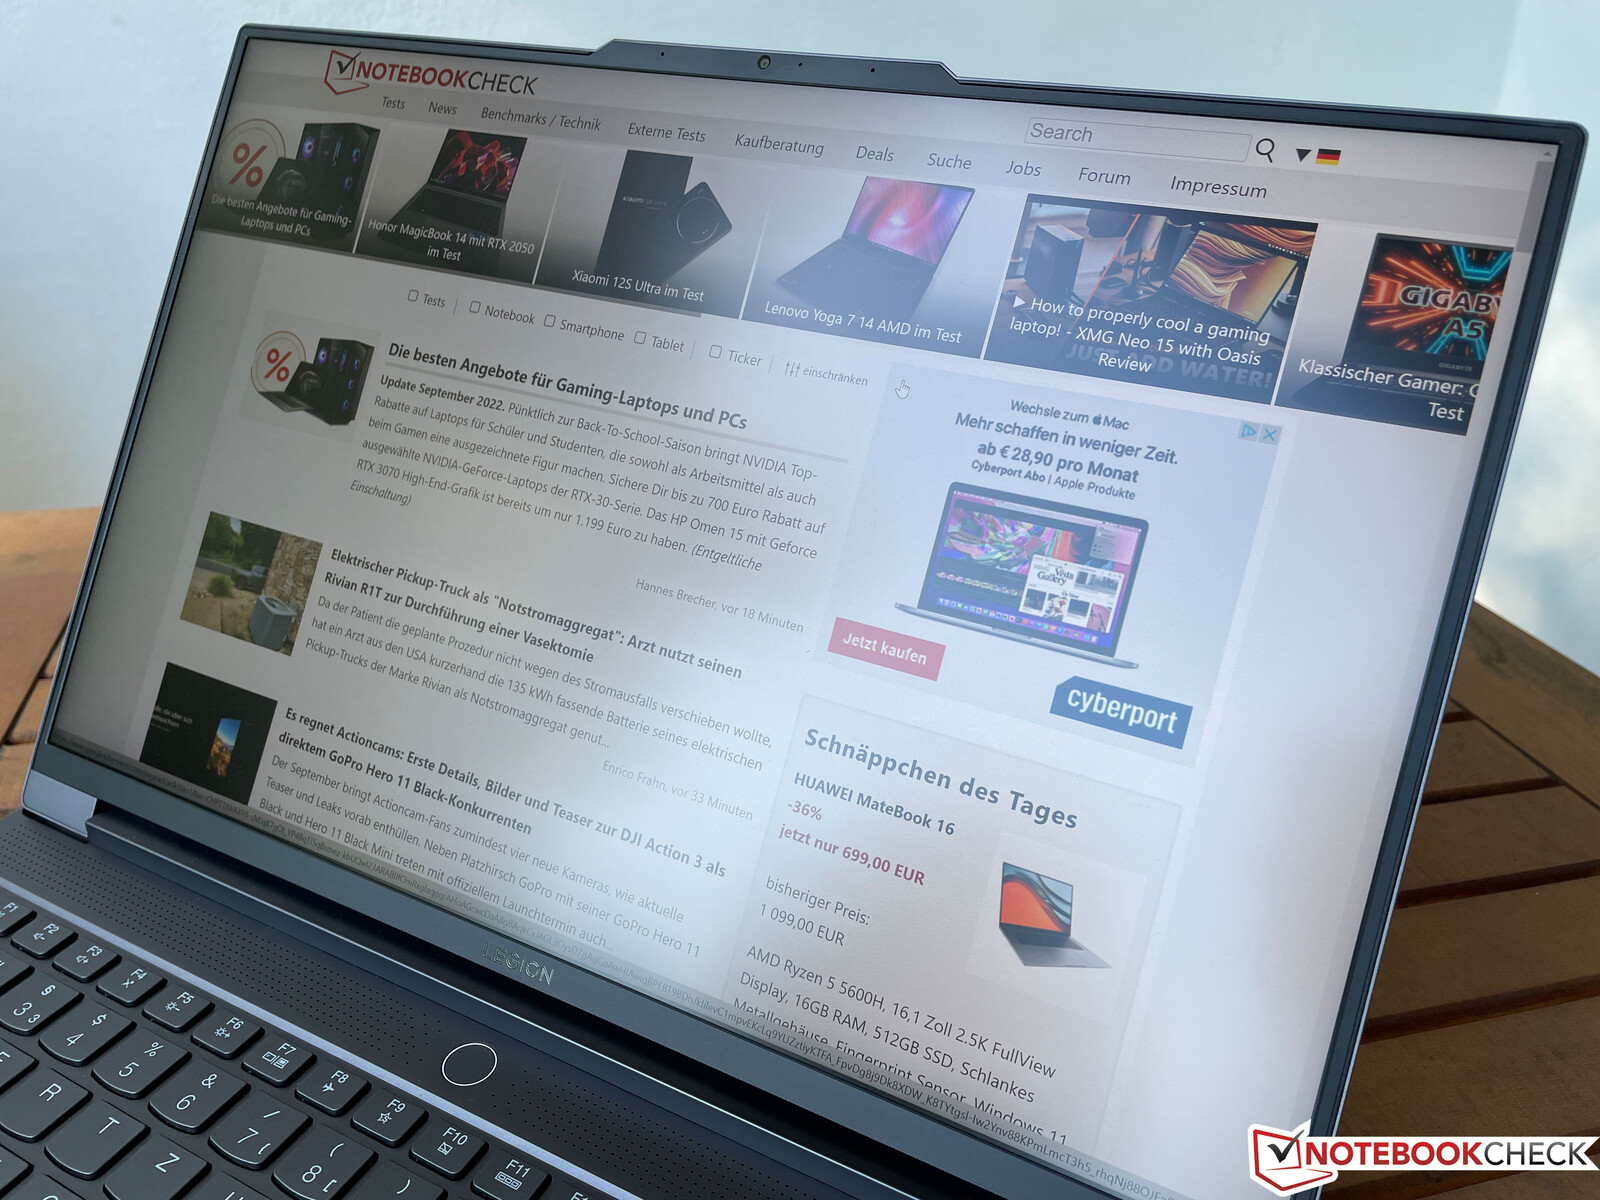
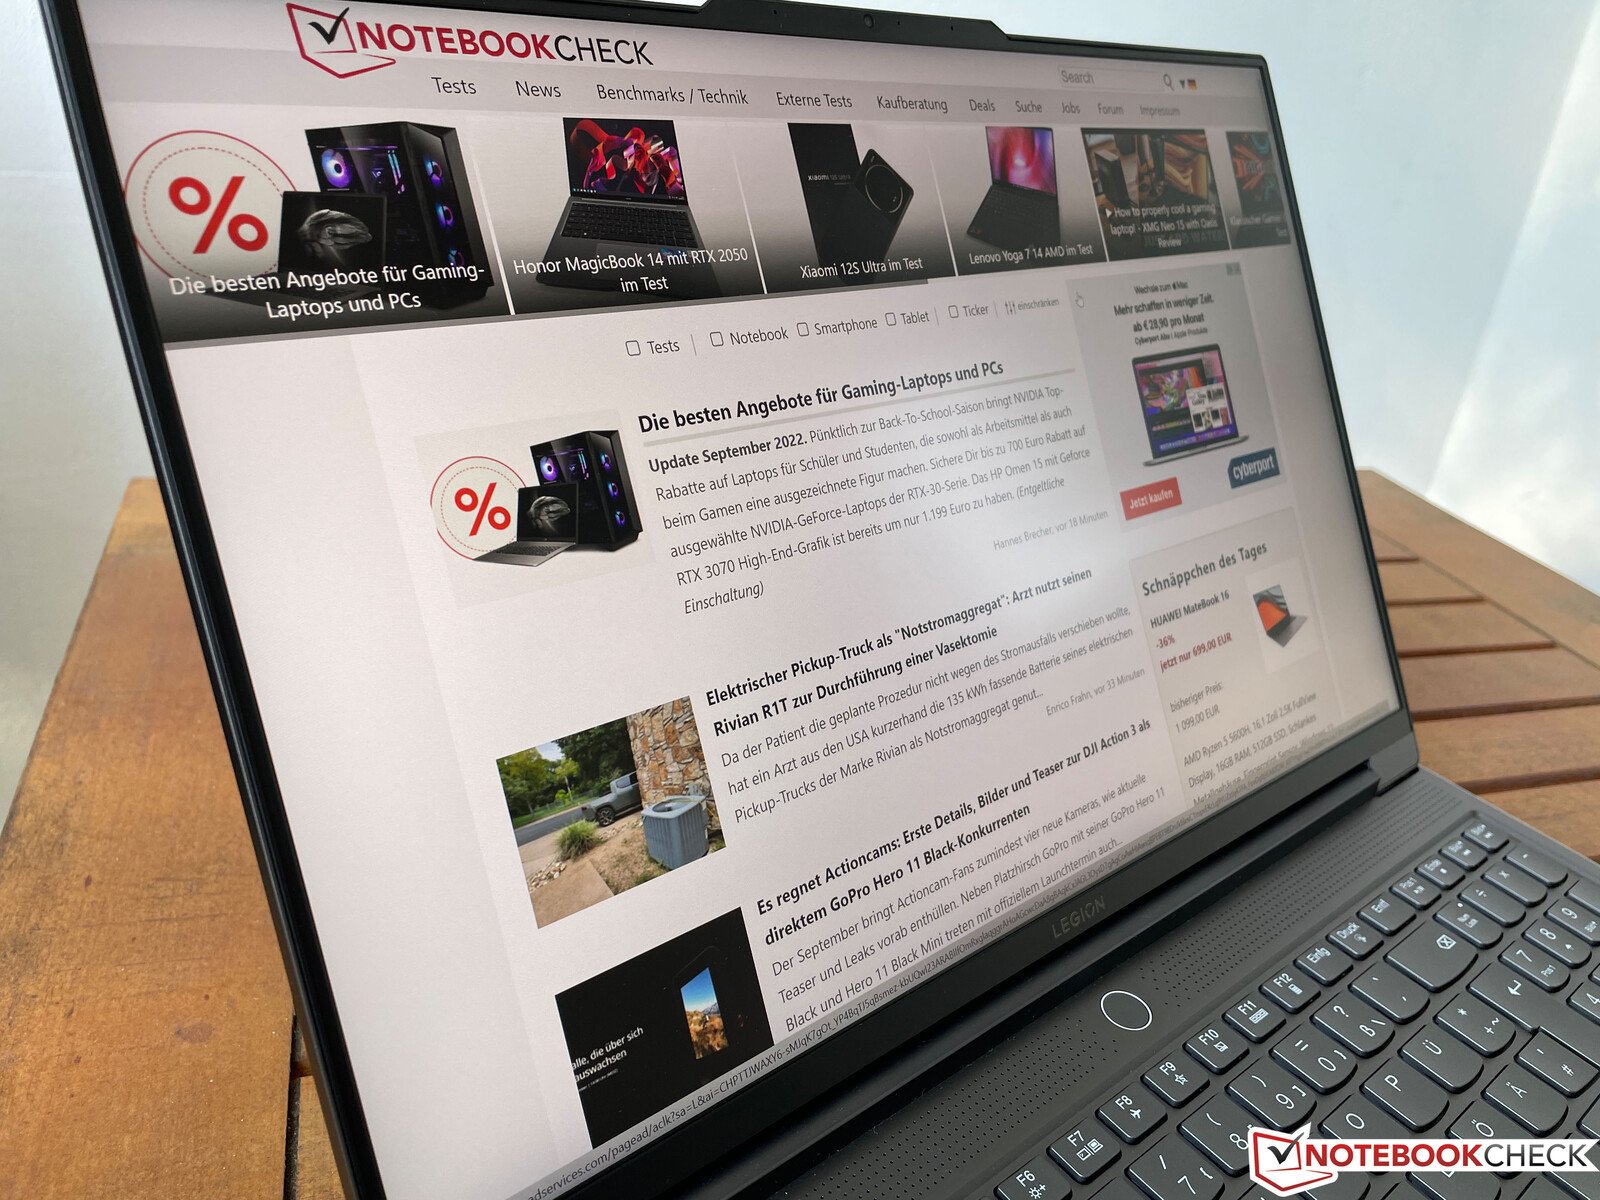
显示屏--联想安装了一个快速的165赫兹面板

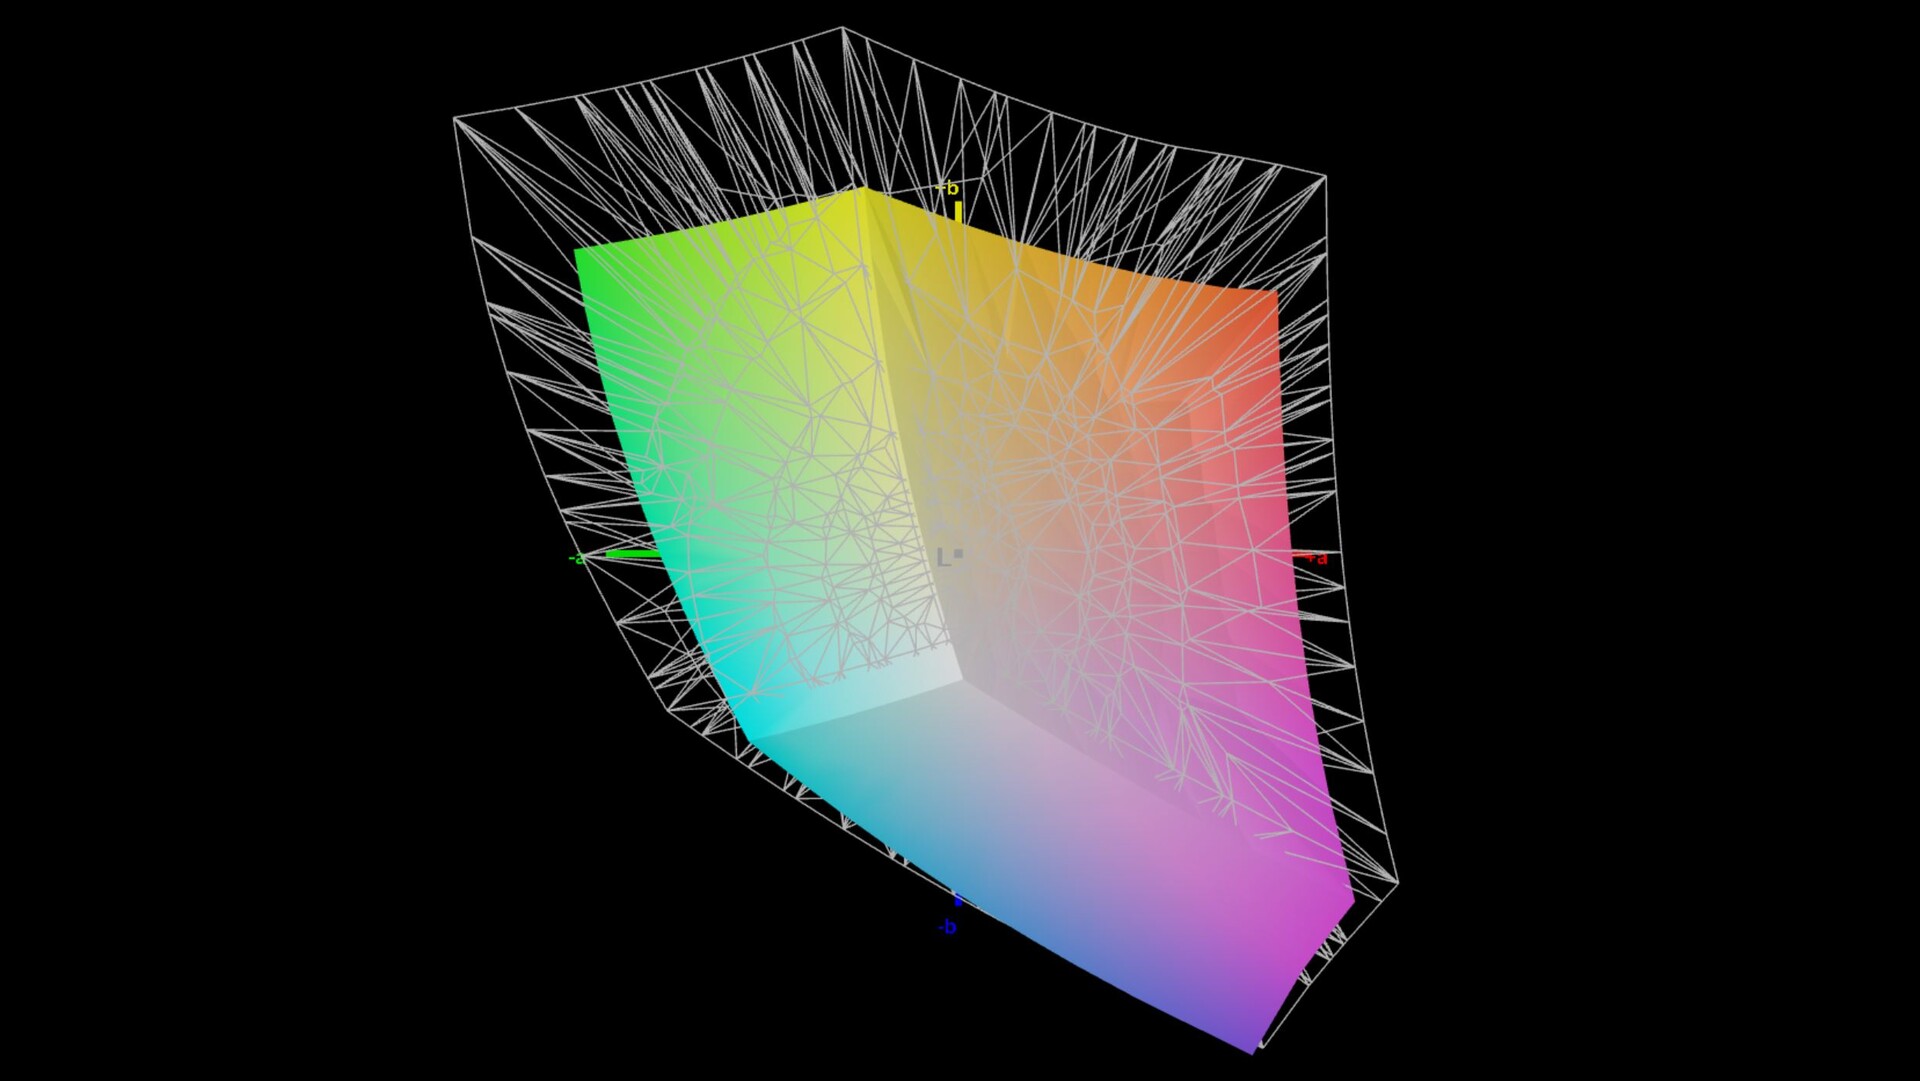
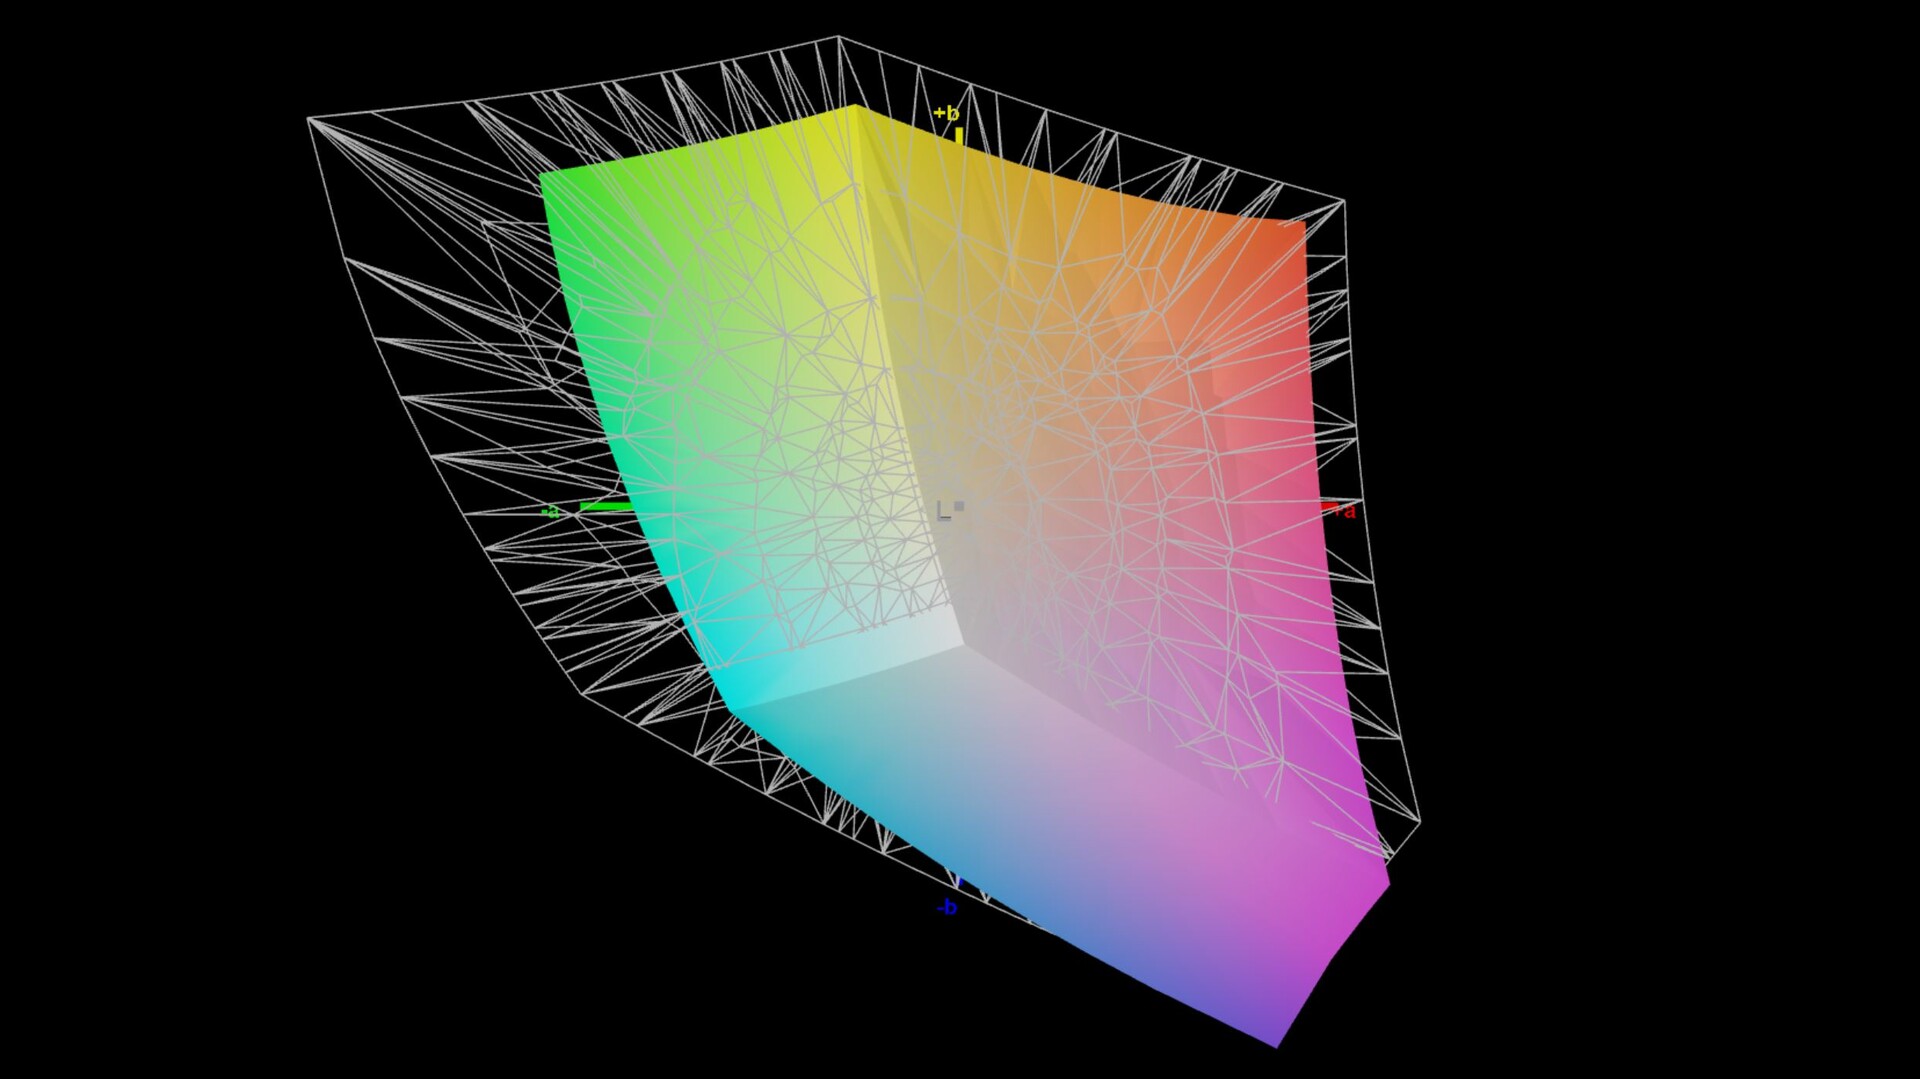
联想安装了一个16英寸的IPS显示屏,分辨率为2560x1600,表面为亚光,主观画质非常好。由于高刷新率,移动非常流畅,所有内容都显示得非常清晰,即使是明亮的表面也完全没有颗粒感。该面板还提供了非常快的响应时间,我们没有发现任何PWM闪烁。HDR内容和G-Sync也得到了支持。
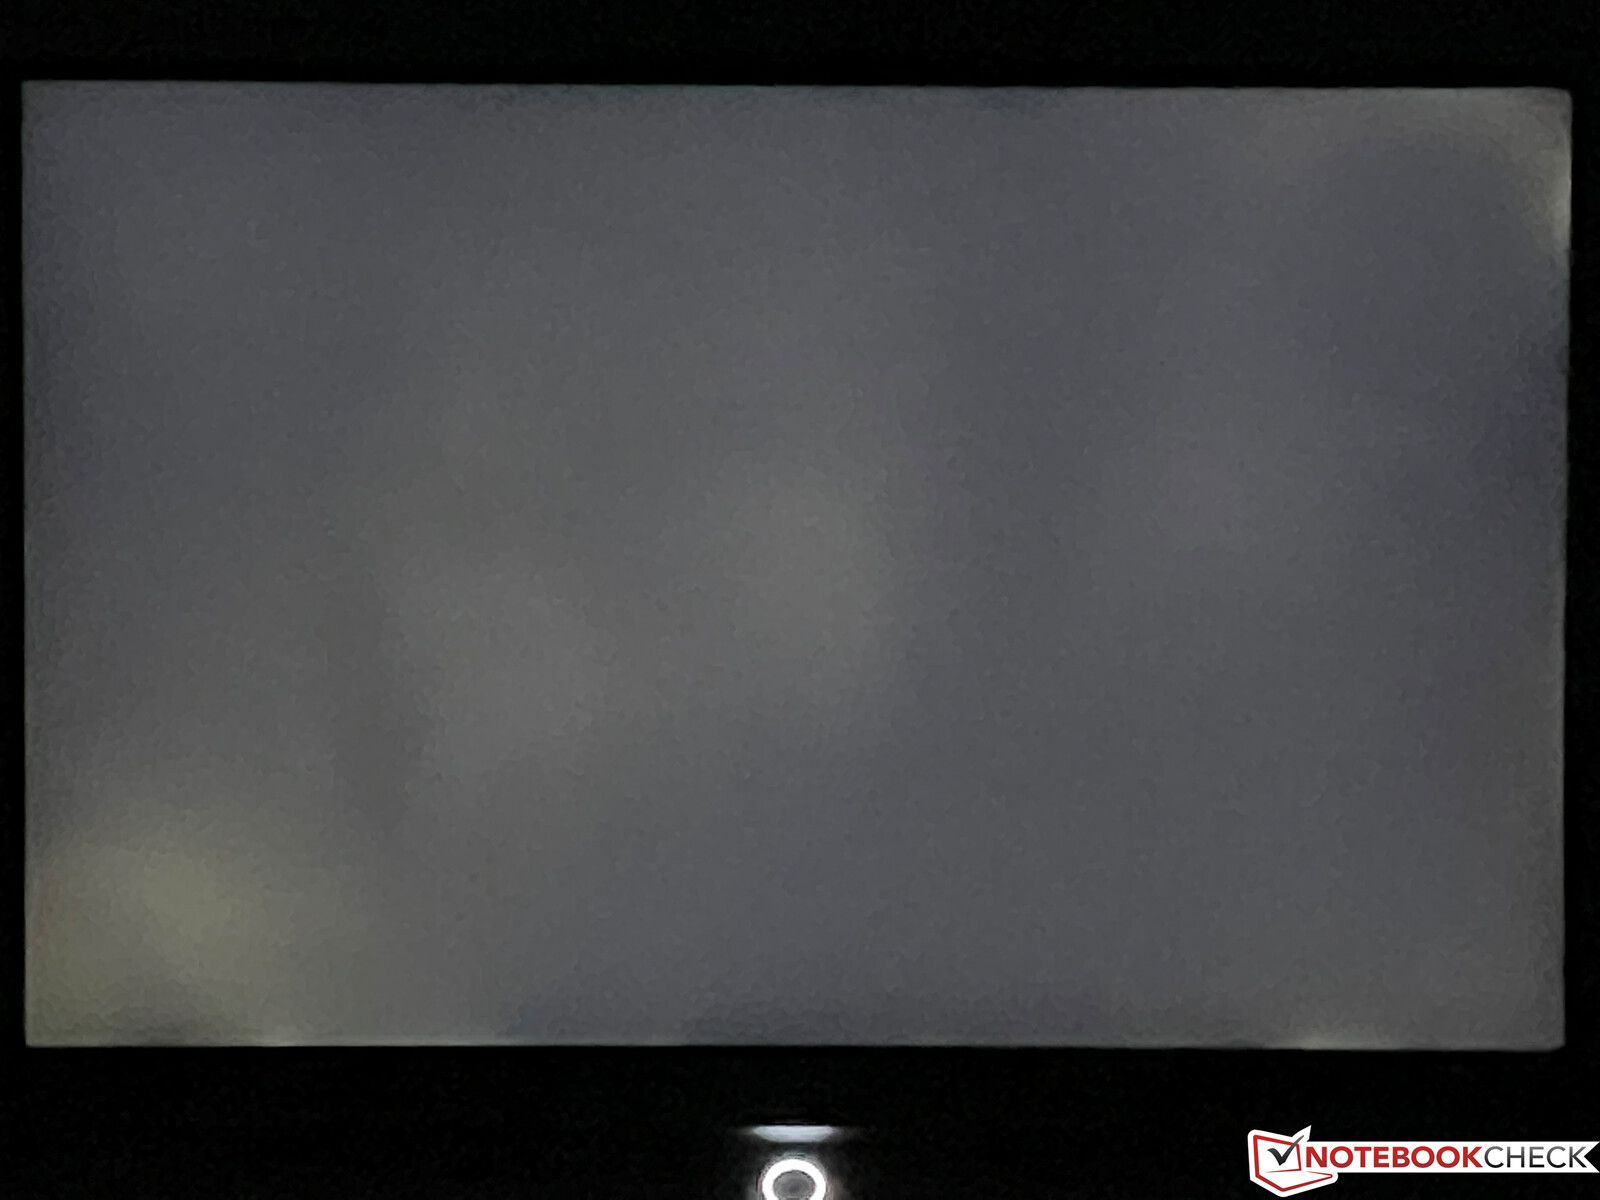
联想指定的亮度为500cd/m²,这甚至超过了我们的审查样本,平均为523cd/m²。然而,0.44的黑值相对较高,这就是为什么对比度 "只有"~1,200:1。当然,其他显示技术,如OLED或迷你LED在这里有优势。在全亮度下,你还可以在黑暗的背景上看到轻微的光晕,但这在实践中不应该是一个问题。
| |||||||||||||||||||||||||
Brightness Distribution: 88 %
Center on Battery: 546 cd/m²
Contrast: 1243:1 (Black: 0.44 cd/m²)
ΔE ColorChecker Calman: 2.1 | ∀{0.5-29.43 Ø4.71}
calibrated: 0.9
ΔE Greyscale Calman: 3.2 | ∀{0.09-98 Ø4.96}
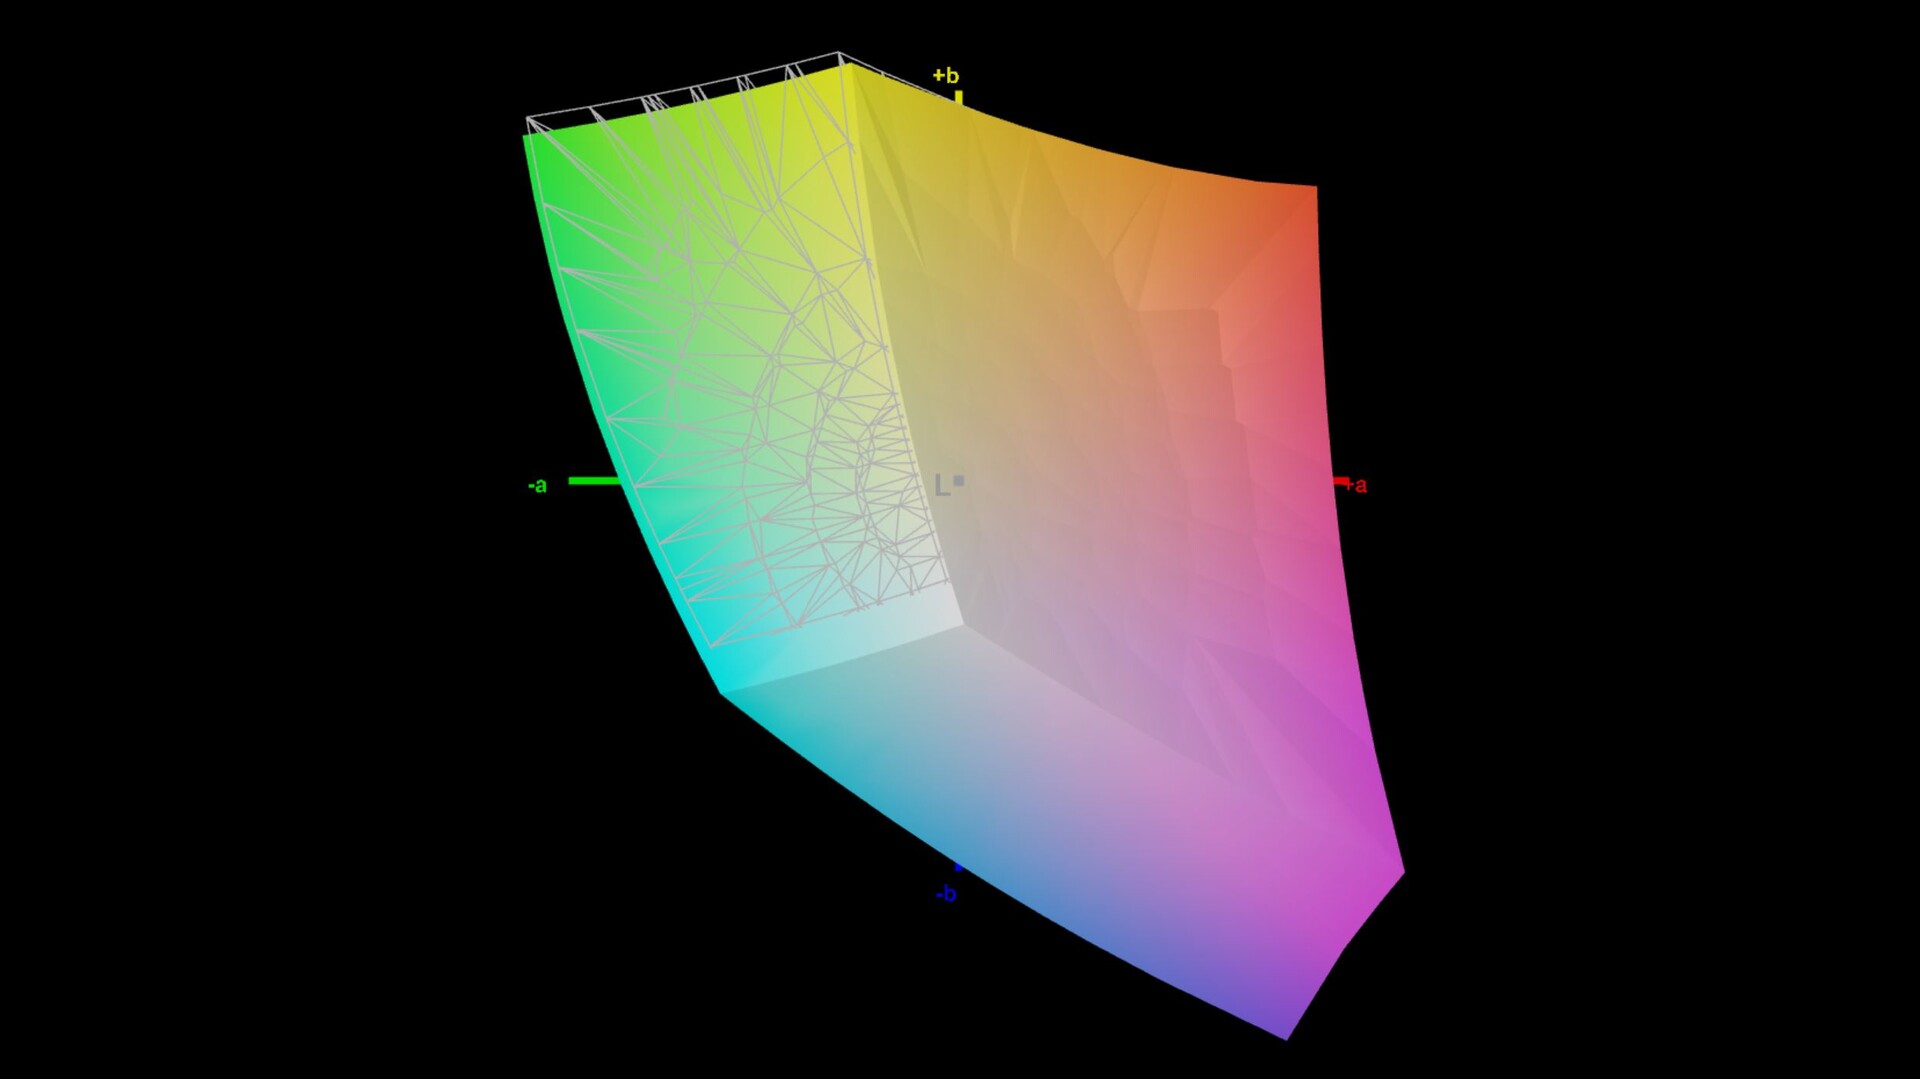
70.8% AdobeRGB 1998 (Argyll 3D)
98.2% sRGB (Argyll 3D)
69.3% Display P3 (Argyll 3D)
Gamma: 2.23
CCT: 6979 K
| Lenovo Legion 7 16IAX7-82TD004SGE NE160QDM-NY1, IPS, 2560x1600, 16" | Schenker XMG Neo 17 M22 BOE0A99, IPS, 2560x1600, 17" | MSI Titan GT77 12UHS Sharp SHP1544 LQ173M1JW08, IPS-Level, 1920x1080, 17.3" | Aorus 17X XES Sharp SHP1563, IPS, 1920x1080, 17.3" | Asus ROG Flow X16 GV601RW-M5082W AUO B160QAN02.S, Mini LED, 2560x1600, 16.1" | Razer Blade 17 Early 2022 AU Optronics B173ZAN06.9, IPS, 3840x2160, 17.3" | Asus ROG Zephyrus Duo 16 GX650RX BOE NE160QAM-NX1, IPS-Level, 3840x2400, 16" | |
|---|---|---|---|---|---|---|---|
| Display | 0% | 2% | 2% | 24% | 23% | 22% | |
| Display P3 Coverage (%) | 69.3 | 69 0% | 70.8 2% | 70.1 1% | 99.82 44% | 99.4 43% | 98 41% |
| sRGB Coverage (%) | 98.2 | 99.8 2% | 98.9 1% | 99.9 2% | 99.99 2% | 100 2% | 99.9 2% |
| AdobeRGB 1998 Coverage (%) | 70.8 | 69.6 -2% | 73 3% | 71.9 2% | 90.21 27% | 87.3 23% | 86.3 22% |
| Response Times | 3% | 41% | 35% | -42% | 20% | -8% | |
| Response Time Grey 50% / Grey 80% * (ms) | 12.6 ? | 10.8 ? 14% | 3.03 ? 76% | 3.4 ? 73% | 11 ? 13% | 7.5 ? 40% | 14.6 ? -16% |
| Response Time Black / White * (ms) | 5.6 ? | 6.1 ? -9% | 5.28 ? 6% | 5.8 ? -4% | 11 ? -96% | 5.6 ? -0% | 5.6 ? -0% |
| PWM Frequency (Hz) | 7400 ? | ||||||
| Screen | 9% | -23% | -39% | 27% | 16% | -19% | |
| Brightness middle (cd/m²) | 547 | 415 -24% | 280 -49% | 278 -49% | 498 -9% | 503 -8% | 459 -16% |
| Brightness (cd/m²) | 523 | 399 -24% | 275 -47% | 273 -48% | 502 -4% | 486 -7% | 434 -17% |
| Brightness Distribution (%) | 88 | 90 2% | 79 -10% | 79 -10% | 94 7% | 84 -5% | 88 0% |
| Black Level * (cd/m²) | 0.44 | 0.43 2% | 0.4 9% | 0.26 41% | 0.11 75% | 0.44 -0% | 0.44 -0% |
| Contrast (:1) | 1243 | 965 -22% | 700 -44% | 1069 -14% | 4527 264% | 1143 -8% | 1043 -16% |
| Colorchecker dE 2000 * | 2.1 | 1.44 31% | 2.1 -0% | 3.96 -89% | 1.87 11% | 1.08 49% | 2.97 -41% |
| Colorchecker dE 2000 max. * | 7 | 2.33 67% | 5.83 17% | 10.78 -54% | 6.15 12% | 4.54 35% | 8.13 -16% |
| Colorchecker dE 2000 calibrated * | 0.9 | 0.89 1% | 1.58 -76% | 1.07 -19% | 1.94 -116% | 0.6 33% | 1.03 -14% |
| Greyscale dE 2000 * | 3.2 | 1.8 44% | 3.3 -3% | 6.8 -113% | 3.15 2% | 1.3 59% | 4.9 -53% |
| Gamma | 2.23 99% | 2.132 103% | 2.13 103% | 2.224 99% | 330.95 1% | 2.151 102% | 2.235 98% |
| CCT | 6979 93% | 6327 103% | 7060 92% | 7651 85% | 7294 89% | 6541 99% | 6775 96% |
| Total Average (Program / Settings) | 4% /
6% | 7% /
-8% | -1% /
-20% | 3% /
17% | 20% /
18% | -2% /
-9% |
* ... smaller is better
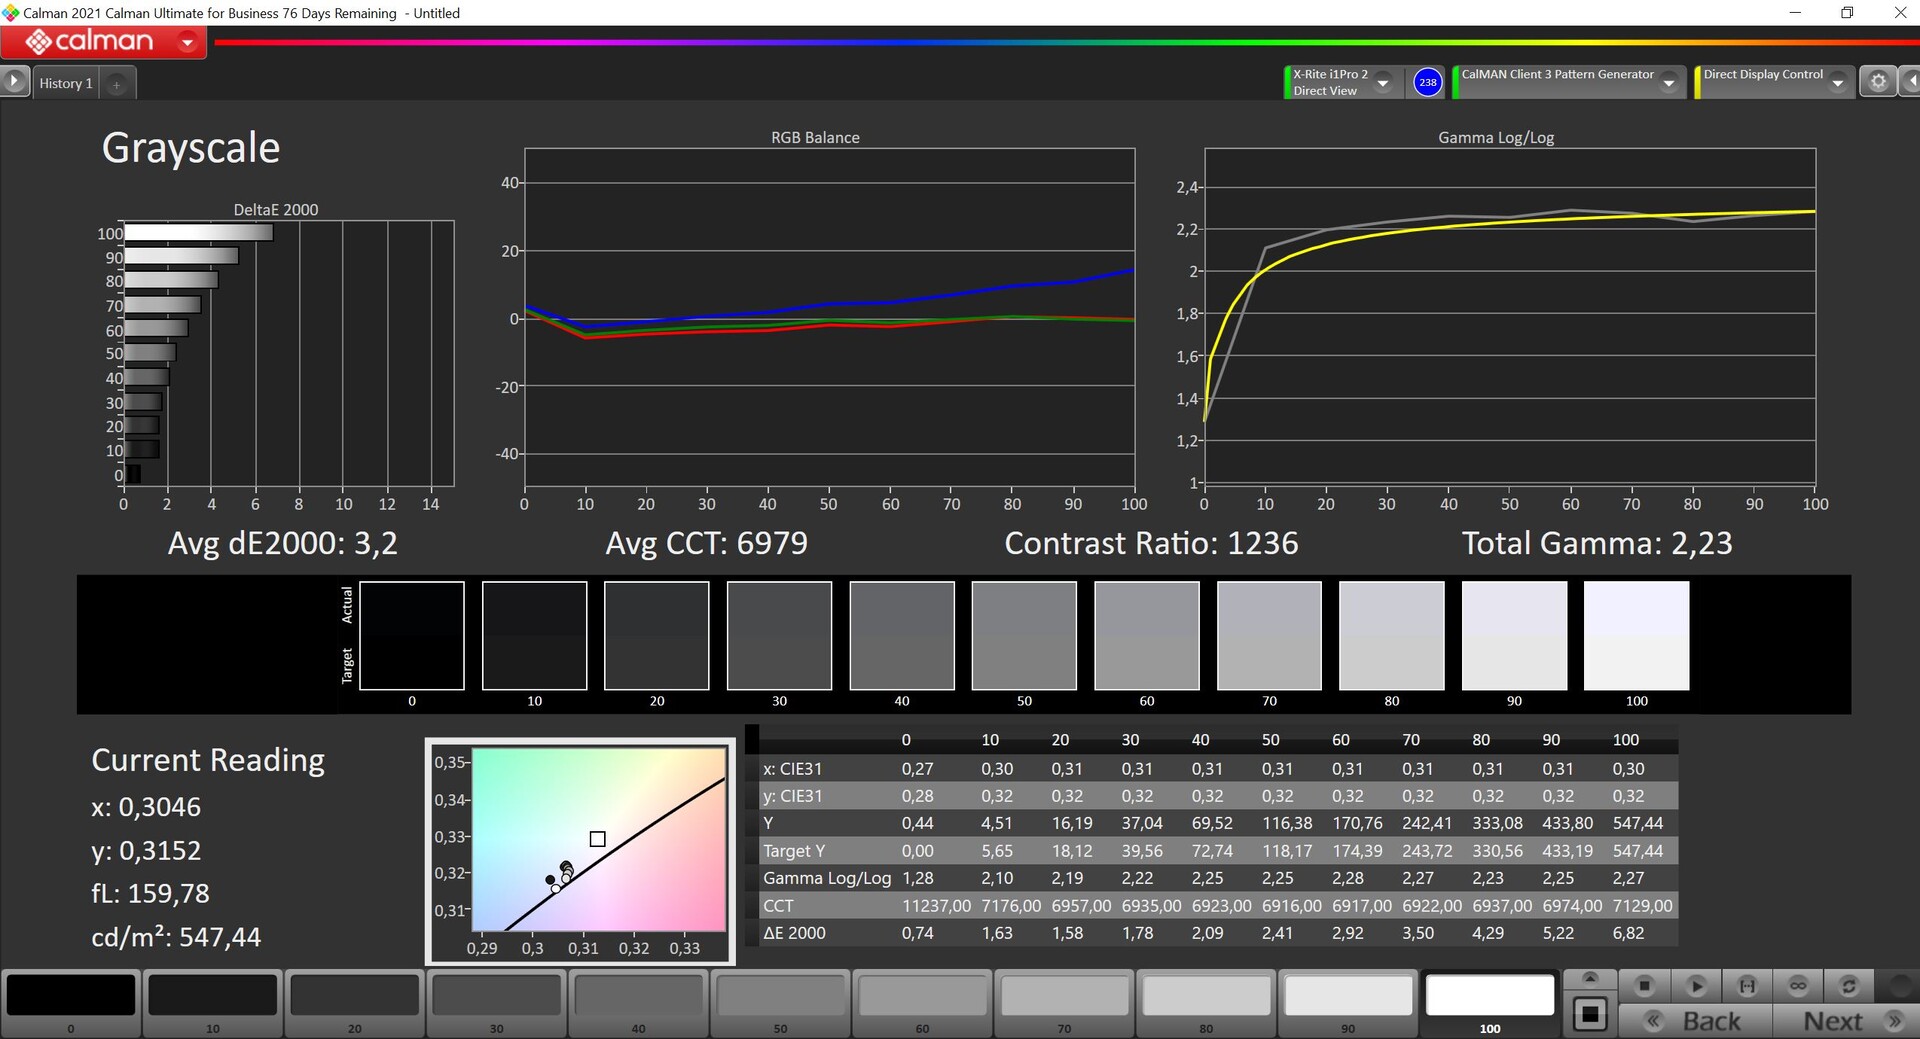
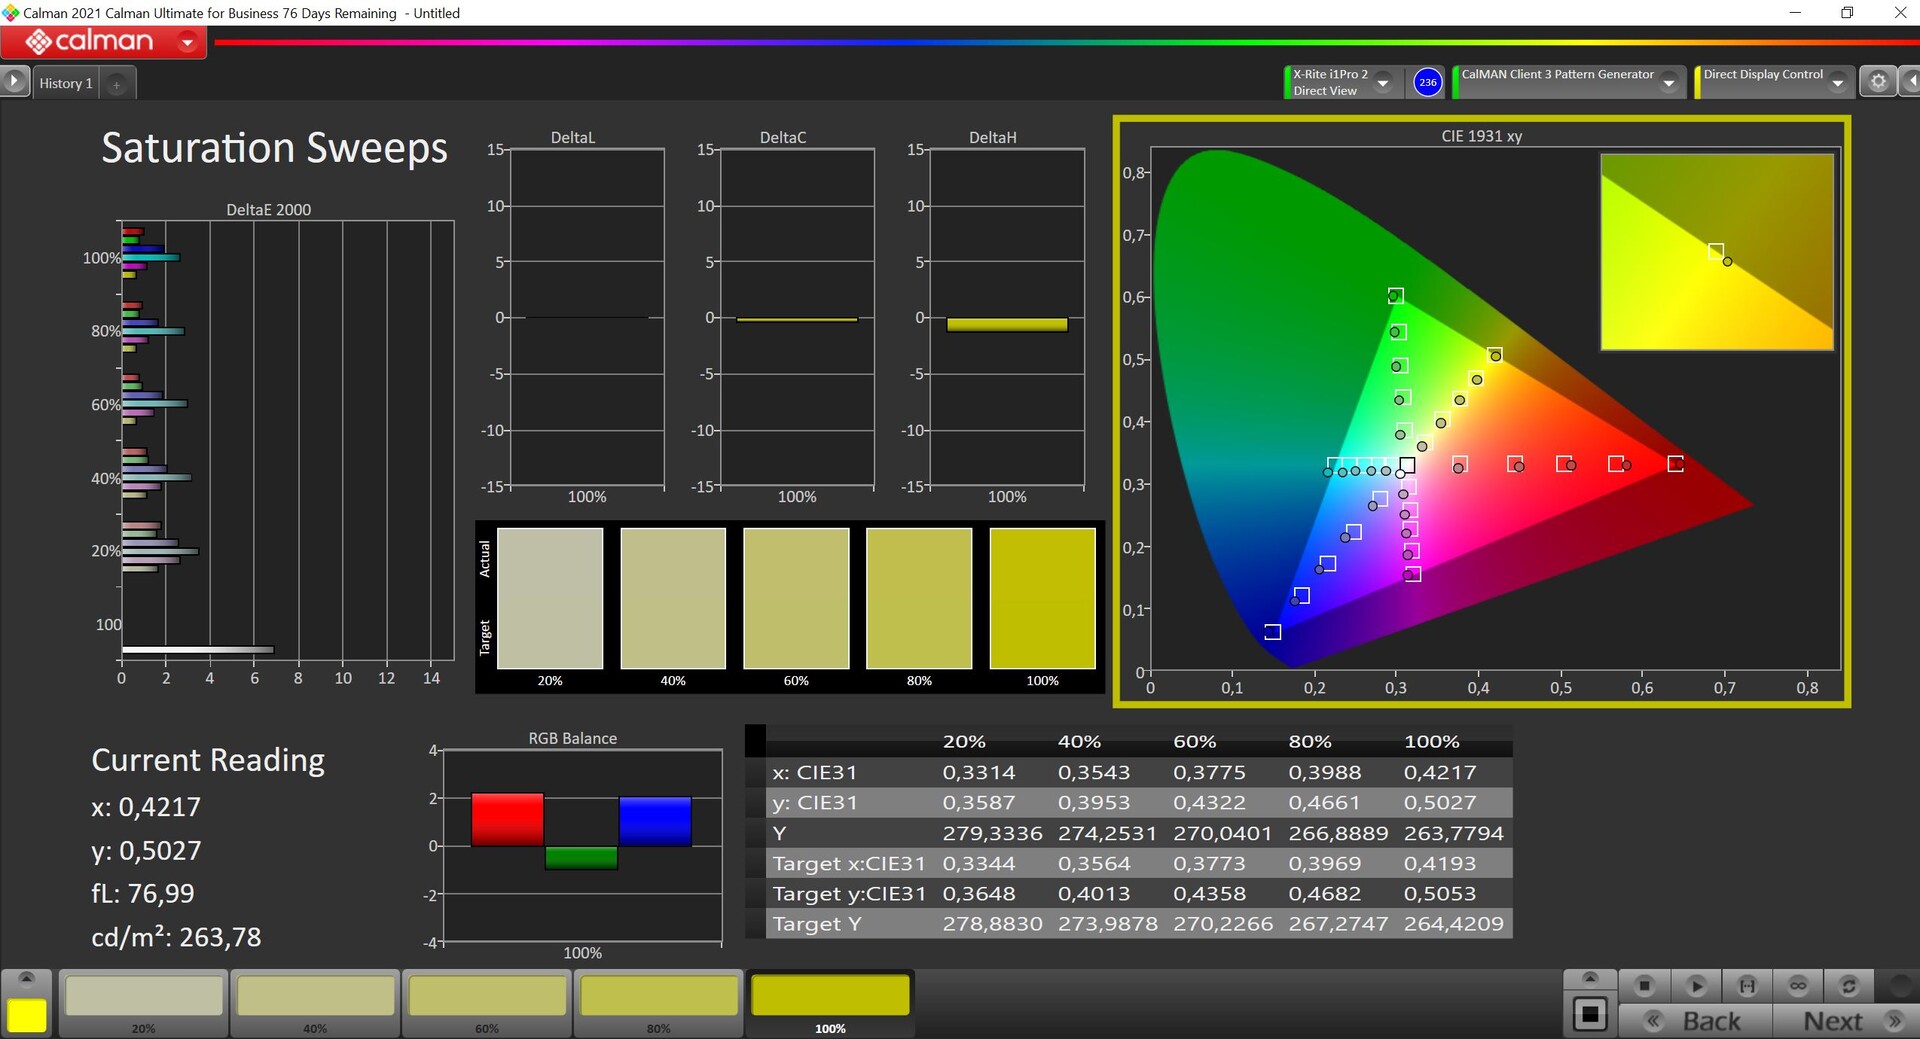
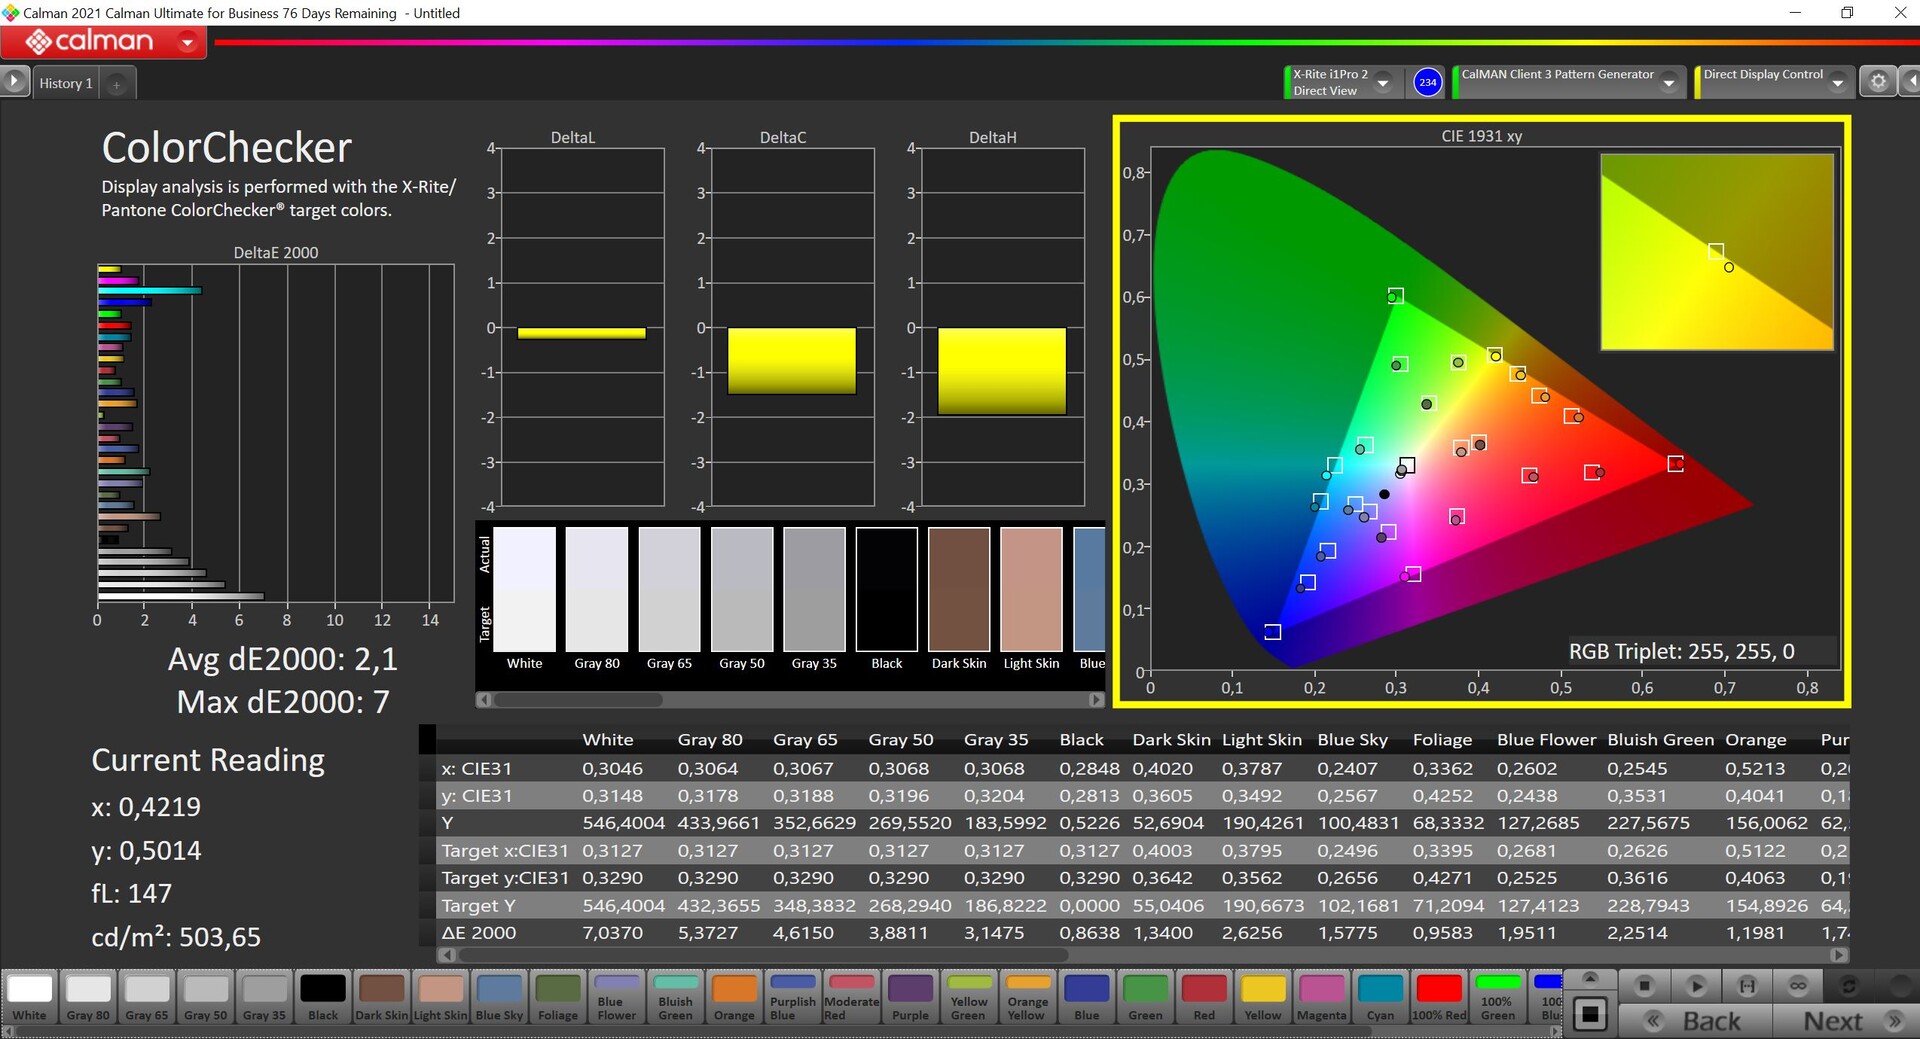
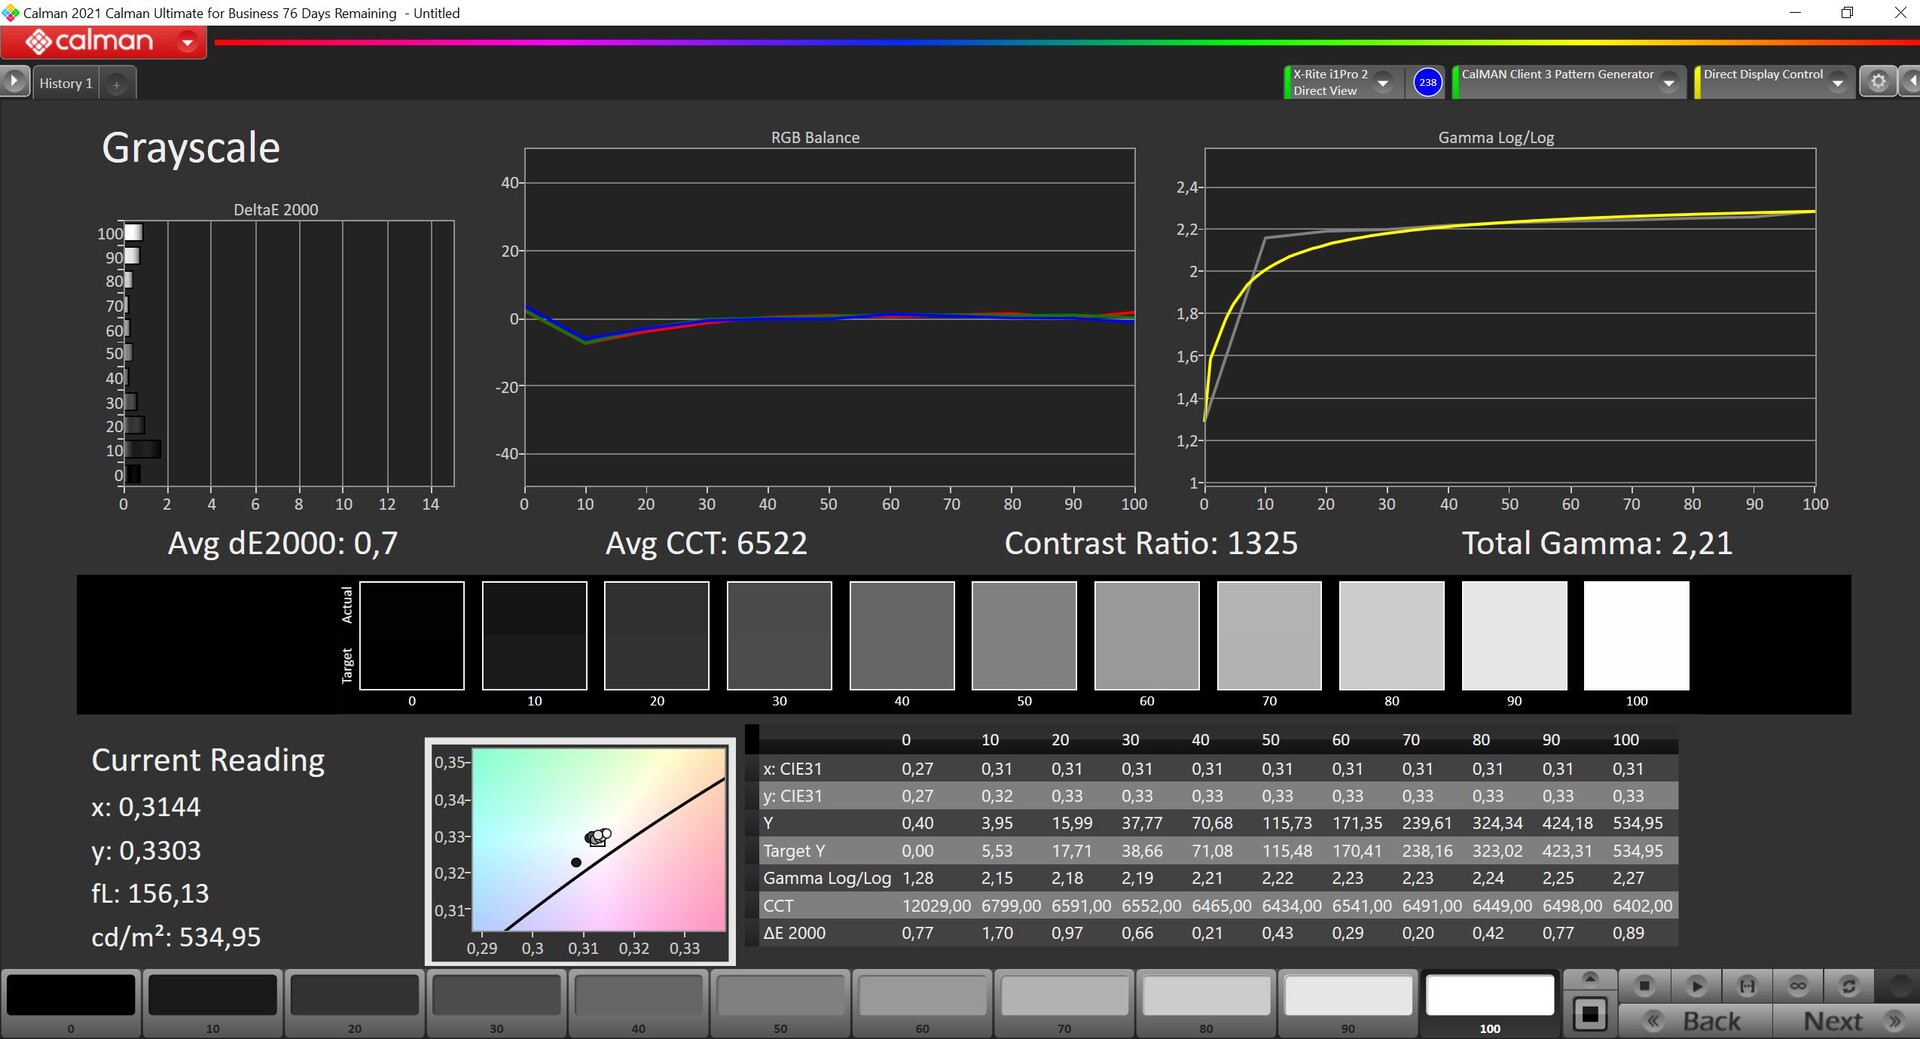
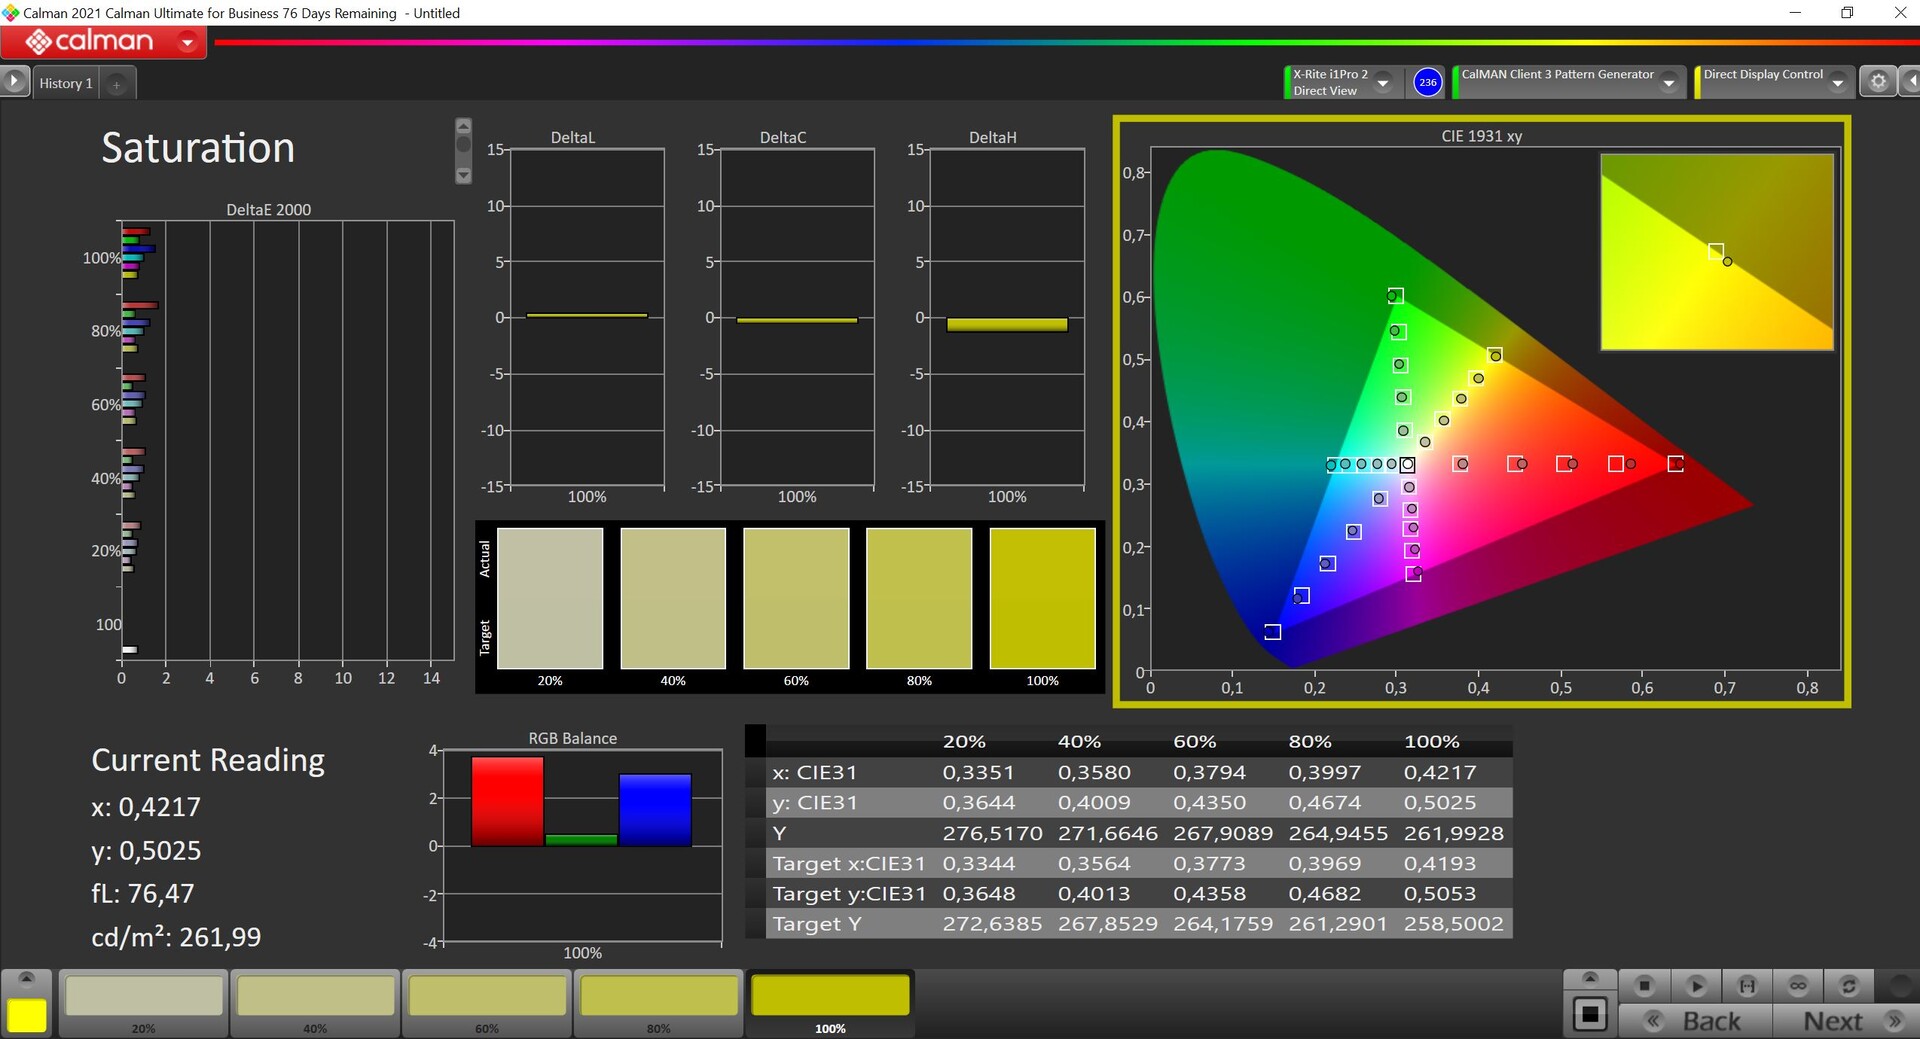
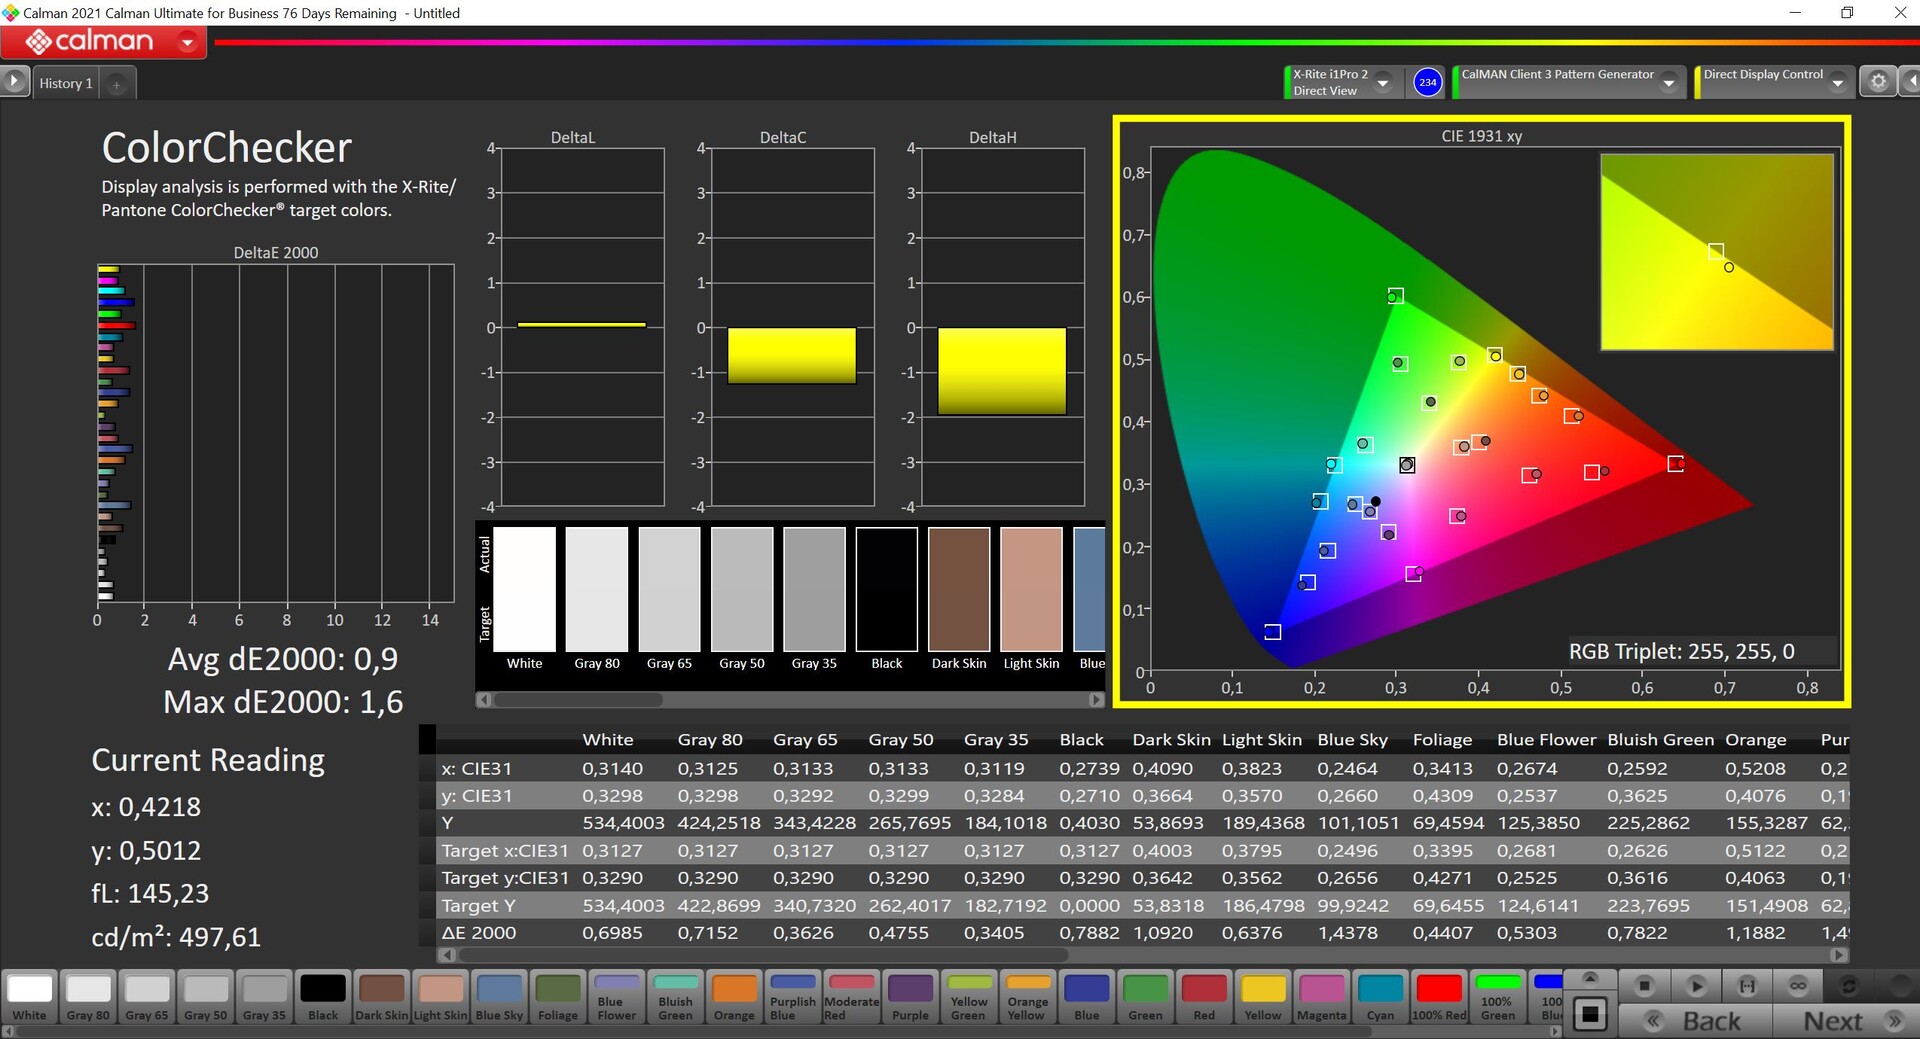
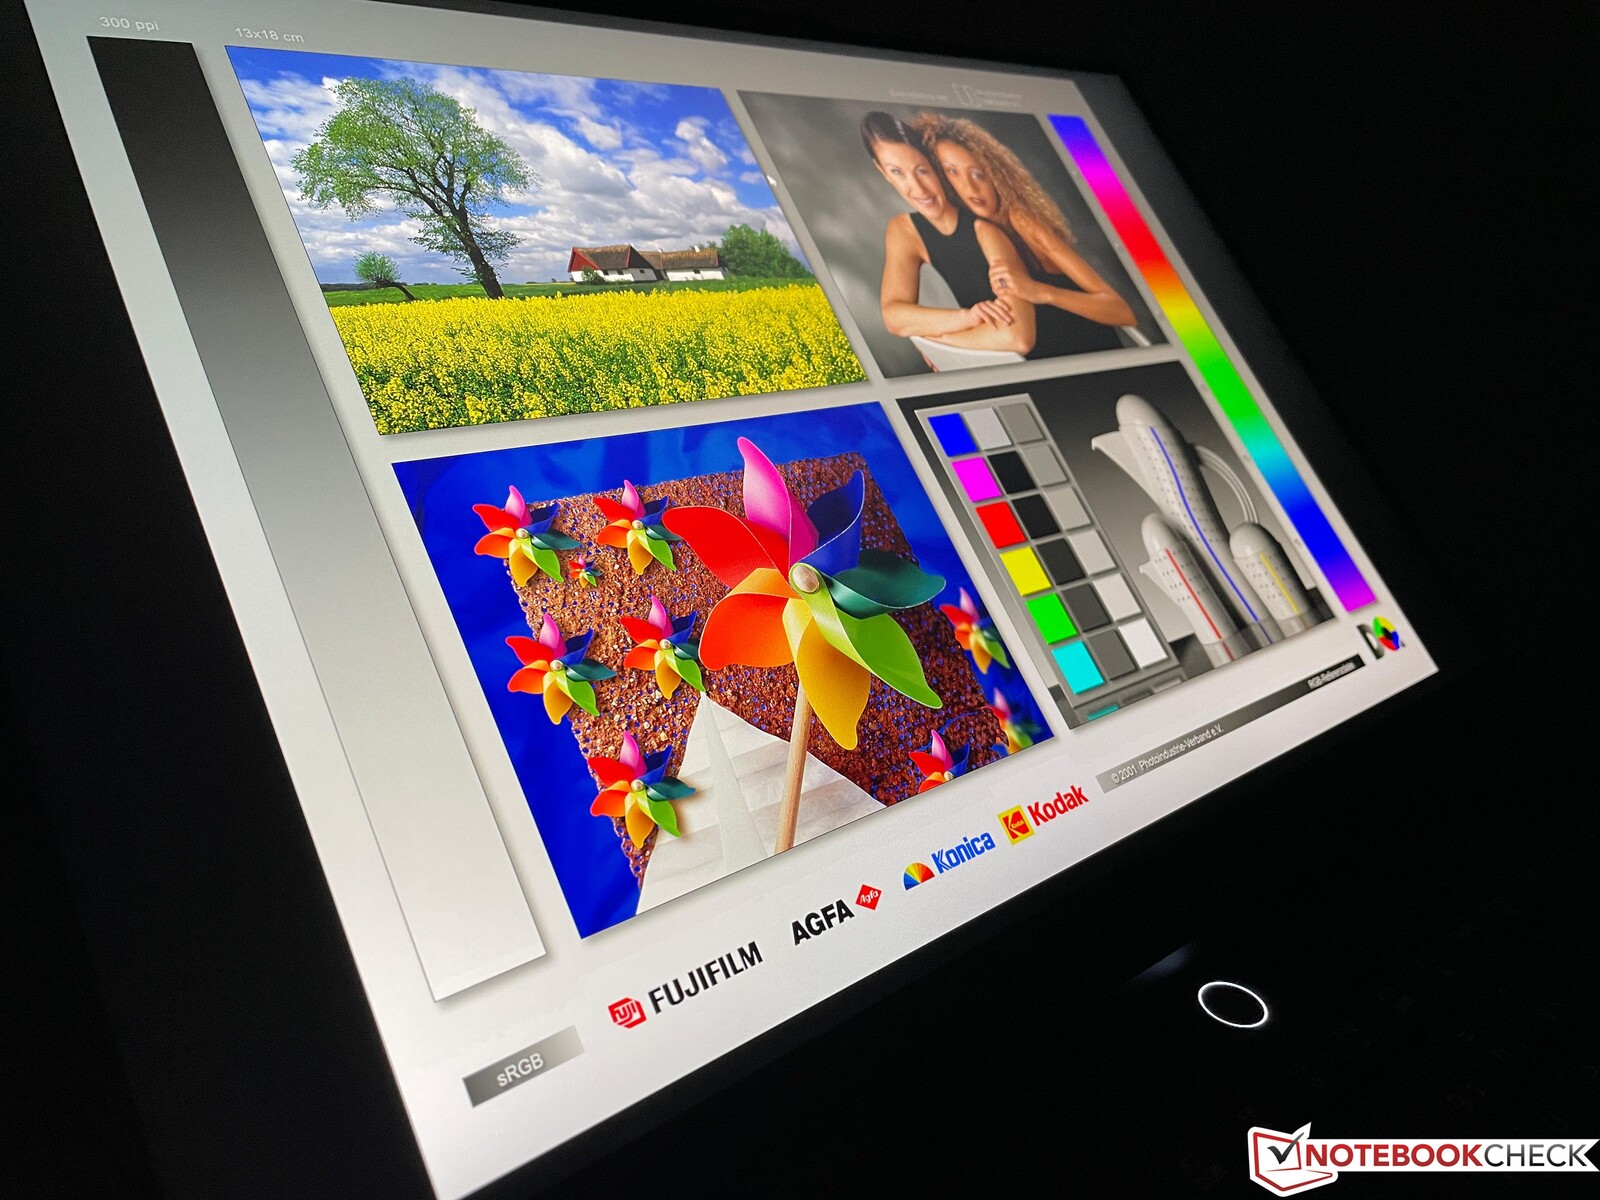
在交付状态下,我们用专业的CalMAN软件(X-Rite i1 Pro 2)进行分析,发现灰度有偏蓝,色温略微过冷,但色彩非常准确。通过我们自己的校准(配置文件可在上面免费下载),我们能够将偏蓝现象控制住,并显著提高色彩准确性。
虽然面板只覆盖了小的sRGB色彩空间,但这台笔记本电脑主要用于游戏,因此显示器非常适用于这个目的。
Display Response Times
| ↔ Response Time Black to White | ||
|---|---|---|
| 5.6 ms ... rise ↗ and fall ↘ combined | ↗ 1.5 ms rise | 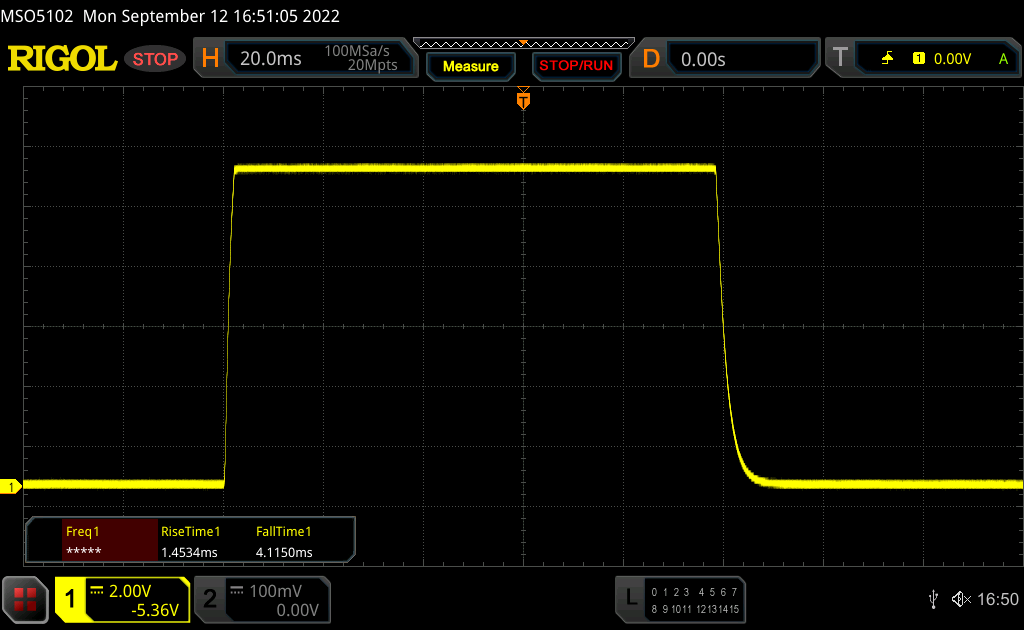 |
| ↘ 4.1 ms fall | ||
| The screen shows very fast response rates in our tests and should be very well suited for fast-paced gaming. In comparison, all tested devices range from 0.1 (minimum) to 240 (maximum) ms. » 18 % of all devices are better. This means that the measured response time is better than the average of all tested devices (19.8 ms). | ||
| ↔ Response Time 50% Grey to 80% Grey | ||
| 12.6 ms ... rise ↗ and fall ↘ combined | ↗ 5.9 ms rise | 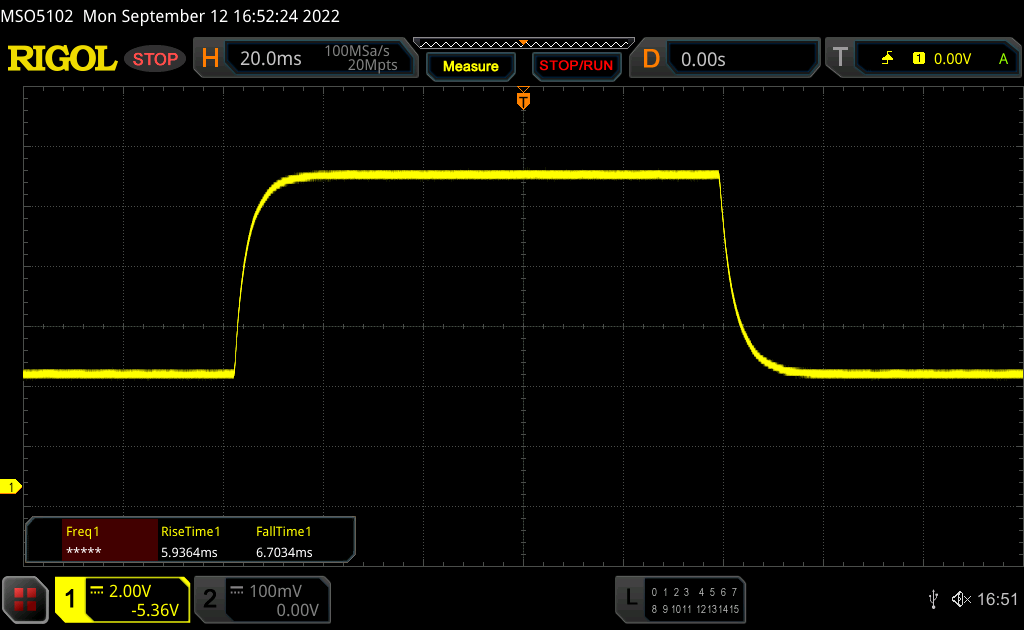 |
| ↘ 6.7 ms fall | ||
| The screen shows good response rates in our tests, but may be too slow for competitive gamers. In comparison, all tested devices range from 0.165 (minimum) to 636 (maximum) ms. » 26 % of all devices are better. This means that the measured response time is better than the average of all tested devices (31 ms). | ||
Screen Flickering / PWM (Pulse-Width Modulation)
| Screen flickering / PWM not detected |  | ||
In comparison: 52 % of all tested devices do not use PWM to dim the display. If PWM was detected, an average of 7754 (minimum: 5 - maximum: 343500) Hz was measured. | |||
你可能不会经常在户外使用沉重的16英寸笔记本,但由于良好的亮度和哑光屏幕,Legion 7 16还是可以在明亮的环境中使用。IPS面板的可视角度稳定性非常好。
性能 - 英特尔HX CPU和GeForce RTX 3080 Ti
测试条件
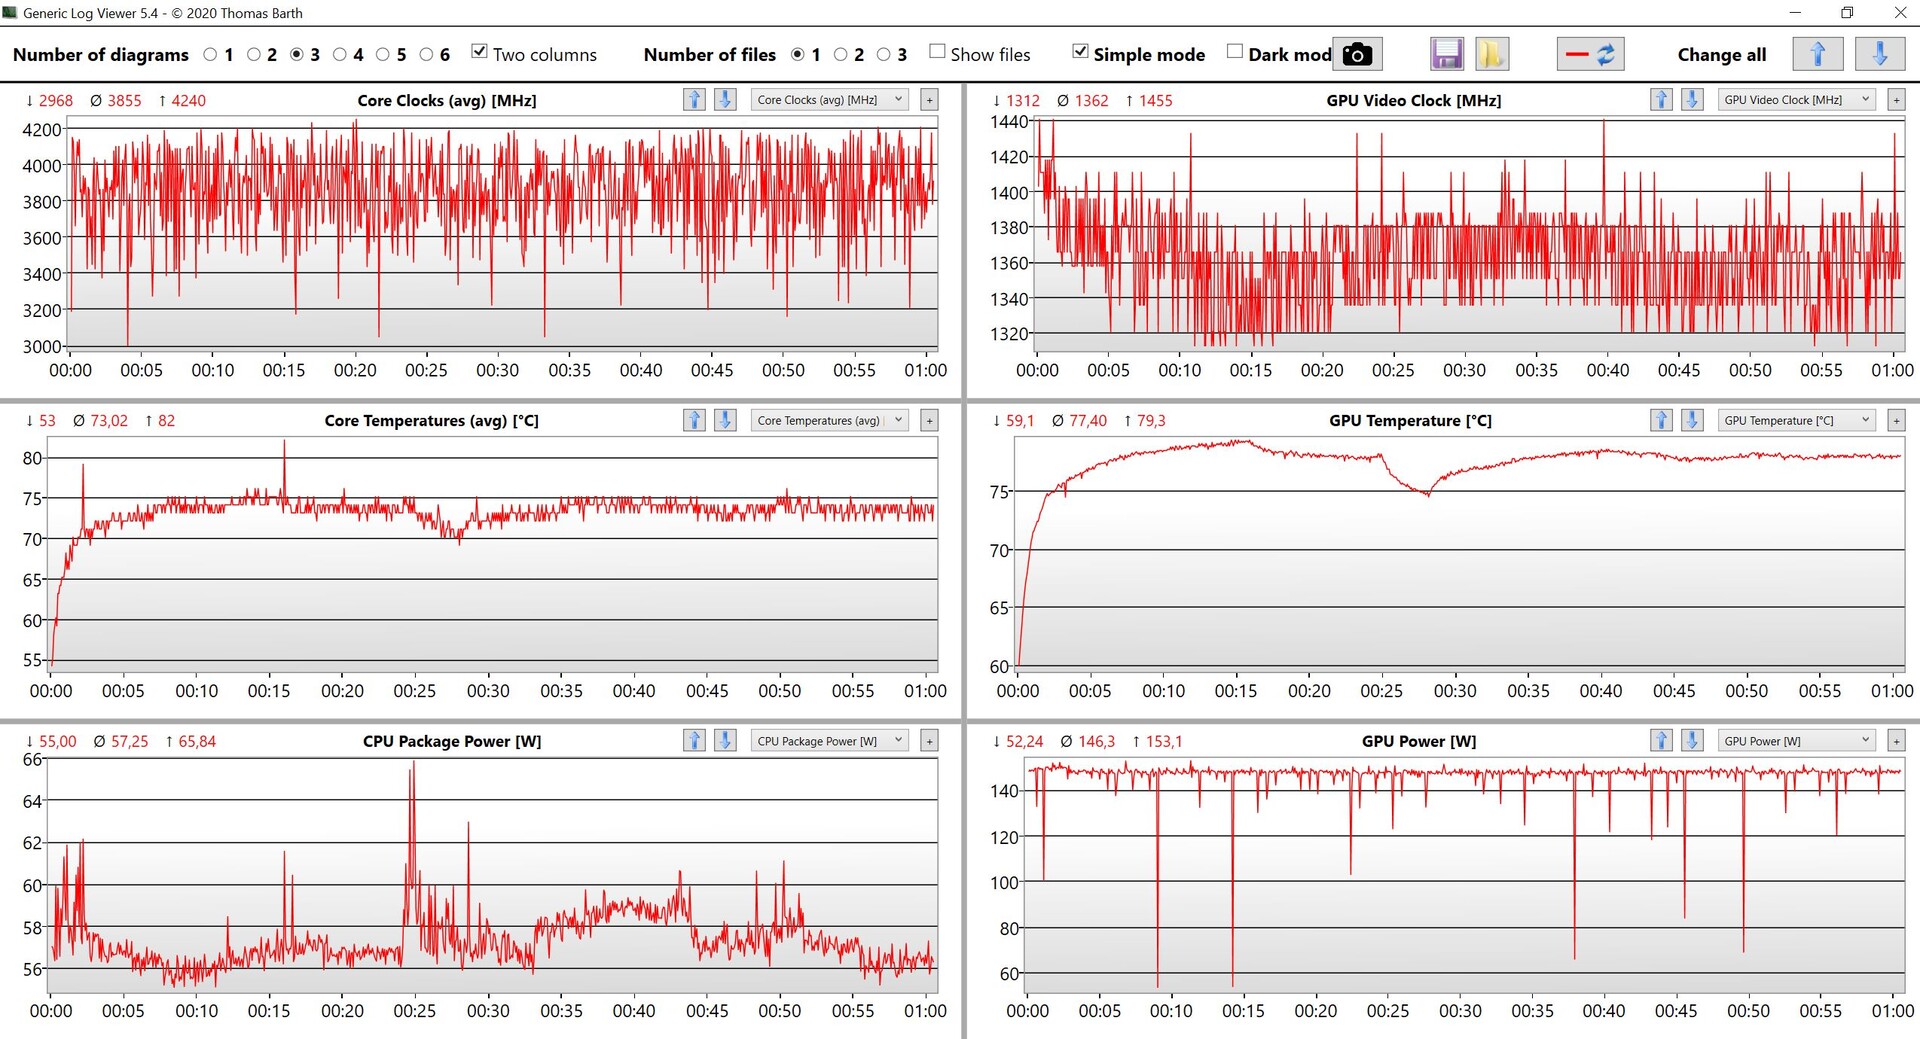
联想通过预装的Vantage软件提供三种不同的性能配置,可以通过软件或Fn+Q组合键进行切换。激活的模式非常方便地通过电源按钮的照明显示出来(白色=平衡,蓝色=安静, 红色=性能)。我们在下表中列出了各自的TDP/TGP设置。
| 模式 | CPU负载 | GPU负载 | 压力测试 | 最大风扇噪音 |
|---|---|---|---|---|
| 静音 | 113瓦 | 64瓦 | CPU:86瓦GPU 。42 瓦 |
39 dB(A) |
| 平衡 | 121瓦 | 115瓦 | CPU:86瓦GPU :115 瓦 |
48,8 dB(A) |
| 性能 | 165 -> 136瓦 | 115瓦 | CPU:94瓦GPU :150 瓦 |
54,2 dB(A) |
此外,图形模式可以在Vantage软件中进行切换,你可以将其设置为只使用专用显卡。这在我们的随机测试中没有产生重大影响,这就是为什么我们用预设的混合GPU模式与性能 模式相结合进行测量和基准测试。然而,性能 模式在电池模式下是不可用的。
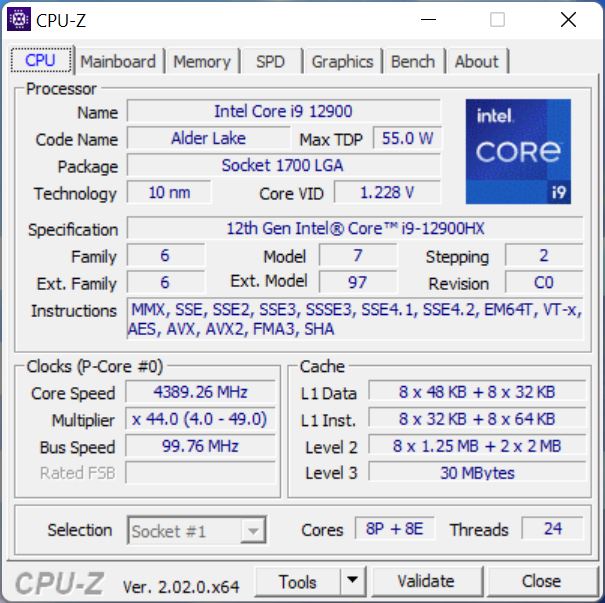
处理器 - Core i9-12900HX
芯片 酷睿i9-12900HX是目前英特尔最快的移动处理器,基于Alder Lake S级的桌面芯片。有8个性能核心,包括超线程和8个效率核心,因此该芯片可以同时处理总共24个线程。消耗峰值高达165瓦,然后迅速平息在136瓦,这使得在基准测试中取得优异成绩。酷睿i9的效率不是特别高,但比起 AMD Ryzen 9 6900HX在我们所有的CPU测试中,Legion 7 16的优势是平均39%。此外,评测设备与同样配备酷睿i9-12900HX的较大的17英寸机型不相上下。
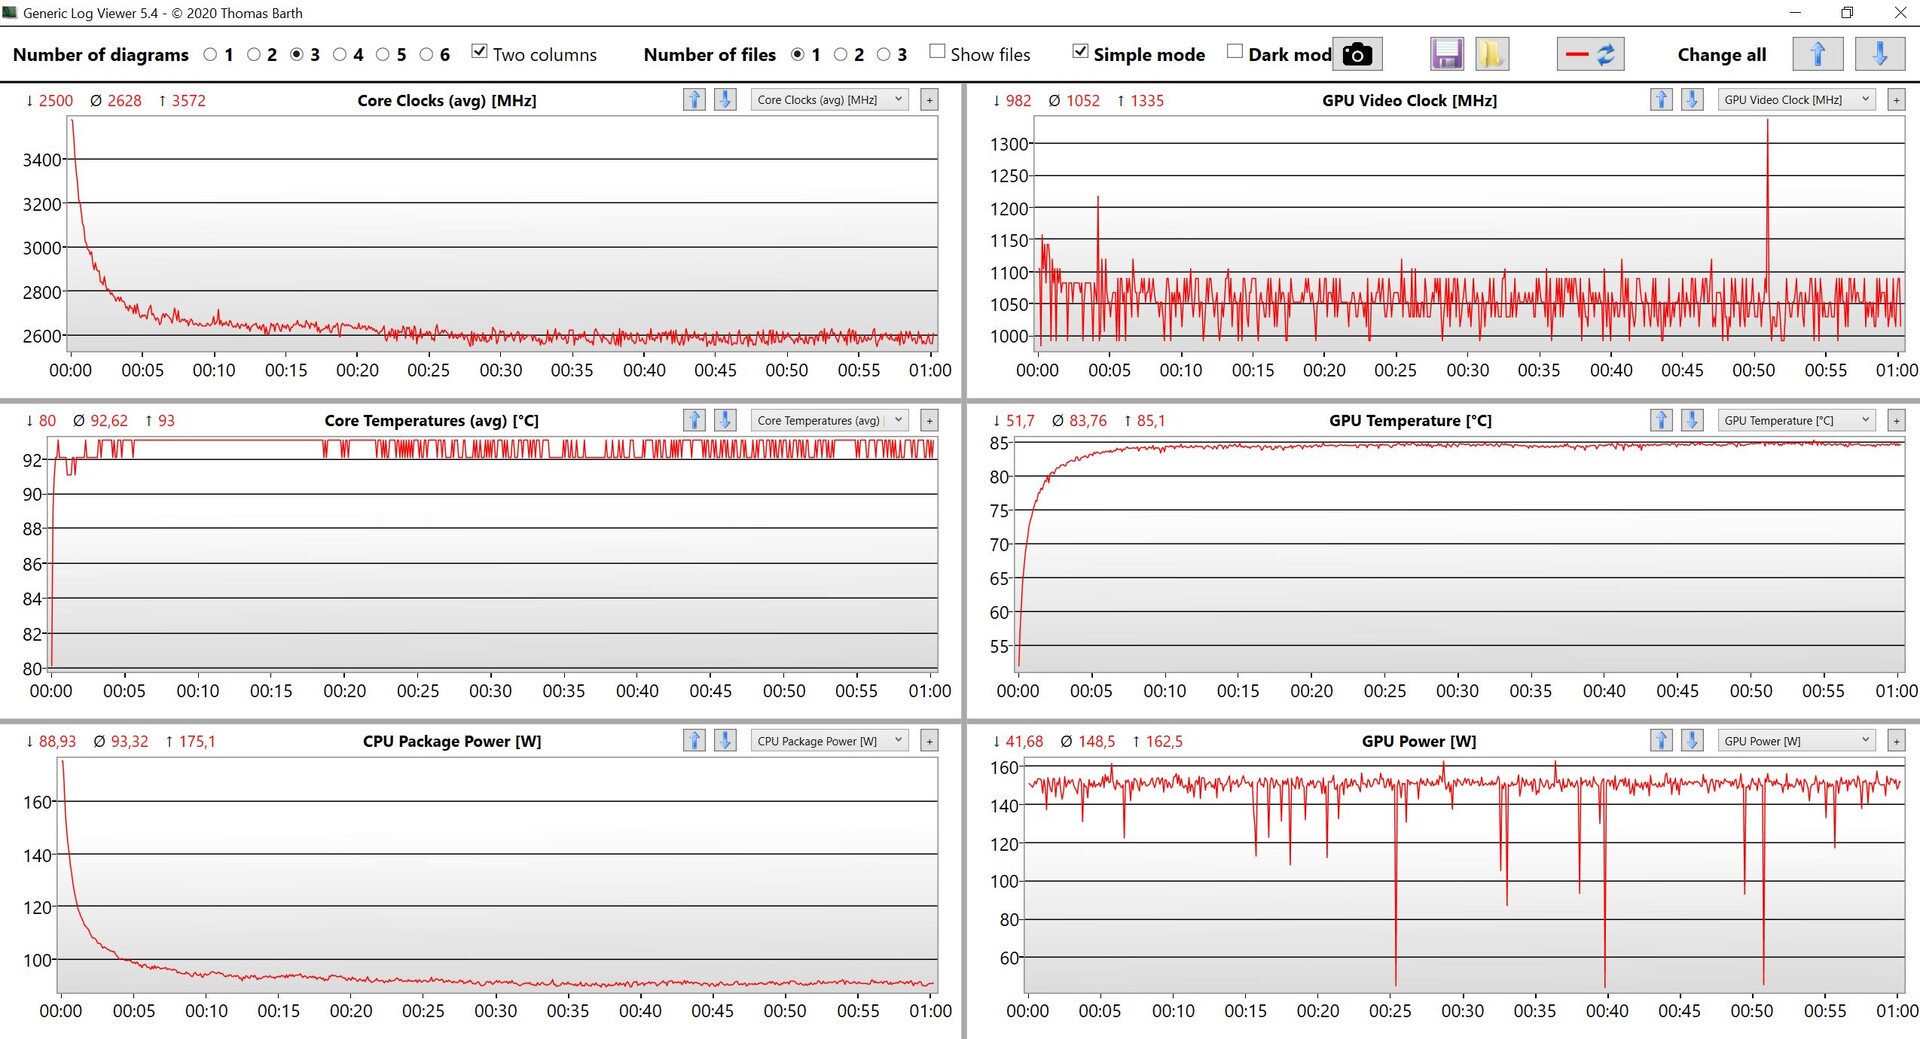
即使在长时间的负载下,性能仍然完全稳定,但在电池模式下,消耗很快就达到了40瓦左右,这相当于在多核测试中的性能损失高达75%。更多CPU基准测试可在 这里.
Cinebench R15 Multi Sustained Load
Cinebench R23: Multi Core | Single Core
Cinebench R20: CPU (Multi Core) | CPU (Single Core)
Cinebench R15: CPU Multi 64Bit | CPU Single 64Bit
Blender: v2.79 BMW27 CPU
7-Zip 18.03: 7z b 4 | 7z b 4 -mmt1
Geekbench 5.5: Multi-Core | Single-Core
HWBOT x265 Benchmark v2.2: 4k Preset
LibreOffice : 20 Documents To PDF
R Benchmark 2.5: Overall mean
| CPU Performance rating | |
| Average of class Gaming | |
| Lenovo Legion 7 16IAX7-82TD004SGE | |
| MSI Titan GT77 12UHS | |
| Average Intel Core i9-12900HX | |
| Aorus 17X XES | |
| Asus ROG Zephyrus Duo 16 GX650RX | |
| Lenovo Legion 7 16ARHA7 | |
| Schenker XMG Neo 17 M22 | |
| Razer Blade 17 Early 2022 | |
| Asus ROG Flow X16 GV601RW-M5082W | |
| Cinebench R23 / Multi Core | |
| Average of class Gaming (10488 - 42661, n=107, last 2 years) | |
| MSI Titan GT77 12UHS | |
| Average Intel Core i9-12900HX (18337 - 23482, n=8) | |
| Lenovo Legion 7 16IAX7-82TD004SGE | |
| Aorus 17X XES | |
| Lenovo Legion 7 16ARHA7 | |
| Asus ROG Flow X16 GV601RW-M5082W | |
| Schenker XMG Neo 17 M22 | |
| Asus ROG Zephyrus Duo 16 GX650RX | |
| Razer Blade 17 Early 2022 | |
| Cinebench R23 / Single Core | |
| Average of class Gaming (1166 - 2415, n=107, last 2 years) | |
| Lenovo Legion 7 16IAX7-82TD004SGE | |
| Aorus 17X XES | |
| Average Intel Core i9-12900HX (1897 - 1936, n=8) | |
| MSI Titan GT77 12UHS | |
| Razer Blade 17 Early 2022 | |
| Asus ROG Zephyrus Duo 16 GX650RX | |
| Lenovo Legion 7 16ARHA7 | |
| Schenker XMG Neo 17 M22 | |
| Asus ROG Flow X16 GV601RW-M5082W | |
| Cinebench R20 / CPU (Multi Core) | |
| Average of class Gaming (4029 - 16433, n=106, last 2 years) | |
| MSI Titan GT77 12UHS | |
| Average Intel Core i9-12900HX (7037 - 9042, n=8) | |
| Lenovo Legion 7 16IAX7-82TD004SGE | |
| Aorus 17X XES | |
| Lenovo Legion 7 16ARHA7 | |
| Asus ROG Flow X16 GV601RW-M5082W | |
| Schenker XMG Neo 17 M22 | |
| Asus ROG Zephyrus Duo 16 GX650RX | |
| Razer Blade 17 Early 2022 | |
| Cinebench R20 / CPU (Single Core) | |
| Average of class Gaming (442 - 913, n=106, last 2 years) | |
| Lenovo Legion 7 16IAX7-82TD004SGE | |
| Aorus 17X XES | |
| MSI Titan GT77 12UHS | |
| Average Intel Core i9-12900HX (728 - 745, n=8) | |
| Razer Blade 17 Early 2022 | |
| Lenovo Legion 7 16ARHA7 | |
| Schenker XMG Neo 17 M22 | |
| Asus ROG Flow X16 GV601RW-M5082W | |
| Asus ROG Zephyrus Duo 16 GX650RX | |
| Cinebench R15 / CPU Multi 64Bit | |
| Average of class Gaming (1578 - 6330, n=105, last 2 years) | |
| MSI Titan GT77 12UHS | |
| Lenovo Legion 7 16IAX7-82TD004SGE | |
| Average Intel Core i9-12900HX (2830 - 3652, n=8) | |
| Aorus 17X XES | |
| Lenovo Legion 7 16ARHA7 | |
| Asus ROG Flow X16 GV601RW-M5082W | |
| Schenker XMG Neo 17 M22 | |
| Asus ROG Zephyrus Duo 16 GX650RX | |
| Razer Blade 17 Early 2022 | |
| Cinebench R15 / CPU Single 64Bit | |
| Average of class Gaming (188.8 - 350, n=106, last 2 years) | |
| Lenovo Legion 7 16IAX7-82TD004SGE | |
| MSI Titan GT77 12UHS | |
| Average Intel Core i9-12900HX (274 - 282, n=8) | |
| Aorus 17X XES | |
| Razer Blade 17 Early 2022 | |
| Lenovo Legion 7 16ARHA7 | |
| Asus ROG Zephyrus Duo 16 GX650RX | |
| Schenker XMG Neo 17 M22 | |
| Asus ROG Flow X16 GV601RW-M5082W | |
| Blender / v2.79 BMW27 CPU | |
| Razer Blade 17 Early 2022 | |
| Asus ROG Flow X16 GV601RW-M5082W | |
| Asus ROG Zephyrus Duo 16 GX650RX | |
| Schenker XMG Neo 17 M22 | |
| Lenovo Legion 7 16ARHA7 | |
| Aorus 17X XES | |
| Average Intel Core i9-12900HX (144 - 201, n=8) | |
| Average of class Gaming (79 - 330, n=104, last 2 years) | |
| Lenovo Legion 7 16IAX7-82TD004SGE | |
| MSI Titan GT77 12UHS | |
| 7-Zip 18.03 / 7z b 4 | |
| Average of class Gaming (33491 - 148086, n=105, last 2 years) | |
| Lenovo Legion 7 16IAX7-82TD004SGE | |
| MSI Titan GT77 12UHS | |
| Average Intel Core i9-12900HX (69778 - 88128, n=7) | |
| Aorus 17X XES | |
| Asus ROG Zephyrus Duo 16 GX650RX | |
| Schenker XMG Neo 17 M22 | |
| Lenovo Legion 7 16ARHA7 | |
| Asus ROG Flow X16 GV601RW-M5082W | |
| Razer Blade 17 Early 2022 | |
| 7-Zip 18.03 / 7z b 4 -mmt1 | |
| Average of class Gaming (4199 - 7436, n=105, last 2 years) | |
| Lenovo Legion 7 16IAX7-82TD004SGE | |
| Aorus 17X XES | |
| Average Intel Core i9-12900HX (6165 - 6358, n=7) | |
| MSI Titan GT77 12UHS | |
| Razer Blade 17 Early 2022 | |
| Schenker XMG Neo 17 M22 | |
| Asus ROG Zephyrus Duo 16 GX650RX | |
| Asus ROG Flow X16 GV601RW-M5082W | |
| Lenovo Legion 7 16ARHA7 | |
| Geekbench 5.5 / Multi-Core | |
| Average of class Gaming (6460 - 28263, n=105, last 2 years) | |
| Lenovo Legion 7 16IAX7-82TD004SGE | |
| MSI Titan GT77 12UHS | |
| Average Intel Core i9-12900HX (15116 - 16925, n=8) | |
| Aorus 17X XES | |
| Asus ROG Zephyrus Duo 16 GX650RX | |
| Schenker XMG Neo 17 M22 | |
| Lenovo Legion 7 16ARHA7 | |
| Razer Blade 17 Early 2022 | |
| Asus ROG Flow X16 GV601RW-M5082W | |
| Geekbench 5.5 / Single-Core | |
| Average of class Gaming (986 - 2474, n=105, last 2 years) | |
| MSI Titan GT77 12UHS | |
| Average Intel Core i9-12900HX (1874 - 1949, n=8) | |
| Aorus 17X XES | |
| Lenovo Legion 7 16IAX7-82TD004SGE | |
| Razer Blade 17 Early 2022 | |
| Asus ROG Zephyrus Duo 16 GX650RX | |
| Schenker XMG Neo 17 M22 | |
| Lenovo Legion 7 16ARHA7 | |
| Asus ROG Flow X16 GV601RW-M5082W | |
| HWBOT x265 Benchmark v2.2 / 4k Preset | |
| Average of class Gaming (11.5 - 44.4, n=105, last 2 years) | |
| MSI Titan GT77 12UHS | |
| Lenovo Legion 7 16IAX7-82TD004SGE | |
| Average Intel Core i9-12900HX (19.6 - 26.6, n=7) | |
| Aorus 17X XES | |
| Lenovo Legion 7 16ARHA7 | |
| Asus ROG Zephyrus Duo 16 GX650RX | |
| Schenker XMG Neo 17 M22 | |
| Asus ROG Flow X16 GV601RW-M5082W | |
| Razer Blade 17 Early 2022 | |
| LibreOffice / 20 Documents To PDF | |
| Asus ROG Flow X16 GV601RW-M5082W | |
| Schenker XMG Neo 17 M22 | |
| Lenovo Legion 7 16ARHA7 | |
| Average of class Gaming (33.2 - 88.8, n=105, last 2 years) | |
| Asus ROG Zephyrus Duo 16 GX650RX | |
| Razer Blade 17 Early 2022 | |
| MSI Titan GT77 12UHS | |
| Aorus 17X XES | |
| Average Intel Core i9-12900HX (33.6 - 42.4, n=7) | |
| Lenovo Legion 7 16IAX7-82TD004SGE | |
| R Benchmark 2.5 / Overall mean | |
| Asus ROG Flow X16 GV601RW-M5082W | |
| Lenovo Legion 7 16ARHA7 | |
| Schenker XMG Neo 17 M22 | |
| Asus ROG Zephyrus Duo 16 GX650RX | |
| Razer Blade 17 Early 2022 | |
| Average of class Gaming (0.3439 - 0.759, n=106, last 2 years) | |
| Average Intel Core i9-12900HX (0.4159 - 0.4242, n=7) | |
| Lenovo Legion 7 16IAX7-82TD004SGE | |
| MSI Titan GT77 12UHS | |
| Aorus 17X XES | |
* ... smaller is better
AIDA64: FP32 Ray-Trace | FPU Julia | CPU SHA3 | CPU Queen | FPU SinJulia | FPU Mandel | CPU AES | CPU ZLib | FP64 Ray-Trace | CPU PhotoWorxx
| Performance rating | |
| Average of class Gaming | |
| MSI Titan GT77 12UHS | |
| Average Intel Core i9-12900HX | |
| Lenovo Legion 7 16ARHA7 | |
| Asus ROG Zephyrus Duo 16 GX650RX | |
| Asus ROG Flow X16 GV601RW-M5082W | |
| Schenker XMG Neo 17 M22 | |
| Aorus 17X XES | |
| Lenovo Legion 7 16IAX7-82TD004SGE | |
| Razer Blade 17 Early 2022 | |
| AIDA64 / FP32 Ray-Trace | |
| Average of class Gaming (10227 - 85542, n=105, last 2 years) | |
| MSI Titan GT77 12UHS | |
| Average Intel Core i9-12900HX (11535 - 22183, n=7) | |
| Lenovo Legion 7 16ARHA7 | |
| Asus ROG Zephyrus Duo 16 GX650RX | |
| Schenker XMG Neo 17 M22 | |
| Asus ROG Flow X16 GV601RW-M5082W | |
| Aorus 17X XES | |
| Lenovo Legion 7 16IAX7-82TD004SGE | |
| Razer Blade 17 Early 2022 | |
| AIDA64 / FPU Julia | |
| Average of class Gaming (51376 - 238426, n=105, last 2 years) | |
| MSI Titan GT77 12UHS | |
| Lenovo Legion 7 16ARHA7 | |
| Asus ROG Zephyrus Duo 16 GX650RX | |
| Asus ROG Flow X16 GV601RW-M5082W | |
| Schenker XMG Neo 17 M22 | |
| Average Intel Core i9-12900HX (52916 - 110093, n=7) | |
| Aorus 17X XES | |
| Lenovo Legion 7 16IAX7-82TD004SGE | |
| Razer Blade 17 Early 2022 | |
| AIDA64 / CPU SHA3 | |
| Average of class Gaming (2180 - 10115, n=105, last 2 years) | |
| MSI Titan GT77 12UHS | |
| Average Intel Core i9-12900HX (3559 - 5123, n=7) | |
| Lenovo Legion 7 16IAX7-82TD004SGE | |
| Lenovo Legion 7 16ARHA7 | |
| Asus ROG Flow X16 GV601RW-M5082W | |
| Aorus 17X XES | |
| Asus ROG Zephyrus Duo 16 GX650RX | |
| Schenker XMG Neo 17 M22 | |
| Razer Blade 17 Early 2022 | |
| AIDA64 / CPU Queen | |
| Average of class Gaming (49785 - 173351, n=90, last 2 years) | |
| Lenovo Legion 7 16ARHA7 | |
| Asus ROG Zephyrus Duo 16 GX650RX | |
| Aorus 17X XES | |
| Asus ROG Flow X16 GV601RW-M5082W | |
| MSI Titan GT77 12UHS | |
| Average Intel Core i9-12900HX (101029 - 104457, n=7) | |
| Schenker XMG Neo 17 M22 | |
| Lenovo Legion 7 16IAX7-82TD004SGE | |
| Razer Blade 17 Early 2022 | |
| AIDA64 / FPU SinJulia | |
| Average of class Gaming (4424 - 33636, n=105, last 2 years) | |
| Lenovo Legion 7 16IAX7-82TD004SGE | |
| Lenovo Legion 7 16ARHA7 | |
| MSI Titan GT77 12UHS | |
| Asus ROG Zephyrus Duo 16 GX650RX | |
| Asus ROG Flow X16 GV601RW-M5082W | |
| Schenker XMG Neo 17 M22 | |
| Average Intel Core i9-12900HX (10475 - 13062, n=7) | |
| Aorus 17X XES | |
| Razer Blade 17 Early 2022 | |
| AIDA64 / FPU Mandel | |
| Average of class Gaming (25115 - 128721, n=105, last 2 years) | |
| Lenovo Legion 7 16ARHA7 | |
| Asus ROG Zephyrus Duo 16 GX650RX | |
| Asus ROG Flow X16 GV601RW-M5082W | |
| Schenker XMG Neo 17 M22 | |
| MSI Titan GT77 12UHS | |
| Average Intel Core i9-12900HX (31779 - 53628, n=7) | |
| Aorus 17X XES | |
| Lenovo Legion 7 16IAX7-82TD004SGE | |
| Razer Blade 17 Early 2022 | |
| AIDA64 / CPU AES | |
| MSI Titan GT77 12UHS | |
| Average Intel Core i9-12900HX (125268 - 183146, n=7) | |
| Asus ROG Flow X16 GV601RW-M5082W | |
| Lenovo Legion 7 16ARHA7 | |
| Asus ROG Zephyrus Duo 16 GX650RX | |
| Schenker XMG Neo 17 M22 | |
| Aorus 17X XES | |
| Lenovo Legion 7 16IAX7-82TD004SGE | |
| Average of class Gaming (39258 - 247074, n=105, last 2 years) | |
| Razer Blade 17 Early 2022 | |
| AIDA64 / CPU ZLib | |
| Average of class Gaming (574 - 2531, n=105, last 2 years) | |
| Lenovo Legion 7 16IAX7-82TD004SGE | |
| MSI Titan GT77 12UHS | |
| Average Intel Core i9-12900HX (990 - 1408, n=7) | |
| Aorus 17X XES | |
| Lenovo Legion 7 16ARHA7 | |
| Asus ROG Zephyrus Duo 16 GX650RX | |
| Asus ROG Flow X16 GV601RW-M5082W | |
| Schenker XMG Neo 17 M22 | |
| Razer Blade 17 Early 2022 | |
| AIDA64 / FP64 Ray-Trace | |
| Average of class Gaming (5509 - 45446, n=105, last 2 years) | |
| MSI Titan GT77 12UHS | |
| Average Intel Core i9-12900HX (6663 - 11913, n=7) | |
| Lenovo Legion 7 16ARHA7 | |
| Asus ROG Zephyrus Duo 16 GX650RX | |
| Asus ROG Flow X16 GV601RW-M5082W | |
| Schenker XMG Neo 17 M22 | |
| Aorus 17X XES | |
| Lenovo Legion 7 16IAX7-82TD004SGE | |
| Razer Blade 17 Early 2022 | |
| AIDA64 / CPU PhotoWorxx | |
| Average of class Gaming (12271 - 89891, n=105, last 2 years) | |
| Average Intel Core i9-12900HX (40239 - 47710, n=7) | |
| MSI Titan GT77 12UHS | |
| Aorus 17X XES | |
| Lenovo Legion 7 16IAX7-82TD004SGE | |
| Razer Blade 17 Early 2022 | |
| Lenovo Legion 7 16ARHA7 | |
| Schenker XMG Neo 17 M22 | |
| Asus ROG Zephyrus Duo 16 GX650RX | |
| Asus ROG Flow X16 GV601RW-M5082W | |
系统性能
我们对Legion 7 16的主观性能印象非常好,考虑到这些组件,这并不令人惊讶。合成测试中的良好结果证实了这一印象。该评测设备是市场上最快的设备之一。在测试中也没有出现问题。
CrossMark: Overall | Productivity | Creativity | Responsiveness
| PCMark 10 / Score | |
| Lenovo Legion 7 16IAX7-82TD004SGE | |
| Average of class Gaming (5828 - 12414, n=93, last 2 years) | |
| MSI Titan GT77 12UHS | |
| Average Intel Core i9-12900HX, NVIDIA GeForce RTX 3080 Ti Laptop GPU (6812 - 8636, n=6) | |
| Aorus 17X XES | |
| Lenovo Legion 7 16ARHA7 | |
| Razer Blade 17 Early 2022 | |
| Schenker XMG Neo 17 M22 | |
| Asus ROG Flow X16 GV601RW-M5082W | |
| Asus ROG Zephyrus Duo 16 GX650RX | |
| PCMark 10 / Essentials | |
| Lenovo Legion 7 16IAX7-82TD004SGE | |
| MSI Titan GT77 12UHS | |
| Average of class Gaming (8810 - 11935, n=97, last 2 years) | |
| Average Intel Core i9-12900HX, NVIDIA GeForce RTX 3080 Ti Laptop GPU (9598 - 11192, n=6) | |
| Aorus 17X XES | |
| Lenovo Legion 7 16ARHA7 | |
| Razer Blade 17 Early 2022 | |
| Asus ROG Flow X16 GV601RW-M5082W | |
| Schenker XMG Neo 17 M22 | |
| Asus ROG Zephyrus Duo 16 GX650RX | |
| PCMark 10 / Productivity | |
| Average of class Gaming (6845 - 25323, n=95, last 2 years) | |
| Lenovo Legion 7 16IAX7-82TD004SGE | |
| Average Intel Core i9-12900HX, NVIDIA GeForce RTX 3080 Ti Laptop GPU (9365 - 10932, n=6) | |
| Aorus 17X XES | |
| MSI Titan GT77 12UHS | |
| Asus ROG Flow X16 GV601RW-M5082W | |
| Schenker XMG Neo 17 M22 | |
| Razer Blade 17 Early 2022 | |
| Lenovo Legion 7 16ARHA7 | |
| Asus ROG Zephyrus Duo 16 GX650RX | |
| PCMark 10 / Digital Content Creation | |
| Lenovo Legion 7 16IAX7-82TD004SGE | |
| Average of class Gaming (7602 - 19954, n=95, last 2 years) | |
| MSI Titan GT77 12UHS | |
| Average Intel Core i9-12900HX, NVIDIA GeForce RTX 3080 Ti Laptop GPU (9543 - 14291, n=6) | |
| Aorus 17X XES | |
| Lenovo Legion 7 16ARHA7 | |
| Razer Blade 17 Early 2022 | |
| Schenker XMG Neo 17 M22 | |
| Asus ROG Zephyrus Duo 16 GX650RX | |
| Asus ROG Flow X16 GV601RW-M5082W | |
| CrossMark / Overall | |
| Aorus 17X XES | |
| Average Intel Core i9-12900HX, NVIDIA GeForce RTX 3080 Ti Laptop GPU (2108 - 2170, n=5) | |
| Lenovo Legion 7 16IAX7-82TD004SGE | |
| MSI Titan GT77 12UHS | |
| Average of class Gaming (1366 - 2409, n=94, last 2 years) | |
| Razer Blade 17 Early 2022 | |
| Asus ROG Zephyrus Duo 16 GX650RX | |
| Schenker XMG Neo 17 M22 | |
| Asus ROG Flow X16 GV601RW-M5082W | |
| Lenovo Legion 7 16ARHA7 | |
| CrossMark / Productivity | |
| Aorus 17X XES | |
| Average Intel Core i9-12900HX, NVIDIA GeForce RTX 3080 Ti Laptop GPU (1978 - 2047, n=5) | |
| Lenovo Legion 7 16IAX7-82TD004SGE | |
| MSI Titan GT77 12UHS | |
| Average of class Gaming (1386 - 2254, n=94, last 2 years) | |
| Razer Blade 17 Early 2022 | |
| Asus ROG Zephyrus Duo 16 GX650RX | |
| Schenker XMG Neo 17 M22 | |
| Asus ROG Flow X16 GV601RW-M5082W | |
| Lenovo Legion 7 16ARHA7 | |
| CrossMark / Creativity | |
| Average Intel Core i9-12900HX, NVIDIA GeForce RTX 3080 Ti Laptop GPU (2288 - 2366, n=5) | |
| Lenovo Legion 7 16IAX7-82TD004SGE | |
| Aorus 17X XES | |
| MSI Titan GT77 12UHS | |
| Average of class Gaming (1343 - 2786, n=94, last 2 years) | |
| Razer Blade 17 Early 2022 | |
| Schenker XMG Neo 17 M22 | |
| Asus ROG Flow X16 GV601RW-M5082W | |
| Lenovo Legion 7 16ARHA7 | |
| Asus ROG Zephyrus Duo 16 GX650RX | |
| CrossMark / Responsiveness | |
| Aorus 17X XES | |
| Average Intel Core i9-12900HX, NVIDIA GeForce RTX 3080 Ti Laptop GPU (1991 - 2090, n=5) | |
| Lenovo Legion 7 16IAX7-82TD004SGE | |
| MSI Titan GT77 12UHS | |
| Asus ROG Zephyrus Duo 16 GX650RX | |
| Average of class Gaming (1226 - 2334, n=94, last 2 years) | |
| Razer Blade 17 Early 2022 | |
| Asus ROG Flow X16 GV601RW-M5082W | |
| Schenker XMG Neo 17 M22 | |
| Lenovo Legion 7 16ARHA7 | |
| PCMark 10 Score | 8636 points | |
Help | ||
| AIDA64 / Memory Copy | |
| Average of class Gaming (21750 - 129946, n=105, last 2 years) | |
| Average Intel Core i9-12900HX (62852 - 70863, n=7) | |
| MSI Titan GT77 12UHS | |
| Lenovo Legion 7 16IAX7-82TD004SGE | |
| Aorus 17X XES | |
| Razer Blade 17 Early 2022 | |
| Asus ROG Zephyrus Duo 16 GX650RX | |
| Lenovo Legion 7 16ARHA7 | |
| Schenker XMG Neo 17 M22 | |
| Asus ROG Flow X16 GV601RW-M5082W | |
| AIDA64 / Memory Read | |
| Average of class Gaming (22956 - 118858, n=105, last 2 years) | |
| Lenovo Legion 7 16IAX7-82TD004SGE | |
| Aorus 17X XES | |
| Average Intel Core i9-12900HX (62140 - 72930, n=7) | |
| Razer Blade 17 Early 2022 | |
| MSI Titan GT77 12UHS | |
| Asus ROG Zephyrus Duo 16 GX650RX | |
| Lenovo Legion 7 16ARHA7 | |
| Schenker XMG Neo 17 M22 | |
| Asus ROG Flow X16 GV601RW-M5082W | |
| AIDA64 / Memory Write | |
| Average of class Gaming (22297 - 135096, n=105, last 2 years) | |
| Lenovo Legion 7 16IAX7-82TD004SGE | |
| Average Intel Core i9-12900HX (60001 - 68782, n=7) | |
| MSI Titan GT77 12UHS | |
| Aorus 17X XES | |
| Razer Blade 17 Early 2022 | |
| Asus ROG Zephyrus Duo 16 GX650RX | |
| Schenker XMG Neo 17 M22 | |
| Lenovo Legion 7 16ARHA7 | |
| Asus ROG Flow X16 GV601RW-M5082W | |
| AIDA64 / Memory Latency | |
| Average of class Gaming (75.3 - 259, n=105, last 2 years) | |
| Asus ROG Flow X16 GV601RW-M5082W | |
| Asus ROG Zephyrus Duo 16 GX650RX | |
| Schenker XMG Neo 17 M22 | |
| MSI Titan GT77 12UHS | |
| Average Intel Core i9-12900HX (83.9 - 93.4, n=7) | |
| Aorus 17X XES | |
| Lenovo Legion 7 16IAX7-82TD004SGE | |
| Lenovo Legion 7 16ARHA7 | |
* ... smaller is better
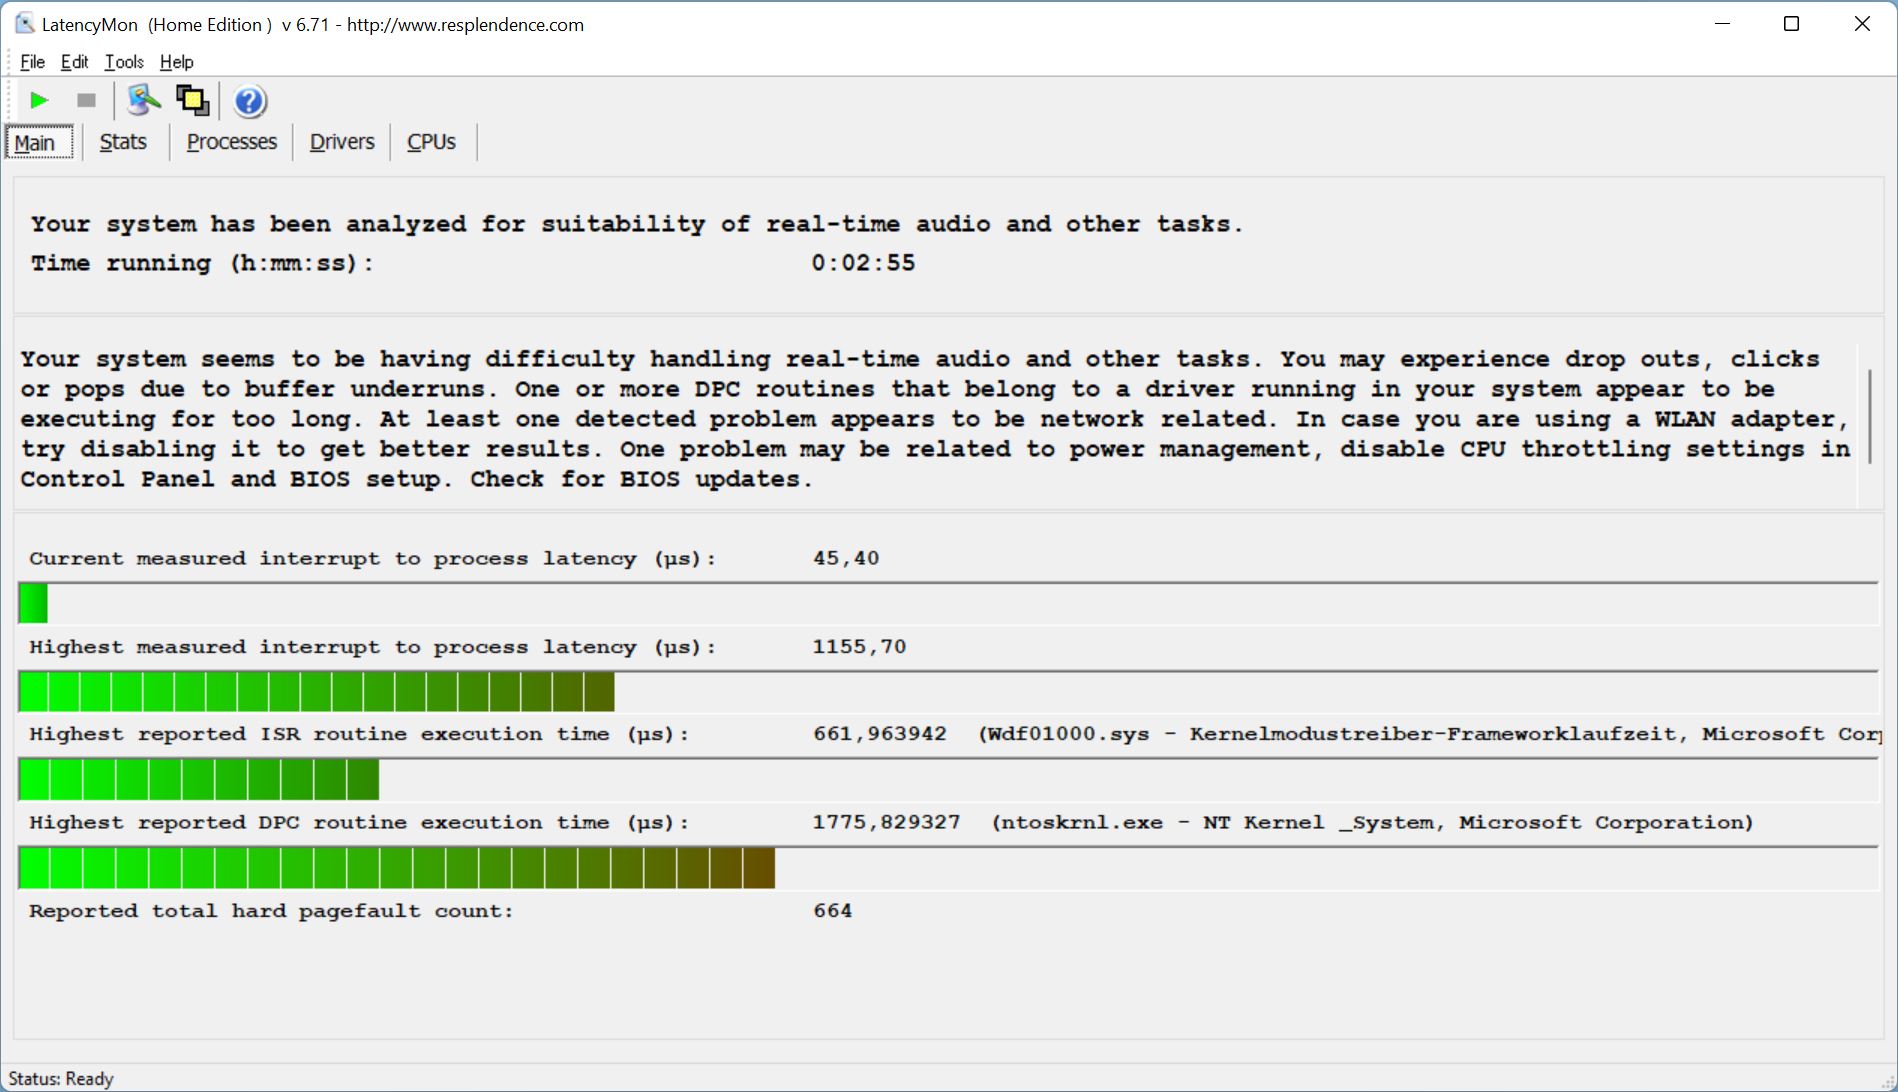
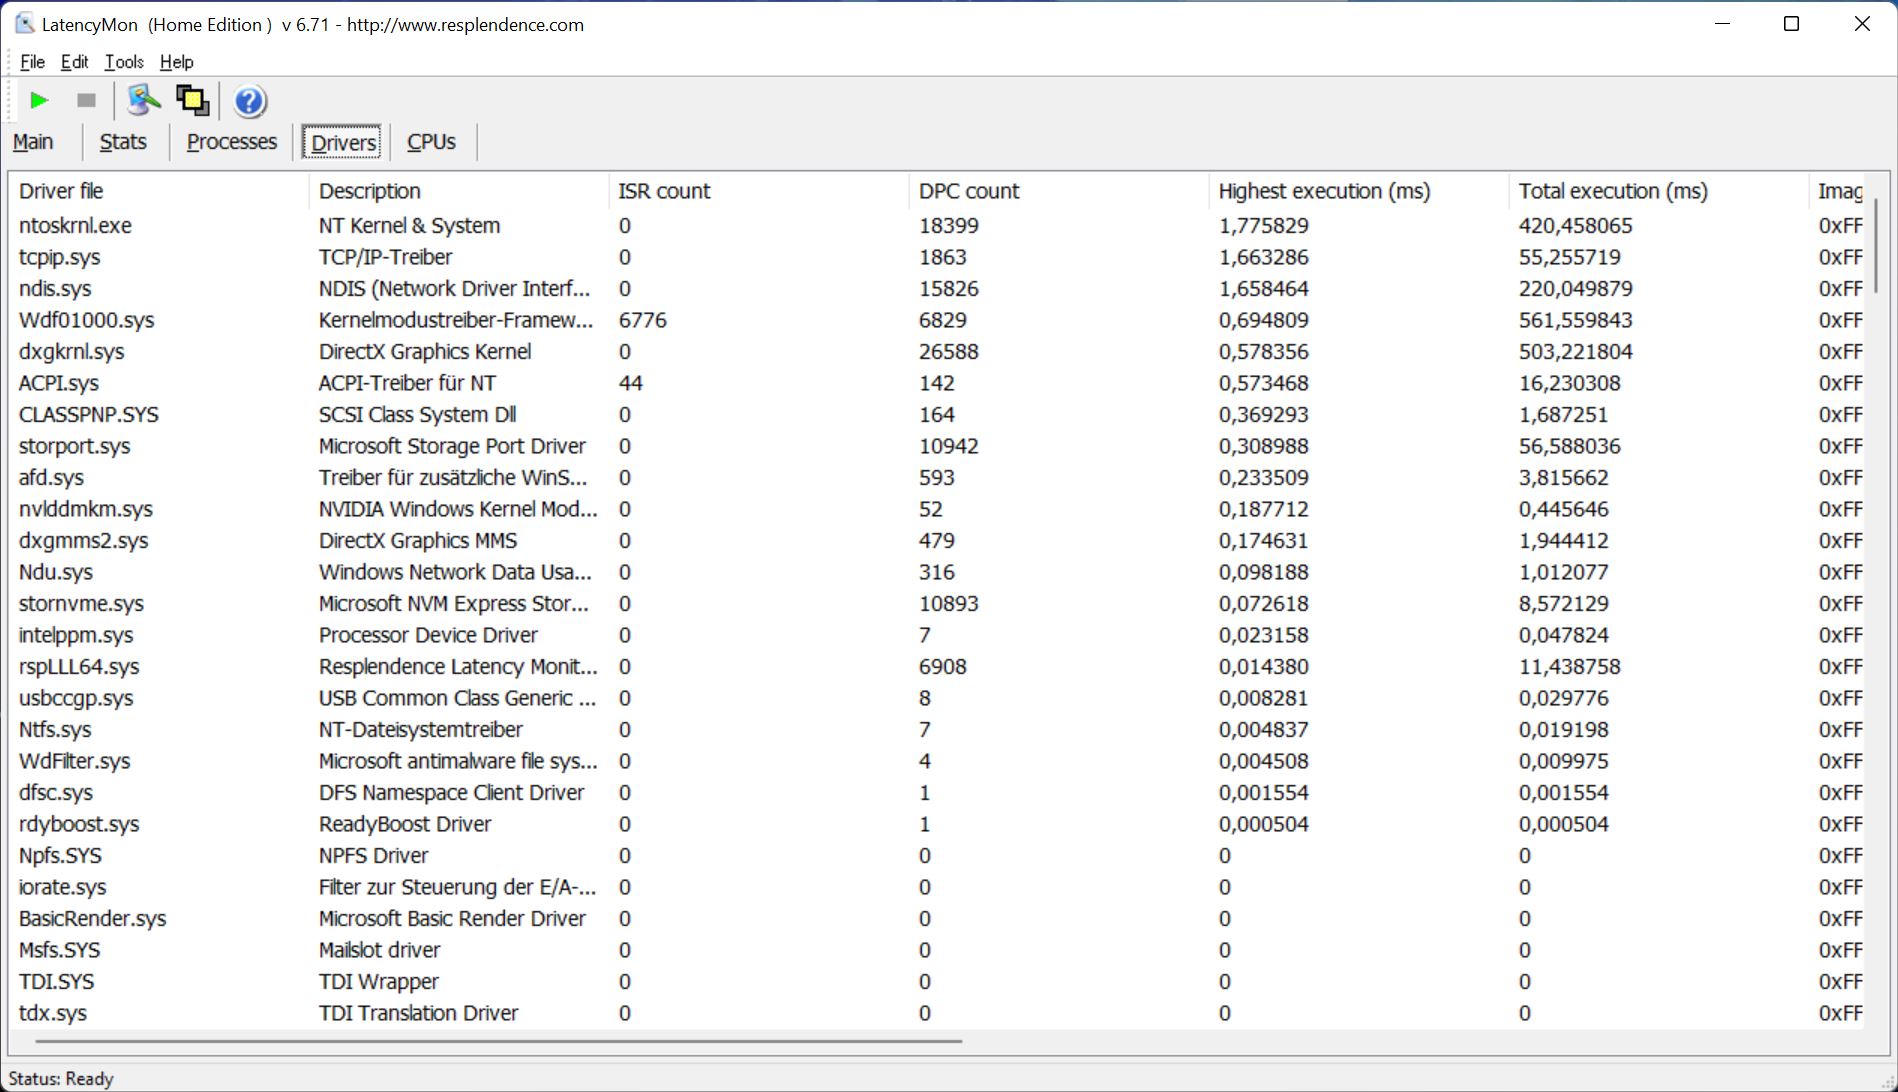
DPC延时
在我们的标准化延迟测试中(网页浏览、4K YouTube播放、CPU负载),评测设备在目前的BIOS版本下显示出轻微的局限性,因此不是最适合使用实时音频应用程序。
| DPC Latencies / LatencyMon - interrupt to process latency (max), Web, Youtube, Prime95 | |
| Schenker XMG Neo 17 M22 | |
| MSI Titan GT77 12UHS | |
| MSI Titan GT77 12UHS | |
| Lenovo Legion 7 16ARHA7 | |
| Asus ROG Flow X16 GV601RW-M5082W | |
| Lenovo Legion 7 16IAX7-82TD004SGE | |
| Aorus 17X XES | |
| Asus ROG Zephyrus Duo 16 GX650RX | |
| Razer Blade 17 Early 2022 | |
* ... smaller is better
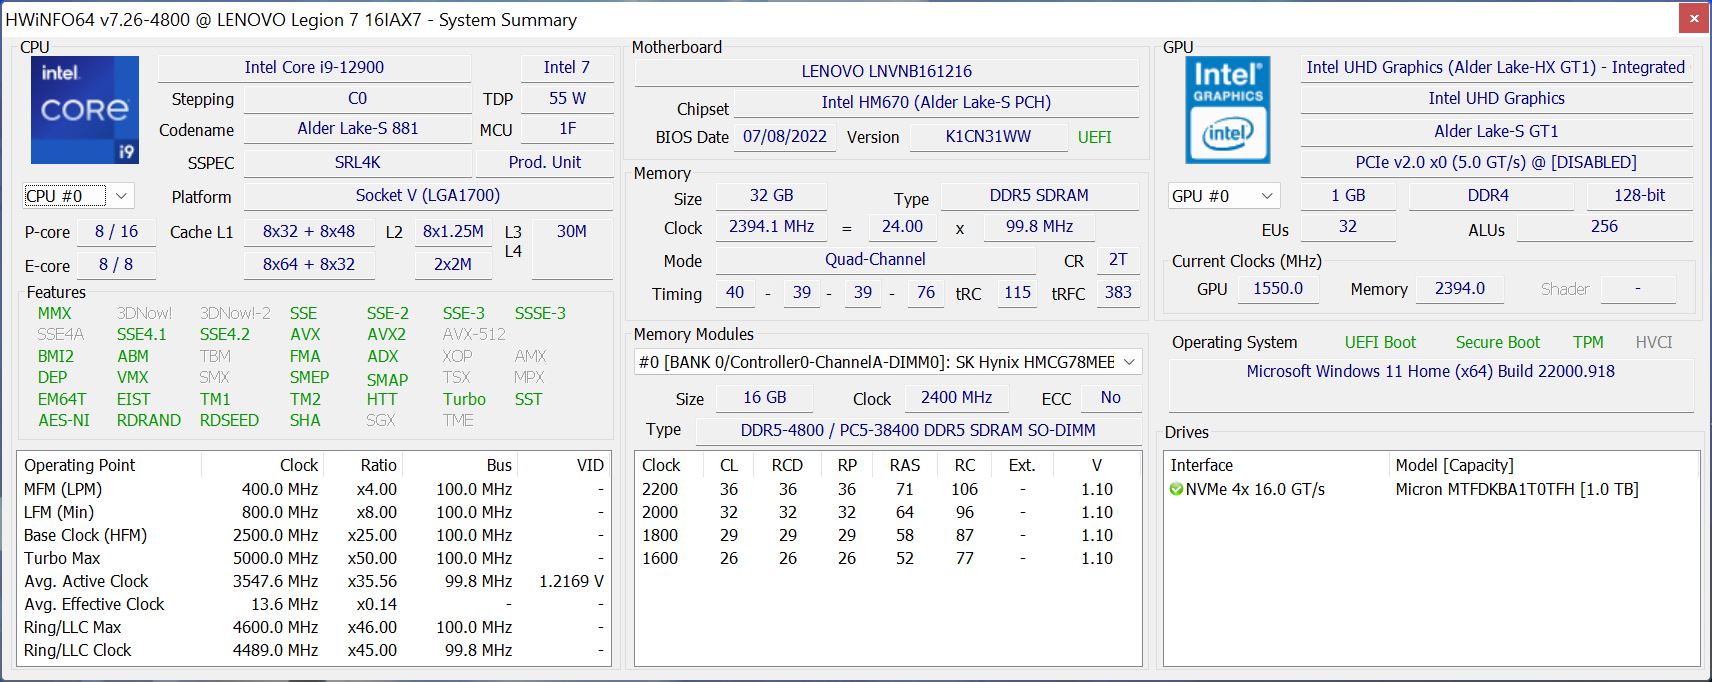
存储设备
Legion 为M.2-2280固态硬盘提供了两个现代化的PCIe 4.0插槽,这些插槽还配备了散热器。在我们的审查配置中,其中一个插槽未被占用,另一个配备了快速的美光3400-SSD,提供了1TB的存储容量(首次启动后可使用886GB)。传输速率非常好,超过6GB/s,在长时间的负载中,性能只有极小的下降。没有登记任何温度问题。更多的SSD基准测试可在这里.

* ... smaller is better
Sustained Read Performance: DiskSpd Read Loop, Queue Depth 8
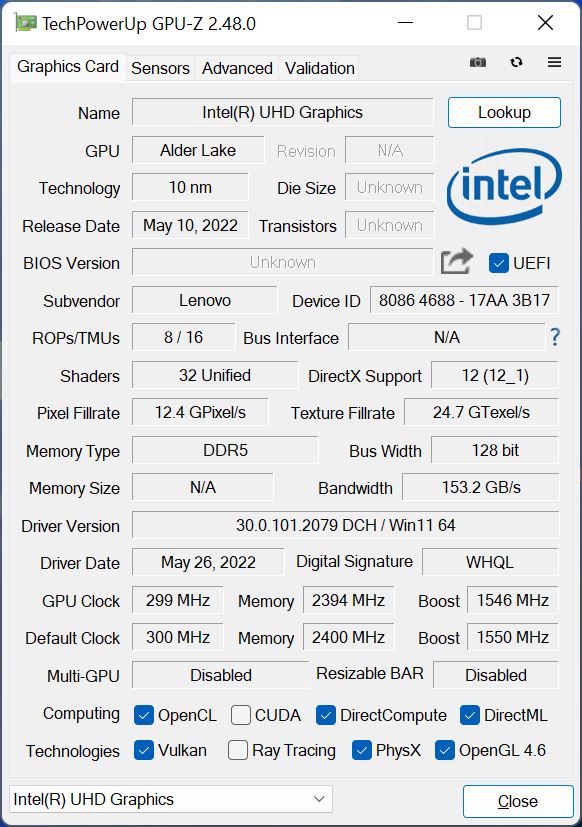
图形卡
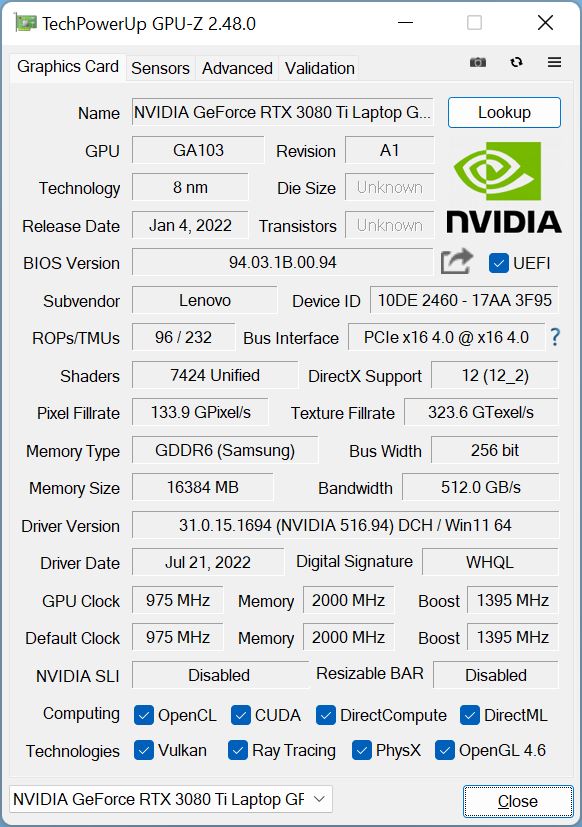
的 NvidiaGeForce RTX 3080 Ti是目前最快的移动显卡,在Legion 7 16中以高达180瓦的TGP运行。最大核心时钟为1,590 MHz,显存为16 GB。在合成基准测试中表现出色,总体上比我们数据库中RTX 3080 Ti的平均结果略微领先10%。然而,在 Radeon RX 6850M XT在合成测试中只略微慢一些。
除了混合模式,即在负载下自动激活Nvidia GPU,你还可以完全禁用集成显卡,以获得稍多的性能,尽管这需要重新启动。
即使在较长的负载期间,图形性能也保持稳定。然而,GPU在电池电源上最多只允许消耗45瓦,这就是为什么GPU性能在与电源断开时下降75%。更多的GPU基准测试可在这里.
| 3DMark 11 Performance | 37061 points | |
| 3DMark Fire Strike Score | 30432 points | |
| 3DMark Time Spy Score | 12751 points | |
Help | ||
| Blender | |
| Lenovo Legion 7 16IAX7-82TD004SGE | |
| v3.3 Classroom CPU * | |
| v3.3 Classroom CUDA * | |
| v3.3 Classroom OPTIX/RTX * | |
| MSI Titan GT77 12UHS | |
| v3.3 Classroom CPU * | |
| v3.3 Classroom CUDA * | |
| v3.3 Classroom OPTIX/RTX * | |
| Aorus 17X XES | |
| v3.3 Classroom CPU * | |
| v3.3 Classroom CUDA * | |
| v3.3 Classroom OPTIX/RTX * | |
| Asus ROG Flow X16 GV601RW-M5082W | |
| v3.3 Classroom CPU * | |
| v3.3 Classroom CUDA * | |
| Lenovo Legion 7 16ARHA7 | |
| v3.3 Classroom CPU * | |
| v3.3 Classroom HIP/AMD * | |
| Average of class Gaming | |
| v3.3 Classroom CPU * | |
| v3.3 Classroom CUDA * | |
| v3.3 Classroom OPTIX/RTX * | |
* ... smaller is better | |
游戏性能
Legion 7 16的游戏性能非常好,正如预期。即使是像《赛博朋克2077》这样高要求的游戏,在原生QHD分辨率下仍能顺利运行。总的来说,结果是非常好的,但在许多情况下Radeon RX 6850M XT并没有远远落后,而且价格也便宜很多。另一方面,当Legion 与电源插座断开时,游戏性能会出现大幅下降。Witcher 3例如,在超强设置下,仅以30 FPS运行了55分钟。
| F1 2021 | |
| 2560x1440 Ultra High Preset + Raytracing AA:T AF:16x | |
| Schenker XMG Neo 17 M22 | |
| Razer Blade 17 Early 2022 | |
| Asus ROG Zephyrus Duo 16 GX650RX | |
| Lenovo Legion 7 16ARHA7 | |
| Average NVIDIA GeForce RTX 3080 Ti Laptop GPU (30 - 120.1, n=19) | |
| Lenovo Legion 7 16IAX7-82TD004SGE | |
| 1920x1080 Ultra High Preset + Raytracing AA:T AF:16x | |
| MSI Titan GT77 12UHS | |
| Schenker XMG Neo 17 M22 | |
| Lenovo Legion 7 16ARHA7 | |
| Razer Blade 17 Early 2022 | |
| Asus ROG Zephyrus Duo 16 GX650RX | |
| Average NVIDIA GeForce RTX 3080 Ti Laptop GPU (30.2 - 160.6, n=30) | |
| Lenovo Legion 7 16IAX7-82TD004SGE | |
Witcher 3 FPS Chart
| low | med. | high | ultra | QHD | |
|---|---|---|---|---|---|
| GTA V (2015) | 187.1 | 186.5 | 183.4 | 111.4 | 82.4 |
| The Witcher 3 (2015) | 279 | 251 | 114.4 | ||
| Dota 2 Reborn (2015) | 206 | 185.1 | 177.8 | 168 | |
| Final Fantasy XV Benchmark (2018) | 223 | 163.9 | 121.2 | 92.8 | |
| X-Plane 11.11 (2018) | 170.5 | 150.5 | 120.2 | ||
| Far Cry 5 (2018) | 192 | 176 | 166 | 153 | 129 |
| Strange Brigade (2018) | 361 | 194 | 156 | 137.6 | 107 |
| F1 2021 (2021) | 337 | 207 | 182.1 | 97.5 | 74.9 |
| Cyberpunk 2077 1.6 (2022) | 89 | 78 | 64 | 54 | 36 |
排放--Legion ,有响亮的风扇
噪声
Legion 7 16的冷却系统由一个蒸汽室和两个风扇组成。笔记本电脑闲置时,这两个风扇通常不活动,但它们也不时启动,你可以听到轻微的嘶嘶声。一旦处理器或GPU被置于压力之下,笔记本电脑就会迅速变得明显地响起来。根据游戏的情况,你可以使用安静 模式来测试游戏在所需设置下是否仍能顺利运行。用户可以在不戴耳机的情况下玩到40dB(A)左右,但在其他两种模式下则不行。在这里,我们在Witcher 3 ,测得的数据在46至49dB(A)之间,在压力测试中甚至高达54dB(A)。负载停止后,风扇继续运行了几分钟,大约为32 dB(A)。没有其他电子噪音被记录下来。
Noise level
| Idle |
| 24.5 / 30 / 32.5 dB(A) |
| Load |
| 43.9 / 54.2 dB(A) |
 | ||
30 dB silent 40 dB(A) audible 50 dB(A) loud |
||
min: | ||
| Lenovo Legion 7 16IAX7-82TD004SGE GeForce RTX 3080 Ti Laptop GPU, i9-12900HX, Micron 3400 1TB MTFDKBA1T0TFH | Schenker XMG Neo 17 M22 GeForce RTX 3080 Ti Laptop GPU, R9 6900HX, Samsung SSD 980 Pro 1TB MZ-V8P1T0BW | MSI Titan GT77 12UHS GeForce RTX 3080 Ti Laptop GPU, i9-12900HX, Samsung PM9A1 MZVL21T0HCLR | Aorus 17X XES GeForce RTX 3070 Ti Laptop GPU, i9-12900HX, Gigabyte AG470S1TB-SI B10 | Asus ROG Flow X16 GV601RW-M5082W GeForce RTX 3070 Ti Laptop GPU, R9 6900HS, Micron 3400 1TB MTFDKBA1T0TFH | Razer Blade 17 Early 2022 GeForce RTX 3080 Ti Laptop GPU, i9-12900H, Samsung PM9A1 MZVL21T0HCLR | Asus ROG Zephyrus Duo 16 GX650RX GeForce RTX 3080 Ti Laptop GPU, R9 6900HX, 2x Samsung SSD 980 Pro 2TB MZ-V8P2T0 (RAID 0) | Lenovo Legion 7 16ARHA7 Radeon RX 6850M XT, R9 6900HX, Samsung PM9A1 MZVL22T0HBLB | |
|---|---|---|---|---|---|---|---|---|
| Noise | -7% | 5% | -11% | 1% | -2% | 4% | 13% | |
| off / environment * (dB) | 24.5 | 26 -6% | 21.9 11% | 26 -6% | 25.5 -4% | 26 -6% | 26 -6% | 22.8 7% |
| Idle Minimum * (dB) | 24.5 | 26 -6% | 24.53 -0% | 28 -14% | 25.5 -4% | 26 -6% | 26 -6% | 23 6% |
| Idle Average * (dB) | 30 | 29 3% | 24.53 18% | 32 -7% | 25.5 15% | 27 10% | 27 10% | 23 23% |
| Idle Maximum * (dB) | 32.5 | 40 -23% | 24.53 25% | 38 -17% | 27.4 16% | 32 2% | 29 11% | 23 29% |
| Load Average * (dB) | 43.9 | 47 -7% | 46.25 -5% | 53 -21% | 49.9 -14% | 50 -14% | 41 7% | 26.8 39% |
| Witcher 3 ultra * (dB) | 48.8 | 52 -7% | 56.86 -17% | 54 -11% | 51 -5% | 48 2% | 54.3 -11% | |
| Load Maximum * (dB) | 54.2 | 54 -0% | 54.25 -0% | 55 -1% | 55 -1% | 51 6% | 50 8% | 54.2 -0% |
* ... smaller is better
温度
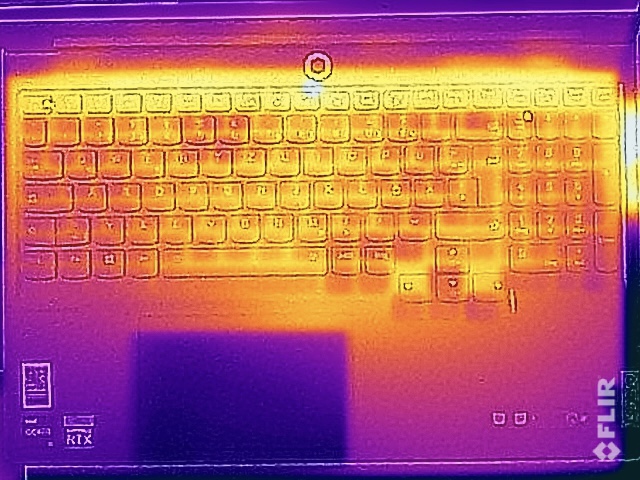
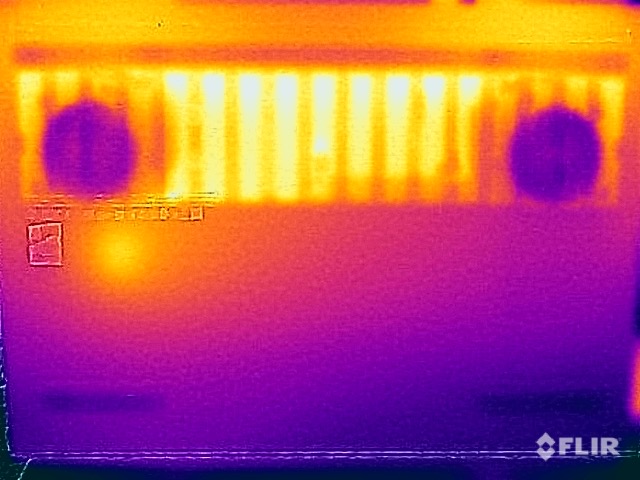
由于笔记本闲置时风扇被停用,后部区域的表面明显发热,但这并不导致任何限制。然而,在游戏时,你不应该把设备放在你的大腿上,因为我们测量到底部的温度高达60℃。键盘区域也在45°C的温度下大幅升温,这一点也很明显,但除了手指略微发热外,继续打字并不构成问题。
在压力测试中,处理器很快就达到了93瓦,显卡达到了150瓦。这些数值在整个测试中也保持稳定。
(±) The maximum temperature on the upper side is 44.4 °C / 112 F, compared to the average of 40.4 °C / 105 F, ranging from 21.2 to 68.8 °C for the class Gaming.
(-) The bottom heats up to a maximum of 60.8 °C / 141 F, compared to the average of 43.2 °C / 110 F
(+) In idle usage, the average temperature for the upper side is 31.1 °C / 88 F, compared to the device average of 33.9 °C / 93 F.
(-) Playing The Witcher 3, the average temperature for the upper side is 39.1 °C / 102 F, compared to the device average of 33.9 °C / 93 F.
(±) The palmrests and touchpad can get very hot to the touch with a maximum of 39.6 °C / 103.3 F.
(-) The average temperature of the palmrest area of similar devices was 28.8 °C / 83.8 F (-10.8 °C / -19.5 F).
| Lenovo Legion 7 16IAX7-82TD004SGE Intel Core i9-12900HX, NVIDIA GeForce RTX 3080 Ti Laptop GPU | Schenker XMG Neo 17 M22 AMD Ryzen 9 6900HX, NVIDIA GeForce RTX 3080 Ti Laptop GPU | MSI Titan GT77 12UHS Intel Core i9-12900HX, NVIDIA GeForce RTX 3080 Ti Laptop GPU | Aorus 17X XES Intel Core i9-12900HX, NVIDIA GeForce RTX 3070 Ti Laptop GPU | Asus ROG Flow X16 GV601RW-M5082W AMD Ryzen 9 6900HS, NVIDIA GeForce RTX 3070 Ti Laptop GPU | Razer Blade 17 Early 2022 Intel Core i9-12900H, NVIDIA GeForce RTX 3080 Ti Laptop GPU | Asus ROG Zephyrus Duo 16 GX650RX AMD Ryzen 9 6900HX, NVIDIA GeForce RTX 3080 Ti Laptop GPU | Lenovo Legion 7 16ARHA7 AMD Ryzen 9 6900HX, AMD Radeon RX 6850M XT | |
|---|---|---|---|---|---|---|---|---|
| Heat | 8% | 5% | -7% | -1% | -3% | 9% | 15% | |
| Maximum Upper Side * (°C) | 44.4 | 49 -10% | 40.8 8% | 54 -22% | 55.1 -24% | 50 -13% | 45 -1% | 37.2 16% |
| Maximum Bottom * (°C) | 60.8 | 52 14% | 52.4 14% | 58 5% | 50.3 17% | 56 8% | 50 18% | 43 29% |
| Idle Upper Side * (°C) | 33.8 | 30 11% | 34.6 -2% | 37 -9% | 35.5 -5% | 36 -7% | 33 2% | 34 -1% |
| Idle Bottom * (°C) | 38.8 | 33 15% | 38.4 1% | 39 -1% | 36.1 7% | 38 2% | 33 15% | 32.8 15% |
* ... smaller is better
发言人
尽管机箱很大,联想只安装了两个立体声扬声器(2x 2瓦),在声音方面可以接受,但没有什么特别之处。反正这些扬声器对游戏来说不是最好的,所以用户应该使用耳机。当制造商在紧凑型超极本中安装4或6个模块的音响系统时,你应该期待更好的扬声器,即使是在旗舰游戏笔记本电脑中。
Lenovo Legion 7 16IAX7-82TD004SGE audio analysis
(+) | speakers can play relatively loud (83 dB)
Bass 100 - 315 Hz
(±) | reduced bass - on average 8.3% lower than median
(±) | linearity of bass is average (10.9% delta to prev. frequency)
Mids 400 - 2000 Hz
(±) | higher mids - on average 6.1% higher than median
(±) | linearity of mids is average (7.9% delta to prev. frequency)
Highs 2 - 16 kHz
(+) | balanced highs - only 3.1% away from median
(+) | highs are linear (5.6% delta to prev. frequency)
Overall 100 - 16.000 Hz
(+) | overall sound is linear (14.9% difference to median)
Compared to same class
» 30% of all tested devices in this class were better, 7% similar, 63% worse
» The best had a delta of 6%, average was 18%, worst was 132%
Compared to all devices tested
» 20% of all tested devices were better, 4% similar, 76% worse
» The best had a delta of 4%, average was 23%, worst was 134%
Asus ROG Zephyrus Duo 16 GX650RX audio analysis
(±) | speaker loudness is average but good (80 dB)
Bass 100 - 315 Hz
(±) | reduced bass - on average 8.9% lower than median
(±) | linearity of bass is average (12.4% delta to prev. frequency)
Mids 400 - 2000 Hz
(±) | higher mids - on average 6.8% higher than median
(+) | mids are linear (4.3% delta to prev. frequency)
Highs 2 - 16 kHz
(±) | reduced highs - on average 6% lower than median
(±) | linearity of highs is average (7.3% delta to prev. frequency)
Overall 100 - 16.000 Hz
(±) | linearity of overall sound is average (16.5% difference to median)
Compared to same class
» 42% of all tested devices in this class were better, 7% similar, 51% worse
» The best had a delta of 6%, average was 18%, worst was 132%
Compared to all devices tested
» 28% of all tested devices were better, 6% similar, 66% worse
» The best had a delta of 4%, average was 23%, worst was 134%
能量管理--耐力不足的游戏者
消耗功率
Legion 7 16不是一个特别经济的笔记本。即使在空闲状态下,我们测量的功率也超过了25瓦。当游戏时,你可以期待250瓦左右,甚至在压力测试中短时间内略高于300瓦。因此,附带的300瓦电源刚好够用,但在极端负载的情况下,没有为电池充电留下空间。
| Off / Standby | |
| Idle | |
| Load |
|
Key:
min: | |
| Lenovo Legion 7 16IAX7-82TD004SGE i9-12900HX, GeForce RTX 3080 Ti Laptop GPU, Micron 3400 1TB MTFDKBA1T0TFH, IPS, 2560x1600, 16" | Schenker XMG Neo 17 M22 R9 6900HX, GeForce RTX 3080 Ti Laptop GPU, Samsung SSD 980 Pro 1TB MZ-V8P1T0BW, IPS, 2560x1600, 17" | MSI Titan GT77 12UHS i9-12900HX, GeForce RTX 3080 Ti Laptop GPU, Samsung PM9A1 MZVL21T0HCLR, IPS-Level, 1920x1080, 17.3" | Aorus 17X XES i9-12900HX, GeForce RTX 3070 Ti Laptop GPU, Gigabyte AG470S1TB-SI B10, IPS, 1920x1080, 17.3" | Asus ROG Flow X16 GV601RW-M5082W R9 6900HS, GeForce RTX 3070 Ti Laptop GPU, Micron 3400 1TB MTFDKBA1T0TFH, Mini LED, 2560x1600, 16.1" | Razer Blade 17 Early 2022 i9-12900H, GeForce RTX 3080 Ti Laptop GPU, Samsung PM9A1 MZVL21T0HCLR, IPS, 3840x2160, 17.3" | Asus ROG Zephyrus Duo 16 GX650RX R9 6900HX, GeForce RTX 3080 Ti Laptop GPU, 2x Samsung SSD 980 Pro 2TB MZ-V8P2T0 (RAID 0), IPS-Level, 3840x2400, 16" | Lenovo Legion 7 16ARHA7 R9 6900HX, Radeon RX 6850M XT, Samsung PM9A1 MZVL22T0HBLB, IPS, 2560x1600, 16" | Average NVIDIA GeForce RTX 3080 Ti Laptop GPU | Average of class Gaming | |
|---|---|---|---|---|---|---|---|---|---|---|
| Power Consumption | 34% | -18% | -6% | 5% | 6% | 9% | 19% | 4% | 19% | |
| Idle Minimum * (Watt) | 19.2 | 7 64% | 30.21 -57% | 18 6% | 12.2 36% | 17 11% | 19 1% | 9.9 48% | 17.2 ? 10% | 13 ? 32% |
| Idle Average * (Watt) | 25.1 | 11 56% | 32.42 -29% | 28 -12% | 25.5 -2% | 23 8% | 24 4% | 22 12% | 23.3 ? 7% | 19 ? 24% |
| Idle Maximum * (Watt) | 27.1 | 17 37% | 33.7 -24% | 36 -33% | 29.8 -10% | 34 -25% | 31 -14% | 23.1 15% | 30.8 ? -14% | 24.6 ? 9% |
| Load Average * (Watt) | 132 | 92 30% | 125.09 5% | 153 -16% | 183 -39% | 120 9% | 104 21% | 94.4 28% | 121.2 ? 8% | 110.7 ? 16% |
| Witcher 3 ultra * (Watt) | 253 | 221 13% | 256 -1% | 221 13% | 183.6 27% | 229 9% | 186.5 26% | 249 2% | ||
| Load Maximum * (Watt) | 308.9 | 306 1% | 321.88 -4% | 290 6% | 253 18% | 243 21% | 256 17% | 276 11% | 276 ? 11% | 259 ? 16% |
* ... smaller is better
Power consumption Witcher 3 / Stress test
Power consumption with an external monitor
电池寿命
虽然联想安装了最大的电池,有99.99Wh,但组件根本需要大量的电力,即使有主动图形切换,实际运行时间也最多限制在4-5小时。在负载情况下,尽管性能下降,但笔记本电脑仅在一小时后就没电了。至少,使用300瓦的电源适配器可以迅速为电池充电,特别是当快速充电功能处于激活状态时。然后,当设备开机时,只需71分钟就能使电池完全充电。
| Lenovo Legion 7 16IAX7-82TD004SGE i9-12900HX, GeForce RTX 3080 Ti Laptop GPU, 99 Wh | Schenker XMG Neo 17 M22 R9 6900HX, GeForce RTX 3080 Ti Laptop GPU, 99 Wh | MSI Titan GT77 12UHS i9-12900HX, GeForce RTX 3080 Ti Laptop GPU, 99.9 Wh | Aorus 17X XES i9-12900HX, GeForce RTX 3070 Ti Laptop GPU, 99 Wh | Asus ROG Flow X16 GV601RW-M5082W R9 6900HS, GeForce RTX 3070 Ti Laptop GPU, 90 Wh | Razer Blade 17 Early 2022 i9-12900H, GeForce RTX 3080 Ti Laptop GPU, 82 Wh | Asus ROG Zephyrus Duo 16 GX650RX R9 6900HX, GeForce RTX 3080 Ti Laptop GPU, 90 Wh | Lenovo Legion 7 16ARHA7 R9 6900HX, Radeon RX 6850M XT, 99 Wh | Average of class Gaming | |
|---|---|---|---|---|---|---|---|---|---|
| Battery runtime | 95% | 65% | 24% | 19% | 40% | 66% | 110% | 79% | |
| H.264 (h) | 5.1 | 6.6 29% | 7.2 41% | 3.8 -25% | 4.8 -6% | 9.3 82% | 8.32 ? 63% | ||
| WiFi v1.3 (h) | 4.5 | 9 100% | 6.9 53% | 4.4 -2% | 5.7 27% | 3.8 -16% | 7.8 73% | 7.3 62% | 7.11 ? 58% |
| Witcher 3 ultra (h) | 0.9 | 1.5 67% | 0.9 0% | ||||||
| Load (h) | 0.7 | 1.8 157% | 1.4 100% | 1.4 100% | 0.9 29% | 1.7 143% | 1 43% | 1.8 157% | 1.502 ? 115% |
| Reader / Idle (h) | 12 | 7.1 | 12.5 | 4.9 | 8.27 ? |
Pros
Cons
结论 -Legion 7是一个优秀的游戏者

新的联想Legion 7是一个非常好的游戏笔记本,尽管它有相对紧凑的16英寸外壳,但不必没有最强大的组件。由于良好的冷却效果,在性能方面没有做出任何妥协。这两款 酷睿i9-12900HX和 GeForce RTX 3080 Ti都具有非常高的性能。然而,这是有代价的:考虑到更便宜的AMD型号的性能,这不可避免地提出了性价比的问题,4500欧元(约4500美元)的价格已经不是特别好。
对于这个价格来说,一个更好的面板也是可取的。毫无疑问,165赫兹的哑光WQHD面板非常适用于游戏,但如果是OLED或迷你LED显示屏就更好了。键盘也有改进的余地。
全力前进。联想在Legion 7 16中结合了市场上最快的组件,并将它们安装在一个带有大量照明的时尚铝制外壳中。然而,顶级型号也非常昂贵,建议零售价为4500欧元(约合4500美元)。
该 Legion 7 16的AMD型号在性价比方面有很大的优势,但具有可比性的17英寸设备(英特尔HX CPU,GeForce RTX 3080 Ti)的竞争者也不是真的便宜。
价格和可用性
Lenovo Legion 7 16IAX7-82TD004SGE
- 09/15/2022 v7 (old)
Andreas Osthoff
Price comparison

