Razer Blade 15 Advanced Model Early 2022评测 - 具有快速显示功能的紧凑型游戏笔记本电脑
装有最新的英特尔和Nvidia芯片,Razer Blade 15 2022春季型号承诺对流行的15英寸游戏笔记本电脑系列进行迭代改进。这里审查的模型和之前审查的模型之间的主要区别是 之前审查的Blade 15 2022的主要区别是1080p 360 Hz的面板,所以读者可以坚持在这篇评论中了解基本相同的物理规格的细节。刀锋15的直接竞争对手包括其他高性能15.6英寸游戏笔记本电脑,如 申克XMG Neo 15 E22,以及 华硕ROG Strix Scar 15,以及 MSI Stealth GS66 12UGS和 微星Vector GP66 12UGS.
进一步的Razer评论。
潜在的竞争对手比较
Rating | Date | Model | Weight | Height | Size | Resolution | Price |
|---|---|---|---|---|---|---|---|
| 88.3 % v7 (old) | 05 / 2022 | Razer Blade 15 Advanced Model Early 2022 i7-12800H, GeForce RTX 3080 Ti Laptop GPU | 2.1 kg | 16.99 mm | 15.60" | 1920x1080 | |
| 89.1 % v7 (old) | 03 / 2022 | Razer Blade 15 2022 i7-12800H, GeForce RTX 3080 Ti Laptop GPU | 2.1 kg | 16.99 mm | 15.60" | 2560x1440 | |
v (old) | 03 / 2022 | Schenker XMG Neo 15 E22 (Early 2022, RTX 3080 Ti) i7-12700H, GeForce RTX 3080 Ti Laptop GPU | 2.2 kg | 26.6 mm | 15.60" | 2560x1440 | |
| 86.3 % v7 (old) | 09 / 2021 | Asus ROG Strix Scar 15 G533QS R9 5900HX, GeForce RTX 3080 Laptop GPU | 2.3 kg | 27.2 mm | 15.60" | 2560x1440 | |
| 84.5 % v7 (old) | 02 / 2022 | MSI Stealth GS66 12UGS i7-12700H, GeForce RTX 3070 Ti Laptop GPU | 2.2 kg | 19.8 mm | 15.60" | 2560x1440 | |
| 86.9 % v7 (old) | 03 / 2022 | MSI Vector GP66 12UGS i9-12900H, GeForce RTX 3070 Ti Laptop GPU | 2.3 kg | 23.4 mm | 15.60" | 1920x1080 |
箱子 - 结构紧凑,适合旅行
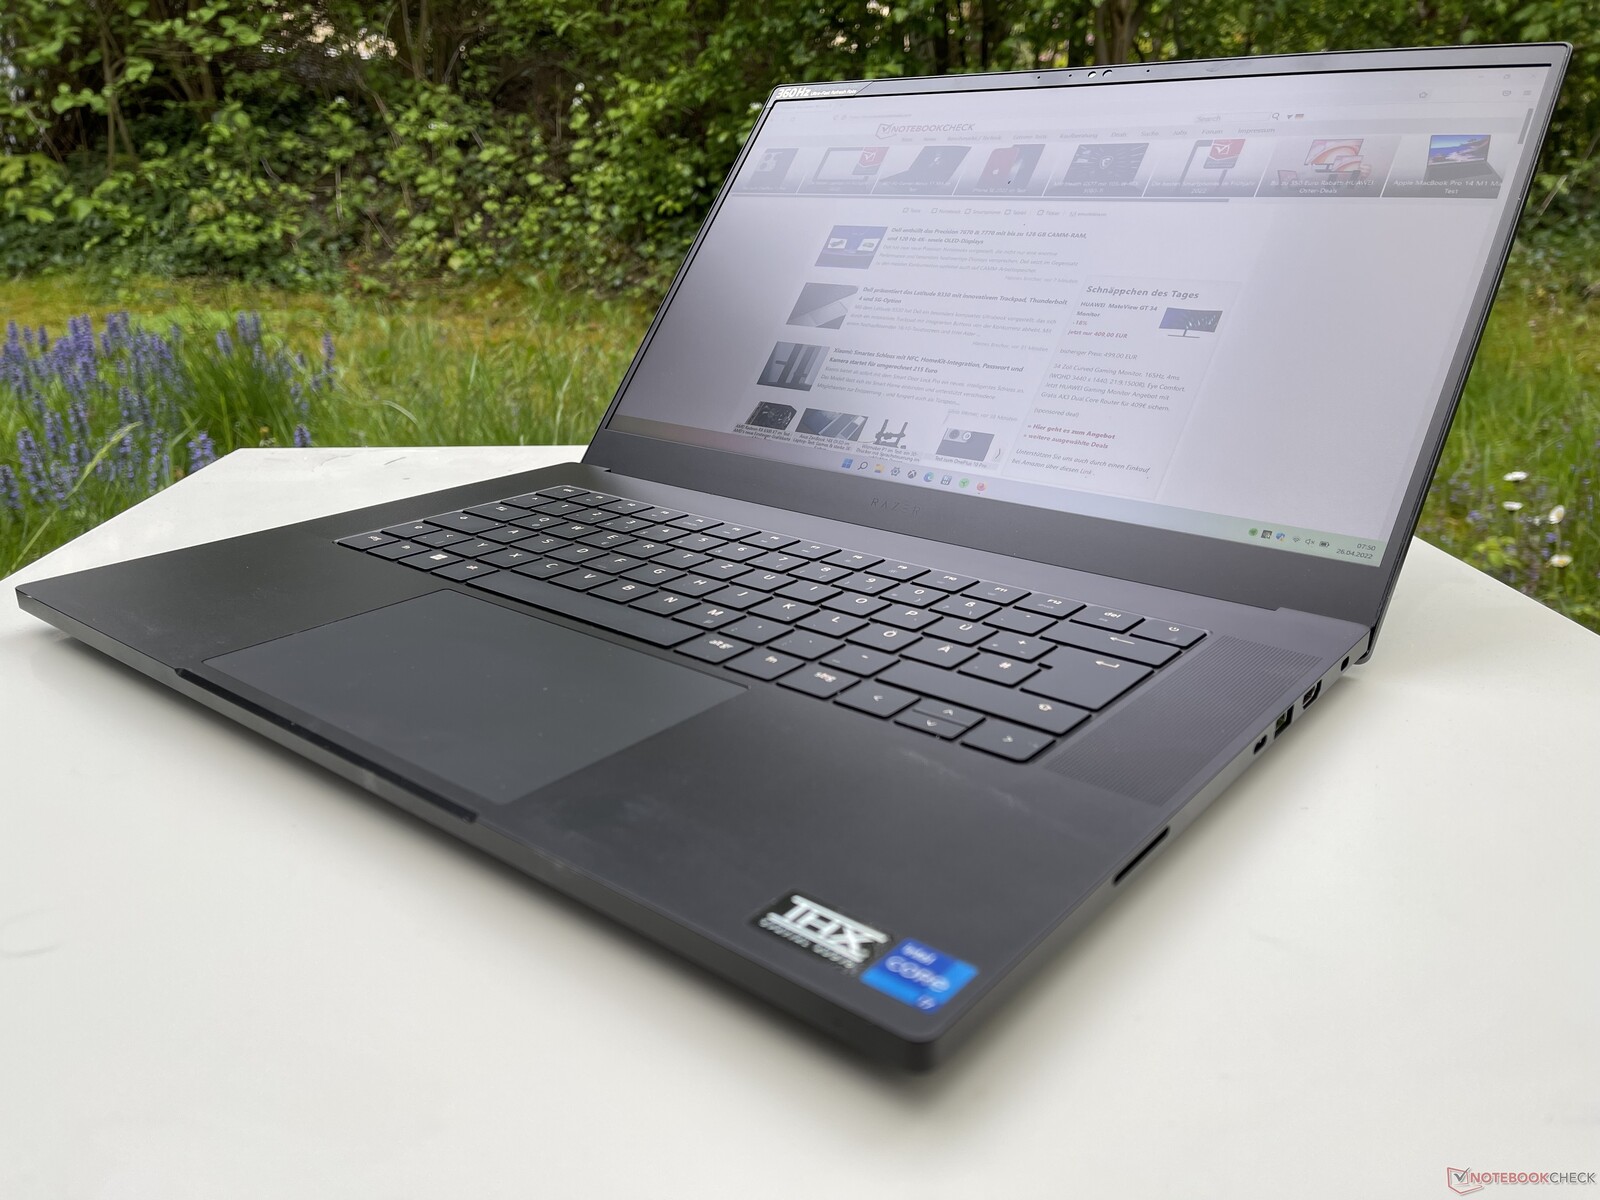
在表壳方面,我们再次看到熟悉的、光滑的金属结构,Blade系列最初就是以这种结构而闻名的。因此,稳定性、做工和抗扭性仍然很好。反面是对指纹的高敏感度。
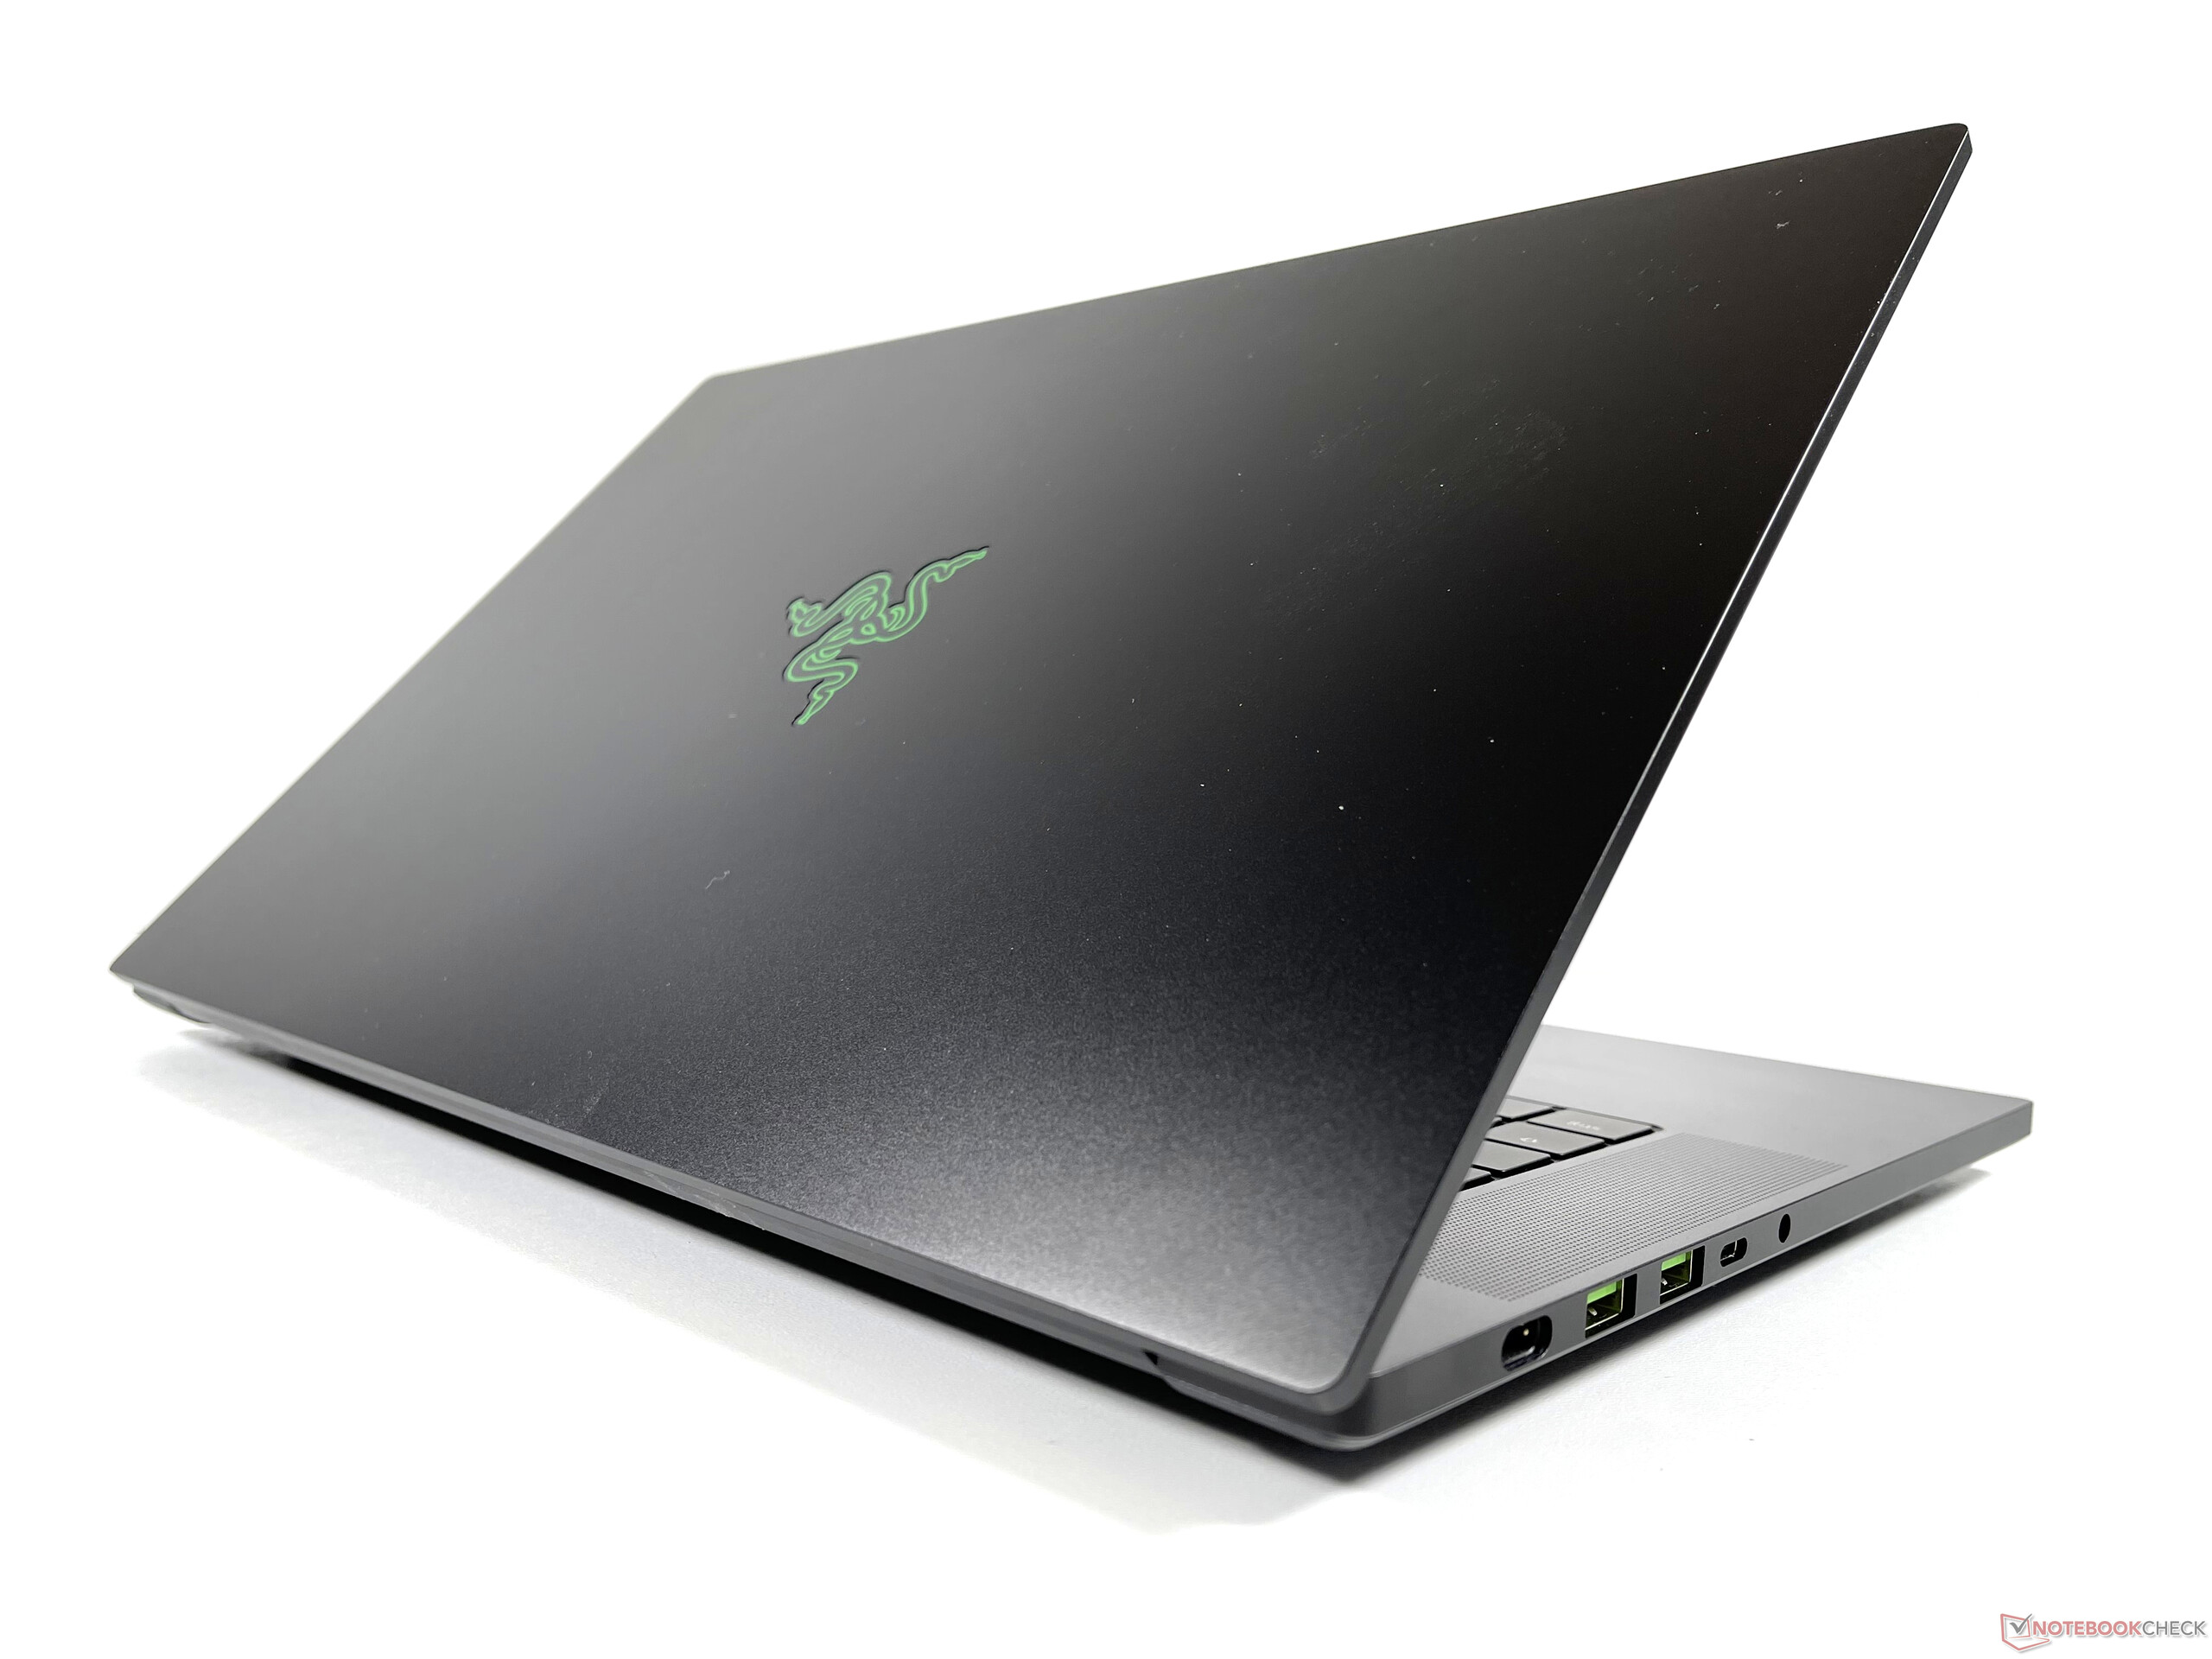
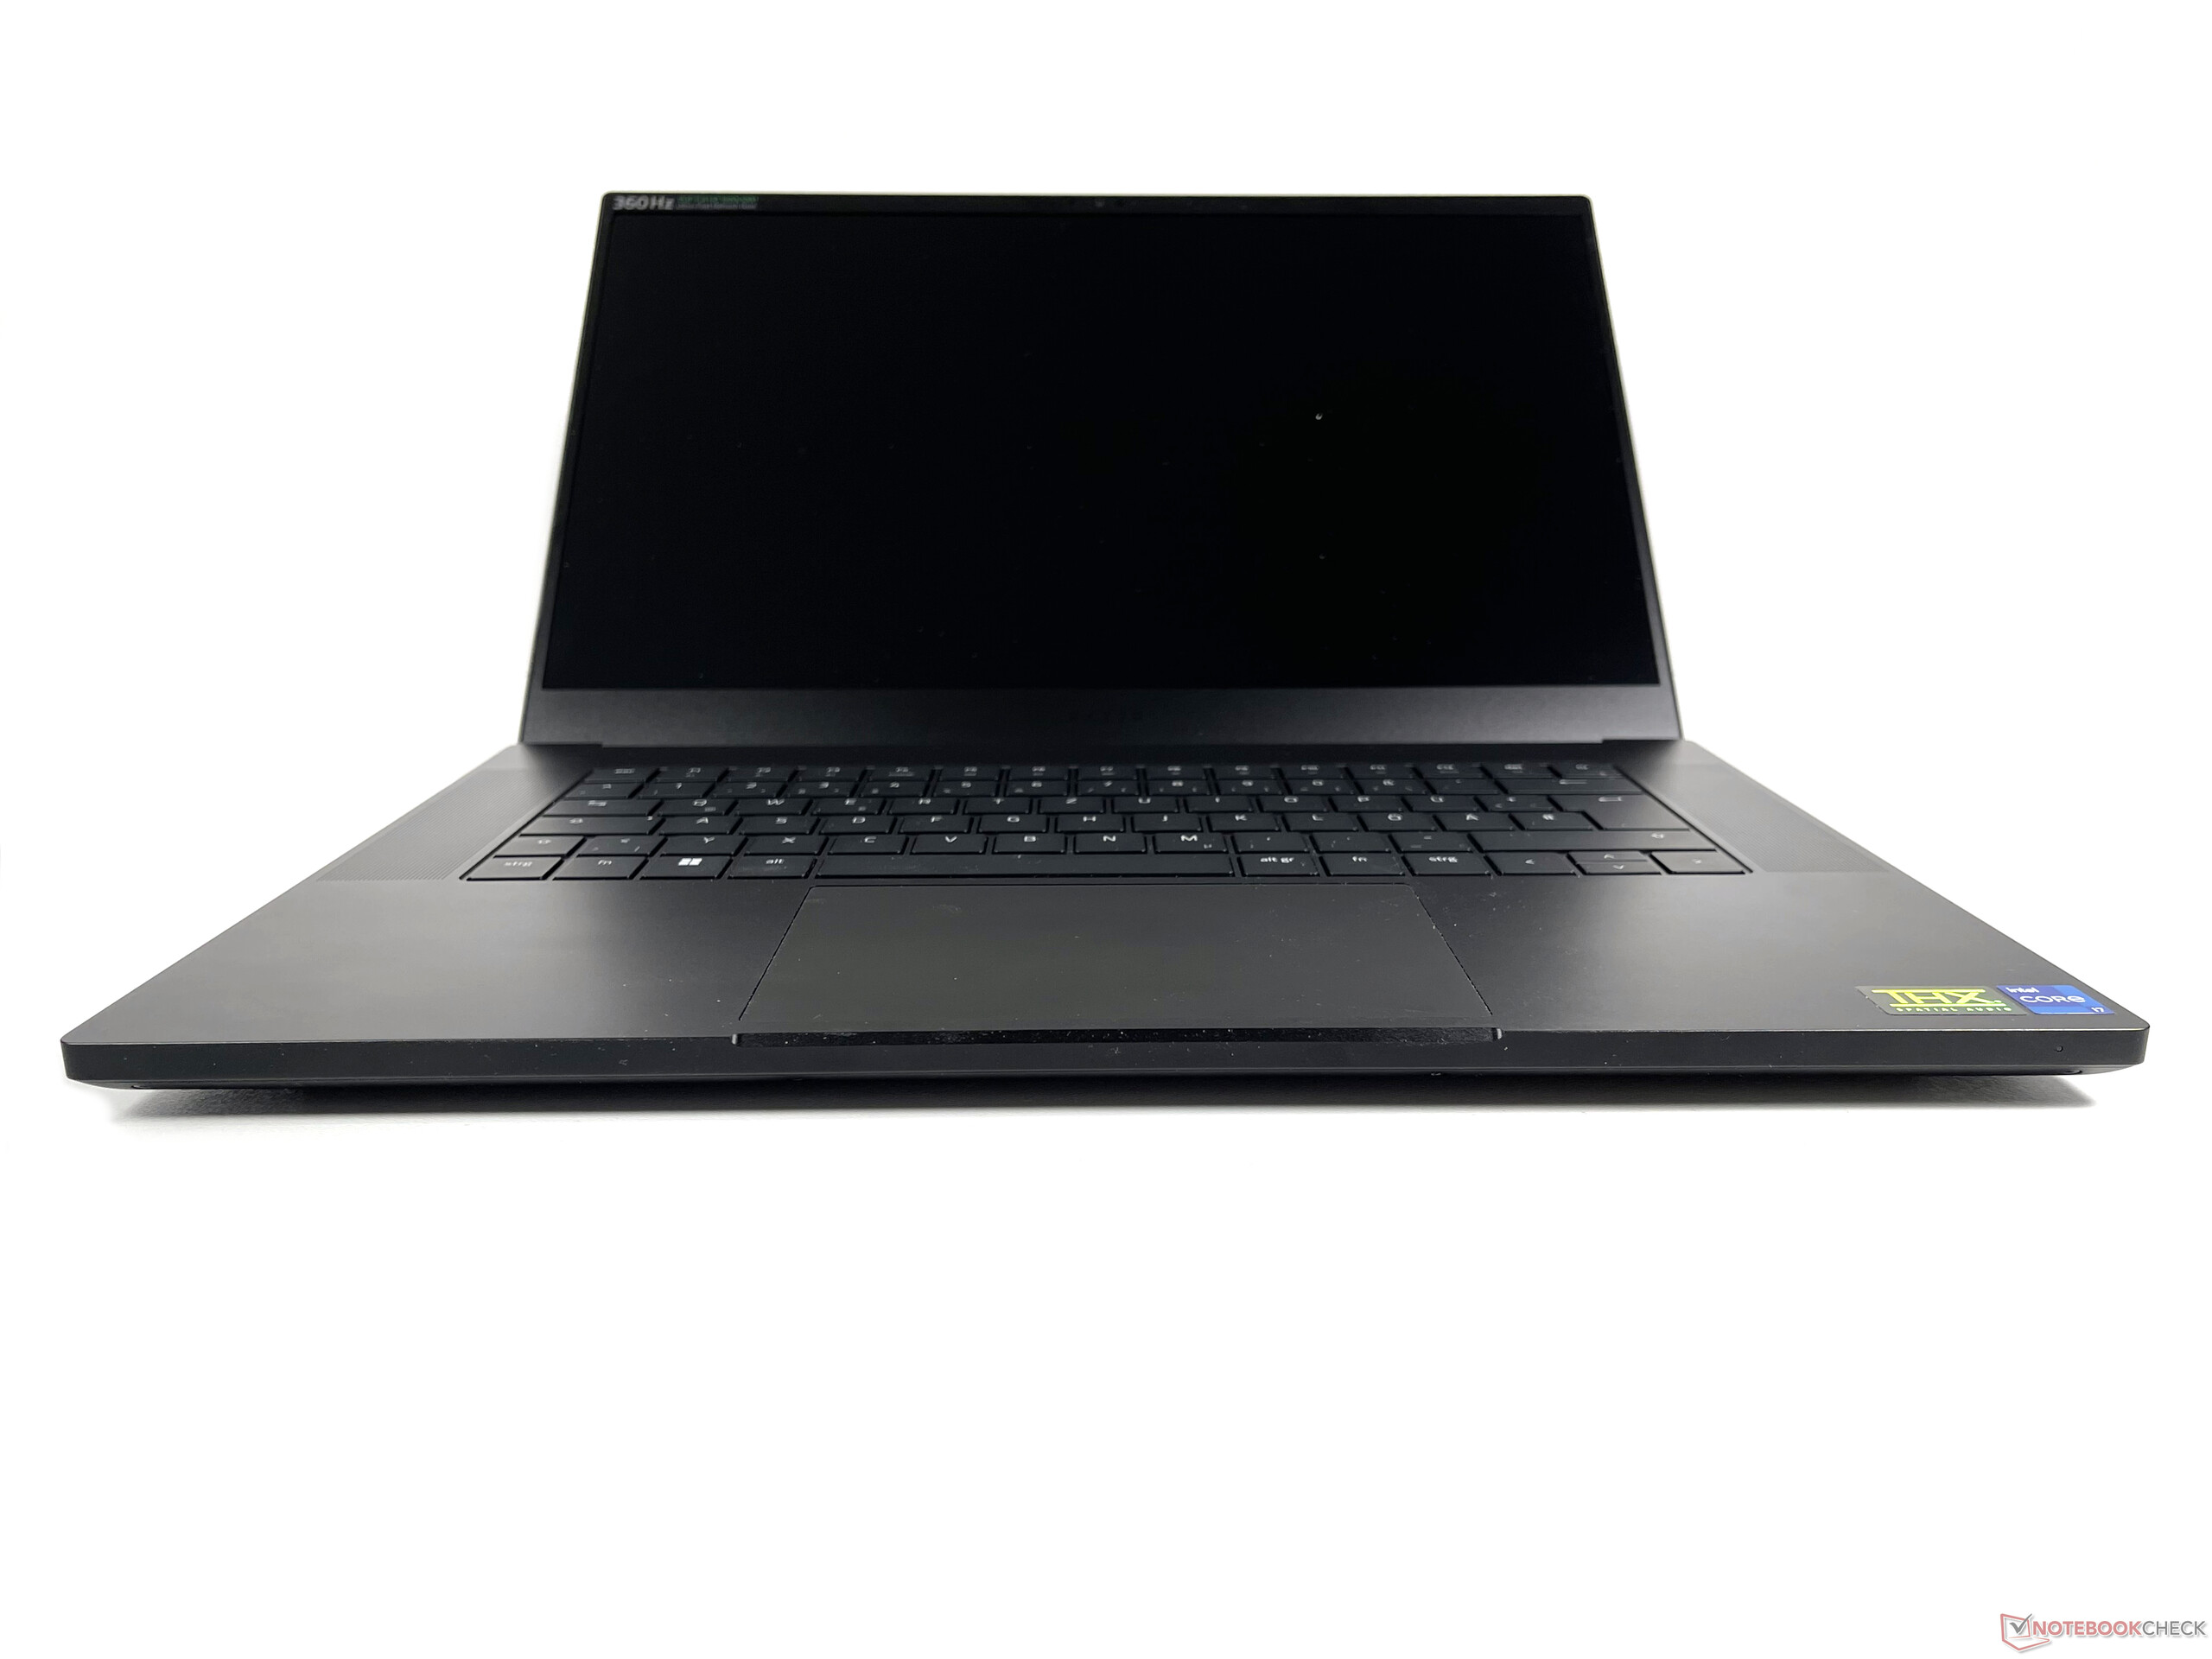
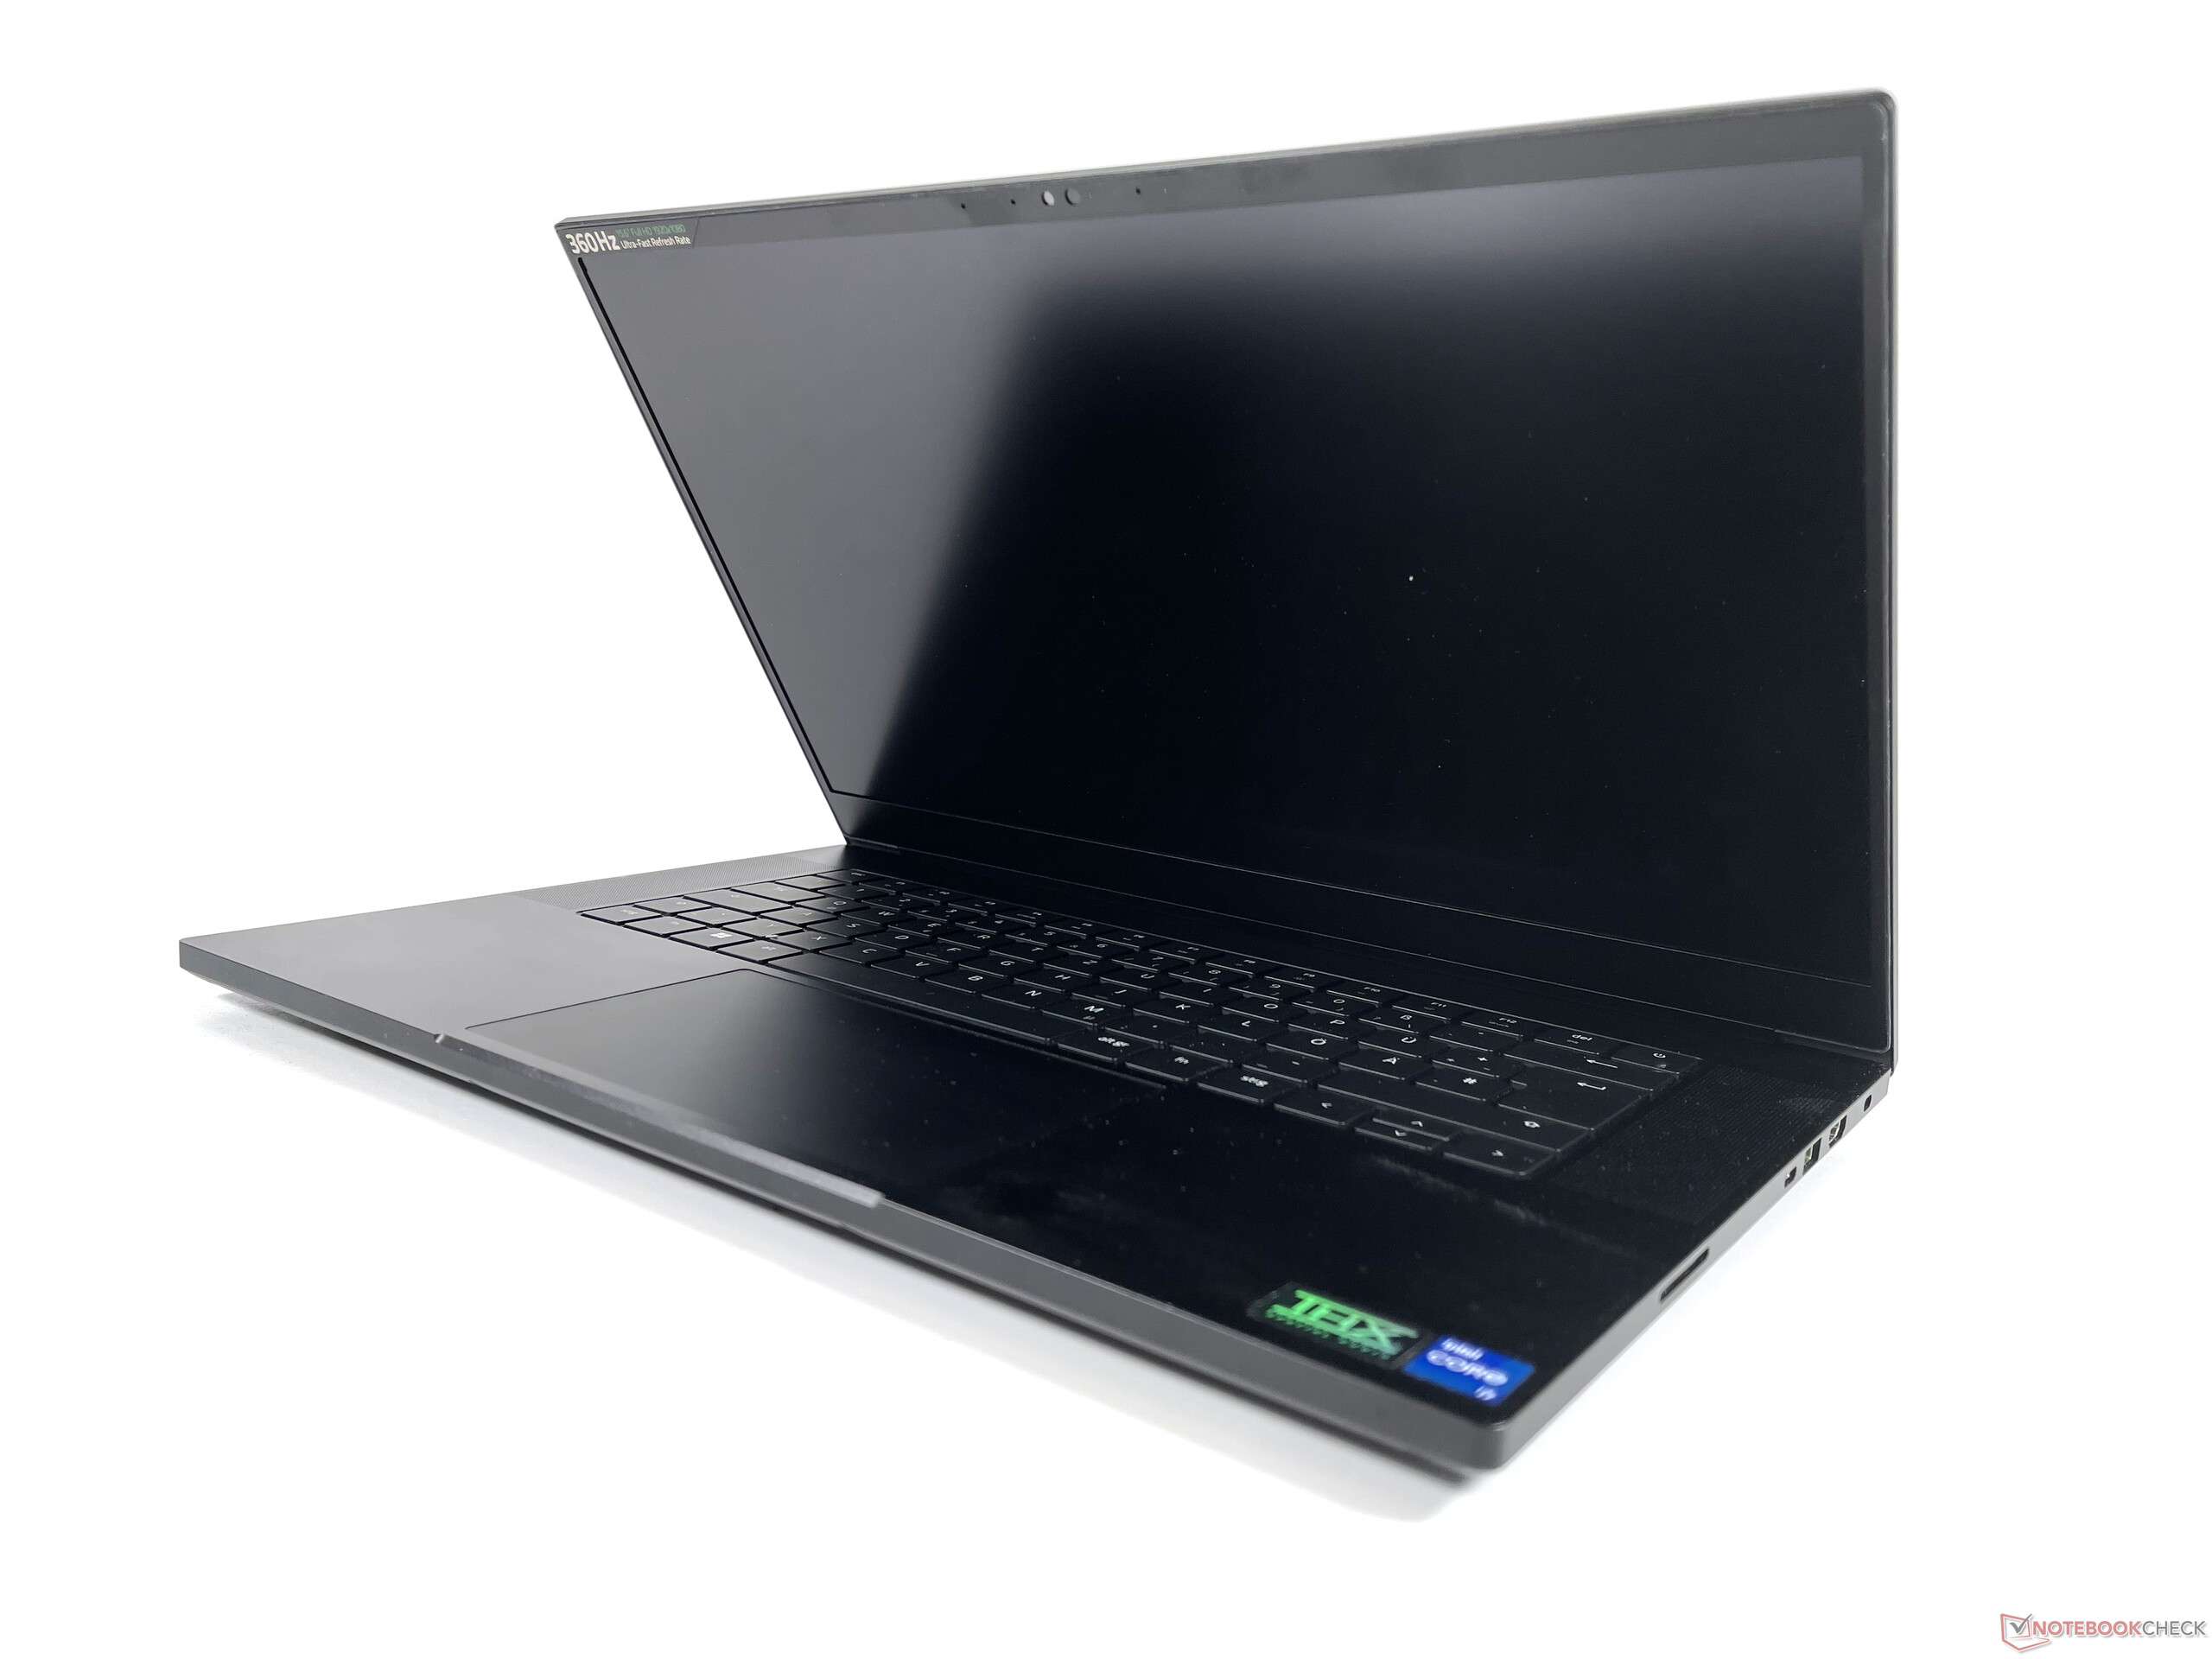
Razer Blade 15是一款非常紧凑的15.6英寸笔记本电脑,比大多数竞争对手既小又薄。特别是,ROG Strix Scar 15和XMG Neo 15 E22明显更厚,比我们2.1公斤的审查设备重约100-200克。
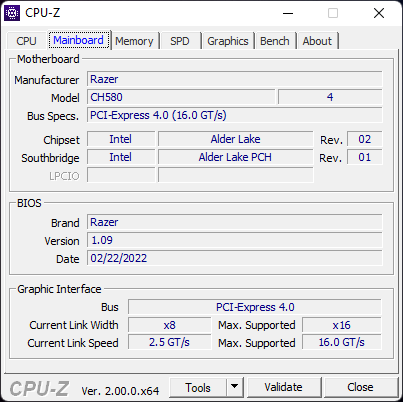
硬件 - 具有现代连接功能的刀片15
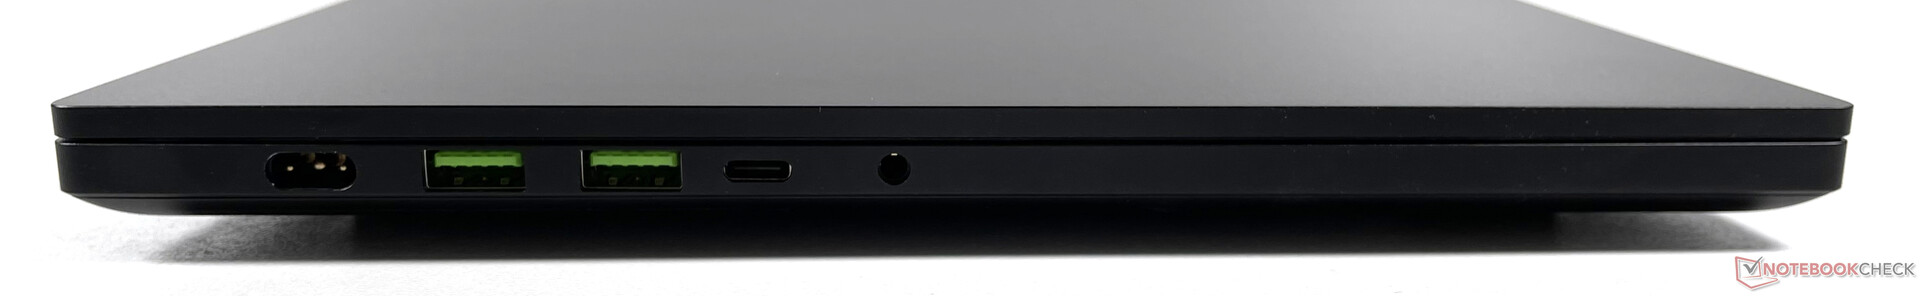
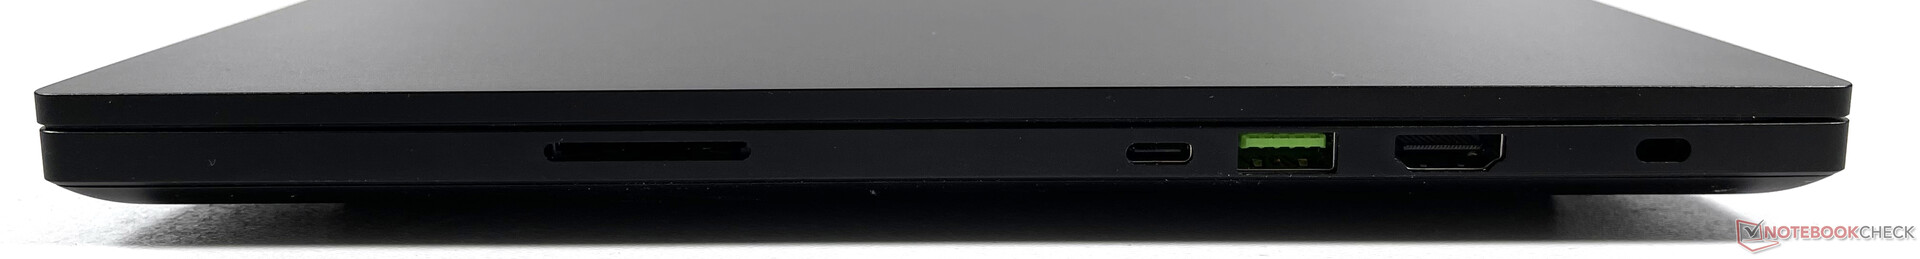
在连接方面没有什么大的惊喜。值得一提的是全面的SD读卡器和支持2.1版本的HDMI端口。与许多竞争对手不同,如 XMG Neo 15 E22的情况,这里没有专用的LAN端口。但是,如果需要的话,可以通过雷电底座来解决这个问题。
SD卡阅读器
SD读卡器的性能处于较高的水平。在用我们的microSD AV PRO 128GB V60卡进行的连续AS-SSD读取测试中,我们的评测设备上出现了一个错误。
| SD Card Reader - average JPG Copy Test (av. of 3 runs) | |
| Razer Blade 15 2022 (Toshiba Exceria Pro SDXC 64 GB UHS-II) | |
| Razer Blade 15 Advanced Model Early 2022 (AV PRO microSD 128 GB V60) | |
| Average of class Gaming (20.9 - 210, n=54, last 2 years) | |
| Schenker XMG Neo 15 E22 (Early 2022, RTX 3080 Ti) | |
沟通
当连接到我们的华硕GT-AXE11000测试路由器时,集成的杀手Wi-Fi 6E 1690i模块提供了非常快的传输速率。还提供了蓝牙5.2支持。
| Networking | |
| iperf3 transmit AXE11000 | |
| Razer Blade 15 Advanced Model Early 2022 | |
| Average of class Gaming (560 - 1862, n=93, last 2 years) | |
| iperf3 receive AXE11000 | |
| Razer Blade 15 Advanced Model Early 2022 | |
| MSI Stealth GS66 12UGS | |
| Average of class Gaming (680 - 1745, n=93, last 2 years) | |
网络摄像头


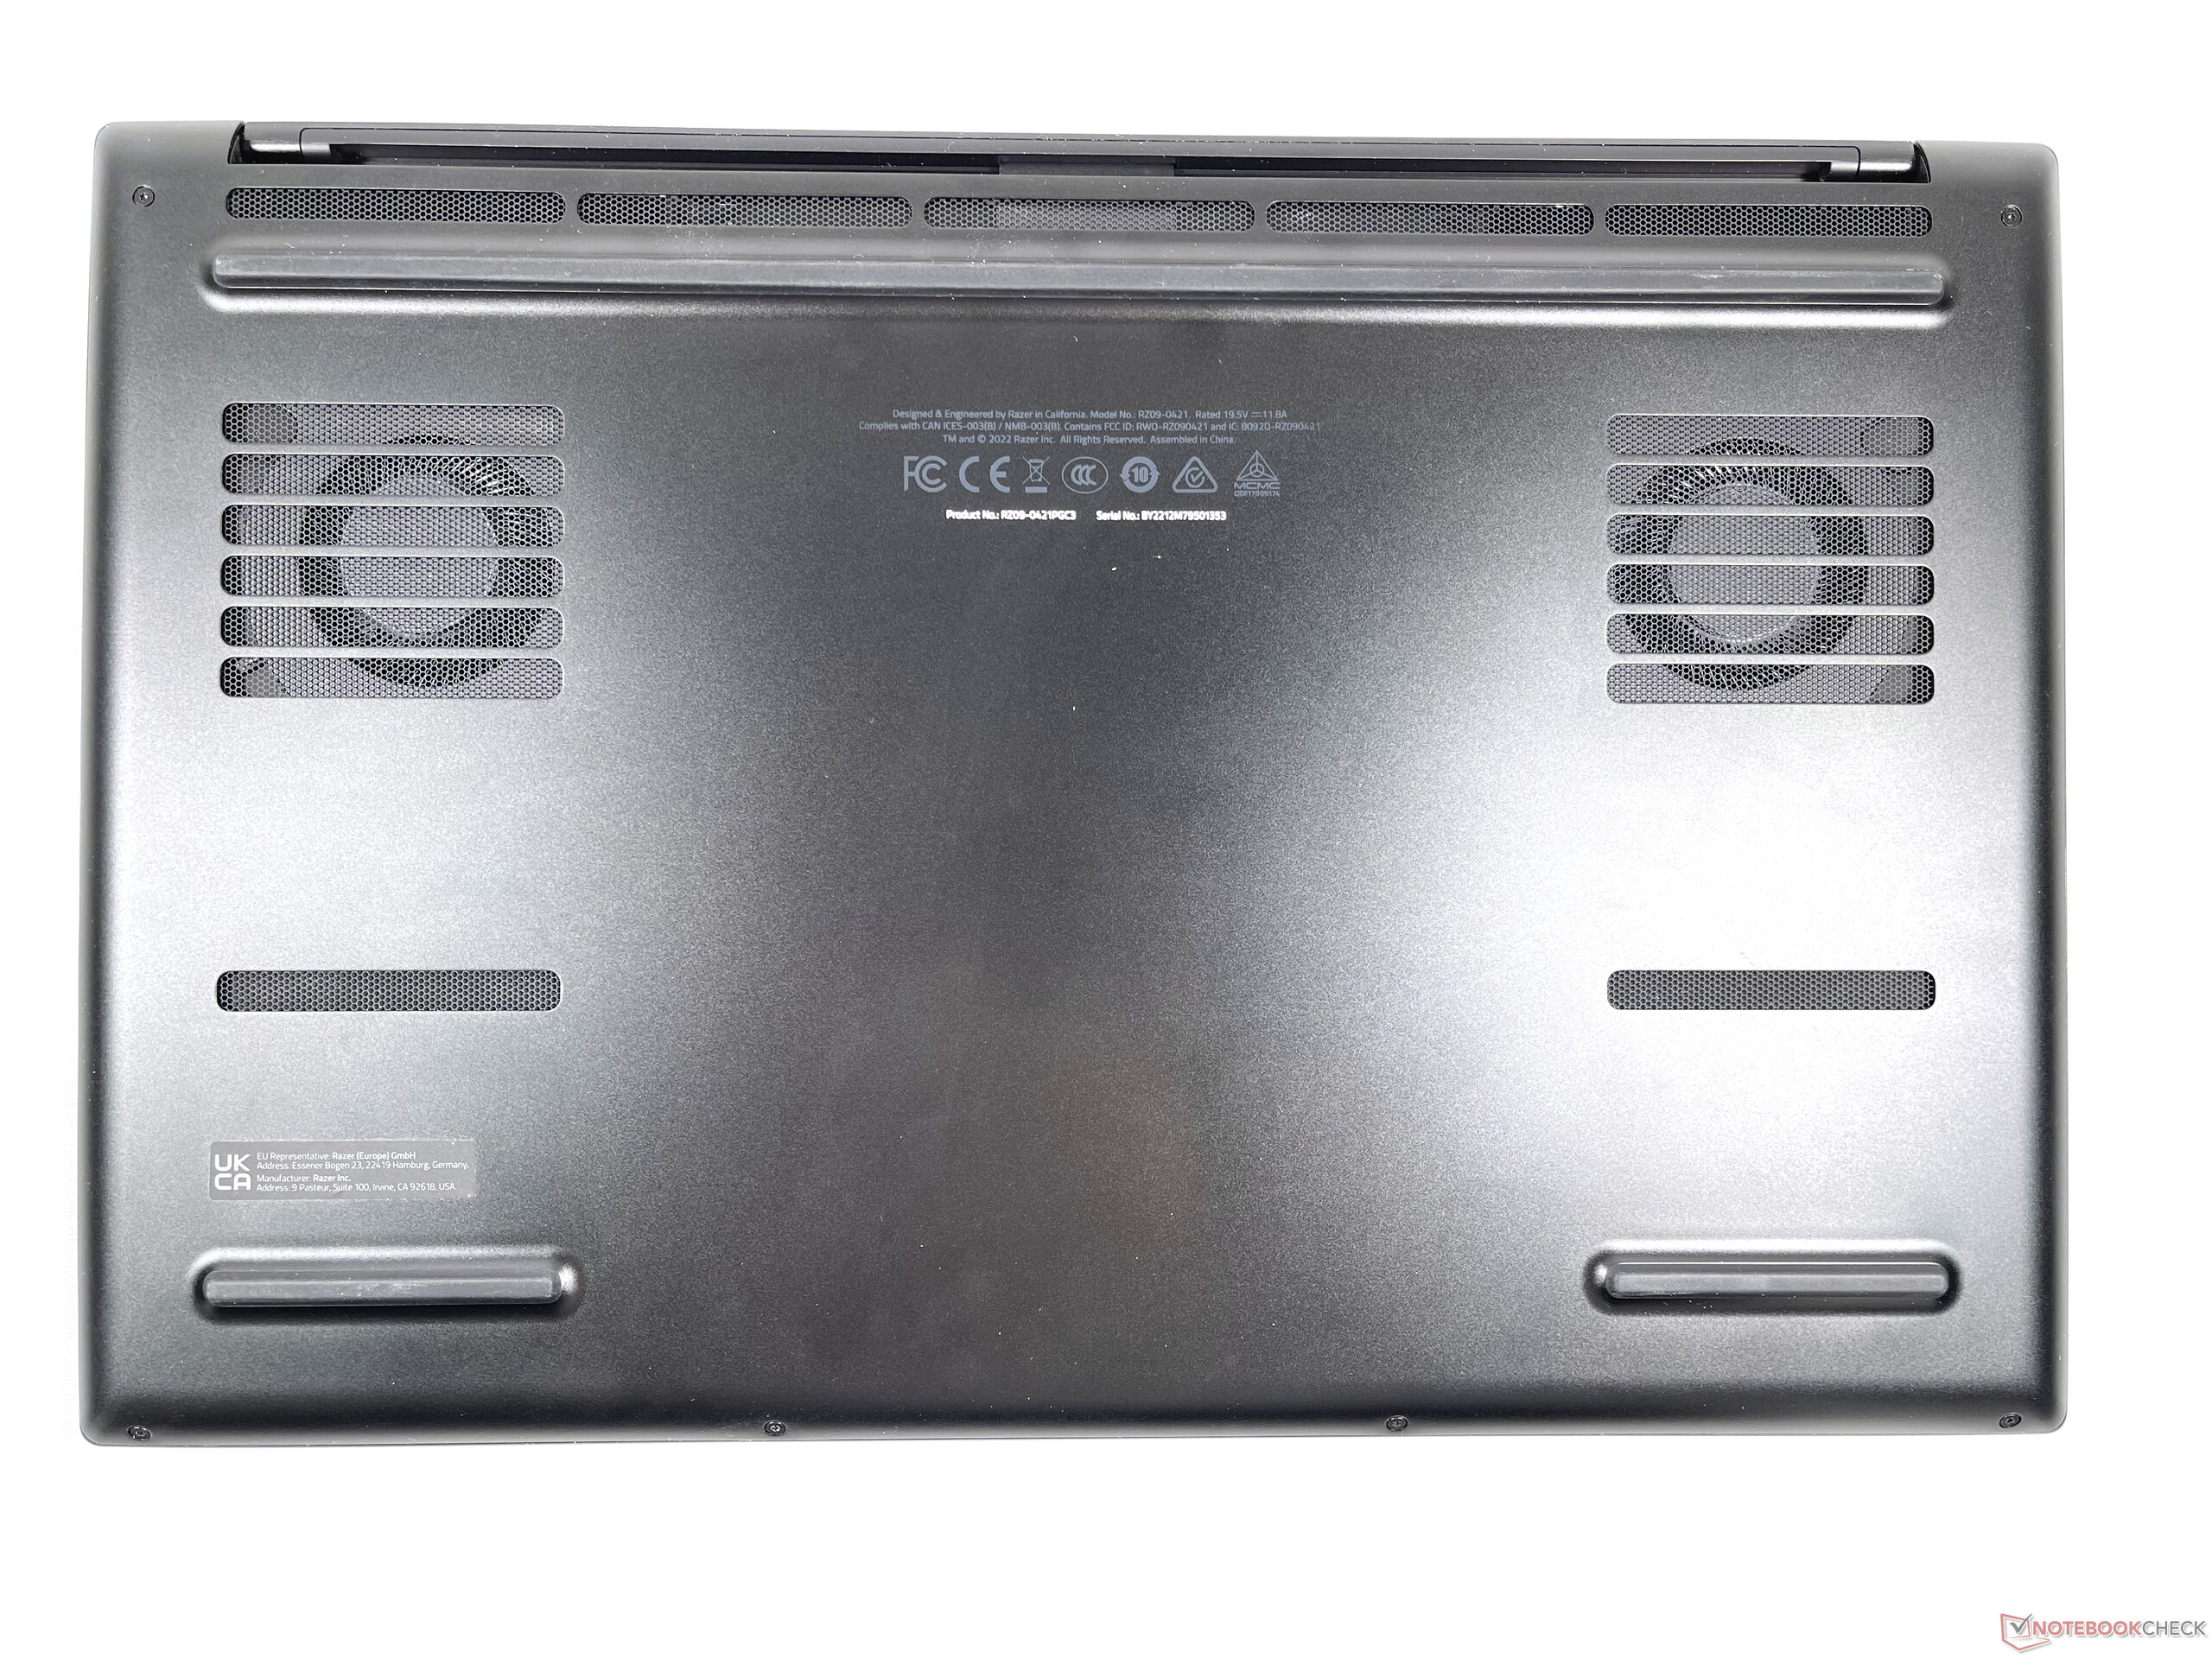
维护
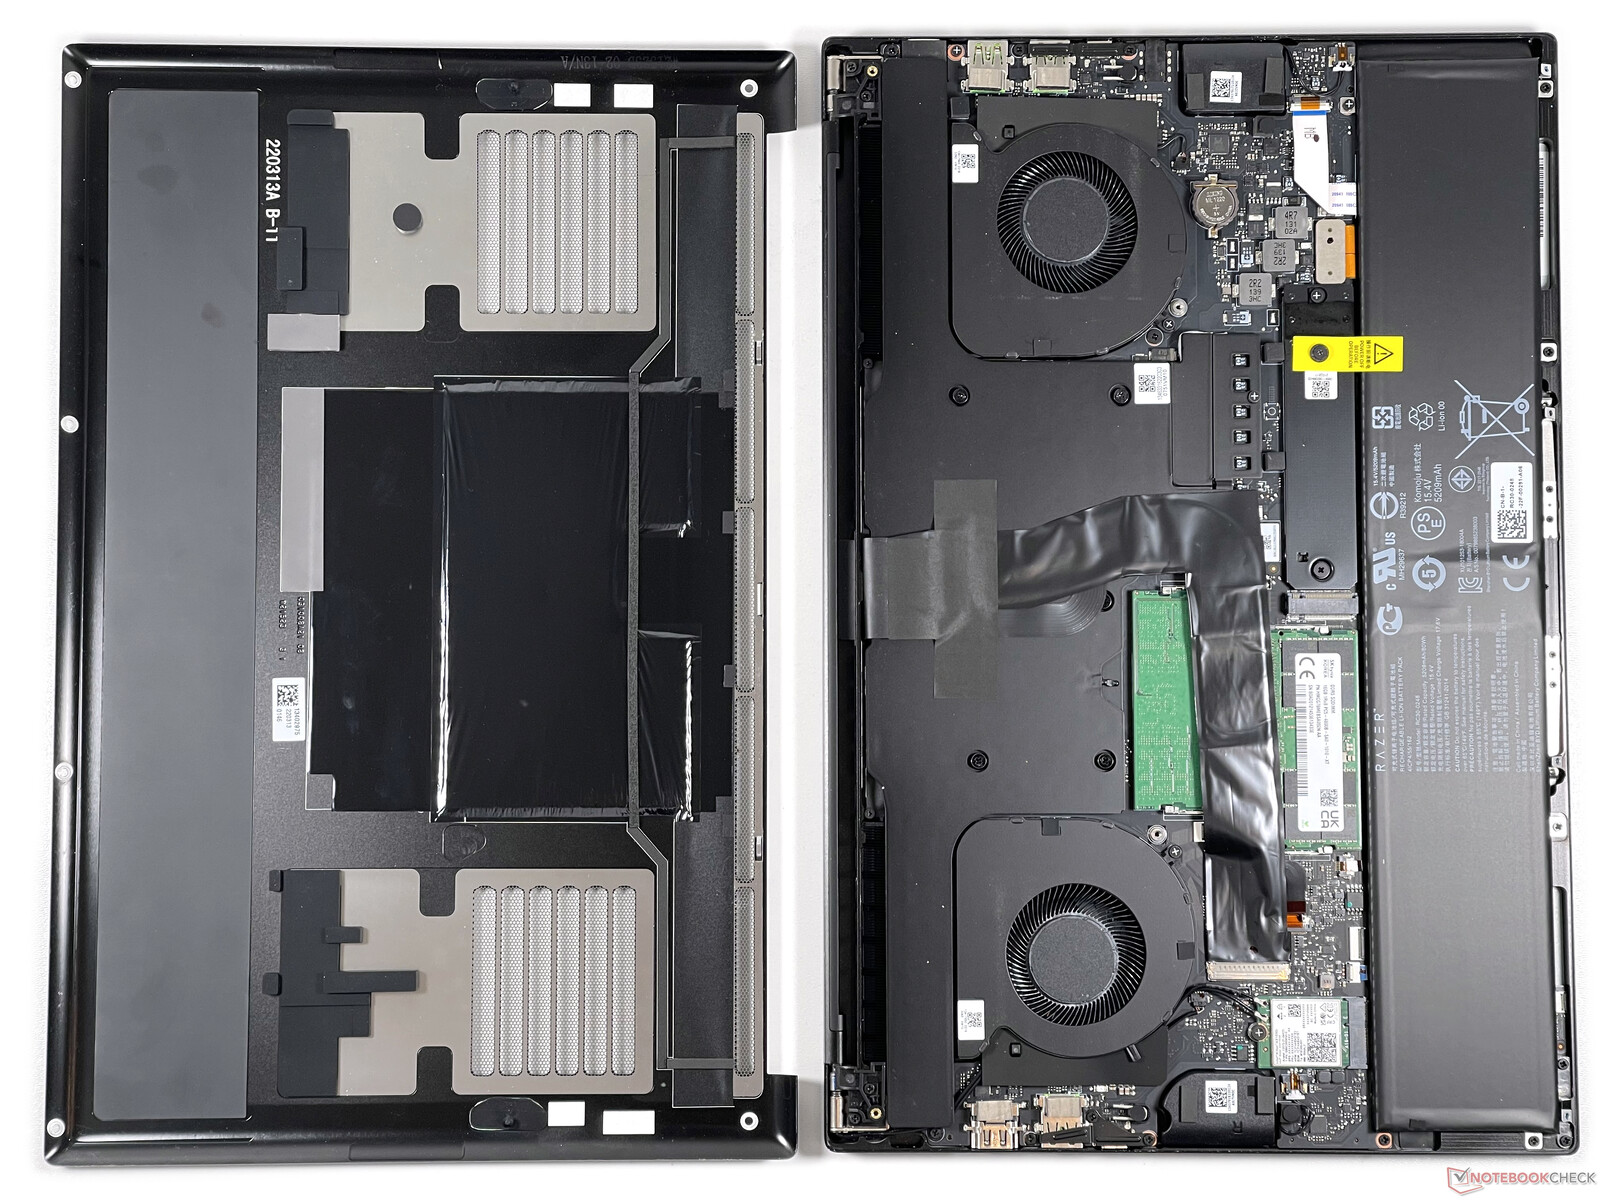
卸下六颗Torx螺丝(T5)后,可以接触到两个内存模块、电池、WLAN模块和(卸下一个额外的盖子后)M.2 SSD。
输入设备 - 大型点击板和整洁的键盘
键盘
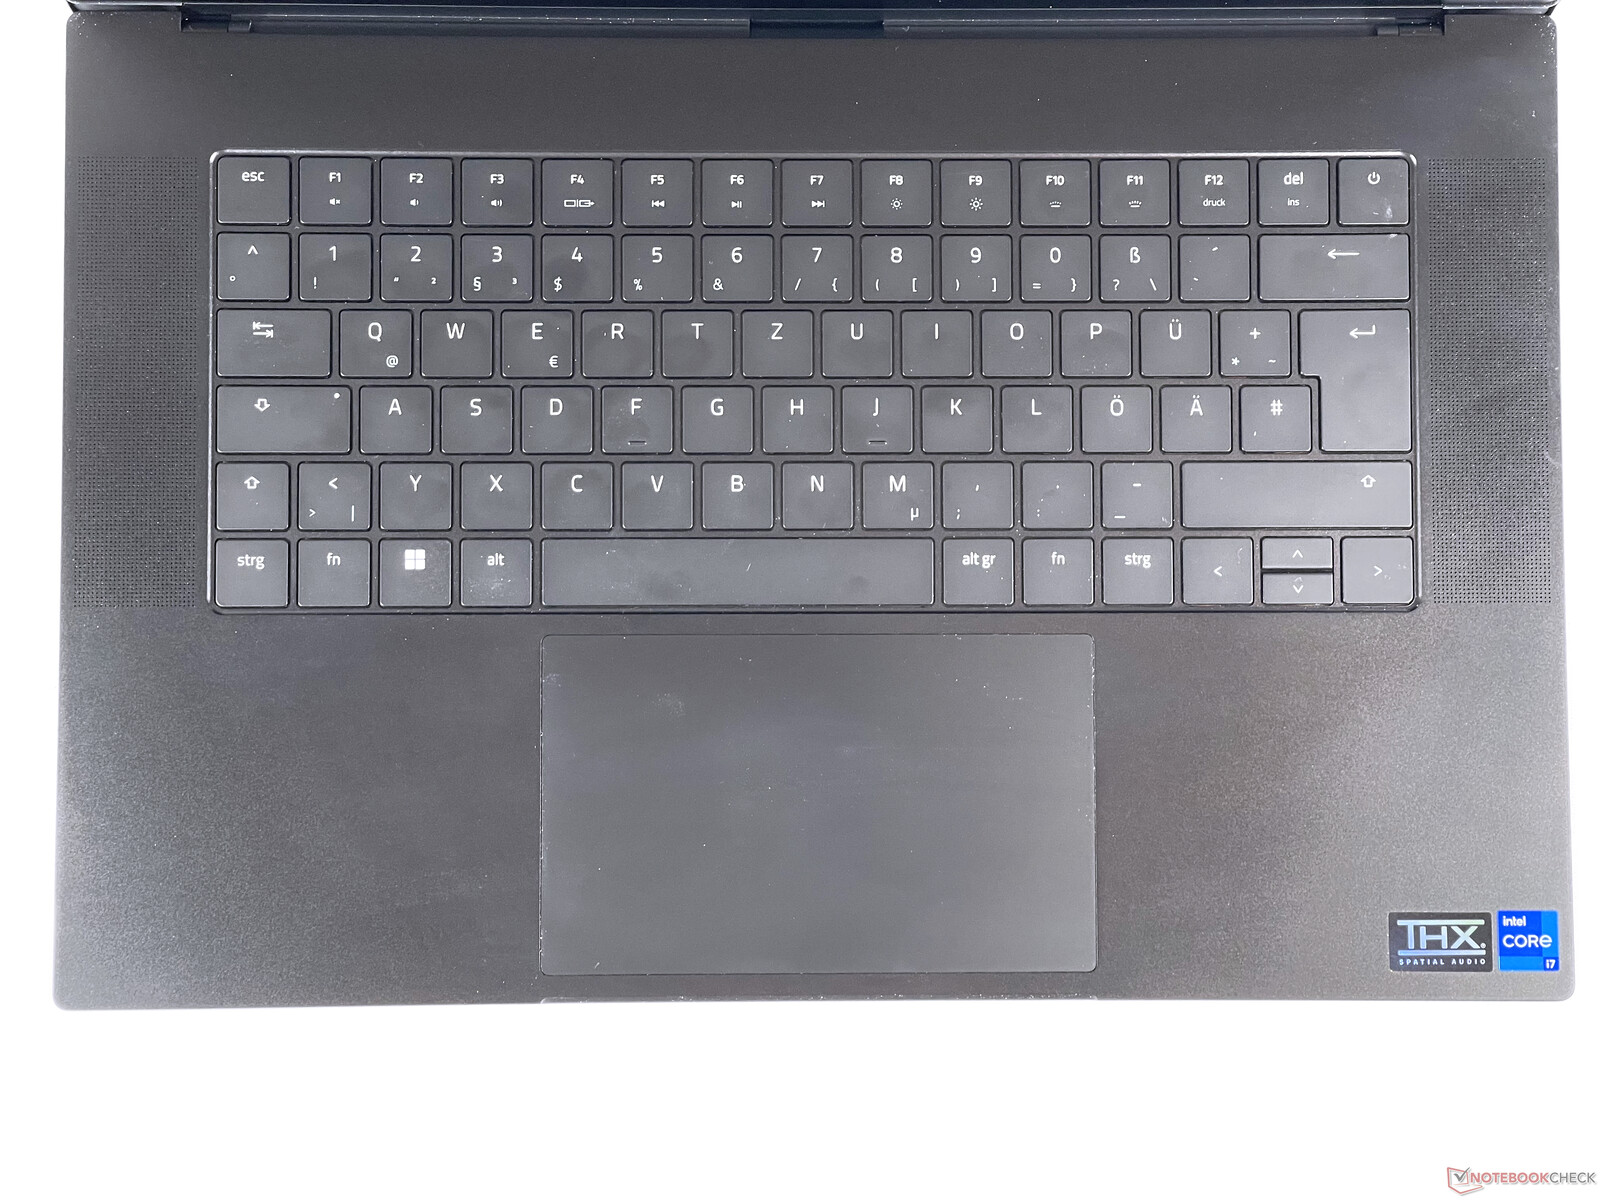
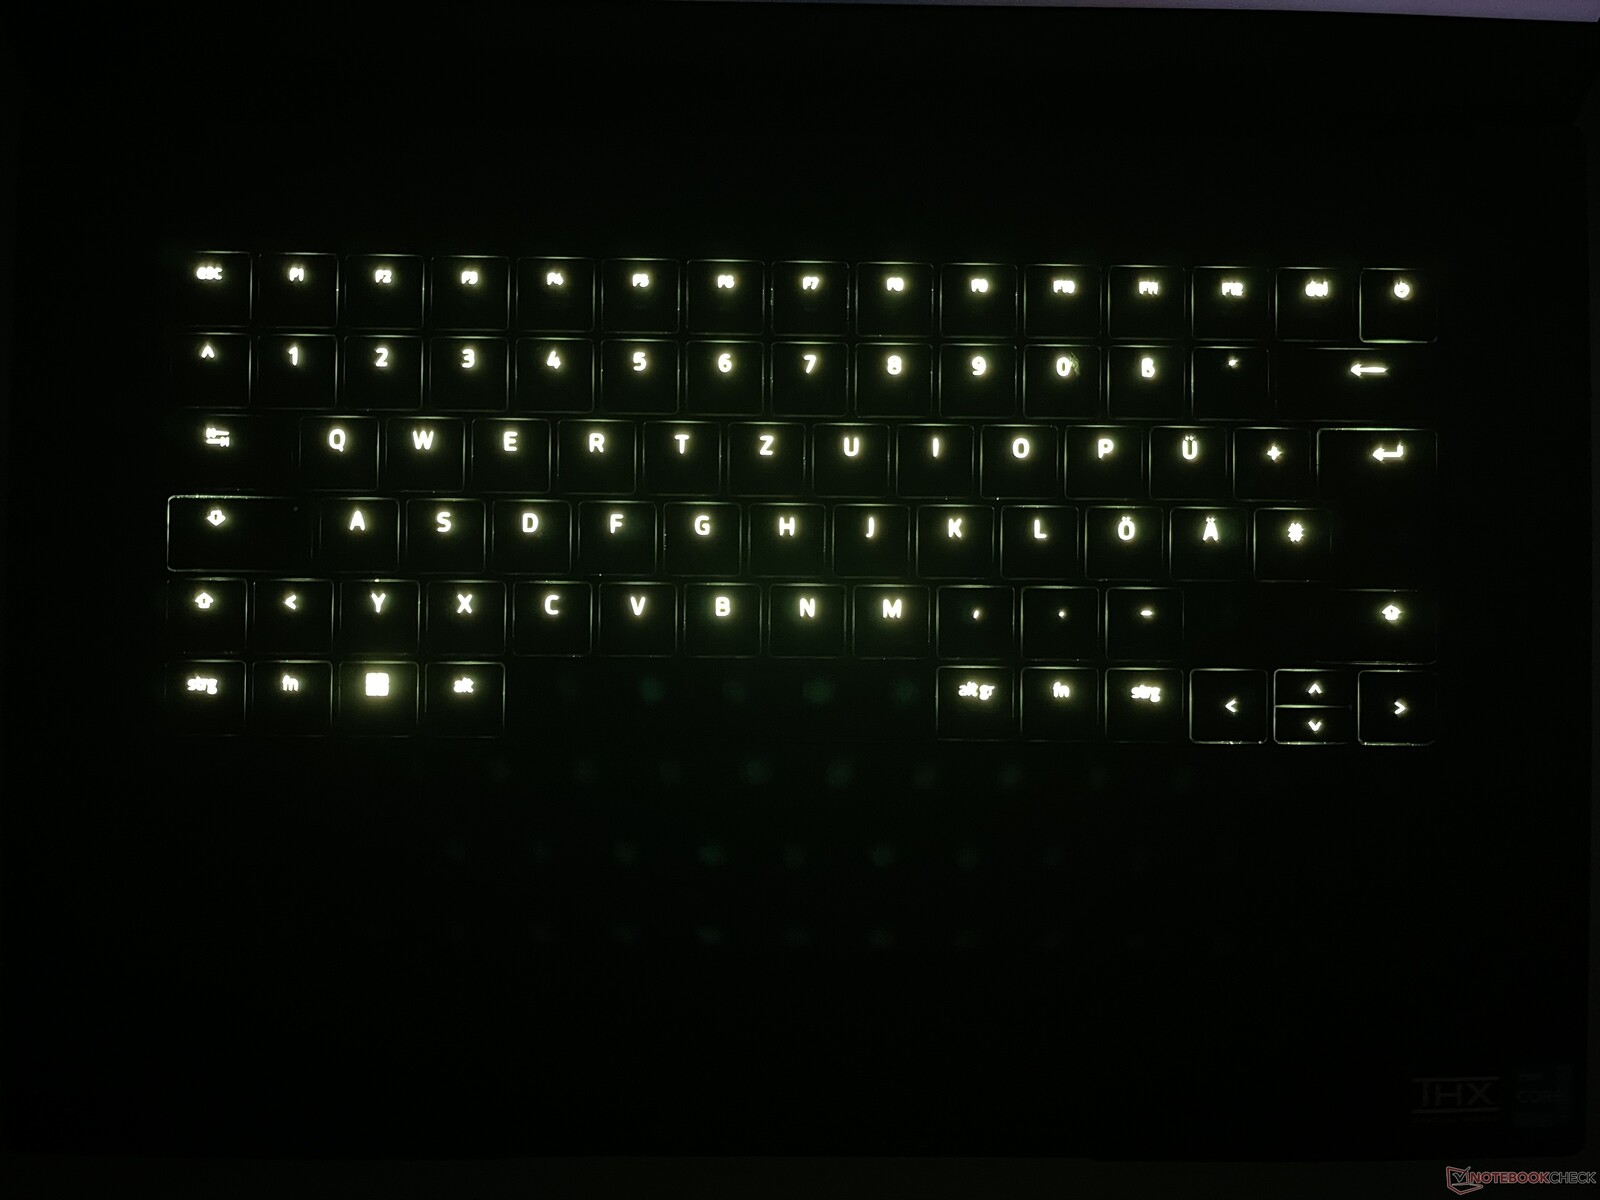
键盘具有16个亮度级别的RGB按键照明(包括 "关闭")和半高的向上和向下箭头键,这使得Razer能够将整个键盘置于扬声器开口之间的一个矩形区域内。键盘提供了一个平坦的键程和安静的、消音的打字声。按键阻力适中,打字时,键盘中心几乎不产生位移。
触摸板
触摸板的面积约为13x8厘米,允许手指出色地滑行。点击的特点是键程短,触觉反馈清晰。
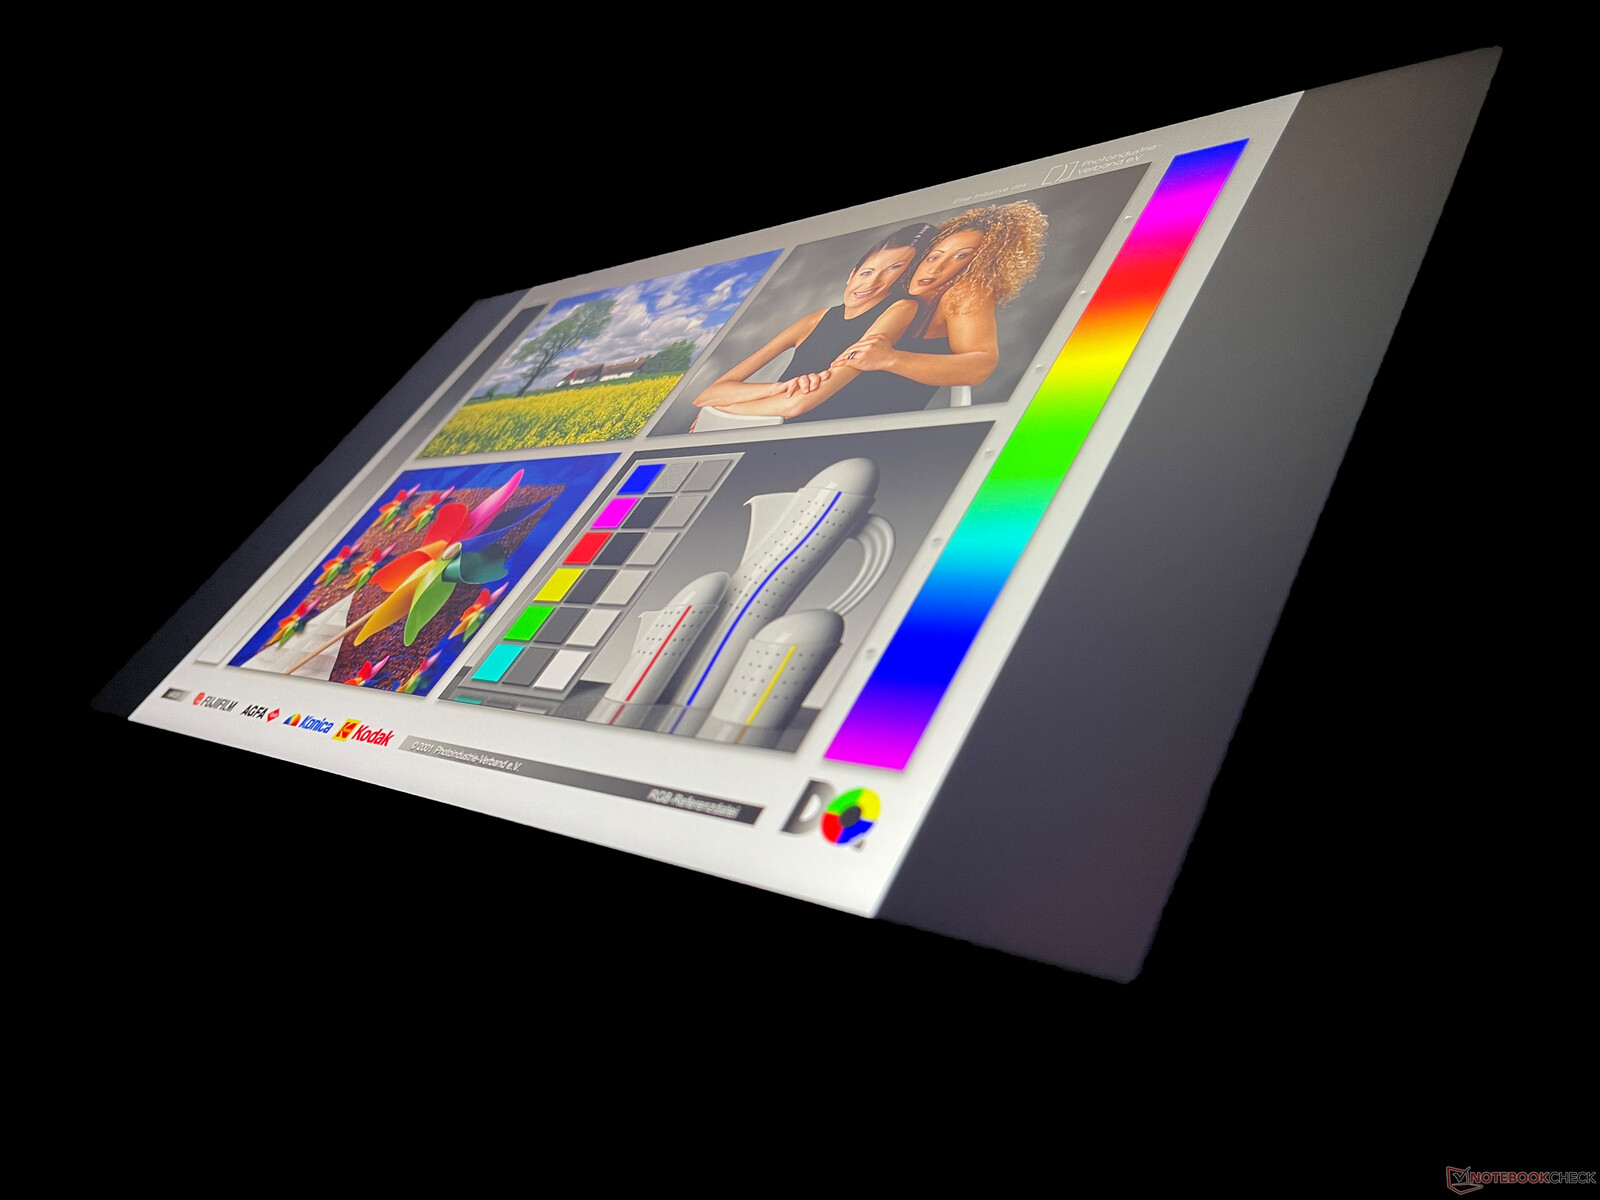
显示屏------快速面板,色彩光谱有限
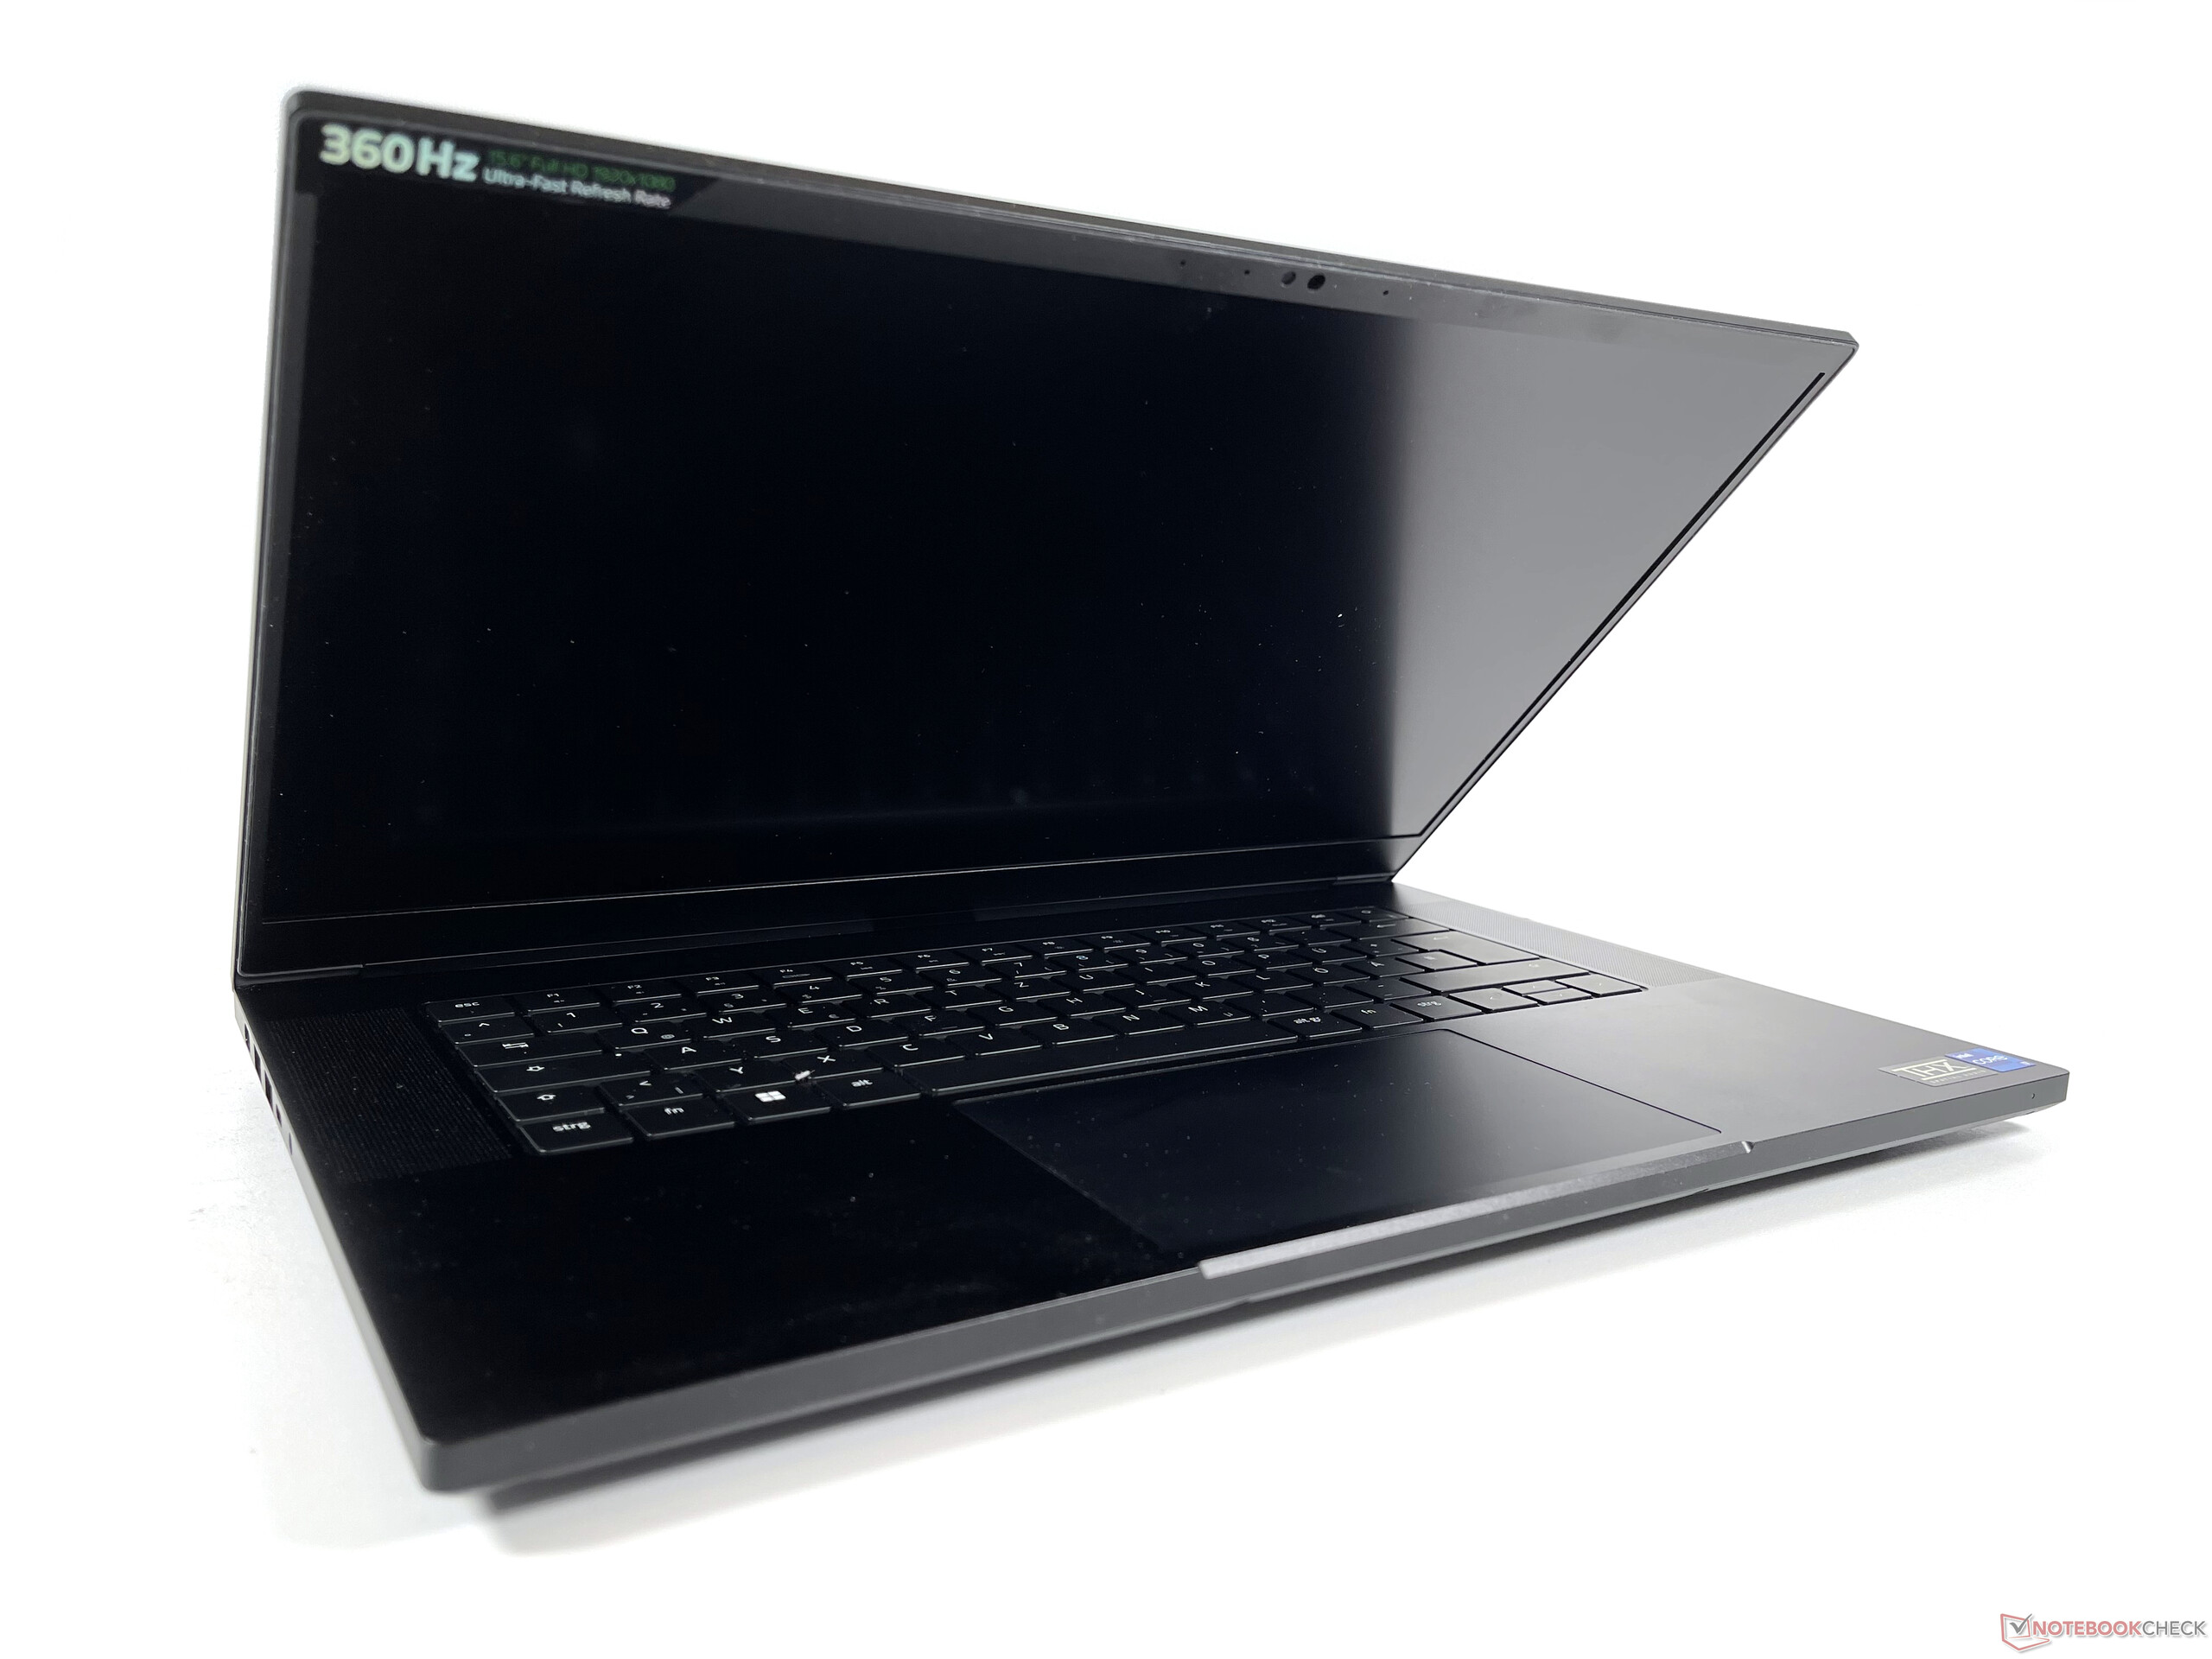
我们的评测设备中安装了一块哑光全高清IPS面板,原始分辨率为1920x1080像素,刷新率为360赫兹。另外,还有一个QHD 240赫兹和4K 144赫兹的显示屏,每一个都应该覆盖DCI-P3色彩空间。QHD型号还支持Nvidia G-Sync和Advanced Optimus。
平均315cd/m²的亮度对于大多数应用场景来说是绰绰有余的,再加上0.24的体面黑值,在同类比较中,对比度高于平均水平的1375:1。灰色到灰色的反应时间特别短,我们无法检测到任何PWM。
| |||||||||||||||||||||||||
Brightness Distribution: 89 %
Center on Battery: 330 cd/m²
Contrast: 1375:1 (Black: 0.24 cd/m²)
ΔE ColorChecker Calman: 1.47 | ∀{0.5-29.43 Ø4.72}
calibrated: 0.63
ΔE Greyscale Calman: 1.8 | ∀{0.09-98 Ø4.97}
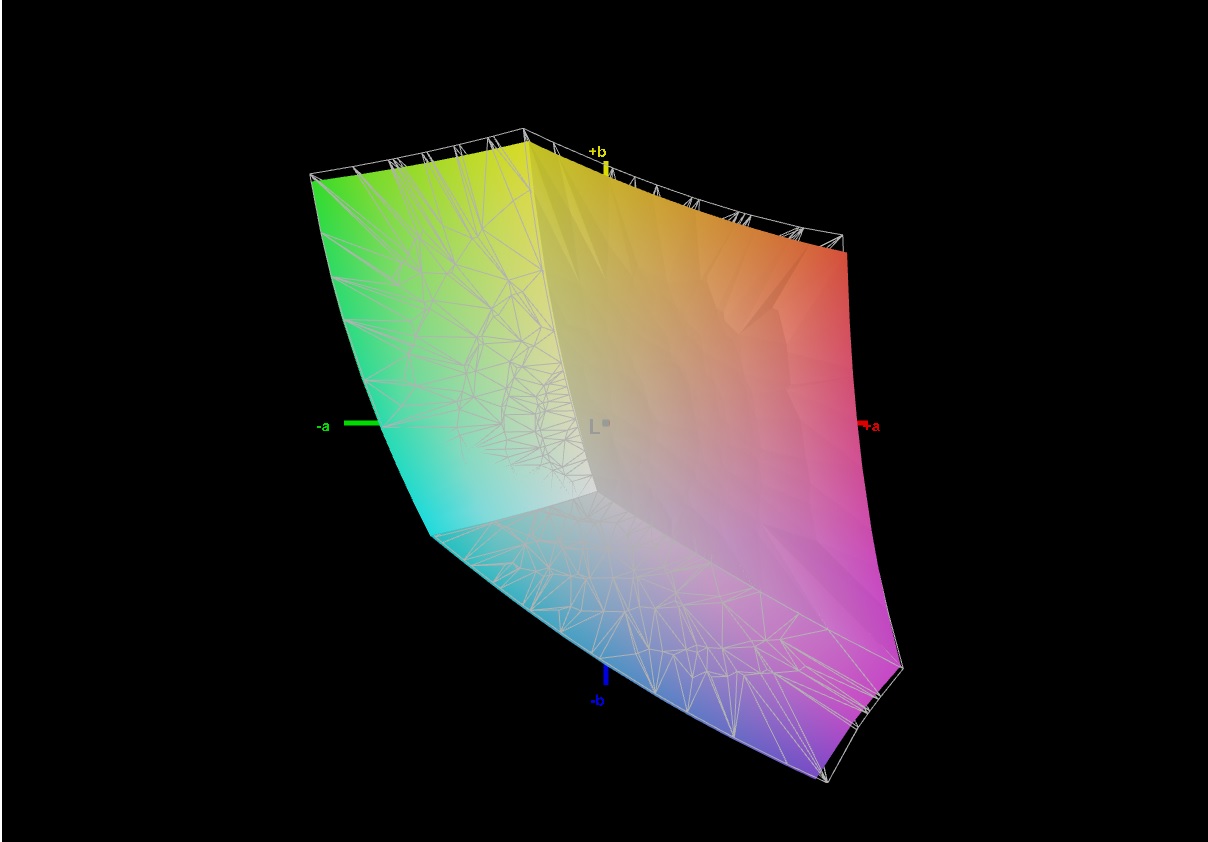
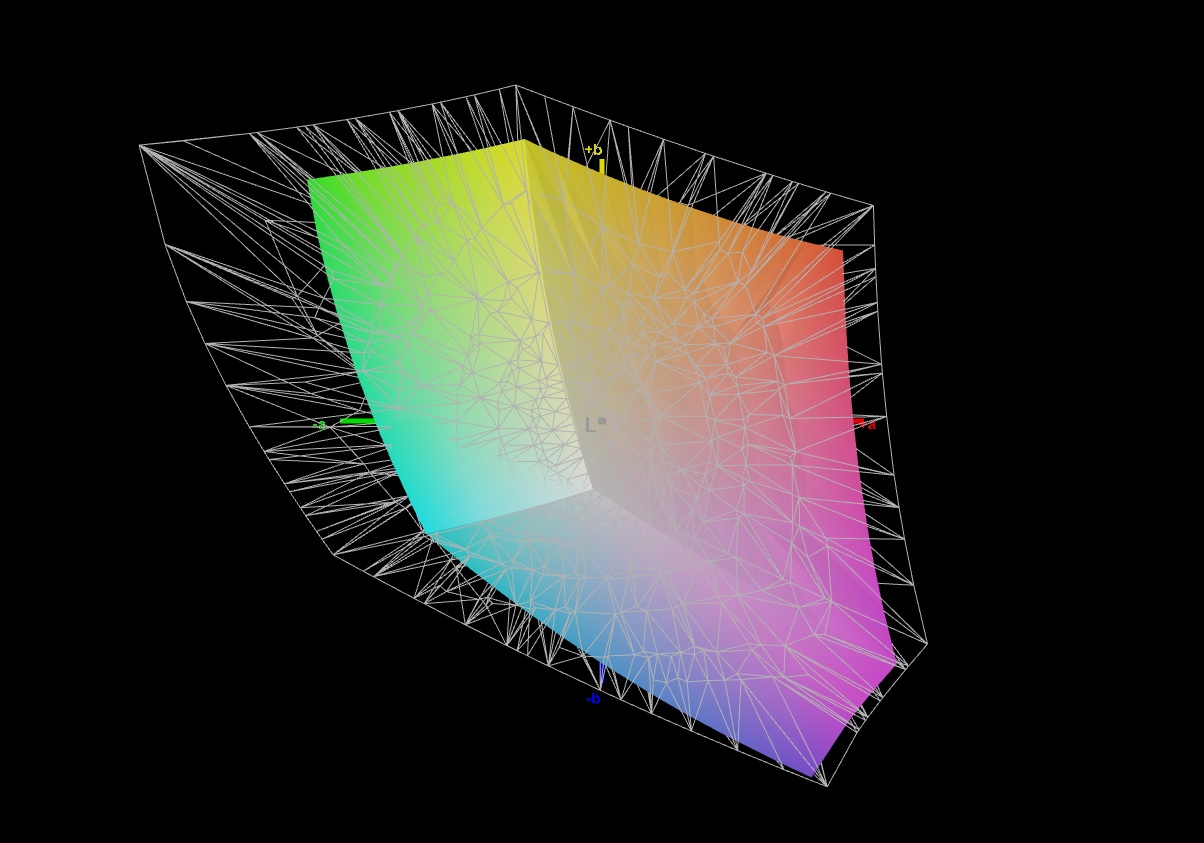
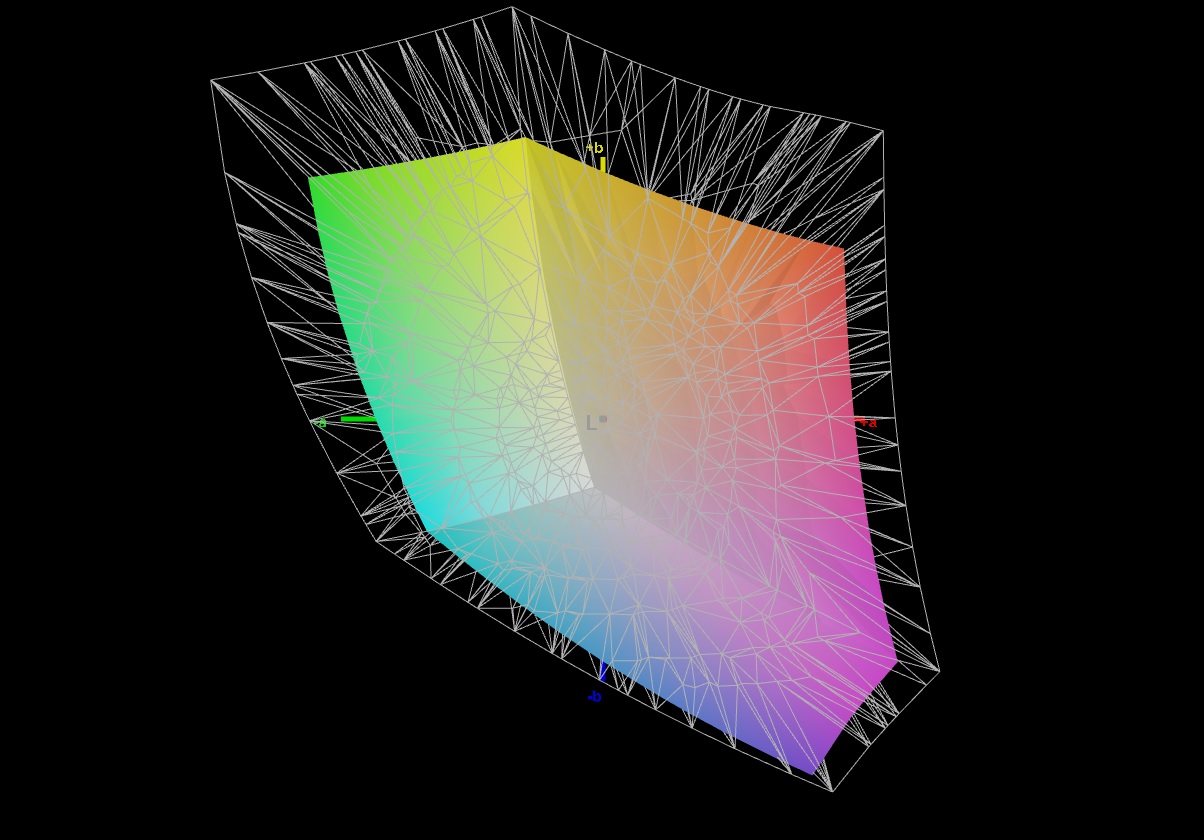
67.4% AdobeRGB 1998 (Argyll 3D)
85.1% sRGB (Argyll 3D)
65.3% Display P3 (Argyll 3D)
Gamma: 2.282
CCT: 6499 K
| Razer Blade 15 Advanced Model Early 2022 TL156VDXP02-0, IPS, 1920x1080, 15.6" | Razer Blade 15 2022 Sharp LQ156T1JW03, IPS, 2560x1440, 15.6" | Schenker XMG Neo 15 E22 (Early 2022, RTX 3080 Ti) BOE0A67 (BOE CQ NE156QHM-NZ1), IPS, 2560x1440, 15.6" | Asus ROG Strix Scar 15 G533QS BOE CQ NE156QHM-NY1, IPS, 2560x1440, 15.6" | MSI Stealth GS66 12UGS Sharp LQ156T1JW04 (SHP153C), IPS-Level, 2560x1440, 15.6" | MSI Vector GP66 12UGS BOE NE156FHM-NZ3, IPS, 1920x1080, 15.6" | |
|---|---|---|---|---|---|---|
| Display | 33% | 31% | 31% | 10% | ||
| Display P3 Coverage (%) | 65.3 | 99.1 52% | 97.6 49% | 96.4 48% | 70.1 7% | |
| sRGB Coverage (%) | 85.1 | 99.9 17% | 99.9 17% | 99.7 17% | 99.5 17% | |
| AdobeRGB 1998 Coverage (%) | 67.4 | 86.8 29% | 85.3 27% | 85.6 27% | 72.1 7% | |
| Response Times | -123% | -119% | -122% | -10% | -13% | |
| Response Time Grey 50% / Grey 80% * (ms) | 4.3 ? | 14.4 ? -235% | 14.4 ? -235% | 14 ? -226% | 6 ? -40% | 5.8 ? -35% |
| Response Time Black / White * (ms) | 10.5 ? | 11.6 ? -10% | 10.8 ? -3% | 12.4 ? -18% | 8.4 ? 20% | 9.6 ? 9% |
| PWM Frequency (Hz) | ||||||
| Screen | -54% | -38% | -77% | -87% | -45% | |
| Brightness middle (cd/m²) | 330 | 286 -13% | 295 -11% | 304.3 -8% | 272 -18% | 353.1 7% |
| Brightness (cd/m²) | 315 | 271 -14% | 277 -12% | 286 -9% | 253 -20% | 325 3% |
| Brightness Distribution (%) | 89 | 89 0% | 62 -30% | 76 -15% | 87 -2% | 85 -4% |
| Black Level * (cd/m²) | 0.24 | 0.25 -4% | 0.28 -17% | 0.33 -38% | 0.25 -4% | 0.38 -58% |
| Contrast (:1) | 1375 | 1144 -17% | 1054 -23% | 922 -33% | 1088 -21% | 929 -32% |
| Colorchecker dE 2000 * | 1.47 | 2.74 -86% | 2.36 -61% | 2.76 -88% | 3.73 -154% | 2.24 -52% |
| Colorchecker dE 2000 max. * | 2.73 | 5.21 -91% | 4.24 -55% | 5.57 -104% | 9.43 -245% | 5 -83% |
| Colorchecker dE 2000 calibrated * | 0.63 | 2.52 -300% | 2.38 -278% | 0.98 -56% | 1.02 -62% | |
| Greyscale dE 2000 * | 1.8 | 1.1 39% | 3.43 -91% | 4 -122% | 6.5 -261% | 4 -122% |
| Gamma | 2.282 96% | 2.2 100% | 2.44 90% | 2.14 103% | 2.172 101% | 2.24 98% |
| CCT | 6499 100% | 6408 101% | 6266 104% | 6844 95% | 6485 100% | 6864 95% |
| Total Average (Program / Settings) | -48% /
-45% | -79% /
-54% | -56% /
-60% | -22% /
-51% | -16% /
-28% |
* ... smaller is better
在我们的配置中,Razer Blade 15只能覆盖85%的sRGB色彩空间。考虑到制造商声称的 "高达100%",我们在这里期待更多。
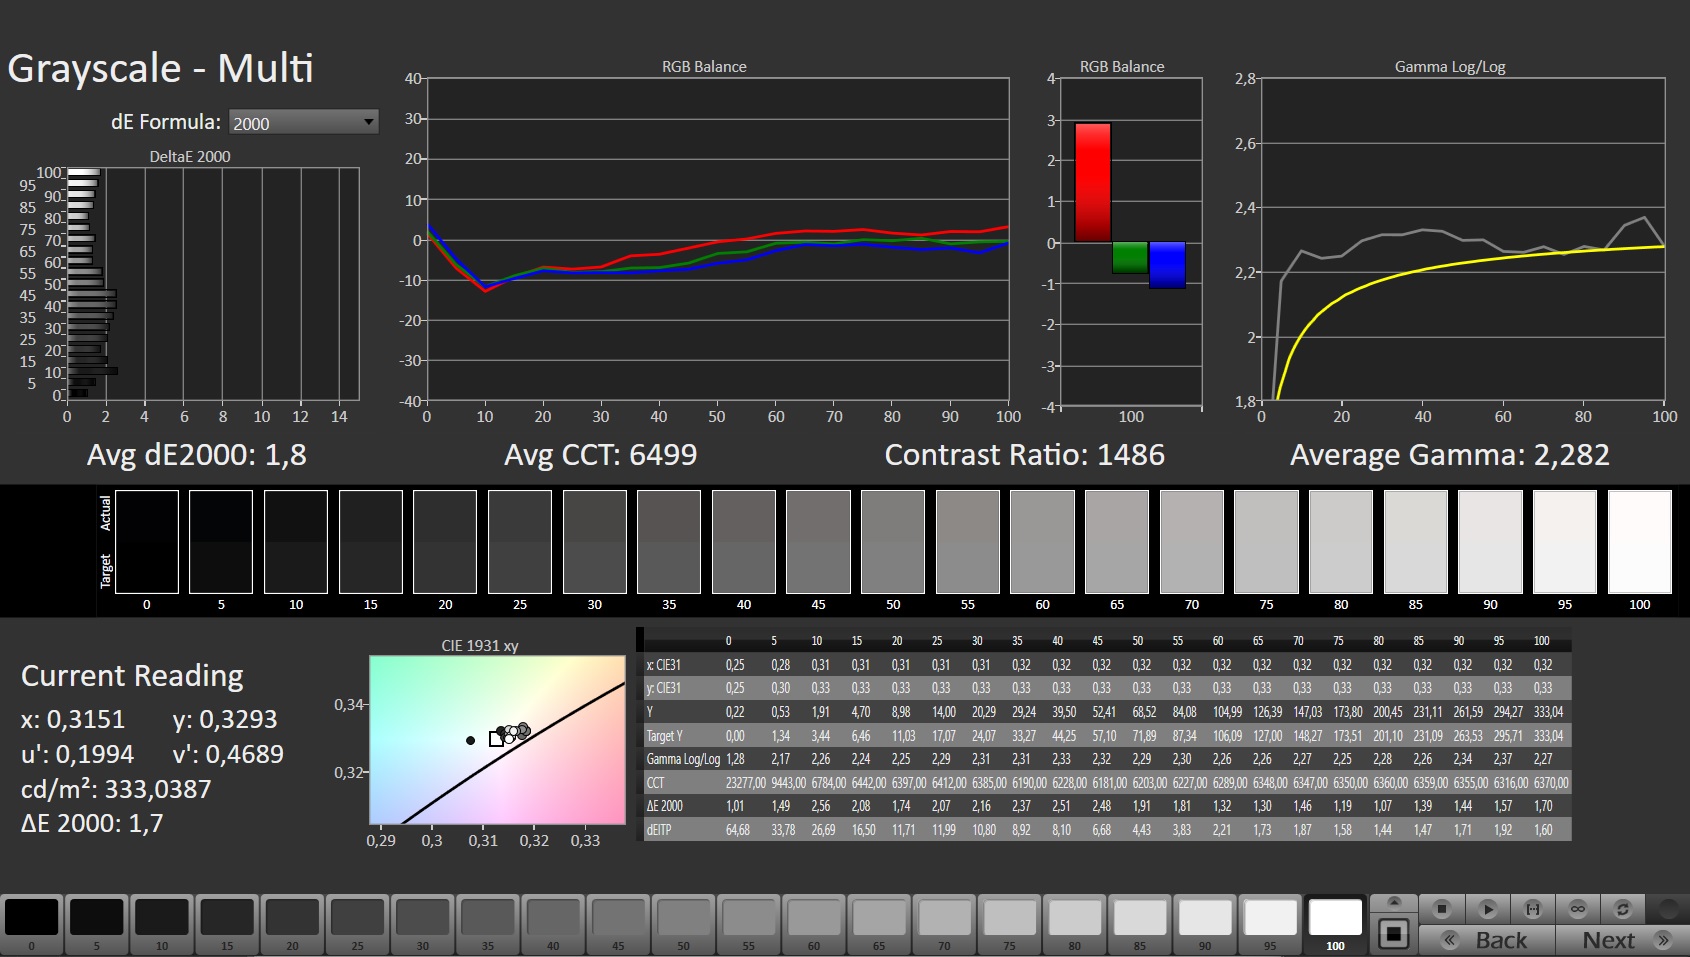
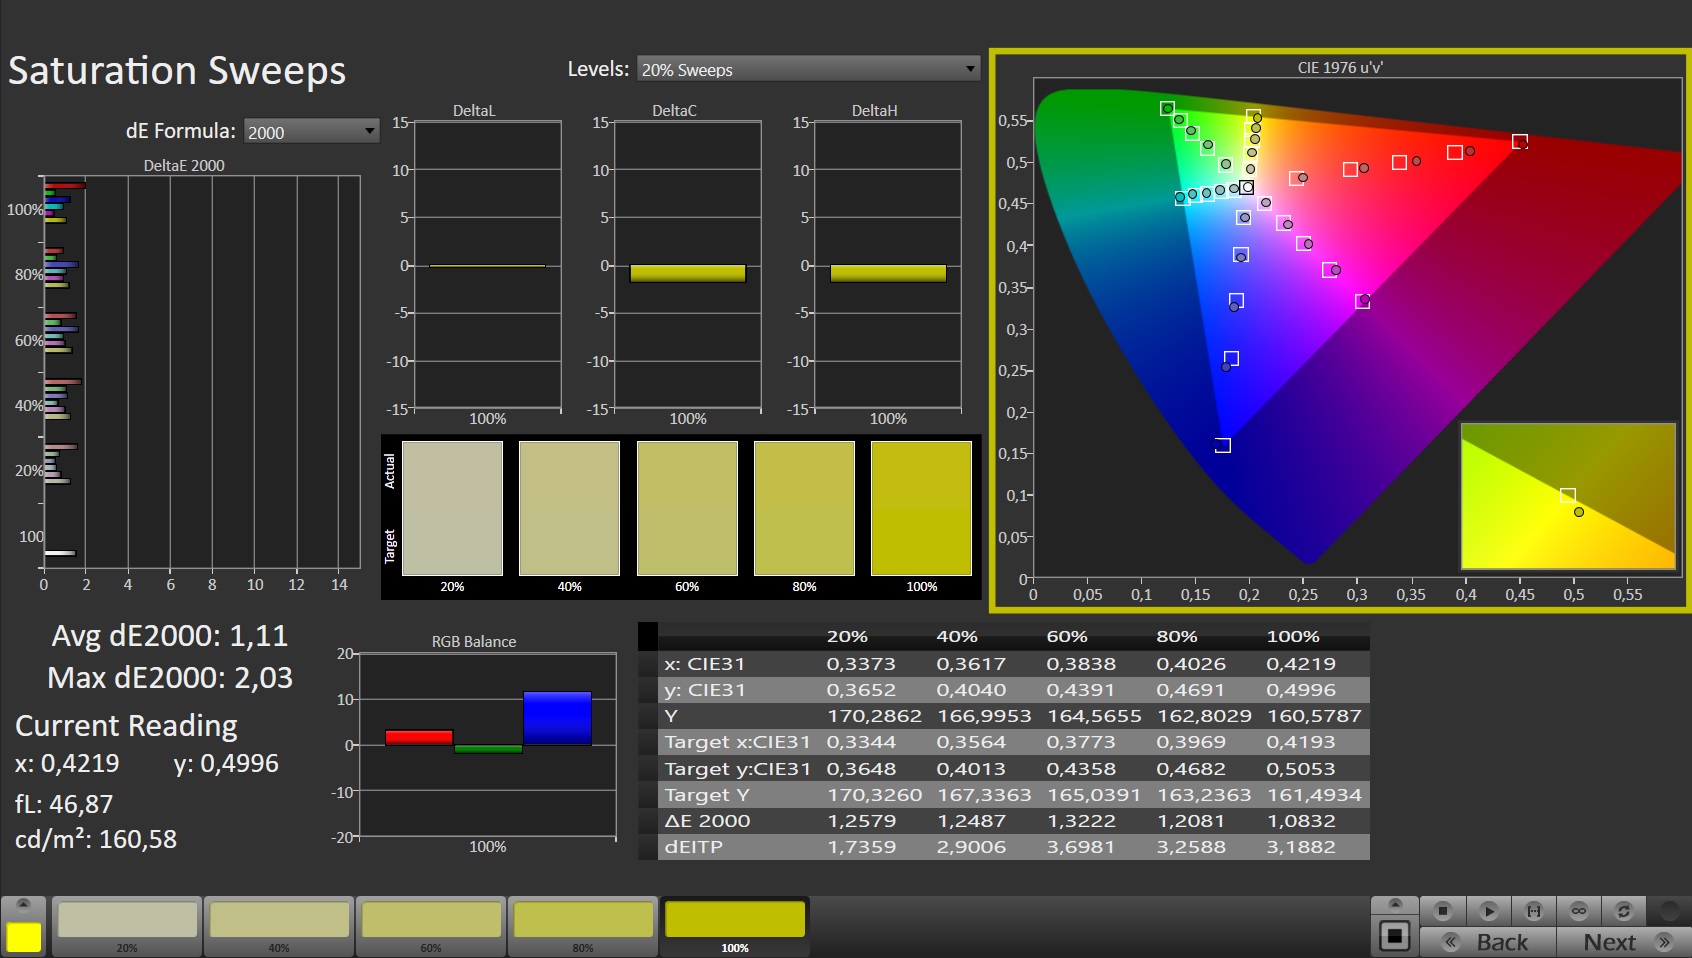
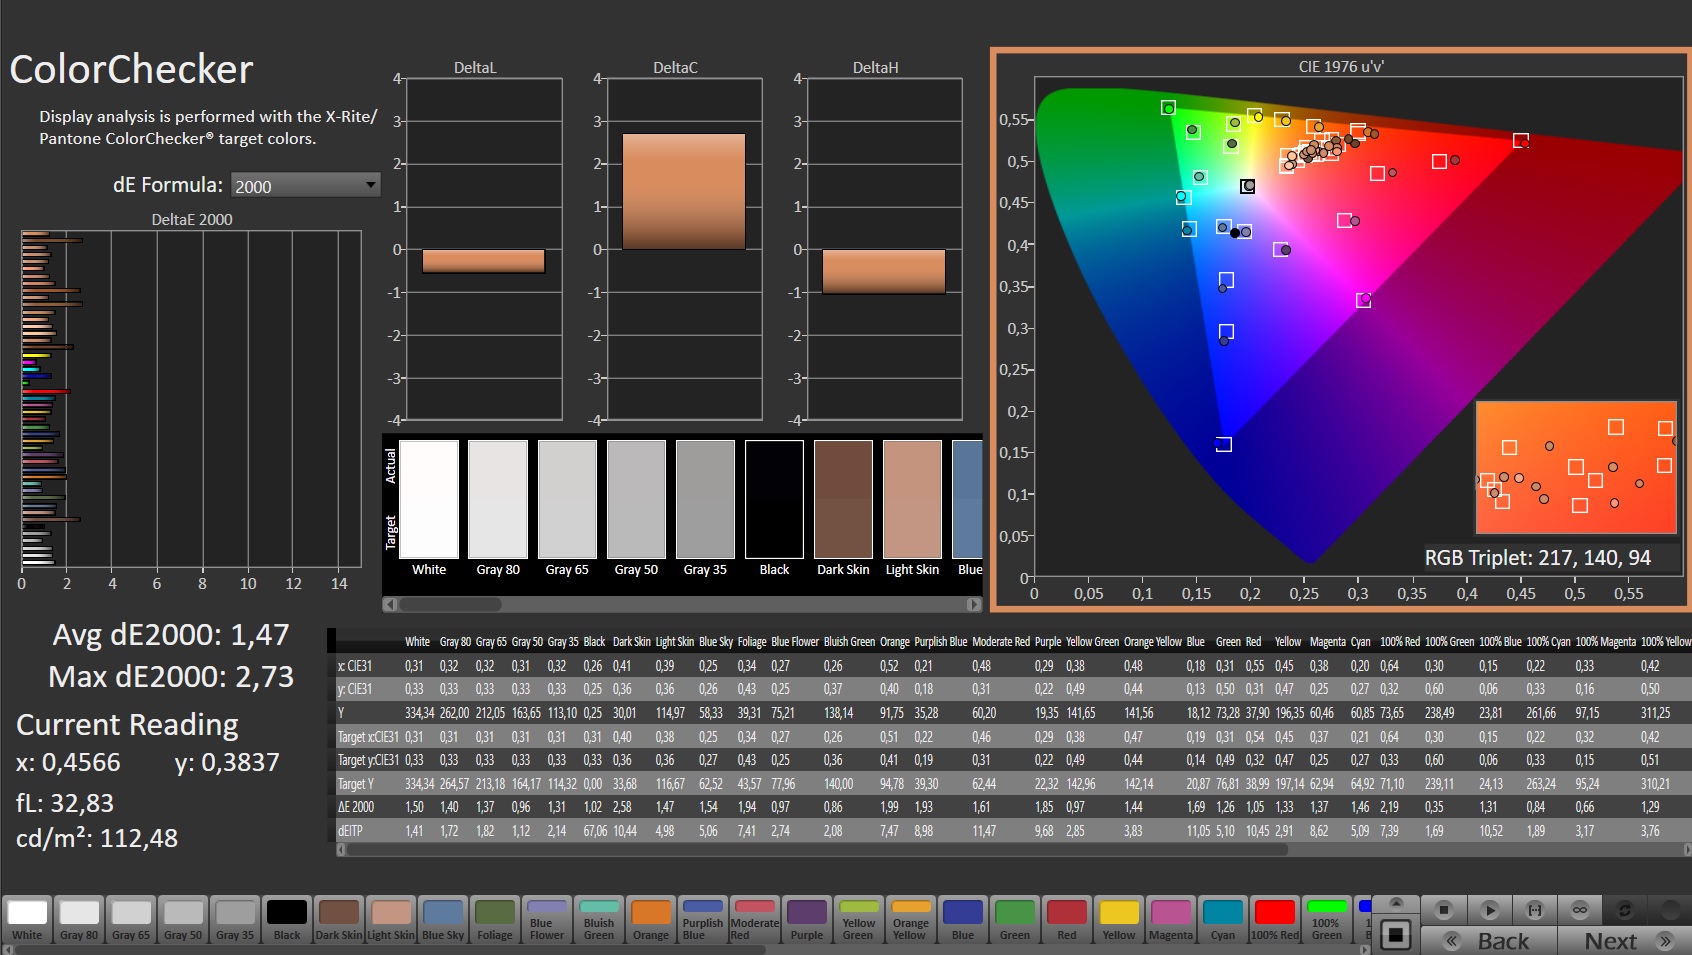
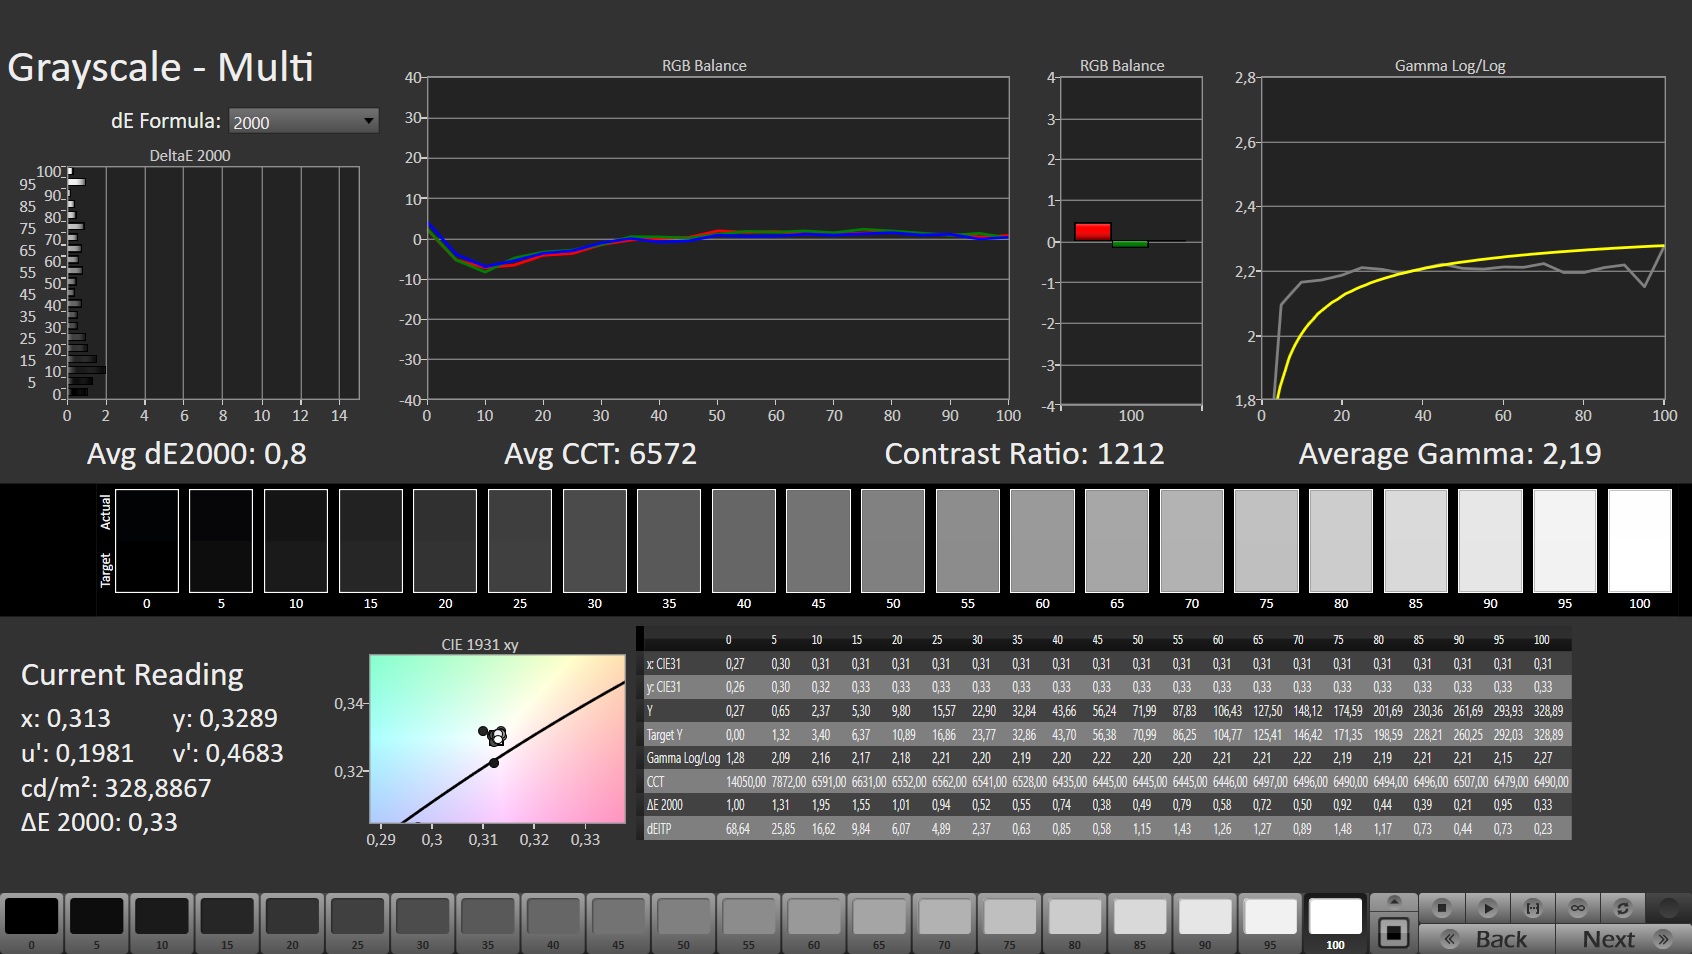
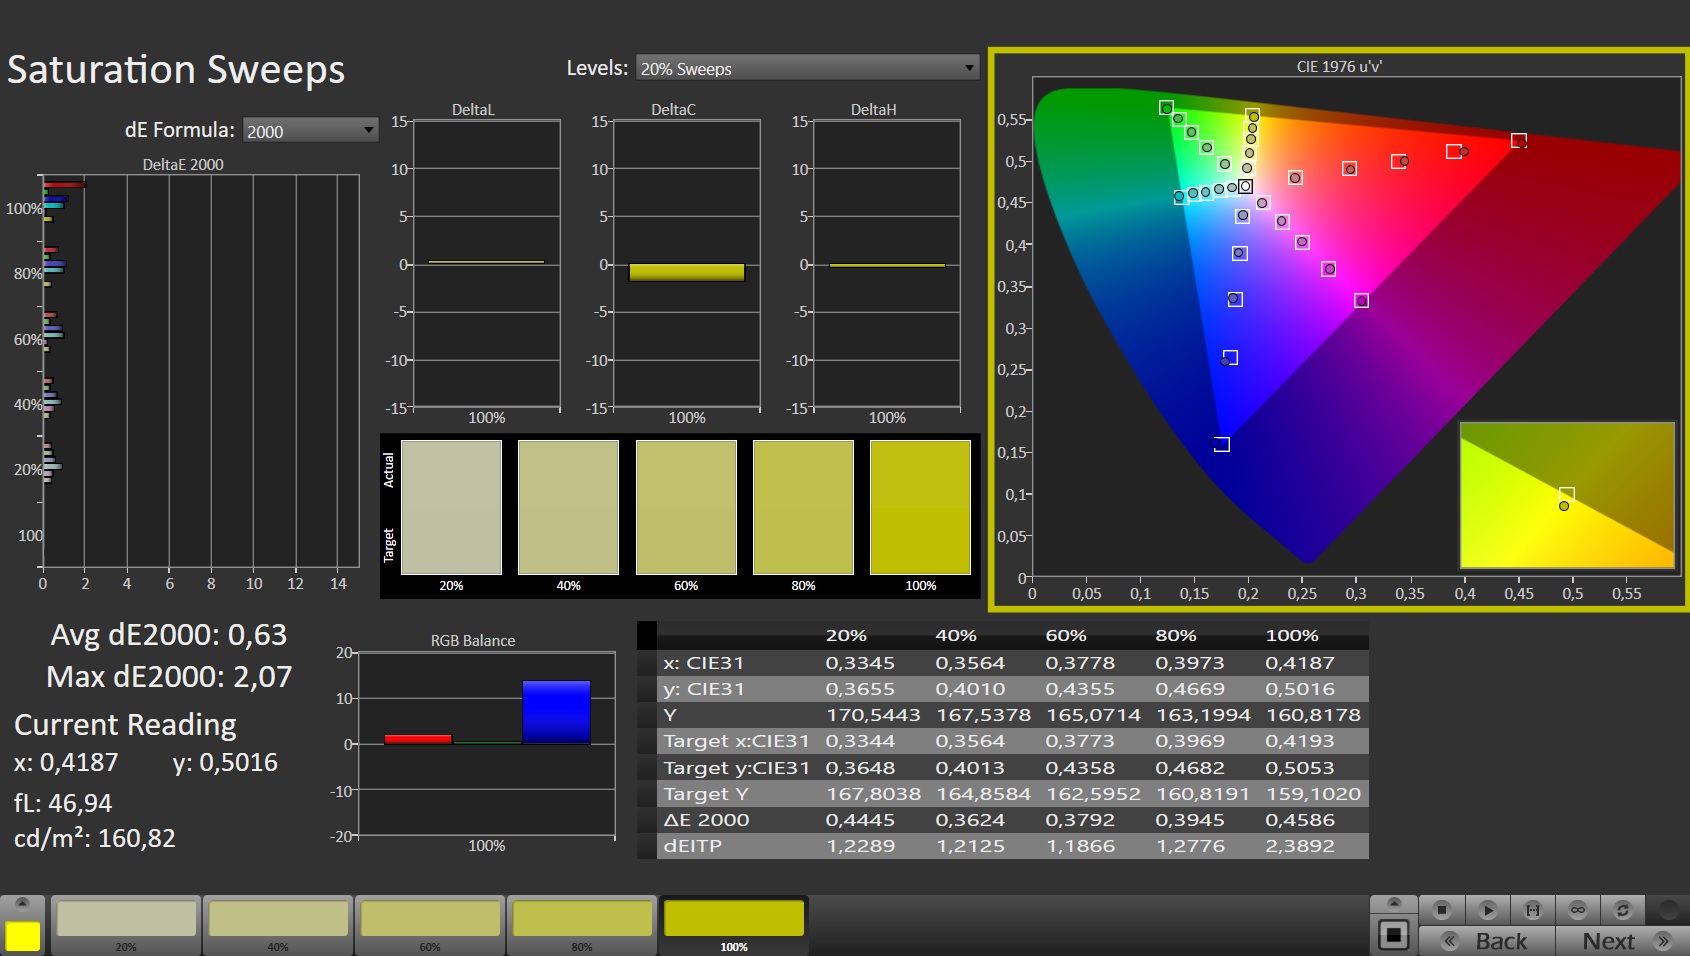
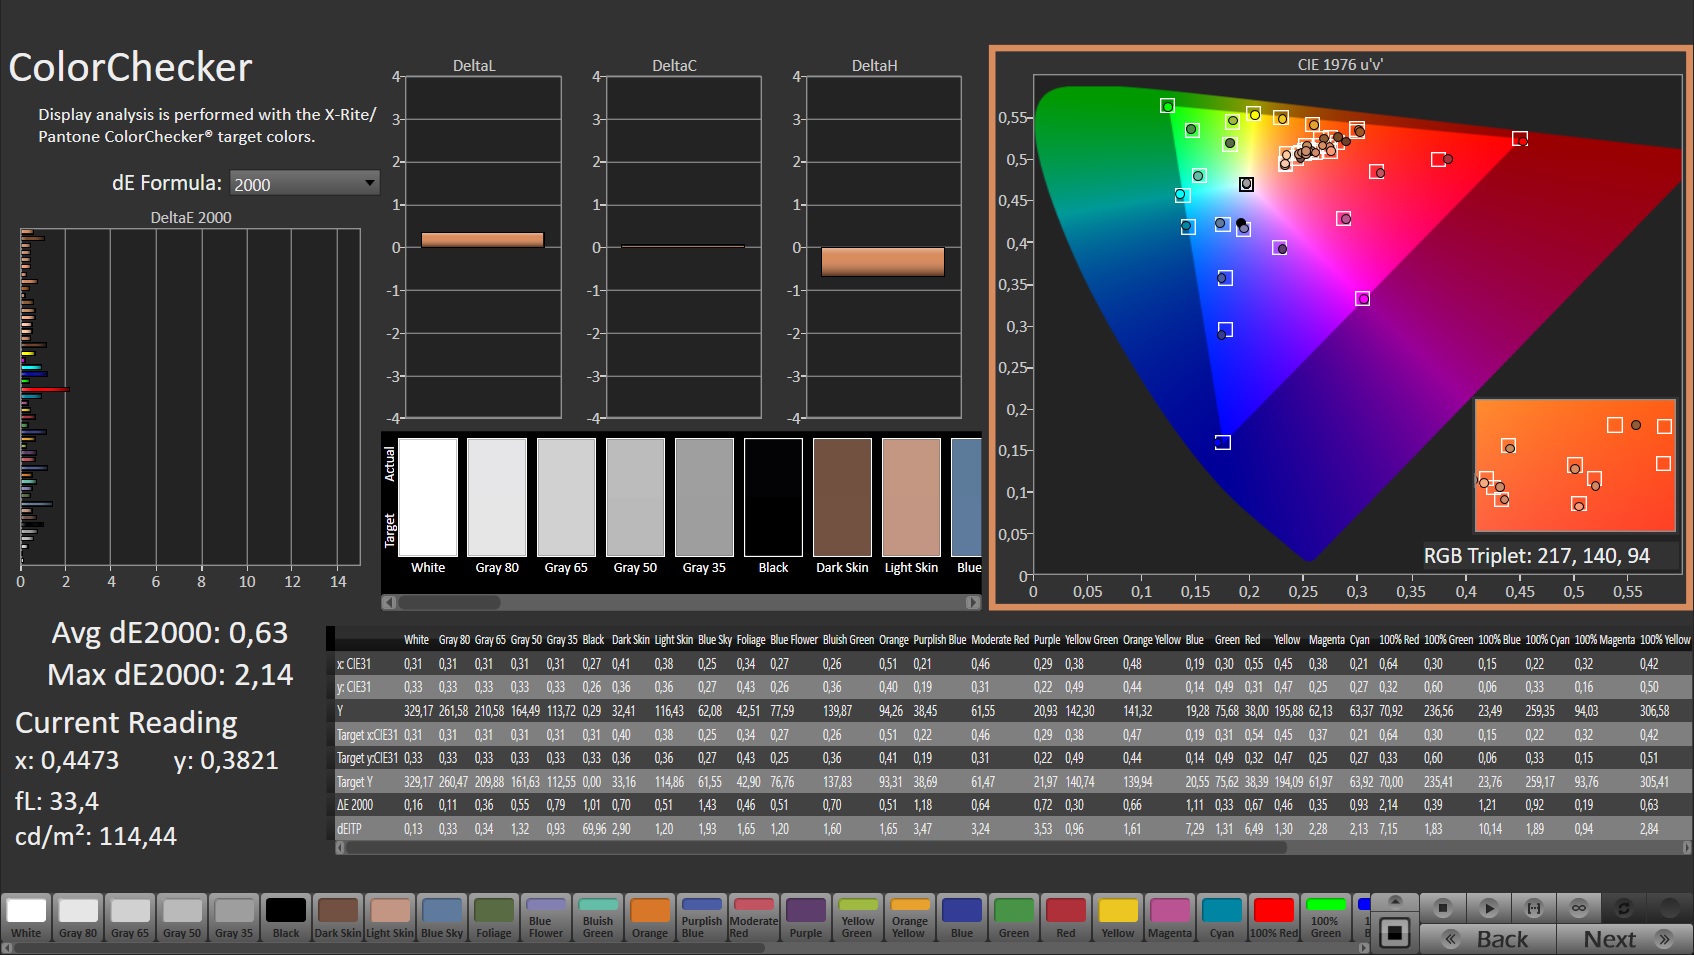
交付时,灰度和颜色的DeltaE色彩空间偏差已经在理想范围内(小于3),并且可以通过后续校准分别提高到0.63和0.8的稳固水平。
Display Response Times
| ↔ Response Time Black to White | ||
|---|---|---|
| 10.5 ms ... rise ↗ and fall ↘ combined | ↗ 5.7 ms rise | 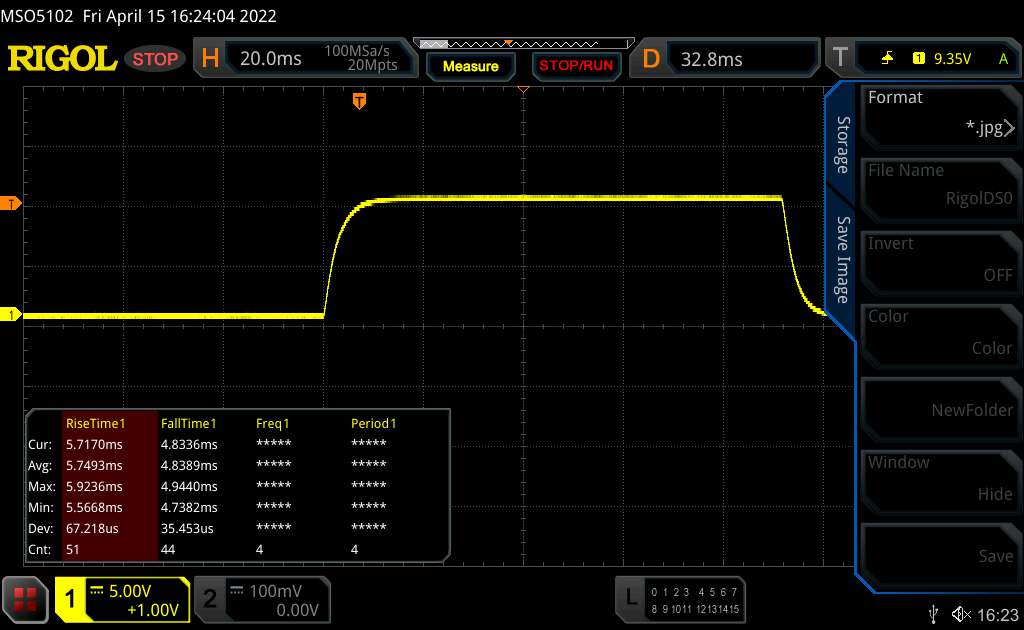 |
| ↘ 4.8 ms fall | ||
| The screen shows good response rates in our tests, but may be too slow for competitive gamers. In comparison, all tested devices range from 0.1 (minimum) to 240 (maximum) ms. » 29 % of all devices are better. This means that the measured response time is better than the average of all tested devices (19.8 ms). | ||
| ↔ Response Time 50% Grey to 80% Grey | ||
| 4.3 ms ... rise ↗ and fall ↘ combined | ↗ 2.4 ms rise | 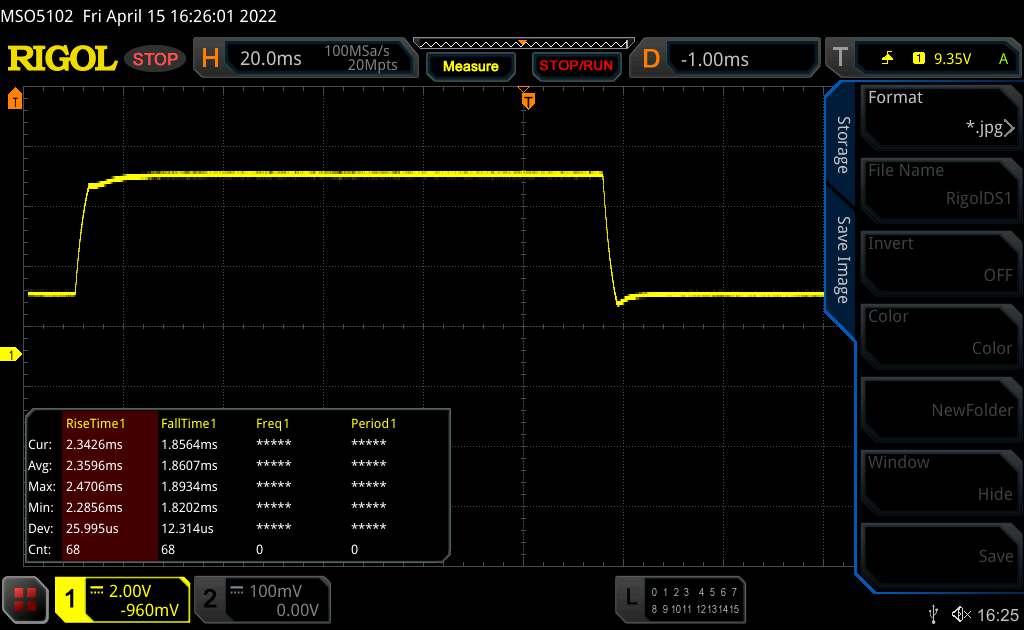 |
| ↘ 1.9 ms fall | ||
| The screen shows very fast response rates in our tests and should be very well suited for fast-paced gaming. In comparison, all tested devices range from 0.165 (minimum) to 636 (maximum) ms. » 16 % of all devices are better. This means that the measured response time is better than the average of all tested devices (31 ms). | ||
Screen Flickering / PWM (Pulse-Width Modulation)
| Screen flickering / PWM not detected | 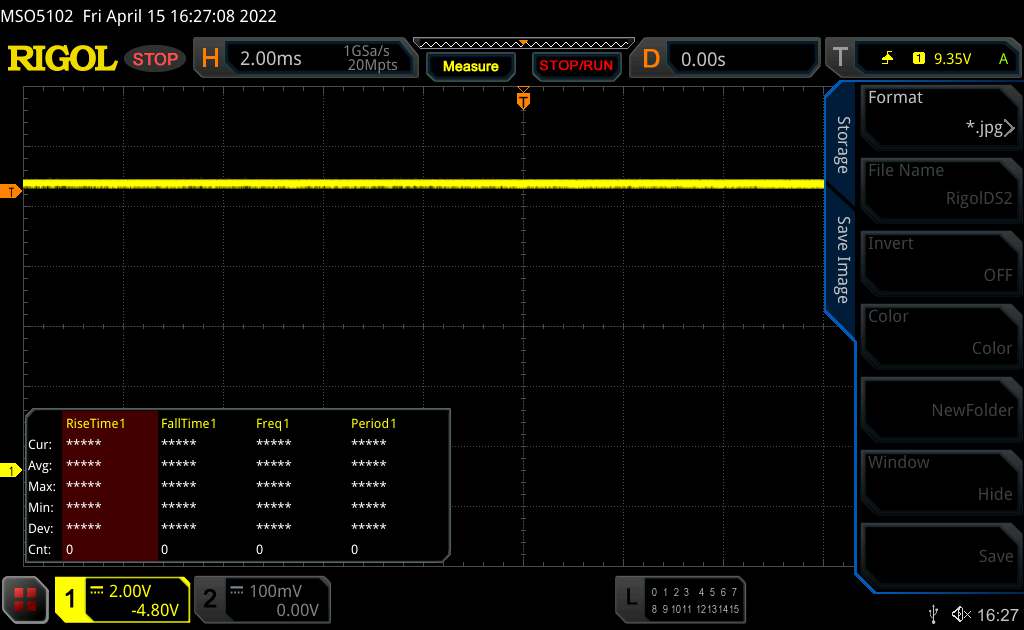 | ||
In comparison: 52 % of all tested devices do not use PWM to dim the display. If PWM was detected, an average of 7769 (minimum: 5 - maximum: 343500) Hz was measured. | |||
由于亮度超过300cd/m²,只要你呆在阴凉处,该显示器也可用于户外使用。
可视角度是一流的。即使在陡峭的角度,IPS显示屏的颜色和对比度也几乎没有失真。
性能 - 拥有顶级硬件的Razer游戏笔记本
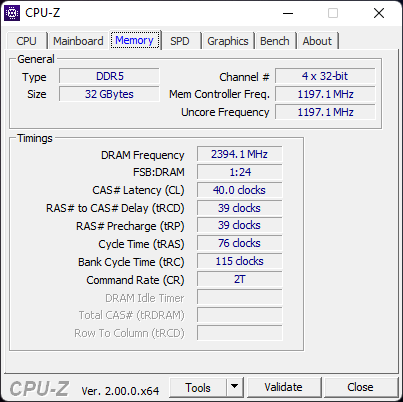
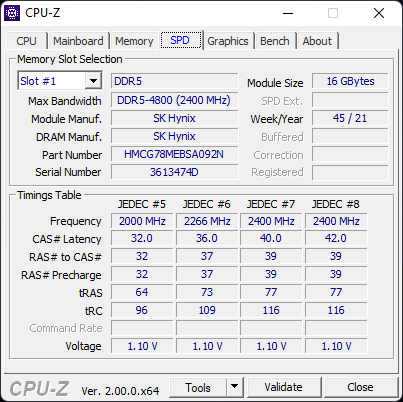
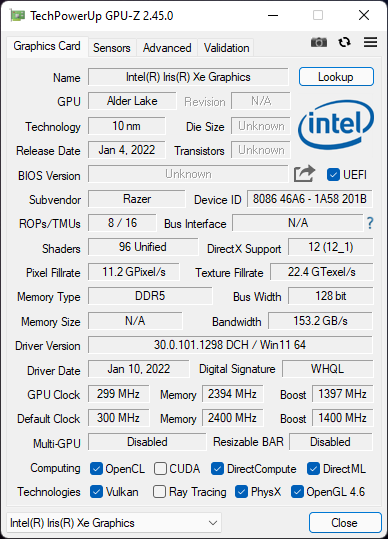
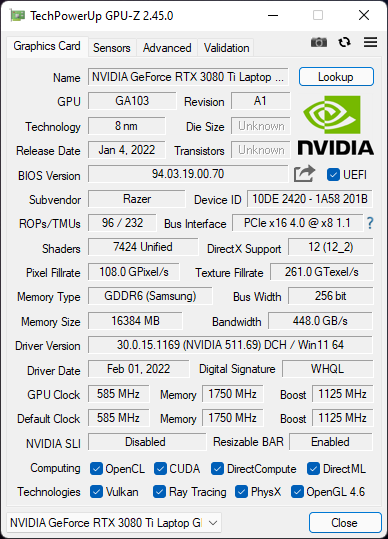
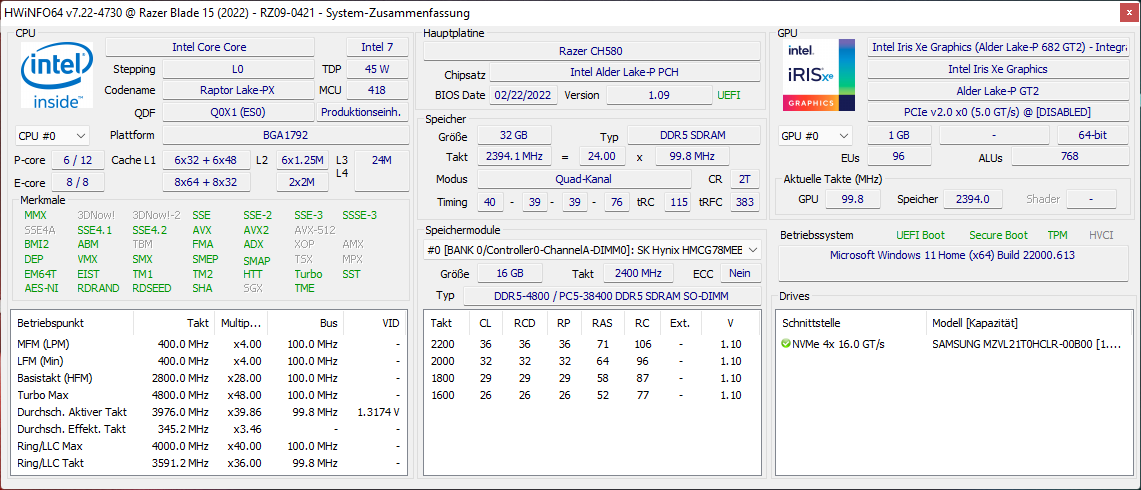
我们的Razer Blade 15配备了一个 英特尔酷睿i7-12800H和一个 NvidiaGeForce RTX 3080 Ti.还有32GB四通道模式的DDR5内存和1TB PCIe 4.0固态硬盘。结合4K面板, 笔记本电脑是可供选择的与 酷睿i9-12900H.
测试条件
为了在测试中获得新的见解,我们用Synapse "平衡 "配置文件进行了所有测量。这使得GPU的最大TGP约为95W,同时也限制了CPU的工作。你可以在我们的评论中找到可实现的最大分数。 其他评论.
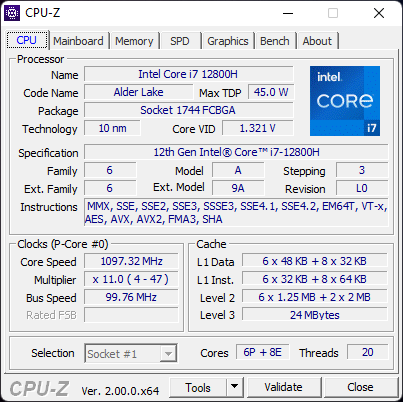
处理器
在我们选择的配置文件下,Cinebench R15多线程测试在电池模式下取得了相同的分数。 英特尔酷睿i7-12800H是一个全新的第12代英特尔处理器,支持DDR5内存。DDR5功能允许两个RAM模块以四通道模式运行。
在 "平衡 "模式下,Razer Blade 15在CPU性能方面不如没有性能限制的情况下能跟上竞争对手。即使是名义上较弱的 酷睿i7-12700H在Cinebench R15多循环测试中,即使是XMG Neo 15 E22的名义上较弱的酷睿i7-12700H也能在两种情况下击败我们的评测设备。一些单线程基准测试结果更好的事实,可能是由于在TDP限制之前就达到了温度限制。涡轮增压只在短时间内保持活跃。
在我们选择的配置文件下,Cinebench R15多线程测试在电池模式下提供相同的分数。
Cinebench R15 Multi Sustained Load
* ... smaller is better
AIDA64: FP32 Ray-Trace | FPU Julia | CPU SHA3 | CPU Queen | FPU SinJulia | FPU Mandel | CPU AES | CPU ZLib | FP64 Ray-Trace | CPU PhotoWorxx
| Performance rating | |
| Average of class Gaming | |
| Asus ROG Strix Scar 15 G533QS | |
| MSI Stealth GS66 12UGS | |
| Schenker XMG Neo 15 E22 (Early 2022, RTX 3080 Ti) | |
| MSI Vector GP66 12UGS | |
| Average Intel Core i7-12800H | |
| Razer Blade 15 2022 | |
| Razer Blade 15 Advanced Model Early 2022 | |
| AIDA64 / FP32 Ray-Trace | |
| Average of class Gaming (10227 - 85542, n=107, last 2 years) | |
| Asus ROG Strix Scar 15 G533QS | |
| Schenker XMG Neo 15 E22 (Early 2022, RTX 3080 Ti) | |
| MSI Stealth GS66 12UGS | |
| Average Intel Core i7-12800H (5839 - 15206, n=5) | |
| MSI Vector GP66 12UGS | |
| Razer Blade 15 2022 | |
| Razer Blade 15 Advanced Model Early 2022 | |
| AIDA64 / FPU Julia | |
| Average of class Gaming (51376 - 238426, n=107, last 2 years) | |
| Asus ROG Strix Scar 15 G533QS | |
| Average Intel Core i7-12800H (27801 - 80002, n=5) | |
| Schenker XMG Neo 15 E22 (Early 2022, RTX 3080 Ti) | |
| MSI Stealth GS66 12UGS | |
| MSI Vector GP66 12UGS | |
| Razer Blade 15 2022 | |
| Razer Blade 15 Advanced Model Early 2022 | |
| AIDA64 / CPU SHA3 | |
| Average of class Gaming (2180 - 9817, n=107, last 2 years) | |
| Asus ROG Strix Scar 15 G533QS | |
| Schenker XMG Neo 15 E22 (Early 2022, RTX 3080 Ti) | |
| MSI Stealth GS66 12UGS | |
| MSI Vector GP66 12UGS | |
| Average Intel Core i7-12800H (2013 - 3684, n=5) | |
| Razer Blade 15 2022 | |
| Razer Blade 15 Advanced Model Early 2022 | |
| AIDA64 / CPU Queen | |
| Average of class Gaming (49785 - 173351, n=95, last 2 years) | |
| MSI Vector GP66 12UGS | |
| Asus ROG Strix Scar 15 G533QS | |
| MSI Stealth GS66 12UGS | |
| Schenker XMG Neo 15 E22 (Early 2022, RTX 3080 Ti) | |
| Average Intel Core i7-12800H (85965 - 108084, n=5) | |
| Razer Blade 15 2022 | |
| Razer Blade 15 Advanced Model Early 2022 | |
| AIDA64 / FPU SinJulia | |
| Average of class Gaming (4424 - 33636, n=107, last 2 years) | |
| Asus ROG Strix Scar 15 G533QS | |
| Schenker XMG Neo 15 E22 (Early 2022, RTX 3080 Ti) | |
| MSI Stealth GS66 12UGS | |
| MSI Vector GP66 12UGS | |
| Razer Blade 15 2022 | |
| Average Intel Core i7-12800H (7027 - 9658, n=5) | |
| Razer Blade 15 Advanced Model Early 2022 | |
| AIDA64 / FPU Mandel | |
| Average of class Gaming (25115 - 128721, n=107, last 2 years) | |
| Asus ROG Strix Scar 15 G533QS | |
| Schenker XMG Neo 15 E22 (Early 2022, RTX 3080 Ti) | |
| MSI Stealth GS66 12UGS | |
| Average Intel Core i7-12800H (15765 - 38179, n=5) | |
| MSI Vector GP66 12UGS | |
| Razer Blade 15 2022 | |
| Razer Blade 15 Advanced Model Early 2022 | |
| AIDA64 / CPU AES | |
| Asus ROG Strix Scar 15 G533QS | |
| Average of class Gaming (39258 - 247074, n=107, last 2 years) | |
| MSI Stealth GS66 12UGS | |
| MSI Vector GP66 12UGS | |
| Schenker XMG Neo 15 E22 (Early 2022, RTX 3080 Ti) | |
| Razer Blade 15 Advanced Model Early 2022 | |
| Average Intel Core i7-12800H (55371 - 73928, n=5) | |
| Razer Blade 15 2022 | |
| AIDA64 / CPU ZLib | |
| Average of class Gaming (574 - 2531, n=107, last 2 years) | |
| Schenker XMG Neo 15 E22 (Early 2022, RTX 3080 Ti) | |
| MSI Vector GP66 12UGS | |
| MSI Stealth GS66 12UGS | |
| Razer Blade 15 2022 | |
| Average Intel Core i7-12800H (701 - 1047, n=5) | |
| Asus ROG Strix Scar 15 G533QS | |
| Razer Blade 15 Advanced Model Early 2022 | |
| AIDA64 / FP64 Ray-Trace | |
| Average of class Gaming (5509 - 45446, n=107, last 2 years) | |
| Asus ROG Strix Scar 15 G533QS | |
| Schenker XMG Neo 15 E22 (Early 2022, RTX 3080 Ti) | |
| MSI Stealth GS66 12UGS | |
| Average Intel Core i7-12800H (3257 - 8559, n=5) | |
| MSI Vector GP66 12UGS | |
| Razer Blade 15 2022 | |
| Razer Blade 15 Advanced Model Early 2022 | |
| AIDA64 / CPU PhotoWorxx | |
| Average of class Gaming (12271 - 89891, n=107, last 2 years) | |
| Razer Blade 15 2022 | |
| Schenker XMG Neo 15 E22 (Early 2022, RTX 3080 Ti) | |
| MSI Stealth GS66 12UGS | |
| Razer Blade 15 Advanced Model Early 2022 | |
| Average Intel Core i7-12800H (31329 - 40992, n=5) | |
| MSI Vector GP66 12UGS | |
| Asus ROG Strix Scar 15 G533QS | |
系统性能
根据PCMark 10的测试,系统性能很稳定。在日常使用中,操作速度平稳,没有明显的延迟,这就是为什么你可以无忧无虑地使用 "平衡 "模式。
CrossMark: Overall | Productivity | Creativity | Responsiveness
| PCMark 10 / Score | |
| Average of class Gaming (5828 - 11574, n=95, last 2 years) | |
| MSI Vector GP66 12UGS | |
| Razer Blade 15 2022 | |
| Average Intel Core i7-12800H, NVIDIA GeForce RTX 3080 Ti Laptop GPU (7313 - 7744, n=3) | |
| MSI Stealth GS66 12UGS | |
| Razer Blade 15 Advanced Model Early 2022 | |
| Schenker XMG Neo 15 E22 (Early 2022, RTX 3080 Ti) | |
| Asus ROG Strix Scar 15 G533QS | |
| PCMark 10 / Essentials | |
| MSI Vector GP66 12UGS | |
| MSI Stealth GS66 12UGS | |
| Razer Blade 15 2022 | |
| Average Intel Core i7-12800H, NVIDIA GeForce RTX 3080 Ti Laptop GPU (10597 - 10814, n=3) | |
| Average of class Gaming (8810 - 12600, n=99, last 2 years) | |
| Razer Blade 15 Advanced Model Early 2022 | |
| Asus ROG Strix Scar 15 G533QS | |
| Schenker XMG Neo 15 E22 (Early 2022, RTX 3080 Ti) | |
| PCMark 10 / Productivity | |
| Average of class Gaming (6845 - 21327, n=97, last 2 years) | |
| MSI Vector GP66 12UGS | |
| Asus ROG Strix Scar 15 G533QS | |
| Razer Blade 15 Advanced Model Early 2022 | |
| Razer Blade 15 2022 | |
| Average Intel Core i7-12800H, NVIDIA GeForce RTX 3080 Ti Laptop GPU (9470 - 9675, n=3) | |
| MSI Stealth GS66 12UGS | |
| Schenker XMG Neo 15 E22 (Early 2022, RTX 3080 Ti) | |
| PCMark 10 / Digital Content Creation | |
| Average of class Gaming (7602 - 19657, n=97, last 2 years) | |
| MSI Vector GP66 12UGS | |
| Razer Blade 15 2022 | |
| Average Intel Core i7-12800H, NVIDIA GeForce RTX 3080 Ti Laptop GPU (10351 - 12306, n=3) | |
| MSI Stealth GS66 12UGS | |
| Schenker XMG Neo 15 E22 (Early 2022, RTX 3080 Ti) | |
| Razer Blade 15 Advanced Model Early 2022 | |
| Asus ROG Strix Scar 15 G533QS | |
| CrossMark / Overall | |
| Average of class Gaming (1366 - 2409, n=95, last 2 years) | |
| Razer Blade 15 Advanced Model Early 2022 | |
| Average Intel Core i7-12800H, NVIDIA GeForce RTX 3080 Ti Laptop GPU (n=1) | |
| CrossMark / Productivity | |
| Average of class Gaming (1386 - 2254, n=95, last 2 years) | |
| Razer Blade 15 Advanced Model Early 2022 | |
| Average Intel Core i7-12800H, NVIDIA GeForce RTX 3080 Ti Laptop GPU (n=1) | |
| CrossMark / Creativity | |
| Average of class Gaming (1343 - 2729, n=95, last 2 years) | |
| Razer Blade 15 Advanced Model Early 2022 | |
| Average Intel Core i7-12800H, NVIDIA GeForce RTX 3080 Ti Laptop GPU (n=1) | |
| CrossMark / Responsiveness | |
| Average of class Gaming (1226 - 2334, n=95, last 2 years) | |
| Razer Blade 15 Advanced Model Early 2022 | |
| Average Intel Core i7-12800H, NVIDIA GeForce RTX 3080 Ti Laptop GPU (n=1) | |
| PCMark 8 Home Score Accelerated v2 | 6657 points | |
| PCMark 8 Work Score Accelerated v2 | 7009 points | |
| PCMark 10 Score | 7313 points | |
Help | ||
| AIDA64 / Memory Copy | |
| Average of class Gaming (21750 - 129946, n=107, last 2 years) | |
| Schenker XMG Neo 15 E22 (Early 2022, RTX 3080 Ti) | |
| Razer Blade 15 2022 | |
| MSI Stealth GS66 12UGS | |
| Razer Blade 15 Advanced Model Early 2022 | |
| Average Intel Core i7-12800H (48643 - 62522, n=5) | |
| MSI Vector GP66 12UGS | |
| Asus ROG Strix Scar 15 G533QS | |
| AIDA64 / Memory Read | |
| Average of class Gaming (22956 - 118858, n=107, last 2 years) | |
| Schenker XMG Neo 15 E22 (Early 2022, RTX 3080 Ti) | |
| Razer Blade 15 2022 | |
| MSI Stealth GS66 12UGS | |
| Razer Blade 15 Advanced Model Early 2022 | |
| Average Intel Core i7-12800H (56629 - 66199, n=5) | |
| MSI Vector GP66 12UGS | |
| Asus ROG Strix Scar 15 G533QS | |
| AIDA64 / Memory Write | |
| Average of class Gaming (22297 - 135096, n=107, last 2 years) | |
| MSI Stealth GS66 12UGS | |
| Razer Blade 15 2022 | |
| Razer Blade 15 Advanced Model Early 2022 | |
| Schenker XMG Neo 15 E22 (Early 2022, RTX 3080 Ti) | |
| Average Intel Core i7-12800H (50923 - 66074, n=5) | |
| MSI Vector GP66 12UGS | |
| Asus ROG Strix Scar 15 G533QS | |
| AIDA64 / Memory Latency | |
| Average of class Gaming (75.3 - 259, n=107, last 2 years) | |
| Razer Blade 15 Advanced Model Early 2022 | |
| MSI Stealth GS66 12UGS | |
| MSI Vector GP66 12UGS | |
| Asus ROG Strix Scar 15 G533QS | |
| Average Intel Core i7-12800H (89.3 - 95.2, n=5) | |
| Schenker XMG Neo 15 E22 (Early 2022, RTX 3080 Ti) | |
| Razer Blade 15 2022 | |
* ... smaller is better
DPC延迟
根据LatencyMon,在我们测试的配置中,DPC延迟对于实时音频和视频编辑来说可能太高。
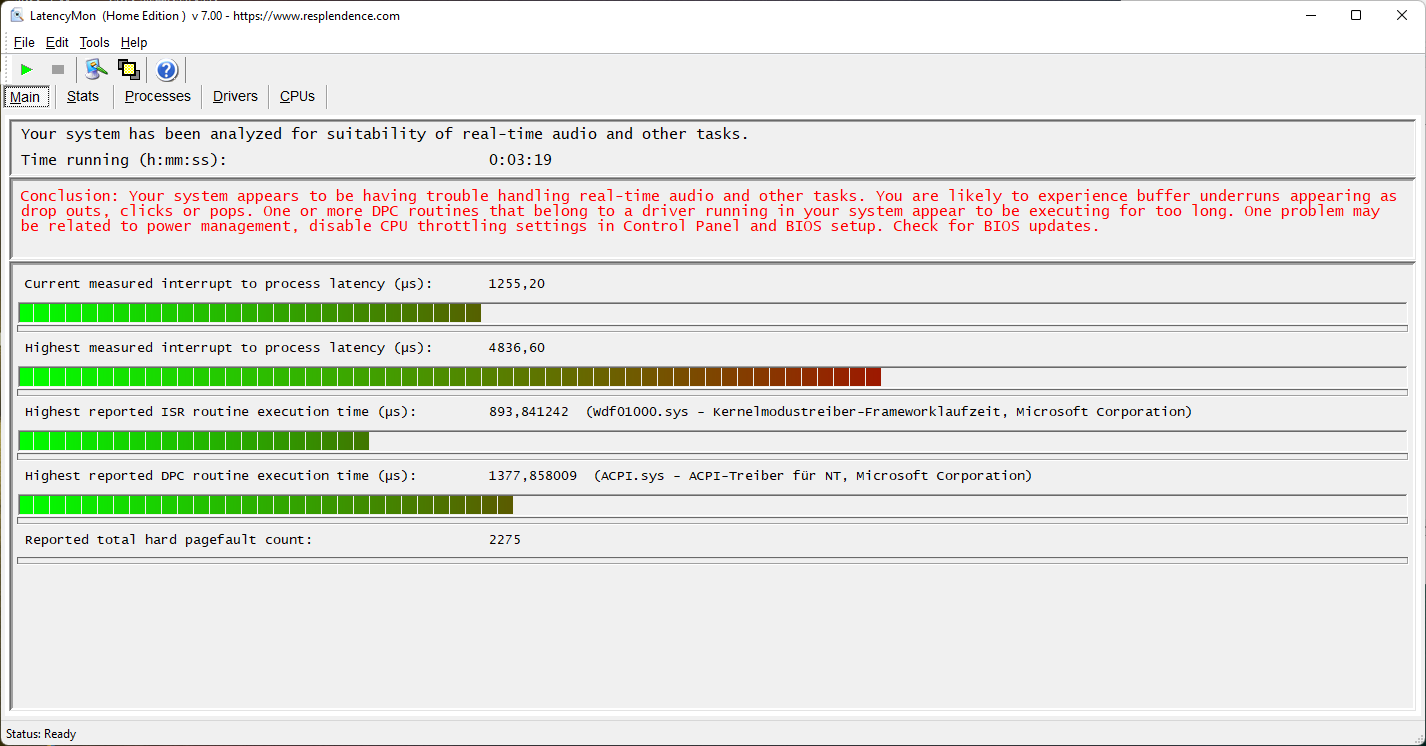
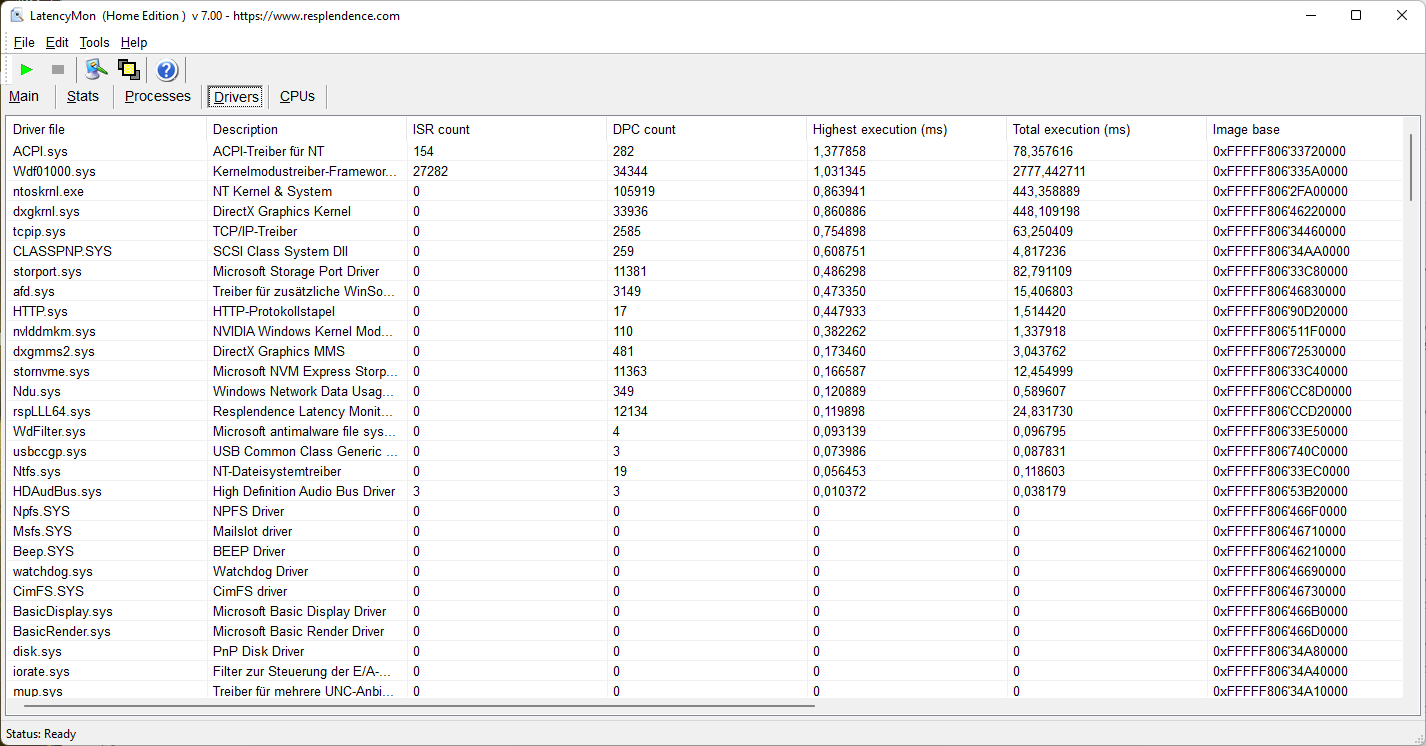
| DPC Latencies / LatencyMon - interrupt to process latency (max), Web, Youtube, Prime95 | |
| Razer Blade 15 Advanced Model Early 2022 | |
| MSI Vector GP66 12UGS | |
| MSI Stealth GS66 12UGS | |
| Asus ROG Strix Scar 15 G533QS | |
| Razer Blade 15 2022 | |
| Schenker XMG Neo 15 E22 (Early 2022, RTX 3080 Ti) | |
* ... smaller is better
存储设备
在我们的评测设备中安装了一个1TB的三星PM9A1 M.2 SDD,带有PCIe 4.0,这导致了非常高的数据传输率。由于SSTC的PCIe 4.0固态硬盘 "CA6-8D1024 "被安装在我们的 第一个Blade 15评测设备因此,驱动器型号和传输速率可能有所不同。

* ... smaller is better
Sustained Read Performance: DiskSpd Read Loop, Queue Depth 8
GPU
手机 NvidiaGeForce RTX 3080 Ti拥有16GB的VRAM,属于Ampere Refresh一代。根据3DMark基准测试,使用 "平衡 "模式会导致约10-20%的性能下降。在《Witcher 3 》的帧率进展中可以看到小幅度的下降,但这对游戏体验的主观影响很小。
在电池模式下,性能是有限的。Fire Strike ,在电池模式下,物理和图形得分分别为12,888和10,344,而在主电源模式下为21866和25240。
| 3DMark 11 Performance | 25091 points | |
| 3DMark Ice Storm Standard Score | 158195 points | |
| 3DMark Cloud Gate Standard Score | 43351 points | |
| 3DMark Fire Strike Score | 21106 points | |
| 3DMark Time Spy Score | 9596 points | |
Help | ||
游戏性能
在平衡性能模式下,Gming基准测试自然较弱。尽管如此,绝对帧率仍然很高,足以带来流畅的游戏体验,所以你不一定要在高性能模式下运行Blade 15。
Witcher 3 FPS Diagram
| low | med. | high | ultra | |
|---|---|---|---|---|
| GTA V (2015) | 178.7 | 170.7 | 153.4 | 92.4 |
| The Witcher 3 (2015) | 316 | 200 | 155.5 | 89.3 |
| Dota 2 Reborn (2015) | 59.9 | 59.9 | 59.9 | 59.9 |
| Final Fantasy XV Benchmark (2018) | 148.3 | 119.4 | 90.4 | |
| X-Plane 11.11 (2018) | 124.3 | 109.5 | 93.4 | |
| Strange Brigade (2018) | 361 | 212 | 167.6 | 149.8 |
排放 - 导热外壳
噪声
风扇很迟钝,在它们启动之前会让组件变得有点热。特别是,在平衡模式下,负载下的平均噪音水平明显降低。我们的第一台Blade 15的噪音水平是 第一台Blade 15(模式:最大性能)在通常范围内。在我们的评测设备中没有检测到线圈的呜呜声。
Noise level
| Idle |
| 26 / 27 / 29 dB(A) |
| Load |
| 37 / 45 dB(A) |
 | ||
30 dB silent 40 dB(A) audible 50 dB(A) loud |
||
min: | ||
| Razer Blade 15 Advanced Model Early 2022 i7-12800H, GeForce RTX 3080 Ti Laptop GPU | Razer Blade 15 2022 i7-12800H, GeForce RTX 3080 Ti Laptop GPU | Schenker XMG Neo 15 E22 (Early 2022, RTX 3080 Ti) i7-12700H, GeForce RTX 3080 Ti Laptop GPU | Asus ROG Strix Scar 15 G533QS R9 5900HX, GeForce RTX 3080 Laptop GPU | MSI Stealth GS66 12UGS i7-12700H, GeForce RTX 3070 Ti Laptop GPU | MSI Vector GP66 12UGS i9-12900H, GeForce RTX 3070 Ti Laptop GPU | |
|---|---|---|---|---|---|---|
| Noise | -5% | -2% | -8% | -12% | -2% | |
| off / environment * (dB) | 26 | 25.4 2% | 24 8% | 25.5 2% | 24 8% | 22.9 12% |
| Idle Minimum * (dB) | 26 | 26.2 -1% | 24 8% | 25.5 2% | 31 -19% | 23.4 10% |
| Idle Average * (dB) | 27 | 26.2 3% | 24 11% | 25.5 6% | 32 -19% | 23.4 13% |
| Idle Maximum * (dB) | 29 | 28.4 2% | 27.76 4% | 37.1 -28% | 35 -21% | 27.4 6% |
| Load Average * (dB) | 37 | 44.7 -21% | 38.81 -5% | 39.2 -6% | 48 -30% | 36 3% |
| Witcher 3 ultra * (dB) | 44 | 44.7 -2% | 54.2 -23% | 50.5 -15% | 43 2% | 58.2 -32% |
| Load Maximum * (dB) | 45 | 51.9 -15% | 54.18 -20% | 51.8 -15% | 48 -7% | 58 -29% |
* ... smaller is better
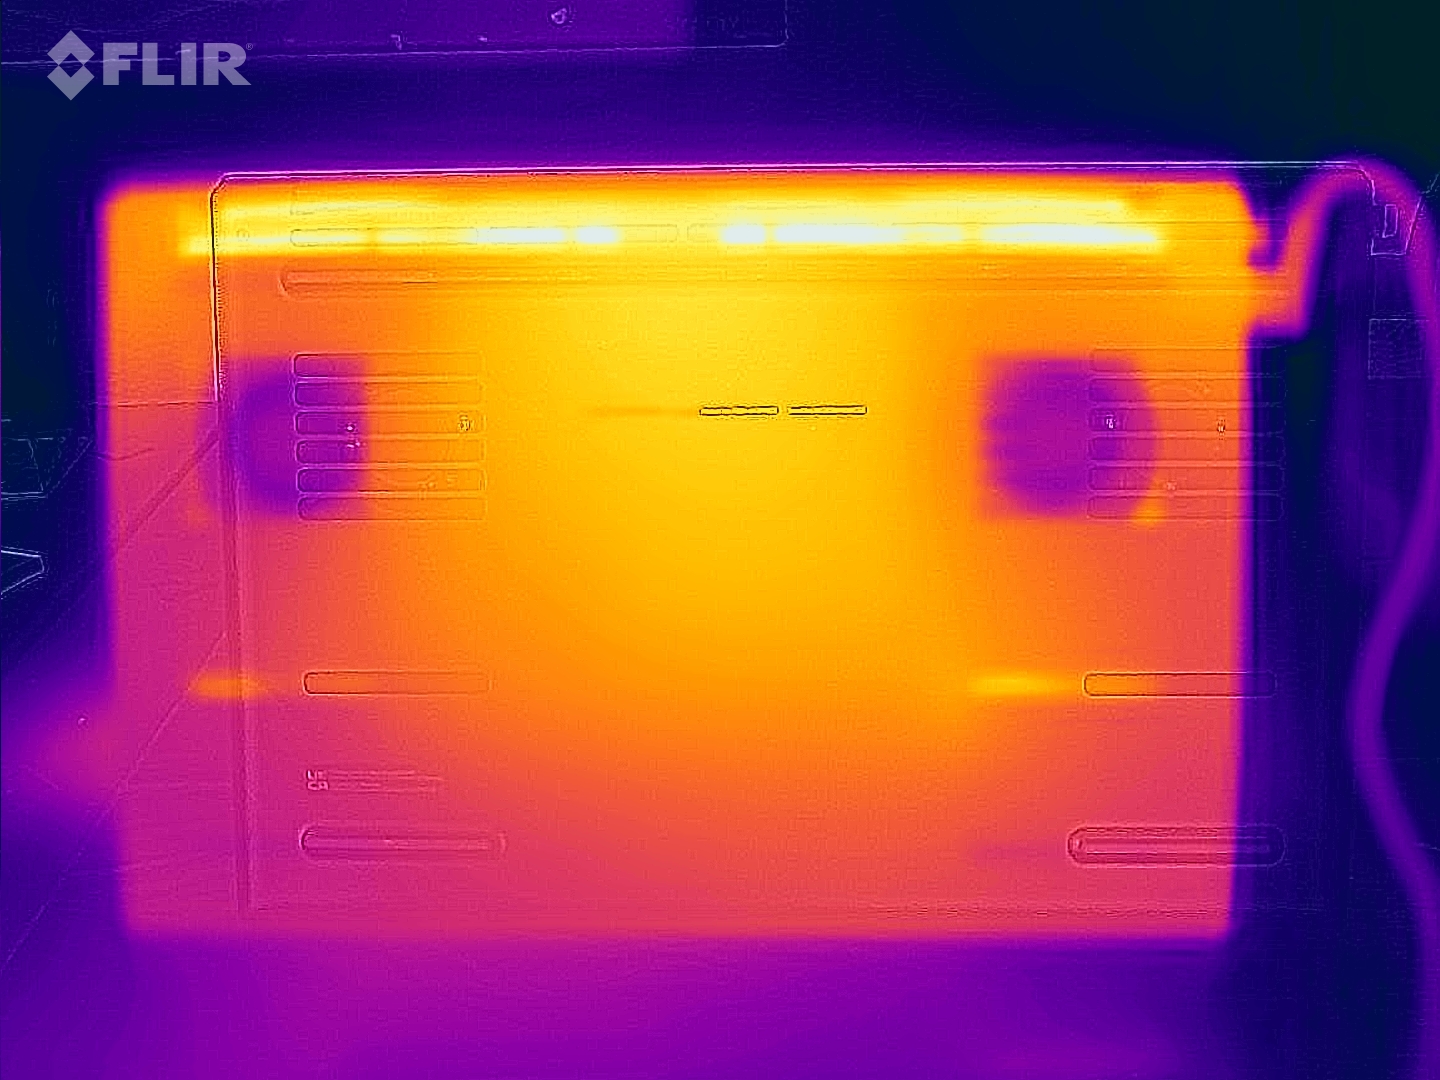
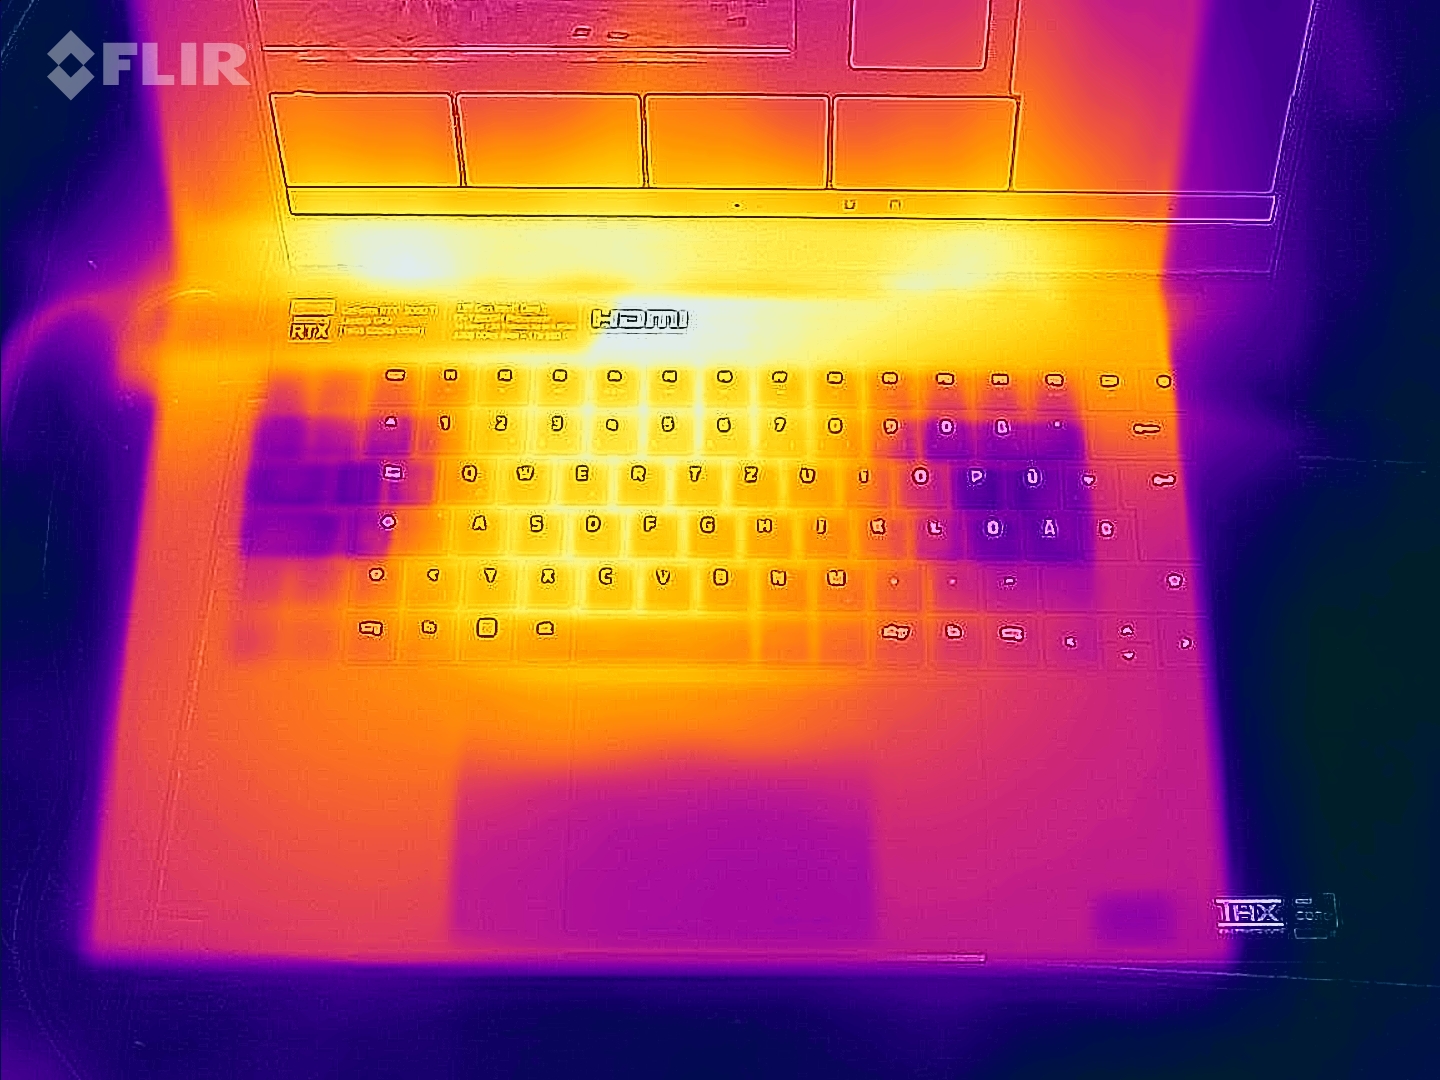
温度
由于金属结构和强大的组件,机箱在适度负载下会变得相对较热。例如,在播放《Witcher 3》时,笔记本电脑也会通过控制面强烈发热。
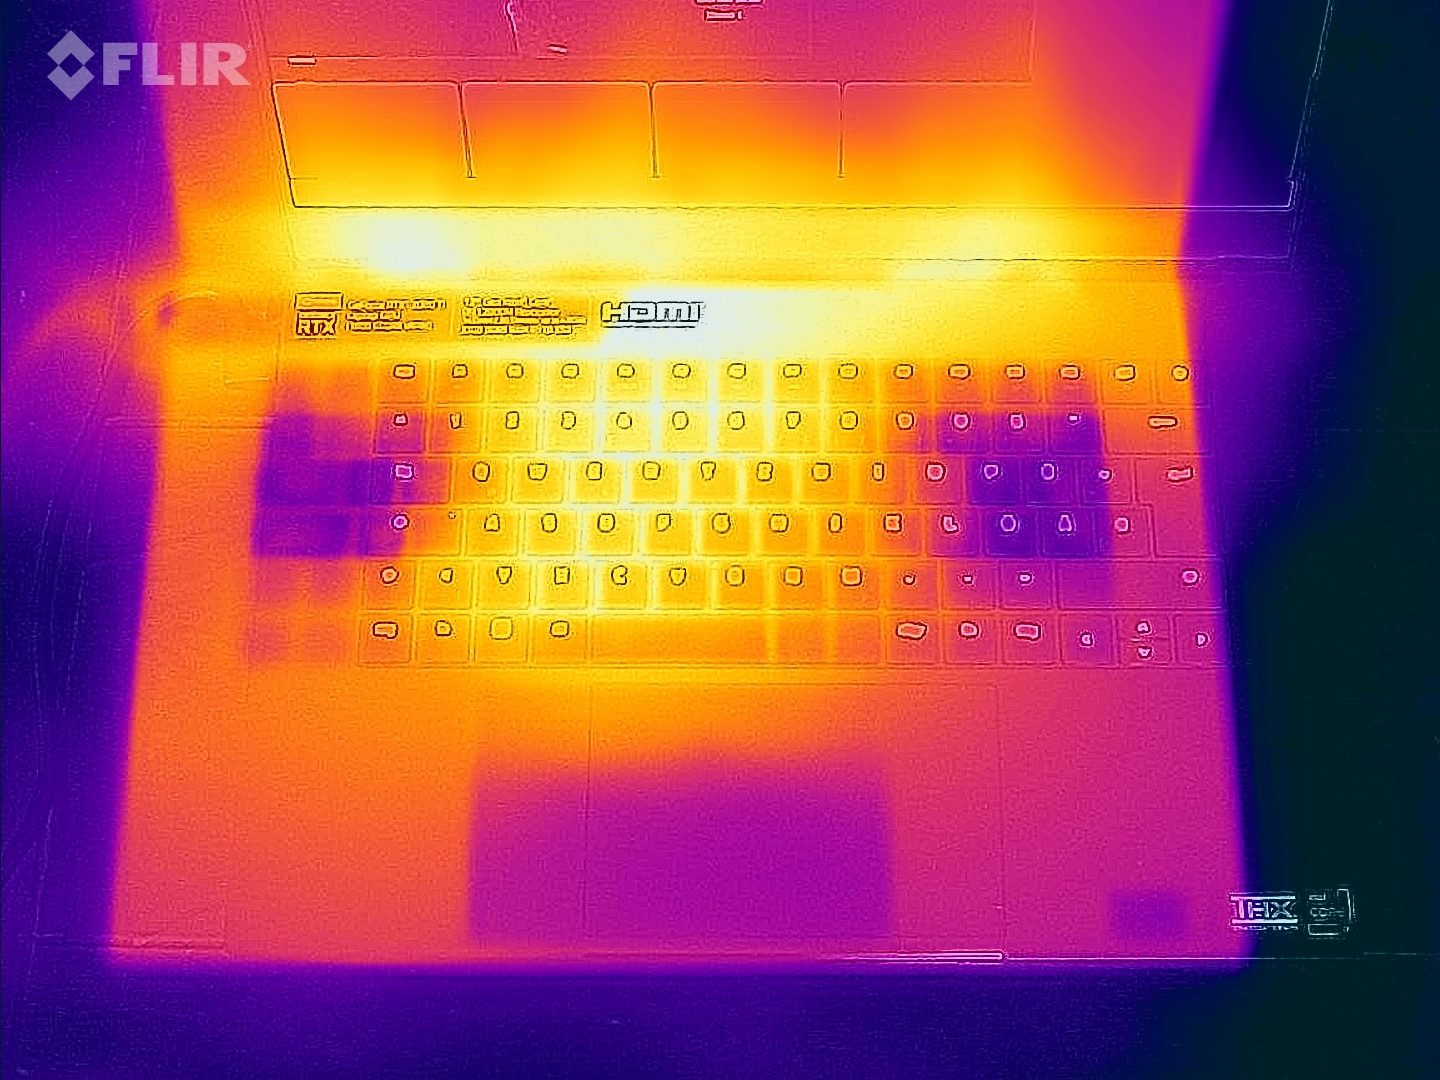
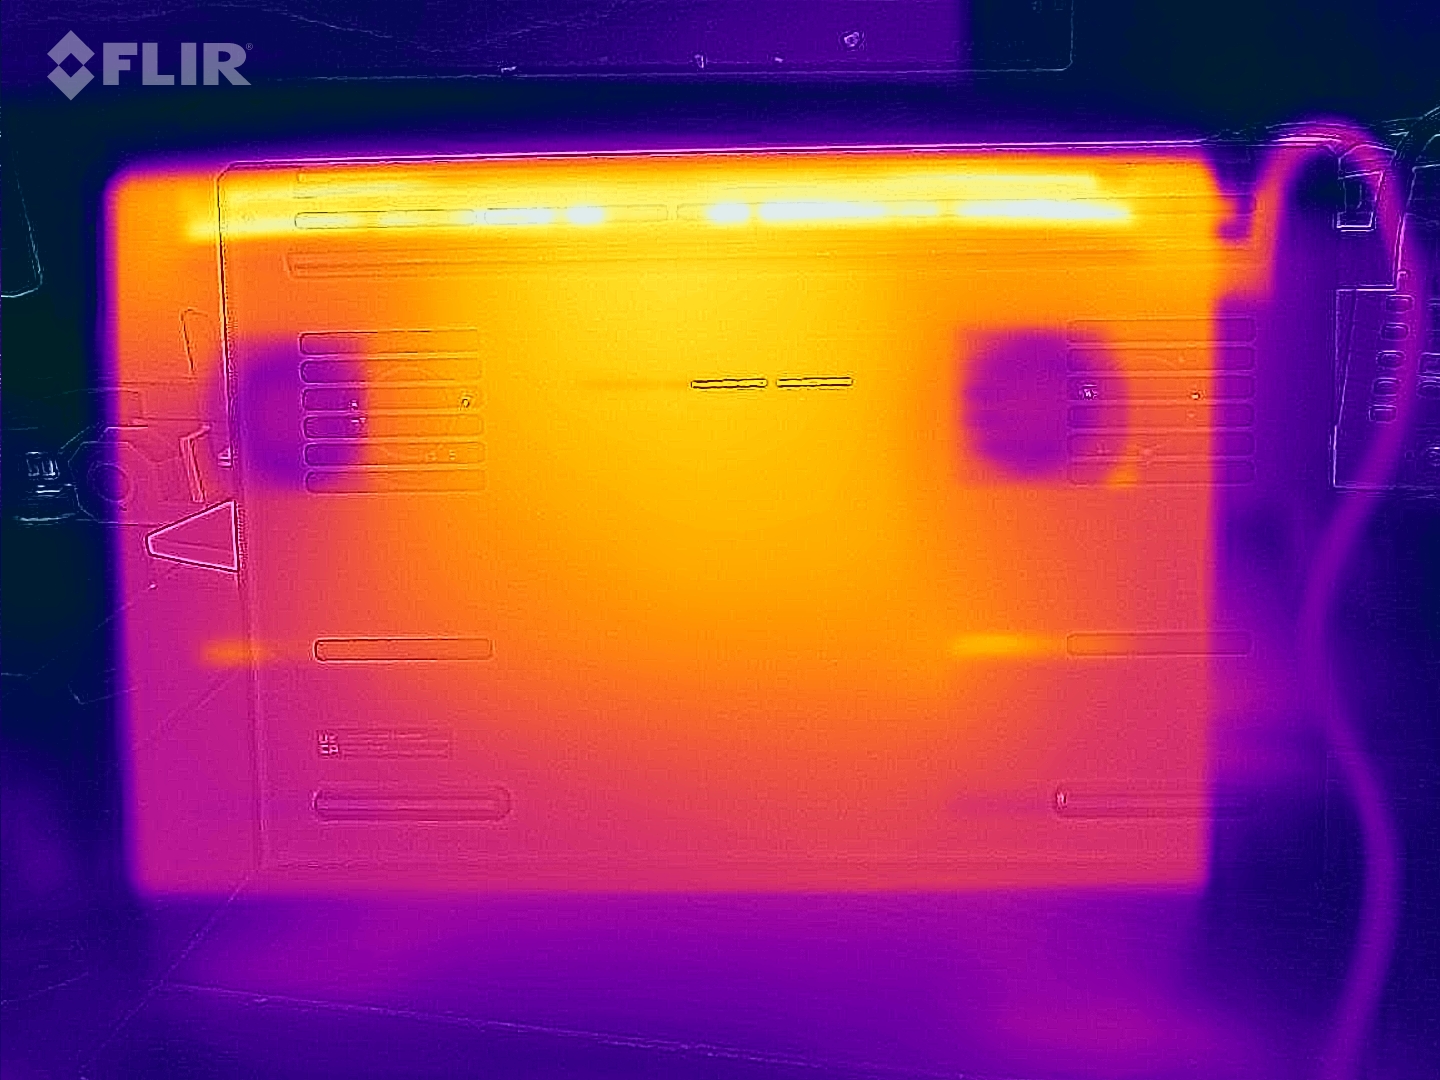
(-) The maximum temperature on the upper side is 53 °C / 127 F, compared to the average of 40.4 °C / 105 F, ranging from 21.2 to 68.8 °C for the class Gaming.
(-) The bottom heats up to a maximum of 53 °C / 127 F, compared to the average of 43.2 °C / 110 F
(±) In idle usage, the average temperature for the upper side is 33.2 °C / 92 F, compared to the device average of 33.9 °C / 93 F.
(-) Playing The Witcher 3, the average temperature for the upper side is 45.2 °C / 113 F, compared to the device average of 33.9 °C / 93 F.
(-) The palmrests and touchpad can get very hot to the touch with a maximum of 43 °C / 109.4 F.
(-) The average temperature of the palmrest area of similar devices was 28.8 °C / 83.8 F (-14.2 °C / -25.6 F).
| Razer Blade 15 Advanced Model Early 2022 Intel Core i7-12800H, NVIDIA GeForce RTX 3080 Ti Laptop GPU | Razer Blade 15 2022 Intel Core i7-12800H, NVIDIA GeForce RTX 3080 Ti Laptop GPU | Schenker XMG Neo 15 E22 (Early 2022, RTX 3080 Ti) Intel Core i7-12700H, NVIDIA GeForce RTX 3080 Ti Laptop GPU | Asus ROG Strix Scar 15 G533QS AMD Ryzen 9 5900HX, NVIDIA GeForce RTX 3080 Laptop GPU | MSI Stealth GS66 12UGS Intel Core i7-12700H, NVIDIA GeForce RTX 3070 Ti Laptop GPU | MSI Vector GP66 12UGS Intel Core i9-12900H, NVIDIA GeForce RTX 3070 Ti Laptop GPU | |
|---|---|---|---|---|---|---|
| Heat | 3% | -3% | 8% | 11% | 12% | |
| Maximum Upper Side * (°C) | 53 | 50 6% | 52 2% | 43.4 18% | 54 -2% | 40.2 24% |
| Maximum Bottom * (°C) | 53 | 47 11% | 68 -28% | 48.2 9% | 59 -11% | 43.8 17% |
| Idle Upper Side * (°C) | 36 | 37.4 -4% | 32 11% | 35.2 2% | 26 28% | 34.8 3% |
| Idle Bottom * (°C) | 38 | 38.4 -1% | 36 5% | 37 3% | 27 29% | 37 3% |
* ... smaller is better
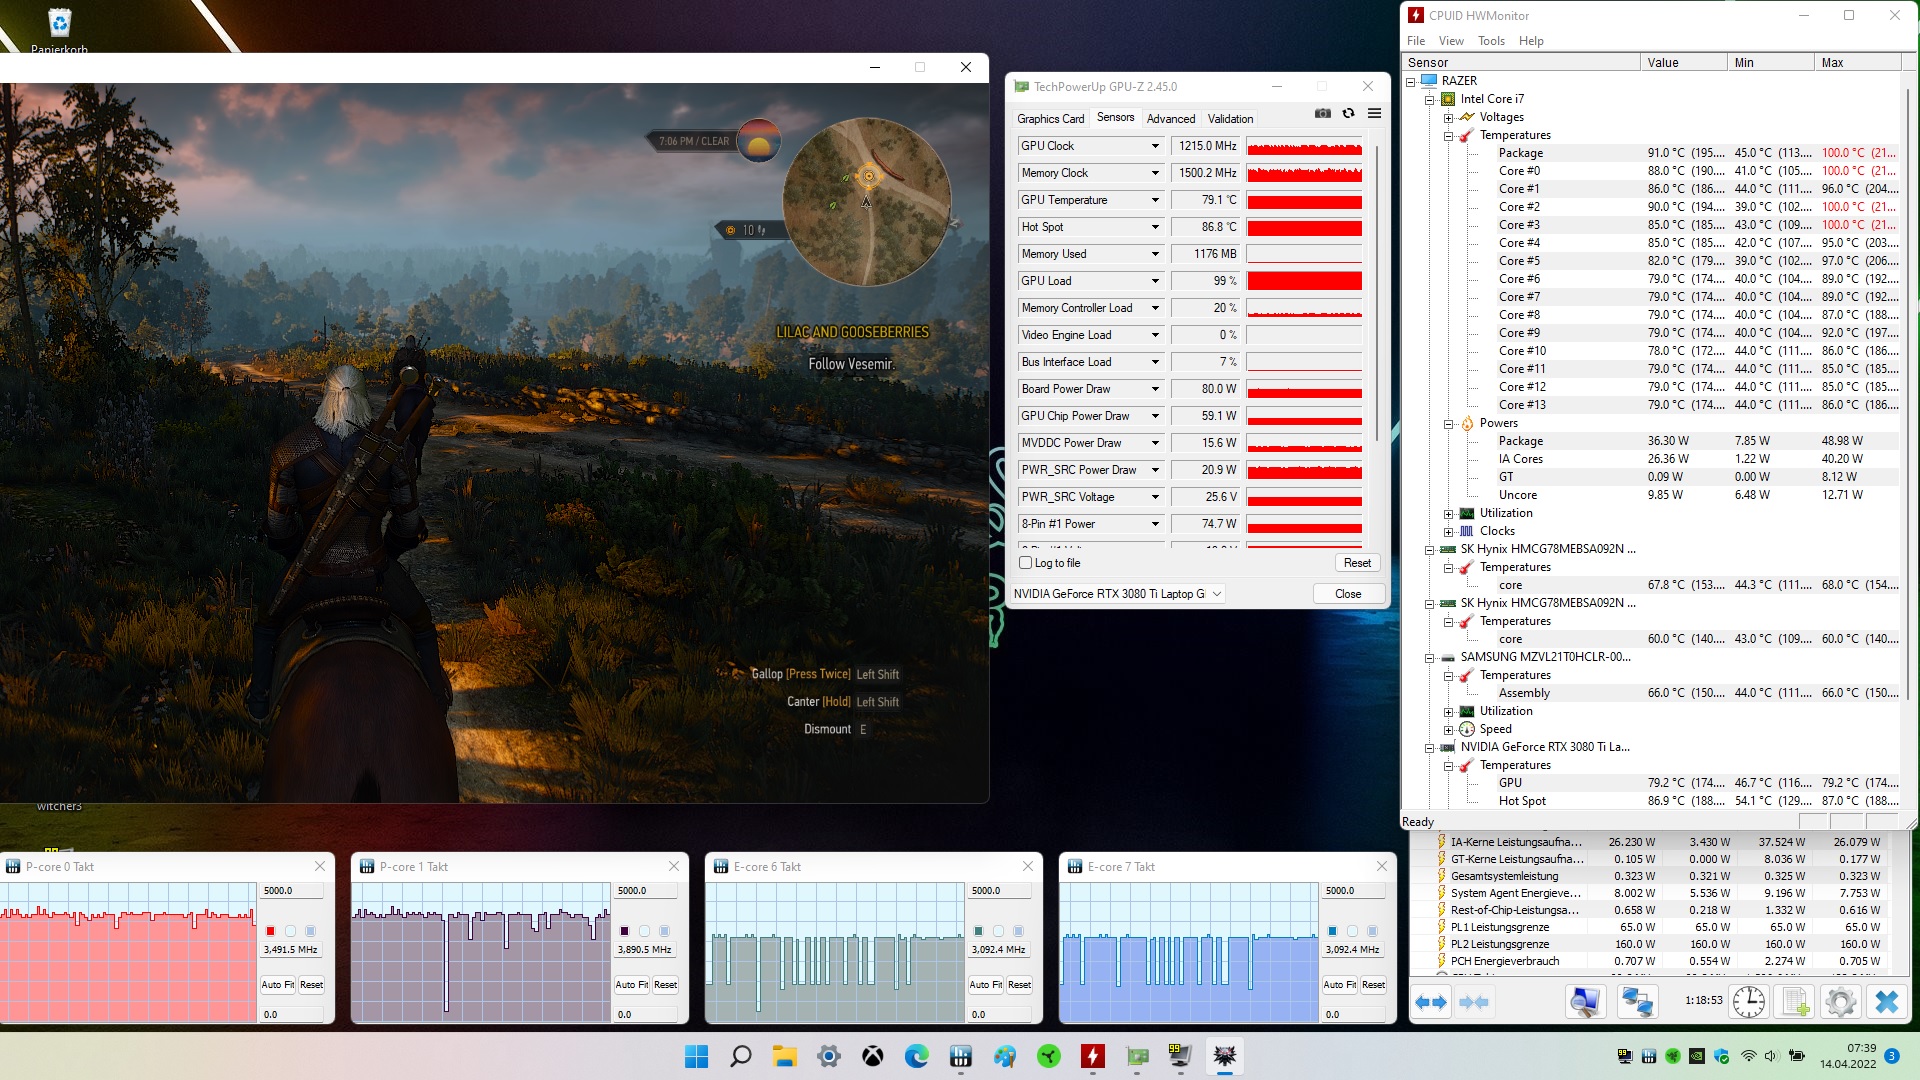
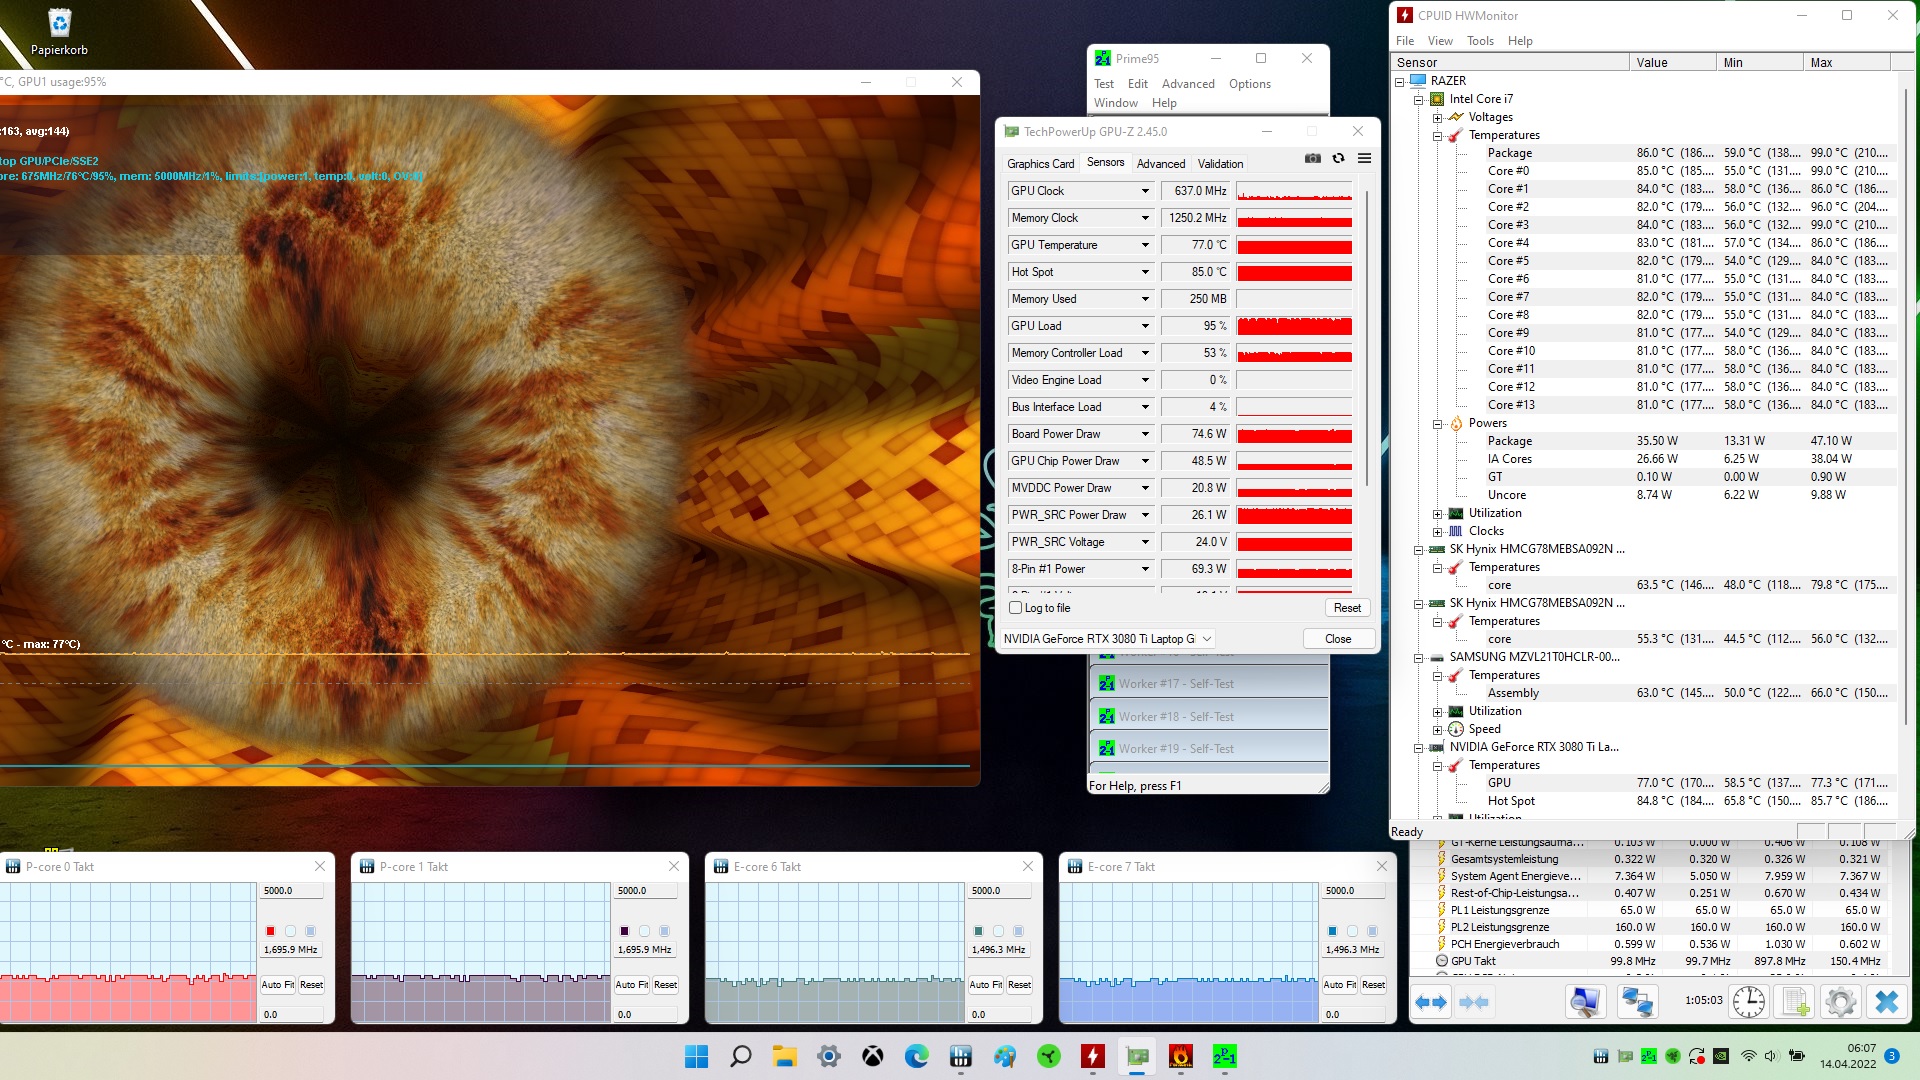
压力测试
在我们的压力测试中,我们同时用Prime95和FurMark加载系统。测试开始时,CPU的P核和E核的时钟速度分别为2和1.9GHz,并分别稳定在1.7和1.5GHz,在较长的时间内稳定在85℃左右。GPU以大约1100MHz的速度开始,最终在640MHz和77℃的核心温度下趋于平稳。
发言人
扬声器的调音不均匀。粉红噪声图显示MacBook Pro 16的频率下降明显更平坦,它是这个学科中最好的笔记本电脑之一。外部音频设备可以通过蓝牙、USB或3.5毫米端口连接。
Razer Blade 15 Advanced Model Early 2022 audio analysis
(+) | speakers can play relatively loud (92 dB)
Bass 100 - 315 Hz
(-) | nearly no bass - on average 21.8% lower than median
(±) | linearity of bass is average (9.2% delta to prev. frequency)
Mids 400 - 2000 Hz
(+) | balanced mids - only 4.1% away from median
(+) | mids are linear (3.4% delta to prev. frequency)
Highs 2 - 16 kHz
(+) | balanced highs - only 3.3% away from median
(+) | highs are linear (6.8% delta to prev. frequency)
Overall 100 - 16.000 Hz
(±) | linearity of overall sound is average (15% difference to median)
Compared to same class
» 32% of all tested devices in this class were better, 6% similar, 62% worse
» The best had a delta of 6%, average was 18%, worst was 132%
Compared to all devices tested
» 20% of all tested devices were better, 4% similar, 75% worse
» The best had a delta of 4%, average was 24%, worst was 134%
Apple MacBook Pro 16 2021 M1 Pro audio analysis
(+) | speakers can play relatively loud (84.7 dB)
Bass 100 - 315 Hz
(+) | good bass - only 3.8% away from median
(+) | bass is linear (5.2% delta to prev. frequency)
Mids 400 - 2000 Hz
(+) | balanced mids - only 1.3% away from median
(+) | mids are linear (2.1% delta to prev. frequency)
Highs 2 - 16 kHz
(+) | balanced highs - only 1.9% away from median
(+) | highs are linear (2.7% delta to prev. frequency)
Overall 100 - 16.000 Hz
(+) | overall sound is linear (4.6% difference to median)
Compared to same class
» 0% of all tested devices in this class were better, 0% similar, 100% worse
» The best had a delta of 5%, average was 17%, worst was 45%
Compared to all devices tested
» 0% of all tested devices were better, 0% similar, 100% worse
» The best had a delta of 4%, average was 24%, worst was 134%
能源管理 - 没有运行时间记录
消耗功率
平均19W的空闲消耗值明显低于之前评测的 Razer Blade 15 (36.4 W).这可能是由于更经济的性能配置和更低的显示分辨率。在The Witcher 3中,总体消耗量降低了约13%。
在同时执行Prime95和FurMark的过程中,230W电源的最大消耗量为179W,230W电源的尺寸足够大。
| Off / Standby | |
| Idle | |
| Load |
|
Key:
min: | |
| Razer Blade 15 Advanced Model Early 2022 i7-12800H, GeForce RTX 3080 Ti Laptop GPU | Razer Blade 15 2022 i7-12800H, GeForce RTX 3080 Ti Laptop GPU | Schenker XMG Neo 15 E22 (Early 2022, RTX 3080 Ti) i7-12700H, GeForce RTX 3080 Ti Laptop GPU | Asus ROG Strix Scar 15 G533QS R9 5900HX, GeForce RTX 3080 Laptop GPU | MSI Stealth GS66 12UGS i7-12700H, GeForce RTX 3070 Ti Laptop GPU | MSI Vector GP66 12UGS i9-12900H, GeForce RTX 3070 Ti Laptop GPU | Average of class Gaming | |
|---|---|---|---|---|---|---|---|
| Power Consumption | -48% | -14% | -2% | 5% | -34% | -4% | |
| Idle Minimum * (Watt) | 17 | 33.2 -95% | 14 18% | 11.2 34% | 11 35% | 17.5 -3% | 13.2 ? 22% |
| Idle Average * (Watt) | 19 | 36.4 -92% | 18 5% | 16.4 14% | 16 16% | 20.1 -6% | 18.9 ? 1% |
| Idle Maximum * (Watt) | 25 | 37.6 -50% | 19 24% | 29.4 -18% | 23 8% | 47.3 -89% | 24.5 ? 2% |
| Load Average * (Watt) | 108 | 116.7 -8% | 115 -6% | 106.2 2% | 110 -2% | 107.3 1% | 108.8 ? -1% |
| Witcher 3 ultra * (Watt) | 150 | 172 -15% | 228 -52% | 189 -26% | 151 -1% | 225 -50% | |
| Load Maximum * (Watt) | 179 | 228.6 -28% | 307 -72% | 213.6 -19% | 230 -28% | 277.7 -55% | 254 ? -42% |
* ... smaller is better
Power Consumption Witcher 3 / Stress test
{
电池寿命
在我们的实际WLAN测试中,Blade 15实现了4:53小时的运行时间,几乎没有任何竞争对手可以跟上7:20小时的速度。 华硕ROG Strix Scar 15,而 微星Vector GP66 尽管电池容量较小(65Wh对80Wh),但也能提供更长的运行时间。
| Razer Blade 15 Advanced Model Early 2022 i7-12800H, GeForce RTX 3080 Ti Laptop GPU, 80 Wh | Razer Blade 15 2022 i7-12800H, GeForce RTX 3080 Ti Laptop GPU, 80 Wh | Schenker XMG Neo 15 E22 (Early 2022, RTX 3080 Ti) i7-12700H, GeForce RTX 3080 Ti Laptop GPU, 93 Wh | Asus ROG Strix Scar 15 G533QS R9 5900HX, GeForce RTX 3080 Laptop GPU, 90 Wh | MSI Stealth GS66 12UGS i7-12700H, GeForce RTX 3070 Ti Laptop GPU, 99.9 Wh | MSI Vector GP66 12UGS i9-12900H, GeForce RTX 3070 Ti Laptop GPU, 65 Wh | Average of class Gaming | |
|---|---|---|---|---|---|---|---|
| Battery runtime | 0% | 48% | 19% | -5% | -12% | 16% | |
| Reader / Idle (h) | 8.1 | 11.1 37% | 7.8 -4% | 7.9 -2% | 8.71 ? 8% | ||
| H.264 (h) | 5.9 | 6.9 17% | 8.28 ? 40% | ||||
| WiFi v1.3 (h) | 4.9 | 4.9 0% | 6.7 37% | 7.3 49% | 5.4 10% | 5.7 16% | 6.96 ? 42% |
| Load (h) | 2 | 3.8 90% | 1.4 -30% | 1.6 -20% | 1 -50% | 1.47 ? -26% |
Pros
Cons
判决书
刀片15是一款非常紧凑且制作精良的笔记本电脑。连接性与英特尔和Nvidia的新芯片一样现代,并通过快速的SD读卡器得到了很好的完善。显示屏提供了令人难以置信的平滑视觉表现和体面的最大亮度,但与QHD型号不同的是,高级优化功能有所欠缺,色彩空间覆盖率可以更好一点。然而,考虑到目标群体,后者是可以接受的。
在 "平衡 "模式下的基准测试给出了一个有趣的画面。在实践中,性能往往是绰绰有余的,噪音水平也明显降低。然而,机箱的表面仍然发热非常强烈。
如果你正在寻找一个时尚、紧凑的游戏笔记本电脑,并有一个特别快的显示屏,那就不要再找了。然而,对温度敏感的用户应该在这里保持警惕。
另一个批评点是扬声器。许多便宜的笔记本电脑提供更好的声音。
华硕的ROG Strix Scar 15是Razer Blade 15的一个不太紧凑、基于AMD的替代品,电池运行时间更长。对于经常外出并需要大量性能的用户来说,Razer Blade 15可能仍然是正确的选择。
价格和可用性
我们配置的Razer Blade 15目前在B&H Photo Video有售。售价为3,699.99美元,或通过Razer官方网站以同样的价格出售。
Razer Blade 15 Advanced Model Early 2022
- 05/04/2022 v7 (old)
Marius Schell
Price comparison

