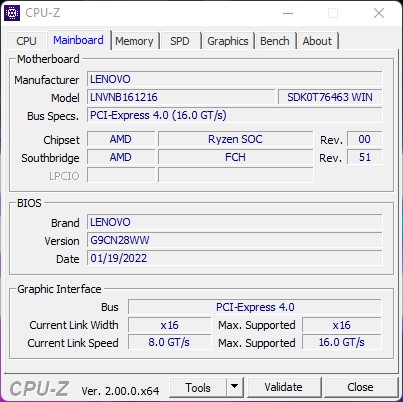
联想Legion 5 15评论。AMD的新Radeon RX 6600M与Ryzen 5 5600H相遇

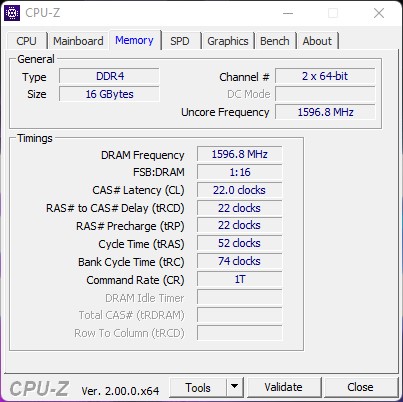
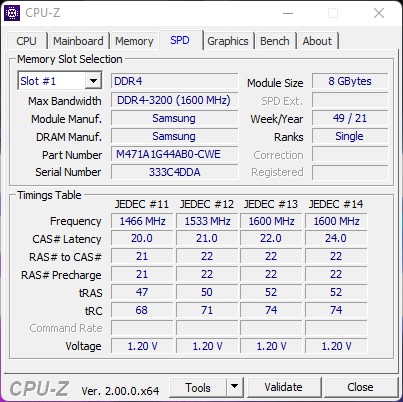
联想的Legion 系列在游戏笔记本领域是一个家喻户晓的名字。联想建立这个品牌已经有好几年了,并在此基础上继续发展。目前的联想Legion 5 15ACH6A也是这种情况,它配备了基于目前Zen3架构的AMD Ryzen 5600H。GPU是AMD Radeon RX 6600M,这是一款中端市场的新移动显卡,提供8GB的VRAM,这对于这个价格范围是合适的。其余硬件包括16GB内存和512GB固态硬盘,以及一个165赫兹的显示屏,这加强了笔记本电脑的预期目的。
该机器目前的售价略低于1,000欧元,对于所提供的产品来说,这是一个极具竞争力的价格。性能是否符合预期,将在本评论的后面揭晓。
类似装备的设备被用来进行比较。这些设备的清单可以在下面的表格中找到。
潜在的竞争对手比较
Rating | Date | Model | Weight | Height | Size | Resolution | Price |
|---|---|---|---|---|---|---|---|
| 82.6 % v7 (old) | 05 / 2022 | Lenovo Legion 5 15ACH6A-82NW0010GE R5 5600H, Radeon RX 6600M | 2.5 kg | 25.75 mm | 15.60" | 1920x1080 | |
| 80.7 % v7 (old) | 09 / 2021 | Gigabyte G5 KC i5-10500H, GeForce RTX 3060 Laptop GPU | 2.1 kg | 28 mm | 15.60" | 1920x1080 | |
| 85.9 % v7 (old) | 10 / 2021 | Asus TUF Gaming F15 FX506HM i7-11800H, GeForce RTX 3060 Laptop GPU | 2.3 kg | 24.9 mm | 15.60" | 1920x1080 | |
| 84.3 % v7 (old) | 10 / 2021 | HP Victus 16-e0179ng R7 5800H, GeForce RTX 3060 Laptop GPU | 2.5 kg | 23.5 mm | 16.10" | 1920x1080 | |
| 81.4 % v7 (old) | 12 / 2021 | Medion Erazer Deputy P25 R7 5800H, GeForce RTX 3060 Laptop GPU | 2.3 kg | 26 mm | 15.60" | 1920x1080 | |
| 82.7 % v7 (old) | 10 / 2021 | Dell G15 5515 R7 5800H, GeForce RTX 3050 Ti Laptop GPU | 2.4 kg | 24.9 mm | 15.60" | 1920x1080 |
案例
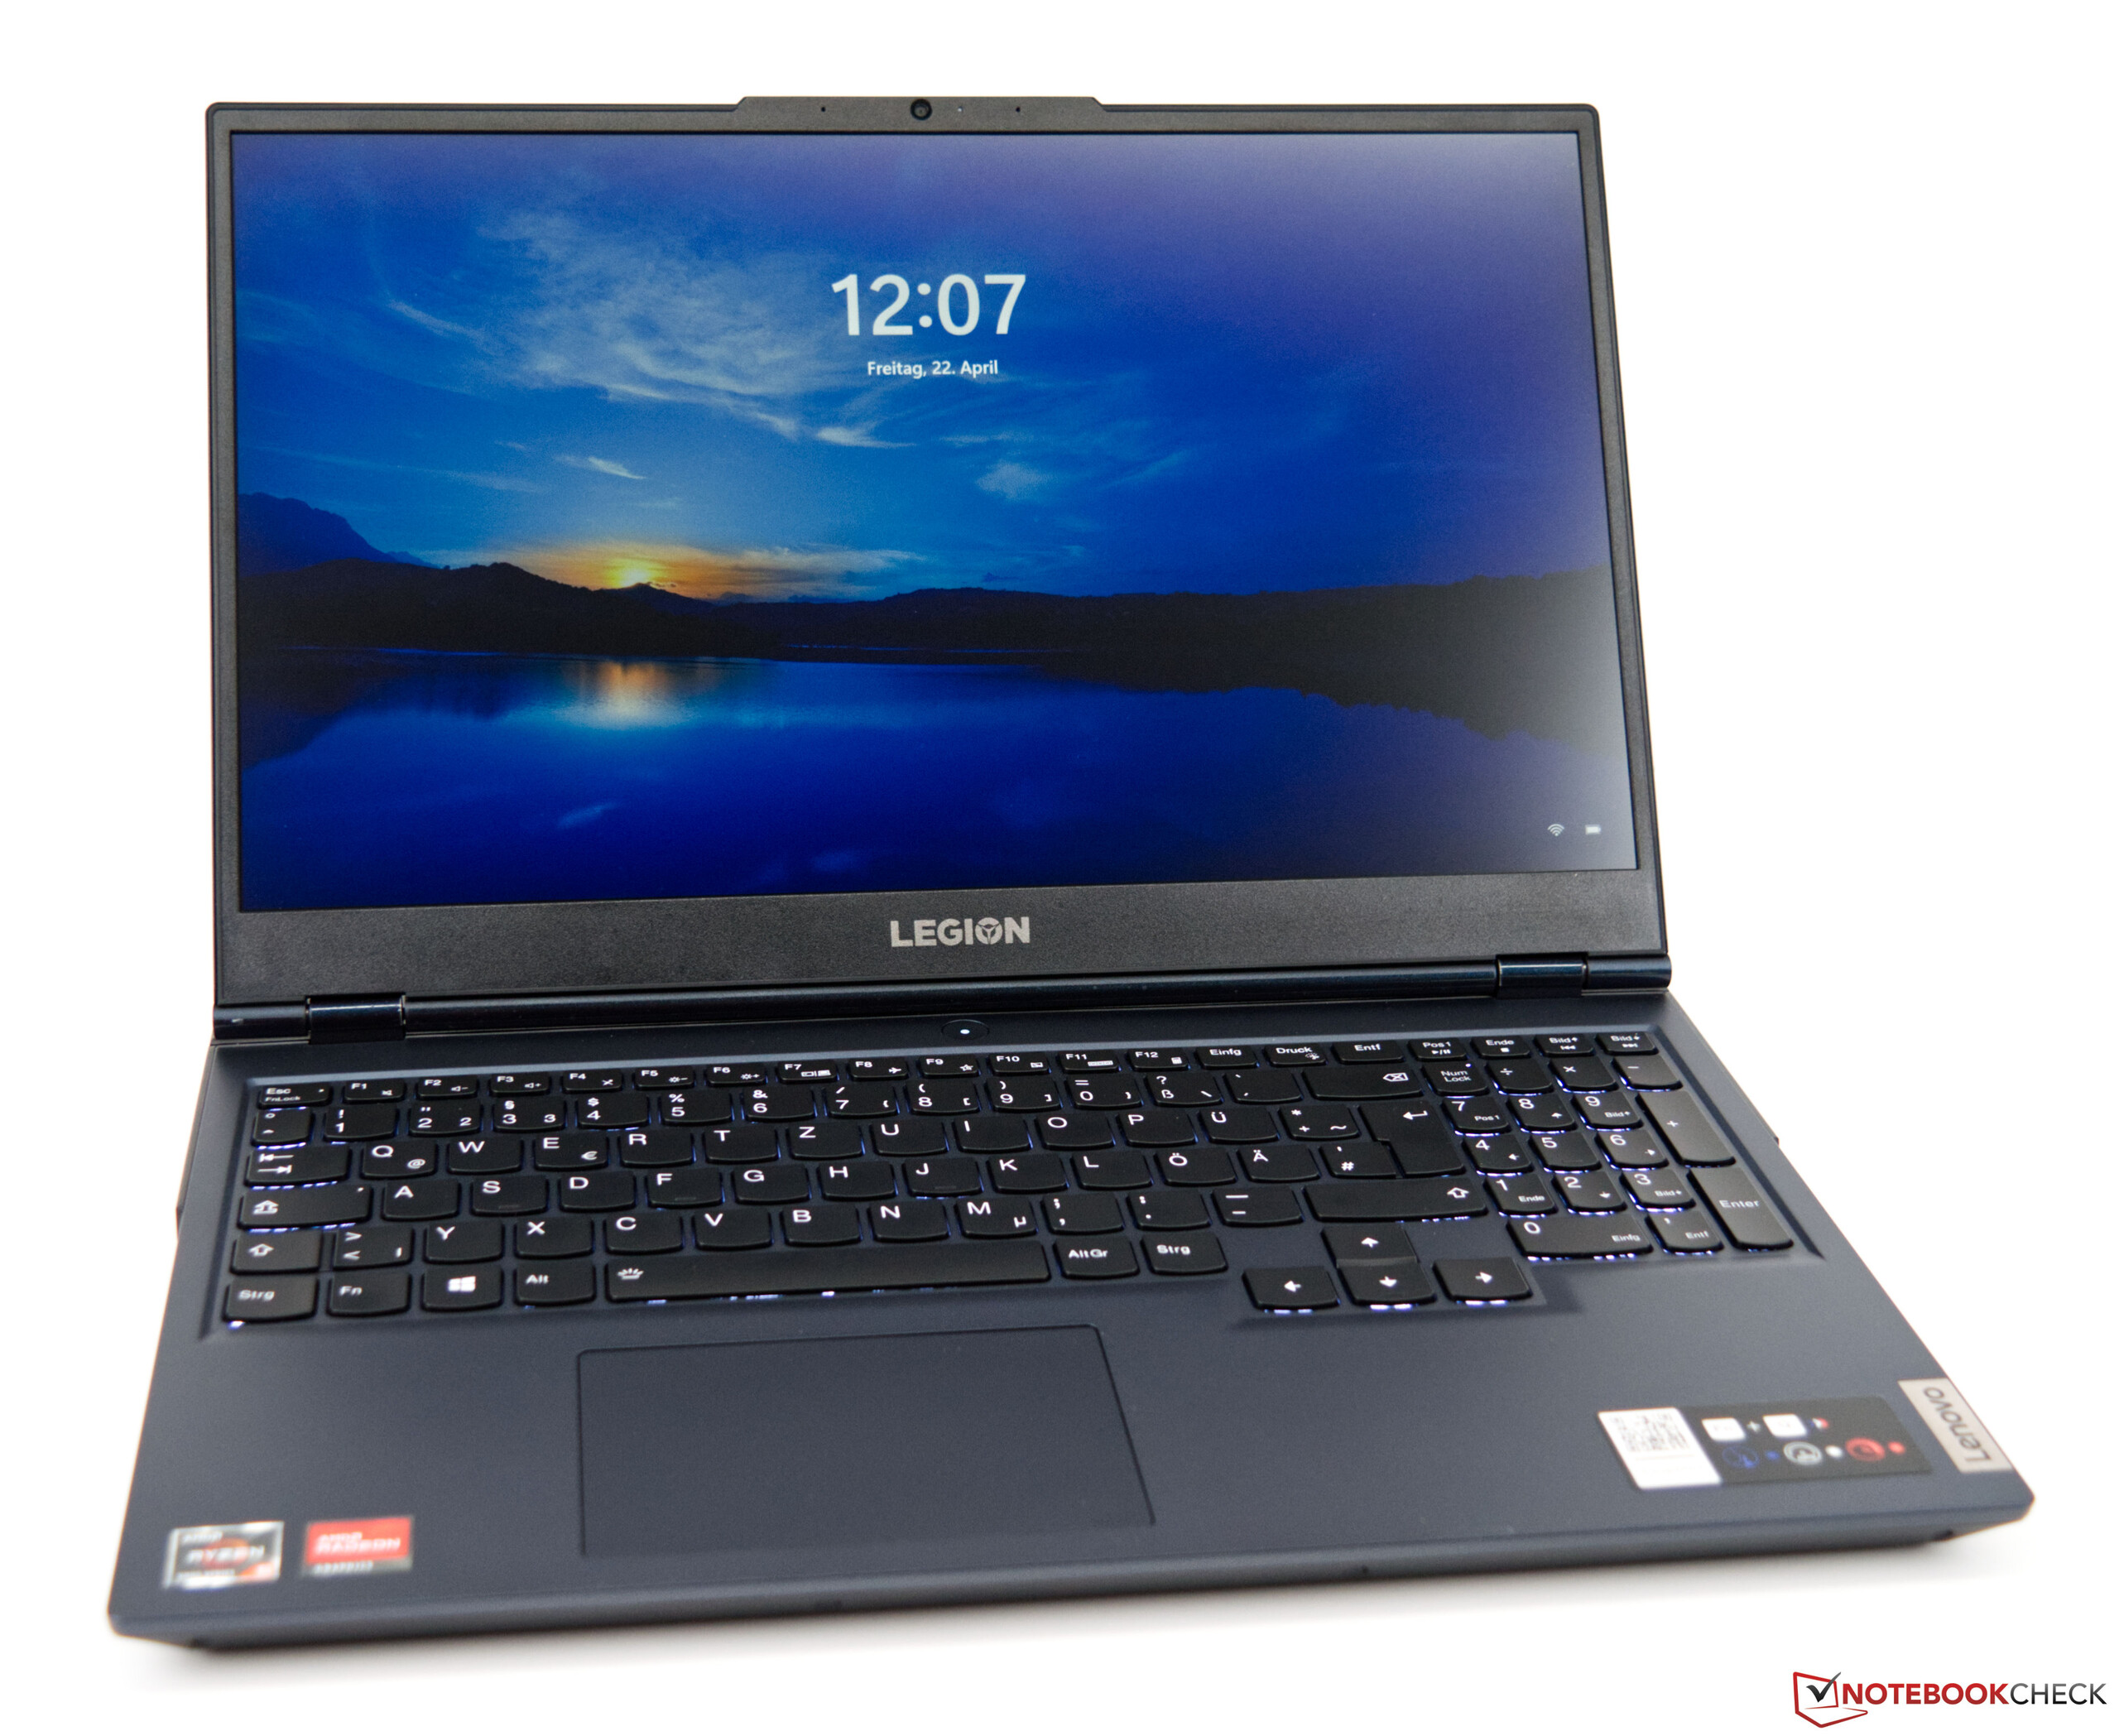
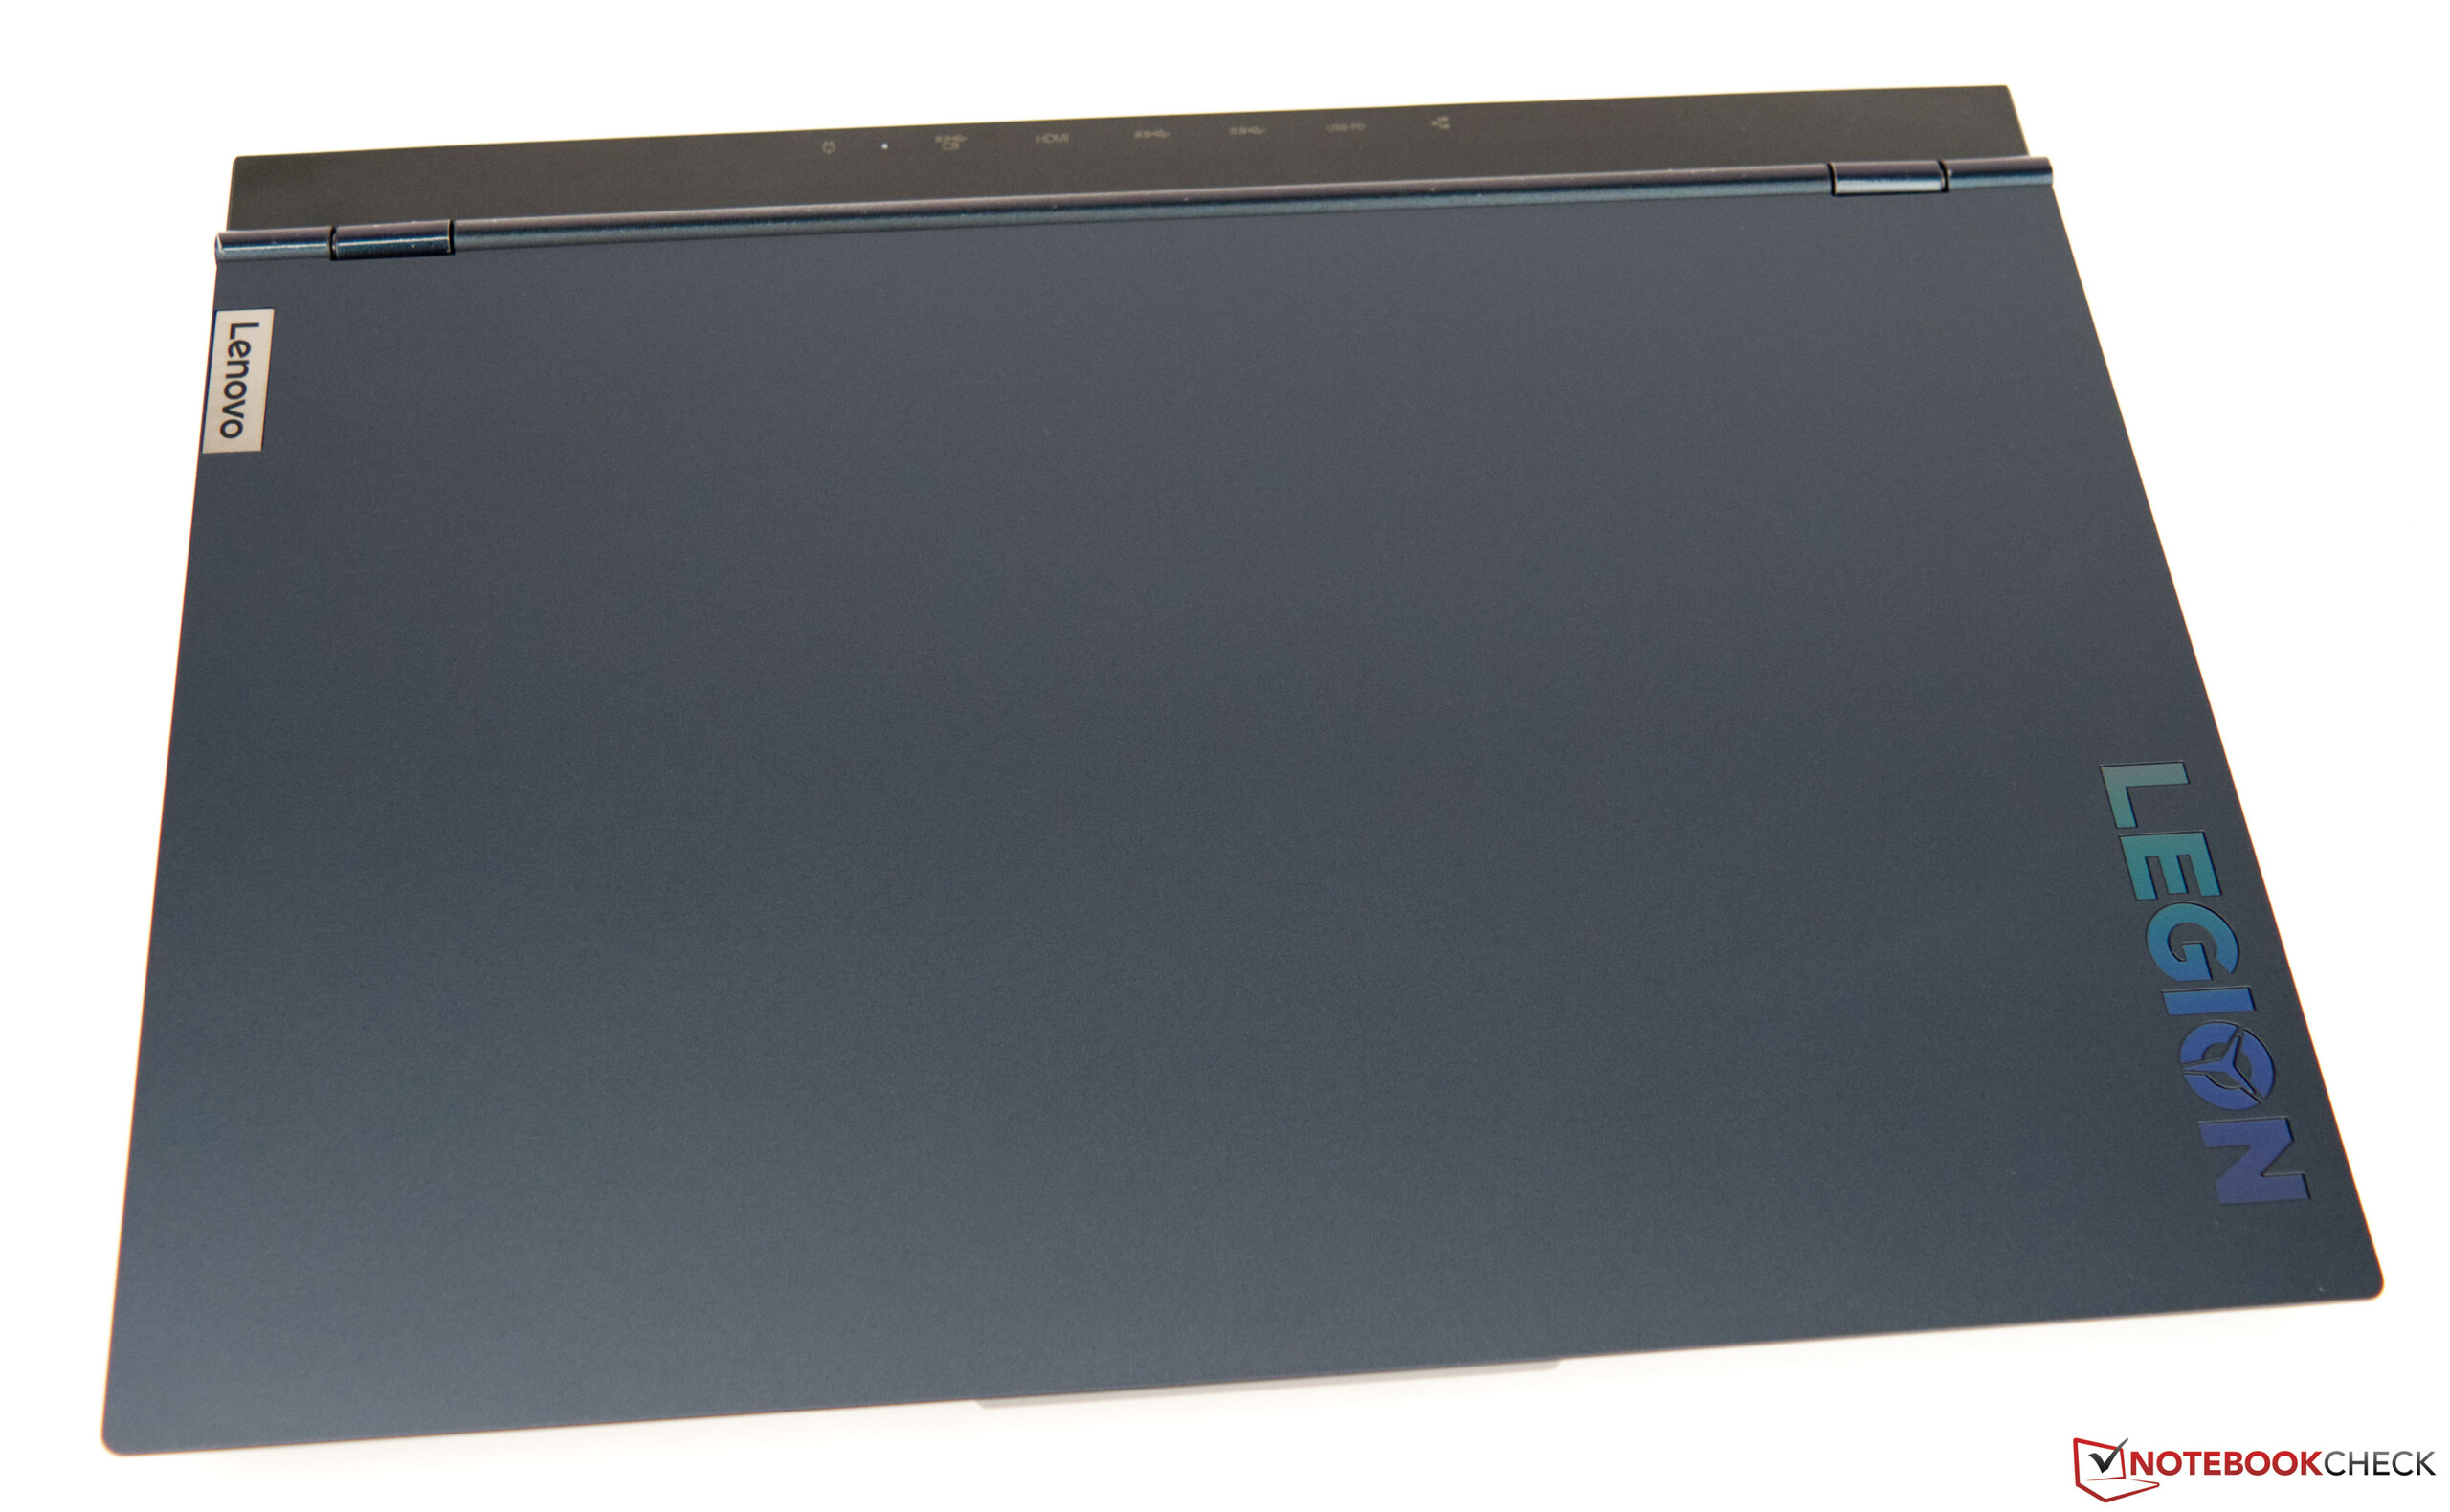
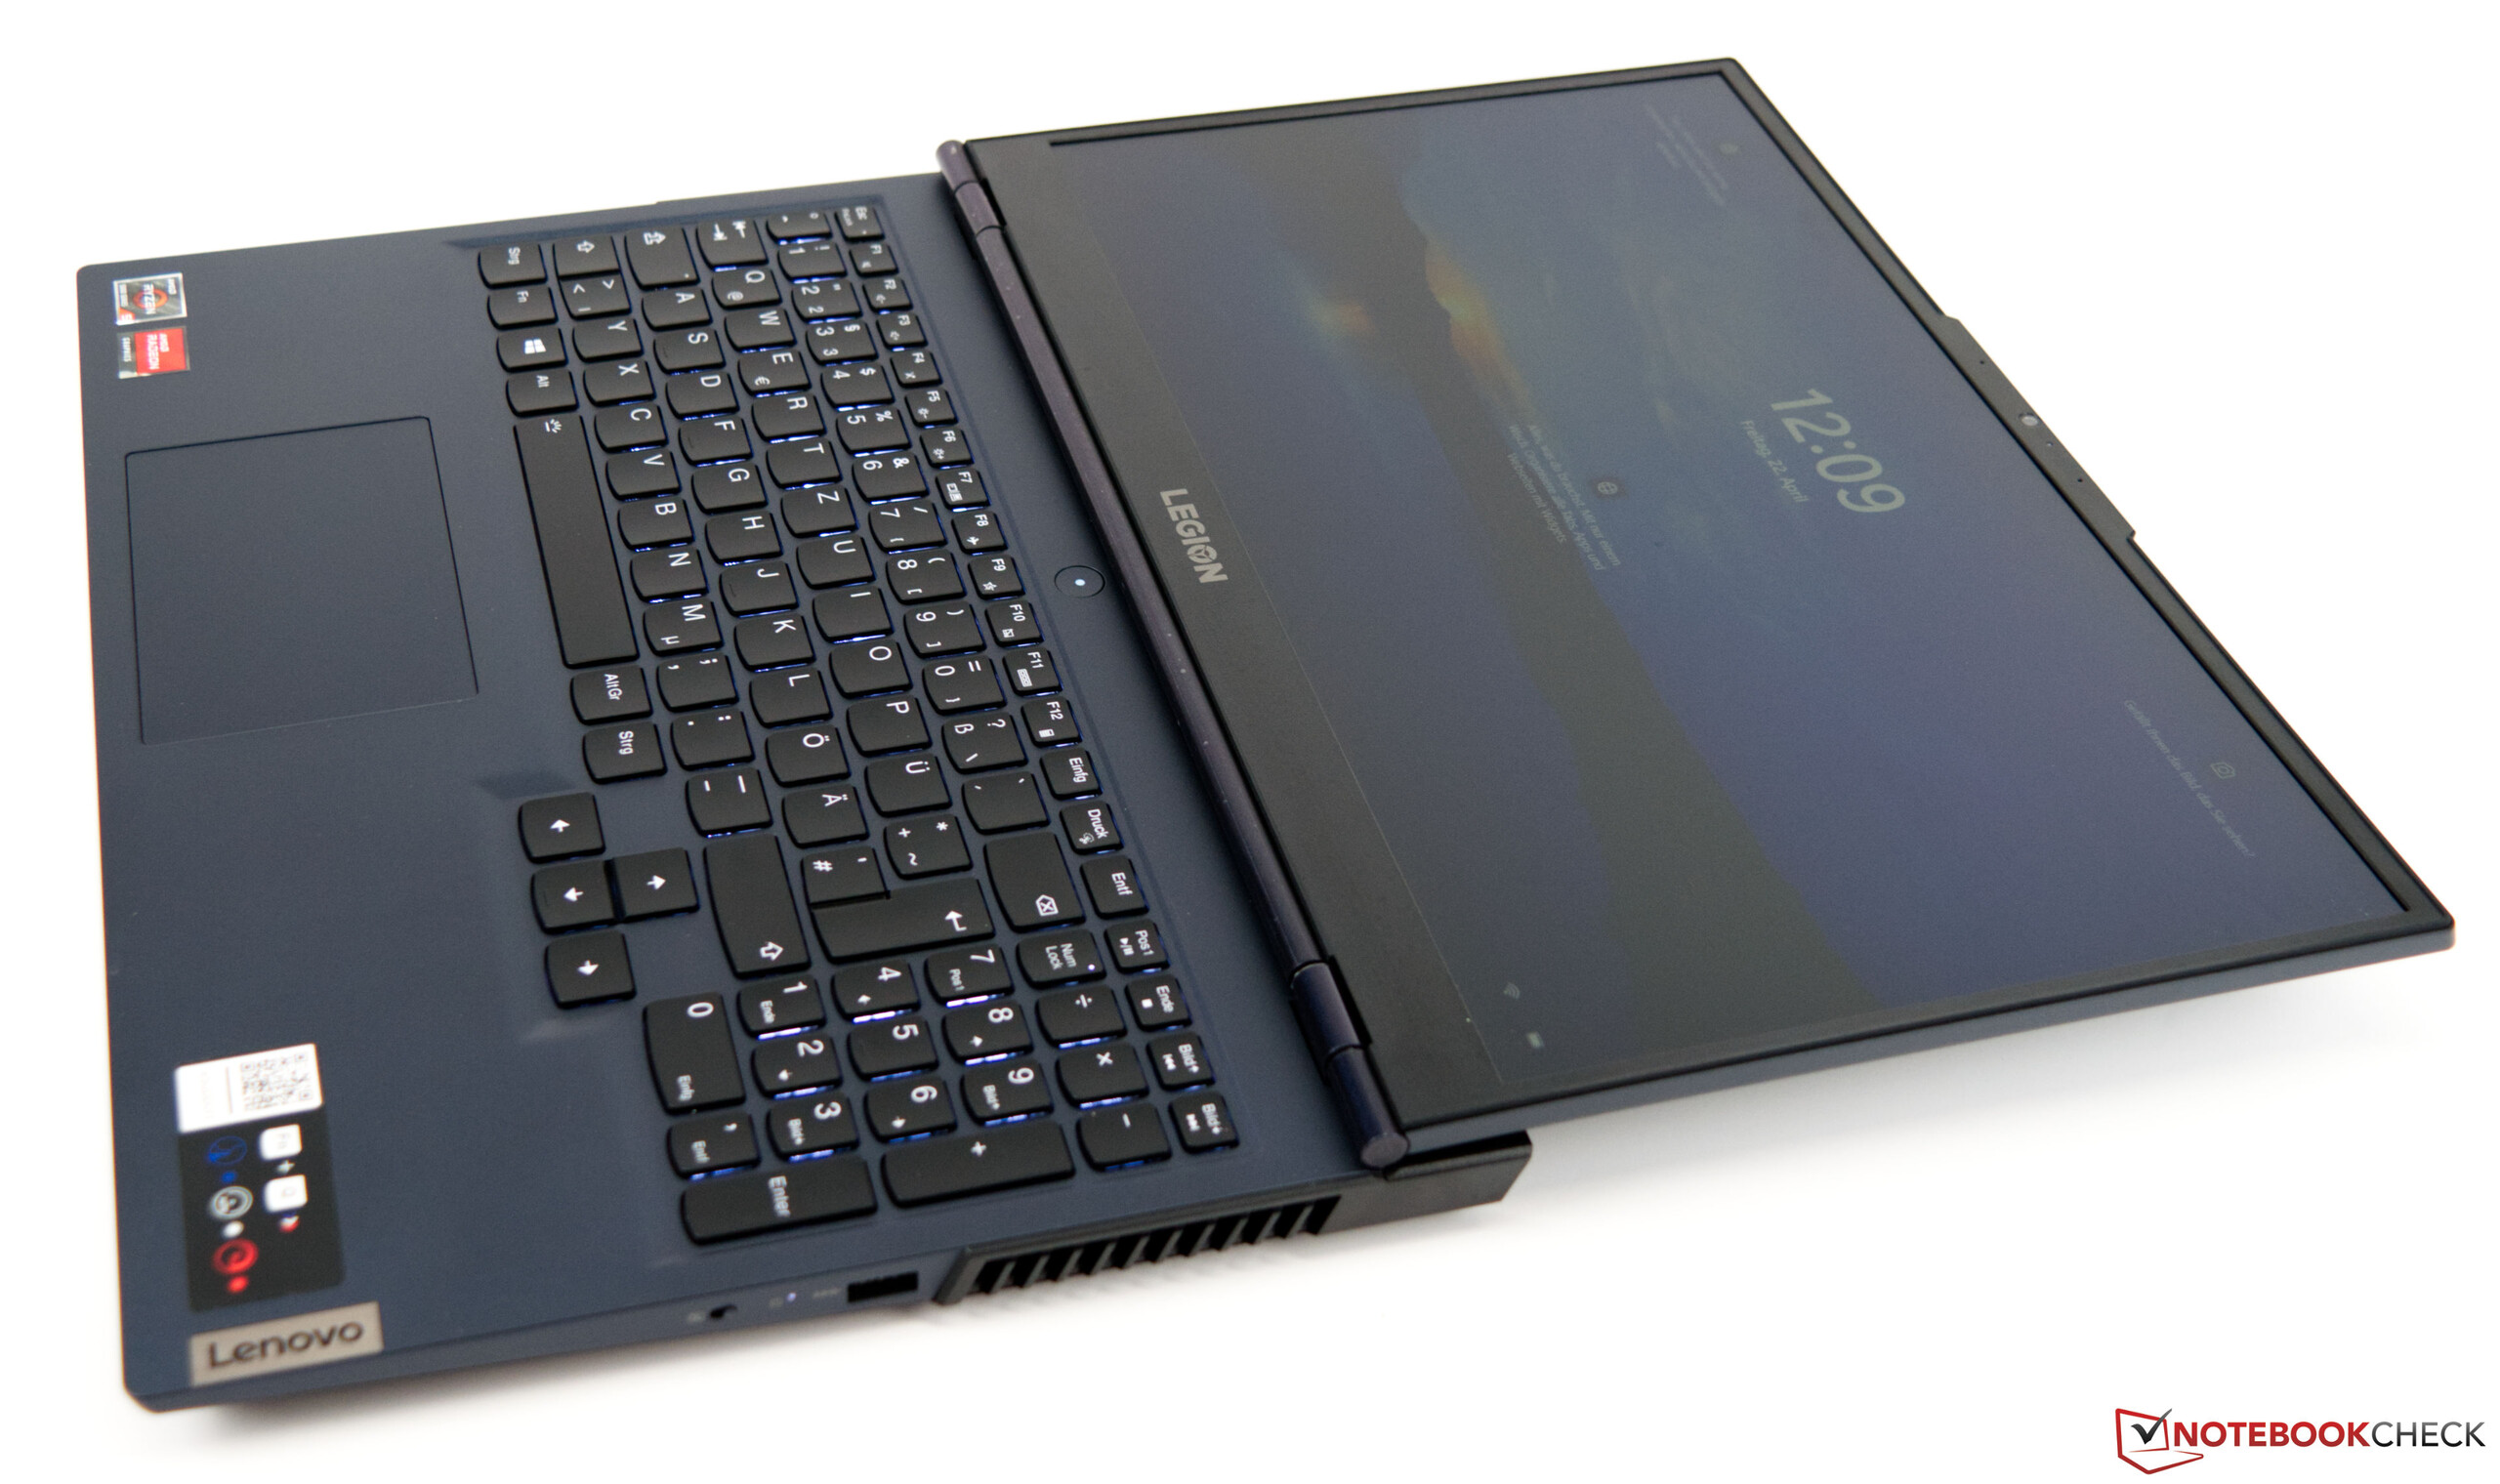
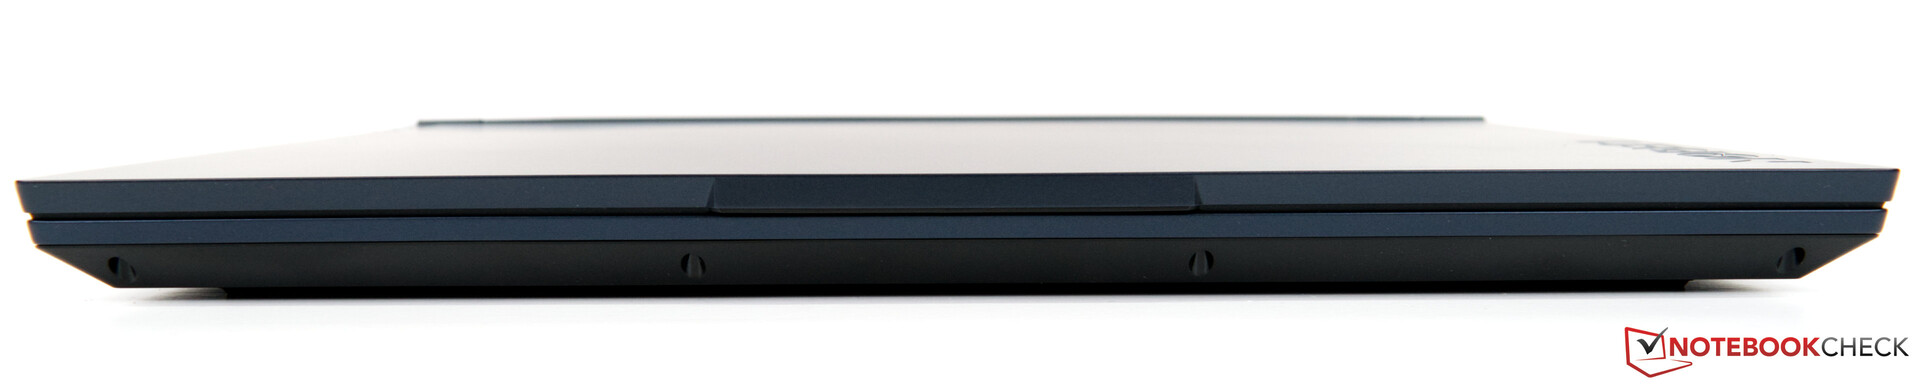
联想Legion 5 15ACH6A可以清楚地识别为一台游戏笔记本电脑。在光学方面,联想仍然忠实于其Legion 系列:这个相当不起眼的设备以字母的形式提供了微妙的亮点,表明了设备的等级。在颜色方面,幻影蓝很适合该设备,而且不显突兀。联想继续采用久经考验的材料,主要使用塑料作为外壳。尽管如此,Legion 5 15ACH6A看起来质量很高,底座提供了良好的刚性。不过,在压力测试中,键盘的中心部位略有屈服。尽管尺寸较小,但显示屏盖提供了与联想Legion 5 17相似的扭转刚度--它可以不费吹灰之力地扭转。选择性的力的冲击并不构成问题,而且可以很好地吸收。显示器的开启角度非常大,为180°。铰链给人以高质量和稳定的印象,但不能完全防止摇晃。底座的重量足以让人用一只手打开显示器。
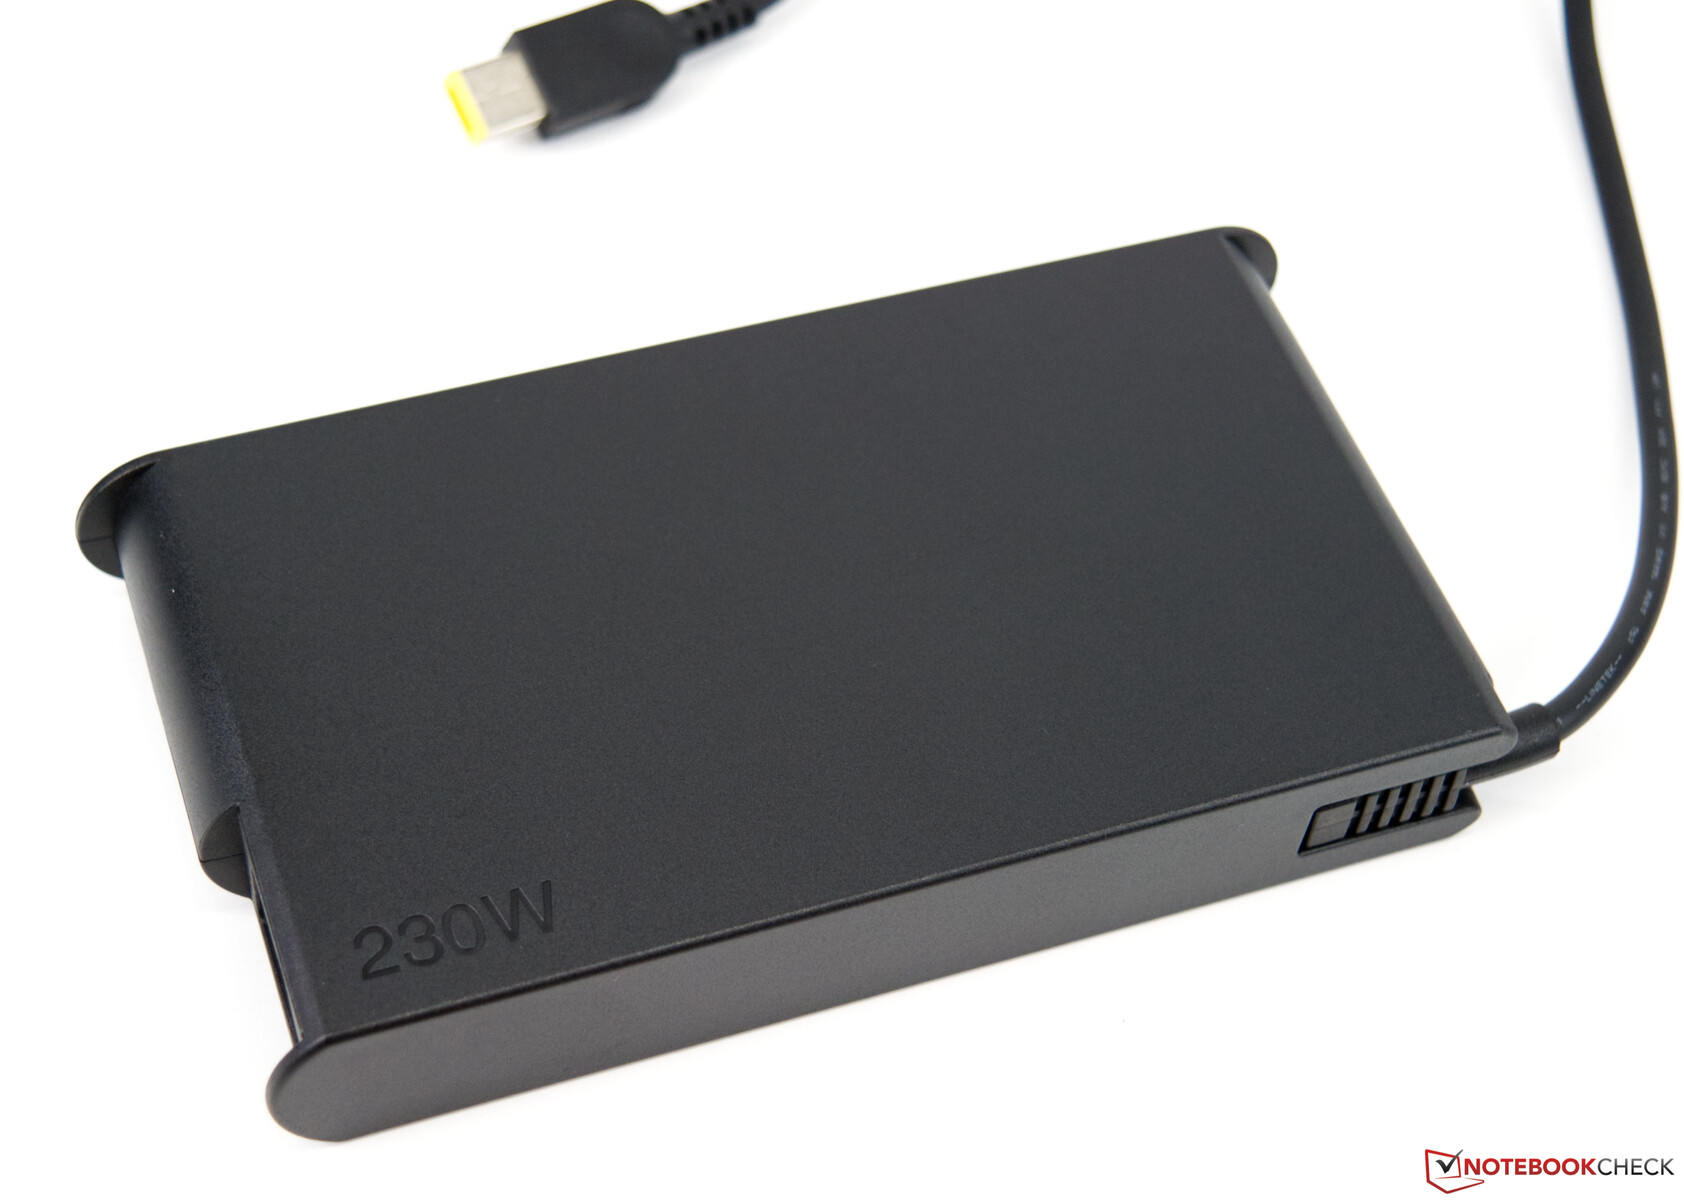
联想Legion 5 15的重量为2.5公斤,在15英寸级别中完全不是一个轻量级。除了惠普Victus 16之外,所有的对比设备的重量都要小一点。在尺寸方面,没有明显的差异。纤细但强大的230瓦的电源适配器又增加了866克的重量。
硬件设施
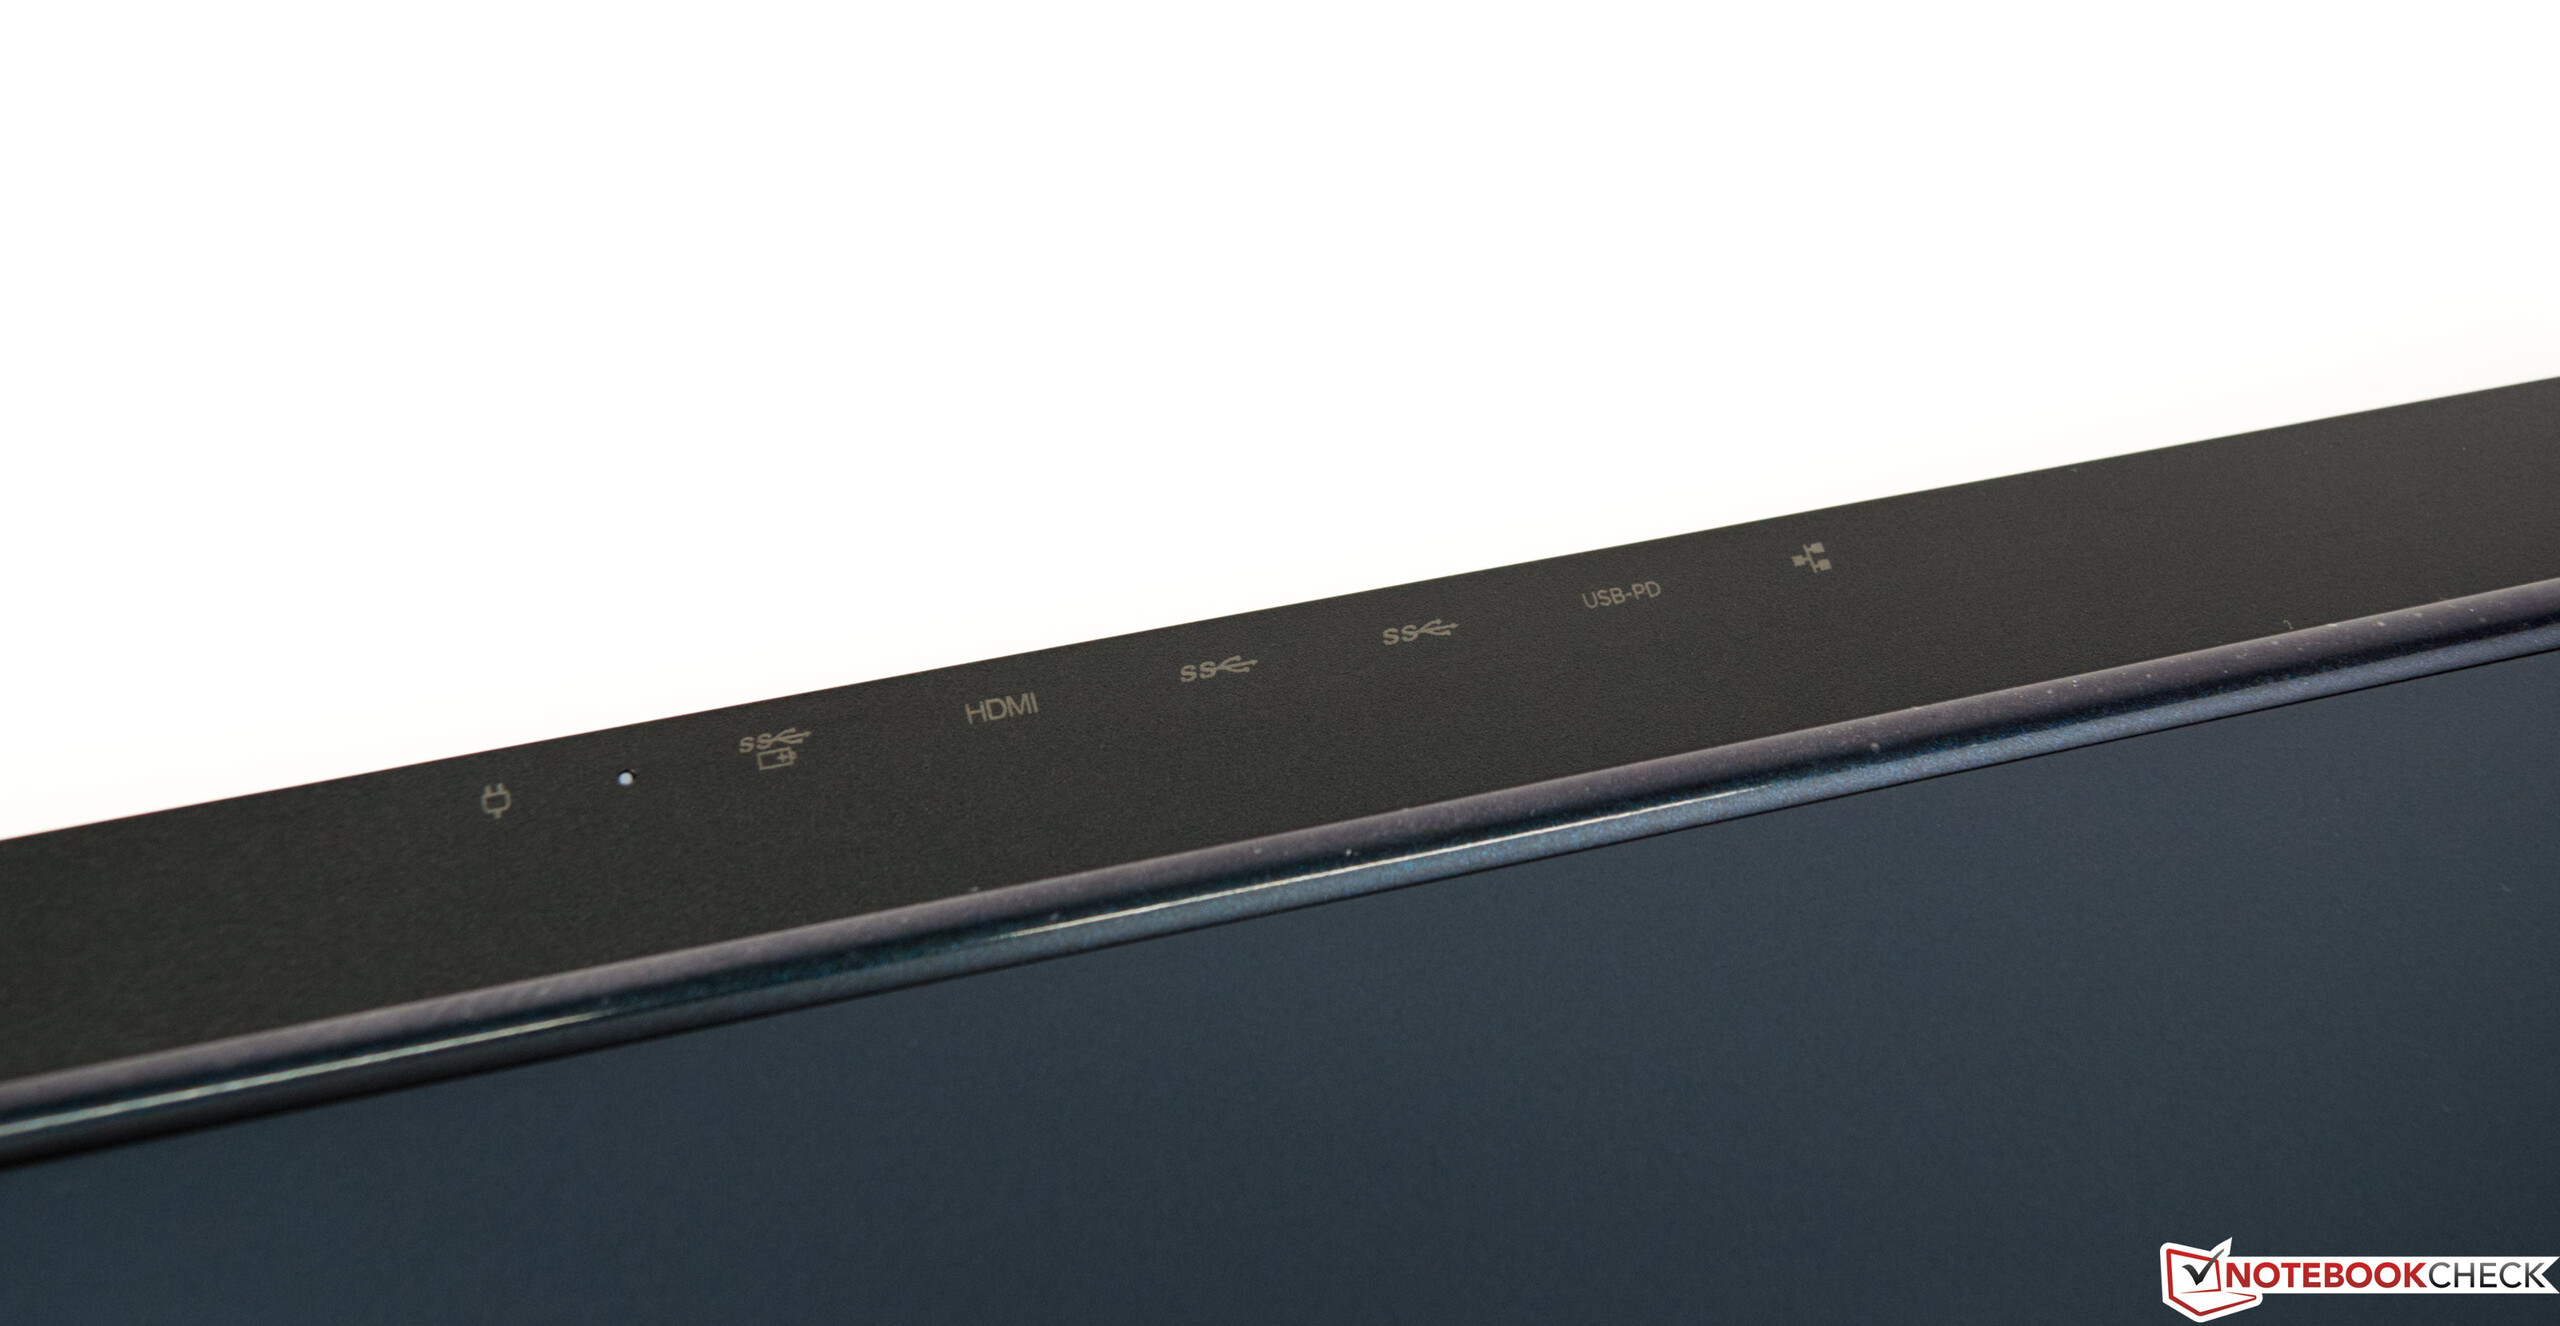
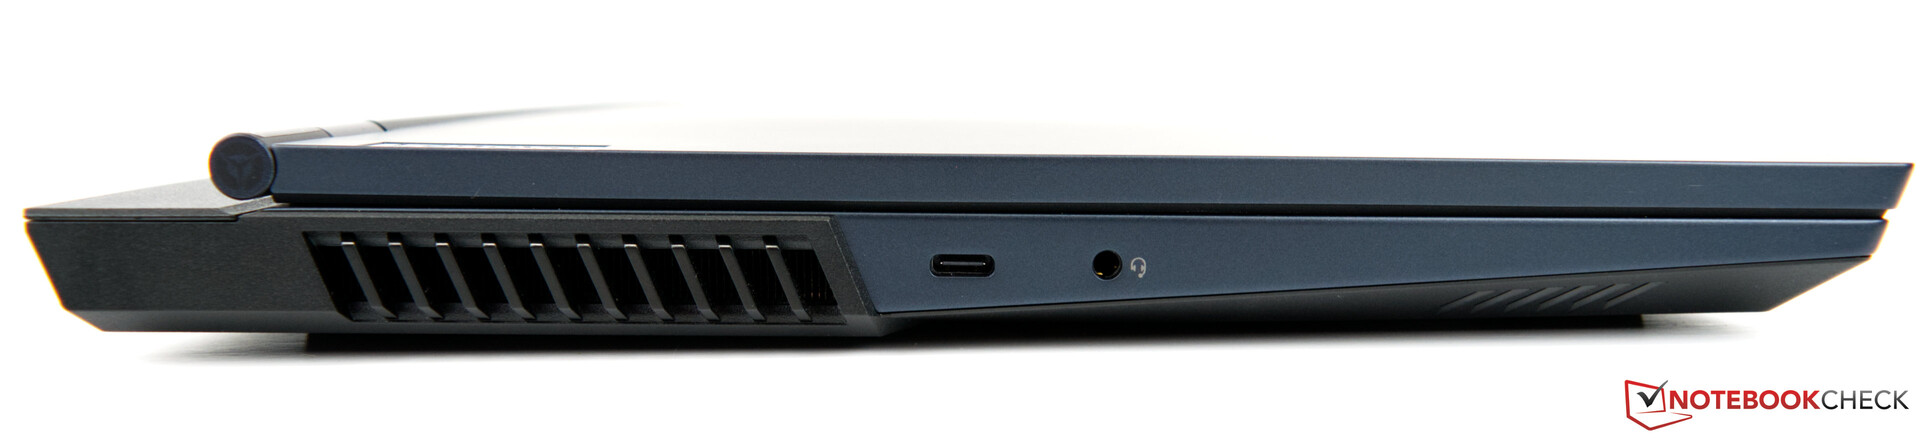
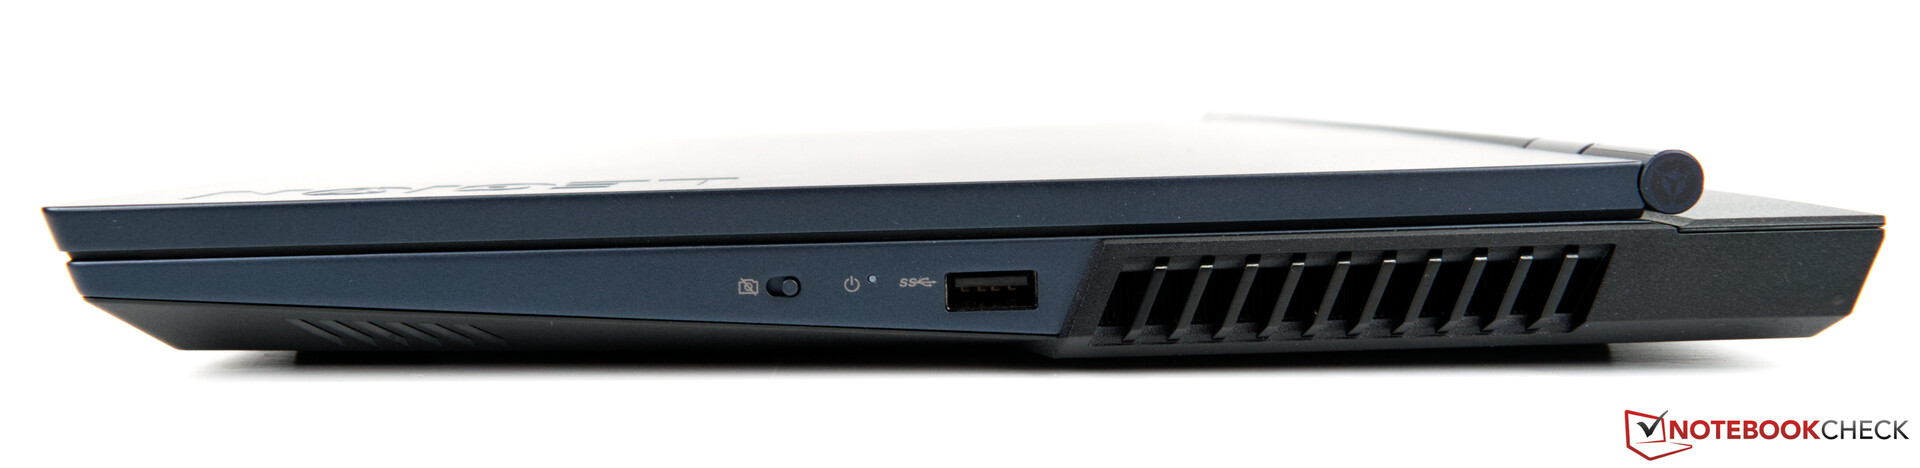
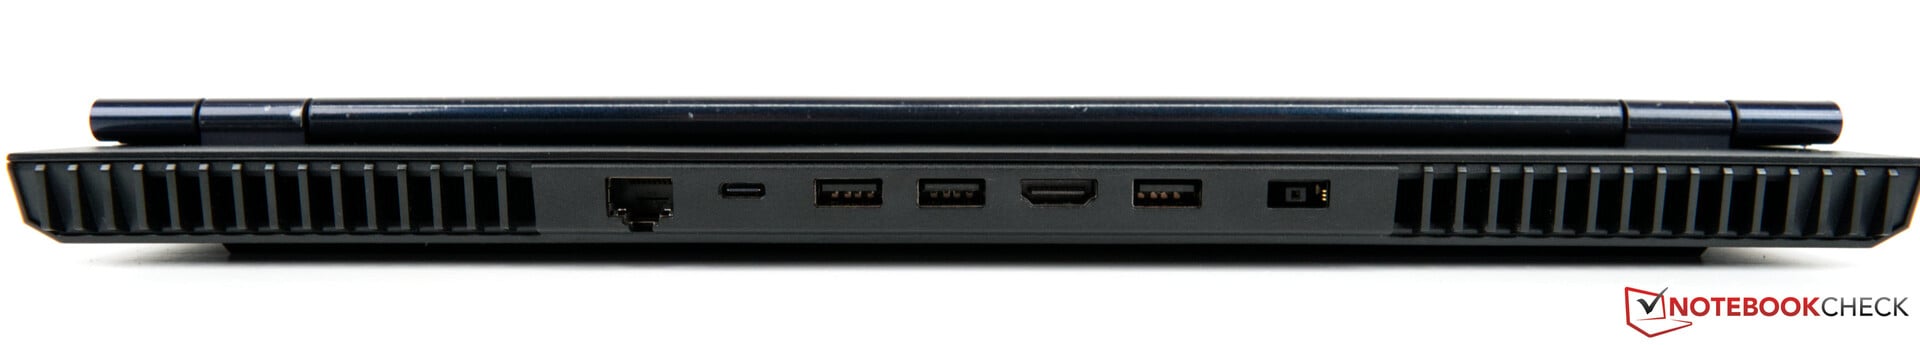
联想Legion 5 15提供了广泛的外部端口选择。提供了四个USB端口,这个数字通常不是笔记本电脑的标准。还有一个HDMI输出和一个网络连接。通过联想Legion 5 15,总共可以操作两个外部显示器,通过后部的USB-C端口实现。然而,一个SD读卡器却没有。
沟通
联想Legion 5 15配备了最新的Realtek WLAN模块。在我们的测试中,WLAN模块提供了坚实的性能,然而,这远远低于同类产品的平均水平。相比之下,除华硕TUF Gaming F15外,竞争对手提供的结果一直较好。但所测得的性能仍足以满足日常使用。
网络摄像头
几乎没有任何游戏笔记本电脑提供良好的网络摄像头质量。联想Legion 5 15也不例外:它缺乏色彩保真度和图像清晰度,你可以在我们的照片中看到。


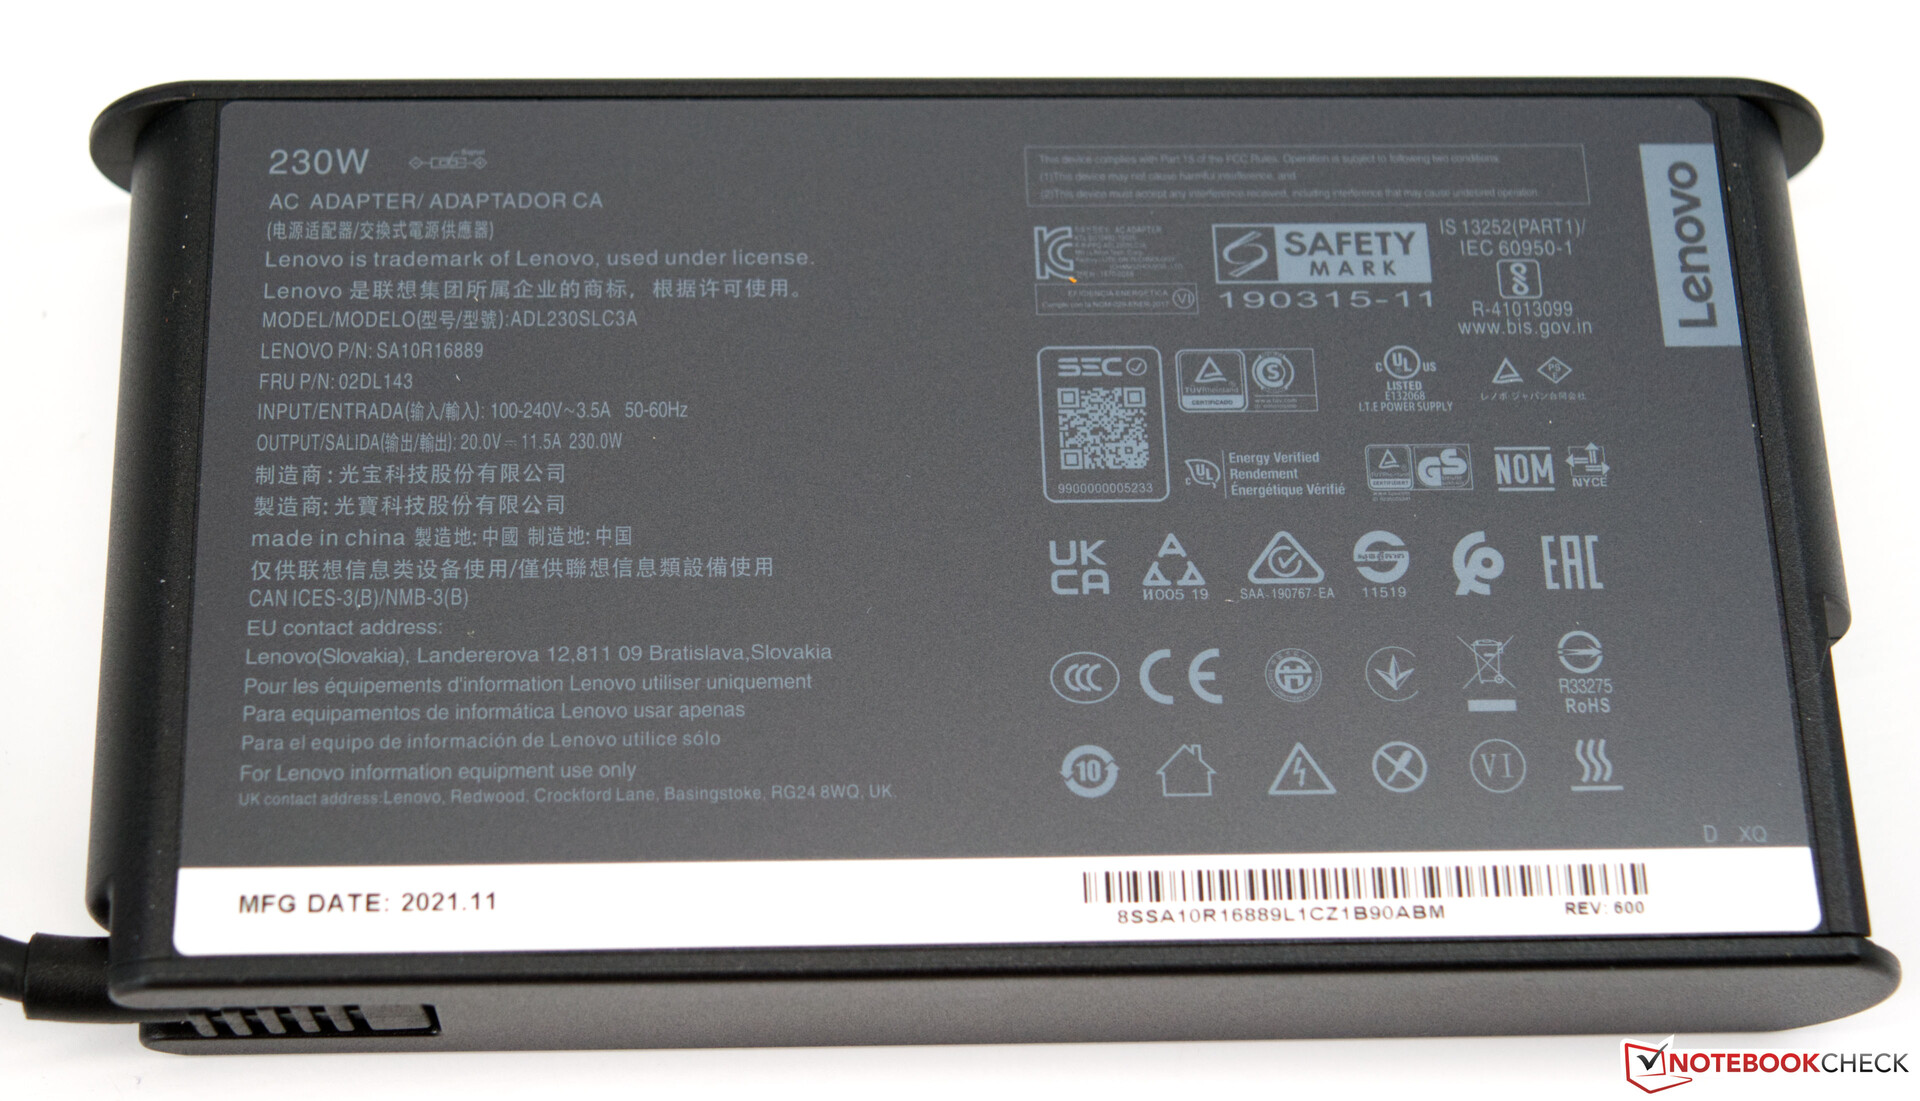
辅料
交货包括一个230瓦的超薄电源,重量不到850克,还有几本信息手册。
维护
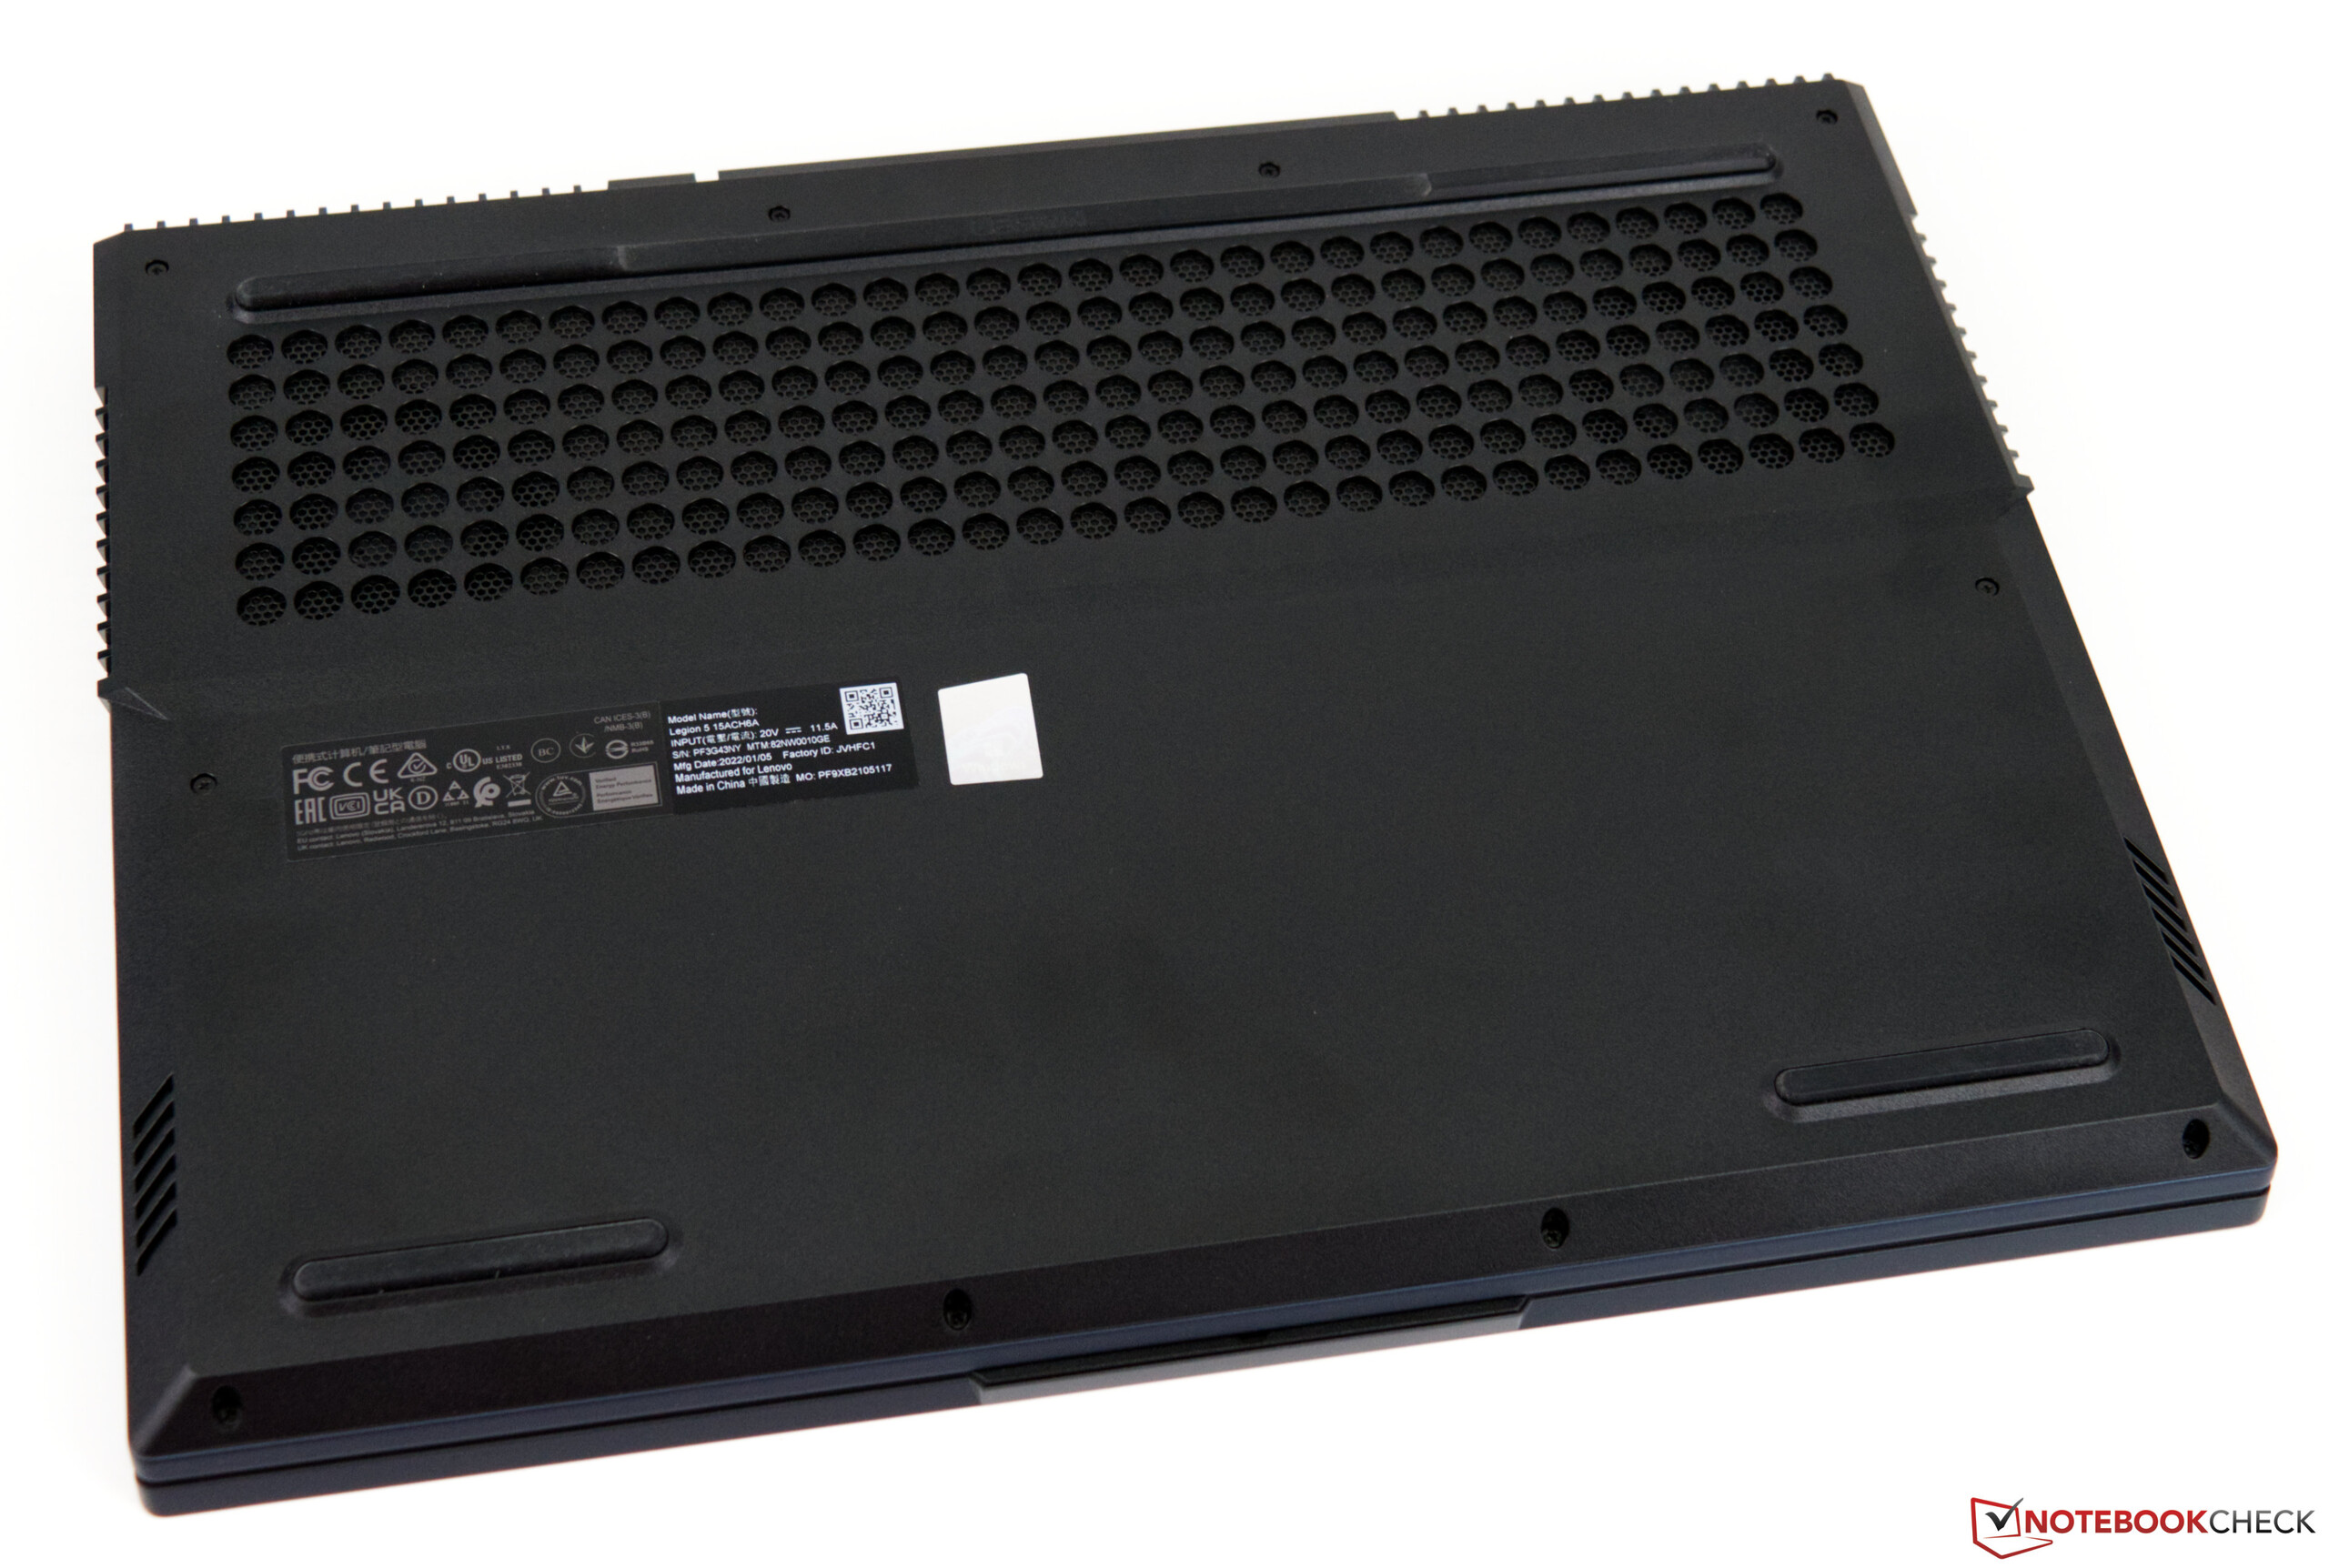
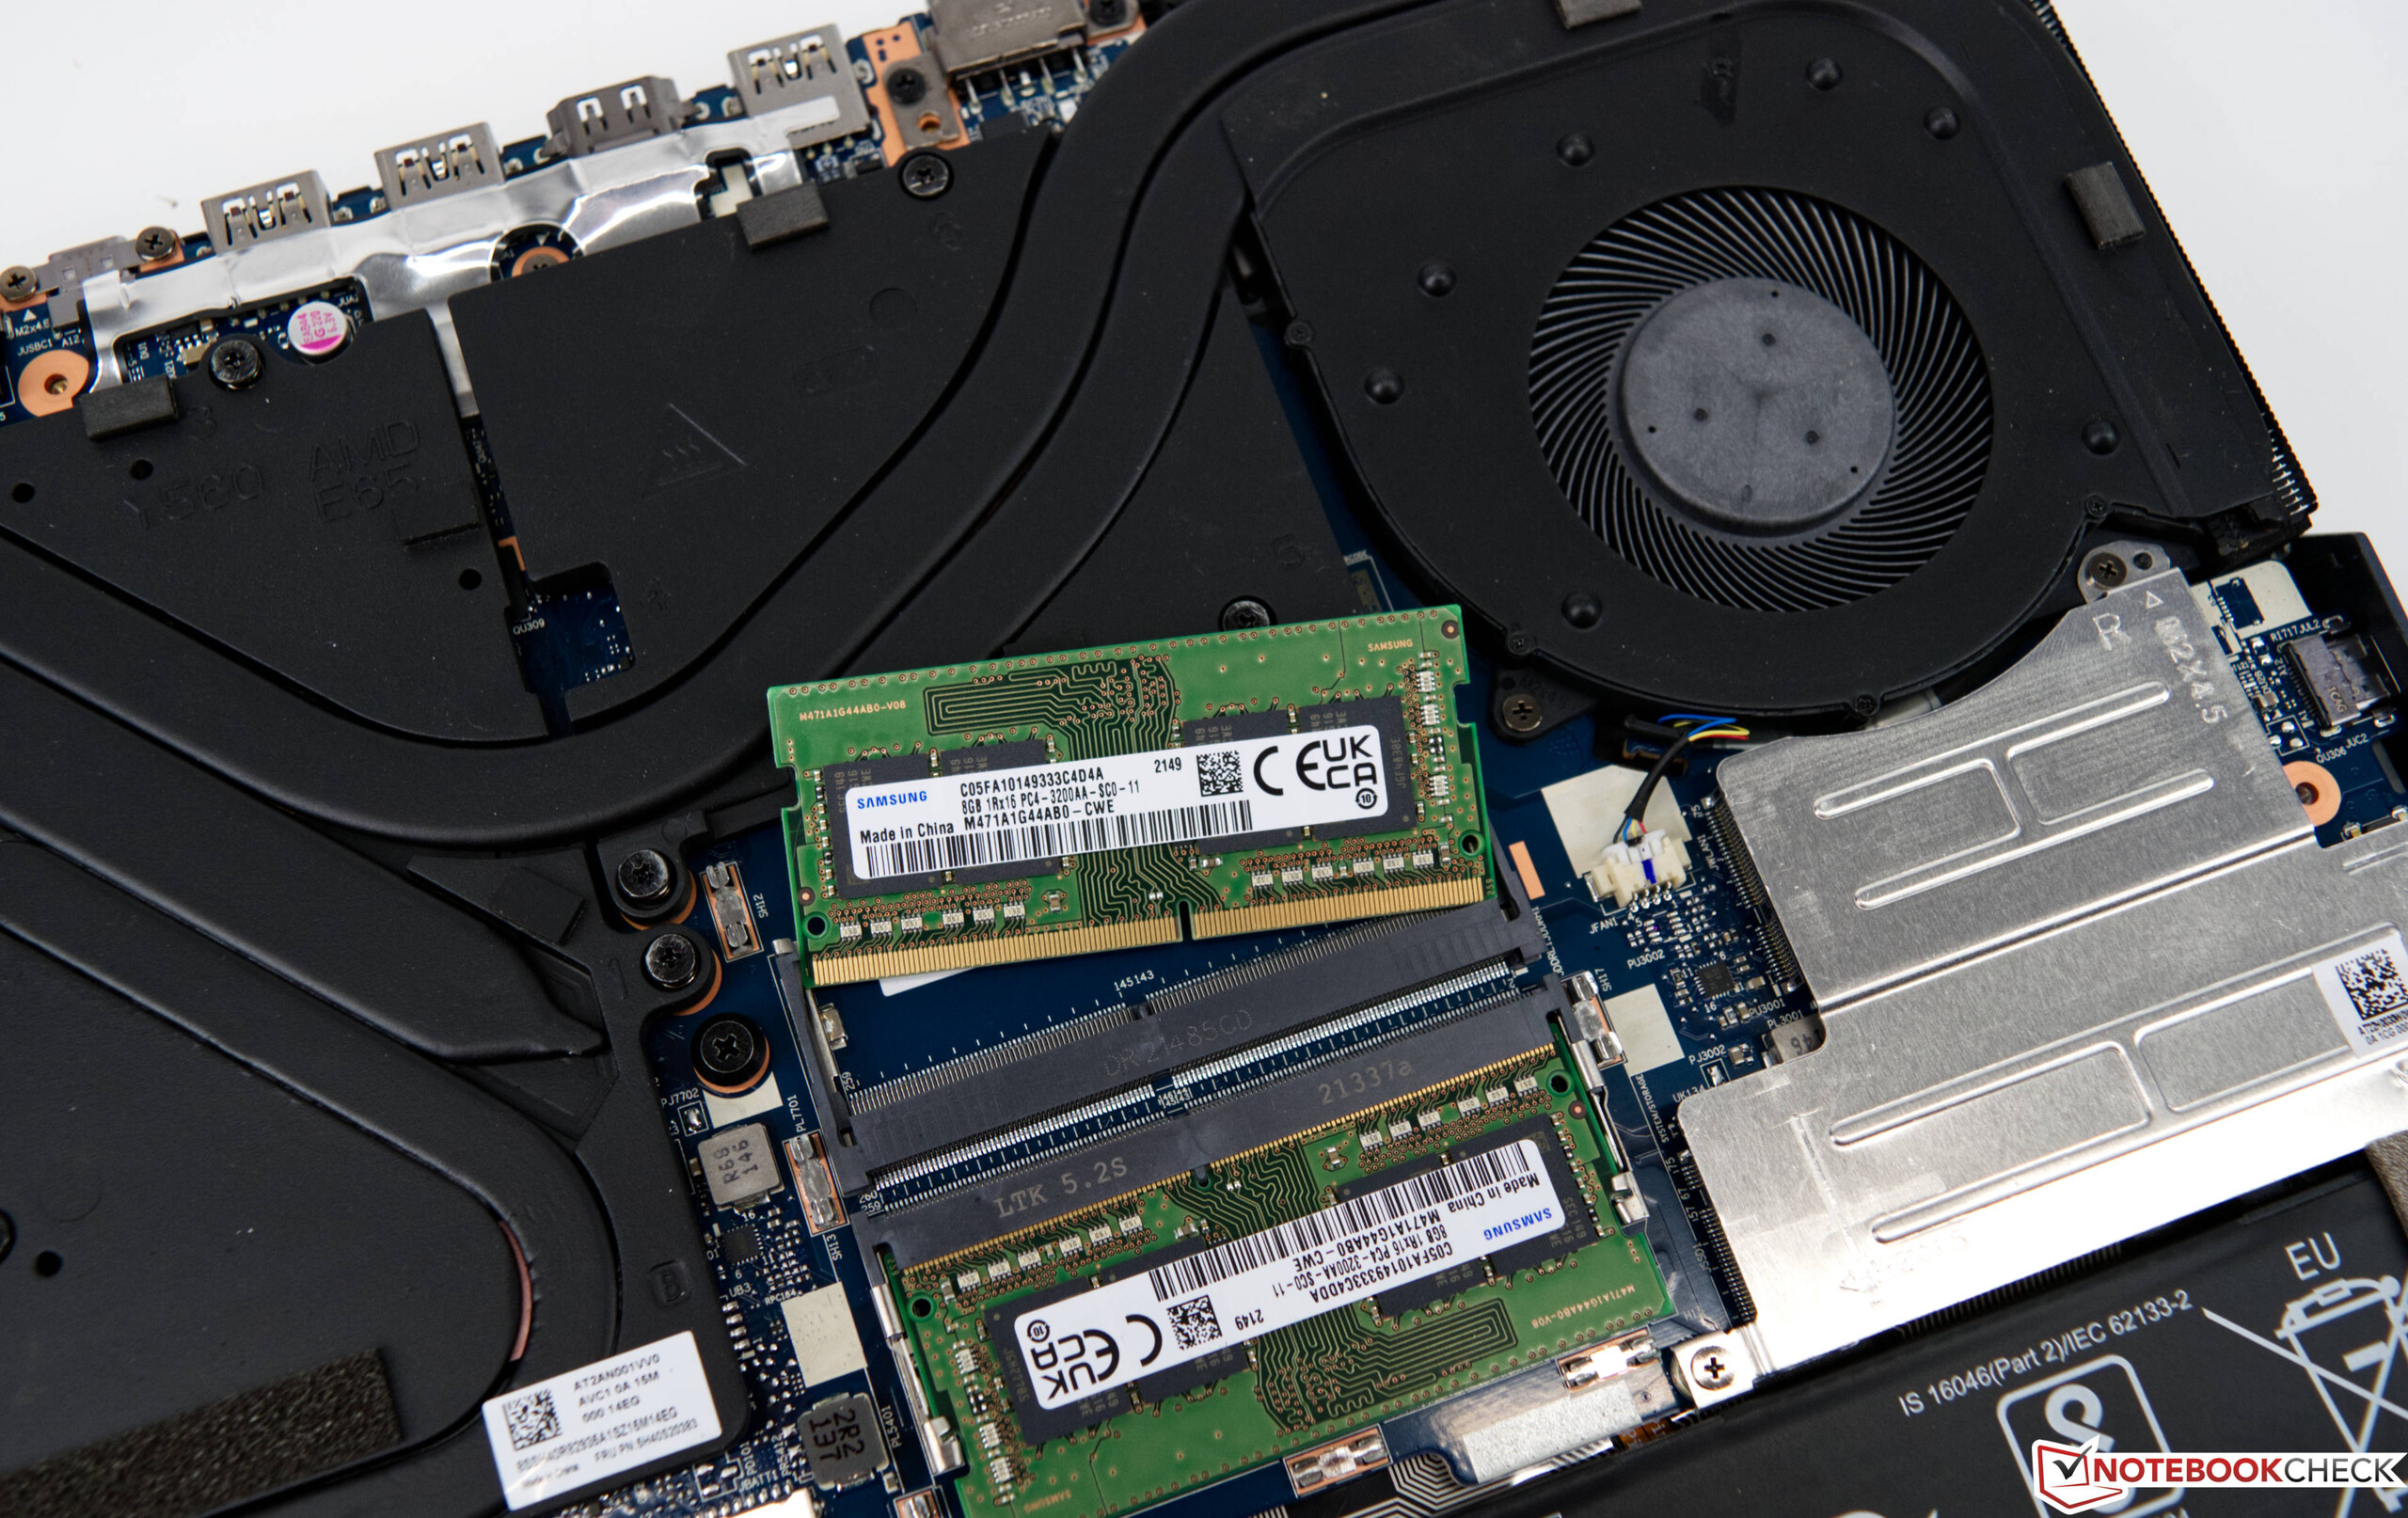
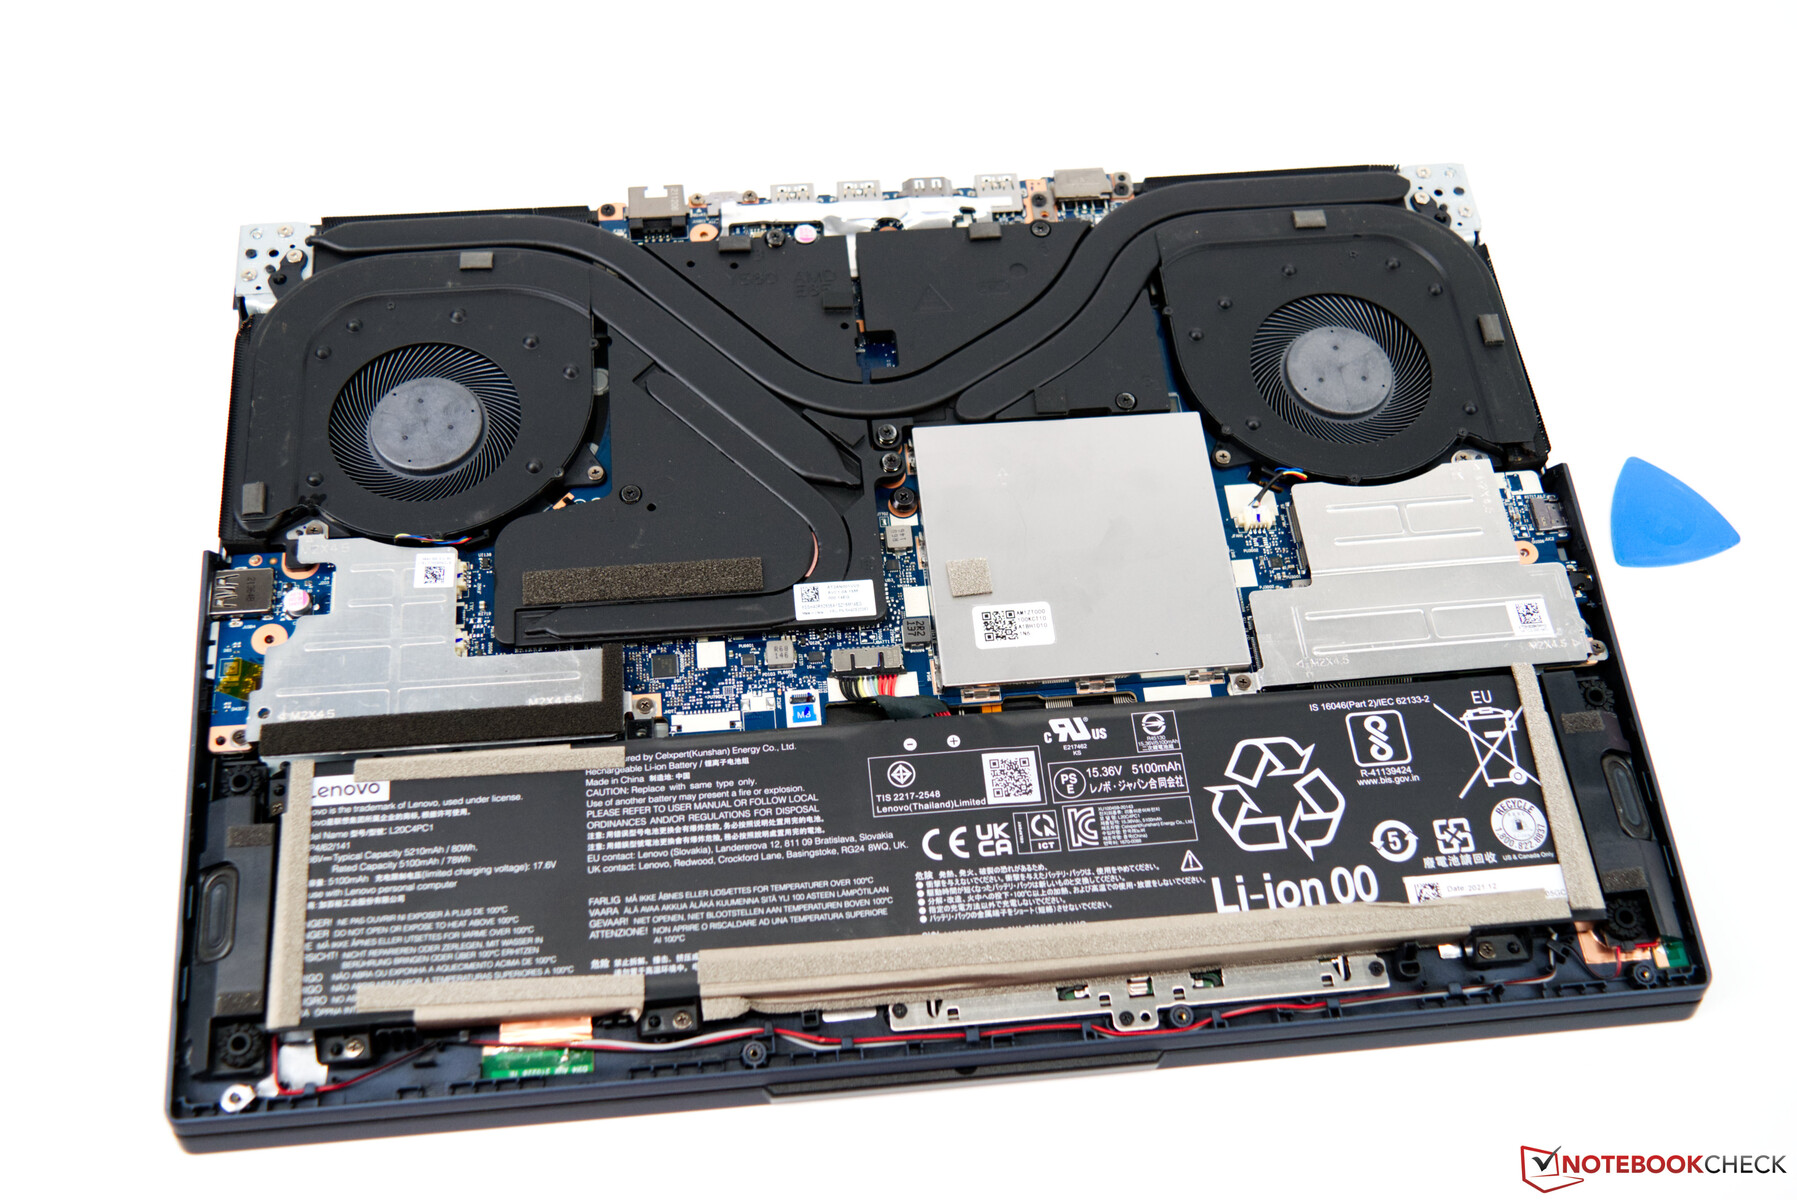
为了维修,由于没有维修帽,必须拆除底板。只有使用合适的工具才能拆除。否则会有损坏的风险,因为即使在所有螺钉被卸下后,底板仍然被大量的塑料夹子固定在原处。已安装的组件,如内存、固态硬盘或WiFi模块,位于一个单独的盖子下,可以很容易地取下。在我们的案例中,联想Legion 5 15仍为另一个存储设备提供空间。
担保
直接从联想购买笔记本电脑的人可以获得36个月的保修(PremiumCare)。
输入设备
键盘
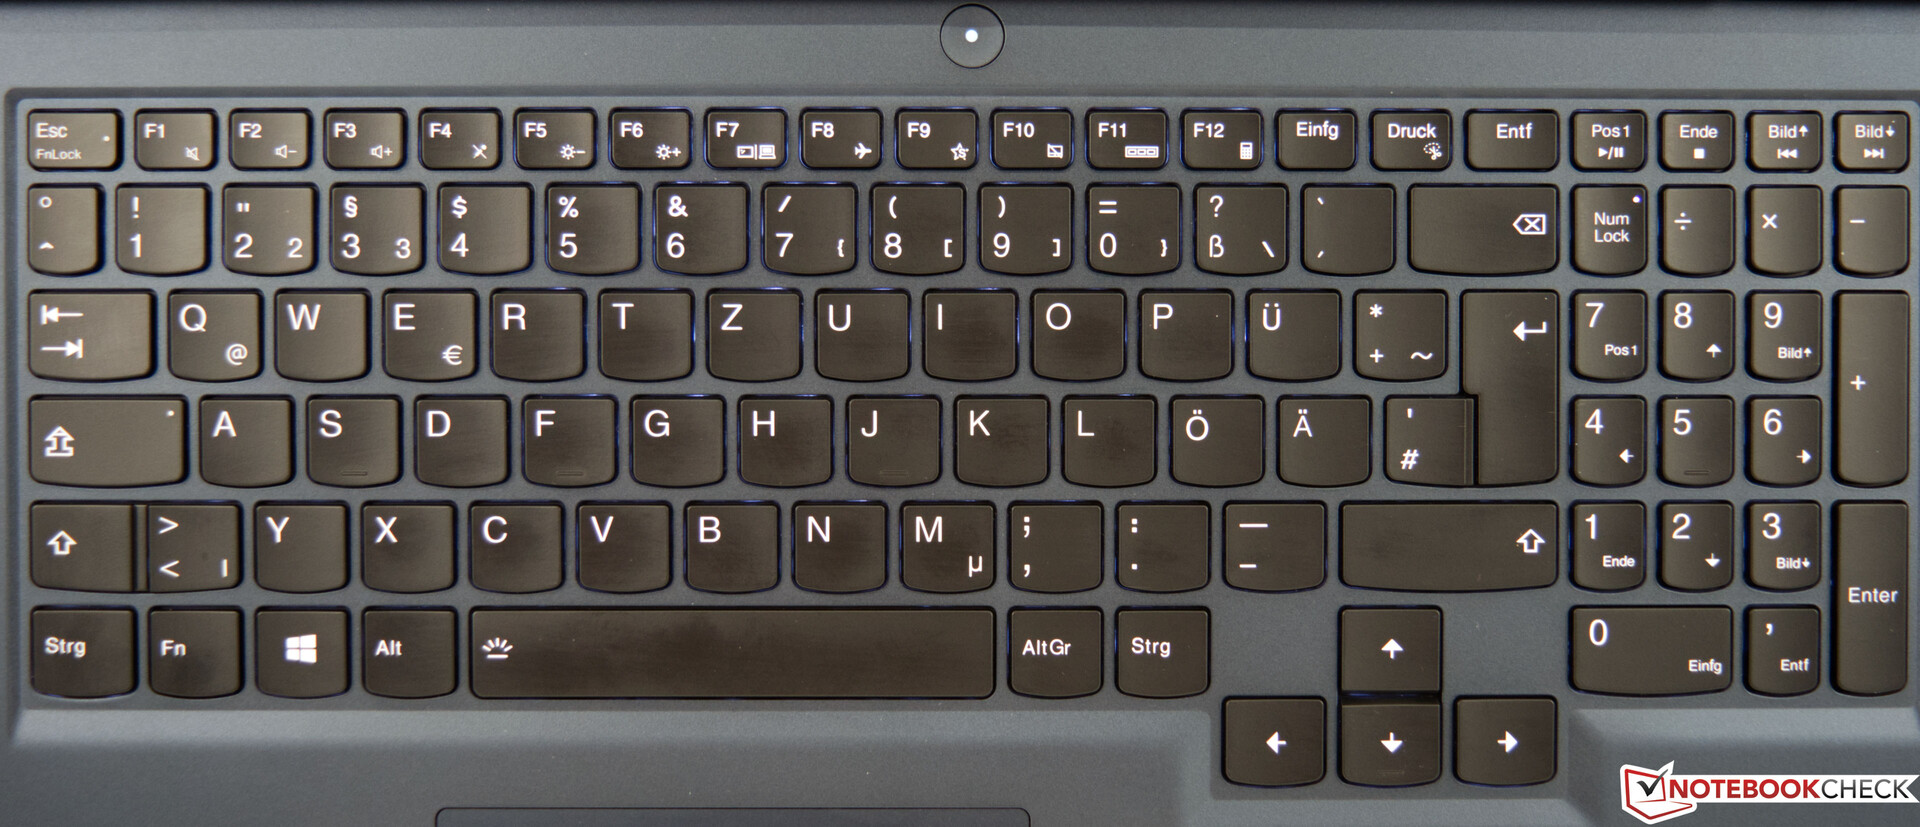
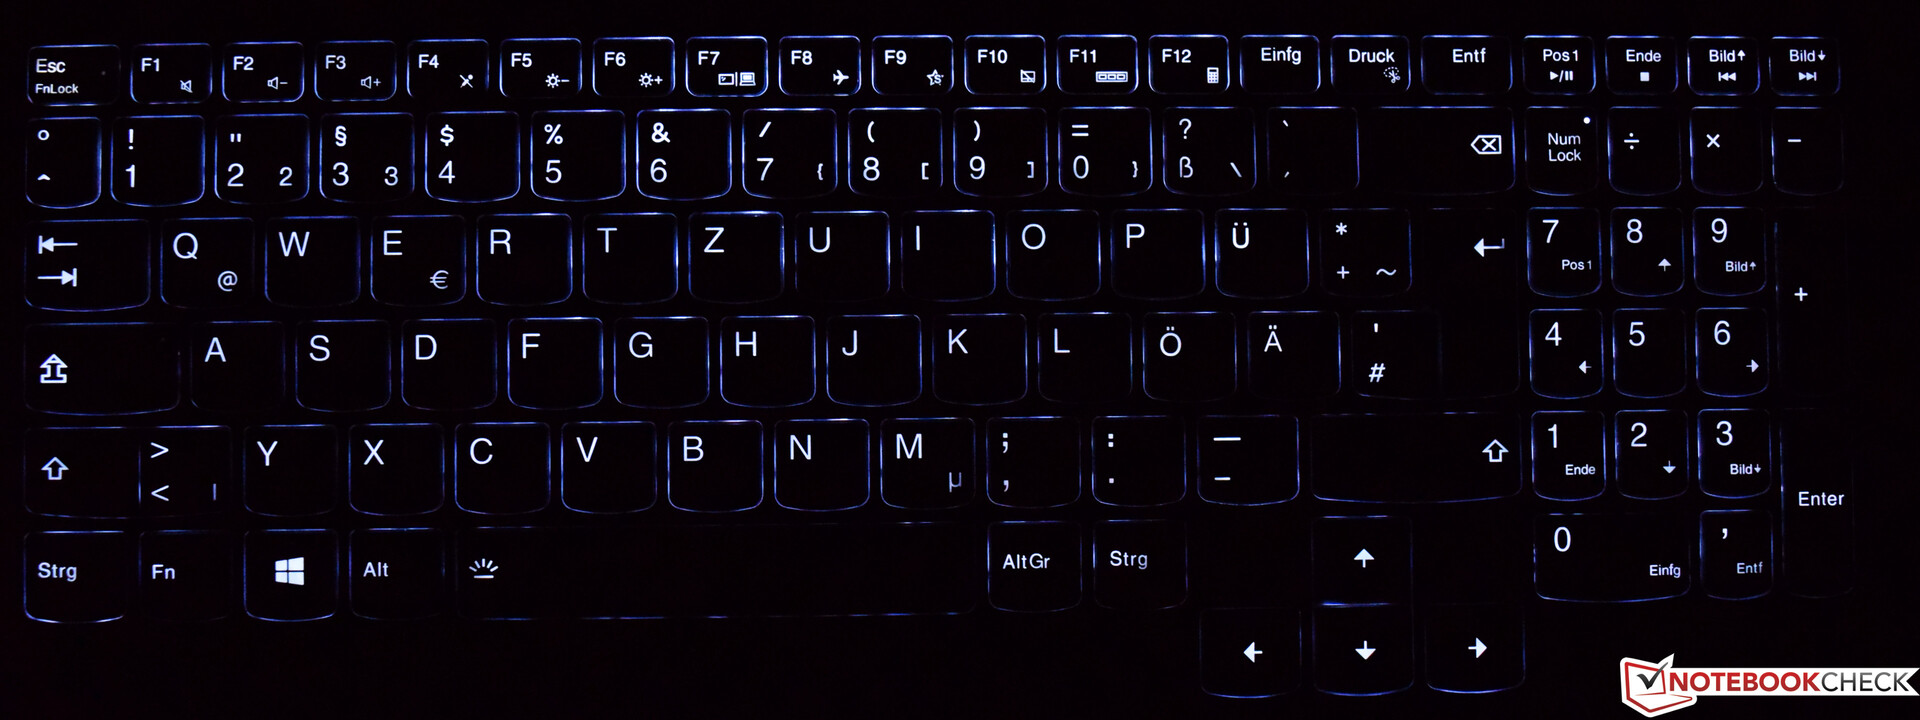
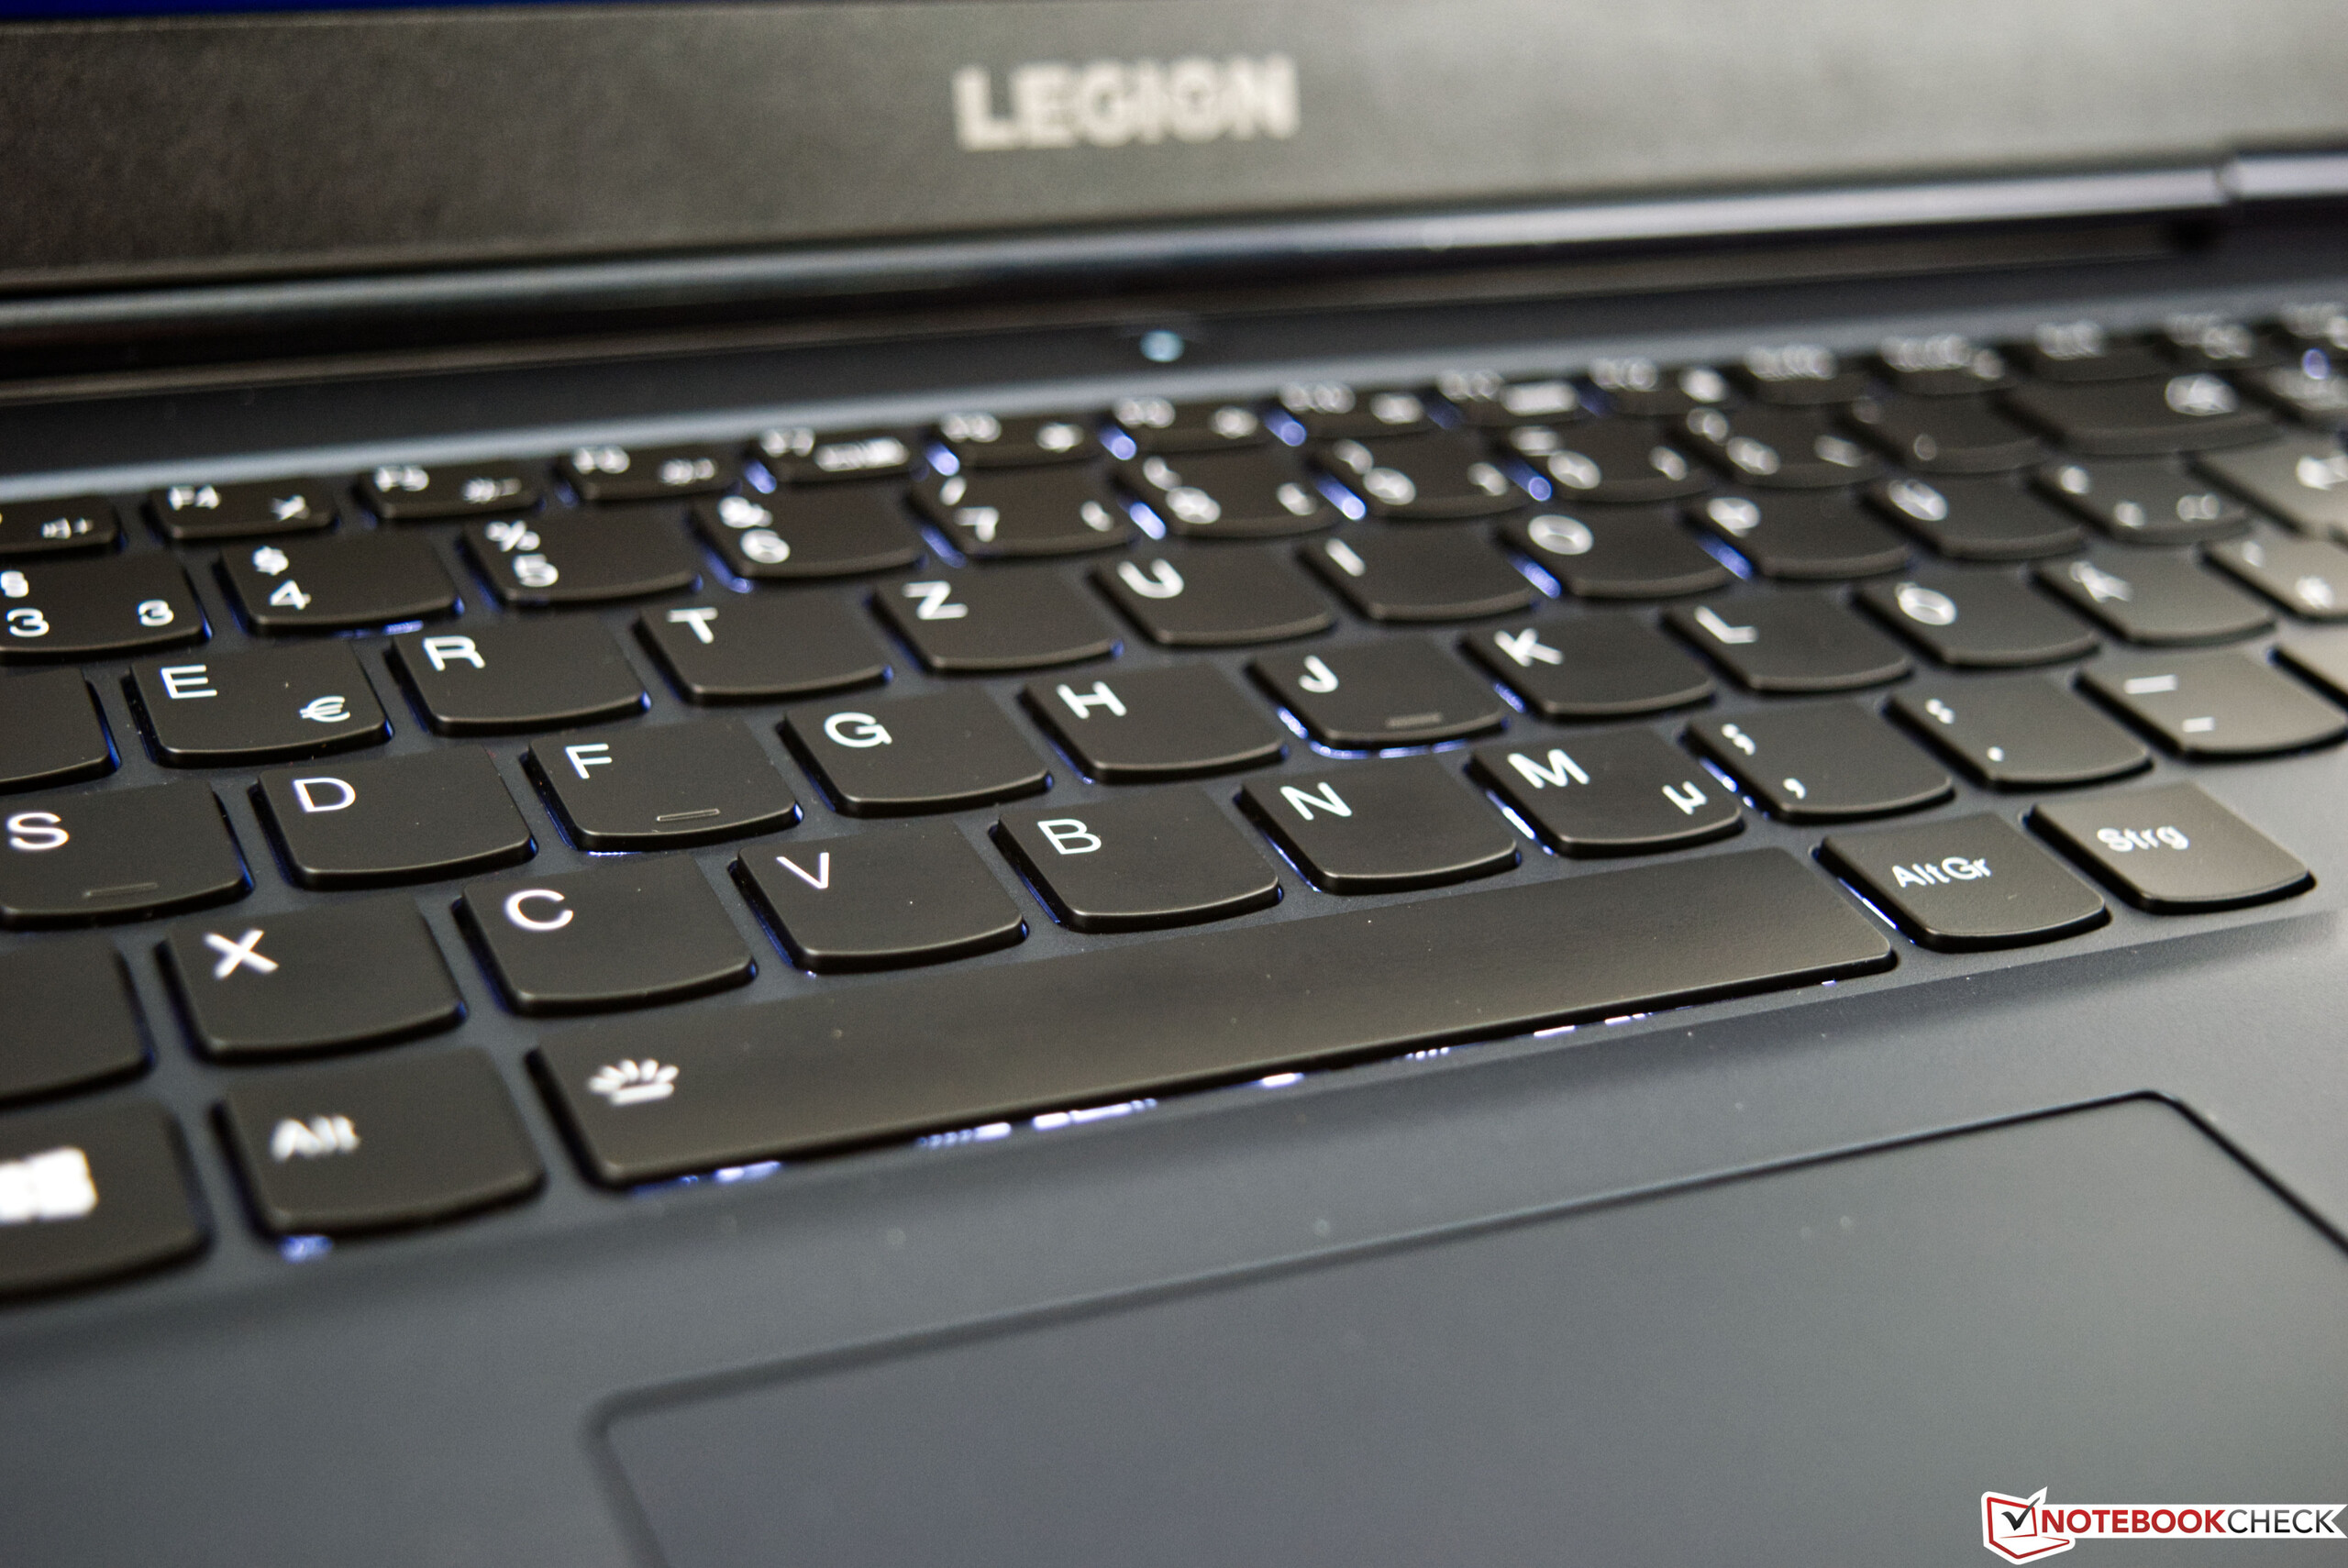
联想为Legion 5 15使用了6线chiclet键盘,这一点我们已经从17英寸的变体中知道。随之而来的照明有两个可调节的级别。键盘大得令人愉快,方向键的尺寸也很合适。只有1.5毫米的短行程伴随着轻微的消音行程和明显的压力点。因此,没有海绵状的打字感觉。
触摸板
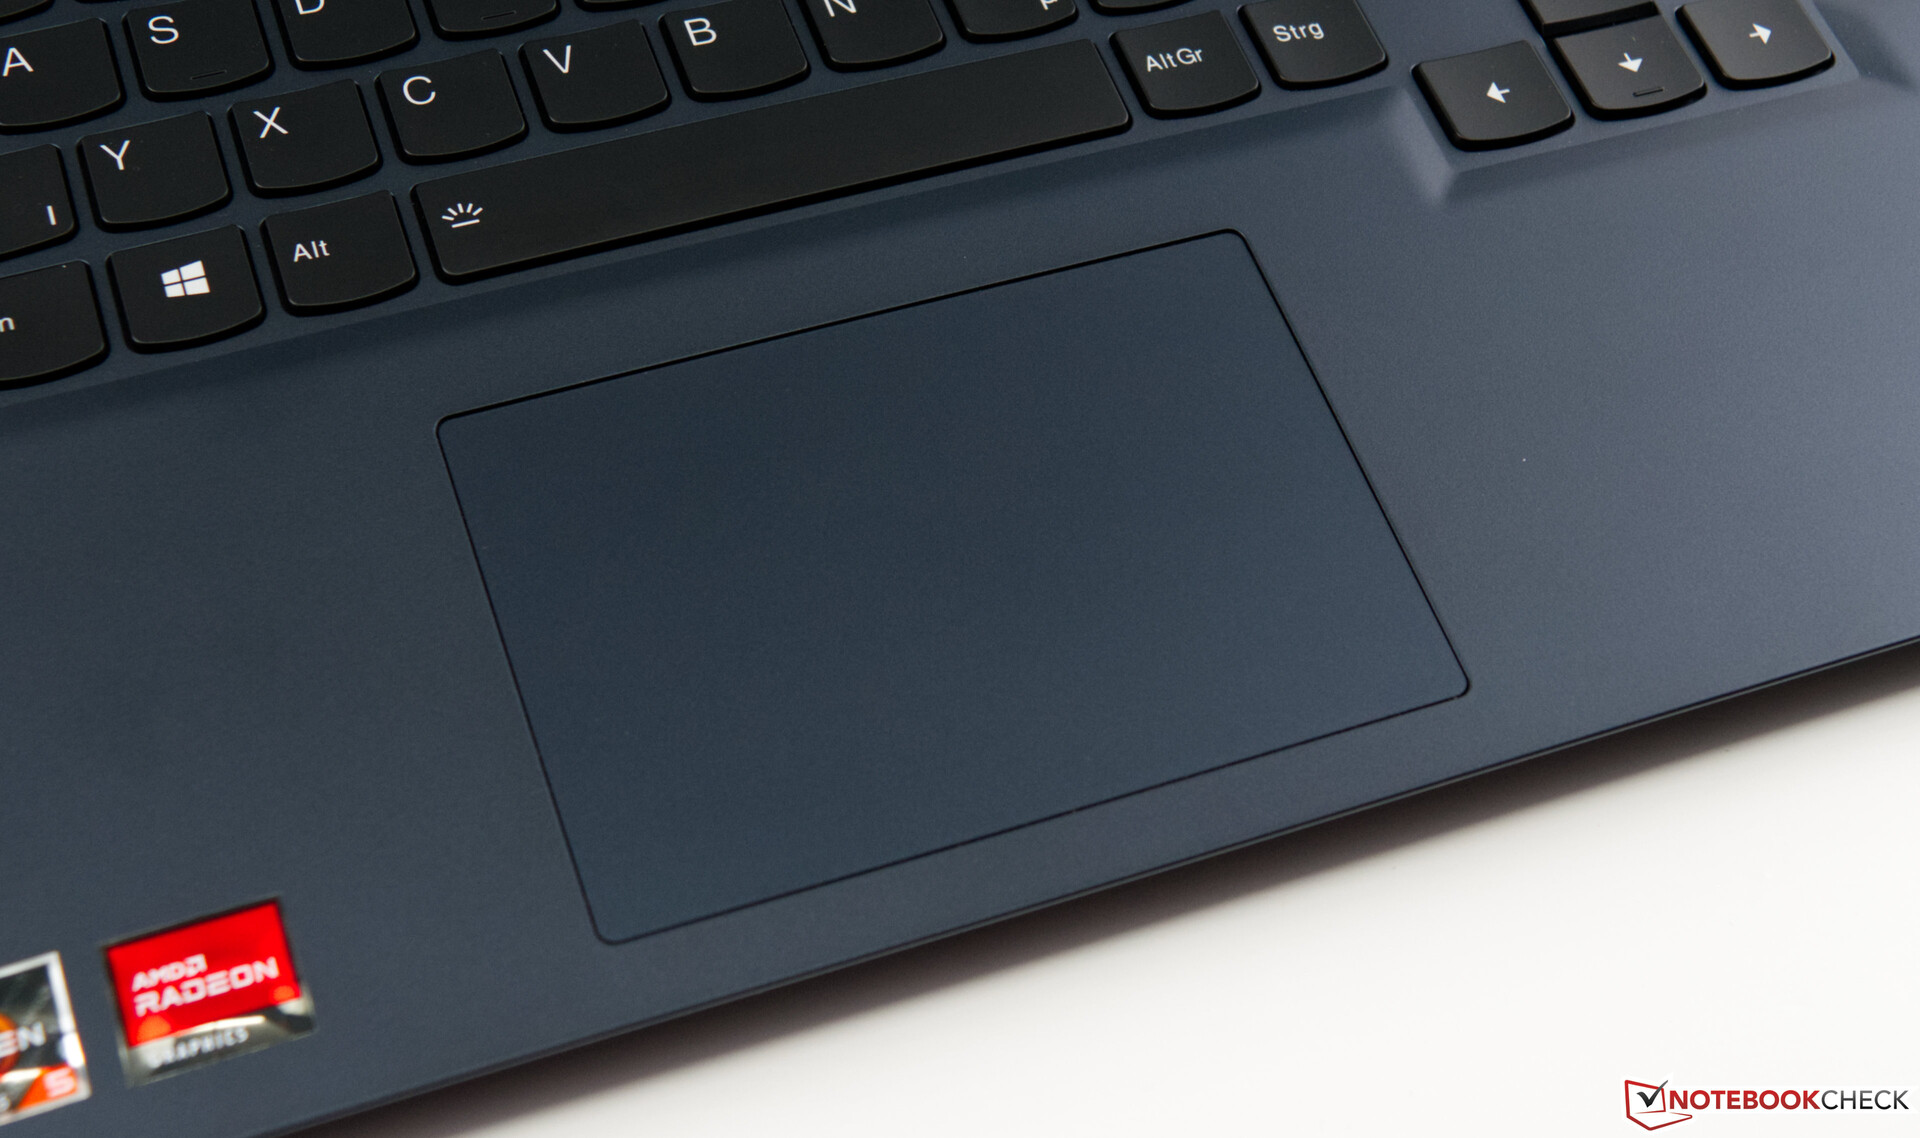
7 x 10.5厘米,内置触摸板的尺寸与联想Legion 5 17相同。但与它的大兄弟相比,它在这里并不显得那么微不足道。输入表面非常敏感,对手指的移动反应迅速。在使用我们的测试样本时,我们没有发现任何不准确的地方。像往常一样,两个输入键位于底部区域,按下后会发出清晰可闻的咔哒声。
显示


这里评论的Legion 5 15配备了165赫兹刷新率的哑光FHD显示屏。另外,该机型也有WQHD选项。此外,联想为Legion 5 15提供刷新率为60和120赫兹的FHD面板。我们测试设备的15英寸IPS显示屏提供1920x1080像素的原始分辨率,对应的计算像素密度为141PPI。
在我们的测量中,内置显示屏达到了规定的亮度。平均为328cd/m²,明显超过了默认值(300cd/m²)。对比度为1159:1,这是IPS面板的一个典型值。由于更好的黑色水平,竞争对手在这里提供了部分更好的数值。
联想Legion 5 15应该不会出现因PWM导致的眼睛疲劳。PWM不用于调节内置显示屏的亮度。在混浊方面有一个小缺点:在两个下角可以看到光渗出,但这只在非常黑暗的场景中才会明显。
| |||||||||||||||||||||||||
Brightness Distribution: 85 %
Center on Battery: 371 cd/m²
Contrast: 1159:1 (Black: 0.32 cd/m²)
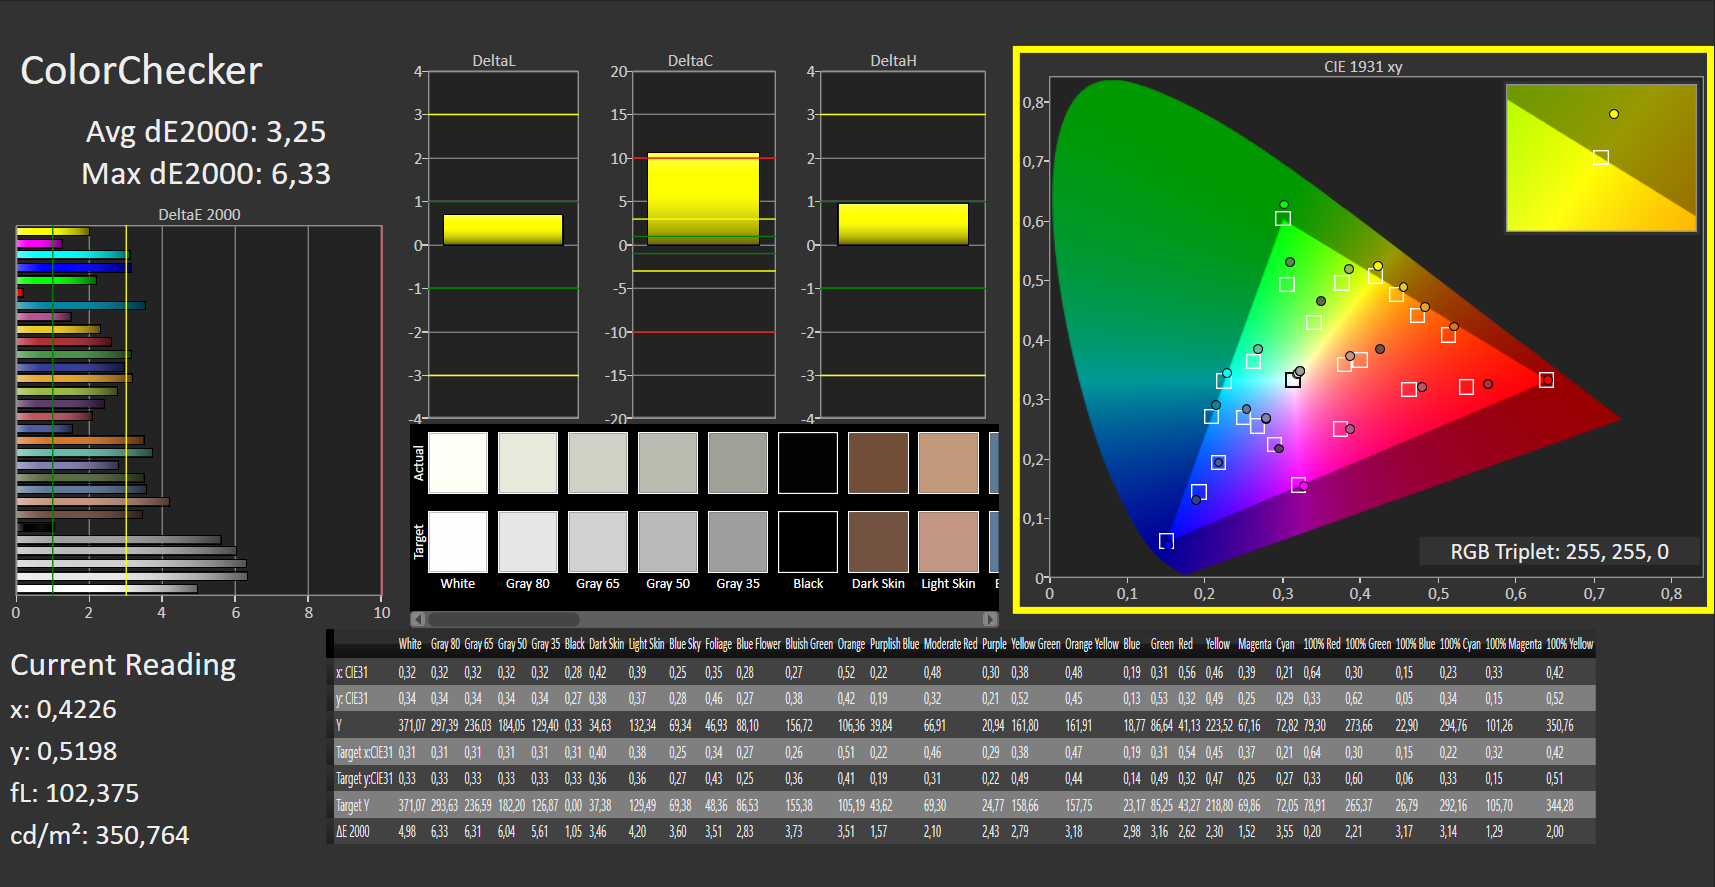
ΔE ColorChecker Calman: 3.25 | ∀{0.5-29.43 Ø4.71}
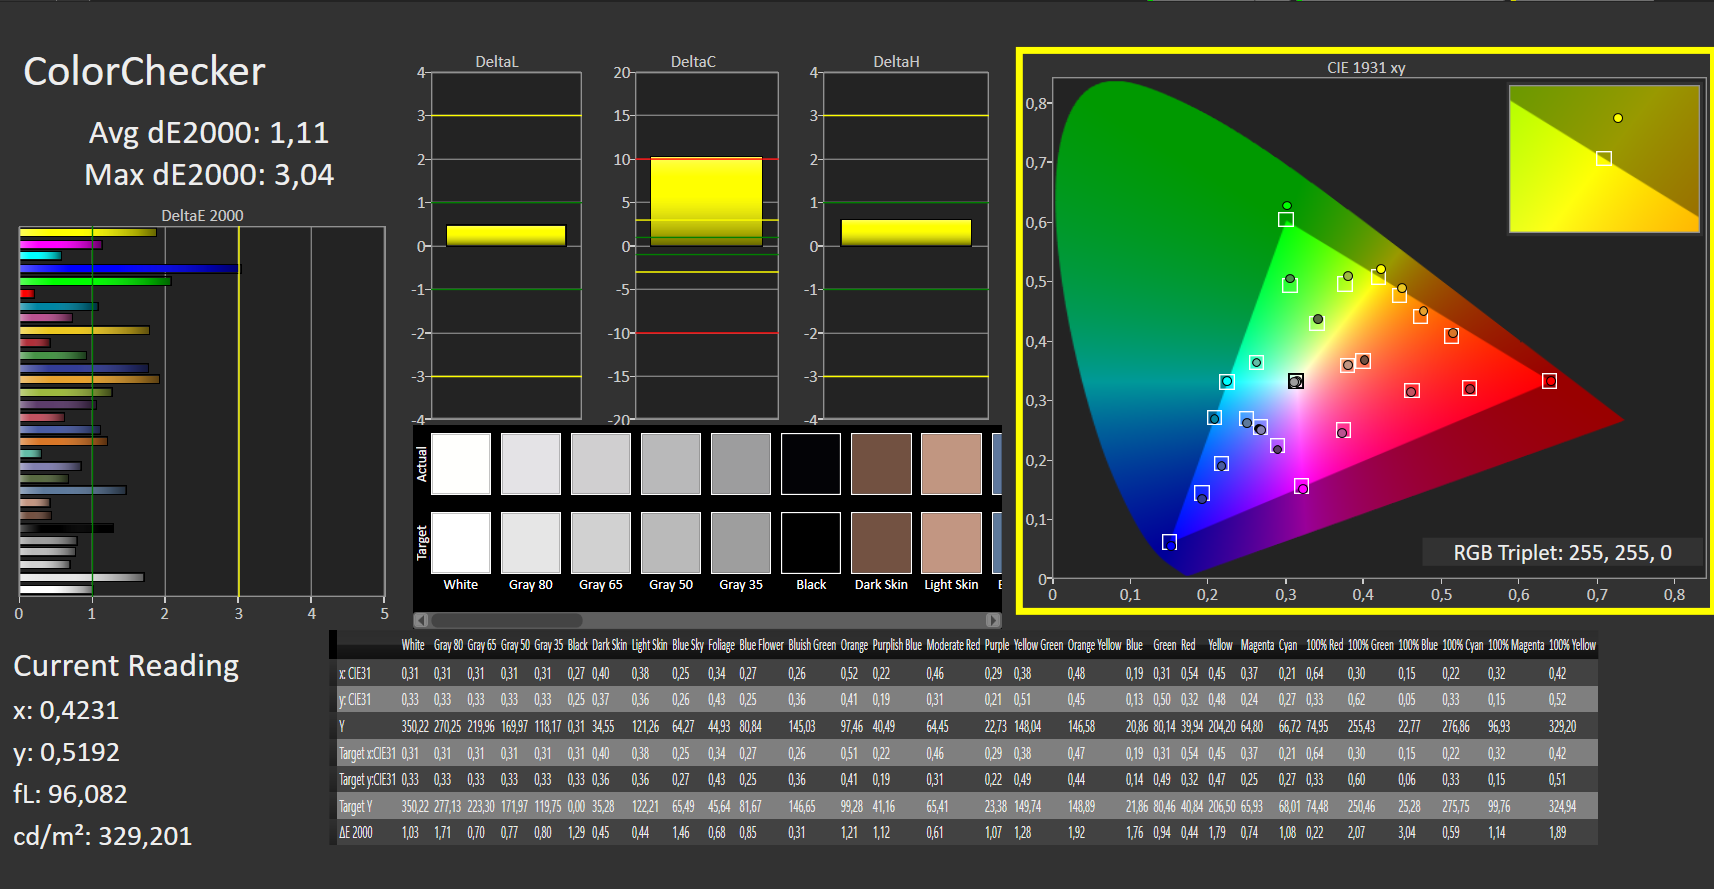
calibrated: 1.11
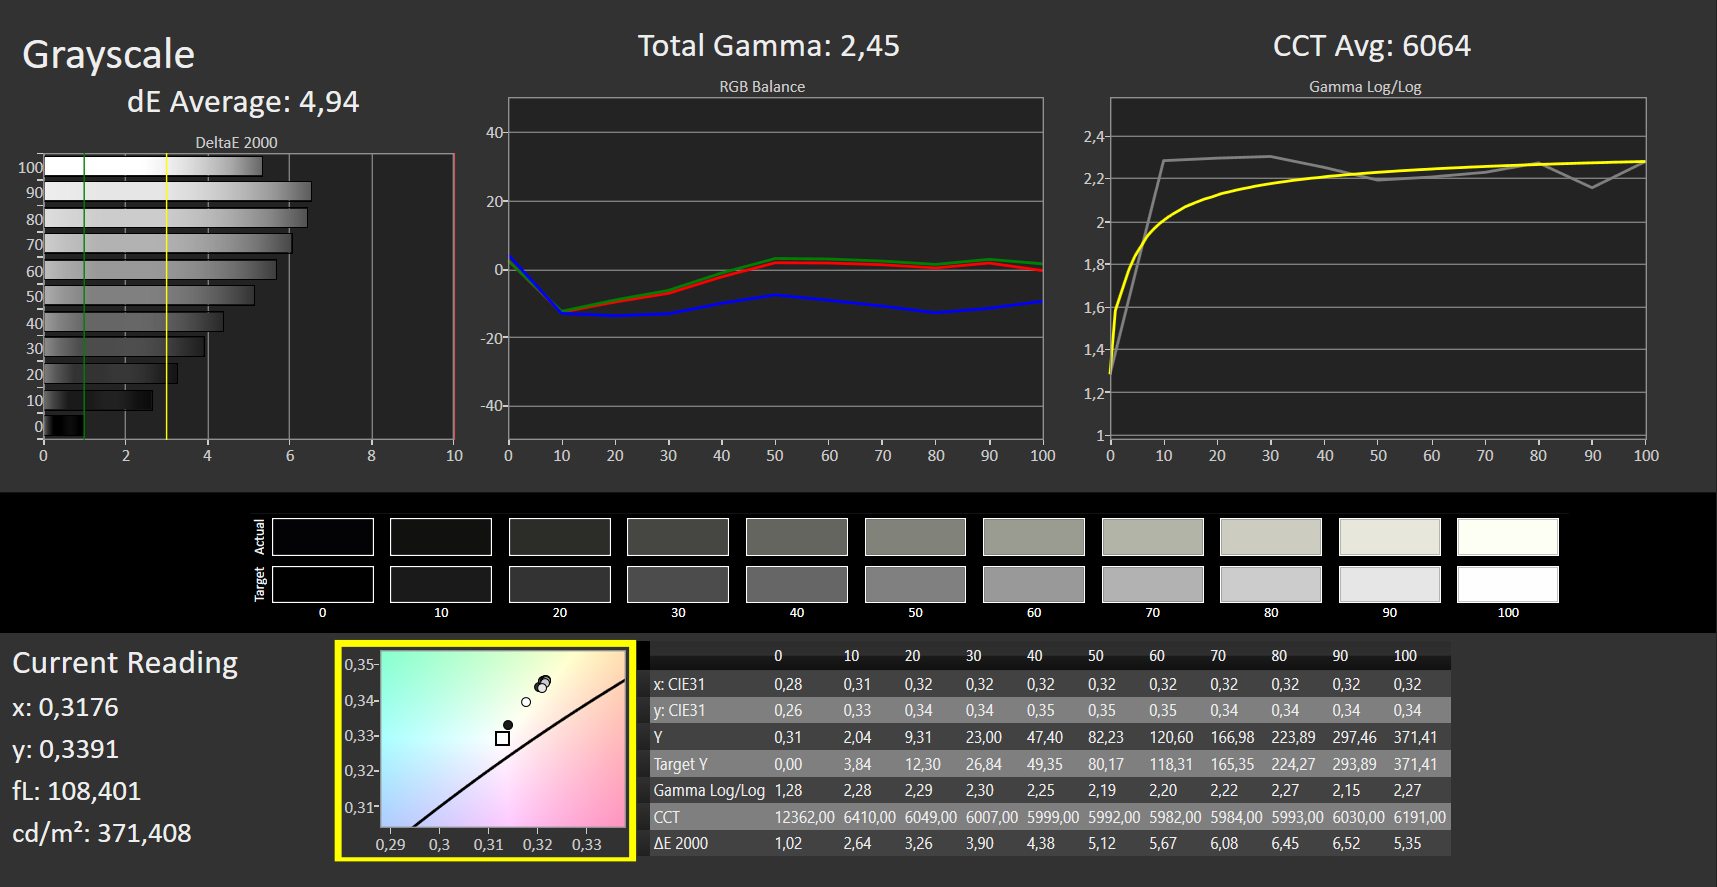
ΔE Greyscale Calman: 4.94 | ∀{0.09-98 Ø4.96}
72.3% AdobeRGB 1998 (Argyll 3D)
99.1% sRGB (Argyll 3D)
71.1% Display P3 (Argyll 3D)
Gamma: 2.45
CCT: 6064 K
| Lenovo Legion 5 15ACH6A-82NW0010GE LGD06A5, IPS, 1920x1080, 15.6" | Gigabyte G5 KC LM156LF-1F02, IPS, 1920x1080, 15.6" | Asus TUF Gaming F15 FX506HM Chi Mei N156HRA-EA1, IPS, 1920x1080, 15.6" | HP Victus 16-e0179ng BOE09BE, IPS, 1920x1080, 16.1" | Medion Erazer Deputy P25 Panda LM156LF-2F03, IPS, 1920x1080, 15.6" | Dell G15 5515 BOE092A, IPS, 1920x1080, 15.6" | |
|---|---|---|---|---|---|---|
| Display | -3% | -39% | 2% | -42% | -44% | |
| Display P3 Coverage (%) | 71.1 | 68.2 -4% | 41.9 -41% | 72.6 2% | 39.7 -44% | 39.1 -45% |
| sRGB Coverage (%) | 99.1 | 96.7 -2% | 62.9 -37% | 100 1% | 59.7 -40% | 56.9 -43% |
| AdobeRGB 1998 Coverage (%) | 72.3 | 69.6 -4% | 43.3 -40% | 73.5 2% | 41.1 -43% | 40.4 -44% |
| Response Times | -20% | -175% | -52% | -288% | -124% | |
| Response Time Grey 50% / Grey 80% * (ms) | 15 ? | 10 ? 33% | 28.4 ? -89% | 9.6 ? 36% | 40.4 ? -169% | 25.2 ? -68% |
| Response Time Black / White * (ms) | 6 ? | 10.4 ? -73% | 21.6 ? -260% | 14.4 ? -140% | 30.4 ? -407% | 16.8 ? -180% |
| PWM Frequency (Hz) | 200 ? | |||||
| Screen | -36% | -54% | 4% | -49% | -74% | |
| Brightness middle (cd/m²) | 371 | 295 -20% | 268.3 -28% | 361 -3% | 283 -24% | 278 -25% |
| Brightness (cd/m²) | 328 | 275 -16% | 257 -22% | 341 4% | 266 -19% | 262 -20% |
| Brightness Distribution (%) | 85 | 86 1% | 84 -1% | 88 4% | 85 0% | 83 -2% |
| Black Level * (cd/m²) | 0.32 | 0.23 28% | 0.34 -6% | 0.3 6% | 0.2 37% | 0.36 -13% |
| Contrast (:1) | 1159 | 1283 11% | 789 -32% | 1203 4% | 1415 22% | 772 -33% |
| Colorchecker dE 2000 * | 3.25 | 5.21 -60% | 5.05 -55% | 2.44 25% | 5.32 -64% | 5.74 -77% |
| Colorchecker dE 2000 max. * | 6.33 | 14.03 -122% | 15.43 -144% | 6.37 -1% | 17.68 -179% | 19.63 -210% |
| Colorchecker dE 2000 calibrated * | 1.11 | 1.73 -56% | 3.21 -189% | 1.26 -14% | 3.94 -255% | 4.7 -323% |
| Greyscale dE 2000 * | 4.94 | 9.4 -90% | 5.5 -11% | 4.6 7% | 2.9 41% | 3.1 37% |
| Gamma | 2.45 90% | 2.046 108% | 2.35 94% | 2.268 97% | 2.062 107% | 2.011 109% |
| CCT | 6064 107% | 8002 81% | 7392 88% | 6609 98% | 7167 91% | 6207 105% |
| Total Average (Program / Settings) | -20% /
-27% | -89% /
-68% | -15% /
-5% | -126% /
-82% | -81% /
-75% |
* ... smaller is better
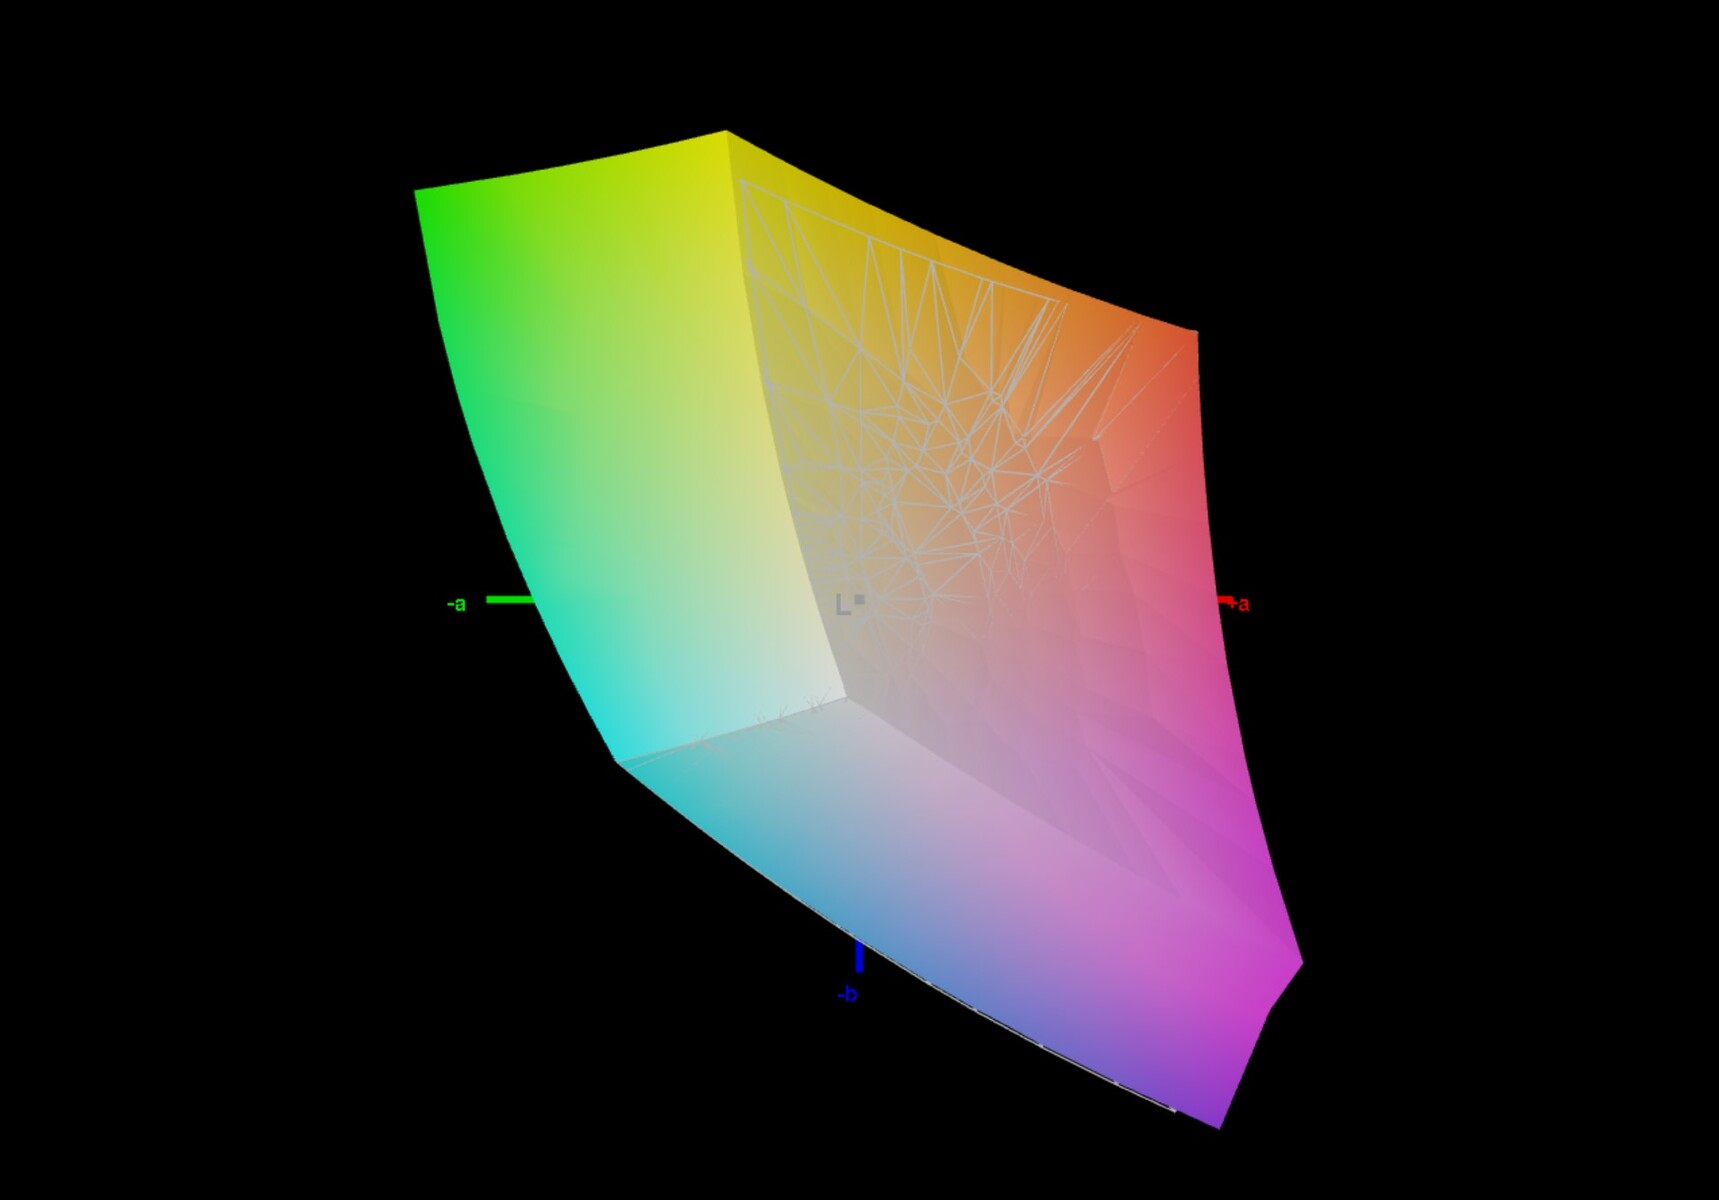
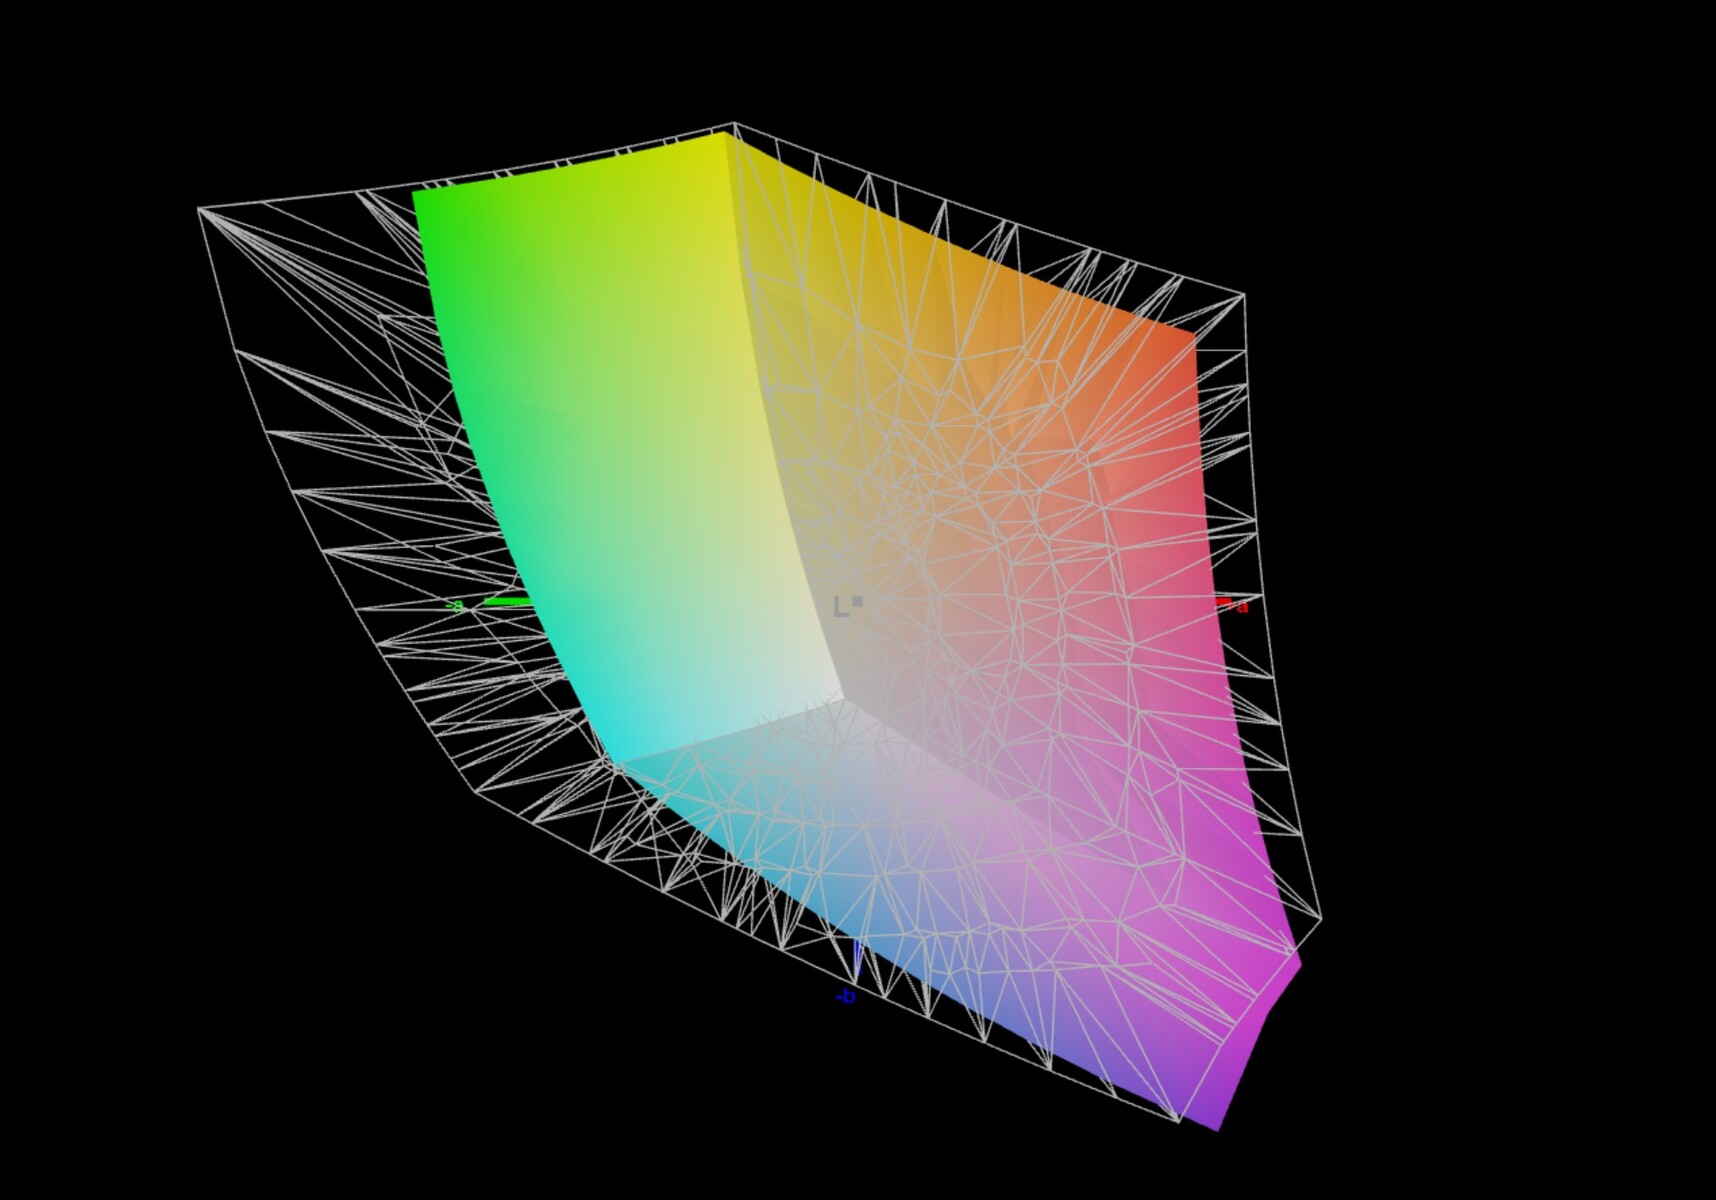
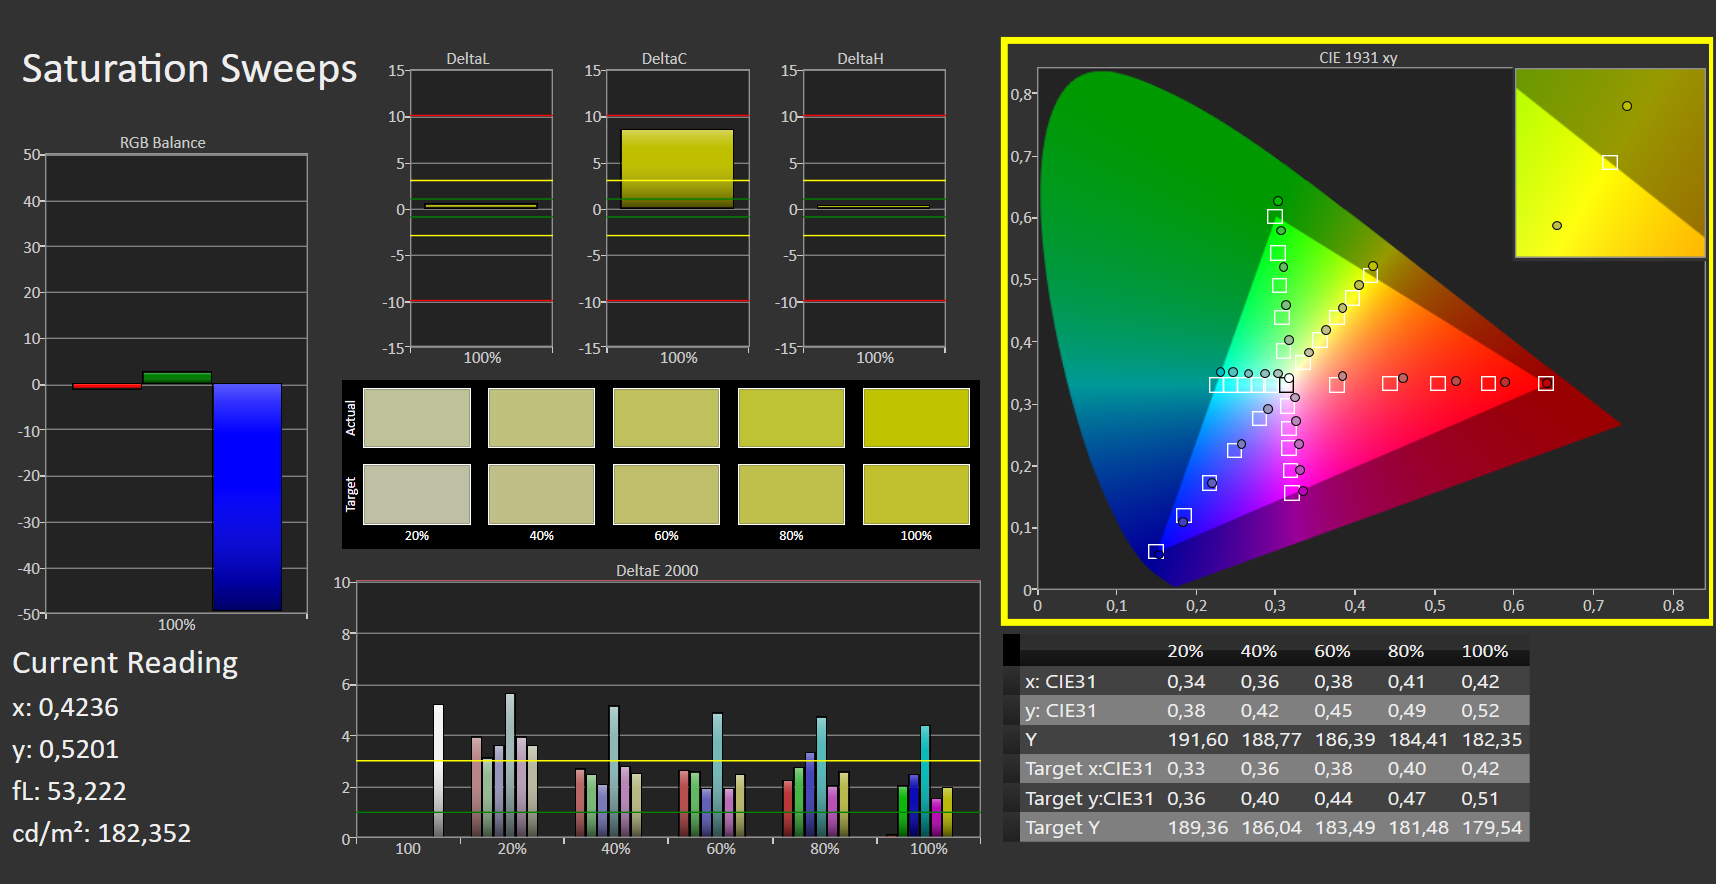
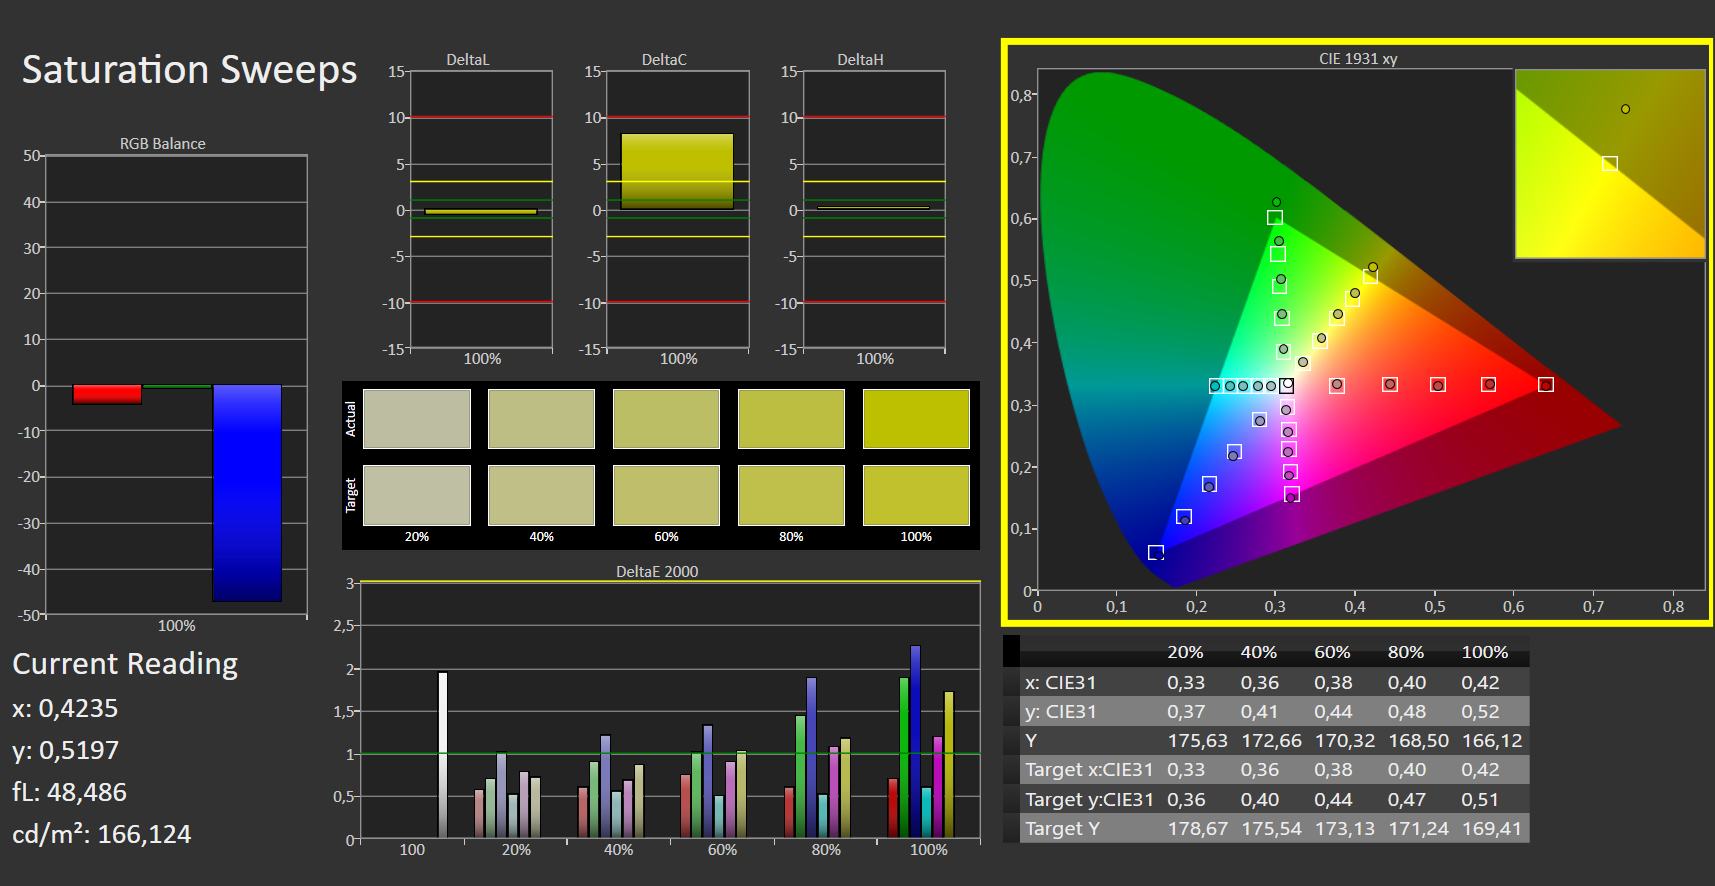
图像质量持续良好。尽管表面是哑光的,但没有发现颗粒感。与sRGB色彩空间相比,测得的灰度和色彩的Delta E-2000值很好,尽管没有完全达到3的目标值。与我们的对比设备相比,Legion 5 15是这里最好的一个。经过手动校准,我们能够大大改善这些数值。

Display Response Times
| ↔ Response Time Black to White | ||
|---|---|---|
| 6 ms ... rise ↗ and fall ↘ combined | ↗ 2 ms rise |  |
| ↘ 4 ms fall | ||
| The screen shows very fast response rates in our tests and should be very well suited for fast-paced gaming. In comparison, all tested devices range from 0.1 (minimum) to 240 (maximum) ms. » 19 % of all devices are better. This means that the measured response time is better than the average of all tested devices (19.8 ms). | ||
| ↔ Response Time 50% Grey to 80% Grey | ||
| 15 ms ... rise ↗ and fall ↘ combined | ↗ 7 ms rise |  |
| ↘ 8 ms fall | ||
| The screen shows good response rates in our tests, but may be too slow for competitive gamers. In comparison, all tested devices range from 0.165 (minimum) to 636 (maximum) ms. » 29 % of all devices are better. This means that the measured response time is better than the average of all tested devices (30.9 ms). | ||
Screen Flickering / PWM (Pulse-Width Modulation)
| Screen flickering / PWM not detected |  | ||
In comparison: 52 % of all tested devices do not use PWM to dim the display. If PWM was detected, an average of 7741 (minimum: 5 - maximum: 343500) Hz was measured. | |||
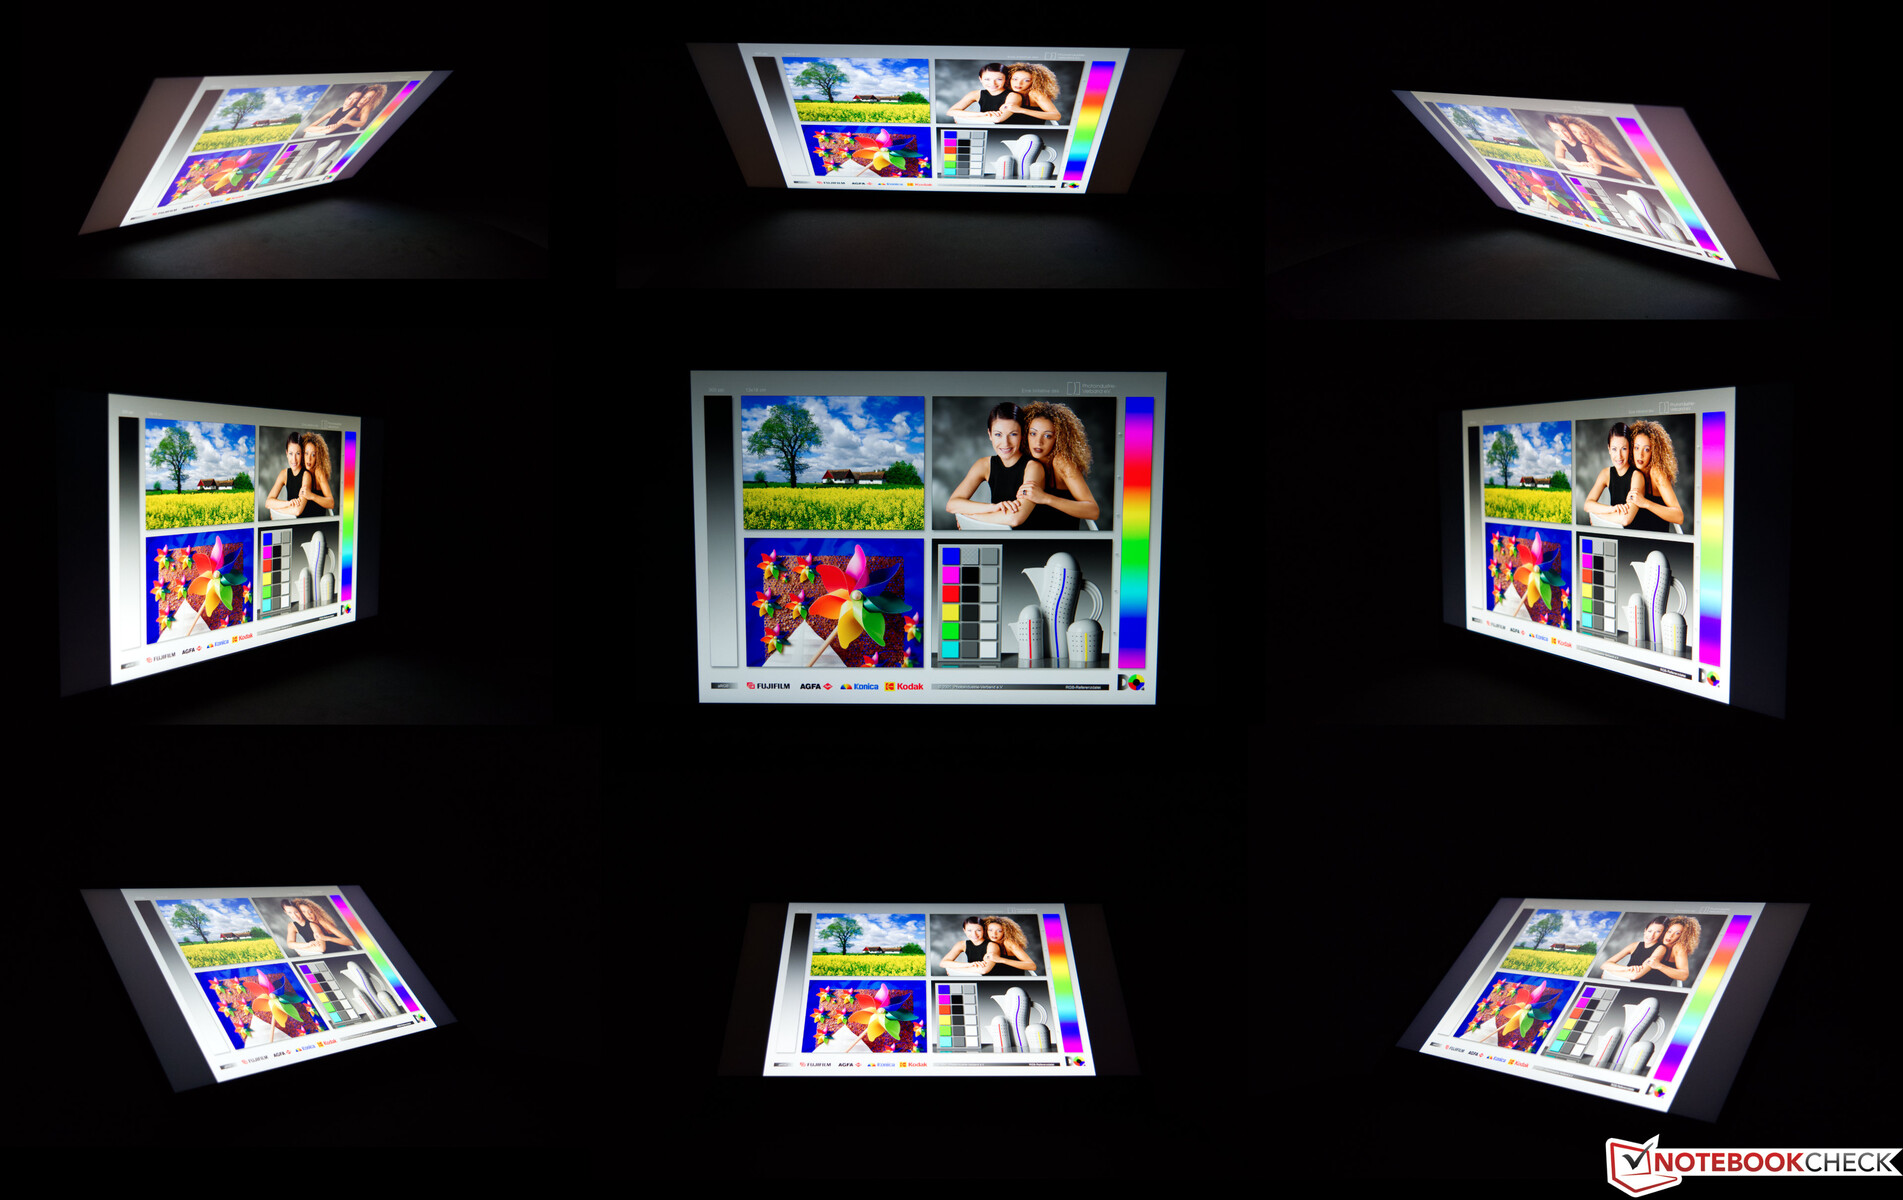
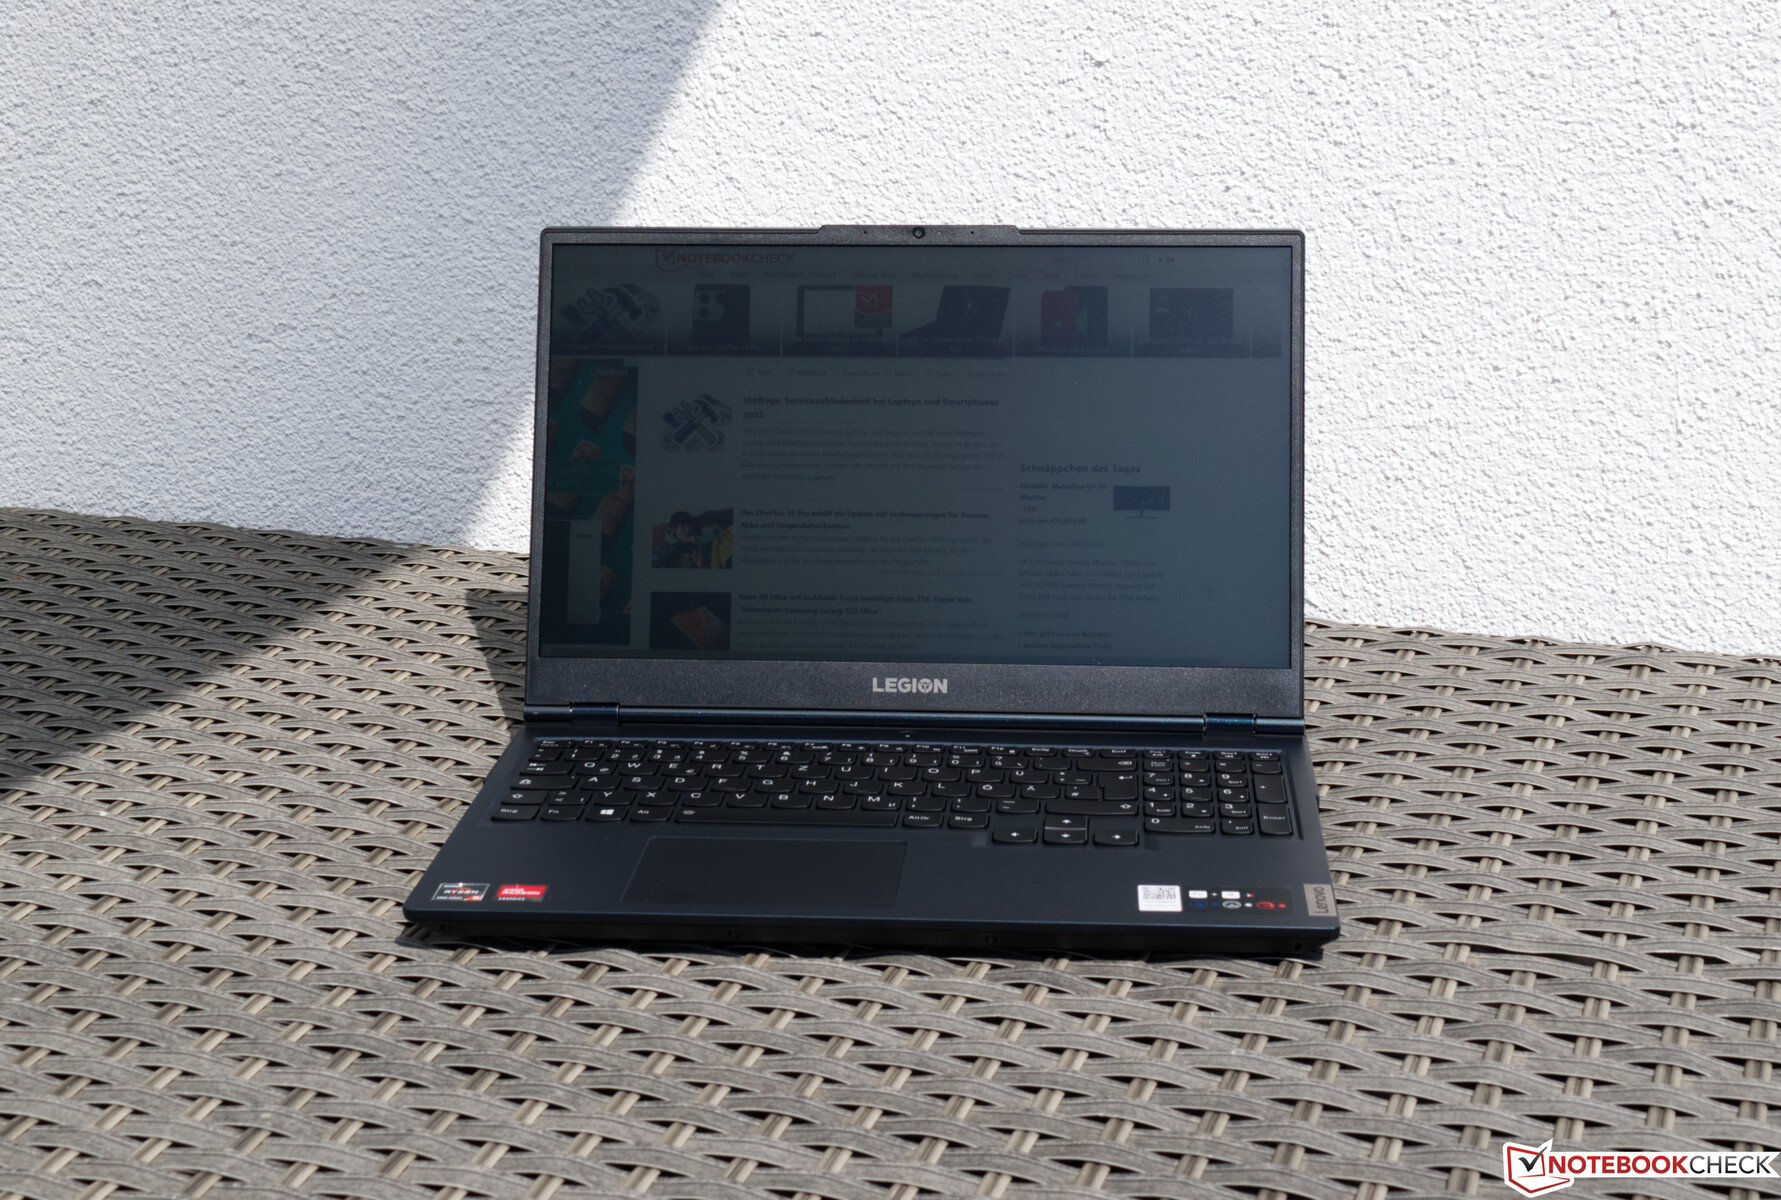
想在阳台上使用联想Legion 5 15的人应该找一个阴凉的地方。在可视角度测试中没有发现任何异常情况。在这里,我们有一个典型的IPS显示屏,在角落的四个图像中出现了最小的雾化。但在正常使用过程中没有这种情况,只有在非常平坦的视角下才会明显。
业绩
那些寻找游戏笔记本的人应该首先看一下性能和价格。联想将其对所提供测试设备性能的信心完全寄托在AMD身上。CPU和GPU都来自AMD,它们共同构成了一个具有坚实性能的体面组合。另外,你也可以获得一个带有Nvidia GPU的变体。然而,为此,你必须在你的钱包里挖得更深一点。
测试条件
在预装的联想Vantage中心,用户可以对系统设置进行各种修改。例如,可以根据预定义的电源选项调整某些组件的性能。所有的基准测试都是用 "电源模式 "配置文件进行的。注意:电源模式只能在连接了电源的情况下使用。
处理器
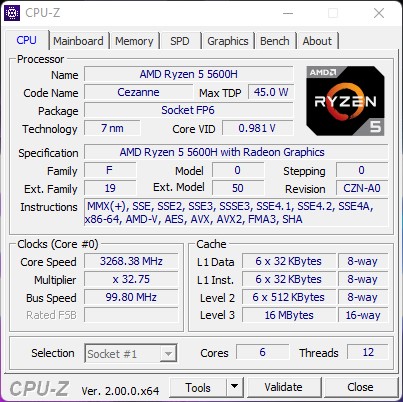
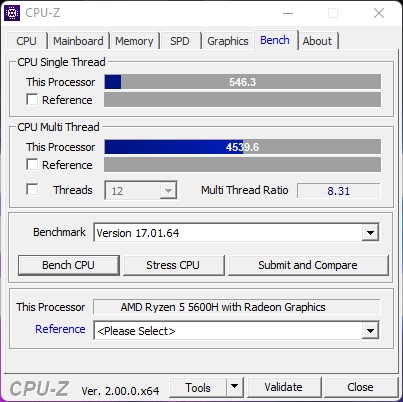
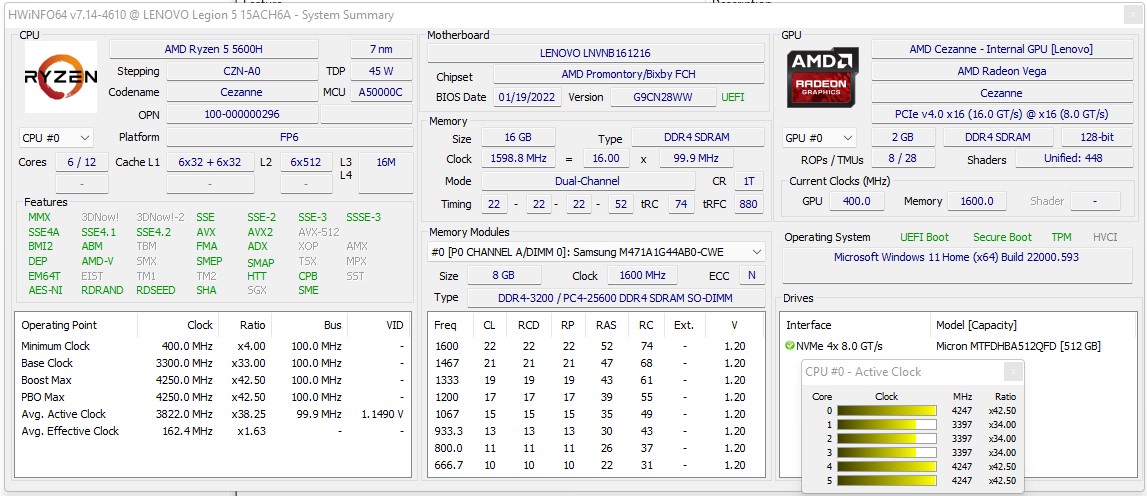
联想Legion 5 15配备了一个 AMD Ryzen 5600H.它有六个核心和十二个线程,为日常使用提供了坚实的性能。然而,我们测试设备的性能产量略低于平均水平。
我们的联想Legion 5 15在负载测试中表现相对较好,我们用Cinebench R15多循环进行了测试。性能在整个过程中保持稳定,没有观察到性能下降的情况。
进一步的比较和基准测试可以在我们的 CPU比较表如下.
CineBench R15 Multi Sustained Load
Cinebench R23: Multi Core | Single Core
Cinebench R20: CPU (Multi Core) | CPU (Single Core)
Cinebench R15: CPU Multi 64Bit | CPU Single 64Bit
Blender: v2.79 BMW27 CPU
7-Zip 18.03: 7z b 4 | 7z b 4 -mmt1
Geekbench 5.5: Multi-Core | Single-Core
HWBOT x265 Benchmark v2.2: 4k Preset
LibreOffice : 20 Documents To PDF
R Benchmark 2.5: Overall mean
| CPU Performance rating | |
| Average of class Gaming | |
| Asus TUF Gaming F15 FX506HM -2! | |
| Medion Erazer Deputy P25 | |
| HP Victus 16-e0179ng | |
| Dell G15 5515 | |
| Lenovo Legion 5 15ACH6A-82NW0010GE | |
| Average AMD Ryzen 5 5600H | |
| Gigabyte G5 KC | |
| Cinebench R23 / Multi Core | |
| Average of class Gaming (10488 - 42661, n=104, last 2 years) | |
| Asus TUF Gaming F15 FX506HM | |
| Medion Erazer Deputy P25 | |
| Dell G15 5515 | |
| Lenovo Legion 5 15ACH6A-82NW0010GE | |
| HP Victus 16-e0179ng | |
| Average AMD Ryzen 5 5600H (7945 - 10416, n=13) | |
| Gigabyte G5 KC | |
| Cinebench R23 / Single Core | |
| Average of class Gaming (1601 - 2415, n=104, last 2 years) | |
| Asus TUF Gaming F15 FX506HM | |
| Medion Erazer Deputy P25 | |
| Dell G15 5515 | |
| HP Victus 16-e0179ng | |
| Lenovo Legion 5 15ACH6A-82NW0010GE | |
| Average AMD Ryzen 5 5600H (1316 - 1381, n=13) | |
| Gigabyte G5 KC | |
| Cinebench R20 / CPU (Multi Core) | |
| Average of class Gaming (4029 - 16433, n=103, last 2 years) | |
| Asus TUF Gaming F15 FX506HM | |
| Medion Erazer Deputy P25 | |
| Dell G15 5515 | |
| HP Victus 16-e0179ng | |
| Lenovo Legion 5 15ACH6A-82NW0010GE | |
| Average AMD Ryzen 5 5600H (3074 - 4059, n=16) | |
| Gigabyte G5 KC | |
| Cinebench R20 / CPU (Single Core) | |
| Average of class Gaming (622 - 913, n=103, last 2 years) | |
| Asus TUF Gaming F15 FX506HM | |
| Medion Erazer Deputy P25 | |
| Dell G15 5515 | |
| HP Victus 16-e0179ng | |
| Lenovo Legion 5 15ACH6A-82NW0010GE | |
| Average AMD Ryzen 5 5600H (527 - 538, n=15) | |
| Gigabyte G5 KC | |
| Cinebench R15 / CPU Multi 64Bit | |
| Average of class Gaming (1578 - 6330, n=102, last 2 years) | |
| Asus TUF Gaming F15 FX506HM | |
| Medion Erazer Deputy P25 | |
| HP Victus 16-e0179ng | |
| Dell G15 5515 | |
| Lenovo Legion 5 15ACH6A-82NW0010GE | |
| Average AMD Ryzen 5 5600H (1319 - 1723, n=16) | |
| Gigabyte G5 KC | |
| Cinebench R15 / CPU Single 64Bit | |
| Average of class Gaming (188.8 - 350, n=103, last 2 years) | |
| HP Victus 16-e0179ng | |
| Medion Erazer Deputy P25 | |
| Asus TUF Gaming F15 FX506HM | |
| Dell G15 5515 | |
| Lenovo Legion 5 15ACH6A-82NW0010GE | |
| Average AMD Ryzen 5 5600H (218 - 225, n=14) | |
| Gigabyte G5 KC | |
| Blender / v2.79 BMW27 CPU | |
| Gigabyte G5 KC | |
| Average AMD Ryzen 5 5600H (300 - 384, n=14) | |
| Lenovo Legion 5 15ACH6A-82NW0010GE | |
| Dell G15 5515 | |
| HP Victus 16-e0179ng | |
| Medion Erazer Deputy P25 | |
| Asus TUF Gaming F15 FX506HM | |
| Average of class Gaming (79 - 330, n=101, last 2 years) | |
| 7-Zip 18.03 / 7z b 4 | |
| Average of class Gaming (33491 - 148086, n=102, last 2 years) | |
| HP Victus 16-e0179ng | |
| Medion Erazer Deputy P25 | |
| Dell G15 5515 | |
| Asus TUF Gaming F15 FX506HM | |
| Lenovo Legion 5 15ACH6A-82NW0010GE | |
| Average AMD Ryzen 5 5600H (36315 - 46562, n=14) | |
| Gigabyte G5 KC | |
| 7-Zip 18.03 / 7z b 4 -mmt1 | |
| Average of class Gaming (4824 - 7436, n=102, last 2 years) | |
| Asus TUF Gaming F15 FX506HM | |
| HP Victus 16-e0179ng | |
| Dell G15 5515 | |
| Medion Erazer Deputy P25 | |
| Average AMD Ryzen 5 5600H (5213 - 5446, n=14) | |
| Lenovo Legion 5 15ACH6A-82NW0010GE | |
| Gigabyte G5 KC | |
| Geekbench 5.5 / Multi-Core | |
| Average of class Gaming (6460 - 28263, n=102, last 2 years) | |
| HP Victus 16-e0179ng | |
| Dell G15 5515 | |
| Medion Erazer Deputy P25 | |
| Lenovo Legion 5 15ACH6A-82NW0010GE | |
| Average AMD Ryzen 5 5600H (4990 - 7253, n=14) | |
| Gigabyte G5 KC | |
| Gigabyte G5 KC | |
| Geekbench 5.5 / Single-Core | |
| Average of class Gaming (1403 - 2474, n=102, last 2 years) | |
| Medion Erazer Deputy P25 | |
| Dell G15 5515 | |
| HP Victus 16-e0179ng | |
| Lenovo Legion 5 15ACH6A-82NW0010GE | |
| Average AMD Ryzen 5 5600H (1365 - 1445, n=14) | |
| Gigabyte G5 KC | |
| Gigabyte G5 KC | |
| HWBOT x265 Benchmark v2.2 / 4k Preset | |
| Average of class Gaming (11.5 - 44.4, n=102, last 2 years) | |
| Asus TUF Gaming F15 FX506HM | |
| HP Victus 16-e0179ng | |
| Medion Erazer Deputy P25 | |
| Dell G15 5515 | |
| Lenovo Legion 5 15ACH6A-82NW0010GE | |
| Average AMD Ryzen 5 5600H (9.92 - 13.3, n=14) | |
| Gigabyte G5 KC | |
| LibreOffice / 20 Documents To PDF | |
| Dell G15 5515 | |
| Average AMD Ryzen 5 5600H (52.2 - 81.5, n=14) | |
| Medion Erazer Deputy P25 | |
| HP Victus 16-e0179ng | |
| Lenovo Legion 5 15ACH6A-82NW0010GE | |
| Gigabyte G5 KC | |
| Average of class Gaming (33.2 - 88.8, n=102, last 2 years) | |
| Asus TUF Gaming F15 FX506HM | |
| R Benchmark 2.5 / Overall mean | |
| Gigabyte G5 KC | |
| Asus TUF Gaming F15 FX506HM | |
| Average AMD Ryzen 5 5600H (0.526 - 0.596, n=14) | |
| Lenovo Legion 5 15ACH6A-82NW0010GE | |
| Medion Erazer Deputy P25 | |
| HP Victus 16-e0179ng | |
| Dell G15 5515 | |
| Average of class Gaming (0.3439 - 0.59, n=102, last 2 years) | |
* ... smaller is better
AIDA64: FP32 Ray-Trace | FPU Julia | CPU SHA3 | CPU Queen | FPU SinJulia | FPU Mandel | CPU AES | CPU ZLib | FP64 Ray-Trace | CPU PhotoWorxx
| Performance rating | |
| Average of class Gaming | |
| HP Victus 16-e0179ng | |
| Dell G15 5515 | |
| Medion Erazer Deputy P25 | |
| Lenovo Legion 5 15ACH6A-82NW0010GE | |
| Average AMD Ryzen 5 5600H | |
| Gigabyte G5 KC | |
| Asus TUF Gaming F15 FX506HM -9! | |
| AIDA64 / FP32 Ray-Trace | |
| Average of class Gaming (10227 - 85542, n=102, last 2 years) | |
| Medion Erazer Deputy P25 | |
| HP Victus 16-e0179ng | |
| Dell G15 5515 | |
| Lenovo Legion 5 15ACH6A-82NW0010GE | |
| Average AMD Ryzen 5 5600H (9181 - 12636, n=14) | |
| Gigabyte G5 KC | |
| AIDA64 / FPU Julia | |
| Average of class Gaming (51376 - 372155, n=102, last 2 years) | |
| Medion Erazer Deputy P25 | |
| HP Victus 16-e0179ng | |
| Dell G15 5515 | |
| Lenovo Legion 5 15ACH6A-82NW0010GE | |
| Average AMD Ryzen 5 5600H (51994 - 78250, n=14) | |
| Gigabyte G5 KC | |
| AIDA64 / CPU SHA3 | |
| Average of class Gaming (2180 - 10115, n=102, last 2 years) | |
| Medion Erazer Deputy P25 | |
| HP Victus 16-e0179ng | |
| Dell G15 5515 | |
| Lenovo Legion 5 15ACH6A-82NW0010GE | |
| Average AMD Ryzen 5 5600H (1587 - 2675, n=14) | |
| Gigabyte G5 KC | |
| AIDA64 / CPU Queen | |
| Average of class Gaming (49785 - 173351, n=86, last 2 years) | |
| Medion Erazer Deputy P25 | |
| HP Victus 16-e0179ng | |
| Dell G15 5515 | |
| Lenovo Legion 5 15ACH6A-82NW0010GE | |
| Average AMD Ryzen 5 5600H (66699 - 77213, n=14) | |
| Gigabyte G5 KC | |
| AIDA64 / FPU SinJulia | |
| Average of class Gaming (4424 - 33636, n=102, last 2 years) | |
| Medion Erazer Deputy P25 | |
| Dell G15 5515 | |
| HP Victus 16-e0179ng | |
| Lenovo Legion 5 15ACH6A-82NW0010GE | |
| Average AMD Ryzen 5 5600H (8340 - 9159, n=14) | |
| Gigabyte G5 KC | |
| AIDA64 / FPU Mandel | |
| Average of class Gaming (25115 - 196829, n=102, last 2 years) | |
| Medion Erazer Deputy P25 | |
| HP Victus 16-e0179ng | |
| Dell G15 5515 | |
| Lenovo Legion 5 15ACH6A-82NW0010GE | |
| Average AMD Ryzen 5 5600H (28268 - 43274, n=14) | |
| Gigabyte G5 KC | |
| AIDA64 / CPU AES | |
| HP Victus 16-e0179ng | |
| Dell G15 5515 | |
| Average of class Gaming (39258 - 247074, n=102, last 2 years) | |
| Lenovo Legion 5 15ACH6A-82NW0010GE | |
| Average AMD Ryzen 5 5600H (39852 - 98939, n=14) | |
| Medion Erazer Deputy P25 | |
| Gigabyte G5 KC | |
| AIDA64 / CPU ZLib | |
| Average of class Gaming (574 - 2531, n=102, last 2 years) | |
| Medion Erazer Deputy P25 | |
| HP Victus 16-e0179ng | |
| Dell G15 5515 | |
| Lenovo Legion 5 15ACH6A-82NW0010GE | |
| Average AMD Ryzen 5 5600H (507 - 649, n=14) | |
| Gigabyte G5 KC | |
| Asus TUF Gaming F15 FX506HM | |
| AIDA64 / FP64 Ray-Trace | |
| Average of class Gaming (5509 - 45446, n=102, last 2 years) | |
| Medion Erazer Deputy P25 | |
| HP Victus 16-e0179ng | |
| Dell G15 5515 | |
| Lenovo Legion 5 15ACH6A-82NW0010GE | |
| Average AMD Ryzen 5 5600H (4811 - 6652, n=14) | |
| Gigabyte G5 KC | |
| AIDA64 / CPU PhotoWorxx | |
| Average of class Gaming (12271 - 89891, n=102, last 2 years) | |
| Gigabyte G5 KC | |
| HP Victus 16-e0179ng | |
| Average AMD Ryzen 5 5600H (7419 - 24746, n=14) | |
| Lenovo Legion 5 15ACH6A-82NW0010GE | |
| Dell G15 5515 | |
| Medion Erazer Deputy P25 | |
系统性能
与之前的CPU基准测试不同,联想Legion 5 15在原始系统性能方面留下了非常好的印象。与竞争对手相比,我们的测试设备几乎总是处于领先地位,但对接近的竞争对手的领先优势只是微不足道。尽管如此,我们的测试设备在这一学科上超过了同类平均水平。
| PCMark 10 / Score | |
| Average of class Gaming (5828 - 12414, n=93, last 2 years) | |
| Lenovo Legion 5 15ACH6A-82NW0010GE | |
| Average AMD Ryzen 5 5600H, AMD Radeon RX 6600M (n=1) | |
| Asus TUF Gaming F15 FX506HM | |
| Medion Erazer Deputy P25 | |
| HP Victus 16-e0179ng | |
| Dell G15 5515 | |
| Gigabyte G5 KC | |
| PCMark 10 / Essentials | |
| Average of class Gaming (8810 - 11935, n=97, last 2 years) | |
| Asus TUF Gaming F15 FX506HM | |
| Lenovo Legion 5 15ACH6A-82NW0010GE | |
| Average AMD Ryzen 5 5600H, AMD Radeon RX 6600M (n=1) | |
| HP Victus 16-e0179ng | |
| Medion Erazer Deputy P25 | |
| Dell G15 5515 | |
| Gigabyte G5 KC | |
| PCMark 10 / Productivity | |
| Average of class Gaming (6845 - 25323, n=95, last 2 years) | |
| Lenovo Legion 5 15ACH6A-82NW0010GE | |
| Average AMD Ryzen 5 5600H, AMD Radeon RX 6600M (n=1) | |
| HP Victus 16-e0179ng | |
| Medion Erazer Deputy P25 | |
| Asus TUF Gaming F15 FX506HM | |
| Dell G15 5515 | |
| Gigabyte G5 KC | |
| PCMark 10 / Digital Content Creation | |
| Average of class Gaming (7602 - 19954, n=95, last 2 years) | |
| Lenovo Legion 5 15ACH6A-82NW0010GE | |
| Average AMD Ryzen 5 5600H, AMD Radeon RX 6600M (n=1) | |
| Asus TUF Gaming F15 FX506HM | |
| Medion Erazer Deputy P25 | |
| HP Victus 16-e0179ng | |
| Gigabyte G5 KC | |
| Dell G15 5515 | |
| PCMark 10 Score | 7091 points | |
Help | ||
| AIDA64 / Memory Copy | |
| Average of class Gaming (21750 - 129946, n=102, last 2 years) | |
| HP Victus 16-e0179ng | |
| Dell G15 5515 | |
| Medion Erazer Deputy P25 | |
| Average AMD Ryzen 5 5600H (20549 - 42141, n=14) | |
| Lenovo Legion 5 15ACH6A-82NW0010GE | |
| Gigabyte G5 KC | |
| AIDA64 / Memory Read | |
| Average of class Gaming (22956 - 118858, n=102, last 2 years) | |
| HP Victus 16-e0179ng | |
| Dell G15 5515 | |
| Average AMD Ryzen 5 5600H (22917 - 47595, n=14) | |
| Lenovo Legion 5 15ACH6A-82NW0010GE | |
| Medion Erazer Deputy P25 | |
| Gigabyte G5 KC | |
| AIDA64 / Memory Write | |
| Average of class Gaming (22297 - 135096, n=102, last 2 years) | |
| Gigabyte G5 KC | |
| Medion Erazer Deputy P25 | |
| HP Victus 16-e0179ng | |
| Average AMD Ryzen 5 5600H (20226 - 44872, n=14) | |
| Dell G15 5515 | |
| Lenovo Legion 5 15ACH6A-82NW0010GE | |
| AIDA64 / Memory Latency | |
| Average of class Gaming (75.3 - 165.4, n=102, last 2 years) | |
| Lenovo Legion 5 15ACH6A-82NW0010GE | |
| HP Victus 16-e0179ng | |
| Medion Erazer Deputy P25 | |
| Average AMD Ryzen 5 5600H (75 - 89.1, n=14) | |
| Dell G15 5515 | |
| Gigabyte G5 KC | |
| Asus TUF Gaming F15 FX506HM | |
* ... smaller is better
DPC延迟
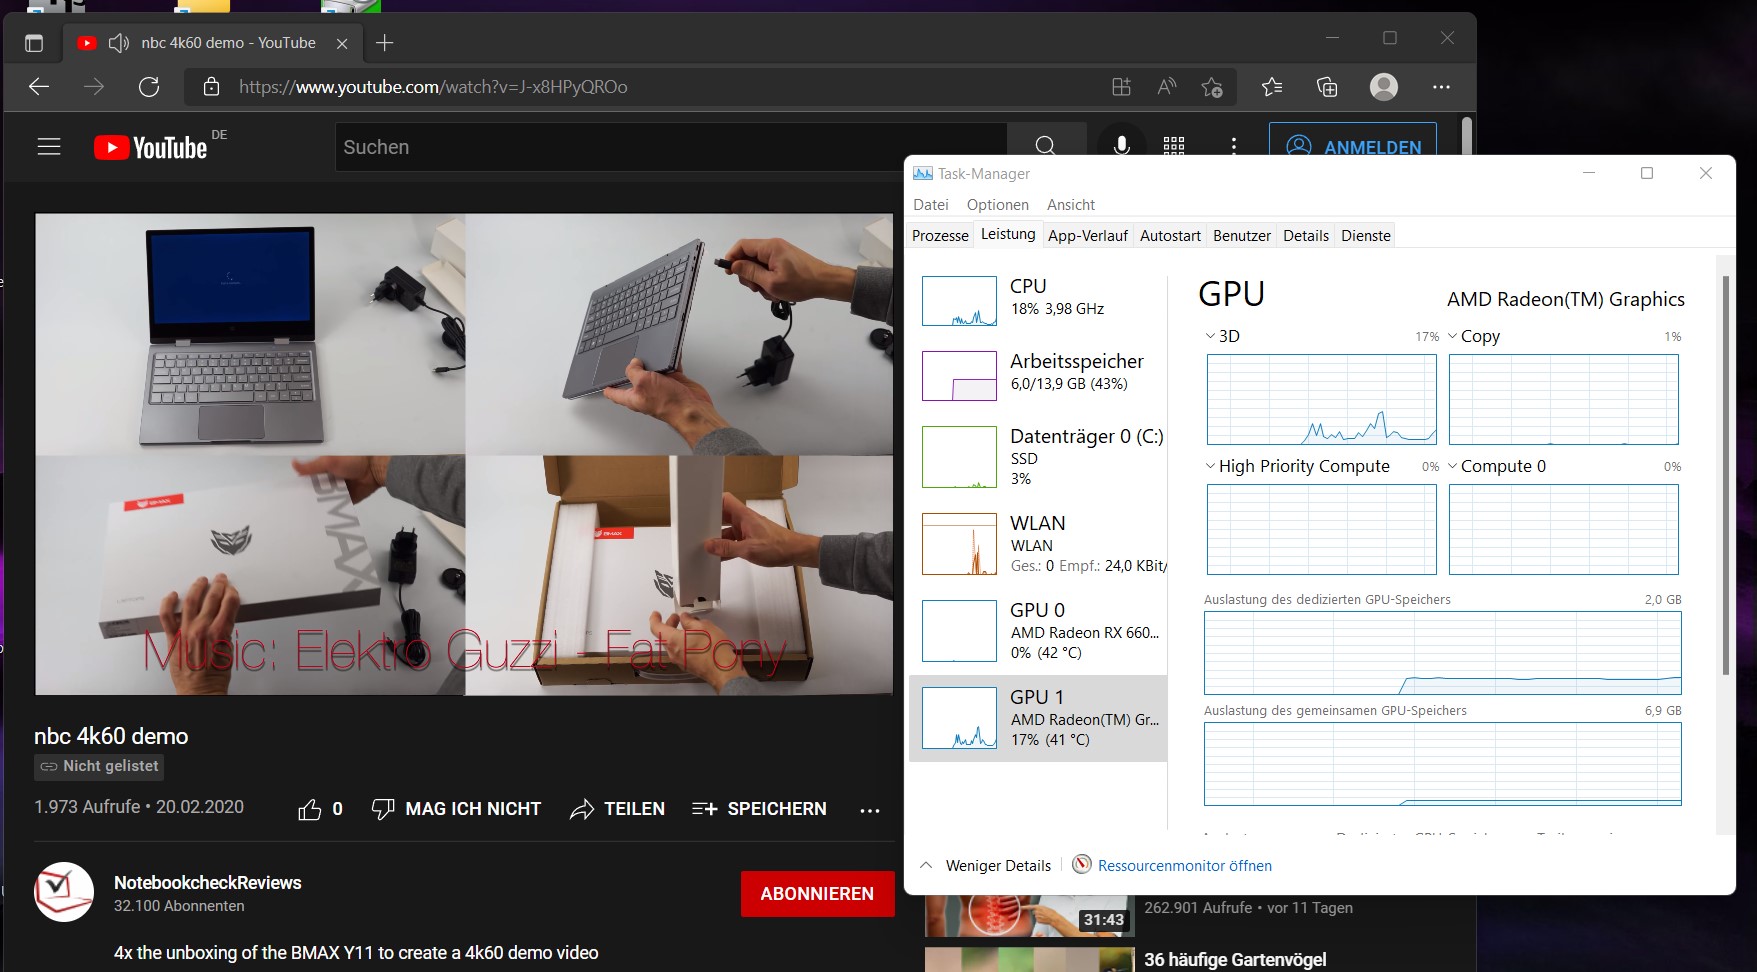
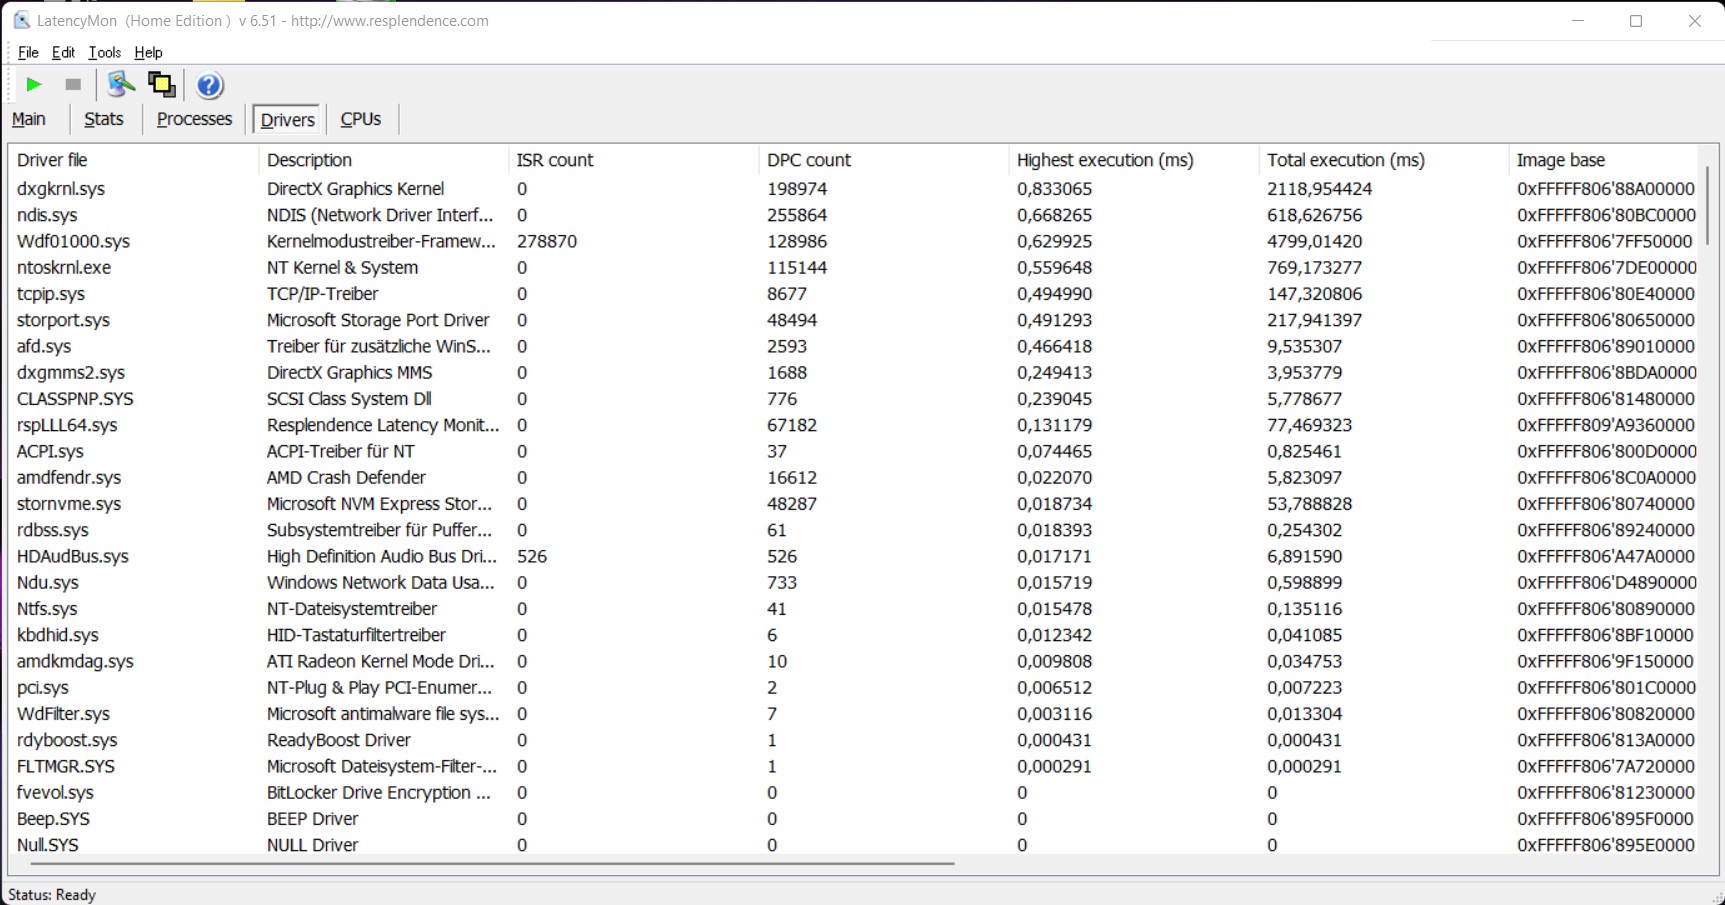
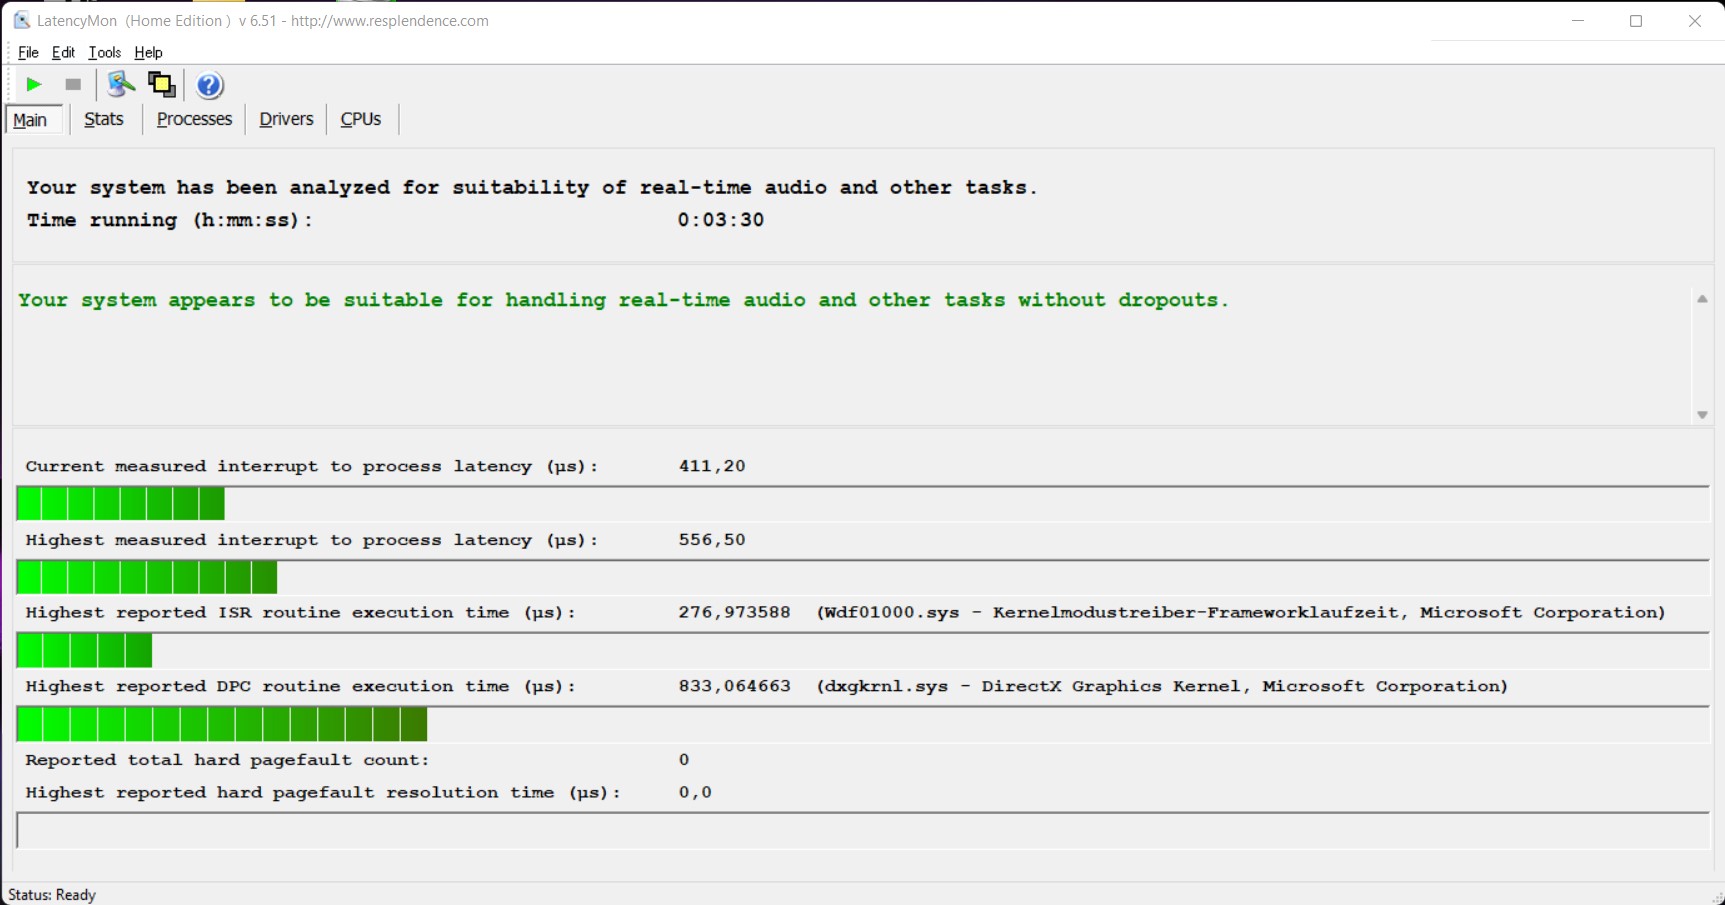
联想Legion 5 15在Edge中打开多个浏览器标签和播放4K YouTube视频都没有问题。LatencyMon没有记录任何增加的延迟。iGPU的负载最小,约为20%。
| DPC Latencies / LatencyMon - interrupt to process latency (max), Web, Youtube, Prime95 | |
| Medion Erazer Deputy P25 | |
| Asus TUF Gaming F15 FX506HM | |
| HP Victus 16-e0179ng | |
| Lenovo Legion 5 15ACH6A-82NW0010GE | |
| Dell G15 5515 | |
| Gigabyte G5 KC | |
* ... smaller is better
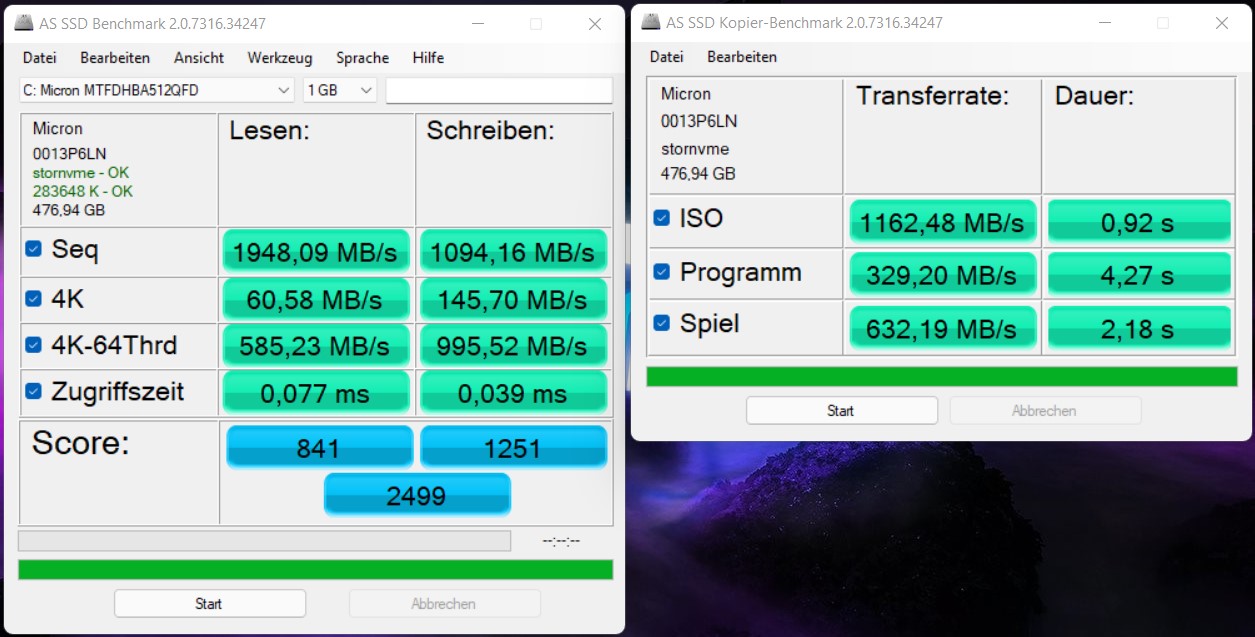
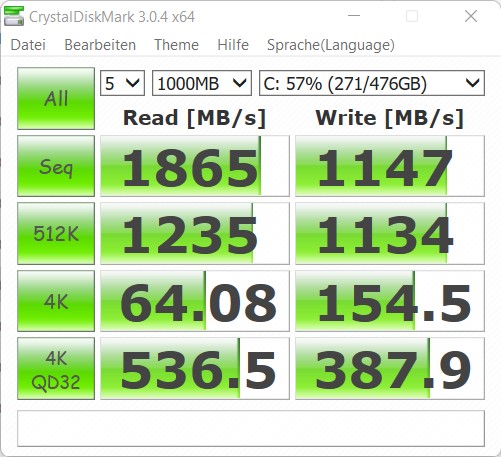
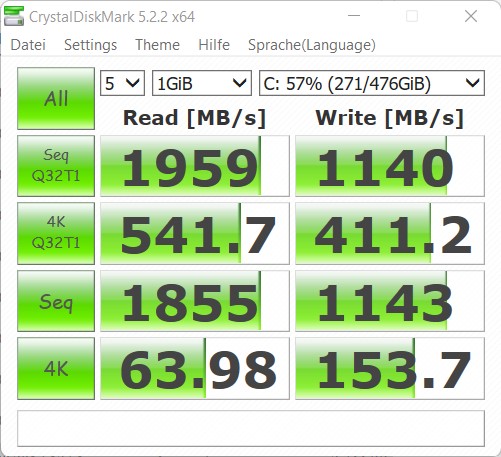
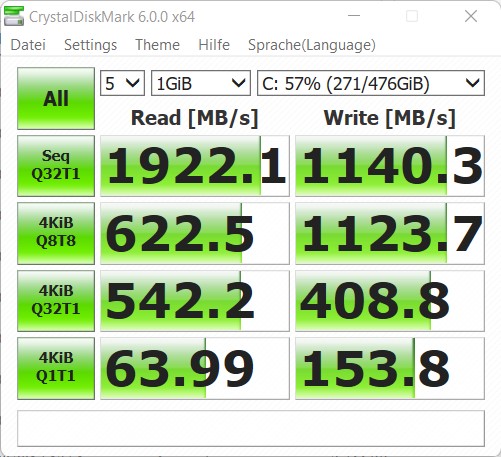
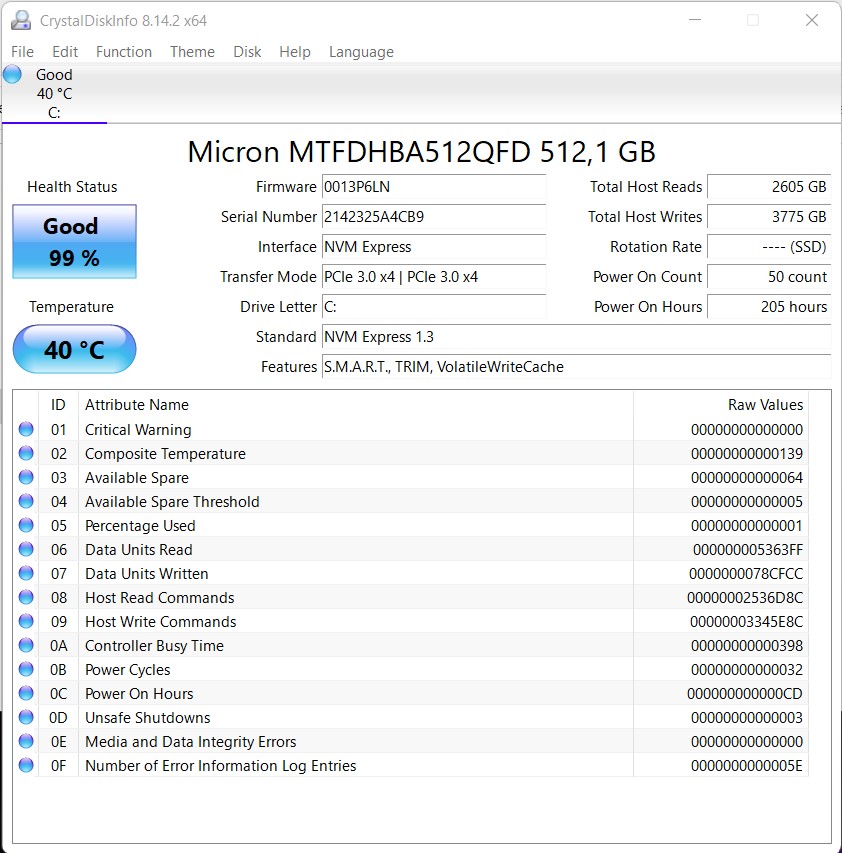
存储设备
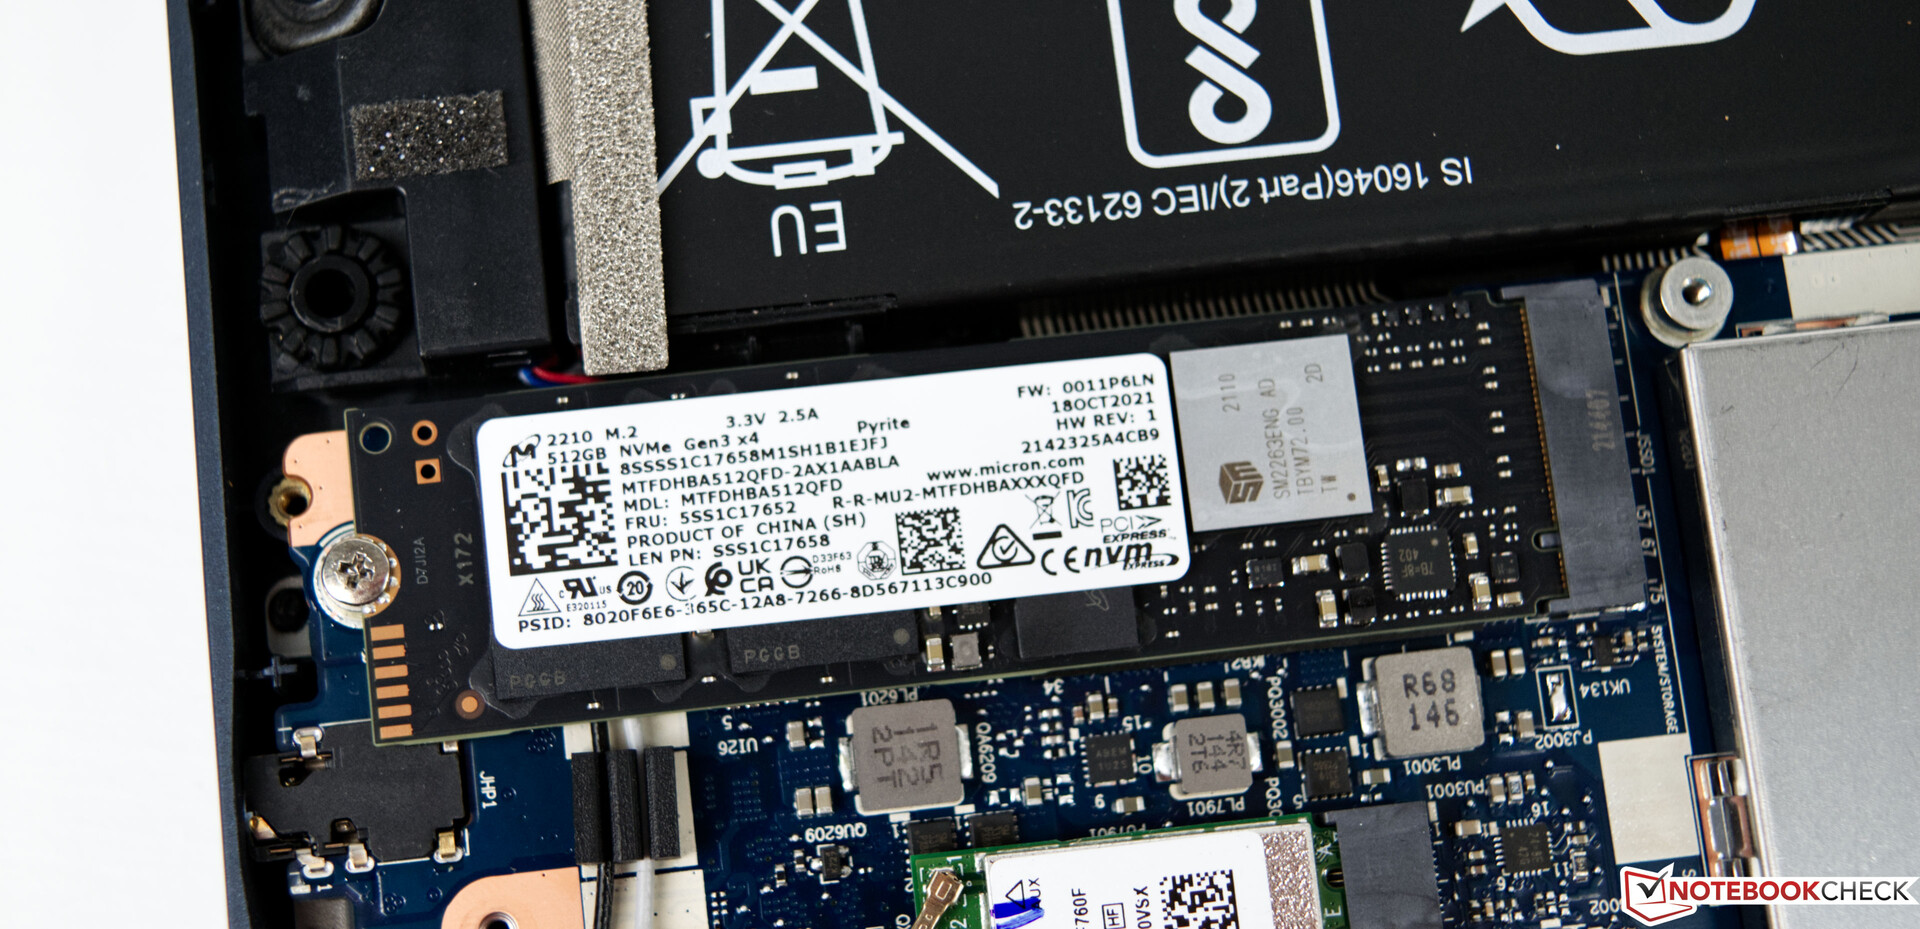
联想在我们的测试设备中安装了美光公司的512GB固态硬盘。然而,512GB的存储空间对于一台游戏笔记本来说并不是很慷慨,我们期望至少有1TB。因此,联想Legion 5 15在这里没有对其他竞争对手构成威胁,甚至在设备级别上落后。
进一步的比较和基准可以在我们下面的比较表中看到。

* ... smaller is better
Sustained Read: DiskSpd Read Loop, Queue Depth 8
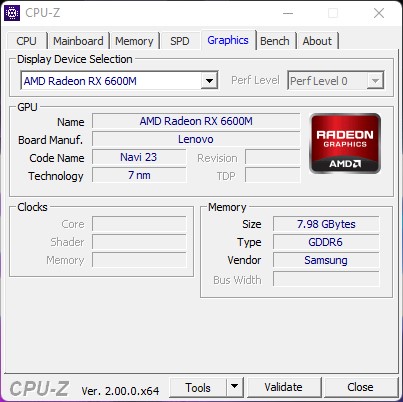
GPU
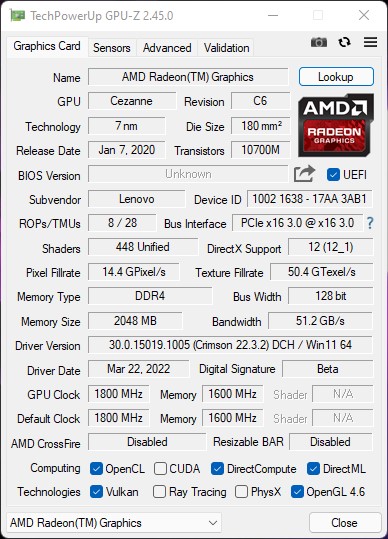
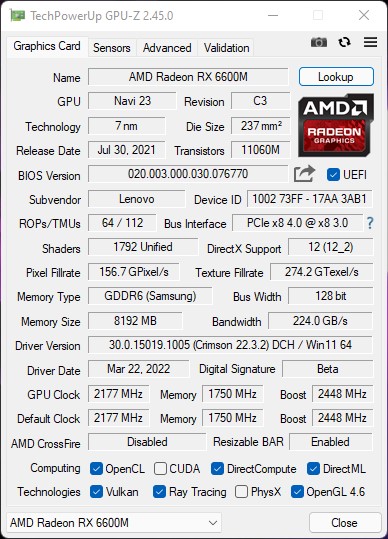
除了CPU之外,GPU对3D性能至关重要,这是游戏笔记本的一个决定性标准。联想Legion 5 15ACH6A采用了AMD的新中端显卡,即 AMD Radeon RX 6600M.这是基于目前的RDNA 2架构,其TDP高达100瓦。然而,在负载下,我们经常登记的消耗值在90瓦左右趋于平稳。对于要求不高的任务,也有iGPU的形式,即 Radeon RX Vega 8.
在第一张性能对比图中,我们的联想Legion 5 15获得第一名。使用NvidiaGeForce RTX 3060笔记本的对比设备几乎都有超强的表现。与AMD Radeon RX 6700M相比,约9%的性能差距是可以预期的。整体而言,AMD Radeon RX 6600M的性能介于NvidiaGeForce RTX 3060笔记本电脑和NvidiaGeForce RTX 3070笔记本电脑之间。
关于进一步的比较和基准,请参考我们的 下面的GPU比较表.
| 3DMark 05 Standard | 44004 points | |
| 3DMark 06 Standard Score | 43447 points | |
| 3DMark Vantage P Result | 68792 points | |
| 3DMark 11 Performance | 23141 points | |
| 3DMark Ice Storm Standard Score | 148265 points | |
| 3DMark Cloud Gate Standard Score | 44854 points | |
| 3DMark Fire Strike Score | 20992 points | |
| 3DMark Fire Strike Extreme Score | 10383 points | |
| 3DMark Time Spy Score | 8013 points | |
Help | ||
游戏性能
在原始游戏性能方面,联想Legion 5 15,其 AMD Radeon RX 6600M由于CPU性能的限制,无法发挥其最大潜力。尽管如此,目前所有的游戏都可以在联想Legion 5 15上玩,没有问题。只有在FarCry 6中,在最大细节下,平均FPS远远低于60大关。
在压力测试中,我们在超级设置下玩Witcher 3 ,性能相对稳定。即使经过长时间的游戏,性能下降和无法播放的帧率也是不可预期的。
Witcher 3 FPS diagram
| low | med. | high | ultra | |
|---|---|---|---|---|
| GTA V (2015) | 167.4 | 158.4 | 130.2 | 73.8 |
| The Witcher 3 (2015) | 255 | 194 | 141 | 81.3 |
| Dota 2 Reborn (2015) | 132.7 | 118 | 110.2 | 104 |
| Rise of the Tomb Raider (2016) | 205 | 161.2 | 121.4 | 95.9 |
| Final Fantasy XV Benchmark (2018) | 138.5 | 104.5 | 78.4 | |
| X-Plane 11.11 (2018) | 64.7 | 50.7 | 45.1 | |
| Far Cry 5 (2018) | 110 | 97 | 93 | 86 |
| Strange Brigade (2018) | 309 | 188.1 | 170 | 151 |
| Shadow of the Tomb Raider (2018) | 135.7 | 117.5 | 114.2 | 105.4 |
| Far Cry New Dawn (2019) | 86 | 76 | 73 | 67 |
| Metro Exodus (2019) | 151.2 | 104.3 | 79.8 | 62.3 |
| Control (2019) | 204 | 93.6 | 69.7 | |
| Borderlands 3 (2019) | 98.8 | 87.7 | 78.8 | 64.5 |
| F1 2020 (2020) | 247 | 188 | 173.5 | 128 |
| Death Stranding (2020) | 126.9 | 122.4 | 115.1 | 111.2 |
| Mafia Definitive Edition (2020) | 96.9 | 85.4 | 79.2 | |
| F1 2021 (2021) | 268 | 194.2 | 174.4 | 95.9 |
| Alan Wake Remastered (2021) | 124.5 | 121.4 | ||
| Far Cry 6 (2021) | 105.6 | 88.1 | 80.5 | 51.6 |
| Guardians of the Galaxy (2021) | 88 | 87 | 86 | 86 |
| Riders Republic (2021) | 89 | 83 | 77 | 76 |
| Forza Horizon 5 (2021) | 154 | 116 | 110 | 89 |
| Farming Simulator 22 (2021) | 170.1 | 134.5 | 119.4 | 112.8 |
| God of War (2022) | 69.7 | 68.1 | 63.6 | 54.2 |
| Rainbow Six Extraction (2022) | 141 | 126 | 120 | 94 |
| Dying Light 2 (2022) | 104.7 | 77.6 | 61.5 | |
| GRID Legends (2022) | 166 | 155 | 133 | 105 |
| Cyberpunk 2077 1.6 (2022) | 111.8 | 98.1 | 75.1 | 60.7 |
| Elex 2 (2022) | 70.8 | 71.4 | 67.6 | 66.1 |
排放
噪声
那些选择游戏笔记本的人,在噪音水平方面需要比性能较差的办公笔记本更宽容一些。联想Legion 5 15在这方面也不例外:该设备的最大噪音为51.3 dB(A),在满负荷的情况下,可以非常清楚地听到。此外,两个紧凑的轴流风扇会产生高频噪音,这使得主观声音水平看起来更加响亮。 从正面看,这款笔记本电脑在空闲和低负载时运行非常安静,经常处于完全沉默状态。
Noise level
| Idle |
| 25 / 25 / 34.5 dB(A) |
| Load |
| 51.1 / 51.3 dB(A) |
 | ||
30 dB silent 40 dB(A) audible 50 dB(A) loud |
||
min: | ||
| Lenovo Legion 5 15ACH6A-82NW0010GE Radeon RX 6600M, R5 5600H, Micron 2210 MTFDHBA512QFD | Gigabyte G5 KC GeForce RTX 3060 Laptop GPU, i5-10500H, ESR512GTLCG-EAC-4 | Asus TUF Gaming F15 FX506HM GeForce RTX 3060 Laptop GPU, i7-11800H, SK Hynix HFM001TD3JX013N | HP Victus 16-e0179ng GeForce RTX 3060 Laptop GPU, R7 5800H, WDC PC SN730 SDBPNTY-1T00 | Medion Erazer Deputy P25 GeForce RTX 3060 Laptop GPU, R7 5800H, Phison E12S-512GB-Phison-SSD-BICS4 | Dell G15 5515 GeForce RTX 3050 Ti Laptop GPU, R7 5800H, Samsung PM991a MZ9LQ512HBLU-00BD1 | |
|---|---|---|---|---|---|---|
| Noise | -22% | 14% | 4% | -7% | 6% | |
| off / environment * (dB) | 25 | 27 -8% | 24.8 1% | 24 4% | 25 -0% | 24 4% |
| Idle Minimum * (dB) | 25 | 31 -24% | 24.6 2% | 24 4% | 27 -8% | 25 -0% |
| Idle Average * (dB) | 25 | 32 -28% | 24.9 -0% | 25 -0% | 29 -16% | 26 -4% |
| Idle Maximum * (dB) | 34.5 | 51 -48% | 24.9 28% | 34 1% | 31 10% | 30 13% |
| Load Average * (dB) | 51.1 | 57 -12% | 27.1 47% | 44 14% | 57 -12% | 44 14% |
| Load Maximum * (dB) | 51.3 | 58 -13% | 49 4% | 52 -1% | 58 -13% | 48 6% |
| Witcher 3 ultra * (dB) | 56 | 46.4 | 50 | 56 | 44 |
* ... smaller is better
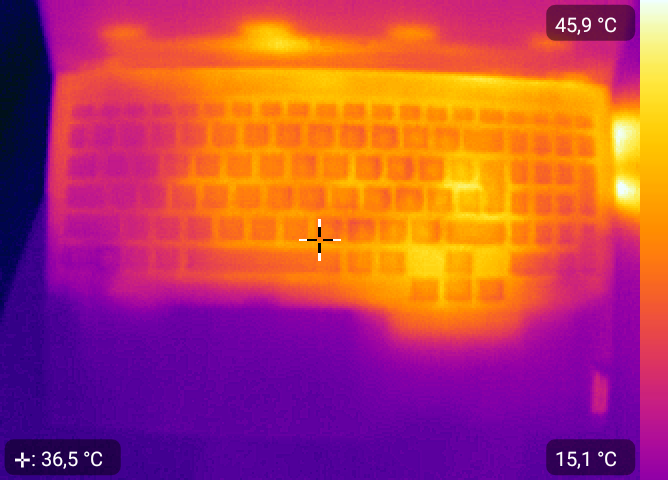
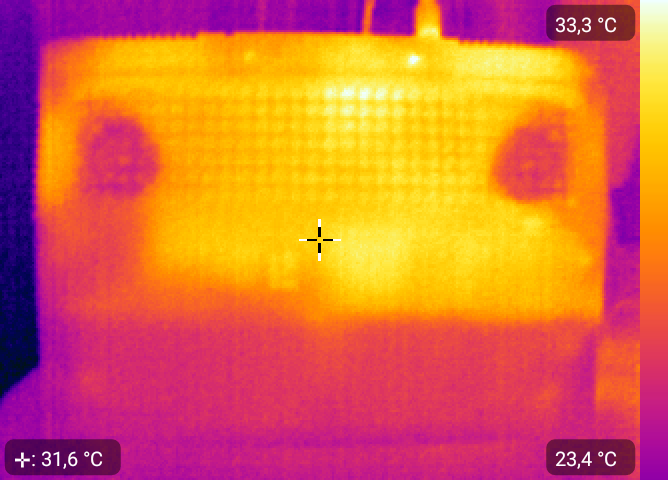
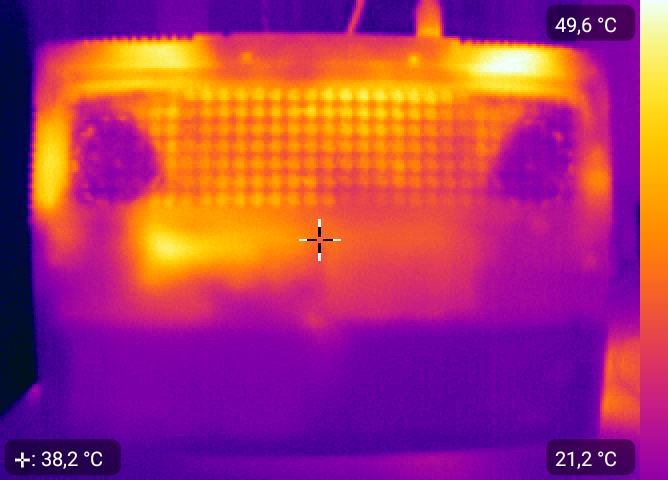
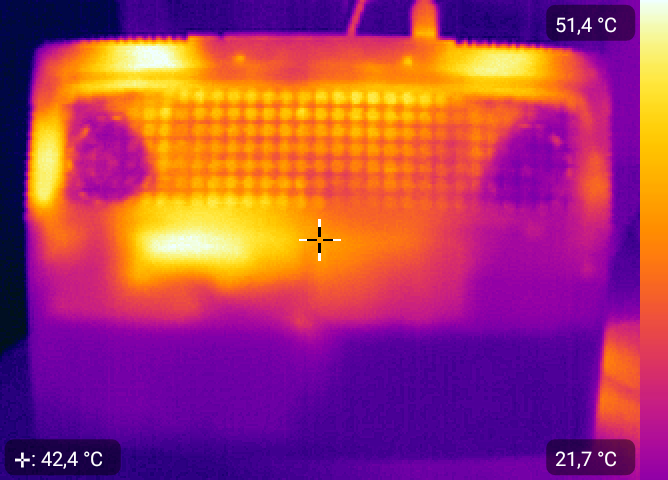
温度
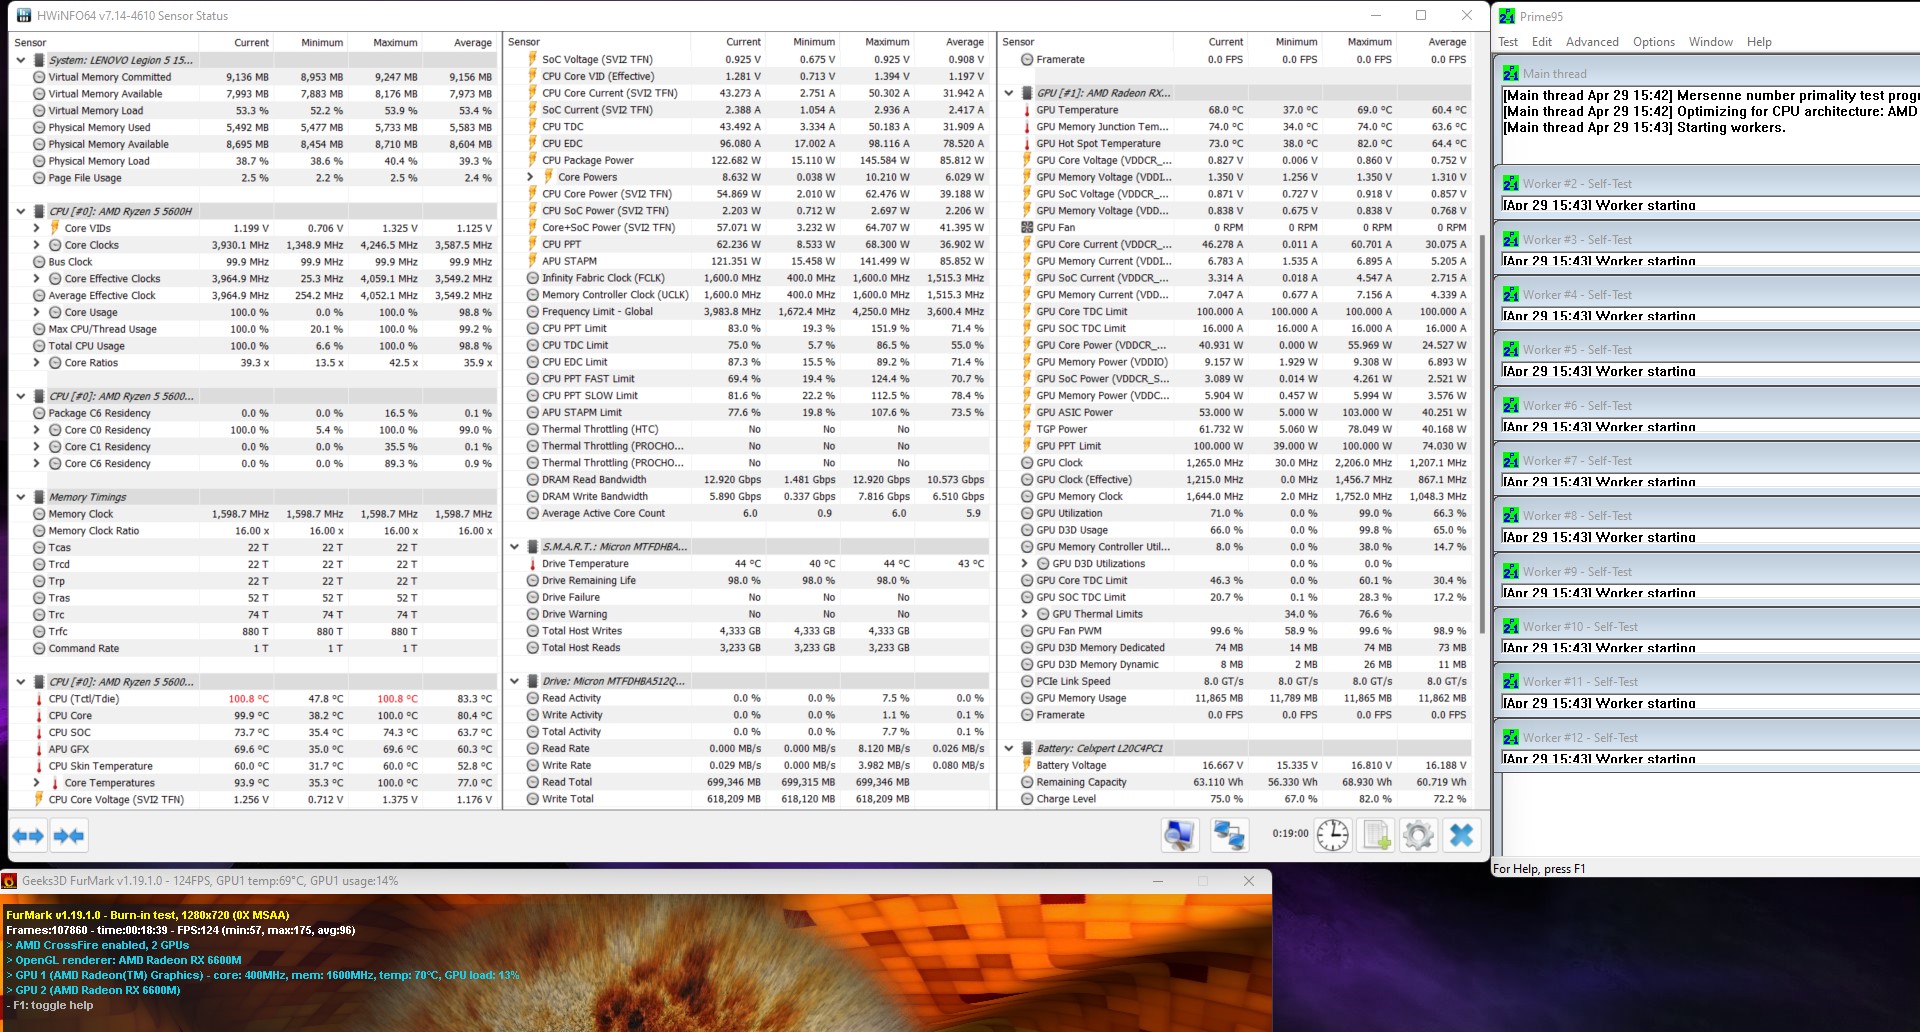
联想并不回避高温,允许SoC在没有节流的情况下运行,直到刚刚超过100℃,在这个温度下,拉开裂缝以防止损坏。尽管如此,SoC的稳定时钟速率为3.6 GHz,高于3.3 GHz的基础时钟。随后,CPU温度稳定在83℃左右。另一方面,显卡在压力测试中没有达到如此高的温度。GPU温度平均为60℃,尽管最高温度略低于70℃。永久负载并没有产生负面影响。与冷启动相比,随后的3D基准测试显示了相同的结果。
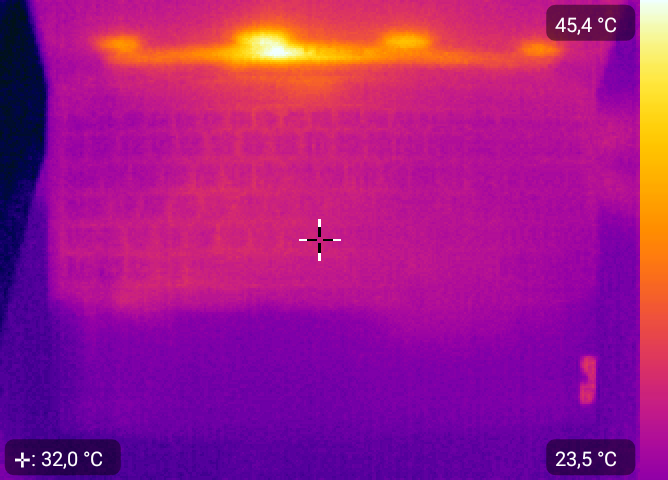
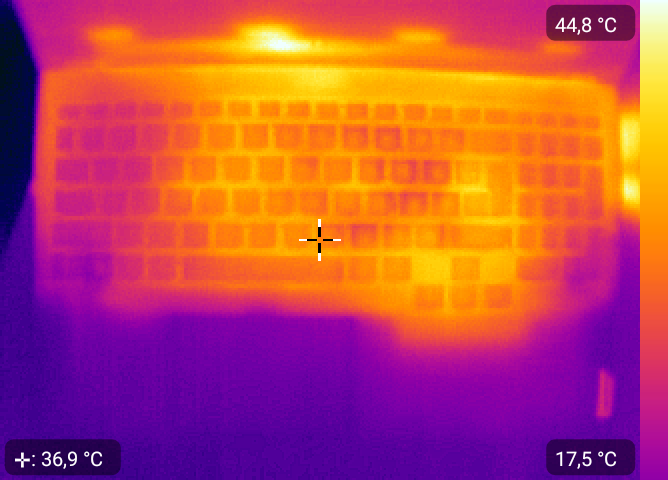
(+) The maximum temperature on the upper side is 39.9 °C / 104 F, compared to the average of 40.4 °C / 105 F, ranging from 21.2 to 68.8 °C for the class Gaming.
(±) The bottom heats up to a maximum of 43.8 °C / 111 F, compared to the average of 43.2 °C / 110 F
(+) In idle usage, the average temperature for the upper side is 27.9 °C / 82 F, compared to the device average of 33.9 °C / 93 F.
(+) The palmrests and touchpad are cooler than skin temperature with a maximum of 27.2 °C / 81 F and are therefore cool to the touch.
(±) The average temperature of the palmrest area of similar devices was 28.8 °C / 83.8 F (+1.6 °C / 2.8 F).
| Lenovo Legion 5 15ACH6A-82NW0010GE AMD Ryzen 5 5600H, AMD Radeon RX 6600M | Gigabyte G5 KC Intel Core i5-10500H, NVIDIA GeForce RTX 3060 Laptop GPU | Asus TUF Gaming F15 FX506HM Intel Core i7-11800H, NVIDIA GeForce RTX 3060 Laptop GPU | HP Victus 16-e0179ng AMD Ryzen 7 5800H, NVIDIA GeForce RTX 3060 Laptop GPU | Medion Erazer Deputy P25 AMD Ryzen 7 5800H, NVIDIA GeForce RTX 3060 Laptop GPU | Dell G15 5515 AMD Ryzen 7 5800H, NVIDIA GeForce RTX 3050 Ti Laptop GPU | |
|---|---|---|---|---|---|---|
| Heat | -10% | 5% | -28% | 12% | 1% | |
| Maximum Upper Side * (°C) | 39.9 | 50 -25% | 46.4 -16% | 51 -28% | 37 7% | 50 -25% |
| Maximum Bottom * (°C) | 43.8 | 49 -12% | 45.4 -4% | 52 -19% | 40 9% | 49 -12% |
| Idle Upper Side * (°C) | 34.1 | 33 3% | 26 24% | 46 -35% | 27 21% | 26 24% |
| Idle Bottom * (°C) | 31.7 | 34 -7% | 27.4 14% | 41 -29% | 29 9% | 26 18% |
* ... smaller is better
发言人
该音响系统只有两个立体声扬声器。高音和中音明显突出,可以清晰地再现语音。然而,由于音量较弱,低音不足。由于笔记本电脑的噪音,建议还是使用耳机,可以通过3.5毫米插孔或USB连接。
Lenovo Legion 5 15ACH6A-82NW0010GE audio analysis
(±) | speaker loudness is average but good (73.8 dB)
Bass 100 - 315 Hz
(-) | nearly no bass - on average 25% lower than median
(±) | linearity of bass is average (13.1% delta to prev. frequency)
Mids 400 - 2000 Hz
(±) | higher mids - on average 6.1% higher than median
(+) | mids are linear (6.9% delta to prev. frequency)
Highs 2 - 16 kHz
(+) | balanced highs - only 3.7% away from median
(±) | linearity of highs is average (9.2% delta to prev. frequency)
Overall 100 - 16.000 Hz
(±) | linearity of overall sound is average (23.3% difference to median)
Compared to same class
» 85% of all tested devices in this class were better, 4% similar, 11% worse
» The best had a delta of 6%, average was 18%, worst was 132%
Compared to all devices tested
» 70% of all tested devices were better, 5% similar, 25% worse
» The best had a delta of 4%, average was 23%, worst was 134%
Dell G15 5515 audio analysis
(±) | speaker loudness is average but good (76 dB)
Bass 100 - 315 Hz
(-) | nearly no bass - on average 22% lower than median
(±) | linearity of bass is average (14.9% delta to prev. frequency)
Mids 400 - 2000 Hz
(+) | balanced mids - only 2.8% away from median
(+) | mids are linear (3% delta to prev. frequency)
Highs 2 - 16 kHz
(+) | balanced highs - only 1.4% away from median
(+) | highs are linear (3.7% delta to prev. frequency)
Overall 100 - 16.000 Hz
(±) | linearity of overall sound is average (16.8% difference to median)
Compared to same class
» 44% of all tested devices in this class were better, 11% similar, 45% worse
» The best had a delta of 6%, average was 18%, worst was 132%
Compared to all devices tested
» 30% of all tested devices were better, 7% similar, 63% worse
» The best had a delta of 4%, average was 23%, worst was 134%
能源管理
消耗功率
在功耗方面,联想Legion 5 15无法跟上这里选择的对比设备。空闲时,联想Legion 5 15的表现还是比较好的。然而,在负载情况下,功耗明显增加,我们记录到的平均功耗为178瓦,与竞争对手相比,这相当令人沮丧。最大功率为181瓦,230瓦的超薄电源足够强大。
| Off / Standby | |
| Idle | |
| Load |
|
Key:
min: | |
| Lenovo Legion 5 15ACH6A-82NW0010GE R5 5600H, Radeon RX 6600M, Micron 2210 MTFDHBA512QFD, IPS, 1920x1080, 15.6" | Gigabyte G5 KC i5-10500H, GeForce RTX 3060 Laptop GPU, ESR512GTLCG-EAC-4, IPS, 1920x1080, 15.6" | Asus TUF Gaming F15 FX506HM i7-11800H, GeForce RTX 3060 Laptop GPU, SK Hynix HFM001TD3JX013N, IPS, 1920x1080, 15.6" | HP Victus 16-e0179ng R7 5800H, GeForce RTX 3060 Laptop GPU, WDC PC SN730 SDBPNTY-1T00, IPS, 1920x1080, 16.1" | Medion Erazer Deputy P25 R7 5800H, GeForce RTX 3060 Laptop GPU, Phison E12S-512GB-Phison-SSD-BICS4, IPS, 1920x1080, 15.6" | Dell G15 5515 R7 5800H, GeForce RTX 3050 Ti Laptop GPU, Samsung PM991a MZ9LQ512HBLU-00BD1, IPS, 1920x1080, 15.6" | Average AMD Radeon RX 6600M | Average of class Gaming | |
|---|---|---|---|---|---|---|---|---|
| Power Consumption | 2% | 5% | 17% | 9% | 23% | -12% | -28% | |
| Idle Minimum * (Watt) | 10 | 8 20% | 9.5 5% | 5 50% | 8 20% | 5 50% | 13.7 ? -37% | 13.1 ? -31% |
| Idle Average * (Watt) | 13.2 | 13 2% | 12.1 8% | 10 24% | 11 17% | 9 32% | 16.6 ? -26% | 19 ? -44% |
| Idle Maximum * (Watt) | 15.6 | 20 -28% | 22.5 -44% | 20 -28% | 16 -3% | 20 -28% | 19.1 ? -22% | 24.6 ? -58% |
| Load Average * (Watt) | 178 | 98 45% | 99.5 44% | 108 39% | 109 39% | 94 47% | 114.4 ? 36% | 111.3 ? 37% |
| Witcher 3 ultra * (Watt) | 181 | 166 8% | 157 13% | 145 20% | 183 -1% | 123 32% | ||
| Load Maximum * (Watt) | 180 | 242 -34% | 173.5 4% | 189 -5% | 211 -17% | 172 4% | 197.8 ? -10% | 260 ? -44% |
* ... smaller is better
Power Consumption Witcher 3 / Stress test
Power Consumption with an external monitor
电池寿命
关于电池寿命,联想在Legion 5 15上做得不错。所有的对比设备在测试中都落后了。在Wi-Fi测试中,内置的80Wh电池能够为联想Legion 5 15提供9小时的电量。
关于电池电量,应该注意的是,GPU性能被明显扼杀。但几乎所有的现代游戏笔记本电脑也是如此。

| Lenovo Legion 5 15ACH6A-82NW0010GE R5 5600H, Radeon RX 6600M, 80 Wh | Gigabyte G5 KC i5-10500H, GeForce RTX 3060 Laptop GPU, 48.96 Wh | Asus TUF Gaming F15 FX506HM i7-11800H, GeForce RTX 3060 Laptop GPU, 90 Wh | HP Victus 16-e0179ng R7 5800H, GeForce RTX 3060 Laptop GPU, 70 Wh | Medion Erazer Deputy P25 R7 5800H, GeForce RTX 3060 Laptop GPU, 49 Wh | Dell G15 5515 R7 5800H, GeForce RTX 3050 Ti Laptop GPU, 56 Wh | Average of class Gaming | |
|---|---|---|---|---|---|---|---|
| Battery runtime | -55% | -9% | -35% | -30% | -11% | -29% | |
| Reader / Idle (h) | 12.8 | 5.2 -59% | 11 -14% | 8.5 -34% | 10.5 -18% | 13.5 5% | 7.84 ? -39% |
| WiFi v1.3 (h) | 9.2 | 3.6 -61% | 7.9 -14% | 5.9 -36% | 6.7 -27% | 8 -13% | 7.08 ? -23% |
| Load (h) | 2 | 1.1 -45% | 2 0% | 1.3 -35% | 1.1 -45% | 1.5 -25% | 1.496 ? -25% |
| H.264 (h) | 8.8 | 8.27 ? |
Pros
Cons
结论 - 稳固的游戏笔记本,电池寿命长


联想Legion 5 15是一款全新的15英寸游戏笔记本,配备最新的AMD GPU和CPU。AMD Ryzen 5 600H ,它的工作做得很好,即使两个额外的核心在CPU重的工作负荷中也会派上用场。为此,你可以购买联想Legion 5 15,配备AMD Ryzen 7 5800H 。至于内置的AMD Radeon RX 6600M ,它使用目前的RDNA 2架构,我们已经知道了很长时间。这款GPU针对的是那些主要想在FHD下游戏的玩家--我们测试设备的内置显示屏不能提供比这更多的东西。至少包括一个165赫兹的选项,而且色彩空间覆盖率比其他一些设备要好。在与Nvidia的直接性能比较中,AMD Radeon RX 6600M介于NvidiaGeForce RTX 3060笔记本电脑 和NvidiaGeForce RTX 3070笔记本电脑 。
联想Legion 5 15是一款全面的游戏笔记本,没有任何花哨的添加物,由于最新的AMD Ryzen CPU与AMD Radeon GPU一起提供了坚实的游戏性能。
联想Legion 5 15是一款基本稳固的游戏笔记本电脑。由于其相对较强的电池寿命,该笔记本也可以作为一个优秀的多媒体设备。外部端口的数量很多。同时,缺乏SD卡读卡器并不是一个大问题。但内置的大容量存储设备确实不足--这里至少应该有一个1TB的SSD。幸运的是,第二个大容量存储设备可以快速而容易地安装。
价格和可用性
这款笔记本电脑目前可以通过联想的美国网站购买各种配置的产品。,起价为879.99美元。
Lenovo Legion 5 15ACH6A-82NW0010GE
- 04/29/2022 v7 (old)
Sebastian Bade
Price comparison

