Eurocom Tornado F5 笔记本电脑简短评测


| SD Card Reader | |
| average JPG Copy Test (av. of 3 runs) | |
| MSI GT73VR 7RF-296 | |
| Eurocom Tornado F5 | |
| MSI GT72VR 7RE-433 | |
| maximum AS SSD Seq Read Test (1GB) | |
| MSI GT73VR 7RF-296 | |
| MSI GT72VR 7RE-433 | |
| Eurocom Tornado F5 | |
| Networking | |
| iperf3 receive AX12 | |
| MSI GT73VR 7RF-296 | |
| EVGA SC17 GTX 1070 | |
| Eurocom Tornado F5 | |
| iperf3 transmit AX12 | |
| MSI GT73VR 7RF-296 | |
| Eurocom Tornado F5 | |
| EVGA SC17 GTX 1070 | |
| |||||||||||||||||||||||||
Brightness Distribution: 90 %
Center on Battery: 315.8 cd/m²
Contrast: 957:1 (Black: 0.33 cd/m²)
ΔE ColorChecker Calman: 5 | ∀{0.5-29.43 Ø4.71}
ΔE Greyscale Calman: 4.2 | ∀{0.09-98 Ø4.96}
83% sRGB (Argyll 1.6.3 3D)
54.5% AdobeRGB 1998 (Argyll 1.6.3 3D)
60.7% AdobeRGB 1998 (Argyll 3D)
83% sRGB (Argyll 3D)
64.5% Display P3 (Argyll 3D)
Gamma: 2.12
CCT: 6107 K
| Eurocom Tornado F5 IPS, 15.6", 1920x1080 | Asus Strix GL502VM-FY039T LG Philips LP156WF6-SPB6 (LGD046F), IPS, 15.6", 1920x1080 | Acer Predator 15 G9-593-765Q LG Philips LP156WF6-SPP1 (LGD04D5), IPS, 15.6", 1920x1080 | Asus Zenbook UX510UW-CN044T LG Philips LP156WF6-SPB6, IPS, 15.6", 1920x1080 | MSI GS63VR-6RF16H22 Stealth Pro Samsung 156HL01-104 (SDC324C) , IPS, 15.6", 1920x1080 | |
|---|---|---|---|---|---|
| Display | 0% | 0% | -4% | 12% | |
| Display P3 Coverage (%) | 64.5 | 64.5 0% | 63.6 -1% | 61.5 -5% | 67.8 5% |
| sRGB Coverage (%) | 83 | 83.4 0% | 83.9 1% | 80.4 -3% | 97.4 17% |
| AdobeRGB 1998 Coverage (%) | 60.7 | 60.9 0% | 61.3 1% | 58.8 -3% | 69.7 15% |
| Response Times | 1% | 8% | -1% | 17% | |
| Response Time Grey 50% / Grey 80% * (ms) | 33.6 ? | 40 ? -19% | 35 ? -4% | 40 ? -19% | |
| Response Time Black / White * (ms) | 31.2 ? | 25 ? 20% | 25 ? 20% | 26 ? 17% | 26 ? 17% |
| PWM Frequency (Hz) | 202 ? | ||||
| Screen | 3% | 5% | -6% | 8% | |
| Brightness middle (cd/m²) | 315.8 | 321 2% | 273 -14% | 326 3% | 293 -7% |
| Brightness (cd/m²) | 310 | 296 -5% | 267 -14% | 316 2% | 279 -10% |
| Brightness Distribution (%) | 90 | 88 -2% | 83 -8% | 80 -11% | 84 -7% |
| Black Level * (cd/m²) | 0.33 | 0.33 -0% | 0.27 18% | 0.35 -6% | 0.33 -0% |
| Contrast (:1) | 957 | 973 2% | 1011 6% | 931 -3% | 888 -7% |
| Colorchecker dE 2000 * | 5 | 4.42 12% | 3.77 25% | 5.49 -10% | 3.59 28% |
| Colorchecker dE 2000 max. * | 10.1 | 9.78 3% | 10.64 -5% | 11.36 -12% | 5.79 43% |
| Greyscale dE 2000 * | 4.2 | 3.34 20% | 2.48 41% | 4.84 -15% | 3.86 8% |
| Gamma | 2.12 104% | 2.4 92% | 2.37 93% | 2.23 99% | 2.53 87% |
| CCT | 6107 106% | 6213 105% | 6854 95% | 5971 109% | 7229 90% |
| Color Space (Percent of AdobeRGB 1998) (%) | 54.5 | 55 1% | 55 1% | 53 -3% | 63 16% |
| Color Space (Percent of sRGB) (%) | 83 | 83 0% | 84 1% | 80 -4% | 97 17% |
| Total Average (Program / Settings) | 1% /
2% | 4% /
5% | -4% /
-5% | 12% /
10% |
* ... smaller is better
Display Response Times
| ↔ Response Time Black to White | ||
|---|---|---|
| 31.2 ms ... rise ↗ and fall ↘ combined | ↗ 4.4 ms rise | 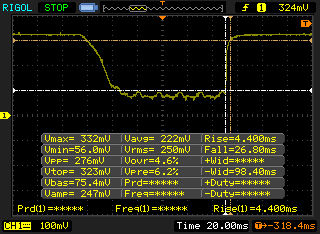 |
| ↘ 26.8 ms fall | ||
| The screen shows slow response rates in our tests and will be unsatisfactory for gamers. In comparison, all tested devices range from 0.1 (minimum) to 240 (maximum) ms. » 84 % of all devices are better. This means that the measured response time is worse than the average of all tested devices (19.8 ms). | ||
| ↔ Response Time 50% Grey to 80% Grey | ||
| 33.6 ms ... rise ↗ and fall ↘ combined | ↗ 8.4 ms rise | 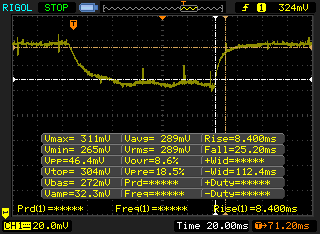 |
| ↘ 25.2 ms fall | ||
| The screen shows slow response rates in our tests and will be unsatisfactory for gamers. In comparison, all tested devices range from 0.165 (minimum) to 636 (maximum) ms. » 46 % of all devices are better. This means that the measured response time is similar to the average of all tested devices (30.9 ms). | ||
Screen Flickering / PWM (Pulse-Width Modulation)
| Screen flickering / PWM not detected | 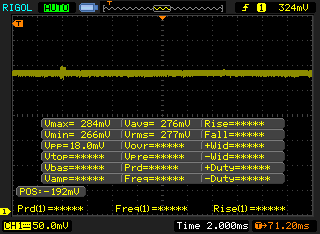 | ||
In comparison: 52 % of all tested devices do not use PWM to dim the display. If PWM was detected, an average of 7741 (minimum: 5 - maximum: 343500) Hz was measured. | |||
| Cinebench R15 | |
| CPU Single 64Bit | |
| Eurocom Tornado F5 | |
| Eurocom Sky X7E2 | |
| EVGA SC17 GTX 1070 | |
| MSI GE62 2QC-468XPL | |
| MSI GE72VR-6RF16H21 | |
| Eurocom Shark 4 | |
| CPU Multi 64Bit | |
| Eurocom Tornado F5 | |
| Eurocom Sky X7E2 | |
| MSI GE62 2QC-468XPL | |
| EVGA SC17 GTX 1070 | |
| MSI GE72VR-6RF16H21 | |
| Eurocom Shark 4 | |
| Cinebench R11.5 | |
| CPU Single 64Bit | |
| Eurocom Tornado F5 | |
| Eurocom Sky X7E2 | |
| MSI GE62 2QC-468XPL | |
| EVGA SC17 GTX 1070 | |
| Eurocom Shark 4 | |
| MSI GE72VR-6RF16H21 | |
| CPU Multi 64Bit | |
| Eurocom Tornado F5 | |
| Eurocom Sky X7E2 | |
| MSI GE62 2QC-468XPL | |
| EVGA SC17 GTX 1070 | |
| MSI GE72VR-6RF16H21 | |
| Eurocom Shark 4 | |
| Cinebench R10 | |
| Rendering Multiple CPUs 32Bit | |
| Eurocom Tornado F5 | |
| Eurocom Sky X7E2 | |
| MSI GE62 2QC-468XPL | |
| EVGA SC17 GTX 1070 | |
| MSI GE72VR-6RF16H21 | |
| Eurocom Shark 4 | |
| Rendering Single 32Bit | |
| Eurocom Tornado F5 | |
| Eurocom Sky X7E2 | |
| EVGA SC17 GTX 1070 | |
| MSI GE62 2QC-468XPL | |
| Eurocom Shark 4 | |
| MSI GE72VR-6RF16H21 | |
| wPrime 2.10 - 1024m | |
| Eurocom Shark 4 | |
| EVGA SC17 GTX 1070 | |
| MSI GE62 2QC-468XPL | |
| Eurocom Sky X7E2 | |
| Eurocom Tornado F5 | |
| Super Pi Mod 1.5 XS 32M - 32M | |
| MSI GE62 2QC-468XPL | |
| EVGA SC17 GTX 1070 | |
| Eurocom Shark 4 | |
| Eurocom Sky X7E2 | |
| Eurocom Tornado F5 | |
* ... smaller is better
| PCMark 8 | |
| Home Score Accelerated v2 | |
| Eurocom Tornado F5 | |
| Eurocom Sky X7E2 | |
| EVGA SC17 GTX 1070 | |
| Eurocom Shark 4 | |
| Work Score Accelerated v2 | |
| Eurocom Tornado F5 | |
| Eurocom Shark 4 | |
| Eurocom Sky X7E2 | |
| EVGA SC17 GTX 1070 | |
| Creative Score Accelerated v2 | |
| Eurocom Tornado F5 | |
| Eurocom Sky X7E2 | |
| EVGA SC17 GTX 1070 | |
| Eurocom Shark 4 | |
| PCMark 8 Home Score Accelerated v2 | 5476 points | |
| PCMark 8 Creative Score Accelerated v2 | 8593 points | |
| PCMark 8 Work Score Accelerated v2 | 6515 points | |
Help | ||
| Eurocom Tornado F5 Samsung SSD 960 Pro 512 GB m.2 | MSI GT73VR 7RF-296 2x Samsung SM951 MZVPV256HDGL (RAID 0) | Eurocom Sky X7E2 Samsung SM951 MZVPV512HDGL m.2 PCI-e | EVGA SC17 GTX 1070 Samsung SM951 MZVPV256 m.2 | MSI GE72VR-6RF16H21 Toshiba HG6 THNSNJ256G8NY | |
|---|---|---|---|---|---|
| CrystalDiskMark 3.0 | 43% | 3% | -8% | -64% | |
| Read Seq (MB/s) | 2145 | 3219 50% | 1673 -22% | 1658 -23% | 510 -76% |
| Write Seq (MB/s) | 1724 | 2572 49% | 1576 -9% | 1249 -28% | 274.6 -84% |
| Read 512 (MB/s) | 715 | 1776 148% | 1180 65% | 1044 46% | 427.2 -40% |
| Write 512 (MB/s) | 967 | 2445 153% | 1561 61% | 1254 30% | 247.2 -74% |
| Read 4k (MB/s) | 55.9 | 51.1 -9% | 51.5 -8% | 51.6 -8% | 21.23 -62% |
| Write 4k (MB/s) | 180.6 | 141.3 -22% | 144 -20% | 145.2 -20% | 86.8 -52% |
| Read 4k QD32 (MB/s) | 744 | 658 -12% | 694 -7% | 601 -19% | 335.4 -55% |
| Write 4k QD32 (MB/s) | 634 | 554 -13% | 422.1 -33% | 386.8 -39% | 178.1 -72% |

| 3DMark | |
| 3840x2160 Fire Strike Ultra Graphics | |
| MSI Gaming Z GeForce GTX 1070 OC Bios Desktop PC | |
| Eurocom Tornado F5 | |
| Asus G701VO-CS74K | |
| MSI GE72VR-6RF16H21 | |
| Asus Strix GL502VY-DS71 | |
| Fire Strike Extreme Graphics | |
| Aorus X7 DT v6 | |
| Eurocom Tornado F5 | |
| Asus G701VO-CS74K | |
| MSI GE72VR-6RF16H21 | |
| Asus Strix GL502VY-DS71 | |
| 1920x1080 Fire Strike Graphics | |
| Aorus X7 DT v6 | |
| MSI Gaming Z GeForce GTX 1070 OC Bios Desktop PC | |
| Eurocom Tornado F5 | |
| Asus G701VO-CS74K | |
| MSI GE72VR-6RF16H21 | |
| Asus Strix GL502VY-DS71 | |
| 3DMark 11 Performance | 18317 points | |
| 3DMark Ice Storm Standard Score | 174858 points | |
| 3DMark Cloud Gate Standard Score | 34367 points | |
| 3DMark Fire Strike Score | 14664 points | |
| 3DMark Fire Strike Extreme Score | 7647 points | |
Help | ||
| Rise of the Tomb Raider - 1920x1080 Very High Preset AA:FX AF:16x | |
| Aorus X7 DT v6 | |
| Eurocom Tornado F5 | |
| Nvidia GeForce GTX 1070 Founders Edition | |
| MSI GT72VR 6RD-063US | |
| Asus G701VO-CS74K | |
| Asus Strix GL502VT-DS74 | |
| Sleeping Dogs - 1920x1080 Extreme Preset AA:Extreme | |
| Aorus X7 DT v6 | |
| Eurocom Tornado F5 | |
| Asus G701VO-CS74K | |
| Asus Strix GL502VT-DS74 | |
| Guild Wars 2 - 1920x1080 All Maximum / On AA:FX | |
| Eurocom Tornado F5 | |
| MSI GT72VR 6RD-063US | |
| BioShock Infinite - 1920x1080 Ultra Preset, DX11 (DDOF) | |
| Aorus X7 DT v6 | |
| Nvidia GeForce GTX 1070 Founders Edition | |
| Eurocom Tornado F5 | |
| Asus G701VO-CS74K | |
| MSI GT72VR 6RD-063US | |
| Asus Strix GL502VT-DS74 | |
| Metro: Last Light - 1920x1080 Very High (DX11) AF:16x | |
| Aorus X7 DT v6 | |
| Nvidia GeForce GTX 1070 Founders Edition | |
| Eurocom Tornado F5 | |
| Asus G701VO-CS74K | |
| MSI GT72VR 6RD-063US | |
| Asus Strix GL502VT-DS74 | |
| Batman: Arkham Knight - 1920x1080 High / On AA:SM AF:16x | |
| Aorus X7 DT v6 | |
| Eurocom Tornado F5 | |
| Asus G701VO-CS74K | |
| MSI GT72VR 6RD-063US | |
| Asus Strix GL502VT-DS74 | |
| Fallout 4 - 1920x1080 Ultra Preset AA:T AF:16x | |
| Aorus X7 DT v6 | |
| Nvidia GeForce GTX 1070 Founders Edition | |
| Eurocom Tornado F5 | |
| Asus G701VO-CS74K | |
| MSI GT72VR 6RD-063US | |
| Asus Strix GL502VT-DS74 | |
| Doom - 1920x1080 Ultra Preset AA:SM | |
| Aorus X7 DT v6 | |
| Eurocom Tornado F5 | |
| Nvidia GeForce GTX 1070 Founders Edition | |
| MSI GT72VR 6RD-063US | |
| Asus G701VO-CS74K | |
| Overwatch - 1920x1080 Epic (Render Scale 100 %) AA:SM AF:16x | |
| Nvidia GeForce GTX 1070 Founders Edition | |
| Eurocom Tornado F5 | |
| Asus G701VO-CS74K | |
| MSI GT72VR 6RD-063US | |
| Mafia 3 - 1920x1080 High Preset | |
| Eurocom Tornado F5 | |
| Ashes of the Singularity - 1920x1080 high | |
| Eurocom Tornado F5 | |
| Nvidia GeForce GTX 1070 Founders Edition | |
| low | med. | high | ultra | |
|---|---|---|---|---|
| Sleeping Dogs (2012) | 117.1 | |||
| Guild Wars 2 (2012) | 91.7 | |||
| BioShock Infinite (2013) | 149.6 | |||
| Metro: Last Light (2013) | 117.6 | |||
| Batman: Arkham Knight (2015) | 87 | |||
| Metal Gear Solid V (2015) | 60 | |||
| Fallout 4 (2015) | 107.6 | |||
| Rise of the Tomb Raider (2016) | 98 | |||
| Ashes of the Singularity (2016) | 78.2 | |||
| Doom (2016) | 136.5 | |||
| Overwatch (2016) | 160.5 | |||
| Mafia 3 (2016) | 66 |
Noise level
| Idle |
| 33.3 / 33.5 / 33.5 dB(A) |
| Load |
| 44.2 / 52.5 dB(A) |
 | ||
30 dB silent 40 dB(A) audible 50 dB(A) loud |
||
min: | ||
| Eurocom Tornado F5 GeForce GTX 1070 Mobile, i7-7700K, Samsung SSD 960 Pro 512 GB m.2 | MSI GT73VR 7RF-296 GeForce GTX 1080 Mobile, i7-7820HK, 2x Samsung SM951 MZVPV256HDGL (RAID 0) | MSI GT72VR 7RE-433 GeForce GTX 1070 Mobile, i7-7700HQ, Kingston RBU-SNS8152S3256GG5 | EVGA SC17 GTX 1070 GeForce GTX 1070 Mobile, 6820HK, Samsung SM951 MZVPV256 m.2 | Aorus X7 DT v6 GeForce GTX 1080 Mobile, 6820HK, Samsung SM951 MZVPV512HDGL m.2 PCI-e | |
|---|---|---|---|---|---|
| Noise | -2% | 2% | -1% | -5% | |
| off / environment * (dB) | 29.4 | 30 -2% | 31 -5% | 29.2 1% | 28.6 3% |
| Idle Minimum * (dB) | 33.3 | 34 -2% | 34 -2% | 33.9 -2% | 32.2 3% |
| Idle Average * (dB) | 33.5 | 35 -4% | 35 -4% | 33.9 -1% | 35.2 -5% |
| Idle Maximum * (dB) | 33.5 | 37 -10% | 37 -10% | 33.9 -1% | 35.2 -5% |
| Load Average * (dB) | 44.2 | 39 12% | 37 16% | 43.8 1% | 51.7 -17% |
| Load Maximum * (dB) | 52.5 | 56 -7% | 44 16% | 53.4 -2% | 55.7 -6% |
* ... smaller is better
(+) The maximum temperature on the upper side is 37.4 °C / 99 F, compared to the average of 40.4 °C / 105 F, ranging from 21.2 to 68.8 °C for the class Gaming.
(±) The bottom heats up to a maximum of 44.8 °C / 113 F, compared to the average of 43.2 °C / 110 F
(+) In idle usage, the average temperature for the upper side is 23.8 °C / 75 F, compared to the device average of 33.9 °C / 93 F.
(+) The palmrests and touchpad are cooler than skin temperature with a maximum of 28.8 °C / 83.8 F and are therefore cool to the touch.
(±) The average temperature of the palmrest area of similar devices was 28.8 °C / 83.8 F (0 °C / 0 F).
Eurocom Tornado F5 audio analysis
(-) | not very loud speakers (71.3 dB)
Bass 100 - 315 Hz
(±) | reduced bass - on average 13.2% lower than median
(±) | linearity of bass is average (10.6% delta to prev. frequency)
Mids 400 - 2000 Hz
(±) | higher mids - on average 5.1% higher than median
(±) | linearity of mids is average (12.8% delta to prev. frequency)
Highs 2 - 16 kHz
(+) | balanced highs - only 2.7% away from median
(±) | linearity of highs is average (7.2% delta to prev. frequency)
Overall 100 - 16.000 Hz
(±) | linearity of overall sound is average (24.4% difference to median)
Compared to same class
» 88% of all tested devices in this class were better, 3% similar, 8% worse
» The best had a delta of 6%, average was 18%, worst was 132%
Compared to all devices tested
» 74% of all tested devices were better, 6% similar, 20% worse
» The best had a delta of 4%, average was 23%, worst was 134%
Apple MacBook 12 (Early 2016) 1.1 GHz audio analysis
(+) | speakers can play relatively loud (83.6 dB)
Bass 100 - 315 Hz
(±) | reduced bass - on average 11.3% lower than median
(±) | linearity of bass is average (14.2% delta to prev. frequency)
Mids 400 - 2000 Hz
(+) | balanced mids - only 2.4% away from median
(+) | mids are linear (5.5% delta to prev. frequency)
Highs 2 - 16 kHz
(+) | balanced highs - only 2% away from median
(+) | highs are linear (4.5% delta to prev. frequency)
Overall 100 - 16.000 Hz
(+) | overall sound is linear (10.2% difference to median)
Compared to same class
» 7% of all tested devices in this class were better, 2% similar, 90% worse
» The best had a delta of 5%, average was 18%, worst was 53%
Compared to all devices tested
» 5% of all tested devices were better, 1% similar, 94% worse
» The best had a delta of 4%, average was 23%, worst was 134%
| Off / Standby | |
| Idle | |
| Load |
|
Key:
min: | |
| Eurocom Tornado F5 i7-7700K, GeForce GTX 1070 Mobile, Samsung SSD 960 Pro 512 GB m.2, IPS, 1920x1080, 15.6" | MSI GT73VR 7RF-296 i7-7820HK, GeForce GTX 1080 Mobile, 2x Samsung SM951 MZVPV256HDGL (RAID 0), TN LED, 1920x1080, 17.3" | MSI GT72VR 7RE-433 i7-7700HQ, GeForce GTX 1070 Mobile, Kingston RBU-SNS8152S3256GG5, TN LED, 1920x1080, 17.3" | MSI GE62 2QC-468XPL 5700HQ, GeForce GTX 960M, Samsung SSD PM851 256 GB MZNTE256HMHP, TN, 1920x1080, 15.6" | Aorus X7 DT v6 6820HK, GeForce GTX 1080 Mobile, Samsung SM951 MZVPV512HDGL m.2 PCI-e, TN LED, 2560x1440, 17.3" | |
|---|---|---|---|---|---|
| Power Consumption | -28% | 8% | 7% | -32% | |
| Idle Minimum * (Watt) | 21.2 | 29 -37% | 20 6% | 15.5 27% | 31.5 -49% |
| Idle Average * (Watt) | 25.1 | 35 -39% | 27 -8% | 22.5 10% | 33.9 -35% |
| Idle Maximum * (Watt) | 26.3 | 40 -52% | 31 -18% | 44.9 -71% | 34.6 -32% |
| Load Average * (Watt) | 169.4 | 94 45% | 86 49% | 122.4 28% | 205.6 -21% |
| Load Maximum * (Watt) | 202.4 | 315 -56% | 184 9% | 122.6 39% | 250.8 -24% |
* ... smaller is better
| Eurocom Tornado F5 i7-7700K, GeForce GTX 1070 Mobile, 75.24 Wh | MSI GT73VR 7RF-296 i7-7820HK, GeForce GTX 1080 Mobile, 75.2 Wh | Eurocom Sky X7E2 6700K, GeForce GTX 1080 Mobile, 89 Wh | EVGA SC17 GTX 1070 6820HK, GeForce GTX 1070 Mobile, 74.48 Wh | Aorus X7 DT v6 6820HK, GeForce GTX 1080 Mobile, 94 Wh | |
|---|---|---|---|---|---|
| Battery runtime | -25% | -26% | -20% | -9% | |
| Reader / Idle (h) | 4.9 | 2.3 -53% | 4 -18% | 3 -39% | |
| WiFi v1.3 (h) | 3.6 | 2.7 -25% | 1.7 -53% | 2.7 -25% | 2.4 -33% |
| Load (h) | 1.1 | 1.4 27% | 0.9 -18% | 1.6 45% |
Pros
Cons
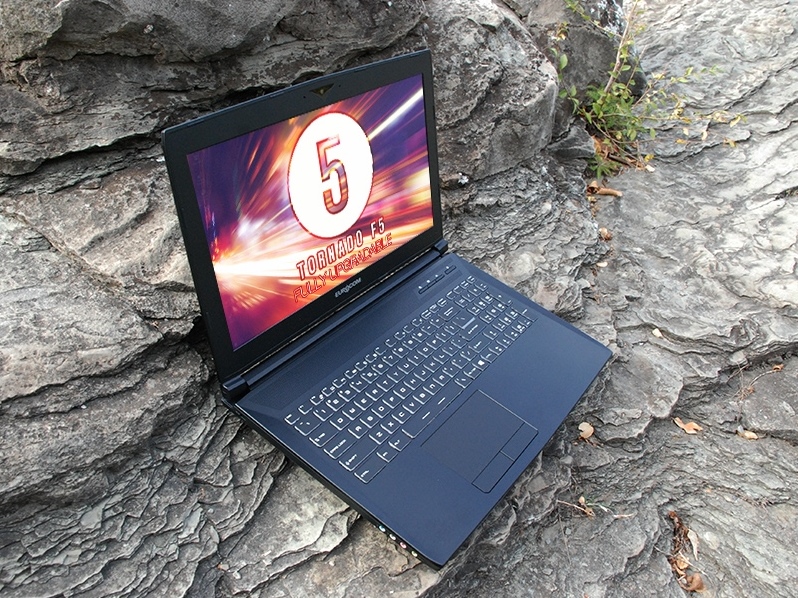
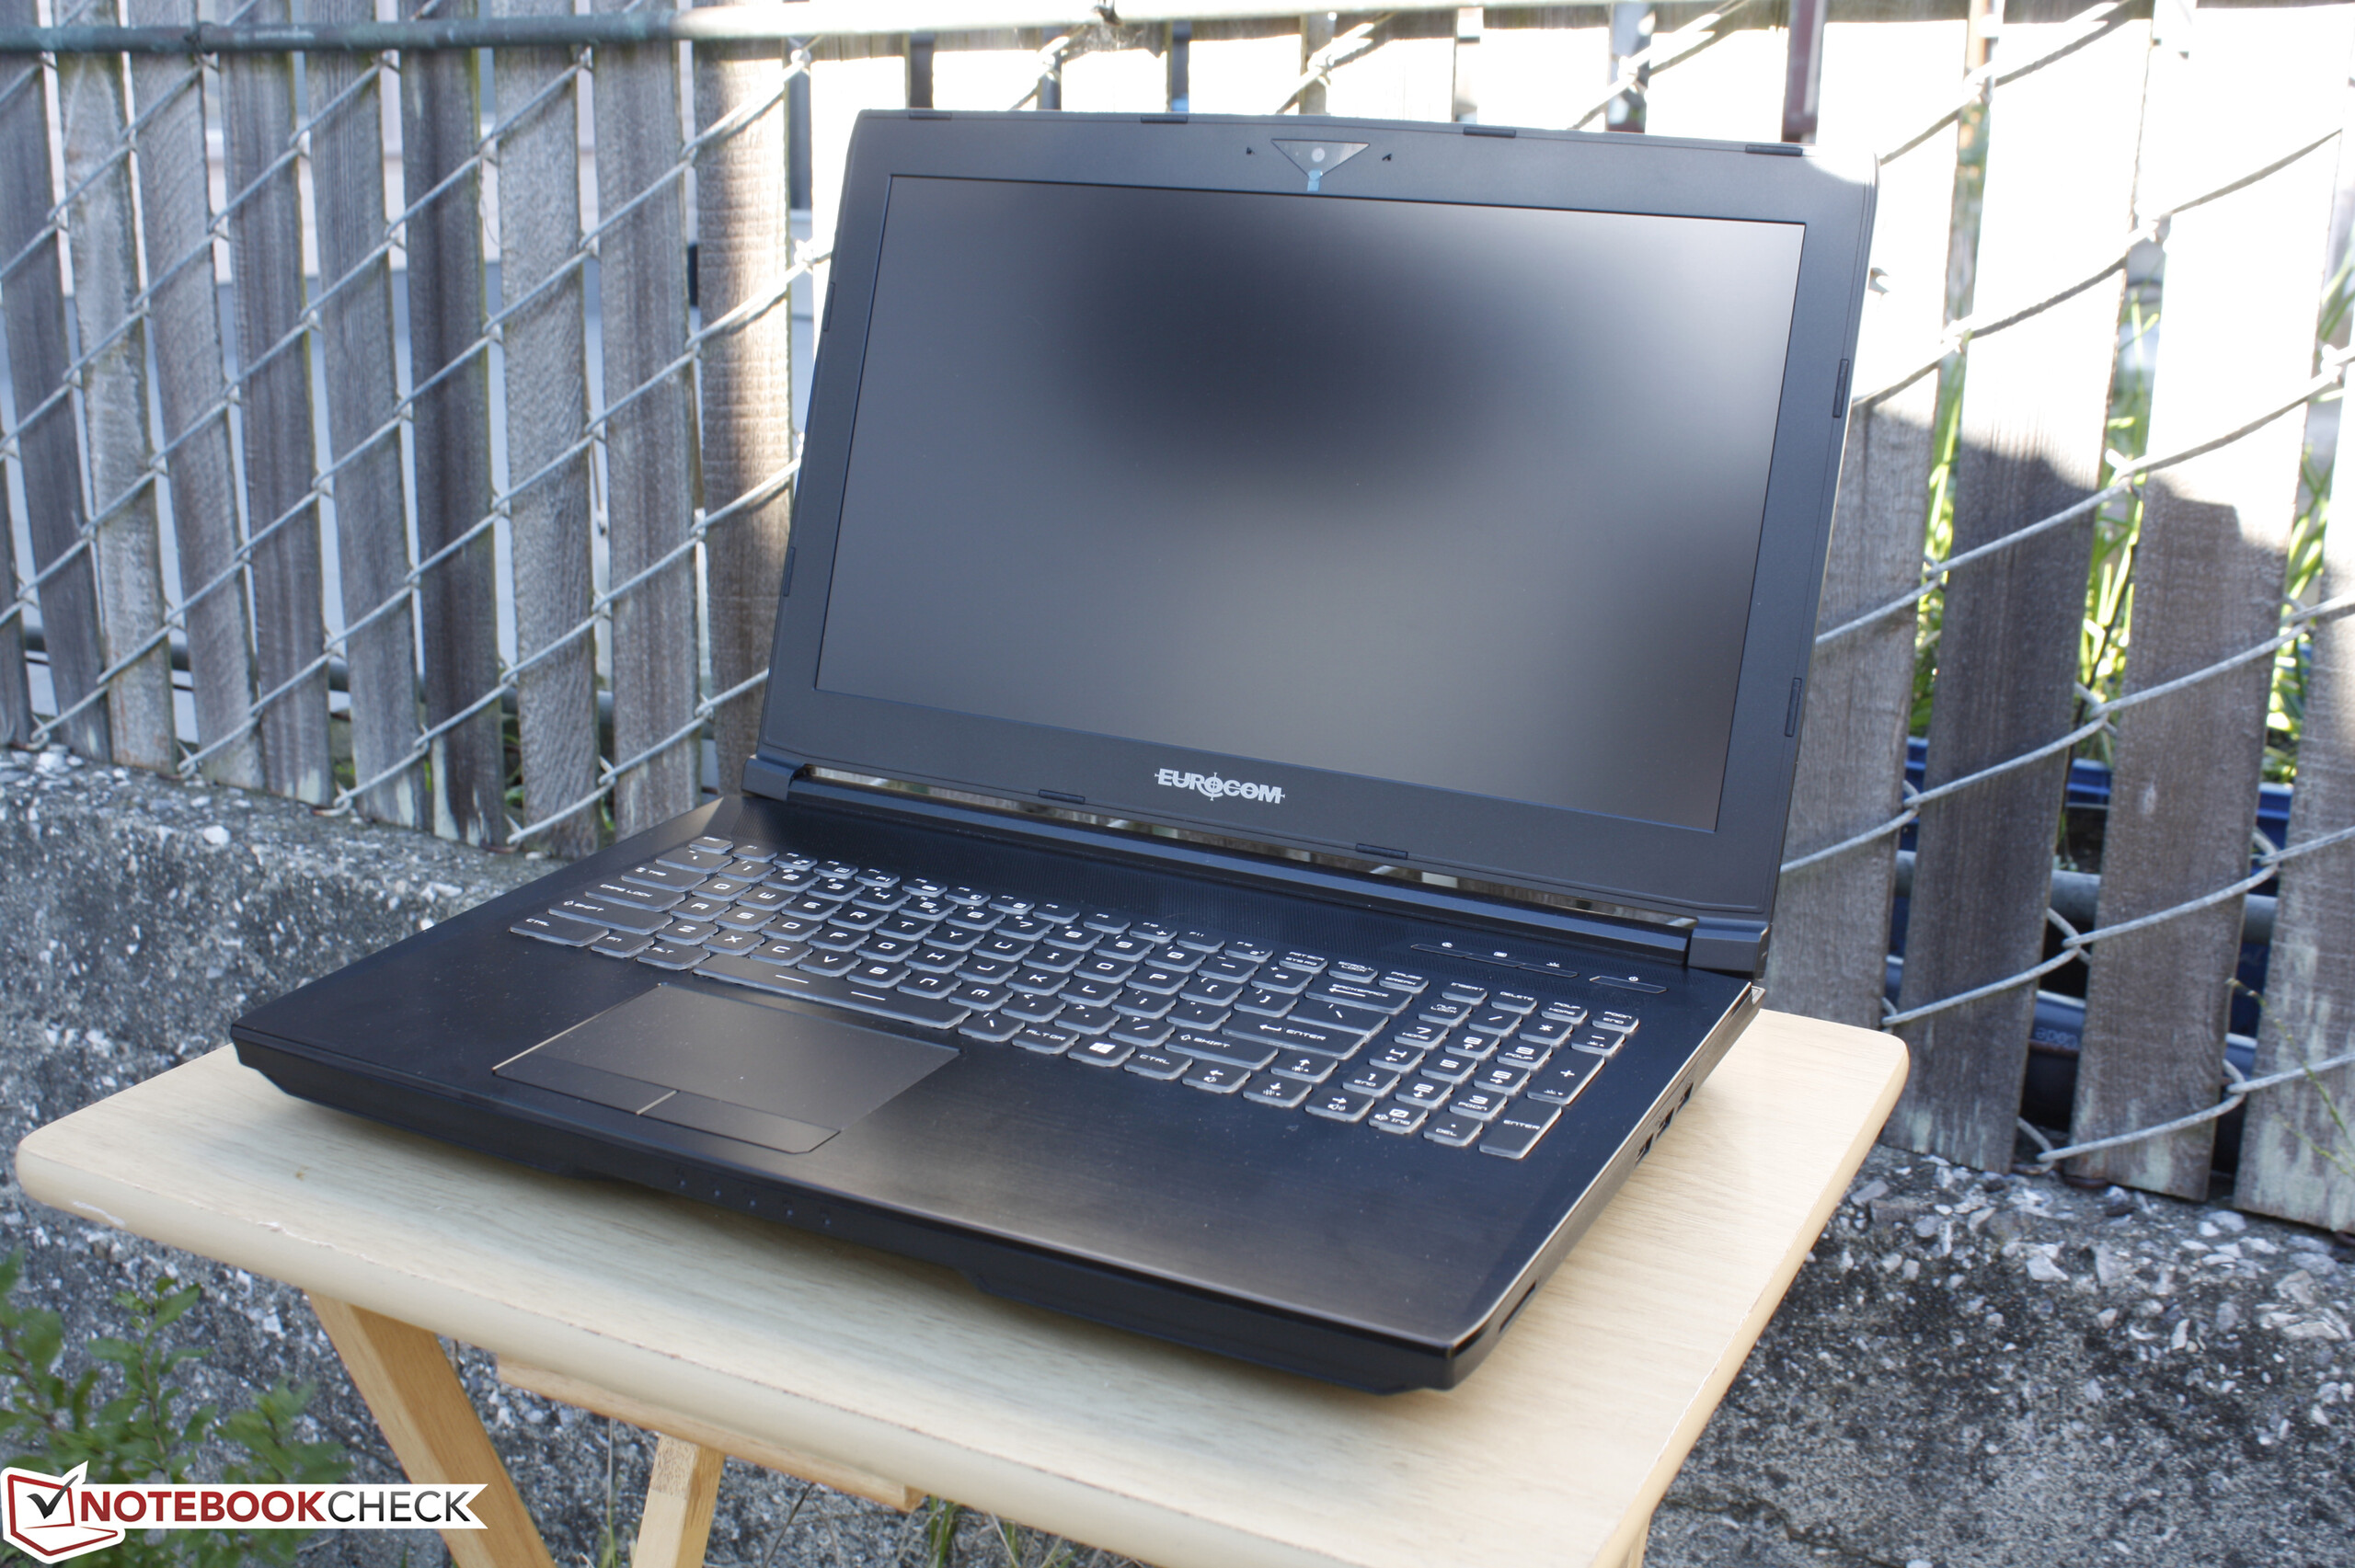
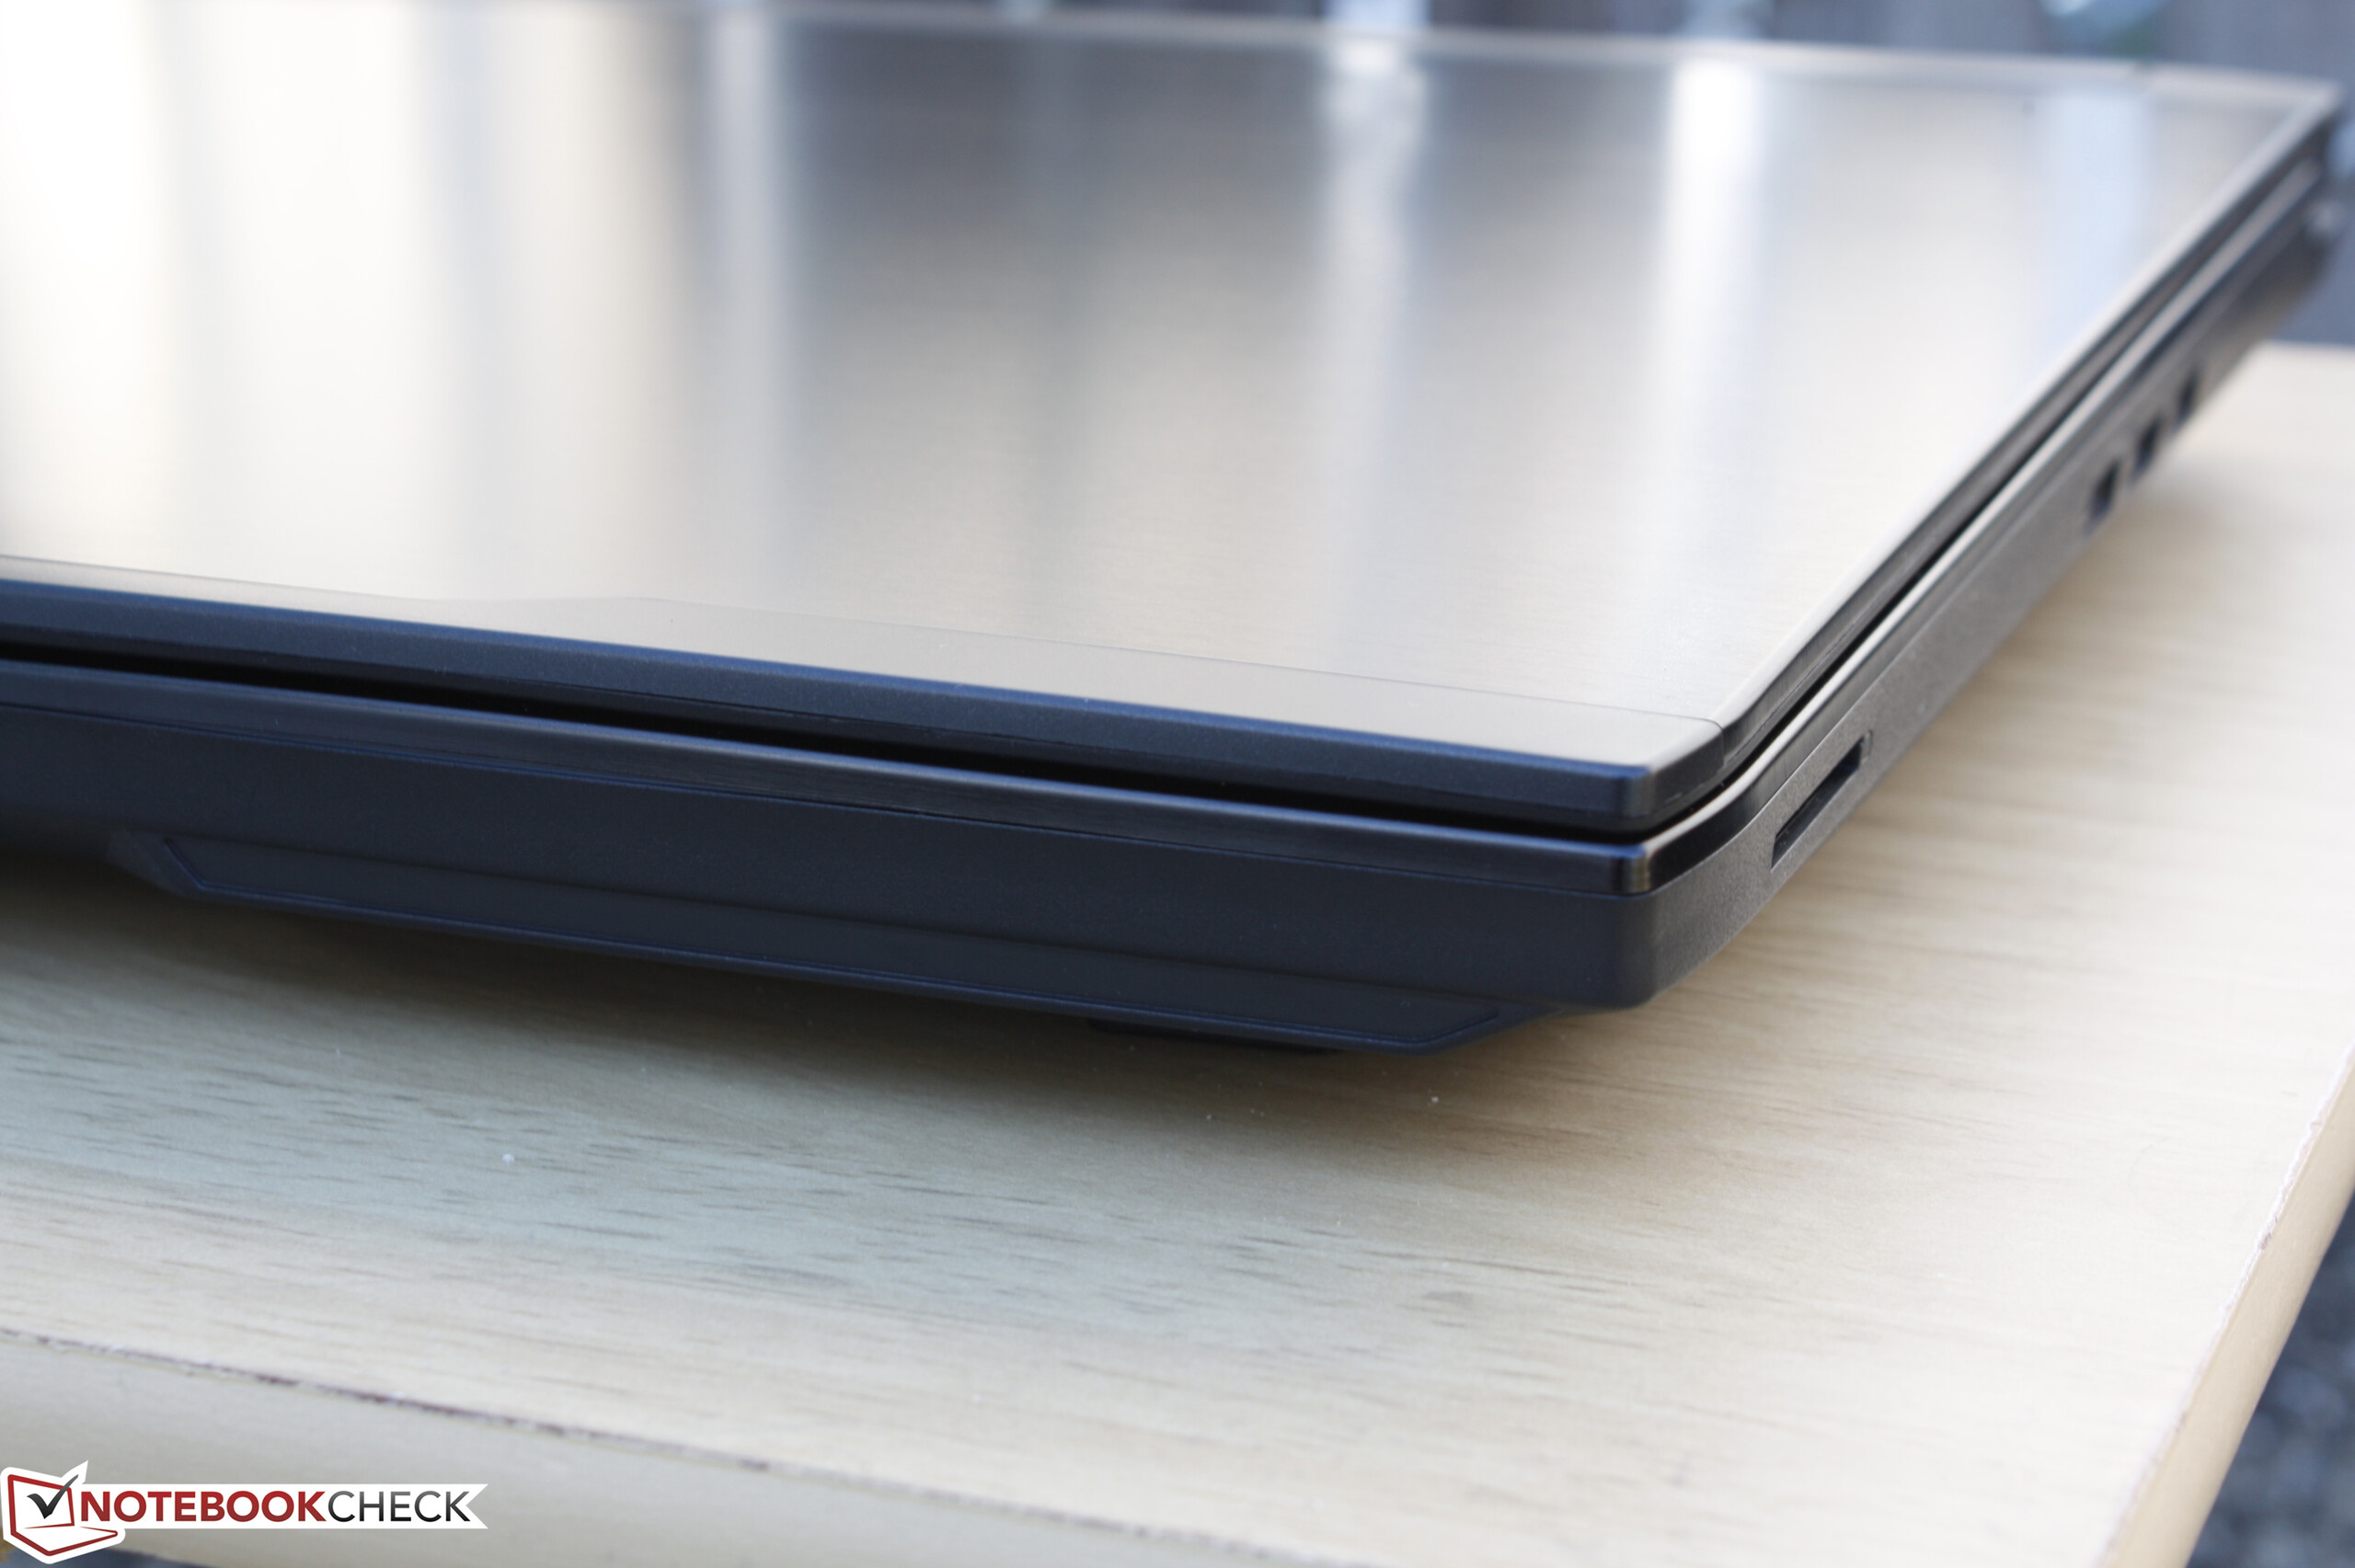
Tornado F5延续了Eurocom的高性能、高个性化空间的传统,同时相比其他大厂商的同类产品提供了更好的续航表现。Eurocom系统的一大优势是可以不需要破坏质保封条就能更换台式型处理器和升级显卡。
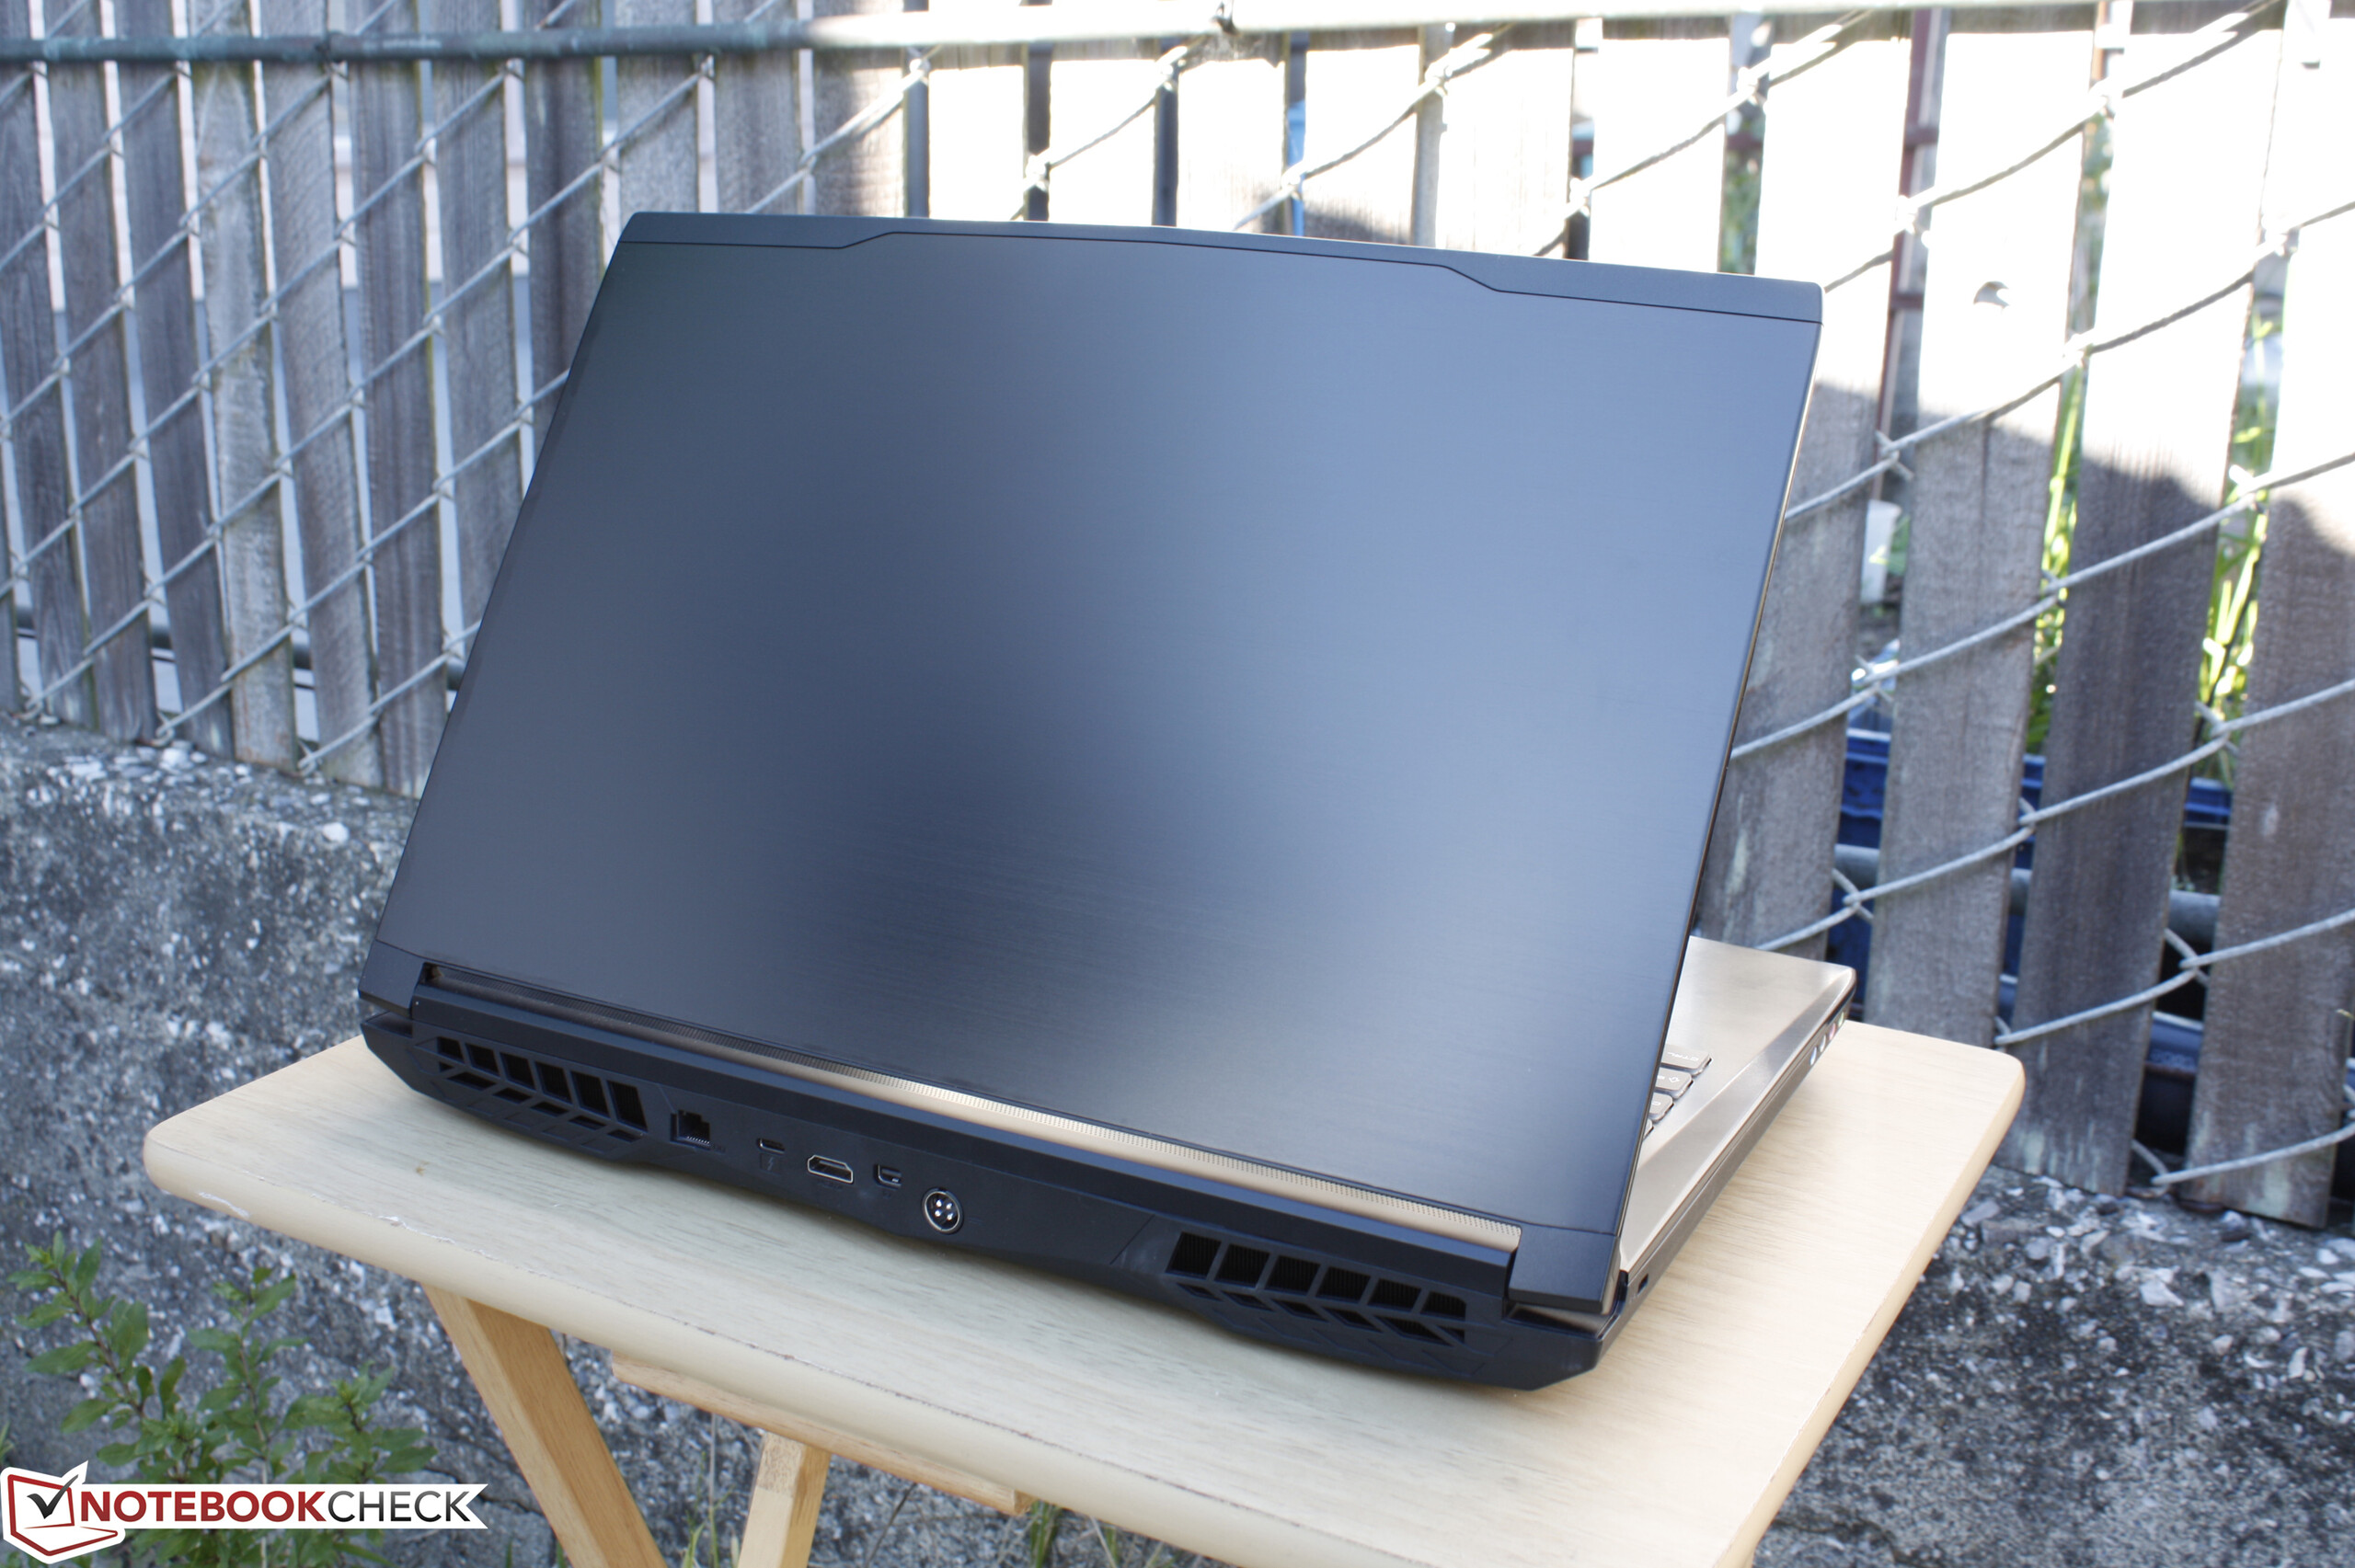
如果你对这一点不感兴趣的话,那么骨灰级的Tornado F5相比主流系统如微星GE62,华硕GL502或最新的惠普 Omen 17则没有太大优势。同样搭配GTX 1070显卡的这些设备定价较低,也相对更轻便。这几个机型的整体系统性能可能较低,不过在游戏性能上几乎毫无二致,因为i7-5700HQ和i7-6700HQ处理器的性能对大部分游戏来说都绰绰有余。
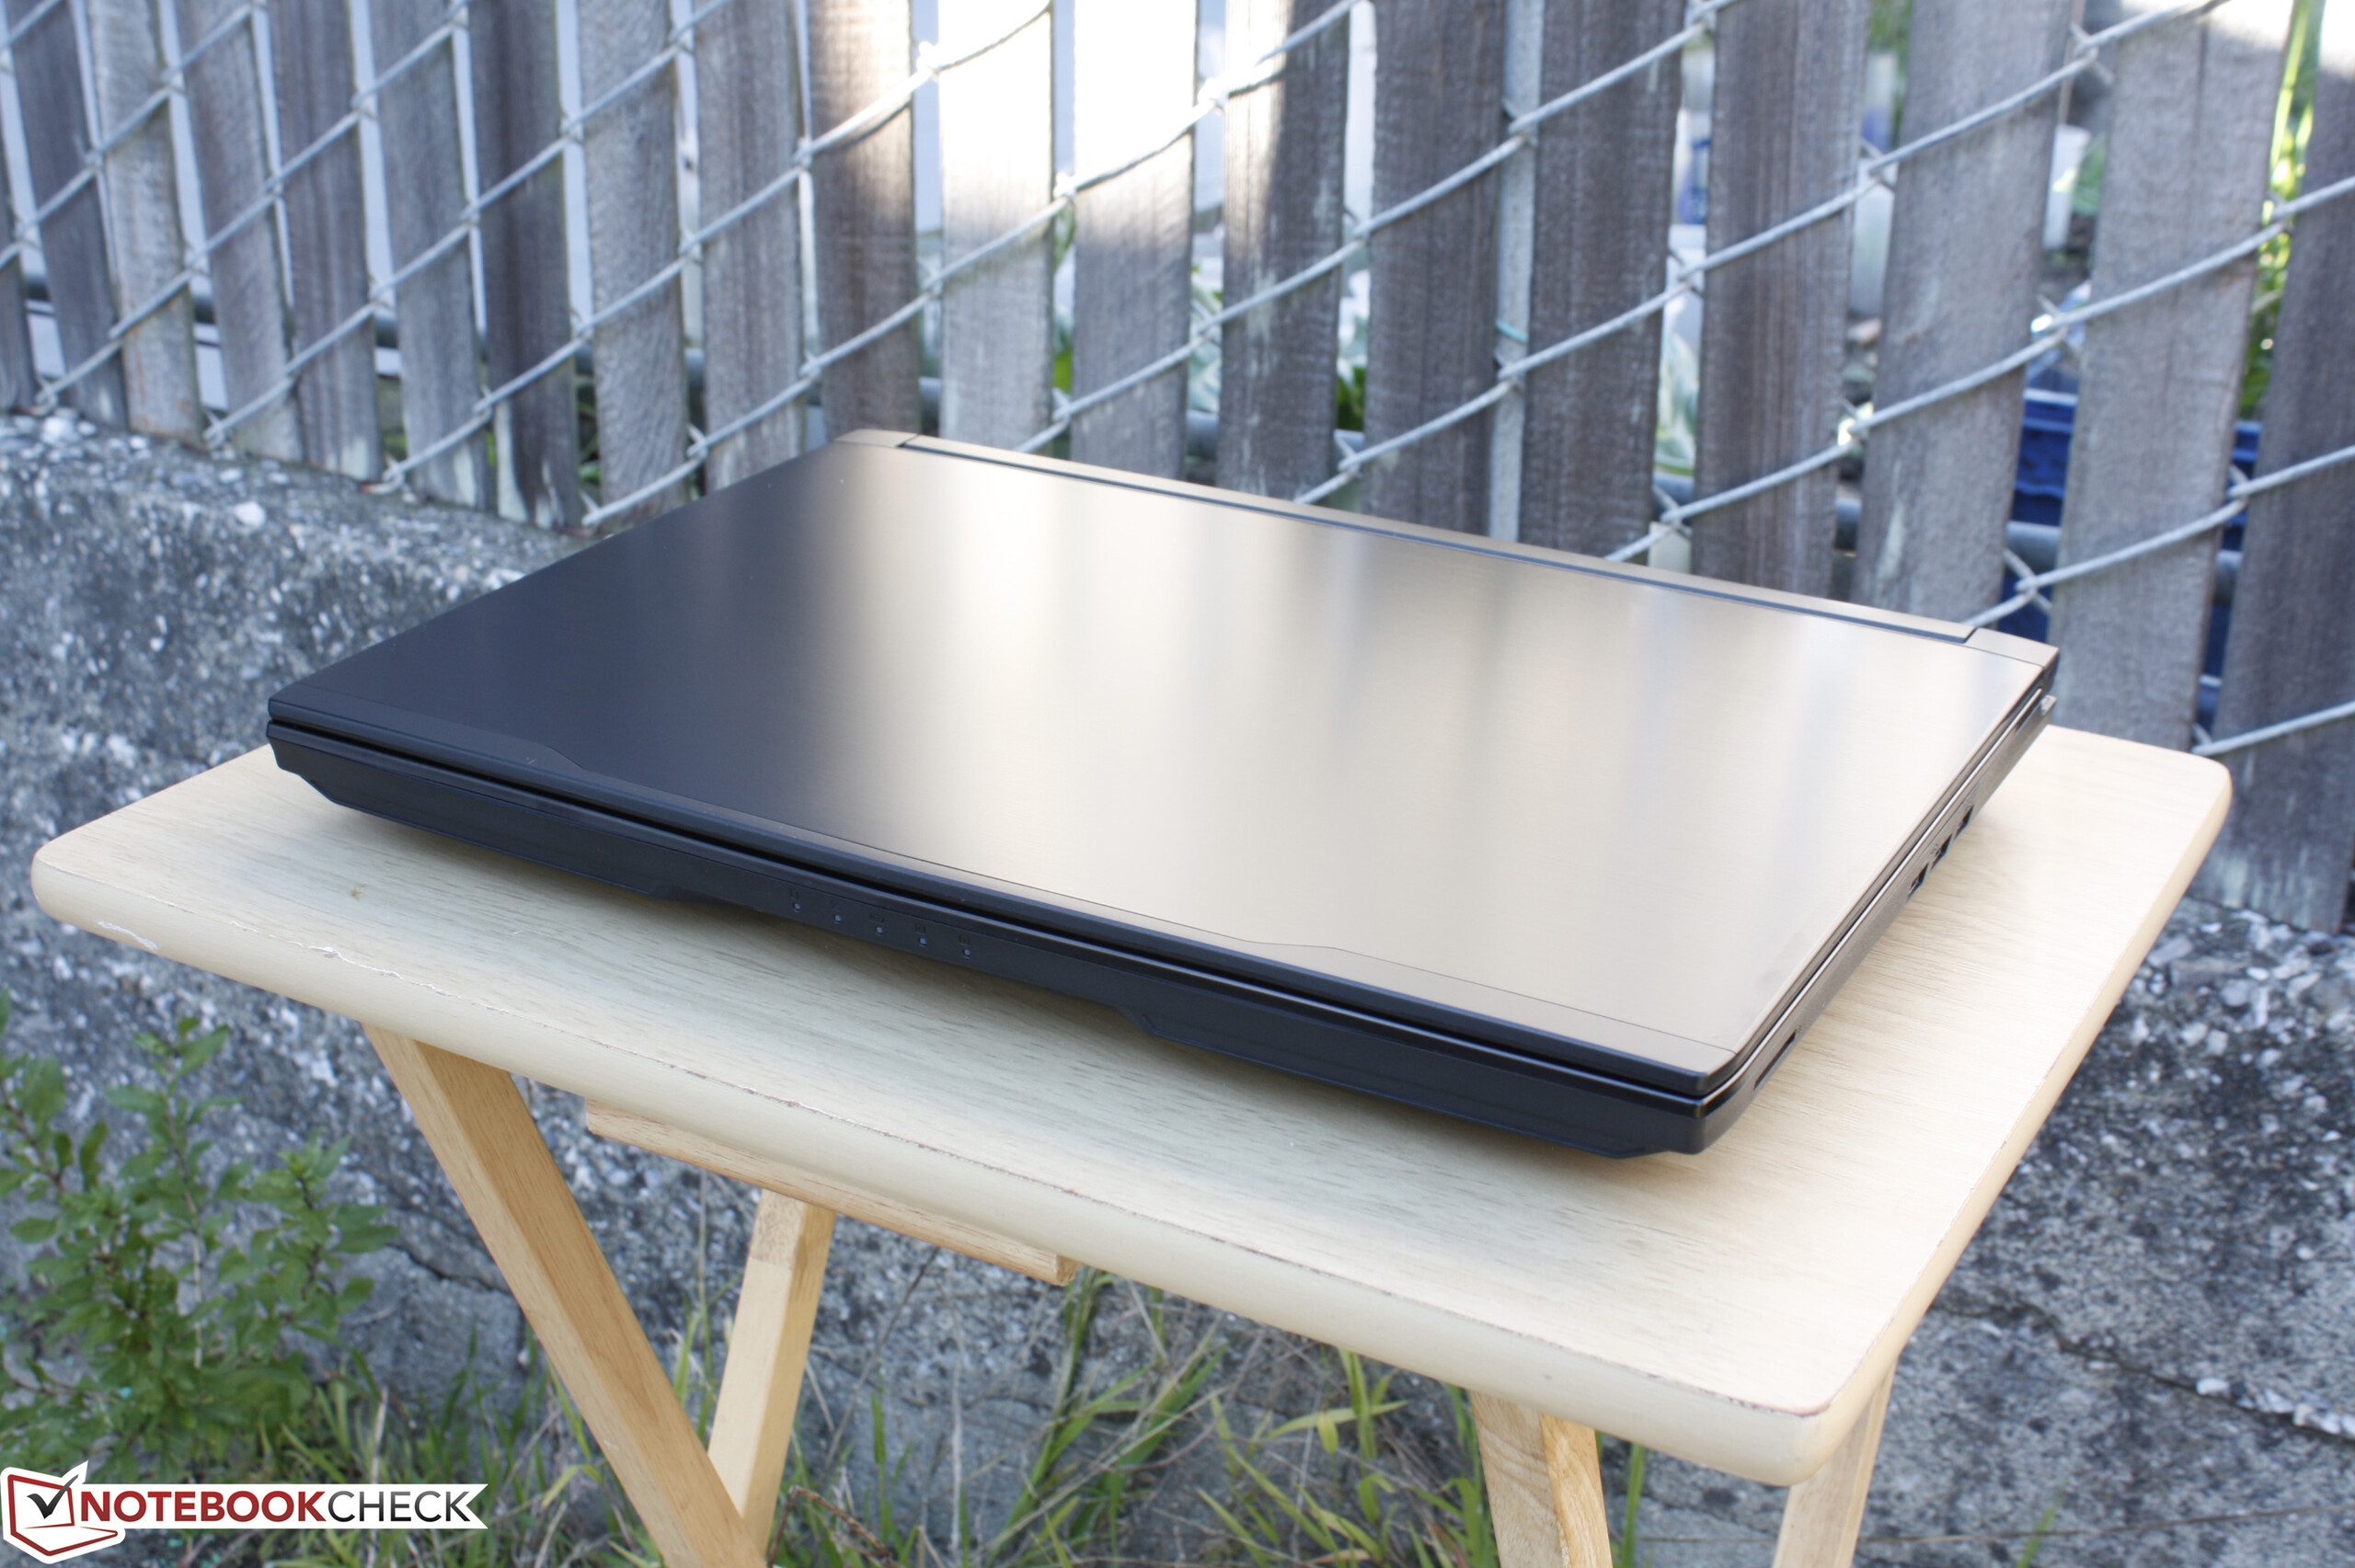
这台设备在游戏中没有遇到任何严重的降频问题。不过在使用更极端的Prime95测试时,它的核心温度在降频后也达到了近100度。因此,期待它可以为i7-7700K提供很大超频空间的用户可能会失望了。GTX 1070的运行温度相比较为合理,因为这款机型还可以选择搭配性能更高的GTX 1080显卡。不过这台至今最快之一的Eurocom设备在这两个方面依然在同屏幕尺寸设备中达到了领先的水平。
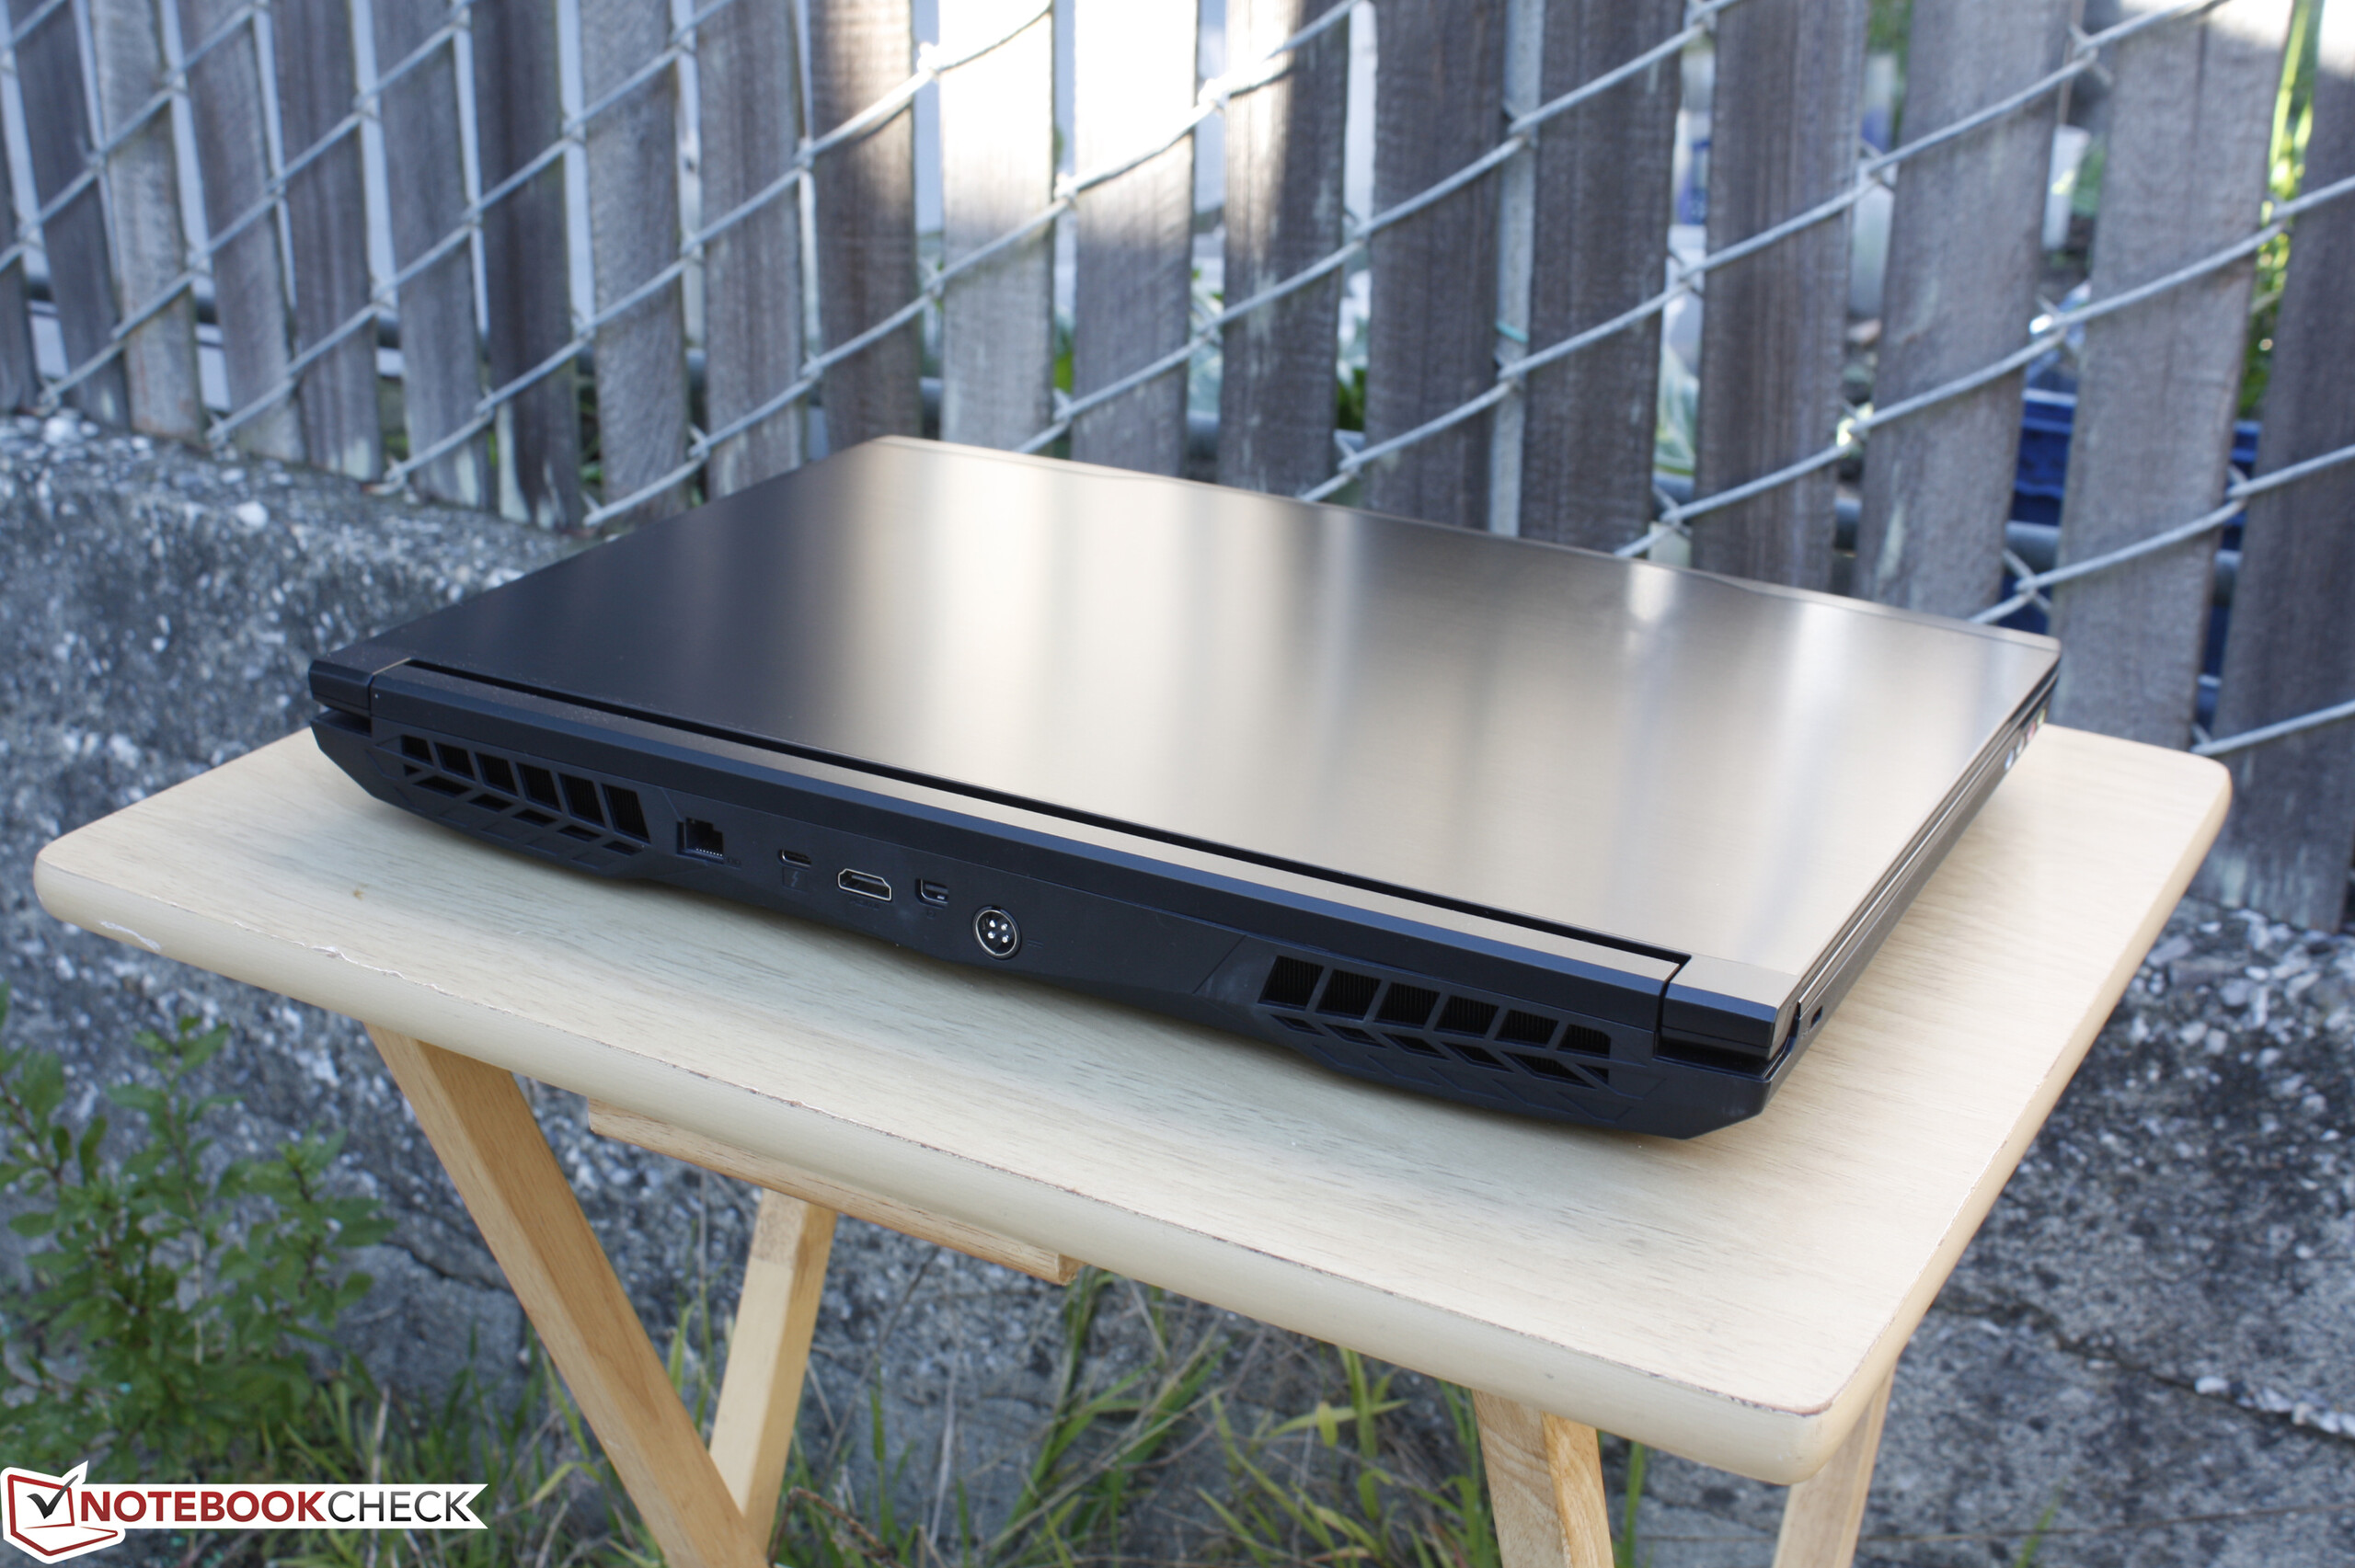
它的机身坚固度还有待改进,同时核心温度也需要降低。除此之外,Tornado F5凭借强劲的性能和自定义空间可以完全战胜竞争产品,如果它的售价不会高的离谱的话。
注:本文是基于完整评测的缩减版本,阅读完整的英文评测,请点击这里。
Eurocom Tornado F5
- 01/03/2017 v6 (old)
Allen Ngo
Price comparison
