Notebookcheck Logo

EA Sports FC 24》技术评测:笔记本电脑和台式机基准测试

新名字,老问题。 尽管 EA 已被多个国家认定违反了赌博法,但足球模拟游戏《FC》(前身为《FIFA》)仍然享有一定的知名度。在这篇评测中,我们将看看 2024 版的图形要求。
Gaming Laptop / Notebook Desktop Gamecheck
EA Sports FC 24

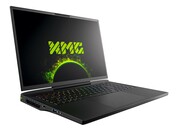
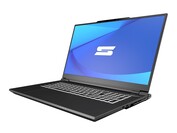
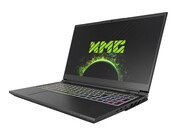
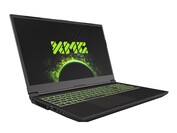
现在,我们使用这些笔记本电脑进行游戏基准测试。点击图片访问相应的产品页面。本文末尾列出了所有其他测试系统(塔式电脑、迷你电脑等)。

技术方面

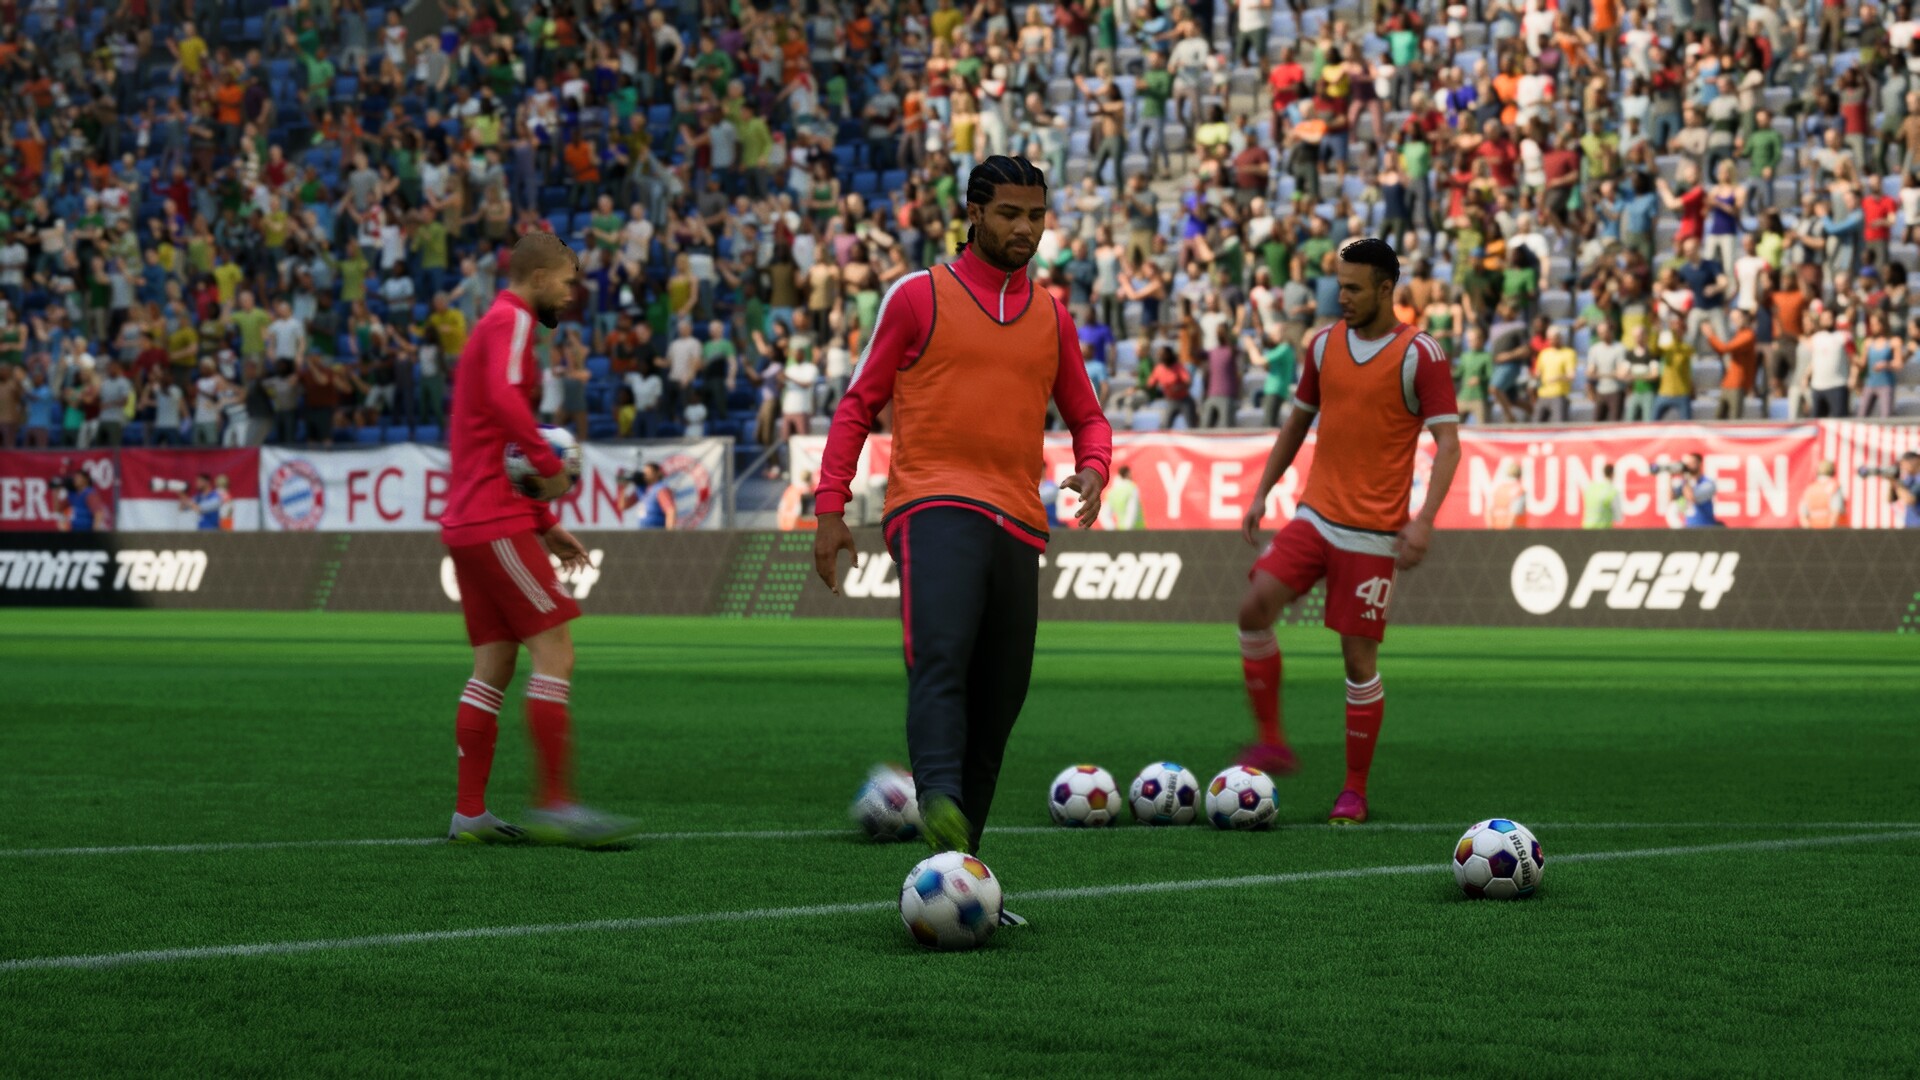
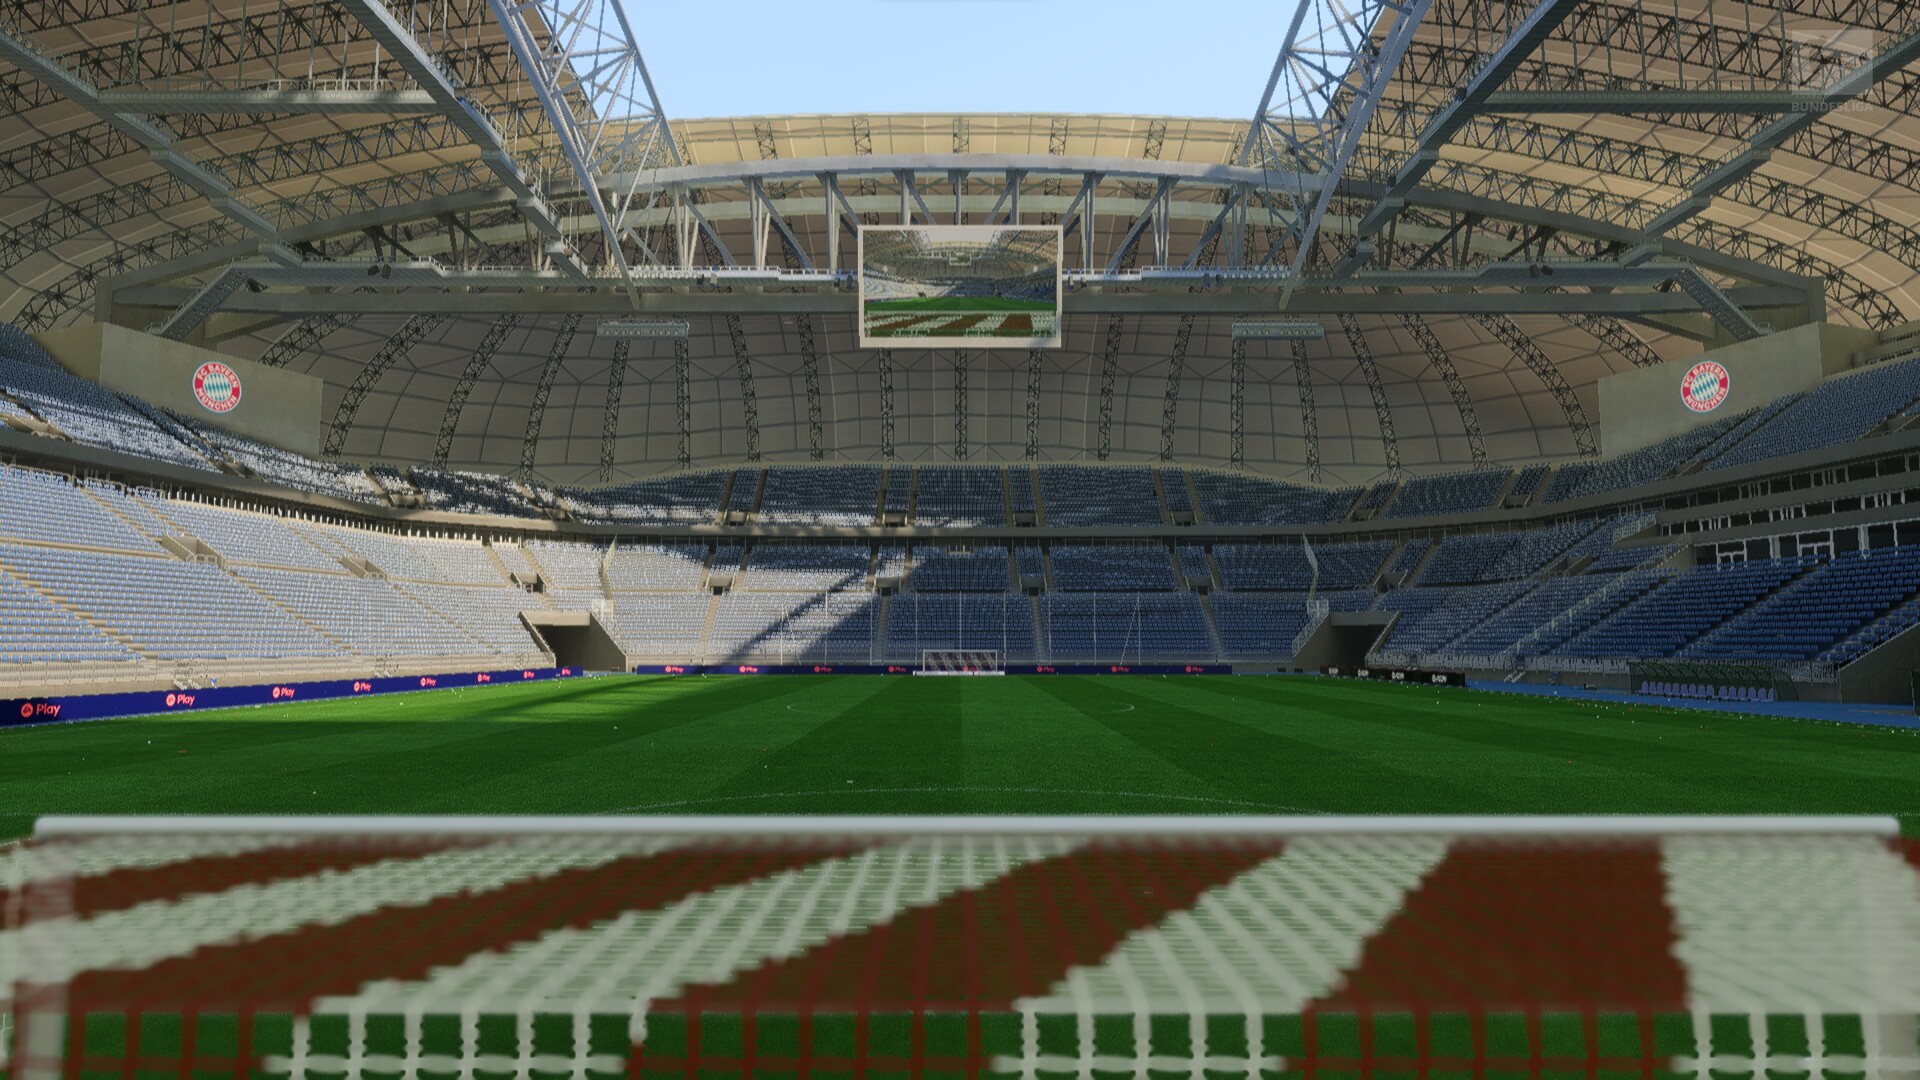
对于今年的表现分析,我们可以简单地重复使用我们写过的关于 上一届国际足联.EA 最新版足球电子游戏继承了该系列游戏一贯的优点和缺点。虽然特写镜头、回放等看起来相当不错和逼真(但也耗费了更多的性能),但寒霜引擎在比赛中默认视角下的运行仍然明显低于其潜力,导致视觉效果平平。这里可能还有很大的改进空间。尽管这有助于保持相当低的硬件要求。

EA Sports FC 24
EA Sports FC 24
EA Sports FC 24

游戏的控制同样需要改进。鼠标和键盘的操作仍然相当糟糕--尤其是菜单,再次变得非常复杂,需要不必要的点击才能浏览。此外,即使您选择的是 Steam 版本,强制安装的 EA 应用程序和 EA anticheat 程序仍会带来一些问题。例如,启动游戏感觉就像要花很长时间,而且时不时还会收到莫名其妙的错误信息。此外,在测试过程中,我们还发现在加载本身就非常大气、制作精良的视频时,经常会出现卡顿现象,而且无论使用何种硬件和设置,都会出现这种情况。

EA Sports FC 24
EA Sports FC 24
EA Sports FC 24

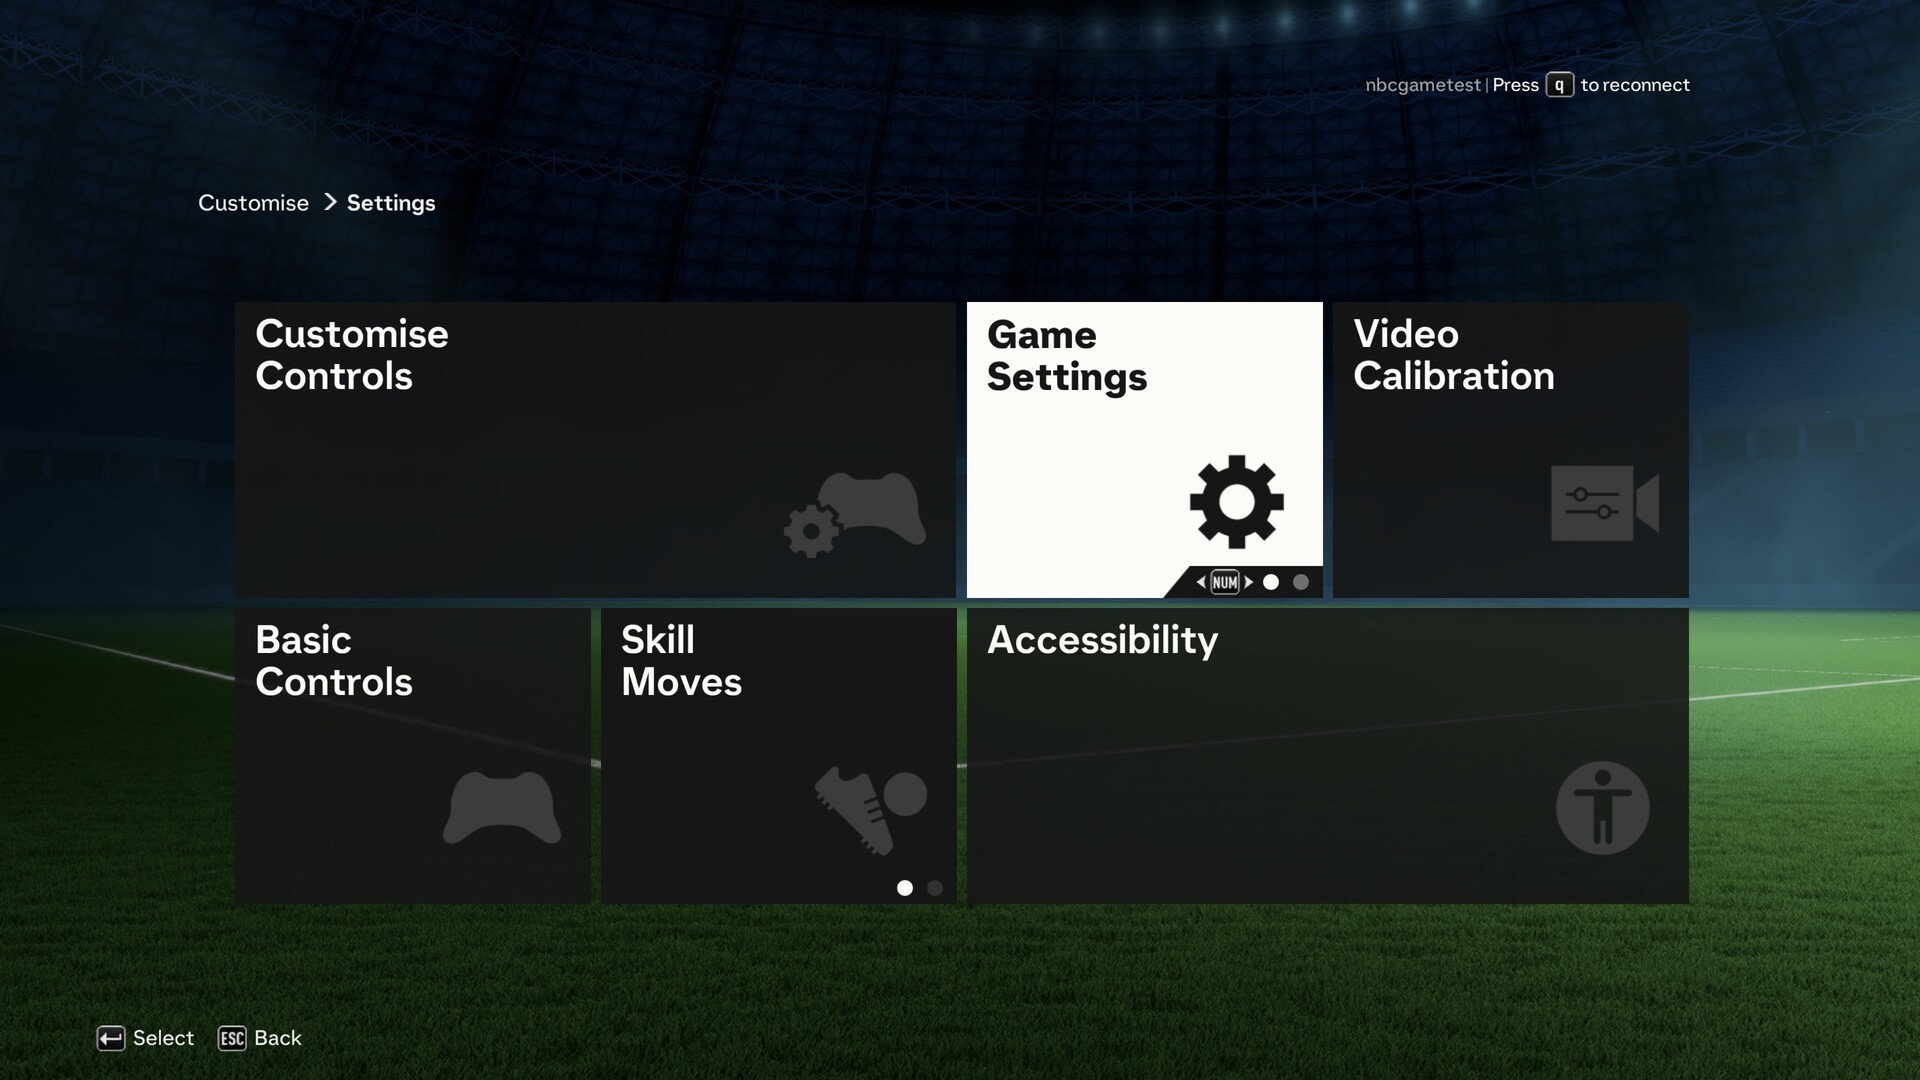
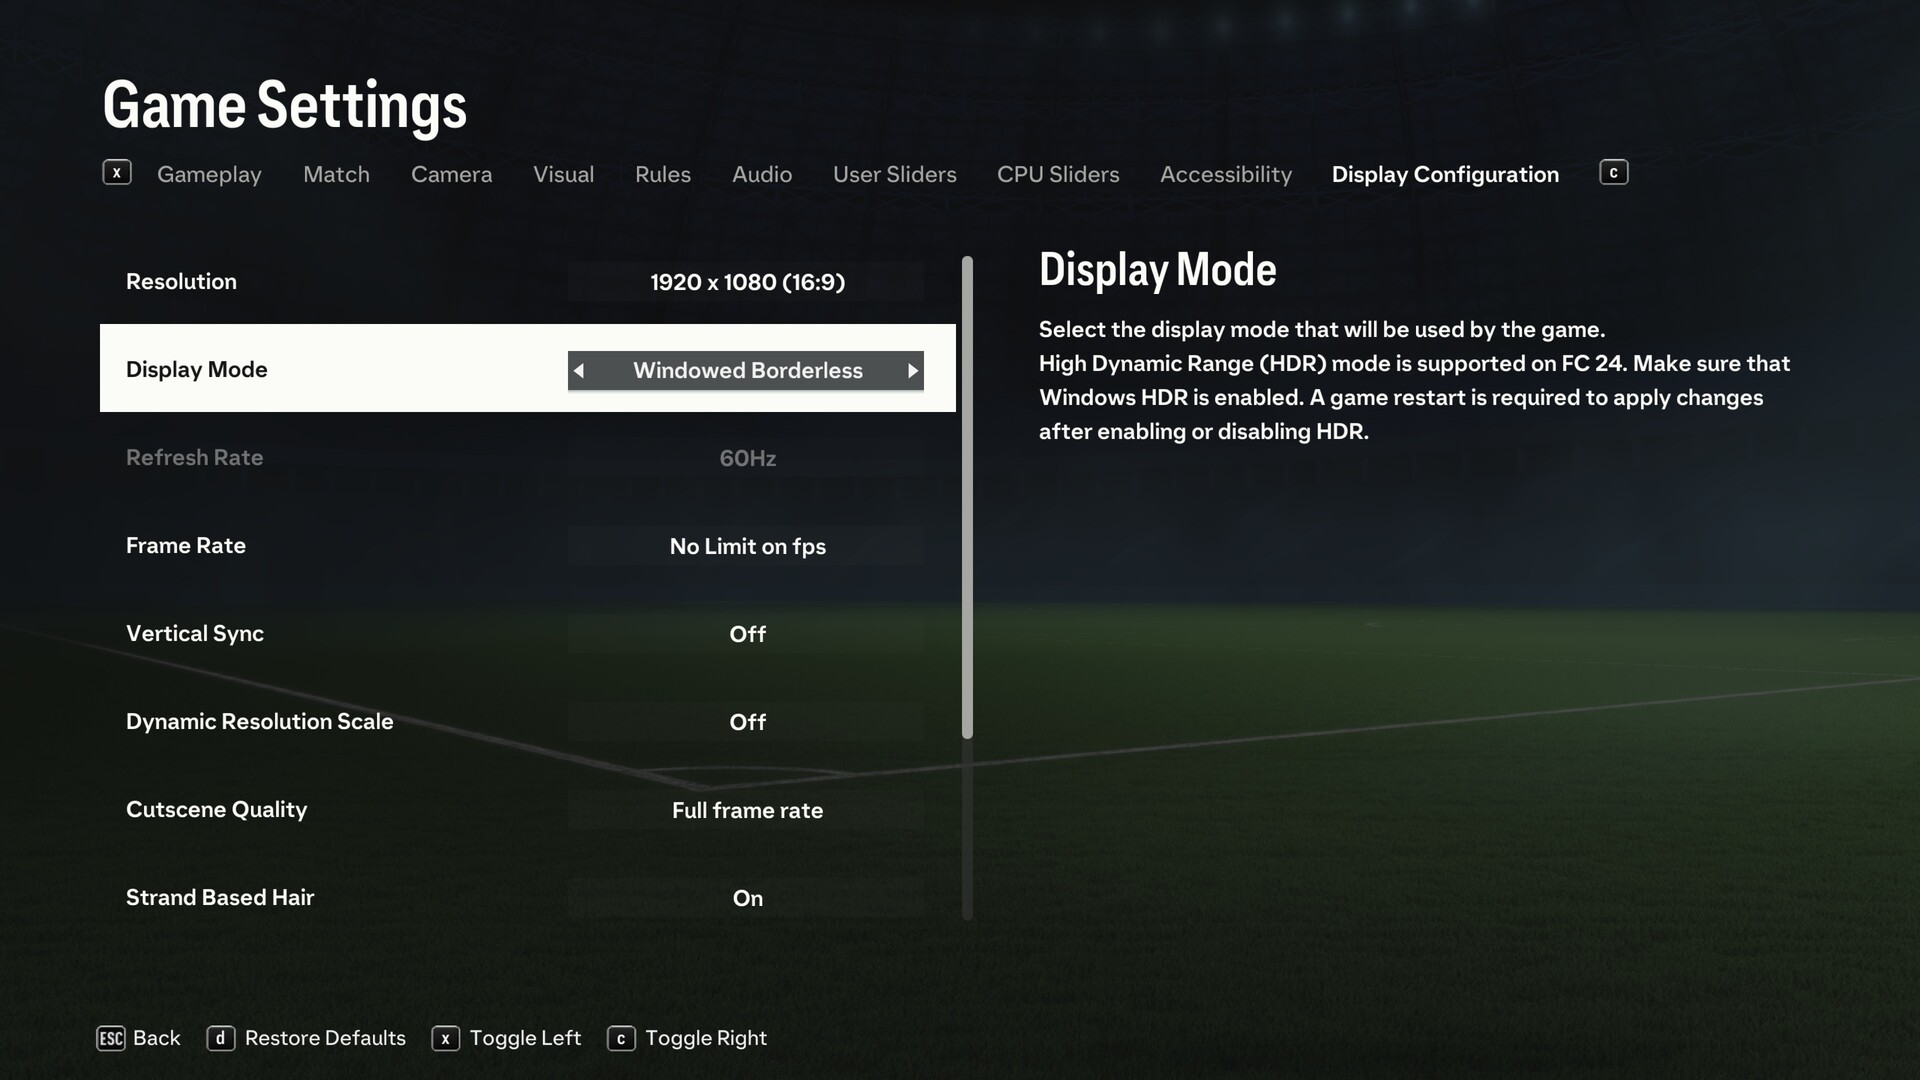
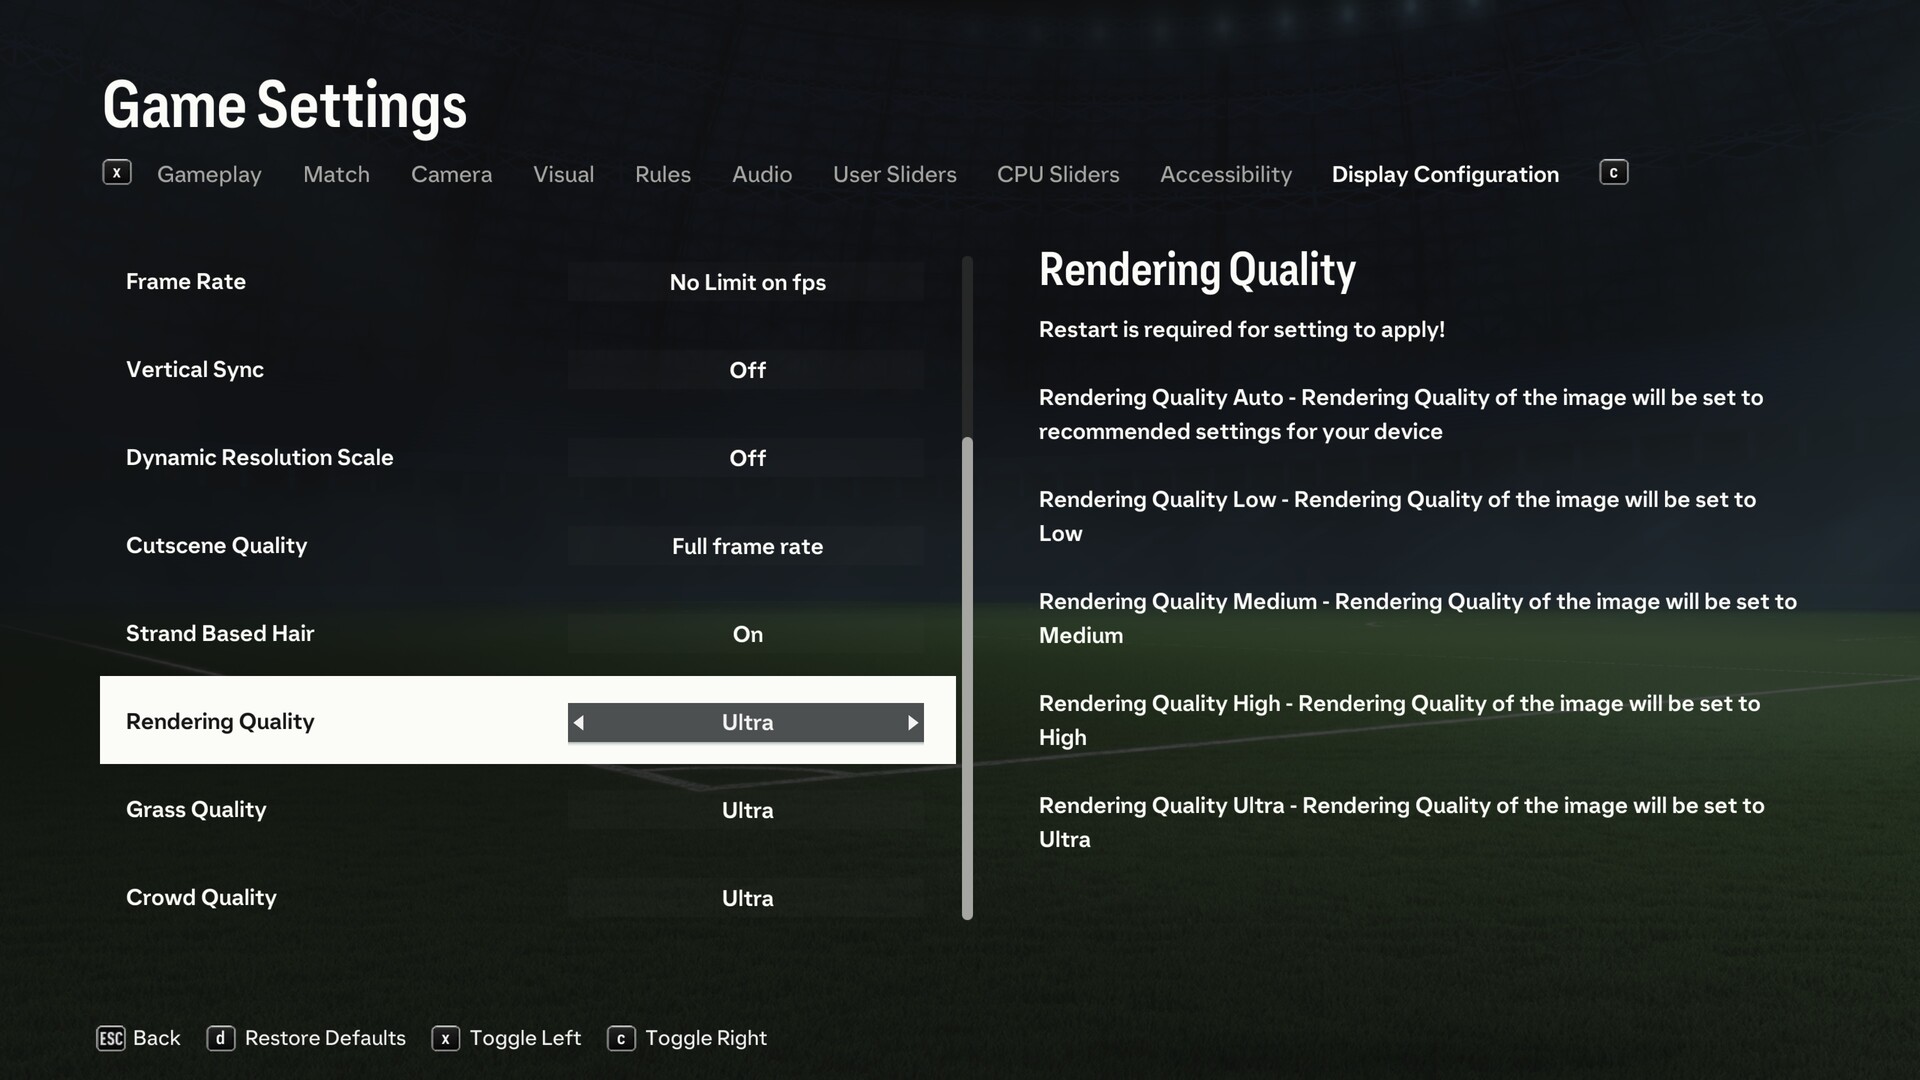
再来看图形菜单:游戏中完全可以访问图形菜单,就像《FIFA 23》中的图形菜单一样。遗憾的是,那些期待着大量选项的玩家要失望了。除了渲染质量,你能自定义的其他质量选项只有剪辑、草地和人群。此外,还有启用或禁用帧速率上限、VSync 和动态分辨率的选项。当然,你也可以在图形菜单中调整分辨率和显示模式。开发人员决定不加入 DLSS 等现代功能或任何有用的预设。个别设置的对比图片也同样找不到,但至少提供了书面说明。此外,更改某些设置后还需要重新启动游戏,这一点也不太理想。

EA Sports FC 24
EA Sports FC 24
EA Sports FC 24

基准

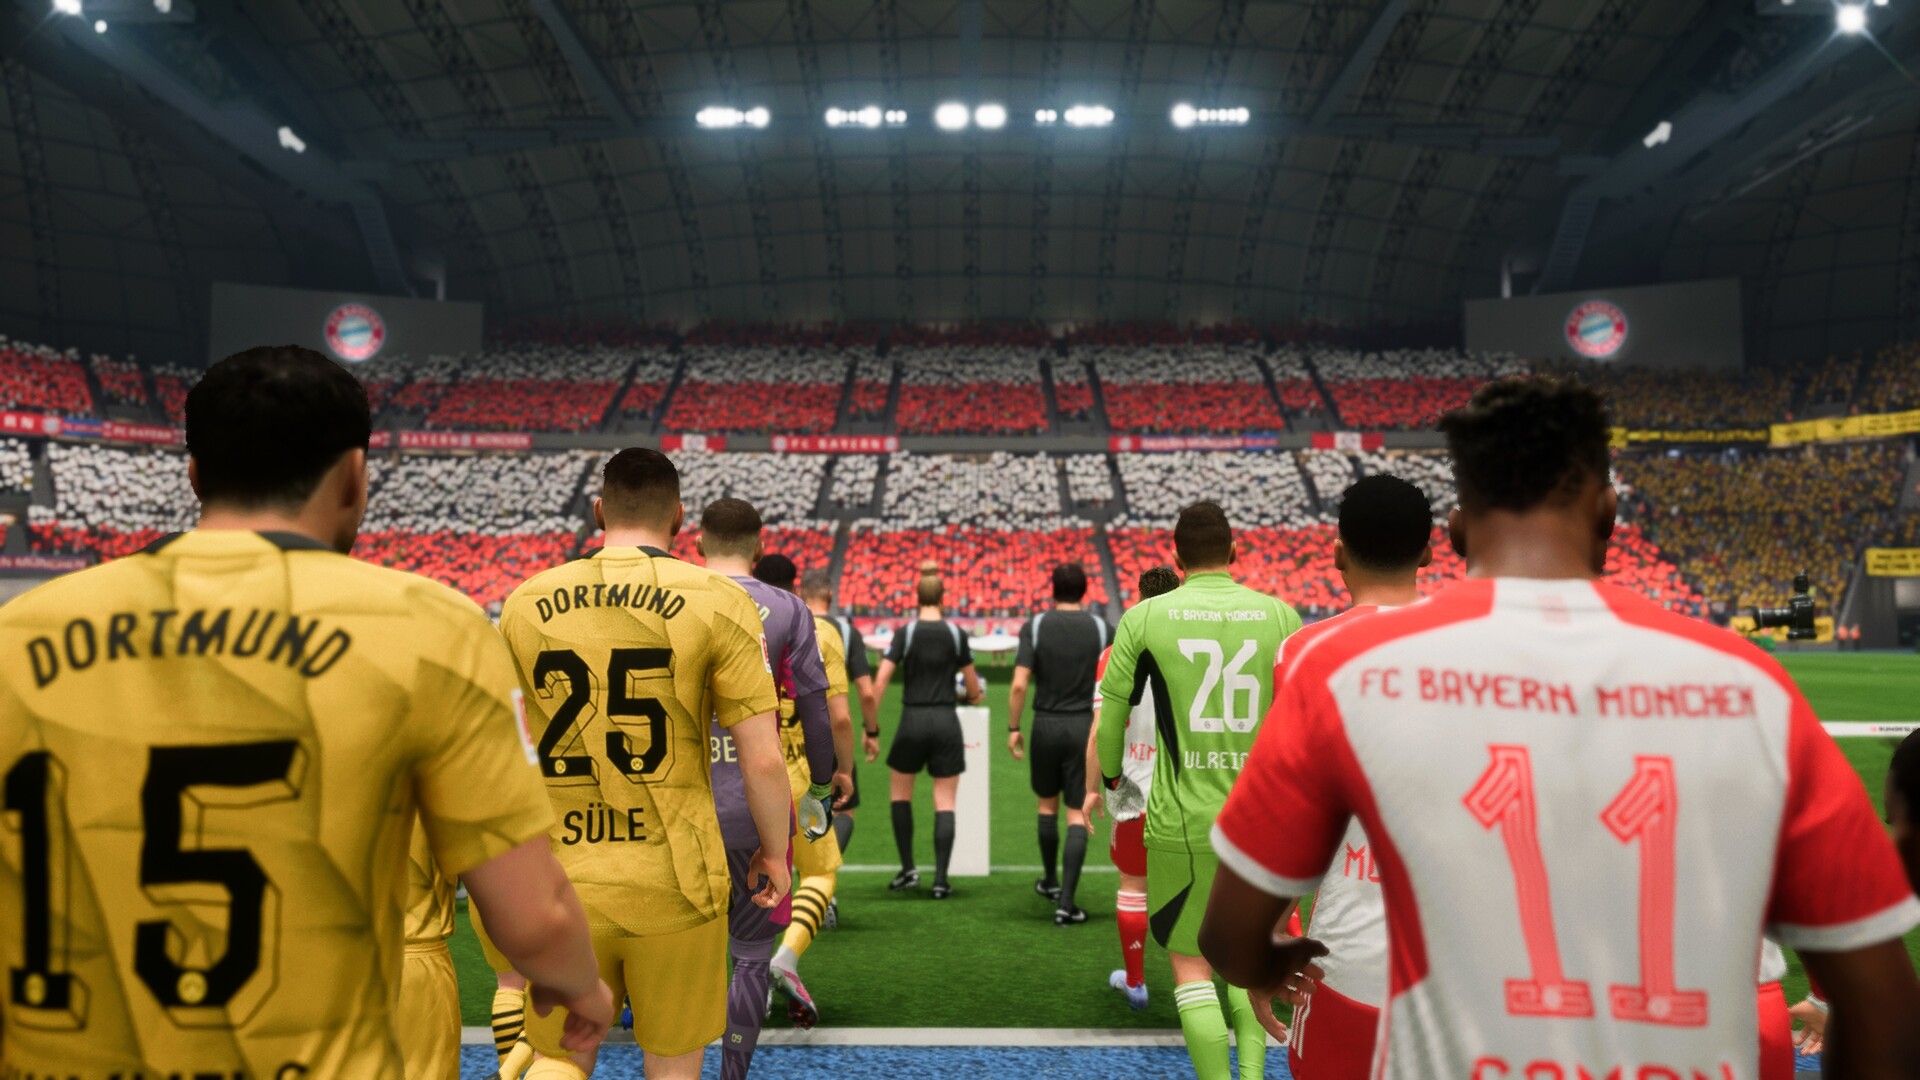
与往年一样,我们使用拜仁慕尼黑和多特蒙德之间的一场开球比赛作为基准(比赛设置:夏季,下午 4 点,天气晴朗)。半场比赛设定为 6 分钟,我们使用 CapFrameX 记录了至少 4 分钟的比赛表现(大约相当于 40 秒)。由于重播的 FPS 数较低,我们避免或跳过了重播。由于足球模拟游戏对 GPU 的要求并不高,因此在中等分辨率和设置下,性能较强的显卡可能会受到 CPU 的限制。

成果


全高清(1,920 x 1,080)

虽然 iGPU 在 720p 和最低设置下运行许多游戏时都会遇到困难,但它们通常足以在全高清下处理 FC 24。例如 Radeon 680M在此分辨率下,当细节设置为中等或更高时(我们通常建议在此游戏中使用),FPS 仅略低于 60。不过,我们在游戏过程中经常会遇到奇怪的卡顿现象,图像渲染看起来也不是很干净。

EA Sports FC 24
    1920x1080 Low Preset     1920x1080 Medium Preset     1920x1080 High Preset     1920x1080 Ultra Preset
NVIDIA GeForce RTX 4080, i9-13900K
Desktop-PC Asus ROG Strix Z790-F
312 (152.9min, 225P0.1, 244P1) fps ∼100%
263 (107.2min, 130.2P0.1, 201P1) fps ∼100%
262 (113.1min, 132.3P0.1, 202P1) fps ∼100%
AMD Radeon RX 7900 XT, i9-13900K
Desktop-PC Asus ROG Strix Z790-F
254 (87.2min, 144.4P0.1, 181P1) fps ∼81%
220 (30.2min, 87P0.1, 153.6P1) fps ∼84%
211 (68.3min, 89.1P0.1, 151.3P1) fps ∼81%
NVIDIA GeForce RTX 4090 Laptop GPU, i9-13900HX
XMG Neo 17 E23
219 (60.4min, 152.9P0.1, 169.7P1) fps ∼70%
179.3 (44.9min, 81P0.1, 138.5P1) fps ∼68%
171.3 (71.2min, 82P0.1, 130.7P1) fps ∼65%
NVIDIA GeForce RTX 4080 Laptop GPU, i9-13900HX
Schenker Key 17 Pro E23
216 (111.9min, 128P0.1, 164.4P1) fps ∼69%
177.9 (36.1min, 72.6P0.1, 126.7P1) fps ∼68%
167.2 (2.72min, 75.9P0.1, 120.3P1) fps ∼64%
NVIDIA GeForce RTX 3080 Ti Laptop GPU, i9-12900H
Asus ROG Strix Scar 17 G733ZX
231 (83.4min, 161.2P0.1, 184.1P1) fps ∼74%
194.3 (4.14min, 62.3P0.1, 143P1) fps ∼74%
182.8 (49.6min, 86.9P0.1, 138.9P1) fps ∼70%
NVIDIA GeForce RTX 3070 Ti Laptop GPU, i7-12700H
Acer Predator Helios 300 PH315-55
154 (79.4min, 100.8P0.1, 115.6P1) fps ∼49%
134.2 (45.1min, 60.7P0.1, 89.4P1) fps ∼51%
129.7 (33.3min, 56.2P0.1, 96.1P1) fps ∼50%
NVIDIA GeForce RTX 4070 Laptop GPU, i9-13900HX
XMG Pro 15 E23
192.7 (107.7min, 138.6P0.1, 148.9P1) fps ∼62%
162.3 (33.8min, 68.1P0.1, 118.6P1) fps ∼62%
150.1 (27.4min, 69.5P0.1, 105P1) fps ∼57%
NVIDIA GeForce RTX 4060 Laptop GPU, i9-13900HX
XMG Pro 15 E23
179.2 (26.5min, 92.9P0.1, 121.9P1) fps ∼57%
149.4 (37min, 51.6P0.1, 98.7P1) fps ∼57%
137.8 (22.4min, 46.8P0.1, 72.6P1) fps ∼53%
NVIDIA GeForce RTX 4050 Laptop GPU, i9-13900HX
XMG Focus 15 E23
163.8 (86.8min, 119.7P0.1, 139.3P1) fps ∼53%
144 (50.2min, 63.5P0.1, 111.7P1) fps ∼55%
132.5 (42min, 54.9P0.1, 76P1) fps ∼51%
AMD Radeon RX 6800S, R9 6900HS
Asus ROG Zephyrus G14
181.5 (93.1min, 122.2P0.1, 139.6P1) fps ∼100%
162.4 (58.9min, 100.6P0.1, 125.6P1) fps ∼52%
138.4 (46.8min, 56.5P0.1, 104.1P1) fps ∼53%
126.2 (24.5min, 51.7P0.1, 96.5P1) fps ∼48%
AMD Radeon 780M, R9 7940HS
Minisforum Venus Series UM790 Pro
107.8 (71.7min, 84.4P0.1, 92.4P1) fps ∼59%
98.4 (25min, 65.2P0.1, 79.9P1) fps ∼32%
78.2 (42.4min, 43.5P0.1, 52.3P1) fps ∼30%
71.9 (23.6min, 41.4P0.1, 60.2P1) fps ∼27%
AMD Radeon 680M, R9 6900HS
Asus ROG Zephyrus G14
80.3 (25.7min, 27.8P0.1, 36.1P1) fps ∼44%
57.9 (13.7min, 19P0.1, 23.3P1) fps ∼19%
42 (12.4min, 12.5P0.1, 17.1P1) fps ∼16%
39.5 (5.97min, 7.1P0.1, 12.6P1) fps ∼15%

QHD (2,560 x 1,440)

中端显卡就能满足您以 QHD 高清体验游戏的需要。例如 GeForce RTX 4050就足以在 1440p 和最高设置下输出约 100 FPS。

EA Sports FC 24
    2560x1440 Ultra Preset
NVIDIA GeForce RTX 4080, i9-13900K
Desktop-PC Asus ROG Strix Z790-F
261 (97.7min, 124P0.1, 196.5P1) fps ∼100%
AMD Radeon RX 7900 XT, i9-13900K
Desktop-PC Asus ROG Strix Z790-F
203 (76.4min, 82.8P0.1, 132P1) fps ∼78%
NVIDIA GeForce RTX 4090 Laptop GPU, i9-13900HX
XMG Neo 17 E23
167.6 (37.4min, 72.7P0.1, 126.7P1) fps ∼64%
NVIDIA GeForce RTX 4080 Laptop GPU, i9-13900HX
Schenker Key 17 Pro E23
163.4 (4.3min, 21.5P0.1, 98.5P1) fps ∼63%
NVIDIA GeForce RTX 3080 Ti Laptop GPU, i9-12900H
Asus ROG Strix Scar 17 G733ZX
151.7 (27.1min, 65.9P0.1, 112.1P1) fps ∼58%
NVIDIA GeForce RTX 4070 Laptop GPU, i9-13900HX
XMG Pro 15 E23
138.4 (38.6min, 58.7P0.1, 107.5P1) fps ∼53%
NVIDIA GeForce RTX 3070 Ti Laptop GPU, i7-12700H
Acer Predator Helios 300 PH315-55
129.2 (32.6min, 60.2P0.1, 80.5P1) fps ∼50%
NVIDIA GeForce RTX 4060 Laptop GPU, i9-13900HX
XMG Pro 15 E23
121 (30.1min, 42.9P0.1, 71.6P1) fps ∼46%
NVIDIA GeForce RTX 4050 Laptop GPU, i9-13900HX
XMG Focus 15 E23
100.9 (29.4min, 42.3P0.1, 58.9P1) fps ∼39%
AMD Radeon 780M, R9 7940HS
Minisforum Venus Series UM790 Pro
51.7 (32.4min, 33.8P0.1, 42.6P1) fps ∼20%

超高清(3,840 x 2,160)

在 4K 下运行游戏并不一定需要高端 GPU。即使是之前提到的 RTX 4050 也有足够的能力在 4K 和超高设置下接近 60 FPS。

EA Sports FC 24
    3840x2160 Ultra Preset
NVIDIA GeForce RTX 4080, i9-13900K
Desktop-PC Asus ROG Strix Z790-F
188 (90.5min, 107.3P0.1, 145.7P1) fps ∼100%
AMD Radeon RX 7900 XT, i9-13900K
Desktop-PC Asus ROG Strix Z790-F
166.9 (60.3min, 75.4P0.1, 121.8P1) fps ∼89%
NVIDIA GeForce RTX 4090 Laptop GPU, i9-13900HX
XMG Neo 17 E23
153.2 (35.2min, 49.8P0.1, 106.2P1) fps ∼81%
NVIDIA GeForce RTX 4080 Laptop GPU, i9-13900HX
Schenker Key 17 Pro E23
125.2 (25.7min, 57.6P0.1, 94.7P1) fps ∼67%
NVIDIA GeForce RTX 3080 Ti Laptop GPU, i9-12900H
Asus ROG Strix Scar 17 G733ZX
97.8 (43.7min, 47.3P0.1, 77P1) fps ∼52%
NVIDIA GeForce RTX 4070 Laptop GPU, i9-13900HX
XMG Pro 15 E23
82.4 (31.6min, 34.9P0.1, 61.7P1) fps ∼44%
NVIDIA GeForce RTX 3070 Ti Laptop GPU, i7-12700H
Acer Predator Helios 300 PH315-55
81.8 (32.4min, 36.7P0.1, 62.2P1) fps ∼44%
NVIDIA GeForce RTX 4060 Laptop GPU, i9-13900HX
XMG Pro 15 E23
70.7 (39.3min, 42.6P0.1, 58.2P1) fps ∼38%
NVIDIA GeForce RTX 4050 Laptop GPU, i9-13900HX
XMG Focus 15 E23
56.8 (21min, 27.3P0.1, 39.9P1) fps ∼30%
AMD Radeon 780M, R9 7940HS
Minisforum Venus Series UM790 Pro
26.8 (15.4min, 15.5P0.1, 17.1P1) fps ∼14%

备注

由于游戏测试非常耗时,而且经常受到安装或激活限制,因此在发布本文时,我们只能为您提供部分基准测试结果。我们将在未来几天或几周内添加更多显卡。

Overview

Show Restrictions
PosModel< PrevNext >EA Sports FC 24
 EA Sports FC 24 (2023)
low
1920x1080
Low Preset
med.
1920x1080
Medium Preset
high
1920x1080
High Preset
ultra
1920x1080
Ultra Preset
QHD
2560x1440
Ultra Preset
4K
3840x2160
Ultra Preset
NVIDIA GeForce RTX 4090
391n2
328.5n2
274.5n2
272n2
271n2
252n2
NVIDIA GeForce RTX 4080
312
263
262
261
188
AMD Radeon RX 7900 XT
254
220
211
203
166.9
AMD Radeon RX 6950 XT
412
299
360
254
220
143.9
NVIDIA GeForce RTX 4090 Laptop GPU
219
179.3
171.3
167.6
153.2
NVIDIA GeForce RTX 3090
374
318
264
264
248
157.7
NVIDIA GeForce RTX 4080 Laptop GPU
216
177.9
167.2
163.4
125.2
AMD Radeon RX 6800
366
322
263
225
193.8
124
AMD Radeon RX 7700 XT
395
345
274
246
199.1
127.2
NVIDIA Titan RTX
338
292
247
228
178.7
109.5
NVIDIA GeForce RTX 3070 Ti
358
318
262
246
190
116.6
NVIDIA GeForce RTX 3080 Ti Laptop GPU
231
194.3
174.55n2
151.7
97.8
NVIDIA GeForce RTX 4070 Laptop GPU
192.7
162.3
150.1
138.4
82.4
AMD Radeon RX 6750 XT
323
287
243
207
170.9
98.9
AMD Radeon RX 6700 XT
315
284
235
198.3
166.7
97.8
NVIDIA GeForce RTX 3080 Laptop GPU
194.2
174.2
148.6
148.35n2
129.85n2
79.95n2
NVIDIA GeForce RTX 3060 Ti
310
280
230
193.6
148.2
90.6
Intel Arc A770
221
201
161.3
152.5
123
77
AMD Radeon RX 7600
304
274
215
180.4
144.7
87.8
PosModel< PrevNext >EA Sports FC 24
low med. high ultra QHD 4K
NVIDIA GeForce RTX 3070 Ti Laptop GPU
154
134.2
129.7
129.2
81.8
NVIDIA GeForce RTX 4060 Laptop GPU
198.3
179.2n3
149.4n3
137.8n3
119.25n2
70.7
AMD Radeon RX 6650 XT
280
253
198
165.8
128.8
75.1
NVIDIA GeForce RTX 3070 Laptop GPU
249
199.3
161.7
151.4
129
79.5
AMD Radeon RX 6800S
181.5
162.4
138.4
126.2
AMD Radeon RX 7600M XT
202
172.2
142.7
128.3
105.3
68.7
Intel Arc A750
191.8
176.2
136.5
127.2
105.7
67.7
NVIDIA Titan X Pascal
205
184.1
153.4
136.2
105.5
66.6
NVIDIA GeForce RTX 2070 Super (Desktop)
254
230
185.1
170.8
131.3
76.5
AMD Radeon RX 5700 XT (Desktop)
285
250
195.7
173
139.7
88.1
NVIDIA GeForce RTX 3060 Laptop GPU
125.6
101
58.2
AMD Radeon RX 7600S
183
153.3
131.3
103.7
64.6
NVIDIA GeForce RTX 2060 Super (Desktop)
217
199.1
167.7
146.9
111.5
67.4
AMD Radeon RX 6600
249
222
173.9
147.4
112.6
67
AMD Radeon RX 5700 (Desktop)
247
218
183.4
157.1
120.4
75.6
AMD Radeon RX 5600 XT (Desktop)
239
210
168.7
146.3
113.8
71.8
NVIDIA GeForce GTX 1660 Super (Desktop)
180.8
164
141.7
120.8
89.2
18.8
AMD Radeon RX 6500 XT
161.4
145.7
101.3
55.7
44.2
28.8
AMD Radeon RX 5500 XT (Desktop)
170.7
151.7
124.8
101.3
77.8
46.4
NVIDIA GeForce RTX 4050 Laptop GPU
163.8
144
132.5
100.9
56.8
PosModel< PrevNext >EA Sports FC 24
low med. high ultra QHD 4K
Intel Arc A730M
121.8
NVIDIA GeForce GTX 1660 Ti Mobile
93.9
NVIDIA GeForce GTX 1660 (Desktop)
166.9
156.7
130
107.2
77.9
23.8
NVIDIA GeForce GTX 1650 Super (Desktop)
157.3
144
114.6
103.5
65.8
7.5
NVIDIA GeForce RTX 3050 4GB Laptop GPU
73.2
NVIDIA GeForce GTX 1650 Ti Mobile
66.8
AMD Radeon RX 5500M
82.7
65.9
62.3
NVIDIA GeForce RTX 2050 Mobile
43.2
NVIDIA GeForce GTX 1650 Mobile
58
AMD Radeon 780M
104.5n2
94n2
75.6n2
56.25n2
51.7
26.8
AMD Radeon 680M
80.3
57.9
42
39.5
Intel Iris Xe Graphics G7 96EUs
43.6
NVIDIA GeForce MX350
32.4
NVIDIA GeForce MX250
22.9
Intel Iris Xe Graphics G7 80EUs
34.6
Intel Iris Plus Graphics G7 (Ice Lake 64 EU)
23.9
AMD Radeon RX Vega 10
30.3
26.9
20.3
Intel UHD Graphics Xe 32EUs (Tiger Lake-H)
24.1
AMD Radeon RX Vega 8 (Ryzen 4000/5000)
34
AMD Radeon RX Vega 6 (Ryzen 4000/5000)
32.1
PosModel< PrevNext >EA Sports FC 24
low med. high ultra QHD 4K
Intel UHD Graphics 630
13.1
Intel UHD Graphics Xe 16EUs (Tiger Lake-H)
10.7
AMD Radeon RX Vega 3
13.8
(-) * Smaller values are better. / n123 Number of benchmarks for this median value / * Approximate position


Legend
5Stutters – This game is very likely to stutter and have poor frame rates. Based on all known benchmarks using the specified graphical settings, average frame rates are expected to fall below 25fps
May Stutter – This graphics card has not been explicitly tested on this game. Based on interpolated information from surrounding graphics cards of similar performance levels, stutters and poor frame rates are expected.
30Fluent – Based on all known benchmarks using the specified graphical settings, this game should run at or above 25fps
40Fluent – Based on all known benchmarks using the specified graphical settings, this game should run at or above 35fps
60Fluent – Based on all known benchmarks using the specified graphical settings, this game should run at or above 58fps
May Run Fluently – This graphics card has not been explicitly tested on this game. Based on interpolated information from surrounding graphics cards of similar performance levels, fluent frame rates are expected.
?Uncertain – This graphics card experienced unexpected performance issues during testing for this game. A slower card may be able to achieve better and more consistent frame rates than this particular GPU running the same benchmark scene.
Uncertain – This graphics card has not been explicitly tested on this game and no reliable interpolation can be made based on the performances of surrounding cards of the same class or family.
The value in the fields displays the average frame rate of all values in the database. Move your cursor over the value to see individual results.

All test systems

笔记本 显卡 处理器 内存
XMG Neo 17 E23 NvidiaGeForce RTX 4090 @175 W TGP (16 GB GDDR6X) Intel Core i9-13900HX 2 x 16 GB DDR5
Schenker Key 17 Pro E23 NvidiaGeForce RTX 4080 @175 W TGP (12 GB GDDR6X) Intel Core i9-13900HX 2 x 16 GB DDR5
XMG Pro 15 E23 NvidiaGeForce RTX 4070 @140 W TGP (8 GB GDDR6) Intel Core i9-13900HX 2 x 16 GB DDR5
XMG Pro 15 E23 NvidiaGeForce RTX 4060 @140 W TGP (8 GB GDDR6) Intel Core i9-13900HX 2 x 16 GB DDR5
XMG Focus 15 E23 NvidiaGeForce RTX 4050 @140 W TGP (6 GB GDDR6) Intel Core i9-13900HX 2 x 16 GB DDR5
华硕 ROG Strix Scar 17 NvidiaGeForce RTX 3080 Ti @150 W TGP (16 GB GDDR6) Intel Core i9-12900H 2 x 16 GB DDR5
Acer Predator Helios 300 NvidiaGeForce RTX 3070 Ti @150 W TGP (8 GB GDDR6) Intel Core i7-12700H 2 x 8 GB DDR5
华硕 ROG Zephyrus G14 AMD Radeon RX 6800S (8 GB GDDR6) & AMD Radeon 680M AMD Ryzen 9 6900HS 2 x 16 GB DDR5
塔式电脑 显卡 处理器 内存
定制 I / 华硕 ROG Strix Z790-F / G.Skill Trident Z5 RGB NvidiaGeForce RTX 4080 (16 GB GDDR6X)
AMD Radeon RX 7900 XT (20 GB GDDR6)
Intel Core i9-13900K 2 x 24 GB DDR5
定制 II PalitGeForce RTX 4090 GameRock OC (24 GB GDDR6X)
Nvidia GeForce RTX 3090 FE (24 GB GDDR6X)
MSIGeForce RTX 3070 Ti Suprim X (8 GB GDDR6X)
NvidiaGeForce RTX 3060 Ti (8GB GDDR6X)
Nvidia Titan RTX (24GB GDDR6)GDDR6)
Nvidia GeForce RTX 2070 Super (8GB GDDR6)
Nvidia GeForce RTX 2060 Super(8 GB GDDR6)
KFA2 GeForce GTX 1660 Super (6GB GDDR6)
PNY GeForce GTX 1660 (6 GB GDDR5)
KFA2 GeForce GTX 1650 Super (4 GB GDDR6)
AMD Radeon RX 7600 (8 GB DDR6) AMD Radeon RX 7600 (8GBDDR6)GB DDR6)
AMD Radeon RX 6950 XT (16GB DDR6)
AMD Radeon RX 6800 (16GB DDR6)
AMD Radeon RX 6750 XT (12GB DDR6)
AMD Radeon RX 6700 XT (12GB DDR6)
AMD Radeon RX 6650 XT (8 GB GDDR6)
AMD RadeonRX 6600 (8 GB GDDR6)
AMD Radeon RX 5700XT (8 GB GDDR6)
AMD Radeon RX 5700(8 GB GDDR6)
AMD Radeon RX 5600 XT (6GB GDDR6)
AMD Radeon RX 5500 XT (8GB GDDR6)
AMD Ryzen 9 7950X 2 x 16 GB DDR5
Mini-PC 显卡 处理器 内存
Minisforum NUCXi7 NvidiaGeForce RTX 3070 @125 W TGP (8 GB GDDR6) Intel Core i7-11800H 2 x 8 GB DDR4
Minisforum HX99G AMD Radeon RX 6600M @100 W TGP (8 GB GDDR6) AMD Ryzen 9 6900HX 2 x 16 GB DDR5
Minisforum Neptune Series HN2673 Intel Arc A730M Intel Core i7-12650H 2 x 8 GB DDR4
Minisforum UM790 Pro AMD Radeon 780M AMD Ryzen 9 7940HS 2 x 32 GB DDR5
4K 显示器 操作系统 Nvidia 驱动程序 AMD 驱动程序
技嘉 M32U Windows 11 ForceWare 537.58 Adrenalin 23.10.1
Please share our article, every link counts!
> Notebookcheck中文版(NBC中国) > 评测 > EA Sports FC 24》技术评测:笔记本电脑和台式机基准测试
Florian Glaser, 2023-10-17 (Update: 2023-10-17)