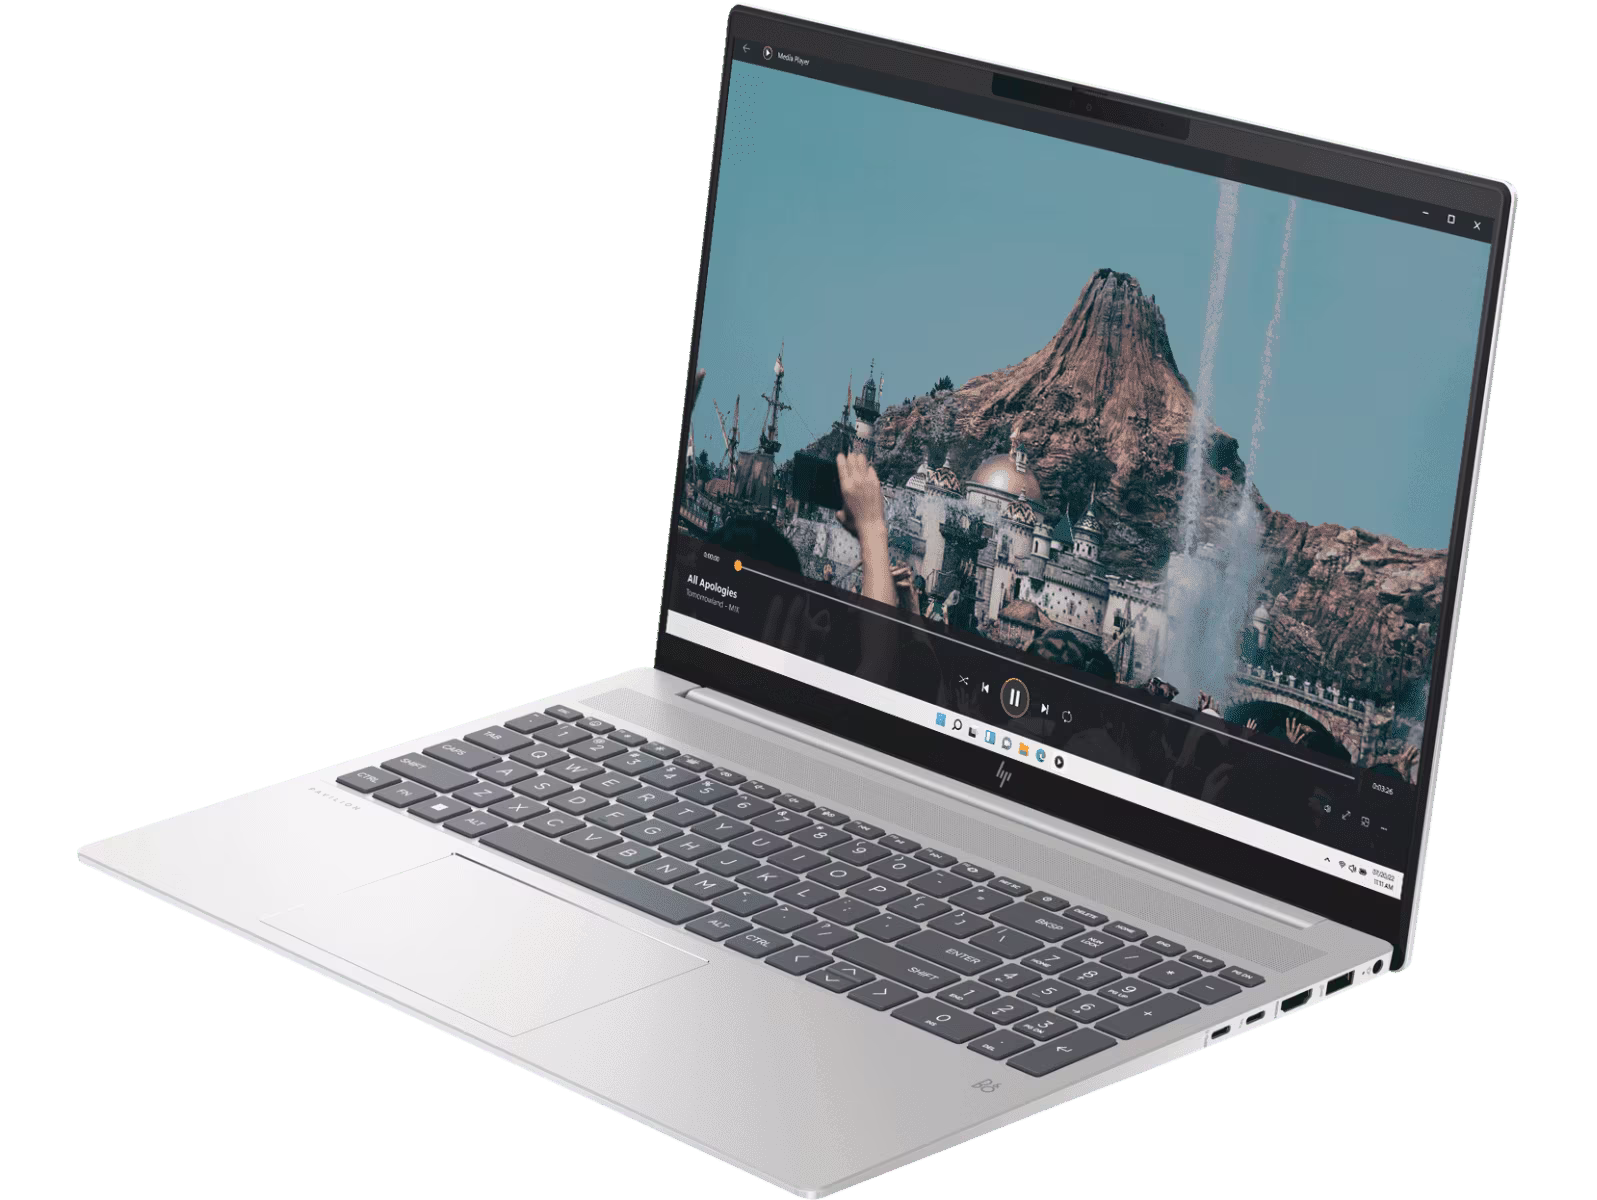
惠普Pavilion Plus 16 评论:配备 RTX 4050 的高级多媒体笔记本电脑
回顾")
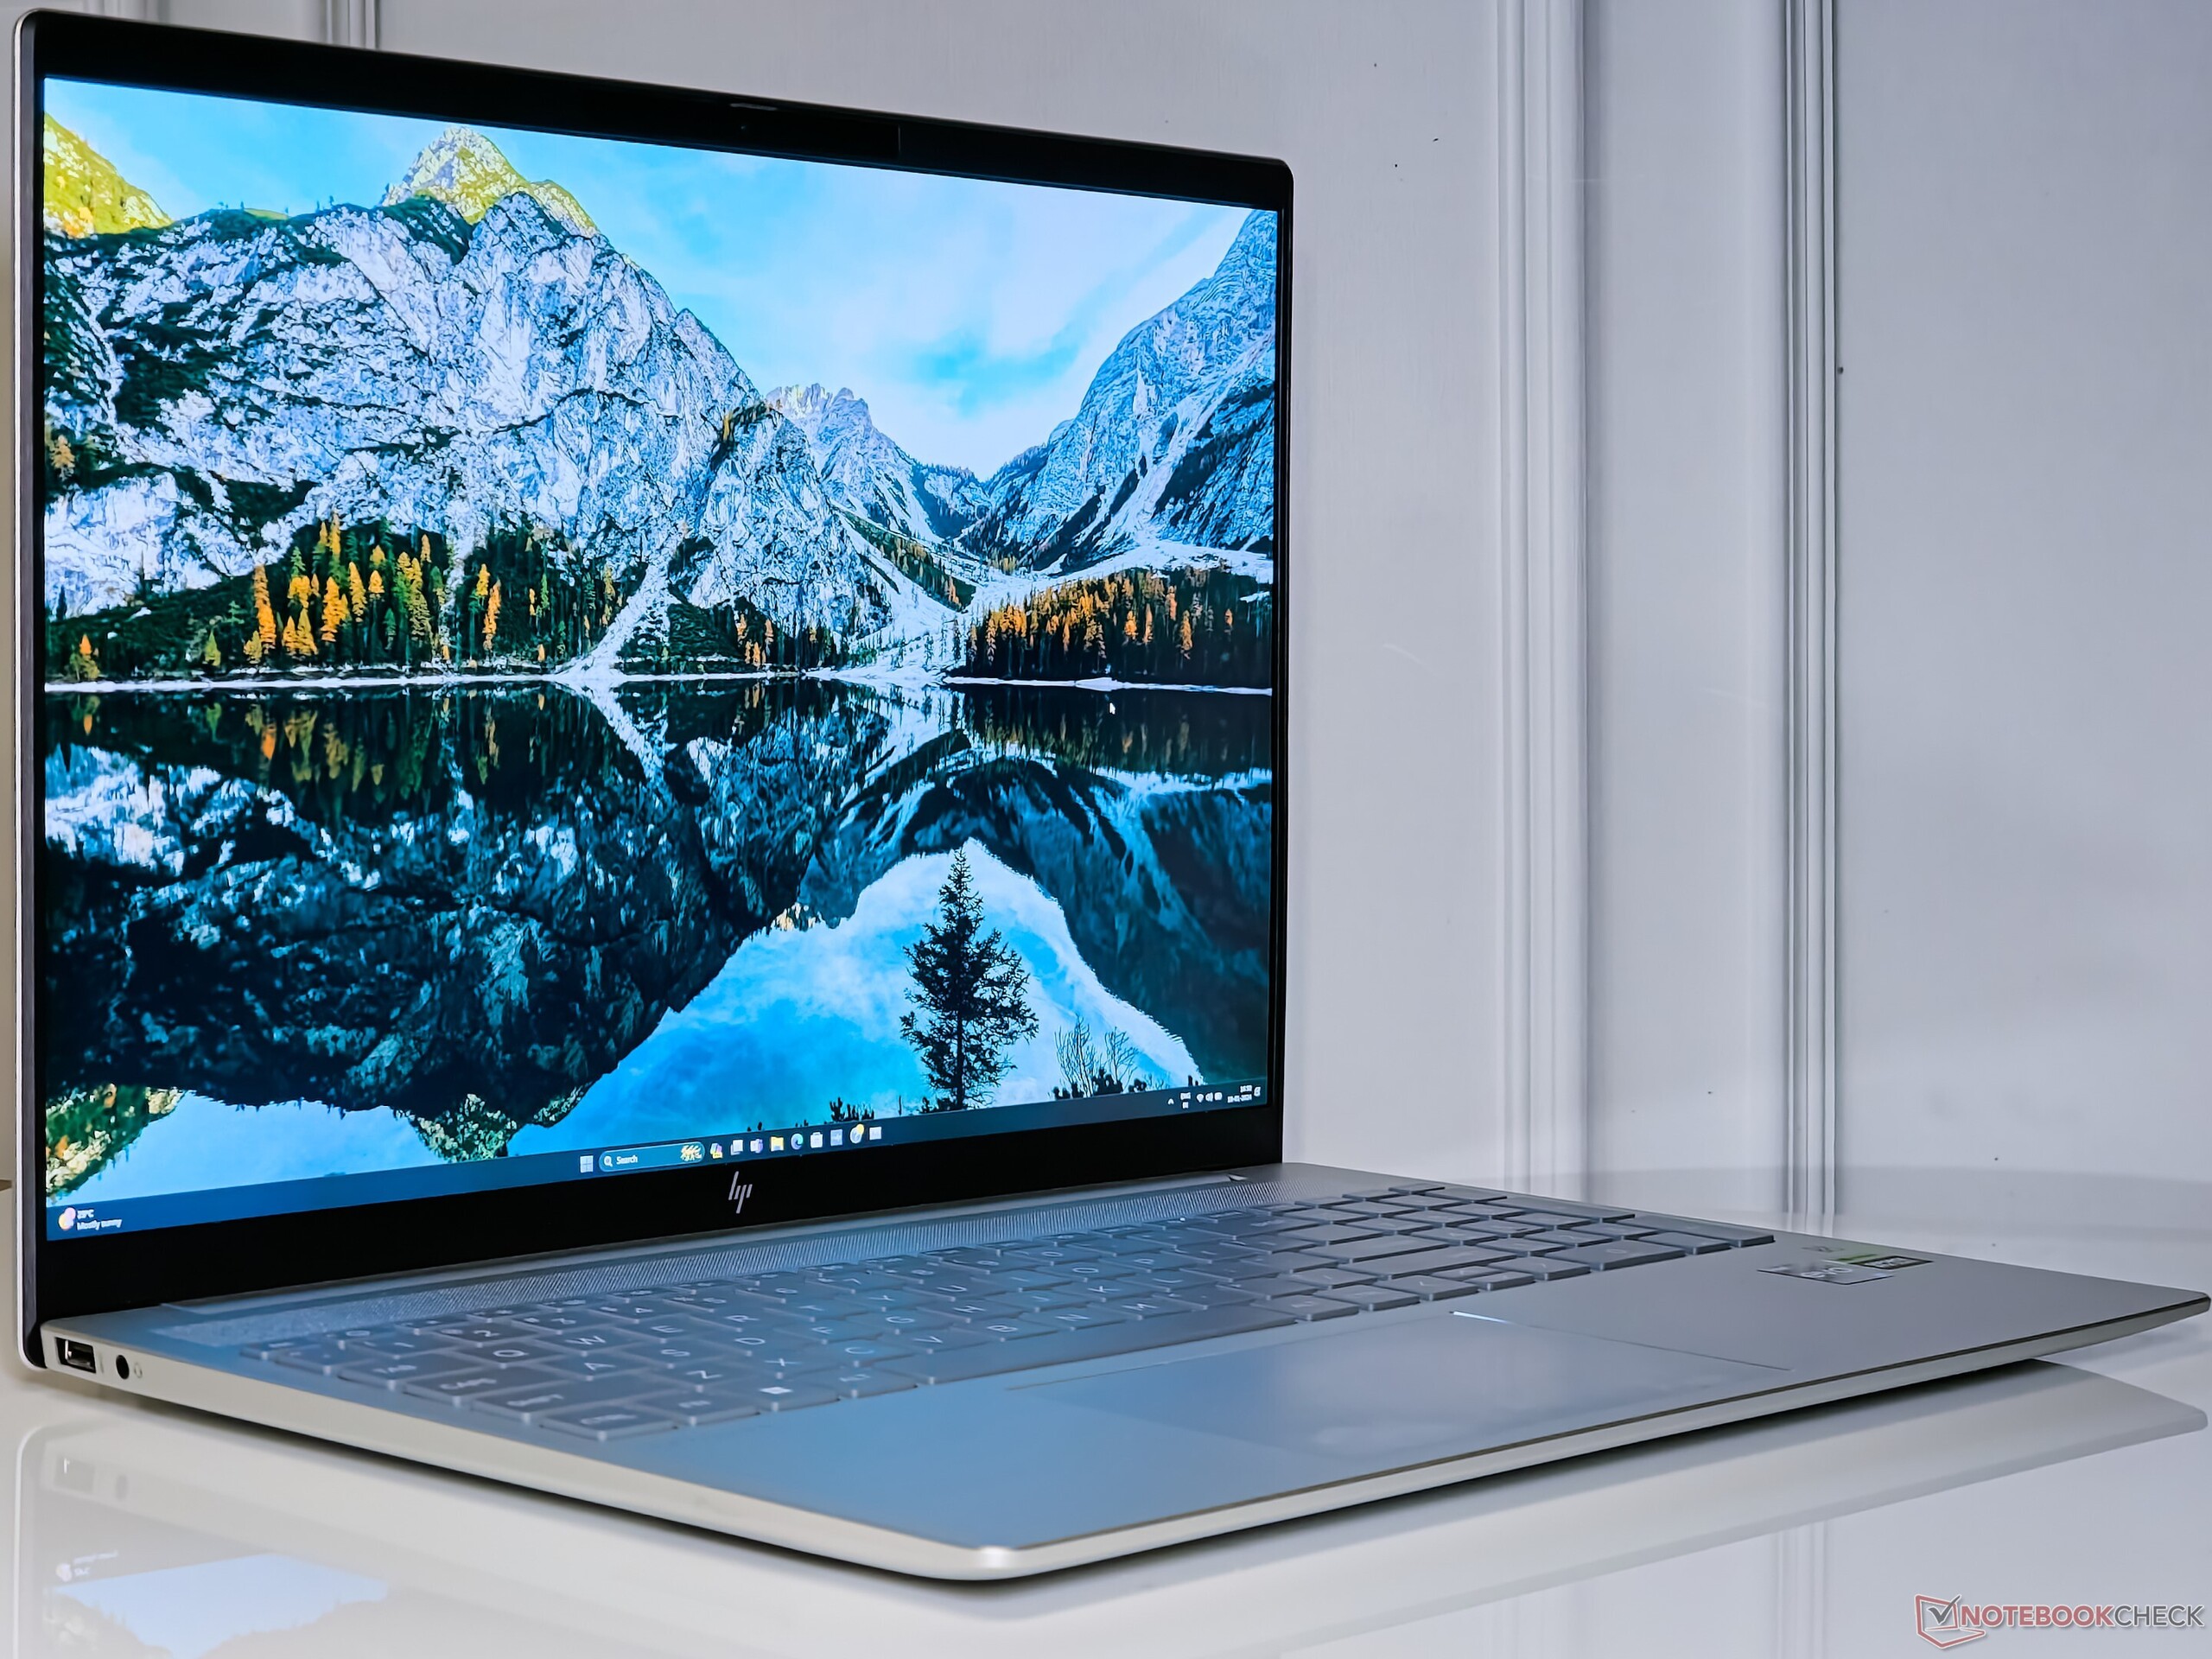
惠普最近推出了两款新的Pavilion Plus 机型,作为 Envy 系列更经济实惠的替代产品。我们曾评测过Pavilion Plus 14 的两个版本 英特尔猛禽湖和 AMD Zen 4和 AMD Zen 4 两款机型。现在,我们来看看更大的Pavilion Plus 16。
Pavilion Plus 16 放弃了Pavilion Plus 14 的 "IMAX 增强 "OLED 面板,转而提供 H 系列处理器和可选的 Nvidia 显卡。
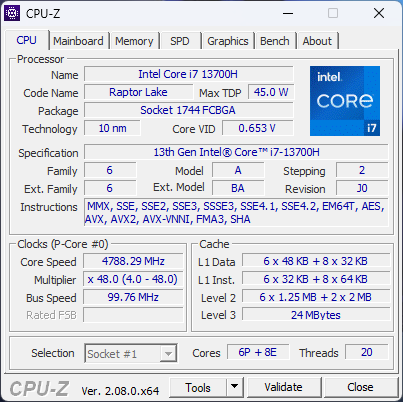
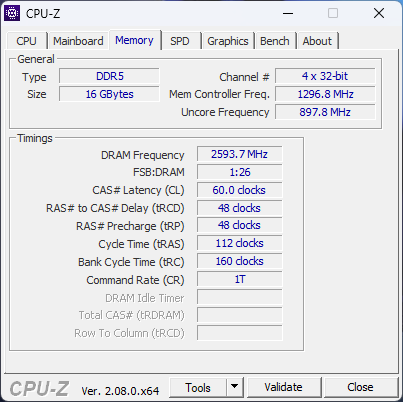
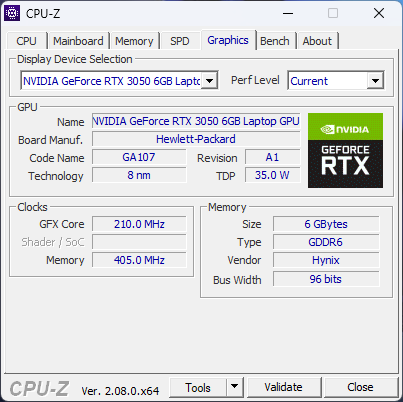
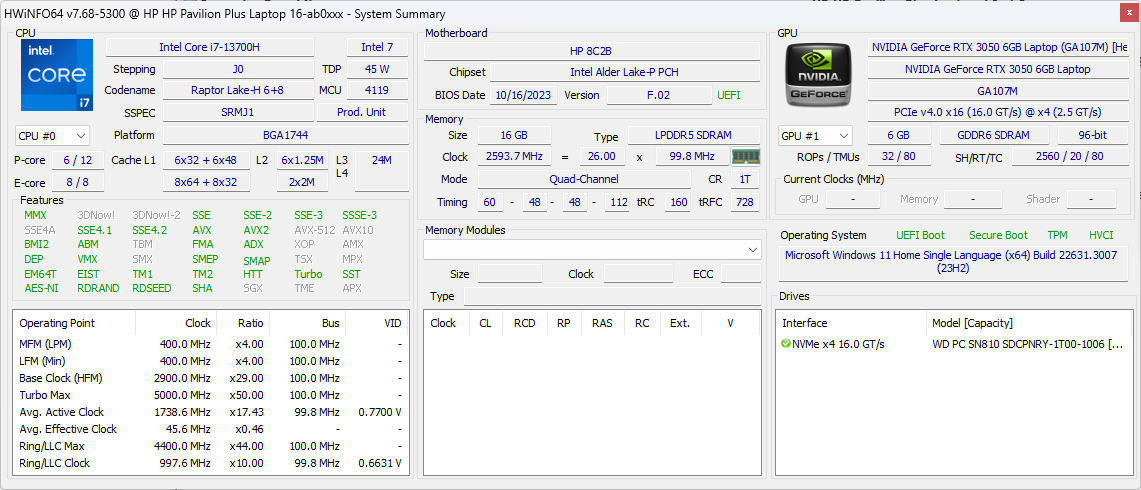
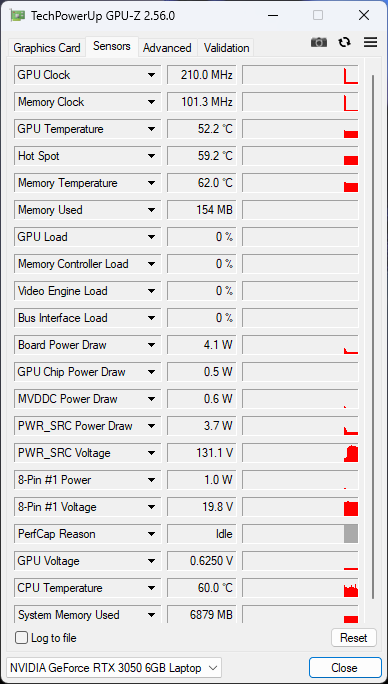
我们的Pavilion Plus 16 配备了 英特尔酷睿 i7-13700H处理器、16 GB 内存、1 TB SSD 和 16 英寸 2560 x 1600 120 Hz IPS 显示屏。Pavilion Plus 16 是少数配备了 英伟达GeForce RTX 3050 6 GB 笔记本电脑 GPU.该配置在惠普印度官方商城的售价为 1,24,999 ₹(1,350 美元)。
潜在的竞争对手比较
Rating | Date | Model | Weight | Height | Size | Resolution | Price |
|---|---|---|---|---|---|---|---|
| 88.7 % v7 (old) | 02 / 2024 | HP Pavilion Plus 16-ab0456tx i7-13700H, GeForce RTX 3050 6GB Laptop GPU | 1.9 kg | 19.9 mm | 16.00" | 2560x1600 | |
| 88.2 % v7 (old) | 01 / 2024 | Schenker Vision 14 M23 RTX 3050 i7-13700H, GeForce RTX 3050 6GB Laptop GPU | 1.3 kg | 16.6 mm | 14.00" | 2880x1800 | |
| 87.1 % v7 (old) | 08 / 2023 | Dell Inspiron 16 Plus 7630 i7-13700H, GeForce RTX 4060 Laptop GPU | 2.2 kg | 19.95 mm | 16.00" | 2560x1600 | |
| 85.6 % v7 (old) | 08 / 2023 | Asus VivoBook 14X K3405 i5-13500H, GeForce RTX 3050 4GB Laptop GPU | 1.4 kg | 18.9 mm | 14.00" | 2880x1800 | |
| 89.2 % v7 (old) | 04 / 2023 | Lenovo Slim Pro 7 14ARP8 R7 7735HS, GeForce RTX 3050 6GB Laptop GPU | 1.6 kg | 15.6 mm | 14.50" | 2560x1600 | |
| 87.6 % v7 (old) | 11 / 2023 | Asus VivoBook Pro 16 K6602VU i9-13900H, GeForce RTX 4050 Laptop GPU | 1.9 kg | 19 mm | 16.00" | 3200x2000 | |
| 89.4 % v7 (old) | 04 / 2023 | Samsung Galaxy Book3 Ultra 16 i7-13700H, GeForce RTX 4050 Laptop GPU | 1.8 kg | 16.5 mm | 16.00" | 2880x1800 |
底盘坚固的全金属结构
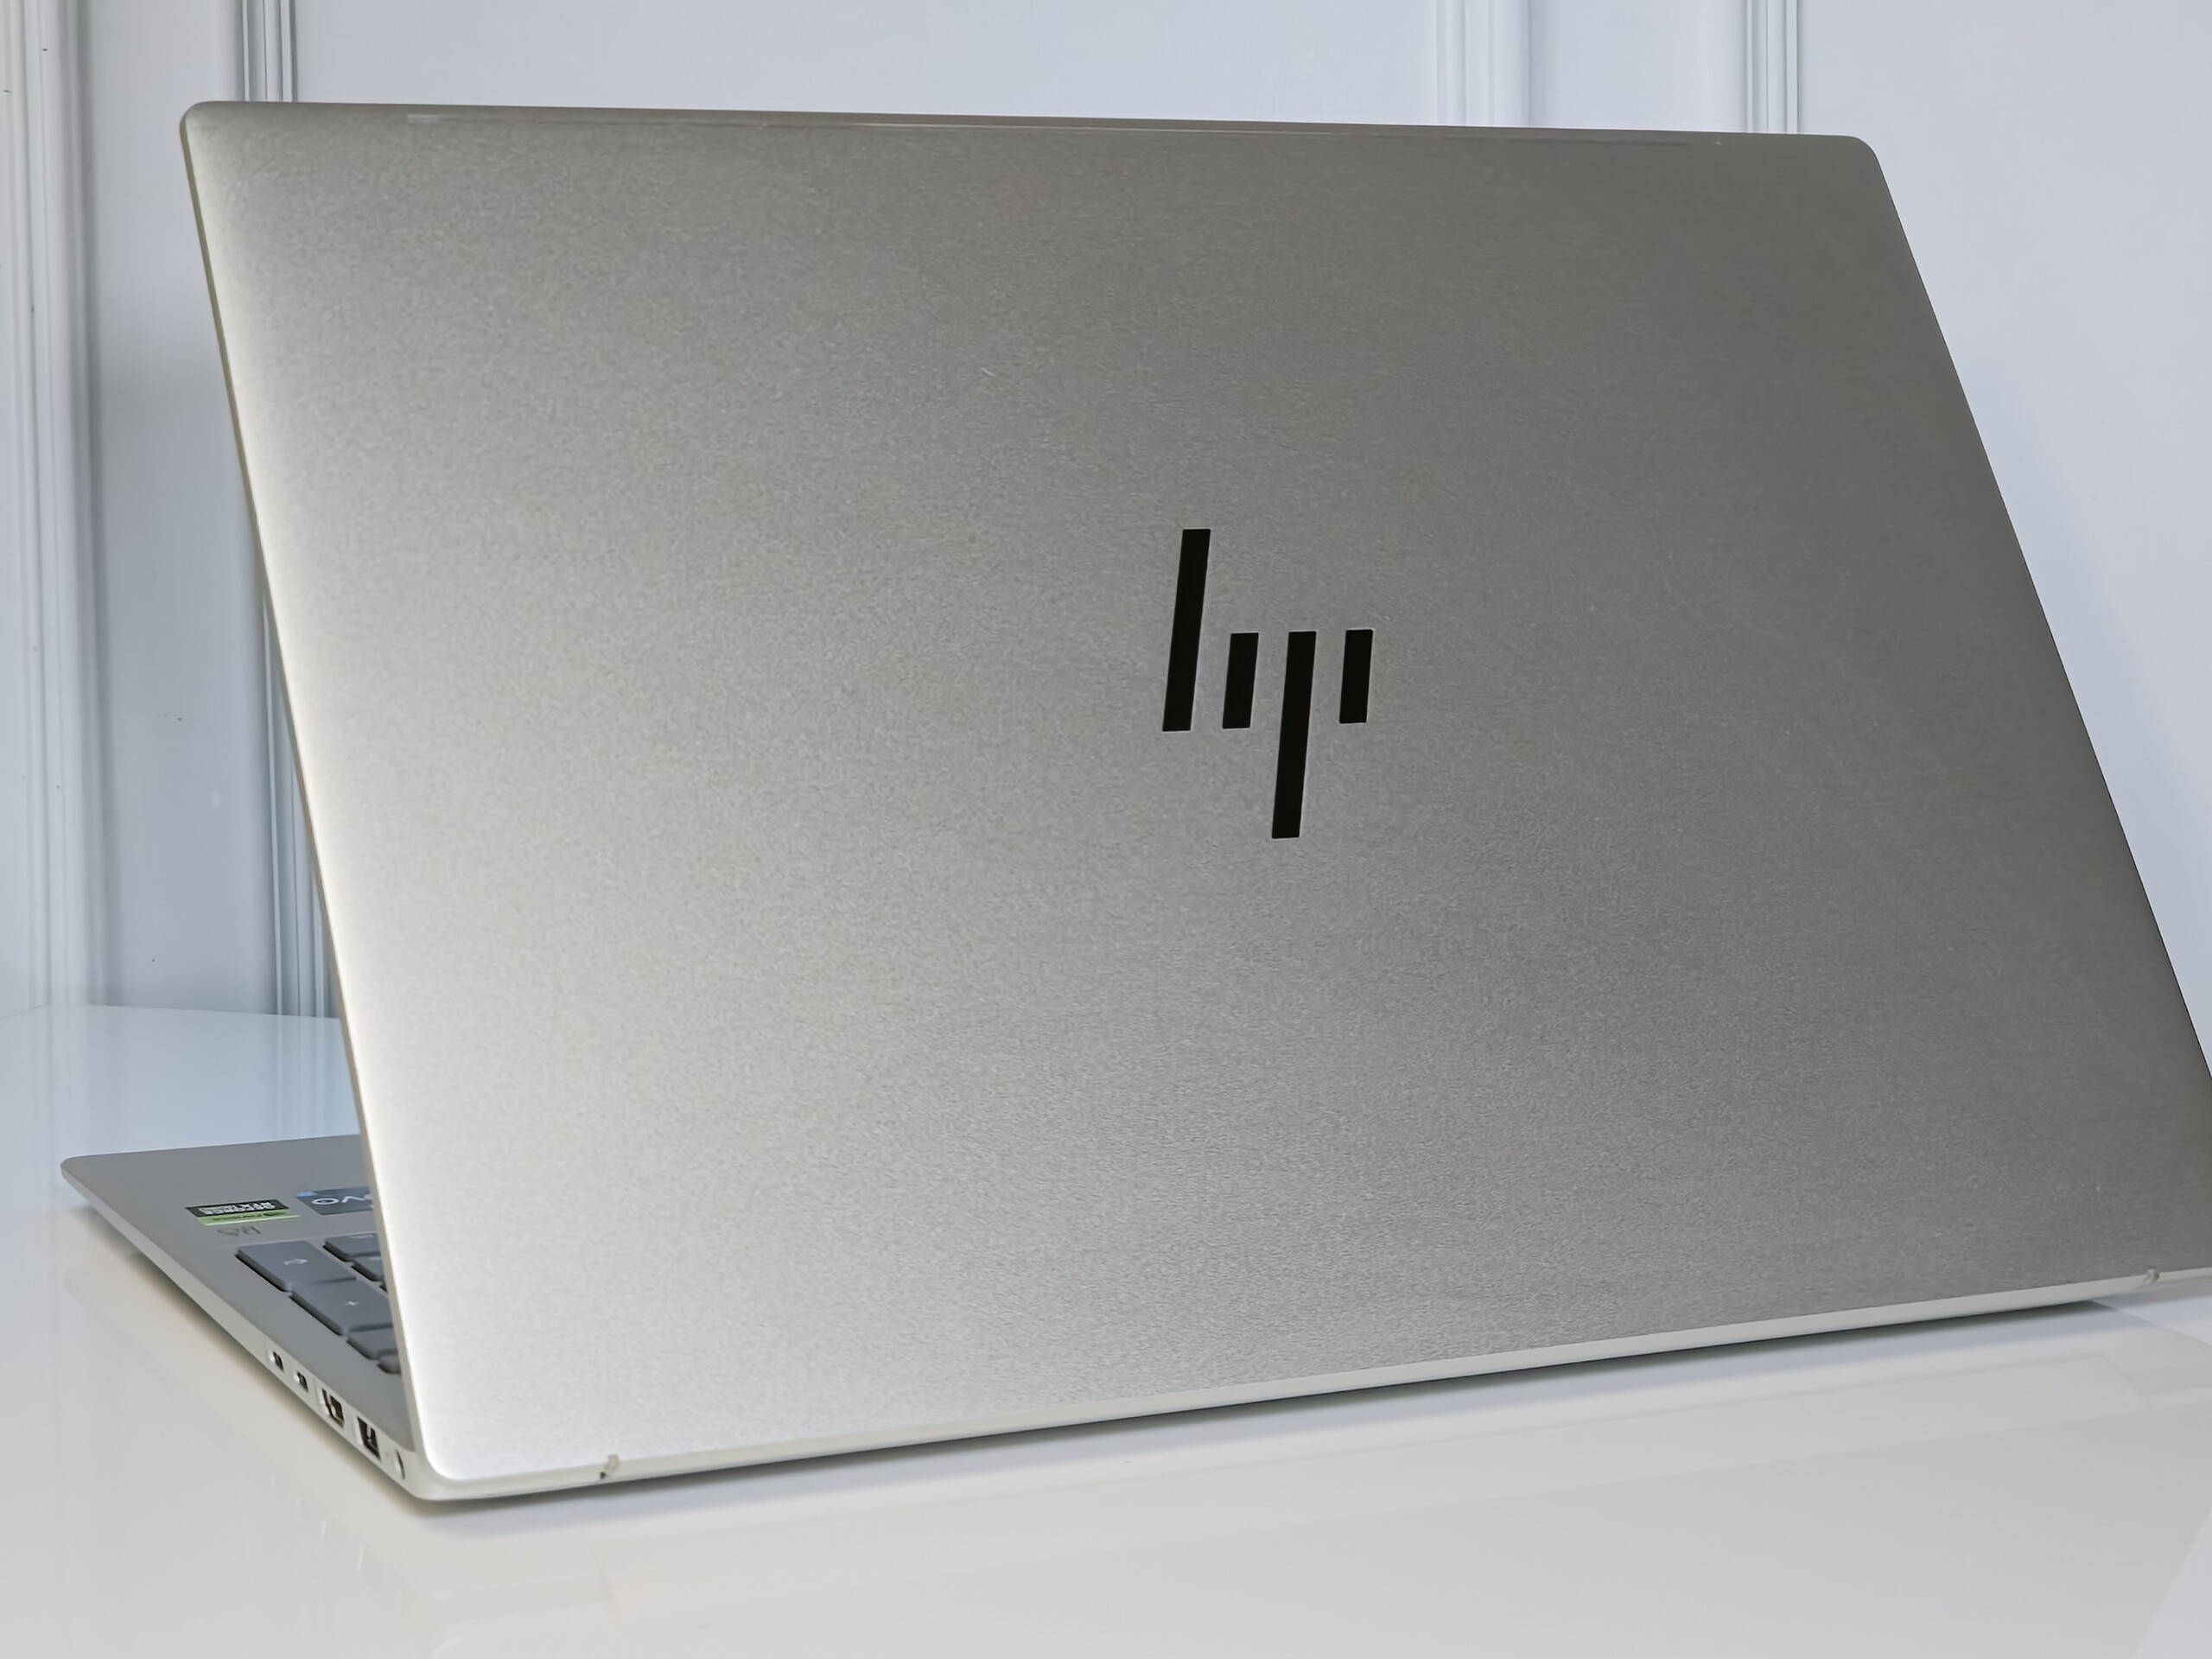
与Pavilion Plus 14 相似,Pavilion Plus 16 的 A、C 和 D 盖采用了自然银色金属结构,而盖子则由铝制成。
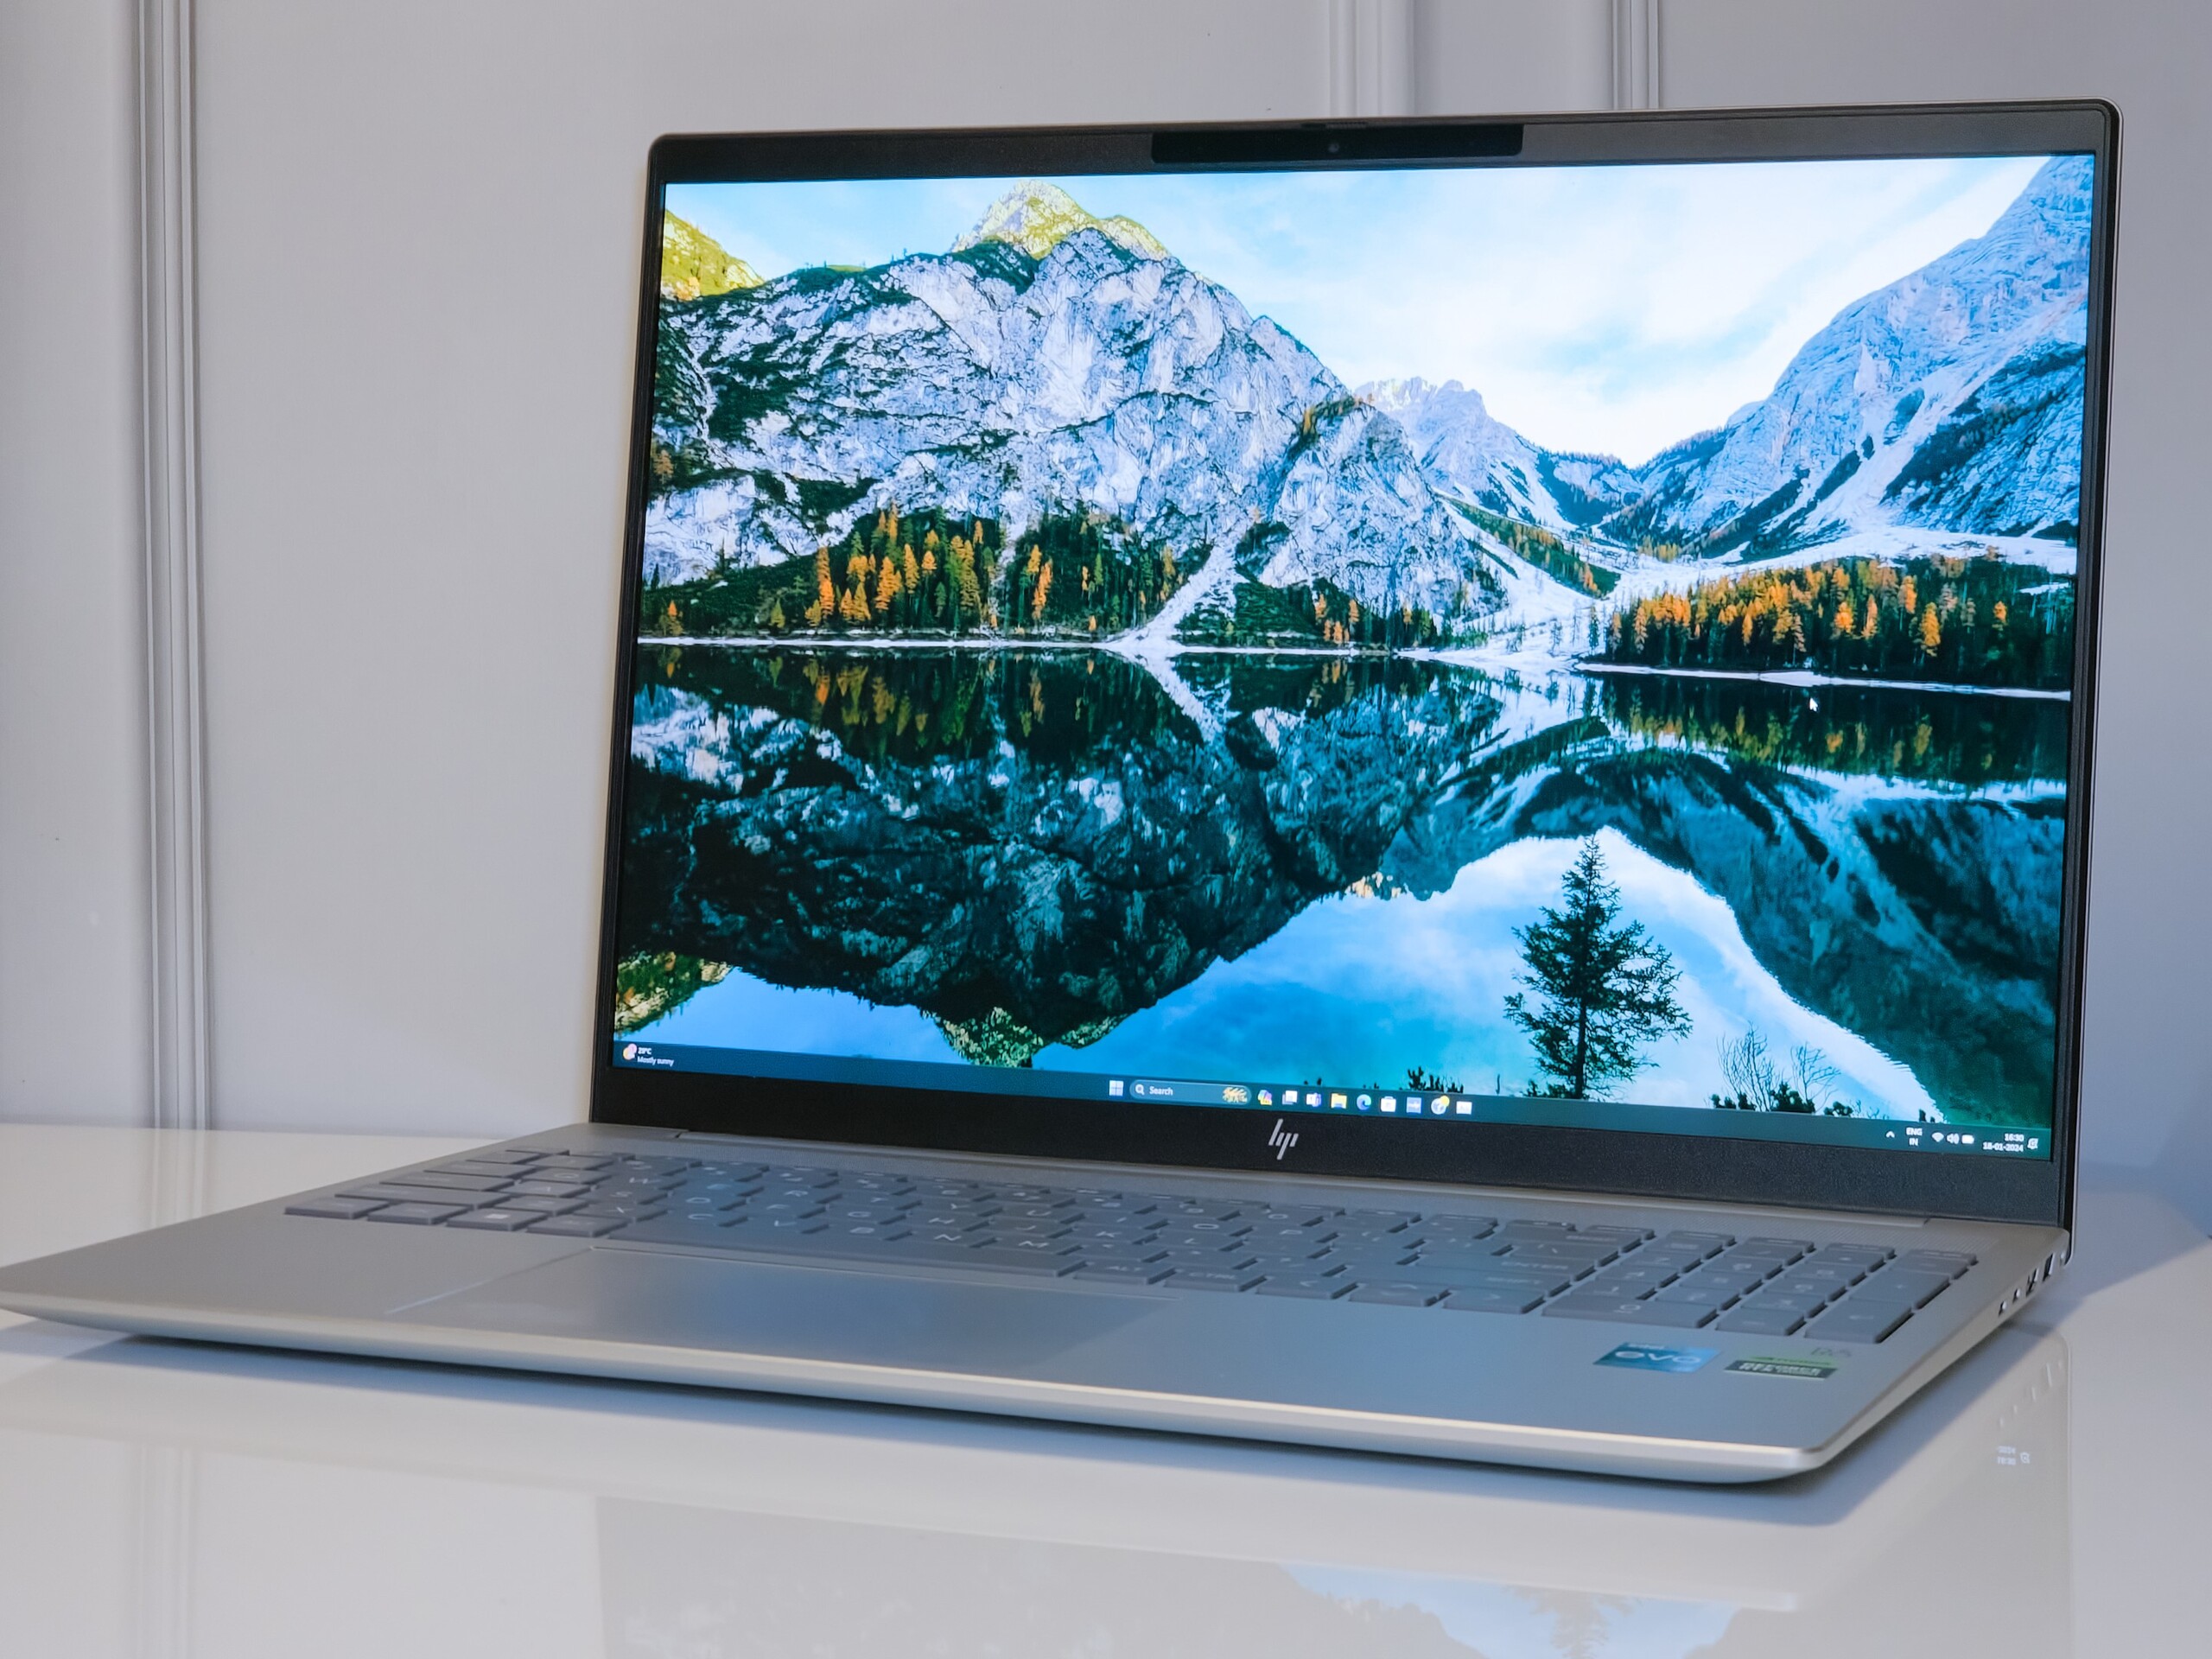
整体制造质量几乎无可挑剔。我们没有注意到盖子或键盘面板有任何特别的弯曲。
惠普宣传的屏占比为 89.74%,但实际测量值为 83%。这款笔记本电脑的重量为 1.9 千克,与其他流行的 16 英寸多媒体笔记本电脑相仿。
连接性稳定的无线局域网吞吐量
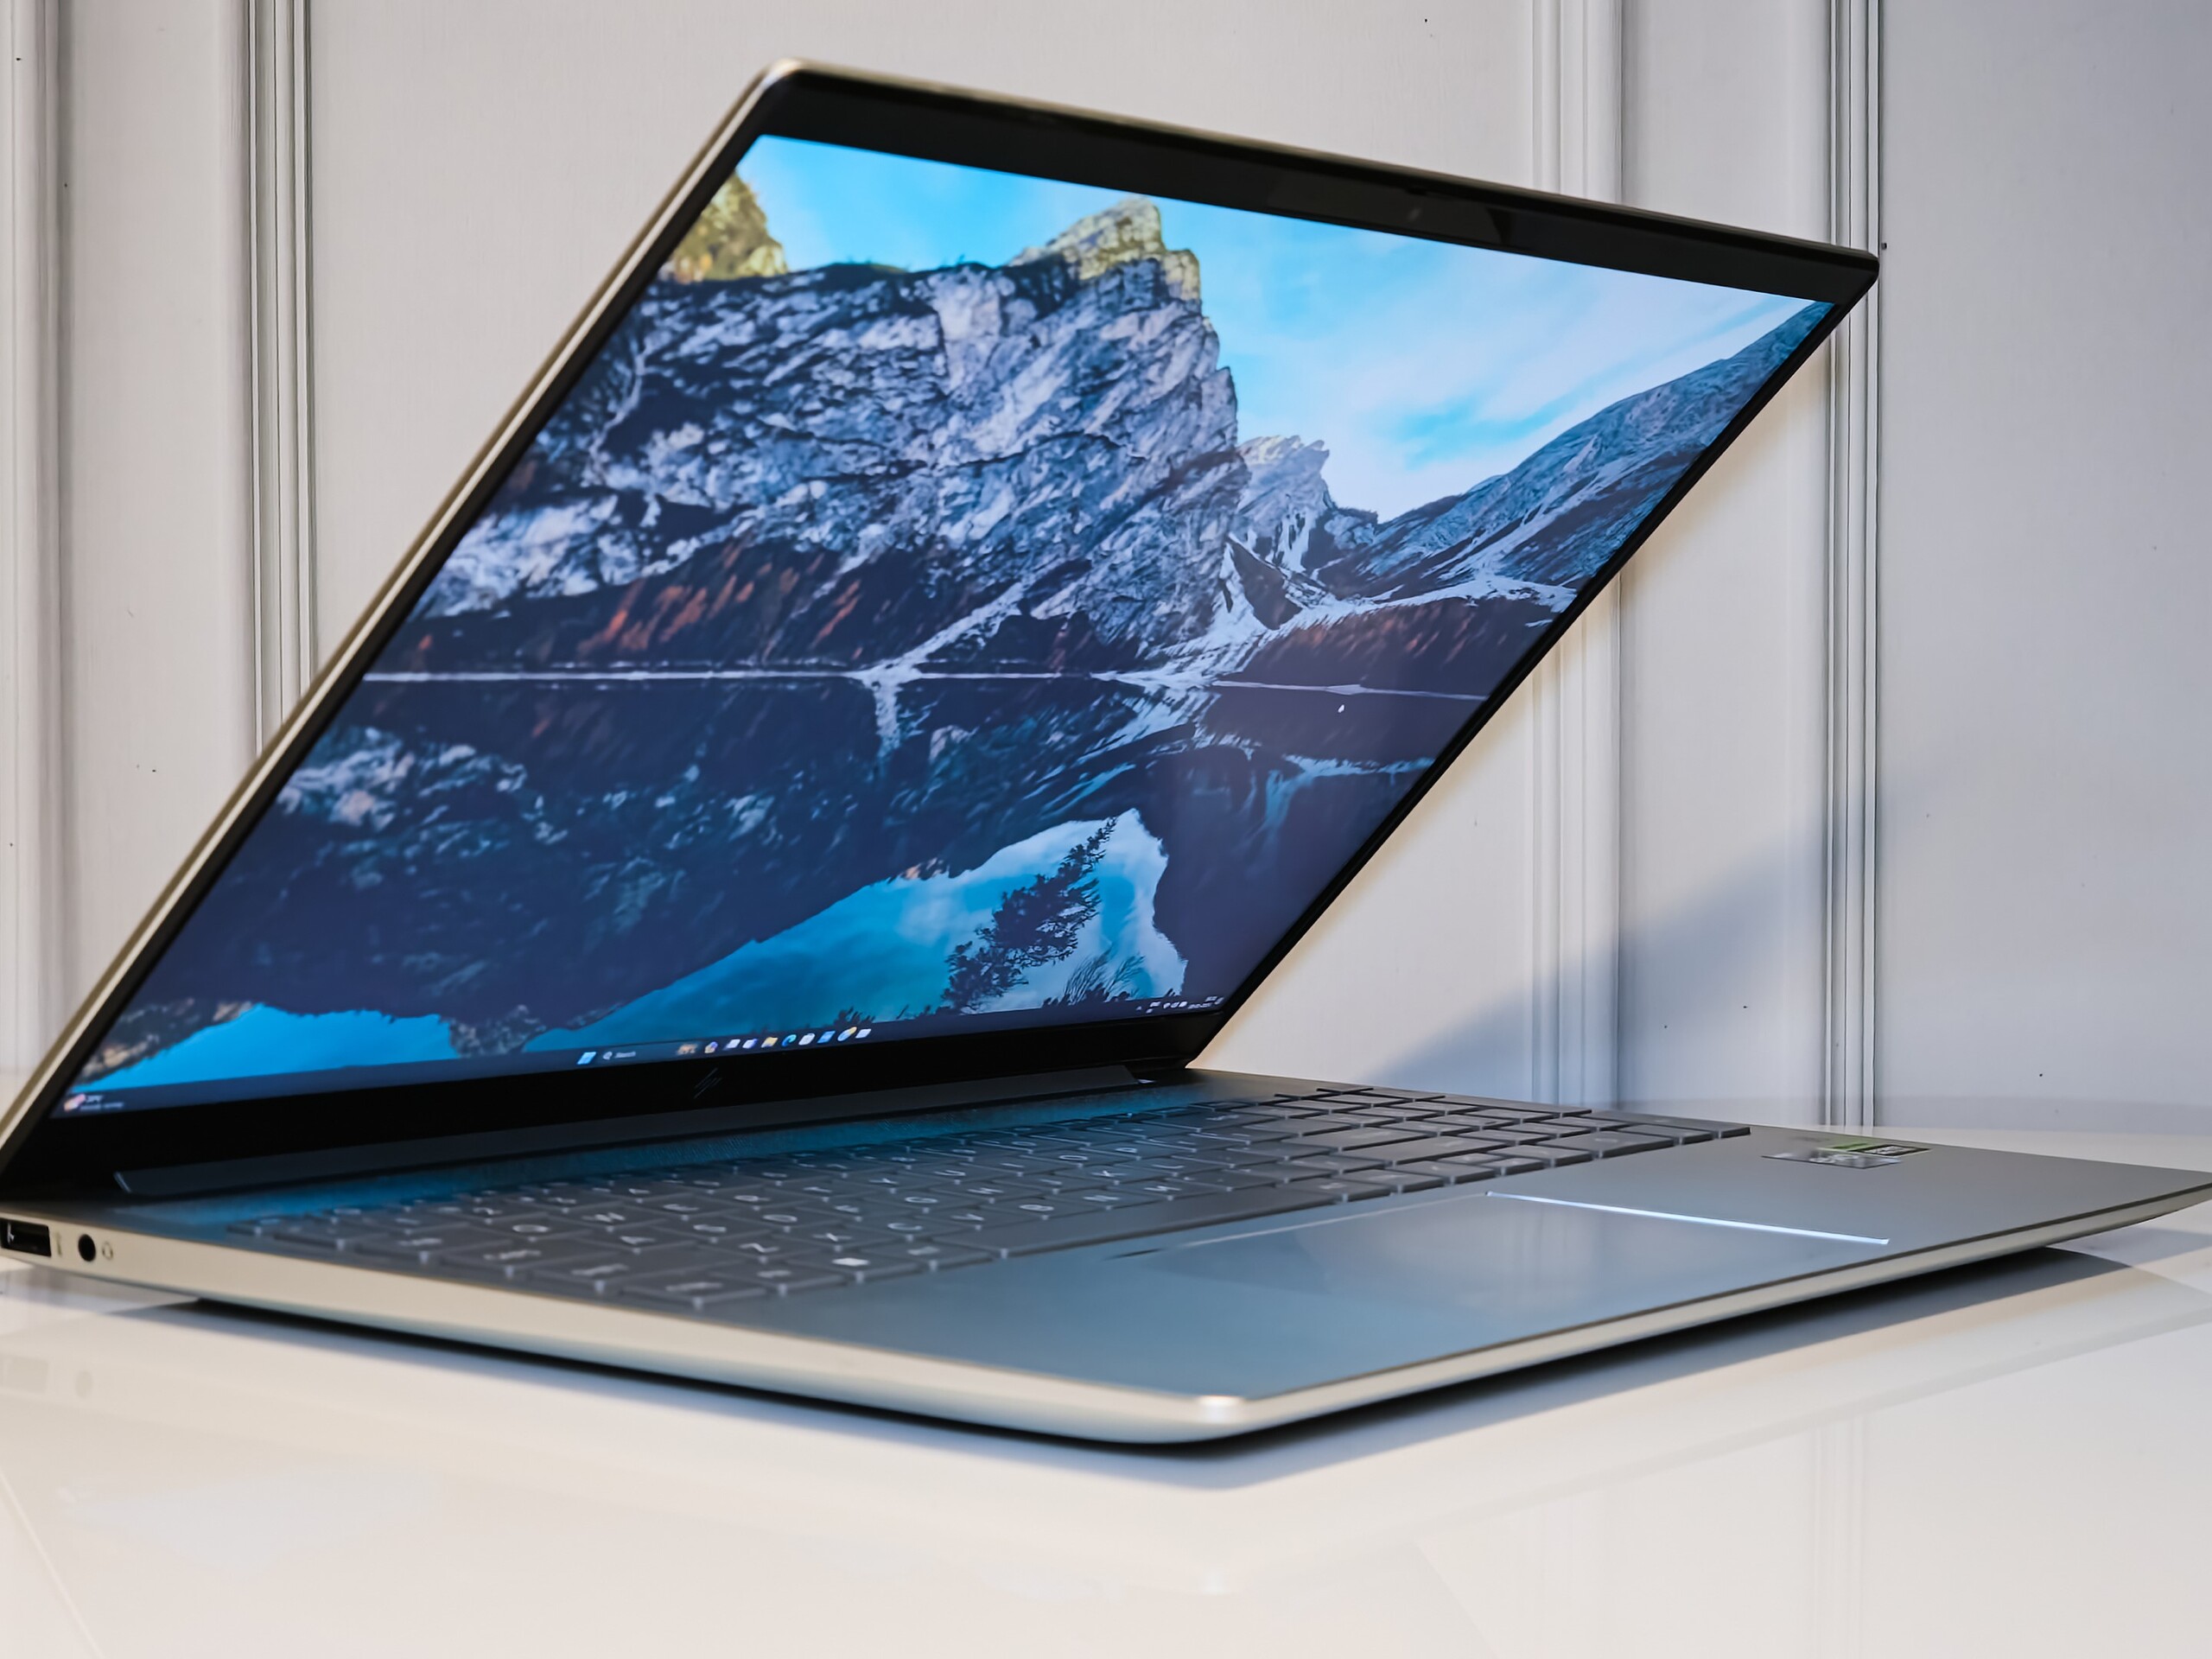
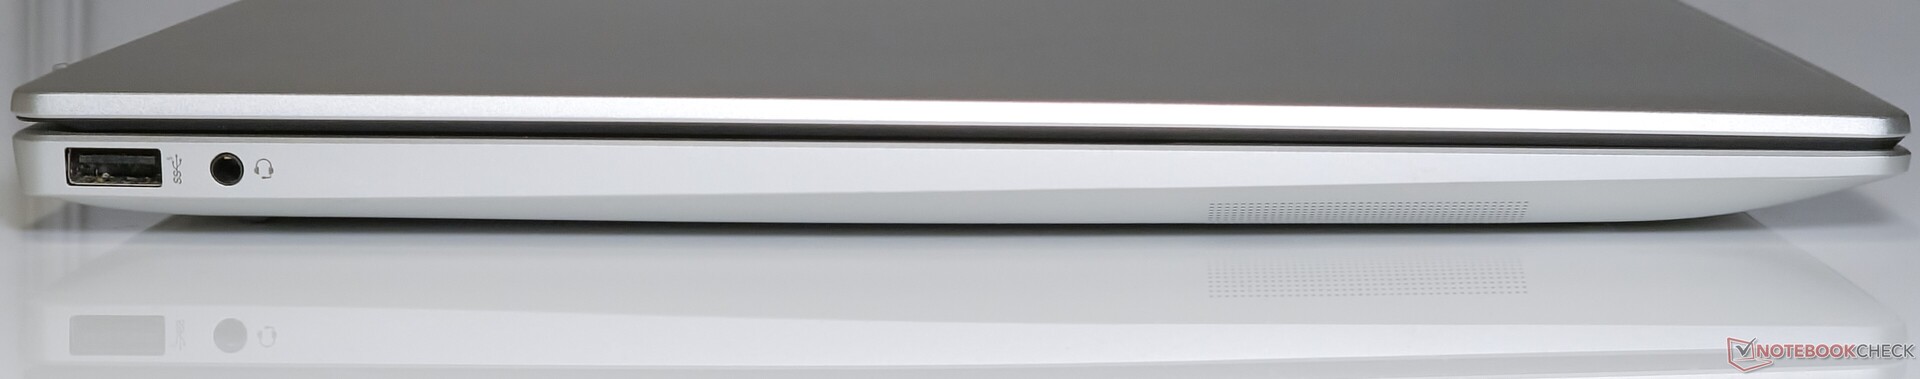
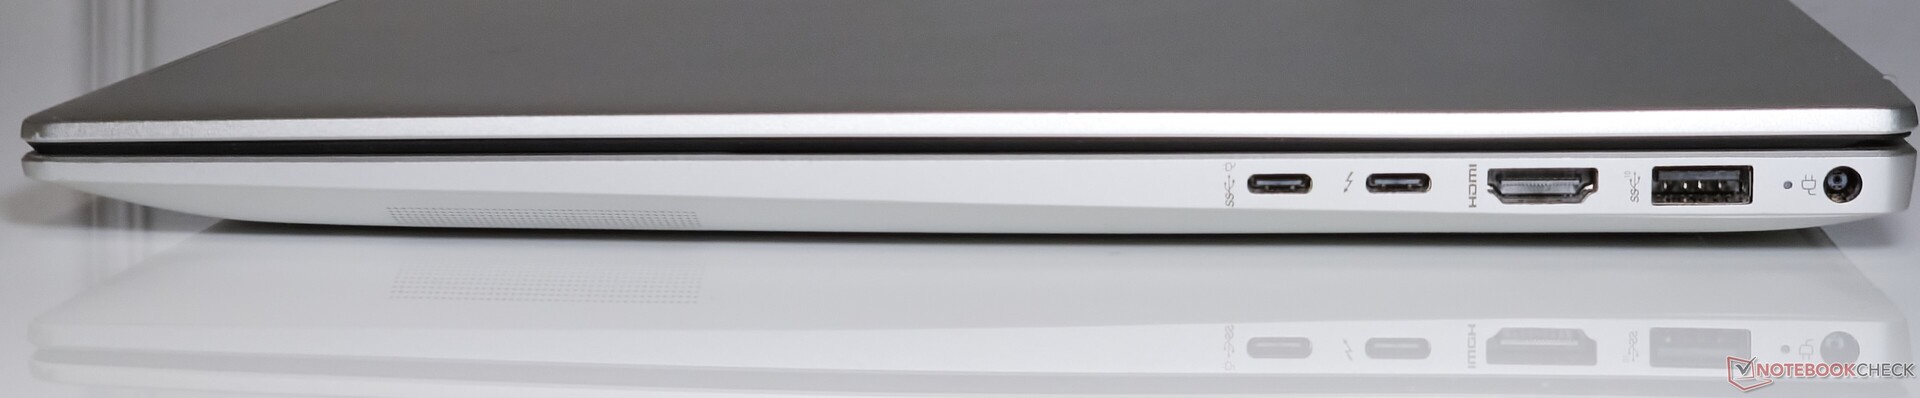
Pavilion Plus 16 提供了丰富的端口选择,包括 USB Type-A 和 USB Type-C 端口,其中包括 Thunderbolt 4。
端口的位置很好,不会妨碍相邻外设的连接,但其中一个 Type-C 端口本可以放在左侧,这样分布会更均匀。
交流
Pavilion Plus 16 在 5 GHz 频段的 iPerf3 性能比我们观察到的华硕 VivoBook Pro 16 稍微慢一些。 华硕 VivoBook Pro 16采用相同英特尔 Wi-Fi 6E AX211 无线局域网卡的华硕 VivoBook Pro 16 稍微慢一些。
Pavilion 弥补了 VivoBook Pro 16 在 6 GHz 接收性能上的不足,但差距不大。
iPerf3 在 5 GHz 和 6 GHz 频段的性能相当稳定,没有出现任何故障,这与我们在联想超薄 Pro 7 上看到的情况不同。 联想超薄 Pro 7采用联发科 Wi-Fi 6E MT7922 芯片的情况不同。
| Networking / iperf3 transmit AXE11000 | |
| Asus VivoBook 14X K3405 | |
| HP Pavilion Plus 16-ab0456tx | |
| Asus VivoBook Pro 16 K6602VU | |
| Samsung Galaxy Book3 Ultra 16 | |
| Average of class Multimedia (606 - 1978, n=56, last 2 years) | |
| Lenovo Slim Pro 7 14ARP8 | |
| Dell Inspiron 16 Plus 7630 | |
| Average Intel Wi-Fi 6E AX211 (64 - 1921, n=276) | |
| Networking / iperf3 receive AXE11000 | |
| Asus VivoBook 14X K3405 | |
| Asus VivoBook Pro 16 K6602VU | |
| HP Pavilion Plus 16-ab0456tx | |
| Samsung Galaxy Book3 Ultra 16 | |
| Lenovo Slim Pro 7 14ARP8 | |
| Average Intel Wi-Fi 6E AX211 (582 - 1890, n=276) | |
| Average of class Multimedia (682 - 1818, n=56, last 2 years) | |
| Dell Inspiron 16 Plus 7630 | |
| Networking / iperf3 transmit AXE11000 6GHz | |
| HP Pavilion Plus 16-ab0456tx | |
| Dell Inspiron 16 Plus 7630 | |
| Average of class Multimedia (869 - 2373, n=23, last 2 years) | |
| Asus VivoBook 14X K3405 | |
| Asus VivoBook Pro 16 K6602VU | |
| Average Intel Wi-Fi 6E AX211 (385 - 1851, n=226) | |
| Networking / iperf3 receive AXE11000 6GHz | |
| HP Pavilion Plus 16-ab0456tx | |
| Average of class Multimedia (1212 - 2361, n=23, last 2 years) | |
| Asus VivoBook Pro 16 K6602VU | |
| Asus VivoBook 14X K3405 | |
| Average Intel Wi-Fi 6E AX211 (700 - 1857, n=226) | |
| Dell Inspiron 16 Plus 7630 | |
网络摄像头
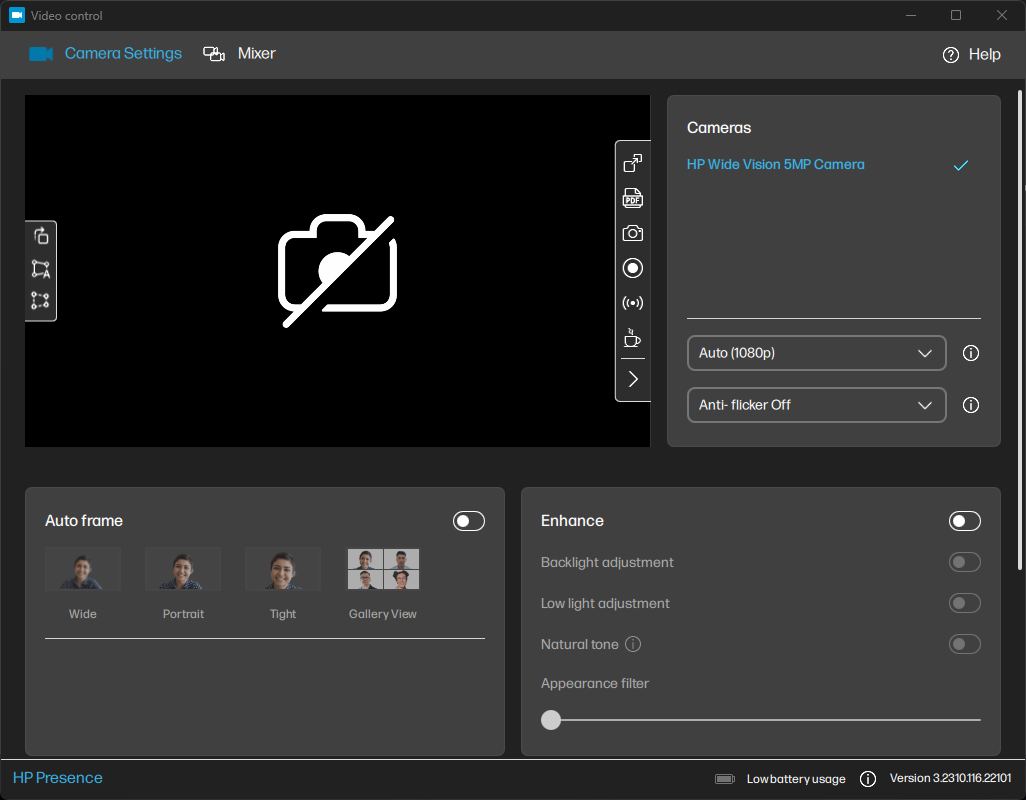
500 万像素网络摄像头可拍摄出不错的图像,非常适合视频会议使用。作为一款笔记本电脑网络摄像头,该摄像头能很好地保留细节,但在光线不足的情况下可能会出现问题。
惠普提供了一些有趣的实用工具,如惠普增强照明(HP Enhanced Lighting),它可以增亮拍摄对象周围的屏幕,还有一个视频控制应用程序,可以提供额外的取景和图像调整选项。


安全
惠普为Pavilion Plus 16 提供了一个兼容 Windows Hello 的红外摄像头和一个用于网络摄像头的隐私快门。在我们使用该设备期间,红外摄像头的运行速度相当快。
此外,还配备了 TPM 2.0 模块,以满足 Windows 11 的安全要求。
配件和保修
包装盒内除了 135 W 电源适配器和常规文件外,没有其他附件。
惠普为Pavilion Plus 16 在印度提供一年保修。购买者可以通过购买符合条件的惠普护理包将保修期延长三年。.
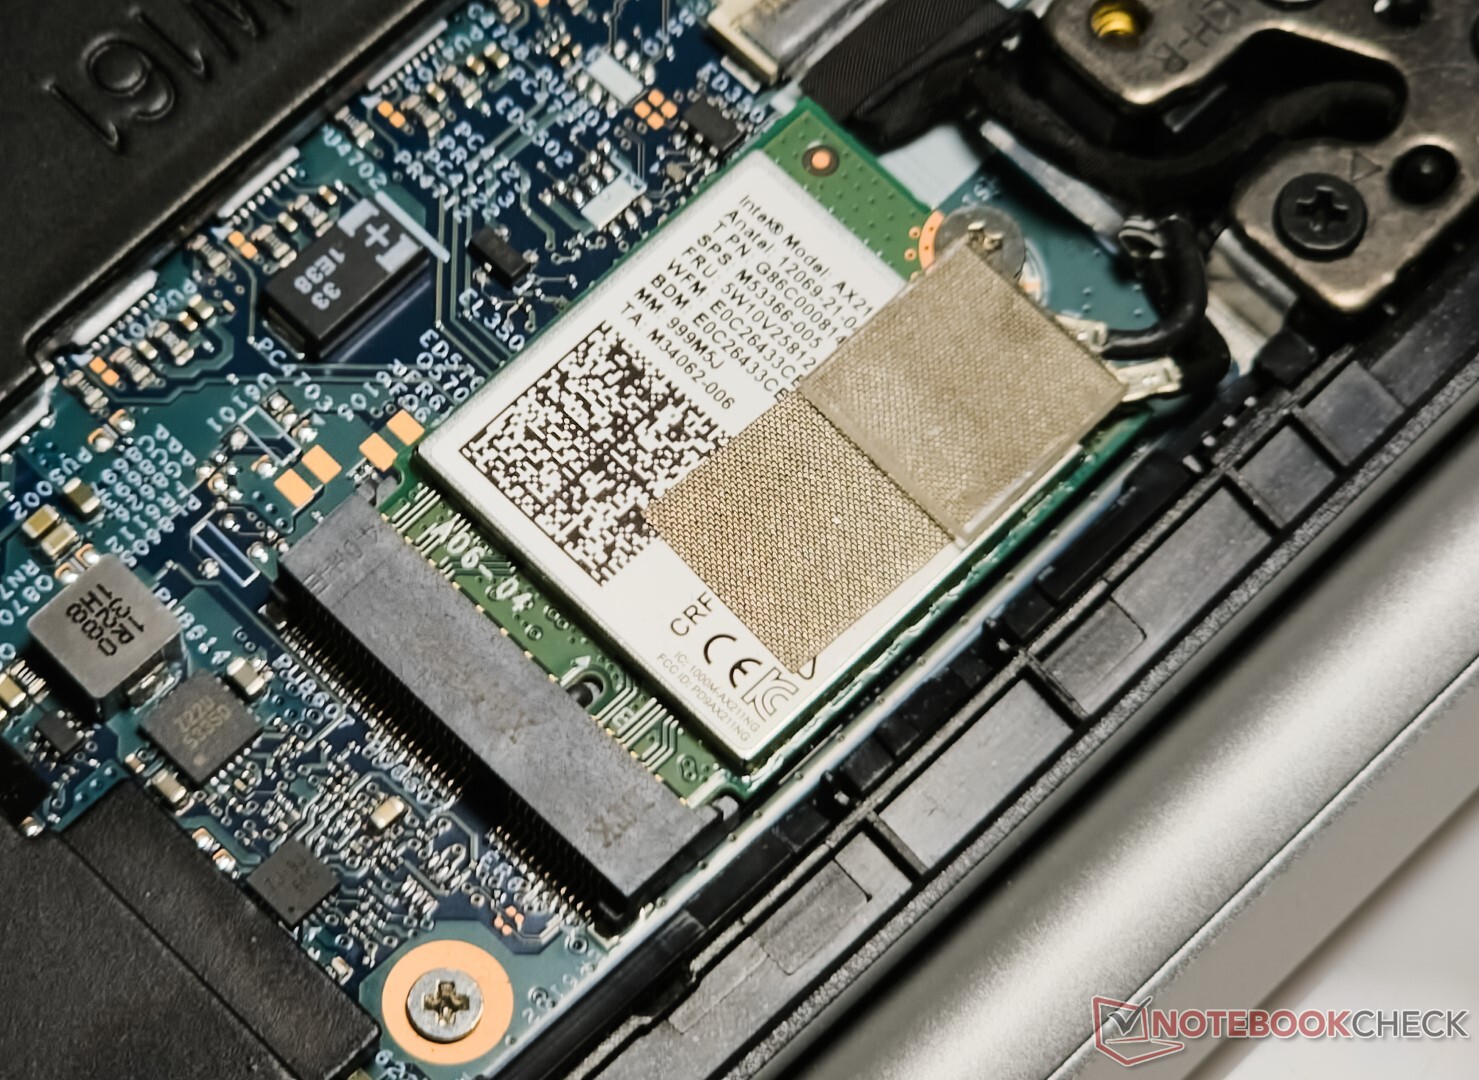
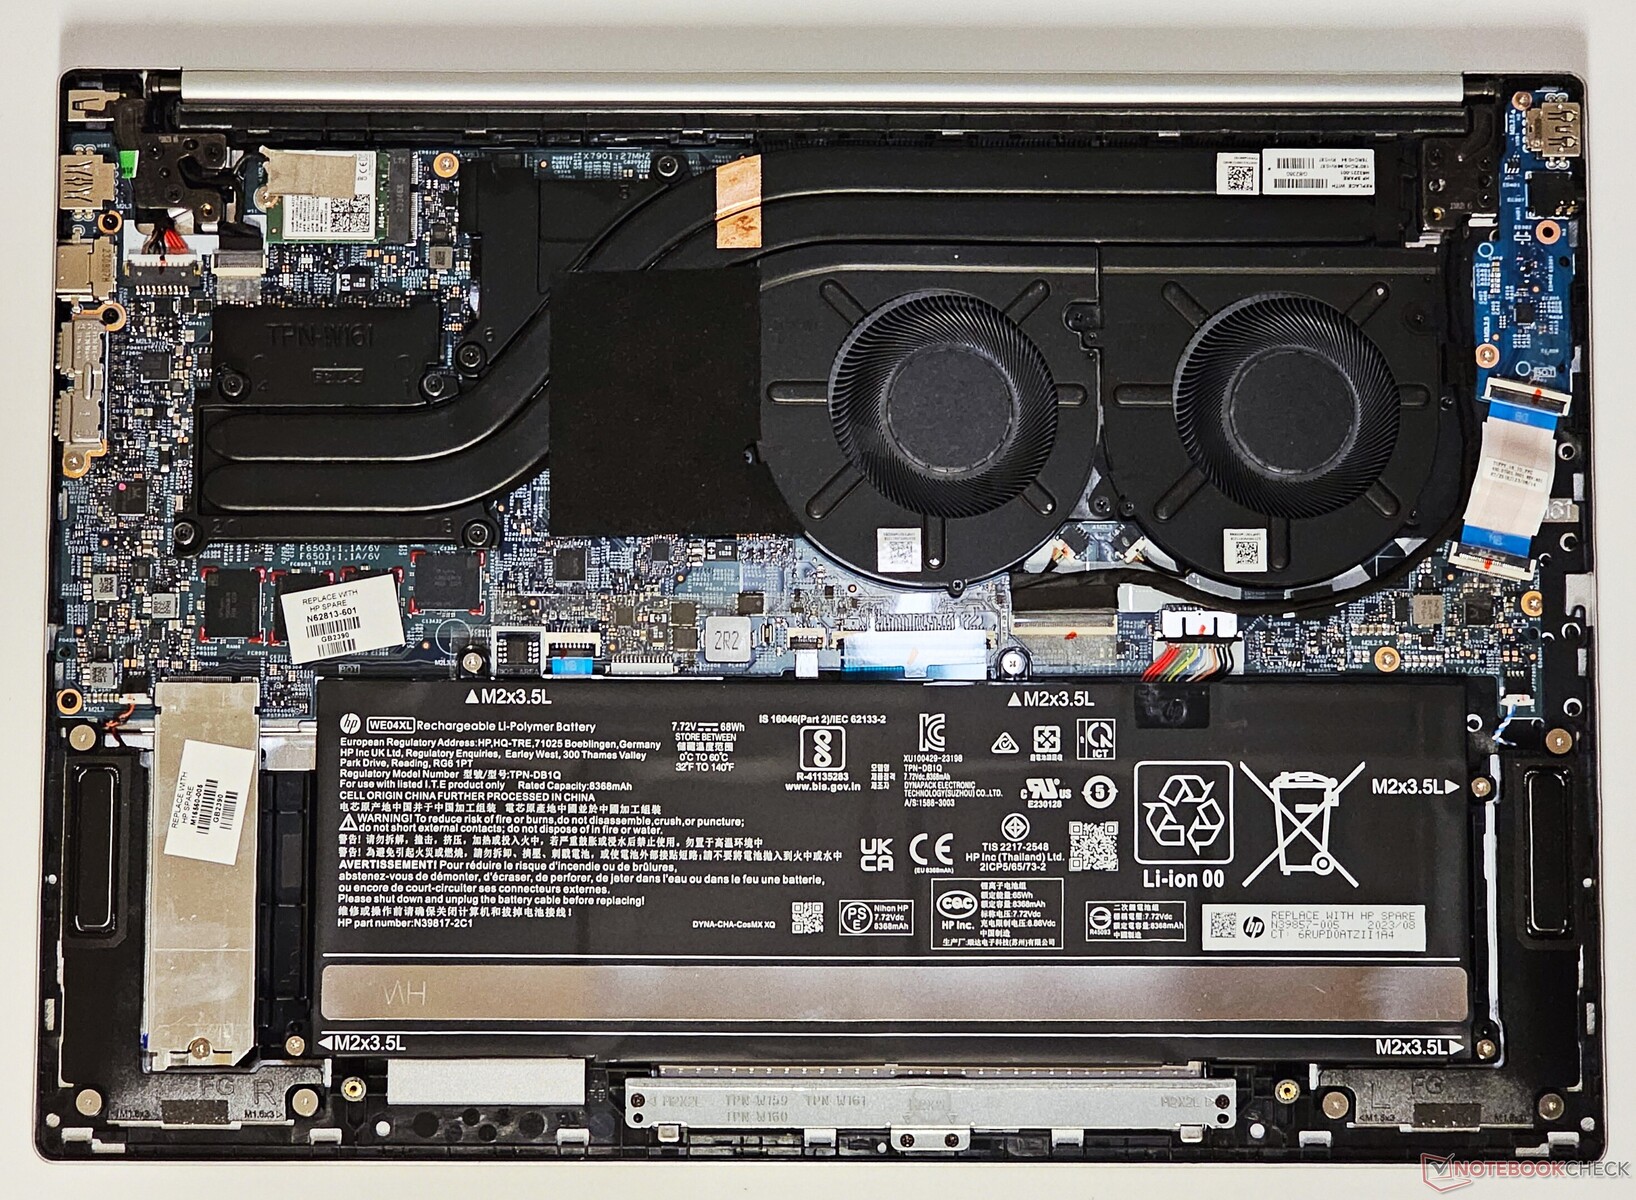
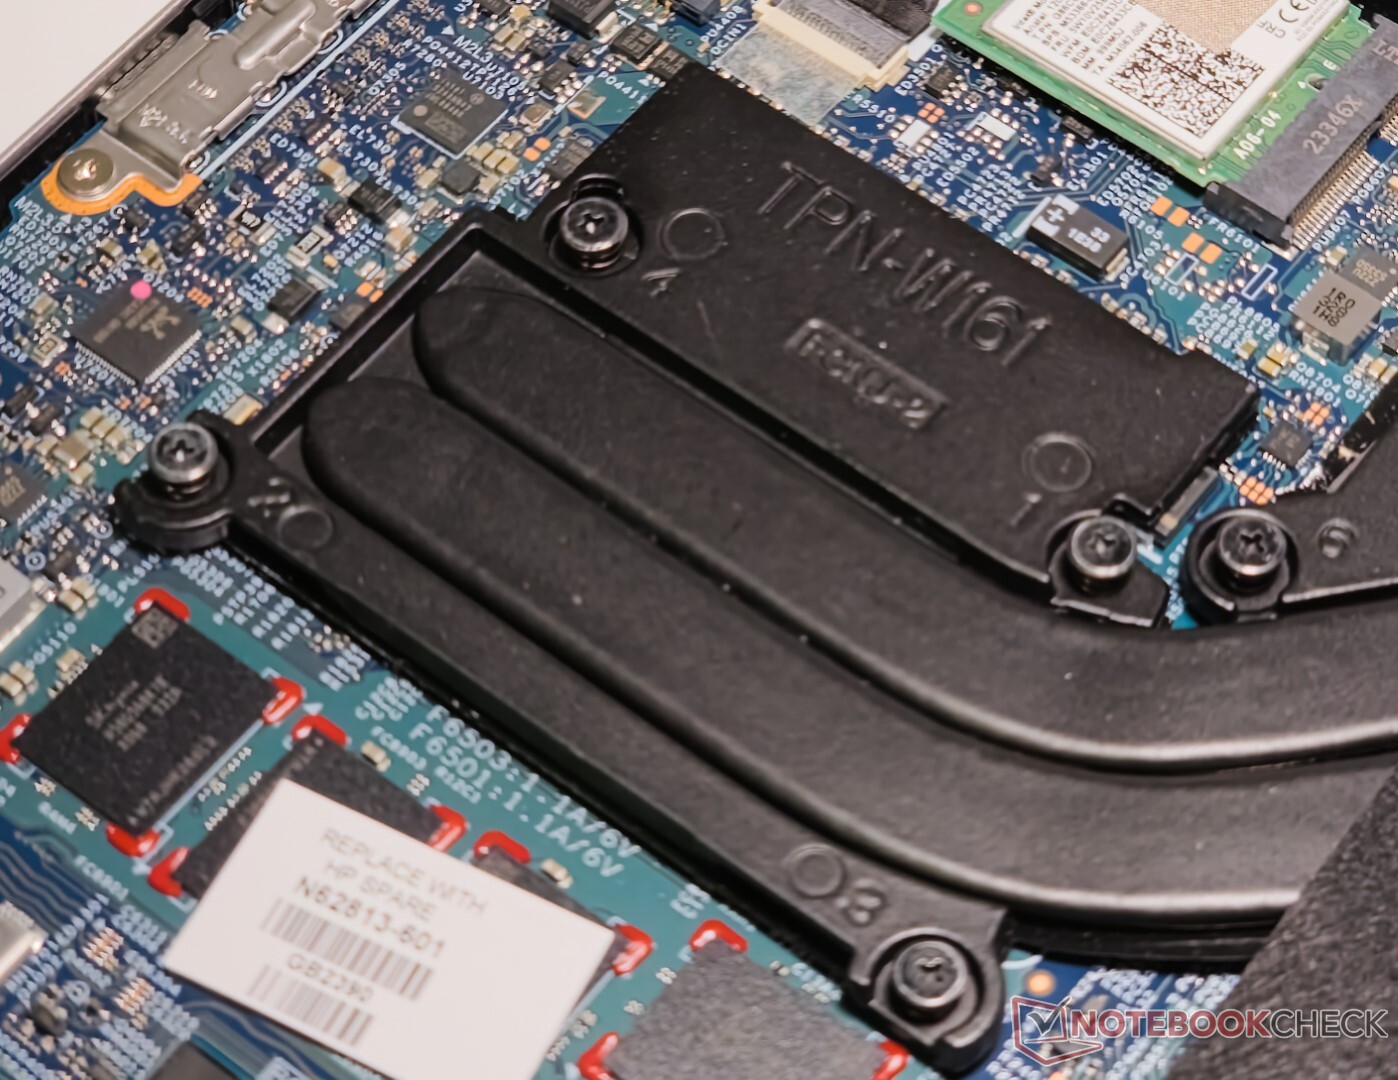
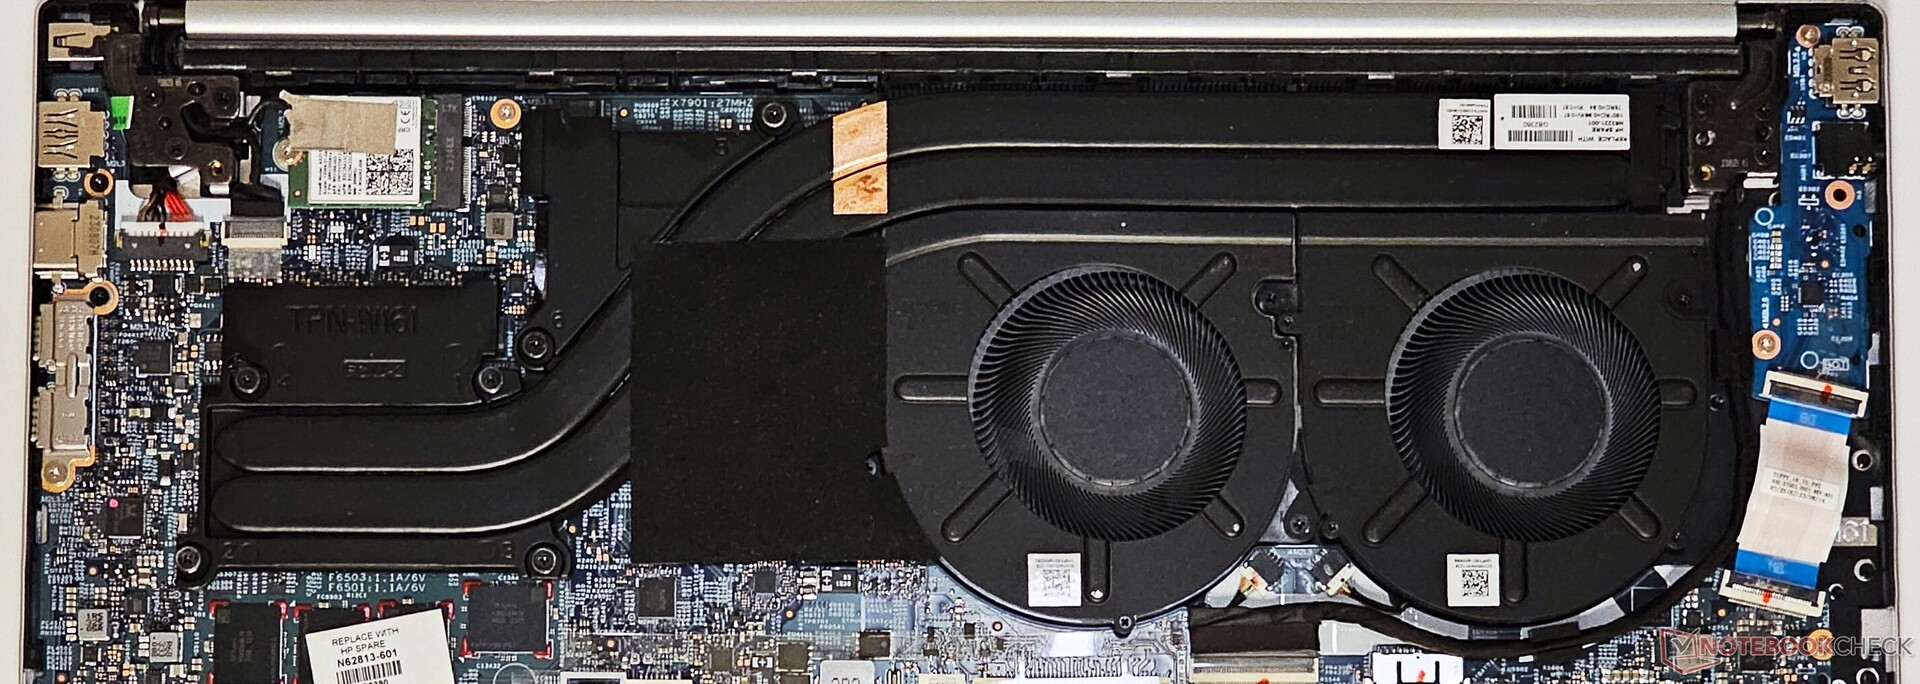
维护
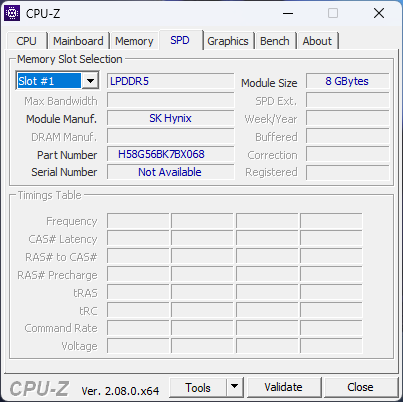
卸下四颗 PH0 螺钉后,可撬开底部面板。内存是焊接的,但 WLAN 卡、NVMe SSD 和电池组可以根据需要更换。
输入设备全尺寸数字键盘,触感良好
键盘
Pavilion Plus 16 的键盘提供了不错的键入体验。灰色键帽与自然银色机身形成了良好的对比。数字键盘空间宽敞,在 Excel 中进行数字运算时非常方便。不过它缺少数字锁定指示灯。
电源键位于 Delete 键旁边,这可能会让初次使用的用户感到困惑。顶部和底部的方向键也感觉很拥挤。三段式白色背光有助于在光线不足时清晰显示。
触摸板
12.5 厘米 x 8 厘米的触摸板空间宽敞,滑动顺畅,反馈良好。不过,行程并不深。
整个触摸板就像鼠标左键一样。点击触摸板中部和底部比点击顶部反应更灵敏。
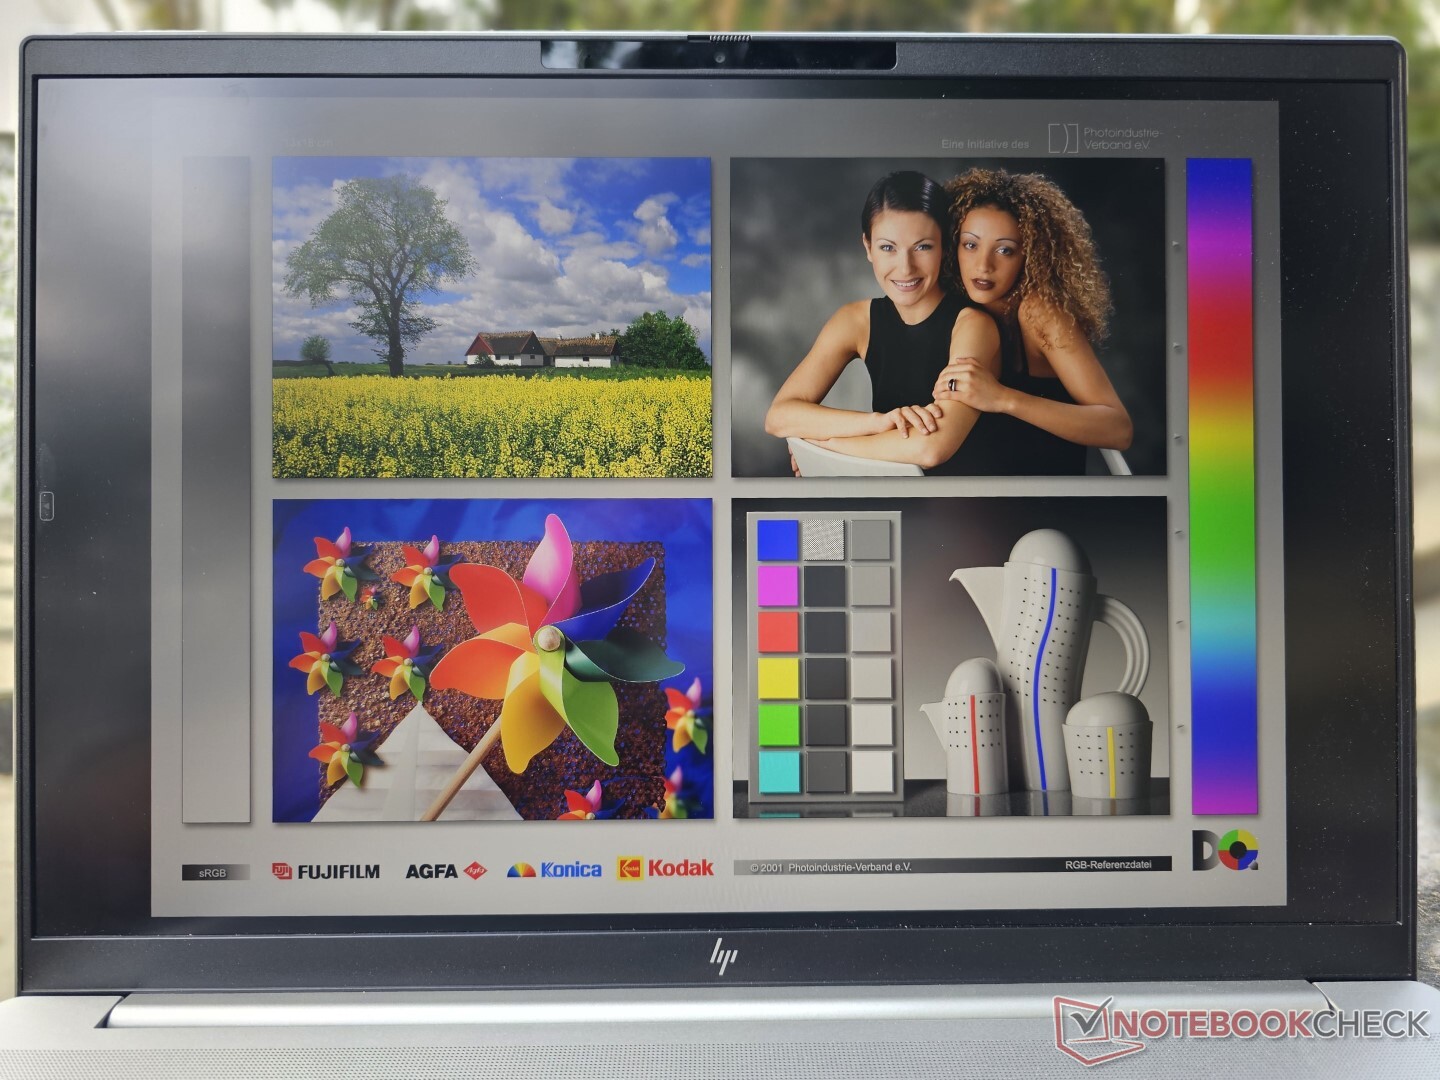
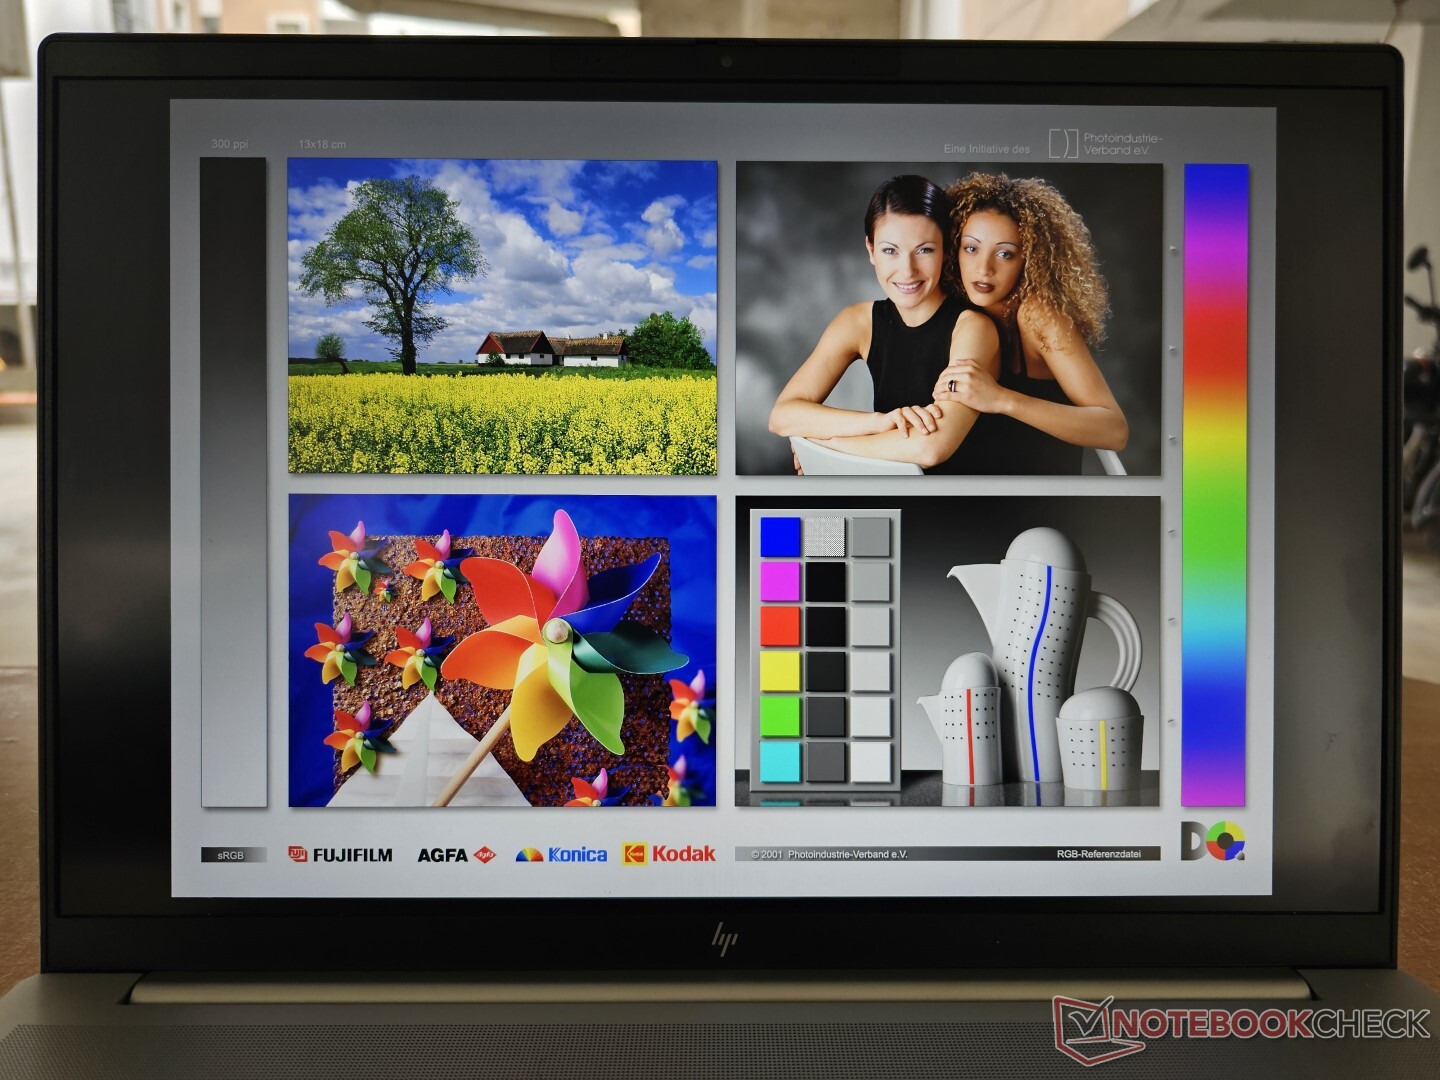
显示屏120 Hz WQXGA 面板,色彩逼真,无 PWM
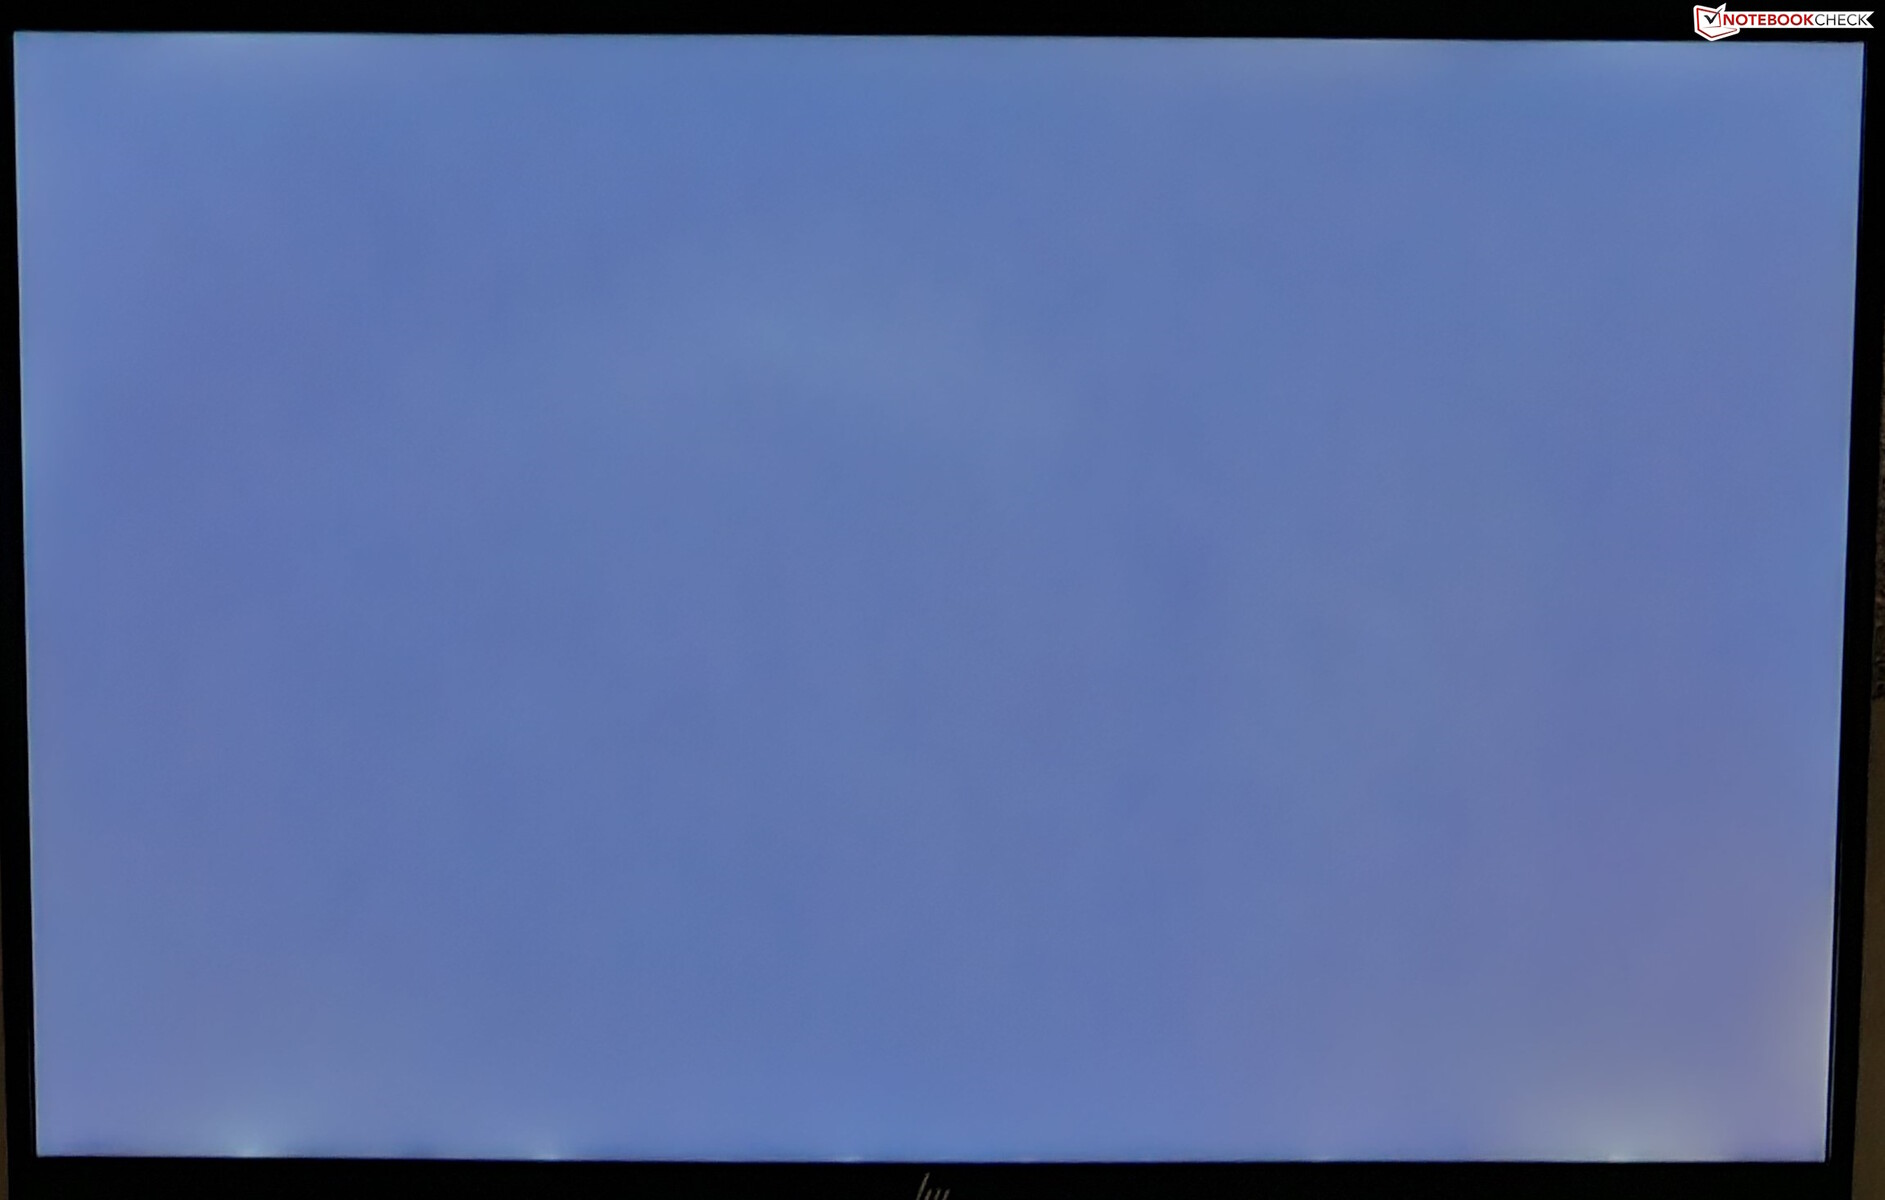
Pavilion Plus 16 配备了 16 英寸 16:10 2560 x 1600 WQXGA IPS 面板,刷新率为 120 Hz,额定亮度为 400 尼特。
我们测得的最大亮度为 415 尼特,平均亮度为 394 尼特,亮度分布达到 90%。由于采用的是 IPS 面板,该显示屏无法避免背光溢出现象--在长时间曝光的情况下,下角部分会出现这种现象。
主观而言,Pavilion Plus 16 提供了良好的观看体验,适合工作和娱乐。

| |||||||||||||||||||||||||
Brightness Distribution: 90 %
Center on Battery: 401 cd/m²
Contrast: 1185:1 (Black: 0.34 cd/m²)
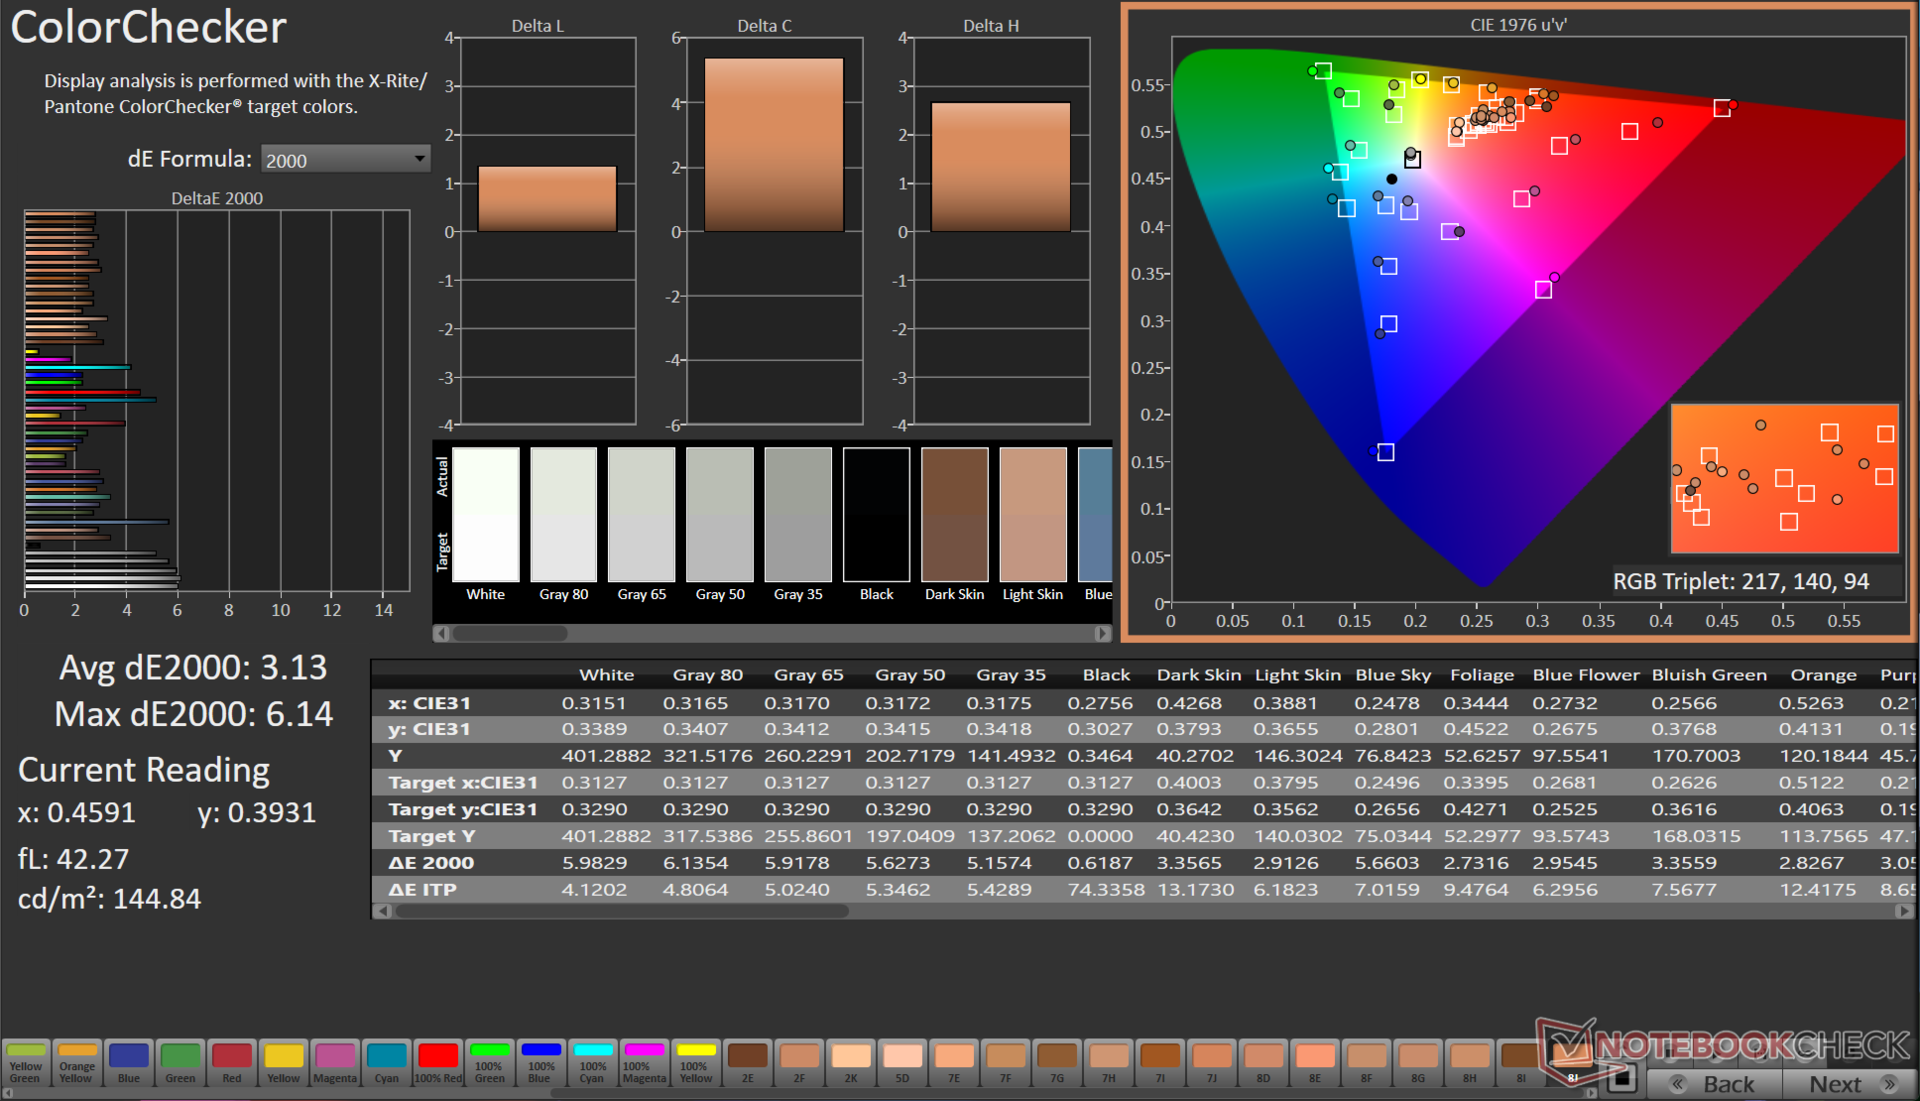
ΔE ColorChecker Calman: 3.13 | ∀{0.5-29.43 Ø4.71}
calibrated: 1.65
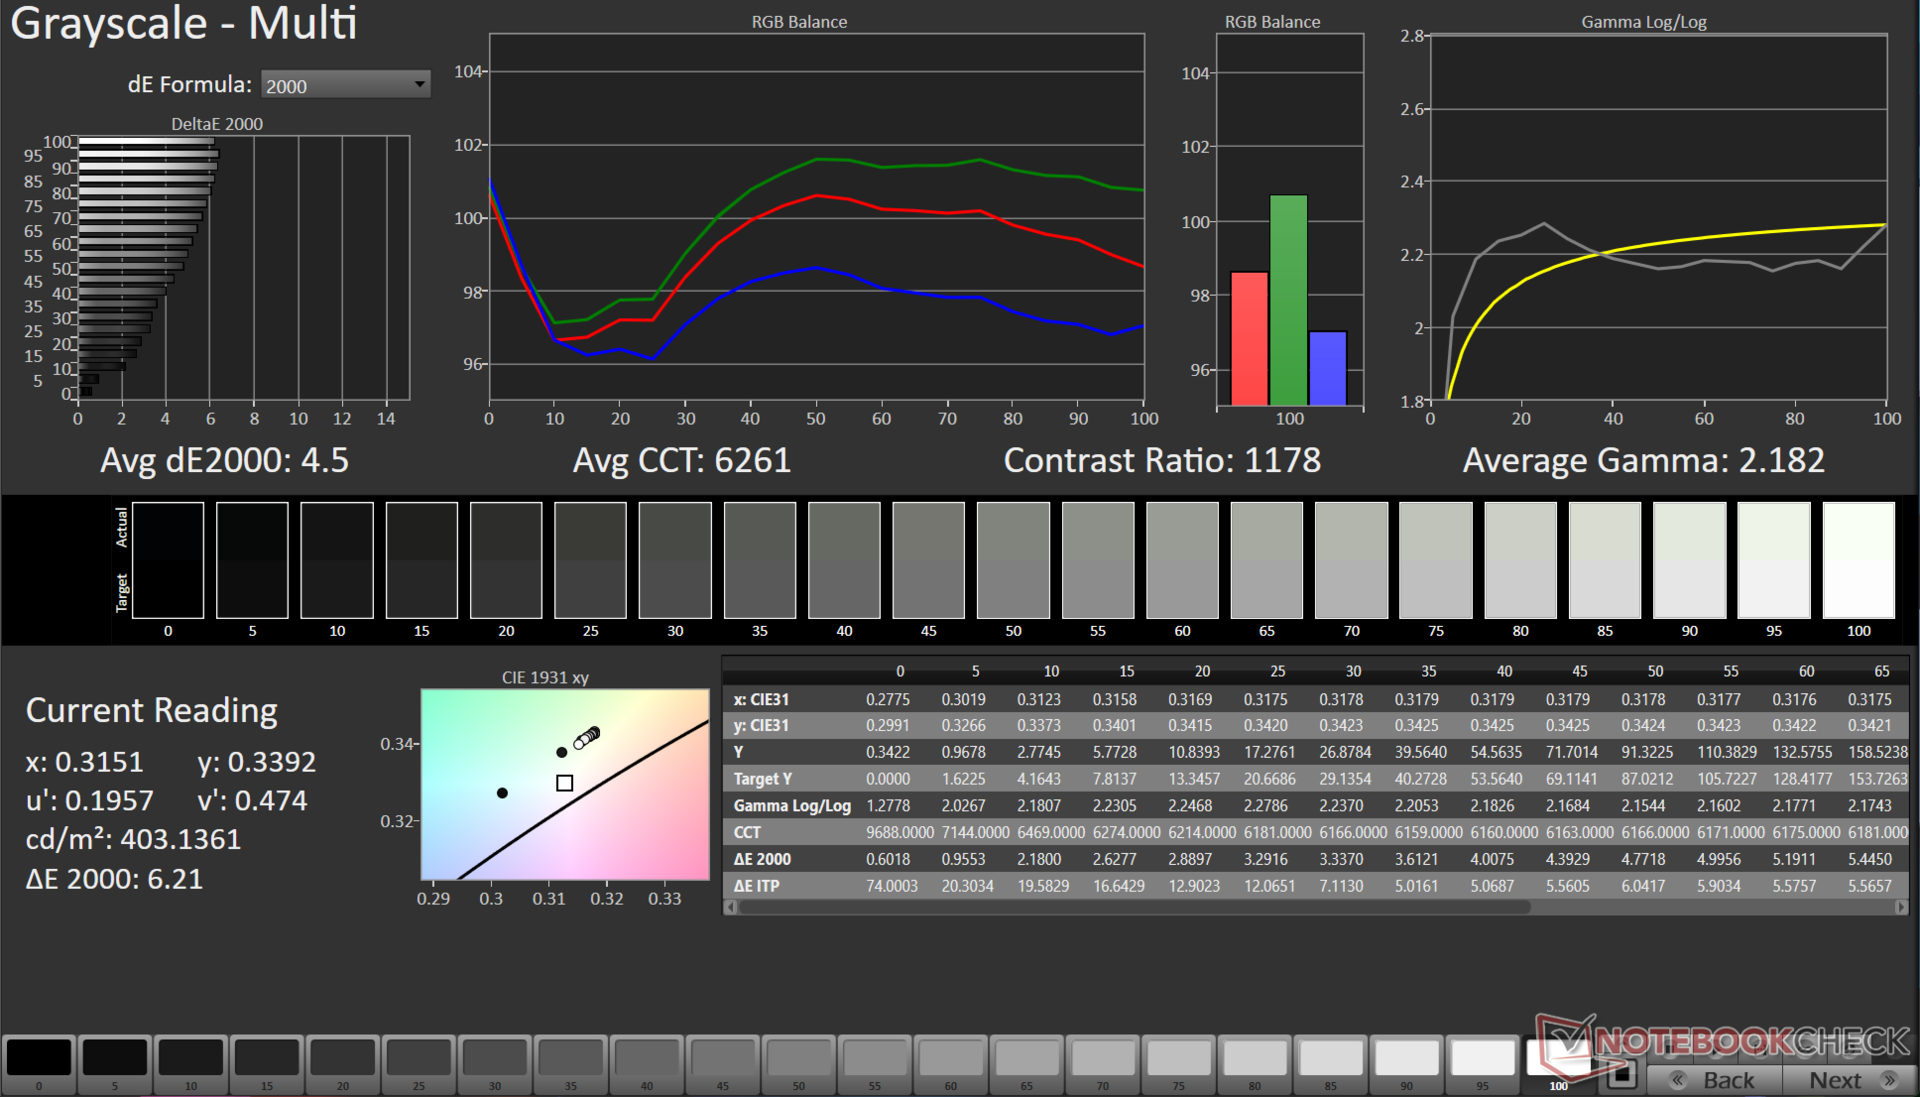
ΔE Greyscale Calman: 4.5 | ∀{0.09-98 Ø4.96}
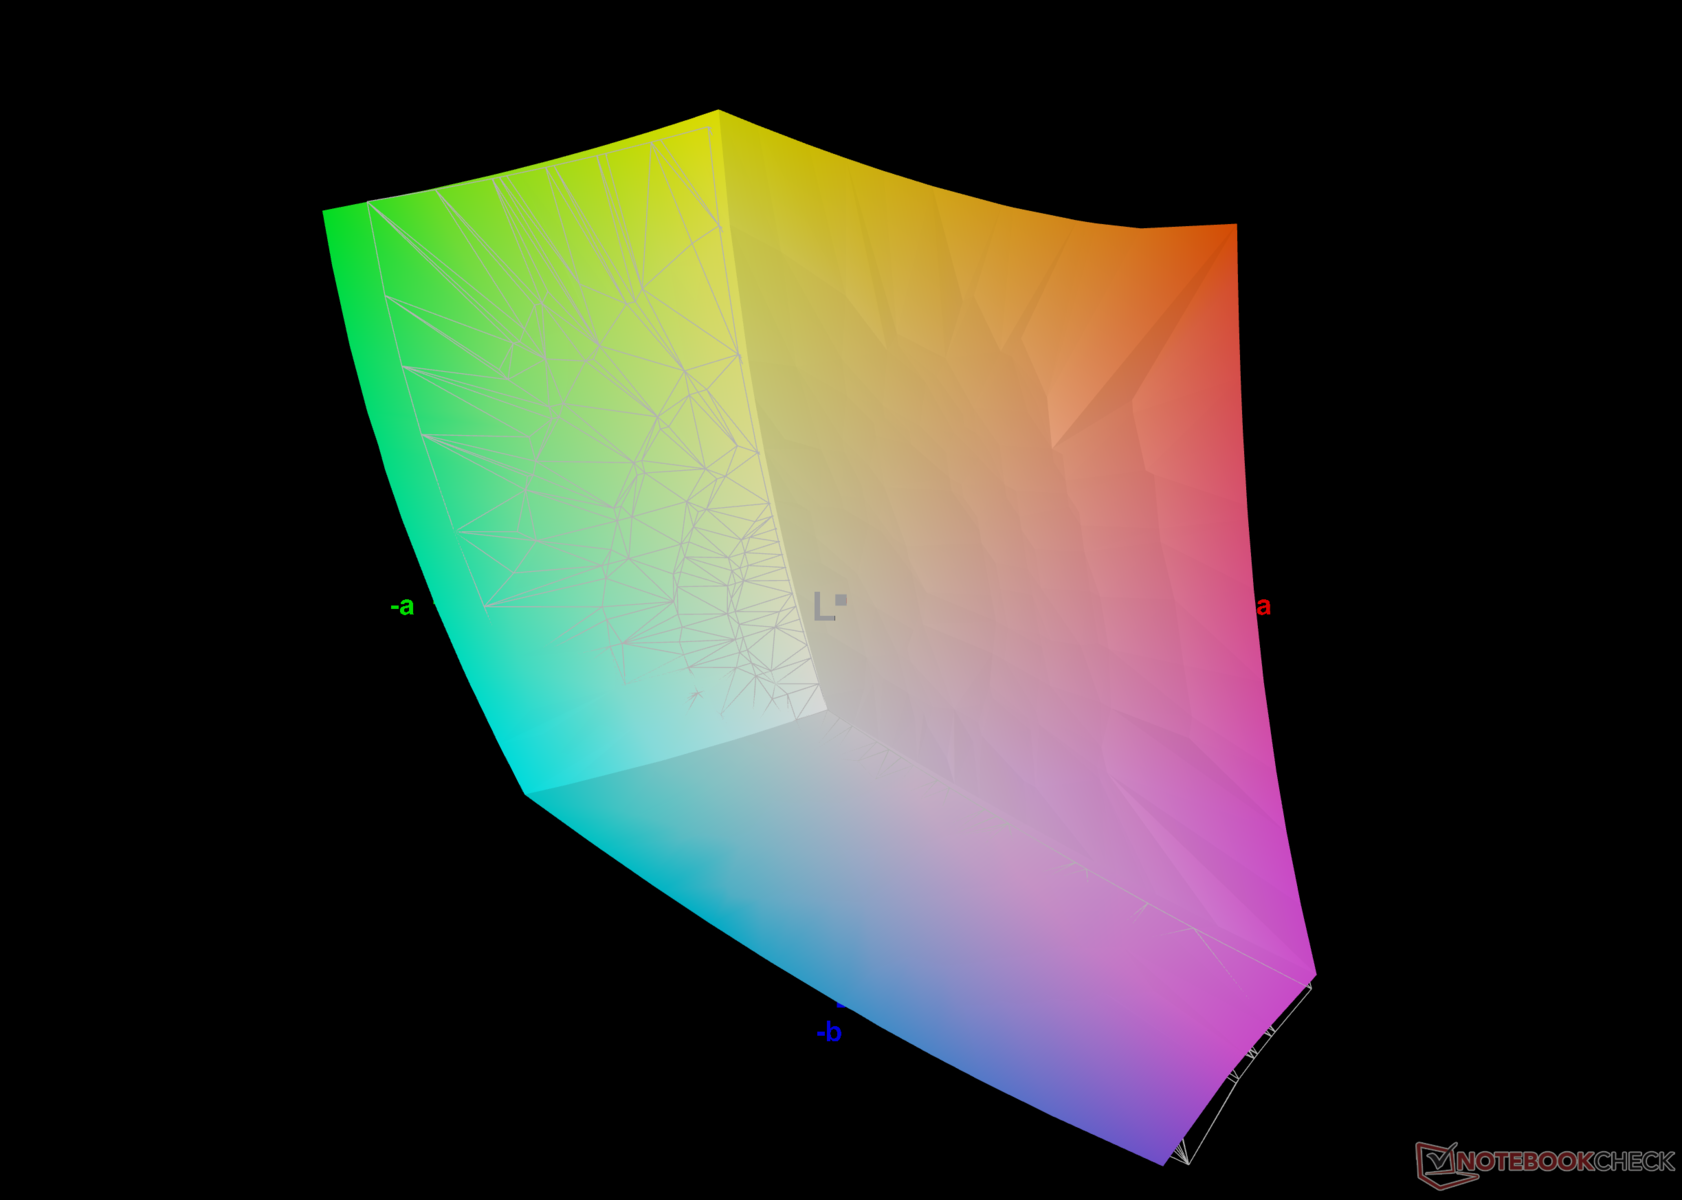
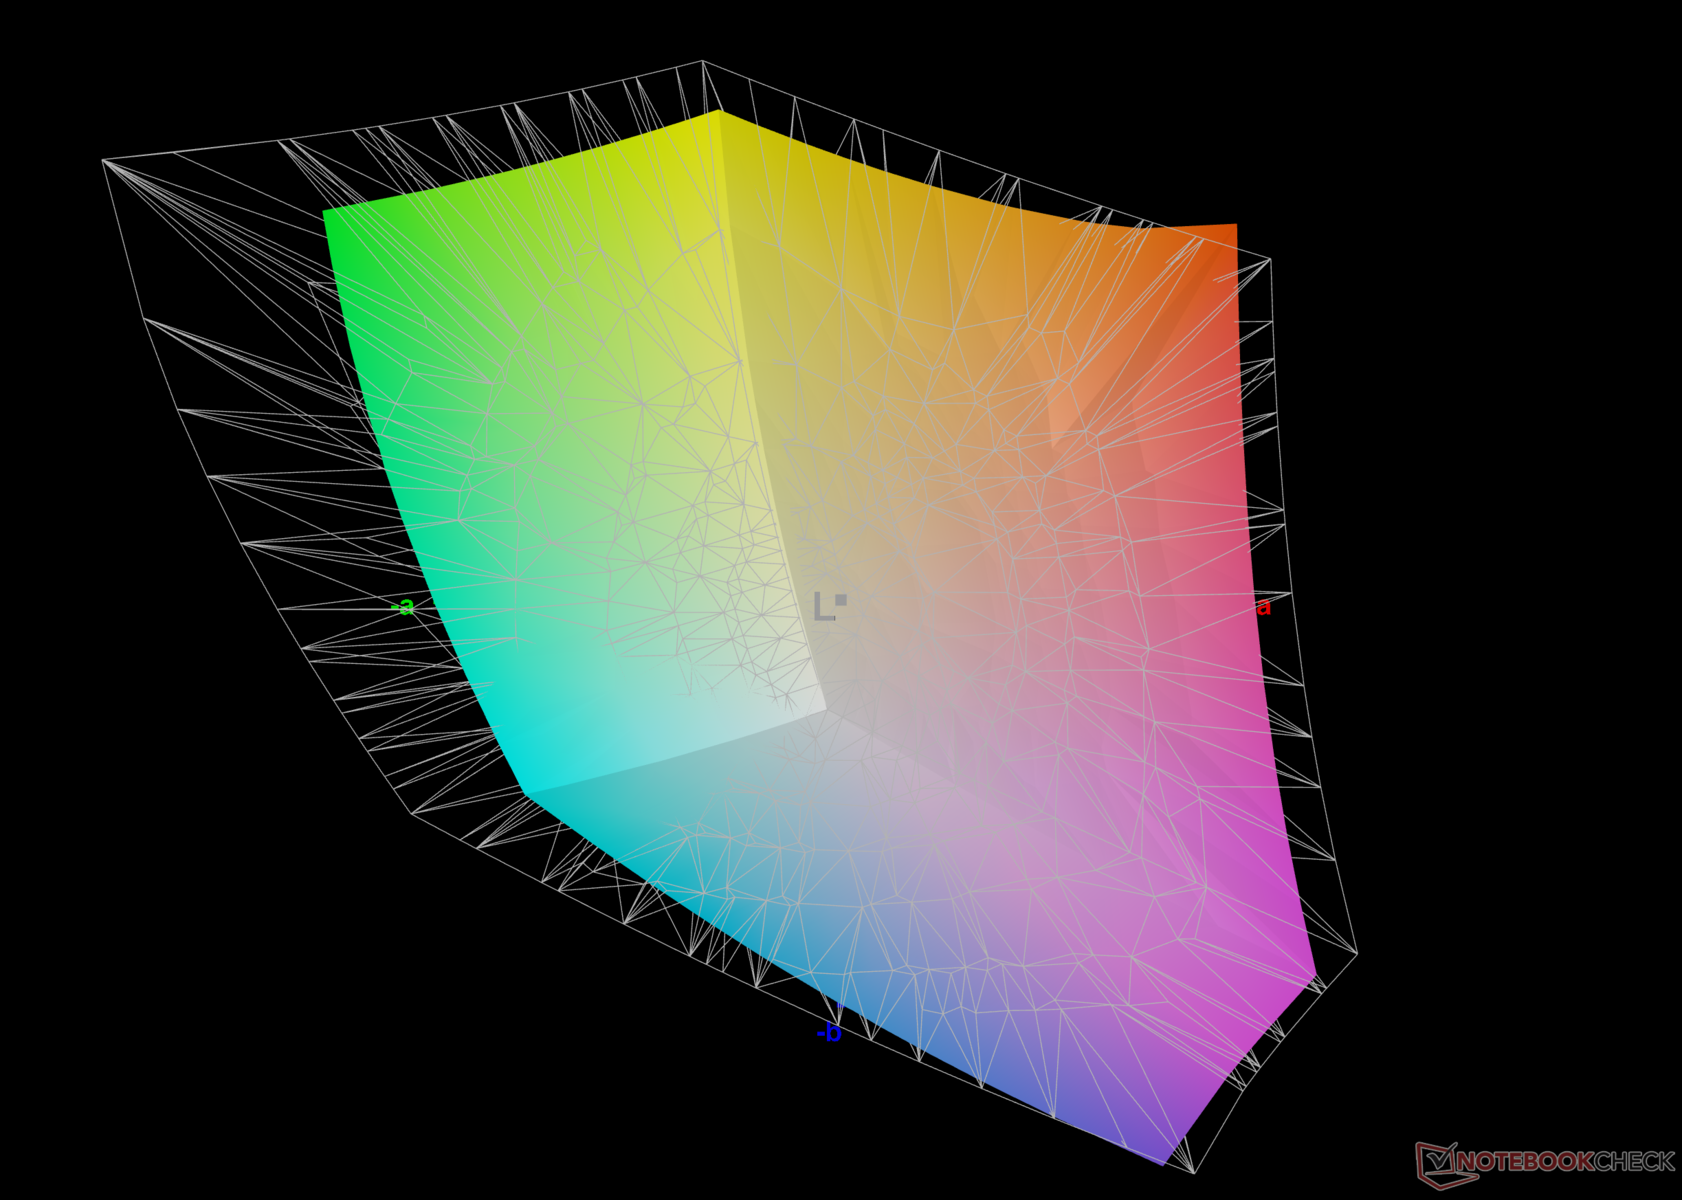
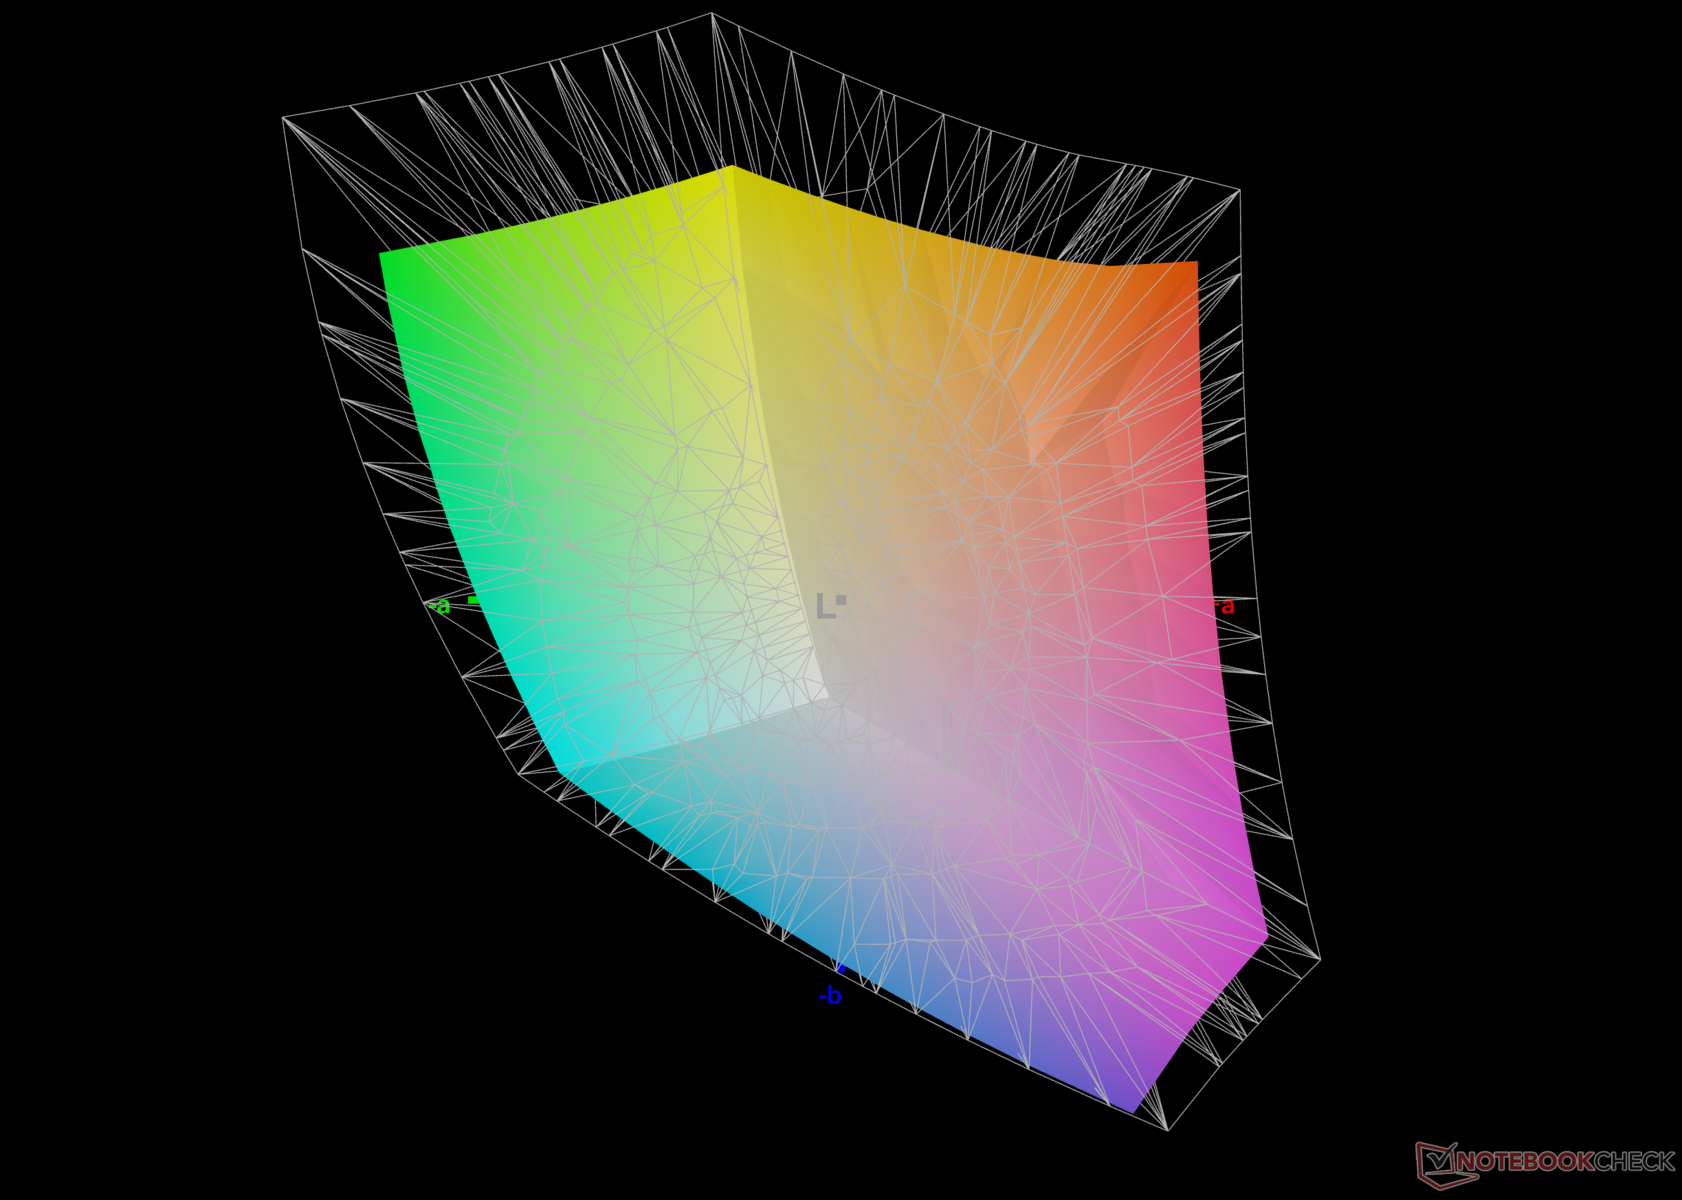
76.5% AdobeRGB 1998 (Argyll 3D)
99% sRGB (Argyll 3D)
74.6% Display P3 (Argyll 3D)
Gamma: 2.18
CCT: 6261 K
| HP Pavilion Plus 16-ab0456tx AU Optronics AUOFDA4, IPS, 2560x1600, 16" | Schenker Vision 14 2023 CSOT T3 MNE007ZA1-3, IPS, 2880x1800, 14" | Dell Inspiron 16 Plus 7630 LG Philips 160WQ2, IPS, 2560x1600, 16" | Asus VivoBook 14X K3405 Samsung ATNA40YK07-1, , 2880x1800, 14" | Lenovo Slim Pro 7 14ARP8 LEN89C1, IPS, 2560x1600, 14.5" | Asus VivoBook Pro 16 K6602VU Samsung ATNA60BX01-1, OLED, 3200x2000, 16" | Samsung Galaxy Book3 Ultra 16 Samsung ATNA60CL03-0, AMOLED, 2880x1800, 16" | |
|---|---|---|---|---|---|---|---|
| Display | 0% | -3% | 20% | -2% | 20% | 20% | |
| Display P3 Coverage (%) | 74.6 | 74.7 0% | 70.1 -6% | 99.9 34% | 72.9 -2% | 98.7 32% | 99.9 34% |
| sRGB Coverage (%) | 99 | 99.6 1% | 99.6 1% | 100 1% | 98.2 -1% | 99.7 1% | 100 1% |
| AdobeRGB 1998 Coverage (%) | 76.5 | 75.8 -1% | 72.3 -5% | 96.5 26% | 74.6 -2% | 96.5 26% | 96.3 26% |
| Response Times | -193% | -274% | -14% | -220% | -3% | 93% | |
| Response Time Grey 50% / Grey 80% * (ms) | 9.06 ? | 32.2 ? -255% | 35 ? -286% | 1.15 ? 87% | 31.8 ? -251% | 0.68 ? 92% | 0.49 ? 95% |
| Response Time Black / White * (ms) | 6.7 ? | 15.4 ? -130% | 24.2 ? -261% | 14.4 ? -115% | 19.3 ? -188% | 13.2 ? -97% | 0.65 ? 90% |
| PWM Frequency (Hz) | 90.02 ? | 240 ? | 240 ? | ||||
| Screen | 21% | 1% | 5% | 3% | -10% | 135% | |
| Brightness middle (cd/m²) | 403 | 402 0% | 299.4 -26% | 369 -8% | 344.7 -14% | 353 -12% | 400 -1% |
| Brightness (cd/m²) | 394 | 371 -6% | 290 -26% | 364 -8% | 334 -15% | 354 -10% | 399 1% |
| Brightness Distribution (%) | 90 | 86 -4% | 92 2% | 85 -6% | 92 2% | 98 9% | 93 3% |
| Black Level * (cd/m²) | 0.34 | 0.27 21% | 0.21 38% | 0.31 9% | 0.03 91% | ||
| Contrast (:1) | 1185 | 1489 26% | 1426 20% | 1112 -6% | 13333 1025% | ||
| Colorchecker dE 2000 * | 3.13 | 1.8 42% | 4.25 -36% | 2.85 9% | 3.01 4% | 4.23 -35% | 2.3 27% |
| Colorchecker dE 2000 max. * | 6.14 | 3.6 41% | 6.71 -9% | 4.22 31% | 6.3 -3% | 7.13 -16% | 4.15 32% |
| Colorchecker dE 2000 calibrated * | 1.65 | 1.5 9% | 0.52 68% | 2.18 -32% | 0.83 50% | 2.42 -47% | 1.66 -1% |
| Greyscale dE 2000 * | 4.5 | 1.8 60% | 5.5 -22% | 2.2 51% | 4.6 -2% | 2.5 44% | 2.7 40% |
| Gamma | 2.18 101% | 2.27 97% | 2.35 94% | 2.15 102% | 2.28 96% | 2.4 92% | 2.266 97% |
| CCT | 6261 104% | 6695 97% | 6368 102% | 6518 100% | 6420 101% | 6642 98% | 7047 92% |
| Total Average (Program / Settings) | -57% /
-14% | -92% /
-39% | 4% /
6% | -73% /
-30% | 2% /
-1% | 83% /
105% |
* ... smaller is better
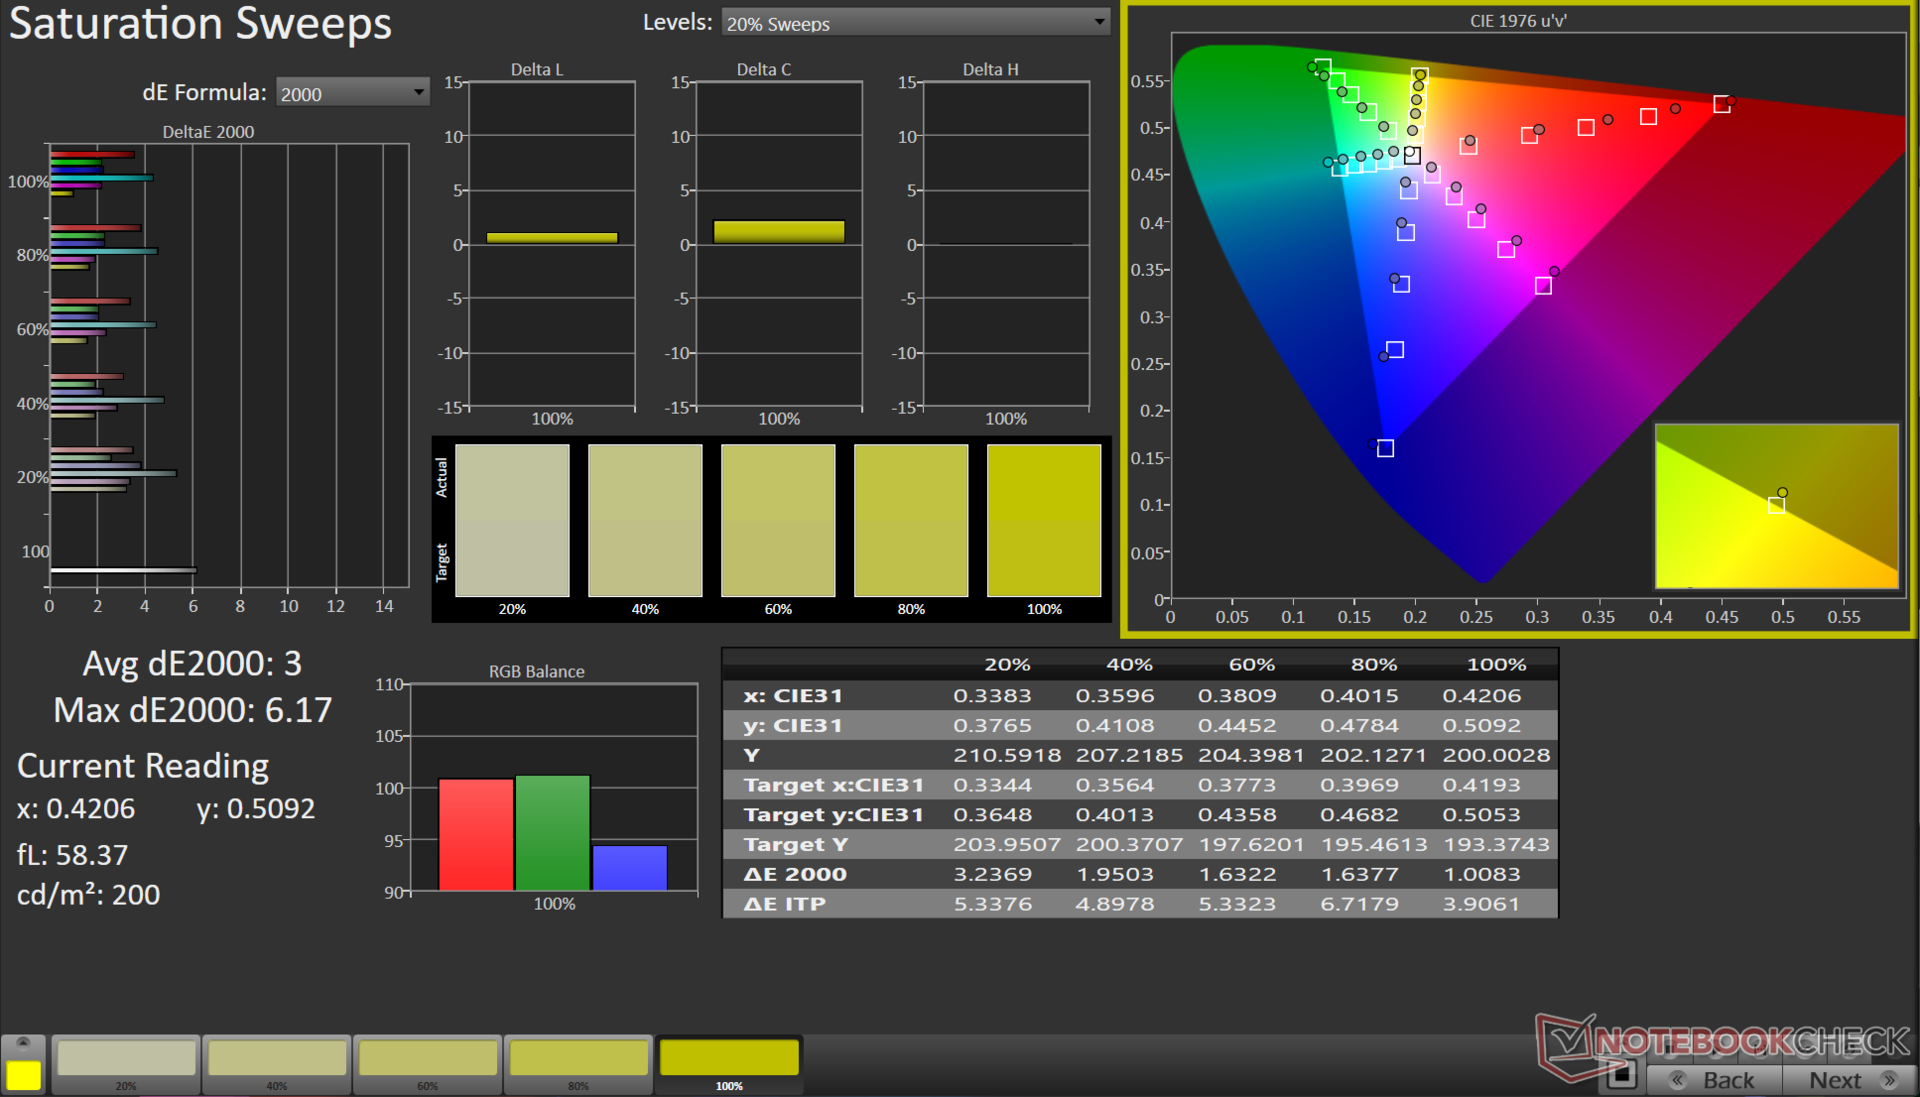
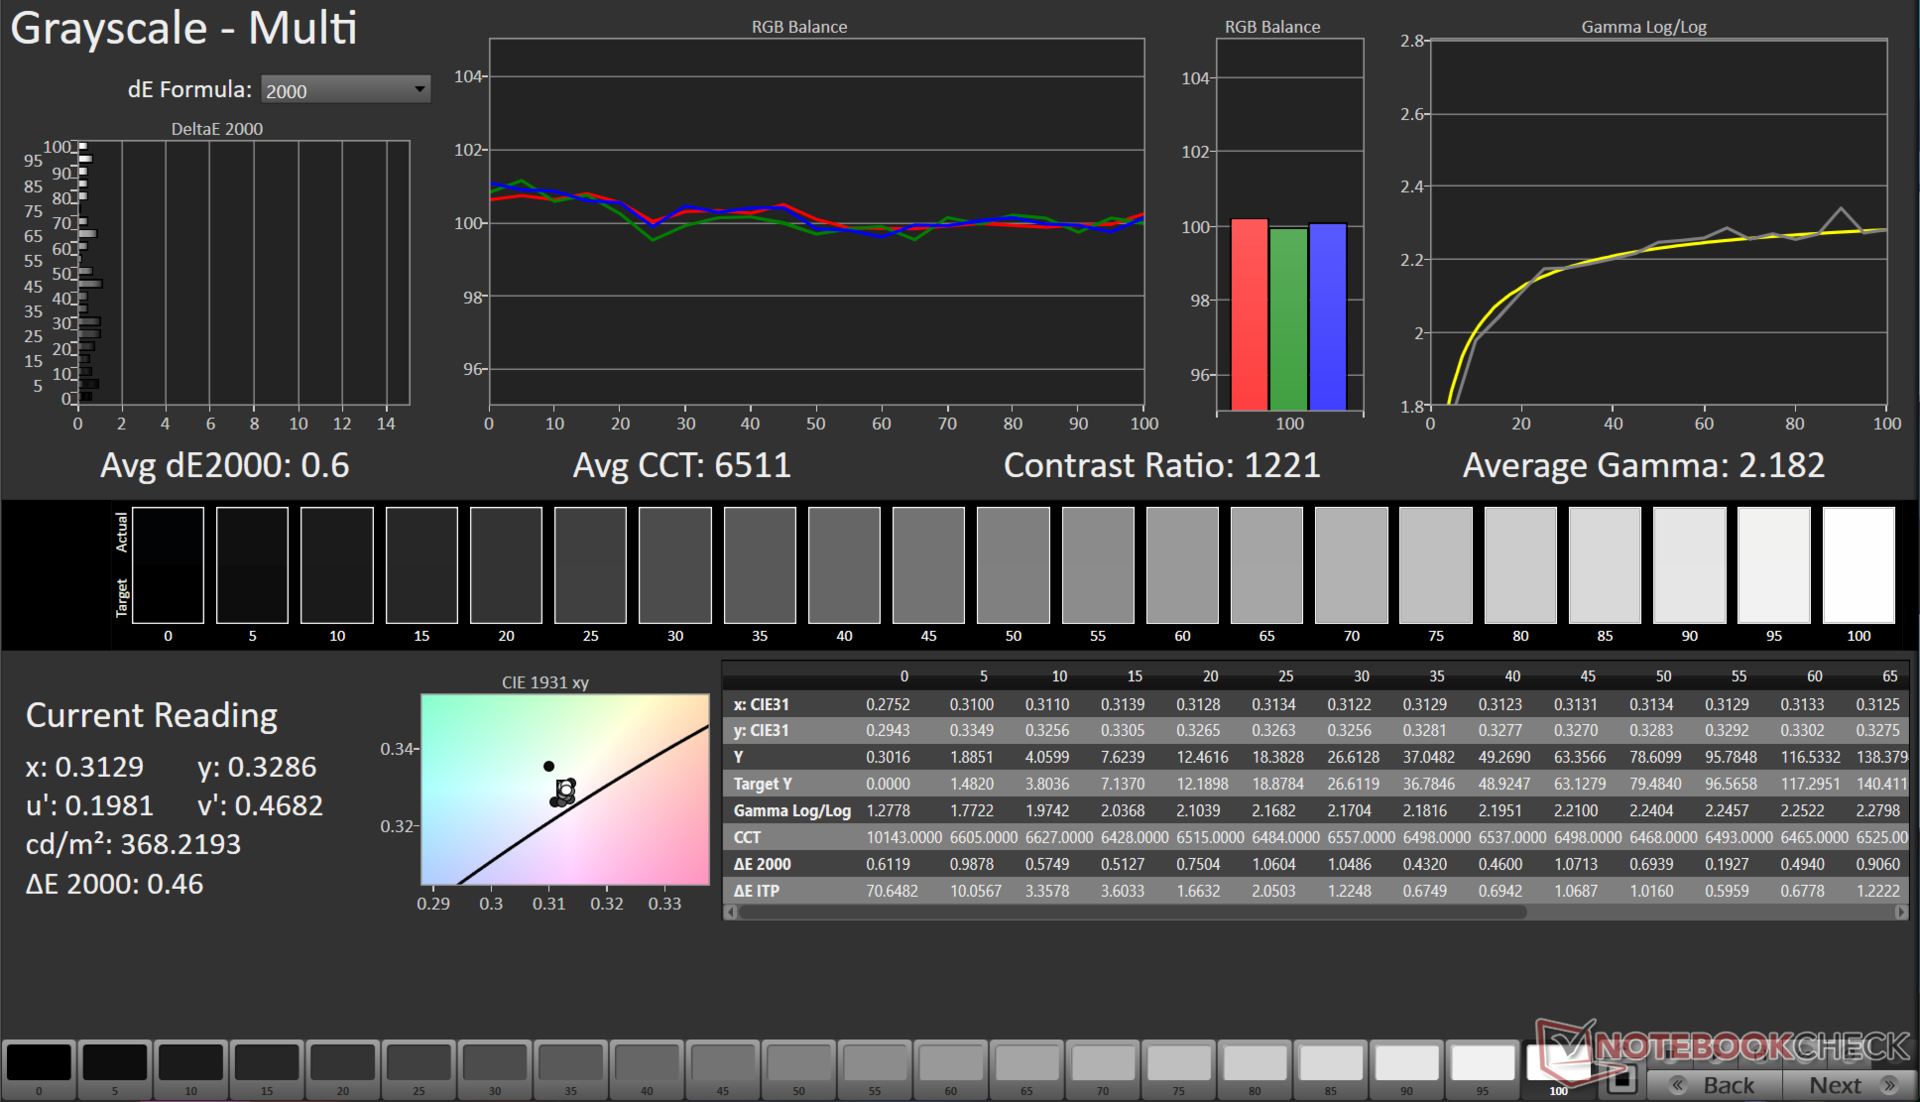
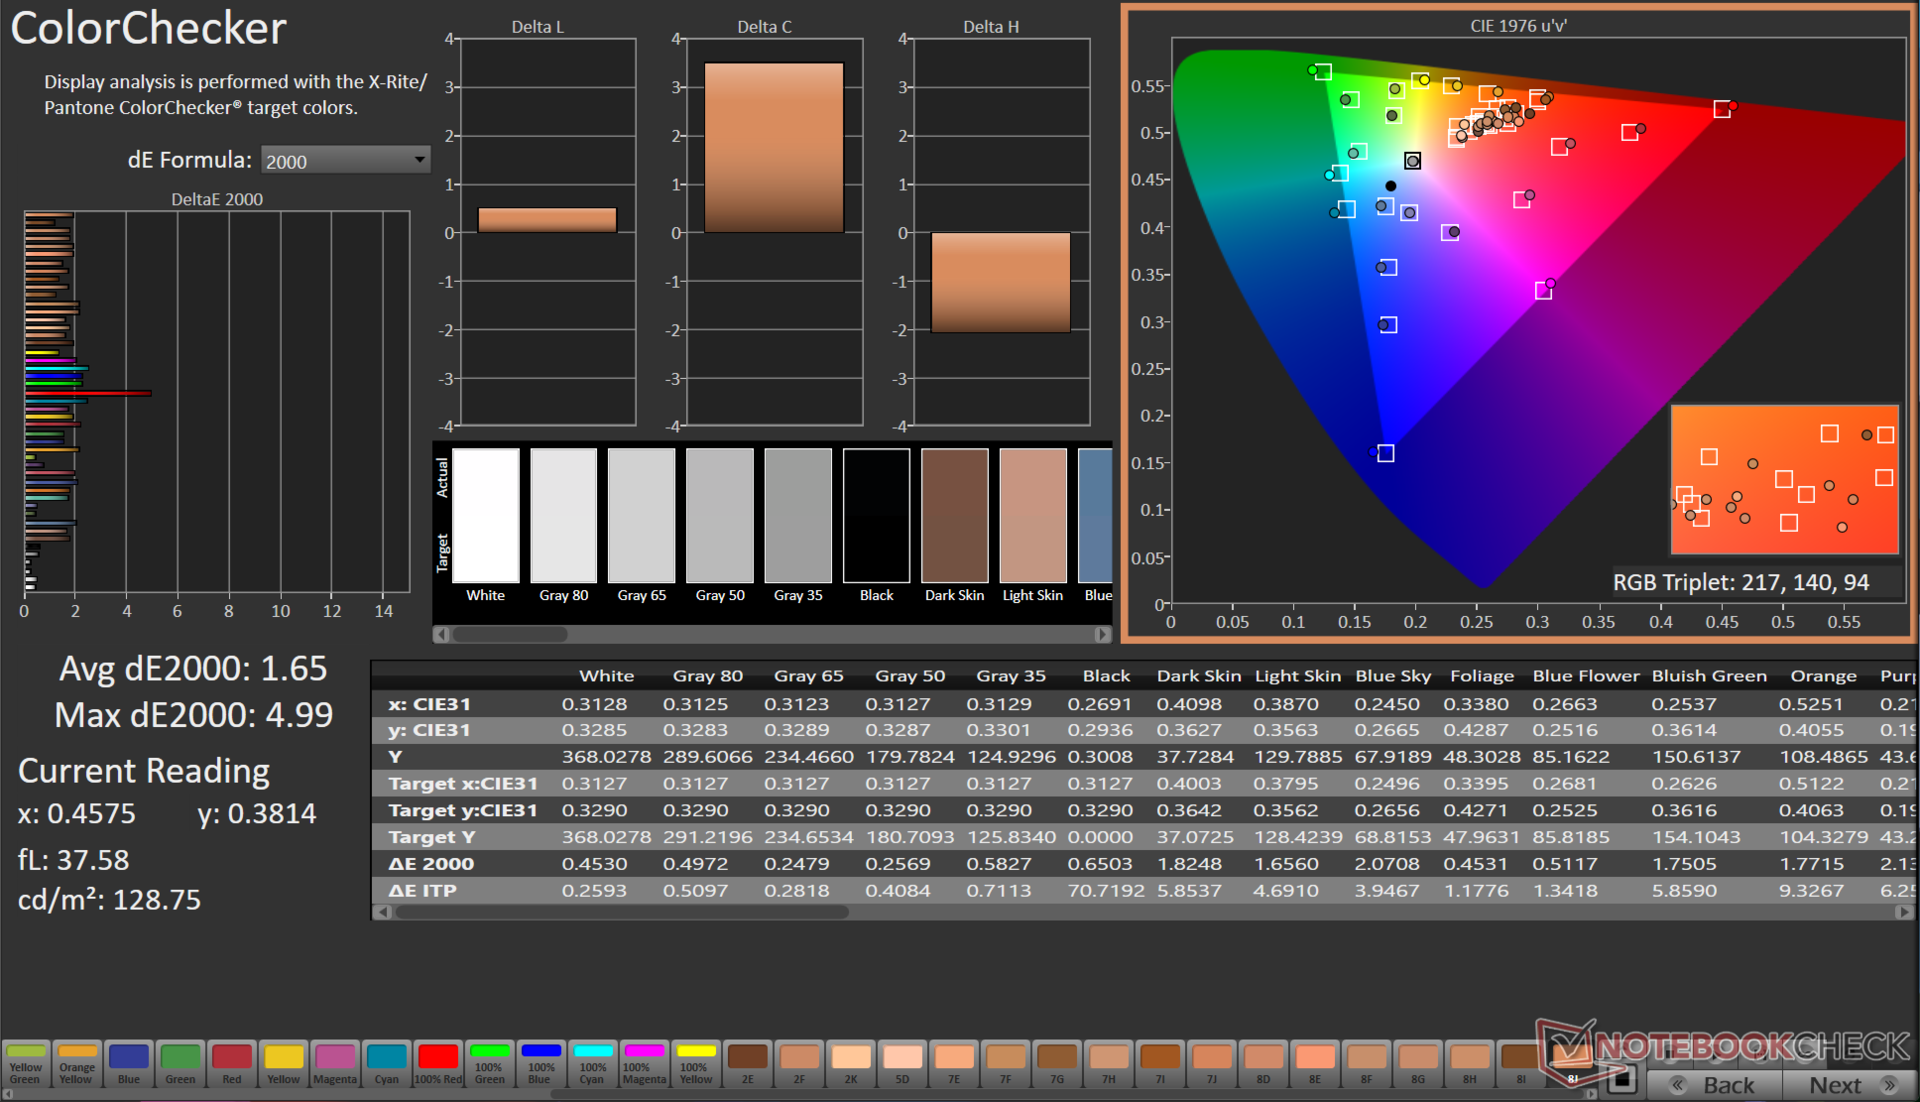
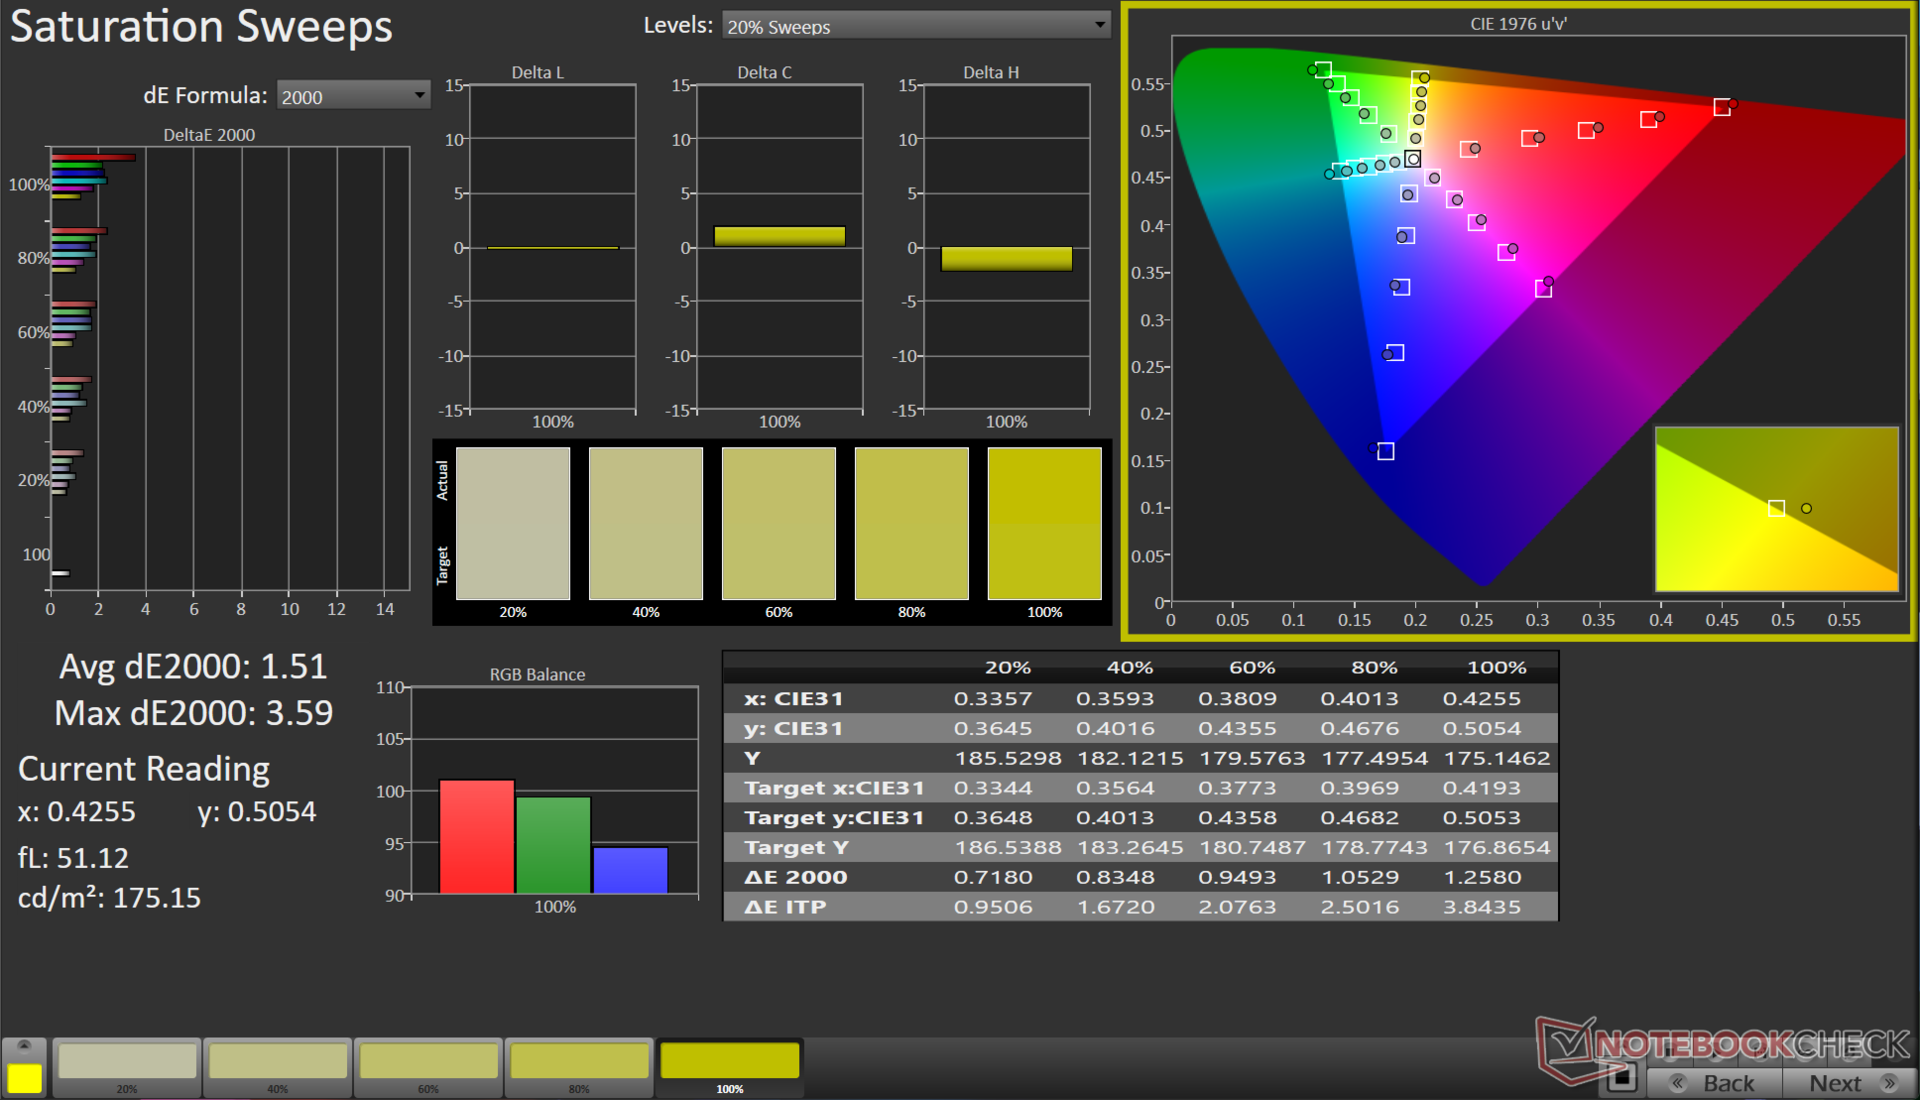
该面板覆盖了 99% 的 sRGB 色彩空间,同时还能很好地再现 Adobe RGB 和 Display P3 色彩。这使得Pavilion Plus 16 适合一般多媒体消费和基本编辑工作流程,尤其是网络内容。
使用肖像显示器公司提供的 X-Rite i1Basic Pro 3 分光光度计和 Calman Ultimate 软件,我们将灰度和 ColorChecker Delta E 2000 的平均值分别从 4.5 提高到 0.6 和 3.13 提高到 1.65。
我们的校准文件可从上面的链接下载。
Display Response Times
| ↔ Response Time Black to White | ||
|---|---|---|
| 6.7 ms ... rise ↗ and fall ↘ combined | ↗ 3.6 ms rise | 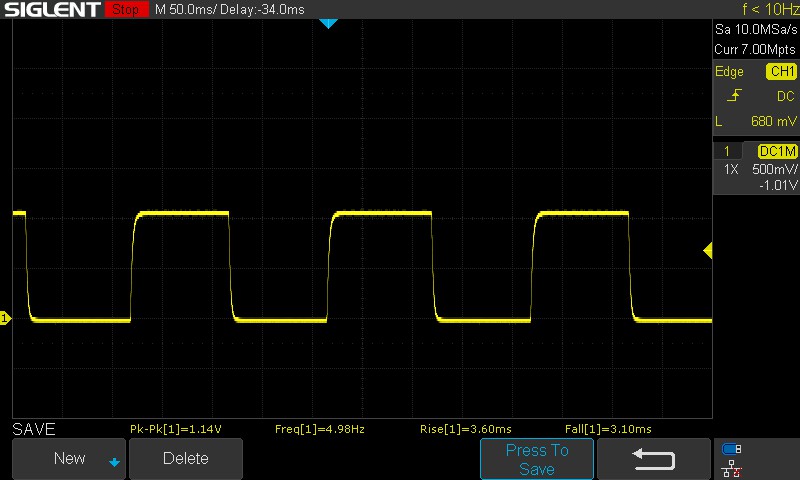 |
| ↘ 3.1 ms fall | ||
| The screen shows very fast response rates in our tests and should be very well suited for fast-paced gaming. In comparison, all tested devices range from 0.1 (minimum) to 240 (maximum) ms. » 21 % of all devices are better. This means that the measured response time is better than the average of all tested devices (19.8 ms). | ||
| ↔ Response Time 50% Grey to 80% Grey | ||
| 9.06 ms ... rise ↗ and fall ↘ combined | ↗ 4.27 ms rise | 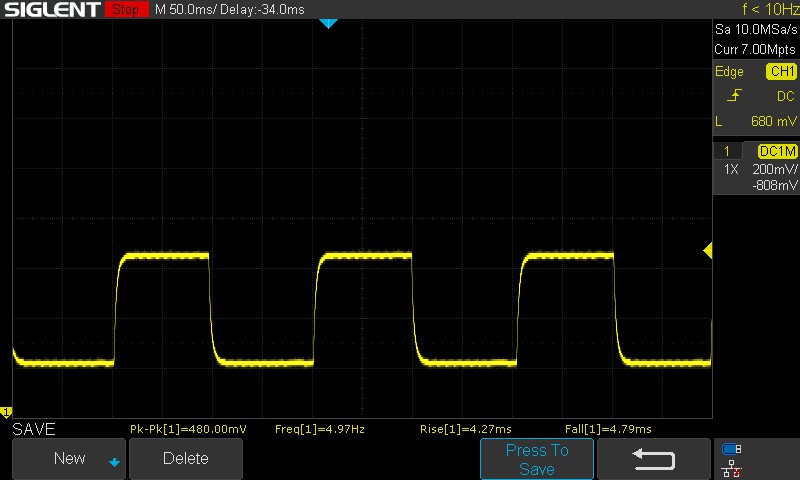 |
| ↘ 4.79 ms fall | ||
| The screen shows fast response rates in our tests and should be suited for gaming. In comparison, all tested devices range from 0.165 (minimum) to 636 (maximum) ms. » 23 % of all devices are better. This means that the measured response time is better than the average of all tested devices (31 ms). | ||
Screen Flickering / PWM (Pulse-Width Modulation)
| Screen flickering / PWM not detected | ≤ 100 % brightness setting | 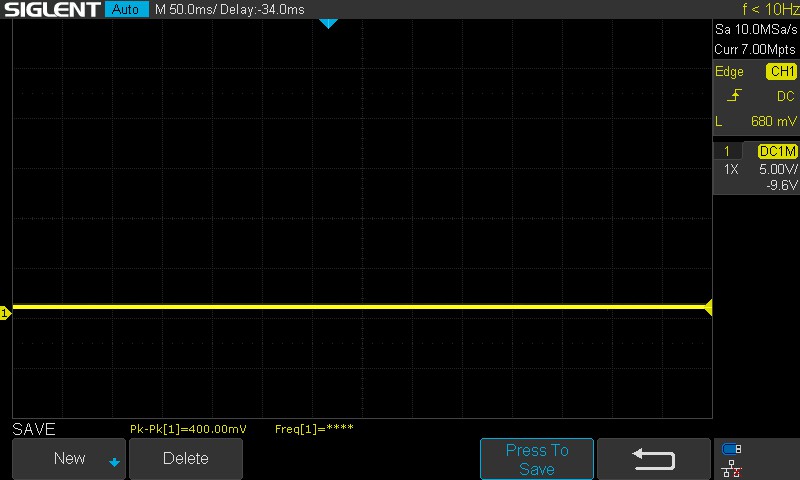 | |
In comparison: 52 % of all tested devices do not use PWM to dim the display. If PWM was detected, an average of 7757 (minimum: 5 - maximum: 343500) Hz was measured. | |||
鉴于Pavilion Plus 16 并非针对游戏人群,因此响应时间还算不错。在所有测试亮度水平下,我们都没有观察到 PWM,这是一件好事。
欲了解更多信息,请查看我们的文章"为什么 PWM 如此令人头疼"。我们的PWM 排名表 提供了评测设备的 PWM 测量概览。
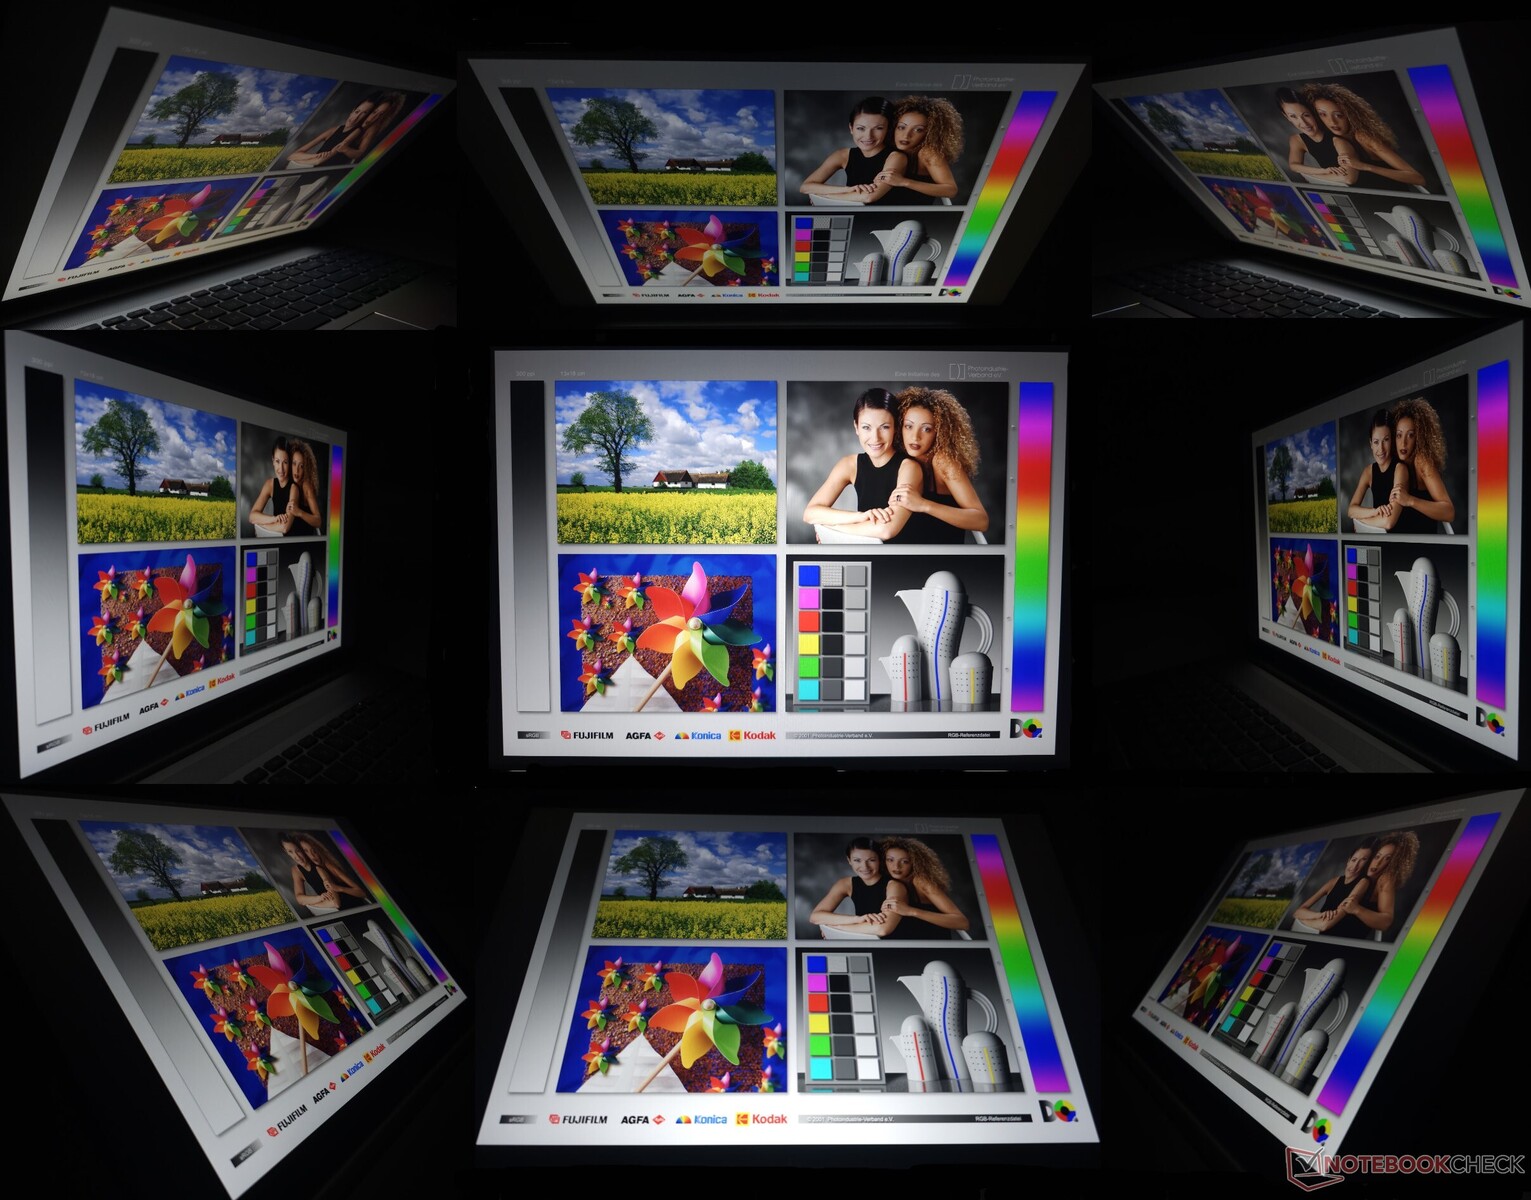
只要没有阳光直射显示屏,室外观看在最大亮度下一般都没问题。可视角度稳定,但我们观察到在极端情况下亮度和色彩信息会丢失。
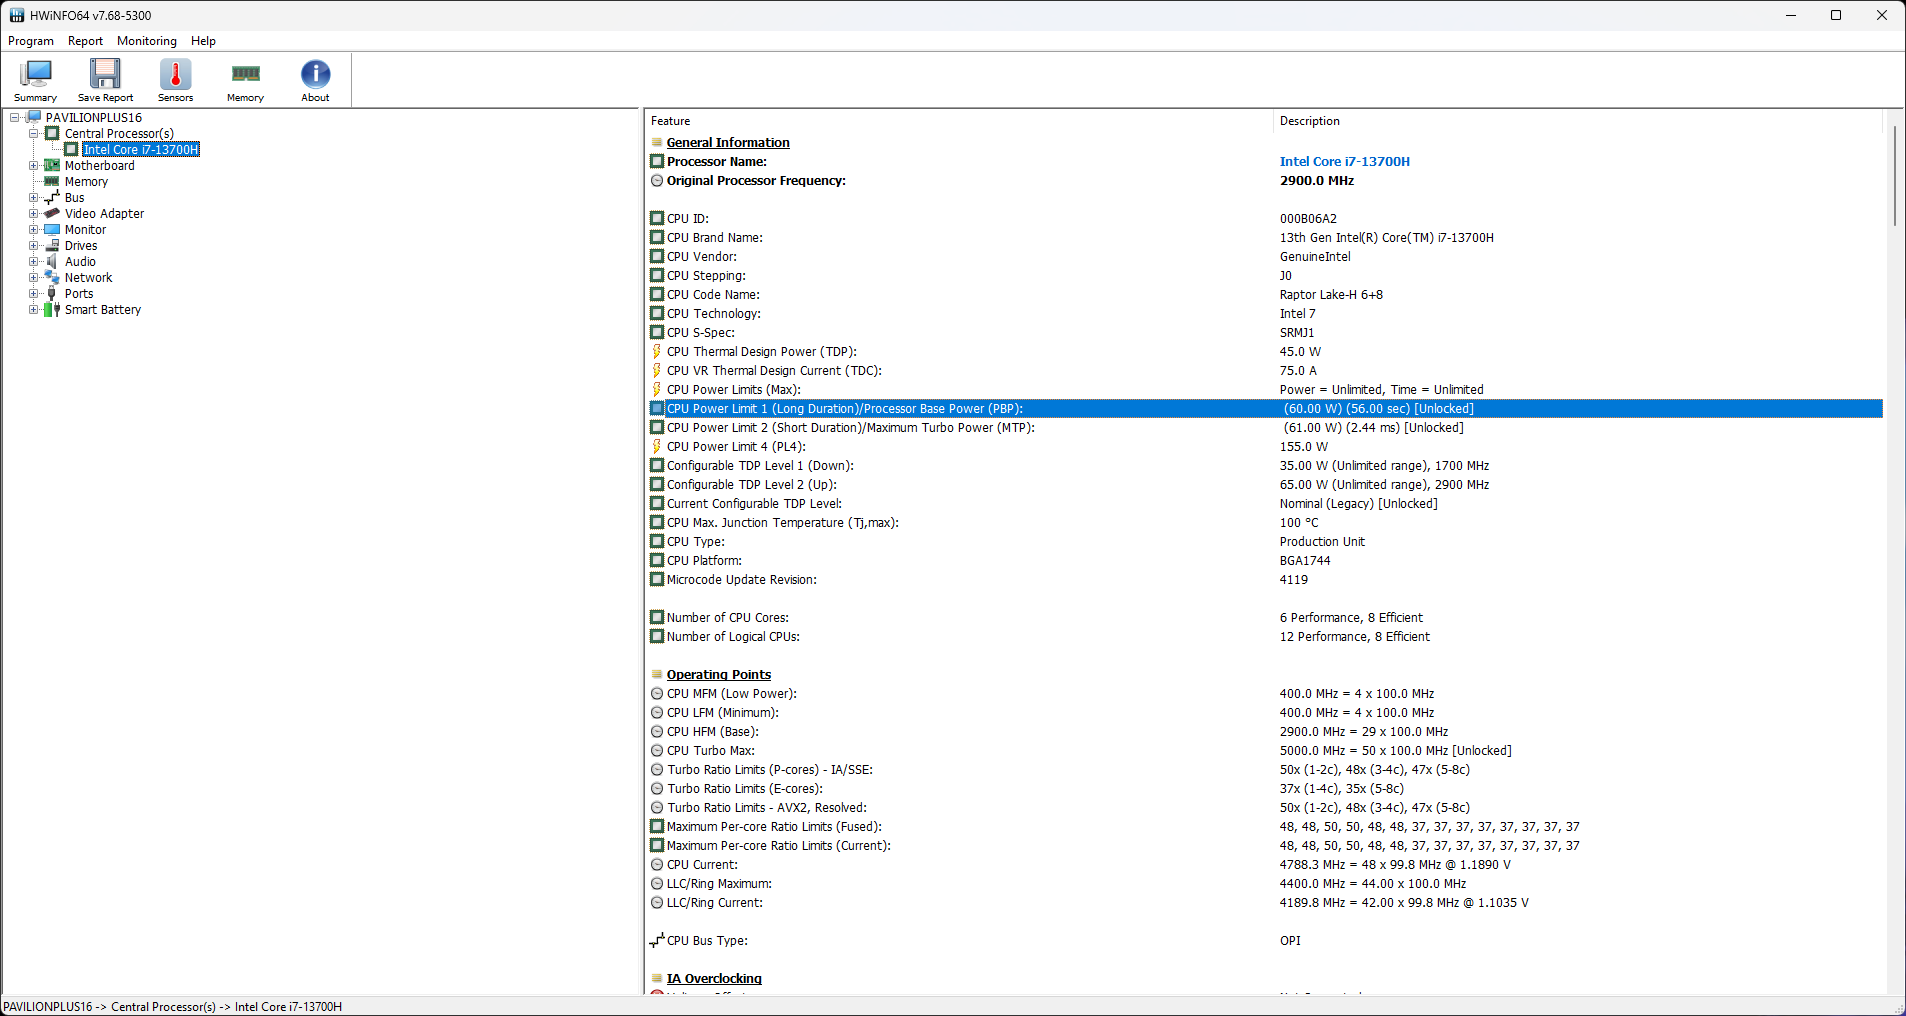
性能:酷睿 i7-13700H 受限于低 PL2
根据地区的不同,惠普提供Pavilion Plus 16 英寸 酷睿 i5-13500H和酷睿 i7-13700H 两种配置,并可选配 RTX 3050 6GB 显卡。
测试条件
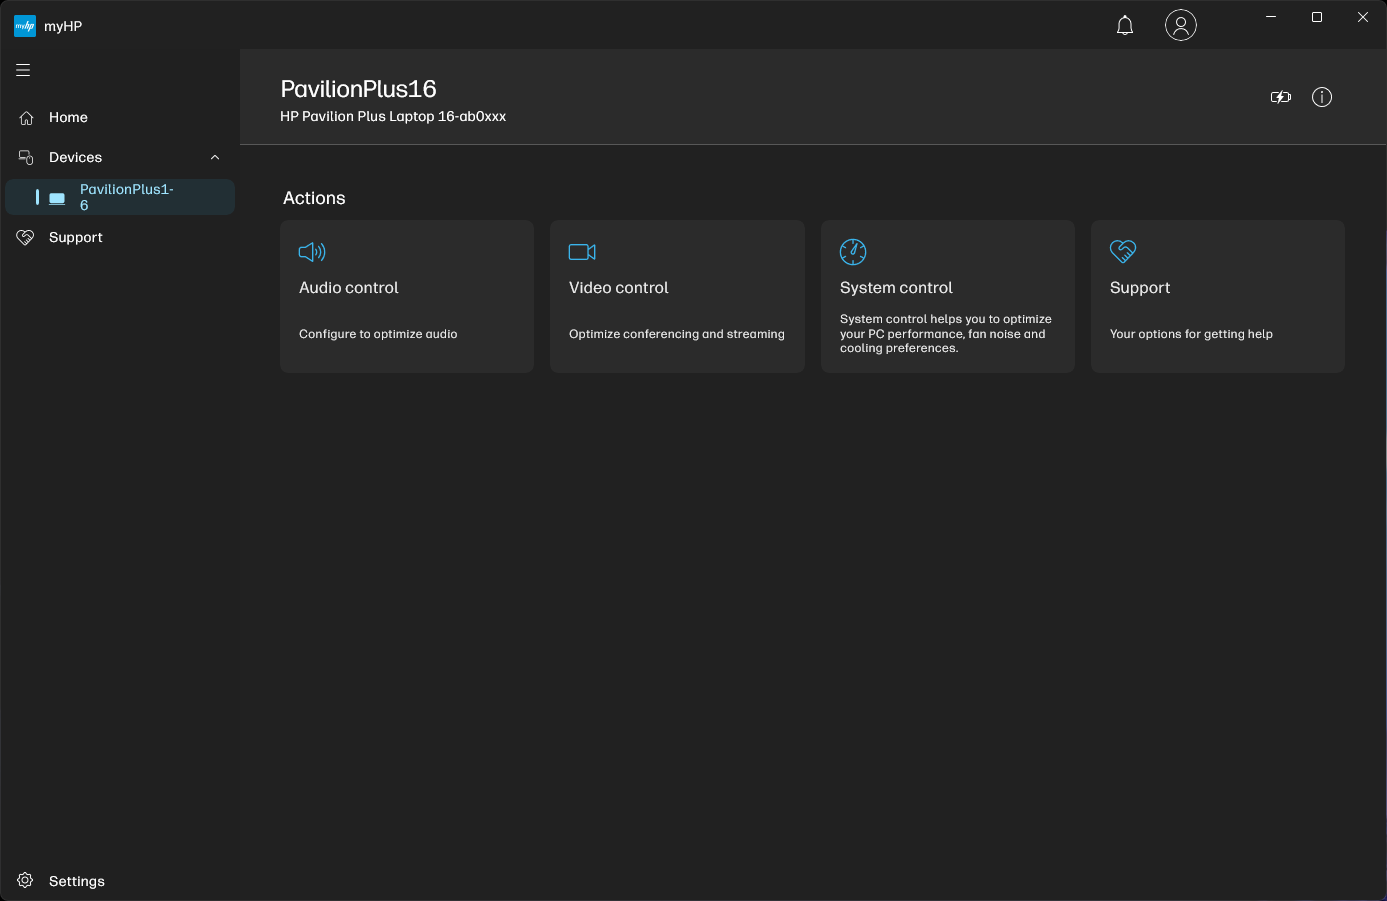
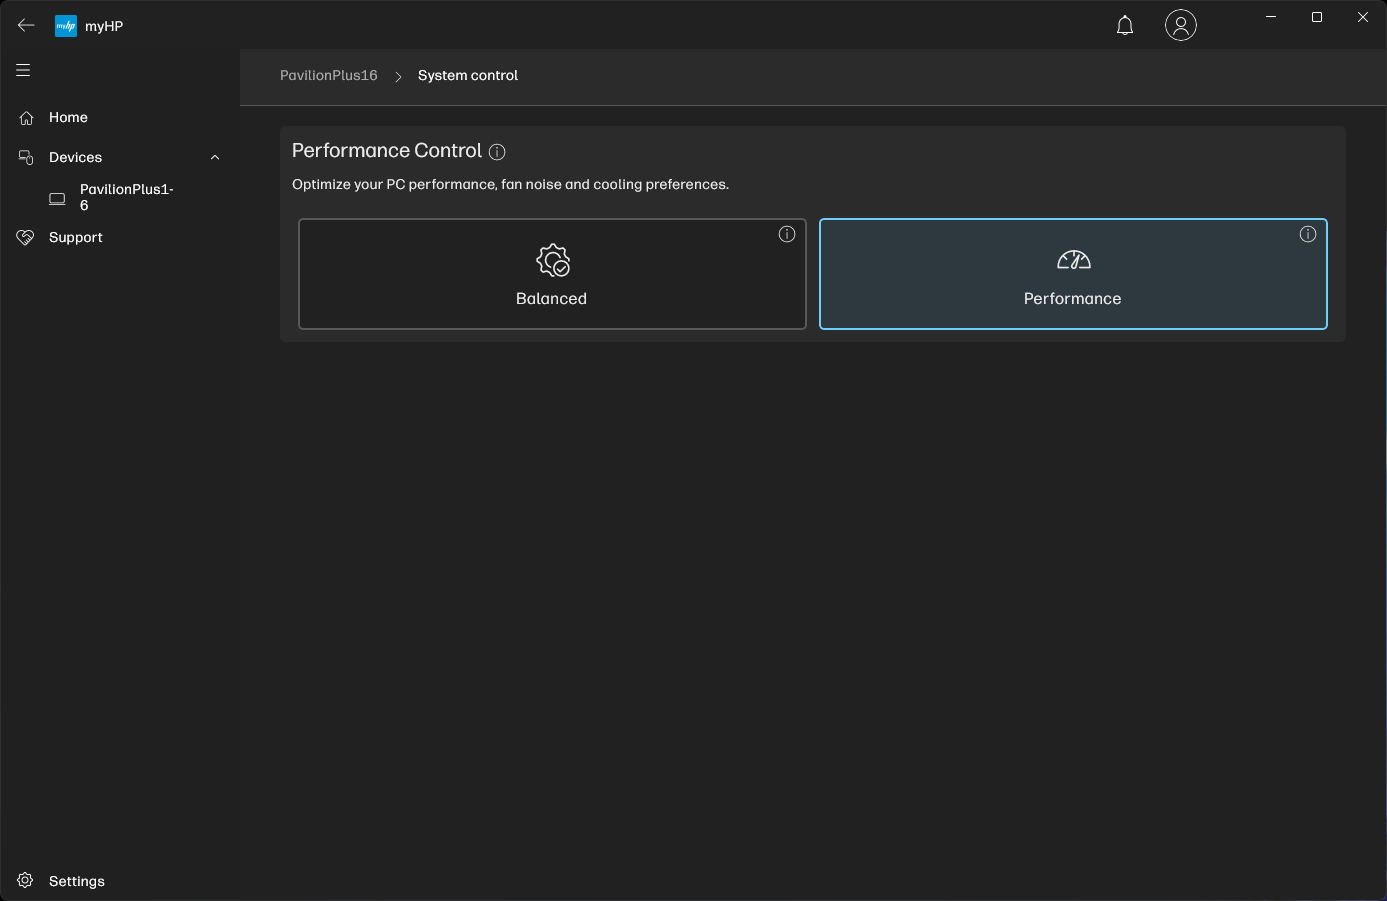
myHP 应用程序允许用户在两种运行模式之间进行选择:平衡模式和性能模式。平衡模式使用 50 W 的 PL1,在性能模式下可增至 60 W。这两种模式下的 PL2 上限均为 61 W。
RTX 3050 6GB GPU 默认运行在 MSHybrid / Optimus 模式下,无法进行 MUX 切换。
我们使用性能模式进行所有基准测试。在电池供电情况下,PL1/PL2 降至 35 W / 35 W。
处理器
Pavilion Plus 16 的酷睿 i7-13700H 受限于较低的 PL2 值。这在多核基准测试中表现得尤为明显,它明显落后于戴尔 Inspiron 16 Plus 7630 等机型。 戴尔 Inspiron 16 Plus 7630戴尔 Inspiron 16 Plus 7630 采用了 89 W PL2 的酷睿 i7-13700H。
尽管如此,在 Cinebench R15 多核循环测试中,Pavilion Plus 16 的散热似乎非常有效,确保了性能的持续性。
Pavilion Plus 16 在大多数 CPU 单核心排行榜上名列前茅,但它的单核心性能却不如申克 Vision 14 M23。 申克 Vision 14 M23在这些测试中紧随其后。
Cinebench R15 Multi Loop
Cinebench R23: Multi Core | Single Core
Cinebench R20: CPU (Multi Core) | CPU (Single Core)
Cinebench R15: CPU Multi 64Bit | CPU Single 64Bit
Blender: v2.79 BMW27 CPU
7-Zip 18.03: 7z b 4 | 7z b 4 -mmt1
Geekbench 6.7: Multi-Core | Single-Core
Geekbench 5.5: Multi-Core | Single-Core
HWBOT x265 Benchmark v2.2: 4k Preset
LibreOffice : 20 Documents To PDF
R Benchmark 2.5: Overall mean
| CPU Performance rating | |
| Average of class Multimedia | |
| Dell Inspiron 16 Plus 7630 | |
| Average Intel Core i7-13700H | |
| HP Pavilion Plus 16-ab0456tx | |
| Asus VivoBook Pro 16 K6602VU | |
| Samsung Galaxy Book3 Ultra 16 -2! | |
| Schenker Vision 14 M23 RTX 3050 | |
| Asus VivoBook 14X K3405 -2! | |
| Lenovo Slim Pro 7 14ARP8 -2! | |
| Cinebench R23 / Multi Core | |
| Average of class Multimedia (4861 - 33362, n=76, last 2 years) | |
| Dell Inspiron 16 Plus 7630 | |
| Samsung Galaxy Book3 Ultra 16 | |
| Average Intel Core i7-13700H (5890 - 20034, n=29) | |
| Asus VivoBook Pro 16 K6602VU | |
| Asus VivoBook 14X K3405 | |
| Schenker Vision 14 M23 RTX 3050 | |
| Lenovo Slim Pro 7 14ARP8 | |
| HP Pavilion Plus 16-ab0456tx | |
| Cinebench R23 / Single Core | |
| Average of class Multimedia (1128 - 2459, n=68, last 2 years) | |
| HP Pavilion Plus 16-ab0456tx | |
| Schenker Vision 14 M23 RTX 3050 | |
| Dell Inspiron 16 Plus 7630 | |
| Average Intel Core i7-13700H (1323 - 1914, n=29) | |
| Asus VivoBook Pro 16 K6602VU | |
| Asus VivoBook 14X K3405 | |
| Samsung Galaxy Book3 Ultra 16 | |
| Lenovo Slim Pro 7 14ARP8 | |
| Cinebench R20 / CPU (Multi Core) | |
| Average of class Multimedia (1887 - 12912, n=59, last 2 years) | |
| Dell Inspiron 16 Plus 7630 | |
| Samsung Galaxy Book3 Ultra 16 | |
| Average Intel Core i7-13700H (2322 - 7674, n=29) | |
| HP Pavilion Plus 16-ab0456tx | |
| Asus VivoBook Pro 16 K6602VU | |
| Asus VivoBook 14X K3405 | |
| Schenker Vision 14 M23 RTX 3050 | |
| Lenovo Slim Pro 7 14ARP8 | |
| Cinebench R20 / CPU (Single Core) | |
| HP Pavilion Plus 16-ab0456tx | |
| Schenker Vision 14 M23 RTX 3050 | |
| Average of class Multimedia (425 - 853, n=59, last 2 years) | |
| Dell Inspiron 16 Plus 7630 | |
| Average Intel Core i7-13700H (508 - 741, n=29) | |
| Asus VivoBook Pro 16 K6602VU | |
| Asus VivoBook 14X K3405 | |
| Samsung Galaxy Book3 Ultra 16 | |
| Lenovo Slim Pro 7 14ARP8 | |
| Cinebench R15 / CPU Multi 64Bit | |
| Average of class Multimedia (856 - 5224, n=63, last 2 years) | |
| Samsung Galaxy Book3 Ultra 16 | |
| Asus VivoBook Pro 16 K6602VU | |
| Dell Inspiron 16 Plus 7630 | |
| Average Intel Core i7-13700H (905 - 2982, n=29) | |
| Asus VivoBook 14X K3405 | |
| HP Pavilion Plus 16-ab0456tx | |
| Lenovo Slim Pro 7 14ARP8 | |
| Schenker Vision 14 M23 RTX 3050 | |
| Cinebench R15 / CPU Single 64Bit | |
| Average of class Multimedia (184.8 - 326, n=61, last 2 years) | |
| HP Pavilion Plus 16-ab0456tx | |
| Schenker Vision 14 M23 RTX 3050 | |
| Dell Inspiron 16 Plus 7630 | |
| Average Intel Core i7-13700H (213 - 278, n=29) | |
| Asus VivoBook Pro 16 K6602VU | |
| Asus VivoBook 14X K3405 | |
| Samsung Galaxy Book3 Ultra 16 | |
| Lenovo Slim Pro 7 14ARP8 | |
| Blender / v2.79 BMW27 CPU | |
| Schenker Vision 14 M23 RTX 3050 | |
| Average of class Multimedia (100 - 557, n=60, last 2 years) | |
| Lenovo Slim Pro 7 14ARP8 | |
| Asus VivoBook 14X K3405 | |
| Average Intel Core i7-13700H (169 - 555, n=29) | |
| Samsung Galaxy Book3 Ultra 16 | |
| Dell Inspiron 16 Plus 7630 | |
| HP Pavilion Plus 16-ab0456tx | |
| Asus VivoBook Pro 16 K6602VU | |
| 7-Zip 18.03 / 7z b 4 | |
| Asus VivoBook Pro 16 K6602VU | |
| HP Pavilion Plus 16-ab0456tx | |
| Samsung Galaxy Book3 Ultra 16 | |
| Average Intel Core i7-13700H (27322 - 76344, n=29) | |
| Dell Inspiron 16 Plus 7630 | |
| Average of class Multimedia (26062 - 130368, n=57, last 2 years) | |
| Lenovo Slim Pro 7 14ARP8 | |
| Schenker Vision 14 M23 RTX 3050 | |
| Asus VivoBook 14X K3405 | |
| 7-Zip 18.03 / 7z b 4 -mmt1 | |
| Schenker Vision 14 M23 RTX 3050 | |
| HP Pavilion Plus 16-ab0456tx | |
| Average of class Multimedia (3666 - 7545, n=58, last 2 years) | |
| Average Intel Core i7-13700H (4825 - 6238, n=29) | |
| Asus VivoBook Pro 16 K6602VU | |
| Dell Inspiron 16 Plus 7630 | |
| Asus VivoBook 14X K3405 | |
| Samsung Galaxy Book3 Ultra 16 | |
| Lenovo Slim Pro 7 14ARP8 | |
| Geekbench 6.7 / Multi-Core | |
| Average of class Multimedia (4983 - 29415, n=71, last 2 years) | |
| Dell Inspiron 16 Plus 7630 | |
| HP Pavilion Plus 16-ab0456tx | |
| Schenker Vision 14 M23 RTX 3050 | |
| Average Intel Core i7-13700H (8415 - 13832, n=13) | |
| Asus VivoBook Pro 16 K6602VU | |
| Geekbench 6.7 / Single-Core | |
| Average of class Multimedia (1534 - 4335, n=70, last 2 years) | |
| Schenker Vision 14 M23 RTX 3050 | |
| Dell Inspiron 16 Plus 7630 | |
| HP Pavilion Plus 16-ab0456tx | |
| Average Intel Core i7-13700H (2316 - 2639, n=13) | |
| Asus VivoBook Pro 16 K6602VU | |
| Geekbench 5.5 / Multi-Core | |
| Average of class Multimedia (4652 - 20422, n=58, last 2 years) | |
| Dell Inspiron 16 Plus 7630 | |
| Average Intel Core i7-13700H (6165 - 14215, n=29) | |
| Samsung Galaxy Book3 Ultra 16 | |
| HP Pavilion Plus 16-ab0456tx | |
| Schenker Vision 14 M23 RTX 3050 | |
| Asus VivoBook Pro 16 K6602VU | |
| Asus VivoBook 14X K3405 | |
| Lenovo Slim Pro 7 14ARP8 | |
| Geekbench 5.5 / Single-Core | |
| Average of class Multimedia (805 - 2974, n=58, last 2 years) | |
| Dell Inspiron 16 Plus 7630 | |
| Schenker Vision 14 M23 RTX 3050 | |
| HP Pavilion Plus 16-ab0456tx | |
| Average Intel Core i7-13700H (1362 - 1919, n=29) | |
| Asus VivoBook Pro 16 K6602VU | |
| Samsung Galaxy Book3 Ultra 16 | |
| Asus VivoBook 14X K3405 | |
| Lenovo Slim Pro 7 14ARP8 | |
| HWBOT x265 Benchmark v2.2 / 4k Preset | |
| Average of class Multimedia (5.26 - 36.1, n=58, last 2 years) | |
| Samsung Galaxy Book3 Ultra 16 | |
| Asus VivoBook Pro 16 K6602VU | |
| Average Intel Core i7-13700H (6.72 - 21.2, n=29) | |
| HP Pavilion Plus 16-ab0456tx | |
| Lenovo Slim Pro 7 14ARP8 | |
| Dell Inspiron 16 Plus 7630 | |
| Asus VivoBook 14X K3405 | |
| Schenker Vision 14 M23 RTX 3050 | |
| LibreOffice / 20 Documents To PDF | |
| HP Pavilion Plus 16-ab0456tx | |
| Lenovo Slim Pro 7 14ARP8 | |
| Schenker Vision 14 M23 RTX 3050 | |
| Asus VivoBook Pro 16 K6602VU | |
| Average of class Multimedia (23.9 - 146.7, n=59, last 2 years) | |
| Samsung Galaxy Book3 Ultra 16 | |
| Average Intel Core i7-13700H (31.3 - 62.4, n=29) | |
| Asus VivoBook 14X K3405 | |
| Dell Inspiron 16 Plus 7630 | |
| R Benchmark 2.5 / Overall mean | |
| Lenovo Slim Pro 7 14ARP8 | |
| Asus VivoBook 14X K3405 | |
| Samsung Galaxy Book3 Ultra 16 | |
| Asus VivoBook Pro 16 K6602VU | |
| Average Intel Core i7-13700H (0.4308 - 0.607, n=29) | |
| Average of class Multimedia (0.3604 - 0.947, n=58, last 2 years) | |
| Schenker Vision 14 M23 RTX 3050 | |
| HP Pavilion Plus 16-ab0456tx | |
| Dell Inspiron 16 Plus 7630 | |
* ... smaller is better
AIDA64: FP32 Ray-Trace | FPU Julia | CPU SHA3 | CPU Queen | FPU SinJulia | FPU Mandel | CPU AES | CPU ZLib | FP64 Ray-Trace | CPU PhotoWorxx
| Performance rating | |
| Average of class Multimedia | |
| Asus VivoBook Pro 16 K6602VU | |
| Lenovo Slim Pro 7 14ARP8 | |
| HP Pavilion Plus 16-ab0456tx | |
| Samsung Galaxy Book3 Ultra 16 | |
| Average Intel Core i7-13700H | |
| Dell Inspiron 16 Plus 7630 | |
| Asus VivoBook 14X K3405 | |
| Schenker Vision 14 M23 RTX 3050 | |
| AIDA64 / FP32 Ray-Trace | |
| Average of class Multimedia (2214 - 50388, n=55, last 2 years) | |
| Lenovo Slim Pro 7 14ARP8 | |
| HP Pavilion Plus 16-ab0456tx | |
| Samsung Galaxy Book3 Ultra 16 | |
| Average Intel Core i7-13700H (4986 - 18908, n=29) | |
| Dell Inspiron 16 Plus 7630 | |
| Asus VivoBook Pro 16 K6602VU | |
| Asus VivoBook 14X K3405 | |
| Schenker Vision 14 M23 RTX 3050 | |
| AIDA64 / FPU Julia | |
| Lenovo Slim Pro 7 14ARP8 | |
| Average of class Multimedia (12867 - 201874, n=56, last 2 years) | |
| HP Pavilion Plus 16-ab0456tx | |
| Asus VivoBook Pro 16 K6602VU | |
| Average Intel Core i7-13700H (25360 - 92359, n=29) | |
| Samsung Galaxy Book3 Ultra 16 | |
| Dell Inspiron 16 Plus 7630 | |
| Asus VivoBook 14X K3405 | |
| Schenker Vision 14 M23 RTX 3050 | |
| AIDA64 / CPU SHA3 | |
| Average of class Multimedia (626 - 8623, n=56, last 2 years) | |
| Asus VivoBook 14X K3405 | |
| HP Pavilion Plus 16-ab0456tx | |
| Asus VivoBook Pro 16 K6602VU | |
| Samsung Galaxy Book3 Ultra 16 | |
| Average Intel Core i7-13700H (1339 - 4224, n=29) | |
| Lenovo Slim Pro 7 14ARP8 | |
| Dell Inspiron 16 Plus 7630 | |
| Schenker Vision 14 M23 RTX 3050 | |
| AIDA64 / CPU Queen | |
| Dell Inspiron 16 Plus 7630 | |
| Samsung Galaxy Book3 Ultra 16 | |
| HP Pavilion Plus 16-ab0456tx | |
| Average Intel Core i7-13700H (59324 - 107159, n=29) | |
| Asus VivoBook Pro 16 K6602VU | |
| Lenovo Slim Pro 7 14ARP8 | |
| Schenker Vision 14 M23 RTX 3050 | |
| Asus VivoBook 14X K3405 | |
| Average of class Multimedia (13483 - 181505, n=43, last 2 years) | |
| AIDA64 / FPU SinJulia | |
| Lenovo Slim Pro 7 14ARP8 | |
| HP Pavilion Plus 16-ab0456tx | |
| Samsung Galaxy Book3 Ultra 16 | |
| Average of class Multimedia (886 - 28794, n=56, last 2 years) | |
| Dell Inspiron 16 Plus 7630 | |
| Asus VivoBook Pro 16 K6602VU | |
| Average Intel Core i7-13700H (4800 - 11050, n=29) | |
| Schenker Vision 14 M23 RTX 3050 | |
| Asus VivoBook 14X K3405 | |
| AIDA64 / FPU Mandel | |
| Lenovo Slim Pro 7 14ARP8 | |
| Average of class Multimedia (6395 - 105740, n=55, last 2 years) | |
| HP Pavilion Plus 16-ab0456tx | |
| Samsung Galaxy Book3 Ultra 16 | |
| Average Intel Core i7-13700H (12321 - 45118, n=29) | |
| Asus VivoBook Pro 16 K6602VU | |
| Dell Inspiron 16 Plus 7630 | |
| Asus VivoBook 14X K3405 | |
| Schenker Vision 14 M23 RTX 3050 | |
| AIDA64 / CPU AES | |
| Asus VivoBook Pro 16 K6602VU | |
| Asus VivoBook 14X K3405 | |
| Average Intel Core i7-13700H (28769 - 151254, n=29) | |
| HP Pavilion Plus 16-ab0456tx | |
| Samsung Galaxy Book3 Ultra 16 | |
| Average of class Multimedia (8171 - 126790, n=56, last 2 years) | |
| Dell Inspiron 16 Plus 7630 | |
| Schenker Vision 14 M23 RTX 3050 | |
| Lenovo Slim Pro 7 14ARP8 | |
| AIDA64 / CPU ZLib | |
| Samsung Galaxy Book3 Ultra 16 | |
| Average of class Multimedia (143.8 - 2022, n=56, last 2 years) | |
| HP Pavilion Plus 16-ab0456tx | |
| Asus VivoBook Pro 16 K6602VU | |
| Average Intel Core i7-13700H (389 - 1215, n=29) | |
| Asus VivoBook 14X K3405 | |
| Dell Inspiron 16 Plus 7630 | |
| Schenker Vision 14 M23 RTX 3050 | |
| Lenovo Slim Pro 7 14ARP8 | |
| AIDA64 / FP64 Ray-Trace | |
| Average of class Multimedia (1014 - 26875, n=56, last 2 years) | |
| HP Pavilion Plus 16-ab0456tx | |
| Lenovo Slim Pro 7 14ARP8 | |
| Samsung Galaxy Book3 Ultra 16 | |
| Asus VivoBook Pro 16 K6602VU | |
| Average Intel Core i7-13700H (2540 - 10135, n=29) | |
| Dell Inspiron 16 Plus 7630 | |
| Asus VivoBook 14X K3405 | |
| Schenker Vision 14 M23 RTX 3050 | |
| AIDA64 / CPU PhotoWorxx | |
| Average of class Multimedia (8187 - 88154, n=56, last 2 years) | |
| Samsung Galaxy Book3 Ultra 16 | |
| Schenker Vision 14 M23 RTX 3050 | |
| HP Pavilion Plus 16-ab0456tx | |
| Average Intel Core i7-13700H (12872 - 52727, n=29) | |
| Asus VivoBook Pro 16 K6602VU | |
| Dell Inspiron 16 Plus 7630 | |
| Lenovo Slim Pro 7 14ARP8 | |
| Asus VivoBook 14X K3405 | |
查看我们的专用 英特尔酷睿 i7-13700H页面,了解更多性能比较。
系统性能
Pavilion Plus 16 在某种程度上超越了 VivoBook Pro 16,配备了 酷睿 i9-13900H和 RTX 4050组合的 VivoBook Pro 16,但在 PCMark 10 中输给后者 6%。
除此之外,该系统在执行日常工作和网页浏览任务时反应相当灵敏。
CrossMark: Overall | Productivity | Creativity | Responsiveness
AIDA64: Memory Copy | Memory Read | Memory Write | Memory Latency
WebXPRT 3: Overall
WebXPRT 4: Overall
Mozilla Kraken 1.1: Total
| PCMark 10 / Score | |
| Average of class Multimedia (4325 - 10386, n=54, last 2 years) | |
| Dell Inspiron 16 Plus 7630 | |
| Asus VivoBook Pro 16 K6602VU | |
| Samsung Galaxy Book3 Ultra 16 | |
| Asus VivoBook 14X K3405 | |
| HP Pavilion Plus 16-ab0456tx | |
| Average Intel Core i7-13700H, NVIDIA GeForce RTX 3050 6GB Laptop GPU (6290 - 6597, n=2) | |
| Lenovo Slim Pro 7 14ARP8 | |
| Schenker Vision 14 M23 RTX 3050 | |
| PCMark 10 / Essentials | |
| Dell Inspiron 16 Plus 7630 | |
| Samsung Galaxy Book3 Ultra 16 | |
| Average of class Multimedia (8025 - 11664, n=53, last 2 years) | |
| Asus VivoBook Pro 16 K6602VU | |
| Asus VivoBook 14X K3405 | |
| HP Pavilion Plus 16-ab0456tx | |
| Average Intel Core i7-13700H, NVIDIA GeForce RTX 3050 6GB Laptop GPU (9943 - 10112, n=2) | |
| Lenovo Slim Pro 7 14ARP8 | |
| Schenker Vision 14 M23 RTX 3050 | |
| PCMark 10 / Productivity | |
| Average of class Multimedia (7323 - 18233, n=53, last 2 years) | |
| Dell Inspiron 16 Plus 7630 | |
| Asus VivoBook 14X K3405 | |
| Schenker Vision 14 M23 RTX 3050 | |
| Average Intel Core i7-13700H, NVIDIA GeForce RTX 3050 6GB Laptop GPU (8803 - 8950, n=2) | |
| HP Pavilion Plus 16-ab0456tx | |
| Asus VivoBook Pro 16 K6602VU | |
| Samsung Galaxy Book3 Ultra 16 | |
| Lenovo Slim Pro 7 14ARP8 | |
| PCMark 10 / Digital Content Creation | |
| Dell Inspiron 16 Plus 7630 | |
| Asus VivoBook Pro 16 K6602VU | |
| Average of class Multimedia (3651 - 16240, n=53, last 2 years) | |
| Samsung Galaxy Book3 Ultra 16 | |
| Lenovo Slim Pro 7 14ARP8 | |
| HP Pavilion Plus 16-ab0456tx | |
| Asus VivoBook 14X K3405 | |
| Average Intel Core i7-13700H, NVIDIA GeForce RTX 3050 6GB Laptop GPU (7590 - 8752, n=2) | |
| Schenker Vision 14 M23 RTX 3050 | |
| CrossMark / Overall | |
| Average of class Multimedia (866 - 2728, n=62, last 2 years) | |
| Dell Inspiron 16 Plus 7630 | |
| HP Pavilion Plus 16-ab0456tx | |
| Asus VivoBook Pro 16 K6602VU | |
| Asus VivoBook 14X K3405 | |
| Average Intel Core i7-13700H, NVIDIA GeForce RTX 3050 6GB Laptop GPU (1504 - 1752, n=2) | |
| Samsung Galaxy Book3 Ultra 16 | |
| Schenker Vision 14 M23 RTX 3050 | |
| Lenovo Slim Pro 7 14ARP8 | |
| CrossMark / Productivity | |
| Average of class Multimedia (931 - 2489, n=62, last 2 years) | |
| Dell Inspiron 16 Plus 7630 | |
| Asus VivoBook Pro 16 K6602VU | |
| HP Pavilion Plus 16-ab0456tx | |
| Asus VivoBook 14X K3405 | |
| Average Intel Core i7-13700H, NVIDIA GeForce RTX 3050 6GB Laptop GPU (1417 - 1657, n=2) | |
| Samsung Galaxy Book3 Ultra 16 | |
| Schenker Vision 14 M23 RTX 3050 | |
| Lenovo Slim Pro 7 14ARP8 | |
| CrossMark / Creativity | |
| Average of class Multimedia (907 - 3465, n=62, last 2 years) | |
| Dell Inspiron 16 Plus 7630 | |
| HP Pavilion Plus 16-ab0456tx | |
| Asus VivoBook Pro 16 K6602VU | |
| Average Intel Core i7-13700H, NVIDIA GeForce RTX 3050 6GB Laptop GPU (1711 - 1970, n=2) | |
| Schenker Vision 14 M23 RTX 3050 | |
| Asus VivoBook 14X K3405 | |
| Samsung Galaxy Book3 Ultra 16 | |
| Lenovo Slim Pro 7 14ARP8 | |
| CrossMark / Responsiveness | |
| Dell Inspiron 16 Plus 7630 | |
| Average of class Multimedia (605 - 2024, n=62, last 2 years) | |
| Asus VivoBook Pro 16 K6602VU | |
| Samsung Galaxy Book3 Ultra 16 | |
| Asus VivoBook 14X K3405 | |
| HP Pavilion Plus 16-ab0456tx | |
| Average Intel Core i7-13700H, NVIDIA GeForce RTX 3050 6GB Laptop GPU (1220 - 1458, n=2) | |
| Schenker Vision 14 M23 RTX 3050 | |
| Lenovo Slim Pro 7 14ARP8 | |
| AIDA64 / Memory Copy | |
| Average of class Multimedia (11299 - 132135, n=56, last 2 years) | |
| Samsung Galaxy Book3 Ultra 16 | |
| Schenker Vision 14 M23 RTX 3050 | |
| Average Intel Core i7-13700H, NVIDIA GeForce RTX 3050 6GB Laptop GPU (64356 - 65837, n=2) | |
| HP Pavilion Plus 16-ab0456tx | |
| Dell Inspiron 16 Plus 7630 | |
| Asus VivoBook Pro 16 K6602VU | |
| Lenovo Slim Pro 7 14ARP8 | |
| Asus VivoBook 14X K3405 | |
| AIDA64 / Memory Read | |
| Average of class Multimedia (11624 - 174586, n=56, last 2 years) | |
| Schenker Vision 14 M23 RTX 3050 | |
| Samsung Galaxy Book3 Ultra 16 | |
| Average Intel Core i7-13700H, NVIDIA GeForce RTX 3050 6GB Laptop GPU (65825 - 70861, n=2) | |
| Dell Inspiron 16 Plus 7630 | |
| Asus VivoBook Pro 16 K6602VU | |
| HP Pavilion Plus 16-ab0456tx | |
| Lenovo Slim Pro 7 14ARP8 | |
| Asus VivoBook 14X K3405 | |
| AIDA64 / Memory Write | |
| Samsung Galaxy Book3 Ultra 16 | |
| Average of class Multimedia (11755 - 134998, n=56, last 2 years) | |
| HP Pavilion Plus 16-ab0456tx | |
| Average Intel Core i7-13700H, NVIDIA GeForce RTX 3050 6GB Laptop GPU (68174 - 76930, n=2) | |
| Schenker Vision 14 M23 RTX 3050 | |
| Asus VivoBook Pro 16 K6602VU | |
| Dell Inspiron 16 Plus 7630 | |
| Lenovo Slim Pro 7 14ARP8 | |
| Asus VivoBook 14X K3405 | |
| AIDA64 / Memory Latency | |
| Average of class Multimedia (7 - 535, n=55, last 2 years) | |
| Lenovo Slim Pro 7 14ARP8 | |
| Samsung Galaxy Book3 Ultra 16 | |
| Dell Inspiron 16 Plus 7630 | |
| Asus VivoBook Pro 16 K6602VU | |
| HP Pavilion Plus 16-ab0456tx | |
| Asus VivoBook 14X K3405 | |
| Average Intel Core i7-13700H, NVIDIA GeForce RTX 3050 6GB Laptop GPU (85.7 - 89.7, n=2) | |
| Schenker Vision 14 M23 RTX 3050 | |
| WebXPRT 3 / Overall | |
| Average of class Multimedia (136.4 - 596, n=65, last 2 years) | |
| Dell Inspiron 16 Plus 7630 | |
| Schenker Vision 14 M23 RTX 3050 | |
| Average Intel Core i7-13700H, NVIDIA GeForce RTX 3050 6GB Laptop GPU (286 - 300, n=2) | |
| HP Pavilion Plus 16-ab0456tx | |
| Asus VivoBook 14X K3405 | |
| Lenovo Slim Pro 7 14ARP8 | |
| Samsung Galaxy Book3 Ultra 16 | |
| WebXPRT 4 / Overall | |
| Schenker Vision 14 M23 RTX 3050 | |
| Average Intel Core i7-13700H, NVIDIA GeForce RTX 3050 6GB Laptop GPU (273 - 325, n=2) | |
| Average of class Multimedia (167.3 - 402, n=67, last 2 years) | |
| Dell Inspiron 16 Plus 7630 | |
| HP Pavilion Plus 16-ab0456tx | |
| Asus VivoBook 14X K3405 | |
| Asus VivoBook Pro 16 K6602VU | |
| Samsung Galaxy Book3 Ultra 16 | |
| Lenovo Slim Pro 7 14ARP8 | |
| Mozilla Kraken 1.1 / Total | |
| Lenovo Slim Pro 7 14ARP8 | |
| Samsung Galaxy Book3 Ultra 16 | |
| Asus VivoBook 14X K3405 | |
| Asus VivoBook Pro 16 K6602VU | |
| Dell Inspiron 16 Plus 7630 | |
| Schenker Vision 14 M23 RTX 3050 | |
| Average Intel Core i7-13700H, NVIDIA GeForce RTX 3050 6GB Laptop GPU (490 - 496, n=2) | |
| HP Pavilion Plus 16-ab0456tx | |
| Average of class Multimedia (228 - 835, n=68, last 2 years) | |
* ... smaller is better
| PCMark 8 Home Score Accelerated v2 | 5525 points | |
| PCMark 8 Work Score Accelerated v2 | 5653 points | |
| PCMark 10 Score | 6597 points | |
Help | ||
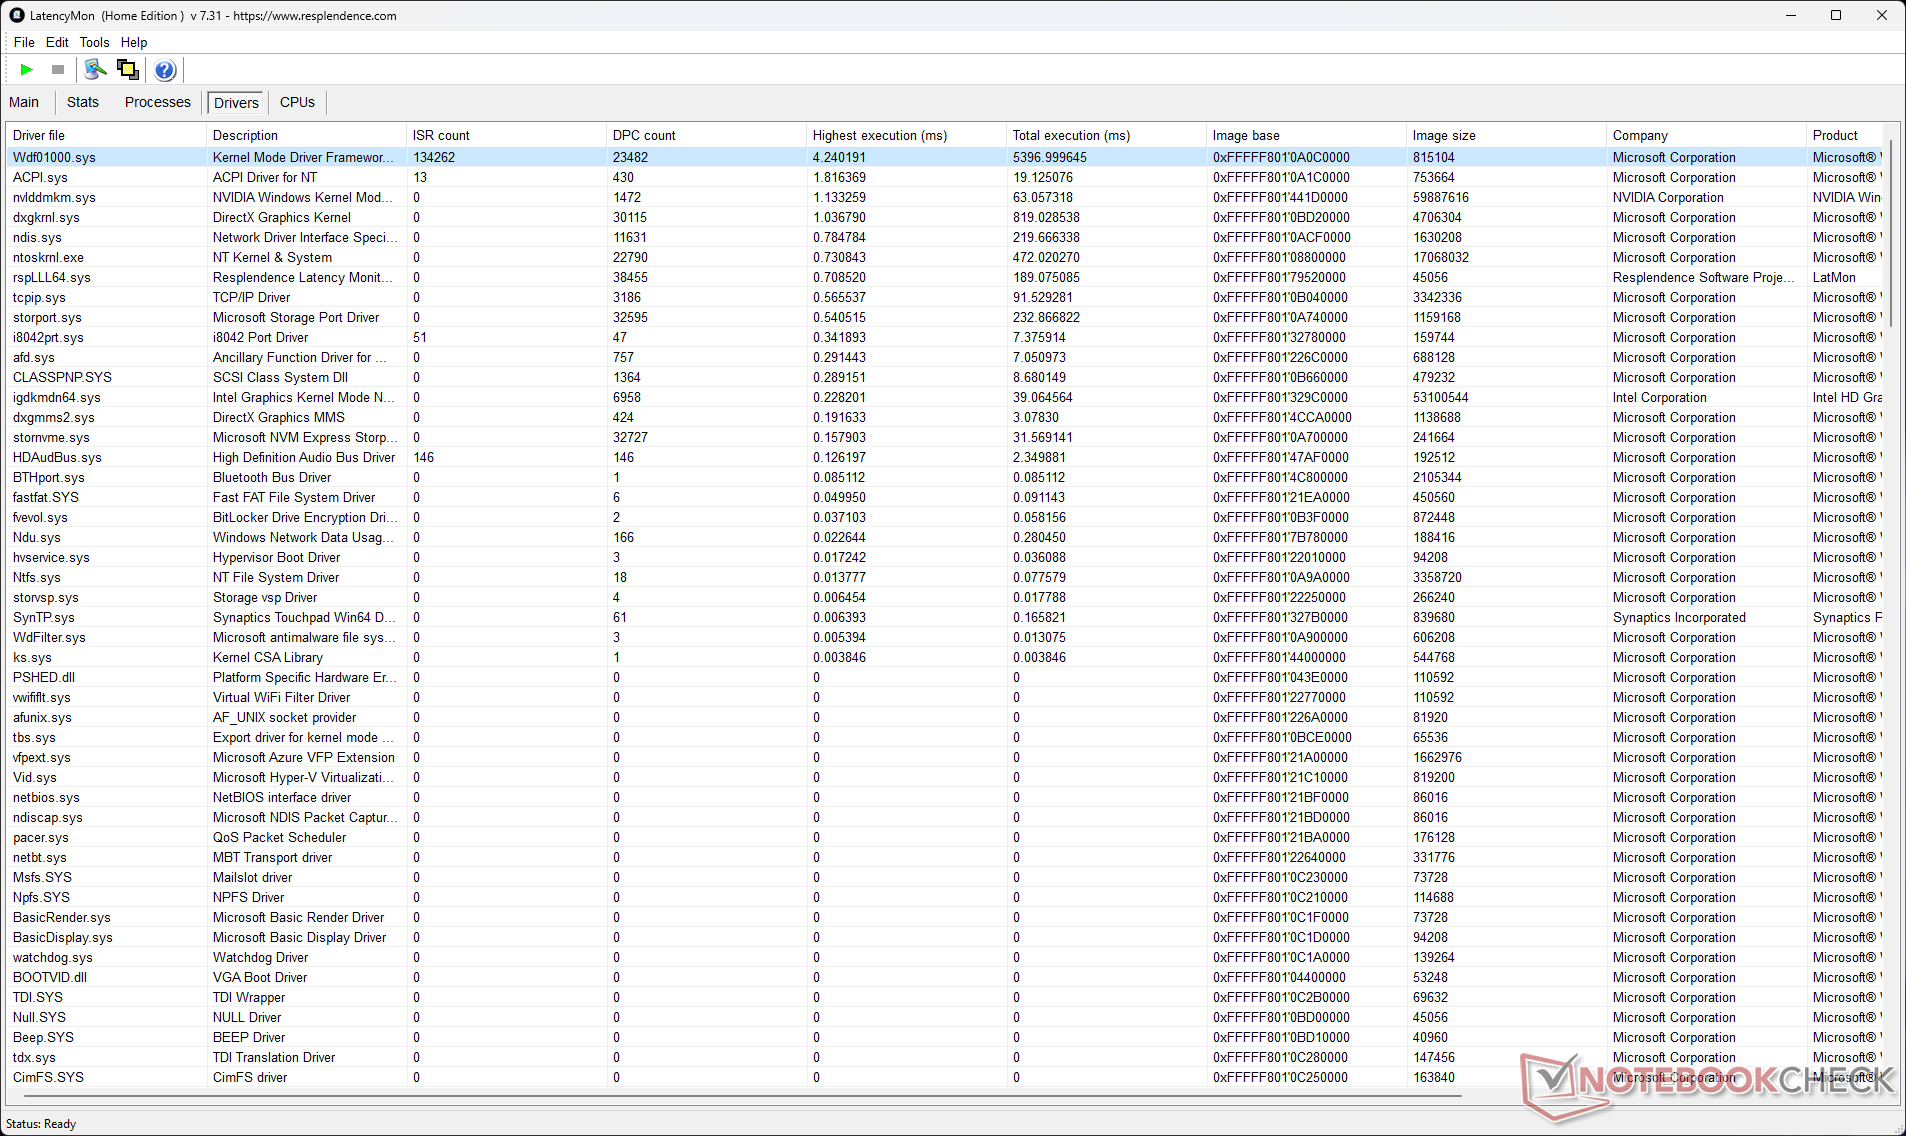
DPC 延迟
Pavilion Plus 16 的中断到处理延迟时间实测值为 5325.1 μs,偏高,这可能会引起实时音频和视频工作流程用户的担忧。
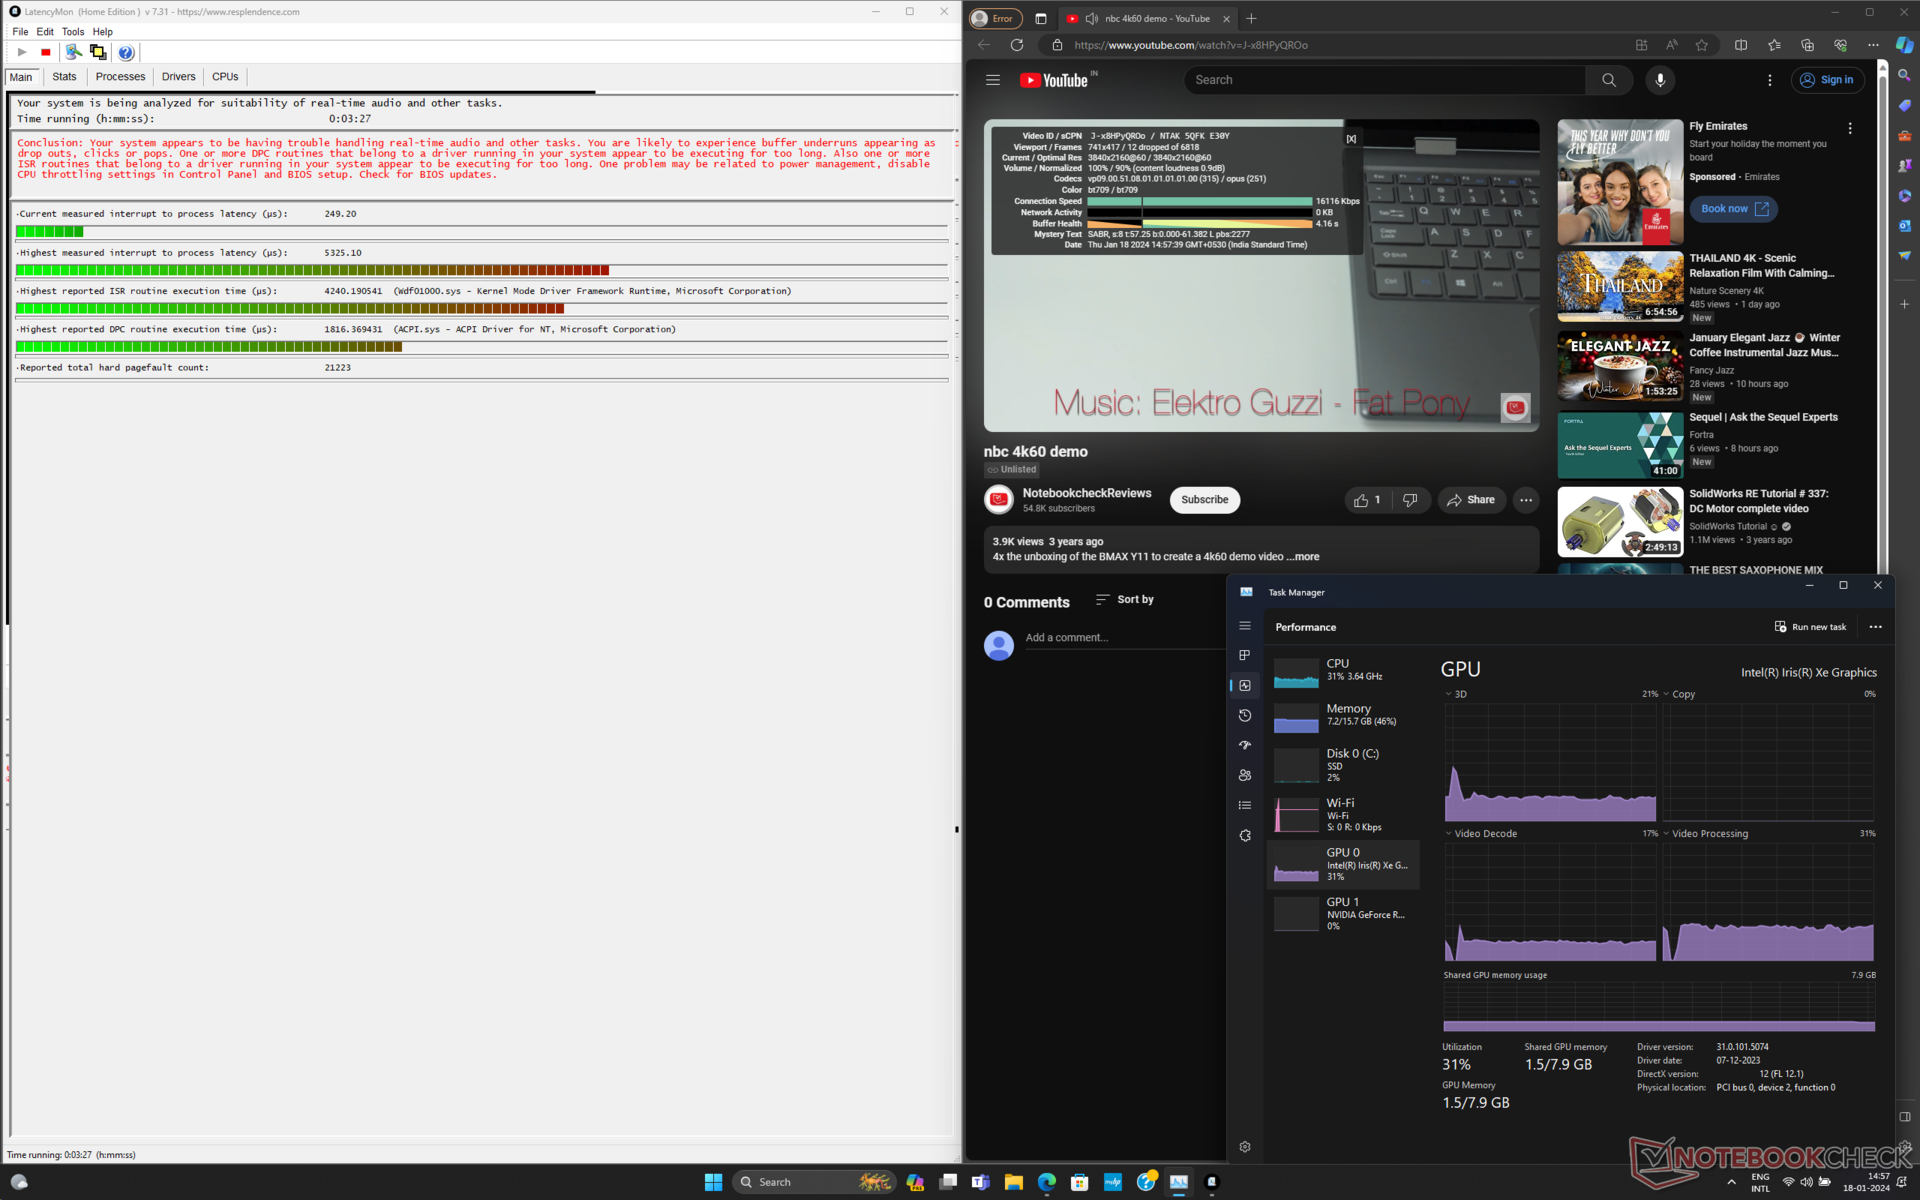
| DPC Latencies / LatencyMon - interrupt to process latency (max), Web, Youtube, Prime95 | |
| HP Pavilion Plus 16-ab0456tx | |
| Samsung Galaxy Book3 Ultra 16 | |
| Asus VivoBook Pro 16 K6602VU | |
| Schenker Vision 14 M23 RTX 3050 | |
| Lenovo Slim Pro 7 14ARP8 | |
| Asus VivoBook 14X K3405 | |
| Dell Inspiron 16 Plus 7630 | |
* ... smaller is better
我们的 DPC 延迟排名页面提供更多已评测设备的延迟比较。
存储设备
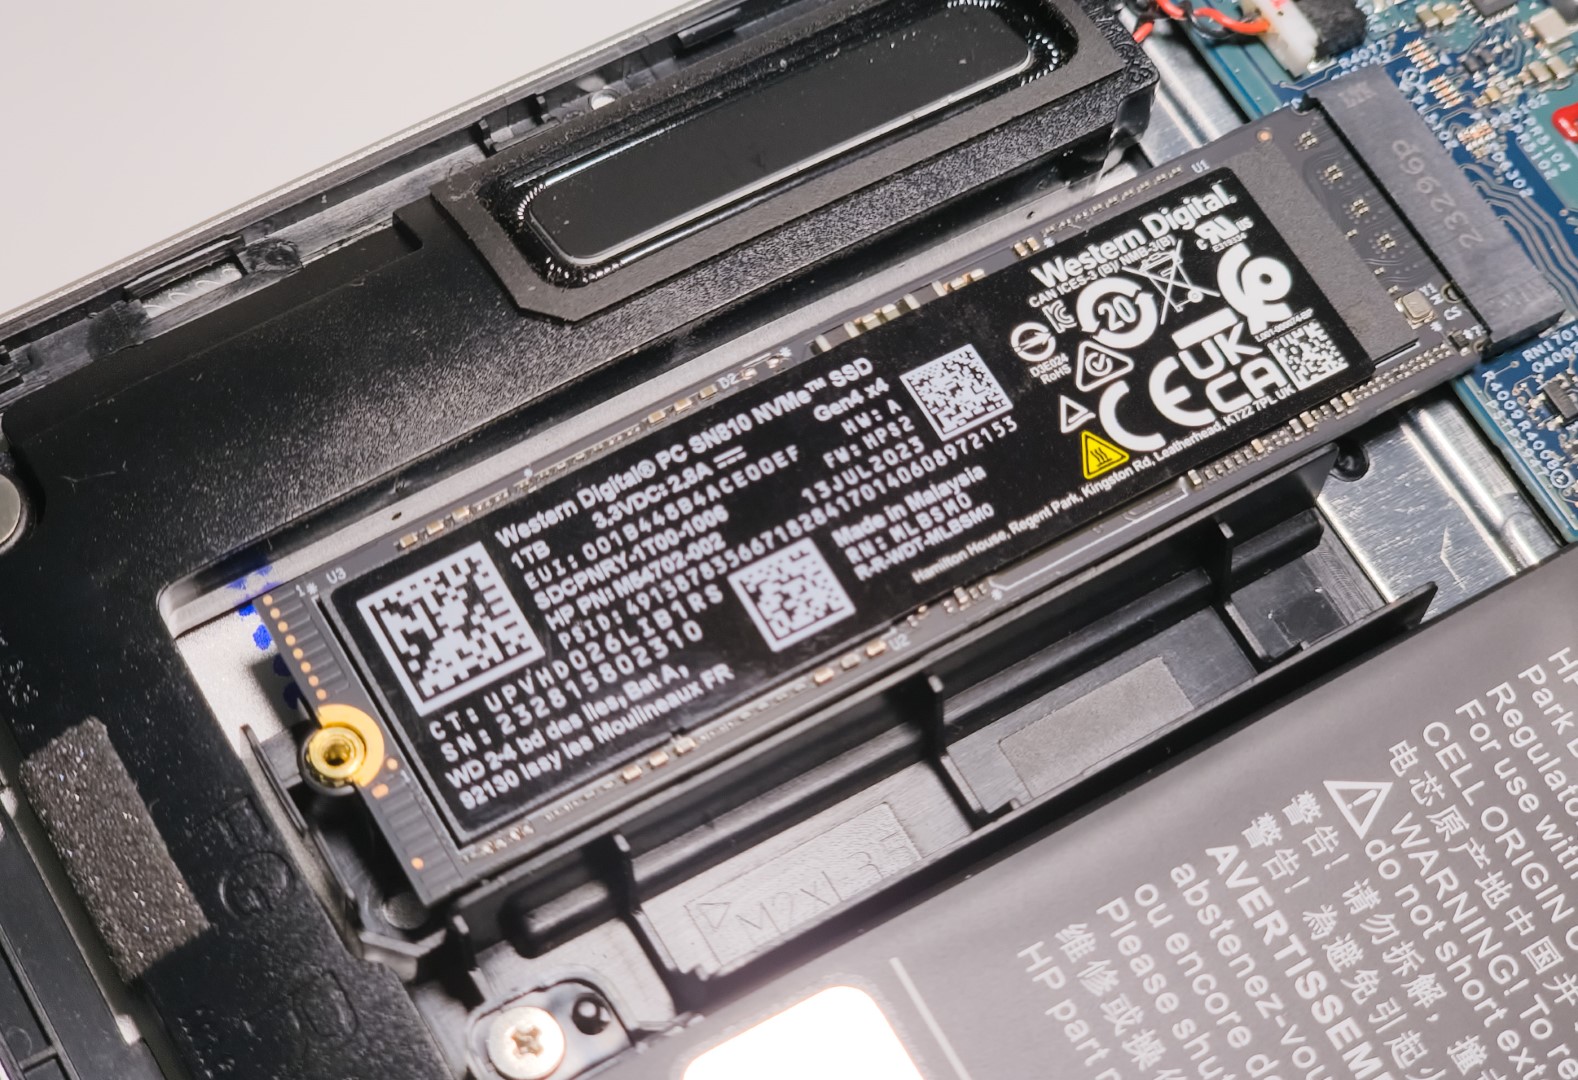
我们的Pavilion Plus 16 设备安装了西部数据 PC SN810 1 TB NVMe 硬盘。累计硬盘性能比申克 Vision 14 M23 中的三星 990 Pro 慢约 10%,比申克 Vision 14 M23 中的三星 PM9A1 慢约 16%。 三星Galaxy Book3 Ultra 16.
较低的 4K 读/写性能是造成这一性能差距的主要原因。
遗憾的是,机箱内只能安装一个固态硬盘。也无法添加 2.5 英寸硬盘。

* ... smaller is better
磁盘节流DiskSpd 读取循环,队列深度 8
虽然惠普为固态硬盘提供了散热罩,但在队列深度为 8 的 DiskSpd 读取循环测试中,这显然不足以防止硬盘在第 25 次循环后出现节流。
更多存储基准可在我们的 固态硬盘比较页面.
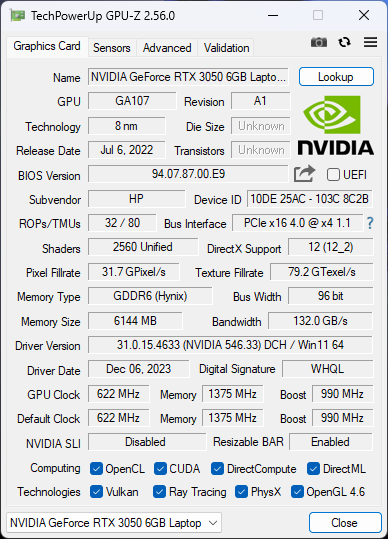
图形处理器性能
Pavilion Plus 16 是除联想 Slim Pro 7 和申克 Vision 14 M23 之外,我们测试过的唯一采用较新 RTX 3050 6 GB 笔记本 GPU 的笔记本电脑。
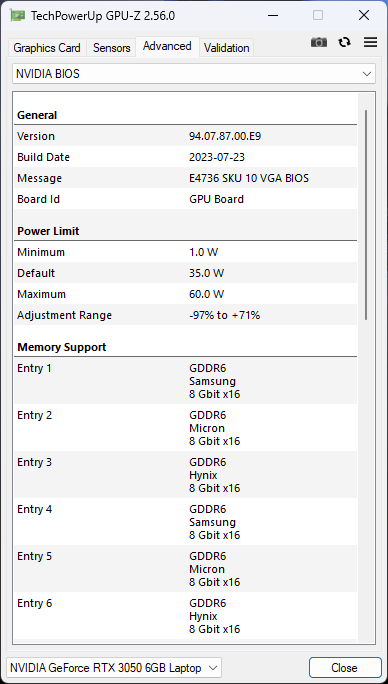
惠普笔记本的 RTX 3050 6 GB 额定 TGP 为 60 W,而申克和联想分别为 50 W 和 63 W。
因此,Slim 7 Pro 的 3DMark 累计性能略高于Pavilion Plus 16,而 Vision 14 M23 则落后惠普 5%。
| 3DMark 11 Performance | 17282 points | |
| 3DMark Ice Storm Standard Score | 82182 points | |
| 3DMark Cloud Gate Standard Score | 43015 points | |
| 3DMark Fire Strike Score | 10890 points | |
| 3DMark Fire Strike Extreme Score | 5641 points | |
Help | ||
| Blender / v3.3 Classroom OPTIX/RTX | |
| Asus VivoBook 14X K3405 | |
| Schenker Vision 14 M23 RTX 3050 | |
| Average NVIDIA GeForce RTX 3050 4GB Laptop GPU (53 - 99, n=12) | |
| Lenovo Slim Pro 7 14ARP8 | |
| HP Pavilion Plus 16-ab0456tx | |
| Average of class Multimedia (12 - 105, n=23, last 2 years) | |
| Samsung Galaxy Book3 Ultra 16 | |
| Asus VivoBook Pro 16 K6602VU | |
| Dell Inspiron 16 Plus 7630 | |
| Blender / v3.3 Classroom CUDA | |
| Asus VivoBook 14X K3405 | |
| Asus VivoBook 14X K3405 | |
| Average NVIDIA GeForce RTX 3050 4GB Laptop GPU (97 - 152, n=13) | |
| Schenker Vision 14 M23 RTX 3050 | |
| Lenovo Slim Pro 7 14ARP8 | |
| HP Pavilion Plus 16-ab0456tx | |
| Samsung Galaxy Book3 Ultra 16 | |
| Average of class Multimedia (20 - 186, n=23, last 2 years) | |
| Asus VivoBook Pro 16 K6602VU | |
| Dell Inspiron 16 Plus 7630 | |
| Blender / v3.3 Classroom CPU | |
| Average NVIDIA GeForce RTX 3050 4GB Laptop GPU (388 - 937, n=11) | |
| Schenker Vision 14 M23 RTX 3050 | |
| Asus VivoBook 14X K3405 | |
| Lenovo Slim Pro 7 14ARP8 | |
| Dell Inspiron 16 Plus 7630 | |
| Average of class Multimedia (134.5 - 1042, n=63, last 2 years) | |
| Samsung Galaxy Book3 Ultra 16 | |
| HP Pavilion Plus 16-ab0456tx | |
| Asus VivoBook Pro 16 K6602VU | |
* ... smaller is better
游戏性能
与 RTX 3050 4GB 相比,我们发现 RTX 3050 6GB 在 1080p 游戏中的累积优势约为 10%。 RTX 3050 4 GB平均水平。
与 Slim Pro 7 和 Vision 14 M23 相比,Pavilion Plus 16 的 RTX 3050 在 1080p 游戏性能方面显示出良好的累积优势,而与 VivoBook Pro 16 的 65 W RTX 4050 笔记本电脑 GPU 相比则落后 25%。
有趣的是,Pavilion Plus 16 还能在整体游戏性能上超越配备 RTX 4050 的Galaxy Book3 Ultra 16,但这是因为后者在Dota 2 Reborn和X-Plane 11 中表现不佳。
RTX 3050 6 GB 可以在 1080p 超高设置下流畅运行旧版游戏,但在 1080p 高设置以上的现代 AAA 游戏中却很吃力。
Witcher 3 FPS 图表
在TheWitcher 3 1080p Ultra 的压力测试中,我们没有发现明显的节流现象,这说明散热效率很高。
| low | med. | high | ultra | QHD | |
|---|---|---|---|---|---|
| GTA V (2015) | 177.9 | 172 | 123.3 | 62.7 | 42.7 |
| The Witcher 3 (2015) | 244 | 159.1 | 91.4 | 50.1 | 37 |
| Dota 2 Reborn (2015) | 155.2 | 131 | 124.2 | 116.9 | |
| Final Fantasy XV Benchmark (2018) | 128.2 | 70.9 | 52 | 37.4 | |
| X-Plane 11.11 (2018) | 140.6 | 117 | 97.3 | ||
| Far Cry 5 (2018) | 89 | 82 | 76 | 52 | |
| Strange Brigade (2018) | 256 | 112.8 | 91.9 | 80.5 | 57.1 |
| F1 22 (2022) | 150.2 | 145.3 | 109.5 | 34 | 20.1 |
| F1 23 (2023) | 150.1 | 141.2 | 97.5 | 26 | 14.3 |
| Cyberpunk 2077 (2023) | 67.6 | 52.1 | 43.2 | 36.9 | 21.3 |
| Assassin's Creed Mirage (2023) | 70 | 63 | 55 | 41 | 31 |
| Avatar Frontiers of Pandora (2023) | 39.5 | 36.3 | 31.5 | 23.4 | 15.1 |
请参阅我们专门的 NvidiaGeForce RTX 3050 6 GB 笔记本电脑 GPU页面了解更多信息。
排放:风扇噪音尚可忍受,但负载情况下表面温度较高
系统噪音
在最大负载下的性能模式下,我们测得的声压级 (SPL) 为 42.1 dB(A)。惠普似乎为风扇噪音设定了限制,在平衡模式下低于 35 dB(A),在性能模式下低于 45 dB(A)。
Noise level
| Idle |
| 22.22 / 22.22 / 22.22 dB(A) |
| Load |
| 42.03 / 42.1 dB(A) |
 | ||
30 dB silent 40 dB(A) audible 50 dB(A) loud |
||
min: | ||
| 性能模式 | 空闲 dB(A) | 负载平均 dB(A) | 负载最大 dB(A) | Witcher 3 1080p Ultra dB(A) |
|---|---|---|---|---|
| 平衡 | 22.22 | 33.81 | 34.08 | 34.41 / 48 fps |
| 性能 | 22.22 | 42.03 | 42.1 | 42.1 / 50 帧/秒 |
| HP Pavilion Plus 16-ab0456tx i7-13700H, GeForce RTX 3050 6GB Laptop GPU | Schenker Vision 14 M23 RTX 3050 i7-13700H, GeForce RTX 3050 6GB Laptop GPU | Dell Inspiron 16 Plus 7630 i7-13700H, GeForce RTX 4060 Laptop GPU | Asus VivoBook 14X K3405 i5-13500H, GeForce RTX 3050 4GB Laptop GPU | Lenovo Slim Pro 7 14ARP8 R7 7735HS, GeForce RTX 3050 6GB Laptop GPU | Asus VivoBook Pro 16 K6602VU i9-13900H, GeForce RTX 4050 Laptop GPU | Samsung Galaxy Book3 Ultra 16 i7-13700H, GeForce RTX 4050 Laptop GPU | |
|---|---|---|---|---|---|---|---|
| Noise | -10% | -7% | -10% | -4% | -14% | -9% | |
| off / environment * (dB) | 22.22 | 23.5 -6% | 23.2 -4% | 21.46 3% | 22.7 -2% | 20.96 6% | 25 -13% |
| Idle Minimum * (dB) | 22.22 | 23.5 -6% | 23.2 -4% | 22.08 1% | 22.8 -3% | 25.28 -14% | 26 -17% |
| Idle Average * (dB) | 22.22 | 23.5 -6% | 23.2 -4% | 22.08 1% | 22.8 -3% | 25.28 -14% | 27 -22% |
| Idle Maximum * (dB) | 22.22 | 26 -17% | 23.2 -4% | 22.08 1% | 22.8 -3% | 25.28 -14% | 28 -26% |
| Load Average * (dB) | 42.03 | 43.6 -4% | 35.1 16% | 52.98 -26% | 43.8 -4% | 51.88 -23% | 40 5% |
| Witcher 3 ultra * (dB) | 42.1 | 48.7 -16% | 52.5 -25% | 52.7 -25% | 43.8 -4% | 49 -16% | 39 7% |
| Load Maximum * (dB) | 42.1 | 49.1 -17% | 52.5 -25% | 52.67 -25% | 47.1 -12% | 51.8 -23% | 41 3% |
* ... smaller is better
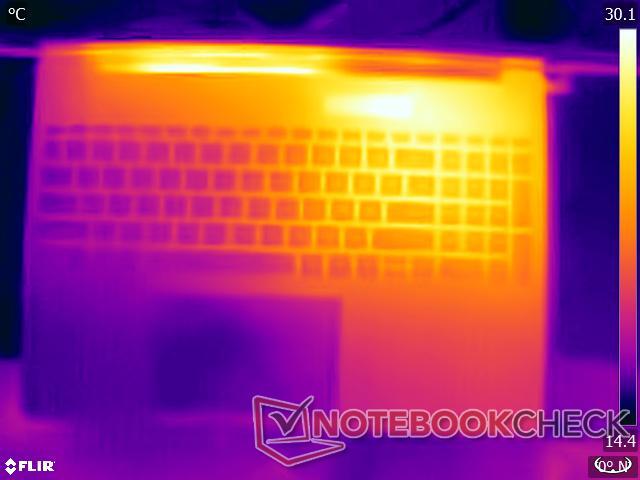
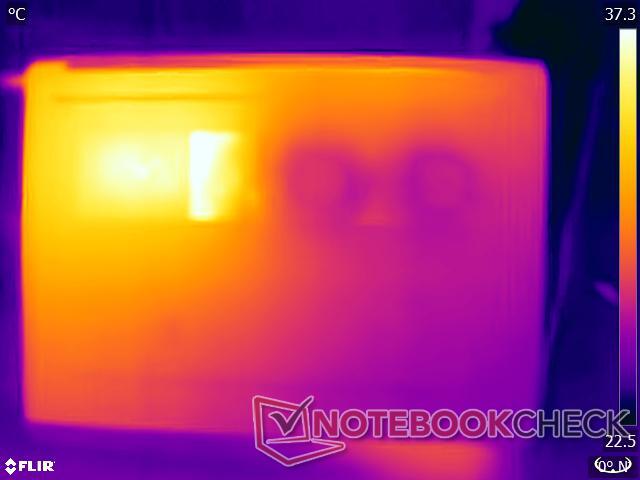
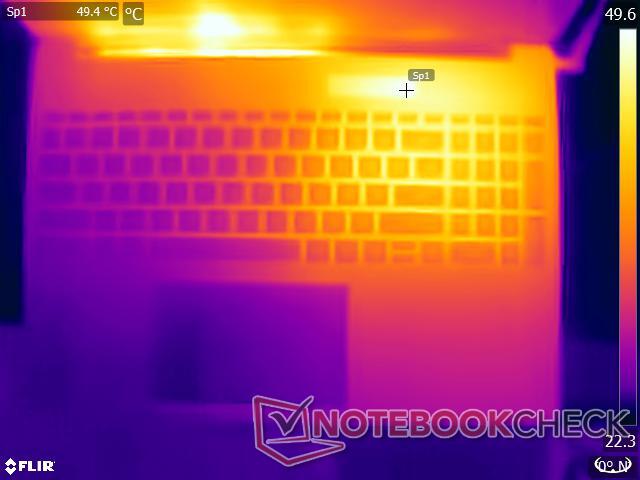
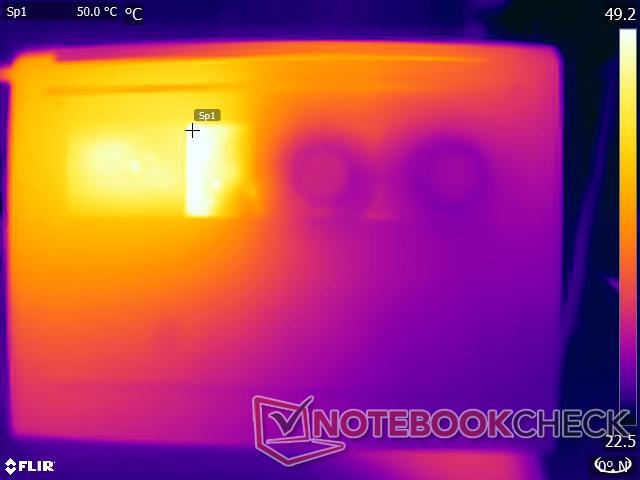
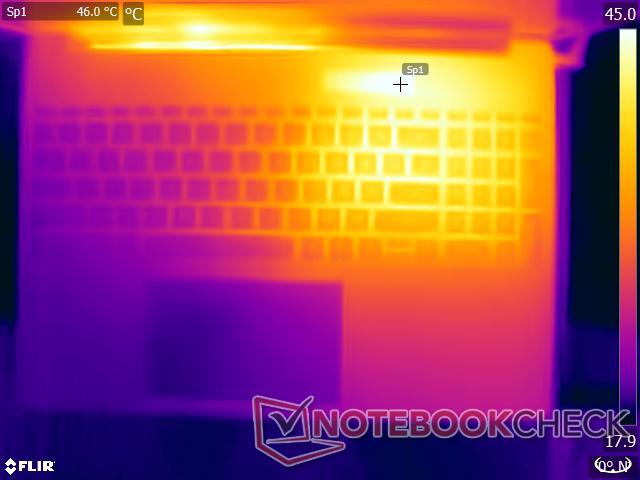
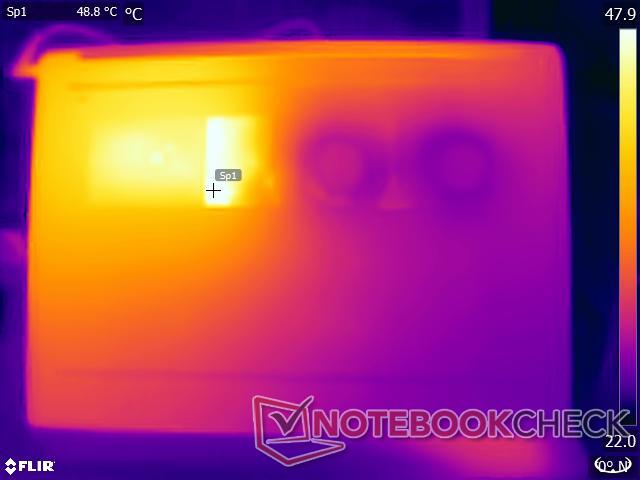
温度
Pavilion Plus 16 采用了双风扇双热管系统来冷却 CPU 和 GPU。在我们的压力测试中,这种设置被推向了极限,表面温度最高达到 49.6°C,最低达到 45.8°C。
虽然该设备可以舒适地放在膝上执行轻量级任务,但在繁重的工作负载下会让人感到不舒服。
(-) The maximum temperature on the upper side is 49.6 °C / 121 F, compared to the average of 36.8 °C / 98 F, ranging from 21 to 71 °C for the class Multimedia.
(-) The bottom heats up to a maximum of 45.8 °C / 114 F, compared to the average of 39.1 °C / 102 F
(±) In idle usage, the average temperature for the upper side is 32.3 °C / 90 F, compared to the device average of 31.3 °C / 88 F.
(-) Playing The Witcher 3, the average temperature for the upper side is 39.7 °C / 103 F, compared to the device average of 31.3 °C / 88 F.
(+) The palmrests and touchpad are reaching skin temperature as a maximum (35 °C / 95 F) and are therefore not hot.
(-) The average temperature of the palmrest area of similar devices was 28.7 °C / 83.7 F (-6.3 °C / -11.3 F).
| HP Pavilion Plus 16-ab0456tx Intel Core i7-13700H, NVIDIA GeForce RTX 3050 6GB Laptop GPU | Schenker Vision 14 M23 RTX 3050 Intel Core i7-13700H, NVIDIA GeForce RTX 3050 6GB Laptop GPU | Dell Inspiron 16 Plus 7630 Intel Core i7-13700H, NVIDIA GeForce RTX 4060 Laptop GPU | Asus VivoBook 14X K3405 Intel Core i5-13500H, NVIDIA GeForce RTX 3050 4GB Laptop GPU | Lenovo Slim Pro 7 14ARP8 AMD Ryzen 7 7735HS, NVIDIA GeForce RTX 3050 6GB Laptop GPU | Asus VivoBook Pro 16 K6602VU Intel Core i9-13900H, NVIDIA GeForce RTX 4050 Laptop GPU | Samsung Galaxy Book3 Ultra 16 Intel Core i7-13700H, NVIDIA GeForce RTX 4050 Laptop GPU | |
|---|---|---|---|---|---|---|---|
| Heat | 10% | 6% | -2% | 19% | -1% | 22% | |
| Maximum Upper Side * (°C) | 49.6 | 48.5 2% | 47.8 4% | 49.2 1% | 42.2 15% | 42.6 14% | 41 17% |
| Maximum Bottom * (°C) | 45.8 | 52.8 -15% | 42.2 8% | 54 -18% | 49 -7% | 48.4 -6% | 44 4% |
| Idle Upper Side * (°C) | 39.2 | 27.6 30% | 35.2 10% | 33.6 14% | 24.4 38% | 39.4 -1% | 23 41% |
| Idle Bottom * (°C) | 35.4 | 27 24% | 35 1% | 37.6 -6% | 25.2 29% | 39.8 -12% | 26 27% |
* ... smaller is better
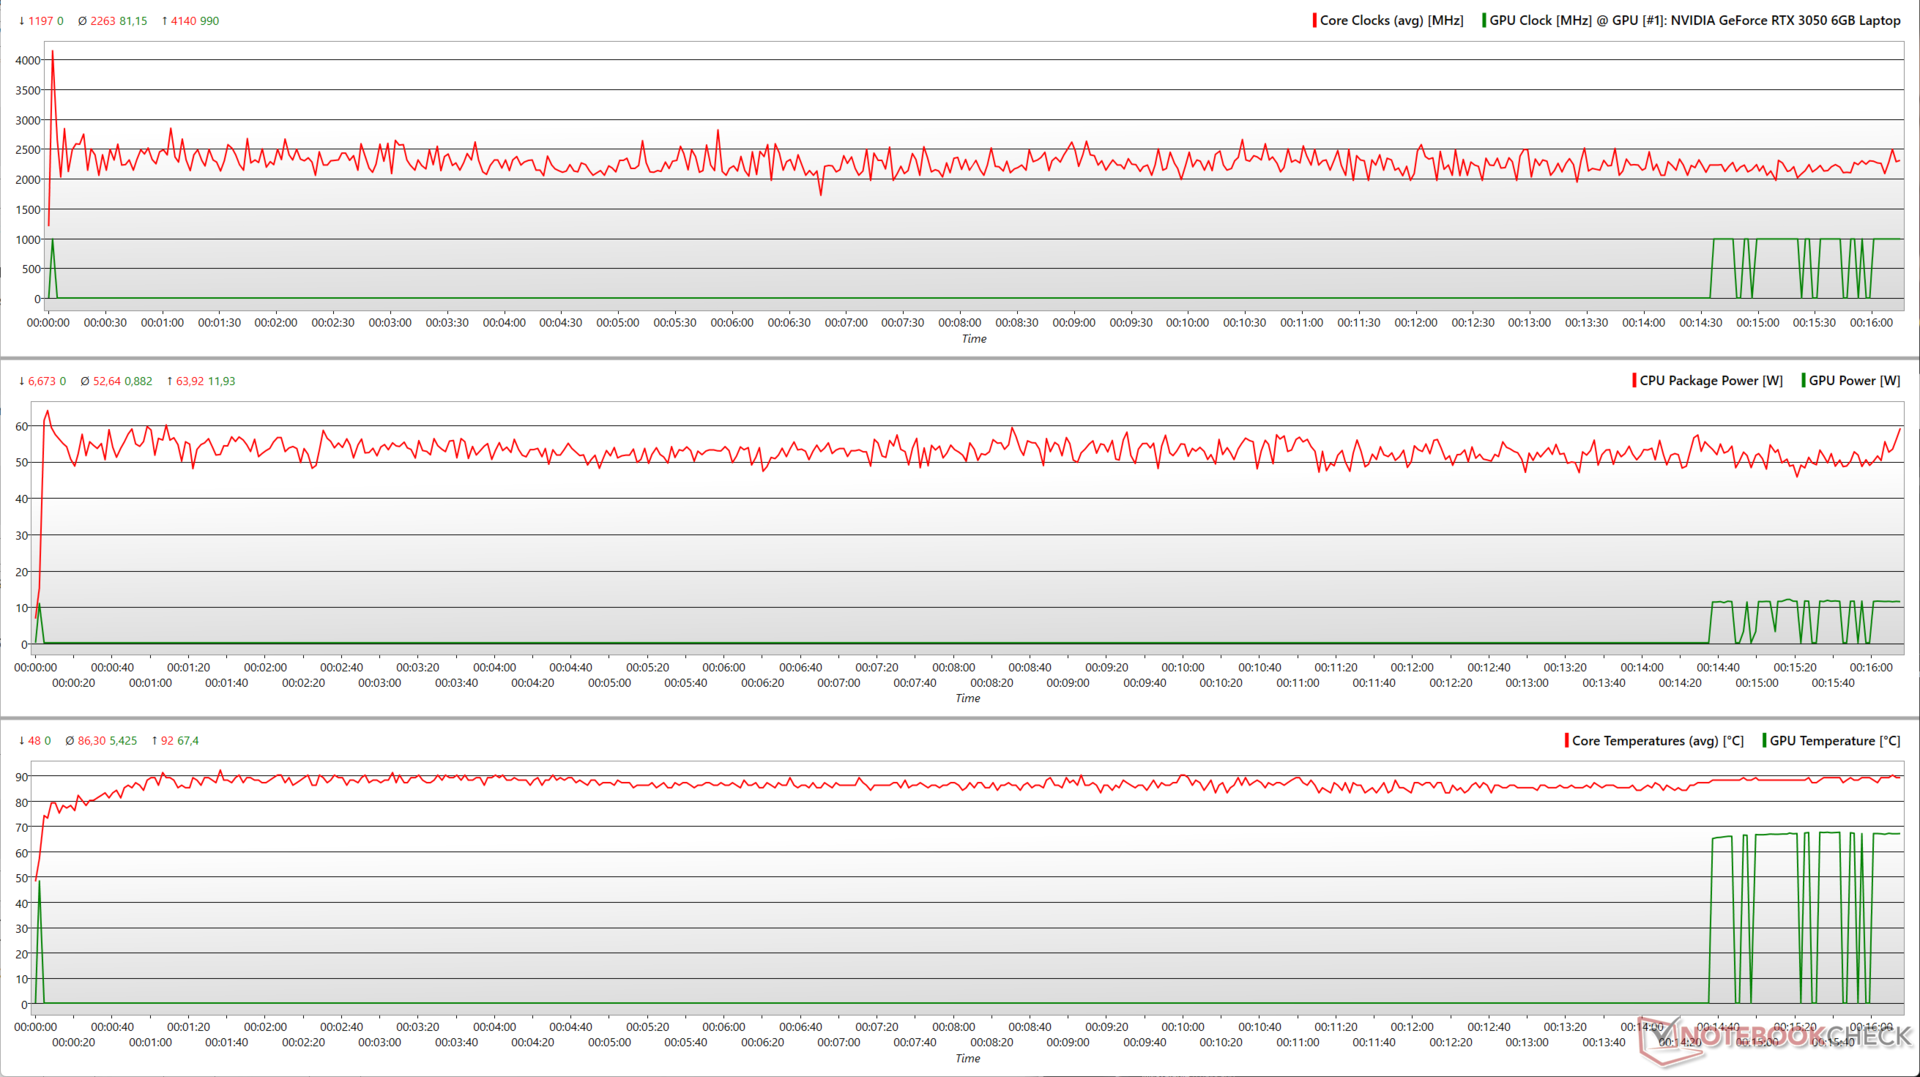
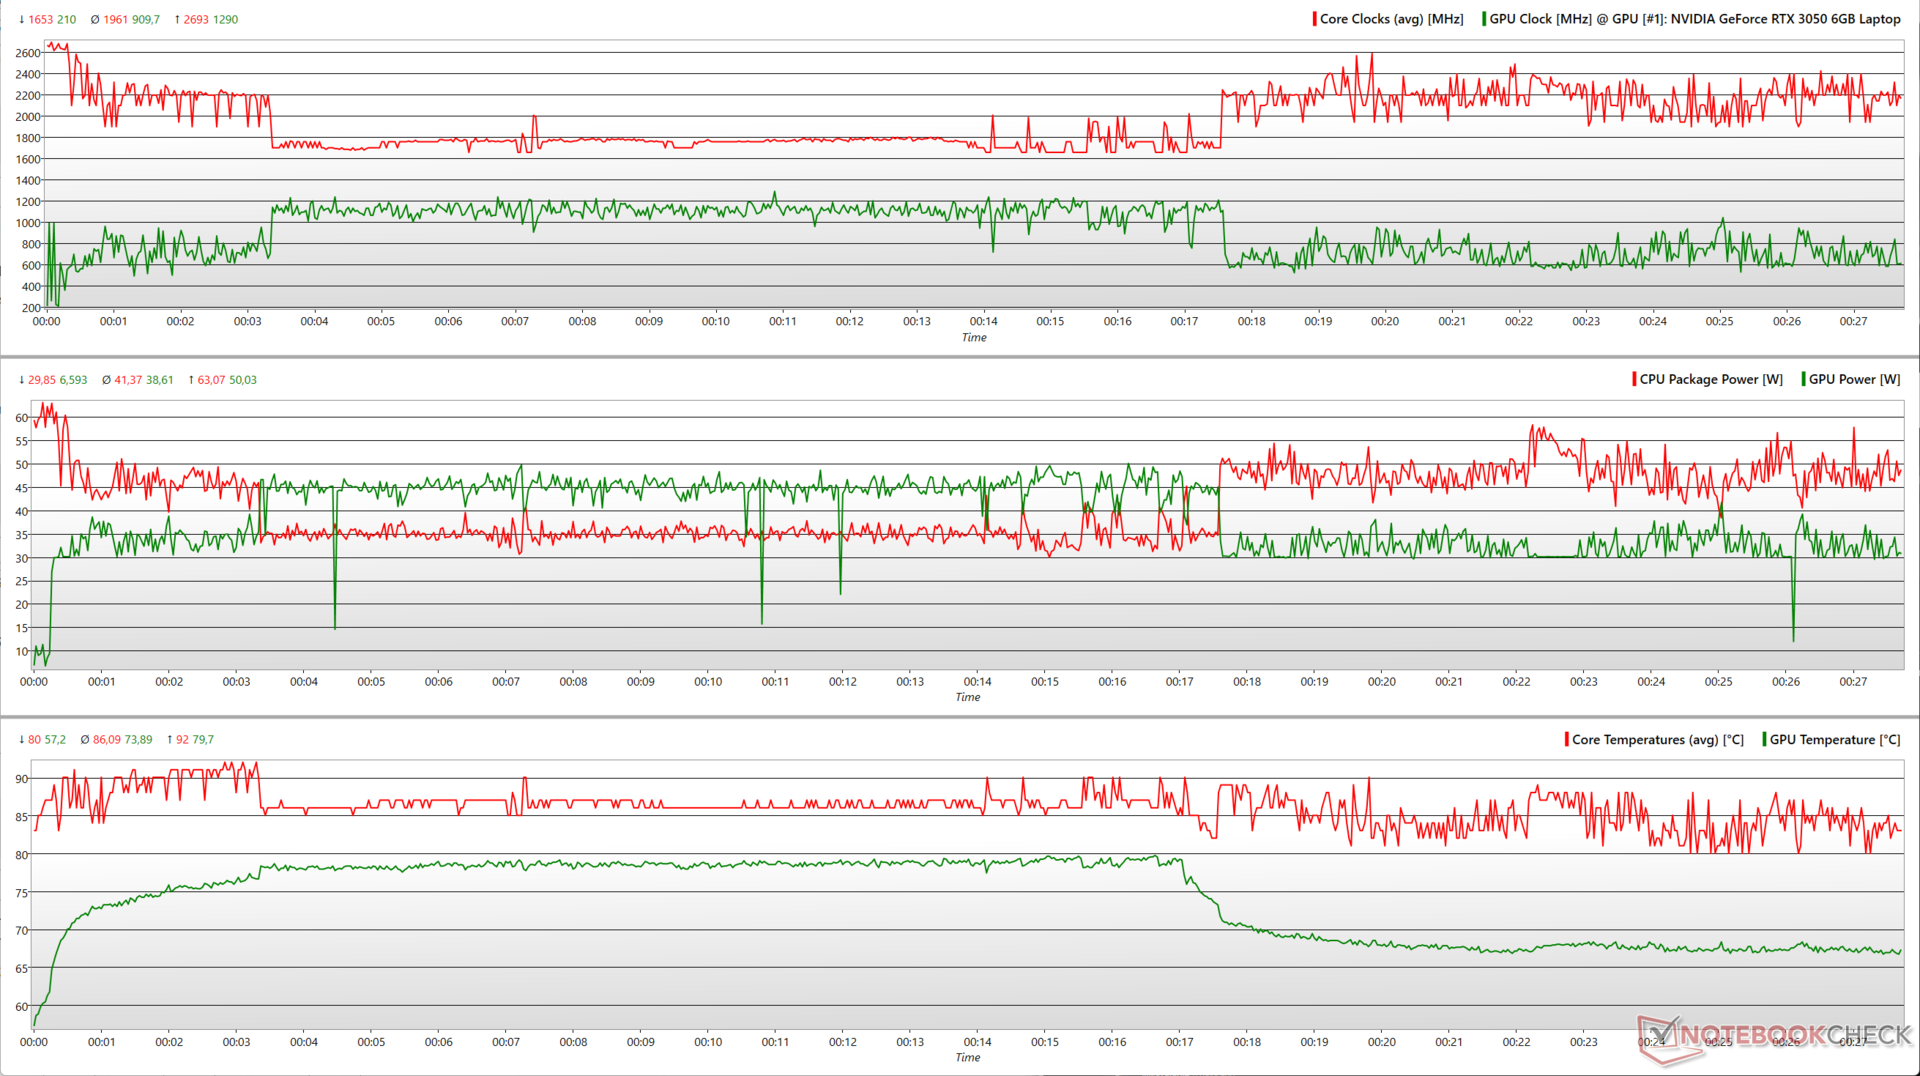
压力测试
在 Prime95 in-place large FFTs 压力测试中,Pavilion Plus 16 的酷睿 i7-13700H 平均主频为 2.2 GHz,而封装功耗平均为 53 W。
加入 FurMark 后,Core i7-13700H 和 RTX 3050 竞争功耗,导致 CPU 和 GPU 的时钟时断时续地上升和下降。
平均而言,Core i7-13700H 的时钟频率最高只能达到 1.96 GHz,而 RTX 3050 的时钟频率为 910 MHz,平均功耗分别为 41 W 和 39 W。
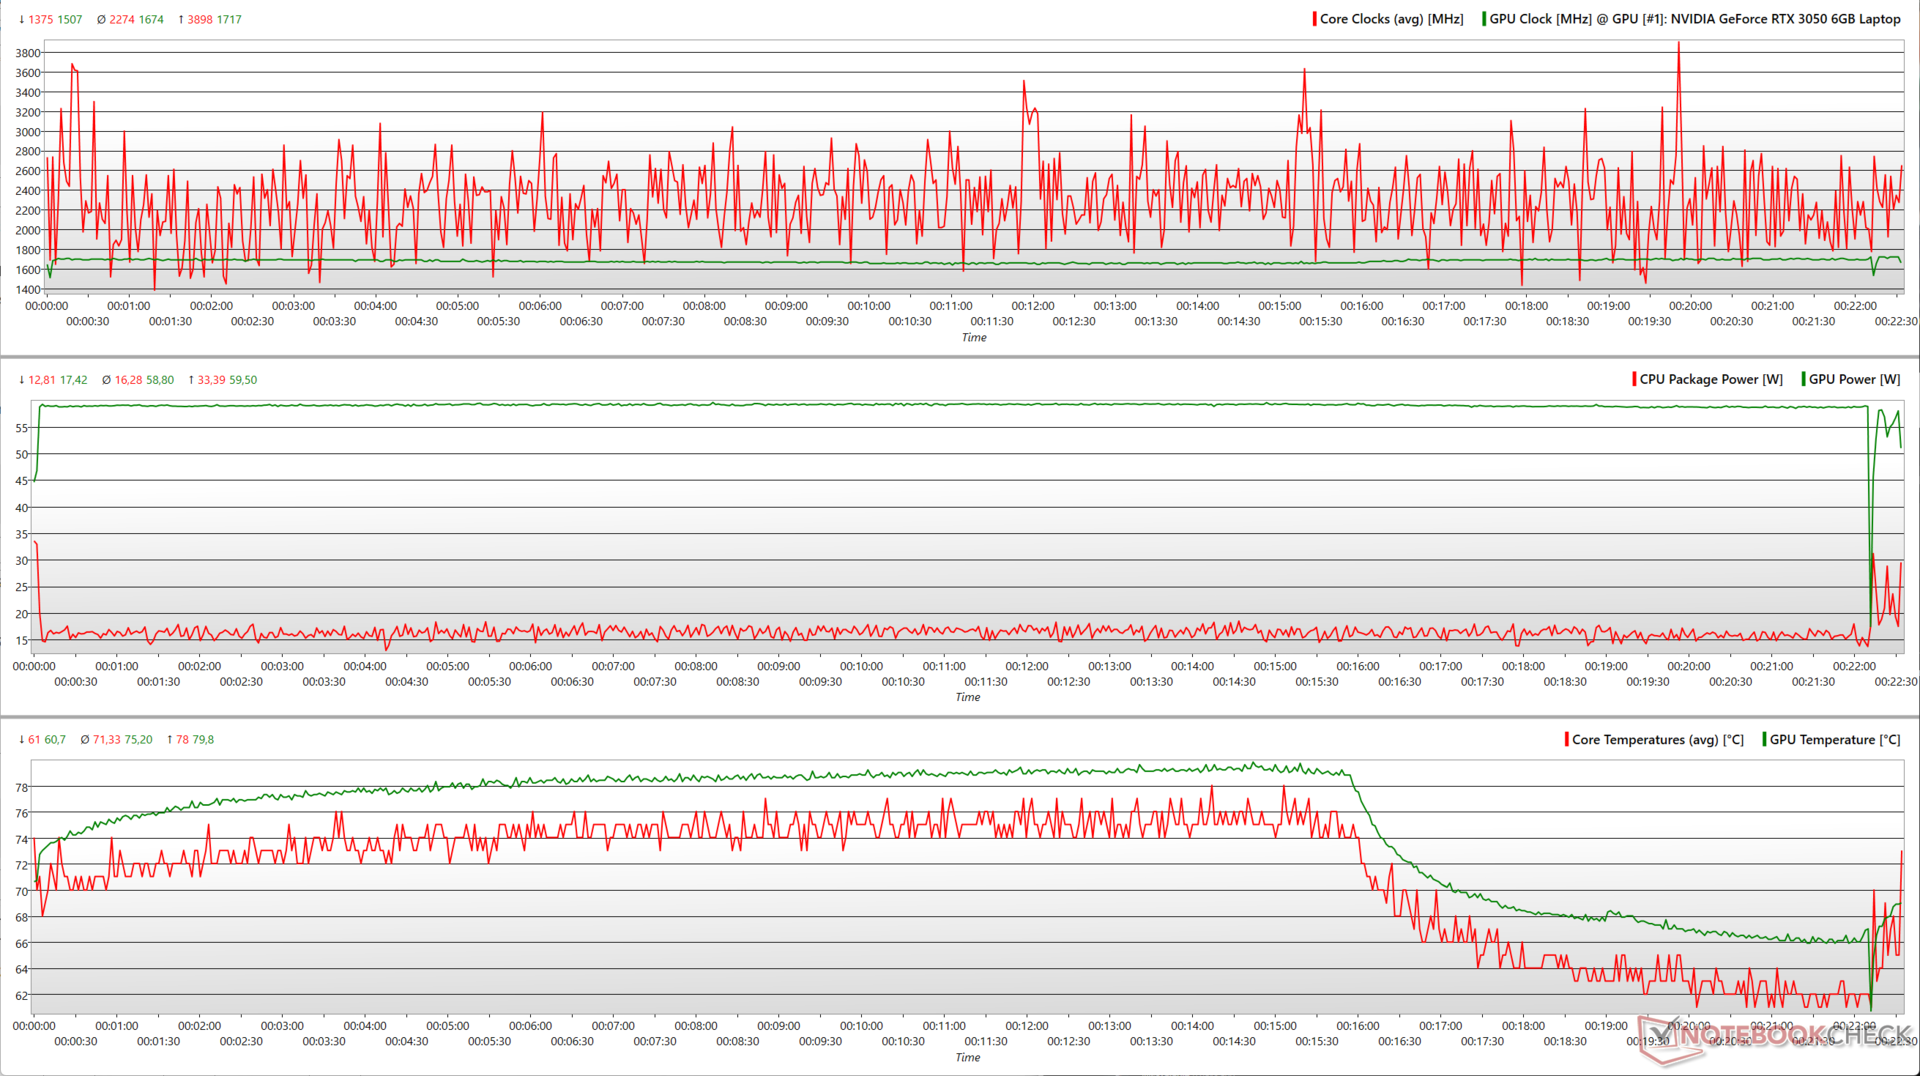
在 1080p 超高清环境下, Witcher 3 。现在,RTX 3050 几乎可以持续利用接近 60 W 的最大 TGP。
有趣的是,即使 CPU/GPU 时钟和功率保持相对不变,核心温度也会在一段时间后开始下降。
| 压力测试 | CPU 时钟 (GHz) | GPU 时钟 (MHz) | CPU 平均温度 (°C) | GPU 平均温度(°C) |
| 系统空闲 | 3.74 | - | 52 | 31.1 |
| Prime95 | 2.1 | - | 86 | 67.4 |
| Prime95 + FurMark | 1.93 | 735 | 86 | 73.5 |
| Witcher 3 1080p Ultra | 2.2 | 1,717 | 71 | 74.2 |
发言人
Pavilion Plus 16 配有一对立体声扬声器,其输出音量为 74.2 dB(A),在大多数普通大小的房间中都足够使用。低音清晰可辨,但并不突出。不过,中高音相对清晰。
不过,用户可以通过外置扬声器或蓝牙 5.3 获得更好的音效。
HP Pavilion Plus 16-ab0456tx audio analysis
(±) | speaker loudness is average but good (74.2 dB)
Bass 100 - 315 Hz
(±) | reduced bass - on average 14.7% lower than median
(±) | linearity of bass is average (7.8% delta to prev. frequency)
Mids 400 - 2000 Hz
(+) | balanced mids - only 3.4% away from median
(+) | mids are linear (4.2% delta to prev. frequency)
Highs 2 - 16 kHz
(+) | balanced highs - only 4.6% away from median
(+) | highs are linear (4.8% delta to prev. frequency)
Overall 100 - 16.000 Hz
(±) | linearity of overall sound is average (16.7% difference to median)
Compared to same class
» 44% of all tested devices in this class were better, 8% similar, 48% worse
» The best had a delta of 5%, average was 17%, worst was 45%
Compared to all devices tested
» 29% of all tested devices were better, 7% similar, 64% worse
» The best had a delta of 4%, average was 23%, worst was 134%
Apple MacBook Pro 16 2021 M1 Pro audio analysis
(+) | speakers can play relatively loud (84.7 dB)
Bass 100 - 315 Hz
(+) | good bass - only 3.8% away from median
(+) | bass is linear (5.2% delta to prev. frequency)
Mids 400 - 2000 Hz
(+) | balanced mids - only 1.3% away from median
(+) | mids are linear (2.1% delta to prev. frequency)
Highs 2 - 16 kHz
(+) | balanced highs - only 1.9% away from median
(+) | highs are linear (2.7% delta to prev. frequency)
Overall 100 - 16.000 Hz
(+) | overall sound is linear (4.6% difference to median)
Compared to same class
» 0% of all tested devices in this class were better, 0% similar, 100% worse
» The best had a delta of 5%, average was 17%, worst was 45%
Compared to all devices tested
» 0% of all tested devices were better, 0% similar, 100% worse
» The best had a delta of 4%, average was 23%, worst was 134%
能源管理:经济省电,电池寿命长
耗电量
Pavilion Plus 16 的功耗相对于给定硬件的总体功耗较低。虽然申克 Vision 14 M23 和联想 Slim Pro 7 在平均负载和 Witcher 3 下更省电,但 Pavilion Plus 16 在最大负载下更省电。
随机提供的 135 W 电源适配器足以在压力下为笔记本供电。
| Off / Standby | |
| Idle | |
| Load |
|
Key:
min: | |
| HP Pavilion Plus 16-ab0456tx i7-13700H, GeForce RTX 3050 6GB Laptop GPU, IPS, 2560x1600, 16" | Schenker Vision 14 M23 RTX 3050 i7-13700H, GeForce RTX 3050 6GB Laptop GPU, IPS, 2880x1800, 14" | Dell Inspiron 16 Plus 7630 i7-13700H, GeForce RTX 4060 Laptop GPU, IPS, 2560x1600, 16" | Asus VivoBook 14X K3405 i5-13500H, GeForce RTX 3050 4GB Laptop GPU, , 2880x1800, 14" | Lenovo Slim Pro 7 14ARP8 R7 7735HS, GeForce RTX 3050 6GB Laptop GPU, IPS, 2560x1600, 14.5" | Asus VivoBook Pro 16 K6602VU i9-13900H, GeForce RTX 4050 Laptop GPU, OLED, 3200x2000, 16" | Samsung Galaxy Book3 Ultra 16 i7-13700H, GeForce RTX 4050 Laptop GPU, AMOLED, 2880x1800, 16" | Average NVIDIA GeForce RTX 3050 6GB Laptop GPU | Average of class Multimedia | |
|---|---|---|---|---|---|---|---|---|---|
| Power Consumption | -2% | -100% | 6% | -30% | -141% | 20% | -8% | -14% | |
| Idle Minimum * (Watt) | 3.3 | 5.2 -58% | 15.6 -373% | 4.96 -50% | 7.6 -130% | 21.06 -538% | 3 9% | 4.55 ? -38% | 5.72 ? -73% |
| Idle Average * (Watt) | 7.3 | 7.8 -7% | 17.7 -142% | 7.54 -3% | 12.2 -67% | 24.27 -232% | 5 32% | 8.63 ? -18% | 10.2 ? -40% |
| Idle Maximum * (Watt) | 14.24 | 9 37% | 20.6 -45% | 9.31 35% | 12.8 10% | 25.12 -76% | 11 23% | 11.7 ? 18% | 12.4 ? 13% |
| Load Average * (Watt) | 91.7 | 78.6 14% | 87.4 5% | 83.4 9% | 76.5 17% | 52.4 43% | 72 21% | 86.6 ? 6% | 65.5 ? 29% |
| Witcher 3 ultra * (Watt) | 96.2 | 86.8 10% | 121.7 -27% | 73.3 24% | 89.5 7% | 110.2 -15% | 69.7 28% | ||
| Load Maximum * (Watt) | 115.8 | 121.2 -5% | 138 -19% | 91.74 21% | 135.7 -17% | 146 -26% | 108 7% | 127.6 ? -10% | 114 ? 2% |
* ... smaller is better
Power Consumption: The Witcher 3 / Stress test
Power Consumption: External monitor
电池寿命
强劲但低功耗的内部结构有助于实现良好的电池续航时间。Pavilion Plus 16 的电池容量为 68 瓦时,在亮度为 150 尼特的情况下,可实现近 10.5 小时的网页浏览和 12 小时的 1080p 视频播放,运行时间令人印象深刻。
| HP Pavilion Plus 16-ab0456tx i7-13700H, GeForce RTX 3050 6GB Laptop GPU, 68 Wh | Schenker Vision 14 M23 RTX 3050 i7-13700H, GeForce RTX 3050 6GB Laptop GPU, 99 Wh | Dell Inspiron 16 Plus 7630 i7-13700H, GeForce RTX 4060 Laptop GPU, 86 Wh | Asus VivoBook 14X K3405 i5-13500H, GeForce RTX 3050 4GB Laptop GPU, 63 Wh | Lenovo Slim Pro 7 14ARP8 R7 7735HS, GeForce RTX 3050 6GB Laptop GPU, 73 Wh | Asus VivoBook Pro 16 K6602VU i9-13900H, GeForce RTX 4050 Laptop GPU, 96 Wh | Samsung Galaxy Book3 Ultra 16 i7-13700H, GeForce RTX 4050 Laptop GPU, 76 Wh | Average of class Multimedia | |
|---|---|---|---|---|---|---|---|---|
| Battery runtime | 16% | -10% | -18% | 1% | -11% | 2% | 27% | |
| H.264 (h) | 12 | 10.4 -13% | 9.8 -18% | 13.4 12% | 16.4 ? 37% | |||
| WiFi v1.3 (h) | 10.4 | 12.1 16% | 9.4 -10% | 8.1 -22% | 10.5 1% | 10.1 -3% | 9.6 -8% | 12.2 ? 17% |
| Reader / Idle (h) | 17.6 | 18.2 | 24.9 ? | |||||
| Load (h) | 1.4 | 1.1 | 1.8 | 1.668 ? | ||||
| Witcher 3 ultra (h) | 1.3 |
Pros
Cons
评价:巨大潜力因妥协而受阻
惠普Pavilion Plus 16 满足了人们对现代多媒体笔记本电脑的大部分要求,适合工作和娱乐。Pavilion Plus 16 采用全金属结构,没有多余的弯曲,散发出高档的质感,端口选择也涵盖了基本功能。
2560 x 1600 120 Hz 的面板不具备 HDR 或广泛的 Adobe RGB 和 Display P3 覆盖范围,这与 Pavilion Plus 14的 2.8K OLED 面板。不过,它能满足基本需求,响应时间合适,没有 PWM 闪烁。
惠普Pavilion Plus 16 是一款全能型多媒体和生产力笔记本电脑,但从售价来看,它最好至少能配备 RTX 4050"。
一旦开始与竞争对手进行比较,性能上的局限性就显而易见了。事实证明,与戴尔 Inspiron 16 Plus 7630 相比,60 W PL2 对Pavilion Plus 16 的多核性能尤其不利。 戴尔 Inspiron 16 Plus 7630甚至 三星Galaxy Book3 Ultra 16甚至三星 Book3 Ultra 16,它们都采用了更高瓦数的酷睿 i7-13700H。
惠普本可以在额外的电源配置文件中轻松允许 80 W PL2 或更高的功率,以最大限度地发挥芯片的潜力。然而,在当前配置的负载下,散热子系统已经显得十分紧张。
NvidiaGeForce RTX 3050 6 GB 在性能和能效方面都不及 Ada 代。虽然 1080p 游戏性能比 RTX 3050 4 GB 有了明显提升,但合成测试并未显示出太大的激励作用。
Pavilion Plus 16 在惠普网站上的售价为 1350 美元,比 Inspiron 16 Plus 7630 高出 100 美元,后者提供 60 W RTX 4060 和性能更好的酷睿 i7-13700H。尽管如此,在印度市场,Pavilion Plus 16 的售价比 Inspiron 16 Plus 7630 便宜。
华硕 华硕 VivoBook Pro 16华硕 VivoBook Pro 16 配备 3.2K OLED 显示屏、酷睿 i9-13900H 和高达 RTX 4060 的处理器,对于初出茅庐的创作者来说是一个绝佳的选择,只要塑料材质和 300 美元的额外溢价不会让你望而却步。
价格和供应情况
经测试的惠普Pavilion Plus 16-ab0456tx 可从惠普印度官方网站购买,售价为 1,24,999 英镑。网站上购买,价格为 1,24,999 ₹。在惠普美国网站上也可以配置这款笔记本电脑,价格为 1,350 美元。
亚马逊印度站提供的Pavilion Plus 16 不含 RTX 3050 dGPU,售价为 1,25,900 英镑。
HP Pavilion Plus 16-ab0456tx
- 02/07/2024 v7 (old)
Vaidyanathan Subramaniam
Transparency
The selection of devices to be reviewed is made by our editorial team. The test sample was provided to the author as a loan by the manufacturer or retailer for the purpose of this review. The lender had no influence on this review, nor did the manufacturer receive a copy of this review before publication. There was no obligation to publish this review. As an independent media company, Notebookcheck is not subjected to the authority of manufacturers, retailers or publishers.
This is how Notebookcheck is testing
Every year, Notebookcheck independently reviews hundreds of laptops and smartphones using standardized procedures to ensure that all results are comparable. We have continuously developed our test methods for around 20 years and set industry standards in the process. In our test labs, high-quality measuring equipment is utilized by experienced technicians and editors. These tests involve a multi-stage validation process. Our complex rating system is based on hundreds of well-founded measurements and benchmarks, which maintains objectivity. Further information on our test methods can be found here.
Price comparison

