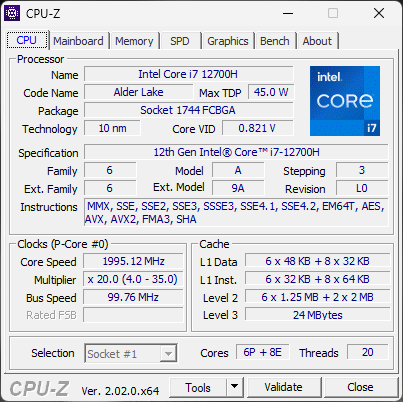
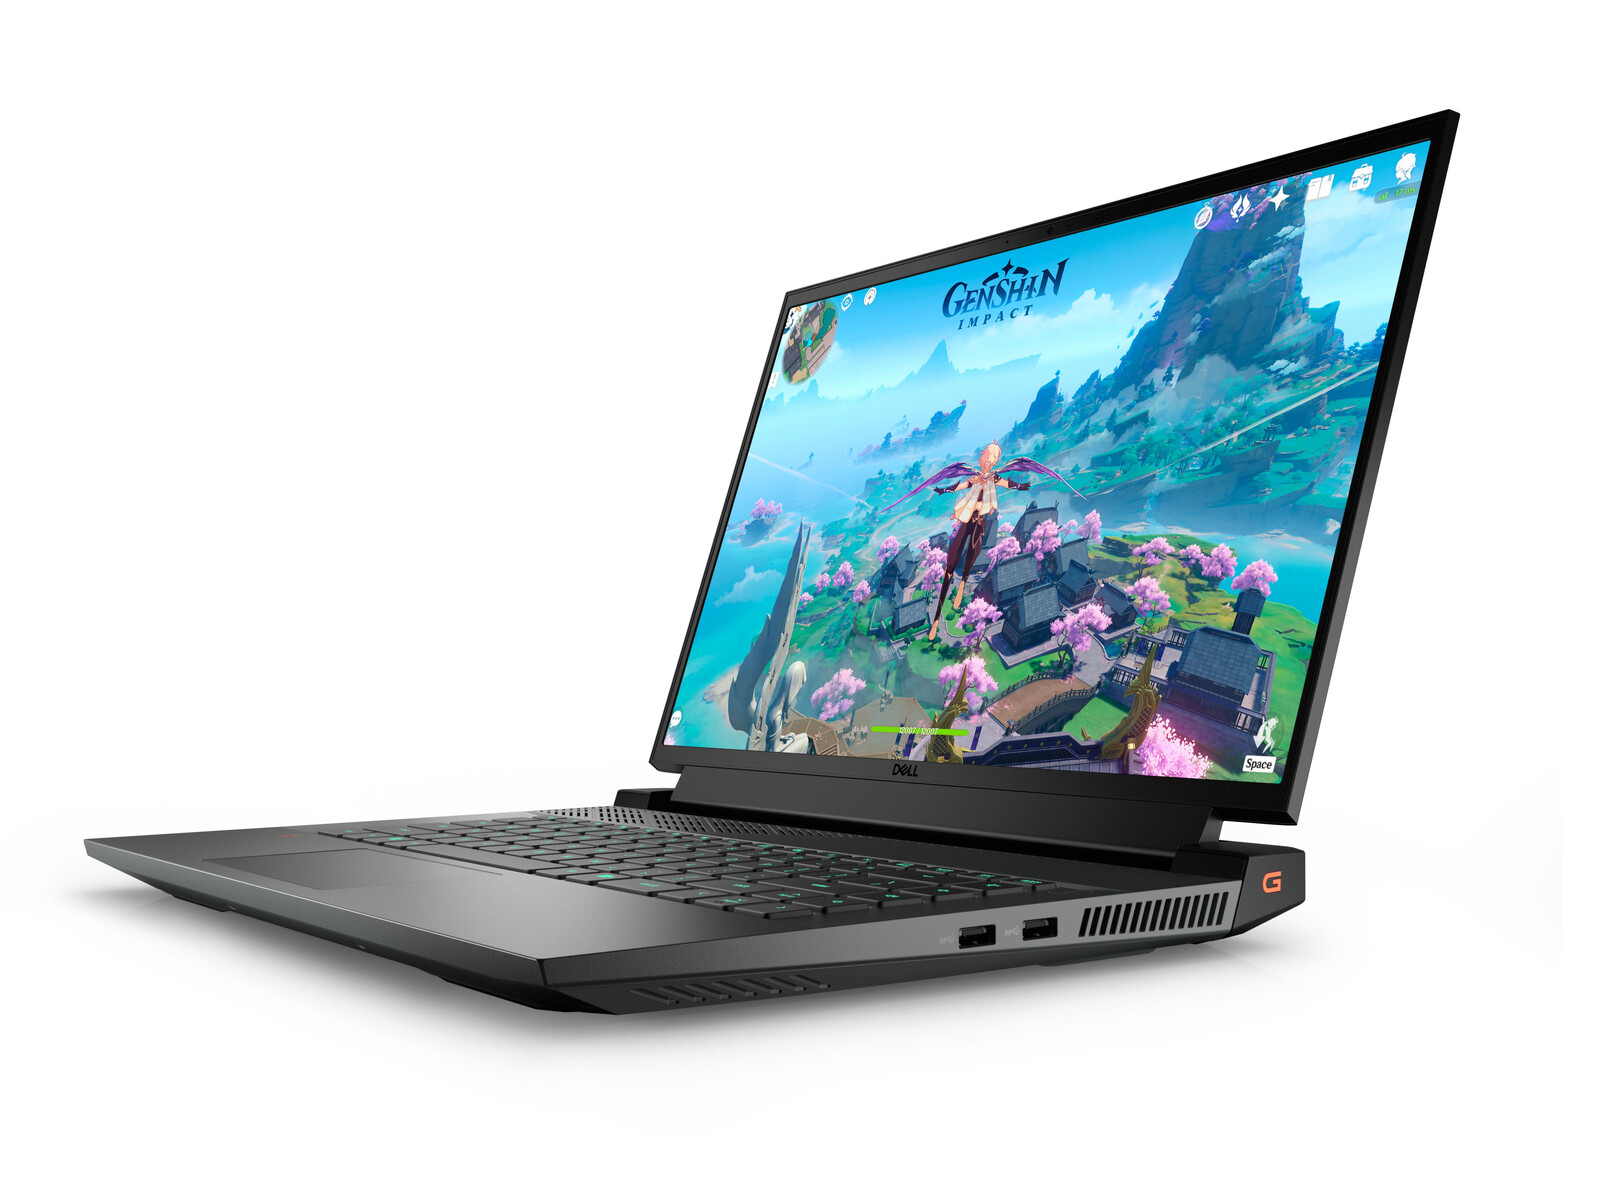
戴尔G16 7620笔记本电脑评测。厚实的结构,快速的性能
戴尔G系列由经济型到中端游戏笔记本组成,与高端的Alienware系列形成鲜明对比。该系列只有几年历史,最初的G15和G17型号分别涵盖15.6英寸和17.3英寸的外形尺寸。对于2022年,戴尔推出了一个名为G16的16英寸机型,配备了最新的英特尔第12代Core-H系列CPU和Nvidia RTX Ampere GPU。
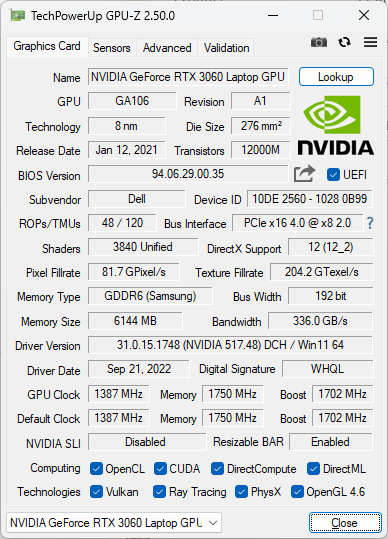
我们审查的单位是一个中端配置,配备酷睿i7-12700H CPU和130 WGeForce RTX 3060 GPU,零售价约1500美元。其他SKU可使用较慢的RTX 3050 Ti、较快的RTX 3070 Ti或Core i9-12900H代替。所有目前的配置都配备了相同的16英寸1600p 165 Hz显示屏。
这一领域的竞争者包括其他16英寸游戏笔记本电脑,如 联想Legion 7 16, 惠普Victus 16, 华硕ROG Zephyrus M16, 或 Acer Swift X SFX16.
更多戴尔评论。
潜在的竞争对手比较
Rating | Date | Model | Weight | Height | Size | Resolution | Price |
|---|---|---|---|---|---|---|---|
| 86.1 % v7 (old) | 10 / 2022 | Dell G16 7620 i7-12700H, GeForce RTX 3060 Laptop GPU | 2.6 kg | 26.9 mm | 16.00" | 2560x1600 | |
| 90.8 % v7 (old) | 09 / 2022 | Lenovo Legion 7 16ARHA7 R9 6900HX, Radeon RX 6850M XT | 2.6 kg | 19.4 mm | 16.00" | 2560x1600 | |
| 82.3 % v7 (old) | 05 / 2022 | HP Victus 16-e0145ng R5 5600H, GeForce RTX 3050 Ti Laptop GPU | 2.4 kg | 23.5 mm | 16.10" | 1920x1080 | |
| 85.6 % v7 (old) | 06 / 2021 | Asus ROG Zephyrus M16 GU603H i9-11900H, GeForce RTX 3070 Laptop GPU | 2 kg | 20 mm | 16.00" | 2560x1600 | |
| 86.6 % v7 (old) | 07 / 2022 | Lenovo Legion 5 Pro 16IAH7H i7-12700H, GeForce RTX 3060 Laptop GPU | 2.6 kg | 27 mm | 16.00" | 2560x1600 | |
| 86.2 % v7 (old) | 07 / 2022 | Acer Swift X SFX16-51G-5388 i5-11320H, GeForce RTX 3050 4GB Laptop GPU | 1.8 kg | 18.9 mm | 16.10" | 1920x1080 |
案例 - 一个更大的G15
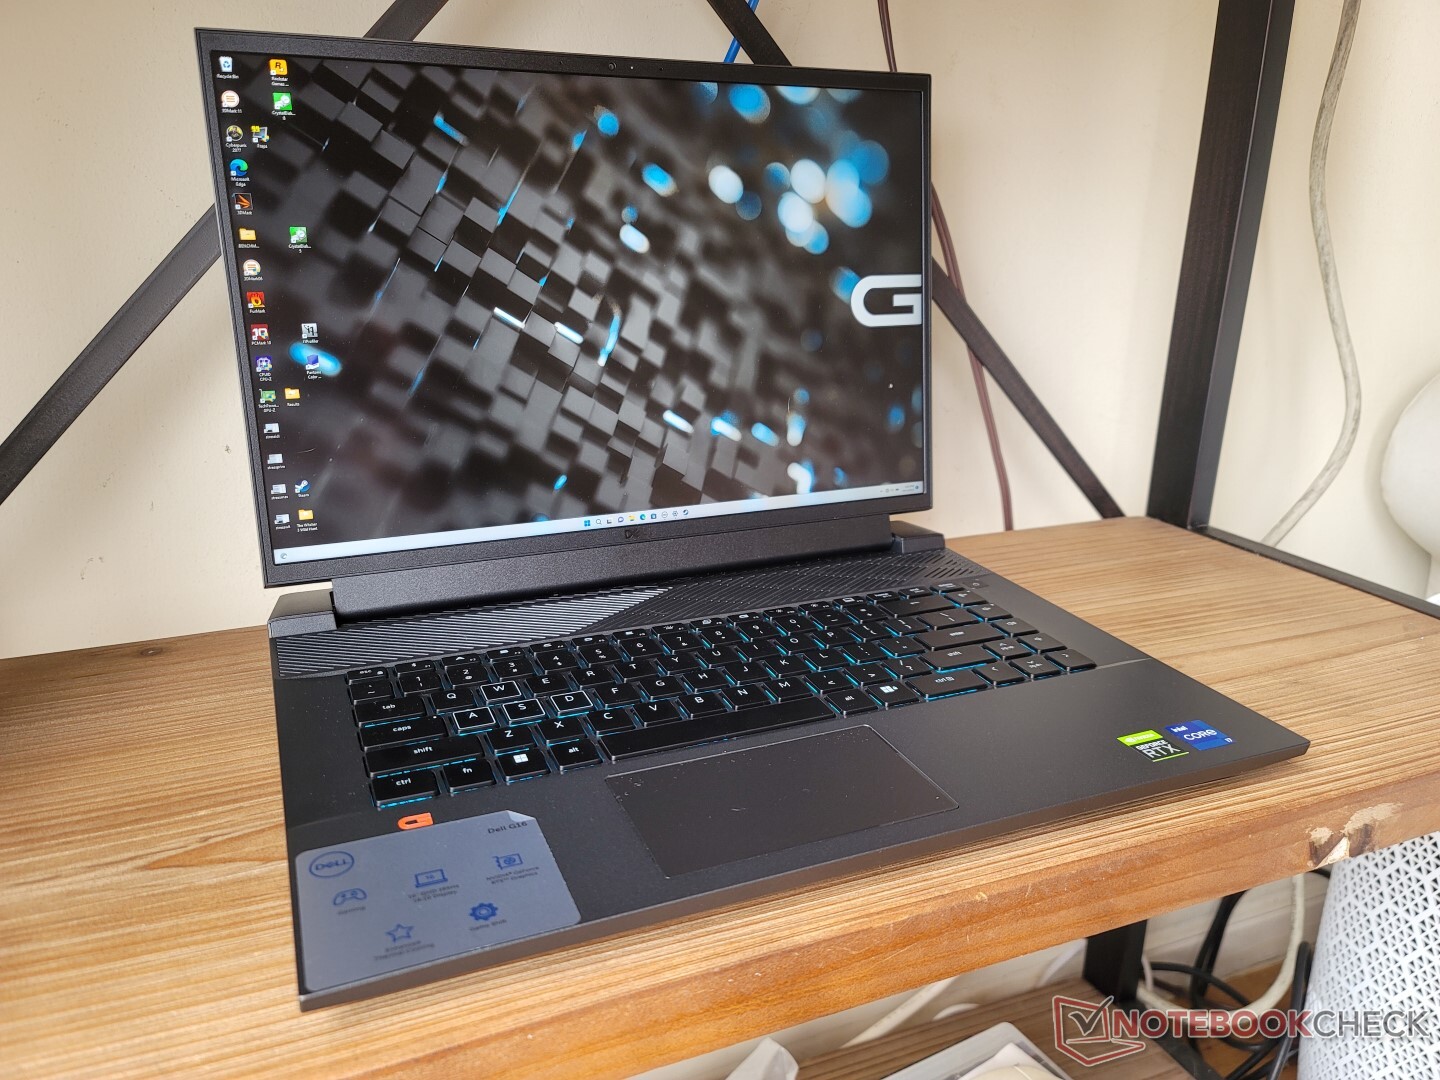
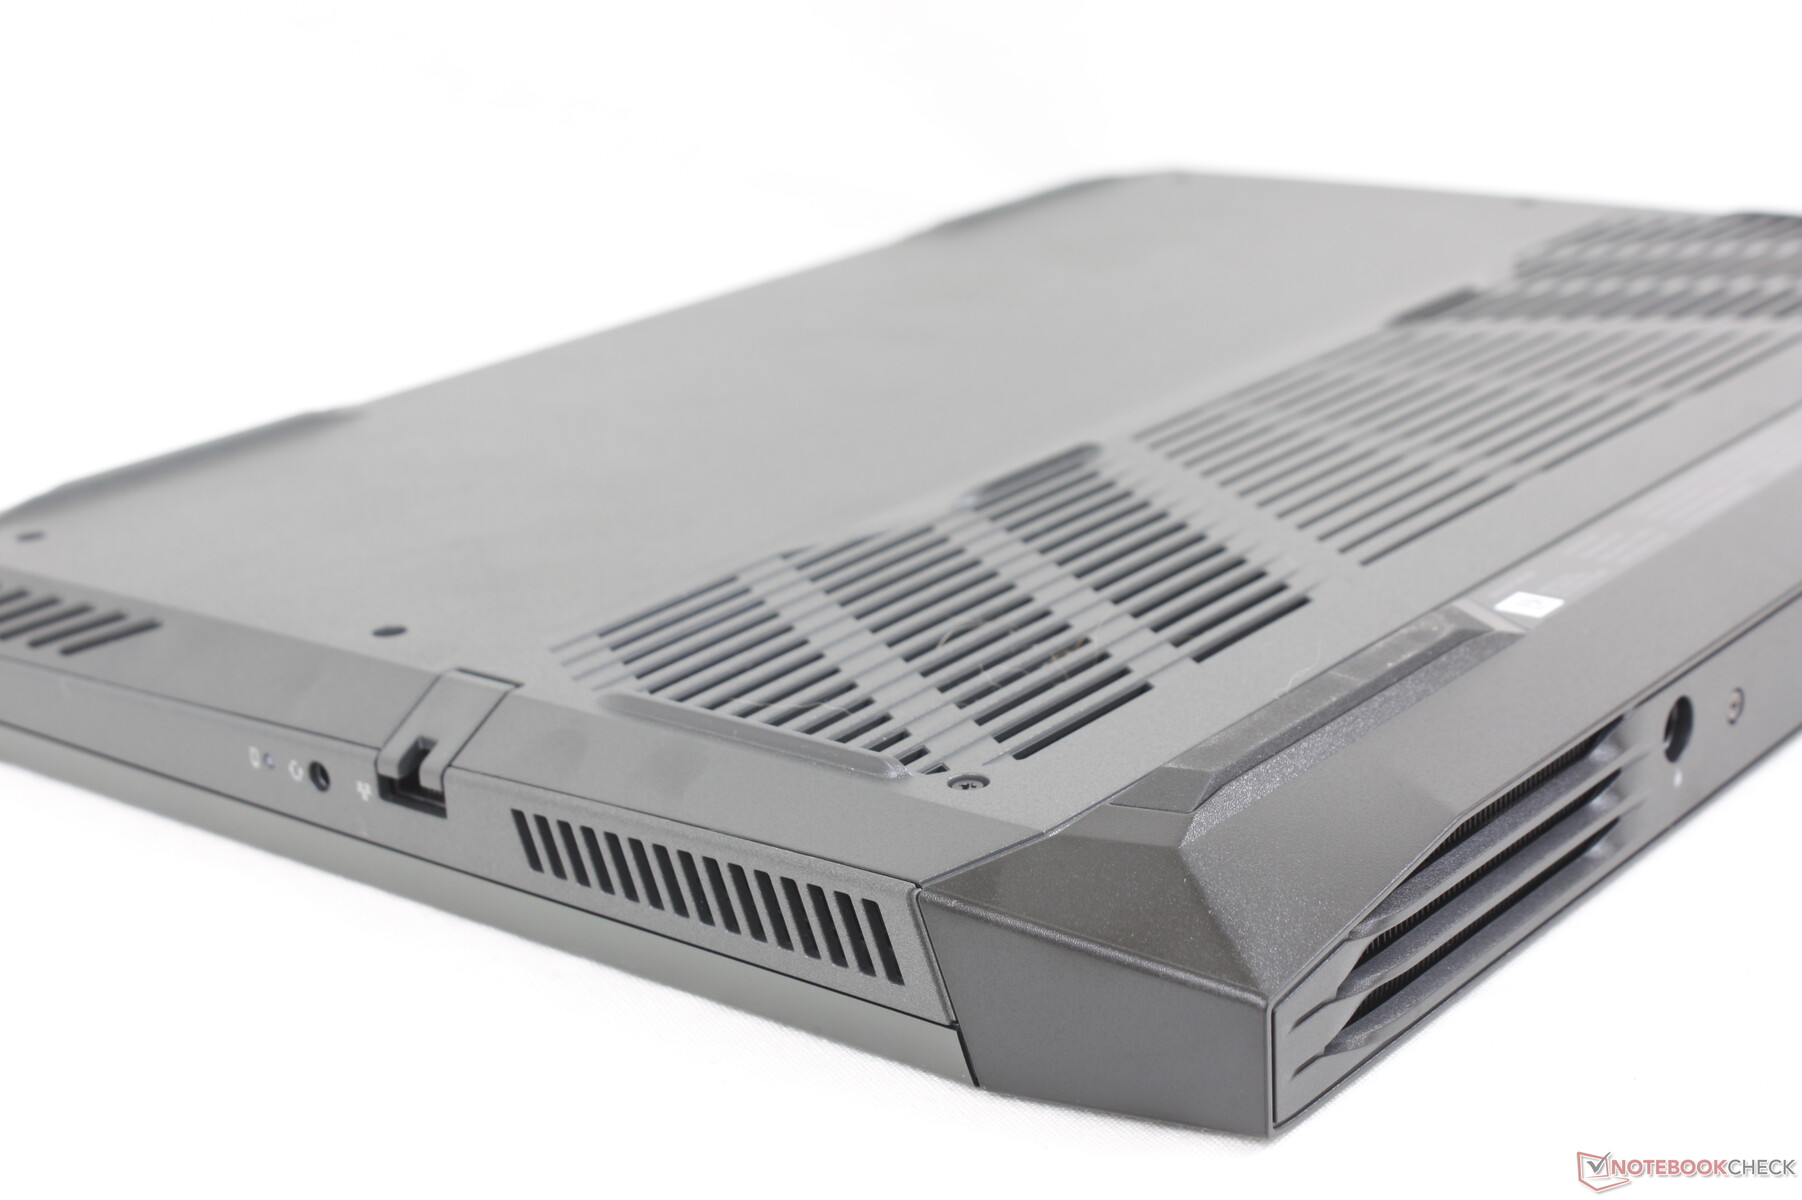
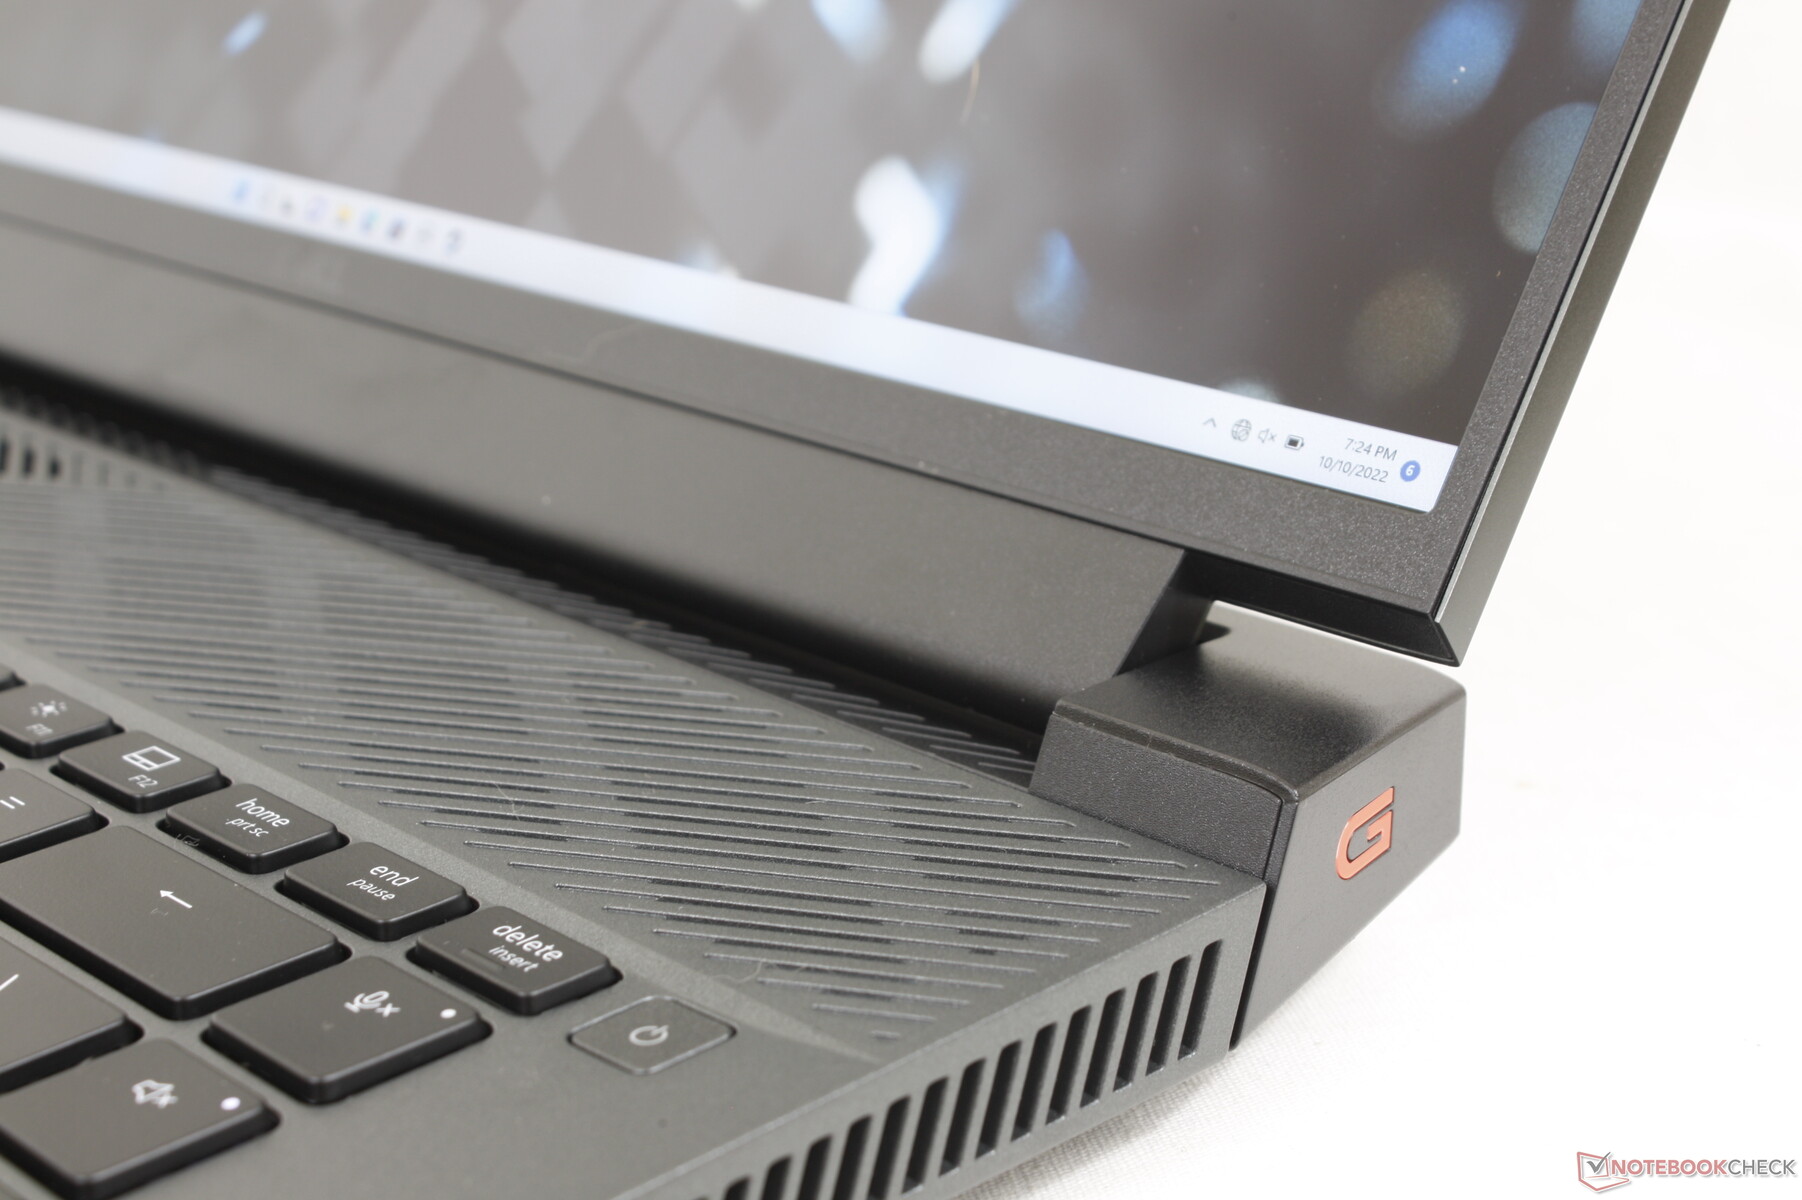
整体设计与现有的16:9 15.6英寸有许多相似之处。 戴尔G15但为新的16:10形式因素进行了改造。黑曜石色的塑料底座和阳极氧化铝盖子的材料保持不变,具有熟悉的光滑质感和感觉。像Alienware笔记本的光亮内框或RGB环这样的 "玩家 "美学在G系列上没有出现。
底座和键盘中心周围的机箱刚性很强,弯曲和扭曲的情况很少。盖子表现出相对较多的弯曲,但没有明显的幅度,不会引起任何关注。
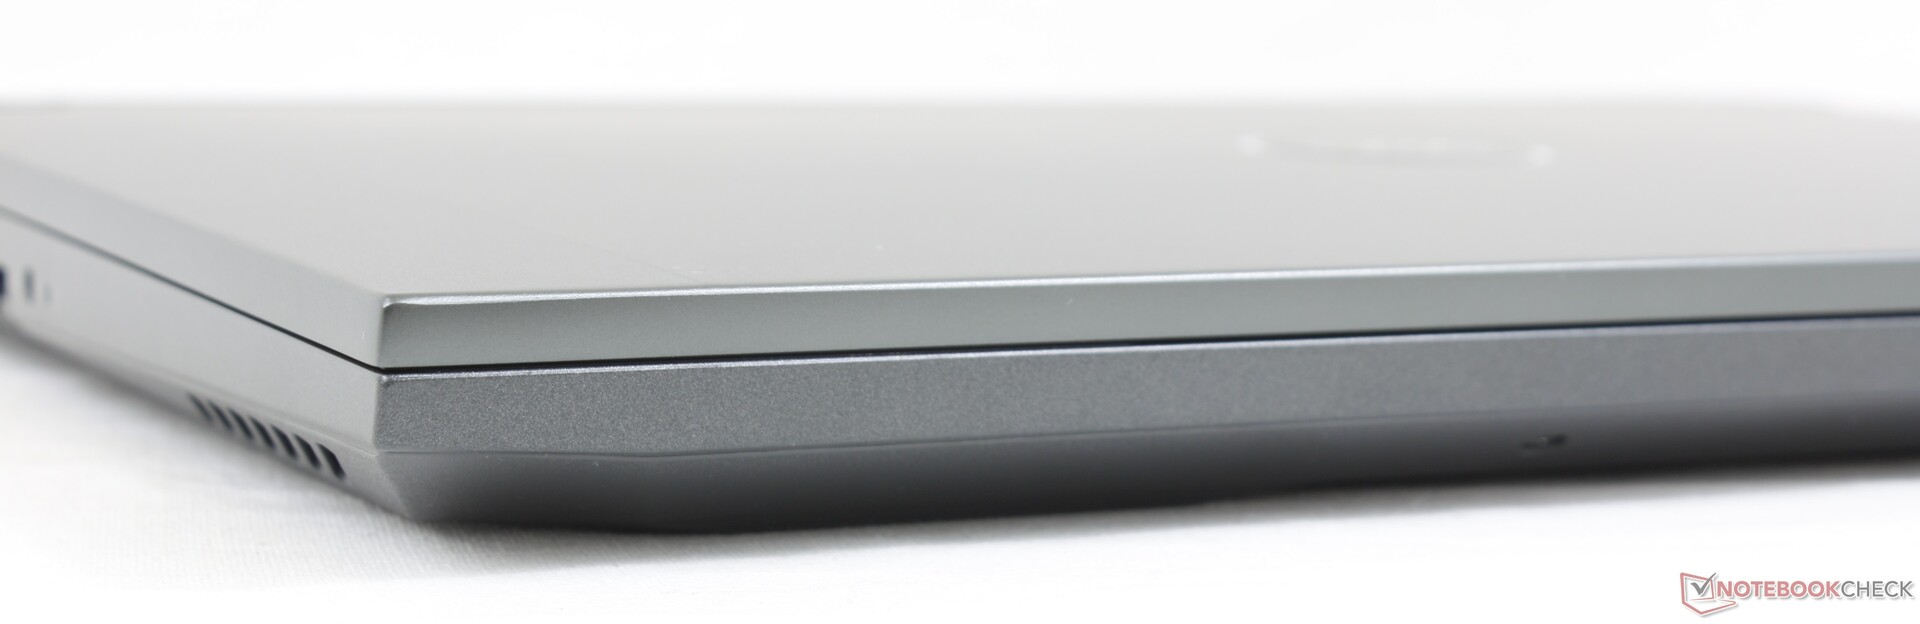
戴尔游戏笔记本电脑通常比竞争对手重,G16也不例外。在2.6公斤,该模型比 惠普Victus 16、宏碁Swift X和华硕Zephyrus M16各重几百克。因此,G16也比同尺寸类别中的大多数其他游戏笔记本电脑更厚。
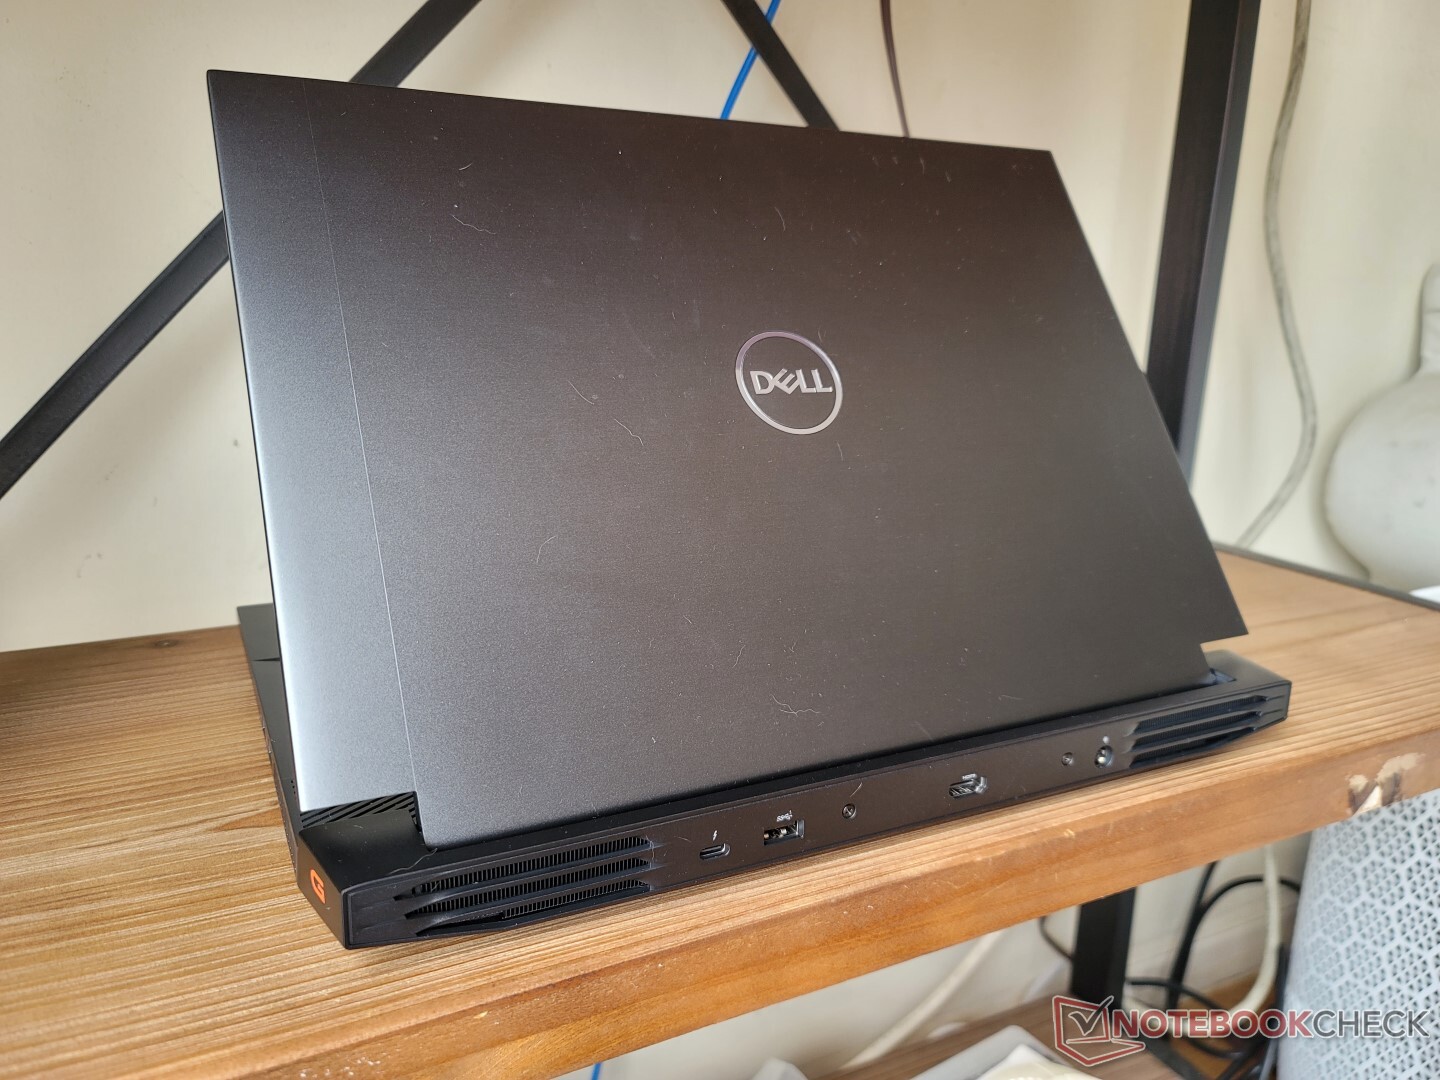
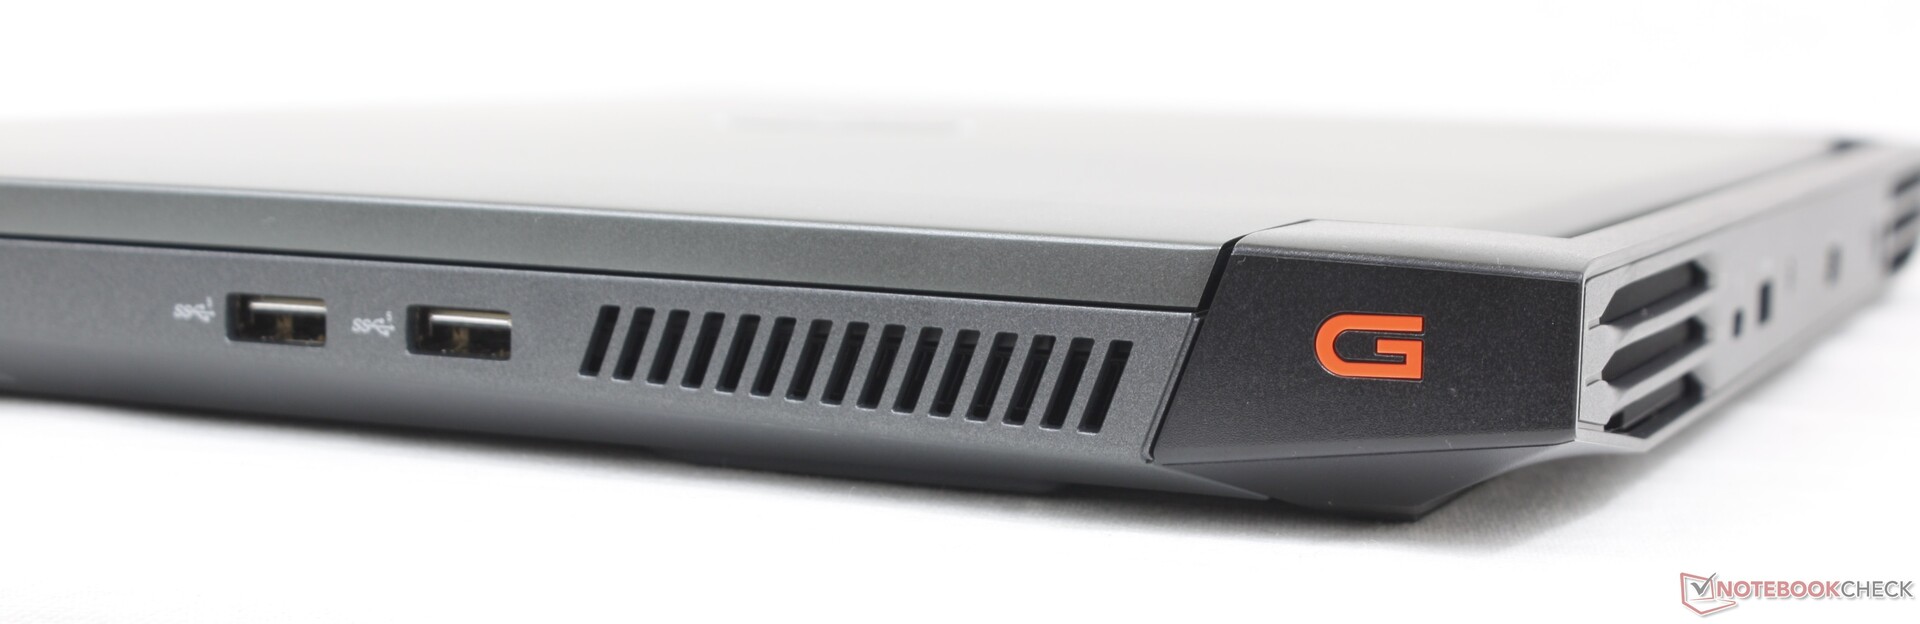
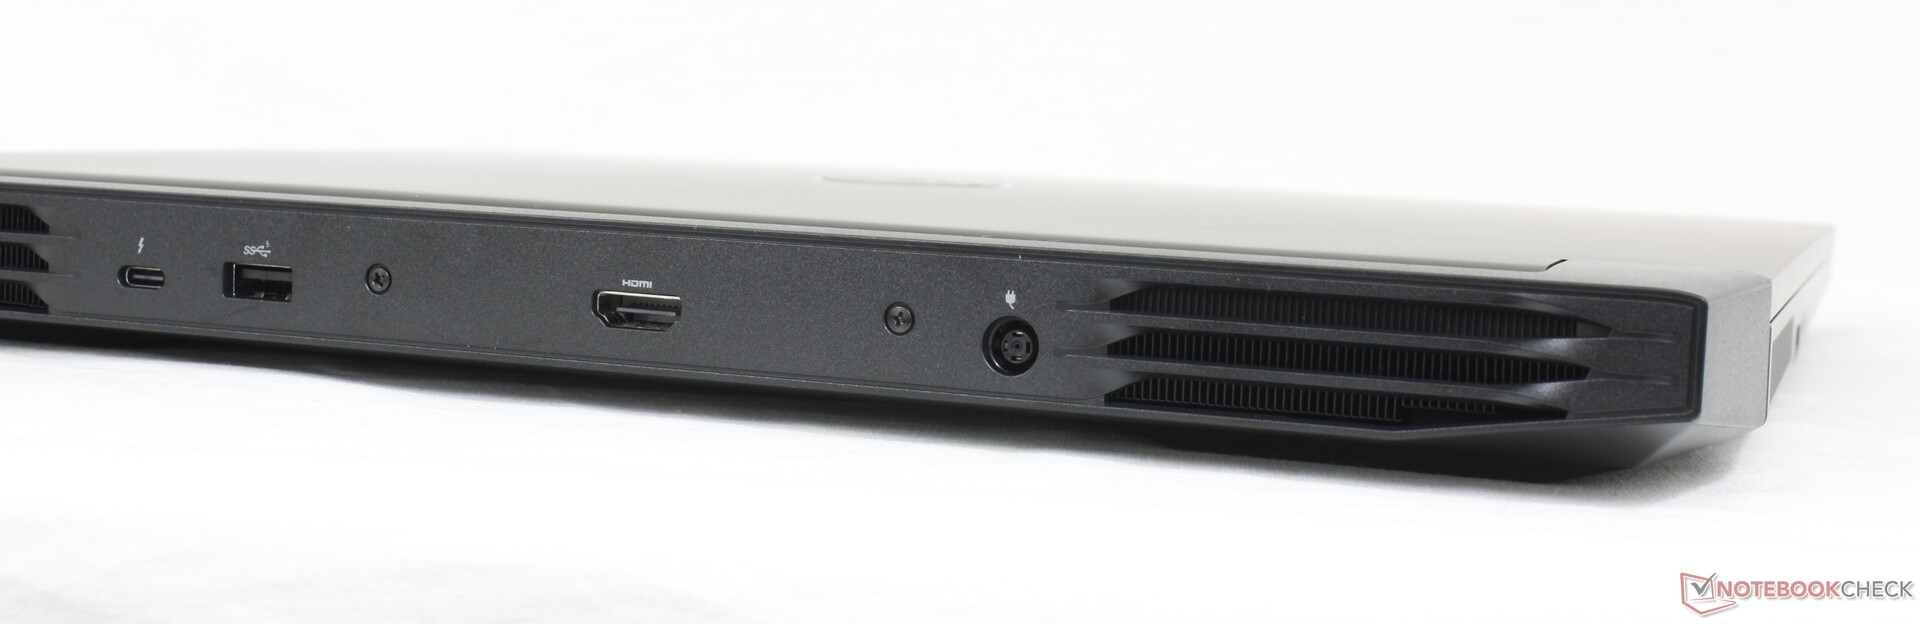
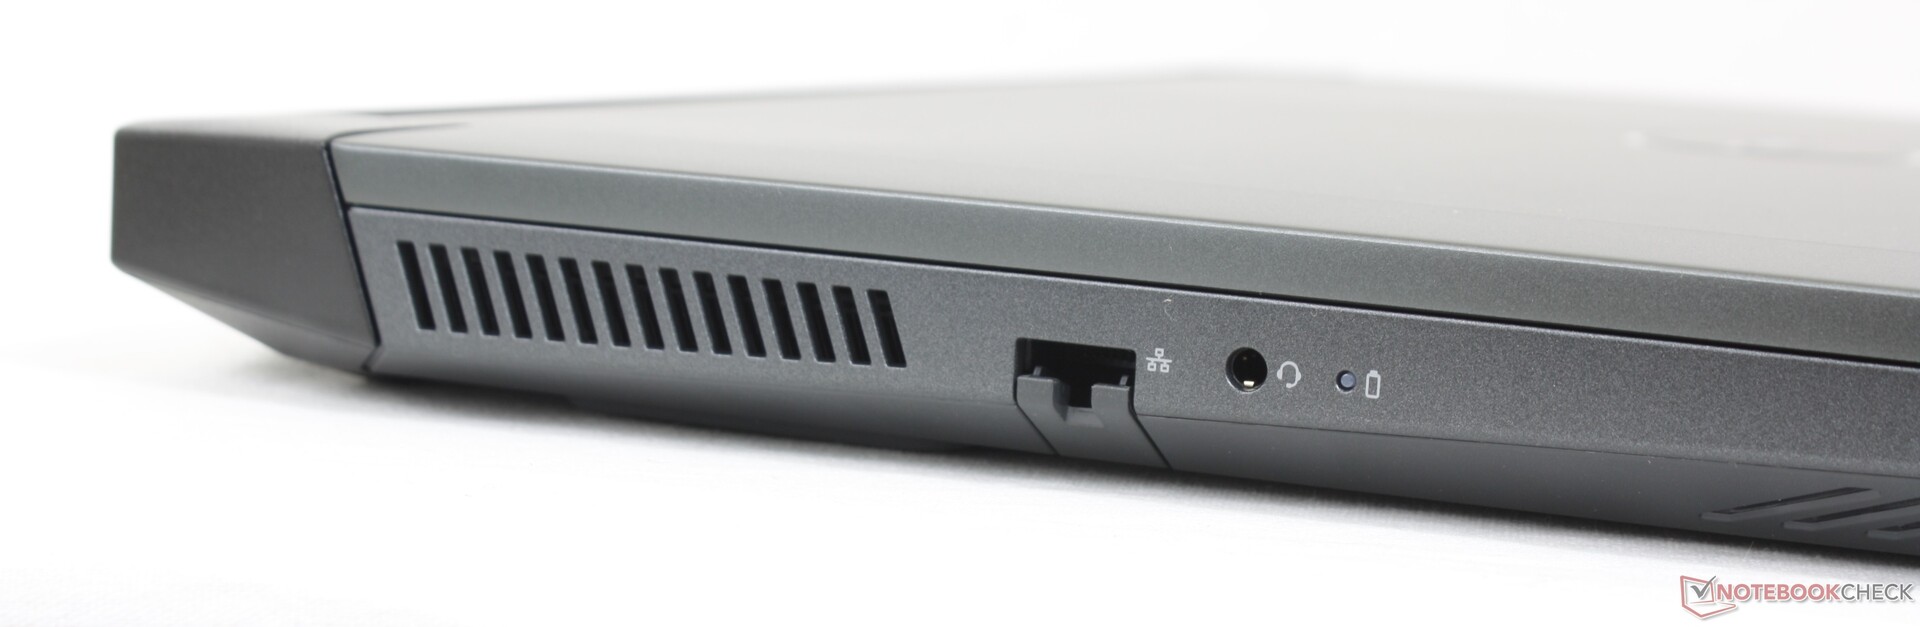
连接性 - 支持Thunderbolt 4
端口选项与惠普Victus 16最为相似,尽管是重新安排的。事实上,由于左右边缘的大型通风格栅,G16上一半的端口是沿着后部的。我们希望在未来看到更多的USB-C端口,因为只有一个,而竞争者有三个。联想Legion 5 Pro.
通信 - 6 GHz 不包括在内
英特尔AX201是Wi-Fi 6和蓝牙5.2连接的标准配置。没有可能节省成本的Wi-Fi 6E选项。当与我们的AXE11000路由器配对时,传输率是稳定的,如果不是令人印象深刻的话。
| Networking | |
| iperf3 transmit AX12 | |
| Acer Swift X SFX16-51G-5388 | |
| Asus ROG Zephyrus M16 GU603H | |
| iperf3 receive AX12 | |
| Acer Swift X SFX16-51G-5388 | |
| Asus ROG Zephyrus M16 GU603H | |
| iperf3 receive AXE11000 6GHz | |
| Lenovo Legion 5 Pro 16IAH7H | |
| Lenovo Legion 7 16ARHA7 | |
| iperf3 receive AXE11000 | |
| Dell G16 7620 | |
| HP Victus 16-e0145ng | |
| iperf3 transmit AXE11000 6GHz | |
| Lenovo Legion 7 16ARHA7 | |
| Lenovo Legion 5 Pro 16IAH7H | |
| iperf3 transmit AXE11000 | |
| Dell G16 7620 | |
| HP Victus 16-e0145ng | |
网络摄像头
网络摄像头是令人失望的100万像素,画面非常浑浊。也没有红外传感器或隐私快门。


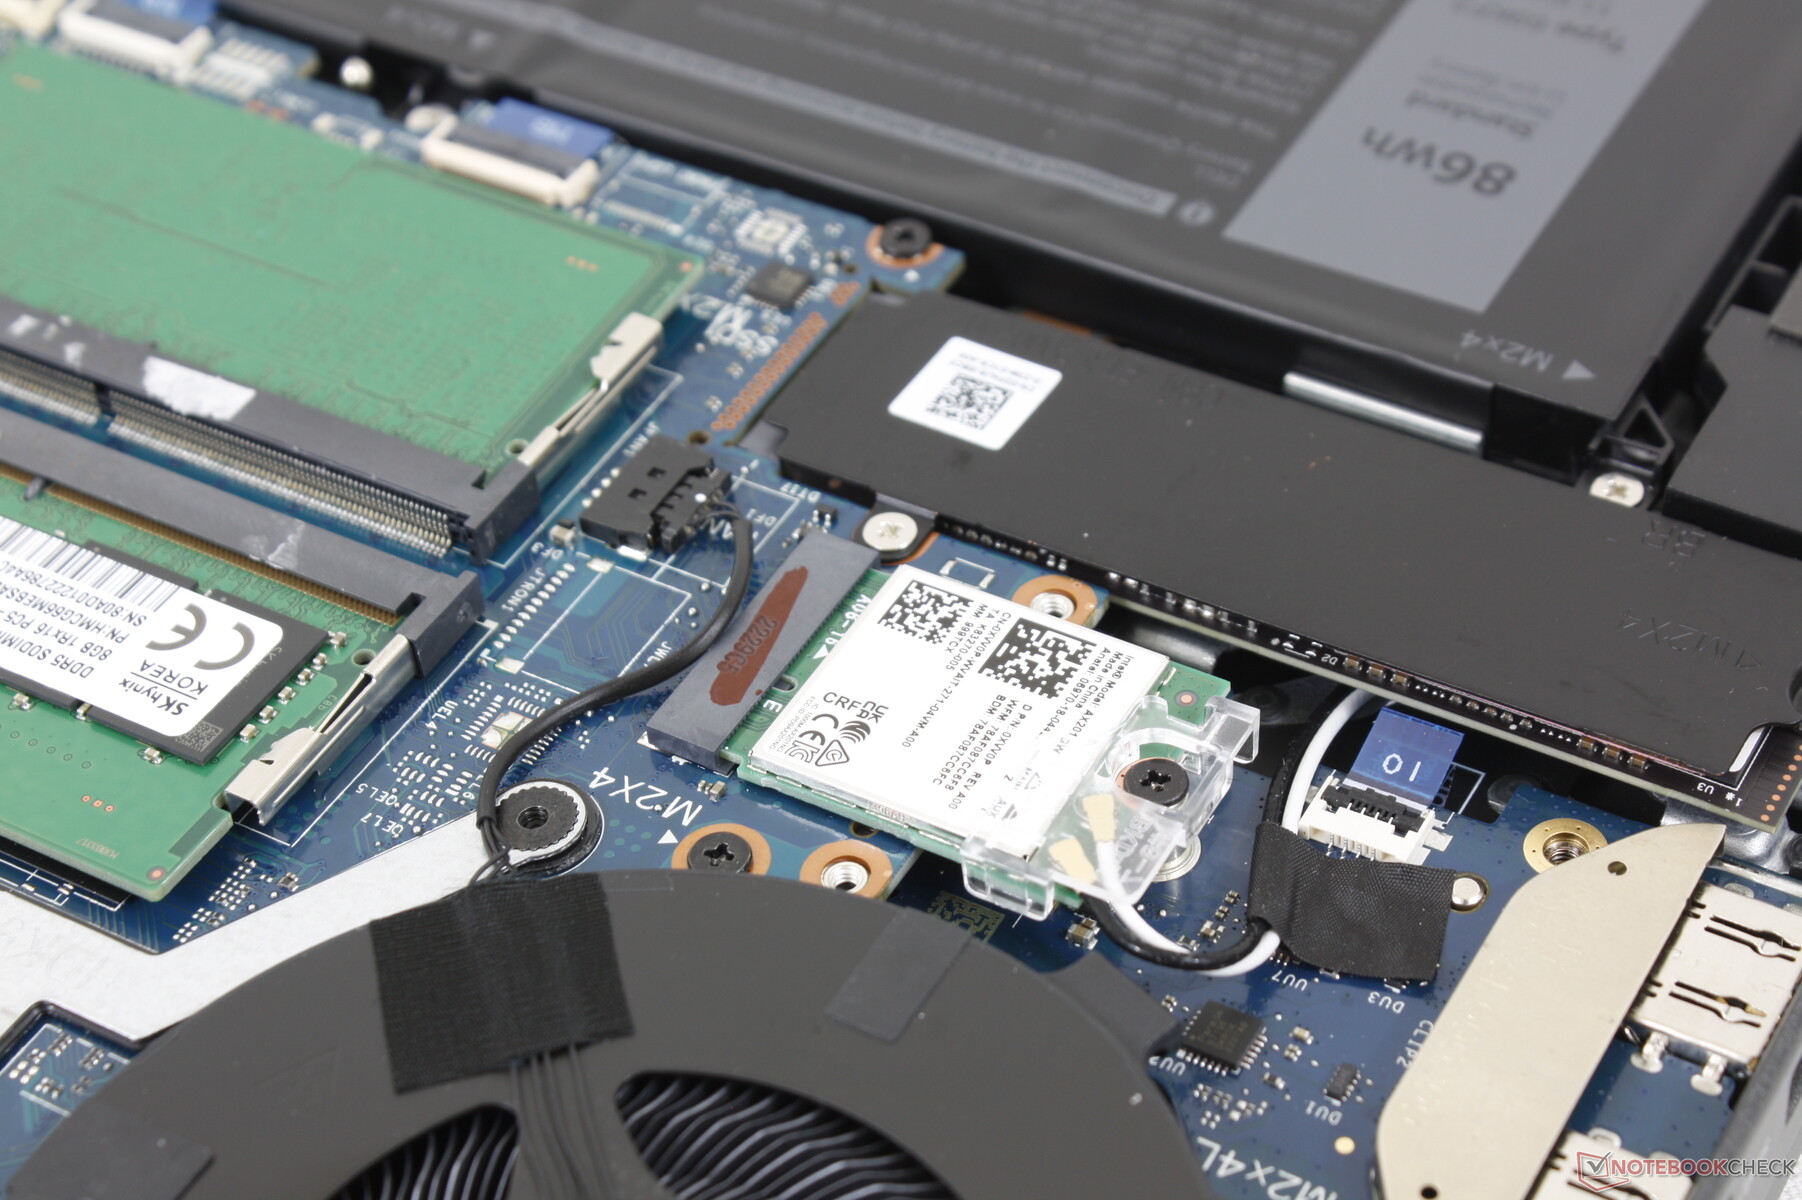
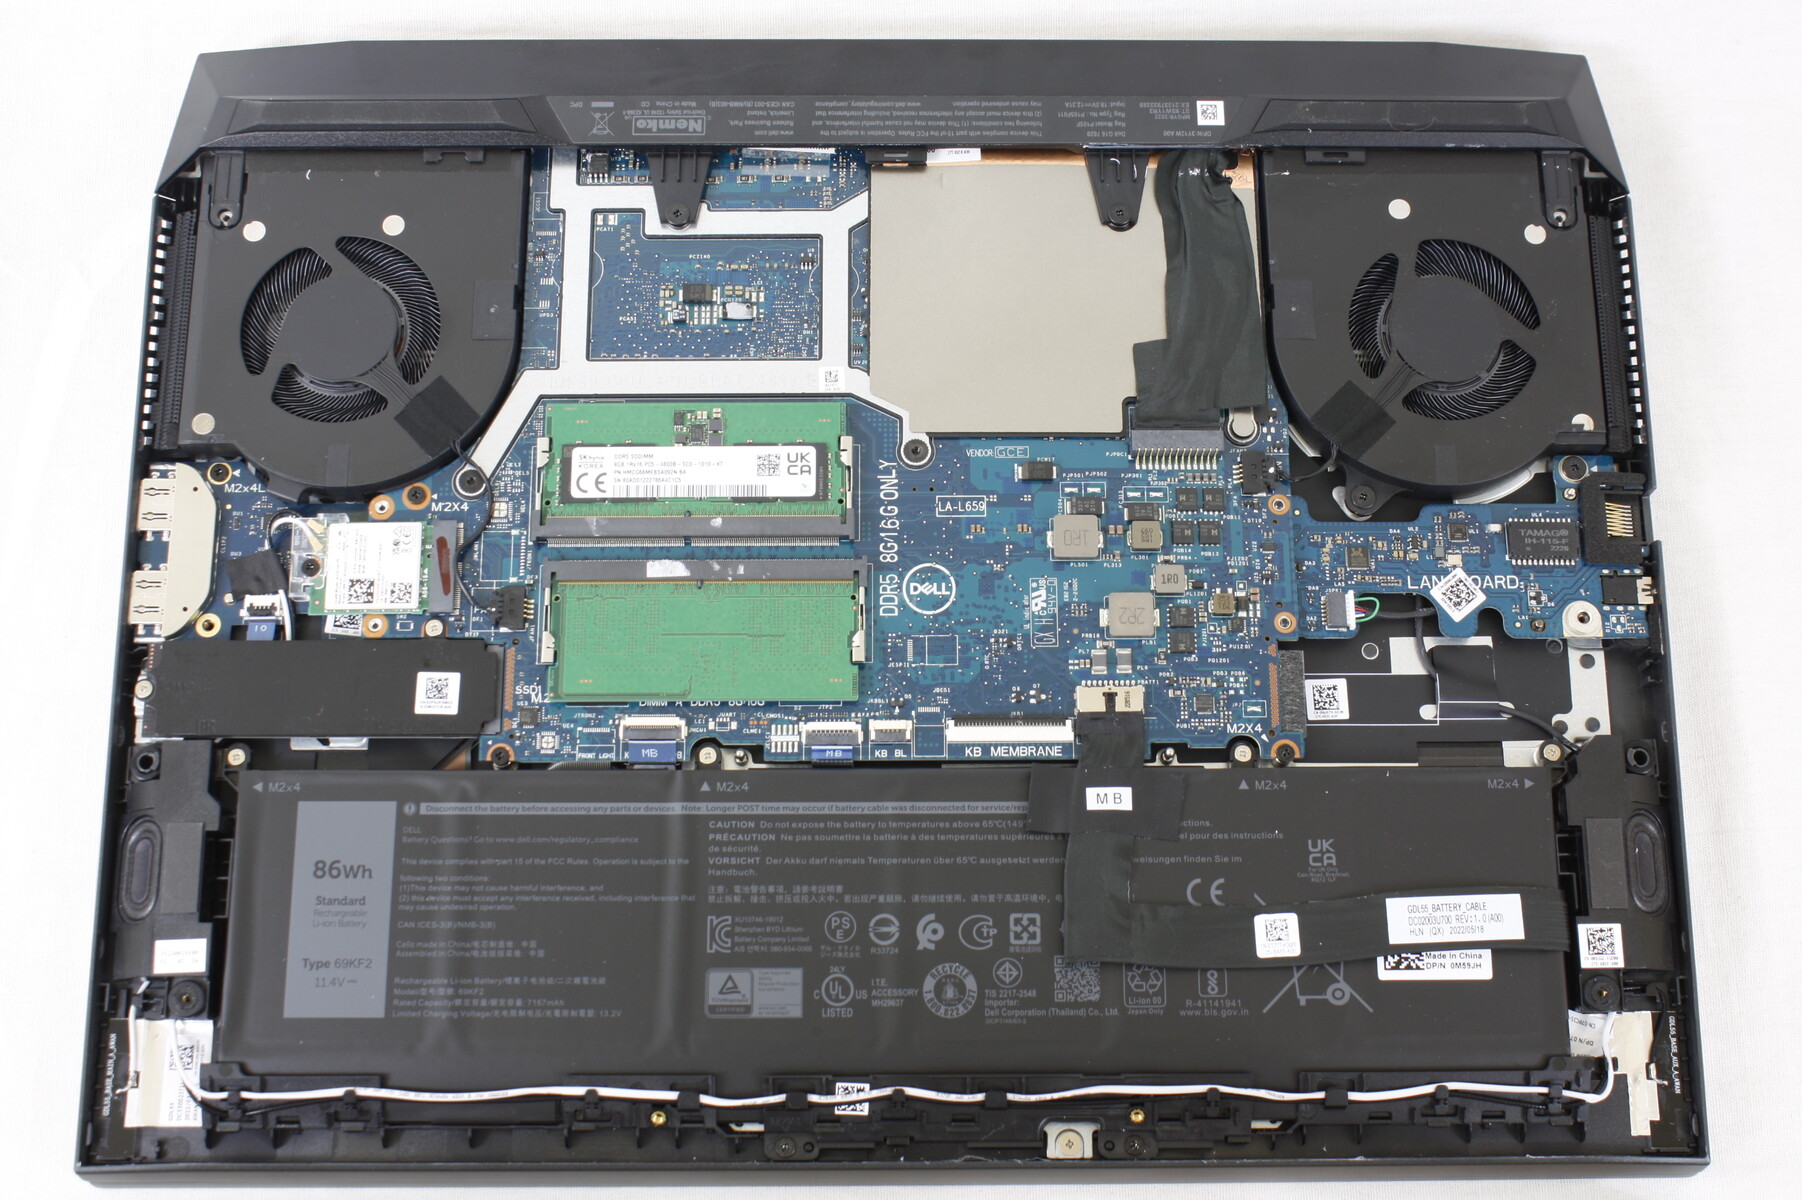
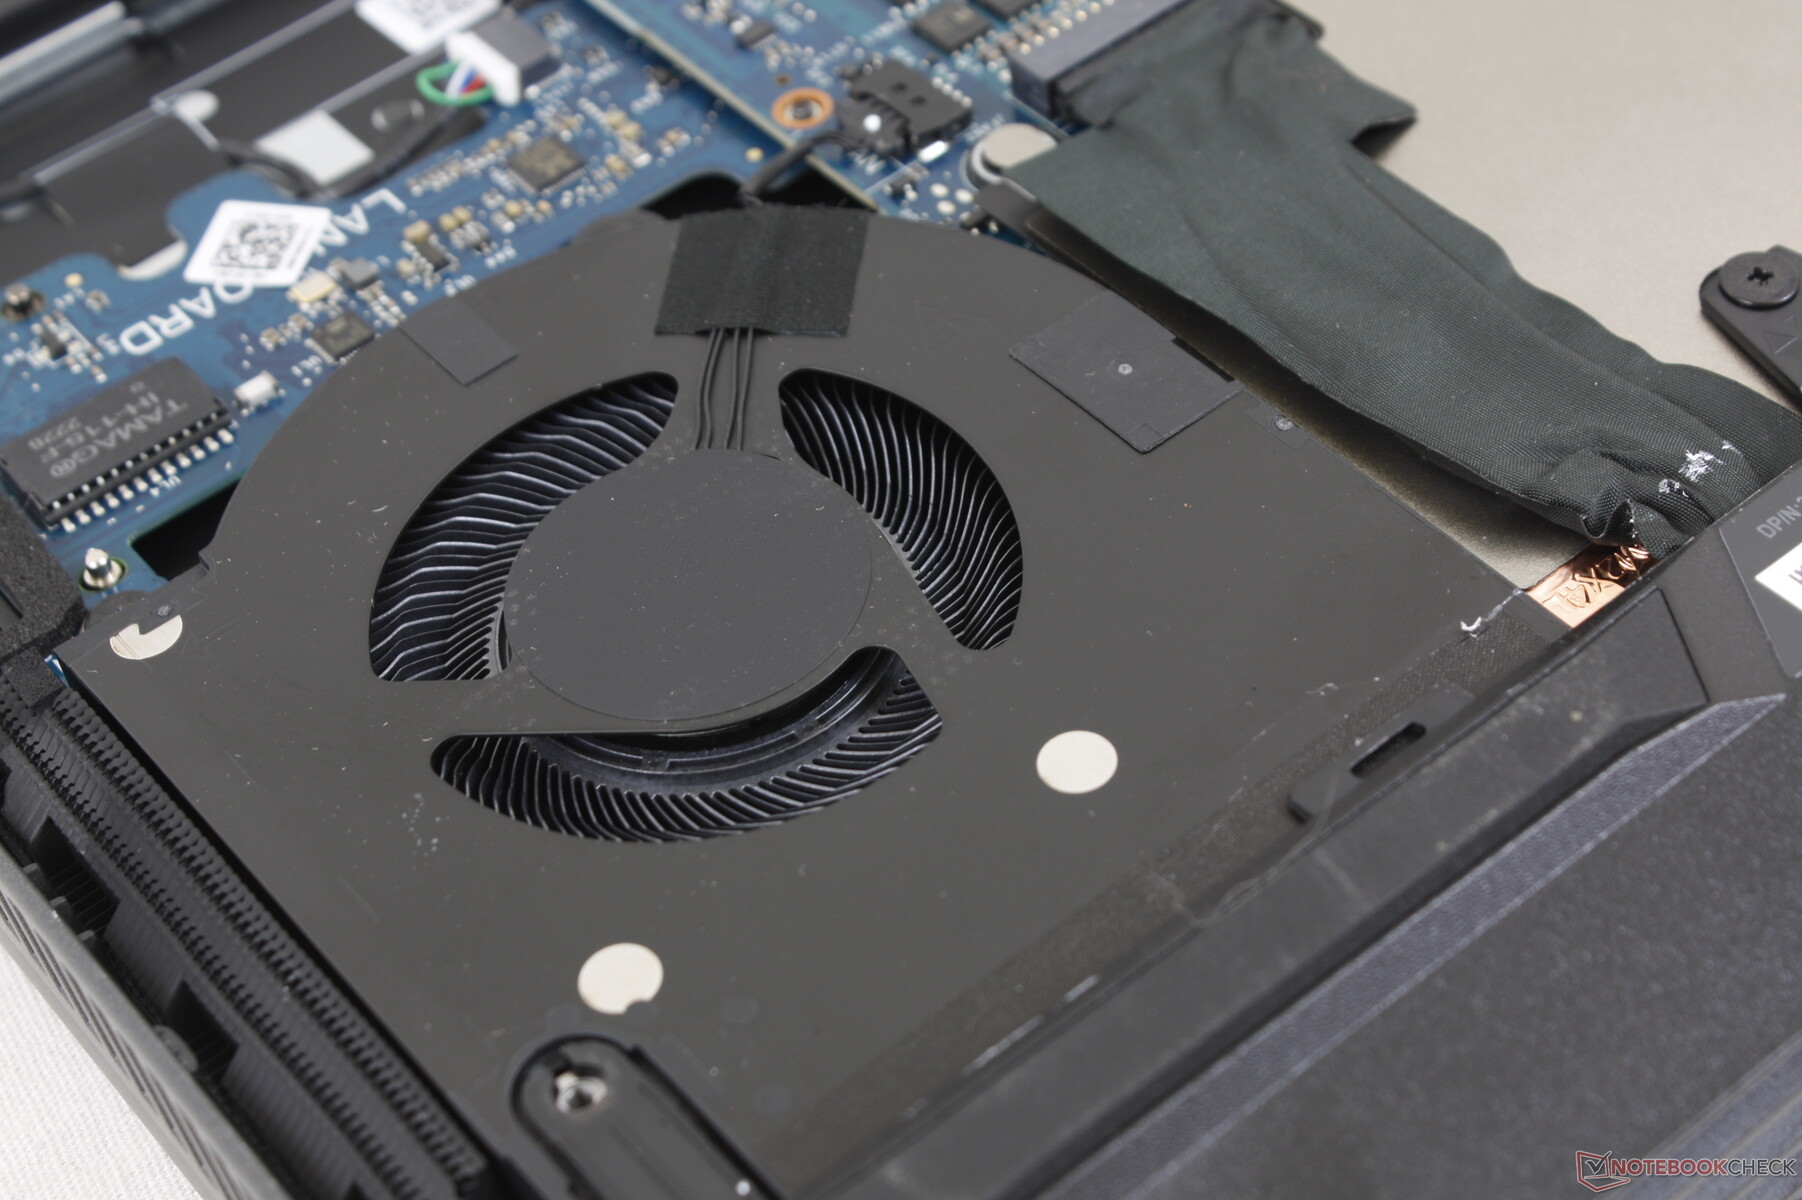
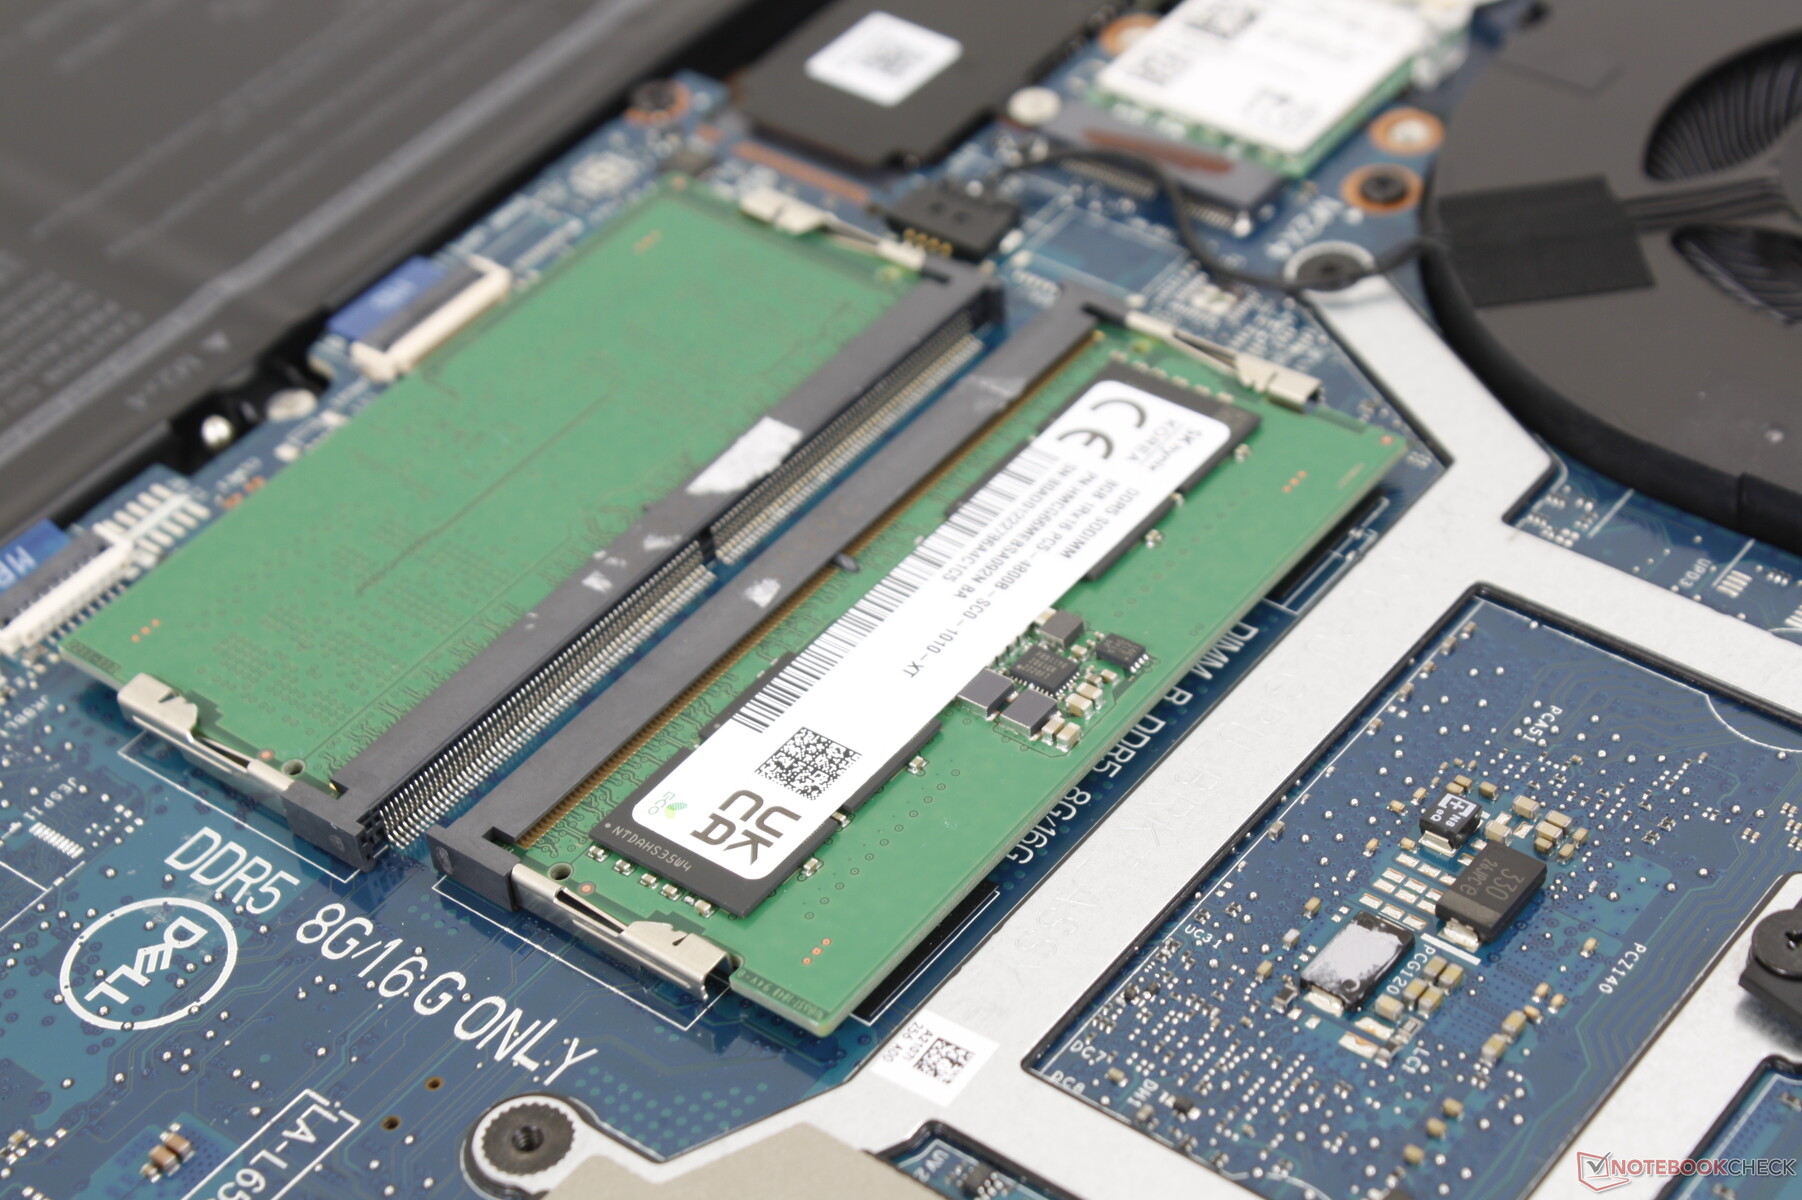
维护
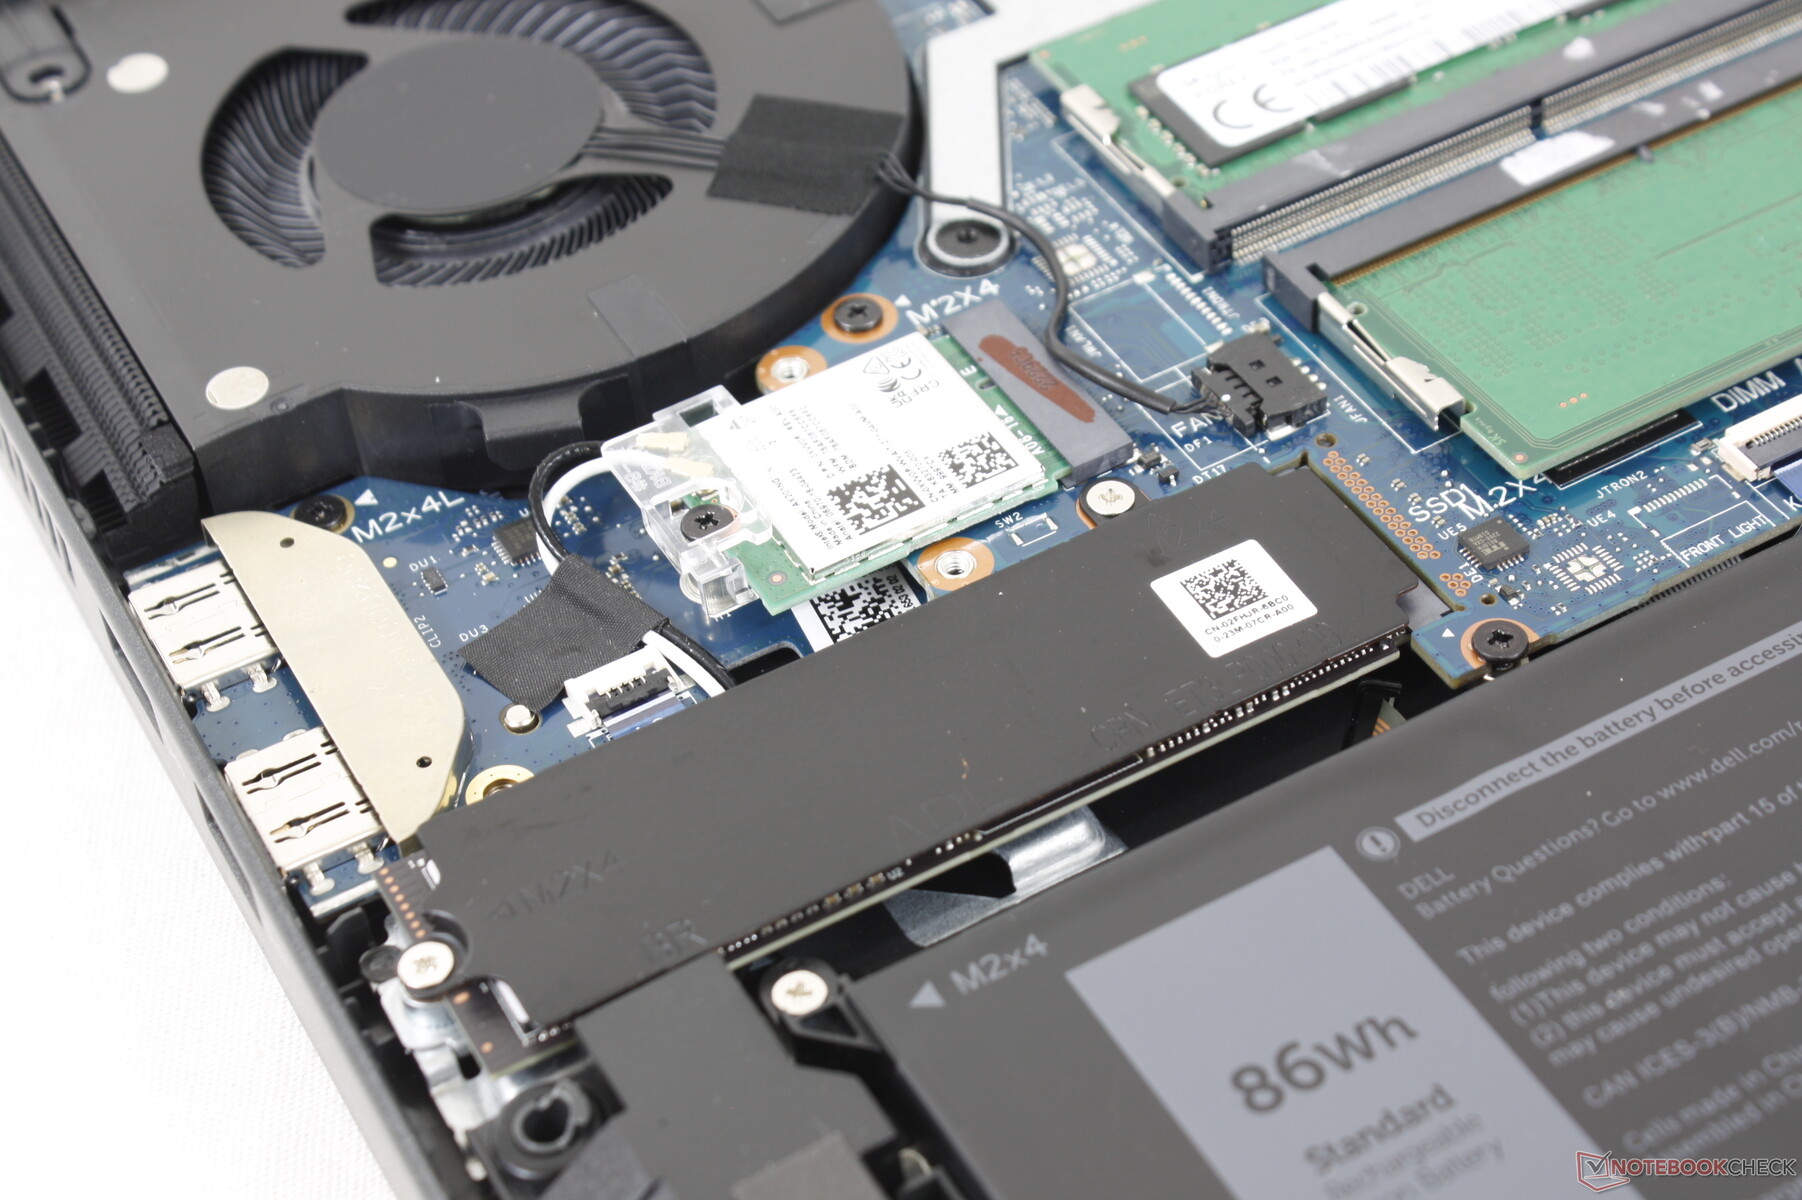
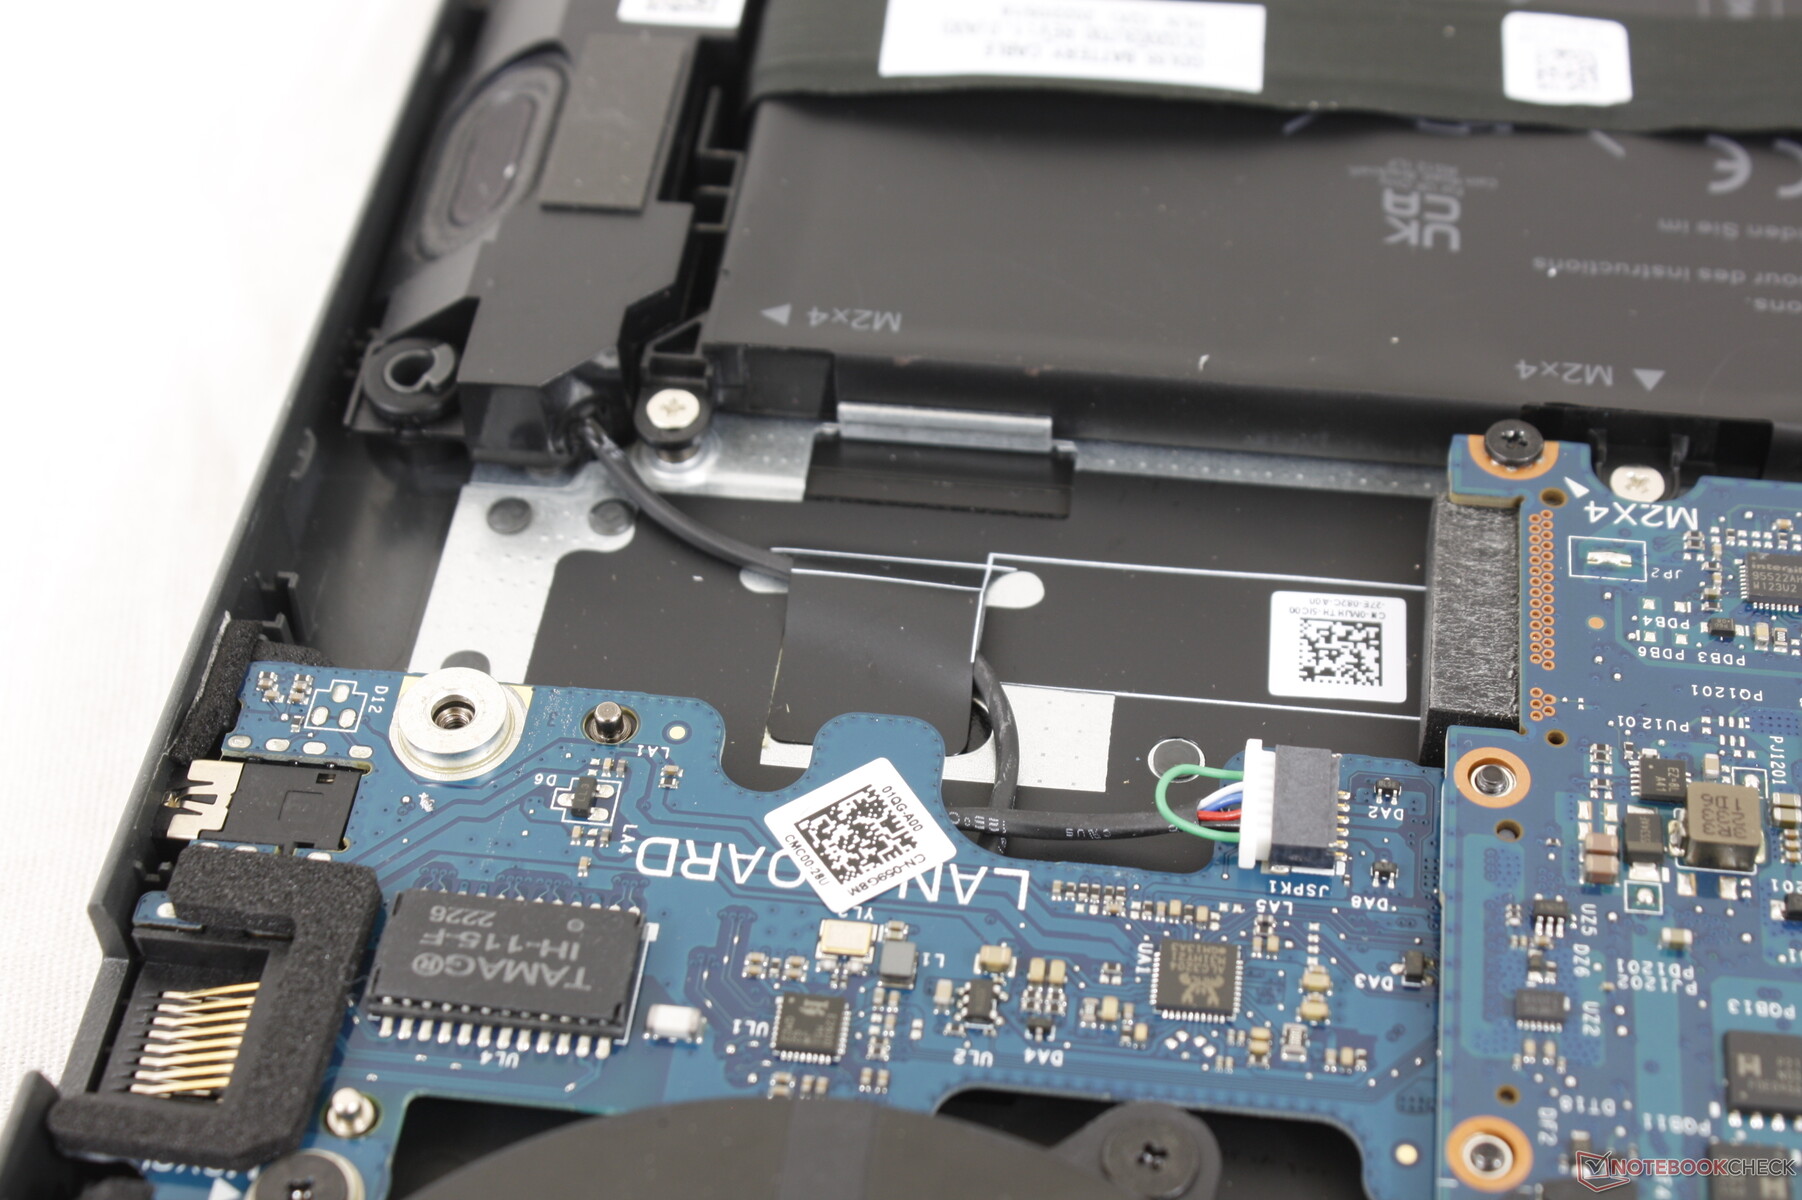
底部面板由8颗飞利浦螺钉固定,便于维修。用户可以直接接触到2个DDR5 SODIMM插槽、1个M.2 2280 SSD插槽、电池和可拆卸的M.2 WLAN模块。热管和处理器在另一侧,需要进一步拆卸才能进入。
配件和保修
除了交流电适配器和文件之外,盒子里没有任何额外的东西。如果在美国购买,通常有一年的制造商有限保修。
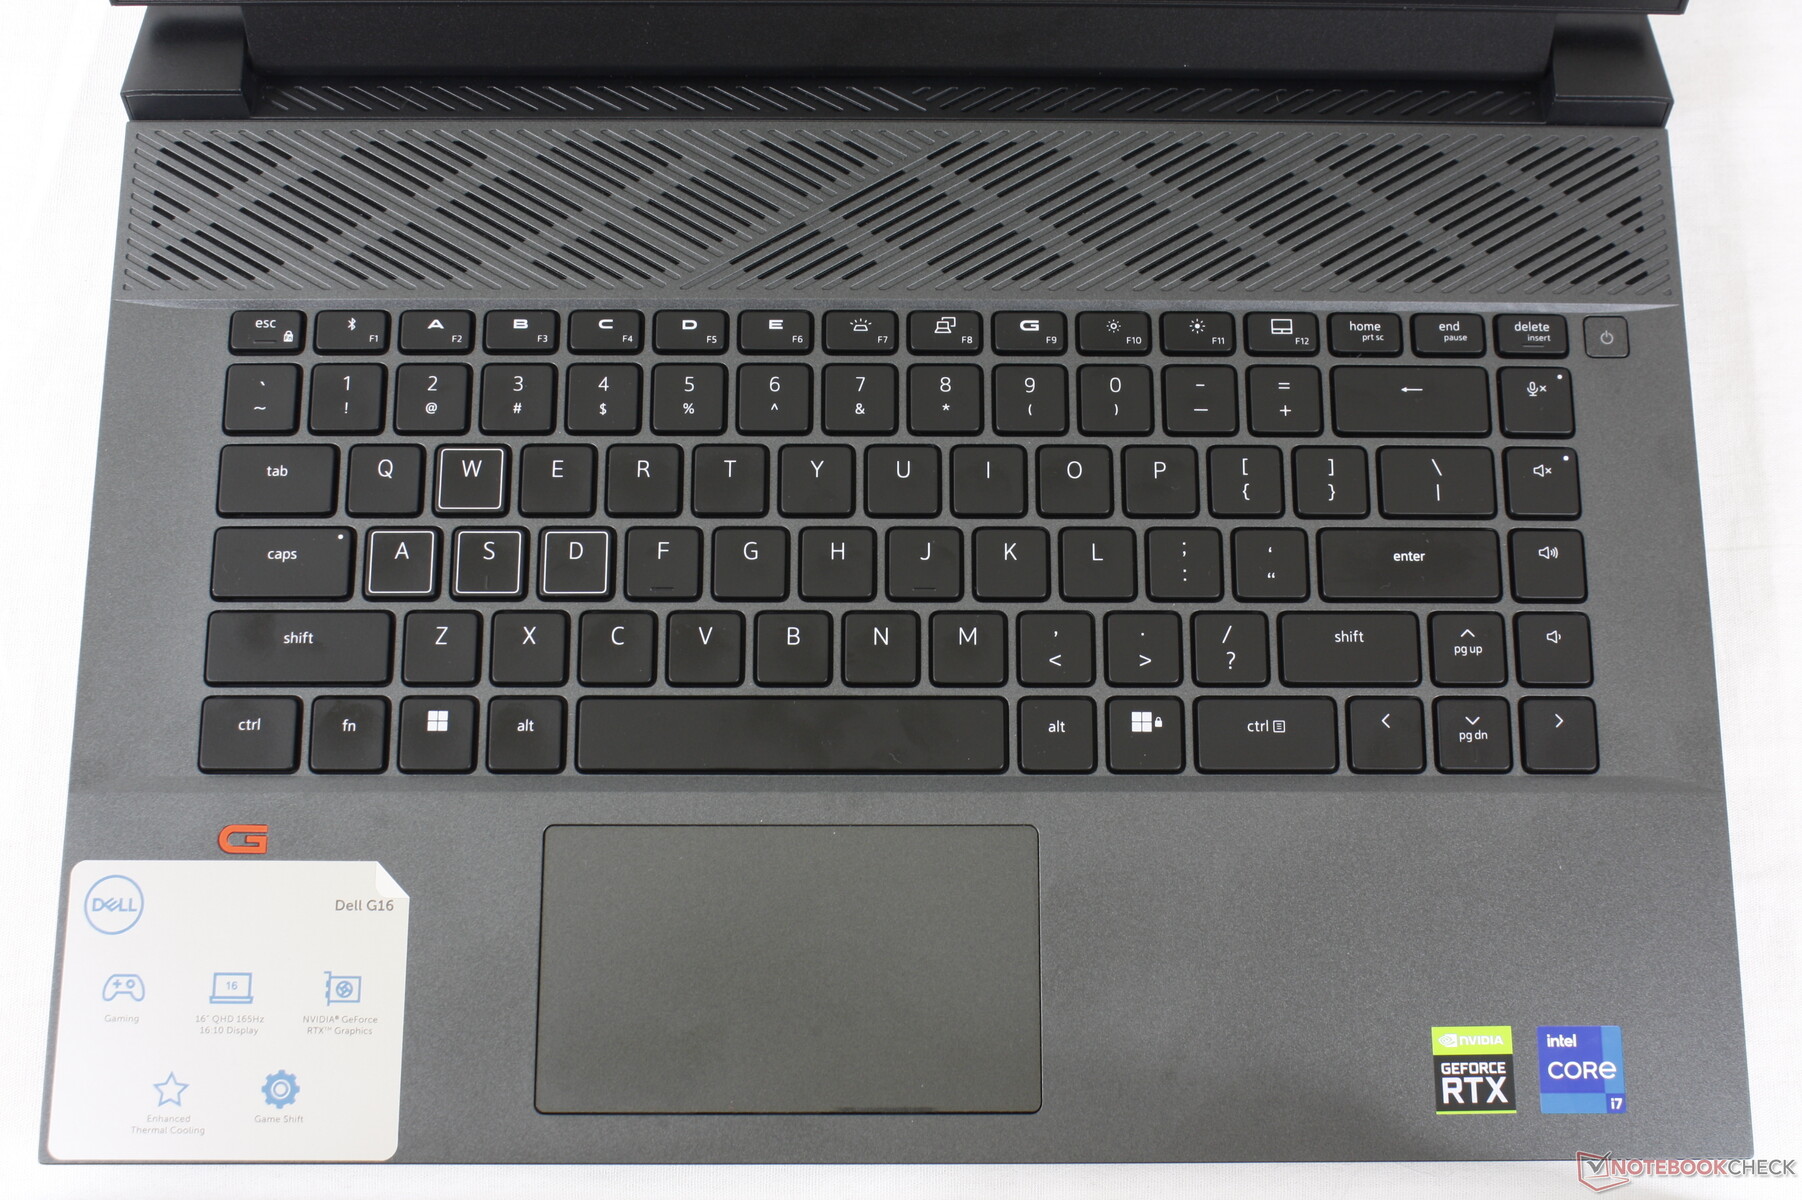
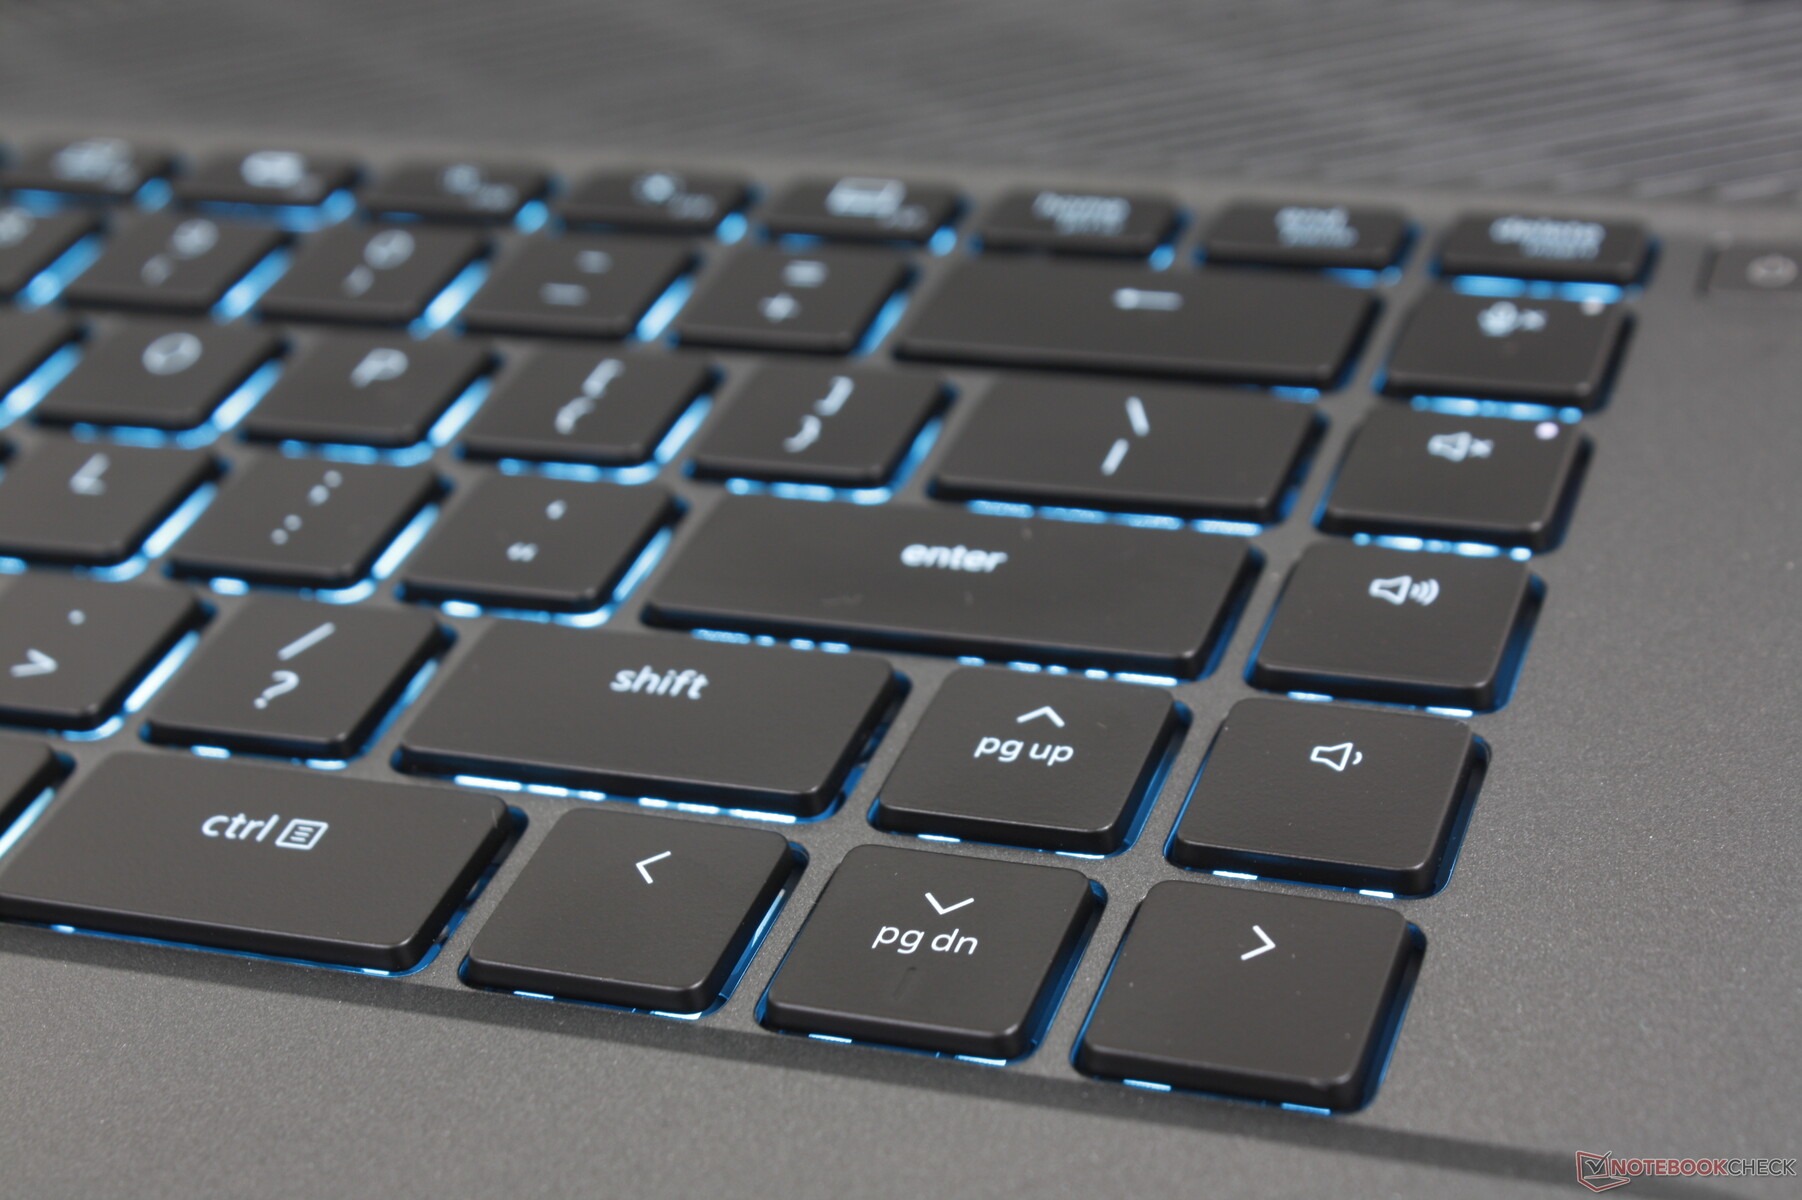
输入设备--不再有Numpad
键盘
虽然戴尔可以很容易地将完全相同的G15键盘用于其新的G16模型,但他们却选择了一个完全不同的键盘。G16键盘放弃了小键盘,改用全尺寸的方向键,这在不同的应用或游戏中是一个混合包。从好的方面看,按键反馈感觉比G15更清晰、更牢固,打字体验更令人满意。
恼人的是,用户必须为G16的每个键的RGB照明功能支付更多费用。如我们下面的图片所示,该型号配备了一个单区蓝色LED背光。
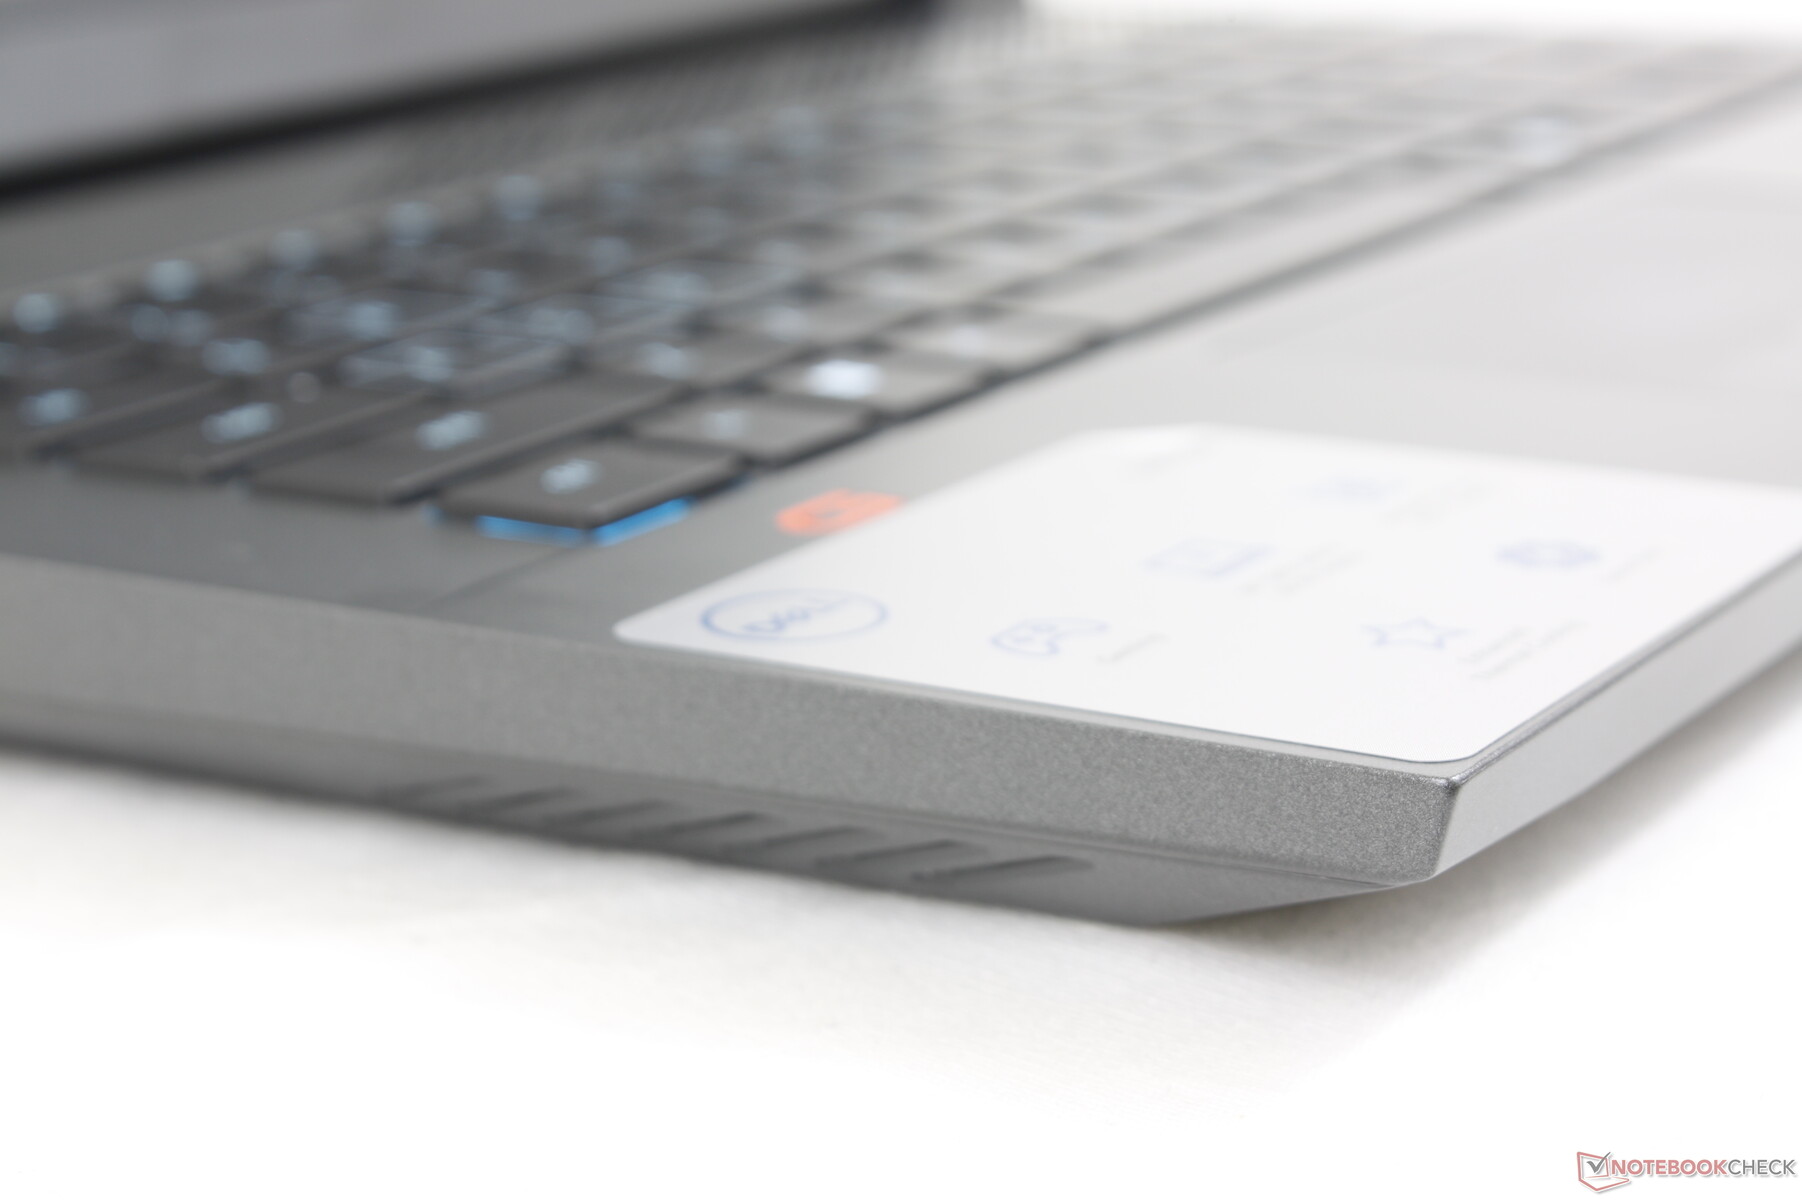
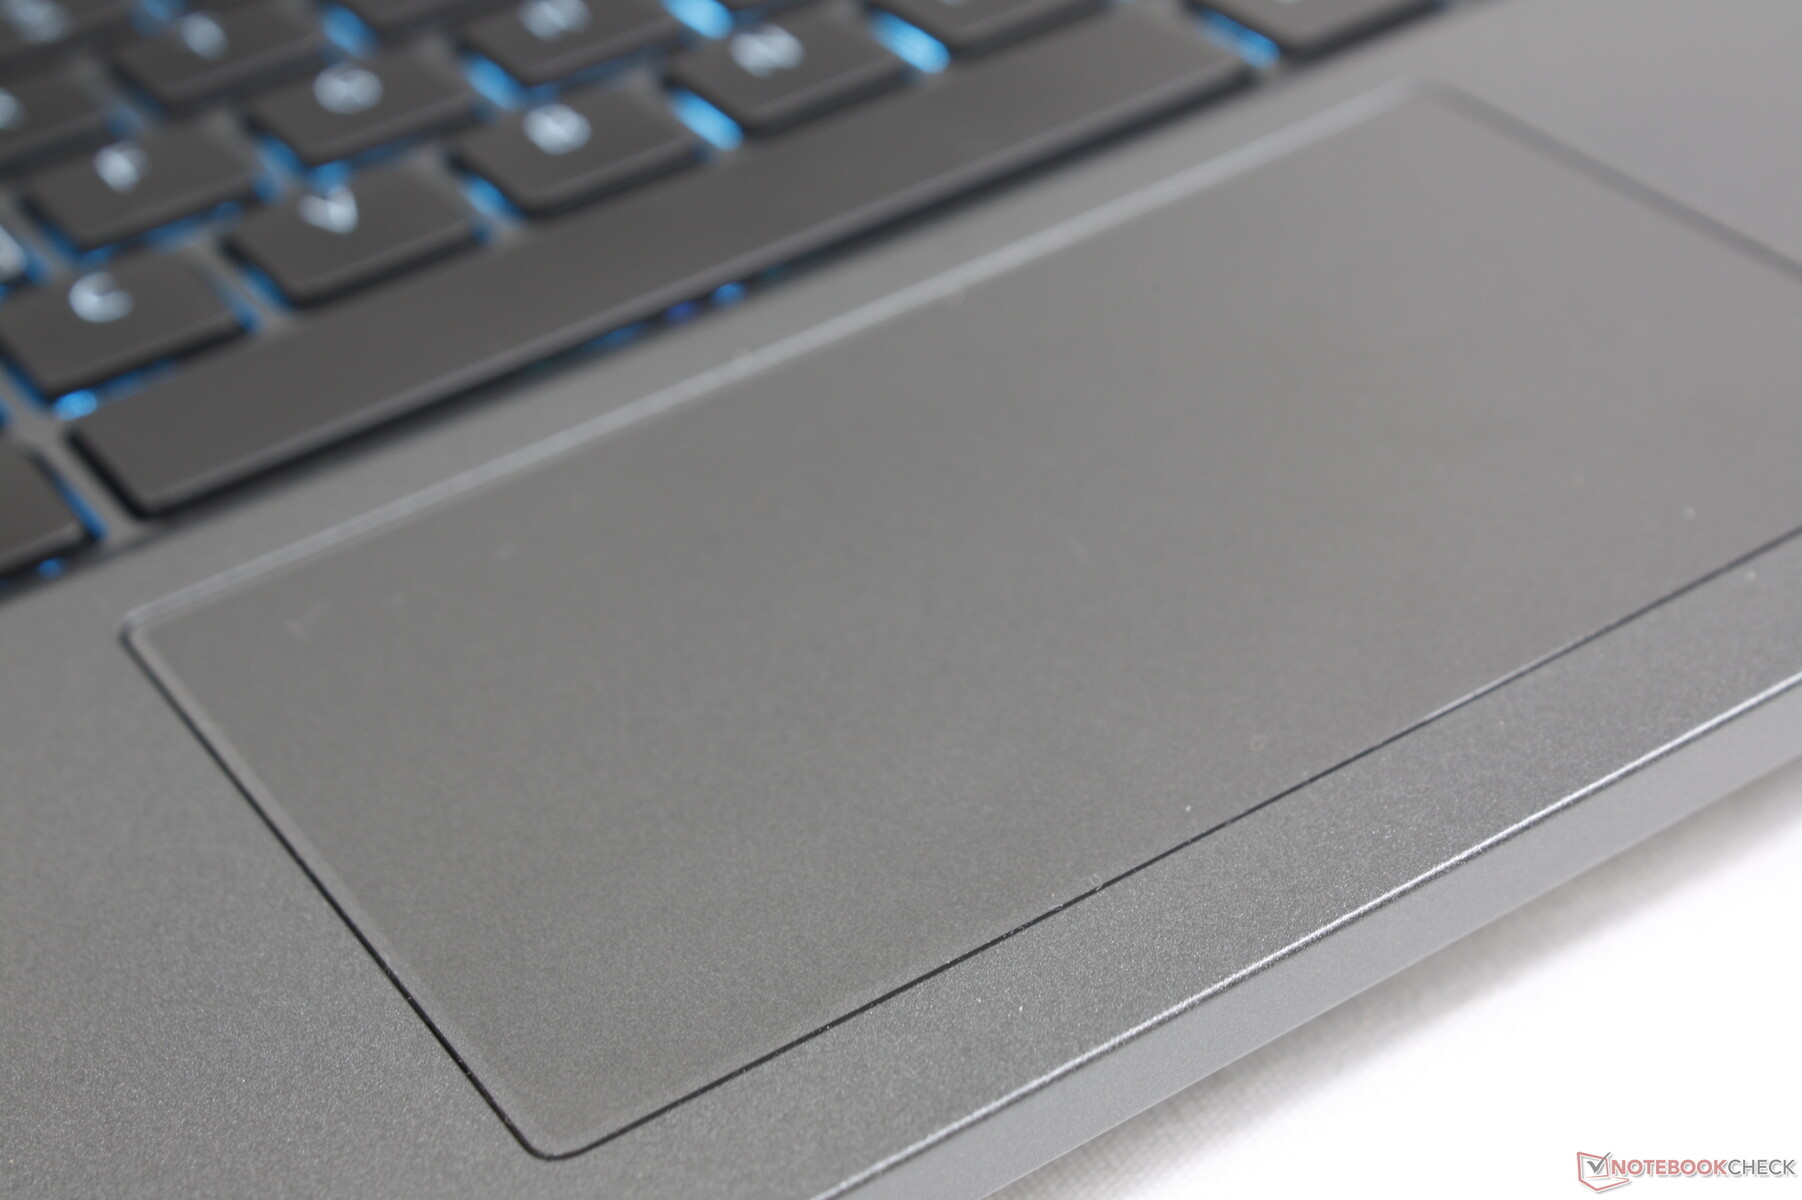
触摸板
G16的点击板只有10.5 x 6厘米,是我们在这个价格范围内的任何笔记本电脑上看到的最小的点击板之一。笔记本上的点击板 Inspiron 16 Plus 7620相比之下是11.5 x 8厘米。不过,小尺寸并不是什么大问题,因为游戏玩家的目标受众可能会随时准备好鼠标。

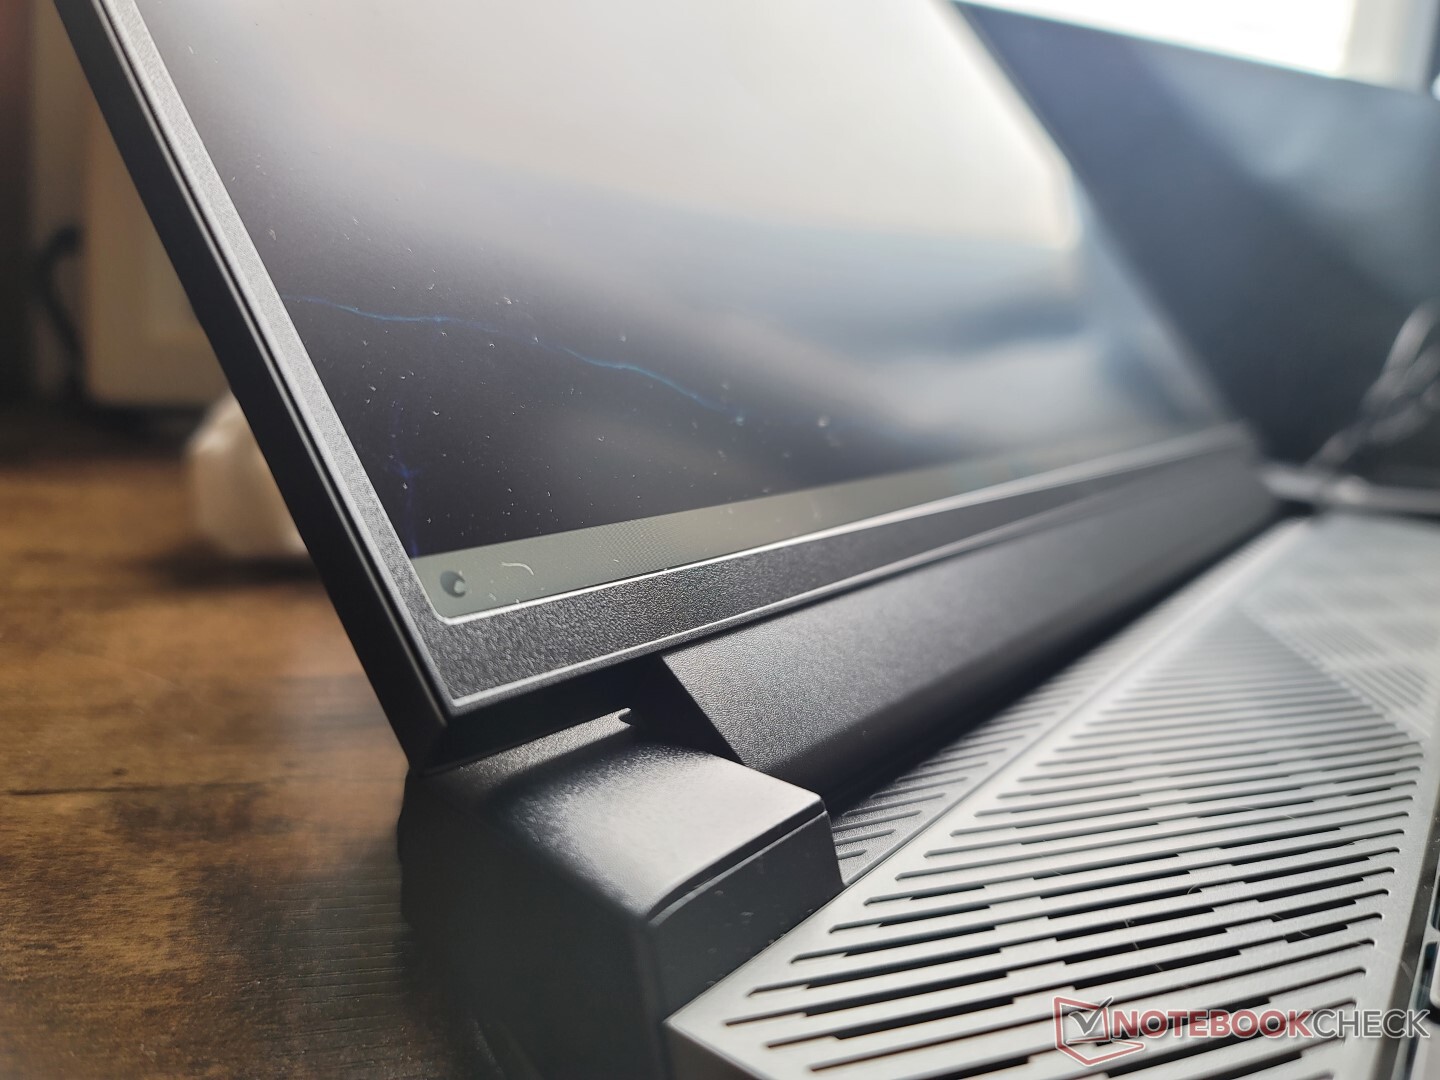
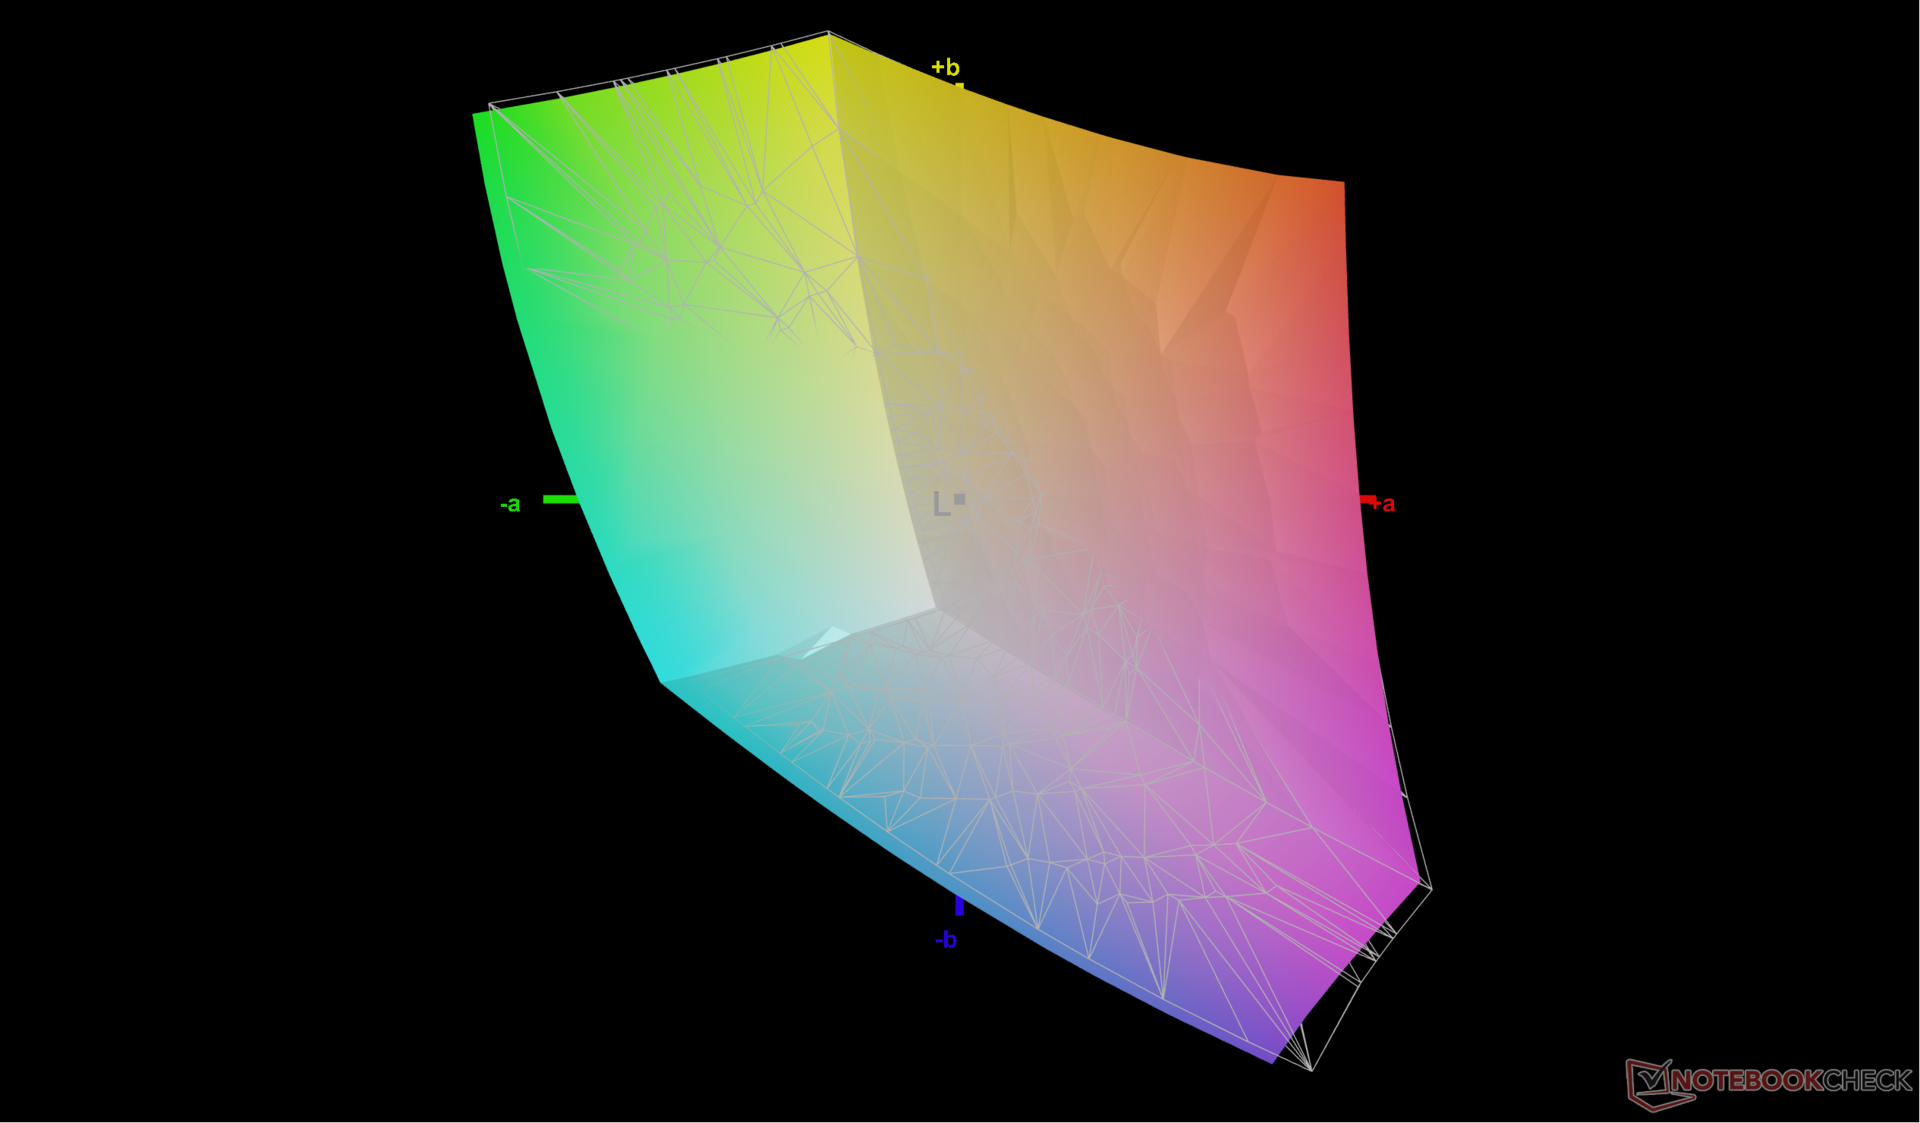
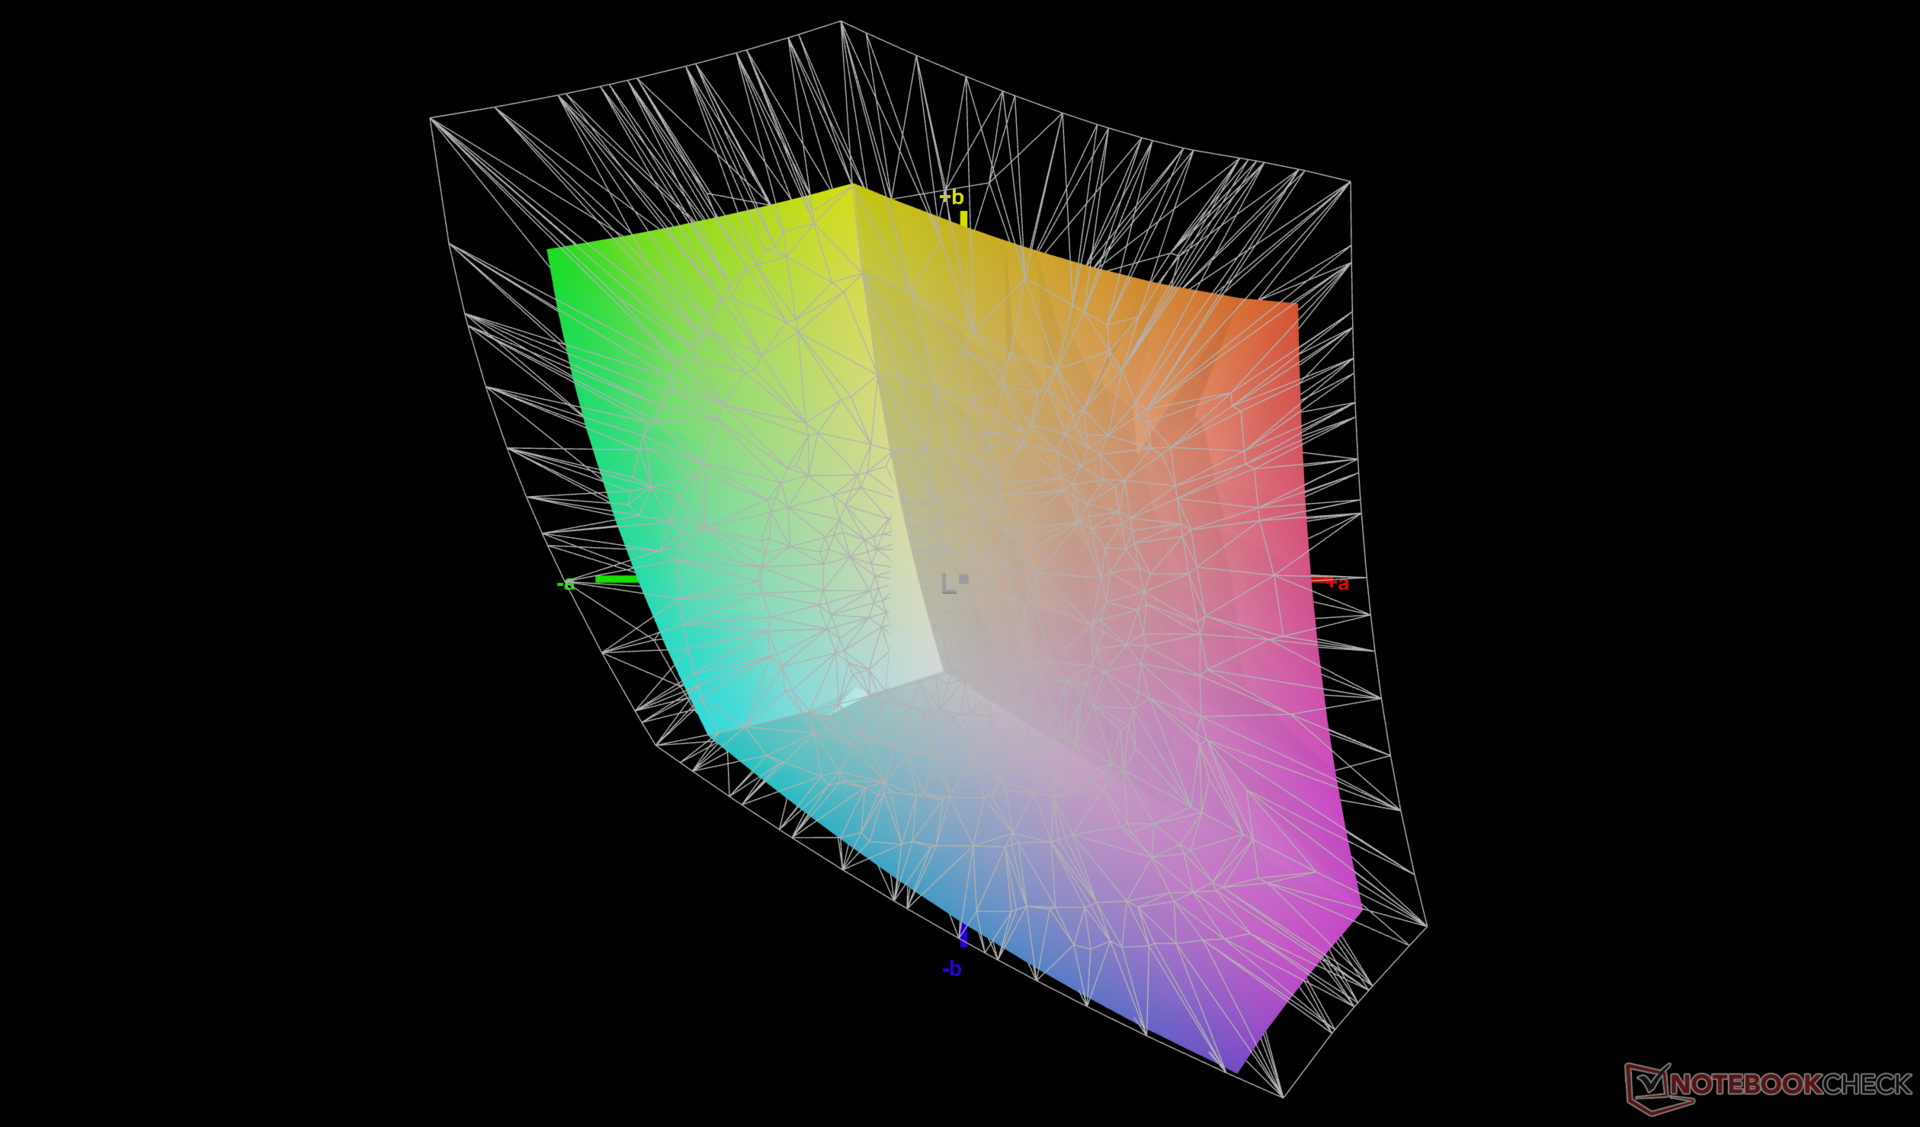
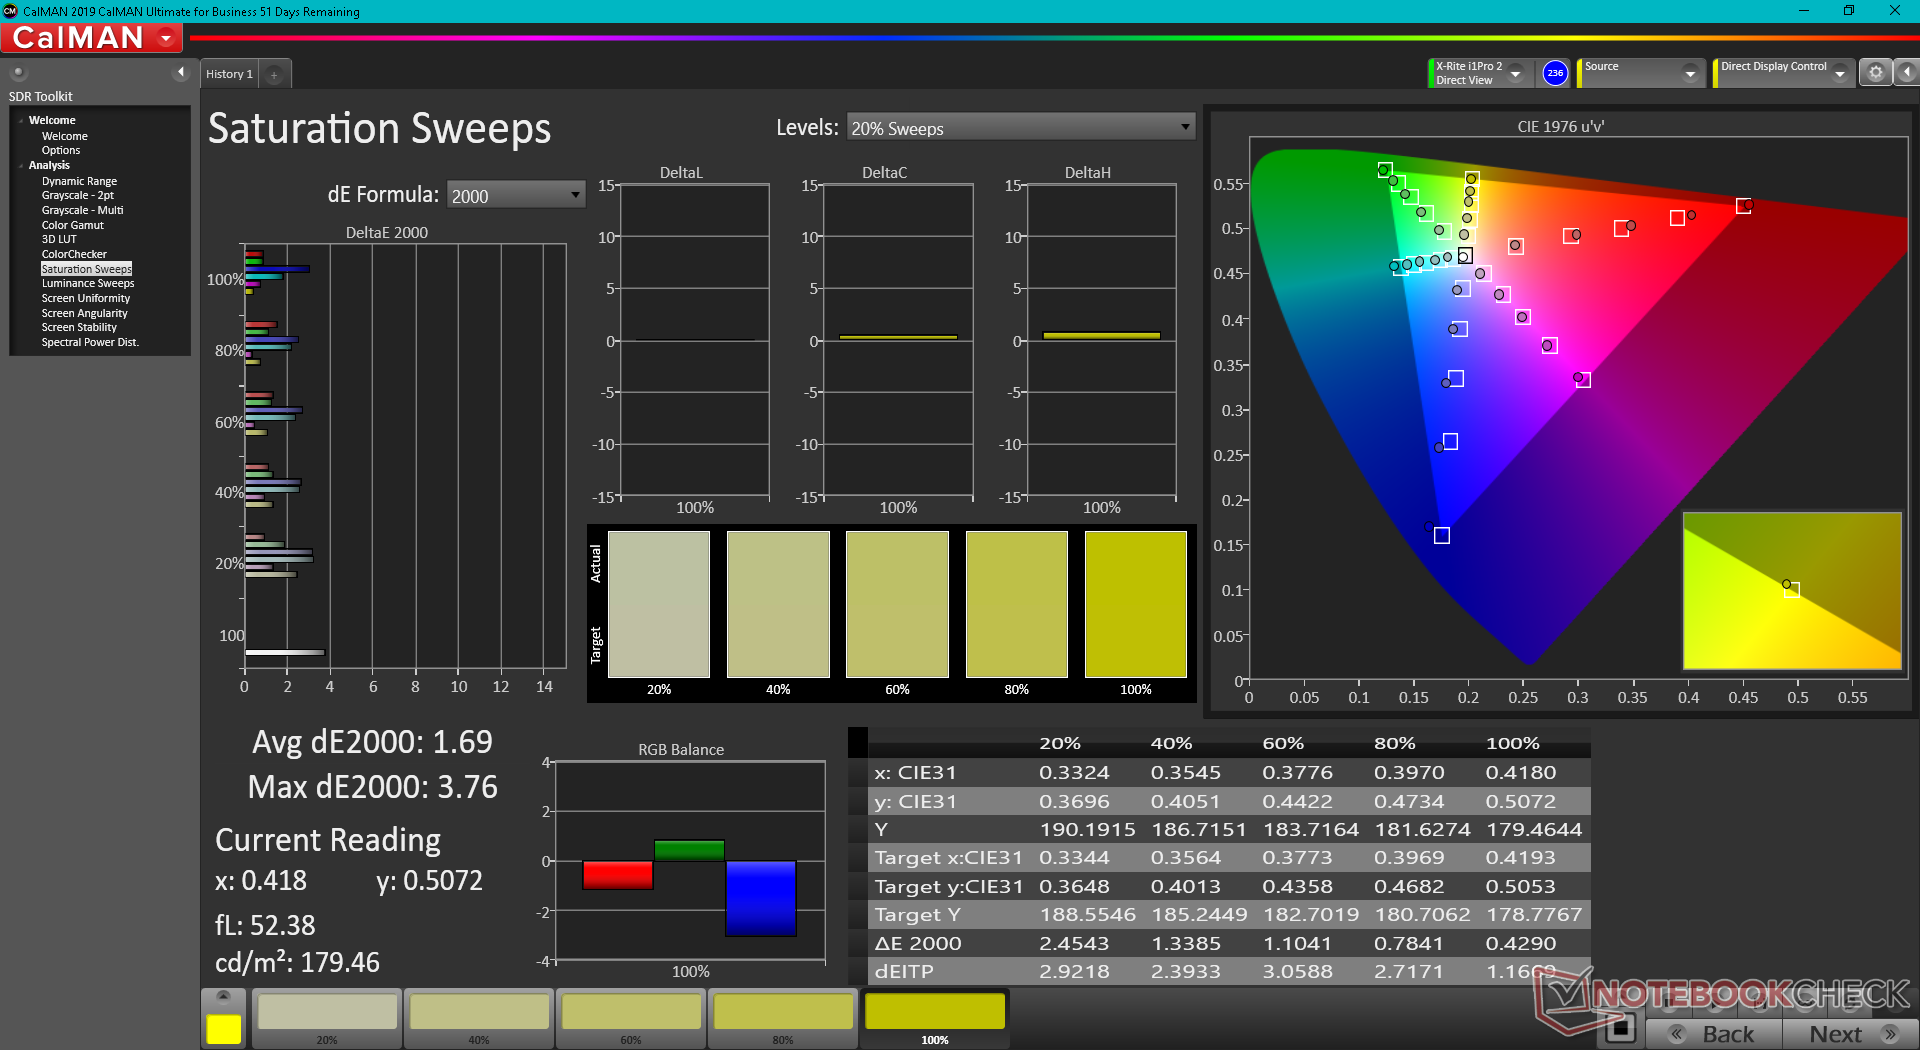
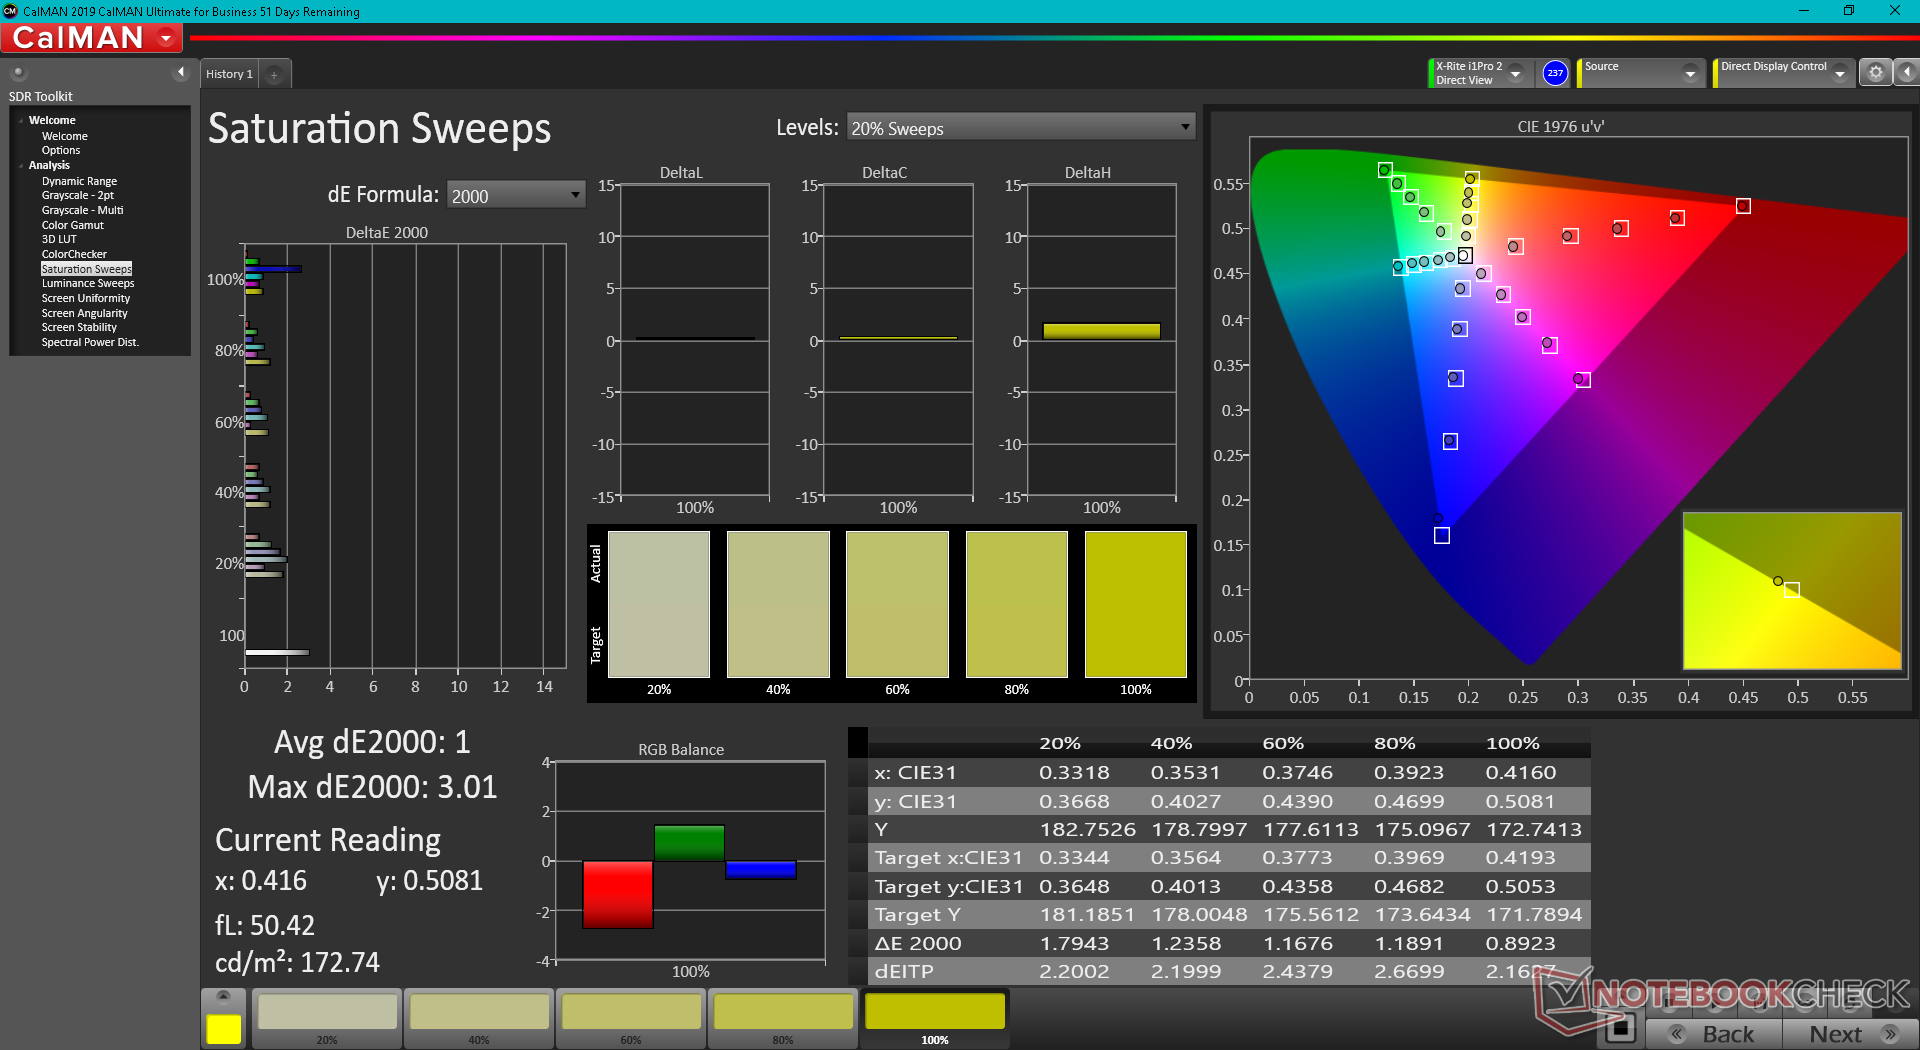
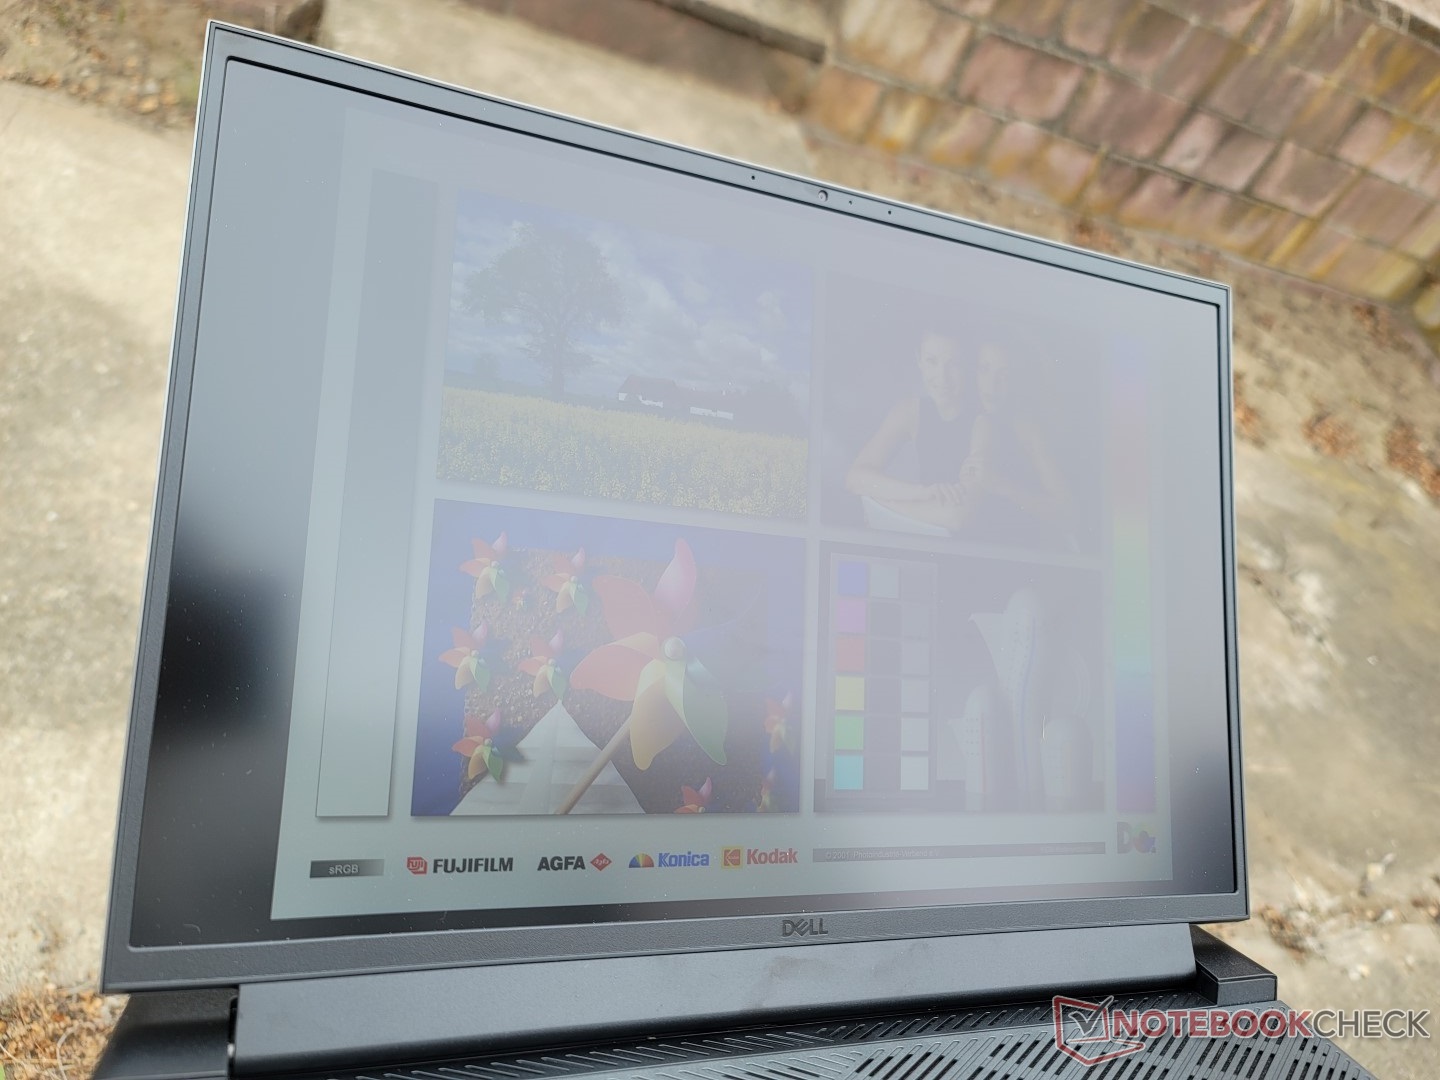
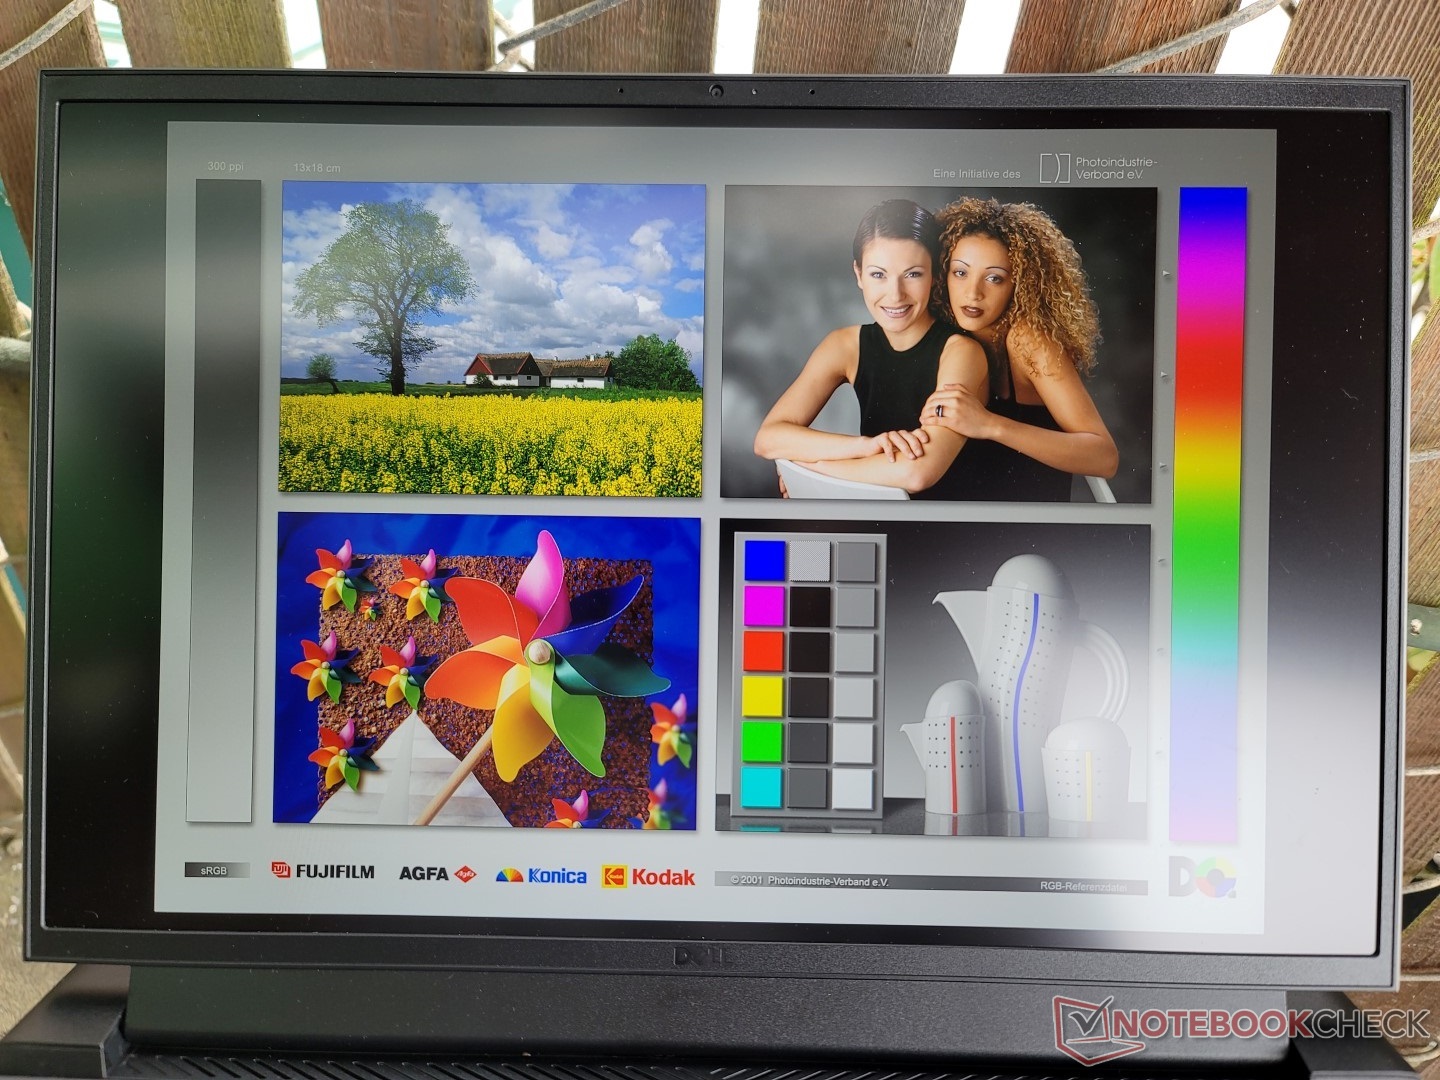
显示屏 - IPS,全sRGB,165赫兹,和快速响应时间
这里的面板与目前随联想Legion 7 16ARHA7发货的面板相似,因为它们拥有相同的制造商、相同的高刷新率、相同的分辨率、相同的100% sRGB目标,甚至还有几乎相同的对比度和黑白响应时间。图像质量明显好于惠普Victus 16上的奇美面板。虽然没有其他选择有点遗憾,但这至少意味着所有G16用户应该得到同样出色的观看体验,没有意外的低端显示配置。


| |||||||||||||||||||||||||
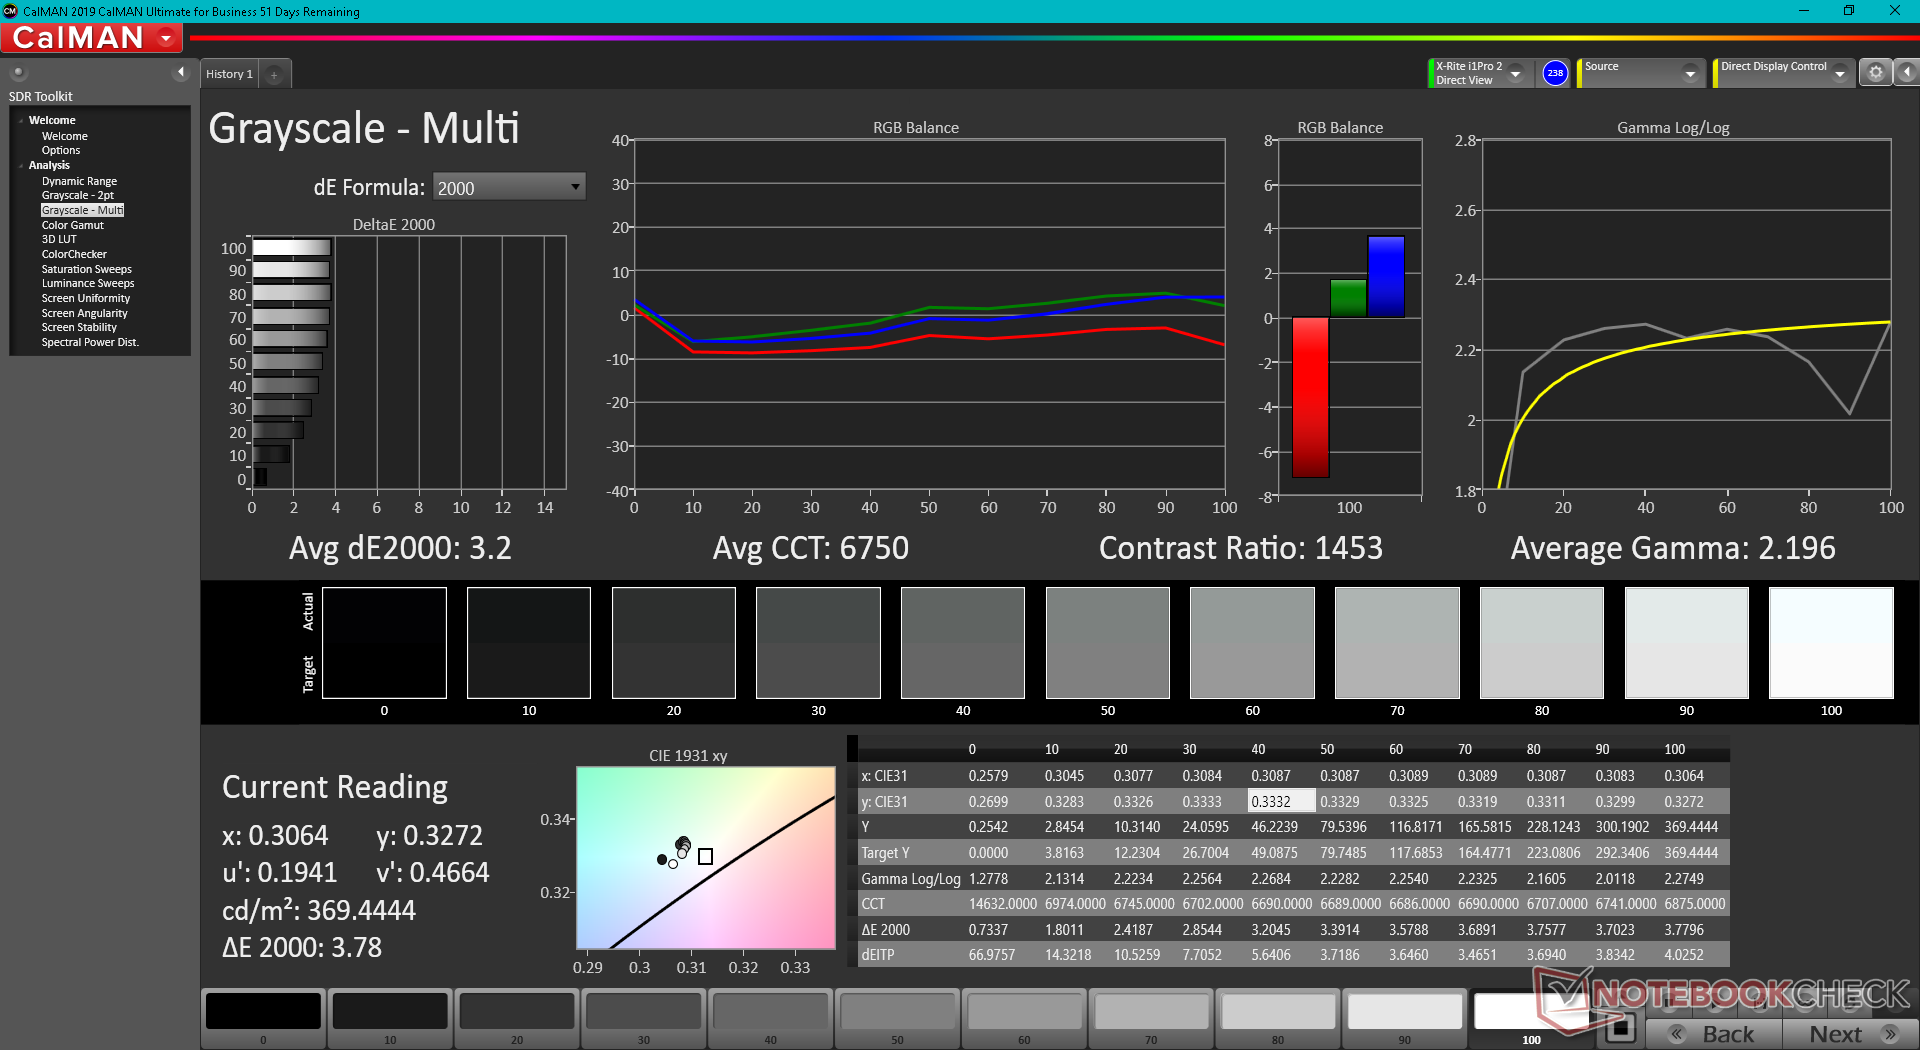
Brightness Distribution: 83 %
Center on Battery: 369.4 cd/m²
Contrast: 1154:1 (Black: 0.32 cd/m²)
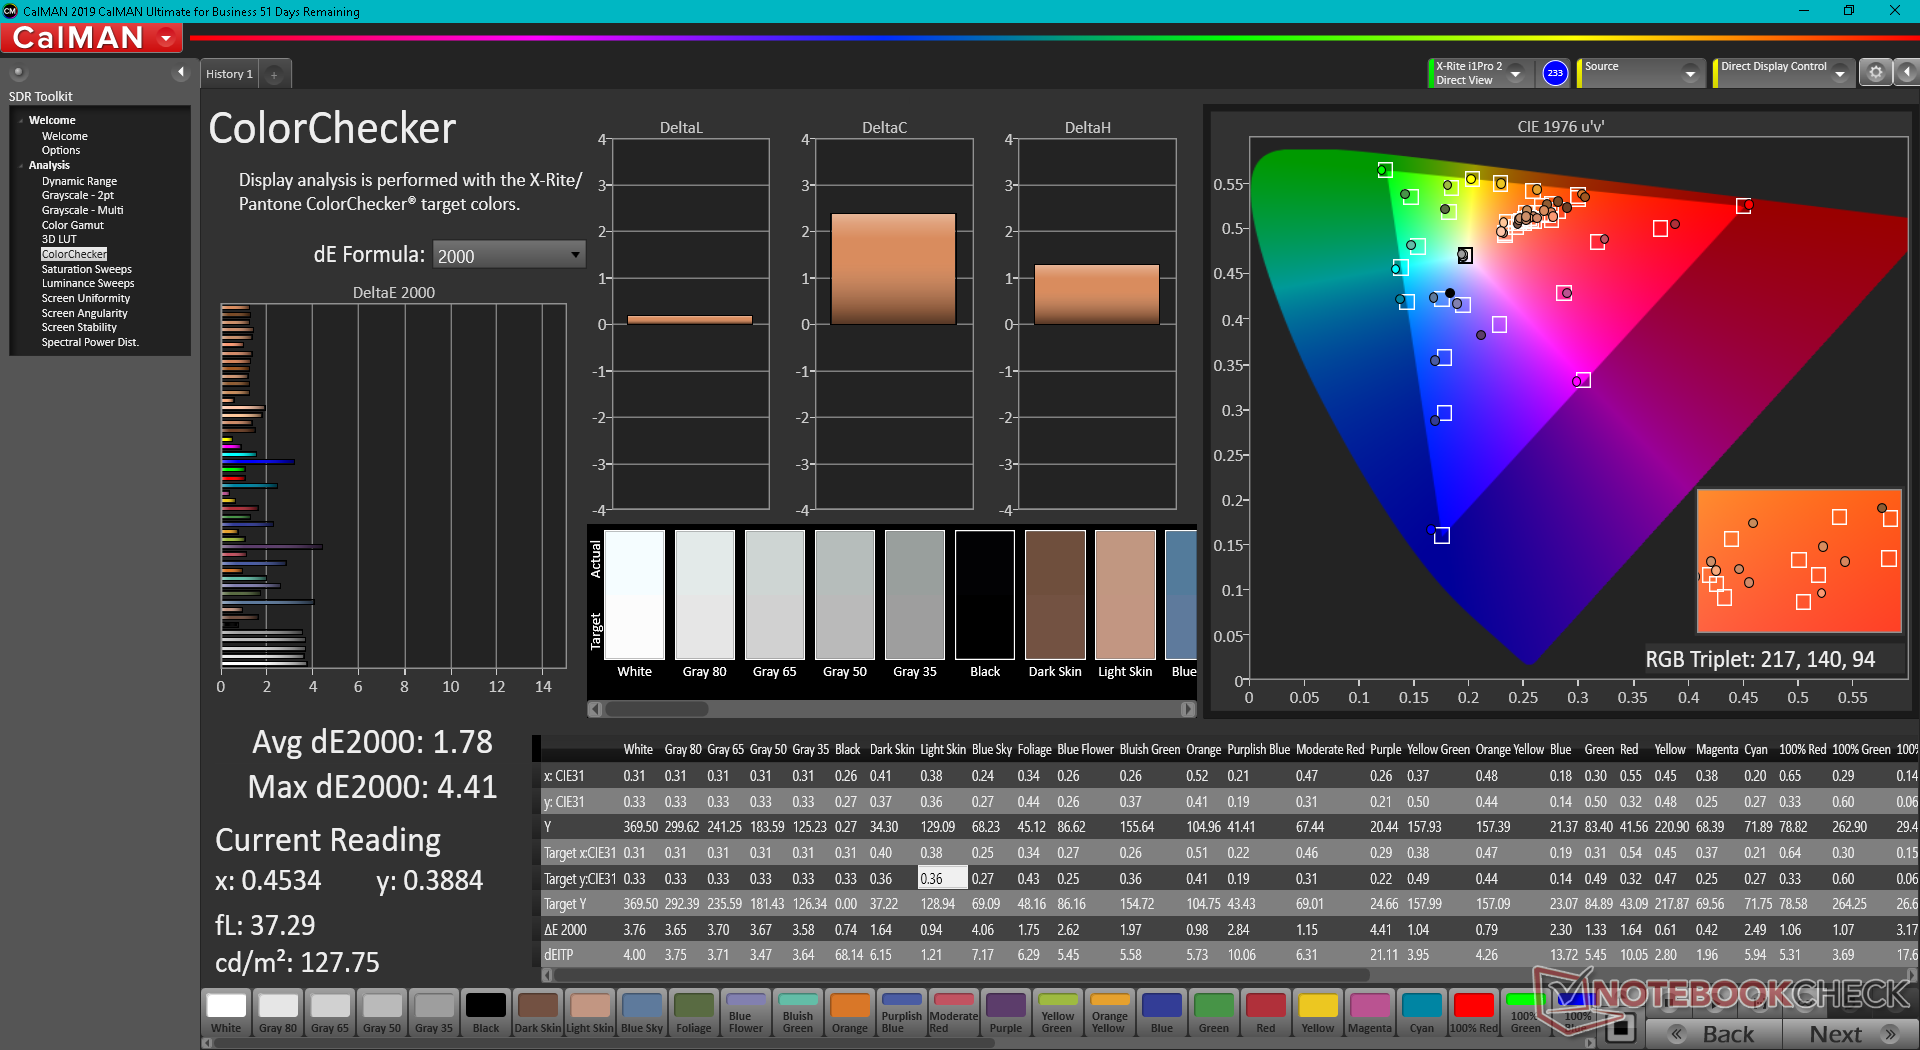
ΔE ColorChecker Calman: 1.78 | ∀{0.5-29.43 Ø4.71}
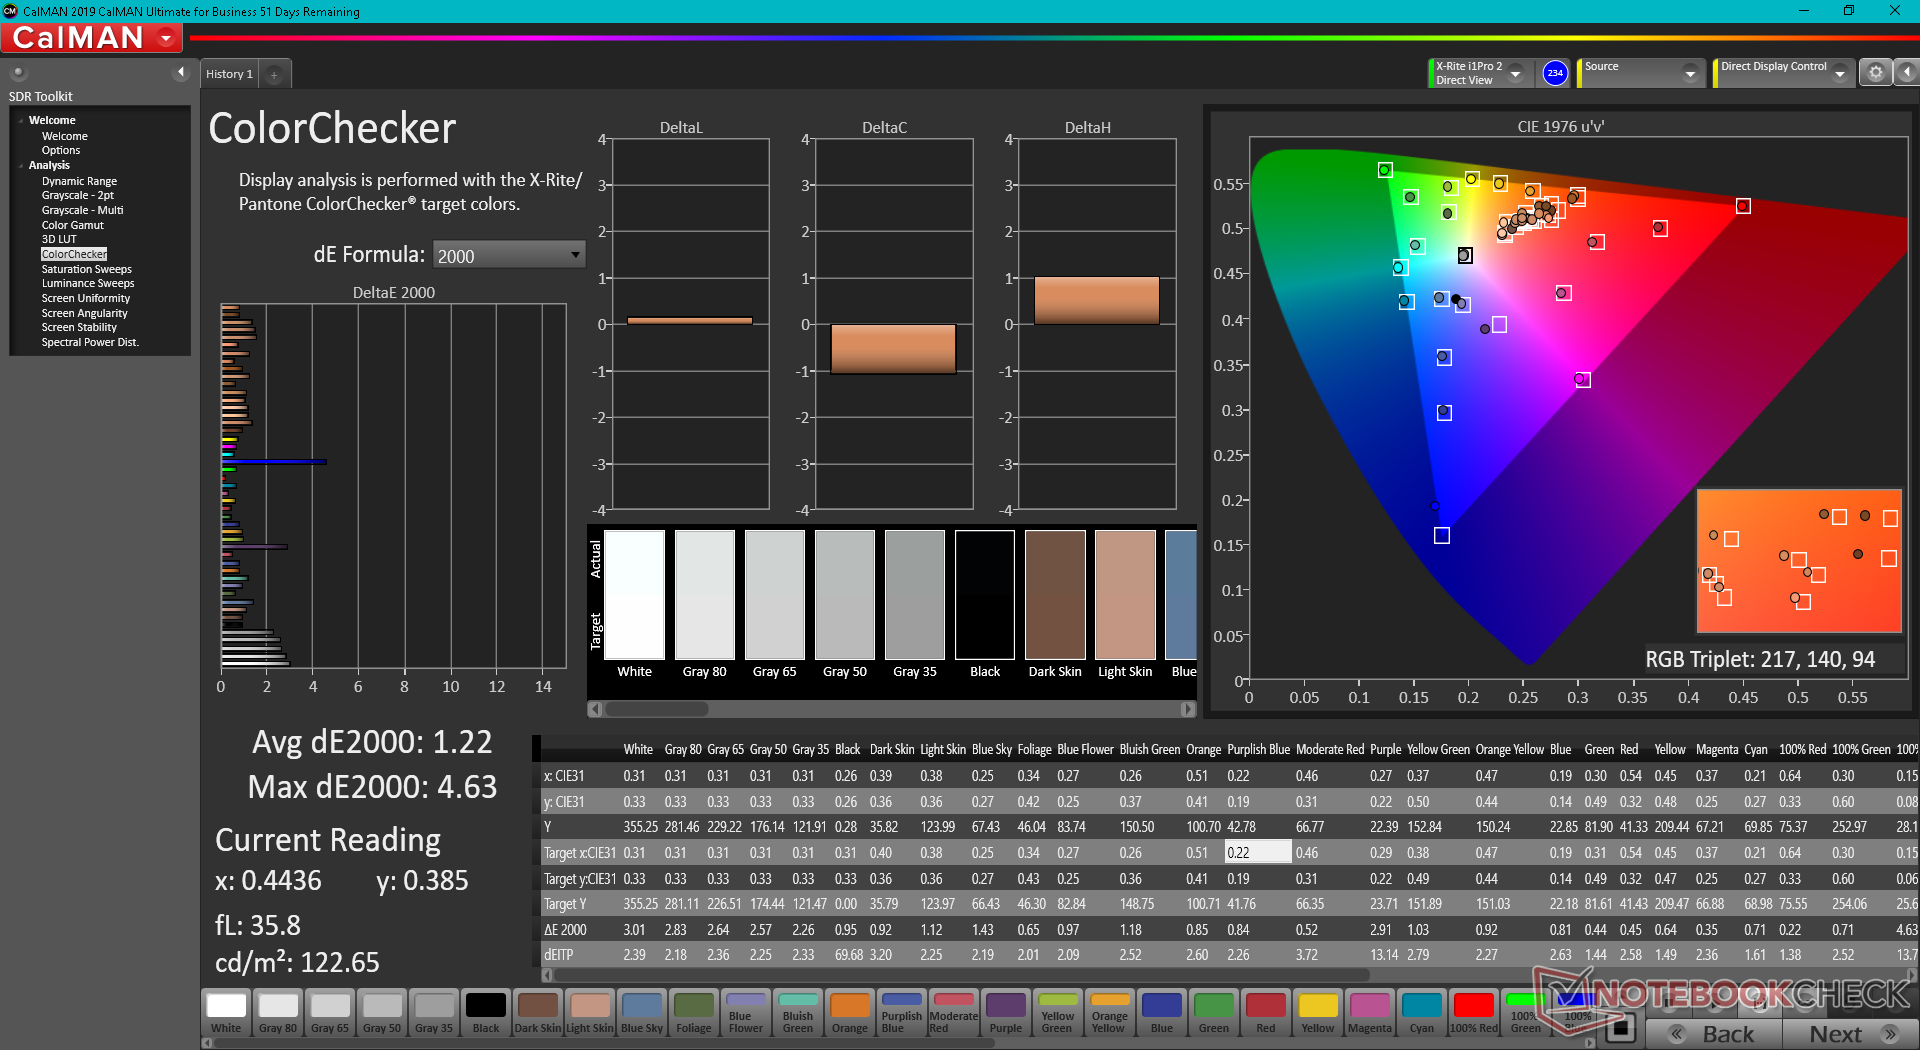
calibrated: 1.22
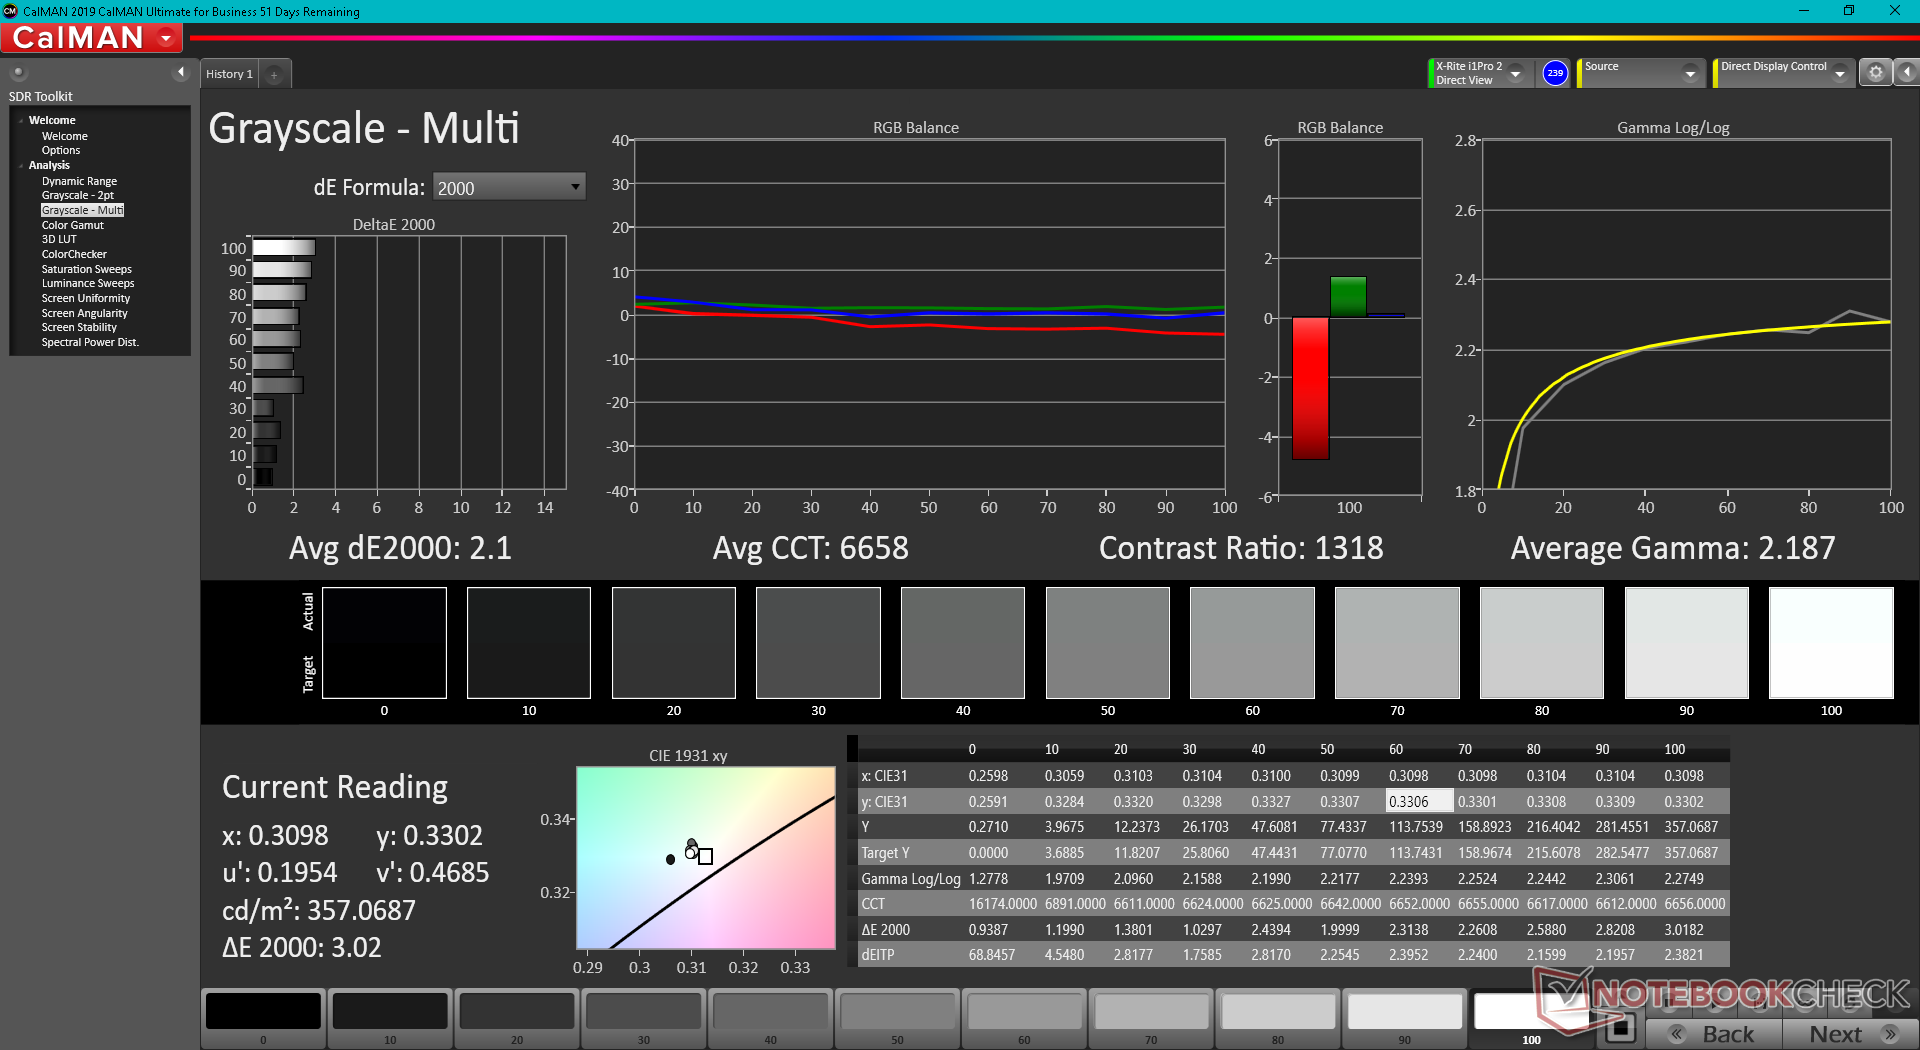
ΔE Greyscale Calman: 3.2 | ∀{0.09-98 Ø4.96}
70.5% AdobeRGB 1998 (Argyll 3D)
98% sRGB (Argyll 3D)
68.3% Display P3 (Argyll 3D)
Gamma: 2.2
CCT: 6750 K
| Dell G16 7620 BOE NE16QDM, IPS, 2560x1600, 16" | Lenovo Legion 7 16ARHA7 BOE CQ NE160QDM-NY1, IPS, 2560x1600, 16" | HP Victus 16-e0145ng CMN1609, IPS, 1920x1080, 16.1" | Asus ROG Zephyrus M16 GU603H AU Optronics AUOC199, IPS, 2560x1600, 16" | Lenovo Legion 5 Pro 16IAH7H BOE CCQ_NE160QDM_NY1, IPS, 2560x1600, 16" | Acer Swift X SFX16-51G-5388 Chi Mei N161HCA-EA3, , 1920x1080, 16.1" | |
|---|---|---|---|---|---|---|
| Display | -6% | -38% | 0% | -4% | ||
| Display P3 Coverage (%) | 68.3 | 63.7 -7% | 41.6 -39% | 68.53 0% | 65.1 -5% | |
| sRGB Coverage (%) | 98 | 95.3 -3% | 61.9 -37% | 98.38 0% | 95.65 -2% | |
| AdobeRGB 1998 Coverage (%) | 70.5 | 65.7 -7% | 43 -39% | 70.45 0% | 66.75 -5% | |
| Response Times | 1% | -166% | 43% | -11% | -171% | |
| Response Time Grey 50% / Grey 80% * (ms) | 8.6 ? | 9.2 ? -7% | 29.6 ? -244% | 4.8 ? 44% | 14 ? -63% | 30 ? -249% |
| Response Time Black / White * (ms) | 10.4 ? | 9.6 ? 8% | 19.4 ? -87% | 6 ? 42% | 6 ? 42% | 20 ? -92% |
| PWM Frequency (Hz) | ||||||
| Screen | -2% | -119% | -29% | 3% | 14% | |
| Brightness middle (cd/m²) | 369.4 | 478.8 30% | 257 -30% | 448 21% | 515 39% | 276 -25% |
| Brightness (cd/m²) | 348 | 477 37% | 239 -31% | 446 28% | 475 36% | 264 -24% |
| Brightness Distribution (%) | 83 | 90 8% | 88 6% | 86 4% | 85 2% | 85 2% |
| Black Level * (cd/m²) | 0.32 | 0.43 -34% | 0.25 22% | 0.48 -50% | 0.45 -41% | 0.16 50% |
| Contrast (:1) | 1154 | 1113 -4% | 1028 -11% | 933 -19% | 1144 -1% | 1725 49% |
| Colorchecker dE 2000 * | 1.78 | 2.24 -26% | 6.91 -288% | 2.76 -55% | 2.38 -34% | 1.8 -1% |
| Colorchecker dE 2000 max. * | 4.41 | 4.49 -2% | 22.27 -405% | 7.09 -61% | 4.37 1% | 3.77 15% |
| Colorchecker dE 2000 calibrated * | 1.22 | 1.89 -55% | 3.61 -196% | 2.86 -134% | 1.1 10% | 0.63 48% |
| Greyscale dE 2000 * | 3.2 | 2.3 28% | 7.5 -134% | 3.1 3% | 2.71 15% | 2.76 14% |
| Gamma | 2.2 100% | 2.25 98% | 2.125 104% | 2.153 102% | 2.49 88% | 2.37 93% |
| CCT | 6750 96% | 6955 93% | 6025 108% | 6826 95% | 6117 106% | 6564 99% |
| Color Space (Percent of AdobeRGB 1998) (%) | 87 | |||||
| Color Space (Percent of sRGB) (%) | 100 | |||||
| Total Average (Program / Settings) | -2% /
-2% | -108% /
-108% | 7% /
-16% | -3% /
0% | -54% /
-16% |
* ... smaller is better
尽管戴尔没有对G16进行预校准程序,但开箱后的颜色校准得很好。用X-Rite色度计对面板进行校准,可以将平均灰度和彩色DeltaE值分别从3.2和1.78略微提高到2.1和1.22。因此,对于大多数用户来说,终端用户校准是没有必要的。
用户可以应用我们上面的校准配置文件以获得更准确的显示。
Display Response Times
| ↔ Response Time Black to White | ||
|---|---|---|
| 10.4 ms ... rise ↗ and fall ↘ combined | ↗ 5.2 ms rise | 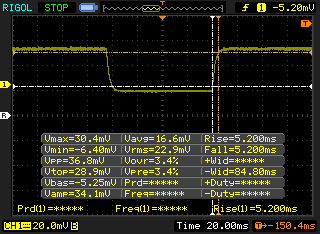 |
| ↘ 5.2 ms fall | ||
| The screen shows good response rates in our tests, but may be too slow for competitive gamers. In comparison, all tested devices range from 0.1 (minimum) to 240 (maximum) ms. » 28 % of all devices are better. This means that the measured response time is better than the average of all tested devices (19.8 ms). | ||
| ↔ Response Time 50% Grey to 80% Grey | ||
| 8.6 ms ... rise ↗ and fall ↘ combined | ↗ 3.4 ms rise | 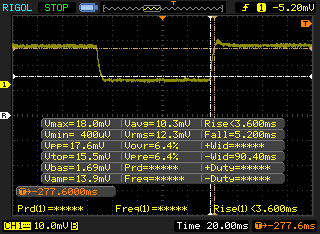 |
| ↘ 5.2 ms fall | ||
| The screen shows fast response rates in our tests and should be suited for gaming. In comparison, all tested devices range from 0.165 (minimum) to 636 (maximum) ms. » 22 % of all devices are better. This means that the measured response time is better than the average of all tested devices (31 ms). | ||
Screen Flickering / PWM (Pulse-Width Modulation)
| Screen flickering / PWM not detected | 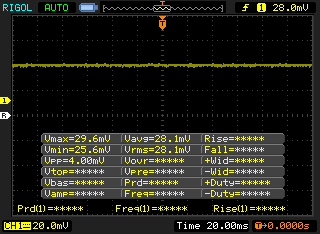 | ||
In comparison: 52 % of all tested devices do not use PWM to dim the display. If PWM was detected, an average of 7757 (minimum: 5 - maximum: 343500) Hz was measured. | |||
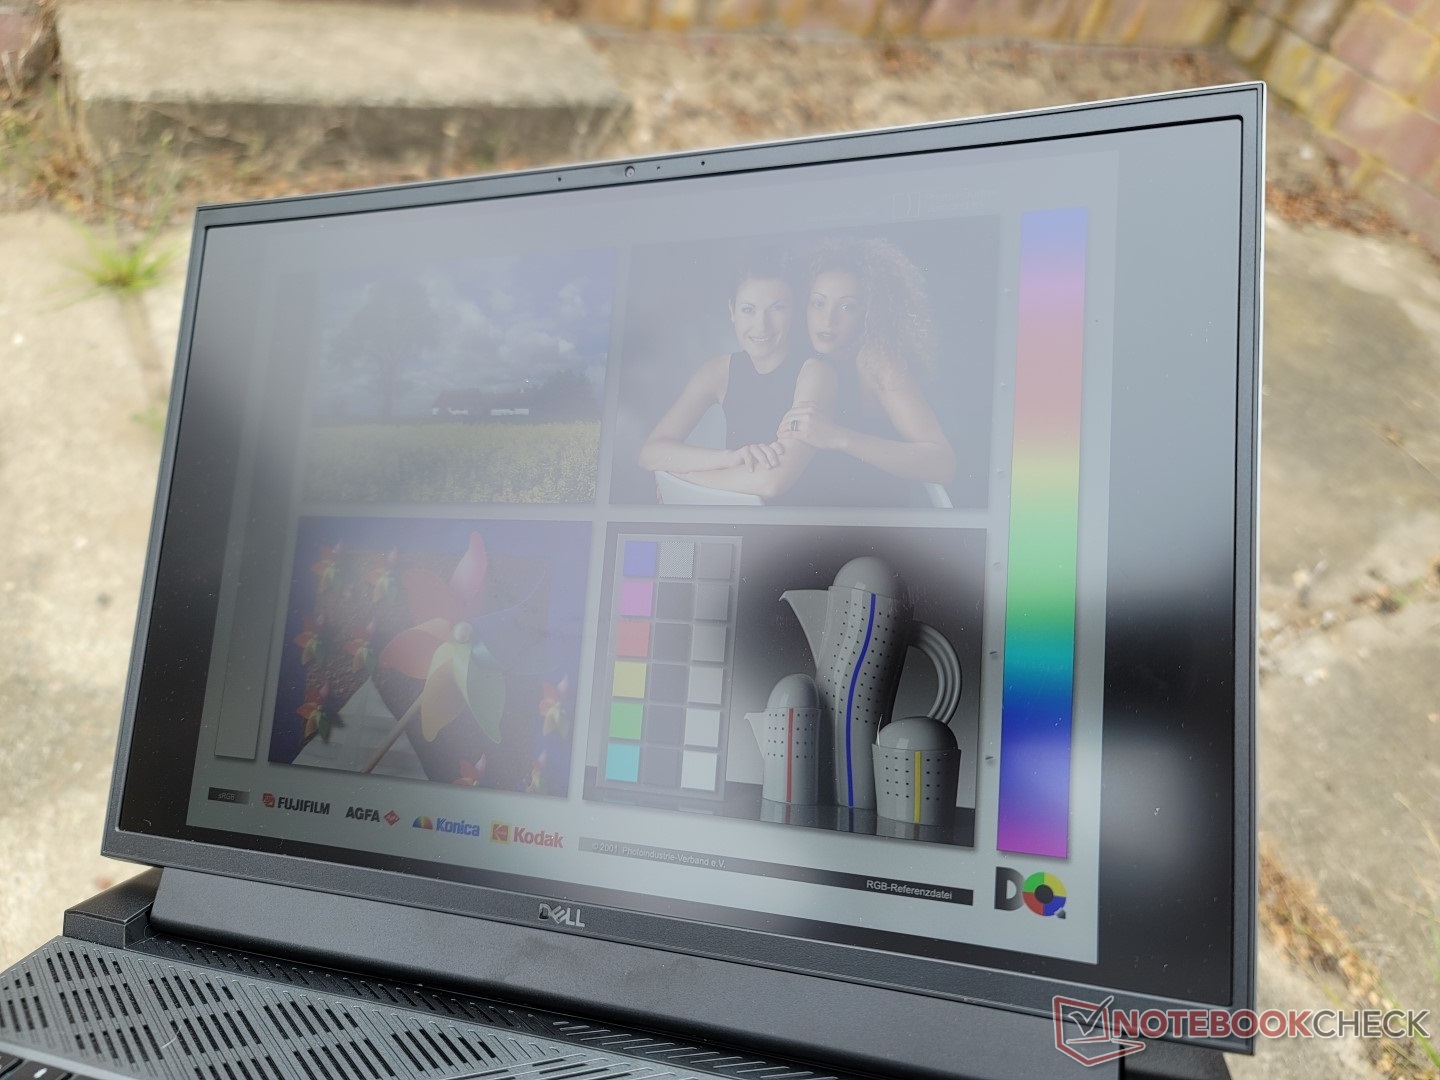
如果在树荫下,户外能见度还不错,但如果在较亮的环境照明下,眩光会变得太重。替代产品如联想 Legion 5 Pro 16或 Legion 7 16有更明亮的显示屏,每个约500尼特,如果户外能见度是一个问题的话。
性能 - 比平均水平更快
测试条件
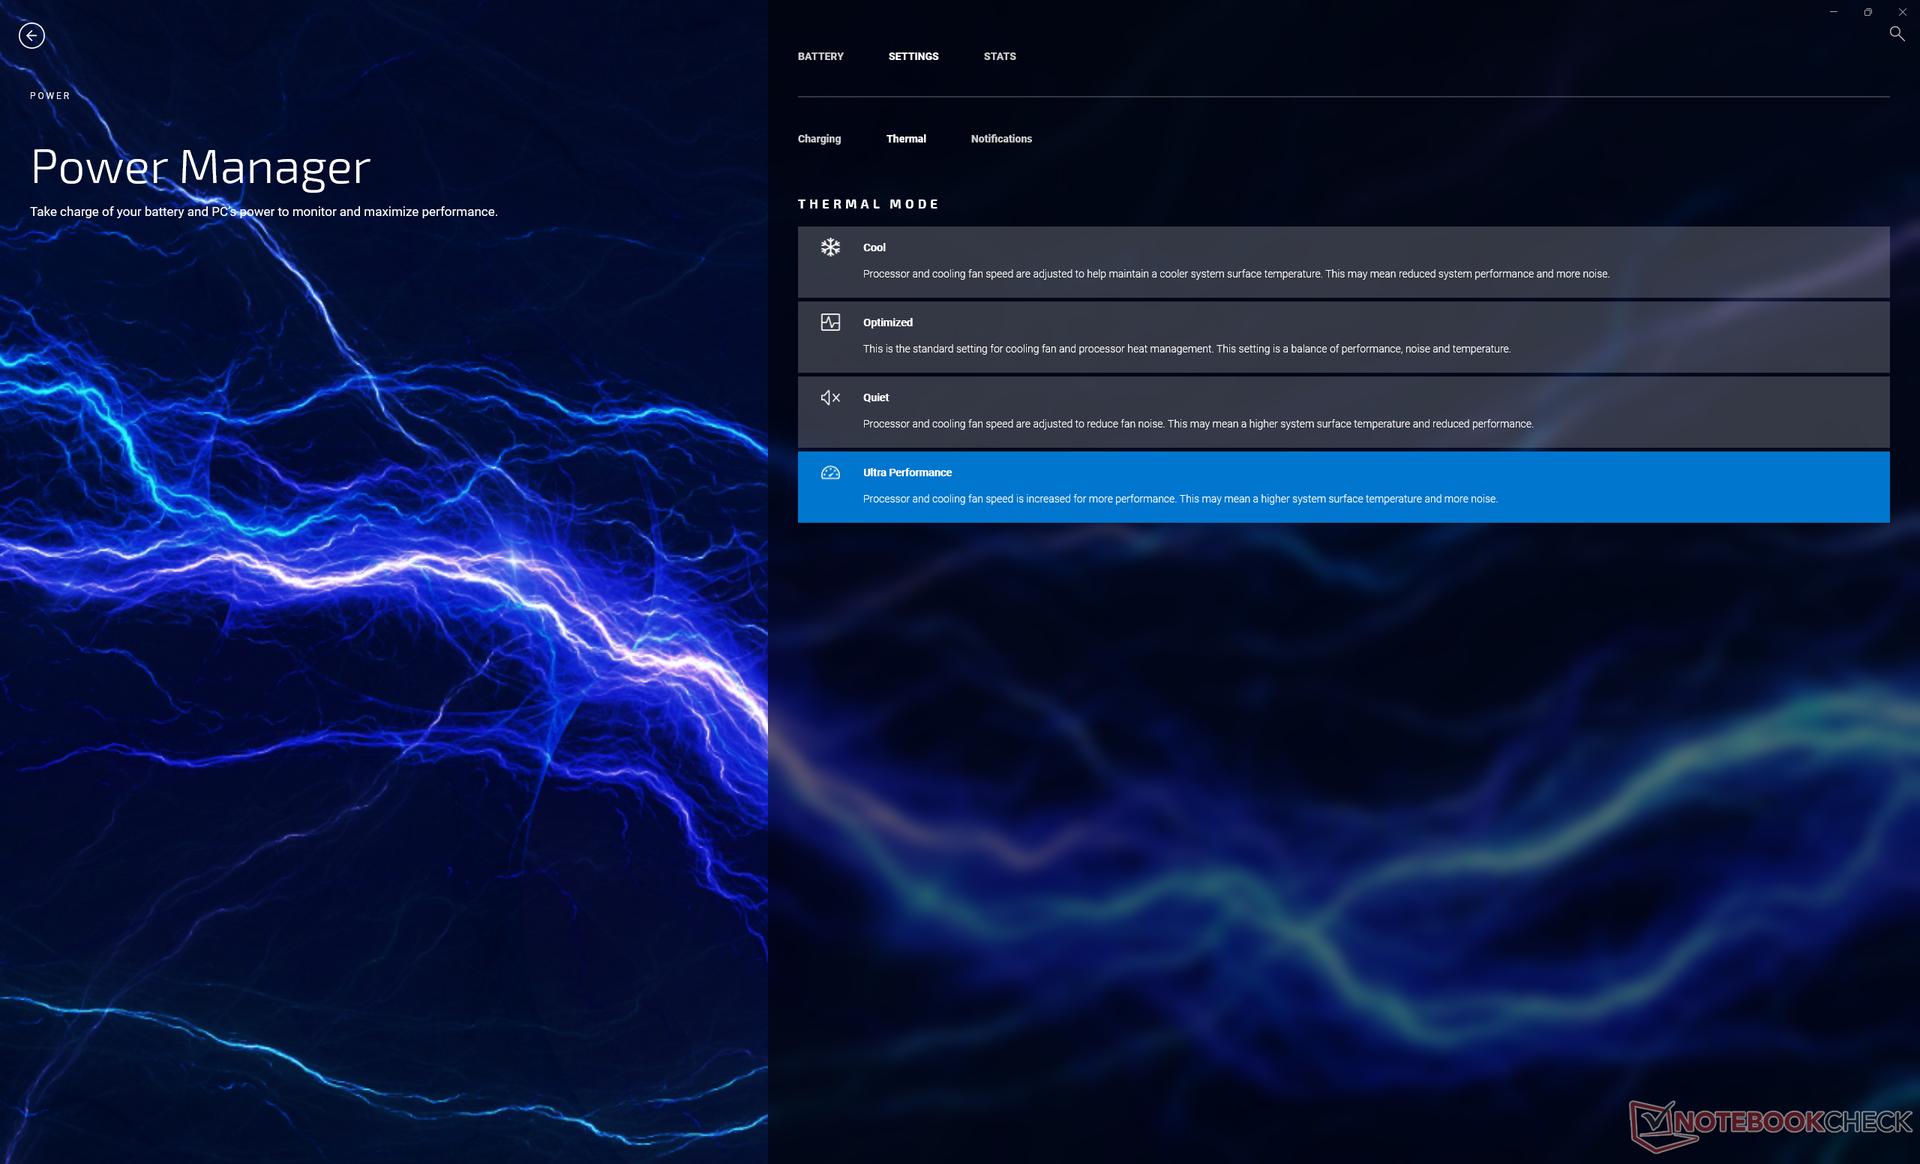
在运行以下任何基准测试之前,我们通过Windows将我们的设备设置为性能模式,并通过My Dell软件设置为超性能模式。我们还确保禁用Optimus,并通过Nvidia控制面板将系统设置为独立GPU模式。建议用户熟悉 "我的戴尔 "和 "戴尔更新",因为这两个预装的应用程序对于调整系统的行为至关重要。
处理器
多线程性能非常好,其结果比我们数据库中具有相同功能的普通笔记本电脑快5%到10%。 酷睿i7-12700HCPU。该CPU甚至比上一代产品快20%到30%。 酷睿i9-11900H在多线程工作负载中比上一代酷睿i9-11900H快20%至30%,但单线程性能可能会慢10%。
根据我们的经验,升级到酷睿i9-12900H预计只能将性能提高约5%。Alienware x15 R2.因此,就每美元的性能而言,酷睿i7-12700H是一个更好的选择。
性能的可持续性很好,比戴尔 Inspiron 16 Plus 7620配备相同的CPU,正如我们下面的CineBench R15 xT循环测试对比图所示。
Cinebench R15 Multi Loop
Cinebench R23: Multi Core | Single Core
Cinebench R15: CPU Multi 64Bit | CPU Single 64Bit
Blender: v2.79 BMW27 CPU
7-Zip 18.03: 7z b 4 | 7z b 4 -mmt1
Geekbench 5.5: Multi-Core | Single-Core
HWBOT x265 Benchmark v2.2: 4k Preset
LibreOffice : 20 Documents To PDF
R Benchmark 2.5: Overall mean
| Cinebench R20 / CPU (Multi Core) | |
| Lenovo Legion 7 16IAX7-82TD004SGE | |
| Lenovo Legion 5 Pro 16IAH7H | |
| Alienware x17 R2 P48E | |
| Alienware x15 R2 P111F | |
| Dell G16 7620 | |
| Average Intel Core i7-12700H (1576 - 7407, n=64) | |
| Lenovo Legion 7 16ARHA7 | |
| Asus ROG Zephyrus M16 GU603H | |
| HP Victus 16-e0145ng | |
| Razer Blade 15 Advanced Model Early 2021 | |
| Acer Swift X SFX16-51G-5388 | |
| Cinebench R20 / CPU (Single Core) | |
| Lenovo Legion 7 16IAX7-82TD004SGE | |
| Alienware x15 R2 P111F | |
| Alienware x17 R2 P48E | |
| Average Intel Core i7-12700H (300 - 704, n=64) | |
| Lenovo Legion 5 Pro 16IAH7H | |
| Dell G16 7620 | |
| Lenovo Legion 7 16ARHA7 | |
| Asus ROG Zephyrus M16 GU603H | |
| Acer Swift X SFX16-51G-5388 | |
| HP Victus 16-e0145ng | |
| Razer Blade 15 Advanced Model Early 2021 | |
| Cinebench R23 / Multi Core | |
| Lenovo Legion 7 16IAX7-82TD004SGE | |
| Lenovo Legion 5 Pro 16IAH7H | |
| Alienware x17 R2 P48E | |
| Dell G16 7620 | |
| Alienware x15 R2 P111F | |
| Average Intel Core i7-12700H (4032 - 19330, n=64) | |
| Lenovo Legion 7 16ARHA7 | |
| HP Victus 16-e0145ng | |
| Razer Blade 15 Advanced Model Early 2021 | |
| Acer Swift X SFX16-51G-5388 | |
| Cinebench R23 / Single Core | |
| Lenovo Legion 7 16IAX7-82TD004SGE | |
| Alienware x17 R2 P48E | |
| Alienware x15 R2 P111F | |
| Average Intel Core i7-12700H (778 - 1826, n=63) | |
| Lenovo Legion 5 Pro 16IAH7H | |
| Dell G16 7620 | |
| Lenovo Legion 7 16ARHA7 | |
| HP Victus 16-e0145ng | |
| Acer Swift X SFX16-51G-5388 | |
| Razer Blade 15 Advanced Model Early 2021 | |
| Cinebench R15 / CPU Multi 64Bit | |
| Lenovo Legion 7 16IAX7-82TD004SGE | |
| Alienware x17 R2 P48E | |
| Lenovo Legion 5 Pro 16IAH7H | |
| Alienware x15 R2 P111F | |
| Dell G16 7620 | |
| Average Intel Core i7-12700H (1379 - 2916, n=70) | |
| Lenovo Legion 7 16ARHA7 | |
| Asus ROG Zephyrus M16 GU603H | |
| HP Victus 16-e0145ng | |
| Razer Blade 15 Advanced Model Early 2021 | |
| Acer Swift X SFX16-51G-5388 | |
| Cinebench R15 / CPU Single 64Bit | |
| Lenovo Legion 7 16IAX7-82TD004SGE | |
| Alienware x15 R2 P111F | |
| Alienware x17 R2 P48E | |
| Average Intel Core i7-12700H (113 - 263, n=65) | |
| Lenovo Legion 7 16ARHA7 | |
| Lenovo Legion 5 Pro 16IAH7H | |
| Dell G16 7620 | |
| Asus ROG Zephyrus M16 GU603H | |
| HP Victus 16-e0145ng | |
| Acer Swift X SFX16-51G-5388 | |
| Razer Blade 15 Advanced Model Early 2021 | |
| Blender / v2.79 BMW27 CPU | |
| Acer Swift X SFX16-51G-5388 | |
| Razer Blade 15 Advanced Model Early 2021 | |
| HP Victus 16-e0145ng | |
| Asus ROG Zephyrus M16 GU603H | |
| Average Intel Core i7-12700H (168 - 732, n=63) | |
| Lenovo Legion 7 16ARHA7 | |
| Alienware x15 R2 P111F | |
| Dell G16 7620 | |
| Alienware x17 R2 P48E | |
| Lenovo Legion 5 Pro 16IAH7H | |
| Lenovo Legion 7 16IAX7-82TD004SGE | |
| 7-Zip 18.03 / 7z b 4 | |
| Lenovo Legion 7 16IAX7-82TD004SGE | |
| Alienware x15 R2 P111F | |
| Lenovo Legion 5 Pro 16IAH7H | |
| Alienware x17 R2 P48E | |
| Dell G16 7620 | |
| Lenovo Legion 7 16ARHA7 | |
| Average Intel Core i7-12700H (22844 - 73067, n=63) | |
| Asus ROG Zephyrus M16 GU603H | |
| HP Victus 16-e0145ng | |
| Razer Blade 15 Advanced Model Early 2021 | |
| Acer Swift X SFX16-51G-5388 | |
| 7-Zip 18.03 / 7z b 4 -mmt1 | |
| Lenovo Legion 7 16IAX7-82TD004SGE | |
| Alienware x15 R2 P111F | |
| Alienware x17 R2 P48E | |
| Lenovo Legion 7 16ARHA7 | |
| Average Intel Core i7-12700H (2743 - 5972, n=63) | |
| Asus ROG Zephyrus M16 GU603H | |
| Lenovo Legion 5 Pro 16IAH7H | |
| HP Victus 16-e0145ng | |
| Dell G16 7620 | |
| Razer Blade 15 Advanced Model Early 2021 | |
| Acer Swift X SFX16-51G-5388 | |
| Geekbench 5.5 / Multi-Core | |
| Lenovo Legion 7 16IAX7-82TD004SGE | |
| Alienware x15 R2 P111F | |
| Alienware x17 R2 P48E | |
| Lenovo Legion 5 Pro 16IAH7H | |
| Dell G16 7620 | |
| Average Intel Core i7-12700H (5144 - 13745, n=64) | |
| Lenovo Legion 7 16ARHA7 | |
| Asus ROG Zephyrus M16 GU603H | |
| HP Victus 16-e0145ng | |
| Razer Blade 15 Advanced Model Early 2021 | |
| Acer Swift X SFX16-51G-5388 | |
| Geekbench 5.5 / Single-Core | |
| Alienware x17 R2 P48E | |
| Lenovo Legion 7 16IAX7-82TD004SGE | |
| Alienware x15 R2 P111F | |
| Average Intel Core i7-12700H (803 - 1851, n=64) | |
| Lenovo Legion 5 Pro 16IAH7H | |
| Dell G16 7620 | |
| Asus ROG Zephyrus M16 GU603H | |
| Lenovo Legion 7 16ARHA7 | |
| Acer Swift X SFX16-51G-5388 | |
| HP Victus 16-e0145ng | |
| Razer Blade 15 Advanced Model Early 2021 | |
| HWBOT x265 Benchmark v2.2 / 4k Preset | |
| Lenovo Legion 7 16IAX7-82TD004SGE | |
| Alienware x17 R2 P48E | |
| Lenovo Legion 5 Pro 16IAH7H | |
| Alienware x15 R2 P111F | |
| Dell G16 7620 | |
| Lenovo Legion 7 16ARHA7 | |
| Average Intel Core i7-12700H (4.67 - 21.8, n=64) | |
| Asus ROG Zephyrus M16 GU603H | |
| HP Victus 16-e0145ng | |
| Razer Blade 15 Advanced Model Early 2021 | |
| Acer Swift X SFX16-51G-5388 | |
| LibreOffice / 20 Documents To PDF | |
| HP Victus 16-e0145ng | |
| Razer Blade 15 Advanced Model Early 2021 | |
| Lenovo Legion 7 16ARHA7 | |
| Dell G16 7620 | |
| Acer Swift X SFX16-51G-5388 | |
| Alienware x15 R2 P111F | |
| Average Intel Core i7-12700H (34.2 - 95.3, n=63) | |
| Alienware x17 R2 P48E | |
| Asus ROG Zephyrus M16 GU603H | |
| Lenovo Legion 5 Pro 16IAH7H | |
| Lenovo Legion 7 16IAX7-82TD004SGE | |
| R Benchmark 2.5 / Overall mean | |
| Acer Swift X SFX16-51G-5388 | |
| Razer Blade 15 Advanced Model Early 2021 | |
| Asus ROG Zephyrus M16 GU603H | |
| HP Victus 16-e0145ng | |
| Dell G16 7620 | |
| Lenovo Legion 7 16ARHA7 | |
| Lenovo Legion 5 Pro 16IAH7H | |
| Average Intel Core i7-12700H (0.4441 - 1.052, n=63) | |
| Alienware x15 R2 P111F | |
| Alienware x17 R2 P48E | |
| Lenovo Legion 7 16IAX7-82TD004SGE | |
* ... smaller is better
AIDA64: FP32 Ray-Trace | FPU Julia | CPU SHA3 | CPU Queen | FPU SinJulia | FPU Mandel | CPU AES | CPU ZLib | FP64 Ray-Trace | CPU PhotoWorxx
| Performance rating | |
| Lenovo Legion 7 16ARHA7 | |
| Dell G16 7620 | |
| Lenovo Legion 5 Pro 16IAH7H | |
| Average Intel Core i7-12700H | |
| HP Victus 16-e0145ng | |
| Acer Swift X SFX16-51G-5388 | |
| Asus ROG Zephyrus M16 GU603H -9! | |
| AIDA64 / FP32 Ray-Trace | |
| Lenovo Legion 7 16ARHA7 | |
| Dell G16 7620 | |
| Lenovo Legion 5 Pro 16IAH7H | |
| Lenovo Legion 5 Pro 16IAH7H | |
| HP Victus 16-e0145ng | |
| Average Intel Core i7-12700H (2585 - 17957, n=64) | |
| Acer Swift X SFX16-51G-5388 | |
| AIDA64 / FPU Julia | |
| Lenovo Legion 7 16ARHA7 | |
| Dell G16 7620 | |
| Lenovo Legion 5 Pro 16IAH7H | |
| Lenovo Legion 5 Pro 16IAH7H | |
| HP Victus 16-e0145ng | |
| Average Intel Core i7-12700H (12439 - 90760, n=64) | |
| Acer Swift X SFX16-51G-5388 | |
| AIDA64 / CPU SHA3 | |
| Dell G16 7620 | |
| Lenovo Legion 7 16ARHA7 | |
| Lenovo Legion 5 Pro 16IAH7H | |
| Lenovo Legion 5 Pro 16IAH7H | |
| Average Intel Core i7-12700H (833 - 4242, n=64) | |
| HP Victus 16-e0145ng | |
| Acer Swift X SFX16-51G-5388 | |
| AIDA64 / CPU Queen | |
| Lenovo Legion 7 16ARHA7 | |
| Dell G16 7620 | |
| Lenovo Legion 5 Pro 16IAH7H | |
| Average Intel Core i7-12700H (57923 - 103202, n=63) | |
| HP Victus 16-e0145ng | |
| Acer Swift X SFX16-51G-5388 | |
| AIDA64 / FPU SinJulia | |
| Lenovo Legion 7 16ARHA7 | |
| Lenovo Legion 5 Pro 16IAH7H | |
| Lenovo Legion 5 Pro 16IAH7H | |
| Dell G16 7620 | |
| Average Intel Core i7-12700H (3249 - 9939, n=64) | |
| HP Victus 16-e0145ng | |
| Acer Swift X SFX16-51G-5388 | |
| AIDA64 / FPU Mandel | |
| Lenovo Legion 7 16ARHA7 | |
| HP Victus 16-e0145ng | |
| Lenovo Legion 5 Pro 16IAH7H | |
| Lenovo Legion 5 Pro 16IAH7H | |
| Dell G16 7620 | |
| Average Intel Core i7-12700H (7135 - 44760, n=64) | |
| Acer Swift X SFX16-51G-5388 | |
| AIDA64 / CPU AES | |
| Lenovo Legion 7 16ARHA7 | |
| Lenovo Legion 5 Pro 16IAH7H | |
| Lenovo Legion 5 Pro 16IAH7H | |
| Average Intel Core i7-12700H (31839 - 144360, n=64) | |
| Dell G16 7620 | |
| Acer Swift X SFX16-51G-5388 | |
| HP Victus 16-e0145ng | |
| AIDA64 / CPU ZLib | |
| Lenovo Legion 5 Pro 16IAH7H | |
| Lenovo Legion 5 Pro 16IAH7H | |
| Dell G16 7620 | |
| Average Intel Core i7-12700H (305 - 1171, n=64) | |
| Lenovo Legion 7 16ARHA7 | |
| HP Victus 16-e0145ng | |
| Acer Swift X SFX16-51G-5388 | |
| Asus ROG Zephyrus M16 GU603H | |
| AIDA64 / FP64 Ray-Trace | |
| Lenovo Legion 7 16ARHA7 | |
| Dell G16 7620 | |
| Lenovo Legion 5 Pro 16IAH7H | |
| Lenovo Legion 5 Pro 16IAH7H | |
| HP Victus 16-e0145ng | |
| Average Intel Core i7-12700H (1437 - 9692, n=64) | |
| Acer Swift X SFX16-51G-5388 | |
| AIDA64 / CPU PhotoWorxx | |
| Acer Swift X SFX16-51G-5388 | |
| Dell G16 7620 | |
| Lenovo Legion 5 Pro 16IAH7H | |
| Lenovo Legion 5 Pro 16IAH7H | |
| Average Intel Core i7-12700H (12863 - 52207, n=64) | |
| Lenovo Legion 7 16ARHA7 | |
| HP Victus 16-e0145ng | |
系统性能
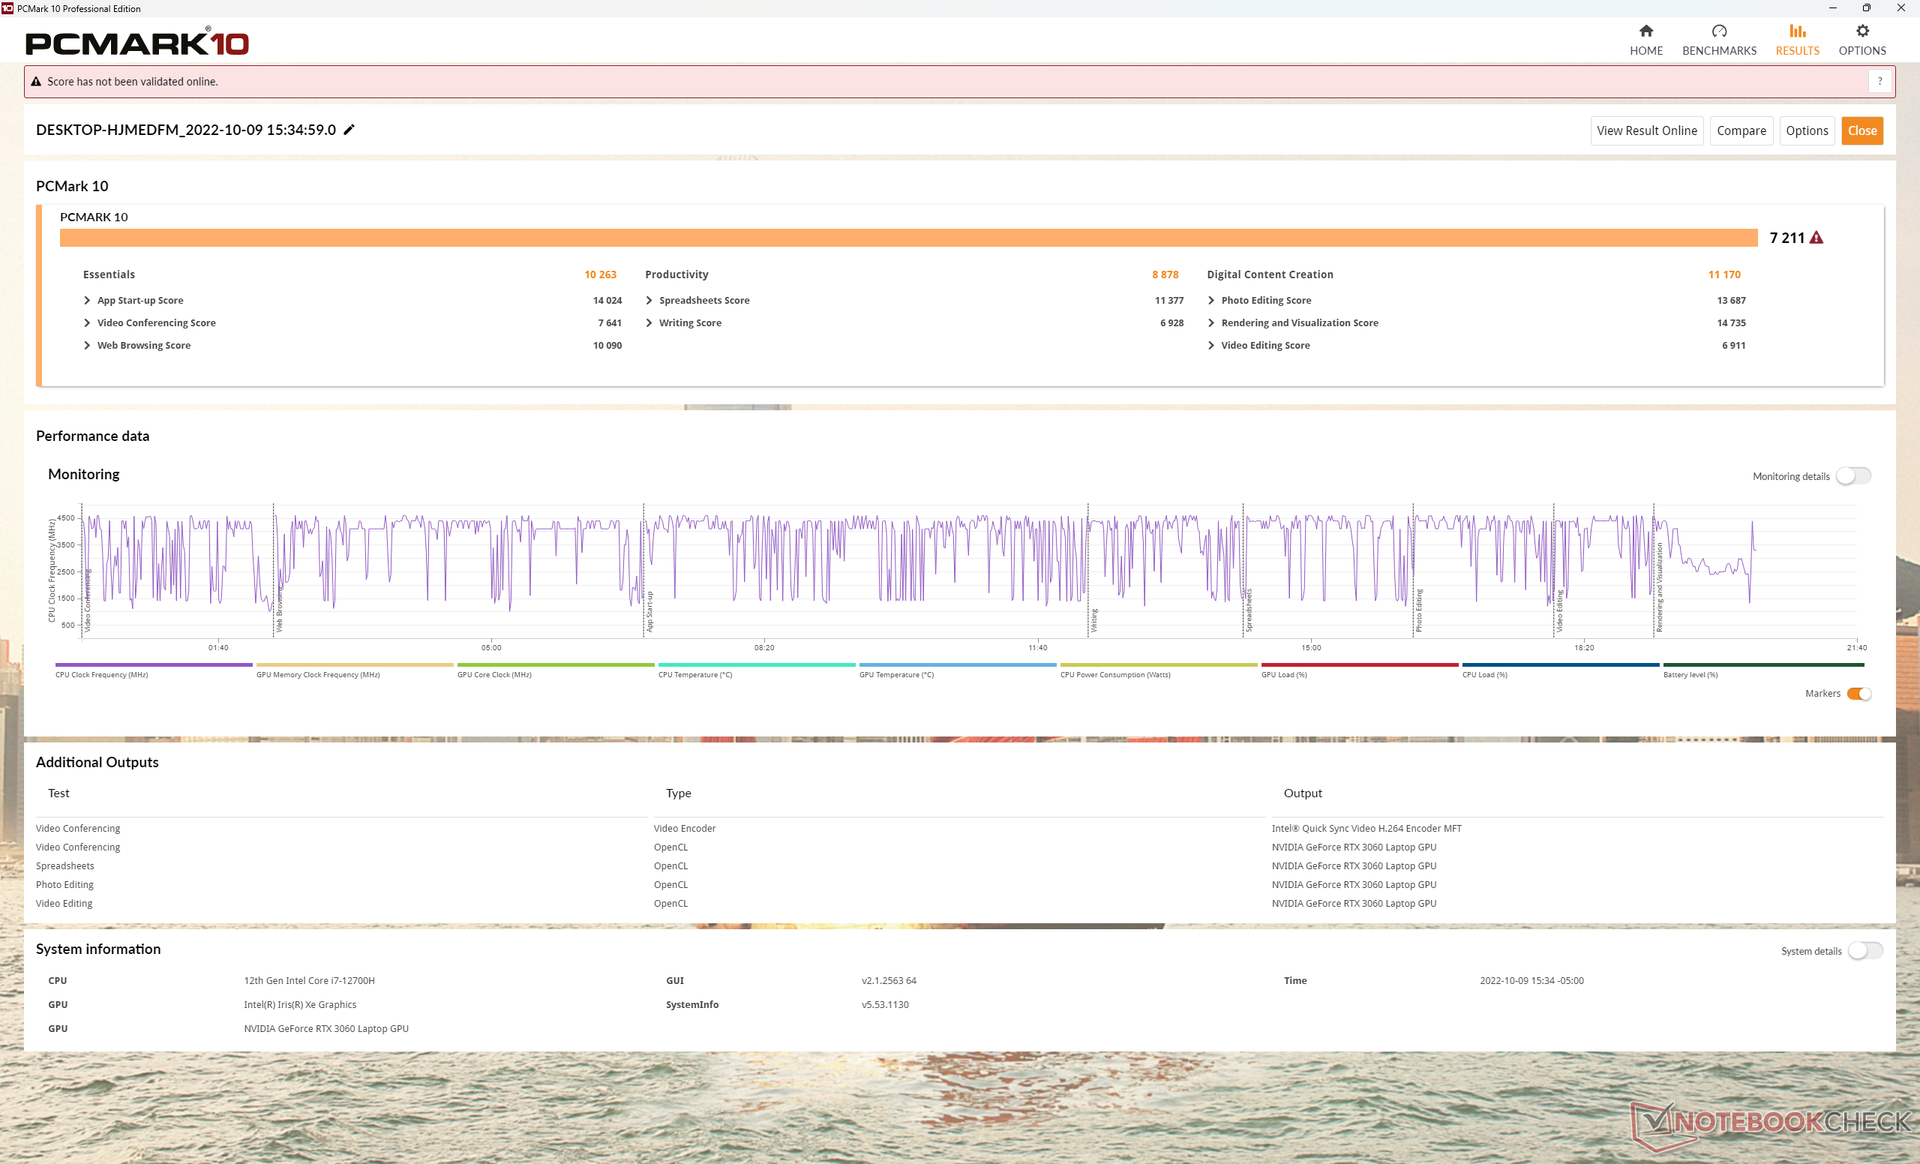
PCMark的结果是在其他具有相同Core i7-12700H CPU和RTX 3060 GPU的笔记本电脑的几个百分点之内。分数也比去年的 Alienware m15 R5采用相同的GPU但较慢的AMD Ryzen 7 5800H。
CrossMark: Overall | Productivity | Creativity | Responsiveness
| PCMark 10 / Score | |
| Lenovo Legion 5 Pro 16IAH7H | |
| Lenovo Legion 7 16ARHA7 | |
| Average Intel Core i7-12700H, NVIDIA GeForce RTX 3060 Laptop GPU (5986 - 8156, n=12) | |
| Dell G16 7620 | |
| Asus ROG Zephyrus M16 GU603H | |
| HP Victus 16-e0145ng | |
| Acer Swift X SFX16-51G-5388 | |
| PCMark 10 / Essentials | |
| Lenovo Legion 5 Pro 16IAH7H | |
| Average Intel Core i7-12700H, NVIDIA GeForce RTX 3060 Laptop GPU (9289 - 12144, n=12) | |
| Asus ROG Zephyrus M16 GU603H | |
| Lenovo Legion 7 16ARHA7 | |
| Dell G16 7620 | |
| HP Victus 16-e0145ng | |
| Acer Swift X SFX16-51G-5388 | |
| PCMark 10 / Productivity | |
| Lenovo Legion 5 Pro 16IAH7H | |
| Average Intel Core i7-12700H, NVIDIA GeForce RTX 3060 Laptop GPU (6161 - 10362, n=12) | |
| Asus ROG Zephyrus M16 GU603H | |
| Lenovo Legion 7 16ARHA7 | |
| Dell G16 7620 | |
| Acer Swift X SFX16-51G-5388 | |
| HP Victus 16-e0145ng | |
| PCMark 10 / Digital Content Creation | |
| Lenovo Legion 7 16ARHA7 | |
| Lenovo Legion 5 Pro 16IAH7H | |
| Dell G16 7620 | |
| Average Intel Core i7-12700H, NVIDIA GeForce RTX 3060 Laptop GPU (8950 - 12554, n=12) | |
| Asus ROG Zephyrus M16 GU603H | |
| HP Victus 16-e0145ng | |
| Acer Swift X SFX16-51G-5388 | |
| CrossMark / Overall | |
| Average Intel Core i7-12700H, NVIDIA GeForce RTX 3060 Laptop GPU (1649 - 2017, n=11) | |
| Dell G16 7620 | |
| Lenovo Legion 5 Pro 16IAH7H | |
| Lenovo Legion 7 16ARHA7 | |
| Acer Swift X SFX16-51G-5388 | |
| CrossMark / Productivity | |
| Average Intel Core i7-12700H, NVIDIA GeForce RTX 3060 Laptop GPU (1536 - 1958, n=11) | |
| Lenovo Legion 5 Pro 16IAH7H | |
| Dell G16 7620 | |
| Lenovo Legion 7 16ARHA7 | |
| Acer Swift X SFX16-51G-5388 | |
| CrossMark / Creativity | |
| Average Intel Core i7-12700H, NVIDIA GeForce RTX 3060 Laptop GPU (1816 - 2084, n=11) | |
| Dell G16 7620 | |
| Lenovo Legion 5 Pro 16IAH7H | |
| Lenovo Legion 7 16ARHA7 | |
| Acer Swift X SFX16-51G-5388 | |
| CrossMark / Responsiveness | |
| Lenovo Legion 5 Pro 16IAH7H | |
| Average Intel Core i7-12700H, NVIDIA GeForce RTX 3060 Laptop GPU (1210 - 2207, n=11) | |
| Dell G16 7620 | |
| Lenovo Legion 7 16ARHA7 | |
| Acer Swift X SFX16-51G-5388 | |
| PCMark 10 Score | 7211 points | |
Help | ||
| AIDA64 / Memory Copy | |
| Acer Swift X SFX16-51G-5388 | |
| Lenovo Legion 5 Pro 16IAH7H | |
| Lenovo Legion 5 Pro 16IAH7H | |
| Dell G16 7620 | |
| Average Intel Core i7-12700H (25615 - 80511, n=64) | |
| Lenovo Legion 7 16ARHA7 | |
| HP Victus 16-e0145ng | |
| AIDA64 / Memory Read | |
| Dell G16 7620 | |
| Lenovo Legion 5 Pro 16IAH7H | |
| Lenovo Legion 5 Pro 16IAH7H | |
| Average Intel Core i7-12700H (25586 - 79442, n=64) | |
| Acer Swift X SFX16-51G-5388 | |
| Lenovo Legion 7 16ARHA7 | |
| HP Victus 16-e0145ng | |
| AIDA64 / Memory Write | |
| Acer Swift X SFX16-51G-5388 | |
| Lenovo Legion 5 Pro 16IAH7H | |
| Lenovo Legion 5 Pro 16IAH7H | |
| Dell G16 7620 | |
| Lenovo Legion 7 16ARHA7 | |
| Average Intel Core i7-12700H (23679 - 88660, n=64) | |
| HP Victus 16-e0145ng | |
| AIDA64 / Memory Latency | |
| Lenovo Legion 5 Pro 16IAH7H | |
| Lenovo Legion 5 Pro 16IAH7H | |
| Acer Swift X SFX16-51G-5388 | |
| Dell G16 7620 | |
| Lenovo Legion 7 16ARHA7 | |
| Average Intel Core i7-12700H (76.2 - 133.9, n=62) | |
| HP Victus 16-e0145ng | |
| Asus ROG Zephyrus M16 GU603H | |
* ... smaller is better
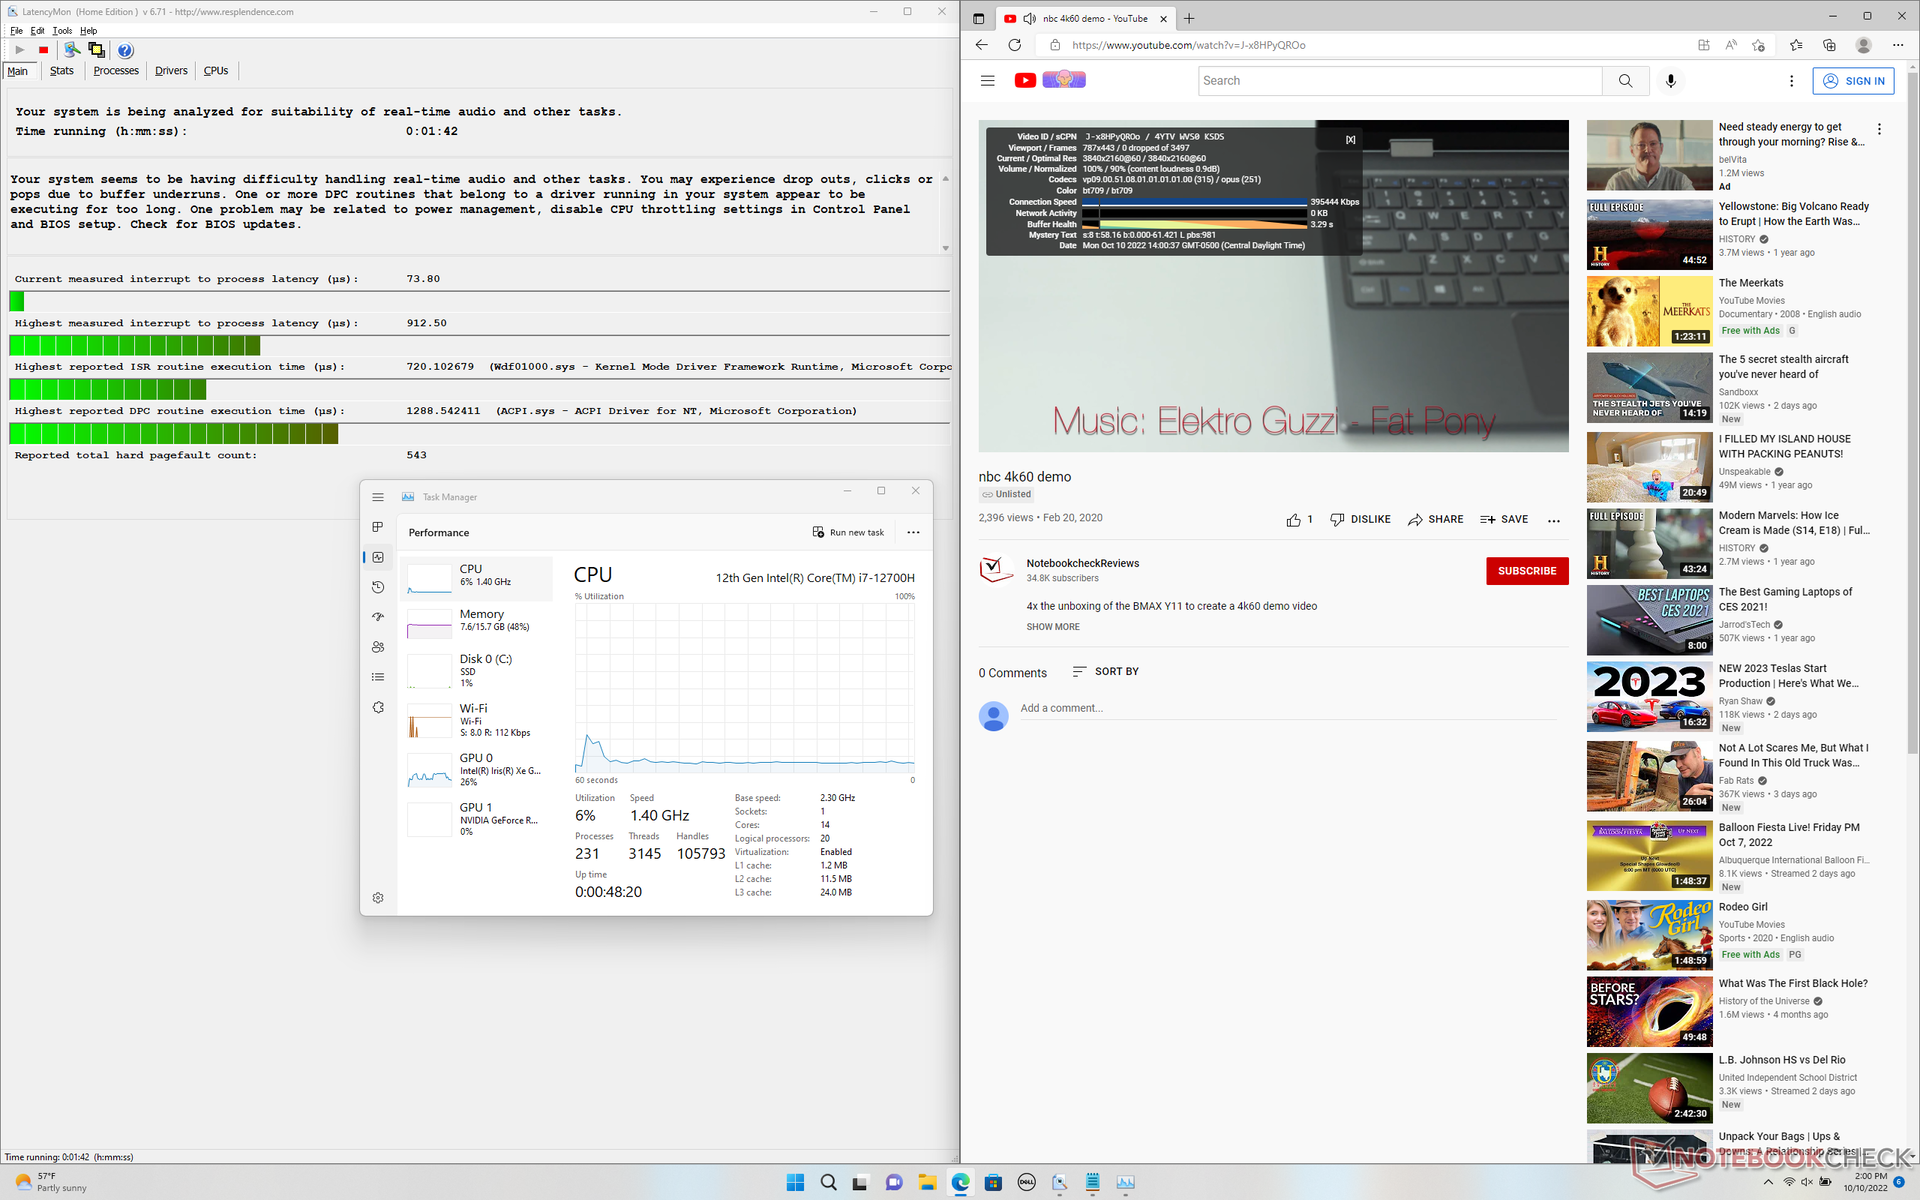
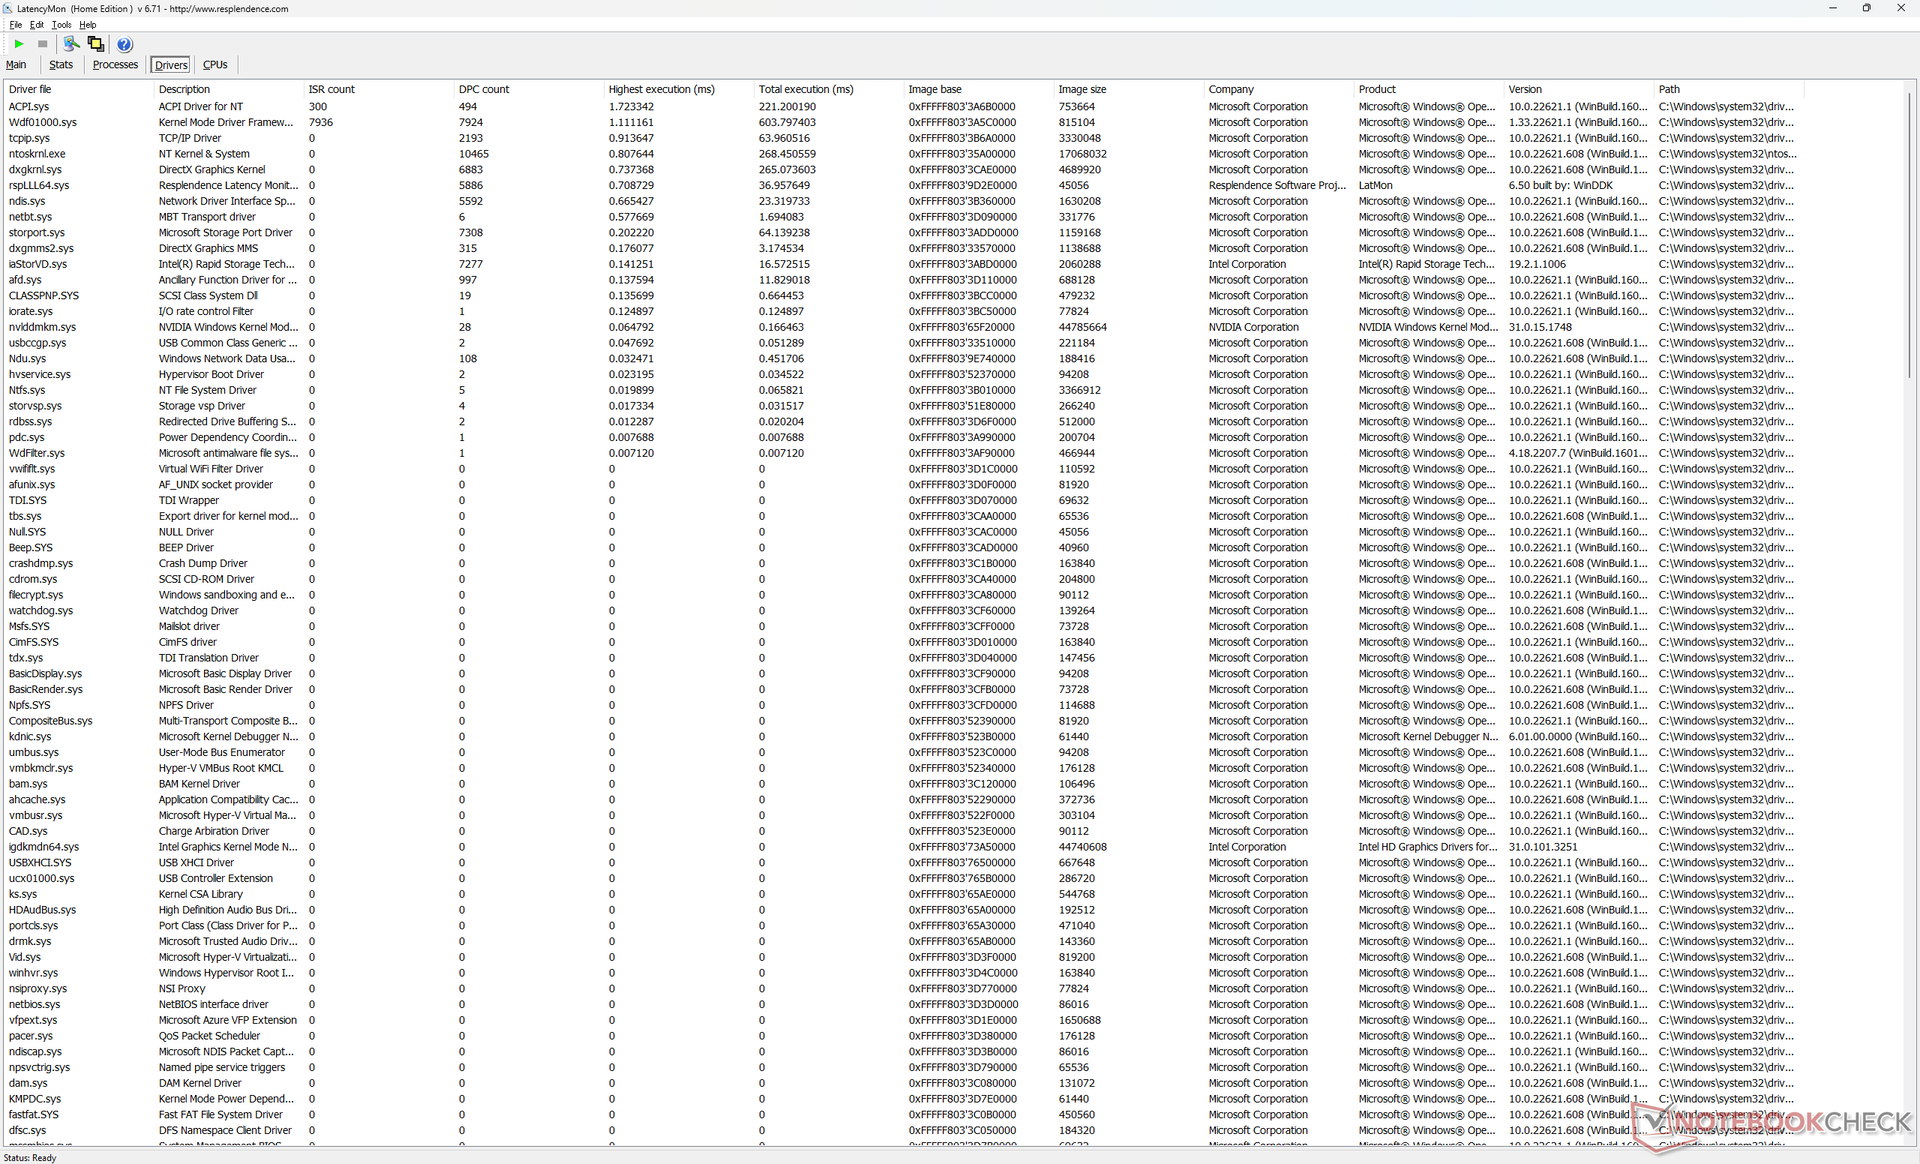
DPC延时
LatencyMon显示,在我们的主页上打开多个浏览器标签时有轻微的DPC问题。在60 FPS的情况下,4K视频播放是完美的,没有掉帧。
| DPC Latencies / LatencyMon - interrupt to process latency (max), Web, Youtube, Prime95 | |
| Acer Swift X SFX16-51G-5388 | |
| Lenovo Legion 7 16ARHA7 | |
| Asus ROG Zephyrus M16 GU603H | |
| Dell G16 7620 | |
| HP Victus 16-e0145ng | |
| Lenovo Legion 5 Pro 16IAH7H | |
* ... smaller is better
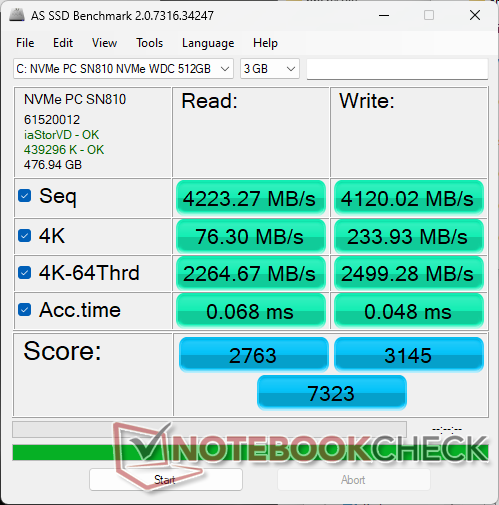
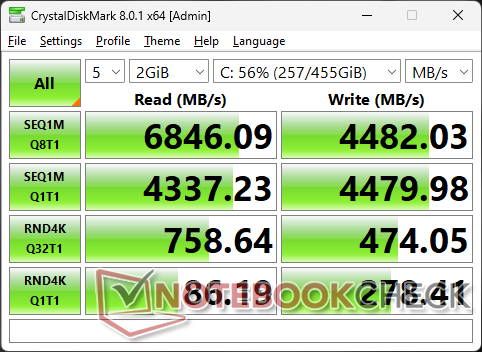
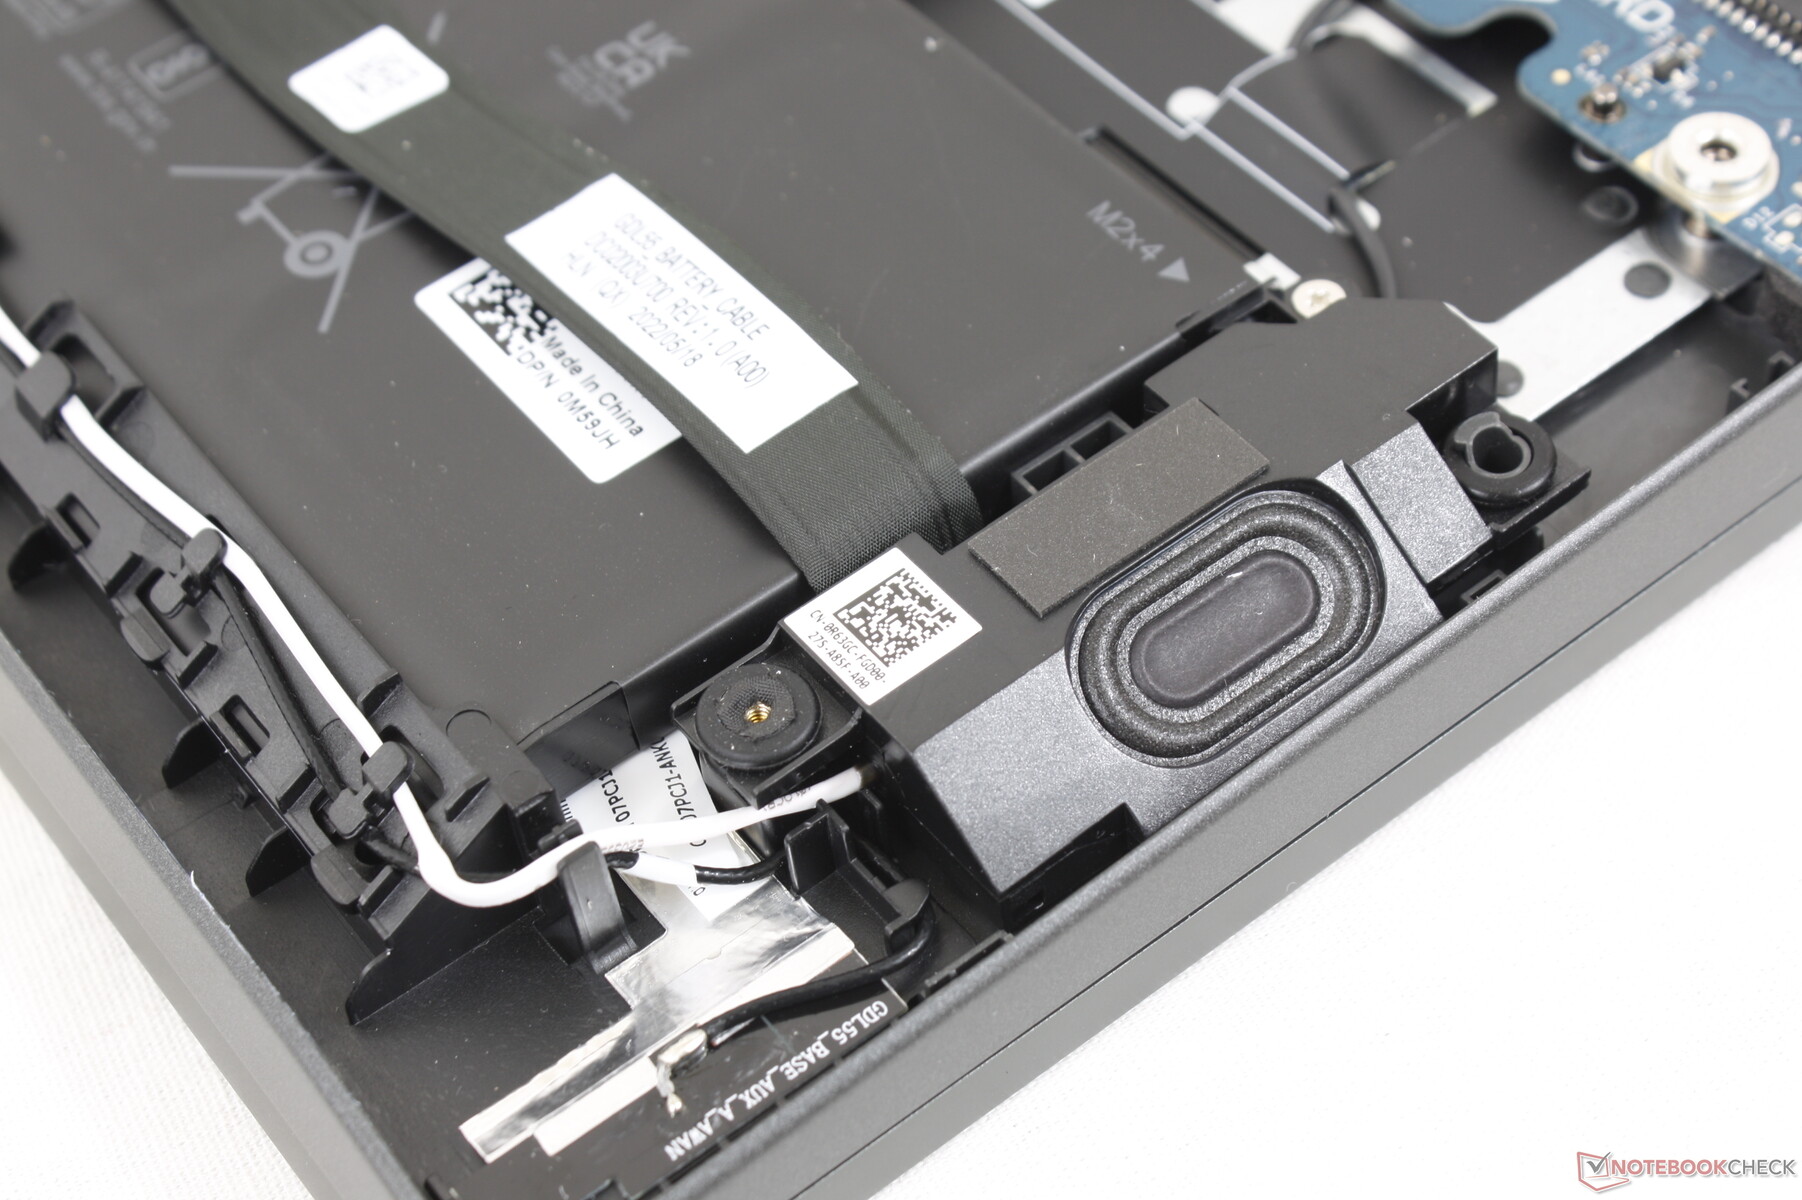
存储设备
如我们下面的图片所示,该主板有空间容纳两个M.2 2280 SSD。然而,目前所有的配置都是在移除第二个连接器的情况下发货的,这意味着G16最多只能支持一块内部M.2 2280固态硬盘。
我们的测试设备配备了中档的 WDC PC SN810PCIe4 x4 NVMe固态硬盘,理论上连续读取和写入速度分别高达6000 MB/s和4000 MB/s。 根据制造商的说法.我们设备中的硬盘能够达到6700 MB/s,但它无法长时间保持这些快速的速度。例如,当在一个循环中运行DiskSpd时,读取率最终会节流到3500MB/s。

| Drive Performance rating - Percent | |
| Lenovo Legion 5 Pro 16IAH7H | |
| Asus ROG Zephyrus M16 GU603H | |
| Dell G16 7620 | |
| Lenovo Legion 7 16ARHA7 | |
| HP Victus 16-e0145ng | |
| Acer Swift X SFX16-51G-5388 | |
* ... smaller is better
Disk Throttling: DiskSpd Read Loop, Queue Depth 8
GPU性能 - 130 W TGP图形
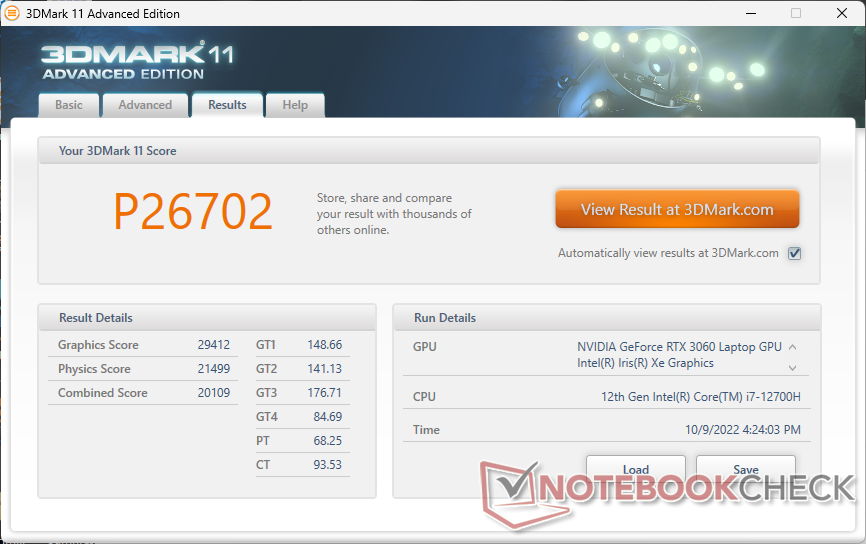
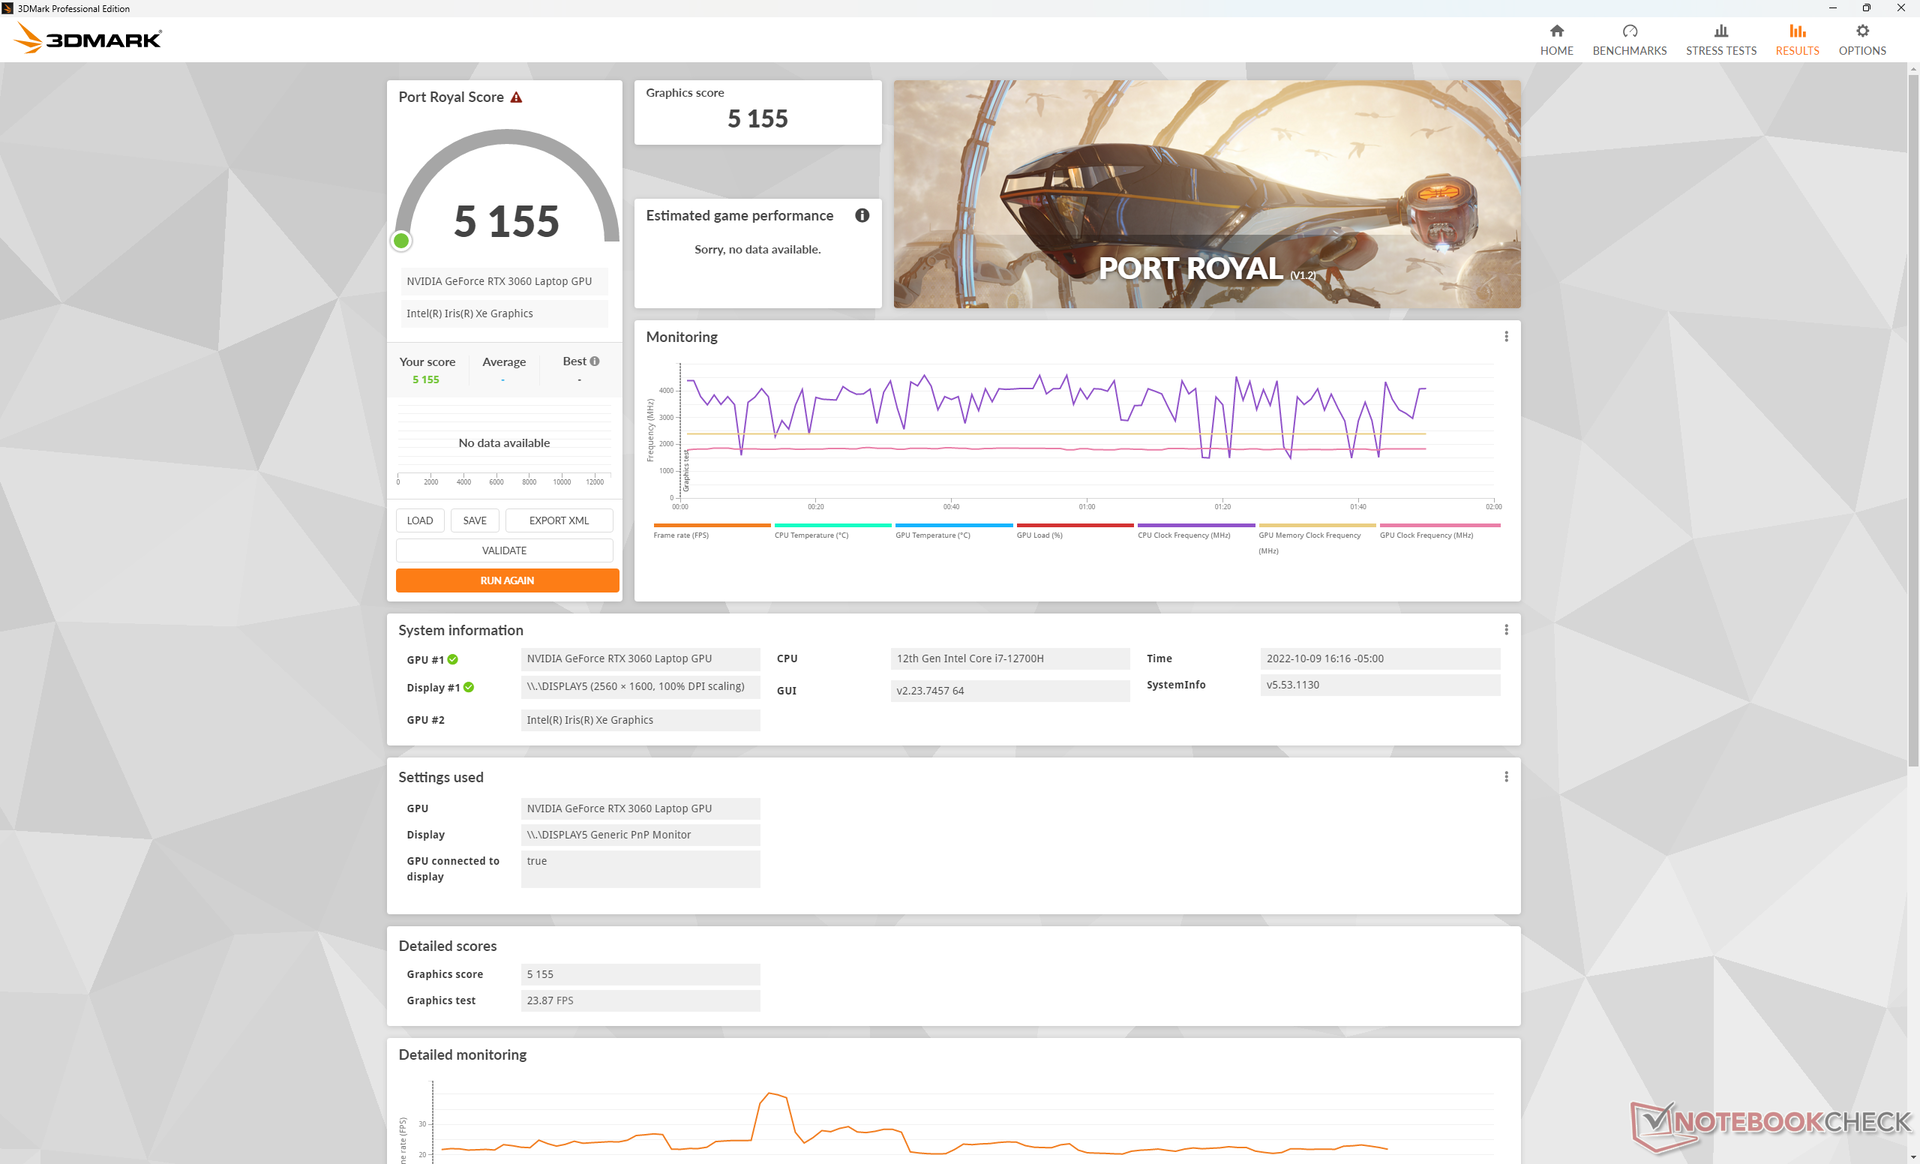
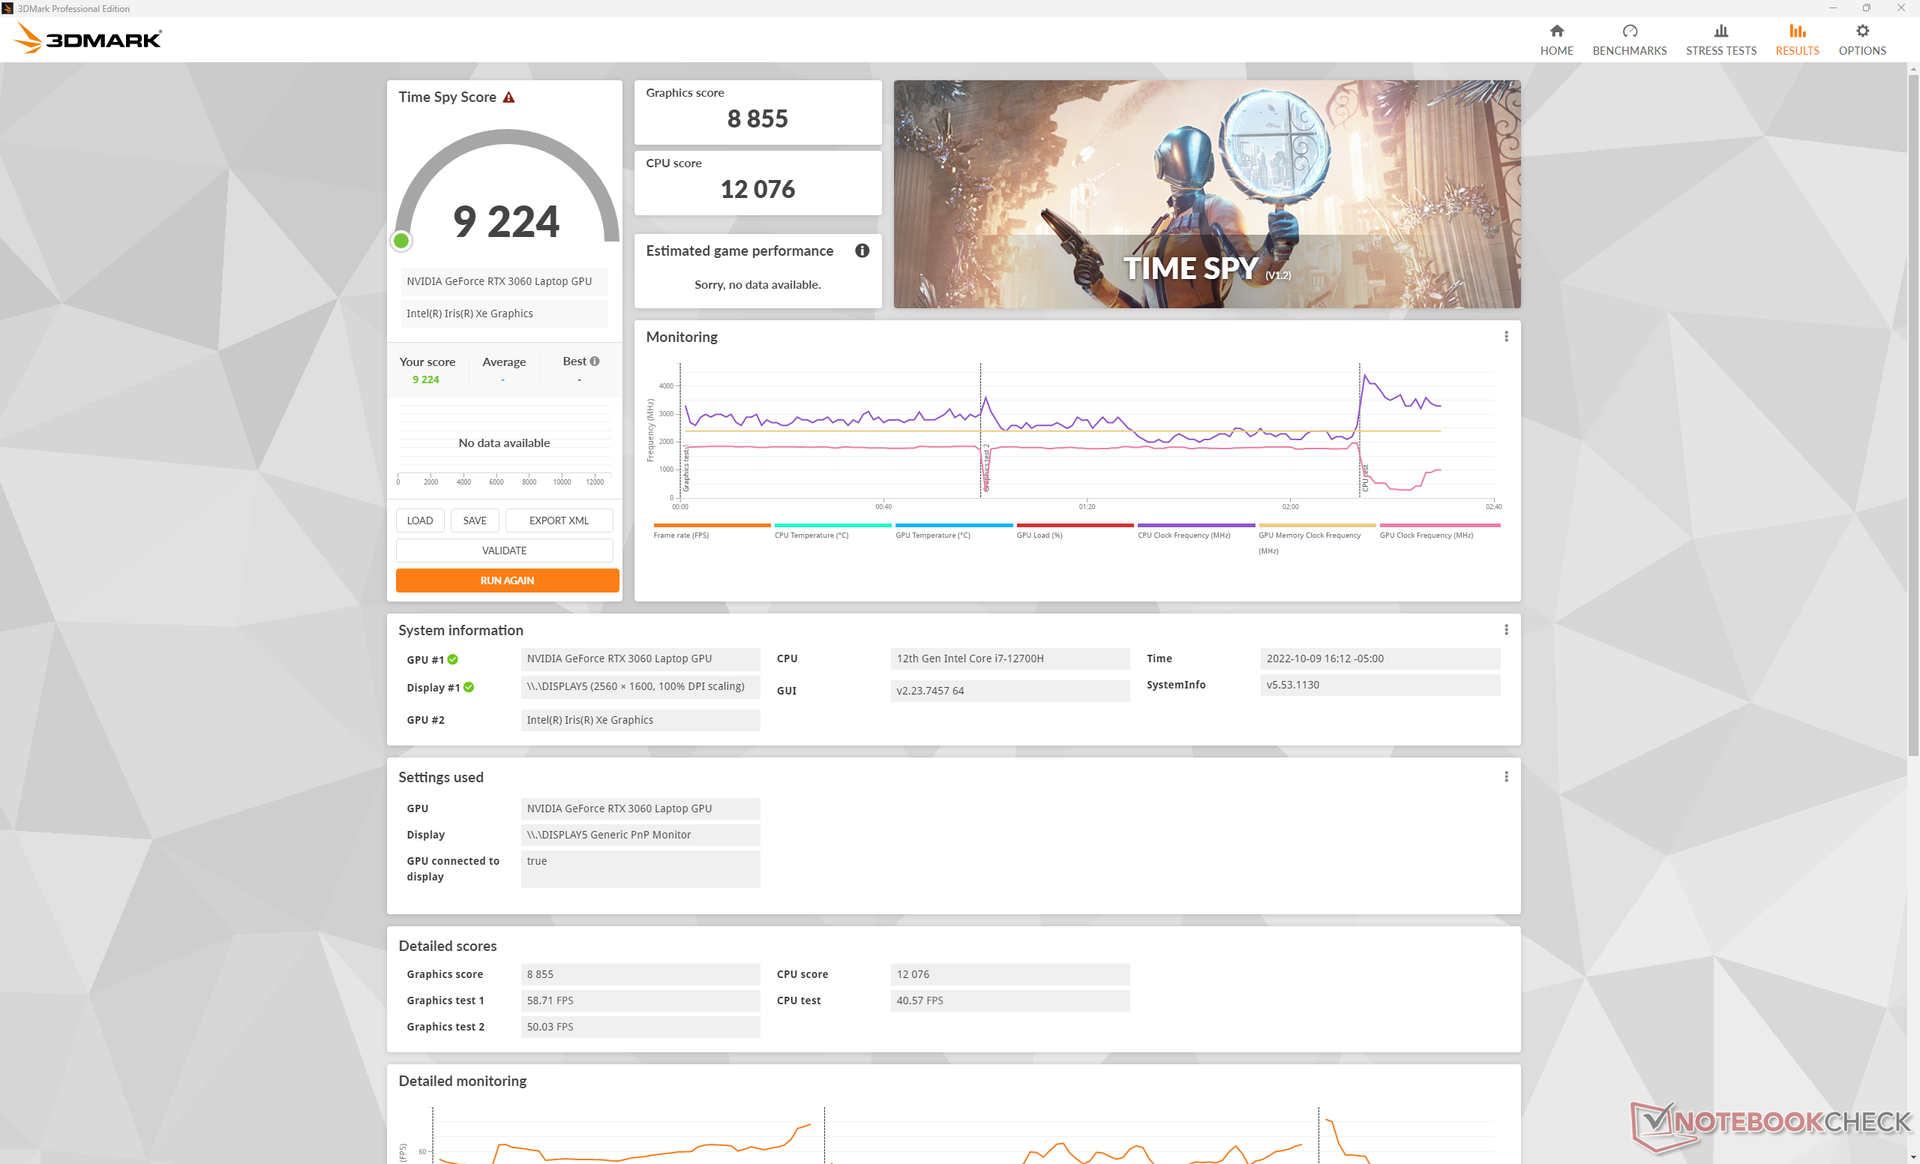
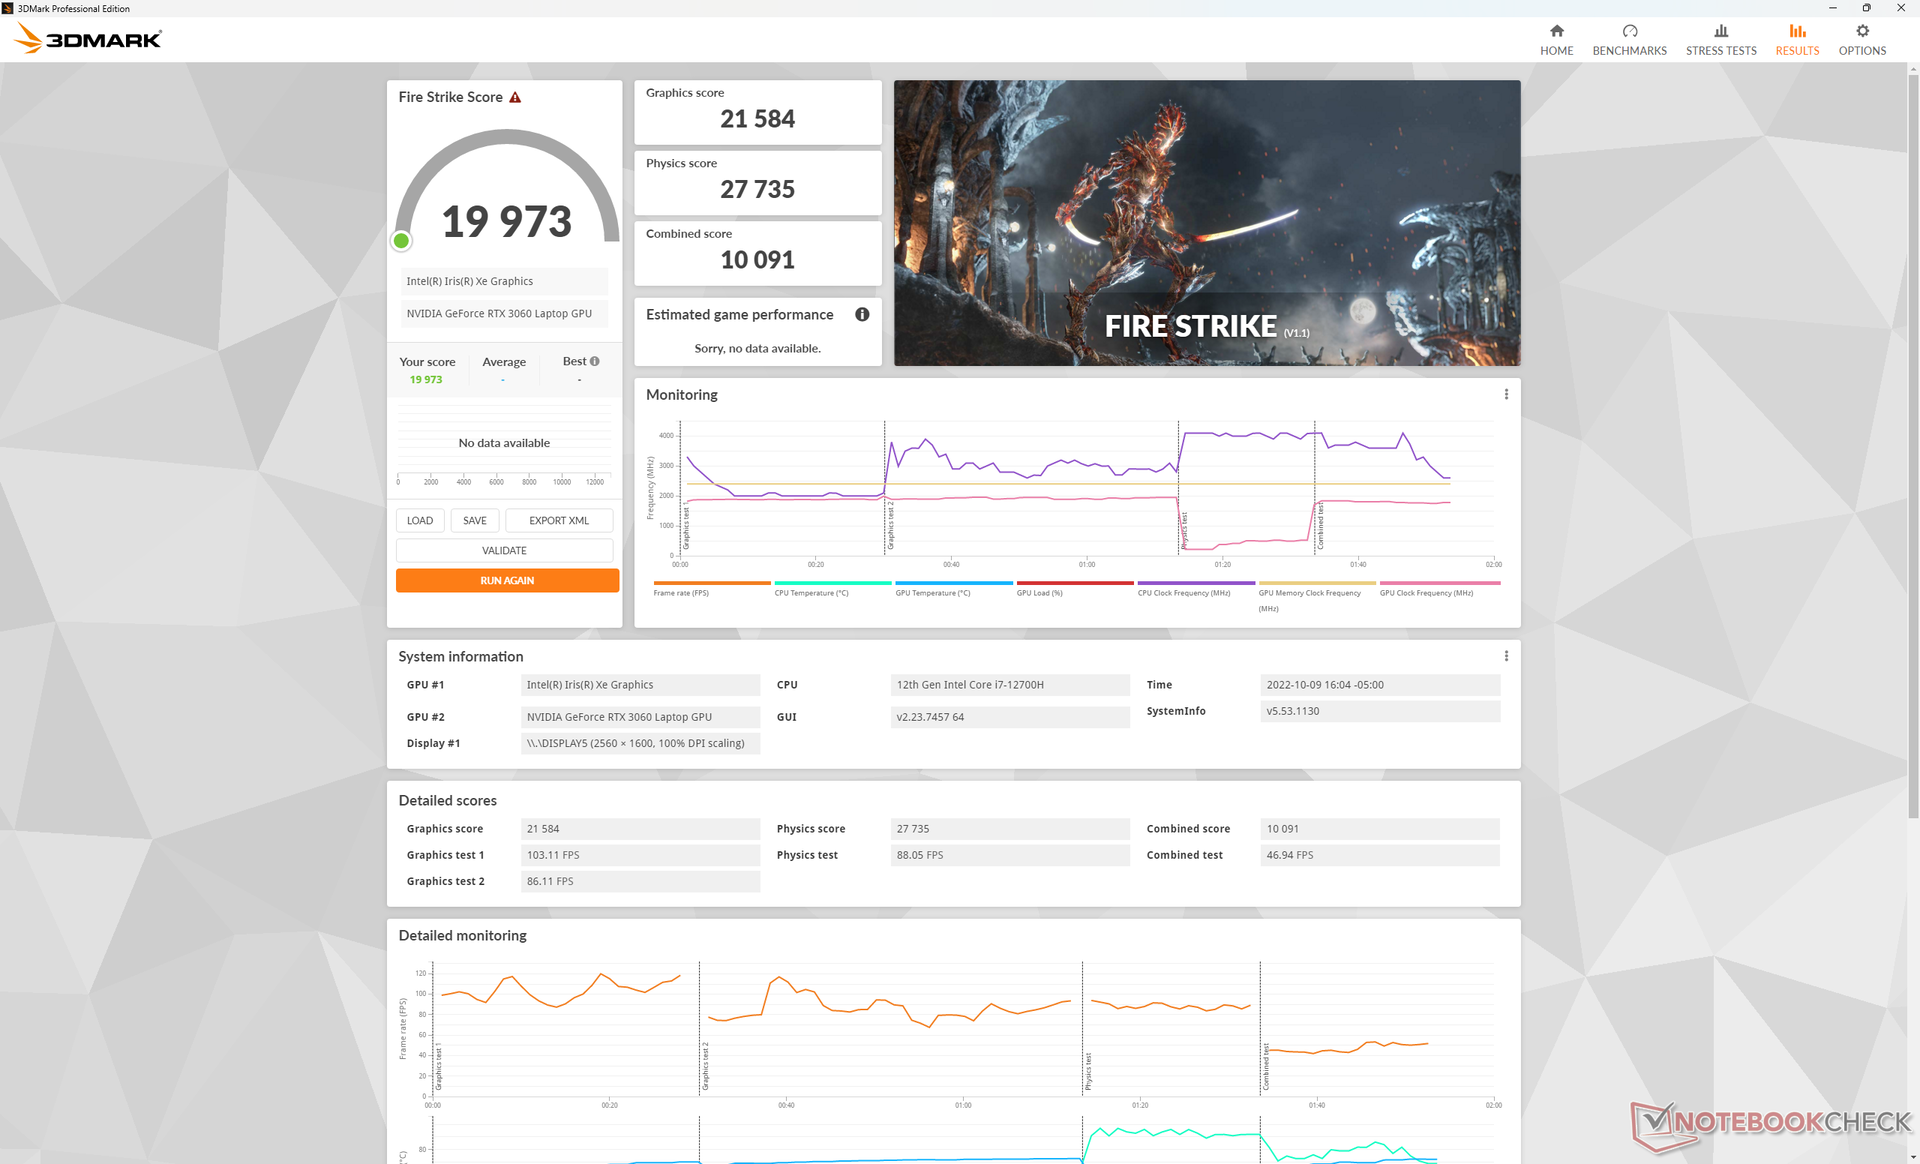
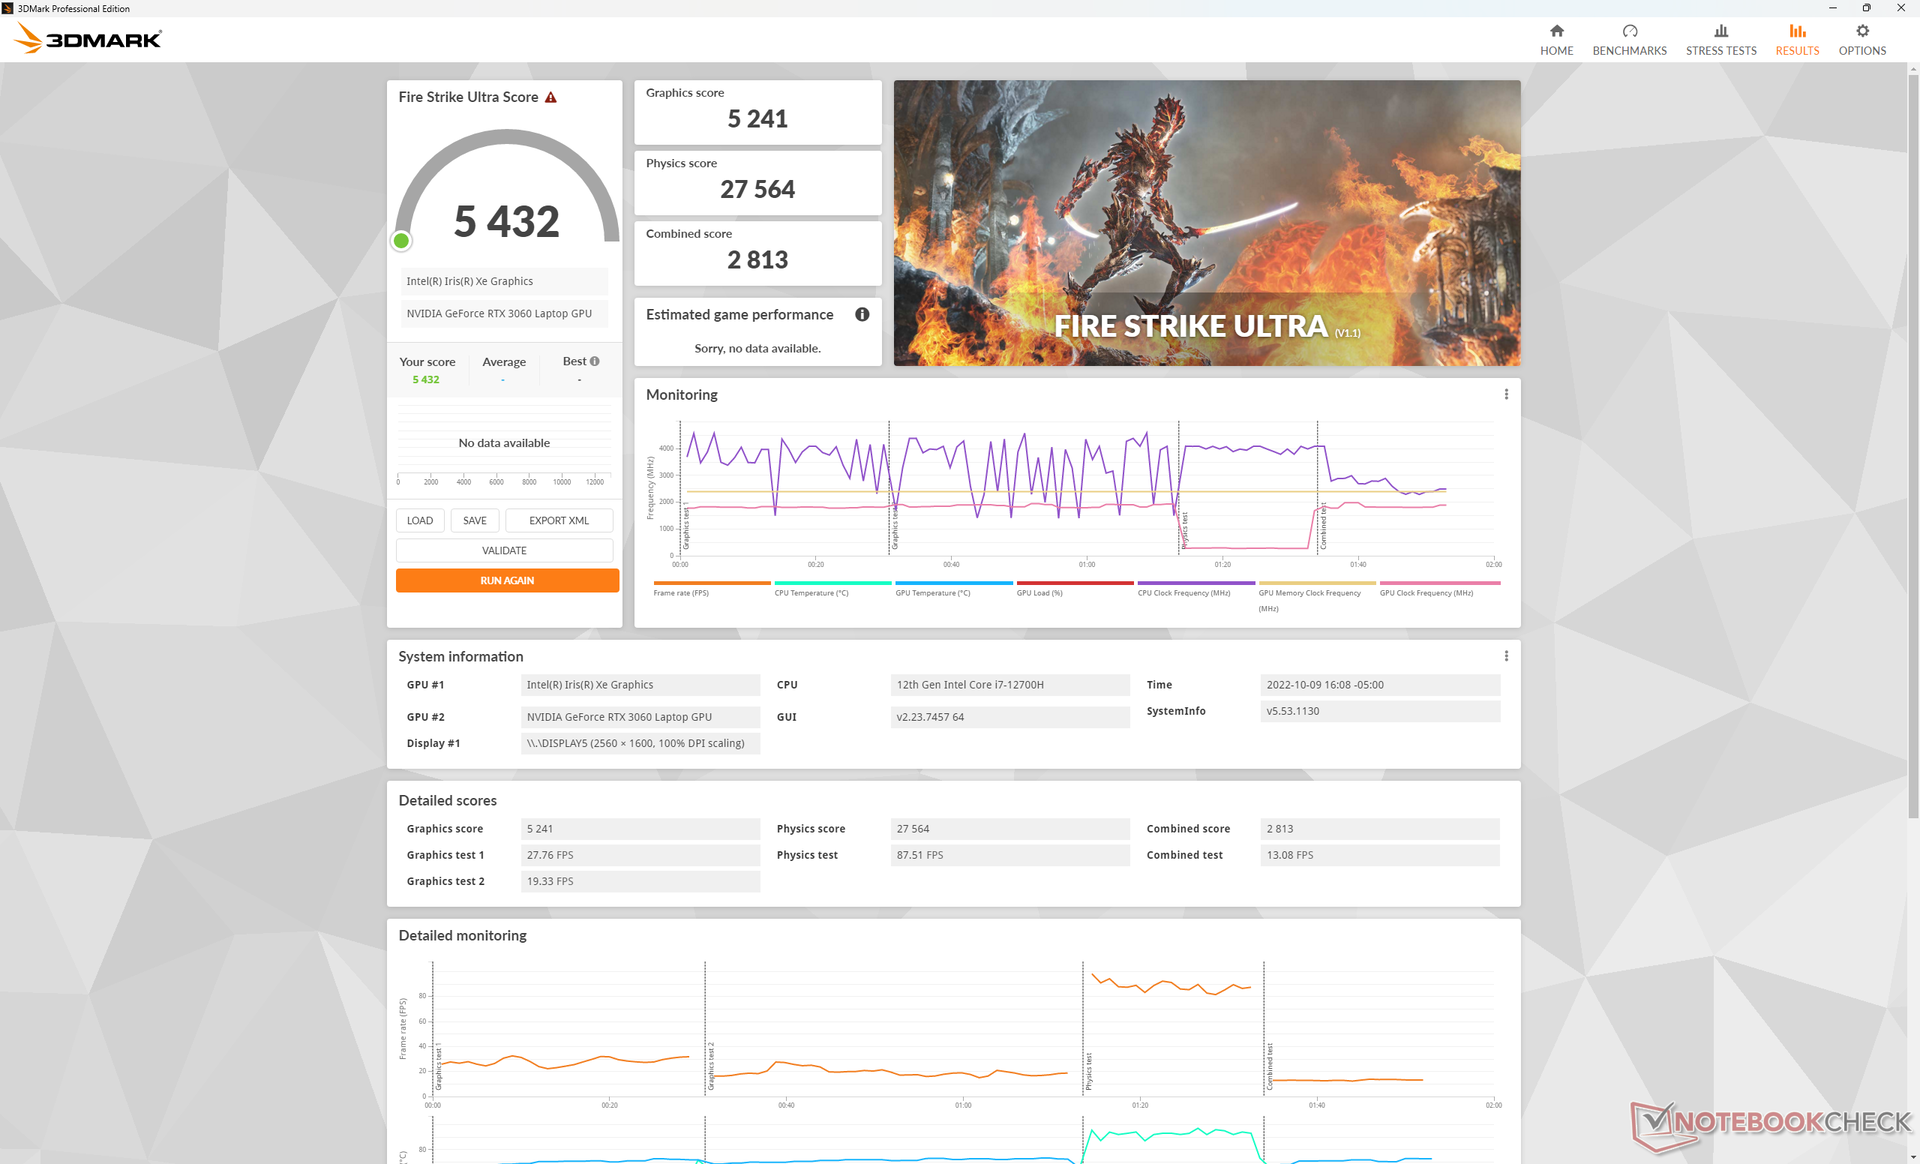
图形性能非常好,其结果比我们数据库中配备相同设备的普通笔记本电脑快5%至10%。 GeForce RTX 3060GPU。总体性能现在在适当的桌面RTX 3060的10%以内。这部分是由于戴尔G16的130 W TGP目标,在涉及到游戏笔记本电脑时,它处于光谱的高端。
升级到 RTX 3070 Ti配置预计将提高图形性能约20%至30%,而降级到 RTX 3050 Ti配置将使性能下降约30%至35%。
在优化模式而不是超性能模式下运行对性能的影响非常小。在优化模式下进行的Fire Strike 测试,物理和图形得分分别为26289和21492分,而在超性能模式下则为27735和21584分。
| 3DMark 11 - 1280x720 Performance GPU | |
| Lenovo Legion 7 16IAX7-82TD004SGE | |
| Lenovo Legion 7 16ARHA7 | |
| Schenker XMG Neo 15 (Ryzen 9 6900HX, RTX 3070 Ti) | |
| Razer Blade 15 Advanced Model Early 2021 | |
| Lenovo Legion 5 Pro 16IAH7H | |
| Dell G16 7620 | |
| Inno3D GeForce RTX 3060 Twin X2 | |
| Average NVIDIA GeForce RTX 3060 Laptop GPU (13799 - 30772, n=43) | |
| Asus ROG Zephyrus M16 GU603H | |
| HP Victus 16-e0145ng | |
| Acer Swift X SFX16-51G-5388 | |
| 3DMark 11 Performance | 26702 points | |
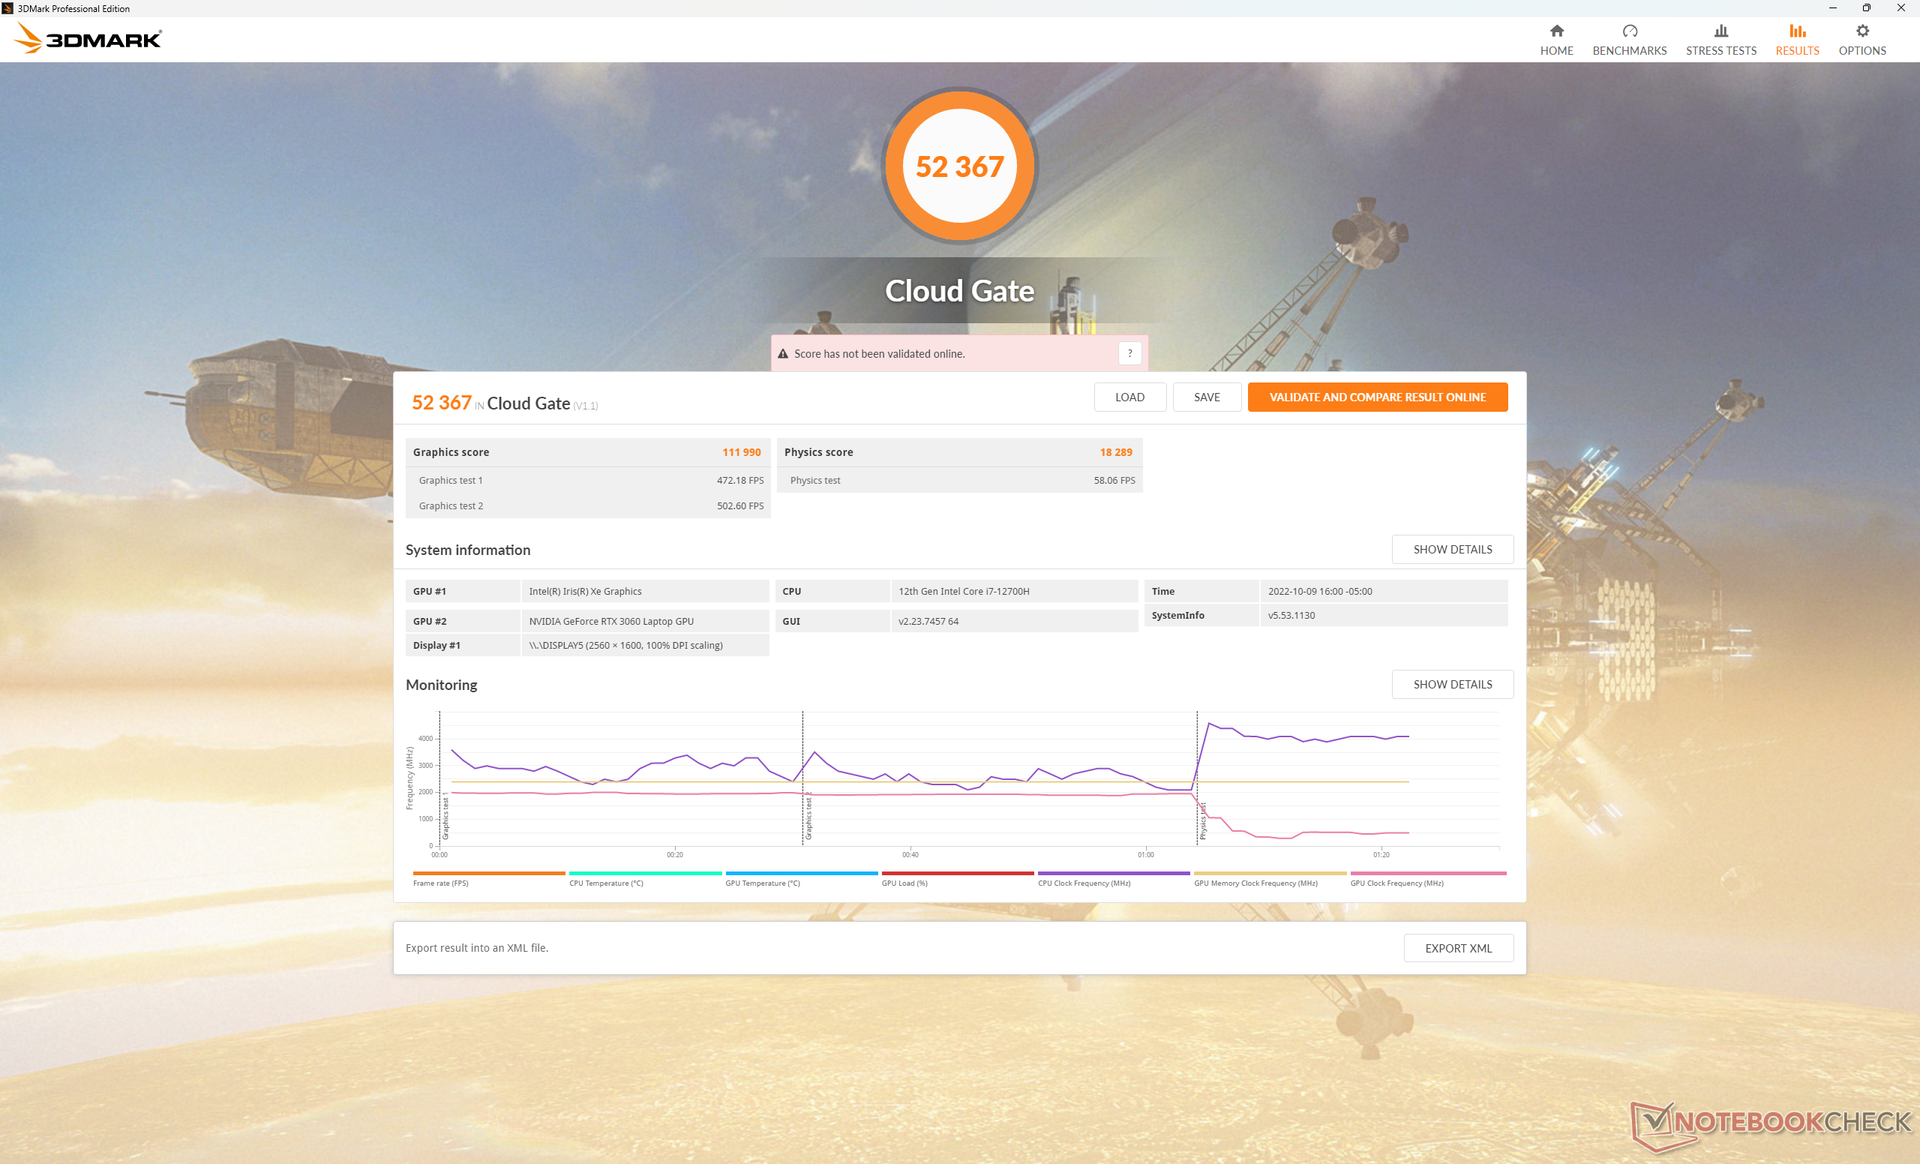
| 3DMark Cloud Gate Standard Score | 52367 points | |
| 3DMark Fire Strike Score | 19973 points | |
| 3DMark Time Spy Score | 9224 points | |
Help | ||
* ... smaller is better
如我们的下图所示,在运行Witcher 3 ,可以观察到暂时的性能下降到低至43FPS。这种突然的变化通常是由某些后台程序的资源管理不善造成的,比如制造商预装的任何软件,它们会打断当前的焦点程序。
Witcher 3 FPS Chart
| low | med. | high | ultra | QHD | |
|---|---|---|---|---|---|
| GTA V (2015) | 185.6 | 179.9 | 176.2 | 108.7 | 82.1 |
| The Witcher 3 (2015) | 415.2 | 260.5 | 167.2 | 86.6 | |
| Dota 2 Reborn (2015) | 171.8 | 159.3 | 159 | 147.2 | |
| Final Fantasy XV Benchmark (2018) | 176.7 | 123.3 | 89.4 | 67.1 | |
| X-Plane 11.11 (2018) | 147.8 | 130.5 | 102.6 | ||
| Strange Brigade (2018) | 395 | 228 | 180.2 | 155.5 | 113 |
| Cyberpunk 2077 1.6 (2022) | 125.1 | 105.4 | 80.4 | 66.8 | 41.6 |
排放
系统噪音--几乎没有静音
G16的内部风扇几乎从不空转,即使是在设置为最低功率的情况下。例如,在 "安静 "模式下,我们仍然能够记录到28 dB(A)的风扇噪音,而安静的背景是23 dB(A)。这足以在视频流时引起注意,也比许多其他游戏笔记本在类似条件下的声音大,如联想Legion 7 16或惠普Victus 16。
好消息是,高底噪意味着当更高的负载被引入时,风扇会更慢地升温。例如,当运行3DMark 06的第一个基准场景时,风扇噪音最高为32 dB(A),而宏碁Swift X SFX16 HP Victus 16则为40 dB(A)或更高。
当运行在平衡模式和性能模式时,风扇噪音将稳定在45.7 dB(A)和48.3 dB(A)。 Witcher 3在平衡模式和性能模式下运行时,风扇噪音将分别稳定在45.7 dB(A)和48.3 dB(A)。
Noise level
| Idle |
| 28.3 / 28.8 / 28.9 dB(A) |
| Load |
| 32.4 / 48.1 dB(A) |
 | ||
30 dB silent 40 dB(A) audible 50 dB(A) loud |
||
min: | ||
| Dell G16 7620 GeForce RTX 3060 Laptop GPU, i7-12700H, WDC PC SN810 512GB | Lenovo Legion 7 16ARHA7 Radeon RX 6850M XT, R9 6900HX, Samsung PM9A1 MZVL22T0HBLB | HP Victus 16-e0145ng GeForce RTX 3050 Ti Laptop GPU, R5 5600H, Samsung SSD PM981a MZVLB512HBJQ | Asus ROG Zephyrus M16 GU603H GeForce RTX 3070 Laptop GPU, i9-11900H, Samsung PM9A1 MZVL22T0HBLB | Lenovo Legion 5 Pro 16IAH7H GeForce RTX 3060 Laptop GPU, i7-12700H, 2x Samsung PM9A1 MZVL21T0HCLR (RAID 0) | Acer Swift X SFX16-51G-5388 GeForce RTX 3050 4GB Laptop GPU, i5-11320H, Samsung PM991 MZVLQ512HBLU | |
|---|---|---|---|---|---|---|
| Noise | 8% | -9% | -17% | -14% | -1% | |
| off / environment * (dB) | 23.2 | 22.8 2% | 26 -12% | 25 -8% | 24.6 -6% | 25.4 -9% |
| Idle Minimum * (dB) | 28.3 | 23 19% | 26 8% | 25 12% | 28.7 -1% | 25.4 10% |
| Idle Average * (dB) | 28.8 | 23 20% | 28 3% | 31 -8% | 32 -11% | 25.4 12% |
| Idle Maximum * (dB) | 28.9 | 23 20% | 34 -18% | 42 -45% | 32 -11% | 27.8 4% |
| Load Average * (dB) | 32.4 | 26.8 17% | 44 -36% | 48 -48% | 45.2 -40% | 41 -27% |
| Witcher 3 ultra * (dB) | 48.3 | 54.3 -12% | 48 1% | 52 -8% | ||
| Load Maximum * (dB) | 48.1 | 54.2 -13% | 53 -10% | 56 -16% | 54.4 -13% | 47 2% |
* ... smaller is better
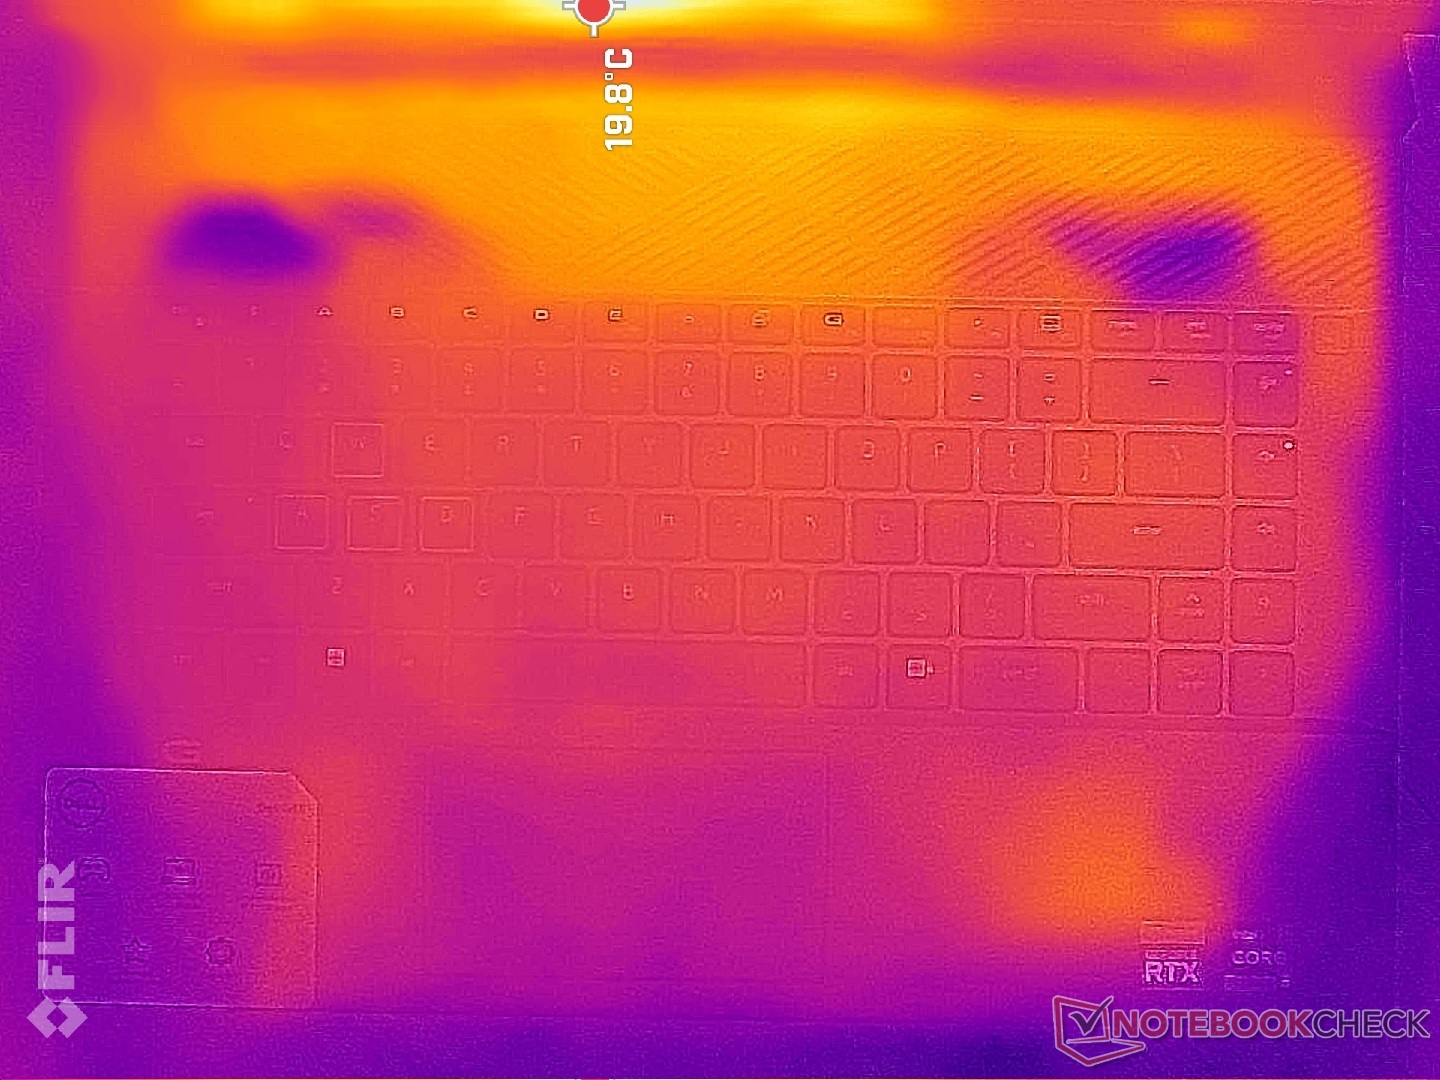
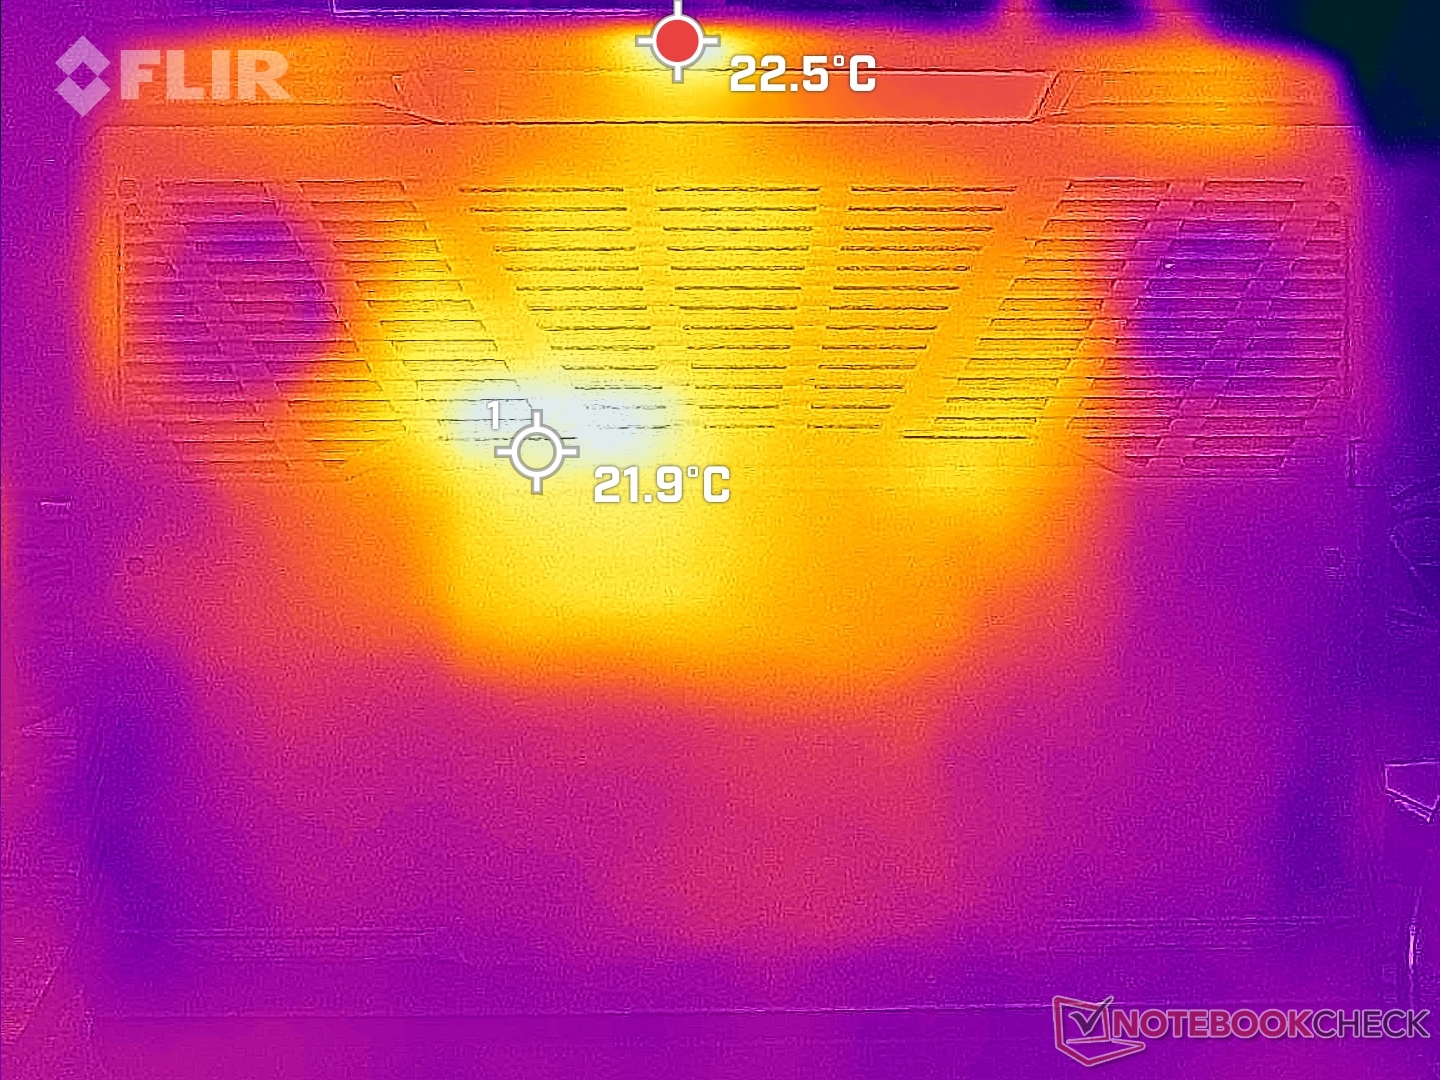
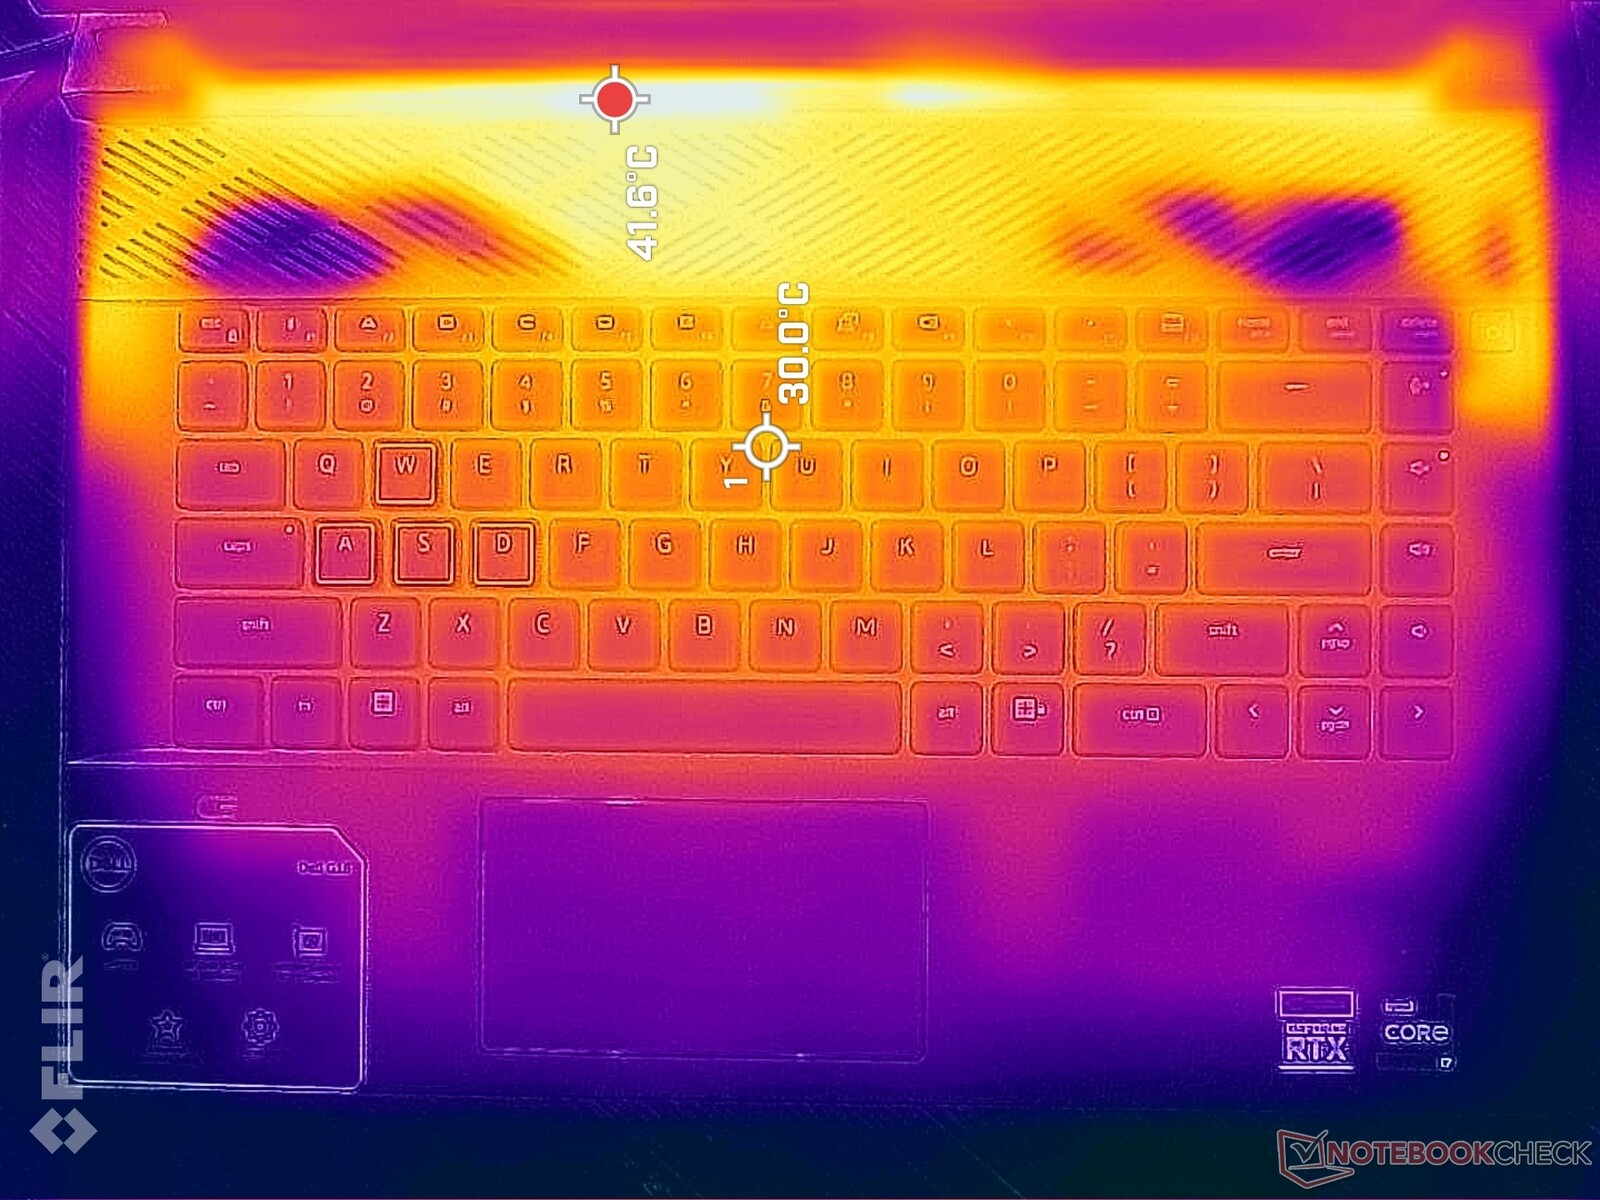
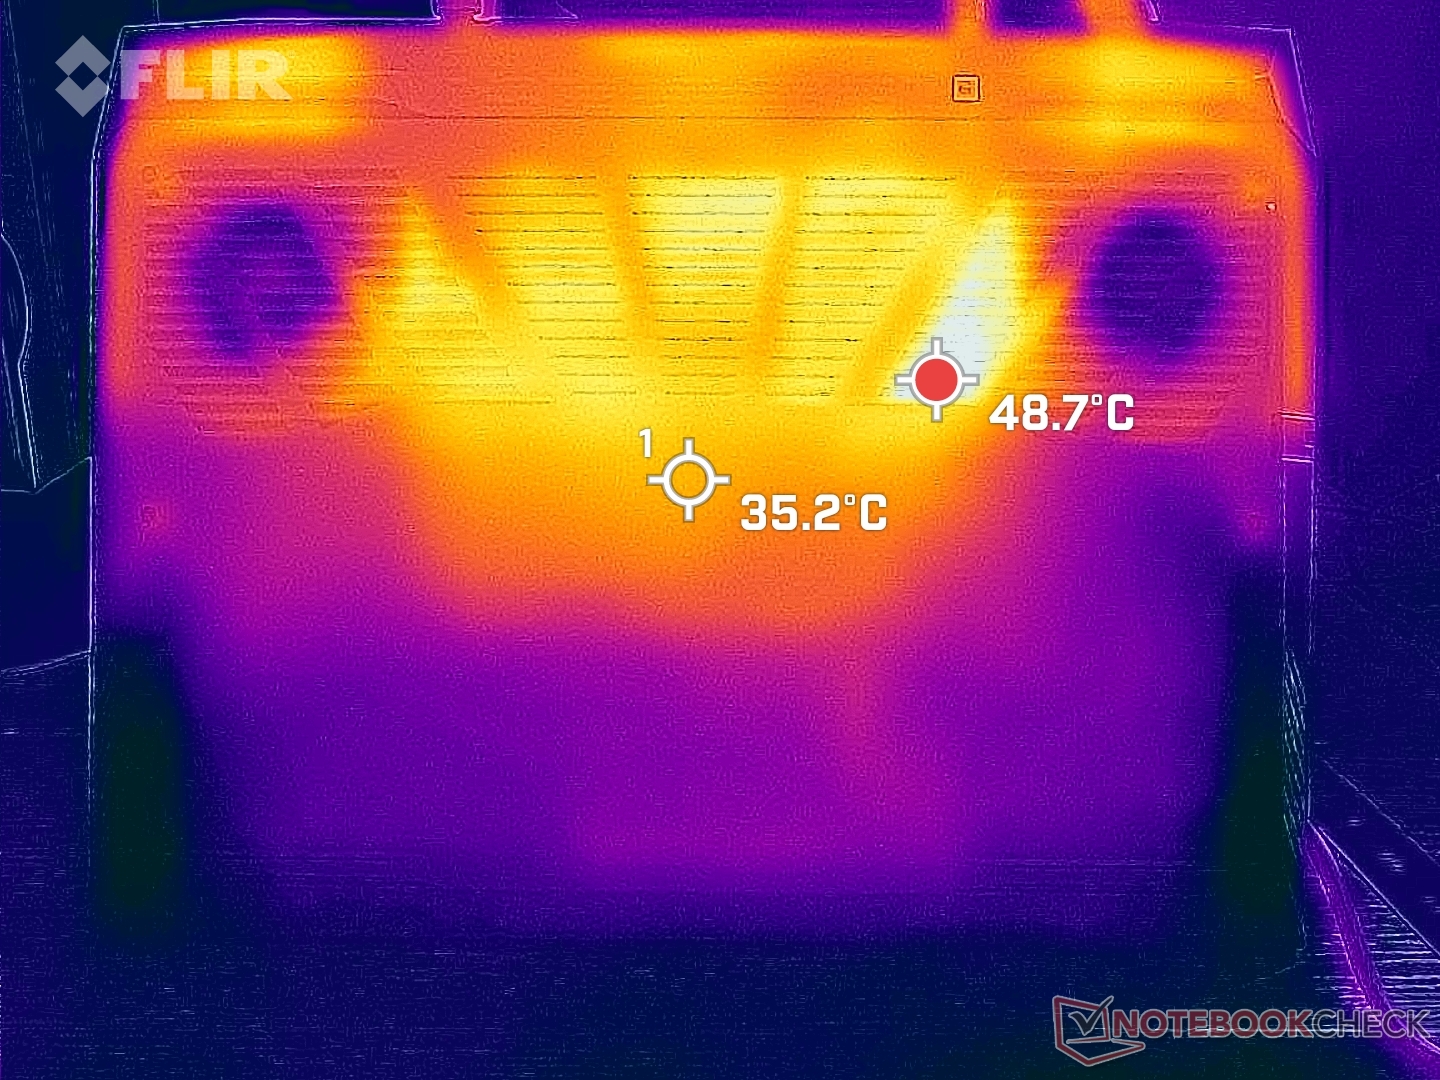
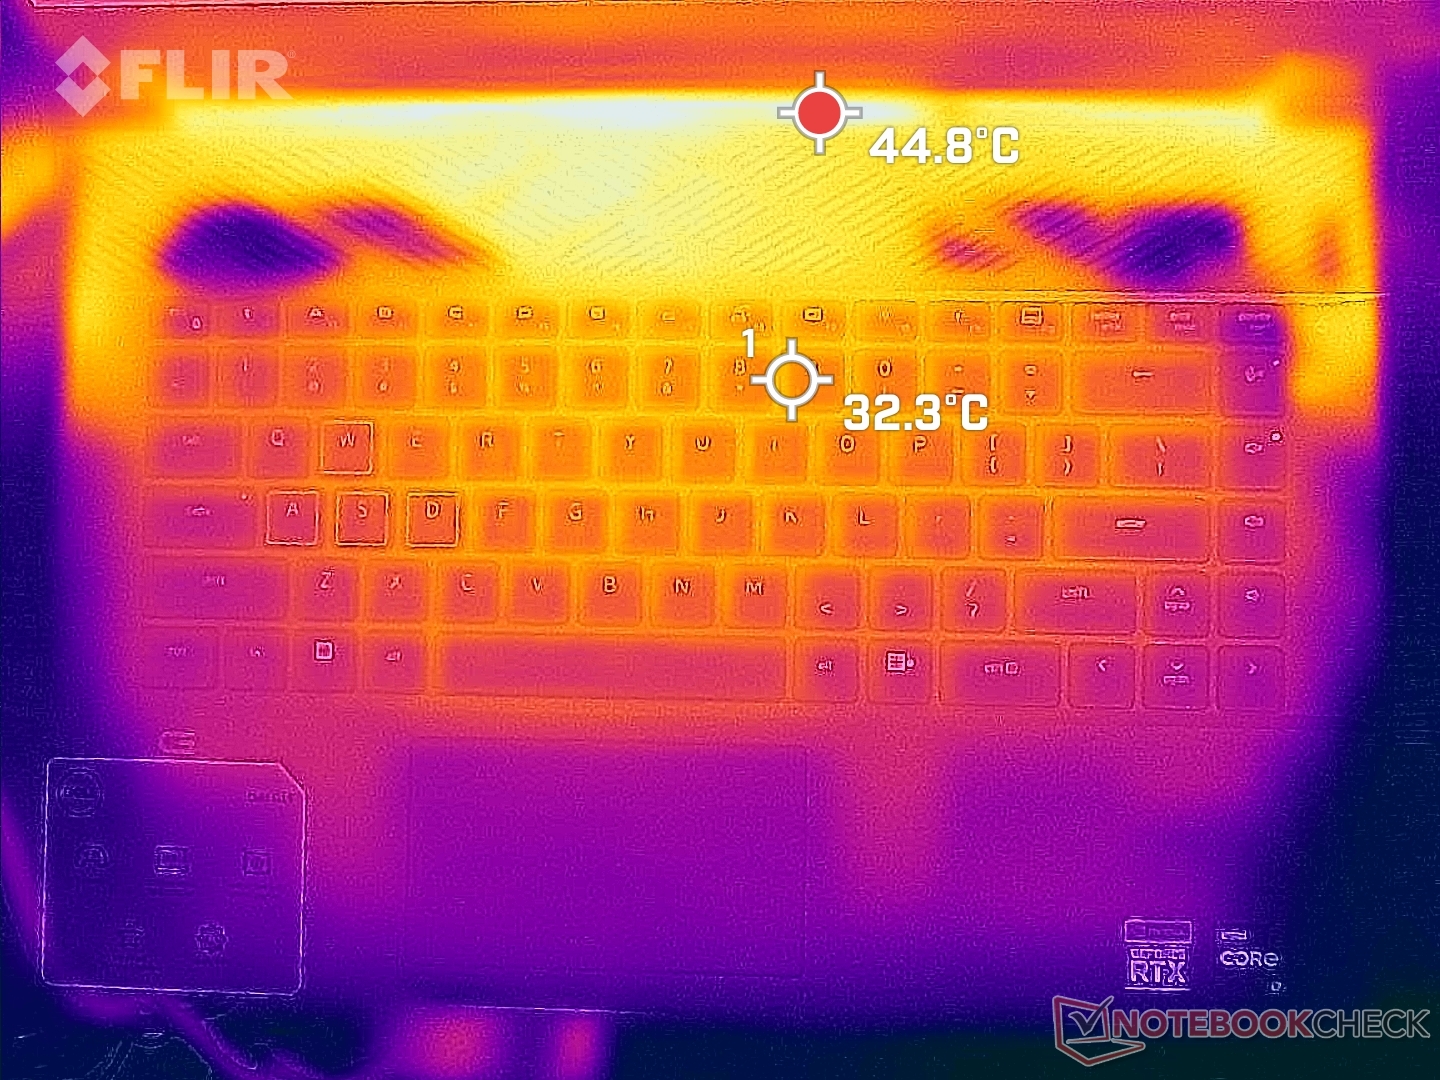
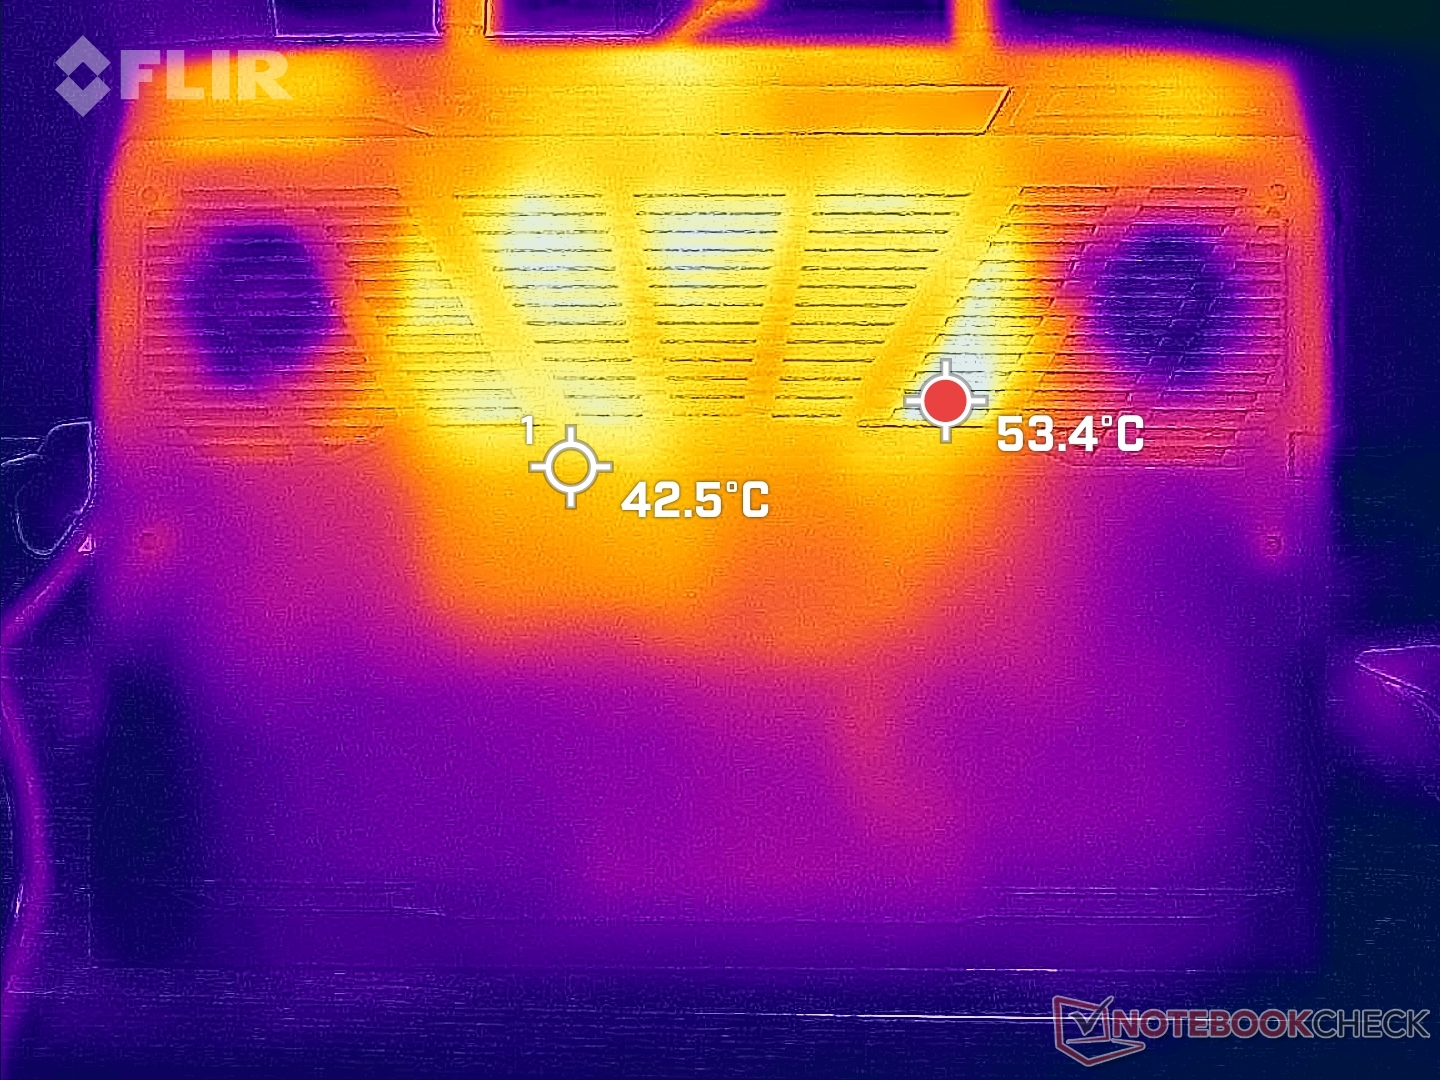
温度 - 朝向后方非常温暖
游戏时,顶部和底部的表面温度可分别达到48摄氏度和51摄氏度,而顶部和底部的温度为54摄氏度和46摄氏度。 HP Victus 16在类似条件下的温度。值得庆幸的是,这些热点都在后面,远离键盘按键或正面区域。因此,在游戏时,掌托和按键不会出现不舒服的温度。
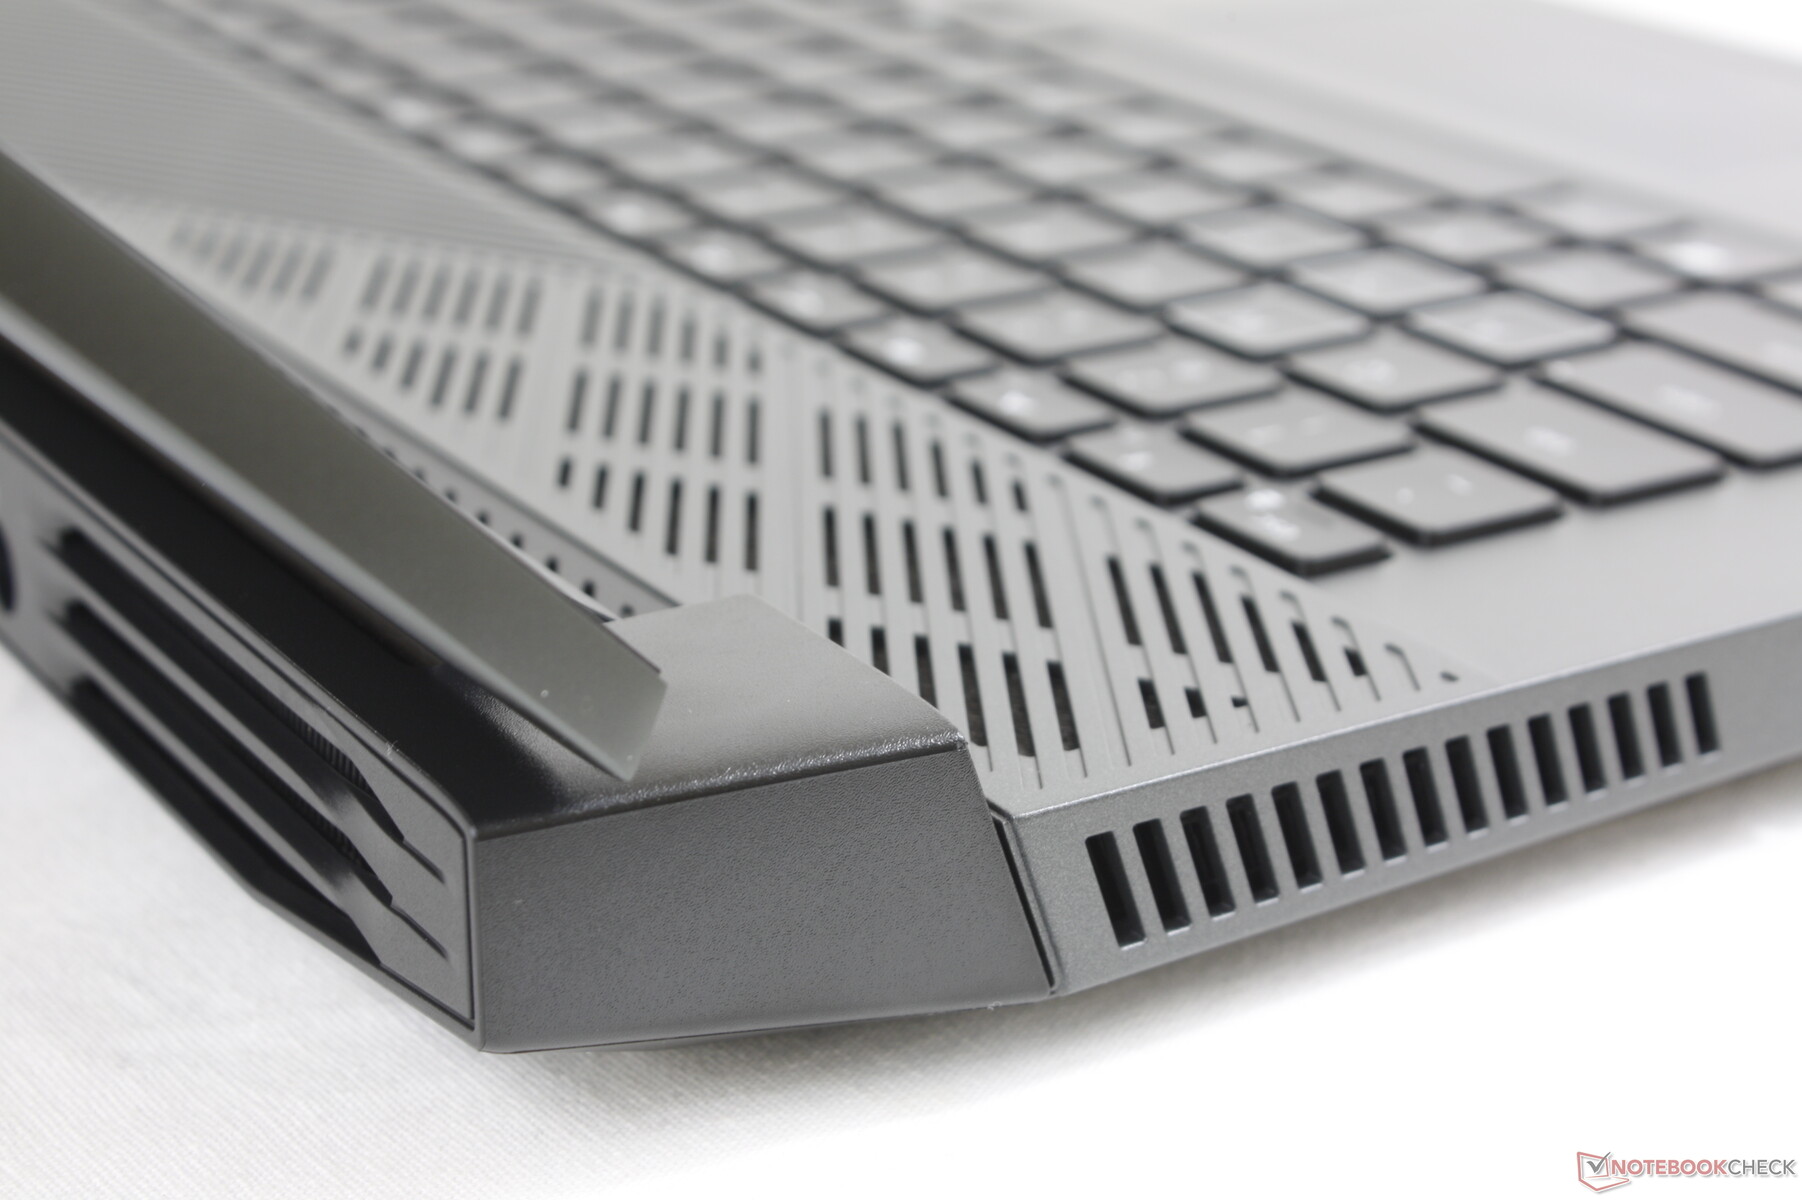
后面的大部分空间都是用来通风的,这一点从底座四面的许多栅栏可以看出。
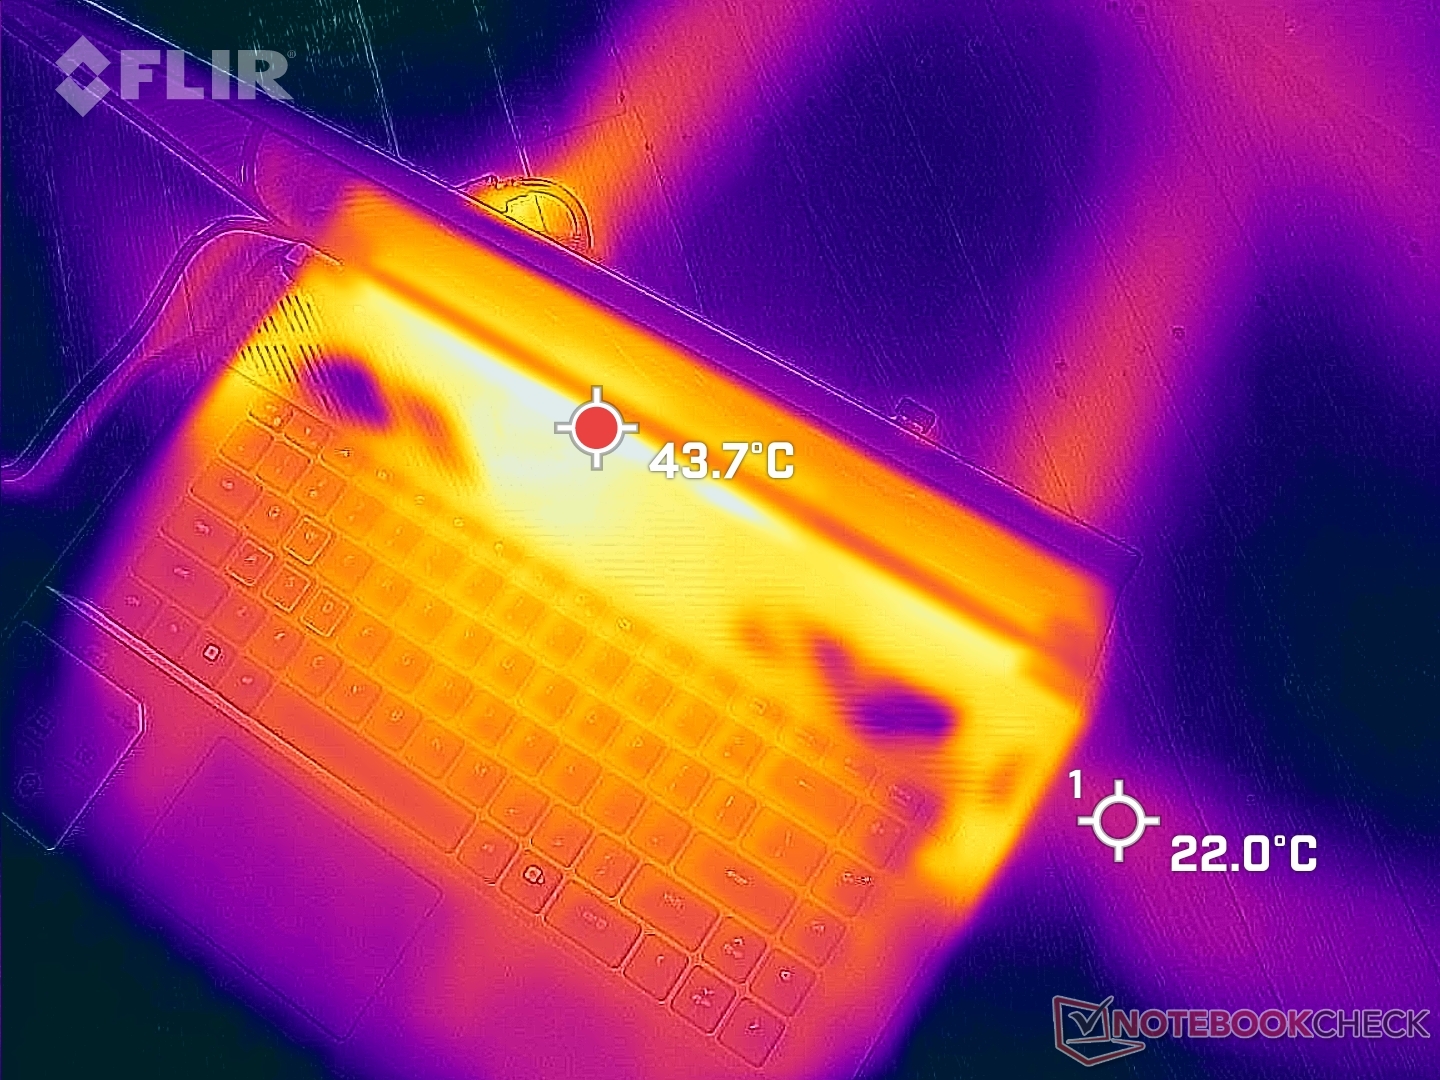
(-) The maximum temperature on the upper side is 47.6 °C / 118 F, compared to the average of 40.4 °C / 105 F, ranging from 21.2 to 68.8 °C for the class Gaming.
(-) The bottom heats up to a maximum of 54 °C / 129 F, compared to the average of 43.2 °C / 110 F
(+) In idle usage, the average temperature for the upper side is 21.8 °C / 71 F, compared to the device average of 33.9 °C / 93 F.
(±) Playing The Witcher 3, the average temperature for the upper side is 33.7 °C / 93 F, compared to the device average of 33.9 °C / 93 F.
(+) The palmrests and touchpad are cooler than skin temperature with a maximum of 30.2 °C / 86.4 F and are therefore cool to the touch.
(±) The average temperature of the palmrest area of similar devices was 28.8 °C / 83.8 F (-1.4 °C / -2.6 F).
| Dell G16 7620 Intel Core i7-12700H, NVIDIA GeForce RTX 3060 Laptop GPU | Lenovo Legion 7 16ARHA7 AMD Ryzen 9 6900HX, AMD Radeon RX 6850M XT | HP Victus 16-e0145ng AMD Ryzen 5 5600H, NVIDIA GeForce RTX 3050 Ti Laptop GPU | Asus ROG Zephyrus M16 GU603H Intel Core i9-11900H, NVIDIA GeForce RTX 3070 Laptop GPU | Lenovo Legion 5 Pro 16IAH7H Intel Core i7-12700H, NVIDIA GeForce RTX 3060 Laptop GPU | Acer Swift X SFX16-51G-5388 Intel Core i5-11320H, NVIDIA GeForce RTX 3050 4GB Laptop GPU | |
|---|---|---|---|---|---|---|
| Heat | -10% | -26% | -35% | -19% | -15% | |
| Maximum Upper Side * (°C) | 47.6 | 37.2 22% | 54 -13% | 52 -9% | 45.8 4% | 52.4 -10% |
| Maximum Bottom * (°C) | 54 | 43 20% | 47 13% | 53 2% | 66.3 -23% | 50 7% |
| Idle Upper Side * (°C) | 23 | 34 -48% | 41 -78% | 38 -65% | 30.4 -32% | 30.3 -32% |
| Idle Bottom * (°C) | 24.6 | 32.8 -33% | 31 -26% | 41 -67% | 30.4 -24% | 30.4 -24% |
* ... smaller is better
压力测试
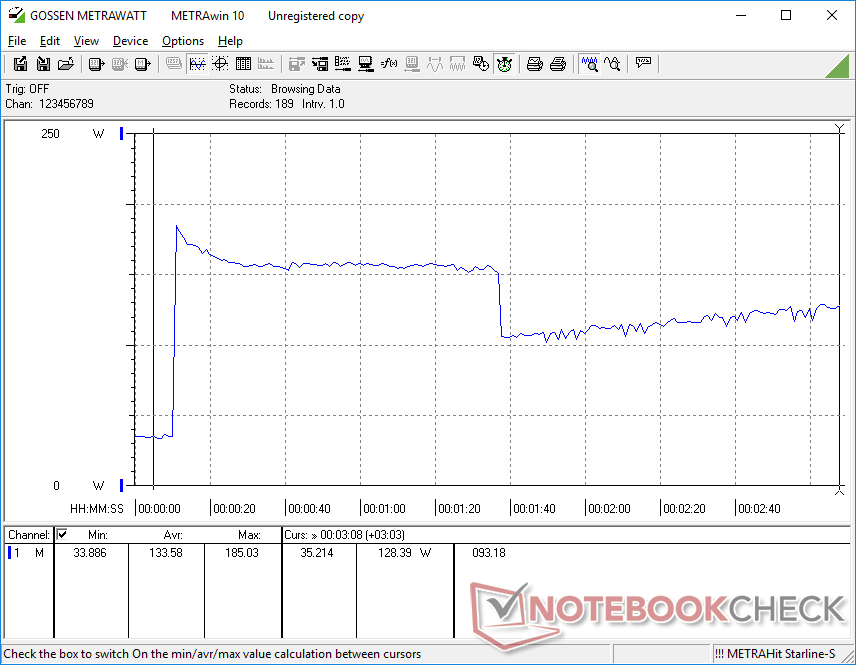
当系统受到压力时,CPU温度变得非常高。例如,当运行Prime95时,时钟频率和电路板功耗将分别提升到4.1GHz和117W,持续约一分钟,温度高达99C。 HP Envy 16GeForce G16已经很高的核心温度表明,成本较高的Core i9-12900H SKU可能最多只能带来微小的性能提升。
运行Witcher 3 ,将导致稳定的GPU核心时钟、温度和主板功耗分别为1777 MHz、86 C和114 W,而TGP的目标是130 W。在前面提到的Envy 16上重复同样的测试将导致稍慢的核心时钟速率,并降低温度和功率需求。然而,更令人担忧的是,G16的CPU温度再次超过90℃,比竞争对手的游戏笔记本电脑要高得多。
用电池供电运行严重限制了性能。在电池上进行的Fire Strike 测试将返回物理和图形分数,分别为19465和4162分,而在主电源上则为27735和21584分。
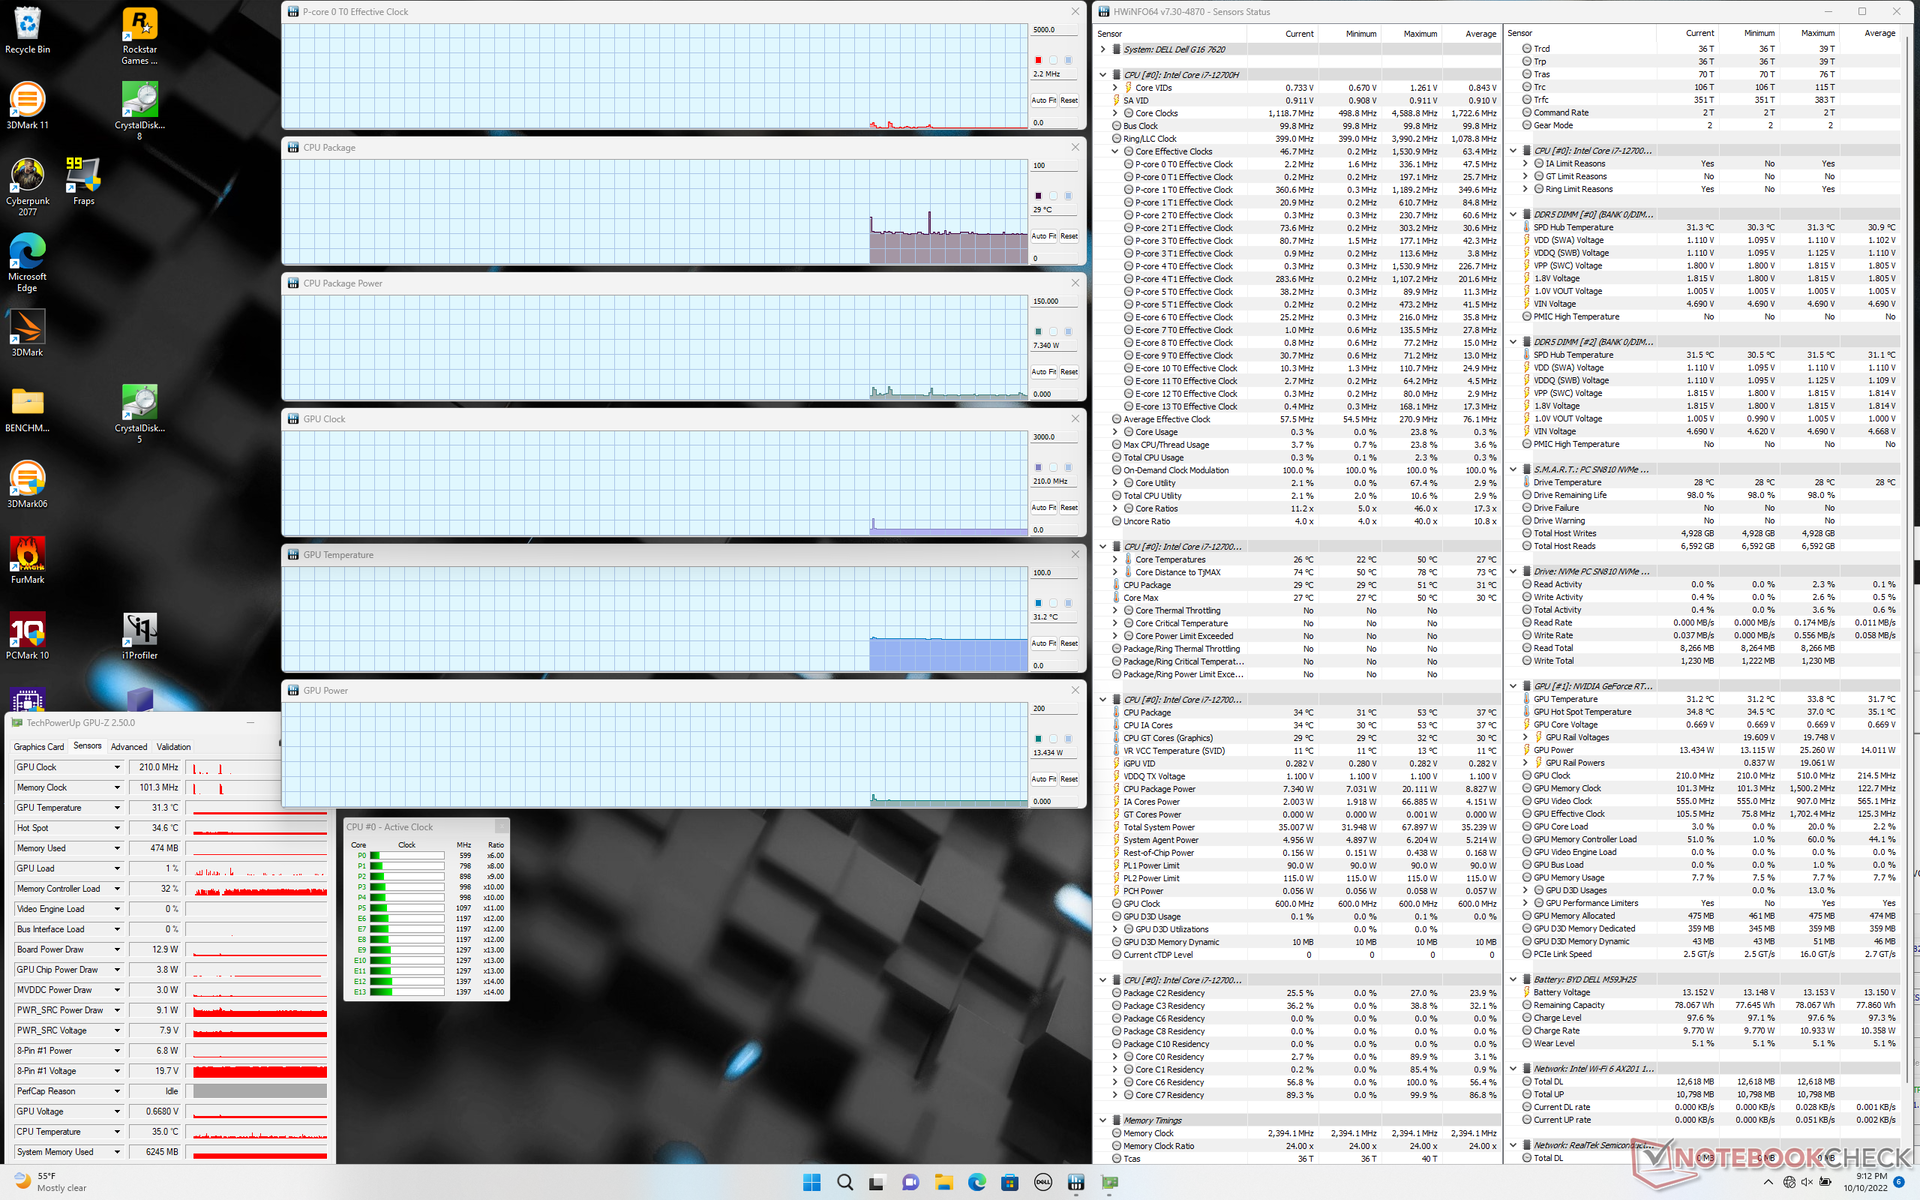
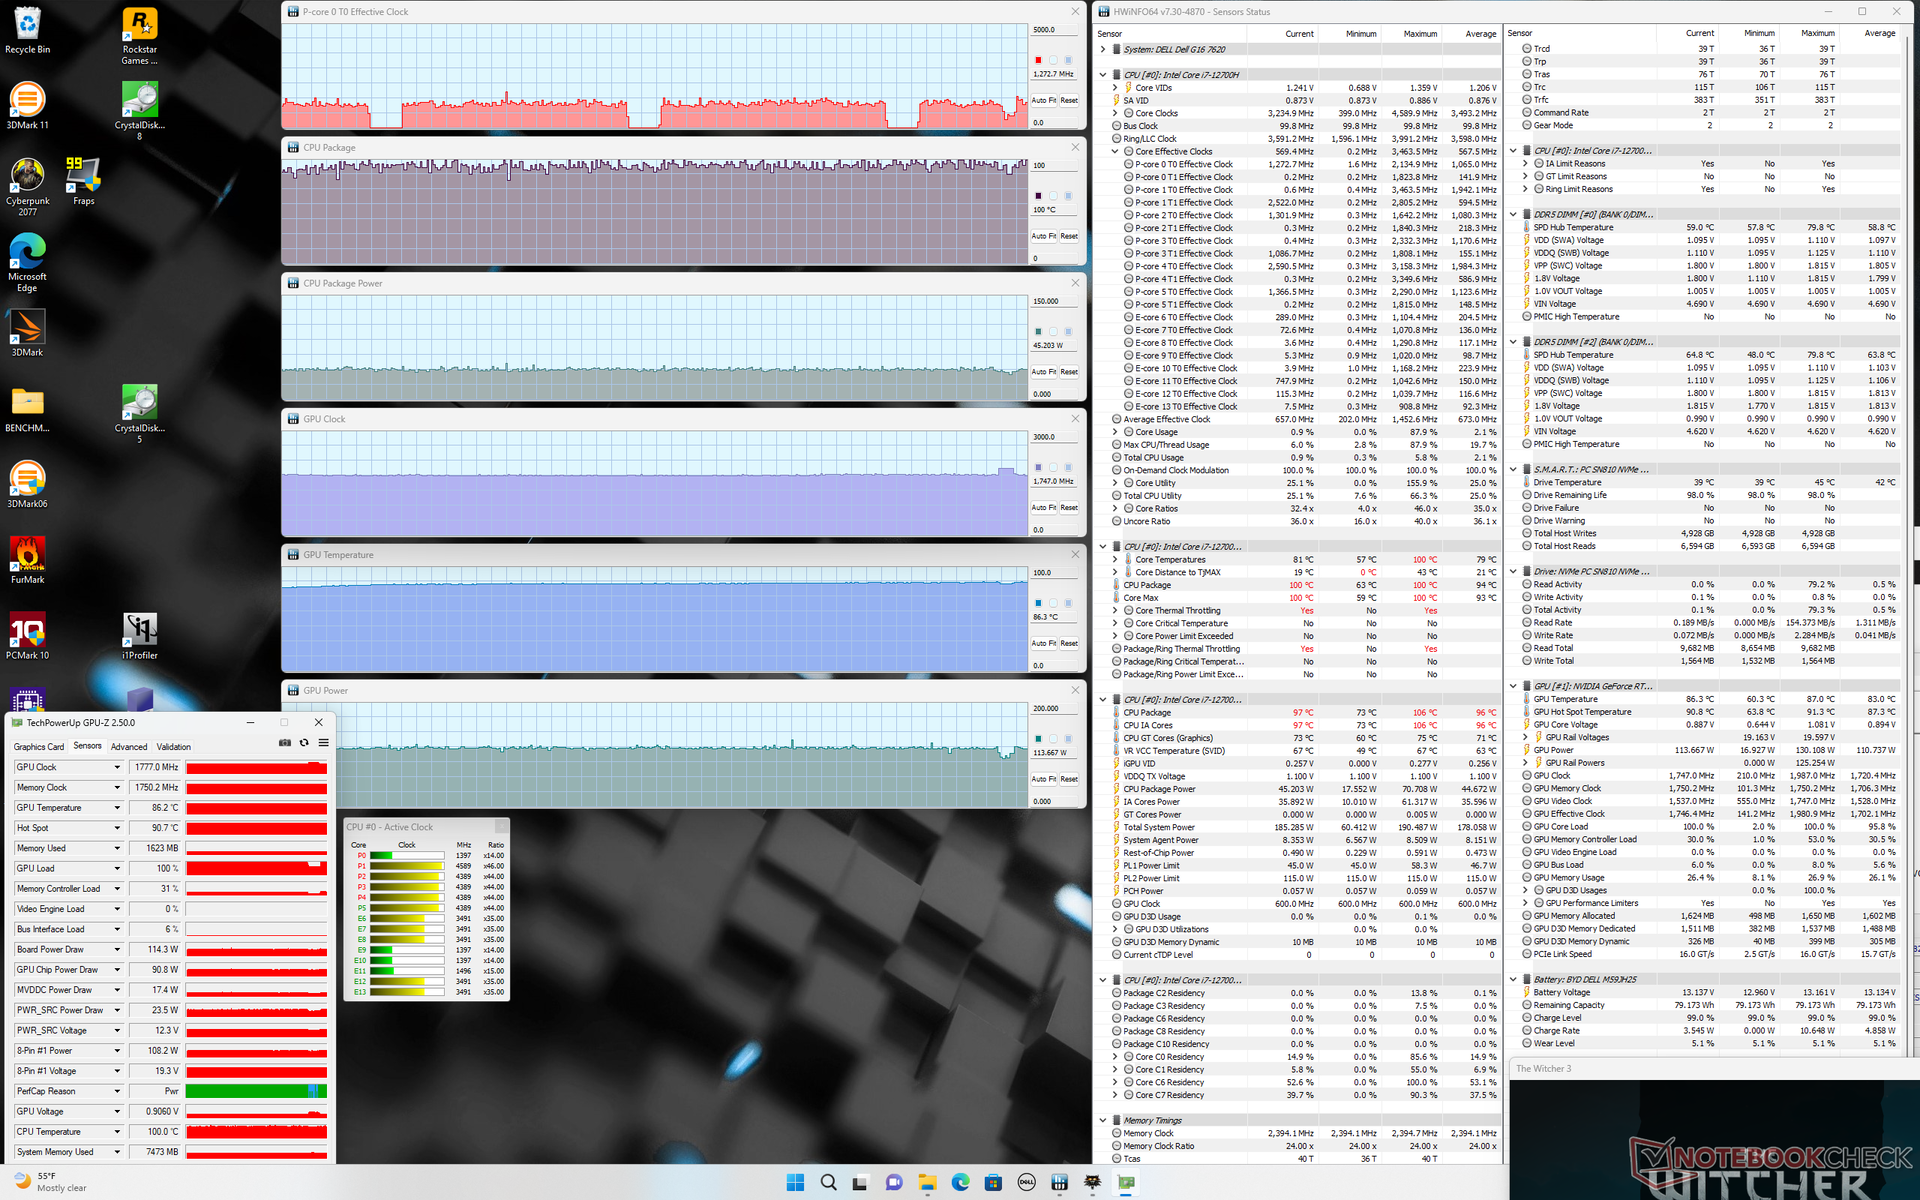
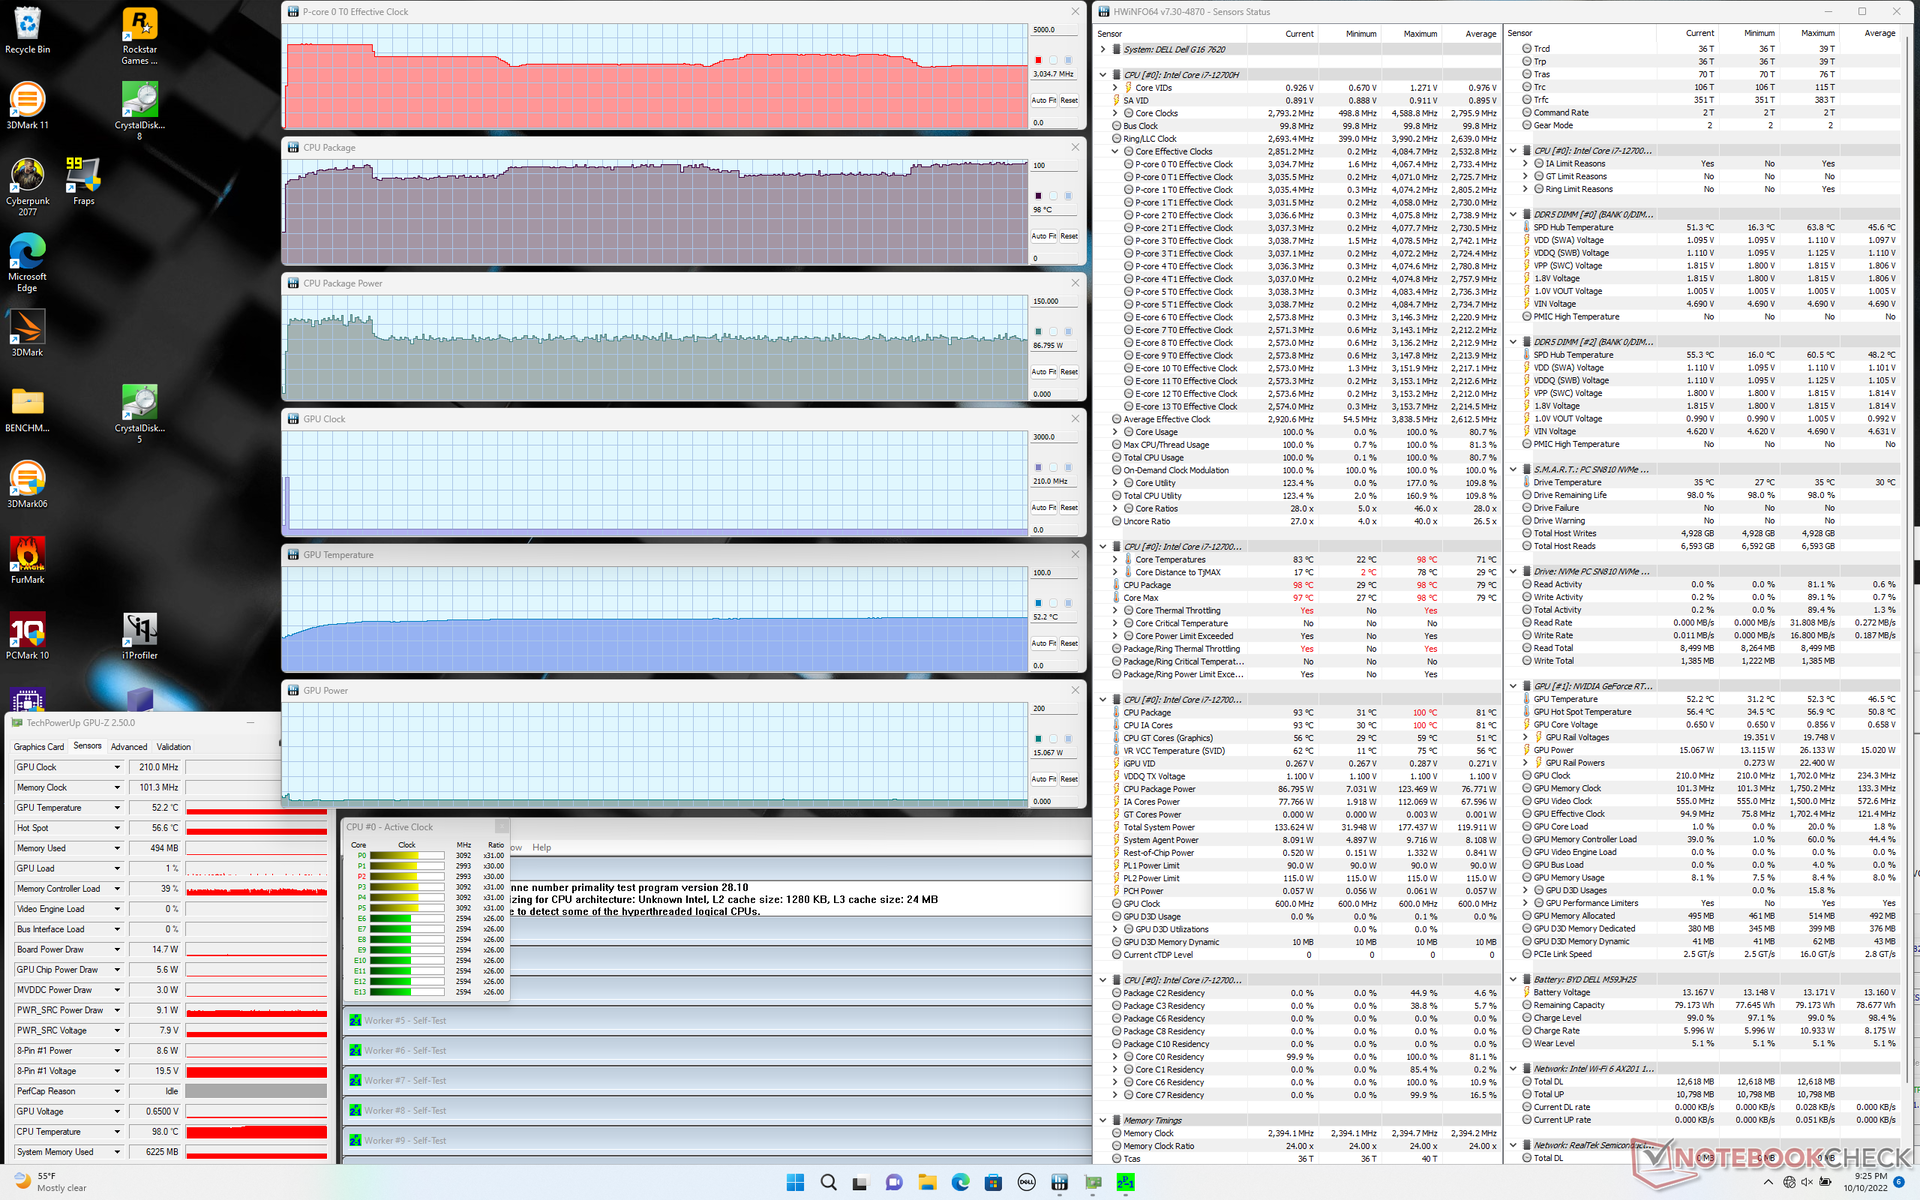
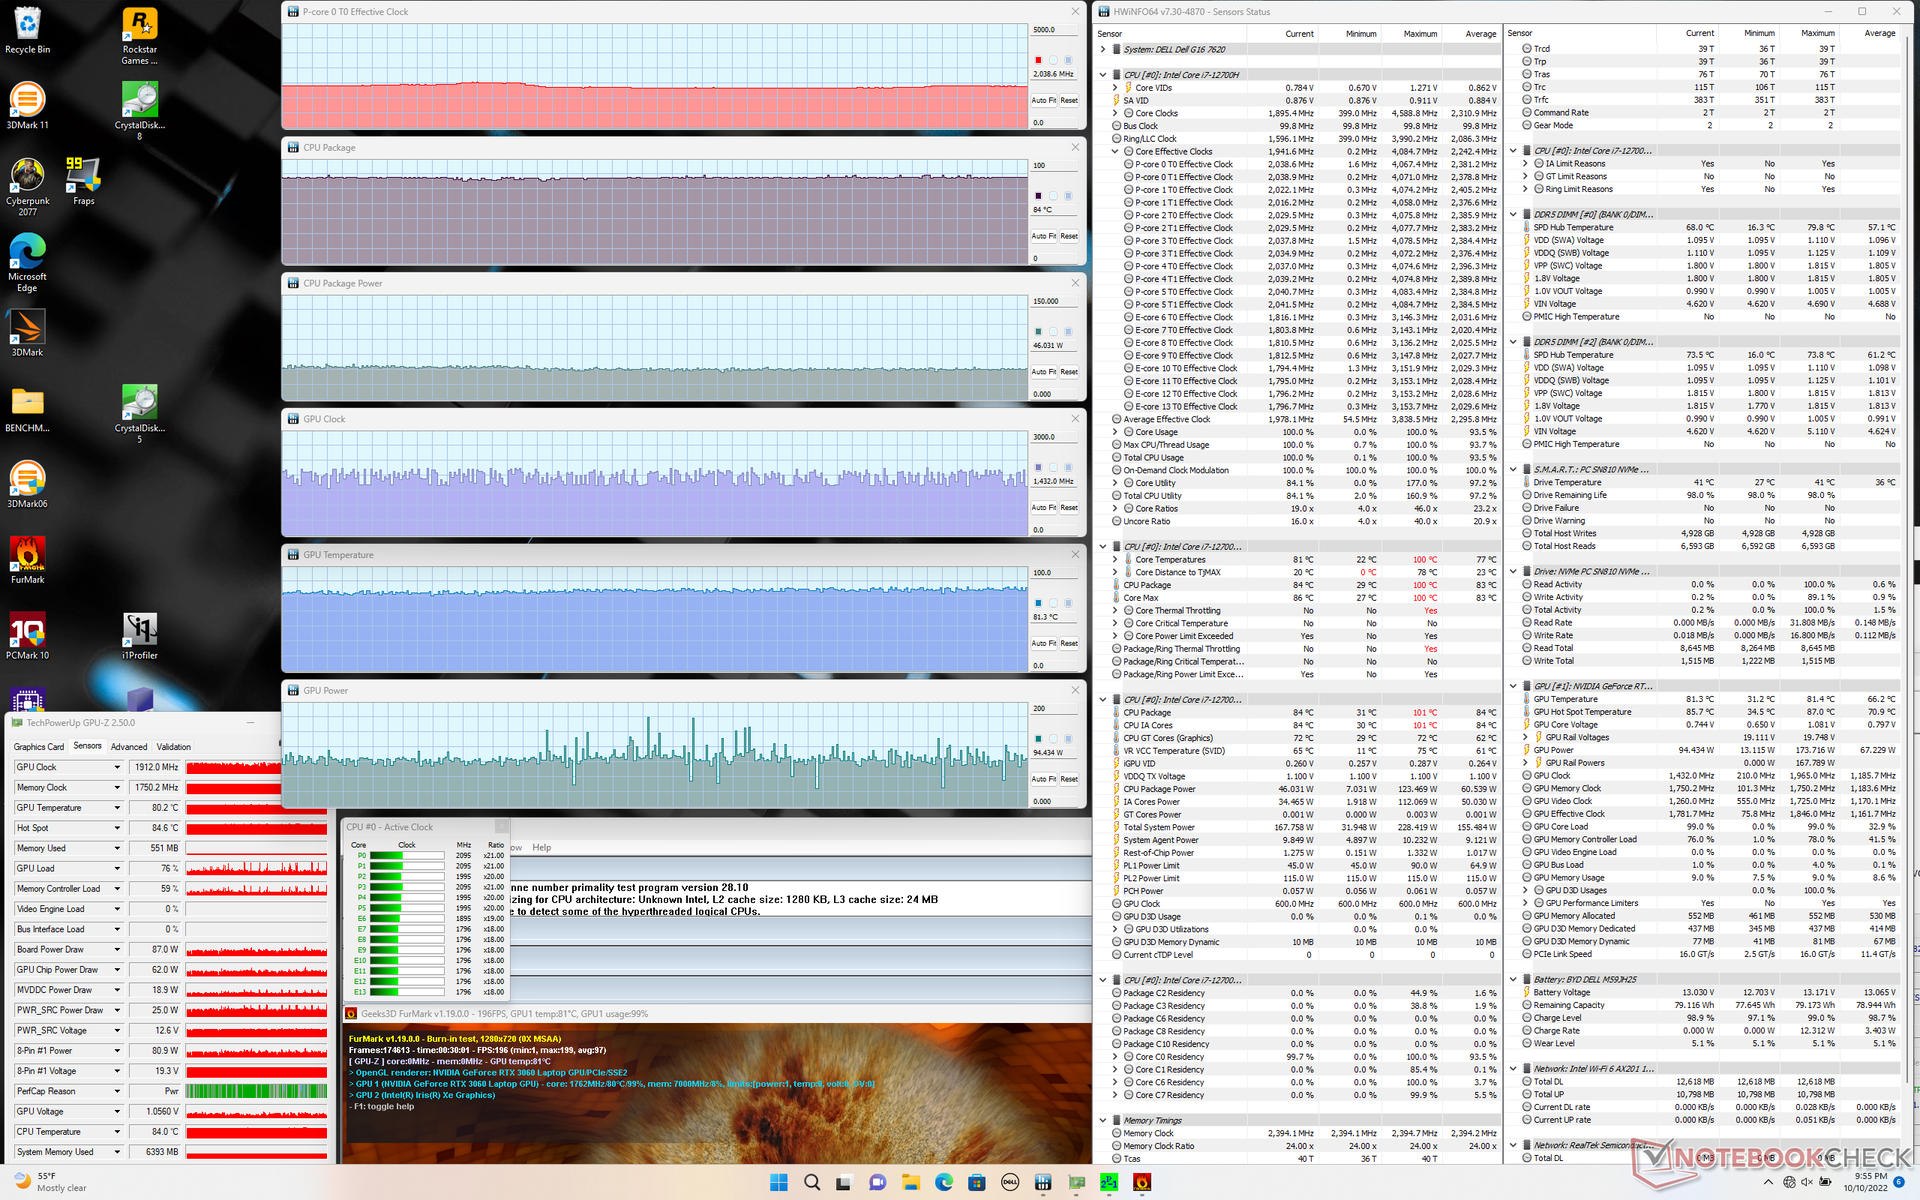
| CPU时钟(GHz) | GPU时钟(MHz) | CPU平均温度(℃) | GPU平均温度(℃) | |
| 系统空闲 | -- | -- | 29 | 31 |
| Prime95压力 | 3.1 - 3.6 | - | 86 - 98 | 52 |
| Prime95 + FurMark 压力 | 2.0 | ~1432 - ~1912 | 84 | 81 |
| Witcher 3 应力 | ~1.3 | 1777 | ~99 | 86 |
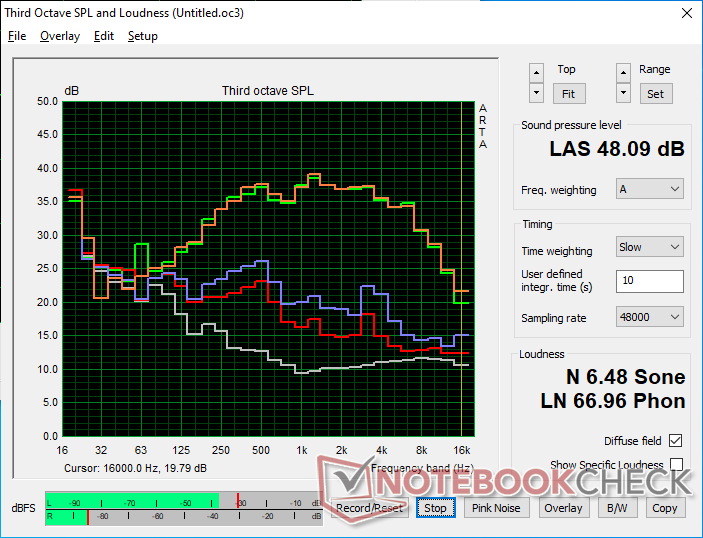
发言人
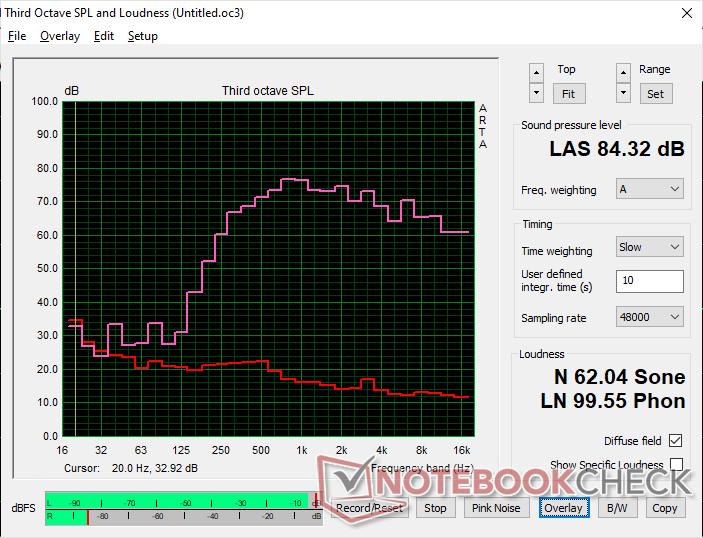
Dell G16 7620 audio analysis
(+) | speakers can play relatively loud (84.3 dB)
Bass 100 - 315 Hz
(-) | nearly no bass - on average 21.8% lower than median
(±) | linearity of bass is average (14.5% delta to prev. frequency)
Mids 400 - 2000 Hz
(+) | balanced mids - only 4.9% away from median
(+) | mids are linear (3.5% delta to prev. frequency)
Highs 2 - 16 kHz
(+) | balanced highs - only 2.6% away from median
(±) | linearity of highs is average (7.7% delta to prev. frequency)
Overall 100 - 16.000 Hz
(±) | linearity of overall sound is average (17.2% difference to median)
Compared to same class
» 47% of all tested devices in this class were better, 11% similar, 42% worse
» The best had a delta of 6%, average was 18%, worst was 132%
Compared to all devices tested
» 32% of all tested devices were better, 8% similar, 60% worse
» The best had a delta of 4%, average was 23%, worst was 134%
Apple MacBook Pro 16 2021 M1 Pro audio analysis
(+) | speakers can play relatively loud (84.7 dB)
Bass 100 - 315 Hz
(+) | good bass - only 3.8% away from median
(+) | bass is linear (5.2% delta to prev. frequency)
Mids 400 - 2000 Hz
(+) | balanced mids - only 1.3% away from median
(+) | mids are linear (2.1% delta to prev. frequency)
Highs 2 - 16 kHz
(+) | balanced highs - only 1.9% away from median
(+) | highs are linear (2.7% delta to prev. frequency)
Overall 100 - 16.000 Hz
(+) | overall sound is linear (4.6% difference to median)
Compared to same class
» 0% of all tested devices in this class were better, 0% similar, 100% worse
» The best had a delta of 5%, average was 17%, worst was 45%
Compared to all devices tested
» 0% of all tested devices were better, 0% similar, 100% worse
» The best had a delta of 4%, average was 23%, worst was 134%
能源管理--大多数情况下的需求
消耗功率
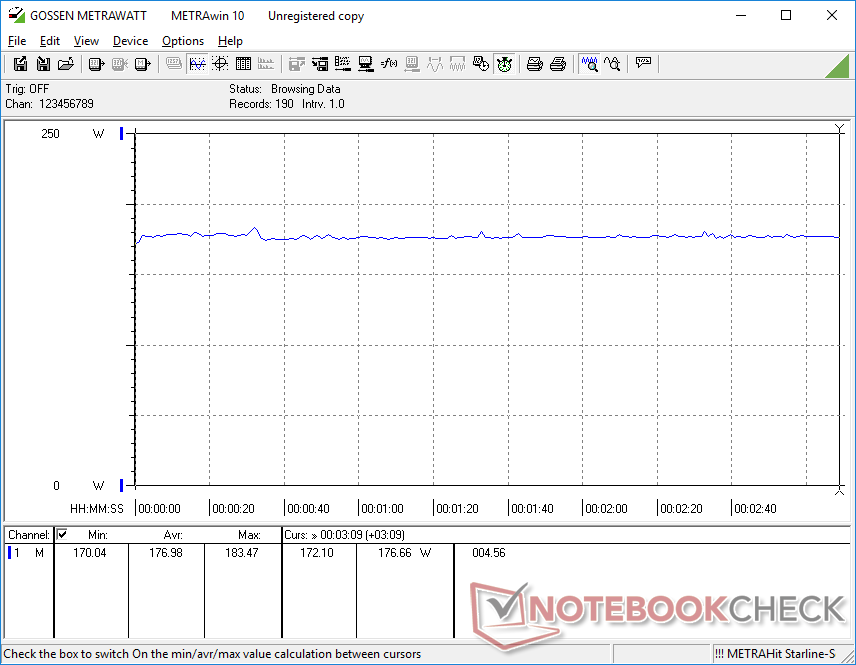
尽管如此,这个范围只比使用相同CPU和GPU的HP Envy 16略高。在运行游戏时,预计功耗将高达177瓦,或比惠普Envy 16的功耗低约20瓦。 联想Legion 5 Pro或 华硕ROG Strix Scar 15.
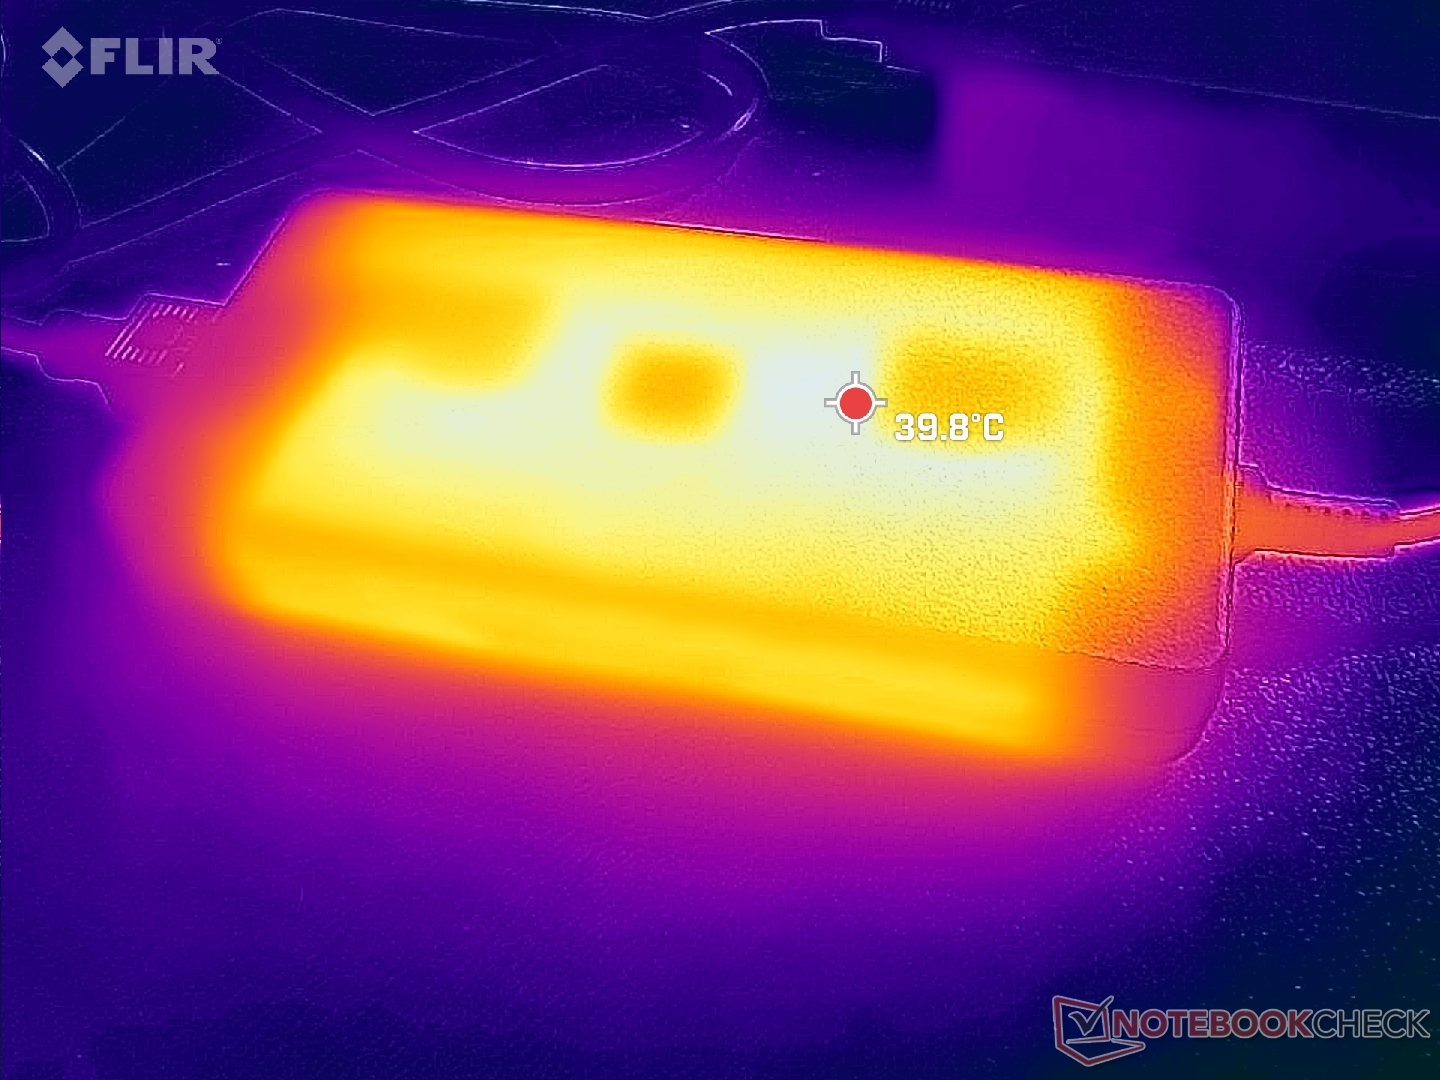
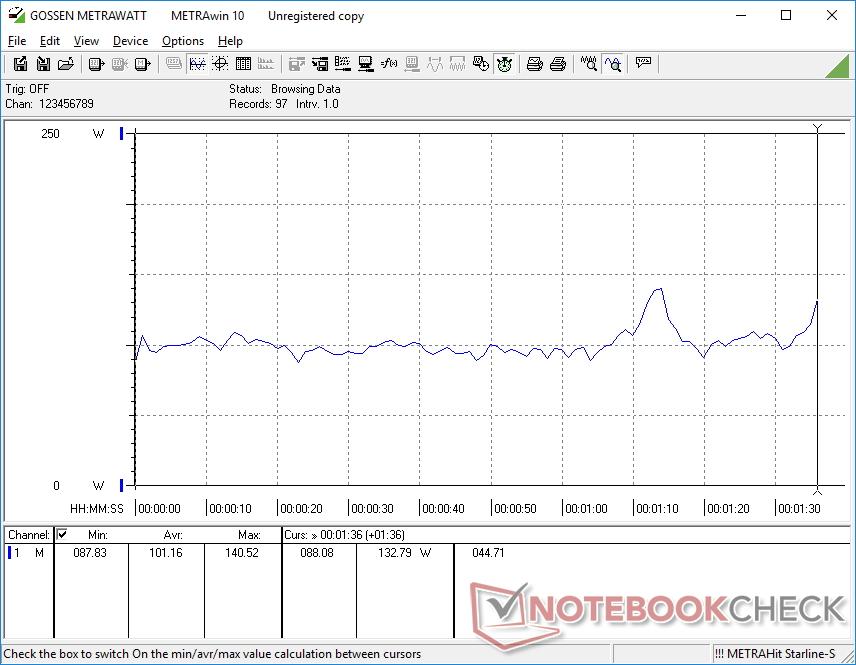
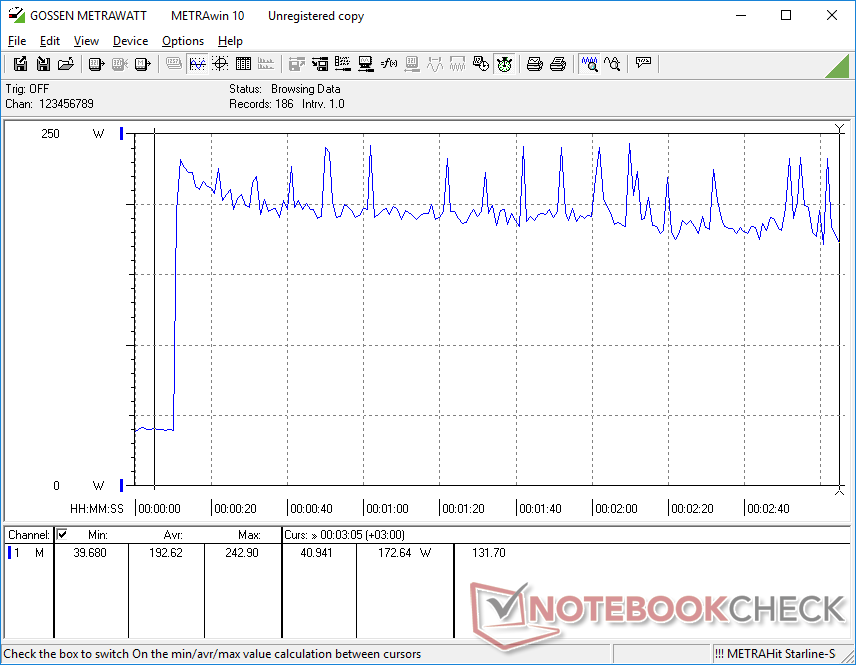
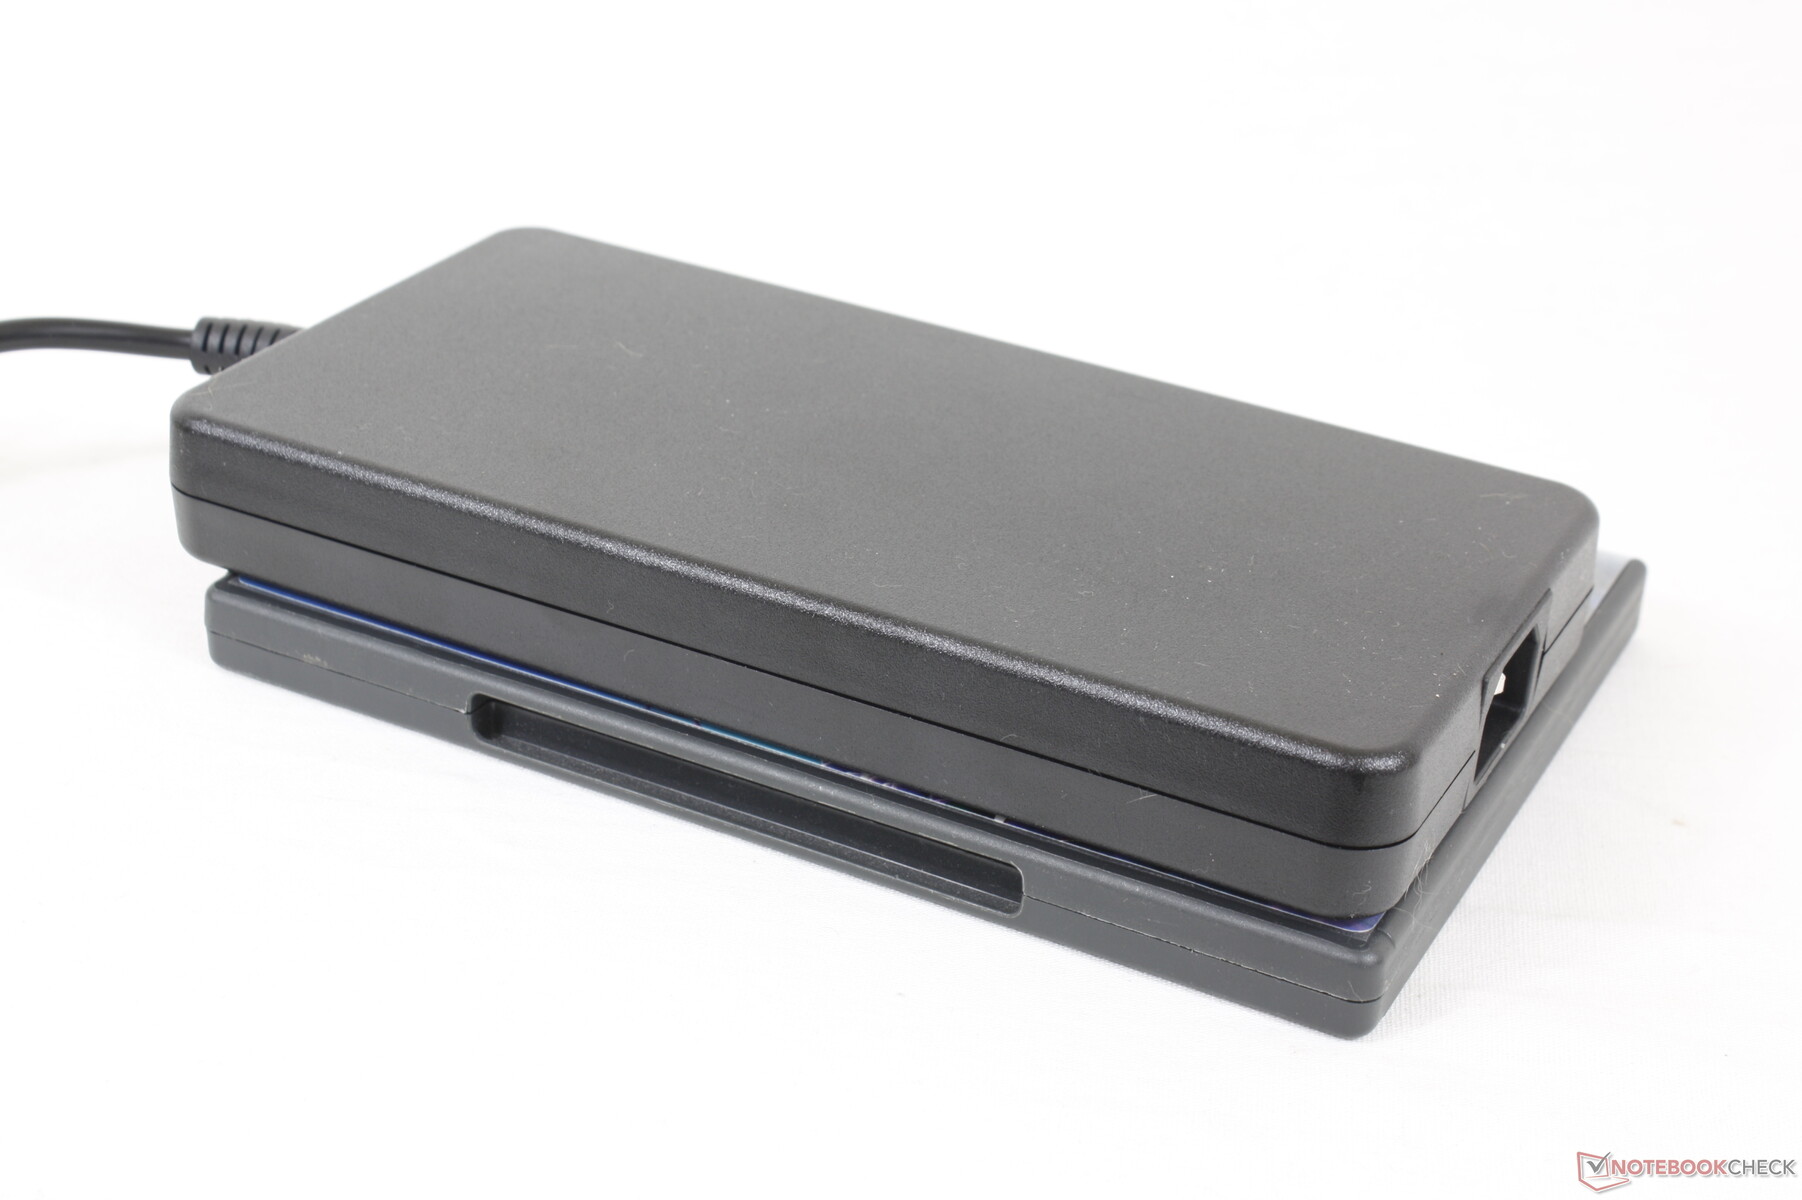
当CPU和GPU各自处于100%的利用率时,我们能够从大型(约19.9 x 10 x 2.5厘米)240 W交流适配器中记录到243 W的最大消耗。在这样的条件下,消费会在180W和240W之间循环,这可能是由于热限制。
| Off / Standby | |
| Idle | |
| Load |
|
Key:
min: | |
| Dell G16 7620 i7-12700H, GeForce RTX 3060 Laptop GPU, WDC PC SN810 512GB, IPS, 2560x1600, 16" | Lenovo Legion 7 16ARHA7 R9 6900HX, Radeon RX 6850M XT, Samsung PM9A1 MZVL22T0HBLB, IPS, 2560x1600, 16" | HP Victus 16-e0145ng R5 5600H, GeForce RTX 3050 Ti Laptop GPU, Samsung SSD PM981a MZVLB512HBJQ, IPS, 1920x1080, 16.1" | Asus ROG Zephyrus M16 GU603H i9-11900H, GeForce RTX 3070 Laptop GPU, Samsung PM9A1 MZVL22T0HBLB, IPS, 2560x1600, 16" | Lenovo Legion 5 Pro 16IAH7H i7-12700H, GeForce RTX 3060 Laptop GPU, 2x Samsung PM9A1 MZVL21T0HCLR (RAID 0), IPS, 2560x1600, 16" | Acer Swift X SFX16-51G-5388 i5-11320H, GeForce RTX 3050 4GB Laptop GPU, Samsung PM991 MZVLQ512HBLU, , 1920x1080, 16.1" | |
|---|---|---|---|---|---|---|
| Power Consumption | -2% | 35% | 6% | -39% | 51% | |
| Idle Minimum * (Watt) | 14.4 | 9.9 31% | 7 51% | 11 24% | 22.8 -58% | 7 51% |
| Idle Average * (Watt) | 17.8 | 22 -24% | 9 49% | 20 -12% | 26.5 -49% | 10.1 43% |
| Idle Maximum * (Watt) | 31.5 | 23.1 27% | 15 52% | 30 5% | 41 -30% | 15 52% |
| Load Average * (Watt) | 101.2 | 94.4 7% | 93 8% | 111 -10% | 191 -89% | 63.3 37% |
| Witcher 3 ultra * (Watt) | 176.9 | 249 -41% | 134.5 24% | 156 12% | 194.7 -10% | 63.3 64% |
| Load Maximum * (Watt) | 242.9 | 276 -14% | 185 24% | 197 19% | 238 2% | 94 61% |
* ... smaller is better
Power Consumption Witcher 3 / Stresstest
Power Consumption external Monitor
电池寿命 - 不是那么好
即使对于大型游戏笔记本电脑来说,运行时间也只是平均水平。WLAN电池续航时间仅有不到5小时,相比之下,在7个小时内就可以完成。联想Legion 7 16ARHA7或HP Victus 16。
从空电到满电大约需要2小时。该机型不支持USB-PD,因此不能通过USB-C充电。
| Dell G16 7620 i7-12700H, GeForce RTX 3060 Laptop GPU, 84 Wh | Lenovo Legion 7 16ARHA7 R9 6900HX, Radeon RX 6850M XT, 99 Wh | HP Victus 16-e0145ng R5 5600H, GeForce RTX 3050 Ti Laptop GPU, 70 Wh | Asus ROG Zephyrus M16 GU603H i9-11900H, GeForce RTX 3070 Laptop GPU, 90 Wh | Lenovo Legion 5 Pro 16IAH7H i7-12700H, GeForce RTX 3060 Laptop GPU, 80 Wh | Acer Swift X SFX16-51G-5388 i5-11320H, GeForce RTX 3050 4GB Laptop GPU, 58.7 Wh | |
|---|---|---|---|---|---|---|
| Battery runtime | 57% | 42% | 90% | -21% | 88% | |
| Reader / Idle (h) | 7.1 | 4.9 -31% | 13.3 87% | |||
| WiFi v1.3 (h) | 5 | 7.3 46% | 7.1 42% | 7.7 54% | 3.6 -28% | 8.1 62% |
| Load (h) | 0.7 | 1.8 157% | 1.6 129% | 0.6 -14% | 1.5 114% | |
| H.264 (h) | 4.1 | 8.4 | ||||
| Witcher 3 ultra (h) | 2.1 | |||||
| Gaming (h) | 1.1 |
Pros
Cons
评语 - 大而快
G16与一些最新的 笔记本电脑或好或坏。更具体地说,该系统比许多竞争对手更大、更重,它甚至运行得更热,游戏时核心温度徘徊在90℃左右。因此,对于希望获得轻薄型游戏笔记本体验的用户来说,G16不是最佳解决方案。替代产品,如联想Legion 7 16或 华硕ROG Zephyrus M16更薄、更轻,甚至两者都有,同时提供类似的显示屏和处理器选项。
戴尔G16在性能方面表现出色,但代价是占地面积较大,重量较重,核心温度较高。
戴尔系统在性能上的挣扎得到了弥补。该系统比其他大多数拥有完全相同的CPU和GPU的笔记本电脑更快,这是由于其更厚的外形和更高的温度的直接结果。即便如此,平均的电池寿命,缺乏二级固态硬盘支持,糟糕的网络摄像头,以及不方便的大型电源砖意味着仍有很大的改进空间。
价格和可用性
戴尔G16 7620现在正通过百思买发货。在我们目前的配置下,价格为1600美元。截至本文写作时,它还没有在亚马逊上出现。更多的SKU可以直接从戴尔订购https://www.dell.com/en-us/shop/dell-laptops/dell-g16-gaming-laptop/spd/g-series-16-7620-laptop/cag16w11p2c5355从1140美元到1935美元不等。
Dell G16 7620
- 10/18/2022 v7 (old)
Allen Ngo
Price comparison

