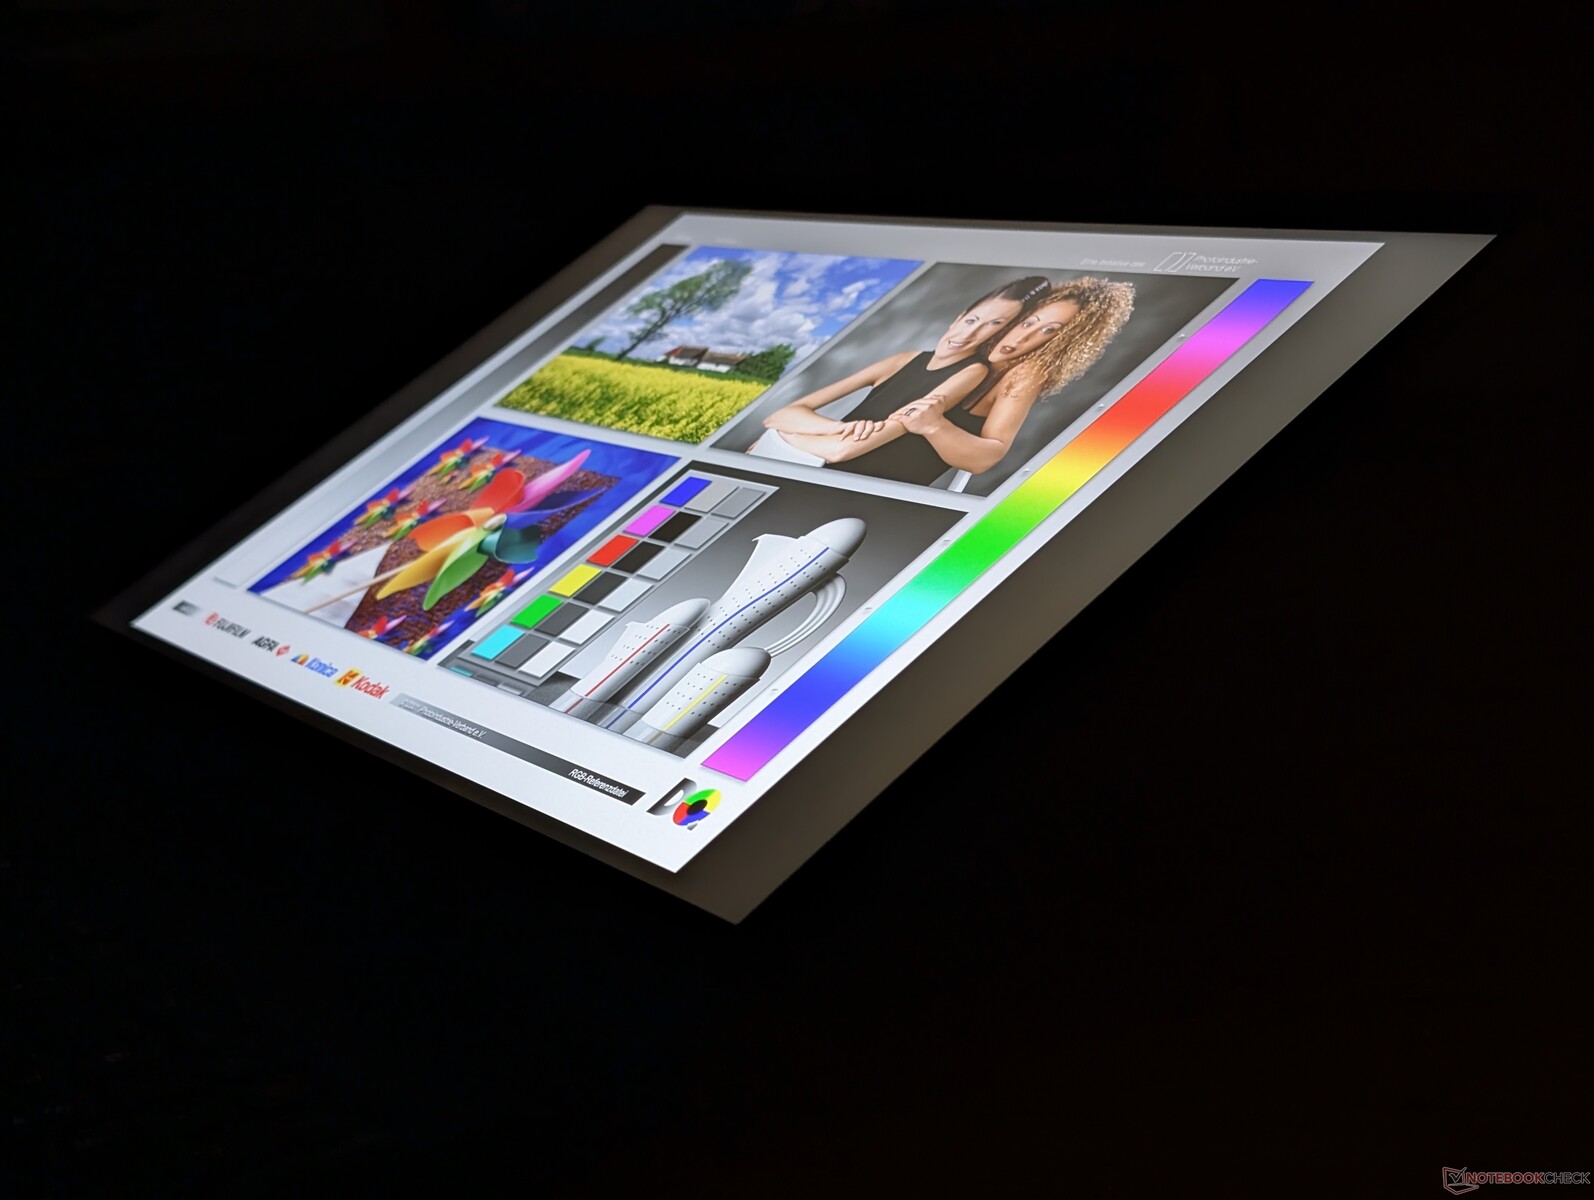
结论 - 比 16X 极光薄得多
Alienware 16 Aurora 与价格较高的 16X Aurora.虽然性能下降是意料之中的事,但黑白响应时间受到的影响却让玩家难以接受,因为在玩快节奏游戏时会出现明显的重影。这是竞争对手如 技嘉游戏 A16或 华硕 TUF GAMING A16等竞争对手在这方面表现更佳。其他较小的遗漏还包括 RGB 键以及对 G-Sync 和 Thunderbolt 的支持,但预算有限的中端游戏玩家不太可能错过这些精品。
该型号有一些明显的优势。与 16X Aurora 相比,16X Aurora 的硬件要求更低,因此机身更薄,电池寿命更长,交流适配器更小,便于携带。由于 16X Aurora 显得有些笨重,因此这些优势非常显著。
至于其游戏功能,16 Aurora 可能很难在原生 2K 分辨率下运行要求苛刻的游戏,因为移动 RTX 5060 GPU 更倾向于 1080p。在较低设置下启用 DLSS 和帧生成是最大限度发挥 RTX 5060 GPU 潜力的关键。否则,游戏性能与旧版 RTX 4060 相比只会有微弱的提升。
Pros
Cons
价格和供应情况
戴尔目前已开始发售Alienware 16 Aurora,评测价格为 1100 美元。也有配备 RTX 4050 或 RTX 5050 的较低配置。亚马逊上也有配置可供选择,起价 1300 美元。
- $1,399.00Alienware 16 Aurora Laptop AC16250-16-inch 16:10 WQXGA Display, Intel Core 7-240H Series 2, 16GB DDR5 RAM, 1TB SSD, NVIDIA GeForce RTX 5060 8GB GDDR7, Windows 11 Home, Onsite Service - Blue
- $2,306.87Alienware 16 Aurora Gaming Laptop AC16250-16-inch WQXGA 120Hz Display, Intel Core 9-270H Processor, 32GB DDR5 RAM, 1TB SSD, NVIDIA GeForce RTX 5070 Graphics, Windows 11 Home - Blue
- $1,398.99Dell Alienware 16 Aurora Gaming Laptop AC16250, 16" WQXGA Display, NVIDIA GeForce RTX 5050, Intel Core 7-240H, 16GB RAM, 1TB SSD, Backlit Keyboard, with Lifetime MS Office, Wins 11 Pro
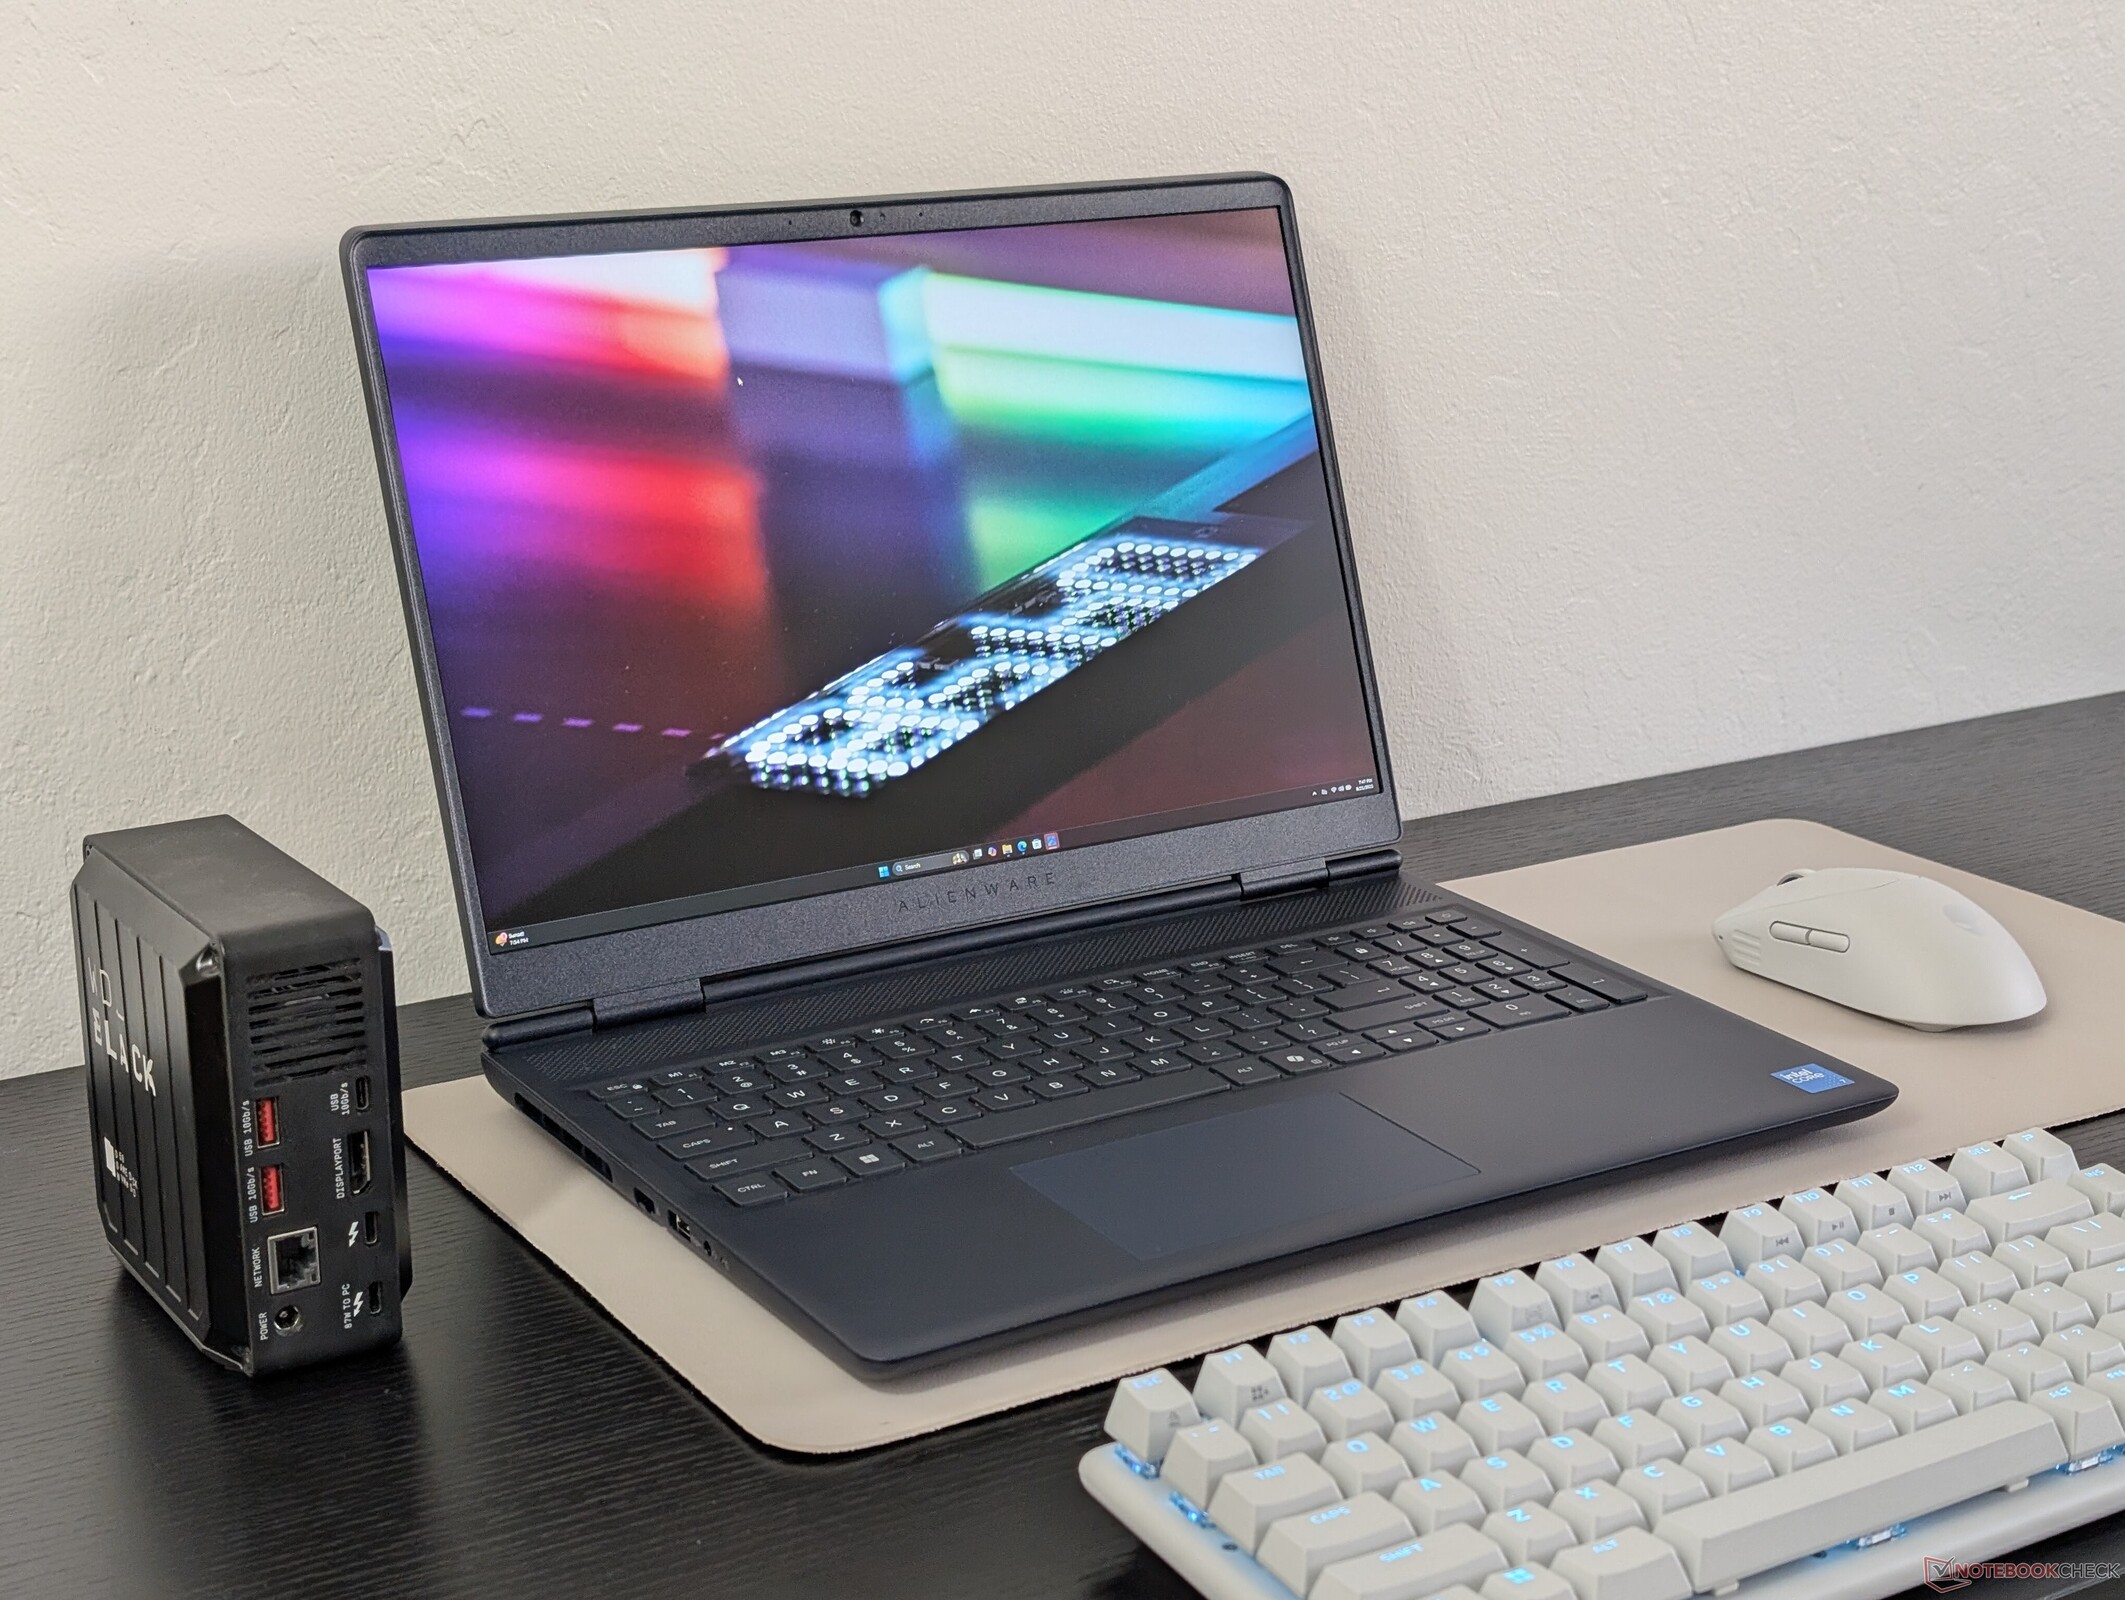
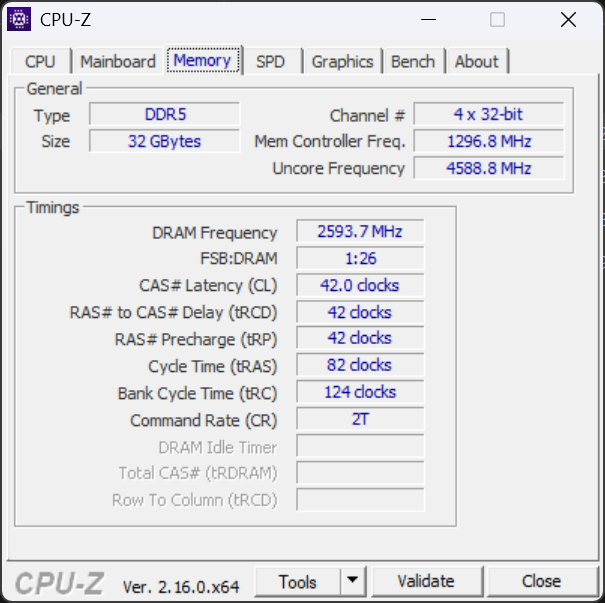
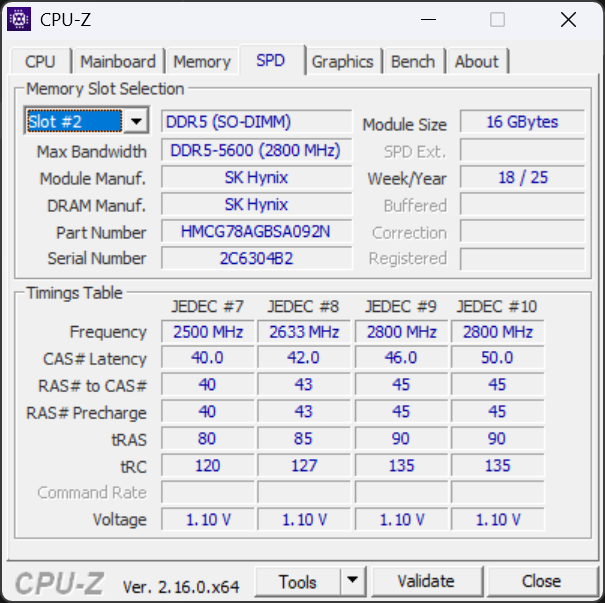
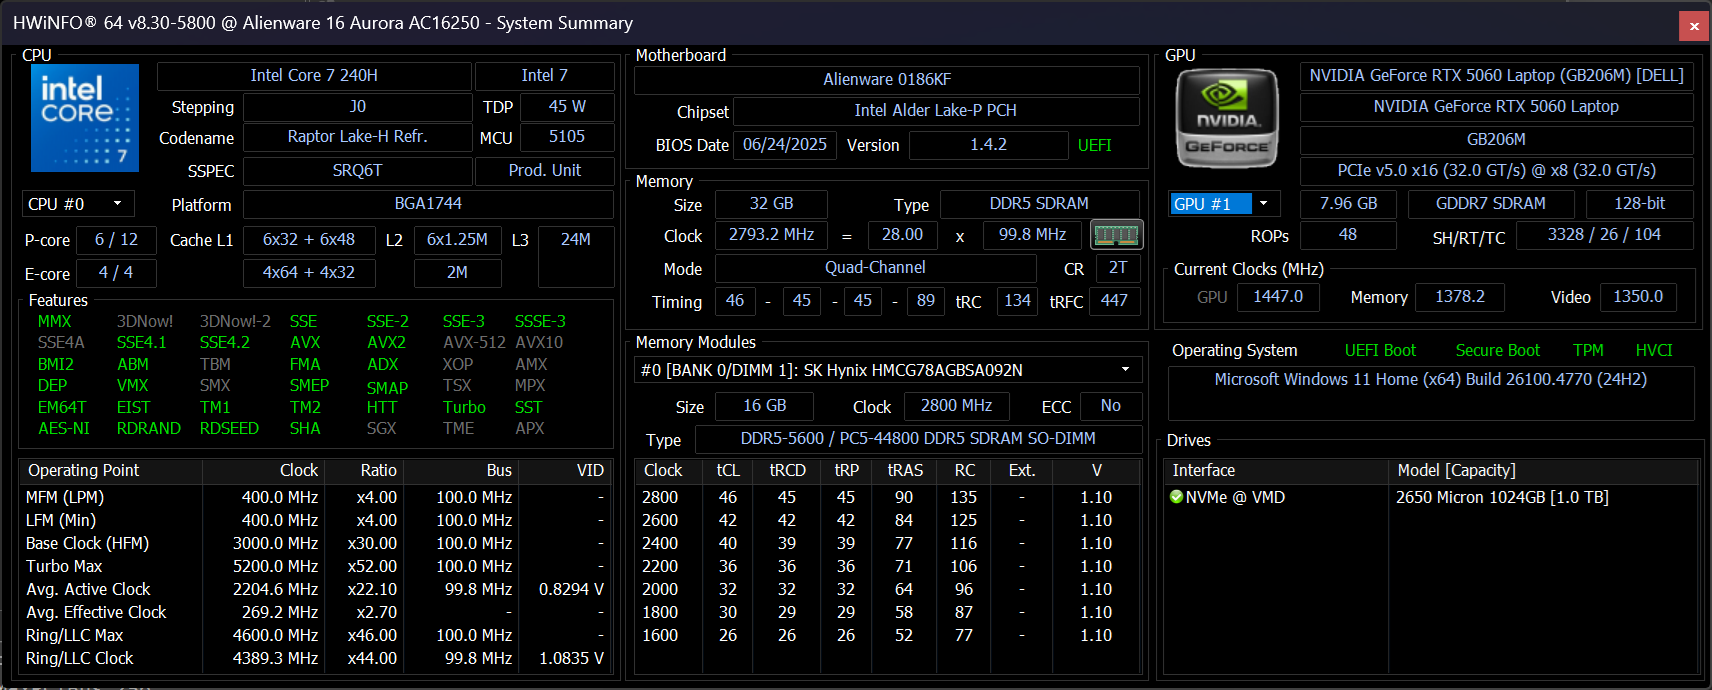
Alienware 16 Aurora 是更经济实惠的版本。 Alienware 16X Aurora.它配备了 Raptor Lake Core 7 240H CPU、80 WGeForce RTX 5060 GPU 和 1600p120 sRGB 显示屏,而不是 16X Aurora 的 Arrow Lake Core Ultra 9 275HX、115 W RTX 5070 和 1600p240 P3 显示屏。除此之外,该系统在外观上与 16X Aurora 几乎完全相同。
建议查看我们现有的 16X Aurora 评测,了解有关 16 Aurora 物理特性的更多信息。本页将重点介绍这两种配置之间的主要区别。
Alienware 16 Aurora 的竞争对手包括其他经济型 16 英寸游戏笔记本电脑,如 联想Legion 5 16, 微星 Sword 16或 华硕 ROG TUF 系列.
更多戴尔评测:
规格
案例
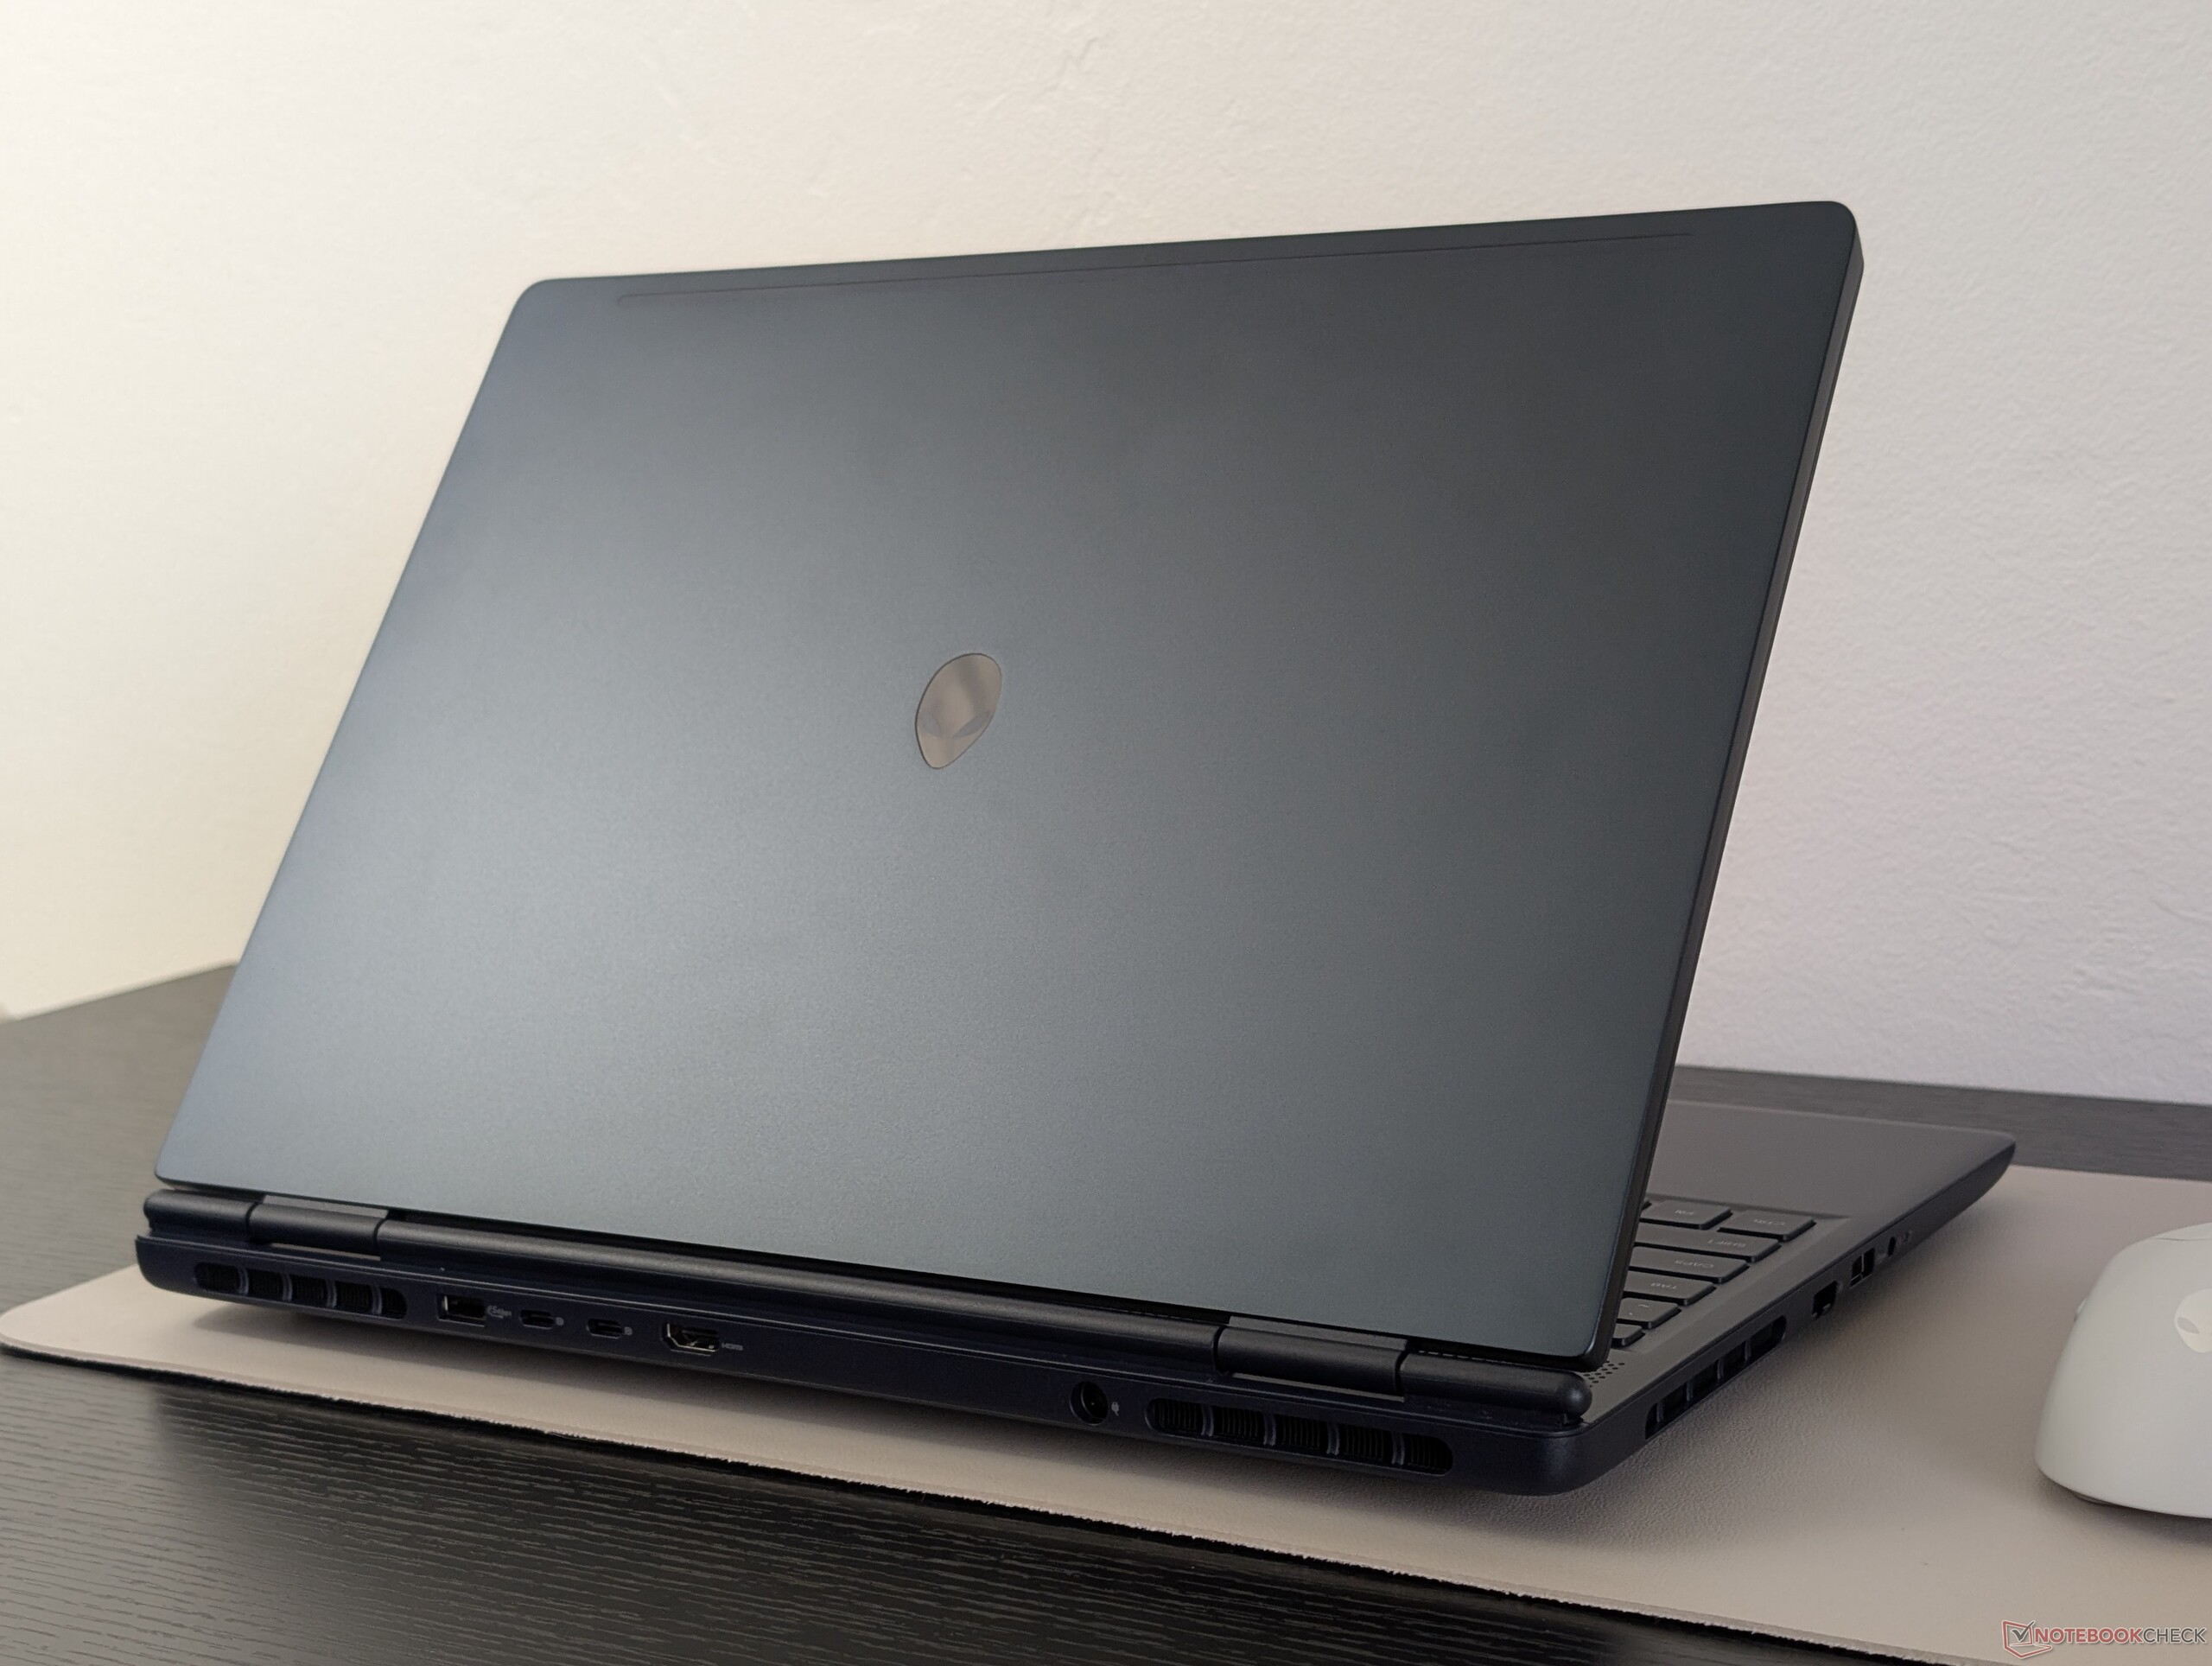
虽然机身和重量与 16X Aurora 几乎相同,但要注意的是,16 Aurora 要薄得多(15.2 毫米对 23.4 毫米)。用户还需要注意的是,16 Aurora 失去了对 Thunderbolt 的支持,因此对接功能更加有限。
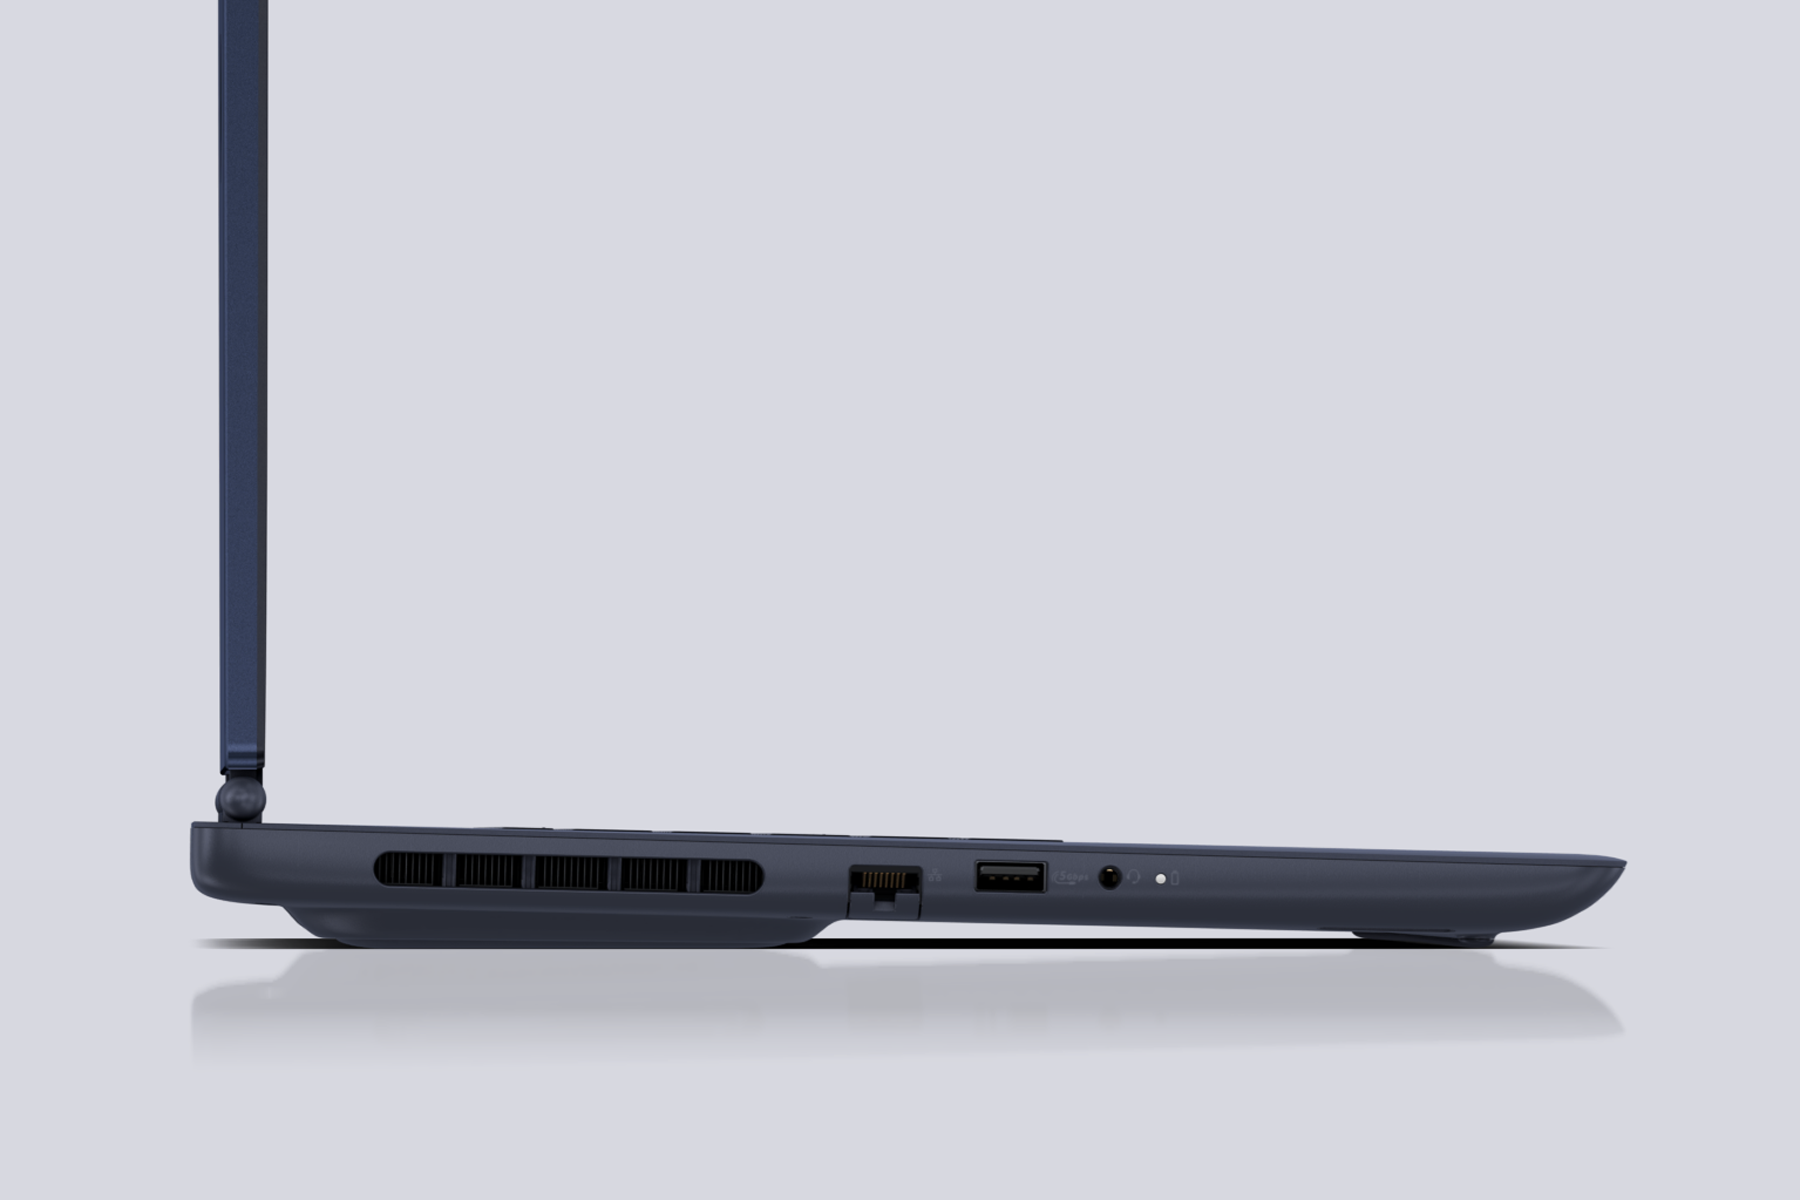
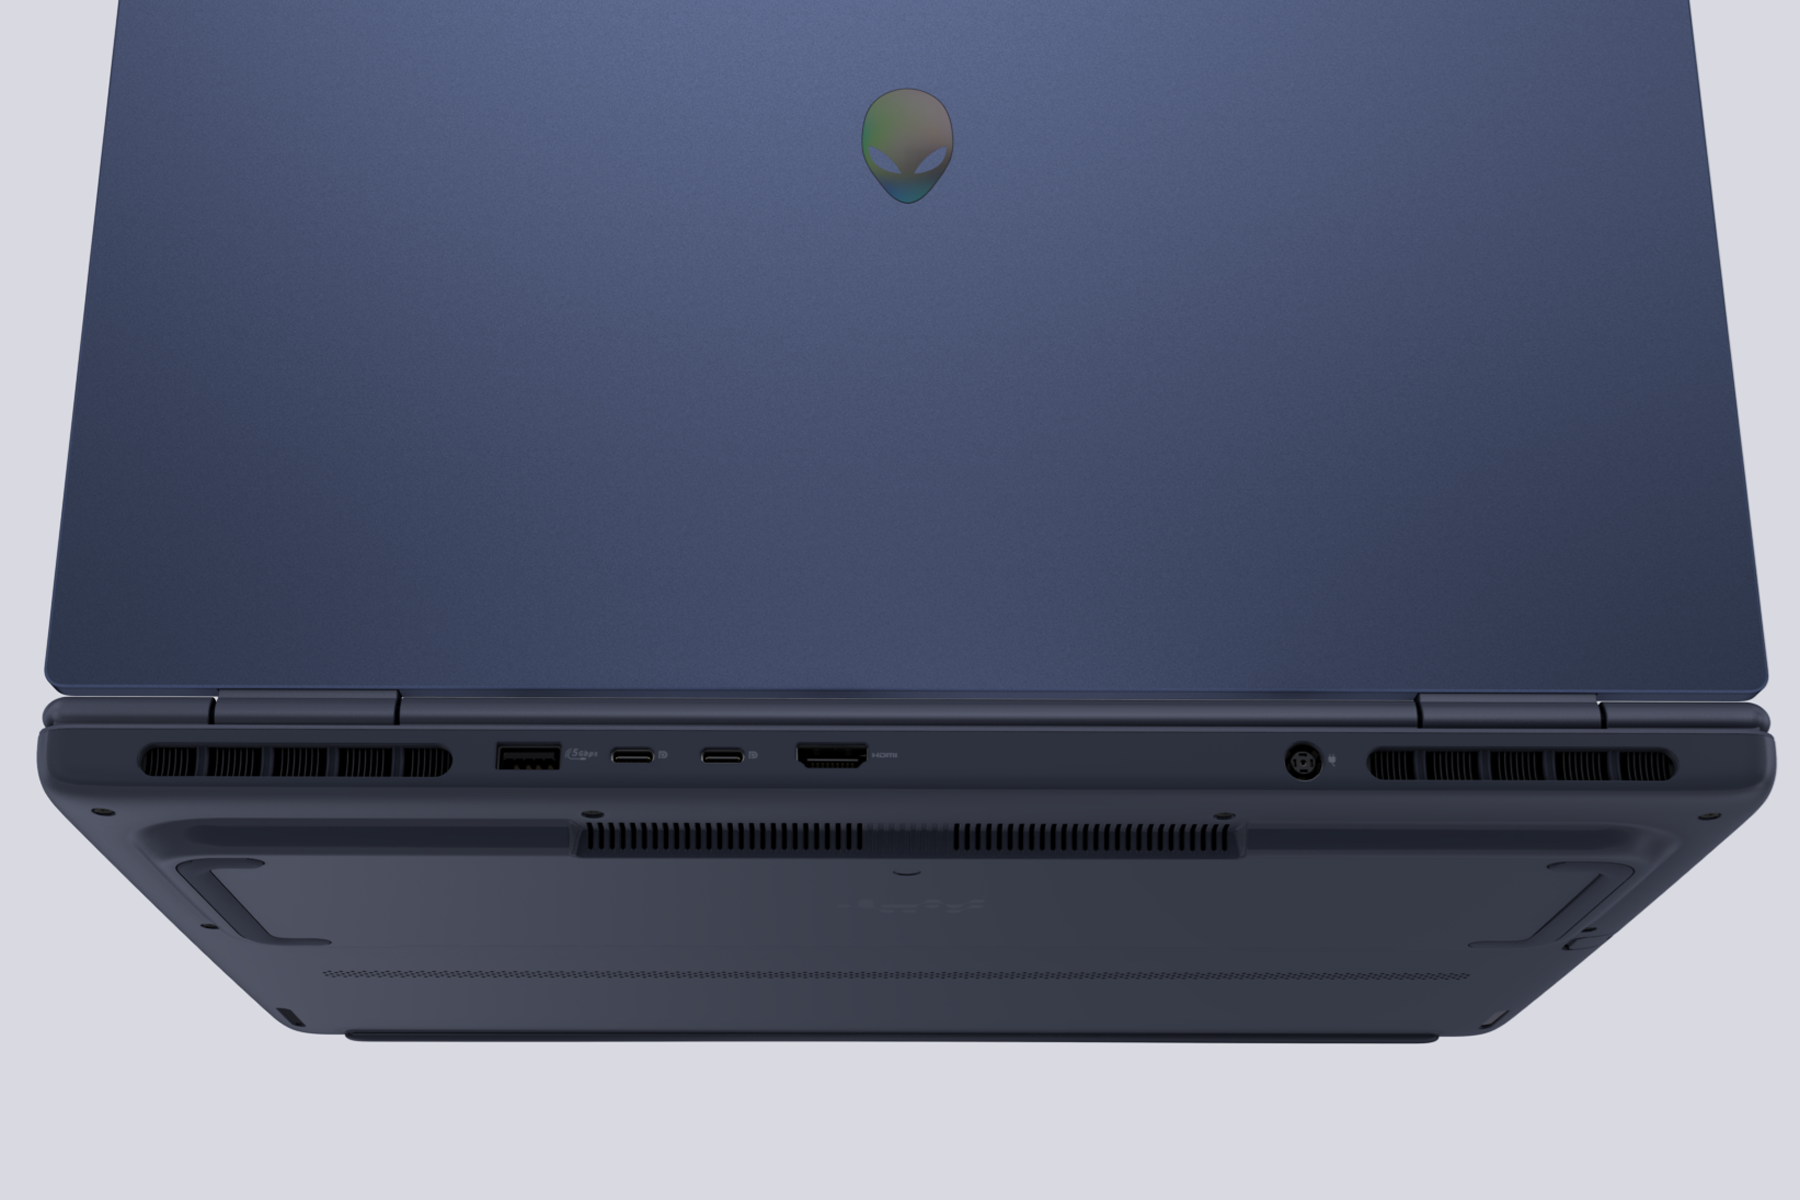
连接性
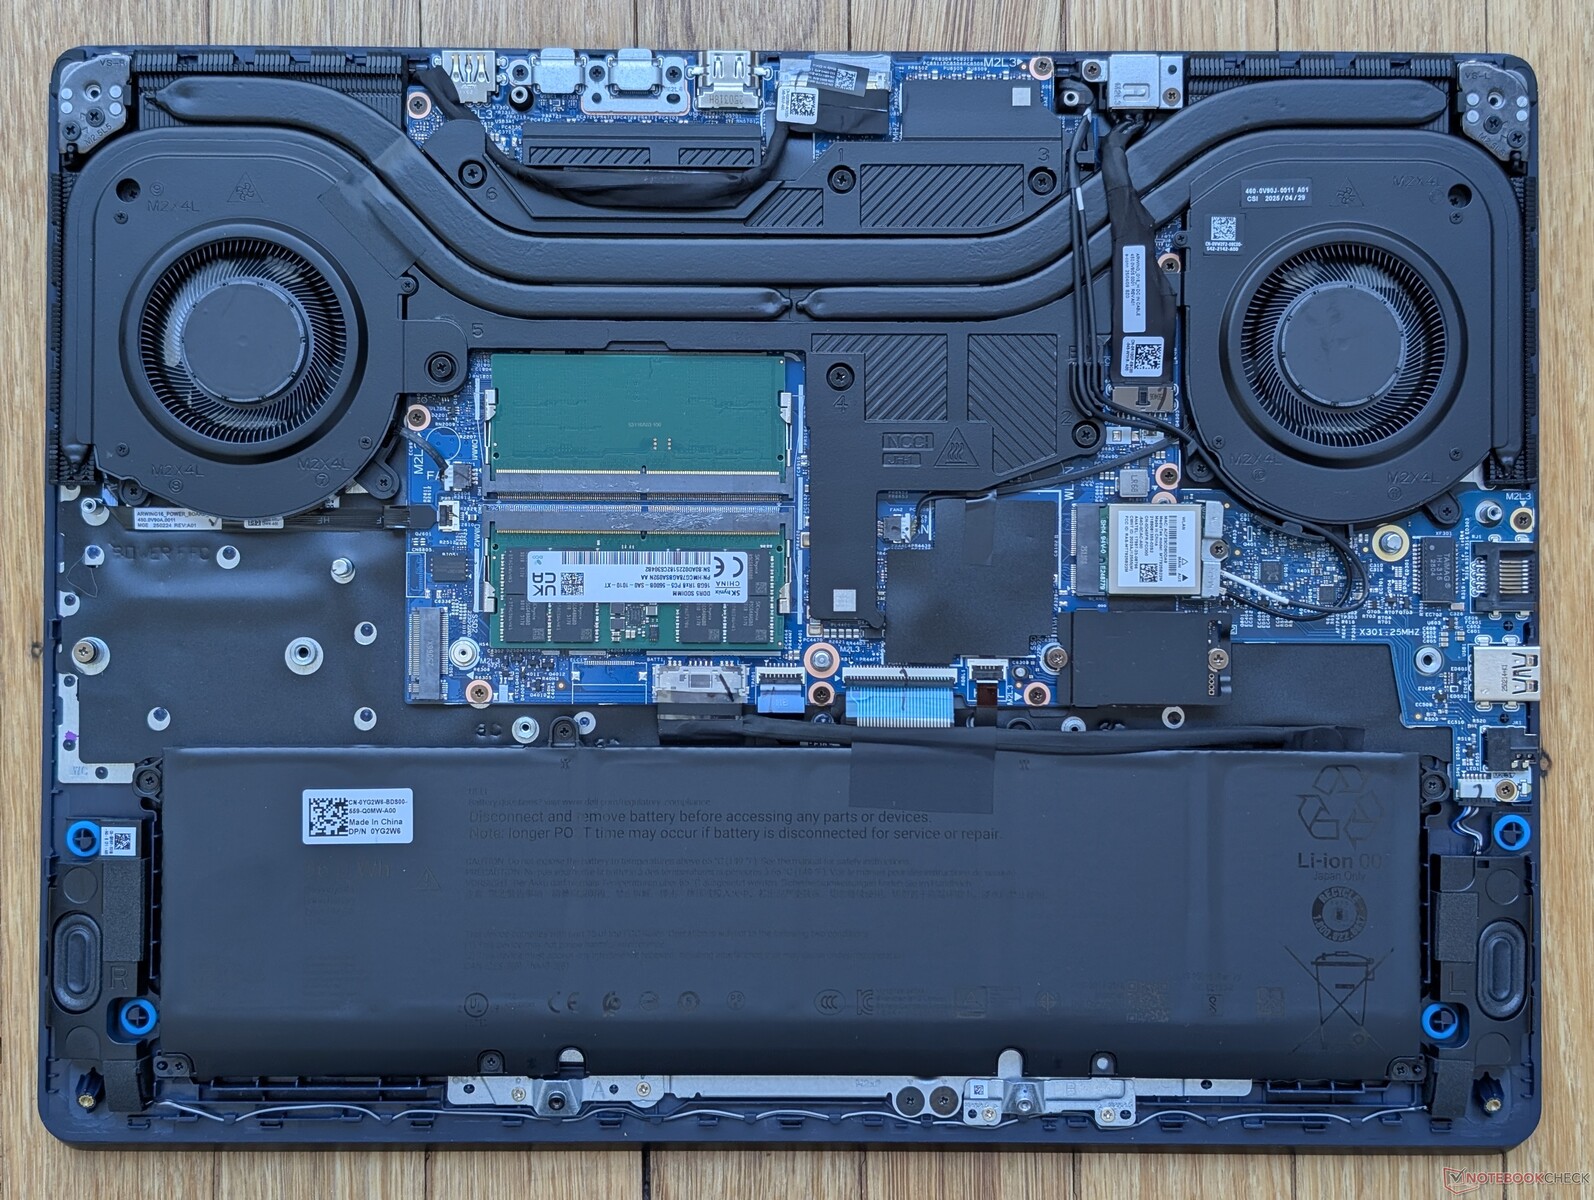
维护
尽管冷却解决方案略有变化,但维修工作与 16X Aurora 完全相同。
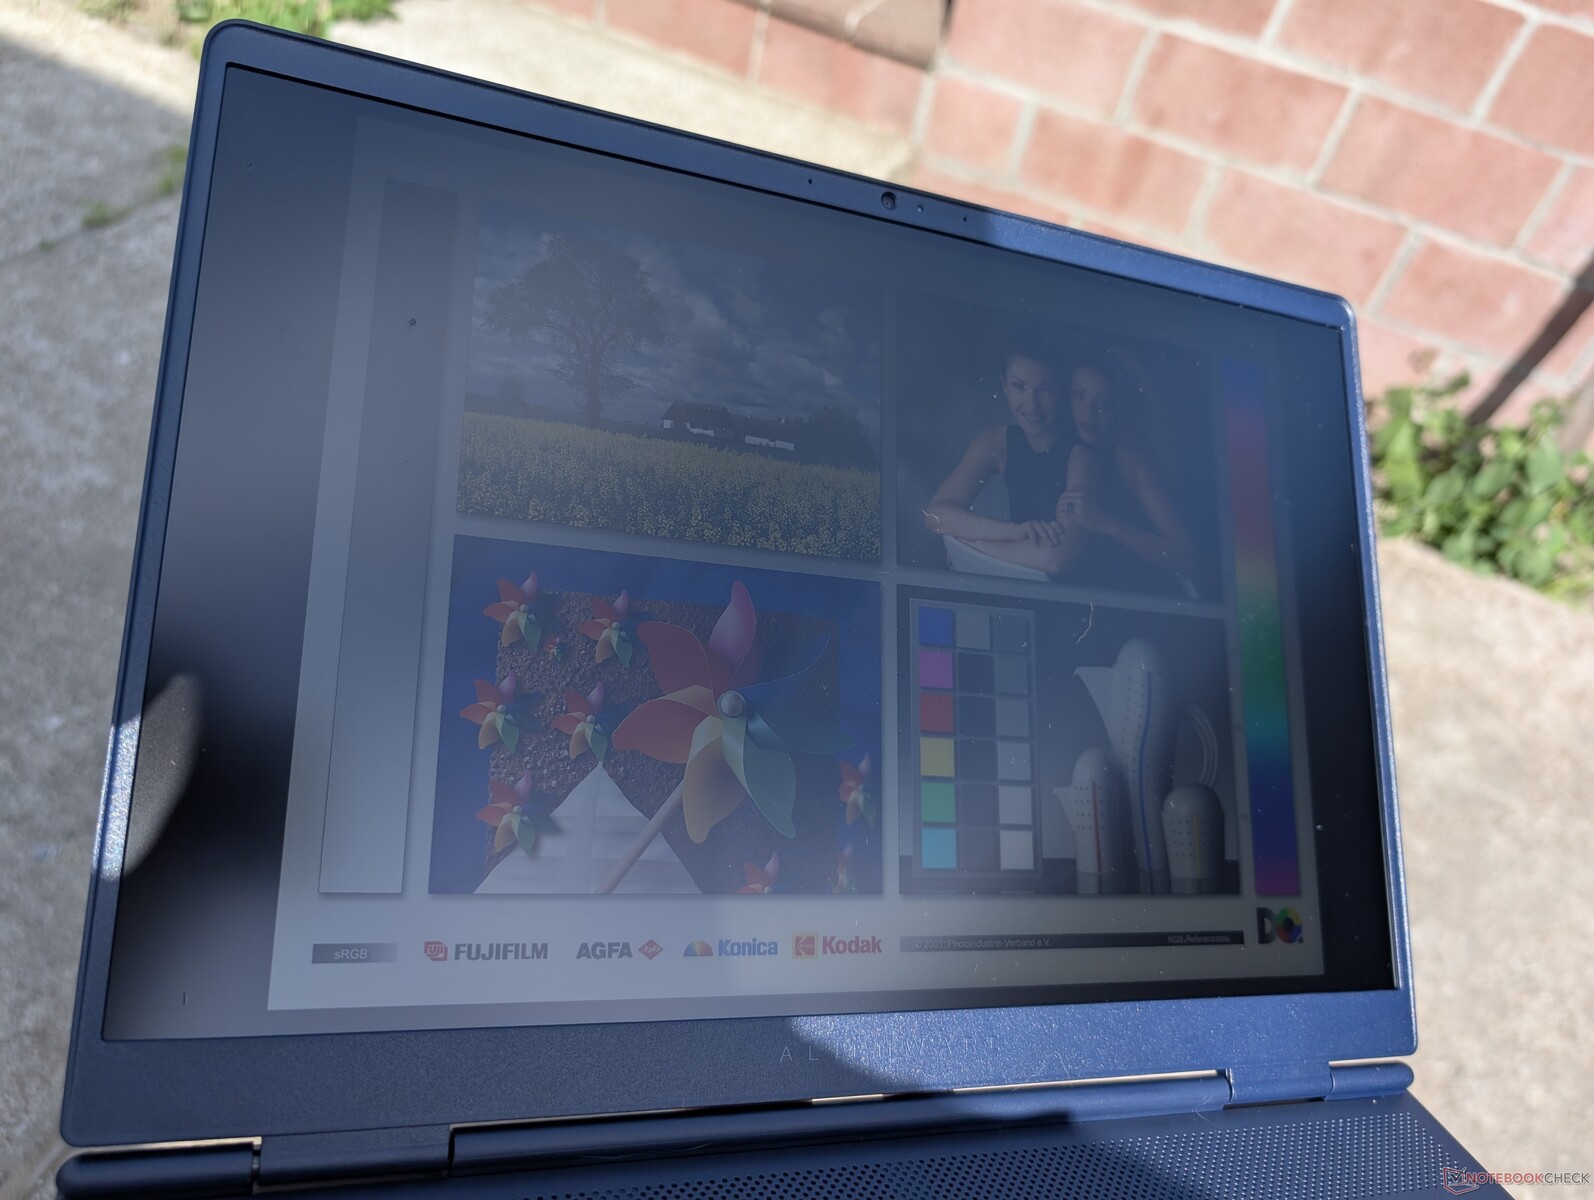
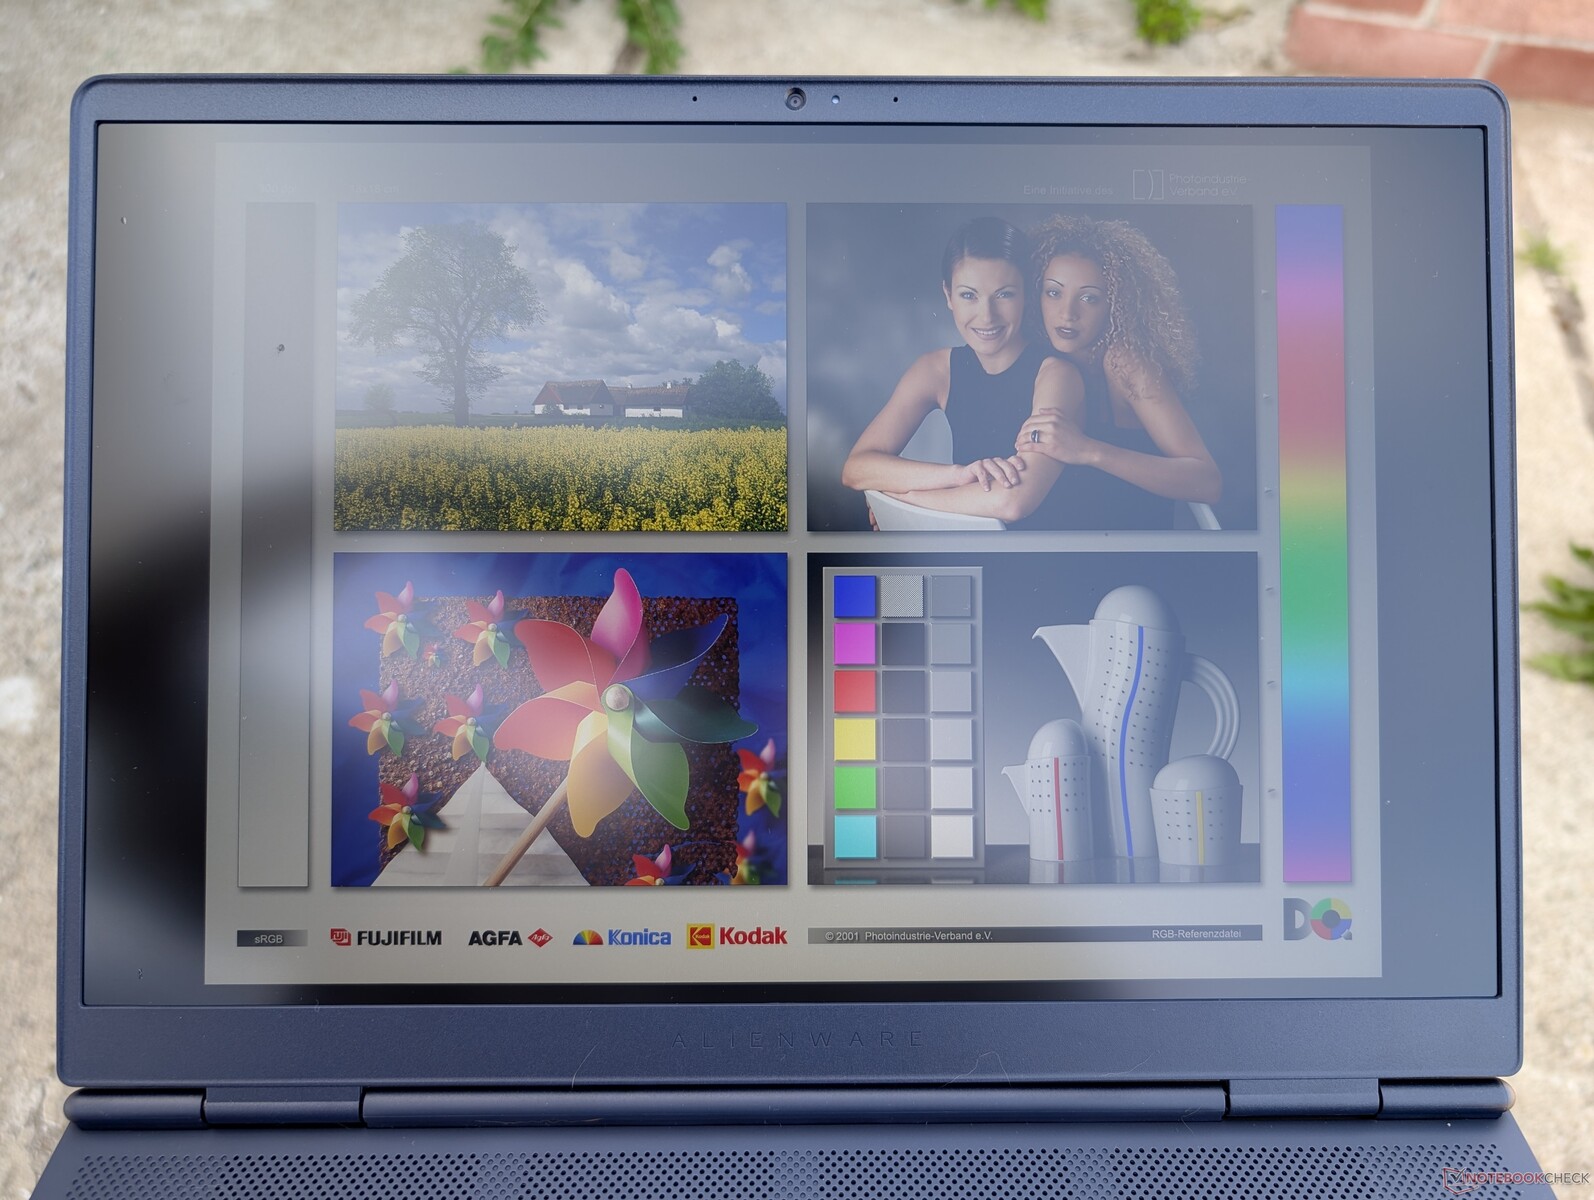
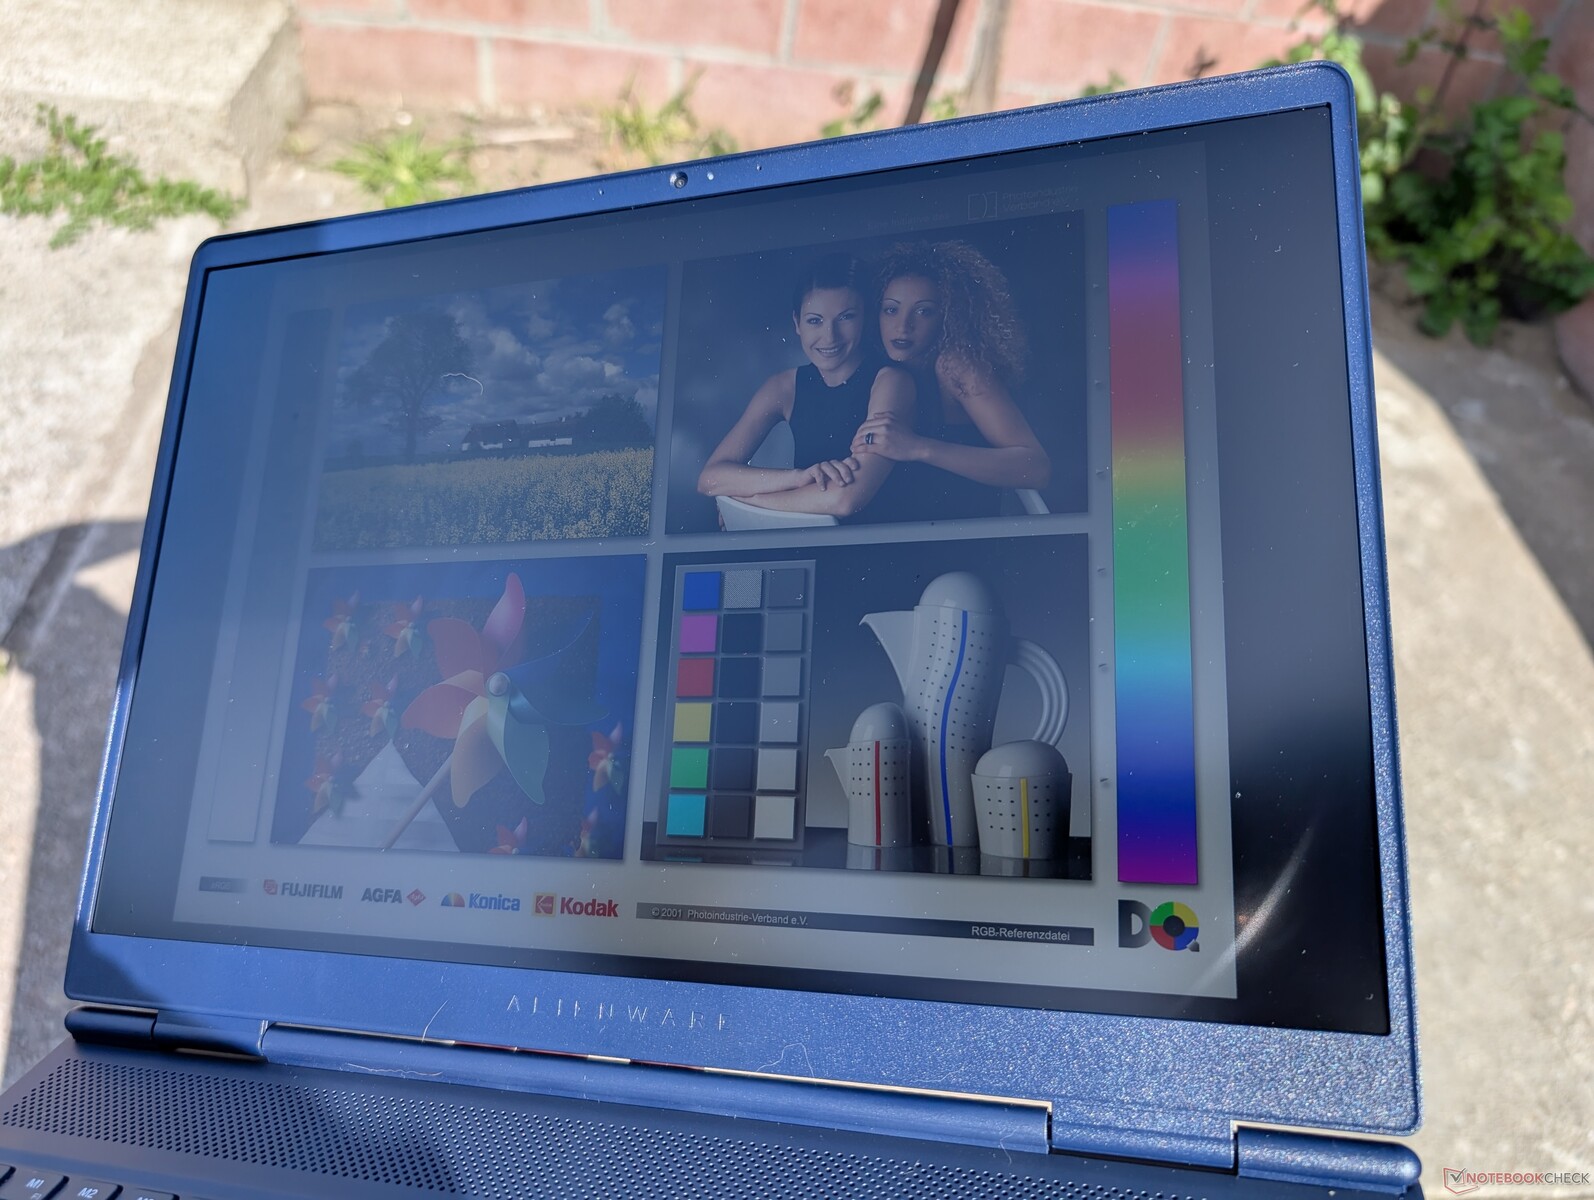
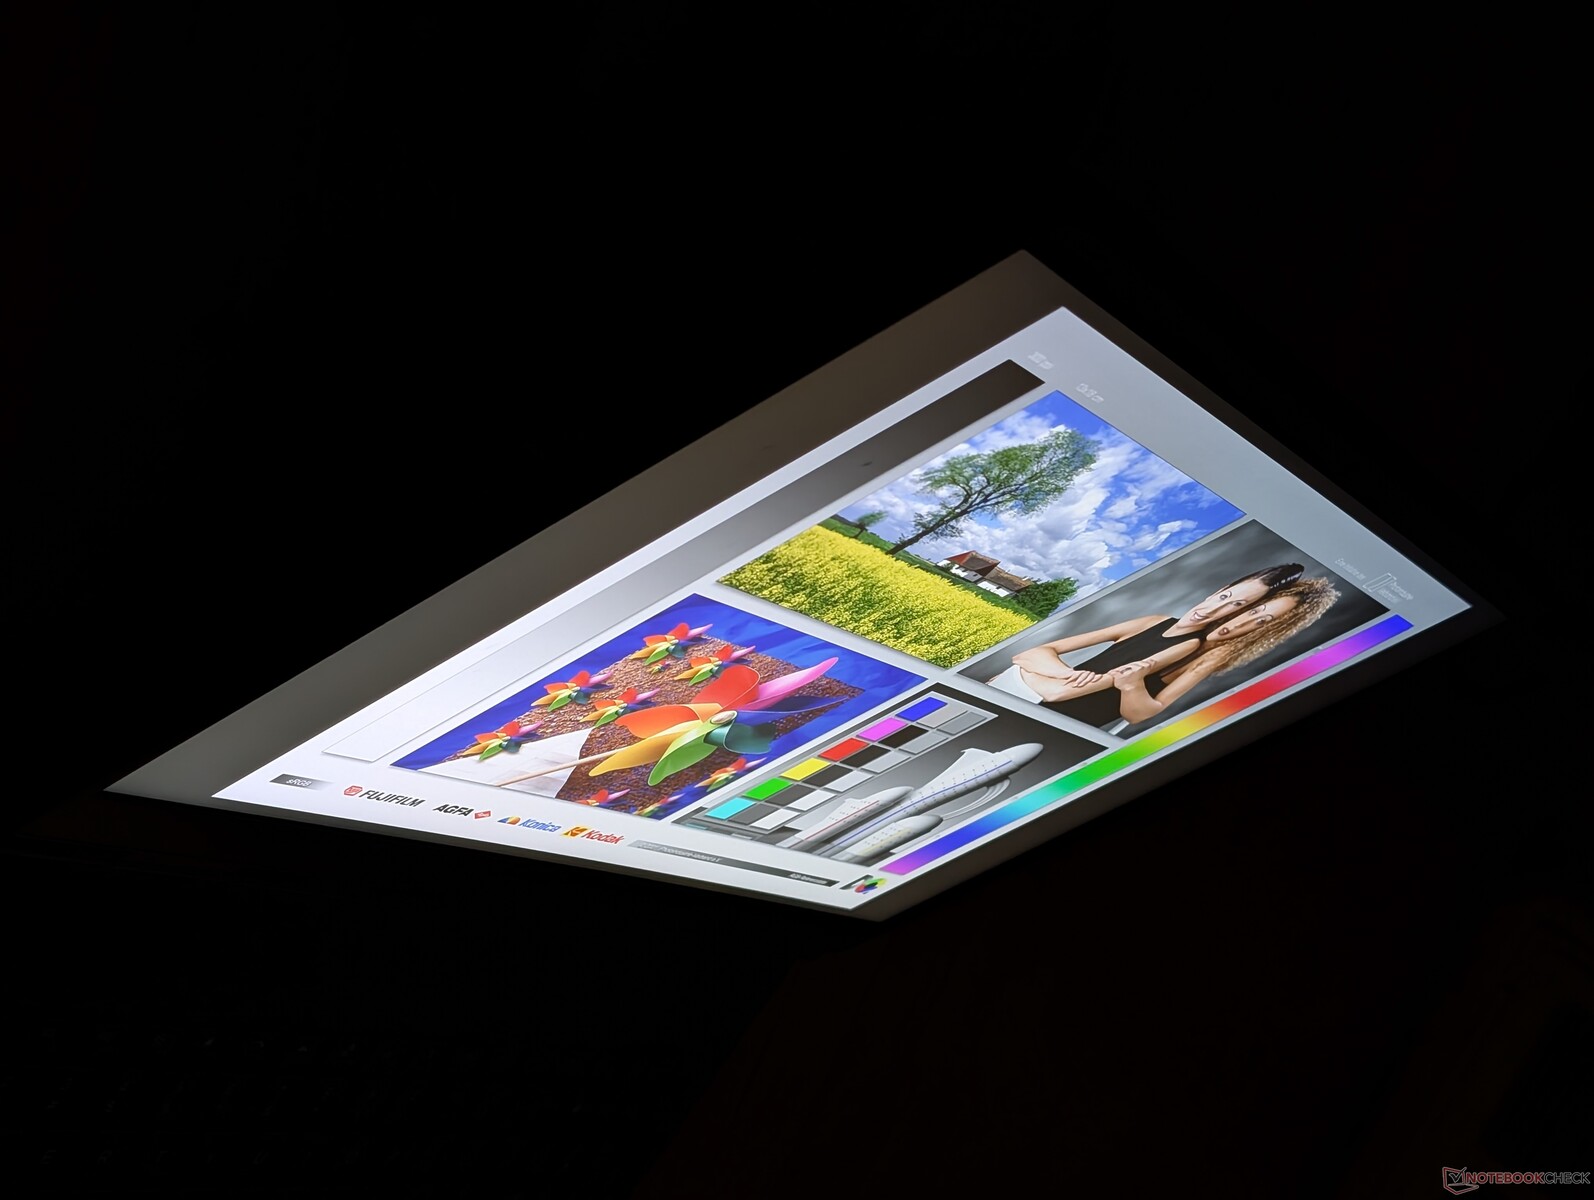
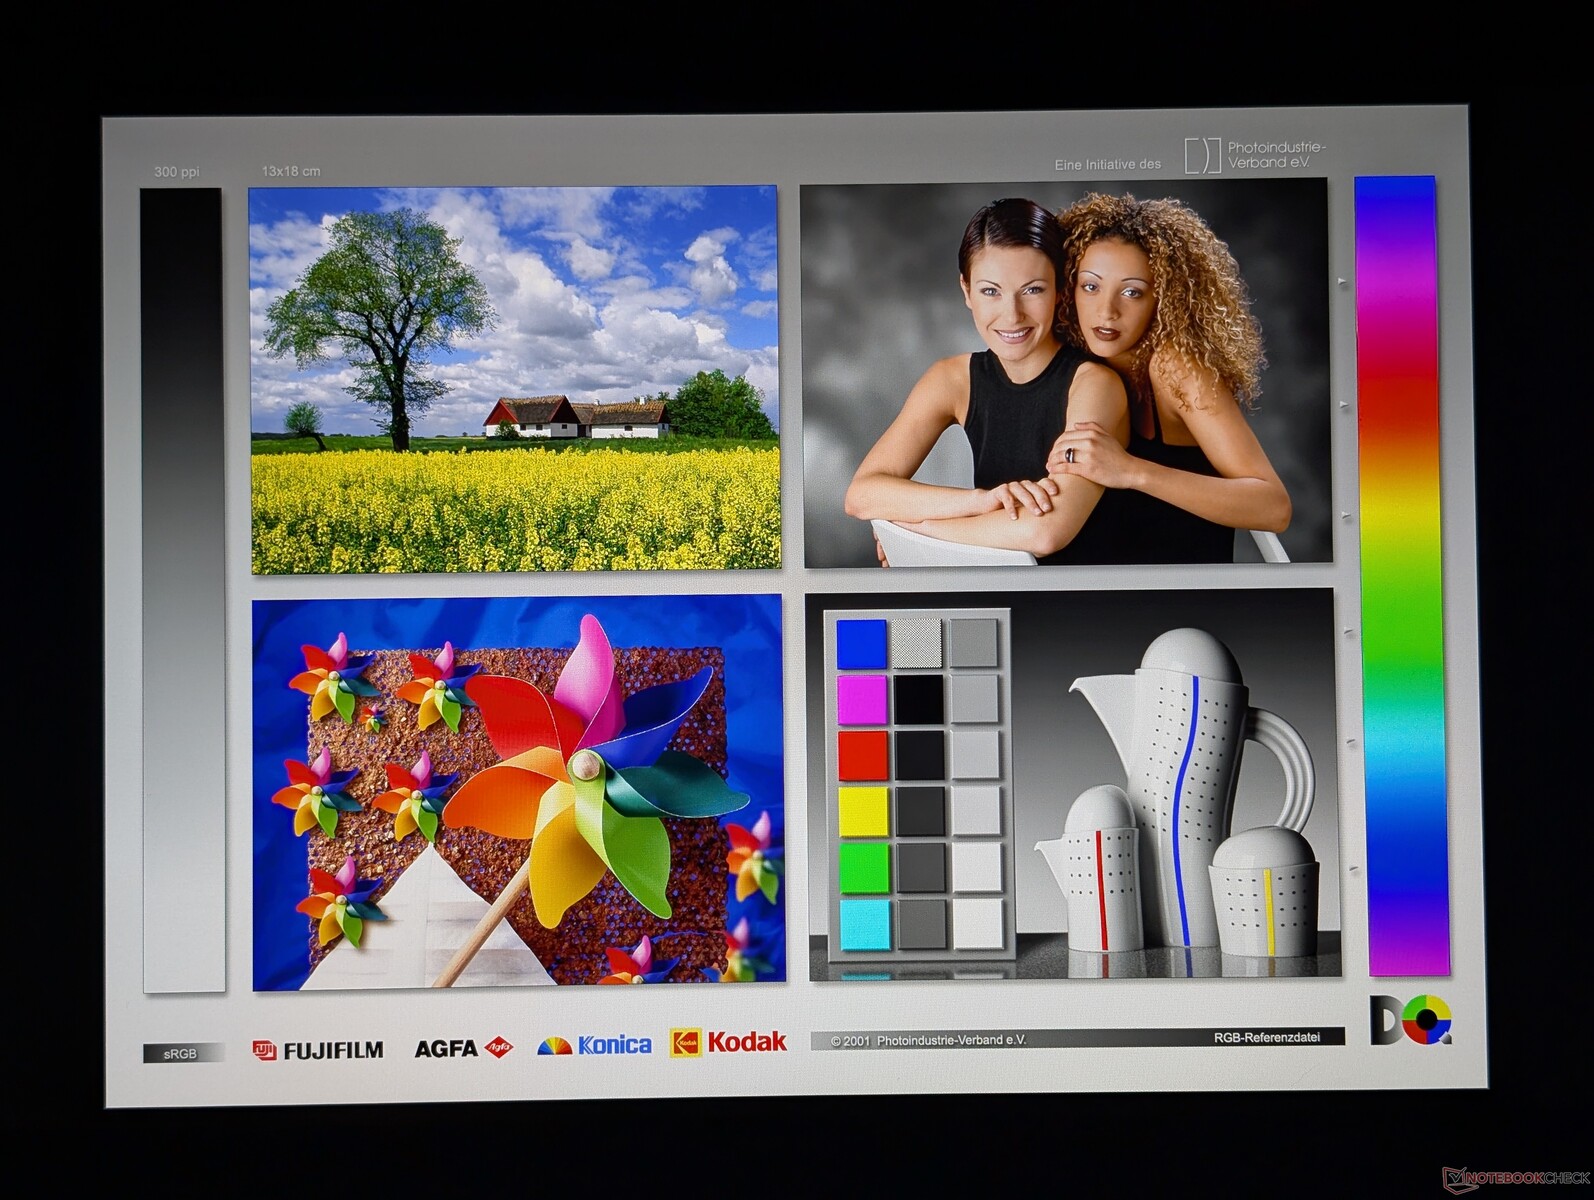
显示屏
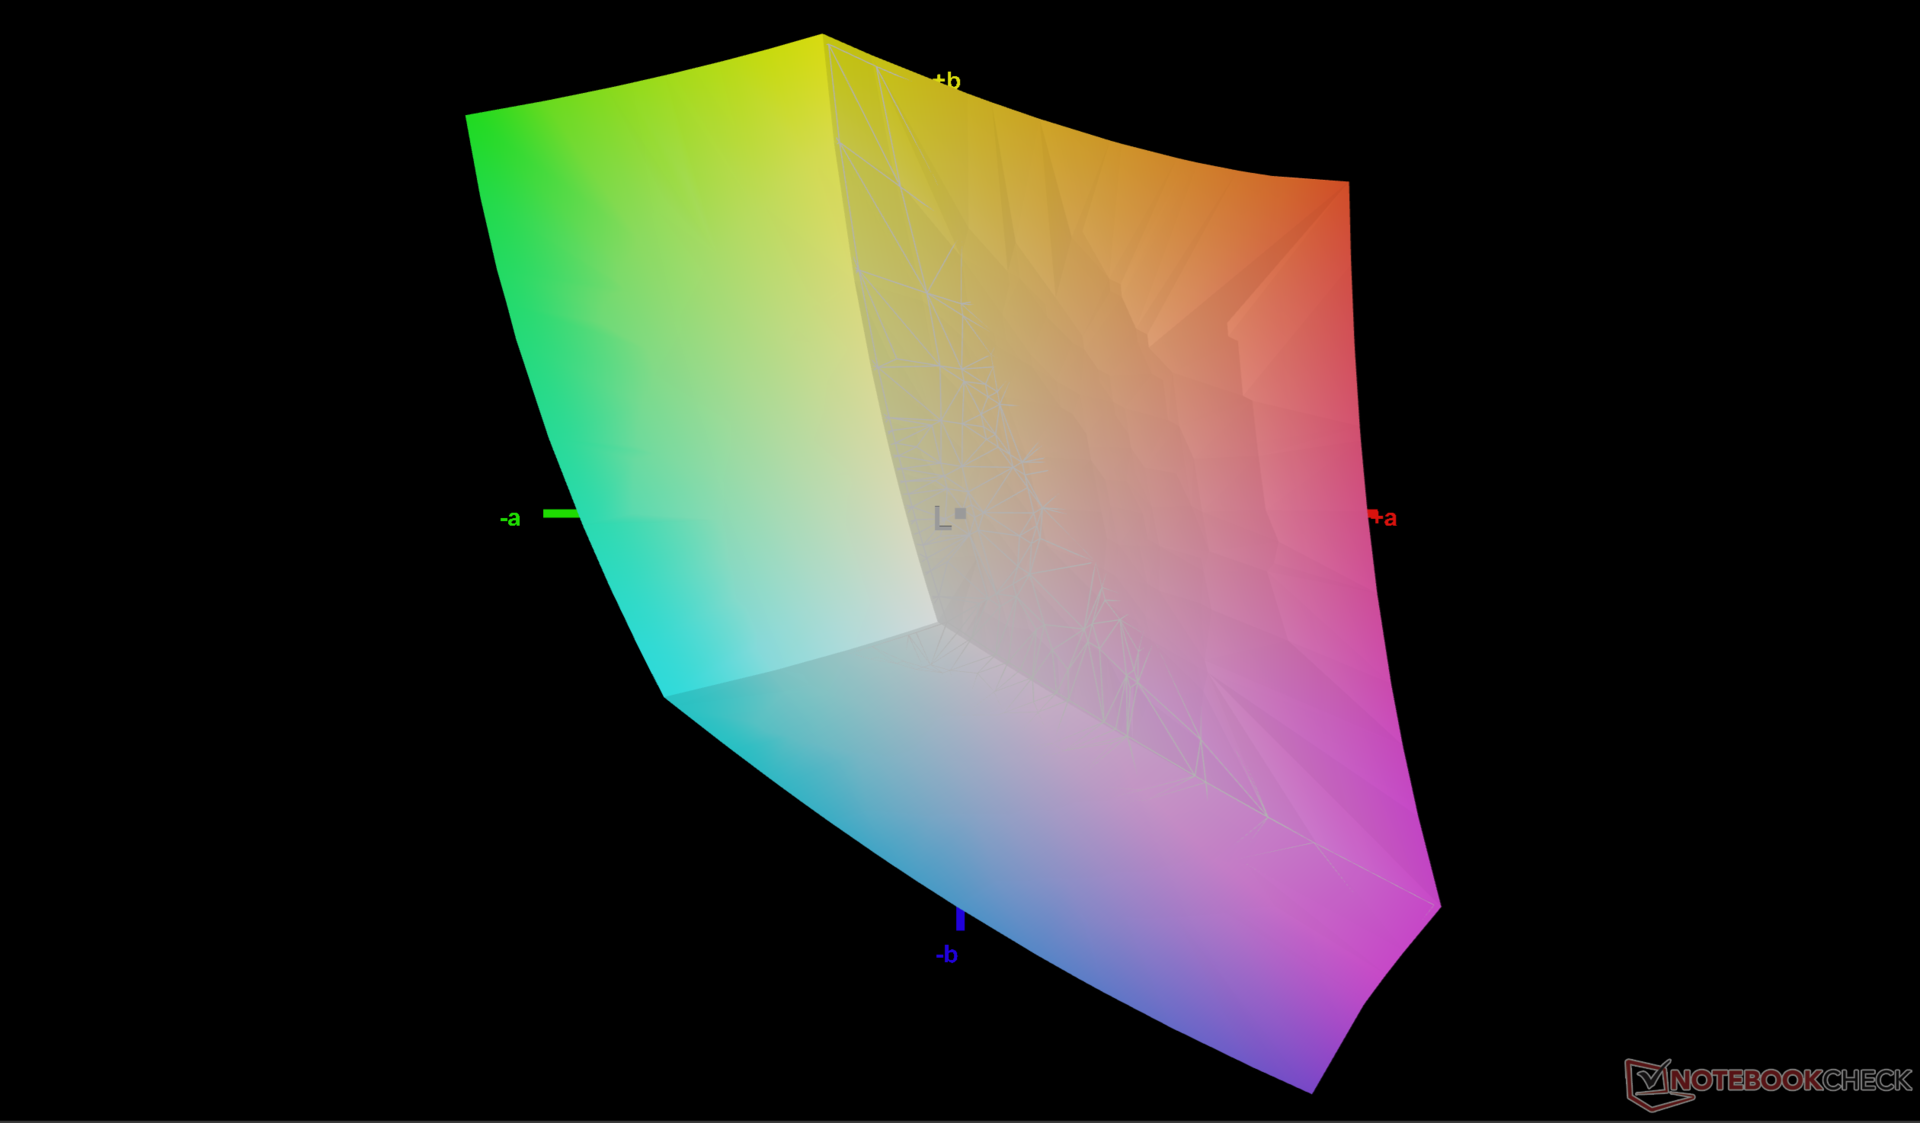
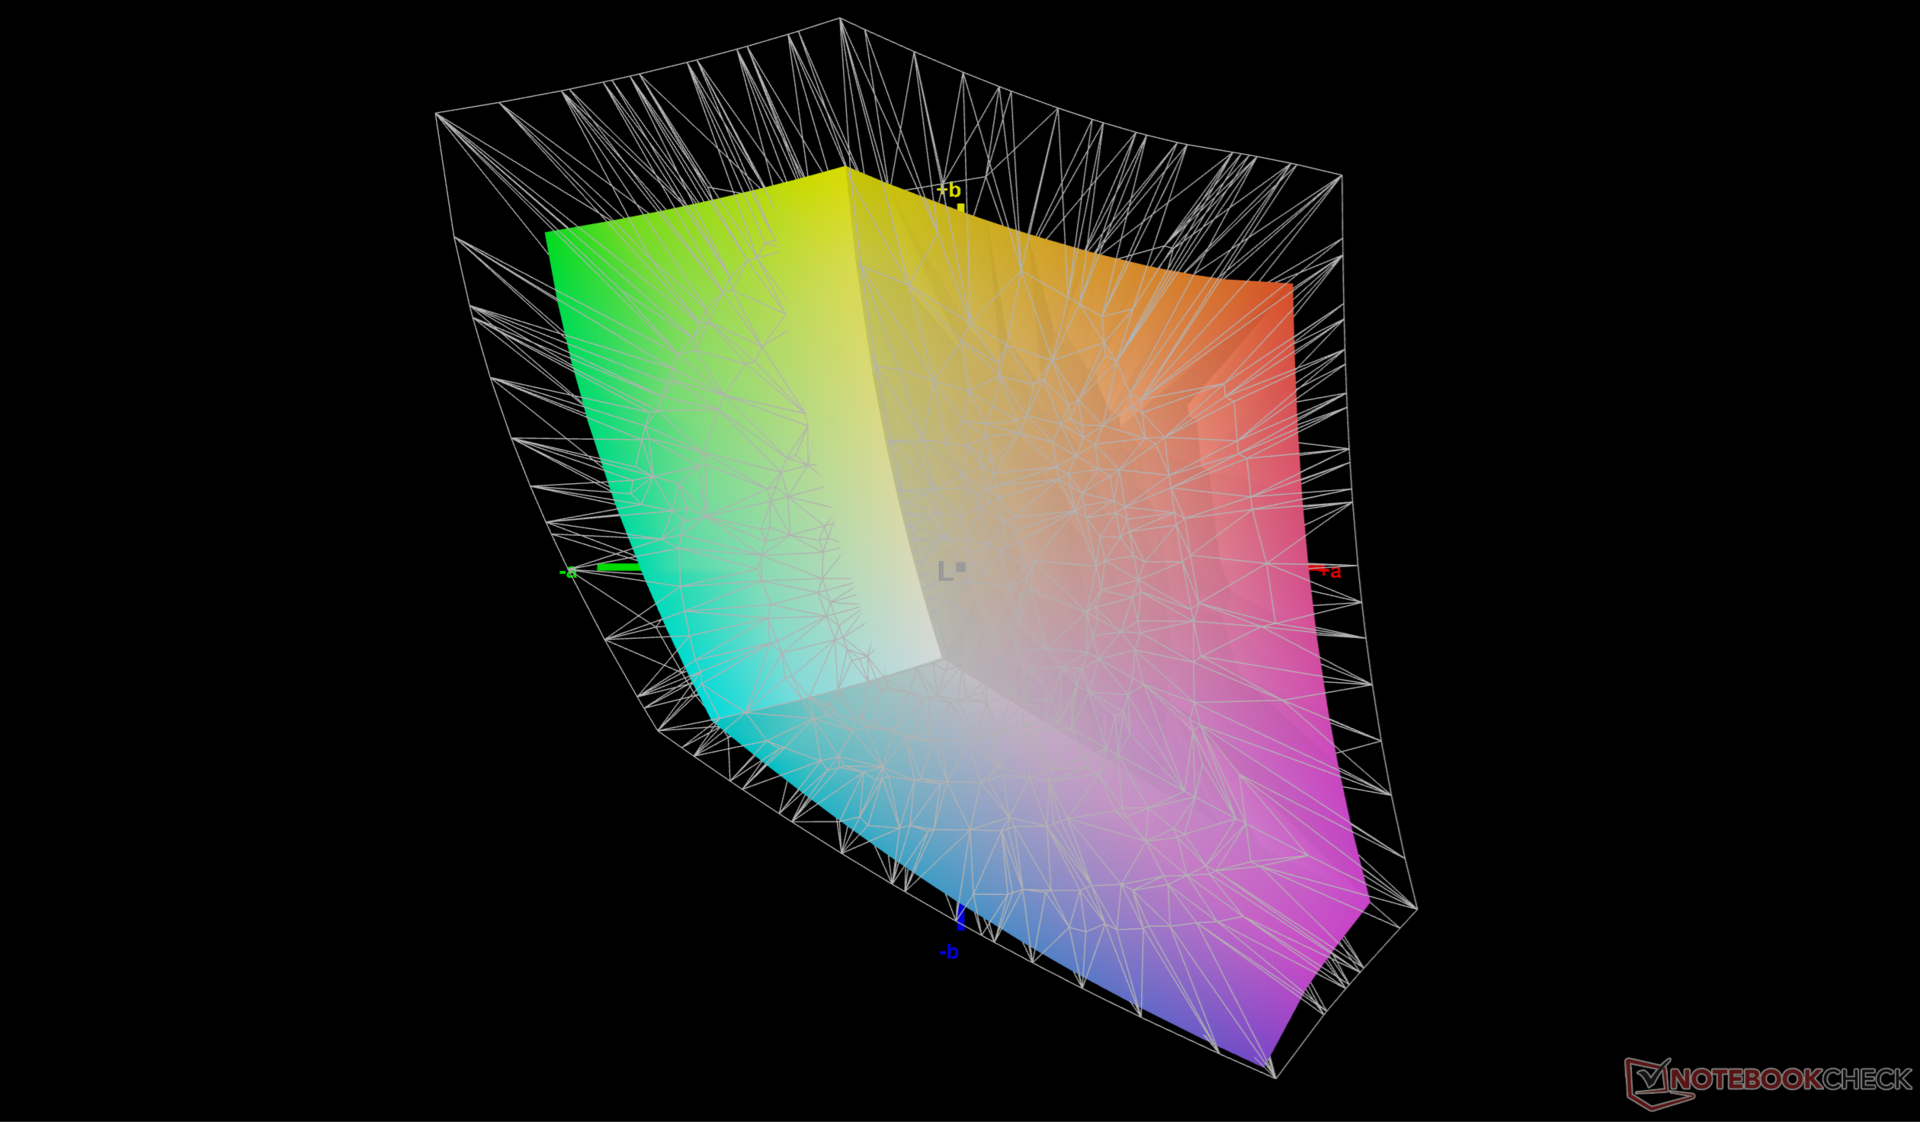
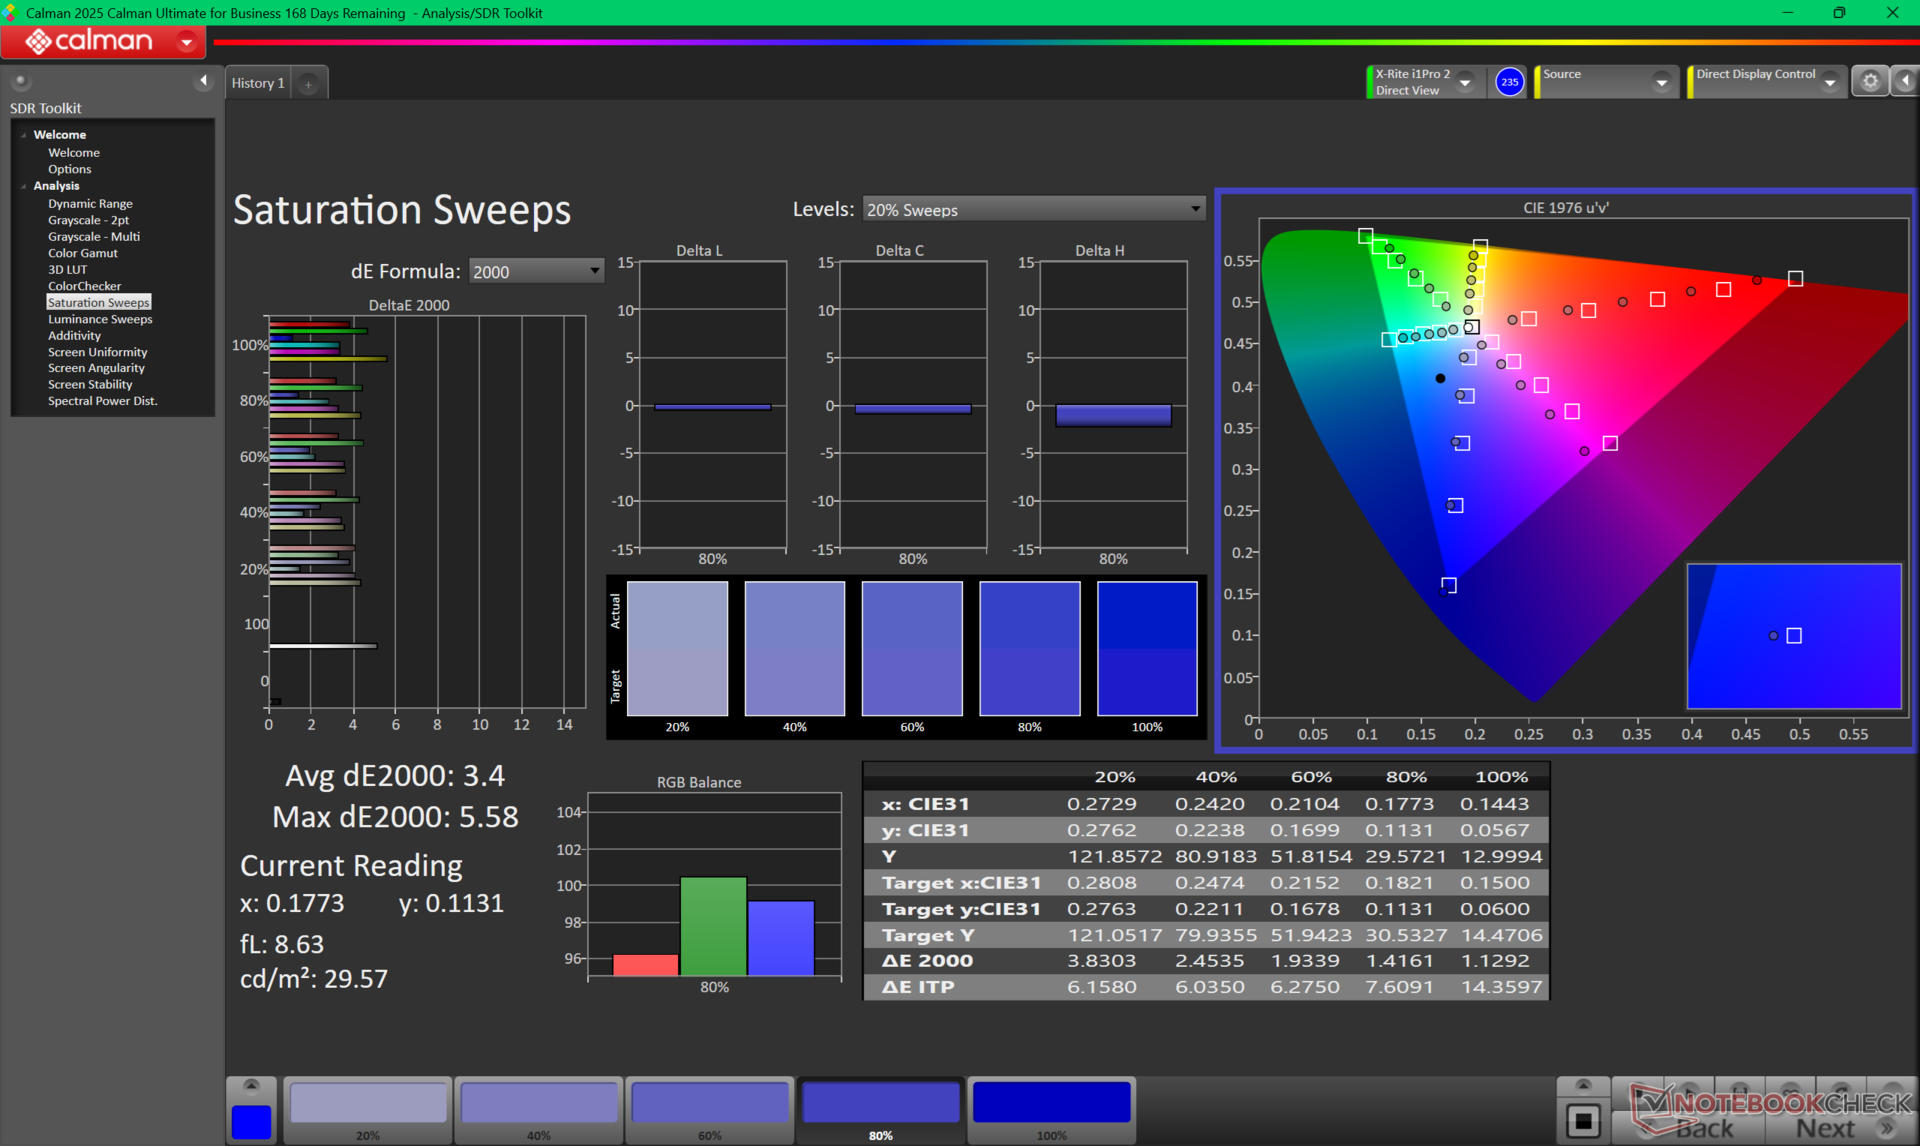
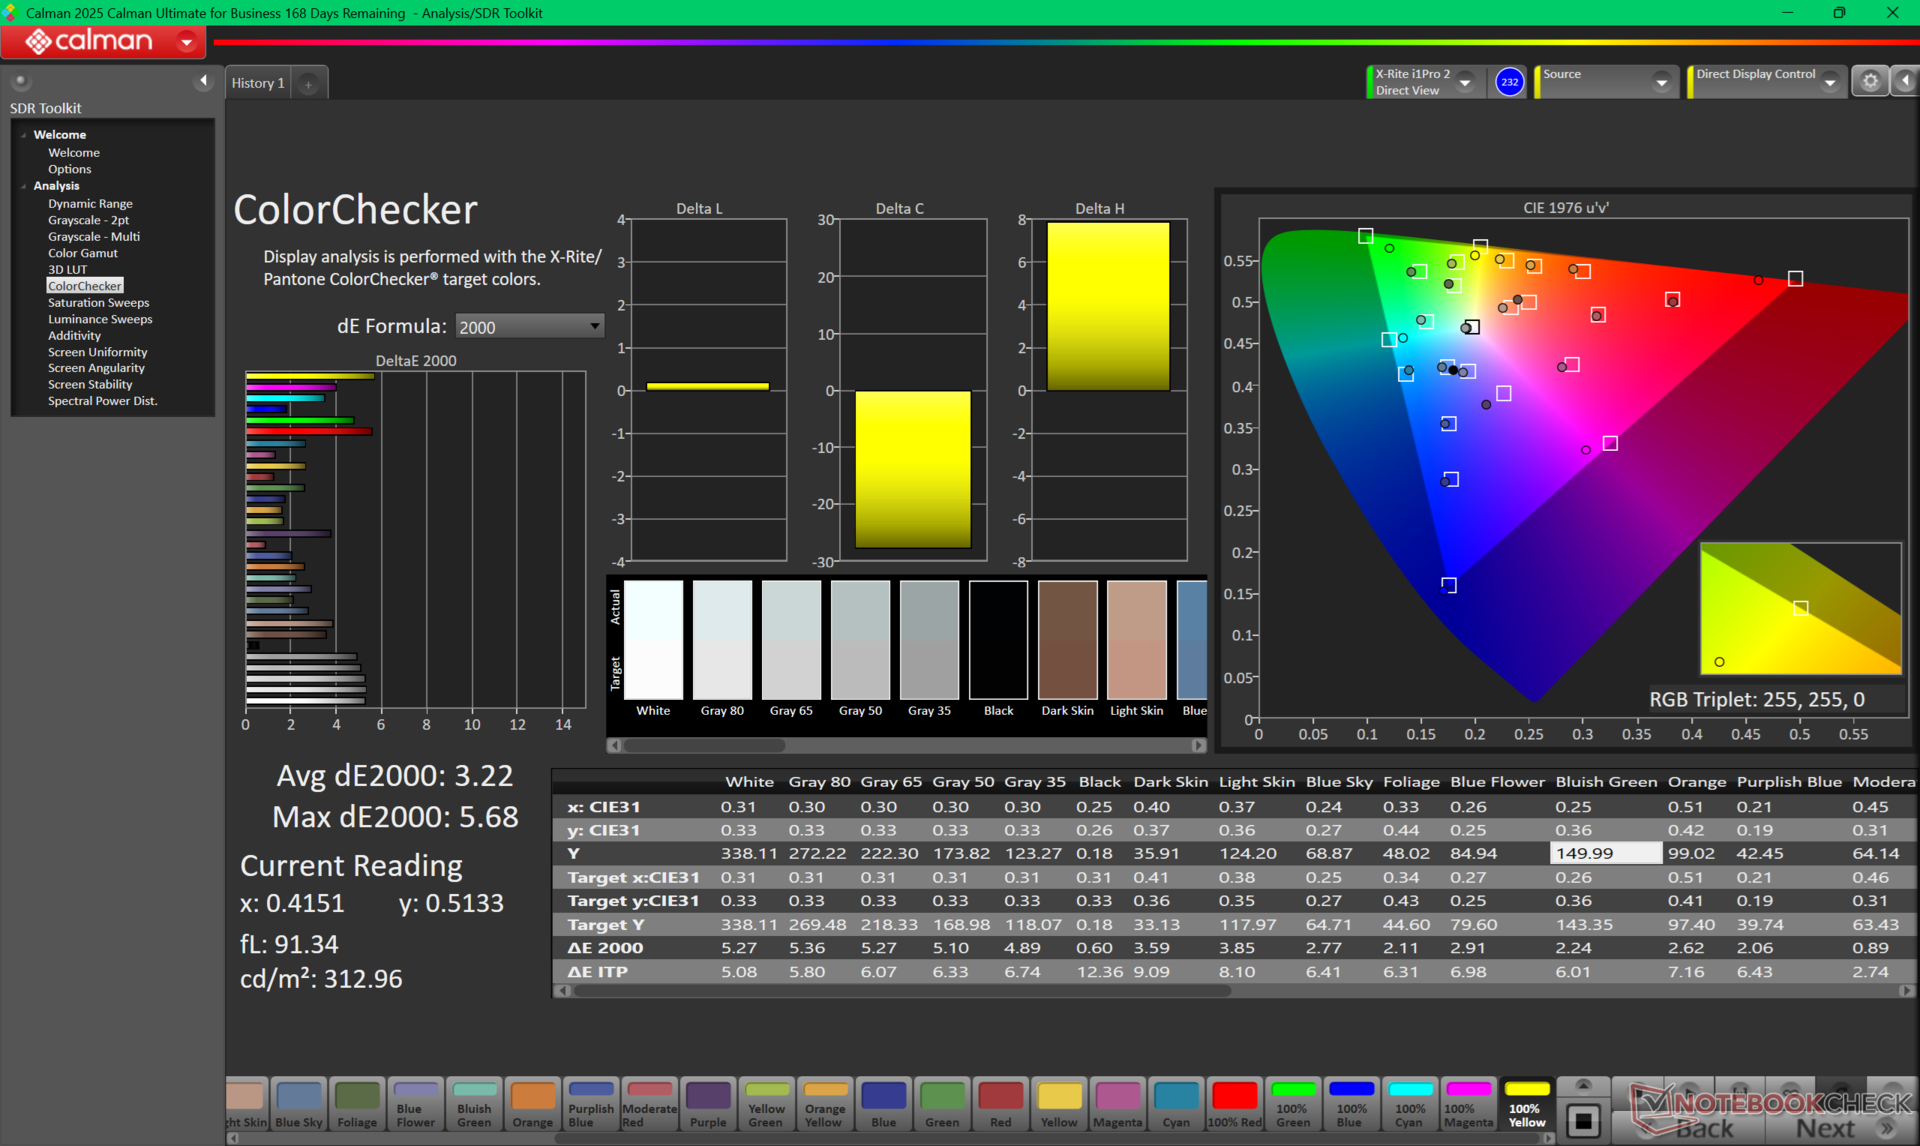
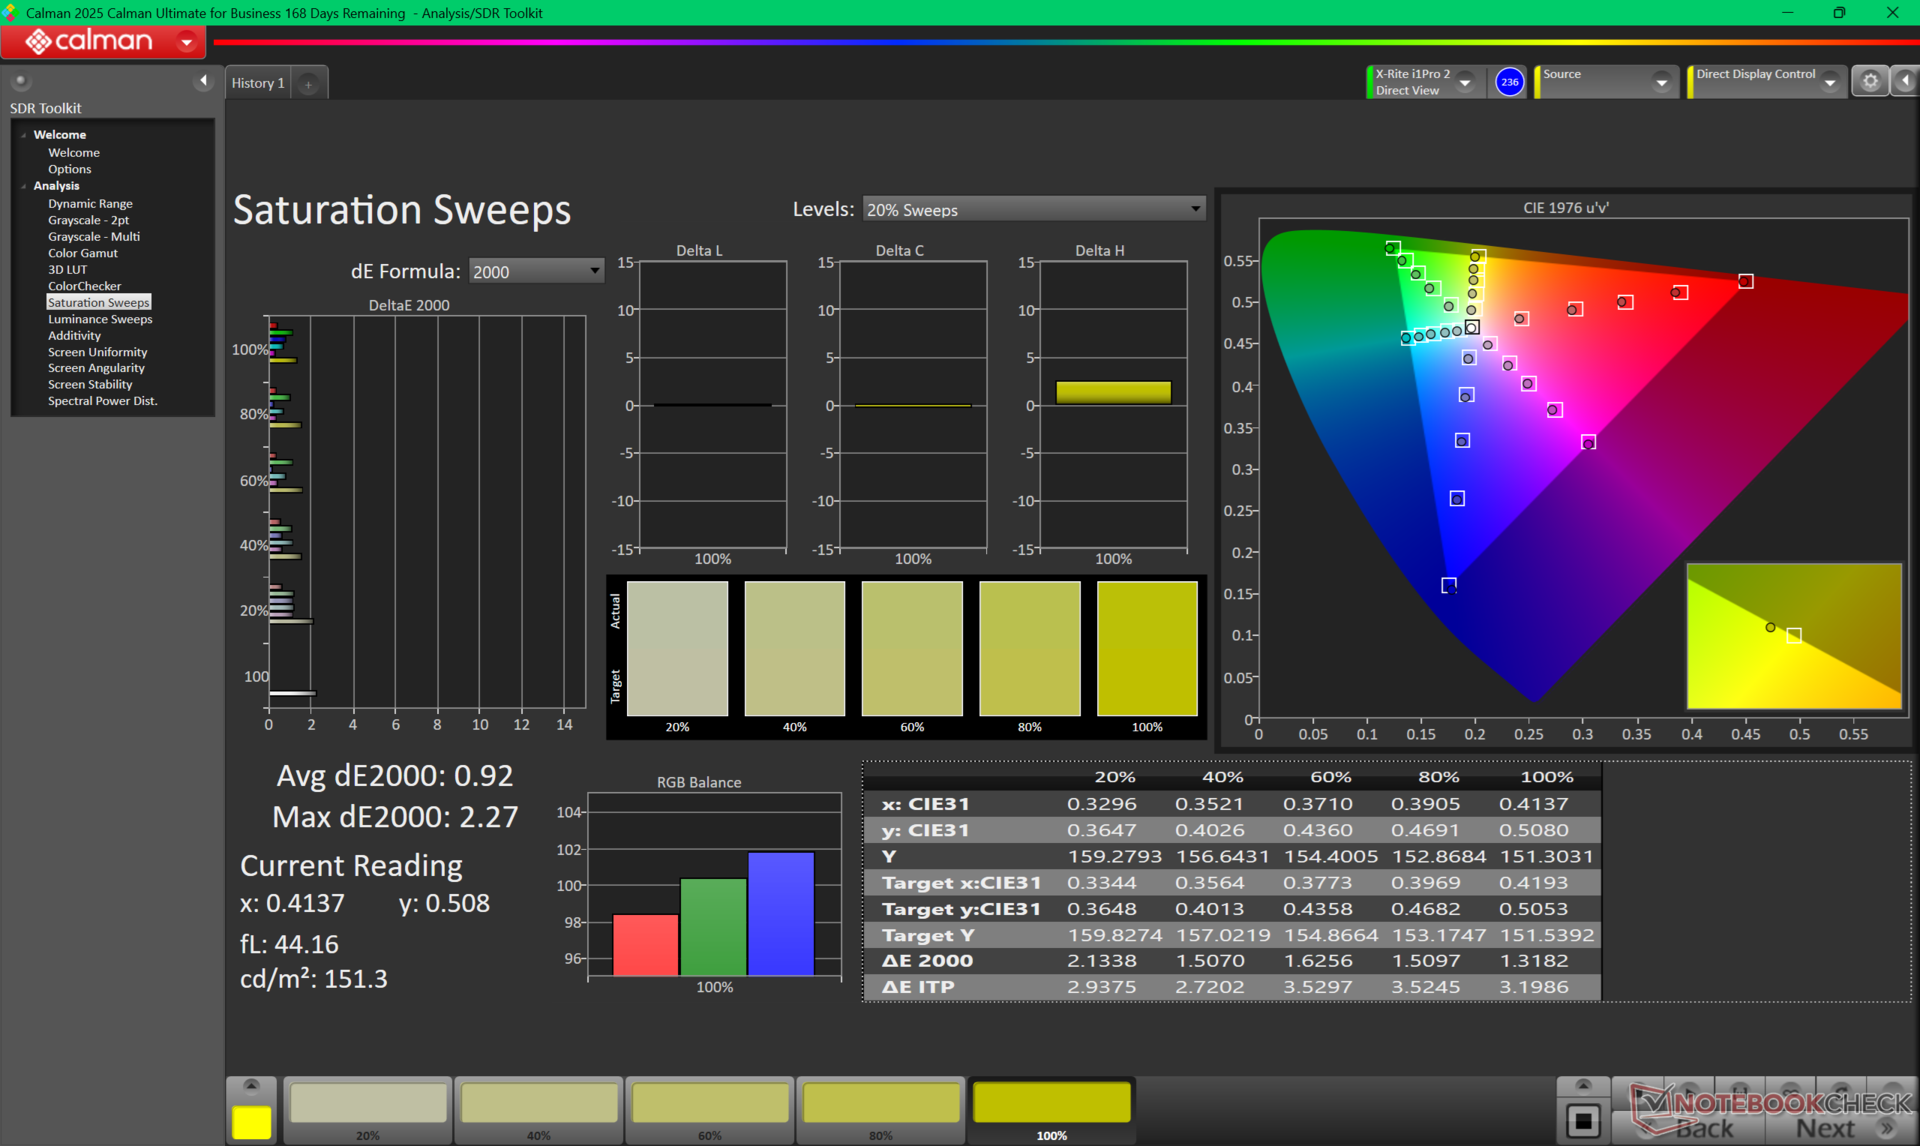
16X Aurora 配备的是 1600p 240 Hz G-Sync 显示屏,具有完整的 P3 色彩,而 16 Aurora 配备的是 1600p 120 Hz 显示屏,具有 sRGB 色彩,没有 G-Sync。其他隐藏的降级包括屏幕更暗(约 500 尼特对约 350 尼特),黑白和灰白响应时间明显更慢,游戏时鬼影更多。遗憾的是,后者在玩F1 24等快速移动的赛车游戏或 FPS 游戏时非常明显。

| |||||||||||||||||||||||||
Brightness Distribution: 88 %
Center on Battery: 345.3 cd/m²
Contrast: 1501:1 (Black: 0.23 cd/m²)
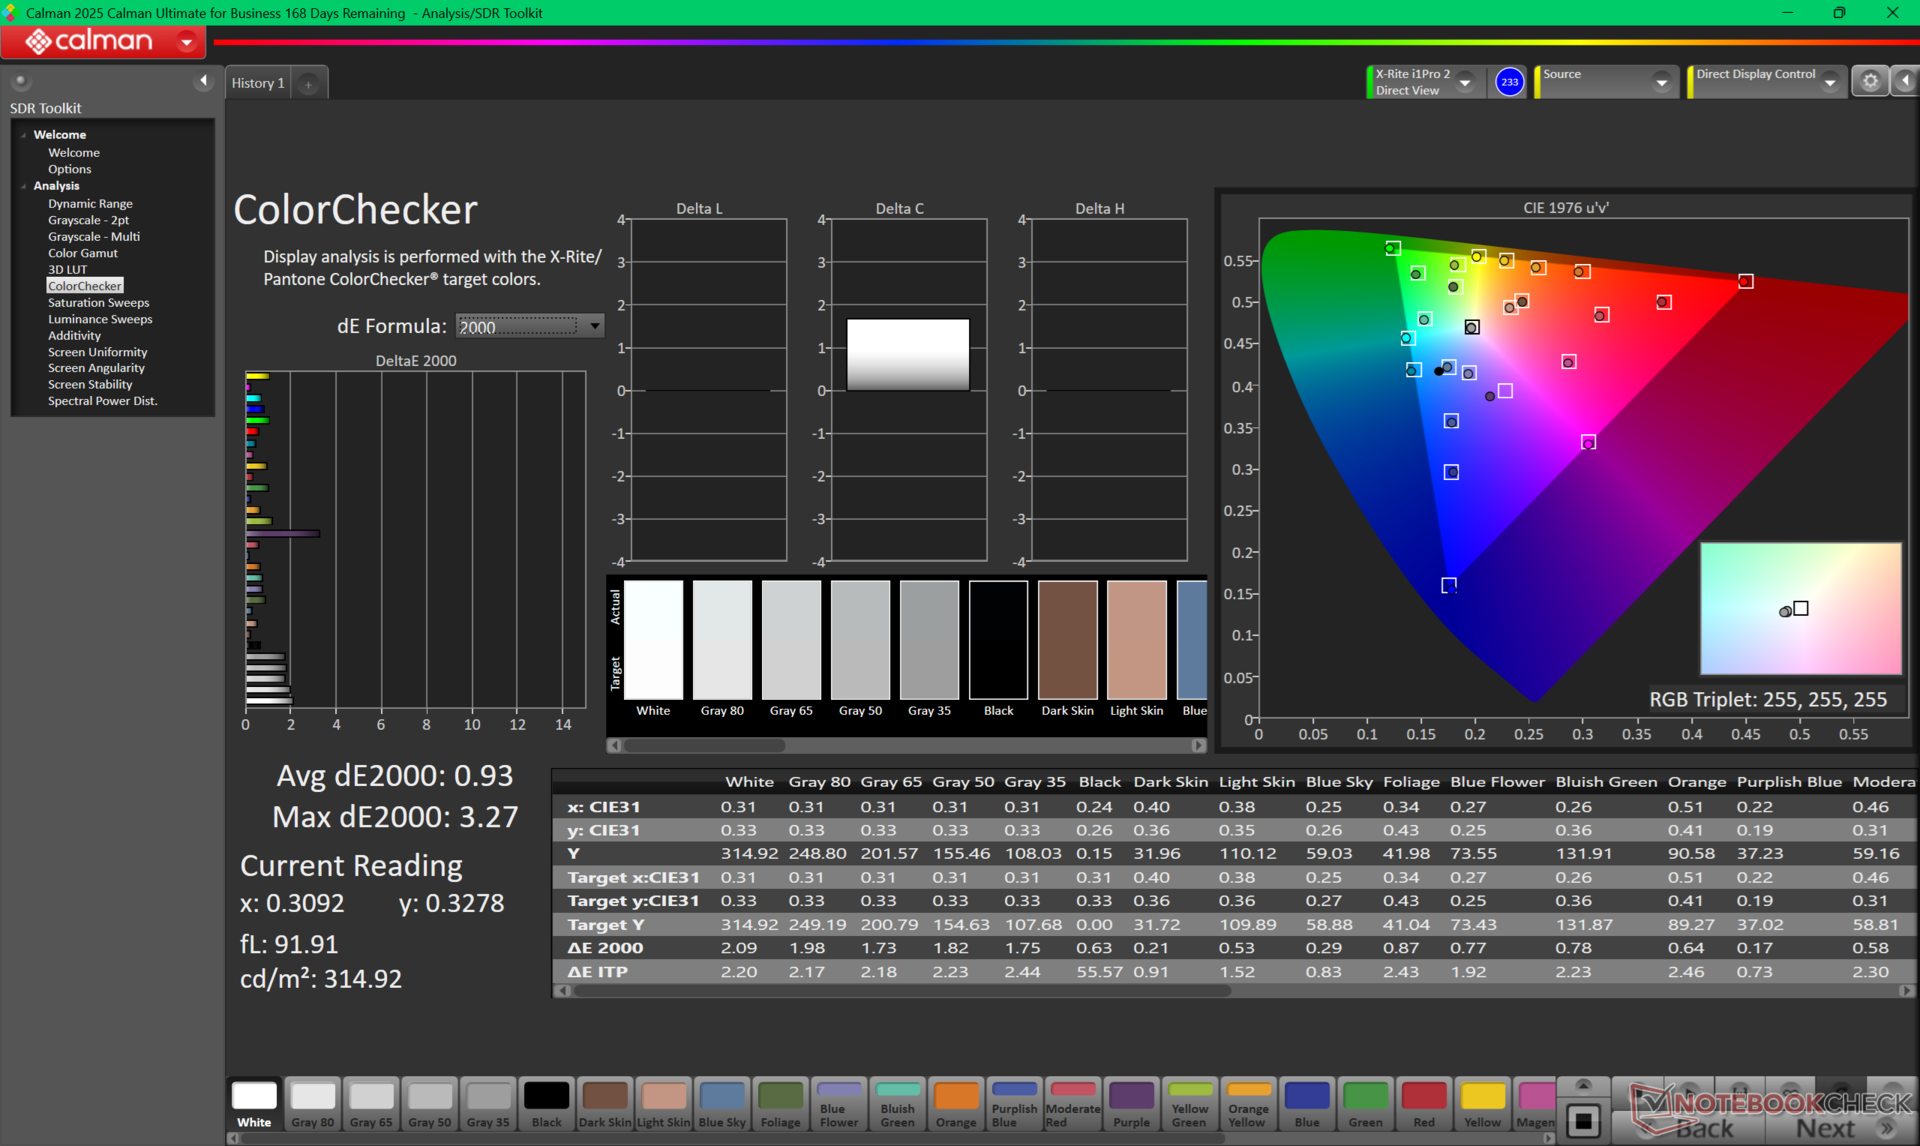
ΔE ColorChecker Calman: 3.22 | ∀{0.5-29.43 Ø4.72}
calibrated: 0.93
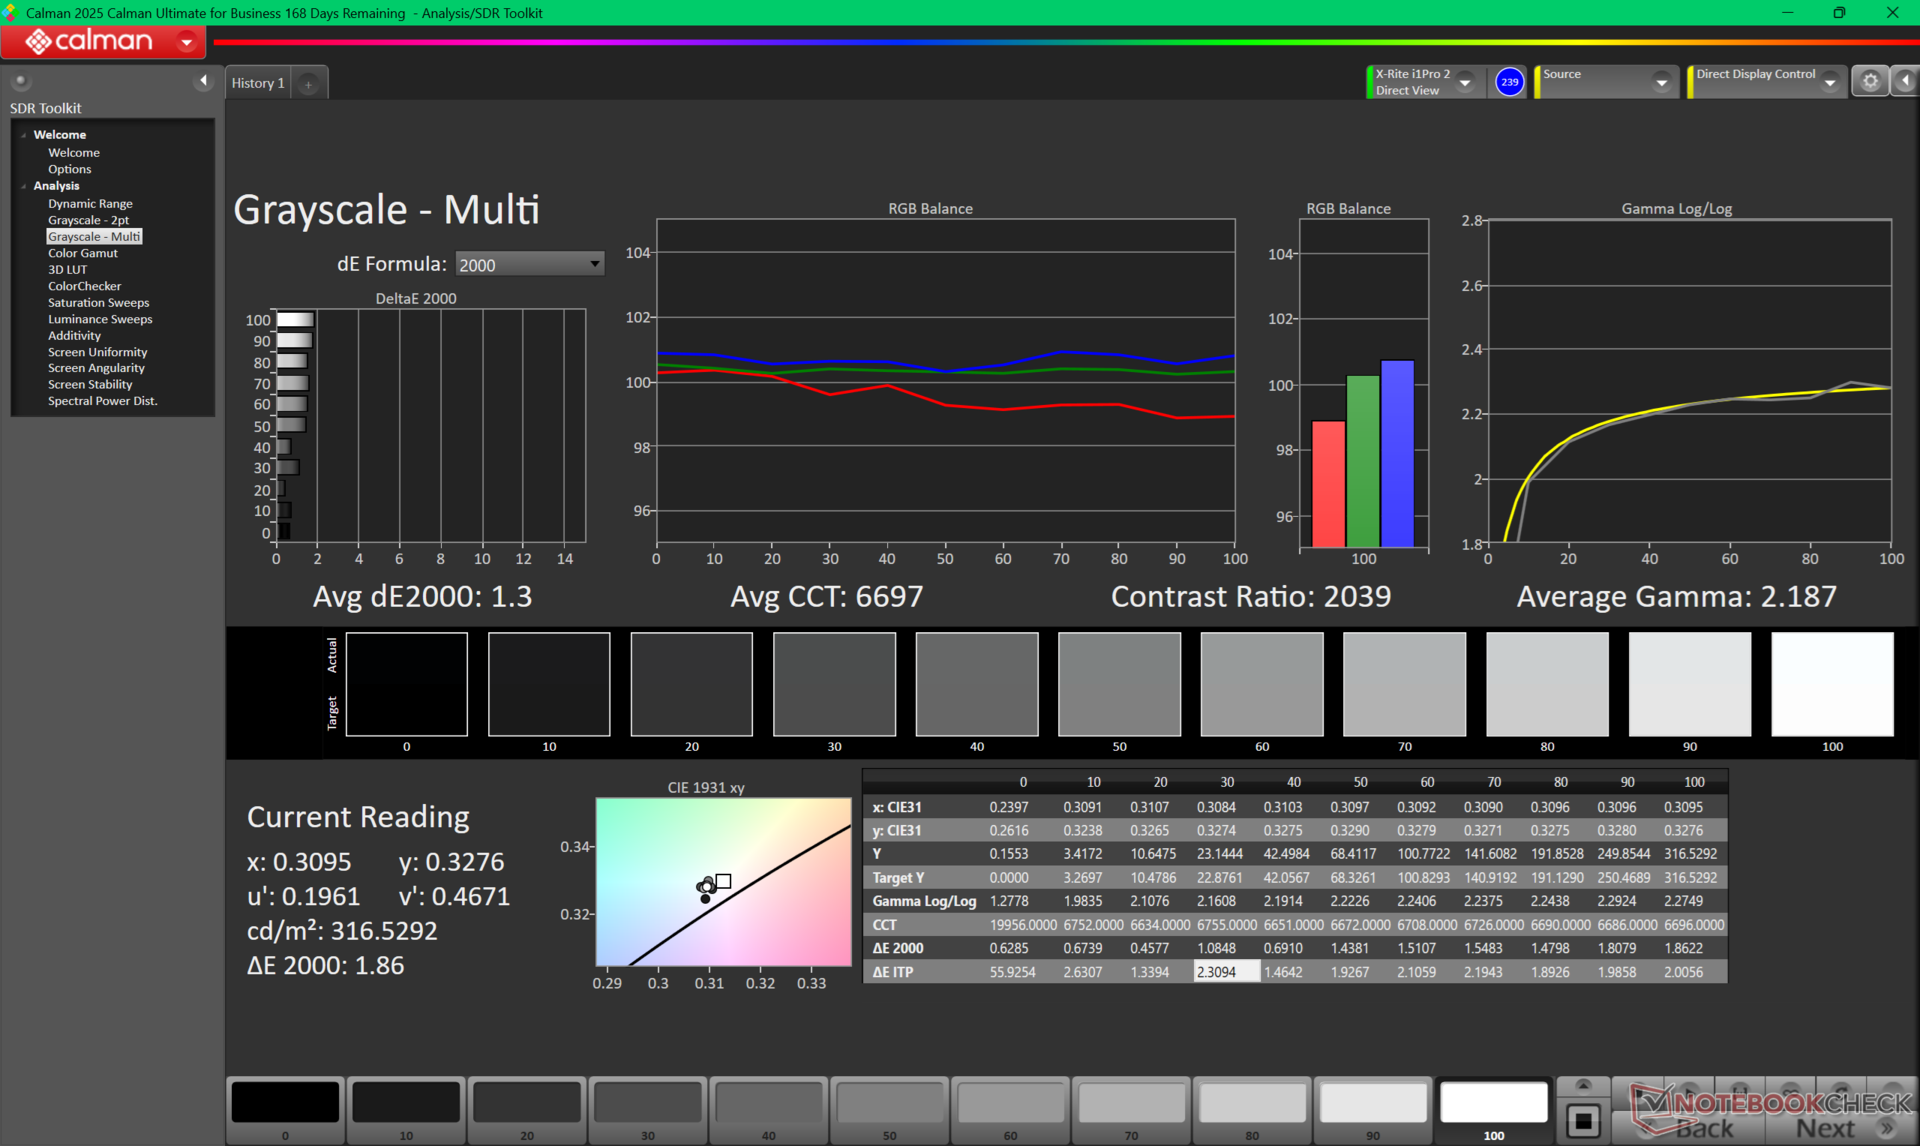
ΔE Greyscale Calman: 4.5 | ∀{0.09-98 Ø4.97}
72.1% AdobeRGB 1998 (Argyll 3D)
99.9% sRGB (Argyll 3D)
70.8% Display P3 (Argyll 3D)
Gamma: 2.1
CCT: 7041 K
| Alienware 16 Aurora BOE NE16N41, IPS, 2560x1600, 16", 120 Hz | Alienware 16X Aurora, RTX 5070 LG Philips 160WQG, IPS, 2560x1600, 16", 240 Hz | Lenovo LOQ 15AHP10 CSOT MNF601BA1-4, IPS, 1920x1080, 15.6", 144 Hz | Gigabyte Gaming A16 GA6H NE160QDM-NYJ (BOE0C80), IPS, 2560x1600, 16", 165 Hz | Asus TUF Gaming A16 FA608WV B160UAN08.1 (AUO9BB0), IPS, 1920x1200, 16", 144 Hz | HP Victus 16 (2024) Chi Mei CMN163E, IPS, 1920x1080, 16.1", 144 Hz | |
|---|---|---|---|---|---|---|
| Display | 20% | -3% | -1% | -42% | -40% | |
| Display P3 Coverage (%) | 70.8 | 96.9 37% | 67.3 -5% | 69.4 -2% | 39.8 -44% | 41.3 -42% |
| sRGB Coverage (%) | 99.9 | 99.8 0% | 99.2 -1% | 99.5 0% | 59.7 -40% | 61.7 -38% |
| AdobeRGB 1998 Coverage (%) | 72.1 | 89.7 24% | 69.1 -4% | 71.6 -1% | 41.1 -43% | 42.7 -41% |
| Response Times | 81% | 30% | 74% | 72% | 39% | |
| Response Time Grey 50% / Grey 80% * (ms) | 49.5 ? | 4.3 ? 91% | 33.9 ? 32% | 14.3 ? 71% | 13.6 ? 73% | 28.6 ? 42% |
| Response Time Black / White * (ms) | 29.3 ? | 8.7 ? 70% | 21.2 ? 28% | 7 ? 76% | 8.4 ? 71% | 18.7 ? 36% |
| PWM Frequency (Hz) | ||||||
| Screen | -5% | 16% | -21% | -81% | -69% | |
| Brightness middle (cd/m²) | 345.3 | 493.2 43% | 318 -8% | 432 25% | 347 0% | 287 -17% |
| Brightness (cd/m²) | 324 | 477 47% | 300 -7% | 425 31% | 321 -1% | 288 -11% |
| Brightness Distribution (%) | 88 | 93 6% | 89 1% | 91 3% | 88 0% | 86 -2% |
| Black Level * (cd/m²) | 0.23 | 0.5 -117% | 0.2 13% | 0.37 -61% | 0.3 -30% | 0.19 17% |
| Contrast (:1) | 1501 | 986 -34% | 1590 6% | 1168 -22% | 1157 -23% | 1511 1% |
| Colorchecker dE 2000 * | 3.22 | 3.57 -11% | 1.33 59% | 4.76 -48% | 5.89 -83% | 5.46 -70% |
| Colorchecker dE 2000 max. * | 5.68 | 7.03 -24% | 4.42 22% | 8.59 -51% | 19.26 -239% | 20.36 -258% |
| Colorchecker dE 2000 calibrated * | 0.93 | 0.68 27% | 0.94 -1% | 1.18 -27% | 4.3 -362% | 3.52 -278% |
| Greyscale dE 2000 * | 4.5 | 3.7 18% | 1.9 58% | 6.2 -38% | 4.27 5% | 4.8 -7% |
| Gamma | 2.1 105% | 2.16 102% | 2.187 101% | 2.079 106% | 2.47 89% | 2.108 104% |
| CCT | 7041 92% | 5876 111% | 6678 97% | 6690 97% | 7158 91% | 6442 101% |
| Total Average (Program / Settings) | 32% /
13% | 14% /
14% | 17% /
-3% | -17% /
-51% | -23% /
-48% |
* ... smaller is better

Display Response Times
| ↔ Response Time Black to White | ||
|---|---|---|
| 29.3 ms ... rise ↗ and fall ↘ combined | ↗ 14.2 ms rise | 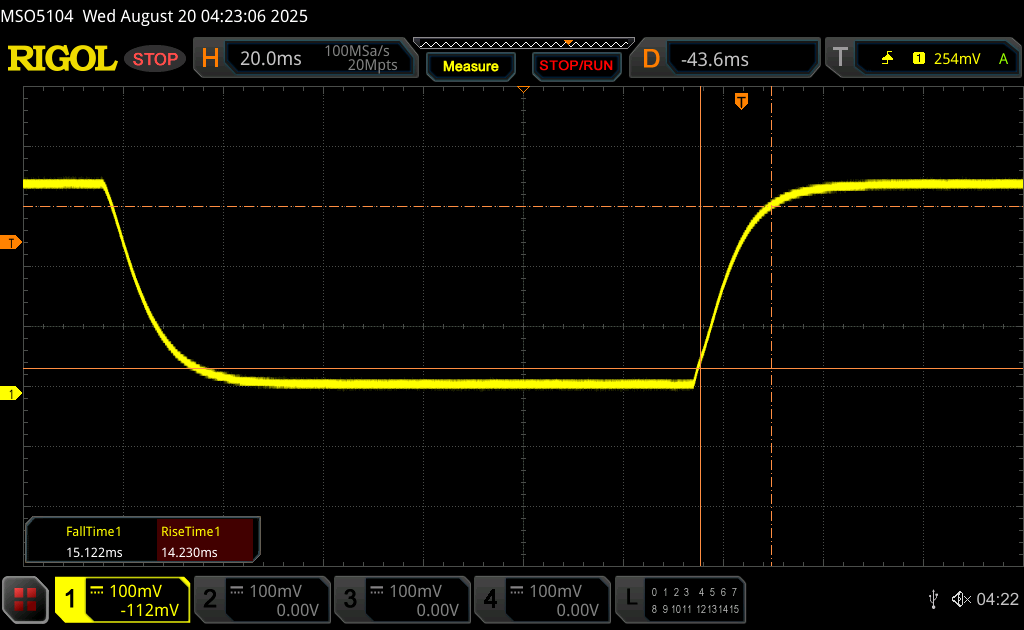 |
| ↘ 15.1 ms fall | ||
| The screen shows relatively slow response rates in our tests and may be too slow for gamers. In comparison, all tested devices range from 0.1 (minimum) to 240 (maximum) ms. » 79 % of all devices are better. This means that the measured response time is worse than the average of all tested devices (19.8 ms). | ||
| ↔ Response Time 50% Grey to 80% Grey | ||
| 49.5 ms ... rise ↗ and fall ↘ combined | ↗ 23.1 ms rise | 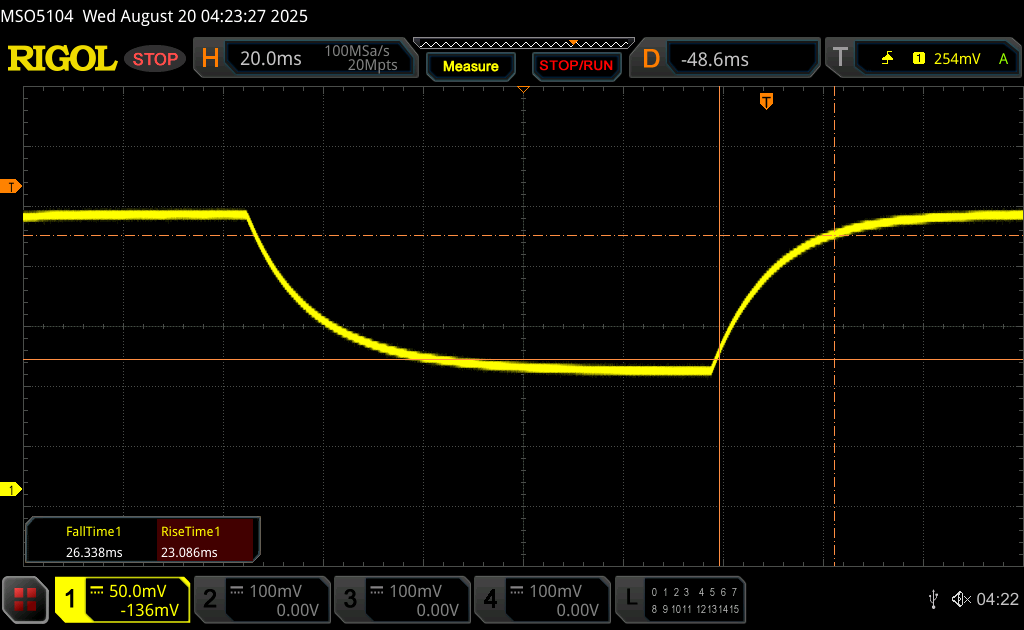 |
| ↘ 26.4 ms fall | ||
| The screen shows slow response rates in our tests and will be unsatisfactory for gamers. In comparison, all tested devices range from 0.165 (minimum) to 636 (maximum) ms. » 85 % of all devices are better. This means that the measured response time is worse than the average of all tested devices (31 ms). | ||
Screen Flickering / PWM (Pulse-Width Modulation)
| Screen flickering / PWM not detected | 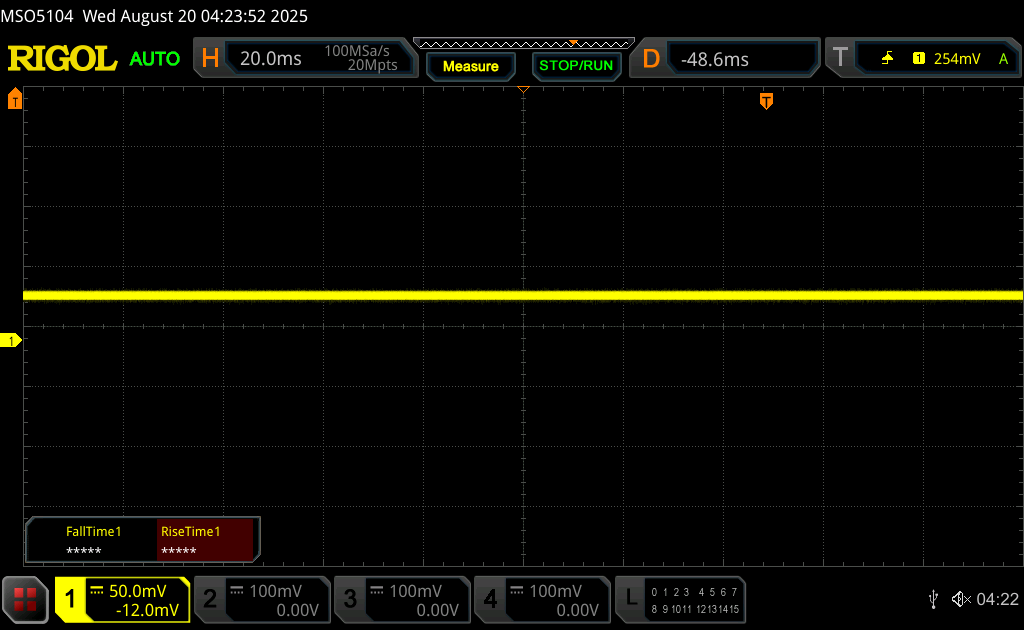 | ||
In comparison: 52 % of all tested devices do not use PWM to dim the display. If PWM was detected, an average of 7765 (minimum: 5 - maximum: 343500) Hz was measured. | |||
性能
测试条件
在运行以下基准测试之前,我们将 Windows 和 Alienware Command Center 都设置为性能模式。
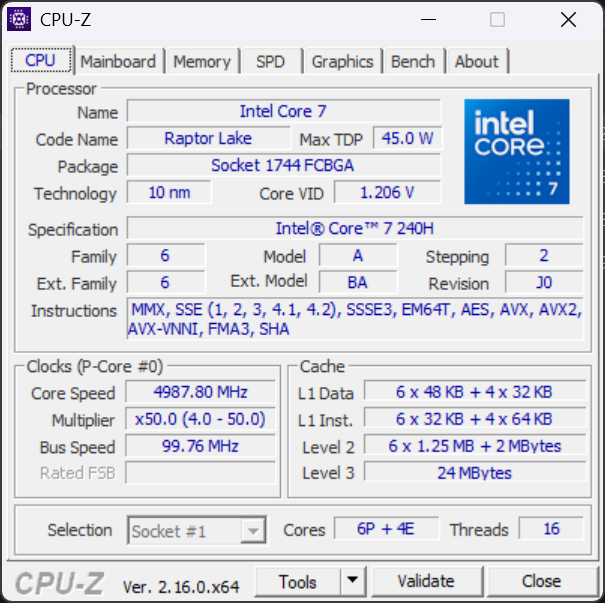
处理器
从 Core Ultra 9 275HX降至 酷睿 7 240H多线程性能大幅下降近 55%。原始性能比多年前的 酷睿 i7-12700H.
Cinebench R15 多回路运行
Cinebench R23: Multi Core | Single Core
Cinebench R20: CPU (Multi Core) | CPU (Single Core)
Cinebench R15: CPU Multi 64Bit | CPU Single 64Bit
Blender: v2.79 BMW27 CPU
7-Zip 18.03: 7z b 4 | 7z b 4 -mmt1
Geekbench 6.7: Multi-Core | Single-Core
Geekbench 5.5: Multi-Core | Single-Core
HWBOT x265 Benchmark v2.2: 4k Preset
LibreOffice : 20 Documents To PDF
R Benchmark 2.5: Overall mean
* ... smaller is better
AIDA64: FP32 Ray-Trace | FPU Julia | CPU SHA3 | CPU Queen | FPU SinJulia | FPU Mandel | CPU AES | CPU ZLib | FP64 Ray-Trace | CPU PhotoWorxx
| Performance rating | |
| Alienware 16X Aurora, RTX 5070 | |
| Asus TUF Gaming A16 FA608WV | |
| Lenovo LOQ 15AHP10 | |
| HP Victus 16 (2024) | |
| Alienware 16 Aurora | |
| Average Intel Core 7 240H | |
| Gigabyte Gaming A16 GA6H | |
| AIDA64 / FP32 Ray-Trace | |
| Asus TUF Gaming A16 FA608WV | |
| Alienware 16X Aurora, RTX 5070 | |
| Lenovo LOQ 15AHP10 | |
| HP Victus 16 (2024) | |
| Alienware 16 Aurora | |
| Average Intel Core 7 240H (11867 - 15972, n=5) | |
| Gigabyte Gaming A16 GA6H | |
| AIDA64 / FPU Julia | |
| Alienware 16X Aurora, RTX 5070 | |
| Asus TUF Gaming A16 FA608WV | |
| Lenovo LOQ 15AHP10 | |
| HP Victus 16 (2024) | |
| Alienware 16 Aurora | |
| Average Intel Core 7 240H (59260 - 80238, n=5) | |
| Gigabyte Gaming A16 GA6H | |
| AIDA64 / CPU SHA3 | |
| Alienware 16X Aurora, RTX 5070 | |
| Asus TUF Gaming A16 FA608WV | |
| Lenovo LOQ 15AHP10 | |
| HP Victus 16 (2024) | |
| Alienware 16 Aurora | |
| Average Intel Core 7 240H (2455 - 3287, n=5) | |
| Gigabyte Gaming A16 GA6H | |
| AIDA64 / CPU Queen | |
| Alienware 16X Aurora, RTX 5070 | |
| HP Victus 16 (2024) | |
| Lenovo LOQ 15AHP10 | |
| Asus TUF Gaming A16 FA608WV | |
| Alienware 16 Aurora | |
| Average Intel Core 7 240H (75356 - 86602, n=3) | |
| Gigabyte Gaming A16 GA6H | |
| AIDA64 / FPU SinJulia | |
| Asus TUF Gaming A16 FA608WV | |
| Lenovo LOQ 15AHP10 | |
| Alienware 16X Aurora, RTX 5070 | |
| HP Victus 16 (2024) | |
| Alienware 16 Aurora | |
| Average Intel Core 7 240H (7777 - 9366, n=5) | |
| Gigabyte Gaming A16 GA6H | |
| AIDA64 / FPU Mandel | |
| Alienware 16X Aurora, RTX 5070 | |
| Asus TUF Gaming A16 FA608WV | |
| Lenovo LOQ 15AHP10 | |
| HP Victus 16 (2024) | |
| Alienware 16 Aurora | |
| Average Intel Core 7 240H (29381 - 39967, n=5) | |
| Gigabyte Gaming A16 GA6H | |
| AIDA64 / CPU AES | |
| Alienware 16X Aurora, RTX 5070 | |
| HP Victus 16 (2024) | |
| Asus TUF Gaming A16 FA608WV | |
| Lenovo LOQ 15AHP10 | |
| Alienware 16 Aurora | |
| Average Intel Core 7 240H (50528 - 67855, n=5) | |
| Gigabyte Gaming A16 GA6H | |
| AIDA64 / CPU ZLib | |
| Alienware 16X Aurora, RTX 5070 | |
| Asus TUF Gaming A16 FA608WV | |
| HP Victus 16 (2024) | |
| Lenovo LOQ 15AHP10 | |
| Alienware 16 Aurora | |
| Average Intel Core 7 240H (725 - 951, n=5) | |
| Gigabyte Gaming A16 GA6H | |
| AIDA64 / FP64 Ray-Trace | |
| Asus TUF Gaming A16 FA608WV | |
| Alienware 16X Aurora, RTX 5070 | |
| Lenovo LOQ 15AHP10 | |
| HP Victus 16 (2024) | |
| Alienware 16 Aurora | |
| Average Intel Core 7 240H (6389 - 8569, n=5) | |
| Gigabyte Gaming A16 GA6H | |
| AIDA64 / CPU PhotoWorxx | |
| Alienware 16X Aurora, RTX 5070 | |
| Alienware 16 Aurora | |
| HP Victus 16 (2024) | |
| Average Intel Core 7 240H (21710 - 44874, n=5) | |
| Asus TUF Gaming A16 FA608WV | |
| Lenovo LOQ 15AHP10 | |
| Gigabyte Gaming A16 GA6H | |
| AIDA64 / Memory Copy | |
| Asus TUF Gaming A16 FA608WV | |
| Alienware 16X Aurora, RTX 5070 | |
| HP Victus 16 (2024) | |
| Alienware 16 Aurora | |
| Average Intel Core 7 240H (34965 - 69215, n=5) | |
| Lenovo LOQ 15AHP10 | |
| Gigabyte Gaming A16 GA6H | |
| AIDA64 / Memory Read | |
| Asus TUF Gaming A16 FA608WV | |
| Alienware 16X Aurora, RTX 5070 | |
| HP Victus 16 (2024) | |
| Alienware 16 Aurora | |
| Average Intel Core 7 240H (39706 - 71870, n=5) | |
| Gigabyte Gaming A16 GA6H | |
| Lenovo LOQ 15AHP10 | |
| AIDA64 / Memory Write | |
| Asus TUF Gaming A16 FA608WV | |
| Alienware 16X Aurora, RTX 5070 | |
| HP Victus 16 (2024) | |
| Average Intel Core 7 240H (33560 - 80488, n=5) | |
| Alienware 16 Aurora | |
| Lenovo LOQ 15AHP10 | |
| Gigabyte Gaming A16 GA6H | |
| AIDA64 / Memory Latency | |
| Alienware 16X Aurora, RTX 5070 | |
| Asus TUF Gaming A16 FA608WV | |
| Alienware 16 Aurora | |
| Average Intel Core 7 240H (97.1 - 125.6, n=5) | |
| Gigabyte Gaming A16 GA6H | |
| Lenovo LOQ 15AHP10 | |
| HP Victus 16 (2024) | |
* ... smaller is better
压力测试
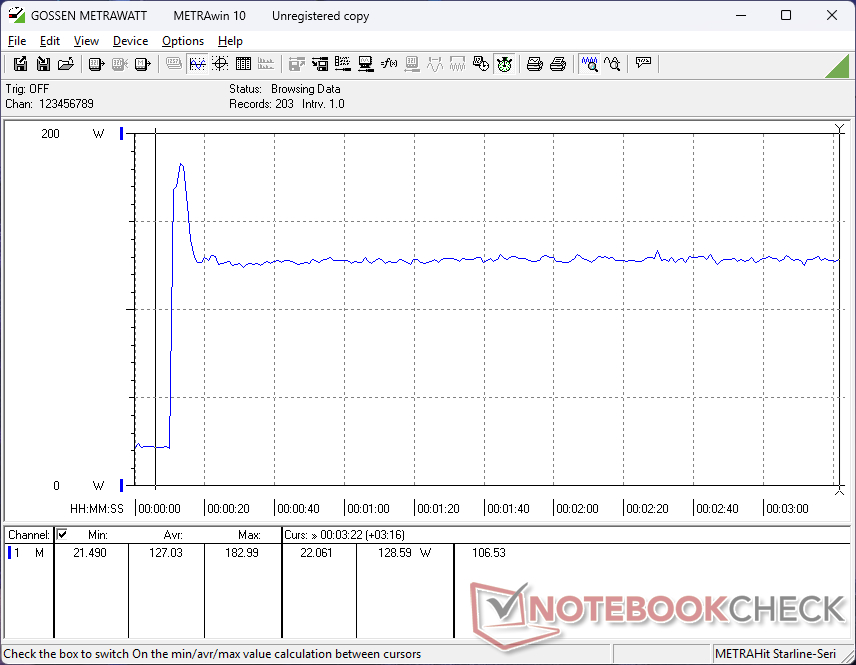
在启动 Prime95 压力模式时,CPU 会提升至 4.3 GHz 和 120 W,然后稳步降至 3.7 GHz 和 95 W。核心温度也会稳定在 100 C,因此尽管性能差距很大,CPU 运行时的温度并不比 16X Aurora 低。
在平衡模式、性能模式和超频模式下,运行《赛博朋克 2077》时 GPU 板的平均功耗分别为 31 W、58 W 和 51 W。性能模式和超频模式之间的差异似乎表明,超频模式并不一定能大幅提高性能,因为时钟频率仍然非常动态。
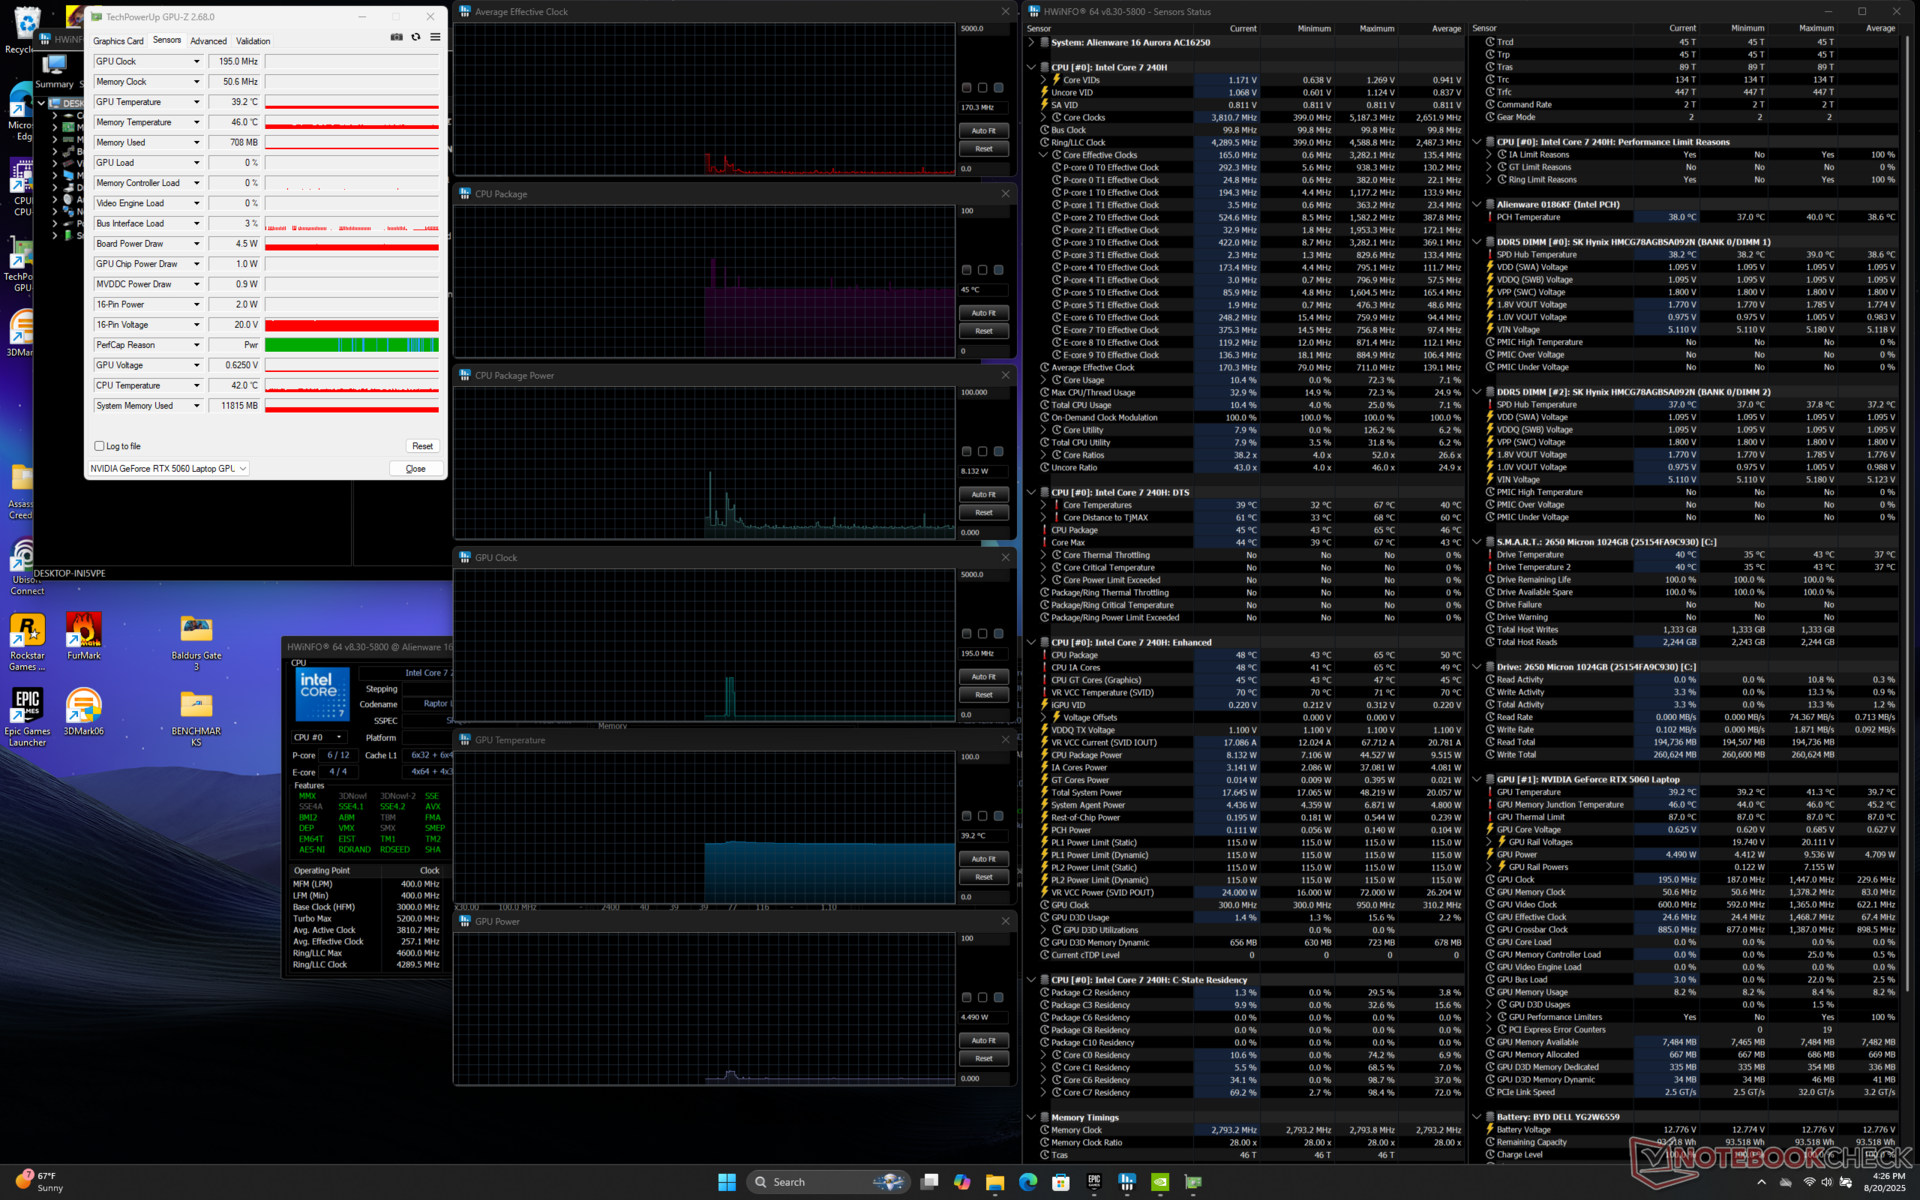
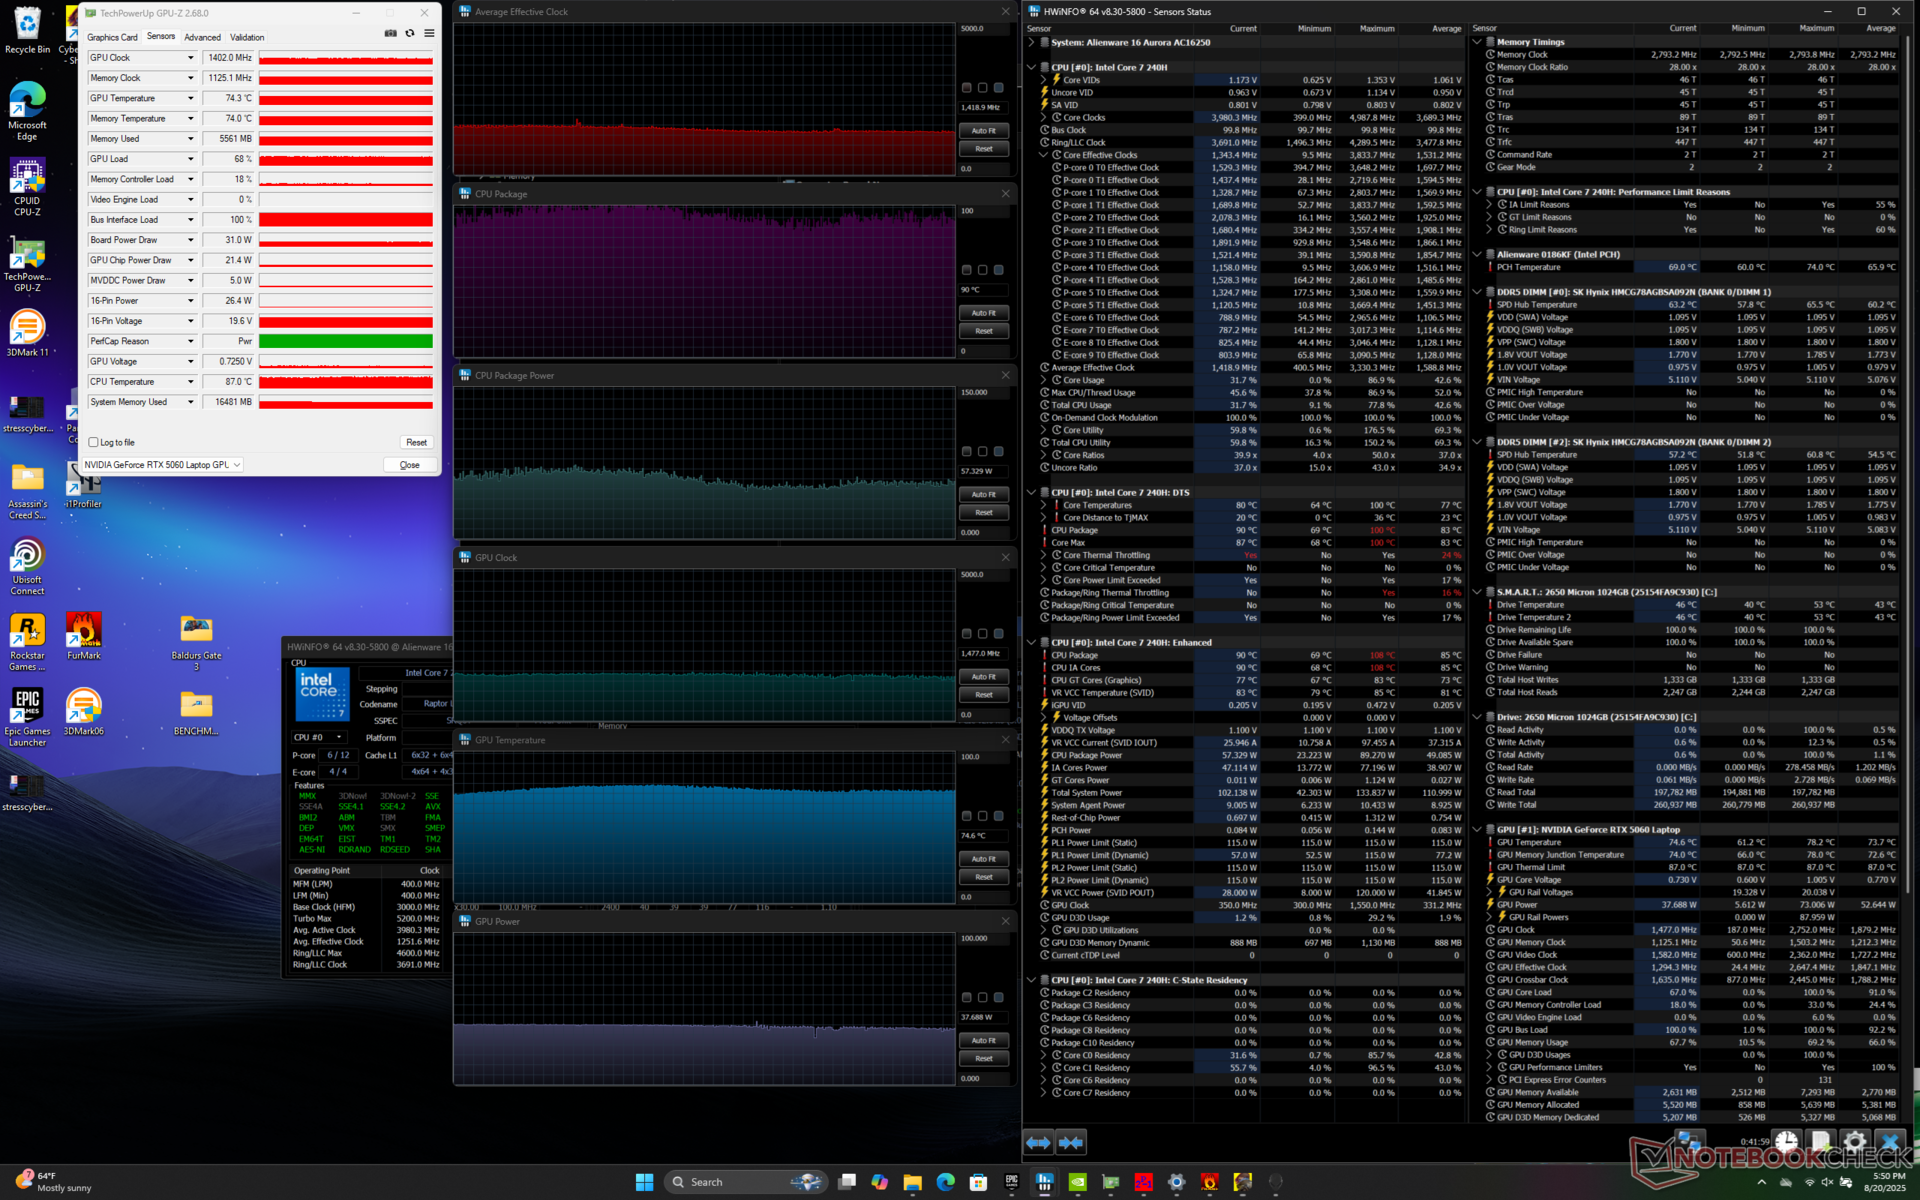
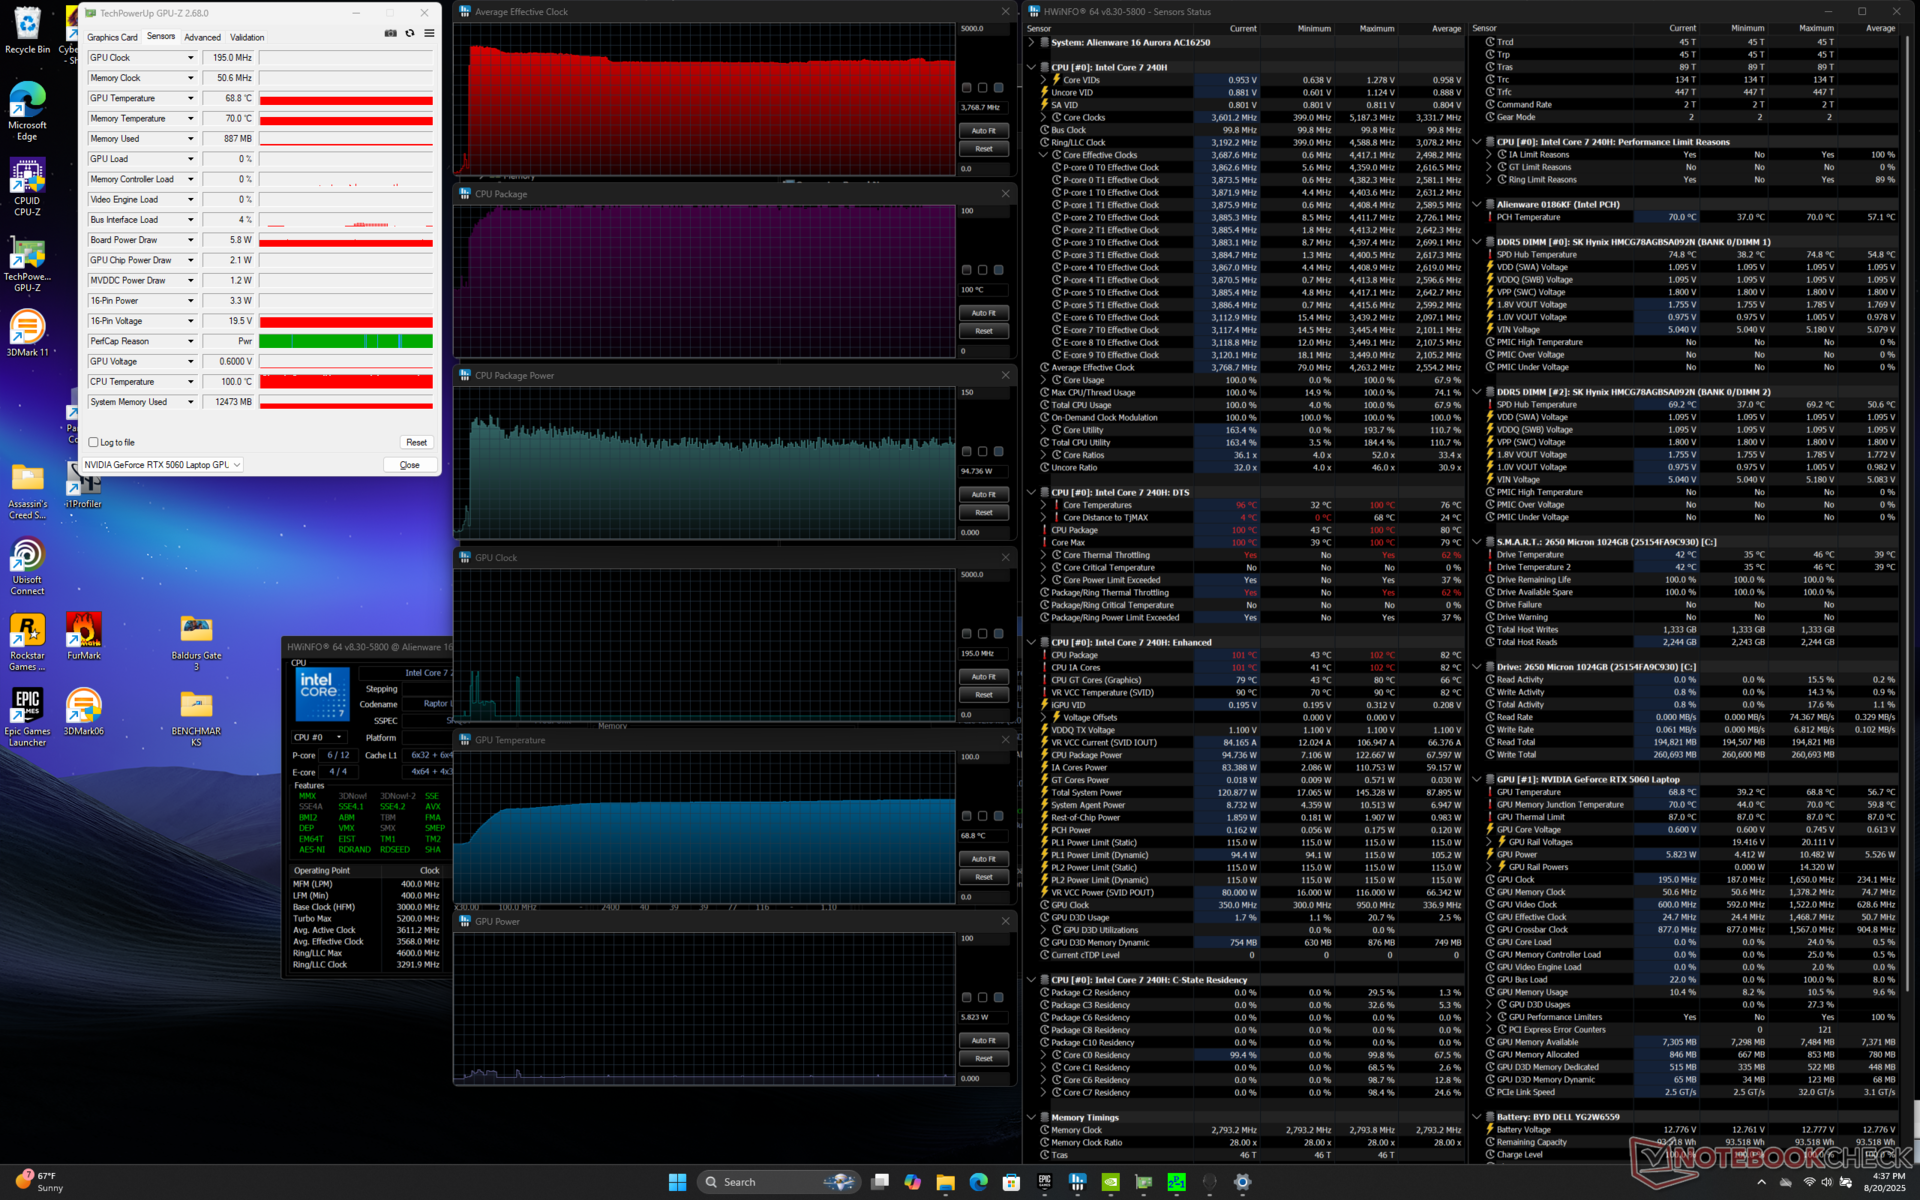
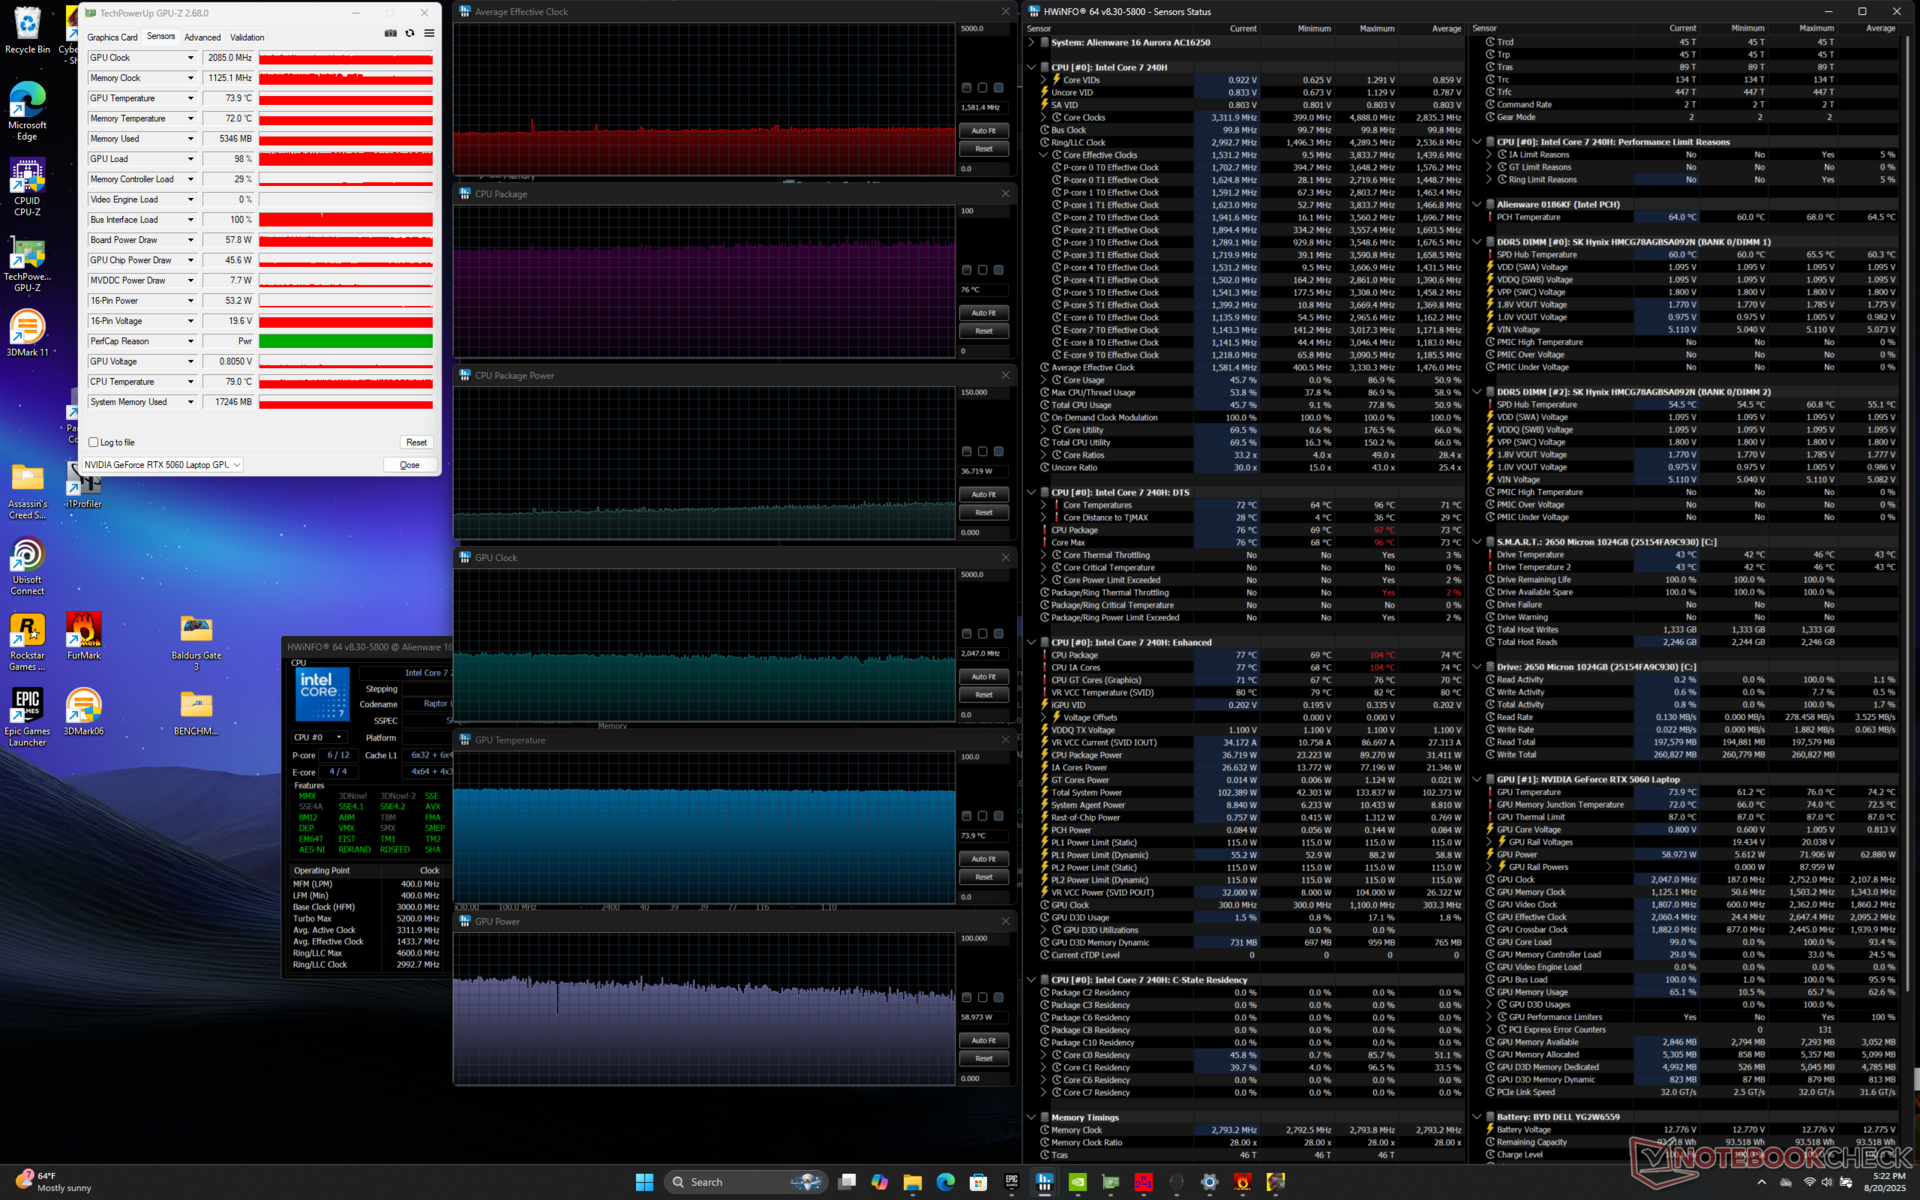
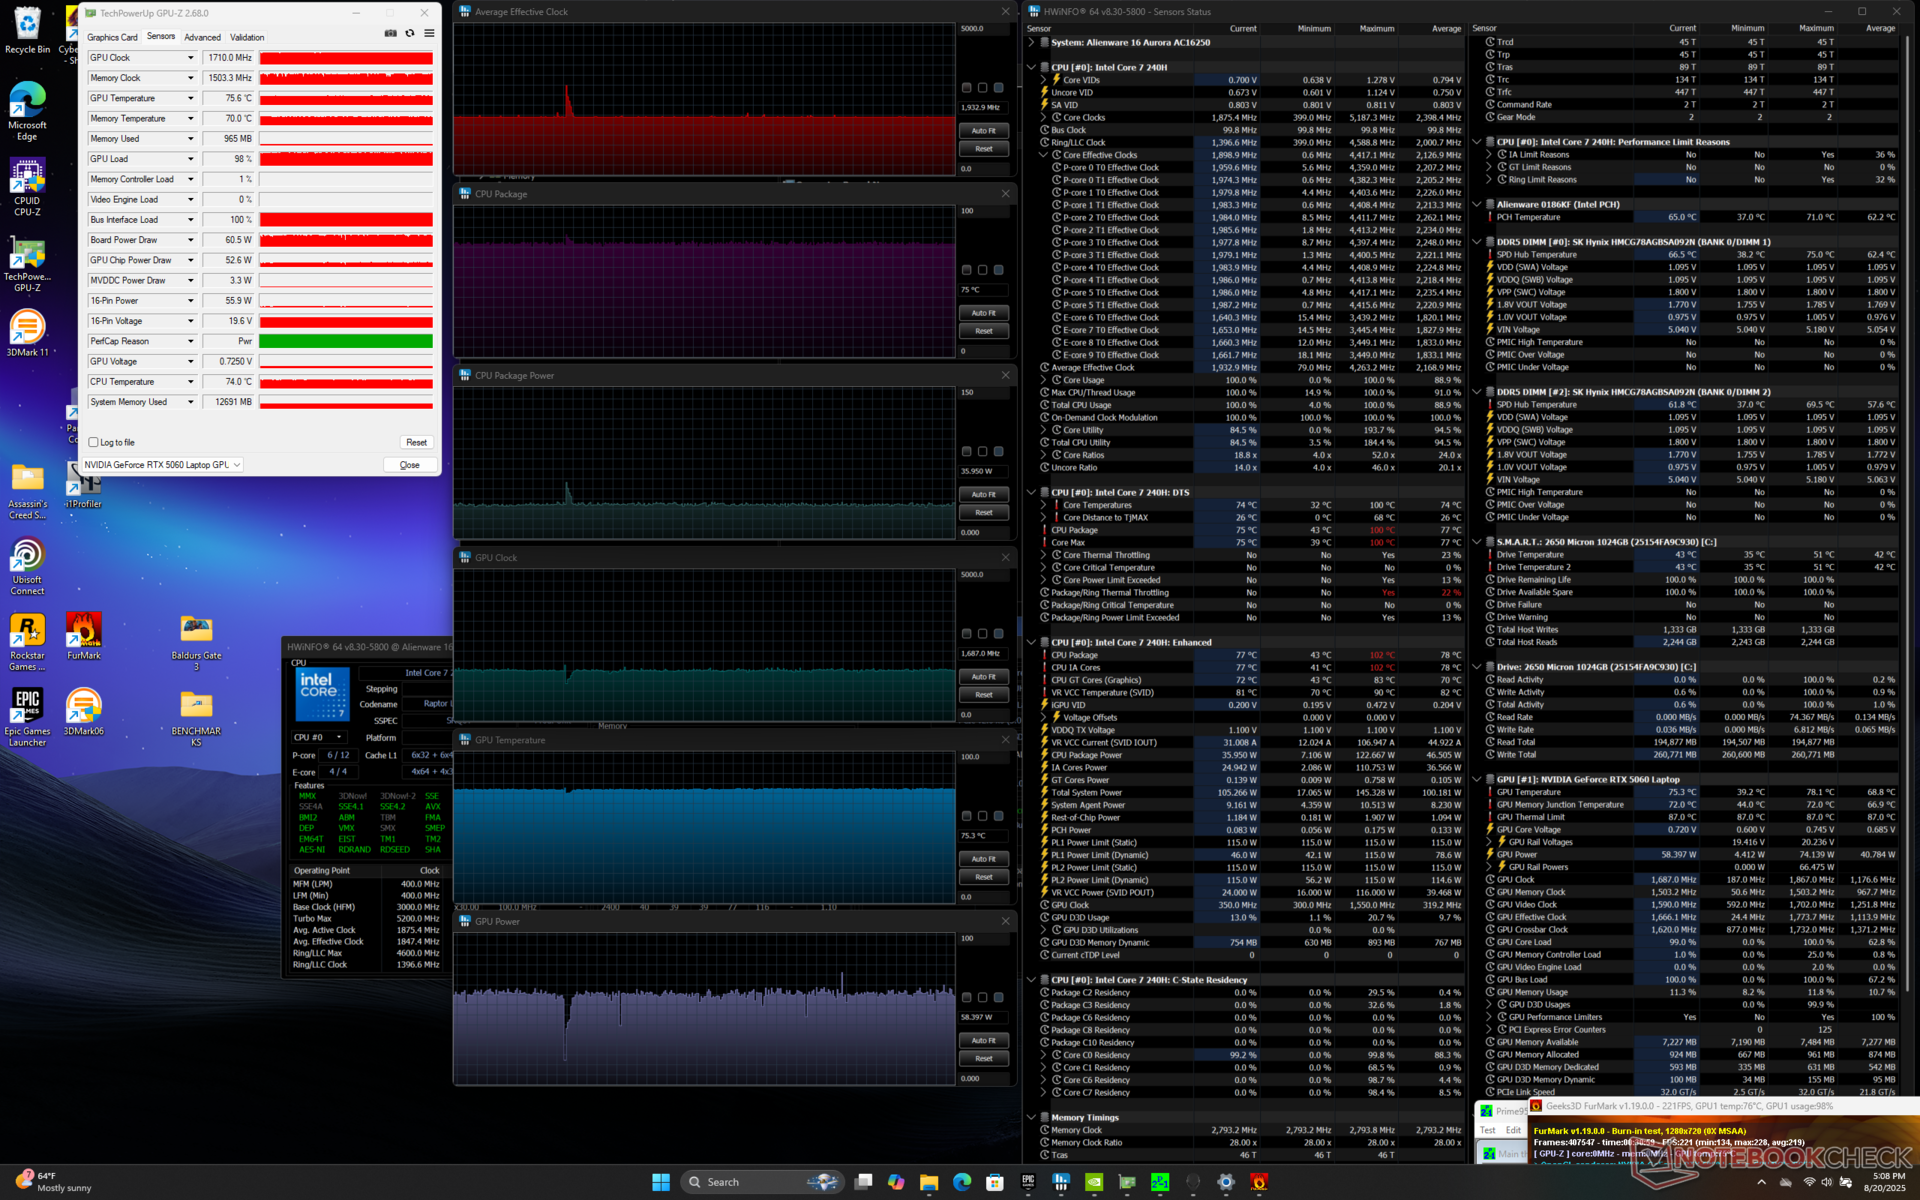
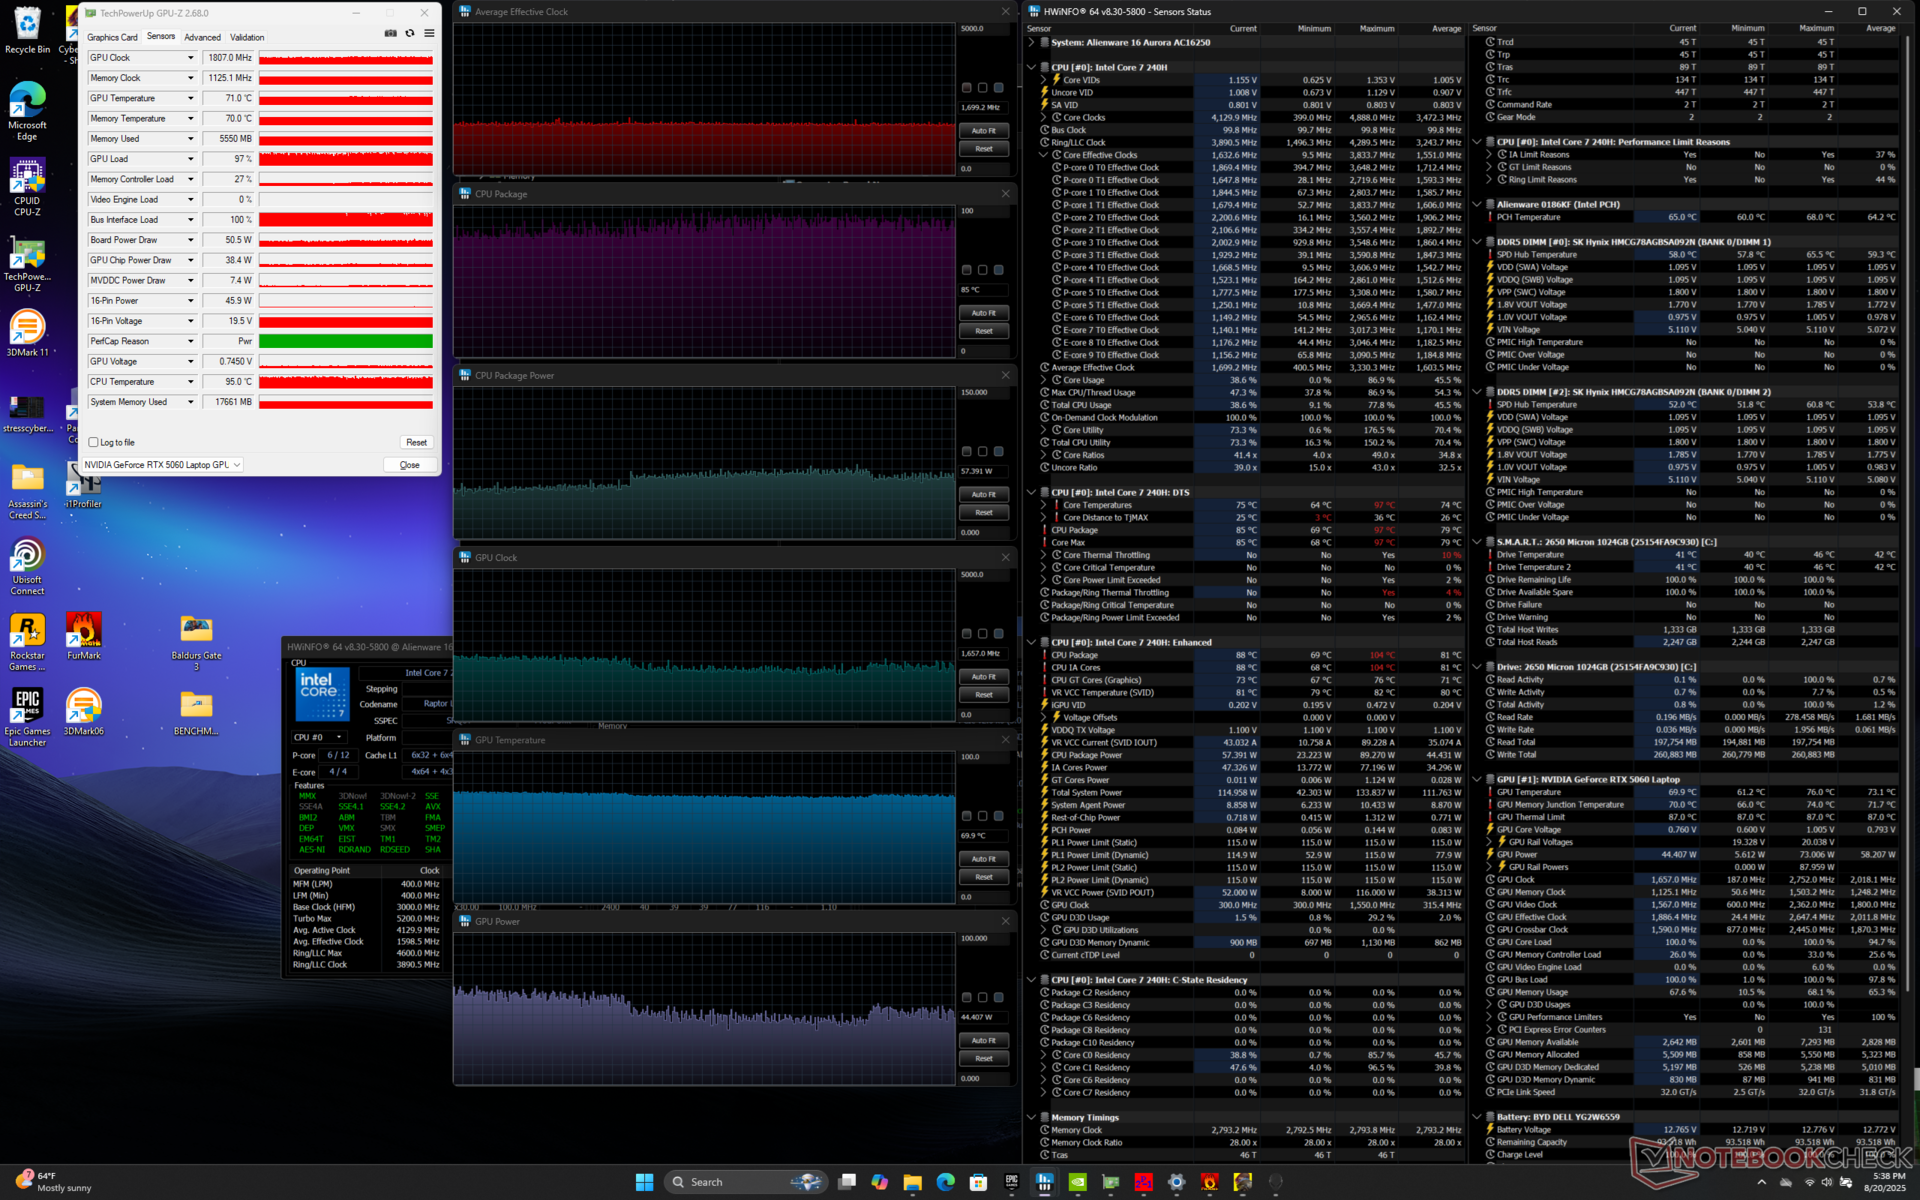
| 平均 CPU 时钟 (GHz) | GPU 时钟 (MHz) | 平均 CPU 温度 (°C) | 平均 GPU 温度 (°C) | |
| 系统闲置 | -- | -- | 45 | 39 |
| Prime95 压力 | 3.8 | -- | 100 | 69 |
| Prime95 + FurMark 压力 | 1.9 | 1710 | 75 | 75 |
| 赛博朋克 2077》压力(平衡模式) | 1.4 | 1402 | 90 | 75 |
| 赛博朋克2077压力(性能模式) | 1.6 | 2085 | 76 | 74 |
| 赛博朋克2077压力(涡轮增压模式) | 1.7 | 1807 | 85 | 70 |
图形处理器性能
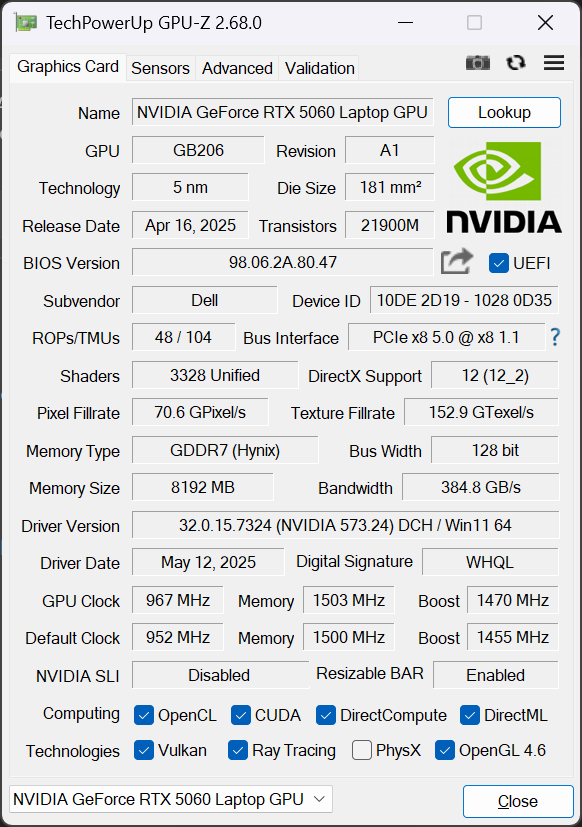
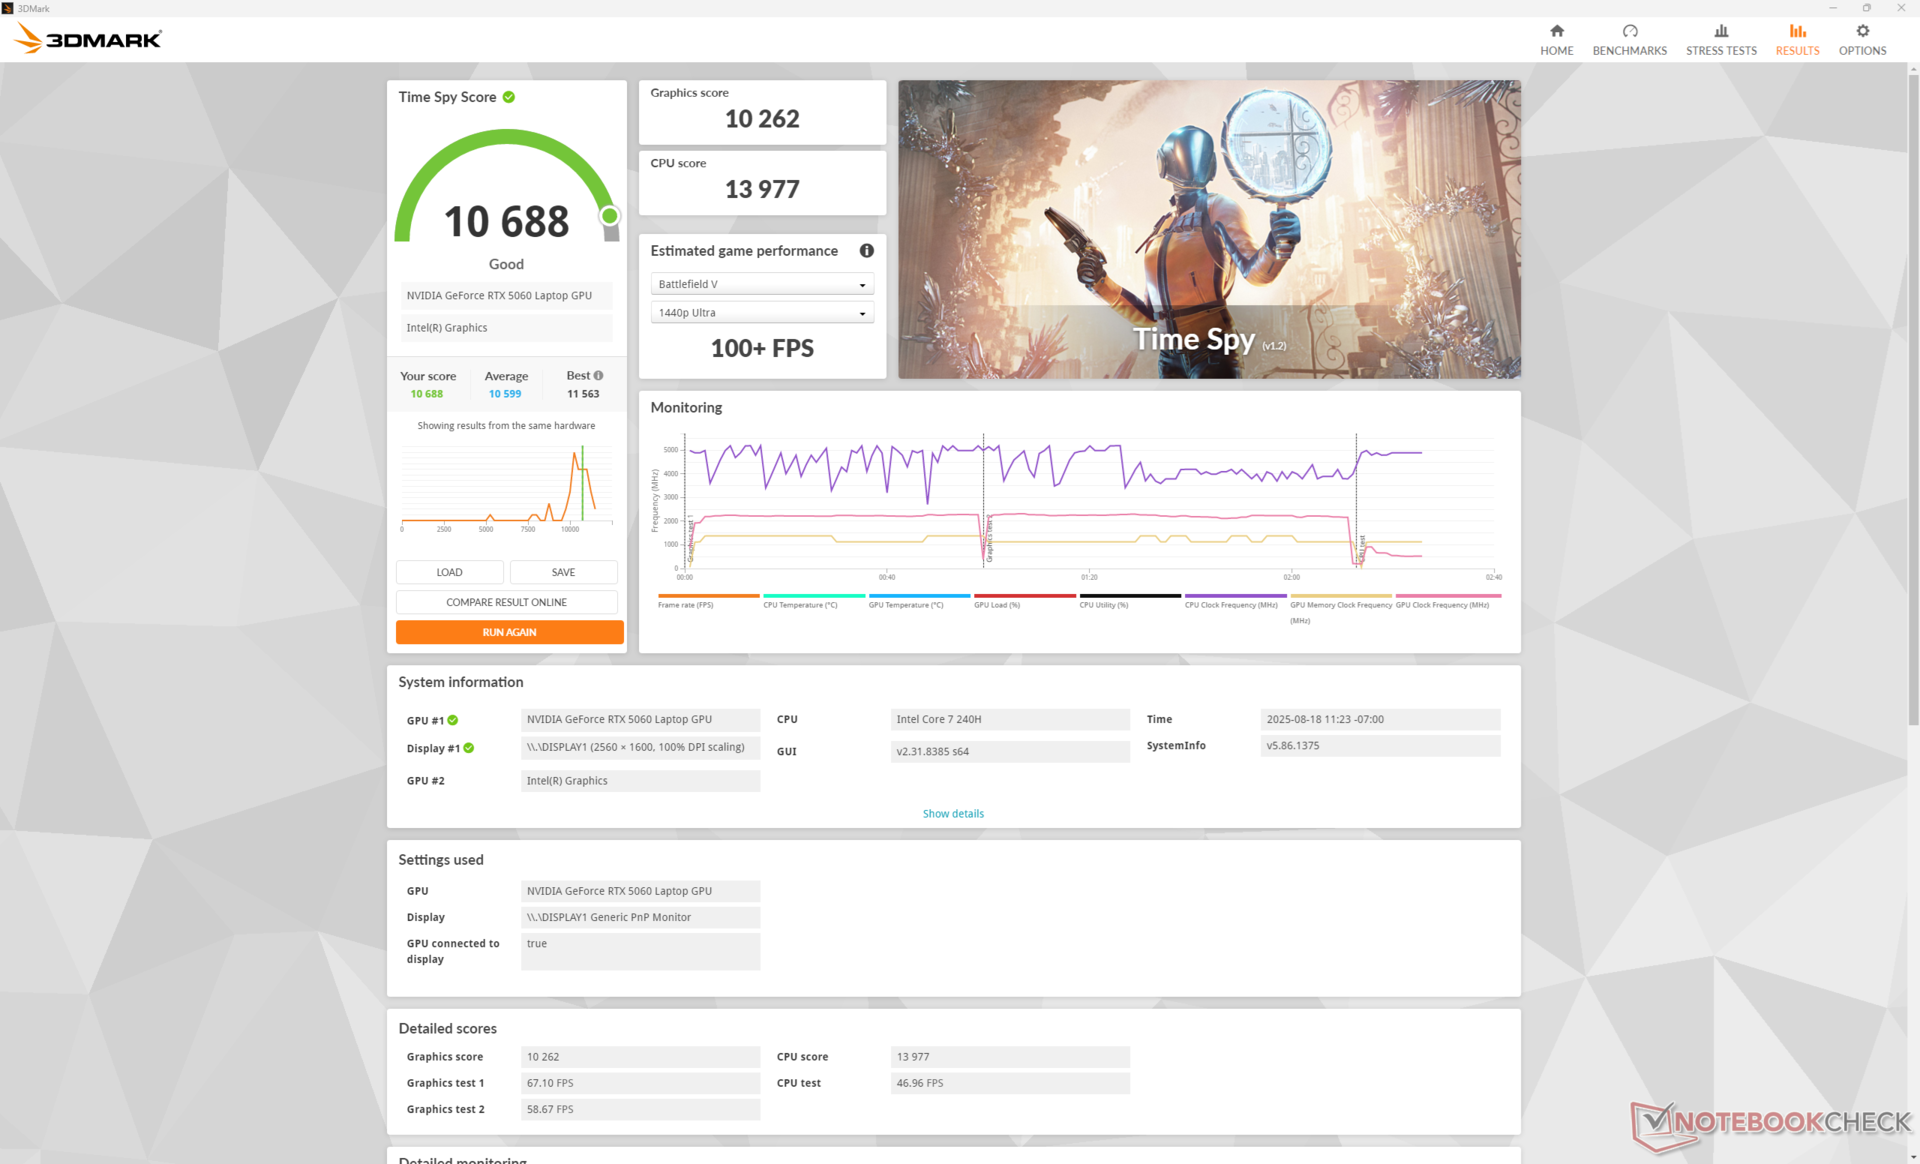
我们的 移动 RTX 5060要比 移动 RTX 5070慢约 20%至 30%。移动 RTX 5060 和 台式机 RTX 5060之间的性能差距也类似,最多为 30%。
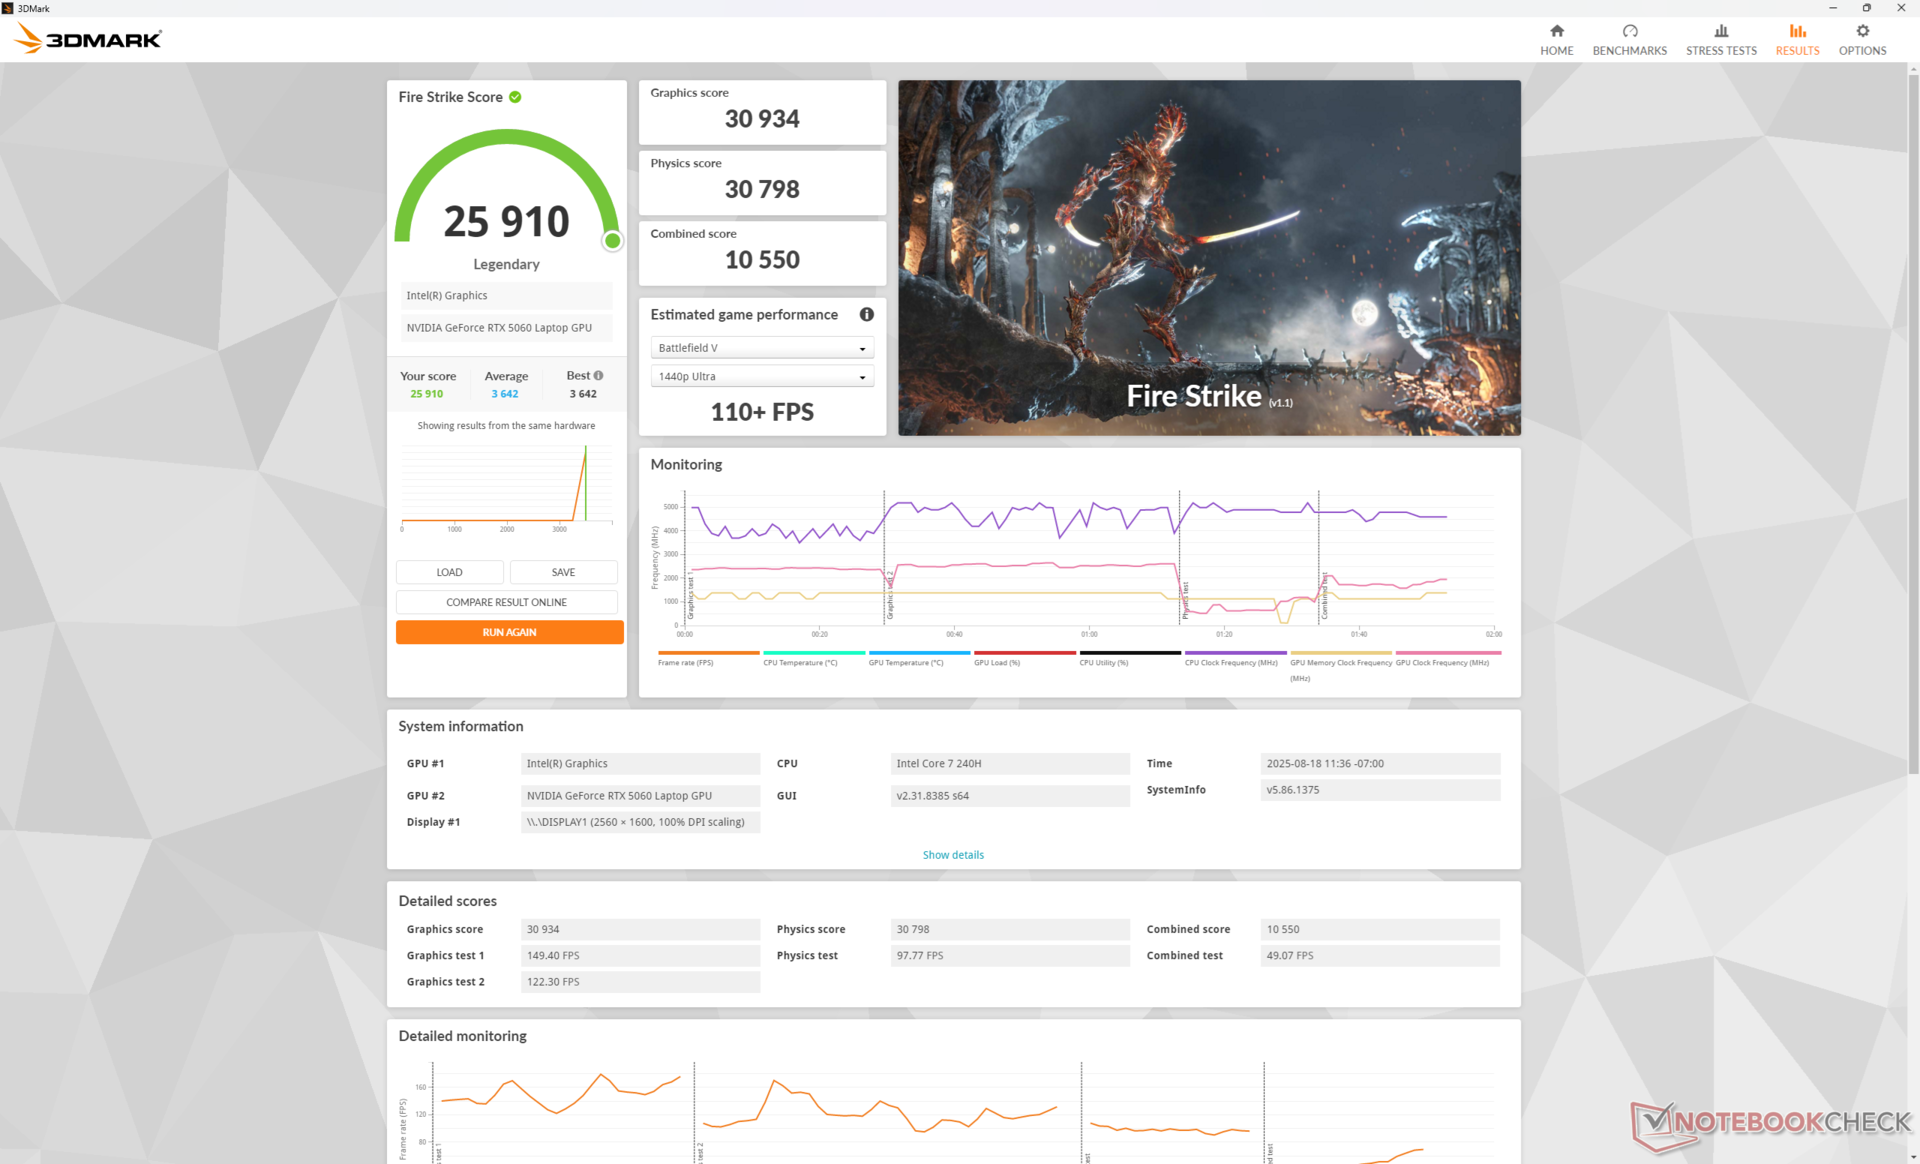
在超频模式下运行可能会略微提高图形性能,但会牺牲处理器性能,如下表Fire Strike 所示。
| 电源配置文件 | 图形分数 | 物理得分 | 综合得分 |
| 超速模式 | 30934 | 30798 | 10550 |
| 性能模式 | 29332 (-5%) | 32145 (+4%) | 8911 (-16%) |
| 平衡模式 | 28162 (-9%) | 31743 (+3%) | 9795 (-7%) |
| 电池电量 | 27155 (-12%) | 21692 (-30%) | 9020 (-15%) |
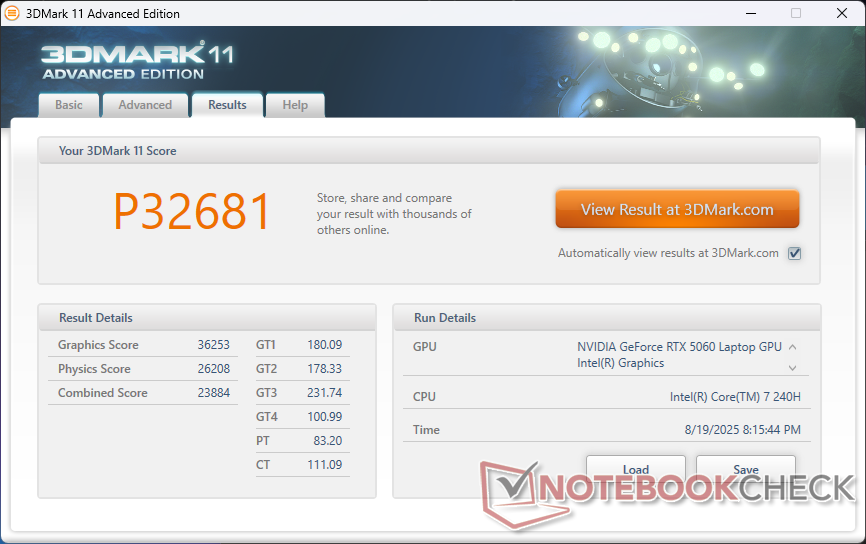
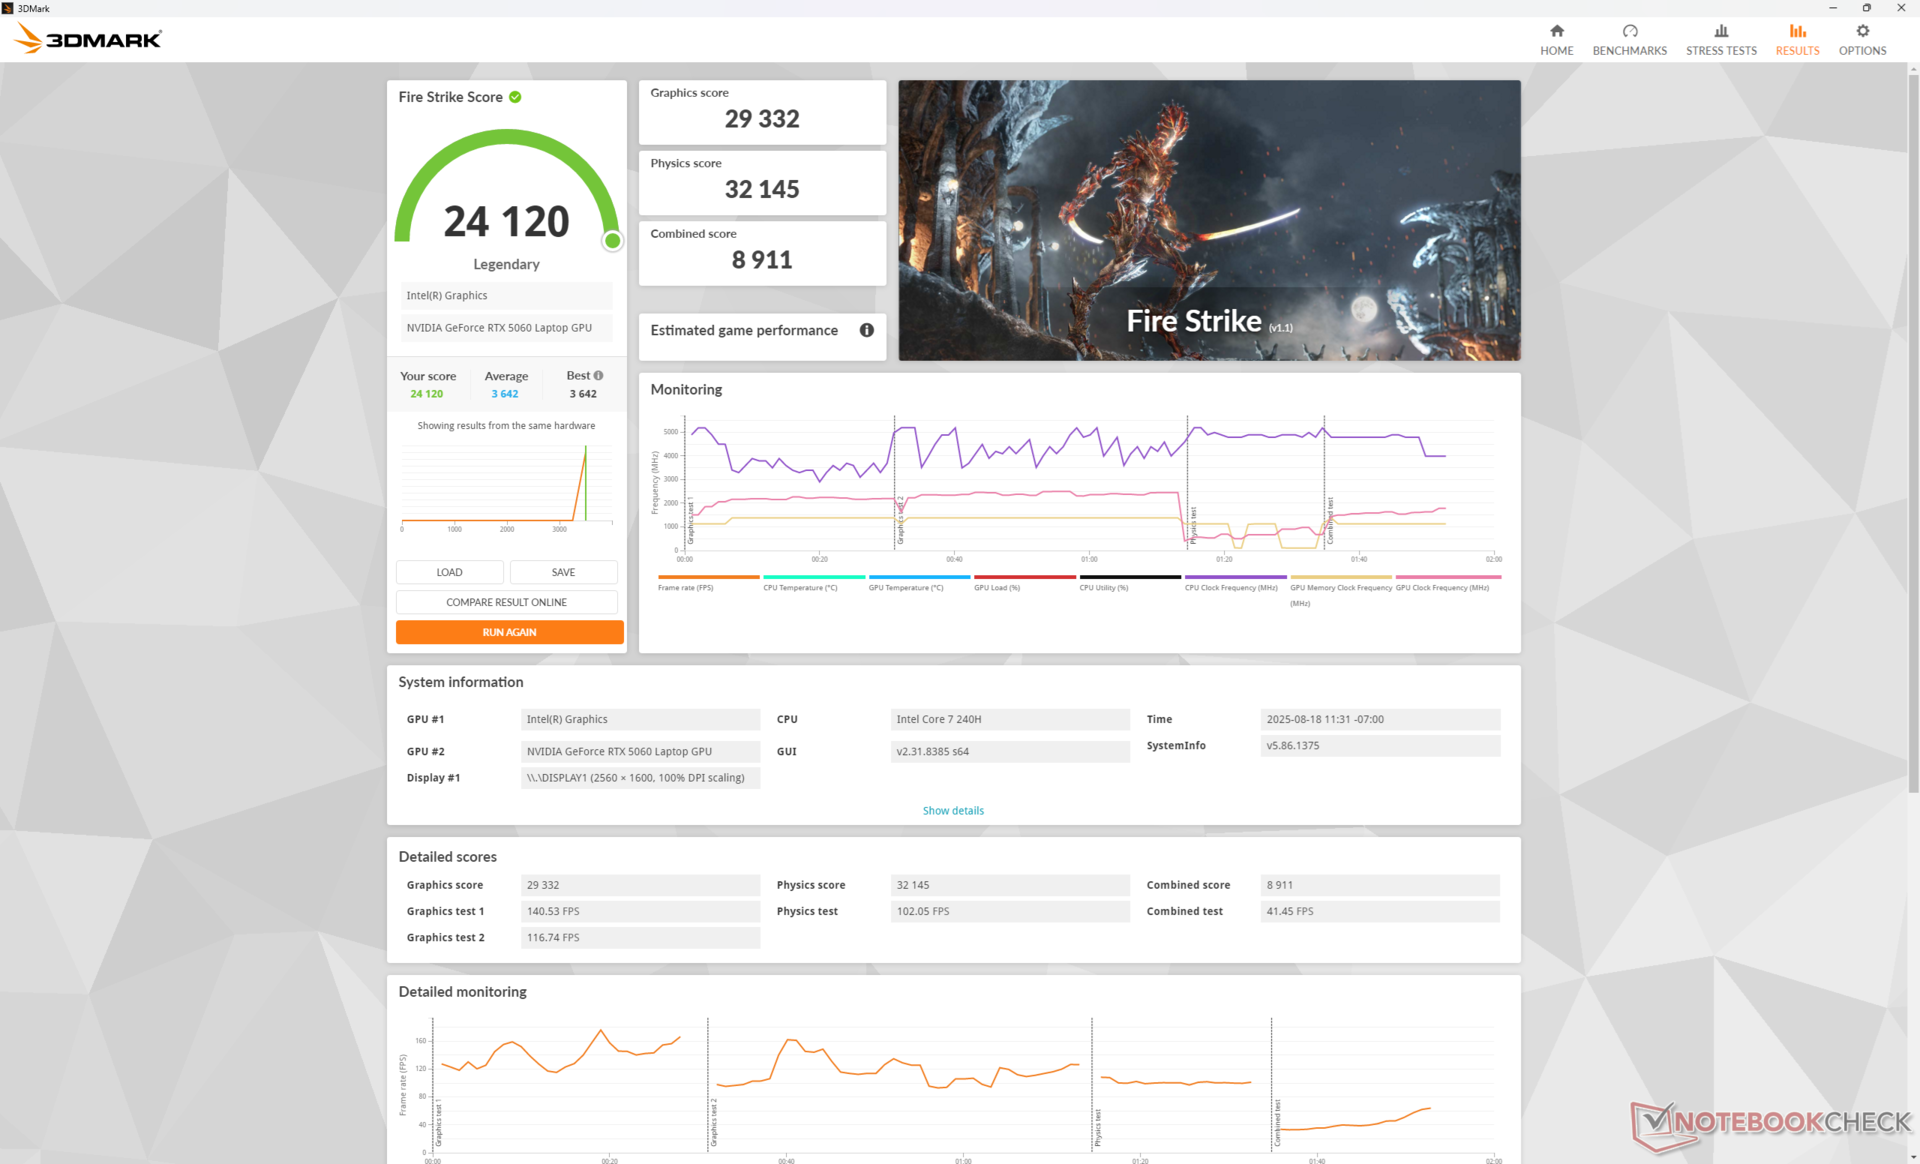
| 3DMark 11 Performance | 32681 points | |
| 3DMark Fire Strike Score | 24120 points | |
| 3DMark Time Spy Score | 10688 points | |
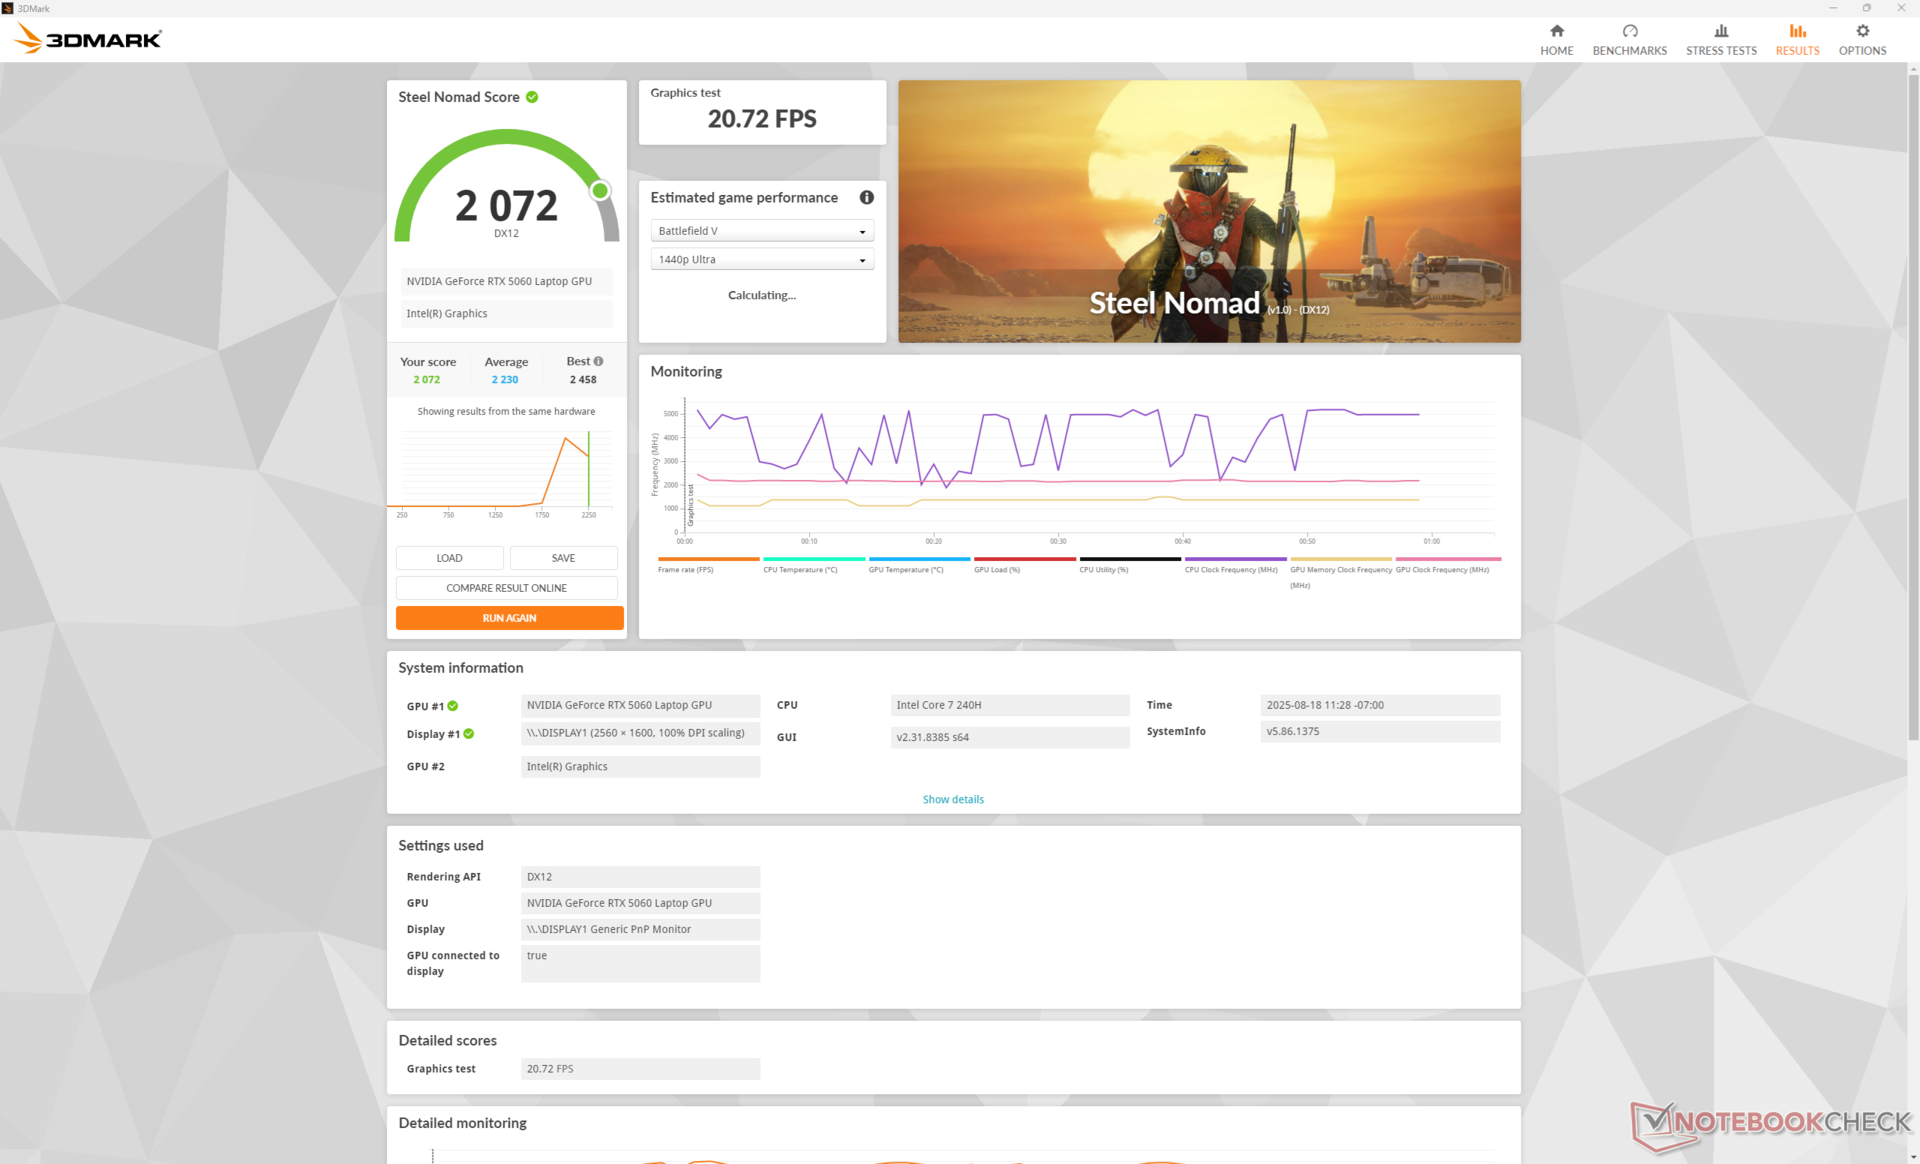
| 3DMark Steel Nomad Score | 2072 points | |
Help | ||
* ... smaller is better
游戏性能
如果玩要求更高的游戏,移动版GeForce RTX 5060 几乎只能用于高 1080p 或中等 1440p 游戏。例如,在《艾伦觉醒 2》中,在保持图形设置不变的情况下从 1080p 跳转到 1440p,帧率几乎会降低一半。如果在更高分辨率下进行游戏,则需要更大幅度地降低设置。
如果需要高图形设置,建议在 1080p 下使用 DLSS 和帧生成器。例如,在 1080p 高光线追踪设置下运行《艾伦觉醒 2》 ,平均帧数仅为 24。启用 DLSS 质量模式和 2 倍 FG 会将平均帧率提升至 76,尽管会有明显的输入延迟。如果您希望使用显示器的原生 2K 分辨率,则应将大部分设置保持在中等左右。
| Performance rating - Percent | |
| Alienware 16X Aurora, RTX 5070 | |
| Alienware 16 Aurora | |
| Gigabyte Gaming A16 GA6H | |
| Lenovo LOQ 15AHP10 | |
| HP Victus 16 (2024) -1! | |
| Asus TUF Gaming A16 FA608WV | |
| Cyberpunk 2077 - 1920x1080 Ultra Preset (FSR off) | |
| Alienware 16X Aurora, RTX 5070 | |
| Lenovo LOQ 15AHP10 | |
| Gigabyte Gaming A16 GA6H | |
| Alienware 16 Aurora | |
| Asus TUF Gaming A16 FA608WV | |
| HP Victus 16 (2024) | |
| Baldur's Gate 3 - 1920x1080 Ultra Preset AA:T | |
| Alienware 16X Aurora, RTX 5070 | |
| Alienware 16 Aurora | |
| Gigabyte Gaming A16 GA6H | |
| Lenovo LOQ 15AHP10 | |
| Asus TUF Gaming A16 FA608WV | |
| GTA V - 1920x1080 Highest AA:4xMSAA + FX AF:16x | |
| Alienware 16X Aurora, RTX 5070 | |
| Alienware 16 Aurora | |
| Asus TUF Gaming A16 FA608WV | |
| HP Victus 16 (2024) | |
| Lenovo LOQ 15AHP10 | |
| Gigabyte Gaming A16 GA6H | |
| Final Fantasy XV Benchmark - 1920x1080 High Quality | |
| Alienware 16X Aurora, RTX 5070 | |
| Lenovo LOQ 15AHP10 | |
| Alienware 16 Aurora | |
| Asus TUF Gaming A16 FA608WV | |
| HP Victus 16 (2024) | |
| Gigabyte Gaming A16 GA6H | |
| Strange Brigade - 1920x1080 ultra AA:ultra AF:16 | |
| Alienware 16X Aurora, RTX 5070 | |
| Lenovo LOQ 15AHP10 | |
| Gigabyte Gaming A16 GA6H | |
| Asus TUF Gaming A16 FA608WV | |
| Alienware 16 Aurora | |
| HP Victus 16 (2024) | |
| Dota 2 Reborn - 1920x1080 ultra (3/3) best looking | |
| Alienware 16X Aurora, RTX 5070 | |
| Alienware 16 Aurora | |
| HP Victus 16 (2024) | |
| Gigabyte Gaming A16 GA6H | |
| Asus TUF Gaming A16 FA608WV | |
| Lenovo LOQ 15AHP10 | |
| X-Plane 11.11 - 1920x1080 high (fps_test=3) | |
| Alienware 16X Aurora, RTX 5070 | |
| HP Victus 16 (2024) | |
| Gigabyte Gaming A16 GA6H | |
| Alienware 16 Aurora | |
| Lenovo LOQ 15AHP10 | |
| Asus TUF Gaming A16 FA608WV | |
| F1 24 | |
| 1920x1080 Ultra High Preset AA:T AF:16x | |
| Chuwi Gamebook, R9 9955HX | |
| Alienware 16X Aurora, RTX 5070 | |
| Zotac GeForce RTX 5060 AMP | |
| Average NVIDIA GeForce RTX 5060 Laptop (46.1 - 77.5, n=9) | |
| Alienware 16 Aurora | |
| 2560x1440 Ultra High Preset AA:T AF:16x | |
| Chuwi Gamebook, R9 9955HX | |
| Alienware 16X Aurora, RTX 5070 | |
| Zotac GeForce RTX 5060 AMP | |
| Average NVIDIA GeForce RTX 5060 Laptop (29.8 - 49.1, n=9) | |
| Alienware 16 Aurora | |
| 3840x2160 Ultra High Preset AA:T AF:16x | |
| Zotac GeForce RTX 5060 AMP | |
| Alienware 16X Aurora, RTX 5070 | |
| Alienware 16 Aurora | |
| Average NVIDIA GeForce RTX 5060 Laptop (n=1) | |
| 3840x2160 Ultra High Preset + Quality DLSS AF:16x | |
| Zotac GeForce RTX 5060 AMP | |
| Alienware 16X Aurora, RTX 5070 | |
| Alienware 16 Aurora | |
| Average NVIDIA GeForce RTX 5060 Laptop (n=1) | |
| 2560x1440 Ultra High Preset + Quality DLSS AF:16x | |
| Chuwi Gamebook, R9 9955HX | |
| Alienware 16X Aurora, RTX 5070 | |
| Zotac GeForce RTX 5060 AMP | |
| Average NVIDIA GeForce RTX 5060 Laptop (46 - 74.5, n=8) | |
| Alienware 16 Aurora | |
| Indiana Jones and the Great Circle | |
| 1920x1080 High Preset | |
| Chuwi Gamebook, R9 9955HX | |
| Zotac GeForce RTX 5060 AMP | |
| Average NVIDIA GeForce RTX 5060 Laptop (52.8 - 68.1, n=3) | |
| Alienware 16X Aurora, RTX 5070 | |
| Alienware 16 Aurora | |
| 1920x1080 Very Ultra Preset | |
| Chuwi Gamebook, R9 9955HX | |
| Zotac GeForce RTX 5060 AMP | |
| Alienware 16 Aurora | |
| Average NVIDIA GeForce RTX 5060 Laptop (6.3 - 15.6, n=3) | |
| Alienware 16X Aurora, RTX 5070 | |
| 2560x1440 Very Ultra Preset | |
| Chuwi Gamebook, R9 9955HX | |
| Alienware 16 Aurora | |
| Average NVIDIA GeForce RTX 5060 Laptop (4.2 - 10.1, n=3) | |
| Alienware 16X Aurora, RTX 5070 | |
| Zotac GeForce RTX 5060 AMP | |
| Monster Hunter Wilds | |
| 1920x1080 medium, no upscaling | |
| Chuwi Gamebook, R9 9955HX | |
| Alienware 16X Aurora, RTX 5070 | |
| Zotac GeForce RTX 5060 AMP | |
| Average NVIDIA GeForce RTX 5060 Laptop (45.2 - 68.3, n=4) | |
| Alienware 16 Aurora | |
| 1920x1080 ultra, RT: high, no upscaling | |
| Chuwi Gamebook, R9 9955HX | |
| Zotac GeForce RTX 5060 AMP | |
| Alienware 16X Aurora, RTX 5070 | |
| Alienware 16 Aurora | |
| Average NVIDIA GeForce RTX 5060 Laptop (16.6 - 36.5, n=4) | |
| 2560x1440 ultra, RT: high, no upscaling | |
| Chuwi Gamebook, R9 9955HX | |
| Alienware 16X Aurora, RTX 5070 | |
| Alienware 16 Aurora | |
| Average NVIDIA GeForce RTX 5060 Laptop (13.9 - 20.9, n=3) | |
赛博朋克 2077》超 FPS 图表
| low | med. | high | ultra | QHD DLSS | QHD | 4K DLSS | 4K | |
|---|---|---|---|---|---|---|---|---|
| GTA V (2015) | 186.8 | 186.2 | 179.7 | 120 | 96.7 | 90.2 | ||
| Dota 2 Reborn (2015) | 195.1 | 178.3 | 171.9 | 156.1 | 105.2 | |||
| Final Fantasy XV Benchmark (2018) | 212 | 142 | 109.5 | 79.1 | 45 | |||
| X-Plane 11.11 (2018) | 125.4 | 105.2 | 93.6 | 62.9 | ||||
| Strange Brigade (2018) | 356 | 260 | 219 | 191.1 | 133.7 | 72.8 | ||
| Baldur's Gate 3 (2023) | 135.9 | 117 | 106 | 105.3 | 101.3 | 70.2 | 56.5 | 34.8 |
| Cyberpunk 2077 (2023) | 123.9 | 104.3 | 86.7 | 80.1 | 58.9 | 48.5 | 21.5 | |
| Alan Wake 2 (2023) | 66.2 | 59.1 | 54.6 | 31.2 | 12.1 | |||
| F1 24 (2024) | 181.2 | 176.8 | 154.3 | 46.1 | 46 | 29.8 | 9.21 | 10.7 |
| Black Myth: Wukong (2024) | 83 | 63 | 48 | 26 | 30 | 19 | 9 | |
| Indiana Jones and the Great Circle (2024) | 102.1 | 54.9 | 14.1 | 10.1 | 5.3 | |||
| Monster Hunter Wilds (2025) | 49.4 | 45.2 | 33.5 | 17.8 | 10.6 | |||
| Assassin's Creed Shadows (2025) | 50 | 47 | 45 | 31 | 24 | 26 | 14 |
排放量
系统噪音
在平衡模式、性能模式和超频模式下,运行《赛博朋克 2077》时的风扇噪音分别稳定在 46.8 dB(A)、49.9 dB(A) 和 55.6 dB(A)。与我们在 16X Aurora 上观察到的水平接近。
Noise level
| Idle |
| 24 / 25.6 / 25.6 dB(A) |
| Load |
| 46.8 / 55.6 dB(A) |
 | ||
30 dB silent 40 dB(A) audible 50 dB(A) loud |
||
min: | ||
| Alienware 16 Aurora GeForce RTX 5060 Laptop, Core 7 240H | Alienware 16X Aurora, RTX 5070 GeForce RTX 5070 Laptop, Ultra 9 275HX | Lenovo LOQ 15AHP10 GeForce RTX 5060 Laptop, R7 250, Micron 2500 1TB MTFDKBA1T0QGN | Gigabyte Gaming A16 GA6H GeForce RTX 5070 Laptop, i7-13620H, Kingston OM8PGP41024Q-A0 | Asus TUF Gaming A16 FA608WV GeForce RTX 4060 Laptop GPU, Ryzen AI 9 HX 370, Micron 2400 MTFDKBA1T0QFM | HP Victus 16 (2024) GeForce RTX 4060 Laptop GPU, i7-14700HX, Kioxia XG8 KXG80ZNV512G | |
|---|---|---|---|---|---|---|
| Noise | 5% | -37% | -5% | 13% | -8% | |
| off / environment * (dB) | 22.9 | 23.7 -3% | 25 -9% | 24 -5% | 23 -0% | 25 -9% |
| Idle Minimum * (dB) | 24 | 23.9 -0% | 43 -79% | 25 -4% | 23 4% | 28 -17% |
| Idle Average * (dB) | 25.6 | 23.9 7% | 45 -76% | 26 -2% | 23 10% | 29 -13% |
| Idle Maximum * (dB) | 25.6 | 26.1 -2% | 48 -88% | 27 -5% | 29.11 -14% | 33 -29% |
| Load Average * (dB) | 46.8 | 26.8 43% | 53 -13% | 54 -15% | 31 34% | 45 4% |
| Cyberpunk 2077 ultra * (dB) | 49.9 | 51.8 -4% | 51 -2% | 54 -8% | 36.23 27% | |
| Load Maximum * (dB) | 55.6 | 58 -4% | 53 5% | 55 1% | 39.44 29% | 48 14% |
| Witcher 3 ultra * (dB) | 43 |
* ... smaller is better
能源管理
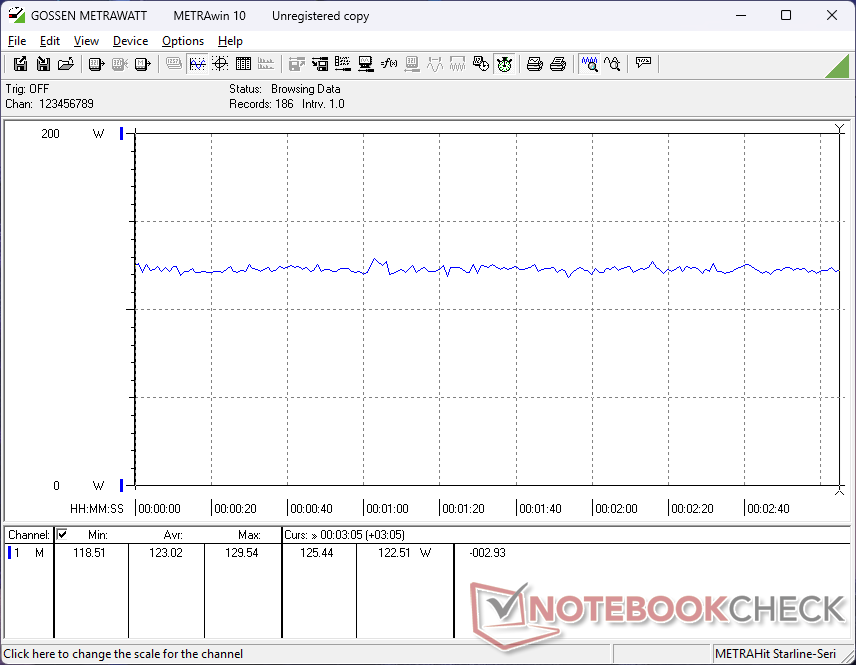
耗电量
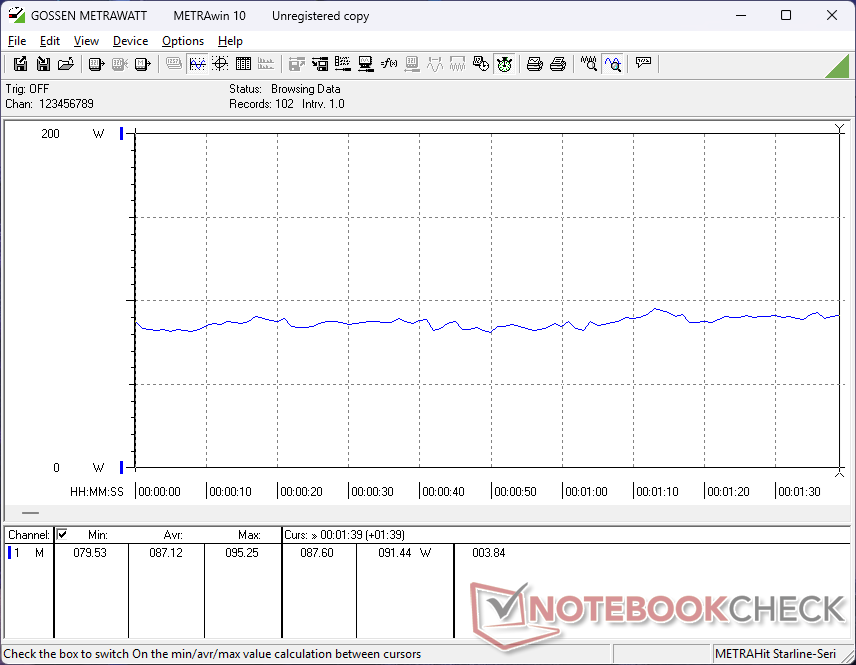
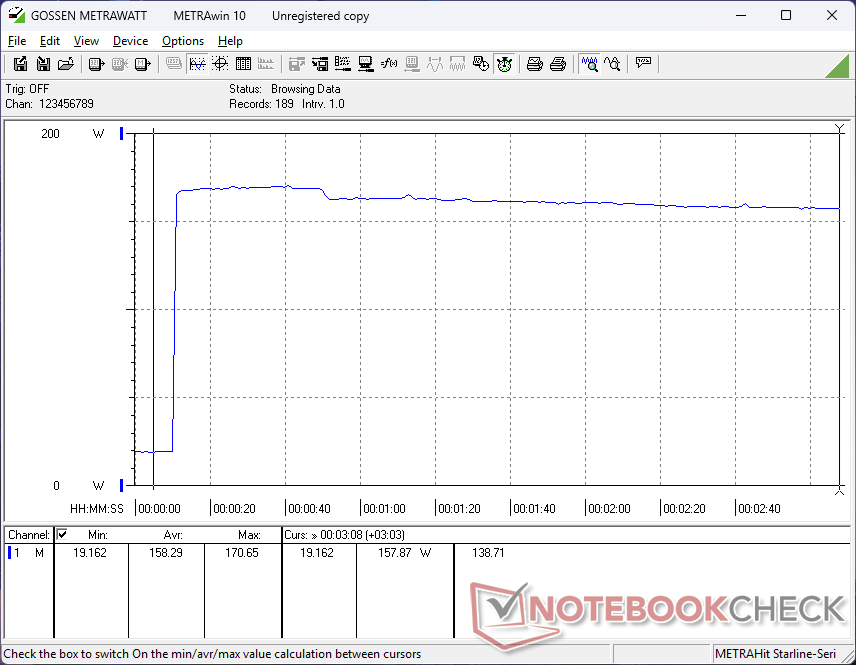
与 16X Aurora 相比,16Aurora 的组件速度更慢,因此整体功耗明显降低。当然,缺点是游戏时的图形性能比 16X Aurora RTX 5070 低 30%。
也许最值得注意的是,在 16 Aurora 上运行 Prime95 所需的功耗与 16X Aurora 不相上下,尽管 16 Aurora 的 CPU 运行速度比 16X Aurora 慢 50%。这是因为 16 Aurora 使用的是老一代处理器,内核数量不到 16X Aurora 的一半。
值得注意的是,16 Aurora 配备的 180 瓦交流适配器比 16X Aurora 配备的 280 瓦交流适配器(约 15.5 x 7.5 x 3 厘米 ~20.5 x 10.5 x 2.5 厘米)更小巧。
| Off / Standby | |
| Idle | |
| Load |
|
Key:
min: | |
| Alienware 16 Aurora Core 7 240H, GeForce RTX 5060 Laptop, , IPS, 2560x1600, 16" | Alienware 16X Aurora, RTX 5070 Ultra 9 275HX, GeForce RTX 5070 Laptop, , IPS, 2560x1600, 16" | Lenovo LOQ 15AHP10 R7 250, GeForce RTX 5060 Laptop, Micron 2500 1TB MTFDKBA1T0QGN, IPS, 1920x1080, 15.6" | Gigabyte Gaming A16 GA6H i7-13620H, GeForce RTX 5070 Laptop, Kingston OM8PGP41024Q-A0, IPS, 2560x1600, 16" | Asus TUF Gaming A16 FA608WV Ryzen AI 9 HX 370, GeForce RTX 4060 Laptop GPU, Micron 2400 MTFDKBA1T0QFM, IPS, 1920x1200, 16" | HP Victus 16 (2024) i7-14700HX, GeForce RTX 4060 Laptop GPU, Kioxia XG8 KXG80ZNV512G, IPS, 1920x1080, 16.1" | |
|---|---|---|---|---|---|---|
| Power Consumption | -100% | -60% | -14% | -8% | -37% | |
| Idle Minimum * (Watt) | 4.4 | 20.1 -357% | 20 -355% | 9 -105% | 6.8 -55% | 9 -105% |
| Idle Average * (Watt) | 18 | 27.6 -53% | 20.7 -15% | 11 39% | 12.7 29% | 15 17% |
| Idle Maximum * (Watt) | 18.2 | 31.8 -75% | 22.7 -25% | 23 -26% | 15.2 16% | 23 -26% |
| Load Average * (Watt) | 87.1 | 102.7 -18% | 71 18% | 91 -4% | 85 2% | 123 -41% |
| Cyberpunk 2077 ultra external monitor * (Watt) | 120.6 | 192.3 -59% | 151.1 -25% | 130 -8% | 143 -19% | |
| Cyberpunk 2077 ultra * (Watt) | 123 | 217 -76% | 153.1 -24% | 132.5 -8% | 145 -18% | |
| Load Maximum * (Watt) | 183 | 292 -60% | 172 6% | 155 15% | 199 -9% | 241 -32% |
| Witcher 3 ultra * (Watt) | 143.7 |
* ... smaller is better
功耗 赛博朋克/压力测试
外部显示器功耗
电池寿命
由于上述节电效果,无线局域网的运行时间增加了三个多小时。
| Alienware 16 Aurora Core 7 240H, GeForce RTX 5060 Laptop, 96 Wh | Alienware 16X Aurora, RTX 5070 Ultra 9 275HX, GeForce RTX 5070 Laptop, 96 Wh | Lenovo LOQ 15AHP10 R7 250, GeForce RTX 5060 Laptop, 60 Wh | Gigabyte Gaming A16 GA6H i7-13620H, GeForce RTX 5070 Laptop, 76 Wh | Asus TUF Gaming A16 FA608WV Ryzen AI 9 HX 370, GeForce RTX 4060 Laptop GPU, 90 Wh | HP Victus 16 (2024) i7-14700HX, GeForce RTX 4060 Laptop GPU, 83 Wh | |
|---|---|---|---|---|---|---|
| Battery runtime | -43% | -40% | 3% | 89% | 13% | |
| WiFi v1.3 (h) | 7.5 | 4.3 -43% | 4.5 -40% | 7.7 3% | 14.2 89% | 8.5 13% |
| Reader / Idle (h) | 6.9 | |||||
| Load (h) | 1.3 | 2.1 | ||||
| H.264 (h) | 14.7 |
笔记本检查评级
Alienware 16 Aurora 兼顾了重返校园的需求,如电池续航时间和轻薄,以及在 1080p 下舒适运行最新游戏所需的性能。
Alienware 16 Aurora
- 08/27/2025 v8
Allen Ngo
 Total Sustainability Score:
 潜在竞争对手比较
Image | Model / Review | Price | Weight | Height | Display |
|---|---|---|---|---|---|
1. 76.2%  | Alienware 16 Aurora Intel Core 7 240H ⎘ NVIDIA GeForce RTX 5060 Laptop ⎘ 32 GB Memory | Amazon: List Price: 1100 USD | 2.6 kg | 15.2 mm | 16.00" 2560x1600 189 PPI IPS |
2. 84.9%  | Alienware 16X Aurora, RTX 5070 Intel Core Ultra 9 275HX ⎘ NVIDIA GeForce RTX 5070 Laptop ⎘ 32 GB Memory | Amazon: List Price: 1800 USD | 2.5 kg | 23.4 mm | 16.00" 2560x1600 189 PPI IPS |
3. 85.9%  | Asus ROG Zephyrus G16 GA605WV AMD Ryzen AI 9 HX 370 ⎘ NVIDIA GeForce RTX 4060 Laptop GPU ⎘ 32 GB Memory, 1024 GB SSD | Amazon: List Price: 2599€ | 1.8 kg | 17.2 mm | 16.00" 2560x1600 189 PPI OLED |
4. 89% v7 (old)  | Lenovo Legion Pro 5 16ARX8 (R5 7645HX, RTX 4050) AMD Ryzen 5 7645HX ⎘ NVIDIA GeForce RTX 4050 Laptop GPU ⎘ 16 GB Memory, 512 GB SSD | Amazon: 1. $1,799.00 Lenovo Legion Pro 5 16Arx8 1... 2. $1,779.00 Lenovo Legion Pro 5 16" WQXG... 3. $1,367.40 Lenovo Legion 5 Gen 10 Gamin... List Price: 1500€ | 2.5 kg | 27.3 mm | 16.00" 2560x1600 189 PPI IPS |
5. 89.5% v7 (old)  | Acer Predator Helios 16 PH16-71-731Q Intel Core i7-13700HX ⎘ NVIDIA GeForce RTX 4060 Laptop GPU ⎘ 16 GB Memory, 1024 GB SSD | Amazon: 1. $139.99 HOULISE Replacement for Acer... 2. $90.33 LCDBros Screen for Acer Pred... 3. $155.00 Generic Replacement Screen 1... List Price: 2099€ | 2.6 kg | 26.9 mm | 16.00" 2560x1600 189 PPI IPS-LED |
6. 81.9%  | HP Omen Max 16 ah000 Intel Core Ultra 9 275HX ⎘ NVIDIA GeForce RTX 5090 Laptop ⎘ 32 GB Memory, 2048 GB SSD | Amazon: List Price: 3800 USD | 2.8 kg | 24.9 mm | 16.00" 2560x1600 189 PPI OLED |
Transparency
The selection of devices to be reviewed is made by our editorial team. The test sample was provided to the author as a loan by the manufacturer or retailer for the purpose of this review. The lender had no influence on this review, nor did the manufacturer receive a copy of this review before publication. There was no obligation to publish this review. As an independent media company, Notebookcheck is not subjected to the authority of manufacturers, retailers or publishers.
This is how Notebookcheck is testing
Every year, Notebookcheck independently reviews hundreds of laptops and smartphones using standardized procedures to ensure that all results are comparable. We have continuously developed our test methods for around 20 years and set industry standards in the process. In our test labs, high-quality measuring equipment is utilized by experienced technicians and editors. These tests involve a multi-stage validation process. Our complex rating system is based on hundreds of well-founded measurements and benchmarks, which maintains objectivity. Further information on our test methods can be found here.

